UNITED STATES
SECURITIES AND EXCHANGE COMMISSION
Washington, DC 20549
FORM N-CSRS
CERTIFIED SHAREHOLDER REPORT OF REGISTERED
MANAGEMENT INVESTMENT COMPANIES
Investment Company Act file number 811-05878
Franklin Value Investors Trust
(Exact name of registrant as specified in charter)
One Franklin Parkway, San Mateo, CA 94403-1906
(Address of principal executive offices) (Zip code)
Craig S. Tyle, One Franklin Parkway, San Mateo, CA 94403-1906
(Name and address of agent for service)
Registrant’s telephone number, including area Code: (650) 312-2000
Date of fiscal year end: 10/31
Date of reporting period: 4/30/17
| Item 1. | Reports to Stockholders. |
| | | | |
 | | Semiannual Report and Shareholder Letter April 30, 2017 | | |
Sign up for electronic delivery at franklintempleton.com/edelivery
Franklin Templeton Investments
Gain From Our Perspective®
At Franklin Templeton Investments, we’re dedicated to one goal: delivering exceptional asset management for our clients. By bringing together multiple, world-class investment teams in a single firm, we’re able to offer specialized expertise across styles and asset classes, all supported by the strength and resources of one of the world’s largest asset managers. This has helped us to become a trusted partner to individual and institutional investors across the globe.
Dear Shareholder:
During the six months ended April 30, 2017, mostly upbeat economic data, improved U.S. corporate earnings and supportive global monetary policies were positives for U.S. securities markets. After maintaining its target interest rate in the 0.25%–0.50% range for nearly a year, the U.S. Federal Reserve (Fed) increased its target range for the federal funds rate twice, in December 2016 and March 2017, to 0.75%–1.00%, noting improved employment and hints of higher inflation. The 10-year U.S. Treasury yield began the period at 1.84% and ended the period at 2.29%. In this environment, U.S. stocks, as measured by the Standard & Poor’s® 500 Index, generated a +13.32% total return for the six-month period.1 Value stocks, as measured by the Russell 3000® Value Index’s +12.18% total return, underperformed growth stocks, as measured by the Russell 3000® Growth Index’s +15.47% total return.1
In all economic environments, we are committed to our long-term perspective and disciplined investment approach as we conduct a diligent, fundamental analysis of securities with a regular emphasis on investment risk management.
Franklin Value Investors Trust is organized into four portfolios, each managed in the same value spirit but with a different focus. While the Funds generally have distinct investment approaches, our fundamental operating principles remain the same: prudent investment selection and constant professional management. You can be confident the Funds’ managers will remain committed to their commonsense, value investment philosophy in any economic or financial market environment. We believe our value Funds provide shareholders with
attractively valued portfolios of well-managed, financially sound companies that possess the potential for solid earnings growth and, with patience, capital appreciation over the long term.
The enclosed semiannual report for Franklin Value Investors Trust includes more detail about prevailing conditions during the period and a discussion about investment decisions. We encourage you to discuss your investment goals with your financial advisor, who can review your overall portfolio, reassess your goals and help you stay focused on the long term. Please remember all securities markets fluctuate, as do mutual fund share prices.
We are grateful for the trust you have placed in Franklin Value Investors Trust and look forward to continuing to serve your investment needs.
Sincerely,

Donald G. Taylor, CPA
Chief Executive Officer – Investment Management
Franklin Value Investors Trust
This letter reflects our analysis and opinions as of April 30, 2017, unless otherwise indicated. The information is not a complete analysis of every aspect of any market, country, industry, security or fund. Statements of fact are from sources considered reliable.
1. Source: Morningstar.
Russell Investment Group is the source and owner of the trademarks, service marks and copyrights related to the Russell Indices. Russell® is a trademark of Russell Investment Group.
See www.franklintempletondatasources.com for additional data provider information.
| | | | | | | | |
| Not FDIC Insured | | | | | May Lose Value | | | | | No Bank Guarantee |
| | | | |
| | | |
| franklintempleton.com | | Not part of the semiannual report | | 1 |
Contents
Semiannual Report
Visit franklintempleton.com for fund updates, to access your account, or to find helpful financial planning tools.
| | | | |
| | | |
| 2 | | Semiannual Report | | franklintempleton.com |
Semiannual Report
Economic and Market Overview
U.S. economic growth decelerated in 2017’s first quarter, largely due to declines in private inventory investment and government spending. However, an increase in exports and personal consumption, as well as residential and nonresidential fixed investment aided growth. The manufacturing sector generally expanded and the services sector also continued to grow. The unemployment rate decreased from 4.8% in October 2016 to 4.4% at period-end.1 Monthly retail sales were volatile, but grew for most of the period. Annual inflation, as measured by the Consumer Price Index, modestly increased from 1.6% to 2.2% during the period.
At its December meeting, the U.S. Federal Reserve (Fed) raised its target range for the federal funds rate from 0.25%–0.50% to 0.50%–0.75%, as policymakers cited improved labor market conditions and higher inflation. The Fed kept its interest rate unchanged at its February meeting, but incoming economic data, along with statements by Fed officials in late February and early March, heightened many investors’ expectations for a March interest-rate hike. The Fed, at its March meeting, made the widely anticipated increase in its federal funds target rate to 0.75%–1.00%.
U.S. equity markets rose during the period, benefiting from mostly upbeat economic data, better U.S. corporate earnings and signs of improvement in the Chinese and European economies. The European Central Bank’s December announcement to extend its quantitative easing program beyond March 2017, investor optimism arising from pro-growth and pro-business policy plans in the U.S. and the results of the first round of presidential elections in France also helped U.S. equities. However, investor concerns about the terms of the U.K.’s exit from the European Union (also known as “Brexit”) and geopolitical tensions in the Middle East and the Korean peninsula weighed on market sentiment. The broad U.S. stock market, as measured by the Standard & Poor’s® 500 Index, generated a +13.32% total return for the six-month period.2
The foregoing information reflects our analysis and opinions as of April 30, 2017. The information is not a complete analysis of every aspect of any market, country, industry, security or fund. Statements of fact are from sources considered reliable.
1. Source: Bureau of Labor Statistics.
2. Source: Morningstar.
See www.franklintempletondatasources.com for additional data provider information.
| | | | |
| | | |
| franklintempleton.com | | Semiannual Report | | 3 |
Franklin Balance Sheet Investment Fund
We are pleased to bring you Franklin Balance Sheet Investment Fund’s semiannual report for the period ended April 30, 2017.
Your Fund’s Goal and Main Investments
The Fund seeks high total return, of which capital appreciation and income are components, by investing most of its assets in equity securities of companies of any size that we believe are undervalued in the marketplace at the time of purchase but have the potential for capital appreciation. The Fund invests predominantly in common stocks.
Performance Overview
The Fund’s Class A shares delivered a +15.59% cumulative total return for the six months under review. In comparison, the Russell 3000® Value Index, which measures performance of those Russell 3000® Index companies with lower price-to-book ratios and lower forecasted growth values, generated a +12.18% total return for the same period.1 You can find more of the Fund’s performance data in the Performance Summary beginning on page 7.
Performance data represent past performance, which does not guarantee future results. Investment return and principal value will fluctuate, and you may have a gain or loss when you sell your shares. Current performance may differ from figures shown. For most recent month-end performance, go to franklintempleton.com or call (800) 342-5236.
Investment Strategy
Our strategy uses low price-to-book value as its primary reference valuation measure. Book value per share is a company’s net worth or shareholders’ equity on an accounting or “book” basis, divided by shares outstanding. The equity securities bought by the Fund will typically be purchased at a low price relative to book value. This strategy is not aimed at short-term trading gains, and we do not adhere to the composition of the benchmark. Rather, we try to identify individual companies that meet our investment criteria, with a 3-5 year investment horizon.
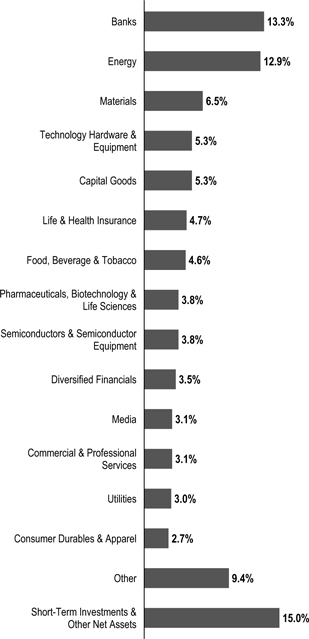
Portfolio Composition
Based on Total Net Assets as of 4/30/17
Manager’s Discussion
During the six months under review, holdings that positively contributed to Fund performance included Corning, Citizens Financial Group and MKS Instruments.
1. Source: Morningstar.
The index is unmanaged and includes reinvestment of any income or distributions. It does not reflect any fees, expenses or sales charges. One cannot invest directly in an index, and an index is not representative of the Fund’s portfolio.
See www.franklintempletondatasources.com for additional data provider information.
The dollar value, number of shares or principal amount, and names of all portfolio holdings are listed in the Fund’s Statement of Investments (SOI). The SOI begins on page 34.
| | | | |
| | | |
| 4 | | Semiannual Report | | franklintempleton.com |
FRANKLIN BALANCE SHEET INVESTMENT FUND
Corning, a leading innovator in the field of material science, was the largest Fund position at period-end. The company’s fourth quarter financial results showed improving trends in its glass display and fiber optics businesses. Earnings for the past three quarters beat analysts’ expectations. We believe the company offered what we considered attractive growth opportunities through its science, technology and innovation in the specialty glass market, where it began to break into new end markets such as data centers, automotive and life sciences. The company also exhibited, in our view, excellent value characteristics, such as strong free cash flow, low capital requirements, an increasing dividend and large share repurchases.
Citizens Financial Group is a northeastern regional bank that was divested from Royal Bank of Scotland2 at a discount to its book value. We feel the firm was managed poorly within a larger conglomerate. Citizens’ new management team has focused on reducing costs, improving growth and returns. The execution of this strategy, coupled with successful investments have led Citizens’ stock to appreciate in value.
MKS Instruments provides subsystems solutions and instruments to semiconductor and other advanced manufacturing industries. During the period, MKS enjoyed strong industry trends, and the company’s ongoing operating model improvements have driven their target profitability progressively higher. These factors coupled with the firm’s diversification away from semiconductors through the acquisition of laser manufacturer Newport,2 its paydown of its debt and an increase in dividends led to higher market valuations.
Detractors from Fund performance included Cloud Peak Energy, Trinity Place Holdings and QEP Resources.
Cloud Peak Energy mines thermal coal in the Powder River Basin of Wyoming and Montana. Warm winters and regulatory pressures have diminished domestic demand for Cloud Peak’s coal. Additionally, low global prices and a strong dollar have undercut export volumes that Cloud Peak needs to operate profitably.
Trinity Place is a real estate development company that requires capital for the development of its landmark New York City assets. The stock sold off after the company announced it would allow existing stockholders to buy additional shares at below market prices to fund a development.
2. Not a Fund holding.
QEP Resources, a natural gas exploration and production company, announced quarterly earnings that were unexpectedly positive. Investors, however, focused on the company’s capital spending plan for 2017 that exceeded most analysts’ estimates. Investors were disappointed the production growth associated with this elevated spending could be pushed out into 2018. The company also experienced some weather related operational difficulties.
| | | | |
| Top 10 Holdings | | | |
| 4/30/17 | | | |
| |
Company Sector/Industry | |
| % of Total
Net Assets |
|
| |
| |
Corning Inc. | | | 4.4% | |
Technology Hardware & Equipment | | | | |
| |
| |
JPMorgan Chase & Co. | | | 3.0% | |
Banks | | | | |
| |
| |
Royal Dutch Shell PLC | | | 2.6% | |
Energy | | | | |
| |
| |
Bank of America Corp. | | | 2.5% | |
Banks | | | | |
| |
| |
Bunge Ltd. | | | 2.3% | |
Food, Beverage & Tobacco | | | | |
| |
| |
Bio-Rad Laboratories Inc. | | | 2.3% | |
Pharmaceuticals, Biotechnology & Life Sciences | | | | |
| |
| |
Morgan Stanley | | | 2.0% | |
Diversified Financials | | | | |
| |
| |
Comerica Inc. | | | 2.0% | |
Banks | | | | |
| |
| |
Toll Brothers Inc. | | | 1.9% | |
Consumer Durables & Apparel | | | | |
| |
| |
MKS Instruments Inc. | | | 1.9% | |
Semiconductors & Semiconductor Equipment | | | | |
| |
During the reporting period, several large new purchases included Bank of America, a multinational banking and financial services corporation; Allergan, a pharmaceutical company; The Bank of New York Mellon, a banking and financial services holding company; TimkenSteel, a steel manufacturer; and Kulicke & Soffa, a designer, manufacturer and retailer of capital equipment and expendable tools used to assemble semiconductor devices, among several others. We also added to existing positions including Royal Dutch Shell, an oil and gas exploration company; The Mosaic Company, a producer of fertilizers; and Chevron, a large integrated energy company.
In contrast, the Fund’s largest liquidations included Brooks Automation, Regions Financial and Superior Energy Services.
| | | | |
| | | |
| franklintempleton.com | | Semiannual Report | | 5 |
FRANKLIN BALANCE SHEET INVESTMENT FUND
We also reduced several holdings including Devon Energy and the aforementioned Citizens Financial Group and MKS Instruments.
Thank you for your participation in Franklin Balance Sheet Investment Fund. We look forward to continuing to serve your investment needs.
| | |
 | | 
Grace Hoefig Lead Portfolio Manager |
| |
| | Bruce C. Baughman, CPA Donald G. Taylor, CPA |
| |
| | Portfolio Management Team |
The foregoing information reflects our analysis, opinions and portfolio holdings as of April 30, 2017, the end of the reporting period. The way we implement our main investment strategies and the resulting portfolio holdings may change depending on factors such as market and economic conditions. These opinions may not be relied upon as investment advice or an offer for a particular security. The information is not a complete analysis of every aspect of any market, country, industry, security or the Fund. Statements of fact are from sources considered reliable, but the investment manager makes no representation or warranty as to their completeness or accuracy. Although historical performance is no guarantee of future results, these insights may help you understand our investment management philosophy.
| | | | |
| | | |
| 6 | | Semiannual Report | | franklintempleton.com |
FRANKLIN BALANCE SHEET INVESTMENT FUND
Performance Summary as of April 30, 2017
The performance table does not reflect any taxes that a shareholder would pay on Fund dividends, capital gain distributions, if any, or any realized gains on the sale of Fund shares. Total return reflects reinvestment of the Fund’s dividends and capital gain distributions, if any, and any unrealized gains or losses. Your dividend income will vary depending on dividends or interest paid by securities in the Fund’s portfolio, adjusted for operating expenses of each class. Capital gain distributions are net profits realized from the sale of portfolio securities.
Performance as of 4/30/171
Cumulative total return excludes sales charges. Average annual total return include maximum sales charges. Sales charges will vary depending on the size of the investment and the class of share purchased. The maximum is 5.75% and the minimum is 0%. Class A: 5.75% maximum initial sales charge; Advisor Class: no sales charges. For other share classes, visit franklintempleton.com.
| | | | | | | | |
| Share Class | | Cumulative
Total Return2 | | | Average Annual
Total Return3 | |
| | |
A | | | | | | | | |
6-Month | | | +15.59% | | | | +8.95% | |
1-Year | | | +19.41% | | | | +12.54% | |
5-Year | | | +62.37% | | | | +8.88% | |
10-Year | | | +40.92% | | | | +2.88% | |
| | |
Advisor | | | | | | | | |
6-Month | | | +15.76% | | | | +15.76% | |
1-Year | | | +19.74% | | | | +19.74% | |
5-Year | | | +64.39% | | | | +10.45% | |
10-Year | | | +46.51% | | | | +3.89% | |
Performance data represent past performance, which does not guarantee future results. Investment return and principal value will fluctuate, and you may have a gain or loss when you sell your shares. Current performance may differ from figures shown. For most recent month-end performance, go to franklintempleton.com or call (800) 342-5236.
See page 8 for Performance Summary footnotes.
| | | | |
| | | |
| franklintempleton.com | | Semiannual Report | | 7 |
FRANKLIN BALANCE SHEET INVESTMENT FUND
PERFORMANCE SUMMARY
Distributions (11/1/16–4/30/17)
| | | | | | | | | | | | |
| Share Class | | Net Investment
Income | | | Long-Term
Capital Gain | | | Total | |
A | | | $0.1826 | | | | $2.3089 | | | | $2.4915 | |
C | | | $ — | | | | $2.3089 | | | | $2.3089 | |
R | | | $0.0950 | | | | $2.3089 | | | | $2.4039 | |
R6 | | | $0.2861 | | | | $2.3089 | | | | $2.5950 | |
Advisor | | | $0.2839 | | | | $2.3089 | | | | $2.5928 | |
Total Annual Operating Expenses4
| | | | | | |
| Share Class | | With Waiver | | | Without Waiver |
A | | | 0.93% | | | 0.96% |
Advisor | | | 0.68% | | | 0.71% |
Each class of shares is available to certain eligible investors and has different annual fees and expenses, as described in the prospectus.
All investments involve risks, including possible loss of principal. Value securities may not increase in price as anticipated or may decline further in value. While smaller and midsize companies may offer substantial opportunities for capital growth, they may also involve heightened risks and should be considered speculative. Historically, smaller- and midsize- company securities have been more volatile in price than larger-company securities, especially over the short term. In addition, the Fund may invest up to 25% of its total assets in foreign securities, which involve special risks, including currency fluctuations and economic and political uncertainty. The Fund is actively managed but there is no guarantee that the manager’s investment decisions will produce the desired results. The Fund’s prospectus also includes a description of the main investment risks.
1. The Fund has a fee waiver associated with any investment it makes in a Franklin Templeton money fund and/or other Franklin Templeton fund, contractually guaranteed through 2/28/18. Fund investment results reflect the fee waiver; without this waiver, the results would have been lower.
2. Cumulative total return represents the change in value of an investment over the periods indicated.
3. Average annual total return represents the average annual change in value of an investment over the periods indicated. Return for less than one year, if any, has not been annualized.
4. Figures are as stated in the Fund’s current prospectus and may differ from the expense ratios disclosed in the Your Fund’s Expenses and Financial Highlights sections in this report. In periods of market volatility, assets may decline significantly, causing total annual Fund operating expenses to become higher than the figures shown.
| | | | |
| | | |
| 8 | | Semiannual Report | | franklintempleton.com |
FRANKLIN BALANCE SHEET INVESTMENT FUND
Your Fund’s Expenses
As a Fund shareholder, you can incur two types of costs: (1) transaction costs, including sales charges (loads) on Fund purchases and redemptions; and (2) ongoing Fund costs, including management fees, distribution and service (12b-1) fees, and other Fund expenses. All mutual funds have ongoing costs, sometimes referred to as operating expenses. The table below shows ongoing costs of investing in the Fund and can help you understand these costs and compare them with those of other mutual funds. The table assumes a $1,000 investment held for the six months indicated.
Actual Fund Expenses
The table below provides information about actual account values and actual expenses in the columns under the heading “Actual.” In these columns the Fund’s actual return, which includes the effect of Fund expenses, is used to calculate the “Ending Account Value” for each class of shares. You can estimate the expenses you paid during the period by following these steps (of course, your account value and expenses will differ from those in this illustration): Divide your account value by $1,000 (if your account had an $8,600 value, then $8,600 ÷ $1,000 = 8.6). Then multiply the result by the number in the row for your class of shares under the headings “Actual” and “Expenses Paid During Period” (if Actual Expenses Paid During Period were $7.50, then 8.6 x $7.50 = $64.50). In this illustration, the actual expenses paid this period are $64.50.
Hypothetical Example for Comparison with Other Funds
Under the heading “Hypothetical” in the table, information is provided about hypothetical account values and hypothetical expenses based on the Fund’s actual expense ratio and an assumed rate of return of 5% per year before expenses, which is not the Fund’s actual return. This information may not be used to estimate the actual ending account balance or expenses you paid for the period, but it can help you compare ongoing costs of investing in the Fund with those of other funds. To do so, compare this 5% hypothetical example for the class of shares you hold with the 5% hypothetical examples that appear in the shareholder reports of other funds.
Please note that expenses shown in the table are meant to highlight ongoing costs and do not reflect any transactional costs. Therefore, information under the heading “Hypothetical” is useful in comparing ongoing costs only, and will not help you compare total costs of owning different funds. In addition, if transactional costs were included, your total costs would have been higher.
| | | | | | | | | | | | |
| | | | | Actual
(actual return after expenses) | | Hypothetical
(5% annual return before expenses) | | |
Share Class | | Beginning
Account
Value 11/1/16 | | Ending
Account
Value 4/30/17 | | Expenses Paid During Period 11/1/16–4/30/171,2 | | Ending Account
Value 4/30/17 | | Expenses Paid During Period 11/1/16–4/30/171,2 | | Net
Annualized
Expense
Ratio2 |
| | | | | | |
| | | | | | |
| A | | $1,000 | | $1,155.90 | | $4.65 | | $1,020.48 | | $4.36 | | 0.87% |
| | | | | | |
| C | | $1,000 | | $1,151.70 | | $8.64 | | $1,016.76 | | $8.10 | | 1.62% |
| | | | | | |
| R | | $1,000 | | $1,154.70 | | $5.98 | | $1,019.24 | | $5.61 | | 1.12% |
| | | | | | |
| R6 | | $1,000 | | $1,158.20 | | $2.52 | | $1,022.46 | | $2.36 | | 0.47% |
| | | | | | |
| Advisor | | $1,000 | | $1,157.60 | | $3.32 | | $1,021.72 | | $3.11 | | 0.62% |
1. Expenses are equal to the annualized expense ratio for the six-month period as indicated above–in the far right column–multiplied by the simple average account value over the period indicated, and then multiplied by 181/365 to reflect the one-half year period.
2. Reflects expenses after fee waivers and expense reimbursements. Does not include acquired fund fees and expenses.
| | | | |
| | | |
| franklintempleton.com | | Semiannual Report | | 9 |
Franklin MicroCap Value Fund
This semiannual report for Franklin MicroCap Value Fund covers the period ended April 30, 2017. The Fund closed to new investors (with the exception of certain retirement accounts) in January 2004 and has remained closed except for two days in mid-February 2013, when the Fund was opened on a limited basis. Existing shareholders may add to or reduce their investments in the Fund; however, once an account is reduced to zero, it may not be reopened unless the Fund reopens.
Your Fund’s Goal and Main Investments
The Fund seeks high total return, of which capital appreciation and income are components, by investing at least 80% of its net assets in securities of companies with market capitalizations under $500 million at the time of purchase that we believe are undervalued in the marketplace and have the potential for capital appreciation. The Fund invests predominantly in common stocks.
Performance Overview
The Fund’s Class A shares delivered a +14.33% cumulative total return for the six months under review. In comparison, the Russell 2000® Value Index, which measures performance of those Russell 2000® Index companies with lower price-to-book ratios and lower forecasted growth values, generated a +18.26% total return for the same period.1 You can find more of the Fund’s performance data in the Performance Summary beginning on page 13.
Performance data represent past performance, which does not guarantee future results. Investment return and principal value will fluctuate, and you may have a gain or loss when you sell your shares. Current performance may differ from figures shown. For most recent month-end performance, go to franklintempleton.com or call (800) 342-5236.
Investment Strategy
Our strategy is to buy shares of financially sound, well-established companies at a low price-to-book value, where we have reasonable confidence that book value will increase over several years. We limit purchases to companies with market capitalizations of less than $500 million, which we define as “microcap.”1 Book value per share is a company’s net
Portfolio Composition
Based on Total Net Assets as of 4/30/17
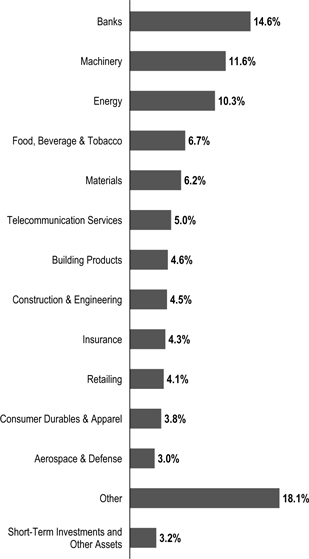
worth or shareholders’ equity on an accounting or “book” basis, divided by shares outstanding. This strategy is not aimed at short-term trading gains, nor do we consider the composition of any index. Rather, we try to identify individual companies that meet our investment criteria, and we assume at purchase that we will hold the positions for several years.
1. Source: Morningstar.
The index is unmanaged and includes reinvestment of any income or distributions. It does not reflect any fees, expenses or sales charges. One cannot invest directly in an index, and an index is not representative of the Fund’s portfolio.
See www.franklintempletondatasources.com for additional data provider information.
The dollar value, number of shares or principal amount, and names of all portfolio holdings are listed in the Fund’s Statement of Investments (SOI). The SOI begins on page 40.
| | | | |
| | | |
| 10 | | Semiannual Report | | franklintempleton.com |
FRANKLIN MICROCAP VALUE FUND
| | | | |
| Top 10 Holdings | | | |
| 4/30/17 | | | |
| |
Company Sector/Industry | | % of Total
Net Assets | |
| |
| Seneca Foods Corp. | | | 4.3% | |
| Food, Beverage & Tobacco | | | | |
| |
| Healthcare Services Group Inc. | | | 2.9% | |
| Commercial & Professional Services | | | | |
| |
| Bar Harbor Bankshares | | | 2.7% | |
| Banks | | | | |
| |
| Hurco Cos. Inc. | | | 2.5% | |
| Machinery | | | | |
| |
| Alamo Group Inc. | | | 2.5% | |
| Machinery | | | | |
| |
| Miller Industries Inc. | | | 2.4% | |
| Machinery | | | | |
| |
| Delta Apparel Inc. | | | 2.4% | |
| Consumer Durables & Apparel | | | | |
| |
| Northeast Bancorp | | | 2.3% | |
| Banks | | | | |
| |
| Sterling Construction Co. | | | 2.3% | |
| Construction & Engineering | | | | |
| |
| First Defiance Financial Corp. | | | 2.3% | |
| Banks | | | | |
| |
Manager’s Discussion
During the six months under review, holdings that positively contributed to Fund performance included Seneca Foods, Ducommun and Northeast Bancorp.
Seneca Foods produces and distributes canned and frozen fruit and vegetables. The company’s results can be volatile, given the need to estimate full-year volumes and expenses over the annual harvest and pack cycle, and the effects of changing commodity prices on its inventory accounting method. Seneca reported increased sales in its second fiscal quarter, including contributions from recent acquisitions.
Ducommun manufactures components for commercial, military and space aircraft. The company reported improved margins, divested certain non-core operations and reduced debt during the period. We believe Ducommun could benefit from the Trump administration’s plan for greater military spending.
Northeast Bancorp is based in Lewiston, Maine. Along with activities typical of community banks, Northeast specializes in purchasing performing commercial real estate loans at varying discounts to outstanding principal balances. Northeast generates a higher net interest margin thereby, and has enjoyed good loan collections. The bank reported two successive quarters of record earnings in the period under review.
Detractors from Fund performance included PHI, Cloud Peak Energy and Celadon Group.
PHI provides helicopter transportation to the offshore energy industry in the Gulf of Mexico and air medical services on land. The recovery so far in energy prices has been enough to stimulate exploration and production on land, but not enough to restart the relatively more expensive deep water projects PHI serves. PHI’s flight hours in Gulf continued to decline as a result.
Cloud Peak Energy mines thermal coal in the Powder River Basin of Wyoming and Montana. Warm winters and regulatory pressures have diminished domestic demand for Cloud Peak’s coal. Additionally, low global prices and a strong dollar have undercut export volumes that Cloud Peak needs to operate profitably.
Celadon Group is a trucking company that has grown through acquisitions and by emphasizing equipment leasing and services. Celadon has been a target of short sellers who claim the company accounted improperly for certain transactions. In April, the company’s auditors withdrew their opinion on previously issued financial statements, citing additional information and a possible need for prolonged investigatory work before revised statements can be issued. The stock sold off as a result of that announcement.
During the reporting period, we initiated a position in Titan Machinery, an agriculture and construction equipment dealer. We also added to some positions including Aegean Marine Petroleum Network, an international marine fuel logistics company; Invacare, a manufacturer of wheelchairs, bariatric equipment, disability scooters, respiratory products and other homecare products; and the aforementioned Celadon Group
We exited positions including Fred’s, KCAP Financial, Ecology and Environment, Citizens Community Bancorp and Broadwind Energy. In addition, Providence and Worcester Railroad was acquired during the period in an all cash deal by Genesee & Wyoming. The Fund also reduced its holdings in John B. Sanfilippo & Son, Sterling Construction and the aforementioned Seneca Foods, among others.
| | | | |
| | | |
| franklintempleton.com | | Semiannual Report | | 11 |
FRANKLIN MICROCAP VALUE FUND
Thank you for your participation in Franklin MicroCap Value Fund. We look forward to continuing to serve your investment needs.
| | |
 | | 
Bruce C. Baughman, CPA Lead Portfolio Manager |
| | |
| | Portfolio Management Team |
The foregoing information reflects our analysis, opinions and portfolio holdings as of April 30, 2017, the end of the reporting period. The way we implement our main investment strategies and the resulting portfolio holdings may change depending on factors such as market and economic conditions. These opinions may not be relied upon as investment advice or an offer for a particular security. The information is not a complete analysis of every aspect of any market, country, industry, security or the Fund. Statements of fact are from sources considered reliable, but the investment manager makes no representation or warranty as to their completeness or accuracy. Although historical performance is no guarantee of future results, these insights may help you understand our investment management philosophy.
| | | | |
| | | |
| 12 | | Semiannual Report | | franklintempleton.com |
FRANKLIN MICROCAP VALUE FUND
Performance Summary as of April 30, 2017
The performance table does not reflect any taxes that a shareholder would pay on Fund dividends, capital gain distributions, if any, or any realized gains on the sale of Fund shares. Total return reflects reinvestment of the Fund’s dividends and capital gain distributions, if any, and any unrealized gains or losses. Your dividend income will vary depending on dividends or interest paid by securities in the Fund’s portfolio, adjusted for operating expenses of each class. Capital gain distributions are net profits realized from the sale of portfolio securities.
Performance as of 4/30/171
Cumulative total return excludes sales charges. Average annual total return include maximum sales charges. Sales charges will vary depending on the size of the investment and the class of share purchased. The maximum is 5.75% and the minimum is 0%. Class A: 5.75% maximum initial sales charge; Advisor Class: no sales charges. For other share classes, visit franklintempleton.com.
| | | | | | | | |
| Share Class | | Cumulative
Total Return2 | | | Average Annual
Total Return3 | |
| | |
A | | | | | | | | |
6-Month | | | +14.33% | | | | +7.76% | |
1-Year | | | +16.98% | | | | +10.25% | |
5-Year | | | +68.04% | | | | +9.63% | |
10-Year | | | +76.43% | | | | +5.22% | |
| | |
Advisor | | | | | | | | |
6-Month | | | +14.48% | | | | +14.48% | |
1-Year | | | +17.31% | | | | +17.31% | |
5-Year | | | +70.10% | | | | +11.21% | |
10-Year | | | +80.77% | | | | +6.10% | |
Performance data represent past performance, which does not guarantee future results. Investment return and principal value will fluctuate, and you may have a gain or loss when you sell your shares. Current performance may differ from figures shown. For most recent month-end performance, go to franklintempleton.com or call (800) 342-5236.
See page 14 for Performance Summary footnotes.
| | | | |
| | | |
| franklintempleton.com | | Semiannual Report | | 13 |
FRANKLIN MICROCAP VALUE FUND
PERFORMANCE SUMMARY
Distributions (11/1/16–4/30/17)
| | | | | | | | | | | | | | | | |
| Share Class | | Net Investment
Income | | | Short-Term
Capital Gain | | | Long-Term
Capital Gain | | | Total | |
A | | | $0.1071 | | | | $0.0390 | | | | $2.9578 | | | | $3.1039 | |
R6 | | | $0.2332 | | | | $0.0390 | | | | $2.9578 | | | | $3.2300 | |
Advisor | | | $0.1913 | | | | $0.0390 | | | | $2.9578 | | | | $3.1881 | |
Total Annual Operating Expenses4
| | | | | | |
| Share Class | | With Waiver | | | Without Waiver |
A | | | 1.19% | | | 1.20% |
Advisor | | | 0.95% | | | 0.96% |
Each class of shares is available to certain eligible investors and has different annual fees and expenses, as described in the prospectus.
All investments involve risks, including possible loss of principal. The Fund’s ability to invest in smaller company securities that may have limited liquidity involves additional risks, such as relatively small revenues, limited product lines and small market share. Historically, these stocks have exhibited greater price volatility than larger company stocks, especially over the short term. In addition, the Fund may invest up to 25% of its total assets in foreign securities, which involve special risks, including currency fluctuations and economic and political uncertainty. The Fund is actively managed but there is no guarantee that the manager’s investment decisions will produce the desired results. The Fund’s prospectus also includes a description of the main investment risks.
The Fund has a fee waiver associated with any investment it makes in a Franklin Templeton money fund and/or other Franklin Templeton fund, contractually guaranteed through 2/28/18. Fund investment results reflect the fee waiver; without this waiver, the results would have been lower.
2. Cumulative total return represents the change in value of an investment over the periods indicated.
3. Average annual total return represents the average annual change in value of an investment over the periods indicated. Return for less than one year, if any, has not been annualized.
4. Figures are as stated in the Fund’s current prospectus and may differ from the expense ratios disclosed in the Your Fund’s Expenses and Financial Highlights sections in this report. In periods of market volatility, assets may decline significantly, causing total annual Fund operating expenses to become higher than the figures shown.
| | | | |
| | | |
| 14 | | Semiannual Report | | franklintempleton.com |
FRANKLIN MICROCAP VALUE FUND
Your Fund’s Expenses
As a Fund shareholder, you can incur two types of costs: (1) transaction costs, including sales charges (loads) on Fund purchases and redemptions; and (2) ongoing Fund costs, including management fees, distribution and service (12b-1) fees, and other Fund expenses. All mutual funds have ongoing costs, sometimes referred to as operating expenses. The table below shows ongoing costs of investing in the Fund and can help you understand these costs and compare them with those of other mutual funds. The table assumes a $1,000 investment held for the six months indicated.
Actual Fund Expenses
The table below provides information about actual account values and actual expenses in the columns under the heading “Actual.” In these columns the Fund’s actual return, which includes the effect of Fund expenses, is used to calculate the “Ending Account Value” for each class of shares. You can estimate the expenses you paid during the period by following these steps (of course, your account value and expenses will differ from those in this illustration): Divide your account value by $1,000 (if your account had an $8,600 value, then $8,600 ÷ $1,000 = 8.6). Then multiply the result by the number in the row for your class of shares under the headings “Actual” and “Expenses Paid During Period” (if Actual Expenses Paid During Period were $7.50, then 8.6 x $7.50 = $64.50). In this illustration, the actual expenses paid this period are $64.50.
Hypothetical Example for Comparison with Other Funds
Under the heading “Hypothetical” in the table, information is provided about hypothetical account values and hypothetical expenses based on the Fund’s actual expense ratio and an assumed rate of return of 5% per year before expenses, which is not the Fund’s actual return. This information may not be used to estimate the actual ending account balance or expenses you paid for the period, but it can help you compare ongoing costs of investing in the Fund with those of other funds. To do so, compare this 5% hypothetical example for the class of shares you hold with the 5% hypothetical examples that appear in the shareholder reports of other funds.
Please note that expenses shown in the table are meant to highlight ongoing costs and do not reflect any transactional costs. Therefore, information under the heading “Hypothetical” is useful in comparing ongoing costs only, and will not help you compare total costs of owning different funds. In addition, if transactional costs were included, your total costs would have been higher.
| | | | | | | | | | | | |
| | | | | Actual
(actual return after expenses) | | Hypothetical
(5% annual return before expenses) | | |
Share Class | | Beginning
Account
Value 11/1/16 | | Ending
Account
Value 4/30/17 | | Expenses Paid During
Period
11/1/16–4/30/171,2 | | Ending Account
Value 4/30/17 | | Expenses Paid During Period
11/1/16–4/30/171,2 | | Net
Annualized
Expense
Ratio2 |
| | | | | | |
| | | | | | |
| A | | $1,000 | | $1,143.30 | | $6.22 | | $1,018.99 | | $5.86 | | 1.17% |
| | | | | | |
| R6 | | $1,000 | | $1,145.60 | | $4.26 | | $1,020.83 | | $4.01 | | 0.80% |
| | | | | | |
| Advisor | | $1,000 | | $1,144.80 | | $4.95 | | $1,020.18 | | $4.66 | | 0.93% |
1. Expenses are equal to the annualized expense ratio for the six-month period as indicated above–in the far right column–multiplied by the simple average account value over the period indicated, and then multiplied by 181/365 to reflect the one-half year period.
2. Reflects expenses after fee waivers and expense reimbursements. Does not include acquired fund fees and expenses.
| | | | |
| | | |
| franklintempleton.com | | Semiannual Report | | 15 |
Franklin MidCap Value Fund
This semiannual report for Franklin MidCap Value Fund covers the period ended April 30, 2017. On May 22, 2017, the Board approved a proposal to reorganize Franklin MidCap Value Fund with and into Franklin Small Cap Value Fund, subject to approval by the shareholders of Franklin MidCap Value Fund.
Your Fund’s Goal and Main Investments
The Fund seeks long-term total return by investing at least 80% of net assets in securities of mid-capitalization companies that we believe are undervalued in the marketplace at the time of purchase but have the potential for capital appreciation. We define mid-capitalization companies as those with market capitalizations that are similar in size at the time of purchase to those in the Russell Midcap® Index.1 The Fund invests predominantly in common stocks.
Performance Overview
The Fund’s Class A shares delivered a +11.42% cumulative total return for the six months under review. In comparison, the Russell Midcap® Value Index, which measures performance of those Russell Midcap® Index companies with lower price-to-book ratios and lower forecasted growth values, generated a +12.42% total return for the same period.2 You can find more of the Fund’s performance data in the Performance Summary beginning on page 19.
Performance data represent past performance, which does not guarantee future results. Investment return and principal value will fluctuate, and you may have a gain or loss when you sell your shares. Current performance may differ from figures shown. For most recent month-end performance, go to franklintempleton.com or call (800) 342-5236.
Investment Strategy
Our goal is to invest in mid-capitalization companies that we determine are currently undervalued and have the potential for capital appreciation. The Fund purchases stocks that are out of favor in the market for reasons we believe will prove to be temporary in nature. In addition, the Fund may invest in companies with valuable intangibles we believe are not reflected in the stock price. This strategy is not aimed at
Portfolio Composition
Based on Total Net Assets as of 4/30/17
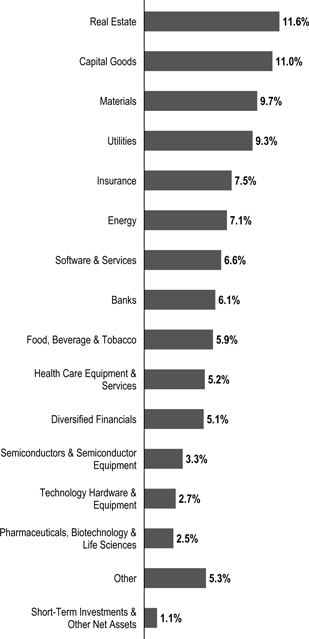
short-term trading gains, nor do we consider the composition of any index. Rather, we try to identify attractively priced, financially sound companies that meet our investment criteria,
1. The Russell Midcap Index is market capitalization weighted and measures performance of the smallest companies in the Russell 1000 Index, which represent a modest amount of the Russell 1000 Index’s total market capitalization.
2. Source: Morningstar.
The index is unmanaged and includes reinvestment of any income or distributions. It does not reflect any fees, expenses or sales charges. One cannot invest directly in an index, and an index is not representative of the Fund’s portfolio.
See www.franklintempletondatasources.com for additional data provider information.
The dollar value, number of shares or principal amount, and names of all portfolio holdings are listed in the Fund’s Statement of Investments (SOI). The SOI begins on page 47.
| | | | |
| | | |
| 16 | | Semiannual Report | | franklintempleton.com |
FRANKLIN MIDCAP VALUE FUND
and we assume at purchase that we will hold the position for several years.
Manager’s Discussion
During the six months under review, holdings that positively contributed to Fund performance included Mobileye, SLM and Western Digital.
Mobileye, a designer of advanced driver assistance systems, rose on Intel’s announcement that it would acquire the company at a significant premium to its prior day stock price.
SLM, the nation’s largest private originator of education loans, rallied following the U.S. presidential election, fueled by the defeat of the opposition candidate who proposed a plan for free tuition. Such a policy could have significantly reduced the need for student loans offered by SLM. In our view, the new administration’s goals increase the potential for privatization of federal student lending, creating a bigger role for private lenders such as SLM.
Western Digital, a manufacturer of storage technology, rallied on better-than-expected quarterly earnings driven by a favorable volume and pricing environment for hard disk drives and solid state memory. Western Digital has seen strong demand for its high-capacity disk drives for data center use, along with an improving personal computer market.
Detractors from Fund performance included DDR, J. C. Penney and Envision Healthcare.
DDR is a real estate investment trust (REIT) focused on retail shopping centers. Store closure announcements and retail bankruptcy concerns negatively impacted analysts’ sentiments and valuations of DDR. In our view, the stock traded at a discount to net asset value at period-end. In March, DDR announced the hiring of a new management team that previously ran Equity One (not a fund holding). The management team is well regarded in the shopping REIT industry, and we believe the change could set the stage for a potential long-term turnaround.
J. C. Penney reported weaker than expected sales results based on continued traffic declines and competitive pressures from off-price and on-line purchases. Uncertainty about a border tax also pressured the entire retail sector during the period.
Envision Healthcare reported lower-than-expected earnings driven by softer volumes and a higher percentage of lower margin in-network revenues. We view both these issues as
temporary and believe the pending merger with AmSurg could create a dominant player within the health care outsourcing industry.
| | | | |
| Top 10 Holdings | | | |
| 4/30/17 | | | |
| |
Company Sector/Industry | | % of Total
Net Assets | |
| |
| TreeHouse Foods Inc. | | | 2.6% | |
| Food, Beverage & Tobacco | | | | |
| |
| Envision Healthcare Corp. | | | 2.1% | |
| Health Care Equipment & Services | | | | |
| |
| Roper Technologies Inc. | | | 1.9% | |
| Capital Goods | | | | |
| |
| Western Digital Corp. | | | 1.9% | |
| Technology Hardware & Equipment | | | | |
| |
| Hologic Inc. | | | 1.8% | |
| Health Care Equipment & Services | | | | |
| |
| Textron Inc. | | | 1.8% | |
| Capital Goods | | | | |
| |
| Pinnacle Foods Inc. | | | 1.8% | |
| Food, Beverage & Tobacco | | | | |
| |
| SLM Corp. | | | 1.6% | |
| Diversified Financials | | | | |
| |
| XL Group Ltd. | | | 1.5% | |
| Insurance | | | | |
| |
| WestRock Co. | | | 1.5% | |
| Materials | | | | |
| |
During the reporting period, the Fund initiated positions in Textron, a diversified manufacturer; Molson Coors, a brewing company; the aforementioned Envision Healthcare; Huntington Bancshares, a bank holding company; and WEC Energy Group, an electricity and natural gas provider. We also added to several positions with the largest purchases including the aforementioned Mobileye and DDR Corp, along with Roper Technologies, a diversified industrial company.
The Fund exited positions including The J. M. Smucker Company, Zions Bancorp, Sabre, CalAtlantic Group and Michael Kors Holdings. We also reduced holdings in many positions including Mobileye, Toll Brothers and Pinnacle Foods.
| | | | |
| | | |
| franklintempleton.com | | Semiannual Report | | 17 |
FRANKLIN MIDCAP VALUE FUND
Thank you for your participation in Franklin MidCap Value Fund. It has been our pleasure serving your investment needs.
| | |
 | | 
Sam Kerner, CFA Lead Portfolio Manager |
| | |
| | Jakov Stipanov, CFA |
| | Donald G. Taylor, CPA |
| | |
| | Portfolio Management Team |
The foregoing information reflects our analysis, opinions and portfolio holdings as of April 30, 2017, the end of the reporting period. The way we implement our main investment strategies and the resulting portfolio holdings may change depending on factors such as market and economic conditions. These opinions may not be relied upon as investment advice or an offer for a particular security. The information is not a complete analysis of every aspect of any market, country, industry, security or the Fund. Statements of fact are from sources considered reliable, but the investment manager makes no representation or warranty as to their completeness or accuracy. Although historical performance is no guarantee of future results, these insights may help you understand our investment management philosophy.
| | | | |
| | | |
| 18 | | Semiannual Report | | franklintempleton.com |
FRANKLIN MIDCAP VALUE FUND
Performance Summary as of April 30, 2017
The performance table does not reflect any taxes that a shareholder would pay on Fund dividends, capital gain distributions, if any, or any realized gains on the sale of Fund shares. Total return reflects reinvestment of the Fund’s dividends and capital gain distributions, if any, and any unrealized gains or losses. Your dividend income will vary depending on dividends or interest paid by securities in the Fund’s portfolio, adjusted for operating expenses of each class. Capital gain distributions are net profits realized from the sale of portfolio securities.
Performance as of 4/30/171
Cumulative total return excludes sales charges. Average annual total return include maximum sales charges. Sales charges will vary depending on the size of the investment and the class of share purchased. The maximum is 5.75% and the minimum is 0%. Class A: 5.75% maximum initial sales charge; Advisor Class: no sales charges. For other share classes, visit franklintempleton.com.
| | | | | | | | |
| Share Class | | Cumulative
Total Return2 | | | Average Annual
Total Return3 | |
| | |
A | | | | | | | | |
6-Month | | | +11.42% | | | | +4.99% | |
1-Year | | | +15.39% | | | | +8.73% | |
5-Year | | | +63.40% | | | | +9.03% | |
10-Year | | | +57.64% | | | | +4.04% | |
| | |
Advisor | | | | | | | | |
6-Month | | | +11.65% | | | | +11.65% | |
1-Year | | | +15.84% | | | | +15.84% | |
5-Year | | | +65.88% | | | | +10.65% | |
10-Year | | | +62.73% | | | | +4.99% | |
Performance data represent past performance, which does not guarantee future results. Investment return and principal value will fluctuate, and you may have a gain or loss when you sell your shares. Current performance may differ from figures shown. For most recent month-end performance, go to franklintempleton.com or call (800) 342-5236.
See page 20 for Performance Summary footnotes.
| | | | |
| | | |
| franklintempleton.com | | Semiannual Report | | 19 |
FRANKLIN MIDCAP VALUE FUND
PERFORMANCE SUMMARY
Distributions (11/1/16–4/30/17)
| | | | | | | | | | | | |
| Share Class | | Net Investment
Income | | | Long-Term
Capital Gain | | | Total | |
A | | | $0.1116 | | | | $0.1770 | | | | $0.2886 | |
C | | | $0.0100 | | | | $0.1770 | | | | $0.1870 | |
R | | | $0.0742 | | | | $0.1770 | | | | $0.2512 | |
Advisor | | | $0.1520 | | | | $0.1770 | | | | $0.3290 | |
Total Annual Operating Expenses4
| | | | | | |
| Share Class | | With Waiver | | | Without Waiver |
A | | | 1.30% | | | 1.54% |
Advisor | | | 1.05% | | | 1.29% |
Each class of shares is available to certain eligible investors and has different annual fees and expenses, as described in the prospectus.
All investments involve risks, including possible loss of principal. Stock prices fluctuate, sometimes rapidly and dramatically, due to factors affecting individual companies, particular industries or sectors, or general market conditions. Historically, midsize company securities have been more volatile in price than larger company securities, especially over the short term. Midsize companies may be more susceptible to particular economic events or competitive factors than are larger, more broadly diversified companies. In addition, the Fund may invest up to 25% of its total assets in foreign securities, which involve special risks, including currency fluctuations and economic and political uncertainty. The Fund is actively managed but there is no guarantee that the manager’s investment decisions will produce the desired results. The Fund’s prospectus also includes a description of the main investment risks.
1. The Fund has an expense reduction and a fee waiver associated with any investments it makes in a Franklin Templeton money fund and/or other Franklin Templeton fund, contractually guaranteed through 2/28/18. Fund investment results reflect the expense reduction and fee waiver; without these reductions, the results would have been lower.
2. Cumulative total return represents the change in value of an investment over the periods indicated.
3. Average annual total return represents the average annual change in value of an investment over the periods indicated. Return for less than one year, if any, has not been annualized.
4. Figures are as stated in the Fund’s current prospectus and may differ from the expense ratios disclosed in the Your Fund’s Expenses and Financial Highlights sections in this report. In periods of market volatility, assets may decline significantly, causing total annual Fund operating expenses to become higher than the figures shown.
| | | | |
| | | |
| 20 | | Semiannual Report | | franklintempleton.com |
FRANKLIN MIDCAP VALUE FUND
Your Fund’s Expenses
As a Fund shareholder, you can incur two types of costs: (1) transaction costs, including sales charges (loads) on Fund purchases and redemptions; and (2) ongoing Fund costs, including management fees, distribution and service (12b-1) fees, and other Fund expenses. All mutual funds have ongoing costs, sometimes referred to as operating expenses. The table below shows ongoing costs of investing in the Fund and can help you understand these costs and compare them with those of other mutual funds. The table assumes a $1,000 investment held for the six months indicated.
Actual Fund Expenses
The table below provides information about actual account values and actual expenses in the columns under the heading “Actual.” In these columns the Fund’s actual return, which includes the effect of Fund expenses, is used to calculate the “Ending Account Value” for each class of shares. You can estimate the expenses you paid during the period by following these steps (of course, your account value and expenses will differ from those in this illustration): Divide your account value by $1,000 (if your account had an $8,600 value, then $8,600 ÷ $1,000 = 8.6). Then multiply the result by the number in the row for your class of shares under the headings “Actual” and “Expenses Paid During Period” (if Actual Expenses Paid During Period were $7.50, then 8.6 x $7.50 = $64.50). In this illustration, the actual expenses paid this period are $64.50.
Hypothetical Example for Comparison with Other Funds
Under the heading “Hypothetical” in the table, information is provided about hypothetical account values and hypothetical expenses based on the Fund’s actual expense ratio and an assumed rate of return of 5% per year before expenses, which is not the Fund’s actual return. This information may not be used to estimate the actual ending account balance or expenses you paid for the period, but it can help you compare ongoing costs of investing in the Fund with those of other funds. To do so, compare this 5% hypothetical example for the class of shares you hold with the 5% hypothetical examples that appear in the shareholder reports of other funds.
Please note that expenses shown in the table are meant to highlight ongoing costs and do not reflect any transactional costs. Therefore, information under the heading “Hypothetical” is useful in comparing ongoing costs only, and will not help you compare total costs of owning different funds. In addition, if transactional costs were included, your total costs would have been higher.
| | | | | | | | | | | | |
| | | | | Actual
(actual return after expenses) | | Hypothetical
(5% annual return before expenses) | | |
Share Class | | Beginning
Account
Value 11/1/16 | | Ending Account Value 4/30/17 | | Expenses Paid During Period 11/1/16–4/30/171,2 | | Ending Account Value 4/30/17 | | Expenses Paid During Period 11/1/16–4/30/171,2 | | Net
Annualized
Expense
Ratio2 |
| | | | | | |
| | | | | | |
| A | | $1,000 | | $1,114.20 | | $6.81 | | $1,018.35 | | $6.51 | | 1.30% |
| | | | | | |
| C | | $1,000 | | $1,109.80 | | $10.72 | | $1,014.63 | | $10.24 | | 2.05% |
| | | | | | |
| R | | $1,000 | | $1,112.90 | | $8.12 | | $1,017.11 | | $7.75 | | 1.55% |
| | | | | | |
| Advisor | | $1,000 | | $1,116.50 | | $5.51 | | $1,019.59 | | $5.26 | | 1.05% |
1. Expenses are equal to the annualized expense ratio for the six-month period as indicated above–in the far right column–multiplied by the simple average account value over the period indicated, and then multiplied by 181/365 to reflect the one-half year period.
2. Reflects expenses after fee waivers. Does not include acquired fund fees and expenses.
| | | | |
| | | |
| franklintempleton.com | | Semiannual Report | | 21 |
Franklin Small Cap Value Fund
This semiannual report for Franklin Small Cap Value Fund covers the period ended April 30, 2017.
Your Fund’s Goal and Main Investments
Under normal market conditions, the Fund invests at least 80% of its net assets in investments of small-capitalization (small-cap) companies. Small-cap companies are companies with market capitalizations (the total market value of a company’s outstanding stock) not exceeding either: 1) the highest market capitalization in the Russell 2000 Index; or 2) the 12-month average of the highest market capitalization in the Russell 2000 Index, whichever is greater, at the time of purchase. The Fund generally invests in equity securities that the Fund’s investment manager believes are undervalued at the time of purchase and have the potential for capital appreciation. The Fund invests predominantly in common stocks.
Performance Overview
The Fund’s Class A shares delivered a +13.49% cumulative total return for the six months under review. In comparison, the Fund’s new benchmark, the Russell 2000TM Value Index, which measures performance of those Russell 2000TM Index companies with lower price-to-book ratios and lower forecasted growth values, generated a +18.26% total return for the same period, while its previous benchmark, the Russell 2500TM Value Index, which measures performance of those Russell 2500TM Index companies with lower price-to-book ratios and lower forecasted growth values, posted a +14.43% total return for the same period.1,2 As the investment manager believes the composition of the Russell 2000 ValueTM Index aligns more closely with the Fund’s portfolio, it has replaced the Russell 2500TM Value Index as the Fund’s benchmark. You can find more of the Fund’s performance data in the Performance Summary beginning on page 26.
Performance data represent past performance, which does not guarantee future results. Investment return and principal value will fluctuate, and you may have a gain or loss when you sell your shares. Current performance may differ from figures shown. For most recent month-end performance, go to franklintempleton.com or call (800) 342-5236.
Portfolio Composition
Based on Total Net Assets as of 4/30/17
Investment Strategy
We seek to invest in small-capitalization companies that we believe are selling below their underlying worth and hold them until they reach what we consider their fair value. We seek a diversified portfolio of fundamentally sound companies
1. The Russell 2000TM Index is market capitalization weighted and measures performance of the 2,000 smallest companies in the Russell 3000 Index, which represent a small amount of the total market capitalization of the Russell 3000 Index.
2. Source: Morningstar.
The indexes are unmanaged and include reinvestment of any income or distributions. They do not reflect any fees, expenses or sales charges. One cannot invest directly in an index, and an index is not representative of the Fund’s portfolio.
See www.franklintempletondatasources.com for additional data provider information.
The dollar value, number of shares or principal amount, and names of all portfolio holdings are listed in the Fund’s Statement of Investments (SOI). The SOI begins on page 57.
| | | | |
| | | |
| 22 | | Semiannual Report | | franklintempleton.com |
FRANKLIN SMALL CAP VALUE FUND
purchased at attractive prices, often when they are out of favor with other investors. Portfolio securities are selected without regard to benchmark comparisons and are based on fundamental, bottom-up research focusing on several criteria, such as low price relative to earnings, book value or cash flow. We also consider stocks with recent sharp price declines that we believe still have significant growth potential or that possess valuable intangibles not reflected in the stock price.
Manager’s Discussion
During the six months under review, holdings that positively contributed to Fund performance included MKS Instruments, Hill-Rom Holdings and SAIA.
MKS Instruments provides subsystems solutions and instruments to semiconductor and other advanced manufacturing industries. During the period, MKS enjoyed strong industry trends, and the company’s ongoing operating model improvements have driven their profitability targets progressively higher. These factors coupled with the firm’s diversification away from semiconductors through the acquisition of laser manufacturer Newport,3 its paydown of its debt and an increase in dividends led to higher market valuation.
Hill-Rom Holdings is a manufacturer of medical equipment including hospital beds, surgical tables and diagnostic tools. The company’s shares rose due to stability in hospital capital spending, which led to modest growth in its U.S. patient support business. Hill-Rom’s international business recovered with strong organic growth during its quarter ended March 2017 and management expected the momentum to continue through the remainder of the year. The company completed the acquisition of Mortara Instruments,3 a provider of diagnostic cardiology and patient monitoring technology, services and devices. Mortara will complement Hill-Rom’s Welch Allyn3 business, and analysts believe it could be additive to earnings. The company continues to focus on reducing the debt incurred from the Welch and Mortara acquisitions, improving overall margins through operational efficiencies, bringing out new products in 2017 and increasing the penetration of its existing suite of products.
SAIA, a less-than-truckload (LTL) carrier, experienced an increase in its share price due to planned expansion in 12 states in the northeast, which will expand its market size significantly. The company opened the first four terminals in May 2017. SAIA is also entering an exclusive partnership with TST
Overland Express3 to provide cross-border LTL services both to and from Canada. Additionally SAIA reported improvement in tonnage, shipment and pricing trends in its quarter ending March 2017 and continued into April 2017.
Detractors from Fund performance included Detour Gold, Mueller Water Products and Huron Consulting Group.
Detour Gold, a gold mining company with assets located in Ontario, Canada, was negatively impacted by a downward revision in 2017 gold production estimates due to heavy rains that delayed mining progress. Additionally, mining at the West Detour pit, which accounts for a significant portion of gold reserves, was pushed out from 2019 to 2025 because of delays in securing mining permits. Also, gold prices were down during the period despite a recovery that began in mid-December. The company has invested in equipment to increase mining levels over the next few years.
Mueller Water Products manufactures and markets products and services for use in the transmission, distribution and measurement of water, primarily in the U.S. and Canada. One of the company’s divisions had sales that fell below management’s expectations after Mueller’s municipal clients paused their spending. The company’s management team attributed the pause to the 2016 U.S. elections. During the elections, municipalities became unsure if a potential federal infrastructure spending bill would lead to an incremental increase in available funds. We remain positive about the company. Mueller has transformed itself, through its divestitures of U.S. Pipes3 and Anvil International,3 into a pure-play water infrastructure company. Also, the company’s new chief executive officer is intent on improving Mueller’s manufacturing abilities.
Huron Consulting Group, a provider of consulting services to the health care, education and life sciences end markets, was negatively impacted by a decline in its health care practice. The demand for operational improvement and revenue cycle management projects declined during the period as hospitals became cautious about committing to larger projects amid policy uncertainty. The company restructured its health care business, which allowed Huron to reduce its cost base, offer flexible solutions to clients and involve senior professionals in the sales process. Additionally, the company acquired Pope Woodhead3 and Innosight3 to expand its strategic consulting capabilities.
3. Not a Fund holding.
| | | | |
| | | |
| franklintempleton.com | | Semiannual Report | | 23 |
FRANKLIN SMALL CAP VALUE FUND
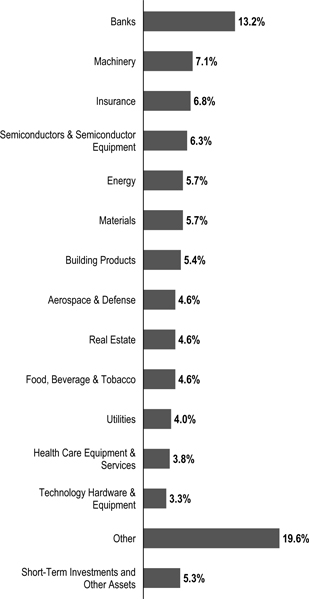
Top 10 Holdings
4/30/17
| | | | |
Company Sector/Industry | | % of Total
Net Assets | |
AAR Corp. Aerospace & Defense | | | 2.8% | |
Maple Leaf Foods Inc. Food, Beverage & Tobacco | | | 2.7% | |
Sensient Technologies Corp. Materials | | | 2.2% | |
Hill-Rom Holdings Inc. Health Care Equipment & Services | | | 2.1% | |
LTC Properties Inc. Real Estate | | | 2.1% | |
Columbia Banking System Inc. Banks | | | 2.0% | |
IDACORP Inc. Utilities | | | 2.0% | |
Simpson Manufacturing Co. Inc. Building Products | | | 2.0% | |
Gerresheimer AG Pharmaceuticals, Biotechnology & Life Sciences | | | 1.9% | |
MKS Instruments Inc. Semiconductors & Semiconductor Equipment | | | 1.9% | |
During the reporting period, we added some new positions with the largest purchases including Kennametal, a supplier of tooling and industrial materials; Zebra Technologies, a manufacturer of marking, tracking and computer printing technologies; Horace Mann Educators, an insurance company focused on serving educators; Glacier Bancorp, a multi-bank holding company, headquartered in Montana; and Titan International, a manufacturer of mounted tire and wheel systems for off highway equipment. The Fund also added to several holdings including First Horizon National, a bank holding company; Simpson Manufacturing, an engineering firm and building materials producer; and the aforementioned Mueller Water Products.
In contrast, the Fund exited positions including Omega Protein, Cato, Brunswick, Genesco and West Marine. Additionally, Mentor Graphics and Endurance Specialty Holdings were acquired in all cash deals during the period. We also reduced holdings in several positions including Astec Industries, HB Fuller and Unit Corporation.
Thank you for your participation in Franklin Small Cap Value Fund. We look forward to continuing to serve your investment needs.
| | |
 | | 
|
| | Steven B. Raineri Lead Portfolio Manager |
| |
| | Christopher Meeker, CFA Donald G. Taylor, CPA |
| |
| | Portfolio Management Team |
| | | | |
| | | |
| 24 | | Semiannual Report | | franklintempleton.com |
FRANKLIN SMALL CAP VALUE FUND
The foregoing information reflects our analysis, opinions and portfolio holdings as of April 30, 2017, the end of the reporting period. The way we implement our main investment strategies and the resulting portfolio holdings may change depending on factors such as market and economic conditions. These opinions may not be relied upon as investment advice or an offer for a particular security. The information is not a complete analysis of every aspect of any market, country, industry, security or the Fund. Statements of fact are from sources considered reliable, but the investment manager makes no representation or warranty as to their completeness or accuracy. Although historical performance is no guarantee of future results, these insights may help you understand our investment management philosophy.
| | | | |
| | | |
| franklintempleton.com | | Semiannual Report | | 25 |
FRANKLIN SMALL CAP VALUE FUND
Performance Summary as of April 30, 2017
The performance table does not reflect any taxes that a shareholder would pay on Fund dividends, capital gain distributions, if any, or any realized gains on the sale of Fund shares. Total return reflects reinvestment of the Fund’s dividends and capital gain distributions, if any, and any unrealized gains or losses. Your dividend income will vary depending on dividends or interest paid by securities in the Fund’s portfolio, adjusted for operating expenses of each class. Capital gain distributions are net profits realized from the sale of portfolio securities.
Performance as of 4/30/171
Cumulative total return excludes sales charges. Average annual total return include maximum sales charges. Sales charges will vary depending on the size of the investment and the class of share purchased. The maximum is 5.75% and the minimum is 0%. Class A: 5.75% maximum initial sales charge; Advisor Class: no sales charges. For other share classes, visit franklintempleton.com.
| | | | | | | | |
| Share Class | | Cumulative
Total Return2 | | | Average Annual
Total Return3 | |
| | |
A | | | | | | | | |
6-Month | | | +13.49% | | | | +6.96% | |
1-Year | | | +23.37% | | | | +16.27% | |
5-Year | | | +75.62% | | | | +10.60% | |
10-Year | | | +90.51% | | | | +6.03% | |
| | |
Advisor | | | | | | | | |
6-Month | | | +13.63% | | | | +13.63% | |
1-Year | | | +23.67% | | | | +23.67% | |
5-Year | | | +78.09% | | | | +12.23% | |
10-Year | | | +96.00% | | | | +6.96% | |
Performance data represent past performance, which does not guarantee future results. Investment return and principal value will fluctuate, and you may have a gain or loss when you sell your shares. Current performance may differ from figures shown. For most recent month-end performance, go to franklintempleton.com or call (800) 342-5236.
See page 27 for Performance Summary footnotes.
| | | | |
| | | |
| 26 | | Semiannual Report | | franklintempleton.com |
FRANKLIN SMALL CAP VALUE FUND
PERFORMANCE SUMMARY
Distributions (11/1/16–4/30/17)
| | | | | | | | | | | | |
| Share Class | | Net Investment
Income | | | Long-Term
Capital Gain | | | Total | |
A | | | $0.1246 | | | | $2.6143 | | | | $2.7389 | |
C | | | $ — | | | | $2.6143 | | | | $2.6143 | |
R | | | $ — | | | | $2.6143 | | | | $2.6143 | |
R6 | | | $0.3524 | | | | $2.6143 | | | | $2.9667 | |
Advisor | | | $0.2667 | | | | $2.6143 | | | | $2.8810 | |
Total Annual Operating Expenses4
| | | | | | |
| Share Class | | With Waiver | | | Without Waiver |
A | | | 1.11% | | | 1.13% |
Advisor | | | 0.86% | | | 0.88% |
Each class of shares is available to certain eligible investors and has different annual fees and expenses, as described in the prospectus.
All investments involve risks, including possible loss of principal. The Fund’s investments in smaller company stocks carry special risks as such stocks have historically exhibited greater price volatility than larger company stocks, particularly over the short term. Additionally, smaller companies often have relatively small revenues, limited product lines and small market share. In addition, the Fund may invest up to 25% of its total assets in foreign securities, which involve special risks, including currency fluctuations and economic and political uncertainty. The Fund is actively managed but there is no guarantee that the manager’s investment decisions will produce the desired results. The Fund’s prospectus also includes a description of the main investment risks.
1. The Fund has a fee waiver associated with any investment it makes in a Franklin Templeton money fund and/or other Franklin Templeton fund, contractually guaranteed through 2/28/18. Fund investment results reflect the fee waiver; without this waiver, the results would have been lower.
2. Cumulative total return represents the change in value of an investment over the periods indicated.
3. Average annual total return represents the average annual change in value of an investment over the periods indicated. Return for less than one year, if any, has not been annualized.
4. Figures are as stated in the Fund’s current prospectus and may differ from the expense ratios disclosed in the Your Fund’s Expenses and Financial Highlights sections in this report. In periods of market volatility, assets may decline significantly, causing total annual Fund operating expenses to become higher than the figures shown.
| | | | |
| | | |
| franklintempleton.com | | Semiannual Report | | 27 |
FRANKLIN SMALL CAP VALUE FUND
Your Fund’s Expenses
As a Fund shareholder, you can incur two types of costs: (1) transaction costs, including sales charges (loads) on Fund purchases and redemptions; and (2) ongoing Fund costs, including management fees, distribution and service (12b-1) fees, and other Fund expenses. All mutual funds have ongoing costs, sometimes referred to as operating expenses. The table below shows ongoing costs of investing in the Fund and can help you understand these costs and compare them with those of other mutual funds. The table assumes a $1,000 investment held for the six months indicated.
Actual Fund Expenses
The table below provides information about actual account values and actual expenses in the columns under the heading “Actual.” In these columns the Fund’s actual return, which includes the effect of Fund expenses, is used to calculate the “Ending Account Value” for each class of shares. You can estimate the expenses you paid during the period by following these steps (of course, your account value and expenses will differ from those in this illustration): Divide your account value by $1,000 (if your account had an $8,600 value, then $8,600 ÷ $1,000 = 8.6). Then multiply the result by the number in the row for your class of shares under the headings “Actual” and “Expenses Paid During Period” (if Actual Expenses Paid During Period were $7.50, then 8.6 x $7.50 = $64.50). In this illustration, the actual expenses paid this period are $64.50.
Hypothetical Example for Comparison with Other Funds
Under the heading “Hypothetical” in the table, information is provided about hypothetical account values and hypothetical expenses based on the Fund’s actual expense ratio and an assumed rate of return of 5% per year before expenses, which is not the Fund’s actual return. This information may not be used to estimate the actual ending account balance or expenses you paid for the period, but it can help you compare ongoing costs of investing in the Fund with those of other funds. To do so, compare this 5% hypothetical example for the class of shares you hold with the 5% hypothetical examples that appear in the shareholder reports of other funds.
Please note that expenses shown in the table are meant to highlight ongoing costs and do not reflect any transactional costs. Therefore, information under the heading “Hypothetical” is useful in comparing ongoing costs only, and will not help you compare total costs of owning different funds. In addition, if transactional costs were included, your total costs would have been higher.
| | | | | | | | | | | | |
| | | | | Actual
(actual return after expenses) | | Hypothetical
(5% annual return before expenses) | | |
Share Class | | Beginning
Account
Value 11/1/16 | | Ending Account
Value 4/30/17 | | Expenses Paid During
Period 11/1/16–4/30/171,2 | | Ending Account Value 4/30/17 | | Expenses Paid During Period 11/1/16–4/30/171,2 | | Net
Annualized
Expense
Ratio2 |
| | | | | | |
| A | | $1,000 | | $1,134.90 | | $5.51 | | $1,019.64 | | $5.21 | | 1.04% |
| C | | $1,000 | | $1,130.40 | | $9.46 | | $1,015.92 | | $8.95 | | 1.79% |
| R | | $1,000 | | $1,133.50 | | $6.82 | | $1,018.40 | | $6.46 | | 1.29% |
| R6 | | $1,000 | | $1,137.30 | | $3.02 | | $1,021.97 | | $2.86 | | 0.57% |
| Advisor | | $1,000 | | $1,136.30 | | $4.18 | | $1,020.88 | | $3.96 | | 0.79% |
1. Expenses are equal to the annualized expense ratio for the six-month period as indicated above–in the far right column–multiplied by the simple average account value over the period indicated, and then multiplied by 181/365 to reflect the one-half year period.
2. Reflects expenses after fee waivers. Does not include acquired fund fees and expenses.
| | | | |
| | | |
| 28 | | Semiannual Report | | franklintempleton.com |
FRANKLIN VALUE INVESTORS TRUST
Financial Highlights
Franklin Balance Sheet Investment Fund
| | | | | | | | | | | | | | | | | | | | | | | | |
| | | Six Months Ended
April 30, 2017 (unaudited) | | | Year Ended October 31, | |
| | | | | |
| | | | 2016 | | | 2015 | | | 2014 | | | 2013 | | | 2012 | |
| |
| | | | | | |
Class A | | | | | | | | | | | | | | | | | | | | | | | | |
Per share operating performance | | | | | | | | | | | | | | | | | | | | | | | | |
| | | | | | |
(for a share outstanding throughout the period) | | | | | | | | | | | | | | | | | | | | | | | | |
| | | | | | |
Net asset value, beginning of period | | | $35.40 | | | | $40.06 | | | | $51.55 | | | | $53.98 | | | | $43.01 | | | | $44.05 | |
| | | | |
| | | | | | |
Income from investment operationsa: | | | | | | | | | | | | | | | | | | | | | | | | |
| | | | | | |
Net investment incomeb | | | 0.21 | c | | | 0.22 | | | | 0.19 | | | | 0.46 | d | | | 0.64 | e | | | 0.48 | |
| | | | | | |
Net realized and unrealized gains (losses) | | | 5.29 | | | | 1.17 | | | | (3.92 | ) | | | 3.06 | | | | 13.15 | | | | 3.65 | |
| | | | |
| | | | | | |
Total from investment operations | | | 5.50 | | | | 1.39 | | | | (3.73 | ) | | | 3.52 | | | | 13.79 | | | | 4.13 | |
| | | | |
Less distributions from: | | | | | | | | | | | | | | | | | | | | | | | | |
| | | | | | |
Net investment income | | | (0.18 | ) | | | (0.28 | ) | | | (0.17 | ) | | | (0.65 | ) | | | (0.66 | ) | | | (0.25) | |
| | | | | | |
Net realized gains | | | (2.31 | ) | | | (5.77 | ) | | | (7.59 | ) | | | (5.30 | ) | | | (2.16 | ) | | | (4.92) | |
| | | | |
| | | | | | |
Total distributions | | | (2.49 | ) | | | (6.05 | ) | | | (7.76 | ) | | | (5.95 | ) | | | (2.82 | ) | | | (5.17) | |
| | | | |
| | | | | | |
Net asset value, end of period | | | $38.41 | | | | $35.40 | | | | $40.06 | | | | $51.55 | | | | $53.98 | | | | $43.01 | |
| | | | |
| | | | | | |
Total returnf | | | 15.59% | | | | 4.44% | | | | (7.73)% | | | | 6.97% | | | | 33.97% | | | | 11.09% | |
| | | | | | |
| Ratios to average net assetsg | | | | | | | | | | | | | | | | | | | | | | | | |
| | | | | | |
Expenses before waiver and payments by affiliates | | | 0.92% | | | | 0.94% | | | | 0.95% | | | | 0.90% | | | | 0.91% | | | | 0.99% | |
| | | | | | |
Expenses net of waiver and payments by affiliates | | | 0.87% | h | | | 0.91% | h | | | 0.94% | | | | 0.89% | h | | | 0.91% | | | | 0.99% | |
| | | | | | |
Net investment income | | | 1.13% | c | | | 0.62% | | | | 0.45% | | | | 0.89% | d | | | 1.34% | e | | | 1.16% | |
| | | | | | |
| Supplemental data | | | | | | | | | | | | | | | | | | | | | | | | |
| | | | | | |
Net assets, end of period (000’s) | | | $857,143 | | | | $795,663 | | | | $915,285 | | | | $1,221,903 | | | | $1,256,543 | | | | $1,079,418 | |
| | | | | | |
Portfolio turnover rate | | | 14.88% | | | | 30.25% | | | | 26.31% | | | | 25.08% | | | | 11.54% | | | | 7.91% | i |
aThe amount shown for a share outstanding throughout the period may not correlate with the Statement of Operations for the period due to the timing of sales and repurchases of the Fund’s shares in relation to income earned and/or fluctuating fair value of the investments of the Fund.
bBased on average daily shares outstanding.
cNet investment income per share includes approximately $0.09 per share related to income received in the form of special dividends in connection with certain Fund holdings. Excluding this amount, the ratio of net investment income to average net assets would have been 0.66%.
dNet investment income per share includes approximately $0.15 per share related to income received in the form of special dividends in connection with certain Fund holdings. Excluding this amount, the ratio of net investment income to average net assets would have been 0.61%.
eNet investment income per share includes approximately $0.15 per share related to income received in the form of special dividends in connection with certain Fund holdings. Excluding this amount, the ratio of net investment income to average net assets would have been 1.02%.
fTotal return does not reflect sales commissions or contingent deferred sales charges, if applicable, and is not annualized for periods less than one year.
gRatios are annualized for periods less than one year.
hBenefit of expense reduction rounds to less than 0.01%.
iExcludes the value of portfolio securities delivered as a result of a redemption in-kind.
| | | | | | |
franklintempleton.com | | The accompanying notes are an integral part of these financial statements. | Semiannual Report | | | 29 | |
FRANKLIN VALUE INVESTORS TRUST
FINANCIAL HIGHLIGHTS
Franklin Balance Sheet Investment Fund (continued)
| | | | | | | | | | | | | | | | | | | | | | | | |
| | | Six Months Ended
April 30, 2017 | | | Year Ended October 31, | |
| | | (unaudited) | | | 2016 | | | 2015 | | | 2014 | | | 2013 | | | 2012 | |
| Class C | | | | | | | | | | | | | | | | | | | | | | | | |
Per share operating performance (for a share outstanding throughout the period) | | | | | | | | | | | | | | | | | | | | | | | | |
| | | | | | |
Net asset value, beginning of period | | | $34.01 | | | | $38.70 | | | | $50.22 | | | | $52.77 | | | | $42.10 | | | | $43.27 | |
| | | | |
| | | | | | |
Income from investment operationsa: | | | | | | | | | | | | | | | | | | | | | | | | |
| | | | | | |
Net investment income (loss)b | | | 0.07 | c | | | (0.04 | ) | | | (0.12 | ) | | | 0.07 | d | | | 0.25 | e | | | 0.15 | |
| | | | | | |
Net realized and unrealized gains (losses) | | | 5.08 | | | | 1.12 | | | | (3.81 | ) | | | 2.99 | | | | 12.93 | | | | 3.60 | |
| | | | |
| | | | | | |
Total from investment operations | | | 5.15 | | | | 1.08 | | | | (3.93 | ) | | | 3.06 | | | | 13.18 | | | | 3.75 | |
| | | | |
Less distributions from: | | | | | | | | | | | | | | | | | | | | | | | | |
| | | | | | |
Net investment income | | | — | | | | — | | | | — | | | | (0.31 | ) | | | (0.35 | ) | | | — | |
| | | | | | |
Net realized gains | | | (2.31 | ) | | | (5.77 | ) | | | (7.59 | ) | | | (5.30 | ) | | | (2.16 | ) | | | (4.92) | |
| | | | |
| | | | | | |
Total distributions | | | (2.31 | ) | | | (5.77 | ) | | | (7.59 | ) | | | (5.61 | ) | | | (2.51 | ) | | | (4.92) | |
| | | | |
| | | | | | |
Net asset value, end of period | | | $36.85 | | | | $34.01 | | | | $38.70 | | | | $50.22 | | | | $52.77 | | | | $42.10 | |
| | | | |
| | | | | | |
Total returnf | | | 15.17% | | | | 3.65% | | | | (8.41)% | | | | 6.17% | | | | 33.01% | | | | 10.25% | |
| | | | | | |
| Ratios to average net assetsg | | | | | | | | | | | | | | | | | | | | | | | | |
| | | | | | |
Expenses before waiver and payments by affiliates | | | 1.67% | | | | 1.69% | | | | 1.70% | | | | 1.65% | | | | 1.66% | | | | 1.74% | |
| | | | | | |
Expenses net of waiver and payments by affiliates | | | 1.62% | h | | | 1.66% | h | | | 1.69% | | | | 1.64% | h | | | 1.66% | | | | 1.74% | |
| | | | | | |
Net investment income (loss) | | | 0.38% | c | | | (0.13)% | | | | (0.30)% | | | | 0.14% | d | | | 0.59% | e | | | 0.41% | |
| | | | | | |
| Supplemental data | | | | | | | | | | | | | | | | | | | | | | | | |
| | | | | | |
Net assets, end of period (000’s) | | | $66,976 | | | | $61,567 | | | | $73,185 | | | | $96,279 | | | | $96,462 | | | | $71,723 | |
| | | | | | |
Portfolio turnover rate | | | 14.88% | | | | 30.25% | | | | 26.31% | | | | 25.08% | | | | 11.54% | | | | 7.91%i | |
aThe amount shown for a share outstanding throughout the period may not correlate with the Statement of Operations for the period due to the timing of sales and repurchases of the Fund’s shares in relation to income earned and/or fluctuating fair value of the investments of the Fund.
bBased on average daily shares outstanding.
cNet investment income per share includes approximately $0.09 per share related to income received in the form of special dividends in connection with certain Fund holdings. Excluding this amount, the ratio of net investment income to average net assets would have been (0.09)%.
dNet investment income per share includes approximately $0.15 per share related to income received in the form of special dividends in connection with certain Fund holdings. Excluding this amount, the ratio of net investment income to average net assets would have been (0.14)%.
eNet investment income per share includes approximately $0.15 per share related to income received in the form of special dividends in connection with certain Fund holdings. Excluding this amount, the ratio of net investment income to average net assets would have been 0.27%.
fTotal return does not reflect sales commissions or contingent deferred sales charges, if applicable, and is not annualized for periods less than one year.
gRatios are annualized for periods less than one year.
hBenefit of expense reduction rounds to less than 0.01%.
iExcludes the value of portfolio securities delivered as a result of a redemption in-kind.
| | | | |
30 | | Semiannual Report | The accompanying notes are an integral part of these financial statements. | | franklintempleton.com |
FRANKLIN VALUE INVESTORS TRUST
FINANCIAL HIGHLIGHTS
Franklin Balance Sheet Investment Fund (continued)
| | | | | | | | | | | | | | | | | | | | | | | | |
| | | Six Months Ended
April 30, 2017 | | | Year Ended October 31, | |
| | | (unaudited) | | | 2016 | | | 2015 | | | 2014 | | | 2013 | | | 2012 | |
| Class R | | | | | | | | | | | | | | | | | | | | | | | | |
Per share operating performance (for a share outstanding throughout the period) | | | | | | | | | | | | | | | | | | | | | | | | |
| | | | | | |
Net asset value, beginning of period | | | $35.42 | | | | $40.06 | | | | $51.48 | | | | $53.90 | | | | $42.95 | | | | $43.94 | |
| | | | |
| | | | | | |
Income from investment operationsa: | | | | | | | | | | | | | | | | | | | | | | | | |
| | | | | | |
Net investment incomeb | | | 0.17 | c | | | 0.13 | | | | 0.09 | | | | 0.36 | d | | | 0.49 | e | | | 0.37 | |
| | | | | | |
Net realized and unrealized gains (losses) | | | 5.30 | | | | 1.17 | | | | (3.91 | ) | | | 3.01 | | | | 13.18 | | | | 3.65 | |
| | | | |
| | | | | | |
Total from investment operations | | | 5.47 | | | | 1.30 | | | | (3.82 | ) | | | 3.37 | | | | 13.67 | | | | 4.02 | |
| | | | |
| | | | | | |
Less distributions from: | | | | | | | | | | | | | | | | | | | | | | | | |
| | | | | | |
Net investment income | | | (0.10 | ) | | | (0.17 | ) | | | (0.01 | ) | | | (0.49 | ) | | | (0.56 | ) | | | (0.09) | |
| | | | | | |
Net realized gains | | | (2.31 | ) | | | (5.77 | ) | | | (7.59 | ) | | | (5.30 | ) | | | (2.16 | ) | | | (4.92) | |
| | | | |
| | | | | | |
Total distributions | | | (2.41 | ) | | | (5.94 | ) | | | (7.60 | ) | | | (5.79 | ) | | | (2.72 | ) | | | (5.01) | |
| | | | |
| | | | | | |
Net asset value, end of period | | | $38.48 | | | | $35.42 | | | | $40.06 | | | | $51.48 | | | | $53.90 | | | | $42.95 | |
| | | | |
| | | | | | |
Total returnf | | | 15.47% | | | | 4.17% | | | | (7.94)% | | | | 6.67% | | | | 33.67% | | | | 10.80% | |
| | | | | | |
| Ratios to average net assetsg | | | | | | | | | | | | | | | | | | | | | | | | |
| | | | | | |
Expenses before waiver and payments by affiliates | | | 1.17% | | | | 1.19% | | | | 1.20% | | | | 1.15% | | | | 1.16% | | | | 1.24% | |
| | | | | | |
Expenses net of waiver and payments by affiliates | | | 1.12% | h | | | 1.16% | h | | | 1.19% | | | | 1.14% | h | | | 1.16% | | | | 1.24% | |
| | | | | | |
Net investment income | | | 0.88% | c | | | 0.37% | | | | 0.20% | | | | 0.64% | d | | | 1.09% | e | | | 0.91% | |
| | | | | | |
| Supplemental data | | | | | | | | | | | | | | | | | | | | | | | | |
| | | | | | |
Net assets, end of period (000’s) | | | $8,941 | | | | $8,486 | | | | $9,831 | | | | $14,261 | | | | $17,992 | | | | $15,053 | |
| | | | | | |
Portfolio turnover rate | | | 14.88% | | | | 30.25% | | | | 26.31% | | | | 25.08% | | | | 11.54% | | | | 7.91% | i |
aThe amount shown for a share outstanding throughout the period may not correlate with the Statement of Operations for the period due to the timing of sales and repurchases of the Fund’s shares in relation to income earned and/or fluctuating fair value of the investments of the Fund.
bBased on average daily shares outstanding.
cNet investment income per share includes approximately $0.09 per share related to income received in the form of special dividends in connection with certain Fund holdings. Excluding this amount, the ratio of net investment income to average net assets would have been 0.41%.
dNet investment income per share includes approximately $0.15 per share related to income received in the form of special dividends in connection with certain Fund holdings. Excluding this amount, the ratio of net investment income to average net assets would have been 0.36%.
eNet investment income per share includes approximately $0.15 per share related to income received in the form of special dividends in connection with certain Fund holdings. Excluding this amount, the ratio of net investment income to average net assets would have been 0.77%.
fTotal return is not annualized for periods less than one year.
gRatios are annualized for periods less than one year.
hBenefit of expense reduction rounds to less than 0.01%.
iExcludes the value of portfolio securities delivered as a result of a redemption in-kind.
| | | | | | |
franklintempleton.com | | The accompanying notes are an integral part of these financial statements. | Semiannual Report | | | 31 | |
FRANKLIN VALUE INVESTORS TRUST
FINANCIAL HIGHLIGHTS
Franklin Balance Sheet Investment Fund (continued)
| | | | | | | | | | | | | | | | | | | | |
| | | Six Months Ended
April 30, 2017 | | | Year Ended October 31, | |
| | | (unaudited) | | | 2016 | | | 2015 | | | 2014 | | | 2013a | |
| Class R6 | | | | | | | | | | | | | | | | | | | | |
Per share operating performance (for a share outstanding throughout the period) | | | | | | | | | | | | | | | | | | | | |
| | | | | |
Net asset value, beginning of period | | | $36.40 | | | | $41.10 | | | | $52.70 | | | | $55.06 | | | | $47.79 | |
| | | | |
| | | | | |
Income from investment operationsb: | | | | | | | | | | | | | | | | | | | | |
| | | | | |
Net investment incomec | | | 0.30 | d | | | 0.35 | | | | 0.37 | | | | 0.47 | e | | | 0.32f | |
| | | | | |
Net realized and unrealized gains (losses) | | | 5.45 | | | | 1.20 | | | | (3.99 | ) | | | 3.32 | | | | 6.95 | |
| | | | |
| | | | | |
Total from investment operations | | | 5.75 | | | | 1.55 | | | | (3.62 | ) | | | 3.79 | | | | 7.27 | |
| | | | |
| | | | | |
Less distributions from: | | | | | | | | | | | | | | | | | | | | |
| | | | | |
Net investment income | | | (0.29 | ) | | | (0.48 | ) | | | (0.39 | ) | | | (0.85 | ) | | | — | |
| | | | | |
Net realized gains | | | (2.31 | ) | | | (5.77 | ) | | | (7.59 | ) | | | (5.30 | ) | | | — | |
| | | | |
| | | | | |
Total distributions | | | (2.60 | ) | | | (6.25 | ) | | | (7.98 | ) | | | (6.15 | ) | | | — | |
| | | | |
Net asset value, end of period. | | | $39.55 | | | | $36.40 | | | | $41.10 | | | | $52.70 | | | | $55.06 | |
| | | | |
| | | | | |
Total returng | | | 15.82% | | | | 4.86% | | | | (7.33)% | | | | 7.37% | | | | 15.21% | |
| | | | | |
| Ratios to average net assetsh | | | | | | | | | | | | | | | | | | | | |
| | | | | |
Expenses before waiver and payments by affiliates | | | 0.65% | | | | 0.53% | | | | 0.51% | | | | 0.50% | | | | 2.10% | |
| | | | | |
Expenses net of waiver and payments by affiliates | | | 0.47% | i | | | 0.50% | i | | | 0.50% | | | | 0.49% | i | | | 0.51% | |
| | | | | |
Net investment income. | | | 1.53% | d | | | 1.03% | | | | 0.89% | | | | 1.29% | e | | | 1.25%f | |
| | | | | |
| Supplemental data | | | | | | | | | | | | | | | | | | | | |
| | | | | |
Net assets, end of period (000’s) | | | $230 | | | | $157 | | | | $7,412 | | | | $7,863 | | | | $6 | |
| | | | | |
Portfolio turnover rate | | | 14.88% | | | | 30.25% | | | | 26.31% | | | | 25.08% | | | | 11.54% | |
aFor the period May 1, 2013 (effective date) to October 31, 2013.
bThe amount shown for a share outstanding throughout the period may not correlate with the Statement of Operations for the period due to the timing of sales and repurchases of the Fund’s shares in relation to income earned and/or fluctuating fair value of the investments of the Fund.
cBased on average daily shares outstanding.
dNet investment income per share includes approximately $0.09 per share related to income received in the form of special dividends in connection with certain Fund holdings. Excluding this amount, the ratio of net investment income to average net assets would have been 1.06%.
eNet investment income per share includes approximately $0.15 per share related to income received in the form of special dividends in connection with certain Fund holdings. Excluding this amount, the ratio of net investment income to average net assets would have been 1.01%.
fNet investment income per share includes approximately $0.07 per share related to income received in the form of special dividends in connection with certain Fund holdings. Excluding this amount, the ratio of net investment income to average net assets would have been 1.00%.
gTotal return is not annualized for periods less than one year.
hRatios are annualized for periods less than one year.
iBenefit of expense reduction rounds to less than 0.01%.
| | | | |
32 | | Semiannual Report | The accompanying notes are an integral part of these financial statements. | | franklintempleton.com |
FRANKLIN VALUE INVESTORS TRUST
FINANCIAL HIGHLIGHTS
Franklin Balance Sheet Investment Fund (continued)
| | | | | | | | | | | | | | | | | | | | | | | | |
| | | Six Months Ended
April 30, 2017 | | | Year Ended October 31, | |
| | | (unaudited) | | | 2016 | | | 2015 | | | 2014 | | | 2013 | | | 2012 | |
| Advisor Class | | | | | | | | | | | | | | | | | | | | | | | | |
Per share operating performance (for a share outstanding throughout the period) | | | | | | | | | | | | | | | | | | | | | | | | |
| | | | | | |
Net asset value, beginning of period | | | $36.45 | | | | $41.08 | | | | $52.68 | | | | $55.04 | | | | $43.79 | | | | $44.82 | |
| | | | |
| | | | | | |
Income from investment operationsa: | | | | | | | | | | | | | | | | | | | | | | | | |
| | | | | | |
Net investment incomeb | | | 0.27 | c | | | 0.31 | | | | 0.30 | | | | 0.60 | d | | | 0.79 | e | | | 0.58 | |
| | | | | | |
Net realized and unrealized gains (losses) | | | 5.45 | | | | 1.20 | | | | (4.00 | ) | | | 3.12 | | | | 13.40 | | | | 3.69 | |
| | | | |
Total from investment operations | | | 5.72 | | | | 1.51 | | | | (3.70 | ) | | | 3.72 | | | | 14.19 | | | | 4.27 | |
| | | | | | |
Less distributions from: | | | | | | | | | | | | | | | | | | | | | | | | |
| | | | | | |
Net investment income | | | (0.28 | ) | | | (0.37 | ) | | | (0.31 | ) | | | (0.78 | ) | | | (0.78 | ) | | | (0.38) | |
| | | | | | |
Net realized gains | | | (2.31 | ) | | | (5.77 | ) | | | (7.59 | ) | | | (5.30 | ) | | | (2.16 | ) | | | (4.92) | |
| | | | |
| | | | | | |
Total distributions | | | (2.59 | ) | | | (6.14 | ) | | | (7.90 | ) | | | (6.08 | ) | | | (2.94 | ) | | | (5.30) | |
| | | | |
| | | | | | |
Net asset value, end of period | | | $39.58 | | | | $36.45 | | | | $41.08 | | | | $52.68 | | | | $55.04 | | | | $43.79 | |
| | | | |
| | | | | | |
Total returnf | | | 15.76% | | | | 4.69% | | | | (7.51)% | | | | 7.23% | | | | 34.39% | | | | 11.34% | |
| | | | | | |
| Ratios to average net assetsg | | | | | | | | | | | | | | | | | | | | | | | | |
| | | | | | |
Expenses before waiver and payments by affiliates | | | 0.67% | | | | 0.69% | | | | 0.70% | | | | 0.65% | | | | 0.66% | | | | 0.74% | |
| | | | | | |
Expenses net of waiver and payments by affiliates | | | 0.62% | h | | | 0.66% | h | | | 0.69% | | | | 0.64% | h | | | 0.66% | | | | 0.74% | |
| | | | | | |
Net investment income | | | 1.38% | c | | | 0.87% | | | | 0.70% | | | | 1.14% | d | | | 1.59% | e | | | 1.41% | |
| | | | | | |
| Supplemental data | | | | | | | | | | | | | | | | | | | | | | | | |
| | | | | | |
Net assets, end of period (000’s) | | | $99,051 | | | | $75,573 | | | | $69,330 | | | | $115,254 | | | | $107,925 | | | | $115,694 | |
| | | | | | |
Portfolio turnover rate | | | 14.88% | | | | 30.25% | | | | 26.31% | | | | 25.08% | | | | 11.54% | | | | 7.91% | i |
aThe amount shown for a share outstanding throughout the period may not correlate with the Statement of Operations for the period due to the timing of sales and repurchases of the Fund’s shares in relation to income earned and/or fluctuating fair value of the investments of the Fund.
bBased on average daily shares outstanding.
cNet investment income per share includes approximately $0.09 per share related to income received in the form of special dividends in connection with certain Fund holdings. Excluding this amount, the ratio of net investment income to average net assets would have been 0.91%.
dNet investment income per share includes approximately $0.15 per share related to income received in the form of special dividends in connection with certain Fund holdings. Excluding this amount, the ratio of net investment income to average net assets would have been 0.86%.
eNet investment income per share includes approximately $0.15 per share related to income received in the form of special dividends in connection with certain Fund holdings. Excluding this amount, the ratio of net investment income to average net assets would have been 1.27%.
fTotal return is not annualized for periods less than one year.
gRatios are annualized for periods less than one year.
hBenefit of expense reduction rounds to less than 0.01%.
iExcludes the value of portfolio securities delivered as a result of a redemption in-kind.
| | | | | | |
franklintempleton.com | | The accompanying notes are an integral part of these financial statements. | Semiannual Report | | | 33 | |
FRANKLIN VALUE INVESTORS TRUST
Statement of Investments, April 30, 2017 (unaudited)
Franklin Balance Sheet Investment Fund
| | | | | | | | | | |
| | | | | Shares | | | Value | |
| | Common Stocks 84.1% | | | | | | | | |
| | Automobiles & Components 1.5% | | | | | | | | |
| | General Motors Co. | | | 454,000 | | | $ | 15,726,560 | |
| | | | | | | | | | |
| | Banks 13.3% | | | | | | | | |
| | Bank of America Corp. | | | 1,113,100 | | | | 25,979,754 | |
| | Citigroup Inc. | | | 294,400 | | | | 17,404,928 | |
| | Citizens Financial Group Inc. | | | 441,300 | | | | 16,200,123 | |
| | Comerica Inc. | | | 289,800 | | | | 20,488,860 | |
| | Farmers & Merchants Bank of Long Beach | | | 1,475 | | | | 10,923,850 | |
| | JPMorgan Chase & Co. | | | 360,200 | | | | 31,337,400 | |
| | PNC Financial Services Group Inc. | | | 123,100 | | | | 14,741,225 | |
| | | | | | | | | | |
| | | | | | | | | 137,076,140 | |
| | | | | | | | | | |
| | Capital Goods 5.1% | | | | | | | | |
| | Arconic Inc. | | | 89,043 | | | | 2,433,545 | |
| a | | Chart Industries Inc. | | | 43,900 | | | | 1,602,789 | |
| | Mueller Industries Inc. | | | 298,000 | | | | 9,547,920 | |
| | Regal Beloit Corp. | | | 174,800 | | | | 13,782,980 | |
| | Terex Corp. | | | 353,100 | | | | 12,351,438 | |
| a | | WESCO International Inc. | | | 204,300 | | | | 12,452,085 | |
| | | | | | | | | | |
| | | | | | | | | 52,170,757 | |
| | | | | | | | | | |
| | Commercial & Professional Services 3.1% | | | | | | | | |
| a | | Acco Brands Corp. | | | 609,680 | | | | 8,687,940 | |
| a | | FTI Consulting Inc. | | | 142,100 | | | | 4,915,239 | |
| | Heidrick & Struggles International Inc. | | | 544,600 | | | | 11,708,900 | |
| | Tetra Tech Inc. | | | 155,000 | | | | 6,812,250 | |
| | | | | | | | | | |
| | | | | | | | | 32,124,329 | |
| | | | | | | | | | |
| | Consumer Durables & Apparel 2.7% | | | | | | | | |
| | M.D.C. Holdings Inc. | | | 265,125 | | | | 8,221,526 | |
| | Toll Brothers Inc. | | | 533,600 | | | | 19,204,264 | |
| | | | | | | | | | |
| | | | | | | | | 27,425,790 | |
| | | | | | | | | | |
| | Consumer Services 1.5% | | | | | | | | |
| | Vail Resorts Inc. | | | 79,900 | | | | 15,793,034 | |
| | | | | | | | | | |
| | Diversified Financials 3.5% | | | | | | | | |
| | The Bank of New York Mellon Corp. | | | 275,300 | | | | 12,955,618 | |
| | Capital One Financial Corp. | | | 30,000 | | | | 2,411,400 | |
| | Morgan Stanley | | | 479,900 | | | | 20,813,263 | |
| | | | | | | | | | |
| | | | | | | | | 36,180,281 | |
| | | | | | | | | | |
| | Energy 12.9% | | | | | | | | |
| a | | Arch Coal Inc. | | | 127,000 | | | | 8,920,480 | |
| | Chevron Corp. | | | 166,900 | | | | 17,808,230 | |
| a | | Cloud Peak Energy Inc. | | | 1,268,800 | | | | 4,275,856 | |
| | Devon Energy Corp. | | | 195,400 | | | | 7,716,346 | |
| a | | McDermott International Inc. | | | 2,854,700 | | | | 18,669,738 | |
| | Occidental Petroleum Corp. | | | 199,500 | | | | 12,277,230 | |
| a | | QEP Resources Inc. | | | 703,300 | | | | 8,305,973 | |
| a | | Rowan Cos. PLC | | | 1,239,300 | | | | 17,436,951 | |
| | Royal Dutch Shell PLC, A, ADR (United Kingdom) | | | 520,100 | | | | 27,144,019 | |
| | Tenaris SA (Italy) | | | 494,500 | | | | 7,745,915 | |
| | Valero Energy Corp. | | | 40,900 | | | | 2,642,549 | |
| | | | | | | | | | |
| | | | | | | | | 132,943,287 | |
| | | | | | | | | | |
| | | | |
34 | | Semiannual Report | | franklintempleton.com |
FRANKLIN VALUE INVESTORS TRUST
STATEMENT OF INVESTMENTS (UNAUDITED)
Franklin Balance Sheet Investment Fund (continued)
| | | | | | | | | | |
| | | | | Shares | | | Value | |
| | Common Stocks (continued) | | | | | | | | |
| | Food, Beverage & Tobacco 4.6% | | | | | | | | |
| | Archer-Daniels-Midland Co. | | | 359,100 | | | $ | 16,428,825 | |
| | Bunge Ltd. | | | 302,500 | | | | 23,906,575 | |
| | GrainCorp Ltd. (Australia) | | | 459,436 | | | | 3,068,504 | |
| | Sanderson Farms Inc. | | | 38,400 | | | | 4,445,952 | |
| | | | | | | | | | |
| | | | | | | | | 47,849,856 | |
| | | | | | | | | | |
| | Health Care Equipment & Services 0.8% | | | | | | | | |
| | National Healthcare Corp. | | | 105,000 | | | | 7,814,100 | |
| | | | | | | | | | |
| | Life & Health Insurance 4.7% | | | | | | | | |
| | MetLife Inc. | | | 256,900 | | | | 13,309,989 | |
| | National Western Life Group Inc., A | | | 51,500 | | | | 15,771,360 | |
| | Prudential Financial Inc. | | | 178,200 | | | | 19,072,746 | |
| | | | | | | | | | |
| | | | | | | | | 48,154,095 | |
| | | | | | | | | | |
| | Materials 6.5% | | | | | | | | |
| | Albemarle Corp. | | | 62,000 | | | | 6,752,420 | |
| | Aperam SA (Luxembourg) | | | 213,700 | | | | 10,759,250 | |
| a | | Century Aluminum Co. | | | 737,800 | | | | 10,063,592 | |
| | Domtar Corp. | | | 220,000 | | | | 8,723,000 | |
| | The Mosaic Co. | | | 461,300 | | | | 12,422,809 | |
| | Reliance Steel & Aluminum Co. | | | 113,600 | | | | 8,953,952 | |
| a | | TimkenSteel Corp. | | | 644,400 | | | | 9,717,552 | |
| | | | | | | | | | |
| | | | | | | | | 67,392,575 | |
| | | | | | | | | | |
| | Media 3.1% | | | | | | | | |
| | News Corp., B | | | 1,085,700 | | | | 14,114,100 | |
| | Scholastic Corp. | | | 187,100 | | | | 8,088,333 | |
| | Time Inc. | | | 654,100 | | | | 9,942,320 | |
| | | | | | | | | | |
| | | | | | | | | 32,144,753 | |
| | | | | | | | | | |
| | Multi-line Insurance 0.2% | | | | | | | | |
| | American International Group Inc. | | | 41,000 | | | | 2,497,310 | |
| | | | | | | | | | |
| | Pharmaceuticals, Biotechnology & Life Sciences 3.8% | | | | | | | | |
| | Allergan PLC | | | 66,200 | | | | 16,143,532 | |
| a | | Bio-Rad Laboratories Inc., A | | | 107,628 | | | | 23,490,887 | |
| | | | | | | | | | |
| | | | | | | | | 39,634,419 | |
| | | | | | | | | | |
| | Property & Casualty Insurance 2.4% | | | | | | | | |
| | Chubb Ltd. | | | 105,332 | | | | 14,456,817 | |
| | The Travelers Cos. Inc. | | | 80,100 | | | �� | 9,744,966 | |
| | | | | | | | | | |
| | | | | | | | | 24,201,783 | |
| | | | | | | | | | |
| | Real Estate 0.6% | | | | | | | | |
| a | | Trinity Place Holdings Inc. | | | 909,834 | | | | 6,487,116 | |
| | | | | | | | | | |
| | Retailing 0.3% | | | | | | | | |
| | Abercrombie & Fitch Co., A | | | 228,500 | | | | 2,739,715 | |
| | | | | | | | | | |
| | Semiconductors & Semiconductor Equipment 3.8% | | | | | | | | |
| a | | Kulicke and Soffa Industries Inc. (Singapore) | | | 416,000 | | | | 9,285,120 | |
| | MKS Instruments Inc. | | | 245,000 | | | | 19,171,250 | |
| a | | Photronics Inc. | | | 921,500 | | | | 10,597,250 | |
| | | | | | | | | | |
| | | | | | | | | 39,053,620 | |
| | | | | | | | | | |
| | | | | | |
franklintempleton.com | | Semiannual Report | | | 35 | |
FRANKLIN VALUE INVESTORS TRUST
STATEMENT OF INVESTMENTS (UNAUDITED)
Franklin Balance Sheet Investment Fund (continued)
| | | | | | | | | | |
| | | | | Shares | | | Value | |
| | Common Stocks (continued) | | | | | | | | |
| | Technology Hardware & Equipment 5.3% | | | | | | | | |
| | Corning Inc. | | | 1,558,600 | | | | $ 44,965,610 | |
| a | | Rogers Corp. | | | 96,200 | | | | 9,902,828 | |
| | | | | | | | | | |
| | | | | | | | | 54,868,438 | |
| | | | | | | | | | |
| | Telecommunication Services 1.4% | | | | | | | | |
| a | | Iridium Communications Inc. | | | 771,883 | | | | 8,181,960 | |
| a | | ORBCOMM Inc. | | | 665,300 | | | | 6,413,492 | |
| | | | | | | | | | |
| | | | | | | | | 14,595,452 | |
| | | | | | | | | | |
| | Utilities 3.0% | | | | | | | | |
| | Eversource Energy | | | 136,000 | | | | 8,078,400 | |
| | Great Plains Energy Inc. | | | 86,300 | | | | 2,553,617 | |
| | IDACORP Inc. | | | 134,000 | | | | 11,325,680 | |
| | PNM Resources Inc. | | | 249,000 | | | | 9,275,250 | |
| | | | | | | | | | |
| | | | | | | | | 31,232,947 | |
| | | | | | | | | | |
| | Total Common Stocks (Cost $612,918,852) | | | | | | | 868,106,357 | |
| | | | | | | | | | |
| | Convertible Preferred Stocks (Cost $4,719,389) 0.7% | | | | | | | | |
| | Telecommunication Services 0.7% | | | | | | | | |
| | Iridium Communications Inc., 6.75%, cvt., pfd., B | | | 20,000 | | | | 7,381,250 | |
| | | | | | | | | | |
| | | | | Principal
Amount | | | | |
| | Corporate Bonds (Cost $1,490,000) 0.2% | | | | | | | | |
| | Capital Goods 0.2% | | | | | | | | |
| | Mueller Industries Inc., 6.00%, 3/01/27 | | | $ 1,490,000 | | | | 1,497,450 | |
| | | | | | | | | | |
| | Total Investments before Short Term Investments (Cost $619,128,241) | | | | | | | 876,985,057 | |
| | | | | | | | | | |
| | | | | Shares | | | | |
| | Short Term Investments (Cost $155,179,685) 15.0% | | | | | | | | |
| | Money Market Funds 15.0% | | | | | | | | |
| b,c | | Institutional Fiduciary Trust Money Market Portfolio, 0.37% | | | 155,179,685 | | | | 155,179,685 | |
| | | | | | | | | | |
| | Total Investments (Cost $774,307,926) 100.0% | | | | | |
| 1,032,164,742
|
|
| | Other Assets, less Liabilities 0.0%† | | | | | | | 175,774 | |
| | | | | | | | | | |
| | Net Assets 100.0% | | | | | | | $1,032,340,516 | |
| | | | | | | | | | |
See Abbreviations on page 83.
†Rounds to less than 0.1% of net assets.
aNon-income producing.
bSee Note 3(f) regarding investments in affiliated management investment companies.
cThe rate shown is the annualized seven-day yield at period end.
| | | | |
36 | | Semiannual Report | The accompanying notes are an integral part of these financial statements. | | franklintempleton.com |
FRANKLIN VALUE INVESTORS TRUST
Financial Highlights
Franklin MicroCap Value Fund
| | | | | | | | | | | | | | | | | | | | | | | | |
| | | Six Months Ended
April 30, 2017 | | | Year Ended October 31, | |
| | | (unaudited) | | | 2016 | | | 2015 | | | 2014 | | | 2013 | | | 2012 | |
| Class A | | | | | | | | | | | | | | | | | | | | | | | | |
Per share operating performance (for a share outstanding throughout the period) | | | | | | | | | | | | | | | | | | | | | | | | |
| | | | | | |
Net asset value, beginning of period | | | $31.33 | | | | $32.90 | | | | $39.88 | | | | $40.99 | | | | $32.60 | | | | $32.38 | |
| | | | |
| | | | | | |
Income from investment operationsa: | | | | | | | | | | | | | | | | | | | | | | | | |
| | | | | | |
Net investment income (loss)b | | | 0.02 | | | | 0.11 | c | | | — | d | | | (0.07 | )e | | | 0.10 | f | | | 0.30g | |
| | | | | | |
Net realized and unrealized gains (losses) | | | 4.56 | | | | 2.22 | | | | (3.33 | ) | | | 1.44 | | | | 10.25 | | | | 3.77 | |
| | | | |
| | | | | | |
| Total from investment operations | | | 4.58 | | | | 2.33 | | | | (3.33 | ) | | | 1.37 | | | | 10.35 | | | | 4.07 | |
| | | | |
| | | | | | |
| Less distributions from: | | | | | | | | | | | | | | | | | | | | | | | | |
| | | | | | |
Net investment income | | | (0.11 | ) | | | — | | | | — | | | | (0.04 | ) | | | (0.52 | ) | | | (0.02) | |
| | | | | | |
Net realized gains | | | (3.00 | ) | | | (3.90 | ) | | | (3.65 | ) | | | (2.44 | ) | | | (1.44 | ) | | | (3.83) | |
| | | | |
| | | | | | |
| Total distributions | | | (3.11 | ) | | | (3.90 | ) | | | (3.65 | ) | | | (2.48 | ) | | | (1.96 | ) | | | (3.85) | |
| | | | |
| | | | | | |
| Net asset value, end of period | | | $32.80 | | | | $31.33 | | | | $32.90 | | | | $39.88 | | | | $40.99 | | | | $32.60 | |
| | | | |
| | | | | | |
Total returnh | | | 14.33% | | | | 8.25% | | | | (8.58)% | | | | 3.39% | | | | 33.64% | | | | 14.70% | |
| | | | | | |
| Ratios to average net assetsi | | | | | | | | | | | | | | | | | | | | | | | | |
| | | | | | |
Expenses before waiver and payments by affiliates | | | 1.18% | | | | 1.19% | | | | 1.20% | | | | 1.16% | | | | 1.15% | | | | 1.16% | |
| | | | | | |
Expenses net of waiver and payments by affiliates | | | 1.17% | j | | | 1.18% | j | | | 1.19% | | | | 1.14% | j | | | 1.15% | | | | 1.16% | |
| | | | | | |
Net investment income (loss) | | | 0.13% | | | | 0.36% | c | | | 0.02% | | | | (0.17)% | e | | | 0.36% | f | | | 1.01% | g |
| | | | | | |
| Supplemental data | | | | | | | | | | | | | | | | | | | | | | | | |
| | | | | | |
Net assets, end of period (000’s) | | | $240,590 | | | | $232,964 | | | | $258,143 | | | | $346,820 | | | | $370,763 | | | | $202,636 | |
| | | | | | |
Portfolio turnover rate | | | 3.89% | | | | 11.72% | | | | 8.64% | | | | 11.63% | | | | 11.31% | | | | 5.03% | |
aThe amount shown for a share outstanding throughout the period may not correlate with the Statement of Operations for the period due to the timing of sales and repurchases of the Fund’s shares in relation to income earned and/or fluctuating fair value of the investments of the Fund.
bBased on average daily shares outstanding.
cNet investment income per share includes approximately $0.07 per share related to income received in the form of special dividends in connection with certain Fund holdings. Excluding this amount, the ratio of net investment income to average net assets would have been 0.13%.
dAmount rounds to less than $0.01 per share.
eNet investment income per share includes approximately $0.06 per share related to income received in the form of special dividends in connection with certain Fund holdings. Excluding this amount, the ratio of net investment income to average net assets would have been (0.31)%.
fNet investment income per share includes approximately $0.17 per share related to income received in the form of special dividends in connection with certain Fund holdings. Excluding this amount, the ratio of net investment income to average net assets would have been (0.10)%.
gNet investment income per share includes approximately $0.23 per share related to income received in the form of special dividends in connection with certain Fund holdings. Excluding this amount, the ratio of net investment income to average net assets would have been 0.25%.
hTotal return does not reflect sales commissions or contingent deferred sales charges, if applicable, and is not annualized for periods less than one year.
iRatios are annualized for periods less than one year.
jBenefit of expense reduction rounds to less than 0.01%.
| | | | | | |
franklintempleton.com | | The accompanying notes are an integral part of these financial statements. | Semiannual Report | | | 37 | |
FRANKLIN VALUE INVESTORS TRUST
FINANCIAL HIGHLIGHTS
Franklin MicroCap Value Fund (continued)
| | | | | | | | | | | | | | | | | | | | |
| | | Six Months Ended
April 30, 2017 | | | Year Ended October 31, | |
| | | (unaudited) | | | 2016 | | | 2015 | | | 2014 | | | 2013a | |
| | | | | |
| Class R6 | | | | | | | | | | | | | | | | | | | | |
| | | | | |
Per share operating performance (for a share outstanding throughout the period) | | | | | | | | | | | | | | | | | | | | |
| | | | | |
Net asset value, beginning of period | | | $31.66 | | | | $33.09 | | | | $39.94 | | | | $41.03 | | | | $34.43 | |
| | | | |
| | | | | |
Income from investment operationsb: | | | | | | | | | | | | | | | | | | | | |
| | | | | |
Net investment incomec | | | 0.08 | | | | 0.22 | d | | | 0.14 | | | | 0.03 | e | | | 0.04 | |
| | | | | |
Net realized and unrealized gains (losses) | | | 4.61 | | | | 2.25 | | | | (3.34 | ) | | | 1.50 | | | | 6.56 | |
| | | | |
| | | | | |
Total from investment operations | | | 4.69 | | | | 2.47 | | | | (3.20 | ) | | | 1.53 | | | | 6.60 | |
| | | | |
| | | | | |
Less distributions from: | | | | | | | | | | | | | | | | | | | | |
| | | | | |
Net investment income | | | (0.23 | ) | | | — | | | | — | | | | (0.18 | ) | | | — | |
| | | | | |
Net realized gains | | | (3.00 | ) | | | (3.90 | ) | | | (3.65 | ) | | | (2.44 | ) | | | — | |
| | | | |
| | | | | |
Total distributions | | | (3.23 | ) | | | (3.90 | ) | | | (3.65 | ) | | | (2.62 | ) | | | — | |
| | | | |
| | | | | |
Net asset value, end of period | | | $33.12 | | | | $31.66 | | | | $33.09 | | | | $39.94 | | | | $41.03 | |
| | | | |
| | | | | |
Total returnf | | | 14.56% | | | | 8.67% | | | | (8.21)% | | | | 3.79% | | | | 19.17% | |
| | | | | |
| Ratios to average net assetsg | | | | | | | | | | | | | | | | | | | | |
| | | | | |
Expenses before waiver and payments by affiliates | | | 0.81% | | | | 0.81% | | | | 0.81% | | | | 0.79% | | | | 0.79% | |
| | | | | |
Expenses net of waiver and payments by affiliates | | | 0.80% | h | | | 0.80% | h | | | 0.80% | | | | 0.77% | h | | | 0.79% | |
| | | | | |
Net investment income | | | 0.50% | | | | 0.74% | d | | | 0.41% | | | | 0.20% | e | | | 0.19% | |
| | | | | |
| Supplemental data | | | | | | | | | | | | | | | | | | | | |
| | | | | |
Net assets, end of period (000’s) | | | $21,719 | | | | $18,288 | | | | $18,031 | | | | $25,020 | | | | $59,597 | |
| | | | | |
Portfolio turnover rate | | | 3.89% | | | | 11.72% | | | | 8.64% | | | | 11.63% | | | | 11.31% | |
aFor the period May 1, 2013 (effective date) to October 31, 2013.
bThe amount shown for a share outstanding throughout the period may not correlate with the Statement of Operations for the period due to the timing of sales and repurchases of the Fund’s shares in relation to income earned and/or fluctuating fair value of the investments of the Fund.
cBased on average daily shares outstanding.
dNet investment income per share includes approximately $0.07 per share related to income received in the form of special dividends in connection with certain Fund holdings. Excluding this amount, the ratio of net investment income to average net assets would have been 0.51%.
eNet investment income per share includes approximately $0.06 per share related to income received in the form of special dividends in connection with certain Fund holdings. Excluding this amount, the ratio of net investment income to average net assets would have been 0.06%.
fTotal return is not annualized for periods less than one year.
gRatios are annualized for periods less than one year.
hBenefit of expense reduction rounds to less than 0.01%.
| | | | |
38 | | Semiannual Report | The accompanying notes are an integral part of these financial statements. | | franklintempleton.com |
FRANKLIN VALUE INVESTORS TRUST
FINANCIAL HIGHLIGHTS
Franklin MicroCap Value Fund (continued)
| | | | | | | | | | | | | | | | | | | | | | | | |
| | | Six Months Ended
April 30, 2017 | | | Year Ended October 31, | |
| | | (unaudited) | | | 2016 | | | 2015 | | | 2014 | | | 2013 | | | 2012 | |
| | | | | | |
| Advisor Class | | | | | | | | | | | | | | | | | | | | | | | | |
| | | | | | |
Per share operating performance
(for a share outstanding throughout the period) | | | | | | | | | | | | | | | | | | | | | | | | |
| | | | | | |
Net asset value, beginning of period | | | $31.52 | | | | $33.00 | | | | $39.90 | | | | $40.99 | | | | $32.61 | | | | $32.41 | |
| | | | |
| | | | | | |
Income from investment operationsa: | | | | | | | | | | | | | | | | | | | | | | | | |
| | | | | | |
Net investment incomeb | | | 0.06 | | | | 0.18 | c | | | 0.09 | | | | 0.04 | d | | | 0.31 | e | | | 0.39 | f |
| | | | | | |
Net realized and unrealized gains (losses) | | | 4.59 | | | | 2.24 | | | | (3.34 | ) | | | 1.43 | | | | 10.11 | | | | 3.74 | |
| | | | |
| | | | | | |
Total from investment operations | | | 4.65 | | | | 2.42 | | | | (3.25 | ) | | | 1.47 | | | | 10.42 | | | | 4.13 | |
| | | | |
| | | | | | |
Less distributions from: | | | | | | | | | | | | | | | | | | | | | | | | |
| | | | | | |
Net investment income | | | (0.19 | ) | | | — | | | | — | | | | (0.12 | ) | | | (0.60 | ) | | | (0.10 | ) |
| | | | | | |
Net realized gains | | | (3.00 | ) | | | (3.90 | ) | | | (3.65 | ) | | | (2.44 | ) | | | (1.44 | ) | | | (3.83 | ) |
| | | | |
| | | | | | |
Total distributions | | | (3.19 | ) | | | (3.90 | ) | | | (3.65 | ) | | | (2.56 | ) | | | (2.04 | ) | | | (3.93 | ) |
| | | | |
| | | | | | |
Net asset value, end of period | | | $32.98 | | | | $31.52 | | | | $33.00 | | | | $39.90 | | | | $40.99 | | | | $32.61 | |
| | | | |
| | | | | | |
Total returng | | | 14.48% | | | | 8.53% | | | | (8.36)% | | | | 3.64% | | | | 33.93% | | | | 14.97% | |
| | | | | | |
| Ratios to average net assetsh | | | | | | | | | | | | | | | | | | | | | | | | |
| | | | | | |
Expenses before waiver and payments by affiliates | | | 0.94% | | | | 0.95% | | | | 0.96% | | | | 0.92% | | | | 0.91% | | | | 0.92% | |
| | | | | | |
Expenses net of waiver and payments by affiliates | | | 0.93% | i | | | 0.94% | i | | | 0.95% | | | | 0.90% | i | | | 0.91% | | | | 0.92% | |
| | | | | | |
Net investment income | | | 0.37% | | | | 0.60% | c | | | 0.26% | | | | 0.07% | d | | | 0.60% | e | | | 1.25% | f |
| | | | | | |
| Supplemental data | | | | | | | | | | | | | | | | | | | | | | | | |
| | | | | | |
Net assets, end of period (000’s) | | | $75,604 | | | | $63,410 | | | | $67,538 | | | | $89,880 | | | | $116,292 | | | | $165,296 | |
| | | | | | |
Portfolio turnover rate | | | 3.89% | | | | 11.72% | | | | 8.64% | | | | 11.63% | | | | 11.31% | | | | 5.03% | |
aThe amount shown for a share outstanding throughout the period may not correlate with the Statement of Operations for the period due to the timing of sales and repurchases of the Fund’s shares in relation to income earned and/or fluctuating fair value of the investments of the Fund.
bBased on average daily shares outstanding.
cNet investment income per share includes approximately $0.07 per share related to income received in the form of special dividends in connection with certain Fund holdings. Excluding this amount, the ratio of net investment income to average net assets would have been 0.37%.
dNet investment income per share includes approximately $0.06 per share related to income received in the form of special dividends in connection with certain Fund holdings. Excluding this amount, the ratio of net investment income to average net assets would have been (0.07)%.
eNet investment income per share includes approximately $0.17 per share related to income received in the form of special dividends in connection with certain Fund holdings. Excluding this amount, the ratio of net investment income to average net assets would have been 0.14%.
fNet investment income per share includes approximately $0.23 per share related to income received in the form of special dividends in connection with certain Fund holdings. Excluding this amount, the ratio of net investment income to average net assets would have been 0.49%.
gTotal return is not annualized for periods less than one year.
hRatios are annualized for periods less than one year.
iBenefit of expense reduction rounds to less than 0.01%.
| | | | | | |
franklintempleton.com | | The accompanying notes are an integral part of these financial statements. | Semiannual Report | | | 39 | |
FRANKLIN VALUE INVESTORS TRUST
Statement of Investments, April 30, 2017 (unaudited)
Franklin MicroCap Value Fund
| | | | | | | | | | |
| | | | | Shares | | | Value | |
| | Common Stocks 96.8% | | | | | | | | |
| | Aerospace & Defense 3.0% | | | | | | | | |
| a | | Ducommun Inc. | | | 225,000 | | | $ | 6,612,750 | |
| a | | Sparton Corp. | | | 160,000 | | | | 3,563,200 | |
| | | | | | | | | | |
| | | | | | | | | 10,175,950 | |
| | | | | | | | | | |
| | Banks 14.6% | | | | | | | | |
| | Bar Harbor Bankshares | | | 294,000 | | | | 9,052,260 | |
| | County Bancorp Inc. | | | 50,000 | | | | 1,372,500 | |
| | First Defiance Financial Corp. | | | 142,900 | | | | 7,665,156 | |
| | First Internet Bancorp. | | | 83,000 | | | | 2,452,650 | |
| | Investar Holding Corp. | | | 220,000 | | | | 4,895,000 | |
| b | | Northeast Bancorp. | | | 459,500 | | | | 7,696,625 | |
| | Old Line Bancshares Inc. | | | 64,145 | | | | 1,780,665 | |
| | Peoples Financial Services Corp. | | | 87,543 | | | | 3,934,183 | |
| | Southern Missouri Bancorp Inc. | | | 114,000 | | | | 3,796,200 | |
| | WSFS Financial Corp. | | | 140,000 | | | | 6,608,000 | |
| | | | | | | | | | |
| | | | | | | | | 49,253,239 | |
| | | | | | | | | | |
| | Building Products 4.6% | | | | | | | | |
| a | | Armstrong Flooring Inc. | | | 160,000 | | | | 3,070,400 | |
| | Burnham Holdings Inc., A | | | 200,000 | | | | 3,280,000 | |
| a,b | | Continental Materials Corp. | | | 113,000 | | | | 2,491,650 | |
| a | | Gibraltar Industries Inc. | | | 170,000 | | | | 6,672,500 | |
| | | | | | | | | | |
| | | | | | | | | 15,514,550 | |
| | | | | | | | | | |
| | | |
| | Commercial & Professional Services 2.9% | | | | | | | | |
| | Healthcare Services Group Inc. | | | 216,800 | | | | 9,953,288 | |
| | | | | | | | | | |
| | Construction & Engineering 4.5% | | | | | | | | |
| a | | Northwest Pipe Co. | | | 287,600 | | | | 4,029,276 | |
| a | | Orion Group Holdings Inc. | | | 445,000 | | | | 3,359,750 | |
| a | | Sterling Construction Co. | | | 809,100 | | | | 7,694,541 | |
| | | | | | | | | | |
| | | | | | | | | 15,083,567 | |
| | | | | | | | | | |
| | Consumer Durables & Apparel 3.8% | | | | | | | | |
| a,b | | Delta Apparel Inc. | | | 455,100 | | | | 7,977,903 | |
| | Flexsteel Industries Inc. | | | 42,000 | | | | 2,231,040 | |
| | Rocky Brands Inc. | | | 177,800 | | | | 2,524,760 | |
| | | | | | | | | | |
| | | | | | | | | 12,733,703 | |
| | | | | | | | | | |
| | Consumer Services 1.9% | | | | | | | | |
| a,b | | Full House Resorts Inc. | | | 1,923,520 | | | | 4,635,683 | |
| | Golden Entertainment Inc. | | | 129,800 | | | | 1,822,392 | |
| | | | | | | | | | |
| | | | | | | | | 6,458,075 | |
| | | | | | | | | | |
| | Diversified Financials 0.6% | | | | | | | | |
| | Arbor Realty Trust Inc. | | | 220,000 | | | | 1,898,600 | |
| a,b | | Origen Financial Inc. | | | 1,900,000 | | | | 240,825 | |
| | | | | | | | | | |
| | | | | | | | | 2,139,425 | |
| | | | | | | | | | |
| | Electrical Equipment 1.6% | | | | | | | | |
| a,b | | Global Power Equipment Group Inc. | | | 1,275,000 | | | | 5,533,500 | |
| | | | | | | | | | |
| | Energy 10.3% | | | | | | | | |
| | Adams Resources & Energy Inc. | | | 16,600 | | | | 674,292 | |
| | Aegean Marine Petroleum Network Inc. (Greece) | | | 550,000 | | | | 6,132,500 | |
| | Ardmore Shipping Corp. (Ireland) | | | 489,000 | | | | 3,789,750 | |
| a | | Cloud Peak Energy Inc. | | | 580,000 | | | | 1,954,600 | |
| | | | |
| | | |
| 40 | | Semiannual Report | | franklintempleton.com |
FRANKLIN VALUE INVESTORS TRUST
STATEMENT OF INVESTMENTS (UNAUDITED)
Franklin MicroCap Value Fund (continued)
| | | | | | | | | | |
| | | | | Shares | | | Value | |
| | Common Stocks (continued) | | | | | | | | |
| | Energy (continued) | | | | | | | | |
| | Gulf Island Fabrication Inc. | | | 227,000 | | | $ | 2,258,650 | |
a | | Natural Gas Services Group Inc. | | | 182,000 | | | | 4,986,800 | |
a | | Pacific Ethanol Inc. | | | 325,000 | | | | 2,210,000 | |
a | | Parker Drilling Co. | | | 500,000 | | | | 825,000 | |
a | | PHI Inc. | | | 17,600 | | | | 204,600 | |
a | | PHI Inc., non-voting | | | 391,000 | | | | 4,586,430 | |
a | | Renewable Energy Group Inc. | | | 323,100 | | | | 3,376,395 | |
a | | Tesco Corp. | | | 555,200 | | | | 3,636,560 | |
| | | | | | | | | | |
| | | | | | | | | 34,635,577 | |
| | | | | | | | | | |
| | | |
| | Food & Staples Retailing 1.8% | | | | | | | | |
| | Village Super Market Inc., A | | | 227,000 | | | | 5,990,530 | |
| | | | | | | | | | |
| | Food, Beverage & Tobacco 6.7% | | | | | | | | |
| | John B. Sanfilippo & Son Inc. | | | 35,000 | | | | 2,572,500 | |
| | Omega Protein Corp. | | | 276,000 | | | | 5,561,400 | |
a | | Seneca Foods Corp., A | | | 261,500 | | | | 9,727,800 | |
a | | Seneca Foods Corp., B | | | 121,500 | | | | 4,920,750 | |
| | | | | | | | | | |
| | | | | | | | | 22,782,450 | |
| | | | | | | | | | |
| | | |
| | Health Care Equipment & Services 1.3% | | | | | | | | |
| | Invacare Corp. | | | 290,000 | | | | 4,263,000 | |
| | | | | | | | | | |
| | Insurance 4.3% | | | | | | | | |
a | | ACMAT Corp., A | | | 196,300 | | | | 3,731,663 | |
| | Baldwin & Lyons Inc., B | | | 276,801 | | | | 6,781,624 | |
a | | Global Indemnity Ltd. (Cayman Islands) | | | 60,000 | | | | 2,433,000 | |
a | | Hallmark Financial Services Inc. | | | 162,600 | | | | 1,708,926 | |
| | | | | | | | | | |
| | | | | | | | | 14,655,213 | |
| | | | | | | | | | |
| | | |
| | Machinery 11.6% | | | | | | | | |
| | Alamo Group Inc. | | | 104,900 | | | | 8,293,394 | |
b | | Hardinge Inc. | | | 725,000 | | | | 7,612,500 | |
| | Hurco Cos. Inc. | | | 290,000 | | | | 8,410,000 | |
a | | Key Technology Inc. | | | 20,000 | | | | 260,800 | |
| | Miller Industries Inc. | | | 322,000 | | | | 8,178,800 | |
| | Spartan Motors Inc. | | | 775,900 | | | | 6,401,175 | |
| | | | | | | | | | |
| | | | | | | | | 39,156,669 | |
| | | | | | | | | | |
| | | |
| | Materials 6.2% | | | | | | | | |
| | Friedman Industries Inc. | | | 120,000 | | | | 744,000 | |
| | Mercer International Inc. (Canada) | | | 200,000 | | | | 2,440,000 | |
| | The Monarch Cement Co. | | | 128,600 | | | | 6,301,400 | |
| | Olympic Steel Inc. | | | 163,200 | | | | 3,680,160 | |
| | Schnitzer Steel Industries Inc., A | | | 91,400 | | | | 1,727,460 | |
a | | Universal Stainless & Alloy Products Inc. | | | 331,000 | | | | 5,974,550 | |
| | | | | | | | | | |
| | | | | | | | | 20,867,570 | |
| | | | | | | | | | |
| | | |
| | Real Estate 1.1% | | | | | | | | |
a | | Bresler & Reiner Inc. | | | 205,000 | | | | 20,500 | |
| | Griffin Industrial Realty Inc. | | | 122,000 | | | | 3,692,940 | |
| | | | | | | | | | |
| | | | | | | | | 3,713,440 | |
| | | | | | | | | | |
| | | | |
| | | |
| franklintempleton.com | | Semiannual Report | | 41 |
FRANKLIN VALUE INVESTORS TRUST
STATEMENT OF INVESTMENTS (UNAUDITED)
Franklin MicroCap Value Fund (continued)
| | | | | | | | | | |
| | | | | Shares | | | Value | |
| | Common Stocks (continued) | | | | | | | | |
| | Retailing 4.1% | | | | | | | | |
| | Caleres Inc. | | | 172,000 | | | $ | 4,957,040 | |
| | Haverty Furniture Cos. Inc. | | | 155,000 | | | | 3,820,750 | |
| | Shoe Carnival Inc. | | | 200,000 | | | | 5,074,000 | |
| | | | | | | | | | |
| | | | | | | | | 13,851,790 | |
| | | | | | | | | | |
| | | |
| | Semiconductors & Semiconductor Equipment 1.5% | | | | | | | | |
a | | Photronics Inc. | | | 452,000 | | | | 5,198,000 | |
| | | | | | | | | | |
| | | |
| | Technology Hardware & Equipment 2.3% | | | | | | | | |
a | | Key Tronic Corp. | | | 480,000 | | | | 3,777,600 | |
a | | Kimball Electronics Inc. | | | 99,000 | | | | 1,707,750 | |
| | Richardson Electronics Ltd. | | | 375,000 | | | | 2,242,500 | |
| | | | | | | | | | |
| | | | | | | | | 7,727,850 | |
| | | | | | | | | | |
| | | |
| | Telecommunication Services 5.0% | | | | | | | | |
a | | Alaska Communications Systems Group Inc. | | | 1,179,600 | | | | 2,772,060 | |
| | ATN International Inc. | | | 66,000 | | | | 4,566,540 | |
a | | Hawaiian Telcom Holdco Inc. | | | 225,000 | | | | 5,726,250 | |
| | North State Telecommunications Corp., B | | | 21,757 | | | | 1,370,691 | |
a | | ORBCOMM Inc. | | | 250,000 | | | | 2,410,000 | |
| | | | | | | | | | |
| | | | | | | | | 16,845,541 | |
| | | | | | | | | | |
| | | |
| | Trading Companies & Distributors 1.5% | | | | | | | | |
| | Central Steel and Wire Co. | | | 3,700 | | | | 1,537,295 | |
| | Houston Wire & Cable Co. | | | 250,000 | | | | 1,562,500 | |
a | | Titan Machinery Inc. | | | 130,000 | | | | 2,060,500 | |
| | | | | | | | | | |
| | | | | | | | | 5,160,295 | |
| | | | | | | | | | |
| | | |
| | Transportation 0.8% | | | | | | | | |
| | Celadon Group Inc. | | | 440,000 | | | | 1,738,000 | |
a | | Global Ship Lease Inc., A (United Kingdom) | | | 700,000 | | | | 910,000 | |
| | | | | | | | | | |
| | | | | | | | | 2,648,000 | |
| | | | | | | | | | |
| | | |
| | Utilities 0.8% | | | | | | | | |
| | Gas Natural Inc. | | | 227,000 | | | | 2,837,500 | |
| | | | | | | | | | |
| | Total Common Stocks (Cost $202,952,145) | | | | | | | 327,178,722 | |
| | | | | | | | | | |
| | | |
| | Short Term Investments (Cost $9,813,422) 2.9% | | | | | | | | |
| | | |
| | Money Market Funds 2.9% | | | | | | | | |
c,d | | Institutional Fiduciary Trust Money Market Portfolio, 0.37% | | | 9,813,422 | | | | 9,813,422 | |
| | | | | | | | | | |
| | | |
| | Total Investments (Cost $212,765,567) 99.7% | | | | | | | 336,992,144 | |
| | Other Assets, less Liabilities 0.3% | | | | | | | 920,569 | |
| | | | | | | | | | |
| | Net Assets 100.0% | | | | | | $ | 337,912,713 | |
| | | | | | | | | | |
aNon-income producing.
bSee Note 7 regarding holdings of 5% voting securities.
cSee Note 3(f) regarding investments in affiliated management investment companies.
dThe rate shown is the annualized seven-day yield at period end.
| | | | |
42 | | Semiannual Report | The accompanying notes are an integral part of these financial statements. | | franklintempleton.com |
FRANKLIN VALUE INVESTORS TRUST
Financial Highlights
Franklin MidCap Value Fund
| | | | | | | | | | | | | | | | | | | | | | | | |
| | | Six Months Ended
April 30, 2017 (unaudited) | | | Year Ended October 31, | |
| | | | | |
| | | | 2016 | | | 2015 | | | 2014 | | | 2013 | | | 2012 | |
| |
| | | | | | |
Class A | | | | | | | | | | | | | | | | | | | | | | | | |
| | | | | | |
| Per share operating performance | | | | | | | | | | | | | | | | | | | | | | | | |
| | | | | | |
(for a share outstanding throughout the period) | | | | | | | | | | | | | | | | | | | | | | | | |
| | | | | | |
Net asset value, beginning of period | | | $14.53 | | | | $15.22 | | | | $16.13 | | | | $14.76 | | | | $11.38 | | | | $10.39 | |
| | | | |
| | | | | | |
Income from investment operationsa: | | | | | | | | | | | | | | | | | | | | | | | | |
| | | | | | |
Net investment incomeb | | | — | c | | | 0.12 | d | | | 0.11 | | | | 0.08 | e | | | 0.11 | f | | | 0.08 | |
| | | | | | |
Net realized and unrealized gains (losses) | | | 1.65 | | | | 0.48 | | | | (0.60 | ) | | | 1.37 | | | | 3.43 | | | | 0.96 | |
| | | | |
| | | | | | |
Total from investment operations | | | 1.65 | | | | 0.60 | | | | (0.49 | ) | | | 1.45 | | | | 3.54 | | | | 1.04 | |
| | | | |
| | | | | | |
Less distributions from: | | | | | | | | | | | | | | | | | | | | | | | | |
| | | | | | |
Net investment income | | | (0.11 | ) | | | (0.07 | ) | | | (0.11 | ) | | | (0.08 | ) | | | (0.16 | ) | | | (0.05) | |
| | | | | | |
Net realized gains | | | (0.18 | ) | | | (1.22 | ) | | | (0.31 | ) | | | — | | | | — | | | | — | |
| | | | |
| | | | | | |
Total distributions | | | (0.29 | ) | | | (1.29 | ) | | | (0.42 | ) | | | (0.08 | ) | | | (0.16 | ) | | | (0.05) | |
| | | | |
| | | | | | |
Net asset value, end of period | | | $15.89 | | | | $14.53 | | | | $15.22 | | | | $16.13 | | | | $14.76 | | | | $11.38 | |
| | | | |
| | | | | | |
Total returng | | | 11.42% | | | | 4.61% | | | | (3.07 | )% | | | 9.91% | | | | 31.47% | | | | 10.04% | |
| | | | | | |
| Ratios to average net assetsh | | | | | | | | | | | | | | | | | | | | | | | | |
| | | | | | |
Expenses before waiver and payments by affiliates | | | 1.51% | | | | 1.54% | | | | 1.60% | | | | 1.56% | | | | 1.64% | | | | 1.70% | |
| | | | | | |
Expenses net of waiver and payments by affiliates | | | 1.30% | | | | 1.30% | | | | 1.34% | | | | 1.35% | i | | | 1.35% | | | | 1.35% | |
| | | | | | |
Net investment income | | | 0.01% | | | | 0.87% | d | | | 0.72% | | | | 0.50% | e | | | 0.83% | f | | | 0.78% | |
| | | | | | |
| Supplemental data | | | | | | | | | | | | | | | | | | | | | | | | |
| | | | | | |
Net assets, end of period (000’s) | | | $153,929 | | | | $128,906 | | | | $127,043 | | | | $128,483 | | | | $102,866 | | | | $64,265 | |
| | | | | | |
Portfolio turnover rate | | | 30.16% | | | | 86.55% | | | | 61.80% | | | | 24.44% | | | | 10.00% | | | | 22.29% | |
aThe amount shown for a share outstanding throughout the period may not correlate with the Statement of Operations for the period due to the timing of sales and repurchases of the Fund’s shares in relation to income earned and/or fluctuating fair value of the investments of the Fund.
bBased on average daily shares outstanding.
cAmount rounds to less than $0.01 per share.
dNet investment income per share includes approximately $0.05 per share related to income received in the form of special dividends in connection with certain Fund holdings. Excluding this amount, the ratio of net investment income to average net assets would have been 0.49%.
eNet investment income per share includes approximately $0.02 per share related to income received in the form of special dividends in connection with certain Fund holdings. Excluding this amount, the ratio of net investment income to average net assets would have been 0.38%.
fNet investment income per share includes approximately $0.03 per share related to income received in the form of special dividends in connection with certain Fund holdings. Excluding this amount, the ratio of net investment income to average net assets would have been 0.61%.
gTotal return does not reflect sales commissions or contingent deferred sales charges, if applicable, and is not annualized for periods less than one year.
hRatios are annualized for periods less than one year.
iBenefit of expense reduction rounds to less than 0.01%.
| | | | | | |
franklintempleton.com | | The accompanying notes are an integral part of these financial statements. | Semiannual Report | | | 43 | |
FRANKLIN VALUE INVESTORS TRUST
FINANCIAL HIGHLIGHTS
Franklin MidCap Value Fund (continued)
| | | | | | | | | | | | | | | | | | | | | | | | |
| | | Six Months Ended
April 30, 2017 | | | Year Ended October 31, | |
| | | (unaudited) | | | 2016 | | | 2015 | | | 2014 | | | 2013 | | | 2012 | |
| | | | | | |
| Class C | | | | | | | | | | | | | | | | | | | | | | | | |
Per share operating performance | | | | | | | | | | | | | | | | | | | | | | | | |
| | | | | | |
(for a share outstanding throughout the period) | | | | | | | | | | | | | | | | | | | | | | | | |
| | | | | | |
Net asset value, beginning of period | | | $14.24 | | | | $14.97 | | | | $15.87 | | | | $14.55 | | | | $11.21 | | | | $10.25 | |
| | | | |
| | | | | | |
Income from investment operationsa: | | | | | | | | | | | | | | | | | | | | | | | | |
| | | | | | |
Net investment income (loss)b | | | (0.06 | ) | | | 0.02c | | | | — | d | | | (0.03 | )e | | | 0.02 | f | | | 0.01 | |
| | | | | | |
Net realized and unrealized gains (losses) | | | 1.62 | | | | 0.47 | | | | (0.59 | ) | | | 1.36 | | | | 3.39 | | | | 0.95 | |
| | | | |
| | | | | | |
Total from investment operations | | | 1.56 | | | | 0.49 | | | | (0.59 | ) | | | 1.33 | | | | 3.41 | | | | 0.96 | |
| | | | |
| | | | | | |
Less distributions from: | | | | | | | | | | | | | | | | | | | | | | | | |
| | | | | | |
Net investment income | | | (0.01 | ) | | | — | | | | — | | | | (0.01 | ) | | | (0.07 | ) | | | — | |
| | | | | | |
Net realized gains | | | (0.18 | ) | | | (1.22 | ) | | | (0.31 | ) | | | — | | | | — | | | | — | |
| | | | |
| | | | | | |
Total distributions | | | (0.19 | ) | | | (1.22 | ) | | | (0.31 | ) | | | (0.01 | ) | | | (0.07 | ) | | | — | |
| | | | |
| | | | | | |
Net asset value, end of period | | | $15.61 | | | | $14.24 | | | | $14.97 | | | | $15.87 | | | | $14.55 | | | | $11.21 | |
| | | | |
| | | | | | |
Total returng | | | 10.98% | | | | 3.88% | | | | (3.75)% | | | | 9.12% | | | | 30.56% | | | | 9.37% | |
| | | | | | |
| Ratios to average net assetsh | | | | | | | | | | | | | | | | | | | | | | | | |
| | | | | | |
Expenses before waiver and payments by affiliates | | | 2.26% | | | | 2.28% | | | | 2.31% | | | | 2.26% | | | | 2.34% | | | | 2.39% | |
| | | | | | |
Expenses net of waiver and payments by affiliates | | | 2.05% | | | | 2.04% | | | | 2.05% | | | | 2.05% | i | | | 2.05% | | | | 2.04% | |
| | | | | | |
Net investment income (loss) | | | (0.74)% | | | | 0.13% | c | | | 0.01% | | | | (0.20)% | e | | | 0.13% | f | | | 0.09% | |
| | | | | | |
| Supplemental data | | | | | | | | | | | | | | | | | | | | | | | | |
| | | | | | |
Net assets, end of period (000’s) | | | $27,494 | | | | $23,197 | | | | $23,329 | | | | $23,926 | | | | $21,965 | | | | $12,175 | |
| | | | | | |
Portfolio turnover rate | | | 30.16% | | | | 86.55% | | | | 61.80% | | | | 24.44% | | | | 10.00% | | | | 22.29% | |
aThe amount shown for a share outstanding throughout the period may not correlate with the Statement of Operations for the period due to the timing of sales and repurchases of the Fund’s shares in relation to income earned and/or fluctuating fair value of the investments of the Fund.
bBased on average daily shares outstanding.
cNet investment income per share includes approximately $0.05 per share related to income received in the form of special dividends in connection with certain Fund holdings. Excluding this amount, the ratio of net investment income to average net assets would have been (0.25)%.
dAmount rounds to less than $0.01 per share.
eNet investment income per share includes approximately $0.02 per share related to income received in the form of special dividends in connection with certain Fund holdings. Excluding this amount, the ratio of net investment income to average net assets would have been (0.32)%.
fNet investment income per share includes approximately $0.03 per share related to income received in the form of special dividends in connection with certain Fund holdings. Excluding this amount, the ratio of net investment income to average net assets would have been (0.09)%.
gTotal return does not reflect sales commissions or contingent deferred sales charges, if applicable, and is not annualized for periods less than one year.
hRatios are annualized for periods less than one year.
iBenefit of expense reduction rounds to less than 0.01%.
| | | | |
44 | | Semiannual Report | The accompanying notes are an integral part of these financial statements. | | franklintempleton.com |
FRANKLIN VALUE INVESTORS TRUST
FINANCIAL HIGHLIGHTS
Franklin MidCap Value Fund (continued)
| | | | | | | | | | | | | | | | | | | | | | | | |
| | | Six Months Ended
April 30, 2017 (unaudited) | | | Year Ended October 31, | |
| | | | | |
| | | | 2016 | | | 2015 | | | 2014 | | | 2013 | | | 2012 | |
| |
| | | | | | |
Class R | | | | | | | | | | | | | | | | | | | | | | | | |
Per share operating performance | | | | | | | | | | | | | �� | | | | | | | | | | | |
| | | | | | |
(for a share outstanding throughout the period) | | | | | | | | | | | | | | | | | | | | | | | | |
| | | | | | |
Net asset value, beginning of period | | | $14.53 | | | | $15.19 | | | | $16.09 | | | | $14.71 | | | | $11.35 | | | | $10.36 | |
| | | | |
| | | | | | |
Income from investment operationsa: | | | | | | | | | | | | | | | | | | | | | | | | |
| | | | | | |
Net investment income (loss)b | | | (0.02 | ) | | | 0.09 | c | | | 0.08 | | | | 0.05 | d | | | 0.08 | e | | | 0.06 | |
| | | | | | |
Net realized and unrealized gains (losses) | | | 1.65 | | | | 0.48 | | | | (0.61 | ) | | | 1.38 | | | | 3.42 | | | | 0.95 | |
| | | | |
| | | | | | |
Total from investment operations | | | 1.63 | | | | 0.57 | | | | (0.53 | ) | | | 1.43 | | | | 3.50 | | | | 1.01 | |
| | | | |
Less distributions from: | | | | | | | | | | | | | | | | | | | | | | | | |
| | | | | | |
Net investment income | | | (0.07 | ) | | | (0.01 | ) | | | (0.06 | ) | | | (0.05 | ) | | | (0.14 | ) | | | (0.02) | |
| | | | | | |
Net realized gains | | | (0.18 | ) | | | (1.22 | ) | | | (0.31 | ) | | | — | | | | — | | | | — | |
| | | | |
| | | | | | |
Total distributions | | | (0.25 | ) | | | (1.23 | ) | | | (0.37 | ) | | | (0.05 | ) | | | (0.14 | ) | | | (0.02) | |
| | | | |
| | | | | | |
Net asset value, end of period | | | $15.91 | | | | $14.53 | | | | $15.19 | | | | $16.09 | | | | $14.71 | | | | $11.35 | |
| | | | |
| | | | | | |
Total returnf | | | 11.29% | | | | 4.40% | | | | (3.30)% | | | | 9.75% | | | | 31.22% | | | | 9.77% | |
| | | | | | |
| Ratios to average net assetsg | | | | | | | | | | | | | | | | | | | | | | | | |
| | | | | | |
Expenses before waiver and payments by affiliates | | | 1.76% | | | | 1.79% | | | | 1.81% | | | | 1.76% | | | | 1.84% | | | | 1.90% | |
| | | | | | |
Expenses net of waiver and payments by affiliates | | | 1.55% | | | | 1.55% | | | | 1.55% | | | | 1.55% | h | | | 1.55% | | | | 1.55% | |
| | | | | | |
Net investment income (loss) | | | (0.24)% | | | | 0.62% | c | | | 0.51% | | | | 0.30% | d | | | 0.63% | e | | | 0.58% | |
| | | | | | |
| Supplemental data | | | | | | | | | | | | | | | | | | | | | | | | |
| | | | | | |
Net assets, end of period (000’s) | | | $667 | | | | $712 | | | | $755 | | | | $1,103 | | | | $1,000 | | | | $485 | |
| | | | | | |
Portfolio turnover rate | | | 30.16% | | | | 86.55% | | | | 61.80% | | | | 24.44% | | | | 10.00% | | | | 22.29% | |
aThe amount shown for a share outstanding throughout the period may not correlate with the Statement of Operations for the period due to the timing of sales and repurchases of the Fund’s shares in relation to income earned and/or fluctuating fair value of the investments of the Fund.
bBased on average daily shares outstanding.
cNet investment income per share includes approximately $0.05 per share related to income received in the form of special dividends in connection with certain Fund holdings. Excluding this amount, the ratio of net investment income to average net assets would have been 0.24%.
dNet investment income per share includes approximately $0.02 per share related to income received in the form of special dividends in connection with certain Fund holdings. Excluding this amount, the ratio of net investment income to average net assets would have been 0.18%.
eNet investment income per share includes approximately $0.03 per share related to income received in the form of special dividends in connection with certain Fund holdings. Excluding this amount, the ratio of net investment income to average net assets would have been 0.41%.
fTotal return is not annualized for periods less than one year.
gRatios are annualized for periods less than one year.
hBenefit of expense reduction rounds to less than 0.01%.
| | | | | | |
franklintempleton.com | | The accompanying notes are an integral part of these financial statements. | Semiannual Report | | | 45 | |
FRANKLIN VALUE INVESTORS TRUST
FINANCIAL HIGHLIGHTS
Franklin MidCap Value Fund (continued)
| | | | | | | | | | | | | | | | | | | | | | | | |
| | | Six Months Ended
April 30, 2017 | | | Year Ended October 31, | |
| | | | | |
| | | (unaudited) | | | 2016 | | | 2015 | | | 2014 | | | 2013 | | | 2012 | |
| |
| Advisor Class | | | | | | | | | | | | | | | | | | | | | | | | |
| Per share operating performance | | | | | | | | | | | | | | | | | | | | | | | | |
| | | | | | |
(for a share outstanding throughout the period) | | | | | | | | | | | | | | | | | | | | | | | | |
| | | | | | |
Net asset value, beginning of period | | | $14.61 | | | | $15.31 | | | | $16.23 | | | | $14.84 | | | | $11.44 | | | | $10.45 | |
| | | | |
| | | | | | |
Income from investment operationsa: | | | | | | | | | | | | | | | | | | | | | | | | |
| | | | | | |
Net investment incomeb | | | 0.02 | | | | 0.16 | c | | | 0.16 | | | | 0.13 | d | | | 0.15 | e | | | 0.12 | |
| | | | | | |
Net realized and unrealized gains (losses) | | | 1.68 | | | | 0.47 | | | | (0.62 | ) | | | 1.38 | | | | 3.45 | | | | 0.95 | |
| | | | |
Total from investment operations | | | 1.70 | | | | 0.63 | | | | (0.46 | ) | | | 1.51 | | | | 3.60 | | | | 1.07 | |
| | | | |
Less distributions from: | | | | | | | | | | | | | | | | | | | | | | | | |
| | | | | | |
Net investment income | | | (0.15 | ) | | | (0.11 | ) | | | (0.15 | ) | | | (0.12 | ) | | | (0.20 | ) | | | (0.08) | |
| | | | | | |
Net realized gains | | | (0.18 | ) | | | (1.22 | ) | | | (0.31 | ) | | | — | | | | — | | | | — | |
| | | | |
Total distributions | | | (0.33 | ) | | | (1.33 | ) | | | (0.46 | ) | | | (0.12 | ) | | | (0.20 | ) | | | (0.08) | |
| | | | |
Net asset value, end of period | | | $15.98 | | | | $14.61 | | | | $15.31 | | | | $16.23 | | | | $14.84 | | | | $11.44 | |
| | | | |
| | | | | | |
Total returnf | | | 11.65% | | | | 4.93% | | | | (2.83)% | | | | 10.25% | | | | 31.94% | | | | 10.35% | |
| | | | | | |
| Ratios to average net assetsg | | | | | | | | | | | | | | | | | | | | | | | | |
| | | | | | |
Expenses before waiver and payments by affiliates | | | 1.26% | | | | 1.29% | | | | 1.31% | | | | 1.26% | | | | 1.34% | | | | 1.40% | |
| | | | | | |
Expenses net of waiver and payments by affiliates | | | 1.05% | | | | 1.05% | | | | 1.05% | | | | 1.05% | h | | | 1.05% | | | | 1.05% | |
| | | | | | |
Net investment income | | | 0.26% | | | | 1.12% | c | | | 1.01% | | | | 0.80% | d | | | 1.13% | e | | | 1.08% | |
| | | | | | |
| Supplemental data | | | | | | | | | | | | | | | | | | | | | | | | |
| | | | | | |
Net assets, end of period (000’s) | | | $10,185 | | | | $5,980 | | | | $4,706 | | | | $4,369 | | | | $3,596 | | | | $2,507 | |
| | | | | | |
Portfolio turnover rate | | | 30.16% | | | | 86.55% | | | | 61.80% | | | | 24.44% | | | | 10.00% | | | | 22.29% | |
aThe amount shown for a share outstanding throughout the period may not correlate with the Statement of Operations for the period due to the timing of sales and repurchases of the Fund’s shares in relation to income earned and/or fluctuating fair value of the investments of the Fund.
bBased on average daily shares outstanding.
cNet investment income per share includes approximately $0.05 per share related to income received in the form of special dividends in connection with certain Fund holdings. Excluding this amount, the ratio of net investment income to average net assets would have been 0.74%.
dNet investment income per share includes approximately $0.02 per share related to income received in the form of special dividends in connection with certain Fund holdings. Excluding this amount, the ratio of net investment income to average net assets would have been 0.68%.
eNet investment income per share includes approximately $0.03 per share related to income received in the form of special dividends in connection with certain Fund holdings. Excluding this amount, the ratio of net investment income to average net assets would have been 0.91%.
fTotal return is not annualized for periods less than one year.
gRatios are annualized for periods less than one year.
hBenefit of expense reduction rounds to less than 0.01%.
| | | | |
46 | | Semiannual Report | The accompanying notes are an integral part of these financial statements. | | franklintempleton.com |
FRANKLIN VALUE INVESTORS TRUST
Statement of Investments, April 30, 2017 (unaudited)
Franklin MidCap Value Fund
| | | | | | | | | | |
| | | | | Shares/
Units | | | Value | |
| | Common Stocks and Other Equity Interests 98.9% | | | | | | | | |
| | Automobiles & Components 0.5% | | | | | | | | |
| | Delphi Automotive PLC (United Kingdom) | | | 12,600 | | | $ | 1,013,040 | |
| | | | | | | | | | |
| | Banks 6.1% | | | | | | | | |
| | Citizens Financial Group Inc. | | | 27,200 | | | | 998,512 | |
| | First Horizon National Corp. | | | 157,900 | | | | 2,897,465 | |
| | First Republic Bank/CA | | | 25,700 | | | | 2,376,222 | |
| | Huntington Bancshares Inc. | | | 180,400 | | | | 2,319,944 | |
| | KeyCorp. | | | 54,700 | | | | 997,728 | |
| | SunTrust Banks Inc. | | | 37,100 | | | | 2,107,651 | |
| | | | | | | | | | |
| | | | | | | | | 11,697,522 | |
| | | | | | | | | | |
| | Capital Goods 11.0% | | | | | | | | |
| | BWX Technologies Inc. | | | 29,100 | | | | 1,430,847 | |
| | Carlisle Cos. Inc. | | | 16,500 | | | | 1,672,935 | |
| | Johnson Controls International PLC | | | 69,100 | | | | 2,872,487 | |
| | L3 Technologies Inc. | | | 15,300 | | | | 2,628,081 | |
| | Parker-Hannifin Corp. | | | 6,400 | | | | 1,029,120 | |
| | Pentair PLC (United Kingdom) | | | 13,800 | | | | 890,238 | |
| | Roper Technologies Inc. | | | 16,900 | | | | 3,696,030 | |
| | Textron Inc. | | | 75,900 | | | | 3,541,494 | |
| a | | WABCO Holdings Inc. | | | 11,200 | | | | 1,331,344 | |
| | Xylem Inc. | | | 38,300 | | | | 1,969,003 | |
| | | | | | | | | | |
| | | | | | | | | 21,061,579 | |
| | | | | | | | | | |
| | Consumer Durables & Apparel 1.0% | | | | | | | | |
| | PVH Corp. | | | 8,200 | | | | 828,446 | |
| | Toll Brothers Inc. | | | 28,800 | | | | 1,036,512 | |
| | | | | | | | | | |
| | | | | | | | | 1,864,958 | |
| | | | | | | | | | |
| | Diversified Financials 5.1% | | | | | | | | |
| | Invesco Ltd. | | | 31,200 | | | | 1,027,728 | |
| | Navient Corp. | | | 54,000 | | | | 820,800 | |
| | Northern Trust Corp. | | | 12,100 | | | | 1,089,000 | |
| | Raymond James Financial Inc. | | | 11,400 | | | | 849,528 | |
| a | | SLM Corp. | | | 238,400 | | | | 2,989,536 | |
| | Synchrony Financial | | | 74,500 | | | | 2,071,100 | |
| | T. Rowe Price Group Inc. | | | 13,700 | | | | 971,193 | |
| | | | | | | | | | |
| | | | | | | | | 9,818,885 | |
| | | | | | | | | | |
| | Energy 7.1% | | | | | | | | |
| | Baker Hughes Inc. | | | 14,000 | | | | 831,180 | |
| | Cameco Corp. (Canada) | | | 73,000 | | | | 700,070 | |
| a | | Concho Resources Inc. | | | 7,100 | | | | 899,286 | |
| | Devon Energy Corp. | | | 21,700 | | | | 856,933 | |
| a | | Diamondback Energy Inc. | | | 9,300 | | | | 928,512 | |
| | EQT Corp. | | | 16,800 | | | | 976,752 | |
| | Helmerich & Payne Inc. | | | 20,700 | | | | 1,255,248 | |
| | Marathon Petroleum Corp. | | | 56,400 | | | | 2,873,016 | |
| | Noble Energy Inc. | | | 82,300 | | | | 2,660,759 | |
| | Pioneer Natural Resources Co. | | | 5,000 | | | | 864,950 | |
| a | | TechnipFMC PLC (United Kingdom) | | | 29,800 | | | | 897,874 | |
| | | | | | | | | | |
| | | | | | | | | 13,744,580 | |
| | | | | | | | | | |
| | | | | | |
franklintempleton.com | | Semiannual Report | | | 47 | |
FRANKLIN VALUE INVESTORS TRUST
STATEMENT OF INVESTMENTS (UNAUDITED)
Franklin MidCap Value Fund (continued)
| | | | | | | | | | |
| | | | | Shares/
Units | | | Value | |
| | Common Stocks and Other Equity Interests (continued) | | | | | | | | |
| | Food, Beverage & Tobacco 5.9% | | | | | | | | |
| | Molson Coors Brewing Co., B | | | 30,100 | | | $ | 2,886,289 | |
| | Pinnacle Foods Inc. | | | 59,900 | | | | 3,483,185 | |
| a | | TreeHouse Foods Inc. | | | 56,100 | | | | 4,914,360 | |
| | | | | | | | | | |
| | | | | | | | | 11,283,834 | |
| | | | | | | | | | |
| | | |
| | Health Care Equipment & Services 5.2% | | | | | | | | |
| | DENTSPLY SIRONA Inc. | | | 13,600 | | | | 860,064 | |
| a | | Envision Healthcare Corp. | | | 71,400 | | | | 4,000,542 | |
| a | | Hologic Inc. | | | 78,600 | | | | 3,548,790 | |
| | Zimmer Biomet Holdings Inc. | | | 13,800 | | | | 1,651,170 | |
| | | | | | | | | | |
| | | | | | | | | 10,060,566 | |
| | | | | | | | | | |
| | | |
| | Insurance 7.5% | | | | | | | | |
| | Arthur J. Gallagher & Co. | | | 17,200 | | | | 959,932 | |
| | The Hartford Financial Services Group Inc. | | | 39,700 | | | | 1,919,892 | |
| | Lincoln National Corp. | | | 20,000 | | | | 1,318,600 | |
| | Principal Financial Group Inc. | | | 15,300 | | | | 996,489 | |
| | The Progressive Corp. | | | 36,400 | | | | 1,445,808 | |
| | RenaissanceRe Holdings Ltd. | | | 6,500 | | | | 924,105 | |
| | Willis Towers Watson PLC | | | 18,000 | | | | 2,387,160 | |
| | WR Berkley Corp. | | | 21,200 | | | | 1,441,176 | |
| | XL Group Ltd. (Bermuda) | | | 70,800 | | | | 2,962,980 | |
| | | | | | | | | | |
| | | | | | | | | 14,356,142 | |
| | | | | | | | | | |
| | | |
| | Materials 9.7% | | | | | | | | |
| | Albemarle Corp. | | | 7,400 | | | | 805,934 | |
| a | | Axalta Coating Systems Ltd. | | | 45,200 | | | | 1,417,924 | |
| | Ferroglobe PLC | | | 294,275 | | | | 2,839,754 | |
| a,b | | Ferroglobe Representation and Warranty Insurance Trust | | | 196,900 | | | | — | |
| a | | Freeport-McMoRan Inc. | | | 76,800 | | | | 979,200 | |
| a | | Ingevity Corp. | | | 46,309 | | | | 2,928,118 | |
| | Martin Marietta Materials Inc. | | | 6,000 | | | | 1,321,140 | |
| | The Mosaic Co. | | | 31,600 | | | | 850,988 | |
| | Newmont Mining Corp. | | | 44,500 | | | | 1,504,545 | |
| | Nucor Corp. | | | 38,300 | | | | 2,348,939 | |
| | Tahoe Resources Inc. (Canada) | | | 82,800 | | | | 667,368 | |
| | WestRock Co. | | | 54,956 | | | | 2,943,443 | |
| | | | | | | | | | |
| | | | | | | | | 18,607,353 | |
| | | | | | | | | | |
| | | |
| | Media 2.0% | | | | | | | | |
| | John Wiley & Sons Inc., A | | | 14,500 | | | | 764,150 | |
| | TEGNA Inc. | | | 51,200 | | | | 1,304,576 | |
| | Viacom Inc., B | | | 43,300 | | | | 1,842,848 | |
| | | | | | | | | | |
| | | | | | | | | 3,911,574 | |
| | | | | | | | | | |
| | | |
| | Pharmaceuticals, Biotechnology & Life Sciences 2.5% | | | | | | | | |
| | Agilent Technologies Inc. | | | 18,200 | | | | 1,001,910 | |
| a | | Jazz Pharmaceuticals PLC | | | 4,900 | | | | 780,472 | |
| | Perrigo Co. PLC | | | 28,800 | | | | 2,129,472 | |
| a | | Waters Corp. | | | 5,800 | | | | 985,362 | |
| | | | | | | | | | |
| | | | | | | | | 4,897,216 | |
| | | | | | | | | | |
| | | | |
| | | |
| 48 | | Semiannual Report | | franklintempleton.com |
FRANKLIN VALUE INVESTORS TRUST
STATEMENT OF INVESTMENTS (UNAUDITED)
Franklin MidCap Value Fund (continued)
| | | | | | | | | | |
| | | | | Shares/
Units | | | Value | |
| | Common Stocks and Other Equity Interests (continued) | | | | | | | | |
| | Real Estate 11.6% | | | | | | | | |
| | Alexandria Real Estate Equities Inc. | | | 15,200 | | | $ | 1,710,152 | |
| | Boston Properties Inc. | | | 12,300 | | | | 1,557,180 | |
| | DDR Corp. | | | 234,800 | | | | 2,538,188 | |
| | Duke Realty Corp. | | | 53,000 | | | | 1,469,690 | |
| | GGP Inc. | | | 46,600 | | | | 1,007,026 | |
| | Healthcare Realty Trust Inc. | | | 43,600 | | | | 1,430,080 | |
| | Host Hotels & Resorts Inc. | | | 35,800 | | | | 642,610 | |
| | Kilroy Realty Corp. | | | 18,200 | | | | 1,283,646 | |
| | Life Storage Inc. | | | 25,500 | | | | 1,998,945 | |
| | Mid-America Apartment Communities Inc. | | | 14,000 | | | | 1,388,940 | |
| | Physicians Realty Trust | | | 50,400 | | | | 989,856 | |
| | Prologis Inc. | | | 15,900 | | | | 865,119 | |
| | Realogy Holdings Corp. | | | 87,900 | | | | 2,685,345 | |
| | UDR Inc. | | | 23,200 | | | | 866,288 | |
| | Weingarten Realty Investors | | | 24,600 | | | | 806,142 | |
| | Weyerhaeuser Co. | | | 29,500 | | | | 999,165 | |
| | | | | | | | | | |
| | | | | | | | | 22,238,372 | |
| | | | | | | | | | |
| | | |
| | Retailing 1.0% | | | | | | | | |
a,c | | J.C. Penney Co. Inc. | | | 128,600 | | | | 691,868 | |
| | L Brands Inc. | | | 23,600 | | | | 1,246,316 | |
| | | | | | | | | | |
| | | | | | | | | 1,938,184 | |
| | | | | | | | | | |
| | | |
| | Semiconductors & Semiconductor Equipment 3.3% | | | | | | | | |
a | | First Solar Inc. | | | 11,900 | | | | 351,645 | |
| | Lam Research Corp. | | | 19,200 | | | | 2,781,120 | |
| | Versum Materials Inc. | | | 65,300 | | | | 2,090,906 | |
| | Xilinx Inc. | | | 17,100 | | | | 1,079,181 | |
| | | | | | | | | | |
| | | | | | | | | 6,302,852 | |
| | | | | | | | | | |
| | | |
| | Software & Services 6.6% | | | | | | | | |
a | | Autodesk Inc. | | | 16,700 | | | | 1,504,169 | |
| | Leidos Holdings Inc. | | | 18,125 | | | | 954,463 | |
a | | Mobileye NV (Israel) | | | 38,500 | | | | 2,383,920 | |
a | | PTC Inc. | | | 35,200 | | | | 1,902,560 | |
a | | Red Hat Inc. | | | 24,800 | | | | 2,184,384 | |
| | Science Applications International Corp. | | | 16,071 | | | | 1,173,022 | |
| | Total System Services Inc. | | | 46,000 | | | | 2,636,260 | |
| | | | | | | | | | |
| | | | | | | | | 12,738,778 | |
| | | | | | | | | | |
| | | |
| | Technology Hardware & Equipment 2.7% | | | 39,150 | | | | 1,465,385 | |
a | | Keysight Technologies Inc. | | | | | | | | |
| | Western Digital Corp. | | | 41,100 | | | | 3,660,777 | |
| | | | | | | | | | |
| | | | | | | | | 5,126,162 | |
| | | | | | | | | | |
| | | |
| | Transportation 0.8% | | | | | | | | |
a | | JetBlue Airways Corp. | | | 68,400 | | | | 1,493,172 | |
| | | | | | | | | | |
| | | |
| | Utilities 9.3% | | | | | | | | |
| | American Water Works Co. Inc. | | | 20,800 | | | | 1,659,008 | |
| | Atmos Energy Corp. | | | 15,600 | | | | 1,263,912 | |
| | CenterPoint Energy Inc. | | | 36,600 | | | | 1,044,198 | |
| | CMS Energy Corp. | | | 22,200 | | | | 1,007,880 | |
| | DTE Energy Co. | | | 11,800 | | | | 1,234,162 | |
| | | | |
| | | |
| franklintempleton.com | | Semiannual Report | | 49 |
FRANKLIN VALUE INVESTORS TRUST
STATEMENT OF INVESTMENTS (UNAUDITED)
Franklin MidCap Value Fund (continued)
| | | | | | | | | | |
| | | | | Shares/
Units | | | Value | |
| | Common Stocks and Other Equity Interests (continued) | | | | | | | | |
| | Utilities (continued) | | | | | | | | |
| | Edison International | | | 16,300 | | | $ | 1,303,511 | |
| | Eversource Energy | | | 21,300 | | | | 1,265,220 | |
| | FirstEnergy Corp. | | | 37,200 | | | | 1,113,768 | |
| | PNM Resources Inc. | | | 34,900 | | | | 1,300,025 | |
| | Sempra Energy | | | 14,800 | | | | 1,672,696 | |
| | UGI Corp. | | | 25,000 | | | | 1,254,000 | |
| | WEC Energy Group Inc. | | | 31,500 | | | | 1,906,380 | |
| | Xcel Energy Inc. | | | 42,600 | | | | 1,919,130 | |
| | | | | | | | | | |
| | | | | | | | | 17,943,890 | |
| | | | | | | | | | |
| | | |
| | Total Common Stocks and Other Equity Interests (Cost $160,473,485) | | | | | | | 190,098,659 | |
| | | | | | | | | | |
| | | |
| | Management Investment Companies (Cost $6,785) 0.0%† | | | | | | | | |
| | Diversified Financials 0.0%† | | | | | | | | |
| | iShares Russell Mid-Cap Value ETF | | | 100 | | | | 8,312 | |
| | | | | | | | | | |
| | Total Investments before Short Term Investments (Cost $160,480,270) | | | | | | | 190,106,971 | |
| | | | | | | | | | |
| | | |
| | Short Term Investments 1.6% | | | | | | | | |
| | Money Market Funds (Cost $2,378,192) 1.2% | | | | | | | | |
| d,e | | Institutional Fiduciary Trust Money Market Portfolio, 0.37% | | | 2,378,192 | | | | 2,378,192 | |
| | | | | | | | | | |
| f | | Investments from Cash Collateral Received for Loaned Securities 0.4% | | | | | | | | |
| | Money Market Funds (Cost $591,000) 0.3% | | | | | | | | |
| d,e | | Institutional Fiduciary Trust Money Market Portfolio, 0.37% | | | 591,000 | | | | 591,000 | |
| | | | | | | | | | |
| | | |
| | | | | Principal
Amount | | | | |
| | Repurchase Agreement (Cost $147,972) 0.1% | | | | | | | | |
| g | | Joint Repurchase Agreement, 0.81%, 4/28/17 (Maturity Value $147,982) | | | | | | | | |
| | J.P. Morgan Securities LLC | | | | | | | | |
| | Collateralized by U.S. Treasury Notes, Index Linked, 0.125% - 2.625%, 7/15/17 - 1/15/22 (valued at $150,935) | | $ | 147,972 | | | | 147,972 | |
| | | | | | | | | | |
| | Total Investments from Cash Collateral Received for Loaned Securities (Cost $738,972) | | | | | | | 738,972 | |
| | | | | | | | | | |
| | Total Investments (Cost $163,597,434) 100.5% | | | | | | | 193,224,135 | |
| | Other Assets, less Liabilities (0.5)% | | | | | | | (949,699 | ) |
| | | | | | | | | | |
| | Net Assets 100.0% | | | | | | $ | 192,274,436 | |
| | | | | | | | | | |
| | | | |
| | | |
| 50 | | Semiannual Report | | franklintempleton.com |
FRANKLIN VALUE INVESTORS TRUST
STATEMENT OF INVESTMENTS (UNAUDITED)
Franklin MidCap Value Fund (continued)
See Abbreviations on page 83.
†Rounds to less than 0.1% of net assets.
aNon-income producing.
bSecurity has been deemed illiquid because it may not be able to be sold within seven days.
cA portion or all of the security is on loan at April 30, 2017. See Note 1(d).
dSee Note 3(f) regarding investments in affiliated management investment companies.
eThe rate shown is the annualized seven-day yield at period end.
fSee Note 1(d) regarding securities on loan.
gSee Note 1(c) regarding joint repurchase agreement.
| | | | | | |
franklintempleton.com | | The accompanying notes are an integral part of these financial statements. | Semiannual Report | | | 51 | |
FRANKLIN VALUE INVESTORS TRUST
Financial Highlights
Franklin Small Cap Value Fund
| | | | | | | | | | | | | | | | | | | | | | | | |
| | | Six Months Ended April 30, 2017 (unaudited) | | | | | | | | | | | | | | | | |
| | | | Year Ended October 31, | |
| | | | | |
| | | | 2016 | | | 2015 | | | 2014 | | | 2013 | | | 2012 | |
| |
| Class A | | | | | | | | | | | | | | | | | | | | | | | | |
Per share operating performance | | | | | | | | | | | | | | | | | | | | | | | | |
(for a share outstanding throughout the period) | | | | | | | | | | | | | | | | | | | | | | | | |
| | | | | | |
Net asset value, beginning of period | | | $51.45 | | | | $51.72 | | | | $58.96 | | | | $59.76 | | | | $45.12 | | | | $42.25 | |
| | | | |
| | | | | | |
Income from investment operationsa: | | | | | | | | | | | | | | | | | | | | | | | | |
| | | | | | |
Net investment incomeb | | | 0.21 | c | | | 0.20 | | | | 0.30 | d | | | 0.16 | e | | | 0.30 | f | | | 0.34g | |
| | | | | | |
Net realized and unrealized gains (losses) | | | 6.69 | | | | 4.74 | | | | (2.33 | ) | | | 2.03 | | | | 16.30 | | | | 4.47 | |
| | | | |
| | | | | | |
Total from investment operations | | | 6.90 | | | | 4.94 | | | | (2.03 | ) | | | 2.19 | | | | 16.60 | | | | 4.81 | |
| | | | |
| | | | | | |
Less distributions from: | | | | | | | | | | | | | | | | | | | | | | | | |
| | | | | | |
Net investment income | | | (0.12 | ) | | | (0.29 | ) | | | (0.12 | ) | | | (0.25 | ) | | | (0.49 | ) | | | (0.17) | |
| | | | | | |
Net realized gains | | | (2.61 | ) | | | (4.92 | ) | | | (5.09 | ) | | | (2.74 | ) | | | (1.47 | ) | | | (1.77) | |
| | | | |
| | | | | | |
Total distributions | | | (2.73 | ) | | | (5.21 | ) | | | (5.21 | ) | | | (2.99 | ) | | | (1.96 | ) | | | (1.94) | |
| | | | |
| | | | | | |
Net asset value, end of period | | | $55.62 | | | | $51.45 | | | | $51.72 | | | | $58.96 | | | | $59.76 | | | | $45.12 | |
| | | | |
| | | | | | |
Total returnh | | | 13.49% | | | | 11.15% | | | | (3.31)% | | | | 3.76% | | | | 38.15% | | | | 12.08% | |
| | | | | | |
Ratios to average net assetsi | | | | | | | | | | | | | | | | | | | | | | | | |
| | | | | | |
Expenses before waiver and payments by affiliates | | | 1.06% | | | | 1.11% | | | | 1.16% | | | | 1.13% | | | | 1.19% | | | | 1.26% | |
| | | | | | |
Expenses net of waiver and payments by affiliates | | | 1.04% | | | | 1.09%j | | | | 1.15% | | | | 1.13% | j,k | | | 1.19% | | | | 1.26% | |
| | | | | | |
Net investment income | | | 0.76% | c | | | 0.40% | | | | 0.56% | d | | | 0.27% | e | | | 0.57% | f | | | 0.79%g | |
| | | | | | |
Supplemental data | | | | | | | | | | | | | | | | | | | | | | | | |
| | | | | | |
Net assets, end of period (000’s) | | | $1,246,219 | | | | $1,125,268 | | | | $1,062,353 | | | | $1,294,724 | | | | $1,224,592 | | | | $856,541 | |
| | | | | | |
Portfolio turnover rate | | | 11.61% | | | | 41.89% | | | | 25.88% | | | | 21.30% | | | | 13.04% | | | | 5.18% | |
aThe amount shown for a share outstanding throughout the period may not correlate with the Statement of Operations for the period due to the timing of sales and repurchases of the Fund’s shares in relation to income earned, and/or fluctuating fair value of the investments of the Fund.
bBased on average daily shares outstanding.
cNet investment income per share includes approximately $0.15 per share related to income received in the form of special dividends in connection with certain Fund holdings. Excluding this amount, the ratio of net investment income to average net assets would have been 0.21%.
dNet investment income per share includes approximately $0.11 per share related to income received in the form of special dividends in connection with certain Fund holdings. Excluding this amount, the ratio of net investment income to average net assets would have been 0.36%.
eNet investment income per share includes approximately $0.04 per share related to income received in the form of special dividends in connection with certain Fund holdings. Excluding this amount, the ratio of net investment income to average net assets would have been 0.21%.
fNet investment income per share includes approximately $0.10 per share related to income received in the form of special dividends in connection with certain Fund holdings. Excluding this amount, the ratio of net investment income to average net assets would have been 0.38%.
gNet investment income per share includes approximately $0.14 per share related to income received in the form of special dividends in connection with certain Fund holdings. Excluding this amount, the ratio of net investment income to average net assets would have been 0.48%.
hTotal return does not reflect sales commissions or contingent deferred sales charges, if applicable, and is not annualized for periods less than one year.
iRatios are annualized for periods less than one year.
jBenefit of expense reduction rounds to less than 0.01%.
kBenefit of waiver and payments by affiliates rounds to less than 0.01%.
| | | | |
| 52 | | Semiannual Report | The accompanying notes are an integral part of these financial statements. | | franklintempleton.com |
FRANKLIN VALUE INVESTORS TRUST
FINANCIAL HIGHLIGHTS
Franklin Small Cap Value Fund (continued)
| | | | | | | | | | | | | | | | | | | | | | | | |
| | | Six Months Ended April 30, 2017 (unaudited) | | | | | | | | | | | | | | | | |
| | | | | |
| | | | Year Ended October 31, | |
| | | | 2016 | | | 2015 | | | 2014 | | | 2013 | | | 2012 | |
| |
| Class C | | | | | | | | | | | | | | | | | | | | | | | | |
Per share operating performance | | | | | | | | | | | | | | | | | | | | | | | | |
(for a share outstanding throughout the period) | | | | | | | | | | | | | | | | | | | | | | | | |
| | | | | | |
Net asset value, beginning of period | | | $46.42 | | | | $47.22 | | | | $54.53 | | | | $55.62 | | | | $42.12 | | | | $39.66 | |
| | | | |
| | | | | | |
Income from investment operationsa: | | | | | | | | | | | | | | | | | | | | | | | | |
| | | | | | |
Net investment income (loss)b | | | — | c | | | (0.14 | ) | | | (0.07 | )d | | | (0.24 | )e | | | (0.05 | )f | | | 0.04g | |
| | | | | | |
Net realized and unrealized gains (losses) | | | 6.04 | | | | 4.26 | | | | (2.15 | ) | | | 1.89 | | | | 15.21 | | | | 4.19 | |
| | | | |
| | | | | | |
Total from investment operations | | | 6.04 | | | | 4.12 | | | | (2.22 | ) | | | 1.65 | | | | 15.16 | | | | 4.23 | |
| | | | |
| | | | | | |
Less distributions from: | | | | | | | | | | | | | | | | | | | | | | | | |
| | | | | | |
Net investment income | | | — | | | | — | | | | — | | | | — | | | | (0.19 | ) | | | — | |
| | | | | | |
Net realized gains | | | (2.61 | ) | | | (4.92 | ) | | | (5.09 | ) | | | (2.74 | ) | | | (1.47 | ) | | | (1.77) | |
| | | | |
| | | | | | |
Total distributions | | | (2.61 | ) | | | (4.92 | ) | | | (5.09 | ) | | | (2.74 | ) | | | (1.66 | ) | | | (1.77) | |
| | | | |
| | | | | | |
Net asset value, end of period | | | $49.85 | | | | $46.42 | | | | $47.22 | | | | $54.53 | | | | $55.62 | | | | $42.12 | |
| | | | |
| | | | | | |
Total returnh | | | 13.04% | | | | 10.35% | | | | (4.01)% | | | | 3.03% | | | | 37.23% | | | | 11.29% | |
| | | | | | |
Ratios to average net assetsi | | | | | | | | | | | | | | | | | | | | | | | | |
| | | | | | |
Expenses before waiver and payments by affiliates | | | 1.81% | | | | 1.86% | | | | 1.87% | | | | 1.83% | | | | 1.89% | | | | 1.95% | |
| | | | | | |
Expenses net of waiver and payments by affiliates | | | 1.79% | | | | 1.84% | j | | | 1.86% | | | | 1.83% | j,k | | | 1.89% | | | | 1.95% | |
| | | | | | |
Net investment income (loss) | | | 0.01% | c | | | (0.35)% | | | | (0.15)% | d | | | (0.43)% | e | | | (0.13)% | f | | | 0.10%g | |
| | | | | | |
Supplemental data | | | | | | | | | | | | | | | | | | | | | | | | |
| | | | | | |
Net assets, end of period (000’s) | | | $238,807 | | | | $219,150 | | | | $229,119 | | | | $266,845 | | | | $247,742 | | | | $183,986 | |
| | | | | | |
Portfolio turnover rate | | | 11.61% | | | | 41.89% | | | | 25.88% | | | | 21.30% | | | | 13.04% | | | | 5.18% | |
aThe amount shown for a share outstanding throughout the period may not correlate with the Statement of Operations for the period due to the timing of sales and repurchases of the Fund’s shares in relation to income earned and/or fluctuating fair value of the investments of the Fund.
bBased on average daily shares outstanding.
cNet investment income per share includes approximately $0.15 per share related to income received in the form of special dividends in connection with certain Fund holdings. Excluding this amount, the ratio of net investment income to average net assets would have been (0.54)%.
dNet investment income per share includes approximately $0.11 per share related to income received in the form of special dividends in connection with certain Fund holdings. Excluding this amount, the ratio of net investment income to average net assets would have been (0.35)%.
eNet investment income per share includes approximately $0.04 per share related to income received in the form of special dividends in connection with certain Fund holdings. Excluding this amount, the ratio of net investment income to average net assets would have been (0.49)%.
fNet investment income per share includes approximately $0.10 per share related to income received in the form of special dividends in connection with certain Fund holdings. Excluding this amount, the ratio of net investment income to average net assets would have been (0.32)%.
gNet investment income per share includes approximately $0.14 per share related to income received in the form of special dividends in connection with certain Fund holdings. Excluding this amount, the ratio of net investment income to average net assets would have been (0.21)%.
hTotal return does not reflect sales commissions or contingent deferred sales charges, if applicable, and is not annualized for periods less than one year.
iRatios are annualized for periods less than one year.
jBenefit of expense reduction rounds to less than 0.01%.
kBenefit of waiver and payments by affiliates rounds to less than 0.01%.
| | | | | | |
franklintempleton.com | | The accompanying notes are an integral part of these financial statements. | Semiannual Report | | | 53 | |
FRANKLIN VALUE INVESTORS TRUST
FINANCIAL HIGHLIGHTS
Franklin Small Cap Value Fund (continued)
| | | | | | | | | | | | | | | | | | | | | | | | |
| | | Six Months Ended April 30, 2017 (unaudited) | | | | | | | | | | | | | | | | |
| | | | Year Ended October 31, | |
| | | | | |
| | | | 2016 | | | 2015 | | | 2014 | | | 2013 | | | 2012 | |
| |
| Class R | | | | | | | | | | | | | | | | | | | | | | | | |
| Per share operating performance | | | | | | | | | | | | | | | | | | | | | | | | |
| (for a share outstanding throughout the period) | | | | | | | | | | | | | | | | | | | | | | | | |
| | | | | | |
Net asset value, beginning of period | | | $50.87 | | | | $51.18 | | | | $58.40 | | | | $59.21 | | | | $44.71 | | | | $41.88 | |
| | | | |
| | | | | | |
Income from investment operationsa: | | | | | | | | | | | | | | | | | | | | | | | | |
| | | | | | |
Net investment incomeb | | | 0.14 | c | | | 0.08 | | | | 0.19 | d | | | 0.04 | e | | | 0.21 | f | | | 0.26g | |
| | | | | | |
Net realized and unrealized gains (losses) | | | 6.63 | | | | 4.69 | | | | (2.32 | ) | | | 2.02 | | | | 16.15 | | | | 4.42 | |
| | | | |
| | | | | | |
Total from investment operations | | | 6.77 | | | | 4.77 | | | | (2.13 | ) | | | 2.06 | | | | 16.36 | | | | 4.68 | |
| | | | |
| | | | | | |
Less distributions from: | | | | | | | | | | | | | | | | | | | | | | | | |
| | | | | | |
Net investment income | | | — | | | | (0.16 | ) | | | (— | )h | | | (0.13 | ) | | | (0.39 | ) | | | (0.08) | |
| | | | | | |
Net realized gains | | | (2.61 | ) | | | (4.92 | ) | | | (5.09 | ) | | | (2.74 | ) | | | (1.47 | ) | | | (1.77) | |
| | | | |
| | | | | | |
Total distributions | | | (2.61 | ) | | | (5.08 | ) | | | (5.09 | ) | | | (2.87 | ) | | | (1.86 | ) | | | (1.85) | |
| | | | |
| | | | | | |
Net asset value, end of period | | | $55.03 | | | | $50.87 | | | | $51.18 | | | | $58.40 | | | | $59.21 | | | | $44.71 | |
| | | | |
| | | | | | |
Total returni | | | 13.35% | | | | 10.90% | | | | (3.53)% | | | | 3.55% | | | | 37.91% | | | | 11.85% | |
| | | | | | |
Ratios to average net assetsj | | | | | | | | | | | | | | | | | | | | | | | | |
| | | | | | |
Expenses before waiver and payments by affiliates | | | 1.31% | | | | 1.36% | | | | 1.37% | | | | 1.33% | | | | 1.39% | | | | 1.46% | |
| | | | | | |
Expenses net of waiver and payments by affiliates | | | 1.29% | | | | 1.34% | k | | | 1.36% | | | | 1.33% | k,l | | | 1.39% | | | | 1.46% | |
| | | | | | |
Net investment income | | | 0.51% | c | | | 0.15% | | | | 0.35% | d | | | 0.07% | e | | | 0.37% | f | | | 0.59%g | |
| | | | | | |
Supplemental data | | | | | | | | | | | | | | | | | | | | | | | | |
| | | | | | |
Net assets, end of period (000’s) | | | $228,591 | | | | $212,194 | | | | $221,939 | | | | $280,908 | | | | $272,697 | | | | $220,539 | |
| | | | | | |
Portfolio turnover rate | | | 11.61% | | | | 41.89% | | | | 25.88% | | | | 21.30% | | | | 13.04% | | | | 5.18% | |
aThe amount shown for a share outstanding throughout the period may not correlate with the Statement of Operations for the period due to the timing of sales and repurchases of the Fund’s shares in relation to income earned, and/or fluctuating fair value of the investments of the Fund.
bBased on average daily shares outstanding.
cNet investment income per share includes approximately $0.15 per share related to income received in the form of special dividends in connection with certain Fund holdings. Excluding this amount, the ratio of net investment income to average net assets would have been (0.04%).
dNet investment income per share includes approximately $0.11 per share related to income received in the form of special dividends in connection with certain Fund holdings. Excluding this amount, the ratio of net investment income to average net assets would have been 0.15%.
eNet investment income per share includes approximately $0.04 per share related to income received in the form of special dividends in connection with certain Fund holdings. Excluding this amount, the ratio of net investment income to average net assets would have been 0.01%.
fNet investment income per share includes approximately $0.10 per share related to income received in the form of special dividends in connection with certain Fund holdings. Excluding this amount, the ratio of net investment income to average net assets would have been 0.18%.
gNet investment income per share includes approximately $0.14 per share related to income received in the form of special dividends in connection with certain Fund holdings. Excluding this amount, the ratio of net investment income to average net assets would have been 0.28%.
hAmount rounds to less than $0.01 per share.
iTotal return is not annualized for periods less than one year.
jRatios are annualized for periods less than one year.
kBenefit of expense reduction rounds to less than 0.01%.
lBenefit of waiver and payments by affiliates rounds to less than 0.01%.
| | | | |
54 | | Semiannual Report | The accompanying notes are an integral part of these financial statements. | | franklintempleton.com |
FRANKLIN VALUE INVESTORS TRUST
FINANCIAL HIGHLIGHTS
Franklin Small Cap Value Fund (continued)
| | | | | | | | | | | | | | | | | | | | |
| | | Six Months Ended April 30, 2017 (unaudited) | | | | |
| | | | Year Ended October 31, | |
| | | | 2016 | | | 2015 | | | 2014 | | | 2013a | |
| |
| Class R6 | | | | | | | | | | | | | | | | | | | | |
Per share operating performance | | | | | | | | | | | | | | | | | | | | |
(for a share outstanding throughout the period) | | | | | | | | | | | | | | | | | | | | |
| | | | | |
Net asset value, beginning of period | | | $53.60 | | | | $53.75 | | | | $61.09 | | | | $61.78 | | | | $50.83 | |
| | | | |
| | | | | |
Income from investment operationsb: | | | | | | | | | | | | | | | | | | | | |
| | | | | |
Net investment incomec | | | 0.35 | d | | | 0.43 | | | | 0.62 | e | | | 0.42 | f | | | 0.19 | |
| | | | | |
Net realized and unrealized gains (losses) | | | 6.98 | | | | 4.93 | | | | (2.43 | ) | | | 2.16 | | | | 10.76 | |
| | | | |
| | | | | |
Total from investment operations | | | 7.33 | | | | 5.36 | | | | (1.81 | ) | | | 2.58 | | | | 10.95 | |
| | | | |
| | | | | |
Less distributions from: | | | | | | | | | | | | | | | | | | | | |
| | | | | |
Net investment income | | | (0.35 | ) | | | (0.59 | ) | | | (0.44 | ) | | | (0.53 | ) | | | — | |
| | | | | |
Net realized gains | | | (2.61 | ) | | | (4.92 | ) | | | (5.09 | ) | | | (2.74 | ) | | | — | |
| | | | |
| | | | | |
Total distributions | | | (2.96 | ) | | | (5.51 | ) | | | (5.53 | ) | | | (3.27 | ) | | | — | |
| | | | |
| | | | | |
Net asset value, end of period | | | $57.97 | | | | $53.60 | | | | $53.75 | | | | $61.09 | | | | $61.78 | |
| | | | |
| | | | | |
Total returng | | | 13.73% | | | | 11.69% | | | | (2.80)% | | | | 4.31% | | | | 21.54% | |
| | | | | |
Ratios to average net assetsh | | | | | | | | | | | | | | | | | | | | |
| | | | | |
Expenses before waiver and payments by affiliates | | | 0.59% | | | | 0.64% | | | | 0.62% | | | | 0.60% | | | | 2.09% | |
| | | | | |
Expenses net of waiver and payments by affiliates | | | 0.57% | | | | 0.62% | i | | | 0.61% | | | | 0.60% | i,j | | | 0.64% | |
| | | | | |
Net investment income | | | 1.23% | d | | | 0.87% | | | | 1.10% | e | | | 0.80% | f | | | 0.68% | |
| | | | | |
Supplemental data | | | | | | | | | | | | | | | | | | | | |
| | | | | |
Net assets, end of period (000’s) | | | $144,741 | | | | $100,101 | | | | $59,339 | | | | $34,278 | | | | $17 | |
| | | | | |
Portfolio turnover rate | | | 11.61% | | | | 41.89% | | | | 25.88% | | | | 21.30% | | | | 13.04% | |
aFor the period May 1, 2013 (effective date) to October 31, 2013.
bThe amount shown for a share outstanding throughout the period may not correlate with the Statement of Operations for the period due to the timing of sales and repurchases of the Fund’s shares in relation to income earned and/or fluctuating fair value of the investments of the Fund.
cBased on average daily shares outstanding.
dNet investment income per share includes approximately $0.15 per share related to income received in the form of special dividends in connection with certain Fund holdings. Excluding this amount, the ratio of net investment income to average net assets would have been 0.68%.
eNet investment income per share includes approximately $0.11 per share related to income received in the form of special dividends in connection with certain Fund holdings. Excluding this amount, the ratio of net investment income to average net assets would have been 0.90%.
fNet investment income per share includes approximately $0.04 per share related to income received in the form of special dividends in connection with certain Fund holdings. Excluding this amount, the ratio of net investment income to average net assets would have been 0.74%.
gTotal return is not annualized for periods less than one year.
hRatios are annualized for periods less than one year.
iBenefit of expense reduction rounds to less than 0.01%.
jBenefit of waiver and payments by affiliates rounds to less than 0.01%.
| | | | | | |
franklintempleton.com | | The accompanying notes are an integral part of these financial statements. | Semiannual Report | | | 55 | |
FRANKLIN VALUE INVESTORS TRUST
FINANCIAL HIGHLIGHTS
Franklin Small Cap Value Fund (continued)
| | | | | | | | | | | | | | | | | | | | | | | | |
| | | Six Months Ended April 30, 2017 (unaudited) | | | | | | | | | | | | | | | | |
| | | | Year Ended October 31, | |
| | | | | |
| | | | 2016 | | | 2015 | | | 2014 | | | 2013 | | | 2012 | |
| |
| Advisor Class | | | | | | | | | | | | | | | | | | | | | | | | |
Per share operating performance | | | | | | | | | | | | | | | | | | | | | | | | |
(for a share outstanding throughout the period) | | | | | | | | | | | | | | | | | | | | | | | | |
| | | | | | |
Net asset value, beginning of period | | | $53.58 | | | | $53.67 | | | | $61.01 | | | | $61.72 | | | | $46.54 | | | | $43.53 | |
| | | | |
| | | | | | |
Income from investment operationsa: | | | | | | | | | | | | | | | | | | | | | | | | |
| | | | | | |
Net investment incomeb | | | 0.29 | c | | | 0.32 | | | | 0.47 | d | | | 0.34 | e | | | 0.46 | f | | | 0.48g | |
| | | | | | |
Net realized and unrealized gains (losses) | | | 6.99 | | | | 4.94 | | | | (2.41 | ) | | | 2.10 | | | | 16.82 | | | | 4.60 | |
| | | | |
| | | | | | |
Total from investment operations | | | 7.28 | | | | 5.26 | | | | (1.94 | ) | | | 2.44 | | | | 17.28 | | | | 5.08 | |
| | | | |
| | | | | | |
Less distributions from: | | | | | | | | | | | | | | | | | | | | | | | | |
| | | | | | |
Net investment income | | | (0.27 | ) | | | (0.43 | ) | | | (0.31 | ) | | | (0.41 | ) | | | (0.63 | ) | | | (0.30) | |
| | | | | | |
Net realized gains | | | (2.61 | ) | | | (4.92 | ) | | | (5.09 | ) | | | (2.74 | ) | | | (1.47 | ) | | | (1.77) | |
| | | | |
| | | | | | |
Total distributions | | | (2.88 | ) | | | (5.35 | ) | | | (5.40 | ) | | | (3.15 | ) | | | (2.10 | ) | | | (2.07) | |
| | | | |
| | | | | | |
Net asset value, end of period | | | $57.98 | | | | $53.58 | | | | $53.67 | | | | $61.01 | | | | $61.72 | | | | $46.54 | |
| | | | |
| | | | | | |
Total returnh | | | 13.63% | | | | 11.43% | | | | (3.03)% | | | | 4.07% | | | | 38.56% | | | | 12.42% | |
| | | | | | |
Ratios to average net assetsi | | | | | | | | | | | | | | | | | | | | | | | | |
| | | | | | |
Expenses before waiver and payments by affiliates | | | 0.81% | | | | 0.86% | | | | 0.87% | | | | 0.83% | | | | 0.89% | | | | 0.96% | |
| | | | | | |
Expenses net of waiver and payments by affiliates | | | 0.79% | | | | 0.84% | j | | | 0.86% | | | | 0.83% | j,k | | | 0.89% | | | | 0.96% | |
| | | | | | |
Net investment income | | | 1.01% | c | | | 0.65% | | | | 0.85% | d | | | 0.57% | e | | | 0.87% | f | | | 1.09%g | |
| | | | | | |
Supplemental data | | | | | | | | | | | | | | | | | | | | | | | | |
| | | | | | |
Net assets, end of period (000’s) | | | $1,042,650 | | | | $893,324 | | | | $635,499 | | | | $816,430 | | | | $653,660 | | | | $419,840 | |
| | | | | | |
Portfolio turnover rate | | | 11.61% | | | | 41.89% | | | | 25.88% | | | | 21.30% | | | | 13.04% | | | | 5.18% | |
aThe amount shown for a share outstanding throughout the period may not correlate with the Statement of Operations for the period due to the timing of sales and repurchases of the Fund’s shares in relation to income earned and/or fluctuating fair value of the investments of the Fund.
bBased on average daily shares outstanding.
cNet investment income per share includes approximately $0.15 per share related to income received in the form of special dividends in connection with certain Fund holdings. Excluding this amount, the ratio of net investment income to average net assets would have been 0.46%.
dNet investment income per share includes approximately $0.11 per share related to income received in the form of special dividends in connection with certain Fund holdings. Excluding this amount, the ratio of net investment income to average net assets would have been 0.65%.
eNet investment income per share includes approximately $0.04 per share related to income received in the form of special dividends in connection with certain Fund holdings. Excluding this amount, the ratio of net investment income to average net assets would have been 0.51%.
fNet investment income per share includes approximately $0.10 per share related to income received in the form of special dividends in connection with certain Fund holdings. Excluding this amount, the ratio of net investment income to average net assets would have been 0.68%.
gNet investment income per share includes approximately $0.14 per share related to income received in the form of special dividends in connection with certain Fund holdings. Excluding this amount, the ratio of net investment income to average net assets would have been 0.78%.
hTotal return is not annualized for periods less than one year.
iRatios are annualized for periods less than one year.
jBenefit of expense reduction rounds to less than 0.01%.
kBenefit of waiver and payments by affiliates rounds to less than 0.01%.
| | | | |
56 | | Semiannual Report | The accompanying notes are an integral part of these financial statements. | | franklintempleton.com |
FRANKLIN VALUE INVESTORS TRUST
Statement of Investments, April 30, 2017 (unaudited)
Franklin Small Cap Value Fund
| | | | | | | | | | |
| | | | | Shares | | | Value | |
| | Common Stocks 94.0% | | | | | | | | |
| | Aerospace & Defense 4.6% | | | | | | | | |
| a | | AAR Corp. | | | 2,220,607 | | | $ | 79,919,646 | |
| | Cubic Corp. | | | 483,500 | | | | 25,093,650 | |
| b | | Esterline Technologies Corp. | | | 312,800 | | | | 28,605,560 | |
| | | | | | | | | | |
| | | |
| | | | | | | | | 133,618,856 | |
| | | | | | | | | | |
| | Automobiles & Components 2.9% | | | | | | | | |
| | Gentex Corp. | | | 726,100 | | | | 14,993,965 | |
| | LCI Industries | | | 345,300 | | | | 34,927,095 | |
| | Thor Industries Inc. | | | 313,600 | | | | 30,162,048 | |
| | Winnebago Industries Inc. | | | 184,000 | | | | 5,280,800 | |
| | | | | | | | | | |
| | | |
| | | | | | | | | 85,363,908 | |
| | | | | | | | | | |
| | Banks 13.2% | | | | | | | | |
| | Access National Corp. | | | 429,213 | | | | 12,159,604 | |
| | BNC Bancorp | | | 1,328,100 | | | | 44,424,945 | |
| | Bryn Mawr Bank Corp. | | | 194,800 | | | | 8,356,920 | |
| | Chemical Financial Corp. | | | 1,150,055 | | | | 54,570,110 | |
| | Columbia Banking System Inc. | | | 1,496,500 | | | | 59,126,715 | |
| | EverBank Financial Corp. | | | 1,291,400 | | | | 25,182,300 | |
| | First Horizon National Corp. | | | 2,950,200 | | | | 54,136,170 | |
| | First of Long Island Corp. | | | 663,850 | | | | 18,056,720 | |
| | German American Bancorp Inc. | | | 214,200 | | | | 7,042,896 | |
| | Glacier Bancorp Inc. | | | 437,600 | | | | 14,782,128 | |
| | Lakeland Financial Corp. | | | 1,083,500 | | | | 49,472,610 | |
| | Peoples Bancorp Inc. | | | 456,226 | | | | 15,274,446 | |
| | TrustCo Bank Corp. NY | | | 1,103,300 | | | | 8,771,235 | |
| | Washington Trust Bancorp Inc. | | | 218,300 | | | | 10,740,360 | |
| | | | | | | | | | |
| | | |
| | | | | | | | | 382,097,159 | |
| | | | | | | | | | |
| | Building Products 5.4% | | | | | | | | |
| b | | Armstrong Flooring Inc. | | | 965,000 | | | | 18,518,350 | |
| b | | Gibraltar Industries Inc. | | | 789,100 | | | | 30,972,175 | |
| | Griffon Corp. | | | 613,690 | | | | 14,728,560 | |
| | Insteel Industries Inc. | | | 265,200 | | | | 9,231,612 | |
| | Simpson Manufacturing Co. Inc. | | | 1,373,100 | | | | 57,272,001 | |
| | Universal Forest Products Inc. | | | 279,000 | | | | 26,585,910 | |
| | | | | | | | | | |
| | | |
| | | | | | | | | 157,308,608 | |
| | | | | | | | | | |
| | Commercial & Professional Services 2.2% | | | | | | | | |
| b | | Huron Consulting Group Inc. | | | 412,200 | | | | 18,342,900 | |
| | McGrath RentCorp. | | | 869,831 | | | | 30,278,817 | |
| | MSA Safety Inc. | | | 208,585 | | | | 16,238,342 | |
| | | | | | | | | | |
| | | |
| | | | | | | | | 64,860,059 | |
| | | | | | | | | | |
| | Construction & Engineering 2.2% | | | | | | | | |
| | Argan Inc. | | | 35,833 | | | | 2,395,436 | |
| | EMCOR Group Inc. | | | 504,800 | | | | 33,185,552 | |
| | Granite Construction Inc. | | | 540,070 | | | | 28,467,090 | |
| | | | | | | | | | |
| | | |
| | | | | | | | | 64,048,078 | |
| | | | | | | | | | |
| | Consumer Durables & Apparel 2.8% | | | | | | | | |
| b | | BRP Inc. (Canada) | | | 1,562,300 | | | | 36,937,080 | |
| | Hooker Furniture Corp. | | | 208,200 | | | | 9,046,290 | |
| | La-Z-Boy Inc. | | | 484,800 | | | | 13,525,920 | |
| | | | | | |
| | | |
| franklintempleton.com | | Semiannual Report | | | 57 | |
FRANKLIN VALUE INVESTORS TRUST
STATEMENT OF INVESTMENTS (UNAUDITED)
Franklin Small Cap Value Fund (continued)
| | | | | | | | | | |
| | | | | Shares | | | Value | |
| | Common Stocks (continued) | | | | | | | | |
| | Consumer Durables & Apparel (continued) | | | | | | | | |
| b | | M/I Homes Inc. | | | 759,800 | | | $ | 20,636,168 | |
| | | | | | | | | | |
| | | |
| | | | | | | | | 80,145,458 | |
| | | | | | | | | | |
| | Consumer Services 0.3% | | | | | | | | |
| | Brinker International Inc. | | | 229,803 | | | | 10,154,995 | |
| | | | | | | | | | |
| | Electrical Equipment 1.8% | | | | | | | | |
| | Encore Wire Corp. | | | 46,800 | | | | 2,068,560 | |
| | EnerSys | | | 430,300 | | | | 35,762,233 | |
| | Regal Beloit Corp. | | | 165,100 | | | | 13,018,135 | |
| | | | | | | | | | |
| | | |
| | | | | | | | | 50,848,928 | |
| | | | | | | | | | |
| | Energy 5.1% | | | | | | | | |
| b | | Energen Corp. | | | 554,700 | | | | 28,838,853 | |
| b | | Helix Energy Solutions Group Inc. | | | 1,496,400 | | | | 9,157,968 | |
| | Hunting PLC (United Kingdom) | | | 4,953,224 | | | | 36,089,501 | |
| b | | Natural Gas Services Group Inc. | | | 326,300 | | | | 8,940,620 | |
| b | | Oil States International Inc. | | | 1,067,800 | | | | 31,767,050 | |
| b | | PHI Inc. | | | 40,000 | | | | 465,000 | |
| b | | PHI Inc., non-voting | | | 71,200 | | | | 835,176 | |
| b | | Rowan Cos. PLC | | | 644,784 | | | | 9,072,111 | |
| b | | Unit Corp. | | | 1,080,700 | | | | 23,224,243 | |
| | | | | | | | | | |
| | | |
| | | | | | | | | 148,390,522 | |
| | | | | | | | | | |
| | Food, Beverage & Tobacco 4.6% | | | | | | | | |
| | AGT Food and Ingredients Inc. (Canada) | | | 507,800 | | | | 11,730,481 | |
| | Dairy Crest Group PLC (United Kingdom) | | | 2,368,500 | | | | 17,609,850 | |
| | GrainCorp Ltd. (Australia) | | | 717,046 | | | | 4,789,043 | |
| a,b | | Landec Corp. | | | 1,423,100 | | | | 19,567,625 | |
| | Maple Leaf Foods Inc. (Canada) | | | 3,171,800 | | | | 79,405,382 | |
| | | | | | | | | | |
| | | |
| | | | | | | | | 133,102,381 | |
| | | | | | | | | | |
| | Health Care Equipment & Services 3.8% | | | | | | | | |
| | Hill-Rom Holdings Inc. | | | 807,500 | | | | 61,079,300 | |
| | STERIS PLC | | | 675,100 | | | | 49,822,380 | |
| | | | | | | | | | |
| | | |
| | | | | | | | | 110,901,680 | |
| | | | | | | | | | |
| | Industrial Conglomerates 1.2% | | | | | | | | |
| | Carlisle Cos. Inc. | | | 332,100 | | | | 33,671,619 | |
| | | | | | | | | | |
| | Insurance 6.8% | | | | | | | | |
| | Arthur J. Gallagher & Co. | | | 304,400 | | | | 16,988,564 | |
| | Aspen Insurance Holdings Ltd. | | | 917,100 | | | | 48,010,185 | |
| | The Hanover Insurance Group Inc. | | | 425,400 | | | | 37,550,058 | |
| | Horace Mann Educators Corp. | | | 566,600 | | | | 21,899,090 | |
| | Old Republic International Corp. | | | 1,448,500 | | | | 29,954,980 | |
| | Validus Holdings Ltd. | | | 791,311 | | | | 43,743,672 | |
| | | | | | | | | | |
| | | |
| | | | | | | | | 198,146,549 | |
| | | | | | | | | | |
| | Machinery 7.0% | | | | | | | | |
| | Astec Industries Inc. | | | 434,100 | | | | 27,500,235 | |
| | Federal Signal Corp. | | | 449,600 | | | | 7,018,256 | |
| | Franklin Electric Co. Inc. | | | 165,700 | | | | 6,810,270 | |
| | Hillenbrand Inc. | | | 151,400 | | | | 5,586,660 | |
| | John Bean Technologies Corp. | | | 18,000 | | | | 1,595,700 | |
| | Kennametal Inc. | | | 941,800 | | | | 39,160,044 | |
| | | | |
| | | |
| 58 | | Semiannual Report | | franklintempleton.com |
FRANKLIN VALUE INVESTORS TRUST
STATEMENT OF INVESTMENTS (UNAUDITED)
Franklin Small Cap Value Fund (continued)
| | | | | | | | | | |
| | | | | Shares | | | Value | |
| | Common Stocks (continued) | | | | | | | | |
| | Machinery (continued) | | | | | | | | |
| | Lindsay Corp. | | | 115,125 | | | $ | 9,999,757 | |
| b | | The Manitowoc Co. Inc. | | | 1,729,400 | | | | 10,324,518 | |
| | Miller Industries Inc. | | | 55,400 | | | | 1,407,160 | |
| | Mueller Industries Inc. | | | 906,400 | | | | 29,041,056 | |
| | Mueller Water Products Inc., A | | | 4,180,300 | | | | 47,028,375 | |
| | Spartan Motors Inc. | | | 5,000 | | | | 41,250 | |
| | Titan International Inc. | | | 1,333,400 | | | | 14,280,714 | |
| | Watts Water Technologies Inc., A | | | 70,300 | | | | 4,372,660 | |
| | | | | | | | | | |
| | | |
| | | | | | | | | 204,166,655 | |
| | | | | | | | | | |
| | Materials 5.7% | | | | | | | | |
| | AptarGroup Inc. | | | 84,600 | | | | 6,793,380 | |
| b | | Detour Gold Corp. (Canada) | | | 1,605,800 | | | | 20,294,564 | |
| | H.B. Fuller Co. | | | 152,100 | | | | 8,035,443 | |
| b | | Ingevity Corp. | | | 448,000 | | | | 28,327,040 | |
| | Minerals Technologies Inc. | | | 100,500 | | | | 7,909,350 | |
| | OceanaGold Corp. (Australia) | | | 6,569,600 | | | | 21,418,947 | |
| | A Schulman Inc. | | | 60,376 | | | | 1,910,900 | |
| | Sensient Technologies Corp. | | | 795,800 | | | | 65,096,440 | |
| | Stepan Co. | | | 54,100 | | | | 4,587,680 | |
| | | | | | | | | | |
| | | |
| | | | | | | | | 164,373,744 | |
| | | | | | | | | | |
| | Pharmaceuticals, Biotechnology & Life Sciences 1.9% | | | | | | | | |
| | Gerresheimer AG (Germany) | | | 711,900 | | | | 55,849,545 | |
| | | | | | | | | | |
| | Real Estate 4.6% | | | | | | | | |
| | Brandywine Realty Trust | | | 2,520,600 | | | | 42,774,582 | |
| | LTC Properties Inc. | | | 1,254,531 | | | | 60,016,763 | |
| | Sunstone Hotel Investors Inc. | | | 2,052,400 | | | | 30,560,236 | |
| | | | | | | | | | |
| | | |
| | | | | | | | | 133,351,581 | |
| | | | | | | | | | |
| | Retailing 0.8% | | | | | | | | |
| | Caleres Inc. | | | 646,900 | | | | 18,643,658 | |
| | The Finish Line Inc., A | | | 368,400 | | | | 5,824,404 | |
| | | | | | | | | | |
| | | |
| | | | | | | | | 24,468,062 | |
| | | | | | | | | | |
| | Semiconductors & Semiconductor Equipment 6.3% | | | | | | | | |
| | Cohu Inc. | | | 1,050,000 | | | | 19,666,500 | |
| b | | Kulicke and Soffa Industries Inc. (Singapore) | | | 1,413,915 | | | | 31,558,583 | |
| | MKS Instruments Inc. | | | 710,900 | | | | 55,627,925 | |
| b | | Photronics Inc. | | | 2,929,700 | | | | 33,691,550 | |
| | Versum Materials Inc. | | | 1,287,000 | | | | 41,209,740 | |
| | | | | | | | | | |
| | | |
| | | | | | | | | 181,754,298 | |
| | | | | | | | | | |
| | Technology Hardware & Equipment 3.3% | | | | | | | | |
| b | | NetScout Systems Inc. | | | 1,103,700 | | | | 41,554,305 | |
| b | | Rogers Corp. | | | 224,800 | | | | 23,140,912 | |
| b | | Zebra Technologies Corp., A | | | 316,600 | | | | 29,845,882 | |
| | | | | | | | | | |
| | | |
| | | | | | | | | 94,541,099 | |
| | | | | | | | | | |
| | Telecommunication Services 0.8% | | | | | | | | |
| b | | ORBCOMM Inc. | | | 2,387,000 | | | | 23,010,680 | |
| | | | | | | | | | |
| | | | | | |
| | | |
| franklintempleton.com | | Semiannual Report | | | 59 | |
FRANKLIN VALUE INVESTORS TRUST
STATEMENT OF INVESTMENTS (UNAUDITED)
Franklin Small Cap Value Fund (continued)
| | | | | | | | | | |
| | | | | Shares | | | Value | |
| | Common Stocks (continued) | | | | | | | | |
| | Transportation 2.7% | | | | | | | | |
| b | | SAIA Inc. | | | 785,900 | | | $ | 37,841,085 | |
| b | | Spirit Airlines Inc. | | | 688,800 | | | | 39,447,576 | |
| | | | | | | | | | |
| | | |
| | | | | | | | | 77,288,661 | |
| | | | | | | | | | |
| | Utilities 4.0% | | | | | | | | |
| | Connecticut Water Service Inc. | | | 82,800 | | | | 4,443,876 | |
| | IDACORP Inc. | | | 681,520 | | | | 57,602,070 | |
| | Spire Inc. | | | 785,000 | | | | 53,811,750 | |
| | | | | | | | | | |
| | | |
| | | | | | | | | 115,857,696 | |
| | | | | | | | | | |
| | | |
| | Total Common Stocks (Cost $1,982,820,915) | | | | | | | 2,727,320,821 | |
| | | | | | | | | | |
| | | |
| | | | | Principal
Amount | | | | |
| | Corporate Bonds 0.7% | | | | | | | | |
| | Energy 0.6% | | | | | | | | |
| | Unit Corp., senior sub. note, 6.625%, 5/15/21 | | $ | 17,386,000 | | | | 17,386,000 | |
| | | | | | | | | | |
| | Machinery 0.1% | | | | | | | | |
| | Mueller Industries Inc., 6.00%, 3/01/27 | | | 4,532,000 | | | | 4,554,660 | |
| | | | | | | | | | |
| | | |
| | Total Corporate Bonds (Cost $21,087,141) | | | | | | | 21,940,660 | |
| | | | | | | | | | |
| | | |
| | Total Investments before Short Term Investments (Cost $2,003,908,056) | | | | | | | 2,749,261,481 | |
| | | | | | | | | | |
| | | |
| | | | | Shares | | | | |
| | Short Term Investments (Cost $164,514,231) 5.7% | | | | | | | | |
| | Money Market Funds 5.7% | | | | | | | | |
| c,d | | Institutional Fiduciary Trust Money Market Portfolio, 0.37% | | | 164,514,231 | | | | 164,514,231 | |
| | | | | | | | | | |
| | | |
| | Total Investments (Cost $2,168,422,287) 100.4% | | | | | | | 2,913,775,712 | |
| | Other Assets, less Liabilities (0.4)% | | | | | | | (12,767,867 | ) |
| | | | | | | | | | |
| | | |
| | Net Assets 100.0% | | | | | | $ | 2,901,007,845 | |
| | | | | | | | | | |
See Abbreviations on page 83.
aSee Note 7 regarding holdings of 5% voting securities.
bNon-income producing.
cSee Note 3(f) regarding investments in affiliated management investment companies.
dThe rate shown is the annualized seven-day yield at period end.
| | | | |
| | | |
| 60 | | Semiannual Report | The accompanying notes are an integral part of these financial statements. | | franklintempleton.com |
FRANKLIN VALUE INVESTORS TRUST
Financial Statements
Statements of Assets and Liabilities
April 30, 2017 (unaudited)
| | | | | | | | | | | | |
| | | Franklin Balance Sheet
Investment Fund | | | Franklin MicroCap
Value Fund | | | Franklin MidCap
Value Fund | |
Assets: | | | | | | | | | | | | |
Investments in securities: | | | | | | | | | | | | |
Cost - Unaffiliated issuers | | | $ 619,128,241 | | | | $174,066,840 | | | | $160,480,270 | |
Cost - Non-controlled affiliates (Note 3f and 7) | | | 155,179,685 | | | | 38,698,727 | | | | 2,969,192 | |
Cost - Repurchase agreements | | | — | | | | — | | | | 147,972 | |
| | | | |
Total cost of investments | | | $ 774,307,926 | | | | $212,765,567 | | | | $163,597,434 | |
| | | | |
Value - Unaffiliated issuers | | | $ 876,985,057 | | | | $290,990,036 | | | | $190,106,971 | |
Value - Non-controlled affiliates (Note 3f and 7) | | | 155,179,685 | | | | 46,002,108 | | | | 2,969,192 | |
Value - Repurchase agreements | | | — | | | | — | | | | 147,972 | |
| | | | |
Total value of investments* | | | 1,032,164,742 | | | | 336,992,144 | | | | 193,224,135 | |
Receivables: | | | | | | | | | | | | |
Investment securities sold | | | 1,094,087 | | | | 1,790,890 | | | | — | |
Capital shares sold | | | 1,401,429 | | | | 90,604 | | | | 384,425 | |
Dividends and interest | | | 591,310 | | | | 1,200 | | | | 55,363 | |
Other assets | | | 882 | | | | 295 | | | | 152 | |
| | | | |
Total assets | | | 1,035,252,450 | | | | 338,875,133 | | | | 193,664,075 | |
| | | | |
Liabilities: | | | | | | | | | | | | |
Payables: | | | | | | | | | | | | |
Investment securities purchased | | | 217,535 | | | | 80,223 | | | | — | |
Capital shares redeemed | | | 1,748,222 | | | | 513,092 | | | | 373,531 | |
Management fees | | | 359,329 | | | | 203,140 | | | | 120,818 | |
Distribution fees | | | 233,989 | | | | 47,170 | | | | 54,501 | |
Transfer agent fees | | | 287,310 | | | | 75,385 | | | | 49,928 | |
Trustees’ fees and expenses | | | 1,924 | | | | 363 | | | | 59 | |
Payable upon return of securities loaned | | | — | | | | — | | | | 738,972 | |
Accrued expenses and other liabilities | | | 63,625 | | | | 43,047 | | | | 51,830 | |
| | | | |
Total liabilities | | | 2,911,934 | | | | 962,420 | | | | 1,389,639 | |
| | | | |
Net assets, at value | | | $1,032,340,516 | | | | $337,912,713 | | | | $192,274,436 | |
| | | | |
Net assets consist of: | | | | | | | | | | | | |
Paid-in capital | | | $ 735,398,345 | | | | $202,793,716 | | | | $155,941,848 | |
Undistributed net investment income | | | 4,001,150 | | | | 67,877 | | | | — | |
Distributions in excess of net investment income | | | — | | | | — | | | | (445,403 | ) |
Net unrealized appreciation (depreciation) | | | 257,856,816 | | | | 124,226,577 | | | | 29,626,701 | |
Accumulated net realized gain (loss) | | | 35,084,205 | | | | 10,824,543 | | | | 7,151,290 | |
| | | | |
Net assets, at value | | | $1,032,340,516 | | | | $337,912,713 | | | | $192,274,436 | |
| | | | |
| | | | | | | | | | | | |
*Includes securities loaned | | $ | — | | | $ | — | | | $ | 691,330 | |
| | | | | | |
franklintempleton.com | | The accompanying notes are an integral part of these financial statements. | Semiannual Report | | | 61 | |
FRANKLIN VALUE INVESTORS TRUST
FINANCIAL STATEMENTS
Statements of Assets and Liabilities (continued)
April 30, 2017 (unaudited)
| | | | | | | | | | | | |
| | | Franklin Balance Sheet
Investment Fund | | | Franklin MicroCap
Value Fund | | | Franklin MidCap
Value Fund | |
| | | |
| Class A: | | | | | | | | | | | | |
Net assets, at value | | | $857,143,494 | | | | $240,589,910 | | | | $153,928,724 | |
| | | | |
Shares outstanding | | | 22,315,249 | | | | 7,334,564 | | | | 9,684,897 | |
| | | | |
Net asset value per sharea | | | $38.41 | | | | $32.80 | | | | $15.89 | |
| | | | |
Maximum offering price per share (net asset value per share ÷ 94.25%) | | | $40.75 | | | | $34.80 | | | | $16.86 | |
| | | | |
| | | |
| Class C: | | | | | | | | | | | | |
Net assets, at value | | | $ 66,976,075 | | | | | | | | $ 27,494,238 | |
| | | | | | | | | | | | |
Shares outstanding | | | 1,817,340 | | | | | | | | 1,761,417 | |
| | | | | | | | | | | | |
Net asset value and maximum offering price per sharea | | | $36.85 | | | | | | | | $15.61 | |
| | | | | | | | | | | | |
| | | |
| Class R: | | | | | | | | | | | | |
Net assets, at value | | | $ 8,940,593 | | | | | | | | $ 666,757 | |
| | | | | | | | | | | | |
Shares outstanding | | | 232,348 | | | | | | | | 41,907 | |
| | | | | | | | | | | | |
Net asset value and maximum offering price per share | | | $38.48 | | | | | | | | $15.91 | |
| | | | | | | | | | | | |
| | | |
| Class R6: | | | | | | | | | | | | |
Net assets, at value | | | $ 229,787 | | | | $ 21,718,790 | | | | | |
| | | | | | | | |
Shares outstanding | | | 5,810 | | | | 655,819 | | | | | |
| | | | | | | | |
Net asset value and maximum offering price per share | | | $39.55 | | | | $33.12 | | | | | |
| | | | | | | | |
| | | |
| Advisor Class: | | | | | | | | | | | | |
Net assets, at value | | | $ 99,050,567 | | | | $ 75,604,013 | | | | $ 10,184,717 | |
| | | | |
Shares outstanding | | | 2,502,570 | | | | 2,292,571 | | | | 637,348 | |
| | | | |
Net asset value and maximum offering price per share | | | $39.58 | | | | $32.98 | | | | $15.98 | |
| | | | |
aRedemption price is equal to net asset value less contingent deferred sales charges, if applicable.
| | | | |
62 | | Semiannual Report | The accompanying notes are an integral part of these financial statements. | | franklintempleton.com |
FRANKLIN VALUE INVESTORS TRUST
FINANCIAL STATEMENTS
Statements of Assets and Liabilities (continued)
April 30, 2017 (unaudited)
| | | | |
| | | Franklin Small Cap
Value Fund | |
Assets: | |
Investments in securities: | |
Cost - Unaffiliated issuers | | | $1,936,652,156 | |
Cost - Non-controlled affiliates (Note 3f and 7) | | | 231,770,131 | |
| | | | |
Total cost of investments | | | $2,168,422,287 | |
| | | | |
Value - Unaffiliated issuers | | | $2,649,774,210 | |
Value - Non-controlled affiliates (Note 3f and 7) | | | 264,001,502 | |
| | | | |
Total value of investments | | | 2,913,775,712 | |
Receivables: | |
Capital shares sold | | | 3,100,385 | |
Dividends and interest | | | 1,906,016 | |
Other assets | | | 2,413 | |
| | | | |
Total assets | | | 2,918,784,526 | |
| | | | |
Liabilities: | |
Payables: | |
Investment securities purchased | | | 8,203,966 | |
Capital shares redeemed | | | 6,525,578 | |
Management fees | | | 1,275,890 | |
Distribution fees | | | 539,226 | |
Transfer agent fees | | | 1,005,203 | |
Accrued expenses and other liabilities | | | 226,818 | |
| | | | |
Total liabilities | | | 17,776,681 | |
| | | | |
Net assets, at value | | | $2,901,007,845 | |
| | | | |
Net assets consist of: | |
Paid-in capital | | | $2,083,995,905 | |
Undistributed net investment income | | | 8,342,445 | |
Net unrealized appreciation (depreciation) | | | 745,347,395 | |
Accumulated net realized gain (loss) | | | 63,322,100 | |
| | | | |
Net assets, at value | | | $2,901,007,845 | |
| | | | |
| | | | | | |
franklintempleton.com | | The accompanying notes are an integral part of these financial statements. | Semiannual Report | | | 63 | |
FRANKLIN VALUE INVESTORS TRUST
FINANCIAL STATEMENTS
Statements of Assets and Liabilities (continued)
April 30, 2017 (unaudited)
| | | | |
| | | Franklin Small Cap
Value Fund | |
|
| Class A: | |
Net assets, at value | | | $1,246,219,247 | |
| | | | |
Shares outstanding | | | 22,405,784 | |
| | | | |
Net asset value per sharea | | | $55.62 | |
| | | | |
Maximum offering price per share (net asset value per share ÷ 94.25%) | | | $59.01 | |
| | | | |
|
| Class C: | |
Net assets, at value | | | $ 238,806,972 | |
| | | | |
Shares outstanding | | | 4,790,077 | |
| | | | |
Net asset value and maximum offering price per sharea | | | $49.85 | |
| | | | |
|
| Class R: | |
Net assets, at value | | | $ 228,590,867 | |
| | | | |
Shares outstanding | | | 4,154,278 | |
| | | | |
Net asset value and maximum offering price per share | | | $55.03 | |
| | | | |
|
| Class R6: | |
Net assets, at value | | | $ 144,741,096 | |
| | | | |
Shares outstanding | | | 2,496,766 | |
| | | | |
Net asset value and maximum offering price per share | | | $57.97 | |
| | | | |
|
| Advisor Class: | |
Net assets, at value | | | $1,042,649,663 | |
| | | | |
Shares outstanding | | | 17,983,934 | |
| | | | |
Net asset value and maximum offering price per share | | | $57.98 | |
| | | | |
aRedemption price is equal to net asset value less contingent deferred sales charges, if applicable.
| | | | |
64 | | Semiannual Report | The accompanying notes are an integral part of these financial statements. | | franklintempleton.com |
FRANKLIN VALUE INVESTORS TRUST
FINANCIAL STATEMENTS
Statements of Operations
for the six months ended April 30, 2017 (unaudited)
| | | | | | | | | | | | |
| | | Franklin Balance Sheet
Investment Fund | | | Franklin MicroCap
Value Fund | | | Franklin MidCap
Value Fund | |
Investment income: | | | | | | | | | | | | |
Dividends: | | | | | | | | | | | | |
Unaffiliated issuers | | | $ 10,227,370 | | | | $ 2,177,839 | | | | $ 1,177,449 | |
Non-controlled affiliates (Note 3f and 7) | | | 126,345 | | | | 48,529 | | | | 2,686 | |
Interest | | | 12,417 | | | | — | | | | — | |
Income from securities loaned (net of fees and rebates) | | | — | | | | 730 | | | | 1,982 | |
| | | | |
Total investment income | | | 10,366,132 | | | | 2,227,098 | | | | 1,182,117 | |
| | | | |
Expenses: | | | | | | | | | | | | |
Management fees (Note 3a) | | | 2,461,284 | | | | 1,293,158 | | | | 854,984 | |
Distribution fees: (Note 3c) | | | | | | | | | | | | |
Class A | | | 1,086,372 | | | | 304,422 | | | | 181,366 | |
Class C | | | 339,388 | | | | — | | | | 131,505 | |
Class R | | | 22,903 | | | | — | | | | 1,741 | |
Transfer agent fees: (Note 3e) | | | | | | | | | | | | |
Class A | | | 706,652 | | | | 158,622 | | | | 151,090 | |
Class C | | | 55,187 | | | | — | | | | 27,297 | |
Class R | | | 7,499 | | | | — | | | | 727 | |
Class R6 | | | 138 | | | | 108 | | | | — | |
Advisor Class | | | 74,340 | | | | 46,164 | | | | 8,220 | |
Custodian fees (Note 4) | | | 4,183 | | | | 1,378 | | | | 681 | |
Reports to shareholders | | | 77,344 | | | | 20,740 | | | | 19,879 | |
Registration and filing fees | | | 59,164 | | | | 35,547 | | | | 32,344 | |
Professional fees | | | 33,533 | | | | 24,839 | | | | 23,808 | |
Trustees’ fees and expenses | | | 24,366 | | | | 8,022 | | | | 3,796 | |
Other | | | 9,453 | | | | 6,142 | | | | 6,368 | |
| | | | |
Total expenses | | | 4,961,806 | | | | 1,899,142 | | | | 1,443,806 | |
Expense reductions (Note 4) | | | (23 | ) | | | (26 | ) | | | — | |
Expenses waived/paid by affiliates (Note 3f and 3g) | | | (281,119 | ) | | | (19,911 | ) | | | (183,548 | ) |
| | | | |
Net expenses | | | 4,680,664 | | | | 1,879,205 | | | | 1,260,258 | |
| | | | |
Net investment income (loss) | | | 5,685,468 | | | | 347,893 | | | | (78,141 | ) |
| | | | |
Realized and unrealized gains (losses): | | | | | | | | | | | | |
Net realized gain (loss) from: | | | | | | | | | | | | |
Investments: | | | | | | | | | | | | |
Unaffiliated issuers | | | 36,829,644 | | | | 10,554,039 | | | | 7,327,757 | |
Non-controlled affiliates (Note 3f and 7) | | | (92,880 | ) | | | (6,751 | ) | | | — | |
Realized gain distributions from REITs | | | — | | | | 202,496 | | | | 205,872 | |
Foreign currency transactions | | | 9,609 | | | | — | | | | — | |
| | | | |
Net realized gain (loss) | | | 36,746,373 | | | | 10,749,784 | | | | 7,533,629 | |
| | | | |
Net change in unrealized appreciation (depreciation) on: | | | | | | | | | | | | |
Investments | | | 103,323,435 | | | | 33,982,184 | | | | 10,972,570 | |
| | | | |
Net realized and unrealized gain (loss) | | | 140,069,808 | | | | 44,731,968 | | | | 18,506,199 | |
| | | | |
Net increase (decrease) in net assets resulting from operations | | | $145,755,276 | | | | $45,079,861 | | | | $18,428,058 | |
| | | | |
| | | | | | |
franklintempleton.com | | The accompanying notes are an integral part of these financial statements. | Semiannual Report | | | 65 | |
FRANKLIN VALUE INVESTORS TRUST
FINANCIAL STATEMENTS
Statements of Operations (continued)
for the six months ended April 30, 2017 (unaudited)
| | | | |
| | | Franklin Small Cap
Value Fund | |
Investment income: | | | | |
Dividends: | | | | |
Unaffiliated issuers | | | $ 24,314,931 | |
Non-controlled affiliates (Note 3f and 7) | | | 475,809 | |
Interest | | | 695,789 | |
Income from securities loaned (net of fees and rebates) | | | 7,272 | |
| | | | |
Total investment income | | | 25,493,801 | |
| | | | |
| |
Expenses: | | | | |
Management fees (Note 3a) | | | 8,027,135 | |
Distribution fees: (Note 3c) | | | | |
Class A | | | 1,549,419 | |
Class C | | | 1,197,230 | |
Class R | | | 570,337 | |
Transfer agent fees: (Note 3e) | | | | |
Class A | | | 1,339,845 | |
Class C | | | 258,716 | |
Class R | | | 248,215 | |
Class R6 | | | 3,139 | |
Advisor Class | | | 1,084,049 | |
Custodian fees (Note 4) | | | 20,266 | |
Reports to shareholders | | | 153,814 | |
Registration and filing fees | | | 118,026 | |
Professional fees | | | 45,848 | |
Trustees’ fees and expenses | | | 52,931 | |
Other | | | 22,689 | |
| | | | |
Total expenses | | | 14,691,659 | |
Expenses waived/paid by affiliates (Note 3f and 3g) | | | (383,119 | ) |
| | | | |
Net expenses | | | 14,308,540 | |
| | | | |
Net investment income | | | 11,185,261 | |
| | | | |
Realized and unrealized gains (losses): | | | | |
Net realized gain (loss) from: | | | | |
Investments: | | | | |
Unaffiliated issuers | | | 63,550,572 | |
Non-controlled affiliates (Note 3f and 7) | | | 1,279,203 | |
Realized gain distributions from REITs | | | 1,169,912 | |
Foreign currency transactions | | | (58,785 | ) |
| | | | |
Net realized gain (loss) | | | 65,940,902 | |
| | | | |
Net change in unrealized appreciation (depreciation) on: | | | | |
Investments | | | 267,369,886 | |
Translation of other assets and liabilities denominated in foreign currencies | | | (2,167 | ) |
| | | | |
Net change in unrealized appreciation (depreciation) | | | 267,367,719 | |
| | | | |
Net realized and unrealized gain (loss) | | | 333,308,621 | |
| | | | |
Net increase (decrease) in net assets resulting from operations | | | $344,493,882 | |
| | | | |
| | | | |
66 | | Semiannual Report | The accompanying notes are an integral part of these financial statements. | | franklintempleton.com |
FRANKLIN VALUE INVESTORS TRUST
FINANCIAL STATEMENTS
Statements of Changes in Net Assets
| | | | | | | | | | | | | | | | |
| | | Franklin Balance Sheet Investment Fund | | | Franklin MicroCap Value Fund | |
| | | Six Months Ended
April 30, 2017
(unaudited) | | | Year Ended
October 31,
2016 | | | Six Months Ended
April 30, 2017
(unaudited) | | | Year Ended
October 31, 2016 | |
Increase (decrease) in net assets: | | | | | | | | | | | | | | | | |
Operations: | | | | | | | | | | | | | | | | |
Net investment income | | | $ 5,685,468 | | | | $ 5,747,265 | | | | $ 347,893 | | | | $ 1,347,749 | |
Net realized gain (loss) | | | 36,746,373 | | | | 66,590,811 | | | | 10,749,784 | | | | 31,952,200 | |
Net change in unrealized appreciation (depreciation) | | | 103,323,435 | | | | (32,021,337 | ) | | | 33,982,184 | | | | (7,844,719 | ) |
| | | | |
Net increase (decrease) in net assets
resulting from operations | | | 145,755,276 | | | | 40,316,739 | | | | 45,079,861 | | | | 25,455,230 | |
| | | | |
Distributions to shareholders from: | | | | | | | | | | | | | | | | |
Net investment income: | | | | | | | | | | | | | | | | |
Class A | | | (4,060,815 | ) | | | (6,163,510 | ) | | | (781,224 | ) | | | — | |
Class R | | | (22,684 | ) | | | (40,973 | ) | | | — | | | | — | |
Class R6 | | | (1,447 | ) | | | (86,862 | ) | | | (135,057 | ) | | | — | |
Advisor Class | | | (600,153 | ) | | | (567,388 | ) | | | (384,628 | ) | | | — | |
Net realized gains: | | | | | | | | | | | | | | | | |
Class A | | | (51,331,731 | ) | | | (127,240,321 | ) | | | (21,859,680 | ) | | | (29,640,539 | ) |
Class C | | | (4,188,910 | ) | | | (10,707,264 | ) | | | — | | | | — | |
Class R | | | (551,321 | ) | | | (1,392,805 | ) | | | — | | | | — | |
Class R6 | | | (11,683 | ) | | | (1,044,533 | ) | | | (1,735,581 | ) | | | (2,087,901 | ) |
Advisor Class | | | (4,880,914 | ) | | | (8,916,476 | ) | | | (6,025,380 | ) | | | (7,083,319 | ) |
| | | | |
Total distributions to shareholders | | | (65,649,658 | ) | | | (156,160,132 | ) | | | (30,921,550 | ) | | | (38,811,759 | ) |
| | | | |
Capital share transactions: (Note 2) | | | | | | | | | | | | | | | | |
Class A | | | (6,211,784 | ) | | | (20,929,475 | ) | | | (3,112,866 | ) | | | (14,615,220 | ) |
Class C | | | 312,885 | | | | (2,931,602 | ) | | | — | | | | — | |
Class R | | | (287,535 | ) | | | (225,350 | ) | | | — | | | | — | |
Class R6 | | | 59,372 | | | | (6,369,642 | ) | | | 2,676,679 | | | | 800,571 | |
Advisor Class | | | 16,916,018 | | | | 12,702,903 | | | | 9,528,054 | | | | (1,878,032 | ) |
| | | | |
Total capital share transactions | | | 10,788,956 | | | | (17,753,166 | ) | | | 9,091,867 | | | | (15,692,681 | ) |
| | | | |
Net increase (decrease) in net assets | | | 90,894,574 | | | | (133,596,559 | ) | | | 23,250,178 | | | | (29,049,210 | ) |
Net assets: | | | | | | | | | | | | | | | | |
Beginning of period | | | 941,445,942 | | | | 1,075,042,501 | | | | 314,662,535 | | | | 343,711,745 | |
| | | | |
End of period | | | $1,032,340,516 | | | | $ 941,445,942 | | | | $337,912,713 | | | | $314,662,535 | |
| | | | |
Undistributed net investment income included in net assets: | | | | | | | | | | | | | | | | |
End of period | | | $ 4,001,150 | | | | $ 3,000,781 | | | | $ 67,877 | | | | $ 1,020,893 | |
| | | | |
| | | | | | |
franklintempleton.com | | The accompanying notes are an integral part of these financial statements. | Semiannual Report | | | 67 | |
FRANKLIN VALUE INVESTORS TRUST
FINANCIAL STATEMENTS
Statements of Changes in Net Assets (continued)
| | | | | | | | | | | | | | | | |
| | | Franklin MidCap Value Fund | | | Franklin Small Cap Value Fund | |
| | | Six Months Ended
April 30, 2017
(unaudited) | | | Year Ended
October 31, 2016 | | | Six Months Ended
April 30, 2017
(unaudited) | | | Year Ended
October 31, 2016 | |
Increase (decrease) in net assets: | | | | | | | | | | | | | | | | |
Operations: | | | | | | | | | | | | | | | | |
Net investment income (loss) | | | $ (78,141 | ) | | | $ 1,173,444 | | | | $ 11,185,261 | | | | $8,464,997 | |
Net realized gain (loss) | | | 7,533,629 | | | | 2,243,105 | | | | 65,940,902 | | | | 142,535,280 | |
Net change in unrealized appreciation (depreciation) | | | 10,972,570 | | | | 3,250,542 | | | | 267,367,719 | | | | 67,063,792 | |
| | | | |
Net increase (decrease) in net assets resulting from operations | | | 18,428,058 | | | | 6,667,091 | | | | 344,493,882 | | | | 218,064,069 | |
| | | | |
Distributions to shareholders from: | | | | | | | | | | | | | | | | |
Net investment income: | | | | | | | | | | | | | | | | |
Class A | | | (1,012,511 | ) | | | (566,129 | ) | | | (2,771,255 | ) | | | (5,808,824 | ) |
Class C | | | (16,784 | ) | | | — | | | | — | | | | — | |
Class R | | | (3,475 | ) | | | (487 | ) | | | — | | | | (679,366 | ) |
Class R6 | | | — | | | | — | | | | (694,508 | ) | | | (693,643 | ) |
Advisor Class | | | (64,778 | ) | | | (34,226 | ) | | | (4,517,276 | ) | | | (4,845,956 | ) |
Net realized gains: | | | | | | | | | | | | | | | | |
Class A | | | (1,605,864 | ) | | | (10,163,601 | ) | | | (58,123,153 | ) | | | (99,834,697 | ) |
Class C | | | (297,073 | ) | | | (1,886,762 | ) | | | (12,431,099 | ) | | | (23,379,887 | ) |
Class R | | | (8,290 | ) | | | (57,562 | ) | | | (10,985,538 | ) | | | (21,061,215 | ) |
Class R6 | | | — | | | | — | | | | (5,152,248 | ) | | | (5,810,056 | ) |
Advisor Class | | | (75,432 | ) | | | (366,722 | ) | | | (44,280,146 | ) | | | (55,891,621 | ) |
| | | | |
Total distributions to shareholders | | | (3,084,207 | ) | | | (13,075,489 | ) | | | (138,955,223 | ) | | | (218,005,265 | ) |
| | | | |
Capital share transactions: (Note 2) | | | | | | | | | | | | | | | | |
Class A | | | 12,647,089 | | | | 6,921,151 | | | | 30,414,554 | | | | 57,050,882 | |
Class C | | | 1,998,432 | | | | 973,731 | | | | 3,484,267 | | | | (8,339,210 | ) |
Class R | | | (108,475 | ) | | | (13,076 | ) | | | (827,626 | ) | | | (8,987,914 | ) |
Class R6 | | | — | | | | — | | | | 36,092,298 | | | | 39,750,357 | |
Advisor Class | | | 3,598,375 | | | | 1,487,504 | | | | 76,268,945 | | | | 262,254,964 | |
| | | | |
Total capital share transactions | | | 18,135,421 | | | | 9,369,310 | | | | 145,432,438 | | | | 341,729,079 | |
| | | | |
Net increase (decrease) in net assets | | | 33,479,272 | | | | 2,960,912 | | | | 350,971,097 | | | | 341,787,883 | |
Net assets: | | | | | | | | | | | | | | | | |
Beginning of period | | | 158,795,164 | | | | 155,834,252 | | | | 2,550,036,748 | | | | 2,208,248,865 | |
| | | | |
End of period | | | $192,274,436 | | | | $158,795,164 | | | | $2,901,007,845 | | | | $2,550,036,748 | |
| | | | |
Undistributed net investment income included in net assets: | | | | | | | | | | | | | | | | |
End of period | | | $ — | | | | $ 730,286 | | | | $ 8,342,445 | | | | $ 5,140,223 | |
| | | | |
Distributions in excess of net investment income included in net assets: | | | | | | | | | | | | | | | | |
End of period | | | $ (445,403 | ) | | | $ — | | | | $ — | | | | $ — | |
| | | | |
| | | | |
68 | | Semiannual Report | The accompanying notes are an integral part of these financial statements. | | franklintempleton.com |
FRANKLIN VALUE INVESTORS TRUST
Notes to Financial Statements (unaudited)
1. Organization and Significant Accounting Policies
Franklin Value Investors Trust (Trust) is registered under the Investment Company Act of 1940 (1940 Act) as an open-end management investment company, consisting of four separate funds (Funds) and applies the specialized accounting and reporting guidance in U.S. Generally Accepted Accounting Principles (U.S. GAAP). The classes of shares offered within each of the Funds are indicated below. Each class of shares may differ by its initial sales load, contingent deferred sales charges, voting rights on matters affecting a single class, its exchange privilege and fees primarily due to differing arrangements for distribution and transfer agent fees.
|
| Class A, Class R6 & Advisor Class |
Franklin MicroCap Value Funda
|
| Class A, Class C, Class R & Advisor Class |
Franklin MidCap Value Fund
|
| Class A, Class C, Class R, Class R6 & Advisor Class |
Franklin Balance Sheet Investment Fund
Franklin Small Cap Value Fund
aFranklin MicroCap Value Fund was closed to new investors with limited exceptions effective January 2004, and has remained closed except for two days in mid-February 2013, when the Fund was opened on a limited basis.
The following summarizes the Funds’ significant accounting policies.
a. Financial Instrument Valuation
The Funds’ investments in financial instruments are carried at fair value daily. Fair value is the price that would be received to sell an asset or paid to transfer a liability in an orderly transaction between market participants on the measurement date. The Funds calculate the net asset value (NAV) per share as of 4 p.m. Eastern time each day the New York Stock Exchange (NYSE) is open for trading. Under compliance policies and procedures approved by the Trust’s Board of Trustees (the Board), the Funds’ administrator has responsibility for oversight of valuation, including leading the cross-functional Valuation Committee (VC). The VC provides administration and oversight of the Funds’ valuation policies and procedures, which are approved annually by the Board. Among other things, these procedures allow the Funds to utilize independent pricing services, quotations from securities and financial instrument dealers, and other market sources to determine fair value.
Equity securities and exchange traded funds listed on an exchange or on the NASDAQ National Market System are valued at the last quoted sale price or the official closing price of the day, respectively. Foreign equity securities are valued as of the close of trading on the foreign stock exchange on which the security is primarily traded or as of 4 p.m. Eastern time. The value is then converted into its U.S. dollar equivalent at the foreign exchange rate in effect at 4 p.m. Eastern time on the day that the value of the security is determined. Over-the-counter (OTC) securities are valued within the range of the most recent quoted bid and ask prices. Securities that trade in multiple markets or on multiple exchanges are valued according to the broadest and most representative market. Certain equity securities are valued based upon fundamental characteristics or relationships to similar securities.
Debt securities generally trade in the OTC market rather than on a securities exchange. The Funds’ pricing services use multiple valuation techniques to determine fair value. In instances where sufficient market activity exists, the pricing services may utilize a market-based approach through which quotes from market makers are used to determine fair value. In instances where sufficient market activity may not exist or is limited, the pricing services also utilize proprietary valuation models which may consider market characteristics such as benchmark yield curves, credit spreads, estimated default rates, anticipated market interest rate volatility, coupon rates, anticipated timing of principal repayments, underlying collateral, and other unique security features in order to estimate the relevant cash flows, which are then discounted to calculate the fair value.
Investments in open-end mutual funds are valued at the closing NAV. Investments in repurchase agreements are valued at cost, which approximates fair value.
The Funds have procedures to determine the fair value of financial instruments for which market prices are not reliable or readily available. Under these procedures, the VC convenes on a regular basis to review such financial instruments and considers a number of factors, including significant unobservable valuation inputs, when arriving at fair value. The VC primarily employs a market-based approach which may use related or comparable assets or liabilities, recent transactions, market multiples, book values, and other relevant information for the investment to determine the fair value of the investment. An income-based valuation approach may also be used in which the anticipated future cash flows of the investment are discounted to calculate fair value. Discounts may also be
| | | | |
| | | |
| franklintempleton.com | | Semiannual Report | | 69 |
FRANKLIN VALUE INVESTORS TRUST
NOTES TO FINANCIAL STATEMENTS (UNAUDITED)
1. Organization and Significant Accounting
Policies (continued)
a. Financial Instrument Valuation (continued)
applied due to the nature or duration of any restrictions on the disposition of the investments. Due to the inherent uncertainty of valuations of such investments, the fair values may differ significantly from the values that would have been used had an active market existed. The VC employs various methods for calibrating these valuation approaches including a regular review of key inputs and assumptions, transactional back-testing or disposition analysis, and reviews of any related market activity.
Trading in securities on foreign securities stock exchanges and OTC markets may be completed before 4 p.m. Eastern time. In addition, trading in certain foreign markets may not take place on every Funds’ business day. Occasionally, events occur between the time at which trading in a foreign security is completed and 4 p.m. Eastern time that might call into question the reliability of the value of a portfolio security held by the Fund. As a result, differences may arise between the value of the Funds’ portfolio securities as determined at the foreign market close and the latest indications of value at 4 p.m. Eastern time. In order to minimize the potential for these differences, the VC monitors price movements following the close of trading in foreign stock markets through a series of country specific market proxies (such as baskets of American Depositary Receipts, futures contracts and exchange traded funds). These price movements are measured against established trigger thresholds for each specific market proxy to assist in determining if an event has occurred that may call into question the reliability of the values of the foreign securities held by the Funds. If such an event occurs, the securities may be valued using fair value procedures, which may include the use of independent pricing services.
When the last day of the reporting period is a non-business day, certain foreign markets may be open on those days that the Funds’ NAV is not calculated, which could result in differences between the value of the Funds’ portfolio securities on the last business day and the last calendar day of the reporting period. Any significant security valuation changes due to an open foreign market are adjusted and reflected by the Funds for financial reporting purposes.
b. Foreign Currency Translation
Portfolio securities and other assets and liabilities denominated in foreign currencies are translated into U.S. dollars based on the exchange rate of such currencies against U.S. dollars on the date of valuation. The Funds may enter into foreign currency exchange contracts to facilitate transactions denominated in a foreign currency. Purchases and sales of securities, income and expense items denominated in foreign currencies are translated into U.S. dollars at the exchange rate in effect on the transaction date. Portfolio securities and assets and liabilities denominated in foreign currencies contain risks that those currencies will decline in value relative to the U.S. dollar. Occasionally, events may impact the availability or reliability of foreign exchange rates used to convert the U.S. dollar equivalent value. If such an event occurs, the foreign exchange rate will be valued at fair value using procedures established and approved by the Board.
The Funds do not separately report the effect of changes in foreign exchange rates from changes in market prices on securities held. Such changes are included in net realized and unrealized gain or loss from investments in the Statements of Operations.
Realized foreign exchange gains or losses arise from sales of foreign currencies, currency gains or losses realized between the trade and settlement dates on securities transactions and the difference between the recorded amounts of dividends, interest, and foreign withholding taxes and the U.S. dollar equivalent of the amounts actually received or paid. Net unrealized foreign exchange gains and losses arise from changes in foreign exchange rates on foreign denominated assets and liabilities other than investments in securities held at the end of the reporting period.
c. Joint Repurchase Agreement
Certain or all Funds enter into a joint repurchase agreement whereby their uninvested cash balance is deposited into a joint cash account with other funds managed by the investment manager or an affiliate of the investment manager and is used to invest in one or more repurchase agreements. The value and face amount of the joint repurchase agreement are allocated to the funds based on their pro-rata interest. A repurchase agreement is accounted for as a loan by the Fund to the seller, collateralized by securities which are delivered to the Funds’ custodian. The fair value, including accrued interest, of the initial collateralization is required to be at least 102% of the dollar amount invested by the funds, with the value of the
| | | | |
| | | |
| 70 | | Semiannual Report | | franklintempleton.com |
FRANKLIN VALUE INVESTORS TRUST
NOTES TO FINANCIAL STATEMENTS (UNAUDITED)
underlying securities marked to market daily to maintain coverage of at least 100%. Repurchase agreements are subject to the terms of Master Repurchase Agreements (MRAs) with approved counterparties (sellers). The MRAs contain various provisions, including but not limited to events of default and maintenance of collateral for repurchase agreements. In the event of default by either the seller or the Funds, certain MRAs may permit the non-defaulting party to net and close-out all transactions, if any, traded under such agreements. The Funds may sell securities it holds as collateral and apply the proceeds towards the repurchase price and any other amounts owed by the seller to the Funds in the event of default by the seller. This could involve costs or delays in addition to a loss on the securities if their value falls below the repurchase price owed by the seller. The joint repurchase agreement held by the Funds at period end, as indicated in the Statements of Investments, had been entered into on April 28, 2017.
d. Securities Lending
Certain or all Funds participate in an agency based securities lending program to earn additional income. The Fund receives cash collateral against the loaned securities in an amount equal to at least 102% of the fair value of the loaned securities. Collateral is maintained over the life of the loan in an amount not less than 100% of the fair value of loaned securities, as determined at the close of Fund business each day; any additional collateral required due to changes in security values is delivered to the Fund on the next business day. The collateral is deposited into a joint cash account with other funds and is used to invest in a money market fund managed by Franklin Advisers, Inc., an affiliate of the Funds, and/or a joint repurchase agreement. The Fund may receive income from the investment of cash collateral, in addition to lending fees and rebates paid by the borrower. Income from securities loaned, net of fees paid to the securities lending agent and/or third-party vendor, is reported separately in the Statements of Operations. The Fund bears the market risk with respect to the collateral investment, securities loaned, and the risk that the agent may default on its obligations to the Fund. If the borrower defaults on its obligation to return the securities loaned, the Fund has the right to repurchase the securities in the open market using the collateral received. The securities lending agent has agreed to indemnify the Fund in the event of default by a third party borrower.
e. Income and Deferred Taxes
It is each Fund’s policy to qualify as a regulated investment company under the Internal Revenue Code. Each Fund intends to distribute to shareholders substantially all of its taxable income and net realized gains to relieve it from federal income and excise taxes. As a result, no provision for U.S. federal income taxes is required.
The Funds may be subject to foreign taxation related to income received, capital gains on the sale of securities and certain foreign currency transactions in the foreign jurisdictions in which the Funds invest. Foreign taxes, if any, are recorded based on the tax regulations and rates that exist in the foreign markets in which the Funds invest. When a capital gain tax is determined to apply, certain or all Funds record an estimated deferred tax liability in an amount that would be payable if the securities were disposed of on the valuation date. As a result of several court cases, in certain countries across the European Union, certain or all Funds filed additional tax reclaims for previously withheld taxes on dividends earned in those countries (EU reclaims). These additional filings are subject to various administrative proceedings by the local jurisdictions’ tax authorities within the European Union, as well as a number of related judicial proceedings. Income recognized, if any, for EU reclaims is reflected as other income in the Statements of Operations and any related receivable, if any, is reflected as European Union tax reclaims in the Statements of Assets and Liabilities. When uncertainty exists as to the ultimate resolution of these proceedings, the likelihood of receipt of these EU reclaims, and the potential timing of payment, no amounts are reflected in the financial statements. For U.S. income tax purposes, EU reclaims received by the Funds, if any, reduce the amounts of foreign taxes Fund shareholders can use as tax credits in their individual income tax returns.
Each Fund may recognize an income tax liability related to its uncertain tax positions under U.S. GAAP when the uncertain tax position has a less than 50% probability that it will be sustained upon examination by the tax authorities based on its technical merits. As of April 30, 2017, each Fund has determined that no tax liability is required in its financial statements related to uncertain tax positions for any open tax years (or expected to be taken in future tax years). Open tax years are those that remain subject to examination and are based on each tax jurisdiction’s statute of limitation.
| | | | |
| | | |
| franklintempleton.com | | Semiannual Report | | 71 |
FRANKLIN VALUE INVESTORS TRUST
NOTES TO FINANCIAL STATEMENTS (UNAUDITED)
1. Organization and Significant Accounting
Policies (continued)
f. Security Transactions, Investment Income, Expenses and
Distributions
Security transactions are accounted for on trade date. Realized gains and losses on security transactions are determined on a specific identification basis. Interest income and estimated expenses are accrued daily. Amortization of premium and accretion of discount on debt securities are included in interest income. Dividend income is recorded on the ex-dividend date except for certain dividends from securities where the dividend rate is not available. In such cases, the dividend is recorded as soon as the information is received by the Funds. Distributions to shareholders are recorded on the ex-dividend date and are determined according to income tax regulations (tax basis). Distributable earnings determined on a tax basis may differ from earnings recorded in accordance with U.S. GAAP. These differences may be permanent or temporary. Permanent differences are reclassified among capital accounts to reflect their tax character. These reclassifications have no impact on net assets or the results of operations. Temporary differences are not reclassified, as they may reverse in subsequent periods.
Common expenses incurred by the Trust are allocated among the Funds based on the ratio of net assets of each Fund to the combined net assets of the Trust. Fund specific expenses are charged directly to the Fund that incurred the expense.
Realized and unrealized gains and losses and net investment income, not including class specific expenses, are allocated daily to each class of shares based upon the relative proportion
of net assets of each class. Differences in per share distributions, by class, are generally due to differences in class specific expenses.
Distributions received by the Funds from certain securities may be a return of capital (ROC). Such distributions reduce the cost basis of the securities, and any distributions in excess of the cost basis are recognized as capital gains.
g. Accounting Estimates
The preparation of financial statements in accordance with U.S. GAAP requires management to make estimates and assumptions that affect the reported amounts of assets and liabilities at the date of the financial statements and the amounts of income and expenses during the reporting period. Actual results could differ from those estimates.
h. Guarantees and Indemnifications
Under the Trust’s organizational documents, its officers and trustees are indemnified by the Trust against certain liabilities arising out of the performance of their duties to the Trust. Additionally, in the normal course of business, the Trust, on behalf of the Funds, enters into contracts with service providers that contain general indemnification clauses. The Trust’s maximum exposure under these arrangements is unknown as this would involve future claims that may be made against the Trust that have not yet occurred. Currently, the Trust expects the risk of loss to be remote.
| | | | |
| | | |
| 72 | | Semiannual Report | | franklintempleton.com |
FRANKLIN VALUE INVESTORS TRUST
NOTES TO FINANCIAL STATEMENTS (UNAUDITED)
2. Shares of Beneficial Interest
At April 30, 2017, there were an unlimited number of shares authorized (without par value). Transactions in the Funds’ shares were as follows:
| | | | | | | | | | | | | | | | |
| | | Franklin Balance Sheet | | | Franklin MicroCap | |
| | | Investment Fund | | | Value Fund | |
| | | | |
| | | Shares | | | Amount | | | Shares | | | Amount | |
| | | | |
| Class A Shares: | | | | | | | | | | | | | | | | |
| Six Months ended April 30, 2017 | | | | | | | | | | | | | | | | |
| Shares sold | | | 3,903,744 | | | $ | 150,705,469 | | | | 209,419 | | | $ | 7,038,157 | |
| Shares issued in reinvestment of distributions | | | 1,350,871 | | | | 51,495,207 | | | | 647,525 | | | | 21,828,068 | |
| Shares redeemed | | | (5,417,959) | | | | (208,412,460) | | | | (958,190) | | | | (31,979,091) | |
| | | | |
| Net increase (decrease) | | | (163,344) | | | $ | (6,211,784) | | | | (101,246) | | | $ | (3,112,866) | |
| | | | |
| Year ended October 31, 2016 | | | | | | | | | | | | | | | | |
| Shares sold | | | 3,788,284 | | | $ | 129,548,000 | | | | 356,685 | | | $ | 10,517,221 | |
| Shares issued in reinvestment of distributions | | | 3,737,816 | | | | 124,132,878 | | | | 996,581 | | | | 28,382,616 | |
| Shares redeemed | | | (7,892,827) | | | | (274,610,353) | | | | (1,763,502) | | | | (53,515,057) | |
| | | | |
| Net increase (decrease) | | | (366,727) | | | $ | (20,929,475) | | | | (410,236) | | | $ | (14,615,220) | |
| | | | |
| Class C Shares: | | | | | | | | | | | | | | | | |
| Six Months ended April 30, 2017 | | | | | | | | | | | | | | | | |
| Shares sold | | | 189,051 | | | $ | 6,998,463 | | | | | | | | | |
| Shares issued in reinvestment of distributions | | | 112,965 | | | | 4,143,570 | | | | | | | | | |
| Shares redeemed | | | (294,927) | | | | (10,829,148) | | | | | | | | | |
| | | | | | | | | | | | |
| Net increase (decrease) | | | 7,089 | | | $ | 312,885 | | | | | | | | | |
| | | | | | | | | | | | |
| Year ended October 31, 2016 | | | | | | | | | | | | | | | | |
| Shares sold | | | 209,480 | | | $ | 6,928,314 | | | | | | | | | |
| Shares issued in reinvestment of distributions | | | 328,845 | | | | 10,562,502 | | | | | | | | | |
| Shares redeemed | | | (619,094) | | | | (20,422,418) | | | | | | | | | |
| | | | | | | | | | | | |
| Net increase (decrease) | | | (80,769) | | | $ | (2,931,602) | | | | | | | | | |
| | | | | | | | | | | | |
| Class R Shares: | | | | | | | | | | | | | | | | |
| Six Months ended April 30, 2017 | | | | | | | | | | | | | | | | |
| Shares sold | | | 21,660 | | | $ | 829,954 | | | | | | | | | |
| Shares issued in reinvestment of distributions | | | 15,015 | | | | 574,005 | | | | | | | | | |
| Shares redeemed | | | (43,901) | | | | (1,691,494) | | | | | | | | | |
| | | | | | | | | | | | |
| Net increase (decrease) | | | (7,226) | | | $ | (287,535) | | | | | | | | | |
| | | | | | | | | | | | |
| Year ended October 31, 2016 | | | | | | | | | | | | | | | | |
| Shares sold | | | 39,717 | | | $ | 1,367,615 | | | | | | | | | |
| Shares issued in reinvestment of distributions | | | 43,057 | | | | 1,433,778 | | | | | | | | | |
| Shares redeemed | | | (88,601) | | | | (3,026,743) | | | | | | | | | |
| | | | | | | | | | | | |
| Net increase (decrease) | | | (5,827) | | | $ | (225,350) | | | | | | | | | |
| | | | | | | | | | | | |
| | | | |
| | | |
| franklintempleton.com | | Semiannual Report | | 73 |
FRANKLIN VALUE INVESTORS TRUST
NOTES TO FINANCIAL STATEMENTS (UNAUDITED)
2. Shares of Beneficial Interest (continued)
| | | | | | | | | | | | | | | | |
| | | Franklin Balance Sheet | | | Franklin MicroCap | |
| | | Investment Fund | | | Value Fund | |
| | | | |
| | | Shares | | | Amount | | | Shares | | | Amount | |
| Class R6 Shares: | | | | | | | | | | | | | | | | |
| Six Months ended April 30, 2017 | | | | | | | | | | | | | | | | |
| Shares sold | | | 2,169 | | | $ | 85,587 | | | | 146,585 | | | $ | 4,994,878 | |
| Shares issued in reinvestment of distributions | | | 335 | | | | 13,130 | | | | 328 | | | | 11,145 | |
| Shares redeemed | | | (1,010) | | | | (39,345) | | | | (68,746) | | | | (2,329,344) | |
| | | | |
| Net increase (decrease) | | | 1,494 | | | $ | 59,372 | | | | 78,167 | | | $ | 2,676,679 | |
| | | | |
| Year ended October 31, 2016 | | | | | | | | | | | | | | | | |
| Shares sold | | | 72,039 | | | $ | 2,491,495 | | | | 152,058 | | | $ | 4,534,813 | |
| Shares issued in reinvestment of distributions | | | 722 | | | | 24,574 | | | | 950 | | | | 27,259 | |
| Shares redeemed | | | (248,767) | | | | (8,885,711) | | | | (120,212) | | | | (3,761,501) | |
| | | | |
| Net increase (decrease) | | | (176,006) | | | $ | (6,369,642) | | | | 32,796 | | | $ | 800,571 | |
| | | | |
| Advisor Class Shares: | | | | | | | | | | | | | | | | |
| Six Months ended April 30, 2017 | | | | | | | | | | | | | | | | |
| Shares sold | | | 795,996 | | | $ | 31,365,581 | | | | 380,138 | | | $ | 12,814,354 | |
| Shares issued in reinvestment of distributions | | | 135,705 | | | | 5,326,412 | | | | 181,159 | | | | 6,134,063 | |
| Shares redeemed | | | (502,310) | | | | (19,775,975) | | | | (280,463) | | | | (9,420,363) | |
| | | | |
| Net increase (decrease) | | | 429,391 | | | $ | 16,916,018 | | | | 280,834 | | | $ | 9,528,054 | |
| | | | |
| Year ended October 31, 2016 | | | | | | | | | | | | | | | | |
| Shares sold | | | 1,022,225 | | | $ | 36,994,037 | | | | 443,266 | | | $ | 13,682,421 | |
| Shares issued in reinvestment of distributions | | | 267,802 | | | | 9,137,398 | | | | 227,808 | | | | 6,513,025 | |
| Shares redeemed | | | (904,675) | | | | (33,428,532) | | | | (705,636) | | | | (22,073,478) | |
| | | | |
| Net increase (decrease) | | | 385,352 | | | $ | 12,702,903 | | | | (34,562) | | | $ | (1,878,032) | |
| | | | |
| | | Franklin MidCap | | | Franklin Small Cap | |
| | | Value Fund | | | Value Fund | |
| | | | |
| | | Shares | | | Amount | | | Shares | | | Amount | |
| Class A Shares: | | | | | | | | | | | | | | | | |
| Six Months ended April 30, 2017 | | | | | | | | | | | | | | | | |
| Shares sold | | | 1,906,054 | | | $ | 29,590,848 | | | | 3,807,446 | | | $ | 209,994,361 | |
| Shares issued in reinvestment of distributions | | | 168,958 | | | | 2,585,061 | | | | 1,010,594 | | | | 55,825,164 | |
| Shares redeemed | | | (1,259,405) | | | | (19,528,820) | | | | (4,285,303) | | | | (235,404,971) | |
| | | | |
| Net increase (decrease) | | | 815,607 | | | $ | 12,647,089 | | | | 532,737 | | | $ | 30,414,554 | |
| | | | |
| Year ended October 31, 2016 | | | | | | | | | | | | | | | | |
| Shares sold | | | 2,008,588 | | | $ | 28,082,865 | | | | 4,705,984 | | | $ | 230,621,518 | |
| Shares issued in reinvestment of distributions | | | 789,108 | | | | 10,581,940 | | | | 2,182,073 | | | | 96,404,005 | |
| Shares issued on reorganization | | | — | | | | — | | | | 771,169 | | | | 32,670,477 | |
| Shares redeemed | | | (2,273,020) | | | | (31,743,654) | | | | (6,327,141) | | | | (302,645,118) | |
| | | | |
| Net increase (decrease) | | | 524,676 | | | $ | 6,921,151 | | | | 1,332,085 | | | $ | 57,050,882 | |
| | | | |
| | | | |
| | | |
| 74 | | Semiannual Report | | franklintempleton.com |
FRANKLIN VALUE INVESTORS TRUST
NOTES TO FINANCIAL STATEMENTS (UNAUDITED)
| | | | | | | | | | | | | | | | |
| | | Franklin MidCap
Value Fund | | | Franklin Small Cap
Value Fund | |
| | | Shares | | | Amount | | | Shares | | | Amount | |
| Class C Shares: | | | | | | | | | | | | | | | | |
Six Months ended April 30, 2017 | | | | | | | | | | | | | | | | |
Shares sold | | | 382,059 | | | $ | 5,828,142 | | | | 572,621 | | | $ | 28,241,183 | |
Shares issued in reinvestment of distributions | | | 20,598 | | | | 310,417 | | | | 234,411 | | | | 11,638,500 | |
Shares redeemed | | | (270,699 | ) | | | (4,140,127 | ) | | | (738,174 | ) | | | (36,395,416) | |
| | | | |
Net increase (decrease) | | | 131,958 | | | $ | 1,998,432 | | | | 68,858 | | | $ | 3,484,267 | |
Year ended October 31, 2016 | | | | | | | | | | | | | | | | |
Shares sold | | | 404,432 | | | $ | 5,582,883 | | | | 712,170 | | | $ | 31,364,976 | |
Shares issued in reinvestment of distributions | | | 138,620 | | | | 1,832,553 | | | | 535,257 | | | | 21,474,498 | |
Shares issued on reorganization | | | — | | | | — | | | | 148,730 | | | | 5,709,810 | |
Shares redeemed | | | (472,144 | ) | | | (6,441,705 | ) | | | (1,527,317 | ) | | | (66,888,494) | |
| | | | |
Net increase (decrease) | | | 70,908 | | | $ | 973,731 | | | | (131,160 | ) | | $ | (8,339,210) | |
| Class R Shares: | | | | | | | | | | | | | | | | |
Six Months ended April 30, 2017 | | | | | | | | | | | | | | | | |
Shares sold | | | 4,190 | | | $ | 65,945 | | | | 689,527 | | | $ | 37,546,215 | |
Shares issued in reinvestment of distributions | | | 768 | | | | 11,765 | | | | 191,550 | | | | 10,477,784 | |
Shares redeemed | | | (12,062 | ) | | | (186,185 | ) | | | (898,067 | ) | | | (48,851,625) | |
| | | | |
Net increase (decrease) | | | (7,104 | ) | | $ | (108,475 | ) | | | (16,990 | ) | | $ | (827,626) | |
Year ended October 31, 2016 | | | | | | | | | | | | | | | | |
Shares sold | | | 6,784 | | | $ | 96,073 | | | | 925,146 | | | $ | 44,110,152 | |
Shares issued in reinvestment of distributions | | | 4,322 | | | | 58,049 | | | | 473,666 | | | | 20,737,082 | |
Shares issued on reorganization | | | — | | | | — | | | | 1,308 | | | | 54,856 | |
Shares redeemed | | | (11,824 | ) | | | (167,198 | ) | | | (1,564,983 | ) | | | (73,890,004) | |
| | | | |
Net increase (decrease) | | | (718 | ) | | $ | (13,076 | ) | | | (164,863 | ) | | $ | (8,987,914) | |
| Class R6 Shares: | | | | | | | | | | | | | | | | |
Six Months ended April 30, 2017 | | | | | | | | | | | | | | | | |
Shares sold | | | | | | | | | | | 875,995 | | | $ | 50,182,811 | |
Shares issued in reinvestment of distributions | | | | | | | | | | | 79,035 | | | | 4,542,911 | |
Shares redeemed | | | | | | | | | | | (325,740 | ) | | | (18,633,424) | |
| | | | |
Net increase (decrease) | | | | | | | | | | | 629,290 | | | $ | 36,092,298 | |
Year ended October 31, 2016 | | | | | | | | | | | | | | | | |
Shares sold | | | | | | | | | | | 993,588 | | | $ | 51,685,865 | |
Shares issued in reinvestment of distributions | | | | | | | | | | | 94,970 | | | | 4,353,446 | |
Shares redeemed | | | | | | | | | | | (325,163 | ) | | | (16,288,954) | |
| | | | |
Net increase (decrease) | | | | | | | | | | | 763,395 | | | $ | 39,750,357 | |
| | | | | | |
| | | |
| franklintempleton.com | | Semiannual Report | | | 75 | |
FRANKLIN VALUE INVESTORS TRUST
NOTES TO FINANCIAL STATEMENTS (UNAUDITED)
2. Shares of Beneficial Interest (continued)
| | | | | | | | | | | | | | | | |
| | | Franklin MidCap
Value Fund | | | Franklin Small Cap
Value Fund | |
| | | Shares | | | Amount | | | Shares | | | Amount | |
| Advisor Class Shares: | | | | | | | | | | | | | | | | |
Six Months ended April 30, 2017 | | | | | | | | | | | | | | | | |
Shares sold | | | 357,586 | | | $ | 5,596,013 | | | | 3,233,104 | | | $ | 185,905,798 | |
Shares issued in reinvestment of distributions | | | 8,156 | | | | 125,195 | | | | 813,656 | | | | 46,809,648 | |
Shares redeemed | | | (137,570 | ) | | | (2,122,833 | ) | | | (2,734,260 | ) | | | (156,446,501) | |
Net increase (decrease) | | | 228,172 | | | $ | 3,598,375 | | | | 1,312,500 | | | $ | 76,268,945 | |
Year ended October 31, 2016 | | | | | | | | | | | | | | | | |
Shares sold | | | 290,876 | | | $ | 4,276,186 | | | | 8,800,748 | | | $ | 461,859,393 | |
Shares issued in reinvestment of distributions | | | 27,119 | | | | 365,015 | | | | 1,240,446 | | | | 56,948,853 | |
Shares issued on reorganization | | | — | | | | — | | | | 57,090 | | | | 2,515,323 | |
Shares redeemed | | | (216,129 | ) | | | (3,153,697 | ) | | | (5,268,076 | ) | | | (259,068,605) | |
Net increase (decrease) | | | 101,866 | | | $ | 1,487,504 | | | | 4,830,208 | | | $ | 262,254,964 | |
3. Transactions with Affiliates
Franklin Resources, Inc. is the holding company for various subsidiaries that together are referred to as Franklin Templeton Investments. Certain officers and trustees of the Trust are also officers and/or directors of the following subsidiaries:
| | |
| Subsidiary | | Affiliation |
Franklin Advisory Services, LLC (Advisory Services) | | Investment manager |
Franklin Templeton Services, LLC (FT Services) | | Administrative manager |
Franklin Templeton Distributors, Inc. (Distributors) | | Principal underwriter |
Franklin Templeton Investor Services, LLC (Investor Services) | | Transfer agent |
a. Management Fees
Franklin Balance Sheet Investment Fund pays an investment management fee to Advisory Services based on the average daily net assets of the Fund as follows:
| | |
| Annualized Fee Rate | | Net Assets |
0.625% | | Up to and including $100 million |
0.500% | | Over $100 million, up to and including $250 million |
0.450% | | Over $250 million, up to and including $7.5 billion |
0.440% | | Over $7.5 billion, up to and including $10 billion |
0.430% | | Over $10 billion, up to and including $12.5 billion |
0.420% | | Over $12.5 billion, up to and including $15 billion |
0.400% | | In excess of $15 billion |
Franklin MicroCap Value Fund pays an investment management fee to Advisory Services of 0.75% per year of the average daily net assets of the Fund.
| | | | |
| | | |
| 76 | | Semiannual Report | | franklintempleton.com |
FRANKLIN VALUE INVESTORS TRUST
NOTES TO FINANCIAL STATEMENTS (UNAUDITED)
Franklin MidCap Value Fund pays an investment management fee to Advisory Services based on the average daily net assets of the Fund as follows:
| | |
| Annualized Fee Rate | | Net Assets |
0.950% | | Up to and including $500 million |
0.850% | | Over $500 million, up to and including $1 billion |
0.800% | | Over $1 billion, up to and including $1.5 billion |
0.750% | | Over $1.5 billion, up to and including $6.5 billion |
0.725% | | Over $6.5 billion, up to and including $11.5 billion |
0.700% | | Over $11.5 billion, up to and including $16.5 billion |
0.690% | | Over $16.5 billion, up to and including $19 billion |
0.680% | | Over $19 billion, up to and including $21.5 billion |
0.670% | | In excess of $21.5 billion |
Franklin Small Cap Value Fund pays an investment management fee to Advisory Services based on the average daily net assets of the Fund as follows:
| | |
| Annualized Fee Rate | | Net Assets |
0.750% | | Up to and including $500 million |
0.625% | | Over $500 million, up to and including $1 billion |
0.500% | | Over $1 billion, up to and including $5 billion |
0.490% | | In excess of $5 billion |
For the period ended April 30, 2017, each Fund’s annualized effective investment management fee rate based on average daily net assets was as follows:
| | | | | | |
Franklin Balance
Sheet
Investment Fund | | Franklin MicroCap
Value Fund | | Franklin MidCap
Value Fund | | Franklin Small
Cap
Value Fund |
0.474% | | 0.750% | | 0.950% | | 0.565% |
b. Administrative Fees
Under an agreement with Advisory Services, FT Services provides administrative services to the Funds. The fee is paid by Advisory Services based on the Funds’ average daily net assets and is not an additional expense of the Funds.
c. Distribution Fees
The Board has adopted distribution plans for each share class, with the exception of Class R6 and Advisor Class shares, pursuant to Rule 12b-1 under the 1940 Act. Under the Funds’ Class A reimbursement distribution plans, the Funds reimburse Distributors for costs incurred in connection with the servicing, sale and distribution of each Fund’s shares up to the maximum annual plan rate. Under the Class A reimbursement distribution plans, costs exceeding the maximum for the current plan year cannot be reimbursed in subsequent periods. In addition, under the Funds’ Class C and R compensation distribution plans, the Funds pay Distributors for costs incurred in connection with the servicing, sale and distribution of each Fund’s shares up to the maximum annual plan rate for each class. The plan year, for purposes of monitoring compliance with the maximum annual plan rates, is February 1 through January 31 for each Fund.
| | | | |
| | | |
| franklintempleton.com | | Semiannual Report | | 77 |
FRANKLIN VALUE INVESTORS TRUST
NOTES TO FINANCIAL STATEMENTS (UNAUDITED)
3. Transactions with Affiliates (continued)
c. Distribution Fees (continued)
The maximum annual plan rates, based on the average daily net assets, for each class, are as follows:
| | | | | | | | | | | | | | | | |
| | | Franklin Balance Sheet
Investment Fund | | | Franklin MicroCap
Value Fund | | | Franklin MidCap
Value Fund | | | Franklin Small Cap
Value Fund | |
Reimbursement Plans: | | | | | | | | | | | | | | | | |
Class A | | | 0.25% | | | | 0.25% | | | | 0.35% | | | | 0.35% | |
Compensation Plans: | | | | | | | | | | | | | | | | |
Class C | | | 1.00% | | | | — | | | | 1.00% | | | | 1.00% | |
Class R | | | 0.50% | | | | — | | | | 0.50% | | | | 0.50% | |
For Franklin MidCap Value Fund and Franklin Small Cap Value Fund, the Board has set the current rate at 0.25% per year for Class A shares until further notice and approval by the Board.
d. Sales Charges/Underwriting Agreements
Front-end sales charges and contingent deferred sales charges (CDSC) do not represent expenses of the Funds. These charges are deducted from the proceeds of sales of fund shares prior to investment or from redemption proceeds prior to remittance, as applicable. Distributors has advised the Funds of the following commission transactions related to the sales and redemptions of the Funds’ shares for the period:
| | | | | | | | | | | | | | | | |
| | | Franklin Balance Sheet
Investment Fund | | | Franklin MicroCap
Value Fund | | | Franklin MidCap
Value Fund | | | Franklin Small Cap
Value Fund | |
Sales charges retained net of commissions paid to unaffiliated brokers/dealers | | | $137,498 | | | | $6,770 | | | | $60,488 | | | | $267,261 | |
CDSC retained | | | $ 13,860 | | | | $ — | | | | $ 1,181 | | | | $ 8,818 | |
e. Transfer Agent Fees
Each class of shares, except for Class R6, pays transfer agent fees to Investor Services for its performance of shareholder servicing obligations and reimburses Investor Services for out of pocket expenses incurred, including shareholder servicing fees paid to third parties. These fees are allocated daily based upon their relative proportion of such classes’ aggregate net assets. Class R6 pays Investor Services transfer agent fees specific to that class.
For the period ended April 30, 2017, the Funds paid transfer agent fees as noted in the Statements of Operations of which the following amounts were retained by Investor Services:
| | | | | | | | | | | | | | | | |
| | | Franklin Balance Sheet
Investment Fund | | | Franklin MicroCap
Value Fund | | | Franklin MidCap
Value Fund | | | Franklin Small Cap
Value Fund | |
Transfer agent fees | | | $347,029 | | | | $73,557 | | | | $90,856 | | | | $1,083,849 | |
| | | | |
| | | |
| 78 | | Semiannual Report | | franklintempleton.com |
FRANKLIN VALUE INVESTORS TRUST
NOTES TO FINANCIAL STATEMENTS (UNAUDITED)
f. Investments in Affiliated Management Investment Companies
Certain or all Funds invest in one or more affiliated management investment companies for purposes other than exercising a controlling influence over the management or policies. Management fees paid by the Funds are waived on assets invested in the affiliated management investment companies, as noted in the Statements of Operations, in an amount not to exceed the management and administrative fees paid directly or indirectly by each affiliate. Prior to November 1, 2013, the waiver was accounted for as a reduction to management fees. During the period ended April 30, 2017, investments in affiliated management investment companies were as follows:
| | | | | | | | | | | | | | | | | | | | | | | | | | | | | | | | |
| | | Number of
Shares Held at Beginning
of Period | | | Gross
Additions | | | Gross
Reductions | | | Number of
Shares Held at End of Period | | | Value at End of Period | | | Investment
Income | | | Realized
Gain (Loss) | | | % of
Affiliated
Fund Shares
Outstanding
Held at End
of Period | |
| Franklin Balance Sheet Investment Fund | | | | | | | | | | | | | | | | | | | | | | | | | | | | | | | | |
| Non-Controlled Affiliates | | | | | | | | | | | | | | | | | | | | | | | | | | | | | | | | |
Institutional Fiduciary Trust Money Market Portfolio, 0.37% | | | 164,192,937 | | | | 91,556,074 | | | | (100,569,326 | ) | | | 155,179,685 | | | $ | 155,179,685 | | | $ | 126,345 | | | | $— | | | | 0.8% | |
| | | | | | | | | | | | | | | | | | | | | | | | |
| Franklin MicroCap Value Fund | | | | | | | | | | | | | | | | | | | | | | | | | | | | | | | | |
| Non-Controlled Affiliates | | | | | | | | | | | | | | | | | | | | | | | | | | | | | | | | |
Institutional Fiduciary Trust Money Market Portfolio, 0.37% | | | 8,048,646 | | | | 25,227,979 | | | | (23,463,203 | ) | | | 9,813,422 | | | $ | 9,813,422 | | | $ | 9,059 | | | | $— | | | | 0.1% | |
| | | | | | | | | | | | | | | | | | | | | | | | |
| Franklin MidCap Value Fund | | | | | | | | | | | | | | | | | | | | | | | | | | | | | | | | |
| Non-Controlled Affiliates | | | | | | | | | | | | | | | | | | | | | | | | | | | | | | | | |
Institutional Fiduciary Trust Money Market Portfolio, 0.37% | | | 4,347,627 | | | | 40,159,150 | | | | (41,537,585 | ) | | | 2,969,192 | | | $ | 2,969,192 | | | | $ 2,686 | | | | $— | | | | 0.0%a | |
| | | | | | | | | | | | | | | | | | | | | | | | |
| Franklin Small Cap Value Fund | | | | | | | | | | | | | | | | | | | | | | | | | | | | | | | | |
| Non-Controlled Affiliates | | | | | | | | | | | | | | | | | | | | | | | | | | | | | | | | |
Institutional Fiduciary Trust Money Market Portfolio, 0.37% | | | 279,727,587 | | | | 226,146,471 | | | | (341,359,827 | ) | | | 164,514,231 | | | $ | 164,514,231 | | | $ | 162,030 | | | | $— | | | | 0.8% | |
| | | | | | | | | | | | | | | | | | | | | | | | |
aRounds to less than 0.1%. | | | | | | | | | | | | | | | | | | | | | | | | | | | | | | | | |
g. Waiver and Expense Reimbursements
Advisory Services has contractually agreed in advance to waive or limit its fees and to assume as its own expense certain expenses otherwise payable by Franklin MidCap Value Fund so that the expenses (excluding distribution fees, and acquired fund fees and expenses) for each class of the Fund does not exceed 1.05% based on the average net assets of each class (other than certain non-routine expenses or costs, including those relating to litigation, indemnification, reorganizations, and liquidations) until February 28, 2018. Total expenses waived or paid are not subject to recapture subsequent to the Fund’s fiscal year end.
Additionally, Investor Services has contractually agreed in advance to waive or limit its fees so that the Class R6 transfer agent fees do not exceed 0.01% until February 28, 2018. For Franklin MicroCap Value Fund and Franklin Small Cap Value Fund, there were no Class R6 transfer agent fees waived during the period ended April 30, 2017.
4. Expense Offset Arrangement
The Funds have entered into an arrangement with their custodian whereby credits realized as a result of uninvested cash balances are used to reduce a portion of the Funds’ custodian expenses. During the period ended April 30, 2017, the custodian fees were reduced as noted in the Statements of Operations.
| | | | |
| | | |
| franklintempleton.com | | Semiannual Report | | 79 |
FRANKLIN VALUE INVESTORS TRUST
NOTES TO FINANCIAL STATEMENTS (UNAUDITED)
5. Income Taxes
At April 30, 2017, the cost of investments and net unrealized appreciation (depreciation) for income tax purposes were as follows:
| | | | | | | | | | | | |
| | | Franklin Balance Sheet
Investment Fund | | Franklin MicroCap
Value Fund | | | Franklin MidCap
Value Fund | | Franklin Small Cap
Value Fund | |
Cost of investments | | $775,969,331 | | | $212,765,567 | | | $163,979,443 | | | $2,171,039,215 | |
| | | |
Unrealized appreciation | | $278,245,972 | | | $149,441,564 | | | $35,725,055 | | | $771,301,257 | |
Unrealized depreciation | | (22,050,561) | | | (25,214,987 | ) | | (6,480,363) | | | (28,564,760 | ) |
| | | |
Net unrealized appreciation (depreciation) | | $256,195,411 | | | $124,226,577 | | | $29,244,692 | | | $742,736,497 | |
| | | |
Differences between income and/or capital gains as determined on a book basis and a tax basis are primarily due to differing treatment of wash sales.
6. Investment Transactions
Purchases and sales of investments (excluding short term securities) for the period ended April 30, 2017, were as follows:
| | | | | | | | | | | | |
| | | Franklin Balance Sheet
Investment Fund | | Franklin MicroCap
Value Fund | | | Franklin MidCap
Value Fund | | Franklin Small Cap
Value Fund | |
Purchases | | $129,372,311 | | | $12,948,795 | | | $70,142,462 | | | $466,693,866 | |
Sales | | $173,184,122 | | | $35,829,878 | | | $53,175,086 | | | $303,775,539 | |
At April 30, 2017, in connection with securities lending transactions, the Franklin MidCap Value Fund loaned equity investments and received $738,972 of cash collateral. The gross amount of recognized liability for such transactions is included in payable upon return of securities loaned in the Statement of Assets and Liabilities. The agreements can be terminated at any time.
7. Holdings of 5% Voting Securities of Portfolio Companies
The 1940 Act defines “affiliated companies” to include investments in portfolio companies in which a fund owns 5% or more of the outstanding voting securities. During the period ended April 30, 2017, investments in “affiliated companies” were as follows:
| | | | | | | | | | | | | | | | | | | | | | | | | | | | |
| Name of Issuer | | Number of
Shares Held
at Beginning
of Period | | | Gross
Additions | | | Gross
Reductions | | | Number of
Shares Held
at End
of Period | | | Value
at End of Period | | | Investment
Income | | | Realized
Gain
(Loss) | |
| Franklin Balance Sheet Investment Fund | | | | | | | | | | | | | | | | | | | | | | | | | |
| Non-Controlled Affiliates | | | | | | | | | | | | | | | | | | | | | | | | | |
Trinity Place Holdings Inc. (Value is —% of Net Assets) | | | 1,342,554 | | | | — | | | | (432,720 | ) | | | 909,834 | | | $ | —a | | | $ | — | | | $ | (92,880 | ) |
| | | | | | | | | | | | | | | | | | | | |
| Franklin MicroCap Value Fund | | | | | | | | | | | | | | | | | | | | | | | | | |
| Non-Controlled Affiliates | | | | | | | | | | | | | | | | | | | | | | | | | |
Continental Materials Corp. | | | 116,914 | | | | — | | | | (3,914 | ) | | | 113,000 | | | $ | 2,491,650 | | | $ | — | | | $ | 21,314 | |
Delta Apparel Inc. | | | 455,100 | | | | — | | | | — | | | | 455,100 | | | | 7,977,903 | | | | — | | | | — | |
Full House Resorts Inc. | | | 1,945,304 | | | | — | | | | (21,784 | ) | | | 1,923,520 | | | | 4,635,683 | | | | — | | | | (32,274 | ) |
Global Power Equipment Group Inc. | | | 1,275,000 | | | | — | | | | — | | | | 1,275,000 | | | | 5,533,500 | | | | — | | | | — | |
Hardinge Inc. | | | 764,000 | | | | — | | | | (39,000 | ) | | | 725,000 | | | | 7,612,500 | | | | 30,280 | | | | 4,209 | |
Northeast Bancorp | | | 459,500 | | | | — | | | | — | | | | 459,500 | | | | 7,696,625 | | | | 9,190 | | | | — | |
Origen Financial Inc. | | | 1,900,000 | | | | — | | | | — | | | | 1,900,000 | | | | 240,825 | | | | — | | | | — | |
| | | | | | | | | | | | | | | | | | | | |
| Total Affiliated Securities (Value is 10.7% of Net Assets) | | | | | | | | | | | $ | 36,188,686 | | | $ | 39,470 | | | $ | (6,751 | ) |
| | | | | | | | | | | | | | | | | | | | |
| Franklin Small Cap Value Fund | | | | | | | | | | | | | | | | | | | | | | | | | |
| Non-Controlled Affiliates | | | | | | | | | | | | | | | | | | | | | | | | | |
AAR Corp. | | | 2,010,507 | | | | 345,000 | | | | (134,900 | ) | | | 2,220,607 | | | $ | 79,919,646 | | | $ | 313,779 | | | $ | 1,279,203 | |
| | | | |
| | | |
| 80 | | Semiannual Report | | franklintempleton.com |
FRANKLIN VALUE INVESTORS TRUST
NOTES TO FINANCIAL STATEMENTS (UNAUDITED)
| | | | | | | | | | | | | | | | | | | | | | | | | | | | |
| Name of Issuer | | Number of
Shares Held
at Beginning
of Period | | | Gross
Additions | | | Gross
Reductions | | | Number of
Shares Held
at End
of Period | | | Value
at End of Period | | | Investment
Income | | | Realized
Gain
(Loss) | |
| Franklin Small Cap Value Fund (continued) | | | | | | | | | | | | | | | | | | | | | | | | | |
| Non-Controlled Affiliates (continued) | | | | | | | | | | | | | | | | | | | | | | | | | |
Landec Corp. | | | 1,423,100 | | | | — | | | | — | | | | 1,423,100 | | | $ | 19,567,625 | | | $ | — | | | $ | — | |
| | | | | | | | | | | | | | | | | | | | |
Total Affiliated Securities (Value is 3.4% of Net Assets) | | | | | | | $ | 99,487,271 | | | $ | 313,779 | | | $ | 1,279,203 | |
| | | | | | | | | | | | | | | | | | | | |
aAs of April 30, 2017, no longer an affiliate.
8. Upcoming Acquisitions/Reorganization
On May 22, 2017, the Board approved a proposal to reorganize Franklin MidCap Value Fund with and into Franklin Small Cap Value Fund, subject to approval by the shareholders of Franklin MidCap Value Fund.
9. Credit Facility
The Funds, together with other U.S. registered and foreign investment funds (collectively, Borrowers), managed by Franklin Templeton Investments, are borrowers in a joint syndicated senior unsecured credit facility totaling $2 billion (Global Credit Facility) which matures on February 9, 2018. This Global Credit Facility provides a source of funds to the Borrowers for temporary and emergency purposes, including the ability to meet future unanticipated or unusually large redemption requests.
Under the terms of the Global Credit Facility, the Funds shall, in addition to interest charged on any borrowings made by the Funds and other costs incurred by the Funds, pay their share of fees and expenses incurred in connection with the implementation and maintenance of the Global Credit Facility, based upon their relative share of the aggregate net assets of all of the Borrowers, including an annual commitment fee of 0.15% based upon the unused portion of the Global Credit Facility. These fees are reflected in other expenses in the Statements of Operations. During the period ended April 30, 2017, the Funds did not use the Global Credit Facility.
10. Fair Value Measurements
The Funds follow a fair value hierarchy that distinguishes between market data obtained from independent sources (observable inputs) and the Funds’ own market assumptions (unobservable inputs). These inputs are used in determining the value of the Funds’ financial instruments and are summarized in the following fair value hierarchy:
| | • | | Level 1 – quoted prices in active markets for identical financial instruments |
| | • | | Level 2 – other significant observable inputs (including quoted prices for similar financial instruments, interest rates, prepayment speed, credit risk, etc.) |
| | • | | Level 3 – significant unobservable inputs (including the Funds’ own assumptions in determining the fair value of financial instruments) |
The input levels are not necessarily an indication of the risk or liquidity associated with financial instruments at that level.
For movements between the levels within the fair value hierarchy, the Funds have adopted a policy of recognizing the transfers as of the date of the underlying event which caused the movement.
| | | | |
| | | |
| franklintempleton.com | | Semiannual Report | | 81 |
FRANKLIN VALUE INVESTORS TRUST
NOTES TO FINANCIAL STATEMENTS (UNAUDITED)
10. Fair Value Measurements (continued)
A summary of inputs used as of April 30, 2017, in valuing the Funds’ assets carried at fair value, is as follows:
| | | | | | | | | | | | | | | | |
| | | Level 1 | | | Level 2 | | | Level 3 | | | Total | |
| | | | |
| Franklin Balance Sheet Investment Fund | | | | | | | | | | | | | | | | |
Assets: | | | | | | | | | | | | | | | | |
Investments in Securities: | | | | | | | | | | | | | | | | |
Equity Investments:a | | | | | | | | | | | | | | | | |
Telecommunication Services | | $ | 14,595,452 | | | $ | 7,381,250 | | | $ | — | | | $ | 21,976,702 | |
All Other Equity Investmentsb | | | 853,510,905 | | | | — | | | | — | | | | 853,510,905 | |
Corporate Bonds | | | — | | | | 1,497,450 | | | | — | | | | 1,497,450 | |
Short Term Investments | | | 155,179,685 | | | | — | | | | — | | | | 155,179,685 | |
| | | | |
| | | | |
Total Investments in Securities | | $ | 1,023,286,042 | | | $ | 8,878,700 | | | $ | — | | | $ | 1,032,164,742 | |
| | | | |
| | | | |
| Franklin MicroCap Value Fund | | | | | | | | | | | | | | | | |
Assets: | | | | | | | | | | | | | | | | |
Investments in Securities: | | | | | | | | | | | | | | | | |
Equity Investmentsb | | $ | 327,178,722 | | | $ | — | | | $ | — | | | $ | 327,178,722 | |
Short Term Investments | | | 9,813,422 | | | | — | | | | — | | | | 9,813,422 | |
| | | | |
| | | | |
Total Investments in Securities | | $ | 336,992,144 | | | $ | — | | | $ | — | | | $ | 336,992,144 | |
| | | | |
| | | | |
| Franklin MidCap Value Fund | | | | | | | | | | | | | | | | |
Assets: | | | | | | | | | | | | | | | | |
Investments in Securities: | | | | | | | | | | | | | | | | |
Equity Investmentsa,b | | $ | 190,106,971 | | | $ | — | | | $ | —c | | | $ | 190,106,971 | |
Short Term Investments | | | 2,969,192 | | | | 147,972 | | | | — | | | | 3,117,164 | |
| | | | |
| | | | |
Total Investments in Securities | | $ | 193,076,163 | | | $ | 147,972 | | | $ | — | | | $ | 193,224,135 | |
| | | | |
| | | | |
| Franklin Small Cap Value Fund | | | | | | | | | | | | | | | | |
Assets: | | | | | | | | | | | | | | | | |
Investments in Securities: | | | | | | | | | | | | | | | | |
Equity Investmentsb | | $ | 2,727,320,821 | | | $ | — | | | $ | — | | | $ | 2,727,320,821 | |
Corporate Bonds | | | — | | | | 21,940,660 | | | | — | | | | 21,940,660 | |
Short Term Investments | | | 164,514,231 | | | | — | | | | — | | | | 164,514,231 | |
| | | | |
| | | | |
Total Investments in Securities | | $ | 2,891,835,052 | | | $ | 21,940,660 | | | $ | — | | | $ | 2,913,775,712 | |
| | | | |
aIncludes common, convertible preferred stocks and management investment companies as well as other equity investments.
bFor detailed categories, see the accompanying Statements of Investments.
cIncludes securities determined to have no value at April 30, 2017.
A reconciliation of assets in which Level 3 inputs are used in determining fair value is presented when there are significant Level 3 financial instruments at the end of the period.
11. Investment Company Reporting Modernization
In October 2016, the U.S. Securities and Exchange Commission adopted new rules and amended existing rules (together, final rules) intended to modernize the reporting and disclosure of information by registered investment companies. In part, the final rules amend Regulation S-X and require standardized, enhanced disclosures about derivatives in investment company financial statements, as well as other amendments. The compliance date for the amendments to Regulation S-X is August 1, 2017. Management is currently evaluating the impact that the adoption of the amendments to Regulation S-X will have on the Funds’ financial statements and related disclosures.
| | | | |
| | | |
| 82 | | Semiannual Report | | franklintempleton.com |
FRANKLIN VALUE INVESTORS TRUST
NOTES TO FINANCIAL STATEMENTS (UNAUDITED)
12. Subsequent Events
The Funds have evaluated subsequent events through the issuance of the financial statements and determined that no events have occurred that require disclosure other than those already disclosed in the financial statements.
Abbreviations
| | | | | | | | | | |
| Selected Portfolio | | | | |
| ADR | | American Depositary Receipt | | | | | | | | |
| ETF | | Exchange Traded Fund | | | | | | | | |
| | | | |
| | | |
| franklintempleton.com | | Semiannual Report | | 83 |
FRANKLIN VALUE INVESTORS TRUST
Shareholder Information
Board Approval of Investment Management Agreements
FRANKLIN VALUE INVESTORS TRUST
At a meeting held February 23, 2016, the Board of Trustees (Board), including a majority of trustees that are not “interested persons” as such term is defined in section 2(a)(19) of the Investment Company Act of 1940 (hereinafter referred to as “non-interested Trustees” or “independent Trustees”), approved renewal of the investment management agreement for each of the Funds within the Trust (Fund(s)). In reaching this decision, the Board took into account information furnished throughout the year at regular Board meetings, as well as information prepared specifically in connection with the annual renewal review process. Information furnished and discussed throughout the year included investment performance reports and related financial information for each Fund, along with periodic reports on expenses, shareholder services, legal and compliance matters, risk control, pricing, brokerage commissions and execution, and other services provided by the Investment Manager (Manager) and its affiliates, as well as marketing support payments made to financial intermediaries. Information furnished specifically in connection with the renewal process included a report for each Fund prepared by Broadridge Financial Solutions, Inc. (Broadridge), an independent organization, as well as additional material, including a Fund profitability analysis prepared by management. The Broadridge reports, which utilize data from Lipper Inc. (Lipper), compared each Fund’s investment performance and expenses with those of other mutual funds deemed comparable to the Fund as selected by Lipper. The Fund profitability analysis discussed the profitability to Franklin Templeton Investments (FTI) from its overall U.S. fund operations, as well as on an individual fund-by-fund basis. Additional material accompanying such profitability analysis included information on a fund-by-fund basis listing portfolio managers and other accounts they manage, as well as information on management fees charged by the Manager and its affiliates to U.S. funds and other accounts, including management’s explanation of differences where relevant. Such material also included a memorandum prepared by management describing project initiatives and capital investments relating to the services provided to the Funds by the FTI organization, as well as a memorandum relating to economies of scale and an analysis concerning transfer agent fees charged by an affiliate of the Manager. The Board also noted that they received an annual report on all marketing support payments made by FTI to financial intermediaries, as
well as a memorandum relating to third-party servicing arrangements in response to a Guidance Update from the U.S. Securities and Exchange Commission (SEC) relating to mutual fund distribution and sub accounting fees.
In considering such materials, the independent Trustees received assistance and advice from and met separately with independent counsel. While the investment management agreements for all Funds were considered at the same Board meeting, the Board dealt with each Fund separately. In approving continuance of the investment management agreement for each Fund, the Board, including a majority of independent Trustees, determined that the existing management fee structure was fair and reasonable and that continuance of the investment management agreement was in the best interests of such Fund and its shareholders. While attention was given to all information furnished, the following discusses some primary factors relevant to the Board’s decision.
NATURE, EXTENT AND QUALITY OF SERVICES. The Board was satisfied with the nature and quality of the overall services provided by the Manager and its affiliates to the Funds and their shareholders, other than as noted below with respect to performance. The Board’s opinion was based, in part, upon periodic reports furnished it showing that the investment policies and restrictions for each Fund were consistently complied with as well as other reports periodically furnished the Board covering matters such as the compliance of portfolio managers and other management personnel with the code of ethics adopted throughout the Franklin Templeton fund complex, the adherence to fair value pricing procedures established by the Board, and the accuracy of net asset value calculations. The Board also noted the extent of benefits provided Fund shareholders from being part of the Franklin Templeton family of funds, including the right to exchange investments between the same class of shares of different funds without a sales charge, the ability to reinvest Fund dividends into other funds and the right to combine holdings in other funds to obtain a reduced sales charge. Favorable consideration was given to management’s continual efforts and expenditures in establishing effective business continuity plans and developing strategies to address cybersecurity threats. Among other factors taken into account by the Board were the Manager’s best execution trading policies, including a favorable report on the efficiency of its trading operations by an independent portfolio trading analytical firm, which also covered foreign exchange transactions. Consideration was also given to the experience of each Fund’s portfolio management team, the number of accounts managed and general method of
| | | | |
| | | |
| 84 | | Semiannual Report | | franklintempleton.com |
FRANKLIN VALUE INVESTORS TRUST
SHAREHOLDER INFORMATION
compensation. In this latter respect, the Board noted that a primary factor in management’s determination of a portfolio manager’s bonus compensation was the relative investment performance of the funds he or she managed and that a portion of such bonus was required to be invested in a pre-designated list of funds within such person’s fund management area so as to be aligned with the interests of shareholders. In this respect, the Board, after making inquiries of management, received assurances that bonus composition was not unduly influenced by one-year or short-term performance but was based primarily on longer periods consistent with the interests of long-term shareholders. The Board also took into account the cost and quality of transfer agent and shareholder services provided Fund shareholders by an affiliate of the Manager, and steps taken by FTI to enhance analytical support to the investment management groups and provide additional oversight of liquidity risk and complex securities. It was noted that the Funds did not currently invest in derivatives or other complex instruments. The Board also took into account, among other things, management’s efforts in establishing a global credit facility for the benefit of the Funds and other accounts managed by FTI to provide a source of cash for temporary and emergency purposes or to meet unusual redemption requests as well as the strong financial position of the Manager’s parent company and its commitment to the mutual fund business as evidenced by its continued introduction of new funds and reassessment of the fund offerings in response to the market environment.
INVESTMENT PERFORMANCE. The Board placed significant emphasis on the investment performance of each Fund in view of its importance to shareholders. While consideration was given to performance reports and discussions with the portfolio management team at Board meetings throughout the year, particular attention in assessing performance was given to the Broadridge reports furnished for the agreement renewals. The Broadridge reports prepared for each individual Fund showed the investment performance of its Class A shares in comparison to a performance universe selected by Lipper. Comparative performance for each Fund was shown for 2015 and for the previous 10 years ended December 31, 2015, for those Funds that had been in existence for such length of time and for lesser periods for other Funds depending on when their operations commenced. The following summarizes the performance results for each of the Funds.
Franklin All Cap Value Fund - The performance universe for this Fund consisted of the Fund and all retail and institutional
multi-cap value funds. The Broadridge report showed the performance of the Fund to be in the lowest performing quintile of such universe during 2015, and on an annualized basis to be in the lowest performing quintile of such universe for the previous three- and five-year periods. Management explained the factors affecting performance this year and noted their proposal, which was approved by the Board in October 2015, to reorganize the Fund into Franklin Small Cap Value Fund, effective on or about April 1, 2016. In view of this pending reorganization, the Board did not believe that further action was warranted.
Franklin Balance Sheet Investment Fund - The performance universe for this Fund consisted of the Fund and all retail and institutional mid-cap value funds as selected by Lipper. The Broadridge report showed the Fund’s total return during 2015 to be in the lowest performing quintile of its performance universe, and on an annualized basis to be in the lowest performing quintile of such universe for the previous three-, five- and 10-year periods. In discussing such performance, management pointed out that the Fund’s performance reflected adherence to its stated investment policy of investing in companies having low price-to-book ratios with strong balance sheets, which have been out of favor during the past five years but which appear to warrant continued investment. Management noted that investment in the energy sector was a large factor in the Fund’s relative underperformance and that, over time that exposure had been reduced. Management explained that it had been focused on the investment process with the goal of delivering improved returns. While not satisfied with the Fund’s relative performance as set forth in the Broadridge report, the Board accepted management’s explanation and noted that the Fund’s annualized returns for the three- and five-year periods exceeded 7% and 6%, respectively.
Franklin Large Cap Value Fund - The performance universe for this Fund consisted of the Fund and all retail and institutional large-cap value funds as selected by Lipper. The Broadridge report comparison showed the Fund’s total return during 2015 to be in the lowest performing quintile of such universe, and on an annualized basis to be in the lowest performing quintile of such universe for the previous three-, five- and 10-year periods. The Board noted that during the past year management had proposed and the Board had approved the reorganization of the Fund into the Franklin Rising Dividends Fund, a fund with several similar principal investment strategies and investment risks but a larger asset size, lower annual fund operating expenses, better historical performance and more favorable sales prospects. In view of this
| | | | |
| | | |
| franklintempleton.com | | Semiannual Report | | 85 |
FRANKLIN VALUE INVESTORS TRUST
SHAREHOLDER INFORMATION
planned reorganization, the Board did not believe that further action was warranted.
Franklin MicroCap Value Fund - The performance universe for this Fund consisted of the Fund and all retail and institutional small-cap value funds as selected by Lipper. The Broadridge report comparison showed the Fund’s total return during 2015 to be in the second-lowest performing quintile of such performance universe, and on an annualized basis to be in the lowest performing quintile of such universe for the previous three-year period and the middle performing quintile during the previous five- and 10-year periods. The Board discussed with management the limited opportunity set for the Fund and the factors that may influence performance in the future. They also discussed the impact of the Fund’s exposure to the energy sector and the impact of allocation during the period. They discussed their work with Franklin’s portfolio analytics team to develop strategies to address allocation effects going forward. Taking this into account and noting the Fund’s longer term positive annualized returns—over 6%, 7% and 6% over the past three-, five- and 10-year periods, respectively—the Board found the performance to be acceptable.
Franklin MidCap Value Fund - The performance universe for this Fund consisted of the Fund and all retail and institutional mid-cap value funds as selected by Lipper. The Broadridge report showed the Fund’s total return for 2015 to be in the second-lowest performing quintile of such universe, and on an annualized basis to be in the lowest performing quintile of such universe for the previous three-, five- and 10-year periods. The Board was not satisfied with such performance, and discussed the Fund’s investment strategy with management and reasons for such comparative underperformance. Management discussed the impact of the materials and financial sectors on short-term results and the energy sector on longer term results. They discussed the implementation of changes to the investment process to incorporate a more robust screening process. Over the past year, the Fund was repositioned and the cash level was reduced. While expressing disappointment with the results, the Board noted that additions to the portfolio management team were made in 2014 and the more recent changes in process needed time to work, and so determined that no further change in portfolio management was warranted at this time. The Board noted that, while the Fund’s 2015 total return as shown in the Broadridge report was -7.58%, its annualized return for the three- and five-year periods was in excess of 9% and 7%, respectively.
Franklin Small Cap Value Fund - The performance universe for this Fund consisted of the Fund and all retail and institutional small-cap value funds as selected by Lipper. The Broadridge report comparison showed that the Fund’s total return for 2015 placed it in the second-lowest performing quintile of such performance universe and that its total return on an annualized basis was in the second-lowest performing quintile of such universe for the previous three- and five-year periods, and in the middle performing quintile of such universe for the previous 10-year period. Management discussed with the Board steps being taken to address the underperformance of the Fund, including reduced exposure to poorly performing sectors. In light of management’s discussion, the Board found the Fund’s overall comparative performance as shown in the Broadridge report to be acceptable and noted that its annualized returns in the three-, five- and 10-year periods exceeded 7%, 7% and 6%, respectively.
COMPARATIVE EXPENSES. Consideration was given to a comparative analysis of the management fees and total expense ratio of each Fund compared with those of a group of other funds selected by Lipper as constituting its appropriate Lipper expense group. Lipper expense data is based upon information taken from each fund’s most recent annual report, which reflects historical asset levels that may be quite different from those currently existing, particularly in a period of market volatility. While recognizing such inherent limitation and the fact that expense ratios generally increase as assets decline and decrease as assets grow, the Board believed the independent analysis conducted by Lipper to be an appropriate measure of comparative expenses. In reviewing comparative costs, Lipper provides information on each Fund’s contractual investment management fee in comparison with the contractual investment management fee that would have been charged by other funds within its Lipper expense group assuming they were similar in size to the Fund, as well as the actual total expenses of the Fund in comparison with those of its expense group. The Lipper contractual investment management fee comparison includes within such fee any separate administrative fees, and the Lipper actual total expenses, for comparative consistency, are shown by Lipper for Fund Class A shares for funds having multiple share classes. Such expense comparisons in the case of Franklin All Cap Value Fund, Franklin Balance Sheet Investment Fund, Franklin MicroCap Value Fund, and Franklin Small Cap Value Fund, showed its contractual investment management fee rate and total expense ratios to be in either the least expensive or second-least expensive quintile of its respective Lipper expense group. The Board was satisfied with the expenses of these Funds. The Broadridge report for Franklin Large Cap Value
| | | | |
| | | |
| 86 | | Semiannual Report | | franklintempleton.com |
FRANKLIN VALUE INVESTORS TRUST
SHAREHOLDER INFORMATION
Fund showed its contractual fee rates to be in the second-highest expensive quintile of its expense group, with the actual total expense ratio of Franklin Large Cap Value Fund at approximately 14.5 basis points above the median of such expense group. The Broadridge report for Franklin MidCap Value Fund showed its contractual investment management fee rate to be 10 basis points above the median of its expense group, and its actual total expense ratio to be approximately 10 basis points above the median of such expense group after the fee waiver. The Board found the expenses of such Funds to be acceptable, noting that the expenses of Franklin MidCap Value Fund and Franklin All Cap Value Fund were being subsidized by management.
MANAGEMENT PROFITABILITY. The Board also considered the level of profits realized by the Manager and its affiliates in connection with the operation of each Fund. In this respect, the Board reviewed the Fund profitability analysis that addresses the overall profitability of Franklin Templeton’s U.S. fund business, as well as its profits in providing management and other services to each of the individual funds during the 12-month period ended September 30, 2015, being the most recent fiscal year-end for Franklin Resources, Inc., the Manager’s parent. In reviewing the analysis, the Board recognized that allocation methodologies are inherently subjective and various allocation methodologies may be reasonable while producing different results. In this respect, the Board noted that while management continuously makes refinements to its methodologies in response to organizational and product related changes, the overall approach as defined by the primary drivers and activity measurements has remained consistent with that used in the Fund’s profitability report presentations from prior years. Additionally, the Funds’ independent registered public accounting firm had been engaged by the Manager to periodically review the reasonableness of the allocation methodologies to be used solely by the Funds’ Board in reference to the profitability analysis. In reviewing and discussing such analysis, management discussed with the Board its belief that costs incurred in establishing the infrastructure necessary for the type of mutual fund operations conducted by the Manager and its affiliates may not be fully reflected in the expenses allocated to each Fund in determining its profitability, as well as the fact that the level of profits, to a certain extent, reflected operational cost savings and efficiencies initiated by management. The Board also took into account management’s expenditures in improving shareholder services provided the Funds, as well as the need to implement systems and meet additional regulatory and compliance requirements resulting from statutes such as the
Sarbanes-Oxley and Dodd-Frank Acts and recent SEC and other regulatory requirements. In addition, the Board considered a third-party study comparing the profitability of the Manager’s parent on an overall basis to other publicly held managers broken down to show profitability from management operations exclusive of distribution expenses, as well as profitability including distribution expenses. The Board also considered the extent to which the Manager and its affiliates might derive ancillary benefits from fund operations, including revenues generated from transfer agent services and potential benefits resulting from personnel and systems enhancements necessitated by fund growth, increased leverage with service providers and counterparties, allocation of fund brokerage and the use of commission dollars to pay for research. Based upon its consideration of all these factors, the Board determined that the level of profits realized by the Manager and its affiliates from providing services to each Fund was not excessive in view of the nature, quality and extent of services provided.
ECONOMIES OF SCALE. The Board also considered whether economies of scale are realized by the Manager as the Funds grow larger and the extent to which this is reflected in the level of management fees charged. While recognizing that any precise determination is inherently subjective, the Board noted that based upon the Fund profitability analysis, it appears that as some funds get larger, at some point economies of scale do result in the Manager realizing a larger profit margin on management services provided such a fund. The Board also noted that economies of scale are shared with each Fund and its shareholders through management fee breakpoints so that as a Fund grows in size, its effective management fee rate declines. The Board believed that to the extent economies of scale may be realized by the Manager of these Funds and their affiliates, there was a sharing of benefits with each of these Funds and their shareholders. The fee structure of Franklin Small Cap Value Fund provides an initial fee of 0.75% on the first $500 million of Fund net assets; 0.625% on the next $500 million of Fund net assets, 0.50% on Fund net assets in excess of $1 billion, and 0.49% on net assets in excess of $5 billion. At December 31, 2015, the Fund’s net assets were approximately $2.06 billion. The Board believed that to the extent economies of scale may be realized by the Manager and its affiliates, the schedule of fees under the investment management agreement, which was revised in 2014 to add an additional breakpoint, provides a reasonable sharing of benefits with the Fund and its shareholders. The fee structure of both Franklin MidCap Value Fund and Franklin All Cap Value Fund contain breakpoints and the Board felt that in view of their small size no economies of scale were realized in their
| | | | |
| | | |
| franklintempleton.com | | Semiannual Report | | 87 |
FRANKLIN VALUE INVESTORS TRUST
SHAREHOLDER INFORMATION
operations, noting that the expenses of both Funds were subsidized by management. The fee structure under the investment management agreement for Franklin MicroCap Value Fund provides a flat fee of 0.75% at all asset levels. In discussing the absence of breakpoints with the independent Trustees, management pointed out that this Fund invests only in domestic and foreign securities with a market capitalization of less than $500 million that are believed to be undervalued. Management stated its belief that such limited investment options curtail the potential size of the Fund, thus preventing the type of economies of scale that might benefit other funds from increases in size and also pointed out that the Fund, whose asset size was approximately $317 million at year-end, has been closed to new investors, with limited exceptions, since January 14, 2004, and had a very brief re-opening on February 15, 2013 and closed again to new investors (with limited exceptions) on February 19, 2013. Management also expressed its view that this fee was relatively low for this type of a fund and pointed out the favorable comparison of fees and expenses within its Lipper expense group. The independent Trustees acknowledged that management’s explanation provided a reasonable basis for believing the existing fee rate under the investment management agreement was fair and that, in view of the Fund’s current modest size, management was not benefiting from any meaningful economies of scale in its management of this Fund.
Proxy Voting Policies and Procedures
The Trust’s investment manager has established Proxy Voting Policies and Procedures (Policies) that the Trust uses to determine how to vote proxies relating to portfolio securities. Shareholders may view the Trust’s complete Policies online at franklintempleton.com. Alternatively, shareholders may request copies of the Policies free of charge by calling the Proxy Group collect at (954) 527-7678 or by sending a written request to: Franklin Templeton Companies, LLC, 300 S.E. 2nd Street, Fort Lauderdale, FL 33301, Attention: Proxy Group. Copies of the Trust’s proxy voting records are also made available online at franklintempleton.com and posted on the U.S. Securities and Exchange Commission’s website at sec.gov and reflect the most recent 12-month period ended June 30.
Quarterly Statement of Investments
The Trust files a complete statement of investments with the U.S. Securities and Exchange Commission for the first and third quarters for each fiscal year on Form N-Q. Shareholders may view the filed Form N-Q by visiting the Commission’s website at sec.gov. The filed form may also be viewed and
copied at the Commission’s Public Reference Room in Washington, DC. Information regarding the operations of the Public Reference Room may be obtained by calling (800) SEC-0330.
| | | | |
| | | |
| 88 | | Semiannual Report | | franklintempleton.com |
Semiannual Report and Shareholder Letter
Franklin Value Investors Trust
Investment Manager
Franklin Advisory Services, LLC
Distributor
Franklin Templeton Distributors, Inc.
(800) DIAL BEN® / 342-5236
franklintempleton.com
Shareholder Services
(800) 632-2301
Authorized for distribution only when accompanied or preceded by a summary prospectus and/or prospectus. Investors should carefully consider a fund’s investment goals, risks, charges and expenses before investing. A prospectus contains this and other information; please read it carefully before investing.
To help ensure we provide you with quality service, all calls to and from our service areas are monitored and/or recorded.
| | |
| © 2017 Franklin Templeton Investments. All rights reserved. | | FVIT S 06/17 |
(a) The Registrant has adopted a code of ethics that applies to its principal executive officers and principal financial and accounting officer.
(f) Pursuant to Item 12(a)(1), the Registrant is attaching as an exhibit a copy of its code of ethics that applies to its principal executive officers and principal financial and accounting officer.
| Item 3. | Audit Committee Financial Expert. |
(a)(1) The Registrant has an audit committee financial expert serving on its audit committee.
(2) The audit committee financial expert is David W. Niemiec and he is “independent” as defined under the relevant Securities and Exchange Commission Rules and Releases.
| | |
Item 4. Principal Accountant Fees and Services. | | N/A |
| |
Item 5. Audit Committee of Listed Registrants. | | N/A |
| |
Item 6. Schedule of Investments. | | N/A |
| |
Item 7. Disclosure of Proxy Voting Policies and Procedures for Closed-End Management Investment Companies. | | N/A |
| |
Item 8. Portfolio Managers of Closed-End Management Investment Companies. | | N/A |
| |
Item 9. Purchases of Equity Securities by Closed-End Management Investment Company and Affiliated Purchasers. | | N/A |
| Item 10. | Submission of Matters to a Vote of Security Holders. |
There have been no changes to the procedures by which shareholders may recommend nominees to the Registrant’s Board of Trustees that would require disclosure herein.
| Item 11. | Controls and Procedures. |
(a) Evaluation of Disclosure Controls and Procedures. The Registrant maintains disclosure controls and procedures that are designed to ensure that information required to be disclosed in the Registrant’s filings under the Securities Exchange Act of 1934 and the Investment Company Act of 1940 is recorded, processed, summarized and reported within the periods specified in the rules and forms of the Securities and Exchange Commission. Such information is accumulated and communicated to the Registrant’s management, including its principal executive officer and principal financial officer, as appropriate, to allow timely decisions regarding required disclosure. The Registrant’s management, including the principal executive officer and the principal financial officer, recognizes that any set of controls and procedures, no matter how well designed and operated, can provide only reasonable assurance of achieving the desired control objectives.
Within 90 days prior to the filing date of this Shareholder Report on Form N-CSR, the Registrant had carried out an evaluation, under the supervision and with the participation of the Registrant’s management, including the Registrant’s principal executive officer and the Registrant’s principal financial officer, of the effectiveness of the design and operation of the Registrant’s disclosure controls and procedures. Based on such evaluation, the Registrant’s principal executive officer and principal financial officer concluded that the Registrant’s disclosure controls and procedures are effective.
(b) Changes in Internal Controls. There have been no changes in the Registrant’s internal controls or in other factors that could materially affect the internal controls over financial reporting subsequent to the date of their evaluation in connection with the preparation of this Shareholder Report on Form N-CSR.
(a)(1) Code of Ethics
(a)(2) Certifications pursuant to Section 302 of the Sarbanes-Oxley Act of 2002 of Matthew T. Hinkle, Chief Executive Officer—Finance and Administration, and Robert G. Kubilis, Chief Financial Officer and Chief Accounting Officer
(b) Certifications pursuant to Section 906 of the Sarbanes-Oxley Act of 2002 of Matthew T. Hinkle, Chief Executive Officer—Finance and Administration, and Robert G. Kubilis, Chief Financial Officer and Chief Accounting Officer
SIGNATURES
Pursuant to the requirements of the Securities Exchange Act of 1934 and the Investment Company Act of 1940, the registrant has duly caused this report to be signed on its behalf by the undersigned, thereunto duly authorized.
| | |
| FRANKLIN VALUE INVESTORS TRUST |
| |
| By | | /S/ MATTHEW T. HINKLE |
| | Matthew T. Hinkle |
| | Chief Executive Officer – |
| | Finance and Administration |
| Date | | June 26, 2017 |
Pursuant to the requirements of the Securities Exchange Act of 1934 and the Investment Company Act of 1940, this report has been signed below by the following persons on behalf of the registrant and in the capacities and on the dates indicated.
| | |
| By | | /S/ MATTHEW T. HINKLE |
| | Matthew T. Hinkle |
| | Chief Executive Officer – |
| | Finance and Administration |
| Date | | June 26, 2017 |
| | |
| By | | /S/ ROBERT G. KUBILIS |
| | Robert G. Kubilis |
| | Chief Financial Officer and |
| | Chief Accounting Officer |
| Date | | June 26, 2017 |