UNITED STATES
SECURITIES AND EXCHANGE COMMISSION
Washington, D.C. 20549
FORM N-CSR
CERTIFIED SHAREHOLDER REPORT OF REGISTERED
MANAGEMENT INVESTMENT COMPANIES
Investment Company Act file number811-5979
John Hancock California Tax-Free Income Fund
(Exact name of registrant as specified in charter)
200 Berkeley Street, Boston, Massachusetts 02116
(Address of principal executive offices) (Zip code)
Salvatore Schiavone
Treasurer
200 Berkeley Street
Boston, Massachusetts 02116
(Name and address of agent for service)
Registrant's telephone number, including area code:617-663-4497
| Date of fiscal year end: | May 31 |
| | |
| | |
| Date of reporting period: | May 31, 2019 |
ITEM 1. REPORTS TO STOCKHOLDERS.
John Hancock
California Tax-Free Income Fund
Annual report 5/31/19
Beginning on January 1, 2021, as permitted by regulations adopted by the Securities and Exchange Commission, paper copies of the Fund's shareholder reports like this one will no longer be sent by mail, unless you specifically request paper copies of the reports from the Fund or from your financial intermediary. Instead, the reports will be made available on a website, and you will be notified by mail each time a report is posted and provided with a website link to access the report.
If you already elected to receive shareholder reports electronically, you will not be affected by this change, and you do not need to take any action. You may elect to receive shareholder reports and other communications electronically by calling John Hancock Investment Management at 800-225-5291 (Class A, Class B and Class C shares) or 888-972-8696 (Class I and Class R6 shares) or by contacting your financial intermediary.
You may elect to receive all reports in paper, free of charge, at any time. You can inform John Hancock Investment Management or your financial intermediary that you wish to continue receiving paper copies of your shareholder reports by following the instructions listed above. Your election to receive reports in paper will apply to all funds held with John Hancock Investment Management or your financial intermediary.

A message to shareholders
Dear shareholder,
A solid and stable economy enabled the U.S. Federal Reserve (Fed) to continue normalizing monetary policy for most of 2018; however, concerns about the strength of the broader global economy and the durability of the now 10-year-old bull market led investors to dial back riskexposures. Those concerns may ultimately have been shared by the Fed, which shifted to a neutral stance on interest rates in the beginning of 2019 after three years of hikes. The markets responded favorably, with most bond indexes registering gains before hitting a patch of turbulence in May as trade turmoil between the United States and China flared again.
As always, your best resource in unpredictable markets is your financial advisor, who can help position your portfolio so that it's sufficiently diversified to meet your long-term objectives and to withstand the inevitable turbulence along the way.
On behalf of everyone at John Hancock Investment Management, I'd like to take this opportunity to welcome new shareholders and thank existing shareholders for the continued trust you've placed in us.
Sincerely,
Andrew G. Arnott
President and CEO,
John Hancock Investment Management
Head of Wealth and Asset Management,
United States and Europe
This commentary reflects the CEO's views as of this report's period end and are subject to change at any time. Diversification does not guarantee investment returns and does not eliminate risk of loss. All investments entail risks, including the possible loss of principal. For more up-to-date information, you can visit our website at jhinvestments.com.
John Hancock
California Tax-Free Income Fund
Table of contents
| | | |
| 2 | | Your fund at a glance |
| 5 | | Discussion of fund performance |
| 7 | | A look at performance |
| 9 | | Your expenses |
| 11 | | Fund's investments |
| 17 | | Financial statements |
| 20 | | Financial highlights |
| 25 | | Notes to financial statements |
| 32 | | Report of independent registered public accounting firm |
| 33 | | Tax information |
| 34 | | Trustees and Officers |
| 38 | | More information |
ANNUAL REPORT | JOHN HANCOCK CALIFORNIA TAX-FREE INCOME FUND 1
INVESTMENT OBJECTIVE
The fund seeks a high level of current income, consistent with preservation of capital, that is exempt from federal and California personal income taxes.
AVERAGE ANNUAL TOTAL RETURNS AS OF 5/31/19 (%)
The Bloomberg Barclays California Municipal Bond Index is an unmanaged index comprising California investment-grade municipal bonds.
It is not possible to invest directly in an index. Index figures do not reflect expenses or sales charges, which would result in lower returns.
Figures from Morningstar, Inc. include reinvested distributions and do not take into account sales charges. Actual load-adjusted performance is lower.
The past performance shown here reflects reinvested distributions and the beneficial effect of any expense reductions, and does not guarantee future results. Performance of the other share classes will vary based on the difference in the fees and expenses of those classes. Shares will fluctuate in value and, when redeemed, may be worth more or less than their original cost. Current month-end performance may be lower or higher than the performance cited, and can be found at jhinvestments.com or by calling 800-225-5291. For further information on the fund's objectives, risks, and strategy, see the fund's prospectus.
ANNUAL REPORT | JOHN HANCOCK CALIFORNIA TAX-FREE INCOME FUND 2
PERFORMANCE HIGHLIGHTS OVER THE LAST TWELVE MONTHS
Broad rally for municipal bonds
Municipal bonds advanced as declining new issuance and strong investor demand produced a favorable backdrop for municipal bond performance.
The fund trailed its benchmark
The fund posted a solid gain but underperformed its benchmark, the Bloomberg Barclays California Municipal Bond Index.
Individual security selection detracted
Individual security selection was the primary factor behind the fund's underperformance of its benchmark.
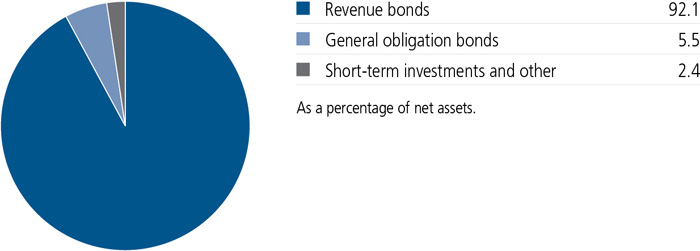
PORTFOLIO COMPOSITION AS OF 5/31/19 (%)
A note about risks
The fund is subject to various risks as described in the fund's prospectus. For more information, please refer to the "Principal risks" section of the prospectus.
ANNUAL REPORT | JOHN HANCOCK CALIFORNIA TAX-FREE INCOME FUND 3
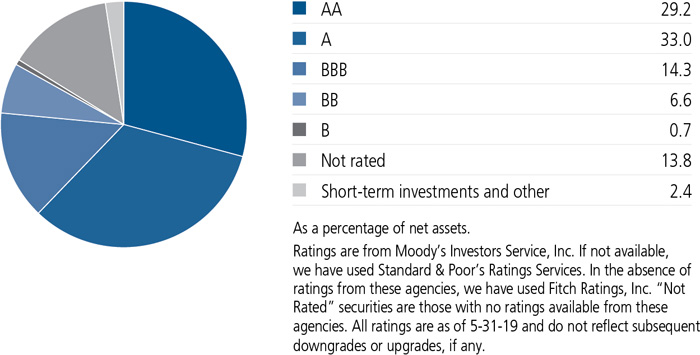
QUALITY COMPOSITION AS OF 5/31/19 (%)
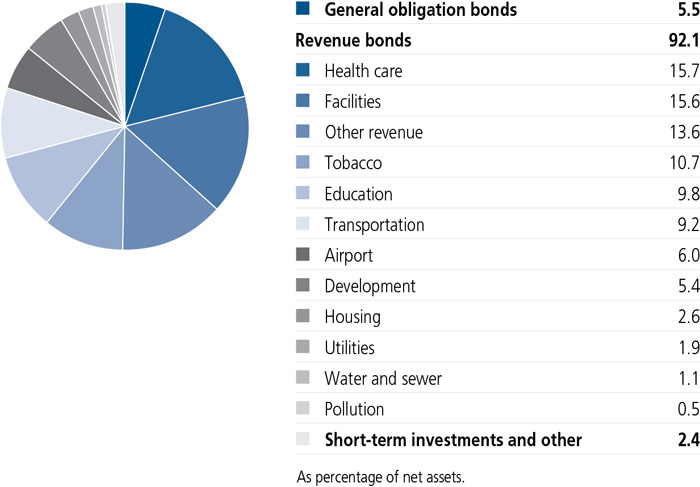
SECTOR COMPOSITION AS OF 5/31/19 (%)
ANNUAL REPORT | JOHN HANCOCK CALIFORNIA TAX-FREE INCOME FUND 4
Discussion of fund performance
How did the municipal bond market perform during the 12 months ended May 31, 2019?
Municipal bonds enjoyed strong returns for the period, with the Bloomberg Barclays Municipal Bond Index returning 6.40%. California municipal bonds modestly lagged the broader market as the fund's benchmark, the Bloomberg Barclays California Municipal Bond Index, returned 6.10%.
The most important factor was a supply-and-demand imbalance in the municipal bond market. The outstanding supply of municipal bonds contracted as tax reform provisions that took effect in 2018 led to a significant decline in new municipal bond issuance. On the demand side, banks and insurance companies continued to sell municipal bonds from their investment portfolios as a result of lower corporate tax rates, but this was more than offset by a significant increase in demand from retail investors, including those investing through mutual funds. Growing demand for municipal bonds, coupled with a shrinking supply of outstanding bonds, provided a tailwind for municipal bond performance.
Another key factor was a shift in interest-rate policy by the U.S. Federal Reserve (Fed). After raising short-term interest rates four times in 2018, the Fed shifted to a wait-and-see approach in 2019 amid trade tensions between the United States and China, continued uncertainty surrounding Brexit, and a slowdown in global economic growth. The bond market responded with a broad rally across the board, particularly in the last two months of the period, as investors began to price in expectations of a potential Fed rate cut later this year.
How about municipal credit quality in California?
Credit conditions in California improved notably, driven by higher-than-expected tax revenues at both the state and local levels. Federal tax reform and a stronger economy in 2018 contributed to the increase in municipal tax revenues. So far, California's new governor has maintained his predecessor's fiscal considerations, building up the state's rainy-day fund to its maximum level, as well as beginning to address the state's pension issues.
How did the fund perform during the period?
The fund posted a solid gain but trailed the return of its benchmark. The primary factor behind the underperformance was individual security selection, particularly
ANNUAL REPORT | JOHN HANCOCK CALIFORNIA TAX-FREE INCOME FUND 5
among healthcare and education bonds. The fund's exposure to advanced refunding bonds, which were historically used by municipal bond issuers to refinance existing debt, also detracted from performance as these bonds tend to underperform during sharp market rallies. On the positive side, the fund's duration (a measure of interest-rate sensitivity) was longer than that of the index, which contributed favorably to relative results as yields fell during the last part of the period.
What themes do you see affecting municipal bond market performance as we move into the second half of 2019?
Fed interest-rate policy and trade conflicts will be key factors for municipal bonds going forward. If inflation remains low and U.S. economic growth continues to slow, we could see the Fed lower short-term rates before year end. With regard to trade, continued uncertainty could put further downward pressure on global growth, while a successful resolution to the conflicts could provide an economic boost, which would have implications for both interest rates and municipal tax revenues. Within the municipal market, we don't expect to see any changes in the supply/demand situation in the near term. Demand for municipal bonds should remain robust, while new issuance is likely to remain subdued.
MANAGED BY
| | |
 | Jeffrey N. Given, CFA
On the fund since 2018
Investing since 1993 |
 | Dennis DiCicco
On the fund since 2018
Investing since 2013 |

The views expressed in this report are exclusively those of Jeffrey N. Given, CFA and Dennis DiCicco, Manulife Investment Management, and are subject to change. They are not meant as investment advice. Please note that the holdings discussed in this report may not have been held by the fund for the entire period. Portfolio composition is subject to review in accordance with the fund's investment strategy and may vary in the future. Current and future portfolio holdings are subject to risk.
ANNUAL REPORT | JOHN HANCOCK CALIFORNIA TAX-FREE INCOME FUND 6
TOTAL RETURNS FOR THE PERIOD ENDED MAY 31, 2019
| | | | | | | | | | | | | | |
Average annual
total returns (%)
with maximum sales charge | | Cumulative
total returns (%)
with maximum sales charge | | SEC
30-day
yield (%)
subsidized | | SEC
30-day
yield (%)
unsubsidized1 | | Tax-
equivalent
subsidized
yield (%)2 |
| | 1-year | 5-year | 10-year | | | 5-year | 10-year | | as of
5-31-19 | | as of
5-31-19 | | as of
5-31-19 |
| Class A | 1.32 | 2.77 | 4.96 | | | 14.62 | 62.22 | | 1.94 | | 1.93 | | 3.78 |
| Class B | -0.22 | 2.48 | 4.74 | | | 13.05 | 58.90 | | 1.28 | | 1.18 | | 2.49 |
| Class C | 3.78 | 2.84 | 4.57 | | | 15.05 | 56.41 | | 1.28 | | 1.18 | | 2.49 |
| Class I3,4 | 5.72 | 3.68 | 5.42 | | | 19.83 | 69.47 | | 2.17 | | 2.17 | | 4.23 |
| Class R63,4 | 5.76 | 3.66 | 5.41 | | | 19.70 | 69.29 | | 2.20 | | 2.19 | | 4.29 |
| Index 1† | 6.10 | 3.61 | 5.07 | | | 19.42 | 64.02 | | — | | — | | |
| Index 2† | 6.40 | 3.58 | 4.58 | | | 19.25 | 56.53 | | — | | — | | |
Performance figures assume all distributions have been reinvested. Figures reflect maximum sales charges on Class A shares of 4.0% and the applicable contingent deferred sales charge (CDSC) on Class B and Class C shares. The returns for Class A shares have been adjusted to reflect the reduction in the maximum sales charge from 4.5% to 4.0%, effective 2-3-14. The Class B shares' CDSC declines annually between years 1 to 6 according to the following schedule: 5%, 4%, 3%, 3%, 2%, 1%. No sales charge will be assessed after the sixth year. Class C shares sold within one year of purchase are subject to a 1% CDSC. Sales charges are not applicable to Class I and Class R6 shares.
The expense ratios of the fund, both net (including any fee waivers and/or expense limitations) and gross (excluding any fee waivers and/or expense limitations), are set forth according to the most recent publicly available prospectus for the fund and may differ from those disclosed in the Financial highlights tables in this report. Net expenses reflect contractual expense limitations in effect until September 30, 2020 and are subject to change. Had the contractual fee waivers and expense limitations not been in place, gross expenses would apply. The expense ratios are as follows:
| | | | | | |
| | Class A | Class B | Class C | Class I | Class R6 |
| Gross (%) | 0.85 | 1.70 | 1.70 | 0.70 | 0.68 |
| Net (%) | 0.84 | 1.59 | 1.59 | 0.69 | 0.67 |
Please refer to the most recent prospectus and annual or semiannual report for more information on expenses and any expense limitation arrangements for each class.
The returns reflect past results and should not be considered indicative of future performance. The return and principal value of an investment will fluctuate so that shares, when redeemed, may be worth more or less than their original cost. Due to market volatility and other factors, the fund's current performance may be higher or lower than the performance shown. For current to the most recent month-end performance data, please call 800-225-5291 or visit the fund's website at jhinvestments.com.
The performance table above and the chart on the next page do not reflect the deduction of taxes that a shareholder would pay on fund distributions or the redemption of fund shares. The fund's performance results reflect any applicable fee waivers or expense reductions, without which the expenses would increase and results would have been less favorable.
| † | Index 1 is the Bloomberg Barclays California Municipal Bond Index; Index 2 is the Bloomberg Barclays Municipal Bond Index. |
See the following page for footnotes.
ANNUAL REPORT | JOHN HANCOCK CALIFORNIA TAX-FREE INCOME FUND 7
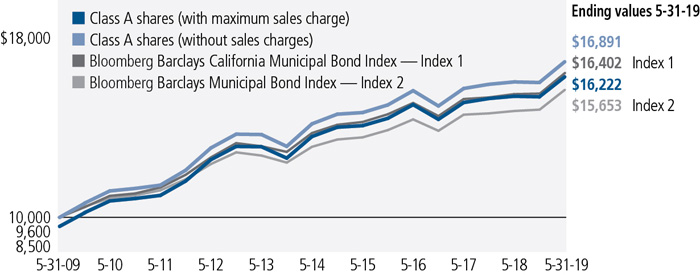
This chart and table show what happened to a hypothetical $10,000 investment in John Hancock California Tax-Free Income Fund for the share classes and periods indicated, assuming all distributions were reinvested. For comparison, we've shown the same investment in two separate indexes.
| | | | | | |
| | Start date | With maximum
sales charge ($) | Without
sales charge ($) | Index 1 ($) | Index 2 ($) |
| Class B5 | 5-31-09 | 15,890 | 15,890 | 16,402 | 15,653 |
| Class C5 | 5-31-09 | 15,641 | 15,641 | 16,402 | 15,653 |
| Class I3,4 | 5-31-09 | 16,947 | 16,947 | 16,402 | 15,653 |
| Class R63,4 | 5-31-09 | 16,929 | 16,929 | 16,402 | 15,653 |
The values shown in the chart for Class A shares with maximum sales charge have been adjusted to reflect the reduction in the Class A shares' maximum sales charge from 4.5% to 4.0%, which became effective on 2-3-14.
The Bloomberg Barclays California Municipal Bond Index is an unmanaged index composed of California investment-grade municipal bonds.
The Bloomberg Barclays Municipal Bond Index is an unmanaged index representative of the tax-exempt bond market.
It is not possible to invest directly in an index. Index figures do not reflect expenses or sales charges, which would result in lower returns.
Footnotes related to performance pages
| 1 | Unsubsidized yield reflects what the yield would have been without the effect of reimbursements and waivers. |
| 2 | Tax-equivalent yield is based on the maximum federal income tax rate of 40.8% and a state tax rate of 13.3%. |
| 3 | Class I shares and Class R6 shares were first offered on 2-13-17 and 8-30-17, respectively. Returns prior to these dates are those of Class A shares that have not been adjusted for class-specific expenses; otherwise, returns would vary. |
| 4 | For certain type of investors, as described in the fund's prospectus. |
| 5 | The contingent deferred sales charge is not applicable. |
ANNUAL REPORT | JOHN HANCOCK CALIFORNIA TAX-FREE INCOME FUND 8
These examples are intended to help you understand your ongoing operating expenses of investing in the fund so you can compare these costs with the ongoing costs of investing in other mutual funds.
Understanding fund expenses
As a shareholder of the fund, you incur two types of costs:
■Transaction costs,which include sales charges (loads) on purchases or redemptions (varies by share class), minimum account fee charge, etc.
■Ongoing operating expenses, including management fees, distribution and service fees (if applicable), and other fund expenses.
We are presenting only your ongoing operating expenses here.
Actual expenses/actual returns
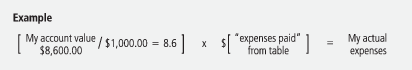
The first line of each share class in the table on the following page is intended to provide information about the fund’s actual ongoing operating expenses, and is based on the fund’s actual return. It assumes an account value of $1,000.00 on December 1, 2018, with the same investment held until May 31, 2019.
Together with the value of your account, you may use this information to estimate the operating expenses that you paid over the period. Simply divide your account value at May 31, 2019, by $1,000.00, then multiply it by the “expenses paid” for your share class from the table. For example, for an account value of $8,600.00, the operating expenses should be calculated as follows:
Hypothetical example for comparison purposes
The second line of each share class in the table on the following page allows you to compare the fund’s ongoing operating expenses with those of any other fund. It provides an example of the fund’s hypothetical account values and hypothetical expenses based on each class’s actual expense ratio and an assumed 5% annualized return before expenses (which is not the class’s actual return). It assumes an account value of $1,000.00 on December 1, 2018, with the same investment held until May 31, 2019. Look in any other fund shareholder report to find its hypothetical example and you will be able to compare these expenses. Please remember that these hypothetical account values and expenses may not be used to estimate the actual ending account balance or expenses you paid for the period.
| | ANNUAL REPORT | JOHN HANCOCK CALIFORNIA TAX-FREE INCOME FUND | 9 |
Remember, these examples do not include any transaction costs, therefore, these examples will not help you to determine the relative total costs of owning different funds. If transaction costs were included, your expenses would have been higher. See the prospectus for details regarding transaction costs.
SHAREHOLDER EXPENSE EXAMPLE CHART
| | | Account
value on
12-1-2018 | Ending
value on
5-31-2019 | Expenses
paid during
period ended
5-31-20191 | Annualized
expense
ratio |
| Class A | Actual expenses/actual returns | $1,000.00 | $1,057.50 | $4.36 | 0.85% |
| | Hypothetical example | 1,000.00 | 1,020.70 | 4.28 | 0.85% |
| Class B | Actual expenses/actual returns | 1,000.00 | 1,053.50 | 8.14 | 1.59% |
| | Hypothetical example | 1,000.00 | 1,017.00 | 8.00 | 1.59% |
| Class C | Actual expenses/actual returns | 1,000.00 | 1,053.50 | 8.14 | 1.59% |
| | Hypothetical example | 1,000.00 | 1,017.00 | 8.00 | 1.59% |
| Class I | Actual expenses/actual returns | 1,000.00 | 1,058.20 | 3.54 | 0.69% |
| | Hypothetical example | 1,000.00 | 1,021.50 | 3.48 | 0.69% |
| Class R6 | Actual expenses/actual returns | 1,000.00 | 1,058.40 | 3.39 | 0.66% |
| | Hypothetical example | 1,000.00 | 1,021.60 | 3.33 | 0.66% |
| 1 | Expenses are equal to the annualized expense ratio, multiplied by the average account value over the period, multiplied by 182/365 (to reflect the one-half year period). |
| 10 | JOHN HANCOCK CALIFORNIA TAX-FREE INCOME FUND | ANNUAL REPORT | |
AS OF 5-31-19
| | Rate (%) | Maturity date | | Par value^ | Value |
| Municipal bonds 97.6% | | | | | $204,735,640 |
| (Cost $190,725,879) | | | | | |
| California 96.7% | | | | | 202,877,647 |
ABAG Finance Authority for Nonprofit Corps.
Sharp HealthCare, Series A | 5.000 | 08-01-43 | | 2,000,000 | 2,233,060 |
Anaheim Public Financing Authority
Series A | 5.000 | 05-01-46 | | 1,000,000 | 1,131,590 |
Burbank Unified School District
Convertible Capital Appreciation Election 2013, GO (0.000% to 8-1-23, then 4.500% thereafter) | 0.000 | 08-01-37 | | 1,770,000 | 1,720,192 |
California Community Housing Agency
Annadel Apartments, Series A (A) | 5.000 | 04-01-49 | | 1,000,000 | 1,089,010 |
California County Tobacco Securitization Agency
Fresno County Funding Corp. | 6.000 | 06-01-35 | | 1,765,000 | 1,765,812 |
California County Tobacco Securitization Agency
Kern County Tobacco Funding Corp., Series 2014 | 5.000 | 06-01-40 | | 1,500,000 | 1,582,530 |
California County Tobacco Securitization Agency
Public Improvements | 5.250 | 06-01-21 | | 2,530,000 | 2,565,319 |
California County Tobacco Securitization Agency
Stanislaus Funding, Series A | 5.500 | 06-01-33 | | 110,000 | 110,000 |
California Educational Facilities Authority
Pepperdine University | 5.000 | 10-01-49 | | 2,550,000 | 2,968,022 |
California Educational Facilities Authority
University of Redlands, Series A | 5.000 | 10-01-35 | | 1,000,000 | 1,142,220 |
California Health Facilities Financing Authority
Children's Hospital, Series A | 5.000 | 08-15-47 | | 1,000,000 | 1,153,060 |
California Health Facilities Financing Authority
El Camino Hospital | 5.000 | 02-01-42 | | 1,000,000 | 1,162,210 |
California Health Facilities Financing Authority
El Camino Hospital | 5.000 | 02-01-47 | | 1,425,000 | 1,650,278 |
California Health Facilities Financing Authority
Lucile Packard Children's Hospital, Series A | 5.000 | 08-15-43 | | 1,000,000 | 1,125,110 |
California Health Facilities Financing Authority
Lucile Packard Children's Hospital, Series B | 5.000 | 08-15-55 | | 1,000,000 | 1,134,690 |
California Health Facilities Financing Authority
Sutter Health, Series A | 5.000 | 08-15-43 | | 1,000,000 | 1,143,730 |
California Municipal Finance Authority
Channing House Project, Series A (B) | 4.000 | 05-15-40 | | 1,500,000 | 1,626,180 |
California Municipal Finance Authority
Collegiate Housing Foundation Davis-I, LLC, West Village Student Housing Project | 5.000 | 05-15-33 | | 1,000,000 | 1,204,180 |
California Municipal Finance Authority
LINXS APM Project, Series A, AMT | 5.000 | 12-31-47 | | 1,000,000 | 1,156,460 |
California Municipal Finance Authority
Paradise Valley Estates Project, Series A (B) | 5.000 | 01-01-49 | | 1,500,000 | 1,762,485 |
| SEE NOTES TO FINANCIAL STATEMENTS | ANNUAL REPORT | JOHN HANCOCK CALIFORNIA TAX-FREE INCOME FUND | 11 |
| | Rate (%) | Maturity date | | Par value^ | Value |
| California (continued) | | | | | |
California Municipal Finance Authority
Retirement Housing Foundation Obligation Group, Series A | 5.000 | 11-15-31 | | 1,500,000 | $1,900,830 |
California Municipal Finance Authority
William Jessup University | 5.000 | 08-01-39 | | 1,500,000 | 1,654,440 |
California Municipal Finance Authority
Wineville School Project, Series A (B) | 5.000 | 10-01-42 | | 2,000,000 | 2,295,680 |
California Pollution Control Financing Authority
Calplant I Project, AMT (A) | 7.500 | 07-01-32 | | 1,000,000 | 1,051,530 |
California Pollution Control Financing Authority
San Diego County Water Authority Desalination Project Pipeline (A) | 5.000 | 07-01-39 | | 1,000,000 | 1,181,790 |
California Pollution Control Financing Authority
San Diego County Water Authority Desalination Project Pipeline (A) | 5.000 | 11-21-45 | | 1,500,000 | 1,756,215 |
California Pollution Control Financing Authority
Waste Management, Inc., Series A1, AMT | 3.375 | 07-01-25 | | 1,000,000 | 1,062,160 |
California Pollution Control Financing Authority
Waste Management, Inc., Series A3, AMT | 4.300 | 07-01-40 | | 4,675,000 | 5,068,448 |
California Public Finance Authority
Henry Mayo Newhall Hospital | 5.000 | 10-15-47 | | 2,000,000 | 2,216,200 |
California School Finance Authority
Aspire Public Schools (A) | 5.000 | 08-01-46 | | 3,275,000 | 3,612,947 |
California School Finance Authority
Kipp LA Project, Series A (A) | 5.000 | 07-01-47 | | 1,500,000 | 1,713,825 |
California State Public Works Board
Various Capital Projects, Series A | 5.000 | 04-01-37 | | 1,000,000 | 1,089,590 |
California State Public Works Board
Various Correctional Facilities, Series A | 5.000 | 09-01-39 | | 2,500,000 | 2,840,800 |
California State University
College and University Revenue, Series A | 5.000 | 11-01-44 | | 2,000,000 | 2,285,860 |
California Statewide Communities Development Authority
Adventist Health System, Series A | 5.000 | 03-01-48 | | 1,885,000 | 2,219,154 |
California Statewide Communities Development Authority
American Baptist Homes West | 6.250 | 10-01-39 | | 2,000,000 | 2,030,400 |
California Statewide Communities Development Authority
CHF Irvine LLC | 5.000 | 05-15-40 | | 2,735,000 | 3,130,782 |
California Statewide Communities Development Authority
Front Porch Communities and Services, Series A | 5.000 | 04-01-47 | | 500,000 | 578,210 |
California Statewide Communities Development Authority
Infrastructure Program Revenue, Series B | 5.000 | 09-02-44 | | 1,000,000 | 1,055,060 |
California Statewide Communities Development Authority
Los Angeles Jewish Homes, Series S (B) | 5.000 | 08-01-44 | | 2,625,000 | 2,930,996 |
| 12 | JOHN HANCOCK CALIFORNIA TAX-FREE INCOME FUND | ANNUAL REPORT | SEE NOTES TO FINANCIAL STATEMENTS |
| | Rate (%) | Maturity date | | Par value^ | Value |
| California (continued) | | | | | |
California Statewide Communities Development Authority
Redlands Community Hospital OB | 5.000 | 10-01-46 | | 2,000,000 | $2,291,540 |
California Statewide Communities Development Authority
Redwoods Project (B) | 5.375 | 11-15-44 | | 1,500,000 | 1,725,150 |
California Statewide Communities Development Authority
Senior Living of Southern California (A) | 7.250 | 11-15-41 | | 1,700,000 | 1,740,732 |
California Statewide Financing Authority
Tobacco Settlement, Series A | 6.000 | 05-01-37 | | 2,500,000 | 2,516,400 |
California Statewide Financing Authority
Tobacco Settlement, Series B | 6.000 | 05-01-37 | | 3,000,000 | 3,019,680 |
City of Belmont
Library Project, Series A (B) | 5.750 | 08-01-24 | | 1,000,000 | 1,141,460 |
City of Irvine
Community Facilities District | 5.000 | 09-01-49 | | 2,000,000 | 2,185,200 |
City of La Verne
Brethren Hillcrest Homes | 5.000 | 05-15-36 | | 750,000 | 786,278 |
City of Long Beach
Alamitos Bay Marina Project, Series 2015 | 5.000 | 05-15-45 | | 1,000,000 | 1,100,740 |
City of Long Beach
District 6-Pike Project | 6.250 | 10-01-26 | | 2,265,000 | 2,267,786 |
City of Los Angeles Department of Airports
Los Angeles International Airport, AMT | 5.000 | 05-15-43 | | 2,000,000 | 2,420,140 |
City of San Clemente
Community Facilities District, Series 2006-1 | 5.000 | 09-01-46 | | 1,980,000 | 2,196,810 |
City of San Francisco Public Utilities Commission
Green Bonds, Series A | 5.000 | 11-01-45 | | 1,500,000 | 1,722,195 |
City of San Mateo
Community Facilities District, Series 2008-1 Bay Meadows | 5.500 | 09-01-44 | | 2,000,000 | 2,161,620 |
Foothill-Eastern Transportation Corridor Agency
Highway Revenue Tolls, Series A | 5.750 | 01-15-46 | | 5,000,000 | 5,792,200 |
Golden State Tobacco Securitization Corp.
Series A | 5.000 | 06-01-40 | | 5,000,000 | 5,765,900 |
Golden State Tobacco Securitization Corp.
Series A | 5.000 | 06-01-45 | | 3,250,000 | 3,734,900 |
Inland Valley Development Agency
Series A | 5.000 | 09-01-44 | | 2,500,000 | 2,802,450 |
Lancaster School District
School Improvements (B)(C) | 1.418 | 04-01-22 | | 1,380,000 | 1,325,186 |
Los Angeles Community Facilities District
Cascades Business Park | 6.400 | 09-01-22 | | 310,000 | 311,345 |
Los Angeles County Public Works Financing Authority
Series D | 5.000 | 12-01-45 | | 3,000,000 | 3,484,950 |
Los Angeles County Regional Financing Authority
Montecedro, Inc. Project, Series A (B) | 5.000 | 11-15-44 | | 1,355,000 | 1,499,579 |
| SEE NOTES TO FINANCIAL STATEMENTS | ANNUAL REPORT | JOHN HANCOCK CALIFORNIA TAX-FREE INCOME FUND | 13 |
| | Rate (%) | Maturity date | | Par value^ | Value |
| California (continued) | | | | | |
Los Angeles Department of Water & Power
Power Systems, Series D | 5.000 | 07-01-44 | | 1,000,000 | $1,142,500 |
Marin Healthcare District
Election of 2013, GO | 4.000 | 08-01-45 | | 1,000,000 | 1,072,070 |
Morgan Hill Redevelopment Agency Successor Agency
Series A | 5.000 | 09-01-33 | | 1,750,000 | 1,984,675 |
M-S-R Energy Authority
Natural Gas Revenue, Series B | 6.500 | 11-01-39 | | 1,500,000 | 2,250,915 |
Norman Y. Mineta San Jose International Airport SJC
Series A, AMT | 5.000 | 03-01-47 | | 3,000,000 | 3,471,810 |
Oakland Unified School District/Alameda County
Election of 2012, GO | 6.625 | 08-01-38 | | 1,000,000 | 1,114,310 |
Oakland Unified School District/Alameda County
Series A, GO | 5.000 | 08-01-40 | | 1,500,000 | 1,702,140 |
Orange County Community Facilities District
2017-1 Esencia Village, Series A | 5.000 | 08-15-47 | | 2,000,000 | 2,310,640 |
Pacifica School District
Series C, GO (B)(C) | 2.005 | 08-01-26 | | 1,000,000 | 865,550 |
Port of Los Angeles
Series A, AMT | 5.000 | 08-01-44 | | 2,000,000 | 2,260,020 |
River Islands Public Financing Authority
Community Facilities District, Series 2003-1 | 5.000 | 09-01-48 | | 1,250,000 | 1,376,875 |
River Islands Public Financing Authority
Community Facilities District, Series 2003-1 | 5.500 | 09-01-45 | | 2,000,000 | 2,158,480 |
Riverside County Transportation Commission
Senior Lien, Series A | 5.750 | 06-01-48 | | 1,000,000 | 1,105,790 |
San Diego County Regional Airport Authority
Consol Rental Car Facilities, Series A | 5.000 | 07-01-44 | | 4,925,000 | 5,608,935 |
San Diego Public Facilities Financing Authority
Series A | 5.000 | 10-15-44 | | 1,000,000 | 1,167,150 |
San Diego Unified School District
Series I, GO (C) | 3.738 | 07-01-39 | | 1,250,000 | 591,713 |
San Francisco City & County Airport Commission International Airport
Special Facilities Lease, SFO Fuel Company LLC, Series A, AMT | 5.000 | 01-01-47 | | 2,000,000 | 2,378,500 |
San Francisco City & County Redevelopment Agency
Department of General Services Lease, No. 6, Mission Bay South, Series A | 5.150 | 08-01-35 | | 1,250,000 | 1,251,675 |
San Francisco City & County Redevelopment Agency
Mission Bay Project, Series A | 5.000 | 08-01-43 | | 1,000,000 | 1,128,390 |
San Joaquin Hills Transportation Corridor Agency
Highway Revenue Tolls, Escrowed to Maturity (C) | 1.367 | 01-01-22 | | 6,500,000 | 6,272,240 |
San Joaquin Hills Transportation Corridor Agency
Highway Revenue Tolls, Series A | 5.000 | 01-15-44 | | 2,500,000 | 2,814,725 |
| 14 | JOHN HANCOCK CALIFORNIA TAX-FREE INCOME FUND | ANNUAL REPORT | SEE NOTES TO FINANCIAL STATEMENTS |
| | Rate (%) | Maturity date | | Par value^ | Value |
| California (continued) | | | | | |
San Mateo Joint Powers Financing Authority
Capital Projects Program (B) | 5.000 | 07-01-21 | | 1,815,000 | $1,916,132 |
Santa Ana Financing Authority
Police Administration & Holding Facility (B) | 6.250 | 07-01-24 | | 5,000,000 | 5,703,150 |
Santa Ana Financing Authority
Prerefunded, Police Administration & Holding Facility (B) | 6.250 | 07-01-24 | | 5,000,000 | 5,762,300 |
Santa Margarita Water District
Community Facilities District, Series 2013-1 | 5.625 | 09-01-43 | | 775,000 | 850,485 |
South Orange County Public Financing Authority
Series A | 5.000 | 08-15-33 | | 1,000,000 | 1,079,080 |
South Orange County Public Financing Authority
Series A | 5.000 | 08-15-34 | | 450,000 | 485,271 |
Southern California Public Power Authority
Natural Gas Revenue, Series A | 5.250 | 11-01-26 | | 2,000,000 | 2,407,340 |
Southern California Public Power Authority
Series A | 5.000 | 07-01-38 | | 1,000,000 | 1,156,040 |
State of California
Various Purpose, GO | 5.000 | 04-01-29 | | 1,000,000 | 1,303,370 |
State of California
Various Purpose, GO | 5.000 | 04-01-32 | | 2,000,000 | 2,711,460 |
Stockton Public Financing Authority
Delta Water Supply Project, Series A | 6.250 | 10-01-40 | | 1,150,000 | 1,364,130 |
Sweetwater Union High School District
Election of 2006, Series 2016 B, GO | 4.000 | 08-01-42 | | 500,000 | 528,300 |
Tobacco Securitization Authority of Southern California
Series A1 | 5.000 | 06-01-37 | | 1,500,000 | 1,507,575 |
University of California
Series AZ | 5.000 | 05-15-48 | | 4,000,000 | 4,821,400 |
West Covina Redevelopment Agency
Fashion Plaza | 6.000 | 09-01-22 | | 2,825,000 | 3,034,107 |
William S. Hart Union High School District
Community Facilities District, Series 2015-1 | 5.000 | 09-01-47 | | 1,000,000 | 1,125,108 |
| Puerto Rico 0.9% | | | | | 1,857,993 |
Puerto Rico Sales Tax Financing Corp. Sales Tax Revenue
Series A-1 | 4.750 | 07-01-53 | | 1,926,000 | 1,857,993 |
|
| | Yield* (%) | Maturity date | | Par value^ | Value |
| Short-term investments 1.4% | | | | | $2,866,000 |
| (Cost $2,865,815) | | | | | |
| U.S. Government Agency 0.7% | | | | | 1,473,000 |
| Federal Agricultural Mortgage Corp. Discount Note | 2.250 | 06-03-19 | | 277,000 | 277,000 |
| Federal Home Loan Bank Discount Note | 2.250 | 06-03-19 | | 1,196,000 | 1,196,000 |
| SEE NOTES TO FINANCIAL STATEMENTS | ANNUAL REPORT | JOHN HANCOCK CALIFORNIA TAX-FREE INCOME FUND | 15 |
| | | | | Par value^ | Value |
| Repurchase agreement 0.7% | | | | | $1,393,000 |
| Barclays Tri-Party Repurchase Agreement dated 5-31-19 at 2.450% to be repurchased at $1,287,263 on 6-3-19, collateralized by $1,216,700 U.S. Treasury Bonds, 3.000% due 2-15-47 (valued at $1,313,011, including interest) | | | | 1,287,000 | 1,287,000 |
| Repurchase Agreement with State Street Corp. dated 5-31-19 at 1.300% to be repurchased at $106,011 on 6-3-19, collateralized by $110,000 U.S. Treasury Notes, 2.375% due 3-15-21 (valued at $111,044, including interest) | | | | 106,000 | 106,000 |
|
| Total investments (Cost $193,591,694) 99.0% | | | $207,601,640 |
| Other assets and liabilities, net 1.0% | | | | | 2,081,293 |
| Total net assets 100.0% | | | | | $209,682,933 |
| The percentage shown for each investment category is the total value of the category as a percentage of the net assets of the fund. |
| ^All par values are denominated in U.S. dollars unless otherwise indicated. |
| Security Abbreviations and Legend |
| AMT | Interest earned from these securities may be considered a tax preference item for purpose of the Federal Alternative Minimum Tax. |
| GO | General Obligation |
| (A) | These securities are exempt from registration under Rule 144A of the Securities Act of 1933. Such securities may be resold, normally to qualified institutional buyers, in transactions exempt from registration. |
| (B) | Bond is insured by one or more of the companies listed in the insurance coverage table below. |
| (C) | Zero coupon bonds are issued at a discount from their principal amount in lieu of paying interest periodically. Rate shown is the effective yield at period end. |
| * | Yield represents either the annualized yield at the date of purchase, the stated coupon rate or, for floating rate securities, the rate at period end. |
At 5-31-19, the aggregate cost of investments for federal income tax purposes was $191,969,402. Net unrealized appreciation aggregated to $15,632,238, of which $15,632,238 related to gross unrealized appreciation and $0 related to gross unrealized depreciation.
| Insurance coverage | As a % of total
investments |
| National Public Finance Guarantee Corp. | 6.9 |
| California Mortgage Insurance | 4.6 |
| Build America Mutual Assurance Company | 1.1 |
| Assured Guaranty Municipal Corp. | 0.6 |
| Ambac Financial Group, Inc. | 0.5 |
| TOTAL | 13.7 |
| 16 | JOHN HANCOCK CALIFORNIA TAX-FREE INCOME FUND | ANNUAL REPORT | SEE NOTES TO FINANCIAL STATEMENTS |
STATEMENT OF ASSETS AND LIABILITIES 5-31-19
| Assets | |
| Unaffiliated investments, at value (Cost $193,591,694) | $207,601,640 |
| Cash | 456 |
| Interest receivable | 2,473,881 |
| Receivable for fund shares sold | 99,189 |
| Other assets | 14,247 |
| Total assets | 210,189,413 |
| Liabilities | |
| Distributions payable | 68,996 |
| Payable for fund shares repurchased | 201,765 |
| Payable to affiliates | |
| Investment management fees | 96,720 |
| Accounting and legal services fees | 21,212 |
| Transfer agent fees | 7,260 |
| Distribution and service fees | 22,089 |
| Trustees' fees | 251 |
| Other liabilities and accrued expenses | 88,187 |
| Total liabilities | 506,480 |
| Net assets | $209,682,933 |
| Net assets consist of | |
| Paid-in capital | $192,812,010 |
| Total distributable earnings (loss) | 16,870,923 |
| Net assets | $209,682,933 |
| |
| Net asset value per share | |
| Based on net asset value and shares outstanding - the fund has an unlimited number of shares authorized with no par value | |
| Class A ($175,963,731 ÷ 16,090,999 shares)1 | $10.94 |
| Class B ($456,864 ÷ 41,750 shares)1 | $10.94 |
| Class C ($19,050,679 ÷ 1,742,113 shares)1 | $10.94 |
| Class I ($10,397,322 ÷ 950,300 shares) | $10.94 |
| Class R6 ($3,814,337 ÷ 348,524 shares) | $10.94 |
| Maximum offering price per share | |
| Class A (net asset value per share ÷ 96%)2 | $11.40 |
| 1 | Redemption price per share is equal to net asset value less any applicable contingent deferred sales charge. |
| 2 | On single retail sales of less than $100,000. On sales of $100,000 or more and on group sales the offering price is reduced. |
| SEE NOTES TO FINANCIAL STATEMENTS | ANNUAL REPORT | JOHN HANCOCK California Tax-Free Income Fund | 17 |
STATEMENT OF OPERATIONSFor the year ended 5-31-19
| Investment income | |
| Interest | $8,746,570 |
| Expenses | |
| Investment management fees | 1,125,514 |
| Distribution and service fees | 454,780 |
| Accounting and legal services fees | 45,511 |
| Transfer agent fees | 91,710 |
| Trustees' fees | 3,722 |
| Custodian fees | 42,444 |
| State registration fees | 16,200 |
| Printing and postage | 42,121 |
| Professional fees | 64,574 |
| Other | 19,679 |
| Total expenses | 1,906,255 |
| Less expense reductions | (35,619) |
| Net expenses | 1,870,636 |
| Net investment income | 6,875,934 |
| Realized and unrealized gain (loss) | |
| Net realized gain (loss) on | |
| Unaffiliated investments | 1,195,778 |
| | 1,195,778 |
| Change in net unrealized appreciation (depreciation) of | |
| Unaffiliated investments | 2,813,074 |
| | 2,813,074 |
| Net realized and unrealized gain | 4,008,852 |
| Increase in net assets from operations | $10,884,786 |
| | |
| 18 | JOHN HANCOCK California Tax-Free Income Fund | ANNUAL REPORT | SEE NOTES TO FINANCIAL STATEMENTS |
STATEMENTS OF CHANGES IN NET ASSETS
| | Year ended
5-31-19 | Year ended
5-31-18 |
| Increase (decrease) in net assets | | |
| From operations | | |
| Net investment income | $6,875,934 | $7,567,995 |
| Net realized gain | 1,195,778 | 3,657,106 |
| Change in net unrealized appreciation (depreciation) | 2,813,074 | (7,254,241) |
| Increase in net assets resulting from operations | 10,884,786 | 3,970,860 |
| Distributions to shareholders | | |
| From net investment income and net realized gain | | |
| Class A | (5,986,856) | — |
| Class B | (13,485) | — |
| Class C | (524,922) | — |
| Class I | (383,200) | — |
| Class R61 | (95,093) | — |
| From net investment income | | |
| Class A | — | (6,668,292) |
| Class B | — | (21,463) |
| Class C | — | (713,380) |
| Class I | — | (232,023) |
| Class R61 | — | (37,906) |
| Total distributions | (7,003,556) | (7,673,064) |
| From fund share transactions | (7,928,934) | (31,580,973) |
| Total decrease | (4,047,704) | (35,283,177) |
| Net assets | | |
| Beginning of year | 213,730,637 | 249,013,814 |
| End of year2 | $209,682,933 | $213,730,637 |
| 1 | The inception date for Class R6 shares is 8-30-17. |
| 2 | Net assets - End of year includes undistributed net investment income of $(25,404) at May 31, 2018. The SEC eliminated the requirement to disclose undistributed net investment income in the current reporting period. |
| SEE NOTES TO FINANCIAL STATEMENTS | ANNUAL REPORT | JOHN HANCOCK California Tax-Free Income Fund | 19 |
| CLASS A SHARES Period ended | 5-31-19 | 5-31-18 | 5-31-17 | 5-31-16 | 5-31-15 |
| Per share operating performance | | | | | |
| Net asset value, beginning of period | $10.73 | $10.90 | $11.22 | $10.91 | $10.95 |
| Net investment income1 | 0.36 | 0.36 | 0.37 | 0.39 | 0.42 |
| Net realized and unrealized gain (loss) on investments | 0.22 | (0.16) | (0.30) | 0.32 | (0.04) |
| Total from investment operations | 0.58 | 0.20 | 0.07 | 0.71 | 0.38 |
| Less distributions | | | | | |
| From net investment income | (0.36) | (0.37) | (0.39) | (0.40) | (0.42) |
| From net realized gain | (0.01) | — | — | — | — |
| Total distributions | (0.37) | (0.37) | (0.39) | (0.40) | (0.42) |
| Net asset value, end of period | $10.94 | $10.73 | $10.90 | $11.22 | $10.91 |
| Total return (%)2,3 | 5.57 | 1.85 | 0.63 | 6.63 | 3.53 |
| Ratios and supplemental data | | | | | |
| Net assets, end of period (in millions) | $176 | $181 | $213 | $254 | $235 |
| Ratios (as a percentage of average net assets): | | | | | |
| Expenses before reductions | 0.86 | 0.85 | 0.83 | 0.84 | 0.83 |
| Expenses including reductions | 0.85 | 0.84 | 0.83 | 0.83 | 0.82 |
| Net investment income | 3.42 | 3.37 | 3.35 | 3.53 | 3.78 |
| Portfolio turnover (%) | 22 | 9 | 17 | 20 | 19 |
| 1 | Based on average daily shares outstanding. |
| 2 | Total returns would have been lower had certain expenses not been reduced during the applicable periods. |
| 3 | Does not reflect the effect of sales charges, if any. |
| 20 | JOHN HANCOCK California Tax-Free Income Fund | ANNUAL REPORT | SEE NOTES TO FINANCIAL STATEMENTS |
| CLASS B SHARES Period ended | 5-31-19 | 5-31-18 | 5-31-17 | 5-31-16 | 5-31-15 |
| Per share operating performance | | | | | |
| Net asset value, beginning of period | $10.73 | $10.91 | $11.23 | $10.91 | $10.95 |
| Net investment income1 | 0.28 | 0.28 | 0.28 | 0.31 | 0.34 |
| Net realized and unrealized gain (loss) on investments | 0.22 | (0.17) | (0.30) | 0.33 | (0.04) |
| Total from investment operations | 0.50 | 0.11 | (0.02) | 0.64 | 0.30 |
| Less distributions | | | | | |
| From net investment income | (0.28) | (0.29) | (0.30) | (0.32) | (0.34) |
| From net realized gain | (0.01) | — | — | — | — |
| Total distributions | (0.29) | (0.29) | (0.30) | (0.32) | (0.34) |
| Net asset value, end of period | $10.94 | $10.73 | $10.91 | $11.23 | $10.91 |
| Total return (%)2,3 | 4.78 | 1.00 | (0.12) | 5.93 | 2.76 |
| Ratios and supplemental data | | | | | |
| Net assets, end of period (in millions) | $—4 | $1 | $1 | $2 | $2 |
| Ratios (as a percentage of average net assets): | | | | | |
| Expenses before reductions | 1.71 | 1.70 | 1.69 | 1.69 | 1.68 |
| Expenses including reductions | 1.60 | 1.59 | 1.58 | 1.58 | 1.58 |
| Net investment income | 2.67 | 2.61 | 2.59 | 2.78 | 3.04 |
| Portfolio turnover (%) | 22 | 9 | 17 | 20 | 19 |
| 1 | Based on average daily shares outstanding. |
| 2 | Total returns would have been lower had certain expenses not been reduced during the applicable periods. |
| 3 | Does not reflect the effect of sales charges, if any. |
| 4 | Less than $500,000. |
| SEE NOTES TO FINANCIAL STATEMENTS | ANNUAL REPORT | JOHN HANCOCK California Tax-Free Income Fund | 21 |
| CLASS C SHARES Period ended | 5-31-19 | 5-31-18 | 5-31-17 | 5-31-16 | 5-31-15 |
| Per share operating performance | | | | | |
| Net asset value, beginning of period | $10.73 | $10.90 | $11.22 | $10.91 | $10.95 |
| Net investment income1 | 0.28 | 0.28 | 0.29 | 0.31 | 0.33 |
| Net realized and unrealized gain (loss) on investments | 0.22 | (0.16) | (0.31) | 0.32 | (0.03) |
| Total from investment operations | 0.50 | 0.12 | (0.02) | 0.63 | 0.30 |
| Less distributions | | | | | |
| From net investment income | (0.28) | (0.29) | (0.30) | (0.32) | (0.34) |
| From net realized gain | (0.01) | — | — | — | — |
| Total distributions | (0.29) | (0.29) | (0.30) | (0.32) | (0.34) |
| Net asset value, end of period | $10.94 | $10.73 | $10.90 | $11.22 | $10.91 |
| Total return (%)2,3 | 4.78 | 1.09 | (0.13) | 5.83 | 2.76 |
| Ratios and supplemental data | | | | | |
| Net assets, end of period (in millions) | $19 | $21 | $30 | $36 | $34 |
| Ratios (as a percentage of average net assets): | | | | | |
| Expenses before reductions | 1.71 | 1.70 | 1.68 | 1.69 | 1.68 |
| Expenses including reductions | 1.60 | 1.59 | 1.58 | 1.58 | 1.57 |
| Net investment income | 2.67 | 2.62 | 2.60 | 2.78 | 3.03 |
| Portfolio turnover (%) | 22 | 9 | 17 | 20 | 19 |
| 1 | Based on average daily shares outstanding. |
| 2 | Total returns would have been lower had certain expenses not been reduced during the applicable periods. |
| 3 | Does not reflect the effect of sales charges, if any. |
| 22 | JOHN HANCOCK California Tax-Free Income Fund | ANNUAL REPORT | SEE NOTES TO FINANCIAL STATEMENTS |
| CLASS I SHARES Period ended | 5-31-19 | 5-31-18 | 5-31-171 |
| Per share operating performance | | | |
| Net asset value, beginning of period | $10.73 | $10.91 | $10.70 |
| Net investment income2 | 0.38 | 0.38 | 0.12 |
| Net realized and unrealized gain (loss) on investments | 0.22 | (0.17) | 0.21 |
| Total from investment operations | 0.60 | 0.21 | 0.33 |
| Less distributions | | | |
| From net investment income | (0.38) | (0.39) | (0.12) |
| From net realized gain | (0.01) | — | — |
| Total distributions | (0.39) | (0.39) | (0.12) |
| Net asset value, end of period | $10.94 | $10.73 | $10.91 |
| Total return (%)3 | 5.72 | 1.91 | 3.094 |
| Ratios and supplemental data | | | |
| Net assets, end of period (in millions) | $10 | $10 | $5 |
| Ratios (as a percentage of average net assets): | | | |
| Expenses before reductions | 0.71 | 0.70 | 0.675 |
| Expenses including reductions | 0.70 | 0.69 | 0.665 |
| Net investment income | 3.58 | 3.53 | 3.765 |
| Portfolio turnover (%) | 22 | 9 | 176 |
| 1 | The inception date for Class I shares is 2-13-17. |
| 2 | Based on average daily shares outstanding. |
| 3 | Total returns would have been lower had certain expenses not been reduced during the applicable periods. |
| 4 | Not annualized. |
| 5 | Annualized. |
| 6 | Portfolio turnover is shown for the period from 6-1-16 to 5-31-17. |
| SEE NOTES TO FINANCIAL STATEMENTS | ANNUAL REPORT | JOHN HANCOCK California Tax-Free Income Fund | 23 |
| CLASS R6 SHARES Period ended | 5-31-19 | 5-31-181 |
| Per share operating performance | | |
| Net asset value, beginning of period | $10.73 | $10.95 |
| Net investment income2 | 0.38 | 0.29 |
| Net realized and unrealized gain (loss) on investments | 0.22 | (0.22) |
| Total from investment operations | 0.60 | 0.07 |
| Less distributions | | |
| From net investment income | (0.38) | (0.29) |
| From net realized gain | (0.01) | — |
| Total distributions | (0.39) | (0.29) |
| Net asset value, end of period | $10.94 | $10.73 |
| Total return (%)3 | 5.76 | 0.664 |
| Ratios and supplemental data | | |
| Net assets, end of period (in millions) | $4 | $2 |
| Ratios (as a percentage of average net assets): | | |
| Expenses before reductions | 0.68 | 0.685 |
| Expenses including reductions | 0.67 | 0.675 |
| Net investment income | 3.58 | 3.565 |
| Portfolio turnover (%) | 22 | 96 |
| 1 | The inception date for Class R6 shares is 8-30-17. |
| 2 | Based on average daily shares outstanding. |
| 3 | Total returns would have been lower had certain expenses not been reduced during the applicable periods. |
| 4 | Not annualized. |
| 5 | Annualized. |
| 6 | Portfolio turnover is shown for the period from 6-1-17 to 5-31-18. |
| 24 | JOHN HANCOCK California Tax-Free Income Fund | ANNUAL REPORT | SEE NOTES TO FINANCIAL STATEMENTS |
| Notes to financial statements | |
Note 1—Organization
John Hancock California Tax-Free Income Fund (the fund) is a series of John Hancock California Tax-Free Income Fund (the Trust), an open-end management investment company organized as a Massachusetts business trust and registered under the Investment Company Act of 1940, as amended (the 1940 Act). The investment objective of the fund is to seek a high level of current income, consistent with preservation of capital, that is exempt from federal and California personal income taxes.
The fund may offer multiple classes of shares. The shares currently outstanding are detailed in the Statement of assets and liabilities. Class A and Class C shares are offered to all investors. Class B shares are closed to new investors. Class I shares are offered to institutions and certain investors. Class R6 shares are only available to certain retirement plans, institutions and other investors. Class B shares convert to Class A shares eight years after purchase. Class C shares convert to Class A shares ten years after purchase (certain exclusions may apply). Shareholders of each class have exclusive voting rights to matters that affect that class. The distribution and service fees, if any, and transfer agent fees for each class may differ.
Note 2—Significant accounting policies
The financial statements have been prepared in conformity with accounting principles generally accepted in the United States of America (US GAAP), which require management to make certain estimates and assumptions as of the date of the financial statements. Actual results could differ from those estimates and those differences could be significant. The fund qualifies as an investment company under Topic 946 of Accounting Standards Codification of US GAAP.
Events or transactions occurring after the end of the fiscal period through the date that the financial statements were issued have been evaluated in the preparation of the financial statements. The following summarizes the significant accounting policies of the fund:
Security valuation. Investments are stated at value as of the scheduled close of regular trading on the New York Stock Exchange (NYSE), normally at 4:00 P.M., Eastern Time. In case of emergency or other disruption resulting in the NYSE not opening for trading or the NYSE closing at a time other than the regularly scheduled close, the net asset value (NAV) may be determined as of the regularly scheduled close of the NYSE pursuant to the fund's Valuation Policies and Procedures.
In order to value the securities, the fund uses the following valuation techniques: Debt obligations are typically valued based on the evaluated prices provided by an independent pricing vendor. Independent pricing vendors utilize matrix pricing which takes into account factors such as institutional-size trading in similar groups of securities, yield, quality, coupon rate, maturity, type of issue, trading characteristics and other market data, as well as broker supplied prices.
Other portfolio securities and assets, for which reliable market quotations are not readily available, are valued at fair value as determined in good faith by the fund's Pricing Committee following procedures established by the Board of Trustees. The frequency with which these fair valuation procedures are used cannot be predicted and fair value of securities may differ significantly from the value that would have been used had a ready market for such securities existed.
The fund uses a three-tier hierarchy to prioritize the pricing assumptions, referred to as inputs, used in valuation techniques to measure fair value. Level 1 includes securities valued using quoted prices in active markets for identical securities. Level 2 includes securities valued using other significant observable inputs. Observable inputs may include quoted prices for similar securities, interest rates, prepayment speeds and credit risk. Prices for securities valued using these inputs are received from independent pricing vendors and brokers and are based on
| | ANNUAL REPORT | JOHN HANCOCK California Tax-Free Income Fund | 25 |
an evaluation of the inputs described. Level 3 includes securities valued using significant unobservable inputs when market prices are not readily available or reliable, including the fund's own assumptions in determining the fair value of investments. Factors used in determining value may include market or issuer specific events or trends, changes in interest rates and credit quality. The inputs or methodology used for valuing securities are not necessarily an indication of the risks associated with investing in those securities. Changes in valuation techniques and related inputs may result in transfers into or out of an assigned level within the disclosure hierarchy.
As of May 31, 2019, all investments are categorized as Level 2 under the hierarchy described above.
Repurchase agreements. The fund may enter into repurchase agreements. When the fund enters into a repurchase agreement, it receives collateral that is held in a segregated account by the fund's custodian, or for tri-party repurchase agreements, collateral is held at a third-party custodian bank in a segregated account for the benefit of the fund. The collateral amount is marked-to-market and monitored on a daily basis to ensure that the collateral held is in an amount not less than the principal amount of the repurchase agreement plus any accrued interest. Collateral received by the fund for repurchase agreements is disclosed in the Fund’s investments as part of the caption related to the repurchase agreement.
Repurchase agreements are typically governed by the terms and conditions of the Master Repurchase Agreement and/or Global Master Repurchase Agreement (collectively, MRA). Upon an event of default, the non-defaulting party may close out all transactions traded under the MRA and net amounts owed. Absent an event of default, assets and liabilities resulting from repurchase agreements are not offset in the Statement of assets and liabilities. In the event of a default by the counterparty, realization of the collateral proceeds could be delayed, during which time the collateral value may decline or the counterparty may have insufficient assets to pay back claims resulting from close-out of the transactions.
Security transactions and related investment income. Investment security transactions are accounted for on a trade date plus one basis for daily NAV calculations. However, for financial reporting purposes, investment transactions are reported on trade date. Interest income is accrued as earned. Interest income includes coupon interest and amortization/accretion of premiums/discounts on debt securities. Debt obligations may be placed in a non-accrual status and related interest income may be reduced by stopping current accruals and writing off interest receivable when the collection of all or a portion of interest has become doubtful. Gains and losses on securities sold are determined on the basis of identified cost and may include proceeds from litigation.
Line of credit. The fund may have the ability to borrow from banks for temporary or emergency purposes, including meeting redemption requests that otherwise might require the untimely sale of securities. Pursuant to the fund's custodian agreement, the custodian may loan money to the fund to make properly authorized payments. The fund is obligated to repay the custodian for any overdraft, including any related costs or expenses. The custodian may have a lien, security interest or security entitlement in any fund property that is not otherwise segregated or pledged, to the extent of any overdraft, and to the maximum extent permitted by law.
The fund and other affiliated funds, have entered into a syndicated line of credit agreement with Citibank, N.A. as the administrative agent that enables them to participate in a $750 million unsecured committed line of credit. Excluding commitments designated for a certain fund and subject to the needs of all other affiliated funds, the fund can borrow up to an aggregate commitment amount of $500 million, subject to asset coverage and other limitations as specified in the agreement. A commitment fee payable at the end of each calendar quarter, based on the average daily unused portion of the line of credit, is charged to each participating fund based on a combination of fixed and asset based allocations and is reflected in Other expenses on the Statement of operations. For the year ended May 31, 2019, the fund had no borrowings under the line of credit. Commitment fees for the year ended May 31, 2019 were $2,250.
| 26 | JOHN HANCOCK California Tax-Free Income Fund | ANNUAL REPORT | |
Expenses. Within the John Hancock group of funds complex, expenses that are directly attributable to an individual fund are allocated to such fund. Expenses that are not readily attributable to a specific fund are allocated among all funds in an equitable manner, taking into consideration, among other things, the nature and type of expense and the fund’s relative net assets. Expense estimates are accrued in the period to which they relate and adjustments are made when actual amounts are known.
Class allocations. Income, common expenses and realized and unrealized gains (losses) are determined at the fund level and allocated daily to each class of shares based on the net assets of the class. Class-specific expenses, such as distribution and service fees, if any, and transfer agent fees, for all classes, are charged daily at the class level based on the net assets of each class and the specific expense rates applicable to each class.
Federal income taxes. The fund intends to continue to qualify as a regulated investment company by complying with the applicable provisions of the Internal Revenue Code and will not be subject to federal income tax on taxable income that is distributed to shareholders. Therefore, no federal income tax provision is required.
As of May 31, 2019, the fund had no uncertain tax positions that would require financial statement recognition, derecognition or disclosure. The fund's federal tax returns are subject to examination by the Internal Revenue Service for a period of three years.
Distribution of income and gains. Distributions to shareholders from net investment income and net realized gains, if any, are recorded on the ex-date. The fund generally declares dividends daily and pays them monthly. Capital gain distributions, if any, are typically distributed annually.
The tax character of distributions for the years ended May 31, 2019 and 2018 was as follows:
| | May 31, 2019 | May 31, 2018 |
| Ordinary Income | $71,775 | $38,301 |
| Exempt Income | 6,741,640 | 7,634,763 |
| Tax Long-term cap gains | 190,141 | - |
| Total | $7,003,556 | $7,673,064 |
Distributions paid by the fund with respect to each class of shares are calculated in the same manner, at the same time and in the same amount, except for the effect of class level expenses that may be applied differently to each class. As of May 31, 2019, the components of distributable earnings on a tax basis consisted of $84,446 of undistributed exempt interest and $1,223,235 of undistributed long-term capital gains.
Such distributions and distributable earnings, on a tax basis, are determined in conformity with income tax regulations, which may differ from US GAAP. Distributions in excess of tax basis earnings and profits, if any, are reported in the fund’s financial statements as a return of capital.
Capital accounts within the financial statements are adjusted for permanent book-tax differences. These adjustments have no impact on net assets or the results of operations. Temporary book-tax differences, if any, will reverse in a subsequent period. Book-tax differences are primarily attributable to accretion on debt securities.
Note 3—Guarantees and indemnifications
Under the Trust's organizational documents, its Officers and Trustees are indemnified against certain liabilities arising out of the performance of their duties to the Trust, including the fund. Additionally, in the normal course of business, the fund enters into contracts with service providers that contain general indemnification clauses. The fund's maximum exposure under these arrangements is unknown, as this would involve future claims that may be made against the fund that have not yet occurred. The risk of material loss from such claims is considered remote.
| | ANNUAL REPORT | JOHN HANCOCK California Tax-Free Income Fund | 27 |
Note 4—Fees and transactions with affiliates
John Hancock Advisers, LLC (the Advisor) serves as investment advisor for the fund. John Hancock Funds, LLC (the Distributor), an affiliate of the Advisor, serves as principal underwriter of the fund. The Advisor and the Distributor are indirect, wholly owned subsidiaries of Manulife Financial Corporation (MFC). Effective June 28, 2019, the Advisor changed its name to John Hancock Investment Management LLC and the Distributor changed its name to John Hancock Investment Management Distributors LLC.
Management fee. The fund has an investment management agreement with the Advisor under which the fund pays a monthly management fee to the Advisor, equivalent on an annual basis, to the sum of: (a) 0.550% of the first $500 million of the fund’s average daily net assets, (b) 0.500% of the next $500 million of the fund’s average daily net assets, (c) 0.475% of the next $1 billion of the fund’s average daily net assets; and (d) 0.450% of the fund’s average daily net assets in excess of $2 billion. The Advisor has a subadvisory agreement with Manulife Investment Management (US) LLC, an indirectly owned subsidiary of MFC and an affiliate of the Advisor. Prior to May 7, 2019, Manulife Investment Management (US) LLC was known as John Hancock Asset Management a division of Manulife Asset Management (US) LLC. The fund is not responsible for payment of the subadvisory fees.
The Advisor has contractually agreed to waive a portion of its management fee and/or reimburse expenses for certain funds of the John Hancock group of funds complex, including the fund (the participating portfolios). This waiver is based upon aggregate net assets of all the participating portfolios. The amount of the reimbursement is calculated daily and allocated among all the participating portfolios in proportion to the daily net assets of each fund. During the year ended May 31, 2019, this waiver amounted to 0.01% of the fund’s average net assets. This arrangement expires on July 31, 2021, unless renewed by mutual agreement of the fund and the Advisor based upon a determination that this is appropriate under the circumstances at that time.
For the year ended May 31, 2019, the expense reductions described above amounted to the following:
| Class | Expense reduction |
| Class A | $13,359 |
| Class B | 39 |
| Class C | 1,495 |
| Class | Expense reduction |
| Class I | $818 |
| Class R6 | 200 |
| Total | $15,911 |
Expenses waived or reimbursed in the current fiscal period are not subject to recapture in future fiscal periods.
The investment management fees, including the impact of the waivers and reimbursements as described above, incurred for the year ended May 31, 2019 were equivalent to a net annual effective rate of 0.54% the fund's average daily net assets.
Accounting and legal services. Pursuant to the Accounting and Legal Services Agreement, the fund reimburses the Advisor for all expenses associated with providing the administrative, financial, legal, compliance, accounting and recordkeeping services to the fund, including the preparation of all tax returns, periodic reports to shareholders and regulatory reports, among other services. These expenses are allocated to each share class based on its relative net assets at the time the expense was incurred. These accounting and legal services fees incurred for the year ended May 31, 2019 amounted to an annual rate of 0.02% of the fund's average daily net assets.
Distribution and service plans. The fund has a distribution agreement with the Distributor. The fund has adopted distribution and service plans pursuant to Rule 12b-1 under the 1940 Act, to pay the Distributor for services provided as the distributor of shares of the fund. The fund may pay up to the following contractual rates of distribution and service fees under these arrangements, expressed as an annual percentage of average daily net assets for each class of the fund's shares:
| 28 | JOHN HANCOCK California Tax-Free Income Fund | ANNUAL REPORT | |
| Class | Rule 12b-1 Fee |
| Class A | 0.15% |
| Class B | 1.00% |
| Class | Rule 12b-1 Fee |
| Class C | 1.00% |
The fund’s Distributor has contractually agreed to waive 0.10% of Rule12b-1 fees for Class B and Class C shares. The current waiver agreement expires on September 30, 2020, unless renewed by mutual agreement of the fund and the Distributor based upon a determination that this is appropriate under the circumstances at the time. This contractual waiver amounted to $493 and $19,215 for Class B and Class C shares, respectively, for the year ended May 31, 2019.
Sales charges. Class A shares are assessed up-front sales charges, which resulted in payments to the Distributor amounting to $105,534 for the year ended May 31, 2019. Of this amount, $14,702 was retained and used for printing prospectuses, advertising, sales literature and other purposes, $89,223 was paid as sales commissions to broker-dealers and $1,609 was paid as sales commissions to sales personnel of Signator Investors, Inc., which had been a broker-dealer affiliate of the Advisor through November 2, 2018.
Class A, Class B and Class C shares may be subject to contingent deferred sales charges (CDSCs). Certain Class A shares that are acquired through purchases of $1 million or more and are redeemed within one year of purchase are subject to a 1.00% sales charge. Class B shares that are redeemed within six years of purchase are subject to CDSCs, at declining rates, beginning at 5.00%. Class C shares that are redeemed within one year of purchase are subject to a 1.00% CDSC. CDSCs are applied to the lesser of the current market value at the time of redemption or the original purchase cost of the shares being redeemed. Proceeds from CDSCs are used to compensate the Distributor for providing distribution-related services in connection with the sale of these shares. During the year ended May 31, 2019, CDSCs received by the Distributor amounted to $16,935, $0 and $410 for Class A, Class B and Class C shares, respectively.
Transfer agent fees. The John Hancock group of funds has a complex-wide transfer agent agreement with John Hancock Signature Services, Inc. (Signature Services), an affiliate of the Advisor. The transfer agent fees paid to Signature Services are determined based on the cost to Signature Services (Signature Services Cost) of providing recordkeeping services. It also includes out-of-pocket expenses, including payments made to third-parties for recordkeeping services provided to their clients who invest in one or more John Hancock funds. In addition, Signature Services Cost may be reduced by certain fees that Signature Services receives in connection with retirement and small accounts. Signature Services Cost is calculated monthly and allocated, as applicable, to five categories of share classes: Retail Share and Institutional Share Classes of Non-Municipal Bond Funds, Class R6 Shares, Retirement Share Classes and Municipal Bond Share Classes. Within each of these categories, the applicable costs are allocated to the affected John Hancock affiliated funds and/or classes, based on the relative average daily net assets.
Class level expenses. Class level expenses for the year ended May 31, 2019 were:
| Class | Distribution and service fees | Transfer agent fees |
| Class A | $257,696 | $77,689 |
| Class B | 4,935 | 223 |
| Class C | 192,149 | 8,699 |
| Class I | — | 4,763 |
| Class R6 | — | 336 |
| Total | $454,780 | $91,710 |
| | ANNUAL REPORT | JOHN HANCOCK California Tax-Free Income Fund | 29 |
Trustee expenses. The fund compensates each Trustee who is not an employee of the Advisor or its affiliates. The costs of paying Trustee compensation and expenses are allocated to the fund based on its net assets relative to other funds within the John Hancock group of funds complex.
Note 5—Fund share transactions
Transactions in fund shares for the years ended May 31, 2019 and 2018 were as follows:
| | Year Ended 5-31-19 | Year Ended 5-31-18 |
| | Shares | Amount | Shares | Amount |
| Class A shares | | | | |
| Sold | 1,485,306 | $15,841,456 | 1,413,219 | $15,285,851 |
| Distributions reinvested | 486,236 | 5,184,585 | 537,129 | 5,808,310 |
| Repurchased | (2,729,594) | (29,030,019) | (4,646,534) | (50,310,393) |
| Net decrease | (758,052) | $(8,003,978) | (2,696,186) | $(29,216,232) |
| Class B shares | | | | |
| Sold | — | — | 5 | $54 |
| Distributions reinvested | 1,180 | $12,592 | 1,797 | 19,477 |
| Repurchased | (10,172) | (108,962) | (51,019) | (556,337) |
| Net decrease | (8,992) | $(96,370) | (49,217) | $(536,806) |
| Class C shares | | | | |
| Sold | 170,291 | $1,816,298 | 159,254 | $1,732,105 |
| Distributions reinvested | 44,213 | 471,363 | 58,072 | 628,003 |
| Repurchased | (414,613) | (4,418,882) | (1,041,792) | (11,261,086) |
| Net decrease | (200,109) | $(2,131,221) | (824,466) | $(8,900,978) |
| Class I shares | | | | |
| Sold | 402,220 | $4,291,234 | 608,319 | $6,559,214 |
| Distributions reinvested | 34,749 | 370,533 | 19,526 | 210,739 |
| Repurchased | (379,555) | (4,028,096) | (166,355) | (1,794,490) |
| Net increase | 57,414 | $633,671 | 461,490 | $4,975,463 |
| Class R6 shares1 | | | | |
| Sold | 208,519 | $2,218,628 | 207,692 | $2,268,357 |
| Distributions reinvested | 8,894 | 95,093 | 3,427 | 36,852 |
| Repurchased | (60,709) | (644,757) | (19,299) | (207,629) |
| Net increase | 156,704 | $1,668,964 | 191,820 | $2,097,580 |
| Total net decrease | (753,035) | $(7,928,934) | (2,916,559) | $(31,580,973) |
| 1 | The inception date for Class R6 shares is 8-30-17. |
Note 6—Purchase and sale of securities
Purchases and sales of securities, other than short-term investments amounted to $43,290,759 and $52,704,731, respectively, for the year ended May 31, 2019.
| 30 | JOHN HANCOCK California Tax-Free Income Fund | ANNUAL REPORT | |
Note 7—State or region risk
To the extent that the fund invests heavily in bonds from any given state or region, its performance could be disproportionately affected by factors particular to that state or region. These factors may include economic or political changes, tax-base erosion, possible state constitutional limits on tax increases, detrimental budget deficits and other financial difficulties, and changes to the credit ratings assigned to those states’ municipal issuers.
Note 8—New accounting pronouncement
In March 2017, the Financial Accounting Standards Board issued Accounting Standards Update (ASU) 2017-08, Premium Amortization on Purchased Callable Debt Securities, which shortens the premium amortization period for purchased non contingently callable debt securities. The standard is effective for annual periods beginning after December 15, 2018 and interim periods within those fiscal years. Management has performed an analysis and has determined that the ASU will not have a material impact to the fund.
| | ANNUAL REPORT | JOHN HANCOCK California Tax-Free Income Fund | 31 |
Report of Independent Registered Public Accounting Firm
To the Board of Trustees and Shareholders of John Hancock California Tax-Free Income Fund
Opinion on the Financial Statements
We have audited the accompanying statement of assets and liabilities, including the Fund’s investments, of John Hancock California Tax-Free Income Fund (the “Fund”) as of May 31, 2019, the related statement of operations for the year ended May 31, 2019, the statements of changes in net assets for each of the two years in the period ended May 31, 2019, including the related notes, and the financial highlights for each of the periods indicated therein (collectively referred to as the “financial statements”). In our opinion, the financial statements present fairly, in all material respects, the financial position of the Fund as of May 31, 2019, the results of its operations for the year then ended, the changes in its net assets for each of the two years in the period ended May 31, 2019 and the financial highlights for each of the periods indicated therein in conformity with accounting principles generally accepted in the United States of America.
Basis for Opinion
These financial statements are the responsibility of the Fund's management. Our responsibility is to express an opinion on the Fund’s financial statements based on our audits. We are a public accounting firm registered with the Public Company Accounting Oversight Board (United States) (“PCAOB”) and are required to be independent with respect to the Fund in accordance with the U.S. federal securities laws and the applicable rules and regulations of the Securities and Exchange Commission and the PCAOB.
We conducted our audits of these financial statements in accordance with the standards of the PCAOB. Those standards require that we plan and perform the audit to obtain reasonable assurance about whether the financial statements are free of material misstatement, whether due to error or fraud.
Our audits included performing procedures to assess the risks of material misstatement of the financial statements, whether due to error or fraud, and performing procedures that respond to those risks. Such procedures included examining, on a test basis, evidence regarding the amounts and disclosures in the financial statements. Our audits also included evaluating the accounting principles used and significant estimates made by management, as well as evaluating the overall presentation of the financial statements. Our procedures included confirmation of securities owned as of May 31, 2019 by correspondence with the custodian and brokers. We believe that our audits provide a reasonable basis for our opinion.
/s/ PricewaterhouseCoopers LLP
Boston, Massachusetts
July 17, 2019
We have served as the auditor of one or more investment companies in the John Hancock group of funds since 1988.
| 32 | JOHN HANCOCK CALIFORNIA TAX-FREE INCOME FUND | ANNUAL REPORT | |
TAX INFORMATION
Unaudited
For federal income tax purposes, the following information is furnished with respect to the distributions of the fund, if any, paid during its taxable year ended May 31, 2019.
The fund paid $190,141 in long term capital gain dividends.
99.09% of dividends from net investment income are exempt-interest dividends.
Eligible shareholders will be mailed a 2019 Form 1099-DIV in early 2020. This will reflect the tax character of all distributions paid in calendar year 2019.
Please consult a tax advisor regarding the tax consequences of your investment in the fund.
| | ANNUAL REPORT | JOHN HANCOCK CALIFORNIA TAX-FREE INCOME FUND | 33 |
This chart provides information about the Trustees and Officers who oversee your John Hancock fund. Officers elected by the Trustees manage the day-to-day operations of the fund and execute policies formulated by the Trustees.
Independent Trustees
| | | |
Name, year of birth
Position(s) held with Trust
Principal occupation(s) and other
directorships during past 5 years | Trustee
of the
Trust
since1 | Number of John
Hancock funds
overseen by
Trustee |
| Hassell H. McClellan, Born: 1945 | 2012 | 211 |
Trustee and Chairperson of the Board
Director/Trustee, Virtus Funds (since 2008); Director, The Barnes Group (since 2010); Associate Professor, The Wallace E. Carroll School of Management, Boston College (retired 2013). Trustee (since 2005) and Chairperson of the Board (since 2017) of various trusts within the John Hancock Fund Complex. |
| | | |
| Charles L. Bardelis,2 Born: 1941 | 2012 | 211 |
Trustee
Director, Island Commuter Corp. (marine transport). Trustee of various trusts within the John Hancock Fund Complex (since 1988). |
| | | |
| James R. Boyle,Born: 1959 | 2015 | 211 |
Trustee
Chief Executive Officer, Foresters Financial (since 2018); Chairman and Chief Executive Officer, Zillion Group, Inc. (formerly HealthFleet, Inc.) (healthcare) (2014-2018); Executive Vice President and Chief Executive Officer, U.S. Life Insurance Division of Genworth Financial, Inc. (insurance) (January 2014-July 2014); Senior Executive Vice President, Manulife Financial, President and Chief Executive Officer, John Hancock (1999-2012); Chairman and Director, John Hancock Investment Management LLC, John Hancock Investment Management Distributors LLC, and John Hancock Variable Trust Advisers LLC (2005-2010). Trustee of various trusts within the John Hancock Fund Complex (2005-2014 and since 2015). |
| | | |
| Peter S. Burgess,2 Born: 1942 | 2012 | 211 |
Trustee
Consultant (financial, accounting, and auditing matters) (since 1999); Certified Public Accountant; Partner, Arthur Andersen (independent public accounting firm) (prior to 1999); Director, Lincoln Educational Services Corporation (since 2004); Director, Symetra Financial Corporation (2010-2016); Director, PMA Capital Corporation (2004-2010). Trustee of various trusts within the John Hancock Fund Complex (since 2005). |
| | | |
| William H. Cunningham, Born: 1944 | 1989 | 211 |
Trustee
Professor, University of Texas, Austin, Texas (since 1971); former Chancellor, University of Texas System and former President of the University of Texas, Austin, Texas; Chairman (since 2009) and Director (since 2006), Lincoln National Corporation (insurance); Director, Southwest Airlines (since 2000); former Director, LIN Television (2009-2014). Trustee of various trusts within the John Hancock Fund Complex (since 1986). |
| | | |
| Grace K. Fey, Born: 1946 | 2012 | 211 |
Trustee
Chief Executive Officer, Grace Fey Advisors (since 2007); Director and Executive Vice President, Frontier Capital Management Company (1988-2007); Director, Fiduciary Trust (since 2009). Trustee of various trusts within the John Hancock Fund Complex (since 2008). |
ANNUAL REPORT | JOHN HANCOCK CALIFORNIA TAX-FREE INCOME FUND 34
Independent Trustees (continued)
| | | |
Name, year of birth
Position(s) held with Trust
Principal occupation(s) and other
directorships during past 5 years | Trustee
of the
Trust
since1 | Number of John
Hancock funds
overseen by
Trustee |
| Theron S. Hoffman,2 Born: 1947 | 2012 | 211 |
Trustee
Chief Executive Officer, T. Hoffman Associates, LLC (consulting firm) (since 2003); Director, The Todd Organization (consulting firm) (2003-2010); President, Westport Resources Management (investment management consulting firm) (2006-2008); Board Member, Senior Managing Director, Partner, and Operating Head, Putnam Investments (2000-2003); Executive Vice President, The Thomson Corp. (financial and legal information publishing) (1997-2000). Trustee of various trusts within the John Hancock Fund Complex (since 2008). |
| | | |
| Deborah C. Jackson, Born: 1952 | 2008 | 211 |
Trustee
President, Cambridge College, Cambridge, Massachusetts (since 2011); Board of Directors, National Association of Corporate Directors/New England (since 2015); Board of Directors, Association of Independent Colleges and Universities of Massachusetts (since 2014); Chief Executive Officer, American Red Cross of Massachusetts Bay (2002-2011); Board of Directors of Eastern Bank Corporation (since 2001); Board of Directors of Eastern Bank Charitable Foundation (since 2001); Board of Directors of American Student Assistance Corporation (1996-2009); Board of Directors of Boston Stock Exchange (2002-2008); Board of Directors of Harvard Pilgrim Healthcare (health benefits company) (2007-2011). Trustee of various trusts within the John Hancock Fund Complex (since 2008). |
| | | |
| James M. Oates, Born: 1946 | 2012 | 211 |
Trustee
Managing Director, Wydown Group (financial consulting firm) (since 1994); Chairman and Director, Emerson Investment Management, Inc. (2000-2015); Independent Chairman, Hudson Castle Group, Inc. (formerly IBEX Capital Markets, Inc.) (financial services company) (1997-2011); Director, Stifel Financial (since 1996); Director, Investor Financial Services Corporation (1995-2007); Director, Connecticut River Bancorp (1998-2014); Director/Trustee, Virtus Funds (since 1988). Trustee (since 2004) and Chairperson of the Board (2005-2016) of various trusts within the John Hancock Fund Complex. |
| | | |
| Steven R. Pruchansky, Born: 1944 | 1994 | 211 |
Trustee and Vice Chairperson of the Board
Managing Director, Pru Realty (since 2017); Chairman and Chief Executive Officer, Greenscapes of Southwest Florida, Inc. (since 2000); Director and President, Greenscapes of Southwest Florida, Inc. (until 2000); Member, Board of Advisors, First American Bank (until 2010); Managing Director, Jon James, LLC (real estate) (since 2000); Partner, Right Funding, LLC (2014-2017); Director, First Signature Bank & Trust Company (until 1991); Director, Mast Realty Trust (until 1994); President, Maxwell Building Corp. (until 1991). Trustee (since 1992), Chairperson of the Board (2011-2012), and Vice Chairperson of the Board (since 2012) of various trusts within the John Hancock Fund Complex. |
| | | |
| Gregory A. Russo, Born: 1949 | 2009 | 211 |
Trustee
Director and Audit Committee Chairman (since 2012), and Member, Audit Committee and Finance Committee (since 2011), NCH Healthcare System, Inc. (holding company for multi-entity healthcare system); Director and Member (since 2012) and Finance Committee Chairman (since 2014), The Moorings, Inc. (nonprofit continuing care community); Vice Chairman, Risk & Regulatory Matters, KPMG LLP (KPMG) (2002-2006); Vice Chairman, Industrial Markets, KPMG (1998-2002); Chairman and Treasurer, Westchester County, New York, Chamber of Commerce (1986-1992); Director, Treasurer, and Chairman of Audit and Finance Committees, Putnam Hospital Center (1989-1995); Director and Chairman of Fundraising Campaign, United Way of Westchester and Putnam Counties, New York (1990-1995). Trustee of various trusts within the John Hancock Fund Complex (since 2008). |
ANNUAL REPORT | JOHN HANCOCK CALIFORNIA TAX-FREE INCOME FUND 35
Non-Independent Trustees3
| | | |
Name, year of birth
Position(s) held with Trust
Principal occupation(s) and other
directorships during past 5 years | Trustee
of the
Trust
since1 | Number of John
Hancock funds
overseen by
Trustee |
| Andrew G. Arnott, Born: 1971 | 2017 | 211 |
President and Non-Independent Trustee
Head of Wealth and Asset Management, United States and Europe, for John Hancock and Manulife (since 2018); Executive Vice President, John Hancock Financial Services (since 2009, including prior positions); Director and Executive Vice President, John Hancock Investment Management LLC (since 2005, including prior positions); Director and Executive Vice President, John Hancock Variable Trust Advisers LLC (since 2006, including prior positions); President, John Hancock Investment Management Distributors LLC (since 2004, including prior positions); President of various trusts within the John Hancock Fund Complex (since 2007, including prior positions). |
| | | |
| Marianne Harrison, Born: 1963 | 2018 | 211 |
Non-Independent Trustee
President and CEO, John Hancock (since 2017); President and CEO, Manulife Canadian Division (2013-2017); Member, Board of Directors, American Council of Life Insurers (ACLI) (since 2018); Member, Board of Directors, Communitech, an industry-led innovation center that fosters technology companies in Canada (since 2017); Member, Board of Directors, Manulife Assurance Canada (since 2015); Board Member, St. Mary's General Hospital Foundation (since 2014); Member, Board of Directors, Manulife Bank of Canada (since 2013); Member, Standing Committee of the Canadian Life & Health Assurance Association (since 2013); Member, Board of Directors, John Hancock USA, John Hancock Life & Health, John Hancock New York (2012-2013). Trustee of various trusts within the John Hancock Fund Complex (since 2018). |
Principal officers who are not Trustees
| | |
Name, year of birth
Position(s) held with Trust
Principal occupation(s)
during past 5 years | Officer
of the
Trust
since |
| Francis V. Knox, Jr.,Born: 1947 | 2005 |
Chief Compliance Officer
Vice President, John Hancock Financial Services (since 2005); Chief Compliance Officer, various trusts within the John Hancock Fund Complex, John Hancock Investment Management LLC, and John Hancock Variable Trust Advisers LLC (since 2005). |
| | |
| Charles A. Rizzo, Born: 1957 | 2007 |
Chief Financial Officer
Vice President, John Hancock Financial Services (since 2008); Senior Vice President, John Hancock Investment Management LLC and John Hancock Variable Trust Advisers LLC (since 2008); Chief Financial Officer of various trusts within the John Hancock Fund Complex (since 2007). |
| | |
| Salvatore Schiavone, Born: 1965 | 2010 |
Treasurer
Assistant Vice President, John Hancock Financial Services (since 2007); Vice President, John Hancock Investment Management LLC and John Hancock Variable Trust Advisers LLC (since 2007); Treasurer of various trusts within the John Hancock Fund Complex (since 2007, including prior positions). |
ANNUAL REPORT | JOHN HANCOCK CALIFORNIA TAX-FREE INCOME FUND 36
Principal officers who are notTrustees (continued)
| | | |
Name, year of birth
Position(s) held with Trust
Principal occupation(s)
during past 5 years | Officer
of the
Trust
since |
| Christopher (Kit) Sechler,Born: 1973 | 2018 |
Chief Legal Officer and Secretary
Vice President and Deputy Chief Counsel, John Hancock Investments (since 2015); Assistant Vice President and Senior Counsel (2009-2015), John Hancock Investments; Chief Legal Officer and Secretary of various trusts within the John Hancock Fund Complex (since 2018); Assistant Secretary of John Hancock Investment Management, LLC and John Hancock Variable Trust Advisers LLC (since 2009). |
The business address for all Trustees and Officers is 200 Berkeley Street, Boston, Massachusetts 02116-5023.
The Statement of Additional Information of the fund includes additional information about members of the Board of Trustees of the Trust and is available without charge, upon request, by calling 800-225-5291.
| 1 | Each Trustee holds office until his or her successor is elected and qualified, or until the Trustee's death, retirement, resignation, or removal. Mr. Boyle has served as Trustee at various times prior to the date listed in the table. |
| 2 | Member of the Audit Committee. |
| 3 | The Trustee is a Non-Independent Trustee due to current or former positions with the Advisor and certain affiliates. |
ANNUAL REPORT | JOHN HANCOCK CALIFORNIA TAX-FREE INCOME FUND 37
| | |
Trustees
Hassell H. McClellan,Chairperson
Steven R. Pruchansky,Vice Chairperson
Andrew G. Arnott†
Charles L. Bardelis*
James R. Boyle
Peter S. Burgess*
William H. Cunningham
Grace K. Fey
Marianne Harrison†#
Theron S. Hoffman*
Deborah C. Jackson
James M. Oates
Gregory A. Russo
Officers
Andrew G. Arnott
President
Francis V. Knox, Jr.
Chief Compliance Officer
Charles A. Rizzo
Chief Financial Officer
Salvatore Schiavone
Treasurer
Christopher (Kit) Sechler**
Secretary and Chief Legal Officer
| Investment advisor
John Hancock Investment Management LLC
Subadvisor
Manulife Investment Management (US) LLC
Portfolio Managers
Dennis DiCicco
Jeffrey N. Given, CFA
Principal distributor
John Hancock Investment Management Distributors LLC
Custodian
State Street Bank and Trust Company
Transfer agent
John Hancock Signature Services, Inc.
Legal counsel
K&L Gates LLP
Independent registered public accounting firm
PricewaterhouseCoopers LLP
|
* Member of the Audit Committee
† Non-Independent Trustee
# Effective 6-19-18
** Effective 9-13-18
The fund's proxy voting policies and procedures, as well as the fund proxy voting record for the most recent twelve-month period ended June 30, are available free of charge on the Securities and Exchange Commission (SEC) website at sec.gov or on our website.
All of the fund's holdings as of the end of the third month of every fiscal quarter are filed with the SEC on Form N-PORT within 60 days of the end of the fiscal quarter. The fund's Form N-PORT filings are available on our website and the SEC's website, sec.gov.
We make this information on your fund, as well asmonthly portfolio holdings, and other fund details available on our website at jhinvestments.com or by calling 800-225-5291.
| | | | |
| | You can also contact us: |
| | 800-225-5291
jhinvestments.com | Regular mail:
John Hancock Signature Services, Inc.
P.O. Box 55913
Boston, MA 02205-5913
| Express mail:
John Hancock Signature Services, Inc.
2000 Crown Colony Drive
Suite 55913
Quincy, MA 02169-0953
|
ANNUAL REPORT | JOHN HANCOCK CALIFORNIA TAX-FREE INCOME FUND 38
John Hancock family of funds
| | | |
DOMESTIC EQUITY FUNDS
Blue Chip Growth
Classic Value
Disciplined Value
Disciplined Value Mid Cap
Equity Income
Financial Industries
Fundamental All Cap Core
Fundamental Large Cap Core
Fundamental Large Cap Value
New Opportunities
Regional Bank
Small Cap Core
Small Cap Growth
Small Cap Value
U.S. Global Leaders Growth
U.S. Quality Growth
Value Equity
GLOBAL AND INTERNATIONAL EQUITY FUNDS
Disciplined Value International
Emerging Markets
Emerging Markets Equity
Fundamental Global Franchise
Global Equity
Global Shareholder Yield
Global Thematic Opportunities
International Dynamic Growth
International Growth
International Small Company
| | INCOME FUNDS
Bond
California Tax-Free Income
Emerging Markets Debt
Floating Rate Income
Government Income
High Yield
High Yield Municipal Bond
Income
Investment Grade Bond
Money Market
Short Duration Bond
Short Duration Credit Opportunities
Spectrum Income
Strategic Income Opportunities
Tax-Free Bond
ALTERNATIVE AND SPECIALTY FUNDS
Absolute Return Currency
Alternative Asset Allocation
Disciplined Alternative Yield
Global Absolute Return Strategies
Infrastructure
Seaport Long/Short
|
A fund's investment objectives, risks, charges, and expenses should be considered carefully before investing. The prospectus contains this and other important information about the fund. To obtain a prospectus, contact your financial professional, call John Hancock Investments at 800-225-5291, or visit our website at jhinvestments.com. Please read the prospectus carefully before investing or sending money.
| | | |
ASSET ALLOCATION
Balanced
Income Allocation
Multi-Index Lifetime Portfolios
Multi-Index Preservation Portfolios
Multimanager Lifestyle Portfolios
Multimanager Lifetime Portfolios
Retirement Income 2040
EXCHANGE-TRADED FUNDS
John Hancock Multifactor Consumer Discretionary ETF
John Hancock Multifactor Consumer Staples ETF
John Hancock Multifactor Developed International ETF
John Hancock Multifactor Emerging Markets ETF
John Hancock Multifactor Energy ETF
John Hancock Multifactor Financials ETF
John Hancock Multifactor Healthcare ETF
John Hancock Multifactor Industrials ETF
John Hancock Multifactor Large Cap ETF
John Hancock Multifactor Materials ETF
John Hancock Multifactor Media and
Communications ETF
John Hancock Multifactor Mid Cap ETF
John Hancock Multifactor Small Cap ETF
John Hancock Multifactor Technology ETF
John Hancock Multifactor Utilities ETF
| | ENVIRONMENTAL, SOCIAL, AND
GOVERNANCE FUNDS
ESG All Cap Core
ESG Core Bond
ESG International Equity
ESG Large Cap Core
CLOSED-END FUNDS
Financial Opportunities
Hedged Equity & Income
Income Securities Trust
Investors Trust
Preferred Income
Preferred Income II
Preferred Income III
Premium Dividend
Tax-Advantaged Dividend Income
Tax-Advantaged Global Shareholder Yield
|
John Hancock Multifactor ETF shares are bought and sold at market price (not NAV), and are not individually redeemed
from the fund. Brokerage commissions will reduce returns.
John Hancock ETFs are distributed by Foreside Fund Services, LLC, and are subadvised by Dimensional Fund Advisors LP.
Foreside is not affiliated with John Hancock Funds, LLC or Dimensional Fund Advisors LP.
Dimensional Fund Advisors LP receives compensation from John Hancock in connection with licensing rights to the
John Hancock Dimensional indexes. Dimensional Fund Advisors LP does not sponsor, endorse, or sell, and makes no
representation as to the advisability of investing in, John Hancock Multifactor ETFs.
John Hancock Investment Management
A trusted brand
John Hancock Investment Management is a premier asset manager
representing one of America's most trusted brands, with a heritage of
financial stewardship dating back to 1862. Helping our shareholders
pursue their financial goals is at the core of everything we do. It's why
we support the role of professional financial advice and operate with
the highest standards of conduct and integrity.
A better way to invest
We serve investors globally through a unique multimanager approach:
We search the world to find proven portfolio teams with specialized
expertise for every strategy we offer, then we apply robust investment
oversight to ensure they continue to meet our uncompromising
standards and serve the best interests of our shareholders.
Results for investors
Our unique approach to asset management enables us to provide
a diverse set of investments backed by some of the world's best
managers, along with strong risk-adjusted returns across asset classes.
John Hancock Investment Management Distributors, LLC n Member FINRA, SIPC
200 Berkeley Street n Boston, MA 02116-5010 n 800-225-5291 n jhinvestments.com
This report is for the information of the shareholders of John Hancock California Tax-Free Income Fund. It is not authorized for distribution to prospective investors unless preceded or accompanied by a prospectus.
ITEM 2. CODE OF ETHICS.
As of the end of the year, May 31, 2019, the registrant has adopted a code of ethics, as defined in Item 2 of Form N-CSR, that applies to its Chief Executive Officer, Chief Financial Officer and Treasurer (respectively, the principal executive officer, the principal financial officer and the principal accounting officer, the “Covered Officers”). A copy of the code of ethics is filed as an exhibit to this Form N-CSR.
ITEM 3. AUDIT COMMITTEE FINANCIAL EXPERT.
Peter S. Burgess is the audit committee financial expert and is “independent”, pursuant to general instructions on Form N-CSR Item 3.
ITEM 4. PRINCIPAL ACCOUNTANT FEES AND SERVICES.
(a) Audit Fees
The aggregate fees billed for professional services rendered by the principal accountant for the audits of the registrant’s annual financial statements or services that are normally provided by the accountant in connection with statutory and regulatory filings or engagements amounted to the following for the fiscal years ended May 31, 2019 and 2018. These fees were billed to the registrant and were approved by the registrant’s audit committee.
| Fund | May 31, 2019 | May 31, 2018 |
| John Hancock California Tax-Free Income Fund | $ | 44,425 | $ | 40,625 |
(b) Audit-Related Services
Audit-related fees for assurance and related services by the principal accountant are billed to the registrant or to the registrant’s investment adviser (not including any sub-adviser whose role is primarily portfolio management and is subcontracted with or overseen by another investment adviser), and any entity controlling, controlled by, or under common control with the adviser ("control affiliates") that provides ongoing services to the registrant. The nature of the services provided was affiliated service provider internal controls reviews. Additionally, amounts billed to control affiliates were $113,000 and $110,200 for the fiscal years ended May 31, 2019 and 2018, respectively.
| Fund | May 31, 2019 | May 31, 2018 |
| John Hancock California Tax-Free Income Fund | $ | 571 | $ | 540 |
(c) Tax Fees
The aggregate fees billed for professional services rendered by the principal accountant for tax compliance, tax advice and tax planning (“tax fees”) amounted to the following for the fiscal years ended May 31, 2019 and 2018. The nature of the services comprising the tax fees was the review of the registrant’s tax returns and tax distribution requirements. These fees were billed to the registrant and were approved by the registrant’s audit committee.
| Fund | May 31, 2019 | May 31, 2018 |
| John Hancock California Tax-Free Income Fund | $ | 3,650 | $ | 3,650 |
(d) All Other Fees
The nature of the services comprising all other fees is attestation services surrounding new class launches. Other fees billed for professional services rendered by the principal accountant to the registrant or to the control affiliates for the fiscal years ended May 31, 2019 and 2018 amounted to the following:
| Fund | May 31, 2019 | May 31, 2018 |
| John Hancock California Tax-Free Income Fund | $ | 89 | $ | 3,834 |
(e)(1) Audit Committee Pre-Approval Policies and Procedures:
The trust’s Audit Committee must pre-approve all audit and non-audit services provided by the independent registered public accounting firm (the “Auditor”) relating to the operations or financial reporting of the funds. Prior to the commencement of any audit or non-audit services to a fund, the Audit Committee reviews the services to determine whether they are appropriate and permissible under applicable law.
The trust’s Audit Committee has adopted policies and procedures to, among other purposes, provide a framework for the Committee’s consideration of audit-related and non-audit services by the Auditor. The policies and procedures require that any audit-related and non-audit service provided by the Auditor and any non-audit service provided by the Auditor to a fund service provider that relates directly to the operations and financial reporting of a fund are subject to approval by the Audit Committee before such service is provided. Audit-related services provided by the Auditor that are expected to exceed $25,000 per year/per fund are subject to specific pre-approval by the Audit Committee. Tax services provided by the Auditor that are expected to exceed $30,000 per year/per fund are subject to specific pre-approval by the Audit Committee.
All audit services, as well as the audit-related and non-audit services that are expected to exceed the amounts stated above, must be approved in advance of provision of the service by formal resolution of the Audit Committee. At the regularly scheduled Audit Committee meetings, the Committee reviews a report summarizing the services, including fees, provided by the Auditor.
(e)(2) Services approved pursuant to paragraph (c)(7)(i)(C) of Rule 2-01 of Regulation S-X:
Audit-Related Fees, Tax Fees and All Other Fees:
There were no amounts that were approved by the Audit Committee pursuant to the de minimis exception under Rule 2-01 of Regulation S-X.
(f) According to the registrant’s principal accountant for the fiscal year ended May 31, 2019, the percentage of hours spent on the audit of the registrant's financial statements for the most recent fiscal year that were attributed to work performed by persons who were not full-time, permanent employees of principal accountant was less than 50%.
(g) The aggregate non-audit fees billed by the registrant’s principal accountant for non-audit services rendered to the registrant and rendered to the registrant's control affiliates for the fiscal years ended May 31, 2019 and 2018 amounted to the following:
| Trust | May 31, 2019 | May 31, 2018 |
| John Hancock California Tax-Free Income Fund | $ | 919,444 | $ | 6,716,119 |
(h) The audit committee of the registrant has considered the non-audit services provided by the registrant’s principal accountant to the control affiliates and has determined that the services that were not pre-approved are compatible with maintaining the principal accountant’s independence.
ITEM 5. AUDIT COMMITTEE OF LISTED REGISTRANTS.
The registrant has a separately-designated standing audit committee comprised of independent trustees. The members of the audit committee are as follows:
Peter S. Burgess - Chairman
Charles L. Bardelis
Theron S. Hoffman
ITEM 6. SCHEDULE OF INVESTMENTS.
(a) Not applicable.
(b) Not applicable.
ITEM 7. DISCLOSURE OF PROXY VOTING POLICIES AND PROCEDURES FOR CLOSED-END MANAGEMENT INVESTMENT COMPANIES.
Not applicable.
ITEM 8. PORTFOLIO MANAGERS OF CLOSED-END MANAGEMENT INVESTMENT COMPANIES.
Not applicable.
ITEM 9. PURCHASES OF EQUITY SECURITIES BY CLOSED-END MANAGEMENT INVESTMENT COMPANY AND AFFILIATED PURCHASERS.
Not applicable.
ITEM 10. SUBMISSION OF MATTERS TO A VOTE OF SECURITY HOLDERS.
The registrant has adopted procedures by which shareholders may recommend nominees to the registrant’s Board of Trustees. A copy of the procedures is filed as an exhibit to this Form N-CSR. See attached “John Hancock Funds – Nominating, Governance and Administration Committee Charter”.
ITEM 11. CONTROLS AND PROCEDURES.
(a) Based upon their evaluation of the registrant's disclosure controls and procedures as conducted within 90 days of the filing date of this Form N-CSR, the registrant's principal executive officer and principal financial officer have concluded that those disclosure controls and procedures provide reasonable assurance that the material information required to be disclosed by the registrant on this report is recorded, processed, summarized and reported within the time periods specified in the Securities and Exchange Commission's rules and forms.
(b) There were no changes in the registrant’s internal control over financial reporting that occurred during the fourth fiscal quarter of the period covered by this report that have materially affected, or are reasonably likely to materially affect, the registrant's internal control over financial reporting.
ITEM 12. DISCLOSURE OF SECURITIES LENDING ACTIVITIES FOR CLOSED-END MANAGEMENT INVESTMENT COMPANIES.: Not applicable.
ITEM 13. EXHIBITS.
(a)(1) Code of Ethics for Covered Officers is attached.
(a)(2) Separate certifications for the registrant's principal executive officer and principal financial officer, as required by Section 302 of the Sarbanes-Oxley Act of 2002 and Rule 30a-2(a) under the Investment Company Act of 1940, are attached.
(b)(1) Separate certifications for the registrant's principal executive officer and principal financial officer, as required by 18 U.S.C. Section 1350, as adopted pursuant to Section 906 of the Sarbanes-Oxley Act of 2002, and Rule 30a-2(b) under the Investment Company Act of 1940, are attached. The certifications furnished pursuant to this paragraph are not deemed to be "filed" for purposes of Section 18 of the Securities Exchange Act of 1934, or otherwise subject to the liability of that section. Such certifications are not deemed to be incorporated by reference into any filing under the Securities Act of 1933 or the Securities Exchange Act of 1934, except to the extent that the Registrant specifically incorporates them by reference.
(c)(1) Submission of Matters to a Vote of Security Holders is attached. See attached “John Hancock Funds – Nominating, Governance and Administration Committee Charter”.
SIGNATURES
Pursuant to the requirements of the Securities Exchange Act of 1934 and the InvestmentCompany Act of 1940, the registrant has duly caused this report to be signed on its behalf by the undersigned, thereunto duly authorized.
John Hancock California Tax-Free Income Fund
| By: | | /s/ Andrew Arnott |
| | Andrew Arnott |
| | President |
| |
| Date: | | July 22, 2019 |
Pursuant to the requirements of the Securities Exchange Act of 1934 and the Investment Company Act of 1940, this report has been signed below by the following persons on behalf of the registrant and in the capacities and on the dates indicated.
| By: | | /s/ Andrew Arnott |
| | Andrew Arnott |
| | President |
| |
| Date: | | July 22, 2019 |
| By: | | /s/ Charles A. Rizzo |
| | Charles A. Rizzo |
| | Chief Financial Officer |
| |
| Date: | | July 22, 2019 |