UNITED STATES
SECURITIES AND EXCHANGE COMMISSION
Washington, D.C. 20549
FORM N-CSR
CERTIFIED SHAREHOLDER REPORT OF REGISTERED
MANAGEMENT INVESTMENT COMPANIES
Investment Company Act file number 811-05979
John Hancock California Tax-Free Income Fund
(Exact name of registrant as specified in charter)
200 Berkeley Street, Boston, Massachusetts 02116
(Address of principal executive offices) (Zip code)
Salvatore Schiavone
Treasurer
200 Berkeley Street
Boston, Massachusetts 02116
(Name and address of agent for service)
Registrant's telephone number, including area code: 617-663-4497
| Date of fiscal year end: | May 31 | |
| Date of reporting period: | May 31, 2020 |
ITEM 1. REPORTS TO STOCKHOLDERS.
John Hancock
California Tax-Free Income Fund
Annual report 5/31/2020
Beginning on January 1, 2021, as permitted by regulations adopted by the Securities and Exchange Commission, paper copies of the fund's shareholder reports like this one will no longer be sent by mail, unless you specifically request paper copies of the reports from the fund or from your financial intermediary. Instead, the reports will be made available on a website, and you will be notified by mail each time a report is posted and provided with a website link to access the report.
If you already elected to receive shareholder reports electronically, you will not be affected by this change, and you do not need to take any action. You may elect to receive shareholder reports and other communications electronically by calling John Hancock Investment Management at 800-225-5291 (Class A, Class B and Class C shares) or 888-972-8696 (Class I and Class R6 shares) or by contacting your financial intermediary.
You may elect to receive all reports in paper, free of charge, at any time. You can inform John Hancock Investment Management or your financial intermediary that you wish to continue receiving paper copies of your shareholder reports by following the instructions listed above. Your election to receive reports in paper will apply to all funds held with John Hancock Investment Management or your financial intermediary.


A message to shareholders
Dear shareholder,
Global financial markets delivered strong returns during first half of the 12-month period ended May 31, 2020; however, heightened fears over the coronavirus (COVID-19) sent markets tumbling during the latter half of February and early March. Investors reacted by exiting higher-risk assets and moving into cash, leading to a liquidity crunch in the fixed-income markets.
In response to the sell-off, the U.S. Federal Reserve acted quickly, lowering interest rates to near zero and reinstating quantitative easing, as well as announcing its plans to shore up short-term debt. These steps, along with the passage of a $2 trillion federal economic stimulus bill, helped lift the markets during the last two months of the period, while credit spreads rebounded off their highs as liquidity concerns eased.
The continued spread of COVID-19, trade disputes, rising unemployment, and other geopolitical tensions may continue to create uncertainty among businesses and investors. Your financial professional can help position your portfolio so that it's sufficiently diversified to seek to meet your long-term objectives and to withstand the inevitable bouts of market volatility along the way.
On behalf of everyone at John Hancock Investment Management, I'd like to take this opportunity to welcome new shareholders and thank existing shareholders for the continued trust you've placed in us.
Sincerely,

Andrew G. Arnott
President and CEO,
John Hancock Investment Management
Head of Wealth and Asset Management,
United States and Europe
This commentary reflects the CEO's views as of this report's period end and are subject to change at any time. Diversification does not guarantee investment returns and does not eliminate risk of loss. All investments entail risks, including the possible loss of principal. For more up-to-date information, you can visit our website at jhinvestments.com.
John Hancock
California Tax-Free Income Fund
Table of contents
| 2 | Your fund at a glance | |
| 5 | Manager's discussion of fund performance | |
| 7 | A look at performance | |
| 9 | Your expenses | |
| 11 | Fund's investments | |
| 18 | Financial statements | |
| 21 | Financial highlights | |
| 26 | Notes to financial statements | |
| 33 | Report of independent registered public accounting firm | |
| 34 | Tax information | |
| 35 | Statement regarding liquidity risk management | |
| 38 | Trustees and Officers | |
| 42 | More information |
INVESTMENT OBJECTIVE
The fund seeks a high level of current income, consistent with preservation of capital, that is exempt from federal and California personal income taxes.
AVERAGE ANNUAL TOTAL RETURNS AS OF 5/31/2020 (%)
The Bloomberg Barclays California Municipal Bond Index is an unmanaged index comprising California investment-grade municipal bonds.
It is not possible to invest directly in an index. Index figures do not reflect expenses or sales charges, which would result in lower returns.
The fund's Morningstar category average is a group of funds with similar investment objectives and strategies and is the equal-weighted return of all funds per category. Morningstar places funds in certain categories based on their historical portfolio holdings. Figures from Morningstar, Inc. include reinvested distributions and do not take into account sales charges. Actual load-adjusted performance is lower.
The past performance shown here reflects reinvested distributions and the beneficial effect of any expense reductions, and does not guarantee future results. Performance of the other share classes will vary based on the difference in the fees and expenses of those classes. Shares will fluctuate in value and, when redeemed, may be worth more or less than their original cost. Current month-end performance may be lower or higher than the performance cited, and can be found at jhinvestments.com or by calling 800-225-5291. For further information on the fund's objectives, risks, and strategy, see the fund's prospectus.
PERFORMANCE HIGHLIGHTS OVER THE LAST TWELVE MONTHS
Municipal bonds performed well despite pandemic
Favorable supply-and-demand dynamics contributed to positive returns for municipal bonds, overcoming extraordinary volatility resulting from the COVID-19 pandemic.
Fund underperformed its benchmark
The fund's gain for the period trailed that of its benchmark, the Bloomberg Barclays California Municipal Bond Index.
Education and healthcare bonds detracted
Fund holdings in the education and healthcare sectors, both of which were adversely affected by the pandemic, contributed the most to the fund's underperformance of the benchmark.
QUALITY COMPOSITION AS OF 5/31/2020 (%)
PORTFOLIO COMPOSITION AS OF 5/31/2020 (%)
SECTOR COMPOSITION AS OF 5/31/2020 (%)
A note about risks
The fund may be subject to various risks as described in the fund's prospectus. A widespread health crisis such as a global pandemic could cause substantial market volatility, exchange trading suspensions and closures, impact the ability to complete redemptions, and affect fund performance. For example, the novel coronavirus disease (COVID-19) has resulted in significant disruptions to global business activity. The impact of a health crisis and other epidemics and pandemics that may arise in the future, could affect the global economy in ways that cannot necessarily be foreseen at the present time. A health crisis may exacerbate other pre-existing political, social, and economic risks. Any such impact could adversely affect the fund's performance, resulting in losses to your investment. For more information, please refer to the "Principal risks" section of the prospectus.
Can you discuss the municipal bond market's performance during the 12 months ended May 31, 2020?
It was an extraordinary 12-month period. From the beginning of the period into early 2020, municipal bond performance was driven by the same supply-and-demand imbalance that had been in place since early 2018. Demand for the tax benefits of municipal bonds remained strong as investors responded to recently imposed limits on state and local tax deductions, while other tax reform provisions led to a significant decline in municipal bond issuance. This combination, along with three interest rate cuts by the U.S. Federal Reserve (Fed) in the latter half of 2019, led to solid gains for municipal bonds.
Market conditions shifted dramatically over the last three months of the period as the COVID-19 pandemic disrupted global economic activity, resulting in a massive repricing of risk. As the U.S. economy shut down, concerns about a sharp drop-off in state and local tax revenues led to a broad sell-off in the municipal bond market. The Fed responded swiftly, slashing interest rates and announcing new quantitative easing measures, while Congress approved multiple stimulus bills. These efforts, along with the gradual reopening of many states' economies late in the period, helped reverse some of the decline in the municipal market.
Despite the extreme volatility over the last few months, municipal bonds posted positive returns for the period, while California municipal bonds outperformed the broader market.
How has the COVID-19 pandemic affected municipal credit quality in California?
The credit rating agencies have put some California municipal securities on negative credit watch, but they have generally avoided issuing rating downgrades at this point given the unprecedented nature of the pandemic. There is basically no visibility on state and local tax revenues going forward, though the recent reopenings are a positive sign. In addition, the state of California has maintained prudent fiscal discipline and savvy financial management in recent years, which should help sustain the state's finances during this challenging period.
How did the fund perform?
The fund posted a positive return but trailed its benchmark, the Bloomberg Barclays California Municipal Bond Index. The underperformance occurred entirely during the COVID-related downturn as fund holdings in the education and healthcare sectors detracted the most. The closure of many colleges and universities put downward pressure on higher education bonds, while the cancellation of elective surgeries—a significant source of revenue for many healthcare facilities—weighed on the healthcare sector. On the positive side, the fund's longer duration (a measure of interest-rate sensitivity) added value as the fund benefited more than the index from the overall decline in municipal bond yields.
Did you make any changes to the portfolio in response to the pandemic?
While holding on to our highest-conviction credits, we took advantage of the broad market decline to trade up in quality at attractive yield levels. We believe these adjustments will help the fund weather an uncertain environment, especially in regard to the pandemic and its effects on municipal tax revenues. We expect the favorable supply and demand situation in the municipal market to continue, even as state and local governments increase their borrowing to cover tax revenue shortfalls in the near term.
MANAGED BY
| Jeffrey N. Given, CFA, Manulife IM (US) |
| Dennis DiCicco, Manulife IM (US) |
![]()
TOTAL RETURNS FOR THE PERIOD ENDED MAY 31, 2020
| Average annual total returns (%) with maximum sales charge | Cumulative total returns (%) with maximum sales charge | SEC 30-day yield (%) subsidized | SEC 30-day yield (%) unsubsidized1 | Tax- equivalent subsidized yield (%)2 | |||||||||
| 1-year | 5-year | 10-year | 5-year | 10-year | as of 5-31-20 | as of 5-31-20 | as of 5-31-20 | ||||||
| Class A | -2.86 | 2.32 | 3.92 | 12.15 | 46.95 | 1.98 | 1.98 | 3.86 | |||||
| Class B | -4.40 | 2.02 | 3.71 | 10.53 | 44.01 | 1.34 | 1.23 | 2.61 | |||||
| Class C | -0.51 | 2.38 | 3.56 | 12.49 | 41.88 | 1.33 | 1.23 | 2.59 | |||||
| Class I3,4 | 1.37 | 3.25 | 4.40 | 17.34 | 53.82 | 2.20 | 2.19 | 4.29 | |||||
| Class R63,4 | 1.40 | 3.23 | 4.39 | 17.25 | 53.69 | 2.24 | 2.24 | 4.36 | |||||
| Index 1† | 4.59 | 3.82 | 4.59 | 20.60 | 56.63 | — | — | ||||||
| Index 2† | 3.98 | 3.74 | 4.14 | 20.17 | 49.97 | — | — | ||||||
Performance figures assume all distributions have been reinvested. Figures reflect maximum sales charges on Class A shares of 4.0% and the applicable contingent deferred sales charge (CDSC) on Class B and Class C shares. The returns for Class A shares have been adjusted to reflect the reduction in the maximum sales charge from 4.5% to 4.0%, effective 2-3-14. The Class B shares' CDSC declines annually between years 1 to 6 according to the following schedule: 5%, 4%, 3%, 3%, 2%, 1%. No sales charge will be assessed after the sixth year. Class C shares sold within one year of purchase are subject to a 1% CDSC. Sales charges are not applicable to Class I and Class R6 shares.
The expense ratios of the fund, both net (including any fee waivers and/or expense limitations) and gross (excluding any fee waivers and/or expense limitations), are set forth according to the most recent publicly available prospectus for the fund and may differ from those disclosed in the Financial highlights tables in this report. Net expenses reflect contractual expense limitations in effect until September 30, 2021 and are subject to change. Had the contractual fee waivers and expense limitations not been in place, gross expenses would apply. The expense ratios are as follows:
| Class A | Class B | Class C | Class I | Class R6 | |
| Gross (%) | 0.86 | 1.71 | 1.71 | 0.71 | 0.68 |
| Net (%) | 0.85 | 1.60 | 1.60 | 0.70 | 0.67 |
Please refer to the most recent prospectus and annual or semiannual report for more information on expenses and any expense limitation arrangements for each class.
The returns reflect past results and should not be considered indicative of future performance. The return and principal value of an investment will fluctuate so that shares, when redeemed, may be worth more or less than their original cost. Due to market volatility and other factors, the fund's current performance may be higher or lower than the performance shown. For current to the most recent month-end performance data, please call 800-225-5291 or visit the fund's website at jhinvestments.com.
The performance table above and the chart on the next page do not reflect the deduction of taxes that a shareholder would pay on fund distributions or the redemption of fund shares. The fund's performance results reflect any applicable fee waivers or expense reductions, without which the expenses would increase and results would have been less favorable.
| † | Index 1 is the Bloomberg Barclays California Municipal Bond Index; Index 2 is the Bloomberg Barclays Municipal Bond Index. |
See the following page for footnotes.
This chart and table show what happened to a hypothetical $10,000 investment in John Hancock California Tax-Free Income Fund for the share classes and periods indicated, assuming all distributions were reinvested. For comparison, we've shown the same investment in two separate indexes.
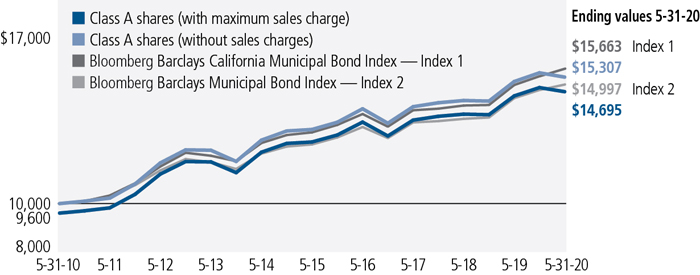
| Start date | With maximum sales charge ($) | Without sales charge ($) | Index 1 ($) | Index 2 ($) | |
| Class B5 | 5-31-10 | 14,401 | 14,401 | 15,663 | 14,997 |
| Class C5 | 5-31-10 | 14,188 | 14,188 | 15,663 | 14,997 |
| Class I3,4 | 5-31-10 | 15,382 | 15,382 | 15,663 | 14,997 |
| Class R63,4 | 5-31-10 | 15,369 | 15,369 | 15,663 | 14,997 |
The values shown in the chart for Class A shares with maximum sales charge have been adjusted to reflect the reduction in the Class A shares' maximum sales charge from 4.5% to 4.0%, which became effective on 2-3-14.
The Bloomberg Barclays California Municipal Bond Index is an unmanaged index composed of California investment-grade municipal bonds.
The Bloomberg Barclays Municipal Bond Index is an unmanaged index representative of the tax-exempt bond market.
It is not possible to invest directly in an index. Index figures do not reflect expenses or sales charges, which would result in lower returns.
Footnotes related to performance pages
| 1 | Unsubsidized yield reflects what the yield would have been without the effect of reimbursements and waivers. |
| 2 | Tax-equivalent yield is based on the maximum federal income tax rate of 40.8% and a state tax rate of 13.3%. |
| 3 | Class I shares and Class R6 shares were first offered on 2-13-17 and 8-30-17, respectively. Returns prior to these dates are those of Class A shares that have not been adjusted for class-specific expenses; otherwise, returns would vary. |
| 4 | For certain type of investors, as described in the fund's prospectus. |
| 5 | The contingent deferred sales charge is not applicable. |
| ANNUAL REPORT | JOHN HANCOCK CALIFORNIA TAX-FREE INCOME FUND | 9 |
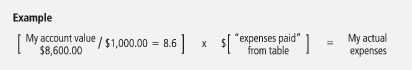
| Account value on 12-1-2019 | Ending value on 5-31-2020 | Expenses paid during period ended 5-31-20201 | Annualized expense ratio | ||
| Class A | Actual expenses/actual returns | $1,000.00 | $ 988.30 | $4.23 | 0.85% |
| Hypothetical example | 1,000.00 | 1,020.80 | 4.29 | 0.85% | |
| Class B | Actual expenses/actual returns | 1,000.00 | 983.70 | 7.93 | 1.60% |
| Hypothetical example | 1,000.00 | 1,017.00 | 8.07 | 1.60% | |
| Class C | Actual expenses/actual returns | 1,000.00 | 984.60 | 7.94 | 1.60% |
| Hypothetical example | 1,000.00 | 1,017.00 | 8.07 | 1.60% | |
| Class I | Actual expenses/actual returns | 1,000.00 | 989.10 | 3.48 | 0.70% |
| Hypothetical example | 1,000.00 | 1,021.50 | 3.54 | 0.70% | |
| Class R6 | Actual expenses/actual returns | 1,000.00 | 988.30 | 3.33 | 0.67% |
| Hypothetical example | 1,000.00 | 1,021.70 | 3.39 | 0.67% |
| 1 | Expenses are equal to the annualized expense ratio, multiplied by the average account value over the period, multiplied by 183/366 (to reflect the one-half year period). |
| 10 | JOHN HANCOCK CALIFORNIA TAX-FREE INCOME FUND | ANNUAL REPORT |
| Rate (%) | Maturity date | Par value^ | Value | ||
| Municipal bonds 98.4% | $207,798,624 | ||||
| (Cost $197,376,428) | |||||
| California 97.0% | 204,869,383 | ||||
| ABAG Finance Authority for Nonprofit Corps. Sharp HealthCare, Series A | 5.000 | 08-01-43 | 2,000,000 | 2,194,339 | |
| Burbank Unified School District Convertible Capital Appreciation Election 2013, GO (0.000% to 8-1-23, then 4.500% thereafter) | 0.000 | 08-01-37 | 1,770,000 | 1,874,412 | |
| California Community Housing Agency Annadel Apartments, Series A (A) | 5.000 | 04-01-49 | 1,000,000 | 1,037,520 | |
| California Community Housing Agency Serenity at Larkspur, Series A (A) | 5.000 | 02-01-50 | 1,000,000 | 1,040,370 | |
| California Community Housing Agency Verdant at Green Valley Project, Series A (A) | 5.000 | 08-01-49 | 1,000,000 | 1,038,670 | |
| California County Tobacco Securitization Agency Fresno County Funding Corp. | 6.000 | 06-01-35 | 1,765,000 | 1,765,618 | |
| California County Tobacco Securitization Agency Kern County Tobacco Funding Corp. | 5.000 | 06-01-40 | 1,500,000 | 1,535,415 | |
| California Educational Facilities Authority Pepperdine University | 5.000 | 10-01-49 | 2,550,000 | 3,013,947 | |
| California Educational Facilities Authority University of Redlands, Series A | 5.000 | 10-01-35 | 1,000,000 | 1,095,680 | |
| California Enterprise Development Authority Academy for Academic Excellence Project, Series A (A) | 5.000 | 07-01-40 | 430,000 | 430,237 | |
| California Enterprise Development Authority Academy for Academic Excellence Project, Series A (A) | 5.000 | 07-01-50 | 350,000 | 341,478 | |
| California Enterprise Development Authority Academy for Academic Excellence Project, Series A (A) | 5.000 | 07-01-55 | 240,000 | 230,789 | |
| California Health Facilities Financing Authority Children's Hospital, Series A | 5.000 | 08-15-47 | 1,000,000 | 1,104,810 | |
| California Health Facilities Financing Authority City of Hope Obligated Group | 4.000 | 11-15-45 | 1,000,000 | 1,100,570 | |
| California Health Facilities Financing Authority El Camino Hospital | 5.000 | 02-01-42 | 1,000,000 | 1,163,770 | |
| California Health Facilities Financing Authority El Camino Hospital | 5.000 | 02-01-47 | 1,425,000 | 1,647,728 | |
| California Health Facilities Financing Authority Lucile Packard Children's Hospital, Series B | 5.000 | 08-15-55 | 1,000,000 | 1,133,840 | |
| California Health Facilities Financing Authority Lucile Salter Packard Children's Hospital, Series A | 5.000 | 08-15-43 | 1,000,000 | 1,108,560 | |
| California Health Facilities Financing Authority Standford Health Care, Series A | 4.000 | 08-15-50 | 1,000,000 | 1,134,550 | |
| California Health Facilities Financing Authority Sutter Health, Series A | 5.000 | 08-15-43 | 1,000,000 | 1,132,910 |
| SEE NOTES TO FINANCIAL STATEMENTS | ANNUAL REPORT | JOHN HANCOCK CALIFORNIA TAX-FREE INCOME FUND | 11 |
| Rate (%) | Maturity date | Par value^ | Value | ||
| California (continued) | |||||
| California Housing Finance Series A | 4.250 | 01-15-35 | 989,524 | $1,023,435 | |
| California Municipal Finance Authority Channing House Project, Series A (B) | 4.000 | 05-15-40 | 1,500,000 | 1,650,930 | |
| California Municipal Finance Authority Collegiate Housing Foundation Davis-I, LLC, West Village Student Housing Project (B) | 4.000 | 05-15-48 | 1,365,000 | 1,379,947 | |
| California Municipal Finance Authority HumanGood Obligated Group, Series A | 5.000 | 10-01-44 | 1,000,000 | 1,026,110 | |
| California Municipal Finance Authority LINXS APM Project, AMT | 5.000 | 12-31-43 | 1,000,000 | 1,084,270 | |
| California Municipal Finance Authority Paradise Valley Estates Project, Series A (B) | 5.000 | 01-01-49 | 1,500,000 | 1,759,470 | |
| California Municipal Finance Authority Retirement Housing Foundation Obligation Group, Series A | 5.000 | 11-15-31 | 1,500,000 | 1,677,705 | |
| California Municipal Finance Authority William Jessup University | 5.000 | 08-01-39 | 1,500,000 | 1,511,970 | |
| California Municipal Finance Authority Wineville School Project, Series A (B) | 5.000 | 10-01-42 | 2,000,000 | 2,292,720 | |
| California Pollution Control Financing Authority San Diego County Water Authority Desalination Project Pipeline (A) | 5.000 | 07-01-39 | 1,000,000 | 1,102,530 | |
| California Pollution Control Financing Authority San Diego County Water Authority Desalination Project Pipeline (A) | 5.000 | 11-21-45 | 1,500,000 | 1,637,595 | |
| California Pollution Control Financing Authority Waste Management, Inc., Series A1, AMT | 3.375 | 07-01-25 | 1,000,000 | 1,073,110 | |
| California Pollution Control Financing Authority Waste Management, Inc., Series A3, AMT | 4.300 | 07-01-40 | 4,675,000 | 5,225,481 | |
| California Public Finance Authority Excelsior Charter Schools Project, Series A (A) | 5.000 | 06-15-50 | 500,000 | 494,620 | |
| California Public Finance Authority Excelsior Charter Schools Project, Series A (A) | 5.000 | 06-15-55 | 500,000 | 484,335 | |
| California Public Finance Authority Henry Mayo Newhall Hospital | 5.000 | 10-15-47 | 2,000,000 | 2,157,760 | |
| California Public Finance Authority Trinity Classical Academy, Series A (A) | 5.000 | 07-01-44 | 110,000 | 107,733 | |
| California Public Finance Authority Trinity Classical Academy, Series A (A) | 5.000 | 07-01-54 | 325,000 | 311,708 | |
| California School Finance Authority Aspire Public Schools (A) | 5.000 | 08-01-46 | 3,275,000 | 3,398,369 | |
| California School Finance Authority Granada Hills Charter High School Obligated Group (A) | 5.000 | 07-01-43 | 1,000,000 | 1,046,780 | |
| California School Finance Authority Kipp LA Project, Series A (A) | 5.000 | 07-01-47 | 1,500,000 | 1,605,270 | |
| California State Public Works Board Various Capital Projects, Series A | 5.000 | 04-01-37 | 1,000,000 | 1,070,340 |
| 12 | JOHN HANCOCK CALIFORNIA TAX-FREE INCOME FUND | ANNUAL REPORT | SEE NOTES TO FINANCIAL STATEMENTS |
| Rate (%) | Maturity date | Par value^ | Value | ||
| California (continued) | |||||
| California State Public Works Board Various Correctional Facilities, Series A | 5.000 | 09-01-39 | 2,500,000 | $2,845,300 | |
| California State University College and University Revenue, Series A | 5.000 | 11-01-44 | 2,000,000 | 2,314,840 | |
| California Statewide Communities Development Authority Adventist Health System, Series A | 5.000 | 03-01-48 | 1,885,000 | 2,184,960 | |
| California Statewide Communities Development Authority CHF Irvine LLC | 5.000 | 05-15-40 | 2,735,000 | 2,874,102 | |
| California Statewide Communities Development Authority Front Porch Communities and Services, Series A | 5.000 | 04-01-47 | 500,000 | 564,135 | |
| California Statewide Communities Development Authority Infrastructure Program Revenue, Series B | 5.000 | 09-02-44 | 1,000,000 | 1,042,650 | |
| California Statewide Communities Development Authority Redlands Community Hospital | 5.000 | 10-01-46 | 2,000,000 | 2,187,800 | |
| California Statewide Communities Development Authority Redwoods Project (B) | 5.375 | 11-15-44 | 1,500,000 | 1,690,620 | |
| California Statewide Financing Authority Tobacco Settlement, Series A | 6.000 | 05-01-37 | 2,500,000 | 2,507,225 | |
| California Statewide Financing Authority Tobacco Settlement, Series B | 6.000 | 05-01-37 | 3,000,000 | 3,008,670 | |
| City of Belmont Library Project, Series A (B) | 5.750 | 08-01-24 | 1,000,000 | 1,122,950 | |
| City of Irvine Community Facilities District, No. 2013-3 Great Park | 5.000 | 09-01-49 | 2,000,000 | 2,145,640 | |
| City of La Verne Brethren Hillcrest Homes | 5.000 | 05-15-36 | 750,000 | 746,715 | |
| City of Long Beach Alamitos Bay Marina Project | 5.000 | 05-15-45 | 1,000,000 | 1,007,550 | |
| City of Long Beach Community Facilities District 6-Pike Project | 6.250 | 10-01-26 | 2,035,000 | 2,038,622 | |
| City of Long Beach Harbor Revenue, Series A | 5.000 | 05-15-49 | 2,000,000 | 2,460,380 | |
| City of Los Angeles Department of Airports Los Angeles International Airport, Series D, AMT | 4.000 | 05-15-44 | 2,000,000 | 2,126,440 | |
| City of San Clemente Community Facilities District, No. 2006-1 | 5.000 | 09-01-46 | 1,980,000 | 2,139,806 | |
| City of San Francisco Public Utilities Commission Water Revenue Green Bonds, Series A | 5.000 | 11-01-45 | 1,500,000 | 1,768,545 | |
| City of San Mateo Community Facilities District, No. 2008-1 Bay Meadows | 5.500 | 09-01-44 | 2,000,000 | 2,101,100 |
| SEE NOTES TO FINANCIAL STATEMENTS | ANNUAL REPORT | JOHN HANCOCK CALIFORNIA TAX-FREE INCOME FUND | 13 |
| Rate (%) | Maturity date | Par value^ | Value | ||
| California (continued) | |||||
| College of the Sequoias Tulare Area Improvement District No. 3 Election of 2008, Series B, GO (B)(C) | 2.645 | 08-01-40 | 2,890,000 | $1,693,916 | |
| Foothill-Eastern Transportation Corridor Agency Highway Revenue Tolls, Series A | 5.750 | 01-15-46 | 5,000,000 | 5,521,000 | |
| Golden State Tobacco Securitization Corp. Series A | 5.000 | 06-01-40 | 5,000,000 | 5,733,050 | |
| Golden State Tobacco Securitization Corp. Series A | 5.000 | 06-01-45 | 3,250,000 | 3,700,353 | |
| Golden State Tobacco Securitization Corp. Series A-1 | 3.500 | 06-01-36 | 2,000,000 | 2,004,020 | |
| Golden State Tobacco Securitization Corp. Series A-1 | 5.000 | 06-01-47 | 1,610,000 | 1,610,692 | |
| Inland Valley Development Agency Series A | 5.000 | 09-01-44 | 2,500,000 | 2,714,700 | |
| Lancaster School District School Improvements (B)(C) | 0.404 | 04-01-22 | 1,380,000 | 1,369,691 | |
| Los Angeles Community Facilities District Cascades Business Park | 6.400 | 09-01-22 | 240,000 | 241,421 | |
| Los Angeles County Public Works Financing Authority Series D | 5.000 | 12-01-45 | 3,000,000 | 3,503,220 | |
| Los Angeles County Regional Financing Authority Montecedro, Inc. Project, Series A (B) | 5.000 | 11-15-44 | 1,355,000 | 1,490,473 | |
| Los Angeles Department of Water & Power Power Systems, Series D | 5.000 | 07-01-44 | 1,000,000 | 1,151,050 | |
| Los Angeles Unified School District Series RYQ, GO | 4.000 | 07-01-44 | 1,500,000 | 1,750,905 | |
| Marin Healthcare District Election of 2013, GO | 4.000 | 08-01-45 | 1,000,000 | 1,096,650 | |
| Metropolitan Water District of Southern California Series A | 5.000 | 10-01-49 | 1,500,000 | 1,932,165 | |
| Morgan Hill Redevelopment Successor Agency Series A | 5.000 | 09-01-33 | 1,750,000 | 1,981,455 | |
| M-S-R Energy Authority Natural Gas Revenue, Series B | 6.500 | 11-01-39 | 1,500,000 | 2,243,925 | |
| Norman Y. Mineta San Jose International Airport SJC Series A, AMT | 5.000 | 03-01-47 | 3,000,000 | 3,380,640 | |
| Oakland Unified School District/Alameda County Series A, GO | 5.000 | 08-01-40 | 1,500,000 | 1,727,895 | |
| Orange County Community Facilities District 2017-1 Esencia Village, Series A | 5.000 | 08-15-47 | 2,000,000 | 2,230,420 | |
| Pacifica School District Series C, GO (B)(C) | 1.118 | 08-01-26 | 1,000,000 | 932,770 | |
| Port of Los Angeles Series A, AMT | 5.000 | 08-01-44 | 2,000,000 | 2,248,080 | |
| River Islands Public Financing Authority Community Facilities District, No. 2003-1 | 5.500 | 09-01-45 | 2,000,000 | 2,124,840 |
| 14 | JOHN HANCOCK CALIFORNIA TAX-FREE INCOME FUND | ANNUAL REPORT | SEE NOTES TO FINANCIAL STATEMENTS |
| Rate (%) | Maturity date | Par value^ | Value | ||
| California (continued) | |||||
| River Islands Public Financing Authority Community Facilities District, No. 2003-1, Series A | 5.000 | 09-01-48 | 1,250,000 | $1,365,463 | |
| Riverside County Transportation Commission Senior Lien, Series A | 5.750 | 06-01-48 | 1,000,000 | 1,068,490 | |
| Sacramento Municipal Utility District Electric Revenue, Series H | 4.000 | 08-15-45 | 1,500,000 | 1,778,700 | |
| San Diego Public Facilities Financing Authority Capital Improvement Projects, Series A | 5.000 | 10-15-44 | 1,000,000 | 1,182,780 | |
| San Diego Public Facilities Financing Authority Series A | 3.000 | 08-01-49 | 1,500,000 | 1,572,150 | |
| San Diego Public Facilities Financing Authority Series A | 4.000 | 08-01-45 | 500,000 | 588,075 | |
| San Diego Unified School District Series I, GO (C) | 3.511 | 07-01-39 | 1,250,000 | 640,813 | |
| San Francisco City & County Airport Commission Special Facilities Lease, SFO Fuel Company LLC, Series A, AMT | 5.000 | 01-01-47 | 2,000,000 | 2,313,200 | |
| San Francisco City & County Airport Commission (California) Series E, AMT | 5.000 | 05-01-50 | 1,500,000 | 1,735,095 | |
| San Francisco City & County Redevelopment Successor Agency Department of General Services Lease, No. 6, Mission Bay South, Series A | 5.150 | 08-01-35 | 1,250,000 | 1,255,100 | |
| San Francisco City & County Redevelopment Successor Agency Mission Bay Project, Series A | 5.000 | 08-01-43 | 1,000,000 | 1,092,260 | |
| San Joaquin Hills Transportation Corridor Agency Highway Revenue Tolls, Escrowed to Maturity (C) | 0.402 | 01-01-22 | 4,500,000 | 4,470,971 | |
| San Joaquin Hills Transportation Corridor Agency Highway Revenue Tolls, Series A | 5.000 | 01-15-44 | 2,500,000 | 2,675,100 | |
| San Mateo Joint Powers Financing Authority Capital Projects Program (B) | 5.000 | 07-01-21 | 1,815,000 | 1,866,619 | |
| Santa Ana Financing Authority Police Administration & Holding Facility, Series A (B) | 6.250 | 07-01-24 | 5,000,000 | 5,630,650 | |
| Santa Ana Financing Authority Prerefunded, Police Administration & Holding Facility, Series A (B) | 6.250 | 07-01-24 | 5,000,000 | 5,598,450 | |
| Santa Margarita Water District Community Facilities District, No. 2013-1 | 5.625 | 09-01-43 | 745,000 | 797,701 | |
| Santee School District Election of 2006, Series E, GO (B)(C) | 2.973 | 05-01-51 | 1,530,000 | 610,394 | |
| South Orange County Public Financing Authority Series A | 5.000 | 08-15-33 | 1,000,000 | 1,061,200 | |
| South Orange County Public Financing Authority Series A | 5.000 | 08-15-34 | 450,000 | 476,942 | |
| Southern California Public Power Authority Apex Power Project, Series A | 5.000 | 07-01-38 | 1,000,000 | 1,155,380 |
| SEE NOTES TO FINANCIAL STATEMENTS | ANNUAL REPORT | JOHN HANCOCK CALIFORNIA TAX-FREE INCOME FUND | 15 |
| Rate (%) | Maturity date | Par value^ | Value | ||
| California (continued) | |||||
| Southern California Public Power Authority Natural Gas Project Revenue, Series A | 5.250 | 11-01-26 | 2,000,000 | $2,394,420 | |
| State of California Construction Bonds, GO | 5.000 | 10-01-49 | 1,000,000 | 1,270,290 | |
| State of California Various Purpose, GO | 3.000 | 03-01-50 | 1,500,000 | 1,578,915 | |
| State of California Various Purpose, GO | 5.000 | 04-01-32 | 2,000,000 | 2,805,000 | |
| State of California Various Purpose-Bid Group B, GO | 5.000 | 08-01-36 | 1,000,000 | 1,274,640 | |
| Sweetwater Union High School District Ad Valorem Property Tax, GO | 4.000 | 08-01-42 | 500,000 | 541,675 | |
| Turlock Irrigation District Electricity, Power & Light Revenues (D) | 5.000 | 01-01-41 | 1,000,000 | 1,259,890 | |
| University of California Series AZ | 5.000 | 05-15-48 | 1,500,000 | 1,847,685 | |
| West Covina Community Development Commission Successor Agency Fashion Plaza | 6.000 | 09-01-22 | 2,215,000 | 2,369,673 | |
| William S. Hart Union High School District Community Facilities District, No. 2015-1 | 5.000 | 09-01-47 | 1,000,000 | 1,082,880 | |
| Puerto Rico 1.4% | 2,929,241 | ||||
| Puerto Rico Sales Tax Financing Corp. Series A-1 | 4.750 | 07-01-53 | 1,500,000 | 1,459,530 | |
| Puerto Rico Sales Tax Financing Corp. Series A-1 (C) | 5.247 | 07-01-46 | 2,500,000 | 645,950 | |
| Puerto Rico Sales Tax Financing Corp. Series A-2 | 4.784 | 07-01-58 | 850,000 | 823,761 | |
| Par value^ | Value | ||||
| Short-term investments 1.2% | $2,478,000 | ||||
| (Cost $2,478,000) | |||||
| Repurchase agreement 1.2% | $2,478,000 | ||||
| Barclays Tri-Party Repurchase Agreement dated 5-29-20 at 0.050% to be repurchased at $2,298,010 on 6-1-20, collateralized by $2,000,700 U.S. Treasury Notes, 2.750% due 2-15-28 (valued at $2,344,048) | 2,298,000 | 2,298,000 | |||
| Repurchase Agreement with State Street Corp. dated 5-29-20 at 0.000% to be repurchased at $180,000 on 6-1-20, collateralized by $175,000 U.S. Treasury Notes, 2.000% due 11-30-22 (valued at $184,553) | 180,000 | 180,000 | |||
| Total investments (Cost $199,854,428) 99.6% | $210,276,624 | ||||
| Other assets and liabilities, net 0.4% | 867,679 | ||||
| Total net assets 100.0% | $211,144,303 | ||||
| 16 | JOHN HANCOCK CALIFORNIA TAX-FREE INCOME FUND | ANNUAL REPORT | SEE NOTES TO FINANCIAL STATEMENTS |
| The percentage shown for each investment category is the total value of the category as a percentage of the net assets of the fund. | |
| ^All par values are denominated in U.S. dollars unless otherwise indicated. | |
| Security Abbreviations and Legend | |
| AMT | Interest earned from these securities may be considered a tax preference item for purpose of the Federal Alternative Minimum Tax. |
| GO | General Obligation |
| (A) | These securities are exempt from registration under Rule 144A of the Securities Act of 1933. Such securities may be resold, normally to qualified institutional buyers, in transactions exempt from registration. |
| (B) | Bond is insured by one or more of the companies listed in the insurance coverage table below. |
| (C) | Zero coupon bonds are issued at a discount from their principal amount in lieu of paying interest periodically. Rate shown is the effective yield at period end. |
| (D) | Security purchased or sold on a when-issued or delayed delivery basis. |
| Insurance coverage | As a % of total investments |
| National Public Finance Guarantee Corp. | 6.7 |
| California Mortgage Insurance | 3.1 |
| Assured Guaranty Municipal Corp. | 1.7 |
| Build America Mutual Assurance Company | 1.7 |
| Ambac Financial Group, Inc. | 0.5 |
| TOTAL | 13.7 |
| SEE NOTES TO FINANCIAL STATEMENTS | ANNUAL REPORT | JOHN HANCOCK CALIFORNIA TAX-FREE INCOME FUND | 17 |
| Assets | |
| Unaffiliated investments, at value (Cost $199,854,428) | $210,276,624 |
| Cash | 821 |
| Interest receivable | 2,447,913 |
| Receivable for fund shares sold | 51,386 |
| Other assets | 9,420 |
| Total assets | 212,786,164 |
| Liabilities | |
| Distributions payable | 59,428 |
| Payable for delayed delivery securities purchased | 1,211,320 |
| Payable for fund shares repurchased | 184,347 |
| Payable to affiliates | |
| Investment management fees | 95,980 |
| Accounting and legal services fees | 13,457 |
| Transfer agent fees | 7,204 |
| Distribution and service fees | 21,621 |
| Trustees' fees | 182 |
| Other liabilities and accrued expenses | 48,322 |
| Total liabilities | 1,641,861 |
| Net assets | $211,144,303 |
| Net assets consist of | |
| Paid-in capital | $200,218,452 |
| Total distributable earnings (loss) | 10,925,851 |
| Net assets | $211,144,303 |
| Net asset value per share | |
| Based on net asset value and shares outstanding - the fund has an unlimited number of shares authorized with no par value | |
| Class A ($173,206,180 ÷ 16,255,522 shares)1 | $10.66 |
| Class B ($285,028 ÷ 26,731 shares)1 | $10.66 |
| Class C ($15,503,736 ÷ 1,455,005 shares)1 | $10.66 |
| Class I ($15,319,637 ÷ 1,437,040 shares) | $10.66 |
| Class R6 ($6,829,722 ÷ 640,465 shares) | $10.66 |
| Maximum offering price per share | |
| Class A (net asset value per share ÷ 96%)2 | $11.10 |
| 1 | Redemption price per share is equal to net asset value less any applicable contingent deferred sales charge. |
| 2 | On single retail sales of less than $100,000. On sales of $100,000 or more and on group sales the offering price is reduced. |
| 18 | JOHN HANCOCK California Tax-Free Income Fund | ANNUAL REPORT | SEE NOTES TO FINANCIAL STATEMENTS |
| Investment income | |
| Interest | $8,484,573 |
| Expenses | |
| Investment management fees | 1,178,990 |
| Distribution and service fees | 447,915 |
| Accounting and legal services fees | 36,194 |
| Transfer agent fees | 88,886 |
| Trustees' fees | 3,743 |
| Custodian fees | 52,319 |
| State registration fees | 14,277 |
| Printing and postage | 47,425 |
| Professional fees | 61,220 |
| Other | 17,261 |
| Total expenses | 1,948,230 |
| Less expense reductions | (33,306) |
| Net expenses | 1,914,924 |
| Net investment income | 6,569,649 |
| Realized and unrealized gain (loss) | |
| Net realized gain (loss) on | |
| Unaffiliated investments | (845,679) |
| (845,679) | |
| Change in net unrealized appreciation (depreciation) of | |
| Unaffiliated investments | (3,587,750) |
| (3,587,750) | |
| Net realized and unrealized loss | (4,433,429) |
| Increase in net assets from operations | $2,136,220 |
| SEE NOTES TO FINANCIAL STATEMENTS | ANNUAL REPORT | JOHN HANCOCK California Tax-Free Income Fund | 19 |
| Year ended 5-31-20 | Year ended 5-31-19 | |
| Increase (decrease) in net assets | ||
| From operations | ||
| Net investment income | $6,569,649 | $6,875,934 |
| Net realized gain (loss) | (845,679) | 1,195,778 |
| Change in net unrealized appreciation (depreciation) | (3,587,750) | 2,813,074 |
| Increase in net assets resulting from operations | 2,136,220 | 10,884,786 |
| Distributions to shareholders | ||
| From earnings | ||
| Class A | (6,845,190) | (5,986,856) |
| Class B | (11,003) | (13,485) |
| Class C | (537,072) | (524,922) |
| Class I | (483,472) | (383,200) |
| Class R6 | (204,555) | (95,093) |
| Total distributions | (8,081,292) | (7,003,556) |
| From fund share transactions | 7,406,442 | (7,928,934) |
| Total increase (decrease) | 1,461,370 | (4,047,704) |
| Net assets | ||
| Beginning of year | 209,682,933 | 213,730,637 |
| End of year | $211,144,303 | $209,682,933 |
| 20 | JOHN HANCOCK California Tax-Free Income Fund | ANNUAL REPORT | SEE NOTES TO FINANCIAL STATEMENTS |
| CLASS A SHARES Period ended | 5-31-20 | 5-31-19 | 5-31-18 | 5-31-17 | 5-31-16 |
| Per share operating performance | |||||
| Net asset value, beginning of period | $10.94 | $10.73 | $10.90 | $11.22 | $10.91 |
| Net investment income1 | 0.34 | 0.36 | 0.36 | 0.37 | 0.39 |
| Net realized and unrealized gain (loss) on investments | (0.20) | 0.22 | (0.16) | (0.30) | 0.32 |
| Total from investment operations | 0.14 | 0.58 | 0.20 | 0.07 | 0.71 |
| Less distributions | |||||
| From net investment income | (0.34) | (0.36) | (0.37) | (0.39) | (0.40) |
| From net realized gain | (0.08) | (0.01) | — | — | — |
| Total distributions | (0.42) | (0.37) | (0.37) | (0.39) | (0.40) |
| Net asset value, end of period | $10.66 | $10.94 | $10.73 | $10.90 | $11.22 |
| Total return (%)2,3 | 1.22 | 5.57 | 1.85 | 0.63 | 6.63 |
| Ratios and supplemental data | |||||
| Net assets, end of period (in millions) | $173 | $176 | $181 | $213 | $254 |
| Ratios (as a percentage of average net assets): | |||||
| Expenses before reductions | 0.85 | 0.86 | 0.85 | 0.83 | 0.84 |
| Expenses including reductions | 0.84 | 0.85 | 0.84 | 0.83 | 0.83 |
| Net investment income | 3.12 | 3.42 | 3.37 | 3.35 | 3.53 |
| Portfolio turnover (%) | 22 | 22 | 9 | 17 | 20 |
| 1 | Based on average daily shares outstanding. |
| 2 | Total returns would have been lower had certain expenses not been reduced during the applicable periods. |
| 3 | Does not reflect the effect of sales charges, if any. |
| SEE NOTES TO FINANCIAL STATEMENTS | ANNUAL REPORT | JOHN HANCOCK California Tax-Free Income Fund | 21 |
| CLASS B SHARES Period ended | 5-31-20 | 5-31-19 | 5-31-18 | 5-31-17 | 5-31-16 |
| Per share operating performance | |||||
| Net asset value, beginning of period | $10.94 | $10.73 | $10.91 | $11.23 | $10.91 |
| Net investment income1 | 0.26 | 0.28 | 0.28 | 0.28 | 0.31 |
| Net realized and unrealized gain (loss) on investments | (0.20) | 0.22 | (0.17) | (0.30) | 0.33 |
| Total from investment operations | 0.06 | 0.50 | 0.11 | (0.02) | 0.64 |
| Less distributions | |||||
| From net investment income | (0.26) | (0.28) | (0.29) | (0.30) | (0.32) |
| From net realized gain | (0.08) | (0.01) | — | — | — |
| Total distributions | (0.34) | (0.29) | (0.29) | (0.30) | (0.32) |
| Net asset value, end of period | $10.66 | $10.94 | $10.73 | $10.91 | $11.23 |
| Total return (%)2,3 | 0.47 | 4.78 | 1.00 | (0.12) | 5.93 |
| Ratios and supplemental data | |||||
| Net assets, end of period (in millions) | $— 4 | $— 4 | $1 | $1 | $2 |
| Ratios (as a percentage of average net assets): | |||||
| Expenses before reductions | 1.70 | 1.71 | 1.70 | 1.69 | 1.69 |
| Expenses including reductions | 1.59 | 1.60 | 1.59 | 1.58 | 1.58 |
| Net investment income | 2.36 | 2.67 | 2.61 | 2.59 | 2.78 |
| Portfolio turnover (%) | 22 | 22 | 9 | 17 | 20 |
| 1 | Based on average daily shares outstanding. |
| 2 | Total returns would have been lower had certain expenses not been reduced during the applicable periods. |
| 3 | Does not reflect the effect of sales charges, if any. |
| 4 | Less than $500,000. |
| 22 | JOHN HANCOCK California Tax-Free Income Fund | ANNUAL REPORT | SEE NOTES TO FINANCIAL STATEMENTS |
| CLASS C SHARES Period ended | 5-31-20 | 5-31-19 | 5-31-18 | 5-31-17 | 5-31-16 |
| Per share operating performance | |||||
| Net asset value, beginning of period | $10.94 | $10.73 | $10.90 | $11.22 | $10.91 |
| Net investment income1 | 0.26 | 0.28 | 0.28 | 0.29 | 0.31 |
| Net realized and unrealized gain (loss) on investments | (0.20) | 0.22 | (0.16) | (0.31) | 0.32 |
| Total from investment operations | 0.06 | 0.50 | 0.12 | (0.02) | 0.63 |
| Less distributions | |||||
| From net investment income | (0.26) | (0.28) | (0.29) | (0.30) | (0.32) |
| From net realized gain | (0.08) | (0.01) | — | — | — |
| Total distributions | (0.34) | (0.29) | (0.29) | (0.30) | (0.32) |
| Net asset value, end of period | $10.66 | $10.94 | $10.73 | $10.90 | $11.22 |
| Total return (%)2,3 | 0.47 | 4.78 | 1.09 | (0.13) | 5.83 |
| Ratios and supplemental data | |||||
| Net assets, end of period (in millions) | $16 | $19 | $21 | $30 | $36 |
| Ratios (as a percentage of average net assets): | |||||
| Expenses before reductions | 1.70 | 1.71 | 1.70 | 1.68 | 1.69 |
| Expenses including reductions | 1.59 | 1.60 | 1.59 | 1.58 | 1.58 |
| Net investment income | 2.37 | 2.67 | 2.62 | 2.60 | 2.78 |
| Portfolio turnover (%) | 22 | 22 | 9 | 17 | 20 |
| 1 | Based on average daily shares outstanding. |
| 2 | Total returns would have been lower had certain expenses not been reduced during the applicable periods. |
| 3 | Does not reflect the effect of sales charges, if any. |
| SEE NOTES TO FINANCIAL STATEMENTS | ANNUAL REPORT | JOHN HANCOCK California Tax-Free Income Fund | 23 |
| CLASS I SHARES Period ended | 5-31-20 | 5-31-19 | 5-31-18 | 5-31-17 1 |
| Per share operating performance | ||||
| Net asset value, beginning of period | $10.94 | $10.73 | $10.91 | $10.70 |
| Net investment income2 | 0.35 | 0.38 | 0.38 | 0.12 |
| Net realized and unrealized gain (loss) on investments | (0.20) | 0.22 | (0.17) | 0.21 |
| Total from investment operations | 0.15 | 0.60 | 0.21 | 0.33 |
| Less distributions | ||||
| From net investment income | (0.35) | (0.38) | (0.39) | (0.12) |
| From net realized gain | (0.08) | (0.01) | — | — |
| Total distributions | (0.43) | (0.39) | (0.39) | (0.12) |
| Net asset value, end of period | $10.66 | $10.94 | $10.73 | $10.91 |
| Total return (%)3 | 1.37 | 5.72 | 1.91 | 3.09 4 |
| Ratios and supplemental data | ||||
| Net assets, end of period (in millions) | $15 | $10 | $10 | $5 |
| Ratios (as a percentage of average net assets): | ||||
| Expenses before reductions | 0.70 | 0.71 | 0.70 | 0.67 5 |
| Expenses including reductions | 0.69 | 0.70 | 0.69 | 0.66 5 |
| Net investment income | 3.25 | 3.58 | 3.53 | 3.76 5 |
| Portfolio turnover (%) | 22 | 22 | 9 | 17 6 |
| 1 | The inception date for Class I shares is 2-13-17. |
| 2 | Based on average daily shares outstanding. |
| 3 | Total returns would have been lower had certain expenses not been reduced during the applicable periods. |
| 4 | Not annualized. |
| 5 | Annualized. |
| 6 | Portfolio turnover is shown for the period from 6-1-16 to 5-31-17. |
| 24 | JOHN HANCOCK California Tax-Free Income Fund | ANNUAL REPORT | SEE NOTES TO FINANCIAL STATEMENTS |
| CLASS R6 SHARES Period ended | 5-31-20 | 5-31-19 | 5-31-18 1 |
| Per share operating performance | |||
| Net asset value, beginning of period | $10.94 | $10.73 | $10.95 |
| Net investment income2 | 0.36 | 0.38 | 0.29 |
| Net realized and unrealized gain (loss) on investments | (0.20) | 0.22 | (0.22) |
| Total from investment operations | 0.16 | 0.60 | 0.07 |
| Less distributions | |||
| From net investment income | (0.36) | (0.38) | (0.29) |
| From net realized gain | (0.08) | (0.01) | — |
| Total distributions | (0.44) | (0.39) | (0.29) |
| Net asset value, end of period | $10.66 | $10.94 | $10.73 |
| Total return (%)3 | 1.40 | 5.76 | 0.66 4 |
| Ratios and supplemental data | |||
| Net assets, end of period (in millions) | $7 | $4 | $2 |
| Ratios (as a percentage of average net assets): | |||
| Expenses before reductions | 0.67 | 0.68 | 0.68 5 |
| Expenses including reductions | 0.66 | 0.67 | 0.67 5 |
| Net investment income | 3.28 | 3.58 | 3.56 5 |
| Portfolio turnover (%) | 22 | 22 | 9 6 |
| 1 | The inception date for Class R6 shares is 8-30-17. |
| 2 | Based on average daily shares outstanding. |
| 3 | Total returns would have been lower had certain expenses not been reduced during the applicable periods. |
| 4 | Not annualized. |
| 5 | Annualized. |
| 6 | Portfolio turnover is shown for the period from 6-1-17 to 5-31-18. |
| SEE NOTES TO FINANCIAL STATEMENTS | ANNUAL REPORT | JOHN HANCOCK California Tax-Free Income Fund | 25 |
| 26 | JOHN HANCOCK California Tax-Free Income Fund | ANNUAL REPORT |
| ANNUAL REPORT | JOHN HANCOCK California Tax-Free Income Fund | 27 |
| May 31, 2020 | May 31, 2019 | |
| Ordinary income | $112,199 | $71,775 |
| Exempt Income | 6,478,674 | 6,741,640 |
| Long-term capital gains | 1,490,419 | 190,141 |
| Total | $8,081,292 | $7,003,556 |
| 28 | JOHN HANCOCK California Tax-Free Income Fund | ANNUAL REPORT |
| Class | Expense reduction |
| Class A | $12,837 |
| Class B | 26 |
| Class C | 1,262 |
| Class | Expense reduction |
| Class I | $877 |
| Class R6 | 363 |
| Total | $15,365 |
| ANNUAL REPORT | JOHN HANCOCK California Tax-Free Income Fund | 29 |
| Class | Rule 12b-1 Fee |
| Class A | 0.15% |
| Class B | 1.00% |
| Class C | 1.00% |
| 30 | JOHN HANCOCK California Tax-Free Income Fund | ANNUAL REPORT |
| Class | Distribution and service fees | Transfer agent fees |
| Class A | $268,510 | $75,469 |
| Class B | 3,577 | 151 |
| Class C | 175,828 | 7,409 |
| Class I | — | 5,177 |
| Class R6 | — | 680 |
| Total | $447,915 | $88,886 |
| Year Ended 5-31-20 | Year Ended 5-31-19 | |||
| Shares | Amount | Shares | Amount | |
| Class A shares | ||||
| Sold | 2,742,491 | $29,865,452 | 1,485,306 | $15,841,456 |
| Distributions reinvested | 550,117 | 6,010,551 | 486,236 | 5,184,585 |
| Repurchased | (3,128,085) | (33,652,400) | (2,729,594) | (29,030,019) |
| Net increase (decrease) | 164,523 | $2,223,603 | (758,052) | $(8,003,978) |
| Class B shares | ||||
| Distributions reinvested | 1,002 | $10,964 | 1,180 | $12,592 |
| Repurchased | (16,021) | (174,085) | (10,172) | (108,962) |
| Net decrease | (15,019) | $(163,121) | (8,992) | $(96,370) |
| Class C shares | ||||
| Sold | 156,921 | $1,731,793 | 170,291 | $1,816,298 |
| Distributions reinvested | 44,733 | 488,997 | 44,213 | 471,363 |
| Repurchased | (488,762) | (5,312,564) | (414,613) | (4,418,882) |
| Net decrease | (287,108) | $(3,091,774) | (200,109) | $(2,131,221) |
| Class I shares | ||||
| Sold | 1,001,484 | $10,757,915 | 402,220 | $4,291,234 |
| Distributions reinvested | 43,138 | 471,429 | 34,749 | 370,533 |
| Repurchased | (557,882) | (5,999,036) | (379,555) | (4,028,096) |
| Net increase | 486,740 | $5,230,308 | 57,414 | $633,671 |
| ANNUAL REPORT | JOHN HANCOCK California Tax-Free Income Fund | 31 |
| Year Ended 5-31-20 | Year Ended 5-31-19 | |||
| Shares | Amount | Shares | Amount | |
| Class R6 shares | ||||
| Sold | 395,872 | $4,305,698 | 208,519 | $2,218,628 |
| Distributions reinvested | 18,767 | 204,555 | 8,894 | 95,093 |
| Repurchased | (122,698) | (1,302,827) | (60,709) | (644,757) |
| Net increase | 291,941 | $3,207,426 | 156,704 | $1,668,964 |
| Total net increase (decrease) | 641,077 | $7,406,442 | (753,035) | $(7,928,934) |
| 32 | JOHN HANCOCK California Tax-Free Income Fund | ANNUAL REPORT |
| ANNUAL REPORT | JOHN HANCOCK CALIFORNIA TAX-FREE INCOME FUND | 33 |
| 34 | JOHN HANCOCK CALIFORNIA TAX-FREE INCOME FUND | ANNUAL REPORT |
STATEMENT REGARDING LIQUIDITY RISK MANAGEMENT
Operation of the Liquidity Risk Management Program
This section describes operation and effectiveness of the Liquidity Risk Management Program (LRMP) established in accordance with Rule 22e-4 under the Investment Company Act of 1940, as amended (the Liquidity Rule). The Board of Trustees (the Board) of each Fund in the John Hancock Group of Funds (each a Fund and collectively, the Funds) that is subject to the requirements of the Liquidity Rule has appointed John Hancock Investment Management LLC and John Hancock Variable Trust Advisers LLC (together, the Advisor) to serve as Administrator of the LRMP with respect to each of the Funds, including John Hancock California Tax-Free Income Fund, subject to the oversight of the Board. In order to provide a mechanism and process to perform the functions necessary to administer the LRMP, the Advisor established the Liquidity Risk Management Committee (the Committee). The Fund's subadvisor, Manulife Investment Management (US) LLC (the Subadvisor) executes the day-to-day investment management and security-level activities of the Fund in accordance with the requirements of the LRMP, subject to the supervision of the Advisor and the Board.
The Committee holds monthly meetings to: (1) review the day-to-day operations of the LRMP; (2) review and approve month end liquidity classifications; (3) review quarterly testing and determinations, as applicable; and (4) review other LRMP related material. The Committee also conducts daily, monthly, quarterly, and annual quantitative and qualitative assessments of each subadvisor to a Fund that is subject to the requirements of the Liquidity Rule and is a part of the LRMP to monitor investment performance issues, risks and trends. In addition, the Committee may conduct ad-hoc reviews and meetings with subadvisors as issues and trends are identified, including potential liquidity and valuation issues.
The Committee provided the Board at a meeting held on March 15-17, 2020 with a written report which addressed the Committee's assessment of the adequacy and effectiveness of the implementation and operation of the LRMP and any material changes to the LRMP. The report, which covered the period December 1, 2018 through December 31, 2019, included an assessment of important aspects of the LRMP including, but not limited to:
| • | Operation of the Fund's Redemption-In-Kind Procedures; |
| • | Highly Liquid Investment Minimum (HLIM) determination; |
| • | Compliance with the 15% limit on illiquid investments; |
| • | Reasonably Anticipated Trade Size (RATS) determination; |
| • | Security-level liquidity classifications; and |
| • | Liquidity risk assessment. |
The report also covered material liquidity matters which occurred or were reported during this period applicable to the Fund, if any, and the Committee's actions to address such matters.
Redemption-In-Kind Procedures
Rule 22e-4 requires any fund that engages in or reserves the right to engage in in-kind redemptions to adopt and implement written policies and procedures regarding in-kind redemptions as part of the management of its liquidity risk. These procedures address the process for redeeming in kind, as well as the circumstances under which the Fund would consider redeeming in kind. Anticipated large redemption activity will be evaluated to identify situations where redeeming in securities instead of cash may be appropriate.
As part of its annual assessment of the LRMP, the Committee reviewed the implementation and operation of the Redemption-In-Kind Procedures and determined they are operating in a manner that such procedures are adequate and effective to manage in-kind redemptions on behalf of the Fund as part of the LRMP.
Highly Liquid Investment Minimum determination
The Committee uses an HLIM model to determine a Fund's HLIM. This process incorporates the Fund's investment strategy, historical redemptions, liquidity classification rollup percentages and cash balances, redemption policy, access to funding sources, distribution channels and client concentrations. If the Fund falls below its established HLIM for a period greater than 7 consecutive calendar days, the Committee prepares a report to the Board within one business day following the seventh consecutive calendar day with an explanation of how the Fund plans to restore its HLIM within a reasonable period of time.
Based on the HLIM model, the Committee has determined that the Fund qualifies as a Primarily Highly Liquid Fund (PHLF). It is therefore not required to establish a HLIM. The Fund is tested quarterly to confirm its PHLF status.
As part of its annual assessment of the LRMP, the Committee reviewed the policies and procedures in place with respect to HLIM and PHLF determinations, and determined that such policies and procedures are operating in a manner that is adequate and effective as part of the LRMP.
Compliance with the 15% limit on illiquid investments
Rule 22e-4 sets an aggregate illiquid investment limit of 15% for a fund. Funds are prohibited from acquiring an illiquid investment if this results in greater than 15% of its net assets being classified as illiquid. When applying this limit, the Committee defines "illiquid investment" to mean any investment that the Fund reasonably expects cannot be sold or disposed of in current market conditions in seven calendar days or less without the sale or disposition significantly changing the market value of the investment. If a 15% illiquid investment limit breach occurs for longer than 1 business day, the Fund is required to notify the Board and provide a plan on how to bring illiquid investments within the 15% threshold, and after 7 days confidentially notify the Securities and Exchange Commission (the SEC).
In February 2019, as a result of extended security markets closures in connection with the Chinese New Year in certain countries, the SEC released guidance, and the Committee approved and adopted an Extended Market Holiday Policy to plan for and monitor known Extended Market Holidays (defined as all expected market holiday closures spanning four or more calendar days).
As part of its annual assessment of the LRMP, the Committee reviewed the policies and procedures in place with respect to the 15% illiquid investment limit and determined such policies and procedures are operating in a manner that is adequate and effective as part of the LMRP.
Reasonably Anticipated Trade Size determination
In order to assess the liquidity risk of a Fund, the Committee considers the impact on the Fund that redemptions of a RATS would have under both normal and reasonably foreseeable stressed conditions. Modelling the Fund's RATS requires quantifying cash flow volatility and analyzing distribution channel concentration and redemption risk. The model is designed to estimate the amount of assets that the Fund could reasonably anticipate trading on a given day, during both normal and reasonably foreseeable stressed conditions, to satisfy redemption requests.
As part of its annual assessment of the LRMP, the Committee reviewed the policies and procedures in place with respect to RATS determinations and determined that such policies and procedures are operating in a manner that is adequate and effective at making RATS determinations as part of the LRMP.
Security-level liquidity classifications
When classifying the liquidity of portfolio securities, the Fund adheres to the liquidity classification procedures established by the Advisor. In assigning a liquidity classification to Fund portfolio holdings, the following key inputs, among others, are considered: the Fund's RATS, feedback from the applicable Subadvisor on market-, trading- and investment-specific considerations, an assessment of current market conditions and fund portfolio holdings, and a value impact standard. The Subadvisor also provides position-level data to the Committee for use in monthly classification reconciliation in order to identify any classifications that may need to be changed as a result of the above considerations.
As part of its annual assessment of the LRMP, the Committee reviewed the policies and procedures in place with respect to security-level liquidity classifications and determined that such policies and procedures are operating in a manner that is adequate and effective as part of the LRMP.
Liquidity risk assessment
The Committee periodically reviews and assesses, the Fund's liquidity risk, including its investment strategy and liquidity of portfolio investments during both normal and reasonably foreseeable stressed conditions (including whether the investment strategy is appropriate for an open-end fund, the extent to which the strategy involves a relatively concentrated portfolio or large positions in particular issuers, and the use of borrowings for investment purposes and derivatives), cash flow analysis during both normal and reasonably foreseeable stressed conditions, and holdings of cash and cash equivalents, as well as borrowing arrangements and other funding sources.
The Committee also monitors global events, such as the COVID-19 Coronavirus, that could impact the markets and liquidity of portfolio investments and their classifications.
As part of its annual assessment of the LRMP, the Committee reviewed Fund-Level Liquidity Risk Assessment Reports for each of the Funds and determined that the investment strategy for each Fund continues to be appropriate for an open-ended structure.
Adequacy and Effectiveness
Based on the review and assessment conducted by the Committee, the Committee has determined that the LRMP has been implemented, and is operating in a manner that is adequate and effective at assessing and managing the liquidity risk of each Fund.
This chart provides information about the Trustees and Officers who oversee your John Hancock fund. Officers elected by the Trustees manage the day-to-day operations of the fund and execute policies formulated by the Trustees.
Independent Trustees
| Name, year of birth Position(s) held with Trust Principal occupation(s) and other directorships during past 5 years | Trustee of the Trust since1 | Number of John Hancock funds overseen by Trustee |
| Hassell H. McClellan, Born: 1945 | 2012 | 195 |
| Trustee and Chairperson of the Board Director/Trustee, Virtus Funds (since 2008); Director, The Barnes Group (since 2010); Associate Professor, The Wallace E. Carroll School of Management, Boston College (retired 2013). Trustee (since 2005) and Chairperson of the Board (since 2017) of various trusts within the John Hancock Fund Complex. | ||
| Charles L. Bardelis,2 Born: 1941 | 2012 | 195 |
| Trustee Director, Island Commuter Corp. (marine transport). Trustee of various trusts within the John Hancock Fund Complex (since 1988). | ||
| James R. Boyle, Born: 1959 | 2015 | 195 |
| Trustee Chief Executive Officer, Foresters Financial (since 2018); Chairman and Chief Executive Officer, Zillion Group, Inc. (formerly HealthFleet, Inc.) (healthcare) (2014-2018); Executive Vice President and Chief Executive Officer, U.S. Life Insurance Division of Genworth Financial, Inc. (insurance) (January 2014-July 2014); Senior Executive Vice President, Manulife Financial, President and Chief Executive Officer, John Hancock (1999-2012); Chairman and Director, John Hancock Investment Management LLC, John Hancock Investment Management Distributors LLC, and John Hancock Variable Trust Advisers LLC (2005-2010). Trustee of various trusts within the John Hancock Fund Complex (2005-2014 and since 2015). | ||
| Peter S. Burgess,2 Born: 1942 | 2012 | 195 |
| Trustee Consultant (financial, accounting, and auditing matters) (since 1999); Certified Public Accountant; Partner, Arthur Andersen (independent public accounting firm) (prior to 1999); Director, Lincoln Educational Services Corporation (since 2004); Director, Symetra Financial Corporation (2010-2016); Director, PMA Capital Corporation (2004-2010). Trustee of various trusts within the John Hancock Fund Complex (since 2005). | ||
| William H. Cunningham, Born: 1944 | 1989 | 195 |
| Trustee Professor, University of Texas, Austin, Texas (since 1971); former Chancellor, University of Texas System and former President of the University of Texas, Austin, Texas; Chairman (since 2009) and Director (since 2006), Lincoln National Corporation (insurance); Director, Southwest Airlines (since 2000); former Director, LIN Television (2009-2014). Trustee of various trusts within the John Hancock Fund Complex (since 1986). | ||
| Grace K. Fey, Born: 1946 | 2012 | 195 |
| Trustee Chief Executive Officer, Grace Fey Advisors (since 2007); Director and Executive Vice President, Frontier Capital Management Company (1988-2007); Director, Fiduciary Trust (since 2009). Trustee of various trusts within the John Hancock Fund Complex (since 2008). | ||
Independent Trustees (continued)
| Name, year of birth Position(s) held with Trust Principal occupation(s) and other directorships during past 5 years | Trustee of the Trust since1 | Number of John Hancock funds overseen by Trustee |
| Deborah C. Jackson, Born: 1952 | 2008 | 195 |
| Trustee President, Cambridge College, Cambridge, Massachusetts (since 2011); Board of Directors, Massachusetts Women's Forum (since 2018); Board of Directors, National Association of Corporate Directors/New England (since 2015); Board of Directors, Association of Independent Colleges and Universities of Massachusetts (2014-2017); Chief Executive Officer, American Red Cross of Massachusetts Bay (2002-2011); Board of Directors of Eastern Bank Corporation (since 2001); Board of Directors of Eastern Bank Charitable Foundation (since 2001); Board of Directors of American Student Assistance Corporation (1996-2009); Board of Directors of Boston Stock Exchange (2002-2008); Board of Directors of Harvard Pilgrim Healthcare (health benefits company) (2007-2011). Trustee of various trusts within the John Hancock Fund Complex (since 2008). | ||
| James M. Oates,2 Born: 1946 | 2012 | 195 |
| Trustee Managing Director, Wydown Group (financial consulting firm) (since 1994); Chairman and Director, Emerson Investment Management, Inc. (2000-2015); Independent Chairman, Hudson Castle Group, Inc. (formerly IBEX Capital Markets, Inc.) (financial services company) (1997-2011); Director, Stifel Financial (since 1996); Director, Investor Financial Services Corporation (1995-2007); Director, Connecticut River Bancorp (1998-2014); Director/Trustee, Virtus Funds (since 1988). Trustee (since 2004) and Chairperson of the Board (2005-2016) of various trusts within the John Hancock Fund Complex. | ||
| Steven R. Pruchansky, Born: 1944 | 1994 | 195 |
| Trustee and Vice Chairperson of the Board Managing Director, Pru Realty (since 2017); Chairman and Chief Executive Officer, Greenscapes of Southwest Florida, Inc. (2014-2020); Director and President, Greenscapes of Southwest Florida, Inc. (until 2000); Member, Board of Advisors, First American Bank (until 2010); Managing Director, Jon James, LLC (real estate) (since 2000); Partner, Right Funding, LLC (2014-2017); Director, First Signature Bank & Trust Company (until 1991); Director, Mast Realty Trust (until 1994); President, Maxwell Building Corp. (until 1991). Trustee (since 1992), Chairperson of the Board (2011-2012), and Vice Chairperson of the Board (since 2012) of various trusts within the John Hancock Fund Complex. | ||
| Gregory A. Russo, Born: 1949 | 2009 | 195 |
| Trustee Director and Audit Committee Chairman (2012-2020), and Member, Audit Committee and Finance Committee (2011-2020), NCH Healthcare System, Inc. (holding company for multi-entity healthcare system); Director and Member (2012-2018) and Finance Committee Chairman (2014-2018), The Moorings, Inc. (nonprofit continuing care community); Vice Chairman, Risk & Regulatory Matters, KPMG LLP (KPMG) (2002-2006); Vice Chairman, Industrial Markets, KPMG (1998-2002); Chairman and Treasurer, Westchester County, New York, Chamber of Commerce (1986-1992); Director, Treasurer, and Chairman of Audit and Finance Committees, Putnam Hospital Center (1989-1995); Director and Chairman of Fundraising Campaign, United Way of Westchester and Putnam Counties, New York (1990-1995). Trustee of various trusts within the John Hancock Fund Complex (since 2008). | ||
Non-Independent Trustees3
| Name, year of birth Position(s) held with Trust Principal occupation(s) and other directorships during past 5 years | Trustee of the Trust since1 | Number of John Hancock funds overseen by Trustee |
| Andrew G. Arnott, Born: 1971 | 2017 | 195 |
| President and Non-Independent Trustee Head of Wealth and Asset Management, United States and Europe, for John Hancock and Manulife (since 2018); Executive Vice President, John Hancock Financial Services (since 2009, including prior positions); Director and Executive Vice President, John Hancock Investment Management LLC (since 2005, including prior positions); Director and Executive Vice President, John Hancock Variable Trust Advisers LLC (since 2006, including prior positions); President, John Hancock Investment Management Distributors LLC (since 2004, including prior positions); President of various trusts within the John Hancock Fund Complex (since 2007, including prior positions). Trustee of various trusts within the John Hancock Fund Complex (since 2017). | ||
| Marianne Harrison, Born: 1963 | 2018 | 195 |
| Non-Independent Trustee President and CEO, John Hancock (since 2017); President and CEO, Manulife Canadian Division (2013-2017); Member, Board of Directors, CAE Inc. (since 2019); Member, Board of Directors, MA Competitive Partnership Board (since 2018); Member, Board of Directors, American Council of Life Insurers (ACLI) (since 2018); Member, Board of Directors, Communitech, an industry-led innovation center that fosters technology companies in Canada (2017-2019); Member, Board of Directors, Manulife Assurance Canada (2015-2017); Board Member, St. Mary's General Hospital Foundation (2014-2017); Member, Board of Directors, Manulife Bank of Canada (2013-2017); Member, Standing Committee of the Canadian Life & Health Assurance Association (2013-2017); Member, Board of Directors, John Hancock USA, John Hancock Life & Health, John Hancock New York (2012-2013). Trustee of various trusts within the John Hancock Fund Complex (since 2018). | ||
Principal officers who are not Trustees
| Name, year of birth Position(s) held with Trust Principal occupation(s) during past 5 years | Officer of the Trust since |
| Francis V. Knox, Jr., Born: 1947 | 2005 |
| Chief Compliance Officer Vice President, John Hancock Financial Services (since 2005); Chief Compliance Officer, various trusts within the John Hancock Fund Complex, John Hancock Investment Management LLC, and John Hancock Variable Trust Advisers LLC (since 2005). | |
| Charles A. Rizzo, Born: 1957 | 2007 |
| Chief Financial Officer Vice President, John Hancock Financial Services (since 2008); Senior Vice President, John Hancock Investment Management LLC and John Hancock Variable Trust Advisers LLC (since 2008); Chief Financial Officer of various trusts within the John Hancock Fund Complex (since 2007). | |
| Salvatore Schiavone, Born: 1965 | 2010 |
| Treasurer Assistant Vice President, John Hancock Financial Services (since 2007); Vice President, John Hancock Investment Management LLC and John Hancock Variable Trust Advisers LLC (since 2007); Treasurer of various trusts within the John Hancock Fund Complex (since 2007, including prior positions). | |
Principal officers who are not Trustees (continued)
| Name, year of birth Position(s) held with Trust Principal occupation(s) during past 5 years | Officer of the Trust since |
| Christopher (Kit) Sechler, Born: 1973 | 2018 |
| Chief Legal Officer and Secretary Vice President and Deputy Chief Counsel, John Hancock Investments (since 2015); Assistant Vice President and Senior Counsel (2009-2015), John Hancock Investment Management; Chief Legal Officer and Secretary of various trusts within the John Hancock Fund Complex (since 2018); Assistant Secretary of John Hancock Investment Management LLC and John Hancock Variable Trust Advisers LLC (since 2009). | |
The business address for all Trustees and Officers is 200 Berkeley Street, Boston, Massachusetts 02116-5023.
The Statement of Additional Information of the fund includes additional information about members of the Board of Trustees of the Trust and is available without charge, upon request, by calling 800-225-5291.
| 1 | Each Trustee holds office until his or her successor is elected and qualified, or until the Trustee's death, retirement, resignation, or removal. Mr. Boyle has served as Trustee at various times prior to the date listed in the table. |
| 2 | Member of the Audit Committee. |
| 3 | The Trustee is a Non-Independent Trustee due to current or former positions with the Advisor and certain affiliates. |
Trustees Hassell H. McClellan, Chairperson Officers Andrew G. Arnott Francis V. Knox, Jr. Charles A. Rizzo Salvatore Schiavone Christopher (Kit) Sechler | Investment advisor John Hancock Investment Management LLC Subadvisor Manulife Investment Management (US) LLC Portfolio Managers Dennis DiCicco Principal distributor John Hancock Investment Management Distributors LLC Custodian State Street Bank and Trust Company Transfer agent John Hancock Signature Services, Inc. Legal counsel K&L Gates LLP Independent registered public accounting firm PricewaterhouseCoopers LLP |
* Member of the Audit Committee
† Non-Independent Trustee
The fund's proxy voting policies and procedures, as well as the fund proxy voting record for the most recent twelve-month period ended June 30, are available free of charge on the Securities and Exchange Commission (SEC) website at sec.gov or on our website.
All of the fund's holdings as of the end of the third month of every fiscal quarter are filed with the SEC on Form N-PORT within 60 days of the end of the fiscal quarter. The fund's Form N-PORT filings are available on our website and the SEC's website, sec.gov.
We make this information on your fund, as well as monthly portfolio holdings, and other fund details available on our website at jhinvestments.com or by calling 800-225-5291.
| You can also contact us: | |||
| 800-225-5291 jhinvestments.com | Regular mail: John Hancock Signature Services, Inc. | Express mail: John Hancock Signature Services, Inc. | |
John Hancock family of funds
DOMESTIC EQUITY FUNDS Blue Chip Growth Classic Value Disciplined Value Disciplined Value Mid Cap Equity Income Financial Industries Fundamental All Cap Core Fundamental Large Cap Core New Opportunities Regional Bank Small Cap Core Small Cap Growth Small Cap Value U.S. Global Leaders Growth U.S. Quality Growth GLOBAL AND INTERNATIONAL EQUITY FUNDS Disciplined Value International Emerging Markets Emerging Markets Equity Fundamental Global Franchise Global Equity Global Shareholder Yield Global Thematic Opportunities International Dynamic Growth International Growth International Small Company | INCOME FUNDS Bond California Tax-Free Income Emerging Markets Debt Floating Rate Income Government Income High Yield High Yield Municipal Bond Income Investment Grade Bond Money Market Short Duration Bond Short Duration Credit Opportunities Strategic Income Opportunities Tax-Free Bond ALTERNATIVE AND SPECIALTY FUNDS Absolute Return Currency Alternative Asset Allocation Alternative Risk Premia Diversified Macro Infrastructure Multi-Asset Absolute Return Seaport Long/Short |
A fund's investment objectives, risks, charges, and expenses should be considered carefully before investing. The prospectus contains this and other important information about the fund. To obtain a prospectus, contact your financial professional, call John Hancock Investment Management at 800-225-5291, or visit our website at jhinvestments.com. Please read the prospectus carefully before investing or sending money.
ASSET ALLOCATION Balanced Multi-Asset High Income Multi-Index Lifetime Portfolios Multi-Index Preservation Portfolios Multimanager Lifestyle Portfolios Multimanager Lifetime Portfolios Retirement Income 2040 EXCHANGE-TRADED FUNDS John Hancock Multifactor Consumer Discretionary ETF John Hancock Multifactor Consumer Staples ETF John Hancock Multifactor Developed International ETF John Hancock Multifactor Emerging Markets ETF John Hancock Multifactor Energy ETF John Hancock Multifactor Financials ETF John Hancock Multifactor Healthcare ETF John Hancock Multifactor Industrials ETF John Hancock Multifactor Large Cap ETF John Hancock Multifactor Materials ETF John Hancock Multifactor Media and John Hancock Multifactor Mid Cap ETF John Hancock Multifactor Small Cap ETF John Hancock Multifactor Technology ETF John Hancock Multifactor Utilities ETF | ENVIRONMENTAL, SOCIAL, AND ESG All Cap Core ESG Core Bond ESG International Equity ESG Large Cap Core CLOSED-END FUNDS Financial Opportunities Hedged Equity & Income Income Securities Trust Investors Trust Preferred Income Preferred Income II Preferred Income III Premium Dividend Tax-Advantaged Dividend Income Tax-Advantaged Global Shareholder Yield |
John Hancock Multifactor ETF shares are bought and sold at market price (not NAV), and are not individually redeemed
from the fund. Brokerage commissions will reduce returns.
John Hancock ETFs are distributed by Foreside Fund Services, LLC, and are subadvised by Dimensional Fund Advisors LP.
Foreside is not affiliated with John Hancock Investment Management Distributors LLC or Dimensional Fund Advisors LP.
Dimensional Fund Advisors LP receives compensation from John Hancock in connection with licensing rights to the
John Hancock Dimensional indexes. Dimensional Fund Advisors LP does not sponsor, endorse, or sell, and makes no
representation as to the advisability of investing in, John Hancock Multifactor ETFs.
John Hancock Investment Management
A trusted brand
John Hancock Investment Management is a premier asset manager
representing one of America's most trusted brands, with a heritage of
financial stewardship dating back to 1862. Helping our shareholders
pursue their financial goals is at the core of everything we do. It's why
we support the role of professional financial advice and operate with
the highest standards of conduct and integrity.
A better way to invest
We serve investors globally through a unique multimanager approach:
We search the world to find proven portfolio teams with specialized
expertise for every strategy we offer, then we apply robust investment
oversight to ensure they continue to meet our uncompromising
standards and serve the best interests of our shareholders.
Results for investors
Our unique approach to asset management enables us to provide
a diverse set of investments backed by some of the world's best
managers, along with strong risk-adjusted returns across asset classes.
![]()
John Hancock Investment Management Distributors LLC n Member FINRA, SIPC
200 Berkeley Street n Boston, MA 02116-5010 n 800-225-5291 n jhinvestments.com
This report is for the information of the shareholders of John Hancock California Tax-Free Income Fund. It is not authorized for distribution to prospective investors unless preceded or accompanied by a prospectus.

| MF1210527 | 53A 5/20 7/2020 |
ITEM 2. CODE OF ETHICS.
As of the end of the year, May 31, 2020, the registrant has adopted a code of ethics, as defined in Item 2 of Form N-CSR, that applies to its Chief Executive Officer, Chief Financial Officer and Treasurer (respectively, the principal executive officer, the principal financial officer and the principal accounting officer, the “Covered Officers”). A copy of the code of ethics is filed as an exhibit to this Form N-CSR.
ITEM 3. AUDIT COMMITTEE FINANCIAL EXPERT.
Peter S. Burgess is the audit committee financial expert and is “independent”, pursuant to general instructions on Form N-CSR Item 3.
ITEM 4. PRINCIPAL ACCOUNTANT FEES AND SERVICES.
(a) Audit Fees
The aggregate fees billed for professional services rendered by the principal accountant for the audits of the registrant’s annual financial statements or services that are normally provided by the accountant in connection with statutory and regulatory filings or engagements amounted to the following for the fiscal years ended May 31, 2020 and 2019. These fees were billed to the registrant and were approved by the registrant’s audit committee.
| Fund | May 31, 2020 | May 31, 2019 | ||
| John Hancock California Tax-Free Income Fund | $ | 48,173 | $ | 44,425 |
(b) Audit-Related Services
Audit-related fees for assurance and related services by the principal accountant are billed to the registrant or to the registrant’s investment adviser (not including any sub-adviser whose role is primarily portfolio management and is subcontracted with or overseen by another investment adviser), and any entity controlling, controlled by, or under common control with the adviser ("control affiliates") that provides ongoing services to the registrant. The nature of the services provided was affiliated service provider internal controls reviews. Additionally, amounts billed to control affiliates were $116,467 and $113,000 for the fiscal years ended May 31, 2020 and 2019, respectively.
| Fund | May 31, 2020 | May 31, 2019 | ||
| John Hancock California Tax-Free Income Fund | $ | 591 | $ | 571 |
(c) Tax Fees
The aggregate fees billed for professional services rendered by the principal accountant for tax compliance, tax advice and tax planning (“tax fees”) amounted to the following for the fiscal years ended May 31, 2020 and 2019. The nature of the services comprising the tax fees was the review of the registrant’s tax returns and tax distribution requirements. These fees were billed to the registrant and were approved by the registrant’s audit committee.
| Fund | May 31, 2020 | May 31, 2019 | ||
| John Hancock California Tax-Free Income Fund | $ | 3,760 | $ | 3,650 |
(d) All Other Fees
Other fees billed for professional services rendered by the principal accountant to the registrant or to the control affiliates for the fiscal years ended May 31, 2020 and 2019 amounted to the following:
| Fund | May 31, 2020 | May 31, 2019 | ||
| John Hancock California Tax-Free Income Fund | $ | 89 | $ | 89 |
(e)(1) Audit Committee Pre-Approval Policies and Procedures:
The trust’s Audit Committee must pre-approve all audit and non-audit services provided by the independent registered public accounting firm (the “Auditor”) relating to the operations or financial reporting of the funds. Prior to the commencement of any audit or non-audit services to a fund, the Audit Committee reviews the services to determine whether they are appropriate and permissible under applicable law.
The trust’s Audit Committee has adopted policies and procedures to, among other purposes, provide a framework for the Committee’s consideration of audit-related and non-audit services by the Auditor. The policies and procedures require that any audit-related and non-audit service provided by the Auditor and any non-audit service provided by the Auditor to a fund service provider that relates directly to the operations and financial reporting of a fund are subject to approval by the Audit Committee before such service is provided. Audit-related services provided by the Auditor that are expected to exceed $25,000 per year/per fund are subject to specific pre-approval by the Audit Committee. Tax services provided by the Auditor that are expected to exceed $30,000 per year/per fund are subject to specific pre-approval by the Audit Committee.
All audit services, as well as the audit-related and non-audit services that are expected to exceed the amounts stated above, must be approved in advance of provision of the service by formal resolution of the Audit Committee. At the regularly scheduled Audit Committee meetings, the Committee reviews a report summarizing the services, including fees, provided by the Auditor.
(e)(2) Services approved pursuant to paragraph (c)(7)(i)(C) of Rule 2-01 of Regulation S-X:
Audit-Related Fees, Tax Fees and All Other Fees:
There were no amounts that were approved by the Audit Committee pursuant to the de minimis exception under Rule 2-01 of Regulation S-X.
(f) According to the registrant’s principal accountant for the fiscal year ended May 31, 2020, the percentage of hours spent on the audit of the registrant's financial statements for the most recent fiscal year that were attributed to work performed by persons who were not full-time, permanent employees of principal accountant was less than 50%.
(g) The aggregate non-audit fees billed by the registrant’s principal accountant for non-audit services rendered to the registrant and rendered to the registrant's control affiliates for the fiscal years ended May 31, 2020 and 2019 amounted to the following:
| Trust | May 31, 2020 | May 31, 2019 | ||
| John Hancock California Tax-Free Income Fund | $ | 1,016,848 | $ | 919,444 |
(h) The audit committee of the registrant has considered the non-audit services provided by the registrant’s principal accountant to the control affiliates and has determined that the services that were not pre-approved are compatible with maintaining the principal accountant’s independence.
ITEM 5. AUDIT COMMITTEE OF LISTED REGISTRANTS.
The registrant has a separately-designated standing audit committee comprised of independent trustees. The members of the audit committee are as follows:
Peter S. Burgess - Chairman
Charles L. Bardelis
Theron S. Hoffman
ITEM 6. SCHEDULE OF INVESTMENTS.
(a) Not applicable.
(b) Not applicable.
ITEM 7. DISCLOSURE OF PROXY VOTING POLICIES AND PROCEDURES FOR CLOSED-END MANAGEMENT INVESTMENT COMPANIES.
Not applicable.
ITEM 8. PORTFOLIO MANAGERS OF CLOSED-END MANAGEMENT INVESTMENT COMPANIES.
Not applicable.
ITEM 9. PURCHASES OF EQUITY SECURITIES BY CLOSED-END MANAGEMENT INVESTMENT COMPANY AND AFFILIATED PURCHASERS.
Not applicable.
ITEM 10. SUBMISSION OF MATTERS TO A VOTE OF SECURITY HOLDERS.
The registrant has adopted procedures by which shareholders may recommend nominees to the registrant's Board of Trustees. A copy of the procedures is filed as an exhibit to this Form N-CSR. See attached “John Hancock Funds – Nominating, Governance and Administration Committee Charter”.
ITEM 11. CONTROLS AND PROCEDURES.
(a) Based upon their evaluation of the registrant's disclosure controls and procedures as conducted within 90 days of the filing date of this Form N-CSR, the registrant's principal executive officer and principal financial officer have concluded that those disclosure controls and procedures provide reasonable assurance that the material information required to be disclosed by the registrant on this report is recorded, processed, summarized and reported within the time periods specified in the Securities and Exchange Commission's rules and forms.
(b) There were no changes in the registrant's internal control over financial reporting that occurred during the period covered by this report that have materially affected, or are reasonably likely to materially affect, the registrant's internal control over financial reporting.
ITEM 12. DISCLOSURE OF SECURITIES LENDING ACTIVITIES FOR CLOSED-END MANAGEMENT INVESTMENT COMPANIES.: Not applicable.
ITEM 13. EXHIBITS.
(a)(1) Code of Ethics for Covered Officers is attached.
(a)(2) Separate certifications for the registrant's principal executive officer and principal financial officer, as required by Section 302 of the Sarbanes-Oxley Act of 2002 and Rule 30a-2(a) under the Investment Company Act of 1940, are attached.
(c)(1) Submission of Matters to a Vote of Security Holders is attached. See attached “John Hancock Funds – Nominating, Governance and Administration Committee Charter”.
SIGNATURES
Pursuant to the requirements of the Securities Exchange Act of 1934 and the Investment Company Act of 1940, the registrant has duly caused this report to be signed on its behalf by the undersigned, thereunto duly authorized.
John Hancock California Tax-Free Income Fund
| By: | /s/ Andrew Arnott | |
| Andrew Arnott | ||
| President | ||
| Date: | July 14, 2020 | |
| Pursuant to the requirements of the Securities Exchange Act of 1934 and the Investment Company Act of 1940, this report has been signed below by the following persons on behalf of the registrant and in the capacities and on the dates indicated. | ||
| By: | /s/ Andrew Arnott | |
| Andrew Arnott | ||
| President | ||
| Date: | July 14, 2020 | |
| By: | /s/ Charles A. Rizzo | |
| Charles A. Rizzo | ||
| Chief Financial Officer | ||
| Date: | July 14, 2020 | |