UNITED STATES
SECURITIES AND EXCHANGE COMMISSION
Washington, D.C. 20549
FORM N-CSR
CERTIFIED SHAREHOLDER REPORT OF REGISTERED MANAGEMENT
INVESTMENT COMPANIES
Investment Company Act file number | 811- 5883 | |||||
|
| |||||
| Dreyfus Index Funds, Inc. |
| ||||
| (Exact name of Registrant as specified in charter) |
| ||||
|
|
| ||||
|
c/o The Dreyfus Corporation 200 Park Avenue New York, New York 10166 |
| ||||
| (Address of principal executive offices) (Zip code) |
| ||||
|
|
| ||||
| John Pak, Esq. 200 Park Avenue New York, New York 10166 |
| ||||
| (Name and address of agent for service) |
| ||||
| ||||||
Registrant's telephone number, including area code: | (212) 922-6000 | |||||
|
| |||||
Date of fiscal year end:
| 10/31 |
| ||||
Date of reporting period: | 10/31/2013 |
| ||||
| Dreyfus International |
| Stock Index Fund |
ANNUAL REPORT October 31, 2013
Save time. Save paper. View your next shareholder report online as soon as it’s available. Log into www.dreyfus.com and sign up for Dreyfus eCommunications. It’s simple and only takes a few minutes.
The views expressed in this report reflect those of the portfolio manager only through the end of the period covered and do not necessarily represent the views of Dreyfus or any other person in the Dreyfus organization. Any such views are subject to change at any time based upon market or other conditions and Dreyfus disclaims any responsibility to update such views.These views may not be relied on as investment advice and, because investment decisions for a Dreyfus fund are based on numerous factors, may not be relied on as an indication of trading intent on behalf of any Dreyfus fund.

Contents | |
THE FUND | |
| 2 | A Letter from the President |
| 3 | Discussion of Fund Performance |
| 6 | Fund Performance |
| 7 | Understanding Your Fund’s Expenses |
| 7 | Comparing Your Fund’s Expenses With Those of Other Funds |
| 8 | Statement of Investments |
| 37 | Statement of Financial Futures |
| 38 | Statement of Assets and Liabilities |
| 39 | Statement of Operations |
| 40 | Statement of Changes in Net Assets |
| 41 | Financial Highlights |
| 42 | Notes to Financial Statements |
| 56 | Report of Independent Registered Public Accounting Firm |
| 57 | Important Tax Information |
| 58 | Board Members Information |
| 60 | Officers of the Fund |
FOR MORE INFORMATION | |
Back Cover |
Dreyfus International
Stock Index Fund
The Fund
A LETTER FROM THE PRESIDENT
Dear Shareholder:
We are pleased to present this annual report for Dreyfus International Stock Index Fund, covering the 12-month period from November 1, 2012, through October 31, 2013. For information about how the fund performed during the reporting period, as well as general market perspectives, we provide a Discussion of Fund Performance on the pages that follow.
Improving global economic conditions drove developed stock markets higher over much of the reporting period. Europe appeared to put the worst of its sovereign debt and banking crises behind it, and Japan embarked on a new economic course designed to reflate its long-stagnant domestic economy. However, the world’s emerging markets struggled with the effects of local economic slowdowns. As a result, equity market returns varied widely from one country to another over the past 12 months.
We currently expect global economic conditions to continue to improve in 2014, with stronger growth in many developed countries fueled by past and continuing monetary ease. The emerging markets seem poised for moderate economic expansion despite recently negative investor sentiment. In the United States, we anticipate accelerating growth supported by the fading drags of tighter federal fiscal policies and downsizing on the state and local levels. For more information on how these observations may affect your investments, we encourage you to speak with your financial advisor.
Thank you for your continued confidence and support.

J. Charles Cardona
President
The Dreyfus Corporation
November 15, 2013
2
DISCUSSION OF FUND PERFORMANCE
For the reporting period of November 1, 2012, through October 31, 2013, as provided byThomas J. Durante, CFA, Richard A. Brown, CFA, and Karen Q.Wong, CFA, Portfolio Managers
Fund and Market Performance Overview
For the 12-month period ended October 31, 2013, Dreyfus International Stock Index Fund produced a total return of 26.01%.1 This compares with a 26.88% total return for the fund’s benchmark, the Morgan Stanley Capital International Europe, Australasia, Far East Index (the “MSCI EAFE® Index” or the “Index”), during the same period.2
International stocks responded positively to a recovering global economy during the reporting period.The difference in returns between the fund and the MSCI EAFE® Index was primarily the result of transaction costs and operating expenses that are not reflected in the MSCI EAFE® Index’s results.
The Fund’s Investment Approach
The fund seeks to match the performance of the MSCI EAFE® Index, a broadly diversified, international index composed of approximately 1,000 companies located in developed markets outside the United States and Canada. To pursue its goal, the fund is generally fully invested in stocks included in the MSCI EAFE® Index. The fund’s investments are selected to match the benchmark composition along individual name, country, and industry weighting, and other benchmark characteristics. Under these circumstances, the fund maintains approximately the same weighting for each stock as the MSCI EAFE® Index does.
The fund employed futures contracts and currency forward contracts during the reporting period in its efforts to replicate the returns of the MSCI EAFE® Index.
Recovering Global Economy Fueled Stock Markets’ Gains
Stock markets throughout the developed world rallied in response to the aggressively accommodative monetary policies adopted by most major central banks.The United States led the global recovery, as domestic economic growth has been supported by employment gains, rebounding housing markets, and a massive quantitative easing program.The worst of Europe’s financial crisis seems to be over, as evidenced by the
The Fund 3
DISCUSSION OF FUND PERFORMANCE (continued)
end of a regional recession, greater confidence in the banking system, and rebounding stock prices, particularly in previously hard hit nations. Japan’s stock market was lifted by newly stimulative fiscal and monetary policies from a new government seeking to reflate the domestic economy after years of stagnation.
Although stocks from the emerging markets are not part of the MSCI EAFE® Index, it is worth noting that many developing nations struggled with economic slowdowns during the reporting period. In this environment, some emerging stock markets, such as China, fared relatively well, while others, most notably India and Brazil, underperformed global market averages.
Financials Sector Led the International Markets’ Advance
All of the economic sectors represented in the MSCI EAFE® posted positive absolute returns during the reporting period. The markets’ gains were led by the financials sector, which rebounded from previously depressed levels as investor confidence improved. Commercial banks fared especially well in Japan, where an aggressively accommodative monetary policy boosted liquidity in the banking system. Banks in the United Kingdom also gained value in the midst of a recovering housing market. Despite slowing growth in the emerging markets, Australian banks continued to benefit from financing opportunities in nearby developing nations. Gains among investment banks were driven by rallying equity markets, intensifying mergers-and-acquisitions activity, and rising bond issuance volumes. Wealth management firms prospered as stock prices climbed.
The consumer discretionary sector was supported by Japanese automobile manufacturers, which benefited from a depreciating local currency that fueled exports to the United States and China. Sales of Japanese vehicles in China also were buoyed by improved relations between the two countries as concerns surrounding a territorial dispute waned. German automakers also fared well in the recovering global economy, due primarily to robust demand from affluent consumers for luxury brands. Other strong performers in the consumer discretionary sector included consumer electronics producers and media companies. In the health care sector, large pharmaceutical developers benefited from waning concerns regarding research-and-development efforts, as well as diversification by some major drug companies into the health-and-beauty category.
4
The energy sector ranked among the weaker segments of the MSCI EAFE® Index as a glut of shale oil drove commodity prices lower, hurting profit margins for refiners. Although the utilities sector posted double-digit returns for the reporting period, it lagged sector averages when investors turned their attention away from income-oriented stocks and toward industry groups with greater growth potential.
From a county perspective, Japan and the United Kingdom ranked as the reporting period’s top performers, while Israel was the only country in the MSCI EAFE® Index to post a negative absolute return.
Replicating the Performance of the MSCI EAFE Index
Although we do not actively manage the fund’s investments in response to macroeconomic trends, it is worth noting that recent evidence of sustained global growth has the potential to fuel further gains in international equity markets. As always, we have continued to monitor the factors considered by the fund’s investment model in light of current market conditions.
November 15, 2013
Equity funds are subject generally to market, market sector, market liquidity, issuer and investment style risks, among other factors, to varying degrees, all of which are more fully described in the fund’s prospectus.
The fund’s performance will be influenced by political, social and economic factors affecting investments in foreign companies. Special risks associated with investments in foreign companies include exposure to currency fluctuations, less liquidity, less developed or less efficient trading markets, lack of comprehensive company information, political instability and differing auditing and legal standards.
| 1 Total return includes reinvestment of dividends and any capital gains paid. Past performance is no guarantee of future |
| results. Share price, yield and investment return fluctuate such that upon redemption, fund shares may be worth more |
| or less than their original cost. |
| 2 SOURCE: LIPPER INC. — Reflects reinvestment of net dividends and, where applicable, capital gain |
| distributions.The Morgan Stanley Capital International Europe,Australasia, Far East (MSCI EAFE) Index is an |
| unmanaged index composed of a sample of companies representative of the market structure of European and Pacific |
| Basin countries.The index reflects actual investable opportunities for global investors for stocks that are free of foreign |
| ownership limits or legal restrictions at the country level. Investors cannot invest directly in any index. |
The Fund 5
FUND PERFORMANCE
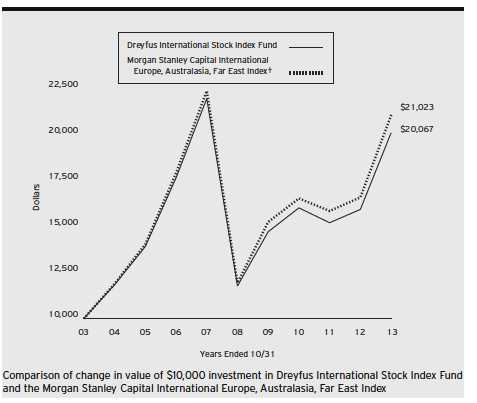
| Average Annual Total Returns as of 10/31/13 | ||||||
| 1 | Year | 5 Years | 10 Years | |||
| Fund | 26.01 | % | 11.28 | % | 7.21 | % |
| Morgan Stanley Capital International | ||||||
| Europe, Australasia, Far East Index | 26.88 | % | 11.99 | % | 7.71 | % |
† Source: Lipper Inc.
Past performance is not predictive of future performance.The fund’s performance shown in the graph and table does not reflect the deduction of taxes that a shareholder would pay on fund distributions or the redemption of fund shares.
The above graph compares a $10,000 investment made in Dreyfus International Stock Index Fund on 10/31/03 to a $10,000 investment made in the Morgan Stanley Capital International Europe, Australasia, Far East Index (the “Index”) on that date. All dividends and capital gain distributions are reinvested.
The fund’s performance shown in the line graph above takes into account all applicable fees and expenses.The Index is an unmanaged index composed of a sample of companies representative of the market structure of European and Pacific Basin countries. Unlike a mutual fund, the Index is not subject to charges, fees and other expenses. Investors cannot invest directly in any index. Further information relating to fund performance, including expense reimbursements, if applicable, is contained in the Financial Highlights section of the prospectus and elsewhere in this report.
6
UNDERSTANDING YOUR FUND’S EXPENSES (Unaudited)
As a mutual fund investor, you pay ongoing expenses, such as management fees and other expenses. Using the information below, you can estimate how these expenses affect your investment and compare them with the expenses of other funds.You also may pay one-time transaction expenses, including sales charges (loads) and redemption fees, which are not shown in this section and would have resulted in higher total expenses. For more information, see your fund’s prospectus or talk to your financial adviser.
Review your fund’s expenses
The table below shows the expenses you would have paid on a $1,000 investment in Dreyfus International Stock Index Fund from May 1, 2013 to October 31, 2013. It also shows how much a $1,000 investment would be worth at the close of the period, assuming actual returns and expenses.
Expenses and Value of a $1,000 Investment
assuming actual returns for the six months ended October 31, 2013
| Expenses paid per $1,000† | $ | 3.15 |
| Ending value (after expenses) | $ | 1,082.20 |
COMPARING YOUR FUND’S EXPENSES
WITH THOSE OF OTHER FUNDS (Unaudited)
Using the SEC’s method to compare expenses
The Securities and Exchange Commission (SEC) has established guidelines to help investors assess fund expenses. Per these guidelines, the table below shows your fund’s expenses based on a $1,000 investment, assuming a hypothetical 5% annualized return. You can use this information to compare the ongoing expenses (but not transaction expenses or total cost) of investing in the fund with those of other funds.All mutual fund shareholder reports will provide this information to help you make this comparison. Please note that you cannot use this information to estimate your actual ending account balance and expenses paid during the period.
Expenses and Value of a $1,000 Investment
assuming a hypothetical 5% annualized return for the six months ended October 31, 2013
| Expenses paid per $1,000† | $ | 3.06 |
| Ending value (after expenses) | $ | 1,022.18 |
| † Expenses are equal to the fund’s annualized expense ratio of .60%, multiplied by the average account value over the |
| period, multiplied by 184/365 (to reflect the one-half year period). |
The Fund 7
STATEMENT OF INVESTMENTS
October 31, 2013
| Common Stocks—97.9% | Shares | Value ($) | |
| Australia—8.0% | |||
| AGL Energy | 24,617 | 363,893 | |
| ALS | 15,390 | 145,895 | |
| Alumina | 112,290 | a | 109,315 |
| Amcor | 51,547 | 528,123 | |
| AMP | 129,896 | 581,937 | |
| APA Group | 35,806 | 205,083 | |
| Asciano | 42,600 | 234,334 | |
| ASX | 7,859 | 272,532 | |
| Aurizon Holdings | 90,019 | 407,541 | |
| Australia & New Zealand Banking Group | 119,856 | 3,833,471 | |
| Bendigo and Adelaide Bank | 17,917 | 184,584 | |
| BHP Billiton | 140,217 | 4,990,948 | |
| Boral | 34,041 | 158,939 | |
| Brambles | 68,663 | 603,542 | |
| Caltex Australia | 6,352 | 111,247 | |
| CFS Retail Property Trust Group | 87,781 | 171,741 | |
| Coca-Cola Amatil | 26,007 | 317,090 | |
| Cochlear | 2,583 | 143,794 | |
| Commonwealth Bank of Australia | 70,374 | 5,060,399 | |
| Computershare | 20,839 | 211,535 | |
| Crown | 18,248 | 290,959 | |
| CSL | 21,550 | 1,415,579 | |
| Dexus Property Group | 213,483 | 218,925 | |
| Echo Entertainment Group | 30,084 | 75,350 | |
| Federation Centres | 64,376 | 150,896 | |
| Flight Centre | 2,140 | 104,995 | |
| Fortescue Metals Group | 70,564 | 347,475 | |
| Goodman Group | 76,129 | 364,085 | |
| GPT Group | 71,651 | 249,891 | |
| Harvey Norman Holdings | 21,349 | 65,781 | |
| Iluka Resources | 18,724 | 182,280 | |
| Incitec Pivot | 64,208 | 161,426 | |
| Insurance Australia Group | 88,784 | 518,591 | |
| James Hardie Industries-CDI | 18,114 | 187,127 | |
| Leighton Holdings | 7,421 | 125,620 | |
| Lend Lease Group | 22,150 | 238,661 |
8
| Common Stocks (continued) | Shares | Value ($) | ||
| Australia (continued) | ||||
| Macquarie Group | 13,477 | 648,992 | ||
| Metcash | 34,689 | 109,834 | ||
| Mirvac Group | 148,466 | 244,162 | ||
| National Australia Bank | 102,354 | 3,415,895 | ||
| Newcrest Mining | 32,706 | 318,395 | ||
| Orica | 16,344 | 325,480 | ||
| Origin Energy | 48,366 | 668,785 | ||
| Qantas Airways | 41,721 | a | 49,094 | |
| QBE Insurance Group | 52,795 | 738,510 | ||
| Ramsay Health Care | 5,278 | 193,554 | ||
| Rio Tinto | 19,112 | 1,155,900 | ||
| Santos | 42,612 | 610,970 | ||
| Seek | 13,527 | 166,078 | ||
| Sonic Healthcare | 16,149 | 246,349 | ||
| SP AusNet | 72,030 | 85,099 | ||
| Stockland | 102,337 | 387,864 | ||
| Suncorp Group | 56,629 | 716,139 | ||
| Sydney Airport | 8,175 | 32,375 | ||
| Tabcorp Holdings | 33,277 | 113,227 | ||
| Tatts Group | 60,376 | 179,183 | ||
| Telstra | 191,280 | 936,486 | ||
| Toll Holdings | 28,622 | 156,091 | ||
| Transurban Group | 62,395 | 418,707 | ||
| Treasury Wine Estates | 25,721 | 114,258 | ||
| Wesfarmers | 44,059 | a | 1,789,378 | |
| Westfield Group | 91,512 | 935,852 | ||
| Westfield Retail Trust | 135,515 | 395,775 | ||
| Westpac Banking | 135,528 | 4,392,366 | ||
| Whitehaven Coal | 19,528 | a | 29,900 | |
| Woodside Petroleum | 28,919 | 1,061,062 | ||
| Woolworths | 54,506 | 1,797,926 | ||
| WorleyParsons | 8,268 | 172,388 | ||
| 45,939,658 | ||||
| Austria—.3% | ||||
| Andritz | 3,077 | 189,547 | ||
| Erste Group Bank | 11,446 | 403,674 |
The Fund 9
STATEMENT OF INVESTMENTS (continued)
| Common Stocks (continued) | Shares | Value ($) | |
| Austria (continued) | |||
| IMMOFINANZ | 43,712 | a | 191,404 |
| OMV | 6,042 | 288,314 | |
| Raiffeisen Bank International | 2,344 | 86,152 | |
| Telekom Austria | 9,805 | 80,769 | |
| Verbund | 3,340 | 78,431 | |
| Vienna Insurance Group | 1,670 | 88,487 | |
| Voestalpine | 5,020 | 237,092 | |
| 1,643,870 | |||
| Belgium—1.2% | |||
| Ageas | 9,815 | 417,715 | |
| Anheuser-Busch InBev | 35,098 | 3,650,333 | |
| Belgacom | 6,323 | 173,118 | |
| Colruyt | 3,021 | 168,973 | |
| Delhaize Group | 4,547 | 290,566 | |
| Groupe Bruxelles Lambert | 3,659 | 326,747 | |
| Groupe Bruxelles Lambert (STRIP) | 236 | a,b | 0 |
| KBC Groep | 10,131 | 552,280 | |
| Solvay | 2,629 | 411,568 | |
| Telenet Group Holding | 2,398 | 131,701 | |
| UCB | 4,996 | 328,449 | |
| Umicore | 4,980 | 237,570 | |
| 6,689,020 | |||
| China—.0% | |||
| AAC Technologies Holdings | 30,000 | 132,529 | |
| Yangzijiang Shipbuilding Holdings | 91,000 | 86,443 | |
| 218,972 | |||
| Denmark—1.1% | |||
| AP Moller—Maersk, Cl. A | 25 | 225,914 | |
| AP Moller—Maersk, Cl. B | 59 | 570,855 | |
| Carlsberg, Cl. B | 4,562 | 455,515 | |
| Coloplast, Cl. B | 4,688 | 305,692 | |
| Danske Bank | 28,887 | a | 674,683 |
| DSV | 7,535 | 220,430 | |
| Novo Nordisk, Cl. B | 17,402 | 2,895,450 | |
| Novozymes, Cl. B | 9,781 | 383,174 | |
| TDC | 32,635 | 294,670 |
10
| Common Stocks (continued) | Shares | Value ($) | ||
| Denmark (continued) | ||||
| Tryg | 1,152 | 105,275 | ||
| William Demant Holding | 1,152 | a | 113,978 | |
| 6,245,636 | ||||
| Finland—.9% | ||||
| Elisa | 6,364 | 159,249 | ||
| Fortum | 18,860 | 419,959 | ||
| Kesko, Cl. B | 2,995 | 99,547 | ||
| Kone, Cl. B | 6,865 | 605,398 | ||
| Metso | 5,858 | 230,658 | ||
| Neste Oil | 6,048 | 119,973 | ||
| Nokia | 164,269 | a | 1,242,316 | |
| Nokian Renkaat | 4,986 | 252,309 | ||
| Orion, Cl. B | 4,426 | 118,926 | ||
| Pohjola Bank, Cl. A | 5,263 | 95,897 | ||
| Sampo, Cl. A | 18,425 | 872,830 | ||
| Stora Enso, Cl. R | 25,317 | 235,464 | ||
| UPM-Kymmene | 21,691 | 344,872 | ||
| Wartsila | 7,884 | 349,717 | ||
| 5,147,115 | ||||
| France—9.2% | ||||
| Accor | 6,674 | 299,171 | ||
| Aeroports de Paris | 1,389 | 148,422 | ||
| Air Liquide | 13,636 | 1,856,989 | ||
| Alstom | 9,153 | 340,514 | ||
| Arkema | 2,734 | 310,406 | ||
| Atos | 2,389 | 203,962 | ||
| AXA | 78,480 | 1,960,641 | ||
| BNP Paribas | 43,424 | 3,215,632 | ||
| Bouygues | 8,391 | 328,002 | ||
| Bureau Veritas | 10,016 | 302,448 | ||
| Cap Gemini | 6,082 | 400,094 | ||
| Carrefour | 26,473 | 969,765 | ||
| Casino Guichard Perrachon | 2,567 | 288,971 | ||
| CGG | 7,241 | a | 159,320 | |
| Christian Dior | 2,410 | 458,106 | ||
| Cie de St-Gobain | 17,499 | 920,556 |
The Fund 11
STATEMENT OF INVESTMENTS (continued)
| Common Stocks (continued) | Shares | Value ($) | |
| France (continued) | |||
| Cie Generale des Etablissements Michelin | 8,018 | 838,477 | |
| CNP Assurances | 6,982 | 123,238 | |
| Credit Agricole | 44,157 | a | 533,414 |
| Danone | 25,014 | 1,855,052 | |
| Dassault Systemes | 2,782 | 338,104 | |
| Edenred | 8,329 | 283,001 | |
| Electricite de France | 10,686 | 374,912 | |
| Essilor International | 8,954 | 961,645 | |
| Eurazeo | 1,459 | 110,399 | |
| Eutelsat Communications | 6,600 | 209,199 | |
| Fonciere Des Regions | 1,253 | 107,469 | |
| GDF Suez | 58,117 | 1,447,184 | |
| Gecina | 1,000 | 133,807 | |
| Groupe Eurotunnel | 24,439 | 236,987 | |
| ICADE | 1,675 | 154,353 | |
| Iliad | 1,003 | 229,332 | |
| Imerys | 1,513 | 121,552 | |
| JCDecaux | 2,555 | 102,650 | |
| Kering | 3,328 | 756,189 | |
| Klepierre | 4,592 | 206,248 | |
| L’Oreal | 10,581 | 1,812,322 | |
| Lafarge | 7,993 | 553,262 | |
| Lagardere | 4,997 | 181,762 | |
| Legrand | 11,665 | 662,512 | |
| LVMH Moet Hennessy Louis Vuitton | 11,103 | 2,137,657 | |
| Natixis | 41,498 | 223,799 | |
| Orange | 81,362 | 1,116,848 | |
| Pernod-Ricard | 9,306 | 1,118,221 | |
| Publicis Groupe | 7,865 | 655,995 | |
| Remy Cointreau | 1,207 | 119,109 | |
| Renault | 8,462 | 741,176 | |
| Rexel | 9,689 | 242,715 | |
| Safran | 11,015 | 704,038 | |
| Sanofi | 52,018 | 5,547,099 | |
| Schneider Electric | 23,082 | 1,944,628 | |
| SCOR | 6,401 | 226,270 |
12
| Common Stocks (continued) | Shares | Value ($) | |
| France (continued) | |||
| Societe BIC | 1,136 | 141,979 | |
| Societe Generale | 30,748 | 1,745,912 | |
| Sodexo | 3,999 | 388,167 | |
| Suez Environnement | 12,864 | 224,527 | |
| Technip | 4,344 | 455,037 | |
| Thales | 3,664 | 224,862 | |
| Total | 93,370 | 5,738,405 | |
| Unibail-Rodamco | 4,238 | 1,110,554 | |
| Vallourec | 4,360 | 259,436 | |
| Veolia Environnement | 15,458 | 264,871 | |
| Vinci | 20,331 | 1,304,175 | |
| Vivendi | 52,274 | 1,326,883 | |
| Wendel | 1,490 | 207,970 | |
| Zodiac Aerospace | 1,443 | 231,190 | |
| 52,897,592 | |||
| Germany—8.2% | |||
| Adidas | 9,181 | 1,048,103 | |
| Allianz | 19,920 | 3,351,058 | |
| Axel Springer | 1,517 | 91,482 | |
| BASF | 40,111 | 4,173,339 | |
| Bayer | 36,109 | 4,487,947 | |
| Bayerische Motoren Werke | 14,496 | 1,644,235 | |
| Beiersdorf | 4,287 | 409,253 | |
| Brenntag | 2,284 | 387,019 | |
| Celesio | 3,952 | 123,066 | |
| Commerzbank | 42,760 | a | 549,747 |
| Continental | 4,912 | 900,021 | |
| Daimler | 42,024 | 3,448,603 | |
| Deutsche Bank | 44,590 | 2,157,122 | |
| Deutsche Boerse | 8,501 | 640,019 | |
| Deutsche Lufthansa | 9,327 | 180,649 | |
| Deutsche Post | 39,730 | 1,344,544 | |
| Deutsche Telekom | 122,910 | 1,935,827 | |
| E.ON | 78,883 | 1,441,081 | |
| Fraport Frankfurt Airport Services Worldwide | 1,609 | 124,677 | |
| Fresenius & Co. | 5,497 | 714,488 |
The Fund 13
STATEMENT OF INVESTMENTS (continued)
| Common Stocks (continued) | Shares | Value ($) | |
| Germany (continued) | |||
| Fresenius Medical Care & Co. | 9,487 | 628,079 | |
| GEA Group | 7,622 | 331,679 | |
| Hannover Rueck | 2,427 | 194,718 | |
| HeidelbergCement | 6,000 | 472,987 | |
| Henkel & Co. | 5,541 | 512,263 | |
| Hochtief | 1,402 | 127,178 | |
| Hugo Boss | 1,386 | 180,733 | |
| Infineon Technologies | 45,970 | 444,964 | |
| K+S | 7,058 | 180,065 | |
| Kabel Deutschland Holding | 981 | 123,339 | |
| LANXESS | 3,616 | 254,516 | |
| Linde | 8,108 | 1,540,664 | |
| MAN | 1,622 | 195,452 | |
| Merck | 2,756 | 458,766 | |
| Metro | 5,401 | 253,253 | |
| Muenchener Rueckversicherungs | 7,853 | 1,640,951 | |
| OSRAM Licht | 3,826 | a | 198,258 |
| ProSiebenSat.1 Media | 5,020 | 239,103 | |
| RWE | 21,529 | 794,794 | |
| SAP | 40,258 | 3,162,656 | |
| Siemens | 34,622 | 4,427,231 | |
| Suedzucker | 3,784 | 121,919 | |
| Telefonica Deutschland Holding | 11,353 | 89,543 | |
| ThyssenKrupp | 16,741 | a | 427,896 |
| United Internet | 4,460 | 176,218 | |
| Volkswagen | 1,298 | 318,107 | |
| 46,647,612 | |||
| Greece—.0% | |||
| Hellenic Telecommunications Organization | 10,491 | a | 132,329 |
| OPAP | 10,992 | 136,559 | |
| 268,888 | |||
| Hong Kong—2.7% | |||
| AIA Group | 526,400 | 2,671,719 | |
| ASM Pacific Technology | 10,800 | 104,127 | |
| Bank of East Asia | 56,950 | 246,443 | |
| BOC Hong Kong Holdings | 158,000 | 515,594 |
14
| Common Stocks (continued) | Shares | Value ($) | |
| Hong Kong (continued) | |||
| Cathay Pacific Airways | 52,000 | 103,155 | |
| Cheung Kong Holdings | 61,000 | 953,592 | |
| Cheung Kong Infrastructure Holdings | 27,000 | 187,882 | |
| CLP Holdings | 77,788 | 626,077 | |
| First Pacific | 92,250 | 104,946 | |
| Galaxy Entertainment Group | 93,000 | a | 693,931 |
| Hang Lung Properties | 100,000 | 329,550 | |
| Hang Seng Bank | 32,700 | 544,086 | |
| Henderson Land Development | 48,038 | 284,709 | |
| HKT Trust | 87,000 | 80,682 | |
| Hong Kong & China Gas | 252,661 | 590,509 | |
| Hong Kong Exchanges & Clearing | 48,200 | 777,119 | |
| Hopewell Holdings | 26,000 | 87,527 | |
| Hutchison Whampoa | 93,800 | 1,168,719 | |
| Hysan Development | 28,000 | 130,917 | |
| Kerry Properties | 29,500 | 127,847 | |
| Li & Fung | 259,200 | 366,417 | |
| Link REIT | 98,000 | 494,234 | |
| MGM China Holdings | 40,000 | 137,753 | |
| MTR | 66,000 | 255,811 | |
| New World Development | 162,786 | 225,503 | |
| Noble Group | 161,963 | 134,296 | |
| NWS Holdings | 60,000 | 93,641 | |
| Orient Overseas International | 11,300 | 58,373 | |
| PCCW | 167,000 | 75,390 | |
| Power Assets Holdings | 59,500 | 495,769 | |
| Shangri-La Asia | 65,000 | 119,051 | |
| Sino Land | 127,730 | 179,247 | |
| SJM Holdings | 78,530 | 253,731 | |
| Sun Hung Kai Properties | 70,699 | 926,482 | |
| Swire Pacific, Cl. A | 30,000 | 346,511 | |
| Swire Properties | 46,400 | 125,680 | |
| Wharf Holdings | 66,311 | 558,507 | |
| Wheelock & Co. | 37,000 | 188,985 | |
| Yue Yuen Industrial Holdings | 32,300 | 88,739 | |
| 15,453,251 |
The Fund 15
STATEMENT OF INVESTMENTS (continued)
| Common Stocks (continued) | Shares | Value ($) | ||
| Ireland—.3% | ||||
| Bank of Ireland | 857,556 | a | 314,375 | |
| CRH | 32,074 | 779,520 | ||
| Elan | 21,591 | a | 357,646 | |
| Irish Bank Resolution | 35,225 | a,b | 0 | |
| Kerry Group, Cl. A | 6,342 | 404,711 | ||
| Ryanair Holdings | 4,000 | a | 33,129 | |
| 1,889,381 | ||||
| Israel—.4% | ||||
| Bank Hapoalim | 42,826 | 229,660 | ||
| Bank Leumi Le-Israel | 55,519 | a | 211,921 | |
| Bezeq Israeli Telecommunication | 76,662 | 133,508 | ||
| Delek Group | 202 | 69,887 | ||
| Israel | 117 | a | 59,027 | |
| Israel Chemicals | 18,647 | 154,305 | ||
| Israel Discount Bank, Cl. A | 1 | a | 2 | |
| Mizrahi Tefahot Bank | 6,222 | 73,050 | ||
| NICE Systems | 2,452 | 96,655 | ||
| Teva Pharmaceutical Industries | 37,214 | 1,393,052 | ||
| 2,421,067 | ||||
| Italy—2.3% | ||||
| Assicurazioni Generali | 51,235 | 1,197,902 | ||
| Atlantia | 14,628 | 320,759 | ||
| Banca Monte dei Paschi di Siena | 281,163 | a | 88,948 | |
| CNH Industrial | 41,752 | a | 493,761 | |
| Enel | 288,682 | 1,273,868 | ||
| Enel Green Power | 70,150 | 170,682 | ||
| Eni | 111,194 | 2,815,669 | ||
| EXOR | 4,561 | 180,765 | ||
| Fiat | 35,936 | a | 282,507 | |
| Finmeccanica | 15,364 | a | 112,751 | |
| Intesa Sanpaolo | 510,043 | 1,267,992 | ||
| Luxottica Group | 7,387 | 401,189 | ||
| Mediobanca | 23,963 | 218,804 | ||
| Pirelli & C | 9,607 | 135,396 | ||
| Prysmian | 8,493 | 207,565 | ||
| Saipem | 10,910 | 255,674 |
16
| Common Stocks (continued) | Shares | Value ($) | |
| Italy (continued) | |||
| Snam | 89,752 | 462,585 | |
| STMicroelectronics | 26,028 | 201,295 | |
| Telecom Italia | 446,650 | 435,122 | |
| Telecom Italia-RSP | 266,227 | 208,027 | |
| Tenaris | 20,122 | 472,102 | |
| Terna Rete Elettrica Nazionale | 61,801 | 306,274 | |
| UniCredit | 190,323 | 1,431,602 | |
| Unione di Banche Italiane | 33,961 | 235,165 | |
| 13,176,404 | |||
| Japan—20.6% | |||
| ABC-Mart | 1,000 | 49,934 | |
| Acom | 15,500 | a | 60,373 |
| Advantest | 6,400 | 76,152 | |
| Aeon | 26,700 | 363,042 | |
| AEON Financial Service | 2,860 | 87,403 | |
| AEON Mall | 5,280 | 149,760 | |
| Air Water | 7,000 | 99,664 | |
| Aisin Seiki | 8,500 | 343,613 | |
| Ajinomoto | 25,800 | 360,250 | |
| Alfresa Holdings | 1,900 | 103,570 | |
| Amada | 14,000 | 119,882 | |
| ANA Holdings | 55,000 | 114,665 | |
| Aozora Bank | 46,959 | 136,106 | |
| Arnest One | 5,000 | b | 137,293 |
| Asahi Glass | 43,800 | 269,490 | |
| Asahi Group Holdings | 16,500 | 444,676 | |
| Asahi Kasei | 55,900 | 423,528 | |
| Asics | 7,000 | 122,943 | |
| Astellas Pharma | 19,079 | 1,059,405 | |
| Bank of Kyoto | 14,000 | 122,730 | |
| Bank of Yokohama | 50,000 | 274,586 | |
| Benesse Holdings | 3,300 | 122,831 | |
| Bridgestone | 28,500 | 972,414 | |
| Brother Industries | 9,100 | 102,818 | |
| CALBEE | 3,600 | 94,238 | |
| Canon | 49,650 | 1,560,241 |
The Fund 17
STATEMENT OF INVESTMENTS (continued)
| Common Stocks (continued) | Shares | Value ($) | |
| Japan (continued) | |||
| Casio Computer | 9,300 | 88,621 | |
| Central Japan Railway | 6,300 | 813,689 | |
| Chiba Bank | 33,000 | 234,252 | |
| Chiyoda | 6,000 | 75,786 | |
| Chubu Electric Power | 28,600 | 422,325 | |
| Chugai Pharmaceutical | 10,028 | 234,969 | |
| Chugoku Bank | 6,000 | 86,098 | |
| Chugoku Electric Power | 13,700 | 209,269 | |
| Citizen Holdings | 12,400 | 87,896 | |
| Coca-Cola West | 2,700 | 54,670 | |
| Cosmo Oil | 27,000 | a | 47,503 |
| Credit Saison | 7,100 | 193,223 | |
| Dai Nippon Printing | 24,800 | 259,274 | |
| Dai-ichi Life Insurance | 35,200 | 499,738 | |
| Daicel | 11,000 | 92,403 | |
| Daido Steel | 12,200 | 69,728 | |
| Daihatsu Motor | 8,000 | 154,744 | |
| Daiichi Sankyo | 29,683 | 548,802 | |
| Daikin Industries | 10,300 | 589,739 | |
| Dainippon Sumitomo Pharma | 6,900 | 92,346 | |
| Daito Trust Construction | 3,000 | 305,400 | |
| Daiwa House Industry | 26,400 | 526,496 | |
| Daiwa Securities Group | 73,000 | 662,219 | |
| DeNA | 4,300 | 93,539 | |
| Denso | 21,300 | 1,019,185 | |
| Dentsu | 9,500 | 356,987 | |
| Don Quijote | 2,100 | 139,245 | |
| East Japan Railway | 14,800 | 1,280,871 | |
| Eisai | 11,200 | 438,523 | |
| Electric Power Development | 5,280 | 168,071 | |
| FamilyMart | 2,617 | 116,971 | |
| FANUC | 8,429 | 1,347,543 | |
| Fast Retailing | 2,358 | 787,759 | |
| Fuji Electric | 21,000 | 93,756 | |
| Fuji Heavy Industries | 26,000 | 706,254 | |
| FUJIFILM Holdings | 19,700 | 479,427 |
18
| Common Stocks (continued) | Shares | Value ($) | ||
| Japan (continued) | ||||
| Fujitsu | 80,800 | a | 345,945 | |
| Fukuoka Financial Group | 33,000 | 148,337 | ||
| Furukawa Electric | 28,000 | 64,639 | ||
| Gree | 4,300 | 36,952 | ||
| GungHo Online Entertainment | 140 | a | 87,705 | |
| Gunma Bank | 18,000 | 103,610 | ||
| Hachijuni Bank | 20,000 | 122,852 | ||
| Hakuhodo DY Holdings | 8,400 | 64,753 | ||
| Hamamatsu Photonics | 3,200 | 119,435 | ||
| Hankyu Hanshin Holdings | 48,000 | 268,484 | ||
| Hino Motors | 12,000 | 168,290 | ||
| Hirose Electric | 1,300 | 197,519 | ||
| Hiroshima Bank | 24,000 | 101,536 | ||
| Hisamitsu Pharmaceutical | 2,900 | 156,310 | ||
| Hitachi | 211,900 | 1,476,167 | ||
| Hitachi Chemical | 4,000 | 61,141 | ||
| Hitachi Construction Machinery | 5,000 | 105,105 | ||
| Hitachi High-Technologies | 2,700 | 61,837 | ||
| Hitachi Metals | 8,000 | 107,393 | ||
| Hokkaido Electric Power | 8,200 | a | 105,242 | |
| Hokuhoku Financial Group | 51,000 | 104,770 | ||
| Hokuriku Electric Power | 7,700 | 109,318 | ||
| Honda Motor | 71,259 | 2,837,171 | ||
| Hoya | 18,500 | 442,698 | ||
| Hulic | 10,800 | 170,902 | ||
| Ibiden | 5,600 | 96,589 | ||
| Idemitsu Kosan | 900 | 75,145 | ||
| IHI | 59,000 | 248,408 | ||
| INPEX | 36,400 | 419,786 | ||
| Isetan Mitsukoshi Holdings | 15,020 | 226,530 | ||
| Isuzu Motors | 49,000 | 302,980 | ||
| ITOCHU | 66,200 | 793,080 | ||
| Itochu Techno-Solutions | 900 | 35,193 | ||
| Iyo Bank | 11,000 | 114,329 | ||
| J Front Retailing | 19,800 | 153,438 | ||
| Japan Airlines | 2,600 | 151,510 |
The Fund 19
STATEMENT OF INVESTMENTS (continued)
| Common Stocks (continued) | Shares | Value ($) | |
| Japan (continued) | |||
| Japan Exchange Group | 10,000 | 230,550 | |
| Japan Petroleum Exploration | 1,400 | 56,809 | |
| Japan Prime Realty Investment | 31 | 103,092 | |
| Japan Real Estate Investment | 27 | 308,909 | |
| Japan Retail Fund Investment | 94 | 190,524 | |
| Japan Steel Works | 13,000 | 72,318 | |
| Japan Tobacco | 48,100 | 1,736,550 | |
| JFE Holdings | 21,660 | 489,459 | |
| JGC | 9,000 | 342,774 | |
| Joyo Bank | 26,462 | 136,710 | |
| JSR | 7,700 | 145,809 | |
| JTEKT | 8,000 | 101,942 | |
| JX Holdings | 95,876 | 472,896 | |
| Kajima | 38,800 | 163,755 | |
| Kamigumi | 9,400 | 81,544 | |
| Kaneka | 12,000 | 75,786 | |
| Kansai Electric Power | 29,899 | a | 377,044 |
| Kansai Paint | 10,000 | 133,428 | |
| Kao | 23,200 | 770,345 | |
| Kawasaki Heavy Industries | 58,000 | 225,323 | |
| KDDI | 23,600 | 1,274,443 | |
| Keikyu | 20,000 | 187,735 | |
| Keio | 25,000 | 172,633 | |
| Keisei Electric Railway | 11,000 | 113,099 | |
| Keyence | 1,985 | 847,859 | |
| Kikkoman | 6,000 | 108,980 | |
| Kinden | 6,000 | 65,656 | |
| Kintetsu | 79,354 | 291,333 | |
| Kirin Holdings | 38,000 | 553,402 | |
| Kobe Steel | 113,000 | a | 198,810 |
| Koito Manufacturing | 4,000 | 72,613 | |
| Komatsu | 41,000 | 892,301 | |
| Konami | 4,400 | 105,917 | |
| Konica Minolta | 19,500 | 161,029 | |
| Kubota | 47,000 | 692,118 | |
| Kuraray | 14,000 | 163,734 |
20
| Common Stocks (continued) | Shares | Value ($) | |
| Japan (continued) | |||
| Kurita Water Industries | 4,800 | 104,465 | |
| Kyocera | 14,300 | 738,778 | |
| Kyowa Hakko Kirin | 8,705 | 95,876 | |
| Kyushu Electric Power | 18,000 | a | 252,436 |
| Lawson | 3,000 | 240,110 | |
| LIXIL Group | 12,124 | 283,341 | |
| M3 | 36 | 98,302 | |
| Mabuchi Motor | 1,000 | 52,985 | |
| Makita | 4,600 | 231,567 | |
| Marubeni | 73,000 | 569,419 | |
| Marui Group | 8,300 | 79,092 | |
| Maruichi Steel Tube | 2,000 | 48,734 | |
| Mazda Motor | 115,000 | a | 514,594 |
| McDonald’s Holdings Japan | 3,000 | 82,864 | |
| Medipal Holdings | 5,800 | 78,096 | |
| MEIJI Holdings | 2,521 | 140,497 | |
| Miraca Holdings | 2,600 | 116,740 | |
| Mitsubishi | 61,598 | 1,241,607 | |
| Mitsubishi Chemical Holdings | 59,380 | 276,579 | |
| Mitsubishi Electric | 85,000 | 929,269 | |
| Mitsubishi Estate | 55,000 | 1,564,477 | |
| Mitsubishi Gas Chemical | 16,000 | 130,174 | |
| Mitsubishi Heavy Industries | 133,700 | 845,738 | |
| Mitsubishi Logistics | 6,000 | 82,925 | |
| Mitsubishi Materials | 45,000 | 175,277 | |
| Mitsubishi Motors | 18,300 | a | 204,347 |
| Mitsubishi Tanabe Pharma | 9,200 | 129,490 | |
| Mitsubishi UFJ Financial Group | 556,590 | 3,509,466 | |
| Mitsubishi UFJ Lease & Finance | 25,500 | 143,669 | |
| Mitsui & Co. | 76,200 | 1,084,918 | |
| Mitsui Chemicals | 38,000 | 100,478 | |
| Mitsui Fudosan | 36,286 | 1,193,788 | |
| Mitsui OSK Lines | 50,000 | 210,516 | |
| Mizuho Financial Group | 1,004,200 | 2,093,573 | |
| MS&AD Insurance Group Holdings | 22,357 | 574,102 | |
| Murata Manufacturing | 8,900 | 712,326 |
The Fund 21
STATEMENT OF INVESTMENTS (continued)
| Common Stocks (continued) | Shares | Value ($) |
| Japan (continued) | ||
| Nabtesco | 4,500 | 109,422 |
| Namco Bandai Holdings | 7,850 | 147,691 |
| NEC | 103,800 | 232,238 |
| NEXON | 4,600 | 53,611 |
| NGK Insulators | 11,000 | 183,911 |
| NGK Spark Plug | 7,926 | 180,155 |
| NHK Spring | 7,000 | 72,826 |
| Nidec | 4,300 | 416,750 |
| Nikon | 14,160 | 260,649 |
| Nintendo | 4,725 | 529,538 |
| Nippon Building Fund | 30 | 371,301 |
| Nippon Electric Glass | 17,085 | 87,571 |
| Nippon Express | 32,000 | 160,114 |
| Nippon Meat Packers | 7,000 | 102,085 |
| Nippon Prologis REIT | 11 | 109,631 |
| Nippon Steel & Sumitomo Metal | 333,615 | 1,095,878 |
| Nippon Telegraph & Telephone | 19,200 | 993,878 |
| Nippon Yusen | 69,800 | 212,247 |
| Nishi-Nippon City Bank | 26,000 | 70,070 |
| Nissan Motor | 109,100 | 1,089,558 |
| Nisshin Seifun Group | 8,580 | 92,754 |
| Nissin Foods Holdings | 2,600 | 111,055 |
| Nitori Holdings | 1,400 | 131,130 |
| Nitto Denko | 7,300 | 380,850 |
| NKSJ Holdings | 14,770 | 379,727 |
| NOK | 3,400 | 52,281 |
| Nomura Holdings | 159,200 | 1,170,564 |
| Nomura Real Estate Holdings | 5,700 | 143,703 |
| Nomura Real Estate Office Fund | 14 | 69,124 |
| Nomura Research Institute | 3,900 | 130,489 |
| NSK | 20,000 | 211,939 |
| NTT Data | 5,500 | 181,786 |
| NTT DoCoMo | 63,700 | 1,010,597 |
| NTT Urban Development | 5,500 | 69,750 |
| Obayashi | 30,000 | 191,295 |
| Odakyu Electric Railway | 28,000 | 269,379 |
22
| Common Stocks (continued) | Shares | Value ($) | |
| Japan (continued) | |||
| OJI Holdings | 35,000 | 159,463 | |
| Olympus | 10,000 | a | 319,333 |
| Omron | 8,400 | 319,496 | |
| Ono Pharmaceutical | 3,400 | 255,873 | |
| ORACLE JAPAN | 1,400 | 55,243 | |
| Oriental Land | 2,100 | 335,727 | |
| ORIX | 54,900 | 941,334 | |
| Osaka Gas | 83,000 | 348,612 | |
| OTSUKA | 700 | 90,623 | |
| Otsuka Holdings | 15,500 | 439,795 | |
| Panasonic | 96,895 | 970,625 | |
| Park24 | 3,800 | 74,045 | |
| Rakuten | 32,100 | 417,205 | |
| Resona Holdings | 83,500 | 433,082 | |
| Ricoh | 28,000 | 294,152 | |
| Rinnai | 1,500 | 115,936 | |
| Rohm | 3,800 | 155,161 | |
| Sankyo | 2,200 | 104,261 | |
| Sanrio | 2,100 | 114,899 | |
| Santen Pharmaceutical | 3,300 | 166,292 | |
| SBI Holdings | 7,830 | 94,122 | |
| Secom | 9,300 | 558,019 | |
| Sega Sammy Holdings | 7,484 | 191,419 | |
| Sekisui Chemical | 19,000 | 219,699 | |
| Sekisui House | 23,000 | 328,170 | |
| Seven & I Holdings | 33,060 | 1,217,098 | |
| Seven Bank | 26,000 | 91,752 | |
| Sharp | 46,000 | a | 135,198 |
| Shikoku Electric Power | 8,600 | a | 152,881 |
| Shimadzu | 9,000 | 87,776 | |
| Shimamura | 1,000 | 112,173 | |
| Shimano | 3,300 | 288,620 | |
| Shimizu | 23,000 | 117,421 | |
| Shin-Etsu Chemical | 18,000 | 1,012,306 | |
| Shinsei Bank | 67,000 | 156,036 | |
| Shionogi & Co. | 13,100 | 288,565 |
The Fund 23
STATEMENT OF INVESTMENTS (continued)
| Common Stocks (continued) | Shares | Value ($) |
| Japan (continued) | ||
| Shiseido | 16,100 | 274,255 |
| Shizuoka Bank | 23,400 | 262,486 |
| Showa Denko | 57,000 | 77,098 |
| Showa Shell Sekiyu | 8,500 | 91,112 |
| SMC | 2,200 | 509,672 |
| Softbank | 42,000 | 3,118,072 |
| Sojitz | 54,600 | 105,502 |
| Sony | 44,380 | 847,160 |
| Sony Financial Holdings | 7,000 | 130,062 |
| Stanley Electric | 6,700 | 155,218 |
| Sumco | 4,900 | 44,351 |
| Sumitomo | 49,600 | 643,140 |
| Sumitomo Chemical | 66,000 | 240,293 |
| Sumitomo Electric Industries | 33,300 | 497,146 |
| Sumitomo Heavy Industries | 25,000 | 110,088 |
| Sumitomo Metal Mining | 23,000 | 317,645 |
| Sumitomo Mitsui Financial Group | 55,600 | 2,666,063 |
| Sumitomo Mitsui Trust Holdings | 145,640 | 713,907 |
| Sumitomo Realty & Development | 16,000 | 752,568 |
| Sumitomo Rubber Industries | 7,600 | 105,270 |
| Suntory Beverage & Food | 5,200 | 170,813 |
| Suruga Bank | 8,000 | 126,431 |
| Suzuken | 2,920 | 105,124 |
| Suzuki Motor | 16,200 | 405,453 |
| Sysmex | 3,200 | 210,556 |
| T&D Holdings | 23,800 | 284,399 |
| Taiheiyo Cement | 54,000 | 227,906 |
| Taisei | 39,000 | 199,105 |
| Taisho Pharmaceutical Holdings | 1,500 | 105,105 |
| Taiyo Nippon Sanso | 12,000 | 81,888 |
| Takashimaya | 12,000 | 113,984 |
| Takeda Pharmaceutical | 34,600 | 1,641,503 |
| TDK | 5,500 | 232,686 |
| Teijin | 40,000 | 89,495 |
| Terumo | 6,800 | 327,794 |
| THK | 4,400 | 95,491 |
24
| Common Stocks (continued) | Shares | Value ($) | ||
| Japan (continued) | ||||
| Tobu Railway | 45,000 | 232,482 | ||
| Toho | 5,600 | 119,654 | ||
| Toho Gas | 18,000 | 93,542 | ||
| Tohoku Electric Power | 19,800 | a | 238,615 | |
| Tokio Marine Holdings | 30,400 | 990,867 | ||
| Tokyo Electric Power | 64,072 | a | 340,788 | |
| Tokyo Electron | 7,600 | 415,051 | ||
| Tokyo Gas | 108,000 | 584,318 | ||
| Tokyo Tatemono | 17,000 | 158,538 | ||
| Tokyu | 50,820 | 344,726 | ||
| Tokyu Fudosan Holdings | 24,000 | a | 235,777 | |
| TonenGeneral Sekiyu | 13,000 | 120,574 | ||
| Toppan Printing | 25,000 | 196,786 | ||
| Toray Industries | 63,000 | 392,108 | ||
| Toshiba | 177,000 | 748,825 | ||
| TOTO | 12,000 | 168,901 | ||
| Toyo Seikan Group Holdings | 7,100 | 146,722 | ||
| Toyo Suisan Kaisha | 4,000 | 126,920 | ||
| Toyoda Gosei | 2,400 | 59,701 | ||
| Toyota Boshoku | 2,600 | 34,665 | ||
| Toyota Industries | 6,700 | 294,015 | ||
| Toyota Motor | 120,357 | 7,784,710 | ||
| Toyota Tsusho | 8,700 | 240,571 | ||
| Trend Micro | 4,700 | 173,986 | ||
| Tsumura & Co. | 2,300 | 72,043 | ||
| Ube Industries | 46,600 | 96,205 | ||
| Unicharm | 5,000 | 319,841 | ||
| United Urban Investment | 97 | 148,070 | ||
| USS | 9,800 | 143,118 | ||
| West Japan Railway | 7,600 | 339,693 | ||
| Yahoo! Japan | 61,400 | 285,364 | ||
| Yakult Honsha | 3,600 | 182,142 | ||
| Yamada Denki | 36,200 | 101,241 | ||
| Yamaguchi Financial Group | 9,000 | 84,481 | ||
| Yamaha | 7,200 | 106,905 | ||
| Yamaha Motor | 11,200 | 170,625 |
The Fund 25
STATEMENT OF INVESTMENTS (continued)
| Common Stocks (continued) | Shares | Value ($) | |
| Japan (continued) | |||
| Yamato Holdings | 15,600 | 334,116 | |
| Yamato Kogyo | 1,800 | 66,541 | |
| Yamazaki Baking | 4,000 | 40,598 | |
| Yaskawa Electric | 9,000 | 115,875 | |
| Yokogawa Electric | 8,800 | 114,553 | |
| Yokohama Rubber | 9,000 | 87,684 | |
| 117,750,608 | |||
| Luxembourg—.1% | |||
| SES | 12,925 | 376,250 | |
| Macau—.2% | |||
| Sands China | 106,613 | 757,691 | |
| Wynn Macau | 71,200 | 273,210 | |
| 1,030,901 | |||
| Mexico—.0% | |||
| Fresnillo | 8,530 | 133,420 | |
| Netherlands—3.0% | |||
| Aegon | 78,438 | 624,513 | |
| Akzo Nobel | 10,555 | 767,574 | |
| ASML Holding | 15,647 | 1,485,436 | |
| Corio | 2,835 | 123,695 | |
| Delta Lloyd | 8,633 | 183,559 | |
| European Aeronautic Defence and Space | 25,473 | 1,750,402 | |
| Fugro | 3,133 | 196,038 | |
| Gemalto | 3,324 | 372,743 | |
| Heineken | 10,138 | 700,634 | |
| Heineken Holding | 4,582 | 291,745 | |
| ING Groep | 167,600 | a | 2,135,193 |
| Koninklijke Ahold | 44,322 | 843,701 | |
| Koninklijke Boskalis Westminster | 3,270 | 157,482 | |
| Koninklijke DSM | 6,810 | 515,852 | |
| Koninklijke KPN | 141,360 | a | 451,808 |
| Koninklijke Philips | 41,931 | 1,484,787 | |
| Koninklijke Vopak | 2,912 | 179,284 | |
| OCI | 3,786 | a | 145,578 |
| QIAGEN | 9,940 | a | 228,624 |
26
| Common Stocks (continued) | Shares | Value ($) | |
| Netherlands (continued) | |||
| Randstad Holding | 5,158 | 318,335 | |
| Reed Elsevier | 30,515 | 614,642 | |
| TNT Express | 14,652 | 135,278 | |
| Unilever | 71,188 | 2,819,451 | |
| Wolters Kluwer | 13,416 | 363,948 | |
| Ziggo | 6,792 | 291,457 | |
| 17,181,759 | |||
| New Zealand—.1% | |||
| Auckland International Airport | 42,260 | 119,731 | |
| Contact Energy | 16,082 | 69,740 | |
| Fletcher Building | 27,701 | 228,582 | |
| SKYCITY Entertainment Group | 26,289 | 84,471 | |
| Telecom Corporation of New Zealand | 78,060 | 151,523 | |
| 654,047 | |||
| Norway—.8% | |||
| Aker Solutions | 6,700 | 92,626 | |
| DNB | 43,039 | 762,738 | |
| Gjensidige Forsikring | 8,002 | 149,339 | |
| Norsk Hydro | 38,511 | 172,079 | |
| Orkla | 31,249 | 253,276 | |
| Seadrill | 16,512 | 764,156 | |
| Statoil | 48,944 | 1,159,255 | |
| Telenor | 30,891 | 742,042 | |
| Yara International | 8,213 | 354,565 | |
| 4,450,076 | |||
| Portugal—.2% | |||
| Banco Espirito Santo | 66,352 | a | 87,657 |
| Energias de Portugal | 88,059 | 324,254 | |
| Galp Energia | 15,778 | 267,355 | |
| Jeronimo Martins | 10,446 | 193,032 | |
| Portugal Telecom | 27,519 | 124,235 | |
| 996,533 | |||
| Singapore—1.5% | |||
| Ascendas Real Estate Investment Trust | 91,912 | 175,359 | |
| CapitaCommercial Trust | 76,000 | 90,243 |
The Fund 27
STATEMENT OF INVESTMENTS (continued)
| Common Stocks (continued) | Shares | Value ($) | |
| Singapore (continued) | |||
| CapitaLand | 105,500 | 264,981 | |
| CapitaMall Trust | 97,000 | 157,736 | |
| CapitaMalls Asia | 65,000 | 105,700 | |
| City Developments | 17,000 | 140,960 | |
| ComfortDelGro | 78,700 | 121,959 | |
| DBS Group Holdings | 74,588 | 1,005,155 | |
| Genting Singapore | 250,527 | 307,562 | |
| Global Logistic Properties | 134,843 | 335,425 | |
| Golden Agri-Resources | 325,440 | 157,192 | |
| Hutchison Port Holdings Trust | 227,000 | 165,710 | |
| Jardine Cycle & Carriage | 4,422 | 130,467 | |
| Keppel | 61,700 | 538,919 | |
| Keppel Land | 26,000 | 77,653 | |
| Olam International | 62,995 | 78,097 | |
| Oversea-Chinese Banking | 112,942 | 945,578 | |
| SembCorp Industries | 43,254 | 185,245 | |
| SembCorp Marine | 38,000 | 137,659 | |
| Singapore Airlines | 21,733 | 182,479 | |
| Singapore Exchange | 35,000 | 206,811 | |
| Singapore Press Holdings | 69,075 | 236,330 | |
| Singapore Technologies Engineering | 68,000 | 231,010 | |
| Singapore Telecommunications | 349,951 | 1,064,897 | |
| StarHub | 26,918 | 96,430 | |
| United Overseas Bank | 56,112 | 941,373 | |
| UOL Group | 21,111 | 111,996 | |
| Wilmar International | 88,000 | 245,114 | |
| 8,438,040 | |||
| Spain—3.3% | |||
| Abertis Infraestructuras | 15,807 | 339,100 | |
| Acciona | 1,014 | 64,336 | |
| ACS Actividades de Construccion y Servicios | 6,606 | 216,834 | |
| Amadeus IT Holding, Cl. A | 16,771 | 622,784 | |
| Banco Bilbao Vizcaya Argentaria | 247,539 | 2,900,183 | |
| Banco de Sabadell | 150,772 | 386,905 | |
| Banco Popular Espanol | 52,819 | a | 300,630 |
28
| Common Stocks (continued) | Shares | Value ($) | |
| Spain (continued) | |||
| Banco Santander | 486,353 | 4,318,016 | |
| Bankia | 185,397 | a | 277,399 |
| CaixaBank | 51,538 | 267,938 | |
| Distribuidora Internacional de Alimentacion | 24,682 | 225,637 | |
| Enagas | 8,817 | 235,715 | |
| Ferrovial | 16,561 | 315,813 | |
| Gas Natural SDG | 15,873 | 374,352 | |
| Grifols | 6,781 | 278,095 | |
| Iberdrola | 208,262 | 1,308,654 | |
| Inditex | 9,554 | 1,569,611 | |
| Mapfre | 35,362 | 142,310 | |
| Red Electrica | 4,424 | 275,768 | |
| Repsol | 37,562 | 1,008,780 | |
| Telefonica | 178,991 | a | 3,155,691 |
| Zardoya Otis | 6,340 | 110,443 | |
| 18,694,994 | |||
| Sweden—3.1% | |||
| Alfa Laval | 13,304 | 303,854 | |
| Assa Abloy, Cl. B | 14,709 | 730,224 | |
| Atlas Copco, Cl. A | 29,500 | 818,528 | |
| Atlas Copco, Cl. B | 17,260 | 429,632 | |
| Boliden | 11,860 | 168,930 | |
| Electrolux, Ser. B | 10,914 | 269,479 | |
| Elekta, Cl. B | 14,946 | 220,498 | |
| Ericsson, Cl. B | 133,172 | 1,589,626 | |
| Getinge, Cl. B | 8,218 | 260,615 | |
| Hennes & Mauritz, Cl. B | 41,544 | 1,795,097 | |
| Hexagon, Cl. B | 9,712 | 291,658 | |
| Husqvarna, Cl. B | 16,174 | 95,146 | |
| Industrivarden, Cl. C | 5,510 | 98,210 | |
| Investment AB Kinnevik, Cl. B | 9,939 | 366,268 | |
| Investor, Cl. B | 20,074 | 644,965 | |
| Lundin Petroleum | 8,991 | a | 185,646 |
| Millicom International Cellular, SDR | 3,010 | 277,540 | |
| Nordea Bank | 124,140 | 1,590,053 |
The Fund 29
STATEMENT OF INVESTMENTS (continued)
| Common Stocks (continued) | Shares | Value ($) | ||
| Sweden (continued) | ||||
| Ratos, Cl. B | 9,138 | 79,181 | ||
| Sandvik | 46,959 | 635,536 | ||
| Scania, Cl. B | 13,131 | 263,429 | ||
| Securitas, Cl. B | 13,206 | 150,808 | ||
| Skandinaviska Enskilda Banken, Cl. A | 66,843 | 809,743 | ||
| Skanska, Cl. B | 15,609 | 300,856 | ||
| SKF, Cl. B | 17,338 | 459,400 | ||
| Svenska Cellulosa, Cl. B | 25,704 | 729,861 | ||
| Svenska Handelsbanken, Cl. A | 21,901 | 992,297 | ||
| Swedbank, Cl. A | 39,764 | 1,037,047 | ||
| Swedish Match | 8,494 | 280,247 | ||
| Tele2, Cl. B | 14,263 | 172,123 | ||
| TeliaSonera | 104,685 | 867,522 | ||
| Volvo, Cl. B | 66,427 | 853,396 | ||
| 17,767,415 | ||||
| Switzerland—9.2% | ||||
| ABB | 96,147 | a | 2,455,200 | |
| Actelion | 4,790 | a | 370,857 | |
| Adecco | 5,868 | a | 432,978 | |
| Aryzta | 3,825 | a | 285,816 | |
| Baloise Holding | 2,177 | 253,366 | ||
| Banque Cantonale Vaudoise | 127 | 70,684 | ||
| Barry Callebaut | 84 | a | 87,763 | |
| Cie Financiere Richemont | 22,823 | 2,340,530 | ||
| Coca-Cola HBC-CDI | 8,469 | a | 244,699 | |
| Credit Suisse Group | 65,537 | a | 2,039,025 | |
| EMS-Chemie Holding | 319 | 116,283 | ||
| Geberit | 1,716 | 513,088 | ||
| Givaudan | 366 | a | 519,544 | |
| Glencore Xstrata | 463,800 | a | 2,528,453 | |
| Holcim | 10,070 | a | 750,242 | |
| Julius Baer Group | 9,648 | a | 474,133 | |
| Kuehne + Nagel International | 2,216 | 280,129 | ||
| Lindt & Spruengli | 4 | 201,201 |
30
| Common Stocks (continued) | Shares | Value ($) | ||
| Switzerland (continued) | ||||
| Lindt & Spruengli-PC | 38 | 160,401 | ||
| Lonza Group | 2,290 | a | 204,683 | |
| Nestle | 140,686 | 10,155,875 | ||
| Novartis | 100,370 | 7,793,097 | ||
| Pargesa Holding-BR | 1,256 | 100,012 | ||
| Partners Group Holding | 804 | 208,321 | ||
| Roche Holding | 30,654 | 8,486,565 | ||
| Schindler Holding | 876 | 124,543 | ||
| Schindler Holding-PC | 1,996 | 283,116 | ||
| SGS | 242 | 567,027 | ||
| Sika-BR | 92 | 290,089 | ||
| Sonova Holding | 2,104 | a | 273,855 | |
| Sulzer | 959 | 150,189 | ||
| Swatch Group | 1,746 | 194,545 | ||
| Swatch Group-BR | 1,355 | 866,895 | ||
| Swiss Life Holding | 1,301 | a | 258,522 | |
| Swiss Prime Site | 2,461 | a | 186,606 | |
| Swiss Re | 15,433 | a | 1,355,607 | |
| Swisscom | 993 | 506,815 | ||
| Syngenta | 4,076 | 1,646,392 | ||
| UBS | 159,236 | a | 3,081,704 | |
| Zurich Insurance Group | 6,491 | a | 1,794,888 | |
| 52,653,738 | ||||
| United Kingdom—21.1% | ||||
| 3i Group | 40,656 | 243,218 | ||
| Aberdeen Asset Management | 39,934 | 283,592 | ||
| Admiral Group | 7,931 | 162,646 | ||
| Aggreko | 11,359 | 293,232 | ||
| AMEC | 12,404 | 234,090 | ||
| Anglo American | 61,028 | 1,453,118 | ||
| Antofagasta | 16,062 | 220,197 | ||
| ArcelorMittal | 44,041 | 695,737 | ||
| ARM Holdings | 61,341 | 969,288 | ||
| Associated British Foods | 15,183 | 551,892 |
The Fund 31
STATEMENT OF INVESTMENTS (continued)
| Common Stocks (continued) | Shares | Value ($) |
| United Kingdom (continued) | ||
| AstraZeneca | 54,714 | 2,902,956 |
| Aviva | 129,495 | 932,484 |
| Babcock International Group | 16,124 | 329,631 |
| BAE Systems | 142,072 | 1,035,806 |
| Barclays | 667,584 | 2,821,607 |
| BG Group | 148,735 | 3,037,087 |
| BHP Billiton | 92,303 | 2,857,135 |
| BP | 828,753 | 6,414,275 |
| British American Tobacco | 83,752 | 4,614,169 |
| British Land | 41,797 | 416,851 |
| British Sky Broadcasting Group | 44,969 | 675,973 |
| BT Group | 344,754 | 2,083,991 |
| Bunzl | 14,415 | 318,269 |
| Burberry Group | 18,830 | 463,451 |
| Capita | 27,912 | 441,279 |
| Carnival | 7,529 | 268,483 |
| Centrica | 226,746 | 1,284,847 |
| Cobham | 48,785 | 225,437 |
| Compass Group | 79,827 | 1,148,120 |
| Croda International | 5,720 | 223,418 |
| Diageo | 109,646 | 3,493,299 |
| Direct Line Insurance Group | 35,078 | 126,550 |
| easyJet | 6,447 | 135,314 |
| Experian | 44,360 | 903,317 |
| G4S | 69,237 | 290,305 |
| GKN | 72,532 | 427,863 |
| GlaxoSmithKline | 215,014 | 5,666,066 |
| Hammerson | 30,961 | 262,613 |
| Hargreaves Lansdown | 8,738 | 166,726 |
| HSBC Holdings | 812,655 | 8,887,905 |
| ICAP | 23,517 | 145,249 |
| IMI | 14,139 | 344,367 |
| Imperial Tobacco Group | 42,644 | 1,592,475 |
32
| Common Stocks (continued) | Shares | Value ($) | ||
| United Kingdom (continued) | ||||
| Inmarsat | 19,204 | 221,856 | ||
| InterContinental Hotels Group | 11,377 | 331,457 | ||
| International Consolidated Airlines Group | 38,774 | a | 215,847 | |
| Intertek Group | 7,156 | 382,314 | ||
| Intu Properties | 30,561 | 168,664 | ||
| Invensys | 29,946 | 241,519 | ||
| Investec | 22,476 | 157,343 | ||
| ITV | 165,158 | 505,534 | ||
| J Sainsbury | 53,650 | 339,361 | ||
| Johnson Matthey | 9,078 | 437,255 | ||
| Kingfisher | 104,497 | 632,508 | ||
| Land Securities Group | 33,367 | 528,858 | ||
| Legal & General Group | 259,925 | 901,467 | ||
| Lloyds Banking Group | 2,020,879 | a | 2,512,206 | |
| London Stock Exchange Group | 8,128 | 213,994 | ||
| Marks & Spencer Group | 71,242 | 575,149 | ||
| Meggitt | 35,133 | 322,505 | ||
| Melrose Industries | 53,387 | 274,096 | ||
| National Grid | 160,449 | 2,018,251 | ||
| Next | 7,044 | 614,982 | ||
| Old Mutual | 215,569 | 703,735 | ||
| Pearson | 35,962 | 751,911 | ||
| Persimmon | 13,910 | a | 282,139 | |
| Petrofac | 11,812 | 277,085 | ||
| Prudential | 111,928 | 2,295,379 | ||
| Randgold Resources | 3,820 | 284,202 | ||
| Reckitt Benckiser Group | 28,291 | 2,199,156 | ||
| Reed Elsevier | 52,262 | 732,390 | ||
| Resolution | 59,778 | 342,563 | ||
| Rexam | 32,104 | 267,418 | ||
| Rio Tinto | 55,553 | 2,812,968 | ||
| Rolls-Royce Holdings | 82,337 | a | 1,518,232 | |
| Royal Bank of Scotland Group | 94,511 | a | 557,061 |
The Fund 33
STATEMENT OF INVESTMENTS (continued)
| Common Stocks (continued) | Shares | Value ($) |
| United Kingdom (continued) | ||
| Royal Dutch Shell, Cl. A | 165,780 | 5,519,620 |
| Royal Dutch Shell, Cl. B | 111,762 | 3,869,836 |
| RSA Insurance Group | 150,053 | 308,926 |
| SABMiller | 42,047 | 2,193,803 |
| Sage Group | 47,658 | 257,596 |
| Schroders | 4,200 | 173,678 |
| Segro | 28,963 | 151,765 |
| Serco Group | 22,690 | 202,645 |
| Severn Trent | 10,096 | 300,612 |
| Shire | 24,317 | 1,072,620 |
| Smith & Nephew | 38,604 | 493,328 |
| Smiths Group | 17,455 | 401,621 |
| SSE | 42,318 | 960,801 |
| Standard Chartered | 105,811 | 2,544,031 |
| Standard Life | 101,000 | 570,045 |
| Subsea 7 | 11,106 | 234,879 |
| Tate & Lyle | 18,866 | 239,429 |
| Tesco | 353,371 | 2,063,555 |
| Travis Perkins | 10,931 | 325,299 |
| TUI Travel | 20,087 | 124,000 |
| Tullow Oil | 39,988 | 604,305 |
| Unilever | 56,121 | 2,272,123 |
| United Utilities Group | 30,314 | 342,428 |
| Vedanta Resources | 4,090 | 69,711 |
| Vodafone Group | 2,124,054 | 7,645,872 |
| Weir Group | 9,465 | 342,225 |
| Whitbread | 7,724 | 425,169 |
| William Hill | 35,017 | 225,092 |
| WM Morrison Supermarkets | 93,911 | 424,028 |
| Wolseley | 12,082 | 651,107 |
34
| Common Stocks (continued) | Shares | Value ($) | |||
| United Kingdom (continued) | |||||
| WPP | 57,743 | 1,226,762 | |||
| 120,900,644 | |||||
| United States—.1% | |||||
| Transocean | 15,858 | 749,600 | |||
| Total Common Stocks | |||||
| (cost $481,767,316) | 560,416,491 | ||||
| Preferred Stocks—.6% | |||||
| Germany | |||||
| Bayerische Motoren Werke | 2,454 | 205,180 | |||
| Fuchs Petrolub | 1,499 | 121,302 | |||
| Henkel & Co. | 7,831 | 847,416 | |||
| Porsche Automobil Holding | 6,751 | 632,376 | |||
| RWE | 1,967 | 67,168 | |||
| Volkswagen | 6,333 | 1,609,669 | |||
| Total Preferred Stocks | |||||
| (cost $2,080,591) | 3,483,111 | ||||
| Number of | |||||
| Rights—.0% | Rights | Value ($) | |||
| Spain—.0% | |||||
| Banco Santander | |||||
| (cost $101,388) | 486,353 | a | 103,675 | ||
| Principal | |||||
Short-Term Investments—.1% | Amount ($) | Value ($) | |||
| U.S. Treasury Bills: | |||||
| 0.03%, 12/5/13 | 275,000 | c | 274,992 | ||
| 0.03%, 3/13/14 | 230,000 | c | 229,953 | ||
| Total Short-Term Investments | |||||
| (cost $504,970) | 504,945 | ||||
The Fund 35
STATEMENT OF INVESTMENTS (continued)
| Other Investment—1.0% | Shares | Value ($) | |
| Registered Investment Company; | |||
| Dreyfus Institutional Preferred | |||
| Plus Money Market Fund | |||
| (cost $5,735,539) | 5,735,539 | d | 5,735,539 |
| Total Investments (cost $490,189,804) | 99.6 | % | 570,243,761 |
| Cash and Receivables (Net) | .4 | % | 2,361,021 |
| Net Assets | 100.0 | % | 572,604,782 |
| BR—Bearer Certificate |
| CDI—Chess Depository Interest |
| PC—Participation Certificate |
| REIT—Real Estate Investment Trust |
| RSP—Risparmio (Savings) Shares |
| SDR—Swedish Depository Receipts |
| STRIP—Separate Trading of Registered Interest and Principal of Securities |
| a Non-income producing security. |
| b The valuation of this security has been determined in good faith by management under the direction of the Board of |
| Directors.At October 31, 2013, the value of these securities amounted to $137,293 or .02% of net assets. |
| c Held by or on behalf of a counterparty for open financial futures contracts. |
| d Investment in affiliated money market mutual fund. |
| Portfolio Summary (Unaudited)† | |||
| Value (%) | Value (%) | ||
| Financial | 25.5 | Telecommunication Services | 5.5 |
| Industrial | 12.6 | Information Technology | 4.2 |
| Consumer Discretionary | 11.5 | Utilities | 3.6 |
| Consumer Staples | 11.0 | Short-Term/ | |
| Health Care | 9.8 | Money Market Investments | 1.1 |
| Materials | 8.0 | ||
| Energy | 6.8 | 99.6 | |
| † Based on net assets. | |||
| See notes to financial statements. | |||
36
STATEMENT OF FINANCIAL FUTURES
October 31, 2013
| Market Value | Unrealized | ||||
| Covered by | Appreciation | ||||
| Contracts | Contracts ($) | Expiration | at 10/31/2013 | ($) | |
| Financial Futures Long | |||||
| ASX SPI 200 Index | 8 | 1,023,789 | December 2013 | 32,123 | |
| Euro STOXX 50 | 66 | 2,741,225 | December 2013 | 108,523 | |
| FTSE 100 Index | 24 | 2,581,558 | December 2013 | 85,026 | |
| TOPIX | 15 | 1,829,808 | December 2013 | 13,096 | |
| 238,768 | |||||
| See notes to financial statements. | |||||
The Fund 37
STATEMENT OF ASSETS AND LIABILITIES
October 31, 2013
| Cost | Value | ||
| Assets ($): | |||
| Investments in securities—See Statement of Investments: | |||
| Unaffiliated issuers | 484,454,265 | 564,508,222 | |
| Affiliated issuers | 5,735,539 | 5,735,539 | |
| Cash | 578,643 | ||
| Cash denominated in foreign currencies | 768,863 | 765,997 | |
| Dividends receivable | 1,962,064 | ||
| Receivable for shares of Common Stock subscribed | 129,261 | ||
| Unrealized appreciation on forward foreign | |||
| currency exchange contracts—Note 4 | 101,494 | ||
| 573,781,220 | |||
| Liabilities ($): | |||
| Due to The Dreyfus Corporation and affiliates—Note 3(b) | 286,275 | ||
| Payable for shares of Common Stock redeemed | 820,888 | ||
| Unrealized depreciation on forward foreign | |||
| currency exchange contracts—Note 4 | 57,231 | ||
| Payable for futures variation margin—Note 4 | 12,044 | ||
| 1,176,438 | |||
| Net Assets ($) | 572,604,782 | ||
| Composition of Net Assets ($): | |||
| Paid-in capital | 504,046,623 | ||
| Accumulated undistributed investment income—net | 7,793,762 | ||
| Accumulated net realized gain (loss) on investments | (19,575,279 | ) | |
| Accumulated net unrealized appreciation (depreciation) on | |||
| investments and foreign currency transactions (including | |||
| $238,768 net unrealized appreciation on financial futures) | 80,339,676 | ||
| Net Assets ($) | 572,604,782 | ||
| Shares Outstanding | |||
| (200 million shares of $.001 par value Common Stock authorized) | 33,454,081 | ||
| Net Asset Value, offering and redemption price per share ($) | 17.12 | ||
| See notes to financial statements. | |||
38
STATEMENT OF OPERATIONS
Year Ended October 31, 2013
| Investment Income ($): | ||
| Income: | ||
| Cash dividends (net of $1,147,362 foreign taxes withheld at source): | ||
| Unaffiliated issuers | 14,556,850 | |
| Affiliated issuers | 4,654 | |
| Interest | 10,416 | |
| Total Income | 14,571,920 | |
| Expenses: | ||
| Management fee—Note 3(a) | 1,788,157 | |
| Shareholder servicing costs—Note 3(b) | 1,277,255 | |
| Directors’ fees—Note 3(a,c) | 45,638 | |
| Interest expense—Note 2 | 8,926 | |
| Loan commitment fees—Note 2 | 4,629 | |
| Total Expenses | 3,124,605 | |
| Less—Directors’ fees reimbursed by the Manager—Note 3(a) | (45,638 | ) |
| Net Expenses | 3,078,967 | |
| Investment Income—Net | 11,492,953 | |
| Realized and Unrealized Gain (Loss) on Investments—Note 4 ($): | ||
| Net realized gain (loss) on investments and foreign currency transactions | 12,449,380 | |
| Net realized gain (loss) on financial futures | 1,914,776 | |
| Net realized gain (loss) on forward foreign currency exchange contracts | (1,140,924 | ) |
| Net Realized Gain (Loss) | 13,223,232 | |
| Net unrealized appreciation (depreciation) on | ||
| investments and foreign currency transactions | 90,613,806 | |
| Net unrealized appreciation (depreciation) on financial futures | 250,977 | |
| Net unrealized appreciation (depreciation) on | ||
| forward foreign currency exchange contracts | 82,989 | |
| Net Unrealized Appreciation (Depreciation) | 90,947,772 | |
| Net Realized and Unrealized Gain (Loss) on Investments | 104,171,004 | |
| Net Increase in Net Assets Resulting from Operations | 115,663,957 | |
| See notes to financial statements. | ||
The Fund 39
STATEMENT OF CHANGES IN NET ASSETS
| Year Ended October 31, | ||||
| 2013 | 2012 | |||
| Operations ($): | ||||
| Investment income—net | 11,492,953 | 12,327,067 | ||
| Net realized gain (loss) on investments | 13,223,232 | 13,859,254 | ||
| Net unrealized appreciation | ||||
| (depreciation) on investments | 90,947,772 | (9,292,695 | ) | |
| Net Increase (Decrease) in Net Assets | ||||
| Resulting from Operations | 115,663,957 | 16,893,626 | ||
| Dividends to Shareholders from ($): | ||||
| Investment income—net | (12,705,604 | ) | (14,103,072 | ) |
| Capital Stock Transactions ($): | ||||
| Net proceeds from shares sold | 275,778,066 | 158,345,329 | ||
| Dividends reinvested | 12,035,945 | 13,170,185 | ||
| Cost of shares redeemed | (273,185,774 | ) | (210,664,725 | ) |
| Increase (Decrease) in Net Assets | ||||
| from Capital Stock Transactions | 14,628,237 | (39,149,211 | ) | |
| Total Increase (Decrease) in Net Assets | 117,586,590 | (36,358,657 | ) | |
| Net Assets ($): | ||||
| Beginning of Period | 455,018,192 | 491,376,849 | ||
| End of Period | 572,604,782 | 455,018,192 | ||
| Undistributed investment income—net | 7,793,762 | 9,405,608 | ||
| Capital Share Transactions: (Shares) | ||||
| Shares sold | 17,713,613 | 11,940,137 | ||
| Shares issued for dividends reinvested | 839,912 | 1,053,615 | ||
| Shares redeemed | (17,683,082 | ) | (16,038,020 | ) |
| Net Increase (Decrease) in Shares Outstanding | 870,443 | (3,044,268 | ) | |
| See notes to financial statements. | ||||
40
FINANCIAL HIGHLIGHTS
The following table describes the performance for the fiscal periods indicated. Total return shows how much your investment in the fund would have increased (or decreased) during each period, assuming you had reinvested all dividends and distributions.These figures have been derived from the fund’s financial statements.
| Year Ended October 31, | ||||||||||
| 2013 | 2012 | 2011 | 2010 | 2009 | ||||||
| Per Share Data ($): | ||||||||||
| Net asset value, beginning of period | 13.96 | 13.79 | 14.84 | 14.05 | 11.51 | |||||
| Investment Operations: | ||||||||||
| Investment income—neta | .35 | .37 | .38 | .31 | .30 | |||||
| Net realized and unrealized | ||||||||||
| gain (loss) on investments | 3.20 | .24 | (1.10 | ) | .89 | 2.51 | ||||
| Total from Investment Operations | 3.55 | .61 | (.72 | ) | 1.20 | 2.81 | ||||
| Distributions: | ||||||||||
| Dividends from investment income—net | (.39 | ) | (.44 | ) | (.33 | ) | (.33 | ) | (.25 | ) |
| Dividends from net realized | ||||||||||
| gain on investments | — | — | — | (.08 | ) | (.02 | ) | |||
| Total Distributions | (.39 | ) | (.44 | ) | (.33 | ) | (.41 | ) | (.27 | ) |
| Net asset value, end of period | 17.12 | 13.96 | 13.79 | 14.84 | 14.05 | |||||
| Total Return (%) | 26.01 | 4.79 | (5.03 | ) | 8.73 | 25.13 | ||||
| Ratios/Supplemental Data (%): | ||||||||||
| Ratio of total expenses | ||||||||||
| to average net assets | .61 | .61 | .61 | .61 | .61 | |||||
| Ratio of net expenses | ||||||||||
| to average net assets | .60 | .60 | .60 | .60 | .60 | |||||
| Ratio of net investment income | ||||||||||
| to average net assets | 2.25 | 2.75 | 2.52 | 2.25 | 2.53 | |||||
| Portfolio Turnover Rate | 23.12 | 11.11 | 6.14 | 10.49 | 17.26 | |||||
| Net Assets, end of period ($ x 1,000) | 572,605 | 455,018 | 491,377 | 561,428 | 547,282 | |||||
| a Based on average shares outstanding at each month end. | ||||||||||
| See notes to financial statements. | ||||||||||
The Fund 41
NOTES TO FINANCIAL STATEMENTS
NOTE 1—Significant Accounting Policies:
Dreyfus International Stock Index Fund (the “fund”) is a separate non-diversified series of Dreyfus Index Funds, Inc. (the “Company”), which is registered under the Investment Company Act of 1940, as amended (the “Act”), as an open-end management investment company and operates as a series company currently offering three series, including the fund. The fund’s investment objective is to match the performance of the Morgan Stanley Capital International Europe, Australasia, Far East (free) Index (MSCI EAFE ®).The Dreyfus Corporation (the “Manager” or “Dreyfus”), a wholly-owned subsidiary of The Bank of New York Mellon Corporation (“BNY Mellon”), serves as the fund’s investment adviser. MBSC Securities Corporation (the “Distributor”), a wholly-owned subsidiary of the Manager, is the distributor of the fund’s shares, which are sold to the public without a sales charge.
The Company accounts separately for the assets, liabilities and operations of each series. Expenses directly attributable to each series are charged to that series’ operations; expenses which are applicable to all series are allocated among them on a pro rata basis.
The Financial Accounting Standards Board (“FASB”) Accounting Standards Codification is the exclusive reference of authoritative U.S. generally accepted accounting principles (“GAAP”) recognized by the FASB to be applied by nongovernmental entities. Rules and interpretive releases of the Securities and Exchange Commission (“SEC”) under authority of federal laws are also sources of authoritative GAAP for SEC registrants. The fund’s financial statements are prepared in accordance with GAAP, which may require the use of management estimates and assumptions.Actual results could differ from those estimates.
The Company enters into contracts that contain a variety of indemnifications. The fund’s maximum exposure under these arrangements is unknown.The fund does not anticipate recognizing any loss related to these arrangements.
(a) Portfolio valuation: The fair value of a financial instrument is the amount that would be received to sell an asset or paid to transfer a lia-
42
bility in an orderly transaction between market participants at the measurement date (i.e., the exit price). GAAP establishes a fair value hierarchy that prioritizes the inputs of valuation techniques used to measure fair value. This hierarchy gives the highest priority to unadjusted quoted prices in active markets for identical assets or liabilities (Level 1 measurements) and the lowest priority to unobservable inputs (Level 3 measurements).
Additionally, GAAP provides guidance on determining whether the volume and activity in a market has decreased significantly and whether such a decrease in activity results in transactions that are not orderly. GAAP requires enhanced disclosures around valuation inputs and techniques used during annual and interim periods.
Various inputs are used in determining the value of the fund’s investments relating to fair value measurements.These inputs are summarized in the three broad levels listed below:
Level 1—unadjusted quoted prices in active markets for identical investments.
Level 2—other significant observable inputs (including quoted prices for similar investments, interest rates, prepayment speeds, credit risk, etc.).
Level 3—significant unobservable inputs (including the fund’s own assumptions in determining the fair value of investments).
The inputs or methodology used for valuing securities are not necessarily an indication of the risk associated with investing in those securities.
Changes in valuation techniques may result in transfers in or out of an assigned level within the disclosure hierarchy. Valuation techniques used to value the fund’s investments are as follows:
Investments in securities are valued at the last sales price on the securities exchange or national securities market on which such securities are primarily traded. Securities listed on the National Market System for which market quotations are available are valued at the official closing
The Fund 43
NOTES TO FINANCIAL STATEMENTS (continued)
price or, if there is no official closing price that day, at the last sales price. Securities not listed on an exchange or the national securities market, or securities for which there were no transactions, are valued at the average of the most recent bid and asked prices, except for open short positions, where the asked price is used for valuation purposes. Bid price is used when no asked price is available. Registered investment companies that are not traded on an exchange are valued at their net asset value. All of the preceding securities are categorized within Level 1 of the fair value hierarchy.
U.S. Treasury Bills are valued at the mean price between quoted bid prices and asked prices by an independent pricing service (the “Service”) approved by the Company’s Board of Directors (the “Board”).These securities are generally categorized within Level 2 of the fair value hierarchy.
The Service’s procedures are reviewed by Dreyfus under the general supervision of the Board.
Fair valuing of securities may be determined with the assistance of a pricing service using calculations based on indices of domestic securities and other appropriate indicators, such as prices of relevant American Depository Receipts and financial futures. Utilizing these techniques may result in transfers between Level 1 and Level 2 of the fair value hierarchy.
When market quotations or official closing prices are not readily available, or are determined not to reflect accurately fair value, such as when the value of a security has been significantly affected by events after the close of the exchange or market on which the security is principally traded (for example, a foreign exchange or market), but before the fund calculates its net asset value, the fund may value these investments at fair value as determined in accordance with the procedures approved by the Board. Certain factors may be considered when fair valuing investments such as: fundamental analytical data, the nature and duration of restrictions on disposition, an evaluation of the forces that influence
44
the market in which the securities are purchased and sold, and public trading in similar securities of the issuer or comparable issuers. These securities are either categorized within Level 2 or 3 of the fair value hierarchy depending on the relevant inputs used.
For restricted securities where observable inputs are limited, assumptions about market activity and risk are used and are categorized within Level 3 of the fair value hierarchy.
Investments denominated in foreign currencies are translated to U.S. dollars at the prevailing rates of exchange.
Financial futures, which are traded on an exchange, are valued at the last sales price on the securities exchange on which such securities are primarily traded or at the last sales price on the national securities market on each business day and are generally categorized within Level 1 of the fair value hierarchy. Forward foreign currency exchange contracts (“forward contracts”) are valued at the forward rate and are generally categorized within Level 2 of the fair value hierarchy.
The following is a summary of the inputs used as of October 31, 2013 in valuing the fund’s investments:
| Level 2—Other | Level 3— | |||
| Level 1— | Significant | Significant | ||
| Unadjusted | Observable | Unobservable | ||
| Quoted Prices | Inputs | Inputs | Total | |
| Assets ($) | ||||
| Investments in Securities: | ||||
| Equity Securities— | ||||
| Domestic | ||||
| Common Stocks† | 749,600 | — | — | 749,600 |
| Equity Securities— | ||||
| Foreign | ||||
| Common Stocks† | 559,529,598 | 137,293 | 0 | 559,666,891 |
| Equity Securities— | ||||
| Foreign Preferred | ||||
| Stocks† | 3,483,111 | — | — | 3,483,111 |
| Mutual Funds | 5,735,539 | — | — | 5,735,539 |
| Rights† | 103,675 | — | — | 103,675 |
The Fund 45
NOTES TO FINANCIAL STATEMENTS (continued)
| Level 2—Other | Level 3— | |||||
| Level 1— | Significant | Significant | ||||
| Unadjusted | Observable | Unobservable | ||||
| Quoted Prices | Inputs | Inputs | Total | |||
| Assets ($) (continued) | ||||||
| Investments in | ||||||
| Securities (continued): | ||||||
| U.S. Treasury | — | 504,945 | — | 504,945 | ||
| Other Financial | ||||||
| Instruments: | ||||||
| Financial Futures†† | 238,768 | — | — | 238,768 | ||
| Forward Foreign | ||||||
| Currency Exchange | ||||||
| Contracts†† | — | 101,494 | — | 101,494 | ||
| Liabilities ($) | ||||||
| Other Financial | ||||||
| Instruments: | ||||||
| Forward Foreign | ||||||
| Currency Exchange | ||||||
| Contracts†† | — | (57,231 | ) | — | (57,231 | ) |
| † | See Statement of Investments for additional detailed categorizations. |
| †† | Amount shown represents unrealized appreciation (depreciation) at period end. |
At October 31, 2013, there were no transfers between Level 1 and Level 2 of the fair value hiearchy.
The following is a reconciliation of Level 3 assets for which significant unobservable inputs were used to determine fair value:
| Equity Securities— | ||
| Foreign Common Stock ($) | ||
| Balance as of 10/31/2012 | 46 | |
| Realized gain (loss) | — | |
| Change in unrealized appreciation (depreciation) | (46 | ) |
| Purchases | — | |
| Sales | — | |
| Transfers into Level 3 | — | |
| Transfers out of Level 3 | — | |
| Balance as of 10/31/2013 | 0 | |
| The amount of total gains (losses) for the period | ||
| included in earnings attributable to the change in | ||
| unrealized gains (losses) relating to investments | ||
| still held at 10/31/2013 | (46 | ) |
46
(b) Foreign currency transactions: The fund does not isolate that portion of the results of operations resulting from changes in foreign exchange rates on investments from the fluctuations arising from changes in the market prices of securities held. Such fluctuations are included with the net realized and unrealized gain or loss on investments.
Net realized foreign exchange gains or losses arise from sales of foreign currencies, currency gains or losses realized on securities transactions between trade and settlement date, and the difference between the amounts of dividends, interest and foreign withholding taxes recorded on the fund’s books and the U.S. dollar equivalent of the amounts actually received or paid. Net unrealized foreign exchange gains and losses arise from changes in the value of assets and liabilities other than investments resulting from changes in exchange rates. Foreign currency gains and losses on foreign currency transactions are also included with net realized and unrealized gain or loss on investments.
(c) Securities transactions and investment income: Securities transactions are recorded on a trade date basis. Realized gains and losses from securities transactions are recorded on the identified cost basis. Dividend income is recognized on the ex-dividend date and interest income, including, where applicable, accretion of discount and amortization of premium on investments, is recognized on the accrual basis.
(d) Affiliated issuers: Investments in other investment companies advised by Dreyfus are defined as “affiliated” under the Act. Investments in affiliated investment companies during the period ended October 31, 2013 were as follows:
| Affiliated | |||||
| Investment | Value | Value | Net | ||
| Company | 10/31/2012($) | Purchases ($) | Sales($) | 10/31/2013 ($) | Assets (%) |
| Dreyfus | |||||
| Institutional | |||||
| Preferred | |||||
| Plus Money | |||||
| Market Fund | 3,979,648 | 164,846,562 | 163,090,671 | 5,735,539 | 1.0 |
The Fund 47
NOTES TO FINANCIAL STATEMENTS (continued)
(e) Risk: Investing in foreign markets may involve special risks and considerations not typically associated with investing in the U.S.These risks include revaluation of currencies, high rates of inflation, repatriation restrictions on income and capital, and adverse political and economic developments. Moreover, securities issued in these markets may be less liquid, subject to government ownership controls and delayed settlements, and their prices may be more volatile than those of comparable securities in the U.S.
(f) Dividends to shareholders: Dividends are recorded on the ex-dividend date. Dividends from investment income-net and dividends from net realized capital gains, if any, are normally declared and paid annually, but the fund may make distributions on a more frequent basis to comply with the distribution requirements of the Internal Revenue Code of 1986, as amended (the “Code”).To the extent that net realized capital gains can be offset by capital loss carryovers, it is the policy of the fund not to distribute such gains. Income and capital gain distributions are determined in accordance with income tax regulations, which may differ from GAAP.
(g) Federal income taxes: It is the policy of the fund to continue to qualify as a regulated investment company, if such qualification is in the best interests of its shareholders, by complying with the applicable provisions of the Code, and to make distributions of taxable income sufficient to relieve it from substantially all federal income and excise taxes.
As of and during the period ended October 31, 2013, the fund did not have any liabilities for any uncertain tax positions.The fund recognizes interest and penalties, if any, related to uncertain tax positions as income tax expense in the Statement of Operations. During the period ended October 31, 2013, the fund did not incur any interest or penalties.
Each tax year in the four-year period ended October 31, 2013 remains subject to examination by the Internal Revenue Service and state taxing authorities.
48
At October 31, 2013, the components of accumulated earnings on a tax basis were as follows: undistributed ordinary income $10,314,242, undistributed capital gains $5,878,013 and unrealized appreciation $52,365,904.
The tax character of distributions paid to shareholders during the fiscal periods ended October 31, 2013 and October 31, 2012 were as follows: ordinary income $12,705,604 and $14,103,072.
During the period ended October 31, 2013, as a result of permanent book to tax differences, primarily due to the tax treatment for passive foreign investment companies and foreign currency gains and losses, the fund decreased accumulated undistributed investment income-net by $399,195 and increased accumulated net realized gain (loss) on investments by the same amount. Net assets and net asset value per share were not affected by this reclassification.
(h) Accounting Pronouncement: In January 2013, FASB issued Accounting Standards Update No. 2013-01 (“ASU 2013-01”), “Clarifying the Scope of Disclosures about Offsetting Assets and Liabilities”, which replaced Accounting Standards Update No. 2011-11 (“ASU 2011-11”), “Disclosures about Offsetting Assets and Liabilities”. ASU 2013-01 is effective for fiscal years beginning on or after January 1, 2013, and interim periods within those annual periods.ASU 2011-11 was intended to enhance disclosure requirements on the offsetting of financial assets and liabilities.ASU 2013-01 limits the scope of the new balance sheet offsetting disclosures to derivatives, repurchase agreements, and securities lending transactions to the extent that they are (1) offset in the financial statements or (2) subject to enforceable master netting arrangements (“MNA”) or similar agreements. Management is currently evaluating the application of ASU 2013-01 and its impact on the fund’s financial statements.
The Fund 49
NOTES TO FINANCIAL STATEMENTS (continued)
NOTE 2—Bank Lines of Credit:
The fund participates with other Dreyfus-managed funds in a $265 million unsecured credit facility led by Citibank, N.A. and a $300 million unsecured credit facility provided by The Bank of New York Mellon, a subsidiary of BNY Mellon and an affiliate of Dreyfus (each, a “Facility”), each to be utilized primarily for temporary or emergency purposes, including the financing of redemptions. Prior to October 9, 2013, the unsecured credit facility with Citibank, N.A. was $210 million. In connection therewith, the fund has agreed to pay its pro rata portion of commitment fees for each Facility. Interest is charged to the fund based on rates determined pursuant to the terms of the respective Facility at the time of borrowing.
The average amount of borrowings outstanding under the Facilities during the period ended October 31, 2013 was approximately $792,100 with a related weighted average annualized interest rate of 1.13%.
NOTE 3—Management Fee and Other Transactions With Affiliates:
(a) Pursuant to a management agreement (the “Agreement”) with the Manager, the management fee is computed at the annual rate of .35% of the value of the fund’s average daily net assets and is payable monthly. Under the terms of the Agreement, the Manager has agreed to pay all of the fund’s direct expenses, except management fees, Shareholder Services Plan fees, brokerage fees and commissions, taxes, interest expense, commitment fees on borrowings, fees and expenses of non-interested Board members, fees and expenses of independent counsel to the fund and extraordinary expenses. The Manager has also agreed to reduce its management fee in an amount equal to the fund’s allocable portion of the accrued fees and expenses of the non-interested Board members and fees and expenses of independent counsel to the fund and to non-interested Board members. During the period ended October 31, 2013, fees reimbursed by the Manager amounted to $45,638.
50
(b) Under the Shareholder Services Plan, the fund pays the Distributor for the provision of certain services, at an annual rate of .25% of the value of the fund’s average daily net assets. The services provided may include personal services relating to shareholder accounts, such as answering shareholder inquiries regarding the fund and providing reports and other information, and services related to the maintenance of shareholder accounts.The Distributor may make payments to Service Agents (securities dealers, financial institutions or other industry professionals) with respect to these services. The Distributor determines the amounts to be paid to Service Agents. During the period ended October 31, 2013, the fund was charged $1,277,255 pursuant to the Shareholder Services Plan.
The components of “Due to The Dreyfus Corporation and affiliates” in the Statement of Assets and Liabilities consist of: management fees $168,465 and Shareholder Services Plan fees $120,332, which are offset against an expense reimbursement currently in effect in the amount of $2,522.
(c) Each Board member also serves as a Board member of other funds within the Dreyfus complex. Annual retainer fees and attendance fees are allocated to each fund based on net assets.
NOTE 4—Securities Transactions:
The aggregate amount of purchases and sales of investment securities, excluding short-term securities, forward contracts and financial futures, during the period ended October 31, 2013, amounted to $129,521,304 and $115,676,755, respectively.
Derivatives: A derivative is a financial instrument whose performance is derived from the performance of another asset. Each type of derivative instrument that was held by the fund during the period ended October 31, 2013 is discussed below.
The Fund 51
NOTES TO FINANCIAL STATEMENTS (continued)
Financial Futures: In the normal course of pursuing its investment objective, the fund is exposed to market risk, including equity price risk as a result of changes in value of underlying financial instruments.The fund invests in financial futures in order to manage its exposure to or protect against changes in the market. A financial futures contract represents a commitment for the future purchase or a sale of an asset at a specified date. Upon entering into such contracts, these investments require initial margin deposits with a counterparty, which consist of cash or cash equivalents.The amount of these deposits is determined by the exchange or Board of Trade on which the contract is traded and is subject to change.Accordingly, variation margin payments are received or made to reflect daily unrealized gains or losses which are recorded in the Statement of Operations.When the contracts are closed, the fund recognizes a realized gain or loss which is reflected in the Statement of Operations.There is minimal counterparty credit risk to the fund with financial futures since they are exchange traded, and the exchange guarantees the financial futures against default. Financial futures open at October 31, 2013 are set forth in the Statement of Financial Futures.
Forward Foreign Currency Exchange Contracts: The fund enters into forward contracts in order to hedge its exposure to changes in foreign currency exchange rates on its foreign portfolio holdings, to settle foreign currency transactions or as a part of its investment strategy.When executing forward contracts, the fund is obligated to buy or sell a foreign currency at a specified rate on a certain date in the future.With respect to sales of forward contracts, the fund incurs a loss if the value of the contract increases between the date the forward contract is opened and the date the forward contract is closed. The fund realizes a gain if the value of the contract decreases between those dates.With respect to purchases of forward contracts, the fund incurs a loss if the value of the contract decreases between the date the forward contract is opened and the date the forward contract is closed.The fund realizes a gain if the value of the contract increases between those dates.Any realized or unrealized gains or losses which occurred during the period are reflected in the
52
Statement of Operations.The fund is exposed to foreign currency risk as a result of changes in value of underlying financial instruments.The fund is also exposed to credit risk associated with counterparty nonper-formance on these forward contracts, which is generally limited to the unrealized gain on each open contract.The following summarizes open forward contracts at October 31, 2013:
| Foreign | Unrealized | |||||
| Forward Foreign Currency | Currency | Appreciation | ||||
| Exchange Contracts | Amounts | Cost ($) | Value ($) | (Depreciation) ($) | ||
| Purchases: | ||||||
| Australian Dollar, Expiring: | ||||||
| 12/18/2013 | a | 595,755 | 563,156 | 561,245 | (1,911 | ) |
| 12/18/2013 | b | 341,360 | 315,506 | 321,586 | 6,080 | |
| 12/18/2013 | c | 1,407,568 | 1,312,758 | 1,326,032 | 13,274 | |
| British Pound, Expiring: | ||||||
| 12/18/2013 | a | 904,649 | 1,459,112 | 1,449,976 | (9,136 | ) |
| 12/18/2013 | c | 2,171,656 | 3,473,660 | 3,480,742 | 7,082 | |
| 12/18/2013 | d | 130,700 | 210,688 | 209,487 | (1,201 | ) |
| 12/18/2013 | e | 446,680 | 705,417 | 715,941 | 10,524 | |
| Euro, | ||||||
| Expiring: | ||||||
| 12/18/2013 | a | 1,078,522 | 1,467,362 | 1,464,480 | (2,882 | ) |
| 12/18/2013 | b | 545,967 | 724,490 | 741,346 | 16,856 | |
| 12/18/2013 | c | 2,618,497 | 3,523,226 | 3,555,547 | 32,321 | |
| 12/18/2013 | d | 150,300 | 205,363 | 204,086 | (1,277 | ) |
| Japanese Yen, | ||||||
| Expiring: | ||||||
| 12/18/2013 | a | 86,188,169 | 878,913 | 876,803 | (2,110 | ) |
| 12/18/2013 | c | 263,698,782 | 2,677,999 | 2,682,641 | 4,642 | |
| 12/18/2013 | d | 72,210,656 | 723,893 | 734,608 | 10,715 | |
| Sales: | Proceeds ($) | |||||
| Australian Dollar, | ||||||
| Expiring: | ||||||
| 12/18/2013 | a | 1,162,454 | 1,090,744 | 1,095,117 | (4,373 | ) |
| 12/18/2013 | c | 311,474 | 288,571 | 293,431 | (4,860 | ) |
| British Pound, | ||||||
| Expiring: | ||||||
| 12/18/2013 | a | 1,965,771 | 3,145,424 | 3,150,749 | (5,325 | ) |
| 12/18/2013 | c | 462,053 | 740,395 | 740,581 | (186 | ) |
The Fund 53
NOTES TO FINANCIAL STATEMENTS (continued)
| Foreign | Unrealized | |||||
| Forward Foreign Currency | Currency | Appreciation | ||||
| Exchange Contracts | Amounts | Proceeds ($) | Value ($) | (Depreciation) ($) | ||
| Sales (continued): | ||||||
| Euro, | ||||||
| Expiring: | ||||||
| 12/18/2013a | 2,170,395 | 2,933,484 | 2,947,088 | (13,604 | ) | |
| 12/18/2013c | 773,734 | 1,043,735 | 1,050,621 | (6,886 | ) | |
| Japanese Yen, | ||||||
| Expiring: | ||||||
| 12/18/2013a | 197,873,561 | 2,012,158 | 2,012,993 | (835 | ) | |
| 12/18/2013c | 83,338,543 | 845,169 | 847,814 | (2,645 | ) | |
| Gross Unrealized | ||||||
| Appreciation | 101,494 | |||||
| Gross Unrealized | ||||||
| Depreciation | (57,231 | ) |
| Counterparties: | |
| a | Bank of America |
| b | Bank of Montreal |
| c | Citigroup |
| d | Credit Suisse |
| e | Royal Bank of Canada |
The following tables show the fund’s exposure to different types of market risk as it relates to the Statement of Assets and Liabilities and the Statement of Operations, respectively.
Fair value of derivative instruments as of October 31, 2013 is shown below:
| Derivative | Derivative | |||
| Assets ($) | Liabilities ($) | |||
| Foreign exchange risk1 | 101,494 | Foreign exchange risk2 | (57,231 | ) |
| Equity risk3 | 238,768 | |||
| Gross fair value of | ||||
| derivatives contracts | 340,262 | (57,231 | ) |
Statement of Assets and Liabilities location:
| 1 | Unrealized appreciation on forward foreign currency exchange contracts. |
| 2 | Unrealized depreciation on forward foreign currency exchange contracts. |
| 3 | Includes cumulative appreciation on financial futures as reported in the Statement of Financial |
| Futures, but only the unpaid variation margin is reported in the Statement of Assets and Liabilities. |
54
The effect of derivative instruments in the Statement of Operations during the period ended October 31, 2013 is shown below:
| Amount of realized gain (loss) on derivatives recognized in income ($) | |||||
| Financial | Forward | ||||
| Underlying risk | Futures4 | Contracts5 | Total | ||
| Equity | 1,914,776 | — | 1,914,776 | ||
| Foreign exchange | — | (1,140,924 | ) | (1,140,924 | ) |
| Total | 1,914,776 | (1,140,924 | ) | 773,852 | |
Change in unrealized appreciation (depreciation) on derivatives recognized in income ($)
| Financial | Forward | ||
| Underlying risk | Futures6 | Contracts7 | Total |
| Equity | 250,977 | — | 250,977 |
| Foreign exchange | — | 82,989 | 82,989 |
| Total | 250,977 | 82,989 | 333,966 |
Statement of Operations location:
| 4 | Net realized gain (loss) on financial futures. |
| 5 | Net realized gain (loss) on forward foreign currency exchange contracts. |
| 6 | Net unrealized appreciation (depreciation) on financial futures. |
| 7 | Net unrealized appreciation (depreciation) on forward foreign currency exchange contracts. |
The following summarizes the average market value of derivatives outstanding during the period ended October 31, 2013:
| Average Market Value ($) | |
| Equity financial futures | 5,295,088 |
| Forward contracts | 6,102,795 |
At October 31, 2013, the cost of investments for federal income tax purposes was $517,926,152; accordingly, accumulated net unrealized appreciation on investments was $52,317,609, consisting of $122,659,351 gross unrealized appreciation and $70,341,742 gross unrealized depreciation.
The Fund 55
REPORT OF INDEPENDENT REGISTERED
PUBLIC ACCOUNTING FIRM
Shareholders and Board of Directors
Dreyfus International Stock Index Fund
We have audited the accompanying statement of assets and liabilities, including the statements of investments and financial futures, of Dreyfus International Stock Index Fund (one of the series comprising Dreyfus Index Funds, Inc.) as of October 31, 2013, and the related statement of operations for the year then ended, the statement of changes in net assets for each of the two years in the period then ended, and the financial highlights for each of the five years in the period then ended.These financial statements and financial highlights are the responsibility of the Fund’s management. Our responsibility is to express an opinion on these financial statements and financial highlights based on our audits.
We conducted our audits in accordance with the standards of the Public Company Accounting Oversight Board (United States).Those standards require that we plan and perform the audit to obtain reasonable assurance about whether the financial statements and financial highlights are free of material misstatement.We were not engaged to perform an audit of the Fund’s internal control over financial reporting. Our audits included consideration of internal control over financial reporting as a basis for designing audit procedures that are appropriate in the circumstances, but not for the purpose of expressing an opinion on the effectiveness of the Fund’s internal control over financial reporting. Accordingly, we express no such opinion. An audit also includes examining, on a test basis, evidence supporting the amounts and disclosures in the financial statements and financial highlights, assessing the accounting principles used and significant estimates made by management, and evaluating the overall financial statement presentation. Our procedures included confirmation of securities owned as of October 31, 2013 by correspondence with the custodian and others. We believe that our audits provide a reasonable basis for our opinion.
In our opinion, the financial statements and financial highlights referred to above present fairly, in all material respects, the financial position of Dreyfus International Stock Index Fund at October 31, 2013, the results of its operations for the year then ended, the changes in its net assets for each of the two years in the period then ended, and the financial highlights for each of the five years in the period then ended, in conformity with U.S. generally accepted accounting principles.
New York, New York
December 27, 2013
56
IMPORTANT TAX INFORMATION (Unaudited)
In accordance with federal tax law, the fund elects to provide each shareholder with their portion of the fund’s foreign taxes paid and the income sourced from foreign countries. Accordingly, the fund hereby reports the following information regarding its fiscal year ended October 31, 2013:
—the total amount of taxes paid to foreign countries was $1,125,547
—the total amount of income sourced from foreign countries was $15,704,211.
Where required by federal tax law rules, shareholders will receive notification of their proportionate share of foreign taxes paid and foreign sourced income for the 2013 calendar year with Form 1099-DIV which will be mailed in early 2014. For the fiscal year ended October 31, 2013, certain dividends paid by the fund may be subject to a maximum tax rate of 15%, as provided for by the Jobs and Growth Tax Relief Reconciliation Act of 2003. Of the distributions paid during the fiscal year, $12,705,604 represents the maximum amount that may be considered qualified dividend income.
The Fund 57
BOARD MEMBERS INFORMATION (Unaudited)
| Joseph S. DiMartino (70) |
| Chairman of the Board (1995) |
| Principal Occupation During Past 5Years: |
| • Corporate Director and Trustee |
| Other Public Company Board Memberships During Past 5Years: |
| • CBIZ (formerly, Century Business Services, Inc.), a provider of outsourcing functions for small |
| and medium size companies, Director (1997-present) |
| • The Newark Group, a provider of a national market of paper recovery facilities, paperboard |
| mills and paperboard converting plants, Director (2000-2010) |
| • Sunair Services Corporation, a provider of certain outdoor-related services to homes and |
| businesses, Director (2005-2009) |
| No. of Portfolios for which Board Member Serves: 141 |
| ——————— |
| Peggy C. Davis (70) |
| Board Member (2006) |
| Principal Occupation During Past 5Years: |
| • Shad Professor of Law, New York University School of Law (1983-present) |
| No. of Portfolios for which Board Member Serves: 56 |
| ——————— |
| David P. Feldman (73) |
| Board Member (1989) |
| Principal Occupation During Past 5Years: |
| • Corporate Director and Trustee |
| Other Public Company Board Memberships During Past 5Years: |
| • BBH Mutual Funds Group (4 registered mutual funds), Director (1992-present) |
| No. of Portfolios for which Board Member Serves: 42 |
| ——————— |
| Ehud Houminer (73) |
| Board Member (1996) |
| Principal Occupation During Past 5Years: |
| • Executive-in-Residence at the Columbia Business School, Columbia University (1992-present) |
| Other Public Company Board Memberships During Past 5Years: |
| • Avnet Inc., an electronics distributor, Director (1993-2012) |
| No. of Portfolios for which Board Member Serves: 66 |
58
| Lynn Martin (73) |
| Board Member (2012) |
| Principal Occupation During Past 5Years: |
| • President ofThe Martin Hall Group LLC, a human resources consulting firm (January 2005-2012) |
| Other Public Company Board Memberships During Past 5Years: |
| • AT&T Inc., a telecommunications company, Director (1999-2012) |
| • Ryder System, Inc., a supply chain and transportation management company, Director (1993-2012) |
| • The Proctor & Gamble Co., a consumer products company, Director (1994-2009) |
| • Constellation Energy Group Inc., Director (2003-2009) |
| No. of Portfolios for which Board Member Serves: 42 |
| ——————— |
| Robin A. Melvin (50) |
| Board Member (2012) |
| Principal Occupation During Past 5Years: |
| • Board Member, Illinois Mentoring Partnership, non-profit organization dedicated to increasing |
| the quantity and quality of mentoring services in Illinois (2013-present) |
| • Director, Boisi Family Foundation, a private family foundation that supports youth-serving orga- |
| nizations that promote the self sufficiency of youth from disadvantaged circumstances (1995-2012) |
| No. of Portfolios for which Board Member Serves: 90 |
| ——————— |
| Dr. Martin Peretz (74) |
| Board Member (2006) |
| Principal Occupation During Past 5Years: |
| • Editor-in-Chief Emeritus of The New Republic Magazine (2010-2011) (previously, |
| Editor-in-Chief, 1974-2010) |
| • Director of TheStreet.com, a financial information service on the web (1996-2010) |
| Other Public Company Board Memberships During Past 5Years: |
| • Pershing Square Capital Management,Adviser (2009-present) |
| No. of Portfolios for which Board Member Serves: 42 |
| ——————— |
| Once elected all Board Members serve for an indefinite term, but achieve Emeritus status upon reaching age 80.The |
| address of the Board Members and Officers is c/o The Dreyfus Corporation, 200 Park Avenue, NewYork, NewYork |
| 10166.Additional information about the Board Members is available in the fund’s Statement of Additional Information |
| which can be obtained from Dreyfus free of charge by calling this toll free number: 1-800-DREYFUS. |
| James F. Henry, Emeritus Board Member |
| Dr. Paul A. Marks, Emeritus Board Member |
| Philip L.Toia, Emeritus Board Member |
The Fund 59
OFFICERS OF THE FUND (Unaudited)

60

The Fund 61
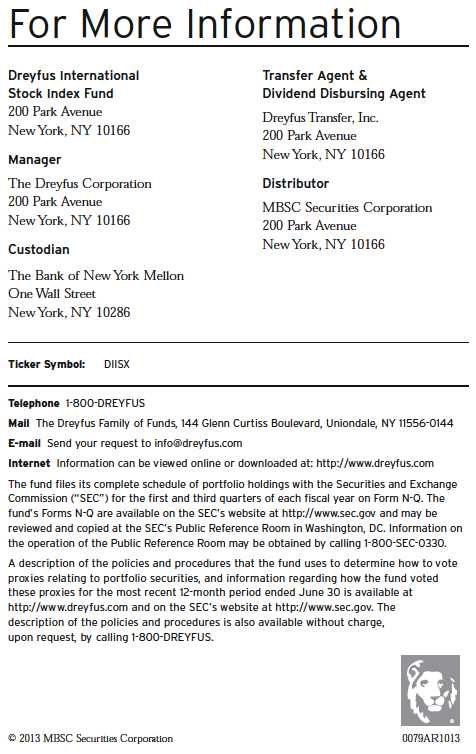
Dreyfus
S&P 500
Index Fund
ANNUAL REPORT October 31, 2013
Save time. Save paper. View your next shareholder report online as soon as it’s available. Log into www.dreyfus.com and sign up for Dreyfus eCommunications. It’s simple and only takes a few minutes.
The views expressed in this report reflect those of the portfolio manager only through the end of the period covered and do not necessarily represent the views of Dreyfus or any other person in the Dreyfus organization. Any such views are subject to change at any time based upon market or other conditions and Dreyfus disclaims any responsibility to update such views.These views may not be relied on as investment advice and, because investment decisions for a Dreyfus fund are based on numerous factors, may not be relied on as an indication of trading intent on behalf of any Dreyfus fund.
Contents | |
THE FUND | |
| 2 | A Letter from the President |
| 3 | Discussion of Fund Performance |
| 6 | Fund Performance |
| 7 | Understanding Your Fund’s Expenses |
| 7 | Comparing Your Fund’s Expenses With Those of Other Funds |
| 8 | Statement of Investments |
| 25 | Statement of Financial Futures |
| 26 | Statement of Assets and Liabilities |
| 27 | Statement of Operations |
| 28 | Statement of Changes in Net Assets |
| 29 | Financial Highlights |
| 30 | Notes to Financial Statements |
| 42 | Report of Independent Registered Public Accounting Firm |
| 43 | Important Tax Information |
| 44 | Board Members Information |
| 46 | Officers of the Fund |
FOR MORE INFORMATION | |
Back Cover |
Dreyfus
S&P 500 Index Fund
The Fund
A LETTER FROM THE PRESIDENT
Dear Shareholder:
We are pleased to present this annual report for Dreyfus S&P 500 Index Fund, covering the 12-month period from November 1, 2012, through October 31, 2013. For information about how the fund performed during the reporting period, as well as general market perspectives, we provide a Discussion of Fund Performance on the pages that follow.
Although expectations of higher long-term interest rates and a more moderately stimulative monetary policy sparked volatility in the U.S stock market at times during the reporting period, improved U.S. economic conditions drove stock prices substantially higher for the reporting period overall. Even the 16-day U.S. government shutdown in October failed to derail the market’s advance, enabling some broad measures of stock market performance to reach new record highs by the end of the month. Stocks across most capitalization ranges and investment styles produced strong results.
We currently expect U.S. economic conditions to continue to improve in 2014, with accelerating growth supported by the fading drags of tighter federal fiscal policies and downsizing on the state and local levels. Moreover, inflation is likely to remain muted, so monetary policy can remain stimulative. Globally, we anticipate stronger growth in many developed countries due to past and continuing monetary ease, while emerging markets seem poised for moderate economic expansion despite recently negative investor sentiment. For more information on how these observations may affect your investments, we encourage you to speak with your financial advisor.
Thank you for your continued confidence and support.

J. Charles Cardona
President
The Dreyfus Corporation
November 15, 2013
2
DISCUSSION OF FUND PERFORMANCE
For the period of November 1, 2012, through October 31, 2013, as provided by Thomas J. Durante, CFA, Karen Q.Wong, CFA, and Richard A. Brown, CFA, Portfolio Managers
Fund and Market Performance Overview
For the 12-month period ended October 31, 2013, Dreyfus S&P 500 Index Fund produced a total return of 26.56%.1 In comparison, the Standard & Poor’s® 500 Composite Stock Price Index (“S&P 500 Index”), the fund’s benchmark, returned 27.16% for the same period.2,3
U.S. stocks responded positively during the reporting period to recovering global and domestic economies.The difference in returns between the fund and the S&P 500 Index was primarily the result of transaction costs and operating expenses that are not reflected in the S&P 500 Index’s results.
The Fund’s Investment Approach
The fund seeks to match the total return of the S&P 500 Index by generally investing in all 500 stocks in the S&P 500 Index in proportion to their respective weightings. Often considered a barometer for the stock market in general, the S&P 500 Index is made up of 500 widely held common stocks across 10 economic sectors. Each stock is weighted by its float-adjusted market capitalization; that is, larger companies have greater representation in the S&P 500 Index than smaller ones.
The fund employed futures contracts during the reporting period in its efforts to replicate the returns of the S&P 500 Index.
Recovering U.S. and Global Economies Fueled Market Gains
The reporting period began soon after the start of a sustained stock market rally driven by improved U.S. employment and housing markets. Investors were particularly encouraged by a new round of quantitative easing from the Federal Reserve Board (the “Fed”) involving massive monthly purchases of U.S. government securities. Improving conditions in overseas markets also contributed to greater optimism as investors responded positively to the potential for improved earnings among U.S.-based multinationals and more robust export activity to overseas markets.
The Fund 3
DISCUSSION OF FUND PERFORMANCE (continued)
Economic data continued to improve, and stocks generally continued to rally, through the spring of 2013. However, in late May, relatively hawkish remarks by Fed chairman Ben Bernanke were widely interpreted as a signal that U.S. monetary policymakers would back away from their quantitative easing program sooner than many analysts had expected, sparking volatility that erased some of the market’s previous gains.The S&P 500 Index generally stabilized over the summer, and stocks advanced strongly in September when the Fed refrained from tapering its bond purchasing program. Even a 16-day federal government shutdown in October failed to derail the rally, enabling the S&P 500 Index to reach record highs by the reporting period’s end.
The Financials Sector Led the Market’s Advance
All of the economic sectors represented in the S&P 500 Index produced double-digit gains over the reporting period, reflecting broad-based support for U.S. equities. The financials sector led the market rally as large, diversified financial institutions rebounded from previously depressed levels in the wake of the 2007–2009 U.S. financial crisis. Big banks particularly benefited from widening net interest margins and greater mortgage refinancing activity as the U.S. economic recovery gained traction and long-term interest rates moved higher. In the insurance industry, financial results were bolstered by higher premiums at a time when relatively few domestic natural disasters kept claims low. Capital markets-oriented companies advanced along with the financial markets. However, large cap real estate investment trusts lagged sector averages by a wide margin when investors turned away from income-oriented stocks and toward their more growth-oriented counterparts.
In the consumer discretionary sector, media companies advanced strongly amid more robust spending by consumers on activities such as movies and visits to theme parks. Specialty retailers also gained value, including home improvement chains benefiting from recovering housing markets. Internet retailers exhibited strong earnings growth over the reporting period, with some Internet-related stocks doubling and tripling in value. Finally, in the industrials sector, aerospace and defense companies posted strong gains despite the potentially negative implications of reduced government spending stemming from protracted budget disagreements in Congress.
4
The fund received less favorable contributions from the materials sector, where metals-and-mining companies struggled with lower commodity prices due to waning demand for construction materials in the emerging markets. In addition, coal producers in the energy sector were hurt by intensifying competition from lower cost natural gas.
Replicating the Performance of the S&P 500 Index
Although we do not actively manage the fund’s investments in response to macroeconomic trends, it is worth noting that recent evidence of sustained domestic and global growth has the potential to fuel further gains in U.S. equity markets.As always, we have continued to monitor the factors considered by the fund’s investment model in light of current market conditions.
November 15, 2013
Equity funds are subject generally to market, market sector, market liquidity, issuer and investment style risks, among other factors, to varying degrees, all of which are more fully described in the fund’s prospectus.
| 1 | Total return includes reinvestment of dividends and any capital gains paid. Past performance is no guarantee of future |
| results. Share price and investment return fluctuate such that upon redemption, fund shares may be worth more or less | |
| than their original cost. | |
| 2 | SOURCE: LIPPER INC. — Reflects reinvestment of dividends and, where applicable, capital gain distributions. |
| The Standard & Poor’s 500 Composite Stock Price Index is a widely accepted, unmanaged index of U.S. stock | |
| market performance. Investors cannot invest directly in any index. | |
| 3 | “Standard & Poor’s®,” “S&P®,” “Standard & Poor’s® 500” and “S&P 500®” are registered trademarks of |
| Standard & Poor’s Financial Services LLC, and have been licensed for use on behalf of the fund.The fund is not | |
| sponsored, managed, advised, sold or promoted by Standard & Poor’s and its affiliates and Standard & Poor’s and its | |
| affiliates make no representation regarding the advisability of investing in the fund. |
The Fund 5
FUND PERFORMANCE

| Average Annual Total Returns as of 10/31/13 | ||||||
| 1 | Year | 5 Years | 10 Years | |||
| Fund | 26.56 | % | 14.67 | % | 6.98 | % |
| Standard & Poor’s 500 | ||||||
| Composite Stock Price Index | 27.16 | % | 15.16 | % | 7.45 | % |
† Source: Lipper Inc.
Past performance is not predictive of future performance.The fund’s performance shown in the graph and table does not reflect the deduction of taxes that a shareholder would pay on fund distributions or the redemption of fund shares. The above graph compares a $10,000 investment made in Dreyfus S&P 500 Index Fund on 10/31/03 to a $10,000 investment made in the Standard & Poor’s 500 Composite Stock Price Index (the “Index”) on that date. All dividends and capital gain distributions are reinvested.
The fund’s performance shown in the line graph above takes into account all applicable fees and expenses.The Index is a widely accepted, unmanaged index of U.S. stock market performance. Unlike a mutual fund, the Index is not subject to charges, fees and other expenses. Investors cannot invest directly in any index. Further information relating to fund performance, including expense reimbursements, if applicable, is contained in the Financial Highlights section of the prospectus and elsewhere in this report.
6
UNDERSTANDING YOUR FUND’S EXPENSES (Unaudited)
As a mutual fund investor, you pay ongoing expenses, such as management fees and other expenses. Using the information below, you can estimate how these expenses affect your investment and compare them with the expenses of other funds.You also may pay one-time transaction expenses, including sales charges (loads) and redemption fees, which are not shown in this section and would have resulted in higher total expenses. For more information, see your fund’s prospectus or talk to your financial adviser.
Review your fund’s expenses
The table below shows the expenses you would have paid on a $1,000 investment in Dreyfus S&P 500 Index Fund from May 1, 2013 to October 31, 2013. It also shows how much a $1,000 investment would be worth at the close of the period, assuming actual returns and expenses.
Expenses and Value of a $1,000 Investment
assuming actual returns for the six months ended October 31, 2013
| Expenses paid per $1,000† | $ | 2.66 |
| Ending value (after expenses) | $ | 1,108.70 |
COMPARING YOUR FUND’S EXPENSES
WITH THOSE OF OTHER FUNDS (Unaudited)
Using the SEC’s method to compare expenses
The Securities and Exchange Commission (SEC) has established guidelines to help investors assess fund expenses. Per these guidelines, the table below shows your fund’s expenses based on a $1,000 investment, assuming a hypothetical 5% annualized return. You can use this information to compare the ongoing expenses (but not transaction expenses or total cost) of investing in the fund with those of other funds.All mutual fund shareholder reports will provide this information to help you make this comparison. Please note that you cannot use this information to estimate your actual ending account balance and expenses paid during the period.
Expenses and Value of a $1,000 Investment
assuming a hypothetical 5% annualized return for the six months ended October 31, 2013
| Expenses paid per $1,000† | $ | 2.55 |
| Ending value (after expenses) | $ | 1,022.68 |
| † Expenses are equal to the fund’s annualized expense ratio of .50%, multiplied by the average account value over the |
| period, multiplied by 184/365 (to reflect the one-half year period). |
The Fund 7
STATEMENT OF INVESTMENTS
October 31, 2013
| Common Stocks��99.4% | Shares | Value ($) | |
| Automobiles & Components—1.1% | |||
| BorgWarner | 19,930 | 2,055,381 | |
| Delphi Automotive | 49,333 | 2,821,848 | |
| Ford Motor | 688,460 | 11,779,551 | |
| General Motors | 163,941 | a | 6,057,620 |
| Goodyear Tire & Rubber | 43,150 | 905,287 | |
| Harley-Davidson | 38,501 | 2,465,604 | |
| Johnson Controls | 121,027 | 5,585,396 | |
| 31,670,687 | |||
| Banks—2.8% | |||
| BB&T | 123,747 | 4,203,686 | |
| Comerica | 33,381 | 1,445,397 | |
| Fifth Third Bancorp | 157,110 | 2,989,803 | |
| Hudson City Bancorp | 87,836 | 788,767 | |
| Huntington Bancshares | 151,668 | 1,334,678 | |
| KeyCorp | 158,395 | 1,984,689 | |
| M&T Bank | 23,072 | 2,596,292 | |
| People’s United Financial | 59,919 | 864,631 | |
| PNC Financial Services Group | 93,887 | 6,903,511 | |
| Regions Financial | 248,633 | 2,394,336 | |
| SunTrust Banks | 95,122 | 3,199,904 | |
| U.S. Bancorp | 323,680 | 12,092,685 | |
| Wells Fargo & Co. | 846,286 | 36,127,949 | |
| Zions Bancorporation | 33,419 | 948,097 | |
| 77,874,425 | |||
| Capital Goods—8.1% | |||
| 3M | 114,302 | 14,384,907 | |
| AMETEK | 42,934 | 2,053,533 | |
| Boeing | 121,368 | 15,838,524 | |
| Caterpillar | 111,899 | 9,327,901 | |
| Cummins | 30,235 | 3,840,450 | |
| Danaher | 104,321 | 7,520,501 | |
| Deere & Co. | 66,646 | 5,454,309 | |
| Dover | 29,488 | 2,706,704 | |
| Eaton | 82,524 | 5,822,893 | |
| Emerson Electric | 125,622 | 8,412,905 | |
| Fastenal | 47,507 | b | 2,365,849 |
8
| Common Stocks (continued) | Shares | Value ($) | ||
| Capital Goods (continued) | ||||
| Flowserve | 24,375 | 1,693,331 | ||
| Fluor | 28,452 | 2,111,707 | ||
| General Dynamics | 58,727 | 5,087,520 | ||
| General Electric | 1,784,005 | 46,633,891 | ||
| Honeywell International | 138,113 | 11,978,540 | ||
| Illinois Tool Works | 72,900 | 5,743,791 | ||
| Ingersoll-Rand | 46,900 | 3,167,157 | ||
| Jacobs Engineering Group | 22,340 | a | 1,358,719 | |
| Joy Global | 18,859 | b | 1,070,248 | |
| L-3 Communications Holdings | 16,154 | 1,622,669 | ||
| Lockheed Martin | 46,962 | 6,261,913 | ||
| Masco | 61,285 | 1,294,952 | ||
| Northrop Grumman | 40,889 | 4,395,976 | ||
| PACCAR | 62,463 | 3,472,943 | ||
| Pall | 19,090 | 1,537,127 | ||
| Parker Hannifin | 25,965 | 3,030,635 | ||
| Pentair | 34,313 | 2,302,059 | ||
| Precision Castparts | 25,553 | 6,476,408 | ||
| Quanta Services | 37,851 | a | 1,143,479 | |
| Raytheon | 56,962 | 4,691,960 | ||
| Rockwell Automation | 23,946 | 2,643,878 | ||
| Rockwell Collins | 23,815 | 1,663,001 | ||
| Roper Industries | 17,614 | 2,233,631 | ||
| Snap-on | 10,081 | 1,049,130 | ||
| Stanley Black & Decker | 28,133 | 2,225,039 | ||
| Textron | 48,699 | 1,402,044 | ||
| United Technologies | 147,643 | 15,687,069 | ||
| W.W. Grainger | 10,979 | 2,953,022 | ||
| Xylem | 33,763 | 1,164,823 | ||
| 223,825,138 | ||||
| Commercial & Professional Services—.7% | ||||
| ADT | 35,540 | b | 1,541,370 | |
| Cintas | 17,248 | 927,425 | ||
| Dun & Bradstreet | 6,424 | 698,867 | ||
| Equifax | 20,748 | 1,341,773 | ||
| Iron Mountain | 30,330 | 804,958 |
The Fund 9
STATEMENT OF INVESTMENTS (continued)
| Common Stocks (continued) | Shares | Value ($) | |
| Commercial & Professional | |||
| Services (continued) | |||
| Nielsen Holdings | 37,109 | 1,463,579 | |
| Pitney Bowes | 37,470 | b | 799,610 |
| Republic Services | 48,258 | 1,615,195 | |
| Robert Half International | 24,946 | 961,169 | |
| Stericycle | 14,882 | a | 1,729,288 |
| Tyco International | 80,800 | 2,953,240 | |
| Waste Management | 76,952 | 3,350,490 | |
| 18,186,964 | |||
| Consumer Durables & Apparel—1.2% | |||
| Coach | 49,351 | 2,501,109 | |
| D.R. Horton | 48,521 | 919,473 | |
| Fossil Group | 8,635 | a | 1,096,127 |
| Garmin | 19,839 | b | 927,473 |
| Harman International Industries | 11,678 | 946,152 | |
| Hasbro | 19,752 | b | 1,020,191 |
| Leggett & Platt | 25,041 | 744,719 | |
| Lennar, Cl. A | 29,000 | 1,030,950 | |
| Mattel | 60,133 | 2,668,101 | |
| Newell Rubbermaid | 51,414 | 1,523,397 | |
| NIKE, Cl. B | 130,597 | 9,894,029 | |
| PulteGroup | 60,015 | 1,059,265 | |
| PVH | 13,933 | 1,735,634 | |
| Ralph Lauren | 10,735 | 1,778,145 | |
| VF | 15,513 | 3,335,295 | |
| Whirlpool | 14,030 | 2,048,520 | |
| 33,228,580 | |||
| Consumer Services—1.8% | |||
| Carnival | 75,553 | 2,617,911 | |
| Chipotle Mexican Grill | 5,387 | a | 2,838,787 |
| Darden Restaurants | 23,707 | 1,221,622 | |
| H&R Block | 48,006 | 1,365,291 | |
| International Game Technology | 44,710 | 840,548 | |
| Marriott International, Cl. A | 40,417 | 1,821,998 | |
| McDonald’s | 174,871 | 16,878,549 | |
| Starbucks | 132,187 | 10,713,756 |
10
| Common Stocks (continued) | Shares | Value ($) | ||
| Consumer Services (continued) | ||||
| Starwood Hotels & Resorts Worldwide | 34,602 | c | 2,547,399 | |
| Wyndham Worldwide | 23,021 | 1,528,594 | ||
| Wynn Resorts | 13,838 | 2,300,567 | ||
| Yum! Brands | 77,691 | 5,253,465 | ||
| 49,928,487 | ||||
| Diversified Financials—8.2% | ||||
| American Express | 163,300 | 13,357,940 | ||
| Ameriprise Financial | 34,606 | 3,479,287 | ||
| Bank of America | 1,880,878 | 26,257,057 | ||
| Bank of New York Mellon | 202,050 | 6,425,190 | ||
| Berkshire Hathaway, Cl. B | 315,257 | a | 36,279,776 | |
| BlackRock | 22,255 | 6,694,527 | ||
| Capital One Financial | 103,073 | 7,078,023 | ||
| Charles Schwab | 205,233 | 4,648,527 | ||
| Citigroup | 532,410 | 25,970,960 | ||
| CME Group | 55,780 | 4,139,434 | ||
| Discover Financial Services | 84,813 | 4,400,098 | ||
| E*TRADE Financial | 42,286 | a | 715,056 | |
| Franklin Resources | 71,181 | 3,833,809 | ||
| Goldman Sachs Group | 73,504 | 11,823,853 | ||
| IntercontinentalExchange | 12,790 | a | 2,465,017 | |
| Invesco | 78,462 | 2,648,093 | ||
| JPMorgan Chase & Co. | 659,264 | 33,978,467 | ||
| Legg Mason | 19,474 | 749,165 | ||
| Leucadia National | 52,336 | 1,483,202 | ||
| McGraw-Hill Financial | 47,654 | 3,320,531 | ||
| Moody’s | 34,693 | 2,451,407 | ||
| Morgan Stanley | 245,067 | 7,040,775 | ||
| NASDAQ OMX Group | 19,811 | 701,904 | ||
| Northern Trust | 38,540 | 2,174,427 | ||
| NYSE Euronext | 43,808 | 1,928,428 | ||
| SLM | 74,903 | 1,900,289 | ||
| State Street | 77,600 | 5,437,432 | ||
| T. Rowe Price Group | 46,303 | 3,584,315 | ||
| 224,966,989 |
The Fund 11
STATEMENT OF INVESTMENTS (continued)
| Common Stocks (continued) | Shares | Value ($) | ||
| Energy—10.5% | ||||
| Anadarko Petroleum | 87,723 | 8,359,125 | ||
| Apache | 70,345 | 6,246,636 | ||
| Baker Hughes | 77,748 | 4,516,381 | ||
| Cabot Oil & Gas | 73,970 | 2,612,620 | ||
| Cameron International | 43,473 | a | 2,384,929 | |
| Chesapeake Energy | 87,315 | 2,441,327 | ||
| Chevron | 338,442 | 40,599,502 | ||
| ConocoPhillips | 213,879 | 15,677,331 | ||
| CONSOL Energy | 40,833 | 1,490,405 | ||
| Denbury Resources | 67,122 | a | 1,274,647 | |
| Devon Energy | 67,754 | 4,283,408 | ||
| Diamond Offshore Drilling | 12,503 | 774,311 | ||
| Ensco, Cl. A | 40,955 | 2,361,056 | ||
| EOG Resources | 47,535 | 8,480,244 | ||
| EQT | 26,271 | 2,249,060 | ||
| Exxon Mobil | 771,337 | 69,127,222 | ||
| FMC Technologies | 41,942 | a | 2,120,168 | |
| Halliburton | 147,449 | 7,819,220 | ||
| Helmerich & Payne | 19,077 | 1,479,421 | ||
| Hess | 51,236 | 4,160,363 | ||
| Kinder Morgan | 119,486 | 4,219,051 | ||
| Marathon Oil | 124,828 | 4,401,435 | ||
| Marathon Petroleum | 55,624 | 3,986,016 | ||
| Murphy Oil | 30,154 | 1,818,889 | ||
| Nabors Industries | 46,161 | 806,894 | ||
| National Oilwell Varco | 75,603 | 6,137,452 | ||
| Newfield Exploration | 23,525 | a | 716,336 | |
| Noble | 45,097 | 1,700,157 | ||
| Noble Energy | 62,386 | 4,674,583 | ||
| Occidental Petroleum | 140,864 | 13,534,213 | ||
| Peabody Energy | 48,931 | 953,176 | ||
| Phillips 66 | 107,319 | 6,914,563 | ||
| Pioneer Natural Resources | 24,222 | 4,960,181 | ||
| QEP Resources | 32,621 | 1,078,450 | ||
| Range Resources | 28,835 | 2,183,098 | ||
| Rowan, Cl. A | 22,488 | a | 811,367 |
12
| Common Stocks (continued) | Shares | Value ($) | |
| Energy (continued) | |||
| Schlumberger | 231,565 | 21,702,272 | |
| Southwestern Energy | 62,547 | a | 2,327,999 |
| Spectra Energy | 117,779 | 4,189,399 | |
| Tesoro | 22,791 | 1,114,252 | |
| Transocean | 58,859 | 2,770,493 | |
| Valero Energy | 93,909 | 3,866,234 | |
| Williams | 118,711 | 4,239,170 | |
| WPX Energy | 35,479 | a | 785,505 |
| 288,348,561 | |||
| Food & Staples Retailing—2.4% | |||
| Costco Wholesale | 76,227 | 8,994,786 | |
| CVS Caremark | 216,201 | 13,460,674 | |
| Kroger | 90,682 | 3,884,817 | |
| Safeway | 41,753 | 1,457,180 | |
| Sysco | 103,774 | 3,356,051 | |
| Wal-Mart Stores | 284,878 | 21,864,386 | |
| Walgreen | 151,712 | 8,987,419 | |
| Whole Foods Market | 66,094 | 4,172,514 | |
| 66,177,827 | |||
| Food, Beverage & Tobacco—5.5% | |||
| Altria Group | 352,776 | 13,133,850 | |
| Archer-Daniels-Midland | 116,265 | 4,755,239 | |
| Beam | 29,044 | 1,954,661 | |
| Brown-Forman, Cl. B | 28,832 | 2,104,159 | |
| Campbell Soup | 31,488 | 1,340,444 | |
| Coca-Cola | 667,458 | 26,411,313 | |
| Coca-Cola Enterprises | 43,196 | 1,802,569 | |
| ConAgra Foods | 73,325 | 2,332,468 | |
| Constellation Brands, Cl. A | 29,427 | a | 1,921,583 |
| Dr. Pepper Snapple Group | 35,584 | 1,684,902 | |
| General Mills | 112,648 | 5,679,712 | |
| Hershey | 26,365 | 2,616,463 | |
| Hormel Foods | 22,888 | 994,712 | |
| J.M. Smucker | 18,779 | 2,088,413 | |
| Kellogg | 44,935 | 2,842,139 | |
| Kraft Foods Group | 104,852 | 5,701,852 |
The Fund 13
STATEMENT OF INVESTMENTS (continued)
| Common Stocks (continued) | Shares | Value ($) | |
| Food, Beverage & Tobacco (continued) | |||
| Lorillard | 65,356 | 3,333,810 | |
| McCormick & Co. | 23,885 | 1,651,648 | |
| Mead Johnson Nutrition | 35,637 | 2,910,117 | |
| Molson Coors Brewing, Cl. B | 27,760 | 1,499,040 | |
| Mondelez International, Cl. A | 310,975 | 10,461,199 | |
| Monster Beverage | 24,802 | a | 1,419,418 |
| PepsiCo | 269,921 | 22,697,657 | |
| Philip Morris International | 283,346 | 25,251,796 | |
| Reynolds American | 56,564 | 2,905,693 | |
| Tyson Foods, Cl. A | 49,245 | 1,362,609 | |
| 150,857,466 | |||
| Health Care Equipment & Services—4.2% | |||
| Abbott Laboratories | 273,325 | 9,990,029 | |
| Aetna | 65,220 | 4,089,294 | |
| AmerisourceBergen | 39,860 | 2,604,054 | |
| Baxter International | 95,335 | 6,279,716 | |
| Becton Dickinson & Co. | 34,191 | 3,594,500 | |
| Boston Scientific | 234,573 | a | 2,742,158 |
| C.R. Bard | 13,683 | 1,863,898 | |
| Cardinal Health | 59,365 | 3,482,351 | |
| CareFusion | 37,094 | a | 1,438,134 |
| Cerner | 52,544 | a | 2,944,040 |
| Cigna | 49,546 | 3,814,051 | |
| Covidien | 80,012 | 5,129,569 | |
| DaVita HealthCare Partners | 31,313 | a | 1,760,104 |
| DENTSPLY International | 24,840 | 1,169,964 | |
| Edwards Lifesciences | 20,371 | a | 1,327,985 |
| Express Scripts Holding | 143,182 | a | 8,951,739 |
| Humana | 27,772 | 2,559,190 | |
| Intuitive Surgical | 7,070 | a | 2,626,505 |
| Laboratory Corp. of America Holdings | 15,623 | a | 1,576,361 |
| McKesson | 40,118 | 6,272,048 | |
| Medtronic | 175,430 | 10,069,682 | |
| Patterson | 15,412 | 655,164 | |
| Quest Diagnostics | 26,987 | 1,616,791 | |
| St. Jude Medical | 50,870 | 2,919,429 |
14
| Common Stocks (continued) | Shares | Value ($) | |
| Health Care Equipment & Services (continued) | |||
| Stryker | 51,099 | 3,774,172 | |
| Tenet Healthcare | 19,011 | a | 897,129 |
| UnitedHealth Group | 178,956 | 12,215,537 | |
| Varian Medical Systems | 18,628 | a | 1,352,020 |
| WellPoint | 52,413 | 4,444,622 | |
| Zimmer Holdings | 30,386 | 2,657,863 | |
| 114,818,099 | |||
| Household & Personal Products—2.3% | |||
| Avon Products | 77,007 | 1,347,623 | |
| Clorox | 23,250 | 2,096,918 | |
| Colgate-Palmolive | 153,865 | 9,959,681 | |
| Estee Lauder, Cl. A | 45,374 | 3,219,739 | |
| Kimberly-Clark | 67,282 | 7,266,456 | |
| Procter & Gamble | 479,701 | 38,735,856 | |
| 62,626,273 | |||
| Insurance—3.0% | |||
| ACE | 60,100 | 5,735,944 | |
| Aflac | 80,915 | 5,257,857 | |
| Allstate | 81,224 | 4,309,745 | |
| American International Group | 259,860 | 13,421,769 | |
| Aon | 53,383 | 4,222,061 | |
| Assurant | 14,133 | 826,498 | |
| Chubb | 44,362 | 4,084,853 | |
| Cincinnati Financial | 26,035 | 1,301,750 | |
| Genworth Financial, Cl. A | 83,117 | a | 1,207,690 |
| Hartford Financial Services Group | 78,341 | 2,640,092 | |
| Lincoln National | 46,850 | 2,127,459 | |
| Loews | 54,392 | 2,627,678 | |
| Marsh & McLennan | 96,269 | 4,409,120 | |
| MetLife | 195,515 | 9,249,815 | |
| Principal Financial Group | 48,175 | 2,286,385 | |
| Progressive | 98,789 | 2,565,550 | |
| Prudential Financial | 81,030 | 6,595,032 | |
| Torchmark | 15,514 | 1,130,350 | |
| Travelers | 65,562 | 5,658,001 | |
| Unum Group | 46,363 | 1,471,562 |
The Fund 15
STATEMENT OF INVESTMENTS (continued)
| Common Stocks (continued) | Shares | Value ($) | |
| Insurance (continued) | |||
| XL Group | 51,483 | 1,573,835 | |
| 82,703,046 | |||
| Materials—3.5% | |||
| Air Products & Chemicals | 37,229 | 4,058,333 | |
| Airgas | 11,990 | 1,307,749 | |
| Alcoa | 192,245 | 1,782,111 | |
| Allegheny Technologies | 18,808 | 622,545 | |
| Avery Dennison | 17,132 | 807,260 | |
| Ball | 24,565 | 1,200,983 | |
| Bemis | 17,582 | 701,522 | |
| CF Industries Holdings | 9,979 | 2,151,472 | |
| Cliffs Natural Resources | 26,122 | b | 670,813 |
| Dow Chemical | 211,178 | 8,335,196 | |
| E.I. du Pont de Nemours & Co. | 162,427 | 9,940,532 | |
| Eastman Chemical | 26,907 | 2,120,003 | |
| Ecolab | 47,543 | 5,039,558 | |
| FMC | 23,716 | 1,725,576 | |
| Freeport-McMoRan Copper & Gold | 183,601 | 6,749,173 | |
| International Flavors & Fragrances | 14,164 | 1,170,655 | |
| International Paper | 77,314 | 3,448,978 | |
| LyondellBasell Industries, Cl. A | 78,023 | 5,820,516 | |
| MeadWestvaco | 30,975 | 1,079,479 | |
| Monsanto | 93,100 | 9,764,328 | |
| Mosaic | 60,370 | 2,767,965 | |
| Newmont Mining | 87,851 | 2,394,818 | |
| Nucor | 54,989 | 2,846,781 | |
| Owens-Illinois | 30,119 | a | 957,483 |
| PPG Industries | 25,046 | 4,572,899 | |
| Praxair | 51,782 | 6,457,733 | |
| Sealed Air | 34,582 | 1,043,685 | |
| Sherwin-Williams | 15,328 | 2,881,664 | |
| Sigma-Aldrich | 21,630 | 1,869,481 | |
| United States Steel | 26,106 | b | 649,778 |
| Vulcan Materials | 23,664 | 1,267,207 | |
| 96,206,276 |
16
| Common Stocks (continued) | Shares | Value ($) | ||
| Media—3.7% | ||||
| Cablevision Systems (NY Group), Cl. A | 40,411 | 628,391 | ||
| CBS, Cl. B | 98,729 | 5,838,833 | ||
| Comcast, Cl. A | 457,732 | 21,778,889 | ||
| DIRECTV | 88,866 | a | 5,553,236 | |
| Discovery Communications, Cl. A | 41,024 | a | 3,647,854 | |
| Gannett | 40,778 | 1,128,327 | ||
| Interpublic Group of Cos | 70,523 | 1,184,786 | ||
| News Corp., Cl. A | 88,680 | a | 1,560,768 | |
| Omnicom Group | 44,949 | 3,061,476 | ||
| Scripps Networks Interactive, Cl. A | 19,387 | 1,560,653 | ||
| Time Warner | 161,859 | 11,126,188 | ||
| Time Warner Cable | 49,758 | 5,978,424 | ||
| Twenty-First Century Fox, Cl. A | 349,518 | 11,911,573 | ||
| Viacom, Cl. B | 75,629 | 6,299,139 | ||
| Walt Disney | 290,702 | 19,939,250 | ||
| Washington Post, Cl. B | 721 | 463,834 | ||
| 101,661,621 | ||||
| Pharmaceuticals, Biotech & | ||||
| Life Sciences—8.8% | ||||
| AbbVie | 277,114 | 13,426,173 | ||
| Actavis | 30,560 | a | 4,723,965 | |
| Agilent Technologies | 57,834 | 2,935,654 | ||
| Alexion Pharmaceuticals | 34,152 | a | 4,198,988 | |
| Allergan | 51,609 | 4,676,291 | ||
| Amgen | 131,744 | 15,282,304 | ||
| Biogen Idec | 41,511 | a | 10,136,571 | |
| Bristol-Myers Squibb | 287,820 | 15,116,306 | ||
| Celgene | 72,363 | a | 10,745,182 | |
| Eli Lilly & Co. | 174,348 | 8,686,017 | ||
| Forest Laboratories | 40,896 | a | 1,923,339 | |
| Gilead Sciences | 267,758 | a | 19,008,140 | |
| Hospira | 29,933 | a | 1,212,885 | |
| Johnson & Johnson | 493,675 | 45,719,242 | ||
| Life Technologies | 30,145 | a | 2,270,220 | |
| Merck & Co. | 512,293 | 23,099,291 |
The Fund 17
STATEMENT OF INVESTMENTS (continued)
| Common Stocks (continued) | Shares | Value ($) | ||
| Pharmaceuticals, Biotech & | ||||
| Life Sciences (continued) | ||||
| Mylan | 67,858 | a | 2,569,782 | |
| PerkinElmer | 20,343 | 773,848 | ||
| Perrigo | 16,699 | 2,302,625 | ||
| Pfizer | 1,159,451 | 35,571,957 | ||
| Regeneron Pharmaceuticals | 13,571 | a | 3,903,020 | |
| Thermo Fisher Scientific | 63,220 | 6,181,652 | ||
| Vertex Pharmaceuticals | 40,928 | a | 2,919,804 | |
| Waters | 15,374 | a | 1,551,544 | |
| Zoetis | 88,758 | 2,810,078 | ||
| 241,744,878 | ||||
| Real Estate—2.0% | ||||
| American Tower | 68,729 | c | 5,453,646 | |
| Apartment Investment & Management, Cl. A | 26,808 | c | 750,088 | |
| AvalonBay Communities | 21,504 | c | 2,689,075 | |
| Boston Properties | 26,639 | c | 2,757,137 | |
| CBRE Group, Cl. A | 49,281 | a | 1,144,798 | |
| Equity Residential | 59,485 | c | 3,114,635 | |
| HCP | 81,083 | c | 3,364,945 | |
| Health Care | 49,680 | c | 3,221,748 | |
| Host Hotels & Resorts | 133,127 | c | 2,469,506 | |
| Kimco Realty | 73,713 | c | 1,583,355 | |
| Macerich | 24,295 | c | 1,438,507 | |
| Plum Creek Timber | 28,023 | c | 1,272,244 | |
| Prologis | 88,122 | c | 3,520,474 | |
| Public Storage | 25,509 | c | 4,259,238 | |
| Simon Property Group | 54,561 | c | 8,432,403 | |
| Ventas | 51,526 | c | 3,361,556 | |
| Vornado Realty Trust | 29,837 | c | 2,657,283 | |
| Weyerhaeuser | 103,639 | c | 3,150,626 | |
| 54,641,264 | ||||
| Retailing—4.5% | ||||
| Abercrombie & Fitch, Cl. A | 14,039 | 526,182 | ||
| Amazon.com | 64,764 | a | 23,576,039 | |
| AutoNation | 11,377 | a | 548,713 | |
| AutoZone | 6,335 | a | 2,753,761 |
18
| Common Stocks (continued) | Shares | Value ($) | ||
| Retailing (continued) | ||||
| Bed Bath & Beyond | 38,065 | a | 2,943,186 | |
| Best Buy | 45,619 | 1,952,493 | ||
| CarMax | 40,103 | a | 1,884,440 | |
| Dollar General | 52,042 | a | 3,006,987 | |
| Dollar Tree | 39,617 | a | 2,313,633 | |
| Expedia | 19,054 | 1,121,900 | ||
| Family Dollar Stores | 16,391 | 1,129,012 | ||
| GameStop, Cl. A | 21,251 | 1,164,980 | ||
| Gap | 49,014 | 1,813,028 | ||
| Genuine Parts | 27,282 | 2,150,640 | ||
| Home Depot | 250,649 | 19,523,051 | ||
| J.C. Penney | 33,996 | a,b | 254,970 | |
| Kohl’s | 36,281 | 2,060,761 | ||
| L Brands | 42,890 | 2,685,343 | ||
| Lowe’s | 183,597 | 9,139,459 | ||
| Macy’s | 65,746 | 3,031,548 | ||
| Netflix | 10,456 | a | 3,371,851 | |
| Nordstrom | 25,627 | 1,549,665 | ||
| O’Reilly Automotive | 18,935 | a | 2,344,342 | |
| PetSmart | 18,442 | 1,341,840 | ||
| priceline.com | 9,058 | a | 9,545,592 | |
| Ross Stores | 37,454 | 2,897,067 | ||
| Staples | 114,694 | b | 1,848,867 | |
| Target | 110,048 | 7,130,010 | ||
| The TJX Companies | 125,681 | 7,640,148 | ||
| Tiffany & Co. | 19,557 | 1,548,328 | ||
| TripAdvisor | 19,513 | a | 1,613,920 | |
| Urban Outfitters | 19,231 | a | 728,470 | |
| 125,140,226 | ||||
| Semiconductors & Semiconductor | ||||
| Equipment—2.0% | ||||
| Altera | 54,958 | 1,846,589 | ||
| Analog Devices | 54,685 | 2,695,971 | ||
| Applied Materials | 211,234 | 3,770,527 | ||
| Broadcom, Cl. A | 97,634 | 2,608,780 | ||
| First Solar | 10,675 | a,b | 536,632 |
The Fund 19
STATEMENT OF INVESTMENTS (continued)
| Common Stocks (continued) | Shares | Value ($) | |
| Semiconductors & Semiconductor | |||
| Equipment (continued) | |||
| Intel | 871,841 | 21,299,076 | |
| KLA-Tencor | 29,810 | 1,955,536 | |
| Lam Research | 29,623 | a | 1,606,455 |
| Linear Technology | 40,484 | 1,665,512 | |
| LSI | 100,482 | 852,087 | |
| Microchip Technology | 33,824 | b | 1,453,079 |
| Micron Technology | 182,598 | a | 3,228,333 |
| NVIDIA | 103,156 | b | 1,565,908 |
| Teradyne | 35,007 | a,b | 612,272 |
| Texas Instruments | 192,105 | 8,083,778 | |
| Xilinx | 46,090 | 2,093,408 | |
| 55,873,943 | |||
| Software & Services—9.3% | |||
| Accenture, Cl. A | 113,387 | 8,333,945 | |
| Adobe Systems | 81,146 | a | 4,398,113 |
| Akamai Technologies | 30,772 | a | 1,376,739 |
| Autodesk | 38,698 | a | 1,544,437 |
| Automatic Data Processing | 84,116 | 6,306,177 | |
| CA | 56,982 | 1,809,748 | |
| Citrix Systems | 32,379 | a | 1,838,480 |
| Cognizant Technology Solutions, Cl. A | 52,834 | a | 4,592,860 |
| Computer Sciences | 26,846 | 1,322,434 | |
| eBay | 203,583 | a | 10,730,860 |
| Electronic Arts | 54,599 | a | 1,433,224 |
| Fidelity National Information Services | 52,142 | 2,541,923 | |
| Fiserv | 22,421 | a | 2,348,151 |
| Google, Cl. A | 49,005 | a | 50,503,573 |
| International Business Machines | 180,338 | 32,318,373 | |
| Intuit | 52,697 | 3,763,093 | |
| MasterCard, Cl. A | 18,258 | 13,092,812 | |
| Microsoft | 1,327,962 | 46,943,457 | |
| Oracle | 624,037 | 20,905,239 | |
| Paychex | 56,075 | b | 2,369,730 |
| Red Hat | 32,818 | a | 1,420,035 |
| salesforce.com | 96,292 | a | 5,138,141 |
20
| Common Stocks (continued) | Shares | Value ($) | |
| Software & Services (continued) | |||
| Symantec | 121,375 | 2,760,068 | |
| Teradata | 28,299 | a | 1,247,137 |
| Total System Services | 28,103 | 838,312 | |
| VeriSign | 24,007 | a | 1,303,100 |
| Visa, Cl. A | 90,305 | 17,760,284 | |
| Western Union | 95,917 | 1,632,507 | |
| Yahoo! | 166,553 | a | 5,484,590 |
| 256,057,542 | |||
| Technology Hardware & | |||
| Equipment—6.3% | |||
| Amphenol, Cl. A | 27,399 | 2,199,866 | |
| Apple | 159,215 | 83,165,955 | |
| Cisco Systems | 938,428 | 21,114,630 | |
| Corning | 259,674 | 4,437,829 | |
| EMC | 366,008 | 8,809,813 | |
| F5 Networks | 13,854 | a | 1,129,240 |
| FLIR Systems | 25,374 | 722,652 | |
| Harris | 19,507 | 1,208,654 | |
| Hewlett-Packard | 337,721 | 8,230,261 | |
| Jabil Circuit | 32,358 | 674,988 | |
| JDS Uniphase | 40,459 | a | 529,608 |
| Juniper Networks | 88,073 | a | 1,641,681 |
| Molex | 23,506 | 907,332 | |
| Motorola Solutions | 42,082 | 2,630,967 | |
| NetApp | 60,429 | 2,345,249 | |
| QUALCOMM | 300,203 | 20,855,102 | |
| SanDisk | 41,490 | 2,883,555 | |
| Seagate Technology | 54,136 | 2,635,340 | |
| TE Connectivity | 71,800 | 3,696,982 | |
| Western Digital | 36,364 | 2,532,025 | |
| Xerox | 205,876 | 2,046,407 | |
| 174,398,136 | |||
| Telecommunication Services—2.5% | |||
| AT&T | 930,082 | 33,668,968 | |
| CenturyLink | 106,702 | 3,612,930 | |
| Crown Castle International | 57,706 | a | 4,386,810 |
The Fund 21
STATEMENT OF INVESTMENTS (continued)
| Common Stocks (continued) | Shares | Value ($) | |
| Telecommunication Services (continued) | |||
| Frontier Communications | 184,604 | b | 814,104 |
| Verizon Communications | 500,926 | 25,301,772 | |
| Windstream Holdings | 106,795 | b | 913,097 |
| 68,697,681 | |||
| Transportation—1.9% | |||
| C.H. Robinson Worldwide | 27,677 | 1,653,424 | |
| CSX | 180,347 | 4,699,843 | |
| Delta Air Lines | 149,923 | 3,954,969 | |
| Expeditors International of Washington | 35,804 | 1,621,563 | |
| FedEx | 51,758 | 6,780,298 | |
| Kansas City Southern | 19,473 | 2,366,359 | |
| Norfolk Southern | 55,156 | 4,744,519 | |
| Ryder System | 9,785 | 644,147 | |
| Southwest Airlines | 125,480 | 2,160,766 | |
| Union Pacific | 81,644 | 12,360,902 | |
| United Parcel Service, Cl. B | 127,139 | 12,490,135 | |
| 53,476,925 | |||
| Utilities—3.1% | |||
| AES | 108,632 | 1,530,625 | |
| AGL Resources | 21,260 | 1,017,504 | |
| Ameren | 41,415 | 1,498,395 | |
| American Electric Power | 85,842 | 4,020,839 | |
| CenterPoint Energy | 76,447 | 1,880,596 | |
| CMS Energy | 45,572 | 1,251,407 | |
| Consolidated Edison | 51,773 | 3,014,224 | |
| Dominion Resources | 101,352 | 6,461,190 | |
| DTE Energy | 30,234 | 2,090,379 | |
| Duke Energy | 124,174 | 8,907,001 | |
| Edison International | 56,928 | 2,791,180 | |
| Entergy | 31,245 | 2,022,176 | |
| Exelon | 151,261 | 4,316,989 | |
| FirstEnergy | 73,944 | 2,800,259 | |
| Integrys Energy Group | 13,486 | 791,358 |
22
| Common Stocks (continued) | Shares | Value ($) | ||
| Utilities (continued) | ||||
| NextEra Energy | 74,959 | 6,352,775 | ||
| NiSource | 55,163 | 1,738,738 | ||
| Northeast Utilities | 55,335 | 2,373,318 | ||
| NRG Energy | 58,519 | 1,669,547 | ||
| ONEOK | 36,024 | 2,035,356 | ||
| Pepco Holdings | 42,315 | 815,833 | ||
| PG&E | 78,384 | 3,280,370 | ||
| Pinnacle West Capital | 20,017 | 1,121,553 | ||
| PPL | 112,079 | 3,432,980 | ||
| Public Service Enterprise Group | 89,128 | 2,985,788 | ||
| SCANA | 24,197 | 1,128,306 | ||
| Sempra Energy | 39,726 | 3,620,628 | ||
| Southern | 152,952 | 6,257,266 | ||
| TECO Energy | 37,265 | 639,840 | ||
| Wisconsin Energy | 38,946 | 1,640,016 | ||
| Xcel Energy | 86,034 | 2,482,941 | ||
| 85,969,377 | ||||
| Total Common Stocks | ||||
| (cost $1,223,984,353) | 2,739,080,411 | |||
| Principal | ||||
Short-Term Investments—.1% | Amount ($) | Value ($) | ||
| U.S. Treasury Bills: | ||||
| 0.04%, 3/13/14 | 795,000 | d | 794,839 | |
| 0.06%, 12/5/13 | 400,000 | d | 399,988 | |
| Total Short-Term Investments | ||||
| (cost $1,194,871) | 1,194,827 | |||
| Other Investment—.6% | Shares | Value ($) | ||
| Registered Investment Company; | ||||
| Dreyfus | ||||
| Institutional Preferred | ||||
| Plus Money Market Fund | ||||
| (cost $16,179,554) | 16,179,554 | e | 16,179,554 | |
The Fund 23
STATEMENT OF INVESTMENTS (continued)
| Investment of Cash Collateral | ||||
| for Securities Loaned—.3% | Shares | Value ($) | ||
| Registered Investment Company; | ||||
| Dreyfus Institutional Cash Advantage Fund | ||||
| (cost $9,096,284) | 9,096,284 | e | 9,096,284 | |
| Total Investments (cost $1,250,455,062) | 100.4 | % | 2,765,551,076 | |
| Liabilities, Less Cash and Receivables | (.4 | %) | (10,150,720 | ) |
| Net Assets | 100.0 | % | 2,755,400,356 |
| a Non-income producing security. |
| b Security, or portion thereof, on loan.At October 31, 2013, the value of the fund’s securities on loan was |
| $14,466,025 and the value of the collateral held by the fund was $14,807,451, consisting of cash collateral of |
| $9,096,284 and U.S. Government & Agency securities valued at $5,711,167. |
| c Investment in real estate investment trust. |
| d Held by or on behalf of a counterparty for open financial futures contracts. |
| e Investment in affiliated money market mutual fund. |
| Portfolio Summary (Unaudited)† | |||
| Value (%) | Value (%) | ||
| Energy | 10.5 | Banks | 2.8 |
| Software & Services | 9.3 | Telecommunication Services | 2.5 |
| Pharmaceuticals, | Food & Staples Retailing | 2.4 | |
| Biotech & Life Sciences | 8.8 | Household & Personal Products | 2.3 |
| Diversified Financials | 8.2 | Real Estate | 2.0 |
| Capital Goods | 8.1 | Semiconductors & | |
| Technology Hardware & Equipment | 6.3 | Semiconductor Equipment | 2.0 |
| Food, Beverage & Tobacco | 5.5 | Transportation | 1.9 |
| Retailing | 4.5 | Consumer Services | 1.8 |
| Health Care Equipment & Services | 4.2 | Consumer Durables & Apparel | 1.2 |
| Media | 3.7 | Automobiles & Components | 1.1 |
| Materials | 3.5 | Short-Term/Money Market Investments | 1.0 |
| Utilities | 3.1 | Commercial & Professional Services | .7 |
| Insurance | 3.0 | 100.4 | |
| † Based on net assets. | |||
| See notes to financial statements. | |||
24
STATEMENT OF FINANCIAL FUTURES
October 31, 2013
| Market Value | Unrealized | ||||
| Covered by | Appreciation | ||||
| Contracts | Contracts ($) | Expiration | at 10/31/2013 | ($) | |
| Financial Futures Long | |||||
| Standard & Poor’s 500 E-mini | 222 | 19,436,100 | December 2013 | 221,294 | |
| See notes to financial statements. | |||||
The Fund 25
STATEMENT OF ASSETS AND LIABILITIES
October 31, 2013
| Cost | Value | |
| Assets ($): | ||
| Investments in securities—See Statement of | ||
| Investments (including securities on loan, | ||
| valued at $14,466,025)—Notes 1(b): | ||
| Unaffiliated issuers | 1,225,179,224 | 2,740,275,238 |
| Affiliated issuers | 25,275,838 | 25,275,838 |
| Cash | 2,301,771 | |
| Dividends and securities lending income receivable | 2,831,571 | |
| Receivable for shares of Common Stock subscribed | 119,566 | |
| Other assets | 15,802 | |
| 2,770,819,786 | ||
| Liabilities ($): | ||
| Due to The Dreyfus Corporation and affiliates—Note 3(b) | 1,127,993 | |
| Liability for securities on loan—Note 1(b) | 9,096,284 | |
| Payable for shares of Common Stock redeemed | 5,083,064 | |
| Payable for futures variation margin—Note 4 | 108,089 | |
| Accrued expenses | 4,000 | |
| 15,419,430 | ||
| Net Assets ($) | 2,755,400,356 | |
| Composition of Net Assets ($): | ||
| Paid-in capital | 1,203,650,124 | |
| Accumulated undistributed investment income—net | 33,551,676 | |
| Accumulated net realized gain (loss) on investments | 2,881,248 | |
| Accumulated net unrealized appreciation (depreciation) | ||
| on investments (including $221,294 net unrealized | ||
| appreciation on financial futures) | 1,515,317,308 | |
| Net Assets ($) | 2,755,400,356 | |
| Shares Outstanding | ||
| (200 million shares of $.001 par value Common Stock authorized) | 57,471,474 | |
| Net Asset Value, offering and redemption price per share ($) | 47.94 | |
| See notes to financial statements. | ||
26
STATEMENT OF OPERATIONS
Year Ended October 31, 2013
| Investment Income ($): | ||
| Income: | ||
| Cash dividends (net of $36,239 foreign taxes withheld at source): | ||
| Unaffiliated issuers | 56,877,028 | |
| Affiliated issuers | 23,973 | |
| Income from securities lending—Note 1(b) | 130,611 | |
| Interest | 593 | |
| Total Income | 57,032,205 | |
| Expenses: | ||
| Management fee—Note 3(a) | 6,346,420 | |
| Shareholder servicing costs—Note 3(b) | 6,346,420 | |
| Directors’ fees —Note 3(a,c) | 233,960 | |
| Loan commitment fees—Note 2 | 23,293 | |
| Interest expense—Note 2 | 539 | |
| Total Expenses | 12,950,632 | |
| Less—Directors’ fees reimbursed by the Manager—Note 3(a) | (233,960 | ) |
| Net Expenses | 12,716,672 | |
| Investment Income—Net | 44,315,533 | |
| Realized and Unrealized Gain (Loss) on Investments—Note 4 ($): | ||
| Net realized gain (loss) on investments | 48,037,920 | |
| Net realized gain (loss) on financial futures | 6,094,929 | |
| Net Realized Gain (Loss) | 54,132,849 | |
| Net unrealized appreciation (depreciation) on investments | 496,980,799 | |
| Net unrealized appreciation (depreciation) on financial futures | 601,285 | |
| Net Unrealized Appreciation (Depreciation) | 497,582,084 | |
| Net Realized and Unrealized Gain (Loss) on Investments | 551,714,933 | |
| Net Increase in Net Assets Resulting from Operations | 596,030,466 | |
| See notes to financial statements. | ||
The Fund 27
STATEMENT OF CHANGES IN NET ASSETS
| Year Ended October 31, | ||||
| 2013 | 2012 | |||
| Operations ($): | ||||
| Investment income—net | 44,315,533 | 39,361,595 | ||
| Net realized gain (loss) on investments | 54,132,849 | 34,144,991 | ||
| Net unrealized appreciation | ||||
| (depreciation) on investments | 497,582,084 | 247,671,231 | ||
| Net Increase (Decrease) in Net Assets | ||||
| Resulting from Operations | 596,030,466 | 315,177,817 | ||
| Dividends to Shareholders from ($): | ||||
| Investment income—net | (41,840,455 | ) | (35,011,268 | ) |
| Net realized gain on investments | (32,223,101 | ) | (13,904,370 | ) |
| Total Dividends | (74,063,556 | ) | (48,915,638 | ) |
| Capital Stock Transactions ($): | ||||
| Net proceeds from shares sold | 622,424,752 | 489,324,679 | ||
| Dividends reinvested | 72,174,741 | 47,707,705 | ||
| Cost of shares redeemed | (788,067,025 | ) | (706,917,641 | ) |
| Increase (Decrease) in Net Assets | ||||
| from Capital Stock Transactions | (93,467,532 | ) | (169,885,257 | ) |
| Total Increase (Decrease) in Net Assets | 428,499,378 | 96,376,922 | ||
| Net Assets ($): | ||||
| Beginning of Period | 2,326,900,978 | 2,230,524,056 | ||
| End of Period | 2,755,400,356 | 2,326,900,978 | ||
| Undistributed investment income—net | 33,551,676 | 31,416,211 | ||
| Capital Share Transactions (Shares): | ||||
| Shares sold | 14,520,000 | 13,183,860 | ||
| Shares issued for dividends reinvested | 1,889,752 | 1,396,382 | ||
| Shares redeemed | (18,408,216 | ) | (19,030,487 | ) |
| Net Increase (Decrease) in Shares Outstanding | (1,998,464 | ) | (4,450,245 | ) |
| See notes to financial statements. | ||||
28
FINANCIAL HIGHLIGHTS
The following table describes the performance for the fiscal periods indicated. Total return shows how much your investment in the fund would have increased (or decreased) during each period, assuming you had reinvested all dividends and distributions.These figures have been derived from the fund’s financial statements.
| Year Ended October 31, | ||||||||||
| 2013 | 2012 | 2011 | 2010 | 2009 | ||||||
| Per Share Data ($): | ||||||||||
| Net asset value, | ||||||||||
| beginning of period | 39.13 | 34.90 | 33.62 | 29.45 | 27.66 | |||||
| Investment Operations: | ||||||||||
| Investment income—neta | .75 | .63 | .55 | .49 | .53 | |||||
| Net realized and unrealized | ||||||||||
| gain (loss) on investments | 9.32 | 4.38 | 2.00 | 4.19 | 1.93 | |||||
| Total from Investment Operations | 10.07 | 5.01 | 2.55 | 4.68 | 2.46 | |||||
| Distributions: | ||||||||||
| Dividends from | ||||||||||
| investment income—net | (.71 | ) | (.56 | ) | (.51 | ) | (.51 | ) | (.67 | ) |
| Dividends from net realized | ||||||||||
| gain on investments | (.55 | ) | (.22 | ) | (.76 | ) | — | — | ||
| Total Distributions | (1.26 | ) | (.78 | ) | (1.27 | ) | (.51 | ) | (.67 | ) |
| Net asset value, end of period | 47.94 | 39.13 | 34.90 | 33.62 | 29.45 | |||||
| Total Return (%) | 26.56 | 14.67 | 7.61 | 16.02 | 9.42 | |||||
| Ratios/Supplemental Data (%): | ||||||||||
| Ratio of total expenses | ||||||||||
| to average net assets | .51 | .51 | .51 | .51 | .51 | |||||
| Ratio of net expenses | ||||||||||
| to average net assets | .50 | .50 | .50 | .50 | .50 | |||||
| Ratio of net investment income | ||||||||||
| to average net assets | 1.75 | 1.71 | 1.55 | 1.55 | 2.06 | |||||
| Portfolio Turnover Rate | 2.92 | 3.20 | 3.38 | 5.45 | 4.36 | |||||
| Net Assets, end of period | ||||||||||
| ($ x 1,000) | 2,755,400 | 2,326,901 | 2,230,524 | 2,327,872 | 2,238,885 | |||||
| a Based on average shares outstanding at each month end. | ||||||||||
| See notes to financial statements. | ||||||||||
The Fund 29
NOTES TO FINANCIAL STATEMENTS
NOTE 1—Significant Accounting Policies:
Dreyfus S&P 500 Index Fund (the “fund”) is a separate non-diversified series of Dreyfus Index Funds, Inc. (the “Company”), which is registered under the Investment Company Act of 1940, as amended (the “Act”), as an open-end management investment company and operates as a series company currently offering three series, including the fund.The fund’s investment objective is to match the performance of the Standard & Poor’s 500® Composite Stock Price Index. The Dreyfus Corporation (the “Manager” or “Dreyfus”), a wholly-owned subsidiary of The Bank of NewYork Mellon Corporation (“BNY Mellon”), serves as the fund’s investment adviser. MBSC Securities Corporation (the “Distributor”), a wholly-owned subsidiary of the Manager, is the distributor of the fund’s shares, which are sold to the public without a sales charge.
The Company accounts separately for the assets, liabilities and operations of each series. Expenses directly attributable to each series are charged to that series’ operations; expenses which are applicable to all series are allocated among them on a pro rata basis.
The Financial Accounting Standards Board (“FASB”) Accounting Standards Codification is the exclusive reference of authoritative U.S. generally accepted accounting principles (“GAAP”) recognized by the FASB to be applied by nongovernmental entities. Rules and interpretive releases of the Securities and Exchange Commission (“SEC”) under authority of federal laws are also sources of authoritative GAAP for SEC registrants. The fund’s financial statements are prepared in accordance with GAAP, which may require the use of management estimates and assumptions.Actual results could differ from those estimates.
The Company enters into contracts that contain a variety of indemnifications. The fund’s maximum exposure under these arrangements is unknown.The fund does not anticipate recognizing any loss related to these arrangements.
(a) Portfolio valuation: The fair value of a financial instrument is the amount that would be received to sell an asset or paid to transfer a liability in an orderly transaction between market participants at the
30
measurement date (i.e., the exit price). GAAP establishes a fair value hierarchy that prioritizes the inputs of valuation techniques used to measure fair value. This hierarchy gives the highest priority to unadjusted quoted prices in active markets for identical assets or liabilities (Level 1 measurements) and the lowest priority to unobservable inputs (Level 3 measurements).
Additionally, GAAP provides guidance on determining whether the volume and activity in a market has decreased significantly and whether such a decrease in activity results in transactions that are not orderly. GAAP requires enhanced disclosures around valuation inputs and techniques used during annual and interim periods.
Various inputs are used in determining the value of the fund’s investments relating to fair value measurements.These inputs are summarized in the three broad levels listed below:
Level 1—unadjusted quoted prices in active markets for identical investments.
Level 2—other significant observable inputs (including quoted prices for similar investments, interest rates, prepayment speeds, credit risk, etc.).
Level 3—significant unobservable inputs (including the fund’s own assumptions in determining the fair value of investments).
The inputs or methodology used for valuing securities are not necessarily an indication of the risk associated with investing in those securities.
Changes in valuation techniques may result in transfers in or out of an assigned level within the disclosure hierarchy. Valuation techniques used to value the fund’s investments are as follows:
Investments in securities are valued at the last sales price on the securities exchange or national securities market on which such securities are primarily traded. Securities listed on the National Market System for which market quotations are available are valued at the official closing price or, if there is no official closing price that day, at the last sales
The Fund 31
NOTES TO FINANCIAL STATEMENTS (continued)
price. Securities not listed on an exchange or the national securities market, or securities for which there were no transactions, are valued at the average of the most recent bid and asked prices, except for open short positions, where the asked price is used for valuation purposes. Bid price is used when no asked price is available. Registered investment companies that are not traded on an exchange are valued at their net asset value. All of the preceding securities are categorized within Level 1 of the fair value hierarchy.
U.S. Treasury Bills are valued at the mean price between quoted bid prices and asked prices by an independent pricing service (the “Service”) approved by the Company’s Board of Directors (the “Board”).These securities are generally categorized within Level 2 of the fair value hierarchy.
The Service’s procedures are reviewed by Dreyfus under the general supervision of the Board.
Fair valuing of securities may be determined with the assistance of a pricing service using calculations based on indices of domestic securities and other appropriate indicators, such as prices of relevant American Depository Receipts and financial futures. Utilizing these techniques may result in transfers between Level 1 and Level 2 of the fair value hierarchy.
When market quotations or official closing prices are not readily available, or are determined not to reflect accurately fair value, such as when the value of a security has been significantly affected by events after the close of the exchange or market on which the security is principally traded (for example, a foreign exchange or market), but before the fund calculates its net asset value, the fund may value these investments at fair value as determined in accordance with the procedures approved by the Board. Certain factors may be considered when fair valuing investments such as: fundamental analytical data, the nature and duration of restrictions on disposition, an evaluation of the forces that influence the market in which the securities are purchased and sold, and public trading in similar securities of the issuer or comparable issuers.These securities are
32
either categorized within Level 2 or 3 of the fair value hierarchy depending on the relevant inputs used.
For restricted securities where observable inputs are limited, assumptions about market activity and risk are used and are categorized within Level 3 of the fair value hierarchy.
Financial futures, which are traded on an exchange, are valued at the last sales price on the securities exchange on which such securities are primarily traded or at the last sales price on the national securities market on each business day and are generally categorized within Level 1 of the fair value hierarchy.
The following is a summary of the inputs used as of October 31, 2013 in valuing the fund’s investments:
| Level 2—Other | Level 3— | |||
| Level 1— | Significant | Significant | ||
| Unadjusted | Observable | Unobservable | ||
| Quoted Prices | Inputs | Inputs | Total | |
| Assets ($) | ||||
| Investments in Securities: | ||||
| Equity Securities— | ||||
| Domestic | ||||
| Common Stocks† | 2,736,719,355 | — | — | 2,736,719,355 |
| Equity Securities— | ||||
| Foreign | ||||
| Common Stocks† | 2,361,056 | — | — | 2,361,056 |
| Mutual Funds | 25,275,838 | — | — | 25,275,838 |
| U.S. Treasury | — | 1,194,827 | — | 1,194,827 |
| Other Financial | ||||
| Instruments: | ||||
| Financial Futures†† | 221,294 | — | — | 221,294 |
| † | See Statement of Investments for additional detailed categorizations. |
| †† | Amount shown represents unrealized appreciation at period end. |
At October 31, 2013, there were no transfers between Level 1 and Level 2 of the fair value hierarchy.
(b) Securities transactions and investment income: Securities transactions are recorded on a trade date basis. Realized gains and losses
The Fund 33
NOTES TO FINANCIAL STATEMENTS (continued)
from securities transactions are recorded on the identified cost basis. Dividend income is recognized on the ex-dividend date and interest income, including, where applicable, accretion of discount and amortization of premium on investments, is recognized on the accrual basis.
Pursuant to a securities lending agreement with The Bank of New York Mellon, a subsidiary of BNY Mellon and an affiliate of Dreyfus, the fund may lend securities to qualified institutions. It is the fund’s policy that, at origination, all loans are secured by collateral of at least 102% of the value of U.S. securities loaned and 105% of the value of foreign securities loaned. Collateral equivalent to at least 100% of the market value of securities on loan is maintained at all times. Collateral is either in the form of cash, which can be invested in certain money market mutual funds managed by the Manager or U.S. Government and Agency securities. The fund is entitled to receive all dividends, interest and distributions on securities loaned, in addition to income earned as a result of the lending transaction. Should a borrower fail to return the securities in a timely manner, The Bank of New York Mellon is required to replace the securities for the benefit of the fund or credit the fund with the market value of the unreturned securities and is subrogated to the fund’s rights against the borrower and the collateral. During the period ended October 31, 2013, The Bank of New York Mellon earned $39,959 from lending portfolio securities, pursuant to the securities lending agreement.
(c) Affiliated issuers: Investments in other investment companies advised by Dreyfus are defined as “affiliated” under the Act. Investments in affiliated investment companies during the period ended October 31, 2013 were as follows:
| Affiliated | |||||||
| Investment | Value | Value | Net | ||||
| Company | 10/31/2012 | ($) | Purchases ($) | Sales ($) | 10/31/2013 | ($) | Assets (%) |
| Dreyfus | |||||||
| Institutional | |||||||
| Preferred | |||||||
| Plus Money | |||||||
| Market | |||||||
| Fund | 12,331,059 | 255,776,081 | 251,927,586 | 16,179,554 | .6 |
34
| Affiliated | ||||||
| Investment | Value | Value | Net | |||
| Company | 10/31/2012($) | Purchases ($) | Sales ($) | 10/31/2013($) | Assets (%) | |
| Dreyfus | ||||||
| Institutional | ||||||
| Cash | ||||||
| Advantage | ||||||
| Fund | 14,944,677 | 130,501,332 | 136,349,725 | 9,096,284 | .3 | |
| Total | 27,275,736 | 386,277,413 | 388,277,311 | 25,275,838 | .9 |
(d) Dividends to shareholders: Dividends are recorded on the ex-dividend date. Dividends from investment income-net and dividends from net realized capital gains, if any, are normally declared and paid annually, but the fund may make distributions on a more frequent basis to comply with the distribution requirements of the Internal Revenue Code of 1986, as amended (the “Code”).To the extent that net realized capital gains can be offset by capital loss carryovers, it is the policy of the fund not to distribute such gains. Income and capital gain distributions are determined in accordance with income tax regulations, which may differ from GAAP.
(e) Federal income taxes: It is the policy of the fund to continue to qualify as a regulated investment company, if such qualification is in the best interests of its shareholders, by complying with the applicable provisions of the Code, and to make distributions of taxable income sufficient to relieve it from substantially all federal income and excise taxes.
As of and during the period ended October 31, 2013, the fund did not have any liabilities for any uncertain tax positions.The fund recognizes interest and penalties, if any, related to uncertain tax positions as income tax expense in the Statement of Operations. During the period ended October 31, 2013, the fund did not incur any interest or penalties.
Each tax year in the four-year period ended October 31, 2013 remains subject to examination by the Internal Revenue Service and state taxing authorities.
The Fund 35
NOTES TO FINANCIAL STATEMENTS (continued)
At October 31, 2013, the components of accumulated earnings on a tax basis were as follows: undistributed ordinary income $36,540,330, undistributed capital gains $54,403,086 and unrealized appreciation $1,460,806,816.
The tax character of distributions paid to shareholders during the fiscal periods ended October 31, 2013 and October 31, 2012 were as follows: ordinary income $44,234,704 and $38,184,950, and long-term capital gains $29,828,852 and $10,730,688, respectively.
During the period ended October 31, 2013, as a result of permanent book to tax differences, primarily due to the tax treatment for real estate investment trusts, the fund decreased accumulated undistributed investment income-net by $339,613 and increased accumulated net realized gain (loss) on investments by the same amount. Net assets and net asset value per share were not affected by this reclassification.
(f) Accounting Pronouncement: In January 2013, FASB issued Accounting Standards Update No. 2013-01 (“ASU 2013-01”), “Clarifying the Scope of Disclosures about Offsetting Assets and Liabilities”, which replaced Accounting Standards Update No. 2011-11 (“ASU 2011-11”), “Disclosures about Offsetting Assets and Liabilities”. ASU 2013-01 is effective for fiscal years beginning on or after January 1, 2013, and interim periods within those annual periods.ASU 2011-11 was intended to enhance disclosure requirements on the offsetting of financial assets and liabilities.ASU 2013-01 limits the scope of the new balance sheet offsetting disclosures to derivatives, repurchase agreements, and securities lending transactions to the extent that they are (1) offset in the financial statements or (2) subject to enforceable master netting arrangements (“MNA”) or similar agreements. Management is currently evaluating the application of ASU 2013-01 and its impact on the fund’s financial statements.
NOTE 2—Bank Lines of Credit:
The fund participates with other Dreyfus-managed funds in a $265 million unsecured credit facility led by Citibank, N.A. and a $300 million unsecured credit facility provided by The Bank of New York
36
Mellon (each, a “Facility”), each to be utilized primarily for temporary or emergency purposes, including the financing of redemptions. Prior to October 9, 2013, the unsecured credit facility with Citibank, N.A. was $210 million. In connection therewith, the fund has agreed to pay its pro rata portion of commitment fees for each Facility. Interest is charged to the fund based on rates determined pursuant to the terms of the respective Facility at the time of borrowing.
The average amount of borrowings outstanding under the Facilities during the period ended October 31, 2013 was approximately $48,200 with a related weighted average annualized interest rate of 1.12%.
NOTE 3—Management Fee and Other Transactions With Affiliates:
(a) Pursuant to a management agreement (the “Agreement”) with the Manager, the management fee is computed at the annual rate of .25% of the value of the fund’s average daily net assets and is payable monthly. Under the terms of the Agreement, the Manager has agreed to pay all of the fund’s direct expenses, except management fees, Shareholder Services Plan fees, brokerage fees and commissions, taxes, interest expense, commitment fees on borrowings, fees and expenses of non-interested Board members, fees and expenses of independent counsel to the fund and extraordinary expenses. The Manager has also agreed to reduce its management fee in an amount equal to the fund’s allocable portion of the accrued fees and expenses of the non-interested Board members and fees and expenses of independent counsel to the fund and to non-interested Board members. During the period ended October 31, 2013, fees reimbursed by the Manager amounted to $233,960.
(b) Under the Shareholder Services Plan, the fund pays the Distributor for the provision of certain services, at an annual rate of .25% of the value of the fund’s average daily net assets.The services provided may include personal services relating to shareholder accounts, such as answering shareholder inquiries regarding the fund and providing reports and other information, and services related to the maintenance of shareholder
The Fund 37
NOTES TO FINANCIAL STATEMENTS (continued)
accounts.The Distributor may make payments to Service Agents (securities dealers, financial institutions or other industry professionals) with respect to these services.The Distributor determines the amounts to be paid to Service Agents. During the period ended October 31, 2013, the fund was charged $6,346,420 pursuant to the Shareholder Services Plan.
The components of “Due to The Dreyfus Corporation and affiliates” in the Statement of Assets and Liabilities consist of: management fees $574,179 and Shareholder Services Plan fees $574,179, which are offset against an expense reimbursement currently in effect in the amount of $20,365.
(c) Each Board member also serves as a Board member of other funds within the Dreyfus complex. Annual retainer fees and attendance fees are allocated to each fund based on net assets.
NOTE 4—Securities Transactions:
The aggregate amount of purchases and sales of investment securities, excluding short-term securities and financial futures, during the period ended October 31, 2013, amounted to $72,785,197 and $191,088,741, respectively.
Derivatives: A derivative is a financial instrument whose performance is derived from the performance of another asset. Each type of derivative instrument that was held by the fund during the period ended October 31, 2013 is discussed below.
Financial Futures: In the normal course of pursuing its investment objective, the fund is exposed to market risk, including equity price risk as a result of changes in value of underlying financial instruments.The fund invests in financial futures in order to manage its exposure to or protect against changes in the market. A financial futures contract represents a commitment for the future purchase or a sale of an asset at a specified date. Upon entering into such contracts, these investments require initial margin deposits with a counterparty, which consist of cash or cash equivalents.The amount of these deposits is determined by the exchange or Board of Trade on which the contract is traded and is
38
subject to change.Accordingly, variation margin payments are received or made to reflect daily unrealized gains or losses which are recorded in the Statement of Operations.When the contracts are closed, the fund recognizes a realized gain or loss which is reflected in the Statement of Operations.There is minimal counterparty credit risk to the fund with financial futures since they are exchange traded, and the exchange guarantees the financial futures against default. Financial futures open at October 31, 2013 are set forth in the Statement of Financial Futures.
The following summarizes the average market value of derivatives outstanding during the period ended October 31, 2013:
| Average Market Value ($) | |
| Equity financial futures | 31,652,978 |
At October 31, 2013, the cost of investments for federal income tax purposes was $1,304,744,260; accordingly, accumulated net unrealized appreciation on investments was $1,460,806,816, consisting of $1,567,931,409 gross unrealized appreciation and $107,124,593 gross unrealized depreciation.
NOTE 5—Pending Legal Matters:
The fund and many other entities have been named as defendants in numerous pending litigations as a result of their participation in the leveraged buyout transaction (“LBO”) of the Tribune Company (“Tribune”).The cases allege that Tribune took on billions of dollars of debt in the LBO to purchase its own stock from shareholders at $34 per share.The LBO was closed in a two-step transaction with shares being repurchased by Tribune in a tender offer in June 2007 (“Step One”) and in a go-private merger in December 2007 (“Step Two”). In 2008, approximately one year after the LBO was concluded,Tribune filed for bankruptcy protection under Chapter 11. Thereafter, in approximately June 2011, certain Tribune creditors filed dozens of complaints in various courts throughout the country alleging that the payments made to shareholders in the LBO were “fraudulent conveyances” under state
The Fund 39
NOTES TO FINANCIAL STATEMENTS (continued)
and/or federal law, and that the shareholders must return the payments they received for their shares to satisfy the plaintiffs’ unpaid claims.These cases have been consolidated for coordinated pre-trial proceedings in a multi-district litigation in the United States District Court for the Southern District of New York titled In re Tribune Company Fraudulent Conveyance Litigation (S.D.N.Y. Nos. 11-md-2296 and 12-mc-2296 (RJS) (“Tribune MDL”)). On March 27, 2013, the Tribune MDL was reassigned from Judge William H. Pauley to Judge Richard J. Sullivan. No explanation was given for the reassignment.
In addition, there was a case pending in United States Bankruptcy Court for the District of Delaware brought by the Unsecured Creditors Committee of the Tribune Company that has since been transferred to theTribune MDL (formerly The Official Committee of Unsecured Creditors of Tribune Co. v. FitzSimons, et al., Bankr. D. Del.Adv. Pro. No. 10-54010 (KJC)).The case was originally filed on November 1, 2010. In a Fourth Amended Complaint filed in November 2012, among other claims, the Creditors Committee sought recovery under the Bankruptcy Code for alleged “fraudulent conveyances” from more than 5,000 Tribune shareholders (“Shareholder Defendants”), including the fund, and a defendants’ class of all shareholders who tendered their Tribune stock in the LBO and received cash in exchange.There were 35 other counts in the Fourth Amended Complaint that did not relate to claims against Shareholder Defendants, but instead were brought against parties directly involved in approval or execution of the leveraged buyout. On January 10, 2013, pursuant to the Tribune bankruptcy plan, Mark S. Kirchner, as Litigation Trustee for the Tribune Litigation Trust, became the successor plaintiff to the Creditors Committee in this case.The case is now proceeding as: Mark S. Kirchner, as Litigation Trustee for the Tribune Litigation Trust v. FitzSimons, et al., S.D.N.Y. No. 12-cv-2652 (RJS). On August 1, 2013, the plaintiff filed a Fifth Amended Complaint with the Court. The Fifth Amended Complaint contains more detailed allegations regarding the steps Tribune took in consideration and execution of the LBO, but does not change the legal basis for the claim previously alleged against the Shareholder Defendants.
40
On November 6, 2012, a motion to dismiss was filed in the Tribune MDL. Oral argument on the motion to dismiss was held on May 23, 2013. On September 23, 2013 Judge Sullivan granted the motion to dismiss on standing grounds, after rejecting defendants’ preemption arguments. By granting the motion, Judge Sullivan dismissed nearly 50 cases in theTribune MDL, including all cases with Deutsche BankTrust Company Americas or William A. Niese as the lead plaintiff.The fund was a defendant in at least one of the dismissed cases.The motion had no effect on the FitzSimons case, which had been stayed.
On September 30, 2013, plaintiffs appealed the motion to dismiss decision to the U.S. Court of Appeals for the Second Circuit. On October 28, 2013, certain defendants cross-appealed from Judge Sullivan’s decision, seeking review of the arguments that Judge Sullivan rejected in his decision. Briefing on the appeal and cross appeal is scheduled for completion in April 2014.
On November 11, 2013, Judge Sullivan entered Master Case Order No. 4 in the Tribune MDL. Master Case Order No. 4 addressed numerous procedural and administrative tasks for the cases that remain in the Tribune MDL, including the FitzSimons case. Under Master Case Order No. 4, the parties – through their executive committees and liaison counsel – are to attempt to negotiate a protocol for motions to dismiss and other procedural issues in December 2013 and January 2014. No answers to the Fifth Amended Complaint in the FitzSimons case may be filed at this time, and no briefing schedule for any further motions has been set.
At this stage in the proceedings, it is not possible to assess with any reasonable certainty the probable outcomes of the pending litigations. Consequently, at this time, management is unable to estimate the possible loss that may result.
The Fund 41
REPORT OF INDEPENDENT REGISTERED
PUBLIC ACCOUNTING FIRM
Shareholders and Board of Directors
Dreyfus S&P 500 Index Fund
We have audited the accompanying statement of assets and liabilities, including the statements of investments and financial futures, of Dreyfus S&P 500 Index Fund (one of the series comprising Dreyfus Index Funds, Inc.) as of October 31, 2013, and the related statement of operations for the year then ended, the statement of changes in net assets for each of the two years in the period then ended, and the financial highlights for each of the five years in the period then ended.These financial statements and financial highlights are the responsibility of the Fund’s management. Our responsibility is to express an opinion on these financial statements and financial highlights based on our audits.
We conducted our audits in accordance with the standards of the Public Company Accounting Oversight Board (United States).Those standards require that we plan and perform the audit to obtain reasonable assurance about whether the financial statements and financial highlights are free of material misstatement.We were not engaged to perform an audit of the Fund’s internal control over financial reporting. Our audits included consideration of internal control over financial reporting as a basis for designing audit procedures that are appropriate in the circumstances, but not for the purpose of expressing an opinion on the effectiveness of the Fund’s internal control over financial reporting. Accordingly, we express no such opinion.An audit also includes examining, on a test basis, evidence supporting the amounts and disclosures in the financial statements and financial highlights, assessing the accounting principles used and significant estimates made by management, and evaluating the overall financial statement presentation. Our procedures included confirmation of securities owned as of October 31, 2013 by correspondence with the custodian and others.We believe that our audits provide a reasonable basis for our opinion.
In our opinion, the financial statements and financial highlights referred to above present fairly, in all material respects, the financial position of Dreyfus S&P 500 Index Fund at October 31, 2013, the results of its operations for the year then ended, the changes in its net assets for each of the two years in the period then ended, and the financial highlights for each of the five years in the period then ended, in conformity with U.S. generally accepted accounting principles.

New York, New York
December 27, 2013
42
IMPORTANT TAX INFORMATION (Unaudited)
In accordance with federal tax law, the fund hereby reports 100% of the ordinary dividends paid during the fiscal year ended October 31, 2013 as qualifying for the corporate dividends received deduction. For the fiscal year ended October 31, 2013, certain dividends paid by the fund may be subject to a maximum tax rate of 15%, as provided for by the Jobs and Growth Tax Relief Reconciliation Act of 2003. Of the distributions paid during the fiscal year, $44,234,704 represents the maximum amount that may be considered qualified dividend income. Shareholders will receive notification in early 2014 of the percentage applicable to the preparation of their 2013 income tax returns.Also, the fund hereby designates $.5073 per share as a long-term capital gain distribution and $.0408 per share as a short-term capital gain distribution paid on December 27, 2012 and the fund also reports $.0010 per share as a long-term capital gain distribution paid on March 19, 2013.
The Fund 43
BOARD MEMBERS INFORMATION (Unaudited)
| Joseph S. DiMartino (70) |
| Chairman of the Board (1995) |
| Principal Occupation During Past 5Years: |
| • Corporate Director and Trustee |
| Other Public Company Board Memberships During Past 5Years: |
| • CBIZ (formerly, Century Business Services, Inc.), a provider of outsourcing functions for small |
| and medium size companies, Director (1997-present) |
| • The Newark Group, a provider of a national market of paper recovery facilities, paperboard |
| mills and paperboard converting plants, Director (2000-2010) |
| • Sunair Services Corporation, a provider of certain outdoor-related services to homes and |
| businesses, Director (2005-2009) |
| No. of Portfolios for which Board Member Serves: 141 |
| ——————— |
| Peggy C. Davis (70) |
| Board Member (2006) |
| Principal Occupation During Past 5Years: |
| • Shad Professor of Law, New York University School of Law (1983-present) |
| No. of Portfolios for which Board Member Serves: 56 |
| ——————— |
| David P. Feldman (73) |
| Board Member (1989) |
| Principal Occupation During Past 5Years: |
| • Corporate Director and Trustee |
| Other Public Company Board Memberships During Past 5Years: |
| • BBH Mutual Funds Group (4 registered mutual funds), Director (1992-present) |
| No. of Portfolios for which Board Member Serves: 42 |
| ——————— |
| Ehud Houminer (73) |
| Board Member (1996) |
| Principal Occupation During Past 5Years: |
| • Executive-in-Residence at the Columbia Business School, Columbia University (1992-present) |
| Other Public Company Board Memberships During Past 5Years: |
| • Avnet Inc., an electronics distributor, Director (1993-2012) |
| No. of Portfolios for which Board Member Serves: 66 |
44
| Lynn Martin (73) |
| Board Member (2012) |
| Principal Occupation During Past 5Years: |
| • President ofThe Martin Hall Group LLC, a human resources consulting firm ( January 2005-2012) |
| Other Public Company Board Memberships During Past 5Years: |
| • AT&T Inc., a telecommunications company, Director (1999-2012) |
| • Ryder System, Inc., a supply chain and transportation management company, Director (1993-2012) |
| • The Proctor & Gamble Co., a consumer products company, Director (1994-2009) |
| • Constellation Energy Group Inc., Director (2003-2009) |
| No. of Portfolios for which Board Member Serves: 42 |
| ——————— |
| Robin A. Melvin (50) |
| Board Member (2012) |
| Principal Occupation During Past 5Years: |
| • Board Member, Illinois Mentoring Partnership, non-profit organization dedicated to increasing |
| the quantity and quality of mentoring services in Illinois (2013-present) |
| • Director, Boisi Family Foundation, a private family foundation that supports youth-serving organi- |
| zations that promote the self sufficiency of youth from disadvantaged circumstances (1995-2012) |
| No. of Portfolios for which Board Member Serves: 90 |
| ——————— |
| Dr. Martin Peretz (74) |
| Board Member (2006) |
| Principal Occupation During Past 5Years: |
| • Editor-in-Chief Emeritus of The New Republic Magazine (2010-2011) (previously, |
| Editor-in-Chief, 1974-2010) |
| • Director of TheStreet.com, a financial information service on the web (1996-2010) |
| Other Public Company Board Memberships During Past 5Years: |
| • Pershing Square Capital Management,Adviser (2009-present) |
| No. of Portfolios for which Board Member Serves: 42 |
| ——————— |
| Once elected all Board Members serve for an indefinite term, but achieve Emeritus status upon reaching age 80.The |
| address of the Board Members and Officers is c/o The Dreyfus Corporation, 200 Park Avenue, NewYork, NewYork |
| 10166.Additional information about the Board Members is available in the fund’s Statement of Additional Information |
| which can be obtained from Dreyfus free of charge by calling this toll free number: 1-800-DREYFUS. |
| James F. Henry, Emeritus Board Member |
| Dr. Paul A. Marks, Emeritus Board Member |
| Philip L.Toia, Emeritus Board Member |
The Fund 45
OFFICERS OF THE FUND (Unaudited)
46
The Fund 47
NOTES
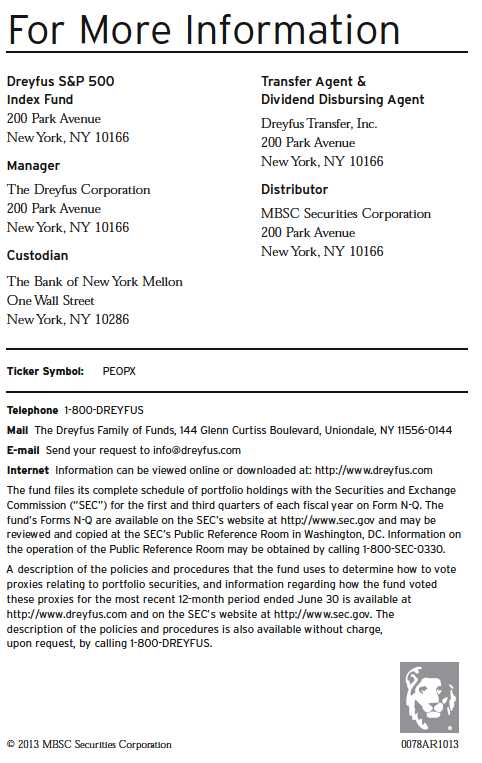
| Dreyfus |
| Smallcap |
| Stock Index Fund |
ANNUAL REPORT October 31, 2013
Save time. Save paper. View your next shareholder report online as soon as it’s available. Log into www.dreyfus.com and sign up for Dreyfus eCommunications. It’s simple and only takes a few minutes.
The views expressed in this report reflect those of the portfolio manager only through the end of the period covered and do not necessarily represent the views of Dreyfus or any other person in the Dreyfus organization. Any such views are subject to change at any time based upon market or other conditions and Dreyfus disclaims any responsibility to update such views.These views may not be relied on as investment advice and, because investment decisions for a Dreyfus fund are based on numerous factors, may not be relied on as an indication of trading intent on behalf of any Dreyfus fund.

Contents | |
THE FUND | |
| 2 | A Letter from the President |
| 3 | Discussion of Fund Performance |
| 6 | Fund Performance |
| 7 | Understanding Your Fund’s Expenses |
| 7 | Comparing Your Fund’s Expenses With Those of Other Funds |
| 8 | Statement of Investments |
| 28 | Statement of Financial Futures |
| 29 | Statement of Assets and Liabilities |
| 30 | Statement of Operations |
| 31 | Statement of Changes in Net Assets |
| 32 | Financial Highlights |
| 33 | Notes to Financial Statements |
| 43 | Report of Independent Registered Public Accounting Firm |
| 44 | Important Tax Information |
| 45 | Board Members Information |
| 47 | Officers of the Fund |
FOR MORE INFORMATION | |
Back Cover |
Dreyfus
Smallcap Stock Index Fund
The Fund
A LETTER FROM THE PRESIDENT
Dear Shareholder:
We are pleased to present this annual report for Dreyfus Smallcap Stock Index Fund, covering the 12-month period from November 1, 2012, through October 31, 2013. For information about how the fund performed during the reporting period, as well as general market perspectives, we provide a Discussion of Fund Performance on the pages that follow.
Although expectations of higher long-term interest rates and a more moderately stimulative monetary policy sparked volatility in the U.S stock market at times during the reporting period, improved U.S. economic conditions drove stock prices substantially higher for the reporting period overall. Even the 16-day U.S. government shutdown in October failed to derail the market’s advance, enabling some broad measures of stock market performance to reach new record highs by the end of the month. Stocks across most capitalization ranges and investment styles produced strong results.
We currently expect U.S. economic conditions to continue to improve in 2014, with accelerating growth supported by the fading drags of tighter federal fiscal policies and downsizing on the state and local levels. Moreover, inflation is likely to remain muted, so monetary policy can remain stimulative. Globally, we anticipate stronger growth in many developed countries due to past and continuing monetary ease, while emerging markets seem poised for moderate economic expansion despite recently negative investor sentiment. For more information on how these observations may affect your investments, we encourage you to speak with your financial advisor.
Thank you for your continued confidence and support.

J. Charles Cardona
President
The Dreyfus Corporation
November 15, 2013
2
DISCUSSION OF FUND PERFORMANCE
For the reporting period of November 1, 2012, through October 31, 2013, as provided by Thomas J. Durante, Richard A. Brown, and Karen Q.Wong, Portfolio Managers
Fund and Market Performance Overview
For the 12-month period ended October 31, 2013, Dreyfus Smallcap Stock Index Fund produced a total return of 38.63%.1 In comparison, the Standard & Poor’s SmallCap 600® Index (“S&P 600 Index”), the fund’s benchmark, produced a 39.08% total return for the same period.2,3
Small-cap stocks responded positively to recovering global and domestic economies during the reporting period. The difference in returns between the fund and the S&P 600 Index was primarily the result of transaction costs and operating expenses that are not reflected in the S&P 600 Index’s results.
The Fund’s Investment Approach
The fund seeks to match the total return of the S&P 600 Index by generally investing in a representative sample of the stocks listed in the S&P 600 Index.The S&P 600 Index is composed of 600 domestic stocks across 10 economic sectors. Each stock is weighted by its market capitalization; that is, larger companies have greater representation in the S&P 600 Index than smaller ones.The fund may also use stock index futures as a substitute for the sale or purchase of stocks.
The fund employed futures contracts during the reporting period in its efforts to replicate the returns of the S&P 600 Index.
Recovering U.S. and Global Economies Fueled Market Gains
The reporting period began soon after the start of a sustained stock market rally driven by improved U.S. employment and housing markets. Investors were particularly encouraged by a new round of quantitative easing from the Federal Reserve Board (the “Fed”) involving massive monthly purchases of U.S. government securities. Improving conditions in overseas markets also contributed to greater optimism as investors responded positively to the potential for more robust export activity to overseas markets.
The Fund 3
DISCUSSION OF FUND PERFORMANCE (continued)
Economic data continued to improve, and stocks generally continued to rally, through the spring of 2013. However, in late May, remarks by Fed chairman Ben Bernanke were widely interpreted as a signal that U.S. monetary policymakers would begin to back away from their quantitative easing program sooner than expected, sparking volatility that erased some of the market’s previous gains. The S&P 600 Index generally stabilized over the summer, and stocks advanced strongly in September when the Fed refrained from tapering its bond purchasing program. Even a 16-day federal government shutdown in October failed to derail the rally, enabling the S&P 600 Index to reach record highs by the reporting period’s end.
In this constructive environment, small-cap stocks produced higher returns, on average, than their large- and midcap counterparts.
Information Technology Sector Led the Market’s Advance
All of the economic sectors represented in the S&P 600 Index produced double-digit gains for the reporting period, reflecting broad-based support for small-cap stocks.The information technology sector led the market rally as producers of electrical equipment, manufacturers of electrical components, and software developers benefited from intensifying demand for productivity and efficiency enhancements among business enterprises. Results were especially strong among software companies providing cloud computing and data management services, as well as automation technology providers serving a growing U.S. manufacturing base. Rising mergers-and-acquisitions activity also buoyed the small-cap information technology sector during the reporting period.
In the financials sector, commercial banks with a regional focus benefited from strengthening housing markets, higher lending volumes, and declining loan losses. Banks in areas experiencing a boom in shale oil and natural gas production fared especially well. Real estate investment trusts (“REITs”) in the small-cap space gained value as more companies converted to REITs for tax purposes. Gains were especially robust among REITs specializing in correctional facilities and office space. In the consumer discretionary sector, hotels, restaurants, and leisure companies advanced particularly strongly. For example, casual dining restaurant chains encountered more
4
robust customer spending at a time when the cost of opening new locations fell significantly. Meanwhile, textile companies and apparel producers benefited from greater mergers-and-acquisitions activity, and some have cut costs and boosted profit margins by outsourcing their manufacturing operations.
The fund received less favorable contributions from the telecommunications services and utilities sectors due to cash flow issues. In other areas, REITs specializing in residential apartments and mortgages lagged amid waning demand for rentals, and coal producers were hurt by competition from lower cost natural gas.
Replicating the Performance of the S&P 600 Index
Although we do not actively manage the fund’s investments in response to macroeconomic trends, it is worth noting that recent evidence of sustained domestic and global growth has the potential to fuel further gains in U.S. equity markets, including small-cap stocks. As always, we have continued to monitor the factors considered by the fund’s investment model in light of current market conditions.
November 15, 2013
Equity funds are subject generally to market, market sector, market liquidity, issuer and investment style risks, among other factors, to varying degrees, all of which are more fully described in the fund’s prospectus. Stocks of small-cap companies often experience sharper price fluctuations than stocks of larger-cap companies.
| 1 Total return includes reinvestment of dividends and any capital gains paid. Past performance is no guarantee of future |
| results. Share price and investment return fluctuate such that upon redemption, fund shares may be worth more or less |
| than their original cost. |
| 2 SOURCE: LIPPER INC. — Reflects the reinvestment of dividends and, where applicable, capital gain |
| distributions.The Standard & Poor’s SmallCap 600 Index is a broad-based index and a widely accepted, |
| unmanaged index of overall small-cap stock market performance. Investors cannot invest directly in any index. |
| 3 “Standard & Poor’s®,” “S&P®” and “S&P SmallCap 600®” are registered trademarks of Standard & Poor’s |
| Financial Services LLC, and have been licensed for use on behalf of the fund.The fund is not sponsored, endorsed, |
| managed, advised, sold or promoted by Standard & Poor’s and its affiliates and Standard & Poor’s and its affiliates |
| make no representation regarding the advisability of investing in the fund. |
The Fund 5
FUND PERFORMANCE
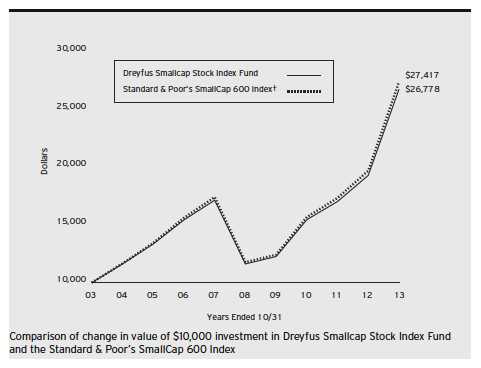
| Average Annual Total Returns as of 10/31/13 | ||||||
| 1 | Year | 5 Years | 10 Years | |||
| Fund | 38.63 | % | 18.14 | % | 10.35 | % |
| Standard & Poor’s SmallCap 600 Index | 39.08 | % | 18.41 | % | 10.61 | % |
† Source: Lipper Inc.
Past performance is not predictive of future performance.The fund’s performance shown in the graph and table does not reflect the deduction of taxes that a shareholder would pay on fund distributions or the redemption of fund shares. The above graph compares a $10,000 investment made in Dreyfus Smallcap Stock Index Fund on 10/31/03 to a $10,000 investment made in the Standard & Poor’s SmallCap 600 Index (the “Index”) on that date. All dividends and capital gain distributions are reinvested.
The fund’s performance shown in the line graph above takes into account all applicable fees and expenses.The Index is a broad-based index and a widely accepted, unmanaged index of overall small-cap stock market performance. Unlike a mutual fund, the Index is not subject to charges, fees and other expenses. Investors cannot invest directly in any index. Further information relating to fund performance, including expense reimbursements, if applicable, is contained in the Financial Highlights section of the prospectus and elsewhere in this report.
6
UNDERSTANDING YOUR FUND’S EXPENSES (Unaudited)
As a mutual fund investor, you pay ongoing expenses, such as management fees and other expenses. Using the information below, you can estimate how these expenses affect your investment and compare them with the expenses of other funds.You also may pay one-time transaction expenses, including sales charges (loads) and redemption fees, which are not shown in this section and would have resulted in higher total expenses. For more information, see your fund’s prospectus or talk to your financial adviser.
Review your fund’s expenses
The table below shows the expenses you would have paid on a $1,000 investment in Dreyfus Smallcap Stock Index Fund from May 1, 2013 to October 31, 2013. It also shows how much a $1,000 investment would be worth at the close of the period, assuming actual returns and expenses.
Expenses and Value of a $1,000 Investment
assuming actual returns for the six months ended October 31, 2013
| Expenses paid per $1,000† | $ | 2.76 |
| Ending value (after expenses) | $ | 1,193.60 |
COMPARING YOUR FUND’S EXPENSES
WITH THOSE OF OTHER FUNDS (Unaudited)
Using the SEC’s method to compare expenses
The Securities and Exchange Commission (SEC) has established guidelines to help investors assess fund expenses. Per these guidelines, the table below shows your fund’s expenses based on a $1,000 investment, assuming a hypothetical 5% annualized return. You can use this information to compare the ongoing expenses (but not transaction expenses or total cost) of investing in the fund with those of other funds.All mutual fund shareholder reports will provide this information to help you make this comparison. Please note that you cannot use this information to estimate your actual ending account balance and expenses paid during the period.
Expenses and Value of a $1,000 Investment
assuming a hypothetical 5% annualized return for the six months ended October 31, 2013
| Expenses paid per $1,000† | $ | 2.55 |
| Ending value (after expenses) | $ | 1,022.68 |
| † Expenses are equal to the fund’s annualized expense ratio of .50%, multiplied by the average account value over the |
| period, multiplied by 184/365 (to reflect the one-half year period). |
The Fund 7
STATEMENT OF INVESTMENTS
October 31, 2013
| Common Stocks—98.1% | Shares | Value ($) | |
| Automobiles & Components—.7% | |||
| Dorman Products | 73,651 | 3,580,175 | |
| Drew Industries | 42,172 | 2,119,565 | |
| Spartan Motors | 35,411 | 240,441 | |
| Standard Motor Products | 53,229 | 1,924,761 | |
| Superior Industries International | 64,277 | 1,205,194 | |
| Winnebago Industries | 70,269 | a | 2,084,179 |
| 11,154,315 | |||
| Banks—7.9% | |||
| Bank Mutual | 124,051 | 788,964 | |
| Bank of the Ozarks | 66,979 | 3,314,121 | |
| Banner | 61,727 | 2,361,675 | |
| BBCN Bancorp | 166,642 | 2,471,301 | |
| BofI Holding | 27,491 | a | 1,661,006 |
| Boston Private Financial Holdings | 230,533 | 2,625,771 | |
| Brookline Bancorp | 116,688 | 1,035,023 | |
| Cardinal Financial | 75,620 | 1,247,730 | |
| City Holding | 34,261 | b | 1,558,875 |
| Columbia Banking System | 121,171 | 3,112,883 | |
| Community Bank System | 79,896 | 2,901,024 | |
| CVB Financial | 182,959 | 2,660,224 | |
| Dime Community Bancshares | 39,459 | 645,549 | |
| F.N.B | 340,750 | 4,262,782 | |
| First BanCorp | 296,193 | a | 1,643,871 |
| First Commonwealth Financial | 248,983 | 2,163,662 | |
| First Financial Bancorp | 143,697 | 2,230,177 | |
| First Financial Bankshares | 68,350 | b | 4,204,208 |
| First Midwest Bancorp | 163,521 | 2,719,354 | |
| Glacier Bancorp | 198,712 | 5,490,413 | |
| Hanmi Financial | 103,277 | 1,805,282 | |
| Home Bancshares | 116,314 | 3,940,718 | |
| Independent Bank | 40,613 | 1,457,194 | |
| MB Financial | 149,666 | 4,445,080 | |
| National Penn Bancshares | 321,669 | 3,335,708 | |
| NBT Bankcorp | 82,433 | 2,008,892 | |
| Northwest Bancshares | 185,017 | 2,588,388 | |
| Old National Bancorp | 254,066 | 3,694,120 |
8
| Common Stocks (continued) | Shares | Value ($) | ||
| Banks (continued) | ||||
| Oritani Financial | 127,329 | 2,065,276 | ||
| PacWest Bancorp | 81,617 | b | 3,105,527 | |
| Pinnacle Financial Partners | 97,807 | 3,032,017 | ||
| PrivateBancorp | 180,247 | 4,390,817 | ||
| Provident Financial Services | 120,937 | 2,266,359 | ||
| Provident New York Bancorp | 99,087 | a | 1,161,300 | |
| S&T Bancorp | 91,097 | 2,233,698 | ||
| Simmons First National, Cl. A | 43,038 | 1,409,064 | ||
| Sterling Bancorp | 72,100 | 1,063,475 | ||
| Susquehanna Bancshares | 459,246 | 5,412,214 | ||
| Taylor Capital Group | 19,934 | a | 458,482 | |
| Texas Capital Bancshares | 90,922 | a | 4,732,490 | |
| Tompkins Financial | 15,787 | 778,615 | ||
| TrustCo Bank | 152,778 | 1,026,668 | ||
| UMB Financial | 79,734 | 4,697,927 | ||
| Umpqua Holdings | 300,244 | b | 4,914,994 | |
| United Bankshares | 91,503 | b | 2,706,659 | |
| United Community Banks | 126,622 | a | 1,974,037 | |
| ViewPoint Financial Group | 105,269 | 2,295,917 | ||
| Wilshire Bancorp | 169,402 | 1,434,835 | ||
| Wintrust Financial | 108,149 | 4,705,563 | ||
| 128,239,929 | ||||
| Capital Goods—9.8% | ||||
| A.O. Smith | 194,190 | 10,029,913 | ||
| AAON | 87,893 | 2,373,990 | ||
| AAR | 109,216 | 3,197,844 | ||
| Actuant, Cl. A | 161,244 | 6,056,325 | ||
| Aegion | 91,284 | a | 1,871,322 | |
| Aerovironment | 21,883 | a | 593,248 | |
| Albany International, Cl. A | 81,615 | 3,004,248 | ||
| American Science & Engineering | 22,657 | 1,490,377 | ||
| Apogee Enterprises | 69,254 | 2,166,265 | ||
| Applied Industrial Technologies | 102,365 | 4,842,888 | ||
| Astec Industries | 52,446 | 1,773,199 | ||
| AZZ | 55,754 | 2,503,355 | ||
| Barnes Group | 124,422 | 4,421,958 |
The Fund 9
STATEMENT OF INVESTMENTS (continued)
| Common Stocks (continued) | Shares | Value ($) | ||
| Capital Goods (continued) | ||||
| Brady, Cl. A | 100,440 | 2,931,844 | ||
| Briggs & Stratton | 144,769 | 2,655,063 | ||
| CIRCOR International | 46,047 | 3,396,887 | ||
| Comfort Systems USA | 101,139 | 1,884,220 | ||
| Cubic | 39,546 | 2,076,165 | ||
| Curtiss-Wright | 112,504 | 5,600,449 | ||
| DXP Enterprises | 23,342 | a | 2,145,130 | |
| Dycom Industries | 72,978 | a | 2,163,798 | |
| EMCOR Group | 166,740 | 6,179,384 | ||
| Encore Wire | 35,287 | 1,747,765 | ||
| EnerSys | 123,089 | 8,166,955 | ||
| Engility Holdings | 30,825 | a | 954,650 | |
| EnPro Industries | 51,344 | a | 3,063,696 | |
| ESCO Technologies | 53,007 | 1,912,493 | ||
| Federal Signal | 182,602 | a | 2,499,821 | |
| Franklin Electric | 79,213 | 2,998,212 | ||
| GenCorp | 117,770 | a,b | 1,978,536 | |
| Gibraltar Industries | 67,653 | a | 1,083,125 | |
| Griffon | 85,291 | 1,068,696 | ||
| II-VI | 150,601 | a | 2,569,253 | |
| John Bean Technologies | 83,222 | 2,261,974 | ||
| Kaman | 62,967 | 2,341,113 | ||
| Lindsay | 37,246 | 2,831,068 | ||
| Lydall | 70,360 | a | 1,281,959 | |
| Moog, Cl. A | 117,459 | a | 7,015,826 | |
| Mueller Industries | 69,025 | 4,161,517 | ||
| National Presto Industries | 9,225 | b | 650,824 | |
| Orbital Sciences | 146,385 | a | 3,377,102 | |
| Orion Marine Group | 68,783 | a | 859,787 | |
| Powell Industries | 13,551 | a | 851,409 | |
| Quanex Building Products | 61,382 | 1,091,372 | ||
| Simpson Manufacturing | 95,937 | 3,400,967 | ||
| Standex International | 27,535 | 1,693,678 | ||
| Teledyne Technologies | 93,151 | a | 8,273,672 | |
| Tennant | 40,580 | 2,462,800 |
10
| Common Stocks (continued) | Shares | Value ($) | ||
| Capital Goods (continued) | ||||
| Titan International | 117,588 | 1,705,026 | ||
| Toro | 135,979 | 8,014,602 | ||
| Universal Forest Products | 46,216 | 2,445,751 | ||
| Vicor | 30,461 | a | 268,361 | |
| Watts Water Technologies, Cl. A | 59,363 | 3,429,994 | ||
| 159,819,876 | ||||
| Commercial & Professional Services—3.4% | ||||
| ABM Industries | 122,066 | 3,358,036 | ||
| CDI | 31,718 | 509,074 | ||
| Consolidated Graphics | 27,207 | a | 1,743,697 | |
| Exponent | 24,055 | 1,818,799 | ||
| G&K Services, Cl. A | 48,185 | 3,006,744 | ||
| Healthcare Services Group | 151,327 | b | 4,144,847 | |
| Heidrick & Struggles International | 31,554 | 584,380 | ||
| Insperity | 57,339 | 2,217,299 | ||
| Interface | 142,575 | 2,887,144 | ||
| Kelly Services, Cl. A | 60,424 | 1,260,445 | ||
| Korn/Ferry International | 123,105 | a | 2,929,899 | |
| Mobile Mini | 99,005 | a | 3,576,061 | |
| Navigant Consulting | 134,192 | a | 2,328,231 | |
| On Assignment | 103,922 | a | 3,511,524 | |
| Resources Connection | 104,396 | 1,332,093 | ||
| Tetra Tech | 149,965 | a | 3,918,585 | |
| TrueBlue | 93,298 | a | 2,304,461 | |
| UniFirst | 42,089 | 4,327,591 | ||
| United Stationers | 107,777 | 4,789,610 | ||
| Viad | 58,580 | 1,564,086 | ||
| WageWorks | 63,796 | a | 3,266,993 | |
| 55,379,599 | ||||
| Consumer Durables & Apparel—4.9% | ||||
| Arctic Cat | 41,737 | 2,187,019 | ||
| Blyth | 25,232 | b | 348,454 | |
| Brunswick | 227,781 | 10,279,757 | ||
| Callaway Golf | 148,917 | 1,255,370 | ||
| Crocs | 219,329 | a | 2,671,427 |
The Fund 11
STATEMENT OF INVESTMENTS (continued)
| Common Stocks (continued) | Shares | Value ($) | ||
| Consumer Durables & Apparel (continued) | ||||
| Ethan Allen Interiors | 84,606 | b | 2,253,904 | |
| Fifth & Pacific Companies | 274,530 | a | 7,272,300 | |
| Helen of Troy | 66,087 | a | 3,087,585 | |
| Iconix Brand Group | 138,251 | a | 4,989,479 | |
| iRobot | 67,101 | a | 2,272,711 | |
| JAKKS Pacific | 54,153 | b | 348,745 | |
| La-Z-Boy | 142,581 | 3,290,769 | ||
| M/I Homes | 58,256 | a | 1,192,500 | |
| Meritage Homes | 78,925 | a | 3,582,406 | |
| Movado Group | 38,346 | 1,788,074 | ||
| Oxford Industries | 29,479 | 2,115,708 | ||
| Perry Ellis International | 28,940 | 550,149 | ||
| Quiksilver | 274,188 | a,b | 2,281,244 | |
| Ryland Group | 114,976 | 4,622,035 | ||
| Skechers USA, Cl. A | 100,883 | a | 2,939,731 | |
| Standard Pacific | 345,548 | a | 2,740,196 | |
| Steven Madden | 153,159 | a | 5,617,872 | |
| Sturm Ruger & Co. | 52,900 | b | 3,460,189 | |
| Universal Electronics | 45,404 | a | 1,766,670 | |
| Wolverine World Wide | 113,449 | 6,550,545 | ||
| 79,464,839 | ||||
| Consumer Services—4.5% | ||||
| American Public Education | 57,826 | a,b | 2,314,775 | |
| Biglari Holdings | 2,801 | a | 1,221,292 | |
| BJ’s Restaurants | 45,538 | a | 1,232,258 | |
| Boyd Gaming | 171,013 | a | 1,805,897 | |
| Buffalo Wild Wings | 40,059 | a | 5,711,612 | |
| Capella Education | 29,091 | a | 1,772,224 | |
| Career Education | 106,256 | a | 582,283 | |
| CEC Entertainment | 51,716 | 2,397,037 | ||
| Corinthian Colleges | 192,110 | a | 411,115 | |
| Cracker Barrel Old Country Store | 53,294 | 5,855,412 | ||
| DineEquity | 44,028 | 3,613,378 | ||
| FTD Companies | 44,529 | a | 1,562,968 | |
| Hillenbrand | 130,755 | 3,689,906 |
12
| Common Stocks (continued) | Shares | Value ($) | ||
| Consumer Services (continued) | ||||
| Interval Leisure Group | 97,344 | 2,362,539 | ||
| ITT Educational Services | 34,497 | a,b | 1,384,020 | |
| Jack in the Box | 118,485 | a | 4,819,970 | |
| Lincoln Educational Services | 24,106 | 115,227 | ||
| Marcus | 79,304 | 1,138,805 | ||
| Marriott Vacations Worldwide | 84,754 | a | 4,244,480 | |
| Monarch Casino & Resort | 28,495 | a | 481,850 | |
| Multimedia Games Holding Company | 69,218 | a | 2,250,277 | |
| Outerwall | 69,598 | a,b | 4,522,478 | |
| Papa John’s International | 31,547 | 2,387,161 | ||
| Pinnacle Entertainment | 125,924 | a | 2,946,622 | |
| Red Robin Gourmet Burgers | 32,520 | a | 2,477,374 | |
| Ruby Tuesday | 112,421 | a | 666,657 | |
| Ruth’s Hospitality Group | 110,912 | 1,352,017 | ||
| SHFL Entertainment | 116,913 | a | 2,710,043 | |
| Sonic | 122,335 | a | 2,361,065 | |
| Strayer Education | 27,002 | b | 1,067,389 | |
| Texas Roadhouse | 150,819 | 4,135,457 | ||
| Universal Technical Institute | 18,545 | 246,463 | ||
| 73,840,051 | ||||
| Diversified Financials—4.0% | ||||
| Calamos Asset Management, Cl. A | 56,552 | 555,341 | ||
| Cash America International | 79,558 | 3,138,563 | ||
| Encore Capital Group | 49,212 | a,b | 2,404,006 | |
| Evercore Partners, Cl. A | 77,053 | 3,888,865 | ||
| EZCORP, Cl. A | 120,166 | a | 1,890,211 | |
| Financial Engines | 121,393 | 6,782,227 | ||
| First Cash Financial Services | 63,470 | a | 3,839,300 | |
| FXCM, Cl. A | 66,019 | 1,082,051 | ||
| Green Dot, Cl. A | 65,955 | a | 1,415,394 | |
| HFF, Cl. A | 86,263 | 2,117,757 | ||
| Interactive Brokers Group, Cl. A | 89,061 | 1,837,328 | ||
| Investment Technology Group | 99,774 | a | 1,598,379 | |
| MarketAxess Holdings | 95,178 | 6,208,461 | ||
| Piper Jaffray | 37,502 | a | 1,345,947 |
The Fund 13
STATEMENT OF INVESTMENTS (continued)
| Common Stocks (continued) | Shares | Value ($) | ||
| Diversified Financials (continued) | ||||
| Portfolio Recovery Associates | 121,686 | a | 7,234,233 | |
| Prospect Capital | 571,609 | 6,482,046 | ||
| Stifel Financial | 128,875 | a | 5,277,431 | |
| Virtus Investment Partners | 19,169 | a | 3,901,275 | |
| World Acceptance | 32,370 | a,b | 3,370,364 | |
| 64,369,179 | ||||
| Energy—4.1% | ||||
| Approach Resources | 67,605 | a,b | 1,903,081 | |
| Basic Energy Services | 54,213 | a | 795,305 | |
| Bristow Group | 80,731 | 6,496,424 | ||
| C&J Energy Services | 121,299 | a,b | 2,794,729 | |
| Carrizo Oil & Gas | 96,303 | a | 4,221,924 | |
| Cloud Peak Energy | 130,513 | a | 2,037,308 | |
| Comstock Resources | 117,678 | 2,013,471 | ||
| Contango Oil & Gas | 30,420 | 1,303,497 | ||
| ERA Group | 50,728 | a | 1,603,005 | |
| Exterran Holdings | 158,565 | a | 4,527,031 | |
| Forest Oil | 312,040 | a | 1,479,070 | |
| Geospace Technologies | 26,652 | a | 2,596,438 | |
| Gulf Island Fabrication | 35,016 | 883,104 | ||
| Hornbeck Offshore Services | 71,185 | a | 3,934,395 | |
| ION Geophysical | 250,297 | a | 1,161,378 | |
| Matrix Service | 71,058 | a | 1,477,296 | |
| Newpark Resources | 208,281 | a | 2,655,583 | |
| Northern Oil and Gas | 145,444 | a,b | 2,389,645 | |
| PDC Energy | 82,112 | a | 5,568,015 | |
| Penn Virginia | 113,768 | a | 968,166 | |
| PetroQuest Energy | 202,126 | a | 954,035 | |
| Pioneer Energy Services | 109,026 | a | 915,818 | |
| SEACOR Holdings | 50,323 | 4,921,589 | ||
| Stone Energy | 130,365 | a | 4,544,524 | |
| Swift Energy | 97,977 | a,b | 1,344,244 | |
| Tesco | 73,477 | a | 1,262,335 | |
| TETRA Technologies | 194,412 | a | 2,521,524 | |
| 67,272,934 |
14
| Common Stocks (continued) | Shares | Value ($) | ||
| Food & Staples Retailing—.7% | ||||
| Andersons | 50,153 | 3,720,350 | ||
| Casey’s General Stores | 88,079 | 6,419,198 | ||
| Nash Finch | 23,924 | 671,307 | ||
| Spartan Stores | 55,528 | 1,306,574 | ||
| 12,117,429 | ||||
| Food, Beverage & Tobacco—2.8% | ||||
| Alliance One International | 206,329 | a | 612,797 | |
| Annie’s | 34,110 | a,b | 1,611,697 | |
| B&G Foods | 111,256 | 3,766,016 | ||
| Boston Beer, Cl. A | 18,533 | a,b | 4,254,991 | |
| Cal-Maine Foods | 31,107 | 1,578,058 | ||
| Calavo Growers | 25,423 | b | 754,809 | |
| Darling International | 279,793 | a | 6,510,783 | |
| Diamond Foods | 35,332 | a,b | 862,454 | |
| Hain Celestial Group | 108,120 | a | 8,998,828 | |
| J&J Snack Foods | 37,416 | 3,201,687 | ||
| Sanderson Farms | 56,403 | 3,565,234 | ||
| Seneca Foods, Cl. A | 22,294 | a | 653,660 | |
| Snyders-Lance | 98,471 | 2,953,145 | ||
| TreeHouse Foods | 86,856 | a | 6,363,071 | |
| 45,687,230 | ||||
| Health Care Equipment & Services—7.6% | ||||
| Abaxis | 51,716 | 1,847,813 | ||
| ABIOMED | 84,454 | a,b | 2,025,207 | |
| Air Methods | 76,364 | 3,338,634 | ||
| Align Technology | 175,746 | a | 10,028,067 | |
| Almost Family | 13,758 | 264,566 | ||
| Amedisys | 52,896 | a | 861,147 | |
| AMN Healthcare Services | 124,131 | a | 1,539,224 | |
| AmSurg | 73,692 | a | 3,160,650 | |
| Analogic | 30,991 | 2,858,300 | ||
| Bio-Reference Labs | 55,869 | a,b | 1,810,714 | |
| Cantel Medical | 72,481 | 2,544,083 | ||
| Centene | 140,349 | a | 7,882,000 | |
| Chemed | 52,856 | b | 3,584,694 |
The Fund 15
STATEMENT OF INVESTMENTS (continued)
| Common Stocks (continued) | Shares | Value ($) | ||
| Health Care Equipment & Services (continued) | ||||
| Computer Programs & Systems | 22,312 | 1,272,676 | ||
| CONMED | 78,023 | 2,829,894 | ||
| CorVel | 34,141 | a | 1,420,266 | |
| Cross Country Healthcare | 47,524 | a | 282,293 | |
| CryoLife | 117,742 | 1,058,501 | ||
| Cyberonics | 62,683 | a | 3,620,570 | |
| Cynosure, Cl. A | 28,957 | a | 625,761 | |
| Ensign Group | 39,031 | 1,661,940 | ||
| Gentiva Health Services | 69,047 | a | 790,588 | |
| Greatbatch | 53,487 | a | 2,038,924 | |
| Haemonetics | 113,715 | a | 4,612,280 | |
| Hanger | 79,384 | a | 2,913,393 | |
| HealthStream | 44,056 | a | 1,573,680 | |
| Healthways | 76,756 | a | 739,160 | |
| ICU Medical | 28,717 | a | 1,774,711 | |
| Integra LifeSciences Holdings | 36,876 | a | 1,688,183 | |
| Invacare | 67,234 | 1,443,514 | ||
| IPC The Hospitalist | 38,965 | a | 2,134,892 | |
| Kindred Healthcare | 128,486 | 1,783,386 | ||
| Landauer | 14,214 | 687,958 | ||
| LHC Group | 45,193 | a | 930,976 | |
| Magellan Health Services | 69,615 | a | 4,086,400 | |
| Medidata Solutions | 58,559 | a | 6,459,643 | |
| Meridian Bioscience | 120,398 | b | 2,976,239 | |
| Merit Medical Systems | 61,074 | a | 976,573 | |
| Molina Healthcare | 67,068 | a | 2,122,032 | |
| MWI Veterinary Supply | 30,111 | a | 4,776,809 | |
| Natus Medical | 61,408 | a | 1,211,580 | |
| Neogen | 74,276 | a | 3,433,014 | |
| NuVasive | 116,837 | a | 3,713,080 | |
| Omnicell | 75,893 | a | 1,750,851 | |
| PharMerica | 87,688 | a | 1,294,275 | |
| Quality Systems | 102,178 | 2,331,702 | ||
| SurModics | 49,312 | a | 1,162,777 |
16
| Common Stocks (continued) | Shares | Value ($) | ||
| Health Care Equipment & Services (continued) | ||||
| Symmetry Medical | 124,679 | a | 1,009,900 | |
| West Pharmaceutical Services | 172,404 | 8,335,733 | ||
| 123,269,253 | ||||
| Household & Personal Products—.6% | ||||
| Central Garden & Pet, Cl. A | 83,702 | a | 616,047 | |
| Inter Parfums | 48,060 | 1,689,790 | ||
| Medifast | 45,985 | a | 1,071,910 | |
| Prestige Brands Holdings | 123,833 | a | 3,867,305 | |
| WD-40 | 39,322 | 2,850,452 | ||
| 10,095,504 | ||||
| Insurance—2.0% | ||||
| AMERISAFE | 41,460 | 1,596,210 | ||
| eHealth | 38,530 | a | 1,642,149 | |
| Employers Holdings | 92,733 | 2,788,481 | ||
| HCI Group | 23,906 | b | 1,050,430 | |
| Horace Mann Educators | 90,463 | 2,505,825 | ||
| Infinity Property & Casualty | 21,935 | 1,504,302 | ||
| Meadowbrook Insurance Group | 85,817 | 569,825 | ||
| Navigators Group | 27,164 | a | 1,527,703 | |
| ProAssurance | 137,473 | 6,230,276 | ||
| RLI | 35,228 | 3,328,341 | ||
| Safety Insurance Group | 24,293 | 1,328,584 | ||
| Selective Insurance Group | 155,129 | 4,075,239 | ||
| Stewart Information Services | 68,040 | 2,131,013 | ||
| Tower Group International | 71,359 | b | 259,033 | |
| United Fire Group | 60,477 | 1,917,121 | ||
| 32,454,532 | ||||
| Materials—5.8% | ||||
| A. Schulman | 78,696 | 2,606,412 | ||
| A.M. Castle & Co. | 57,307 | a | 820,063 | |
| AK Steel Holding | 285,202 | a,b | 1,254,889 | |
| AMCOL International | 73,432 | 2,355,699 | ||
| American Vanguard | 69,461 | 1,812,932 | ||
| Balchem | 63,911 | 3,659,544 |
The Fund 17
STATEMENT OF INVESTMENTS (continued)
| Common Stocks (continued) | Shares | Value ($) | ||
| Materials (continued) | ||||
| Calgon Carbon | 152,790 | a | 3,048,160 | |
| Century Aluminum | 127,164 | a | 1,103,784 | |
| Clearwater Paper | 46,495 | a | 2,427,969 | |
| Deltic Timber | 17,831 | 1,139,044 | ||
| Flotek Industries | 92,613 | a | 1,980,066 | |
| Glatfelter | 95,747 | 2,508,571 | ||
| Globe Specialty Metals | 150,180 | 2,634,157 | ||
| H.B. Fuller | 132,210 | 6,328,893 | ||
| Hawkins | 9,943 | 358,047 | ||
| Haynes International | 24,753 | 1,334,187 | ||
| Headwaters | 169,779 | a | 1,482,171 | |
| Innophos Holdings | 49,524 | 2,482,143 | ||
| Kaiser Aluminum | 52,833 | 3,563,586 | ||
| KapStone Paper and Packaging | 91,049 | 4,730,906 | ||
| Koppers Holdings | 59,774 | 2,660,541 | ||
| Kraton Performance Polymers | 74,046 | a | 1,574,958 | |
| LSB Industries | 31,061 | a | 1,140,560 | |
| Materion | 52,121 | 1,553,727 | ||
| Myers Industries | 86,122 | 1,534,694 | ||
| Neenah Paper | 49,555 | 2,038,693 | ||
| Olympic Steel | 32,677 | 894,369 | ||
| OM Group | 82,017 | a | 2,788,578 | |
| PolyOne | 228,598 | 6,926,519 | ||
| Quaker Chemical | 38,920 | 2,954,417 | ||
| RTI International Metals | 70,137 | a | 2,377,644 | |
| Schweitzer-Mauduit International | 83,806 | 5,185,915 | ||
| Stepan | 46,620 | 2,744,519 | ||
| Stillwater Mining | 253,416 | a | 2,764,769 | |
| SunCoke Energy | 194,125 | a | 3,882,500 | |
| Texas Industries | 47,419 | a | 2,546,400 | |
| Tredegar | 46,188 | 1,349,613 | ||
| Wausau Paper | 79,155 | 926,113 | ||
| Zep | 50,170 | 997,881 | ||
| 94,473,633 |
18
| Common Stocks (continued) | Shares | Value ($) | ||
| Media—.6% | ||||
| Digital Generation | 62,184 | a,b | 786,628 | |
| E.W. Scripps, Cl. A | 70,159 | a | 1,390,551 | |
| Harte-Hanks | 118,810 | 946,916 | ||
| Live Nation | 355,711 | a | 6,915,022 | |
| 10,039,117 | ||||
| Pharmaceuticals, Biotech & | ||||
| Life Sciences—3.0% | ||||
| Acorda Therapeutics | 97,521 | a | 2,985,118 | |
| Affymetrix | 194,002 | a | 1,371,594 | |
| Akorn | 182,185 | a | 3,723,861 | |
| ArQule | 98,879 | a | 222,478 | |
| Cambrex | 73,248 | a | 1,232,031 | |
| Emergent BioSolutions | 65,860 | a | 1,286,246 | |
| Hi-Tech Pharmacal | 30,192 | 1,300,973 | ||
| Impax Laboratories | 149,952 | a | 3,038,028 | |
| Luminex | 102,315 | a | 1,995,142 | |
| Medicines | 137,431 | a | 4,661,660 | |
| Momenta Pharmaceuticals | 121,863 | a | 1,997,335 | |
| PAREXEL International | 146,273 | a | 6,686,139 | |
| Questcor Pharmaceuticals | 139,619 | b | 8,568,418 | |
| Santarus | 158,791 | a | 3,704,594 | |
| Spectrum Pharmaceuticals | 114,974 | b | 987,627 | |
| ViroPharma | 144,585 | a | 5,612,790 | |
| 49,374,034 | ||||
| Real Estate—7.2% | ||||
| Acadia Realty Trust | 114,885 | c | 3,063,983 | |
| Agree Realty | 29,991 | c | 946,816 | |
| American Assets Trust | 81,645 | c | 2,717,962 | |
| Associated Estates Realty | 117,252 | c | 1,798,646 | |
| Capstead Mortgage | 228,819 | c | 2,706,929 | |
| Cedar Realty Trust | 228,442 | c | 1,304,404 | |
| Coresite Realty | 48,998 | b,c | 1,589,495 | |
| Cousins Properties | 475,968 | c | 5,392,717 | |
| DiamondRock Hospitality | 416,501 | c | 4,743,946 |
The Fund 19
STATEMENT OF INVESTMENTS (continued)
| Common Stocks (continued) | Shares | Value ($) | ||
| Real Estate (continued) | ||||
| EastGroup Properties | 74,435 | c | 4,738,532 | |
| EPR Properties | 132,184 | c | 6,790,292 | |
| Forestar Group | 67,995 | a,c | 1,518,328 | |
| Franklin Street Properties | 178,998 | c | 2,362,774 | |
| Geo Group | 187,904 | 6,627,374 | ||
| Getty Realty | 40,530 | c | 777,365 | |
| Government Properties Income Trust | 153,577 | c | 3,754,958 | |
| Healthcare Realty Trust | 208,408 | c | 5,003,876 | |
| Inland Real Estate | 255,035 | c | 2,726,324 | |
| Kite Realty Group Trust | 150,719 | c | 964,602 | |
| LaSalle Hotel Properties | 241,783 | c | 7,507,362 | |
| Lexington Realty Trust | 537,238 | c | 6,285,685 | |
| LTC Properties | 90,893 | c | 3,585,729 | |
| Medical Properties Trust | 416,270 | c | 5,428,161 | |
| Parkway Properties | 68,157 | c | 1,234,323 | |
| Pennsylvania Real Estate Investment Trust | 148,397 | c | 2,690,438 | |
| Post Properties | 135,141 | c | 6,181,349 | |
| PS Business Parks | 49,689 | c | 4,049,157 | |
| Sabra Health Care | 83,627 | c | 2,249,566 | |
| Saul Centers | 18,988 | c | 892,436 | |
| Sovran Self Storage | 82,292 | c | 6,294,515 | |
| Tanger Factory Outlet Centers | 243,894 | c | 8,499,706 | |
| Universal Health Realty Income Trust | 27,265 | c | 1,197,479 | |
| Urstadt Biddle Properties, Cl. A | 68,697 | c | 1,356,079 | |
| 116,981,308 | ||||
| Retailing—5.1% | ||||
| Barnes & Noble | 88,250 | a | 1,246,972 | |
| Big 5 Sporting Goods | 52,516 | 993,078 | ||
| Blue Nile | 33,014 | a | 1,355,885 | |
| Brown Shoe Company | 114,211 | 2,562,895 | ||
| Buckle | 74,001 | b | 3,621,609 | |
| Cato, Cl. A | 68,122 | 2,041,616 | ||
| Children’s Place Retail Stores | 60,891 | a | 3,324,040 | |
| Christopher & Banks | 97,446 | a | 562,263 | |
| Finish Line, Cl. A | 95,562 | 2,392,872 |
20
| Common Stocks (continued) | Shares | Value ($) | ||
| Retailing (continued) | ||||
| Francesca’s Holdings | 117,440 | a,b | 2,112,746 | |
| Fred’s, Cl. A | 72,931 | b | 1,181,482 | |
| Genesco | 59,617 | a | 4,060,514 | |
| Group 1 Automotive | 45,165 | b | 2,890,560 | |
| Haverty Furniture | 55,446 | 1,541,953 | ||
| Hibbett Sports | 61,066 | a,b | 3,561,980 | |
| JOS. A. Bank Clothiers | 61,319 | a | 2,942,086 | |
| Kirkland’s | 33,769 | a | 599,400 | |
| Lithia Motors, Cl. A | 47,305 | 2,973,119 | ||
| Lumber Liquidators Holdings | 66,643 | a,b | 7,609,964 | |
| MarineMax | 51,909 | a | 764,620 | |
| Men’s Wearhouse | 124,641 | 5,272,314 | ||
| Monro Muffler Brake | 70,654 | b | 3,250,084 | |
| NutriSystem | 60,003 | 1,128,056 | ||
| OfficeMax | 216,685 | 3,245,941 | ||
| PEP Boys-Manny Moe & Jack | 119,904 | a | 1,551,558 | |
| PetMed Express | 49,956 | b | 741,347 | |
| Pool | 103,507 | 5,628,711 | ||
| Select Comfort | 129,874 | a | 2,379,292 | |
| Sonic Automotive, Cl. A | 78,048 | 1,738,909 | ||
| Stage Stores | 77,859 | 1,607,788 | ||
| Stein Mart | 53,935 | 796,620 | ||
| Tuesday Morning | 92,686 | a | 1,311,507 | |
| Vitamin Shoppe | 70,537 | a | 3,308,891 | |
| VOXX International | 42,775 | a | 663,440 | |
| Zale | 76,854 | a | 1,201,228 | |
| Zumiez | 51,508 | a | 1,526,697 | |
| 83,692,037 | ||||
| Semiconductors & Semiconductor | ||||
| Equipment—3.8% | ||||
| Advanced Energy Industries | 108,587 | a | 2,267,297 | |
| ATMI | 64,396 | a | 1,760,587 | |
| Brooks Automation | 155,413 | 1,498,181 | ||
| Cabot Microelectronics | 56,810 | a | 2,322,961 | |
| Ceva | 32,891 | a | 471,328 |
The Fund 21
STATEMENT OF INVESTMENTS (continued)
| Common Stocks (continued) | Shares | Value ($) | ||
| Semiconductors & Semiconductor | ||||
| Equipment (continued) | ||||
| Cirrus Logic | 167,558 | a,b | 3,758,326 | |
| Cohu | 53,365 | 510,169 | ||
| Diodes | 92,542 | a | 2,241,367 | |
| DSP Group | 61,946 | a | 461,498 | |
| Entropic Communications | 229,667 | a | 982,975 | |
| Exar | 137,670 | a | 1,587,335 | |
| GT Advanced Technologies | 245,922 | a,b | 1,844,415 | |
| Hittite Microwave | 66,665 | a | 4,259,227 | |
| Kopin | 154,486 | a | 566,964 | |
| Kulicke & Soffa Industries | 211,891 | a | 2,733,394 | |
| Micrel | 73,470 | 675,924 | ||
| Microsemi | 229,368 | a | 5,764,018 | |
| MKS Instruments | 137,379 | 4,071,914 | ||
| Monolithic Power Systems | 63,004 | 2,006,047 | ||
| Nanometrics | 32,487 | a | 603,608 | |
| Pericom Semiconductor | 88,145 | a | 712,212 | |
| Power Integrations | 80,536 | 4,625,988 | ||
| Rubicon Technology | 23,377 | a,b | 201,042 | |
| Rudolph Technologies | 68,686 | a | 728,072 | |
| Sigma Designs | 82,778 | a | 450,312 | |
| Supertex | 34,392 | 877,340 | ||
| Synaptics | 78,690 | a | 3,659,085 | |
| Tessera Technologies | 114,229 | 2,172,636 | ||
| TriQuint Semiconductor | 401,804 | a | 3,186,306 | |
| Ultratech | 66,849 | a | 1,590,338 | |
| Veeco Instruments | 90,348 | a,b | 2,639,065 | |
| 61,229,931 | ||||
| Software & Services—6.8% | ||||
| Blackbaud | 117,152 | 4,217,472 | ||
| Blucora | 88,714 | a | 2,096,312 | |
| Bottomline Technologies | 87,435 | a | 2,747,208 | |
| CACI International, Cl. A | 64,283 | a | 4,627,090 | |
| Cardtronics | 117,570 | a | 4,614,622 | |
| CIBER | 157,632 | a | 512,304 |
22
| Common Stocks (continued) | Shares | Value ($) | ||
| Software & Services (continued) | ||||
| comScore | 78,377 | a | 2,094,233 | |
| CSG Systems International | 82,001 | 2,284,548 | ||
| DealerTrack Technologies | 95,495 | a | 3,561,963 | |
| Dice Holdings | 141,160 | a | 1,041,761 | |
| Digital River | 94,559 | a | 1,686,933 | |
| Ebix | 81,229 | b | 924,386 | |
| EPIQ Systems | 65,575 | 981,002 | ||
| ExlService Holdings | 89,260 | a | 2,580,507 | |
| Forrester Research | 35,925 | 1,394,249 | ||
| Heartland Payment Systems | 96,611 | b | 3,907,915 | |
| Higher One Holdings | 92,890 | a,b | 738,475 | |
| iGATE | 77,163 | a | 2,456,870 | |
| Interactive Intelligence Group | 30,128 | a | 1,851,366 | |
| j2 Global | 100,432 | b | 5,521,751 | |
| Liquidity Services | 57,584 | a,b | 1,503,518 | |
| LivePerson | 104,328 | a | 974,424 | |
| LogMeIn | 45,925 | a | 1,483,377 | |
| Manhattan Associates | 49,037 | a | 5,222,931 | |
| MAXIMUS | 163,368 | 7,915,180 | ||
| MicroStrategy, Cl. A | 16,372 | a | 1,997,220 | |
| Monotype Imaging Holdings | 102,111 | 2,881,572 | ||
| Monster Worldwide | 267,956 | a | 1,157,570 | |
| NetScout Systems | 103,210 | a | 2,922,907 | |
| NIC | 136,363 | 3,357,257 | ||
| OpenTable | 52,744 | a | 3,664,653 | |
| Perficient | 84,161 | a | 1,522,472 | |
| Progress Software | 149,529 | a | 3,881,773 | |
| QuinStreet | 75,147 | a | 668,057 | |
| Stamps.com | 40,139 | a | 1,823,916 | |
| SYKES Enterprises | 78,199 | a | 1,463,885 | |
| Synchronoss Technologies | 70,080 | a | 2,426,170 | |
| Take-Two | ||||
| Interactive Software | 216,221 | a | 3,872,518 | |
| Tangoe | 67,533 | a | 1,289,880 | |
| TeleTech Holdings | 66,792 | a | 1,767,984 |
The Fund 23
STATEMENT OF INVESTMENTS (continued)
| Common Stocks (continued) | Shares | Value ($) | ||
| Software & Services (continued) | ||||
| Tyler Technologies | 67,815 | a | 6,558,389 | |
| VASCO Data Security International | 74,580 | a | 560,096 | |
| Virtusa | 42,482 | a | 1,320,341 | |
| XO Group | 98,520 | a | 1,367,458 | |
| 111,444,515 | ||||
| Technology Hardware & Equipment—7.0% | ||||
| Agilysys | 45,484 | a | 534,437 | |
| Anixter International | 63,065 | a | 5,391,427 | |
| ARRIS Group | 279,026 | a | 4,983,404 | |
| Avid Technology | 118,377 | a | 881,909 | |
| Badger Meter | 33,852 | 1,760,643 | ||
| Bel Fuse, Cl. B | 27,512 | 578,852 | ||
| Belden | 97,013 | 6,525,094 | ||
| Benchmark Electronics | 153,891 | a | 3,497,942 | |
| Black Box | 43,791 | 1,096,527 | ||
| CalAmp | 75,147 | a | 1,768,209 | |
| Checkpoint Systems | 130,074 | a | 2,213,859 | |
| Cognex | 181,128 | 5,660,250 | ||
| Coherent | 67,386 | 4,460,279 | ||
| Comtech Telecommunications | 57,462 | 1,725,009 | ||
| CTS | 84,121 | 1,566,333 | ||
| Daktronics | 75,376 | 901,497 | ||
| Digi International | 45,297 | a | 456,594 | |
| DTS | 32,071 | a | 641,420 | |
| Electro Scientific Industries | 60,473 | 724,467 | ||
| Electronics for Imaging | 109,530 | a | 3,757,974 | |
| FARO Technologies | 44,819 | a | 2,128,902 | |
| FEI | 94,150 | 8,386,882 | ||
| Harmonic | 292,861 | a | 2,140,814 | |
| Insight Enterprises | 117,003 | a | 2,465,253 | |
| Ixia | 133,452 | a | 1,892,349 | |
| Littelfuse | 51,065 | 4,342,057 | ||
| Measurement Specialties | 36,778 | a | 2,049,638 | |
| Mercury Systems | 38,000 | a | 350,360 | |
| Methode Electronics | 71,944 | 1,840,328 |
24
| Common Stocks (continued) | Shares | Value ($) | ||
| Technology Hardware & Equipment (continued) | ||||
| MTS Systems | 30,797 | 2,011,660 | ||
| NETGEAR | 89,902 | a | 2,585,582 | |
| Newport | 98,400 | a | 1,561,608 | |
| Oplink Communications | 45,066 | a | 822,454 | |
| OSI Systems | 37,648 | a | 2,742,280 | |
| Park Electrochemical | 43,156 | 1,210,526 | ||
| PC-Tel | 37,611 | 346,397 | ||
| Plexus | 84,192 | a | 3,222,870 | |
| Procera Networks | 36,460 | a | 515,909 | |
| QLogic | 200,056 | a | 2,470,692 | |
| Rofin-Sinar Technologies | 80,079 | a | 2,102,074 | |
| Rogers | 40,751 | a | 2,484,181 | |
| ScanSource | 83,180 | a | 3,199,103 | |
| Super Micro Computer | 58,581 | a | 815,448 | |
| Symmetricom | 143,190 | a | 1,026,672 | |
| SYNNEX | 60,254 | a | 3,693,570 | |
| TTM Technologies | 143,143 | a | 1,252,501 | |
| ViaSat | 98,223 | a | 6,494,505 | |
| 113,280,741 | ||||
| Telecommunication Services—.4% | ||||
| Atlantic Tele-Network | 28,432 | 1,575,701 | ||
| Cbeyond | 86,151 | a | 554,812 | |
| Cincinnati Bell | 439,366 | a | 1,256,587 | |
| General Communication, Cl. A | 124,143 | a | 1,180,600 | |
| Lumos Networks | 23,731 | 522,319 | ||
| NTELOS Holdings | 46,856 | 892,138 | ||
| USA Mobility | 57,553 | 858,691 | ||
| 6,840,848 | ||||
| Transportation—1.9% | ||||
| Allegiant Travel | 32,652 | 3,404,624 | ||
| Arkansas Best | 61,428 | 1,681,284 | ||
| Atlas Air Worldwide Holdings | 53,205 | a | 1,970,181 | |
| Forward Air | 80,990 | 3,278,475 | ||
| Heartland Express | 119,694 | 1,718,806 | ||
| Hub Group, Cl. A | 80,728 | a | 2,965,139 |
The Fund 25
STATEMENT OF INVESTMENTS (continued)
| Common Stocks (continued) | Shares | Value ($) | |||
| Transportation (continued) | |||||
| Knight Transportation | 171,879 | 2,916,787 | |||
| Old Dominion Freight Line | 177,583 | a | 8,328,643 | ||
| Saia | 57,719 | a | 1,877,599 | ||
| SkyWest | 149,698 | 2,251,458 | |||
| 30,392,996 | |||||
| Utilities—3.5% | |||||
| Allete | 79,551 | 4,019,712 | |||
| American States Water | 102,513 | 2,919,570 | |||
| Avista | 144,490 | 4,015,377 | |||
| El Paso Electric | 79,953 | 2,811,947 | |||
| Laclede Group | 60,410 | 2,843,499 | |||
| New Jersey Resources | 112,286 | 5,168,525 | |||
| Northwest Natural Gas | 78,135 | 3,393,403 | |||
| NorthWestern | 102,268 | 4,687,965 | |||
| Piedmont Natural Gas | 165,051 | b | 5,634,841 | ||
| South Jersey Industries | 68,053 | 4,052,556 | |||
| Southwest Gas | 122,213 | 6,631,277 | |||
| UIL Holdings | 148,059 | 5,703,233 | |||
| UNS Energy | 110,972 | 5,490,895 | |||
| 57,372,800 | |||||
| Total Common Stocks | |||||
| (cost $1,049,241,250) | 1,598,286,630 | ||||
| Principal | |||||
Short-Term Investments—.1% | Amount ($) | Value ($) | |||
| U.S. Treasury Bills; | |||||
| 0.04%, 3/13/14 | |||||
| (cost $1,089,827) | 1,090,000 | d | 1,089,780 | ||
| Other Investment—1.6% | Shares | Value ($) | |||
| Registered Investment Company; | |||||
| Dreyfus Institutional Preferred | |||||
| Plus Money Market Fund | |||||
| (cost $25,904,984) | 25,904,984 | e | 25,904,984 | ||
26
| Investment of Cash Collateral | ||||
| for Securities Loaned—4.8% | Shares | Value ($) | ||
| Registered Investment Company; | ||||
| Dreyfus Institutional Cash Advantage Fund | ||||
| (cost $78,759,292) | 78,759,292 | e | 78,759,292 | |
| Total Investments (cost $1,154,995,353) | 104.6 | % | 1,704,040,686 | |
| Liabilities, Less Cash and Receivables | (4.6 | %) | (75,675,546 | ) |
| Net Assets | 100.0 | % | 1,628,365,140 |
| a Non-income producing security. |
| b Security, or portion thereof, on loan.At October 31, 2013, the value of the fund’s securities on loan was |
| $78,688,368 and the value of the collateral held by the fund was $80,999,641, consisting of cash collateral of |
| $78,759,292 and U.S. Government & Agency securities valued at $2,240,349. |
| c Investment in real estate investment trust. |
| d Held by or on behalf of a counterparty for open financial futures contracts. |
| e Investment in affiliated money market mutual fund. |
| Portfolio Summary (Unaudited)† | |||
| Value (%) | Value (%) | ||
| Capital Goods | 9.8 | Semiconductors & | |
| Banks | 7.9 | Semiconductor Equipment | 3.8 |
| Health Care Equipment & Services | 7.6 | Utilities | 3.5 |
| Real Estate | 7.2 | Commercial & Professional Services | 3.4 |
| Technology Hardware & Equipment | 7.0 | Pharmaceuticals, Biotech & Life Sciences | 3.0 |
| Software & Services | 6.8 | Food, Beverage & Tobacco | 2.8 |
| Short-Term/ | Insurance | 2.0 | |
| Money Market Investments | 6.5 | Transportation | 1.9 |
| Materials | 5.8 | Automobiles & Components | .7 |
| Retailing | 5.1 | Food & Staples Retailing | .7 |
| Consumer Durables & Apparel | 4.9 | Household & Personal Products | .6 |
| Consumer Services | 4.5 | Media | .6 |
| Energy | 4.1 | Telecommunication Services | .4 |
| Diversified Financials | 4.0 | 104.6 | |
| † Based on net assets. | |||
| See notes to financial statements. | |||
The Fund 27
STATEMENT OF FINANCIAL FUTURES
October 31, 2013
| Market Value | Unrealized | ||||
| Covered by | (Depreciation) | ||||
| Contracts | Contracts ($) | Expiration | at 10/31/2013 | ($) | |
| Financial Futures Long | |||||
| Russell 2000 Mini | 245 | 26,896,100 | December 2013 | (276,663 | ) |
| See notes to financial statements. | |||||
28
STATEMENT OF ASSETS AND LIABILITIES
October 31, 2013
| Cost | Value | |
| Assets ($): | ||
| Investments in securities—See Statement of Investments (including | ||
| securities on loan, valued at $78,688,368)—Note 1(b): | ||
| Unaffiliated issuers | 1,050,331,077 | 1,599,376,410 |
| Affiliated issuers | 104,664,276 | 104,664,276 |
| Cash | 4,937,851 | |
| Receivable for investment securities sold | 1,754,683 | |
| Dividends and securities lending income receivable | 835,393 | |
| Receivable for shares of Common Stock subscribed | 680,149 | |
| Other assets | 33,142 | |
| 1,712,281,904 | ||
| Liabilities ($): | ||
| Due to The Dreyfus Corporation and affiliates—Note 3(b) | 664,449 | |
| Liability for securities on loan—Note 1(b) | 78,759,292 | |
| Payable for investment securities purchased | 2,721,846 | |
| Payable for shares of Common Stock redeemed | 1,550,577 | |
| Payable for futures variation margin—Note 4 | 215,600 | |
| Accrued expenses | 5,000 | |
| 83,916,764 | ||
| Net Assets ($) | 1,628,365,140 | |
| Composition of Net Assets ($): | ||
| Paid-in capital | 1,023,703,741 | |
| Accumulated undistributed investment income—net | 8,009,548 | |
| Accumulated net realized gain (loss) on investments | 47,883,181 | |
| Accumulated net unrealized appreciation (depreciation) | ||
| on investments [including ($276,663) net unrealized | ||
| depreciation on financial futures] | 548,768,670 | |
| Net Assets ($) | 1,628,365,140 | |
| Shares Outstanding | ||
| (200 million shares of $.001 par value Common Stock authorized) | 55,848,660 | |
| Net Asset Value, offering and redemption price per share ($) | 29.16 | |
| See notes to financial statements. | ||
The Fund 29
STATEMENT OF OPERATIONS
Year Ended October 31, 2013
| Investment Income ($): | ||
| Income: | ||
| Cash dividends: | ||
| Unaffiliated issuers | 20,506,882 | |
| Affiliated issuers | 14,240 | |
| Income from securities lending—Note 1(b) | 1,566,385 | |
| Interest | 368 | |
| Total Income | 22,087,875 | |
| Expenses: | ||
| Management fee—Note 3(a) | 3,387,886 | |
| Shareholder servicing costs—Note 3(b) | 3,387,886 | |
| Directors’ fees—Note 3(a,c) | 123,481 | |
| Loan commitment fees—Note 2 | 12,522 | |
| Interest expense—Note 2 | 1,634 | |
| Total Expenses | 6,913,409 | |
| Less—Directors’ fees reimbursed by the Manager—Note 3(a) | (123,481 | ) |
| Net Expenses | 6,789,928 | |
| Investment Income—Net | 15,297,947 | |
| Realized and Unrealized Gain (Loss) on Investments—Note 4 ($): | ||
| Net realized gain (loss) on investments | 57,301,450 | |
| Net realized gain (loss) on financial futures | 3,237,562 | |
| Net Realized Gain (Loss) | 60,539,012 | |
| Net unrealized appreciation (depreciation) on investments | 359,952,381 | |
| Net unrealized appreciation (depreciation) on financial futures | 76,697 | |
| Net Unrealized Appreciation (Depreciation) | 360,029,078 | |
| Net Realized and Unrealized Gain (Loss) on Investments | 420,568,090 | |
| Net Increase in Net Assets Resulting from Operations | 435,866,037 | |
| See notes to financial statements. | ||
30
STATEMENT OF CHANGES IN NET ASSETS
| Year Ended October 31, | ||||
| 2013 | 2012 | |||
| Operations ($): | ||||
| Investment income—net | 15,297,947 | 10,572,127 | ||
| Net realized gain (loss) on investments | 60,539,012 | 32,493,512 | ||
| Net unrealized appreciation | ||||
| (depreciation) on investments | 360,029,078 | 87,969,308 | ||
| Net Increase (Decrease) in Net Assets | ||||
| Resulting from Operations | 435,866,037 | 131,034,947 | ||
| Dividends to Shareholders from ($): | ||||
| Investment income—net | (16,002,743 | ) | (5,417,284 | ) |
| Net realized gain on investments | (31,995,533 | ) | (36,365,943 | ) |
| Total Dividends | (47,998,276 | ) | (41,783,227 | ) |
| Capital Stock Transactions ($): | ||||
| Net proceeds from shares sold | 592,851,557 | 367,884,451 | ||
| Dividends reinvested | 45,945,653 | 40,209,530 | ||
| Cost of shares redeemed | (526,229,862 | ) | (395,072,263 | ) |
| Increase (Decrease) in Net Assets | ||||
| from Capital Stock Transactions | 112,567,348 | 13,021,718 | ||
| Total Increase (Decrease) in Net Assets | 500,435,109 | 102,273,438 | ||
| Net Assets ($): | ||||
| Beginning of Period | 1,127,930,031 | 1,025,656,593 | ||
| End of Period | 1,628,365,140 | 1,127,930,031 | ||
| Undistributed investment income—net | 8,009,548 | 8,698,697 | ||
| Capital Share Transactions (Shares): | ||||
| Shares sold | 23,441,246 | 17,292,143 | ||
| Shares issued for dividends reinvested | 2,118,524 | 2,043,682 | ||
| Shares redeemed | (21,090,274 | ) | (18,694,097 | ) |
| Net Increase (Decrease) in Shares Outstanding | 4,469,496 | 641,728 | ||
| See notes to financial statements. | ||||
The Fund 31
FINANCIAL HIGHLIGHTS
The following table describes the performance for the fiscal periods indicated. Total return shows how much your investment in the fund would have increased (or decreased) during each period, assuming you had reinvested all dividends and distributions.These figures have been derived from the fund’s financial statements.
| Year Ended October 31, | ||||||||||
| 2013 | 2012 | 2011 | 2010 | 2009 | ||||||
| Per Share Data ($): | ||||||||||
| Net asset value, | ||||||||||
| beginning of period | 21.95 | 20.21 | 18.82 | 15.04 | 15.71 | |||||
| Investment Operations: | ||||||||||
| Investment income—neta | .28 | .20 | .14 | .11 | .15 | |||||
| Net realized and unrealized | ||||||||||
| gain (loss) on investments | 7.88 | 2.39 | 1.80 | 3.80 | .45 | |||||
| Total from Investment Operations | 8.16 | 2.59 | 1.94 | 3.91 | .60 | |||||
| Distributions: | ||||||||||
| Dividends from | ||||||||||
| investment income—net | (.32 | ) | (.11 | ) | (.16 | ) | (.13 | ) | (.23 | ) |
| Dividends from net realized | ||||||||||
| gain on investments | (.63 | ) | (.74 | ) | (.39 | ) | — | (1.04 | ) | |
| Total Distributions | (.95 | ) | (.85 | ) | (.55 | ) | (.13 | ) | (1.27 | ) |
| Net asset value, end of period | 29.16 | 21.95 | 20.21 | 18.82 | 15.04 | |||||
| Total Return (%) | 38.63 | 13.24 | 10.29 | 26.08 | 5.43 | |||||
| Ratios/Supplemental Data (%): | ||||||||||
| Ratio of total expenses | ||||||||||
| to average net assets | .51 | .51 | .51 | .51 | .51 | |||||
| Ratio of net expenses | ||||||||||
| to average net assets | .50 | .50 | .50 | .50 | .50 | |||||
| Ratio of net investment income | ||||||||||
| to average net assets | 1.13 | .97 | .68 | .65 | 1.11 | |||||
| Portfolio Turnover Rate | 20.89 | 14.64 | 22.25 | 20.72 | 25.48 | |||||
| Net Assets, end of period | ||||||||||
| ($ x 1,000) | 1,628,365 | 1,127,930 | 1,025,657 | 1,002,700 | 804,184 | |||||
| a Based on average shares outstanding at each month end. | ||||||||||
| See notes to financial statements. | ||||||||||
32
NOTES TO FINANCIAL STATEMENTS
NOTE 1—Significant Accounting Policies:
Dreyfus Smallcap Stock Index Fund (the “fund”) is a separate non-diversified series of Dreyfus Index Funds, Inc. (the “Company”), which is registered under the Investment Company Act of 1940, as amended (the “Act”), as an open-end management investment company and operates as a series company currently offering three series, including the fund. The fund’s investment objective is to match the performance of the Standard & Poor’s® SmallCap 600 Index. The Dreyfus Corporation (the “Manager” or “Dreyfus”), a wholly-owned subsidiary of The Bank of New York Mellon Corporation (“BNY Mellon”), serves as the fund’s investment adviser. MBSC Securities Corporation (the “Distributor”), a wholly-owned subsidiary of the Manager, is the distributor of the fund’s shares, which are sold to the public without a sales charge.
The Company accounts separately for the assets, liabilities and operations of each series. Expenses directly attributable to each series are charged to that series’ operations; expenses which are applicable to all series are allocated among them on a pro rata basis.
The Financial Accounting Standards Board (“FASB”) Accounting Standards Codification is the exclusive reference of authoritative U.S. generally accepted accounting principles (“GAAP”) recognized by the FASB to be applied by nongovernmental entities. Rules and interpretive releases of the Securities and Exchange Commission (“SEC”) under authority of federal laws are also sources of authoritative GAAP for SEC registrants. The fund’s financial statements are prepared in accordance with GAAP, which may require the use of management estimates and assumptions.Actual results could differ from those estimates.
The Company enters into contracts that contain a variety of indemnifications. The fund’s maximum exposure under these arrangements is unknown.The fund does not anticipate recognizing any loss related to these arrangements.
The Fund 33
NOTES TO FINANCIAL STATEMENTS (continued)
(a) Portfolio valuation: The fair value of a financial instrument is the amount that would be received to sell an asset or paid to transfer a liability in an orderly transaction between market participants at the measurement date (i.e., the exit price). GAAP establishes a fair value hierarchy that prioritizes the inputs of valuation techniques used to measure fair value. This hierarchy gives the highest priority to unadjusted quoted prices in active markets for identical assets or liabilities (Level 1 measurements) and the lowest priority to unobservable inputs (Level 3 measurements).
Additionally, GAAP provides guidance on determining whether the volume and activity in a market has decreased significantly and whether such a decrease in activity results in transactions that are not orderly. GAAP requires enhanced disclosures around valuation inputs and techniques used during annual and interim periods.
Various inputs are used in determining the value of the fund’s investments relating to fair value measurements.These inputs are summarized in the three broad levels listed below:
Level 1—unadjusted quoted prices in active markets for identical investments.
Level 2—other significant observable inputs (including quoted prices for similar investments, interest rates, prepayment speeds, credit risk, etc.).
Level 3—significant unobservable inputs (including the fund’s own assumptions in determining the fair value of investments).
The inputs or methodology used for valuing securities are not necessarily an indication of the risk associated with investing in those securities.
Changes in valuation techniques may result in transfers in or out of an assigned level within the disclosure hierarchy. Valuation techniques used to value the fund’s investments are as follows:
34
Investments in securities are valued at the last sales price on the securities exchange or national securities market on which such securities are primarily traded. Securities listed on the National Market System for which market quotations are available are valued at the official closing price or, if there is no official closing price that day, at the last sales price. Securities not listed on an exchange or the national securities market, or securities for which there were no transactions, are valued at the average of the most recent bid and asked prices, except for open short positions, where the asked price is used for valuation purposes. Bid price is used when no asked price is available. Registered investment companies that are not traded on an exchange are valued at their net asset value. All of the preceding securities are categorized within Level 1 of the fair value hierarchy.
U.S. Treasury Bills are valued at the mean price between quoted bid prices and asked prices by an independent pricing service (the “Service”) approved by the Company’s Board of Directors (the “Board”).These securities are generally categorized within Level 2 of the fair value hierarchy.
The Service’s procedures are reviewed by Dreyfus under the general supervision of the Board.
Fair valuing of securities may be determined with the assistance of a pricing service using calculations based on indices of domestic securities and other appropriate indicators, such as prices of relevant American Depository Receipts and financial futures. Utilizing these techniques may result in transfers between Level 1 and Level 2 of the fair value hierarchy.
When market quotations or official closing prices are not readily available, or are determined not to reflect accurately fair value, such as when the value of a security has been significantly affected by events
The Fund 35
NOTES TO FINANCIAL STATEMENTS (continued)
after the close of the exchange or market on which the security is principally traded (for example, a foreign exchange or market), but before the fund calculates its net asset value, the fund may value these investments at fair value as determined in accordance with the procedures approved by the Board. Certain factors may be considered when fair valuing investments such as: fundamental analytical data, the nature and duration of restrictions on disposition, an evaluation of the forces that influence the market in which the securities are purchased and sold, and public trading in similar securities of the issuer or comparable issuers. These securities are either categorized within Level 2 or 3 of the fair value hierarchy depending on the relevant inputs used.
For restricted securities where observable inputs are limited, assumptions about market activity and risk are used and are categorized within Level 3 of the fair value hierarchy.
Financial futures, which are traded on an exchange, are valued at the last sales price on the securities exchange on which such securities are primarily traded or at the last sales price on the national securities market on each business day and are generally categorized within Level 1 of the fair value hierarchy.
The following is a summary of the inputs used as of October 31, 2013 in valuing the fund’s investments:
| Level 2—Other | Level 3— | |||
| Level 1— | Significant | Significant | ||
| Unadjusted | Observable | Unobservable | ||
| Quoted Prices | Inputs | Inputs | Total | |
| Assets ($) | ||||
| Investments in Securities: | ||||
| Equity Securities— | ||||
| Domestic | ||||
| Common | ||||
| Stocks† | 1,595,553,236 | — | — | 1,595,553,236 |
| Equity Securities— | ||||
| Foreign | ||||
| Common Stocks† | 2,733,394 | — | — | 2,733,394 |
| Mutual Funds | 104,664,276 | — | — | 104,664,276 |
| U.S. Treasury | — | 1,089,780 | — | 1,089,780 |
36
| Level 2—Other | Level 3— | |||||
| Level 1— | Significant | Significant | ||||
| Unadjusted | Observable | Unobservable | ||||
| Quoted Prices | Inputs | Inputs | Total | |||
| Liabilities ($) | ||||||
| Other Financial | ||||||
| Instruments: | ||||||
| Financial Futures†† | (276,663 | ) | — | — | (276,663 | ) |
| † | See Statement of Investments for additional detailed categorizations. |
| †† | Amount shown represents unrealized (depreciation) at period end. |
At October 31, 2013, there were no transfers between Level 1 and Level 2 of the fair value hierarchy.
(b) Securities transactions and investment income: Securities transactions are recorded on a trade date basis. Realized gains and losses from securities transactions are recorded on the identified cost basis. Dividend income is recognized on the ex-dividend date and interest income, including, where applicable, accretion of discount and amortization of premium on investments, is recognized on the accrual basis.
Pursuant to a securities lending agreement with The Bank of New York Mellon, a subsidiary of BNY Mellon and an affiliate of Dreyfus, the fund may lend securities to qualified institutions. It is the fund’s policy that, at origination, all loans are secured by collateral of at least 102% of the value of U.S. securities loaned and 105% of the value of foreign securities loaned. Collateral equivalent to at least 100% of the market value of securities on loan is maintained at all times. Collateral is either in the form of cash, which can be invested in certain money market mutual funds managed by the Manager or U.S. Government and Agency securities. The fund is entitled to receive all dividends, interest and distributions on securities loaned, in addition to income earned as a result of the lending transaction. Should a borrower fail to return the securities in a timely manner, The Bank of New York Mellon is required to replace the securities for the benefit of the fund or credit the fund with the market value of the unreturned securities and is subrogated to the fund’s rights against the borrower and the
The Fund 37
NOTES TO FINANCIAL STATEMENTS (continued)
collateral. During the period ended October 31, 2013, The Bank of New York Mellon earned $424,354 from lending portfolio securities, pursuant to the securities lending agreement.
(c) Affiliated issuers: Investments in other investment companies advised by Dreyfus are defined as “affiliated” under the Act. Investments in affiliated investment companies during the period ended October 31, 2013 were as follows:
| Affiliated | ||||||
| Investment | Value | Value | Net | |||
| Company | 10/31/2012($) | Purchases ($) | Sales ($) | 10/31/2013($) | Assets (%) | |
| Dreyfus | ||||||
| Institutional | ||||||
| Preferred | ||||||
| Plus Money | ||||||
| Market | ||||||
| Fund | 14,458,071 | 384,214,561 | 372,767,648 | 25,904,984 | 1.6 | |
| Dreyfus | ||||||
| Institutional | ||||||
| Cash | ||||||
| Advantage | ||||||
| Fund | 93,317,744 | 396,242,943 | 410,801,395 | 78,759,292 | 4.8 | |
| Total | 107,775,815 | 780,457,504 | 783,569,043 | 104,664,276 | 6.4 | |
(d) Dividends to shareholders: Dividends are recorded on the ex-dividend date. Dividends from investment income-net and dividends from net realized capital gains, if any, are normally declared and paid annually, but the fund may make distributions on a more frequent basis to comply with the distribution requirements of the Internal Revenue Code of 1986, as amended (the “Code”).To the extent that net realized capital gains can be offset by capital loss carryovers, it is the policy of the fund not to distribute such gains. Income and capital gain distributions are determined in accordance with income tax regulations, which may differ from GAAP.
(e) Federal income taxes: It is the policy of the fund to continue to qualify as a regulated investment company, if such qualification is in the best interests of its shareholders, by complying with the applicable provisions of the Code, and to make distributions of taxable income sufficient to relieve it from substantially all federal income and excise taxes.
38
As of and during the period ended October 31, 2013, the fund did not have any liabilities for any uncertain tax positions.The fund recognizes interest and penalties, if any, related to uncertain tax positions as income tax expense in the Statement of Operations. During the period ended October 31, 2013, the fund did not incur any interest or penalties.
Each tax year in the four-year period ended October 31, 2013 remains subject to examination by the Internal Revenue Service and state taxing authorities.
At October 31, 2013, the components of accumulated earnings on a tax basis were as follows: undistributed ordinary income $15,512,702, undistributed capital gains $52,680,978 and unrealized appreciation $536,467,719.
The tax character of distributions paid to shareholders during the fiscal periods ended October 31, 2013 and October 31, 2012 were as follows: ordinary income $17,724,942 and $11,863,852, and long-term capital gains $30,273,334 and $29,919,375, respectively.
During the period ended October 31, 2013, as a result of permanent book to tax differences, primarily due to the tax treatment for dividend reclassification, the fund increased accumulated undistributed investment income-net by $15,647 and decreased accumulated net realized gain (loss) on investments by the same amount. Net assets and net asset value per share were not affected by this reclassification.
(f) Accounting Pronouncement: In January 2013, FASB issued Accounting Standards Update No. 2013-01 (“ASU 2013-01”), “Clarifying the Scope of Disclosures about Offsetting Assets and Liabilities”, which replaced Accounting Standards Update No. 2011-11 (“ASU 2011-11”), “Disclosures about Offsetting Assets and Liabilities”. ASU 2013-01 is effective for fiscal years beginning on or after January 1, 2013, and interim periods within those annual periods.ASU 2011-11 was intended to enhance disclosure requirements on the offsetting of financial assets and liabilities.ASU 2013-01 limits the scope of the new balance sheet offsetting disclosures to derivatives, repurchase agreements,
The Fund 39
NOTES TO FINANCIAL STATEMENTS (continued)
and securities lending transactions to the extent that they are (1) offset in the financial statements or (2) subject to enforceable master netting arrangements (“MNA”) or similar agreements. Management is currently evaluating the application of ASU 2013-01 and its impact on the fund’s financial statements.
NOTE 2—Bank Lines of Credit:
The fund participates with other Dreyfus-managed funds in a $265 million unsecured credit facility led by Citibank, N.A. and a $300 million unsecured credit facility provided by The Bank of New York Mellon (each, a “Facility”), each to be utilized primarily for temporary or emergency purposes, including the financing of redemptions. Prior to October 9, 2013, the unsecured credit facility with Citibank, N.A. was $210 million. In connection therewith, the fund has agreed to pay its pro rata portion of commitment fees for each Facility. Interest is charged to the fund based on rates determined pursuant to the terms of the respective Facility at the time of borrowing.
The average amount of borrowings outstanding under the Facilities during the period ended October 31, 2013 was approximately $145,200 with a related weighted average annualized interest rate of 1.13%.
NOTE 3—Management Fee and Other Transactions With Affiliates:
(a) Pursuant to a management agreement (the “Agreement”) with the Manager, the management fee is computed at the annual rate of .25% of the value of the fund’s average daily net assets and is payable monthly. Under the terms of the Agreement, the Manager has agreed to pay all of the fund’s direct expenses, except management fees, Shareholder Services Plan fees, brokerage fees and commissions, taxes, interest expense, commitment fees on borrowings, fees and expenses of non-interested Board members, fees and expenses of independent counsel to the fund and extraordinary expenses. The Manager has also agreed to reduce its management fee in an amount equal to the fund’s allocable
40
portion of the accrued fees and expenses of the non-interested Board members and fees and expenses of independent counsel to the fund and to non-interested Board members. During the period ended October 31, 2013, fees reimbursed by the Manager amounted to $123,481.
(b) Under the Shareholder Services Plan, the fund pays the Distributor for the provision of certain services, at an annual rate of .25% of the value of the fund’s average daily net assets. The services provided may include personal services relating to shareholder accounts, such as answering shareholder inquiries regarding the fund and providing reports and other information, and services related to the maintenance of shareholder accounts.The Distributor may make payments to Service Agents (securities dealers, financial institutions or other industry professionals) with respect to these services. The Distributor determines the amounts to be paid to Service Agents. During the period ended October 31, 2013, the fund was charged $3,387,886 pursuant to the Shareholder Services Plan.
The components of “Due to The Dreyfus Corporation and affiliates” in the Statement of Assets and Liabilities consist of: management fees $337,157 and Shareholder Services Plan fees $337,157, which are offset against an expense reimbursement currently in effect in the amount of $9,865.
(c) Each Board member also serves as a Board member of other funds within the Dreyfus complex. Annual retainer fees and attendance fees are allocated to each fund based on net assets.
NOTE 4—Securities Transactions:
The aggregate amount of purchases and sales of investment securities, excluding short-term securities and financial futures, during the period ended October 31, 2013, amounted to $348,700,220 and $278,339,462, respectively.
The Fund 41
NOTES TO FINANCIAL STATEMENTS (continued)
Derivatives: A derivative is a financial instrument whose performance is derived from the performance of another asset. Each type of derivative instrument that was held by the fund during the period ended October 31, 2013 is discussed below.
Financial Futures: In the normal course of pursuing its investment objective, the fund is exposed to market risk, including equity price risk as a result of changes in value of underlying financial instruments.The fund invests in financial futures in order to manage its exposure to or protect against changes in the market. A financial futures contract represents a commitment for the future purchase or a sale of an asset at a specified date. Upon entering into such contracts, these investments require initial margin deposits with a counterparty, which consist of cash or cash equivalents.The amount of these deposits is determined by the exchange or Board of Trade on which the contract is traded and is subject to change.Accordingly, variation margin payments are received or made to reflect daily unrealized gains or losses which are recorded in the Statement of Operations.When the contracts are closed, the fund recognizes a realized gain or loss which is reflected in the Statement of Operations.There is minimal counterparty credit risk to the fund with financial futures since they are exchange traded, and the exchange guarantees the financial futures against default. Financial futures open at October 31, 2013 are set forth in the Statement of Financial Futures.
The following summarizes the average market value of derivatives outstanding during the period ended October 31, 2013:
| Average Market Value ($) | |
| Equity financial futures | 19,059,805 |
At October 31, 2013, the cost of investments for federal income tax purposes was $1,167,572,967; accordingly, accumulated net unrealized appreciation on investments was $536,467,719, consisting of $584,711,617 gross unrealized appreciation and $48,243,898 gross unrealized depreciation.
42
REPORT OF INDEPENDENT REGISTERED
PUBLIC ACCOUNTING FIRM
Shareholders and Board of Directors
Dreyfus Smallcap Stock Index Fund
We have audited the accompanying statement of assets and liabilities, including the statements of investments and financial futures, of Dreyfus Smallcap Stock Index Fund (one of the series comprising Dreyfus Index Funds, Inc.) as of October 31, 2013, and the related statement of operations for the year then ended, the statement of changes in net assets for each of the two years in the period then ended, and the financial highlights for each of the five years in the period then ended.These financial statements and financial highlights are the responsibility of the Fund’s management. Our responsibility is to express an opinion on these financial statements and financial highlights based on our audits.
We conducted our audits in accordance with the standards of the Public Company Accounting Oversight Board (United States).Those standards require that we plan and perform the audit to obtain reasonable assurance about whether the financial statements and financial highlights are free of material misstatement.We were not engaged to perform an audit of the Fund’s internal control over financial reporting. Our audits included consideration of internal control over financial reporting as a basis for designing audit procedures that are appropriate in the circumstances, but not for the purpose of expressing an opinion on the effectiveness of the Fund’s internal control over financial reporting. Accordingly, we express no such opinion. An audit also includes examining, on a test basis, evidence supporting the amounts and disclosures in the financial statements and financial highlights, assessing the accounting principles used and significant estimates made by management, and evaluating the overall financial statement presentation. Our procedures included confirmation of securities owned as of October 31, 2013 by correspondence with the custodian and others.We believe that our audits provide a reasonable basis for our opinion.
In our opinion, the financial statements and financial highlights referred to above present fairly, in all material respects, the financial position of Dreyfus Smallcap Stock Index Fund at October 31, 2013, the results of its operations for the year then ended, the changes in its net assets for each of the two years in the period then ended, and the financial highlights for each of the five years in the period then ended, in conformity with U.S. generally accepted accounting principles.
New York, New York
December 27, 2013
The Fund 43
IMPORTANT TAX INFORMATION (Unaudited)
In accordance with federal tax law, the fund hereby reports 93.09% of the ordinary dividends paid during the fiscal year ended October 31, 2013 as qualifying for the corporate dividends received deduction. For the fiscal year ended October 31, 2013, certain dividends paid by the fund may be subject to a maximum tax rate of 15%, as provided for by the Jobs and Growth Tax Relief Reconciliation Act of 2003. Of the distributions paid during the fiscal year, $17,213,645 represents the maximum amount that may be considered qualified dividend income. Shareholders will receive notification in early 2014 of the percentage applicable to the preparation of their 2013 income tax returns. Also, the fund hereby designates $.5849 per share as a long-term capital gain distribution and $.0339 per share as a short-term capital gain distribution paid on December 27, 2012 and the fund also reports $.0104 per share as a long-term capital gain distribution paid on March 19, 2013.
44
BOARD MEMBERS INFORMATION (Unaudited)
| Joseph S. DiMartino (70) |
| Chairman of the Board (1995) |
| Principal Occupation During Past 5Years: |
| • Corporate Director and Trustee |
| Other Public Company Board Memberships During Past 5Years: |
| • CBIZ (formerly, Century Business Services, Inc.), a provider of outsourcing functions for small |
| and medium size companies, Director (1997-present) |
| • The Newark Group, a provider of a national market of paper recovery facilities, paperboard |
| mills and paperboard converting plants, Director (2000-2010) |
| • Sunair Services Corporation, a provider of certain outdoor-related services to homes and |
| businesses, Director (2005-2009) |
| No. of Portfolios for which Board Member Serves: 141 |
| ——————— |
| Peggy C. Davis (70) |
| Board Member (2006) |
| Principal Occupation During Past 5Years: |
| • Shad Professor of Law, New York University School of Law (1983-present) |
| No. of Portfolios for which Board Member Serves: 56 |
| ——————— |
| David P. Feldman (73) |
| Board Member (1989) |
| Principal Occupation During Past 5Years: |
| • Corporate Director and Trustee |
| Other Public Company Board Memberships During Past 5Years: |
| • BBH Mutual Funds Group (4 registered mutual funds), Director (1992-present) |
| No. of Portfolios for which Board Member Serves: 42 |
| ——————— |
| Ehud Houminer (73) |
| Board Member (1996) |
| Principal Occupation During Past 5Years: |
| • Executive-in-Residence at the Columbia Business School, Columbia University (1992-present) |
| Other Public Company Board Memberships During Past 5Years: |
| • Avnet Inc., an electronics distributor, Director (1993-2012) |
| No. of Portfolios for which Board Member Serves: 66 |
The Fund 45
BOARD MEMBERS INFORMATION (Unaudited) (continued)
| Lynn Martin (73) |
| Board Member (2012) |
| Principal Occupation During Past 5Years: |
| • President ofThe Martin Hall Group LLC, a human resources consulting firm (January 2005-2012) |
| Other Public Company Board Memberships During Past 5Years: |
| • AT&T Inc., a telecommunications company, Director (1999-2012) |
| • Ryder System, Inc., a supply chain and transportation management company, Director (1993-2012) |
| • The Proctor & Gamble Co., a consumer products company, Director (1994-2009) |
| • Constellation Energy Group Inc., Director (2003-2009) |
| No. of Portfolios for which Board Member Serves: 42 |
| ——————— |
| Robin A. Melvin (50) |
| Board Member (2012) |
| Principal Occupation During Past 5Years: |
| • Board Member, Illinois Mentoring Partnership, non-profit organization dedicated to increasing |
| the quantity and quality of mentoring services in Illinois (2013-present) |
| • Director, Boisi Family Foundation, a private family foundation that supports youth-serving orga- |
| nizations that promote the self sufficiency of youth from disadvantaged circumstances (1995-2012) |
| No. of Portfolios for which Board Member Serves: 90 |
| ——————— |
| Dr. Martin Peretz (74) |
| Board Member (2006) |
| Principal Occupation During Past 5Years: |
| • Editor-in-Chief Emeritus of The New Republic Magazine (2010-2011) (previously, |
| Editor-in-Chief, 1974-2010) |
| • Director of TheStreet.com, a financial information service on the web (1996-2010) |
| Other Public Company Board Memberships During Past 5Years: |
| • Pershing Square Capital Management,Adviser (2009-present) |
| No. of Portfolios for which Board Member Serves: 42 |
| ——————— |
| Once elected all Board Members serve for an indefinite term, but achieve Emeritus status upon reaching age 80.The |
| address of the Board Members and Officers is c/o The Dreyfus Corporation, 200 Park Avenue, NewYork, NewYork |
| 10166.Additional information about the Board Members is available in the fund’s Statement of Additional Information |
| which can be obtained from Dreyfus free of charge by calling this toll free number: 1-800-DREYFUS. |
| James F. Henry, Emeritus Board Member |
| Dr. Paul A. Marks, Emeritus Board Member |
| Philip L.Toia, Emeritus Board Member |
46
OFFICERS OF THE FUND (Unaudited)
The Fund 47
OFFICERS OF THE FUND (Unaudited) (continued)
48
Item 2. Code of Ethics.
The Registrant has adopted a code of ethics that applies to the Registrant's principal executive officer, principal financial officer, principal accounting officer or controller, or persons performing similar functions. There have been no amendments to, or waivers in connection with, the Code of Ethics during the period covered by this Report.
Item 3. Audit Committee Financial Expert.
The Registrant's Board has determined that David P. Feldman, a member of the Audit Committee of the Board, is an audit committee financial expert as defined by the Securities and Exchange Commission (the "SEC"). David P. Feldman is "independent" as defined by the SEC for purposes of audit committee financial expert determinations.
Item 4. Principal Accountant Fees and Services.
(a) Audit Fees. The aggregate fees billed for each of the last two fiscal years (the "Reporting Periods") for professional services rendered by the Registrant's principal accountant (the "Auditor") for the audit of the Registrant's annual financial statements or services that are normally provided by the Auditor in connection with the statutory and regulatory filings or engagements for the Reporting Periods, were $103,338 in 2012 and $105,764 in 2013.
(b) Audit-Related Fees. The aggregate fees billed in the Reporting Periods for assurance and related services by the Auditor that are reasonably related to the performance of the audit of the Registrant's financial statements and are not reported under paragraph (a) of this Item 4 were $18,000 in 2012 and $18,000 in 2013. These services consisted of one or more of the following: (i) agreed upon procedures related to compliance with Internal Revenue Code section 817(h), (ii) security counts required by Rule 17f-2 under the Investment Company Act of 1940, as amended, (iii) advisory services as to the accounting or disclosure treatment of Registrant transactions or events and (iv) advisory services to the accounting or disclosure treatment of the actual or potential impact to the Registrant of final or proposed rules, standards or interpretations by the Securities and Exchange Commission, the Financial Accounting Standards Boards or other regulatory or standard-setting bodies.
The aggregate fees billed in the Reporting Periods for non-audit assurance and related services by the Auditor to the Registrant's investment adviser (not including any sub-investment adviser whose role is primarily portfolio management and is subcontracted with or overseen by another investment adviser), and any entity controlling, controlled by or under common control with the investment adviser that provides ongoing services to the Registrant ("Service Affiliates"), that were reasonably related to the performance of the annual audit of the Service Affiliate, which required pre-approval by the Audit Committee were $-0- in 2012 and $-0- in 2013.
(c) Tax Fees. The aggregate fees billed in the Reporting Periods for professional services rendered by the Auditor for tax compliance, tax advice, and tax planning ("Tax Services") were $30,188 in 2012 and $33,564 in 2013. These services consisted of: (i) review or preparation of U.S. federal, state, local and excise tax returns; (ii) U.S. federal, state and local tax planning, advice and assistance regarding statutory, regulatory or administrative developments; (iii) tax advice regarding tax qualification matters and/or treatment of various financial instruments held or proposed to be acquired or held, and (iv) determination of Passive Foreign Investment Companies. The aggregate fees billed in the Reporting Periods for Tax Services by the Auditor to Service Affiliates, which required pre-approval by the Audit Committee were $-0- in 2012 and $-0- in 2013.
(d) All Other Fees. The aggregate fees billed in the Reporting Periods for products and services provided by the Auditor, other than the services reported in paragraphs (a) through (c) of this Item, were $3,907 in 2012 and $4,044 in 2013. These services consisted of a review of the Registrant's anti-money laundering program.
The aggregate fees billed in the Reporting Periods for Non-Audit Services by the Auditor to Service Affiliates, other than the services reported in paragraphs (b) through (c) of this Item, which required pre-approval by the Audit Committee, were $200,000 in 2012 and $-0- in 2013.
(e)(1) Audit Committee Pre-Approval Policies and Procedures. The Registrant's Audit Committee has established policies and procedures (the "Policy") for pre-approval (within specified fee limits) of the Auditor's engagements for non-audit services to the Registrant and Service Affiliates without specific case-by-case consideration. The pre-approved services in the Policy can include pre-approved audit services, pre-approved audit-related services, pre-approved tax services and pre-approved all other services. Pre-approval considerations include whether the proposed services are compatible with maintaining the Auditor's independence. Pre-approvals pursuant to the Policy are considered annually.
(e)(2) Note: None of the services described in paragraphs (b) through (d) of this Item 4 were approved by the Audit Committee pursuant to paragraph (c)(7)(i)(C) of Rule 2-01 of Regulation S-X.
(f) None of the hours expended on the principal accountant's engagement to audit the registrant's financial statements for the most recent fiscal year were attributed to work performed by persons other than the principal account's full-time, permanent employees.
Non-Audit Fees. The aggregate non-audit fees billed by the Auditor for services rendered to the Registrant, and rendered to Service Affiliates, for the Reporting Periods were $47,346,640 in 2012 and $53,266,415 in 2013.
Auditor Independence. The Registrant's Audit Committee has considered whether the provision of non-audit services that were rendered to Service Affiliates, which were not pre-approved (not requiring pre-approval), is compatible with maintaining the Auditor's independence.
Item 5. Audit Committee of Listed Registrants.
Not applicable. [CLOSED-END FUNDS ONLY]
Item 6. Investments.
(a) Not applicable.
Item 7. Disclosure of Proxy Voting Policies and Procedures for Closed-End Management Investment Companies.
Not applicable. [CLOSED-END FUNDS ONLY]
Item 8. Portfolio Managers of Closed-End Management Investment Companies.
Not applicable. [CLOSED-END FUNDS ONLY, beginning with reports for periods ended on and after December 31, 2005]
Item 9. Purchases of Equity Securities by Closed-End Management Investment Companies and Affiliated Purchasers.
Not applicable. [CLOSED-END FUNDS ONLY]
Item 10. Submission of Matters to a Vote of Security Holders.
There have been no material changes to the procedures applicable to Item 10.
Item 11. Controls and Procedures.
(a) The Registrant's principal executive and principal financial officers have concluded, based on their evaluation of the Registrant's disclosure controls and procedures as of a date within 90 days of the filing date of this report, that the Registrant's disclosure controls and procedures are reasonably designed to ensure that information required to be disclosed by the Registrant on Form N-CSR is recorded, processed, summarized and reported within the required time periods and that information required to be disclosed by the Registrant in the reports that it files or submits on Form N-CSR is accumulated and communicated to the Registrant's management, including its principal executive and principal financial officers, as appropriate to allow timely decisions regarding required disclosure.
(b) There were no changes to the Registrant's internal control over financial reporting that occurred during the second fiscal quarter of the period covered by this report that have materially affected, or are reasonably likely to materially affect, the Registrant's internal control over financial reporting.
Item 12. Exhibits.
(a)(1) Code of ethics referred to in Item 2.
(a)(2) Certifications of principal executive and principal financial officers as required by Rule 30a-2(a) under the Investment Company Act of 1940.
(a)(3) Not applicable.
(b) Certification of principal executive and principal financial officers as required by Rule 30a-2(b) under the Investment Company Act of 1940.
SIGNATURES
Pursuant to the requirements of the Securities Exchange Act of 1934 and the Investment Company Act of 1940, the Registrant has duly caused this Report to be signed on its behalf by the undersigned, thereunto duly authorized.
Dreyfus Index Funds, Inc.
By: /s/ Bradley J. Skapyak | |
Bradley J. Skapyak President
| |
Date: | December 18, 2013 |
| |
Pursuant to the requirements of the Securities Exchange Act of 1934 and the Investment Company Act of 1940, this Report has been signed below by the following persons on behalf of the Registrant and in the capacities and on the dates indicated. | |
| |
By: /s/ Bradley J. Skapyak | |
Bradley J. Skapyak President
| |
Date: | December 18, 2013 |
| |
By: /s/ James Windels | |
James Windels Treasurer
| |
Date: | December 18, 2013 |
| |
EXHIBIT INDEX
(a)(1) Code of ethics referred to in Item 2.
(a)(2) Certifications of principal executive and principal financial officers as required by Rule 30a-2(a) under the Investment Company Act of 1940. (EX-99.CERT)
(b) Certification of principal executive and principal financial officers as required by Rule 30a-2(b) under the Investment Company Act of 1940. (EX-99.906CERT)