UNITED STATES
SECURITIES AND EXCHANGE COMMISSION
Washington, D.C. 20549
FORM N-CSR
CERTIFIED SHAREHOLDER REPORT OF REGISTERED MANAGEMENT
INVESTMENT COMPANIES
Investment Company Act file number | 811- 5883 | |||||
|
| |||||
| Dreyfus Index Funds, Inc. |
| ||||
| (Exact name of Registrant as specified in charter) |
| ||||
|
|
| ||||
|
c/o The Dreyfus Corporation 200 Park Avenue New York, New York 10166 |
| ||||
| (Address of principal executive offices) (Zip code) |
| ||||
|
|
| ||||
| Michael A. Rosenberg, Esq. 200 Park Avenue New York, New York 10166 |
| ||||
| (Name and address of agent for service) |
| ||||
| ||||||
Registrant's telephone number, including area code: | (212) 922-6000 | |||||
|
| |||||
Date of fiscal year end:
| 10/31 |
| ||||
Date of reporting period: | 10/31/2010 |
| ||||
| Dreyfus International |
| Stock Index Fund |
ANNUAL REPORT October 31, 2010
Save time. Save paper. View your next shareholder report online as soon as it’s available. Log into www.dreyfus.com and sign up for Dreyfus eCommunications. It’s simple and only takes a few minutes.
The views expressed in this report reflect those of the portfolio manager only through the end of the period covered and do not necessarily represent the views of Dreyfus or any other person in the Dreyfus organization. Any such views are subject to change at any time based upon market or other conditions and Dreyfus disclaims any responsibility to update such views.These views may not be relied on as investment advice and, because investment decisions for a Dreyfus fund are based on numerous factors, may not be relied on as an indication of trading intent on behalf of any Dreyfus fund.

Contents | |
THE FUND | |
| 2 | A Letter from the Chairman and CEO |
| 3 | Discussion of Fund Performance |
| 6 | Fund Performance |
| 7 | Understanding Your Fund’s Expenses |
| 7 | Comparing Your Fund’s Expenses With Those of Other Funds |
| 8 | Statement of Investments |
| 38 | Statement of Financial Futures |
| 39 | Statement of Assets and Liabilities |
| 40 | Statement of Operations |
| 41 | Statement of Changes in Net Assets |
| 42 | Financial Highlights |
| 43 | Notes to Financial Statements |
| 57 | Report of Independent Registered Public Accounting Firm |
| 58 | Important Tax Information |
| 59 | Board Members Information |
| 61 | Officers of the Fund |
FOR MORE INFORMATION | |
Back Cover |
Dreyfus International
Stock Index Fund
The Fund

A LETTER FROM THE CHAIRMAN AND CEO
Dear Shareholder:
We are pleased to present this annual report for Dreyfus International Stock Index Fund, covering the 12-month period from November 1, 2009, through October 31, 2010.
Although a double-dip recession has recently become an increasingly unlikely scenario in our view, persistent uncertainty regarding the breadth and strength of the U.S. and global economic recoveries led to bouts of heightened volatility for U.S. stocks during most of 2010.The spending power of the U.S. consumer, long an important catalyst for economic growth, has been diminished by concerns over job security and an inability to generate cash from home equity.The second major driver of sustainable growth, corporate investment, has been stunted to a similar extent by tight credit conditions. However, the recent announcement of additional quantitative easing (QE2) measures by the Federal Reserve Board, as well as improved fundamentals across many developing nations, have helped support moderate global economic growth.
Uncertainty will probably remain in the broader financial markets until we see more evidence of robust economic growth, but we remain optimistic regarding the prospects for equities. Many stocks of quality companies with healthy balance sheets, higher credit ratings and strong cash flows appear to be currently priced at a discount.With that, we strongly suggest that you meet with your financial advisor to discuss the potential opportunities which may exist in the global markets, as well as to evaluate your portfolio to help meet your individual investment needs and your future goals relative to your risk-tolerance level.
For information about how the fund performed during the reporting period, as well as general market perspectives, we provide a Discussion of Fund Performance on the pages that follow.
Thank you for your continued confidence and support.

Jonathan R. Baum
Chairman and Chief Executive Officer
The Dreyfus Corporation
November 15, 2010
2

DISCUSSION OF FUND PERFORMANCE
For the period of November 1, 2009, through October 31, 2010, as provided by Thomas J. Durante, CFA, Karen Q. Wong and Richard A. Brown, Portfolio Managers
Fund and Market Performance Overview
For the 12-month period ended October 31, 2010, Dreyfus International Stock Index Fund produced a total return of 8.73%.1 This compares with a 8.36% total return for the fund’s benchmark, the Morgan Stanley Capital International Europe,Australasia, Far East Index (the “MSCI EAFE Index” or the “Index”), during the same period.2
International stock markets encountered heightened volatility during the reporting period, as the global economy gradually recovered due to robust ongoing demand from the emerging markets, more than offsetting weakness in Europe stemming from a sovereign debt crisis.
The Fund’s Investment Approach
The fund seeks to match the performance of the MSCI EAFE Index, a broadly diversified, international index composed of approximately 1,000 companies located in developed markets outside the United States and Canada.The fund attempts to match the Index’s return before fees and expenses by aligning the portfolio composition with the composition of the MSCI EAFE Index.The fund also invests in securities that represent the market as a whole, such as stock index futures, and manages its exposure to foreign currencies so that the fund’s currency profile matches the currency makeup of the MSCI EAFE Index.
Global Markets Advanced Despite Economic Headwinds
Throughout the first half of the reporting period, unemployment remained stubbornly high and credit availability was relatively tight in many regions of the world. However, those factors were offset by improved manufacturing activity and robust demand for energy and industrial commodities from the emerging markets of Asia, most notably China and India. In addition, many of the emerging markets remained fiscally strong due, in part, to undervalued currencies that
The Fund 3
DISCUSSION OF FUND PERFORMANCE (continued)
helped boost exports, limited exposure to the 2008 financial crisis and increased domestic consumption by an expanding middle class.
In contrast, a sovereign debt crisis in Europe weighed heavily on the region’s stock markets and the economies of Portugal, Italy, Ireland, Greece and Spain, which suffered from heavy debt loads that proved difficult to finance under tighter credit conditions. Other European nations fared better, including the United Kingdom and Germany. As it has for some time, Japan’s economy remained under pressure from deflationary pressures and tepid domestic demand.
Higher Commodities Prices Boosted Key Market Sectors
In this mixed environment, the Index’s best relative performance stemmed from the materials, industrials and consumer sectors. Within the materials sector, rising commodity prices helped fuel gains for U.K.-based mining company Anglo American and global metals-and-mining giants Rio Tinto and BHP Billiton. Other winners included Fortescue Metals Group and Newcrest Mining, a gold and copper mining firm that advanced sharply when it acquired Lihir Gold. German chemical company BASF and France’s Air Liquide also posted solid gains as industrial demand recovered.
In the industrials sector, the Index’s results were boosted by German electronic and industrial engineering firm Siemens and Japan’s Fanuc, which serves the recovering automotive industry. Other winners included French electrical equipment manufacturer Schneider Electric, and, in the United Kingdom, Rolls-Royce Group, which now ranks as the world’s second largest aircraft engine maker.
Retailers and Automakers Saw Improved Consumer Spending
An increase in consumer spending enabled the fund’s consumer staples holdings to post double-digit returns. Winners included Swiss food giant Nestlé and U.K. household and personal care products maker Reckitt Benckiser Group. Retailers also achieved significant gains, including Australia’s Wesfarmer Ltd. and French-owned Carrefour. Distillers proved successful, including Belgium’s Anheuser-Busch InBev and the United Kingdom’s SABMiller. Sales of trucks and automobiles bounced back from previously depressed levels, benefiting automakers
4
including Germany’s Daimler, Volkswagen and Bayerische Motoren Werke (BMW) and Honda Motor of Japan. Sellers of luxury goods products also flourished, including France’s LVMH Group, Moet Hennessey LouisVuitton, Burberry Group in the United Kingdom and Switzerland’s Compagnie Financiere Richemont.
In contrast, financial stocks generally disappointed, as the European debt crisis caused a number of Greek banks to post declines of 60% or more. Those stocks included National Bank of Greece, Alpha Bank, Piraeus Bank, Marfin Investment Group and EFG Eurobank Ergasias. Spanish banks also lagged, including Banco Santander, Banco Bilbao Vizcaya Argentaria and Banco Popular Español.
Index Funds Offer Diversification Benefits
An as index fund, we attempt to replicate the returns of the MSCI EAFE Index by closely approximating its composition. In our view, one of the greatest benefits of an index fund is that it offers a broadly diversified investment vehicle that can help investors manage risks by limiting the impact on the overall portfolio of unexpected losses in any single country, industry group or holding.
November 15, 2010
| Please note, the position in any security highlighted in italicized typeface was sold during the | |
| reporting period. | |
| Equity funds are subject generally to market, market sector, market liquidity, issuer and investment | |
| style risks, among other factors, to varying degrees, all of which are more fully described in the | |
| fund’s prospectus. | |
| The fund’s performance will be influenced by political, social and economic factors affecting | |
| investments in foreign companies. Special risks associated with investments in foreign companies | |
| include exposure to currency fluctuations, less liquidity, less developed or less efficient trading | |
| markets, lack of comprehensive company information, political instability and differing auditing | |
| and legal standards. | |
| 1 | Total return includes reinvestment of dividends and any capital gains paid. Past performance is no |
| guarantee of future results. Share price, yield and investment return fluctuate such that upon | |
| redemption, fund shares may be worth more or less than their original cost. | |
| 2 | SOURCE: LIPPER INC. — Reflects reinvestment of net dividends and, where applicable, |
| capital gain distributions.The Morgan Stanley Capital International Europe,Australasia, Far | |
| East (MSCI EAFE) Index is an unmanaged index composed of a sample of companies | |
| representative of the market structure of European and Pacific Basin countries.The index reflects | |
| actual investable opportunities for global investors for stocks that are free of foreign ownership | |
| limits or legal restrictions at the country level. Investors cannot invest directly in any index. |
The Fund 5

Comparison of change in value of $10,000 investment in Dreyfus International Stock Index Fund and the Morgan Stanley Capital International Europe, Australasia, Far East Free Index
| Average Annual Total Returns as of 10/31/10 | |||
| 1 Year | 5 Years | 10 Years | |
| Fund | 8.73% | 2.86% | 2.45% |
| Morgan Stanley Capital International | |||
| Europe, Australasia, Far East Free Index | 8.36% | 3.31% | 3.17% |
† Source: Lipper Inc.
Past performance is not predictive of future performance.The fund’s performance shown in the graph and table does not reflect the deduction of taxes that a shareholder would pay on fund distributions or the redemption of fund shares.
The above graph compares a $10,000 investment made in Dreyfus International Stock Index Fund on 10/31/00 to a $10,000 investment made in the Morgan Stanley Capital International Europe,Australasia, Far East Free Index (the “Index”) on that date.All dividends and capital gain distributions are reinvested.
The fund’s performance shown in the line graph takes into account all applicable fees and expenses.The Index is an unmanaged index composed of a sample of companies representative of the market structure of European and Pacific Basin countries and includes net dividends reinvested and reflects actual investable opportunities for global investors for stocks that are free of foreign ownership limits or legal restrictions at the security or country level. Unlike a mutual fund, the Index is not subject to charges, fees and other expenses. Investors cannot invest directly in any index. Further information relating to fund performance, including expense reimbursements, if applicable, is contained in the Financial Highlights section of the prospectus and elsewhere in this report.
6
UNDERSTANDING YOUR FUND’S EXPENSES (Unaudited)
As a mutual fund investor, you pay ongoing expenses, such as management fees and other expenses. Using the information below, you can estimate how these expenses affect your investment and compare them with the expenses of other funds.You also may pay one-time transaction expenses, including sales charges (loads) and redemption fees, which are not shown in this section and would have resulted in higher total expenses. For more information, see your fund’s prospectus or talk to your financial adviser.
Review your fund’s expenses
The table below shows the expenses you would have paid on a $1,000 investment in Dreyfus International Stock Index Fund from May 1, 2010 to October 31, 2010. It also shows how much a $1,000 investment would be worth at the close of the period, assuming actual returns and expenses.
Expenses and Value of a $1,000 Investment
assuming actual returns for the six months ended October 31, 2010
| Expenses paid per $1,000† | $ 3.12 |
| Ending value (after expenses) | $1,062.30 |
COMPARING YOUR FUND’S EXPENSES
WITH THOSE OF OTHER FUNDS (Unaudited)
Using the SEC’s method to compare expenses
The Securities and Exchange Commission (SEC) has established guidelines to help investors assess fund expenses. Per these guidelines, the table below shows your fund’s expenses based on a $1,000 investment, assuming a hypothetical 5% annualized return. You can use this information to compare the ongoing expenses (but not transaction expenses or total cost) of investing in the fund with those of other funds.All mutual fund shareholder reports will provide this information to help you make this comparison. Please note that you cannot use this information to estimate your actual ending account balance and expenses paid during the period.
Expenses and Value of a $1,000 Investment assuming a hypothetical 5% annualized return for the six months ended October 31, 2010
| Expenses paid per $1,000† | $ 3.06 |
| Ending value (after expenses) | $1,022.18 |
| † Expenses are equal to the fund’s annualized expense ratio of .60%, multiplied by the average account value over the |
| period, multiplied by 184/365 (to reflect the one-half year period). |
The Fund 7
STATEMENT OF INVESTMENTS
October 31, 2010
| Common Stocks—97.1% | Shares | Value ($) |
| Australia—8.3% | ||
| AGL Energy | 22,974 | 362,333 |
| Alumina | 132,098 | 262,849 |
| Amcor | 60,882 | 401,026 |
| AMP | 104,666 | 547,850 |
| Aristocrat Leisure | 22,601 | 77,759 |
| Asciano Group | 147,855 a | 226,812 |
| ASX | 8,579 | 311,979 |
| Australia & New Zealand Banking Group | 129,581 | 3,151,249 |
| AXA Asia Pacific Holdings | 53,416 | 284,830 |
| Bendigo and Adelaide Bank | 17,666 | 156,712 |
| BHP Billiton | 171,908 | 7,063,697 |
| Billabong International | 8,993 | 71,665 |
| BlueScope Steel | 91,697 | 179,313 |
| Boral | 31,989 | 137,651 |
| Brambles | 71,591 | 447,005 |
| Caltex Australia | 6,352 | 72,349 |
| CFS Retail Property Trust | 94,834 | 172,899 |
| Coca-Cola Amatil | 28,324 | 337,878 |
| Cochlear | 2,889 | 201,114 |
| Commonwealth Bank of Australia | 79,260 | 3,799,073 |
| Computershare | 24,153 | 239,589 |
| Crown | 23,845 | 194,696 |
| CSL | 29,247 | 941,167 |
| CSR | 71,593 | 127,719 |
| Dexus Property Group | 242,514 | 197,301 |
| Energy Resources of Australia | 2,999 | 38,244 |
| Fairfax Media | 105,013 | 149,254 |
| Fortescue Metals Group | 63,911 a | 391,535 |
| Foster’s Group | 100,850 | 577,303 |
| Goodman Fielder | 66,293 | 96,496 |
| Goodman Group | 316,833 | 195,653 |
| GPT Group | 93,796 | 256,509 |
| Harvey Norman Holdings | 31,092 | 101,486 |
| Incitec Pivot | 83,565 | 304,707 |
| Insurance Australia Group | 103,594 | 385,863 |
8
| Common Stocks (continued) | Shares | Value ($) | |
| Australia (continued) | |||
| Intoll Group | 108,605 | 160,214 | |
| James Hardie Industries-CDI | 22,829 | a | 120,612 |
| Leighton Holdings | 7,148 | 257,137 | |
| Lend Lease Group | 27,459 | 194,059 | |
| MacArthur Coal | 6,442 | 75,900 | |
| Macquarie Group | 17,560 | 623,086 | |
| MAp Group | 41,877 | 125,196 | |
| Metcash | 38,630 | 165,471 | |
| Mirvac Group | 158,113 | 200,702 | |
| National Australia Bank | 108,451 | 2,706,491 | |
| Newcrest Mining | 38,875 | 1,522,687 | |
| OneSteel | 73,726 | 195,119 | |
| Orica | 18,200 | 449,202 | |
| Origin Energy | 45,459 | 710,269 | |
| OZ Minerals | 164,157 | a | 251,819 |
| Paladin Energy | 33,468 | a | 134,502 |
| Qantas Airways | 55,702 | a | 155,061 |
| QBE Insurance Group | 53,896 | 907,600 | |
| Rio Tinto | 22,241 | 1,802,694 | |
| Santos | 42,846 | 530,010 | |
| Sims Metal Management | 8,218 | 132,348 | |
| Sonic Healthcare | 18,514 | 197,625 | |
| SP Ausnet | 62,635 | 57,097 | |
| Stockland | 120,083 | 443,749 | |
| Suncorp-Metway | 64,780 | 584,176 | |
| TABCORP Holdings | 33,673 | 243,586 | |
| Tatts Group | 70,864 | 173,652 | |
| Telstra | 224,517 | 587,591 | |
| Toll Holdings | 33,878 | 205,885 | |
| Transurban Group | 64,872 | 333,199 | |
| Wesfarmers | 51,297 | 1,666,323 | |
| Wesfarmers-PPS | 7,780 | 254,631 | |
| Westfield Group | 111,763 | 1,356,230 | |
| Westpac Banking | 152,318 | 3,389,158 | |
| Woodside Petroleum | 27,715 | 1,181,732 |
The Fund 9
STATEMENT OF INVESTMENTS (continued)
| Common Stocks (continued) | Shares | Value ($) | |
| Australia (continued) | |||
| Woolworths | 63,341 | 1,760,162 | |
| WorleyParsons | 10,577 | 237,936 | |
| 46,556,476 | |||
| Austria—.3% | |||
| Erste Group Bank | 9,504 | 428,385 | |
| IMMOFINANZ | 49,649 | a | 195,289 |
| OMV | 7,484 | 279,241 | |
| Raiffeisen Bank International | 3,091 | 173,994 | |
| Telekom Austria | 17,644 | 269,756 | |
| Verbund | 4,010 | 160,042 | |
| Vienna Insurance Group | 2,207 | 118,543 | |
| Voestalpine | 5,799 | 229,589 | |
| 1,854,839 | |||
| Belgium—1.0% | |||
| Ageas | 110,945 | 340,631 | |
| Anheuser-Busch InBev | 36,894 | 2,309,336 | |
| Anheuser-Busch InBev (STRIP) | 12,680 | a | 53 |
| Belgacom | 7,731 | 302,909 | |
| Cie Nationale a Portefeuille | 1,371 | 72,992 | |
| Colruyt | 4,105 | 230,959 | |
| Delhaize Group | 5,029 | 350,817 | |
| Dexia | 31,667 a | 140,800 | |
| Groupe Bruxelles Lambert | 4,113 | 363,749 | |
| Groupe Bruxelles Lambert (STRIP) | 236 | a | 3 |
| KBC Groep | 8,356 a | 362,994 | |
| Mobistar | 1,360 | 89,900 | |
| Solvay | 3,065 | 324,145 | |
| UCB | 5,144 | 199,260 | |
| Umicore | 5,756 | 270,568 | |
| 5,359,116 | |||
| China—.1% | |||
| Foxconn International Holdings | 132,000 | a | 97,396 |
| Sands China | 109,813 | 239,392 | |
| Yangzijiang Shipbuilding Holdings | 81,000 | 117,033 | |
| 453,821 | |||
10
| Common Stocks (continued) | Shares | Value ($) | |
| Denmark—1.0% | |||
| AP Moller—Maersk, Cl. A | 30 | 251,810 | |
| AP Moller—Maersk, Cl. B | 68 | 589,403 | |
| Carlsberg, Cl. B | 5,582 | 609,731 | |
| Coloplast, Cl. B | 1,189 | 147,053 | |
| Danske Bank | 23,393 | a | 621,371 |
| DSV | 10,631 | 217,584 | |
| Novo Nordisk, Cl. B | 22,261 | 2,340,315 | |
| Novozymes, Cl. B | 2,468 | 328,469 | |
| Tryg | 1,536 | 77,305 | |
| Vestas Wind Systems | 10,228 | a | 326,015 |
| William Demant Holding | 1,278 | a | 95,694 |
| 5,604,750 | |||
| Finland—1.1% | |||
| Elisa | 6,364 | 135,952 | |
| Fortum | 22,888 | 648,008 | |
| Kesko, Cl. B | 3,623 | 179,367 | |
| Kone, Cl. B | 8,003 | 428,248 | |
| Metso | 6,332 | 299,843 | |
| Neste Oil | 6,406 | 106,132 | |
| Nokia | 191,307 | 2,063,355 | |
| Nokian Renkaat | 5,429 | 187,889 | |
| Orion, Cl. B | 4,426 | 93,936 | |
| Outokumpu | 7,143 | 128,171 | |
| Pohjola Bank | 7,347 | 92,874 | |
| Rautaruukki | 4,060 | 80,525 | |
| Sampo, Cl. A | 21,632 | 605,232 | |
| Sanoma | 4,669 | 105,064 | |
| Stora Enso, Cl. R | 29,938 | 297,100 | |
| UPM-Kymmene | 27,030 | 448,947 | |
| Wartsila | 4,180 | 292,811 | |
| 6,193,454 | |||
| France—9.5% | |||
| Accor | 7,894 | 323,284 | |
| Aeroports de Paris | 1,537 | 130,376 | |
| Air France | 7,338 | a | 133,760 |
The Fund 11
STATEMENT OF INVESTMENTS (continued)
| Common Stocks (continued) | Shares | Value ($) | |
| France (continued) | |||
| Air Liquide | 14,441 | 1,865,440 | |
| Alcatel-Lucent | 118,275 a | 414,590 | |
| Alstom | 10,751 | 541,824 | |
| Atos Origin | 2,389 a | 110,322 | |
| AXA | 87,638 | 1,593,241 | |
| BioMerieux | 590 | 56,697 | |
| BNP Paribas | 48,491 | 3,541,727 | |
| Bouygues | 11,866 | 522,234 | |
| Bureau Veritas | 2,465 | 181,925 | |
| Cap Gemini | 7,608 | 387,601 | |
| Carrefour | 30,577 | 1,648,101 | |
| Casino Guichard Perrachon | 3,007 | 282,110 | |
| Christian Dior | 3,253 | 469,991 | |
| Cie de St-Gobain | 19,556 | 912,186 | |
| Cie Generale d’Optique Essilor International | 10,186 | 679,274 | |
| Cie Generale de Geophysique-Veritas | 8,008 | a | 186,432 |
| Cie Generale des Etablissements Michelin, Cl. B | 8,988 | 713,938 | |
| CNP Assurances | 8,148 | 162,398 | |
| Credit Agricole | 48,532 | 794,274 | |
| Danone | 29,770 | 1,881,624 | |
| Dassault Systemes | 3,123 | 239,212 | |
| Edenred | 7,894 a | 165,126 | |
| EDF | 13,562 | 620,627 | |
| Eiffage | 2,009 | 99,126 | |
| Eramet | 324 | 112,154 | |
| Eurazeo | 1,682 | 127,644 | |
| Eutelsat Communications | 5,239 | 196,495 | |
| Fonciere des Regions | 1,148 | 130,839 | |
| France Telecom | 94,714 | 2,272,804 | |
| GDF Suez | 63,560 | 2,533,637 | |
| Gecina | 1,000 | 121,199 | |
| Groupe Eurotunnel | 26,075 | 258,800 | |
| Hermes International | 2,718 | 575,915 | |
| ICADE | 1,094 | 120,123 | |
12
| Common Stocks (continued) | Shares | Value ($) |
| France (continued) | ||
| Iliad | 735 | 82,645 |
| Imerys | 1,905 | 113,535 |
| Ipsen | 1,640 | 57,669 |
| JC Decaux | 3,387 a | 99,071 |
| Klepierre | 4,591 | 178,349 |
| L’Oreal | 12,220 | 1,432,811 |
| Lafarge | 10,508 | 599,681 |
| Lagardere | 6,046 | 257,519 |
| Legrand | 6,520 | 251,383 |
| LVMH Moet Hennessy Louis Vuitton | 12,503 | 1,956,743 |
| Metropole Television | 3,249 | 79,252 |
| Natixis | 46,403 a | 284,230 |
| Neopost | 1,569 | 130,168 |
| PagesJaunes Groupe | 6,051 | 66,441 |
| Pernod-Ricard | 10,056 | 890,459 |
| Peugeot | 7,792 a | 309,739 |
| PPR | 3,912 | 640,509 |
| Publicis Groupe | 6,643 | 330,451 |
| Renault | 10,002 a | 555,026 |
| Safran | 8,590 | 271,974 |
| Sanofi-Aventis | 53,655 | 3,742,158 |
| Schneider Electric | 12,267 | 1,739,081 |
| SCOR | 8,435 | 207,159 |
| Societe BIC | 1,432 | 126,883 |
| Societe Generale | 32,111 | 1,920,242 |
| Societe Television Francaise 1 | 6,190 | 100,875 |
| Sodexo | 4,880 | 317,158 |
| Suez Environnement | 13,374 | 261,074 |
| Technip | 4,948 | 415,313 |
| Thales | 4,382 | 178,422 |
| Total | 108,237 | 5,873,845 |
| Unibail-Rodamco | 4,639 | 965,223 |
| Vallourec | 5,598 | 580,201 |
| Veolia Environnement | 17,741 | 520,409 |
The Fund 13
STATEMENT OF INVESTMENTS (continued)
| Common Stocks (continued) | Shares | Value ($) | |
| France (continued) | |||
| Vinci | 22,202 | 1,184,345 | |
| Vivendi | 62,752 | 1,787,544 | |
| 53,614,637 | |||
| Germany—7.6% | |||
| Adidas | 10,785 | 702,581 | |
| Allianz | 23,207 | 2,904,262 | |
| BASF | 46,981 | 3,413,808 | |
| Bayer | 42,299 | 3,152,377 | |
| Bayerische Motoren Werke | 16,863 | 1,207,279 | |
| Beiersdorf | 5,218 | 339,488 | |
| Celesio | 3,952 | 94,093 | |
| Commerzbank | 36,589 | a | 329,285 |
| Continental | 2,534 | a | 219,843 |
| Daimler | 46,134 a | 3,041,274 | |
| Deutsche Bank | 47,613 | 2,741,050 | |
| Deutsche Boerse | 10,223 | 718,401 | |
| Deutsche Lufthansa | 11,634 | a | 248,614 |
| Deutsche Post | 44,384 | 826,633 | |
| Deutsche Postbank | 4,595 a | 159,792 | |
| Deutsche Telekom | 144,787 | 2,094,892 | |
| E.ON | 92,078 | 2,879,517 | |
| Fraport AG Frankfurt Airport Services Worldwide | 1,957 | 123,979 | |
| Fresenius | 1,394 | 122,858 | |
| Fresenius Medical Care & Co. | 9,728 | 618,851 | |
| GEA Group | 9,030 | 235,828 | |
| Hannover Rueckversicherung | 3,039 | 153,538 | |
| HeidelbergCement | 7,045 | 368,025 | |
| Henkel & Co. | 6,718 | 333,202 | |
| Hochtief | 2,305 | 199,430 | |
| Infineon Technologies | 56,400 | a | 443,374 |
| K+S | 7,234 | 502,825 | |
| Linde | 8,602 | 1,236,833 | |
| MAN | 5,442 | 597,540 | |
| Merck | 3,332 | 277,173 | |
| Metro | 6,743 | 471,976 | |
| Muenchener Rueckversicherungs | 9,786 | 1,528,127 | |
14
| Common Stocks (continued) | Shares | Value ($) | |
| Germany (continued) | |||
| Puma | 268 | 88,988 | |
| RWE | 21,351 | 1,528,293 | |
| Salzgitter | 2,195 | 157,392 | |
| SAP | 43,856 | 2,283,989 | |
| Siemens | 42,119 | 4,805,036 | |
| Suedzucker | 3,046 | 71,971 | |
| ThyssenKrupp | 17,206 | 632,299 | |
| TUI | 7,370 a | 85,984 | |
| United Internet | 5,818 | 104,112 | |
| Volkswagen | 1,464 | 192,004 | |
| Wacker Chemie | 762 | 157,011 | |
| 42,393,827 | |||
| Greece—.3% | |||
| Alpha Bank | 25,409 | a | 168,103 |
| Bank of Cyprus Public | 34,598 | 161,094 | |
| Coca-Cola Hellenic Bottling | 9,393 | 242,828 | |
| EFG Eurobank Ergasias | 16,597 | a | 102,653 |
| Hellenic Telecommunications Organization | 13,152 | 105,109 | |
| National Bank of Greece | 49,923 | a | 546,081 |
| OPAP | 10,949 | 206,203 | |
| Piraeus Bank | 16,634 | a | 86,467 |
| Public Power | 6,826 | 114,323 | |
| 1,732,861 | |||
| Hong Kong—2.5% | |||
| ASM Pacific Technology | 9,600 | 86,560 | |
| Bank of East Asia | 78,350 | 334,531 | |
| BOC Hong Kong Holdings | 190,500 | 597,132 | |
| Cathay Pacific Airways | 63,000 | 169,440 | |
| Cheung Kong Holdings | 71,000 | 1,080,712 | |
| Cheung Kong Infrastructure Holdings | 27,000 | 112,844 | |
| CLP Holdings | 100,788 | 819,066 | |
| Esprit Holdings | 59,759 | 321,832 | |
| Hang Lung Group | 41,000 | 272,106 | |
| Hang Lung Properties | 107,000 | 523,799 | |
| Hang Seng Bank | 39,400 | 576,340 | |
| Henderson Land Development | 54,762 | 388,871 | |
The Fund 15
STATEMENT OF INVESTMENTS (continued)
| Common Stocks (continued) | Shares | Value ($) | |
| Hong Kong (continued) | |||
| Hong Kong & China Gas | 225,231 | 542,718 | |
| Hong Kong Exchanges & Clearing | 52,100 | 1,146,532 | |
| HongKong Electric Holdings | 71,000 | 451,060 | |
| Hopewell Holdings | 33,000 | 103,866 | |
| Hutchison Whampoa | 108,800 | 1,072,239 | |
| Hysan Development | 34,000 | 131,355 | |
| Kerry Properties | 36,000 | 199,683 | |
| Li & Fung | 118,600 | 626,481 | |
| Lifestyle International Holdings | 27,500 | 63,781 | |
| Link REIT | 112,500 | 346,833 | |
| Mongolia Energy | 190,000 | a | 72,791 |
| MTR | 76,500 | 291,107 | |
| New World Development | 138,191 | 272,735 | |
| NWS Holdings | 40,000 | 94,320 | |
| Orient Overseas International | 11,300 | 99,046 | |
| PCCW | 167,000 | 63,764 | |
| Shangri-La Asia | 73,000 | 164,225 | |
| Sino Land | 90,664 | 189,227 | |
| Sun Hung Kai Properties | 71,699 | 1,228,233 | |
| Swire Pacific, Cl. A | 40,000 | 567,573 | |
| Television Broadcasts | 13,000 | 69,257 | |
| Wharf Holdings | 71,192 | 467,432 | |
| Wheelock & Co. | 49,000 | 171,607 | |
| Wing Hang Bank | 10,500 | 122,712 | |
| Wynn Macau | 78,800 | 174,223 | |
| Yue Yuen Industrial Holdings | 39,800 | 142,724 | |
| 14,158,757 | |||
| Ireland—.2% | |||
| Anglo Irish Bank | 35,225 | a,b | 49 |
| CRH | 36,508 | 624,383 | |
| Elan | 23,710 a | 133,465 | |
| Governor & Co. of the Bank of Ireland | 129,718 | a | 96,097 |
| Kerry Group, Cl. A | 7,435 | 272,297 | |
| Ryanair Holdings | 4,000 | 22,972 | |
| 1,149,263 | |||
16
| Common Stocks (continued) | Shares | Value ($) | |
| Israel—.8% | |||
| Bank Hapoalim | 50,958 | a | 231,137 |
| Bank Leumi Le-Israel | 60,678 | a | 279,398 |
| Bezeq Israeli Telecommunication | 88,933 | 235,817 | |
| Cellcom Israel | 2,512 | 84,850 | |
| Delek Group | 202 | 55,841 | |
| Discount Investment | 1,448 | 33,098 | |
| Elbit Systems | 1,178 | 62,958 | |
| Israel | 117 a | 125,512 | |
| Israel Chemicals | 22,812 | 348,878 | |
| Israel Discount Bank, Cl. A | 27,397 | a | 55,909 |
| Makhteshim-Agan Industries | 12,148 | a | 61,049 |
| Mizrahi Tefahot Bank | 6,222 | 58,190 | |
| NICE Systems | 3,141 | a | 102,122 |
| Ormat Industries | 3,363 | 26,873 | |
| Partner Communications | 4,318 | 87,061 | |
| Teva Pharmaceutical Industries | 47,663 | 2,481,806 | |
| 4,330,499 | |||
| Italy—2.8% | |||
| A2A | 55,689 | 90,637 | |
| Assicurazioni Generali | 59,485 | 1,302,175 | |
| Atlantia | 12,804 | 292,213 | |
| Autogrill | 6,976 a | 92,887 | |
| Banca Carige | 32,548 | 78,715 | |
| Banca Monte dei Paschi di Siena | 111,297 | a | 156,392 |
| Banca Popolare di Milano Scarl | 20,979 | 97,900 | |
| Banco Popolare | 32,159 | 172,644 | |
| Enel | 336,051 | 1,916,175 | |
| ENI | 133,146 | 2,996,100 | |
| EXOR | 2,841 | 72,932 | |
| Fiat | 39,337 | 664,838 | |
| Finmeccanica | 19,876 | 277,084 | |
| Intesa Sanpaolo | 392,620 | 1,379,256 | |
| Intesa Sanpaolo-RSP | 47,999 | 131,359 | |
| Luxottica Group | 5,885 | 173,651 | |
| Mediaset | 37,823 | 278,621 | |
The Fund 17
STATEMENT OF INVESTMENTS (continued)
| Common Stocks (continued) | Shares | Value ($) | |
| Italy (continued) | |||
| Mediobanca | 23,810 | 246,380 | |
| Mediolanum | 14,252 | 66,904 | |
| Parmalat | 85,517 | 234,866 | |
| Pirelli & C | 11,503 | 98,086 | |
| Prelios | 11,503 a | 6,739 | |
| Prysmian | 9,251 | 179,111 | |
| Saipem | 13,611 | 604,046 | |
| Snam Rete Gas | 72,977 | 394,817 | |
| Telecom Italia | 474,711 | 727,097 | |
| Telecom Italia-RSP | 319,041 | 390,221 | |
| Terna Rete Elettrica Nazionale | 67,119 | 309,250 | |
| UniCredit | 688,709 | 1,792,895 | |
| Unione di Banche Italiane | 32,249 | 339,980 | |
| 15,563,971 | |||
| Japan—20.4% | |||
| 77 Bank | 17,000 | 80,199 | |
| ABC-Mart | 1,600 | 54,366 | |
| Acom | 2,736 | 31,351 | |
| Advantest | 8,200 | 155,856 | |
| Aeon | 30,100 | 354,250 | |
| Aeon Credit Service | 3,960 | 45,524 | |
| Aeon Mall | 3,900 | 91,412 | |
| Air Water | 7,000 | 81,601 | |
| Aisin Seiki | 9,900 | 310,581 | |
| Ajinomoto | 34,800 | 331,799 | |
| Alfresa Holdings | 1,900 | 79,845 | |
| All Nippon Airways | 41,000 | a | 155,245 |
| Amada | 20,000 | 131,595 | |
| Aozora Bank | 21,959 | 36,803 | |
| Asahi Breweries | 20,100 | 405,493 | |
| Asahi Glass | 51,800 | 497,100 | |
| Asahi Kasei | 65,900 | 386,973 | |
| Asics | 9,000 | 97,095 | |
| Astellas Pharma | 22,979 | 854,117 | |
| Bank of Kyoto | 17,000 | 151,955 | |
| Bank of Yokohama | 63,000 | 309,721 | |
18
| Common Stocks (continued) | Shares | Value ($) |
| Japan (continued) | ||
| Benesse Holdings | 3,700 | 177,536 |
| Bridgestone | 34,000 | 609,088 |
| Brother Industries | 12,900 | 164,633 |
| Canon | 57,950 | 2,676,276 |
| Canon Marketing Japan | 2,900 | 36,110 |
| Casio Computer | 13,100 | 92,050 |
| Central Japan Railway | 79 | 597,281 |
| Chiba Bank | 39,000 | 240,633 |
| Chiyoda | 8,000 | 66,245 |
| Chubu Electric Power | 33,600 | 849,281 |
| Chugai Pharmaceutical | 11,428 | 199,901 |
| Chugoku Bank | 9,000 | 104,358 |
| Chugoku Electric Power | 15,700 | 316,534 |
| Chuo Mitsui Trust Holdings | 52,380 | 189,231 |
| Citizen Holdings | 12,400 | 71,275 |
| COCA-COLA WEST | 2,700 | 41,263 |
| Cosmo Oil | 36,000 | 96,983 |
| Credit Saison | 6,800 | 96,745 |
| Dai Nippon Printing | 28,800 | 363,263 |
| Dai-ichi Life Insurance | 420 | 508,901 |
| Daicel Chemical Industries | 15,000 | 104,283 |
| Daido Steel | 14,200 | 72,278 |
| Daihatsu Motor | 9,000 | 121,564 |
| Daiichi Sankyo | 34,183 | 723,551 |
| Daikin Industries | 11,800 | 410,327 |
| Dainippon Sumitomo Pharma | 9,000 | 81,117 |
| Daito Trust Construction | 3,700 | 223,240 |
| Daiwa House Industry | 25,400 | 274,024 |
| Daiwa Securities Group | 87,000 | 354,264 |
| Dena | 4,000 | 103,389 |
| Denki Kagaku Kogyo | 27,600 | 121,296 |
| Denso | 25,500 | 793,017 |
| Dentsu | 9,200 | 216,780 |
| Dowa Holdings | 11,350 | 68,903 |
| East Japan Railway | 17,300 | 1,068,498 |
| Eisai | 13,000 | 446,729 |
The Fund 19
STATEMENT OF INVESTMENTS (continued)
| Common Stocks (continued) | Shares | Value ($) | |
| Japan (continued) | |||
| Electric Power Development | 5,980 | 177,061 | |
| Elpida Memory | 9,400 | a | 96,276 |
| FamilyMart | 3,000 | 106,369 | |
| Fanuc | 9,800 | 1,417,381 | |
| Fast Retailing | 2,800 | 366,034 | |
| Fuji Electric Holdings | 29,000 | 69,125 | |
| Fuji Heavy Industries | 31,000 | 214,364 | |
| Fuji Media Holdings | 11 | 14,557 | |
| FUJIFILM Holdings | 23,500 | 783,333 | |
| Fujitsu | 97,800 | 667,784 | |
| Fukuoka Financial Group | 39,000 | 151,546 | |
| Furukawa Electric | 35,000 | 130,354 | |
| GS Yuasa | 21,000 | 140,000 | |
| Gunma Bank | 22,000 | 110,341 | |
| Hachijuni Bank | 21,000 | 107,933 | |
| Hakuhodo DY Holdings | 1,170 | 58,536 | |
| Hamamatsu Photonics | 3,200 | 103,369 | |
| Hankyu Hashin Holdings | 56,000 | 268,355 | |
| Hino Motors | 12,000 | 51,844 | |
| Hirose Electric | 1,600 | 160,894 | |
| Hiroshima Bank | 24,000 | 98,026 | |
| Hisamitsu Pharmaceutical | 3,400 | 139,292 | |
| Hitachi | 229,900 | 1,038,903 | |
| Hitachi Chemical | 5,200 | 96,511 | |
| Hitachi Construction Machinery | 5,000 | 106,207 | |
| Hitachi High-Technologies | 3,900 | 75,724 | |
| Hitachi Metals | 8,000 | 91,074 | |
| Hokkaido Electric Power | 9,600 | 201,773 | |
| Hokuhoku Financial Group | 63,000 | 116,536 | |
| Hokuriku Electric Power | 9,300 | 225,486 | |
| Honda Motor | 84,420 | 3,078,107 | |
| Hoya | 22,800 | 532,708 | |
| Ibiden | 7,100 | 174,701 | |
| Idemitsu Kosan | 1,100 | 92,452 | |
| IHI | 73,000 | 138,659 | |
| INPEX | 108 | 561,117 |
20
| Common Stocks (continued) | Shares | Value ($) |
| Japan (continued) | ||
| Isetan Mitsukoshi Holdings | 20,020 | 220,705 |
| Isuzu Motors | 61,000 | 234,761 |
| Ito En | 3,300 | 52,972 |
| ITOCHU | 76,300 | 668,750 |
| Itochu Techno-Solutions | 1,400 | 47,710 |
| Iyo Bank | 14,000 | 104,283 |
| J Front Retailing | 26,800 | 137,410 |
| Jafco | 1,600 | 33,410 |
| Japan Petroleum Exploration | 1,400 | 53,445 |
| Japan Prime Realty Investment | 36 | 89,341 |
| Japan Real Estate Investment | 26 | 250,155 |
| Japan Retail Fund Investment | 78 | 121,721 |
| Japan Steel Works | 17,000 | 161,875 |
| Japan Tobacco | 236 | 733,343 |
| JFE Holdings | 23,360 | 728,496 |
| JGC | 11,000 | 210,304 |
| Joyo Bank | 31,462 | 136,706 |
| JS Group | 12,924 | 254,148 |
| JSR | 9,100 | 157,372 |
| JTEKT | 10,800 | 108,335 |
| Jupiter Telecommunications | 120 | 129,758 |
| JX Holdings | 117,776 | 691,596 |
| Kajima | 40,800 | 95,732 |
| Kamigumi | 12,400 | 96,829 |
| Kaneka | 16,000 | 98,920 |
| Kansai Electric Power | 38,499 | 974,065 |
| Kansai Paint | 11,000 | 102,557 |
| Kao | 28,300 | 717,777 |
| Kawasaki Heavy Industries | 76,000 | 209,460 |
| Kawasaki Kisen Kaisha | 35,000 | 136,437 |
| KDDI | 153 | 823,408 |
| Keikyu Corp | 24,000 | 226,741 |
| Keio | 31,000 | 216,673 |
| Keisei Electric Railway | 13,000 | 86,828 |
| Keyence | 2,105 | 521,350 |
| Kikkoman | 8,000 | 86,207 |
The Fund 21
STATEMENT OF INVESTMENTS (continued)
| Common Stocks (continued) | Shares | Value ($) | |
| Japan (continued) | |||
| Kinden | 6,000 | 51,546 | |
| Kintetsu | 81,354 | 257,545 | |
| Kirin Holdings | 43,000 | 589,348 | |
| Kobe Steel | 127,000 | 279,069 | |
| Koito Manufacturing | 6,000 | 78,436 | |
| Komatsu | 48,300 | 1,182,466 | |
| Konami | 5,200 | 91,541 | |
| Konica Minolta Holdings | 25,000 | 242,086 | |
| Kubota | 61,000 | 542,222 | |
| Kuraray | 18,500 | 264,811 | |
| Kurita Water Industries | 5,700 | 148,037 | |
| Kyocera | 8,500 | 847,362 | |
| Kyowa Hakko Kirin | 14,705 | 143,855 | |
| Kyushu Electric Power | 19,500 | 461,657 | |
| Lawson | 3,100 | 140,857 | |
| Mabuchi Motor | 1,500 | 79,423 | |
| Makita | 5,700 | 200,261 | |
| Marubeni | 83,000 | 521,390 | |
| Marui Group | 10,900 | 85,657 | |
| Maruichi Steel Tube | 2,000 | 39,553 | |
| Matsui Securities | 8,000 | 45,289 | |
| Mazda Motor | 78,000 | 198,510 | |
| McDonald’s Holdings Japan | 3,000 | 76,089 | |
| Medipal Holdings | 7,700 | 89,857 | |
| MEIJI Holdings | 3,521 | 162,390 | |
| Minebea | 18,000 | 98,771 | |
| Mitsubishi | 69,300 | 1,664,749 | |
| Mitsubishi Chemical Holdings | 62,600 | 322,520 | |
| Mitsubishi Electric | 98,000 | 918,560 | |
| Mitsubishi Estate | 60,000 | 1,050,279 | |
| Mitsubishi Gas Chemical | 20,000 | 123,650 | |
| Mitsubishi Heavy Industries | 156,700 | 569,995 | |
| Mitsubishi Logistics | 6,000 | 72,551 | |
| Mitsubishi Materials | 61,000 | a | 190,838 |
| Mitsubishi Motors | 203,000 a | 241,937 | |
| Mitsubishi Tanabe Pharma | 11,000 | 179,714 | |
22
| Common Stocks (continued) | Shares | Value ($) | |
| Japan (continued) | |||
| Mitsubishi UFJ Financial Group | 651,390 | 3,032,542 | |
| Mitsubishi UFJ Lease & Finance | 2,910 | 97,253 | |
| Mitsui & Co. | 88,600 | 1,391,421 | |
| Mitsui Chemicals | 41,000 | 120,124 | |
| Mitsui Engineering & Shipbuilding | 34,000 | 76,822 | |
| Mitsui Fudosan | 43,000 | 811,955 | |
| Mitsui Mining & Smelting | 34,000 | 103,414 | |
| Mitsui OSK Lines | 58,000 | 371,546 | |
| Mitsumi Electric | 4,800 | 81,698 | |
| Mizuho Financial Group | 1,029,100 | 1,494,782 | |
| Mizuho Securities | 34,000 | 72,179 | |
| Mizuho Trust & Banking | 92,000 | a | 82,235 |
| MS & AD Insurance Group Holdings | 27,257 | 654,100 | |
| Murata Manufacturing | 10,400 | 584,233 | |
| Namco Bandai Holdings | 10,350 | 95,341 | |
| NEC | 140,800 | 391,548 | |
| NGK Insulators | 13,000 | 196,735 | |
| NGK Spark Plug | 8,000 | 111,434 | |
| NHK Spring | 7,000 | 59,354 | |
| Nidec | 5,600 | 553,395 | |
| Nikon | 16,000 | 301,924 | |
| Nintendo | 5,150 | 1,333,054 | |
| Nippon Building Fund | 27 | 264,134 | |
| Nippon Electric Glass | 18,085 | 232,826 | |
| Nippon Express | 44,000 | 174,798 | |
| Nippon Meat Packers | 9,000 | 104,581 | |
| Nippon Paper Group | 4,900 | 124,462 | |
| Nippon Sheet Glass | 34,000 | 74,711 | |
| Nippon Steel | 259,100 | 813,809 | |
| Nippon Telegraph & Telephone | 26,500 | 1,202,452 | |
| Nippon Yusen | 81,800 | 344,261 | |
| Nishi-Nippon City Bank | 33,000 | 90,130 | |
| Nissan Chemical Industries | 7,000 | 80,211 | |
| Nissan Motor | 126,600 | 1,115,903 | |
| Nissha Printing | 1,400 | 30,868 | |
| Nisshin Seifun Group | 9,800 | 121,177 |
The Fund 23
STATEMENT OF INVESTMENTS (continued)
| Common Stocks (continued) | Shares | Value ($) | |
| Japan (continued) | |||
| Nisshin Steel | 42,000 | 75,605 | |
| Nisshinbo Holdings | 7,000 | 70,826 | |
| Nissin Foods Holdings | 3,200 | 115,844 | |
| Nitori | 1,950 | 171,397 | |
| Nitto Denko | 8,600 | 321,366 | |
| NKSJ Holdings | 72,500 | a | 497,734 |
| NOK | 5,300 | 94,551 | |
| Nomura Holdings | 179,700 | 932,521 | |
| Nomura Real Estate Holdings | 5,400 | 82,793 | |
| Nomura Real Estate Office Fund | 12 | 73,669 | |
| Nomura Research Institute | 5,700 | 107,348 | |
| NSK | 23,000 | 174,178 | |
| NTN | 25,000 | 113,284 | |
| NTT Data | 65 | 199,559 | |
| NTT DoCoMo | 796 | 1,339,019 | |
| NTT Urban Development | 55 | 50,391 | |
| Obayashi | 35,000 | 142,520 | |
| Obic | 350 | 64,569 | |
| Odakyu Electric Railway | 32,000 | 294,773 | |
| OJI Paper | 44,000 | 203,203 | |
| Olympus | 11,000 | 288,144 | |
| Omron | 10,500 | 243,501 | |
| Ono Pharmaceutical | 4,200 | 178,324 | |
| ORACLE JAPAN | 2,000 | 90,875 | |
| Oriental Land | 2,700 | 261,453 | |
| ORIX | 5,460 | 497,534 | |
| Osaka Gas | 101,000 | 381,179 | |
| OTSUKA | 1,000 | 63,439 | |
| Panasonic | 100,095 | 1,470,048 | |
| Rakuten | 372 | 286,331 | |
| Resona Holdings | 31,600 | 251,858 | |
| Ricoh | 34,000 | 475,282 | |
| Rinnai | 1,800 | 109,497 | |
| Rohm | 5,100 | 317,840 | |
| Sankyo | 2,800 | 149,125 | |
| Santen Pharmaceutical | 3,800 | 131,054 |
24
| Common Stocks (continued) | Shares | Value ($) | |
| Japan (continued) | |||
| Sapporo Hokuyo Holdings | 15,000 | 61,825 | |
| Sapporo Holdings | 13,000 | 51,161 | |
| SBI Holdings | 887 | 108,356 | |
| Secom | 11,000 | 499,131 | |
| Sega Sammy Holdings | 9,984 | 162,867 | |
| Seiko Epson | 6,700 | 106,718 | |
| Sekisui Chemical | 22,000 | 139,839 | |
| Sekisui House | 31,000 | 291,335 | |
| Senshu Ikeda Holdings | 41,600 | 55,260 | |
| Seven & I Holdings | 38,260 | 889,646 | |
| Seven Bank | 26 | 46,771 | |
| Sharp | 51,000 | 503,352 | |
| Shikoku Electric Power | 9,200 | 271,945 | |
| Shimadzu | 12,000 | 90,130 | |
| Shimamura | 1,200 | 115,009 | |
| Shimano | 3,500 | 174,674 | |
| Shimizu | 29,000 | 111,968 | |
| Shin-Etsu Chemical | 20,900 | 1,057,325 | |
| Shinko Electric Industries | 4,200 | 40,827 | |
| Shinsei Bank | 50,000 | a | 39,727 |
| Shionogi & Co. | 15,400 | 268,042 | |
| Shiseido | 18,000 | 375,866 | |
| Shizuoka Bank | 31,400 | 268,976 | |
| Showa Denko | 72,000 | 131,397 | |
| Showa Shell Sekiyu | 11,300 | 94,973 | |
| SMC | 2,700 | 412,291 | |
| Softbank | 41,400 | 1,331,173 | |
| Sojitz | 66,600 | 122,369 | |
| Sony | 51,280 | 1,712,516 | |
| Sony Financial Holdings | 43 | 149,472 | |
| Square Enix Holdings | 3,700 | 77,307 | |
| Stanley Electric | 8,200 | 137,532 | |
| SUMCO | 6,800 a | 105,271 | |
| Sumitomo | 57,100 | 723,054 | |
| Sumitomo Chemical | 82,000 | 357,318 | |
| Sumitomo Electric Industries | 38,000 | 484,494 | |
The Fund 25
STATEMENT OF INVESTMENTS (continued)
| Common Stocks (continued) | Shares | Value ($) | |
| Japan (continued) | |||
| Sumitomo Heavy Industries | 29,000 | 164,891 | |
| Sumitomo Metal Industries | 173,000 | 401,626 | |
| Sumitomo Metal Mining | 27,000 | 428,380 | |
| Sumitomo Mitsui Financial Group | 68,600 | 2,054,168 | |
| Sumitomo Realty & Development | 19,000 | 413,731 | |
| Sumitomo Rubber Industries | 9,400 | 101,177 | |
| Sumitomo Trust & Banking | 74,000 | 405,140 | |
| Suruga Bank | 12,000 | 108,156 | |
| Suzuken | 3,720 | 116,888 | |
| Suzuki Motor | 16,900 | 411,852 | |
| Sysmex | 1,600 | 109,646 | |
| T & D Holdings | 14,650 | 299,911 | |
| Taiheiyo Cement | 50,000 | a | 54,004 |
| Taisei | 58,000 | 123,849 | |
| Taisho Pharmaceutical | 6,000 | 126,034 | |
| Taiyo Nippon Sanso | 15,000 | 120,484 | |
| Takashimaya | 15,000 | 112,849 | |
| Takeda Pharmaceutical | 38,300 | 1,792,564 | |
| TDK | 6,100 | 347,976 | |
| Teijin | 47,000 | 173,880 | |
| Terumo | 8,500 | 431,068 | |
| THK | 6,700 | 128,760 | |
| Tobu Railway | 40,000 | 224,457 | |
| Toho | 5,800 | 89,430 | |
| Toho Gas | 22,000 | 116,077 | |
| Tohoku Electric Power | 22,300 | 500,262 | |
| Tokio Marine Holdings | 36,900 | 1,038,972 | |
| Tokuyama | 18,000 | 98,547 | |
| Tokyo Electric Power | 72,872 | 1,741,510 | |
| Tokyo Electron | 8,800 | 496,536 | |
| Tokyo Gas | 135,000 | 635,196 | |
| Tokyo Steel Manufacturing | 5,500 | 54,488 | |
| Tokyo Tatemono | 19,000 | 76,660 | |
| Tokyu | 57,820 | 258,413 | |
| Tokyu Land | 24,000 | 109,348 |
26
| Common Stocks (continued) | Shares | Value ($) |
| Japan (continued) | ||
| TonenGeneral Sekiyu | 14,000 | 124,618 |
| Toppan Printing | 28,000 | 225,251 |
| Toray Industries | 68,000 | 393,395 |
| Toshiba | 205,000 | 1,025,636 |
| Tosoh | 29,000 | 77,405 |
| TOTO | 14,000 | 92,812 |
| Toyo Seikan Kaisha | 7,200 | 122,726 |
| Toyo Suisan Kaisha | 5,000 | 107,138 |
| Toyoda Gosei | 3,600 | 77,497 |
| Toyota Boshoku | 4,200 | 71,121 |
| Toyota Industries | 9,600 | 270,540 |
| Toyota Motor | 141,214 | 5,012,177 |
| Toyota Tsusho | 11,600 | 179,868 |
| Trend Micro | 5,200 | 147,059 |
| Tsumura & Co. | 3,100 | 95,290 |
| Ube Industries | 55,600 | 135,980 |
| UNICHARM | 6,300 | 240,503 |
| UNY | 9,000 | 74,972 |
| Ushio | 5,900 | 98,223 |
| USS | 980 | 76,161 |
| West Japan Railway | 88 | 326,436 |
| Yahoo! Japan | 751 | 262,547 |
| Yakult Honsha | 5,100 | 148,980 |
| Yamada Denki | 4,410 | 286,335 |
| Yamaguchi Financial Group | 11,000 | 99,826 |
| Yamaha | 9,200 | 112,730 |
| Yamaha Motor | 13,600 a | 208,685 |
| Yamato Holdings | 20,600 | 259,322 |
| Yamato Kogyo | 2,800 | 71,747 |
| Yamazaki Baking | 6,000 | 73,073 |
| Yaskawa Electric | 12,000 | 93,706 |
| Yokogawa Electric | 11,500 | 75,525 |
| 114,475,038 | ||
| Luxembourg—.5% | ||
| ArcelorMittal | 43,789 | 1,405,608 |
The Fund 27
STATEMENT OF INVESTMENTS (continued)
| Common Stocks (continued) | Shares | Value ($) | |
| Luxembourg (continued) | |||
| Millicom International Cellular, SDR | 4,027 | 378,993 | |
| SES | 16,018 | 409,979 | |
| Tenaris | 24,240 | 502,670 | |
| 2,697,250 | |||
| Netherlands—2.7% | |||
| Aegon | 81,616 a | 516,594 | |
| Akzo Nobel | 12,145 | 720,111 | |
| ASML Holding | 22,623 | 745,526 | |
| Corio | 2,950 | 216,408 | |
| Delta Lloyd | 3,776 | 77,858 | |
| European Aeronautic Defence and Space | 20,994 | a | 551,053 |
| Fugro | 3,368 | 237,943 | |
| Heineken | 13,266 | 671,523 | |
| Heineken Holding | 5,874 | 252,601 | |
| ING Groep | 195,682 | 2,086,063 | |
| Koninklijke Ahold | 60,513 | 835,178 | |
| Koninklijke Boskalis Westminster | 3,558 | 143,906 | |
| Koninklijke DSM | 8,006 | 427,518 | |
| Koninklijke KPN | 83,992 | 1,400,878 | |
| Koninklijke Philips Electronics | 50,315 | 1,519,632 | |
| Koninklijke Vopak | 3,832 | 191,419 | |
| QIAGEN | 11,934 a | 225,832 | |
| Randstad Holding | 5,958 | a | 283,210 |
| Reed Elsevier | 34,639 | 450,729 | |
| SBM Offshore | 8,291 | 168,936 | |
| STMicroelectronics | 32,926 | 287,579 | |
| TNT | 18,872 | 500,994 | |
| Unilever | 83,263 | 2,465,556 | |
| Wolters Kluwer | 15,164 | 344,493 | |
| 15,321,540 | |||
| New Zealand—.1% | |||
| Auckland International Airport | 37,613 | 60,410 | |
| Contact Energy | 16,082 | a | 71,952 |
| Fletcher Building | 32,253 | 202,517 | |
28
| Common Stocks (continued) | Shares | Value ($) | |
| New Zealand (continued) | |||
| Sky City Entertainment Group | 33,202 | 76,687 | |
| Telecom Corporation of New Zealand | 91,185 | 142,964 | |
| 554,530 | |||
| Norway—.8% | |||
| Aker Solutions | 8,329 | 126,156 | |
| DnB NOR | 51,118 | 697,880 | |
| Norsk Hydro | 37,703 | 229,582 | |
| Orkla | 41,365 | 398,260 | |
| Renewable Energy | 18,350 | a | 63,552 |
| SeaDrill | 14,482 | 436,248 | |
| Statoil | 56,854 | 1,234,760 | |
| Telenor | 41,965 | 673,039 | |
| Yara International | 9,814 | 513,272 | |
| 4,372,749 | |||
| Portugal—.3% | |||
| Banco Comercial Portugues, Cl. R | 154,733 | 140,651 | |
| Banco Espirito Santo | 27,218 | 135,053 | |
| Brisa Auto-Estradas de Portugal | 9,633 | 72,849 | |
| Cimpor-Cimentos de Portugal | 12,398 | 86,004 | |
| Energias de Portugal | 90,472 | 345,677 | |
| Galp Energia, Cl. B | 12,510 | 240,992 | |
| Jeronimo Martins | 11,415 | 171,031 | |
| Portugal Telecom | 29,308 | 422,422 | |
| 1,614,679 | |||
| Singapore—1.7% | |||
| Ascendas Real Estate Investment Trust | 74,281 | 118,230 | |
| CapitaLand | 132,500 | 398,242 | |
| CapitaMall Trust | 120,000 | 183,581 | |
| Capitamalls Asia | 74,000 | 122,357 | |
| City Developments | 27,000 | 265,358 | |
| ComfortDelgro | 93,700 | 107,148 | |
| Cosco Singapore | 48,000 | 68,982 | |
| DBS Group Holdings | 86,588 | 929,939 | |
| Fraser and Neave | 50,150 | 241,789 |
The Fund 29
STATEMENT OF INVESTMENTS (continued)
| Common Stocks (continued) | Shares | Value ($) | |
| Singapore (continued) | |||
| Genting Singapore | 312,527 | a | 523,997 |
| Global Logistic Properties | 65,000 | 116,515 | |
| Golden Agri-Resources | 275,440 | 138,332 | |
| Jardine Cycle & Carriage | 5,422 | 164,639 | |
| Keppel | 67,000 | 516,639 | |
| Keppel Land | 36,000 | 123,222 | |
| Neptune Orient Lines | 56,000 | a | 92,594 |
| Noble Group | 161,963 | 232,761 | |
| Olam International | 59,300 | 143,410 | |
| Oversea-Chinese Banking | 123,942 | 862,830 | |
| SembCorp Industries | 53,254 | 188,451 | |
| SembCorp Marine | 41,000 | 145,721 | |
| Singapore Airlines | 27,733 | 338,989 | |
| Singapore Exchange | 46,000 | 312,768 | |
| Singapore Press Holdings | 80,075 | 256,760 | |
| Singapore Technologies Engineering | 92,000 | 235,287 | |
| Singapore Telecommunications | 404,951 | 966,814 | |
| StarHub | 26,918 | 55,115 | |
| United Overseas Bank | 62,112 | 894,547 | |
| UOL Group | 23,111 | 81,248 | |
| Wilmar International | 98,000 | 484,605 | |
| 9,310,870 | |||
| Spain—3.7% | |||
| Abertis Infraestructuras | 14,741 | 290,731 | |
| Acciona | 1,296 | 113,842 | |
| Acerinox | 5,086 | 83,273 | |
| ACS Actividades de Construccion y Servicios | 7,321 | 383,715 | |
| Banco Bilbao Vizcaya Argentaria | 181,992 | 2,390,371 | |
| Banco de Sabadell | 50,919 | 247,348 | |
| Banco de Valencia | 11,051 | 62,207 | |
| Banco Popular Espanol | 45,199 | 291,933 | |
| Banco Santander | 421,476 | 5,407,579 | |
| Bankinter | 16,421 | 109,279 | |
| Criteria Caixacorp | 42,917 | 242,000 | |
| EDP Renovaveis | 13,006 | a | 75,363 |
| Enagas | 8,939 | 196,738 |
30
| Common Stocks (continued) | Shares | Value ($) | |
| Spain (continued) | |||
| Ferrovial | 23,356 | 265,931 | |
| Fomento de Construcciones y Contratas | 1,877 | 50,559 | |
| Gamesa Corp Tecnologica | 10,626 | a | 73,845 |
| Gas Natural | 11,514 | 168,354 | |
| Gestevision Telecinco | 5,695 | 72,553 | |
| Grifols | 6,640 | 107,378 | |
| Iberdrola | 205,972 | 1,734,851 | |
| Iberdrola Renovables | 48,509 | 163,769 | |
| Iberia Lineas Aereas de Espana | 23,577 | a | 103,322 |
| Inditex | 11,087 | 924,739 | |
| Indra Sistemas | 5,136 | 100,403 | |
| Mapfre | 40,701 | 134,863 | |
| Red Electrica | 5,475 | 274,671 | |
| Repsol | 37,271 | 1,032,169 | |
| Telefonica | 210,340 | 5,671,591 | |
| Zardoya Otis | 7,387 | 122,898 | |
| 20,896,275 | |||
| Sweden—2.9% | |||
| Alfa Laval | 17,158 | 296,344 | |
| Assa Abloy, Cl. B | 16,208 | 413,860 | |
| Atlas Copco, Cl. A | 34,606 | 720,539 | |
| Atlas Copco, Cl. B | 20,174 | 383,338 | |
| Boliden | 13,856 | 234,354 | |
| Electrolux, Ser. B | 12,421 | 300,118 | |
| Getinge, Cl. B | 10,269 | 216,723 | |
| Hennes & Mauritz, Cl. B | 52,207 | 1,832,972 | |
| Hexagon AB | 9,044 | 183,316 | |
| Holmen, Cl. B | 3,004 | 95,030 | |
| Husqvarna, Cl. B | 20,545 | 143,929 | |
| Investor, Cl. B | 22,969 | 469,678 | |
| Kinnevik Investment, Cl. B | 11,875 | 244,241 | |
| Modern Times Group, Cl. B | 2,552 | 182,359 | |
| Nordea Bank | 165,106 | 1,811,199 | |
| Ratos, Cl. B | 5,558 | 197,461 | |
| Sandvik | 52,869 | 794,056 | |
| Scania, Cl. B | 16,508 | 349,626 |
The Fund 31
STATEMENT OF INVESTMENTS (continued)
| Common Stocks (continued) | Shares | Value ($) | |
| Sweden (continued) | |||
| Securitas, Cl. B | 15,857 | 172,767 | |
| Skandinaviska Enskilda Banken, Cl. A | 73,450 | 566,921 | |
| Skanska, Cl. B | 20,691 | 394,396 | |
| SKF, Cl. B | 20,274 | 521,614 | |
| SSAB, Cl. A | 9,760 | 136,326 | |
| SSAB, Cl. B | 5,288 | 65,226 | |
| Svenska Cellulosa, Cl. B | 28,862 | 445,971 | |
| Svenska Handelsbanken, Cl. A | 24,854 | 809,598 | |
| Swedbank, Cl. A | 36,621 | a | 509,331 |
| Swedish Match | 11,752 | 327,248 | |
| Tele2, Cl. B | 16,050 | 351,895 | |
| Telefonaktiebolaget LM Ericsson, Cl. B | 153,688 | 1,682,506 | |
| TeliaSonera | 114,147 | 949,139 | |
| Volvo, Cl. B | 55,217 | a | 744,907 |
| 16,546,988 | |||
| Switzerland—7.5% | |||
| ABB | 113,112 | 2,343,897 | |
| Actelion | 5,019 a | 250,618 | |
| Adecco | 6,268 | 350,524 | |
| Aryzta | 4,085 | 181,302 | |
| Baloise Holding | 2,556 | 236,368 | |
| Cie Financiere Richemont, Cl. A | 26,609 | 1,327,880 | |
| Credit Suisse Group | 57,585 | 2,380,102 | |
| GAM Holding | 11,520 a | 182,141 | |
| Geberit | 2,016 | 386,391 | |
| Givaudan | 410 | 422,715 | |
| Holcim | 12,454 | 776,871 | |
| Julius Baer Group | 10,717 | 452,653 | |
| Kuehne & Nagel International | 2,891 | 357,737 | |
| Lindt & Spruengli | 6 | 172,344 | |
| Lindt & Spruengli-PC | 47 | 127,739 | |
| Logitech International | 9,187 | a | 174,305 |
| Lonza Group | 2,241 | 196,301 | |
| Nestle | 177,676 | 9,737,404 | |
| Nobel Biocare Holding | 6,201 | 102,583 | |
| Novartis | 108,075 | 6,269,119 | |
32
| Common Stocks (continued) | Shares | Value ($) | |
| Switzerland (continued) | |||
| Pargesa Holding | 1,539 | 122,134 | |
| Roche Holding | 35,973 | 5,285,306 | |
| Schindler Holding | 2,461 | 263,991 | |
| Schindler Holding-PC | 1,057 | 114,996 | |
| SGS | 276 | 441,993 | |
| Sika | 104 | 206,202 | |
| Sonova Holding | 2,369 | 274,597 | |
| Straumann Holding | 380 | 79,593 | |
| Swatch Group | 2,143 | 149,040 | |
| Swatch Group-BR | 1,609 | 615,297 | |
| Swiss Life Holding | 1,524 | a | 186,723 |
| Swiss Reinsurance | 17,890 | 860,393 | |
| Swisscom | 1,214 | 507,448 | |
| Syngenta | 4,821 | 1,334,292 | |
| Synthes | 3,082 | 367,897 | |
| UBS | 186,179 a | 3,153,780 | |
| Zurich Financial Services | 7,564 | 1,852,738 | |
| 42,245,414 | |||
| United Kingdom—21.0% | |||
| 3i Group | 49,824 | 238,657 | |
| Admiral Group | 10,809 | 281,687 | |
| Aggreko | 13,180 | 331,886 | |
| AMEC | 17,013 | 295,396 | |
| Anglo American | 67,441 | 3,135,537 | |
| Antofagasta | 20,373 | 430,606 | |
| ARM Holdings | 66,452 | 385,982 | |
| Associated British Foods | 18,863 | 315,756 | |
| AstraZeneca | 73,792 | 3,692,137 | |
| Autonomy | 11,216 a | 262,168 | |
| Aviva | 145,220 | 924,298 | |
| Babcock International Group | 13,900 | 128,895 | |
| BAE Systems | 175,300 | 966,088 | |
| Balfour Beatty | 33,777 | 149,425 | |
| Barclays | 585,031 | 2,568,461 | |
| BG Group | 172,958 | 3,361,160 | |
| BHP Billiton | 112,940 | 3,996,877 | |
The Fund 33
STATEMENT OF INVESTMENTS (continued)
| Common Stocks (continued) | Shares | Value ($) | |
| United Kingdom (continued) | |||
| BP | 962,346 | 6,551,344 | |
| British Airways | 29,271 | a | 126,683 |
| British American Tobacco | 102,186 | 3,888,319 | |
| British Land | 43,407 | 353,588 | |
| British Sky Broadcasting Group | 57,701 | 651,762 | |
| BT Group | 394,046 | 968,310 | |
| Bunzl | 16,760 | 198,021 | |
| Burberry Group | 23,186 | 377,740 | |
| Cable & Wireless Worldwide | 140,485 | 157,674 | |
| Cairn Energy | 74,002 | a | 456,575 |
| Capita Group | 31,077 | 380,842 | |
| Capital Shopping Centres Group | 24,270 | 149,158 | |
| Carnival | 9,179 | 394,767 | |
| Centrica | 262,305 | 1,393,156 | |
| Cobham | 58,884 | 218,037 | |
| Compass Group | 98,184 | 802,934 | |
| Diageo | 128,022 | 2,357,928 | |
| Eurasian Natural Resources | 13,200 | 183,711 | |
| Experian | 52,763 | 612,013 | |
| Firstgroup | 25,087 | 163,605 | |
| Fresnillo | 9,006 | 179,985 | |
| G4S | 72,991 | 305,398 | |
| GlaxoSmithKline | 265,896 | 5,190,641 | |
| Hammerson | 35,663 | 238,962 | |
| Home Retail Group | 44,656 | 156,357 | |
| HSBC Holdings | 897,174 | 9,310,689 | |
| ICAP | 27,917 | 203,619 | |
| Imperial Tobacco Group | 51,949 | 1,660,288 | |
| Inmarsat | 23,343 | 243,331 | |
| Intercontinental Hotels Group | 13,743 | 265,205 | |
| International Power | 79,135 | 527,972 | |
| Intertek Group | 7,577 | 224,716 | |
| Invensys | 41,117 | 189,456 | |
| Investec | 22,001 | 175,243 | |
| ITV | 187,172 a | 204,238 | |
| J Sainsbury | 64,644 | 402,352 | |
34
| Common Stocks (continued) | Shares | Value ($) | |
| United Kingdom (continued) | |||
| Johnson Matthey | 11,081 | 339,090 | |
| Kazakhmys | 10,953 | 230,453 | |
| Kingfisher | 118,901 | 452,055 | |
| Land Securities Group | 39,463 | 427,142 | |
| Legal & General Group | 304,912 | 489,443 | |
| Lloyds Banking Group | 2,087,557 | a | 2,300,929 |
| London Stock Exchange Group | 7,101 | 83,332 | |
| Lonmin | 7,908 a | 221,131 | |
| Man Group | 88,798 | 370,258 | |
| Marks & Spencer Group | 82,497 | 563,724 | |
| National Grid | 176,652 | 1,666,342 | |
| Next | 9,365 | 342,127 | |
| Old Mutual | 283,488 | 588,759 | |
| Pearson | 42,503 | 648,618 | |
| Petrofac | 13,173 | 308,123 | |
| Prudential | 129,377 | 1,304,174 | |
| Randgold Resources | 4,552 | 423,928 | |
| Reckitt Benckiser Group | 31,449 | 1,755,295 | |
| Reed Elsevier | 62,459 | 534,247 | |
| Resolution | 72,253 | 302,541 | |
| Rexam | 46,669 | 237,050 | |
| Rio Tinto | 74,207 | 4,788,390 | |
| Rolls-Royce Group | 94,239 | 975,582 | |
| Royal Bank of Scotland Group | 881,033 | a | 628,374 |
| Royal Dutch Shell, Cl. A | 181,571 | 5,881,383 | |
| Royal Dutch Shell, Cl. B | 137,980 | 4,408,733 | |
| RSA Insurance Group | 183,775 | 384,903 | |
| SABMiller | 48,456 | 1,567,633 | |
| Sage Group | 67,743 | 291,780 | |
| Schroders | 5,805 | 146,547 | |
| Scottish & Southern Energy | 46,888 | 864,340 | |
| Segro | 35,680 | 169,082 | |
| Serco Group | 25,274 | 248,105 | |
| Severn Trent | 12,168 | 271,386 | |
| Shire | 29,445 | 692,497 | |
| Smith & Nephew | 46,312 | 406,499 | |
The Fund 35
STATEMENT OF INVESTMENTS (continued)
| Common Stocks (continued) | Shares | Value ($) | |
| United Kingdom (continued) | |||
| Smiths Group | 19,627 | 374,045 | |
| Standard Chartered | 104,770 | 3,024,321 | |
| Standard Chartered, NPR (Rights) | 13,096 | a | 110,028 |
| Standard Life | 120,093 | 435,850 | |
| Tesco | 410,191 | 2,799,335 | |
| Thomas Cook Group | 43,248 | 125,083 | |
| Tui Travel | 29,455 | 99,412 | |
| Tullow Oil | 45,088 | 854,226 | |
| Unilever | 65,534 | 1,884,913 | |
| United Utilities Group | 36,086 | 352,512 | |
| Vedanta Resources | 6,494 | 215,439 | |
| Vodafone Group | 2,697,933 | 7,326,393 | |
| Whitbread | 8,998 | 243,699 | |
| WM Morrison Supermarkets | 109,098 | 512,463 | |
| Wolseley | 14,763 a | 392,519 | |
| WPP | 65,758 | 763,270 | |
| Xstrata | 105,092 | 2,032,212 | |
| 118,189,350 | |||
| Total Common Stocks | |||
| (cost $498,812,494) | 545,190,954 | ||
| Preferred Stocks—.5% | |||
| Germany; | |||
| Bayerische Motoren Werke | 2,448 | 119,052 | |
| Fresenius | 4,316 | 386,381 | |
| Henkel & Co. | 9,152 | 539,086 | |
| Porsche Automobil Holding | 4,481 | 229,288 | |
| RWE | 1,967 | 133,060 | |
| Volkswagen | 8,661 | 1,300,089 | |
| Total Preferred Stocks | |||
| (cost $1,799,587) | 2,706,956 | ||
36
| Principal | ||
| Short-Term Investments—.1% | Amount | Value ($) |
| U.S. Treasury Bills; | ||
| 0.13%, 12/23/10 | ||
| (cost $694,865) | 695,000 c | 694,860 |
| Other Investment—1.4% | Shares | Value ($) |
| Registered Investment Company; | ||
| Dreyfus Institutional Preferred Plus Money Market Fund | ||
| (cost $7,800,000) | 7,800,000 d | 7,800,000 |
| Total Investments (cost $509,106,946) | 99.1% | 556,392,770 |
| Cash and Receivables (Net) | .9% | 5,034,900 |
| Net Assets | 100.0% | 561,427,670 |
| BR—Bearer Certificate |
| CDI—Chess Depository Interest |
| NPR—Nill Paid Rights |
| PC—Participation Certificate |
| PPS—Price Protected Shares |
| REIT—Real Estate Investment Trust |
| RSP—Risparmio (Savings) Shares |
| SDR—Swedish Depository Receipts |
| STRIP—Separate Trading of Registered Interest and Principal of Securities |
| a Non-income producing security. |
| b The valuation of this security has been determined in good faith by management under the direction of the Board of |
| Directors.At October 31, 2010, the value of this security amounted to $49 or less than .01% of net assets. |
| c Held by a broker as collateral for open financial futures positions. |
| d Investment in affiliated money market mutual fund. |
| Portfolio Summary (Unaudited)† | |||
| Value (%) | Value (%) | ||
| Banking | 13.0 | Diversified Financials | 4.2 |
| Materials | 10.7 | Automobiles & Components | 4.0 |
| Capital Goods | 8.4 | Insurance | 3.8 |
| Energy | 7.3 | Real Estate | 3.1 |
| Food, Beverage & Tobacco | 6.5 | Short-Term/ | |
| Pharmaceuticals & Biotechnology | 6.1 | Money Market Investments | 1.5 |
| Telecommunications | 5.7 | Other | 19.6 |
| Utilities | 5.2 | 99.1 | |
| † Based on net assets. | |||
| See notes to financial statements. | |||
The Fund 37
STATEMENT OF FINANCIAL FUTURES
October 31, 2010
| Unrealized | ||||
| Market Value | Appreciation | |||
| Covered by | (Depreciation) | |||
| Contracts | Contracts ($) | Expiration | at 10/31/2010 ($) | |
| Financial Futures Long | ||||
| DJ Euro Stoxx 50 | 104 | 4,103,742 | December 2010 | 16,058 |
| FTSE 100 | 36 | 3,258,286 | December 2010 | (35,926) |
| SPI 200 Index | 10 | 1,138,747 | December 2010 | (7,869) |
| TOPIX | 29 | 2,901,800 | December 2010 | (84,621) |
| Gross Unrealized Appreciation | 16,058 | |||
| Gross Unrealized Depreciation | (128,416) | |||
| See notes to financial statements. | ||||
38
STATEMENT OF ASSETS AND LIABILITIES
October 31, 2010
| Cost | Value | |
| Assets ($): | ||
| Investments in securities—See Statement of Investments: | ||
| Unaffiliated issuers | 501,306,946 | 548,592,770 |
| Affiliated issuers | 7,800,000 | 7,800,000 |
| Cash | 1,390,274 | |
| Cash denominated in foreign currencies | 1,104,401 | 1,116,135 |
| Dividends and interest receivable | 1,873,450 | |
| Receivable for shares of Common Stock subscribed | 1,252,556 | |
| Receivable for investment securities sold | 146,178 | |
| Unrealized appreciation on forward foreign | ||
| currency exchange contracts—Note 4 | 37,231 | |
| 562,208,594 | ||
| Liabilities ($): | ||
| Due to The Dreyfus Corporation and affiliates—Note 3(b) | 285,641 | |
| Payable for shares of Common Stock redeemed | 258,801 | |
| Payable for investment securities purchased | 149,772 | |
| Payable for futures variation margin—Note 4 | 45,338 | |
| Unrealized depreciation on forward foreign | ||
| currency exchange contracts—Note 4 | 41,372 | |
| 780,924 | ||
| Net Assets ($) | 561,427,670 | |
| Composition of Net Assets ($): | ||
| Paid-in capital | 557,897,079 | |
| Accumulated undistributed investment income—net | 9,034,846 | |
| Accumulated net realized gain (loss) on investments | (52,789,096) | |
| Accumulated net unrealized appreciation (depreciation) on investments | ||
| and foreign currency transactions [including ($112,358) net | ||
| unrealized (depreciation) on financial futures] | 47,284,841 | |
| Net Assets ($) | 561,427,670 | |
| Shares Outstanding | ||
| (200 million shares of $.001 par value Common Stock authorized) | 37,835,675 | |
| Net Asset Value, offering and redemption price per share—Note 3(c) ($) | 14.84 | |
| See notes to financial statements. | ||
The Fund 39
STATEMENT OF OPERATIONS
Year Ended October 31, 2010
| Investment Income ($): | |
| Income: | |
| Cash dividends (net of $1,380,982 foreign taxes withheld at source): | |
| Unaffiliated issuers | 15,516,771 |
| Affiliated issuers | 8,854 |
| Interest | 14,506 |
| Total Income | 15,540,131 |
| Expenses: | |
| Management fee—Note 3(a) | 1,908,019 |
| Shareholder servicing costs—Note 3(b) | 1,362,870 |
| Directors’ fees—Note 3(a) | 31,281 |
| Loan commitment fees—Note 2 | 7,664 |
| Interest expense—Note 2 | 196 |
| Total Expenses | 3,310,030 |
| Less—Directors’ fees reimbursed by the Manager—Note 3(a) | (31,281) |
| Net Expenses | 3,278,749 |
| Investment Income—Net | 12,261,382 |
| Realized and Unrealized Gain (Loss) on Investments—Note 4 ($): | |
| Net realized gain (loss) on investments and foreign currency transactions | (45,684,562) |
| Net realized gain (loss) on financial futures | (164,727) |
| Net realized gain (loss) on forward foreign currency exchange contracts | (746,557) |
| Net Realized Gain (Loss) | (46,595,846) |
| Net unrealized appreciation (depreciation) on | |
| investments and foreign currency transactions | 74,104,920 |
| Net unrealized appreciation (depreciation) on financial futures | 362,152 |
| Net unrealized appreciation (depreciation) on | |
| forward foreign currency exchange contracts | (86,729) |
| Net Unrealized Appreciation (Depreciation) | 74,380,343 |
| Net Realized and Unrealized Gain (Loss) on Investments | 27,784,497 |
| Net Increase in Net Assets Resulting from Operations | 40,045,879 |
| See notes to financial statements. |
40
STATEMENT OF CHANGES IN NET ASSETS
| Year Ended October 31, | ||
| 2010 | 2009 | |
| Operations ($): | ||
| Investment income—net | 12,261,382 | 10,748,143 |
| Net realized gain (loss) on investments | (46,595,846) | 4,497,773 |
| Net unrealized appreciation | ||
| (depreciation) on investments | 74,380,343 | 82,489,486 |
| Net Increase (Decrease) in Net Assets | ||
| Resulting from Operations | 40,045,879 | 97,735,402 |
| Dividends to Shareholders from ($): | ||
| Investment income—net | (13,103,285) | (9,805,885) |
| Net realized gain on investments | (3,322,070) | (778,245) |
| Total Dividends | (16,425,355) | (10,584,130) |
| Capital Stock Transactions ($): | ||
| Net proceeds from shares sold | 181,100,102 | 349,050,223 |
| Dividends reinvested | 15,535,963 | 9,310,050 |
| Cost of shares redeemed | (206,110,488) | (225,160,976) |
| Increase (Decrease) in Net Assets | ||
| from Capital Stock Transactions | (9,474,423) | 133,199,297 |
| Total Increase (Decrease) in Net Assets | 14,146,101 | 220,350,569 |
| Net Assets ($): | ||
| Beginning of Period | 547,281,569 | 326,931,000 |
| End of Period | 561,427,670 | 547,281,569 |
| Undistributed investment income—net | 9,034,846 | 10,313,145 |
| Capital Share Transactions (Shares): | ||
| Shares sold | 13,033,884 | 31,692,805 |
| Shares issued for dividends reinvested | 1,097,173 | 858,486 |
| Shares redeemed | (15,247,182) | (21,995,482) |
| Net Increase (Decrease) in Shares Outstanding | (1,116,125) | 10,555,809 |
| See notes to financial statements. | ||
The Fund 41
FINANCIAL HIGHLIGHTS
The following table describes the performance for the fiscal periods indicated. Total return shows how much your investment in the fund would have increased (or decreased) during each period, assuming you had reinvested all dividends and distributions.These figures have been derived from the fund’s financial statements.
| Year Ended October 31, | |||||
| 2010 | 2009 | 2008 | 2007 | 2006 | |
| Per Share Data ($): | |||||
| Net asset value, beginning of period | 14.05 | 11.51 | 21.98 | 18.03 | 14.47 |
| Investment Operations: | |||||
| Investment income—neta | .31 | .30 | .49 | .43 | .38 |
| Net realized and unrealized | |||||
| gain (loss) on investments | .89 | 2.51 | (10.47) | 3.90 | 3.45 |
| Total from Investment Operations | 1.20 | 2.81 | (9.98) | 4.33 | 3.83 |
| Distributions: | |||||
| Dividends from investment income—net | (.33) | (.25) | (.49) | (.38) | (.27) |
| Dividends from net realized | |||||
| gain on investments | (.08) | (.02) | — | — | — |
| Total Distributions | (.41) | (.27) | (.49) | (.38) | (.27) |
| Net asset value, end of period | 14.84 | 14.05 | 11.51 | 21.98 | 18.03 |
| Total Return (%) | 8.73 | 25.13 | (46.37) | 24.40 | 26.83 |
| Ratios/Supplemental Data (%): | |||||
| Ratio of total expenses | |||||
| to average net assets | .61 | .61 | .61 | .61 | .60 |
| Ratio of net expenses | |||||
| to average net assets | .60 | .60 | .60 | .60 | .60 |
| Ratio of net investment income | |||||
| to average net assets | 2.25 | 2.53 | 2.72 | 2.20 | 2.30 |
| Portfolio Turnover Rate | 10.49 | 17.26 | 7.17 | 3.31 | 4.12 |
| Net Assets, end of period ($ x 1,000) | 561,428 | 547,282 | 326,931 | 561,653 | 355,608 |
| a Based on average shares outstanding at each month end. | |||||
| See notes to financial statements. | |||||
42
NOTES TO FINANCIAL STATEMENTS
NOTE 1—Significant Accounting Policies:
Dreyfus International Stock Index Fund (the “fund”) is a separate non-diversified series of Dreyfus Index Funds, Inc. (the “Company”), which is registered under the Investment Company Act of 1940, as amended (the “Act”), as an open-end management investment company and operates as a series company currently offering three series, including the fund. The fund’s investment objective is to match the performance of the Morgan Stanley Capital International Europe, Australasia, Far East Free Index (MSCI EAFE®). The Dreyfus Corporation (the “Manager” or “Dreyfus”), a wholly-owned subsidiary of The Bank of New York Mellon Corporation (“BNY Mellon”), serves as the fund’s investment adviser. MBSC Securities Corporation (the “Distributor”), a wholly-owned subsidiary of the Manager, is the distributor of the fund’s shares, which are sold to the public without a sales charge.
The Company accounts separately for the assets, liabilities and operations of each series. Expenses directly attributable to each series are charged to that series’ operations; expenses which are applicable to all series are allocated among them on a pro rata basis.
The Financial Accounting Standards Board (“FASB”) Accounting Standards Codification (“ASC”) is the exclusive reference of authoritative U.S. generally accepted accounting principles (“GAAP”) recognized by the FASB to be applied by nongovernmental entities. Rules and interpretive releases of the Securities and Exchange Commission (“SEC”) under authority of federal laws are also sources of authoritative GAAP for SEC registrants. The fund’s financial statements are prepared in accordance with GAAP, which may require the use of management estimates and assumptions.Actual results could differ from those estimates.
The Company enters into contracts that contain a variety of indemnifications.The fund’s maximum exposure under these arrangements is unknown.The fund does not anticipate recognizing any loss related to these arrangements.
The Fund 43
NOTES TO FINANCIAL STATEMENTS (continued)
(a) Portfolio valuation: Investments in securities are valued at the last sales price on the securities exchange or national securities market on which such securities are primarily traded. Securities listed on the National Market System for which market quotations are available are valued at the official closing price or, if there is no official closing price that day, at the last sales price. Securities not listed on an exchange or the national securities market, or securities for which there were no transactions, are valued at the average of the most recent bid and asked prices, except for open short positions, where the asked price is used for valuation purposes. Bid price is used when no asked price is available. U.S.Treasury Bills are valued by an independent pricing service approved by the Board of Directors. Register ed investment companies that are not traded on an exchange are valued at their net asset value. When market quotations or official closing prices are not readily available, or are determined not to reflect accurately fair value, such as when the value of a security has been significantly affected by events after the close of the exchange or market on which the security is principally traded (for example, a foreign exchange or market), but before the fund calculates its net asset value, the fund may value these investments at fair value as determined in accordance with the procedures approved by the Board of Directors. Fair valuing of securities may be determined with the assistance of a pricing service using calculations based on indices of domestic securities and other appropriate indicators, such as prices of relevant American Depository Receipts and futures contracts. For other securities that are fair valued by the Board of Directors, certain factors may be considered such as: fundamental analytical data , the nature and duration of restrictions on disposition, an evaluation of the forces that influence the market in which the securities are purchased and sold, and public trading in similar securities of the issuer or comparable issuers. Financial futures are valued at the last sales price. Investments denominated in foreign
44
currencies are translated to U.S. dollars at the prevailing rates of exchange. Forward foreign currency exchange contracts (“forward contracts”) are valued at the forward rate.
The fair value of a financial instrument is the amount that would be received to sell an asset or paid to transfer a liability in an orderly transaction between market participants at the measurement date (i.e. the exit price). GAAP establishes a fair value hierarchy that prioritizes the inputs of valuation techniques used to measure fair value.This hierarchy gives the highest priority to unadjusted quoted prices in active markets for identical assets or liabilities (Level 1 measurements) and the lowest priority to unobservable inputs (Level 3 measurements).
Additionally, GAAP provides guidance on determining whether the volume and activity in a market has decreased significantly and whether such a decrease in activity results in transactions that are not orderly. GAAP requires enhanced disclosures around valuation inputs and techniques used during annual and interim periods.
Various inputs are used in determining the value of the fund’s investments relating to fair value measurements.These inputs are summarized in the three broad levels listed below:
Level 1—unadjusted quoted prices in active markets for identical
investments.
Level 2—other significant observable inputs (including quoted
prices for similar investments, interest rates, prepayment speeds,
credit risk, etc.).
Level 3—significant unobservable inputs (including the fund’s
own assumptions in determining the fair value of investments).
The inputs or methodology used for valuing securities are not necessarily an indication of the risk associated with investing in those securities.
TheFund 45
NOTES TO FINANCIAL STATEMENTS (continued)
The following is a summary of the inputs used as of October 31, 2010 in valuing the fund’s investments:
| Level 2—Other | Level 3— | |||
| Level 1— | Significant | Significant | ||
| Unadjusted | Observable | Unobservable | ||
| Quoted Prices | Inputs | Inputs | Total | |
| Assets ($) | ||||
| Investments in Securities: | ||||
| Equity Securities— | ||||
| Foreign† | 547,897,861 | — | 49 | 547,897,910 |
| Mutual Funds | 7,800,000 | — | — | 7,800,000 |
| U.S. Treasury | — | 694,860 | — | 694,860 |
| Other Financial | ||||
| Instruments: | ||||
| Forward Foreign | ||||
| Currency Exchange | ||||
| Contracts†† | — | 37,231 | — | 37,231 |
| Futures†† | 16,058 | — | — | 16,058 |
| Liabilities ($) | ||||
| Other Financial | ||||
| Instruments: | ||||
| Forward Foreign | ||||
| Currency Exchange | ||||
| Contracts†† | — | (41,372) | — | (41,372) |
| Futures†† | (128,416) | — | — | (128,416) |
| † | See Statement of Investments for country and industry classification. |
| †† | Amount shown represents unrealized appreciation (depreciation) at period end. |
The following is a reconciliation of Level 3 assets for which significant unobservable inputs were used to determine fair value:
| Equity Securities— | |
| Foreign ($) | |
| Balance as of 10/31/2009 | — |
| Realized gain (loss) | — |
| Change in unrealized appreciation (depreciation) | (6,645) |
| Net purchases (sales) | — |
| Transfers in and/or out of Level 3 | 6,694 |
| Balance as of 10/31/2010 | 49 |
| The amount of total gains (losses) for | |
| the period included in earnings | |
| attributable to the change in | |
| unrealized gains (losses) relating | |
| to investments still held at 10/31/2010 | (19,677) |
46
In January 2010, FASB issued Accounting Standards Update (“ASU”) No. 2010-06 “Improving Disclosures about FairValue Measurements”. The portions of ASU No. 2010-06 which require reporting entities to prepare new disclosures surrounding amounts and reasons for significant transfers in and out of Level 1 and Level 2 fair value measurements as well as inputs and valuation techniques used to measure fair value for both recurring and nonrecurring fair value measurements that fall in either Level 2 or Level 3 have been adopted by the fund. No significant transfers between Level 1 or Level 2 fair value measurements occurred at October 31, 2010.The remaining portion of ASU No. 2010-06 requires reporting entities to make new disclosures about information on purchases, sales, issuances and settlements on a gross basis in the reconciliation of activity in Level 3 fair value measurements. These new and revi sed disclosures are required to be implemented for fiscal years beginning after December 15, 2010. Management is currently evaluating the impact that the adoption of this remaining portion of ASU No. 2010-06 may have on the fund’s financial statement disclosures.
(b) Foreign currency transactions: The fund does not isolate that portion of the results of operations resulting from changes in foreign exchange rates on investments from the fluctuations arising from changes in market prices of securities held. Such fluctuations are included with the net realized and unrealized gain or loss on investments.
Net realized foreign exchange gains or losses arise from sales of foreign currencies, currency gains or losses realized on securities transactions between trade and settlement date, and the difference between the amounts of dividends, interest and foreign withholding taxes recorded on the fund’s books and the U.S. dollar equivalent of the amounts actually received or paid. Net unrealized foreign exchange gains and losses arise from changes in the value of assets and liabilities other than investments resulting from changes in exchange rates. Foreign currency gains and losses on investments are included with net realized and unrealized gain or loss on investments.
The Fund 47
NOTES TO FINANCIAL STATEMENTS (continued)
(c) Securities transactions and investment income: Securities transactions are recorded on a trade date basis. Realized gains and losses from securities transactions are recorded on the identified cost basis. Dividend income is recognized on the ex-dividend date and interest income, including, where applicable, accretion of discount and amortization of premium on investments, is recognized on the accrual basis.
Investing in foreign markets may involve special risks and considerations not typically associated with investing in the U.S. These risks include revaluation of currencies, high rates of inflation, repatriation restrictions on income and capital, and adverse political and economic developments. Moreover, securities issued in these markets may be less liquid, subject to government ownership controls and delayed settlements, and their prices may be more volatile than those of comparable securities in the U.S.
(d) Affiliated issuers: Investments in other investment companies advised by Dreyfus are defined as “affiliated” in the Act.
The fund may invest in shares of certain affiliated investment companies also advised or managed by Dreyfus. Investments in affiliated investment companies for the period ended October 31, 2010 were as follows:

(e) Dividends to shareholders: Dividends are recorded on the ex-dividend date. Dividends from investment income-net and dividends from net realized capital gains, if any, are normally declared and paid annually, but the fund may make distributions on a more frequent basis to comply with the distribution requirements of the Internal Revenue
48
Code of 1986, as amended (the “Code”).To the extent that net realized capital gains can be offset by capital loss carryovers, it is the policy of the fund not to distribute such gains. Income and capital gain distributions are determined in accordance with income tax regulations, which may differ from GAAP.
(f) Federal income taxes: It is the policy of the fund to continue to qualify as a regulated investment company, if such qualification is in the best interests of its shareholders, by complying with the applicable provisions of the Code, and to make distributions of taxable income sufficient to relieve it from substantially all federal income and excise taxes.
As of and during the period ended October 31, 2010, the fund did not have any liabilities for any uncertain tax positions.The fund recognizes interest and penalties, if any, related to uncertain tax positions as income tax expense in the Statement of Operations. During the period, the fund did not incur any interest or penalties.
Each of the tax years in the four-year period ended October 31, 2010 remains subject to examination by the Internal Revenue Service and state taxing authorities.
At October 31, 2010, the components of accumulated earnings on a tax basis were as follows: undistributed ordinary income $11,360,850, accumulated capital losses $37,109,984 and unrealized appreciation $29,279,725.
The accumulated capital loss carryover is available for federal income tax purposes to be applied against future net securities profits, if any, realized subsequent to October 31, 2010. If not applied, the carryover expires in fiscal 2018.
The tax character of distributions paid to shareholders during the fiscal periods ended October 31, 2010 and October 31, 2009 were as follows: ordinary income $13,109,592 and $9,805,885 and long-term capital gains $3,315,763 and $778,245, respectively.
The Fund 49
NOTES TO FINANCIAL STATEMENTS (continued)
During the period ended October 31, 2010, as a result of permanent book to tax differences, primarily due to the tax treatment for passive foreign investment companies, foreign currency gains and losses and dividend reclassification, the fund decreased accumulated undistributed investment income-net by $436,396 and increased accumulated net realized gain (loss) on investments by the same amount. Net assets and net asset value per share were not affected by this reclassification.
NOTE 2—Bank Lines of Credit:
The fund participates with other Dreyfus-managed funds in a $225 million unsecured credit facility led by Citibank, N.A. and a $300 million unsecured credit facility provided by The Bank of New York Mellon, a subsidiary of BNY Mellon and an affiliate of Dreyfus, (each, a “Facility”), each to be utilized primarily for temporary or emergency purposes, including the financing of redemptions. In connection therewith, the fund has agreed to pay its pro rata portion of commitment fees for each Facility. Interest is charged to the fund based on rates determined pursuant to the terms of the respective Facility at the time of borrowing.
The average amount of borrowings outstanding under the Facilities during the period ended October 31, 2010, was approximately $13,700 with a related weighted average annualized interest rate of 1.43%.
NOTE 3—Management Fee and Other Transactions With Affiliates:
(a) Pursuant to a management agreement (“Agreement”) with the Manager, the management fee is computed at the annual rate of .35% of the value of the fund’s average daily net assets, and is payable monthly. Under the terms of the Agreement, the Manager has agreed to pay all the expenses of the fund, except management fees, brokerage fees and commissions, taxes, interest fees, commitment fees, Shareholder
50
Services Plan fees, fees and expenses of non-interested Board members (including counsel fees) and extraordinary expenses. In addition, the Manager is required to reduce its fee in an amount equal to the fund’s allocable portion of the accrued fees and expenses of the non-interested Board members (including counsel fees). Each Board member also serves as a Board member of other funds within the Dreyfus complex. Annual retainer fees and attendance fees are allocated to each fund based on net assets. During the period ended October 31, 2010, fees reimbursed by the Manager amounted to $31,281.
(b) Under the Shareholder Services Plan, the fund pays the Distributor for the provision of certain services, at the annual rate of .25% of the value of the fund’s average daily net assets.The services provided may include personal services relating to shareholder accounts, such as answering shareholder inquiries regarding the fund and providing reports and other information, and services related to the maintenance of shareholder accounts. The Distributor may make payments to Service Agents (a securities dealer, financial institution or other industry professional) in respect of these services. The Distributor determines the amounts to be paid to Service Agents. During the period ended October 31, 2010, the fund was charged $1,362,870 pursuant to the Shareholder Services Plan.
The components of “Due to The Dreyfus Corporation and affiliates” in the Statement of Assets and Liabilities consist of: management fees $166,624 and shareholder services plan fees $119,017.
(c) A 2% redemption fee is charged and retained by the fund on certain shares redeemed within sixty days following the date of issuance subject to exceptions, including redemptions made through use of the fund’s exchange privilege. During the period ended October 31, 2010, redemption fees charged and retained by the fund amounted to $50,380.
The Fund 51
NOTES TO FINANCIAL STATEMENTS (continued)
NOTE 4—Securities Transactions:
The aggregate amount of purchases and sales of investment securities, excluding short-term securities, forward contracts and financial futures, during the period ended October 31, 2010, amounted to $55,841,729 and $67,834,837, respectively.
The provisions of ASC Topic 815 “Derivatives and Hedging” require qualitative disclosures about objectives and strategies for using derivatives, quantitative disclosures about fair value amounts of gains and losses on derivative instruments and disclosures about credit-risk-related contingent features in derivative agreements. The disclosure requirements distinguish between derivatives, which are accounted for as “hedges” and those that do not qualify for hedge accounting. Because investment companies value their derivatives at fair value and recognize changes in fair value through the Statement of Operations, they do not qualify for such accounting. Accordingly, even though a fund’s investments in derivatives may represent economic hedges, they are considered to be non-hedge transactions for purposes of this disclosure. The following tables show the fund’s exposure to different types of market risk as it relates to the Statement of Assets and Liabilities and the Statement of Operations, respectively.
Fair value of derivative instruments as of October 31, 2010 is shown below:
| Derivative | Derivative | ||
| Assets ($) | Liabilities ($) | ||
| Equity risk1 | 16,058 | Equity risk1 | (128,416) |
| Foreign exchange risk2 | 37,231 | Foreign exchange risk3 | (41,372) |
| Gross fair value of | |||
| derivative contracts | 53,289 | (169,788) |
Statement of Assets and Liabilities location:
| 1 | Includes cumulative appreciation (depreciation) on futures contracts as reported in the Statement of |
| Financial Futures, but only the unpaid variation margin is reported in the Statement of Assets | |
| and Liabilities. | |
| 2 | Unrealized appreciation on forward foreign currency exchange contracts. |
| 3 | Unrealized depreciation on forward foreign currency exchange contracts. |
52
The effect of derivative instruments in the Statement of Operations during the period ended October 31, 2010 is shown below:
| Amount of realized gain or (loss) on derivatives recognized in income ($) | |||
| Forward | |||
| Underlying risk | Futures4 | Contracts5 | Total |
| Equity | (164,727) | — | (164,727) |
| Foreign exchange | — | (746,557) | (746,557) |
| Total | (164,727) | (746,557) | (911,284) |
| Change in unrealized appreciation or (depreciation) on derivatives recognized in income ($) | |||
| Forward | |||
| Underlying risk | Futures6 | Contracts7 | Total |
| Equity | 362,152 | — | 362,152 |
| Foreign exchange | — | (86,729) | (86,729) |
| Total | 362,152 | (86,729) | 275,423 |
| Statement of Operations location: | |
| 4 | Net realized gain (loss) on financial futures. |
| 5 | Net realized gain (loss) on forward foreign currency exchange contracts. |
| 6 | Net unrealized appreciation (depreciation) on financial futures. |
| 7 | Net unrealized appreciation (depreciation) on forward foreign currency exchange contracts. |
Futures Contracts: In the normal course of pursuing its investment objective, the fund is exposed to market risk, including equity price risk as a result of changes in value of underlying financial instruments. The fund invests in financial futures contracts in order to manage its exposure to or protect against changes in the market. A futures contract represents a commitment for the future purchase or a sale of an asset at a specified date. Upon entering into such contracts, these investments require initial margin deposits with a broker, which consist of cash or cash equivalents.The amount of these deposits is determined by the exchange or Board ofTrade on which the contract is traded and is subject to change. Accordingly, variation margin payments are received or made to reflect daily unrealized gains or losses which are recorded in the Statement of Operations. Futures contracts are valued daily at the last sales price established by the Board of Trade or
The Fund 53
NOTES TO FINANCIAL STATEMENTS (continued)
exchange upon which they are traded.When the contracts are closed, the fund recognizes a realized gain or loss.There is minimal counter-party credit risk to the fund with futures since futures are exchange traded, and the exchange’s clearinghouse guarantees the futures against default. Contracts open at October 31, 2010 are set forth in the Statement of Financial Futures.
Forward Foreign Currency Exchange Contracts: The fund enters into forward contracts in order to hedge its exposure to changes in foreign currency exchange rates on its foreign portfolio holdings, to settle foreign currency transactions or as a part of its investment strategy. When executing forward contracts, the fund is obligated to buy or sell a foreign currency at a specified rate on a certain date in the future. With respect to sales of forward contracts, the fund incurs a loss if the value of the contract increases between the date the forward contract is opened and the date the forward contract is closed.The fund realizes a gain if the value of the contract decreases between those dates.With respect to purchases of forward contracts, the fund incurs a loss if the value of the contract decreases between the date the for ward contract is opened and the date the forward contract is closed.The fund realizes a gain if the value of the contract increases between those dates. Any realized gain or loss which occurred during the period is reflected in the Statement of Operations.The fund is exposed to foreign currency risk as a result of changes in value of underlying financial instruments. The fund is also exposed to credit risk associated with counterparty nonperformance on these forward contracts, which is typically limited to the unrealized gain on each open contract.The following summarizes open forward contracts at October 31, 2010:
| Foreign | Unrealized | |||
| Forward Foreign Currency | Currency | Appreciation | ||
| Exchange Contracts | Amounts | Cost ($) | Value ($) | (Depreciation) ($) |
| Purchases: | ||||
| Australian Dollar, | ||||
| Expiring 12/15/2010 | 901,867 | 888,022 | 878,272 | (9,750) |
| Australian Dollar, | ||||
| Expiring 12/15/2010 | 117,600 | 115,830 | 114,523 | (1,307) |
54
| Foreign | Unrealized | |||
| Forward Foreign Currency | Currency | Appreciation | ||
| Exchange Contracts | Amounts | Cost ($) | Value ($) | (Depreciation) ($) |
| Purchases (continued): | ||||
| British Pound, | ||||
| Expiring 12/15/2010 | 229,000 | 366,160 | 366,801 | 641 |
| British Pound, | ||||
| Expiring 12/15/2010 | 816,695 | 1,308,304 | 1,308,143 | (161) |
| British Pound, | ||||
| Expiring 12/15/2010 | 114,300 | 182,630 | 183,080 | 450 |
| British Pound, | ||||
| Expiring 12/15/2010 | 170,300 | 270,612 | 272,778 | 2,166 |
| British Pound, | ||||
| Expiring 12/15/2010 | 57,100 | 90,027 | 91,460 | 1,433 |
| British Pound, | ||||
| Expiring 12/15/2010 | 114,300 | 179,654 | 183,080 | 3,426 |
| British Pound, | ||||
| Expiring 12/15/2010 | 56,900 | 90,033 | 91,140 | 1,107 |
| British Pound, | ||||
| Expiring 12/15/2010 | 113,300 | 181,028 | 181,479 | 451 |
| Euro, | ||||
| Expiring 12/15/2010 | 1,340,755 | 1,888,219 | 1,864,954 | (23,265) |
| Euro, | ||||
| Expiring 12/15/2010 | 254,700 | 358,015 | 354,281 | (3,734) |
| Euro, | ||||
| Expiring 12/15/2010 | 226,100 | 315,522 | 314,499 | (1,023) |
| Euro, | ||||
| Expiring 12/15/2010 | 141,400 | 197,434 | 196,683 | (751) |
| Euro, | ||||
| Expiring 12/15/2010 | 28,400 | 39,739 | 39,504 | (235) |
| Euro, | ||||
| Expiring 12/15/2010 | 114,500 | 160,413 | 159,267 | (1,146) |
| Euro, | ||||
| Expiring 12/15/2010 | 142,400 | 196,658 | 198,075 | 1,417 |
| Euro, | ||||
| Expiring 12/15/2010 | 141,900 | 197,307 | 197,379 | 72 |
| Japanese Yen, | ||||
| Expiring 12/15/2010 | 41,125,000 | 505,616 | 511,292 | 5,676 |
| Japanese Yen, | ||||
| Expiring 12/15/2010 | 41,308,915 | 505,886 | 513,578 | 7,692 |
| Japanese Yen, | ||||
| Expiring 12/15/2010 | 33,460,000 | 411,131 | 415,996 | 4,865 |
| Japanese Yen, | ||||
| Expiring 12/15/2010 | 41,475,000 | 511,177 | 515,643 | 4,466 |
| Japanese Yen, | ||||
| Expiring 12/15/2010 | 8,230,000 | 101,471 | 102,321 | 850 |
The Fund 55
NOTES TO FINANCIAL STATEMENTS (continued)
| Foreign | Unrealized | |||
| Forward Foreign Currency | Currency | Appreciation | ||
| Exchange Contracts | Amounts | Cost ($) | Value ($) | (Depreciation) ($) |
| Purchases (continued): | ||||
| Japanese Yen, | ||||
| Expiring 12/15/2010 | 16,500,000 | 204,975 | 205,138 | 163 |
| Japanese Yen, | ||||
| Expiring 12/15/2010 | 8,160,000 | 100,039 | 101,450 | 1,411 |
| Japanese Yen, | ||||
| Expiring 12/15/2010 | 24,450,000 | 303,121 | 303,978 | 857 |
| Singapore Dollar, | ||||
| Expiring 11/3/2010 | 106,261 | 82,102 | 82,102 | — |
| Sales: | Proceeds ($) | |||
| Euro, | ||||
| Expiring 11/3/2010 | 59,008 | 82,102 | 82,014 | 88 |
| Gross Unrealized Appreciation | 37,231 | |||
| Gross Unrealized Depreciation | (41,372) | |||
At October 31, 2010, the cost of investments for federal income tax purposes was $527,116,291; accordingly, accumulated net unrealized appreciation on investments was $29,276,479, consisting of $96,179,898 gross unrealized appreciation and $66,903,419 gross unrealized depreciation.
56
REPORT OF INDEPENDENT REGISTERED
PUBLIC ACCOUNTING FIRM
Shareholders and Board of Directors
Dreyfus International Stock Index Fund
We have audited the accompanying statement of assets and liabilities, including the statements of investments and financial futures, of Dreyfus International Stock Index Fund (one of the series comprising Dreyfus Index Funds, Inc.) as of October 31, 2010, and the related statement of operations for the year then ended, the statement of changes in net assets for each of the two years in the period then ended and financial highlights for each of the four years in the period then ended.These financial statements and financial highlights are the responsibility of the Fund’s management. Our responsibility is to express an opinion on these financial statements and financial highlights based on our audits.The financial highlights for the year ended October 31, 2006 were audited by other auditors whose report dated December 14, 2006, expressed an unqualified opinion on such financial highlights.
We conducted our audits in accordance with the standards of the Public Company Accounting Oversight Board (United States).Those standards require that we plan and perform the audit to obtain reasonable assurance about whether the financial statements and financial highlights are free of material misstatement.We were not engaged to perform an audit of the Fund’s internal control over financial reporting. Our audits included consideration of internal control over financial reporting as a basis for designing audit procedures that are appropriate in the circumstances, but not for the purpose of expressing an opinion on the effectiveness of the Fund’s internal control over financial reporting. Accordingly, we express no such opinion.An audit also includes examining, on a test basis, evidence supporting the amounts and disclosures in the financial statements and financial highlights, assessing the accounting p rinciples used and significant estimates made by management, and evaluating the overall financial statement presentation. Our procedures included confirmation of securities owned as of October 31, 2010 by correspondence with the custodian and others. We believe that our audits provide a reasonable basis for our opinion.
In our opinion, the financial statements and financial highlights referred to above present fairly, in all material respects, the financial position of Dreyfus International Stock Index Fund at October 31, 2010, the results of its operations for the year then ended, the changes in its net assets for each of the two years in the period then ended and the financial highlights for each of the four years in the period then ended, in conformity with U.S. generally accepted accounting principles.
New York, New York
December 28, 2010
The Fund 57
IMPORTANT TAX INFORMATION (Unaudited)
In accordance with federal tax law, the fund elects to provide each shareholder with their portion of the fund’s foreign taxes paid and the income sourced from foreign countries. Accordingly, the fund hereby makes the following designations regarding its fiscal year ended October 31, 2010:
—the total amount of taxes paid to foreign countries was $1,321,316
—the total amount of income sourced from foreign countries was $16,897,754.
Where required by federal tax law rules, shareholders will receive notification of their proportionate share of foreign taxes paid and foreign sourced income for the 2010 calendar year with Form 1099-DIV which will be mailed in early 2011. For the fiscal year ended October 31, 2010, certain dividends paid by the fund may be subject to a maximum tax rate of 15%, as provided for by the Jobs and Growth Tax Relief Reconciliation Act of 2003. Of the distributions paid during the fiscal year, $13,109,592 represents the maximum amount that may be considered qualified dividend income.Also, the fund hereby designates $.0844 per share as a long-term capital gain distribution paid on December 24, 2009.
58
BOARD MEMBERS INFORMATION (Unaudited)
The Fund 59
BOARD MEMBERS INFORMATION (Unaudited) (continued)
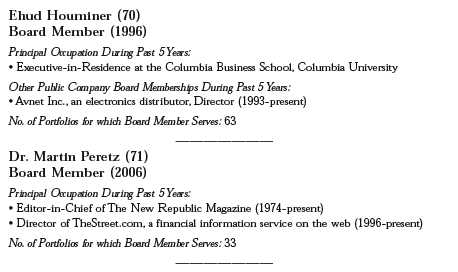
Once elected all Board Members serve for an indefinite term, but achieve Emeritus status upon reaching age 80.The address of the Board Members and Officers is in c/o The Dreyfus Corporation, 200 Park Avenue, NewYork, NewYork 10166.Additional information about the Board Members is available in the fund’s Statement of Additional Information which can be obtained from Dreyfus free of charge by calling this toll free number: 1-800-554-4611.
Dr. Paul A. Marks, Emeritus Board Member
Gloria Messinger, Emeritus Board Member
60
OFFICERS OF THE FUND (Unaudited)
BRADLEY J. SKAPYAK, President since
January 2010.
Chief Operating Officer and a director of the Manager since June 2009. From April 2003 to June 2009, Mr. Skapyak was the head of the Investment Accounting and Support Department of the Manager. He is an officer of 76 investment companies (comprised of 170 portfolios) managed by the Manager. He is 51 years old and has been an employee of the Manager since February 1988.
PHILLIP N. MAISANO, Executive Vice
President since July 2007.
Chief Investment Officer,Vice Chair and a director of the Manager, and an officer of 76 investment companies (comprised of 170 portfolios) managed by the Manager.
Mr. Maisano also is an officer and/or Board member of certain other investment management subsidiaries of The Bank of New York Mellon Corporation, each of which is an affiliate of the Manager. He is 63 years old and has been an employee of the Manager since November 2006. Prior to joining the Manager, Mr. Maisano served as Chairman and Chief Executive Officer of EACM Advisors, an affiliate of the Manager, since August 2004.
MICHAEL A. ROSENBERG, Vice President
and Secretary since August 2005.
Assistant General Counsel of BNY Mellon, and an officer of 77 investment companies (comprised of 195 portfolios) managed by the Manager. He is 50 years old and has been an employee of the Manager since October 1991.
KIESHA ASTWOOD, Vice President and
Assistant Secretary since January 2010.
Counsel of BNY Mellon, and an officer of 77 investment companies (comprised of 195 portfolios) managed by the Manager. She is 37 years old and has been an employee of the Manager since July 1995.
JAMES BITETTO, Vice President and
Assistant Secretary since August 2005.
Senior Counsel of BNY Mellon and Secretary of the Manager, and an officer of 77 investment companies (comprised of 195 portfolios) managed by the Manager. He is 44 years old and has been an employee of the Manager since December 1996.
JONI LACKS CHARATAN, Vice President
and Assistant Secretary since
August 2005.
Senior Counsel of BNY Mellon, and an officer of 77 investment companies (comprised of 195 portfolios) managed by the Manager. She is 54 years old and has been an employee of the Manager since October 1988.
JOSEPH M. CHIOFFI, Vice President and Assistant Secretary since August 2005.
Senior Counsel of BNY Mellon, and an officer of 77 investment companies (comprised of 195 portfolios) managed by the Manager. He is 48 years old and has been an employee of the Manager since June 2000.
KATHLEEN DENICHOLAS, Vice President
and Assistant Secretary since
January 2010.
Senior Counsel of BNY Mellon, and an officer of 77 investment companies (comprised of 195 portfolios) managed by the Manager. She is 36 years old and has been an employee of the Manager since February 2001.
JANETTE E. FARRAGHER, Vice President
and Assistant Secretary since
August 2005.
Assistant General Counsel of BNY Mellon, and an officer of 77 investment companies (comprised of 195 portfolios) managed by the Manager. She is 47 years old and has been an employee of the Manager since February 1984.
The Fund 61
OFFICERS OF THE FUND (Unaudited) (continued)
JOHN B. HAMMALIAN, Vice President and
Assistant Secretary since August 2005.
Managing Counsel of BNY Mellon, and an officer of 77 investment companies (comprised of 195 portfolios) managed by the Manager. He is 47 years old and has been an employee of the Manager since February 1991.
M. CRISTINA MEISER, Vice President and
Assistant Secretary since January 2010.
Senior Counsel of BNY Mellon, and an officer of 77 investment companies (comprised of 195 portfolios) managed by the Manager. She is 40 years old and has been an employee of the Manager since August 2001.
ROBERT R. MULLERY, Vice President and
Assistant Secretary since August 2005.
Managing Counsel of BNY Mellon, and an officer of 77 investment companies (comprised of 195 portfolios) managed by the Manager. He is 58 years old and has been an employee of the Manager since May 1986.
JEFF PRUSNOFSKY, Vice President and
Assistant Secretary since August 2005.
Managing Counsel of BNY Mellon, and an officer of 77 investment companies (comprised of 195 portfolios) managed by the Manager. He is 45 years old and has been an employee of the Manager since October 1990.
JAMES WINDELS, Treasurer since
November 2001.
Director – Mutual Fund Accounting of the Manager, and an officer of 77 investment companies (comprised of 195 portfolios) managed by the Manager. He is 52 years old and has been an employee of the Manager since April 1985.
RICHARD CASSARO, Assistant Treasurer
since January 2008.
Senior Accounting Manager – Money Market and Municipal Bond Funds of the Manager, and an officer of 77 investment companies (comprised of 195 portfolios) managed by the Manager. He is 51 years old and has been an employee of the Manager since September 1982.
GAVIN C. REILLY, Assistant Treasurer
since December 2005.
Tax Manager of the Investment Accounting and Support Department of the Manager, and an officer of 77 investment companies (comprised of 195 portfolios) managed by the Manager. He is 42 years old and has been an employee of the Manager since April 1991.
ROBERT ROBOL, Assistant Treasurer
since August 2005.
Senior Accounting Manager – Fixed Income Funds of the Manager, and an officer of 77 investment companies (comprised of 195 portfolios) managed by the Manager. He is 46 years old and has been an employee of the Manager since October 1988.
ROBERT SALVIOLO, Assistant Treasurer
since July 2007.
Senior Accounting Manager – Equity Funds of the Manager, and an officer of 77 investment companies (comprised of 195 portfolios) managed by the Manager. He is 43 years old and has been an employee of the Manager since June 1989.
62
ROBERT SVAGNA, Assistant Treasurer
since December 2002.
Senior Accounting Manager – Equity Funds of the Manager, and an officer of 77 investment companies (comprised of 195 portfolios) managed by the Manager. He is 43 years old and has been an employee of the Manager since November 1990.
JOSEPH W. CONNOLLY, Chief Compliance Officer since October 2004.
Chief Compliance Officer of the Manager and The Dreyfus Family of Funds (77 investment companies, comprised of 195 portfolios). From November 2001 through March 2004, Mr. Connolly was first Vice-President, Mutual Fund Servicing for Mellon Global Securities Services. In that capacity, Mr. Connolly was responsible for managing Mellon’s Custody, Fund Accounting and Fund Administration services to third-party mutual fund clients.
He is 53 years old and has served in various capacities with the Manager since 1980, including manager of the firm’s Fund Accounting Department from 1997 through October 2001.
NATALIA GRIBAS, Anti-Money Laundering
Compliance Officer since July 2010.
Anti-Money Laundering Compliance Officer of the Distributor, and the Anti-Money Laundering Compliance Officer of 73 investment companies (comprised of 191 portfolios) managed by the Manager. She is 40 years old and has been an employee of the Distributor since September 2008.
The Fund 63
NOTES
For More Information

Ticker Symbol: DIISX
Telephone 1-800-645-6561
Mail The Dreyfus Family of Funds, 144 Glenn Curtiss Boulevard, Uniondale, NY 11556-0144 E-mail Send your request to info@dreyfus.com Internet Information can be viewed online or downloaded at: http://www.dreyfus.com
The fund files its complete schedule of portfolio holdings with the Securities and Exchange Commission (“SEC”) for the first and third quarters of each fiscal year on Form N-Q. The fund’s Forms N-Q are available on the SEC’s website at http://www.sec.gov and may be reviewed and copied at the SEC’s Public Reference Room in Washington, DC. Information on the operation of the Public Reference Room may be obtained by calling 1-800-SEC-0330.
A description of the policies and procedures that the fund uses to determine how to vote proxies relating to portfolio securities, and information regarding how the fund voted these proxies for the most recent 12-month period ended June 30 is available at http://www.dreyfus.com and on the SEC’s website at http://www.sec.gov. The description of the policies and procedures is also available without charge, upon request, by calling 1-800-645-6561.

Save time. Save paper. View your next shareholder report online as soon as it’s available. Log into www.dreyfus.com and sign up for Dreyfus eCommunications. It’s simple and only takes a few minutes.
The views expressed in this report reflect those of the portfolio manager only through the end of the period covered and do not necessarily represent the views of Dreyfus or any other person in the Dreyfus organization. Any such views are subject to change at any time based upon market or other conditions and Dreyfus disclaims any responsibility to update such views.These views may not be relied on as investment advice and, because investment decisions for a Dreyfus fund are based on numerous factors, may not be relied on as an indication of trading intent on behalf of any Dreyfus fund.
Not FDIC-Insured • Not Bank-Guaranteed • May Lose Value
Contents | |
THE FUND | |
| 2 | A Letter from the Chairman and CEO |
| 3 | Discussion of Fund Performance |
| 6 | Fund Performance |
| 7 | Understanding Your Fund’s Expenses |
| 7 | Comparing Your Fund’s Expenses With Those of Other Funds |
| 8 | Statement of Investments |
| 24 | Statement of Financial Futures |
| 25 | Statement of Assets and Liabilities |
| 26 | Statement of Operations |
| 27 | Statement of Changes in Net Assets |
| 28 | Financial Highlights |
| 29 | Notes to Financial Statements |
| 38 | Report of Independent Registered Public Accounting Firm |
| 39 | Important Tax Information |
| 40 | Board Members Information |
| 42 | Officers of the Fund |
FOR MORE INFORMATION | |
Back Cover |
Dreyfus
S&P 500 Index Fund
The Fund

A LETTER FROM THE CHAIRMAN AND CEO
Dear Shareholder:
We are pleased to present this annual report for Dreyfus S&P 500 Index Fund, covering the 12-month period from November 1, 2009, through October 31, 2010.
Although a double-dip recession has recently become an increasingly unlikely scenario in our view, persistent uncertainty regarding the breadth and strength of the U.S. and global economic recoveries led to bouts of heightened volatility for U.S. stocks during most of 2010.The spending power of the U.S. consumer, long an important catalyst for economic growth, has been diminished by concerns over job security and an inability to generate cash from home equity.The second major driver of sustainable growth, corporate investment, has been stunted to a similar extent by tight credit conditions. However, the recent announcement of additional quantitative easing (QE2) measures by the Federal Reserve Board, as well as improved fundamentals across many developing nations, have helped support moderate global economic growth.
Uncertainty will probably remain in the broader financial markets until we see more evidence of robust economic growth, but we remain optimistic regarding the prospects for equities. Many stocks of quality companies with healthy balance sheets, higher credit ratings and strong cash flows appear to be currently priced at a discount.With that, we strongly suggest that you meet with your financial advisor to discuss the potential opportunities which may exist in the global markets, as well as to evaluate your portfolio to help meet your individual investment needs and your future goals relative to your risk-tolerance level.
For information about how the fund performed during the reporting period, as well as general market perspectives, we provide a Discussion of Fund Performance on the pages that follow.
Thank you for your continued confidence and support.

Jonathan R. Baum
Chairman and Chief Executive Officer
The Dreyfus Corporation
November 15, 2010
2

DISCUSSION OF FUND PERFORMANCE
For the period of November 1, 2009, through October 31, 2010, as provided by Thomas J. Durante, CFA, Karen Q. Wong and Richard A. Brown, Portfolio Managers
Fund and Market Performance Overview
For the 12-month period ended October 31, 2010, Dreyfus S&P 500 Index Fund produced a total return of 16.02%.1 In comparison, the Standard & Poor’s 500 Composite Stock Price Index (the “S&P 500 Index”), the fund’s benchmark, produced a 16.54% return for the same period.2,3
Large-cap stocks ended a volatile reporting period with double-digit gains, on average, as investor sentiment was buoyed by a sustained U.S. economic recovery despite a number of economic headwinds. The difference in returns between the fund and the S&P 500 Index was primarily the result of the fund’s transaction costs and operating expenses.
The Fund’s Investment Approach
The fund seeks to match the total return of the S&P 500 Index by generally investing in all 500 stocks in the S&P 500 Index in proportion to their respective weighting. Often considered a barometer for the stock market in general, the S&P 500 Index is made up of 500 widely held common stocks across 10 economic sectors. Each stock is weighted by its float-adjusted market capitalization; that is, larger companies have greater representation in the S&P 500 Index than smaller ones.
Equity Markets Rebounded in Economic Recovery
When the reporting period began, the U.S. economy had returned to growth, aided in large part by fiscal and monetary stimulus programs from the federal government and Federal Reserve Board (the “Fed”), respectively. Early in the reporting period, improving manufacturing activity and an apparent bottoming of housing prices helped bolster confidence among businesses, consumers and investors. Consumer and corporate spending improved, and commodity prices climbed.
TheFund 3
DISCUSSION OF FUND PERFORMANCE (continued)
By May, however, investors were faced with two new global developments. First, Greece found itself unable to refinance a heavy debt load, leading to a sovereign debt crisis that investors feared might spread throughout the European Union. Second, a catastrophic oil spill in the Gulf of Mexico threatened economic activity along the U.S. Gulf Coast as well as the prospects of energy companies engaged in deep-sea drilling. These concerns weighed heavily on investor sentiment and stock prices. However, fears regarding the possibility of a return to recession proved to be unwarranted when, by the end of the summer, a number of economic indicators pointed to continued, albeit subpar, U.S. economic growth.
Throughout the reporting period, the Fed made it clear that it would continue to employ all available tools to stimulate the economy. Indeed, as it has since December 2008, the Fed maintained the overnight federal funds rate in a historically low range between 0% and 0.25%. The Fed also announced plans to embark on a second round of quantitative easing, in which it will purchase $600 billion of U.S.Treasuries to further stimulate the U.S. economy.Anticipation of the Fed’s quantitative easing program helped spark a market rally that persisted through the reporting period’s end.
All Market Sectors in S&P 500 Index Produced Positive Results
All 10 of the economic sectors that comprise the S&P 500 Index produced positive absolute returns during the reporting period, a testament to the breadth of the market rebound. Stronger consumer and business spending helped the information technology sector rank among the S&P 500 Index’s top performing sectors. In addition, many technology firms expanded their overseas presence during the reporting period, made possible, in part, by their ability to borrow money at low interest rates. Cost-cutting measures, such as staff reductions, factory closures and moving operations to lower-cost sites, also helped boost the technology sector’s earnings. Hardware companies with new product lines and significant exposure to overseas markets fared especially well, as did software companies that offer businesses tools for managing data, supporting internal operations and facilitating collaboration and applicati on development.
4
A number of consumer discretionary stocks posted above-average results, most notably media stocks that provide steady dividends to investors. Advertising stocks fared well due to increased revenues from the November elections, and a number of casual dining chains and discount Internet retailers gained value as consumer spending improved. In the industrials sector, an aerospace and defense company performed well amid continued geopolitical uncertainty, and railroad stocks benefited from rising shipping volumes in the recovering economy.
On the other hand, the financials sector produced more mixed results.While banks and diversified financial services companies generally disappointed, those losses were offset by gains from real estate investment trusts.
Index Funds Offer Diversification
As an index fund, we attempt to replicate the returns of the S&P 500 Index by closely approximating its composition. In our view, one of the greatest benefits of an index fund is that it offers a broadly diversified investment vehicle that can help investors manage risks by limiting the impact on the overall portfolio of unexpected losses in any single industry group or holding.
November 15, 2010
| Equity funds are subject generally to market, market sector, market liquidity, issuer and investment | |
| style risks, among other factors, to varying degrees, all of which are more fully described in the | |
| fund’s prospectus. | |
| 1 | Total return includes reinvestment of dividends and any capital gains paid. Past performance is no |
| guarantee of future results. Share price and investment return fluctuate such that upon redemption, | |
| fund shares may be worth more or less than their original cost. | |
| 2 | SOURCE: LIPPER INC. — Reflects reinvestment of dividends daily and, where applicable, |
| capital gain distributions.The Standard & Poor’s 500 Composite Stock Price Index is a widely | |
| accepted, unmanaged index of U.S. stock market performance. Investors cannot invest directly in | |
| any index. | |
| 3 | “Standard & Poor’s®,” “S&P®,” “Standard & Poor’s® 500” and “S&P 500®” are |
| trademarks of The McGraw-Hill Companies, Inc., and have been licensed for use by the fund. | |
| The fund is not sponsored, endorsed, sold or promoted by Standard & Poor’s and Standard & | |
| Poor’s makes no representation regarding the advisability of investing in the fund. |
TheFund 5
FUND PERFORMANCE

| Average Annual Total Returns as of 10/31/10 | |||
| 1 Year | 5 Years | 10 Years | |
| Fund | 16.02% | 1.30% | –0.48% |
| Standard & Poor’s 500 | |||
| Composite Stock Price Index | 16.54% | 1.74% | –0.01% |
† Source: Lipper Inc.
Past performance is not predictive of future performance.The fund’s performance shown in the graph and table does not reflect the deduction of taxes that a shareholder would pay on fund distributions or the redemption of fund shares. The above graph compares a $10,000 investment made in Dreyfus S&P 500 Index Fund on 10/31/00 to a $10,000 investment made in the Standard & Poor’s 500 Composite Stock Price Index (the “Index”) on that date. All dividends and capital gain distributions are reinvested.
The fund’s performance shown in the line graph takes into account all applicable fees and expenses.The Index is a widely accepted, unmanaged index of U.S. stock market performance. Unlike a mutual fund, the Index is not subject to charges, fees and other expenses. Investors cannot invest directly in any index. Further information relating to fund performance, including expense reimbursements, if applicable, is contained in the Financial Highlights section of the prospectus and elsewhere in this report.
6
UNDERSTANDING YOUR FUND’S EXPENSES (Unaudited)
As a mutual fund investor, you pay ongoing expenses, such as management fees and other expenses. Using the information below, you can estimate how these expenses affect your investment and compare them with the expenses of other funds.You also may pay one-time transaction expenses, including sales charges (loads) and redemption fees, which are not shown in this section and would have resulted in higher total expenses. For more information, see your fund’s prospectus or talk to your financial adviser.
Review your fund’s expenses
The table below shows the expenses you would have paid on a $1,000 investment in Dreyfus S&P 500 Index Fund from May 1, 2010 to October 31, 2010. It also shows how much a $1,000 investment would be worth at the close of the period, assuming actual returns and expenses.
| Expenses and Value of a $1,000 Investment | |
| assuming actual returns for the six months ended October 31, 2010 | |
| Expenses paid per $1,000† | $ 2.53 |
| Ending value (after expenses) | $1,004.80 |
| COMPARING YOUR FUND’S EXPENSES |
| WITH THOSE OF OTHER FUNDS (Unaudited) |
Using the SEC’s method to compare expenses
The Securities and Exchange Commission (SEC) has established guidelines to help investors assess fund expenses. Per these guidelines, the table below shows your fund’s expenses based on a $1,000 investment, assuming a hypothetical 5% annualized return. You can use this information to compare the ongoing expenses (but not transaction expenses or total cost) of investing in the fund with those of other funds.All mutual fund shareholder reports will provide this information to help you make this comparison. Please note that you cannot use this information to estimate your actual ending account balance and expenses paid during the period.
| Expenses and Value of a $1,000 Investment | |
| assuming a hypothetical 5% annualized return for the six months ended October 31, 2010 | |
| Expenses paid per $1,000† | $ 2.55 |
| Ending value (after expenses) | $1,022.68 |
† Expenses are equal to the fund’s annualized expense ratio of .50%, multiplied by the average account value over the period, multiplied by 184/365 (to reflect the one-half year period).
TheFund 7
| STATEMENT OF INVESTMENTS |
| October 31, 2010 |
| Common Stocks—99.6% | Shares | Value ($) | |
| Consumer Discretionary—10.6% | |||
| Abercrombie & Fitch, Cl. A | 19,114 | 819,226 | |
| Amazon.com | 76,329 a | 12,604,971 | |
| Apollo Group, Cl. A | 26,621 a | 997,755 | |
| AutoNation | 13,937 a,b | 323,617 | |
| AutoZone | 6,502 a | 1,545,070 | |
| Bed Bath & Beyond | 56,230 a | 2,468,497 | |
| Best Buy | 74,064 | 3,183,271 | |
| Big Lots | 18,170 a | 569,993 | |
| Carmax | 47,849 a | 1,482,841 | |
| Carnival | 94,705 | 4,088,415 | |
| CBS, Cl. B | 147,128 | 2,490,877 | |
| Coach | 66,000 b | 3,300,000 | |
| Comcast, Cl. A | 611,562 | 12,585,946 | |
| D.R. Horton | 60,999 | 636,830 | |
| Darden Restaurants | 30,190 | 1,379,985 | |
| DeVry | 13,444 | 643,430 | |
| DIRECTV, Cl. A | 187,815 a | 8,162,440 | |
| Discovery Communications, Cl. A | 61,030 a | 2,722,548 | |
| Eastman Kodak | 58,563 a,b | 275,832 | |
| Expedia | 46,496 | 1,346,059 | |
| Family Dollar Stores | 30,047 | 1,387,270 | |
| Ford Motor | 742,980 a,b | 10,498,307 | |
| Fortune Brands | 32,379 | 1,750,085 | |
| GameStop, Cl. A | 35,945 a,b | 706,679 | |
| Gannett | 51,104 b | 605,582 | |
| Gap | 97,170 | 1,847,202 | |
| Genuine Parts | 35,440 | 1,696,158 | |
| Goodyear Tire & Rubber | 53,528 a | 547,056 | |
| H & R Block | 72,352 | 853,030 | |
| Harley-Davidson | 51,593 b | 1,582,873 | |
| Harman International Industries | 13,258 a | 444,806 | |
| Hasbro | 30,063 | 1,390,414 | |
| Home Depot | 362,805 | 11,203,418 | |
| International Game Technology | 66,949 | 1,043,735 | |
| Interpublic Group of Cos. | 104,729 a | 1,083,945 | |
| J.C. Penney | 50,482 | 1,574,029 | |
8
| Common Stocks (continued) | Shares | Value ($) |
| Consumer Discretionary (continued) | ||
| Johnson Controls | 144,515 | 5,075,367 |
| Kohl’s | 65,916 a | 3,374,899 |
| Leggett & Platt | 32,113 b | 654,463 |
| Lennar, Cl. A | 30,483 | 442,308 |
| Limited Brands | 57,931 | 1,702,592 |
| Lowe’s | 303,602 | 6,475,831 |
| Macy’s | 90,782 | 2,146,086 |
| Marriott International, Cl. A | 61,598 b | 2,282,206 |
| Mattel | 77,776 | 1,814,514 |
| McDonald’s | 230,149 | 17,898,688 |
| McGraw-Hill | 66,958 | 2,520,969 |
| Meredith | 8,406 b | 285,384 |
| New York Times, Cl. A | 26,261 a,b | 201,422 |
| Newell Rubbermaid | 61,725 | 1,089,446 |
| News, Cl. A | 490,100 | 7,086,846 |
| NIKE, Cl. B | 84,147 | 6,852,932 |
| Nordstrom | 36,363 | 1,400,339 |
| O’Reilly Automotive | 29,469 a | 1,723,937 |
| Office Depot | 60,841 a | 273,176 |
| Omnicom Group | 65,273 | 2,869,401 |
| Polo Ralph Lauren | 14,000 | 1,356,320 |
| Priceline.com | 10,447 a | 3,936,534 |
| Pulte Group | 74,678 a | 586,222 |
| RadioShack | 29,378 | 591,379 |
| Ross Stores | 25,521 | 1,505,484 |
| Scripps Networks Interactive, Cl. A | 19,968 | 1,016,172 |
| Sears Holdings | 10,575 a,b | 761,189 |
| Stanley Black & Decker | 35,710 | 2,212,949 |
| Staples | 157,323 | 3,220,402 |
| Starbucks | 160,638 | 4,574,970 |
| Starwood Hotels & Resorts Worldwide | 40,184 c | 2,175,562 |
| Target | 156,102 | 8,107,938 |
| Tiffany & Co. | 26,977 | 1,429,781 |
| Time Warner | 243,317 | 7,910,236 |
| Time Warner Cable | 76,825 | 4,445,863 |
| TJX | 88,183 | 4,046,718 |
TheFund 9
STATEMENT OF INVESTMENTS (continued)
| Common Stocks (continued) | Shares | Value ($) |
| Consumer Discretionary (continued) | ||
| Urban Outfitters | 27,600 a | 849,252 |
| VF | 18,772 | 1,562,581 |
| Viacom, Cl. B | 131,200 | 5,063,008 |
| Walt Disney | 413,859 | 14,944,448 |
| Washington Post, Cl. B | 1,293 b | 519,980 |
| Whirlpool | 16,260 | 1,232,996 |
| Wyndham Worldwide | 39,403 | 1,132,836 |
| Wynn Resorts | 16,202 | 1,736,368 |
| Yum! Brands | 101,570 | 5,033,809 |
| 245,965,995 | ||
| Consumer Staples—11.1% | ||
| Altria Group | 447,387 | 11,372,577 |
| Archer-Daniels-Midland | 139,571 | 4,650,506 |
| Avon Products | 92,238 | 2,808,647 |
| Brown-Forman, Cl. B | 23,497 | 1,428,853 |
| Campbell Soup | 41,223 b | 1,494,334 |
| Clorox | 29,818 | 1,984,388 |
| Coca-Cola | 499,074 | 30,603,218 |
| Coca-Cola Enterprises | 71,528 | 1,717,387 |
| Colgate-Palmolive | 105,119 | 8,106,777 |
| ConAgra Foods | 95,780 | 2,154,092 |
| Constellation Brands, Cl. A | 43,142 a | 851,192 |
| Costco Wholesale | 94,276 | 5,917,705 |
| CVS Caremark | 293,985 | 8,854,828 |
| Dean Foods | 38,257 a | 397,873 |
| Dr. Pepper Snapple Group | 53,170 | 1,943,364 |
| Estee Lauder, Cl. A | 25,301 | 1,800,672 |
| General Mills | 138,984 | 5,217,459 |
| H.J. Heinz | 67,612 | 3,320,425 |
| Hershey | 33,525 | 1,659,152 |
| Hormel Foods | 15,277 | 701,520 |
| J.M. Smucker | 25,604 | 1,645,825 |
| Kellogg | 56,232 | 2,826,220 |
| Kimberly-Clark | 88,556 | 5,609,137 |
| Kraft Foods, Cl. A | 376,093 | 12,136,521 |
| Kroger | 142,116 | 3,126,552 |
10
| Common Stocks (continued) | Shares | Value ($) | |
| Consumer Staples (continued) | |||
| Lorillard | 33,428 | 2,852,746 | |
| McCormick & Co. | 28,440 b | 1,257,617 | |
| Mead Johnson Nutrition | 43,902 | 2,582,316 | |
| Molson Coors Brewing, Cl. B | 32,799 | 1,549,097 | |
| PepsiCo | 344,102 | 22,469,861 | |
| Philip Morris International | 396,368 | 23,187,528 | |
| Procter & Gamble | 613,954 | 39,029,056 | |
| Reynolds American | 37,263 | 2,418,369 | |
| Safeway | 83,969 | 1,922,890 | |
| Sara Lee | 143,323 | 2,053,819 | |
| SUPERVALU | 47,157 | 508,824 | |
| SYSCO | 127,886 | 3,767,522 | |
| Tyson Foods, Cl. A | 64,322 | 1,000,207 | |
| Wal-Mart Stores | 433,156 | 23,464,061 | |
| Walgreen | 212,366 | 7,194,960 | |
| Whole Foods Market | 31,824 a | 1,265,004 | |
| 258,853,101 | |||
| Energy—11.1% | |||
| Anadarko Petroleum | 106,926 | 6,583,434 | |
| Apache | 78,688 | 7,949,061 | |
| Baker Hughes | 92,891 | 4,303,640 | |
| Cabot Oil & Gas | 23,258 | 674,017 | |
| Cameron International | 52,434 a | 2,293,988 | |
| Chesapeake Energy | 140,165 | 3,041,581 | |
| Chevron | 434,524 | 35,896,028 | |
| ConocoPhillips | 320,345 | 19,028,493 | |
| Consol Energy | 47,310 | 1,739,116 | |
| Denbury Resources | 85,215 a | 1,450,359 | |
| Devon Energy | 94,120 | 6,119,682 | |
| Diamond Offshore Drilling | 15,147 a | 1,002,126 | |
| El Paso | 151,496 | 2,008,837 | |
| EOG Resources | 54,591 | 5,225,451 | |
| EQT | 30,910 | 1,157,270 | |
| Exxon Mobil | 1,100,744 | 73,166,454 | |
| FMC Technologies | 26,430 a | 1,905,603 | |
| Halliburton | 194,745 | 6,204,576 |
TheFund 11
STATEMENT OF INVESTMENTS (continued)
| Common Stocks (continued) | Shares | Value ($) | |
| Energy (continued) | |||
| Helmerich & Payne | 22,748 | 973,159 | |
| Hess | 62,967 | 3,968,810 | |
| Marathon Oil | 153,013 | 5,442,672 | |
| Massey Energy | 21,994 | 925,288 | |
| Murphy Oil | 41,206 | 2,684,983 | |
| Nabors Industries | 60,361 a | 1,261,545 | |
| National Oilwell Varco | 90,443 | 4,862,216 | |
| Noble Energy | 37,295 | 3,038,797 | |
| Occidental Petroleum | 175,252 | 13,780,065 | |
| Peabody Energy | 58,128 | 3,074,971 | |
| Pioneer Natural Resources | 25,901 | 1,807,890 | |
| QEP Resources | 38,467 | 1,270,565 | |
| Range Resources | 33,330 | 1,246,209 | |
| Rowan | 24,712 a | 813,025 | |
| Schlumberger | 294,768 | 20,601,336 | |
| Southwestern Energy | 74,209 a | 2,511,975 | |
| Spectra Energy | 140,621 | 3,342,561 | |
| Sunoco | 26,211 | 982,126 | |
| Tesoro | 30,596 | 396,524 | |
| Valero Energy | 121,364 | 2,178,484 | |
| Williams | 124,566 | 2,680,660 | |
| 257,593,577 | |||
| Financial—15.3% | |||
| ACE | 72,500 | 4,307,950 | |
| Aflac | 101,627 | 5,679,933 | |
| Allstate | 117,588 | 3,585,258 | |
| American Express | 227,907 | 9,449,024 | |
| American International Group | 29,094 a,b | 1,222,239 | |
| Ameriprise Financial | 55,651 | 2,876,600 | |
| AON | 70,934 | 2,819,626 | |
| Apartment Investment & Management, Cl. A | 24,994 b,c | 582,610 | |
| Assurant | 23,160 | 915,746 | |
| AvalonBay Communities | 17,868 b,c | 1,899,547 | |
| Bank of America | 2,164,810 | 24,765,426 | |
| Bank of New York Mellon | 259,964 | 6,514,698 | |
| BB&T | 148,093 b | 3,466,857 | |
12
| Common Stocks (continued) | Shares | Value ($) | |
| Financial (continued) | |||
| Berkshire Hathaway, Cl. B | 373,083 | a | 29,682,483 |
| Boston Properties | 29,707 | c | 2,560,446 |
| Capital One Financial | 97,739 | 3,642,733 | |
| CB Richard Ellis Group, Cl. A | 62,353 | a | 1,144,178 |
| Charles Schwab | 210,122 | 3,235,879 | |
| Chubb | 68,139 | 3,953,425 | |
| Cincinnati Financial | 35,368 | b | 1,041,234 |
| Citigroup | 5,507,511 | a | 22,966,321 |
| CME Group | 14,371 | 4,162,560 | |
| Comerica | 37,265 | 1,333,342 | |
| Discover Financial Services | 113,241 | 1,998,704 | |
| E*TRADE Financial | 42,208 | a | 603,574 |
| Equity Residential | 60,928 | c | 2,962,929 |
| Federated Investors, Cl. B | 19,204 | b | 478,372 |
| Fifth Third Bancorp | 169,481 | 2,128,681 | |
| First Horizon National | 48,646 | a,b | 490,838 |
| Franklin Resources | 32,215 | 3,695,061 | |
| Genworth Financial, Cl. A | 104,835 | a | 1,188,829 |
| Goldman Sachs Group | 111,198 | 17,897,318 | |
| Hartford Financial Services Group | 95,614 | 2,292,824 | |
| HCP | 66,801 | b,c | 2,405,504 |
| Health Care REIT | 26,504 | b,c | 1,354,354 |
| Host Hotels & Resorts | 140,248 | c | 2,228,541 |
| Hudson City Bancorp | 113,365 | 1,320,702 | |
| Huntington Bancshares | 152,222 | 863,099 | |
| IntercontinentalExchange | 15,732 | a | 1,807,135 |
| Invesco | 100,216 | 2,304,968 | |
| Janus Capital Group | 35,442 | 374,268 | |
| JPMorgan Chase & Co. | 858,428 | 32,302,646 | |
| KeyCorp | 182,111 | 1,491,489 | |
| Kimco Realty | 86,903 | b,c | 1,497,339 |
| Legg Mason | 34,399 | b | 1,067,401 |
| Leucadia National | 42,367 | a | 1,076,969 |
| Lincoln National | 68,241 | 1,670,540 | |
| Loews | 69,101 | 2,728,107 | |
| M & T Bank | 17,825 | 1,332,419 | |
TheFund 13
STATEMENT OF INVESTMENTS (continued)
| Common Stocks (continued) | Shares | Value ($) |
| Financial (continued) | ||
| Marsh & McLennan | 116,494 | 2,910,020 |
| Marshall & Ilsley | 111,144 | 656,861 |
| MetLife | 195,710 | 7,892,984 |
| Moody’s | 42,604 b | 1,152,864 |
| Morgan Stanley | 300,776 | 7,480,299 |
| Nasdaq OMX Group | 29,262 a | 615,087 |
| Northern Trust | 52,337 | 2,597,485 |
| NYSE Euronext | 57,658 | 1,766,641 |
| People’s United Financial | 80,578 | 991,915 |
| Plum Creek Timber | 35,241 b,c | 1,298,278 |
| PNC Financial Services Group | 113,399 | 6,112,206 |
| Principal Financial Group | 67,566 | 1,813,471 |
| Progressive | 144,859 | 3,065,216 |
| ProLogis | 101,530 c | 1,385,885 |
| Prudential Financial | 100,869 | 5,303,692 |
| Public Storage | 30,089 c | 2,985,431 |
| Regions Financial | 270,585 | 1,704,686 |
| Simon Property Group | 63,247 c | 6,072,977 |
| SLM | 103,747 a | 1,234,589 |
| State Street | 107,543 | 4,490,996 |
| SunTrust Banks | 106,745 | 2,670,760 |
| T. Rowe Price Group | 56,069 | 3,098,934 |
| Torchmark | 17,878 b | 1,024,052 |
| Travelers | 101,866 | 5,623,003 |
| U.S. Bancorp | 413,230 | 9,991,901 |
| Unum Group | 72,208 | 1,618,903 |
| Ventas | 33,979 b,c | 1,819,915 |
| Vornado Realty Trust | 35,009 c | 3,059,437 |
| Wells Fargo & Co. | 1,130,855 | 29,492,698 |
| Weyerhaeuser | 113,161 c | 1,835,471 |
| XL Group | 74,245 | 1,570,281 |
| Zions Bancorporation | 37,186 | 768,263 |
| 355,475,927 | ||
| Health Care—11.4% | ||
| Abbott Laboratories | 333,935 | 17,137,544 |
| Aetna | 90,403 | 2,699,433 |
14
| Common Stocks (continued) | Shares | Value ($) | |
| Health Care (continued) | |||
| Allergan | 66,627 | 4,824,461 | |
| AmerisourceBergen | 62,408 | 2,048,230 | |
| Amgen | 206,955 | a | 11,835,756 |
| Baxter International | 126,511 | 6,439,410 | |
| Becton Dickinson & Co. | 51,291 | 3,873,496 | |
| Biogen Idec | 52,599 | a | 3,298,483 |
| Boston Scientific | 325,013 | a | 2,073,583 |
| Bristol-Myers Squibb | 369,443 | 9,938,017 | |
| C.R. Bard | 20,897 | 1,736,959 | |
| Cardinal Health | 77,788 | 2,698,466 | |
| CareFusion | 38,984 | a | 941,074 |
| Celgene | 99,910 | a | 6,201,414 |
| Cephalon | 16,011 | a,b | 1,063,771 |
| Cerner | 14,639 | a,b | 1,285,743 |
| CIGNA | 60,274 | 2,121,042 | |
| Coventry Health Care | 32,437 | a | 759,675 |
| DaVita | 22,546 | a | 1,617,676 |
| Dentsply International | 32,252 | 1,012,390 | |
| Eli Lilly & Co. | 218,348 | b | 7,685,850 |
| Express Scripts | 117,528 | a | 5,702,459 |
| Forest Laboratories | 61,932 | a | 2,046,853 |
| Genzyme | 55,198 | a | 3,981,432 |
| Gilead Sciences | 181,817 | a | 7,212,680 |
| Hospira | 35,254 | a | 2,096,908 |
| Humana | 37,106 | a | 2,162,909 |
| Intuitive Surgical | 8,402 | a | 2,209,306 |
| Johnson & Johnson | 595,063 | 37,887,661 | |
| King Pharmaceuticals | 54,829 | a | 775,282 |
| Laboratory Corp. of America Holdings | 22,999 | a,b | 1,870,279 |
| Life Technologies | 39,309 | a | 1,972,526 |
| McKesson | 56,595 | 3,734,138 | |
| Medco Health Solutions | 93,982 | a | 4,936,874 |
| Medtronic | 233,701 | 8,228,612 | |
| Merck & Co. | 665,607 | 24,148,222 | |
| Mylan | 67,791 | a,b | 1,377,513 |
| Patterson | 20,481 | 566,300 |
TheFund 15
STATEMENT OF INVESTMENTS (continued)
| Common Stocks (continued) | Shares | Value ($) | |
| Health Care (continued) | |||
| PerkinElmer | 26,211 | 614,648 | |
| Pfizer | 1,742,260 | 30,315,324 | |
| Quest Diagnostics | 32,760 | 1,609,826 | |
| St. Jude Medical | 70,207 a | 2,688,928 | |
| Stryker | 73,077 | 3,616,581 | |
| Tenet Healthcare | 93,059 a | 405,737 | |
| Thermo Fisher Scientific | 89,074 a | 4,580,185 | |
| UnitedHealth Group | 243,143 | 8,765,305 | |
| Varian Medical Systems | 26,970 a,b | 1,705,043 | |
| Waters | 20,502 a | 1,519,813 | |
| Watson Pharmaceuticals | 23,019 a | 1,073,836 | |
| WellPoint | 86,703 a | 4,711,441 | |
| Zimmer Holdings | 43,879 a | 2,081,620 | |
| 265,890,714 | |||
| Industrial—10.6% | |||
| 3M | 153,815 | 12,954,299 | |
| Avery Dennison | 23,578 | 857,060 | |
| Boeing | 158,384 | 11,188,246 | |
| C.H. Robinson Worldwide | 36,273 b | 2,556,521 | |
| Caterpillar | 135,399 | 10,642,361 | |
| Cintas | 29,128 | 800,146 | |
| CSX | 82,200 | 5,051,190 | |
| Cummins | 43,833 | 3,861,687 | |
| Danaher | 115,558 | 5,010,595 | |
| Deere & Co. | 91,340 | 7,014,912 | |
| Dover | 41,163 | 2,185,755 | |
| Dun & Bradstreet | 11,766 | 875,508 | |
| Eaton | 35,937 | 3,192,284 | |
| Emerson Electric | 162,418 | 8,916,748 | |
| Equifax | 27,615 | 914,885 | |
| Expeditors International | |||
| of Washington | 46,035 | 2,272,288 | |
| Fastenal | 31,664 b | 1,630,063 | |
| FedEx | 67,479 | 5,919,258 | |
| Flowserve | 12,094 | 1,209,400 | |
| Fluor | 39,654 | 1,910,926 | |
16
| Common Stocks (continued) | Shares | Value ($) | |
| Industrial (continued) | |||
| General Dynamics | 83,362 | 5,678,619 | |
| General Electric | 2,310,583 | 37,015,540 | |
| Goodrich | 26,816 | 2,200,789 | |
| Honeywell International | 166,830 | 7,859,361 | |
| Illinois Tool Works | 107,594 | 4,917,046 | |
| Iron Mountain | 43,336 | 944,291 | |
| ITT | 39,289 | 1,854,048 | |
| Jacobs Engineering Group | 27,029 a | 1,043,590 | |
| L-3 Communications Holdings | 25,142 | 1,815,001 | |
| Lockheed Martin | 64,439 | 4,593,856 | |
| Masco | 78,735 | 839,315 | |
| Norfolk Southern | 79,492 | 4,887,963 | |
| Northrop Grumman | 63,685 | 4,025,529 | |
| Paccar | 78,682 | 4,033,239 | |
| Pall | 26,145 | 1,115,607 | |
| Parker Hannifin | 35,164 | 2,691,804 | |
| Pitney Bowes | 45,470 b | 997,612 | |
| Precision Castparts | 30,715 | 4,195,055 | |
| Quanta Services | 45,348 a,b | 891,542 | |
| R.R. Donnelley & Sons | 45,916 | 847,150 | |
| Raytheon | 80,969 | 3,731,052 | |
| Republic Services | 66,399 | 1,979,354 | |
| Robert Half International | 33,588 b | 910,571 | |
| Rockwell Automation | 31,853 | 1,986,672 | |
| Rockwell Collins | 34,955 | 2,115,127 | |
| Roper Industries | 19,610 | 1,361,522 | |
| Ryder System | 12,286 | 537,513 | |
| Snap-On | 12,834 | 654,534 | |
| Southwest Airlines | 160,833 | 2,213,062 | |
| Stericycle | 18,575 a,b | 1,332,571 | |
| Textron | 58,437 b | 1,216,658 | |
| Tyco International | 107,400 | 4,111,272 | |
| Union Pacific | 107,621 | 9,436,209 | |
| United Parcel Service, Cl. B | 214,432 | 14,439,851 | |
| United Technologies | 201,414 | 15,059,725 | |
TheFund 17
STATEMENT OF INVESTMENTS (continued)
| Common Stocks (continued) | Shares | Value ($) |
| Industrial (continued) | ||
| W.W. Grainger | 12,924 | 1,602,964 |
| Waste Management | 104,341 b | 3,727,061 |
| 247,826,807 | ||
| Information Technology—19.3% | ||
| Adobe Systems | 113,134 a | 3,184,722 |
| Advanced Micro Devices | 122,231 a | 895,953 |
| Agilent Technologies | 74,614 a | 2,596,567 |
| Akamai Technologies | 39,149 a | 2,022,829 |
| Altera | 65,840 | 2,054,866 |
| Amphenol, Cl. A | 38,267 | 1,918,325 |
| Analog Devices | 63,506 | 2,138,247 |
| Apple | 197,412 a | 59,395,348 |
| Applied Materials | 291,024 | 3,597,056 |
| Autodesk | 48,462 a | 1,753,355 |
| Automatic Data Processing | 106,485 | 4,730,064 |
| BMC Software | 39,269 a | 1,785,169 |
| Broadcom, Cl. A | 96,686 | 3,938,988 |
| CA | 86,909 | 2,017,158 |
| Cisco Systems | 1,233,810 a | 28,167,882 |
| Citrix Systems | 40,345 a | 2,584,904 |
| Cognizant Technology Solutions, Cl. A | 64,077 a | 4,177,180 |
| Computer Sciences | 32,595 | 1,598,785 |
| Compuware | 55,407 a | 554,624 |
| Corning | 336,167 | 6,145,133 |
| Dell | 371,977 a | 5,349,029 |
| eBay | 249,370 a | 7,433,720 |
| Electronic Arts | 69,819 a | 1,106,631 |
| EMC | 443,348 a | 9,314,741 |
| Fidelity National Information Services | 57,280 | 1,552,288 |
| First Solar | 11,595 a,b | 1,596,400 |
| Fiserv | 33,352 a | 1,818,351 |
| FLIR Systems | 32,947 a | 917,244 |
| Google, Cl. A | 53,658 a | 32,891,817 |
| Harris | 29,010 | 1,310,962 |
| Hewlett-Packard | 490,870 | 20,645,992 |
18
| Common Stocks (continued) | Shares | Value ($) |
| Information Technology (continued) | ||
| Intel | 1,200,300 | 24,090,021 |
| International Business Machines | 272,843 | 39,180,255 |
| Intuit | 61,530 a | 2,953,440 |
| Jabil Circuit | 41,397 | 635,030 |
| JDS Uniphase | 45,176 a | 474,800 |
| Juniper Networks | 115,223 a,b | 3,732,073 |
| KLA-Tencor | 37,852 | 1,352,073 |
| Lexmark International, Cl. A | 17,107 a | 650,579 |
| Linear Technology | 47,774 b | 1,539,756 |
| LSI | 139,386 a | 730,383 |
| MasterCard, Cl. A | 20,668 | 4,961,560 |
| McAfee | 33,158 a | 1,568,373 |
| MEMC Electronic Materials | 49,406 a | 633,385 |
| Microchip Technology | 40,191 b | 1,293,346 |
| Micron Technology | 183,771 a | 1,519,786 |
| Microsoft | 1,644,834 | 43,818,378 |
| Molex | 31,493 b | 639,308 |
| Monster Worldwide | 27,993 a,b | 505,554 |
| Motorola | 500,935 a | 4,082,620 |
| National Semiconductor | 49,173 | 673,670 |
| NetApp | 77,027 a | 4,101,688 |
| Novell | 78,672 a | 466,525 |
| Novellus Systems | 22,868 a | 667,974 |
| NVIDIA | 123,136 a | 1,481,326 |
| Oracle | 836,876 | 24,604,154 |
| Paychex | 70,381 | 1,949,554 |
| QLogic | 25,038 a | 439,918 |
| QUALCOMM | 347,337 | 15,675,319 |
| Red Hat | 41,204 a | 1,741,281 |
| SAIC | 62,491 a | 971,110 |
| Salesforce.com | 25,225 a | 2,927,866 |
| SanDisk | 50,276 a | 1,889,372 |
| Symantec | 175,394 a | 2,837,875 |
| Tellabs | 83,295 | 568,072 |
| Teradata | 37,155 a | 1,462,421 |
| Teradyne | 38,841 a | 436,573 |
TheFund 19
STATEMENT OF INVESTMENTS (continued)
| Common Stocks (continued) | Shares | Value ($) |
| Information Technology (continued) | ||
| Texas Instruments | 258,626 | 7,647,571 |
| Total System Services | 36,269 | 566,159 |
| VeriSign | 37,843 a | 1,315,044 |
| Visa, Cl. A | 106,929 b | 8,358,640 |
| Western Digital | 48,444 a | 1,551,177 |
| Western Union | 145,278 | 2,556,893 |
| Xerox | 296,632 | 3,470,594 |
| Xilinx | 56,192 | 1,506,508 |
| Yahoo! | 289,748 a | 4,783,739 |
| 448,206,073 | ||
| Materials—3.6% | ||
| Air Products & Chemicals | 45,892 | 3,899,443 |
| Airgas | 16,181 | 1,147,718 |
| AK Steel Holding | 25,116 | 316,210 |
| Alcoa | 219,116 | 2,876,993 |
| Allegheny Technologies | 20,961 b | 1,104,435 |
| Ball | 20,821 | 1,340,039 |
| Bemis | 21,989 | 698,371 |
| CF Industries Holdings | 14,930 | 1,829,373 |
| Cliffs Natural Resources | 29,003 | 1,890,996 |
| Dow Chemical | 250,516 | 7,723,408 |
| E.I. du Pont de Nemours & Co. | 195,786 | 9,256,762 |
| Eastman Chemical | 15,823 | 1,243,213 |
| Ecolab | 51,138 | 2,522,126 |
| FMC | 14,921 | 1,090,725 |
| Freeport-McMoRan Copper & Gold | 101,245 | 9,585,877 |
| International Flavors & Fragrances | 16,995 | 852,469 |
| International Paper | 92,412 | 2,336,175 |
| MeadWestvaco | 36,702 | 944,342 |
| Monsanto | 117,729 | 6,995,457 |
| Newmont Mining | 106,964 | 6,510,899 |
| Nucor | 68,465 b | 2,616,732 |
| Owens-Illinois | 36,282 a | 1,016,984 |
| Pactiv | 29,011 a | 962,585 |
| PPG Industries | 35,445 | 2,718,632 |
| Praxair | 66,279 | 6,053,924 |
20
| Common Stocks (continued) | Shares | Value ($) | |
| Materials (continued) | |||
| Sealed Air | 33,902 | 784,831 | |
| Sherwin-Williams | 20,637 | 1,505,882 | |
| Sigma-Aldrich | 26,335 | 1,670,166 | |
| Titanium Metals | 17,674 | a,b | 347,471 |
| United States Steel | 30,945 | b | 1,324,137 |
| Vulcan Materials | 26,353 | b | 962,148 |
| 84,128,523 | |||
| Telecommunication Services—3.1% | |||
| American Tower, Cl. A | 86,963 | a | 4,488,160 |
| AT&T | 1,277,090 | 36,397,065 | |
| CenturyLink | 65,127 | 2,694,955 | |
| Frontier Communications | 215,345 | 1,890,729 | |
| Metropcs Communications | 55,053 | a | 573,102 |
| Qwest Communications International | 373,324 | 2,463,938 | |
| Sprint Nextel | 641,918 | a | 2,644,702 |
| Verizon Communications | 610,976 | 19,838,391 | |
| Windstream | 103,816 | 1,314,311 | |
| 72,305,353 | |||
| Utilities—3.5% | |||
| AES | 144,337 | a | 1,723,383 |
| Allegheny Energy | 37,201 | 863,063 | |
| Ameren | 49,409 | 1,431,873 | |
| American Electric Power | 101,639 | 3,805,364 | |
| CenterPoint Energy | 89,435 | 1,481,044 | |
| CMS Energy | 50,082 | 920,507 | |
| Consolidated Edison | 60,754 | b | 3,020,689 |
| Constellation Energy Group | 43,506 | 1,315,621 | |
| Dominion Resources | 127,288 | 5,531,936 | |
| DTE Energy | 35,148 | 1,643,520 | |
| Duke Energy | 284,769 | 5,185,643 | |
| Edison International | 70,567 | 2,603,922 | |
| Entergy | 40,880 | 3,046,786 | |
| Exelon | 143,480 | 5,856,854 | |
| FirstEnergy | 66,093 | b | 2,400,498 |
| Integrys Energy Group | 16,997 | b | 904,070 |
| NextEra Energy | 89,815 | 4,943,418 |
TheFund 21
STATEMENT OF INVESTMENTS (continued)
| Common Stocks (continued) | Shares | Value ($) |
| Utilities (continued) | ||
| Nicor | 10,073 | 479,777 |
| NiSource | 61,108 | 1,057,779 |
| Northeast Utilities | 37,584 | 1,175,628 |
| NRG Energy | 55,262 a | 1,100,266 |
| ONEOK | 22,471 | 1,119,505 |
| Pepco Holdings | 47,027 | 905,740 |
| PG & E | 84,232 | 4,027,974 |
| Pinnacle West Capital | 22,292 | 917,539 |
| PPL | 103,954 | 2,796,363 |
| Progress Energy | 63,086 | 2,838,870 |
| Public Service Enterprise Group | 110,265 | 3,567,073 |
| SCANA | 23,993 | 979,874 |
| Sempra Energy | 53,341 | 2,852,677 |
| Southern | 179,404 | 6,794,029 |
| TECO Energy | 47,001 b | 826,748 |
| Wisconsin Energy | 25,395 | 1,512,018 |
| Xcel Energy | 97,496 | 2,326,255 |
| 81,956,306 | ||
| Total Common Stocks | ||
| (cost $1,673,512,748) | 2,318,202,376 | |
| Principal | ||
| Short-Term Investments—.0% | Amount ($) | Value ($) |
| U.S. Treasury Bills; | ||
| 0.13%, 12/23/10 | ||
| (cost $829,843) | 830,000 d | 829,832 |
| Other Investment—.2% | Shares | Value ($) |
| Registered Investment Company; | ||
| Dreyfus Institutional Preferred | ||
| Plus Money Market Fund | ||
| (cost $4,865,000) | 4,865,000 e | 4,865,000 |
22
| Investment of Cash Collateral | ||
| for Securities Loaned—2.2% | Shares | Value ($) |
| Registered Investment Company; | ||
| Dreyfus Institutional Cash | ||
| Advantage Plus Fund | ||
| (cost $51,226,301) | 51,226,301 e | 51,226,301 |
| Total Investments (cost $1,730,433,892) | 102.0% | 2,375,123,509 |
| Liabilities, Less Cash and Receivables | (2.0%) | (47,251,490) |
| Net Assets | 100.0% | 2,327,872,019 |
| REIT—Real Estate Investment Trust |
| a Non-income producing security. |
| b Security, or portion thereof, on loan.At October 31, 2010, the market value of the fund’s securities on loan was |
| $54,407,022 and the market value of the collateral held by the fund was $55,533,341, consisting of cash collateral |
| of $51,226,301 and U.S. Government and Agency securities valued at $4,307,040. |
| c Investment in real estate investment trust. |
| d Held by a broker as collateral for open financial futures positions. |
| e Investment in affiliated money market mutual fund. |
| Portfolio Summary (Unaudited)† | |||
| Value (%) | Value (%) | ||
| Information Technology | 19.3 | Materials | 3.6 |
| Financial | 15.3 | Utilities | 3.5 |
| Health Care | 11.4 | Telecommunication Services | 3.1 |
| Consumer Staples | 11.1 | Short-Term/Money | |
| Energy | 11.1 | Market Investments | 2.4 |
| Consumer Discretionary | 10.6 | ||
| Industrial | 10.6 | 102.0 | |
| † Based on net assets. | |||
| See notes to financial statements. | |||
TheFund 23
| STATEMENT OF FINANCIAL FUTURES |
| October 31, 2010 |
| Market Value | Unrealized | |||
| Covered by | Appreciation | |||
| Contracts | Contracts ($) | Expiration | at 10/31/2010 ($) | |
| Financial Futures Long | ||||
| Standard & Poor’s 500 E-mini | 175 | 10,322,375 | December 2010 | 285,932 |
| See notes to financial statements. | ||||
24
| STATEMENT OF ASSETS AND LIABILITIES |
| October 31, 2010 |
| Cost | Value | |
| Assets ($): | ||
| Investments in securities—See Statement of Investments (including | ||
| securities on loan, valued at $54,407,022)—Note 1(b): | ||
| Unaffiliated issuers | 1,674,342,591 | 2,319,032,208 |
| Affiliated issuers | 56,091,301 | 56,091,301 |
| Cash | 4,914,470 | |
| Dividends and interest receivable | 2,651,712 | |
| Receivable for shares of Common Stock subscribed | 1,693,984 | |
| Receivable for futures variation margin—Note 4 | 631 | |
| 2,384,384,306 | ||
| Liabilities ($): | ||
| Due to The Dreyfus Corporation and affiliates—Note 3(b) | 986,608 | |
| Liability for securities on loan—Note 1(b) | 51,226,301 | |
| Payable for shares of Common Stock redeemed | 4,299,378 | |
| 56,512,287 | ||
| Net Assets ($) | 2,327,872,019 | |
| Composition of Net Assets ($): | ||
| Paid-in capital | 1,655,209,313 | |
| Accumulated undistributed investment income—net | 25,855,411 | |
| Accumulated net realized gain (loss) on investments | 1,831,746 | |
| Accumulated net unrealized appreciation (depreciation) | ||
| on investments (including $285,932 net unrealized | ||
| appreciation on financial futures) | 644,975,549 | |
| Net Assets ($) | 2,327,872,019 | |
| Shares Outstanding | ||
| (200 million shares of $.001 par value Common Stock authorized) | 69,235,483 | |
| Net Asset Value, offering and redemption price per share ($) | 33.62 | |
| See notes to financial statements. | ||
TheFund 25
| STATEMENT OF OPERATIONS |
| Year Ended October 31, 2010 |
| Investment Income ($): | |
| Income: | |
| Cash dividends (net of $7,894 foreign taxes withheld at source): | |
| Unaffiliated issuers | 46,841,065 |
| Affiliated issuers | 46,216 |
| Income from securities lending—Note 1(b) | 173,707 |
| Interest | 5,454 |
| Total Income | 47,066,442 |
| Expenses: | |
| Management fee—Note 3(a) | 5,730,892 |
| Shareholder servicing costs—Note 3(b) | 5,730,892 |
| Directors’ fees—Note 3(a) | 129,857 |
| Loan commitment fees—Note 2 | 32,451 |
| Interest expense—Note 2 | 512 |
| Total Expenses | 11,624,604 |
| Less—Directors’ fees reimbursed by the Manager—Note 3(a) | (129,857) |
| Net Expenses | 11,494,747 |
| Investment Income—Net | 35,571,695 |
| Realized and Unrealized Gain (Loss) on Investments—Note 4 ($): | |
| Net realized gain (loss) on investments | 104,587,117 |
| Net realized gain (loss) on financial futures | 1,410,412 |
| Net Realized Gain (Loss) | 105,997,529 |
| Net unrealized appreciation (depreciation) on investments | 198,661,013 |
| Net unrealized appreciation (depreciation) on financial futures | 579,301 |
| Net Unrealized Appreciation (Depreciation) | 199,240,314 |
| Net Realized and Unrealized Gain (Loss) on Investments | 305,237,843 |
| Net Increase in Net Assets Resulting from Operations | 340,809,538 |
| See notes to financial statements. | |
26
STATEMENT OF CHANGES IN NET ASSETS
| Year Ended October 31, | ||
| 2010 | 2009 | |
| Operations ($): | ||
| Investment income—net | 35,571,695 | 40,962,342 |
| Net realized gain (loss) on investments | 105,997,529 | 4,165,418 |
| Net unrealized appreciation | ||
| (depreciation) on investments | 199,240,314 | 150,873,785 |
| Net Increase (Decrease) in Net Assets | ||
| Resulting from Operations | 340,809,538 | 196,001,545 |
| Dividends to Shareholders from ($): | ||
| Investment income—net | (38,533,901) | (50,992,476) |
| Capital Stock Transactions ($): | ||
| Net proceeds from shares sold | 485,529,471 | 540,506,562 |
| Dividends reinvested | 37,789,348 | 49,807,203 |
| Cost of shares redeemed | (736,607,359) | (586,615,451) |
| Increase (Decrease) in Net Assets | ||
| from Capital Stock Transactions | (213,288,540) | 3,698,314 |
| Total Increase (Decrease) in Net Assets | 88,987,097 | 148,707,383 |
| Net Assets ($): | ||
| Beginning of Period | 2,238,884,922 | 2,090,177,539 |
| End of Period | 2,327,872,019 | 2,238,884,922 |
| Undistributed investment income—net | 25,855,411 | 28,886,502 |
| Capital Share Transactions (Shares): | ||
| Shares sold | 15,329,187 | 21,472,196 |
| Shares issued for dividends reinvested | 1,196,255 | 2,051,372 |
| Shares redeemed | (23,322,185) | (23,057,764) |
| Net Increase (Decrease) in Shares Outstanding | (6,796,743) | 465,804 |
| See notes to financial statements. | ||
TheFund 27
FINANCIAL HIGHLIGHTS
The following table describes the performance for the fiscal periods indicated. Total return shows how much your investment in the fund would have increased (or decreased) during each period, assuming you had reinvested all dividends and distributions.These figures have been derived from the fund’s financial statements.
| Year Ended October 31, | |||||
| 2010 | 2009 | 2008 | 2007 | 2006 | |
| Per Share Data ($): | |||||
| Net asset value, | |||||
| beginning of period | 29.45 | 27.66 | 44.18 | 40.57 | 35.50 |
| Investment Operations: | |||||
| Investment income—neta | .49 | .53 | .66 | .61 | .54 |
| Net realized and unrealized | |||||
| gain (loss) on investments | 4.19 | 1.93 | (16.51) | 4.90 | 5.01 |
| Total from | |||||
| Investment Operations | 4.68 | 2.46 | (15.85) | 5.51 | 5.55 |
| Distributions: | |||||
| Dividends from | |||||
| investment income—net | (.51) | (.67) | (.67) | (.56) | (.48) |
| Dividends from net realized | |||||
| gain on investments | — | — | — | (1.34) | — |
| Total Distributions | (.51) | (.67) | (.67) | (1.90) | (.48) |
| Net asset value, end of period | 33.62 | 29.45 | 27.66 | 44.18 | 40.57 |
| Total Return (%) | 16.02 | 9.42 | (36.38) | 14.05 | 15.79 |
| Ratios/Supplemental Data (%): | |||||
| Ratio of total expenses | |||||
| to average net assets | .51 | .51 | .51 | .51 | .50 |
| Ratio of net expenses | |||||
| to average net assets | .50 | .50 | .50 | .50 | .50 |
| Ratio of net investment income | |||||
| to average net assets | 1.55 | 2.06 | 1.77 | 1.47 | 1.45 |
| Portfolio Turnover Rate | 5.45 | 4.36 | 4.95 | 4.71 | 5.04 |
| Net Assets, end of period | |||||
| ($ x 1,000) | 2,327,872 | 2,238,885 | 2,090,178 | 3,735,372 | 3,656,990 |
| a Based on average shares outstanding at each month end. | |||||
| See notes to financial statements. | |||||
28
NOTES TO FINANCIAL STATEMENTS
NOTE 1—Significant Accounting Policies:
Dreyfus S&P 500 Index Fund (the “fund”) is a separate non-diversified series of Dreyfus Index Funds, Inc. (the “Company”), which is registered under the Investment Company Act of 1940, as amended (the “Act”), as an open-end management investment company and operates as a series company currently offering three series, including the fund.The fund’s investment objective is to match the performance of the Standard & Poor’s 500 Composite Stock Price Index. The Dreyfus Corporation (the “Manager” or “Dreyfus”), a wholly-owned subsidiary of The Bank of New York Mellon Corporation (“BNY Mellon”), serves as the fund’s investment adviser. MBSC Securities Corporation (the “Distributor”), a wholly-owned subsidiary of the Manager, is the distributor of the fund’s shares, which are sold to the public without a sales charge.
The Company accounts separately for the assets, liabilities and operations of each series. Expenses directly attributable to each series are charged to that series’ operations; expenses which are applicable to all series are allocated among them on a pro rata basis.
The Financial Accounting Standards Board (“FASB”) Accounting Standards Codification (“ASC”) is the exclusive reference of authoritative U.S. generally accepted accounting principles (“GAAP”) recognized by the FASB to be applied by nongovernmental entities. Rules and interpretive releases of the Securities and Exchange Commission (“SEC”) under authority of federal laws are also sources of authoritative GAAP for SEC registrants. The fund’s financial statements are prepared in accordance with GAAP, which may require the use of management estimates and assumptions.Actual results could differ from those estimates.
The Company enters into contracts that contain a variety of indemnifications.The fund’s maximum exposure under these arrangements is unknown.The fund does not anticipate recognizing any loss related to these arrangements.
(a) Portfolio valuation: Investments in securities are valued at the last sales price on the securities exchange or national securities market on
TheFund 29
NOTES TO FINANCIAL STATEMENTS (continued)
which such securities are primarily traded. Securities listed on the National Market System for which market quotations are available are valued at the official closing price or, if there is no official closing price that day, at the last sales price. Securities not listed on an exchange or the national securities market, or securities for which there were no transactions, are valued at the average of the most recent bid and asked prices, except for open short positions, where the asked price is used for valuation purposes. Bid price is used when no asked price is available. U.S. Treasury Bills are valued by an independent pricing service approved by the Board of Directors. Registered investment companies that are not traded on an exchange are valued at their net asset value. When market quotations or official closing prices are not readily available, or are determined not to reflect accurately fair value, such as when the value of a security has been significantly affected by events after the close of the exchange or market on which the security is principally traded (for example, a foreign exchange or market), but before the fund calculates its net asset value, the fund may value these investments at fair value as determined in accordance with the procedures approved by the Board of Directors. Fair valuing of securities may be determined with the assistance of a pricing service using calculations based on indices of domestic securities and other appropriate indicators, such as prices of relevant American Depository Receipts and futures contracts. For other securities that are fair valued by the Board of Directors, certain factors may be considered such as: fundamental analytical data, the nature and duration of restrictions on disposition, an evaluation of the forces that influence the market in which the securities are purchased and sold, and public trading in similar securities of the issuer or comparable issuers . Financial futures are valued at the last sales price.
The fair value of a financial instrument is the amount that would be received to sell an asset or paid to transfer a liability in an orderly transaction between market participants at the measurement date (i.e. the exit price). GAAP establishes a fair value hierarchy that prioritizes the inputs of valuation techniques used to measure fair value.This hierarchy gives the highest priority to unadjusted quoted prices in active markets for identical assets or liabilities (Level 1 measurements) and the lowest priority to unobservable inputs (Level 3 measurements).
30
Additionally, GAAP provides guidance on determining whether the volume and activity in a market has decreased significantly and whether such a decrease in activity results in transactions that are not orderly. GAAP requires enhanced disclosures around valuation inputs and techniques used during annual and interim periods.
Various inputs are used in determining the value of the fund’s investments relating to fair value measurements.These inputs are summarized in the three broad levels listed below:
Level 1—unadjusted quoted prices in active markets for identical investments.
Level 2—other significant observable inputs (including quoted prices for similar investments, interest rates, prepayment speeds, credit risk, etc.).
Level 3—significant unobservable inputs (including the fund’s own assumptions in determining the fair value of investments).
The inputs or methodology used for valuing securities are not necessarily an indication of the risk associated with investing in those securities.
The following is a summary of the inputs used as of October 31, 2010 in valuing the fund’s investments:
| Level 2—Other | Level 3— | |||
| Level 1— | Significant | Significant | ||
| Unadjusted | Observable | Unobservable | ||
| Quoted Prices | Inputs | Inputs | Total | |
| Assets ($) | ||||
| Investments in Securities: | ||||
| Equity Securities— | ||||
| Domestic† | 2,318,202,376 | — | — | 2,318,202,376 |
| Mutual Funds | 56,091,301 | — | — | 56,091,301 |
| U.S. Treasury | — | 829,832 | — | 829,832 |
| Other Financial | ||||
| Instruments: | ||||
| Futures†† | 285,932 | — | — | 285,932 |
| † | See Statement of Investments for industry classification. |
| †† | Amount shown represents unrealized appreciation at period end. |
TheFund 31
NOTES TO FINANCIAL STATEMENTS (continued)
In January 2010, FASB issued Accounting Standards Update (“ASU”) No. 2010-06 “Improving Disclosures about Fair Value Measurements”. The portions of ASU No. 2010-06 which require reporting entities to prepare new disclosures surrounding amounts and reasons for significant transfers in and out of Level 1 and Level 2 fair value measurements as well as inputs and valuation techniques used to measure fair value for both recurring and nonrecurring fair value measurements that fall in either Level 2 or Level 3 have been adopted by the fund. No significant transfers between Level 1 or Level 2 fair value measurements occurred at October 31, 2010. The remaining portion of ASU No. 2010-06 requires reporting entities to make new disclosures about information on purchases, sales, issuances and settlements on a gross basis in the reconciliation of activity in Level 3 fair value measurements. These new and re vised disclosures are required to be implemented for fiscal years beginning after December 15, 2010. Management is currently evaluating the impact that the adoption of this remaining portion of ASU No. 2010-06 may have on the fund’s financial statement disclosures.
(b) Securities transactions and investment income: Securities transactions are recorded on a trade date basis. Realized gains and losses from securities transactions are recorded on the identified cost basis. Dividend income is recognized on the ex-dividend date and interest income, including, where applicable, accretion of discount and amortization of premium on investments, is recognized on the accrual basis.
Pursuant to a securities lending agreement with The Bank of New York Mellon, a subsidiary of BNY Mellon and an affiliate of Dreyfus, the fund may lend securities to qualified institutions. It is the fund’s policy that, at origination, all loans are secured by collateral of at least 102% of the value of U.S. securities loaned and 105% of the value of foreign securities loaned. Collateral equivalent to at least 100% of the market value of securities on loan is maintained at all times. Collateral is either in the form of cash, which can be invested in certain money market mutual funds managed by the Manager, U.S. Government and Agency securities or letters of credit.The fund is entitled to receive all income on securities loaned, in addition to income earned as a result
32
of the lending transaction. Although each security loaned is fully collateralized, the fund bears the risk of delay in recovery of, or loss of rights in, the securities loaned should a borrower fail to return the securities in a timely manner. During the period ended October 31, 2010, The Bank of New York Mellon earned $74,446 from lending portfolio securities, pursuant to the securities lending agreement.
(c) Affiliated issuers: Investments in other investment companies advised by Dreyfus are defined as “affiliated” in the Act.
The fund may invest in shares of certain affiliated investment companies also advised or managed by Dreyfus. Investments in affiliated investment companies for the period ended October 31, 2010 were as follows:
| Affiliated | ||||
| Investment | Value | Value | Net | |
| Company | 10/31/2009 ($) | Purchases ($) Sales ($) | 10/31/2010 ($) | Assets (%) |
| Dreyfus | ||||
| Institutional | ||||
| Preferred | ||||
| Plus Money | ||||
| Market | ||||
| Fund | 38,872,000 | 328,985,000 362,992,000 | 4,865,000 | .2 |
| Dreyfus | ||||
| Institutional | ||||
| Cash | ||||
| Advantage | ||||
| Plus | ||||
| Fund | 131,454,189 | 1,293,500,520 1,373,728,408 | 51,226,301 | 2.2 |
| Total | 170,326,189 | 1,622,485,520 1,736,720,408 | 56,091,301 | 2.4 |
(d) Dividends to shareholders: Dividends are recorded on the ex-dividend date. Dividends from investment income-net and dividends from net realized capital gains, if any, are normally declared and paid annually, but the fund may make distributions on a more frequent basis to comply with the distribution requirements of the Internal Revenue Code of 1986, as amended (the “Code”).To the extent that net realized capital gains can be offset by capital loss carryovers, it is the policy of the fund not to distribute such gains. Income and capital gain distributions are determined in accordance with income tax regulations, which may differ from GAAP.
TheFund 33
NOTES TO FINANCIAL STATEMENTS (continued)
(e) Federal income taxes: It is the policy of the fund to continue to qualify as a regulated investment company, if such qualification is in the best interests of its shareholders, by complying with the applicable provisions of the Code, and to make distributions of taxable income sufficient to relieve it from substantially all federal income and excise taxes.
As of and during the period ended October 31, 2010, the fund did not have any liabilities for any uncertain tax positions.The fund recognizes interest and penalties, if any, related to uncertain tax positions as income tax expense in the Statement of Operations. During the period, the fund did not incur any interest or penalties.
Each of the tax years in the four-year period ended October 31, 2010 remains subject to examination by the Internal Revenue Service and state taxing authorities.
At October 31, 2010, the components of accumulated earnings on a tax basis were as follows: undistributed ordinary income $25,452,500, undistributed capital gains $51,724,461 and unrealized appreciation $595,485,745.
The tax character of distributions paid to shareholders during the fiscal periods ended October 31, 2010 and October 31, 2009 were as follows: ordinary income $38,533,901 and $50,992,476, respectively.
During the period ended October 31, 2010, as a result of permanent book to tax differences, primarily due to the tax treatment for real estate investment trusts, the fund decreased accumulated undistributed investment income-net by $68,885 and increased accumulated net realized gain (loss) on investments by the same amount. Net assets and net asset value per share were not affected by this reclassification.
NOTE 2—Bank Lines of Credit:
The fund participates with other Dreyfus-managed funds in a $225 million unsecured credit facility led by Citibank, N.A. and a $300 million unsecured credit facility provided by The Bank of New York Mellon (each, a “Facility”), each to be utilized primarily for temporary
34
or emergency purposes, including the financing of redemptions. In connection therewith, the fund has agreed to pay its pro rata portion of commitment fees for each Facility. Interest is charged to the fund based on rates determined pursuant to the terms of the respective Facility at the time of borrowing.
The average amount of borrowings outstanding under the Facilities during the period ended October 31, 2010, was approximately $33,700 with a related weighted average annualized interest rate of 1.52%.
NOTE 3—Management Fee and Other Transactions With Affiliates:
(a) Pursuant to a management agreement (“Agreement”) with the Manager, the management fee is computed at the annual rate of .25% of the value of the fund’s average daily net assets and is payable monthly. Under the terms of the Agreement, the Manager has agreed to pay all the expenses of the fund, except management fees, brokerage fees and commissions, taxes, interest fees, commitment fees, Shareholder Services Plan fees, fees and expenses of non-interested Board members (including counsel fees) and extraordinary expenses. In addition, the Manager is required to reduce its fee in an amount equal to the fund’s allocable portion of the accrued fees and expenses of the non-interested Board members (including counsel fees). Each Board member also serves as a Board member of other funds within the Dreyfus comp lex. Annual retainer fees and attendance fees are allocated to each fund based on net assets. During the period ended October 31, 2010, fees reimbursed by the Manager amounted to $129,857.
(b) Under the Shareholder Services Plan, the fund pays the Distributor for the provision of certain services, at the annual rate of .25% of the value of the fund’s average daily net assets.The services provided may include personal services relating to shareholder accounts, such as answering shareholder inquiries regarding the fund and providing reports and other information, and services related to the maintenance
TheFund 35
NOTES TO FINANCIAL STATEMENTS (continued)
of shareholder accounts. The Distributor may make payments to Service Agents (a securities dealer, financial institution or other industry professional) in respect of these services. The Distributor determines the amounts to be paid to Service Agents. During the period ended October 31, 2010, the fund was charged $5,730,892 pursuant to the Shareholder Services Plan.
The components of “Due to The Dreyfus Corporation and affiliates” in the Statement of Assets and Liabilities consist of: management fees $493,304 and shareholder services plan fees $493,304.
NOTE 4—Securities Transactions:
The aggregate amount of purchases and sales of investment securities, excluding short-term securities and financial futures, during the period ended October 31, 2010, amounted to $121,698,923 and $301,685,749, respectively.
The provisions of ASC Topic 815 “Derivatives and Hedging” require qualitative disclosures about objectives and strategies for using derivatives, quantitative disclosures about fair value amounts of gains and losses on derivative instruments and disclosures about credit-risk-related contingent features in derivative agreements. The disclosure requirements distinguish between derivatives, which are accounted for as “hedges” and those that do not qualify for hedge accounting. Because investment companies value their derivatives at fair value and recognize changes in fair value through the Statement of Operations, they do not qualify for such accounting. Accordingly, even though a fund’s investments in derivatives may represent economic hedges, they are considered to be non-hedge transactions for purposes of this disclosure.
36
Futures Contracts: In the normal course of pursuing its investment objective, the fund is exposed to market risk, including equity price risk as a result of changes in value of underlying financial instruments.The fund invests in financial futures contracts in order to manage its exposure to or protect against changes in the market.A futures contract represents a commitment for the future purchase or a sale of an asset at a specified date. Upon entering into such contracts, these investments require initial margin deposits with a broker, which consist of cash or cash equivalents. The amount of these deposits is determined by the exchange or Board of Trade on which the contract is traded and is subject to change. Accordingly, variation margin payments are received or made to reflect daily unrealized gains or losses which are recorded in the Statement of Operations. Futures contracts are valued daily at the last sales price established by the Board of Trade or exchange upon which they are traded. When the contracts are closed, the fund recognizes a realized gain or loss.There is minimal counterparty credit risk to the fund with futures since futures are exchange traded, and the exchange’s clearinghouse guarantees the futures against default. Contracts open at October 31, 2010 are set forth in the Statement of Financial Futures.
At October 31, 2010, the cost of investments for federal income tax purposes was $1,779,637,764; accordingly, accumulated net unrealized appreciation on investments was $595,485,745, consisting of $899,755,799 gross unrealized appreciation and $304,270,054 gross unrealized depreciation.
TheFund 37
| REPORT OF INDEPENDENT REGISTERED |
| PUBLIC ACCOUNTING FIRM |
Shareholders and Board of Directors
Dreyfus S&P 500 Index Fund
We have audited the accompanying statement of assets and liabilities, including the statements of investments and financial futures, of Dreyfus S&P 500 Index Fund (one of the series comprising Dreyfus Index Funds, Inc.) as of October 31, 2010, and the related statement of operations for the year then ended, the statement of changes in net assets for each of the two years in the period then ended and financial highlights for each of the four years in the period ended.These financial statements and financial highlights are the responsibility of the Fund’s management. Our responsibility is to express an opinion on these financial statements and financial highlights based on our audits.The financial highlights for the year ended October 31, 2006 were audited by other auditors whose report dated December 14, 2006, expressed an unqualified opinion on such financial highlights.
We conducted our audits in accordance with the standards of the Public Company Accounting Oversight Board (United States).Those standards require that we plan and perform the audit to obtain reasonable assurance about whether the financial statements and financial highlights are free of material misstatement.We were not engaged to perform an audit of the Fund’s internal control over financial reporting. Our audits included consideration of internal control over financial reporting as a basis for designing audit procedures that are appropriate in the circumstances, but not for the purpose of expressing an opinion on the effectiveness of the Fund’s internal control over financial reporting. Accordingly, we express no such opinion.An audit also includes examining, on a test basis, evidence supporting the amounts and disclosures in the financial statements and financial highlights, assessing the accounting p rinciples used and significant estimates made by management, and evaluating the overall financial statement presentation. Our procedures included confirmation of securities owned as of October 31, 2010 by correspondence with the custodian and others. We believe that our audits provide a reasonable basis for our opinion.
In our opinion, the financial statements and financial highlights referred to above present fairly, in all material respects, the financial position of Dreyfus S&P 500 Index Fund at October 31, 2010, the results of its operations for the year then ended, the changes in its net assets for each of the two years in the period then ended and the financial highlights for each of the four years in the period then ended, in conformity with U.S. generally accepted accounting principles.

New York, New York
December 28, 2010
38
IMPORTANT TAX INFORMATION (Unaudited)
In accordance with federal tax law, the fund hereby designates 100% of the ordinary dividends paid during the fiscal year ended October 31, 2010 as qualifying for the corporate dividends received deduction. For the fiscal year ended October 31, 2010, certain dividends paid by the fund may be subject to a maximum tax rate of 15%, as provided for by the Jobs and Growth Tax Relief Reconciliation Act of 2003. Of the distributions paid during the fiscal year, $38,533,901 represents the maximum amount that may be considered qualified dividend income. Shareholders will receive notification in early 2011 of the percentage applicable to the preparation of their 2010 income tax returns.
TheFund 39


OFFICERS OF THE FUND (Unaudited)
BRADLEY J. SKAPYAK, President since January 2010.
Chief Operating Officer and a director of the Manager since June 2009. From April 2003 to June 2009, Mr. Skapyak was the head of the Investment Accounting and Support Department of the Manager. He is an officer of 76 investment companies (comprised of 170 portfolios) managed by the Manager. He is 51 years old and has been an employee of the Manager since February 1988.
PHILLIP N. MAISANO, Executive Vice President since July 2007.
Chief Investment Officer,Vice Chair and a director of the Manager, and an officer of 76 investment companies (comprised of 170 portfolios) managed by the Manager. Mr. Maisano also is an officer and/or Board member of certain other investment management subsidiaries of The Bank of New York Mellon Corporation, each of which is an affiliate of the Manager. He is 63 years old and has been an employee of the Manager since November 2006. Prior to joining the Manager, Mr. Maisano served as Chairman and Chief Executive Officer of EACM Advisors, an affiliate of the Manager, since August 2004.
MICHAEL A. ROSENBERG, Vice President and Secretary since August 2005.
Assistant General Counsel of BNY Mellon, and an officer of 77 investment companies (comprised of 195 portfolios) managed by the Manager. He is 50 years old and has been an employee of the Manager since October 1991.
KIESHA ASTWOOD, Vice President and Assistant Secretary since January 2010.
Counsel of BNY Mellon, and an officer of 77 investment companies (comprised of 195 portfolios) managed by the Manager. She is 37 years old and has been an employee of the Manager since July 1995.
JAMES BITETTO, Vice President and Assistant Secretary since August 2005.
Senior Counsel of BNY Mellon and Secretary of the Manager, and an officer of 77 investment companies (comprised of 195 portfolios) managed by the Manager. He is 44 years old and has been an employee of the Manager since December 1996.
JONI LACKS CHARATAN, Vice President and Assistant Secretary since August 2005.
Senior Counsel of BNY Mellon, and an officer of 77 investment companies (comprised of 195 portfolios) managed by the Manager. She is 54 years old and has been an employee of the Manager since October 1988.
JOSEPH M. CHIOFFI, Vice President and Assistant Secretary since August 2005.
Senior Counsel of BNY Mellon, and an officer of 77 investment companies (comprised of 195 portfolios) managed by the Manager. He is 48 years old and has been an employee of the Manager since June 2000.
KATHLEEN DENICHOLAS, Vice President and Assistant Secretary since January 2010.
Senior Counsel of BNY Mellon, and an officer of 77 investment companies (comprised of 195 portfolios) managed by the Manager. She is 36 years old and has been an employee of the Manager since February 2001.
JANETTE E. FARRAGHER, Vice President and Assistant Secretary since August 2005.
Assistant General Counsel of BNY Mellon, and an officer of 77 investment companies (comprised of 195 portfolios) managed by the Manager. She is 47 years old and has been an employee of the Manager since February 1984.
42
JOHN B. HAMMALIAN, Vice President and Assistant Secretary since August 2005.
Managing Counsel of BNY Mellon, and an officer of 77 investment companies (comprised of 195 portfolios) managed by the Manager. He is 47 years old and has been an employee of the Manager since February 1991.
M. CRISTINA MEISER, Vice President and Assistant Secretary since January 2010.
Senior Counsel of BNY Mellon, and an officer of 77 investment companies (comprised of 195 portfolios) managed by the Manager. She is 40 years old and has been an employee of the Manager since August 2001.
ROBERT R. MULLERY, Vice President and Assistant Secretary since August 2005.
Managing Counsel of BNY Mellon, and an officer of 77 investment companies (comprised of 195 portfolios) managed by the Manager. He is 58 years old and has been an employee of the Manager since May 1986.
JEFF PRUSNOFSKY, Vice President and Assistant Secretary since August 2005.
Managing Counsel of BNY Mellon, and an officer of 77 investment companies (comprised of 195 portfolios) managed by the Manager. He is 45 years old and has been an employee of the Manager since October 1990.
JAMES WINDELS, Treasurer since November 2001.
Director – Mutual Fund Accounting of the Manager, and an officer of 77 investment companies (comprised of 195 portfolios) managed by the Manager. He is 52 years old and has been an employee of the Manager since April 1985.
RICHARD CASSARO, Assistant Treasurer since January 2008.
Senior Accounting Manager – Money Market and Municipal Bond Funds of the Manager, and an officer of 77 investment companies (comprised of 195 portfolios) managed by the Manager. He is 51 years old and has been an employee of the Manager since September 1982.
GAVIN C. REILLY, Assistant Treasurer since December 2005.
Tax Manager of the Investment Accounting and Support Department of the Manager, and an officer of 77 investment companies (comprised of 195 portfolios) managed by the Manager. He is 42 years old and has been an employee of the Manager since April 1991.
ROBERT ROBOL, Assistant Treasurer since August 2005.
Senior Accounting Manager – Fixed Income Funds of the Manager, and an officer of 77 investment companies (comprised of 195 portfolios) managed by the Manager. He is 46 years old and has been an employee of the Manager since October 1988.
ROBERT SALVIOLO, Assistant Treasurer since July 2007.
Senior Accounting Manager – Equity Funds of the Manager, and an officer of 77 investment companies (comprised of 195 portfolios) managed by the Manager. He is 43 years old and has been an employee of the Manager since June 1989.
TheFund 43
OFFICERS OF THE FUND (Unaudited) (continued)
ROBERT SVAGNA, Assistant Treasurer since December 2002.
Senior Accounting Manager – Equity Funds the Manager, and an officer of 77 investment companies (comprised of 195 portfolios) managed by the Manager. He is 43 years old and has been an employee of the Manager since November 1990.
JOSEPH W. CONNOLLY, Chief Compliance Officer since October 2004.
Chief Compliance Officer of the Manager and The Dreyfus Family of Funds (77 investment companies, comprised of 195 portfolios). From November 2001 through March 2004, Mr. Connolly was first Vice-President, Mutual Fund Servicing for Mellon Global Securities Services. In that capacity, Mr. Connolly was responsible for managing Mellon’s Custody, Fund Accounting and Fund Administration services to third-party mutual fund clients. He is 53 years old and has served in various capacities with the Manager since 1980, including manager of the firm’s Fund Accounting Department from 1997 through October 2001.
NATALIA GRIBAS, Anti-Money Laundering Compliance Officer since July 2010.
Anti-Money Laundering Compliance Officer of the Distributor, and the Anti-Money Laundering Compliance Officer of 73 investment companies (comprised of 191 portfolios) managed by the Manager. She is 40 years old and has been an employee of the Distributor since September 2008.
44

Save time. Save paper. View your next shareholder report online as soon as it’s available. Log into www.dreyfus.com and sign up for Dreyfus eCommunications. It’s simple and only takes a few minutes.
The views expressed in this report reflect those of the portfolio manager only through the end of the period covered and do not necessarily represent the views of Dreyfus or any other person in the Dreyfus organization. Any such views are subject to change at any time based upon market or other conditions and Dreyfus disclaims any responsibility to update such views.These views may not be relied on as investment advice and, because investment decisions for a Dreyfus fund are based on numerous factors, may not be relied on as an indication of trading intent on behalf of any Dreyfus fund.
Not FDIC-Insured • Not Bank-Guaranteed • May Lose Value
Contents | |
THE FUND | |
| 2 | A Letter from the Chairman and CEO |
| 3 | Discussion of Fund Performance |
| 6 | Fund Performance |
| 7 | Understanding Your Fund’s Expenses |
| 7 | Comparing Your Fund’s Expenses With Those of Other Funds |
| 8 | Statement of Investments |
| 27 | Statement of Financial Futures |
| 28 | Statement of Assets and Liabilities |
| 29 | Statement of Operations |
| 30 | Statement of Changes in Net Assets |
| 31 | Financial Highlights |
| 32 | Notes to Financial Statements |
| 41 | Report of Independent Registered Public Accounting Firm |
| 42 | Important Tax Information |
| 43 | Board Members Information |
| 45 | Officers of the Fund |
FOR MORE INFORMATION | |
Back Cover |
Dreyfus
Smallcap Stock Index Fund
The Fund

A LETTER FROM THE CHAIRMAN AND CEO
Dear Shareholder:
We are pleased to present this annual report for Dreyfus Smallcap Stock Index Fund, covering the 12-month period from November 1, 2009, through October 31, 2010.
Although a double-dip recession has recently become an increasingly unlikely scenario in our view, persistent uncertainty regarding the breadth and strength of the U.S. and global economic recoveries led to bouts of heightened volatility for U.S. stocks during most of 2010.The spending power of the U.S. consumer, long an important catalyst for economic growth, has been diminished by concerns over job security and an inability to generate cash from home equity.The second major driver of sustainable growth, corporate investment, has been stunted to a similar extent by tight credit conditions. However, the recent announcement of additional quantitative easing (QE2) measures by the Federal Reserve Board, as well as improved fundamentals across many developing nations, have helped support moderate global economic growth.
Uncertainty will probably remain in the broader financial markets until we see more evidence of robust economic growth, but we remain optimistic regarding the prospects for equities. Many stocks of quality companies with healthy balance sheets, higher credit ratings and strong cash flows appear to be currently priced at a discount.With that, we strongly suggest that you meet with your financial advisor to discuss the potential opportunities which may exist in the global markets, as well as to evaluate your portfolio to help meet your individual investment needs and your future goals relative to your risk-tolerance level.
For information about how the fund performed during the reporting period, as well as general market perspectives, we provide a Discussion of Fund Performance on the pages that follow.
Thank you for your continued confidence and support.
Jonathan R. Baum
Chairman and Chief Executive Officer
The Dreyfus Corporation
November 15, 2010
2

DISCUSSION OF FUND PERFORMANCE
For the period of November 1, 2009, through October 31, 2010, as provided by Thomas J. Durante, CFA, Karen Q. Wong and Richard A. Brown, Portfolio Managers
Fund and Market Performance Overview
For the 12-month period ended October 31, 2010, Dreyfus Smallcap Stock Index Fund produced a total return of 26.08%.1 In comparison, the Standard & Poor’s SmallCap 600 Index (the “S&P 600 Index”), the fund’s benchmark, produced a 26.27% return for the same period.2,3
Small-cap stocks ended a volatile reporting period with double-digit gains, on average, as investor sentiment was buoyed by a sustained U.S. economic recovery despite a number of economic headwinds. The difference in returns between the fund and its benchmark was primarily due to the fund’s transaction costs and operating expenses.
The Fund’s Investment Approach
The fund seeks to match the total return of the S&P 600 Index by generally investing in a representative sample of the stocks listed in the S&P 600 Index. The S&P 600 Index is composed of 600 domestic stocks across 10 economic sectors. Each stock is weighted by its market capitalization; that is, larger companies have greater representation in the S&P 600 Index than smaller ones. The fund may also use stock index futures as a substitute for the sale or purchase of stocks.
Equity Markets Rebounded Amid Economic Recovery
When the reporting period began, the U.S. economy had returned to growth, aided in large part by fiscal and monetary stimulus programs from the federal government and Federal Reserve Board (the “Fed”), respectively. Early in the reporting period, improving manufacturing activity and an apparent bottoming of housing prices helped bolster confidence among businesses, consumers and investors. Consumer and corporate spending improved, and commodity prices climbed.
TheFund 3
DISCUSSION OF FUND PERFORMANCE (continued)
By May, however, investors were faced with two new global developments. First, Greece found itself unable to refinance a heavy debt load, leading to a sovereign debt crisis that investors feared might spread throughout the European Union. Second, a catastrophic oil spill in the Gulf of Mexico threatened the prospects of energy companies engaged in deep-sea drilling as well as economic activity along the U.S. Gulf Coast. These concerns weighed heavily on investor sentiment and stock prices. However, fears regarding the possibility of a return to recession proved to be unwarranted when, by the end of the summer, a number of economic indicators pointed to continued, albeit subpar, U.S. economic growth.
Throughout the reporting period, the Fed made it clear that it would continue to employ all available tools to stimulate the economy. Indeed, as it has since December 2008, the Fed maintained the overnight federal funds rate in a historically low range between 0.00% and 0.25%.The Fed also announced plans to embark on a second round of quantitative easing, in which it will purchase $600 billion of U.S. Treasuries to further stimulate the U.S. economy. Anticipation of the Fed’s quantitative easing program helped support a market rally through the reporting period’s end.
S&P 600 Index Posted Gains in All Market Sectors
All of the market sectors represented in the S&P 600 Index posted positive absolute returns for the reporting period. Relative performance was particularly strong in the information technology sector, where semiconductor firms benefited from their inventory management strategies during the downturn and the subsequent growth trend in wireless communications. In addition, a number of software developers and hardware providers fared well as more businesses moved toward “cloud computing” for their data management needs, giving them the ability to access, integrate and consolidate data across locations, systems and users. Electronic equipment makers also fared well, largely due to previous cost-cutting measures.
Consumer discretionary stocks produced attractive relative returns in the recovering economy, most notably low-end retailers, farming equipment suppliers, office supply stores and casual dining restaurants.
4
Many of these companies rebounded from previously beaten-down levels while others benefited from cost-cutting measures implemented during the recession. A number of textile, apparel and luxury goods companies also advanced due to improved consumer spending.
Financial stocks generated especially strong performance when mending credit markets and low interest rates helped regional banks and other small-cap financial institutions rebound from their previous lows. However, the bulk of the sector’s positive performance stemmed from real estate investment trusts (REITs), which benefited from a reduction in supply, resulting in less competition. The most robust gains among REITs were produced by those specializing in the apartment, self storage and industrial segments.
Index Investing Offers Diversification
As an index portfolio, our strategy is to attempt to replicate the returns of the S&P 600 Index by investing in a representative sample of the small-cap stocks listed in the S&P 600 Index.The fund offers a diversified investment vehicle that can help investors manage the risks of investing in small-cap stocks by limiting the impact on the overall portfolio of unexpected losses in any single industry group or holding.
November 15, 2010
| Equity funds are subject generally to market, market sector, market liquidity, issuer and investment | |
| style risks, among other factors, to varying degrees, all of which are more fully described in the | |
| fund’s prospectus. Stocks of small-cap companies often experience sharper price fluctuations than | |
| stocks of larger-cap companies. | |
| 1 | Total return includes reinvestment of dividends and any capital gains paid. Past performance is no |
| guarantee of future results. Share price and investment return fluctuate such that upon redemption, | |
| fund shares may be worth more or less than their original cost. | |
| 2 | SOURCE: LIPPER INC. — Reflects the reinvestment of dividends and, where applicable, |
| capital gain distributions.The Standard & Poor’s SmallCap 600 Index is a broad-based index | |
| and a widely accepted, unmanaged index of overall small-cap stock market performance. Investors | |
| cannot invest directly in any index. | |
| 3 | “Standard & Poor’s®,” “S&P®,” “S&P 500®” and “STARS®” are registered trademarks |
| of Standard & Poor's Financial Services LLC, and have been licensed for use on behalf of the | |
| fund.The fund is not sponsored, managed, advised, sold or promoted by Standard & Poor’s and | |
| its affiliates and Standard & Poor’s and its affiliates make no representation regarding the | |
| advisability of investing in the fund. |
TheFund 5
FUND PERFORMANCE
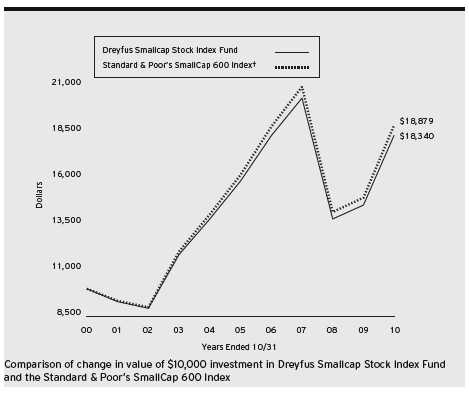
| Average Annual Total Returns as of 10/31/10 | |||
| 1 Year | 5 Years | 10 Years | |
| Fund | 26.08% | 2.96% | 6.25% |
| Standard & Poor’s SmallCap 600 Index | 26.27% | 3.12% | 6.56% |
| † Source: Lipper Inc. |
| Past performance is not predictive of future performance.The fund’s performance shown in the graph and table does not |
| reflect the deduction of taxes that a shareholder would pay on fund distributions or the redemption of fund shares. |
| The above graph compares a $10,000 investment made in Dreyfus Smallcap Stock Index Fund on 10/31/00 to a |
| $10,000 investment made in the Standard & Poor’s SmallCap 600 Index (the “Index”) on that date.All dividends |
| and capital gain distributions are reinvested. |
| The fund’s performance shown in the line graph takes into account all applicable fees and expenses.The Index is a |
| broad-based index and a widely accepted, unmanaged index of overall small-cap stock market performance. Unlike a |
| mutual fund, the Index is not subject to charges, fees and other expenses. Investors cannot invest directly in any index. |
| Further information relating to fund performance, including expense reimbursements, if applicable, is contained in the |
| Financial Highlights section of the prospectus and elsewhere in this report. |
6
UNDERSTANDING YOUR FUND’S EXPENSES (Unaudited)
As a mutual fund investor, you pay ongoing expenses, such as management fees and other expenses. Using the information below, you can estimate how these expenses affect your investment and compare them with the expenses of other funds.You also may pay one-time transaction expenses, including sales charges (loads) and redemption fees, which are not shown in this section and would have resulted in higher total expenses. For more information, see your fund’s prospectus or talk to your financial adviser.
Review your fund’s expenses
The table below shows the expenses you would have paid on a $1,000 investment in Dreyfus Smallcap Stock Index Fund from May 1, 2010 to October 31, 2010. It also shows how much a $1,000 investment would be worth at the close of the period, assuming actual returns and expenses.
| Expenses and Value of a $1,000 Investment | |
| assuming actual returns for the six months ended October 31, 2010 | |
| Expenses paid per $1,000† | $ 2.50 |
| Ending value (after expenses) | $985.30 |
| COMPARING YOUR FUND’S EXPENSES |
| WITH THOSE OF OTHER FUNDS (Unaudited) |
Using the SEC’s method to compare expenses
The Securities and Exchange Commission (SEC) has established guidelines to help investors assess fund expenses. Per these guidelines, the table below shows your fund’s expenses based on a $1,000 investment, assuming a hypothetical 5% annualized return. You can use this information to compare the ongoing expenses (but not transaction expenses or total cost) of investing in the fund with those of other funds.All mutual fund shareholder reports will provide this information to help you make this comparison. Please note that you cannot use this information to estimate your actual ending account balance and expenses paid during the period.
| Expenses and Value of a $1,000 Investment | |
| assuming a hypothetical 5% annualized return for the six months ended October 31, 2010 | |
| Expenses paid per $1,000† | $ 2.55 |
| Ending value (after expenses) | $1,022.68 |
† Expenses are equal to the fund’s annualized expense ratio of .50%, multiplied by the average account value over the period, multiplied by 184/365 (to reflect the one-half year period).
TheFund 7
| STATEMENT OF INVESTMENTS |
| October 31, 2010 |
| Common Stocks—98.8% | Shares | Value ($) |
| Consumer Discretionary—15.7% | ||
| American Public Education | 39,954 a,b | 1,117,114 |
| Arbitron | 62,520 | 1,583,006 |
| Arctic Cat | 27,687 b | 368,514 |
| Audiovox, Cl. A | 48,992 b | 317,468 |
| Big 5 Sporting Goods | 46,114 | 623,461 |
| Biglari Holdings | 2,550 b | 850,144 |
| BJ’s Restaurants | 42,443 a,b | 1,406,985 |
| Blue Nile | 27,901 a,b | 1,188,583 |
| Blyth | 12,616 | 506,154 |
| Brown Shoe | 103,056 | 1,210,908 |
| Brunswick | 205,811 | 3,255,930 |
| Buckle | 47,627 a | 1,385,469 |
| Buffalo Wild Wings | 41,007 b | 1,928,559 |
| Cabela’s | 81,284 a,b | 1,507,005 |
| California Pizza Kitchen | 58,401 b | 964,201 |
| Callaway Golf | 113,504 a | 780,908 |
| Capella Education | 33,308 a,b | 1,826,278 |
| Carter’s | 137,000 b | 3,411,300 |
| Cato, Cl. A | 74,835 | 1,979,386 |
| CEC Entertainment | 57,968 b | 1,924,538 |
| Children’s Place Retail Stores | 65,569 b | 2,888,970 |
| Christopher & Banks | 79,127 | 471,597 |
| Coinstar | 79,065 a,b | 4,552,563 |
| Cracker Barrel Old Country Store | 55,018 | 2,964,920 |
| CROCS | 196,457 b | 2,736,646 |
| Deckers Outdoor | 92,902 b | 5,397,606 |
| DineEquity | 31,843 a,b | 1,415,421 |
| Drew Industries | 39,996 b | 842,716 |
| E.W. Scripps, Cl. A | 57,518 a,b | 502,707 |
| Ethan Allen Interiors | 53,701 a | 814,644 |
| Finish Line, Cl. A | 142,449 | 2,179,470 |
| Fred’s, Cl. A | 90,344 a | 1,082,321 |
| Genesco | 58,830 b | 1,927,271 |
| Group 1 Automotive | 47,488 a,b | 1,674,427 |
| Gymboree | 67,741 b | 4,407,229 |
| Haverty Furniture | 50,453 | 539,343 |
8
| Common Stocks (continued) | Shares | Value ($) |
| Consumer Discretionary (continued) | ||
| Helen of Troy | 78,955 b | 2,025,196 |
| Hibbett Sports | 65,627 a,b | 1,768,648 |
| Hillenbrand | 126,084 | 2,709,545 |
| Hot Topic | 75,705 a | 433,790 |
| HSN | 87,354 b | 2,615,379 |
| Iconix Brand Group | 156,601 b | 2,740,517 |
| Interval Leisure Group | 77,377 b | 1,110,360 |
| Jack in the Box | 111,090 a,b | 2,572,844 |
| JAKKS Pacific | 76,843 a,b | 1,448,491 |
| Jo-Ann Stores | 69,041 a,b | 2,986,023 |
| JOS. A. Bank Clothiers | 60,701 b | 2,646,564 |
| K-Swiss, Cl. A | 38,118 b | 463,515 |
| Kid Brands | 39,407 b | 384,612 |
| Kirkland’s | 25,409 b | 341,751 |
| La-Z-Boy | 117,832 b | 915,555 |
| Lithia Motors, Cl. A | 41,465 a | 451,968 |
| Live Nation | 307,361 b | 2,916,856 |
| Liz Claiborne | 229,042 a,b | 1,401,737 |
| Lumber Liquidators Holdings | 40,043 a,b | 964,235 |
| M/I Homes | 47,422 b | 501,725 |
| Maidenform Brands | 50,988 b | 1,364,439 |
| Marcus | 44,729 | 573,426 |
| MarineMax | 56,103 b | 419,650 |
| Men’s Wearhouse | 104,975 | 2,565,589 |
| Meritage Homes | 69,186 b | 1,266,796 |
| Midas | 23,051 a,b | 169,655 |
| Monarch Casino & Resort | 17,578 b | 203,026 |
| Monro Muffler Brake | 44,500 a | 2,124,430 |
| Movado Group | 24,562 b | 276,077 |
| Multimedia Games | 75,258 b | 295,011 |
| National Presto Industries | 9,446 a | 1,057,291 |
| Nautilus | 49,889 b | 73,836 |
| NutriSystem | 62,744 a | 1,199,665 |
| O’Charleys | 49,617 b | 372,128 |
| OfficeMax | 190,760 b | 3,376,452 |
| Oxford Industries | 36,106 | 831,521 |
TheFund 9
STATEMENT OF INVESTMENTS (continued)
| Common Stocks (continued) | Shares | Value ($) | |
| Consumer Discretionary (continued) | |||
| P.F. Chang’s China Bistro | 53,893 | a | 2,474,767 |
| Papa John’s International | 57,922 | b | 1,496,125 |
| Peet’s Coffee & Tea | 22,859 | a,b | 874,357 |
| PEP Boys-Manny Moe & Jack | 127,211 | 1,487,097 | |
| Perry Ellis International | 24,744 | b | 556,245 |
| PetMed Express | 49,956 | a | 771,820 |
| Pinnacle Entertainment | 135,039 | b | 1,728,499 |
| Polaris Industries | 73,377 | 5,216,371 | |
| Pool | 109,478 | a | 2,204,887 |
| Pre-Paid Legal Services | 17,186 | a,b | 1,034,253 |
| Quiksilver | 294,507 | b | 1,228,094 |
| RC2 | 52,362 | b | 1,104,838 |
| Red Robin Gourmet Burgers | 36,358 | b | 738,067 |
| Ruby Tuesday | 154,067 | b | 1,864,211 |
| Ruth’s Hospitality Group | 61,304 | b | 279,546 |
| Shuffle Master | 134,909 | b | 1,269,494 |
| Skechers USA, Cl. A | 80,889 | b | 1,572,482 |
| Sonic | 121,643 | b | 1,080,190 |
| Sonic Automotive, Cl. A | 90,737 | a | 990,848 |
| Spartan Motors | 80,057 | 406,690 | |
| Stage Stores | 91,024 | 1,213,350 | |
| Standard Motor Products | 42,925 | 456,293 | |
| Standard-Pacific | 238,122 | b | 864,383 |
| Stein Mart | 59,288 | b | 556,714 |
| Steven Madden | 50,945 | b | 2,154,973 |
| Sturm Ruger & Co. | 62,889 a | 984,842 | |
| Superior Industries International | 66,315 | 1,190,354 | |
| Texas Roadhouse | 139,235 | a,b | 2,138,650 |
| True Religion Apparel | 60,943 | a,b | 1,246,284 |
| Tuesday Morning | 87,589 | b | 419,551 |
| Universal Electronics | 30,673 | b | 645,973 |
| Universal Technical Institute | 64,825 | a | 1,254,364 |
| Volcom | 33,292 | a,b | 571,624 |
| Winnebago Industries | 57,571 | b | 575,710 |
| Wolverine World Wide | 111,845 | 3,256,926 |
10
| Common Stocks (continued) | Shares | Value ($) | |
| Consumer Discretionary (continued) | |||
| Zale | 33,242 | a,b | 85,100 |
| Zumiez | 40,155 | a,b | 1,052,864 |
| 157,148,901 | |||
| Consumer Staples—3.5% | |||
| Alliance One International | 254,430 | a,b | 1,124,581 |
| Andersons | 45,786 | 1,802,595 | |
| Boston Beer, Cl. A | 24,733 | b | 1,770,635 |
| Cal-Maine Foods | 26,292 | a | 761,679 |
| Calavo Growers | 25,423 | a | 557,526 |
| Casey’s General Stores | 92,566 | 3,837,786 | |
| Central Garden & Pet, Cl. A | 154,143 | b | 1,610,794 |
| Darling International | 201,775 | b | 2,019,768 |
| Diamond Foods | 41,397 | a | 1,829,747 |
| Great Atlantic & Pacific Tea | 39,122 | a,b | 134,580 |
| Hain Celestial Group | 89,571 | b | 2,215,091 |
| J & J Snack Foods | 32,700 | 1,401,849 | |
| Lance | 67,247 | 1,529,197 | |
| Mannatech | 14,606 | b | 27,313 |
| Medifast | 30,822 | b | 736,029 |
| Nash Finch | 28,940 | 1,212,586 | |
| Sanderson Farms | 48,985 | 2,056,390 | |
| Seneca Foods, Cl. A | 20,597 | b | 475,791 |
| Spartan Stores | 55,528 | 830,144 | |
| TreeHouse Foods | 84,140 | a,b | 3,929,338 |
| United Natural Foods | 101,681 a,b | 3,636,113 | |
| WD-40 | 35,334 | 1,303,471 | |
| 34,803,003 | |||
| Energy—4.9% | |||
| Basic Energy Services | 58,685 | b | 649,056 |
| Bristow Group | 74,384 | b | 2,884,612 |
| CARBO Ceramics | 40,536 | a | 3,395,701 |
| Gulf Island Fabrication | 30,108 | 687,667 | |
| Gulfport Energy | 61,587 | b | 1,026,039 |
| Holly | 89,287 | 2,922,364 | |
| Hornbeck Offshore Services | 35,331 | a,b | 785,761 |
TheFund 11
STATEMENT OF INVESTMENTS (continued)
| Common Stocks (continued) | Shares | Value ($) | |
| Energy (continued) | |||
| ION Geophysical | 333,042 b | 1,628,575 | |
| Lufkin Industries | 66,826 | 3,264,450 | |
| Matrix Service | 65,606 b | 595,702 | |
| Oil States International | 115,829 b | 5,921,178 | |
| Penn Virginia | 105,394 a | 1,561,939 | |
| Petroleum Development | 44,962 b | 1,403,264 | |
| PetroQuest Energy | 134,469 a,b | 750,337 | |
| Pioneer Drilling | 153,382 b | 944,833 | |
| SEACOR Holdings | 43,691 b | 4,139,722 | |
| Seahawk Drilling | 26,370 a,b | 265,810 | |
| SM Energy | 136,010 | 5,668,897 | |
| Stone Energy | 126,432 a,b | 1,976,132 | |
| Swift Energy | 89,687 a,b | 2,856,531 | |
| Tetra Technologies | 189,972 b | 1,854,127 | |
| World Fuel Services | 148,232 a | 4,184,589 | |
| 49,367,286 | |||
| Financial—18.9% | |||
| Acadia Realty Trust | 88,887 c | 1,695,964 | |
| Amerisafe | 38,602 b | 736,912 | |
| Bank Mutual | 45,791 | 220,713 | |
| Bank of the Ozarks | 26,441 a | 1,005,022 | |
| BioMed Realty Trust | 284,584 c | 5,222,116 | |
| Boston Private Financial Holdings | 198,705 | 1,134,606 | |
| Brookline Bancorp | 166,238 | 1,619,158 | |
| Cash America International | 73,710 | 2,596,803 | |
| Cedar Shopping Centers | 115,519 | c | 728,925 |
| City Holding | 34,277 | a | 1,086,581 |
| Colonial Properties Trust | 153,893 | c | 2,759,301 |
| Columbia Banking System | 89,247 | 1,625,188 | |
| Community Bank System | 89,052 | a | 2,081,145 |
| Delphi Financial Group, Cl. A | 113,878 | 3,082,677 | |
| DiamondRock Hospitality | 315,614 | b,c | 3,339,196 |
| Dime Community Bancshares | 39,459 | 575,707 | |
| East West Bancorp | 342,847 | 6,044,393 | |
| EastGroup Properties | 57,916 | c | 2,344,440 |
| eHealth | 52,617 | a,b | 710,856 |
12
| Common Stocks (continued) | Shares | Value ($) |
| Financial (continued) | ||
| Employers Holdings | 85,544 | 1,384,957 |
| Entertainment Properties Trust | 98,831 c | 4,568,957 |
| Extra Space Storage | 196,764 a,c | 3,187,577 |
| EZCORP, Cl. A | 116,804 b | 2,508,950 |
| First BanCorp/Puerto Rico | 89,847 a,b | 27,403 |
| First Cash Financial Services | 61,904 b | 1,799,549 |
| First Commonwealth Financial | 166,239 | 967,511 |
| First Financial Bancorp | 114,217 | 1,923,414 |
| First Financial Bankshares | 44,721 a | 2,113,514 |
| First Midwest Bancorp | 140,234 | 1,501,906 |
| Forestar Group | 74,057 b | 1,266,375 |
| Franklin Street Properties | 131,378 a,c | 1,753,896 |
| Glacier Bancorp | 156,072 a | 2,028,936 |
| Hancock Holding | 60,148 | 1,889,850 |
| Hanmi Financial | 289,195 a,b | 338,358 |
| Healthcare Realty Trust | 158,005 a,c | 3,814,241 |
| Home Bancshares | 48,869 | 1,005,235 |
| Home Properties | 78,104 a,c | 4,252,763 |
| Horace Mann Educators | 88,866 | 1,660,906 |
| Independent Bank/MA | 47,127 | 1,107,013 |
| Infinity Property & Casualty | 27,991 | 1,448,534 |
| Inland Real Estate | 193,657 c | 1,682,879 |
| Interactive Brokers Group, Cl. A | 93,741 b | 1,754,832 |
| Investment Technology Group | 100,819 b | 1,435,663 |
| Kilroy Realty | 113,133 a,c | 3,865,755 |
| Kite Realty Group Trust | 101,822 c | 486,709 |
| LaBranche & Co. | 100,631 b | 327,051 |
| LaSalle Hotel Properties | 164,545 c | 3,898,071 |
| Lexington Realty Trust | 305,658 a,c | 2,378,019 |
| LTC Properties | 62,222 c | 1,732,883 |
| Medical Properties Trust | 270,864 c | 3,030,968 |
| Mid-America Apartment Communities | 69,532 c | 4,243,538 |
| Nara Bancorp | 80,136 b | 628,266 |
| National Financial Partners | 95,764 b | 1,321,543 |
| National Penn Bancshares | 307,347 | 1,994,682 |
| National Retail Properties | 200,787 a,c | 5,441,328 |
TheFund 13
STATEMENT OF INVESTMENTS (continued)
| Common Stocks (continued) | Shares | Value ($) |
| Financial (continued) | ||
| Navigators Group | 27,164 b | 1,248,729 |
| NBT Bankcorp | 74,121 | 1,634,368 |
| Old National Bancorp | 219,509 | 2,076,555 |
| optionsXpress Holdings | 117,458 b | 1,875,804 |
| Parkway Properties | 53,313 c | 829,550 |
| Pennsylvania Real Estate Investment Trust | 121,965 a,c | 1,740,441 |
| Pinnacle Financial Partners | 62,421 a,b | 712,224 |
| Piper Jaffray | 29,132 b | 902,218 |
| Portfolio Recovery Associates | 34,672 b | 2,324,758 |
| Post Properties | 110,680 c | 3,369,099 |
| Presidential Life | 45,610 | 436,488 |
| PrivateBancorp | 139,417 | 1,643,726 |
| ProAssurance | 75,274 b | 4,327,502 |
| PS Business Parks | 46,623 c | 2,762,879 |
| Rewards Network | 23,191 b | 317,717 |
| RLI | 35,734 a | 2,051,846 |
| S&T Bancorp | 49,864 a | 977,334 |
| Safety Insurance Group | 28,970 | 1,345,946 |
| Selective Insurance Group | 120,416 | 2,037,439 |
| Signature Bank | 98,455 b | 4,158,739 |
| Simmons First National, Cl. A | 35,400 | 962,526 |
| Sovran Self Storage | 60,976 c | 2,382,332 |
| Sterling Bancorp | 83,514 | 784,196 |
| Sterling Bancshares | 183,027 | 986,516 |
| Stewart Information Services | 55,461 | 600,088 |
| Stifel Financial | 81,852 a,b | 3,878,966 |
| Susquehanna Bancshares | 302,034 | 2,386,069 |
| SWS Group | 66,150 a | 454,451 |
| Tanger Factory Outlet Centers | 90,159 c | 4,320,419 |
| Tompkins Financial | 20,054 a | 774,084 |
| Tower Group | 107,895 | 2,619,691 |
| TradeStation Group | 68,126 b | 374,012 |
| Trustco Bank | 228,109 a | 1,229,508 |
| UMB Financial | 66,885 | 2,478,758 |
| Umpqua Holdings | 279,294 | 3,072,234 |
| United Bankshares | 83,566 a | 2,232,884 |
14
| Common Stocks (continued) | Shares | Value ($) |
| Financial (continued) | ||
| United Community Banks | 258,754 a,b | 507,158 |
| United Fire & Casualty | 44,689 | 895,121 |
| Universal Health Realty Income Trust | 27,265 c | 1,012,895 |
| Urstadt Biddle Properties, Cl. A | 57,708 c | 1,108,571 |
| Whitney Holding | 195,315 | 1,617,208 |
| Wilshire Bancorp | 47,702 a | 320,080 |
| Wintrust Financial | 78,222 | 2,341,967 |
| World Acceptance | 40,439 a,b | 1,744,943 |
| 189,239,774 | ||
| Health Care—12.4% | ||
| Abaxis | 47,950 b | 1,151,280 |
| Affymetrix | 159,147 b | 712,979 |
| Air Methods | 22,525 a,b | 921,272 |
| Align Technology | 153,820 a,b | 2,619,555 |
| Almost Family | 20,005 a,b | 690,773 |
| Amedisys | 62,308 b | 1,586,362 |
| American Medical Systems Holdings | 178,751 a,b | 3,610,770 |
| AMERIGROUP | 122,912 b | 5,129,118 |
| AMN Healthcare Services | 85,246 b | 451,804 |
| AmSurg | 81,641 b | 1,476,069 |
| Analogic | 26,377 | 1,203,583 |
| ArQule | 88,697 b | 489,607 |
| Bio-Reference Laboratories | 49,050 b | 1,057,518 |
| Cambrex | 68,855 b | 311,913 |
| Cantel Medical | 35,195 | 651,811 |
| Catalyst Health Solutions | 84,526 b | 3,199,309 |
| Centene | 101,562 b | 2,266,864 |
| Chemed | 50,716 | 2,989,201 |
| Computer Programs & Systems | 17,789 | 812,424 |
| CONMED | 49,254 b | 1,084,081 |
| Cooper | 111,770 | 5,514,732 |
| CorVel | 18,192 b | 815,002 |
| Cross Country Healthcare | 71,128 b | 519,234 |
| CryoLife | 100,566 b | 648,651 |
| Cubist Pharmaceuticals | 143,195 b | 3,333,580 |
| Cyberonics | 58,064 b | 1,597,341 |
TheFund 15
STATEMENT OF INVESTMENTS (continued)
| Common Stocks (continued) | Shares | Value ($) |
| Health Care (continued) | ||
| Dionex | 40,051 a,b | 3,573,751 |
| Emergent BioSolutions | 35,762 b | 646,219 |
| Ensign Group | 20,145 | 378,122 |
| Enzo Biochem | 68,002 a,b | 293,089 |
| eResearch Technology | 104,679 b | 797,654 |
| Genoptix | 32,899 b | 559,941 |
| Gentiva Health Services | 72,969 b | 1,698,718 |
| Greatbatch | 67,363 a,b | 1,465,145 |
| Haemonetics | 60,718 b | 3,318,239 |
| Hanger Orthopedic Group | 82,193 b | 1,538,653 |
| HealthSpring | 120,095 b | 3,505,573 |
| Healthways | 73,430 b | 769,546 |
| Hi-Tech Pharmacal | 17,387 a,b | 376,081 |
| HMS Holdings | 56,071 b | 3,370,428 |
| ICU Medical | 24,931 b | 909,981 |
| Integra LifeSciences Holdings | 51,539 b | 2,217,208 |
| Invacare | 85,360 a | 2,304,720 |
| IPC The Hospitalist | 25,580 b | 819,327 |
| Kendle International | 22,906 b | 208,674 |
| Kensey Nash | 30,524 a,b | 822,927 |
| Landauer | 16,638 a | 1,016,415 |
| LCA-Vision | 30,215 b | 210,296 |
| LHC Group | 34,656 a,b | 932,246 |
| Magellan Health Services | 81,976 b | 3,934,848 |
| Martek Biosciences | 76,566 a,b | 1,680,624 |
| MedCath | 30,716 b | 304,396 |
| Meridian Bioscience | 78,405 a | 1,794,690 |
| Merit Medical Systems | 58,194 b | 920,047 |
| Molina Healthcare | 41,262 b | 1,069,511 |
| MWI Veterinary Supply | 25,462 b | 1,456,426 |
| Natus Medical | 59,487 b | 779,280 |
| Neogen | 43,475 b | 1,452,935 |
| Omnicell | 74,150 b | 1,035,876 |
| Osteotech | 27,000 b | 175,230 |
| Palomar Medical Technologies | 27,654 b | 292,579 |
| Par Pharmaceutical Cos. | 89,606 b | 2,913,091 |
16
| Common Stocks (continued) | Shares | Value ($) | |
| Health Care (continued) | |||
| PAREXEL International | 143,364 | b | 3,082,326 |
| PharMerica | 55,465 | a,b | 556,869 |
| PSS World Medical | 117,958 | b | 2,787,348 |
| Quality Systems | 38,405 | a | 2,467,905 |
| Regeneron Pharmaceuticals | 154,395 | b | 4,026,622 |
| RehabCare Group | 51,522 | b | 1,145,334 |
| Res-Care | 57,233 | b | 757,193 |
| Salix Pharmaceuticals | 132,063 | b | 4,995,943 |
| Savient Pharmaceuticals | 142,086 | a,b | 1,763,287 |
| SurModics | 31,651 b | 378,546 | |
| Symmetry Medical | 102,227 b | 904,709 | |
| ViroPharma | 179,822 b | 2,941,888 | |
| West Pharmaceutical Services | 82,206 a | 2,933,932 | |
| Zoll Medical | 44,574 b | 1,449,992 | |
| 124,579,213 | |||
| Industrial—15.5% | |||
| A.O. Smith | 55,329 | 3,100,084 | |
| AAON | 28,315 | a | 695,133 |
| AAR | 80,113 | b | 1,765,691 |
| ABM Industries | 113,743 | a | 2,564,905 |
| Actuant, Cl. A | 141,683 | 3,183,617 | |
| Administaff | 55,230 | 1,447,578 | |
| Aerovironment | 27,263 | a,b | 639,590 |
| Albany International, Cl. A | 61,559 | 1,255,804 | |
| Allegiant Travel | 36,597 a | 1,723,353 | |
| American Science & Engineering | 20,595 | 1,695,998 | |
| Apogee Enterprises | 58,778 | 616,581 | |
| Applied Industrial Technologies | 95,809 | 2,913,552 | |
| Applied Signal Technology | 27,208 | 913,100 | |
| Arkansas Best | 52,948 | a | 1,341,173 |
| Astec Industries | 36,227 | a,b | 1,067,610 |
| AZZ | 30,149 | 1,119,734 | |
| Badger Meter | 28,705 a | 1,192,119 | |
| Barnes Group | 121,464 a | 2,209,430 | |
| Belden | 99,777 | 2,783,778 | |
| Bowne & Co. | 103,779 a | 1,177,892 | |
TheFund 17
STATEMENT OF INVESTMENTS (continued)
| Common Stocks (continued) | Shares | Value ($) |
| Industrial (continued) | ||
| Brady, Cl. A | 122,451 | 3,765,368 |
| Briggs & Stratton | 130,150 a | 2,290,640 |
| Cascade | 18,192 | 643,815 |
| CDI | 12,564 | 180,042 |
| Ceradyne | 59,092 b | 1,406,981 |
| CIRCOR International | 36,637 | 1,285,226 |
| CLARCOR | 113,174 | 4,488,481 |
| Comfort Systems USA | 70,372 | 805,759 |
| Consolidated Graphics | 29,103 b | 1,354,745 |
| Cubic | 41,214 | 1,795,694 |
| Curtiss-Wright | 106,208 | 3,279,703 |
| Dolan | 83,329 b | 891,620 |
| Dycom Industries | 88,559 b | 947,581 |
| EMCOR Group | 155,031 b | 4,007,551 |
| Encore Wire | 39,583 | 821,743 |
| EnPro Industries | 51,336 a,b | 1,803,947 |
| ESCO Technologies | 51,524 | 1,766,243 |
| Esterline Technologies | 66,966 b | 4,047,425 |
| Exponent | 29,920 b | 955,046 |
| Federal Signal | 149,246 | 843,240 |
| Forward Air | 61,491 a | 1,652,878 |
| G & K Services, Cl. A | 42,098 | 1,040,663 |
| GenCorp | 166,733 a,b | 811,990 |
| Geo Group | 139,671 b | 3,582,561 |
| Gibraltar Industries | 76,805 b | 701,230 |
| Griffon | 113,684 b | 1,340,334 |
| Healthcare Services Group | 88,715 | 2,131,821 |
| Heartland Express | 130,597 a | 1,947,201 |
| Heidrick & Struggles International | 38,474 | 826,422 |
| Hub Group, Cl. A | 79,893 b | 2,594,126 |
| II-VI | 52,514 b | 2,065,901 |
| Insituform Technologies, Cl. A | 96,094 b | 2,075,630 |
| Interface, Cl. A | 120,704 | 1,736,931 |
| John Bean Technologies | 53,676 | 917,860 |
| Kaman | 54,206 | 1,460,852 |
| Kaydon | 82,028 | 2,860,316 |
| Kelly Services, Cl. A | 42,457 b | 630,486 |
18
| Common Stocks (continued) | Shares | Value ($) | |
| Industrial (continued) | |||
| Knight Transportation | 130,875 | a | 2,338,736 |
| Lawson Products | 9,558 | 176,154 | |
| Lindsay | 30,312 | a | 1,747,487 |
| Lydall | 33,250 | b | 247,047 |
| Mobile Mini | 68,432 | b | 1,192,770 |
| Moog, Cl. A | 101,652 | b | 3,822,115 |
| Mueller Industries | 77,887 | 2,289,878 | |
| NCI Building Systems | 28,258 | b | 280,037 |
| Old Dominion Freight Line | 94,703 | b | 2,656,419 |
| On Assignment | 81,072 | b | 458,057 |
| Orbital Sciences | 122,493 | b | 1,989,286 |
| Orion Marine Group | 55,660 | b | 696,307 |
| Powell Industries | 18,807 | b | 580,384 |
| Quanex Building Products | 97,514 | 1,757,202 | |
| Robbins & Myers | 78,047 | 2,265,704 | |
| School Specialty | 37,846 | a,b | 507,136 |
| SFN Group | 113,703 | b | 861,869 |
| Simpson Manufacturing | 87,457 | 2,324,607 | |
| SkyWest | 117,020 | 1,774,023 | |
| Standard Register | 37,007 | 118,792 | |
| Standex International | 24,955 | 672,038 | |
| Sykes Enterprises | 84,964 | b | 1,411,252 |
| Teledyne Technologies | 80,888 | b | 3,362,514 |
| Tetra Tech | 150,401 | b | 3,167,445 |
| Toro | 76,732 | 4,355,308 | |
| Tredegar | 44,735 | 862,938 | |
| Triumph Group | 32,718 | 2,734,898 | |
| TrueBlue | 106,557 | b | 1,497,126 |
| UniFirst | 35,899 | 1,652,431 | |
| United Stationers | 50,907 | b | 2,860,973 |
| Universal Forest Products | 40,101 | 1,208,644 | |
| Viad | 37,183 | 742,173 | |
| Vicor | 37,801 | a | 673,236 |
| Volt Information Sciences | 22,219 | b | 179,530 |
| Watts Water Technologies, Cl. A | 75,542 | 2,656,812 | |
| 155,286,102 |
TheFund 19
STATEMENT OF INVESTMENTS (continued)
| Common Stocks (continued) | Shares | Value ($) |
| Information Technology—19.1% | ||
| Actel | 62,893 b | 1,311,948 |
| Advanced Energy Industries | 80,283 b | 1,152,864 |
| Agilysys | 56,250 b | 337,500 |
| Anixter International | 68,080 | 3,655,215 |
| Arris Group | 316,470 b | 2,946,336 |
| ATMI | 81,667 b | 1,443,056 |
| Avid Technology | 53,685 a,b | 677,505 |
| Bel Fuse, Cl. B | 27,512 | 627,549 |
| Benchmark Electronics | 138,634 b | 2,277,757 |
| Black Box | 34,697 | 1,151,940 |
| Blackbaud | 97,933 | 2,486,519 |
| Blue Coat Systems | 97,278 a,b | 2,623,588 |
| Brightpoint | 157,031 b | 1,176,162 |
| Brooks Automation | 155,572 b | 1,056,334 |
| Cabot Microelectronics | 56,281 a,b | 2,174,135 |
| CACI International, Cl. A | 75,270 b | 3,772,532 |
| Checkpoint Systems | 100,383 b | 2,208,426 |
| Ciber | 172,726 b | 633,904 |
| Cognex | 79,224 | 2,115,281 |
| Cohu | 46,209 | 663,099 |
| Commvault Systems | 93,430 b | 2,702,930 |
| Compellent Technologies | 44,772 b | 1,131,388 |
| comScore | 42,243 b | 993,133 |
| Comtech Telecommunications | 64,889 | 1,999,879 |
| Concur Technologies | 95,153 a,b | 4,911,798 |
| CSG Systems International | 93,450 b | 1,816,668 |
| CTS | 85,753 | 870,393 |
| Cymer | 64,043 b | 2,366,389 |
| Cypress Semiconductor | 386,463 b | 5,449,128 |
| Daktronics | 86,058 a | 939,753 |
| DealerTrack Holdings | 89,354 b | 1,726,319 |
| DG Fastchannel | 57,114 a,b | 1,345,035 |
| Digi International | 54,924 b | 530,566 |
| Diodes | 75,838 b | 1,666,919 |
| DSP Group | 61,946 b | 443,533 |
| DTS | 32,642 a,b | 1,299,152 |
20
| Common Stocks (continued) | Shares | Value ($) |
| Information Technology (continued) | ||
| Ebix | 63,379 a,b | 1,565,461 |
| Electro Scientific Industries | 58,052 b | 674,564 |
| EMS Technologies | 33,613 b | 599,656 |
| Epicor Software | 125,132 b | 1,176,241 |
| EPIQ Systems | 74,058 | 867,960 |
| Exar | 73,738 b | 490,358 |
| FARO Technologies | 31,222 b | 753,699 |
| FEI | 81,749 b | 1,778,858 |
| Forrester Research | 32,692 b | 1,081,124 |
| Gerber Scientific | 51,720 b | 346,007 |
| Harmonic | 231,936 b | 1,618,913 |
| Heartland Payment Systems | 73,151 | 1,044,596 |
| Hittite Microwave | 48,397 b | 2,500,673 |
| Hutchinson Technology | 80,571 a,b | 274,747 |
| Infospace | 86,797 b | 732,567 |
| Insight Enterprises | 114,289 b | 1,728,050 |
| Integral Systems | 16,542 a,b | 140,607 |
| Interactive Intelligence | 27,739 b | 685,431 |
| Intermec | 96,780 b | 1,127,487 |
| Intevac | 49,429 b | 499,233 |
| j2 Global Communications | 114,085 a,b | 3,006,140 |
| JDA Software Group | 81,809 b | 2,069,768 |
| Keithley Instruments | 33,442 | 721,678 |
| Knot | 52,488 b | 474,492 |
| Kopin | 143,727 b | 547,600 |
| Kulicke & Soffa Industries | 171,922 b | 1,069,355 |
| Liquidity Services | 38,223 b | 611,568 |
| Littelfuse | 43,647 b | 1,851,942 |
| LoJack | 51,811 b | 253,356 |
| Manhattan Associates | 54,238 b | 1,669,446 |
| MAXIMUS | 36,366 | 2,204,871 |
| Mercury Computer Systems | 49,370 b | 782,021 |
| Methode Electronics | 87,840 | 816,034 |
| Micrel | 122,152 | 1,454,830 |
| Microsemi | 191,166 b | 3,823,320 |
| MicroStrategy, Cl. A | 20,605 b | 1,867,431 |
TheFund 21
STATEMENT OF INVESTMENTS (continued)
| Common Stocks (continued) | Shares | Value ($) |
| Information Technology (continued) | ||
| MKS Instruments | 123,956 b | 2,559,691 |
| Monolithic Power Systems | 65,794 b | 1,057,310 |
| MTS Systems | 35,026 | 1,147,802 |
| NCI, Cl. A | 14,934 b | 278,370 |
| Netgear | 80,783 b | 2,488,924 |
| NetScout Systems | 87,629 b | 2,056,653 |
| Network Equipment Technologies | 50,382 a,b | 159,207 |
| Newport | 95,889 b | 1,393,267 |
| Novatel Wireless | 117,730 b | 1,233,810 |
| Oplink Communications | 46,704 b | 816,386 |
| OSI Systems | 42,753 b | 1,539,108 |
| Park Electrochemical | 48,278 | 1,303,506 |
| PC-Tel | 37,611 b | 222,657 |
| Perficient | 65,150 b | 687,984 |
| Pericom Semiconductor | 59,007 b | 555,846 |
| Phoenix Technologies | 43,930 b | 180,992 |
| Plexus | 88,832 b | 2,696,051 |
| Progress Software | 102,774 b | 3,840,664 |
| Radiant Systems | 61,290 b | 1,195,768 |
| Radisys | 59,131 b | 577,710 |
| Rofin-Sinar Technologies | 63,829 b | 1,782,744 |
| Rogers | 35,225 b | 1,254,010 |
| Rudolph Technologies | 78,777 b | 584,525 |
| ScanSource | 50,044 b | 1,498,317 |
| Sigma Designs | 75,509 b | 861,558 |
| Smith Micro Software | 71,039 b | 863,834 |
| Sonic Solutions | 108,856 b | 1,303,006 |
| Sourcefire | 53,790 b | 1,268,906 |
| Stamps.com | 28,963 b | 462,249 |
| Standard Microsystems | 51,099 b | 1,233,530 |
| StarTek | 22,678 b | 92,526 |
| Stratasys | 37,974 a,b | 1,189,346 |
| Super Micro Computer | 54,586 b | 606,996 |
| Supertex | 18,652 b | 438,135 |
22
| Common Stocks (continued) | Shares | Value ($) |
| Information Technology (continued) | ||
| Symmetricom | 108,096 b | 673,438 |
| Synaptics | 83,844 a,b | 2,257,919 |
| SYNNEX | 50,926 b | 1,478,891 |
| Take-Two Interactive Software | 196,534 a,b | 2,095,052 |
| Taleo, Cl. A | 87,574 b | 2,512,498 |
| Technitrol | 137,673 a | 633,296 |
| Tekelec | 151,294 b | 1,969,848 |
| TeleTech Holdings | 76,947 b | 1,168,055 |
| Tessera Technologies | 108,623 b | 2,143,132 |
| THQ | 205,484 b | 821,936 |
| Tollgrade Communications | 43,360 b | 344,712 |
| Triquint Semiconductor | 387,832 b | 3,994,670 |
| TTM Technologies | 93,135 b | 976,055 |
| Tyler Technologies | 63,120 b | 1,288,279 |
| Ultratech | 44,030 b | 806,189 |
| United Online | 237,490 | 1,467,688 |
| Varian Semiconductor Equipment Associates | 180,224 b | 5,887,918 |
| Veeco Instruments | 89,633 a,b | 3,751,141 |
| ViaSat | 82,479 a,b | 3,395,660 |
| Volterra Semiconductor | 61,162 b | 1,249,540 |
| Websense | 110,196 a,b | 2,217,144 |
| Wright Express | 91,057 b | 3,433,759 |
| 191,592,925 | ||
| Materials—4.2% | ||
| A.M. Castle & Co. | 32,272 b | 496,989 |
| AMCOL International | 57,020 a | 1,581,735 |
| American Vanguard | 36,243 | 267,111 |
| Arch Chemicals | 59,842 | 2,124,989 |
| Balchem | 57,370 | 1,753,227 |
| Brush Engineered Materials | 46,506 b | 1,541,674 |
| Buckeye Technologies | 92,498 | 1,669,589 |
| Calgon Carbon | 127,968 a,b | 1,920,800 |
| Century Aluminum | 116,547 b | 1,575,715 |
| Clearwater Paper | 27,676 b | 2,234,837 |
TheFund 23
STATEMENT OF INVESTMENTS (continued)
| Common Stocks (continued) | Shares | Value ($) | |
| Materials (continued) | |||
| Deltic Timber | 18,614 | 868,902 | |
| Eagle Materials | 89,812 | 2,106,990 | |
| H.B. Fuller | 107,227 | 2,213,165 | |
| Headwaters | 114,236 | a,b | 388,402 |
| Kaiser Aluminum | 30,738 | 1,382,903 | |
| LSB Industries | 34,503 | b | 771,142 |
| Myers Industries | 69,390 | 612,714 | |
| Neenah Paper | 43,859 | 673,236 | |
| Olympic Steel | 27,727 | 621,639 | |
| OM Group | 77,598 | b | 2,581,685 |
| Penford | 13,720 | b | 81,497 |
| PolyOne | 221,012 | b | 2,855,475 |
| Quaker Chemical | 28,284 | 1,030,103 | |
| RTI International Metals | 62,818 | b | 1,953,640 |
| Schulman (A.) | 66,936 | 1,452,511 | |
| Schweitzer-Mauduit International | 42,519 | 2,728,869 | |
| Stepan | 21,702 | 1,463,583 | |
| Texas Industries | 57,458 | a | 1,963,340 |
| Wausau Paper | 113,156 | 955,037 | |
| Zep | 48,367 | 877,377 | |
| 42,748,876 | |||
| Telecommunication Services—.6% | |||
| Atlantic Tele-Network | 20,169 | 852,342 | |
| Cbeyond | 49,678 | a,b | 673,137 |
| General Communication, Cl. A | 82,071 | b | 857,642 |
| Neutral Tandem | 83,109 a,b | 1,215,054 | |
| NTELOS Holdings | 60,809 | 1,104,900 | |
| USA Mobility | 61,809 | 1,040,245 | |
| 5,743,320 | |||
24
| Common Stocks (continued) | Shares | Value ($) |
| Utilities—4.0% | ||
| Allete | 65,426 | 2,380,198 |
| American States Water | 35,051 | 1,309,155 |
| Avista | 140,812 | 3,075,334 |
| Central Vermont Public Service | 15,853 | 320,548 |
| CH Energy Group | 40,454 | 1,838,634 |
| El Paso Electric | 112,113 b | 2,757,980 |
| Laclede Group | 46,246 | 1,623,697 |
| New Jersey Resources | 94,766 | 3,837,075 |
| Northwest Natural Gas | 64,797 a | 3,193,844 |
| NorthWestern | 84,545 | 2,516,905 |
| Piedmont Natural Gas | 150,523 a | 4,438,923 |
| South Jersey Industries | 63,629 | 3,204,356 |
| Southwest Gas | 112,350 | 3,905,286 |
| UIL Holdings | 102,284 | 2,962,145 |
| UniSource Energy | 84,119 | 2,950,053 |
| 40,314,133 | ||
| Total Common Stocks | ||
| (cost $954,451,137) | 990,823,533 | |
| Principal | ||
| Short-Term Investments—.1% | Amount ($) | Value ($) |
| U.S. Treasury Bills; | ||
| 0.14%, 12/23/10 | ||
| (cost $894,824) | 895,000 d | 894,819 |
| Other Investment—1.0% | Shares | Value ($) |
| Registered Investment Company; | ||
| Dreyfus Institutional Preferred | ||
| Plus Money Market Fund | ||
| (cost $10,179,000) | 10,179,000 e | 10,179,000 |
TheFund 25
STATEMENT OF INVESTMENTS (continued)
| Investment of Cash Collateral | ||
| for Securities Loaned—12.4% | Shares | Value ($) |
| Registered Investment Company; | ||
| Dreyfus Institutional Cash | ||
| Advantage Plus Fund | ||
| (cost $123,776,219) | 123,776,219 e | 123,776,219 |
| Total Investments (cost $1,089,301,180) | 112.3% | 1,125,673,571 |
| Liabilities, Less Cash and Receivables | (12.3%) | (122,973,792) |
| Net Assets | 100.0% | 1,002,699,779 |
| a Security, or portion thereof, on loan.At October 31, 2010, the market value of the fund’s securities on loan was |
| $121,850,873 and the market value of the collateral held by the fund was $123,786,299, consisting of cash |
| collateral of $123,776,219 and U.S. Government and Agency securities valued at $10,080. |
| b Non-income producing security. |
| c Investment in real estate investment trust. |
| d Held by a broker as collateral for open financial futures positions. |
| e Investment in affiliated money market mutual fund. |
| Portfolio Summary (Unaudited)† | |||
| Value (%) | Value (%) | ||
| Information Technology | 19.1 | Energy | 4.9 |
| Financial | 18.9 | Materials | 4.2 |
| Consumer Discretionary | 15.7 | Utilities | 4.0 |
| Industrial | 15.5 | Consumer Staples | 3.5 |
| Short-Term/ | Telecommunication Services | .6 | |
| Money Market Investments | 13.5 | ||
| Health Care | 12.4 | 112.3 | |
| † Based on net assets. | |||
| See notes to financial statements. | |||
26
| STATEMENT OF FINANCIAL FUTURES |
| October 31, 2010 |
| Market Value | Unrealized | |||
| Covered by | Appreciation | |||
| Contracts | Contracts ($) | Expiration | at 10/31/2010 ($) | |
| Financial Futures Long | ||||
| Russell 2000 Mini | 167 | 11,726,740 | December 2010 | 187,138 |
| See notes to financial statements. | ||||
TheFund 27
| STATEMENT OF ASSETS AND LIABILITIES |
| October 31, 2010 |
| Cost | Value | |
| Assets ($): | ||
| Investments in securities—See Statement of Investments (including | ||
| securities on loan, valued at $121,850,873)—Note 1(b): | ||
| Unaffiliated issuers | 955,345,961 | 991,718,352 |
| Affiliated issuers | 133,955,219 | 133,955,219 |
| Cash | 954,852 | |
| Receivable for shares of Common Stock subscribed | 1,072,260 | |
| Dividends and interest receivable | 530,002 | |
| Receivable for futures variation margin—Note 4 | 81,178 | |
| 1,128,311,863 | ||
| Liabilities ($): | ||
| Due to The Dreyfus Corporation and affiliates—Note 3(b) | 421,760 | |
| Liability for securities on loan—Note 1(b) | 123,776,219 | |
| Payable for shares of Common Stock redeemed | 1,414,105 | |
| 125,612,084 | ||
| Net Assets ($) | 1,002,699,779 | |
| Composition of Net Assets ($): | ||
| Paid-in capital | 951,659,065 | |
| Accumulated undistributed investment income—net | 4,322,824 | |
| Accumulated net realized gain (loss) on investments | 10,158,361 | |
| Accumulated net unrealized appreciation (depreciation) | ||
| on investments (including $187,138 net unrealized | ||
| appreciation on financial futures) | 36,559,529 | |
| Net Assets ($) | 1,002,699,779 | |
| Shares Outstanding | ||
| (200 million shares of $.001 par value Common Stock authorized) | 53,280,471 | |
| Net Asset Value, offering and redemption price per share ($) | 18.82 | |
| See notes to financial statements. | ||
28
| STATEMENT OF OPERATIONS |
| Year Ended October 31, 2010 |
| Investment Income ($): | |
| Income: | |
| Cash dividends: | |
| Unaffiliated issuers | 9,924,541 |
| Affiliated issuers | 15,222 |
| Income from securities lending—Note 1(b) | 793,235 |
| Interest | 1,083 |
| Total Income | 10,734,081 |
| Expenses: | |
| Management fee—Note 3(a) | 2,323,303 |
| Shareholder servicing costs—Note 3(b) | 2,323,303 |
| Directors’ fees—Note 3(a) | 55,983 |
| Loan commitment fees—Note 2 | 11,930 |
| Interest expense—Note 2 | 3,571 |
| Total Expenses | 4,718,090 |
| Less—Directors’ fees reimbursed by the Manager—Note 3(a) | (55,983) |
| Net Expenses | 4,662,107 |
| Investment Income—Net | 6,071,974 |
| Realized and Unrealized Gain (Loss) on Investments—Note 4 ($): | |
| Net realized gain (loss) on investments | 31,132,429 |
| Net realized gain (loss) on financial futures | 1,413,664 |
| Net Realized Gain (Loss) | 32,546,093 |
| Net unrealized appreciation (depreciation) on investments | 160,272,777 |
| Net unrealized appreciation (depreciation) on financial futures | 895,553 |
| Net Unrealized Appreciation (Depreciation) | 161,168,330 |
| Net Realized and Unrealized Gain (Loss) on Investments | 193,714,423 |
| Net Increase in Net Assets Resulting from Operations | 199,786,397 |
| See notes to financial statements. | |
TheFund 29
STATEMENT OF CHANGES IN NET ASSETS
| Year Ended October 31, | ||
| 2010 | 2009 | |
| Operations ($): | ||
| Investment income—net | 6,071,974 | 7,575,106 |
| Net realized gain (loss) on investments | 32,546,093 | (8,411,902) |
| Net unrealized appreciation | ||
| (depreciation) on investments | 161,168,330 | 44,063,643 |
| Net Increase (Decrease) in Net Assets | ||
| Resulting from Operations | 199,786,397 | 43,226,847 |
| Dividends to Shareholders from ($): | ||
| Investment income—net | (6,764,974) | (10,985,105) |
| Net realized gain on investments | — | (49,270,636) |
| Total Dividends | (6,764,974) | (60,255,741) |
| Capital Stock Transactions ($): | ||
| Net proceeds from shares sold | 347,835,916 | 326,095,099 |
| Dividends reinvested | 6,274,003 | 57,513,861 |
| Cost of shares redeemed | (348,615,530) | (297,041,023) |
| Increase (Decrease) in Net Assets | ||
| from Capital Stock Transactions | 5,494,389 | 86,567,937 |
| Total Increase (Decrease) in Net Assets | 198,515,812 | 69,539,043 |
| Net Assets ($): | ||
| Beginning of Period | 804,183,967 | 734,644,924 |
| End of Period | 1,002,699,779 | 804,183,967 |
| Undistributed investment income—net | 4,322,824 | 5,015,824 |
| Capital Share Transactions (Shares): | ||
| Shares sold | 19,731,208 | 24,497,782 |
| Shares issued for dividends reinvested | 372,356 | 4,593,801 |
| Shares redeemed | (20,289,148) | (22,393,768) |
| Net Increase (Decrease) in Shares Outstanding | (185,584) | 6,697,815 |
| See notes to financial statements. | ||
30
FINANCIAL HIGHLIGHTS
The following table describes the performance for the fiscal periods indicated. Total return shows how much your investment in the fund would have increased (or decreased) during each period, assuming you had reinvested all dividends and distributions.These figures have been derived from the fund’s financial statements.
| Year Ended October 31, | |||||
| 2010 | 2009 | 2008 | 2007 | 2006 | |
| Per Share Data ($): | |||||
| Net asset value, beginning of period | 15.04 | 15.71 | 25.45 | 23.93 | 21.06 |
| Investment Operations: | |||||
| Investment income—neta | .11 | .15 | .22 | .15 | .12 |
| Net realized and unrealized | |||||
| gain (loss) on investments | 3.80 | .45 | (7.85) | 2.45 | 3.11 |
| Total from Investment Operations | 3.91 | .60 | (7.63) | 2.60 | 3.23 |
| Distributions: | |||||
| Dividends from investment income—net | (.13) | (.23) | (.15) | (.12) | (.11) |
| Dividends from net realized | |||||
| gain on investments | — | (1.04) | (1.96) | (.96) | (.25) |
| Total Distributions | (.13) | (1.27) | (2.11) | (1.08) | (.36) |
| Net asset value, end of period | 18.82 | 15.04 | 15.71 | 25.45 | 23.93 |
| Total Return (%) | 26.08 | 5.43 | (32.21) | 11.15 | 15.53 |
| Ratios/Supplemental Data (%): | |||||
| Ratio of total expenses | |||||
| to average net assets | .51 | .51 | .51 | .51 | .50 |
| Ratio of net expenses | |||||
| to average net assets | .50 | .50 | .50 | .50 | .50 |
| Ratio of net investment income | |||||
| to average net assets | .65 | 1.11 | 1.09 | .60 | .52 |
| Portfolio Turnover Rate | 20.72 | 25.48 | 31.84 | 25.08 | 25.05 |
| Net Assets, end of period ($ x 1,000) | 1,002,700 | 804,184 | 734,645 | 998,016 | 888,354 |
| a Based on average shares outstanding at each month end. | |||||
| See notes to financial statements. | |||||
TheFund 31
NOTES TO FINANCIAL STATEMENTS
NOTE 1—Significant Accounting Policies:
Dreyfus Smallcap Stock Index Fund (the “fund”) is a separate non-diversified series of Dreyfus Index Funds, Inc. (the “Company”), which is registered under the Investment Company Act of 1940, as amended (the “Act”), as an open-end management investment company and operates as a series company currently offering three series, including the fund. The fund’s investment objective is to match the performance of the Standard & Poor’s SmallCap 600 Index. The Dreyfus Corporation (the “Manager” or “Dreyfus”), a wholly-owned subsidiary of The Bank of New York Mellon Corporation (“BNY Mellon”), serves as the fund’s investment adviser. MBSC Securities Corporation (the “Distributor”), a wholly-owned subsidiary of the Manager, is the distributor of the fund’s shares, which are sold to the public without a sales charge.
The Company accounts separately for the assets, liabilities and operations of each series. Expenses directly attributable to each series are charged to that series’ operations; expenses which are applicable to all series are allocated among them on a pro rata basis.
The Financial Accounting Standards Board (“FASB”) Accounting Standards Codification (“ASC”) is the exclusive reference of authoritative U.S. generally accepted accounting principles (“GAAP”) recognized by the FASB to be applied by nongovernmental entities. Rules and interpretive releases of the Securities and Exchange Commission (“SEC”) under authority of federal laws are also sources of authoritative GAAP for SEC registrants. The fund’s financial statements are prepared in accordance with GAAP, which may require the use of management estimates and assumptions.Actual results could differ from those estimates.
The Company enters into contracts that contain a variety of indemnifications.The fund’s maximum exposure under these arrangements is unknown.The fund does not anticipate recognizing any loss related to these arrangements.
(a) Portfolio valuation: Investments in securities are valued at the last sales price on the securities exchange or national securities market on which such securities are primarily traded. Securities listed on the
32
National Market System for which market quotations are available are valued at the official closing price or, if there is no official closing price that day, at the last sales price. Securities not listed on an exchange or the national securities market, or securities for which there were no transactions, are valued at the average of the most recent bid and asked prices, except for open short positions, where the asked price is used for valuation purposes. Bid price is used when no asked price is available. U.S. Treasury Bills are valued by an independent pricing service approved by the Board of Directors. Registered investment companies that are not traded on an exchange are valued at their net asset value. When market quotations or official closing prices are not readily available, or are determined not to reflect accurately fair value, such as when the value of a security has been significantly affected by even ts after the close of the exchange or market on which the security is principally traded (for example, a foreign exchange or market), but before the fund calculates its net asset value, the fund may value these investments at fair value as determined in accordance with the procedures approved by the Board of Directors. Fair valuing of securities may be determined with the assistance of a pricing service using calculations based on indices of domestic securities and other appropriate indicators, such as prices of relevant American Depository Receipts and futures contracts. For other securities that are fair valued by the Board of Directors, certain factors may be considered such as: fundamental analytical data, the nature and duration of restrictions on disposition, an evaluation of the forces that influence the market in which the securities are purchased and sold, and public trading in similar securities of the issuer or comparable issuers. Financial futures are valued at the last sales price.
The fair value of a financial instrument is the amount that would be received to sell an asset or paid to transfer a liability in an orderly transaction between market participants at the measurement date (i.e. the exit price). GAAP establishes a fair value hierarchy that prioritizes the inputs of valuation techniques used to measure fair value.This hierarchy gives the highest priority to unadjusted quoted prices in active markets for identical assets or liabilities (Level 1 measurements) and the lowest priority to unobservable inputs (Level 3 measurements).
TheFund 33
NOTES TO FINANCIAL STATEMENTS (continued)
Additionally, GAAP provides guidance on determining whether the volume and activity in a market has decreased significantly and whether such a decrease in activity results in transactions that are not orderly. GAAP requires enhanced disclosures around valuation inputs and techniques used during annual and interim periods.
Various inputs are used in determining the value of the fund’s investments relating to fair value measurements.These inputs are summarized in the three broad levels listed below:
Level 1—unadjusted quoted prices in active markets for identical investments.
Level 2—other significant observable inputs (including quoted prices for similar investments, interest rates, prepayment speeds, credit risk, etc.).
Level 3—significant unobservable inputs (including the fund’s own assumptions in determining the fair value of investments).
The inputs or methodology used for valuing securities are not necessarily an indication of the risk associated with investing in those securities.
The following is a summary of the inputs used as of October 31, 2010 in valuing the fund’s investments:
| Level 2—Other | Level 3— | |||
| Level 1— | Significant | Significant | ||
| Unadjusted | Observable | Unobservable | ||
| Quoted Prices | Inputs | Inputs | Total | |
| Assets ($) | ||||
| Investments in Securities: | ||||
| Equity Securities— | ||||
| Domestic† | 990,796,130 | — | — | 990,796,130 |
| Equity Securities— | ||||
| Foreign† | 27,403 | — | — | 27,403 |
| Mutual Funds | 133,955,219 | — | — | 133,955,219 |
| U.S. Treasury | — | 894,819 | — | 894,819 |
| Other Financial | ||||
| Instruments: | ||||
| Futures†† | 187,138 | — | — | 187,138 |
| † | See Statement of Investments for industry classification. |
| †† | Amount shown represents unrealized appreciation at period end. |
34
In January 2010, FASB issued Accounting Standards Update (“ASU”) No. 2010-06 “Improving Disclosures about FairValue Measurements”. The portions of ASU No. 2010-06 which require reporting entities to prepare new disclosures surrounding amounts and reasons for significant transfers in and out of Level 1 and Level 2 fair value measurements as well as inputs and valuation techniques used to measure fair value for both recurring and nonrecurring fair value measurements that fall in either Level 2 or Level 3 have been adopted by the fund. No significant transfers between Level 1 or Level 2 fair value measurements occurred at October 31, 2010. The remaining portion of ASU No. 2010-06 requires reporting entities to make new disclosures about information on purchases, sales, issuances and settlements on a gross basis in the reconciliation of activity in Level 3 fair value measurements. These new and rev ised disclosures are required to be implemented for fiscal years beginning after December 15, 2010. Management is currently evaluating the impact that the adoption of this remaining portion of ASU No. 2010-06 may have on the fund’s financial statement disclosures.
(b) Securities transactions and investment income: Securities transactions are recorded on a trade date basis. Realized gains and losses from securities transactions are recorded on the identified cost basis. Dividend income is recognized on the ex-dividend date and interest income, including, where applicable, accretion of discount and amortization of premium on investments, is recognized on the accrual basis.
Pursuant to a securities lending agreement with The Bank of New York Mellon, a subsidiary of BNY Mellon and an affiliate of Dreyfus, the fund may lend securities to qualified institutions. It is the fund’s policy that, at origination, all loans are secured by collateral of at least 102% of the value of U.S. securities loaned and 105% of the value of foreign securities loaned. Collateral equivalent to at least 100% of the market value of securities on loan is maintained at all times. Collateral is either in the form of cash, which can be invested in certain money market mutual funds managed by the Manager, U.S. Government and Agency securities or letters of credit.The fund is entitled to receive all
TheFund 35
NOTES TO FINANCIAL STATEMENTS (continued)
income on securities loaned, in addition to income earned as a result of the lending transaction. Although each security loaned is fully collateralized, the fund bears the risk of delay in recovery of, or loss of rights in, the securities loaned should a borrower fail to return the securities in a timely manner. During the period ended October 31, 2010,The Bank of New York Mellon earned $264,412 from lending portfolio securities, pursuant to the securities lending agreement.
(c) Affiliated issuers: Investments in other investment companies advised by Dreyfus are defined as “affiliated” in the Act.
The fund may invest in shares of certain affiliated investment companies also advised or managed by Dreyfus. Investments in affiliated investment companies for the period ended October 31, 2010 were as follows:
| Affiliated | |||||
| Investment | Value | Value | Net | ||
| Company | 10/31/2009 ($) | Purchases ($) | Sales ($) | 10/31/2010 ($) Assets (%) | |
| Dreyfus | |||||
| Institutional | |||||
| Preferred | |||||
| Plus Money | |||||
| Market Fund 7,316,000 | 191,857,000 | 188,994,000 | 10,179,000 | 1.0 | |
| Dreyfus | |||||
| Institutional | |||||
| Cash | |||||
| Advantage | |||||
| Plus Fund | 151,450,309 | 492,249,675 | 519,923,765 123,776,219 | 12.4 | |
| Total | 158,766,309 | 684,106,675 708,917,765 133,955,219 | 13.4 | ||
(d) Dividends to shareholders: Dividends are recorded on the ex-dividend date. Dividends from investment income-net and dividends from net realized capital gains, if any, are normally declared and paid annually, but the fund may make distributions on a more frequent basis to comply with the distribution requirements of the Internal Revenue Code of 1986, as amended (the “Code”).To the extent that net realized capital gains can be offset by capital loss carryovers, it is the policy of the fund not to distribute such gains. Income and capital gain distributions are determined in accordance with income tax regulations, which may differ from GAAP.
36
(e) Federal income taxes: It is the policy of the fund to continue to qualify as a regulated investment company, if such qualification is in the best interests of its shareholders, by complying with the applicable provisions of the Code, and to make distributions of taxable income sufficient to relieve it from substantially all federal income and excise taxes.
As of and during the period ended October 31, 2010, the fund did not have any liabilities for any uncertain tax positions.The fund recognizes interest and penalties, if any, related to uncertain tax positions as income tax expense in the Statement of Operations. During the period, the fund did not incur any interest or penalties.
Each of the tax years in the four-year period ended October 31, 2010 remains subject to examination by the Internal Revenue Service and state taxing authorities.
At October 31, 2010, the components of accumulated earnings on a tax basis were as follows: undistributed ordinary income $4,322,824, undistributed capital gains $21,182,016 and unrealized appreciation $25,535,874.
The tax character of distributions paid to shareholders during the fiscal periods ended October 31, 2010 and October 31, 2009 were as follows: ordinary income $6,764,974 and $10,989,421 and long-term capital gains $0 and $49,266,320, respectively.
NOTE 2—Bank Lines of Credit:
The fund participates with other Dreyfus-managed funds in a $225 million unsecured credit facility led by Citibank, N.A. and a $300 million unsecured credit facility provided by The Bank of New York Mellon (each, a “Facility”), each to be utilized primarily for temporary or emergency purposes, including the financing of redemptions. In connection therewith, the fund has agreed to pay its pro rata portion of commitment fees for each Facility. Interest is charged to the fund based on rates determined pursuant to the terms of the respective Facility at the time of borrowing.
TheFund 37
NOTES TO FINANCIAL STATEMENTS (continued)
The average amount of borrowings outstanding under the Facilities during the period ended October 31, 2010, was approximately $250,200 with a related weighted average annualized interest rate of 1.43%.
NOTE 3—Management Fee and Other Transactions With Affiliates:
(a) Pursuant to a management agreement (“Agreement”) with the Manager, the management fee is computed at the annual rate of .25% of the value of the fund’s average daily net assets and is payable monthly. Under the terms of the Agreement, the Manager has agreed to pay all the expenses of the fund, except management fees, brokerage fees and commissions, taxes, interest fees, commitment fees, Shareholder Services Plan fees, fees and expenses of non-interested Board members (including counsel fees) and extraordinary expenses. In addition, the Manager is required to reduce its fee in an amount equal to the fund’s allocable portion of the accrued fees and expenses of the non-interested Board members (including counsel fees). Each Board member also serves as a Board member of other funds within the Dreyfus comp lex. Annual retainer fees and attendance fees are allocated to each fund based on net assets. During the period ended October 31, 2010, fees reimbursed by the Manager amounted to $55,983.
(b) Under the Shareholder Services Plan, the fund pays the Distributor for the provision of certain services, at the annual rate of .25% of the value of the fund’s average daily net assets.The services provided may include personal services relating to shareholder accounts, such as answering shareholder inquiries regarding the fund and providing reports and other information, and services related to the maintenance of shareholder accounts. The Distributor may make payments to Service Agents (a securities dealer, financial institution or other industry professional) in respect of these services. The Distributor determines the amounts to be paid to Service Agents. During the period ended October 31, 2010, the fund was charged $2,323,303 pursuant to the Shareholder Services Plan.
38
The components of “Due to The Dreyfus Corporation and affiliates” in the Statement of Assets and Liabilities consist of: management fees $210,880 and shareholder services plan fees $210,880.
NOTE 4—Securities Transactions:
The aggregate amount of purchases and sales of investment securities, excluding short-term securities and financial futures, during the period ended October 31, 2010, amounted to $192,978,407 and $188,223,213, respectively.
The provisions of ASC Topic 815 “Derivatives and Hedging” require qualitative disclosures about objectives and strategies for using derivatives, quantitative disclosures about fair value amounts of gains and losses on derivative instruments and disclosures about credit-risk-related contingent features in derivative agreements. The disclosure requirements distinguish between derivatives, which are accounted for as “hedges” and those that do not qualify for hedge accounting. Because investment companies value their derivatives at fair value and recognize changes in fair value through the Statement of Operations, they do not qualify for such accounting. Accordingly, even though a fund’s investments in derivatives may represent economic hedges, they are considered to be non-hedge transactions for purposes of this disclosure.
Futures Contracts: In the normal course of pursuing its investment objective, the fund is exposed to market risk, including equity price risk as a result of changes in value of underlying financial instruments.The fund invests in financial futures contracts in order to manage its exposure to or protect against changes in the market.A futures contract represents a commitment for the future purchase or a sale of an asset at a specified date. Upon entering into such contracts, these investments require initial margin deposits with a broker, which consist of cash or cash equivalents. The amount of these deposits is determined by the exchange or Board of Trade on which the contract is traded and is subject to change.
TheFund 39
NOTES TO FINANCIAL STATEMENTS (continued)
Accordingly, variation margin payments are received or made to reflect daily unrealized gains or losses which are recorded in the Statement of Operations. Futures contracts are valued daily at the last sales price established by the Board of Trade or exchange upon which they are traded. When the contracts are closed, the fund recognizes a realized gain or loss.There is minimal counterparty credit risk to the fund with futures since futures are exchange traded, and the exchange’s clearinghouse guarantees the futures against default. Contracts open at October 31, 2010 are set forth in the Statement of Financial Futures.
At October 31, 2010, the cost of investments for federal income tax purposes was $1,100,137,697; accordingly, accumulated net unrealized appreciation on investments was $25,535,874, consisting of $166,538,709 gross unrealized appreciation and $141,002,835 gross unrealized depreciation.
40
REPORT OF INDEPENDENT REGISTERED
PUBLIC ACCOUNTING FIRM
Shareholders and Board of Directors
Dreyfus Smallcap Stock Index Fund
We have audited the accompanying statement of assets and liabilities, including the statements of investments and financial futures, of Dreyfus Smallcap Stock Index Fund (one of the series comprising Dreyfus Index Funds, Inc.) as of October 31, 2010, and the related statement of operations for the year then ended, the statement of changes in net assets for each of the two years in the period then ended and financial highlights for each of the four years in the period then ended.These financial statements and financial highlights are the responsibility of the Fund’s management. Our responsibility is to express an opinion on these financial statements and financial highlights based on our audits. The financial highlights for the year ended October 31, 2006 were audited by other auditors whose report dated December 14, 2006, expressed an unqualified opinion on such financial highlights.
We conducted our audits in accordance with the standards of the Public Company Accounting Oversight Board (United States).Those standards require that we plan and perform the audit to obtain reasonable assurance about whether the financial statements and financial highlights are free of material misstatement.We were not engaged to perform an audit of the Fund’s internal control over financial reporting. Our audits included consideration of internal control over financial reporting as a basis for designing audit procedures that are appropriate in the circumstances, but not for the purpose of expressing an opinion on the effectiveness of the Fund’s internal control over financial reporting. Accordingly, we express no such opinion.An audit also includes examining, on a test basis, evidence supporting the amounts and disclosures in the financial statements and financial highlights, assessing the accounting p rinciples used and significant estimates made by management, and evaluating the overall financial statement presentation. Our procedures included confirmation of securities owned as of October 31, 2010 by correspondence with the custodian and others. We believe that our audits provide a reasonable basis for our opinion.
In our opinion, the financial statements and financial highlights referred to above present fairly, in all material respects, the financial position of Dreyfus Smallcap Stock Index Fund at October 31, 2010, the results of its operations for the year then ended, the changes in its net assets for each of the two years in the period then ended and the financial highlights for each of the four years in the period then ended, in conformity with U.S. generally accepted accounting principles.

New York, New York
December 28, 2010
TheFund 41
IMPORTANT TAX INFORMATION (Unaudited)
In accordance with federal tax law, the fund hereby designates 90.28% of the ordinary dividends paid during the fiscal year ended October 31, 2010 as qualifying for the corporate dividends received deduction. For the fiscal year ended October 31, 2010, certain dividends paid by the fund may be subject to a maximum tax rate of 15%, as provided for by the Jobs and Growth Tax Relief Reconciliation Act of 2003. Of the distributions paid during the fiscal year, $1,827,058 represents the maximum amount that may be considered qualified dividend income. Shareholders will receive notification in early 2011 of the percentage applicable to the preparation of their 2010 income tax returns.
42

OFFICERS OF THE FUND (Unaudited)
BRADLEY J. SKAPYAK, President since January 2010.
Chief Operating Officer and a director of the Manager since June 2009. From April 2003 to June 2009, Mr. Skapyak was the head of the Investment Accounting and Support Department of the Manager. He is an officer of 76 investment companies (comprised of 170 portfolios) managed by the Manager. He is 51 years old and has been an employee of the Manager since February 1988.
PHILLIP N. MAISANO, Executive Vice President since July 2007.
Chief Investment Officer,Vice Chair and a director of the Manager, and an officer of 76 investment companies (comprised of 170 portfolios) managed by the Manager. Mr. Maisano also is an officer and/or Board member of certain other investment management subsidiaries of The Bank of New York Mellon Corporation, each of which is an affiliate of the Manager. He is 63 years old and has been an employee of the Manager since November 2006. Prior to joining the Manager, Mr. Maisano served as Chairman and Chief Executive Officer of EACM Advisors, an affiliate of the Manager, since August 2004.
MICHAEL A. ROSENBERG, Vice President and Secretary since August 2005.
Assistant General Counsel of BNY Mellon, and an officer of 77 investment companies (comprised of 195 portfolios) managed by the Manager. He is 50 years old and has been an employee of the Manager since October 1991.
KIESHA ASTWOOD, Vice President and Assistant Secretary since January 2010.
Counsel of BNY Mellon, and an officer of 77 investment companies (comprised of 195 portfolios) managed by the Manager. She is 37 years old and has been an employee of the Manager since July 1995.
JAMES BITETTO, Vice President and Assistant Secretary since August 2005.
Senior Counsel of BNY Mellon and Secretary of the Manager, and an officer of 77 investment companies (comprised of 195 portfolios) managed by the Manager. He is 44 years old and has been an employee of the Manager since December 1996.
JONI LACKS CHARATAN, Vice President and Assistant Secretary since August 2005.
Senior Counsel of BNY Mellon, and an officer of 77 investment companies (comprised of 195 portfolios) managed by the Manager. She is 54 years old and has been an employee of the Manager since October 1988.
JOSEPH M. CHIOFFI, Vice President and Assistant Secretary since August 2005.
Senior Counsel of BNY Mellon, and an officer of 77 investment companies (comprised of 195 portfolios) managed by the Manager. He is 48 years old and has been an employee of the Manager since June 2000.
KATHLEEN DENICHOLAS, Vice President and Assistant Secretary since January 2010.
Senior Counsel of BNY Mellon, and an officer of 77 investment companies (comprised of 195 portfolios) managed by the Manager. She is 36 years old and has been an employee of the Manager since February 2001.
JANETTE E. FARRAGHER, Vice President and Assistant Secretary since August 2005.
Assistant General Counsel of BNY Mellon, and an officer of 77 investment companies (comprised of 195 portfolios) managed by the Manager. She is 47 years old and has been an employee of the Manager since February 1984.
TheFund 45
OFFICERS OF THE FUND (Unaudited) (continued)
JOHN B. HAMMALIAN, Vice President and Assistant Secretary since August 2005.
Managing Counsel of BNY Mellon, and an officer of 77 investment companies (comprised of 195 portfolios) managed by the Manager. He is 47 years old and has been an employee of the Manager since February 1991.
M. CRISTINA MEISER, Vice President and Assistant Secretary since January 2010.
Senior Counsel of BNY Mellon, and an officer of 77 investment companies (comprised of 195 portfolios) managed by the Manager. She is 40 years old and has been an employee of the Manager since August 2001.
ROBERT R. MULLERY, Vice President and Assistant Secretary since August 2005.
Managing Counsel of BNY Mellon, and an officer of 77 investment companies (comprised of 195 portfolios) managed by the Manager. He is 58 years old and has been an employee of the Manager since May 1986.
JEFF PRUSNOFSKY, Vice President and Assistant Secretary since August 2005.
Managing Counsel of BNY Mellon, and an officer of 77 investment companies (comprised of 195 portfolios) managed by the Manager. He is 45 years old and has been an employee of the Manager since October 1990.
JAMES WINDELS, Treasurer since November 2001.
Director – Mutual Fund Accounting of the Manager, and an officer of 77 investment companies (comprised of 195 portfolios) managed by the Manager. He is 52 years old and has been an employee of the Manager since April 1985.
RICHARD CASSARO, Assistant Treasurer since January 2008.
Senior Accounting Manager – Money Market and Municipal Bond Funds of the Manager, and an officer of 77 investment companies (comprised of 195 portfolios) managed by the Manager. He is 51 years old and has been an employee of the Manager since September 1982.
GAVIN C. REILLY, Assistant Treasurer since December 2005.
Tax Manager of the Investment Accounting and Support Department of the Manager, and an officer of 77 investment companies (comprised of 195 portfolios) managed by the Manager. He is 42 years old and has been an employee of the Manager since April 1991.
ROBERT ROBOL, Assistant Treasurer since August 2005.
Senior Accounting Manager – Fixed Income Funds of the Manager, and an officer of 77 investment companies (comprised of 195 portfolios) managed by the Manager. He is 46 years old and has been an employee of the Manager since October 1988.
ROBERT SALVIOLO, Assistant Treasurer since July 2007.
Senior Accounting Manager – Equity Funds of the Manager, and an officer of 77 investment companies (comprised of 195 portfolios) managed by the Manager. He is 43 years old and has been an employee of the Manager since June 1989.
46
ROBERT SVAGNA, Assistant Treasurer since December 2002.
Senior Accounting Manager – Equity Funds of the Manager, and an officer of 77 investment companies (comprised of 195 portfolios) managed by the Manager. He is 43 years old and has been an employee of the Manager since November 1990.
JOSEPH W. CONNOLLY, Chief Compliance Officer since October 2004.
Chief Compliance Officer of the Manager and The Dreyfus Family of Funds (77 investment companies, comprised of 195 portfolios). From November 2001 through March 2004, Mr. Connolly was first Vice-President, Mutual Fund Servicing for Mellon Global Securities Services. In that capacity, Mr. Connolly was responsible for managing Mellon’s Custody, Fund Accounting and Fund Administration services to third-party mutual fund clients. He is 53 years old and has served in various capacities with the Manager since 1980, including manager of the firm’s Fund Accounting Department from 1997 through October 2001.
NATALIA GRIBAS, Anti-Money Laundering Compliance Officer since July 2010.
Anti-Money Laundering Compliance Officer of the Distributor, and the Anti-Money Laundering Compliance Officer of 73 investment companies (comprised of 191 portfolios) managed by the Manager. She is 40 years old and has been an employee of the Distributor since September 2008.
TheFund 47
NOTES
Item 2. Code of Ethics.
The Registrant has adopted a code of ethics that applies to the Registrant's principal executive officer, principal financial officer, principal accounting officer or controller, or persons performing similar functions. There have been no amendments to, or waivers in connection with, the Code of Ethics during the period covered by this Report.
Item 3. Audit Committee Financial Expert.
The Registrant's Board has determined that David P. Feldman, a member of the Audit Committee of the Board, is an audit committee financial expert as defined by the Securities and Exchange Commission (the "SEC"). David P. Feldman is "independent" as defined by the SEC for purposes of audit committee financial expert determinations.
Item 4. Principal Accountant Fees and Services.
(a) Audit Fees. The aggregate fees billed for each of the last two fiscal years (the "Reporting Periods") for professional services rendered by the Registrant's principal accountant (the "Auditor") for the audit of the Registrant's annual financial statements or services that are normally provided by the Auditor in connection with the statutory and regulatory filings or engagements for the Reporting Periods, were $126,072 in 2009 and $126,072 in 2010.
(b) Audit-Related Fees. The aggregate fees billed in the Reporting Periods for assurance and related services by the Auditor that are reasonably related to the performance of the audit of the Registrant's financial statements and are not reported under paragraph (a) of this Item 4 were $20,680 in 2009 and $18,608 in 2010. These services consisted of one or more of the following: (i) agreed upon procedures related to compliance with Internal Revenue Code section 817(h), (ii) security counts required by Rule 17f-2 under the Investment Company Act of 1940, as amended, (iii) advisory services as to the accounting or disclosure treatment of Registrant tr ansactions or events and (iv) advisory services to the accounting or disclosure treatment of the actual or potential impact to the Registrant of final or proposed rules, standards or interpretations by the Securities and Exchange Commission, the Financial Accounting Standards Boards or other regulatory or standard-setting bodies.
The aggregate fees billed in the Reporting Periods for non-audit assurance and related services by the Auditor to the Registrant's investment adviser (not including any sub-investment adviser whose role is primarily portfolio management and is subcontracted with or overseen by another investment adviser), and any entity controlling, controlled by or under common control with the investment adviser that provides ongoing services to the Registrant ("Service Affiliates"), that were reasonably related to the performance of the annual audit of the Service Affiliate, which required pre-approval by the Audit Committee were $-0- in 2009 and $-0- in 2010.
(c) Tax Fees. The aggregate fees billed in the Reporting Periods for professional services rendered by the Auditor for tax compliance, tax advice, and tax planning ("Tax Services") were $18,493 in 2009 and $9,549 in 2010. These services consisted of: (i) review or preparation of U.S. federal, state, local and excise tax returns; (ii) U.S. federal, state and local tax planning, advice and assistance regarding statutory, regulatory or administrative developments; (iii) tax advice regarding tax qualification matters and/or treatment of various financial instruments held or proposed to be acquired or held, and (iv) determination of Passive Foreign Investment Companies. The aggregate fees billed in the Reporting Periods for Tax Services by the Auditor to Service Affiliates, which required pre-approval by the Audit Committee were $-0- in 2009 and $-0- in 2010.
(d) All Other Fees. The aggregate fees billed in the Reporting Periods for products and services provided by the Auditor, other than the services reported in paragraphs (a) through (c) of this Item, were $ -0- in 2009 and $1,346 in 2010. These services consisted of a review of the Registrant's anti-money laundering program.
The aggregate fees billed in the Reporting Periods for Non-Audit Services by the Auditor to Service Affiliates, other than the services reported in paragraphs (b) through (c) of this Item, which required pre-approval by the Audit Committee, were $-0- in 2009 and $ -0- in 2010.
(e)(1) Audit Committee Pre-Approval Policies and Procedures. The Registrant's Audit Committee has established policies and procedures (the "Policy") for pre-approval (within specified fee limits) of the Auditor's engagements for non-audit services to the Registrant and Service Affiliates without specific case-by-case consideration. The pre-approved services in the Policy can include pre-approved audit services, pre-approved audit-related services, pre-approved tax services and pre-approved all other services. Pre-approval considerations include whether the proposed services are compatible with maintaining the Auditor's independence. Pre-approvals pursuant to the Policy are considered annually.
(e)(2) Note: None of the services described in paragraphs (b) through (d) of this Item 4 were approved by the Audit Committee pursuant to paragraph (c)(7)(i)(C) of Rule 2-01 of Regulation S-X.
(f) None of the hours expended on the principal accountant's engagement to audit the registrant's financial statements for the most recent fiscal year were attributed to work performed by persons other than the principal account's full-time, permanent employees.
Non-Audit Fees. The aggregate non-audit fees billed by the Auditor for services rendered to the Registrant, and rendered to Service Affiliates, for the Reporting Periods were $25,383,429 in 2009 and $31,544,905 in 2010.
Auditor Independence. The Registrant's Audit Committee has considered whether the provision of non-audit services that were rendered to Service Affiliates, which were not pre-approved (not requiring pre-approval), is compatible with maintaining the Auditor's independence.
Item 5. Audit Committee of Listed Registrants.
Not applicable. [CLOSED-END FUNDS ONLY]
Item 6. Investments.
(a) Not applicable.
Item 7. Disclosure of Proxy Voting Policies and Procedures for Closed-End Management Investment Companies.
Not applicable. [CLOSED-END FUNDS ONLY]
Item 8. Portfolio Managers of Closed-End Management Investment Companies.
Not applicable. [CLOSED-END FUNDS ONLY, beginning with reports for periods ended on and after December 31, 2005]
Item 9. Purchases of Equity Securities by Closed-End Management Investment Companies and Affiliated Purchasers.
Not applicable. [CLOSED-END FUNDS ONLY]
Item 10. Submission of Matters to a Vote of Security Holders.
There have been no material changes to the procedures applicable to Item 10.
Item 11. Controls and Procedures.
(a) The Registrant's principal executive and principal financial officers have concluded, based on their evaluation of the Registrant's disclosure controls and procedures as of a date within 90 days of the filing date of this report, that the Registrant's disclosure controls and procedures are reasonably designed to ensure that information required to be disclosed by the Registrant on Form N-CSR is recorded, processed, summarized and reported within the required time periods and that information required to be disclosed by the Registrant in the reports that it files or submits on Form N-CSR is accumulated and communicated to the Registrant's management, including its principal executive and principal financial officers, as appropriate to allow timely decisions regarding required disclosure.
(b) There were no changes to the Registrant's internal control over financial reporting that occurred during the second fiscal quarter of the period covered by this report that have materially affected, or are reasonably likely to materially affect, the Registrant's internal control over financial reporting.
Item 12. Exhibits.
(a)(1) Code of ethics referred to in Item 2.
(a)(2) Certifications of principal executive and principal financial officers as required by Rule 30a-2(a) under the Investment Company Act of 1940.
(a)(3) Not applicable.
(b) Certification of principal executive and principal financial officers as required by Rule 30a-2(b) under the Investment Company Act of 1940.
SIGNATURES
Pursuant to the requirements of the Securities Exchange Act of 1934 and the Investment Company Act of 1940, the Registrant has duly caused this Report to be signed on its behalf by the undersigned, thereunto duly authorized.
Dreyfus Index Funds, Inc.
By: /s/ Bradley J. Skapyak | |
Bradley J. Skapyak, President
| |
Date: | December 23, 2010 |
| |
Pursuant to the requirements of the Securities Exchange Act of 1934 and the Investment Company Act of 1940, this Report has been signed below by the following persons on behalf of the Registrant and in the capacities and on the dates indicated. | |
| |
By: /s/ Bradley J. Skapyak | |
Bradley J. Skapyak, President
| |
Date: | December 23, 2010 |
| |
By: /s/ James Windels | |
James Windels, Treasurer
| |
Date: | December 23, 2010 |
| |
EXHIBIT INDEX
(a)(1) Code of ethics referred to in Item 2.
(a)(2) Certifications of principal executive and principal financial officers as required by Rule 30a-2(a) under the Investment Company Act of 1940. (EX-99.CERT)
(b) Certification of principal executive and principal financial officers as required by Rule 30a-2(b) under the Investment Company Act of 1940. (EX-99.906CERT)