| UNITED STATES |
| SECURITIES AND EXCHANGE COMMISSION |
| Washington, D.C. 20549 |
FORM N-CSR
| CERTIFIED SHAREHOLDER REPORT OF REGISTERED MANAGEMENT |
| INVESTMENT COMPANIES |
| Investment Company Act file number | 811-5883 |
| Dreyfus Index Funds, Inc. |
| (Exact name of Registrant as specified in charter) |
| c/o The Dreyfus Corporation | ||
| 200 Park Avenue | ||
| New York, New York 10166 | ||
| (Address of principal executive offices) | (Zip code) | |
| Michael A. Rosenberg, Esq. |
| 200 Park Avenue |
| New York, New York 10166 |
| (Name and address of agent for service) |
| Registrant's telephone number, including area code: | (212) 922-6000 |
| Date of fiscal year end: | 10/31 |
| Date of reporting period: | 10/31/08 | |
FORM N-CSR
| Item 1. | Reports to Stockholders. |
-2-
| Dreyfus International Stock Index Fund |
| ANNUAL REPORT October 31, 2008 |
Save time. Save paper. View your next shareholder report online as soon as it’s available. Log into www.dreyfus.com and sign up for Dreyfus eCommunications. It’s simple and only takes a few minutes.
The views expressed in this report reflect those of the portfolio manager only through the end of the period covered and do not necessarily represent the views of Dreyfus or any other person in the Dreyfus organization. Any such views are subject to change at any time based upon market or other conditions and Dreyfus disclaims any responsibility to update such views.These views may not be relied on as investment advice and, because investment decisions for a Dreyfus fund are based on numerous factors, may not be relied on as an indication of trading intent on behalf of any Dreyfus fund.

| Contents | ||
| THE FUND | ||
| 2 | A Letter from the CEO | |
| 3 | Discussion of Fund Performance | |
| 6 | Fund Performance | |
| 7 | Understanding Your Fund’s Expenses | |
| 7 | Comparing Your Fund’s Expenses | |
| With Those of Other Funds | ||
| 8 | Statement of Investments | |
| 39 | Statement of Financial Futures | |
| 40 | Statement of Assets and Liabilities | |
| 41 | Statement of Operations | |
| 42 | Statement of Changes in Net Assets | |
| 43 | Financial Highlights | |
| 44 | Notes to Financial Statements | |
| 53 | Report of Independent Registered | |
| Public Accounting Firm | ||
| 54 | Important Tax Information | |
| 55 | Board Members Information | |
| 58 | Officers of the Fund | |
| FOR MORE INFORMATION |
| Back Cover |
| The Fund |
| Dreyfus International Stock Index Fund |

We present to you this annual report for Dreyfus International Stock Index Fund, covering the 12-month period from November 1, 2007, through October 31, 2008.
These are difficult times for international investors. A credit crunch that began in the United States in 2007 has developed into a full-blown global financial crisis, recently resulting in the failure of several major financial institutions. Meanwhile, the global economic slowdown has gathered momentum, depressing investor sentiment, consumer confidence and business investment around the world. These factors undermined equity returns in most regions, including formerly high-flying emerging markets.
The depth and duration of the economic downturn will depend on how quickly the global financial system can be stabilized.We believe that government efforts in the United States and Europe meet several critical requirements for addressing today’s financial stresses, and we expect them to contribute to a more orderly deleveraging process. However, recuperation from the financial crisis is likely to take time. In the mean-time,we encourage you to keep in touch with your financial advisor and maintain a long-term and disciplined perspective to investing. Indeed, we already are seeing some positive signs, including a likely peak in global inflationary pressures, attractive valuations among fundamentally sound companies and a large pool of worldwide financial liquidity that could be deployed gradually as the economic cycle turns.
For information about how the fund performed during the reporting period, as well as market perspectives, we have provided a Discussion of Fund Performance given by the fund’s Portfolio Managers.
Thank you for your continued confidence and support.

| Jonathan R. Baum Chief Executive Officer The Dreyfus Corporation November 17, 2008 |
2
Fund and Market Performance Overview
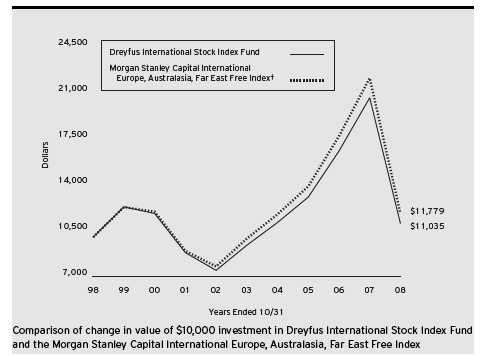
For the 12-month period ended October 31,2008,Dreyfus International Stock Index Fund produced a total return of –46.37% .1 This compares with a –46.62% total return for the fund’s benchmark, the Morgan Stanley Capital International Europe,Australasia, Far East Free Index (the “MSCI EAFE Free Index” or the “Index”), during the same period.2
International stock markets fell sharply during an especially turbulent reporting period due to a worldwide economic slowdown and an intensifying global financial crisis, which was particularly severe over the last two months of the reporting period.
The Fund’s Investment Approach
The fund seeks to match the performance of the MSCI EAFE Free Index, a broadly diversified, international index composed of approximately 1,100 stocks that trade in 21 major markets outside the United States. The fund attempts to match the Index’s return before fees and expenses by aligning the portfolio composition with the composition of the MSCI EAFE Free Index.The fund also invests in securities that represent the market as a whole, such as stock index futures, and manages its exposure to foreign currencies so that the fund’s currency profile matches the currency makeup of the MSCI EAFE Free Index.
International Equities Suffered in a Global Financial Crisis
Following a downward trend established by the United States, most regions of the world were adversely affected by slowing economic growth, which fueled fears of a potentially deep and prolonged global recession. As global demand eased, commodity prices that had soared over the reporting period’s first half plummeted over the second half. Meanwhile, a global credit crunch that began in 2007 developed into a
| The Fund 3 |
D I S C U S S I O N O F F U N D P E R F O R M A N C E (continued)
full-blown financial crisis later in the reporting period, nearly leading to the collapse of the global banking system in September 2008. Government and regulatory authorities intervened, pumping billions of dollars into the system to restore a degree of investor confidence.These efforts included capital infusions by the United States, United Kingdom and other governments, as well as coordinated reductions of short-term interest rates by major central banks.
As market conditions deteriorated, many highly leveraged institutional investors were forced to de-lever their portfolios, selling their more liquid investments to raise cash for margin calls and redemptions. Selling pressure led to broadly lower prices even among fundamentally sound markets and stocks. In addition, the financial crisis left many companies scrambling to secure funding from a rapidly shrinking supply of available credit.
Broad-Based Declines Hurt All Countries and Sectors
All 21 countries tracked by the Index posted negative double-digit absolute returns. Some of the Index’s greater disappointments came from Great Britain, Japan, France, Germany and Australia. Conversely, New Zealand, Portugal, Austria, Ireland and Greece were among the Index’s better relative performers. From a market sector standpoint, the Index’s most significant laggards included the banking, materials, capital goods, diversified financials and energy industry groups, while results were better from stocks within the household and personal products, health care equipment and services, semiconductor, commercial services and suppliers, and software and services areas.
Belgium’s Fortis, the Royal Bank of Scotland and the National Bank of Greece fell sharply due to difficulties encountered in the global credit crisis.The Index also showed declines among individual stocks such as global commodities chain manager Noble Group, a Hong Kong company that manages the flow of raw materials from source to destination.
Some of the Index’s better performers were located in Hong Kong, where Wing Lung Bank rebounded from earlier weakness. A number
4
of Japanese stocks also performed relatively well, including Fast Retailing Co., a casual-wear retailer. Other winners included lender Acom and Hisamitsu Pharmaceutical, a manufacturer and supplier of transdermal patches used primarily to treat pain.
Results in Australia and Germany were mixed. In Australia, laggards included investment management firm Babcock & Brown and Macquarie Goodman Group,an industrial real estate firm.A more favorable contribution to performance came from Origin Energy, a seller of natural gas, electricity and liquefied petroleum gas. In Germany, while the Index’s performance was stifled by department store retailer Karstadt Quelle, automobile maker Volkswagen proved to be the Index’s second best performing stock for the reporting period.
Index Funds Offer Diversification Benefits
As an index fund, we attempt to replicate the returns of the MSCI EAFE Free Index by closely approximating its composition. In our view, one of the benefits of an index fund is that it offers a broadly diversified investment vehicle that can help investors manage risks by limiting the impact on the overall portfolio of unexpected losses in any single country, industry group or holding.
November 17, 2008
| 1 | Total return includes reinvestment of dividends and any capital gains paid. Past performance is no guarantee of future results. Share price, yield and investment return fluctuate such that upon redemption, fund shares may be worth more or less than their original cost. Return figure provided reflects the absorption of certain fund expenses by The Dreyfus Corporation pursuant to an agreement in effect that may be extended, terminated or modified. Had these expenses not been absorbed, the fund’s return would have been lower. |
| 2 | SOURCE: LIPPER INC. — Reflects reinvestment of net dividends and, where applicable, capital gain distributions.The Morgan Stanley Capital International Europe,Australasia, Far East (MSCI EAFE) Free Index is an unmanaged index composed of a sample of companies representative of the market structure of European and Pacific Basin countries.The index reflects actual investable opportunities for global investors for stocks that are free of foreign ownership limits or legal restrictions at the country level. |
The Fund 5
| FUND PERFORMANCE |
| Average Annual Total Returns as of 10/31/08 | ||||||
| 1 Year | 5 Years | 10 Years | ||||
| Fund | (46.37)% | 3.30% | 0.99% | |||
| † Source: Lipper Inc. |
| Past performance is not predictive of future performance.The fund’s performance shown in the graph and table does not |
| reflect the deduction of taxes that a shareholder would pay on fund distributions or the redemption of fund shares. |
| The above graph compares a $10,000 investment made in Dreyfus International Stock Index Fund on 10/31/98 to a |
| $10,000 investment made in the Morgan Stanley Capital International Europe,Australasia, Far East Free Index (the |
| “Index”) on that date.All dividends and capital gain distributions are reinvested. |
| The fund’s performance shown in the line graph takes into account all applicable fees and expenses.The Index is an |
| unmanaged index composed of a sample of companies representative of the market structure of European and Pacific |
| Basin countries and includes net dividends reinvested and reflects actual investable opportunities for global investors for |
| stocks that are free of foreign ownership limits or legal restrictions at the security or country level. Unlike a mutual fund, |
| the Index is not subject to charges, fees and other expenses. Investors cannot invest directly in any index. Further |
| information relating to fund performance, including expense reimbursements, if applicable, is contained in the Financial |
| Highlights section of the prospectus and elsewhere in this report. |
6
UNDERSTANDING YOUR FUND’S EXPENSES (Unaudited)
As a mutual fund investor, you pay ongoing expenses, such as management fees and other expenses. Using the information below, you can estimate how these expenses affect your investment and compare them with the expenses of other funds.You also may pay one-time transaction expenses, including sales charges (loads) and redemption fees, which are not shown in this section and would have resulted in higher total expenses. For more information, see your fund’s prospectus or talk to your financial adviser.
Review your fund’s expenses
The table below shows the expenses you would have paid on a $1,000 investment in Dreyfus International Stock Index Fund from May 1, 2008 to October 31, 2008. It also shows how much a $1,000 investment would be worth at the close of the period, assuming actual returns and expenses.
| Expenses and Value of a $1,000 Investment |
| assuming actual returns for the six months ended October 31, 2008 |
| Expenses paid per $1,000† | $ 2.40 | |
| Ending value (after expenses) | $591.80 |
| COMPARING YOUR FUND’S EXPENSES WITH THOSE OF OTHER FUNDS (Unaudited) |
Using the SEC’s method to compare expenses
The Securities and Exchange Commission (SEC) has established guidelines to help investors assess fund expenses. Per these guidelines, the table below shows your fund’s expenses based on a $1,000 investment, assuming a hypothetical 5% annualized return. You can use this information to compare the ongoing expenses (but not transaction expenses or total cost) of investing in the fund with those of other funds.All mutual fund shareholder reports will provide this information to help you make this comparison. Please note that you cannot use this information to estimate your actual ending account balance and expenses paid during the period.
| Expenses and Value of a $1,000 Investment |
| assuming a hypothetical 5% annualized return for the six months ended October 31, 2008 |
| Expenses paid per $1,000† | $ 3.05 | |
| Ending value (after expenses) | $1,022.12 |
| † Expenses are equal to the fund’s annualized expense ratio of .60%, multiplied by the average account value over the |
| period, multiplied by 184/366 (to reflect the one-half year period). |
The Fund 7
| STATEMENT OF INVESTMENTS O c t o b e r 3 1 , 2 0 0 8 |
| Common Stocks—96.4% | Shares | Value ($) | ||
| Australia—5.8% | ||||
| AGL Energy | 17,165 | 158,682 | ||
| Alumina | 60,463 | 84,015 | ||
| Amcor | 34,100 | 130,912 | ||
| AMP | 77,271 | 280,475 | ||
| Aristocrat Leisure | 12,996 | 32,783 | ||
| Asciano Group | 20,850 | 29,112 | ||
| ASX | 7,107 | 141,032 | ||
| Australia & New Zealand Banking Group | 78,334 | 903,375 | ||
| AXA Asia Pacific Holdings | 32,642 | 95,450 | ||
| Babcock & Brown | 9,065 | 7,819 | ||
| Bendigo and Adelaide Bank | 11,778 | 104,315 | ||
| BHP Billiton | 137,300 | 2,618,871 | ||
| Billabong International | 6,249 | 49,492 | ||
| BlueScope Steel | 34,848 | 101,644 | ||
| Boart Longyear Group | 62,017 | 17,858 | ||
| Boral | 24,301 | 72,602 | ||
| Brambles | 54,273 | 285,343 | ||
| Caltex Australia | 4,873 | 30,247 | ||
| CFS Retail Property Trust | 75,030 | 101,535 | ||
| Coca-Cola Amatil | 23,138 | 123,247 | ||
| Cochlear | 2,530 | 95,590 | ||
| Commonwealth Bank of Australia | 53,951 | 1,456,685 | ||
| Computershare | 17,767 | 98,886 | ||
| Crown | 17,377 | 77,173 | ||
| CSL | 23,852 | 577,152 | ||
| CSR | 37,349 | 53,535 | ||
| Dexus Property Group | 114,018 | 56,532 | ||
| Fairfax Media | 57,398 | 73,077 | ||
| Fortescue Metals Group | 48,260 | a | 95,203 | |
| Foster’s Group | 81,038 | 306,700 | ||
| Goodman Fielder | 49,986 | 54,744 | ||
| Goodman Group | 64,963 | 40,587 | ||
| GPT Group | 77,014 | 38,158 | ||
| Harvey Norman Holdings | 20,532 | 35,114 | ||
| Incitec Pivot | 47,460 | 128,025 | ||
| Insurance Australia Group | 76,973 | 193,779 |
8
| Common Stocks (continued) | Shares | Value ($) | ||
| Australia (continued) | ||||
| James Hardie Industries | 16,388 | 46,158 | ||
| Leighton Holdings | 6,087 | 100,423 | ||
| Lend Lease | 14,124 | 65,384 | ||
| Lion Nathan | 11,086 | 64,511 | ||
| Macquarie Airports | 25,551 | 36,291 | ||
| Macquarie Group | 10,754 | 210,861 | ||
| Macquarie Infrastructure Group | 95,835 | 124,637 | ||
| Macquarie Office Trust (Units) | 72,900 | 13,823 | ||
| Metcash | 34,761 | 93,016 | ||
| Mirvac Group | 38,986 | 26,814 | ||
| National Australia Bank | 66,469 | 1,070,883 | ||
| Newcrest Mining | 19,017 | 262,552 | ||
| OneSteel | 34,146 | 78,130 | ||
| Orica | 15,007 | 192,824 | ||
| Origin Energy | 35,247 | 365,526 | ||
| OZ Minerals | 105,379 | 65,950 | ||
| Paladin Energy | 19,374 | a | 29,825 | |
| Perpetual | 1,401 | 32,402 | ||
| Qantas Airways | 37,434 | 60,073 | ||
| QBE Insurance Group | 36,283 | 621,050 | ||
| Rio Tinto | 11,401 | 585,663 | ||
| Santos | 25,109 | 226,971 | ||
| Sims Group | 5,776 | 55,775 | ||
| Sonic Healthcare | 13,671 | 123,967 | ||
| St. George Bank | 23,011 | 426,431 | ||
| Stockland | 59,258 | 158,972 | ||
| Suncorp-Metway | 38,486 | 204,933 | ||
| Tabcorp Holdings | 23,546 | 106,839 | ||
| Tatts Group | 49,469 | 81,874 | ||
| Telstra | 178,306 | 486,028 | ||
| Toll Holdings | 25,864 | 102,584 | ||
| Transurban Group | 45,946 | 164,387 | ||
| Wesfarmers | 31,398 | 445,890 | ||
| Westfield Group | 71,602 | 790,186 | ||
| Westpac Banking | 76,513 | 1,046,888 | ||
| Woodside Petroleum | 19,233 | 537,065 |
| The Fund 9 |
| S TAT E M E N T O F I N V E S T M E N T S (continued) |
| Common Stocks (continued) | Shares | Value ($) | ||
| Australia (continued) | ||||
| Woolworths | 49,622 | 912,577 | ||
| WorleyParsons | 6,300 | 62,339 | ||
| 18,830,251 | ||||
| Austria—.3% | ||||
| Andritz | 1,336 | 37,457 | ||
| Atrium European Real Estate | 11,588 | a | 52,164 | |
| Erste Group Bank | 7,631 | 200,691 | ||
| IMMOEAST | 14,496 | a | 17,279 | |
| IMMOFINANZ | 16,716 | a | 18,441 | |
| OMV | 6,689 | 211,965 | ||
| Raiffeisen International Bank Holding | 2,034 | 63,191 | ||
| Strabag | 1,910 | 36,959 | ||
| Telekom Austria | 13,353 | 162,550 | ||
| Verbund-Oesterreichische | ||||
| Elektrizitaetswirtschafts, Cl. A | 2,986 | 140,097 | ||
| Vienna Insurance Group | 1,383 | 36,828 | ||
| Voestalpine | 4,288 | 103,311 | ||
| Wienerberger | 3,151 | 51,544 | ||
| 1,132,477 | ||||
| Belgium—.7% | ||||
| Belgacom | 7,027 | 238,270 | ||
| Colruyt | 695 | 155,108 | ||
| Compagnie Nationale a Portefeuille | 1,630 | 87,100 | ||
| Delhaize Group | 4,114 | 228,886 | ||
| Dexia | 19,828 | 102,583 | ||
| Fortis | 88,615 | 100,008 | ||
| Groupe Bruxelles Lambert | 3,128 | 226,505 | ||
| Groupe Bruxelles Lambert (Strip) | 236 | a | 6 | |
| InBev | 7,389 | 294,910 | ||
| KBC Ancora | 1,307 | 38,119 | ||
| KBC Groep | 6,364 | 270,341 | ||
| Mobistar | 1,138 | 74,966 | ||
| Solvay | 2,407 | 221,926 | ||
| UCB | 3,799 | 96,130 | ||
| Umicore | 5,693 | 100,778 | ||
| 2,235,636 |
10
| Common Stocks (continued) | Shares | Value ($) | ||
| China—.0% | ||||
| C.C. Land Holdings | 30,000 | 5,332 | ||
| Foxconn International Holdings | 83,000 | a | 29,964 | |
| 35,296 | ||||
| Denmark—.9% | ||||
| AP Moller—Maersk, Cl. A | 23 | 133,157 | ||
| AP Moller—Maersk, Cl. B | 44 | 251,739 | ||
| Carlsberg, Cl. B | 2,819 | 110,403 | ||
| Coloplast, Cl. B | 1,027 | 74,322 | ||
| Danisco | 1,915 | 82,499 | ||
| Danske Bank | 18,731 | 274,295 | ||
| DSV | 7,324 | 87,298 | ||
| FLSmidth & Co. | 2,007 | 74,159 | ||
| Jyske Bank | 2,176 | a | 64,101 | |
| Novo Nordisk, Cl. B | 18,684 | 992,620 | ||
| Novozymes, Cl. B | 1,759 | 123,402 | ||
| Rockwool International, Cl. B | 243 | 16,303 | ||
| Sydbank | 2,192 | 33,592 | ||
| Topdanmark | 627 | a | 67,262 | |
| TrygVesta | 1,026 | 61,322 | ||
| Vestas Wind Systems | 7,346 | a | 298,331 | |
| William Demant Holding | 980 | a | 37,213 | |
| 2,782,018 | ||||
| Finland—1.4% | ||||
| Cargotec, Cl. B | 1,444 | 19,849 | ||
| Elisa | 5,537 | 82,640 | ||
| Fortum | 17,656 | 430,088 | ||
| Kesko, Cl. B | 2,668 | 61,912 | ||
| Kone, Cl. B | 6,585 | 145,626 | ||
| Metso | 4,783 | 62,834 | ||
| Neste Oil | 4,602 | 72,128 | ||
| Nokia | 155,309 | 2,398,731 | ||
| Nokian Renkaat | 4,614 | 59,795 | ||
| Orion, Cl. B | 3,310 | 48,310 | ||
| Outokumpu | 4,446 | 45,666 | ||
| Pohjola Bank, Cl. A | 5,043 | 66,762 |
| The Fund 11 |
| S TAT E M E N T O F I N V E S T M E N T S (continued) |
| Common Stocks (continued) | Shares | Value ($) | ||
| Finland (continued) | ||||
| Rautaruukki | 3,101 | 50,136 | ||
| Sampo, Cl. A | 17,201 | 339,610 | ||
| Sanoma | 3,180 | 48,349 | ||
| Stora Enso, Cl. R | 23,946 | 220,449 | ||
| UPM-Kymmene | 21,048 | 295,191 | ||
| Wartsila | 3,161 | 79,204 | ||
| YIT | 5,145 | 31,773 | ||
| 4,559,053 | ||||
| France—9.8% | ||||
| Accor | 8,058 | 310,065 | ||
| ADP | 1,217 | 71,451 | ||
| Air France-KLM | 4,856 | 69,181 | ||
| Air Liquide | 10,067 | 859,182 | ||
| Alcatel-Lucent | 97,590 | a | 248,736 | |
| Alstom | 8,435 | 409,926 | ||
| Atos Origin | 2,750 | 63,117 | ||
| AXA | 63,014 | 1,186,591 | ||
| BNP Paribas | 33,118 | 2,351,743 | ||
| Bouygues | 10,064 | 423,433 | ||
| Bureau Veritas | 1,472 | 52,040 | ||
| Cap Gemini | 5,317 | 169,028 | ||
| Carrefour | 25,839 | 1,078,632 | ||
| Casino Guichard Perrachon | 1,681 | 116,172 | ||
| Christian Dior | 2,006 | 120,140 | ||
| Cie de Saint-Gobain | 11,292 | 429,924 | ||
| Cie Generale d’Optique Essilor International | 8,105 | 360,332 | ||
| CNP Assurances | 1,459 | 116,519 | ||
| Compagnie Generale de Geophysique-Veritas | 6,031 | a | 95,672 | |
| Compagnie Generale des | ||||
| Etablissements Michelin, Cl. B | 6,012 | 305,818 | ||
| Credit Agricole | 35,545 | 506,395 | ||
| Dassault Systemes | 2,794 | 114,543 | ||
| Eiffage | 1,558 | 59,269 | ||
| Electricite de France | 8,216 | 488,620 | ||
| Eramet | 193 | 38,423 | ||
| Eurazeo | 1,061 | 63,100 | ||
| Eutelsat Communications | 3,172 | 67,453 |
12
| Common Stocks (continued) | Shares | Value ($) | ||
| France (continued) | ||||
| France Telecom | 74,398 | 1,858,511 | ||
| GDF SUEZ | 44,532 | 1,956,932 | ||
| Gecina | 669 | 46,081 | ||
| Groupe Danone | 17,846 | 983,034 | ||
| Hermes International | 2,850 | 365,009 | ||
| ICADE | 739 | 43,893 | ||
| Imerys | 1,074 | 48,347 | ||
| JC Decaux | 2,248 | 38,654 | ||
| Klepierre | 2,777 | 63,103 | ||
| L’Oreal | 10,158 | 760,166 | ||
| Lafarge | 5,833 | 379,554 | ||
| Lagardere | 5,107 | 200,754 | ||
| Legrand | 3,955 | 65,197 | ||
| LVMH Moet Hennessy Louis Vuitton | 9,755 | 641,563 | ||
| M6-Metropole Television | 3,249 | 50,675 | ||
| Natixis | 37,520 | 81,357 | ||
| Neopost | 1,237 | 102,585 | ||
| PagesJaunes Groupe | 4,274 | 40,160 | ||
| Pernod-Ricard | 6,554 | 422,024 | ||
| Peugeot | 6,519 | 171,901 | ||
| PPR | 3,122 | 196,360 | ||
| Publicis Groupe | 4,951 | 110,809 | ||
| Renault | 7,393 | 223,681 | ||
| Safran | 7,800 | 97,919 | ||
| Sanofi-Aventis | 42,730 | 2,678,312 | ||
| Schneider Electric | 8,813 | 521,889 | ||
| Scor | 6,516 | 105,349 | ||
| Societe BIC | 1,052 | 55,041 | ||
| Societe Generale | 19,011 | 1,016,712 | ||
| Societe Television Francaise 1 | 4,756 | 60,248 | ||
| Sodexo | 3,616 | 171,994 | ||
| Suez Environnement | 10,962 a | a | 208,506 | |
| Technip | 3,926 | 115,747 | ||
| Thales | 3,490 | 138,518 | ||
| Total | 87,707 | 4,761,765 | ||
| Unibail-Rodamco | 3,299 | 489,447 |
The Fund 13
| S TAT E M E N T O F I N V E S T M E N T S (continued) |
| Common Stocks (continued) | Shares | Value ($) | ||
| France (continued) | ||||
| Valeo | 3,209 | 55,300 | ||
| Vallourec | 2,072 | 228,584 | ||
| Veolia Environnement | 15,564 | 379,128 | ||
| Vinci | 16,553 | 587,513 | ||
| Vivendi | 47,429 | 1,227,208 | ||
| Wendel | 1,132 | 53,169 | ||
| Zodiac | 1,889 | 73,034 | ||
| 32,051,238 | ||||
| Germany—8.1% | ||||
| Adidas | 8,387 | 292,786 | ||
| Allianz | 18,409 | 1,354,396 | ||
| Arcandor | 4,661 | a | 10,934 | |
| BASF | 38,533 | 1,273,830 | ||
| Bayer | 31,085 | 1,701,257 | ||
| Bayerische Motoren Werke | 13,620 | 347,404 | ||
| Beiersdorf | 3,345 | 174,331 | ||
| Bilfinger Berger | 1,403 | 63,495 | ||
| Celesio | 3,521 | 103,494 | ||
| Commerzbank | 27,418 | 293,090 | ||
| Continental | 5,802 | 238,081 | ||
| Daimler | 35,352 | 1,201,845 | ||
| Deutsche Bank | 22,110 | 825,400 | ||
| Deutsche Boerse | 7,783 | 611,796 | ||
| Deutsche Lufthansa | 8,954 | 124,214 | ||
| Deutsche Post | 34,711 | 380,733 | ||
| Deutsche Postbank | 3,223 | 65,023 | ||
| Deutsche Telekom | 116,399 | 1,709,210 | ||
| E.ON | 77,229 | 2,904,620 | ||
| Fraport | 1,528 | 49,060 | ||
| Fresenius | 1,281 | 74,721 | ||
| Fresenius Medical Care & Co. | 7,860 | 351,433 | ||
| GEA Group | 5,764 | 82,812 | ||
| Hamburger Hafen und Logistik | 1,184 | 40,237 | ||
| Hannover Rueckversicherung | 2,187 | 54,522 | ||
| HeidelbergerCement | 918 | 67,807 | ||
| Henkel & Co. | 5,348 | 130,477 | ||
| Hochtief | 1,550 | 47,624 |
14
| Common Stocks (continued) | Shares | Value ($) | ||
| Germany (continued) | ||||
| Hypo Real Estate Holding | 7,752 | 50,919 | ||
| Infineon Technologies | 33,834 | a | 105,328 | |
| IVG Immobilien | 3,487 | 22,949 | ||
| K+S | 5,958 | 231,789 | ||
| Linde | 5,366 | 443,033 | ||
| MAN | 4,469 | 219,480 | ||
| Merck | 2,713 | 239,371 | ||
| Metro | 4,266 | 135,671 | ||
| Muenchener Rueckversicherungs | 8,409 | 1,097,229 | ||
| Puma | 242 | 40,332 | ||
| Q-Cells | 2,408 | a | 93,131 | |
| Rheinmetall | 1,480 | 45,191 | ||
| RWE | 18,105 | 1,487,456 | ||
| Salzgitter | 1,544 | 100,165 | ||
| SAP | 35,523 | 1,243,469 | ||
| Siemens | 35,314 | 2,080,481 | ||
| Solarworld | 3,106 | 76,960 | ||
| ThyssenKrupp | 14,436 | 274,767 | ||
| TUI | 8,161 | 98,726 | ||
| United Internet | 4,560 | 40,476 | ||
| Volkswagen | 5,914 | 3,745,886 | ||
| Wacker Chemie | 645 | 70,069 | ||
| 26,517,510 | ||||
| Greece—.5% | ||||
| Alpha Bank | 15,929 | 229,863 | ||
| Coca-Cola Hellenic Bottling | 6,164 | 85,198 | ||
| EFG Eurobank Ergasias | 12,045 | 129,216 | ||
| Hellenic Petroleum | 4,036 | 33,164 | ||
| Hellenic Telecommunications Organization | 11,546 | 161,636 | ||
| Marfin Investment Group | 24,710 | a | 107,161 | |
| National Bank of Greece | 19,855 | 430,530 | ||
| OPAP | 8,652 | 187,169 | ||
| Piraeus Bank | 11,949 | 150,005 | ||
| Public Power | 4,070 | 49,752 | ||
| Titan Cement | 2,341 | 39,481 | ||
| 1,603,175 |
| The Fund 15 |
| S TAT E M E N T O F I N V E S T M E N T S (continued) |
| Common Stocks (continued) | Shares | Value ($) | ||
| Hong Kong—1.9% | ||||
| ASM Pacific Technology | 8,000 | 26,588 | ||
| Bank of East Asia | 52,991 | 104,514 | ||
| BOC Hong Kong Holdings | 143,000 | 160,177 | ||
| Cathay Pacific Airways | 45,000 | 55,241 | ||
| Cheung Kong Holdings | 55,000 | 535,554 | ||
| Cheung Kong Infrastructure Holdings | 19,000 | 68,986 | ||
| Chinese Estates Holdings | 44,000 | 33,315 | ||
| CITIC International Financial Holdings | 61,000 | a | 35,084 | |
| CLP Holdings | 83,788 | 568,937 | ||
| Esprit Holdings | 41,500 | 232,966 | ||
| Hang Lung Group | 32,000 | 103,980 | ||
| Hang Lung Properties | 86,000 | 207,789 | ||
| Hang Seng Bank | 30,700 | 380,562 | ||
| Henderson Land Development | 40,762 | 145,023 | ||
| Hong Kong & China Gas | 155,483 | 274,856 | ||
| Hong Kong Aircraft Engineerg | 2,000 | 15,663 | ||
| Hong Kong Exchanges & Clearing | 41,000 | 419,108 | ||
| HongKong Electric Holdings | 56,000 | 302,334 | ||
| Hopewell Holdings | 24,000 | 73,296 | ||
| Hutchison Telecommunications International | 74,000 | a | 80,103 | |
| Hutchison Whampoa | 84,800 | 464,152 | ||
| Hysan Development | 27,000 | 41,727 | ||
| Kerry Properties | 25,000 | 62,021 | ||
| Kingboard Chemical Holdings | 22,000 | 43,100 | ||
| Lee & Man Paper Manufacturing | 13,000 | 4,285 | ||
| Li & Fung | 86,600 | 174,122 | ||
| Lifestyle International Holdings | 22,000 | 14,307 | ||
| Link REIT | 84,500 | 147,205 | ||
| Mongolia Energy | 126,000 | a | 52,895 | |
| MTR | 54,000 | 120,622 | ||
| New World Development | 87,191 | 73,296 | ||
| NWS Holdings | 37,000 | 38,541 | ||
| Orient Overseas International | 8,300 | 14,686 | ||
| Pacific Basin Shipping | 56,000 | 29,303 | ||
| PCCW | 152,207 | 56,952 | ||
| Shangri-La Asia | 48,000 | 67,133 | ||
| Shun TAK Holdings | 36,000 | 7,306 |
16
| Common Stocks (continued) | Shares | Value ($) | ||
| Hong Kong (continued) | ||||
| Sino Land | 70,664 | 60,591 | ||
| Sun Hung Kai Properties | 57,699 | 496,414 | ||
| Swire Pacific, Cl. A | 33,500 | 233,741 | ||
| Television Broadcasts | 12,000 | 33,114 | ||
| Wharf Holdings | 54,192 | 106,427 | ||
| Wheelock & Co. | 40,000 | 60,249 | ||
| Wing Hang Bank | 7,000 | 32,746 | ||
| Wing Lung Bank | 2,700 | 55,318 | ||
| Yue Yuen Industrial Holdings | 24,800 | 49,108 | ||
| 6,363,437 | ||||
| Ireland—.4% | ||||
| Allied Irish Banks | 37,463 | 182,182 | ||
| Anglo Irish Bank | 27,946 | 88,593 | ||
| Bank of Ireland | 37,375 | 109,005 | ||
| CRH | 21,486 | 468,621 | ||
| Elan | 18,043 | a | 133,845 | |
| Irish Life & Permanent | 10,532 | 36,059 | ||
| Kerry Group, Cl. A | 6,106 | 137,821 | ||
| Ryanair Holdings | 4,000 | a | 13,644 | |
| 1,169,770 | ||||
| Italy—3.4% | ||||
| A2A | 46,138 | 83,370 | ||
| Alleanza Assicurazioni | 18,339 | 120,925 | ||
| Assicurazioni Generali | 43,063 | 1,073,558 | ||
| Atlantia | 9,957 | 180,426 | ||
| Autogrill | 3,846 | 30,520 | ||
| Banca Carige | 29,208 | 61,704 | ||
| Banca Monte dei Paschi di Siena | 100,904 | 193,207 | ||
| Banca Popolare di Milano Scarl | 15,093 | 87,081 | ||
| Banco Popolare | 7,146 | 87,806 | ||
| Banco Popolare di Verona | 19,243 | a | 236,447 | |
| Bulgari | 6,217 | 45,945 | ||
| Enel | 176,282 | 1,166,853 | ||
| ENI | 105,801 | 2,486,010 | ||
| Fiat | 29,409 | 230,279 | ||
| Finmeccanica | 11,819 | 143,112 | ||
| Finmeccanica (Rights) | 11,539 | a | 4,824 |
The Fund 17
| S TAT E M E N T O F I N V E S T M E N T S (continued) |
| Common Stocks (continued) | Shares | Value ($) | ||
| Italy (continued) | ||||
| Fondiaria-SAI | 2,598 | 48,164 | ||
| IFIL Investments | 9,871 | 30,041 | ||
| Intesa Sanpaolo | 347,584 | 1,228,979 | ||
| Italcementi | 5,915 | 53,073 | ||
| Lottomatica | 2,428 | 56,176 | ||
| Luxottica Group | 5,328 | 106,342 | ||
| Mediaset | 29,866 | 160,765 | ||
| Mediobanca | 20,021 | 225,443 | ||
| Mediolanum | 8,361 | 32,252 | ||
| Parmalat | 73,848 | 128,291 | ||
| Pirelli & C | 100,796 | 35,149 | ||
| Prysmian | 4,679 | 56,069 | ||
| Saipem | 10,705 | 197,034 | ||
| Snam Rete Gas | 30,285 | 152,191 | ||
| Telecom Italia | 605,882 | 619,394 | ||
| TERNA SPA | 51,101 | 163,617 | ||
| UniCredit | 461,883 | 1,105,788 | ||
| Unione di Banche Italiane | 24,932 | 415,107 | ||
| Unipol Gruppo Finanziario | 30,497 | 53,367 | ||
| 11,099,309 | ||||
| Japan—23.2% | ||||
| 77 Bank | 16,000 | 76,042 | ||
| Acom | 36 | 1,362 | ||
| Advantest | 5,800 | 85,110 | ||
| Aeon | 26,000 | 248,504 | ||
| Aeon Credit Service | 3,960 | 43,091 | ||
| AEON Mall | 2,800 | 68,591 | ||
| Aiful | 2,525 | 12,028 | ||
| Aioi Insurance | 17,000 | 69,240 | ||
| Aisin Seiki | 8,200 | 142,744 | ||
| Ajinomoto | 26,800 | 234,971 | ||
| Alfresa Holdings | 1,100 | 48,296 | ||
| All Nippon Airways | 25,000 | 95,606 | ||
| Alps Electric | 6,000 | 32,612 | ||
| Amada | 15,000 | 70,126 | ||
| Aozora Bank | 19,959 | 16,688 | ||
| Asahi Breweries | 15,600 | 260,585 |
18
| Common Stocks (continued) | Shares | Value ($) | ||
| Japan (continued) | ||||
| Asahi Glass | 39,800 | 255,384 | ||
| Ashai Kasei | 50,900 | 194,729 | ||
| Asics | 6,000 | 38,003 | ||
| Astellas Pharma | 20,079 | 822,200 | ||
| Bank of Kyoto | 13,000 | 136,344 | ||
| Bank of Yokohama | 50,000 | 240,405 | ||
| Benesse | 3,200 | 134,905 | ||
| Bridgestone | 24,400 | 423,566 | ||
| Brother Industries | 10,100 | 70,680 | ||
| Canon | 43,450 | 1,497,613 | ||
| Canon Marketing Japan | 3,100 | 51,975 | ||
| Casio Computer | 8,900 | 58,091 | ||
| Central Japan Railway | 64 | 524,469 | ||
| Chiba Bank | 33,000 | 160,904 | ||
| Chubu Electric Power | 27,000 | 712,031 | ||
| Chugai Pharmaceutical | 8,428 | 119,522 | ||
| Chugoku Bank | 6,000 | 83,037 | ||
| Chugoku Electric Power | 11,300 | 277,255 | ||
| Chuo Mitsui Trust Holdings | 39,380 | 155,151 | ||
| Citizen Holdings | 13,000 | 71,484 | ||
| COCA-COLA WEST HOLDINGS | 2,700 | 54,079 | ||
| Cosmo Oil | 27,000 | 57,748 | ||
| Credit Saison | 6,500 | 68,604 | ||
| CSK HOLDINGS | 3,600 | 30,072 | ||
| Dai Nippon Printing | 24,800 | 292,521 | ||
| Daicel Chemical Industries | 11,000 | 39,712 | ||
| Daido Steel | 14,200 | 44,744 | ||
| Daihatsu Motor | 8,000 | 59,522 | ||
| Daiichi Sankyo | 27,883 | 571,529 | ||
| Daikin Industries | 11,100 | 249,874 | ||
| Dainippon Sumitomo Pharma | 7,000 | 54,993 | ||
| Daito Trust Construction | 3,200 | 134,656 | ||
| Daiwa House Industry | 21,400 | 189,023 | ||
| Daiwa Securities Group | 54,000 | 300,423 | ||
| Dena | 11 | 24,331 | ||
| Denki Kagaku Kogyo | 18,600 | 41,971 | ||
| Denso | 19,500 | 385,708 |
| The Fund 19 |
| S TAT E M E N T O F I N V E S T M E N T S (continued) |
| Common Stocks (continued) | Shares | Value ($) | ||
| Japan (continued) | ||||
| Dentsu | 81 | 132,486 | ||
| DIC | 24,000 | 38,466 | ||
| Dowa Holdings | 11,000 | 33,897 | ||
| Dowa Holdings (Rights) | 7,000 | a | 0 | |
| East Japan Railway | 139 | 989,351 | ||
| Eisai | 10,400 | 342,430 | ||
| Electric Power Development | 5,180 | 153,876 | ||
| Elpida Memory | 3,900 | a | 20,433 | |
| FamilyMart | 2,600 | 104,009 | ||
| Fanuc | 7,800 | 530,260 | ||
| Fast Retailing | 1,900 | 200,527 | ||
| Fuji Electric Holdings | 21,000 | 31,308 | ||
| Fuji Heavy Industries | 25,000 | 87,243 | ||
| Fuji Media Holdings | 11 | 13,209 | ||
| FUJIFILM Holdings | 19,600 | 434,794 | ||
| Fujitsu | 72,800 | 290,181 | ||
| Fukuoka Financial Group | 29,000 | 94,852 | ||
| Furukawa Electric | 26,000 | 77,983 | ||
| Gunma Bank | 15,000 | 77,708 | ||
| Hachijuni Bank | 18,000 | 88,172 | ||
| Hakuhodo DY Holdings | 1,170 | 53,130 | ||
| Hankyu Hashin Holdings | 49,000 | 231,784 | ||
| Haseko | 44,500 | 39,827 | ||
| Hikari Tsushin | 700 | 10,210 | ||
| Hino Motors | 10,000 | 23,062 | ||
| Hirose Electric | 1,200 | 105,076 | ||
| Hiroshima Bank | 19,000 | 70,435 | ||
| Hisamitsu Pharmaceutical | 2,900 | 121,433 | ||
| Hitachi | 137,900 | 641,422 | ||
| Hitachi Chemical | 3,700 | 37,800 | ||
| Hitachi Construction Machinery | 4,200 | 48,066 | ||
| Hitachi High-Technologies | 2,700 | 44,437 | ||
| Hitachi Metals | 7,000 | 52,630 | ||
| Hokkaido Electric Power | 8,100 | 184,419 | ||
| Hokuhoku Financial Group | 48,000 | 94,523 | ||
| Hokuriku Electric Power | 7,200 | 188,823 | ||
| Honda Motor | 67,220 | 1,672,175 |
20
| Common Stocks (continued) | Shares | Value ($) | ||
| Japan (continued) | ||||
| HOYA | 16,600 | 308,204 | ||
| Ibiden | 5,700 | 109,490 | ||
| Idemitsu Kosan | 1,000 | 58,751 | ||
| IHI | 49,000 | 60,735 | ||
| INPEX | 34 | 198,036 | ||
| Isetan Mitsukoshi Holdings | 13,020 | a | 124,239 | |
| Isuzu Motors | 47,000 | 82,044 | ||
| Ito En | 3,300 | 53,010 | ||
| Itochu | 62,500 | 338,034 | ||
| Itochu Techno-Solutions | 1,400 | 33,449 | ||
| Iyo Bank | 11,000 | 120,212 | ||
| J Front Retailing | 21,800 | 98,650 | ||
| Jafco | 1,600 | 44,268 | ||
| Japan Airlines | 35,600 | a | 81,139 | |
| Japan Petroleum Exploration | 1,000 | 38,380 | ||
| Japan Prime Realty Investment | 21 | 37,471 | ||
| Japan Real Estate Investment | 18 | 160,156 | ||
| Japan Retail Fund Investment | 13 | 48,255 | ||
| Japan Steel Works | 14,000 | 98,793 | ||
| Japan Tobacco | 180 | 640,190 | ||
| JFE Holdings | 20,760 | 545,121 | ||
| JGC | 8,000 | 85,055 | ||
| Joyo Bank | 26,462 | 124,333 | ||
| JS Group | 11,424 | 152,305 | ||
| JSR | 6,700 | 77,845 | ||
| JTEKT | 7,300 | 56,336 | ||
| Jupiter Telecommunications | 109 | 73,382 | ||
| Kajima | 31,800 | 93,884 | ||
| Kamigumi | 11,400 | 91,947 | ||
| Kaneka | 12,000 | 56,724 | ||
| Kansai Electric Power | 31,399 | 800,134 | ||
| Kansai Paint | 11,000 | 62,030 | ||
| Kao | 21,000 | 608,051 | ||
| Kawasaki Heavy Industries | 64,000 | 115,699 | ||
| Kawasaki Kisen Kaisha | 25,000 | 97,398 | ||
| KDDI | 119 | 712,106 | ||
| Keihin Electric Express Railway | 18,000 | 139,240 |
| The Fund 21 |
| S TAT E M E N T O F I N V E S T M E N T S (continued) |
| Common Stocks (continued) | Shares | Value ($) | ||
| Japan (continued) | ||||
| Keio | 24,000 | 124,064 | ||
| Keisei Electric Railway | 10,000 | 48,885 | ||
| Keyence | 1,514 | 292,848 | ||
| Kikkoman | 8,000 | 80,005 | ||
| Kinden | 5,000 | 42,149 | ||
| Kintetsu | 66,354 | 254,538 | ||
| Kirin Holdings | 33,000 | 361,807 | ||
| Kobe Steel | 113,000 | 182,616 | ||
| Komatsu | 35,900 | 390,451 | ||
| Konami | 4,300 | 78,672 | ||
| Konica Minolta Holdings | 18,500 | 120,625 | ||
| Kubota | 46,000 | 236,761 | ||
| Kuraray | 13,500 | 102,116 | ||
| Kurita Water Industries | 4,200 | 95,431 | ||
| Kyocera | 6,400 | 374,484 | ||
| Kyowa Hakko Kogyo | 9,705 | 80,468 | ||
| Kyushu Electric Power | 15,600 | 363,830 | ||
| Lawson | 2,900 | 143,075 | ||
| Leopalace21 | 4,800 | 36,647 | ||
| Mabuchi Motor | 1,100 | 43,242 | ||
| Makita | 4,600 | 85,855 | ||
| Marubeni | 67,000 | 266,022 | ||
| Marui Group | 10,600 | 65,926 | ||
| Maruichi Steel Tube | 2,000 | 46,418 | ||
| Mazda Motor | 34,000 | 77,128 | ||
| Mediceo Paltac Holdings | 5,600 | 60,611 | ||
| Meiji Dairies | 13,000 | 60,261 | ||
| Minebea | 12,000 | 32,073 | ||
| Mitsubishi | 55,300 | 919,361 | ||
| Mitsubishi Chemical Holdings | 51,600 | 211,910 | ||
| Mitsubishi Electric | 77,000 | 475,334 | ||
| Mitsubishi Estate | 48,000 | 846,295 | ||
| Mitsubishi Gas Chemical | 15,000 | 56,426 | ||
| Mitsubishi Heavy Industries | 128,700 | 411,731 | ||
| Mitsubishi Logistics | 4,000 | 36,789 | ||
| Mitsubishi Materials | 48,000 | 110,721 | ||
| Mitsubishi Motors | 152,000 | a | 209,435 |
22
| Common Stocks (continued) | Shares | Value ($) | ||
| Japan (continued) | ||||
| Mitsubishi Rayon | 20,000 | 43,731 | ||
| Mitsubishi Tanabe Pharma | 9,000 | 93,728 | ||
| Mitsubishi UFJ Financial Group | 419,090 | 2,584,949 | ||
| Mitsubishi UFJ Lease & Finance | 2,810 | 68,620 | ||
| Mitsui & Co. | 70,400 | 677,843 | ||
| Mitsui Chemicals | 28,000 | 99,224 | ||
| Mitsui Engineering & Shipbuilding | 30,000 | 41,606 | ||
| Mitsui Fudosan | 34,000 | 586,312 | ||
| Mitsui Mining & Smelting | 20,000 | 36,380 | ||
| Mitsui OSK Lines | 45,000 | 238,672 | ||
| Mitsui Sumitomo Insurance Group Holdings | 15,169 | 432,987 | ||
| Mitsumi Electric | 3,100 | 40,481 | ||
| Mizuho Financial Group | 395 | 947,567 | ||
| Mizuho Trust & Banking | 64,000 | 74,724 | ||
| Murata Manufacturing | 8,600 | 298,526 | ||
| Namco Bandai Holdings | 8,550 | 89,386 | ||
| NEC | 75,800 | 228,150 | ||
| NEC Electronics | 1,100 | a | 11,209 | |
| NGK Insulators | 10,000 | 106,053 | ||
| NGK Spark Plug | 7,000 | 66,836 | ||
| NHK Spring | 6,000 | 24,111 | ||
| Nidec | 4,200 | 216,466 | ||
| Nikon | 13,600 | 190,277 | ||
| Nintendo | 4,050 | 1,279,436 | ||
| Nippon Building Fund | 21 | 203,946 | ||
| Nippon Electric Glass | 13,085 | 80,557 | ||
| Nippon Express | 34,000 | 139,384 | ||
| Nippon Meat Packers | 7,000 | 97,258 | ||
| Nippon Mining Holdings | 38,300 | 118,796 | ||
| Nippon Oil | 51,800 | 214,821 | ||
| Nippon Paper Group | 39 | 104,408 | ||
| Nippon Sheet Glass | 28,000 | 91,162 | ||
| Nippon Steel | 203,100 | 679,829 | ||
| Nippon Telegraph & Telephone | 212 | 871,518 | ||
| Nippon Yusen | 44,800 | 215,111 | ||
| Nipponkoa Insurance | 27,000 | 165,825 | ||
| Nishi-Nippon City Bank | 32,000 | 69,329 |
The Fund 23
| S TAT E M E N T O F I N V E S T M E N T S (continued) |
| Common Stocks (continued) | Shares | Value ($) | ||
| Japan (continued) | ||||
| Nissan Chemical Industries | 6,000 | 48,340 | ||
| Nissan Motor | 89,900 | 471,000 | ||
| Nisshin Seifun Group | 7,800 | 83,834 | ||
| Nisshin Steel | 29,000 | 39,905 | ||
| Nisshinbo Industries | 5,000 | 29,545 | ||
| Nissin Foods Holdings | 3,500 | 100,598 | ||
| Nitori | 1,700 | 106,457 | ||
| Nitto Denko | 7,100 | 156,426 | ||
| NOK | 4,300 | 41,878 | ||
| Nomura Holdings | 72,200 | 672,410 | ||
| Nomura Real Estate Holdings | 1,900 | 36,879 | ||
| Nomura Real Estate Office Fund | 12 | 68,498 | ||
| Nomura Research Institute | 4,200 | 68,436 | ||
| NSK | 17,000 | 71,072 | ||
| NTN | 16,000 | 59,681 | ||
| NTT Data | 50 | 164,189 | ||
| NTT DoCoMo | 640 | 1,017,049 | ||
| NTT Urban Development | 55 | 55,887 | ||
| Obayashi | 26,000 | 126,462 | ||
| Obic | 350 | 44,047 | ||
| Odakyu Electric Railway | 26,000 | 190,567 | ||
| OJI Paper | 35,000 | 133,885 | ||
| OKUMA | 6,000 | 26,863 | ||
| Olympus | 9,000 | 172,209 | ||
| Omron | 7,700 | 109,396 | ||
| Ono Pharmaceutical | 4,000 | 179,249 | ||
| Onward Holdings | 6,000 | 43,548 | ||
| Oracle Japan | 1,500 | 66,191 | ||
| Oriental Land | 2,100 | 149,214 | ||
| ORIX | 3,690 | 392,267 | ||
| Osaka Gas | 76,000 | 273,100 | ||
| OSAKA Titanium Technologies | 600 | 15,604 | ||
| OTSUKA | 600 | 30,370 | ||
| Panasonic | 75,195 | 1,171,142 | ||
| Panasonic Electric Works | 16,000 | 138,167 | ||
| Pioneer | 5,900 | 17,391 | ||
| Promise | 2,700 | 48,089 |
24
| Common Stocks (continued) | Shares | Value ($) | ||
| Japan (continued) | ||||
| Rakuten | 264 | 130,870 | ||
| Resona Holdings | 214 | 221,021 | ||
| Ricoh | 27,000 | 287,665 | ||
| Rohm | 4,300 | 203,588 | ||
| Sankyo | 2,300 | 104,073 | ||
| Santen Pharmaceutical | 3,200 | 81,516 | ||
| Sanyo Electric | 74,000 | a | 110,945 | |
| Sapporo Hokuyo Holdings | 11 | 48,294 | ||
| Sapporo Holdings | 13,000 | 71,093 | ||
| SBI Holdings | 699 | 83,322 | ||
| Secom | 8,400 | 325,682 | ||
| Sega Sammy Holdings | 6,984 | 53,713 | ||
| Seiko Epson | 5,600 | 85,163 | ||
| Sekisui Chemical | 16,000 | 93,065 | ||
| Sekisui House | 18,000 | 182,782 | ||
| Seven & I Holdings | 35,060 | 983,535 | ||
| Sharp | 40,000 | 282,845 | ||
| Shikoku Electric Power | 7,500 | 220,102 | ||
| Shimadzu | 11,000 | 74,894 | ||
| Shimamura | 800 | 55,524 | ||
| Shimano | 2,500 | 73,018 | ||
| Shimizu | 25,000 | 124,881 | ||
| Shin-Etsu Chemical | 16,700 | 875,377 | ||
| Shinko Electric Industries | 2,700 | 17,367 | ||
| Shinko Securities | 22,000 | 53,723 | ||
| Shinsei Bank | 59,000 | 89,797 | ||
| Shionogi & Co. | 12,000 | 203,964 | ||
| Shiseido | 13,000 | 263,765 | ||
| Shizuoka Bank | 24,400 | 213,465 | ||
| Showa Denko | 45,000 | 67,536 | ||
| Showa Shell Sekiyu | 8,400 | 67,730 | ||
| SMC | 2,400 | 229,602 | ||
| Softbank | 31,200 | 305,038 | ||
| Sojitz | 53,200 | 91,092 | ||
| Sompo Japan Insurance | 34,000 | 242,491 | ||
| Sony | 40,980 | 939,081 | ||
| Sony Financial Holdings | 33 | 108,917 |
| The Fund 25 |
| S TAT E M E N T O F I N V E S T M E N T S (continued) |
| Common Stocks (continued) | Shares | Value ($) | ||
| Japan (continued) | ||||
| Square Enix Holdings | 2,800 | 71,718 | ||
| Stanley Electric | 5,700 | 74,081 | ||
| SUMCO | 5,300 | 56,638 | ||
| Sumitomo | 44,000 | 395,220 | ||
| Sumitomo Chemical | 63,000 | 191,274 | ||
| Sumitomo Electric Industries | 31,400 | 252,665 | ||
| Sumitomo Heavy Industries | 21,000 | 64,153 | ||
| Sumitomo Metal Industries | 154,000 | 409,977 | ||
| Sumitomo Metal Mining | 24,000 | 180,094 | ||
| Sumitomo Mitsui Financial Group | 273 | 1,110,153 | ||
| Sumitomo Realty & Development | 15,000 | 241,059 | ||
| Sumitomo Rubber Industries | 7,000 | 61,768 | ||
| Sumitomo Trust & Banking | 56,000 | 260,853 | ||
| Suruga Bank | 10,000 | 93,063 | ||
| Suzuken | 2,820 | 60,361 | ||
| Suzuki Motor | 14,300 | 207,473 | ||
| T & D Holdings | 7,900 | 304,445 | ||
| Taiheiyo Cement | 38,000 | 45,371 | ||
| Taisei | 43,000 | 98,348 | ||
| Taisho Pharmaceutical | 5,000 | 90,399 | ||
| Taiyo Nippon Sanso | 12,000 | 76,943 | ||
| Takashimaya | 11,000 | 86,002 | ||
| Takeda Pharmaceutical | 33,800 | 1,706,211 | ||
| Takefuji | 4,610 | 37,649 | ||
| TDK | 5,200 | 174,008 | ||
| Teijin | 34,000 | 87,672 | ||
| Terumo | 7,000 | 295,561 | ||
| THK | 4,700 | 64,072 | ||
| Tobu Railway | 33,000 | 169,120 | ||
| Toho | 4,300 | 83,571 | ||
| Toho Gas | 20,000 | 116,680 | ||
| Toho Titanium | 800 | 9,302 | ||
| Tohoku Electric Power | 17,100 | 389,195 | ||
| Tokai Rika | 1,600 | 16,594 | ||
| Tokio Marine Holdings | 27,900 | 871,687 | ||
| Tokuyama | 8,000 | 40,167 |
26
| Common Stocks (continued) | Shares | Value ($) | ||
| Japan (continued) | ||||
| Tokyo Broadcasting System | 1,700 | 29,925 | ||
| Tokyo Electric Power | 49,472 | 1,422,743 | ||
| Tokyo Electron | 6,900 | 228,484 | ||
| Tokyo Gas | 96,000 | 418,825 | ||
| Tokyo Steel Manufacturing | 3,500 | 27,019 | ||
| Tokyo Tatemono | 11,000 | 45,024 | ||
| Tokyu | 44,820 | 175,662 | ||
| Tokyu Land | 16,000 | 44,809 | ||
| TonenGeneral Sekiyu | 12,000 | 101,539 | ||
| Toppan Printing | 20,000 | 146,861 | ||
| Toray Industries | 56,000 | 259,955 | ||
| Toshiba | 123,000 | 444,031 | ||
| Tosoh | 20,000 | 40,587 | ||
| TOTO | 11,000 | 78,294 | ||
| Toyo Seikan Kaisha | 7,200 | 90,076 | ||
| Toyo Suisan Kaisha | 4,000 | 102,825 | ||
| Toyoda Gosei | 2,600 | 36,653 | ||
| Toyota Boshoku | 2,400 | 21,898 | ||
| Toyota Industries | 7,400 | 169,517 | ||
| Toyota Motor | 112,014 | 4,422,972 | ||
| Toyota Tsusho | 8,300 | 79,431 | ||
| Trend Micro | 4,000 | 99,176 | ||
| Ube Industries | 46,600 | 96,723 | ||
| UNICHARM | 1,600 | 114,361 | ||
| UNY | 7,000 | 55,036 | ||
| Ushio | 5,500 | 74,771 | ||
| USS | 990 | 60,817 | ||
| West Japan Railway | 70 | 310,485 | ||
| Yahoo! Japan | 627 | 205,598 | ||
| Yakult Honsha | 4,000 | 101,126 | ||
| Yamada Denki | 3,530 | 191,601 | ||
| Yamaguchi Financial Group | 8,000 | 75,979 | ||
| Yamaha | 6,800 | 65,529 | ||
| Yamaha Motor | 7,400 | 81,399 | ||
| Yamato Holdings | 15,400 | 169,651 | ||
| Yamato Kogyo | 1,400 | 32,910 |
| The Fund 27 |
| S TAT E M E N T O F I N V E S T M E N T S (continued) |
| Common Stocks (continued) | Shares | Value ($) | ||
| Japan (continued) | ||||
| Yamazaki Baking | 6,000 | 80,481 | ||
| Yaskawa Electric | 9,000 | 39,294 | ||
| Yokogawa Electric | 11,500 | 53,119 | ||
| 76,147,729 | ||||
| Luxembourg—.4% | ||||
| ArcelorMittal | 35,464 | 901,879 | ||
| Millicom International Cellular | 2,582 | 93,084 | ||
| Reinet Investments | 2,735 | a | 28,027 | |
| SES | 12,261 | 218,288 | ||
| 1,241,278 | ||||
| Netherlands—2.4% | ||||
| Aegon | 55,564 | 223,564 | ||
| Akzo Nobel | 10,890 | 447,760 | ||
| ASML Holding | 17,382 | 299,762 | ||
| Corio | 1,591 | 84,290 | ||
| European Aeronautic Defence and Space | 13,621 | 223,502 | ||
| Fugro | 2,190 | 77,174 | ||
| Heineken | 9,807 | 327,435 | ||
| Heineken Holding | 4,746 | 142,631 | ||
| ING Groep | 77,877 | 714,472 | ||
| Koninklijke Ahold | 47,694 | 506,024 | ||
| Koninklijke Boskalis Westminster | 2,390 | 78,039 | ||
| Koninklijke DSM | 5,771 | 158,872 | ||
| KONINKLIJKE KPN | 73,439 | 1,022,974 | ||
| Koninklijke Philips Electronics | 41,976 | 763,819 | ||
| Randstad Holding | 4,124 | 79,252 | ||
| Reed Elsevier | 25,149 | 332,807 | ||
| SBM Offshore | 5,383 | 93,413 | ||
| SNS Reaal | 4,742 | 34,275 | ||
| STMicroelectronics | 27,564 | 223,522 | ||
| TNT | 15,273 | 315,682 | ||
| TomTom | 2,287 | a | 17,241 | |
| Unilever | 66,372 | 1,585,636 | ||
| Wolters Kluwer | 12,468 | 218,496 | ||
| 7,970,642 |
28
| Common Stocks (continued) | Shares | Value ($) | ||
| New Zealand—.1% | ||||
| Auckland International Airport | 38,406 | 40,702 | ||
| Contact Energy | 12,150 | 50,828 | ||
| Fletcher Building | 23,297 | 77,922 | ||
| Sky City Entertainment Group | 20,093 | 38,328 | ||
| Telecom of New Zealand | 79,333 | 109,533 | ||
| 317,313 | ||||
| Norway—.7% | ||||
| Acergy | 7,144 | 47,010 | ||
| Aker Solutions | 6,487 | 35,122 | ||
| DNB NOR | 28,325 | 161,985 | ||
| Frontline | 1,991 | 60,923 | ||
| Norsk Hydro | 25,958 | 107,962 | ||
| Orkla | 33,359 | 220,504 | ||
| Petroleum Geo-Services | 6,756 | a | 33,267 | |
| Renewable Energy | 5,800 | a | 54,190 | |
| SeaDrill | 11,003 | 104,601 | ||
| StatoilHydro | 53,160 | 1,032,846 | ||
| Storebrand | 16,254 | 37,906 | ||
| Telenor | 33,633 | 199,334 | ||
| Yara International | 8,133 | 168,224 | ||
| 2,263,874 | ||||
| Portugal—.3% | ||||
| Banco BPI | 9,520 | 19,556 | ||
| Banco Comercial Portugues, Cl. R | 88,548 | 102,515 | ||
| Banco Espirito Santo | 8,861 | 84,272 | ||
| Brisa | 11,976 | 91,391 | ||
| Cimpor-Cimentos de Portugal | 12,398 | 56,613 | ||
| Energias de Portugal | 76,062 | 259,067 | ||
| Jeronimo Martins | 9,924 | 50,475 | ||
| Portugal Telecom | 26,094 | 170,175 | ||
| Sonae | 27,207 | 16,560 | ||
| Zon Multimedia Servicos de Telecomunicacoes | 8,174 | 41,450 | ||
| 892,074 | ||||
| Singapore—1.0% | ||||
| Ascendas Real Estate Investment Trust | 38,700 | 41,721 |
| The Fund 29 |
| S TAT E M E N T O F I N V E S T M E N T S (continued) |
| Common Stocks (continued) | Shares | Value ($) | ||
| Singapore (continued) | ||||
| CapitaCommercial Trust | 38,000 | 25,734 | ||
| CapitaLand | 65,000 | 128,306 | ||
| CapitaMall Trust | 42,000 | 54,959 | ||
| City Developments | 19,000 | 82,629 | ||
| ComfortDelgro | 64,700 | 52,826 | ||
| Cosco Singapore | 30,000 | 16,142 | ||
| DBS Group Holdings | 47,059 | 360,045 | ||
| Fraser and Neave | 42,150 | 78,906 | ||
| Genting International | 79,527 | a | 19,532 | |
| Golden Agri-Resources | 186,000 | 24,183 | ||
| Jardine Cycle & Carriage | 5,422 | 34,429 | ||
| Keppel | 50,000 | 153,926 | ||
| Keppel Land | 14,000 | 17,866 | ||
| Neptune Orient Lines | 14,000 | 11,740 | ||
| Noble Group | 52,800 | 38,124 | ||
| Olam International | 54,300 | 47,145 | ||
| Oversea-Chinese Banking | 102,942 | 345,056 | ||
| Parkway Holdings | 27,000 | 28,914 | ||
| SembCorp Industries | 41,254 | 69,534 | ||
| SembCorp Marine | 32,000 | 38,992 | ||
| Singapore Airlines | 22,733 | 171,404 | ||
| Singapore Exchange | 35,000 | 123,071 | ||
| Singapore Press Holdings | 64,075 | 139,232 | ||
| Singapore Technologies Engineering | 50,000 | 79,097 | ||
| Singapore Telecommunications | 315,951 | 531,280 | ||
| United Overseas Bank | 50,112 | 446,036 | ||
| UOL Group | 22,111 | 28,574 | ||
| Venture | 9,000 | 32,708 | ||
| Wilmar International | 36,000 | 60,800 | ||
| Yanlord Land Group | 17,000 | 8,625 | ||
| 3,291,536 | ||||
| Spain—3.9% | ||||
| Abertis Infraestructuras | 11,028 | 187,247 | ||
| Acciona | 1,078 | 100,813 | ||
| Acerinox | 5,729 | 70,976 | ||
| ACS Actividades de Construccion y Servicios | 8,042 | 295,325 | ||
| Banco Bilbao Vizcaya Argentaria | 144,834 | 1,651,079 |
30
| Common Stocks (continued) | Shares | Value ($) | ||
| Spain (continued) | ||||
| Banco de Sabadell | 37,040 | 249,874 | ||
| Banco Popular Espanol | 31,816 | 285,235 | ||
| Banco Santander | 258,958 | 2,748,480 | ||
| Bankinter | 11,084 | 117,782 | ||
| Cintra Concesiones de | ||||
| Infraestructuras de Transporte | 8,171 | 71,804 | ||
| Criteria Caixacorp | 34,586 | 110,519 | ||
| Enagas | 7,508 | 144,998 | ||
| Fomento de Construcciones y Contratas | 1,790 | 70,364 | ||
| Gamesa Corp Tecnologica | 7,374 | 119,221 | ||
| Gas Natural SDG | 4,231 | 128,871 | ||
| Gestevision Telecinco | 5,695 | 45,207 | ||
| Grifols | 5,546 | 109,006 | ||
| Grupo Ferrovial | 2,813 | 85,680 | ||
| Iberdrola | 142,435 | 1,016,864 | ||
| Iberdrola Renovables | 31,737 | 95,379 | ||
| Iberia Lineas Aereas de Espana | 23,577 | 55,010 | ||
| Inditex | 8,745 | 292,310 | ||
| Indra Sistemas | 3,965 | 76,323 | ||
| Mapfre | 27,823 | 87,497 | ||
| Promotora de Informaciones | 2,270 | 8,779 | ||
| Red Electrica | 4,407 | 191,232 | ||
| Repsol | 29,178 | 549,069 | ||
| Sacyr Vallehermoso | 3,126 | 28,540 | ||
| Sacyr Vallehermoso (Rights) | 3,126 | a | 1,982 | |
| Telefonica | 174,487 | 3,190,554 | ||
| Union Fenosa | 15,026 | 316,293 | ||
| Zardoya Otis | 5,579 | 104,702 | ||
| 12,607,015 | ||||
| Sweden—1.9% | ||||
| Alfa Laval | 16,592 | 116,546 | ||
| Assa Abloy, Cl. B | 13,393 | 146,912 | ||
| Atlas Copco, Cl. A | 27,032 | 220,225 | ||
| Atlas Copco, Cl. B | 15,166 | 110,907 | ||
| Boliden | 11,404 | 27,067 | ||
| Electrolux, Ser. B | 9,739 | 87,151 | ||
| Getinge, Cl. B | 7,895 | 108,887 |
The Fund 31
| S TAT E M E N T O F I N V E S T M E N T S (continued) |
| Common Stocks (continued) | Shares | Value ($) | ||
| Sweden (continued) | ||||
| Hennes & Mauritz, Cl. B | 20,866 | 738,861 | ||
| Holmen, Cl. B | 1,992 | 55,713 | ||
| Husqvarna, Cl. B | 10,542 | 72,021 | ||
| Investor, Cl. B | 18,302 | 268,855 | ||
| Lundin Petroleum | 8,981 | a | 41,826 | |
| Modern Times Group, Cl. B | 1,823 | 38,591 | ||
| Nordea Bank | 84,915 | 664,552 | ||
| Sandvik | 39,471 | 250,667 | ||
| Scania, Cl. B | 13,938 | 111,762 | ||
| Securitas, Cl. B | 12,514 | 118,004 | ||
| Skandinaviska Enskilda Banken, Cl. A | 18,814 | 179,222 | ||
| Skanska, Cl. B | 15,616 | 134,233 | ||
| SKF, Cl. B | 15,765 | 141,076 | ||
| Ssab Svenskt Stal, Ser. A | 6,728 | 66,681 | ||
| Ssab Svenskt Stal, Ser. B | 3,205 | 28,578 | ||
| Svenska Cellulosa, Cl. B | 21,762 | 158,445 | ||
| Svenska Handelsbanken, Cl. A | 18,870 | 337,723 | ||
| Swedbank, Cl. A | 15,697 | 125,363 | ||
| Swedish Match | 10,491 | 142,335 | ||
| Tele2, Cl. B | 13,336 | 112,068 | ||
| Telefonaktiebolaget LM Ericsson, Cl. B | 120,886 | 837,499 | ||
| TeliaSonera | 89,475 | 388,001 | ||
| Volvo, Cl. B | 45,073 | 230,152 | ||
| 6,059,923 | ||||
| Switzerland—8.2% | ||||
| ABB | 89,629 | a | 1,147,171 | |
| Actelion | 4,116 | a | 214,953 | |
| Adecco | 4,927 | 169,316 | ||
| Aryzta | 3,024 | a | 106,146 | |
| Baloise Holding | 2,310 | 121,922 | ||
| Compagnie Financiere Richemont | 19,983 | 417,093 | ||
| Credit Suisse Group | 42,555 | 1,581,900 | ||
| EFG International | 2,389 | 50,723 | ||
| Geberit | 1,556 | 159,856 | ||
| Givaudan | 256 | 172,924 | ||
| Holcim | 8,636 | 486,124 | ||
| Julius Baer Holding | 8,295 | 319,713 |
32
| Common Stocks (continued) | Shares | Value ($) | ||
| Switzerland (continued) | ||||
| Kuehne & Nagel International | 2,071 | 123,847 | ||
| Lindt & Spruengli | 38 | 81,072 | ||
| Logitech International | 7,485 | a | 110,733 | |
| Lonza Group | 1,965 | 161,500 | ||
| Nestle | 159,598 | 6,148,632 | ||
| Nobel Biocare Holding | 4,982 | 84,494 | ||
| Novartis | 96,579 | 4,828,743 | ||
| OC Oerlikon | 259 | a | 19,801 | |
| Pargesa Holding | 1,116 | 84,557 | ||
| Roche Holding | 28,522 | 4,317,186 | ||
| Schindler Holding | 2,183 | 93,447 | ||
| SGS | 180 | 175,524 | ||
| Sonova Holding | 1,720 | 70,682 | ||
| Straumann Holding | 343 | 57,556 | ||
| Sulzer | 1,068 | 62,176 | ||
| Swatch Group | 3,248 | 249,077 | ||
| Swiss Life Holding | 1,495 | a | 133,111 | |
| Swiss Reinsurance | 14,041 | 574,118 | ||
| Swisscom | 934 | 282,267 | ||
| Syngenta | 4,147 | 766,878 | ||
| Synthes | 2,393 | 305,873 | ||
| UBS | 119,533 | a | 1,980,193 | |
| Zurich Financial Services | 5,930 | 1,182,903 | ||
| 26,842,211 | ||||
| United Kingdom—21.1% | ||||
| 3i Group | 15,226 | 132,847 | ||
| AMEC | 12,597 | 105,228 | ||
| Anglo American | 53,839 | 1,332,687 | ||
| Antofagasta | 14,506 | 88,947 | ||
| Associated British Foods | 15,157 | 170,327 | ||
| AstraZeneca | 59,541 | 2,530,139 | ||
| Aviva | 106,112 | 630,935 | ||
| BAE Systems | 143,647 | 809,437 | ||
| Balfour Beatty | 19,888 | 80,013 | ||
| Barclays | 331,683 | 958,751 | ||
| Berkeley Group Holdings | 4,303 | a | 51,796 | |
| BG Group | 136,087 | 2,007,520 |
| The Fund 33 |
| S TAT E M E N T O F I N V E S T M E N T S (continued) |
| Common Stocks (continued) | Shares | Value ($) | ||
| United Kingdom (continued) | ||||
| BHP Billiton | 89,820 | 1,528,178 | ||
| BP | 764,388 | 6,264,817 | ||
| British Airways | 20,594 | 45,287 | ||
| British American Tobacco | 70,387 | 1,933,354 | ||
| British Energy Group | 42,421 | 507,207 | ||
| British Land | 20,120 | 200,254 | ||
| British Sky Broadcasting Group | 45,902 | 280,718 | ||
| BT Group | 315,492 | 586,727 | ||
| Bunzl | 13,319 | 134,070 | ||
| Burberry Group | 16,747 | 74,412 | ||
| Cable & Wireless | 100,100 | 198,773 | ||
| Cadbury | 54,184 | 497,270 | ||
| Cairn Energy | 5,407 | a | 140,131 | |
| Capita Group | 24,317 | 250,670 | ||
| Carnival | 6,909 | 151,261 | ||
| Carphone Warehouse Group | 16,486 | 35,694 | ||
| Centrica | 150,333 | 739,629 | ||
| Cobham | 44,887 | 136,349 | ||
| Compass Group | 76,258 | 354,547 | ||
| Daily Mail & General Trust, Cl. A | 10,993 | 51,687 | ||
| Diageo | 103,943 | 1,597,159 | ||
| Drax Group | 14,070 | 130,831 | ||
| Enterprise Inns | 20,106 | 31,512 | ||
| Eurasian Natural Resources | 12,094 | 60,430 | ||
| Experian | 41,933 | 231,376 | ||
| Firstgroup | 19,639 | 129,544 | ||
| Friends Provident | 96,104 | 108,696 | ||
| G4S | 50,586 | 153,006 | ||
| GKN | 25,766 | 49,437 | ||
| GlaxoSmithKline | 222,052 | 4,294,586 | ||
| Hammerson | 11,948 | 137,065 | ||
| Hays | 50,437 | 55,619 | ||
| HBOS | 206,344 | 331,065 | ||
| Home Retail Group | 38,009 | 120,830 | ||
| HSBC Holdings | 487,279 | 5,999,363 | ||
| ICAP | 20,326 | 100,824 | ||
| IMI | 13,028 | 57,887 |
34
| Common Stocks (continued) | Shares | Value ($) | ||
| United Kingdom (continued) | ||||
| Imperial Tobacco Group | 41,508 | 1,116,654 | ||
| Inchcape | 17,639 | 22,515 | ||
| Intercontinental Hotels Group | 10,871 | 92,478 | ||
| International Power | 60,466 | 216,400 | ||
| Invensys | 36,965 | a | 92,217 | |
| Investec | 18,771 | 71,273 | ||
| ITV | 138,441 | 66,546 | ||
| J Sainsbury | 43,552 | 198,792 | ||
| Johnson Matthey | 8,443 | 127,141 | ||
| Kazakhmys | 7,534 | 34,754 | ||
| Kingfisher | 100,222 | 184,604 | ||
| Ladbrokes | 24,809 | 63,234 | ||
| Land Securities Group | 18,845 | 332,195 | ||
| Legal & General Group | 248,619 | 286,415 | ||
| Liberty International | 10,965 | 121,713 | ||
| Lloyds TSB Group | 242,256 | 774,236 | ||
| Logica | 59,228 | 65,792 | ||
| London Stock Exchange Group | 5,370 | 48,459 | ||
| Lonmin | 6,315 | 117,033 | ||
| Man Group | 68,932 | 396,500 | ||
| Marks & Spencer Group | 66,192 | 234,219 | ||
| Meggitt | 23,721 | 52,029 | ||
| Mitchells & Butlers | 20,100 | 50,744 | ||
| Mondi | 17,885 | 64,875 | ||
| National Express Group | 4,590 | 42,273 | ||
| National Grid | 101,624 | 1,155,135 | ||
| Next | 7,537 | 128,355 | ||
| Old Mutual | 191,726 | 155,200 | ||
| Pearson | 33,246 | 326,599 | ||
| Persimmon | 14,743 | 71,463 | ||
| Prudential | 99,348 | 505,641 | ||
| Reckitt Benckiser Group | 24,645 | 1,039,302 | ||
| Reed Elsevier | 44,169 | 388,944 | ||
| Rentokil Initial | 71,091 | 51,689 | ||
| Rexam | 25,044 | 151,034 | ||
| Rio Tinto | 40,595 | 1,878,530 | ||
| Rolls-Royce Group | 74,881 | a | 394,725 |
The Fund 35
| S TAT E M E N T O F I N V E S T M E N T S (continued) |
| Common Stocks (continued) | Shares | Value ($) | ||
| United Kingdom (continued) | ||||
| Royal Bank of Scotland Group | 651,383 | 710,415 | ||
| Royal Dutch Shell, Cl. A | 144,033 | 3,949,266 | ||
| Royal Dutch Shell, Cl. B | 111,289 | 2,983,123 | ||
| RSA Insurance Group | 126,377 | 280,765 | ||
| SABMiller | 36,072 | 573,214 | ||
| Sage Group | 54,097 | 151,214 | ||
| Schroders | 5,354 | 68,427 | ||
| Scottish & Southern Energy | 34,663 | 679,919 | ||
| Segro | 19,989 | 90,593 | ||
| Serco Group | 21,011 | 125,439 | ||
| Severn Trent | 9,908 | 219,320 | ||
| Shire | 22,483 | 297,516 | ||
| Smith & Nephew | 34,762 | 319,587 | ||
| Smiths Group | 15,899 | 205,124 | ||
| Stagecoach Group | 24,823 | 74,199 | ||
| Standard Chartered | 57,999 | 951,172 | ||
| Standard Life | 87,783 | 338,631 | ||
| Tate & Lyle | 17,848 | 106,195 | ||
| Tesco | 319,292 | 1,750,944 | ||
| Thomas Cook Group | 18,592 | 50,467 | ||
| Thomson Reuters | 7,444 | 129,056 | ||
| Tomkins | 32,482 | 60,093 | ||
| Tui Travel | 22,531 | 68,586 | ||
| Tullow Oil | 28,867 | 244,402 | ||
| Unilever | 52,977 | 1,194,938 | ||
| United Business Media | 8,737 | 56,714 | ||
| United Utilities Group | 28,055 | 317,081 | ||
| Vedanta Resources | 5,296 | 72,734 | ||
| Vodafone Group | 2,157,353 | 4,151,504 | ||
| Whitbread | 7,152 | 103,251 |
36
| Common Stocks (continued) | Shares | Value ($) | ||
| United Kingdom (continued) | ||||
| William Hill | 13,032 | 40,218 | ||
| WM Morrison Supermarkets | 99,138 | 422,479 | ||
| Wolseley | 28,420 | 155,208 | ||
| WPP Group | 46,661 | 282,721 | ||
| Xstrata | 25,431 | 433,499 | ||
| 69,376,614 | ||||
| Total Common Stocks | ||||
| (cost $425,239,108) | 315,389,379 | |||
| Preferred Stocks—.4% | ||||
| Germany—.4% | ||||
| Bayerische Motoren Werke | 2,353 | 47,203 | ||
| Fresenius | 3,320 | 210,497 | ||
| Henkel & Co. | 7,493 | 213,879 | ||
| Porsche Automobil Holding | 3,681 | 323,892 | ||
| ProSieben Sat.1 Media | 2,639 | 7,831 | ||
| RWE | 1,511 | 94,767 | ||
| Volkswagen | 4,100 | 252,153 | ||
| 1,150,222 | ||||
| Italy—.0% | ||||
| IFI-Istituto Finanziario Industriale | 1,887 a | 16,271 | ||
| Unipol Gruppo Finanziario | 38,571 | 41,574 | ||
| 57,845 | ||||
| Total Preferred Stocks | ||||
| (cost $1,590,120) | 1,208,067 | |||
| Principal | ||||
| Short-Term Investments—.5% | Amount ($) | Value ($) | ||
| U.S. Treasury Bills; | ||||
| 0.22%, 12/18/08 | ||||
| (cost $1,654,528) | 1,655,000 b | 1,654,125 | ||
| The Fund 37 |
| S TAT E M E N T O F I N V E S T M E N T S (continued) |
| Other Investment—1.5% | Shares | Value ($) | ||
| Registered Investment Company; | ||||
| Dreyfus Institutional Preferred Plus Money Market Fund | ||||
| (cost $4,800,000) | 4,800,000 c | 4,800,000 | ||
| Total Investments (cost $433,283,756) | 98.8% | 323,051,571 | ||
| Cash and Receivables (Net) | 1.2% | 3,879,429 | ||
| Net Assets | 100.0% | 326,931,000 | ||
| a Non-income producing security. | ||||
| b Held by a broker as collateral for open financial futures positions. | ||||
| c Investment in affiliated money market mutual fund. | ||||
| Portfolio Summary (Unaudited)† | ||||||
| Value (%) | Value (%) | |||||
| Banking | 12.3 | Consumer Durables | 2.5 | |||
| Energy | 8.8 | Transportation | 2.5 | |||
| Materials | 8.2 | Food Retail | 2.2 | |||
| Pharmaceuticals & Biotechnology | 7.8 | Short-Term/Money Market Investment | 2.0 | |||
| Capital Goods | 6.8 | Media | 1.5 | |||
| Utilities | 6.7 | Software & Services | 1.4 | |||
| Food, Beverage & Tobacco | 6.4 | Retailing | 1.2 | |||
| Telecommunications | 6.1 | Health Care | 1.0 | |||
| Automobiles & Components | 4.9 | Household & Personal Products | 1.0 | |||
| Insurance | 4.1 | Commercial & Professional Services | .8 | |||
| Diversified Financials | 3.8 | Hotels, Restaurants & Leisure | .8 | |||
| Technology Hardware & Equipment | 3.0 | Semiconductors & Equipment | .4 | |||
| Real Estate | 2.6 | 98.8 | ||||
| † Based on net assets. | ||||||
| See notes to financial statements. | ||||||
38
| STATEMENT OF FINANCIAL FUTURES O c t o b e r 3 1 , 2 0 0 8 |
| Market Value | Unrealized | |||||||
| Covered by | Appreciation | |||||||
| Contracts | Contracts ($) | Expiration | at 10/31/2008 ($) | |||||
| Financial Futures Long | ||||||||
| DJ Euro Stoxx 50 | 133 | 4,371,438 | December 2008 | 408,351 | ||||
| FTSE 100 | 40 | 2,829,814 | December 2008 | 278,152 | ||||
| TOPIX | 27 | 2,344,484 | December 2008 | 125,433 | ||||
| 811,936 | ||||||||
| See notes to financial statements. | ||||||||
| The Fund 39 |
| STATEMENT OF ASSETS AND LIABILITIES O c t o b e r 3 1 , 2 0 0 8 |
| Cost | Value | |||
| Assets ($): | ||||
| Investments in securities—See Statement of Investments: | ||||
| Unaffiliated issuers | 428,483,756 | 318,251,571 | ||
| Affiliated issuers | 4,800,000 | 4,800,000 | ||
| Cash | 1,720,439 | |||
| Cash denominated in foreign currencies | 8,835,671 | 8,759,711 | ||
| Dividends and interest receivable | 1,239,792 | |||
| Receivable for shares of Common Stock subscribed | 1,159,083 | |||
| Receivable for investment securities sold | 644,533 | |||
| Receivable for futures variation margin—Note 4 | 51,675 | |||
| Unrealized appreciation on forward | ||||
| currency exchange contracts—Note 4 | 62,669 | |||
| 336,689,473 | ||||
| Liabilities ($): | ||||
| Due to The Dreyfus Corporation and affiliates—Note 3(b) | 164,838 | |||
| Payable for investment securities purchased | 9,115,828 | |||
| Payable for shares of Common Stock redeemed | 376,147 | |||
| Unrealized depreciation on forward currency | ||||
| exchange contracts—Note 4 | 101,660 | |||
| 9,758,473 | ||||
| Net Assets ($) | 326,931,000 | |||
| Composition of Net Assets ($): | ||||
| Paid-in capital | 434,172,205 | |||
| Accumulated undistributed investment income—net | 8,028,568 | |||
| Accumulated net realized gain (loss) on investments | (5,684,785) | |||
| Accumulated net unrealized appreciation (depreciation) on | ||||
| investments and foreign currency transactions (including | ||||
| $811,936 net unrealized appreciation on financial futures) | (109,584,988) | |||
| Net Assets ($) | 326,931,000 | |||
| Shares Outstanding | ||||
| (200 million shares of $.001 par value Common Stock authorized) | 28,395,991 | |||
| Net Asset Value, offering and redemption price per share—Note 3(c) ($) | 11.51 | |||
| See notes to financial statements. | ||||
40
| STATEMENT OF OPERATIONS Ye a r E n d e d O c t o b e r 3 1 , 2 0 0 8 |
| Investment Income ($): | ||
| Income: | ||
| Dividends (net of $1,513,363 foreign taxes withheld at source): | ||
| Unaffiliated issuers | 15,429,511 | |
| Affiliated issuers | 169,262 | |
| Interest | 113,783 | |
| Total Income | 15,712,556 | |
| Expenses: | ||
| Management fee—Note 3(a) | 1,654,193 | |
| Shareholder servicing costs—Note 3(b) | 1,181,566 | |
| Directors’ fees—Note 3(a) | 27,477 | |
| Loan commitment fees—Note 2 | 5,176 | |
| Total Expenses | 2,868,412 | |
| Less—Directors’ fees reimbursed | ||
| by the Manager—Note 3(a) | (27,477) | |
| Net Expenses | 2,840,935 | |
| Investment Income—Net | 12,871,621 | |
| Realized and Unrealized Gain (Loss) on Investments—Note 4 ($): | ||
| Net realized gain (loss) on investments and foreign currency transactions | 8,409,226 | |
| Net realized gain (loss) on financial futures | (5,550,176) | |
| Net realized gain (loss) on forward currency exchange contracts | (666,926) | |
| Net Realized Gain (Loss) | 2,192,124 | |
| Net unrealized appreciation (depreciation) on investments | ||
| and foreign currency transactions (including $727,199 | ||
| net unrealized appreciation on financial futures) | (280,519,632) | |
| Net Realized and Unrealized Gain (Loss) on Investments | (278,327,508) | |
| Net (Decrease) in Net Assets Resulting from Operations | (265,455,887) | |
| See notes to financial statements. | ||
| The Fund 41 |
STATEMENT OF CHANGES IN NET ASSETS
| Year Ended October 31, | ||||
| 2008 | 2007 | |||
| Operations ($): | ||||
| Investment income—net | 12,871,621 | 9,709,611 | ||
| Net realized gain (loss) on investments | 2,192,124 | 6,604,846 | ||
| Net unrealized appreciation | ||||
| (depreciation) on investments | (280,519,632) | 80,021,875 | ||
| Net Increase (Decrease) in Net Assets | ||||
| Resulting from Operations | (265,455,887) | 96,336,332 | ||
| Dividends to Shareholders from ($): | ||||
| Investment income—net | (12,808,881) | (7,690,026) | ||
| Capital Stock Transactions ($): | ||||
| Net proceeds from shares sold | 201,734,295 | 256,856,349 | ||
| Dividends reinvested | 11,705,486 | 6,942,005 | ||
| Cost of shares redeemed | (169,897,255) | (146,399,902) | ||
| Increase (Decrease) in Net Assets | ||||
| from Capital Stock Transactions | 43,542,526 | 117,398,452 | ||
| Total Increase (Decrease) in Net Assets | (234,722,242) | 206,044,758 | ||
| Net Assets ($): | ||||
| Beginning of Period | 561,653,242 | 355,608,484 | ||
| End of Period | 326,931,000 | 561,653,242 | ||
| Undistributed investment income—net | 8,028,568 | 8,207,479 | ||
| Capital Share Transactions (Shares): | ||||
| Shares sold | 11,936,731 | 12,890,986 | ||
| Shares issued for dividends reinvested | 581,205 | 371,051 | ||
| Shares redeemed | (9,673,592) | (7,438,599) | ||
| Net Increase (Decrease) in Shares Outstanding | 2,844,344 | 5,823,438 | ||
| See notes to financial statements. | ||||
42
FINANCIAL HIGHLIGHTS
The following table describes the performance for the fiscal periods indicated. Total return shows how much your investment in the fund would have increased (or decreased) during each period, assuming you had reinvested all dividends and distributions.These figures have been derived from the fund’s financial statements.
| Year Ended October 31, | ||||||||||
| 2008 | 2007 | 2006 | 2005 | 2004 | ||||||
| Per Share Data ($): | ||||||||||
| Net asset value, beginning of period | 21.98 | 18.03 | 14.47 | 12.57 | 10.91 | |||||
| Investment Operations: | ||||||||||
| Investment income—neta | .49 | .43 | .38 | .29 | .25 | |||||
| Net realized and unrealized | ||||||||||
| gain (loss) on investments | (10.47) | 3.90 | 3.45 | 1.88 | 1.72 | |||||
| Total from Investment Operations | (9.98) | 4.33 | 3.83 | 2.17 | 1.97 | |||||
| Distributions: | ||||||||||
| Dividends from investment income—net | (.49) | (.38) | (.27) | (.27) | (.31) | |||||
| Net asset value, end of period | 11.51 | 21.98 | 18.03 | 14.47 | 12.57 | |||||
| Total Return (%) | (46.37) | 24.40 | 26.83 | 17.40 | 18.40 | |||||
| Ratios/Supplemental Data (%): | ||||||||||
| Ratio of total expenses | ||||||||||
| to average net assets | .61 | .61 | .60 | .60 | .60 | |||||
| Ratio of net expenses | ||||||||||
| to average net assets | .60 | .60 | .60 | .60 | .60 | |||||
| Ratio of net investment income | ||||||||||
| to average net assets | 2.72 | 2.20 | 2.30 | 2.07 | 2.07 | |||||
| Portfolio Turnover Rate | 7.17 | 3.31 | 4.12 | 3.46 | 14.80 | |||||
| Net Assets, end of period ($ x 1,000) | 326,931 | 561,653 | 355,608 | 200,674 | 117,116 | |||||
| a Based on average shares outstanding at each month end. | ||||||||||
| See notes to financial statements. | ||||||||||
| The Fund 43 |
NOTES TO FINANCIAL STATEMENTS
NOTE 1—Significant Accounting Policies:
Dreyfus International Stock Index Fund (the “fund”) is a separate non-diversified series of Dreyfus Index Funds, Inc. (the “Company”) which is registered under the Investment Company Act of 1940, as amended (the “Act”), as an open-end management investment company and operates as a series company currently offering three series, including the fund.The fund’s investment objective is to match the performance of the Morgan Stanley Capital International Europe,Australasia, Far East Free Index (MSCI EAFE Free Index). The Dreyfus Corporation (the “Manager” or “Dreyfus”), a wholly-owned subsidiary of The Bank of New York Mellon Corporation (“BNY Mellon”), serves as the fund’s investment adviser. MBSC Securities Corporation (the “Distributor”), a wholly-owned subsidiary of the Manager, is the distributor of the fund’s shares, which are sold to the public without a sales charge.
Effective July 1, 2008, BNY Mellon has reorganized and consolidated a number of its banking and trust company subsidiaries. As a result of the reorganization, any services previously provided to the fund by Mellon Bank, N.A. or Mellon Trust of New England, N.A. are now provided by The Bank of New York, which has changed its name to The Bank of New York Mellon.
The Company accounts separately for the assets, liabilities and operations of each series. Expenses directly attributable to each series are charged to that series’ operations; expenses which are applicable to all series are allocated among them on a pro rata basis.
The fund’s financial statements are prepared in accordance with U.S. generally accepted accounting principles, which requires the use of management estimates and assumptions. Actual results could differ from those estimates.
The fund enters into contracts that contain a variety of indemnifications. The fund’s maximum exposure under these arrangements is unknown.The fund does not anticipate recognizing any loss related to these arrangements.
44
(a) Portfolio valuation: Investments in securities are valued at the last sales price on the securities exchange or national securities market on which such securities are primarily traded. Securities listed on the National Market System for which market quotations are available are valued at the official closing price or, if there is no official closing price that day, at the last sales price. Securities not listed on an exchange or the national securities market, or securities for which there were no transactions, are valued at the average of the most recent bid and asked prices, except for open short positions, where the asked price is used for valuation purposes. Bid price is used when no asked price is available. Registered investment companies that are not traded on an exchange are valued at their net asset value.When market quotations or official closing prices are not readily available, or are determined not to reflect accurately fair value, such as when the value of a security has been significantly affected by events after the close of the exchange or market on which the security is principally traded (for example, a foreign exchange or market), but before the fund calculates its net asset value, the fund may value these investments at fair value as determined in accordance with the procedures approved by the Board of Directors. Fair valuing of securities may be determined with the assistance of a pricing service using calculations based on indices of domestic securities and other appropriate indicators, such as prices of relevant ADRs and futures contracts. For other securities that are fair valued by the Board of Directors, certain factors may be considered such as: fundamental analytical data, the nature and duration of restrictions on disposition, an evaluation of the forces that influence the market in which the securities are purchased and sold, and public trading in similar securities of the issuer or comparable issuers. Financial futures are valued at the last sales price. Investments denominated in foreign currencies are translated to U.S. dollars at the prevailing rates of exchange. Forward currency exchange contracts are valued at the forward rate.
The Financial Accounting Standards Board (“FASB”) released Statement of Financial Accounting Standards No. 157 “Fair Value
| The Fund 45 |
N O T E S T O F I N A N C I A L S TAT E M E N T S (continued)
Measurements” (“FAS 157”). FAS 157 establishes an authoritative definition of fair value, sets out a framework for measuring fair value, and requires additional disclosures about fair-value measurements. The application of FAS 157 is required for fiscal years beginning after November 15, 2007 and interim periods within those fiscal years. Management does not believe that the application of this standard will have a material impact on the financial statements of the fund.
(b) Foreign currency transactions: The fund does not isolate that portion of the results of operations resulting from changes in foreign exchange rates on investments from the fluctuations arising from changes in market prices of securities held. Such fluctuations are included with the net realized and unrealized gain or loss on investments.
Net realized foreign exchange gains or losses arise from sales and maturities of short-term securities, sales of foreign currencies, currency gains or losses realized on securities transactions and the difference between the amounts of dividends, interest and foreign withholding taxes recorded on the fund’s books and the U.S. dollar equivalent of the amounts actually received or paid. Net unrealized foreign exchange gains and losses arise from changes in the value of assets and liabilities other than investments in securities, resulting from changes in exchange rates. Such gains and losses are included with net realized and unrealized gain or loss on investments.
(c) Securities transactions and investment income: Securities transactions are recorded on a trade date basis. Realized gains and losses from securities transactions are recorded on the identified cost basis. Dividend income is recognized on the ex-dividend date and interest income, including, where applicable, accretion of discount and amortization of premium on investments is recognized on the accrual basis.
Investing in foreign markets may involve special risks and considerations not typically associated with investing in the U.S. These risks include revaluation of currencies, high rates of inflation, repatriation restrictions on income and capital, and adverse political and economic
46
developments. Moreover, securities issued in these markets may be less liquid, subject to government ownership controls and delayed settlements, and their prices may be more volatile than those of comparable securities in the U.S.
(d) Affiliated issuers: Investments in other investment companies advised by the Manager are defined as “affiliated” in the Act.
(e) Dividends to shareholders: Dividends are recorded on the ex-dividend date. Dividends from investment income-net and dividends from net realized capital gains, if any, are normally declared and paid annually, but the fund may make distributions on a more frequent basis to comply with the distribution requirements of the Internal Revenue Code of 1986, as amended (the “Code”).To the extent that net realized capital gains can be offset by capital loss carryovers, it is the policy of the fund not to distribute such gains. Income and capital gain distributions are determined in accordance with income tax regulations, which may differ from U.S. generally accepted accounting principles.
(f) Federal income taxes: It is the policy of the fund to continue to qualify as a regulated investment company, if such qualification is in the best interests of its shareholders, by complying with the applicable provisions of the Code, and to make distributions of taxable income sufficient to relieve it from substantially all federal income and excise taxes.
The fund adopted FASB Interpretation No. 48 “Accounting for Uncertainty in Income Taxes” (“FIN 48”). FIN 48 provides guidance for how uncertain tax positions should be recognized, measured, presented and disclosed in the financial statements. FIN 48 requires the evaluation of tax positions taken or expected to be taken in the course of preparing the fund’s tax returns to determine whether the tax positions are “more-likely-than-not” of being sustained by the applicable tax authority. Liability for tax positions not deemed to meet the more-likely-than-not threshold would be recorded as a tax expense in the current year.The adoption of FIN 48 had no impact on the operations of the fund for the period ended October 31, 2008.
| The Fund 47 |
N O T E S T O F I N A N C I A L S TAT E M E N T S (continued)
As of and during the period ended October 31, 2008, the fund did not have any liabilities for any unrecognized tax positions. The fund recognizes interest and penalties, if any, related to unrecognized tax positions as income tax expense in the Statement of Operations. During the period, the fund did not incur any interest or penalties.
Each of the tax years in the four-year period ended October 31, 2008 remains subject to examination by the Internal Revenue Service and state taxing authorities.
At October 31, 2008, the components of accumulated earnings on a tax basis were as follows: undistributed ordinary income $8,508,104, undistributed capital gains $745,301 and unrealized depreciation $116,494,610.
The tax character of distributions paid to shareholders during the fiscal periods ended October 31, 2008 and October 31, 2007 was as follows: ordinary income $12,808,881 and $7,690,026, respectively.
During the period ended October 31, 2008, as a result of permanent book to tax differences, primarily due to the tax treatment for passive foreign investment companies and foreign currency gains and losses, the fund decreased accumulated undistributed investment income-net by $241,651 and increased accumulated net realized gain (loss) on investments by the same amount. Net assets and net asset value per share were not affected by this reclassification.
NOTE 2—Bank Lines Of Credit:
Prior to October 15, 2008, the fund participated with other Dreyfus-managed funds in a $350 million redemption credit facility. Effective October 15, 2008, the fund participates with other Dreyfus-managed funds in a $145 million redemption credit facility (the “Facility”) to be utilized for temporary or emergency purposes, including the financing of redemptions. In connection therewith, the fund has agreed to pay commitment fees on its pro rata portion of the Facility. Interest is charged to the fund based on prevailing market rates in effect at the time of borrowing. During the period ended October 31, 2008, the fund did not borrow under either Facility.
48
NOTE 3—Management Fee and Other Transactions With Affiliates:
(a) Pursuant to an Investment Management Agreement (“Agreement”) with the Manager, the management fee is computed at the annual rate of .35% of the value of the fund’s average daily net assets, and is payable monthly. Under the terms of the Agreement, the Manager has agreed to pay all the expenses of the fund, except management fees, brokerage commissions, taxes, commitment fees, interest, Shareholder Services Plan fees, fees and expenses of non-interested Board Members (including counsel fees) and extraordinary expenses. In addition, the Manager is required to reduce its fee in an amount equal to the fund’s allocable portion of fees and expenses of the non-interested Board Members (including counsel fees). Each Board member also serves as a Board Member of other funds within the Dreyfus complex (collectively, the “Fund Group”). Currently, the Company and 12 other funds (comprised of 35 portfolios) in the Dreyfus Family of Funds pay each Board member their respective allocated portion of an annual retainer fee of $85,000, and an attendance fee of $10,000 for each regularly scheduled Board meeting, an attendance fee of $2,000 for separate in-person committee meetings that are not held in conjunction with a regularly scheduled Board meeting and an attendance fee of $1,000 for each Board meeting and separate committee meetings attended that are conducted by telephone.The Chairman of the Board receives an additional 25% of such compensation and the Audit Committee Chairman receives an additional $15,000 per annum.The Company also reimburses each Board member for travel and out-of-pocket expenses in connection with attending Board or committee meetings. Subject to the Company’s Emeritus Program Guidelines, Emeritus Board members, if any, receive 50% of the Company’s annual retainer fee and per meeting fee paid at the time the Board member achieves emeritus status. All Board fees are allocated among the funds in the Fund Group in proportion to each fund’s relative net assets.
| The Fund 49 |
N O T E S T O F I N A N C I A L S TAT E M E N T S (continued)
(b) Under the Shareholder Services Plan, the fund pays the Distributor for the provision of certain services, a fee at the annual rate of .25% of the value of the fund’s average daily net assets. The services provided may include personal services relating to shareholder accounts, such as answering shareholder inquiries regarding the fund and providing reports and other information, and services related to the maintenance of shareholder accounts. The Distributor may make payments to Service Agents (a securities dealer, financial institution or other industry professional) in respect of these services. The Distributor determines the amounts to be paid to Service Agents. During the period ended October 31, 2008, the fund was charged $1,181,566 pursuant to the Shareholder Services Plan.
The components of “Due to The Dreyfus Corporation and affiliates” in the Statement of Assets and Liabilities consist of: management fees $96,156, and shareholder services plan fees $68,682.
(c) Prior to December 1, 2007, a 2% redemption fee was charged and retained by the fund on certain shares redeemed within sixty days of issuance, including redemptions made through the use of the fund’s exchange privilege. Effective December 1, 2007, the fund discontinued the redemption fee on shares.The fund reserves the right to reimpose a redemption fee in the future. During the period ended October 31, 2008, redemption fees charged and received by the fund amounted to $27,622.
NOTE 4—Securities Transactions:
The aggregate amount of purchases and sales of investment securities, excluding short-term securities, forward currency exchange contracts and financial futures, during the period ended October 31, 2008, amounted to $70,722,923 and $33,584,151, respectively.
The fund enters into forward currency exchange contracts in order to hedge its exposure to changes in foreign currency exchange rates on its foreign portfolio holdings and to settle foreign currency transactions. When executing forward currency exchange contracts, the
50
fund is obligated to buy or sell a foreign currency at a specified rate on a certain date in the future.With respect to sales of forward currency exchange contracts, the fund would incur a loss if the value of the contract increases between the date the forward contract is opened and the date the forward contract is closed.The fund realizes a gain if the value of the contract decreases between those dates.With respect to purchases of forward currency exchange contracts, the fund would incur a loss if the value of the contract decreases between the date the forward contract is opened and the date the forward contract is closed.The fund realizes a gain if the value of the contract increases between those dates.The fund is also exposed to credit risk associated with counterparty nonperformance on these forward currency exchange contracts, which is typically limited to the unrealized gain on each open contract.The following summarizes open forward currency exchange contracts at October 31, 2008:
| Foreign | Unrealized | |||||||
| Forward Currency | Currency | Appreciation | ||||||
| Exchange Contracts | Amounts | Cost ($) | Value ($) (Depreciation) ($) | |||||
| Purchases: | ||||||||
| British Pound, | ||||||||
| expiring 12/17/2008 | 253,900 | 414,442 | 407,492 | (6,950) | ||||
| British Pound, | ||||||||
| expiring 12/17/2008 | 1,172,402 | 1,846,234 | 1,881,626 | 35,392 | ||||
| Euro, | ||||||||
| expiring 12/17/2008 | 1,161,600 | 1,490,970 | 1,478,494 | (12,476) | ||||
| Euro, | ||||||||
| expiring 12/17/2008 | 1,752,385 | 2,203,407 | 2,230,450 | 27,043 | ||||
| Japanese Yen, | ||||||||
| expiring | ||||||||
| 12/17/2008 | 189,735,645 | 2,012,481 | 1,930,247 | (82,234) | ||||
| Japanese Yen, | ||||||||
| expiring | ||||||||
| 12/17/2008 | 33,920,000 | 344,846 | 345,080 | 234 | ||||
| Total | (38,991) | |||||||
The fund may invest in financial futures contracts in order to gain exposure to or protect against changes in the market.The fund is exposed to market risk as a result of changes in the value of the underlying financial instruments. Investments in financial futures require the fund to “mark to
The Fund 51
N O T E S T O F I N A N C I A L S TAT E M E N T S (continued)
market” on a daily basis, which reflects the change in the market value of the contract at the close of each day’s trading.Accordingly, variation margin payments are received or made to reflect daily unrealized gains or losses.When the contracts are closed, the fund recognizes a realized gain or loss.These investments require initial margin deposits with a broker, which consist of cash or cash equivalents.The amount of these deposits is determined by the exchange or Board of Trade on which the contract is traded and is subject to change. Contracts open at October 31, 2008, are set forth in the Statement of Financial Futures.
At October 31, 2008, the cost of investments for federal income tax purposes was $440,232,369; accordingly, accumulated net unrealized depreciation on investments was $117,180,798,consisting of $13,749,342 gross unrealized appreciation and $130,930,140 gross unrealized depreciation.
In March 2008, the FASB released Statement of Financial Accounting Standards No. 161 “Disclosures about Derivative Instruments and Hedging Activities” (“FAS 161”). FAS 161 requires qualitative disclosures about objectives and strategies for using derivatives, quantitative disclosures about fair value amounts of gains and losses on derivative instruments and disclosures about credit-risk-related contingent features in derivative agreements.The application of FAS 161 is required for fiscal years and interim periods beginning after November 15, 2008. At this time, management is evaluating the implications of FAS 161 and its impact on the financial statements and the accompanying notes has not yet been determined.
52
| REPORT OF INDEPENDENT REGISTERED PUBLIC ACCOUNTING FIRM |
| Shareholders and Board of Directors Dreyfus International Stock Index Fund |
We have audited the accompanying statement of assets and liabilities, including the statements of investments and financial futures, of Dreyfus International Stock Index Fund (one of the series comprising Dreyfus Index Funds, Inc.) as of October 31, 2008 and the related statement of operations for the year then ended and the statement of changes in net assets and financial highlights for each of the two years in the period then ended. These financial statements and financial highlights are the responsibility of the Fund’s management. Our responsibility is to express an opinion on these financial statements and financial highlights based on our audits. The financial highlights for the years ended October 31, 2006, 2005 and 2004 were audited by other auditors whose report dated December 14, 2006, expressed an unqualified opinion on such financial highlights.
We conducted our audits in accordance with the standards of the Public Company Accounting Oversight Board (United States).Those standards require that we plan and perform the audit to obtain reasonable assurance about whether the financial statements and financial highlights are free of material misstatement.We were not engaged to perform an audit of the Fund’s internal control over financial reporting. Our audits included consideration of internal control over financial reporting as a basis for designing audit procedures that are appropriate in the circumstances, but not for the purpose of expressing an opinion on the effectiveness of the Fund’s internal control over financial reporting. Accordingly, we express no such opinion.An audit also includes examining, on a test basis, evidence supporting the amounts and disclosures in the financial statements and financial highlights, assessing the accounting principles used and significant estimates made by management, and evaluating the overall financial statement presentation. Our procedures included confirmation of securities owned as of October 31, 2008 by correspondence with the custodian and others. We believe that our audits provide a reasonable basis for our opinion.
In our opinion, the 2008 and 2007 financial statements and financial highlights referred to above present fairly, in all material respects, the financial position of Dreyfus International Stock Index Fund at October 31, 2008, the results of its operations for the year then ended and the changes in its net assets and the financial highlights for each of the two years in the period then ended, in conformity with U.S. generally accepted accounting principles.
| New York, New York |
| December 23, 2008 |
The Fund 53
IMPORTANT TAX INFORMATION (Unaudited)
In accordance with federal tax law, the fund elects to provide each shareholder with their portion of the fund’s foreign taxes paid and the income sourced from foreign countries. Accordingly, the fund hereby makes the following designations regarding its fiscal year ended October 31, 2008:
—the total amount of taxes paid to foreign countries was $1,490,768
—the total amount of income sourced from foreign countries was $11,153,689.
As required by federal tax law rules, shareholders will receive notification of their proportionate share of foreign taxes paid and foreign sourced income for the 2008 calendar year with Form 1099-DIV which will be mailed by January 31, 2009. For the fiscal year ended October 31, 2008, certain dividends paid by the fund may be subject to a maximum tax rate of 15%, as provided for by the Jobs and Growth Tax Relief Reconciliation Act of 2003. Of the distributions paid during the fiscal year, $5,686,528 represents the maximum amount that may be considered qualified dividend income.
54
BOARD MEMBERS INFORMATION (Unaudited)
| Joseph S. DiMartino (65) Chairman of the Board (1995) Principal Occupation During Past 5Years: |
- Corporate Director and Trustee
Other Board Memberships and Affiliations:
- The Muscular Dystrophy Association, Director
- Century Business Services, Inc., a provider of outsourcing functions for small and medium size companies, Director
- The Newark Group, a provider of a national market of paper recovery facilities, paperboard mills and paperboard converting plants, Director
- Sunair Services Corporation, a provider of certain outdoor-related services to homes and businesses, Director
No. of Portfolios for which Board Member Serves: 167
| ——————— |
| Peggy C. Davis (65) Board Member (2006) Principal Occupation During Past 5Years: |
- Shad Professor of Law, New York University School of Law (1983-present)
- Writer and teacher in the fields of evidence, constitutional theory, family law, social sciences and the law, legal process and professional methodology and training
| No. of Portfolios for which Board Member Serves: 58 |
| ——————— |
| David P. Feldman (68) Board Member (1989) Principal Occupation During Past 5Years: Corporate Director and Trustee Other Board Memberships and Affiliations: |
- BBH Mutual Funds Group (11 funds), Director
- The Jeffrey Company, a private investment company, Director
| No. of Portfolios for which Board Member Serves: 50 |
The Fund 55
B O A R D M E M B E R S I N F O R M AT I O N ( U n a u d i t e d ) (continued)
| James F. Henry (77) Board Member (2006) Principal Occupation During Past 5Years: |
- President,The International Institute for Conflict Prevention and Resolution, a non-profit organization principally engaged in the development of alternatives to business litigation (Retired 2003)
- Advisor to The Elaw Forum, a consultant on managing corporate legal costs
- Advisor to John Jay Homestead (the restored home of the first U.S. Chief Justice)
- Individual Trustee of several trusts
Other Board Memberships and Affiliations:
- Director, advisor and mediator involved in several non-profit organizations, primarily engaged in domestic and international dispute resolution, and historic preservation
No. of Portfolios for which Board Member Serves: 36
| ——————— |
| Ehud Houminer (68) Board Member (1996) Principal Occupation During Past 5Years: |
- Executive-in-Residence at the Columbia Business School, Columbia University
Other Board Memberships and Affiliations:
- Avnet Inc., an electronics distributor, Director
- International Advisory Board to the MBA Program School of Management, Ben Gurion University, Chairman
No. of Portfolios for which Board Member Serves: 63
| ——————— |
| Gloria Messinger (78) Board Member (1996) Principal Occupation During Past 5Years: |
- Arbitrator for American Arbitration Association
- Arbitrator for FINRA (formerly, National Association of Securities Dealers, Inc.)
- Consultant in Intellectual Property
| Other Board Memberships and Affiliations: |
- Theater for a New Audience, Inc., Director
- Brooklyn Philharmonic, Director
No. of Portfolios for which Board Member Serves: 36
56
| Dr. Martin Peretz (69) Board Member (2006) Principal Occupation During Past 5Years: |
- Editor-in-Chief of The New Republic Magazine
- Director of TheStreet.com, a financial information service on the web
| Other Board Memberships and Affiliations: |
- American Council of Trustees and Alumni, Director
- Pershing Square Capital Management, Advisor
- Montefiore Ventures, General Partner
- Harvard Center for Blood Research,Trustee
- Bard College,Trustee
- Board of Overseers of YIVO Institute for Jewish Research, Chairman
| No. of Portfolios for which Board Member Serves: 36 |
| ——————— |
| Anne Wexler (78) Board Member (1991) Principal Occupation During Past 5Years: |
- Chairman of the Wexler & Walker Public Policy Associates, consultants specializing in government relations and public affairs from January 1981 to present
| Other Board Memberships and Affiliations: |
- The Community Foundation for the National Capital Region, Director
- Member of the Council of Foreign Relations
- WETA-DC’s Public TV and Radio Station,Vice Chairman
| No. of Portfolios for which Board Member Serves: 50 |
| ——————— |
Once elected, all Board Members serve for an indefinite term, but achieve Emeritus status upon reaching age 80.The address of the Board Members and Officers is in c/o The Dreyfus Corporation, 200 Park Avenue, NewYork, NewYork 10166.Additional information about the Board Members is available in the fund’s Statement of Additional Information which can be obtained from Dreyfus free of charge by calling this toll free number: 1-800-554-4611.
| John M. Fraser, Jr., Emeritus Board Member Dr. Paul A. Marks, Emeritus Board Member |
The Fund 57
OFFICERS OF THE FUND (Unaudited)
J. DAVID OFFICER, President since December 2006.
Chief Operating Officer,Vice Chairman and a Director of the Manager, and an officer of 77 investment companies (comprised of 167 portfolios) managed by the Manager. He is 60 years old and has been an employee of the Manager since April 1998.
PHILLIP N. MAISANO, Executive Vice President since July 2007.
Chief Investment Officer,Vice Chair and a director of the Manager, and an officer of 77 investment companies (comprised of 167 portfolios) managed by the Manager. Mr. Maisano also is an officer and/or Board member of certain other investment management subsidiaries of The Bank of New York Mellon Corporation, each of which is an affiliate of the Manager. He is 61 years old and has been an employee of the Manager since November 2006. Prior to joining the Manager, Mr. Maisano served as Chairman and Chief Executive Officer of EACM Advisors, an affiliate of the Manager, since August 2004, and served as Chief Executive Officer of Evaluation Associates, a leading institutional investment consulting firm, from 1988 until 2004.
MICHAEL A. ROSENBERG, Vice President and Secretary since August 2005.
Assistant General Counsel of BNY Mellon, and an officer of 78 investment companies (comprised of 188 portfolios) managed by the Manager. He is 48 years old and has been an employee of the Manager since October 1991.
JAMES BITETTO, Vice President and Assistant Secretary since August 2005.
Senior Counsel of BNY Mellon and Secretary of the Manager, and an officer of 78 investment companies (comprised of 188 portfolios) managed by the Manager. He is 42 years old and has been an employee of the Manager since December 1996.
JONI LACKS CHARATAN, Vice President and Assistant Secretary since August 2005.
Senior Counsel of BNY Mellon, and an officer of 78 investment companies (comprised of 188 portfolios) managed by the Manager. She is 53 years old and has been an employee of the Manager since October 1988.
JOSEPH M. CHIOFFI, Vice President and Assistant Secretary since August 2005.
Senior Counsel of BNY Mellon, and an officer of 78 investment companies (comprised of 188 portfolios) managed by the Manager. He is 47 years old and has been an employee of the Manager since June 2000.
JANETTE E. FARRAGHER, Vice President and Assistant Secretary since August 2005.
Assistant General Counsel of BNY Mellon, and an officer of 78 investment companies (comprised of 188 portfolios) managed by the Manager. She is 45 years old and has been an employee of the Manager since February 1984.
JOHN B. HAMMALIAN, Vice President and Assistant Secretary since August 2005.
Managing Counsel of BNY Mellon, and an officer of 78 investment companies (comprised of 188 portfolios) managed by the Manager. He is 45 years old and has been an employee of the Manager since February 1991.
ROBERT R. MULLERY, Vice President and Assistant Secretary since August 2005.
Managing Counsel of BNY Mellon, and an officer of 78 investment companies (comprised of 188 portfolios) managed by the Manager. He is 56 years old and has been an employee of the Manager since May 1986.
58
JEFF PRUSNOFSKY, Vice President and Assistant Secretary since August 2005.
Managing Counsel of BNY Mellon, and an officer of 78 investment companies (comprised of 188 portfolios) managed by the Manager. He is 43 years old and has been an employee of the Manager since October 1990.
JAMES WINDELS, Treasurer since November 2001.
Director – Mutual Fund Accounting of the Manager, and an officer of 78 investment companies (comprised of 188 portfolios) managed by the Manager. He is 49 years old and has been an employee of the Manager since April 1985.
RICHARD CASSARO, Assistant Treasurer since January 2008.
Senior Accounting Manager – Money Market and Municipal Bond Funds of the Manager, and an officer of 78 investment companies (comprised of 188 portfolios) managed by the Manager. He is 49 years old and has been an employee of the Manager since September 1982.
GAVIN C. REILLY, Assistant Treasurer since December 2005.
Tax Manager of the Investment Accounting and Support Department of the Manager, and an officer of 78 investment companies (comprised of 188 portfolios) managed by the Manager. He is 40 years old and has been an employee of the Manager since April 1991.
ROBERT ROBOL, Assistant Treasurer since August 2005.
Senior Accounting Manager – Fixed Income Funds of the Manager, and an officer of 78 investment companies (comprised of 188 portfolios) managed by the Manager. He is 44 years old and has been an employee of the Manager since October 1988.
ROBERT SALVIOLO, Assistant Treasurer since July 2007.
Senior Accounting Manager – Equity Funds of the Manager, and an officer of 78 investment companies (comprised of 188 portfolios) managed by the Manager. He is 41 years old and has been an employee of the Manager since June 1989.
ROBERT SVAGNA, Assistant Treasurer since December 2002.
Senior Accounting Manager – Equity Funds of the Manager, and an officer of 78 investment companies (comprised of 188 portfolios) managed by the Manager. He is 41 years old and has been an employee of the Manager since November 1990.
JOSEPH W. CONNOLLY, Chief Compliance Officer since October 2004.
Chief Compliance Officer of the Manager and The Dreyfus Family of Funds (78 investment companies, comprised of 188 portfolios). From November 2001 through March 2004, Mr. Connolly was first Vice-President, Mutual Fund Servicing for Mellon Global Securities Services. In that capacity, Mr. Connolly was responsible for managing Mellon’s Custody, Fund Accounting and Fund Administration services to third-party mutual fund clients. He is 51 years old and has served in various capacities with the Manager since 1980, including manager of the firm’s Fund Accounting Department from 1997 through October 2001.
WILLIAM GERMENIS, Anti-Money Laundering Compliance Officer since October 2002.
Vice President and Anti-Money Laundering Compliance Officer of the Distributor, and the Anti-Money Laundering Compliance Officer of 74 investment companies (comprised of 184 portfolios) managed by the Manager. He is 38 years old and has been an employee of the Distributor since October 1998.
The Fund 59
N O T E S
For More Information
| Dreyfus International | Transfer Agent & | |
| Stock Index Fund | Dividend Disbursing Agent | |
| 200 Park Avenue | Dreyfus Transfer, Inc. | |
| New York, NY 10166 | 200 Park Avenue | |
| Manager | New York, NY 10166 | |
| The Dreyfus Corporation | Distributor | |
| 200 Park Avenue | MBSC Securities Corporation | |
| New York, NY 10166 | 200 Park Avenue | |
| Custodian | New York, NY 10166 | |
| The Bank of New York Mellon | ||
| One Wall Street | ||
| New York, NY 10286 |
Ticker Symbol: DIISX
Telephone 1-800-645-6561
Mail The Dreyfus Family of Funds, 144 Glenn Curtiss Boulevard, Uniondale, NY 11556-0144 E-mail Send your request to info@dreyfus.com Internet Information can be viewed online or downloaded at: http://www.dreyfus.com
The fund files its complete schedule of portfolio holdings with the Securities and Exchange Commission (“SEC”) for the first and third quarters of each fiscal year on Form N-Q. The fund’s Forms N-Q are available on the SEC’s website at http://www.sec.gov and may be reviewed and copied at the SEC’s Public Reference Room in Washington, DC. Information on the operation of the Public Reference Room may be obtained by calling 1-800-SEC-0330.
A description of the policies and procedures that the fund uses to determine how to vote proxies relating to portfolio securities, and information regarding how the fund voted these proxies for the 12-month period ended June 30, 2008, is available at http://www.dreyfus.com and on the SEC’s website at http://www.sec.gov. The description of the policies and procedures is also available without charge, upon request, by calling 1-800-645-6561.

© 2008 MBSC Securities Corporation
| Dreyfus S&P 500 Index Fund |
| ANNUAL REPORT October 31, 2008 |
Save time. Save paper. View your next shareholder report online as soon as it’s available. Log into www.dreyfus.com and sign up for Dreyfus eCommunications. It’s simple and only takes a few minutes.
The views expressed in this report reflect those of the portfolio manager only through the end of the period covered and do not necessarily represent the views of Dreyfus or any other person in the Dreyfus organization. Any such views are subject to change at any time based upon market or other conditions and Dreyfus disclaims any responsibility to update such views.These views may not be relied on as investment advice and, because investment decisions for a Dreyfus fund are based on numerous factors, may not be relied on as an indication of trading intent on behalf of any Dreyfus fund.
| Contents | ||
| THE FUND | ||
| 2 | A Letter from the CEO | |
| 3 | Discussion of Fund Performance | |
| 6 | Fund Performance | |
| 7 | Understanding Your Fund’s Expenses | |
| 7 | Comparing Your Fund’s Expenses | |
| With Those of Other Funds | ||
| 8 | Statement of Investments | |
| 24 | Statement of Financial Futures | |
| 25 | Statement of Assets and Liabilities | |
| 26 | Statement of Operations | |
| 27 | Statement of Changes in Net Assets | |
| 28 | Financial Highlights | |
| 29 | Notes to Financial Statements | |
| 37 | Report of Independent Registered | |
| Public Accounting Firm | ||
| 38 | Important Tax Information | |
| 39 | Board Members Information | |
| 42 | Officers of the Fund | |
| FOR MORE INFORMATION | ||
| Back Cover | ||
| Dreyfus S&P 500 Index Fund |
The Fund

| A LETTER FROM THE CEO Dear Shareholder: |
We present to you this annual report for Dreyfus S&P 500 Index Fund, covering the 12-month period from November 1, 2007, through October 31, 2008.
These are difficult times for equity investors. A credit crunch that began in early 2007 has developed into a full-blown global financial crisis, recently resulting in the failure of several major financial institutions and prompting a massive government rescue effort. Meanwhile, the U.S. economic slowdown has gathered momentum,depressing investor sentiment, consumer confidence and business investment.These factors undermined returns in most stock market sectors, particularly financial companies and businesses that tend to be more sensitive to economic trends.
The depth and duration of the economic downturn will depend on how quickly the financial system can be stabilized.We believe that the Temporary Guarantee Program for Money Market Funds and the $700 billion rescue package intended to promote greater liquidity in the financial markets meet several critical requirements for addressing today’s financial stresses, and we expect these measures to contribute to a more orderly deleveraging process. However, recuperation from the financial crisis is likely to take time. In the meantime, we encourage you to keep in touch with your financial advisor and maintain a long-term and disciplined perspective to investing. Indeed, we already are seeing some positive signs, including a likely peak in global inflationary pressures, a bottoming of the U.S. dollar, attractive valuations among fundamentally sound companies and a large pool of worldwide financial liquidity that could be deployed gradually as the economic cycle turns.
For information about how the fund performed during the reporting period, as well as market perspectives, we have provided a Discussion of Fund Performance given by the fund’s Portfolio Manager.
Thank you for your continued confidence and support.
| Jonathan R. Baum Chief Executive Officer The Dreyfus Corporation November 17, 2008 |
2

DISCUSSION OF FUND PERFORMANCE
For the period of November 1, 2007, through October 31, 2008, as provided by Thomas Durante, CFA, Portfolio Manager
Fund and Market Performance Overview
For the 12-month period ended October 31, 2008, Dreyfus S&P 500 Index Fund produced a total return of –36.38% .1 In comparison, the Standard & Poor’s 500 Composite Stock Price Index (the “S&P 500 Index”), the fund’s benchmark, produced a –36.08% return for the same period.2,3
Large-cap stocks produced disappointing absolute returns during an especially challenging reporting period. Concerns regarding slowing U.S. and overseas economies, turmoil in world credit markets, the near collapse of the global banking system and, later in the reporting period, slumping commodity prices caused stock prices across most market sectors to fall sharply. The difference in returns between the fund and the S&P 500 Index was primarily the result of transaction costs and operating expenses.
The Fund’s Investment Approach
The fund seeks to match the total return of the S&P 500 Index by generally investing in all 500 stocks in the S&P 500 Index in proportion to their respective weighting. Often considered a barometer for the stock market in general, the S&P 500 Index is made up of 500 widely held common stocks across 10 economic sectors. Each stock is weighted by its market capitalization; that is, larger companies have greater representation in the S&P 500 Index than smaller ones. The S&P 500 Index is dominated by large-cap, blue-chip stocks that comprise nearly 75% of total U.S. market capitalization.
Volatility Increases as Financial Crisis Intensifies
A credit crisis that dominated much of the reporting period developed into a full-blown global financial crisis, resulting in the failure of several major financial institutions. As lenders grew increasingly risk-averse,
The Fund 3
| DISCUSSION OF FUND PERFORMANCE (continued) |
companies across virtually all industry groups scrambled to obtain funding from a rapidly shrinking supply of available credit. Also contributing to the downturn was a barrage of negative economic news, including slowing U.S. and global economies, falling home prices, growing unemployment and sluggish consumer spending.As the slowdown intensified, previously high-flying commodity prices retreated sharply from their highs.These factors caused investors to become more averse to risks, sparking broad-based declines in the stock market.
The Federal Reserve Board (the “Fed”) responded aggressively to the economic slowdown and financial crisis by reducing short-term interest rates and, in March 2008, participating in the rescue of investment bank Bear Stearns.Although the market rallied briefly in the spring, the rebound proved to be short-lived. Over the summer, additional government rescues were announced for insurer American International Group and mortgage agencies Freddie Mac and Fannie Mae. Meanwhile, investment bank Lehman Brothers filed for bankruptcy, Merrill Lynch andWachovia were acquired by competitors,Washington Mutual was seized by regulators, and Goldman Sachs and Morgan Stanley re-registered as bank holding companies to enable them to tap government funds. By September, the financial crisis threatened to spin out of control, and the global banking system came close to collapse.
The U.S. Congress responded to the crisis by making $700 billion available to banks through the controversialTroubled Asset Relief Program. In addition,the Fed and several of the world’s major central banks announced unprecedented,coordinated reductions in short-term interest rates to help strengthen the world’s financial systems.The reporting period ended with all major stock market indices reporting negative double-digit returns.
No Winners in this Turbulent Market Environment
For the 12-month reporting period, none of the 10 sectors in the S&P 500 Index posted a positive absolute return. Declines were most severe among the S&P 500 Index’s financials, technology, energy and industrials areas. A host of diversified financial conglomerates, banks, and insurance companies were hurt by massive sub-prime related losses. Technology
4
stocks retracted amid a slowdown in spending by consumers and corporations, and a slowdown in exports hurt many hardware producers that rely heavily on overseas sales. Semiconductor stocks fell along with hardware sales, while Internet companies were hurt by lower advertising revenues, troubled product launches and reduced consumer spending.
Energy stocks gave back many of their previous gains when crude oil prices dropped from their highs of $141 per barrel in July to $61 per barrel by the reporting period’s end. Refiners, integrated energy producers, drillers, oil field services firms and equipment services companies were particularly hard-hit. Finally, the industrials sector suffered from a sharply reduced number of infrastructure construction projects worldwide, which drove down the stock prices of large industrial conglomerates as well as construction and industrial machinery and equipment stocks.
Index Funds Offer Diversification
As an index fund, we attempt to replicate the returns of the S&P 500 Index by closely approximating its composition. In our view, one of the greatest benefits of an index fund is that it offers a broadly diversified investment vehicle that can help investors manage risks by limiting the impact on the overall portfolio of unexpected losses in any single industry group or holding.
November 17, 2008
| 1 Total return includes reinvestment of dividends and any capital gains paid. Past performance is no guarantee of future results. Share price and investment return fluctuate such that upon redemption, fund shares may be worth more or less than their original cost. Return figure provided reflects the absorption of certain fund expenses by The Dreyfus Corporation pursuant to an agreement in effect that may be extended, terminated or modified. Had these expenses not been absorbed, the fund’s return would have been lower. 2 SOURCE: LIPPER INC. — Reflects reinvestment of dividends daily and, where applicable, capital gain distributions.The Standard & Poor’s 500 Composite Stock Price Index is a widely accepted, unmanaged index of U.S. stock market performance. 3 “Standard & Poor’s®,”“S&P®,”“Standard & Poor’s® 500” and “S&P 500®” are trademarks of The McGraw-Hill Companies, Inc., and have been licensed for use by the fund.The fund is not sponsored, endorsed, sold or promoted by Standard & Poor’s and Standard & Poor’s makes no representation regarding the advisability of investing in the fund. |
| The Fund 5 |
| FUND PERFORMANCE |
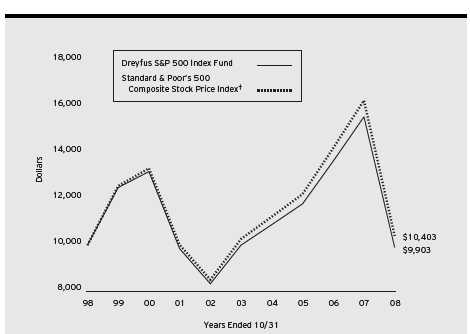
| Comparison of change in value of $10,000 investment in Dreyfus S&P 500 Index Fund and the Standard & Poor’s 500 Composite Stock Price Index |
| Average Annual Total Returns as of 10/31/08 | ||||||
| 1 Year | 5 Years | 10 Years | ||||
| Fund | (36.38)% | (0.20)% | (0.10)% | |||
| † Source: Lipper Inc. Past performance is not predictive of future performance.The fund’s performance shown in the graph and table does not reflect the deduction of taxes that a shareholder would pay on fund distributions or the redemption of fund shares. The above graph compares a $10,000 investment made in Dreyfus S&P 500 Index Fund on 10/31/98 to a $10,000 investment made in the Standard & Poor’s 500 Composite Stock Price Index (the “Index”) on that date. All dividends and capital gain distributions are reinvested. The fund’s performance shown in the line graph takes into account all applicable fees and expenses.The Index is a widely accepted, unmanaged index of U.S. stock market performance and reflects the reinvestment of dividends daily. Unlike a mutual fund, the Index is not subject to charges, fees and other expenses. Investors cannot invest directly in any index. Further information relating to fund performance, including expense reimbursements, if applicable, is contained in the Financial Highlights section of the prospectus and elsewhere in this report. |
6
UNDERSTANDING YOUR FUND’S EXPENSES (Unaudited)
As a mutual fund investor, you pay ongoing expenses, such as management fees and other expenses. Using the information below, you can estimate how these expenses affect your investment and compare them with the expenses of other funds.You also may pay one-time transaction expenses, including sales charges (loads) and redemption fees, which are not shown in this section and would have resulted in higher total expenses. For more information, see your fund’s prospectus or talk to your financial adviser.
Review your fund’s expenses
The table below shows the expenses you would have paid on a $1,000 investment in Dreyfus S&P 500 Index Fund from May 1, 2008 to October 31, 2008. It also shows how much a $1,000 investment would be worth at the close of the period, assuming actual returns and expenses.
| Expenses and Value of a $1,000 Investment assuming actual returns for the six months ended October 31, 2008 |
| Expenses paid per $1,000† | $ 2.14 | |
| Ending value (after expenses) | $705.60 |
| COMPARING YOUR FUND’S EXPENSES WITH THOSE OF OTHER FUNDS (Unaudited) |
Using the SEC’s method to compare expenses
The Securities and Exchange Commission (SEC) has established guidelines to help investors assess fund expenses. Per these guidelines, the table below shows your fund’s expenses based on a $1,000 investment, assuming a hypothetical 5% annualized return. You can use this information to compare the ongoing expenses (but not transaction expenses or total cost) of investing in the fund with those of other funds.All mutual fund shareholder reports will provide this information to help you make this comparison. Please note that you cannot use this information to estimate your actual ending account balance and expenses paid during the period.
| Expenses and Value of a $1,000 Investment assuming a hypothetical 5% annualized return for the six months ended October 31, 2008 |
| Expenses paid per $1,000† | $ 2.54 | |
| Ending value (after expenses) | $1,022.62 |
| † Expenses are equal to the fund’s annualized expense ratio of .50%, multiplied by the average account value over the period, multiplied by 184/366 (to reflect the one-half year period). |
The Fund 7
| STATEMENT OF INVESTMENTS October 31, 2008 |
| Common Stocks—97.6% | Shares | Value ($) | ||
| Consumer Discretionary—8.0% | ||||
| Abercrombie & Fitch, Cl. A | 21,168 | 613,025 | ||
| Amazon.com | 76,740 | a,b | 4,392,598 | |
| Apollo Group, Cl. A | 25,395 | b | 1,765,206 | |
| AutoNation | 26,802 | a,b | 184,129 | |
| AutoZone | 10,088 | b | 1,284,101 | |
| Bed Bath & Beyond | 62,357 | a,b | 1,606,939 | |
| Best Buy | 82,058 | 2,199,975 | ||
| Big Lots | 20,087 | a,b | 490,725 | |
| Black & Decker | 14,270 | a | 722,347 | |
| Carnival | 104,868 | a | 2,663,647 | |
| CBS, Cl. B | 162,937 | 1,582,118 | ||
| Centex | 30,129 | a | 369,080 | |
| Coach | 81,673 | b | 1,682,464 | |
| Comcast, Cl. A | 701,811 | 11,060,541 | ||
| D.R. Horton | 67,450 | a | 497,781 | |
| Darden Restaurants | 33,452 | 741,631 | ||
| DIRECTV Group | 138,539 | a,b | 3,032,619 | |
| Eastman Kodak | 71,001 | a | 651,789 | |
| Expedia | 51,402 | a,b | 488,833 | |
| Family Dollar Stores | 33,266 | a | 895,188 | |
| Ford Motor | 549,186 | a,b | 1,202,717 | |
| Fortune Brands | 35,903 | 1,369,340 | ||
| GameStop, Cl. A | 39,677 | b | 1,086,753 | |
| Gannett | 56,630 | a | 622,930 | |
| Gap | 113,824 | 1,472,883 | ||
| General Motors | 135,191 | a | 781,404 | |
| Genuine Parts | 39,155 | 1,540,749 | ||
| Goodyear Tire & Rubber | 59,181 | b | 527,895 | |
| H & R Block | 80,149 | a | 1,580,538 | |
| Harley-Davidson | 57,065 | a | 1,396,951 | |
| Harman International Industries | 14,877 | 273,290 | ||
| Hasbro | 29,932 | a | 870,123 | |
| Home Depot | 408,370 | 9,633,448 | ||
| International Game Technology | 73,881 | 1,034,334 | ||
| Interpublic Group of Cos. | 116,083 | b | 602,471 |
8
| Common Stocks (continued) | Shares | Value ($) | ||
| Consumer Discretionary (continued) | ||||
| J.C. Penney | 53,156 | 1,271,492 | ||
| Johnson Controls | 142,556 | 2,527,518 | ||
| Jones Apparel Group | 21,182 | a | 235,332 | |
| KB Home | 19,013 | a | 317,327 | |
| Kohl’s | 73,075 | b | 2,567,125 | |
| Leggett & Platt | 38,630 | a | 670,617 | |
| Lennar, Cl. A | 34,261 | a | 265,180 | |
| Limited Brands | 68,114 | 816,006 | ||
| Liz Claiborne | 24,539 | 199,993 | ||
| Lowe’s Cos. | 352,307 | 7,645,062 | ||
| Macy’s | 100,609 | 1,236,485 | ||
| Marriott International, Cl. A | 71,600 | a | 1,494,292 | |
| Mattel | 86,234 | 1,295,235 | ||
| McDonald’s | 270,516 | 15,670,992 | ||
| McGraw-Hill | 77,073 | 2,068,639 | ||
| Meredith | 9,262 | a | 179,405 | |
| New York Times, Cl. A | 28,966 | a | 289,660 | |
| Newell Rubbermaid | 68,205 | 937,819 | ||
| News, Cl. A | 551,722 | 5,870,322 | ||
| NIKE, Cl. B | 94,273 | 5,432,953 | ||
| Nordstrom | 38,007 | a | 687,547 | |
| Office Depot | 67,252 | b | 242,107 | |
| Omnicom Group | 77,438 | 2,287,519 | ||
| Polo Ralph Lauren | 13,678 | a | 645,191 | |
| Pulte Homes | 52,685 | a | 586,911 | |
| RadioShack | 32,300 | 408,918 | ||
| Scripps Networks Interactive, Cl. A | 22,057 | 626,419 | ||
| Sears Holdings | 13,585 | a,b | 784,398 | |
| Sherwin-Williams | 23,990 | 1,365,271 | ||
| Snap-On | 14,181 | 523,988 | ||
| Stanley Works | 19,313 | 632,308 | ||
| Staples | 170,658 | 3,315,885 | ||
| Starbucks | 175,133 | b | 2,299,496 | |
| Starwood Hotels & Resorts Worldwide | 44,558 | 1,004,337 | ||
| Target | 181,409 | a | 7,278,129 |
The Fund 9
| STATEMENT OF INVESTMENTS (continued) |
| Common Stocks (continued) | Shares | Value ($) | ||
| Consumer Discretionary (continued) | ||||
| Tiffany & Co. | 29,894 | a | 820,590 | |
| Time Warner | 861,464 | 8,692,172 | ||
| TJX Cos. | 100,632 | 2,692,912 | ||
| VF | 20,838 | a | 1,148,174 | |
| Viacom, Cl. B | 149,049 | b | 3,013,771 | |
| Walt Disney | 451,272 | 11,687,945 | ||
| Washington Post, Cl. B | 1,437 | 613,312 | ||
| Whirlpool | 17,999 | a | 839,653 | |
| Wyndham Worldwide | 43,577 | a | 356,896 | |
| Yum! Brands | 112,487 | 3,263,248 | ||
| 167,729,113 | ||||
| Consumer Staples—12.6% | ||||
| Altria Group | 495,244 | 9,503,732 | ||
| Anheuser-Busch | 172,907 | 10,725,421 | ||
| Archer-Daniels-Midland | 154,562 | 3,204,070 | ||
| Avon Products | 102,209 | 2,537,849 | ||
| Brown-Forman, Cl. B | 23,436 | 1,064,006 | ||
| Campbell Soup | 51,329 | a | 1,947,936 | |
| Clorox | 33,086 | 2,011,960 | ||
| Coca-Cola | 478,243 | 21,071,387 | ||
| Coca-Cola Enterprises | 75,713 | 760,916 | ||
| Colgate-Palmolive | 121,590 | 7,630,988 | ||
| ConAgra Foods | 109,854 | 1,913,657 | ||
| Constellation Brands, Cl. A | 47,761 | b | 598,923 | |
| Costco Wholesale | 104,486 | 5,956,747 | ||
| CVS Caremark | 345,107 | 10,577,530 | ||
| Dean Foods | 37,319 | a,b | 815,793 | |
| Dr. Pepper Snapple Group | 61,949 | b | 1,418,632 | |
| Estee Lauder, Cl. A | 28,062 | 1,011,354 | ||
| General Mills | 80,781 | 5,472,105 | ||
| H.J. Heinz | 74,982 | 3,285,711 | ||
| Hershey | 40,106 | a | 1,493,547 | |
| Kellogg | 60,104 | 3,030,444 | ||
| Kimberly-Clark | 99,784 | 6,115,761 | ||
| Kraft Foods, Cl. A | 365,076 | 10,638,315 | ||
| Kroger | 157,274 | 4,318,744 |
10
| Common Stocks (continued) | Shares | Value ($) | ||
| Consumer Staples (continued) | ||||
| Lorillard | 42,249 | 2,782,519 | ||
| McCormick & Co. | 31,508 | 1,060,559 | ||
| Molson Coors Brewing, Cl. B | 36,475 | 1,362,706 | ||
| Pepsi Bottling Group | 33,779 | 780,970 | ||
| PepsiCo | 376,634 | 21,471,904 | ||
| Philip Morris International | 495,871 | 21,555,512 | ||
| Procter & Gamble | 730,130 | 47,122,590 | ||
| Reynolds American | 41,207 | 2,017,495 | ||
| Safeway | 105,675 | 2,247,707 | ||
| Sara Lee | 171,310 | a | 1,915,246 | |
| SUPERVALU | 52,104 | 741,961 | ||
| SYSCO | 144,573 | 3,787,813 | ||
| Tyson Foods, Cl. A | 71,441 | a | 624,394 | |
| UST | 35,801 | 2,419,790 | ||
| Wal-Mart Stores | 539,509 | 30,109,997 | ||
| Walgreen | 237,905 | 6,057,061 | ||
| Whole Foods Market | 34,365 | a | 368,393 | |
| 263,532,145 | ||||
| Energy—12.8% | ||||
| Anadarko Petroleum | 112,518 | 3,971,885 | ||
| Apache | 80,388 | 6,618,344 | ||
| Baker Hughes | 73,982 | 2,585,671 | ||
| BJ Services | 72,178 | 927,487 | ||
| Cabot Oil & Gas | 25,678 | 720,781 | ||
| Cameron International | 52,077 | a,b | 1,263,388 | |
| Chesapeake Energy | 125,107 | a | 2,748,601 | |
| Chevron | 494,327 | 36,876,794 | ||
| ConocoPhillips | 365,629 | 19,020,021 | ||
| Consol Energy | 43,840 | 1,376,138 | ||
| Devon Energy | 106,209 | 8,588,060 | ||
| El Paso | 167,868 | a | 1,628,320 | |
| ENSCO International | 34,299 | 1,303,705 | ||
| EOG Resources | 59,759 | 4,835,698 | ||
| Exxon Mobil | 1,249,913 | 92,643,552 | ||
| Halliburton | 210,669 | 4,169,140 | ||
| Hess | 67,994 | 4,093,919 |
The Fund 11
| STATEMENT OF INVESTMENTS (continued) |
| Common Stocks (continued) | Shares | Value ($) | ||
| Energy (continued) | ||||
| Marathon Oil | 169,534 | 4,933,439 | ||
| Massey Energy | 19,878 | 458,983 | ||
| Murphy Oil | 45,663 | 2,312,374 | ||
| Nabors Industries | 66,961 | b | 962,899 | |
| National Oilwell Varco | 100,206 | b | 2,995,157 | |
| Noble | 64,502 | 2,077,609 | ||
| Noble Energy | 41,352 | 2,142,861 | ||
| Occidental Petroleum | 196,491 | 10,913,110 | ||
| Peabody Energy | 66,055 | a | 2,279,558 | |
| Pioneer Natural Resources | 28,595 | a | 795,799 | |
| Range Resources | 37,024 | 1,563,153 | ||
| Rowan | 27,369 | a | 496,474 | |
| Schlumberger | 288,574 | 14,904,847 | ||
| Smith International | 51,789 | 1,785,685 | ||
| Southwestern Energy | 82,272 | b | 2,930,529 | |
| Spectra Energy | 147,527 | 2,851,697 | ||
| Sunoco | 28,954 | 883,097 | ||
| Tesoro | 33,874 | a | 327,562 | |
| Transocean | 76,678 | b | 6,312,900 | |
| Valero Energy | 125,536 | 2,583,531 | ||
| Weatherford International | 163,312 | b | 2,756,707 | |
| Williams | 138,178 | a | 2,897,593 | |
| XTO Energy | 131,968 | 4,744,250 | ||
| 268,281,318 | ||||
| Financial—14.6% | ||||
| Aflac | 114,424 | 5,066,695 | ||
| Allstate | 130,110 | 3,433,603 | ||
| American Capital | 50,111 | a | 704,060 | |
| American Express | 278,725 | 7,664,938 | ||
| American International Group | 644,778 | a | 1,231,526 | |
| Ameriprise Financial | 53,007 | 1,144,951 | ||
| AON | 66,613 | 2,817,730 | ||
| Apartment Investment & Management, Cl. A | 21,272 | a | 311,209 | |
| Assurant | 28,350 | 722,358 | ||
| AvalonBay Communities | 18,434 | 1,309,182 |
12
| Common Stocks (continued) | Shares | Value ($) | ||
| Financial (continued) | ||||
| Bank of America | 1,205,460 | 29,135,968 | ||
| Bank of New York Mellon | 275,485 | 8,980,811 | ||
| BB & T | 131,990 | a | 4,731,841 | |
| Boston Properties | 28,723 | 2,035,886 | ||
| Capital One Financial | 90,209 | a | 3,528,976 | |
| CB Richard Ellis Group, Cl. A | 42,844 b | a,b | 300,336 | |
| Charles Schwab | 224,073 | 4,284,276 | ||
| Chubb | 86,580 | 4,486,576 | ||
| Cincinnati Financial | 39,166 | 1,017,924 | ||
| CIT Group | 69,512 | a | 287,780 | |
| Citigroup | 1,310,011 | 17,881,650 | ||
| CME Group | 16,125 | 4,549,669 | ||
| Comerica | 37,026 | a | 1,021,547 | |
| Developers Diversified Realty | 29,441 | a | 387,738 | |
| Discover Financial Services | 114,517 | 1,402,833 | ||
| E*TRADE FINANCIAL | 133,472 | a,b | 242,919 | |
| Equity Residential | 64,969 | 2,269,367 | ||
| Federated Investors, Cl. B | 21,265 | 514,613 | ||
| Fifth Third Bancorp | 138,249 | a | 1,500,002 | |
| First Horizon National | 47,257 | a | 562,831 | |
| Franklin Resources | 36,528 | 2,483,904 | ||
| General Growth Properties | 56,533 | a | 234,047 | |
| Genworth Financial, Cl. A | 106,549 | 515,697 | ||
| Goldman Sachs Group | 104,486 | 9,664,955 | ||
| Hartford Financial Services Group | 73,186 | 755,280 | ||
| HCP | 61,068 | 1,827,765 | ||
| Host Hotels & Resorts | 124,177 | a | 1,283,990 | |
| Hudson City Bancorp | 124,568 | 2,343,124 | ||
| Huntington Bancshares | 90,178 | a | 852,182 | |
| IntercontinentalExchange | 18,031 | a,b | 1,542,732 | |
| Invesco | 92,644 | 1,381,322 | ||
| Janus Capital Group | 39,704 | a | 466,125 | |
| JPMorgan Chase & Co. | 886,405 | 36,564,206 | ||
| KeyCorp | 119,114 | 1,456,764 | ||
| Kimco Realty | 55,049 | a | 1,243,006 |
The Fund 13
| STATEMENT OF INVESTMENTS (continued) |
| Common Stocks (continued) | Shares | Value ($) | ||
| Financial (continued) | ||||
| Legg Mason | 34,860 a | 773,543 | ||
| Leucadia National | 42,353 a | 1,136,755 | ||
| Lincoln National | 62,353 | 1,074,966 | ||
| Loews | 86,884 | 2,885,418 | ||
| M & T Bank | 18,460 a | 1,497,106 | ||
| Marsh & McLennan Cos. | 123,138 | 3,610,406 | ||
| Marshall & Ilsley | 62,013 a | 1,118,094 | ||
| MBIA | 46,630 a | 458,373 | ||
| Merrill Lynch & Co. | 368,201 a | 6,844,857 | ||
| MetLife | 183,268 a | 6,088,163 | ||
| Moody’s | 47,187 a | 1,207,987 | ||
| Morgan Stanley | 266,519 | 4,656,087 | ||
| Nasdaq OMX Group | 32,701 a,b | 1,061,474 | ||
| National City | 500,178 | 1,350,481 | ||
| Northern Trust | 53,047 | 2,987,077 | ||
| NYSE Euronext | 63,732 | 1,923,432 | ||
| Plum Creek Timber | 40,984 a | 1,527,884 | ||
| PNC Financial Services Group | 83,271 | 5,551,678 | ||
| Principal Financial Group | 62,064 | 1,178,595 | ||
| Progressive | 164,062 | 2,341,165 | ||
| ProLogis | 63,719 | 892,066 | ||
| Prudential Financial | 102,592 | 3,077,760 | ||
| Public Storage | 30,031 | 2,447,527 | ||
| Regions Financial | 166,452 a | 1,845,953 | ||
| Simon Property Group | 54,050 | 3,622,972 | ||
| SLM | 114,918 b | 1,226,175 | ||
| Sovereign Bancorp | 135,018 a,b | 391,552 | ||
| State Street | 103,693 | 4,495,092 | ||
| SunTrust Banks | 84,939 | 3,409,451 | ||
| T. Rowe Price Group | 62,093 a | 2,455,157 | ||
| Torchmark | 21,166 | 884,104 | ||
| Travelers Cos. | 141,955 | 6,040,185 | ||
| U.S. Bancorp | 418,996 | 12,490,271 | ||
| Unum Group | 82,737 a | 1,303,108 | ||
| Vornado Realty Trust | 33,270 | 2,347,199 | ||
| Wachovia | 518,003 a | 3,320,399 |
14
| Common Stocks (continued) | Shares | Value ($) | ||
| Financial (continued) | ||||
| Wells Fargo & Co. | 796,092 | 27,106,933 | ||
| XL Capital, Cl. A | 74,610 a | 723,717 | ||
| Zions Bancorporation | 27,369 a | 1,043,033 | ||
| 304,541,089 | ||||
| Health Care—13.5% | ||||
| Abbott Laboratories | 370,840 | 20,451,826 | ||
| Aetna | 113,228 | 2,815,980 | ||
| Allergan | 73,800 | 2,927,646 | ||
| AmerisourceBergen | 38,318 | 1,198,204 | ||
| Amgen | 254,471 b | 15,240,268 | ||
| Applied Biosystems | 41,254 | 1,271,861 | ||
| Barr Pharmaceuticals | 26,585 b | 1,708,352 | ||
| Baxter International | 150,918 | 9,129,029 | ||
| Becton, Dickinson & Co. | 58,502 | 4,060,038 | ||
| Biogen Idec | 69,670 b | 2,964,458 | ||
| Boston Scientific | 360,281 b | 3,253,337 | ||
| Bristol-Myers Squibb | 475,963 | 9,781,039 | ||
| C.R. Bard | 24,099 | 2,126,736 | ||
| Cardinal Health | 86,241 | 3,294,406 | ||
| Celgene | 109,314 b | 7,024,518 | ||
| CIGNA | 66,675 | 1,086,803 | ||
| Coventry Health Care | 35,889 b | 473,376 | ||
| Covidien | 120,585 | 5,340,710 | ||
| DaVita | 24,942 b | 1,415,459 | ||
| Eli Lilly & Co. | 240,557 | 8,135,638 | ||
| Express Scripts | 59,218 b | 3,589,203 | ||
| Forest Laboratories | 72,995 b | 1,695,674 | ||
| Genzyme | 64,532 b | 4,703,092 | ||
| Gilead Sciences | 221,177 b | 10,140,965 | ||
| Hospira | 39,062 b | 1,086,705 | ||
| Humana | 41,071 b | 1,215,291 | ||
| IMS Health | 45,207 | 648,268 | ||
| Intuitive Surgical | 9,301 b | 1,607,120 | ||
| Johnson & Johnson | 672,405 | 41,245,323 | ||
| King Pharmaceuticals | 60,626 a,b | 532,903 | ||
| Laboratory Corp. of America Holdings | 26,619 b | 1,636,802 |
The Fund 15
| STATEMENT OF INVESTMENTS (continued) |
| Common Stocks (continued) | Shares | Value ($) | ||
| Health Care (continued) | ||||
| McKesson | 66,200 | 2,435,498 | ||
| Medco Health Solutions | 121,495 b | 4,610,735 | ||
| Medtronic | 271,354 | 10,943,707 | ||
| Merck & Co. | 515,323 | 15,949,247 | ||
| Millipore | 13,590 b | 705,185 | ||
| Mylan | 74,939 a,b | 642,227 | ||
| Patterson Cos. | 22,654 a,b | 573,826 | ||
| PerkinElmer | 28,944 | 519,255 | ||
| Pfizer | 1,621,863 | 28,723,194 | ||
| Quest Diagnostics | 37,848 | 1,771,286 | ||
| Schering-Plough | 390,664 | 5,660,721 | ||
| St. Jude Medical | 82,029 b | 3,119,563 | ||
| Stryker | 59,380 | 3,174,455 | ||
| Tenet Healthcare | 103,174 b | 451,902 | ||
| Thermo Fisher Scientific | 100,657 a,b | 4,086,674 | ||
| UnitedHealth Group | 292,642 | 6,944,395 | ||
| Varian Medical Systems | 29,867 b | 1,359,247 | ||
| Waters | 23,645 b | 1,035,651 | ||
| Watson Pharmaceuticals | 25,502 b | 667,387 | ||
| WellPoint | 122,846 b | 4,775,024 | ||
| Wyeth | 320,668 | 10,319,096 | ||
| Zimmer Holdings | 54,047 b | 2,509,402 | ||
| 282,778,707 | ||||
| Industrial—10.7% | ||||
| 3M | 168,081 | 10,807,608 | ||
| Allied Waste Industries | 83,008 b | 864,943 | ||
| Avery Dennison | 26,194 a | 917,314 | ||
| Boeing | 177,977 | 9,302,858 | ||
| Burlington Northern Santa Fe | 67,861 | 6,043,701 | ||
| C.H. Robinson Worldwide | 41,224 a | 2,134,579 | ||
| Caterpillar | 146,314 | 5,584,805 | ||
| Cintas | 32,196 | 763,045 | ||
| Cooper Industries, Cl. A | 42,127 | 1,303,831 | ||
| CSX | 97,918 | 4,476,811 | ||
| Cummins | 48,533 | 1,254,578 |
16
| Common Stocks (continued) | Shares | Value ($) | ||
| Industrial (continued) | ||||
| Danaher | 61,259 a | 3,628,983 | ||
| Deere & Co. | 102,525 | 3,953,364 | ||
| Dover | 45,510 | 1,445,853 | ||
| Eaton | 39,811 | 1,775,571 | ||
| Emerson Electric | 186,503 | 6,104,243 | ||
| Equifax | 30,566 | 797,161 | ||
| Expeditors International Washington | 50,986 | 1,664,693 | ||
| Fastenal | 30,875 a | 1,243,028 | ||
| FedEx | 74,775 | 4,888,042 | ||
| Flowserve | 14,159 | 805,930 | ||
| Fluor | 42,882 | 1,712,278 | ||
| General Dynamics | 95,470 | 5,758,750 | ||
| General Electric | 2,525,592 | 49,274,300 | ||
| Goodrich | 30,823 | 1,126,889 | ||
| Honeywell International | 178,911 | 5,447,840 | ||
| Illinois Tool Works | 96,015 | 3,205,941 | ||
| Ingersoll-Rand, Cl. A | 76,312 | 1,407,956 | ||
| ITT | 43,556 | 1,938,242 | ||
| Jacobs Engineering Group | 29,933 b | 1,090,459 | ||
| L-3 Communications Holdings | 29,491 | 2,393,784 | ||
| Lockheed Martin | 80,039 | 6,807,317 | ||
| Manitowoc | 33,103 | 325,734 | ||
| Masco | 87,110 a | 884,167 | ||
| Monster Worldwide | 30,927 a,b | 440,400 | ||
| Norfolk Southern | 90,139 | 5,402,932 | ||
| Northrop Grumman | 81,069 | 3,801,325 | ||
| Paccar | 87,173 a | 2,548,939 | ||
| Pall | 28,874 | 762,562 | ||
| Parker Hannifin | 40,652 | 1,576,078 | ||
| Pitney Bowes | 50,306 | 1,246,583 | ||
| Precision Castparts | 33,402 | 2,164,784 | ||
| R.R. Donnelley & Sons | 50,710 | 840,265 | ||
| Raytheon | 100,158 | 5,119,075 | ||
| Robert Half International | 37,094 | 699,964 | ||
| Rockwell Automation | 35,176 | 973,320 |
The Fund 17
| STATEMENT OF INVESTMENTS (continued) |
| Common Stocks (continued) | Shares | Value ($) | ||
| Industrial (continued) | ||||
| Rockwell Collins | 38,624 | 1,437,972 | ||
| Ryder System | 13,567 a | 537,525 | ||
| Southwest Airlines | 178,159 | 2,098,713 | ||
| Terex | 23,295 b | 388,794 | ||
| Textron | 59,438 | 1,052,053 | ||
| Tyco International | 113,981 | 2,881,440 | ||
| Union Pacific | 122,394 | 8,172,247 | ||
| United Parcel Service, Cl. B | 242,481 | 12,798,147 | ||
| United Technologies | 231,917 | 12,746,158 | ||
| W.W. Grainger | 15,746 a | 1,237,163 | ||
| Waste Management | 117,750 | 3,677,333 | ||
| 223,738,370 | ||||
| Information Technology—15.4% | ||||
| Adobe Systems | 127,368 b | 3,393,084 | ||
| Advanced Micro Devices | 149,185 a,b | 522,148 | ||
| Affiliated Computer Services, Cl. A | 23,629 a,b | 968,789 | ||
| Agilent Technologies | 85,713 b | 1,901,971 | ||
| Akamai Technologies | 41,155 b | 591,809 | ||
| Altera | 72,768 a | 1,262,525 | ||
| Amphenol, Cl. A | 42,286 | 1,211,494 | ||
| Analog Devices | 70,370 | 1,503,103 | ||
| Apple | 213,109 b | 22,928,397 | ||
| Applied Materials | 322,226 | 4,159,937 | ||
| Autodesk | 53,820 b | 1,146,904 | ||
| Automatic Data Processing | 122,232 | 4,272,008 | ||
| BMC Software | 45,375 b | 1,171,582 | ||
| Broadcom, Cl. A | 106,982 b | 1,827,252 | ||
| CA | 96,127 | 1,711,061 | ||
| Ciena | 22,255 a,b | 213,871 | ||
| Cisco Systems | 1,421,214 b | 25,254,973 | ||
| Citrix Systems | 43,451 b | 1,119,732 | ||
| Cognizant Technology Solutions, Cl. A | 70,988 b | 1,362,970 | ||
| Computer Sciences | 36,163 b | 1,090,676 | ||
| Compuware | 60,745 b | 387,553 | ||
| Convergys | 28,664 b | 220,426 | ||
| Corning | 379,107 | 4,105,729 |
18
| Common Stocks (continued) | Shares | Value ($) | ||
| Information Technology (continued) | ||||
| Dell | 418,860 | b | 5,089,149 | |
| eBay | 262,415 | b | 4,007,077 | |
| Electronic Arts | 77,429 | b | 1,763,833 | |
| EMC | 497,467 | b | 5,860,161 | |
| Fidelity National Information Services | 47,188 | 712,067 | ||
| Fiserv | 39,259 | b | 1,309,680 | |
| Google, Cl. A | 57,491 | b | 20,659,966 | |
| Harris | 32,071 | 1,152,952 | ||
| Hewlett-Packard | 589,199 | 22,554,538 | ||
| Intel | 1,352,500 | 21,640,000 | ||
| International Business Machines | 325,976 | 30,305,989 | ||
| Intuit | 76,919 | b | 1,927,590 | |
| Jabil Circuit | 51,199 | 430,584 | ||
| JDS Uniphase | 50,382 | a,b | 275,086 | |
| Juniper Networks | 131,987 | a,b | 2,473,436 | |
| KLA-Tencor | 41,840 | 972,780 | ||
| Lexmark International, Cl. A | 21,022 | a,b | 542,998 | |
| Linear Technology | 52,986 | a | 1,201,722 | |
| LSI | 154,642 | b | 595,372 | |
| MasterCard, Cl. A | 17,355 | a | 2,565,416 | |
| MEMC Electronic Materials | 54,657 | b | 1,004,596 | |
| Microchip Technology | 44,485 | a | 1,095,666 | |
| Micron Technology | 187,298 | a,b | 882,174 | |
| Microsoft | 1,889,373 | 42,189,699 | ||
| Molex | 34,656 | a | 499,393 | |
| Motorola | 543,730 | 2,919,830 | ||
| National Semiconductor | 48,493 | 638,653 | ||
| NetApp | 78,180 | b | 1,057,775 | |
| Novell | 86,784 | b | 404,413 | |
| Novellus Systems | 25,122 | a,b | 396,928 | |
| NVIDIA | 136,828 | b | 1,198,613 | |
| Oracle | 942,548 | b | 17,239,203 | |
| Paychex | 77,884 | 2,222,809 | ||
| QLogic | 33,100 | a,b | 397,862 | |
| QUALCOMM | 394,701 | 15,101,260 | ||
| Salesforce.com | 24,820 | b | 768,427 |
The Fund 19
| STATEMENT OF INVESTMENTS (continued) |
| Common Stocks (continued) | Shares | Value ($) | ||
| Information Technology (continued) | ||||
| SanDisk | 53,656 b | 477,002 | ||
| Sun Microsystems | 179,834 b | 827,236 | ||
| Symantec | 201,392 b | 2,533,511 | ||
| Tellabs | 101,984 b | 432,412 | ||
| Teradata | 44,219 b | 680,530 | ||
| Teradyne | 42,956 b | 219,076 | ||
| Texas Instruments | 315,047 | 6,162,319 | ||
| Total System Services | 48,946 | 672,518 | ||
| Tyco Electronics | 113,310 | 2,202,746 | ||
| Unisys | 86,629 b | 131,676 | ||
| VeriSign | 46,122 b | 977,786 | ||
| Western Union | 175,029 | 2,670,943 | ||
| Xerox | 211,669 | 1,697,585 | ||
| Xilinx | 67,287 a | 1,239,427 | ||
| Yahoo! | 332,920 b | 4,268,034 | ||
| 321,578,492 | ||||
| Materials—3.1% | ||||
| Air Products & Chemicals | 50,836 | 2,955,097 | ||
| AK Steel Holding | 27,672 a | 385,194 | ||
| Alcoa | 195,258 | 2,247,420 | ||
| Allegheny Technologies | 24,895 a | 660,713 | ||
| Ashland | 13,784 a | 311,380 | ||
| Ball | 23,007 | 786,839 | ||
| Bemis | 24,520 | 609,076 | ||
| CF Industries Holdings | 13,932 | 894,295 | ||
| Dow Chemical | 222,301 | 5,928,768 | ||
| E.I. du Pont de Nemours & Co. | 216,880 | 6,940,160 | ||
| Eastman Chemical | 18,809 a | 759,696 | ||
| Ecolab | 42,041 a | 1,566,448 | ||
| Freeport-McMoRan Copper & Gold | 92,199 a | 2,682,991 | ||
| Hercules | 27,970 | 470,176 | ||
| International Flavors & Fragrances | 18,843 | 600,715 | ||
| International Paper | 102,531 a | 1,765,584 | ||
| MeadWestvaco | 40,694 | 570,937 | ||
| Monsanto | 132,248 | 11,767,427 | ||
| Newmont Mining | 109,644 | 2,888,023 |
20
| Common Stocks (continued) | Shares | Value ($) | ||
| Materials (continued) | ||||
| Nucor | 76,903 | 3,115,341 | ||
| Pactiv | 32,101 a,b | 756,300 | ||
| PPG Industries | 39,334 | 1,950,180 | ||
| Praxair | 75,676 | 4,930,291 | ||
| Rohm & Haas | 30,030 | 2,112,611 | ||
| Sealed Air | 37,613 | 636,412 | ||
| Sigma-Aldrich | 30,487 | 1,337,160 | ||
| Titanium Metals | 19,645 a | 182,895 | ||
| United States Steel | 28,124 a | 1,037,213 | ||
| Vulcan Materials | 26,681 a | 1,448,245 | ||
| Weyerhaeuser | 50,683 | 1,937,104 | ||
| 64,234,691 | ||||
| Telecommunication Services—3.2% | ||||
| American Tower, Cl. A | 94,538 b | 3,054,522 | ||
| AT & T | 1,417,919 | 37,957,692 | ||
| CenturyTel | 24,623 | 618,284 | ||
| Embarq | 34,648 | 1,039,440 | ||
| Frontier Communications | 75,973 a | 578,155 | ||
| Qwest Communications International | 358,160 a | 1,024,338 | ||
| Sprint Nextel | 685,199 | 2,144,673 | ||
| Verizon Communications | 685,056 | 20,325,612 | ||
| Windstream | 106,079 | 796,653 | ||
| 67,539,369 | ||||
| Utilities—3.7% | ||||
| AES | 164,835 b | 1,313,735 | ||
| Allegheny Energy | 41,156 | 1,240,853 | ||
| Ameren | 50,335 | 1,633,371 | ||
| American Electric Power | 96,546 | 3,150,296 | ||
| CenterPoint Energy | 81,557 | 939,537 | ||
| CMS Energy | 55,441 a | 568,270 | ||
| Consolidated Edison | 65,536 a | 2,839,020 | ||
| Constellation Energy Group | 43,820 | 1,060,882 | ||
| Dominion Resources | 139,348 | 5,055,545 | ||
| DTE Energy | 39,010 | 1,377,053 | ||
| Duke Energy | 303,888 | 4,977,685 | ||
| Dynergy, Cl. A | 122,118 b | 444,510 |
The Fund 21
| STATEMENT OF INVESTMENTS (continued) |
| Common Stocks (continued) | Shares | Value ($) | ||
| Utilities (continued) | ||||
| Edison International | 78,168 | 2,781,999 | ||
| Entergy | 45,997 | 3,590,066 | ||
| Exelon | 158,039 | 8,572,035 | ||
| FirstEnergy | 73,205 | 3,818,373 | ||
| FPL Group | 98,109 | 4,634,669 | ||
| Integrys Energy | 18,783 a | 895,386 | ||
| Nicor | 11,128 a | 514,225 | ||
| NiSource | 67,554 | 875,500 | ||
| Pepco Holdings | 49,531 | 1,022,815 | ||
| PG & E | 86,041 | 3,155,123 | ||
| Pinnacle West Capital | 24,716 | 782,261 | ||
| PPL | 89,859 | 2,949,172 | ||
| Progress Energy | 62,848 | 2,474,326 | ||
| Public Service Enterprise Group | 122,070 | 3,436,271 | ||
| Questar | 42,539 | 1,465,894 | ||
| Sempra Energy | 59,097 | 2,516,941 | ||
| Southern | 185,109 | 6,356,643 | ||
| TECO Energy | 51,989 a | 599,953 | ||
| Wisconsin Energy | 28,122 | 1,223,307 | ||
| Xcel Energy | 108,162 | 1,884,182 | ||
| 78,149,898 | ||||
| Total Common Stocks | ||||
| (cost $1,745,694,975) | 2,042,103,192 | |||
| Principal | ||||
| Short-Term Investments—.3% | Amount ($) | Value ($) | ||
| U.S. Treasury Bills; | ||||
| 0.59%, 12/18/08 | ||||
| (cost $6,005,395) | 6,010,000 c | 6,006,821 | ||
| Other Investment—2.3% | Shares | Value ($) | ||
| Registered Investment Company; | ||||
| Dreyfus Institutional Preferred | ||||
| Plus Money Market Fund | ||||
| (cost $47,679,000) | 47,679,000 d | 47,679,000 | ||
22
| Investment of Cash Collateral | ||||
| for Securities Loaned—5.0% | Shares | Value ($) | ||
| Registered Investment Company; | ||||
| Dreyfus Institutional Cash | ||||
| Advantage Plus Fund | ||||
| (cost $103,817,797) | 103,817,797 d | 103,817,797 | ||
| Total Investments (cost $1,903,197,167) | 105.2% | 2,199,606,810 | ||
| Liabilities, Less Cash and Receivables | (5.2%) | (109,429,271) | ||
| Net Assets | 100.0% | 2,090,177,539 | ||
| a All or a portion of these securities are on loan.At October 31, 2008, the total market value of the fund’s securities on loan is $102,190,113 and the total market value of the collateral held by the fund is $105,180,354, consisting of cash collateral of $103,817,797 and U.S. Government and Agency securities valued at $1,362,557. b Non-income producing security. c All or partially held by a broker as collateral for open financial futures positions. d Investment in affiliated money market mutual fund. |
| Portfolio Summary (Unaudited)† | ||||||
| Value (%) | Value (%) | |||||
| Information Technology | 15.4 | Short-Term/Money | ||||
| Financial | 14.6 | Market Investments | 7.6 | |||
| Health Care | 13.5 | Utilities | 3.7 | |||
| Energy | 12.8 | Telecommunication Services | 3.2 | |||
| Consumer Staples | 12.6 | Materials | 3.1 | |||
| Industrial | 10.7 | |||||
| Consumer Discretionary | 8.0 | 105.2 | ||||
| † Based on net assets. | ||||||
| See notes to financial statements. | ||||||
The Fund 23
STATEMENT OF FINANCIAL FUTURES
October 31, 2008
| Market Value | Unrealized | |||||||
| Covered by | (Depreciation) | |||||||
| Contracts | Contracts ($) | Expiration | at 10/31/2008 ($) | |||||
| Financial Futures Long | ||||||||
| Standard & Poor’s 500 E-mini | 970 | 46,914,050 | December 2008 | (1,548,193) | ||||
| See notes to financial statements. | ||||||||
24
STATEMENT OF ASSETS AND LIABILITIES
October 31, 2008
| Cost | Value | |||
| Assets ($): | ||||
| Investments in securities—See Statement | ||||
| of Investments (including securities on loan, | ||||
| valued at $102,190,113)—Note 1(b): | ||||
| Unaffiliated issuers | 1,751,700,370 | 2,048,110,013 | ||
| Affiliated issuers | 151,496,797 | 151,496,797 | ||
| Cash | 2,115,983 | |||
| Receivable for shares of Common Stock subscribed | 4,806,366 | |||
| Dividends and interest receivable | 3,209,860 | |||
| Receivable for futures variation margin—Note 4 | 361,692 | |||
| Receivable for investment securities sold | 72,671 | |||
| 2,210,173,382 | ||||
| Liabilities ($): | ||||
| Due to The Dreyfus Corporation and affiliates—Note 3(b) | 887,988 | |||
| Liability for securities on loan—Note 1(b) | 103,817,797 | |||
| Payable for shares of Common Stock redeemed | 13,751,500 | |||
| Payable for investment securities purchased | 1,531,387 | |||
| Interest payable—Note 2 | 7,171 | |||
| 119,995,843 | ||||
| Net Assets ($) | 2,090,177,539 | |||
| Composition of Net Assets ($): | ||||
| Paid-in capital | 1,864,799,539 | |||
| Accumulated undistributed investment income—net | 39,029,506 | |||
| Accumulated net realized gain (loss) on investments | (108,512,956) | |||
| Accumulated net unrealized appreciation | ||||
| (depreciation) on investments [including ($1,548,193) | ||||
| net unrealized (depreciation) on financial futures] | 294,861,450 | |||
| Net Assets ($) | 2,090,177,539 | |||
| Shares Outstanding | ||||
| (200 million shares of $.001 par value Common Stock authorized) | 75,566,422 | |||
| Net Asset Value, offering and redemption price per share—Note 3(c) ($) | 27.66 | |||
| See notes to financial statements. | ||||
The Fund 25
| STATEMENT OF OPERATIONS Year Ended October 31, 2008 |
| Investment Income ($): | ||
| Income: | ||
| Cash dividends: | ||
| Unaffiliated issuers | 65,906,637 | |
| Affiliated issuers | 912,578 | |
| Income from securities lending | 1,162,964 | |
| Interest | 142,601 | |
| Total Income | 68,124,780 | |
| Expenses: | ||
| Management fee—Note 3(a) | 7,513,863 | |
| Shareholder servicing costs—Note 3(b) | 7,513,863 | |
| Directors’ fees—Note 3(a) | 176,794 | |
| Loan commitment fees—Note 2 | 50,284 | |
| Interest expense—Note 2 | 4,457 | |
| Total Expenses | 15,259,261 | |
| Less—Directors’ fees reimbursed by the Manager—Note 3(a) | (176,794) | |
| Net Expenses | 15,082,467 | |
| Investment Income—Net | 53,042,313 | |
| Realized and Unrealized Gain (Loss) on Investments—Note 4 ($): | ||
| Net realized gain (loss) on investments | (31,131,994) | |
| Net realized gain (loss) on financial futures | (15,377,039) | |
| Net Realized Gain (Loss) | (46,509,033) | |
| Net unrealized appreciation (depreciation) | ||
| on investments [including ($1,701,117) net | ||
| unrealized (depreciation) on financial futures) | (1,265,417,855) | |
| Net Realized and Unrealized Gain (Loss) on Investments | (1,311,926,888) | |
| Net (Decrease) in Net Assets Resulting from Operations | (1,258,884,575) | |
| See notes to financial statements. | ||
26
STATEMENT OF CHANGES IN NET ASSETS
| Year Ended October 31, | ||||
| 2008 | 2007 | |||
| Operations ($): | ||||
| Investment income—net | 53,042,313 | 54,598,049 | ||
| Net realized gain (loss) on investments | (46,509,033) | (10,059,117) | ||
| Net unrealized appreciation | ||||
| (depreciation) on investments | (1,265,417,855) | 443,748,686 | ||
| Net Increase (Decrease) in Net Assets | ||||
| Resulting from Operations | (1,258,884,575) | 488,287,618 | ||
| Dividends to Shareholders from ($): | ||||
| Investment income—net | (55,063,795) | (50,050,073) | ||
| Net realized gain on investments | — | (119,861,285) | ||
| Total Dividends | (55,063,795) | (169,911,358) | ||
| Capital Stock Transactions ($): | ||||
| Net proceeds from shares sold | 639,664,574 | 782,780,152 | ||
| Dividends reinvested | 53,981,579 | 166,653,657 | ||
| Cost of shares redeemed | (1,024,892,229) | (1,189,427,803) | ||
| Increase (Decrease) in Net Assets | ||||
| from Capital Stock Transactions | (331,246,076) | (239,993,994) | ||
| Total Increase (Decrease) in Net Assets | (1,645,194,446) | 78,382,266 | ||
| Net Assets ($): | ||||
| Beginning of Period | 3,735,371,985 | 3,656,989,719 | ||
| End of Period | 2,090,177,539 | 3,735,371,985 | ||
| Undistributed investment income—net | 39,029,506 | 41,767,179 | ||
| Capital Share Transactions (Shares): | ||||
| Shares sold | 17,459,043 | 18,772,781 | ||
| Shares issued for dividends reinvested | 1,296,699 | 4,147,396 | ||
| Shares redeemed | (27,743,716) | (28,498,074) | ||
| Net Increase (Decrease) in Shares Outstanding | (8,987,974) | (5,577,897) | ||
| See notes to financial statements. | ||||
The Fund 27
FINANCIAL HIGHLIGHTS
The following table describes the performance for the fiscal periods indicated. Total return shows how much your investment in the fund would have increased (or decreased) during each period, assuming you had reinvested all dividends and distributions.These figures have been derived from the fund’s financial statements.
| Year Ended October 31, | ||||||||||
| 2008 | 2007 | 2006 | 2005 | 2004 | ||||||
| Per Share Data ($): | ||||||||||
| Net asset value, beginning of period | 44.18 | 40.57 | 35.50 | 33.30 | 30.91 | |||||
| Investment Operations: | ||||||||||
| Investment income—neta | .66 | .61 | .54 | .56 | .39 | |||||
| Net realized and unrealized | ||||||||||
| gain (loss) on investments | (16.51) | 4.90 | 5.01 | 2.16 | 2.35 | |||||
| Total from Investment Operations | (15.85) | 5.51 | 5.55 | 2.72 | 2.74 | |||||
| Distributions: | ||||||||||
| Dividends from investment | ||||||||||
| income—net | (.67) | (.56) | (.48) | (.52) | (.35) | |||||
| Dividends from net realized | ||||||||||
| gain on investments | — | (1.34) | — | — | — | |||||
| Total Distributions | (.67) | (1.90) | (.48) | (.52) | (.35) | |||||
| Net asset value, end of period | 27.66 | 44.18 | 40.57 | 35.50 | 33.30 | |||||
| Total Return (%) | (36.38) | 14.05 | 15.79 | 8.20 | 8.93 | |||||
| Ratios/Supplemental Data (%): | ||||||||||
| Ratio of total expenses | ||||||||||
| to average net assets | .51 | .51 | .50 | .50 | .50 | |||||
| Ratio of net expenses | ||||||||||
| to average net assets | .50 | .50 | .50 | .50 | .50 | |||||
| Ratio of net investment income | ||||||||||
| to average net assets | 1.77 | 1.47 | 1.45 | 1.60 | 1.21 | |||||
| Portfolio Turnover Rate | 4.95 | 4.71 | 5.04 | 7.24 | 1.87 | |||||
| Net Assets, end of period | ||||||||||
| ($ x 1,000) | 2,090,178 | 3,735,372 | 3,656,990 | 3,310,961 | 3,116,177 | |||||
| a Based on average shares outstanding at each month end. | ||||||||||
| See notes to financial statements. | ||||||||||
28
NOTES TO FINANCIAL STATEMENTS
NOTE 1—Significant Accounting Policies:
Dreyfus S&P 500 Index Fund (the “fund”) is a separate non-diversified series of Dreyfus Index Funds, Inc. (the “Company”), which is registered under the Investment Company Act of 1940, as amended (the “Act”), as an open-end management investment company and operates as a series company currently offering three series including the fund.The fund’s investment objective is to match the performance of the Standard & Poor’s 500 Composite Stock Price Index. The Dreyfus Corporation (the “Manager” or “Dreyfus”), a wholly-owned subsidiary of The Bank of New York Mellon Corporation (“BNY Mellon”), serves as the fund’s investment adviser. MBSC Securities Corporation (the “Distributor”), a wholly-owned subsidiary of the Manager, is the distributor of the fund’s shares, which are sold to the public without a sales charge.
Effective July 1, 2008, BNY Mellon has reorganized and consolidated a number of its banking and trust company subsidiaries. As a result of the reorganization, any services previously provided to the fund by Mellon Bank, N.A. or Mellon Trust of New England, N.A. are now provided by The Bank of New York, which has changed its name to The Bank of New York Mellon.
The Company accounts separately for the assets, liabilities and operations of each series. Expenses directly attributable to each series are charged to that series’ operations; expenses which are applicable to all series are allocated among them on a pro rata basis.
The fund’s financial statements are prepared in accordance with U.S. generally accepted accounting principles, which requires the use of management estimates and assumptions. Actual results could differ from those estimates.
The fund enters into contracts that contain a variety of indemnifications. The fund’s maximum exposure under these arrangements is unknown.The fund does not anticipate recognizing any loss related to these arrangements.
The Fund 29
| NOTES TO FINANCIAL STATEMENTS (continued) |
(a) Portfolio valuation: Investments in securities are valued at the last sales price on the securities exchange or national securities market on which such securities are primarily traded. Securities listed on the National Market System for which market quotations are available are valued at the official closing price or, if there is no official closing price that day, at the last sales price. Securities not listed on an exchange or the national securities market, or securities for which there were no transactions, are valued at the average of the most recent bid and asked prices, except for open short positions, where the asked price is used for valuation purposes. Bid price is used when no asked price is available. Registered investment companies that are not traded on an exchange are valued at their net asset value.When market quotations or official closing prices are not readily available, or are determined not to reflect accurately fair value, such as when the value of a security has been significantly affected by events after the close of the exchange or market on which the security is principally traded (for example, a foreign exchange or market), but before the fund calculates its net asset value, the fund may value these investments at fair value as determined in accordance with the procedures approved by the Board of Directors. Fair valuing of securities may be determined with the assistance of a pricing service using calculations based on indices of domestic securities and other appropriate indicators, such as prices of relevant ADRs and futures contracts. For other securities that are fair valued by the Board of Directors, certain factors may be considered such as: fundamental analytical data, the nature and duration of restrictions on disposition, an evaluation of the forces that influence the market in which the securities are purchased and sold, and public trading in similar securities of the issuer or comparable issuers. Financial futures are valued at the last sales price.
The Financial Accounting Standards Board (“FASB”) released Statement of Financial Accounting Standards No. 157 “Fair Value Measurements” (“FAS 157”). FAS 157 establishes an authoritative definition of fair value, sets out a framework for measuring fair value, and requires additional disclosures about fair-value measurements. The
30
application of FAS 157 is required for fiscal years beginning after November 15, 2007 and interim periods within those fiscal years. Management does not believe that the application of this standard will have a material impact on the financial statements of the fund.
(b) Securities transactions and investment income: Securities transactions are recorded on a trade date basis. Realized gains and losses from securities transactions are recorded on the identified cost basis. Dividend income is recognized on the ex-dividend date and interest income, including, where applicable, accretion of discount and amortization of premium on investments, is recognized on the accrual basis.
Pursuant to a securities lending agreement with The Bank of New York Mellon, a subsidiary of BNY Mellon and an affiliate of Dreyfus, the fund may lend securities to qualified institutions. It is the fund’s policy that, at origination all loans are secured by collateral of at least 102% of the value of U.S. securities loaned and 105% of the value of foreign securities loaned. Collateral equivalent to at least 100% of the market value of securities on loan is maintained at all times. Collateral is either in the form of cash, which can be invested in certain money market mutual funds managed by the Manager, U.S. Government and Agency securities or letters of credit.The fund is entitled to receive all income on securities loaned, in addition to income earned as a result of the lending transaction. Although each security loaned is fully collateralized, the fund bears the risk of delay in recovery of, or loss of rights in, the securities loaned should a borrower fail to return the securities in a timely manner. During the period ended October 31, 2008,The Bank of New York Mellon earned $498,413 from lending fund portfolio securities, pursuant to the securities lending agreement.
(c) Affiliated issuers: Investments in other investment companies advised by the Manager are defined as “affiliated” in the Act.
(d) Dividends to shareholders: Dividends are recorded on the ex-dividend date. Dividends from investment income-net and dividends from net realized capital gains, if any, are normally declared and paid annu-
The Fund 31
| NOTES TO FINANCIAL STATEMENTS (continued) |
ally, but the fund may make distributions on a more frequent basis to comply with the distribution requirements of the Internal Revenue Code of 1986, as amended (the “Code”).To the extent that net realized capital gain, can be offset by capital loss carryovers, it is the policy of the fund not to distribute such gains. Income and capital gain distributions are determined in accordance with income tax regulations, which may differ from U.S. generally accepted accounting principles.
(e) Federal income taxes: It is the policy of the fund to continue to qualify as a regulated investment company, if such qualification is in the best interests of its shareholders, by complying with the applicable provisions of the Code, and to make distributions of taxable income sufficient to relieve it from substantially all federal income and excise taxes. Accordingly, no provision for income tax is required.
The fund adopted FASB Interpretation No. 48 “Accounting for Uncertainty in Income Taxes” (“FIN 48”). FIN 48 provides guidance for how uncertain tax positions should be recognized, measured, presented and disclosed in the financial statements. FIN 48 requires the evaluation of tax positions taken or expected to be taken in the course of preparing the fund’s tax returns to determine whether the tax positions are “more-likely-than-not” of being sustained by the applicable tax authority. Liability for tax positions not deemed to meet the more-likely-than-not threshold would be recorded as a tax expense in the current year.The adoption of FIN 48 had no impact on the operations of the fund for the period ended October 31, 2008.
As of and during the period ended October 31, 2008, the fund did not have any liabilities for any unrecognized tax positions. The fund recognizes interest and penalties, if any, related to unrecognized tax positions as income tax expense in the Statement of Operations. During the period, the fund did not incur any interest or penalties.
Each of the tax years in the four-year period ended October 31, 2008 remains subject to examination by the Internal Revenue Service and state taxing authorities.
32
At October 31, 2008, the components of accumulated earnings on a tax basis were as follows: undistributed ordinary income $38,740,910, accumulated capital losses $49,481,499 and unrealized appreciation $236,118,589.
The accumulated capital loss carryover is available for federal income tax purposes to be applied against future net securities profits, if any, realized subsequent to October 31, 2008. If not applied, $9,724,313 of the carryover expires in fiscal 2015 and $39,757,186 expires in fiscal 2016.
The tax character of distributions paid to shareholders during the fiscal periods ended October 31, 2008 and October 31, 2007 was as follows: ordinary income $55,063,795 and $50,050,073 and long-term capital gains $0 and $119,861,285, respectively.
During the period ended October 31, 2008, as a result of permanent book to tax differences, primarily due to the tax treatment for real estate investment trusts, the fund decreased accumulated undistributed investment income-net by $716,191 and increased accumulated net realized gain (loss) on investments by the same amount. Net assets and net asset value per share were not affected by this reclassification.
NOTE 2—Bank Lines of Credit:
Prior to October 15,2008,the fund participated with other Dreyfus-managed funds in a $350 million redemption credit facility. Effective October 15, 2008, the fund participates with other Dreyfus-managed funds in a $145 million redemption credit facility (the “Facility”) to be utilized for temporary or emergency purposes, including the financing of redemptions. In connection therewith, the fund has agreed to pay commitment fees on its pro rata portion of the Facility. Interest is charged to the fund based on prevailing market rates in effect at the time of borrowing.
The average daily amount of borrowings outstanding under the Facilities during the period ended October 31, 2008, was approximately $173,200 with a related weighted average annualized interest rate of 2.57% .
The Fund 33
| NOTES TO FINANCIAL STATEMENTS (continued) |
NOTE 3—Management Fee and Other Transactions With Affiliates:
(a) Pursuant to an Investment Management Agreement (“Agreement”) with the Manager, the management fee is computed at the annual rate of .25% of the value of the fund’s average daily net assets, and is payable monthly. Under the terms of the Agreement, the Manager has agreed to pay all the expenses of the fund, except management fees, brokerage commissions, taxes, interest, commitment fees, Shareholder Services Plan fees, fees and expenses of non-interested Board members (including counsel fees) and extraordinary expenses. In addition, the Manager is required to reduce its fees in an amount equal to the fund’s allocable portion of fees and expenses of the non-interested Board members (including counsel fees). Each Board member also serves as a Board member of other funds within the Dreyfus complex (collectively, the “Fund Group”). Currently, the Company and 12 other funds (comprised of 35 portfolios) in the Dreyfus Family of Funds pay each Board member their respective allocated portion of an annual retainer of $85,000 and an attendance fee of $10,000 for each regularly scheduled Board meeting, an attendance fee of $2,000 for separate in-person committee meeting that is not held in conjunction with a regularly scheduled Board meeting and an attendance fee of $1,000 for each Board meeting and separate committee meetings that are conducted by telephone.The Chairman of the Board receives an additional 25% of such compensation and the Audit Committee Chairman receives an additional $15,000 per annum. The Company also reimburses each Board member for travel and out of pocket expenses in connection with attending Board or committee meetings. Subject to the Company’s Emeritus Program Guidelines, Emeritus Board members, if any, receive 50% of the Company’s annual retainer fee and per meeting fee paid at the time the Board member achieves emeritus status. All Board fees are allocated among the funds in the Fund Group in proportion to each fund’s relative net assets.
(b) Under the Shareholder Services Plan, the fund pays the Distributor for the provision of certain services a fee, at the annual rate of .25% of
34
the value of the fund’s average daily net assets. The services provided may include personal services relating to shareholder accounts, such as answering shareholder inquiries regarding the fund and providing reports and other information, and services related to the maintenance of shareholder accounts. The Distributor may make payments to Service Agents (a securities dealer, financial institution or other industry professional) in respect of these services. The Distributor determines the amounts to be paid to Service Agents. During the period ended October 31, 2008, the fund was charged $7,513,863 pursuant to the Shareholder Services Plan.
The components of “Due to The Dreyfus Corporation and affiliates” in the Statement of Assets and Liabilities consist of: management fees $443,994 and shareholder services plan fees $443,994.
(c) Prior to December 1, 2007, a 1% redemption fee was charged and retained by the fund on certain shares redeemed within thirty days following the date of issuance, including redemptions made through the use of the fund’s exchange privilege. During the period ended October 31, 2008, redemption fees charged and received by the fund amounted to $25. Effective December 1, 2007, the fund discontinued the redemption fee on shares.The fund reserves the right to reimpose a redemption fee in the future.
NOTE 4—Securities Transactions:
The aggregate amount of purchases and sales of investment securities, excluding short-term securities and financial futures during the period ended October 31, 2008, amounted to $148,067,049 and $510,052,136, respectively.
The fund may invest in financial futures contracts in order to gain exposure to or protect against changes in the market.The fund is exposed to market risk as a result of changes in the value of the underlying financial instruments. Investments in financial futures require the fund to “mark to market” on a daily basis, which reflects the change in the market value of the contract at the close of each day’s trading.Accordingly,
The Fund 35
| NOTES TO FINANCIAL STATEMENTS (continued) |
variation margin payments are received or made to reflect daily unrealized gains or losses.When the contracts are closed, the fund recognizes a realized gain or loss.These investments require initial margin deposits with a broker, which consist of cash or cash equivalents.The amount of these deposits is determined by the exchange or Board of Trade on which the contract is traded and is subject to change. Contracts open at October 31, 2008, are set forth in the Statement of Financial Futures.
At October 31, 2008, the cost of investments for federal income tax purposes was $1,963,488,221; accordingly, accumulated net unrealized appreciation on investments was $236,118,589, consisting of $684,531,291 gross unrealized appreciation and $448,412,702 gross unrealized depreciation.
In March 2008, the FASB released Statement of Financial Accounting Standards No. 161 “Disclosures about Derivative Instruments and Hedging Activities” (“FAS 161”). FAS 161 requires qualitative disclosures about objectives and strategies for using derivatives, quantitative disclosures about fair value amounts of gains and losses on derivative instruments and disclosures about credit-risk-related contingent features in derivative agreements.The application of FAS 161 is required for fiscal years and interim periods beginning after November 15, 2008. At this time, management is evaluating the implications of FAS 161 and its impact on the financial statements and the accompanying notes has not yet been determined.
36
| REPORT OF INDEPENDENT REGISTERED PUBLIC ACCOUNTING FIRM |
| Shareholders and Board of Directors |
| Dreyfus S&P 500 Index Fund |
We have audited the accompanying statement of assets and liabilities, including the statements of investments and financial futures, of Dreyfus S&P 500 Index Fund (one of the series comprising Dreyfus Index Funds, Inc.) as of October 31, 2008, and the related statement of operations for the year then ended and the statement of changes in net assets and financial highlights for each of the two years in the period then ended.These financial statements and financial highlights are the responsibility of the Fund’s management. Our responsibility is to express an opinion on these financial statements and financial highlights based on our audits.The financial highlights for each of the years ended October 31, 2006, 2005 and 2004 were audited by other auditors whose report dated December 14, 2006, expressed an unqualified opinion on such financial highlights.
We conducted our audits in accordance with the standards of the Public Company Accounting Oversight Board (United States).Those standards require that we plan and perform the audit to obtain reasonable assurance about whether the financial statements and financial highlights are free of material misstatement.We were not engaged to perform an audit of the Fund’s internal control over financial reporting. Our audits included consideration of internal control over financial reporting as a basis for designing audit procedures that are appropriate in the circumstances, but not for the purpose of expressing an opinion on the effectiveness of the Fund’s internal control over financial reporting. Accordingly, we express no such opinion.An audit also includes examining, on a test basis, evidence supporting the amounts and disclosures in the financial statements and financial highlights, assessing the accounting principles used and significant estimates made by management, and evaluating the overall financial statement presentation. Our procedures included confirmation of securities owned as of October 31, 2008 by correspondence with the custodian and others. We believe that our audits provide a reasonable basis for our opinion.
In our opinion, the 2008 and 2007 financial statements and financial highlights referred to above present fairly, in all material respects, the financial position of Dreyfus S&P 500 Index Fund at October 31, 2008, the results of its operations for the year then ended and the changes in its net assets and the financial highlights for each of the two years in the period then ended, in conformity with U.S. generally accepted accounting principles.
| New York, New York December 23, 2008 |
The Fund 37
IMPORTANT TAX INFORMATION ( U n a u d i t e d )
In accordance with federal tax law, the fund hereby designates 100% of the ordinary dividends paid during the fiscal year ended October 31, 2008 as qualifying for the corporate dividends received deduction. For the fiscal year ended October 31, 2008, certain dividends paid by the fund may be subject to a maximum tax rate of 15%, as provided for by the Jobs and Growth Tax Relief Reconciliation Act of 2003. Of the distributions paid during the fiscal year, $27,616,223 represents the maximum amount that may be considered qualified dividend income. Shareholders will receive notification in January 2009 of the percentage applicable to the preparation of their 2008 income tax returns.
38
BOARD MEMBERS INFORMATION ( U n a u d i t e d )
The Fund 39
BOARD MEMBERS INFORMATION ( U n a u d i t e d ) (continued)
40

The Fund 41
OFFICERS OF THE FUND (Unaudited)
42
The Fund 43
NOTES
For More Information
| Dreyfus S&P 500 | Transfer Agent & | |
| Index Fund | Dividend Disbursing Agent | |
| 200 Park Avenue | Dreyfus Transfer, Inc. | |
| New York, NY 10166 | 200 Park Avenue | |
| Manager | New York, NY 10166 | |
| The Dreyfus Corporation | Distributor | |
| 200 Park Avenue | MBSC Securities Corporation | |
| New York, NY 10166 | 200 Park Avenue | |
| Custodian | New York, NY 10166 | |
| The Bank of New York Mellon | ||
| One Wall Street | ||
| New York, NY 10286 |
| Ticker Symbol: PEOPX |
Telephone 1-800-645-6561
Mail The Dreyfus Family of Funds, 144 Glenn Curtiss Boulevard, Uniondale, NY 11556-0144 E-mail Send your request to info@dreyfus.com Internet Information can be viewed online or downloaded at: http://www.dreyfus.com
The fund files its complete schedule of portfolio holdings with the Securities and Exchange Commission (“SEC”) for the first and third quarters of each fiscal year on Form N-Q. The fund’s Forms N-Q are available on the SEC’s website at http://www.sec.gov and may be reviewed and copied at the SEC’s Public Reference Room in Washington, DC. Information on the operation of the Public Reference Room may be obtained by calling 1-800-SEC-0330.
A description of the policies and procedures that the fund uses to determine how to vote proxies relating to portfolio securities, and information regarding how the fund voted these proxies for the 12-month period ended June 30, 2008, is available at http://www.dreyfus.com and on the SEC’s website at http://www.sec.gov. The description of the policies and procedures is also available without charge, upon request, by calling 1-800-645-6561.
© 2008 MBSC Securities Corporation

| Dreyfus Smallcap Stock Index Fund |
| ANNUAL REPORT October 31, 2008 |
Save time. Save paper. View your next shareholder report online as soon as it’s available. Log into www.dreyfus.com and sign up for Dreyfus eCommunications. It’s simple and only takes a few minutes.
The views expressed in this report reflect those of the portfolio manager only through the end of the period covered and do not necessarily represent the views of Dreyfus or any other person in the Dreyfus organization. Any such views are subject to change at any time based upon market or other conditions and Dreyfus disclaims any responsibility to update such views.These views may not be relied on as investment advice and, because investment decisions for a Dreyfus fund are based on numerous factors, may not be relied on as an indication of trading intent on behalf of any Dreyfus fund.
| Contents | ||
| THE FUND | ||
| 2 | A Letter from the CEO | |
| 3 | Discussion of Fund Performance | |
| 6 | Fund Performance | |
| 7 | Understanding Your Fund’s Expenses | |
| 7 | Comparing Your Fund’s Expenses | |
| With Those of Other Funds | ||
| 8 | Statement of Investments | |
| 26 | Statement of Financial Futures | |
| 27 | Statement of Assets and Liabilities | |
| 28 | Statement of Operations | |
| 29 | Statement of Changes in Net Assets | |
| 30 | Financial Highlights | |
| 31 | Notes to Financial Statements | |
| 39 | Report of Independent Registered | |
| Public Accounting Firm | ||
| 40 | Important Tax Information | |
| 41 | Board Members Information | |
| 44 | Officers of the Fund | |
| FOR MORE INFORMATION | ||
| Back Cover | ||
| Dreyfus Smallcap Stock Index Fund |
The Fund

| A LETTER FROM THE CEO Dear Shareholder: |
We present to you this annual report for Dreyfus Smallcap Stock Index Fund, covering the 12-month period from November 1, 2007, through October 31, 2008.
These are difficult times for equity investors. A credit crunch that began in early 2007 has developed into a full-blown global financial crisis, recently resulting in the failure of several major financial institutions and prompting a massive government rescue effort. Meanwhile, the U.S. economic slowdown has gathered momentum,depressing investor sentiment, consumer confidence and business investment.These factors undermined returns in most stock market sectors, particularly financial companies and businesses that tend to be more sensitive to economic trends.
The depth and duration of the economic downturn will depend on how quickly the financial system can be stabilized.We believe that the Temporary Guarantee Program for Money Market Funds and the $700 billion rescue package intended to promote greater liquidity in the financial markets meet several critical requirements for addressing today’s financial stresses, and we expect these measures to contribute to a more orderly deleveraging process. However, recuperation from the financial crisis is likely to take time. In the meantime, we encourage you to keep in touch with your financial advisor and maintain a long-term and disciplined perspective to investing. Indeed, we already are seeing some positive signs, including a likely peak in global inflationary pressures, a bottoming of the U.S. dollar, attractive valuations among fundamentally sound companies and a large pool of worldwide financial liquidity that could be deployed gradually as the economic cycle turns.
For information about how the fund performed during the reporting period, as well as market perspectives, we have provided a Discussion of Fund Performance given by the fund’s Portfolio Manager.
Thank you for your continued confidence and support.

| Jonathan R. Baum Chief Executive Officer The Dreyfus Corporation November 17, 2008 |
2

DISCUSSION OF FUND PERFORMANCE
For the period of November 1, 2007, through October 31, 2008, as provided by Thomas Durante, CFA, Portfolio Manager
Fund and Market Performance Overview
For the 12-month period ended October 31, 2008, Dreyfus Smallcap Stock Index Fund produced a total return of –32.21% .1 In comparison, the Standard & Poor’s SmallCap 600 Index (the “S&P 600 Index” or the “Index”), the fund’s benchmark, produced a –32.44% return for the same period.2,3
Like other capitalization ranges, small-cap stocks produced disappointing absolute returns during an especially challenging reporting period. Concerns regarding a slowing economy, turmoil in the global credit markets and the near collapse of the global banking system caused stock prices across most market sectors to fall sharply. The difference in returns between the fund and the S&P 600 Index was primarily due to the fund’s sampling strategy.
The Fund’s Investment Approach
The fund seeks to match the total return of the S&P 600 Index by generally investing in a representative sample of the stocks listed in the S&P 600 Index. While the fund generally owns the vast majority of the stocks in the S&P 600 Index, some very small stocks may be excluded from the portfolio.The S&P 600 Index is composed of 600 domestic stocks across 10 economic sectors. Each stock is weighted by its market capitalization; that is, larger companies have greater representation in the S&P 600 Index than smaller ones.The fund may also use stock index futures as a substitute for the sale or purchase of stocks.
Volatility Increases as Financial Crisis Intensifies
A credit crisis that dominated much of the reporting period developed into a full-blown global financial crisis, resulting in the failure of several major financial institutions. As lenders grew increasingly risk-averse, companies across virtually all industry groups scrambled to obtain
The Fund 3
| DISCUSSION OF FUND PERFORMANCE (continued) |
funding from a rapidly shrinking supply of available credit. Also contributing to the downturn was a barrage of negative economic news, including slowing U.S. and global economies, falling home prices, growing unemployment and sluggish consumer spending.As the slowdown intensified, previously high-flying commodity prices retreated sharply from their highs.These factors caused investors to become more averse to risks, sparking broad-based declines in the stock market.
The Federal Reserve Board (the “Fed”) responded aggressively to the economic slowdown and financial crisis by reducing short-term interest rates and, in March 2008, participating in the rescue of investment bank Bear Stearns. Although stock markets rallied briefly in the spring, the rebound proved to be short-lived. Over the summer, additional government rescues were announced for insurer American International Group and mortgage agencies Freddie Mac and Fannie Mae. Meanwhile, investment bank Lehman Brothers filed for bankruptcy, Merrill Lynch and Wachovia were acquired by competitors, Washington Mutual was seized by regulators, and Goldman Sachs and Morgan Stanley re-registered as bank holding companies to enable them to tap government funds. By September, the financial crisis threatened to spin out of control, and the global banking system came close to collapse.
The U.S. Congress responded to the crisis by making $700 billion available to banks through the controversial Troubled Asset Relief Program. In addition, the Fed and several of the world’s major central banks announced unprecedented, coordinated reductions in short-term interest rates to help strengthen the world’s financial systems.The reporting period ended with all major stock market indices reporting negative double-digit returns.
No Winners in this Turbulent Market Environment
Although small-cap stocks fared somewhat better, on average, than their mid- and large-cap counterparts, none of the 10 sectors in the S&P 600 Index posted a positive absolute return over the 12-month reporting period. Declines were especially severe among the Index’s technology, consumer discretionary, industrials and health care sectors. While all industry groups within the small-cap technology sector disappointed,
4
declines were particularly noteworthy among electronic component and hardware companies that manufacture transformers, wires, coils, antennas and meters for wireless and automotive systems.The slowdown in consumer spending hurt a number of the Index’s consumer discretionary stocks, including apparel retailers, restaurants, homebuilders, home furnishing companies and leisure products firms that sell fitness equipment, motorboats, ski equipment, snowmobiles and ATV’s. Laggards among the Index’s industrials stocks included engineering equipment stocks,primar-ily producers of machinery for industrial and chemical plants, aerospace parts makers, firms that provide utility support structures and ceramic products companies with large governmental contracts. Temporary employment firms also lagged.Finally,health care services and equipment stocks detracted, as wellness providers and makers of orthopedic care devices encountered concerns over future coverages.
Index Investing Offers Diversification
As an index fund, our strategy is to attempt to replicate the returns of the S&P 600 Index by investing in a representative sample of the small-cap stocks listed in the S&P 600 Index.The fund offers a diversified investment vehicle that can help investors manage the risks of investing in small-cap stocks by limiting the impact on the overall portfolio of unexpected losses in any single industry group or holding.
November 17, 2008
| 1 Total return includes reinvestment of dividends and any capital gains paid. Past performance is no guarantee of future results. Share price and investment return fluctuate such that upon redemption, fund shares may be worth more or less than their original cost. Return figure provided reflects the absorption of certain fund expenses by The Dreyfus Corporation pursuant to an agreement in effect that may be extended, terminated or modified. Had these expenses not been absorbed, the fund’s return would have been lower. 2 SOURCE: LIPPER INC. — Reflects the reinvestment of dividends and, where applicable, capital gain distributions.The Standard & Poor’s SmallCap 600 Index is a broad-based index and a widely accepted, unmanaged index of overall small-cap stock market performance. 3 Standard & Poor’s®,”“S&P®,” and “Standard & Poor’s SmallCap 600 Index” are trademarks of The McGraw-Hill Companies, Inc., and have been licensed for use by the fund.The fund is not sponsored, endorsed, sold or promoted by Standard & Poor’s and Standard & Poor’s makes no representation regarding the advisability of investing in the fund. |
The Fund 5
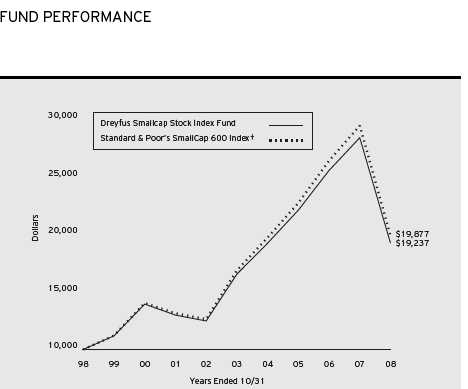
| Comparison of change in value of $10,000 investment in Dreyfus Smallcap Stock Index Fund and the Standard & Poor’s SmallCap 600 Index |
| Average Annual Total Returns as of 10/31/08 | ||||||
| 1 Year | 5 Years | 10 Years | ||||
| Fund | (32.21)% | 3.08% | 6.76% | |||
| † Source: Lipper Inc. Past performance is not predictive of future performance.The fund’s performance shown in the graph and table does not reflect the deduction of taxes that a shareholder would pay on fund distributions or the redemption of fund shares. The above graph compares a $10,000 investment made in Dreyfus Smallcap Stock Index Fund on 10/31/98 to a $10,000 investment made in the Standard & Poor’s SmallCap 600 Index (the “Index”) on that date. All dividends and capital gain distributions are reinvested. The fund’s performance shown in the line graph takes into account all applicable fees and expenses.The Index is a broad based index and a widely accepted, unmanaged index of overall small-cap stock market performance. Unlike a mutual fund, the Index is not subject to charges, fees and other expenses. Investors cannot invest directly in any index. Further information relating to fund performance, including expense reimbursements, if applicable, is contained in the Financial Highlights section of the prospectus and elsewhere in this report. |
6
UNDERSTANDING YOUR FUND’S EXPENSES (Unaudited)
As a mutual fund investor, you pay ongoing expenses, such as management fees and other expenses. Using the information below, you can estimate how these expenses affect your investment and compare them with the expenses of other funds.You also may pay one-time transaction expenses, including sales charges (loads) and redemption fees, which are not shown in this section and would have resulted in higher total expenses. For more information, see your fund’s prospectus or talk to your financial adviser.
Review your fund’s expenses
The table below shows the expenses you would have paid on a $1,000 investment in Dreyfus Smallcap Stock Index Fund from May 1, 2008 to October 31, 2008. It also shows how much a $1,000 investment would be worth at the close of the period, assuming actual returns and expenses.
| Expenses and Value of a $1,000 Investment assuming actual returns for the six months ended October 31, 2008 |
| Expenses paid per $1,000† | $ 2.22 | |
| Ending value (after expenses) | $767.80 |
| COMPARING YOUR FUND’S EXPENSES WITH THOSE OF OTHER FUNDS (Unaudited) |
Using the SEC’s method to compare expenses
The Securities and Exchange Commission (SEC) has established guidelines to help investors assess fund expenses. Per these guidelines, the table below shows your fund’s expenses based on a $1,000 investment, assuming a hypothetical 5% annualized return. You can use this information to compare the ongoing expenses (but not transaction expenses or total cost) of investing in the fund with those of other funds.All mutual fund shareholder reports will provide this information to help you make this comparison. Please note that you cannot use this information to estimate your actual ending account balance and expenses paid during the period.
| Expenses and Value of a $1,000 Investment assuming a hypothetical 5% annualized return for the six months ended October 31, 2008 |
| Expenses paid per $1,000† | $ 2.54 | |
| Ending value (after expenses) | $1,022.62 |
| † Expenses are equal to the fund’s annualized expense ratio of .50%, multiplied by the average account value over the period, multiplied by 184/366 (to reflect the one-half year period). |
The Fund 7
| STATEMENT OF INVESTMENTS October 31, 2008 |
| Common Stocks—98.5% | Shares | Value ($) | ||
| Consumer Discretionary—13.6% | ||||
| 4Kids Entertainment | 15,750 a | 83,317 | ||
| Aaron Rents | 110,347 b | 2,735,502 | ||
| AH Belo, Cl. A | 36,650 b | 121,311 | ||
| Arbitron | 54,257 b | 1,767,693 | ||
| Arctic Cat | 3,500 b | 26,530 | ||
| ATC Technology | 54,759 a | 1,200,865 | ||
| Audiovox, Cl. A | 11,000 a,b | 64,790 | ||
| Big 5 Sporting Goods | 48,150 b | 302,382 | ||
| Blue Nile | 30,576 a,b | 935,014 | ||
| Brown Shoe | 70,275 b | 740,698 | ||
| Brunswick | 169,600 b | 588,512 | ||
| Buckle | 55,652 b | 1,465,861 | ||
| Buffalo Wild Wings | 30,512 a,b | 862,879 | ||
| Cabela’s | 86,900 a,b | 690,855 | ||
| California Pizza Kitchen | 69,400 a | 678,038 | ||
| Carter’s | 115,900 a | 2,461,716 | ||
| Cato, Cl. A | 76,292 | 1,184,052 | ||
| CBRL Group | 51,285 | 1,021,597 | ||
| CEC Entertainment | 53,261 a,b | 1,367,742 | ||
| Champion Enterprises | 131,949 a,b | 246,745 | ||
| Charlotte Russe Holding | 53,400 a,b | 451,230 | ||
| Children’s Place Retail Stores | 43,800 a,b | 1,464,234 | ||
| Christopher & Banks | 71,825 | 374,926 | ||
| CKE Restaurants | 82,950 | 704,245 | ||
| Coinstar | 46,000 a,b | 1,103,540 | ||
| CPI | 4,800 b | 35,040 | ||
| Crocs | 152,300 a,b | 382,273 | ||
| Deckers Outdoor | 29,150 a,b | 2,473,669 | ||
| DineEquity | 23,800 b | 429,114 | ||
| Dress Barn | 109,288 a,b | 1,044,793 | ||
| Drew Industries | 45,753 a,b | 553,611 | ||
| E.W. Scripps, Cl. A | 107,332 | 499,094 | ||
| Ethan Allen Interiors | 65,300 b | 1,168,217 | ||
| Finish Line, Cl. A | 88,847 b | 850,266 | ||
| Fossil | 96,679 a,b | 1,754,724 | ||
| Fred’s, Cl. A | 80,200 | 982,450 |
8
| Common Stocks (continued) | �� Shares | Value ($) | ||
| Consumer Discretionary (continued) | ||||
| Genesco | 44,319 | a,b | 1,099,554 | |
| Group 1 Automotive | 36,100 | b | 362,805 | |
| Gymboree | 64,424 | a,b | 1,666,005 | |
| Haverty Furniture | 12,350 | b | 121,524 | |
| Hibbett Sports | 66,874 | a,b | 1,191,026 | |
| Hillenbrand | 128,250 | 2,436,750 | ||
| Hot Topic | 81,900 | a,b | 530,712 | |
| HSN | 65,050 | a | 400,057 | |
| Iconix Brand Group | 112,050 | a,b | 1,220,224 | |
| Interval Leisure Group | 82,580 | a | 599,531 | |
| Jack in the Box | 117,400 | a,b | 2,359,740 | |
| JAKKS Pacific | 67,648 | a,b | 1,513,286 | |
| Jo-Ann Stores | 56,517 | a,b | 1,082,866 | |
| JoS. A. Bank Clothiers | 39,522 | a,b | 1,006,625 | |
| K-Swiss, Cl. A | 50,179 | b | 759,208 | |
| La-Z-Boy | 71,500 | b | 413,270 | |
| Landry’s Restaurants | 23,150 | b | 290,532 | |
| Libbey | 33,400 | 122,244 | ||
| Lithia Motors, Cl. A | 21,150 | b | 86,715 | |
| Live Nation | 149,950 | a,b | 1,686,937 | |
| LKQ | 280,384 | a | 3,207,593 | |
| M/I Homes | 34,150 | b | 464,782 | |
| Maidenform Brands | 43,741 | a | 480,276 | |
| Marcus | 52,862 | b | 741,654 | |
| MarineMax | 6,800 | a,b | 15,776 | |
| Men’s Wearhouse | 91,900 | b | 1,405,151 | |
| Meritage Homes | 54,150 | a,b | 743,480 | |
| Midas | 49,242 | a,b | 641,623 | |
| Monaco Coach | 36,600 | b | 80,520 | |
| Monarch Casino & Resort | 34,700 | a,b | 309,177 | |
| Movado Group | 49,762 | 756,880 | ||
| Multimedia Games | 63,750 | a | 192,525 | |
| National Presto Industries | 7,500 | 496,875 | ||
| Nautilus | 9,500 | a,b | 23,180 | |
| NutriSystem | 67,679 | b | 957,658 | |
| O’Charleys | 24,550 | b | 184,125 |
The Fund 9
| STATEMENT OF INVESTMENTS (continued) |
| Common Stocks (continued) | Shares | Value ($) | ||
| Consumer Discretionary (continued) | ||||
| OfficeMax | 147,400 | 1,186,570 | ||
| Oxford Industries | 24,950 | 336,077 | ||
| P.F. Chang’s China Bistro | 53,850 a,b | 1,101,771 | ||
| Panera Bread, Cl. A | 67,175 a,b | 3,030,936 | ||
| Papa John’s International | 55,189 a | 1,245,064 | ||
| Peet’s Coffee & Tea | 23,300 a,b | 523,318 | ||
| PEP Boys-Manny Moe & Jack | 55,550 b | 267,751 | ||
| Perry Ellis International | 31,500 a,b | 308,385 | ||
| PetMed Express | 62,914 a,b | 1,111,061 | ||
| Pinnacle Entertainment | 84,700 a,b | 474,320 | ||
| Polaris Industries | 75,509 b | 2,542,388 | ||
| Pool | 90,471 b | 1,575,100 | ||
| Pre-Paid Legal Services | 17,750 a,b | 700,770 | ||
| Quiksilver | 210,450 a | 545,066 | ||
| RC2 | 49,000 a,b | 622,300 | ||
| Red Robin Gourmet Burgers | 38,341 a,b | 582,400 | ||
| Ruby Tuesday | 95,300 a | 229,673 | ||
| Russ Berrie & Co. | 14,150 a | 38,205 | ||
| Ruth’s Hospitality Group | 18,000 a | 41,220 | ||
| Select Comfort | 76,050 a,b | 36,504 | ||
| Shuffle Master | 68,510 a | 264,449 | ||
| Skechers USA, Cl. A | 67,900 a,b | 922,082 | ||
| Skyline | 8,650 b | 187,013 | ||
| Sonic | 123,217 a,b | 1,318,422 | ||
| Sonic Automotive, Cl. A | 52,850 b | 271,121 | ||
| Spartan Motors | 79,750 b | 366,053 | ||
| Stage Stores | 80,500 b | 620,655 | ||
| Stamps.com | 42,274 a | 412,594 | ||
| Standard Motor Products | 12,500 | 52,625 | ||
| Standard-Pacific | 204,200 a | 581,970 | ||
| Steak n Shake | 33,496 a,b | 172,504 | ||
| Stein Mart | 17,250 | 37,088 | ||
| Sturm Ruger & Co. | 35,600 a | 254,540 | ||
| Superior Industries International | 38,800 b | 554,840 | ||
| Texas Roadhouse, Cl. A | 78,650 a,b | 552,123 | ||
| Ticketmaster Entertainment | 80,518 a | 779,414 | ||
| Tractor Supply | 69,473 a,b | 2,887,298 |
10
| Common Stocks (continued) | Shares | Value ($) | ||
| Consumer Discretionary (continued) | ||||
| True Religion Apparel | 34,203 a,b | 572,900 | ||
| Tuesday Morning | 34,850 a,b | 78,064 | ||
| Tween Brands | 44,450 a,b | 378,714 | ||
| UniFirst | 32,506 | 1,060,671 | ||
| Universal Electronics | 39,980 a | 844,777 | ||
| Universal Technical Institute | 40,650 a,b | 670,725 | ||
| Volcom | 33,650 a,b | 435,095 | ||
| Winnebago Industries | 47,050 b | 279,477 | ||
| WMS Industries | 101,446 a,b | 2,536,150 | ||
| Wolverine World Wide | 113,198 b | 2,660,153 | ||
| Zale | 57,400 a,b | 979,244 | ||
| Zumiez | 28,314 a,b | 276,345 | ||
| 99,974,396 | ||||
| Consumer Staples—4.0% | ||||
| Alliance One International | 189,300 a | 632,262 | ||
| Andersons | 41,879 b | 1,115,238 | ||
| Boston Beer, Cl. A | 18,250 a,b | 689,667 | ||
| Cal-Maine Foods | 26,000 | 764,140 | ||
| Casey’s General Stores | 100,550 b | 3,036,610 | ||
| Central Garden & Pet, Cl. A | 134,305 a | 427,090 | ||
| Chattem | 39,000 a,b | 2,951,130 | ||
| Darling International | 178,221 a,b | 1,343,786 | ||
| Flowers Foods | 161,312 b | 4,782,901 | ||
| Great Atlantic & Pacific Tea | 51,450 a,b | 425,491 | ||
| Green Mountain Coffee Roasters | 31,700 a,b | 918,983 | ||
| Hain Celestial Group | 83,450 a,b | 1,939,378 | ||
| J & J Snack Foods | 32,847 | 1,030,082 | ||
| Lance | 51,250 b | 1,060,363 | ||
| Mannatech | 30,900 b | 123,909 | ||
| Nash Finch | 29,766 b | 1,173,673 | ||
| Sanderson Farms | 36,250 b | 1,131,725 | ||
| Spartan Stores | 46,800 b | 1,263,132 | ||
| Spectrum Brands | 40,750 a,b | 24,858 | ||
| TreeHouse Foods | 60,800 a | 1,839,808 | ||
| United Natural Foods | 84,450 a,b | 1,886,613 | ||
| WD-40 | 35,184 | 1,023,854 | ||
| 29,584,693 |
The Fund 11
| STATEMENT OF INVESTMENTS (continued) |
| Common Stocks (continued) | Shares | Value ($) | ||
| Energy—5.1% | ||||
| Atwood Oceanics | 110,500 a | 3,036,540 | ||
| Basic Energy Services | 44,600 a,b | 610,128 | ||
| Bristow Group | 50,950 a,b | 1,262,031 | ||
| CARBO Ceramics | 43,946 b | 1,901,543 | ||
| Dril-Quip | 59,447 a,b | 1,468,341 | ||
| Gulf Island Fabrication | 41,096 | 810,002 | ||
| Hornbeck Offshore Services | 39,850 a,b | 948,430 | ||
| ION Geophysical | 156,391 a | 1,025,925 | ||
| Lufkin Industries | 33,594 b | 1,757,638 | ||
| Matrix Service | 55,050 a | 674,363 | ||
| NATCO Group, Cl. A | 36,450 a,b | 770,553 | ||
| Penn Virginia | 77,968 b | 2,898,071 | ||
| Petroleum Development | 30,750 a,b | 636,833 | ||
| PetroQuest Energy | 87,250 a,b | 868,138 | ||
| Pioneer Drilling | 116,500 a,b | 901,710 | ||
| SEACOR Holdings | 43,800 a,b | 2,942,046 | ||
| Southern Union | 238,748 | 4,111,241 | ||
| St. Mary Land & Exploration | 117,700 | 2,929,553 | ||
| Stone Energy | 79,903 a | 2,424,257 | ||
| Superior Well Services | 37,182 a,b | 622,799 | ||
| Swift Energy | 70,683 a,b | 2,267,511 | ||
| Tetra Technologies | 137,839 a | 959,359 | ||
| World Fuel Services | 66,301 b | 1,420,830 | ||
| 37,247,842 | ||||
| Financial—19.5% | ||||
| Acadia Realty Trust | 60,450 b | 1,092,331 | ||
| Anchor Bancorp Wisconsin | 32,850 b | 187,245 | ||
| Bank Mutual | 111,853 | 1,289,665 | ||
| BankAtlantic Bancorp, Cl. A | 15,200 b | 93,784 | ||
| BioMed Realty Trust | 178,332 b | 2,505,565 | ||
| Boston Private Financial Holdings | 104,850 b | 926,874 | ||
| Brookline Bancorp | 123,352 b | 1,443,218 | ||
| Cascade Bancorp | 57,450 b | 548,073 | ||
| Cash America International | 62,750 | 2,219,467 | ||
| Cedar Shopping Centers | 115,813 | 1,107,172 | ||
| Central Pacific Financial | 59,942 b | 935,095 | ||
| Colonial Properties Trust | 104,150 b | 1,097,741 |
12
| Common Stocks (continued) | Shares | Value ($) | ||
| Financial (continued) | ||||
| Columbia Banking System | 36,262 b | 577,291 | ||
| Community Bank System | 78,089 b | 1,948,321 | ||
| Corus Bankshares | 68,500 b | 150,700 | ||
| Delphi Financial Group, Cl. A | 76,725 | 1,208,419 | ||
| DiamondRock Hospitality | 167,100 | 865,578 | ||
| Dime Community Bancshares | 64,932 | 1,084,364 | ||
| East West Bancorp | 115,825 b | 2,009,564 | ||
| EastGroup Properties | 50,721 | 1,698,139 | ||
| Entertainment Properties Trust | 68,750 | 2,574,687 | ||
| Extra Space Storage | 167,750 b | 1,930,802 | ||
| Financial Federal | 46,000 b | 1,064,900 | ||
| First BanCorp/Puerto Rico | 186,600 | 1,907,052 | ||
| First Cash Financial Services | 57,085 a,b | 877,396 | ||
| First Commonwealth Financial | 166,550 b | 1,842,043 | ||
| First Financial Bancorp | 76,396 | 1,027,526 | ||
| First Financial Bankshares | 44,683 b | 2,421,372 | ||
| First Midwest Bancorp | 94,724 b | 2,103,820 | ||
| FirstFed Financial | 32,860 a,b | 294,097 | ||
| Flagstar Bancorp | 87,400 b | 166,060 | ||
| Forestar Real Estate Group | 63,950 a,b | 559,563 | ||
| Frontier Financial | 95,250 b | 634,365 | ||
| Glacier Bancorp | 118,397 b | 2,388,067 | ||
| Greenhill & Co. | 39,280 b | 2,591,302 | ||
| Guaranty Financial Group | 82,555 a,b | 167,587 | ||
| Hancock Holding | 51,826 | 2,288,636 | ||
| Hanmi Financial | 72,000 b | 288,000 | ||
| Home Bancshares | 25,000 | 651,000 | ||
| Home Properties | 68,052 b | 2,755,425 | ||
| Independent Bank | 38,815 | 142,451 | ||
| Infinity Property & Casualty | 31,650 | 1,260,303 | ||
| Inland Real Estate | 125,559 b | 1,438,906 | ||
| Investment Technology Group | 84,700 a | 1,728,727 | ||
| Irwin Financial | 31,850 b | 70,070 | ||
| Kilroy Realty | 62,650 b | 2,014,197 | ||
| Kite Realty Group Trust | 52,100 | 316,768 | ||
| LaBranche & Co. | 139,809 a | 871,010 | ||
| LandAmerica Financial Group | 42,394 b | 417,581 |
The Fund 13
| STATEMENT OF INVESTMENTS (continued) |
| Common Stocks (continued) | Shares | Value ($) | ||
| Financial (continued) | ||||
| LaSalle Hotel Properties | 86,630 b | 1,219,750 | ||
| Lexington Realty Trust | 164,397 b | 1,320,108 | ||
| LTC Properties | 45,800 | 1,106,986 | ||
| Medical Properties Trust | 119,700 b | 883,386 | ||
| Mid-America Apartment Communities | 56,750 b | 1,999,870 | ||
| Nara Bancorp | 40,000 | 440,000 | ||
| National Financial Partners | 73,350 b | 488,511 | ||
| National Penn Bancshares | 160,600 b | 2,720,564 | ||
| National Retail Properties | 143,350 b | 2,555,931 | ||
| Navigators Group | 24,400 a | 1,232,444 | ||
| Old National Bancorp | 143,050 b | 2,709,367 | ||
| optionsXpress Holdings | 98,051 b | 1,741,386 | ||
| Parkway Properties | 39,105 b | 674,561 | ||
| Pennsylvania Real Estate Investment Trust | 81,475 b | 1,030,659 | ||
| Piper Jaffray | 28,535 a,b | 1,125,706 | ||
| Portfolio Recovery Associates | 34,405 a,b | 1,234,451 | ||
| Post Properties | 90,200 | 2,013,264 | ||
| Presidential Life | 40,600 | 380,828 | ||
| PrivateBancorp | 54,100 b | 1,948,141 | ||
| ProAssurance | 66,679 a,b | 3,664,011 | ||
| Prosperity Bancshares | 74,843 b | 2,485,536 | ||
| Provident Bankshares | 63,624 b | 678,868 | ||
| PS Business Parks | 34,050 | 1,541,444 | ||
| Rewards Network | 63,750 a | 242,250 | ||
| RLI | 37,650 | 2,160,734 | ||
| Safety Insurance Group | 35,037 b | 1,331,056 | ||
| Selective Insurance Group | 100,550 | 2,388,063 | ||
| Senior Housing Properties Trust | 234,801 | 4,501,135 | ||
| Signature Bank | 66,900 a | 2,179,602 | ||
| South Financial Group | 125,950 b | 731,770 | ||
| Sovran Self Storage | 43,608 b | 1,415,080 | ||
| Sterling Bancorp | 52,963 b | 830,460 | ||
| Sterling Bancshares | 130,650 b | 1,039,974 | ||
| Sterling Financial | 103,780 b | 881,092 | ||
| Stewart Information Services | 48,803 b | 810,130 | ||
| Stifel Financial | 52,213 a | 2,279,097 | ||
| Susquehanna Bancshares | 175,659 b | 2,720,958 |
14
| Common Stocks (continued) | Shares | Value ($) | ||
| Financial (continued) | ||||
| SWS Group | 61,854 | 1,148,010 | ||
| Tanger Factory Outlet Centers | 59,250 b | 2,143,073 | ||
| Tower Group | 38,450 b | 808,604 | ||
| TradeStation Group | 55,150 a | 431,825 | ||
| Trustco Bank | 146,686 b | 1,785,169 | ||
| UCBH Holdings | 212,950 b | 1,124,376 | ||
| UMB Financial | 66,757 b | 3,026,095 | ||
| Umpqua Holdings | 122,981 b | 2,093,137 | ||
| United Bankshares | 82,632 b | 2,635,961 | ||
| United Community Banks | 76,181 b | 999,494 | ||
| United Fire & Casualty | 42,244 | 978,793 | ||
| Urstadt Biddle Properties, Cl. A | 41,600 | 681,408 | ||
| Whitney Holding | 122,170 b | 2,321,230 | ||
| Wilshire Bancorp | 56,700 b | 625,401 | ||
| Wintrust Financial | 38,950 b | 997,120 | ||
| World Acceptance | 39,300 a,b | 726,264 | ||
| Zenith National Insurance | 76,050 b | 2,499,003 | ||
| 143,514,455 | ||||
| Health Care—13.3% | ||||
| Abaxis | 41,593 a | 639,284 | ||
| Air Methods | 24,500 a,b | 411,110 | ||
| Alpharma, Cl. A | 86,250 a,b | 2,700,488 | ||
| Amedisys | 51,366 a,b | 2,897,556 | ||
| American Medical Systems Holdings | 150,738 a,b | 1,630,985 | ||
| AMERIGROUP | 114,650 a,b | 2,866,250 | ||
| AMN Healthcare Services | 70,047 a | 629,723 | ||
| AmSurg | 60,450 a | 1,507,623 | ||
| Analogic | 30,714 b | 1,356,330 | ||
| ArQule | 50,000 a,b | 138,000 | ||
| ArthroCare | 58,250 a,b | 1,210,435 | ||
| BIOLASE Technology | 59,900 a,b | 104,226 | ||
| Cambrex | 92,650 a | 416,925 | ||
| Catalyst Health Solutions | 64,900 a | 1,094,863 | ||
| Centene | 90,350 a | 1,702,194 | ||
| Chemed | 47,348 b | 2,073,369 | ||
| CONMED | 65,350 a | 1,712,170 | ||
| Cooper | 100,968 b | 1,663,953 |
The Fund 15
| STATEMENT OF INVESTMENTS (continued) |
| Common Stocks (continued) | Shares | Value ($) | ||
| Health Care (continued) | ||||
| CorVel | 13,000 a | 348,660 | ||
| Cross Country Healthcare | 66,551 a | 753,357 | ||
| CryoLife | 50,400 a | 675,360 | ||
| Cubist Pharmaceuticals | 127,398 a,b | 3,234,635 | ||
| Cyberonics | 48,649 a,b | 619,788 | ||
| Datascope | 27,900 | 1,399,743 | ||
| Dionex | 39,900 a | 2,147,817 | ||
| Eclipsys | 113,233 a,b | 1,681,510 | ||
| Enzo Biochem | 59,267 a | 341,971 | ||
| Gentiva Health Services | 60,916 a,b | 1,653,869 | ||
| Greatbatch | 47,400 a,b | 1,030,950 | ||
| Haemonetics | 49,222 a | 2,907,051 | ||
| HealthSpring | 93,650 a | 1,547,098 | ||
| Healthways | 83,162 a,b | 839,936 | ||
| HMS Holdings | 40,400 a | 1,000,708 | ||
| ICU Medical | 30,565 a | 978,997 | ||
| Immucor | 148,837 a,b | 3,951,622 | ||
| Integra LifeSciences Holdings | 35,563 a,b | 1,335,035 | ||
| Invacare | 75,450 b | 1,372,435 | ||
| Inventiv Health | 76,138 a,b | 721,027 | ||
| Kendle International | 23,691 a,b | 428,096 | ||
| Kensey Nash | 28,007 a | 711,098 | ||
| Landauer | 23,030 | 1,245,002 | ||
| LCA-Vision | 81,107 b | 277,386 | ||
| LHC Group | 30,550 a | 1,077,804 | ||
| Magellan Health Services | 83,100 a | 3,069,714 | ||
| Martek Biosciences | 64,300 a,b | 1,918,069 | ||
| MedCath | 50,890 a | 784,724 | ||
| Mentor | 68,100 b | 1,150,890 | ||
| Meridian Bioscience | 76,150 b | 1,871,767 | ||
| Merit Medical Systems | 61,200 a | 1,119,960 | ||
| Molina Healthcare | 29,550 a,b | 658,079 | ||
| MWI Veterinary Supply | 24,000 a | 831,120 | ||
| Natus Medical | 43,000 a | 657,900 | ||
| Noven Pharmaceuticals | 49,550 a,b | 557,438 | ||
| Odyssey HealthCare | 61,500 a | 589,785 | ||
| Omnicell | 66,300 a | 727,974 |
16
| Common Stocks (continued) | Shares | Value ($) | ||
| Health Care (continued) | ||||
| Osteotech | 35,950 a | 114,681 | ||
| Owens & Minor | 82,350 b | 3,563,285 | ||
| Palomar Medical Technologies | 37,550 a | 429,572 | ||
| Par Pharmaceutical Cos. | 70,803 a | 708,030 | ||
| PAREXEL International | 100,600 a | 1,046,240 | ||
| Pediatrix Medical Group | 94,830 a | 3,665,180 | ||
| PharmaNet Development Group | 59,100 a | 94,560 | ||
| PharMerica | 53,550 a | 1,099,382 | ||
| Phase Forward | 89,100 a,b | 1,271,457 | ||
| PSS World Medical | 131,500 a,b | 2,385,410 | ||
| Regeneron Pharmaceuticals | 116,677 a,b | 2,251,866 | ||
| RehabCare Group | 44,857 a,b | 768,400 | ||
| Res-Care | 56,000 a | 862,960 | ||
| Salix Pharmaceuticals | 91,700 a,b | 843,640 | ||
| Savient Pharmaceuticals | 84,100 a,b | 400,316 | ||
| Sunrise Senior Living | 85,950 a,b | 259,569 | ||
| SurModics | 27,650 a,b | 732,725 | ||
| Symmetry Medical | 60,950 a,b | 787,474 | ||
| Theragenics | 64,500 a | 125,775 | ||
| ViroPharma | 165,340 a,b | 2,073,364 | ||
| West Pharmaceutical Services | 64,900 b | 2,590,808 | ||
| Zoll Medical | 39,948 a | 961,948 | ||
| 98,010,501 | ||||
| Industrial—18.3% | ||||
| A.O. Smith | 50,742 b | 1,600,910 | ||
| AAR | 66,850 a,b | 1,068,931 | ||
| ABM Industries | 86,400 b | 1,410,912 | ||
| Acuity Brands | 86,281 b | 3,016,384 | ||
| Administaff | 50,110 b | 1,001,699 | ||
| Albany International, Cl. A | 38,600 | 562,016 | ||
| Apogee Enterprises | 62,450 | 615,757 | ||
| Applied Industrial Technologies | 79,863 b | 1,612,434 | ||
| Applied Signal Technology | 27,800 | 498,176 | ||
| Arkansas Best | 60,036 b | 1,752,451 | ||
| Astec Industries | 37,800 a,b | 960,876 | ||
| Baldor Electric | 93,983 b | 1,650,341 | ||
| Barnes Group | 82,050 b | 1,190,545 |
The Fund 17
| STATEMENT OF INVESTMENTS (continued) |
| Common Stocks (continued) | Shares | Value ($) | ||
| Industrial (continued) | ||||
| Belden | 89,017 b | 1,855,114 | ||
| Bowne & Co. | 70,473 b | 548,985 | ||
| Brady, Cl. A | 108,818 b | 3,373,358 | ||
| Briggs & Stratton | 100,970 b | 1,591,287 | ||
| C & D Technologies | 30,650 a,b | 107,275 | ||
| Cascade | 17,250 b | 569,422 | ||
| CDI | 40,728 | 529,464 | ||
| Ceradyne | 60,659 a | 1,425,486 | ||
| CLARCOR | 97,950 b | 3,466,450 | ||
| Consolidated Graphics | 30,915 a | 402,204 | ||
| Cubic | 41,116 | 914,831 | ||
| Curtiss-Wright | 91,350 b | 3,370,815 | ||
| EMCOR Group | 147,897 a,b | 2,628,130 | ||
| EnPro Industries | 40,950 a | 909,499 | ||
| Esterline Technologies | 64,017 a | 2,307,813 | ||
| Forward Air | 59,407 b | 1,554,681 | ||
| G & K Services, Cl. A | 40,950 | 925,060 | ||
| Gardner Denver | 111,680 a | 2,861,242 | ||
| GenCorp | 101,850 a,b | 499,065 | ||
| Gibraltar Industries | 64,076 b | 849,007 | ||
| Griffon | 91,437 a,b | 771,728 | ||
| Healthcare Services Group | 80,850 b | 1,338,876 | ||
| Heartland Express | 116,927 b | 1,793,660 | ||
| Heidrick & Struggles International | 33,900 b | 818,007 | ||
| Hub Group, Cl. A | 78,300 a | 2,462,535 | ||
| II-VI | 49,152 a,b | 1,380,680 | ||
| Insituform Technologies, Cl. A | 58,000 a | 778,940 | ||
| Interface, Cl. A | 101,550 | 715,927 | ||
| John Bean Technologies | 59,604 | 499,482 | ||
| Kaman | 48,050 | 1,226,716 | ||
| Kaydon | 53,000 b | 1,770,730 | ||
| Kirby | 109,550 a | 3,759,756 | ||
| Knight Transportation | 108,150 b | 1,719,585 | ||
| Landstar System | 107,250 | 4,138,777 | ||
| Lawson Products | 8,400 b | 250,320 | ||
| Lennox International | 103,063 | 3,073,339 |
18
| Common Stocks (continued) | Shares | Value ($) | ||
| Industrial (continued) | ||||
| Lindsay | 22,450 b | 1,068,171 | ||
| Lydall | 36,000 a | 239,400 | ||
| Magnetek | 21,400 a | 46,010 | ||
| Mobile Mini | 63,050 a,b | 1,059,240 | ||
| Moog, Cl. A | 82,625 a | 2,901,790 | ||
| Mueller Industries | 82,400 b | 1,884,488 | ||
| NCI Building Systems | 46,925 a,b | 873,274 | ||
| Old Dominion Freight Line | 59,550 a,b | 1,806,747 | ||
| On Assignment | 72,650 a | 472,225 | ||
| Orbital Sciences | 116,800 a | 2,393,232 | ||
| Quanex Building Products | 80,308 | 735,621 | ||
| Regal-Beloit | 63,900 b | 2,080,584 | ||
| Robbins & Myers | 73,700 | 1,503,480 | ||
| School Specialty | 39,595 a,b | 831,495 | ||
| Simpson Manufacturing | 86,964 b | 2,003,651 | ||
| SkyWest | 126,100 | 1,943,201 | ||
| Spherion | 128,050 a | 407,199 | ||
| Standard Register | 40,068 | 325,753 | ||
| Standex International | 28,000 | 722,680 | ||
| Sykes Enterprises | 78,062 a | 1,245,870 | ||
| Teledyne Technologies | 75,465 a,b | 3,438,940 | ||
| Tetra Tech | 118,656 a | 2,609,245 | ||
| Toro | 81,647 b | 2,746,605 | ||
| Tredegar | 57,055 b | 839,850 | ||
| Triumph Group | 34,900 b | 1,530,714 | ||
| TrueBlue | 102,882 a | 857,007 | ||
| United Stationers | 52,725 a,b | 1,971,388 | ||
| Universal Forest Products | 41,880 b | 990,462 | ||
| Valmont Industries | 36,985 | 2,026,038 | ||
| Viad | 34,000 b | 742,900 | ||
| Vicor | 30,950 b | 216,341 | ||
| Volt Information Sciences | 29,050 a,b | 222,233 | ||
| Wabash National | 45,150 | 272,706 | ||
| Waste Connections | 155,175 a,b | 5,252,674 | ||
| Watsco | 60,021 b | 2,466,263 | ||
| Watson Wyatt Worldwide, Cl. A | 93,127 b | 3,955,104 |
The Fund 19
| STATEMENT OF INVESTMENTS (continued) |
| Common Stocks (continued) | Shares | Value ($) | ||
| Industrial (continued) | ||||
| Watts Water Technologies, Cl. A | 60,008 b | 1,586,011 | ||
| Woodward Governor | 117,839 | 3,782,632 | ||
| 134,180,902 | ||||
| Information Technology—16.0% | ||||
| Actel | 47,613 a,b | 575,641 | ||
| Adaptec | 221,650 a | 711,496 | ||
| Advanced Energy Industries | 73,200 a,b | 781,044 | ||
| Agilysys | 38,050 b | 152,961 | ||
| Anixter International | 61,657 a,b | 2,072,292 | ||
| Arris Group | 258,714 a,b | 1,787,714 | ||
| ATMI | 69,674 a,b | 847,236 | ||
| Avid Technology | 67,020 a,b | 993,907 | ||
| Axcelis Technologies | 157,150 a,b | 69,146 | ||
| Bankrate | 25,850 a,b | 850,723 | ||
| Bel Fuse, Cl. B | 28,900 | 627,130 | ||
| Benchmark Electronics | 162,250 a,b | 1,945,377 | ||
| Black Box | 39,500 b | 1,201,195 | ||
| Blackbaud | 96,300 b | 1,463,760 | ||
| Blue Coat Systems | 85,496 a,b | 1,154,196 | ||
| Brightpoint | 144,242 a,b | 830,834 | ||
| Brooks Automation | 149,726 a | 1,025,623 | ||
| Cabot Microelectronics | 48,397 a,b | 1,390,446 | ||
| CACI International, Cl. A | 62,850 a,b | 2,588,163 | ||
| Captaris | 53,300 a | 253,708 | ||
| Catapult Communications | 18,450 a | 78,781 | ||
| Checkpoint Systems | 86,100 a | 1,085,721 | ||
| CIBER | 96,150 a | 519,210 | ||
| Cognex | 79,650 b | 1,275,993 | ||
| Cohu | 37,021 b | 523,477 | ||
| Comtech Telecommunications | 51,300 a,b | 2,483,946 | ||
| Concur Technologies | 79,350 a,b | 2,002,000 | ||
| CSG Systems International | 81,474 a | 1,354,913 | ||
| CTS | 88,750 b | 620,362 | ||
| CyberSource | 127,892 a,b | 1,553,888 | ||
| Cymer | 70,500 a,b | 1,725,135 | ||
| Cypress Semiconductor | 311,800 a | 1,562,118 | ||
| Daktronics | 58,800 b | 585,648 |
20
| Common Stocks (continued) | Shares | Value ($) | ||
| Information Technology (continued) | ||||
| DealerTrack Holdings | 95,995 a,b | 1,030,026 | ||
| Digi International | 71,170 a | 728,781 | ||
| Diodes | 60,561 a,b | 598,343 | ||
| DSP Group | 61,050 a | 384,615 | ||
| Electro Scientific Industries | 51,750 a | 433,147 | ||
| EMS Technologies | 32,250 a | 674,025 | ||
| Epicor Software | 129,055 a,b | 909,838 | ||
| EPIQ Systems | 52,200 a,b | 709,398 | ||
| Exar | 103,500 a,b | 691,380 | ||
| FARO Technologies | 35,757 a | 542,434 | ||
| FEI | 64,550 a,b | 1,356,195 | ||
| Gerber Scientific | 48,800 a,b | 233,264 | ||
| Gevity HR | 40,350 b | 137,593 | ||
| Harmonic | 191,720 a,b | 1,363,129 | ||
| Heartland Payment Systems | 58,634 | 1,020,818 | ||
| Hutchinson Technology | 43,100 a | 294,804 | ||
| Informatica | 179,200 a,b | 2,517,760 | ||
| InfoSpace | 84,568 b | 724,748 | ||
| Insight Enterprises | 109,692 a | 1,067,303 | ||
| Integral Systems | 35,200 a | 864,864 | ||
| Intevac | 50,000 a | 389,000 | ||
| Itron | 66,900 a,b | 3,243,312 | ||
| j2 Global Communications | 93,346 a,b | 1,504,738 | ||
| JDA Software Group | 57,150 a | 816,102 | ||
| Keithley Instruments | 21,950 | 93,287 | ||
| Knot | 56,750 a,b | 391,575 | ||
| Kopin | 110,000 a | 255,200 | ||
| Kulicke & Soffa Industries | 93,200 a,b | 274,008 | ||
| Littelfuse | 40,850 a | 762,261 | ||
| LoJack | 57,000 a | 249,090 | ||
| Manhattan Associates | 60,800 a,b | 1,022,048 | ||
| ManTech International, Cl. A | 44,750 a | 2,413,815 | ||
| MAXIMUS | 31,155 b | 995,091 | ||
| Mercury Computer Systems | 30,300 a | 217,554 | ||
| Methode Electronics | 97,465 b | 739,759 | ||
| Micrel | 123,300 b | 906,255 | ||
| Micros Systems | 167,228 a,b | 2,847,893 |
The Fund 21
| STATEMENT OF INVESTMENTS (continued) |
| Common Stocks (continued) | Shares | Value ($) | ||
| Information Technology (continued) | ||||
| Microsemi | 149,218 a | 3,243,999 | ||
| MKS Instruments | 104,850 a,b | 1,944,968 | ||
| MTS Systems | 38,500 | 1,250,480 | ||
| NETGEAR | 83,757 a,b | 925,515 | ||
| Network Equipment Technologies | 39,400 a,b | 107,562 | ||
| Newport | 74,600 a,b | 536,374 | ||
| Novatel Wireless | 99,622 a,b | 519,031 | ||
| Park Electrochemical | 52,605 b | 1,137,320 | ||
| PC-Tel | 38,450 | 225,702 | ||
| Perficient | 73,246 a,b | 402,121 | ||
| Pericom Semiconductor | 38,100 a | 297,180 | ||
| Phoenix Technologies | 44,275 a | 195,696 | ||
| Photronics | 62,000 a | 42,780 | ||
| Plexus | 83,200 a | 1,552,512 | ||
| Progress Software | 91,119 a,b | 2,090,270 | ||
| Quality Systems | 40,997 b | 1,577,975 | ||
| Radiant Systems | 66,840 a | 352,247 | ||
| Radisys | 42,200 a,b | 268,814 | ||
| Rogers | 38,890 a,b | 1,170,589 | ||
| Rudolph Technologies | 78,550 a,b | 263,143 | ||
| ScanSource | 52,000 a,b | 1,031,680 | ||
| Secure Computing | 131,900 a,b | 746,554 | ||
| SI International | 28,700 a | 826,560 | ||
| Skyworks Solutions | 313,430 a,b | 2,234,756 | ||
| Smith Micro Software | 53,500 a,b | 334,375 | ||
| Sonic Solutions | 63,550 a,b | 129,642 | ||
| SPSS | 46,506 a,b | 1,086,380 | ||
| Standard Microsystems | 55,805 a,b | 1,005,048 | ||
| StarTek | 12,400 a | 41,044 | ||
| Stratasys | 40,200 a,b | 485,616 | ||
| Supertex | 34,406 a,b | 829,873 | ||
| Symmetricom | 82,400 a,b | 366,680 | ||
| Synaptics | 70,725 a,b | 2,184,695 | ||
| SYNNEX | 24,700 a,b | 381,121 | ||
| Take-Two Interactive Software | 162,100 a | 1,922,506 |
22
| Common Stocks (continued) | Shares | Value ($) | ||
| Information Technology (continued) | ||||
| Taleo, Cl. A | 54,800 a | 756,240 | ||
| Technitrol | 99,383 | 573,440 | ||
| Tekelec | 122,500 a | 1,554,525 | ||
| THQ | 112,625 a | 839,056 | ||
| Tollgrade Communications | 50,950 a | 224,180 | ||
| Triquint Semiconductor | 281,500 a | 1,261,120 | ||
| TTM Technologies | 74,835 a,b | 535,819 | ||
| Tyler Technologies | 63,800 a,b | 867,042 | ||
| Ultratech | 31,550 a,b | 475,774 | ||
| United Online | 180,330 b | 1,334,442 | ||
| Varian Semiconductor Equipment Associates | 158,997 a,b | 3,119,521 | ||
| Veeco Instruments | 51,550 a,b | 398,997 | ||
| ViaSat | 47,700 a | 869,094 | ||
| Websense | 83,000 a,b | 1,620,160 | ||
| Wright Express | 76,750 a,b | 1,050,708 | ||
| 117,288,163 | ||||
| Materials—3.4% | ||||
| A.M. Castle & Co. | 32,650 b | 397,350 | ||
| AMCOL International | 49,497 b | 1,214,161 | ||
| Arch Chemicals | 46,268 b | 1,312,623 | ||
| Balchem | 33,000 | 843,480 | ||
| Brush Engineered Materials | 37,457 a,b | 459,597 | ||
| Buckeye Technologies | 79,800 a,b | 470,022 | ||
| Calgon Carbon | 100,600 a | 1,339,992 | ||
| Century Aluminum | 71,254 a | 895,663 | ||
| Deltic Timber | 17,100 b | 778,905 | ||
| Georgia Gulf | 73,658 b | 169,413 | ||
| H.B. Fuller | 103,538 b | 1,829,516 | ||
| Headwaters | 85,350 a,b | 904,710 | ||
| Material Sciences | 29,000 a | 142,970 | ||
| Myers Industries | 57,859 b | 611,570 | ||
| Neenah Paper | 40,471 | 365,453 | ||
| NewMarket | 27,650 | 1,042,129 | ||
| Olympic Steel | 20,500 b | 468,630 | ||
| OM Group | 64,169 a | 1,369,366 |
The Fund 23
| STATEMENT OF INVESTMENTS (continued) |
| Common Stocks (continued) | Shares | Value ($) | ||
| Materials (continued) | ||||
| Penford | 13,350 | 171,815 | ||
| PolyOne | 165,800 a,b | 787,550 | ||
| Quaker Chemical | 29,746 | 569,041 | ||
| Rock-Tenn, Cl. A | 83,716 b | 2,545,804 | ||
| RTI International Metals | 46,399 a | 732,640 | ||
| Schulman (A.) | 60,873 b | 1,090,235 | ||
| Schweitzer-Mauduit International | 28,700 b | 479,864 | ||
| Stepan | 14,200 | 508,786 | ||
| Texas Industries | 51,721 b | 1,635,935 | ||
| Wausau Paper | 100,782 | 933,241 | ||
| Zep | 41,900 b | 881,995 | ||
| 24,952,456 | ||||
| Telecommunication Services—.2% | ||||
| Fairpoint Communications | 166,463 b | 662,523 | ||
| General Communication, Cl. A | 71,900 a | 552,192 | ||
| 1,214,715 | ||||
| Utilities—5.1% | ||||
| Allete | 48,240 b | 1,688,400 | ||
| American States Water | 25,900 b | 886,039 | ||
| Atmos Energy | 198,452 | 4,816,430 | ||
| Avista | 123,793 b | 2,458,529 | ||
| Central Vermont Public Service | 24,100 | 479,831 | ||
| CH Energy Group | 29,500 b | 1,216,285 | ||
| Cleco | 126,350 b | 2,907,313 | ||
| El Paso Electric | 81,150 a | 1,502,898 | ||
| Laclede Group | 50,548 b | 2,644,671 | ||
| New Jersey Resources | 89,550 b | 3,334,842 | ||
| Northwest Natural Gas | 51,550 b | 2,622,864 | ||
| Piedmont Natural Gas | 142,112 b | 4,678,327 | ||
| South Jersey Industries | 69,661 b | 2,373,350 | ||
| Southwest Gas | 98,747 | 2,579,272 | ||
| UIL Holdings | 55,181 b | 1,820,973 | ||
| UniSource Energy | 62,090 b | 1,712,442 | ||
| 37,722,466 | ||||
| Total Common Stocks | ||||
| (cost $892,577,371) | 723,690,589 |
24
| Principal | ||||
| Short-Term Investments—.2% | Amount ($) | Value ($) | ||
| U.S. Treasury Bills: | ||||
| 0.32%, 12/26/08 | 375,000 c | 374,847 | ||
| 0.43%, 1/29/09 | 250,000 c | 249,743 | ||
| 0.52%, 1/8/09 | 190,000 c | 189,876 | ||
| 1.63%, 11/6/08 | 325,000 | 324,998 | ||
| Total Short-Term Investments | ||||
| (cost $1,139,291) | 1,139,464 | |||
| Other Investment—.8% | Shares | Value ($) | ||
| Registered Investment Company; | ||||
| Dreyfus Institutional Preferred Plus Money Market Fund | ||||
| (cost $6,200,000) | 6,200,000 d | 6,200,000 | ||
| Investment of Cash Collateral | ||||
| for Securities Loaned—20.2% | ||||
| Registered Investment Company; | ||||
| Dreyfus Institutional Cash Advantage Plus Fund | ||||
| (cost $148,540,655) | 148,540,655 d | 148,540,655 | ||
| Total Investments (cost $1,048,457,317) | 119.7% | 879,570,708 | ||
| Liabilities, Less Cash and Receivables | (19.7%) | (144,925,784) | ||
| Net Assets | 100.0% | 734,644,924 | ||
| a Non-income producing security. b All or a portion of these securities are on loan.At October 31, 2008, the total market value of the fund’s securities on loan is $150,700,727 and the total market value of the collateral held by the fund is $152,335,945, consisting of cash collateral of $148,540,655 and U.S. Government and Agency securities valued at $3,795,290. c All or partially held by a broker as collateral for open financial futures positions. d Investment in affiliated money market mutual fund. |
| Portfolio Summary (Unaudited)† | ||||||
| Value (%) | Value (%) | |||||
| Short-Term/ | Energy | 5.1 | ||||
| Money Market Investments | 21.2 | Utilities | 5.1 | |||
| Financial | 19.5 | Consumer Staples | 4.0 | |||
| Industrial | 18.3 | Materials | 3.4 | |||
| Information Technology | 16.0 | Telecommunication Services | .2 | |||
| Consumer Discretionary | 13.6 | |||||
| Health Care | 13.3 | 119.7 | ||||
| † Based on net assets. See notes to financial statements. |
The Fund 25
STATEMENT OF FINANCIAL FUTURES
October 31, 2008
| Market Value | Unrealized | |||||||
| Covered by | Appreciation | |||||||
| Contracts | Contracts ($) | Expiration | at 10/31/2008 ($) | |||||
| Financial Futures Long | ||||||||
| Russell 2000 Mini | 166 | 8,905,900 | December 2008 | 214,165 | ||||
See notes to financial statements.
26
STATEMENT OF ASSETS AND LIABILITIES
October 31, 2008
| Cost | Value | |||
| Assets ($): | ||||
| Investments in securities—See Statement of Investments (including | ||||
| securities on loan, valued at $150,700,727)—Note 1(b): | ||||
| Unaffiliated issuers | 893,716,662 | 724,830,053 | ||
| Affiliated issuers | 154,740,655 | 154,740,655 | ||
| Cash | 844,612 | |||
| Receivable for investment securities sold | 8,116,879 | |||
| Receivable for shares of Common Stock subscribed | 3,273,964 | |||
| Dividends and interest receivable | 839,806 | |||
| Receivable for futures variation margin—Note 4 | 319,170 | |||
| 892,965,139 | ||||
| Liabilities ($): | ||||
| Due to The Dreyfus Corporation and affiliates—Note 3(b) | 307,950 | |||
| Liability for securities on loan—Note 1(b) | 148,540,655 | |||
| Payable for investment securities purchased | 7,676,327 | |||
| Payable for shares of Common Stock redeemed | 1,789,212 | |||
| Interest payable—Note 2 | 6,071 | |||
| 158,320,215 | ||||
| Net Assets ($) | 734,644,924 | |||
| Composition of Net Assets ($): | ||||
| Paid-in capital | 859,596,739 | |||
| Accumulated undistributed investment income—net | 8,430,139 | |||
| Accumulated net realized gain (loss) on investments | 35,290,490 | |||
| Accumulated net unrealized appreciation (depreciation) | ||||
| on investments (including $214,165 net unrealized | ||||
| appreciation on financial futures) | (168,672,444) | |||
| Net Assets ($) | 734,644,924 | |||
| Shares Outstanding | ||||
| (200 million shares of $.001 par value Common Stock authorized) | 46,768,240 | |||
| Net Asset Value, offering and redemption price per share—Note 3(c) ($) | 15.71 | |||
| See notes to financial statements. | ||||
The Fund 27
| STATEMENT OF OPERATIONS Year Ended October 31, 2008 |
| Investment Income ($): | ||
| Income: | ||
| Dividends (net of $4,419 foreign taxes withheld at source): | ||
| Unaffiliated issuers | 11,594,666 | |
| Affiliated issuers | 68,757 | |
| Income from securities lending | 2,681,344 | |
| Total Income | 14,344,767 | |
| Expenses: | ||
| Management fee—Note 3(a) | 2,256,382 | |
| Shareholder servicing costs—Note 3(b) | 2,256,382 | |
| Directors’ fees—Note 3(a) | 61,742 | |
| Loan commitment fees—Note 2 | 16,212 | |
| Interest expense—Note 2 | 6,470 | |
| Total Expenses | 4,597,188 | |
| Less—Directors’ fees reimbursed by | ||
| the Manager—Note 3(a) | (61,742) | |
| Net Expenses | 4,535,446 | |
| Investment Income—Net | 9,809,321 | |
| Realized and Unrealized Gain (Loss) on Investments—Note 4 ($): | ||
| Net realized gain (loss) on investments | 54,895,529 | |
| Net realized gain (loss) on financial futures | (1,979,255) | |
| Net Realized Gain (Loss) | 52,916,274 | |
| Net unrealized appreciation (depreciation) on investments (including | ||
| $188,241 net unrealized appreciation on financial futures) | (402,828,769) | |
| Net Realized and Unrealized Gain (Loss) on Investments | (349,912,495) | |
| Net (Decrease) in Net Assets Resulting from Operations | (340,103,174) | |
| See notes to financial statements. | ||
28
STATEMENT OF CHANGES IN NET ASSETS
| Year Ended October 31, | ||||
| 2008 | 2007 | |||
| Operations ($): | ||||
| Investment income—net | 9,809,321 | 5,813,558 | ||
| Net realized gain (loss) on investments | 52,916,274 | 79,956,261 | ||
| Net unrealized appreciation | ||||
| (depreciation) on investments | (402,828,769) | 14,043,175 | ||
| Net Increase (Decrease) in Net Assets | ||||
| Resulting from Operations | (340,103,174) | 99,812,994 | ||
| Dividends to Shareholders from ($): | ||||
| Investment income—net | (6,019,379) | (4,514,957) | ||
| Net realized gain on investments | (80,811,626) | (35,949,561) | ||
| Total Dividends | (86,831,005) | (40,464,518) | ||
| Capital Stock Transactions ($): | ||||
| Net proceeds from shares sold | 375,786,729 | 318,431,782 | ||
| Dividends reinvested | 83,065,547 | 38,012,763 | ||
| Cost of shares redeemed | (295,288,868) | (306,131,143) | ||
| Increase (Decrease) in Net Assets | ||||
| from Capital Stock Transactions | 163,563,408 | 50,313,402 | ||
| Total Increase (Decrease) in Net Assets | (263,370,771) | 109,661,878 | ||
| Net Assets ($): | ||||
| Beginning of Period | 998,015,695 | 888,353,817 | ||
| End of Period | 734,644,924 | 998,015,695 | ||
| Undistributed investment income—net | 8,430,139 | 4,648,652 | ||
| Capital Share Transactions (Shares): | ||||
| Shares sold | 18,429,745 | 12,967,972 | ||
| Shares issued for dividends reinvested | 3,871,675 | 1,595,403 | ||
| Shares redeemed | (14,741,481) | (12,477,330) | ||
| Net Increase (Decrease) in Shares Outstanding | 7,559,939 | 2,086,045 | ||
| See notes to financial statements. | ||||
The Fund 29
FINANCIAL HIGHLIGHTS
The following table describes the performance for the fiscal periods indicated. Total return shows how much your investment in the fund would have increased (or decreased) during each period, assuming you had reinvested all dividends and distributions.These figures have been derived from the fund’s financial statements.
| Year Ended October 31, | ||||||||||
| 2008 | 2007 | 2006 | 2005 | 2004 | ||||||
| Per Share Data ($): | ||||||||||
| Net asset value, beginning of period | 25.45 | 23.93 | 21.06 | 18.91 | 16.30 | |||||
| Investment Operations: | ||||||||||
| Investment income—neta | .22 | .15 | .12 | .11 | .11 | |||||
| Net realized and unrealized | ||||||||||
| gain (loss) on investments | (7.85) | 2.45 | 3.11 | 2.68 | 2.55 | |||||
| Total from Investment Operations | (7.63) | 2.60 | 3.23 | 2.79 | 2.66 | |||||
| Distributions: | ||||||||||
| Dividends from investment income—net | (.15) | (.12) | (.11) | (.10) | (.05) | |||||
| Dividends from net realized | ||||||||||
| gain on investments | (1.96) | (.96) | (.25) | (.54) | — | |||||
| Total Distributions | (2.11) | (1.08) | (.36) | (.64) | (.05) | |||||
| Net asset value, end of period | 15.71 | 25.45 | 23.93 | 21.06 | 18.91 | |||||
| Total Return (%) | (32.21) | 11.15 | 15.53 | 14.88 | 16.35 | |||||
| Ratios/Supplemental Data (%): | ||||||||||
| Ratio of total expenses | ||||||||||
| to average net assets | .51 | .51 | .50 | .50 | .50 | |||||
| Ratio of net expenses | ||||||||||
| to average net assets | .50 | .50 | .50 | .50 | .50 | |||||
| Ratio of net investment income | ||||||||||
| to average net assets | 1.09 | .60 | .52 | .55 | .67 | |||||
| Portfolio Turnover Rate | 31.84 | 25.08 | 25.05 | 13.64 | 15.54 | |||||
| Net Assets, end of period ($ x 1,000) | 734,645 | 998,016 | 888,354 | 724,909 | 477,646 | |||||
| a Based on average shares outstanding at each month end. See notes to financial statements. |
30
NOTES TO FINANCIAL STATEMENTS
NOTE 1—Significant Accounting Policies:
Dreyfus Smallcap Stock Index Fund (the “fund”) is a separate non-diversified series of Dreyfus Index Funds, Inc. (the “Company”) which is registered under the Investment Company Act of 1940, as amended (the “Act”), as an open-end management investment company and operates as a series company currently offering three series including the fund.The fund’s investment objective is to match the performance of the Standard & Poor’s SmallCap 600 Index.The Dreyfus Corporation (the “Manager” or “Dreyfus”), a wholly-owned subsidiary of The Bank of New York Mellon Corporation (“BNY Mellon”), serves as the fund’s investment adviser. MBSC Securities Corporation (the “Distributor”), a wholly-owned subsidiary of the Manager, is the distributor of the fund’s shares, which are sold to the public without a sales charge.
Effective July 1, 2008, BNY Mellon has reorganized and consolidated a number of its banking and trust company subsidiaries. As a result of the reorganization, any services previously provided to the fund by Mellon Bank, N.A. or Mellon Trust of New England, N.A. are now provided by The Bank of New York, which has changed its name to The Bank of New York Mellon.
The Company accounts separately for the assets, liabilities and operations of each series. Expenses directly attributable to each series are charged to that series’ operations; expenses which are applicable to all series are allocated among them on a pro rata basis.
The fund’s financial statements are prepared in accordance with U.S. generally accepted accounting principles, which requires the use of management estimates and assumptions.Actual results could differ from those estimates.
The fund enters into contracts that contain a variety of indemnifications. The fund’s maximum exposure under these arrangements is unknown.The fund does not anticipate recognizing any loss related to these arrangements.
The Fund 31
| NOTES TO FINANCIAL STATEMENTS (continued) |
(a) Portfolio valuation: Investments in securities are valued at the last sales price on the securities exchange or national securities market on which such securities are primarily traded. Securities listed on the National Market System for which market quotations are available are valued at the official closing price or, if there is no official closing price that day, at the last sales price. Securities not listed on an exchange or the national securities market, or securities for which there were no transactions, are valued at the average of the most recent bid and asked prices, except for open short positions, where the asked price is used for valuation purposes. Bid price is used when no asked price is available. Registered investment companies that are not traded on an exchange are valued at their net asset value.When market quotations or official closing prices are not readily available, or are determined not to reflect accurately fair value, such as when the value of a security has been significantly affected by events after the close of the exchange or market on which the security is principally traded (for example, a foreign exchange or market), but before the fund calculates its net asset value, the fund may value these investments at fair value as determined in accordance with the procedures approved by the Board of Directors. Fair valuing of securities may be determined with the assistance of a pricing service using calculations based on indices of domestic securities and other appropriate indicators, such as prices of relevant ADRs and futures contracts. For other securities that are fair valued by the Board of Directors, certain factors may be considered such as: fundamental analytical data, the nature and duration of restrictions on disposition, an evaluation of the forces that influence the market in which the securities are purchased and sold, and public trading in similar securities of the issuer or comparable issuers. Financial futures are valued at the last sales price on the principal exchange.
The Financial Accounting Standards Board (“FASB”) released Statement of Financial Accounting Standards No. 157 “Fair Value Measurements” (“FAS 157”). FAS 157 establishes an authoritative definition of fair value, sets out a framework for measuring fair value, and requires additional disclosures about fair-value measurements. The application of FAS 157 is required for fiscal years beginning after
32
November 15, 2007 and interim periods within those fiscal years. Management does not believe that the application of this standard will have a material impact on the financial statements of the fund.
(b) Securities transactions and investment income: Securities transactions are recorded on a trade date basis. Realized gains and losses from securities transactions are recorded on the identified cost basis. Dividend income is recognized on the ex-dividend date and interest income; including, where applicable, accretion of discount and amortization of premium on investments is recognized on the accrual basis.
Pursuant to a securities lending agreement with The Bank of New York Mellon, a subsidiary of BNY Mellon and an affiliate of Dreyfus, the fund may lend securities to qualified institutions. It is the fund’s policy that at origination all loans are secured by collateral of at least 102% of the value of U.S. securities loaned and 105% of the value of foreign securities loaned. Collateral equivalent to at least 100% of the market value of securities on loan is maintained at all times. Collateral is either in the form of cash, which can be invested in certain money market mutual funds managed by the Manager, U.S. Government and Agency securities or letters of credit.The fund is entitled to receive all income on securities loaned, in addition to income earned as a result of the leading transaction. Although each security loaned is fully collateralized, the fund bears the risk of delay in recovery of, or loss of rights in, the securities loaned should a borrower fail to return the securities in a timely manner. During the period ended October 31, 2008,The Bank of New York Mellon earned $893,781 from lending fund portfolio securities, pursuant to the securities lending agreement.
(c) Affiliated issuers: Investments in other investment companies advised by the Manager are defined as “affiliated” in the Act.
(d) Dividends to shareholders: Dividends are recorded on the ex-dividend date. Dividends from investment income-net and dividends from net realized capital gains, if any, are normally declared and paid annually, but the fund may make distributions on a more frequent basis
The Fund 33
| NOTES TO FINANCIAL STATEMENTS (continued) |
to comply with the distribution requirements of the Internal Revenue Code of 1986, as amended (the “Code”).To the extent that net realized capital gains can be offset by capital loss carryovers, it is the policy of the fund not to distribute such gains. Income and capital gain distributions are determined in accordance with income tax regulations, which may differ from U.S. generally accepted accounting principles.
(e) Federal income taxes: It is the policy of the fund to continue to qualify as a regulated investment company, if such qualification is in the best interests of its shareholders, by complying with the applicable provisions of the Code, and to make distributions of taxable income sufficient to relieve it from substantially all federal income and excise taxes.
The fund adopted FASB Interpretation No. 48 “Accounting for Uncertainty in Income Taxes” (“FIN 48”). FIN 48 provides guidance for how uncertain tax positions should be recognized, measured, presented and disclosed in the financial statements. FIN 48 requires the evaluation of tax positions taken or expected to be taken in the course of preparing the fund’s tax returns to determine whether the tax positions are “more-likely-than-not” of being sustained by the applicable tax authority. Liability for tax positions not deemed to meet the more-likely-than-not threshold would be recorded as a tax expense in the current year.The adoption of FIN 48 had no impact on the operations of the fund for the period ended October 31, 2008.
As of and during the period ended October 31, 2008, the fund did not have any liabilities for any unrecognized tax positions. The fund recognizes interest and penalties, if any, related to unrecognized tax positions as income tax expense in the Statement of Operations. During the period, the fund did not incur any interest or penalties.
Each of the tax years in the four-year period ended October 31, 2008 remains subject to examination by the Internal Revenue Service and state taxing authorities.
At October 31, 2008, the components of accumulated earnings on a tax basis were as follows: undistributed ordinary income $8,430,139, undistributed capital gains $49,340,429 and unrealized depreciation $182,722,383.
34
The tax character of distributions paid to shareholders during the fiscal periods ended October 31, 2008 and October 31, 2007 was as follows: ordinary income $12,079,987 and $4,514,957 and long-term capital gains $74,751,018 and $35,949,561, respectively.
During the period ended October 31, 2008, as a result of permanent book to tax differences, primarily due to treating a portion of the proceeds from redemptions as a distribution for tax purposes, the fund decreased accumulated undistributed investment income-net by $8,455, decreased accumulated net realized gain (loss) on investments by $7,906,735 and increased paid-in capital by $7,915,190. Net assets and net asset value per share were not affected by this reclassification.
NOTE 2—Bank Lines of Credit:
Prior to October 15, 2008, the fund participated with other Dreyfus-managed funds in a $350 million redemption credit facility. Effective October 15, 2008 the fund participates with other Dreyfus-managed funds in a $145 million redemption credit facility (the “Facility”) to be utilized for temporary or emergency purposes, including the financing of redemptions. In connection therewith, the fund has agreed to pay commitment fees on its pro rata portion of the Facility. Interest is charged to the fund based on prevailing market rates in effect at the time of borrowing.
The average daily amount of borrowings outstanding under the Facilities during the period ended October 31, 2008, was approximately $152,700 with a related weighted average annualized interest rate of 4.23% .
NOTE 3—Management Fee and Other Transactions With Affiliates:
(a) Pursuant to an Investment Management Agreement (“Agreement”) with the Manager, the management fee is computed at the annual rate of .25% of the value of the fund’s average daily net assets, and is payable monthly. Under the terms of the Agreement, the Manager has agreed to
The Fund 35
| NOTES TO FINANCIAL STATEMENTS (continued) |
pay all the expenses of the fund, except management fees, brokerage commissions, taxes, interest, commitment fees, Shareholder Services Plan fees, fees and expenses of non-interested Board members (including counsel fees) and extraordinary expenses. In addition, the Manager is required to reduce its fee in an amount equal to the fund’s allocable portion of fees and expenses of the non-interested Board members (including counsel fees). Currently, the Company and 12 other funds (comprised of 35 portfolios) in the Dreyfus Family of Funds pay each Board member their respective allocated portion of an annual retainer of $85,000, and an attendance fee of $10,000 for each regularly scheduled Board meeting, an attendance fee of $2,000 for separate in-person committee meeting that is not held in conjunction with a regularly scheduled Board meeting and an attendance fee of $1,000 for each Board meeting and separate committee meetings that are conducted by telephone.The Chairman of the Board receives an additional 25% of such compensation and the Audit Committee Chairman receives an additional $15,000 per annum. The Company also reimburses each Board member for travel and out of pocket expenses in connection with attending Board or committee meetings. Subject to the Company’s Emeritus Program Guidelines, Emeritus Board Members, if any, receive 50% of the Company’s annual retainer fee and per meeting fee paid at the time the Board member achieves emeritus status. All Board fees are allocated among the funds in the Fund Group in proportion to each fund’s relative net assets.
(b) Under the Shareholder Services Plan, the fund pays the Distributor for the provision of certain services at the annual rate of .25% of the value of the fund’s average daily net assets. The services provided may include personal services relating to shareholder accounts, such as answering shareholder inquiries regarding the fund and providing reports and other information, and services related to the maintenance of shareholder accounts.The Distributor may make payments to Service Agents (a securities dealer, bank or other financial institution) in respect of these services.The Distributor determines the amounts to be paid to
36
Service Agents. During the period ended October 31, 2008, the fund was charged $2,256,382 pursuant to the Shareholder Services Plan.
The components of “Due to The Dreyfus Corporation and affiliates” in the Statement of Assets and Liabilities consist of: management fees $153,975 and shareholders services plan fees $153,975.
(c) Prior to December 1, 2007, a 2% redemption fee was charged and retained by the fund on certain shares redeemed within sixty days of purchase subject to exceptions described in the fund’s current prospectus. During the period ended October 31, 2008, redemption fees charged and received by the fund amounted to $1,250. Effective December 1, 2007, the fund discontinued the redemption fee on shares. The fund reserves the right to reimpose a redemption fee in the future.
NOTE 4—Securities Transactions:
The aggregate amount of purchases and sales of investment securities, excluding short-term securities and financial futures, during the period ended October 31, 2008, amounted to $364,251,434 and $288,908,102, respectively.
The fund may invest in financial futures contracts in order to gain exposure to or protect against changes in the market. The fund is exposed to market risk as a result of changes in the value of the underlying financial instruments. Investments in financial futures require the fund to “mark to market” on a daily basis, which reflects the change in the market value of the contract at the close of each day’s trading. Accordingly, variation margin payments are received or made to reflect daily unrealized gains or losses.When the contracts are closed, the fund recognizes a realized gain or loss.These investments require initial margin deposits with a broker, which consist of cash or cash equivalents. The amount of these deposits is determined by the exchange or Board of Trade on which the contract is traded and is subject to change. Contracts open at October 31, 2008, are set forth in the Statement of Financial Futures.
The Fund 37
| NOTES TO FINANCIAL STATEMENTS (continued) |
At October 31, 2008, the cost of investments for federal income tax purposes was $1,062,293,091; accordingly, accumulated net unrealized depreciation on investments was $182,722,383, consisting of $64,286,516 gross unrealized appreciation and $247,008,899 gross unrealized depreciation.
In March 2008, the FASB released Statement of Financial Accounting Standards No. 161 “Disclosures about Derivative Instruments and Hedging Activities” (“FAS 161”). FAS 161 requires qualitative disclosures about objectives and strategies for using derivatives, quantitative disclosures about fair value amounts of gains and losses on derivative instruments and disclosures about credit-risk-related contingent features in derivative agreements.The application of FAS 161 is required for fiscal years and interim periods beginning after November 15, 2008. At this time, management is evaluating the implications of FAS 161 and its impact on the financial statements and the accompanying notes has not yet been determined.
38
| REPORT OF INDEPENDENT REGISTERED PUBLIC ACCOUNTING FIRM |
| Shareholders and Board of Directors Dreyfus Smallcap Stock Index Fund |
We have audited the accompanying statement of assets and liabilities, including the statements of investments and financial futures, of Dreyfus Smallcap Stock Index Fund (one of the series comprising Dreyfus Index Funds, Inc.) as of October 31, 2008, and the related statement of operations for the year then ended, and the statement of changes in net assets and financial highlights for each of the two years in the period then ended. These financial statements and financial highlights are the responsibility of the Fund’s management. Our responsibility is to express an opinion on these financial statements and financial highlights based on our audits. The financial highlights for each of the years ended October 31, 2006, 2005 and 2004 were audited by other auditors whose report dated December 14, 2006, expressed an unqualified opinion on such financial highlights.
We conducted our audits in accordance with the standards of the Public Company Accounting Oversight Board (United States).Those standards require that we plan and perform the audit to obtain reasonable assurance about whether the financial statements and financial highlights are free of material misstatement.We were not engaged to perform an audit of the Fund’s internal control over financial reporting. Our audits included consideration of internal control over financial reporting as a basis for designing audit procedures that are appropriate in the circumstances, but not for the purpose of expressing an opinion on the effectiveness of the Fund’s internal control over financial reporting. Accordingly, we express no such opinion.An audit also includes examining, on a test basis, evidence supporting the amounts and disclosures in the financial statements and financial highlights, assessing the accounting principles used and significant estimates made by management, and evaluating the overall financial statement presentation. Our procedures included confirmation of securities owned as of October 31, 2008 by correspondence with the custodian and others. We believe that our audits provide a reasonable basis for our opinion.
In our opinion, the 2008 and 2007 financial statements and financial highlights referred to above present fairly, in all material respects, the financial position of Dreyfus Smallcap Stock Index Fund at October 31, 2008, the results of its operations for the year then ended, and the changes in its net assets and the financial highlights for each of the two years in the period then ended, in conformity with U.S. generally accepted accounting principles.
![]()
New York, New York
December 23, 2008
The Fund 39
IMPORTANT TAX INFORMATION (Unaudited)
For federal tax purposes, the fund also hereby designates 68.82% of the ordinary dividends paid during the fiscal year ended October 31, 2008 as qualifying for the corporate dividends received deduction. For the fiscal year ended October 31, 2008, certain dividends paid by the fund may be subject to a maximum tax rate of 15%, as provided for by the Jobs and Growth Tax Relief Reconciliation Act of 2003. Of the distributions paid during the fiscal year, $2,309,779 represents the maximum amount that may be considered qualified dividend income. Shareholders will receive notification in January 2009 of the percentage applicable to the preparation of their 2008 income tax returns. Also, the fund hereby designates $82,666,208 as a long-term capital gain dividend and $6,052,152 as a short-term capital gain dividend for the fiscal year ended October 31, 2008.
40
BOARD MEMBERS INFORMATION (Unaudited)
The Fund 41
BOARD MEMBERS INFORMATION (Unaudited) (continued)
42
The Fund 43
OFFICERS OF THE FUND (Unaudited)
44
The Fund 45
For More Information
| Dreyfus | Transfer Agent & | |
| Smallcap Stock | Dividend Disbursing Agent | |
| Index Fund | Dreyfus Transfer, Inc. | |
| 200 Park Avenue | 200 Park Avenue | |
| New York, NY 10166 | New York, NY 10166 | |
| Manager | Distributor | |
| The Dreyfus Corporation | MBSC Securities Corporation | |
| 200 Park Avenue | 200 Park Avenue | |
| New York, NY 10166 | New York, NY 10166 | |
| Custodian | ||
| The Bank of New York Mellon | ||
| One Wall Street | ||
| New York, NY 10286 | ||
Ticker Symbol: DISSX
Telephone 1-800-645-6561
Mail The Dreyfus Family of Funds, 144 Glenn Curtiss Boulevard, Uniondale, NY 11556-0144 E-mail Send your request to info@dreyfus.com Internet Information can be viewed online or downloaded at: http://www.dreyfus.com
The fund files its complete schedule of portfolio holdings with the Securities and Exchange Commission (“SEC”) for the first and third quarters of each fiscal year on Form N-Q. The fund’s Forms N-Q are available on the SEC’s website at http://www.sec.gov and may be reviewed and copied at the SEC’s Public Reference Room in Washington, DC. Information on the operation of the Public Reference Room may be obtained by calling 1-800-SEC-0330.
A description of the policies and procedures that the fund uses to determine how to vote proxies relating to portfolio securities, and information regarding how the fund voted these proxies for the 12-month period ended June 30, 2008, is available at http://www.dreyfus.com and on the SEC’s website at http://www.sec.gov. The description of the policies and procedures is also available without charge, upon request, by calling 1-800-645-6561.
© 2008 MBSC Securities Corporation

| Item 2. | Code of Ethics. |
The Registrant has adopted a code of ethics that applies to the Registrant's principal executive officer, principal financial officer, principal accounting officer or controller, or persons performing similar functions. There have been no amendments to, or waivers in connection with, the Code of Ethics during the period covered by this Report.
| Item 3. | Audit Committee Financial Expert. |
The Registrant's Board has determined that David P. Feldman, a member of the Audit Committee of the Board, is an audit committee financial expert as defined by the Securities and Exchange Commission (the "SEC"). David P. Feldman is "independent" as defined by the SEC for purposes of audit committee financial expert determinations.
| Item 4. | Principal Accountant Fees and Services. |
(a) Audit Fees. The aggregate fees billed for each of the last two fiscal years (the "Reporting Periods") for professional services rendered by the Registrant's principal accountant (the "Auditor") for the audit of the Registrant's annual financial statements or services that are normally provided by the Auditor in connection with the statutory and regulatory filings or engagements for the Reporting Periods, were $123,000 in 2007 and $123,600 in 2008.
(b) Audit-Related Fees. The aggregate fees billed in the Reporting Periods for assurance and related services by the Auditor that are reasonably related to the performance of the audit of the Registrant's financial statements and are not reported under paragraph (a) of this Item 4 were $2,414 in 2007 and $34,815 in 2008. These services consisted of (i) agreed-upon procedures related to compliance with Internal Revenue Code section 817(h), and security counts required by Rule 17f-2 under the Investment Company Act of 1940, as amended.
The aggregate fees billed in the Reporting Periods for non-audit assurance and related services by the Auditor to the Registrant's investment adviser (not including any sub-investment adviser whose role is primarily portfolio management and is subcontracted with or overseen by another investment adviser), and any entity controlling, controlled by or under common control with the investment adviser that provides ongoing services to the Registrant ("Service Affiliates"), that were reasonably related to the performance of the annual audit of the Service Affiliate, which required pre-approval by the Audit Committee were $-0- in 2007 and $-0- in 2008.
Note: For the second paragraph in each of (b) through (d) of this Item 4, certain of such services were not pre-approved prior to May 6, 2003, when such services were required to be pre-approved. On and after May 6, 2003, 100% of all services provided by the Auditor were pre-approved as required. For comparative purposes, the fees shown assume that all such services were pre-approved, including services that were not pre-approved prior to the compliance date of the pre-approval requirement.
(c) Tax Fees. The aggregate fees billed in the Reporting Periods for professional services rendered by the Auditor for tax compliance, tax advice, and tax planning ("Tax Services") were $10,500 in 2007 and $33,264 in 2008. These services consisted of: (i) review or preparation of U.S. federal, state, local and excise tax returns; (ii) U.S. federal, state and local tax planning, advice and assistance regarding statutory, regulatory or administrative developments; (iii) tax advice regarding tax qualification matters and/or treatment of various financial instruments held or proposed to be acquired or held, and (iv) determination of Passive Foreign Investment Companies.
| -3- |
SSL-DOCS2 70128344v15
The aggregate fees billed in the Reporting Periods for Tax Services by the Auditor to Service Affiliates, which required pre-approval by the Audit Committee were $-0- in 2007 and $-0- in 2008.
(d) All Other Fees. The aggregate fees billed in the Reporting Periods for products and services provided by the Auditor, other than the services reported in paragraphs (a) through (c) of this Item, were $-0- in 2007 and $-0- in 2008.
The aggregate fees billed in the Reporting Periods for Non-Audit Services by the Auditor to Service Affiliates, other than the services reported in paragraphs (b) through (c) of this Item, which required pre-approval by the Audit Committee, were $-0- in 2007 and $-0- in 2008.
Audit Committee Pre-Approval Policies and Procedures. The Registrant's Audit Committee has established policies and procedures (the "Policy") for pre-approval (within specified fee limits) of the Auditor's engagements for non-audit services to the Registrant and Service Affiliates without specific case-by-case consideration. Pre-approval considerations include whether the proposed services are compatible with maintaining the Auditor's independence. Pre-approvals pursuant to the Policy are considered annually.
Non-Audit Fees. The aggregate non-audit fees billed by the Auditor for services rendered to the Registrant, and rendered to Service Affiliates, for the Reporting Periods were $1,627,514 in 2007 and $7,879,835 in 2008.
Auditor Independence. The Registrant's Audit Committee has considered whether the provision of non-audit services that were rendered to Service Affiliates, which were not pre-approved (not requiring pre-approval), is compatible with maintaining the Auditor's independence.
| Item 5. | Audit Committee of Listed Registrants. | |
| Not applicable. [CLOSED-END FUNDS ONLY] | ||
| Item 6. | Investments. | |
| (a) | Not applicable. | |
| Item 7. | Disclosure of Proxy Voting Policies and Procedures for Closed-End Management | |
| Investment Companies. | ||
| Not applicable. [CLOSED-END FUNDS ONLY] | ||
| Item 8. | Portfolio Managers of Closed-End Management Investment Companies. | |
| Not applicable. [CLOSED-END FUNDS ONLY, beginning with reports for periods ended | ||
| on and after December 31, 2005] | ||
| Item 9. | Purchases of Equity Securities by Closed-End Management Investment Companies and | |
| Affiliated Purchasers. | ||
| Not applicable. [CLOSED-END FUNDS ONLY] | ||
| Item 10. | Submission of Matters to a Vote of Security Holders. |
| -4- |
SSL-DOCS2 70128344v15
The Registrant has a Nominating Committee (the "Committee"), which is responsible for selecting and nominating persons for election or appointment by the Registrant's Board as Board members. The Committee has adopted a Nominating Committee Charter (the "Charter"). Pursuant to the Charter, the Committee will consider recommendations for nominees from shareholders submitted to the Secretary of the Registrant, c/o The Dreyfus Corporation Legal Department, 200 Park Avenue, 8th Floor East, New York, New York 10166. A nomination submission must include information regarding the recommended nominee as specified in the Charter. This information includes all information relating to a recommended nominee that is required to be disclosed in solicitations or proxy statements for the election of Board members, as well as information sufficient to evaluate the factors to be considered by the Committee, including character and integrity, business and professional experience, and whether the person has the ability to apply sound and independent business judgment and would act in the interests of the Registrant and its shareholders. Nomination submissions are required to be accompanied by a written consent of the individual to stand for election if nominated by the Board and to serve if elected by the shareholders, and such additional information must be provided regarding the recommended nominee as reasonably requested by the Committee.
| Item 11. | Controls and Procedures. |
(a) The Registrant's principal executive and principal financial officers have concluded, based on their evaluation of the Registrant's disclosure controls and procedures as of a date within 90 days of the filing date of this report, that the Registrant's disclosure controls and procedures are reasonably designed to ensure that information required to be disclosed by the Registrant on Form N-CSR is recorded, processed, summarized and reported within the required time periods and that information required to be disclosed by the Registrant in the reports that it files or submits on Form N-CSR is accumulated and communicated to the Registrant's management, including its principal executive and principal financial officers, as appropriate to allow timely decisions regarding required disclosure.
(b) There were no changes to the Registrant's internal control over financial reporting that occurred during the second fiscal quarter of the period covered by this report that have materially affected, or are reasonably likely to materially affect, the Registrant's internal control over financial reporting.
| Item 12. | Exhibits. |
(a)(1) Code of ethics referred to in Item 2.
(a)(2) Certifications of principal executive and principal financial officers as required by Rule 30a-2(a) under the Investment Company Act of 1940.
(a)(3) Not applicable.
(b) Certification of principal executive and principal financial officers as required by Rule 30a-2(b) under the Investment Company Act of 1940.
| -5- |
SSL-DOCS2 70128344v15
| SIGNATURES |
Pursuant to the requirements of the Securities Exchange Act of 1934 and the Investment Company Act of 1940, the Registrant has duly caused this Report to be signed on its behalf by the undersigned, thereunto duly authorized.
Dreyfus Index Funds, Inc.
| By: | /s/ J. David Officer | |
| J. David Officer, | ||
| President | ||
| Date: | December 18, 2008 | |
Pursuant to the requirements of the Securities Exchange Act of 1934 and the Investment Company Act of 1940, this Report has been signed below by the following persons on behalf of the Registrant and in the capacities and on the dates indicated.
| By: | /s/ J. David Officer | |
| J. David Officer, | ||
| President | ||
| Date: | December 18, 2008 | |
| By: | /s/ James Windels | |
| James Windels, | ||
| Treasurer | ||
| Date: | December 18, 2008 | |
| EXHIBIT INDEX |
(a)(1) Code of ethics referred to in Item 2.
(a)(2) Certifications of principal executive and principal financial officers as required by Rule 30a-2(a) under the Investment Company Act of 1940. (EX-99.CERT)
(b) Certification of principal executive and principal financial officers as required by Rule 30a-2(b) under the Investment Company Act of 1940. (EX-99.906CERT)
| -6- |
SSL-DOCS2 70128344v15