| UNITED STATES SECURITIES AND EXCHANGE COMMISSION Washington, D.C. 20549 |
| FORM N-CSR |
| CERTIFIED SHAREHOLDER REPORT OF REGISTERED MANAGEMENT INVESTMENT COMPANIES |
| Investment Company Act file number | 811- 5883 |
| Dreyfus Index Funds, Inc. (Exact name of Registrant as specified in charter) |
| c/o The Dreyfus Corporation 200 Park Avenue New York, New York 10166 (Address of principal executive offices) (Zip code) |
| Michael A. Rosenberg, Esq. 200 Park Avenue New York, New York 10166 (Name and address of agent for service) |
| Registrant's telephone number, including area code: | (212) 922-6000 |
| Date of fiscal year end: | 10/31 | |
| Date of reporting period: | 10/31/09 | |
| FORM N-CSR |
| Item 1. | Reports to Stockholders. |
| Dreyfus International Stock Index Fund |
| ANNUAL REPORT October 31, 2009 |
Save time. Save paper. View your next shareholder report online as soon as it s available. Log into www.dreyfus.com and sign up for Dreyfus eCommunications. It s simple and only takes a few minutes.
The views expressed in this report reflect those of the portfolio manager only through the end of the period covered and do not necessarily represent the views of Dreyfus or any other person in the Dreyfus organization. Any such views are subject to change at any time based upon market or other conditions and Dreyfus disclaims any responsibility to update such views.These views may not be relied on as investment advice and, because investment decisions for a Dreyfus fund are based on numerous factors, may not be relied on as an indication of trading intent on behalf of any Dreyfus fund.

| Contents | |
| THE FUND | |
| 2 | A Letter from the Chairman and CEO |
| 3 | Discussion of Fund Performance |
| 6 | Fund Performance |
| 7 | Understanding Your Fund s Expenses |
| 7 | Comparing Your Fund s Expenses With Those of Other Funds |
| 8 | Statement of Investments |
| 38 | Statement of Financial Futures |
| 39 | Statement of Assets and Liabilities |
| 40 | Statement of Operations |
| 41 | Statement of Changes in Net Assets |
| 42 | Financial Highlights |
| 43 | Notes to Financial Statements |
| 58 | Report of Independent Registered Public Accounting Firm |
| 59 | Important Tax Information |
| 60 | Board Members Information |
| 63 | Officers of the Fund |
| FOR MORE INFORMATION | |
| Back Cover | |
| Dreyfus International Stock Index Fund |
| The Fund |

A LETTER FROM THE CHAIRMAN AND CEO
Dear Shareholder:
We are pleased to present this annual report for Dreyfus International Stock Index Fund, covering the 12-month period from November 1, 2008, through October 31, 2009.
Recent reports of positive economic growth in the United States , European and Asian markets may have signaled the end of the deep global recession that technically began here in the U.S. in late 2007. Signs that the world economies finally have turned a corner include inventory rebuilding among manufacturers, improvements in domestic housing, and more robust consumer spending. These developments helped fuel a sustained worldwide stock rally since the early spring, with the most beaten-down securities in less developed nations generally leading the rebound. Higher-quality stocks within more developed markets have participated in the rally, but have so far lagged on a relative performance basis.
In our judgment, the global financial markets currently appear poised to enter into a new phase in which underlying fundamentals, such as sound capital and financial structures and not bargain hunting are likely to drive investment returns. Of course, the best strategy for your portfolio depends not only on your view of the global economy s direction, but on your current financial needs, future goals and attitudes toward risk. Your financial advisor can help you decide which investments have the potential to benefit from a recovery while guarding against the risk that may accompany unexpected market developments.
For information about how the fund performed during the reporting period, as well as market perspectives, we have provided a Discussion of Fund Performance.
Thank you for your continued confidence and support.

| Jonathan R. Baum Chairman and Chief Executive Officer The Dreyfus Corporation November 16, 2009 |
2

DISCUSSION OF FUND PERFORMANCE
For the period of November 1, 2008, through October 31, 2009, as provided by Karen Q.Wong and Richard A. Brown, Portfolio Managers
Fund and Market Performance Overview
For the 12-month period ended October 31, 2009, Dreyfus International Stock Index Fund produced a total return of 25.13%.1 This compares with a 27.71% total return for the fund s benchmark, the Morgan Stanley Capital International Europe,Australasia, Far East Index (the MSCI EAFE Index or the Index ), during the same period.2
International stocks fell sharply over the first four months of an especially volatile reporting period, but they went on to recover all of those losses and more during a rally that began in March 2009 and continued through the reporting period s end.The fund s returns reflect transaction costs and operating expenses that are not reflected in the Index s return.
The Fund s Investment Approach
The fund seeks to match the performance of the MSCI EAFE Index, a broadly diversified, international index composed of approximately 1,000 companies located in developed markets outside the United States and Canada.The fund attempts to match the Index s return before fees and expenses by aligning the portfolio composition with the composition of the MSCI EAFE Index.The fund also invests in securities that represent the market as a whole, such as stock index futures, and manages its exposure to foreign currencies so that the fund s currency profile matches the currency makeup of the MSCI EAFE Index.
International Equities Posted Impressive Gains in Rally
The reporting period saw both staggering losses and impressive gains, as international stocks lost considerable value over the first four months of the reporting period, only to rebound sharply during its final eight months.The rally erased all of the reporting period s early losses and went on to record substantial gains.
The Fund 3
| DISCUSSION OF FUND PERFORMANCE (continued) |
When the reporting period began, investor sentiment was depressed by a global economic recession characterized by rising unemployment rates, plummeting housing prices and dampened consumer spending. At the same time, the world was in the grip of a financial crisis that nearly led to the collapse of the global banking system.The effects of the financial crisis were particularly severe among European banks, which reported massive write-downs among assets tied to troubled U.S. housing markets. In this environment, all countries and market sectors tracked by the Index posted negative absolute returns.
In early March, investor sentiment suddenly reversed as the international equity markets mirrored a strong rally occurring in the United States.The rebound was led primarily by stocks that had been severely beaten down during the downturn. International stock markets generally outperformed their U.S. counterparts in the rally, and large-cap international stocks significantly outperformed their smaller-cap counterparts. Gains within the emerging markets were especially robust, with all regions posting at least double-digit returns.
All but one of the 21 countries tracked by the Index posted positive absolute returns, and all 10 of the Index s economic sectors recorded double-digit returns, a testament to the depth and breadth of the rally. Geographically, the Index s better performing countries included the United Kingdom,Australia, France, Spain and Germany. Ireland, Finland and Austria generally lagged market averages. From a market sector standpoint, stocks in the financials, materials, industrials and consumer discretionary sectors performed relatively well, while returns in the utilities sector were more modest.
In this favorable investment environment,an impressive 69 of the Index s individual stocks posted triple-digit returns, while only a handful of stocks produced double-digit negative returns. For example, the Index s better performing stocks for the reporting period included two metals-and-mining companies, Kazakhmys and Eurasian Natural Resources Corp., located in the United Kingdom. Three financial stocks posted
4
solid gains, including Fortis, a financial services and insurance giant in Belgium, and two Hong Kong real estate and development firms, New World Development and The Wharf (Holdings) Ltd. Hotelier. Genting International in Singapore and Hong Kong marine shipping giant Orient Overseas (International) also fared well due to robust sales in its Asia/Pacific base.
On the other hand, the vast majority of the Index s declines stemmed from the financials sector, where banks in Ireland proved particularly disappointing, including Anglo Irish Bank, Bank of Ireland and Allied Irish Banks. Other notable detractors included investment management firms KBC Groep (formerly Almancora) and Babcock & Brown, located in Belgium and Australia, respectively.
Index Funds Offer Diversification Benefits
An as index fund, we attempt to replicate the returns of the MSCI EAFE Index by closely approximating its composition. In our view, one of the greatest benefits of an index fund is that it offers a broadly diversified investment vehicle that can help investors manage risks by limiting the impact on the overall portfolio of unexpected losses in any single country, industry group or holding.
November 16, 2009
| 1 | Total return includes reinvestment of dividends and any capital gains paid. Past performance is no | |
| guarantee of future results. Share price, yield and investment return fluctuate such that upon | ||
| redemption, fund shares may be worth more or less than their original cost. | ||
| 2 | SOURCE: LIPPER INC. Reflects reinvestment of net dividends and, where applicable, | |
| capital gain distributions.The Morgan Stanley Capital International Europe,Australasia, Far | ||
| East (MSCI EAFE) Index is an unmanaged index composed of a sample of companies | ||
| representative of the market structure of European and Pacific Basin countries.The index reflects | ||
| actual investable opportunities for global investors for stocks that are free of foreign ownership | ||
| limits or legal restrictions at the country level. |
The Fund 5
FUND PERFORMANCE
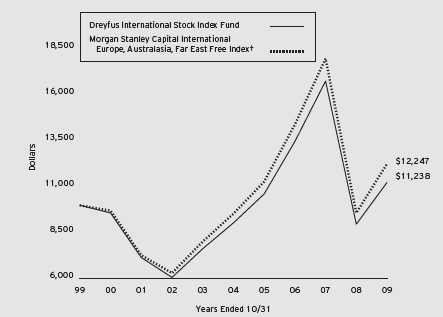
Comparison of change in value of $10,000 investment in Dreyfus International Stock Index Fund and the Morgan Stanley Capital International Europe, Australasia, Far East Free Index
| Average Annual Total Returns as of 10/31/09 | ||||||
| 1 Year | 5 Years | 10 Years | ||||
| Fund | 25.13% | 4.45% | 1.17% | |||
6
UNDERSTANDING YOUR FUND’S EXPENSES (Unaudited)
As a mutual fund investor, you pay ongoing expenses, such as management fees and other expenses. Using the information below, you can estimate how these expenses affect your investment and compare them with the expenses of other funds.You also may pay one-time transaction expenses, including sales charges (loads) and redemption fees, which are not shown in this section and would have resulted in higher total expenses. For more information, see your fund’s prospectus or talk to your financial adviser.
Review your fund’s expenses
The table below shows the expenses you would have paid on a $1,000 investment in Dreyfus International Stock Index Fund from May 1, 2009 to October 31, 2009. It also shows how much a $1,000 investment would be worth at the close of the period, assuming actual returns and expenses.
| Expenses and Value of a $1,000 Investment assuming actual returns for the six months ended October 31, 2009 |
| Expenses paid per $1,000† | $ 3.48 | |
| Ending value (after expenses) | $1,303.30 |
| COMPARING YOUR FUND’S EXPENSES WITH THOSE OF OTHER FUNDS (Unaudited) |
Using the SEC’s method to compare expenses
The Securities and Exchange Commission (SEC) has established guidelines to help investors assess fund expenses. Per these guidelines, the table below shows your fund’s expenses based on a $1,000 investment, assuming a hypothetical 5% annualized return. You can use this information to compare the ongoing expenses (but not transaction expenses or total cost) of investing in the fund with those of other funds.All mutual fund shareholder reports will provide this information to help you make this comparison. Please note that you cannot use this information to estimate your actual ending account balance and expenses paid during the period.
| Expenses and Value of a $1,000 Investment assuming a hypothetical 5% annualized return for the six months ended October 31, 2009 |
| Expenses paid per $1,000† | $ 3.06 | |
| Ending value (after expenses) | $1,022.18 |
† Expenses are equal to the fund’s annualized expense ratio of .60%, multiplied by the average account value over the
period, multiplied by 184/365 (to reflect the one-half year period).
The Fund 7
| STATEMENT OF INVESTMENTS October 31, 2009 |
| Common Stocks 96.9% | Shares | Value ($) | ||
| Australia 8.0% | ||||
| AGL Energy | 24,804 | 307,047 | ||
| Alumina | 132,098 | 193,202 | ||
| Amcor | 64,835 | 334,477 | ||
| AMP | 112,341 | 589,057 | ||
| Aristocrat Leisure | 22,601 | 89,765 | ||
| Arrow Energy | 34,661 a | 125,940 | ||
| Asciano Group | 140,393 a | 190,243 | ||
| ASX | 9,522 | 286,308 | ||
| Australia & New Zealand Banking Group | 128,362 | 2,620,901 | ||
| AXA Asia Pacific Holdings | 51,290 | 191,726 | ||
| Bendigo and Adelaide Bank | 20,652 | 167,185 | ||
| BHP Billiton | 184,275 | 6,074,286 | ||
| Billabong International | 9,556 | 87,197 | ||
| BlueScope Steel | 102,901 | 271,339 | ||
| Boral | 31,989 | 163,414 | ||
| Brambles | 76,555 | 480,960 | ||
| Caltex Australia | 5,748 a | 52,461 | ||
| CFS Retail Property Trust | 94,834 | 162,410 | ||
| Coca-Cola Amatil | 30,901 | 294,231 | ||
| Cochlear | 2,820 | 162,229 | ||
| Commonwealth Bank of Australia | 83,510 | 3,859,053 | ||
| Computershare | 24,153 | 234,699 | ||
| Crown | 24,659 | 178,723 | ||
| CSL | 32,682 | 922,292 | ||
| CSR | 81,884 | 138,957 | ||
| Dexus Property Group | 214,225 | 152,422 | ||
| Energy Resources of Australia | 2,999 | 62,166 | ||
| Fairfax Media | 105,828 | 150,601 | ||
| Fortescue Metals Group | 65,748 a | 220,632 | ||
| Foster s Group | 107,931 | 527,839 | ||
| Goodman Fielder | 84,351 | 121,146 | ||
| Goodman Group | 288,092 | 158,409 | ||
| GPT Group | 439,931 | 228,097 | ||
| Harvey Norman Holdings | 31,092 | 110,006 | ||
| Incitec Pivot | 86,213 | 201,071 | ||
| Insurance Australia Group | 107,784 | 361,659 |
8
| Common Stocks (continued) | Shares | Value ($) | ||
| Australia (continued) | ||||
| James Hardie Industries-CDI | 26,587 a | 169,192 | ||
| Leighton Holdings | 8,503 | 269,301 | ||
| Lend Lease | 25,435 | 210,039 | ||
| Macquarie Group | 16,554 | 721,843 | ||
| Macquarie Infrastructure Group | 128,485 | 165,874 | ||
| Map Group | 41,877 | 107,614 | ||
| Map Group (Rights) | 3,807 a | 1,961 | ||
| Metcash | 38,859 | 164,250 | ||
| Mirvac Group | 131,982 | 173,720 | ||
| National Australia Bank | 105,576 | 2,783,746 | ||
| Newcrest Mining | 26,203 | 748,413 | ||
| Nufarm | 10,738 | 110,240 | ||
| OneSteel | 73,726 | 200,522 | ||
| Orica | 19,095 | 407,335 | ||
| Origin Energy | 48,750 | 694,953 | ||
| OZ Minerals | 164,157 a | 172,919 | ||
| Paladin Energy | 33,468 a | 122,072 | ||
| Perpetual | 2,276 | 74,883 | ||
| Qantas Airways | 65,555 | 161,594 | ||
| QBE Insurance Group | 55,505 | 1,121,441 | ||
| Rio Tinto | 23,558 | 1,313,241 | ||
| Santos | 45,694 | 609,073 | ||
| Sims Metal Management | 7,686 | 137,652 | ||
| Sonic Healthcare | 20,859 | 259,269 | ||
| SP Ausnet | 62,635 | 49,141 | ||
| Stockland | 121,426 | 404,566 | ||
| Suncorp-Metway | 68,860 | 537,823 | ||
| TABCORP Holdings | 33,673 | 214,642 | ||
| Tatts Group | 58,928 | 130,828 | ||
| Telstra | 238,749 | 714,002 | ||
| Toll Holdings | 34,516 | 261,672 | ||
| Transurban Group | 63,094 | 257,104 | ||
| Wesfarmers | 54,732 | 1,353,691 | ||
| Wesfarmers-PPS | 8,823 | 221,856 | ||
| Westfield Group | 113,255 | 1,216,991 | ||
| Westpac Banking | 160,076 | 3,741,988 |
The Fund 9
| STATEMENT OF INVESTMENTS (continued) |
| Common Stocks (continued) | Shares | Value ($) | ||
| Australia (continued) | ||||
| Woodside Petroleum | 27,472 | 1,158,693 | ||
| Woolworths | 67,798 | 1,740,782 | ||
| WorleyParsons | 8,855 | 206,472 | ||
| 43,583,548 | ||||
| Austria .3% | ||||
| Erste Group Bank | 9,685 | 392,967 | ||
| OMV | 8,174 | 339,015 | ||
| Raiffeisen International Bank Holding | 3,091 | 182,972 | ||
| Telekom Austria | 17,644 | 290,266 | ||
| Verbund-Oesterreichische Elektrizitaetswirtschafts, Cl. A | 4,433 | 200,079 | ||
| Vienna Insurance Group | 2,207 | 125,010 | ||
| Voestalpine | 5,954 | 205,126 | ||
| 1,735,435 | ||||
| Belgium 1.0% | ||||
| Anheuser-Busch InBev | 39,774 | 1,878,197 | ||
| Anheuser-Busch InBev (STRIP) | 12,680 a | 94 | ||
| Belgacom | 8,421 | 316,831 | ||
| Colruyt | 821 | 196,056 | ||
| Compagnie Nationale a Portefeuille | 1,980 | 103,870 | ||
| Delhaize Group | 5,546 | 378,047 | ||
| Dexia | 30,228 a | 253,327 | ||
| Fortis | 122,153 a | 532,040 | ||
| Fortis (Rights) | 88,615 a | 0 | ||
| Groupe Bruxelles Lambert | 4,421 | 391,704 | ||
| Groupe Bruxelles Lambert (STRIP) | 236 a | 3 | ||
| KBC Groep | 9,065 a | 392,153 | ||
| Mobistar | 1,807 | 124,708 | ||
| Solvay | 3,347 | 330,127 | ||
| UCB | 5,219 | 223,850 | ||
| Umicore | 6,361 | 194,746 | ||
| 5,315,753 | ||||
| China .0% | ||||
| Foxconn International Holdings | 83,000 a | 73,503 | ||
| Denmark .9% | ||||
| AP Moller Maersk, Cl. A | 30 | 201,622 | ||
| AP Moller Maersk, Cl. B | 60 | 413,949 |
10
| Common Stocks (continued) | Shares | Value ($) | ||
| Denmark (continued) | ||||
| Carlsberg, Cl. B | 6,007 | 425,150 | ||
| Coloplast, Cl. B | 1,443 | 118,579 | ||
| Danske Bank | 24,740 a | 575,081 | ||
| DSV | 12,099 a | 190,212 | ||
| H Lundbeck | 2,653 | 51,676 | ||
| Novo Nordisk, Cl. B | 24,699 | 1,542,433 | ||
| Novozymes, Cl. B | 2,420 | 223,332 | ||
| Topdanmark | 849 a | 123,039 | ||
| TrygVesta | 1,123 | 81,485 | ||
| Vestas Wind Systems | 11,037 a | 784,434 | ||
| William Demant Holding | 1,278 a | 91,592 | ||
| 4,822,584 | ||||
| Finland 1.1% | ||||
| Elisa | 7,550 | 146,932 | ||
| Fortum | 24,140 | 574,507 | ||
| Kesko, Cl. B | 3,623 | 121,237 | ||
| Kone, Cl. B | 8,719 | 327,400 | ||
| Metso | 7,011 | 197,060 | ||
| Neste Oil | 6,406 | 113,988 | ||
| Nokia | 204,761 | 2,607,247 | ||
| Nokian Renkaat | 5,217 | 111,920 | ||
| Orion, Cl. B | 4,426 | 84,437 | ||
| Outokumpu | 5,850 | 97,448 | ||
| Pohjola Bank | 9,841 | 110,061 | ||
| Rautaruukki | 4,060 | 83,385 | ||
| Sampo, Cl. A | 22,967 | 553,030 | ||
| Sanoma | 4,669 | 86,662 | ||
| Stora Enso, Cl. R | 33,336 a | 253,797 | ||
| UPM-Kymmene | 28,870 | 348,437 | ||
| Wartsila | 4,284 | 156,061 | ||
| 5,973,609 | ||||
| France 10.0% | ||||
| Accor | 8,038 | 387,514 | ||
| Aeroports de Paris | 1,537 | 117,311 | ||
| Air France | 7,338 a | 113,249 | ||
| Air Liquide | 13,793 | 1,493,753 |
The Fund 11
| STATEMENT OF INVESTMENTS (continued) |
| Common Stocks (continued) | Shares | Value ($) | ||
| France (continued) | ||||
| Alcatel-Lucent | 128,316 a | 486,562 | ||
| Alstom | 10,894 | 760,680 | ||
| Atos Origin | 2,389 a | 112,584 | ||
| AXA | 86,324 | 2,167,143 | ||
| BioMerieux | 882 | 98,408 | ||
| BNP Paribas | 50,582 | 3,839,772 | ||
| Bouygues | 12,444 | 590,289 | ||
| Bureau Veritas | 2,381 | 131,739 | ||
| Cap Gemini | 8,064 | 376,096 | ||
| Carrefour | 35,009 | 1,511,912 | ||
| Casino Guichard Perrachon | 3,007 | 240,379 | ||
| Christian Dior | 3,498 | 350,853 | ||
| Cie de Saint-Gobain | 19,994 | 982,501 | ||
| Cie Generale d Optique Essilor International | 10,922 | 614,781 | ||
| Cie Generale de Geophysique-Veritas | 8,008 a | 159,567 | ||
| CNP Assurances | 2,037 | 197,671 | ||
| Compagnie Generale des Etablissements Michelin, Cl. B | 7,919 | 590,630 | ||
| Credit Agricole | 48,308 | 934,072 | ||
| Dassault Systemes | 3,726 | 216,135 | ||
| EDF | 13,178 | 738,851 | ||
| Eiffage | 2,009 | 110,089 | ||
| Eramet | 324 | 101,800 | ||
| Eurazeo | 1,602 | 101,378 | ||
| Eutelsat Communications | 4,821 | 153,999 | ||
| Fonciere des Regions | 1,404 | 155,468 | ||
| France Telecom | 100,723 | 2,505,592 | ||
| GDF Suez | 66,374 | 2,791,535 | ||
| Gecina | 908 | 97,209 | ||
| Groupe Danone | 30,328 | 1,832,630 | ||
| Hermes International | 2,881 | 402,930 | ||
| ICADE | 941 | 99,506 | ||
| Iliad | 988 | 107,436 | ||
| Imerys | 1,905 | 105,121 | ||
| Ipsen | 1,640 | 83,916 | ||
| JC Decaux | 4,335 a | 88,074 | ||
| Klepierre | 5,270 | 219,467 | ||
| L Oreal | 12,947 | 1,330,880 |
12
| Common Stocks (continued) | Shares | Value ($) | ||
| France (continued) | ||||
| Lafarge | 10,818 | 885,060 | ||
| Lagardere | 6,172 | 280,525 | ||
| Legrand | 5,117 | 139,673 | ||
| LVMH Moet Hennessy Louis Vuitton | 13,534 | 1,410,790 | ||
| M6-Metropole Television | 3,249 | 78,689 | ||
| Natixis | 52,231 a | 295,926 | ||
| Neopost | 1,569 | 138,019 | ||
| PagesJaunes Groupe | 6,051 | 74,504 | ||
| Pernod-Ricard | 10,506 | 880,305 | ||
| Peugeot | 7,803 a | 256,220 | ||
| PPR | 4,167 | 457,180 | ||
| Publicis Groupe | 6,530 | 249,538 | ||
| Renault | 10,155 a | 458,485 | ||
| Safran | 9,522 | 154,541 | ||
| Sanofi-Aventis | 57,838 | 4,245,089 | ||
| Schneider Electric | 12,625 | 1,322,741 | ||
| SCOR | 8,689 | 222,109 | ||
| Societe BIC | 1,432 | 99,916 | ||
| Societe Des Autoroutes Paris-Rhin-Rhone | 1,152 a | 86,940 | ||
| Societe Generale | 25,609 | 1,714,672 | ||
| Societe Generale (Rights) | 25,609 a | 112,599 | ||
| Societe Television Francaise 1 | 6,190 | 97,769 | ||
| Sodexo | 5,273 | 302,721 | ||
| Suez Environnement | 14,917 | 333,110 | ||
| Technip | 5,860 | 370,314 | ||
| Thales | 5,117 | 249,297 | ||
| Total | 117,175 | 7,025,210 | ||
| Unibail-Rodamco | 4,417 | 983,750 | ||
| Vallourec | 2,855 | 453,676 | ||
| Veolia Environnement | 21,010 | 690,507 | ||
| Vinci | 23,354 | 1,227,725 | ||
| Vivendi | 64,550 | 1,801,468 | ||
| 54,598,550 | ||||
| Germany 7.4% | ||||
| Adidas | 10,594 | 492,373 | ||
| Allianz | 24,923 | 2,869,734 | ||
| BASF | 50,802 | 2,735,884 |
The Fund 13
| STATEMENT OF INVESTMENTS (continued) |
| Common Stocks (continued) | Shares | Value ($) | ||
| Germany (continued) | ||||
| Bayer | 42,055 | 2,930,621 | ||
| Bayerische Motoren Werke | 17,944 | 881,500 | ||
| Beiersdorf | 5,026 | 310,714 | ||
| Celesio | 4,321 | 107,681 | ||
| Commerzbank | 39,753 a | 416,440 | ||
| Daimler | 49,650 | 2,423,309 | ||
| Deutsche Bank | 32,604 | 2,383,869 | ||
| Deutsche Boerse | 10,557 | 858,566 | ||
| Deutsche Lufthansa | 11,799 | 182,793 | ||
| Deutsche Post | 45,924 | 778,884 | ||
| Deutsche Postbank | 4,595 a | 142,984 | ||
| Deutsche Telekom | 156,152 | 2,140,362 | ||
| E.ON | 104,447 | 4,020,630 | ||
| Fraport AG Frankfurt Airport Services Worldwide | 2,261 | 106,752 | ||
| Fresenius | 1,371 | 68,493 | ||
| Fresenius Medical Care & Co. | 10,412 | 506,190 | ||
| GEA Group | 7,860 | 148,790 | ||
| Hamburger Hafen und Logistik | 1,184 | 46,294 | ||
| Hannover Rueckversicherung | 3,028 a | 136,889 | ||
| HeidelbergCement | 6,888 | 413,934 | ||
| Henkel & Co. | 7,334 | 288,270 | ||
| Hochtief | 2,305 | 174,501 | ||
| Infineon Technologies | 61,221 a | 276,857 | ||
| K+S | 8,120 | 445,440 | ||
| Linde | 8,414 | 886,266 | ||
| MAN | 5,797 | 478,807 | ||
| Merck | 3,653 | 344,463 | ||
| Metro | 6,418 | 357,566 | ||
| Muenchener Rueckversicherungs | 11,383 | 1,807,817 | ||
| Puma | 351 | 107,575 | ||
| RWE | 23,068 | 2,031,928 | ||
| Salzgitter | 2,195 | 198,332 | ||
| SAP | 47,242 | 2,146,857 | ||
| Siemens | 45,211 | 4,100,449 | ||
| Solarworld | 4,122 | 89,524 | ||
| Suedzucker | 4,185 | 86,817 |
14
| Common Stocks (continued) | Shares | Value ($) | ||
| Germany (continued) | ||||
| ThyssenKrupp | 18,199 | 588,052 | ||
| TUI | 7,370 a | 51,271 | ||
| United Internet | 5,912 a | 77,284 | ||
| Volkswagen | 4,769 | 778,509 | ||
| Wacker Chemie | 906 | 130,842 | ||
| 40,551,113 | ||||
| Greece .7% | ||||
| Alpha Bank | 19,547 a | 383,291 | ||
| Bank of Cyprus Public | 29,985 | 241,115 | ||
| Coca-Cola Hellenic Bottling | 10,464 | 276,360 | ||
| EFG Eurobank Ergasias | 16,597 a | 266,919 | ||
| Hellenic Petroleum | 6,087 | 74,543 | ||
| Hellenic Telecommunications Organization | 13,152 | 223,159 | ||
| Marfin Investment Group | 31,997 a | 129,355 | ||
| National Bank of Greece | 32,853 a | 1,225,880 | ||
| OPAP | 12,668 | 325,223 | ||
| Piraeus Bank | 16,634 a | 290,830 | ||
| Public Power | 6,826 a | 140,496 | ||
| Titan Cement | 3,357 | 117,338 | ||
| 3,694,509 | ||||
| Hong Kong 2.3% | ||||
| ASM Pacific Technology | 12,500 | 96,976 | ||
| Bank of East Asia | 77,750 | 271,537 | ||
| BOC Hong Kong Holdings | 202,000 | 465,051 | ||
| Cathay Pacific Airways | 63,000 a | 101,381 | ||
| Cheung Kong Holdings | 75,000 | 950,205 | ||
| Cheung Kong Infrastructure Holdings | 20,000 | 71,299 | ||
| Chinese Estates Holdings | 44,000 | 75,420 | ||
| CLP Holdings | 110,788 | 742,092 | ||
| Esprit Holdings | 63,100 | 413,081 | ||
| Hang Lung Group | 46,000 | 230,794 | ||
| Hang Lung Properties | 113,000 | 425,891 | ||
| Hang Seng Bank | 41,500 | 588,873 | ||
| Henderson Land Development | 58,762 | 414,293 | ||
| Hong Kong & China Gas | 217,483 | 518,515 | ||
| Hong Kong Aircraft Engineering | 4,400 | 51,822 |
The Fund 15
| STATEMENT OF INVESTMENTS (continued) |
| Common Stocks (continued) | Shares | Value ($) | ||
| Hong Kong (continued) | ||||
| Hong Kong Exchanges & Clearing | 56,500 | 993,249 | ||
| HongKong Electric Holdings | 76,000 | 406,026 | ||
| Hopewell Holdings | 33,000 | 104,160 | ||
| Hutchison Whampoa | 115,800 | 810,685 | ||
| Hysan Development | 39,000 | 114,997 | ||
| Kerry Properties | 40,500 | 227,361 | ||
| Li & Fung | 120,600 | 499,406 | ||
| Lifestyle International Holdings | 22,000 | 35,481 | ||
| Link REIT | 120,500 | 273,006 | ||
| Mongolia Energy | 126,000 a | 53,122 | ||
| MTR | 73,500 | 259,641 | ||
| New World Development | 138,191 | 296,197 | ||
| NWS Holdings | 37,000 | 70,323 | ||
| Orient Overseas International | 14,800 | 72,030 | ||
| PCCW | 167,000 | 40,956 | ||
| Shangri-La Asia | 73,000 | 140,104 | ||
| Sino Land | 90,664 | 172,850 | ||
| Sun Hung Kai Properties | 76,699 | 1,163,217 | ||
| Swire Pacific, Cl. A | 43,000 | 524,969 | ||
| Television Broadcasts | 13,000 | 61,454 | ||
| Wharf Holdings | 77,192 | 415,005 | ||
| Wheelock & Co. | 49,000 | 156,249 | ||
| Wing Hang Bank | 10,500 | 102,056 | ||
| Yue Yuen Industrial Holdings | 39,800 | 110,540 | ||
| 12,520,314 | ||||
| Ireland .2% | ||||
| Anglo Irish Bank | 35,225 a,b | 19,726 | ||
| CRH | 38,336 | 941,714 | ||
| Elan | 25,006 a | 133,191 | ||
| Kerry Group, Cl. A | 7,193 | 213,850 | ||
| Ryanair Holdings | 4,000 a | 17,410 | ||
| 1,325,891 | ||||
| Italy 3.4% | ||||
| A2A | 55,689 | 103,283 | ||
| ACEA | 3,790 | 44,568 | ||
| Assicurazioni Generali | 66,038 | 1,671,996 | ||
| Atlantia | 14,220 | 337,792 |
16
| Common Stocks (continued) | Shares | Value ($) | ||
| Italy (continued) | ||||
| Autogrill | 6,976 a | 78,945 | ||
| Banca Carige | 32,548 | 92,252 | ||
| Banca Monte dei Paschi di Siena | 112,962 | 215,670 | ||
| Banca Popolare di Milano Scarl | 20,979 | 156,934 | ||
| Banco Popolare | 36,217 a | 316,877 | ||
| Enel | 362,548 | 2,169,104 | ||
| ENI | 143,123 | 3,570,895 | ||
| EXOR | 4,104 | 81,564 | ||
| Fiat | 41,827 a | 627,010 | ||
| Finmeccanica | 22,299 | 376,388 | ||
| Fondiaria-Sai | 3,923 | 71,947 | ||
| Intesa Sanpaolo | 424,635 a | 1,801,265 | ||
| Intesa Sanpaolo-RSP | 47,999 | 157,575 | ||
| Italcementi | 4,571 | 66,195 | ||
| Lottomatica | 2,408 | 51,588 | ||
| Luxottica Group | 6,995 a | 170,602 | ||
| Mediaset | 37,511 | 245,042 | ||
| Mediobanca | 26,763 | 342,948 | ||
| Mediobanca (Warrants 3/18/11) | 25,489 a | 0 | ||
| Mediolanum | 14,252 | 90,946 | ||
| Parmalat | 95,993 | 267,261 | ||
| Pirelli & C | 100,796 a | 56,959 | ||
| Prysmian | 5,280 | 93,406 | ||
| Saipem | 14,523 | 431,559 | ||
| Saras | 18,185 | 59,364 | ||
| Snam Rete Gas | 78,433 | 381,889 | ||
| Telecom Italia | 543,750 | 868,864 | ||
| Telecom Italia-RSP | 333,781 | 369,604 | ||
| Terna Rete Elettrica Nazionale | 72,873 | 290,036 | ||
| UniCredit | 776,873 a | 2,624,881 | ||
| Unione di Banche Italiane | 32,249 | 463,208 | ||
| Unipol Gruppo Finanziario | 44,236 a | 64,485 | ||
| 18,812,902 | ||||
| Japan 20.2% | ||||
| 77 Bank | 17,000 | 97,956 | ||
| ABC-Mart | 1,600 | 45,990 | ||
| Acom | 2,736 | 34,455 |
The Fund 17
| STATEMENT OF INVESTMENTS (continued) |
| Common Stocks (continued) | Shares | Value ($) | ||
| Japan (continued) | ||||
| Advantest | 9,200 | 200,691 | ||
| Aeon | 35,500 | 314,692 | ||
| Aeon Credit Service | 3,960 | 37,657 | ||
| AEON Mall | 3,900 | 82,080 | ||
| Aioi Insurance | 24,000 | 104,855 | ||
| Aisin Seiki | 9,900 | 247,890 | ||
| Ajinomoto | 36,800 | 342,784 | ||
| Alfresa Holdings | 1,900 | 82,249 | ||
| All Nippon Airways | 48,000 | 132,265 | ||
| Amada | 20,000 | 122,006 | ||
| Aozora Bank | 47,959 | 55,495 | ||
| Asahi Breweries | 21,500 | 379,834 | ||
| Asahi Glass | 56,800 | 470,479 | ||
| Ashai Kasei | 69,900 | 342,827 | ||
| Asics | 9,000 | 78,807 | ||
| Astellas Pharma | 24,579 | 894,844 | ||
| Bank of Kyoto | 17,000 | 154,211 | ||
| Bank of Yokohama | 69,000 | 333,008 | ||
| Benesse Holdings | 3,800 | 167,589 | ||
| Bridgestone | 34,000 | 554,236 | ||
| Brother Industries | 12,900 | 145,002 | ||
| Canon | 58,750 | 2,192,344 | ||
| Canon Marketing Japan | 4,500 | 72,202 | ||
| Casio Computer | 13,100 | 94,660 | ||
| Central Japan Railway | 85 | 564,355 | ||
| Chiba Bank | 43,000 | 261,592 | ||
| Chubu Electric Power | 35,900 | 800,398 | ||
| Chugai Pharmaceutical | 12,828 | 251,123 | ||
| Chugoku Bank | 9,000 | 120,316 | ||
| Chugoku Electric Power | 15,700 | 317,110 | ||
| Chuo Mitsui Trust Holdings | 52,380 | 188,590 | ||
| Citizen Holdings | 17,800 | 99,977 | ||
| COCA-COLA WEST | 2,700 | 49,913 | ||
| Cosmo Oil | 36,000 | 93,332 | ||
| Credit Saison | 8,800 | 98,371 | ||
| Dai Nippon Printing | 30,800 | 381,146 |
18
| Common Stocks (continued) | Shares | Value ($) | ||
| Japan (continued) | ||||
| Daicel Chemical Industries | 15,000 | 90,001 | ||
| Daido Steel | 14,200 | 48,113 | ||
| Daihatsu Motor | 9,000 | 92,373 | ||
| Daiichi Sankyo | 36,583 | 719,913 | ||
| Daikin Industries | 12,800 | 433,788 | ||
| Dainippon Sumitomo Pharma | 9,000 | 92,342 | ||
| Daito Trust Construction | 4,200 | 174,615 | ||
| Daiwa House Industry | 26,400 | 278,457 | ||
| Daiwa Securities Group | 89,000 | 470,363 | ||
| Dena | 11 | 37,640 | ||
| Denki Kagaku Kogyo Kabushiki Kaisha | 27,600 | 100,748 | ||
| Denso | 26,400 | 717,121 | ||
| Dentsu | 9,200 | 194,257 | ||
| DIC | 23,000 | 37,552 | ||
| Dowa Holdings | 16,000 | 91,359 | ||
| Dowa Holdings (Rights) | 7,000 a | 0 | ||
| East Japan Railway | 18,400 | 1,172,727 | ||
| Eisai | 13,800 | 486,289 | ||
| Electric Power Development | 7,680 | 238,300 | ||
| Elpida Memory | 7,700 a | 98,747 | ||
| FamilyMart | 3,000 | 88,832 | ||
| Fanuc | 10,400 | 868,678 | ||
| Fast Retailing | 2,500 | 410,956 | ||
| Fuji Electric Holdings | 38,000 | 69,754 | ||
| Fuji Heavy Industries | 37,000 | 142,145 | ||
| Fuji Media Holdings | 11 | 16,040 | ||
| FUJIFILM Holdings | 26,500 | 757,298 | ||
| Fujitsu | 103,800 | 600,171 | ||
| Fukuoka Financial Group | 40,000 | 144,298 | ||
| Furukawa Electric | 35,000 | 131,298 | ||
| GS Yuasa | 21,000 | 178,899 | ||
| Gunma Bank | 22,000 | 113,827 | ||
| Hachijuni Bank | 19,000 | 110,720 | ||
| Hakuhodo DY Holdings | 1,170 | 58,566 | ||
| Hankyu Hashin Holdings | 62,000 | 275,328 | ||
| Hikari Tsushin | 1,300 | 24,398 |
The Fund 19
| STATEMENT OF INVESTMENTS (continued) |
| Common Stocks (continued) | Shares | Value ($) | ||
| Japan (continued) | ||||
| Hino Motors | 10,000 | 36,163 | ||
| Hirose Electric | 1,600 | 164,887 | ||
| Hiroshima Bank | 30,000 | 113,965 | ||
| Hisamitsu Pharmaceutical | 3,400 | 115,824 | ||
| Hitachi | 183,900 | 589,789 | ||
| Hitachi Chemical | 6,300 | 124,915 | ||
| Hitachi Construction Machinery | 6,600 | 152,269 | ||
| Hitachi High-Technologies | 3,900 | 64,200 | ||
| Hitachi Metals | 10,000 | 94,363 | ||
| Hokkaido Electric Power | 9,600 | 184,341 | ||
| Hokuhoku Financial Group | 62,000 | 132,283 | ||
| Hokuriku Electric Power | 10,000 | 227,899 | ||
| Honda Motor | 90,820 | 2,794,638 | ||
| HOYA | 22,600 | 492,193 | ||
| Ibiden | 7,100 | 250,953 | ||
| Idemitsu Kosan | 1,100 | 79,798 | ||
| IHI | 73,000 a | 136,194 | ||
| INPEX | 45 | 366,143 | ||
| Isetan Mitsukoshi Holdings | 20,020 | 188,916 | ||
| Isuzu Motors | 69,000 | 142,709 | ||
| Ito En | 3,300 | 55,659 | ||
| ITOCHU | 84,500 | 524,961 | ||
| Itochu Techno-Solutions | 1,400 | 38,215 | ||
| Iyo Bank | 14,000 | 124,953 | ||
| J Front Retailing | 26,800 | 125,802 | ||
| Jafco | 1,600 | 42,550 | ||
| Japan Airlines | 39,600 a | 50,571 | ||
| Japan Petroleum Exploration | 1,400 | 69,593 | ||
| Japan Prime Realty Investment | 36 | 78,204 | ||
| Japan Real Estate Investment | 22 | 175,451 | ||
| Japan Retail Fund Investment | 17 | 80,248 | ||
| Japan Steel Works | 17,000 | 185,741 | ||
| Japan Tobacco | 244 | 676,302 | ||
| JFE Holdings | 26,560 | 850,525 | ||
| JGC | 11,000 | 210,077 | ||
| Joyo Bank | 37,462 | 163,013 |
20
| Common Stocks (continued) | Shares | Value ($) | ||
| Japan (continued) | ||||
| JS Group | 14,324 | 232,930 | ||
| JSR | 9,100 | 176,158 | ||
| JTEKT | 10,800 | 113,560 | ||
| Jupiter Telecommunications | 142 | 129,717 | ||
| Kajima | 50,800 | 118,727 | ||
| Kamigumi | 15,400 | 113,604 | ||
| Kaneka | 16,000 | 103,697 | ||
| Kansai Electric Power | 41,299 | 892,642 | ||
| Kansai Paint | 11,000 | 91,919 | ||
| Kao | 29,000 | 647,751 | ||
| Kawasaki Heavy Industries | 71,000 | 175,158 | ||
| Kawasaki Kisen Kaisha | 33,000 a | 119,655 | ||
| KDDI | 158 | 834,874 | ||
| Keihin Electric Express Railway | 22,000 | 174,418 | ||
| Keio | 31,000 | 194,509 | ||
| Keisei Electric Railway | 17,000 | 95,066 | ||
| Keyence | 2,305 | 454,794 | ||
| Kikkoman | 8,000 | 91,029 | ||
| Kinden | 6,000 | 48,583 | ||
| Kintetsu | 89,354 | 314,579 | ||
| Kirin Holdings | 45,000 | 734,149 | ||
| Kobe Steel | 138,000 | 248,062 | ||
| Komatsu | 51,400 | 993,264 | ||
| Konami | 5,200 | 93,332 | ||
| Konica Minolta Holdings | 25,000 | 231,887 | ||
| Kubota | 60,000 | 462,873 | ||
| Kuraray | 17,500 | 179,647 | ||
| Kurita Water Industries | 5,800 | 178,354 | ||
| Kyocera | 8,800 | 732,362 | ||
| Kyowa Hakko Kirin | 14,705 | 169,563 | ||
| Kyushu Electric Power | 20,800 | 423,056 | ||
| Lawson | 3,800 | 168,727 | ||
| Leopalace21 | 7,200 a | 38,518 | ||
| Mabuchi Motor | 1,500 | 71,212 | ||
| Makita | 6,500 | 216,110 | ||
| Marubeni | 91,000 | 451,220 |
The Fund 21
| STATEMENT OF INVESTMENTS (continued) |
| Common Stocks (continued) | Shares | Value ($) | ||
| Japan (continued) | ||||
| Marui Group | 14,100 | 79,919 | ||
| Maruichi Steel Tube | 2,000 | 36,980 | ||
| Matsui Securities | 8,000 | 56,423 | ||
| Mazda Motor | 46,000 | 102,098 | ||
| McDonald s Holdings Japan | 3,000 | 60,396 | ||
| Medipal Holdings | 7,700 | 107,895 | ||
| MEIJI Holdings | 3,521 | 142,773 | ||
| Minebea | 18,000 | 74,811 | ||
| Mitsubishi | 74,900 | 1,591,155 | ||
| Mitsubishi Chemical Holdings | 63,100 | 233,414 | ||
| Mitsubishi Electric | 105,000 | 787,495 | ||
| Mitsubishi Estate | 64,000 | 966,329 | ||
| Mitsubishi Gas Chemical | 20,000 | 90,764 | ||
| Mitsubishi Heavy Industries | 164,700 | 575,950 | ||
| Mitsubishi Logistics | 6,000 | 64,421 | ||
| Mitsubishi Materials | 61,000 | 160,437 | ||
| Mitsubishi Motors | 203,000 a | 295,647 | ||
| Mitsubishi Rayon | 33,000 | 114,181 | ||
| Mitsubishi Tanabe Pharma | 11,000 | 140,583 | ||
| Mitsubishi UFJ Financial Group | 512,590 | 2,721,055 | ||
| Mitsubishi UFJ Lease & Finance | 2,860 | 85,210 | ||
| Mitsui & Co. | 95,400 | 1,224,384 | ||
| Mitsui Chemicals | 33,000 | 112,715 | ||
| Mitsui Engineering & Shipbuilding | 45,000 | 115,080 | ||
| Mitsui Fudosan | 45,000 | 718,446 | ||
| Mitsui Mining & Smelting | 34,000 a | 87,308 | ||
| Mitsui OSK Lines | 63,000 | 363,285 | ||
| Mitsui Sumitomo Insurance Group Holdings | 23,469 | 552,512 | ||
| Mitsumi Electric | 4,800 | 97,345 | ||
| Mizuho Financial Group | 694,600 | 1,373,171 | ||
| Mizuho Securities | 34,000 | 115,081 | ||
| Mizuho Trust & Banking | 92,000 a | 85,831 | ||
| Murata Manufacturing | 12,000 | 588,130 | ||
| Namco Bandai Holdings | 10,350 | 106,073 | ||
| NEC | 106,800 | 298,379 | ||
| NGK Insulators | 13,000 | 290,676 |
22
| Common Stocks (continued) | Shares | Value ($) | ||
| Japan (continued) | ||||
| NGK Spark Plug | 10,000 | 112,516 | ||
| NHK Spring | 11,000 | 85,524 | ||
| Nidec | 6,000 | 508,921 | ||
| Nikon | 17,600 | 326,691 | ||
| Nintendo | 5,350 | 1,356,644 | ||
| Nippon Building Fund | 29 | 238,098 | ||
| Nippon Electric Glass | 18,085 | 196,030 | ||
| Nippon Express | 49,000 | 197,437 | ||
| Nippon Meat Packers | 9,000 | 105,097 | ||
| Nippon Mining Holdings | 45,800 | 200,994 | ||
| Nippon Oil | 66,800 | 324,429 | ||
| Nippon Paper Group | 4,900 | 129,278 | ||
| Nippon Sheet Glass | 34,000 | 99,239 | ||
| Nippon Steel | 276,100 | 1,033,993 | ||
| Nippon Telegraph & Telephone | 28,100 | 1,154,432 | ||
| Nippon Yusen | 61,800 | 229,322 | ||
| Nipponkoa Insurance | 35,000 | 189,118 | ||
| Nishi-Nippon City Bank | 41,000 | 101,922 | ||
| Nissan Chemical Industries | 9,000 | 115,177 | ||
| Nissan Motor | 134,600 a | 951,792 | ||
| Nissay Dowa General Insurance | 8,000 | 35,183 | ||
| Nisshin Seifun Group | 9,300 | 122,674 | ||
| Nisshin Steel | 42,000 | 68,535 | ||
| Nisshinbo Holdings | 7,000 | 67,784 | ||
| Nissin Foods Holdings | 3,900 | 137,127 | ||
| Nitori | 1,850 | 149,990 | ||
| Nitto Denko | 9,200 | 272,761 | ||
| NOK | 5,200 | 68,461 | ||
| Nomura Holdings | 195,100 | 1,357,631 | ||
| Nomura Real Estate Holdings | 5,400 | 86,166 | ||
| Nomura Real Estate Office Fund | 17 | 104,632 | ||
| Nomura Research Institute | 5,700 | 122,972 | ||
| NSK | 24,000 | 136,777 | ||
| NTN | 25,000 | 92,803 | ||
| NTT Data | 71 | 202,387 | ||
| NTT DoCoMo | 849 | 1,229,858 |
The Fund 23
| STATEMENT OF INVESTMENTS (continued) |
| Common Stocks (continued) | Shares | Value ($) | ||
| Japan (continued) | ||||
| NTT Urban Development | 55 | 44,076 | ||
| Obayashi | 35,000 | 130,164 | ||
| Obic | 350 | 58,880 | ||
| Odakyu Electric Railway | 35,000 | 284,325 | ||
| OJI Paper | 49,000 | 212,932 | ||
| Olympus | 12,000 | 371,513 | ||
| Omron | 10,400 | 175,127 | ||
| Ono Pharmaceutical | 4,800 | 228,778 | ||
| Onward Holdings | 6,000 | 37,218 | ||
| ORACLE JAPAN | 1,700 | 74,876 | ||
| Oriental Land | 3,000 | 202,432 | ||
| ORIX | 5,800 | 375,960 | ||
| Osaka Gas | 110,000 | 368,165 | ||
| OSAKA Titanium Technologies | 600 | 15,595 | ||
| OTSUKA | 1,000 | 52,089 | ||
| Panasonic | 108,195 | 1,491,575 | ||
| Panasonic Electric Works | 19,000 | 236,030 | ||
| Promise | 3,550 a | 22,639 | ||
| Rakuten | 412 | 280,602 | ||
| Resona Holdings | 26,000 | 308,340 | ||
| Ricoh | 37,000 | 507,734 | ||
| Rinnai | 1,700 | 74,692 | ||
| Rohm | 5,500 | 360,186 | ||
| Sankyo | 2,800 | 158,644 | ||
| Santen Pharmaceutical | 3,800 | 130,475 | ||
| Sanyo Electric | 90,000 a | 216,741 | ||
| Sapporo Hokuyo Holdings | 15,000 | 50,011 | ||
| Sapporo Holdings | 13,000 | 67,924 | ||
| SBI Holdings | 887 | 159,609 | ||
| Secom | 11,700 | 544,140 | ||
| Sega Sammy Holdings | 9,584 | 135,340 | ||
| Seiko Epson | 6,800 | 105,708 | ||
| Sekisui Chemical | 22,000 | 130,186 | ||
| Sekisui House | 28,000 | 238,922 | ||
| Senshu Ikeda Holdings | 26,300 a | 89,487 | ||
| Seven & I Holdings | 41,660 | 908,236 |
24
| Common Stocks (continued) | Shares | Value ($) | ||
| Japan (continued) | ||||
| Seven Bank | 26 | 63,150 | ||
| Sharp | 55,000 | 579,329 | ||
| Shikoku Electric Power | 10,100 | 283,581 | ||
| Shimadzu | 15,000 | 102,768 | ||
| Shimamura | 1,200 | 114,055 | ||
| Shimano | 3,500 | 133,263 | ||
| Shimizu | 28,000 | 105,986 | ||
| Shin-Etsu Chemical | 22,700 | 1,189,166 | ||
| Shinko Electric Industries | 4,200 | 60,647 | ||
| Shinsei Bank | 50,000 a | 64,121 | ||
| Shionogi & Co. | 17,000 | 364,897 | ||
| Shiseido | 19,000 | 346,117 | ||
| Shizuoka Bank | 33,400 | 329,719 | ||
| Showa Denko | 64,000 | 121,240 | ||
| Showa Shell Sekiyu | 11,300 | 110,378 | ||
| SMC | 2,800 | 319,962 | ||
| Softbank | 41,000 | 957,009 | ||
| Sojitz | 66,600 | 122,032 | ||
| Sompo Japan Insurance | 49,000 | 290,747 | ||
| Sony | 55,480 | 1,621,440 | ||
| Sony Financial Holdings | 50 | 142,088 | ||
| Square Enix Holdings | 3,700 | 92,033 | ||
| Stanley Electric | 8,200 | 158,741 | ||
| SUMCO | 6,800 | 128,621 | ||
| Sumitomo | 61,100 | 591,591 | ||
| Sumitomo Chemical | 87,000 | 342,207 | ||
| Sumitomo Electric Industries | 41,200 | 492,624 | ||
| Sumitomo Heavy Industries | 29,000 a | 129,858 | ||
| Sumitomo Metal Industries | 183,000 | 461,734 | ||
| Sumitomo Metal Mining | 29,000 | 451,217 | ||
| Sumitomo Mitsui Financial Group | 50,000 | 1,707,880 | ||
| Sumitomo Realty & Development | 21,000 | 392,403 | ||
| Sumitomo Rubber Industries | 9,400 | 86,144 | ||
| Sumitomo Trust & Banking | 80,000 | 410,595 | ||
| Suruga Bank | 12,000 | 107,858 | ||
| Suzuken | 3,720 | 132,357 |
The Fund 25
| STATEMENT OF INVESTMENTS (continued) |
| Common Stocks (continued) | Shares | Value ($) | ||
| Japan (continued) | ||||
| Suzuki Motor | 19,800 | 479,697 | ||
| T & D Holdings | 12,200 | 311,190 | ||
| Taiheiyo Cement | 50,000 | 57,687 | ||
| Taisei | 58,000 | 113,149 | ||
| Taisho Pharmaceutical | 8,000 | 144,994 | ||
| Taiyo Nippon Sanso | 15,000 | 166,784 | ||
| Takashimaya | 15,000 | 99,649 | ||
| Takeda Pharmaceutical | 41,400 | 1,655,556 | ||
| TDK | 6,100 | 345,039 | ||
| Teijin | 46,000 | 134,146 | ||
| Terumo | 9,200 | 478,082 | ||
| THK | 6,700 | 114,026 | ||
| Tobu Railway | 45,000 | 244,827 | ||
| Toho | 5,800 | 87,197 | ||
| Toho Gas | 22,000 | 113,808 | ||
| Tohoku Electric Power | 23,900 | 489,909 | ||
| Tokio Marine Holdings | 39,100 | 1,000,448 | ||
| Tokuyama | 12,000 | 74,092 | ||
| Tokyo Broadcasting System | 1,700 | 25,104 | ||
| Tokyo Electric Power | 67,172 | 1,648,696 | ||
| Tokyo Electron | 9,400 | 519,620 | ||
| Tokyo Gas | 126,000 | 496,017 | ||
| Tokyo Steel Manufacturing | 5,500 | 71,685 | ||
| Tokyo Tatemono | 14,000 | 65,670 | ||
| Tokyu | 62,820 | 272,944 | ||
| Tokyu Land | 28,000 | 113,059 | ||
| TonenGeneral Sekiyu | 14,000 | 126,885 | ||
| Toppan Printing | 31,000 | 274,112 | ||
| Toray Industries | 74,000 | 417,170 | ||
| Toshiba | 213,000 | 1,196,365 | ||
| Tosoh | 29,000 | 77,464 | ||
| TOTO | 14,000 | 81,747 | ||
| Toyo Seikan Kaisha | 8,800 | 145,671 | ||
| Toyo Suisan Kaisha | 4,000 | 104,302 | ||
| Toyoda Gosei | 3,600 | 99,767 | ||
| Toyota Boshoku | 4,200 | 85,424 |
26
| Common Stocks (continued) | Shares | Value ($) | ||
| Japan (continued) | ||||
| Toyota Industries | 9,200 | 245,622 | ||
| Toyota Motor | 151,414 | 5,958,051 | ||
| Toyota Tsusho | 11,600 | 165,268 | ||
| Trend Micro | 5,500 | 190,974 | ||
| Tsumura & Co. | 3,100 | 105,935 | ||
| Ube Industries | 55,600 | 142,564 | ||
| UNICHARM | 2,100 | 200,072 | ||
| UNY | 9,000 | 66,256 | ||
| Ushio | 5,900 | 91,035 | ||
| USS | 1,330 | 79,232 | ||
| West Japan Railway | 96 | 339,330 | ||
| Yahoo! Japan | 828 | 251,749 | ||
| Yakult Honsha | 5,100 | 130,566 | ||
| Yamada Denki | 4,820 | 292,093 | ||
| Yamaguchi Financial Group | 11,000 | 104,842 | ||
| Yamaha | 9,200 | 95,010 | ||
| Yamaha Motor | 12,800 | 150,317 | ||
| Yamato Holdings | 20,400 | 301,675 | ||
| Yamato Kogyo | 2,800 | 82,805 | ||
| Yamazaki Baking | 6,000 | 73,686 | ||
| Yaskawa Electric | 15,000 | 116,010 | ||
| Yokogawa Electric | 11,500 | 92,156 | ||
| 110,686,143 | ||||
| Luxembourg .5% | ||||
| ArcelorMittal | 47,338 | 1,605,033 | ||
| Millicom International Cellular, SDR | 4,207 a | 276,472 | ||
| SES | 16,018 | 348,716 | ||
| Tenaris | 25,833 | 460,814 | ||
| 2,691,035 | ||||
| Netherlands 2.6% | ||||
| Aegon | 83,912 a | 604,058 | ||
| Akzo Nobel | 12,610 | 749,426 | ||
| ASML Holding | 23,998 | 650,796 | ||
| Corio | 2,917 | 198,947 | ||
| European Aeronautic Defence and Space | 21,543 | 406,379 | ||
| Fugro | 3,791 | 212,578 |
The Fund 27
| STATEMENT OF INVESTMENTS (continued) |
| Common Stocks (continued) | Shares | Value ($) | ||
| Netherlands (continued) | ||||
| Heineken | 13,332 | 592,383 | ||
| Heineken Holding | 5,660 | 221,344 | ||
| ING Groep | 108,077 a | 1,424,953 | ||
| Koninklijke Ahold | 64,606 | 817,870 | ||
| Koninklijke Boskalis Westminster | 3,558 | 125,677 | ||
| Koninklijke DSM | 8,571 | 377,359 | ||
| KONINKLIJKE KPN | 94,640 | 1,724,510 | ||
| Koninklijke Philips Electronics | 52,560 | 1,328,812 | ||
| QIAGEN | 10,612 a | 220,770 | ||
| Randstad Holding | 5,351 a | 204,484 | ||
| Reed Elsevier | 40,595 | 475,573 | ||
| SBM Offshore | 7,969 | 153,675 | ||
| STMicroelectronics | 36,468 | 295,345 | ||
| TNT | 20,204 | 538,964 | ||
| Unilever | 89,674 | 2,779,158 | ||
| Wolters Kluwer | 15,164 | 339,968 | ||
| 14,443,029 | ||||
| New Zealand .1% | ||||
| Auckland International Airport | 65,324 | 94,453 | ||
| Contact Energy | 15,698 | 70,820 | ||
| Fletcher Building | 31,254 | 185,874 | ||
| Sky City Entertainment Group | 33,202 | 82,213 | ||
| Telecom Corporation of New Zealand | 92,121 | 168,052 | ||
| 601,412 | ||||
| Norway .7% | ||||
| DNB NOR | 41,236 a | 477,284 | ||
| Norsk Hydro | 37,703 a | 249,792 | ||
| Orkla | 41,776 | 390,053 | ||
| Renewable Energy | 18,350 a | 110,720 | ||
| SeaDrill | 14,542 | 305,239 | ||
| Statoil | 62,039 | 1,479,686 | ||
| Telenor | 45,919 a | 597,570 | ||
| Yara International | 10,737 | 359,163 | ||
| 3,969,507 |
28
| Common Stocks (continued) | Shares | Value ($) | ||
| Portugal .3% | ||||
| Banco Comercial Portugues, Cl. R | 120,349 | 172,242 | ||
| Banco Espirito Santo | 27,218 | 201,557 | ||
| Brisa Auto-Estradas de Portugal | 9,633 | 95,369 | ||
| Cimpor-Cimentos de Portugal | 12,398 | 96,969 | ||
| Energias de Portugal | 99,918 | 443,304 | ||
| Galp Energia, Cl. B | 7,905 | 133,430 | ||
| Jeronimo Martins | 13,816 | 123,328 | ||
| Portugal Telecom | 30,385 | 349,013 | ||
| 1,615,212 | ||||
| Singapore 1.3% | ||||
| Ascendas Real Estate Investment Trust | 73,281 | 95,490 | ||
| CapitaLand | 143,500 | 415,478 | ||
| CapitaMall Trust | 120,000 | 134,578 | ||
| City Developments | 26,000 | 181,547 | ||
| ComfortDelgro | 93,700 | 101,735 | ||
| Cosco Singapore | 48,000 | 37,832 | ||
| DBS Group Holdings | 92,588 | 846,694 | ||
| Fraser and Neave | 49,150 | 133,697 | ||
| Genting Singapore | 188,527 a | 141,056 | ||
| Golden Agri-Resources | 275,440 a | 82,560 | ||
| Jardine Cycle & Carriage | 8,422 | 138,073 | ||
| Keppel | 72,000 | 414,039 | ||
| Neptune Orient Lines | 56,000 | 62,387 | ||
| Noble Group | 78,800 | 144,080 | ||
| Olam International | 72,300 | 138,915 | ||
| Oversea-Chinese Banking | 135,942 | 731,630 | ||
| SembCorp Industries | 53,254 | 124,696 | ||
| SembCorp Marine | 41,000 | 99,951 | ||
| Singapore Airlines | 30,733 | 295,133 | ||
| Singapore Exchange | 44,000 | 250,108 | ||
| Singapore Press Holdings | 91,075 | 248,377 | ||
| Singapore Technologies Engineering | 78,000 | 157,713 | ||
| Singapore Telecommunications | 430,951 | 894,762 | ||
| StarHub | 26,918 | 36,100 |
The Fund 29
| STATEMENT OF INVESTMENTS (continued) |
| Common Stocks (continued) | Shares | Value ($) | ||
| Singapore (continued) | ||||
| United Overseas Bank | 66,112 | 791,808 | ||
| UOL Group | 22,111 | 52,567 | ||
| Wilmar International | 66,000 | 291,039 | ||
| 7,042,045 | ||||
| Spain 4.7% | ||||
| Abertis Infraestructuras | 15,454 | 330,395 | ||
| Acciona | 1,296 | 158,902 | ||
| Acerinox | 7,125 | 142,498 | ||
| ACS Actividades de Construccion y Servicios | 8,069 | 389,545 | ||
| Banco Bilbao Vizcaya Argentaria | 195,759 | 3,529,531 | ||
| Banco de Sabadell | 49,977 | 338,828 | ||
| Banco de Valencia | 10,791 | 91,867 | ||
| Banco Popular Espanol | 40,796 | 365,970 | ||
| Banco Santander | 447,709 | 7,262,985 | ||
| Banco Santander (Rights) | 447,709 a | 79,269 | ||
| Bankinter | 16,421 | 173,959 | ||
| Cintra Concesiones de Infraestructuras de Transporte | 11,882 | 122,982 | ||
| Criteria Caixacorp | 43,257 | 211,894 | ||
| EDP Renovaveis | 13,006 a | 130,106 | ||
| Enagas | 10,301 | 213,084 | ||
| Fomento de Construcciones y Contratas | 1,877 | 76,768 | ||
| Gamesa Tecnologica | 10,468 | 192,754 | ||
| Gas Natural SDG | 11,428 | 230,917 | ||
| Gestevision Telecinco | 5,695 | 59,239 | ||
| Grifols | 6,640 | 107,816 | ||
| Grupo Ferrovial | 3,402 | 141,850 | ||
| Iberdrola | 202,663 | 1,847,936 | ||
| Iberdrola Renovables | 48,509 | 216,865 | ||
| Iberia Lineas Aereas de Espana | 23,577 a | 65,399 | ||
| Inditex | 12,157 | 717,481 | ||
| Indra Sistemas | 5,136 | 121,322 | ||
| Mapfre | 40,701 | 175,352 | ||
| Red Electrica | 6,028 | 313,158 | ||
| Repsol | 39,644 | 1,062,520 | ||
| Sacyr Vallehermoso | 4,444 a | 67,602 |
30
| Common Stocks (continued) | Shares | Value ($) | ||
| Spain (continued) | ||||
| Telefonica | 232,500 | 6,528,085 | ||
| Zardoya Otis | 7,387 | 148,991 | ||
| 25,615,870 | ||||
| Sweden 2.6% | ||||
| Alfa Laval | 18,893 | 236,934 | ||
| Assa Abloy, Cl. B | 17,744 | 317,749 | ||
| Atlas Copco, Cl. A | 36,802 | 508,751 | ||
| Atlas Copco, Cl. B | 22,311 | 274,105 | ||
| Electrolux, Ser. B | 13,397 a | 329,181 | ||
| Getinge, Cl. B | 10,308 | 195,551 | ||
| Hennes & Mauritz, Cl. B | 28,215 | 1,632,185 | ||
| Holmen, Cl. B | 3,004 | 82,842 | ||
| Husqvarna, Cl. B | 20,920 a | 134,663 | ||
| Investor, Cl. B | 24,068 | 434,749 | ||
| Lundin Petroleum | 10,567 a | 91,992 | ||
| Nordea Bank | 178,055 | 1,965,359 | ||
| Sandvik | 55,102 | 626,572 | ||
| Scania, Cl. B | 18,378 | 241,289 | ||
| Securitas, Cl. B | 16,173 | 154,210 | ||
| Skandinaviska Enskilda Banken, Cl. A | 83,309 a | 524,450 | ||
| Skanska, Cl. B | 21,176 | 318,258 | ||
| SKF, Cl. B | 21,471 | 348,568 | ||
| SSAB, Cl. A | 9,760 | 153,604 | ||
| SSAB, Cl. B | 3,653 | 52,674 | ||
| Svenska Cellulosa, Cl. B | 31,185 | 437,513 | ||
| Svenska Handelsbanken, Cl. A | 27,235 | 722,874 | ||
| Swedbank, Cl. A | 28,804 a | 257,086 | ||
| Swedish Match | 14,428 | 301,736 | ||
| Tele2, Cl. B | 15,789 | 235,281 | ||
| Telefonaktiebolaget LM Ericsson, Cl. B | 164,642 | 1,776,456 | ||
| TeliaSonera | 121,696 | 819,767 | ||
| Volvo, Cl. A | 23,032 | 218,794 | ||
| Volvo, Cl. B | 59,638 | 580,487 | ||
| 13,973,680 |
The Fund 31
| STATEMENT OF INVESTMENTS (continued) |
| Common Stocks (continued) | Shares | Value ($) | ||
| Switzerland 7.7% | ||||
| ABB | 121,467 | 2,280,508 | ||
| Actelion | 5,566 a | 307,849 | ||
| Adecco | 6,790 | 304,945 | ||
| Aryzta | 3,996 | 157,616 | ||
| Baloise Holding | 2,856 | 245,796 | ||
| BKW FMB Energie | 818 | 67,484 | ||
| Compagnie Financiere Richemont, Cl. A | 28,327 | 798,162 | ||
| Credit Suisse Group | 61,888 | 3,350,441 | ||
| GAM Holding | 11,520 | 141,378 | ||
| Geberit | 2,310 | 383,854 | ||
| Givaudan | 408 | 303,535 | ||
| Holcim | 13,303 | 851,366 | ||
| Julius Baer Group | 11,520 | 434,369 | ||
| Kuehne & Nagel International | 2,787 | 253,599 | ||
| Lindt & Spruengli | 6 | 152,804 | ||
| Lindt & Spruengli-PC | 47 | 99,300 | ||
| Logitech International | 9,174 a | 157,729 | ||
| Lonza Group | 2,538 | 198,109 | ||
| Nestle | 199,684 | 9,322,811 | ||
| Nobel Biocare Holding | 6,283 | 179,120 | ||
| Novartis | 116,143 | 6,094,885 | ||
| Pargesa Holding | 1,539 | 123,661 | ||
| Roche Holding | 38,575 | 6,202,883 | ||
| Schindler Holding | 2,701 | 185,385 | ||
| Schindler Holding-PC | 977 | 67,820 | ||
| SGS | 259 | 347,693 | ||
| Sonova Holding | 2,649 | 273,629 | ||
| Straumann Holding | 380 | 92,009 | ||
| Swatch Group | 2,031 | 91,611 | ||
| Swatch Group-BR | 1,712 | 401,988 | ||
| Swiss Life Holding | 1,524 | 183,609 | ||
| Swiss Reinsurance | 19,156 | 785,878 | ||
| Swisscom | 1,348 | 488,597 | ||
| Syngenta | 5,238 | 1,246,790 | ||
| Synthes | 3,341 | 397,952 |
32
| Common Stocks (continued) | Shares | Value ($) | ||
| Switzerland (continued) | ||||
| UBS | 195,616 a | 3,304,034 | ||
| Zurich Financial Services | 8,101 | 1,865,781 | ||
| 42,144,980 | ||||
| United Kingdom 20.9% | ||||
| 3i Group | 54,848 | 238,407 | ||
| Admiral Group | 10,809 | 182,980 | ||
| AMEC | 17,527 | 233,002 | ||
| Anglo American | 72,473 a | 2,646,046 | ||
| Antofagasta | 22,493 | 286,043 | ||
| Associated British Foods | 19,775 | 269,732 | ||
| AstraZeneca | 79,596 | 3,597,544 | ||
| Autonomy | 12,236 a | 270,871 | ||
| Aviva | 151,714 | 959,294 | ||
| BAE Systems | 190,835 | 989,296 | ||
| Balfour Beatty | 24,137 | 105,711 | ||
| Barclays | 606,519 a | 3,219,199 | ||
| Berkeley Group Holdings | 6,240 a | 87,737 | ||
| BG Group | 184,737 | 3,212,579 | ||
| BHP Billiton | 121,354 | 3,287,542 | ||
| BP | 1,028,197 | 9,699,460 | ||
| British Airways | 29,271 a | 87,716 | ||
| British American Tobacco | 109,748 | 3,514,932 | ||
| British Land | 47,174 | 367,178 | ||
| British Sky Broadcasting Group | 62,003 | 544,738 | ||
| BT Group | 419,586 | 908,099 | ||
| Bunzl | 16,833 | 184,376 | ||
| Burberry Group | 23,186 | 205,998 | ||
| Cable & Wireless | 140,485 | 335,773 | ||
| Cadbury | 73,946 | 939,150 | ||
| Cairn Energy | 7,636 a | 332,542 | ||
| Capita Group | 32,791 | 412,408 | ||
| Carnival | 9,179 | 287,019 | ||
| Carphone Warehouse Group | 26,887 | 81,591 | ||
| Centrica | 282,962 | 1,158,117 | ||
| Cobham | 65,746 | 237,985 |
The Fund 33
| STATEMENT OF INVESTMENTS (continued) |
| Common Stocks (continued) | Shares | Value ($) | ||
| United Kingdom (continued) | ||||
| Compass Group | 100,838 | 644,916 | ||
| Diageo | 137,681 | 2,260,377 | ||
| Drax Group | 21,337 | 163,544 | ||
| Eurasian Natural Resources | 15,807 | 217,171 | ||
| Experian | 56,456 | 520,199 | ||
| Firstgroup | 25,087 | 155,566 | ||
| Fresnillo | 10,749 | 131,379 | ||
| Friends Provident Group | 119,750 | 161,069 | ||
| G4S | 70,746 | 295,033 | ||
| GlaxoSmithKline | 284,919 | 5,870,552 | ||
| Hammerson | 39,651 | 265,486 | ||
| Home Retail Group | 45,284 | 217,437 | ||
| HSBC Holdings | 949,998 | 10,549,618 | ||
| ICAP | 26,883 | 180,263 | ||
| Imperial Tobacco Group | 56,080 | 1,663,903 | ||
| Intercontinental Hotels Group | 13,743 | 177,827 | ||
| International Power | 84,104 | 352,126 | ||
| Invensys | 40,561 | 189,209 | ||
| Investec | 22,001 | 158,515 | ||
| J Sainsbury | 62,600 | 340,411 | ||
| Johnson Matthey | 12,153 | 282,856 | ||
| Kazakhmys | 12,328 a | 221,293 | ||
| Kingfisher | 129,204 | 476,206 | ||
| Ladbrokes | 32,620 | 65,437 | ||
| Land Securities Group | 41,874 | 456,930 | ||
| Legal & General Group | 330,163 | 427,214 | ||
| Liberty International | 24,482 | 182,040 | ||
| Lloyds Banking Group | 899,415 a | 1,290,258 | ||
| London Stock Exchange Group | 7,101 | 99,609 | ||
| Lonmin | 8,845 a | 213,299 | ||
| Man Group | 96,029 | 490,695 | ||
| Marks & Spencer Group | 88,313 | 498,578 |
34
| Common Stocks (continued) | Shares | Value ($) | ||
| United Kingdom (continued) | ||||
| National Grid | 134,408 | 1,343,703 | ||
| Next | 10,932 | 323,453 | ||
| Old Mutual | 288,800 | 505,556 | ||
| Pearson | 45,255 | 621,010 | ||
| Petrofac | 12,040 | 186,851 | ||
| Prudential | 139,476 | 1,279,417 | ||
| Randgold Resources | 4,634 | 302,481 | ||
| Reckitt Benckiser Group | 33,434 | 1,672,609 | ||
| Reed Elsevier | 64,462 | 491,113 | ||
| Rexam | 45,479 | 207,653 | ||
| Rio Tinto | 75,386 | 3,346,374 | ||
| Rolls-Royce Group | 100,812 a | 750,768 | ||
| Royal Bank of Scotland Group | 901,343 a | 622,815 | ||
| Royal Dutch Shell, Cl. A | 194,706 | 5,799,425 | ||
| Royal Dutch Shell, Cl. B | 148,136 | 4,297,548 | ||
| RSA Insurance Group | 183,982 | 367,558 | ||
| SABMiller | 52,058 | 1,375,525 | ||
| Sage Group | 74,721 | 262,959 | ||
| Schroders | 7,484 | 135,698 | ||
| Scottish & Southern Energy | 49,822 | 886,115 | ||
| Segro | 42,037 | 244,599 | ||
| Serco Group | 25,133 | 209,417 | ||
| Severn Trent | 13,603 | 213,349 | ||
| Shire | 30,662 | 541,805 | ||
| Smith & Nephew | 49,609 | 441,981 | ||
| Smiths Group | 20,123 | 296,205 | ||
| Standard Chartered | 110,619 | 2,735,982 | ||
| Standard Life | 120,203 | 431,936 | ||
| Tesco | 434,691 | 2,918,743 | ||
| Thomas Cook Group | 26,759 | 90,289 | ||
| Tomkins | 43,862 | 121,536 | ||
| Tui Travel | 29,455 | 113,175 |
The Fund 35
| STATEMENT OF INVESTMENTS (continued) |
| Common Stocks (continued) | Shares | Value ($) | ||
| United Kingdom (continued) | ||||
| Tullow Oil | 44,517 | 871,012 | ||
| Unilever | 70,743 | 2,132,773 | ||
| United Utilities Group | 37,832 | 274,696 | ||
| Vedanta Resources | 7,560 | 260,819 | ||
| Vodafone Group | 2,881,484 | 6,390,685 | ||
| Whitbread | 9,297 | 195,083 | ||
| WM Morrison Supermarkets | 114,874 | 530,185 | ||
| Wolseley | 15,733 a | 321,055 | ||
| WPP | 68,549 | 619,762 | ||
| Xstrata | 105,210 a | 1,530,450 | ||
| 114,366,249 | ||||
| Total Common Stocks | ||||
| (cost $557,044,305) | 530,156,873 | |||
| Preferred Stocks .3% | ||||
| Germany; | ||||
| Bayerische Motoren Werke | 3,061 | 101,121 | ||
| Fresenius | 4,167 | 242,915 | ||
| Henkel & Co. | 9,846 | 449,764 | ||
| Porsche Automobil Holding | 4,643 | 356,637 | ||
| RWE | 1,922 | 151,432 | ||
| Volkswagen | 5,883 | 587,380 | ||
| Total Preferred Stocks | ||||
| (cost $1,741,743) | 1,889,249 | |||
| Principal | ||||
| Short-Term Investments .2% | Amount ($) | Value ($) | ||
| U.S. Treasury Bills; | ||||
| 0.10%, 12/17/09 | ||||
| (cost $1,219,851) | 1,220,000 c | 1,219,954 | ||
36
| Other Investment 2.2% | Shares | Value ($) | ||
| Registered Investment Company; | ||||
| Dreyfus Institutional Preferred Plus Money Market Fund | ||||
| (cost $11,950,000) | 11,950,000 d | 11,950,000 | ||
| Total Investments (cost $571,955,899) | 99.6% | 545,216,076 | ||
| Cash and Receivables (Net) | .4% | 2,065,493 | ||
| Net Assets | 100.0% | 547,281,569 | ||
| BR Bearer Certificate |
| CDI Chess Depository Interest |
| PC Participation Certificate |
| PPS Price Protected Shares |
| REIT Real Estate Investment Trust |
| RSP Risparmio (Savings) Shares |
| SDR Swedish Depository Receipts |
| STRIP Separate Trading of Registered Interest and Principal of Securities |
| a Non-income producing security. |
| b The valuation of this security has been determined in good faith under the direction of the Board of Trustees. |
| c Held by a broker as collateral for open financial futures positions. |
| d Investment in affiliated money market mutual fund. |
| Portfolio Summary (Unaudited) | ||||||
| Value (%) | Value (%) | |||||
| Banking | 14.3 | Diversified Financials | 4.3 | |||
| Materials | 9.6 | Insurance | 4.1 | |||
| Energy | 8.3 | Automobiles & Components | 3.9 | |||
| Capital Goods | 7.6 | Real Estate | 2.9 | |||
| Food, Beverage & Tobacco | 6.6 | Technology Hardware & Equipment | 2.8 | |||
| Pharmaceuticals & Biotechnology | 6.5 | Short-Term/Money Market Investments | 2.4 | |||
| Telecommunications | 5.9 | Other | 14.8 | |||
| Utilities | 5.6 | 99.6 | ||||
| Based on net assets. | ||||||
| See notes to financial statements. | ||||||
The Fund 37
| STATEMENT OF FINANCIAL FUTURES October 31, 2009 |
| Market Value | Unrealized | |||||||
| Covered by | (Depreciation) | |||||||
| Contracts | Contracts ($) | Expiration | at 10/31/2009 ($) | |||||
| Financial Futures Long | ||||||||
| DJ Euro Stoxx 50 | 156 | 6,274,433 | December 2009 | (278,529) | ||||
| FTSE 100 | 44 | 3,627,079 | December 2009 | (66,444) | ||||
| SPI 200 Index | 12 | 1,253,479 | December 2009 | (6,358) | ||||
| TOPIX | 42 | 4,148,033 | December 2009 | (123,179) | ||||
| (474,510) | ||||||||
| See notes to financial statements. | ||||||||
38
| STATEMENT OF ASSETS AND LIABILITIES October 31, 2009 |
| Cost | Value | |||
| Assets ($): | ||||
| Investments in securities See Statement of Investments: | ||||
| Unaffiliated issuers | 560,005,899 | 533,266,076 | ||
| Affiliated issuers | 11,950,000 | 11,950,000 | ||
| Cash | 904,202 | |||
| Cash denominated in foreign currencies | 1,213,123 | 1,216,932 | ||
| Dividends and interest receivable | 1,365,027 | |||
| Receivable for shares of Common Stock subscribed | 614,762 | |||
| Unrealized appreciation on forward foreign currency | ||||
| exchange contracts Note 4 | 128,903 | |||
| Receivable for investment securities sold | 33,138 | |||
| 549,479,040 | ||||
| Liabilities ($): | ||||
| Due to The Dreyfus Corporation and affiliates Note 3(b) | 285,645 | |||
| Payable for shares of Common Stock redeemed | 1,572,115 | |||
| Payable for futures variation margin Note 4 | 202,320 | |||
| Payable for investment securities purchased | 91,076 | |||
| Unrealized depreciation on forward foreign currency | ||||
| exchange contracts Note 4 | 46,315 | |||
| 2,197,471 | ||||
| Net Assets ($) | 547,281,569 | |||
| Composition of Net Assets ($): | ||||
| Paid-in capital | 567,371,502 | |||
| Accumulated undistributed investment income net | 10,313,145 | |||
| Accumulated net realized gain (loss) on investments | (3,307,576) | |||
| Accumulated net unrealized appreciation (depreciation) | ||||
| on investments and foreign currency transactions | ||||
| [including ($474,510) net unrealized (depreciation) | ||||
| on financial futures] | (27,095,502) | |||
| Net Assets ($) | 547,281,569 | |||
| Shares Outstanding | ||||
| (200 million shares of $.001 par value Common Stock authorized) | 38,951,800 | |||
| Net Asset Value, offering and redemption price per share Note 3(c) ($) | 14.05 | |||
| See notes to financial statements. | ||||
The Fund 39
| STATEMENT OF OPERATIONS Year Ended October 31, 2009 |
| Investment Income ($): | ||
| Income: | ||
| Dividends (net of $1,229,724 foreign taxes withheld at source): | ||
| Unaffiliated issuers | 13,291,052 | |
| Affiliated issuers | 14,110 | |
| Total Income | 13,305,162 | |
| Expenses: | ||
| Management fee Note 3(a) | 1,489,100 | |
| Shareholder servicing costs Note 3(b) | 1,063,643 | |
| Directors fees Note 3(a) | 39,155 | |
| Loan commitment fees Note 2 | 4,137 | |
| Interest expense Note 2 | 139 | |
| Total Expenses | 2,596,174 | |
| Less Directors fees reimbursed by the Manager Note 3(a) | (39,155) | |
| Net Expenses | 2,557,019 | |
| Investment Income Net | 10,748,143 | |
| Realized and Unrealized Gain (Loss) on Investments Note 4 ($): | ||
| Net realized gain (loss) on investments and foreign currency transactions | (1,882,157) | |
| Net realized gain (loss) on financial futures | 2,643,341 | |
| Net realized gain (loss) on forward foreign currency exchange contracts | 3,736,589 | |
| Net Realized Gain (Loss) | 4,497,773 | |
| Net unrealized appreciation (depreciation) on investments and | ||
| foreign currency transactions [including ($1,286,446) net unrealized | ||
| (depreciation) on financial futures and $121,579 net unrealized | ||
| appreciation on forward foreign currency exchange contracts] | 82,489,486 | |
| Net Realized and Unrealized Gain (Loss) on Investments | 86,987,259 | |
| Net Increase in Net Assets Resulting from Operations | 97,735,402 | |
| See notes to financial statements. | ||
40
STATEMENT OF CHANGES IN NET ASSETS
| Year Ended October 31, | ||||
| 2009 | 2008 | |||
| Operations ($); | ||||
| Investment income net | 10,748,143 | 12,871,621 | ||
| Net realized gain (loss) on investments | 4,497,773 | 2,192,124 | ||
| Net unrealized appreciation | ||||
| (depreciation) on investments | 82,489,486 | (280,519,632) | ||
| Net Increase (Decrease) in Net Assets | ||||
| Resulting from Operations | 97,735,402 | (265,455,887) | ||
| Dividends to Shareholders from ($): | ||||
| Investment income net | (9,805,885) | (12,808,881) | ||
| Net realized gain on investments | (778,245) | |||
| Total Dividends | (10,584,130) | (12,808,881) | ||
| Capital Stock Transactions ($): | ||||
| Net proceeds from shares sold | 349,050,223 | 201,734,295 | ||
| Dividends reinvested | 9,310,050 | 11,705,486 | ||
| Cost of shares redeemed | (225,160,976) | (169,897,255) | ||
| Increase (Decrease) in Net Assets | ||||
| from Capital Stock Transactions | 133,199,297 | 43,542,526 | ||
| Total Increase (Decrease) in Net Assets | 220,350,569 | (234,722,242) | ||
| Net Assets ($): | ||||
| Beginning of Period | 326,931,000 | 561,653,242 | ||
| End of Period | 547,281,569 | 326,931,000 | ||
| Undistributed investment income net | 10,313,145 | 8,028,568 | ||
| Capital Share Transactions (Shares): | ||||
| Shares sold | 31,692,805 | 11,936,731 | ||
| Shares issued for dividends reinvested | 858,486 | 581,205 | ||
| Shares redeemed | (21,995,482) | (9,673,592) | ||
| Net Increase (Decrease) in Shares Outstanding | 10,555,809 | 2,844,344 | ||
| See notes to financial statements. | ||||
The Fund 41
FINANCIAL HIGHLIGHTS
The following table describes the performance for the fiscal periods indicated.Total return shows how much your investment in the fund would have increased (or decreased) during each period, assuming you had reinvested all dividends and distributions.These figures have been derived from the fund s financial statements.
| Year Ended October 31, | ||||||||||
| 2009 | 2008 | 2007 | 2006 | 2005 | ||||||
| Per Share Data ($): | ||||||||||
| Net asset value, beginning of period | 11.51 | 21.98 | 18.03 | 14.47 | 12.57 | |||||
| Investment Operations: | ||||||||||
| Investment income neta | .30 | .49 | .43 | .38 | .29 | |||||
| Net realized and unrealized gain | ||||||||||
| (loss) on investments | 2.51 | (10.47) | 3.90 | 3.45 | 1.88 | |||||
| Total from Investment Operations | 2.81 | (9.98) | 4.33 | 3.83 | 2.17 | |||||
| Distributions: | ||||||||||
| Dividends from investment income net | (.25) | (.49) | (.38) | (.27) | (.27) | |||||
| Dividends from net realized | ||||||||||
| gain on investments | (.02) | |||||||||
| Total Distributions | (.27) | (.49) | (.38) | (.27) | (.27) | |||||
| Net asset value, end of period | 14.05 | 11.51 | 21.98 | 18.03 | 14.47 | |||||
| Total Return (%) | 25.13 | (46.37) | 24.40 | 26.83 | 17.40 | |||||
| Ratios/Supplemental Data (%): | ||||||||||
| Ratio of total expenses | ||||||||||
| to average net assets | .61 | .61 | .61 | .60 | .60 | |||||
| Ratio of net expenses | ||||||||||
| to average net assets | .60 | .60 | .60 | .60 | .60 | |||||
| Ratio of net investment income | ||||||||||
| to average net assets | 2.53 | 2.72 | 2.20 | 2.30 | 2.07 | |||||
| Portfolio Turnover Rate | 17.26 | 7.17 | 3.31 | 4.12 | 3.46 | |||||
| Net Assets, end of period ($ x 1,000) | 547,282 | 326,931 | 561,653 | 355,608 | 200,674 | |||||
| a Based on average shares outstanding at each month end. | ||||||||||
| See notes to financial statements. | ||||||||||
42
NOTES TO FINANCIAL STATEMENTS
NOTE 1 Significant Accounting Policies:
Dreyfus International Stock Index Fund (the fund ) is a separate non-diversified series of Dreyfus Index Funds, Inc. (the Company ), which is registered under the Investment Company Act of 1940, as amended (the Act ), as an open-end management investment company and operates as a series company currently offering three series, including the fund.The fund s investment objective is to match the performance of the Morgan Stanley Capital International Europe,Australasia, Far East Free Index (MSCI EAFE®).The Dreyfus Corporation (the Manager or Dreyfus ), a wholly-owned subsidiary of The Bank of New York Mellon Corporation ( BNY Mellon ), serves as the fund s investment adviser. MBSC Securities Corporation (the Distributor ), a wholly-owned subsidiary of the Manager is the distributor of the fund s shares, which are sold to the public without a sales charge.
The Company accounts separately for the assets, liabilities and operations of each series. Expenses directly attributable to each series are charged to that series operations; expenses which are applicable to all series are allocated among them on a pro rata basis.
The Financial Accounting Standards Board ( FASB ) Accounting Standards Codification ( ASC ) has become the exclusive reference of authoritative U.S. generally accepted accounting principles ( GAAP ) recognized by the FASB to be applied by nongovernmental entities. Rules and interpretive releases of the Securities and Exchange Commission ( SEC ) under authority of federal laws are also sources of authoritative GAAP for SEC registrants. The ASC has superseded all existing non-SEC accounting and reporting standards. The fund s financial statements are prepared in accordance with GAAP, which may require the use of management estimates and assumptions.Actual results could differ from those estimates.
The Fund 43
| NOTES TO FINANCIAL STATEMENTS (continued) |
The fund enters into contracts that contain a variety of indemnifications. The fund s maximum exposure under these arrangements is unknown.The fund does not anticipate recognizing any loss related to these arrangements.
(a) Portfolio valuation: Investments in securities are valued at the last sales price on the securities exchange or national securities market on which such securities are primarily traded. Securities listed on the National Market System for which market quotations are available are valued at the official closing price or, if there is no official closing price that day, at the last sales price. Securities not listed on an exchange or the national securities market, or securities for which there were no transactions, are valued at the average of the most recent bid and asked prices, except for open short positions, where the asked price is used for valuation purposes. Bid price is used when no asked price is available. Registered investment companies that are not traded on an exchange are valued at their net asset value. When market quotations or official closing pri ces are not readily available, or are determined not to reflect accurately fair value, such as when the value of a security has been significantly affected by events after the close of the exchange or market on which the security is principally traded (for example, a foreign exchange or market),but before the fund calculates its net asset value,the fund may value these investments at fair value as determined in accordance with the procedures approved by the Board of Directors. Fair valuing of securities may be determined with the assistance of a pricing service using calculations based on indices of domestic securities and other appropriate indicators, such as prices of relevant American Depository Receipts and futures contracts. For other securities that are fair valued by the Board of Directors, certain factors may be considered such as: fundamental analytical data, the nature and duration of restrictions on disposition, an evaluation of the forces that influence the market in which the securities are purc hased and sold, and public trading in similar securities of the issuer or comparable issuers. Financial futures
44
are valued at the last sales price. Investments denominated in foreign currencies are translated to U.S. dollars at the prevailing rates of exchange. Forward foreign currency exchange contracts ( forward contracts ) are valued at the forward rate.
The fair value of a financial instrument is the amount that would be received to sell an asset or paid to transfer a liability in an orderly transaction between market participants at the measurement date (i.e. the exit price). GAAP establishes a fair value hierarchy that prioritizes the inputs of valuation techniques used to measure fair value.This hierarchy gives the highest priority to unadjusted quoted prices in active markets for identical assets or liabilities (Level 1 measurements) and the lowest priority to unobservable inputs (Level 3 measurements).
Additionally, GAAP provides guidance on determining whether the volume and activity in a market has decreased significantly and whether such a decrease in activity results in transactions that are not orderly. GAAP requires enhanced disclosures around valuation inputs and techniques used during annual and interim periods.
Various inputs are used in determining the value of the fund s investments relating to fair value measurements. These inputs are summarized in the three broad levels listed below:
| Level 1 unadjusted quoted prices in active markets for identical investments. Level 2 other significant observable inputs (including quoted prices for similar investments, interest rates, prepayment speeds, credit risk, etc.). Level 3 significant unobservable inputs (including the fund s own assumptions in determining the fair value of investments). |
The inputs or methodology used for valuing securities are not necessarily an indication of the risk associated with investing in those securities.
The Fund 45
| NOTES TO FINANCIAL STATEMENTS (continued) |
The following is a summary of the inputs used as of October 31, 2009 in valuing the fund s investments:
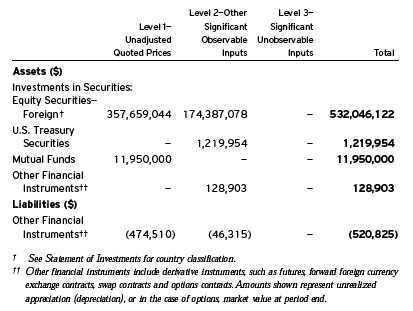
(b) Foreign currency transactions: The fund does not isolate that portion of the results of operations resulting from changes in foreign exchange rates on investments from the fluctuations arising from changes in market prices of securities held. Such fluctuations are included with the net realized and unrealized gain or loss on investments.
Net realized foreign exchange gains or losses arise from sales of foreign currencies, currency gains or losses realized on securities transactions and the difference between the amounts of dividends, interest and foreign withholding taxes recorded on the fund s books and the U.S. dollar equivalent of the amounts actually received or paid. Net unrealized foreign exchange gains and losses arise from changes in the value of assets and liabilities other than investments resulting from changes in exchange rates. Foreign currency gains and losses on investments are included with net realized and unrealized gain or loss on investments.
46
(c) Securities transactions and investment income: Securities transactions are recorded on a trade date basis. Realized gains and losses from securities transactions are recorded on the identified cost basis. Dividend income is recognized on the ex-dividend date and interest income, including, where applicable, accretion of discount and amortization of premium on investments, is recognized on the accrual basis.
Investing in foreign markets may involve special risks and considerations not typically associated with investing in the U.S. These risks include revaluation of currencies, high rates of inflation, repatriation restrictions on income and capital, and adverse political and economic developments. Moreover, securities issued in these markets may be less liquid, subject to government ownership controls and delayed settlements, and their prices may be more volatile than those of comparable securities in the U.S.
(d) Affiliated issuers: Investments in other investment companies advised by the Manager are defined as affiliated in the Act.
(e) Dividends to shareholders: Dividends are recorded on the ex-dividend date. Dividends from investment income-net and dividends from net realized capital gains, if any, are normally declared and paid annually, but the fund may make distributions on a more frequent basis to comply with the distribution requirements of the Internal Revenue Code of 1986, as amended (the Code ).To the extent that net realized capital gains can be offset by capital loss carryovers, it is the policy of the fund not to distribute such gains. Income and capital gain distributions are determined in accordance with income tax regulations, which may differ from GAAP.
(f) Federal income taxes: It is the policy of the fund to continue to qualify as a regulated investment company, if such qualification is in the best interests of its shareholders, by complying with the applicable provisions of the Code, and to make distributions of taxable income sufficient to relieve it from substantially all federal income and excise taxes.
The Fund 47
| NOTES TO FINANCIAL STATEMENTS (continued) |
As of and during the period ended October 31, 2009, the fund did not have any liabilities for any uncertain tax positions.The fund recognizes interest and penalties, if any, related to uncertain tax positions as income tax expense in the Statement of Operations. During the period, the fund did not incur any interest or penalties.
Each of the tax years in the four-year period ended October 31, 2009 remains subject to examination by the Internal Revenue Service and state taxing authorities.
At October 31, 2009, the components of accumulated earnings on a tax basis were as follows: undistributed ordinary income $11,706,018, undistributed capital gains $3,315,764 and unrealized depreciation $35,111,715.
The tax character of distributions paid to shareholders during the fiscal periods ended October 31, 2009 and October 31, 2008 were as follows: ordinary income $9,805,885 and $12,808,881 and long-term capital gains $778,245 and $0, respectively.
During the period ended October 31, 2009, as a result of permanent book to tax differences, primarily due to the tax treatment for passive foreign investment companies and foreign currency gains and losses, the fund increased accumulated undistributed investment income-net by $1,342,319 and decreased accumulated net realized gain (loss) on investments by the same amount. Net assets and net asset value per share were not affected by this reclassification.
NOTE 2 Bank Lines of Credit:
The fund participated with other Dreyfus-managed funds in a $145 million unsecured credit facility led by Citibank, N.A. and a $300 million unsecured credit facility provided by The Bank of New York Mellon (each, a Facility ), each to be utilized primarily for temporary or emergency purposes, including the financing of redemptions.
48
Effective October 14, 2009, the $145 million unsecured credit facility with Citibank, N.A., was increased to $215 million and the fund continues participation in the $300 million unsecured credit facility provided by The Bank of NewYork Mellon. In connection therewith, the fund has agreed to pay its pro rata portion of Facility fees for each Facility. Interest is charged to the fund based on rates determined pursuant to the terms of the respective Facility at the time of borrowing.
The average amount of borrowings outstanding under the Facilities during the period ended October 31, 2009, was approximately $8,800 with a related weighted average annualized interest rate of 1.59%.
NOTE 3 Management Fee and Other Transactions With Affiliates:
(a) Pursuant to a management agreement ( Agreement ) with the Manager, the management fee is computed at the annual rate of .35% of the value of the fund s average daily net assets, and is payable monthly. Under the terms of the Agreement, the Manager has agreed to pay all the expenses of the fund, except management fees, brokerage fees and commissions, taxes, interest fees, commitment fees, Shareholder Services Plan fees, fees and expenses of non-interested Board members (including counsel fees) and extraordinary expenses. In addition, the Manager is required to reduce its fee in an amount equal to the fund s allocable portion of the accrued fees and expenses of the non-interested Board members (including counsel fees). Each Board member also serves as a Board member of other funds within the Dreyfus complex (collectively, the Fund Group ). Currently, the Company a nd 11 other funds (comprised of 33 portfolios) in the Dreyfus Family of Funds pay each Board member their respective allocated portion of an annual retainer fee of $85,000 and an attendance fee of $10,000 for each regularly scheduled Board meeting, an attendance fee of $2,000 for each separate in-person committee meeting that is not held in conjunction
The Fund 49
| NOTES TO FINANCIAL STATEMENTS (continued) |
with a regularly scheduled Board meeting and an attendance fee of $1,000 for each Board meeting and separate committee meeting that is conducted by telephone. The Chairman of the Board receives an additional 25% of such compensation and the Audit Committee Chairman receives an additional $15,000 per annum. The Company also reimburses each Board member for travel and out-of-pocket expenses in connection with attending Board or committee meetings. Subject to the Company s Emeritus Program Guidelines, Emeritus Board members, if any, receive 50% of the Company s annual retainer fee and per meeting fee paid at the time the Board member achieves emeritus status.
(b) Under the Shareholder Services Plan, the fund pays the Distributor for the provision of certain services, at the annual rate of .25% of the value of the fund s average daily net assets.The services provided may include personal services relating to shareholder accounts, such as answering shareholder inquiries regarding the fund and providing reports and other information, and services related to the maintenance of shareholder accounts. The Distributor may make payments to Service Agents (a securities dealer, financial institution or other industry professional) in respect of these services. The Distributor determines the amounts to be paid to Service Agents. During the period ended October 31, 2009, the fund was charged $1,063,643 pursuant to the Shareholder Services Plan.
The components of Due to The Dreyfus Corporation and affiliates in the Statement of Assets and Liabilities consist of: management fees $166,626 and shareholder services plan fees $119,019.
(c) A 2% redemption fee is charged and retained by the fund on certain shares redeemed within sixty days following the date of issuance subject to exceptions, including redemptions made through use of the fund s exchange privilege. During the period ended October 31, 2009, redemption fees charged and retained by the fund amounted to $164,687.
50
NOTE 4 Securities Transactions:
The aggregate amount of purchases and sales of investment securities, excluding short-term securities, forward contracts and financial futures, during the period ended October 31, 2009, amounted to $202,946,581 and $71,617,444, respectively.
The fund adopted the provisions of ASC Topic 815 Derivatives and Hedging which requires qualitative disclosures about objectives and strategies for using derivatives, quantitative disclosures about fair value amounts of gains and losses on derivative instruments and disclosures about credit-risk-related contingent features in derivative agreements. The disclosure requirements distinguish between derivatives, which are accounted for as hedges and those that do not qualify for hedge accounting. Because investment companies value their derivatives at fair value and recognize changes in fair value through the Statement of Operations, they do not qualify for such accounting. Accordingly, even though a fund s investments in derivatives may represent economic hedges, they are considered to be non-hedge transactions for purposes of this disclosure.The following tables show the fund s exposure to different types of market risk as it relates to the St atement of Assets and Liabilities and the Statement of Operations, respectively.
Fair value of derivative instruments as of October 31, 2009 is shown below:
| Derivative | Derivative | |||||
| Assets ($) | Liabilities ($) | |||||
| Equity risk | Equity risk1 | (474,510) | ||||
| Foreign exchange risk2 | 128,903 | Foreign exchange risk3 | (46,315) | |||
| Gross fair value of | ||||||
| derivative contracts | 128,903 | (520,825) |
Statement of Assets and Liabilities location:
| 1 | Includes cumulative appreciation/depreciation of futures contracts as reported in the Statement of | |
| Financial Futures, but only the unpaid variation margin is reported in the Statement of Assets | ||
| and Liabilities. | ||
| 2 | Unrealized appreciation on forward foreign currency exchange contracts. | |
| 3 | Unrealized depreciation on forward foreign currency exchange contracts. |
The Fund 51
| NOTES TO FINANCIAL STATEMENTS (continued) |
The effect of derivative instruments on the Statement of Operations during the period ended October 31, 2009 is shown below:
| Amount of realized gain or (loss) on derivatives recognized in income ($) | ||||||
| Forward | ||||||
| Underlying risk | Futures4 | Contracts5 | Total�� | |||
| Equity | 2,643,341 | 2,643,341 | ||||
| Foreign exchange | 3,736,589 | 3,736,589 | ||||
| Total | 2,643,341 | 3,736,589 | 6,379,930 | |||
| Change in unrealized appreciation or (depreciation) on derivatives recognized in income ($)6 | ||||||
| Forward | ||||||
| Underlying risk | Futures | Contracts | Total | |||
| Equity | (1,286,446) | (1,286,446) | ||||
| Foreign exchange | 121,579 | 121,579 | ||||
| Total | (1,286,446) | 121,579 | (1,164,867) | |||
Statement of Operations location:
| 4 | Net realized gain (loss) on financial futures. | |
| 5 | Net realized gain (loss) on forward foreign currency exchange contracts. | |
| 6 | Net unrealized appreciation (depreciation) on investments, financial futures and forward foreign | |
| currency exchange contracts. |
Futures Contracts: In the normal course of pursuing its investment objectives, the fund is exposed to market risk, including equity price risk as a result of changes in value of underlying financial instruments. The fund may invest in financial futures contracts in order to manage its exposure to or protect against changes in the market.A futures contract represents a commitment for the future purchase or a sale of an asset at a specified date. Upon entering into such contracts, these investments require initial margin deposits with a broker, which consist of cash or cash equivalents.The amount of these deposits is determined by the exchange or Board of Trade on which the contract is traded and is subject to change. Accordingly, variation margin payments are received or made to reflect daily unrealized gains or losses which are recorded in the Statement of Operation s. Futures contracts are valued daily at the last sales price established by the Board of Trade or exchange upon which they are traded. When the contracts are closed, the fund recognizes a realized gain or loss. There is minimal counterparty credit risk to the fund with futures, since futures are exchange traded and the exchange s clearinghouse, as counterparty to
52
all exchange traded futures, guarantees the futures against default. Contracts open at October 31, 2009 are set forth in the Statement of Financial Futures.
Forward Foreign Currency Exchange Contracts: The fund may enter into forward contracts in order to hedge its exposure to changes in foreign currency exchange rates on its foreign portfolio holdings, to settle foreign currency transactions or as a part of an investment strat-egy.When executing forward contracts, the fund is obligated to buy or sell a foreign currency at a specified rate on a certain date in the future. With respect to sales of forward contracts, the fund would incur a loss if the value of the contract increases between the date the forward contract is opened and the date the forward contract is closed. The fund realizes a gain if the value of the contract decreases between those dates.With respect to purchases of forward contracts, the fund would incur a loss if the value of the contract decreases between the date the forward contract is opened and t he date the forward contract is closed. The fund realizes a gain if the value of the contract increases between those dates.The fund is exposed to foreign currency risk as a result of changes in value of underlying financial instruments.The fund is also exposed to credit risk associated with counterparty nonperformance on these forward contracts, which is typically limited to the unrealized gain on each open contract.The following summarizes open forward contracts at October 31, 2009:
| Foreign | Unrealized | |||||||
| Forward Foreign Currency | Currency | Appreciation | ||||||
| Exchange Contracts | Amounts | Cost ($) | Value ($) | Depreciation) ($) | ||||
| Purchases: | ||||||||
| Australian Dollar, | ||||||||
| Expiring 12/16/2009 | 242,673 | 208,448 | 217,428 | 8,980 | ||||
| Australian Dollar, | ||||||||
| Expiring 12/16/2009 | 113,200 | 96,305 | 101,424 | 5,119 | ||||
| Australian Dollar, | ||||||||
| Expiring 12/16/2009 | 114,100 | 97,788 | 102,231 | 4,443 | ||||
| Australian Dollar, | ||||||||
| Expiring 12/16/2009 | 114,000 | 98,448 | 102,141 | 3,693 | ||||
| Australian Dollar, | ||||||||
| Expiring 12/16/2009 | 118,200 | 101,851 | 105,904 | 4,053 | ||||
The Fund 53
| NOTES TO FINANCIAL STATEMENTS (continued) |
| Foreign | Unrealized | |||||||
| Forward Foreign Currency | Currency | Appreciation | ||||||
| Exchange Contracts | Amounts | Cost ($) | Value ($) | (Depreciation) ($) | ||||
| Purchases (continued): | ||||||||
| Australian Dollar, | ||||||||
| Expiring 12/16/2009 | 117,100 | 100,000 | 104,918 | 4,918 | ||||
| Australian Dollar, | ||||||||
| Expiring 12/16/2009 | 214,647 | 186,125 | 192,318 | 6,193 | ||||
| Australian Dollar, | ||||||||
| Expiring 12/16/2009 | 117,200 | 101,520 | 105,007 | 3,487 | ||||
| Australian Dollar, | ||||||||
| Expiring 12/16/2009 | 120,500 | 111,092 | 107,965 | (3,127) | ||||
| Australian Dollar, | ||||||||
| Expiring 12/16/2009 | 114,000 | 103,193 | 102,141 | (1,052) | ||||
| British Pound, | ||||||||
| Expiring 12/16/2009 | 337,967 | 559,855 | 554,529 | (5,326) | ||||
| British Pound, | ||||||||
| Expiring 12/16/2009 | 150,000 | 249,540 | 246,117 | (3,423) | ||||
| British Pound, | ||||||||
| Expiring 12/16/2009 | 49,900 | 83,205 | 81,875 | (1,330) | ||||
| British Pound, | ||||||||
| Expiring 12/16/2009 | 100,200 | 166,286 | 164,406 | (1,880) | ||||
| British Pound, | ||||||||
| Expiring 12/16/2009 | 150,300 | 247,197 | 246,609 | (588) | ||||
| British Pound, | ||||||||
| Expiring 12/16/2009 | 50,800 | 83,868 | 83,352 | (516) | ||||
| British Pound, | ||||||||
| Expiring 12/16/2009 | 51,400 | 83,737 | 84,336 | 599 | ||||
| British Pound, | ||||||||
| Expiring 12/16/2009 | 205,600 | 332,545 | 337,344 | 4,799 | ||||
| British Pound, | ||||||||
| Expiring 12/16/2009 | 102,100 | 167,057 | 167,524 | 467 | ||||
| British Pound, | ||||||||
| Expiring 12/16/2009 | 209,872 | 343,122 | 344,354 | 1,232 | ||||
| British Pound, | ||||||||
| Expiring 12/16/2009 | 102,400 | 168,070 | 168,016 | (54) | ||||
| British Pound, | ||||||||
| Expiring 12/16/2009 | 101,100 | 161,712 | 165,883 | 4,171 | ||||
| British Pound, | ||||||||
| Expiring 12/16/2009 | 51,300 | 81,863 | 84,172 | 2,309 | ||||
| British Pound, | ||||||||
| Expiring 12/16/2009 | 50,900 | 81,692 | 83,515 | 1,823 | ||||
| British Pound, | ||||||||
| Expiring 12/16/2009 | 51,200 | 81,543 | 84,008 | 2,465 | ||||
| British Pound, | ||||||||
| Expiring 12/16/2009 | 52,200 | 86,733 | 85,649 | (1,084) | ||||
| British Pound, | ||||||||
| Expiring 12/16/2009 | 104,400 | 170,748 | 171,297 | 549 | ||||
| British Pound, | ||||||||
| Expiring 12/16/2009 | 51,700 | 84,577 | 84,828 | 251 | ||||
54
| Foreign | Unrealized | |||||||
| Forward Foreign Currency | Currency | Appreciation | ||||||
| Exchange Contracts | Amounts | Cost ($) | Value ($) | (Depreciation) ($) | ||||
| Purchases (continued): | ||||||||
| British Pound, | ||||||||
| Expiring 12/16/2009 | 50,600 | 83,798 | 83,023 | (775) | ||||
| Euro, | ||||||||
| Expiring 12/16/2009 | 537,801 | 784,166 | 791,343 | 7,177 | ||||
| Euro, | ||||||||
| Expiring 12/16/2009 | 169,100 | 245,689 | 248,821 | 3,132 | ||||
| Euro, | ||||||||
| Expiring 12/16/2009 | 197,300 | 287,562 | 290,315 | 2,753 | ||||
| Euro, | ||||||||
| Expiring 12/16/2009 | 226,500 | 331,268 | 333,282 | 2,014 | ||||
| Euro, | ||||||||
| Expiring 12/16/2009 | 140,700 | 205,197 | 207,032 | 1,835 | ||||
| Euro, | ||||||||
| Expiring 12/16/2009 | 28,200 | 41,345 | 41,495 | 150 | ||||
| Euro, | ||||||||
| Expiring 12/16/2009 | 200,400 | 295,337 | 294,877 | (460) | ||||
| Euro, | ||||||||
| Expiring 12/16/2009 | 201,700 | 296,868 | 296,790 | (78) | ||||
| Euro, | ||||||||
| Expiring 12/16/2009 | 230,200 | 337,114 | 338,726 | 1,612 | ||||
| Euro, | ||||||||
| Expiring 12/16/2009 | 455,852 | 673,663 | 670,760 | (2,903) | ||||
| Euro, | ||||||||
| Expiring 12/16/2009 | 228,800 | 338,312 | 336,666 | (1,646) | ||||
| Euro, | ||||||||
| Expiring 12/16/2009 | 114,800 | 169,575 | 168,921 | (654) | ||||
| Euro, | ||||||||
| Expiring 12/16/2009 | 57,400 | 84,724 | 84,461 | (263) | ||||
| Euro, | ||||||||
| Expiring 12/16/2009 | 169,700 | 249,405 | 249,704 | 299 | ||||
| Euro, | ||||||||
| Expiring 12/16/2009 | 56,500 | 82,825 | 83,136 | 311 | ||||
| Euro, | ||||||||
| Expiring 12/16/2009 | 115,200 | 168,030 | 169,510 | 1,480 | ||||
| Euro, | ||||||||
| Expiring 12/16/2009 | 85,400 | 125,782 | 125,661 | (121) | ||||
| Euro, | ||||||||
| Expiring 12/16/2009 | 114,800 | 169,030 | 168,922 | (108) | ||||
| Euro, | ||||||||
| Expiring 12/16/2009 | 57,400 | 85,469 | 84,461 | (1,008) | ||||
| Euro, | ||||||||
| Expiring 12/16/2009 | 58,700 | 87,755 | 86,374 | (1,381) | ||||
| Euro, | ||||||||
| Expiring 12/16/2009 | 116,700 | 174,988 | 171,717 | (3,271) | ||||
The Fund 55
| NOTES TO FINANCIAL STATEMENTS (continued) |
| Foreign | Unrealized | |||||||
| Forward Foreign Currency | Currency | Appreciation | ||||||
| Exchange Contracts | Amounts | Cost ($) | Value ($) | (Depreciation) ($) | ||||
| Purchases (continued): | ||||||||
| Euro, | ||||||||
| Expiring 12/16/2009 | 28,900 | 43,388 | 42,525 | (863) | ||||
| Euro, | ||||||||
| Expiring 12/16/2009 | 201,500 | 302,880 | 296,496 | (6,384) | ||||
| Euro, | ||||||||
| Expiring 12/16/2009 | 84,800 | 125,912 | 124,778 | (1,134) | ||||
| Euro, | ||||||||
| Expiring 12/16/2009 | 55,400 | 81,915 | 81,518 | (397) | ||||
| Euro, | ||||||||
| Expiring 12/16/2009 | 112,600 | 166,579 | 165,685 | (894) | ||||
| Japanese Yen, | ||||||||
| Expiring 12/16/2009 | 18,860,000 | 205,796 | 209,579 | 3,783 | ||||
| Japanese Yen, | ||||||||
| Expiring 12/16/2009 | 49,739,331 | 543,599 | 552,721 | 9,122 | ||||
| Japanese Yen, | ||||||||
| Expiring 12/16/2009 | 18,740,000 | 204,039 | 208,245 | 4,206 | ||||
| Japanese Yen, | ||||||||
| Expiring 12/16/2009 | 9,525,000 | 105,174 | 105,845 | 671 | ||||
| Japanese Yen, | ||||||||
| Expiring 12/16/2009 | 28,350,000 | 312,621 | 315,035 | 2,414 | ||||
| Japanese Yen, | ||||||||
| Expiring 12/16/2009 | 9,300,000 | 101,955 | 103,345 | 1,390 | ||||
| Japanese Yen, | ||||||||
| Expiring 12/16/2009 | 27,720,000 | 304,361 | 308,034 | 3,673 | ||||
| Japanese Yen, | ||||||||
| Expiring 12/16/2009 | 9,330,000 | 102,277 | 103,678 | 1,401 | ||||
| Japanese Yen, | ||||||||
| Expiring 12/16/2009 | 18,690,000 | 202,599 | 207,690 | 5,091 | ||||
| Japanese Yen, | ||||||||
| Expiring 12/16/2009 | 28,035,000 | 307,820 | 311,535 | 3,715 | ||||
| Japanese Yen, | ||||||||
| Expiring 12/16/2009 | 3,065,000 | 33,617 | 34,059 | 442 | ||||
| Japanese Yen, | ||||||||
| Expiring 12/16/2009 | 9,345,000 | 102,893 | 103,845 | 952 | ||||
| Japanese Yen, | ||||||||
| Expiring 12/16/2009 | 9,470,000 | 105,137 | 105,234 | 97 | ||||
| Japanese Yen, | ||||||||
| Expiring 12/16/2009 | 18,510,000 | 207,505 | 205,689 | (1,816) | ||||
| Japanese Yen, | ||||||||
| Expiring 12/16/2009 | 9,040,000 | 100,978 | 100,456 | (522) | ||||
| Japanese Yen, | ||||||||
| Expiring 12/16/2009 | 17,700,000 | 199,945 | 196,688 | (3,257) | ||||
| Japanese Yen, | ||||||||
| Expiring 12/16/2009 | 8,940,000 | 98,669 | 99,344 | 675 | ||||
56
| Foreign | Unrealized | |||||||
| Forward Foreign Currency | Currency | Appreciation | ||||||
| Exchange Contracts | Amounts | Cost ($) | Value ($) | (Depreciation) ($) | ||||
| Purchases (continued): | ||||||||
| Japanese Yen, | ||||||||
| Expiring 12/16/2009 | 9,050,000 | 100,122 | 100,567 | 445 | ||||
| Japanese Yen, | ||||||||
| Expiring 12/16/2009 | 9,120,000 | 100,128 | 101,345 | 1,217 | ||||
| Japanese Yen, | ||||||||
| Expiring 12/16/2009 | 18,170,000 | 197,787 | 201,911 | 4,124 | ||||
| Japanese Yen, | ||||||||
| Expiring 12/16/2009 | 18,050,000 | 196,524 | 200,578 | 4,054 | ||||
| Japanese Yen, | ||||||||
| Expiring 12/16/2009 | 8,790,000 | 96,561 | 97,678 | 1,117 | ||||
| Gross Unrealized Appreciation | 128,903 | |||||||
| Gross Unrealized Depreciation | (46,315) | |||||||
At October 31, 2009, the cost of investments for federal income tax purposes was $579,889,524; accordingly, accumulated net unrealized depreciation on investments was $34,673,448, consisting of $45,635,588 gross unrealized appreciation and $80,309,036 gross unrealized depreciation.
NOTE 5 Subsequent Events Evaluation:
Dreyfus has evaluated the need for disclosures and/or adjustments resulting from subsequent events through December 29, 2009, the date the financial statements were issued. This evaluation did not result in any subsequent events that necessitated disclosures and/or adjustments.
The Fund 57
| REPORT OF INDEPENDENT REGISTERED PUBLIC ACCOUNTING FIRM |
| Shareholders and Board of Directors Dreyfus International Stock Index Fund |
We have audited the accompanying statement of assets and liabilities, including the statements of investments and financial futures, of Dreyfus International Stock Index Fund (one of the series comprising Dreyfus Index Funds, Inc.) as of October 31, 2009 and the related statement of operations for the year then ended,the statement of changes in net assets for each of the two years in the period then ended and financial highlights for each of the three years in the period then ended.These financial statements and financial highlights are the responsibility of the Fund s management. Our responsibility is to express an opinion on these financial statements and financial highlights based on our audits. The financial highlights for the years ended October 31,2006 and 2005, were audited by other auditors whose report dated December 14, 2006, expressed an unqualified opinion on such financial highlights.
We conducted our audits in accordance with the standards of the Public Company Accounting Oversight Board (United States).Those standards require that we plan and perform the audit to obtain reasonable assurance about whether the financial statements and financial highlights are free of material misstatement. We were not engaged to perform an audit of the Fund s internal control over financial reporting. Our audits included consideration of internal control over financial reporting as a basis for designing audit procedures that are appropriate in the circumstances, but not for the purpose of expressing an opinion on the effectiveness of the Fund s internal control over financial reporting. Accordingly, we express no such opinion. An audit also includes examining, on a test basis, evidence supporting the amounts and disclosures in the financial statements and financial highlights, assessing the accounting principles used and significant estim ates made by management, and evaluating the overall financial statement presentation. Our procedures included confirmation of securities owned as of October 31, 2009 by correspondence with the custodian and others. We believe that our audits provide a reasonable basis for our opinion.
In our opinion, the 2009, 2008 and 2007 financial statements and financial highlights referred to above present fairly, in all material respects, the financial position of Dreyfus International Stock Index Fund at October 31, 2009, the results of its operations for the year then ended, the changes in its net assets for each of the two years in the period then ended and the financial highlights for each of the three years in the period then ended, in conformity with U.S. generally accepted accounting principles.

| New York, New York December 29, 2009 |
58
IMPORTANT TAX INFORMATION (Unaudited)
In accordance with federal tax law, the fund elects to provide each shareholder with their portion of the fund s foreign taxes paid and the income sourced from foreign countries.Accordingly, the fund hereby makes the following designations regarding its fiscal year ended October 31, 2009:
![]()
Where required by federal tax law rules, shareholders will receive notification of their proportionate share of foreign taxes paid and foreign sourced income for the 2009 calendar year with Form 1099-DIV which will be mailed in early 2010. For the fiscal year ended October 31, 2009, certain dividends paid by the fund may be subject to a maximum tax rate of 15%, as provided for by the Jobs and Growth Tax Relief Reconciliation Act of 2003. Of the distributions paid during the fiscal year, $5,066,645 represents the maximum amount that may be considered qualified dividend income. Also, the fund hereby designates $.0200 per share as a long-term capital gain distribution paid on December 24, 2008.
The Fund 59
BOARD MEMBERS INFORMATION (Unaudited)
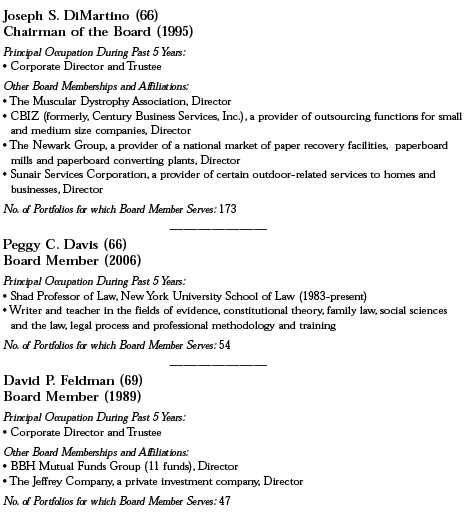
60
The Fund 61
BOARD MEMBERS INFORMATION (Unaudited) (continued)

Once elected all Board Members serve for an indefinite term, but achieve Emeritus status upon reaching age 80.The address of the Board Members and Officers is in c/o The Dreyfus Corporation, 200 Park Avenue, NewYork, NewYork 10166.Additional information about the Board Members is available in the fund s Statement of Additional Information which can be obtained from Dreyfus free of charge by calling this toll free number: 1-800-554-4611.
| John M. Fraser, Jr., Emeritus Board Member Dr. Paul A. Marks, Emeritus Board Member |
62
OFFICERS OF THE FUND (Unaudited)

The Fund 63
OFFICERS OF THE FUND (Unaudited) (continued)
64
For More Information
Ticker Symbol: DIISX
Telephone 1-800-645-6561
Mail The Dreyfus Family of Funds, 144 Glenn Curtiss Boulevard, Uniondale, NY 11556-0144 E-mail Send your request to info@dreyfus.com Internet Information can be viewed online or downloaded at: http://www.dreyfus.com
The fund files its complete schedule of portfolio holdings with the Securities and Exchange Commission ( SEC ) for the first and third quarters of each fiscal year on Form N-Q. The fund s Forms N-Q are available on the SEC s website at http://www.sec.gov and may be reviewed and copied at the SEC s Public Reference Room in Washington, DC. Information on the operation of the Public Reference Room may be obtained by calling 1-800-SEC-0330.
A description of the policies and procedures that the fund uses to determine how to vote proxies relating to portfolio securities, and information regarding how the fund voted these proxies for the most recent 12-month period ended June 30 is available at http://www.dreyfus.com and on the SEC s website at http://www.sec.gov. The description of the policies and procedures is also available without charge, upon request, by calling 1-800-645-6561.
| Dreyfus S&P 500 Index Fund |
| ANNUAL REPORT October 31, 2009 |
Save time. Save paper. View your next shareholder report online as soon as it s available. Log into www.dreyfus.com and sign up for Dreyfus eCommunications. It s simple and only takes a few minutes.
The views expressed in this report reflect those of the portfolio manager only through the end of the period covered and do not necessarily represent the views of Dreyfus or any other person in the Dreyfus organization. Any such views are subject to change at any time based upon market or other conditions and Dreyfus disclaims any responsibility to update such views.These views may not be relied on as investment advice and, because investment decisions for a Dreyfus fund are based on numerous factors, may not be relied on as an indication of trading intent on behalf of any Dreyfus fund.

| Contents | |
| THE FUND | |
| 2 | A Letter from the Chairman and CEO |
| 3 | Discussion of Fund Performance |
| 6 | Fund Performance |
| 7 | Understanding Your Fund s Expenses |
| 7 | Comparing Your Fund s Expenses With Those of Other Funds |
| 8 | Statement of Investments |
| 24 | Statement of Financial Futures |
| 25 | Statement of Assets and Liabilities |
| 26 | Statement of Operations |
| 27 | Statement of Changes in Net Assets |
| 28 | Financial Highlights |
| 29 | Notes to Financial Statements |
| 38 | Report of Independent Registered Public Accounting Firm |
| 39 | Important Tax Information |
| 40 | Board Members Information |
| 43 | Officers of the Fund |
| FOR MORE INFORMATION | |
| Back Cover | |
| Dreyfus S&P 500 Index Fund |
The Fund

A LETTER FROM THE CHAIRMAN AND CEO
Dear Shareholder:
We are pleased to present this annual report for Dreyfus S&P 500 Index Fund, covering the 12-month period from November 1, 2008, through October 31, 2009.
Reports of positive economic growth over the third quarter of 2009 may have signaled the end of the deep recession that technically began in December 2007. Signs that the U.S. economy finally has turned a corner include inventory rebuilding among manufacturers, improvements in home sales and prices, and an increase in consumer spending.These and other positive developments helped fuel a sustained stock market rally since the early spring, with the most beaten-down securities generally leading the rebound. Higher-quality stocks have participated in the rally, but have so far lagged on a relative performance basis.
In our judgment, the financial markets currently appear poised to enter into a new phase in which underlying fundamentals, not bargain hunting, are likely to drive investment returns. Of course, the best strategy for your portfolio depends not only on your view of the economy s direction, but on your current financial needs, future goals and attitudes toward risk.Your financial advisor can help you decide which investments have the potential to benefit from a recovery while guarding against the risks that may accompany unexpected market developments.
For information about how the fund performed during the reporting period, as well as market perspectives, we have provided a Discussion of Fund Performance.
Thank you for your continued confidence and support.

| Jonathan R. Baum Chairman and Chief Executive Officer The Dreyfus Corporation November 16, 2009 |
| 2 |

DISCUSSION OF FUND PERFORMANCE
For the period of November 1, 2008, through October 31, 2009, as provided by Thomas Durante, CFA, Portfolio Manager
Fund and Market Performance Overview
For the 12-month period ended October 31, 2009, Dreyfus S&P 500 Index Fund produced a total return of 9.42%.1 In comparison, the Standard & Poor s 500 Composite Stock Price Index (the S&P 500 Index ), the fund s benchmark, produced a 9.80% return for the same period.2,3
Large-cap stocks fell sharply over the first four months of an especially volatile reporting period, but they went on to recover all of those losses and more during a rally that began in March 2009 and continued through the reporting period s end. The difference in returns between the fund and the S&P 500 Index was primarily the result of transaction costs and operating expenses that are not reflected in the S&P 500 Index s return.
The Fund s Investment Approach
The fund seeks to match the total return of the S&P 500 Index by generally investing in all 500 stocks in the S&P 500 Index in proportion to their respective weighting. Often considered a barometer for the stock market in general, the S&P 500 Index is made up of 500 widely held common stocks across 10 economic sectors. Each stock is weighted by its float-adjusted market capitalization; that is, larger companies have greater representation in the S&P 500 Index than smaller ones.
Equity Markets Bottomed in March, Then Surged Higher
The reporting period began in the midst of the most severe recession since the 1930s, which had been exacerbated by a global banking crisis that left major financial institutions unable to obtain short-term funding due to massive losses among mortgage- and asset-backed securities. In the weeks prior to the start of the reporting period, the U.S. government effectively nationalized insurer AIG and mortgage
The Fund 3
| DISCUSSION OF FUND PERFORMANCE (continued) |
agencies Fannie Mae and Freddie Mac; Lehman Brothers filed for bankruptcy; and other major firms were sold to former rivals. Congress passed the $700 billion Troubled Assets Relief Program (TARP), and the Federal Reserve Board (the Fed ) pumped liquidity into the system to shore up the nation s banks.
As the reporting period began, job losses continued to mount, and consumer confidence plunged. In November 2008, The National Bureau of Economic Research officially declared that the U.S. economy had been in a recession since late 2007.The Fed reduced its target for the overnight federal funds rate to a range between 0% and 0.25%, where it remained through the balance of the reporting period.
In early 2009, the U.S. economy continued to weaken. Home prices fell sharply in January, and more than 650,000 jobs per month were lost in February and March, driving the unemployment rate higher. Meanwhile, consumer confidence reached its lowest level since recordkeeping began in 1967. In an effort to stimulate the economy, the U.S. government enacted the $787 billion American Recovery and Reinvestment Act and took steps to rescue the nation s major automakers as vehicle sales plunged.
After hitting a multi-year low in early March, the S&P 500 Index staged an impressive rebound that continued through the reporting period s end.The equity markets were buoyed by signs that the remedial programs implemented by government and monetary authorities were gaining traction. By the end of the reporting period, stock prices and commodity prices had risen sharply, consumer and corporate sentiment had improved markedly, and inflation-adjusted gross domestic product began a sustained rise in many countries.
Technology and Consumer Stocks Enjoyed a Strong Rebound
Much of the S&P 500 Index s positive performance during the reporting period came from the information technology sector, where many stocks rebounded after experiencing steep declines in 2008. Technology companies with significant exposure to overseas markets fared especially well as the U.S. dollar weakened relative to most other
4
currencies. In addition, stock prices were bolstered by cost-cutting measures, such as staff reductions, factory closures and moving operations to lower-cost sites.
Consumer discretionary stocks also posted relatively strong results, as specialty retailers, automotive retailers and department stores rebounded from beaten-down levels. Media companies gained value in anticipation of greater advertising spending. In the consumer staples area, beverage producers and tobacco companies benefited from their presence in the emerging markets.
The financials sector proved to be the only category of the S&P 500 Index to post a negative absolute return during the reporting period. The stocks of major banks fell sharply due to the credit crisis, poor management of their mortgage businesses, a lack of new borrowing and increased governmental regulations. However, large brokerage firms reported impressive gains as the perceived threat of a global financial meltdown dissipated.
Index Funds Offer Diversification Benefits
As an index fund, we attempt to replicate the returns of the S&P 500 Index by closely approximating its composition. In our view, one of the greatest benefits of an index fund is that it offers a broadly diversified investment vehicle that can help investors manage risks by limiting the impact on the overall portfolio of unexpected losses in any single industry group or holding.
November 16, 2009
| 1 | Total return includes reinvestment of dividends and any capital gains paid. Past performance is no | |
| guarantee of future results. Share price and investment return fluctuate such that upon redemption, | ||
| fund shares may be worth more or less than their original cost. | ||
| 2 | SOURCE: LIPPER INC. Reflects reinvestment of dividends daily and, where applicable, | |
| capital gain distributions.The Standard & Poor s 500 Composite Stock Price Index is a widely | ||
| accepted, unmanaged index of U.S. stock market performance. | ||
| 3 | Standard & Poor s®, S&P®, Standard & Poor s® 500 and S&P 500® are | |
| trademarks of The McGraw-Hill Companies, Inc., and have been licensed for use by the fund. | ||
| The fund is not sponsored, endorsed, sold or promoted by Standard & Poor s and Standard & | ||
| Poor s makes no representation regarding the advisability of investing in the fund. |
The Fund 5
FUND PERFORMANCE
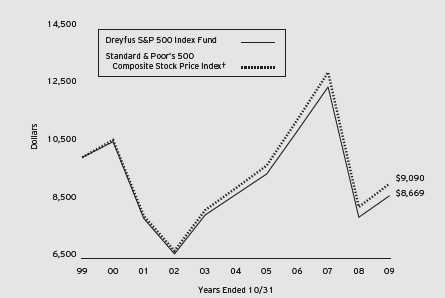
Comparison of change in value of $10,000 investment in Dreyfus S&P 500 Index Fund and the Standard & Poor s 500 Composite Stock Price Index
| Average Annual Total Returns as of 10/31/09 | ||||||
| 1 Year | 5 Years | 10 Years | ||||
| Fund | 9.42% | 0.11% | 1.42% | |||
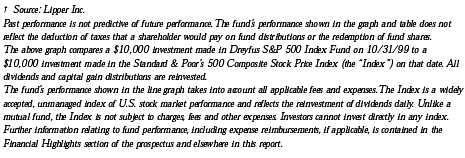
6
UNDERSTANDING YOUR FUND’S EXPENSES (Unaudited)
As a mutual fund investor, you pay ongoing expenses, such as management fees and other expenses. Using the information below, you can estimate how these expenses affect your investment and compare them with the expenses of other funds.You also may pay one-time transaction expenses, including sales charges (loads) and redemption fees, which are not shown in this section and would have resulted in higher total expenses. For more information, see your fund’s prospectus or talk to your financial adviser.
Review your fund’s expenses
The table below shows the expenses you would have paid on a $1,000 investment in Dreyfus S&P 500 Index Fund from May 1, 2009 to October 31, 2009. It also shows how much a $1,000 investment would be worth at the close of the period, assuming actual returns and expenses.
| Expenses and Value of a $1,000 Investment assuming actual returns for the six months ended October 31, 2009 |
| Expenses paid per $1,000† | $2.77 | |
| Ending value (after expenses) | $1,198.10 |
| COMPARING YOUR FUND’S EXPENSES WITH THOSE OF OTHER FUNDS (Unaudited) |
Using the SEC’s method to compare expenses
The Securities and Exchange Commission (SEC) has established guidelines to help investors assess fund expenses. Per these guidelines, the table below shows your fund’s expenses based on a $1,000 investment, assuming a hypothetical 5% annualized return. You can use this information to compare the ongoing expenses (but not transaction expenses or total cost) of investing in the fund with those of other funds.All mutual fund shareholder reports will provide this information to help you make this comparison. Please note that you cannot use this information to estimate your actual ending account balance and expenses paid during the period.
| Expenses and Value of a $1,000 Investment assuming a hypothetical 5% annualized return for the six months ended October 31, 2009 |
| Expenses paid per $1,000† | $2.55 | |
| Ending value (after expenses) | $1,022.68 |
† Expenses are equal to the fund’s annualized expense ratio of .50%, multiplied by the average account value over the
period, multiplied by 184/365 (to reflect the one-half year period).
The Fund 7
| STATEMENT OF INVESTMENTS October 31, 2009 |
| Common Stocks 98.1% | Shares | Value ($) | ||
| Consumer Discretionary 9.0% | ||||
| Abercrombie & Fitch, Cl. A | 21,168 | 694,734 | ||
| Amazon.com | 79,467 a | 9,441,474 | ||
| Apollo Group, Cl. A | 29,608 a,b | 1,690,617 | ||
| AutoNation | 26,802 a,b | 462,066 | ||
| AutoZone | 7,948 a,b | 1,075,444 | ||
| Bed Bath & Beyond | 62,357 a,b | 2,195,590 | ||
| Best Buy | 82,058 b | 3,132,974 | ||
| Big Lots | 20,087 a,b | 503,179 | ||
| Black & Decker | 14,270 | 673,829 | ||
| Carnival | 104,868 | 3,053,756 | ||
| CBS, Cl. B | 162,937 | 1,917,768 | ||
| Coach | 78,943 | 2,602,751 | ||
| Comcast, Cl. A | 695,386 | 10,083,097 | ||
| D.R. Horton | 67,450 b | 739,252 | ||
| Darden Restaurants | 33,452 | 1,013,930 | ||
| DeVry | 14,888 | 823,158 | ||
| DIRECTV Group | 111,796 a,b | 2,940,235 | ||
| Eastman Kodak | 64,824 a,b | 243,090 | ||
| Expedia | 51,402 a,b | 1,165,283 | ||
| Family Dollar Stores | 33,266 b | 941,428 | ||
| Ford Motor | 765,185 a,b | 5,356,295 | ||
| Fortune Brands | 35,903 | 1,398,422 | ||
| GameStop, Cl. A | 39,677 a,b | 963,754 | ||
| Gannett | 56,630 b | 556,107 | ||
| Gap | 113,824 | 2,429,004 | ||
| Genuine Parts | 39,155 b | 1,370,033 | ||
| Goodyear Tire & Rubber | 59,181 a | 762,251 | ||
| H & R Block | 80,149 | 1,469,933 | ||
| Harley-Davidson | 57,065 b | 1,422,060 | ||
| Harman International Industries | 14,877 | 559,524 | ||
| Hasbro | 29,932 | 816,246 | ||
| Home Depot | 408,370 | 10,246,003 | ||
| International Game Technology | 73,881 b | 1,318,037 | ||
| Interpublic Group of Cos. | 116,083 a | 698,820 | ||
| J.C. Penney | 55,986 | 1,854,816 | ||
| Johnson Controls | 156,933 | 3,753,837 |
8
| Common Stocks (continued) | Shares | Value ($) | ||
| Consumer Discretionary (continued) | ||||
| KB Home | 19,013 b | 269,604 | ||
| Kohl s | 73,075 a | 4,181,352 | ||
| Leggett & Platt | 38,630 b | 746,718 | ||
| Lennar, Cl. A | 34,261 b | 431,689 | ||
| Limited Brands | 68,114 b | 1,198,806 | ||
| Lowe s Cos. | 356,361 | 6,973,985 | ||
| Macy s | 100,609 | 1,767,700 | ||
| Marriott International, Cl. A | 62,763 b | 1,572,841 | ||
| Mattel | 86,234 | 1,632,410 | ||
| McDonald s | 263,167 | 15,424,218 | ||
| McGraw-Hill | 77,073 | 2,218,161 | ||
| Meredith | 9,262 b | 250,630 | ||
| New York Times, Cl. A | 28,966 b | 230,859 | ||
| Newell Rubbermaid | 68,205 | 989,655 | ||
| News, Cl. A | 542,669 | 6,251,547 | ||
| NIKE, Cl. B | 94,273 | 5,861,895 | ||
| Nordstrom | 38,007 b | 1,207,862 | ||
| O Reilly Automotive | 32,675 a,b | 1,218,124 | ||
| Office Depot | 67,252 a | 406,875 | ||
| Omnicom Group | 75,050 | 2,572,714 | ||
| Polo Ralph Lauren | 13,678 b | 1,017,917 | ||
| Pulte Homes | 82,060 b | 739,361 | ||
| RadioShack | 32,300 | 545,547 | ||
| Scripps Networks Interactive, Cl. A | 22,057 | 832,872 | ||
| Sears Holdings | 13,585 a,b | 921,878 | ||
| Sherwin-Williams | 23,990 b | 1,368,390 | ||
| Staples | 170,658 b | 3,703,279 | ||
| Starbucks | 175,133 a | 3,324,024 | ||
| Starwood Hotels & Resorts Worldwide | 44,558 b | 1,294,855 | ||
| Target | 181,409 | 8,785,638 | ||
| Tiffany & Co. | 29,894 b | 1,174,535 | ||
| Time Warner | 288,756 | 8,697,331 | ||
| Time Warner Cable | 85,055 | 3,354,569 | ||
| TJX Cos. | 100,632 | 3,758,605 | ||
| VF | 20,838 | 1,480,332 | ||
| Viacom, Cl. B | 149,049 a | 4,112,262 |
The Fund 9
| STATEMENT OF INVESTMENTS (continued) |
| Common Stocks (continued) | Shares | Value ($) | ||
| Consumer Discretionary (continued) | ||||
| Walt Disney | 446,971 | 12,233,596 | ||
| Washington Post, Cl. B | 1,437 | 620,784 | ||
| Whirlpool | 17,999 b | 1,288,548 | ||
| Wyndham Worldwide | 43,577 | 742,988 | ||
| Wynn Resorts | 16,232 a,b | 880,099 | ||
| Yum! Brands | 112,487 | 3,706,447 | ||
| 200,360,299 | ||||
| Consumer Staples 11.7% | ||||
| Altria Group | 500,115 | 9,057,082 | ||
| Archer-Daniels-Midland | 154,562 | 4,655,407 | ||
| Avon Products | 102,209 b | 3,275,798 | ||
| Brown-Forman, Cl. B | 26,050 b | 1,271,501 | ||
| Campbell Soup | 49,681 b | 1,577,372 | ||
| Clorox | 33,086 | 1,959,684 | ||
| Coca-Cola | 557,702 | 29,731,094 | ||
| Coca-Cola Enterprises | 75,713 | 1,443,847 | ||
| Colgate-Palmolive | 120,160 | 9,448,181 | ||
| ConAgra Foods | 109,854 | 2,306,934 | ||
| Constellation Brands, Cl. A | 47,761 a | 755,579 | ||
| Costco Wholesale | 104,486 | 5,940,029 | ||
| CVS Caremark | 347,978 | 12,283,623 | ||
| Dean Foods | 42,477 a | 774,356 | ||
| Dr. Pepper Snapple Group | 61,949 a | 1,688,730 | ||
| Estee Lauder, Cl. A | 28,062 b | 1,192,635 | ||
| General Mills | 78,730 | 5,189,882 | ||
| H.J. Heinz | 74,982 | 3,017,276 | ||
| Hershey | 40,106 | 1,515,606 | ||
| Hormel Foods | 16,901 | 616,210 | ||
| J.M. Smucker | 28,381 | 1,496,530 | ||
| Kellogg | 60,104 | 3,097,760 | ||
| Kimberly-Clark | 99,784 | 6,102,789 | ||
| Kraft Foods, Cl. A | 354,753 | 9,762,803 | ||
| Kroger | 157,274 | 3,637,748 | ||
| Lorillard | 40,584 | 3,154,188 | ||
| McCormick & Co. | 31,508 b | 1,103,095 | ||
| Molson Coors Brewing, Cl. B | 36,475 | 1,786,181 |
10
| Common Stocks (continued) | Shares | Value ($) | ||
| Consumer Staples (continued) | ||||
| Pepsi Bottling Group | 33,779 | 1,264,686 | ||
| PepsiCo | 374,898 | 22,700,074 | ||
| Philip Morris International | 466,844 | 22,109,732 | ||
| Procter & Gamble | 702,114 | 40,722,612 | ||
| Reynolds American | 41,207 b | 1,997,715 | ||
| Safeway | 103,519 | 2,311,579 | ||
| Sara Lee | 171,310 | 1,934,090 | ||
| SUPERVALU | 52,104 | 826,890 | ||
| SYSCO | 144,573 b | 3,823,956 | ||
| Tyson Foods, Cl. A | 71,441 | 894,441 | ||
| Wal-Mart Stores | 523,118 | 25,988,502 | ||
| Walgreen | 237,905 | 8,999,946 | ||
| Whole Foods Market | 34,365 a | 1,101,742 | ||
| 262,517,885 | ||||
| Energy 12.1% | ||||
| Anadarko Petroleum | 118,412 | 7,214,843 | ||
| Apache | 80,388 | 7,566,119 | ||
| Baker Hughes | 73,982 b | 3,112,423 | ||
| BJ Services | 72,178 | 1,385,818 | ||
| Cabot Oil & Gas | 25,678 | 987,833 | ||
| Cameron International | 52,077 a | 1,925,287 | ||
| Chesapeake Energy | 150,590 | 3,689,455 | ||
| Chevron | 482,710 | 36,946,623 | ||
| ConocoPhillips | 357,899 | 17,959,372 | ||
| Consol Energy | 43,840 | 1,876,790 | ||
| Denbury Resources | 60,182 a | 878,657 | ||
| Devon Energy | 107,420 | 6,951,148 | ||
| Diamond Offshore Drilling | 16,768 b | 1,597,152 | ||
| El Paso | 167,868 | 1,646,785 | ||
| ENSCO International | 34,299 | 1,570,551 | ||
| EOG Resources | 59,759 | 4,879,920 | ||
| Exxon Mobil | 1,158,309 | 83,016,006 | ||
| FMC Technologies | 30,382 a,b | 1,598,093 | ||
| Halliburton | 215,816 | 6,303,985 | ||
| Hess | 67,994 | 3,721,992 | ||
| Marathon Oil | 169,534 | 5,420,002 |
The Fund 11
| STATEMENT OF INVESTMENTS (continued) |
| Common Stocks (continued) | Shares | Value ($) | ||
| Energy (continued) | ||||
| Massey Energy | 19,878 b | 578,251 | ||
| Murphy Oil | 45,663 | 2,791,836 | ||
| Nabors Industries | 66,961 a | 1,394,797 | ||
| National Oilwell Varco | 100,206 a | 4,107,444 | ||
| Noble Energy | 41,352 | 2,713,932 | ||
| Occidental Petroleum | 195,563 | 14,839,320 | ||
| Peabody Energy | 64,384 | 2,548,963 | ||
| Pioneer Natural Resources | 28,595 b | 1,175,540 | ||
| Range Resources | 37,024 | 1,853,051 | ||
| Rowan | 27,369 | 636,329 | ||
| Schlumberger | 288,574 | 17,949,303 | ||
| Smith International | 51,789 b | 1,436,109 | ||
| Southwestern Energy | 82,272 a | 3,585,414 | ||
| Spectra Energy | 155,718 | 2,977,328 | ||
| Sunoco | 28,954 | 891,783 | ||
| Tesoro | 33,874 b | 478,978 | ||
| Valero Energy | 134,536 | 2,435,102 | ||
| Williams Cos. | 138,178 | 2,604,655 | ||
| XTO Energy | 139,285 | 5,788,685 | ||
| 271,035,674 | ||||
| Financial 14.3% | ||||
| Aflac | 112,556 | 4,669,948 | ||
| Allstate | 130,110 | 3,847,352 | ||
| American Express | 283,450 | 9,875,398 | ||
| American International Group | 32,238 a,b | 1,083,842 | ||
| Ameriprise Financial | 61,606 | 2,135,880 | ||
| AON | 65,145 | 2,508,734 | ||
| Apartment Investment & Management, Cl. A | 27,723 b,c | 342,379 | ||
| Assurant | 28,350 | 848,516 | ||
| AvalonBay Communities | 19,016 b,c | 1,307,920 | ||
| Bank of America | 2,084,402 | 30,390,581 | ||
| Bank of New York Mellon | 288,116 | 7,681,173 | ||
| BB & T | 164,169 b | 3,925,281 | ||
| Boston Properties | 32,947 c | 2,002,189 | ||
| Capital One Financial | 108,290 b | 3,963,414 | ||
| CB Richard Ellis Group, Cl. A | 53,844 a,b | 557,285 |
12
| Common Stocks (continued) | Shares | Value ($) | ||
| Financial (continued) | ||||
| Charles Schwab | 224,073 | 3,885,426 | ||
| Chubb | 84,598 | 4,104,695 | ||
| Cincinnati Financial | 39,166 | 993,250 | ||
| Citigroup | 3,085,456 | 12,619,515 | ||
| CME Group | 16,125 b | 4,879,586 | ||
| Comerica | 37,026 | 1,027,472 | ||
| Discover Financial Services | 125,913 | 1,780,410 | ||
| E*TRADE FINANCIAL | 204,930 a | 299,198 | ||
| Equity Residential | 64,969 b,c | 1,876,305 | ||
| Federated Investors, Cl. B | 21,265 b | 558,206 | ||
| Fifth Third Bancorp | 188,032 b | 1,681,006 | ||
| First Horizon National | 50,985 a,b | 603,153 | ||
| Franklin Resources | 36,528 | 3,821,925 | ||
| Genworth Financial, Cl. A | 106,549 a | 1,131,550 | ||
| Goldman Sachs Group | 122,601 | 20,863,012 | ||
| Hartford Financial Services Group | 92,722 | 2,273,543 | ||
| HCP | 69,472 c | 2,055,676 | ||
| Health Care REIT | 26,803 b,c | 1,189,249 | ||
| Host Hotels & Resorts | 144,138 b,c | 1,457,235 | ||
| Hudson City Bancorp | 115,611 | 1,519,129 | ||
| Huntington Bancshares | 129,221 | 492,332 | ||
| IntercontinentalExchange | 17,445 a | 1,747,815 | ||
| Invesco | 98,997 | 2,093,786 | ||
| Janus Capital Group | 39,704 | 520,916 | ||
| JPMorgan Chase & Co. | 944,289 | 39,442,952 | ||
| KeyCorp | 202,607 | 1,092,052 | ||
| Kimco Realty | 87,772 b,c | 1,109,438 | ||
| Legg Mason | 38,198 b | 1,111,944 | ||
| Leucadia National | 42,353 a,b | 951,672 | ||
| Lincoln National | 71,045 | 1,693,002 | ||
| Loews | 86,884 | 2,875,860 | ||
| M & T Bank | 18,460 | 1,160,211 | ||
| Marsh & McLennan Cos. | 123,138 | 2,888,817 | ||
| Marshall & Ilsley | 83,929 | 446,502 | ||
| MBIA | 46,630 a,b | 189,318 | ||
| MetLife | 198,014 | 6,738,416 |
The Fund 13
| STATEMENT OF INVESTMENTS (continued) |
| Common Stocks (continued) | Shares | Value ($) | ||
| Financial (continued) | ||||
| Moody s | 47,187 b | 1,117,388 | ||
| Morgan Stanley | 325,829 | 10,465,627 | ||
| Nasdaq OMX Group | 32,701 a | 590,580 | ||
| Northern Trust | 57,973 | 2,913,143 | ||
| NYSE Euronext | 63,732 | 1,647,472 | ||
| People s United Financial | 83,430 | 1,337,383 | ||
| Plum Creek Timber | 40,984 b,c | 1,282,389 | ||
| PNC Financial Services Group | 110,741 | 5,419,665 | ||
| Principal Financial Group | 75,012 | 1,878,300 | ||
| Progressive | 164,062 a | 2,624,992 | ||
| ProLogis | 101,516 b,c | 1,150,176 | ||
| Prudential Financial | 110,286 | 4,988,236 | ||
| Public Storage | 32,082 b,c | 2,361,235 | ||
| Regions Financial | 281,416 b | 1,362,053 | ||
| Simon Property Group | 66,758 b,c | 4,532,201 | ||
| SLM | 114,918 a | 1,114,705 | ||
| State Street | 119,119 | 5,000,616 | ||
| SunTrust Banks | 118,394 | 2,262,509 | ||
| T. Rowe Price Group | 62,093 b | 3,025,792 | ||
| Torchmark | 21,166 b | 859,340 | ||
| Travelers Cos. | 137,527 | 6,847,469 | ||
| U.S. Bancorp | 457,870 | 10,631,741 | ||
| Unum Group | 79,955 | 1,595,102 | ||
| Ventas | 37,634 b,c | 1,510,252 | ||
| Vornado Realty Trust | 38,295 c | 2,280,850 | ||
| Wells Fargo & Co. | 1,123,504 | 30,918,830 | ||
| XL Capital, Cl. A | 82,215 b | 1,349,148 | ||
| Zions Bancorporation | 27,369 b | 387,545 | ||
| 319,769,205 | ||||
| Health Care 12.5% | ||||
| Abbott Laboratories | 372,194 | 18,821,850 | ||
| Aetna | 108,095 | 2,813,713 | ||
| Allergan | 73,800 | 4,151,250 | ||
| AmerisourceBergen | 72,486 | 1,605,565 | ||
| Amgen | 244,822 a | 13,154,286 | ||
| Baxter International | 146,293 | 7,908,600 |
14
| Common Stocks (continued) | Shares | Value ($) | ||
| Health Care (continued) | ||||
| Becton, Dickinson & Co. | 58,502 | 3,999,197 | ||
| Biogen Idec | 69,799 a | 2,940,632 | ||
| Boston Scientific | 360,281 a | 2,925,482 | ||
| Bristol-Myers Squibb | 478,021 | 10,420,858 | ||
| C.R. Bard | 24,099 | 1,809,112 | ||
| Cardinal Health | 86,241 | 2,444,070 | ||
| CareFusion | 43,120 a | 964,594 | ||
| Celgene | 110,639 a | 5,648,121 | ||
| Cephalon | 17,756 a,b | 969,122 | ||
| CIGNA | 66,675 | 1,856,232 | ||
| Coventry Health Care | 35,889 a | 711,679 | ||
| DaVita | 24,942 a | 1,322,674 | ||
| Dentsply International | 35,751 b | 1,178,353 | ||
| Eli Lilly & Co. | 244,742 | 8,323,675 | ||
| Express Scripts | 65,173 a | 5,208,626 | ||
| Forest Laboratories | 72,995 a | 2,019,772 | ||
| Genzyme | 65,323 a | 3,305,344 | ||
| Gilead Sciences | 219,053 a | 9,320,705 | ||
| Hospira | 39,062 a | 1,743,728 | ||
| Humana | 41,071 a | 1,543,448 | ||
| IMS Health | 45,207 | 740,943 | ||
| Intuitive Surgical | 9,301 a,b | 2,291,301 | ||
| Johnson & Johnson | 663,283 | 39,166,861 | ||
| King Pharmaceuticals | 60,626 a,b | 614,141 | ||
| Laboratory Corp. of America Holdings | 26,619 a,b | 1,833,783 | ||
| Life Technologies | 41,668 a | 1,965,480 | ||
| McKesson | 64,415 | 3,783,093 | ||
| Medco Health Solutions | 114,431 a | 6,421,868 | ||
| Medtronic | 266,830 | 9,525,831 | ||
| Merck & Co. | 507,614 b | 15,700,501 | ||
| Millipore | 13,590 a | 910,666 | ||
| Mylan | 74,939 a,b | 1,217,009 | ||
| Patterson Cos. | 22,654 a,b | 578,357 | ||
| PerkinElmer | 28,944 | 538,648 | ||
| Pfizer | 1,941,752 | 33,068,037 | ||
| Quest Diagnostics | 36,340 | 2,032,496 |
The Fund 15
| STATEMENT OF INVESTMENTS (continued) |
| Common Stocks (continued) | Shares | Value ($) | ||
| Health Care (continued) | ||||
| Schering-Plough | 393,668 | 11,101,438 | ||
| St. Jude Medical | 83,785 a | 2,855,393 | ||
| Stryker | 66,150 | 3,042,900 | ||
| Tenet Healthcare | 103,174 a | 528,251 | ||
| Thermo Fisher Scientific | 98,615 a | 4,437,675 | ||
| UnitedHealth Group | 281,027 | 7,292,651 | ||
| Varian Medical Systems | 29,867 a,b | 1,223,950 | ||
| Waters | 23,645 a | 1,357,932 | ||
| Watson Pharmaceuticals | 25,502 a,b | 877,779 | ||
| WellPoint | 114,805 a | 5,368,282 | ||
| Zimmer Holdings | 52,050 a | 2,736,269 | ||
| 278,322,223 | ||||
| Industrial 9.9% | ||||
| 3M | 167,329 | 12,310,395 | ||
| Avery Dennison | 26,194 b | 933,816 | ||
| Boeing | 175,077 | 8,368,681 | ||
| Burlington Northern Santa Fe | 63,917 | 4,814,228 | ||
| C.H. Robinson Worldwide | 41,224 | 2,271,855 | ||
| Caterpillar | 148,731 b | 8,189,129 | ||
| Cintas | 32,196 | 891,507 | ||
| CSX | 95,253 | 4,017,772 | ||
| Cummins | 48,533 | 2,089,831 | ||
| Danaher | 61,259 b | 4,179,702 | ||
| Deere & Co. | 102,525 b | 4,670,014 | ||
| Dover | 45,510 | 1,714,817 | ||
| Dun & Bradstreet | 12,968 | 992,830 | ||
| Eaton | 39,811 | 2,406,575 | ||
| Emerson Electric | 181,657 | 6,857,552 | ||
| Equifax | 30,566 b | 836,897 | ||
| Expeditors International Washington | 50,986 | 1,642,769 | ||
| Fastenal | 30,875 b | 1,065,188 | ||
| FedEx | 74,775 | 5,435,395 | ||
| First Solar | 11,655 a,b | 1,421,094 | ||
| Flowserve | 14,159 | 1,390,555 | ||
| Fluor | 43,829 | 1,946,884 | ||
| General Dynamics | 94,137 | 5,902,390 | ||
| General Electric | 2,556,117 | 36,450,228 |
16
| Common Stocks (continued) | Shares | Value ($) | ||
| Industrial (continued) | ||||
| Goodrich | 29,724 | 1,615,499 | ||
| Honeywell International | 180,201 | 6,467,414 | ||
| Illinois Tool Works | 93,007 | 4,270,881 | ||
| Iron Mountain | 43,371 a | 1,059,554 | ||
| ITT | 43,556 | 2,208,289 | ||
| Jacobs Engineering Group | 29,933 a,b | 1,265,867 | ||
| L-3 Communications Holdings | 28,831 | 2,084,193 | ||
| Lockheed Martin | 78,945 | 5,430,627 | ||
| Masco | 87,110 | 1,023,543 | ||
| Monster Worldwide | 30,927 a | 449,060 | ||
| Norfolk Southern | 90,139 | 4,202,280 | ||
| Northrop Grumman | 76,958 | 3,857,905 | ||
| Paccar | 87,173 b | 3,261,142 | ||
| Pall | 28,874 | 916,461 | ||
| Parker Hannifin | 38,914 | 2,060,885 | ||
| Pitney Bowes | 50,306 | 1,232,497 | ||
| Precision Castparts | 33,402 | 3,190,893 | ||
| Quanta Services | 47,062 a,b | 997,714 | ||
| R.R. Donnelley & Sons | 50,710 | 1,018,257 | ||
| Raytheon | 95,319 | 4,316,044 | ||
| Republic Services | 77,185 | 1,999,863 | ||
| Robert Half International | 37,094 b | 860,581 | ||
| Rockwell Automation | 35,176 b | 1,440,457 | ||
| Rockwell Collins | 38,624 | 1,945,877 | ||
| Ryder System | 13,567 | 550,142 | ||
| Snap-On | 14,181 | 518,032 | ||
| Southwest Airlines | 178,159 | 1,496,536 | ||
| Stanley Works | 19,313 | 873,527 | ||
| Stericycle | 20,544 a,b | 1,075,889 | ||
| Textron | 59,438 b | 1,056,808 | ||
| Union Pacific | 122,394 | 6,748,805 | ||
| United Parcel Service, Cl. B | 240,309 | 12,899,787 | ||
| United Technologies | 227,600 | 13,986,020 | ||
| W.W. Grainger | 15,746 b | 1,475,873 | ||
| Waste Management | 117,750 b | 3,518,370 | ||
| 222,175,676 |
The Fund 17
| STATEMENT OF INVESTMENTS (continued) |
| Common Stocks (continued) | Shares | Value ($) | ||
| Information Technology 18.7% | ||||
| Adobe Systems | 127,368 a | 4,195,502 | ||
| Advanced Micro Devices | 149,185 a,b | 686,251 | ||
| Affiliated Computer Services, Cl. A | 23,629 a | 1,230,834 | ||
| Agilent Technologies | 85,713 a | 2,120,539 | ||
| Akamai Technologies | 41,155 a | 905,410 | ||
| Altera | 72,768 | 1,440,079 | ||
| Amphenol, Cl. A | 42,286 | 1,696,514 | ||
| Analog Devices | 70,370 | 1,803,583 | ||
| Apple | 215,556 a | 40,632,306 | ||
| Applied Materials | 322,226 | 3,931,157 | ||
| Autodesk | 53,820 a | 1,341,733 | ||
| Automatic Data Processing | 122,232 | 4,864,834 | ||
| BMC Software | 45,375 a | 1,686,135 | ||
| Broadcom, Cl. A | 103,410 a | 2,751,740 | ||
| CA | 96,127 | 2,010,977 | ||
| Ciena | 22,255 a,b | 261,051 | ||
| Cisco Systems | 1,388,264 a | 31,721,832 | ||
| Citrix Systems | 43,451 a | 1,597,259 | ||
| Cognizant Technology Solutions, Cl. A | 70,988 a | 2,743,686 | ||
| Computer Sciences | 36,163 a | 1,833,826 | ||
| Compuware | 60,745 a | 428,860 | ||
| Convergys | 28,664 a | 311,004 | ||
| Corning | 379,107 | 5,538,753 | ||
| Dell | 418,860 a,b | 6,069,281 | ||
| eBay | 267,675 a | 5,961,122 | ||
| Electronic Arts | 77,429 a | 1,412,305 | ||
| EMC | 486,463 a | 8,012,046 | ||
| Fidelity National Information Services | 74,945 | 1,630,803 | ||
| Fiserv | 39,259 a | 1,800,810 | ||
| FLIR Systems | 36,500 a,b | 1,015,065 | ||
| Google, Cl. A | 58,000 a | 31,094,960 | ||
| Harris | 32,071 | 1,338,002 | ||
| Hewlett-Packard | 571,240 | 27,111,050 | ||
| Intel | 1,348,469 | 25,769,243 | ||
| International Business Machines | 315,944 | 38,106,006 | ||
| Intuit | 76,919 a,b | 2,236,035 |
18
| Common Stocks (continued) | Shares | Value ($) | ||
| Information Technology (continued) | ||||
| Jabil Circuit | 51,199 | 685,043 | ||
| JDS Uniphase | 50,382 a | 281,635 | ||
| Juniper Networks | 127,484 a,b | 3,252,117 | ||
| KLA-Tencor | 41,840 b | 1,360,218 | ||
| Lexmark International, Cl. A | 18,931 a,b | 482,741 | ||
| Linear Technology | 52,986 b | 1,371,278 | ||
| LSI | 154,642 a | 791,767 | ||
| MasterCard, Cl. A | 21,992 b | 4,816,688 | ||
| McAfee | 36,834 a | 1,542,608 | ||
| MEMC Electronic Materials | 54,657 a | 678,840 | ||
| Microchip Technology | 44,485 b | 1,065,861 | ||
| Micron Technology | 203,621 a,b | 1,382,587 | ||
| Microsoft | 1,860,409 | 51,589,142 | ||
| Molex | 34,656 | 647,028 | ||
| Motorola | 543,730 | 4,659,766 | ||
| National Semiconductor | 54,705 | 707,883 | ||
| NetApp | 78,180 a | 2,114,769 | ||
| Novell | 86,784 a | 354,947 | ||
| Novellus Systems | 25,122 a,b | 517,011 | ||
| NVIDIA | 129,685 a | 1,551,033 | ||
| Oracle | 934,108 | 19,709,679 | ||
| Paychex | 77,884 b | 2,212,684 | ||
| QLogic | 33,100 a,b | 580,574 | ||
| QUALCOMM | 399,750 | 16,553,648 | ||
| Red Hat | 45,592 a | 1,176,730 | ||
| Salesforce.com | 24,820 a,b | 1,408,535 | ||
| SanDisk | 53,656 a | 1,098,875 | ||
| Sun Microsystems | 179,834 a | 1,471,042 | ||
| Symantec | 201,392 a | 3,540,471 | ||
| Tellabs | 101,984 a | 613,944 | ||
| Teradata | 44,219 a | 1,232,826 | ||
| Teradyne | 42,956 a,b | 359,542 | ||
| Texas Instruments | 304,109 | 7,131,356 | ||
| Total System Services | 48,946 b | 781,668 | ||
| VeriSign | 46,122 a,b | 1,052,043 | ||
| Western Digital | 53,734 a | 1,809,761 |
The Fund 19
| STATEMENT OF INVESTMENTS (continued) |
| Common Stocks (continued) | Shares | Value ($) | ||
| Information Technology (continued) | ||||
| Western Union | 169,641 | 3,082,377 | ||
| Xerox | 211,669 | 1,591,751 | ||
| Xilinx | 67,287 b | 1,463,492 | ||
| Yahoo! | 296,870 a | 4,720,233 | ||
| 418,734,786 | ||||
| Materials 3.3% | ||||
| Air Products & Chemicals | 50,836 | 3,920,980 | ||
| Airgas | 19,712 | 874,424 | ||
| AK Steel Holding | 27,672 | 439,154 | ||
| Alcoa | 230,020 | 2,856,848 | ||
| Allegheny Technologies | 23,252 b | 717,557 | ||
| Ball | 23,007 | 1,134,935 | ||
| Bemis | 24,520 | 633,352 | ||
| CF Industries Holdings | 12,437 | 1,035,380 | ||
| Dow Chemical | 275,938 | 6,479,024 | ||
| E.I. du Pont de Nemours & Co. | 216,880 | 6,901,122 | ||
| Eastman Chemical | 17,517 | 919,818 | ||
| Ecolab | 53,635 | 2,357,795 | ||
| FMC | 16,610 | 848,771 | ||
| Freeport-McMoRan Copper & Gold | 99,261 a | 7,281,787 | ||
| International Flavors & Fragrances | 18,843 | 717,730 | ||
| International Paper | 102,531 | 2,287,467 | ||
| MeadWestvaco | 40,694 | 929,044 | ||
| Monsanto | 132,248 | 8,884,421 | ||
| Newmont Mining | 118,408 | 5,146,012 | ||
| Nucor | 75,810 | 3,021,029 | ||
| Owens-Illinois | 40,198 a | 1,281,512 | ||
| Pactiv | 32,101 a | 741,212 | ||
| PPG Industries | 39,334 b | 2,219,618 | ||
| Praxair | 74,469 | 5,915,817 | ||
| Sealed Air | 37,613 | 723,298 | ||
| Sigma-Aldrich | 30,487 | 1,583,190 | ||
| Titanium Metals | 19,645 b | 168,947 | ||
| United States Steel | 34,290 b | 1,182,662 | ||
| Vulcan Materials | 29,292 | 1,348,311 | ||
| Weyerhaeuser | 50,683 | 1,841,820 | ||
| 74,393,037 |
20
| Common Stocks (continued) | Shares | Value ($) | ||
| Telecommunication Services 3.0% | ||||
| American Tower, Cl. A | 94,538 a | 3,480,889 | ||
| AT & T | 1,420,056 | 36,452,837 | ||
| CenturyTel | 72,090 | 2,340,041 | ||
| Frontier Communications | 75,973 | 544,726 | ||
| Metropcs Communications | 61,139 a | 380,896 | ||
| Qwest Communications International | 358,160 b | 1,285,794 | ||
| Sprint Nextel | 685,199 a | 2,028,189 | ||
| Verizon Communications | 683,729 | 20,231,541 | ||
| Windstream | 106,079 | 1,022,602 | ||
| 67,767,515 | ||||
| Utilities 3.6% | ||||
| AES | 164,835 a | 2,154,393 | ||
| Allegheny Energy | 41,156 | 939,180 | ||
| Ameren | 54,942 | 1,337,288 | ||
| American Electric Power | 112,789 | 3,408,483 | ||
| CenterPoint Energy | 90,612 | 1,141,711 | ||
| CMS Energy | 55,441 b | 737,365 | ||
| Consolidated Edison | 65,536 | 2,666,004 | ||
| Constellation Energy Group | 48,198 | 1,490,282 | ||
| Dominion Resources | 141,230 b | 4,814,531 | ||
| DTE Energy | 39,010 | 1,442,590 | ||
| Duke Energy | 310,098 | 4,905,750 | ||
| Dynergy, Cl. A | 122,118 a,b | 244,236 | ||
| Edison International | 78,168 | 2,487,306 | ||
| Entergy | 47,290 | 3,628,089 | ||
| EQT | 31,477 | 1,317,627 | ||
| Exelon | 158,870 | 7,460,535 | ||
| FirstEnergy | 73,205 | 3,168,312 | ||
| FPL Group | 98,109 | 4,817,152 | ||
| Integrys Energy | 18,783 b | 649,892 | ||
| Nicor | 11,128 | 412,626 | ||
| NiSource | 67,554 | 872,798 | ||
| Northeast Utilities | 41,680 | 960,724 | ||
| Pepco Holdings | 52,207 | 779,451 | ||
| PG & E | 88,532 | 3,620,073 | ||
| Pinnacle West Capital | 24,716 | 774,105 | ||
| PPL | 89,859 | 2,645,449 |
The Fund 21
| STATEMENT OF INVESTMENTS (continued) |
| Common Stocks (continued) | Shares | Value ($) | ||
| Utilities (continued) | ||||
| Progress Energy | 66,705 | 2,503,439 | ||
| Progress Energy-CVO | 23,900 a | 3,824 | ||
| Public Service Enterprise Group | 122,070 | 3,637,686 | ||
| Questar | 42,539 | 1,694,754 | ||
| SCANA | 28,286 | 957,198 | ||
| Sempra Energy | 59,097 | 3,040,541 | ||
| Southern | 190,480 | 5,941,071 | ||
| TECO Energy | 51,989 b | 745,522 | ||
| Wisconsin Energy | 28,122 | 1,228,088 | ||
| Xcel Energy | 108,162 | 2,039,935 | ||
| 80,668,010 | ||||
| Total Common Stocks | ||||
| (cost $1,749,716,192) | 2,195,744,310 | |||
| Principal | ||||
| Short-Term Investments .2% | Amount ($) | Value ($) | ||
| U.S. Treasury Bills; | ||||
| 0.12%, 12/17/09 | ||||
| (cost $4,194,355) | 4,195,000 d | 4,194,841 | ||
| Other Investment 1.7% | Shares | Value ($) | ||
| Registered Investment Company; | ||||
| Dreyfus Institutional Preferred | ||||
| Plus Money Market Fund | ||||
| (cost $38,872,000) | 38,872,000 e | 38,872,000 | ||
22
| Investment of Cash Collateral | ||||
| for Securities Loaned 5.9% | Shares | Value ($) | ||
| Registered Investment Company; | ||||
| Dreyfus Institutional Cash | ||||
| Advantage Plus Fund | ||||
| (cost $131,454,189) | 131,454,189 e | 131,454,189 | ||
| Total Investments (cost $1,924,236,736) | 105.9% | 2,370,265,340 | ||
| Liabilities, Less Cash and Receivables | (5.9%) | (131,380,418) | ||
| Net Assets | 100.0% | 2,238,884,922 | ||
| CVO Contingent Value Obligation |
| a Non-income producing security. |
| b All or a portion of these securities are on loan.At October 31, 2009, the total market value of the fund s securities |
| on loan is $124,515,386 and the total market value of the collateral held by the fund is $131,495,361, consisting |
| of cash collateral of $131,454,189 and U.S. Government and Agency securities valued at $41,172. |
| c Investment in Real Estate Investment Trust. |
| d Held by a broker as collateral for open financial futures positions. |
| e Investment in affiliated money market mutual fund. |
| Portfolio Summary (Unaudited) | ||||||
| Value (%) | Value (%) | |||||
| Information Technology | 18.7 | Consumer Discretionary | 9.0 | |||
| Financial | 14.3 | Short-Term/Money Market Investments | 7.8 | |||
| Health Care | 12.5 | Utilities | 3.6 | |||
| Energy | 12.1 | Materials | 3.3 | |||
| Consumer Staples | 11.7 | Telecommunication Services | 3.0 | |||
| Industrial | 9.9 | 105.9 | ||||
The Fund 23
| STATEMENT OF FINANCIAL FUTURES October 31, 2009 |
| Market Value | Unrealized | |||||||
| Covered by | (Depreciation) | |||||||
| Contracts | Contracts ($) | Expiration | at 10/31/2009 ($) | |||||
| Financial Futures Long | ||||||||
| Standard & Poor s 500 E-mini | 865 | 44,677,250 | December 2009 | (293,369) | ||||
| See notes to financial statements. | ||||||||
24
| STATEMENT OF ASSETS AND LIABILITIES October 31, 2009 |
| Cost | Value | |||
| Assets ($): | ||||
| Investments in securities See Statement | ||||
| of Investments (including securities on loan, | ||||
| valued at $124,515,386) Note 1(b): | ||||
| Unaffiliated issuers | 1,753,910,547 | 2,199,939,151 | ||
| Affiliated issuers | 170,326,189 | 170,326,189 | ||
| Cash | 1,535,570 | |||
| Dividends and interest receivable | 2,712,220 | |||
| Receivable for shares of Common Stock subscribed | 1,293,830 | |||
| 2,375,806,960 | ||||
| Liabilities ($): | ||||
| Due to The Dreyfus Corporation and affiliates Note 3(b) | 983,132 | |||
| Liability for securities on loan Note 1(b) | 131,454,189 | |||
| Payable for shares of Common Stock redeemed | 3,244,803 | |||
| Payable for futures variation margin Note 4 | 1,239,914 | |||
| 136,922,038 | ||||
| Net Assets ($) | 2,238,884,922 | |||
| Composition of Net Assets ($): | ||||
| Paid-in capital | 1,868,497,853 | |||
| Accumulated undistributed investment income net | 28,886,502 | |||
| Accumulated net realized gain (loss) on investments | (104,234,668) | |||
| Accumulated net unrealized appreciation (depreciation) | ||||
| on investments [including ($293,369) net unrealized | ||||
| (depreciation) on financial futures] | 445,735,235 | |||
| Net Assets ($) | 2,238,884,922 | |||
| Shares Outstanding | ||||
| (200 million shares of $.001 par value Common Stock authorized) | 76,032,226 | |||
| Net Asset Value, offering and redemption price per share ($) | 29.45 | |||
| See notes to financial statements. | ||||
The Fund 25
| STATEMENT OF OPERATIONS Year Ended October 31, 2009 |
| Investment Income ($): | ||
| Income: | ||
| Cash dividends: | ||
| Unaffiliated issuers | 49,641,060 | |
| Affiliated issuers | 103,869 | |
| Income from securities lending Note 1(b) | 1,147,079 | |
| Interest | 17,133 | |
| Total Income | 50,909,141 | |
| Expenses: | ||
| Management fee Note 3(a) | 4,965,178 | |
| Shareholder servicing costs Note 3(b) | 4,965,178 | |
| Directors fees Note 3(a) | 159,972 | |
| Loan commitment fees Note 2 | 16,443 | |
| Total Expenses | 10,106,771 | |
| Less Directors fees reimbursed | ||
| by the Manager Note 3(a) | (159,972) | |
| Net Expenses | 9,946,799 | |
| Investment Income Net | 40,962,342 | |
| Realized and Unrealized Gain (Loss) on Investments Note 4 ($): | ||
| Net realized gain (loss) on investments | (4,654,018) | |
| Net realized gain (loss) on financial futures | 8,819,436 | |
| Net Realized Gain (Loss) | 4,165,418 | |
| Net unrealized appreciation (depreciation) on investments (including | ||
| $1,254,824 net unrealized appreciation on financial futures) | 150,873,785 | |
| Net Realized and Unrealized Gain (Loss) on Investments | 155,039,203 | |
| Net Increase in Net Assets Resulting from Operations | 196,001,545 | |
| See notes to financial statements. | ||
26
STATEMENT OF CHANGES IN NET ASSETS
| Year Ended October 31, | ||||
| 2009 | 2008 | |||
| Operations ($): | ||||
| Investment income net | 40,962,342 | 53,042,313 | ||
| Net realized gain (loss) on investments | 4,165,418 | (46,509,033) | ||
| Net unrealized appreciation | ||||
| (depreciation) on investments | 150,873,785 | (1,265,417,855) | ||
| Net Increase (Decrease) in Net Assets | ||||
| Resulting from Operations | 196,001,545 | (1,258,884,575) | ||
| Dividends to Shareholders from ($): | ||||
| Investment income net | (50,992,476) | (55,063,795) | ||
| Capital Stock Transactions ($): | ||||
| Net proceeds from shares sold | 540,506,562 | 639,664,574 | ||
| Dividends reinvested | 49,807,203 | 53,981,579 | ||
| Cost of shares redeemed | (586,615,451) | (1,024,892,229) | ||
| Increase (Decrease) in Net Assets | ||||
| from Capital Stock Transactions | 3,698,314 | (331,246,076) | ||
| Total Increase (Decrease) in Net Assets | 148,707,383 | (1,645,194,446) | ||
| Net Assets ($): | ||||
| Beginning of Period | 2,090,177,539 | 3,735,371,985 | ||
| End of Period | 2,238,884,922 | 2,090,177,539 | ||
| Undistributed investment income net | 28,886,502 | 39,029,506 | ||
| Capital Share Transactions (Shares): | ||||
| Shares sold | 21,472,196 | 17,459,043 | ||
| Shares issued for dividends reinvested | 2,051,372 | 1,296,699 | ||
| Shares redeemed | (23,057,764) | (27,743,716) | ||
| Net Increase (Decrease) in Shares Outstanding | 465,804 | (8,987,974) | ||
| See notes to financial statements. | ||||
The Fund 27
FINANCIAL HIGHLIGHTS
The following table describes the performance for the fiscal periods indicated.Total return shows how much your investment in the fund would have increased (or decreased) during each period, assuming you had reinvested all dividends and dis-tributions.These figures have been derived from the fund s financial statements.
| Year Ended October 31, | ||||||||||
| 2009 | 2008 | 2007 | 2006 | 2005 | ||||||
| Per Share Data ($): | ||||||||||
| Net asset value, beginning of period | 27.66 | 44.18 | 40.57 | 35.50 | 33.30 | |||||
| Investment Operations: | ||||||||||
| Investment income neta | .53 | .66 | .61 | .54 | .56 | |||||
| Net realized and unrealized | ||||||||||
| gain (loss) on investments | 1.93 | (16.51) | 4.90 | 5.01 | 2.16 | |||||
| Total from Investment Operations | 2.46 | (15.85) | 5.51 | 5.55 | 2.72 | |||||
| Distributions: | ||||||||||
| Dividends from investment | ||||||||||
| income net | (.67) | (.67) | (.56) | (.48) | (.52) | |||||
| Dividends from net realized | ||||||||||
| gain on investments | (1.34) | |||||||||
| Total Distributions | (.67) | (.67) | (1.90) | (.48) | (.52) | |||||
| Net asset value, end of period | 29.45 | 27.66 | 44.18 | 40.57 | 35.50 | |||||
| Total Return (%) | 9.42 | (36.38) | 14.05 | 15.79 | 8.20 | |||||
| Ratios/Supplemental Data (%): | ||||||||||
| Ratio of total expenses | ||||||||||
| to average net assets | .51 | .51 | .51 | .50 | .50 | |||||
| Ratio of net expenses | ||||||||||
| to average net assets | .50 | .50 | .50 | .50 | .50 | |||||
| Ratio of net investment income | ||||||||||
| to average net assets | 2.06 | 1.77 | 1.47 | 1.45 | 1.60 | |||||
| Portfolio Turnover Rate | 4.36 | 4.95 | 4.71 | 5.04 | 7.24 | |||||
| Net Assets, end of period | ||||||||||
| ($ x 1,000) | 2,238,885 | 2,090,178 | 3,735,372 | 3,656,990 | 3,310,961 | |||||
| a Based on average shares outstanding at each month end. | ||||||||||
| See notes to financial statements. | ||||||||||
28
NOTES TO FINANCIAL STATEMENTS
NOTE 1 Significant Accounting Policies:
Dreyfus S&P 500 Index Fund (the fund ) is a separate non-diversified series of Dreyfus Index Funds, Inc. (the Company ), which is registered under the Investment Company Act of 1940, as amended (the Act ), as an open-end management investment company and operates as a series company currently offering three series, including the fund.The fund s investment objective is to match the performance of the Standard & Poor s 500 Composite Stock Price Index. The Dreyfus Corporation (the Manager or Dreyfus ), a wholly-owned subsidiary of The Bank of New York Mellon Corporation ( BNY Mellon ), serves as the fund s investment adviser. MBSC Securities Corporation (the Distributor ), a wholly-owned subsidiary of the Manager is the distributor of the fund s shares, which are sold to the public without a sales charge.
The Company accounts separately for the assets, liabilities and operations of each series. Expenses directly attributable to each series are charged to that series operations; expenses which are applicable to all series are allocated among them on a pro rata basis.
The Financial Accounting Standards Board ( FASB ) Accounting Standards Codification ( ASC ) has become the exclusive reference of authoritative U.S. generally accepted accounting principles ( GAAP ) recognized by the FASB to be applied by nongovernmental entities. Rules and interpretive releases of the Securities and Exchange Commission ( SEC ) under authority of federal laws are also sources of authoritative GAAP for SEC registrants. The ASC has superseded all existing non-SEC accounting and reporting standards. The fund s financial statements are prepared in accordance with GAAP, which may require the use of management estimates and assumptions.Actual results could differ from those estimates.
The fund enters into contracts that contain a variety of indemnifications. The fund s maximum exposure under these arrangements is unknown.The fund does not anticipate recognizing any loss related to these arrangements.
(a) Portfolio valuation: Investments in securities are valued at the last sales price on the securities exchange or national securities market on which such securities are primarily traded. Securities listed on the
The Fund 29
| NOTES TO FINANCIAL STATEMENTS (continued) |
National Market System for which market quotations are available are valued at the official closing price or, if there is no official closing price that day, at the last sales price. Securities not listed on an exchange or the national securities market, or securities for which there were no transactions, are valued at the average of the most recent bid and asked prices, except for open short positions, where the asked price is used for valuation purposes. Bid price is used when no asked price is available. Registered investment companies that are not traded on an exchange are valued at their net asset value.When market quotations or official closing prices are not readily available, or are determined not to reflect accurately fair value, such as when the value of a security has been significantly affected by events after the close of the exchange or market on which the security is principally traded (for example, a foreign exchange or marke t), but before the fund calculates its net asset value, the fund may value these investments at fair value as determined in accordance with the procedures approved by the Board of Directors. Fair valuing of securities may be determined with the assistance of a pricing service using calculations based on indices of domestic securities and other appropriate indicators, such as prices of relevant American Depository Receipts and futures contracts. For other securities that are fair valued by the Board of Directors, certain factors may be considered such as: fundamental analytical data, the nature and duration of restrictions on disposition, an evaluation of the forces that influence the market in which the securities are purchased and sold, and public trading in similar securities of the issuer or comparable issuers. Financial futures are valued at the last sales price.
The fair value of a financial instrument is the amount that would be received to sell an asset or paid to transfer a liability in an orderly transaction between market participants at the measurement date (i.e. the exit price). GAAP establishes a fair value hierarchy that prioritizes the inputs of valuation techniques used to measure fair value.This hierarchy gives the highest priority to unadjusted quoted prices in active markets for identical assets or liabilities (Level 1 measurements) and the lowest priority to unobservable inputs (Level 3 measurements).
Additionally, GAAP provides guidance on determining whether the volume and activity in a market has decreased significantly and
30
whether such a decrease in activity results in transactions that are not orderly. GAAP requires enhanced disclosures around valuation inputs and techniques used during annual and interim periods.
Various inputs are used in determining the value of the fund s investments relating to fair value measurements. These inputs are summarized in the three broad levels listed below:
| Level 1 unadjusted quoted prices in active markets for identical investments. Level 2 other significant observable inputs (including quoted prices for similar investments, interest rates, prepayment speeds, credit risk, etc.). Level 3 significant unobservable inputs (including the fund s own assumptions in determining the fair value of investments). |
The inputs or methodology used for valuing securities are not necessarily an indication of the risk associated with investing in those securities.
The following is a summary of the inputs used as of October 31, 2009 in valuing the fund s investments:
| Level 1 | Level 2 Other | Level 3 | ||||||
| Unadjusted | Significant | Significant | ||||||
| Quoted | Observable | Unobservable | ||||||
| Prices | Inputs | Inputs | Total | |||||
| Assets ($) | ||||||||
| Investments in Securities: | ||||||||
| Equity Securities | ||||||||
| Domestic | 2,195,744,310 | 2,195,744,310 | ||||||
| U.S. Treasury | ||||||||
| Securities | 4,194,841 | 4,194,841 | ||||||
| Mutual Funds | 170,326,189 | 170,326,189 | ||||||
| Other Financial | ||||||||
| Instruments | ||||||||
| Liabilities ($) | ||||||||
| Other Financial | ||||||||
| Instruments | (293,369) | (293,369) | ||||||
The Fund 31
| NOTES TO FINANCIAL STATEMENTS (continued) |
(b) Securities transactions and investment income: Securities transactions are recorded on a trade date basis. Realized gains and losses from securities transactions are recorded on the identified cost basis. Dividend income is recognized on the ex-dividend date and interest income, including, where applicable, accretion of discount and amortization of premium on investments, is recognized on the accrual basis.
Pursuant to a securities lending agreement with The Bank of New York Mellon, a subsidiary of BNY Mellon and an affiliate of Dreyfus, the fund may lend securities to qualified institutions. It is the fund s policy that, at origination, all loans are secured by collateral of at least 102% of the value of U.S. securities loaned and 105% of the value of foreign securities loaned. Collateral equivalent to at least 100% of the market value of securities on loan is maintained at all times. Collateral is either in the form of cash, which can be invested in certain money market mutual funds managed by the Manager, U.S. Government and Agency securities or letters of credit.The fund is entitled to receive all income on securities loaned, in addition to income earned as a result of the lending transaction. Although each security loaned is fully collateralized, the fund bears the risk of delay in recovery of, or loss of rights in, the securities loaned s hould a borrower fail to return the securities in a timely manner. During the period ended October 31, 2009,The Bank of New York Mellon earned $491,605 from lending fund portfolio securities, pursuant to the securities lending agreement.
(c) Affiliated issuers: Investments in other investment companies advised by the Manager are defined as affiliated in the Act.
(d) Dividends to shareholders: Dividends are recorded on the ex-dividend date. Dividends from investment income-net and dividends from net realized capital gains, if any, are normally declared and paid annually, but the fund may make distributions on a more frequent basis to comply with the distribution requirements of the Internal Revenue Code of 1986, as amended (the Code ).To the extent that net realized capital gains can be offset by capital loss carryovers, it is the policy of the fund not to distribute such gains. Income and capital gain distributions are determined in accordance with income tax regulations, which may differ from GAAP.
32
(e) Federal income taxes: It is the policy of the fund to continue to qualify as a regulated investment company, if such qualification is in the best interests of its shareholders, by complying with the applicable provisions of the Code, and to make distributions of taxable income sufficient to relieve it from substantially all federal income and excise taxes.
As of and during the period ended October 31, 2009, the fund did not have any liabilities for any uncertain tax positions.The fund recognizes interest and penalties, if any, related to uncertain tax positions as income tax expense in the Statement of Operations. During the period, the fund did not incur any interest or penalties.
Each of the tax years in the four-year period ended October 31, 2009 remains subject to examination by the Internal Revenue Service and state taxing authorities.
At October 31, 2009, the components of accumulated earnings on a tax basis were as follows: undistributed ordinary income $28,514,172, accumulated capital losses $49,545,241 and unrealized appreciation $391,418,138.
The accumulated capital loss carryover is available for federal income tax purposes to be applied against future net securities profits, if any, realized subsequent to October 31, 2009. If not applied, $9,724,313 of the carryover expires in fiscal 2015, $39,787,647 expires in fiscal 2016 and $33,281 expires in fiscal 2017.
The tax character of distributions paid to shareholders during the fiscal periods ended October 31, 2009 and October 31, 2008 were as follows: ordinary income $50,992,476 and $55,063,795, respectively.
During the period ended October 31, 2009, as a result of permanent book to tax differences, primarily due to the tax treatment for real estate investment trusts, the fund decreased accumulated undistributed investment income-net by $112,870 and increased accumulated net realized gain (loss) on investments by the same amount. Net assets and net asset value per share were not affected by this reclassification.
The Fund 33
| NOTES TO FINANCIAL STATEMENTS (continued) |
NOTE 2 Bank Lines of Credit:
The fund participated with other Dreyfus-managed funds in a $145 million unsecured credit facility led by Citibank, N.A. and a $300 million unsecured credit facility provided by The Bank of New York Mellon (each, a Facility ), each to be utilized primarily for temporary or emergency purposes, including the financing of redemptions. Effective October 14, 2009, the $145 million unsecured credit facility with Citibank, N.A., was increased to $215 million and the fund continues participation in the $300 million unsecured credit facility provided by The Bank of New York Mellon. In connection therewith, the fund has agreed to pay its pro rata portion of Facility fees for each Facility. Interest is charged to the fund based on rates determined pursuant to the terms of the respective Facility at the time of borrowing. During the period ended October 31, 2009, the fund did not borrow under the Facilities.
NOTE 3 Management Fee and Other Transactions With Affiliates:
(a) Pursuant to a management agreement ( Agreement ) with the Manager, the management fee is computed at the annual rate of .25% of the value of the fund s average daily net assets and is payable monthly. Under the terms of the Agreement, the Manager has agreed to pay all the expenses of the fund, except management fees, brokerage fees and commissions, taxes, interest fees, commitment fees, Shareholder Services Plan fees, fees and expenses of non-interested Board members (including counsel fees) and extraordinary expenses. In addition, the Manager is required to reduce its fee in an amount equal to the fund s allocable portion the accrued of fees and expenses of the non-interested Board members (including counsel fees). Each Board member also serves as a Board member of other funds within the Dreyfus complex (collectively, the Fund Group ). Currently, the Company an d 11 other funds (comprised of 33 portfolios) in the Dreyfus Family of Funds pay each Board member their respective allocated portion of an annual retainer of $85,000 and an attendance fee of $10,000 for each regularly scheduled Board meeting, an attendance
34
fee of $2,000 for each separate in-person committee meeting that is not held in conjunction with a regularly scheduled Board meeting and an attendance fee of $1,000 for each Board meeting and separate committee meeting that is conducted by telephone.The Chairman of the Board receives an additional 25% of such compensation and the Audit Committee Chairman receives an additional $15,000 per annum.The Company also reimburses each Board member for travel and out-of-pocket expenses in connection with attending Board or committee meetings. Subject to the Company s Emeritus Program Guidelines, Emeritus Board members, if any, receive 50% of the Company s annual retainer fee and per meeting fee paid at the time the Board member achieves emeritus status.
(b) Under the Shareholder Services Plan, the fund pays the Distributor for the provision of certain services, at the annual rate of .25% of the value of the fund s average daily net assets. The services provided may include personal services relating to shareholder accounts, such as answering shareholder inquiries regarding the fund and providing reports and other information, and services related to the maintenance of shareholder accounts.The Distributor may make payments to Service Agents (a securities dealer, financial institution or other industry professional) in respect of these services. The Distributor determines the amounts to be paid to Service Agents. During the period ended October 31, 2009, the fund was charged $4,965,178 pursuant to the Shareholder Services Plan.
The components of Due to The Dreyfus Corporation and affiliates in the Statement of Assets and Liabilities consist of: management fees $491,566 and shareholder services plan fees $491,566.
NOTE 4 Securities Transactions:
The aggregate amount of purchases and sales of investment securities, excluding short-term securities and financial futures, during the period ended October 31, 2009, amounted to $94,431,277 and $84,531,626, respectively.
The Fund 35
| NOTES TO FINANCIAL STATEMENTS (continued) |
The fund adopted the provisions of ASC Topic 815 Derivatives and Hedging which requires qualitative disclosures about objectives and strategies for using derivatives, quantitative disclosures about fair value amounts of gains and losses on derivative instruments and disclosures about credit-risk-related contingent features in derivative agreements. The disclosure requirements distinguish between derivatives, which are accounted for as hedges and those that do not qualify for hedge accounting. Because investment companies value their derivatives at fair value and recognize changes in fair value through the Statement of Operations, they do not qualify for such accounting. Accordingly, even though a fund s investments in derivatives may represent economic hedges, they are considered to be non-hedge transactions for purposes of this disclosure.
Futures Contracts: In the normal course of pursuing its investment objectives, the fund is exposed to market risk, including equity price risk as a result of changes in value of underlying financial instruments.The fund may invest in financial futures contracts in order to manage its exposure to or protect against changes in the market.A futures contract represents a commitment for the future purchase or a sale of an asset at a specified date. Upon entering into such contracts, these investments require initial margin deposits with a broker, which consist of cash or cash equivalents. The amount of these deposits is determined by the exchange or Board of Trade on which the contract is traded and is subject to change. Accordingly, variation margin payments are received or made to reflect daily unrealized gains or losses which are recorded in the Statement of Operation s. Futures contracts are valued daily at the last sales price established by the Board of Trade or exchange upon which they are traded. When the contracts are closed, the fund recognizes a realized gain or loss. There is minimal counterparty credit risk to the fund with futures, since futures are exchange traded and the exchange s clearinghouse, as counterparty to all exchange traded futures, guarantees the futures against default. Contracts open at October 31, 2009 are set forth in the Statement of Financial Futures.
36
At October 31, 2009, the cost of investments for federal income tax purposes was $1,978,847,202; accordingly, accumulated net unrealized appreciation on investments was $391,418,138, consisting of $787,652,115 gross unrealized appreciation and $396,233,977 gross unrealized depreciation.
NOTE 5 Subsequent Events Evaluation:
Dreyfus has evaluated the need for disclosures and/or adjustments resulting from subsequent events through December 29, 2009, the date the financial statements were issued. This evaluation did not result in any subsequent events that necessitated disclosures and/or adjustments.
The Fund 37
| REPORT OF INDEPENDENT REGISTERED PUBLIC ACCOUNTING FIRM |
| Shareholders and Board of Directors Dreyfus S&P 500 Index Fund |
We have audited the accompanying statement of assets and liabilities, including the statements of investments and financial futures, of Dreyfus S&P 500 Index Fund (one of the series comprising Dreyfus Index Funds, Inc.) as of October 31, 2009, and the related statement of operations for the year then ended, the statement of changes in net assets for each of the two years in the period then ended and financial highlights for each of the three years in the period then ended. These financial statements and financial highlights are the responsibility of the Fund s management. Our responsibility is to express an opinion on these financial statements and financial highlights based on our audits. The financial highlights for each of the years ended October 31, 2006 and 2005 were audited by other auditors whose report dated December 14, 2006, expressed an unqualified opinion on such financial highlights.
We conducted our audits in accordance with the standards of the Public Company Accounting Oversight Board (United States).Those standards require that we plan and perform the audit to obtain reasonable assurance about whether the financial statements and financial highlights are free of material misstatement.We were not engaged to perform an audit of the Fund s internal control over financial reporting. Our audits included consideration of internal control over financial reporting as a basis for designing audit procedures that are appropriate in the circumstances, but not for the purpose of expressing an opinion on the effectiveness of the Fund s internal control over financial reporting. Accordingly, we express no such opinion.An audit also includes examining, on a test basis, evidence supporting the amounts and disclosures in the financial statements and financial highlights, assessing the accounting principles used and significant estimat es made by management, and evaluating the overall financial statement presentation. Our procedures included confirmation of securities owned as of October 31, 2009 by correspondence with the custodian and others. We believe that our audits provide a reasonable basis for our opinion.
In our opinion, the 2009, 2008 and 2007 financial statements and financial highlights referred to above present fairly, in all material respects, the financial position of Dreyfus S&P 500 Index Fund at October 31, 2009, the results of its operations for the year then ended, the changes in its net assets for each of the two years in the period then ended and the financial highlights for each of the three years in the period then ended, in conformity with U.S. generally accepted accounting principles.

| New York, New York December 29, 2009 |
38
IMPORTANT TAX INFORMATION (Unaudited)
In accordance with federal tax law, the fund hereby designates 100% of the ordinary dividends paid during the fiscal year ended October 31, 2009 as qualifying for the corporate dividends received deduction. For the fiscal year ended October 31, 2009, certain dividends paid by the fund may be subject to a maximum tax rate of 15%, as provided for by the Jobs and Growth Tax Relief Reconciliation Act of 2003. Of the distributions paid during the fiscal year, $13,476,849 represents the maximum amount that may be considered qualified dividend income. Shareholders will receive notification in early 2010 of the percentage applicable to the preparation of their 2009 income tax returns.
The Fund 39
BOARD MEMBERS INFORMATION (Unaudited)
40
The Fund 41
BOARD MEMBERS INFORMATION ( Unaudited) (continued)

Once elected all Board Members serve for an indefinite term, but achieve Emeritus status upon reaching age 80.The address of the Board Members and Officers is in c/o The Dreyfus Corporation, 200 Park Avenue, NewYork, NewYork 10166.Additional information about the Board Members is available in the fund s Statement of Additional Information which can be obtained from Dreyfus free of charge by calling this toll free number: 1-800-554-4611.
| John M. Fraser, Jr., Emeritus Board Member Dr. Paul A. Marks, Emeritus Board Member |
42
OFFICERS OF THE FUND (Unaudited)
The Fund 43
OFFICERS OF THE FUND (Unaudited) (continued)
44
For More Information
Ticker Symbol: PEOPX
Telephone 1-800-645-6561
Mail The Dreyfus Family of Funds, 144 Glenn Curtiss Boulevard, Uniondale, NY 11556-0144 E-mail Send your request to info@dreyfus.com Internet Information can be viewed online or downloaded at: http://www.dreyfus.com
The fund files its complete schedule of portfolio holdings with the Securities and Exchange Commission ( SEC ) for the first and third quarters of each fiscal year on Form N-Q. The fund s Forms N-Q are available on the SEC s website at http://www.sec.gov and may be reviewed and copied at the SEC s Public Reference Room in Washington, DC. Information on the operation of the Public Reference Room may be obtained by calling 1-800-SEC-0330.
A description of the policies and procedures that the fund uses to determine how to vote proxies relating to portfolio securities, and information regarding how the fund voted these proxies for the most recent 12-month period ended June 30 is available at http://www.dreyfus.com and on the SEC s website at http://www.sec.gov. The description of the policies and procedures is also available without charge, upon request, by calling 1-800-645-6561.

| Dreyfus Smallcap Stock Index Fund |
| ANNUAL REPORT October 31, 2009 |
Save time. Save paper. View your next shareholder report online as soon as it s available. Log into www.dreyfus.com and sign up for Dreyfus eCommunications. It s simple and only takes a few minutes.
The views expressed in this report reflect those of the portfolio manager only through the end of the period covered and do not necessarily represent the views of Dreyfus or any other person in the Dreyfus organization. Any such views are subject to change at any time based upon market or other conditions and Dreyfus disclaims any responsibility to update such views.These views may not be relied on as investment advice and, because investment decisions for a Dreyfus fund are based on numerous factors, may not be relied on as an indication of trading intent on behalf of any Dreyfus fund.

| Contents | |
| THE FUND | |
| 2 | A Letter from the Chairman and CEO |
| 3 | Discussion of Fund Performance |
| 6 | Fund Performance |
| 7 | Understanding Your Fund s Expenses |
| 7 | Comparing Your Fund s Expenses With Those of Other Funds |
| 8 | Statement of Investments |
| 26 | Statement of Financial Futures |
| 27 | Statement of Assets and Liabilities |
| 28 | Statement of Operations |
| 29 | Statement of Changes in Net Assets |
| 30 | Financial Highlights |
| 31 | Notes to Financial Statements |
| 40 | Report of Independent Registered Public Accounting Firm |
| 41 | Important Tax Information |
| 42 | Board Members Information |
| 45 | Officers of the Fund |
| FOR MORE INFORMATION | |
| Back Cover | |
| Dreyfus Smallcap Stock Index Fund |
The Fund

A LETTER FROM THE CHAIRMAN AND CEO
Dear Shareholder:
We are pleased to present this annual report for Dreyfus Smallcap Stock Index Fund, covering the 12-month period from November 1, 2008, through October 31, 2009.
Reports of positive economic growth over the third quarter of 2009 may have signaled the end of the deep recession that technically began in December 2007. Signs that the U.S. economy finally has turned a corner include inventory rebuilding among manufacturers, improvements in home sales and prices, and an increase in consumer spending.These and other positive developments helped fuel a sustained stock market rally since the early spring, with the most beaten-down securities generally leading the rebound. Higher-quality stocks have participated in the rally, but have so far lagged on a relative performance basis.
In our judgment, the financial markets currently appear poised to enter into a new phase in which underlying fundamentals, not bargain hunting, are likely to drive investment returns. Of course, the best strategy for your portfolio depends not only on your view of the economy s direction, but on your current financial needs, future goals and attitudes toward risk.Your financial advisor can help you decide which investments have the potential to benefit from a recovery while guarding against the risks that may accompany unexpected market developments.
For information about how the fund performed during the reporting period, as well as market perspectives, we have provided a Discussion of Fund Performance.
Thank you for your continued confidence and support.
| Jonathan R. Baum Chairman and Chief Executive Officer The Dreyfus Corporation November 16, 2009 |
2

DISCUSSION OF FUND PERFORMANCE
For the period of November 1, 2008, through October 31, 2009, as provided by Thomas Durante, CFA, Portfolio Manager
Fund and Market Performance Overview
For the 12-month period ended October 31, 2009, Dreyfus Smallcap Stock Index Fund produced a total return of 5.43%.1 In comparison, the Standard & Poor s SmallCap 600 Index (the S&P 600 Index ), the fund s benchmark, produced a 5.56% return for the same period.2,3
Small-cap stocks fell sharply over the first five months of an especially volatile reporting period, but they went on to recover all of those losses and more during a rally that began in March 2009 and continued through the reporting period s end. The difference in returns between the fund and its benchmark was primarily due to transaction costs and fund operating expenses that are not reflected in the bench-mark s return.
The Fund s Investment Approach
The fund seeks to match the total return of the S&P 600 Index by generally investing in a representative sample of the stocks listed in the S&P 600 Index. The S&P 600 Index is composed of 600 domestic stocks across 10 economic sectors. Each stock is weighted by its market capitalization; that is, larger companies have greater representation in the S&P 600 Index than smaller ones.The fund may also use stock index futures as a substitute for the sale or purchase of stocks.
Equity Markets Bottomed in March, Then Surged Higher
The reporting period began in the midst of the most severe recession since the 1930s, which had been exacerbated by a credit crisis that nearly led to the collapse of the global banking system. In the weeks prior to the start of the reporting period, the U.S. government effectively nationalized insurer AIG and mortgage agencies Fannie Mae and Freddie Mac; Lehman Brothers filed for bankruptcy; and other major firms were sold to former rivals. Congress passed the $700 billion
The Fund 3
| DISCUSSION OF FUND PERFORMANCE (continued) |
Troubled Assets Relief Program (TARP), and the Federal Reserve Board (the Fed ) pumped liquidity into the system to shore up the nation s banks.
As the reporting period began, job losses continued to mount, and consumer confidence plunged. In November 2008, The National Bureau of Economic Research officially declared that the U.S. economy had been in a recession since late 2007. The Fed subsequently reduced its target for the overnight federal funds rate to a range between 0% and 0.25%, where it remained through the balance of the reporting period.
The U.S. economy continued to weaken in early 2009. Home prices fell sharply in January, and more than 650,000 jobs per month were lost in February and March, driving the unemployment rate higher. Meanwhile, consumer confidence reached its lowest level since recordkeeping began in 1967. In an effort to stimulate the economy, the U.S. government enacted the $787 billion American Recovery and Reinvestment Act and took steps to rescue the nation s major automakers.
After bottoming in early March, the S&P 600 Index staged an impressive and sustained rebound.The equity markets were buoyed by signs that the remedial programs implemented by government and monetary authorities were gaining traction. By the end of the reporting period, stock prices and commodity prices had risen sharply, consumer and corporate sentiment had improved, and the U.S. recession appeared to be nearing a conclusion.
Consumer and Technology Stocks Enjoyed a Strong Rebound
Some of the S&P 600 Index s better performers during the reporting period stemmed from the consumer discretionary area, where stocks rebounded from the steep declines of late 2008. In addition, many companies benefited from cost-cutting measures and promotional programs designed to entice customers.This was especially true for clothing retailers and restaurants, the latter of which also benefited from reduced food prices. Other winners in the consumer discretionary sector included furniture rental companies, automotive retailers and casino and gaming firms.
| 4 |
Gains in the technology sector can be attributed to semiconductor equipment producers and software developers that cut costs by halting production early in the downturn, selling off unsold inventories at reduced prices and waiting for demand to return before restocking. Materials stocks also posted relatively strong results, particularly chemical producers that benefited from reduced raw materials costs.
On the other hand, the financials sector suffered declines over the reporting period, as regional banks, thrifts, finance companies, mortgage providers and insurance companies with mortgage-related businesses faltered. In many cases, smaller banks also were saddled with substantial exposure to local commercial real estate markets. Finally, utilities stocks were hurt by the weakened economy as factory and plant closings resulted in lower demand for electricity.
Index Investing Offers Diversification Benefits
As an index portfolio, our strategy is to attempt to replicate the returns of the S&P 600 Index by investing in a representative sample of the small-cap stocks listed in the S&P 600 Index.The fund offers a diversified investment vehicle that can help investors manage the risks of investing in small-cap stocks by limiting the impact on the overall portfolio of unexpected losses in any single industry group or holding.
November 16, 2009
| 1 | Total return includes reinvestment of dividends and any capital gains paid. Past performance is no | |
| guarantee of future results. Share price and investment return fluctuate such that upon redemption, | ||
| fund shares may be worth more or less than their original cost. Return figure provided reflects the | ||
| absorption of certain fund expenses by The Dreyfus Corporation pursuant to an agreement in | ||
| effect that may be extended, terminated or modified. Had these expenses not been absorbed, the | ||
| fund s return would have been lower. | ||
| 2 | SOURCE: LIPPER INC. Reflects the reinvestment of dividends and, where applicable, | |
| capital gain distributions.The Standard & Poor s SmallCap 600 Index is a broad-based index | ||
| and a widely accepted, unmanaged index of overall small-cap stock market performance. | ||
| 3 | Standard & Poor s®, S&P®, and Standard & Poor s SmallCap 600 Index are trademarks | |
| of The McGraw-Hill Companies, Inc., and have been licensed for use by the fund.The fund is | ||
| not sponsored, endorsed, sold or promoted by Standard & Poor s and Standard & Poor s makes no | ||
| representation regarding the advisability of investing in the fund. |
The Fund 5
| FUND PERFORMANCE |
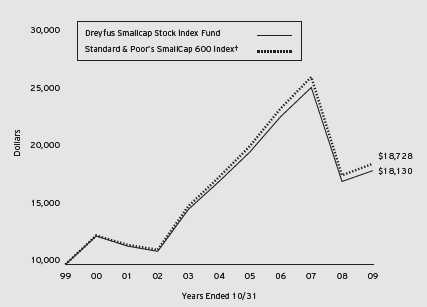
Comparison of change in value of $10,000 investment in Dreyfus Smallcap Stock Index Fund and the Standard & Poor s SmallCap 600 Index
| Average Annual Total Returns as of 10/31/09 | ||||||
| 1 Year | 5 Years | 10 Years | ||||
| Fund | 5.43% | 1.06% | 6.13% | |||

6
UNDERSTANDING YOUR FUND’S EXPENSES (Unaudited)
As a mutual fund investor, you pay ongoing expenses, such as management fees and other expenses. Using the information below, you can estimate how these expenses affect your investment and compare them with the expenses of other funds.You also may pay one-time transaction expenses, including sales charges (loads) and redemption fees, which are not shown in this section and would have resulted in higher total expenses. For more information, see your fund’s prospectus or talk to your financial adviser.
Review your fund’s expenses
The table below shows the expenses you would have paid on a $1,000 investment in Dreyfus Smallcap Stock Index Fund from May 1, 2009 to October 31, 2009. It also shows how much a $1,000 investment would be worth at the close of the period, assuming actual returns and expenses.
| Expenses and Value of a $1,000 Investment assuming actual returns for the six months ended October 31, 2009 |
| Expenses paid per $1,000† | $2.71 | |
| Ending value (after expenses) | $1,150.70 |
| COMPARING YOUR FUND’S EXPENSES WITH THOSE OF OTHER FUNDS (Unaudited) |
Using the SEC’s method to compare expenses
The Securities and Exchange Commission (SEC) has established guidelines to help investors assess fund expenses. Per these guidelines, the table below shows your fund’s expenses based on a $1,000 investment, assuming a hypothetical 5% annualized return. You can use this information to compare the ongoing expenses (but not transaction expenses or total cost) of investing in the fund with those of other funds.All mutual fund shareholder reports will provide this information to help you make this comparison. Please note that you cannot use this information to estimate your actual ending account balance and expenses paid during the period.
| Expenses and Value of a $1,000 Investment assuming a hypothetical 5% annualized return for the six months ended October 31, 2009 |
| Expenses paid per $1,000† | $2.55 | |
| Ending value (after expenses) | $1,022.68 |
† Expenses are equal to the fund’s annualized expense ratio of .50%, multiplied by the average account value over the
period, multiplied by 184/365 (to reflect the one-half year period).
The Fund 7
| STATEMENT OF INVESTMENTS October 31, 2009 |
| Common Stocks 98.9% | Shares | Value ($) | ||
| Consumer Discretionary 14.8% | ||||
| American Public Education | 35,249 a | 1,124,443 | ||
| Arbitron | 55,797 b | 1,209,679 | ||
| Arctic Cat | 22,287 b | 132,385 | ||
| Audiovox, Cl. A | 37,542 a | 242,521 | ||
| Big 5 Sporting Goods | 46,114 | 680,181 | ||
| BJ s Restaurants | 46,009 a | 734,304 | ||
| Blue Nile | 33,426 a,b | 2,007,231 | ||
| Brown Shoe | 90,806 | 941,658 | ||
| Brunswick | 200,089 | 1,896,844 | ||
| Buckle | 52,078 b | 1,562,861 | ||
| Buffalo Wild Wings | 39,577 a,b | 1,623,053 | ||
| Cabela s | 85,474 a,b | 1,074,408 | ||
| California Pizza Kitchen | 57,195 a | 742,963 | ||
| Capella Education | 30,815 a,b | 2,123,153 | ||
| Carter s | 124,071 a | 2,928,076 | ||
| Cato, Cl. A | 70,984 | 1,399,095 | ||
| CEC Entertainment | 51,900 a,b | 1,515,999 | ||
| Children s Place Retail Stores | 54,187 a | 1,704,181 | ||
| Christopher & Banks | 73,203 b | 445,806 | ||
| CKE Restaurants | 123,970 | 1,084,737 | ||
| Coinstar | 66,219 a,b | 2,101,791 | ||
| Cracker Barrel Old Country Store | 49,720 b | 1,648,218 | ||
| Crocs | 195,180 a | 1,186,694 | ||
| Deckers Outdoor | 29,780 a | 2,670,373 | ||
| DineEquity | 35,667 a,b | 754,714 | ||
| Dress Barn | 103,290 a,b | 1,864,384 | ||
| Drew Industries | 40,132 a | 768,126 | ||
| E.W. Scripps, Cl. A | 83,549 a,b | 531,372 | ||
| Ethan Allen Interiors | 57,626 b | 718,020 | ||
| Finish Line, Cl. A | 127,080 | 1,288,591 | ||
| Fred s, Cl. A | 90,344 b | 1,069,673 | ||
| Genesco | 43,500 a,b | 1,134,045 | ||
| Group 1 Automotive | 55,563 b | 1,412,411 | ||
| Gymboree | 64,963 a | 2,765,475 | ||
| Haverty Furniture | 40,659 a,b | 492,380 | ||
| Helen of Troy | 63,303 a | 1,445,840 | ||
| Hibbett Sports | 61,827 a,b | 1,158,638 |
8
| Common Stocks (continued) | Shares | Value ($) | ||
| Consumer Discretionary (continued) | ||||
| Hillenbrand | 129,459 | 2,586,591 | ||
| Hot Topic | 100,703 a,b | 775,413 | ||
| HSN | 87,889 a | 1,313,062 | ||
| Iconix Brand Group | 148,034 a,b | 1,726,076 | ||
| Interval Leisure Group | 81,559 a | 910,198 | ||
| Jack in the Box | 124,213 a | 2,330,236 | ||
| JAKKS Pacific | 58,756 a,b | 836,098 | ||
| Jo-Ann Stores | 59,044 a,b | 1,571,751 | ||
| JoS. A. Bank Clothiers | 42,007 a,b | 1,721,447 | ||
| K-Swiss, Cl. A | 54,730 b | 446,597 | ||
| Kid Brands | 33,442 a | 166,207 | ||
| La-Z-Boy | 116,479 b | 827,001 | ||
| Landry s Restaurants | 24,447 a,b | 266,472 | ||
| Lithia Motors, Cl. A | 41,260 a | 344,108 | ||
| Live Nation | 173,519 a | 1,155,637 | ||
| Liz Claiborne | 213,064 b | 1,222,987 | ||
| M/I Homes | 42,195 a | 471,318 | ||
| Maidenform Brands | 42,540 a | 597,262 | ||
| Marcus | 49,099 | 574,458 | ||
| Men s Wearhouse | 115,444 b | 2,674,837 | ||
| Meritage Homes | 69,692 a | 1,271,182 | ||
| Midas | 31,035 a | 250,142 | ||
| Monarch Casino & Resort | 23,208 a,b | 161,064 | ||
| Monro Muffler Brake | 42,531 | 1,318,036 | ||
| Movado Group | 39,501 b | 413,970 | ||
| Multimedia Games | 52,008 a | 255,359 | ||
| National Presto Industries | 11,971 | 1,040,639 | ||
| Nautilus | 31,939 a | 57,171 | ||
| NutriSystem | 67,878 b | 1,460,735 | ||
| O Charleys | 45,853 a | 321,430 | ||
| OfficeMax | 162,897 a | 1,861,913 | ||
| Oxford Industries | 34,318 b | 664,053 | ||
| P.F. Chang s China Bistro | 53,247 a,b | 1,554,280 | ||
| Papa John s International | 45,797 a | 1,030,433 | ||
| Peet s Coffee & Tea | 24,803 a | 843,302 | ||
| PEP Boys-Manny Moe & Jack | 89,544 | 785,301 | ||
| Perry Ellis International | 24,744 a | 338,250 |
The Fund 9
| STATEMENT OF INVESTMENTS (continued) |
| Common Stocks (continued) | Shares | Value ($) | ||
| Consumer Discretionary (continued) | ||||
| PetMed Express | 50,352 b | 790,023 | ||
| Pinnacle Entertainment | 130,723 a,b | 1,104,609 | ||
| Polaris Industries | 73,880 b | 3,108,132 | ||
| Pool | 102,921 b | 2,015,193 | ||
| Pre-Paid Legal Services | 16,232 a | 641,813 | ||
| Quiksilver | 262,642 a | 522,658 | ||
| RC2 | 42,687 a | 557,492 | ||
| Red Robin Gourmet Burgers | 36,358 a | 607,542 | ||
| Ruby Tuesday | 133,183 a | 886,999 | ||
| Ruth s Hospitality Group | 41,212 a | 128,169 | ||
| Shuffle Master | 116,540 a | 910,177 | ||
| Skechers USA, Cl. A | 69,869 a | 1,524,542 | ||
| Skyline | 16,963 | 296,683 | ||
| Sonic | 127,736 a,b | 1,194,332 | ||
| Sonic Automotive, Cl. A | 83,802 b | 749,190 | ||
| Spartan Motors | 80,057 | 399,484 | ||
| Stage Stores | 84,143 | 992,887 | ||
| Stamps.com | 28,963 a | 290,789 | ||
| Standard Motor Products | 33,749 | 282,142 | ||
| Standard-Pacific | 197,232 a | 591,696 | ||
| Steak n Shake | 62,250 a,b | 725,213 | ||
| Stein Mart | 31,315 a | 297,493 | ||
| Sturm Ruger & Co. | 45,507 b | 483,284 | ||
| Superior Industries International | 54,224 | 720,095 | ||
| Texas Roadhouse | 108,234 a,b | 1,024,976 | ||
| Ticketmaster Entertainment | 99,746 a | 962,549 | ||
| Tractor Supply | 71,677 a,b | 3,203,962 | ||
| True Religion Apparel | 49,053 a,b | 1,264,096 | ||
| Tuesday Morning | 70,389 a | 227,356 | ||
| Tween Brands | 53,500 a | 453,680 | ||
| UniFirst | 34,770 | 1,462,774 | ||
| Universal Electronics | 30,673 a | 631,864 | ||
| Universal Technical Institute | 42,835 a,b | 770,602 | ||
| Volcom | 35,549 a,b | 590,469 | ||
| Winnebago Industries | 56,126 a,b | 645,449 | ||
| Wolverine World Wide | 105,153 | 2,689,814 | ||
| Zale | 69,837 a,b | 330,329 |
10
| Common Stocks (continued) | Shares | Value ($) | ||
| Consumer Discretionary (continued) | ||||
| Zumiez | 43,142 a,b | 581,123 | ||
| 118,989,019 | ||||
| Consumer Staples 4.1% | ||||
| Alliance One International | 207,615 a,b | 915,582 | ||
| Andersons | 41,733 b | 1,294,975 | ||
| Boston Beer, Cl. A | 21,784 a,b | 827,792 | ||
| Cal-Maine Foods | 27,000 | 733,050 | ||
| Casey s General Stores | 114,617 | 3,613,874 | ||
| Central Garden & Pet, Cl. A | 164,897 a,b | 1,559,926 | ||
| Chattem | 42,451 a,b | 2,690,120 | ||
| Darling International | 181,075 a | 1,258,471 | ||
| Diamond Foods | 36,919 b | 1,113,108 | ||
| Great Atlantic & Pacific Tea | 63,422 a,b | 628,512 | ||
| Green Mountain Coffee Roasters | 75,509 a,b | 5,025,124 | ||
| Hain Celestial Group | 86,627 a,b | 1,519,438 | ||
| J & J Snack Foods | 31,240 | 1,223,671 | ||
| Lance | 65,731 | 1,585,432 | ||
| Mannatech | 30,106 | 102,360 | ||
| Nash Finch | 29,853 | 865,140 | ||
| Sanderson Farms | 39,134 b | 1,431,913 | ||
| Spartan Stores | 53,270 | 754,303 | ||
| TreeHouse Foods | 70,147 a,b | 2,623,498 | ||
| United Natural Foods | 92,393 a,b | 2,227,595 | ||
| WD-40 | 35,334 | 1,112,668 | ||
| 33,106,552 | ||||
| Energy 5.9% | ||||
| Atwood Oceanics | 119,716 a,b | 4,248,721 | ||
| Basic Energy Services | 50,966 a,b | 356,762 | ||
| Bristow Group | 78,356 a | 2,284,077 | ||
| CARBO Ceramics | 41,438 b | 2,419,565 | ||
| Dril-Quip | 64,884 a | 3,152,714 | ||
| Gulf Island Fabrication | 32,908 | 629,201 | ||
| Holly | 88,486 b | 2,566,979 | ||
| Hornbeck Offshore Services | 52,832 a | 1,284,346 | ||
| ION Geophysical | 203,045 a | 777,662 | ||
| Lufkin Industries | 33,343 b | 1,902,218 | ||
| Matrix Service | 55,953 a | 496,303 |
The Fund 11
| STATEMENT OF INVESTMENTS (continued) |
| Common Stocks (continued) | Shares | Value ($) | ||
| Energy (continued) | ||||
| NATCO Group, Cl. A | 43,613 a | 1,905,016 | ||
| Oil States International | 107,871 a | 3,715,077 | ||
| Penn Virginia | 99,353 | 2,011,898 | ||
| Petroleum Development | 40,814 a | 681,594 | ||
| PetroQuest Energy | 101,088 a,b | 619,669 | ||
| Pioneer Drilling | 116,922 a | 782,208 | ||
| SEACOR Holdings | 44,860 a | 3,645,772 | ||
| Seahawk Drilling | 25,341 a | 684,207 | ||
| St. Mary Land & Exploration | 136,401 | 4,651,274 | ||
| Stone Energy | 99,840 a,b | 1,530,547 | ||
| Superior Well Services | 33,793 a,b | 358,544 | ||
| Swift Energy | 80,106 a,b | 1,696,645 | ||
| Tetra Technologies | 159,351 a | 1,507,460 | ||
| World Fuel Services | 69,061 b | 3,511,752 | ||
| 47,420,211 | ||||
| Financial 18.9% | ||||
| Acadia Realty Trust | 82,957 b,c | 1,319,016 | ||
| American Physicians Capital | 21,881 | 618,795 | ||
| Amerisafe | 41,880 a | 776,455 | ||
| Bank Mutual | 101,416 | 711,940 | ||
| Bank of the Ozarks | 26,441 b | 601,533 | ||
| BioMed Realty Trust | 205,119 c | 2,783,465 | ||
| Boston Private Financial Holdings | 131,234 | 780,842 | ||
| Brookline Bancorp | 127,833 | 1,251,485 | ||
| Cash America International | 66,897 | 2,024,303 | ||
| Cedar Shopping Centers | 97,590 b,c | 592,371 | ||
| Central Pacific Financial | 60,332 b | 85,068 | ||
| Colonial Properties Trust | 145,972 c | 1,537,085 | ||
| Columbia Banking System | 58,620 b | 861,714 | ||
| Community Bank System | 79,205 b | 1,474,005 | ||
| Delphi Financial Group, Cl. A | 105,629 | 2,292,149 | ||
| DiamondRock Hospitality | 232,576 a | 1,769,903 | ||
| Dime Community Bancshares | 55,897 | 614,308 | ||
| East West Bancorp | 200,770 | 1,812,953 | ||
| EastGroup Properties | 57,165 c | 2,104,244 | ||
| eHealth | 53,625 a | 763,084 | ||
| Employers Holdings | 97,838 | 1,449,959 |
12
| Common Stocks (continued) | Shares | Value ($) | ||
| Financial (continued) | ||||
| Entertainment Properties Trust | 80,894 c | 2,752,014 | ||
| Extra Space Storage | 175,997 c | 1,684,291 | ||
| EZCORP, Cl. A | 106,101 a | 1,376,130 | ||
| Financial Federal | 54,795 b | 1,118,914 | ||
| First BanCorp/Puerto Rico | 164,517 b | 310,937 | ||
| First Cash Financial Services | 58,374 a | 1,002,865 | ||
| First Commonwealth Financial | 166,789 | 875,642 | ||
| First Financial Bancorp | 89,882 | 1,139,704 | ||
| First Financial Bankshares | 46,324 b | 2,244,398 | ||
| First Midwest Bancorp | 104,130 | 1,082,952 | ||
| Forestar Group | 76,746 a | 1,132,771 | ||
| Franklin Street Properties | 141,318 b | 1,523,408 | ||
| Glacier Bancorp | 127,755 b | 1,672,313 | ||
| Greenhill & Co. | 40,598 b | 3,500,766 | ||
| Hancock Holding | 60,754 | 2,203,548 | ||
| Hanmi Financial | 75,745 a,b | 115,890 | ||
| Healthcare Realty Trust | 129,562 c | 2,698,776 | ||
| Home Bancshares | 41,278 | 892,843 | ||
| Home Properties | 75,084 b,c | 2,941,791 | ||
| Independent Bank/MA | 47,127 | 1,002,391 | ||
| Independent Bank/MI | 46,358 b | 54,702 | ||
| Infinity Property & Casualty | 29,794 | 1,152,134 | ||
| Inland Real Estate | 147,260 c | 1,263,491 | ||
| Investment Technology Group | 98,224 a | 2,118,692 | ||
| Kilroy Realty | 96,570 b,c | 2,667,263 | ||
| Kite Realty Group Trust | 121,246 c | 449,823 | ||
| LaBranche & Co. | 104,505 a | 288,434 | ||
| LaSalle Hotel Properties | 141,837 c | 2,433,923 | ||
| Lexington Realty Trust | 183,659 c | 769,531 | ||
| LTC Properties | 49,623 c | 1,178,546 | ||
| Medical Properties Trust | 182,121 b,c | 1,456,968 | ||
| Mid-America Apartment Communities | 64,529 | 2,827,661 | ||
| Nara Bancorp | 44,596 | 328,227 | ||
| National Financial Partners | 91,544 a | 746,084 | ||
| National Penn Bancshares | 268,648 b | 1,509,802 | ||
| National Retail Properties | 174,229 c | 3,376,558 | ||
| Navigators Group | 28,874 a | 1,532,343 |
The Fund 13
| STATEMENT OF INVESTMENTS (continued) |
| Common Stocks (continued) | Shares | Value ($) | ||
| Financial (continued) | ||||
| NBT Bankcorp | 72,962 b | 1,590,572 | ||
| Old National Bancorp | 184,403 b | 1,912,259 | ||
| optionsXpress Holdings | 96,938 | 1,515,141 | ||
| Parkway Properties | 49,361 c | 871,222 | ||
| Pennsylvania Real Estate Investment Trust | 96,412 b,c | 706,700 | ||
| Pinnacle Financial Partners | 69,705 a,b | 885,254 | ||
| Piper Jaffray | 38,578 a | 1,789,633 | ||
| Portfolio Recovery Associates | 34,254 a,b | 1,580,480 | ||
| Post Properties | 104,613 | 1,725,068 | ||
| Presidential Life | 48,660 | 453,998 | ||
| PrivateBancorp | 119,707 b | 1,092,925 | ||
| ProAssurance | 71,363 a | 3,588,132 | ||
| Prosperity Bancshares | 101,092 b | 3,618,083 | ||
| PS Business Parks | 38,395 c | 1,880,203 | ||
| Rewards Network | 19,791 | 212,951 | ||
| RLI | 38,122 | 1,906,100 | ||
| S&T Bancorp | 49,864 b | 785,358 | ||
| Safety Insurance Group | 33,755 | 1,129,780 | ||
| Selective Insurance Group | 111,239 | 1,704,181 | ||
| Senior Housing Properties Trust | 279,068 b,c | 5,380,431 | ||
| Signature Bank | 87,239 a | 2,753,263 | ||
| Simmons First National, Cl. A | 29,514 | 863,580 | ||
| South Financial Group | 337,454 | 269,963 | ||
| Sovran Self Storage | 58,783 c | 1,769,368 | ||
| Sterling Bancorp | 43,636 | 293,670 | ||
| Sterling Bancshares | 170,381 | 949,022 | ||
| Sterling Financial | 111,719 a,b | 89,375 | ||
| Stewart Information Services | 41,929 | 374,845 | ||
| Stifel Financial | 63,469 a | 3,297,849 | ||
| Susquehanna Bancshares | 182,488 b | 1,005,509 | ||
| SWS Group | 63,400 | 848,292 | ||
| Tanger Factory Outlet Centers | 87,198 b,c | 3,319,628 | ||
| Tompkins Financial | 17,007 b | 737,594 | ||
| Tower Group | 88,875 | 2,184,548 | ||
| TradeStation Group | 71,448 a | 551,579 | ||
| Trustco Bank | 179,893 b | 1,070,363 | ||
| UCBH Holdings | 253,992 b | 248,912 |
14
| Common Stocks (continued) | Shares | Value ($) | ||
| Financial (continued) | ||||
| UMB Financial | 66,885 | 2,660,016 | ||
| Umpqua Holdings | 182,425 | 1,807,832 | ||
| United Bankshares | 83,566 b | 1,491,653 | ||
| United Community Banks | 169,148 a,b | 686,741 | ||
| United Fire & Casualty | 49,480 | 864,910 | ||
| Urstadt Biddle Properties, Cl. A | 44,991 | 664,517 | ||
| Whitney Holding | 202,318 b | 1,624,614 | ||
| Wilshire Bancorp | 42,002 | 295,694 | ||
| Wintrust Financial | 57,953 b | 1,634,854 | ||
| World Acceptance | 41,304 a,b | 1,036,317 | ||
| Zenith National Insurance | 82,662 | 2,358,347 | ||
| 151,732,529 | ||||
| Health Care 12.8% | ||||
| Abaxis | 47,950 a,b | 1,094,219 | ||
| Air Methods | 24,742 a | 755,621 | ||
| Align Technology | 142,755 a | 2,244,109 | ||
| Almost Family | 14,145 a,b | 429,301 | ||
| Amedisys | 61,436 a,b | 2,444,538 | ||
| American Medical Systems Holdings | 165,131 a | 2,546,320 | ||
| AMERIGROUP | 118,529 a | 2,613,564 | ||
| AMN Healthcare Services | 85,246 a | 709,247 | ||
| AmSurg | 70,803 a | 1,491,819 | ||
| Analogic | 30,313 | 1,131,887 | ||
| ArQule | 63,043 a | 211,194 | ||
| Bio-Reference Laboratories | 24,525 a | 792,893 | ||
| Cambrex | 68,855 a | 413,130 | ||
| Catalyst Health Solutions | 82,621 a | 2,591,821 | ||
| Centene | 96,720 a | 1,724,518 | ||
| Chemed | 49,367 b | 2,237,312 | ||
| Computer Programs & Systems | 21,124 b | 892,278 | ||
| CONMED | 61,189 a | 1,296,595 | ||
| Cooper | 98,899 | 2,770,161 | ||
| CorVel | 18,192 a | 518,472 | ||
| Cross Country Healthcare | 71,128 a | 587,517 | ||
| CryoLife | 58,412 a | 350,472 | ||
| Cubist Pharmaceuticals | 133,519 a | 2,261,812 | ||
| Cyberonics | 52,739 a | 762,606 |
The Fund 15
| STATEMENT OF INVESTMENTS (continued) |
| Common Stocks (continued) | Shares | Value ($) | ||
| Health Care (continued) | ||||
| Dionex | 39,084 a | 2,653,022 | ||
| Eclipsys | 123,878 a | 2,322,712 | ||
| Enzo Biochem | 67,495 a | 371,897 | ||
| eResearch Technology | 100,261 a | 741,931 | ||
| Genoptix | 27,059 a,b | 941,383 | ||
| Gentiva Health Services | 65,104 a,b | 1,562,496 | ||
| Greatbatch | 48,878 a,b | 961,430 | ||
| Haemonetics | 56,311 a | 2,900,017 | ||
| Hanger Orthopedic Group | 64,283 a | 889,677 | ||
| HealthSpring | 109,825 a | 1,573,792 | ||
| Healthways | 71,290 a | 1,146,343 | ||
| HMS Holdings | 54,907 a | 2,357,157 | ||
| ICU Medical | 28,722 a,b | 1,005,270 | ||
| Integra LifeSciences Holdings | 45,127 a,b | 1,378,179 | ||
| Invacare | 74,093 b | 1,661,906 | ||
| Inventiv Health | 73,357 a | 1,245,602 | ||
| IPC The Hospitalist | 22,450 a | 680,235 | ||
| Kendle International | 37,944 a | 640,495 | ||
| Kensey Nash | 27,446 a | 656,234 | ||
| Landauer | 21,062 | 1,090,801 | ||
| LCA-Vision | 41,315 a | 185,917 | ||
| LHC Group | 34,384 a | 959,657 | ||
| Magellan Health Services | 80,644 a | 2,591,092 | ||
| Martek Biosciences | 73,883 a,b | 1,326,939 | ||
| MedCath | 43,216 a | 354,803 | ||
| MEDNAX | 100,793 a | 5,233,173 | ||
| Meridian Bioscience | 85,417 b | 1,895,403 | ||
| Merit Medical Systems | 58,194 a | 988,134 | ||
| Molina Healthcare | 33,637 a,b | 629,685 | ||
| MWI Veterinary Supply | 27,486 a,b | 973,004 | ||
| Natus Medical | 57,593 a | 799,967 | ||
| Neogen | 32,613 a | 1,033,832 | ||
| Odyssey HealthCare | 72,648 a | 1,012,713 | ||
| Omnicell | 64,706 a | 636,707 | ||
| Osteotech | 37,950 a | 163,944 | ||
| Palomar Medical Technologies | 38,754 a | 393,741 | ||
| Par Pharmaceutical Cos. | 78,894 a | 1,654,407 |
16
| Common Stocks (continued) | Shares | Value ($) | ||
| Health Care (continued) | ||||
| PAREXEL International | 124,403 a | 1,557,526 | ||
| PharMerica | 65,203 a,b | 1,006,082 | ||
| Phase Forward | 90,518 a | 1,186,691 | ||
| PSS World Medical | 128,601 a,b | 2,600,312 | ||
| Quality Systems | 40,164 b | 2,450,807 | ||
| Regeneron Pharmaceuticals | 137,200 a,b | 2,154,040 | ||
| RehabCare Group | 41,439 a | 776,981 | ||
| Res-Care | 53,699 a | 645,999 | ||
| Salix Pharmaceuticals | 102,296 a | 1,881,223 | ||
| Savient Pharmaceuticals | 118,531 a,b | 1,493,491 | ||
| SurModics | 35,826 a,b | 917,504 | ||
| Symmetry Medical | 76,540 a | 610,024 | ||
| Theragenics | 77,716 a | 104,917 | ||
| ViroPharma | 171,008 a,b | 1,289,400 | ||
| West Pharmaceutical Services | 70,832 | 2,795,739 | ||
| Zoll Medical | 48,464 a | 941,171 | ||
| 102,897,010 | ||||
| Industrial 16.8% | ||||
| A.O. Smith | 48,921 | 1,938,739 | ||
| AAON | 28,315 b | 509,953 | ||
| AAR | 81,190 a,b | 1,592,136 | ||
| ABM Industries | 97,216 | 1,825,716 | ||
| Actuant, Cl. A | 142,387 | 2,222,661 | ||
| Acuity Brands | 94,442 b | 2,990,034 | ||
| Administaff | 48,305 | 1,198,930 | ||
| Aerovironment | 33,784 a | 900,681 | ||
| Albany International, Cl. A | 58,494 | 974,510 | ||
| American Science & Engineering | 19,913 | 1,316,648 | ||
| Apogee Enterprises | 69,750 | 923,490 | ||
| Applied Industrial Technologies | 76,736 | 1,552,369 | ||
| Applied Signal Technology | 27,208 | 557,492 | ||
| Arkansas Best | 56,205 b | 1,451,213 | ||
| Astec Industries | 42,265 a,b | 972,095 | ||
| ATC Technology | 45,597 a | 952,977 | ||
| AZZ | 27,619 a | 946,227 | ||
| Badger Meter | 32,564 b | 1,213,660 | ||
| Baldor Electric | 102,250 b | 2,643,162 |
The Fund 17
| STATEMENT OF INVESTMENTS (continued) |
| Common Stocks (continued) | Shares | Value ($) | ||
| Industrial (continued) | ||||
| Barnes Group | 90,928 b | 1,441,209 | ||
| Belden | 102,187 | 2,345,192 | ||
| Bowne & Co. | 84,266 | 550,257 | ||
| Brady, Cl. A | 112,009 | 3,033,204 | ||
| Briggs & Stratton | 105,567 b | 1,974,103 | ||
| C & D Technologies | 46,422 a,b | 84,952 | ||
| Cascade | 18,192 | 451,889 | ||
| CDI | 30,416 | 370,467 | ||
| Ceradyne | 56,380 a | 908,846 | ||
| CIRCOR International | 38,515 | 1,049,534 | ||
| CLARCOR | 108,758 | 3,200,748 | ||
| Comfort Systems USA | 83,814 | 913,573 | ||
| Consolidated Graphics | 28,324 a | 568,179 | ||
| Cubic | 36,678 | 1,273,093 | ||
| Curtiss-Wright | 97,670 | 2,912,519 | ||
| EMCOR Group | 152,331 a | 3,598,058 | ||
| Encore Wire | 41,508 | 861,291 | ||
| EnPro Industries | 49,140 a,b | 1,109,581 | ||
| ESCO Technologies | 57,826 a | 2,271,405 | ||
| Esterline Technologies | 65,702 a | 2,766,711 | ||
| Exponent | 29,920 a | 778,219 | ||
| Forward Air | 62,246 b | 1,328,330 | ||
| G & K Services, Cl. A | 42,098 | 932,471 | ||
| Gardner Denver | 111,157 a | 3,991,648 | ||
| GenCorp | 109,874 a,b | 817,463 | ||
| Geo Group | 111,639 a | 2,361,165 | ||
| Gibraltar Industries | 59,936 | 648,507 | ||
| Griffon | 111,435 a | 977,285 | ||
| Healthcare Services Group | 88,907 | 1,755,913 | ||
| Heartland Express | 113,194 b | 1,539,438 | ||
| Heidrick & Struggles International | 37,546 b | 1,027,259 | ||
| Hub Group, Cl. A | 81,530 a | 2,026,836 | ||
| II-VI | 52,514 a | 1,390,046 | ||
| Insituform Technologies, Cl. A | 80,854 a,b | 1,714,105 | ||
| Interface, Cl. A | 118,961 | 923,137 | ||
| John Bean Technologies | 60,316 | 990,389 | ||
| Kaman | 54,206 | 1,119,896 | ||
| Kaydon | 73,579 b | 2,574,529 |
18
| Common Stocks (continued) | Shares | Value ($) | ||
| Industrial (continued) | ||||
| Knight Transportation | 119,425 b | 1,915,577 | ||
| Lawson Products | 9,558 | 148,627 | ||
| Lindsay | 28,838 b | 946,752 | ||
| Lydall | 40,000 a | 200,000 | ||
| Magnetek | 37,153 a | 46,441 | ||
| Mobile Mini | 75,843 a,b | 1,099,724 | ||
| Moog, Cl. A | 98,535 a | 2,460,419 | ||
| Mueller Industries | 83,134 | 1,966,950 | ||
| NCI Building Systems | 65,416 a | 128,215 | ||
| Old Dominion Freight Line | 58,870 a,b | 1,530,031 | ||
| On Assignment | 81,072 a | 489,675 | ||
| Orbital Sciences | 127,916 a | 1,647,558 | ||
| Quanex Building Products | 78,232 | 1,163,310 | ||
| Regal-Beloit | 77,872 b | 3,650,639 | ||
| Robbins & Myers | 72,194 b | 1,674,901 | ||
| School Specialty | 37,066 a,b | 824,719 | ||
| Simpson Manufacturing | 80,963 | 1,893,725 | ||
| SkyWest | 127,756 | 1,784,751 | ||
| Spherion | 113,815 a | 563,384 | ||
| Standard Register | 37,523 | 178,985 | ||
| Standex International | 27,735 | 487,581 | ||
| Stanley | 29,185 a | 824,476 | ||
| Sykes Enterprises | 71,778 a | 1,704,010 | ||
| Teledyne Technologies | 78,850 a | 2,693,516 | ||
| Tetra Tech | 128,012 a | 3,293,749 | ||
| Toro | 78,389 b | 2,901,961 | ||
| Tredegar | 43,004 | 586,145 | ||
| Triumph Group | 37,396 b | 1,750,507 | ||
| TrueBlue | 95,069 a | 1,150,335 | ||
| United Stationers | 52,892 a | 2,493,329 | ||
| Universal Forest Products | 37,585 b | 1,341,033 | ||
| Viad | 46,113 | 806,978 | ||
| Vicor | 37,801 a | 257,803 | ||
| Volt Information Sciences | 22,979 a | 186,360 | ||
| Watsco | 63,325 b | 3,243,507 | ||
| Watts Water Technologies, Cl. A | 65,095 b | 1,838,934 | ||
| 135,138,747 |
The Fund 19
| STATEMENT OF INVESTMENTS (continued) |
| Common Stocks (continued) | Shares | Value ($) | ||
| Information Technology 17.0% | ||||
| Actel | 53,353 a | 635,968 | ||
| Adaptec | 297,853 a | 950,151 | ||
| Advanced Energy Industries | 67,136 a | 819,731 | ||
| Agilysys | 46,490 b | 218,968 | ||
| Anixter International | 66,918 a,b | 2,800,518 | ||
| Arris Group | 279,788 a,b | 2,870,625 | ||
| ATMI | 69,764 a | 1,056,925 | ||
| Avid Technology | 66,545 a | 840,463 | ||
| Bel Fuse, Cl. B | 27,512 | 497,967 | ||
| Benchmark Electronics | 143,111 a | 2,404,265 | ||
| Black Box | 40,498 | 1,073,602 | ||
| Blackbaud | 92,604 b | 2,054,883 | ||
| Blue Coat Systems | 86,238 a | 1,921,383 | ||
| Brightpoint | 121,633 a | 896,435 | ||
| Brooks Automation | 136,785 a | 941,081 | ||
| Cabot Microelectronics | 52,706 a | 1,685,538 | ||
| CACI International, Cl. A | 65,726 a | 3,129,872 | ||
| Checkpoint Systems | 84,385 a | 1,145,104 | ||
| CIBER | 139,119 a | 447,963 | ||
| Cognex | 83,342 | 1,340,973 | ||
| Cohu | 46,209 | 525,858 | ||
| Commvault Systems | 88,703 a | 1,747,449 | ||
| comScore | 40,555 a,b | 621,708 | ||
| Comtech Telecommunications | 62,080 a,b | 1,994,010 | ||
| Concur Technologies | 92,767 a,b | 3,306,216 | ||
| CSG Systems International | 87,036 a | 1,422,168 | ||
| CTS | 76,747 | 687,653 | ||
| CyberSource | 148,891 a | 2,438,835 | ||
| Cymer | 66,143 a | 2,264,736 | ||
| Cypress Semiconductor | 343,328 a | 2,894,255 | ||
| Daktronics | 71,505 b | 537,718 | ||
| DealerTrack Holdings | 87,886 a,b | 1,448,361 | ||
| Digi International | 54,924 a | 436,646 | ||
| Diodes | 72,291 a | 1,184,127 | ||
| DSP Group | 55,591 a | 321,316 | ||
| DTS | 38,752 a,b | 1,094,744 | ||
| Ebix | 20,857 a | 1,284,791 |
20
| Common Stocks (continued) | Shares | Value ($) | ||
| Information Technology (continued) | ||||
| Electro Scientific Industries | 58,052 a | 635,089 | ||
| EMS Technologies | 33,613 a | 585,875 | ||
| Epicor Software | 127,640 a | 985,381 | ||
| EPIQ Systems | 74,058 a | 933,871 | ||
| Exar | 96,238 a | 664,042 | ||
| FARO Technologies | 36,091 a | 557,967 | ||
| FEI | 81,640 a | 1,943,848 | ||
| Forrester Research | 32,692 a | 828,088 | ||
| Gerber Scientific | 47,929 a | 221,432 | ||
| Harmonic | 204,343 a | 1,072,801 | ||
| Heartland Payment Systems | 58,133 | 714,455 | ||
| Hittite Microwave | 40,995 a,b | 1,508,616 | ||
| Hutchinson Technology | 53,426 a | 310,939 | ||
| Infospace | 75,945 a | 650,849 | ||
| Insight Enterprises | 103,906 a | 1,093,091 | ||
| Integral Systems | 32,647 a | 274,235 | ||
| Intermec | 103,753 a | 1,278,237 | ||
| Intevac | 43,299 a | 441,650 | ||
| j2 Global Communications | 101,105 a,b | 2,067,597 | ||
| JDA Software Group | 63,015 a | 1,250,218 | ||
| Keithley Instruments | 27,984 | 91,228 | ||
| Knot | 59,088 a | 630,469 | ||
| Kopin | 156,935 a | 696,791 | ||
| Kulicke & Soffa Industries | 149,462 a,b | 694,998 | ||
| Littelfuse | 49,927 a | 1,375,988 | ||
| LoJack | 51,541 a | 217,503 | ||
| Manhattan Associates | 52,697 a | 1,209,396 | ||
| MAXIMUS | 37,808 | 1,748,998 | ||
| Mercury Computer Systems | 49,370 a | 528,259 | ||
| Methode Electronics | 90,719 | 657,713 | ||
| Micrel | 102,075 | 762,500 | ||
| Microsemi | 172,097 a,b | 2,290,611 | ||
| MKS Instruments | 104,668 a | 1,637,008 | ||
| MTS Systems | 35,026 | 928,189 | ||
| NETGEAR | 73,754 a | 1,344,535 | ||
| NetScout Systems | 73,950 a | 908,846 | ||
| Network Equipment Technologies | 53,482 a | 176,491 |
The Fund 21
| STATEMENT OF INVESTMENTS (continued) |
| Common Stocks (continued) | Shares | Value ($) | ||
| Information Technology (continued) | ||||
| Newport | 85,086 a | 633,040 | ||
| Novatel Wireless | 73,184 a,b | 652,801 | ||
| Park Electrochemical | 44,808 | 1,007,284 | ||
| PC-Tel | 44,111 a | 258,490 | ||
| Perficient | 70,865 a | 576,841 | ||
| Pericom Semiconductor | 59,007 a | 555,256 | ||
| Phoenix Technologies | 53,509 a | 125,211 | ||
| Plexus | 86,155 a | 2,179,722 | ||
| Progress Software | 91,447 a | 2,112,426 | ||
| Radiant Systems | 59,224 a | 582,764 | ||
| Radisys | 59,131 a,b | 503,205 | ||
| Rogers | 37,433 a | 971,386 | ||
| Rudolph Technologies | 75,536 a | 478,898 | ||
| ScanSource | 60,393 a | 1,533,378 | ||
| Sigma Designs | 65,008 a,b | 780,746 | ||
| Skyworks Solutions | 369,015 a | 3,848,826 | ||
| Smith Micro Software | 65,174 a | 591,780 | ||
| Sonic Solutions | 63,550 a,b | 308,853 | ||
| Standard Microsystems | 51,099 a | 984,167 | ||
| StarTek | 25,855 a | 149,959 | ||
| Stratasys | 41,101 a | 648,574 | ||
| Supertex | 28,733 a | 696,775 | ||
| Symmetricom | 97,066 a | 464,946 | ||
| Synaptics | 75,702 a,b | 1,703,295 | ||
| SYNNEX | 44,489 a,b | 1,144,702 | ||
| Take-Two Interactive Software | 173,067 a | 1,898,545 | ||
| Taleo, Cl. A | 70,413 a,b | 1,530,779 | ||
| Technitrol | 92,938 | 723,987 | ||
| Tekelec | 142,665 a | 2,142,828 | ||
| TeleTech Holdings | 83,826 a | 1,499,647 | ||
| THQ | 146,374 a | 765,536 | ||
| Tollgrade Communications | 43,010 a | 255,910 | ||
| Triquint Semiconductor | 312,463 a | 1,684,176 | ||
| TTM Technologies | 90,954 a | 925,002 | ||
| Tyler Technologies | 59,473 a,b | 1,131,176 | ||
| Ultratech | 48,273 a | 623,687 | ||
| United Online | 189,621 | 1,516,968 | ||
| Varian Semiconductor Equipment Associates | 159,672 a | 4,533,088 |
22
| Common Stocks (continued) | Shares | Value ($) | ||
| Information Technology (continued) | ||||
| Veeco Instruments | 81,978 a,b | 1,996,164 | ||
| ViaSat | 57,883 a | 1,687,289 | ||
| Websense | 100,841 a,b | 1,619,506 | ||
| Wright Express | 90,560 a | 2,527,530 | ||
| 136,415,953 | ||||
| Materials 4.5% | ||||
| A.M. Castle & Co. | 34,021 | 383,417 | ||
| AMCOL International | 48,582 b | 1,265,075 | ||
| American Vanguard | 39,984 | 331,867 | ||
| Arch Chemicals | 54,327 | 1,504,315 | ||
| Balchem | 38,247 | 1,055,235 | ||
| Brush Engineered Materials | 44,017 a | 812,114 | ||
| Buckeye Technologies | 85,537 a | 766,412 | ||
| Calgon Carbon | 115,976 a,b | 1,837,060 | ||
| Century Aluminum | 118,382 a,b | 1,026,372 | ||
| Clearwater Paper | 25,972 a | 1,175,752 | ||
| Deltic Timber | 24,566 b | 1,044,055 | ||
| Eagle Materials | 94,049 b | 2,337,118 | ||
| H.B. Fuller | 103,585 | 1,979,509 | ||
| Headwaters | 88,923 a | 366,363 | ||
| Myers Industries | 60,413 | 529,822 | ||
| Neenah Paper | 32,409 | 335,433 | ||
| NewMarket | 27,653 | 2,585,556 | ||
| Olympic Steel | 22,320 b | 564,696 | ||
| OM Group | 69,501 a,b | 1,877,917 | ||
| Penford | 17,920 | 105,728 | ||
| PolyOne | 233,282 a | 1,301,714 | ||
| Quaker Chemical | 23,770 | 489,662 | ||
| Rock-Tenn, Cl. A | 84,704 | 3,710,035 | ||
| RTI International Metals | 64,011 a | 1,325,668 | ||
| Schulman (A.) | 62,000 | 1,076,940 | ||
| Schweitzer-Mauduit International | 33,442 | 1,727,279 | ||
| Stepan | 18,393 | 1,052,815 | ||
| Texas Industries | 62,206 | 2,070,838 | ||
| Wausau Paper | 99,184 | 869,844 | ||
| Zep | 44,916 | 768,064 | ||
| 36,276,675 |
The Fund 23
| STATEMENT OF INVESTMENTS (continued) |
| Common Stocks (continued) | Shares | Value ($) | ||
| Telecommunication Services .5% | ||||
| Cbeyond | 53,669 a,b | 716,481 | ||
| General Communication, Cl. A | 94,281 a | 579,828 | ||
| Iowa Telecommunications Services | 65,326 b | 768,887 | ||
| Neutral Tandem | 69,103 a | 1,457,382 | ||
| USA Mobility | 49,357 | 537,991 | ||
| 4,060,569 | ||||
| Utilities 3.6% | ||||
| Allete | 60,905 | 2,061,634 | ||
| American States Water | 39,874 | 1,321,823 | ||
| Avista | 125,501 b | 2,379,499 | ||
| Central Vermont Public Service | 23,781 | 461,114 | ||
| CH Energy Group | 35,777 | 1,481,526 | ||
| El Paso Electric | 96,196 a | 1,803,675 | ||
| Laclede Group | 49,755 | 1,527,976 | ||
| New Jersey Resources | 95,007 | 3,344,246 | ||
| Northwest Natural Gas | 57,161 b | 2,389,901 | ||
| Piedmont Natural Gas | 152,808 b | 3,557,370 | ||
| South Jersey Industries | 70,849 | 2,500,261 | ||
| Southwest Gas | 99,779 | 2,493,477 | ||
| UIL Holdings | 68,905 b | 1,769,480 | ||
| UniSource Energy | 79,388 | 2,292,726 | ||
| 29,384,708 | ||||
| Total Common Stocks | ||||
| (cost $919,322,418) | 795,421,973 | |||
| Principal | ||||
| Short-Term Investments .1% | Amount ($) | Value ($) | ||
| U.S. Treasury Bills; | ||||
| 0.10%, 12/17/09 | ||||
| (cost $679,915) | 680,000 d | 679,974 | ||
| Other Investment .9% | Shares | Value ($) | ||
| Registered Investment Company; | ||||
| Dreyfus Institutional Preferred | ||||
| Plus Money Market Fund | ||||
| (cost $7,316,000) | 7,316,000 e | 7,316,000 | ||
24
| Investment of Cash Collateral | ||||
| for Securities Loaned 18.8% | Shares | Value ($) | ||
| Registered Investment Company; | ||||
| Dreyfus Institutional Cash Advantage Plus Fund | ||||
| (cost $151,450,309) | 151,450,309 e | 151,450,309 | ||
| Total Investments (cost $1,078,768,642) | 118.7% | 954,868,256 | ||
| Liabilities, Less Cash and Receivables | (18.7%) | (150,684,289) | ||
| Net Assets | 100.0% | 804,183,967 | ||
| a Non-income producing security. |
| b All or a portion of these securities are on loan.At October 31, 2009, the total market value of the fund s securities |
| on loan is $143,175,037 and the total market value of the collateral held by the fund is $151,450,309. |
| c Investment in Real Estate Investment Trust. |
| d Held by a broker as collateral for open financial futures positions. |
| e Investment in affiliated money market mutual fund. |
| Portfolio Summary (Unaudited) | ||||||
| Value (%) | Value (%) | |||||
| Short-Term/ | Energy | 5.9 | ||||
| Money Market Investments | 19.8 | Materials | 4.5 | |||
| Financial | 18.9 | Consumer Staples | 4.1 | |||
| Information Technology | 17.0 | Utilities | 3.6 | |||
| Industrial | 16.8 | Telecommunication Services | .5 | |||
| Consumer Discretionary | 14.8 | |||||
| Health Care | 12.8 | 118.7 | ||||
The Fund 25
| STATEMENT OF FINANCIAL FUTURES October 31, 2009 |
| Market Value | Unrealized | |||||||
| Covered by | (Depreciation) | |||||||
| Contracts | Contracts ($) | Expiration | at 10/31/2009 ($) | |||||
| Financial Futures Long | ||||||||
| Russell 2000 E-mini | 145 | 8,125,800 | December 2009 | (708,415) | ||||
| See notes to financial statements. | ||||||||
26
| STATEMENT OF ASSETS AND LIABILITIES October 31, 2009 |
| Cost | Value | |||
| Assets ($): | ||||
| Investments in securities See Statement of Investments (including | ||||
| securities on loan, valued at $143,175,037) Note 1(b): | ||||
| Unaffiliated issuers | 920,002,333 | 796,101,947 | ||
| Affiliated issuers | 158,766,309 | 158,766,309 | ||
| Cash | 566,717 | |||
| Receivable for shares of Common Stock subscribed | 1,305,526 | |||
| Dividends and interest receivable | 605,422 | |||
| 957,345,921 | ||||
| Liabilities ($): | ||||
| Due to The Dreyfus Corporation and affiliates Note 3(b) | 361,190 | |||
| Liability for securities on loan Note 1(b) | 151,450,309 | |||
| Payable for investment securities purchased | 578,365 | |||
| Payable for shares of Common Stock redeemed | 535,208 | |||
| Payable for futures variation margin Note 4 | 236,882 | |||
| 153,161,954 | ||||
| Net Assets ($) | 804,183,967 | |||
| Composition of Net Assets ($): | ||||
| Paid-in capital | 946,164,676 | |||
| Accumulated undistributed investment income net | 5,015,824 | |||
| Accumulated net realized gain (loss) on investments | (22,387,732) | |||
| Accumulated net unrealized appreciation (depreciation) | ||||
| on investments [including ($708,415) net unrealized | ||||
| (depreciation) on financial futures] | (124,608,801) | |||
| Net Assets ($) | 804,183,967 | |||
| Shares Outstanding | ||||
| (200 million shares of $.001 par value Common Stock authorized) | 53,466,055 | |||
| Net Asset Value, offering and redemption price per share ($) | 15.04 | |||
| See notes to financial statements. | ||||
The Fund 27
| STATEMENT OF OPERATIONS October 31, 2009 |
| Investment Income ($): | ||
| Income: | ||
| Dividends (net of $3,534 foreign taxes withheld at source): | ||
| Unaffiliated issuers | 9,768,684 | |
| Affiliated issuers | 12,760 | |
| Income from securities lending Note 1(b) | 1,210,017 | |
| Interest | 794 | |
| Total Income | 10,992,255 | |
| Expenses: | ||
| Management fee Note 3(a) | 1,708,346 | |
| Shareholder servicing costs Note 3(b) | 1,708,346 | |
| Directors fees Note 3(a) | 57,371 | |
| Loan commitment fees Note 2 | 457 | |
| Total Expenses | 3,474,520 | |
| Less Directors fees reimbursed by the Manager Note 3(a) | (57,371) | |
| Net Expenses | 3,417,149 | |
| Investment Income Net | 7,575,106 | |
| Realized and Unrealized Gain (Loss) on Investments Note 4 ($): | ||
| Net realized gain (loss) on investments | (8,711,491) | |
| Net realized gain (loss) on financial futures | 299,589 | |
| Net Realized Gain (Loss) | (8,411,902) | |
| Net unrealized appreciation (depreciation) on investments [including | ||
| ($922,580) net unrealized (depreciation) on financial futures] | 44,063,643 | |
| Net Realized and Unrealized Gain (Loss) on Investments | 35,651,741 | |
| Net Increase in Net Assets Resulting from Operations | 43,226,847 | |
| See notes to financial statements. | ||
28
STATEMENT OF CHANGES IN NET ASSETS
| Year Ended October 31, | ||||
| 2009 | 2008 | |||
| Operations ($): | ||||
| Investment income net | 7,575,106 | 9,809,321 | ||
| Net realized gain (loss) on investments | (8,411,902) | 52,916,274 | ||
| Net unrealized appreciation | ||||
| (depreciation) on investments | 44,063,643 | (402,828,769) | ||
| Net Increase (Decrease) in Net Assets | ||||
| Resulting from Operations | 43,226,847 | (340,103,174) | ||
| Dividends to Shareholders from ($): | ||||
| Investment income net | (10,985,105) | (6,019,379) | ||
| Net realized gain on investments | (49,270,636) | (80,811,626) | ||
| Total Dividends | (60,255,741) | (86,831,005) | ||
| Capital Stock Transactions ($): | ||||
| Net proceeds from shares sold | 326,095,099 | 375,786,729 | ||
| Dividends reinvested | 57,513,861 | 83,065,547 | ||
| Cost of shares redeemed | (297,041,023) | (295,288,868) | ||
| Increase (Decrease) in Net Assets | ||||
| from Capital Stock Transactions | 86,567,937 | 163,563,408 | ||
| Total Increase (Decrease) in Net Assets | 69,539,043 | (263,370,771) | ||
| Net Assets ($): | ||||
| Beginning of Period | 734,644,924 | 998,015,695 | ||
| End of Period | 804,183,967 | 734,644,924 | ||
| Undistributed investment income net | 5,015,824 | 8,430,139 | ||
| Capital Share Transactions (Shares): | ||||
| Shares sold | 24,497,782 | 18,429,745 | ||
| Shares issued for dividends reinvested | 4,593,801 | 3,871,675 | ||
| Shares redeemed | (22,393,768) | (14,741,481) | ||
| Net Increase (Decrease) in Shares Outstanding | 6,697,815 | 7,559,939 | ||
| See notes to financial statements. | ||||
The Fund 29
FINANCIAL HIGHLIGHTS
The following table describes the performance for the fiscal periods indicated. Total return shows how much your investment in the fund would have increased (or decreased) during each period, assuming you had reinvested all dividends and distributions.These figures have been derived from the fund s financial statements.
| Year Ended October 31, | ||||||||||
| 2009 | 2008 | 2007 | 2006 | 2005 | ||||||
| Per Share Data ($): | ||||||||||
| Net asset value, beginning of period | 15.71 | 25.45 | 23.93 | 21.06 | 18.91 | |||||
| Investment Operations: | ||||||||||
| Investment income neta | .15 | .22 | .15 | .12 | .11 | |||||
| Net realized and unrealized | ||||||||||
| gain (loss) on investments | .45 | (7.85) | 2.45 | 3.11 | 2.68 | |||||
| Total from Investment Operations | .60 | (7.63) | 2.60 | 3.23 | 2.79 | |||||
| Distributions: | ||||||||||
| Dividends from investment income net | (.23) | (.15) | (.12) | (.11) | (.10) | |||||
| Dividends from net realized | ||||||||||
| gain on investments | (1.04) | (1.96) | (.96) | (.25) | (.54) | |||||
| Total Distributions | (1.27) | (2.11) | (1.08) | (.36) | (.64) | |||||
| Net asset value, end of period | 15.04 | 15.71 | 25.45 | 23.93 | 21.06 | |||||
| Total Return (%) | 5.43 | (32.21) | 11.15 | 15.53 | 14.88 | |||||
| Ratios/Supplemental Data (%): | ||||||||||
| Ratio of total expenses | ||||||||||
| to average net assets | .51 | .51 | .51 | .50 | .50 | |||||
| Ratio of net expenses | ||||||||||
| to average net assets | .50 | .50 | .50 | .50 | .50 | |||||
| Ratio of net investment income | ||||||||||
| to average net assets | 1.11 | 1.09 | .60 | .52 | .55 | |||||
| Portfolio Turnover Rate | 25.48 | 31.84 | 25.08 | 25.05 | 13.64 | |||||
| Net Assets, end of period ($ x 1,000) | 804,184 | 734,645 | 998,016 | 888,354 | 724,909 | |||||
| a Based on average shares outstanding at each month end. | ||||||||||
| See notes to financial statements. | ||||||||||
30
NOTES TO FINANCIAL STATEMENTS
NOTE 1 Significant Accounting Policies:
Dreyfus Smallcap Stock Index Fund (the fund ) is a separate non-diversified series of Dreyfus Index Funds, Inc. (the Company ), which is registered under the Investment Company Act of 1940, as amended (the Act ), as an open-end management investment company and operates as a series company currently offering three series, including the fund.The fund s investment objective is to match the performance of the Standard & Poor s SmallCap 600 Index.The Dreyfus Corporation (the Manager or Dreyfus ), a wholly-owned subsidiary of The Bank of NewYork Mellon Corporation ( BNY Mellon ), serves as the fund s investment adviser. MBSC Securities Corporation (the Distributor ), a wholly-owned subsidiary of the Manager is the distributor of the fund s shares, which are sold to the public without a sales charge.
The Company accounts separately for the assets, liabilities and operations of each series. Expenses directly attributable to each series are charged to that series operations; expenses which are applicable to all series are allocated among them on a pro rata basis.
The Financial Accounting Standards Board ( FASB ) Accounting Standards Codification ( ASC ) has become the exclusive reference of authoritative U.S. generally accepted accounting principles ( GAAP ) recognized by the FASB to be applied by nongovernmental entities. Rules and interpretive releases of the Securities and Exchange Commission ( SEC ) under authority of federal laws are also sources of authoritative GAAP for SEC registrants. The ASC has superseded all existing non-SEC accounting and reporting standards. The fund s financial statements are prepared in accordance with GAAP, which may require the use of management estimates and assumptions.Actual results could differ from those estimates.
The Fund 31
| NOTES TO FINANCIAL STATEMENTS (continued) |
The fund enters into contracts that contain a variety of indemnifications. The fund s maximum exposure under these arrangements is unknown.The fund does not anticipate recognizing any loss related to these arrangements.
(a) Portfolio valuation: Investments in securities are valued at the last sales price on the securities exchange or national securities market on which such securities are primarily traded. Securities listed on the National Market System for which market quotations are available are valued at the official closing price or, if there is no official closing price that day, at the last sales price. Securities not listed on an exchange or the national securities market, or securities for which there were no transactions, are valued at the average of the most recent bid and asked prices, except for open short positions, where the asked price is used for valuation purposes. Bid price is used when no asked price is available. Registered investment companies that are not traded on an exchange are valued at their net asset value.When market quotations or official closing pric es are not readily available, or are determined not to reflect accurately fair value, such as when the value of a security has been significantly affected by events after the close of the exchange or market on which the security is principally traded (for example, a foreign exchange or market), but before the fund calculates its net asset value, the fund may value these investments at fair value as determined in accordance with the procedures approved by the Board of Directors. Fair valuing of securities may be determined with the assistance of a pricing service using calculations based on indices of domestic securities and other appropriate indicators, such as prices of relevant American Depository Receipts and futures contracts. For other securities that are fair valued by the Board of Directors, certain factors may be considered such as: fundamental analytical data, the nature and duration of restrictions on disposition, an evaluation of the
32
forces that influence the market in which the securities are purchased and sold, and public trading in similar securities of the issuer or comparable issuers. Financial futures are valued at the last sales price.
The fair value of a financial instrument is the amount that would be received to sell an asset or paid to transfer a liability in an orderly transaction between market participants at the measurement date (i.e. the exit price). GAAP establishes a fair value hierarchy that prioritizes the inputs of valuation techniques used to measure fair value.This hierarchy gives the highest priority to unadjusted quoted prices in active markets for identical assets or liabilities (Level 1 measurements) and the lowest priority to unobservable inputs (Level 3 measurements).
Additionally, GAAP provides guidance on determining whether the volume and activity in a market has decreased significantly and whether such a decrease in activity results in transactions that are not orderly. GAAP requires enhanced disclosures around valuation inputs and techniques used during annual and interim periods.
Various inputs are used in determining the value of the fund s investments relating to fair value measurements.These inputs are summarized in the three broad levels listed below:
| Level 1 unadjusted quoted prices in active markets for identical investments. Level 2 other significant observable inputs (including quoted prices for similar investments, interest rates, prepayment speeds, credit risk, etc.). Level 3 significant unobservable inputs (including the fund s own assumptions in determining the fair value of investments). |
The inputs or methodology used for valuing securities are not necessarily an indication of the risk associated with investing in those securities.
The Fund 33
| NOTES TO FINANCIAL STATEMENTS (continued) |
The following is a summary of the inputs used as of October 31, 2009 in valuing the fund s investments:
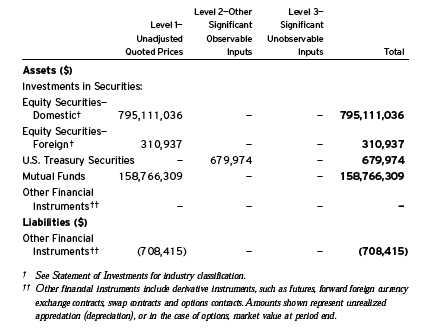
(b) Securities transactions and investment income: Securities transactions are recorded on a trade date basis. Realized gains and losses from securities transactions are recorded on the identified cost basis. Dividend income is recognized on the ex-dividend date and interest income, including, where applicable, accretion of discount and amortization of premium on investments, is recognized on the accrual basis.
Pursuant to a securities lending agreement with The Bank of New York Mellon, a subsidiary of BNY Mellon and an affiliate of Dreyfus, the fund may lend securities to qualified institutions. It is the fund s policy that, at origination, all loans are secured by collateral of at least 102% of the value of U.S. securities loaned and 105% of the value of foreign securities loaned. Collateral equivalent to at least 100% of the market value of securities on loan is maintained at all times. Collateral is either in the form of cash, which can be invested in certain money
34
market mutual funds managed by the Manager, U.S. Government and Agency securities or letters of credit.The fund is entitled to receive all income on securities loaned, in addition to income earned as a result of the lending transaction. Although each security loaned is fully collateralized, the fund bears the risk of delay in recovery of, or loss of rights in, the securities loaned should a borrower fail to return the securities in a timely manner. During the period ended October 31, 2009,The Bank of New York Mellon earned $403,339 from lending fund portfolio securities, pursuant to the securities lending agreement.
(c) Affiliated issuers: Investments in other investment companies advised by the Manager are defined as affiliated in the Act.
(d) Dividends to shareholders: Dividends are recorded on the ex-dividend date. Dividends from investment income-net and dividends from net realized capital gains, if any, are normally declared and paid annually, but the fund may make distributions on a more frequent basis to comply with the distribution requirements of the Internal Revenue Code of 1986, as amended (the Code ).To the extent that net realized capital gains can be offset by capital loss carryovers, it is the policy of the fund not to distribute such gains. Income and capital gain distributions are determined in accordance with income tax regulations, which may differ from GAAP.
(e) Federal income taxes: It is the policy of the fund to continue to qualify as a regulated investment company, if such qualification is in the best interests of its shareholders, by complying with the applicable provisions of the Code, and to make distributions of taxable income sufficient to relieve it from substantially all federal income and excise taxes.
As of and during the period ended October 31, 2009, the fund did not have any liabilities for any uncertain tax positions.The fund recognizes interest and penalties, if any, related to uncertain tax positions as income tax expense in the Statement of Operations. During the period, the fund did not incur any interest or penalties.
The Fund 35
| NOTES TO FINANCIAL STATEMENTS (continued) |
Each of the tax years in the four-year period ended October 31, 2009 remains subject to examination by the Internal Revenue Service and state taxing authorities.
At October 31, 2009, the components of accumulated earnings on a tax basis were as follows: undistributed ordinary income $5,015,824, accumulated capital losses $9,572,587 and unrealized depreciation $137,423,946.
The accumulated capital loss carryover is available for federal income tax purposes to be applied against future net securities profits, if any, realized subsequent to October 31, 2009. If not applied, the carryover expires in fiscal 2017.
The tax character of distributions paid to shareholders during the fiscal periods ended October 31, 2009 and October 31, 2008 were as follows: ordinary income $10,989,421 and $12,079,987 and long-term capital gains $49,266,320 and $74,751,018, respectively.
During the period ended October 31, 2009, as a result of permanent book to tax differences, primarily due to the tax treatment for dividend reclassification, the fund decreased accumulated undistributed investment income-net by $4,316 and increased accumulated net realized gain (loss) on investments by the same amount. Net assets and net asset value per share were not affected by this reclassification.
NOTE 2 Bank Lines of Credit:
The fund participated with other Dreyfus-managed funds in a $145 million unsecured credit facility led by Citibank, N.A. and a $300 million unsecured credit facility provided by The Bank of New York Mellon (each, a Facility ), each to be utilized primarily for temporary or emergency purposes, including the financing of redemptions. Effective October 14, 2009, the $145 million unsecured credit facility with Citibank, N.A., was increased to $215 million and the fund continues participation in the $300 million unsecured credit facility provided by The Bank of NewYork Mellon. In connection therewith, the fund has agreed to pay its pro rata portion of Facility fees for each Facility. Interest is charged to the fund based on rates determined pur-
36
suant to the terms of the respective Facility at the time of borrowing. During the period ended October 31, 2009, the fund did not borrow under the Facilities.
NOTE 3 Management Fee and Other Transactions With Affiliates:
(a) Pursuant to a management agreement ( Agreement ) with the Manager, the management fee is computed at the annual rate of .25% of the value of the fund s average daily net assets and is payable monthly. Under the terms of the Agreement, the Manager has agreed to pay all the expenses of the fund, except management fees, brokerage fees and commissions, taxes, interest fees, commitment fees, Shareholder Services Plan fees, fees and expenses of non-interested Board members (including counsel fees) and extraordinary expenses. In addition, the Manager is required to reduce its fee in an amount equal to the fund s allocable portion of the accrued fees and expenses of the non-interested Board members (including counsel fees). Each Board member also serves as a Board member of other funds within the Dreyfus complex (collectively, the Fund Group ). Currently, the Company an d 11 other funds (comprised of 33 portfolios) in the Dreyfus Family of Funds pay each Board member their respective allocated portion of an annual retainer of $85,000 and an attendance fee of $10,000 for each regularly scheduled Board meeting, an attendance fee of $2,000 for each separate in-person committee meeting that is not held in conjunction with a regularly scheduled Board meeting and an attendance fee of $1,000 for each Board meeting and separate committee meeting that is conducted by telephone.The Chairman of the Board receives an additional 25% of such compensation and the Audit Committee Chairman receives an additional $15,000 per annum.The Company also reimburses each Board member for travel and out-of-pocket expenses in connection with attending Board or committee meetings. Subject to the Company s Emeritus Program Guidelines, Emeritus Board members, if any, receive 50% of the Company s annual retainer fee and per meeting fee paid at the time the Board member achieves emeritus status.
The Fund 37
| NOTES TO FINANCIAL STATEMENTS (continued) |
(b) Under the Shareholder Services Plan, the fund pays the Distributor for the provision of certain services, at the annual rate of .25% of the value of the fund s average daily net assets.The services provided may include personal services relating to shareholder accounts, such as answering shareholder inquiries regarding the fund and providing reports and other information, and services related to the maintenance of shareholder accounts. The Distributor may make payments to Service Agents (a securities dealer, financial institution or other industry professional) in respect of these services. The Distributor determines the amounts to be paid to Service Agents. During the period ended October 31, 2009, the fund was charged $1,708,346 pursuant to the Shareholder Services Plan.
The components of Due to The Dreyfus Corporation and affiliates in the Statement of Assets and Liabilities consist of: management fees $180,595 and shareholder services plan fees $180,595.
NOTE 4 Securities Transactions:
The aggregate amount of purchases and sales of investment securities, excluding short-term securities and financial futures, during the period ended October 31, 2009, amounted to $210,431,738 and $174,202,017, respectively.
The fund adopted the provisions of ASC Topic 815 Derivatives and Hedging which requires qualitative disclosures about objectives and strategies for using derivatives, quantitative disclosures about fair value amounts of gains and losses on derivative instruments and disclosures about credit-risk-related contingent features in derivative agreements. The disclosure requirements distinguish between derivatives, which are accounted for as hedges and those that do not qualify for hedge accounting. Because investment companies value their derivatives at fair value and recognize changes in fair value through the Statement of Operations, they do not qualify for such accounting. Accordingly, even though a fund s investments in derivatives may represent economic hedges, they are considered to be non-hedge transactions for purposes of this disclosure.
38
Futures Contracts: In the normal course of pursuing its investment objectives, the fund is exposed to market risk, including equity price risk as a result of changes in value of underlying financial instruments.The fund may invest in financial futures contracts in order to manage its exposure to or protect against changes in the market.A futures contract represents a commitment for the future purchase or a sale of an asset at a specified date. Upon entering into such contracts, these investments require initial margin deposits with a broker, which consist of cash or cash equivalents. The amount of these deposits is determined by the exchange or Board of Trade on which the contract is traded and is subject to change. Accordingly, variation margin payments are received or made to reflect daily unrealized gains or losses which are recorded in the Statement of Operation s. Futures contracts are valued daily at the last sales price established by the Board of Trade or exchange upon which they are traded. When the contracts are closed, the fund recognizes a realized gain or loss. There is minimal counterparty credit risk to the fund with futures, since futures are exchange traded and the exchange s clearinghouse, as counterparty to all exchange traded futures, guarantees the futures against default. Contracts open at October 31, 2009 are set forth in the Statement of Financial Futures.
At October 31, 2009, the cost of investments for federal income tax purposes was $1,092,292,202; accordingly, accumulated net unrealized depreciation on investments was $137,423,946, consisting of $74,538,040 gross unrealized appreciation and $211,961,986 gross unrealized depreciation.
NOTE 5 Subsequent Events Evaluation:
Dreyfus has evaluated the need for disclosures and/or adjustments resulting from subsequent events through December 29, 2009, the date the financial statements were issued. This evaluation did not result in any subsequent events that necessitated disclosures and/or adjustments.
The Fund 39
| REPORT OF INDEPENDENT REGISTERED PUBLIC ACCOUNTING FIRM |
| Shareholders and Board of Directors Dreyfus Smallcap Stock Index Fund |
We have audited the accompanying statement of assets and liabilities, including the statements of investments and financial futures, of Dreyfus Smallcap Stock Index Fund (one of the series comprising Dreyfus Index Funds, Inc.) as of October 31, 2009, and the related statement of operations for the year then ended, the statement of changes in net assets for each of the two years in the period then ended and financial highlights for each of the three years in the period then ended.These financial statements and financial highlights are the responsibility of the Fund s management. Our responsibility is to express an opinion on these financial statements and financial highlights based on our audits. The financial highlights for each of the years ended October 31, 2006 and 2005 were audited by other auditors whose report dated December 14, 2006, expressed an unqualified opinion on such financial highlights.
We conducted our audits in accordance with the standards of the Public Company Accounting Oversight Board (United States).Those standards require that we plan and perform the audit to obtain reasonable assurance about whether the financial statements and financial highlights are free of material misstatement.We were not engaged to perform an audit of the Fund s internal control over financial reporting. Our audits included consideration of internal control over financial reporting as a basis for designing audit procedures that are appropriate in the circumstances, but not for the purpose of expressing an opinion on the effectiveness of the Fund s internal control over financial reporting.Accordingly, we express no such opinion. An audit also includes examining, on a test basis, evidence supporting the amounts and disclosures in the financial statements and financial highlights, assessing the accounting principles used and significant estimat es made by management, and evaluating the overall financial statement presentation. Our procedures included confirmation of securities owned as of October 31, 2009 by correspondence with the custodian and others. We believe that our audits provide a reasonable basis for our opinion.
In our opinion, the 2009, 2008 and 2007 financial statements and financial highlights referred to above present fairly, in all material respects, the financial position of Dreyfus Smallcap Stock Index Fund at October 31, 2009, the results of its operations for the year then ended, the changes in its net assets for each of the two years in the period then ended and the financial highlights for each of the three years in the period then ended, in conformity with U.S. generally accepted accounting principles.
| NewYork, NewYork December 29, 2009 |
40
IMPORTANT TAX INFORMATION (Unaudited)
In accordance with federal tax law, the fund hereby designates 71.43% of the ordinary dividends paid during the fiscal year ended October 31, 2009 as qualifying for the corporate dividends received deduction. For the fiscal year ended October 31, 2009, certain dividends paid by the fund may be subject to a maximum tax rate of 15%, as provided for by the Jobs and Growth Tax Relief Reconciliation Act of 2003. Of the distributions paid during the fiscal year, $3,995,732 represents the maximum amount that may be considered qualified dividend income. Shareholders will receive notification in early 2010 of the percentage applicable to the preparation of their 2009 income tax returns. Also, the fund hereby designates $1.0290 per share as a long-term capital gain distribution per share paid on December 29, 2008 and also designates $.0068 per share as a long-term capital gain distribution paid on March 30, 2009.
The Fund 41
BOARD MEMBERS INFORMATION (Unaudited)
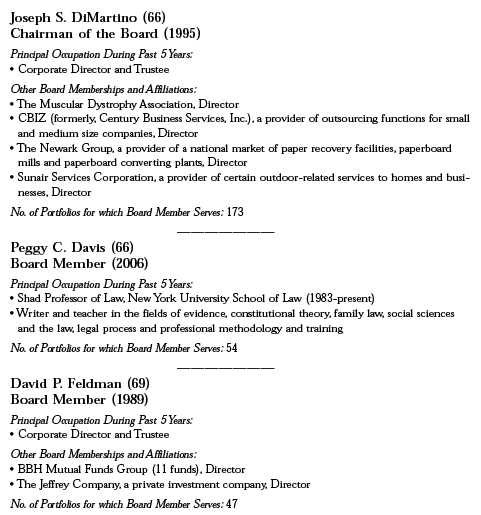
42
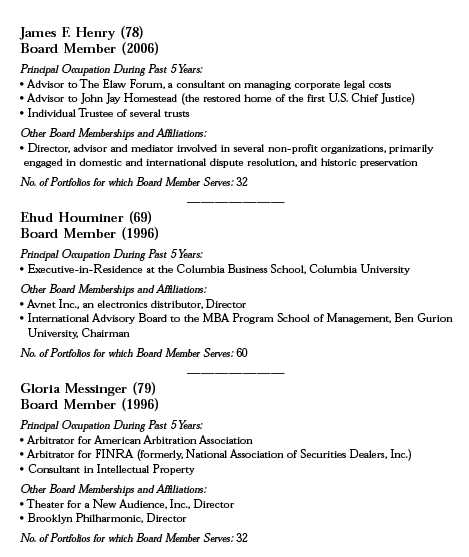
The Fund 43
BOARD MEMBERS INFORMATION (Unaudited) (continued)

Once elected all Board Members serve for an indefinite term, but achieve Emeritus status upon reaching age 80.The address of the Board Members and Officers is in c/o The Dreyfus Corporation, 200 Park Avenue, NewYork, NewYork 10166.Additional information about the Board Members is available in the fund s Statement of Additional Information which can be obtained from Dreyfus free of charge by calling this toll free number: 1-800-554-4611.
| John M. Fraser, Jr., Emeritus Board Member Dr. Paul A. Marks, Emeritus Board Member |
44
OFFICERS OF THE FUND (Unaudited)
The Fund 45
OFFICERS OF THE FUND (Unaudited) (continued)
46
NOTES
For More Information
Item 2. Code of Ethics.
The Registrant has adopted a code of ethics that applies to the Registrant's principal executive officer, principal financial officer, principal accounting officer or controller, or persons performing similar functions. There have been no amendments to, or waivers in connection with, the Code of Ethics during the period covered by this Report.
Item 3. Audit Committee Financial Expert.
The Registrant's Board has determined that David P. Feldman, a member of the Audit Committee of the Board, is an audit committee financial expert as defined by the Securities and Exchange Commission (the "SEC"). David P. Feldman is "independent" as defined by the SEC for purposes of audit committee financial expert determinations.
Item 4. Principal Accountant Fees and Services.
(a) Audit Fees. The aggregate fees billed for each of the last two fiscal years (the "Reporting Periods") for professional services rendered by the Registrant's principal accountant (the "Auditor") for the audit of the Registrant's annual financial statements or services that are normally provided by the Auditor in connection with the statutory and regulatory filings or engagements for the Reporting Periods, were $123,600 in 2008 and $126, 072 in 2009.
(b) Audit-Related Fees. The aggregate fees billed in the Reporting Periods for assurance and related services by the Auditor that are reasonably related to the performance of the audit of the Registrant's financial statements and are not reported under paragraph (a) of this Item 4 were $34,815 in 2008 and $20,680 in 2009. These services consisted of (i) agreed upon procedures related to compliance with Internal Revenue Code section 817(h) and (ii) security counts required by Rule 17f-2 under the Investment Company Act of 1940, as amended.
The aggregate fees billed in the Reporting Periods for non-audit assurance and related services by the Auditor to the Registrant s investment adviser (not including any sub-investment adviser whose role is primarily portfolio management and is subcontracted with or overseen by another investment adviser), and any entity controlling, controlled by or under common control with the investment adviser that provides ongoing services to the Registrant ( Service Affiliates ), that were reasonably related to the performance of the annual audit of the Service Affiliate, which required pre-approval by the Audit Committee were $-0- in 2008 and $-0- in 2009.
(c) Tax Fees. The aggregate fees billed in the Reporting Periods for professional services rendered by the Auditor for tax compliance, tax advice, and tax planning ( Tax Services ) were $33,264 in 2008 and $18,493 in 2009. These services consisted of: (i) review or preparation of U.S. federal, state, local and excise tax returns; (ii) U.S. federal, state and local tax planning, advice and assistance regarding statutory, regulatory or administrative developments; (iii) tax advice regarding tax qualification matters and/or treatment of various financial instruments held or proposed to be acquired or held, and (iv) determination of Passive Foreign Investment Companies.
The aggregate fees billed in the Reporting Periods for Tax Services by the Auditor to Service Affiliates, which required pre-approval by the Audit Committee were $-0- in 2008 and $-0- in 2009.
(d) All Other Fees. The aggregate fees billed in the Reporting Periods for products and services provided by the Auditor, other than the services reported in paragraphs (a) through (c) of this Item, were $-0- in 2008 and $-0- in 2009.
The aggregate fees billed in the Reporting Periods for Non-Audit Services by the Auditor to Service Affiliates, other than the services reported in paragraphs (b) through (c) of this Item, which required pre-approval by the Audit Committee, were $-0- in 2008 and $-0- in 2009.
Note: In each of (b) through (d) of this Item 4, 100% of all services provided by the Auditor were pre-approved as required.
Audit Committee Pre-Approval Policies and Procedures. The Registrant s Audit Committee has established policies and procedures (the Policy ) for pre-approval (within specified fee limits) of the Auditor s engagements for non-audit services to the Registrant and Service Affiliates without specific case-by-case consideration. Pre-approval considerations include whether the proposed services are compatible with maintaining the Auditor s independence. Pre-approvals pursuant to the Policy are considered annually.
Non-Audit Fees. The aggregate non-audit fees billed by the Auditor for services rendered to the Registrant, and rendered to Service Affiliates, for the Reporting Periods were $7,879,835 in 2008 and $25,383,429 in 2009.
Auditor Independence. The Registrant s Audit Committee has considered whether the provision of non-audit services that were rendered to Service Affiliates, which were not pre-approved (not requiring pre-approval), is compatible with maintaining the Auditor s independence.
| Item 5. | Audit Committee of Listed Registrants. | |
| Not applicable. [CLOSED-END FUNDS ONLY] | ||
| Item 6. | Investments. | |
| (b) | Not applicable. | |
| Item 7. | Disclosure of Proxy Voting Policies and Procedures for Closed-End Management | |
| Investment Companies. | ||
| Not applicable. [CLOSED-END FUNDS ONLY] | ||
| Item 8. | Portfolio Managers of Closed-End Management Investment Companies. | |
| Not applicable. [CLOSED-END FUNDS ONLY, beginning with reports for periods ended | ||
| on and after December 31, 2005] | ||
| Item 9. | Purchases of Equity Securities by Closed-End Management Investment Companies and | |
| Affiliated Purchasers. | ||
| Not applicable. [CLOSED-END FUNDS ONLY] | ||
| Item 10. | Submission of Matters to a Vote of Security Holders. | |
| There have been no material changes to the procedures applicable to Item 10. | ||
Item 11. Controls and Procedures.
(a) The Registrant s principal executive and principal financial officers have concluded, based on their evaluation of the Registrant s disclosure controls and procedures as of a date within 90 days of the filing date of this report, that the Registrant s disclosure controls and procedures are reasonably designed to ensure that information required to be disclosed by the Registrant on Form N-CSR is recorded, processed, summarized and reported within the required time periods and that information required to be disclosed by the Registrant in the reports that it files or submits on Form N-CSR is accumulated and communicated to the Registrant s management, including its principal executive and principal financial officers, as appropriate to allow timely decisions regarding required disclosure.
(b) There were no changes to the Registrant s internal control over financial reporting that occurred during the second fiscal quarter of the period covered by this report that have materially affected, or are reasonably likely to materially affect, the Registrant s internal control over financial reporting.
Item 12. Exhibits.
(a)(1) Code of ethics referred to in Item 2.
(a)(2) Certifications of principal executive and principal financial officers as required by Rule 30a-2(a) under the Investment Company Act of 1940.
(a)(3) Not applicable.
(b) Certification of principal executive and principal financial officers as required by Rule 30a-2(b) under the Investment Company Act of 1940.
| SIGNATURES |
Pursuant to the requirements of the Securities Exchange Act of 1934 and the Investment Company Act of 1940, the Registrant has duly caused this Report to be signed on its behalf by the undersigned, thereunto duly authorized.
| Dreyfus Index Funds, Inc. | ||
| By: | /s/ J. David Officer | |
| J. David Officer, | ||
| President | ||
| Date: | December 23, 2009 | |
Pursuant to the requirements of the Securities Exchange Act of 1934 and the Investment Company Act of 1940, this Report has been signed below by the following persons on behalf of the Registrant and in the capacities and on the dates indicated.
| By: | /s/ J. David Officer | |
| J. David Officer, | ||
| President | ||
| Date: | December 23, 2009 | |
| By: | /s/ James Windels | |
| James Windels, | ||
| Treasurer | ||
| Date: | December 23, 2009 | |
| EXHIBIT INDEX |
(a)(1) Code of ethics referred to in Item 2.
(a)(2) Certifications of principal executive and principal financial officers as required by Rule 30a-2(a) under the Investment Company Act of 1940. (EX-99.CERT)
(b) Certification of principal executive and principal financial officers as required by Rule 30a-2(b) under the Investment Company Act of 1940. (EX-99.906CERT)