UNITED STATES
SECURITIES AND EXCHANGE COMMISSION
Washington, D.C. 20549
FORM N-CSR
CERTIFIED SHAREHOLDER REPORT OF REGISTERED MANAGEMENT
INVESTMENT COMPANIES
Investment Company Act file number | 811-05883 | |||||
|
| |||||
| BNY Mellon Index Funds, Inc. |
| ||||
| (Exact name of Registrant as specified in charter) |
| ||||
|
|
| ||||
|
c/o BNY Mellon Investment Adviser, Inc. 240 Greenwich Street New York, New York 10286 |
| ||||
| (Address of principal executive offices) (Zip code) |
| ||||
|
|
| ||||
| Bennett A. MacDougall, Esq. 240 Greenwich Street New York, New York 10286 |
| ||||
| (Name and address of agent for service) |
| ||||
| ||||||
Registrant's telephone number, including area code: | (212) 922-6400 | |||||
|
| |||||
Date of fiscal year end:
| 10/31 |
| ||||
Date of reporting period: | 10/31/2020
|
| ||||
FORM N-CSR
Item 1. Reports to Stockholders.
BNY Mellon International Stock Index Fund
ANNUAL REPORT October 31, 2020 |
|

Save time. Save paper. View your next shareholder report online as soon as it’s available. Log into www.bnymellonim.com/us and sign up for eCommunications. It’s simple and only takes a few minutes. |
The views expressed in this report reflect those of the portfolio manager(s) only through the end of the period covered and do not necessarily represent the views of BNY Mellon Investment Adviser, Inc. or any other person in the BNY Mellon Investment Adviser, Inc. organization. Any such views are subject to change at any time based upon market or other conditions and BNY Mellon Investment Adviser, Inc. disclaims any responsibility to update such views. These views may not be relied on as investment advice and, because investment decisions for a fund in the BNY Mellon Family of Funds are based on numerous factors, may not be relied on as an indication of trading intent on behalf of any fund in the BNY Mellon Family of Funds. |
Not FDIC-Insured • Not Bank-Guaranteed • May Lose Value |
Contents
THE FUND
BNY Mellon Investment Adviser, Inc. | |
With Those of Other Funds | |
in Affiliated Issuers | |
Currency Exchange Contracts | |
Public Accounting Firm | |
FOR MORE INFORMATION
Back Cover
| The Fund |
A LETTER FROM THE PRESIDENT OF BNY MELLON INVESTMENT ADVISER, INC.
Dear Shareholder:
We are pleased to present this annual report for BNY Mellon International Stock Index Fund, covering the 12-month period from November 1, 2019 through October 31, 2020. For information about how the fund performed during the reporting period, as well as general market perspectives, we provide a Discussion of Fund Performance on the pages that follow.
Accommodative rate policies from the U.S. Federal Reserve (the “Fed”) and progress towards a U.S./China trade deal stoked optimism about future economic growth prospects the final months of 2019, fueling an equity rally. As we entered 2020, optimism turned to concern as COVID-19 began to spread across portions of Asia and Europe. When the virus reached the U.S. in March 2020, stocks became volatile. U.S. equities posted historic losses during the month due to investor concern over the economic impact of a widespread quarantine. Global central banks and governments launched emergency stimulus measures to support their respective economies, and equity valuations began to rebound, trending upward until the fall. Volatility returned in September 2020 and continued through October, as concerns over rising COVID-19 infection rates, continued trade tensions, the U.S. Congress’ failure to pass additional financial assistance and anxiety over the upcoming U.S. election constrained equity valuations.
In fixed-income markets, interest rates were heavily influenced by changes in Fed policy and investor concern over COVID-19. In 2019, as stocks rallied in response to Fed rate cuts, risk-asset valuations also rose while Treasuries lagged. When COVID-19 began to emerge, a flight to quality ensued, and Treasury rates fell significantly. The Fed cut rates twice in March 2020, resulting in an overnight lending target rate of nearly zero, and the government launched a large stimulus package. Risk-asset prices began to rebound, and bond indices generally rose until September 2020, when investment-grade instrument prices stalled. Yields in the intermediate and long portions of the Treasury curve rose during October, further constraining bond prices.
We believe the near-term outlook for the U.S. will be challenging, as the country continues to battle COVID-19. As always, we will monitor relevant data for meaningful developments. We encourage you to discuss the risks and opportunities in today’s investment environment with your financial advisor.
Thank you for your continued confidence and support.
Sincerely,

Renee LaRoche-Morris
President
BNY Mellon Investment Adviser, Inc.
November 16, 2020
2
DISCUSSION OF FUND PERFORMANCE (Unaudited)
For the period from November 1, 2019 through October 31, 2020, as provided by Thomas J. Durante, CFA, David France, CFA, Todd Frysinger, CFA, Vlasta Sheremeta, CFA, Michael Stoll, and Marlene Walker Smith, Portfolio Managers
Market and Fund Performance Overview
For the 12-month period ended October 31, 2020, the BNY Mellon International Stock Index Fund Class I shares produced a total return of -6.78%, and its Investor shares returned -7.01%.1 This compares with a -6.86% total return for the fund’s benchmark, the MSCI EAFE Index (the “Index”), during the same period.2
International stocks fell during the period, due in part to volatility stemming from the COVID-19 pandemic. The difference in returns between the fund and the Index was primarily the result of transaction costs and operating expenses that are not reflected in the Index’s results.
The Fund’s Investment Approach
The fund seeks to match the performance of the Index. To pursue its goal, the fund generally is fully invested in stocks included in the Index and in futures whose performance is tied to certain countries included in the Index. The fund generally invests in all stocks included in the Index. The fund’s investments are selected to match the benchmark composition along individual name, country and industry weighting, and other benchmark characteristics. Under these circumstances, the fund maintains approximately the same weighting for each stock as the Index does.
The Index is an unmanaged, free float-adjusted, market capitalization-weighted index that is designed to measure the equity market performance of developed-markets, excluding the United States and Canada. Each stock in the Index is weighted by its float-adjusted market capitalization.
Central Bank Policy and COVID-19 Influence Markets
Equities gained over the end of 2019, as investor optimism regarding trade and future economic growth prospects bolstered sentiment. Continued accommodative policies by the U.S. Federal Reserve (the “Fed”), coupled with encouraging economic data releases, worked to fuel a risk-on environment. Greater certainty as to the timing of Brexit was also forthcoming and aided investor optimism. In addition, as the year-end approached, both the U.S. and China indicated that a ‘Phase-One’ trade deal would be signed in early 2020.
Markets gave way to extreme risk aversion in early 2020, as the global scope of the COVID-19 pandemic became apparent. Equity valuations in the U.S. remained robust throughout January and February 2020, while markets in areas that experienced the virus earlier, such as China, began to experience volatility closer to the start of the calendar year. Financial markets also had to contend with a second major shock in the form of an oil-price war between Saudi Arabia and Russia, which caused oil prices to fall precipitously in March 2020. Worldwide, governments and central banks launched an unprecedented array of fiscal initiatives that sought to offset the economic impact of widespread lockdown measures and bolster asset prices. The intervention provided comfort to investors, and indices began to rally towards the end of March 2020. Supported by the intervention, equities generally went
3
DISCUSSION OF FUND PERFORMANCE (Unaudited) (continued)
on to stage a recovery that lasted through August 2020. However, the recovery was company and sector specific, as several industries that remained affected by COVID-19 prevention procedures did not fully participate. In September, volatility crept back into equity markets, as increasing COVID-19 infection rates began to concern investors. By October, several countries had begun to reinstitute some degree of behavioral restriction among residents in order to stem the spread of the virus. In addition, mounting political rhetoric in the U.S. due to the election, renewed trade difficulties between the U.S. and China, and other geopolitical events stoked investor anxiety. Stocks continued to exhibit volatility through the end of the period.
Financials Sector Constrains Index Returns
The financials sector struggled most during the 12 months. It is the largest sector of the Index and drove its performance downward during the periods of volatility. Banks were particularly hard hit, due in part to their lending exposure to airlines, retail chains and energy companies. Investor concern over these companies’ ability to repay their debts put downward pressure on stock prices. Banks based in the United Kingdom (UK) historically have derived a lot of their revenue from business in China, which decreased substantially during the period. In addition, the UK has failed to reach terms with the European Union (EU) regarding its future financial or trade relationship post-Brexit, further concerning investors. The energy sector saw significant volatility and also underperformed the broader market. A rift between Saudi Arabia and Russia caused the price of oil to plummet in March. It later stabilized but remains low due to decreased demand stemming from reduced business and commuter travel. Within real estate, reduced corporate demand for office space, due to the work-from-home trend, has hurt commercial REITs. Real estate securities investing in Tokyo-based properties have also suffered. When the area anticipated hosting the Olympics, a lot of building occurred. It was anticipated that after the games, the properties would be sold and used for other purposes. The delay of the Tokyo games has caused large financial losses relating to these unused and unsold properties. Retail spaces are also experiencing pressure due to decreased foot traffic.
Conversely, the health care sector provided a tailwind for international markets. Swiss pharmaceutical companies outperformed the broader market, due in part to their production of diagnostic tests. The COVID-19 outbreak caused a sharp increase in demand for diagnostic testing kits, which these companies were able to produce. In addition, European drug companies export large amounts of medicine to emerging-market countries. Demand for these products was strong during the 12 months. Japan-based health care companies also saw strong demand for their products and healthy returns due to the aging population. Telemedicine companies posted some of the best results. The information technology sector also performed well relative to the other Index sectors. Japan-based semiconductor and microchip companies were among the leading companies, as large quantities of exports to China helped drive revenues. Global payment processing companies generally posted positive results as well, benefiting from the shop-from-home trend that has been amplified by the pandemic.
Replicating the Performance of the Index
Although we do not actively manage the fund’s investments in response to macroeconomic trends, it is worth noting that while the spread of COVID-19 and resulting economic
4
implications continue to impact markets and the economy, central banks and governments across the globe remain dedicated to supporting capital markets and the economy with various fiscal and monetary techniques. As always, we continue to monitor factors that affect the fund’s investments.
November 16, 2020
1 Total return includes reinvestment of dividends and any capital gains paid. Past performance is no guarantee of future results. Share price, yield and investment return fluctuate such that upon redemption, fund shares may be worth more or less than their original cost.
2 Source: Lipper Inc. — The MSCI EAFE Index (Europe, Australasia, Far East) is a free float-adjusted, market capitalization-weighted index that is designed to measure the equity market performance of developed-markets, excluding the U.S. and Canada. It reflects reinvestment of net dividends and, where applicable, capital gain distributions. Investors cannot invest directly in any index.
Equities are subject generally to market, market sector, market liquidity, issuer and investment style risks, among other factors, to varying degrees, all of which are more fully described in the fund’s prospectus.
The fund uses an indexing strategy. It does not attempt to manage market volatility, use defensive strategies or reduce the effects of any long-term periods of poor stock performance.
Recent market risks include pandemic risks related to COVID-19. The effects of COVID-19 have contributed to increased volatility in global markets and will likely affect certain countries, companies, industries and market sectors more dramatically than others. To the extent the fund may overweight its investments in certain countries, companies, industries or market sectors, such positions will increase the fund’s exposure to risk of loss from adverse developments affecting those countries, companies, industries or sectors.
Currencies are subject to the risk that those currencies will decline in value relative to a local currency, or, in the case of hedged positions, that the local currency will decline relative to the currency being hedged. Each of these risks could increase the fund’s volatility.
Investing in foreign-denominated and/or domiciled securities involves special risks, including changes in currency exchange rates, political, economic and social instability, limited company information, differing auditing and legal standards and less market liquidity. These risks generally are greater with emerging-market countries.
Diversification cannot assure a profit or protect against loss.
The fund may, but is not required, to use derivative instruments. A small investment in derivatives could have a potentially large impact on the fund’s performance. The use of derivatives involves risks different from, or possibly greater than, the risks associated with investing directly in the underlying assets.
5
FUND PERFORMANCE (Unaudited)
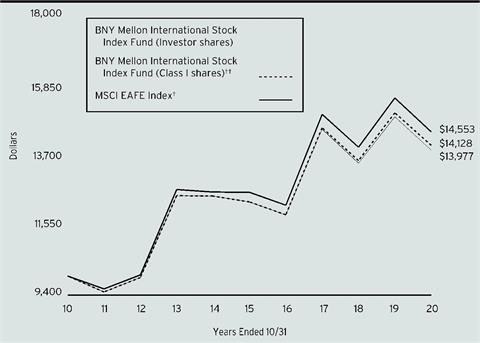
Comparison of change in value of a $10,000 investment in Investor shares and Class I shares of BNY Mellon International Stock Index Fund with a hypothetical investment of $10,000 in the MSCI EAFE Index (the “Index”)
† Source: Lipper Inc.
†† The total return figures presented for Class I shares of the fund reflect the performance of the fund’s Investor shares for the period prior to 8/31/16 (the inception date for Class I shares).
Past performance is not predictive of future performance.
The above graph compares a hypothetical investment of $10,000 made in each of the Investor shares and Class I shares of BNY Mellon International Stock Index Fund on 10/31/10 to a hypothetical investment of $10,000 made in the Index on that date. All dividends and capital gain distributions are reinvested.
The fund’s performance shown in the line graph above takes into account all applicable fees and expenses. The Index (Europe, Australasia, Far East) is a free float-adjusted market capitalization-weighted index that is designed to measure the equity market performance of developed markets, excluding the U.S. and Canada. Unlike a mutual fund, the Index is not subject to charges, fees and other expenses. Investors cannot invest directly in any index. Further information relating to fund performance, including expense reimbursements, if applicable, is contained in the Financial Highlights section of the prospectus and elsewhere in this report.
6
Average Annual Total Returns as of 10/31/2020 | |||||
| Inception Date | 1 Year | 5 Years | 10 Years | |
Investor Shares | 6/30/97 | -7.01% | 2.52% | 3.41% | |
Class I Shares | 8/31/16 | -6.78% | 2.74%† | 3.52%† | |
MSCI EAFE Index | -6.86% | 2.85% | 3.82% | ||
† The total return performance figures presented for Class I shares of the fund reflect the performance of the fund’s Investor shares for the period prior to 8/31/16 (the inception date for Class I shares).
The performance data quoted represents past performance, which is no guarantee of future results. Share price and investment return fluctuate and an investor’s shares may be worth more or less than original cost upon redemption. Current performance may be lower or higher than the performance quoted. Go to www.bnymellonim.com/us for the fund’s most recent month-end returns.
The fund’s performance shown in the graph and table does not reflect the deduction of taxes that a shareholder would pay on fund distributions or the redemption of fund shares.
7
UNDERSTANDING YOUR FUND’S EXPENSES (Unaudited)
As a mutual fund investor, you pay ongoing expenses, such as management fees and other expenses. Using the information below, you can estimate how these expenses affect your investment and compare them with the expenses of other funds. You also may pay one-time transaction expenses, including sales charges (loads) and redemption fees, which are not shown in this section and would have resulted in higher total expenses. For more information, see your fund’s prospectus or talk to your financial adviser.
Review your fund’s expenses
The table below shows the expenses you would have paid on a $1,000 investment in BNY Mellon International Stock Index Fund from May 1, 2020 to October 31, 2020. It also shows how much a $1,000 investment would be worth at the close of the period, assuming actual returns and expenses.
Expenses and Value of a $1,000 Investment |
| |||
Assume actual returns for the six months ended October 31, 2020 |
| |||
|
|
|
|
|
|
| Investor Shares | Class I |
|
Expense paid per $1,000† | $3.15 | $1.84 |
| |
Ending value (after expenses) | $1,090.10 | $1,091.50 |
| |
COMPARING YOUR FUND’S EXPENSES
WITH THOSE OF OTHER FUNDS (Unaudited)
Using the SEC’s method to compare expenses
The Securities and Exchange Commission (“SEC”) has established guidelines to help investors assess fund expenses. Per these guidelines, the table below shows your fund’s expenses based on a $1,000 investment, assuming a hypothetical 5% annualized return. You can use this information to compare the ongoing expenses (but not transaction expenses or total cost) of investing in the fund with those of other funds. All mutual fund shareholder reports will provide this information to help you make this comparison. Please note that you cannot use this information to estimate your actual ending account balance and expenses paid during the period.
Expenses and Value of a $1,000 Investment |
| |||
Assuming a hypothetical 5% annualized return for the six months ended October 31, 2020 |
| |||
|
|
|
|
|
|
| Investor Shares | Class I |
|
Expense paid per $1,000† | $3.05 | $1.78 |
| |
Ending value (after expenses) | $1,022.12 | $1,023.38 |
| |
†Expenses are equal to the fund’s annualized expense ratio of .60% for Investor Shares and .35% for Class I, multiplied by the average account value over the period, multiplied by 184/366 (to reflect the one-half year period). | ||||
8
STATEMENT OF INVESTMENTS
October 31, 2020
Description | Shares | Value ($) | |||||
Common Stocks - 98.3% | |||||||
Australia - 6.8% | |||||||
Afterpay | 7,704 | a | 522,950 | ||||
AGL Energy | 22,924 | 201,681 | |||||
AMP | 120,305 | 129,568 | |||||
Ampol | 9,138 | 167,287 | |||||
APA Group | 42,170 | 312,289 | |||||
Aristocrat Leisure | 21,263 | 430,753 | |||||
ASX | 7,017 | 394,178 | |||||
Aurizon Holdings | 67,294 | 179,102 | |||||
AusNet Services | 70,233 | 98,662 | |||||
Australia & New Zealand Banking Group | 102,788 | 1,366,917 | |||||
BHP Group | 106,973 | 2,572,258 | |||||
BHP Group | 77,394 | 1,502,055 | |||||
BlueScope Steel | 18,173 | 188,252 | |||||
Brambles | 56,175 | 380,065 | |||||
CIMIC Group | 3,476 | a | 52,796 | ||||
Coca-Cola Amatil | 19,430 | 170,255 | |||||
Cochlear | 2,443 | 365,990 | |||||
Coles Group | 48,574 | 607,611 | |||||
Commonwealth Bank of Australia | 64,305 | 3,134,893 | |||||
Computershare | 18,642 | 159,959 | |||||
Crown Resorts | 13,142 | 76,736 | |||||
CSL | 16,496 | 3,352,748 | |||||
Dexus | 38,782 | 235,464 | |||||
Evolution Mining | 60,150 | 235,660 | |||||
Fortescue Metals Group | 61,130 | 749,519 | |||||
Goodman Group | 60,659 | 786,833 | |||||
Insurance Australia Group | 82,365 | 277,630 | |||||
LendLease Group | 23,781 | 200,564 | |||||
Macquarie Group | 12,189 | 1,090,156 | |||||
Magellan Financial Group | 4,531 | 176,652 | |||||
Medibank Private | 98,720 | 185,887 | |||||
Mirvac Group | 143,477 | 213,660 | |||||
National Australia Bank | 115,885 | 1,523,512 | |||||
Newcrest Mining | 29,146 | 601,776 | |||||
Northern Star Resources | 27,654 | 290,209 | |||||
Oil Search | 76,186 | 138,590 | |||||
Orica | 14,150 | 152,508 | |||||
Origin Energy | 66,513 | 188,143 | |||||
Qantas Airways | 29,853 | 88,438 | |||||
QBE Insurance Group | 54,837 | 319,537 | |||||
Ramsay Health Care | 6,665 | 293,327 | |||||
9
STATEMENT OF INVESTMENTS (continued)
Description | Shares | Value ($) | |||||
Common Stocks - 98.3% (continued) | |||||||
Australia - 6.8% (continued) | |||||||
REA Group | 2,009 | 167,813 | |||||
Santos | 64,859 | 217,002 | |||||
Scentre Group | 194,563 | 288,693 | |||||
SEEK | 12,413 | b | 188,520 | ||||
Sonic Healthcare | 16,516 | 405,312 | |||||
South32 | 173,462 | 248,953 | |||||
Stockland | 87,252 | 237,134 | |||||
Suncorp Group | 46,396 | 269,281 | |||||
Sydney Airport | 48,589 | 186,741 | |||||
Tabcorp Holdings | 77,611 | 180,183 | |||||
Telstra | 155,327 | 293,622 | |||||
The GPT Group | 74,002 | 210,481 | |||||
TPG Telecom | 13,924 | a | 70,234 | ||||
Transurban Group | 99,968 | 950,420 | |||||
Treasury Wine Estates | 25,568 | 164,976 | |||||
Vicinity Centres | 134,226 | 114,722 | |||||
Washington H Soul Pattinson & Co. | 3,612 | c | 64,593 | ||||
Wesfarmers | 41,088 | 1,332,415 | |||||
Westpac Banking | 130,992 | 1,669,291 | |||||
WiseTech Global | 4,994 | 101,323 | |||||
Woodside Petroleum | 34,976 | 433,201 | |||||
Woolworths Group | 45,757 | 1,231,696 | |||||
33,141,676 | |||||||
Austria - .2% | |||||||
ANDRITZ | 2,715 | 91,468 | |||||
Erste Group Bank | 10,498 | 215,816 | |||||
OMV | 5,493 | 126,777 | |||||
Raiffeisen Bank International | 5,877 | 84,811 | |||||
Verbund | 2,626 | 151,092 | |||||
Voestalpine | 4,408 | 122,469 | |||||
792,433 | |||||||
Belgium - .9% | |||||||
Ageas | 6,228 | 250,741 | |||||
Anheuser-Busch InBev | 27,916 | 1,449,662 | |||||
Colruyt | 1,939 | 114,780 | |||||
Elia Group | 1,103 | 106,770 | |||||
Galapagos | 1,585 | a,c | 187,252 | ||||
Groupe Bruxelles Lambert | 1,430 | 117,271 | |||||
Groupe Bruxelles Lambert | 2,740 | 224,385 | |||||
KBC Group | 8,974 | 443,971 | |||||
Proximus | 5,579 | 108,490 | |||||
Sofina | 552 | 143,410 | |||||
Solvay | 2,708 | 219,886 | |||||
10
Description | Shares | Value ($) | |||||
Common Stocks - 98.3% (continued) | |||||||
Belgium - .9% (continued) | |||||||
Telenet Group Holding | 1,731 | 66,557 | |||||
UCB | 4,690 | 461,492 | |||||
Umicore | 7,109 | 273,695 | |||||
4,168,362 | |||||||
Chile - .0% | |||||||
Antofagasta | 14,773 | 197,142 | |||||
China - .1% | |||||||
BeiGene, ADR | 1,485 | a,c | 440,332 | ||||
Microport Scientific | 24,000 | 84,817 | |||||
Yangzijiang Shipbuilding Holdings | 85,600 | 57,896 | |||||
583,045 | |||||||
Denmark - 2.6% | |||||||
Ambu, Cl. B | 5,971 | c | 181,208 | ||||
AP Moller - Maersk, Cl. A | 117 | 172,810 | |||||
AP Moller - Maersk, Cl. B | 237 | 379,097 | |||||
Carlsberg, Cl. B | 3,781 | 478,840 | |||||
Chr. Hansen Holding | 3,902 | 393,104 | |||||
Coloplast, Cl. B | 4,331 | 632,369 | |||||
Danske Bank | 24,944 | 331,872 | |||||
Demant | 3,761 | a,c | 118,554 | ||||
DSV Panalpina | 7,578 | 1,227,927 | |||||
Genmab | 2,384 | a | 795,070 | ||||
GN Store Nord | 4,775 | 343,887 | |||||
H. Lundbeck | 2,476 | 69,773 | |||||
Novo Nordisk, Cl. B | 62,580 | 4,002,102 | |||||
Novozymes, Cl. B | 7,701 | 463,339 | |||||
Orsted | 6,920 | d | 1,099,343 | ||||
Pandora | 3,624 | 287,337 | |||||
Tryg | 4,663 | 129,458 | |||||
Vestas Wind Systems | 7,209 | 1,232,310 | |||||
12,338,400 | |||||||
Finland - 1.2% | |||||||
Elisa | 5,062 | 249,099 | |||||
Fortum | 16,195 | 304,931 | |||||
Kone, Cl. B | 12,433 | 989,893 | |||||
Neste | 15,454 | 807,206 | |||||
Nokia | 206,424 | a | 692,945 | ||||
Nordea Bank | 2,007 | a | 15,136 | ||||
Nordea Bank | 115,125 | a | 864,877 | ||||
Orion, Cl. B | 3,918 | 167,737 | |||||
Sampo, Cl. A | 16,991 | 641,421 | |||||
Stora Enso, Cl. R | 21,606 | 315,512 | |||||
UPM-Kymmene | 19,432 | 549,521 | |||||
11
STATEMENT OF INVESTMENTS (continued)
Description | Shares | Value ($) | |||||
Common Stocks - 98.3% (continued) | |||||||
Finland - 1.2% (continued) | |||||||
Wartsila | 17,181 | 136,580 | |||||
5,734,858 | |||||||
France - 10.2% | |||||||
Accor | 7,295 | 187,160 | |||||
Aeroports de Paris | 1,018 | 99,909 | |||||
Air Liquide | 17,189 | 2,516,008 | |||||
Airbus | 21,321 | 1,566,118 | |||||
Alstom | 6,966 | a | 312,638 | ||||
Amundi | 2,291 | d | 150,404 | ||||
Arkema | 2,509 | 246,048 | |||||
Atos | 3,575 | 244,408 | |||||
AXA | 70,031 | 1,131,353 | |||||
BioMerieux | 1,511 | 225,565 | |||||
BNP Paribas | 41,210 | 1,444,951 | |||||
Bollore | 34,337 | 123,196 | |||||
Bouygues | 8,588 | 281,960 | |||||
Bureau Veritas | 11,093 | 244,444 | |||||
Capgemini | 5,873 | 679,269 | |||||
Carrefour | 22,115 | 344,701 | |||||
Cie de Saint-Gobain | 18,676 | 732,650 | |||||
Cie Generale des Etablissements Michelin | 6,247 | 674,422 | |||||
CNP Assurances | 6,406 | 72,535 | |||||
Covivio | 1,790 | 106,640 | |||||
Credit Agricole | 42,696 | 339,743 | |||||
Danone | 22,367 | 1,236,272 | |||||
Dassault Aviation | 84 | 70,350 | |||||
Dassault Systemes | 4,775 | 816,314 | |||||
Edenred | 8,903 | 415,723 | |||||
Eiffage | 3,157 | 230,164 | |||||
Electricite de France | 23,439 | 272,426 | |||||
Engie | 66,733 | 808,912 | |||||
EssilorLuxottica | 10,415 | 1,290,335 | |||||
Eurazeo | 1,454 | 66,184 | |||||
Faurecia | 2,662 | 101,132 | |||||
Gecina | 1,674 | 208,355 | |||||
Getlink | 15,593 | 209,772 | |||||
Hermes International | 1,147 | 1,068,857 | |||||
ICADE | 1,199 | 60,837 | |||||
Iliad | 557 | 107,782 | |||||
Ingenico Group | 2,267 | 326,653 | |||||
Ipsen | 1,448 | 131,882 | |||||
JCDecaux | 3,285 | 50,869 | |||||
12
Description | Shares | Value ($) | |||||
Common Stocks - 98.3% (continued) | |||||||
France - 10.2% (continued) | |||||||
Kering | 2,748 | 1,662,549 | |||||
Klepierre | 7,777 | c | 99,186 | ||||
La Francaise des Jeux SAEM | 3,066 | d | 115,007 | ||||
Legrand | 9,744 | 721,337 | |||||
L'Oreal | 9,141 | 2,960,398 | |||||
LVMH | 10,097 | 4,740,339 | |||||
Natixis | 35,764 | 83,776 | |||||
Orange | 73,540 | 826,279 | |||||
Orpea | 1,918 | 192,139 | |||||
Pernod Ricard | 7,693 | 1,241,434 | |||||
Peugeot | 21,083 | 379,242 | |||||
Publicis Groupe | 7,800 | 271,715 | |||||
Remy Cointreau | 797 | 134,719 | |||||
Renault | 6,851 | 169,751 | |||||
Safran | 11,728 | 1,246,303 | |||||
Sanofi | 41,079 | 3,713,513 | |||||
Sartorius Stedim Biotech | 1,000 | 380,608 | |||||
Schneider Electric | 20,073 | 2,439,517 | |||||
SCOR | 5,857 | 142,831 | |||||
SEB | 789 | 128,410 | |||||
Societe Generale | 29,384 | 401,272 | |||||
Sodexo | 3,282 | 210,942 | |||||
Suez | 12,712 | 233,417 | |||||
Teleperformance | 2,118 | 637,248 | |||||
Thales | 3,920 | 255,610 | |||||
Total | 89,762 | 2,718,251 | |||||
Ubisoft Entertainment | 3,308 | a | 292,230 | ||||
Unibail-Rodamco-Westfield | 5,127 | c | 208,570 | ||||
Valeo | 8,201 | 248,716 | |||||
Veolia Environnement | 19,941 | 371,939 | |||||
Vinci | 18,679 | 1,478,099 | |||||
Vivendi | 29,998 | c | 867,243 | ||||
Wendel | 1,071 | 93,067 | |||||
Worldline | 5,107 | a,d | 379,228 | ||||
49,241,826 | |||||||
Germany - 8.2% | |||||||
adidas | 6,910 | 2,053,243 | |||||
Allianz | 15,149 | 2,666,588 | |||||
BASF | 33,322 | 1,827,248 | |||||
Bayer | 35,632 | 1,674,589 | |||||
Bayerische Motoren Werke | 11,965 | 817,738 | |||||
Beiersdorf | 3,656 | 382,827 | |||||
Brenntag | 5,534 | 353,766 | |||||
13
STATEMENT OF INVESTMENTS (continued)
Description | Shares | Value ($) | |||||
Common Stocks - 98.3% (continued) | |||||||
Germany - 8.2% (continued) | |||||||
Carl Zeiss Meditec-BR | 1,495 | 193,938 | |||||
Commerzbank | 37,552 | 177,843 | |||||
Continental | 3,994 | 424,834 | |||||
Covestro | 6,389 | d | 305,001 | ||||
Daimler | 31,036 | 1,605,791 | |||||
Delivery Hero | 4,701 | a,d | 543,006 | ||||
Deutsche Bank | 72,193 | a | 663,493 | ||||
Deutsche Boerse | 6,877 | 1,012,261 | |||||
Deutsche Lufthansa | 9,899 | a,c | 85,408 | ||||
Deutsche Post | 35,871 | 1,589,769 | |||||
Deutsche Telekom | 120,914 | 1,841,303 | |||||
Deutsche Wohnen | 12,321 | 623,646 | |||||
E.ON | 82,041 | 855,585 | |||||
Evonik Industries | 7,648 | 184,888 | |||||
Fraport Frankfurt Airport Services Worldwide | 1,716 | 62,241 | |||||
Fresenius & Co. | 15,234 | 564,977 | |||||
Fresenius Medical Care & Co. | 7,765 | 593,114 | |||||
GEA Group | 5,805 | 193,079 | |||||
Hannover Rueck | 2,199 | 319,291 | |||||
HeidelbergCement | 5,378 | 307,754 | |||||
Henkel & Co. | 3,829 | 347,469 | |||||
HOCHTIEF | 910 | 67,030 | |||||
Infineon Technologies | 45,821 | 1,283,174 | |||||
KION Group | 2,432 | 189,287 | |||||
Knorr-Bremse | 2,502 | 289,632 | |||||
LANXESS | 2,890 | 146,499 | |||||
LEG Immobilien | 2,545 | 343,900 | |||||
Merck | 4,712 | 697,790 | |||||
METRO | 6,030 | 59,150 | |||||
MTU Aero Engines | 1,919 | 327,657 | |||||
Muenchener Rueckversicherungs-Gesellschaft | 5,128 | 1,200,090 | |||||
Nemetschek | 2,077 | 150,280 | |||||
Puma | 3,605 | 316,127 | |||||
RWE | 23,224 | 862,884 | |||||
SAP | 37,949 | 4,044,359 | |||||
Scout24 | 3,845 | d | 310,520 | ||||
Siemens | 27,792 | 3,257,833 | |||||
Siemens Energy | 14,329 | a | 313,739 | ||||
Siemens Healthineers | 9,471 | d | 406,916 | ||||
Symrise | 4,637 | 573,233 | |||||
TeamViewer | 4,834 | a,d | 213,568 | ||||
14
Description | Shares | Value ($) | |||||
Common Stocks - 98.3% (continued) | |||||||
Germany - 8.2% (continued) | |||||||
Telefonica Deutschland Holding | 38,134 | 96,283 | |||||
ThyssenKrupp | 15,312 | a,c | 73,058 | ||||
Uniper | 7,603 | 227,314 | |||||
United Internet | 3,938 | 138,303 | |||||
Volkswagen | 1,183 | 184,142 | |||||
Vonovia | 18,657 | 1,191,120 | |||||
Zalando | 5,519 | a,d | 515,729 | ||||
39,750,307 | |||||||
Hong Kong - 3.2% | |||||||
AIA Group | 439,400 | 4,144,119 | |||||
ASM Pacific Technology | 10,800 | 108,722 | |||||
BOC Hong Kong Holdings | 134,000 | 371,838 | |||||
Budweiser Brewing | 60,800 | d | 178,633 | ||||
CK Asset Holdings | 92,975 | 430,785 | |||||
CK Hutchison Holdings | 97,475 | 589,700 | |||||
CK Infrastructure Holdings | 24,500 | 115,681 | |||||
CLP Holdings | 60,788 | 559,241 | |||||
Dairy Farm International Holdings | 12,800 | 48,277 | |||||
Galaxy Entertainment Group | 79,277 | 522,928 | |||||
Hang Lung Properties | 76,000 | 185,131 | |||||
Hang Seng Bank | 27,500 | 423,061 | |||||
Henderson Land Development | 51,138 | 181,582 | |||||
HK Electric Investments | 91,000 | 92,599 | |||||
HKT Trust & HKT | 137,660 | 178,095 | |||||
Hong Kong & China Gas | 383,588 | 552,285 | |||||
Hong Kong Exchanges & Clearing | 43,742 | 2,098,051 | |||||
Hongkong Land Holdings | 43,400 | 159,441 | |||||
Jardine Matheson Holdings | 8,246 | 366,871 | |||||
Jardine Strategic Holdings | 8,100 | 175,470 | |||||
Kerry Properties | 22,000 | 53,926 | |||||
Link REIT | 74,122 | 566,010 | |||||
Melco Resorts & Entertainment, ADR | 8,366 | 134,860 | |||||
MTR | 57,756 | 286,447 | |||||
New World Development | 54,141 | 258,394 | |||||
PCCW | 149,476 | 89,945 | |||||
Power Assets Holdings | 51,500 | 264,817 | |||||
Sino Land | 121,730 | 144,497 | |||||
SJM Holdings | 76,530 | 79,720 | |||||
Sun Hung Kai Properties | 47,199 | 605,196 | |||||
Swire Pacific, Cl. A | 20,000 | 91,132 | |||||
Swire Properties | 40,400 | 108,422 | |||||
Techtronic Industries | 50,365 | 677,458 | |||||
The Bank of East Asia | 51,789 | 93,429 | |||||
15
STATEMENT OF INVESTMENTS (continued)
Description | Shares | Value ($) | |||||
Common Stocks - 98.3% (continued) | |||||||
Hong Kong - 3.2% (continued) | |||||||
WH Group | 341,500 | d | 268,430 | ||||
Wharf Real Estate Investment | 60,311 | 232,452 | |||||
15,437,645 | |||||||
Ireland - 1.1% | |||||||
AerCap Holdings | 4,539 | a | 112,703 | ||||
CRH | 28,706 | 1,007,919 | |||||
DCC | 3,712 | 241,673 | |||||
Experian | 32,898 | 1,200,886 | |||||
Flutter Entertainment | 5,641 | 982,959 | |||||
James Hardie Industries-CDI | 16,541 | 404,074 | |||||
Kerry Group, Cl. A | 5,799 | 693,828 | |||||
Kingspan Group | 5,703 | a | 497,399 | ||||
Smurfit Kappa Group | 8,415 | 316,909 | |||||
5,458,350 | |||||||
Isle Of Man - .1% | |||||||
GVC Holdings | 21,048 | 263,622 | |||||
Israel - .6% | |||||||
Azrieli Group | 1,666 | 78,308 | |||||
Bank Hapoalim | 42,819 | a | 251,319 | ||||
Bank Leumi Le-Israel | 53,296 | 252,713 | |||||
Check Point Software Technologies | 4,242 | a,c | 481,722 | ||||
CyberArk Software | 1,371 | a | 135,935 | ||||
Elbit Systems | 973 | 109,847 | |||||
ICL Group | 26,400 | 95,746 | |||||
Israel Discount Bank, Cl. A | 42,579 | 120,070 | |||||
Mizrahi Tefahot Bank | 5,343 | 104,501 | |||||
NICE | 2,269 | a | 517,256 | ||||
Teva Pharmaceutical Industries, ADR | 39,643 | a,c | 345,687 | ||||
Wix.com | 1,853 | a | 458,284 | ||||
2,951,388 | |||||||
Italy - 1.9% | |||||||
Assicurazioni Generali | 39,714 | 532,774 | |||||
Atlantia | 18,206 | a | 279,155 | ||||
Davide Campari-Milano | 20,808 | 217,046 | |||||
DiaSorin | 919 | 201,857 | |||||
Enel | 295,289 | 2,351,785 | |||||
Eni | 93,744 | 659,734 | |||||
Ferrari | 4,554 | 812,607 | |||||
FinecoBank Banca Fineco | 21,990 | 301,148 | |||||
Infrastrutture Wireless Italiane | 8,563 | d | 92,825 | ||||
Intesa Sanpaolo | 598,339 | a | 992,654 | ||||
Leonardo | 14,628 | 69,712 | |||||
16
Description | Shares | Value ($) | |||||
Common Stocks - 98.3% (continued) | |||||||
Italy - 1.9% (continued) | |||||||
Mediobanca Banca Di Credito Finanziario | 23,171 | 164,426 | |||||
Moncler | 7,203 | 288,415 | |||||
Nexi | 13,970 | a,d | 214,700 | ||||
Pirelli & C | 15,237 | d | 63,599 | ||||
Poste Italiane | 20,146 | d | 164,354 | ||||
Prysmian | 9,157 | 249,051 | |||||
Recordati | 3,910 | 202,679 | |||||
Snam | 74,484 | 363,688 | |||||
Telecom Italia | 284,717 | 96,694 | |||||
Telecom Italia-RSP | 235,243 | 85,621 | |||||
Terna Rete Elettrica Nazionale | 50,889 | 344,156 | |||||
UniCredit | 76,566 | 573,595 | |||||
9,322,275 | |||||||
Japan - 26.3% | |||||||
ABC-Mart | 1,200 | 60,824 | |||||
Acom | 15,500 | 69,377 | |||||
Advantest | 7,400 | 430,397 | |||||
Aeon | 23,800 | 608,670 | |||||
AEON Mall | 3,380 | 52,844 | |||||
AGC | 6,960 | 217,269 | |||||
Air Water | 6,800 | 97,153 | |||||
Aisin Seiki | 6,000 | 182,145 | |||||
Ajinomoto | 16,900 | 339,280 | |||||
Alfresa Holdings | 6,700 | 123,145 | |||||
Amada | 11,400 | 99,035 | |||||
ANA Holdings | 4,100 | c | 89,577 | ||||
Aozora Bank | 4,695 | 77,113 | |||||
Asahi Group Holdings | 16,300 | 505,216 | |||||
Asahi Intecc | 7,000 | 217,186 | |||||
Asahi Kasei | 45,400 | 394,297 | |||||
Astellas Pharma | 67,995 | 935,792 | |||||
Bandai Namco Holdings | 7,250 | 538,126 | |||||
Benesse Holdings | 2,700 | 63,562 | |||||
Bridgestone | 19,500 | 635,549 | |||||
Brother Industries | 8,200 | 126,891 | |||||
CALBEE | 3,000 | 91,943 | |||||
Canon | 36,417 | 633,774 | |||||
Casio Computer | 7,400 | 112,132 | |||||
Central Japan Railway | 5,300 | 640,812 | |||||
Chubu Electric Power | 23,200 | 259,591 | |||||
Chugai Pharmaceutical | 24,584 | 948,602 | |||||
Coca-Cola Bottlers Japan Holdings | 4,700 | 66,603 | |||||
17
STATEMENT OF INVESTMENTS (continued)
Description | Shares | Value ($) | |||||
Common Stocks - 98.3% (continued) | |||||||
Japan - 26.3% (continued) | |||||||
Concordia Financial Group | 37,900 | 125,041 | |||||
Cosmos Pharmaceutical | 700 | 119,040 | |||||
CyberAgent | 3,700 | 233,037 | |||||
Dai Nippon Printing | 9,100 | 169,711 | |||||
Daicel | 9,500 | 67,968 | |||||
Daifuku | 3,600 | 370,817 | |||||
Dai-ichi Life Holdings | 38,900 | 579,510 | |||||
Daiichi Sankyo | 61,749 | 1,626,054 | |||||
Daikin Industries | 9,000 | 1,684,984 | |||||
Daito Trust Construction | 2,400 | 218,458 | |||||
Daiwa House Industry | 20,400 | 537,396 | |||||
Daiwa House REIT Investment | 69 | 159,788 | |||||
Daiwa Securities Group | 53,300 | 215,629 | |||||
Denso | 15,600 | 727,332 | |||||
Dentsu Group | 7,800 | 224,966 | |||||
Disco | 1,000 | 268,636 | |||||
East Japan Railway | 11,100 | 581,924 | |||||
Eisai | 9,300 | 723,430 | |||||
Electric Power Development | 4,780 | 64,696 | |||||
ENEOS Holdings | 111,126 | 374,667 | |||||
FamilyMart | 6,868 | 150,115 | |||||
FANUC | 7,029 | 1,494,019 | |||||
Fast Retailing | 2,158 | 1,509,168 | |||||
Fuji Electric | 4,600 | 139,702 | |||||
FUJIFILM Holdings | 13,100 | 667,786 | |||||
Fujitsu | 7,080 | 823,279 | |||||
Fukuoka Financial Group | 6,700 | 111,934 | |||||
GLP J-REIT | 133 | 204,240 | |||||
GMO Payment Gateway | 1,500 | 182,651 | |||||
Hakuhodo DY Holdings | 8,100 | 103,535 | |||||
Hamamatsu Photonics K.K. | 5,300 | 264,486 | |||||
Hankyu Hanshin Holdings | 8,100 | 247,903 | |||||
Hikari Tsushin | 800 | 187,548 | |||||
Hino Motors | 11,700 | 89,854 | |||||
Hirose Electric | 1,233 | 172,321 | |||||
Hisamitsu Pharmaceutical | 2,000 | 95,574 | |||||
Hitachi | 35,380 | 1,193,101 | |||||
Hitachi Construction Machinery | 4,000 | 98,469 | |||||
Hitachi Metals | 7,400 | 98,136 | |||||
Honda Motor | 59,059 | 1,392,634 | |||||
Hoshizaki | 1,900 | 152,137 | |||||
Hoya | 13,600 | 1,539,819 | |||||
Hulic | 12,000 | 111,676 | |||||
18
Description | Shares | Value ($) | |||||
Common Stocks - 98.3% (continued) | |||||||
Japan - 26.3% (continued) | |||||||
Idemitsu Kosan | 6,775 | 137,028 | |||||
Iida Group Holdings | 5,600 | 101,518 | |||||
Inpex | 37,900 | 181,249 | |||||
Isetan Mitsukoshi Holdings | 11,320 | 55,160 | |||||
Isuzu Motors | 20,300 | 165,199 | |||||
Ito En | 1,900 | 120,480 | |||||
ITOCHU | 48,800 | 1,173,948 | |||||
Itochu Techno-Solutions | 3,400 | 115,494 | |||||
Japan Airlines | 4,300 | 75,251 | |||||
Japan Airport Terminal | 1,900 | 82,782 | |||||
Japan Exchange Group | 18,700 | 458,873 | |||||
Japan Post Bank | 15,700 | 125,135 | |||||
Japan Post Holdings | 58,200 | 399,236 | |||||
Japan Post Insurance | 8,000 | 126,837 | |||||
Japan Prime Realty Investment | 31 | 83,853 | |||||
Japan Real Estate Investment | 47 | 230,300 | |||||
Japan Retail Fund Investment | 94 | 135,983 | |||||
Japan Tobacco | 43,800 | 828,296 | |||||
JFE Holdings | 18,560 | a | 129,935 | ||||
JGC Holdings | 9,100 | 75,080 | |||||
JSR | 7,300 | 164,549 | |||||
JTEKT | 8,000 | 63,772 | |||||
Kajima | 16,500 | 175,771 | |||||
Kakaku.com | 4,700 | 124,953 | |||||
Kamigumi | 3,900 | 69,872 | |||||
Kansai Paint | 6,400 | 165,629 | |||||
Kao | 17,500 | 1,244,206 | |||||
Kawasaki Heavy Industries | 5,700 | 67,790 | |||||
KDDI | 59,063 | 1,581,737 | |||||
Keihan Holdings | 3,400 | 129,319 | |||||
Keikyu | 7,700 | 107,834 | |||||
Keio | 3,700 | 215,151 | |||||
Keisei Electric Railway | 4,600 | 128,987 | |||||
Keyence | 6,640 | 3,011,062 | |||||
Kikkoman | 5,200 | 259,524 | |||||
Kintetsu Group Holdings | 6,435 | 257,290 | |||||
Kirin Holdings | 29,900 | 539,894 | |||||
Kobayashi Pharmaceutical | 1,800 | 175,081 | |||||
Kobe Bussan | 4,400 | 123,121 | |||||
Koito Manufacturing | 3,800 | 183,835 | |||||
Komatsu | 31,900 | 715,989 | |||||
Konami Holdings | 3,300 | 129,031 | |||||
Kose | 1,200 | 153,042 | |||||
19
STATEMENT OF INVESTMENTS (continued)
Description | Shares | Value ($) | |||||
Common Stocks - 98.3% (continued) | |||||||
Japan - 26.3% (continued) | |||||||
Kubota | 38,200 | 665,455 | |||||
Kuraray | 10,900 | 100,765 | |||||
Kurita Water Industries | 3,800 | 113,090 | |||||
Kyocera | 11,800 | 650,047 | |||||
Kyowa Kirin | 9,905 | 246,439 | |||||
Kyushu Electric Power | 13,600 | 113,834 | |||||
Kyushu Railway | 5,300 | 112,962 | |||||
Lasertec | 2,800 | 241,822 | |||||
Lawson | 1,800 | 82,784 | |||||
LINE | 1,200 | a | 61,564 | ||||
Lion | 7,900 | 161,120 | |||||
LIXIL Group | 9,624 | 207,609 | |||||
M3 | 16,000 | 1,079,543 | |||||
Makita | 8,300 | 366,898 | |||||
Marubeni | 61,500 | 320,281 | |||||
Marui Group | 6,800 | 122,716 | |||||
Maruichi Steel Tube | 2,000 | 45,993 | |||||
Mazda Motor | 20,600 | 108,923 | |||||
McDonald's Holdings | 2,300 | 109,086 | |||||
Mebuki Financial Group | 33,730 | 67,708 | |||||
Medipal Holdings | 7,100 | 126,961 | |||||
MEIJI Holdings | 4,042 | 293,036 | |||||
Mercari | 3,000 | a | 126,820 | ||||
Minebea Mitsumi | 12,900 | 231,452 | |||||
MISUMI Group | 10,338 | 307,366 | |||||
Mitsubishi | 48,898 | 1,093,575 | |||||
Mitsubishi Chemical Holdings | 45,580 | 256,805 | |||||
Mitsubishi Electric | 66,000 | 847,795 | |||||
Mitsubishi Estate | 43,100 | 643,967 | |||||
Mitsubishi Gas Chemical | 5,500 | 100,198 | |||||
Mitsubishi Heavy Industries | 11,770 | 252,112 | |||||
Mitsubishi Materials | 4,500 | 82,547 | |||||
Mitsubishi Motors | 28,600 | 52,475 | |||||
Mitsubishi UFJ Financial Group | 443,390 | 1,747,806 | |||||
Mitsubishi UFJ Lease & Finance | 15,600 | 65,956 | |||||
Mitsui & Co. | 59,600 | 934,929 | |||||
Mitsui Chemicals | 7,000 | 180,023 | |||||
Mitsui Fudosan | 33,486 | 572,253 | |||||
Miura | 3,100 | 145,722 | |||||
Mizuho Financial Group | 87,350 | 1,076,903 | |||||
MonotaRO | 4,500 | 251,241 | |||||
MS&AD Insurance Group Holdings | 16,357 | 450,940 | |||||
Murata Manufacturing | 21,000 | 1,456,601 | |||||
20
Description | Shares | Value ($) | |||||
Common Stocks - 98.3% (continued) | |||||||
Japan - 26.3% (continued) | |||||||
Nabtesco | 4,100 | 153,847 | |||||
Nagoya Railroad | 6,900 | 183,902 | |||||
NEC | 9,080 | 456,684 | |||||
NEXON | 17,500 | 489,731 | |||||
NGK Insulators | 9,400 | 134,480 | |||||
NGK Spark Plug | 5,526 | 97,162 | |||||
NH Foods | 2,900 | 118,765 | |||||
Nidec | 16,200 | 1,628,533 | |||||
Nihon M&A Center | 5,500 | 321,817 | |||||
Nikon | 11,560 | 70,176 | |||||
Nintendo | 4,025 | 2,197,885 | |||||
Nippon Building Fund | 47 | 237,359 | |||||
Nippon Express | 2,600 | 145,324 | |||||
Nippon Paint Holdings | 5,400 | 486,651 | |||||
Nippon Prologis REIT | 76 | 250,303 | |||||
Nippon Shinyaku | 1,600 | 114,262 | |||||
Nippon Steel | 28,861 | a | 280,105 | ||||
Nippon Telegraph & Telephone | 47,100 | 994,506 | |||||
Nippon Yusen KK | 5,980 | 110,406 | |||||
Nissan Chemical | 4,700 | 249,220 | |||||
Nissan Motor | 85,600 | 302,984 | |||||
Nisshin Seifun Group | 7,138 | 107,009 | |||||
Nissin Foods Holdings | 2,400 | 207,688 | |||||
Nitori Holdings | 2,900 | 598,447 | |||||
Nitto Denko | 5,700 | 400,023 | |||||
Nomura Holdings | 113,200 | 504,717 | |||||
Nomura Real Estate Holdings | 4,600 | 80,611 | |||||
Nomura Real Estate Master Fund | 161 | 192,085 | |||||
Nomura Research Institute | 11,449 | 336,928 | |||||
NSK | 12,200 | 97,737 | |||||
NTT Data | 23,700 | 267,496 | |||||
NTT Docomo | 41,400 | 1,562,682 | |||||
Obayashi | 23,700 | 197,638 | |||||
OBIC | 2,500 | 443,940 | |||||
Odakyu Electric Railway | 10,900 | 263,469 | |||||
Oji Holdings | 33,200 | 140,083 | |||||
Olympus | 42,500 | 812,608 | |||||
Omron | 6,800 | 490,236 | |||||
Ono Pharmaceutical | 13,400 | 380,962 | |||||
Oracle | 1,400 | 140,282 | |||||
Oriental Land | 7,300 | 1,021,432 | |||||
ORIX | 47,300 | 551,946 | |||||
Orix JREIT | 94 | 131,897 | |||||
21
STATEMENT OF INVESTMENTS (continued)
Description | Shares | Value ($) | |||||
Common Stocks - 98.3% (continued) | |||||||
Japan - 26.3% (continued) | |||||||
Osaka Gas | 14,100 | 266,080 | |||||
Otsuka | 3,900 | 178,945 | |||||
Otsuka Holdings | 14,200 | 526,328 | |||||
Pan Pacific International Holdings | 14,700 | 313,924 | |||||
Panasonic | 80,495 | 744,597 | |||||
Park24 | 3,700 | 50,092 | |||||
PeptiDream | 3,400 | a | 157,506 | ||||
Persol Holdings | 6,200 | 94,145 | |||||
Pigeon | 4,100 | 188,838 | |||||
Pola Orbis Holdings | 3,000 | 59,142 | |||||
Rakuten | 30,800 | 300,089 | |||||
Recruit Holdings | 46,100 | 1,760,858 | |||||
Renesas Electronics | 27,600 | a | 225,120 | ||||
Resona Holdings | 77,600 | 255,191 | |||||
Ricoh | 23,400 | 154,082 | |||||
Rinnai | 1,400 | 138,286 | |||||
Rohm | 3,200 | 246,540 | |||||
Ryohin Keikaku | 8,500 | 178,156 | |||||
Santen Pharmaceutical | 13,300 | 236,591 | |||||
SBI Holdings | 8,330 | 192,032 | |||||
SCSK | 1,900 | 94,084 | |||||
Secom | 7,700 | 650,558 | |||||
Sega Sammy Holdings | 6,384 | 80,153 | |||||
Seibu Holdings | 7,900 | 79,301 | |||||
Seiko Epson | 10,000 | 115,979 | |||||
Sekisui Chemical | 13,000 | 203,037 | |||||
Sekisui House | 22,800 | 378,071 | |||||
Seven & i Holdings | 27,260 | 832,566 | |||||
Seven Bank | 19,400 | 44,484 | |||||
SG Holdings | 11,800 | 284,568 | |||||
Sharp | 8,500 | 98,394 | |||||
Shimadzu | 8,300 | 237,320 | |||||
Shimamura | 800 | 85,149 | |||||
Shimano | 2,700 | 615,929 | |||||
Shimizu | 20,400 | 141,165 | |||||
Shin-Etsu Chemical | 12,800 | 1,712,762 | |||||
Shinsei Bank | 5,300 | 63,770 | |||||
Shionogi & Co. | 9,800 | 462,655 | |||||
Shiseido | 14,600 | 903,804 | |||||
Showa Denko K.K. | 5,200 | 88,268 | |||||
SMC | 2,100 | 1,108,803 | |||||
Softbank | 104,000 | 1,207,412 | |||||
SoftBank Group | 56,940 | 3,741,952 | |||||
22
Description | Shares | Value ($) | |||||
Common Stocks - 98.3% (continued) | |||||||
Japan - 26.3% (continued) | |||||||
Sohgo Security Services | 2,500 | 116,430 | |||||
Sompo Holdings | 12,170 | 455,276 | |||||
Sony | 45,780 | 3,815,631 | |||||
Square Enix Holdings | 3,400 | 199,685 | |||||
Stanley Electric | 4,700 | 133,906 | |||||
Subaru | 22,800 | 419,526 | |||||
Sumco | 10,100 | 154,113 | |||||
Sumitomo | 43,700 | 481,661 | |||||
Sumitomo Chemical | 53,400 | 175,055 | |||||
Sumitomo Dainippon Pharma | 6,300 | 74,020 | |||||
Sumitomo Electric Industries | 27,200 | 300,025 | |||||
Sumitomo Heavy Industries | 4,200 | 89,850 | |||||
Sumitomo Metal Mining | 8,500 | 264,299 | |||||
Sumitomo Mitsui Financial Group | 47,300 | 1,310,012 | |||||
Sumitomo Mitsui Trust Holdings | 12,164 | 325,499 | |||||
Sumitomo Realty & Development | 11,000 | 295,368 | |||||
Sumitomo Rubber Industries | 5,500 | 48,409 | |||||
Sundrug | 2,500 | 92,821 | |||||
Suntory Beverage & Food | 4,900 | 169,390 | |||||
Suzuken | 2,212 | 79,891 | |||||
Suzuki Motor | 13,500 | 581,393 | |||||
Sysmex | 6,100 | 574,079 | |||||
T&D Holdings | 19,700 | 196,840 | |||||
Taiheiyo Cement | 4,500 | 105,942 | |||||
Taisei | 6,800 | 211,194 | |||||
Taisho Pharmaceutical Holdings | 1,300 | 78,055 | |||||
Taiyo Nippon Sanso | 5,900 | 86,789 | |||||
Takeda Pharmaceutical | 57,223 | 1,770,893 | |||||
TDK | 4,800 | 563,045 | |||||
Teijin | 7,000 | 107,423 | |||||
Terumo | 23,600 | 869,649 | |||||
The Bank of Kyoto | 2,000 | 88,225 | |||||
The Chiba Bank | 18,400 | 95,058 | |||||
The Chugoku Electric Power Company | 10,800 | 135,442 | |||||
The Kansai Electric Power Company | 26,099 | 236,811 | |||||
The Shizuoka Bank | 15,400 | 103,498 | |||||
The Yokohama Rubber Company | 4,200 | 60,444 | |||||
THK | 4,500 | 118,744 | |||||
TIS | 8,200 | 157,683 | |||||
Tobu Railway | 7,000 | 199,117 | |||||
Toho | 4,200 | 166,506 | |||||
Toho Gas | 2,600 | 134,332 | |||||
Tohoku Electric Power | 15,200 | 133,698 | |||||
23
STATEMENT OF INVESTMENTS (continued)
Description | Shares | Value ($) | |||||
Common Stocks - 98.3% (continued) | |||||||
Japan - 26.3% (continued) | |||||||
Tokio Marine Holdings | 23,100 | 1,034,995 | |||||
Tokyo Century | 1,700 | 83,347 | |||||
Tokyo Electric Power Holdings | 53,972 | a | 139,504 | ||||
Tokyo Electron | 5,400 | 1,447,300 | |||||
Tokyo Gas | 13,800 | 311,607 | |||||
Tokyu | 18,710 | 222,468 | |||||
Tokyu Fudosan Holdings | 23,700 | 103,713 | |||||
Toppan Printing | 9,300 | 117,967 | |||||
Toray Industries | 52,100 | 236,345 | |||||
Toshiba | 14,300 | 361,136 | |||||
Tosoh | 9,300 | 151,439 | |||||
TOTO | 5,100 | 232,604 | |||||
Toyo Suisan Kaisha | 3,300 | 164,339 | |||||
Toyoda Gosei | 2,400 | 60,933 | |||||
Toyota Industries | 5,200 | 336,352 | |||||
Toyota Motor | 77,055 | 5,046,549 | |||||
Toyota Tsusho | 7,800 | 218,407 | |||||
Trend Micro | 5,000 | 280,794 | |||||
Tsuruha Holdings | 1,400 | 195,767 | |||||
Unicharm | 14,900 | 691,790 | |||||
United Urban Investment | 114 | 121,604 | |||||
USS | 7,900 | 145,176 | |||||
Welcia Holdings | 3,400 | 133,706 | |||||
West Japan Railway | 6,000 | 257,745 | |||||
Yakult Honsha | 4,400 | 213,538 | |||||
Yamada Holdings | 28,200 | 137,490 | |||||
Yamaha | 5,000 | 236,839 | |||||
Yamaha Motor | 10,000 | 143,145 | |||||
Yamato Holdings | 11,300 | 298,704 | |||||
Yamazaki Baking | 4,000 | 65,621 | |||||
Yaskawa Electric | 8,600 | 334,652 | |||||
Yokogawa Electric | 8,200 | 120,574 | |||||
Z Holdings | 97,600 | 680,029 | |||||
ZOZO | 3,500 | 89,354 | |||||
127,227,278 | |||||||
Jordan - .0% | |||||||
Hikma Pharmaceuticals | 6,291 | 204,625 | |||||
Luxembourg - .2% | |||||||
ArcelorMittal | 26,767 | 363,454 | |||||
Aroundtown | 35,771 | 171,574 | |||||
Eurofins Scientific | 473 | 377,485 | |||||
SES | 13,837 | 110,866 | |||||
24
Description | Shares | Value ($) | |||||
Common Stocks - 98.3% (continued) | |||||||
Luxembourg - .2% (continued) | |||||||
Tenaris | 18,924 | 90,426 | |||||
1,113,805 | |||||||
Macau - .1% | |||||||
Sands China | 90,613 | 317,587 | |||||
Wynn Macau | 55,200 | a | 76,274 | ||||
393,861 | |||||||
Netherlands - 4.6% | |||||||
ABN AMRO Bank-CVA | 14,731 | a,d | 120,998 | ||||
Adyen | 663 | a,d | 1,118,792 | ||||
Aegon | 62,620 | 169,609 | |||||
Akzo Nobel | 7,107 | 684,774 | |||||
Altice Europe | 23,523 | a | 115,908 | ||||
argenx | 1,466 | a | 364,971 | ||||
ASML Holding | 15,475 | 5,626,008 | |||||
EXOR | 4,022 | 209,137 | |||||
Heineken | 9,468 | 840,670 | |||||
Heineken Holding | 4,119 | 318,430 | |||||
ING Groep | 141,113 | a | 968,225 | ||||
Just Eat Takeaway.com | 4,601 | a,c,d | 511,993 | ||||
Koninklijke Ahold Delhaize | 39,852 | 1,095,115 | |||||
Koninklijke DSM | 6,237 | 998,697 | |||||
Koninklijke KPN | 130,139 | 351,738 | |||||
Koninklijke Philips | 33,182 | 1,541,542 | |||||
Koninklijke Vopak | 2,599 | 135,111 | |||||
NN Group | 10,543 | 368,787 | |||||
Prosus | 17,678 | 1,767,017 | |||||
QIAGEN | 8,435 | a | 400,446 | ||||
Randstad | 4,476 | 223,745 | |||||
Royal Dutch Shell, Cl. A | 148,761 | 1,875,216 | |||||
Royal Dutch Shell, Cl. B | 134,364 | 1,620,556 | |||||
Wolters Kluwer | 9,865 | 799,631 | |||||
22,227,116 | |||||||
New Zealand - .3% | |||||||
Auckland International Airport | 47,414 | 219,557 | |||||
Fisher & Paykel Healthcare | 20,871 | 482,799 | |||||
Mercury NZ | 22,832 | 80,890 | |||||
Meridian Energy | 47,422 | 166,139 | |||||
Ryman Healthcare | 14,311 | 132,393 | |||||
Spark New Zealand | 69,611 | 206,591 | |||||
The a2 Milk Company | 27,818 | a | 269,389 | ||||
1,557,758 | |||||||
Norway - .5% | |||||||
Adevinta | 8,196 | a | 126,788 | ||||
25
STATEMENT OF INVESTMENTS (continued)
Description | Shares | Value ($) | |||||
Common Stocks - 98.3% (continued) | |||||||
Norway - .5% (continued) | |||||||
DNB | 34,770 | a | 469,724 | ||||
Equinor | 36,621 | 469,810 | |||||
Gjensidige Forsikring | 7,414 | 140,970 | |||||
Mowi | 15,826 | c | 250,080 | ||||
Norsk Hydro | 51,748 | 145,039 | |||||
Orkla | 27,924 | 263,638 | |||||
Schibsted, Cl. B | 3,508 | 126,160 | |||||
Telenor | 26,149 | 403,611 | |||||
Yara International | 6,697 | 233,439 | |||||
2,629,259 | |||||||
Portugal - .2% | |||||||
Banco Espirito Santo | 118,053 | a,e | 0 | ||||
EDP - Energias de Portugal | 100,479 | 494,559 | |||||
Galp Energia | 18,224 | 147,791 | |||||
Jeronimo Martins | 9,364 | 148,650 | |||||
791,000 | |||||||
Singapore - 1.0% | |||||||
Ascendas Real Estate Investment Trust | 110,538 | 233,504 | |||||
CapitaLand | 92,300 | 173,997 | |||||
CapitaLand Integrated Commercial Trust | 171,676 | 218,201 | |||||
City Developments | 17,200 | 80,108 | |||||
DBS Group Holdings | 64,888 | 966,526 | |||||
Genting Singapore | 211,227 | 99,973 | |||||
Jardine Cycle & Carriage | 4,113 | 53,469 | |||||
Keppel | 51,900 | 166,769 | |||||
Mapletree Commercial Trust | 82,400 | 103,975 | |||||
Mapletree Logistics Trust | 94,900 | 135,718 | |||||
Oversea-Chinese Banking | 121,836 | c | 750,907 | ||||
Singapore Airlines | 49,033 | 122,124 | |||||
Singapore Exchange | 28,500 | 180,995 | |||||
Singapore Technologies Engineering | 57,600 | 147,640 | |||||
Singapore Telecommunications | 302,551 | 450,302 | |||||
Suntec Real Estate Investment Trust | 67,800 | 66,664 | |||||
United Overseas Bank | 42,863 | 595,810 | |||||
UOL Group | 18,111 | 82,456 | |||||
Venture | 9,800 | 138,535 | |||||
Wilmar International | 68,800 | 203,912 | |||||
4,971,585 | |||||||
Spain - 2.2% | |||||||
ACS Actividades de Construccion y Servicios | 9,635 | 229,067 | |||||
Aena SME | 2,520 | d | 340,376 | ||||
Amadeus IT Group | 16,272 | 779,946 | |||||
26
Description | Shares | Value ($) | |||||
Common Stocks - 98.3% (continued) | |||||||
Spain - 2.2% (continued) | |||||||
Banco Bilbao Vizcaya Argentaria | 240,574 | 692,669 | |||||
Banco Santander | 601,777 | a | 1,204,814 | ||||
Bankinter | 24,299 | 91,373 | |||||
CaixaBank | 127,460 | 232,829 | |||||
Cellnex Telecom | 11,422 | d | 733,722 | ||||
Enagas | 9,330 | 201,717 | |||||
Endesa | 11,689 | 313,340 | |||||
Ferrovial | 17,383 | 376,135 | |||||
Grifols | 10,775 | c | 291,116 | ||||
Iberdrola | 215,707 | 2,544,662 | |||||
Industria de Diseno Textil | 39,472 | 976,727 | |||||
Mapfre | 37,507 | 56,697 | |||||
Natural Energy Group | 11,037 | 204,349 | |||||
Red Electrica | 15,596 | 274,799 | |||||
Repsol | 53,313 | 332,642 | |||||
Siemens Gamesa Renewable Energy | 8,899 | 252,212 | |||||
Telefonica | 175,481 | 573,739 | |||||
10,702,931 | |||||||
Sweden - 3.1% | |||||||
Alfa Laval | 11,711 | 237,714 | |||||
Assa Abloy, Cl. B | 36,207 | 777,516 | |||||
Atlas Copco, Cl. A | 24,570 | 1,085,161 | |||||
Atlas Copco, Cl. B | 14,344 | 550,325 | |||||
Boliden | 9,742 | 266,413 | |||||
Electrolux, Ser. B | 8,307 | 187,318 | |||||
Epiroc, Cl. A | 23,596 | 352,748 | |||||
Epiroc, Cl. B | 14,504 | 208,061 | |||||
EQT | 8,501 | 162,097 | |||||
Essity, Cl. B | 22,138 | 641,213 | |||||
Evolution Gaming Group | 4,549 | d | 338,070 | ||||
Hennes & Mauritz, Cl. B | 29,753 | 483,752 | |||||
Hexagon, Cl. B | 10,163 | 742,199 | |||||
Husqvarna, Cl. B | 15,103 | 156,203 | |||||
ICA Gruppen | 3,745 | 177,267 | |||||
Industrivarden, Cl. C | 5,908 | 151,432 | |||||
Investment AB Latour, Cl. B | 5,282 | 123,368 | |||||
Investor, Cl. B | 16,481 | 990,176 | |||||
Kinnevik, Cl. B | 8,755 | 359,428 | |||||
L E Lundbergforetagen, Cl. B | 2,794 | 125,825 | |||||
Lundin Energy | 7,253 | 138,494 | |||||
Nibe Industrier, Cl. B | 11,651 | 281,089 | |||||
Sandvik | 41,621 | 741,565 | |||||
Securitas, Cl. B | 11,559 | 163,681 | |||||
27
STATEMENT OF INVESTMENTS (continued)
Description | Shares | Value ($) | |||||
Common Stocks - 98.3% (continued) | |||||||
Sweden - 3.1% (continued) | |||||||
Skandinaviska Enskilda Banken, Cl. A | 59,220 | 508,970 | |||||
Skanska, Cl. B | 12,635 | 237,610 | |||||
SKF, Cl. B | 13,964 | 285,987 | |||||
Svenska Cellulosa, Cl. B | 22,763 | 309,011 | |||||
Svenska Handelsbanken, Cl. A | 56,534 | 458,404 | |||||
Swedbank, Cl. A | 32,591 | 511,619 | |||||
Swedish Match | 5,949 | 448,529 | |||||
Tele2, Cl. B | 18,297 | 216,840 | |||||
Telefonaktiebolaget LM Ericsson, Cl. B | 106,785 | 1,189,891 | |||||
Telia | 90,432 | 346,848 | |||||
Volvo, Cl. B | 53,822 | 1,047,934 | |||||
15,002,758 | |||||||
Switzerland - 10.4% | |||||||
ABB | 67,220 | 1,629,991 | |||||
Adecco Group | 5,531 | 271,041 | |||||
Alcon | 17,796 | a | 1,009,288 | ||||
Baloise Holding | 1,644 | 225,129 | |||||
Banque Cantonale Vaudoise | 1,070 | 103,660 | |||||
Barry Callebaut | 113 | 233,366 | |||||
Chocoladefabriken Lindt & Spruengli | 4 | 345,953 | |||||
Chocoladefabriken Lindt & Spruengli-PC | 40 | 316,940 | |||||
Cie Financiere Richemont, CI. A | 18,907 | 1,184,285 | |||||
Clariant | 7,170 | 122,940 | |||||
Coca-Cola HBC | 7,456 | 169,595 | |||||
Credit Suisse Group | 88,716 | 837,941 | |||||
EMS-Chemie Holding | 300 | 263,744 | |||||
Geberit | 1,365 | 776,313 | |||||
Givaudan | 335 | 1,363,530 | |||||
Glencore | 368,429 | 744,710 | |||||
Julius Baer Group | 8,166 | 365,494 | |||||
Kuehne + Nagel International | 1,975 | 394,511 | |||||
LafargeHolcim | 18,916 | 810,684 | |||||
Logitech International | 5,973 | 503,131 | |||||
Lonza Group | 2,700 | 1,632,969 | |||||
Nestle | 108,256 | 12,162,932 | |||||
Novartis | 80,732 | 6,300,816 | |||||
Partners Group Holding | 687 | 618,605 | |||||
Roche Holding | 25,551 | 8,202,272 | |||||
Schindler Holding | 710 | 182,084 | |||||
Schindler Holding-PC | 1,504 | 384,239 | |||||
SGS | 223 | 556,548 | |||||
Sika | 5,136 | 1,262,622 | |||||
Sonova Holding | 1,990 | a | 471,056 | ||||
28
Description | Shares | Value ($) | |||||
Common Stocks - 98.3% (continued) | |||||||
Switzerland - 10.4% (continued) | |||||||
STMicroelectronics | 23,265 | 710,514 | |||||
Straumann Holding | 374 | 390,086 | |||||
Swiss Life Holding | 1,170 | 393,417 | |||||
Swiss Prime Site | 2,854 | 239,853 | |||||
Swiss Re | 10,864 | 779,250 | |||||
Swisscom | 932 | 473,648 | |||||
Temenos | 2,494 | 267,349 | |||||
The Swatch Group | 1,977 | 80,759 | |||||
The Swatch Group-BR | 1,046 | 220,995 | |||||
UBS Group | 132,922 | 1,541,275 | |||||
Vifor Pharma | 1,664 | 186,814 | |||||
Zurich Insurance Group | 5,458 | 1,807,303 | |||||
50,537,652 | |||||||
United Arab Emirates - .0% | |||||||
NMC Health | 4,176 | a,e | 1 | ||||
United Kingdom - 12.3% | |||||||
3i Group | 35,342 | 440,296 | |||||
Admiral Group | 7,139 | 254,433 | |||||
Anglo American | 44,878 | 1,053,834 | |||||
Ashtead Group | 16,329 | 592,543 | |||||
Associated British Foods | 12,660 | 278,566 | |||||
AstraZeneca | 47,700 | 4,801,345 | |||||
Auto Trader Group | 35,091 | d | 263,405 | ||||
AVEVA Group | 2,354 | 131,083 | |||||
Aviva | 145,688 | 487,893 | |||||
BAE Systems | 115,935 | 596,411 | |||||
Barclays | 633,036 | 879,240 | |||||
Barratt Developments | 37,303 | a | 232,742 | ||||
Berkeley Group Holdings | 4,670 | 245,232 | |||||
BP | 735,024 | 1,879,828 | |||||
British American Tobacco | 83,311 | 2,646,949 | |||||
BT Group | 322,405 | 424,319 | |||||
Bunzl | 12,203 | 379,559 | |||||
Burberry Group | 15,013 | 263,864 | |||||
CNH Industrial | 38,491 | 298,834 | |||||
Coca-Cola European Partners | 7,280 | 259,969 | |||||
Compass Group | 64,493 | 882,177 | |||||
Croda International | 4,668 | 364,977 | |||||
Diageo | 84,883 | 2,745,737 | |||||
Direct Line Insurance Group | 51,056 | 174,672 | |||||
Evraz | 18,546 | 86,726 | |||||
Ferguson | 8,120 | 814,800 | |||||
Fiat Chrysler Automobiles | 39,891 | 490,196 | |||||
29
STATEMENT OF INVESTMENTS (continued)
Description | Shares | Value ($) | |||||
Common Stocks - 98.3% (continued) | |||||||
United Kingdom - 12.3% (continued) | |||||||
GlaxoSmithKline | 182,251 | 3,040,714 | |||||
Halma | 13,627 | 418,318 | |||||
Hargreaves Lansdown | 12,484 | 218,934 | |||||
HSBC Holdings | 739,787 | 3,122,546 | |||||
Imperial Brands | 34,449 | 546,478 | |||||
Informa | 53,611 | 290,972 | |||||
InterContinental Hotels Group | 6,454 | a | 326,682 | ||||
Intertek Group | 5,859 | 423,016 | |||||
J Sainsbury | 64,013 | 167,245 | |||||
JD Sports Fashion | 16,008 | 153,388 | |||||
Johnson Matthey | 6,967 | 194,114 | |||||
Kingfisher | 76,088 | a | 283,141 | ||||
Land Securities Group | 25,607 | 169,011 | |||||
Legal & General Group | 218,951 | 526,389 | |||||
Lloyds Banking Group | 2,558,752 | a | 929,463 | ||||
London Stock Exchange Group | 11,457 | 1,229,134 | |||||
M&G | 94,802 | 180,238 | |||||
Melrose Industries | 175,766 | a | 272,619 | ||||
Mondi | 17,731 | 336,334 | |||||
National Grid | 127,247 | 1,514,536 | |||||
Natwest Group | 182,903 | 294,514 | |||||
Next | 4,765 | 360,671 | |||||
Ocado Group | 16,958 | a | 500,232 | ||||
Pearson | 27,152 | 179,654 | |||||
Persimmon | 11,652 | 353,577 | |||||
Prudential | 94,478 | 1,153,909 | |||||
Reckitt Benckiser Group | 25,789 | 2,272,388 | |||||
RELX | 70,760 | 1,400,564 | |||||
Rentokil Initial | 68,008 | 463,712 | |||||
Rio Tinto | 40,729 | 2,308,070 | |||||
Rio Tinto | 13,420 | 875,138 | |||||
Rolls-Royce Holdings | 70,481 | a,c | 65,154 | ||||
RSA Insurance Group | 37,303 | 205,356 | |||||
Schroders | 4,794 | 162,454 | |||||
Segro | 43,538 | 508,942 | |||||
Severn Trent | 8,724 | 274,729 | |||||
Smith & Nephew | 31,859 | 553,899 | |||||
Smiths Group | 14,697 | 253,228 | |||||
Spirax-Sarco Engineering | 2,696 | 394,234 | |||||
SSE | 38,208 | 621,375 | |||||
St. James's Place | 19,650 | 229,788 | |||||
Standard Chartered | 99,449 | 455,171 | |||||
Standard Life Aberdeen | 86,546 | 252,687 | |||||
30
Description | Shares | Value ($) | |||||
Common Stocks - 98.3% (continued) | |||||||
United Kingdom - 12.3% (continued) | |||||||
Taylor Wimpey | 129,139 | a | 176,607 | ||||
Tesco | 354,222 | 943,291 | |||||
The British Land Company | 30,545 | 137,963 | |||||
The Sage Group | 39,858 | 328,447 | |||||
Unilever | 42,428 | 2,419,246 | |||||
Unilever | 53,060 | 2,997,032 | |||||
United Utilities Group | 25,651 | 287,634 | |||||
Vodafone Group | 970,027 | 1,295,781 | |||||
Whitbread | 7,210 | 200,697 | |||||
Wm Morrison Supermarkets | 89,448 | 188,841 | |||||
WPP | 45,240 | 362,240 | |||||
59,790,127 | |||||||
Total Common Stocks (cost $360,940,089) | 476,531,085 | ||||||
Preferred Dividend | |||||||
Preferred Stocks - .6% | |||||||
Germany - .6% | |||||||
Bayerische Motoren Werke | 4.73 | 1,938 | 100,217 | ||||
Fuchs Petrolub | 2.05 | 2,606 | 134,591 | ||||
Henkel & Co. | 2.03 | 6,559 | 640,120 | ||||
Porsche Automobil Holding | 4.07 | 5,584 | 299,211 | ||||
Sartorius | 0.10 | 1,281 | 541,842 | ||||
Volkswagen | 3.25 | 6,788 | 988,948 | ||||
Total Preferred Stocks (cost $1,797,566) | 2,704,929 | ||||||
Number of Rights | |||||||
Rights - .0% | |||||||
Singapore - .0% | |||||||
Mapletree Logistics Trust, CI. R | 1,803 | 0 | |||||
United Kingdom - .0% | |||||||
Rolls-Royce Holdings | 234,936 | 118,700 | |||||
Total Rights (cost $244,281) | 118,700 | ||||||
Principal Amount ($) | |||||||
Short-Term Investments - .1% | |||||||
U.S. Treasury Bills - .1% | |||||||
0.14%, 2/25/21 | 331,000 | f,g | 330,900 | ||||
31
STATEMENT OF INVESTMENTS (continued)
Description | 1-Day | Shares | Value ($) | ||||
Investment Companies - .0% | |||||||
Registered Investment Companies - .0% | |||||||
Dreyfus Institutional Preferred Government Plus Money Market Fund | 0.10 | 13,952 | h | 13,952 | |||
Investment of Cash Collateral for Securities Loaned - .4% | |||||||
Registered Investment Companies - .4% | |||||||
Dreyfus Institutional Preferred Government Plus Money Market Fund | 0.10 | 2,004,872 | h | 2,004,872 | |||
Total Investments (cost $365,331,615) | 99.4% | 481,704,438 | |||||
Cash and Receivables (Net) | .6% | 3,032,772 | |||||
Net Assets | 100.0% | 484,737,210 | |||||
ADR—American Depository Receipt
BR—Bearer Certificate
CDI—Chess Depository Interest
CVA—Company Voluntary Arrangement
PC—Participation Certificate
REIT—Real Estate Investment Trust
RSP—Risparmio (Savings) Shares
a Non-income producing security.
b The valuation of this security has been determined in good faith by management under the direction of the Board of Directors. At October 31, 2020, the value of these securities amounted to $188,520 or .04% of net assets.
c Security, or portion thereof, on loan. At October 31, 2020, the value of the fund’s securities on loan was $2,592,026 and the value of the collateral was $3,022,828, consisting of cash collateral of $2,004,872 and U.S. Government & Agency securities valued at $1,017,956.
d Security exempt from registration pursuant to Rule 144A under the Securities Act of 1933. These securities may be resold in transactions exempt from registration, normally to qualified institutional buyers. At October 31, 2020, these securities were valued at $8,448,619 or 1.74% of net assets.
e The fund held Level 3 securities at October 31, 2020, these securities were valued at $1 or .0% of net assets.
f Held by a counterparty for open exchange traded derivative contracts.
g Security is a discount security. Income is recognized through the accretion of discount.
h Investment in affiliated issuer. The investment objective of this investment company is publicly available and can be found within the investment company’s prospectus.
32
Portfolio Summary (Unaudited) † | Value (%) |
Capital Goods | 10.7 |
Pharmaceuticals Biotechnology & Life Sciences | 10.5 |
Materials | 7.5 |
Banks | 7.1 |
Food, Beverage & Tobacco | 6.7 |
Insurance | 4.6 |
Consumer Durables & Apparel | 4.6 |
Utilities | 4.0 |
Telecommunication Services | 3.9 |
Automobiles & Components | 3.8 |
Diversified Financials | 3.5 |
Household & Personal Products | 3.3 |
Software & Services | 3.2 |
Health Care Equipment & Services | 3.2 |
Real Estate | 3.1 |
Technology Hardware & Equipment | 2.9 |
Energy | 2.7 |
Transportation | 2.4 |
Retailing | 2.3 |
Semiconductors & Semiconductor Equipment | 2.2 |
Commercial & Professional Services | 2.1 |
Media & Entertainment | 1.7 |
Food & Staples Retailing | 1.5 |
Consumer Services | 1.4 |
Investment Companies | .4 |
U.S. Treasury Bills | .1 |
99.4 |
† Based on net assets.
See notes to financial statements.
33
STATEMENT OF INVESTMENTS IN AFFILIATED ISSUERS
Investment Companies | Value | Purchases($)† | Sales($) | Value | Net | Dividends/ |
Registered Investment Companies; | ||||||
Dreyfus Institutional Preferred Government Plus Money Market Fund | 8,547,273 | 83,452,197 | (91,985,518) | 13,952 | .0 | 35,177 |
Investment of Cash Collateral for Securities Loaned; | ||||||
Dreyfus Institutional Preferred Government Plus Money Market Fund | 1,499,874 | 26,646,565 | (26,141,567) | 2,004,872 | .4 | - |
Total | 10,047,147 | 110,098,762 | (118,127,085) | 2,018,824 | .4 | 35,177 |
† Includes reinvested dividends/distributions.
See notes to financial statements.
34
STATEMENT OF FUTURES
October 31, 2020
Description | Number of | Expiration | Notional | Market | Unrealized (Depreciation) ($) | |
Futures Long | ||||||
MSCI EAFE Index | 46 | 12/18/2020 | 4,128,037 | 4,102,970 | (25,067) | |
Gross Unrealized Depreciation | (25,067) | |||||
See notes to financial statements.
35
STATEMENT OF FORWARD FOREIGN CURRENCY EXCHANGE CONTRACTS October 31, 2020
Counterparty/ Purchased | Purchased Currency | Currency | Sold | Settlement Date | Unrealized Appreciation (Depreciation) ($) |
HSBC | |||||
United States Dollar | 165,137 | Swedish Krona | 1,477,104 | 11/2/2020 | (865) |
United States Dollar | 621,535 | British Pound | 482,195 | 11/2/2020 | (3,161) |
United States Dollar | 275,480 | Hong Kong Dollar | 2,136,360 | 11/3/2020 | (88) |
United States Dollar | 512,209 | Swiss Franc | 469,681 | 11/2/2020 | (50) |
United States Dollar | 44,510 | Danish Krone | 284,302 | 11/2/2020 | 29 |
United States Dollar | 1,569,264 | Euro | 1,346,176 | 11/2/2020 | 1,336 |
Societe Generale | |||||
United States Dollar | 406,328 | Australian Dollar | 578,650 | 11/3/2020 | (415) |
United States Dollar | 1,255,894 | Japanese Yen | 131,291,147 | 11/4/2020 | 1,778 |
United States Dollar | 17,689 | New Zealand Dollar | 26,766 | 11/3/2020 | (9) |
United States Dollar | 20,851 | Singapore Dollar | 28,473 | 11/3/2020 | 6 |
Gross Unrealized Appreciation | 3,149 | ||||
Gross Unrealized Depreciation | (4,588) | ||||
See notes to financial statements.
36
STATEMENT OF ASSETS AND LIABILITIES
October 31, 2020
|
|
|
|
|
|
|
|
|
| Cost |
| Value |
|
Assets ($): |
|
|
|
| ||
Investments in securities—See Statement of Investments |
|
|
| |||
Unaffiliated issuers | 363,312,791 |
| 479,685,614 |
| ||
Affiliated issuers |
| 2,018,824 |
| 2,018,824 |
| |
Cash |
|
|
|
| 3,574 |
|
Cash denominated in foreign currency |
|
| 101,731 |
| 100,554 |
|
Receivable for investment securities sold |
| 4,933,378 |
| |||
Tax reclaim receivable |
| 1,907,222 |
| |||
Dividends and securities lending income receivable |
| 1,268,220 |
| |||
Receivable for shares of Common Stock subscribed |
| 174,387 |
| |||
Unrealized appreciation on forward foreign |
| 3,149 |
| |||
|
|
|
|
| 490,094,922 |
|
Liabilities ($): |
|
|
|
| ||
Due to BNY Mellon Investment Adviser, Inc. and affiliates—Note 3(b) |
| 210,653 |
| |||
Note payable—Note 2 |
| 2,500,000 |
| |||
Liability for securities on loan—Note 1(c) |
| 2,004,872 |
| |||
Payable for shares of Common Stock redeemed |
| 611,322 |
| |||
Payable for futures variation margin—Note 4 |
| 19,282 |
| |||
Directors’ fees and expenses payable |
| 6,693 |
| |||
Unrealized depreciation on forward foreign |
| 4,588 |
| |||
Interest payable—Note 2 |
| 302 |
| |||
|
|
|
|
| 5,357,712 |
|
Net Assets ($) |
|
| 484,737,210 |
| ||
Composition of Net Assets ($): |
|
|
|
| ||
Paid-in capital |
|
|
|
| 459,332,647 |
|
Total distributable earnings (loss) |
|
|
|
| 25,404,563 |
|
Net Assets ($) |
|
| 484,737,210 |
| ||
Net Asset Value Per Share | Investor Shares | Class I |
|
Net Assets ($) | 290,572,254 | 194,164,956 |
|
Shares Outstanding | 18,330,438 | 12,239,123 |
|
Net Asset Value Per Share ($) | 15.85 | 15.86 |
|
|
|
|
|
See notes to financial statements. |
|
|
|
37
STATEMENT OF OPERATIONS
Year Ended October 31, 2020
|
|
|
|
|
|
|
|
|
|
|
|
|
|
Investment Income ($): |
|
|
|
| ||
Income: |
|
|
|
| ||
Cash dividends (net of $1,271,179 foreign taxes withheld at source): |
| |||||
Unaffiliated issuers |
|
| 13,232,299 |
| ||
Affiliated issuers |
|
| 35,119 |
| ||
Income from securities lending—Note 1(c) |
|
| 29,175 |
| ||
Interest |
|
| 16,414 |
| ||
Total Income |
|
| 13,313,007 |
| ||
Expenses: |
|
|
|
| ||
Management fee—Note 3(a) |
|
| 1,941,986 |
| ||
Shareholder servicing costs—Note 3(b) |
|
| 814,922 |
| ||
Directors’ fees—Note 3(a,c) |
|
| 51,985 |
| ||
Loan commitment fees—Note 2 |
|
| 18,050 |
| ||
Interest expense—Note 2 |
|
| 3,080 |
| ||
Total Expenses |
|
| 2,830,023 |
| ||
Less—Directors’ fees reimbursed by |
|
| (51,985) |
| ||
Net Expenses |
|
| 2,778,038 |
| ||
Investment Income—Net |
|
| 10,534,969 |
| ||
Realized and Unrealized Gain (Loss) on Investments—Note 4 ($): |
|
| ||||
Net realized gain (loss) on investments and foreign currency transactions | (16,297,391) |
| ||||
Net realized gain (loss) on futures | 452,886 |
| ||||
Net realized gain (loss) on forward foreign currency exchange contracts | 69,009 |
| ||||
Capital gain distributions from affiliated issuers | 58 |
| ||||
Net Realized Gain (Loss) |
|
| (15,775,438) |
| ||
Net change in unrealized appreciation (depreciation) on investments | (39,929,036) |
| ||||
Net change in unrealized appreciation (depreciation) on futures | (315,748) |
| ||||
Net change in unrealized appreciation (depreciation) on | (1,439) |
| ||||
Net Change in Unrealized Appreciation (Depreciation) |
|
| (40,246,223) |
| ||
Net Realized and Unrealized Gain (Loss) on Investments |
|
| (56,021,661) |
| ||
Net (Decrease) in Net Assets Resulting from Operations |
| (45,486,692) |
| |||
|
|
|
|
|
|
|
See notes to financial statements. | ||||||
38
STATEMENT OF CHANGES IN NET ASSETS
|
|
|
| Year Ended October 31, | |||||
|
|
|
| 2020 |
| 2019 |
| ||
Operations ($): |
|
|
|
|
|
|
|
| |
Investment income—net |
|
| 10,534,969 |
|
|
| 17,327,302 |
| |
Net realized gain (loss) on investments |
| (15,775,438) |
|
|
| (7,905,332) |
| ||
Net change in unrealized appreciation |
| (40,246,223) |
|
|
| 53,224,373 |
| ||
Net Increase (Decrease) in Net Assets | (45,486,692) |
|
|
| 62,646,343 |
| |||
Distributions ($): |
| ||||||||
Distributions to shareholders: |
|
|
|
|
|
|
|
| |
Investor Shares |
|
| (10,250,790) |
|
|
| (8,364,440) |
| |
Class I |
|
| (8,149,102) |
|
|
| (5,935,815) |
| |
Total Distributions |
|
| (18,399,892) |
|
|
| (14,300,255) |
| |
Capital Stock Transactions ($): |
| ||||||||
Net proceeds from shares sold: |
|
|
|
|
|
|
|
| |
Investor Shares |
|
| 72,181,155 |
|
|
| 105,823,624 |
| |
Class I |
|
| 83,218,591 |
|
|
| 148,869,919 |
| |
Distributions reinvested: |
|
|
|
|
|
|
|
| |
Investor Shares |
|
| 10,108,504 |
|
|
| 8,283,721 |
| |
Class I |
|
| 2,849,091 |
|
|
| 2,613,946 |
| |
Cost of shares redeemed: |
|
|
|
|
|
|
|
| |
Investor Shares |
|
| (122,621,734) |
|
|
| (113,641,135) |
| |
Class I |
|
| (129,419,920) |
|
|
| (121,154,112) |
| |
Increase (Decrease) in Net Assets | (83,684,313) |
|
|
| 30,795,963 |
| |||
Total Increase (Decrease) in Net Assets | (147,570,897) |
|
|
| 79,142,051 |
| |||
Net Assets ($): |
| ||||||||
Beginning of Period |
|
| 632,308,107 |
|
|
| 553,166,056 |
| |
End of Period |
|
| 484,737,210 |
|
|
| 632,308,107 |
| |
Capital Share Transactions (Shares): |
| ||||||||
Investor Sharesa |
|
|
|
|
|
|
|
| |
Shares sold |
|
| 4,500,560 |
|
|
| 6,463,952 |
| |
Shares issued for distributions reinvested |
|
| 566,938 |
|
|
| 557,451 |
| |
Shares redeemed |
|
| (7,638,466) |
|
|
| (6,941,947) |
| |
Net Increase (Decrease) in Shares Outstanding | (2,570,968) |
|
|
| 79,456 |
| |||
Class Ia |
|
|
|
|
|
|
|
| |
Shares sold |
|
| 5,486,668 |
|
|
| 9,196,723 |
| |
Shares issued for distributions reinvested |
|
| 159,993 |
|
|
| 176,142 |
| |
Shares redeemed |
|
| (8,596,354) |
|
|
| (7,407,853) |
| |
Net Increase (Decrease) in Shares Outstanding | (2,949,693) |
|
|
| 1,965,012 |
| |||
|
|
|
|
|
|
|
|
|
|
aDuring the period ended October 31, 2019, 24,506 Class I shares representing $413,732 were exchanged for 24,506 Investor shares. | |||||||||
See notes to financial statements. | |||||||||
39
FINANCIAL HIGHLIGHTS
The following tables describe the performance for each share class for the fiscal periods indicated. All information (except portfolio turnover rate) reflects financial results for a single fund share. Total return shows how much your investment in the fund would have increased (or decreased) during each period, assuming you had reinvested all dividends and distributions. These figures have been derived from the fund’s financial statements.
Year Ended October 31, | ||||||
Investor Shares | 2020 | 2019 | 2018 | 2017 | 2016a | |
Per Share Data ($): | ||||||
Net asset value, beginning of period | 17.52 | 16.24 | 17.90 | 15.01 | 15.86 | |
Investment Operations: | ||||||
Investment income—netb | .29 | .46 | .40 | .35 | .36 | |
Net realized and unrealized | (1.46) | 1.22 | (1.67) | 2.96 | (.89) | |
Total from Investment Operations | (1.17) | 1.68 | (1.27) | 3.31 | (.53) | |
Distributions: | ||||||
Dividends from | (.50) | (.40) | (.39) | (.42) | (.32) | |
Net asset value, end of period | 15.85 | 17.52 | 16.24 | 17.90 | 15.01 | |
Total Return (%) | (7.01) | 10.79 | (7.30) | 22.71 | (3.37) | |
Ratios/Supplemental Data (%): | ||||||
Ratio of total expenses | .61 | .61 | .61 | .61 | .61 | |
Ratio of net expenses | .60 | .60 | .60 | .60 | .60 | |
Ratio of net investment income | 1.80 | 2.76 | 2.24 | 2.20 | 2.43 | |
Portfolio Turnover Rate | 3.15 | 7.58 | 7.48 | 9.18 | 5.53 | |
Net Assets, end of period ($ x 1,000) | 290,572 | 366,092 | 338,147 | 456,213 | 514,975 | |
a On August 31, 2016, the fund redesignated existing shares as Investor shares.
b Based on average shares outstanding.
See notes to financial statements.
40
Year Ended October 31, | ||||||
Class I Shares | 2020 | 2019 | 2018 | 2017 | 2016a | |
Per Share Data ($): | ||||||
Net asset value, beginning of period | 17.53 | 16.26 | 17.92 | 15.02 | 15.15 | |
Investment Operations: | ||||||
Investment income—netb | .33 | .50 | .46 | .42 | .02 | |
Net realized and unrealized | (1.46) | 1.22 | (1.69) | 2.94 | (.15) | |
Total from Investment Operations | (1.13) | 1.72 | (1.23) | 3.36 | (.13) | |
Distributions: | ||||||
Dividends from | (.54) | (.45) | (.43) | (.46) | - | |
Net asset value, end of period | 15.86 | 17.53 | 16.26 | 17.92 | 15.02 | |
Total Return (%) | (6.78) | 11.06 | (7.06) | 23.04 | (.86)c | |
Ratios/Supplemental Data (%): | ||||||
Ratio of total expenses | .36 | .36 | .36 | .36 | .40d | |
Ratio of net expenses | .35 | .35 | .35 | .35 | .39d | |
Ratio of net investment income | 2.04 | 3.02 | 2.55 | 2.48 | 1.95d | |
Portfolio Turnover Rate | 3.15 | 7.58 | 7.48 | 9.18 | 5.53 | |
Net Assets, end of period ($ x 1,000) | 194,165 | 266,216 | 215,019 | 155,546 | 673 | |
a From August 31, 2016 (commencement of initial offering) to October 31, 2016.
b Based on average shares outstanding.
c Not annualized.
d Annualized.
See notes to financial statements.
41
NOTES TO FINANCIAL STATEMENTS
NOTE 1—Significant Accounting Policies:
BNY Mellon International Stock Index Fund (the “fund”) is a separate non-diversified series of BNY Mellon Index Funds, Inc. (the “Company”), which is registered under the Investment Company Act of 1940, as amended (the “Act”), as an open-end management investment company and operates as a series company currently offering three series, including the fund. The fund’s investment objective is to seek to match the performance of the Morgan Stanley Capital International Europe, Australasia, Far East Index (MSCI EAFE®). BNY Mellon Investment Adviser, Inc. (the “Adviser”), a wholly-owned subsidiary of The Bank of New York Mellon Corporation (“BNY Mellon”), serves as the fund’s investment adviser.
BNY Mellon Securities Corporation (the “Distributor”), a wholly-owned subsidiary of the Adviser, is the distributor of the fund’s shares which are sold to the public without a sales charge. The fund is authorized to issue 300 million shares of $.001 par value Common Stock. The fund currently has authorized two classes of shares: Investor shares (200 million shares authorized) and Class I (100 million shares authorized). Investor shares are sold primarily to retail investors through financial intermediaries and bear Shareholder Services Plan fees. Class I shares are sold at net asset value per share generally to institutional investors. Other differences between the classes include the services offered to and the expenses borne by each class, and certain voting rights. Income, expenses (other than expenses attributable to a specific class), and realized and unrealized gains or losses on investments are allocated to each class of shares based on its relative net assets.
The Company accounts separately for the assets, liabilities and operations of each series. Expenses directly attributable to each series are charged to that series’ operations; expenses which are applicable to all series are allocated among them on a pro rata basis.
The Financial Accounting Standards Board (“FASB”) Accounting Standards Codification (“ASC”) is the exclusive reference of authoritative U.S. generally accepted accounting principles (“GAAP”) recognized by the FASB to be applied by nongovernmental entities. Rules and interpretive releases of the Securities and Exchange Commission (“SEC”) under authority of federal laws are also sources of authoritative GAAP for SEC registrants. The fund is an investment company and applies the accounting and reporting guidance of the FASB ASC Topic 946 Financial Services-Investment Companies. The fund’s financial statements are prepared in
42
accordance with GAAP, which may require the use of management estimates and assumptions. Actual results could differ from those estimates.
The Company enters into contracts that contain a variety of indemnifications. The fund’s maximum exposure under these arrangements is unknown. The fund does not anticipate recognizing any loss related to these arrangements.
(a) Portfolio valuation: The fair value of a financial instrument is the amount that would be received to sell an asset or paid to transfer a liability in an orderly transaction between market participants at the measurement date (i.e., the exit price). GAAP establishes a fair value hierarchy that prioritizes the inputs of valuation techniques used to measure fair value. This hierarchy gives the highest priority to unadjusted quoted prices in active markets for identical assets or liabilities (Level 1 measurements) and the lowest priority to unobservable inputs (Level 3 measurements).
Additionally, GAAP provides guidance on determining whether the volume and activity in a market has decreased significantly and whether such a decrease in activity results in transactions that are not orderly. GAAP requires enhanced disclosures around valuation inputs and techniques used during annual and interim periods.
Various inputs are used in determining the value of the fund’s investments relating to fair value measurements. These inputs are summarized in the three broad levels listed below:
Level 1—unadjusted quoted prices in active markets for identical investments.
Level 2—other significant observable inputs (including quoted prices for similar investments, interest rates, prepayment speeds, credit risk, etc.).
Level 3—significant unobservable inputs (including the fund’s own assumptions in determining the fair value of investments).
The inputs or methodology used for valuing securities are not necessarily an indication of the risk associated with investing in those securities.
Changes in valuation techniques may result in transfers in or out of an assigned level within the disclosure hierarchy. Valuation techniques used to value the fund’s investments are as follows:
Investments in equity securities are valued at the last sales price on the securities exchange or national securities market on which such securities are primarily traded. Securities listed on the National Market System for
43
NOTES TO FINANCIAL STATEMENTS (continued)
which market quotations are available are valued at the official closing price or, if there is no official closing price that day, at the last sales price. For open short positions, asked prices are used for valuation purposes. Bid price is used when no asked price is available. Registered investment companies that are not traded on an exchange are valued at their net asset value. All of the preceding securities are generally categorized within Level 1 of the fair value hierarchy.
Securities not listed on an exchange or the national securities market, or securities for which there were no transactions, are valued at the average of the most recent bid and asked prices. U.S. Treasury Bills are valued at the mean price between quoted bid prices and asked prices by an independent pricing service (the “Service”) approved by the Company’s Board of Directors (the “Board”). These securities are generally categorized within Level 2 of the fair value hierarchy.
The Service is engaged under the general oversight of the Board.
Fair valuing of securities may be determined with the assistance of a pricing service using calculations based on indices of domestic securities and other appropriate indicators, such as prices of relevant ADRs and futures. Utilizing these techniques may result in transfers between Level 1 and Level 2 of the fair value hierarchy.
When market quotations or official closing prices are not readily available, or are determined not to accurately reflect fair value, such as when the value of a security has been significantly affected by events after the close of the exchange or market on which the security is principally traded (for example, a foreign exchange or market), but before the fund calculates its net asset value, the fund may value these investments at fair value as determined in accordance with the procedures approved by the Board. Certain factors may be considered when fair valuing investments such as: fundamental analytical data, the nature and duration of restrictions on disposition, an evaluation of the forces that influence the market in which the securities are purchased and sold, and public trading in similar securities of the issuer or comparable issuers. These securities are either categorized within Level 2 or 3 of the fair value hierarchy depending on the relevant inputs used.
For securities where observable inputs are limited, assumptions about market activity and risk are used and such securities are generally categorized within Level 3 of the fair value hierarchy.
Investments denominated in foreign currencies are translated to U.S. dollars at the prevailing rates of exchange.
44
Futures, which are traded on an exchange, are valued at the last sales price on the securities exchange on which such securities are primarily traded or at the last sales price on the national securities market on each business day and are generally categorized within Level 1 of the fair value hierarchy. Forward foreign currency exchange contracts (“forward contracts”) are valued at the forward rate and are generally categorized within Level 2 of the fair value hierarchy.
The following is a summary of the inputs used as of October 31, 2020 in valuing the fund’s investments:
Level 1 - Unadjusted Quoted Prices | Level 2 - Other Significant Observable Inputs | Level 3 - Significant Unobservable Inputs | Total | |
Assets ($) | ||||
Investments in Securities: † |
|
|
|
|
Equity Securities- | 2,683,231 | 473,847,853†† | 1 | 476,531,085 |
Equity Securities- | - | 2,704,929†† | - | 2,704,929 |
Investment Companies | 2,018,824 | - | - | 2,018,824 |
Rights | 118,700 | 0†† | - | 118,700 |
U.S. Treasury Securities | - | 330,900 | - | 330,900 |
Other Financial Instruments: | ||||
Forward Foreign Currency | - | 3,149 | - | 3,149 |
Liabilities ($) | ||||
Other Financial Instruments: | ||||
Forward Foreign Currency | - | (4,588) | - | (4,588) |
Futures††† | (25,067) | - | - | (25,067) |
† See Statement of Investments for additional detailed categorizations, if any.
†† Securities classified within Level 2 at period end as the values were determined pursuant to the fund’s fair valuation procedures.
††† Amount shown represents unrealized appreciation (depreciation) at period end, but only variation margin on exchanged traded and centrally cleared derivatives, if any, are reported in the Statement of Assets and Liabilities.
The following is a reconciliation of Level 3 assets for which significant unobservable inputs were used to determine fair value:
45
NOTES TO FINANCIAL STATEMENTS (continued)
| Equity Securities— |
Balance as of 10/31/2019 | 0 |
Realized gain (loss) | - |
Change in unrealized appreciation (depreciation) | 0 |
Purchases/Issuances | - |
Sales/Dispositions | - |
Transfers into Level 3† | 1 |
Transfers out of Level 3 | - |
Balance as of 10/31/2020†† | 1 |
The amount of total gains (losses) for the period included in | 0 |
† Transfers into of Level 3 represent the value at the date of transfer. The transfer into Level 3 for the current period was due to the lack of observable inputs.
†† Securities deemed as Level 3 due to the lack of significant observable inputs by management assessment.
(b) Foreign currency transactions: The fund does not isolate that portion of the results of operations resulting from changes in foreign exchange rates on investments from the fluctuations arising from changes in the market prices of securities held. Such fluctuations are included with the net realized and unrealized gain or loss on investments.
Net realized foreign exchange gains or losses arise from sales of foreign currencies, currency gains or losses realized on securities transactions between trade and settlement date, and the difference between the amounts of dividends, interest and foreign withholding taxes recorded on the fund’s books and the U.S. dollar equivalent of the amounts actually received or paid. Net unrealized foreign exchange gains and losses arise from changes in the value of assets and liabilities other than investments resulting from changes in exchange rates. Foreign currency gains and losses on foreign currency transactions are also included with net realized and unrealized gain or loss on investments.
Foreign Taxes: The fund may be subject to foreign taxes (a portion of which may be reclaimable) on income, stock dividends, realized and unrealized capital gains on investments or certain foreign currency transactions. Foreign taxes are recorded in accordance with the fund’s understanding of the applicable foreign tax regulations and rates that exist in the foreign jurisdictions in which the fund invests. These foreign taxes, if any, are paid by the fund and are reflected in the Statement of Operations. Foreign taxes payable or deferred as of October 31, 2020, if any, are disclosed in the fund’s Statement of Assets and Liabilities.
(c) Securities transactions and investment income: Securities transactions are recorded on a trade date basis. Realized gains and losses from securities transactions are recorded on the identified cost basis.
46
Dividend income is recognized on the ex-dividend date and interest income, including, where applicable, accretion of discount and amortization of premium on investments, is recognized on the accrual basis.
Pursuant to a securities lending agreement with The Bank of New York Mellon, a subsidiary of BNY Mellon and an affiliate of the Adviser, the fund may lend securities to qualified institutions. It is the fund’s policy that, at origination, all loans are secured by collateral of at least 102% of the value of U.S. securities loaned and 105% of the value of foreign securities loaned. Collateral equivalent to at least 100% of the market value of securities on loan is maintained at all times. Collateral is either in the form of cash, which can be invested in certain money market mutual funds managed by the Adviser, or U.S. Government and Agency securities. The fund is entitled to receive all dividends, interest and distributions on securities loaned, in addition to income earned as a result of the lending transaction. Should a borrower fail to return the securities in a timely manner, The Bank of New York Mellon is required to replace the securities for the benefit of the fund or credit the fund with the market value of the unreturned securities and is subrogated to the fund’s rights against the borrower and the collateral. Additionally, the contractual maturity of security lending transactions are on an overnight and continuous basis. During the period ended October 31, 2020, The Bank of New York Mellon earned $5,579 from the lending of the fund’s portfolio securities, pursuant to the securities lending agreement.
(d) Affiliated issuers: Investments in other investment companies advised by the Adviser are considered “affiliated” under the Act.
(e) Risk: Investing in foreign markets may involve special risks and considerations not typically associated with investing in the U.S. These risks include revaluation of currencies, high rates of inflation, repatriation restrictions on income and capital, and adverse political, economic developments and public health conditions. Moreover, securities issued in these markets may be less liquid, subject to government ownership controls and delayed settlements, and their prices may be more volatile than those of comparable securities in the U.S. In addition, turbulence in financial markets and reduced liquidity in equity, credit and/or fixed income markets may negatively affect many issuers, which could adversely affect the fund. Global economies and financial markets are becoming increasingly interconnected, and conditions and events in one country, region or financial market may adversely impact issuers in a different country, region or financial market. These risks may be magnified if certain events or developments adversely interrupt the global supply chain; in
47
NOTES TO FINANCIAL STATEMENTS (continued)
these and other circumstances, such risks might affect companies world-wide. Recent examples include pandemic risks related to COVID-19 and aggressive measures taken world-wide in response by governments, including closing borders, restricting international and domestic travel, and the imposition of prolonged quarantines of large populations, and by businesses, including changes to operations and reducing staff. To the extent the fund may overweight its investments in certain countries, companies, industries or market sectors, such positions will increase the fund’s exposure to risk of loss from adverse developments affecting those countries, companies, industries or sectors.
(f) Dividends and distributions to shareholders: Dividends and distributions are recorded on the ex-dividend date. Dividends from investment income-net and dividends from net realized capital gains, if any, are normally declared and paid annually, but the fund may make distributions on a more frequent basis to comply with the distribution requirements of the Internal Revenue Code of 1986, as amended (the “Code”). To the extent that net realized capital gains can be offset by capital loss carryovers, it is the policy of the fund not to distribute such gains. Income and capital gain distributions are determined in accordance with income tax regulations, which may differ from GAAP.
(g) Federal income taxes: It is the policy of the fund to continue to qualify as a regulated investment company, if such qualification is in the best interests of its shareholders, by complying with the applicable provisions of the Code, and to make distributions of taxable income and net realized capital gain sufficient to relieve it from substantially all federal income and excise taxes.
As of and during the period ended October 31, 2020, the fund did not have any liabilities for any uncertain tax positions. The fund recognizes interest and penalties, if any, related to uncertain tax positions as income tax expense in the Statement of Operations. During the period ended October 31, 2020, the fund did not incur any interest or penalties.
Each tax year in the four-year period ended October 31, 2020 remains subject to examination by the Internal Revenue Service and state taxing authorities.
At October 31, 2020, the components of accumulated earnings on a tax basis were as follows: undistributed ordinary income $8,679,285, accumulated capital losses $69,354,409 and unrealized appreciation $86,079,687.
48
The fund is permitted to carry forward capital losses for an unlimited period. Furthermore, capital loss carryovers retain their character as either short-term or long-term capital losses.
The accumulated capital loss carryover is available for federal income tax purposes to be applied against future net realized capital gains, if any, realized subsequent to October 31, 2020. The fund has $94,547 of short-term capital losses and $69,259,862 of long-term capital losses which can be carried forward for an unlimited period.
The tax character of distributions paid to shareholders during the fiscal periods ended October 31, 2020 and October 31, 2019 were as follows: ordinary income $18,399,892 and $14,300,255, respectively.
NOTE 2—Bank Lines of Credit:
The fund participates with other long-term open-end funds managed by the Adviser in a $823.5 million unsecured credit facility led by Citibank, N.A. (the “Citibank Credit Facility”) and a $300 million unsecured credit facility provided by The Bank of New York Mellon (the “BNYM Credit Facility”), a subsidiary of BNY Mellon and an affiliate of the Adviser, each to be utilized primarily for temporary or emergency purposes, including the financing of redemptions (each, a “Facility”). The Citibank Credit Facility is available in two tranches: (i) Tranche A is in an amount equal to $688.5 million and is available to all long-term open-ended funds, including the fund, and (ii) Tranche B is an amount equal to $135 million and is available only to BNY Mellon Floating Rate Income Fund, a series of BNY Mellon Investment Funds IV, Inc. Prior to September 30, 2020, the Citibank Credit Facility was $927 million with Tranche A available in an amount equal to $747 million and Tranche B available in an amount equal to $180 million. Prior to March 11, 2020, the Citibank Credit Facility was $1.030 billion with Tranche A available in an amount equal to $830 million and Tranche B available in an amount equal to $200 million. In connection therewith, the fund has agreed to pay its pro rata portion of commitment fees for Tranche A of the Citibank Credit Facility and the BNYM Credit Facility. Interest is charged to the fund based on rates determined pursuant to the terms of the respective Facility at the time of borrowing.
The average amount of borrowings outstanding under the Facilities during the period ended October 31, 2020 was approximately $185,519 with a related weighted average annualized interest rate of 1.66%.
49
NOTES TO FINANCIAL STATEMENTS (continued)
NOTE 3—Management Fee and Other Transactions with Affiliates:
(a) Pursuant to a management agreement with the Adviser, the management fee is computed at the annual rate of .35% of the value of the fund’s average daily net assets and is payable monthly. Out of its fee, the Adviser pays all of the expenses of the fund, except management fees, Shareholder Services Plan fees, brokerage fees and commissions, taxes, interest expense, commitment fees on borrowings, fees and expenses of interested Directors (including counsel fees) and extraordinary expenses. In addition, the Adviser is required to reduce its fee in an amount equal to the fund’s allocable portion of fees and expenses of the non-interested Directors (including counsel fees). During the period ended October 31, 2020, fees reimbursed by the Adviser amounted to $51,985.
(b) Under the Shareholder Services Plan, Investor shares pay the Distributor at an annual rate of .25% of the value of its average daily net assets for the provision of certain services. The services provided may include personal services relating to shareholder accounts, such as answering shareholder inquiries regarding the fund and providing reports and other information, and services related to the maintenance of shareholder accounts, such as recordkeeping and sub-accounting services. The Distributor may make payments to Service Agents (securities dealers, financial institutions or other industry professionals) with respect to these services. The Distributor determines the amounts to be paid to Service Agents. During the period ended October 31, 2020, the fund was charged $814,922 pursuant to the Shareholder Services Plan.
The components of “Due to BNY Mellon Investment Adviser, Inc. and affiliates” in the Statement of Assets and Liabilities consist of: management fees of $153,426 and Shareholder Services Plan fees of $66,150, which are offset against an expense reimbursement currently in effect in the amount of $8,923.
(c) Each Board member also serves as a Board member of other funds in the BNY Mellon Family of Funds complex. Annual retainer fees and attendance fees are allocated to each fund based on net assets.
NOTE 4—Securities Transactions:
The aggregate amount of purchases and sales of investment securities, excluding short-term securities, futures and forward contracts, during the period ended October 31, 2020, amounted to $17,157,046 and $101,073,259, respectively.
50
Derivatives: A derivative is a financial instrument whose performance is derived from the performance of another asset. The fund enters into International Swaps and Derivatives Association, Inc. Master Agreements or similar agreements (collectively, “Master Agreements”) with its over-the-counter (“OTC”) derivative contract counterparties in order to, among other things, reduce its credit risk to counterparties. Master Agreements include provisions for general obligations, representations, collateral and events of default or termination. Under a Master Agreement, the fund may offset with the counterparty certain derivative financial instruments’ payables and/or receivables with collateral held and/or posted and create one single net payment in the event of default or termination.
Each type of derivative instrument that was held by the fund during the period ended October 31, 2020 is discussed below.
Futures: In the normal course of pursuing its investment objective, the fund is exposed to market risk, including equity price risk, as a result of changes in value of underlying financial instruments. The fund invests in futures in order to manage its exposure to or protect against changes in the market. A futures contract represents a commitment for the future purchase or a sale of an asset at a specified date. Upon entering into such contracts, these investments require initial margin deposits with a counterparty, which consist of cash or cash equivalents. The amount of these deposits is determined by the exchange or Board of Trade on which the contract is traded and is subject to change. Accordingly, variation margin payments are received or made to reflect daily unrealized gains or losses which are recorded in the Statement of Operations. When the contracts are closed, the fund recognizes a realized gain or loss which is reflected in the Statement of Operations. There is minimal counterparty credit risk to the fund with futures since they are exchange traded, and the exchange guarantees the futures against default. Futures open at October 31, 2020, are set forth in the Statement of Futures.
Forward Foreign Currency Exchange Contracts: The fund enters into forward contracts in order to hedge its exposure to changes in foreign currency exchange rates on its foreign portfolio holdings, to settle foreign currency transactions or as a part of its investment strategy. When executing forward contracts, the fund is obligated to buy or sell a foreign currency at a specified rate on a certain date in the future. With respect to sales of forward contracts, the fund incurs a loss if the value of the contract increases between the date the forward contract is opened and the date the forward contract is closed. The fund realizes a gain if the value of the contract decreases between those dates. With respect to purchases of forward contracts, the fund incurs a loss if the value of the contract
51
NOTES TO FINANCIAL STATEMENTS (continued)
decreases between the date the forward contract is opened and the date the forward contract is closed. The fund realizes a gain if the value of the contract increases between those dates. Any realized or unrealized gains or losses which occurred during the period are reflected in the Statement of Operations. The fund is exposed to foreign currency risk as a result of changes in value of underlying financial instruments. The fund is also exposed to credit risk associated with counterparty nonperformance on these forward contracts, which is generally limited to the unrealized gain on each open contract. This risk may be mitigated by Master Agreements, if any, between the fund and the counterparty and the posting of collateral, if any, by the counterparty to the fund to cover the fund’s exposure to the counterparty. Forward contracts open at October 31, 2020 are set forth in the Statement of Forward Foreign Currency Exchange Contracts.
The following tables show the fund’s exposure to different types of market risk as it relates to the Statement of Assets and Liabilities and the Statement of Operations, respectively.
Fair value of derivative instruments as of October 31, 2020 is shown below:
|
| Derivative |
|
|
| Derivative |
|
Equity risk | - |
| Equity risk | (25,067) | 1 | ||
Foreign exchange risk | 3,149 | 2 | Foreign exchange risk | (4,588) | 2 | ||
Gross fair value of | 3,149 |
|
|
| (29,655) |
| |
|
|
|
|
|
|
| |
Statement of Assets and Liabilities location: |
| ||||||
1Includes cumulative appreciation (depreciation) on futures as reported in the Statement of Futures, but only the unpaid variation margin is reported in the Statement of Assets and Liabilities. | |||||||
2Unrealized appreciation (depreciation) on forward foreign currency exchange contracts. | |||||||
The effect of derivative instruments in the Statement of Operations during the period ended October 31, 2020 is shown below:
Amount of realized gain (loss) on derivatives recognized in income ($) |
| |||||
Underlying | Futures | 1 | Forward | 2 | Total |
|
Equity | 452,886 |
| - |
| 452,886 |
|
Foreign | - |
| 69,009 |
| 69,009 |
|
Total | 452,886 |
| 69,009 |
| 521,895 |
|
|
|
|
|
|
|
|
52
Net change in unrealized appreciation (depreciation) |
| ||||||
Underlying | Futures | 3 | Forward | 4 | Total |
| |
Equity | (315,748) |
| - |
| (315,748) |
| |
Foreign | - |
| (1,439) |
| (1,439) |
| |
Total | (315,748) |
| (1,439) |
| (317,187) |
| |
|
|
|
|
|
|
|
|
Statement of Operations location: |
| ||||||
1Net realized gain (loss) on futures. | |||||||
2Net realized gain (loss) on forward foreign currency exchange contracts. | |||||||
3Net change in unrealized appreciation (depreciation) on futures. | |||||||
4Net change in unrealized appreciation (depreciation) on forward foreign currency exchange contracts. | |||||||
The provisions of ASC Topic 210 “Disclosures about Offsetting Assets and Liabilities” require disclosure on the offsetting of financial assets and liabilities. These disclosures are required for certain investments, including derivative financial instruments subject to Master Agreements which are eligible for offsetting in the Statement of Assets and Liabilities and require the fund to disclose both gross and net information with respect to such investments. For financial reporting purposes, the fund does not offset derivative assets and derivative liabilities that are subject to Master Agreements in the Statement of Assets and Liabilities.
At October 31, 2020, derivative assets and liabilities (by type) on a gross basis are as follows:
Derivative Financial Instruments: |
| Assets ($) |
| Liabilities ($) |
|
Futures |
| - |
| (25,067) |
|
Forward contracts |
| 3,149 |
| (4,588) |
|
Total gross amount of derivative |
|
|
|
|
|
assets and liabilities in the |
|
|
|
|
|
Statement of Assets and Liabilities |
| 3,149 |
| (29,655) |
|
Derivatives not subject to |
|
|
|
|
|
Master Agreements |
| - |
| 25,067 |
|
Total gross amount of assets |
|
|
|
|
|
and liabilities subject to |
|
|
|
|
|
Master Agreements |
| 3,149 |
| (4,588) |
|
53
NOTES TO FINANCIAL STATEMENTS (continued)
The following tables present derivative assets and liabilities net of amounts available for offsetting under Master Agreements and net of related collateral received or pledged, if any, as of October 31, 2020:†
|
|
| Financial |
|
|
|
|
|
| Instruments |
|
|
|
|
|
| and Derivatives |
|
|
|
| Gross Amount of |
| Available | Collateral |
| Net Amount of |
Counterparty | Assets ($) | 1 | for Offset ($) | Received ($) |
| Assets ($) |
HSBC | 1,365 |
| (1,365) | - |
| - |
Societe Generale | 1,784 |
| (424) | - |
| 1,360 |
Total | 3,149 |
| (1,789) | - |
| 1,360 |
|
|
|
|
|
|
|
|
|
| Financial |
|
|
|
|
|
| Instruments |
|
|
|
|
|
| and Derivatives |
|
|
|
| Gross Amount of |
| Available | Collateral |
| Net Amount of |
Counterparty | Liabilities ($) | 1 | for Offset ($) | Pledged ($) |
| Liabilities ($) |
HSBC | (4,164) |
| 1,365 | - |
| (2,799) |
Societe Generale | (424) |
| 424 | - |
| - |
Total | (4,588) |
| 1,789 | - |
| (2,799) |
|
|
|
|
|
|
|
1 Absent a default event or early termination, OTC derivative assets and liabilities are presented at gross amounts and are not offset in the Statement of Assets and Liabilities. | ||||||
† See Statement of Investments for detailed information regarding collateral held for open exchange traded derivative contracts. | ||||||
The following summarizes the average market value of derivatives outstanding during the period ended October 31, 2020:
|
| Average Market Value ($) |
Equity futures |
| 5,916,331 |
Forward contracts |
| 606,514 |
|
|
|
At October 31, 2020, the cost of investments for federal income tax purposes was $395,715,574; accordingly, accumulated net unrealized appreciation on investments inclusive of derivative contracts was $85,988,810 consisting of $184,119,963 gross unrealized appreciation and $98,131,153 gross unrealized depreciation.
54
REPORT OF INDEPENDENT REGISTERED PUBLIC ACCOUNTING FIRM
To the Shareholders and the Board of Directors of BNY Mellon International Stock Index Fund
Opinion on the Financial Statements
We have audited the accompanying statement of assets and liabilities of BNY Mellon International Stock Index Fund (the “Fund”) (one of the funds constituting BNY Mellon Index Funds, Inc.), including the statements of investments, investments in affiliated issuers, futures and forward foreign currency exchange contracts, as of October 31, 2020, and the related statement of operations for the year then ended, the statements of changes in net assets for each of the two years in the period then ended, the financial highlights for each of the five years in the period then ended and the related notes (collectively referred to as the “financial statements”). In our opinion, the financial statements present fairly, in all material respects, the financial position of the Fund (one of the funds constituting BNY Mellon Index Funds, Inc.) at October 31, 2020, the results of its operations for the year then ended, the changes in its net assets for each of the two years in the period then ended and its financial highlights for each of the five years in the period then ended, in conformity with U.S. generally accepted accounting principles.
Basis for Opinion
These financial statements are the responsibility of the Fund’s management. Our responsibility is to express an opinion on the Fund’s financial statements based on our audits. We are a public accounting firm registered with the Public Company Accounting Oversight Board (United States) (“PCAOB”) and are required to be independent with respect to the Fund in accordance with the U.S. federal securities laws and the applicable rules and regulations of the Securities and Exchange Commission and the PCAOB.
We conducted our audits in accordance with the standards of the PCAOB. Those standards require that we plan and perform the audit to obtain reasonable assurance about whether the financial statements are free of material misstatement, whether due to error or fraud. The Fund is not required to have, nor were we engaged to perform, an audit of the Fund’s internal control over financial reporting. As part of our audits, we are required to obtain an understanding of internal control over financial reporting, but not for the purpose of expressing an opinion on the effectiveness of the Fund’s internal control over financial reporting. Accordingly, we express no such opinion.
Our audits included performing procedures to assess the risks of material misstatement of the financial statements, whether due to error or fraud, and performing procedures that respond to those risks. Such procedures included examining, on a test basis, evidence regarding the amounts and disclosures in the financial statements. Our procedures included confirmation of securities owned as of October 31, 2020, by correspondence with the custodian and others or by other appropriate auditing procedures where replies from others were not received. Our audits also included evaluating the accounting principles used and significant estimates made by management, as well as evaluating the overall presentation of the financial statements. We believe that our audits provide a reasonable basis for our opinion.

We have served as the auditor of one or more investment companies in the BNY Mellon Family of Funds since at least 1957, but we are unable to determine the specific year.
New York, New York
December 23, 2020
55
IMPORTANT TAX INFORMATION (Unaudited)
In accordance with federal tax law, the fund elects to provide each shareholder with their portion of the fund’s foreign taxes paid and the income sourced from foreign countries. Accordingly, the fund hereby reports the following information regarding its fiscal year ended October 31, 2020:
- the total amount of taxes paid to foreign countries was $1,228,907
- the total amount of income sourced from foreign countries was $14,173,764
Where required by Federal tax law rules, shareholders will receive notification of their proportionate share of foreign taxes paid and foreign sourced income for the 2020 calendar year with Form 1099-DIV which will be mailed in early 2021. For the fiscal year ended October 31, 2020, certain dividends paid by the fund may be subject to a maximum tax rate of 15%, as provided for by the Jobs and Growth Tax Relief Reconciliation Act of 2003. Of the distributions paid during the fiscal year, $18,947,332 represents the maximum amount that may be considered qualified dividend income.
56
LIQUIDITY RISK MANAGEMENT PROGRAM (Unaudited)
Effective June 1, 2019, the fund adopted a liquidity risk management program (the “Liquidity Risk Management Program”) pursuant to the requirements of Rule 22e-4 under the Investment Company Act of 1940, as amended. Rule 22e-4 requires registered open-end funds, including mutual funds and exchange-traded funds but not money market funds, to establish liquidity risk management programs in order to effectively manage fund liquidity and shareholder redemptions. The rule is designed to mitigate the risk that a fund could not meet redemption requests without significantly diluting the interests of remaining investors.
The rule requires the funds to assess, manage and review their liquidity risk at least annually considering applicable factors such as investment strategy and liquidity during normal and foreseeable stressed conditions, including whether the strategy is appropriate for an open-end fund and whether the fund has a relatively concentrated portfolio or large positions in particular issuers. The fund must also assess its use of borrowings and derivatives, short-term and long-term cash flow projections in normal and stressed conditions, holdings of cash and cash equivalents, and borrowing arrangements and other funding sources.
The rule also requires the fund to classify its investments as highly liquid, moderately liquid, less liquid or illiquid based on the number of days the fund expects it would take to liquidate the investment, and to review these classifications at least monthly or more often under certain conditions. The periods range from three or fewer business days for a highly liquid investment to greater than seven calendar days for settlement of a less liquid investment. Illiquid investments are those a fund does not expect to be able to sell or dispose of within seven calendar days without significantly changing the market value. The fund is prohibited from acquiring an investment if, after the acquisition, its holdings of illiquid assets will exceed 15% of its net assets. In addition, if a fund permits redemptions in-kind, the rule requires the fund to establish redemption in-kind policies and procedures governing how and when it will engage in such redemptions.
Pursuant to the rule’s requirements, the Liquidity Risk Management Program has been reviewed and approved by the fund’s board. Furthermore, the board has received a written report prepared by the Program’s Administrator that addresses the operation of the Program, assesses its adequacy and effectiveness and describes any material changes made to the Program.
Assessment of Program
In the opinion of the Program Administrator, the Program approved by the fund board continues to be adequate for the fund and the Program has been implemented effectively. The Program Administrator has monitored the fund’s liquidity risk and the liquidity classification of the securities held by the fund and has determined that the Program is operating effectively.
During the period from June 1, 2019 to March 31, 2020, there were no material changes to the Program and no material liquidity events that impacted the fund. During the period, the fund held sufficient highly liquid assets to meet fund redemptions.
57
LIQUIDITY RISK MANAGEMENT PROGRAM (Unaudited) (continued)
Under normal expected foreseeable fund redemption forecasts and foreseeable stressed fund redemption forecasts, the Program Administrator believes that the fund maintains sufficient highly liquid assets to meet expected fund redemptions.
58
BOARD MEMBERS INFORMATION (Unaudited)
INDEPENDENT BOARD MEMBERS
Chairman of the Board (1995)
Principal Occupation During Past 5 Years:
· Director or Trustee of funds in the BNY Mellon Family of Funds and certain other entities (as described in the fund’s Statement of Additional Information) (1995-Present)
Other Public Company Board Memberships During Past 5 Years:
· CBIZ, Inc., a public company providing professional business services, products and solutions, Director (1997-Present)
No. of Portfolios for which Board Member Serves: 110
———————
Peggy C. Davis (77)
Board Member (2006)
Principal Occupation During Past 5 Years:
· Shad Professor of Law, New York University School of Law (1983-present)
No. of Portfolios for which Board Member Serves: 39
———————
Gina D. France (62)
Board Member (2019)
Principal Occupation During Past 5 Years:
· Founder, President and Chief Executive Officer, France Strategic Partners, a strategy and advisory firm serving corporate clients across the United States (2003 –Present)
· Corporate Director and Trustee (2004 – Present)
Other Public Company Board Memberships During Past 5 Years:
· Huntington Bancshares, a bank holding company headquartered in Columbus, Ohio, Director (2016 – Present)
· Cedar Fair, L.P., a publicly-traded partnership that owns and operates amusement parks and hotels in the U.S. and Canada, Director (2011 – Present)
· CBIZ, Inc., a public company providing professional business services, products and solutions, Director (2015 – Present)
· Baldwin Wallace University, Trustee (2013- 2019)
· FirstMerit Corporation, a diversified financial services company, Director (2004 – 2016)
No. of Portfolios for which Board Member Serves: 25
———————
59
BOARD MEMBERS INFORMATION (Unaudited) (continued)
INDEPENDENT BOARD MEMBERS (continued)
Joan Gulley (73)
Board Member (2017)
Principal Occupation During Past 5 Years:
· PNC Financial Services Group, Inc.(1993-2014), Executive Vice President and Chief Human Resources Officer and Executive Committee Member (2008-2014)
· Director, Nantucket Library (2015-Present)
No. of Portfolios for which Board Member Serves: 43
———————
Robin A. Melvin (57)
Board Member (2012)
Principal Occupation During Past 5 Years:
· Trustee, Westover School, a private girls’ boarding school in Middlebury, Connecticut (2019 – Present); Co-chairman, Mentor Illinois, a non-profit organization dedicated to increasing the quality of mentoring services in Illinois (2014 – 2020); Board member, Mentor Illinois (2013 – 2020)
No. of Portfolios for which Board Member Serves: 88
———————
Once elected all Board Members serve for an indefinite term, but achieve Emeritus status upon reaching age 80. The address of the Board Members and Officers is c/o BNY Mellon Investment Adviser, Inc. 240 Greenwich Street, New York, New York 10286. Additional information about the Board Members is available in the fund’s Statement of Additional Information which can be obtained from the Adviser free of charge by calling this toll free number: 1-800-373-9387.
David P. Feldman, Emeritus Board Member
Ehud Houminer, Emeritus Board Member
James F. Henry, Emeritus Board Member
Lynn Martin, Emeritus Board Member
Dr. Martin Peretz, Emeritus Board Member
Philip L. Toia, Emeritus Board Member
60
OFFICERS OF THE FUND (Unaudited)
RENEE LAROCHE-MORRIS, President since May 2019.
President and a director of BNY Mellon Investment Adviser, Inc. since January 2018. She is an officer of 61 investment companies (comprised of 110 portfolios) managed by the Adviser. She is 49 years old and has been an employee of BNY Mellon since 2003.
JAMES WINDELS, Treasurer since November 2001.
Director-BNY Mellon Fund Administration, and an officer of 63 investment companies (comprised of 141 portfolios) managed by the Adviser or an affiliate of the Adviser. He is 62 years old and has been an employee of the Adviser since April 1985.
BENNETT A. MACDOUGALL, Chief Legal Officer since October 2015.
Chief Legal Officer of the Adviser and Associate General Counsel and Managing Director of BNY Mellon since June 2015; Director and Associate General Counsel of Deutsche Bank–Asset & Wealth Management Division from June 2005 to June 2015, and as Chief Legal Officer of Deutsche Investment Management Americas Inc. from June 2012 to May 2015. He is an officer of 63 investment companies (comprised of 141 portfolios) managed by the Adviser or an affiliate of the Adviser. He is 49 years old and has been an employee of the Adviser since June 2015.
DAVID DIPETRILLO, Vice President since May 2019.
Head of North America Product, BNY Mellon Investment Management since January 2018, Director of Product Strategy, BNY Mellon Investment Management from January 2016 to December 2017; Head of US Retail Product and Channel Marketing, BNY Mellon Investment Management from January 2014 to December 2015. He is an officer of 62 investment companies (comprised of 118 portfolios) managed by the Adviser or an affiliate of the Adviser. He is 42 years old and has been an employee of BNY Mellon since 2005.
JAMES BITETTO, Vice President since August 2005 and Secretary since February 2018.
Senior Managing Counsel of BNY Mellon since December 2019; Managing Counsel of BNY Mellon from April 2014 to December 2019; Secretary of the Adviser, and an officer of 63 investment companies (comprised of 141 portfolios) managed by the Adviser or an affiliate of the Adviser. He is 54 years old and has been an employee of the Adviser since December 1996.
SONALEE CROSS, Vice President and Assistant Secretary since March 2018.
Counsel of BNY Mellon since October 2016; Associate at Proskauer Rose LLP from April 2016 to September 2016; Attorney at EnTrust Capital from August 2015 to February 2016; Associate at Sidley Austin LLP from September 2013 to August 2015. She is an officer of 63 investment companies (comprised of 141 portfolios) managed by the Adviser or an affiliate of the Adviser. She is 33 years old and has been an employee of the Adviser since October 2016.
DEIRDRE CUNNANE, Vice President and Assistant Secretary since March 2019.
Counsel of BNY Mellon since August 2018; Senior Regulatory Specialist at BNY Mellon Investment Management Services from February 2016 to August 2018; Trustee Associate at BNY Mellon Trust Company (Ireland) Limited from August 2013 to February 2016. She is an officer of 63 investment companies (comprised of 141 portfolios) managed by the Adviser or an affiliate of the Adviser. She is 30 years old and has been an employee of the Adviser since August 2018.
SARAH S. KELLEHER, Vice President and Assistant Secretary since April 2014.
Managing Counsel of BNY Mellon since December 2017, Senior Counsel of BNY Mellon from March 2013 to December 2017. She is an officer of 63 investment companies (comprised of 141 portfolios) managed by the Adviser or an affiliate of the Adviser. She is 45 years old and has been an employee of the Adviser since March 2013.
JEFF PRUSNOFSKY, Vice President and Assistant Secretary since August 2005.
Senior Managing Counsel of BNY Mellon, and an officer of 63 investment companies (comprised of 141 portfolios) managed by the Adviser or an affiliate of the Adviser. He is 55 years old and has been an employee of the Adviser since October 1990.
AMANDA QUINN, Vice President and Assistant Secretary since March 2020.
Counsel of BNY Mellon since June 2019; Regulatory Administration Manager at BNY Mellon Investment Management Services from September 2018 to May 2019; Senior Regulatory Specialist at BNY Mellon Investment Management Services from April 2015 to August 2018. She is an officer of 63 investment companies (comprised of 141 portfolios) managed by the Adviser or an affiliate of the Adviser. She is 35 years old and has been an employee of the Adviser since June 2019.
61
OFFICERS OF THE FUND (Unaudited) (continued)
PETER M. SULLIVAN, Vice President and Assistant Secretary since March 2019.
Managing Counsel of BNY Mellon since March 2009, Senior Counsel of BNY Mellon from April 2004 to March 2009, and an officer of 63 investment companies (comprised of 141 portfolios) managed by the Adviser or an affiliate of the Adviser. He is 52 years old and has been an employee of the Adviser since January 2019.
NATALYA ZELENSKY, Vice President and Assistant Secretary since March 2017.
Managing Counsel of BNY Mellon since December 2019; Counsel of BNY Mellon from May 2016 to December 2019; Attorney at Wildermuth Endowment Strategy Fund/Wildermuth Advisory, LLC from November 2015 to May 2016 and Assistant General Counsel at RCS Advisory Services from July 2014 to November 2015. She is an officer of 63 investment companies (comprised of 141 portfolios) managed by the Adviser or an affiliate of the Adviser. She is 35 years old and has been an employee of the Adviser since May 2016.
GAVIN C. REILLY, Assistant Treasurer since December 2005.
Tax Manager-BNY Mellon Fund Administration, and an officer of 63 investment companies (comprised of 141 portfolios) managed by the Adviser or an affiliate of the Adviser. He is 52 years old and has been an employee of the Adviser since April 1991.
ROBERT S. ROBOL, Assistant Treasurer since August 2005.
Senior Accounting Manager-BNY Mellon Fund Administration, and an officer of 63 investment companies (comprised of 141 portfolios) managed by the Adviser or an affiliate of the Adviser. He is 56 years old and has been an employee of the Adviser since October 1988.
ROBERT SALVIOLO, Assistant Treasurer since July 2007.
Senior Accounting Manager–BNY Mellon Fund Administration, and an officer of 63 investment companies (comprised of 141 portfolios) managed by the Adviser or an affiliate of the Adviser. He is 53 years old and has been an employee of the Adviser since June 1989.
ROBERT SVAGNA, Assistant Treasurer since December 2002.
Senior Accounting Manager–BNY Mellon Fund Administration, and an officer of 63 investment companies (comprised of 141 portfolios) managed by the Adviser or an affiliate of the Adviser. He is 53 years old and has been an employee of the Adviser since November 1990.
JOSEPH W. CONNOLLY, Chief Compliance Officer since October 2004.
Chief Compliance Officer of the Adviser, the BNY Mellon Family of Funds and BNY Mellon Funds Trust (62 investment companies, comprised of 133 portfolios). He is 63 years old and has served in various capacities with the Adviser since 1980, including manager of the firm’s Fund Accounting Department from 1997 through October 2001.
CARIDAD M. CAROSELLA, Anti-Money Laundering Compliance Officer since January 2016.
Anti-Money Laundering Compliance Officer of the BNY Mellon Family of Funds and BNY Mellon Funds Trust since January 2016; from May 2015 to December 2015, Interim Anti-Money Laundering Compliance Officer of the BNY Mellon Family of Funds and BNY Mellon Funds Trust and the Distributor; from January 2012 to May 2015, AML Surveillance Officer of the Distributor. She is an officer of 56 investment companies (comprised of 134 portfolios) managed by the Adviser or an affiliate of the Adviser. She is 52 years old and has been an employee of the Distributor since 1997.
62
This page intentionally left blank.
63
This page intentionally left blank.
64
This page intentionally left blank.
65
BNY Mellon International Stock Index Fund
240 Greenwich Street
New York, NY 10286
Adviser
BNY Mellon Investment Adviser, Inc.
240 Greenwich Street
New York, NY 10286
Custodian
The Bank of New York Mellon
240 Greenwich Street
New York, NY 10286
Transfer Agent &
Dividend Disbursing Agent
BNY Mellon Transfer, Inc.
240 Greenwich Street
New York, NY 10286
Distributor
BNY Mellon Securities Corporation
240 Greenwich Street
New York, NY 10286
Ticker Symbols: | Investor: DIISX Class I: DINIX |
Telephone Call your financial representative or 1-800-373-9387
Mail The BNY Mellon Family of Funds, 144 Glenn Curtiss Boulevard, Uniondale, NY 11556-0144
E-mail Send your request to info@bnymellon.com
Internet Information can be viewed online or downloaded at www.bnymellonim.com/us
The fund files its complete schedule of portfolio holdings with the Securities and Exchange Commission (“SEC”) for the first and third quarters of each fiscal year on Form N-PORT. The fund’s Forms N-PORT are available on the SEC’s website at www.sec.gov.
A description of the policies and procedures that the fund uses to determine how to vote proxies relating to portfolio securities and information regarding how the fund voted these proxies for the most recent 12-month period ended June 30 is available at www.bnymellonim.com/us and on the SEC’s website at www.sec.gov and without charge, upon request, by calling 1-800-373-9387.
© 2020 BNY Mellon Securities Corporation |
|

BNY Mellon S&P 500 Index Fund
ANNUAL REPORT October 31, 2020 |
|

Save time. Save paper. View your next shareholder report online as soon as it’s available. Log into www.bnymellonim.com/us and sign up for eCommunications. It’s simple and only takes a few minutes. |
The views expressed in this report reflect those of the portfolio manager(s) only through the end of the period covered and do not necessarily represent the views of BNY Mellon Investment Adviser, Inc. or any other person in the BNY Mellon Investment Adviser, Inc. organization. Any such views are subject to change at any time based upon market or other conditions and BNY Mellon Investment Adviser, Inc. disclaims any responsibility to update such views. These views may not be relied on as investment advice and, because investment decisions for a fund in the BNY Mellon Family of Funds are based on numerous factors, may not be relied on as an indication of trading intent on behalf of any fund in the BNY Mellon Family of Funds. |
Not FDIC-Insured • Not Bank-Guaranteed • May Lose Value |
Contents
THE FUND
BNY Mellon Investment Adviser, Inc. | |
With Those of Other Funds | |
in Affiliated Issuers | |
Public Accounting Firm | |
FOR MORE INFORMATION
Back Cover
| The Fund |
A LETTER FROM THE PRESIDENT OF BNY MELLON INVESTMENT ADVISER, INC.
Dear Shareholder:
We are pleased to present this annual report for BNY Mellon S&P 500 Index Fund, covering the 12-month period from November 1, 2019 through October 31, 2020. For information about how the fund performed during the reporting period, as well as general market perspectives, we provide a Discussion of Fund Performance on the pages that follow.
Accommodative rate policies from the U.S. Federal Reserve (the “Fed”) and progress towards a U.S./China trade deal stoked optimism about future economic growth prospects the final months of 2019, fueling an equity rally. As we entered 2020, optimism turned to concern as COVID-19 began to spread across portions of Asia and Europe. When the virus reached the U.S. in March 2020, stocks became volatile. U.S. equities posted historic losses during the month due to investor concern over the economic impact of a widespread quarantine. Global central banks and governments launched emergency stimulus measures to support their respective economies, and equity valuations began to rebound, trending upward until the fall. Volatility returned in September 2020 and continued through October, as concerns over rising COVID-19 infection rates, continued trade tensions, the U.S. Congress’ failure to pass additional financial assistance and anxiety over the upcoming U.S. election constrained equity valuations.
In fixed-income markets, interest rates were heavily influenced by changes in Fed policy and investor concern over COVID-19. In 2019, as stocks rallied in response to Fed rate cuts, risk-asset valuations also rose while Treasuries lagged. When COVID-19 began to emerge, a flight to quality ensued, and Treasury rates fell significantly. The Fed cut rates twice in March 2020, resulting in an overnight lending target rate of nearly zero, and the government launched a large stimulus package. Risk-asset prices began to rebound, and bond indices generally rose until September 2020, when investment-grade instrument prices stalled. Yields in the intermediate and long portions of the Treasury curve rose during October, further constraining bond prices.
We believe the near-term outlook for the U.S. will be challenging, as the country continues to battle COVID-19. As always, we will monitor relevant data for meaningful developments. We encourage you to discuss the risks and opportunities in today’s investment environment with your financial advisor.
Thank you for your continued confidence and support.
Sincerely,

Renee LaRoche-Morris
President
BNY Mellon Investment Adviser, Inc.
November 16, 2020
2
DISCUSSION OF FUND PERFORMANCE (Unaudited)
For the period from November 1, 2019 through October 31, 2020, as provided by Thomas J. Durante, CFA, David France, CFA, Todd Frysinger, CFA, Vlasta Sheremeta, CFA, Michael Stoll, and Marlene Walker Smith, Portfolio Managers
Market and Fund Performance Overview
For the 12-month period ended October 31, 2020, the BNY Mellon S&P 500 Index Fund produced a total return of 9.13%.1 In comparison, the S&P 500® Index (the “Index”), the fund’s benchmark, returned 9.71% for the same period.2,3
Large-cap equities gained value during the reporting period despite pockets of volatility brought on by COVID-19. The difference in returns between the fund and the Index during the reporting period was primarily the result of transaction costs and operating expenses that are not reflected in the Index’s results.
The Fund’s Investment Approach
The fund seeks to match the performance of the Index. To pursue its goal, the fund generally is fully invested in stocks included in the Index and in futures whose performance is tied to the Index. The fund generally invests in all 500 stocks in the Index in proportion to their weighting in the Index.
The Index is an unmanaged index of 500 common stocks, chosen to reflect the industries of the U.S. economy, and is often considered a proxy for the stock market in general. S&P weights each company’s stock in the Index by its market capitalization (i.e., the share price times the number of shares outstanding), adjusted by the number of available float shares (i.e., those shares available to public investors). Companies included in the Index generally must have market capitalizations in excess of $8.2 billion, to the extent consistent with market conditions.
Central Bank Policy and COVID-19 Influence Markets
U.S. equities gained over the end of 2019, as investor optimism regarding trade and future economic growth prospects bolstered sentiment. Continued accommodative policies by the U.S. Federal Reserve (the “Fed”), coupled with encouraging economic data releases, worked to fuel a risk-on environment. Greater certainty as to the timing of Brexit was also forthcoming and aided investor optimism. In addition, as the year-end approached, both the U.S. and China indicated that a ‘Phase-One’ trade deal would be signed in early 2020.
Markets gave way to extreme risk aversion in early 2020, as the global scope of the COVID-19 pandemic became apparent. Equity valuations in the U.S. remained robust throughout January and February 2020, while markets in areas that experienced the virus earlier, such as China, began to experience volatility closer to the start of the calendar year. Financial markets also had to contend with a second major shock in the form of an oil-price war between Saudi Arabia and Russia, which caused oil prices to fall precipitously in March 2020. Worldwide, governments and central banks launched an unprecedented array of fiscal initiatives that sought to offset the economic impact of widespread lockdown measures and bolster asset prices. The intervention provided comfort to investors, and indices began to rally towards the end of March 2020. Supported by the intervention, equities generally went on to stage a recovery that lasted through August 2020. However, the recovery was company
3
DISCUSSION OF FUND PERFORMANCE (Unaudited) (continued)
and sector specific, as several industries that remained affected by COVID-19 prevention procedures did not fully participate. In September, volatility crept back into equity markets, as increasing COVID-19 infection rates began to concern investors. By October, several countries had begun to reinstitute some degree of behavioral restriction among residents in order to stem the spread of the virus. In addition, mounting political rhetoric in the U.S. due to the election, renewed trade difficulties between the U.S. and China, and other geopolitical events stoked investor anxiety. Stocks continued to exhibit volatility through the end of the period.
During the period, large-cap stocks generally outperformed both their mid-cap and small-cap counterparts.
Information Technology Stocks Lead the Market
The information technology sector led the Index over the reporting period. Technology stocks generally performed well prior to COVID-19, due to increased business spending on technological infrastructure. These securities also continued to lead the Index after COVID-19 appeared, due to increased demand for all things web-based as a result of the stay-at-home orders. Virtual gatherings increased, along with demand for cloud computing infrastructure. Software companies also benefited from increased demand, as did semiconductor and semiconductor equipment companies. Organizations exhibiting the strongest balance sheets generally led the pack. The consumer discretionary sector also delivered strong performance. Not wanting to visit stores in person, people went online to shop. Internet and direct marketing retail companies led the industry. Companies such as Amazon.com were top performers. Within the specialty retail industry, home improvement stores benefited results. Stuck at home, people took on home improvement projects and purchased items from these stores in order to complete them. Within the communication services sector, media and entertainment companies outperformed the broader market. Companies such as Facebook and Alphabet saw expanding user bases and increased traffic on their platforms, which drove up advertising revenue.
Conversely, laggards for the reporting period included the financials sector. Interest rates fell considerably during the 12 months, squeezing the profit margins for lending products. In addition, with widespread unemployment, some banks are reluctant to lend to consumers and businesses. In addition, several banks have loans to energy companies on the books, which are currently threatened due to the low price of oil. Insurance companies also suffered during the period, due in part to investor speculation regarding future costs of claims relating to COVID-19. The energy sector was hurt during the period by historic oil price volatility. Many of the energy companies in the Index are oil, gas and consumable fuels companies, which were directly affected by the falling price of oil. Lastly, the real estate sector was hurt by low demand for commercial real estate. With people working from home, businesses are not renewing their office space leases, and new leases are not being signed. Mall REITs have also been imperiled by reduced foot traffic at retail locations. Some anchor stores have filed for bankruptcy, and others have stopped making lease payments, driving down the price of these securities.
Replicating the Performance of the Index
Although we do not actively manage the fund’s investments in response to macroeconomic trends, it is worth noting that while the spread of COVID-19 and resulting economic
4
implications continue to impact markets and the economy, the U.S. government and Fed remain dedicated to supporting capital markets and the economy with various fiscal and monetary techniques. As always, we continue to monitor factors that affect the fund’s investments.
November 16, 2020
¹ Total return includes reinvestment of dividends and any capital gains paid. The fund’s return reflects the absorption of certain fund expenses by BNY Mellon Investment Adviser, Inc. pursuant to an agreement. Had these expenses not been absorbed, returns would have been lower. Past performance is no guarantee of future results. Share price and investment return fluctuate such that upon redemption, fund shares may be worth more or less than their original cost.
² Source: Lipper Inc. — The S&P 500® Index is widely regarded as the best single gauge of large-cap U.S. equities. The Index includes 500 leading companies and captures approximately 80% coverage of available market capitalization. Investors cannot invest directly in any index.
3 “Standard & Poor’s®,” “S&P®,” “Standard & Poor’s® 500,” and “S&P 500®” are registered trademarks of Standard & Poor’s Financial Services LLC and have been licensed for use on behalf of the fund. The fund is not sponsored, managed, advised, sold or promoted by Standard & Poor’s and its affiliates, and Standard & Poor’s and its affiliates make no representation regarding the advisability of investing in the fund.
Equities are subject generally to market, market sector, market liquidity, issuer and investment style risks, among other factors, to varying degrees, all of which are more fully described in the fund’s prospectus.
The funds uses an indexing strategy. It does not attempt to manage market volatility, use defensive strategies or reduce the effects of any long-term periods of poor stock performance.
Recent market risks include pandemic risks related to COVID-19. The effects of COVID-19 have contributed to increased volatility in global markets and will likely affect certain countries, companies, industries and market sectors more dramatically than others. To the extent the fund may overweight its investments in certain countries, companies, industries or market sectors, such positions will increase the fund’s exposure to risk of loss from adverse developments affecting those countries, companies, industries or sectors.
The fund may, but is not required to, use derivative instruments. A small investment in derivatives could have a potentially large impact on the fund’s performance. The use of derivatives involves risks different from, or possibly greater than, the risks associated with investing directly in the underlying assets.
5
FUND PERFORMANCE (Unaudited)
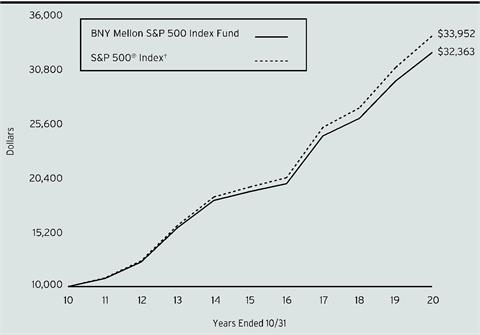
Comparison of change in value of a $10,000 investment in BNY Mellon S&P 500 Index Fund shares with a hypothetical investment of $10,000 in the S&P 500® Index (the “Index”)
† Source: Lipper Inc.
Past performance is not predictive of future performance.
The above graph compares a hypothetical $10,000 investment made in BNY Mellon S&P 500 Index Fund on 10/31/10 to a hypothetical investment of $10,000 made in the Index on that date. All dividends and capital gain distributions are reinvested.
The fund’s performance shown in the line graph above takes into account all applicable fees and expenses. The Index is widely regarded as the best single gauge of large-cap U.S. equities. The index includes 500 leading companies and captures approximately 80% coverage of available market capitalization. Unlike a mutual fund, the Index is not subject to charges, fees and other expenses. Investors cannot invest directly in any index. Further information relating to fund performance, including expense reimbursements, if applicable, is contained in the Financial Highlights section of the prospectus and elsewhere in this report.
Average Annual Total Returns as of 10/31/2020 | |||
| 1 Year | 5 Years | 10 Years |
Fund | 9.13% | 11.15% | 12.46% |
S&P 500® Index | 9.71% | 11.70% | 13.00% |
The performance data quoted represents past performance, which is no guarantee of future results. Share price and investment return fluctuate and an investor’s shares may be worth more or less than original cost upon redemption. Current performance may be lower or higher than the performance quoted. Go to www.bnymellonim.com/us for the fund’s most recent month-end returns.
The fund’s performance shown in the graph and table does not reflect the deduction of taxes that a shareholder would pay on fund distributions or the redemption of fund shares.
6
UNDERSTANDING YOUR FUND’S EXPENSES (Unaudited)
As a mutual fund investor, you pay ongoing expenses, such as management fees and other expenses. Using the information below, you can estimate how these expenses affect your investment and compare them with the expenses of other funds. You also may pay one-time transaction expenses, including sales charges (loads) and redemption fees, which are not shown in this section and would have resulted in higher total expenses. For more information, see your fund’s prospectus or talk to your financial adviser.
Review your fund’s expenses
The table below shows the expenses you would have paid on a $1,000 investment in BNY Mellon S&P 500 Index Fund from May 1, 2020 to October 31, 2020. It also shows how much a $1,000 investment would be worth at the close of the period, assuming actual returns and expenses.
Expenses and Value of a $1,000 Investment |
| ||
Assume actual returns for the six months ended October 31, 2020 |
| ||
|
|
|
|
|
|
|
|
Expense paid per $1,000† | $2.68 |
| |
Ending value (after expenses) | $1,130.20 |
| |
COMPARING YOUR FUND’S EXPENSES
WITH THOSE OF OTHER FUNDS (Unaudited)
Using the SEC’s method to compare expenses
The Securities and Exchange Commission (“SEC”) has established guidelines to help investors assess fund expenses. Per these guidelines, the table below shows your fund’s expenses based on a $1,000 investment, assuming a hypothetical 5% annualized return. You can use this information to compare the ongoing expenses (but not transaction expenses or total cost) of investing in the fund with those of other funds. All mutual fund shareholder reports will provide this information to help you make this comparison. Please note that you cannot use this information to estimate your actual ending account balance and expenses paid during the period.
Expenses and Value of a $1,000 Investment |
| ||
Assuming a hypothetical 5% annualized return for the six months ended October 31, 2020 |
| ||
|
|
|
|
|
|
|
|
Expense paid per $1,000† | $2.54 |
| |
Ending value (after expenses) | $1,022.62 |
| |
†Expenses are equal to the fund’s annualized expense ratio of .50%, multiplied by the average account value over the period, multiplied by 184/366 (to reflect the one-half year period). | |||
7
STATEMENT OF INVESTMENTS
October 31, 2020
Description | Shares | Value ($) | |||||
Common Stocks - 99.6% | |||||||
Automobiles & Components - .4% | |||||||
Aptiv | 20,677 | 1,995,124 | |||||
BorgWarner | 15,670 | 548,137 | |||||
Ford Motor | 303,770 | 2,348,142 | |||||
General Motors | 95,366 | 3,292,988 | |||||
8,184,391 | |||||||
Banks - 3.5% | |||||||
Bank of America | 581,203 | 13,774,511 | |||||
Citigroup | 158,393 | 6,560,638 | |||||
Citizens Financial Group | 31,684 | 863,389 | |||||
Comerica | 10,429 | 474,624 | |||||
Fifth Third Bancorp | 55,984 | 1,299,948 | |||||
First Republic Bank | 13,343 | 1,683,086 | |||||
Huntington Bancshares | 77,500 | 809,100 | |||||
JPMorgan Chase & Co. | 232,473 | 22,791,653 | |||||
KeyCorp | 72,703 | 943,685 | |||||
M&T Bank | 9,911 | 1,026,581 | |||||
People's United Financial | 33,302 | 355,332 | |||||
Regions Financial | 70,382 | 936,081 | |||||
SVB Financial Group | 4,049 | a | 1,177,044 | ||||
The PNC Financial Services Group | 32,190 | 3,601,417 | |||||
Truist Financial | 102,308 | 4,309,213 | |||||
U.S. Bancorp | 105,697 | 4,116,898 | |||||
Wells Fargo & Co. | 315,602 | 6,769,663 | |||||
Zions Bancorp | 12,139 | 391,726 | |||||
71,884,589 | |||||||
Capital Goods - 5.6% | |||||||
3M | 44,232 | 7,075,351 | |||||
A.O. Smith | 10,382 | b | 536,646 | ||||
Allegion | 7,335 | 722,498 | |||||
AMETEK | 17,273 | 1,696,209 | |||||
Carrier Global | 61,318 | 2,047,408 | |||||
Caterpillar | 41,193 | 6,469,361 | |||||
Cummins | 11,141 | 2,449,794 | |||||
Deere & Co. | 23,822 | 5,381,628 | |||||
Dover | 10,892 | 1,205,853 | |||||
Eaton | 30,581 | 3,174,002 | |||||
Emerson Electric | 45,663 | 2,958,506 | |||||
Fastenal | 43,191 | 1,867,147 | |||||
Flowserve | 10,449 | 304,275 | |||||
Fortive | 25,519 | 1,571,970 | |||||
Fortune Brands Home & Security | 10,578 | 855,443 | |||||
8
Description | Shares | Value ($) | |||||
Common Stocks - 99.6% (continued) | |||||||
Capital Goods - 5.6% (continued) | |||||||
General Dynamics | 17,728 | 2,328,218 | |||||
General Electric | 670,475 | 4,974,925 | |||||
Honeywell International | 53,924 | 8,894,764 | |||||
Howmet Aerospace | 28,044 | 483,759 | |||||
Huntington Ingalls Industries | 3,373 | 497,450 | |||||
IDEX | 5,814 | 990,647 | |||||
Illinois Tool Works | 22,194 | 4,347,361 | |||||
Ingersoll Rand | 28,278 | a | 988,033 | ||||
Jacobs Engineering Group | 10,092 | 958,740 | |||||
Johnson Controls International | 56,722 | 2,394,236 | |||||
L3Harris Technologies | 16,601 | 2,674,587 | |||||
Lockheed Martin | 18,892 | 6,614,656 | |||||
Masco | 20,603 | 1,104,321 | |||||
Northrop Grumman | 11,960 | 3,466,247 | |||||
Otis Worldwide | 30,960 | 1,897,229 | |||||
PACCAR | 26,715 | 2,280,927 | |||||
Parker-Hannifin | 10,037 | 2,091,309 | |||||
Pentair | 12,469 | 620,457 | |||||
Quanta Services | 10,675 | 666,440 | |||||
Raytheon Technologies | 116,227 | 6,313,451 | |||||
Rockwell Automation | 8,936 | 2,118,904 | |||||
Roper Technologies | 8,005 | 2,972,577 | |||||
Snap-on | 4,316 | 679,899 | |||||
Stanley Black & Decker | 12,053 | 2,003,209 | |||||
Teledyne Technologies | 2,777 | a | 858,510 | ||||
Textron | 17,615 | 630,617 | |||||
The Boeing Company | 40,723 | 5,879,994 | |||||
Trane Technologies | 18,611 | 2,470,610 | |||||
TransDigm Group | 4,159 | 1,985,548 | |||||
United Rentals | 5,380 | a | 959,200 | ||||
W.W. Grainger | 3,438 | 1,203,369 | |||||
Westinghouse Air Brake Technologies | 13,885 | 823,381 | |||||
Xylem | 13,567 | 1,182,228 | |||||
116,671,894 | |||||||
Commercial & Professional Services - .8% | |||||||
Cintas | 6,550 | 2,060,303 | |||||
Copart | 15,679 | a | 1,730,334 | ||||
Equifax | 9,240 | 1,262,184 | |||||
IHS Markit | 29,098 | 2,353,155 | |||||
Nielsen Holdings | 24,601 | 332,360 | |||||
Republic Services | 16,344 | 1,441,050 | |||||
Robert Half International | 9,086 | 460,569 | |||||
Rollins | 10,744 | 621,540 | |||||
9
STATEMENT OF INVESTMENTS (continued)
Description | Shares | Value ($) | |||||
Common Stocks - 99.6% (continued) | |||||||
Commercial & Professional Services - .8% (continued) | |||||||
Verisk Analytics | 12,643 | 2,250,075 | |||||
Waste Management | 30,133 | 3,251,652 | |||||
15,763,222 | |||||||
Consumer Durables & Apparel - 1.2% | |||||||
D.R. Horton | 25,269 | 1,688,222 | |||||
Garmin | 11,136 | 1,158,367 | |||||
Hanesbrands | 25,020 | 402,071 | |||||
Hasbro | 9,532 | 788,487 | |||||
Leggett & Platt | 10,737 | 448,055 | |||||
Lennar, Cl. A | 21,094 | 1,481,432 | |||||
Mohawk Industries | 4,974 | a | 513,267 | ||||
Newell Brands | 31,279 | 552,387 | |||||
NIKE, Cl. B | 94,865 | 11,391,389 | |||||
NVR | 267 | a | 1,055,475 | ||||
PulteGroup | 20,398 | 831,422 | |||||
PVH | 5,331 | 310,744 | |||||
Ralph Lauren | 3,779 | 252,626 | |||||
Tapestry | 19,155 | 425,816 | |||||
Under Armour, Cl. A | 16,416 | a | 227,197 | ||||
Under Armour, Cl. C | 16,459 | a | 201,294 | ||||
VF | 24,502 | 1,646,534 | |||||
Whirlpool | 4,856 | 898,166 | |||||
24,272,951 | |||||||
Consumer Services - 1.6% | |||||||
Carnival | 37,907 | b | 519,705 | ||||
Chipotle Mexican Grill | 2,139 | a | 2,569,966 | ||||
Darden Restaurants | 10,111 | 929,403 | |||||
Domino's Pizza | 2,972 | 1,124,367 | |||||
Hilton Worldwide Holdings | 21,371 | 1,876,588 | |||||
Las Vegas Sands | 25,576 | 1,229,183 | |||||
Marriott International, Cl. A | 20,681 | 1,920,851 | |||||
McDonald's | 56,709 | 12,079,017 | |||||
MGM Resorts International | 32,255 | 663,485 | |||||
Norwegian Cruise Line Holdings | 17,862 | a,b | 297,045 | ||||
Royal Caribbean Cruises | 12,865 | 725,843 | |||||
Starbucks | 88,985 | 7,738,136 | |||||
Wynn Resorts | 7,600 | 550,468 | |||||
Yum! Brands | 23,248 | 2,169,736 | |||||
34,393,793 | |||||||
Diversified Financials - 4.5% | |||||||
American Express | 49,559 | 4,521,763 | |||||
Ameriprise Financial | 9,384 | 1,509,229 | |||||
Berkshire Hathaway, Cl. B | 151,250 | a | 30,537,375 | ||||
10
Description | Shares | Value ($) | |||||
Common Stocks - 99.6% (continued) | |||||||
Diversified Financials - 4.5% (continued) | |||||||
BlackRock | 10,882 | 6,520,603 | |||||
Capital One Financial | 35,448 | 2,590,540 | |||||
Cboe Global Markets | 8,208 | 667,228 | |||||
CME Group | 27,483 | 4,142,238 | |||||
Discover Financial Services | 23,754 | 1,544,248 | |||||
Franklin Resources | 20,995 | 393,656 | |||||
Intercontinental Exchange | 43,367 | 4,093,845 | |||||
Invesco | 26,305 | 344,859 | |||||
MarketAxess Holdings | 2,849 | 1,535,184 | |||||
Moody's | 12,240 | 3,217,896 | |||||
Morgan Stanley | 108,529 | 5,225,671 | |||||
MSCI | 6,304 | 2,205,391 | |||||
Nasdaq | 8,898 | 1,076,569 | |||||
Northern Trust | 16,141 | 1,263,356 | |||||
Raymond James Financial | 9,695 | 741,086 | |||||
S&P Global | 18,332 | 5,916,286 | |||||
State Street | 27,280 | 1,606,792 | |||||
Synchrony Financial | 40,129 | 1,004,028 | |||||
T. Rowe Price Group | 17,125 | 2,169,053 | |||||
The Bank of New York Mellon | 61,422 | 2,110,460 | |||||
The Charles Schwab | 111,227 | 4,572,542 | |||||
The Goldman Sachs Group | 26,185 | 4,950,012 | |||||
94,459,910 | |||||||
Energy - 2.0% | |||||||
Apache | 30,453 | 252,760 | |||||
Baker Hughes | 51,706 | 763,698 | |||||
Cabot Oil & Gas | 32,441 | 577,125 | |||||
Chevron | 146,655 | 10,192,522 | |||||
Concho Resources | 16,014 | 664,741 | |||||
ConocoPhillips | 81,899 | 2,343,949 | |||||
Devon Energy | 29,668 | 264,935 | |||||
Diamondback Energy | 13,067 | 339,219 | |||||
EOG Resources | 45,642 | 1,562,782 | |||||
Exxon Mobil | 322,136 | 10,508,076 | |||||
Halliburton | 66,520 | 802,231 | |||||
Hess | 21,037 | 782,997 | |||||
HollyFrontier | 12,696 | 235,003 | |||||
Kinder Morgan | 152,448 | 1,814,131 | |||||
Marathon Oil | 66,735 | b | 264,271 | ||||
Marathon Petroleum | 50,053 | 1,476,564 | |||||
National Oilwell Varco | 31,636 | 265,742 | |||||
Occidental Petroleum | 65,270 | 595,915 | |||||
ONEOK | 32,648 | 946,792 | |||||
11
STATEMENT OF INVESTMENTS (continued)
Description | Shares | Value ($) | |||||
Common Stocks - 99.6% (continued) | |||||||
Energy - 2.0% (continued) | |||||||
Phillips 66 | 32,806 | 1,530,728 | |||||
Pioneer Natural Resources | 12,494 | 994,023 | |||||
Schlumberger | 106,127 | 1,585,537 | |||||
TechnipFMC | 34,356 | 189,989 | |||||
The Williams Companies | 92,748 | 1,779,834 | |||||
Valero Energy | 31,883 | 1,231,003 | |||||
41,964,567 | |||||||
Food & Staples Retailing - 1.6% | |||||||
Costco Wholesale | 33,649 | 12,033,555 | |||||
Sysco | 38,373 | 2,122,411 | |||||
The Kroger Company | 59,202 | 1,906,896 | |||||
Walgreens Boots Alliance | 55,952 | 1,904,606 | |||||
Walmart | 105,859 | 14,687,936 | |||||
32,655,404 | |||||||
Food, Beverage & Tobacco - 3.4% | |||||||
Altria Group | 142,555 | 5,143,384 | |||||
Archer-Daniels-Midland | 42,456 | 1,963,165 | |||||
Brown-Forman, Cl. B | 14,054 | 979,704 | |||||
Campbell Soup | 15,112 | 705,277 | |||||
Conagra Brands | 37,340 | 1,310,261 | |||||
Constellation Brands, Cl. A | 12,985 | 2,145,512 | |||||
General Mills | 46,173 | 2,729,748 | |||||
Hormel Foods | 21,103 | 1,027,505 | |||||
Kellogg | 19,753 | 1,242,266 | |||||
Lamb Weston Holdings | 11,228 | 712,417 | |||||
McCormick & Co. | 9,670 | 1,745,532 | |||||
Molson Coors Beverage, Cl. B | 14,408 | 508,026 | |||||
Mondelez International, Cl. A | 108,639 | 5,770,904 | |||||
Monster Beverage | 28,130 | a | 2,153,914 | ||||
PepsiCo | 105,558 | 14,069,826 | |||||
Philip Morris International | 118,597 | 8,422,759 | |||||
The Coca-Cola Company | 294,705 | 14,163,522 | |||||
The Hershey Company | 11,403 | 1,567,456 | |||||
The J.M. Smucker Company | 9,004 | 1,010,249 | |||||
The Kraft Heinz Company | 48,305 | 1,477,650 | |||||
Tyson Foods, Cl. A | 23,372 | 1,337,580 | |||||
70,186,657 | |||||||
Health Care Equipment & Services - 6.7% | |||||||
Abbott Laboratories | 134,968 | 14,186,486 | |||||
ABIOMED | 3,492 | a | 879,565 | ||||
Align Technology | 5,464 | a | 2,328,101 | ||||
AmerisourceBergen | 11,449 | 1,099,905 | |||||
Anthem | 19,280 | 5,259,584 | |||||
12
Description | Shares | Value ($) | |||||
Common Stocks - 99.6% (continued) | |||||||
Health Care Equipment & Services - 6.7% (continued) | |||||||
Baxter International | 38,339 | 2,973,956 | |||||
Becton Dickinson & Co. | 22,027 | 5,091,101 | |||||
Boston Scientific | 110,312 | a | 3,780,392 | ||||
Cardinal Health | 21,884 | 1,002,068 | |||||
Centene | 44,495 | a | 2,629,655 | ||||
Cerner | 23,414 | 1,641,087 | |||||
Cigna | 28,142 | 4,698,870 | |||||
CVS Health | 99,504 | 5,581,179 | |||||
Danaher | 48,101 | 11,041,104 | |||||
DaVita | 5,331 | a,b | 459,799 | ||||
Dentsply Sirona | 17,207 | 811,998 | |||||
DexCom | 7,213 | a | 2,305,131 | ||||
Edwards Lifesciences | 47,173 | a | 3,381,832 | ||||
HCA Healthcare | 19,943 | 2,471,735 | |||||
Henry Schein | 10,901 | a | 693,086 | ||||
Hologic | 20,225 | a | 1,391,885 | ||||
Humana | 10,131 | 4,045,106 | |||||
IDEXX Laboratories | 6,486 | a | 2,755,383 | ||||
Intuitive Surgical | 8,903 | a | 5,939,013 | ||||
Laboratory Corp. of America Holdings | 7,682 | a | 1,534,633 | ||||
McKesson | 12,329 | 1,818,404 | |||||
Medtronic | 102,410 | 10,299,374 | |||||
Quest Diagnostics | 10,388 | 1,268,790 | |||||
ResMed | 10,908 | 2,093,682 | |||||
Steris | 6,402 | 1,134,370 | |||||
Stryker | 24,838 | 5,017,524 | |||||
Teleflex | 3,475 | 1,105,849 | |||||
The Cooper Companies | 3,750 | 1,196,438 | |||||
UnitedHealth Group | 72,494 | 22,120,819 | |||||
Universal Health Services, Cl. B | 5,703 | 624,764 | |||||
Varian Medical Systems | 6,977 | a | 1,205,626 | ||||
West Pharmaceutical Services | 5,598 | 1,523,048 | |||||
Zimmer Biomet Holdings | 15,976 | 2,110,430 | |||||
139,501,772 | |||||||
Household & Personal Products - 2.0% | |||||||
Church & Dwight | 18,935 | 1,673,665 | |||||
Colgate-Palmolive | 65,155 | 5,140,078 | |||||
Kimberly-Clark | 26,269 | 3,483,007 | |||||
The Clorox Company | 9,576 | 1,984,626 | |||||
The Estee Lauder Companies, Cl. A | 17,110 | 3,758,383 | |||||
The Procter & Gamble Company | 189,940 | 26,040,774 | |||||
42,080,533 | |||||||
13
STATEMENT OF INVESTMENTS (continued)
Description | Shares | Value ($) | |||||
Common Stocks - 99.6% (continued) | |||||||
Insurance - 1.8% | |||||||
Aflac | 51,722 | 1,755,962 | |||||
American International Group | 66,390 | 2,090,621 | |||||
Aon, Cl. A | 17,941 | 3,301,323 | |||||
Arthur J. Gallagher & Co. | 15,010 | 1,556,687 | |||||
Assurant | 4,462 | 554,939 | |||||
Chubb | 34,837 | 4,525,675 | |||||
Cincinnati Financial | 11,142 | 788,185 | |||||
Everest Re Group | 2,971 | 585,525 | |||||
Globe Life | 7,241 | 587,173 | |||||
Lincoln National | 14,273 | 500,982 | |||||
Loews | 17,180 | 595,802 | |||||
Marsh & McLennan Companies | 38,457 | 3,978,761 | |||||
MetLife | 58,766 | 2,224,293 | |||||
Principal Financial Group | 19,782 | 775,850 | |||||
Prudential Financial | 29,744 | 1,904,211 | |||||
The Allstate | 24,281 | 2,154,939 | |||||
The Hartford Financial Services Group | 28,321 | 1,090,925 | |||||
The Progressive | 44,448 | 4,084,771 | |||||
The Travelers Companies | 19,089 | 2,304,233 | |||||
Unum Group | 14,589 | 257,642 | |||||
W.R. Berkley | 10,756 | 646,651 | |||||
Willis Towers Watson | 10,088 | 1,840,858 | |||||
38,106,008 | |||||||
Materials - 2.7% | |||||||
Air Products & Chemicals | 16,783 | 4,636,136 | |||||
Albemarle | 7,939 | b | 739,994 | ||||
Amcor | 123,574 | 1,288,877 | |||||
Avery Dennison | 6,132 | 848,607 | |||||
Ball | 25,497 | 2,269,233 | |||||
Celanese | 9,372 | 1,063,816 | |||||
CF Industries Holdings | 15,663 | 432,455 | |||||
Corteva | 56,338 | 1,858,027 | |||||
Dow | 56,580 | 2,573,824 | |||||
DuPont de Nemours | 55,599 | 3,162,471 | |||||
Eastman Chemical | 10,526 | 850,922 | |||||
Ecolab | 19,208 | 3,526,397 | |||||
FMC | 10,009 | 1,028,325 | |||||
Freeport-McMoRan | 110,840 | 1,921,966 | |||||
International Flavors & Fragrances | 8,451 | b | 867,580 | ||||
International Paper | 29,660 | 1,297,625 | |||||
Linde | 40,010 | 8,815,803 | |||||
LyondellBasell Industries, Cl. A | 19,994 | 1,368,589 | |||||
Martin Marietta Materials | 4,648 | 1,237,995 | |||||
14
Description | Shares | Value ($) | |||||
Common Stocks - 99.6% (continued) | |||||||
Materials - 2.7% (continued) | |||||||
Newmont | 60,917 | 3,828,024 | |||||
Nucor | 22,482 | 1,073,740 | |||||
Packaging Corp. of America | 7,582 | 868,063 | |||||
PPG Industries | 18,219 | 2,363,369 | |||||
Sealed Air | 12,911 | 511,146 | |||||
The Mosaic Company | 24,998 | 462,463 | |||||
The Sherwin-Williams Company | 6,282 | 4,321,890 | |||||
Vulcan Materials | 10,457 | 1,514,592 | |||||
WestRock | 19,127 | 718,219 | |||||
55,450,148 | |||||||
Media & Entertainment - 9.3% | |||||||
Activision Blizzard | 59,171 | 4,481,020 | |||||
Alphabet, Cl. A | 22,929 | a | 37,055,786 | ||||
Alphabet, Cl. C | 22,404 | a | 36,317,108 | ||||
Charter Communications, Cl. A | 11,486 | a | 6,935,477 | ||||
Comcast, Cl. A | 347,559 | 14,680,892 | |||||
Discovery, Cl. A | 12,602 | a,b | 255,064 | ||||
Discovery, Cl. C | 23,940 | a | 438,581 | ||||
DISH Network, Cl. A | 19,449 | a | 495,755 | ||||
Electronic Arts | 22,062 | a | 2,643,689 | ||||
Facebook, Cl. A | 183,507 | a | 48,282,527 | ||||
Fox, Cl. A | 27,587 | 731,607 | |||||
Fox, Cl. B | 11,206 | 292,925 | |||||
Live Nation Entertainment | 10,641 | a | 519,281 | ||||
Netflix | 33,632 | a | 16,000,088 | ||||
News Corporation, Cl. A | 32,325 | 424,427 | |||||
News Corporation, Cl. B | 8,955 | 116,594 | |||||
Omnicom Group | 15,898 | 750,386 | |||||
Take-Two Interactive Software | 8,743 | a | 1,354,466 | ||||
The Interpublic Group of Companies | 27,728 | 501,600 | |||||
The Walt Disney Company | 137,796 | 16,707,765 | |||||
60,404 | a | 2,498,309 | |||||
ViacomCBS, Cl. B | 42,147 | 1,204,140 | |||||
192,687,487 | |||||||
Pharmaceuticals Biotechnology & Life Sciences - 7.3% | |||||||
AbbVie | 134,478 | 11,444,078 | |||||
Agilent Technologies | 23,964 | 2,446,485 | |||||
Alexion Pharmaceuticals | 17,023 | a | 1,960,028 | ||||
Amgen | 44,619 | 9,679,646 | |||||
Biogen | 12,001 | a | 3,025,092 | ||||
Bio-Rad Laboratories, Cl. A | 1,589 | a | 931,821 | ||||
Bristol-Myers Squibb | 171,701 | 10,035,923 | |||||
Catalent | 11,448 | a | 1,004,791 | ||||
15
STATEMENT OF INVESTMENTS (continued)
Description | Shares | Value ($) | |||||
Common Stocks - 99.6% (continued) | |||||||
Pharmaceuticals Biotechnology & Life Sciences - 7.3% (continued) | |||||||
Eli Lilly & Co. | 60,453 | 7,886,698 | |||||
Gilead Sciences | 95,342 | 5,544,137 | |||||
Illumina | 11,075 | a | 3,241,653 | ||||
Incyte | 14,539 | a | 1,259,659 | ||||
IQVIA Holdings | 14,685 | a | 2,261,343 | ||||
Johnson & Johnson | 200,880 | 27,542,657 | |||||
Merck & Co. | 192,825 | 14,502,368 | |||||
Mettler-Toledo International | 1,840 | a | 1,836,154 | ||||
Mylan | 38,333 | a | 557,362 | ||||
PerkinElmer | 8,617 | 1,116,332 | |||||
Perrigo | 11,123 | 487,966 | |||||
Pfizer | 423,651 | 15,031,137 | |||||
Regeneron Pharmaceuticals | 8,051 | a | 4,376,202 | ||||
Thermo Fisher Scientific | 30,154 | 14,266,460 | |||||
Vertex Pharmaceuticals | 19,797 | a | 4,124,903 | ||||
Waters | 4,686 | a | 1,044,135 | ||||
Zoetis | 36,129 | 5,728,253 | |||||
151,335,283 | |||||||
Real Estate - 2.6% | |||||||
Alexandria Real Estate Equities | 9,135 | c | 1,384,135 | ||||
American Tower | 33,767 | c | 7,754,592 | ||||
Apartment Investment & Management, Cl. A | 12,020 | c | 383,438 | ||||
AvalonBay Communities | 10,568 | c | 1,470,326 | ||||
Boston Properties | 11,266 | c | 815,771 | ||||
CBRE Group, Cl. A | 26,431 | a | 1,332,122 | ||||
Crown Castle International | 32,181 | c | 5,026,672 | ||||
Digital Realty Trust | 20,812 | c | 3,003,172 | ||||
Duke Realty | 29,377 | c | 1,116,032 | ||||
Equinix | 6,790 | c | 4,965,120 | ||||
Equity Residential | 26,611 | c | 1,250,185 | ||||
Essex Property Trust | 5,123 | c | 1,048,115 | ||||
Extra Space Storage | 10,091 | c | 1,170,051 | ||||
Federal Realty Investment Trust | 4,779 | c | 328,700 | ||||
Healthpeak Properties | 41,156 | c | 1,109,977 | ||||
Host Hotels & Resorts | 55,070 | c | 577,134 | ||||
Iron Mountain | 21,374 | b,c | 557,006 | ||||
Kimco Realty | 34,481 | c | 353,775 | ||||
Mid-America Apartment Communities | 8,654 | c | 1,009,316 | ||||
Prologis | 56,175 | c | 5,572,560 | ||||
Public Storage | 11,706 | c | 2,681,493 | ||||
Realty Income | 27,001 | c | 1,562,278 | ||||
16
Description | Shares | Value ($) | |||||
Common Stocks - 99.6% (continued) | |||||||
Real Estate - 2.6% (continued) | |||||||
Regency Centers | 12,816 | c | 456,121 | ||||
SBA Communications | 8,708 | c | 2,528,542 | ||||
Simon Property Group | 23,178 | c | 1,455,810 | ||||
SL Green Realty | 6,245 | b,c | 267,348 | ||||
UDR | 23,568 | c | 736,264 | ||||
Ventas | 29,237 | c | 1,153,984 | ||||
Vornado Realty Trust | 12,164 | c | 373,800 | ||||
Welltower | 32,157 | c | 1,729,082 | ||||
Weyerhaeuser | 58,654 | c | 1,600,668 | ||||
54,773,589 | |||||||
Retailing - 8.3% | |||||||
Advance Auto Parts | 5,475 | 806,358 | |||||
Amazon.com | 32,505 | a | 98,690,056 | ||||
AutoZone | 1,830 | a | 2,066,033 | ||||
Best Buy | 17,382 | 1,938,962 | |||||
Booking Holdings | 3,113 | a | 5,050,843 | ||||
CarMax | 12,457 | a,b | 1,076,783 | ||||
Dollar General | 19,070 | 3,980,100 | |||||
Dollar Tree | 18,001 | a | 1,625,850 | ||||
eBay | 50,746 | 2,417,032 | |||||
Etsy | 8,262 | a | 1,004,577 | ||||
Expedia Group | 10,409 | 980,007 | |||||
Genuine Parts | 10,649 | 962,989 | |||||
L Brands | 18,759 | 600,476 | |||||
LKQ | 21,839 | a | 698,630 | ||||
Lowe's | 57,565 | 9,101,026 | |||||
O'Reilly Automotive | 5,652 | a | 2,467,663 | ||||
Pool | 2,755 | 963,782 | |||||
Ross Stores | 27,661 | 2,355,887 | |||||
Target | 38,414 | 5,847,379 | |||||
The Gap | 16,135 | 313,826 | |||||
The Home Depot | 82,114 | 21,900,625 | |||||
The TJX Companies | 91,119 | 4,628,845 | |||||
Tiffany & Co. | 8,111 | 1,061,243 | |||||
Tractor Supply | 8,848 | 1,178,642 | |||||
Ulta Beauty | 4,376 | a | 904,826 | ||||
172,622,440 | |||||||
Semiconductors & Semiconductor Equipment - 5.0% | |||||||
Advanced Micro Devices | 90,142 | a | 6,786,791 | ||||
Analog Devices | 28,586 | 3,388,299 | |||||
Applied Materials | 69,347 | 4,107,423 | |||||
Broadcom | 30,645 | 10,714,411 | |||||
Intel | 324,300 | 14,360,004 | |||||
17
STATEMENT OF INVESTMENTS (continued)
Description | Shares | Value ($) | |||||
Common Stocks - 99.6% (continued) | |||||||
Semiconductors & Semiconductor Equipment - 5.0% (continued) | |||||||
KLA | 12,085 | 2,382,920 | |||||
Lam Research | 11,052 | 3,780,668 | |||||
Maxim Integrated Products | 20,566 | 1,432,422 | |||||
Microchip Technology | 19,490 | b | 2,048,009 | ||||
Micron Technology | 84,347 | a | 4,246,028 | ||||
NVIDIA | 47,071 | 23,599,517 | |||||
Qorvo | 8,955 | a | 1,140,509 | ||||
Qualcomm | 85,958 | 10,603,779 | |||||
Skyworks Solutions | 12,574 | 1,776,580 | |||||
Teradyne | 11,462 | 1,006,937 | |||||
Texas Instruments | 69,779 | 10,089,346 | |||||
Xilinx | 18,421 | 2,186,388 | |||||
103,650,031 | |||||||
Software & Services - 14.3% | |||||||
Accenture, Cl. A | 48,470 | 10,513,628 | |||||
Adobe | 36,579 | a | 16,354,471 | ||||
Akamai Technologies | 12,443 | a | 1,183,578 | ||||
Ansys | 6,637 | a | 2,020,104 | ||||
Autodesk | 16,640 | a | 3,919,386 | ||||
Automatic Data Processing | 32,663 | 5,159,447 | |||||
Broadridge Financial Solutions | 8,897 | 1,224,227 | |||||
Cadence Design Systems | 21,033 | a | 2,300,379 | ||||
Citrix Systems | 9,431 | 1,068,249 | |||||
Cognizant Technology Solutions, Cl. A | 41,542 | 2,966,930 | |||||
DXC Technology | 18,152 | 334,360 | |||||
Fidelity National Information Services | 47,140 | 5,873,173 | |||||
Fiserv | 42,200 | a | 4,028,834 | ||||
FLEETCOR Technologies | 6,488 | a | 1,433,264 | ||||
Fortinet | 10,274 | a | 1,133,941 | ||||
Gartner | 7,077 | a | 849,948 | ||||
Global Payments | 22,918 | 3,615,085 | |||||
International Business Machines | 67,804 | 7,570,995 | |||||
Intuit | 19,920 | 6,268,426 | |||||
Jack Henry & Associates | 5,724 | 848,583 | |||||
Leidos Holdings | 10,152 | 842,616 | |||||
Mastercard, Cl. A | 67,382 | 19,449,140 | |||||
Microsoft | 577,780 | 116,983,117 | |||||
NortonLifeLock | 44,891 | 923,408 | |||||
Oracle | 148,558 | 8,335,589 | |||||
Paychex | 24,363 | 2,003,857 | |||||
Paycom Software | 3,760 | a | 1,368,978 | ||||
PayPal Holdings | 89,475 | a | 16,653,982 | ||||
18
Description | Shares | Value ($) | |||||
Common Stocks - 99.6% (continued) | |||||||
Software & Services - 14.3% (continued) | |||||||
salesforce.com | 69,395 | a | 16,118,377 | ||||
ServiceNow | 14,598 | a | 7,263,527 | ||||
Synopsys | 11,748 | a | 2,512,427 | ||||
The Western Union Company | 32,354 | 628,962 | |||||
Tyler Technologies | 3,030 | a | 1,164,671 | ||||
Verisign | 7,589 | a | 1,447,222 | ||||
Visa, Cl. A | 128,625 | b | 23,372,449 | ||||
297,735,330 | |||||||
Technology Hardware & Equipment - 8.0% | |||||||
Amphenol, Cl. A | 22,710 | 2,562,596 | |||||
Apple | 1,227,442 | 133,619,336 | |||||
Arista Networks | 4,394 | a | 917,907 | ||||
CDW | 10,874 | 1,333,152 | |||||
Cisco Systems | 322,637 | 11,582,668 | |||||
Corning | 59,293 | 1,895,597 | |||||
F5 Networks | 4,671 | a | 620,963 | ||||
FLIR Systems | 11,249 | 390,228 | |||||
Hewlett Packard Enterprise | 95,937 | 828,896 | |||||
HP | 106,888 | 1,919,708 | |||||
IPG Photonics | 2,623 | a | 487,773 | ||||
Juniper Networks | 25,931 | 511,359 | |||||
Keysight Technologies | 14,208 | a | 1,489,993 | ||||
Motorola Solutions | 12,798 | 2,022,852 | |||||
NetApp | 17,792 | 780,891 | |||||
Seagate Technology | 16,591 | 793,382 | |||||
TE Connectivity | 25,169 | 2,438,373 | |||||
Vontier | 10,207 | a | 293,349 | ||||
Western Digital | 23,457 | 885,033 | |||||
Xerox Holdings | 15,873 | 275,873 | |||||
Zebra Technologies, Cl. A | 4,091 | a | 1,160,371 | ||||
166,810,300 | |||||||
Telecommunication Services - 1.8% | |||||||
AT&T | 543,169 | 14,676,426 | |||||
CenturyLink | 75,768 | 653,120 | |||||
T-Mobile US | 44,216 | a | 4,844,747 | ||||
Verizon Communications | 315,566 | 17,984,106 | |||||
38,158,399 | |||||||
Transportation - 2.0% | |||||||
Alaska Air Group | 9,960 | 377,384 | |||||
American Airlines Group | 37,731 | b | 425,606 | ||||
C.H. Robinson Worldwide | 10,255 | 906,850 | |||||
CSX | 58,099 | 4,586,335 | |||||
Delta Air Lines | 48,692 | 1,491,923 | |||||
19
STATEMENT OF INVESTMENTS (continued)
Description | Shares | Value ($) | |||||
Common Stocks - 99.6% (continued) | |||||||
Transportation - 2.0% (continued) | |||||||
Expeditors International of Washington | 12,745 | 1,126,276 | |||||
FedEx | 18,312 | 4,751,415 | |||||
J.B. Hunt Transport Services | 6,100 | 742,614 | |||||
Kansas City Southern | 7,272 | 1,280,890 | |||||
Norfolk Southern | 19,362 | 4,048,981 | |||||
Old Dominion Freight Line | 7,405 | 1,409,690 | |||||
Southwest Airlines | 45,206 | 1,786,993 | |||||
Union Pacific | 51,713 | 9,163,026 | |||||
United Airlines Holdings | 22,113 | a | 748,746 | ||||
United Parcel Service, Cl. B | 53,849 | 8,460,216 | |||||
41,306,945 | |||||||
Utilities - 3.2% | |||||||
Alliant Energy | 18,385 | 1,016,323 | |||||
Ameren | 19,244 | 1,561,073 | |||||
American Electric Power | 37,921 | 3,410,236 | |||||
American Water Works | 13,784 | 2,074,630 | |||||
Atmos Energy | 9,283 | b | 850,973 | ||||
CenterPoint Energy | 42,423 | 896,398 | |||||
CMS Energy | 22,275 | 1,410,676 | |||||
Consolidated Edison | 25,438 | 1,996,629 | |||||
Dominion Energy | 64,846 | 5,209,728 | |||||
DTE Energy | 14,919 | 1,841,303 | |||||
Duke Energy | 56,368 | 5,192,056 | |||||
Edison International | 29,420 | 1,648,697 | |||||
Entergy | 15,364 | 1,555,144 | |||||
Evergy | 17,094 | 943,589 | |||||
Eversource Energy | 25,987 | 2,267,885 | |||||
Exelon | 74,377 | 2,966,899 | |||||
FirstEnergy | 43,133 | 1,281,913 | |||||
NextEra Energy | 149,224 | 10,924,689 | |||||
NiSource | 30,097 | 691,328 | |||||
NRG Energy | 18,091 | 572,037 | |||||
Pinnacle West Capital | 8,690 | 708,843 | |||||
PPL | 59,088 | 1,624,920 | |||||
Public Service Enterprise Group | 38,496 | 2,238,542 | |||||
Sempra Energy | 22,073 | 2,767,071 | |||||
The AES | 50,951 | 993,545 | |||||
The Southern Company | 81,482 | 4,681,141 | |||||
WEC Energy Group | 24,173 | 2,430,595 | |||||
Xcel Energy | 40,108 | 2,808,763 | |||||
66,565,626 | |||||||
Total Common Stocks (cost $517,341,822) | 2,071,221,269 | ||||||
20
Description | Principal Amount ($) | Value ($) | |||||
Short-Term Investments - .1% | |||||||
U.S. Treasury Bills - .1% | |||||||
0.20%, 2/25/21 | 638,000 | d,e | 637,806 | ||||
1-Day | Shares | ||||||
Investment Companies - .3% | |||||||
Registered Investment Companies - .3% | |||||||
Dreyfus Institutional Preferred Government Plus Money Market Fund | 0.10 | 5,915,828 | f | 5,915,828 | |||
Investment of Cash Collateral for Securities Loaned - .0% | |||||||
Registered Investment Companies - .0% | |||||||
Dreyfus Institutional Preferred Government Plus Money Market Fund | 0.10 | 637,495 | f | 637,495 | |||
Total Investments (cost $524,532,754) | 100.0% | 2,078,412,398 | |||||
Cash and Receivables (Net) | .0% | 576,099 | |||||
Net Assets | 100.0% | 2,078,988,497 | |||||
a Non-income producing security.
b Security, or portion thereof, on loan. At October 31, 2020, the value of the fund’s securities on loan was $30,319,432 and the value of the collateral was $31,340,338, consisting of cash collateral of $637,495 and U.S. Government & Agency securities valued at $30,702,843.
c Investment in real estate investment trust within the United States.
d Held by a counterparty for open exchange traded derivative contracts.
e Security is a discount security. Income is recognized through the accretion of discount.
f Investment in affiliated issuer. The investment objective of this investment company is publicly available and can be found within the investment company’s prospectus.
Portfolio Summary (Unaudited) † | Value (%) |
Information Technology | 27.3 |
Health Care | 14.0 |
Consumer Discretionary | 11.5 |
Communication Services | 11.1 |
Financials | 9.8 |
Industrials | 8.4 |
Consumer Staples | 7.0 |
Utilities | 3.2 |
Materials | 2.7 |
Real Estate | 2.7 |
Energy | 2.0 |
Investment Companies | .3 |
Government | .0 |
100.0 |
† Based on net assets.
See notes to financial statements.
21
STATEMENT OF INVESTMENTS IN AFFILIATED ISSUERS
Investment Companies | Value | Purchases ($)† | Sales ($) | Value | Net | Dividends/ |
Registered Investment Companies; | ||||||
Dreyfus Institutional Preferred Government Plus Money Market Fund | 9,855,122 | 327,760,207 | (331,699,501) | 5,915,828 | .3 | 93,293 |
Investment of Cash Collateral for Securities Loaned; | ||||||
Dreyfus Institutional Preferred Government Plus Money Market Fund | 728,181 | 35,170,521 | (35,261,207) | 637,495 | .0 | - |
Total | 10,583,303 | 362,930,728 | (366,960,708) | 6,553,323 | .3 | 93,293 |
† Includes reinvested dividends/distributions
See notes to financial statements.
22
STATEMENT OF FUTURES
October 31, 2020
Description | Number of | Expiration | Notional | Market | Unrealized (Depreciation) ($) | |
Futures Long | ||||||
Standard & Poor's 500 E-mini | 50 | 12/18/2020 | 8,700,682 | 8,161,750 | (538,932) | |
Gross Unrealized Depreciation | (538,932) | |||||
See notes to financial statements.
23
STATEMENT OF ASSETS AND LIABILITIES
October 31, 2020
|
|
|
|
|
|
|
|
|
| Cost |
| Value |
|
Assets ($): |
|
|
|
| ||
Investments in securities—See Statement of Investments |
|
|
| |||
Unaffiliated issuers | 517,979,431 |
| 2,071,859,075 |
| ||
Affiliated issuers |
| 6,553,323 |
| 6,553,323 |
| |
Cash |
|
|
|
| 81,728 |
|
Dividends, interest and securities lending income receivable |
| 2,078,793 |
| |||
Receivable for shares of Common Stock subscribed |
| 1,443,149 |
| |||
Prepaid expenses |
|
|
|
| 16 |
|
|
|
|
|
| 2,082,016,084 |
|
Liabilities ($): |
|
|
|
| ||
Due to BNY Mellon Investment Adviser, Inc. and affiliates—Note 3(b) |
| 906,706 |
| |||
Payable for shares of Common Stock redeemed |
| 1,351,266 |
| |||
Liability for securities on loan—Note 1(b) |
| 637,495 |
| |||
Payable for futures variation margin—Note 4 |
| 94,000 |
| |||
Directors’ fees and expenses payable |
| 37,706 |
| |||
Interest payable—Note 2 |
| 414 |
| |||
|
|
|
|
| 3,027,587 |
|
Net Assets ($) |
|
| 2,078,988,497 |
| ||
Composition of Net Assets ($): |
|
|
|
| ||
Paid-in capital |
|
|
|
| 297,613,347 |
|
Total distributable earnings (loss) |
|
|
|
| 1,781,375,150 |
|
Net Assets ($) |
|
| 2,078,988,497 |
| ||
Shares Outstanding |
|
| ||
(200 million shares of $.001 par value Common Stock authorized) | 40,384,192 |
| ||
Net Asset Value Per Share ($) |
| 51.48 |
| |
|
|
|
|
|
See notes to financial statements. |
|
|
|
|
24
STATEMENT OF OPERATIONS
Year Ended October 31, 2020
|
|
|
|
|
|
|
|
|
|
|
|
|
|
Investment Income ($): |
|
|
|
| ||
Income: |
|
|
|
| ||
Cash dividends: |
| |||||
Unaffiliated issuers |
|
| 41,216,715 |
| ||
Affiliated issuers |
|
| 90,993 |
| ||
Income from securities lending—Note 1(b) |
|
| 110,431 |
| ||
Interest |
|
| 60,675 |
| ||
Total Income |
|
| 41,478,814 |
| ||
Expenses: |
|
|
|
| ||
Management fee—Note 3(a) |
|
| 5,406,366 |
| ||
Shareholder servicing costs—Note 3(b) |
|
| 5,406,366 |
| ||
Directors’ fees—Note 3(a,c) |
|
| 218,930 |
| ||
Loan commitment fees—Note 2 |
|
| 73,094 |
| ||
Interest expense—Note 2 |
|
| 2,582 |
| ||
Total Expenses |
|
| 11,107,338 |
| ||
Less—Directors’ fees reimbursed by |
|
| (218,930) |
| ||
Net Expenses |
|
| 10,888,408 |
| ||
Investment Income—Net |
|
| 30,590,406 |
| ||
Realized and Unrealized Gain (Loss) on Investments—Note 4 ($): |
|
| ||||
Net realized gain (loss) on investments | 262,190,121 |
| ||||
Net realized gain (loss) on futures | 1,287,946 |
| ||||
Capital gain distributions from affiliated issuers | 2,300 |
| ||||
Net Realized Gain (Loss) |
|
| 263,480,367 |
| ||
Net change in unrealized appreciation (depreciation) on investments | (103,895,584) |
| ||||
Net change in unrealized appreciation (depreciation) on futures | (902,680) |
| ||||
Net Change in Unrealized Appreciation (Depreciation) |
|
| (104,798,264) |
| ||
Net Realized and Unrealized Gain (Loss) on Investments |
|
| 158,682,103 |
| ||
Net Increase in Net Assets Resulting from Operations |
| 189,272,509 |
| |||
|
|
|
|
|
|
|
See notes to financial statements. | ||||||
25
STATEMENT OF CHANGES IN NET ASSETS
|
|
|
| Year Ended October 31, | |||||
|
|
|
| 2020 |
| 2019 |
| ||
Operations ($): |
|
|
|
|
|
|
|
| |
Investment income—net |
|
| 30,590,406 |
|
|
| 36,001,448 |
| |
Net realized gain (loss) on investments |
| 263,480,367 |
|
|
| 301,803,850 |
| ||
Net change in unrealized appreciation |
| (104,798,264) |
|
|
| (42,160,095) |
| ||
Net Increase (Decrease) in Net Assets | 189,272,509 |
|
|
| 295,645,203 |
| |||
Distributions ($): |
| ||||||||
Distributions to shareholders |
|
| (299,400,194) |
|
|
| (312,814,481) |
| |
Capital Stock Transactions ($): |
| ||||||||
Net proceeds from shares sold |
|
| 290,861,571 |
|
|
| 320,880,718 |
| |
Distributions reinvested |
|
| 291,570,932 |
|
|
| 305,420,036 |
| |
Cost of shares redeemed |
|
| (665,872,499) |
|
|
| (764,586,883) |
| |
Increase (Decrease) in Net Assets | (83,439,996) |
|
|
| (138,286,129) |
| |||
Total Increase (Decrease) in Net Assets | (193,567,681) |
|
|
| (155,455,407) |
| |||
Net Assets ($): |
| ||||||||
Beginning of Period |
|
| 2,272,556,178 |
|
|
| 2,428,011,585 |
| |
End of Period |
|
| 2,078,988,497 |
|
|
| 2,272,556,178 |
| |
Capital Share Transactions (Shares): |
| ||||||||
Shares sold |
|
| 6,043,802 |
|
|
| 6,331,502 |
| |
Shares issued for distributions reinvested |
|
| 5,779,474 |
|
|
| 7,057,271 |
| |
Shares redeemed |
|
| (13,574,483) |
|
|
| (15,051,465) |
| |
Net Increase (Decrease) in Shares Outstanding | (1,751,207) |
|
|
| (1,662,692) |
| |||
|
|
|
|
|
|
|
|
|
|
See notes to financial statements. | |||||||||
26
FINANCIAL HIGHLIGHTS
The following table describes the performance for the fiscal periods indicated. Total return shows how much your investment in the fund would have increased (or decreased) during each period, assuming you had reinvested all dividends and distributions. These figures have been derived from the fund’s financial statements.
Year Ended October 31, | ||||||||
2020 | 2019 | 2018 | 2017 | 2016 | ||||
Per Share Data ($): | ||||||||
Net asset value, | 53.93 | 55.44 | 56.66 | 51.04 | 52.88 | |||
Investment Operations: | ||||||||
Investment income—neta | .71 | .79 | .78 | .80 | .84 | |||
Net realized and unrealized gain | 4.07 | 5.03 | 2.97 | 10.12 | 1.11 | |||
Total from Investment Operations | 4.78 | 5.82 | 3.75 | 10.92 | 1.95 | |||
Distributions: | ||||||||
Dividends from investment | (.85) | (.84) | (.86) | (.91) | (.87) | |||
Dividends from net realized gain | (6.38) | (6.49) | (4.11) | (4.39) | (2.92) | |||
Total Distributions | (7.23) | (7.33) | (4.97) | (5.30) | (3.79) | |||
Net asset value, end of period | 51.48 | 53.93 | 55.44 | 56.66 | 51.04 | |||
Total Return (%) | 9.13 | 13.76 | 6.83 | 23.03 | 3.95 | |||
Ratios/Supplemental Data (%): | ||||||||
Ratio of total expenses to | .51 | .51 | .51 | .51 | .51 | |||
Ratio of net expenses to | .50 | .50 | .50 | .50 | .50 | |||
Ratio of net investment | 1.41 | 1.55 | 1.39 | 1.52 | 1.68 | |||
Portfolio Turnover Rate | 2.43 | 2.81 | 3.06 | 2.88 | 4.25 | |||
Net Assets, end of period | 2,078,988 | 2,272,556 | 2,428,012 | 2,661,282 | 2,478,725 | |||
a Based on average shares outstanding.
See notes to financial statements.
27
NOTES TO FINANCIAL STATEMENTS
NOTE 1—Significant Accounting Policies:
BNY Mellon S&P 500 Index Fund (the “fund”) is a separate non-diversified series of BNY Mellon Index Funds, Inc. (the “Company”), which is registered under the Investment Company Act of 1940, as amended (the “Act”), as an open-end management investment company and operates as a series company currently offering three series, including the fund. The fund’s investment objective is to seek to match the performance of the S&P 500® Composite Stock Price Index. BNY Mellon Investment Adviser, Inc. (the “Adviser”), a wholly-owned subsidiary of The Bank of New York Mellon Corporation (“BNY Mellon”), serves as the fund’s investment adviser. BNY Mellon Securities Corporation (the “Distributor”), a wholly-owned subsidiary of the Adviser, is the distributor of the fund’s shares, which are sold to the public without a sales charge.
The Company accounts separately for the assets, liabilities and operations of each series. Expenses directly attributable to each series are charged to that series’ operations; expenses which are applicable to all series are allocated among them on a pro rata basis.
The Financial Accounting Standards Board (“FASB”) Accounting Standards Codification (“ASC”) is the exclusive reference of authoritative U.S. generally accepted accounting principles (“GAAP”) recognized by the FASB to be applied by nongovernmental entities. Rules and interpretive releases of the Securities and Exchange Commission (“SEC”) under authority of federal laws are also sources of authoritative GAAP for SEC registrants. The fund is an investment company and applies the accounting and reporting guidance of the FASB ASC Topic 946 Financial Services-Investment Companies. The fund’s financial statements are prepared in accordance with GAAP, which may require the use of management estimates and assumptions. Actual results could differ from those estimates.
The Company enters into contracts that contain a variety of indemnifications. The fund’s maximum exposure under these arrangements is unknown. The fund does not anticipate recognizing any loss related to these arrangements.
(a) Portfolio valuation: The fair value of a financial instrument is the amount that would be received to sell an asset or paid to transfer a liability in an orderly transaction between market participants at the measurement date (i.e., the exit price). GAAP establishes a fair value hierarchy that prioritizes the inputs of valuation techniques used to measure fair value.
28
This hierarchy gives the highest priority to unadjusted quoted prices in active markets for identical assets or liabilities (Level 1 measurements) and the lowest priority to unobservable inputs (Level 3 measurements).
Additionally, GAAP provides guidance on determining whether the volume and activity in a market has decreased significantly and whether such a decrease in activity results in transactions that are not orderly. GAAP requires enhanced disclosures around valuation inputs and techniques used during annual and interim periods.
Various inputs are used in determining the value of the fund’s investments relating to fair value measurements. These inputs are summarized in the three broad levels listed below:
Level 1—unadjusted quoted prices in active markets for identical investments.
Level 2—other significant observable inputs (including quoted prices for similar investments, interest rates, prepayment speeds, credit risk, etc.).
Level 3—significant unobservable inputs (including the fund’s own assumptions in determining the fair value of investments).
The inputs or methodology used for valuing securities are not necessarily an indication of the risk associated with investing in those securities.
Changes in valuation techniques may result in transfers in or out of an assigned level within the disclosure hierarchy. Valuation techniques used to value the fund’s investments are as follows:
Investments in equity securities are valued at the last sales price on the securities exchange or national securities market on which such securities are primarily traded. Securities listed on the National Market System for which market quotations are available are valued at the official closing price or, if there is no official closing price that day, at the last sales price. For open short positions, asked prices are used for valuation purposes. Bid price is used when no asked price is available. Registered investment companies that are not traded on an exchange are valued at their net asset value. All of the preceding securities are generally categorized within Level 1 of the fair value hierarchy.
Securities not listed on an exchange or the national securities market, or securities for which there were no transactions, are valued at the average of the most recent bid and asked prices. U.S. Treasury Bills are valued at the mean price between quoted bid prices and asked prices by an independent pricing service (the “Service”) approved by the Company’s Board of
29
NOTES TO FINANCIAL STATEMENTS (continued)
Directors (the “Board”). These securities are generally categorized within Level 2 of the fair value hierarchy.
The Service is engaged under the general oversight of the Board.
Fair valuing of securities may be determined with the assistance of a pricing service using calculations based on indices of domestic securities and other appropriate indicators, such as prices of relevant American Depository Receipts and futures. Utilizing these techniques may result in transfers between Level 1 and Level 2 of the fair value hierarchy.
When market quotations or official closing prices are not readily available, or are determined not to accurately reflect fair value, such as when the value of a security has been significantly affected by events after the close of the exchange or market on which the security is principally traded (for example, a foreign exchange or market), but before the fund calculates its net asset value, the fund may value these investments at fair value as determined in accordance with the procedures approved by the Board. Certain factors may be considered when fair valuing investments such as: fundamental analytical data, the nature and duration of restrictions on disposition, an evaluation of the forces that influence the market in which the securities are purchased and sold, and public trading in similar securities of the issuer or comparable issuers. These securities are either categorized within Level 2 or 3 of the fair value hierarchy depending on the relevant inputs used.
For securities where observable inputs are limited, assumptions about market activity and risk are used and such securities are generally categorized within Level 3 of the fair value hierarchy.
Futures, which are traded on an exchange, are valued at the last sales price on the securities exchange on which such securities are primarily traded or at the last sales price on the national securities market on each business day and are generally categorized within Level 1 of the fair value hierarchy.
The following is a summary of the inputs used as of October 31, 2020 in valuing the fund’s investments:
30
Level 1 - Unadjusted Quoted Prices | Level 2 - Other Significant Observable Inputs | Level 3 -Significant Unobservable Inputs | Total | |
Assets ($) | ||||
Investments in Securities:† | ||||
Equity Securities—Common Stocks | 2,071,221,269 | - | - | 2,071,221,269 |
Investment Companies | 6,553,323 | - | - | 6,553,323 |
U.S. Treasury Securities | - | 637,806 | - | 637,806 |
Liabilities ($) | ||||
Other Financial Instruments: | ||||
Futures†† | (538,932) | - | - | (538,932) |
† See Statement of Investments for additional detailed categorizations, if any.
†† Amount shown represents unrealized appreciation (depreciation) at period end, but only variation margin on exchanged traded and centrally cleared derivatives is reported in the Statement of Assets and Liabilities.
(b) Securities transactions and investment income: Securities transactions are recorded on a trade date basis. Realized gains and losses from securities transactions are recorded on the identified cost basis. Dividend income is recognized on the ex-dividend date and interest income, including, where applicable, accretion of discount and amortization of premium on investments, is recognized on the accrual basis.
Pursuant to a securities lending agreement with The Bank of New York Mellon, a subsidiary of BNY Mellon and an affiliate of the Adviser, the fund may lend securities to qualified institutions. It is the fund’s policy that, at origination, all loans are secured by collateral of at least 102% of the value of U.S. securities loaned and 105% of the value of foreign securities loaned. Collateral equivalent to at least 100% of the market value of securities on loan is maintained at all times. Collateral is either in the form of cash, which can be invested in certain money market mutual funds managed by the Adviser, or U.S. Government and Agency securities. The fund is entitled to receive all dividends, interest and distributions on securities loaned, in addition to income earned as a result of the lending transaction. Should a borrower fail to return the securities in a timely manner, The Bank of New York Mellon is required to replace the securities for the benefit of the fund or credit the fund with the market value of the unreturned securities and is subrogated to the fund’s rights against the borrower and the collateral. Additionally, the contractual maturity of security lending transactions are on an overnight and continuous basis. During the period ended October 31, 2020, The Bank of
31
NOTES TO FINANCIAL STATEMENTS (continued)
New York Mellon earned $21,618 from the lending of the fund’s portfolio securities, pursuant to the securities lending agreement.
(c) Affiliated issuers: Investments in other investment companies advised by the Adviser are considered “affiliated” under the Act.
(d) Risk: Certain events particular to the industries in which the fund’s investments conduct their operations, as well as general economic, political and public health conditions, may have a significant negative impact on the investee’s operations and profitability. In addition, turbulence in financial markets and reduced liquidity in equity, credit and/or fixed income markets may negatively affect many issuers, which could adversely affect the fund. Global economies and financial markets are becoming increasingly interconnected, and conditions and events in one country, region or financial market may adversely impact issuers in a different country, region or financial market. These risks may be magnified if certain events or developments adversely interrupt the global supply chain; in these and other circumstances, such risks might affect companies world-wide. Recent examples include pandemic risks related to COVID-19 and aggressive measures taken world-wide in response by governments, including closing borders, restricting international and domestic travel, and the imposition of prolonged quarantines of large populations, and by businesses, including changes to operations and reducing staff. To the extent the fund may overweight its investments in certain countries, companies, industries or market sectors, such positions will increase the fund’s exposure to risk of loss from adverse developments affecting those countries, companies, industries or sectors.
(e) Dividends and distributions to shareholders: Dividends and distributions are recorded on the ex-dividend date. Dividends from investment income-net and dividends from net realized capital gains, if any, are normally declared and paid annually, but the fund may make distributions on a more frequent basis to comply with the distribution requirements of the Internal Revenue Code of 1986, as amended (the “Code”). To the extent that net realized capital gains can be offset by capital loss carryovers, it is the policy of the fund not to distribute such gains. Income and capital gain distributions are determined in accordance with income tax regulations, which may differ from GAAP.
(f) Federal income taxes: It is the policy of the fund to continue to qualify as a regulated investment company, if such qualification is in the best interests of its shareholders, by complying with the applicable provisions of the Code, and to make distributions of taxable income and net realized capital gain sufficient to relieve it from substantially all federal income and excise taxes.
32
As of and during the period ended October 31, 2020, the fund did not have any liabilities for any uncertain tax positions. The fund recognizes interest and penalties, if any, related to uncertain tax positions as income tax expense in the Statement of Operations. During the period ended October 31, 2020, the fund did not incur any interest or penalties.
Each tax year in the four-year period ended October 31, 2020 remains subject to examination by the Internal Revenue Service and state taxing authorities.
At October 31, 2020, the components of accumulated earnings on a tax basis were as follows: undistributed ordinary income $25,798,142, undistributed capital gains $221,233,908 and unrealized appreciation $1,534,343,100.
The tax character of distributions paid to shareholders during the fiscal periods ended October 31, 2020 and October 31, 2019 were as follows: ordinary income $35,002,478 and $37,621,906, and long-term capital gains $264,397,716 and $275,192,575, respectively.
During the period ended October 31, 2020, as a result of permanent book to tax differences, primarily due to the tax treatment for treating a portion of the proceeds from redemptions as a distribution for tax purposes, the fund decreased total distributable earnings (loss) by $35,803,954 and increased paid-in capital by the same amount. Net assets and net asset value per share were not affected by this reclassification.
NOTE 2—Bank Lines of Credit:
The fund participates with other long-term open-end funds managed by the Adviser in a $823.5 million unsecured credit facility led by Citibank, N.A. (the “Citibank Credit Facility”) and a $300 million unsecured credit facility provided by The Bank of New York Mellon (the “BNYM Credit Facility”), each to be utilized primarily for temporary or emergency purposes, including the financing of redemptions (each, a “Facility”). The Citibank Credit Facility is available in two tranches: (i) Tranche A is in an amount equal to $688.5 million and is available to all long-term open-ended funds, including the fund, and (ii) Tranche B is an amount equal to $135 million and is available only to BNY Mellon Floating Rate Income Fund, a series of BNY Mellon Investment Funds IV, Inc. Prior to September 30, 2020, the Citibank Credit Facility was $927 million with Tranche A available in an amount equal to $747 million and Tranche B available in an amount equal to $180 million. Prior to March 11, 2020, the Citibank Credit Facility was $1.030 billion with Tranche A available in an amount equal to $830 million and Tranche B available in an amount equal to $200 million. In connection therewith, the fund has agreed to pay its pro
33
NOTES TO FINANCIAL STATEMENTS (continued)
rata portion of commitment fees for Tranche A of the Citibank Credit Facility and the BNYM Credit Facility. Interest is charged to the fund based on rates determined pursuant to the terms of the respective Facility at the time of borrowing.
The average amount of borrowings outstanding under the Facilities during the period ended October 31, 2020 was approximately $193,716 with a related weighted average annualized interest rate of 1.33%.
NOTE 3—Management Fee and Other Transactions with Affiliates:
(a) Pursuant to a management agreement (the “Agreement”) with the Adviser, the management fee is computed at the annual rate of .25% of the value of the fund’s average daily net assets and is payable monthly. Out of its fee, the Adviser pays all of the expenses of the fund except management fees, Shareholder Services Plan fees, brokerage fees and commissions, taxes, interest expense, commitment fees on borrowings, fees and expenses of interested Directors (including counsel fees) and extraordinary expenses. In addition, the Adviser is required to reduce its fee in an amount equal to the fund’s allocable portion of fees and expenses of the non-interested Directors (including counsel fees). During the period ended October 31, 2020, fees reimbursed by the Adviser amounted to $218,930.
(b) Under the Shareholder Services Plan, the fund pays the Distributor for the provision of certain services, at an annual rate of .25% of the value of the fund’s average daily net assets. The services provided may include personal services relating to shareholder accounts, such as answering shareholder inquiries regarding the fund and providing reports and other information, and services related to the maintenance of shareholder accounts such as recordkeeping and sub-accounting services. The Distributor may make payments to Service Agents (securities dealers, financial institutions or other industry professionals) with respect to these services. The Distributor determines the amounts to be paid to Service Agents. During the period ended October 31, 2020, the fund was charged $5,406,366 pursuant to the Shareholder Services Plan.
The fund has an arrangement with the custodian whereby the fund will receive interest income or be charged an overdraft fees when cash balances are maintained. For financial reporting purposes, the fund includes this interest income and overdraft fees, if any, as interest income in the Statement of Operations.
The components of “Due to BNY Mellon Investment Adviser, Inc. and affiliates” in the Statement of Assets and Liabilities consist of: management fees of $463,568 and Shareholder Services Plan fees of $463,568, which are
34
offset against an expense reimbursement currently in effect in the amount of $20,430.
(c) Each Board member also serves as a Board member of other funds in the BNY Mellon Family of Funds complex. Annual retainer fees and attendance fees are allocated to each fund based on net assets.
NOTE 4—Securities Transactions:
The aggregate amount of purchases and sales of investment securities, excluding short-term securities and futures, during the period ended October 31, 2020, amounted to $52,069,868 and $400,961,277, respectively.
Derivatives: A derivative is a financial instrument whose performance is derived from the performance of another asset. Each type of derivative instrument that was held by the fund during the period ended October 31, 2020 is discussed below.
Futures: In the normal course of pursuing its investment objective, the fund is exposed to market risk, including equity price risk, as a result of changes in value of underlying financial instruments. The fund invests in futures in order to manage its exposure to or protect against changes in the market. A futures contract represents a commitment for the future purchase or a sale of an asset at a specified date. Upon entering into such contracts, these investments require initial margin deposits with a counterparty, which consist of cash or cash equivalents. The amount of these deposits is determined by the exchange or Board of Trade on which the contract is traded and is subject to change. Accordingly, variation margin payments are received or made to reflect daily unrealized gains or losses which are recorded in the Statement of Operations. When the contracts are closed, the fund recognizes a realized gain or loss which is reflected in the Statement of Operations. There is minimal counterparty credit risk to the fund with futures since they are exchange traded, and the exchange guarantees the futures against default. Futures open at October 31, 2020 are set forth in the Statement of Futures.
The following summarizes the average market value of derivatives outstanding during the period ended October 31, 2020:
|
| Average Market Value ($) |
Equity futures |
| 14,629,898 |
|
|
|
At October 31, 2020, the cost of investments for federal income tax purposes was $544,069,298; accordingly, accumulated net unrealized appreciation on investments was $1,534,343,100, consisting of
35
NOTES TO FINANCIAL STATEMENTS (continued)
$1,586,320,770 gross unrealized appreciation and $51,977,670 gross unrealized depreciation.
NOTE 5—Pending Legal Matters:
The fund and many other entities have been named as defendants in numerous pending litigations as a result of their participation in the leveraged buyout transaction (“LBO”) of the Tribune Company (“Tribune”).
The State Law Cases: In 2008, approximately one year after the Tribune LBO concluded, Tribune filed for bankruptcy protection under Chapter 11 of the Bankruptcy Code (the “Code”). Beginning in June 2011, Tribune creditors filed complaints in various courts, alleging that the payments made to shareholders in the LBO were “fraudulent conveyances” under state and/or federal law, and that the shareholders must return the payments they received for their shares (collectively, “the state law cases”). The state law cases were consolidated for pre-trial proceedings in the United States District Court for the Southern District of New York, under the caption In re Tribune Company Fraudulent Conveyance Litigation (S.D.N.Y. Nos. 11-md-2296 and 12-mc-2296 (RJS) (“Tribune MDL”)). On September 23, 2013, the Court dismissed 50 cases, including at least one case in which the fund was a defendant. On September 30, 2013, plaintiffs appealed the District Court’s decision to the U.S. Court of Appeals for the Second Circuit. On March 29, 2016, the Second Circuit affirmed the dismissal on the ground that the plaintiffs’ claims were preempted by section 546(e) of the Code, which exempts qualified transfers that were made “by or to (or for the benefit of) . . . a financial institution.” The fund is a registered investment company, which the Code defines as a “financial institution.”
On September 9, 2016, Plaintiffs filed a petition for certiorari to the U.S. Supreme Court. During the pendency of the plaintiffs’ cert. petition, the Supreme Court ruled in another case, Merit Management Group, LP v. FTI Consulting, Inc. (“Merit Management”), that Section 546(e) does not exempt qualified transfers from avoidance that merely passed through “financial institutions,” though it does exempt “financial institutions” themselves, like the fund.
On May 15, 2018, in response to the Merit Management decision, the Second Circuit issued an Order in the State Law Cases that “the mandate in this case is recalled in anticipation of further panel review.”
On December 19, 2019, the Second Circuit issued an Amended and Corrected Opinion affirming dismissal of the constructive fraudulent transfer claims notwithstanding Merit Mgmt., because there is an alternate
36
basis for finding that the payments are safe-harbored under Section 546(e); namely, that, with respect to LBO payments, the Tribune Company is itself a “financial institution” because it was the customer of Computershare – a trust company and bank that acted as Tribune’s agent – and because all payments were made in connection with a securities contract.
On January 2, 2020, plaintiffs petitioned the Second Circuit for rehearing by the same panel of judges and/or rehearing en banc by all judges on the Court of Appeals for the Second Circuit. Plaintiffs sought this relief on numerous grounds, including that the panel rendered its decision using an incorrect construction of Section 546(e), improperly considered evidence, and an insufficiently developed factual record. Second Circuit rules state that parties opposing a petition for rehearing and rehearing en banc are not permitted to file a response unless requested by the Court. The Second Circuit did not request any oppositions to plaintiffs’ motion, instead issuing an order on February 6, 2020, denying plaintiffs’-appellants’ petition for rehearing and/or rehearing en banc.
In July 2020, plaintiffs filed a petition for certiorari to the U.S. Supreme Court seeking review of the Second Circuit’s Amended and Corrected Opinion affirming the dismissal of the constructive fraudulent transfer claims. Plaintiffs’ cert. petition identifies three purported errors allegedly justifying Supreme Court review; namely, that the Second Circuit erred in its application of the “presumption against preemption” in the context of the Bankruptcy Code, in its conclusion that the 546(e) safe harbor pre-empts claims brought by creditors, and in its conclusion that the Tribune Company was a “financial institution.” Plaintiffs also formally abandoned their claims against certain defendants believed to have created a financial conflict that precluded a quorum among the Supreme Court justices. In August 2020, defendants opposed the petition for certiorari to the U.S. Supreme Court, arguing that none of the Second Circuit’s findings and holdings warrant review, particularly since its decision does not conflict with the decision of any other court of appeals. In October 2020, the Supreme Court issued an order inviting the Solicitor General of the United States to file a brief expressing the views of the United States on the certiorari petition filed in the state law cases.
The FitzSimons Litigation: On November 1, 2010, a case now styled, Mark S. Kirchner, as Litigation Trustee for the Tribune Litigation Trust v. FitzSimons, et al., S.D.N.Y. No. 12-cv-2652 (RJS) was filed (“the FitzSimons Litigation”). Among other things, the complaint sought recovery of alleged “fraudulent conveyances” from more than 5,000 Tribune shareholders (“Shareholder Defendants”), including the fund, that participated in the Tribune LBO. On May 23, 2014, the defendants filed a motion to dismiss, which the
37
NOTES TO FINANCIAL STATEMENTS (continued)
Court granted on January 9, 2017. The plaintiff then sought leave to file an interlocutory appeal. On February 23, 2017, the Court entered an order stating that it would permit the plaintiff to file an interlocutory appeal after the Court decided other pending motions.
Effective November 1, 2018, Judge Denise Cote was assigned to the case when Judge Richard Sullivan was elevated to the Second Circuit.
On November 30, 2018, the Court issued an Opinion and Order resolving the remaining motions by dismissing most, but not all, of the claims asserted against the individual defendants.
In January 2019, various state law claims asserted against certain individual defendants were dismissed.
Between February and early April 2019, plaintiffs and certain defendants attempted to resolve the dispute through mediation, but ultimately decided to await the Second Circuit’s review of its May 29, 2016 decision before attempting to negotiate a settlement.
On April 4, 2019, plaintiff filed a motion to amend the FitzSimons complaint to add a claim for constructive fraudulent transfer from defendants subject to clawback under the Bankruptcy Code. On April 10, 2019, the affected defendants opposed the motion.
On April 23, 2019, Judge Cote denied plaintiff’s motion to amend the complaint to add a new constructive fraudulent transfer claim because such amendment would be futile and would result in substantial prejudice to the shareholder defendants given that the only claim against the shareholder defendants in FitzSimons has been dismissed for over two years, subject to appeal. Judge Cote considered the amendment futile on the ground that constructive fraudulent transfer claims are barred by the safe harbor provision of Section 546(e), which defines “financial institution” to include, in certain circumstances, the customers of traditional financial institutions, including Tribune.
On July 12, 2019, the Trustee filed a notice of appeal to the Second Circuit from the April 23, 2019, decision denying leave to amend the complaint to add constructive fraudulent transfer claims. On July 15, 2019, the Trustee filed a corrected notice of appeal to remedy technical errors with the notice filed on July 12, 2019. Briefing on these matters began in January 2020, and was completed and fully submitted to the Second Circuit by June 2020. Oral argument occurred in August 2020. In December 2020, Second Circuit Judge and panel member Ralph Winter, Jr., passed away. A decision is still expected in 2021, though it is unknown whether a third panel member will be sought to decide the pending appeal, whether additional
38
briefing or oral argument will be requested or required by a third panel member, if any, or whether any such request will impact the timing to a final decision.
At this stage in the proceedings, management does not believe that a loss is probable and, in any event, is unable to reasonably estimate the possible loss that may result.
39
REPORT OF INDEPENDENT REGISTERED PUBLIC ACCOUNTING FIRM
To the Shareholders and the Board of Directors of BNY Mellon S&P 500 Index Fund
Opinion on the Financial Statements
We have audited the accompanying statement of assets and liabilities of BNY Mellon S&P 500 Index Fund (the “Fund”) (one of the funds constituting BNY Mellon Index Funds, Inc.), including the statements of investments, investments in affiliated issuers and futures, as of October 31, 2020, and the related statement of operations for the year then ended, the statements of changes in net assets for each of the two years in the period then ended, the financial highlights for each of the five years in the period then ended and the related notes (collectively referred to as the “financial statements”). In our opinion, the financial statements present fairly, in all material respects, the financial position of the Fund (one of the funds constituting BNY Mellon Index Funds, Inc.) at October 31, 2020, the results of its operations for the year then ended, the changes in its net assets for each of the two years in the period then ended and its financial highlights for each of the five years in the period then ended, in conformity with U.S. generally accepted accounting principles.
Basis for Opinion
These financial statements are the responsibility of the Fund’s management. Our responsibility is to express an opinion on the Fund’s financial statements based on our audits. We are a public accounting firm registered with the Public Company Accounting Oversight Board (United States) (“PCAOB”) and are required to be independent with respect to the Fund in accordance with the U.S. federal securities laws and the applicable rules and regulations of the Securities and Exchange Commission and the PCAOB.
We conducted our audits in accordance with the standards of the PCAOB. Those standards require that we plan and perform the audit to obtain reasonable assurance about whether the financial statements are free of material misstatement, whether due to error or fraud. The Fund is not required to have, nor were we engaged to perform, an audit of the Fund’s internal control over financial reporting. As part of our audits, we are required to obtain an understanding of internal control over financial reporting, but not for the purpose of expressing an opinion on the effectiveness of the Fund’s internal control over financial reporting. Accordingly, we express no such opinion.
Our audits included performing procedures to assess the risks of material misstatement of the financial statements, whether due to error or fraud, and performing procedures that respond to those risks. Such procedures included examining, on a test basis, evidence regarding the amounts and disclosures in the financial statements. Our procedures included confirmation of securities owned as of October 31, 2020, by correspondence with the custodian and others or by other appropriate auditing procedures where replies from others were not received. Our audits also included evaluating the accounting principles used and significant estimates made by management, as well as evaluating the overall presentation of the financial statements. We believe that our audits provide a reasonable basis for our opinion.

We have served as the auditor of one or more investment companies in the BNY Mellon Family of Funds since at least 1957, but we are unable to determine the specific year.
New York, New York
December 23, 2020
40
IMPORTANT TAX INFORMATION (Unaudited)
For federal tax purposes, the fund hereby reports 100% of the ordinary dividends paid during the fiscal year ended October 31, 2020 as qualifying for the corporate dividends received deduction. Also, certain dividends paid by the fund may be subject to a maximum tax rate of 15%, as provided for by the Jobs and Growth Tax Relief Reconciliation Act of 2003. Of the distributions paid during the fiscal year, $35,002,478 represents the maximum amount that may be considered qualified dividend income. Shareholders will receive notification in early 2021 of the percentage applicable to the preparation of their 2020 income tax returns. The fund also hereby reports $.0044 per share as a long-term capital gain distribution paid on March 24, 2020 and also $6.3766 per share as a long-term capital gain distribution paid on December 26, 2019.
41
LIQUIDITY RISK MANAGEMENT PROGRAM (Unaudited)
Effective June 1, 2019, the fund adopted a liquidity risk management program (the “Liquidity Risk Management Program”) pursuant to the requirements of Rule 22e-4 under the Investment Company Act of 1940, as amended. Rule 22e-4 requires registered open-end funds, including mutual funds and exchange-traded funds but not money market funds, to establish liquidity risk management programs in order to effectively manage fund liquidity and shareholder redemptions. The rule is designed to mitigate the risk that a fund could not meet redemption requests without significantly diluting the interests of remaining investors.
The rule requires the funds to assess, manage and review their liquidity risk at least annually considering applicable factors such as investment strategy and liquidity during normal and foreseeable stressed conditions, including whether the strategy is appropriate for an open-end fund and whether the fund has a relatively concentrated portfolio or large positions in particular issuers. The fund must also assess its use of borrowings and derivatives, short-term and long-term cash flow projections in normal and stressed conditions, holdings of cash and cash equivalents, and borrowing arrangements and other funding sources.
The rule also requires the fund to classify its investments as highly liquid, moderately liquid, less liquid or illiquid based on the number of days the fund expects it would take to liquidate the investment, and to review these classifications at least monthly or more often under certain conditions. The periods range from three or fewer business days for a highly liquid investment to greater than seven calendar days for settlement of a less liquid investment. Illiquid investments are those a fund does not expect to be able to sell or dispose of within seven calendar days without significantly changing the market value. The fund is prohibited from acquiring an investment if, after the acquisition, its holdings of illiquid assets will exceed 15% of its net assets. In addition, if a fund permits redemptions in-kind, the rule requires the fund to establish redemption in-kind policies and procedures governing how and when it will engage in such redemptions.
Pursuant to the rule’s requirements, the Liquidity Risk Management Program has been reviewed and approved by the fund’s board. Furthermore, the board has received a written report prepared by the Program’s Administrator that addresses the operation of the Program, assesses its adequacy and effectiveness and describes any material changes made to the Program.
Assessment of Program
In the opinion of the Program Administrator, the Program approved by the fund board continues to be adequate for the fund and the Program has been implemented effectively. The Program Administrator has monitored the fund’s liquidity risk and the liquidity classification of the securities held by the fund and has determined that the Program is operating effectively.
During the period from June 1, 2019 to March 31, 2020, there were no material changes to the Program and no material liquidity events that impacted the fund. During the period, the fund held sufficient highly liquid assets to meet fund redemptions.
42
Under normal expected foreseeable fund redemption forecasts and foreseeable stressed fund redemption forecasts, the Program Administrator believes that the fund maintains sufficient highly liquid assets to meet expected fund redemptions.
43
BOARD MEMBERS INFORMATION (Unaudited)
INDEPENDENT BOARD MEMBERS
Chairman of the Board (1995)
Principal Occupation During Past 5 Years:
· Director or Trustee of funds in the BNY Mellon Family of Funds and certain other entities (as described in the fund’s Statement of Additional Information) (1995-Present)
Other Public Company Board Memberships During Past 5 Years:
· CBIZ, Inc., a public company providing professional business services, products and solutions, Director (1997-Present)
No. of Portfolios for which Board Member Serves: 110
———————
Peggy C. Davis (77)
Board Member (2006)
Principal Occupation During Past 5 Years:
· Shad Professor of Law, New York University School of Law (1983-present)
No. of Portfolios for which Board Member Serves: 39
———————
Gina D. France (62)
Board Member (2019)
Principal Occupation During Past 5 Years:
· Founder, President and Chief Executive Officer, France Strategic Partners, a strategy and advisory firm serving corporate clients across the United States (2003 –Present)
· Corporate Director and Trustee (2004 – Present)
Other Public Company Board Memberships During Past 5 Years:
· Huntington Bancshares, a bank holding company headquartered in Columbus, Ohio, Director (2016 – Present)
· Cedar Fair, L.P., a publicly-traded partnership that owns and operates amusement parks and hotels in the U.S. and Canada, Director (2011 – Present)
· CBIZ, Inc., a public company providing professional business services, products and solutions, Director (2015 – Present)
· Baldwin Wallace University, Trustee (2013- 2019)
· FirstMerit Corporation, a diversified financial services company, Director (2004 – 2016)
No. of Portfolios for which Board Member Serves: 25
———————
44
Joan Gulley (73)
Board Member (2017)
Principal Occupation During Past 5 Years:
· PNC Financial Services Group, Inc.(1993-2014), Executive Vice President and Chief Human Resources Officer and Executive Committee Member (2008-2014)
· Director, Nantucket Library (2015-Present)
No. of Portfolios for which Board Member Serves: 43
———————
Robin A. Melvin (57)
Board Member (2012)
Principal Occupation During Past 5 Years:
· Trustee, Westover School, a private girls’ boarding school in Middlebury, Connecticut (2019 – Present); Co-chairman, Mentor Illinois, a non-profit organization dedicated to increasing the quality of mentoring services in Illinois (2014 – 2020); Board member, Mentor Illinois (2013 – 2020)
No. of Portfolios for which Board Member Serves: 88
———————
Once elected all Board Members serve for an indefinite term, but achieve Emeritus status upon reaching age 80. The address of the Board Members and Officers is c/o BNY Mellon Investment Adviser, Inc. 240 Greenwich Street, New York, New York 10286. Additional information about the Board Members is available in the fund’s Statement of Additional Information which can be obtained from the Adviser free of charge by calling this toll free number: 1-800-373-9387.
David Feldman, Emeritus Board Member
James F. Henry, Emeritus Board Member
Ehud Houminer, Emeritus Board Member
Lynn Martin, Emeritus Board Member
Dr. Martin Peretz, Emeritus Board Member
Philip L. Toia, Emeritus Board Member
45
OFFICERS OF THE FUND (Unaudited)
RENEE LAROCHE-MORRIS, President since May 2019.
President and a director of BNY Mellon Investment Adviser, Inc. since January 2018. She is an officer of 61 investment companies (comprised of 110 portfolios) managed by the Adviser. She is 49 years old and has been an employee of BNY Mellon since 2003.
JAMES WINDELS, Treasurer since November 2001.
Director-BNY Mellon Fund Administration, and an officer of 63 investment companies (comprised of 141 portfolios) managed by the Adviser or an affiliate of the Adviser. He is 62 years old and has been an employee of the Adviser since April 1985.
BENNETT A. MACDOUGALL, Chief Legal Officer since October 2015.
Chief Legal Officer of the Adviser and Associate General Counsel and Managing Director of BNY Mellon since June 2015; Director and Associate General Counsel of Deutsche Bank–Asset & Wealth Management Division from June 2005 to June 2015, and as Chief Legal Officer of Deutsche Investment Management Americas Inc. from June 2012 to May 2015. He is an officer of 63 investment companies (comprised of 141 portfolios) managed by the Adviser or an affiliate of the Adviser. He is 49 years old and has been an employee of the Adviser since June 2015.
DAVID DIPETRILLO, Vice President since May 2019.
Head of North America Product, BNY Mellon Investment Management since January 2018, Director of Product Strategy, BNY Mellon Investment Management from January 2016 to December 2017; Head of US Retail Product and Channel Marketing, BNY Mellon Investment Management from January 2014 to December 2015. He is an officer of 62 investment companies (comprised of 118 portfolios) managed by the Adviser or an affiliate of the Adviser. He is 42 years old and has been an employee of BNY Mellon since 2005.
JAMES BITETTO, Vice President since August 2005 and Secretary since February 2018.
Senior Managing Counsel of BNY Mellon since December 2019; Managing Counsel of BNY Mellon from April 2014 to December 2019; Secretary of the Adviser, and an officer of 63 investment companies (comprised of 141 portfolios) managed by the Adviser or an affiliate of the Adviser. He is 54 years old and has been an employee of the Adviser since December 1996.
SONALEE CROSS, Vice President and Assistant Secretary since March 2018.
Counsel of BNY Mellon since October 2016; Associate at Proskauer Rose LLP from April 2016 to September 2016; Attorney at EnTrust Capital from August 2015 to February 2016; Associate at Sidley Austin LLP from September 2013 to August 2015. She is an officer of 63 investment companies (comprised of 141 portfolios) managed by the Adviser or an affiliate of the Adviser. She is 33 years old and has been an employee of the Adviser since October 2016.
DEIRDRE CUNNANE, Vice President and Assistant Secretary since March 2019.
Counsel of BNY Mellon since August 2018; Senior Regulatory Specialist at BNY Mellon Investment Management Services from February 2016 to August 2018; Trustee Associate at BNY Mellon Trust Company (Ireland) Limited from August 2013 to February 2016. She is an officer of 63 investment companies (comprised of 141 portfolios) managed by the Adviser or an affiliate of the Adviser. She is 30 years old and has been an employee of the Adviser since August 2018.
SARAH S. KELLEHER, Vice President and Assistant Secretary since April 2014.
Managing Counsel of BNY Mellon since December 2017, Senior Counsel of BNY Mellon from March 2013 to December 2017. She is an officer of 63 investment companies (comprised of 141 portfolios) managed by the Adviser or an affiliate of the Adviser. She is 45 years old and has been an employee of the Adviser since March 2013.
JEFF PRUSNOFSKY, Vice President and Assistant Secretary since August 2005.
Senior Managing Counsel of BNY Mellon, and an officer of 63 investment companies (comprised of 141 portfolios) managed by the Adviser or an affiliate of the Adviser. He is 55 years old and has been an employee of the Adviser since October 1990.
AMANDA QUINN, Vice President and Assistant Secretary since March 2020.
Counsel of BNY Mellon since June 2019; Regulatory Administration Manager at BNY Mellon Investment Management Services from September 2018 to May 2019; Senior Regulatory Specialist at BNY Mellon Investment Management Services from April 2015 to August 2018. She is an officer of 63 investment companies (comprised of 141 portfolios) managed by the Adviser or an affiliate of the Adviser. She is 35 years old and has been an employee of the Adviser since June 2019.
46
PETER M. SULLIVAN, Vice President and Assistant Secretary since March 2019.
Managing Counsel of BNY Mellon since March 2009, Senior Counsel of BNY Mellon from April 2004 to March 2009, and an officer of 63 investment companies (comprised of 141 portfolios) managed by the Adviser or an affiliate of the Adviser. He is 52 years old and has been an employee of the Adviser since January 2019.
NATALYA ZELENSKY, Vice President and Assistant Secretary since March 2017.
Managing Counsel of BNY Mellon since December 2019; Counsel of BNY Mellon from May 2016 to December 2019; Attorney at Wildermuth Endowment Strategy Fund/Wildermuth Advisory, LLC from November 2015 to May 2016 and Assistant General Counsel at RCS Advisory Services from July 2014 to November 2015. She is an officer of 63 investment companies (comprised of 141 portfolios) managed by the Adviser or an affiliate of the Adviser. She is 35 years old and has been an employee of the Adviser since May 2016.
GAVIN C. REILLY, Assistant Treasurer since December 2005.
Tax Manager-BNY Mellon Fund Administration, and an officer of 63 investment companies (comprised of 141 portfolios) managed by the Adviser or an affiliate of the Adviser. He is 52 years old and has been an employee of the Adviser since April 1991.
ROBERT S. ROBOL, Assistant Treasurer since August 2005.
Senior Accounting Manager-BNY Mellon Fund Administration, and an officer of 63 investment companies (comprised of 141 portfolios) managed by the Adviser or an affiliate of the Adviser. He is 56 years old and has been an employee of the Adviser since October 1988.
ROBERT SALVIOLO, Assistant Treasurer since July 2007.
Senior Accounting Manager–BNY Mellon Fund Administration, and an officer of 63 investment companies (comprised of 141 portfolios) managed by the Adviser or an affiliate of the Adviser. He is 53 years old and has been an employee of the Adviser since June 1989.
ROBERT SVAGNA, Assistant Treasurer since December 2002.
Senior Accounting Manager–BNY Mellon Fund Administration, and an officer of 63 investment companies (comprised of 141 portfolios) managed by the Adviser or an affiliate of the Adviser. He is 53 years old and has been an employee of the Adviser since November 1990.
JOSEPH W. CONNOLLY, Chief Compliance Officer since October 2004.
Chief Compliance Officer of the Adviser, the BNY Mellon Family of Funds and BNY Mellon Funds Trust (62 investment companies, comprised of 133 portfolios). He is 63 years old and has served in various capacities with the Adviser since 1980, including manager of the firm’s Fund Accounting Department from 1997 through October 2001.
CARIDAD M. CAROSELLA, Anti-Money Laundering Compliance Officer since January 2016.
Anti-Money Laundering Compliance Officer of the BNY Mellon Family of Funds and BNY Mellon Funds Trust since January 2016; from May 2015 to December 2015, Interim Anti-Money Laundering Compliance Officer of the BNY Mellon Family of Funds and BNY Mellon Funds Trust and the Distributor; from January 2012 to May 2015, AML Surveillance Officer of the Distributor. She is an officer of 56 investment companies (comprised of 134 portfolios) managed by the Adviser or an affiliate of the Adviser. She is 52 years old and has been an employee of the Distributor since 1997.
47
This page intentionally left blank.
48
This page intentionally left blank.
49
BNY Mellon S&P 500 Index Fund
240 Greenwich Street
New York, NY 10286
Adviser
BNY Mellon Investment Adviser, Inc.
240 Greenwich Street
New York, NY 10286
Custodian
The Bank of New York Mellon
240 Greenwich Street
New York, NY 10286
Transfer Agent &
Dividend Disbursing Agent
BNY Mellon Transfer, Inc.
240 Greenwich Street
New York, NY 10286
Distributor
BNY Mellon Securities Corporation
240 Greenwich Street
New York, NY 10286
Ticker Symbol: | PEOPX |
Telephone Call your financial representative or 1-800-373-9387
Mail The BNY Mellon Family of Funds, 144 Glenn Curtiss Boulevard, Uniondale, NY 11556-0144
E-mail Send your request to info@bnymellon.com
Internet Information can be viewed online or downloaded at www.bnymellonim.com/us
The fund files its complete schedule of portfolio holdings with the Securities and Exchange Commission (“SEC”) for the first and third quarters of each fiscal year on Form N-PORT. The fund’s Forms N-PORT are available on the SEC’s website at www.sec.gov.
A description of the policies and procedures that the fund uses to determine how to vote proxies relating to portfolio securities and information regarding how the fund voted these proxies for the most recent 12-month period ended June 30 is available at www.bnymellonim.com/us and on the SEC’s website at www.sec.gov and without charge, upon request, by calling 1-800-373-9387.
© 2020 BNY Mellon Securities Corporation |
|

BNY Mellon Smallcap Stock Index Fund
ANNUAL REPORT October 31, 2020 |
|

Save time. Save paper. View your next shareholder report online as soon as it’s available. Log into www.bnymellonim.com/us and sign up for eCommunications. It’s simple and only takes a few minutes. |
The views expressed in this report reflect those of the portfolio manager(s) only through the end of the period covered and do not necessarily represent the views of BNY Mellon Investment Adviser, Inc. or any other person in the BNY Mellon Investment Adviser, Inc. organization. Any such views are subject to change at any time based upon market or other conditions and BNY Mellon Investment Adviser, Inc. disclaims any responsibility to update such views. These views may not be relied on as investment advice and, because investment decisions for a fund in the BNY Mellon Family of Funds are based on numerous factors, may not be relied on as an indication of trading intent on behalf of any fund in the BNY Mellon Family of Funds. |
Not FDIC-Insured • Not Bank-Guaranteed • May Lose Value |
Contents
THE FUND
BNY Mellon Investment Adviser, Inc. | |
With Those of Other Funds | |
in Affiliated Issuers | |
Public Accounting Firm | |
FOR MORE INFORMATION
Back Cover
| The Fund |
A LETTER FROM THE PRESIDENT OF BNY MELLON INVESTMENT ADVISER, INC.
Dear Shareholder:
We are pleased to present this annual report for BNY Mellon Smallcap Stock Index Fund, covering the 12-month period from November 1, 2019 through October 31, 2020. For information about how the fund performed during the reporting period, as well as general market perspectives, we provide a Discussion of Fund Performance on the pages that follow.
Accommodative rate policies from the U.S. Federal Reserve (the “Fed”) and progress towards a U.S./China trade deal stoked optimism about future economic growth prospects the final months of 2019, fueling an equity rally. As we entered 2020, optimism turned to concern as COVID-19 began to spread across portions of Asia and Europe. When the virus reached the U.S. in March 2020, stocks became volatile. U.S. equities posted historic losses during the month due to investor concern over the economic impact of a widespread quarantine. Global central banks and governments launched emergency stimulus measures to support their respective economies, and equity valuations began to rebound, trending upward until the fall. Volatility returned in September 2020 and continued through October, as concerns over rising COVID-19 infection rates, continued trade tensions, the U.S. Congress’ failure to pass additional financial assistance and anxiety over the upcoming U.S. election constrained equity valuations.
In fixed-income markets, interest rates were heavily influenced by changes in Fed policy and investor concern over COVID-19. In 2019, as stocks rallied in response to Fed rate cuts, risk-asset valuations also rose while Treasuries lagged. When COVID-19 began to emerge, a flight to quality ensued, and Treasury rates fell significantly. The Fed cut rates twice in March 2020, resulting in an overnight lending target rate of nearly zero, and the government launched a large stimulus package. Risk-asset prices began to rebound, and bond indices generally rose until September 2020, when investment-grade instrument prices stalled. Yields in the intermediate and long portions of the Treasury curve rose during October, further constraining bond prices.
We believe the near-term outlook for the U.S. will be challenging, as the country continues to battle COVID-19. As always, we will monitor relevant data for meaningful developments. We encourage you to discuss the risks and opportunities in today’s investment environment with your financial advisor.
Thank you for your continued confidence and support.
Sincerely,

Renee LaRoche-Morris
President
BNY Mellon Investment Adviser, Inc.
November 16, 2020
2
DISCUSSION OF FUND PERFORMANCE (Unaudited)
For the period from November 1, 2019 through October 31, 2020, as provided by Thomas J. Durante, CFA, David France, CFA, Todd Frysinger, CFA, Vlasta Sheremeta, CFA, Michael Stoll, and Marlene Walker Smith, Portfolio Managers
Market and Fund Performance Overview
For the 12-month period ended October 31, 2020, the BNY Mellon Smallcap Stock Index Fund’s Investor shares produced a total return of -8.01%, and its Class I shares returned -7.79%.1 In comparison, the S&P SmallCap 600® Index (the “Index”), the fund’s benchmark, produced a -7.72% total return for the same period.2,3
Small-cap stocks fell during the reporting period, due largely to volatility brought on by the spread of COVID-19. The difference in returns between the fund and the Index during the reporting period was primarily the result of transaction costs and operating expenses that are not reflected in the Index’s results.
The Fund’s Investment Approach
The fund seeks to match the performance of the Index. To pursue its goal, the fund generally is fully invested in all of the stocks that comprise the Index and in futures whose performance is tied to the Index. The fund generally invests in all 600 stocks in the Index in proportion to their weighting in the Index; however, at times, the fund may invest in a representative sample of stocks included in the Index and in futures whose performance is tied to the Index. Under these circumstances, the fund expects to invest in approximately 500 or more of the stocks in the Index.
The Index is an unmanaged index composed of 600 domestic stocks. S&P weights each company’s stock in the Index by its market capitalization (i.e., the share price times the number of shares outstanding), adjusted by the number of available float shares (i.e., those shares available to public investors). Companies included in the Index generally have market capitalizations ranging between approximately $600 million and $2.4 billion, to the extent consistent with market conditions.
Central Bank Policy and COVID-19 Influence Markets
U.S. equities gained over the end of 2019, as investor optimism regarding trade and future economic growth prospects bolstered sentiment. Continued accommodative policies by the U.S. Federal Reserve (the “Fed”), coupled with encouraging economic data releases, worked to fuel a risk-on environment. Greater certainty as to the timing of Brexit was also forthcoming and aided investor optimism. In addition, as the year-end approached, both the U.S. and China indicated that a ‘Phase-One’ trade deal would be signed in early 2020.
Markets gave way to extreme risk aversion in early 2020, as the global scope of the COVID-19 pandemic became apparent. Equity valuations in the U.S. remained robust throughout January and February 2020, while markets in areas that experienced the virus earlier, such as China, began to experience volatility closer to the start of the calendar year. Financial markets also had to contend with a second major shock in the form of an oil-price war between Saudi Arabia and Russia, which caused oil prices to fall precipitously in March 2020. Worldwide, governments and central banks launched an unprecedented array of fiscal initiatives that sought to offset the economic impact of widespread lockdown measures and
3
DISCUSSION OF FUND PERFORMANCE (Unaudited) (continued)
bolster asset prices. The intervention provided comfort to investors, and indices began to rally towards the end of March 2020. Supported by the intervention, equities generally went on to stage a recovery that lasted through August 2020. However, the recovery was company and sector specific, as several industries that remained affected by COVID-19 prevention procedures did not fully participate. In September, volatility crept back into equity markets, as increasing COVID-19 infection rates began to concern investors. By October, several countries had begun to reinstitute some degree of behavioral restriction among residents in order to stem the spread of the virus. In addition, mounting political rhetoric in the U.S. due to the election, renewed trade difficulties between the U.S. and China, and other geopolitical events stoked investor anxiety. Stocks continued to exhibit volatility through the end of the period.
In this environment, small-cap stocks trailed their large-cap and mid-cap counterparts.
Financials Stocks Weigh on the Market
Interest rates fell during the 12-month period, putting downward pressure on many financial stocks. Small banks were particularly hard hit, as a large portion of their revenues depends on mortgage products. Lower rates generally reduce the profitability of lending money. In addition, high rates of unemployment during the period have investors concerned about a possible uptick in mortgage defaults. Banks have set aside large sums of money as reserves in case of loan defaults, which could imperil balance sheet health for these institutions. Insurance company stocks also came under pressure, as investors speculated over the possible extent of costs associated with COVID-19 claims. As people sheltered in place during the period, real estate securities were also hit. Commercial and retail REITs were negatively affected, as people worked from home and did not visit stores in person. The energy sector also performed poorly. Reduced demand for gasoline from commuters and business travelers has helped to depress oil prices. Lower oil prices have financially strained some energy companies, resulting in reduced dividends and investor speculation about corporate viability.
There were spots of resilience within the small-cap markets. Health care companies led the Index for the year. Biotechnology was the best performing industry within the sector. Smaller biotech companies are nimbler than their larger counterparts and can often pivot their research and development efforts quickly. Many companies partnered with larger drug makers to develop and distribute COVID-19 therapies and treatments, bolstering stock prices. Medical equipment and supplies companies also led the broader market. Elective procedures increased the last several months of the period, increasing demand for equipment and supplies. Hospitals and medical offices have also been increasing their orders for diagnostic testing equipment. The consumer discretionary sector also performed well, particularly within the household durables industry. Demand for items such as cleaning products and food storage containers was very strong during the lockdown, boosting stock prices for companies such as Tupperware Brands. Many internet and direct marketing retail companies also posted positive results. People opted to purchase things online as opposed to visiting stores where they could be exposed to the virus. Companies such as Stamps.com and PetMed Express helped drive performance within the sector.
4
Replicating the Performance of the Index
Although we do not actively manage the fund’s investments in response to macroeconomic trends, it is worth noting that while the spread of COVID-19 and resulting economic implications continue to impact markets and the economy, the U.S. government and Fed remain dedicated to supporting capital markets and the economy with various fiscal and monetary techniques. As always, we continue to monitor factors that affect the fund’s investments.
November 16, 2020
¹ Total return includes reinvestment of dividends and any capital gains paid. The fund’s return reflects the absorption of certain fund expenses by BNY Mellon Investment Adviser, Inc. pursuant to an agreement. Had these expenses not been absorbed, returns would have been lower. Past performance is no guarantee of future results. Share price and investment return fluctuate such that upon redemption, fund shares may be worth more or less than their original cost.
² Source: Lipper Inc. — The S&P SmallCap 600® Index measures the small-cap segment of the U.S. equity market. The Index is designed to track companies that meet specific inclusion criteria to ensure that they are liquid and financially viable. Investors cannot invest directly in any index.
3 “Standard & Poor’s®,” “S&P®,” and “S&P SmallCap 600®” are registered trademarks of Standard & Poor’s Financial Services LLC and have been licensed for use on behalf of the fund. The fund is not sponsored, endorsed, managed, advised, sold or promoted by Standard & Poor’s and its affiliates, and Standard & Poor’s and its affiliates make no representation regarding the advisability of investing in the fund.
Equities are subject generally to market, market sector, market liquidity, issuer and investment style risks, among other factors, to varying degrees, all of which are more fully described in the fund’s prospectus.
The fund uses an indexing strategy. It does not attempt to manage market volatility, use defensive strategies or reduce the effects of any long-term periods of stock performance.
Recent market risks include pandemic risks related to COVID-19. The effects of COVID-19 have contributed to increased volatility in global markets and will likely affect certain countries, companies, industries and market sectors more dramatically than others. To the extent the fund may overweight its investments in certain countries, companies, industries or market sectors, such positions will increase the fund's exposure to risk of loss from adverse developments affecting those countries, companies, industries or sectors.
The prices of small company stocks tend to be more volatile than the prices of large company stocks, mainly because these companies have less established and more volatile earnings histories. They also tend to be less liquid than larger company stocks.
The fund may, but is not required to, use derivative instruments. A small investment in derivatives could have a potentially large impact on the fund’s performance. The use of derivatives involves risks different from, or possibly greater than, the risks associated with investing directly in the underlying assets.
5
FUND PERFORMANCE (Unaudited)
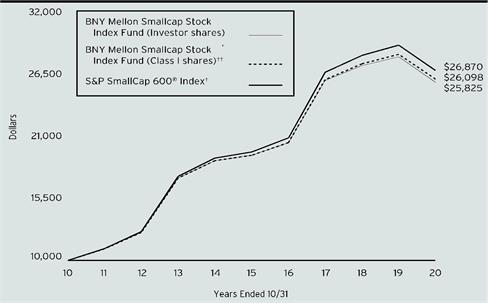
Comparison of change in value of a $10,000 investment in the Investor shares and Class I shares of BNY Mellon Smallcap Stock Index Fund with a hypothetical investment of $10,000 in the S&P SmallCap 600® Index (the “Index”)
† Source: Lipper Inc.
†† The total return figures presented for Class I shares of the fund reflect the performance of the fund’s Investor shares for the period prior to 8/31/16 (the inception date for Class I shares).
Past performance is not predictive of future performance.
The above graph compares a hypothetical $10,000 investment made in the Investor shares and Class I shares of BNY Mellon Smallcap Stock Index Fund on 10/31/10 to a hypothetical investment of $10,000 made in the Index on that date. All dividends and capital gain distributions are reinvested.
The fund’s performance shown in the line graph above takes into account all applicable fees and expenses. The Index measures the small-cap segment of the U.S. equity market. The index is designed to track companies that meet specific inclusion criteria to ensure that they are liquid and financially viable. Unlike a mutual fund, the Index is not subject to charges, fees and other expenses. Investors cannot invest directly in any index. Further information relating to fund performance, including expense reimbursements, if applicable, is contained in the Financial Highlights section of the prospectus and elsewhere in this report.
Average Annual Total Returns as of 10/31/2020 | ||||
Inception | 1 Year | 5 Years | 10 Years | |
Investor shares | 6/30/97 | -8.01% | 5.96% | 9.95% |
Class I Shares | 8/31/16 | -7.79% | 6.18%† | 10.07%† |
S&P SmallCap 600® Index | -7.72% | 6.48% | 10.39% | |
† The total return performance figures presented for Class I shares of the fund reflect the performance of the fund’s Investor shares for the period prior to 8/31/16 (the inception date for Class I shares).
The performance data quoted represents past performance, which is no guarantee of future results. Share price and investment return fluctuate and an investor’s shares may be worth more or less than original cost upon redemption. Current performance may be lower or higher than the performance quoted. Go to www.bnymellonim.com/us for the fund’s most recent month-end returns.
The fund’s performance shown in the graph and table does not reflect the deduction of taxes that a shareholder would pay on fund distributions or the redemption of fund shares.
6
UNDERSTANDING YOUR FUND’S EXPENSES (Unaudited)
As a mutual fund investor, you pay ongoing expenses, such as management fees and other expenses. Using the information below, you can estimate how these expenses affect your investment and compare them with the expenses of other funds. You also may pay one-time transaction expenses, including sales charges (loads) and redemption fees, which are not shown in this section and would have resulted in higher total expenses. For more information, see your fund’s prospectus or talk to your financial adviser.
Review your fund’s expenses
The table below shows the expenses you would have paid on a $1,000 investment in BNY Mellon Smallcap Stock Index Fund from May 1, 2020 to October 31, 2020. It also shows how much a $1,000 investment would be worth at the close of the period, assuming actual returns and expenses.
Expenses and Value of a $1,000 Investment |
| |||
Assume actual returns for the six months ended October 31, 2020 |
| |||
|
|
|
|
|
|
| Investor Shares | Class I |
|
Expense paid per $1,000† | $2.69 | $1.35 |
| |
Ending value (after expenses) | $1,143.60 | $1,145.20 |
| |
COMPARING YOUR FUND’S EXPENSES
WITH THOSE OF OTHER FUNDS (Unaudited)
Using the SEC’s method to compare expenses
The Securities and Exchange Commission (“SEC”) has established guidelines to help investors assess fund expenses. Per these guidelines, the table below shows your fund’s expenses based on a $1,000 investment, assuming a hypothetical 5% annualized return. You can use this information to compare the ongoing expenses (but not transaction expenses or total cost) of investing in the fund with those of other funds. All mutual fund shareholder reports will provide this information to help you make this comparison. Please note that you cannot use this information to estimate your actual ending account balance and expenses paid during the period.
Expenses and Value of a $1,000 Investment |
| |||
Assuming a hypothetical 5% annualized return for the six months ended October 31, 2020 |
| |||
|
|
|
|
|
|
| Investor Shares | Class I |
|
Expense paid per $1,000† | $2.54 | $1.27 |
| |
Ending value (after expenses) | $1,022.62 | $1,023.88 |
| |
†Expenses are equal to the fund’s annualized expense ratio of .50% for Investor Shares and .25% for Class I, multiplied by the average account value over the period, multiplied by 184/366 (to reflect the one-half year period). | ||||
7
STATEMENT OF INVESTMENTS
October 31, 2020
Description | Shares | Value ($) | |||||
Common Stocks - 99.1% | |||||||
Automobiles & Components - 1.8% | |||||||
American Axle & Manufacturing Holdings | 240,292 | a | 1,614,762 | ||||
Cooper Tire & Rubber | 103,593 | 3,562,563 | |||||
Cooper-Standard Holdings | 33,557 | a | 526,509 | ||||
Dorman Products | 60,212 | a | 5,375,125 | ||||
Gentherm | 69,107 | a | 3,198,963 | ||||
LCI Industries | 52,522 | 5,759,563 | |||||
Motorcar Parts of America | 40,449 | a | 595,814 | ||||
Standard Motor Products | 40,872 | 1,871,938 | |||||
Winnebago Industries | 71,270 | 3,346,127 | |||||
25,851,364 | |||||||
Banks - 10.7% | |||||||
Allegiance Bancshares | 40,665 | 1,150,820 | |||||
Ameris Bancorp | 145,296 | 4,257,173 | |||||
Axos Financial | 109,582 | a | 2,987,205 | ||||
Banc of California | 93,426 | 1,121,112 | |||||
BancFirst | 39,232 | 1,743,862 | |||||
BankUnited | 192,389 | 4,857,822 | |||||
Banner | 72,969 | 2,690,367 | |||||
Berkshire Hills Bancorp | 103,698 | 1,351,185 | |||||
Boston Private Financial Holdings | 173,023 | 1,069,282 | |||||
Brookline Bancorp | 159,326 | 1,526,343 | |||||
Cadence Bancorp | 259,872 | 2,915,764 | |||||
Capitol Federal Financial | 275,147 | 3,158,688 | |||||
Central Pacific Financial | 61,426 | 845,836 | |||||
City Holding | 33,907 | 2,049,000 | |||||
Columbia Banking System | 149,086 | 4,235,533 | |||||
Community Bank System | 110,771 | 6,423,610 | |||||
Customers Bancorp | 60,228 | a | 832,351 | ||||
CVB Financial | 265,480 | 4,645,900 | |||||
Dime Community Bancshares | 60,585 | 766,400 | |||||
Eagle Bancorp | 67,455 | 2,018,254 | |||||
FB Financial | 65,077 | 1,919,772 | |||||
First Bancorp | 458,915 | 2,978,358 | |||||
First Commonwealth Financial | 208,618 | 1,798,287 | |||||
First Financial Bancorp | 206,188 | 2,948,488 | |||||
First Hawaiian | 267,915 | 4,624,213 | |||||
First Midwest Bancorp | 240,577 | 3,019,241 | |||||
Flagstar Bancorp | 88,464 | 2,596,418 | |||||
Great Western Bancorp | 118,439 | 1,538,523 | |||||
Hanmi Financial | 63,199 | 568,159 | |||||
8
Description | Shares | Value ($) | |||||
Common Stocks - 99.1% (continued) | |||||||
Banks - 10.7% (continued) | |||||||
Heritage Financial | 76,110 | 1,595,266 | |||||
HomeStreet | 46,723 | 1,451,684 | |||||
Hope Bancorp | 255,034 | 2,058,124 | |||||
Independent Bank | 67,840 | 3,886,554 | |||||
Independent Bank Group | 76,133 | 3,926,940 | |||||
Meta Financial Group | 71,873 | 2,108,754 | |||||
Mr. Cooper Group | 146,718 | a | 3,092,815 | ||||
National Bank Holdings, Cl. A | 63,846 | 1,924,957 | |||||
NBT Bancorp | 90,464 | 2,476,904 | |||||
NMI Holdings, Cl. A | 176,020 | a | 3,782,670 | ||||
Northfield Bancorp | 99,749 | 1,013,450 | |||||
Northwest Bancshares | 265,623 | 2,834,197 | |||||
OFG Bancorp | 108,471 | 1,560,898 | |||||
Old National Bancorp | 340,745 | 4,763,615 | |||||
Pacific Premier Bancorp | 193,722 | 4,939,911 | |||||
Park National | 29,842 | 2,735,019 | |||||
Preferred Bank | 27,660 | 935,738 | |||||
Provident Financial Services | 153,418 | 2,081,882 | |||||
Renasant | 118,068 | 3,366,119 | |||||
S&T Bancorp | 83,593 | 1,654,305 | |||||
Seacoast Banking Corp. of Florida | 109,739 | a | 2,357,194 | ||||
ServisFirst Bancshares | 96,402 | 3,557,234 | |||||
Simmons First National, Cl. A | 226,897 | 3,854,980 | |||||
Southside Bancshares | 66,096 | 1,781,948 | |||||
Tompkins Financial | 25,635 | 1,435,304 | |||||
Triumph Bancorp | 46,744 | a | 1,969,325 | ||||
TrustCo Bank | 199,107 | 1,094,093 | |||||
United Community Bank | 179,489 | 3,758,500 | |||||
Veritex Holdings | 102,952 | 2,031,243 | |||||
Walker & Dunlop | 59,588 | 3,746,893 | |||||
Westamerica Bancorporation | 56,947 | 2,982,314 | |||||
153,396,796 | |||||||
Capital Goods - 11.8% | |||||||
AAON | 85,013 | 4,965,609 | |||||
AAR | 70,799 | 1,377,748 | |||||
Aegion | 63,567 | a | 896,930 | ||||
Aerojet Rocketdyne Holdings | 152,547 | a | 4,945,574 | ||||
AeroVironment | 46,355 | a | 3,539,668 | ||||
Alamo Group | 20,434 | 2,458,823 | |||||
Albany International, Cl. A | 64,939 | 3,307,993 | |||||
American Woodmark | 35,307 | a | 2,916,711 | ||||
Apogee Enterprises | 55,416 | 1,323,888 | |||||
Applied Industrial Technologies | 79,928 | 4,879,604 | |||||
9
STATEMENT OF INVESTMENTS (continued)
Description | Shares | Value ($) | |||||
Common Stocks - 99.1% (continued) | |||||||
Capital Goods - 11.8% (continued) | |||||||
Arcosa | 99,724 | 4,604,257 | |||||
Astec Industries | 47,567 | 2,416,404 | |||||
AZZ | 54,715 | 1,837,877 | |||||
Barnes Group | 95,588 | 3,508,080 | |||||
Chart Industries | 73,521 | a | 6,208,848 | ||||
CIRCOR International | 42,395 | a | 1,182,821 | ||||
Comfort Systems USA | 75,860 | 3,474,388 | |||||
Cubic | 65,093 | 3,847,647 | |||||
DXP Enterprises | 33,621 | a | 525,832 | ||||
Encore Wire | 43,187 | 1,995,671 | |||||
Enerpac Tool Group | 123,251 | 2,197,565 | |||||
EnPro Industries | 43,518 | 2,568,432 | |||||
ESCO Technologies | 54,267 | 4,541,605 | |||||
Federal Signal | 124,280 | 3,564,350 | |||||
Foundation Building Materials | 45,421 | a | 661,330 | ||||
Franklin Electric | 79,926 | 4,773,980 | |||||
Gibraltar Industries | 66,777 | a | 3,836,339 | ||||
GMS | 88,949 | a | 2,010,247 | ||||
Granite Construction | 96,639 | 1,866,099 | |||||
Griffon | 92,994 | 1,993,791 | |||||
Hillenbrand | 155,776 | 4,556,448 | |||||
Insteel Industries | 40,059 | 871,684 | |||||
John Bean Technologies | 66,189 | 5,557,890 | |||||
Kaman | 57,387 | 2,275,968 | |||||
Lindsay | 22,777 | 2,398,418 | |||||
Lydall | 36,304 | a | 718,456 | ||||
Meritor | 148,767 | a | 3,620,989 | ||||
Moog, Cl. A | 61,760 | 3,853,206 | |||||
Mueller Industries | 120,083 | 3,474,001 | |||||
MYR Group | 35,165 | a | 1,503,304 | ||||
National Presto Industries | 10,615 | 882,000 | |||||
NOW | 235,217 | a | 957,333 | ||||
Park Aerospace | 43,326 | 458,822 | |||||
Patrick Industries | 45,624 | 2,543,538 | |||||
PGT Innovations | 123,669 | a | 2,050,432 | ||||
Powell Industries | 17,815 | 420,968 | |||||
Proto Labs | 55,781 | a | 6,586,621 | ||||
Quanex Building Products | 70,965 | 1,291,563 | |||||
Raven Industries | 74,048 | 1,623,132 | |||||
Resideo Technologies | 252,594 | a | 2,546,148 | ||||
SPX | 92,095 | a | 3,903,907 | ||||
SPX FLOW | 87,310 | a | 3,697,579 | ||||
Standex International | 26,090 | 1,619,928 | |||||
10
Description | Shares | Value ($) | |||||
Common Stocks - 99.1% (continued) | |||||||
Capital Goods - 11.8% (continued) | |||||||
Tennant | 39,072 | 2,329,473 | |||||
The Greenbrier Companies | 68,894 | 1,858,760 | |||||
Titan International | 95,909 | 263,750 | |||||
Triumph Group | 109,893 | 725,294 | |||||
UFP Industries | 127,928 | 6,384,887 | |||||
Veritiv | 26,168 | a | 376,819 | ||||
Vicor | 43,209 | a | 3,370,302 | ||||
Wabash National | 109,616 | 1,563,124 | |||||
Watts Water Technologies, Cl. A | 57,283 | 6,345,238 | |||||
168,858,093 | |||||||
Commercial & Professional Services - 2.9% | |||||||
ABM Industries | 137,634 | 4,778,653 | |||||
Brady, Cl. A | 99,685 | 3,760,118 | |||||
Deluxe | 88,121 | 1,889,314 | |||||
Exponent | 107,993 | 7,515,233 | |||||
Forrester Research | 23,600 | a | 871,784 | ||||
Harsco | 166,985 | a | 2,154,107 | ||||
Heidrick & Struggles International | 39,152 | 894,623 | |||||
Interface | 123,523 | 757,196 | |||||
Kelly Services, Cl. A | 72,393 | 1,258,190 | |||||
Korn Ferry | 118,085 | 3,564,986 | |||||
Matthews International, Cl. A | 66,239 | 1,445,997 | |||||
Pitney Bowes | 354,250 | 1,881,068 | |||||
R.R. Donnelley & Sons | 182,459 | 213,477 | |||||
Resources Connection | 64,062 | 688,026 | |||||
Team | 70,344 | a | 377,044 | ||||
TrueBlue | 75,992 | a | 1,179,396 | ||||
U.S. Ecology | 64,222 | 1,960,055 | |||||
UniFirst | 31,820 | 5,212,434 | |||||
Viad | 41,819 | 836,380 | |||||
41,238,081 | |||||||
Consumer Durables & Apparel - 6.1% | |||||||
Callaway Golf | 199,090 | 3,083,904 | |||||
Capri Holdings | 313,841 | a | 6,659,706 | ||||
Cavco Industries | 18,076 | a | 3,111,603 | ||||
Century Communities | 59,300 | a | 2,303,212 | ||||
Crocs | 140,862 | a | 7,371,308 | ||||
Ethan Allen Interiors | 46,779 | 750,803 | |||||
Fossil Group | 99,266 | a | 566,809 | ||||
G-III Apparel Group | 91,127 | a | 1,228,392 | ||||
Installed Building Products | 47,255 | a | 4,278,468 | ||||
iRobot | 58,148 | a | 4,627,418 | ||||
Kontoor Brands | 97,276 | 3,200,380 | |||||
11
STATEMENT OF INVESTMENTS (continued)
Description | Shares | Value ($) | |||||
Common Stocks - 99.1% (continued) | |||||||
Consumer Durables & Apparel - 6.1% (continued) | |||||||
La-Z-Boy | 94,496 | 3,234,598 | |||||
LGI Homes | 46,058 | a | 4,922,679 | ||||
M.D.C. Holdings | 103,308 | 4,495,964 | |||||
M/I Homes | 60,404 | a | 2,471,732 | ||||
Meritage Homes | 78,635 | a | 6,848,322 | ||||
Movado Group | 32,748 | 357,281 | |||||
Oxford Industries | 35,044 | 1,442,762 | |||||
Steven Madden | 161,808 | 3,885,010 | |||||
Sturm Ruger & Co. | 36,503 | 2,440,591 | |||||
Tupperware Brands | 103,485 | 3,282,544 | |||||
Unifi | 27,784 | a | 416,482 | ||||
Universal Electronics | 29,878 | a | 1,107,279 | ||||
Vera Bradley | 44,186 | a | 280,139 | ||||
Vista Outdoor | 123,064 | a | 2,432,975 | ||||
Wolverine World Wide | 170,561 | 4,548,862 | |||||
YETI Holdings | 154,845 | a | 7,661,731 | ||||
87,010,954 | |||||||
Consumer Services - 1.8% | |||||||
American Public Education | 31,295 | a | 884,710 | ||||
BJ's Restaurants | 46,084 | 1,300,030 | |||||
Bloomin‘ Brands | 165,452 | 2,313,019 | |||||
Brinker International | 92,868 | 4,043,473 | |||||
Chuy's Holdings | 40,449 | a | 849,025 | ||||
Dave & Buster's Entertainment | 99,051 | 1,699,715 | |||||
Dine Brands Global | 35,130 | 1,807,439 | |||||
El Pollo Loco Holdings | 40,451 | a | 571,168 | ||||
Fiesta Restaurant Group | 37,377 | a | 322,937 | ||||
Monarch Casino & Resort | 25,857 | a | 1,121,935 | ||||
Perdoceo Education | 144,833 | a | 1,635,165 | ||||
Red Robin Gourmet Burgers | 30,679 | a | 369,375 | ||||
Regis | 47,158 | a | 261,255 | ||||
Ruth's Hospitality Group | 65,322 | 730,300 | |||||
Shake Shack, Cl. A | 74,575 | a | 5,035,304 | ||||
The Cheesecake Factory | 88,471 | 2,629,358 | |||||
25,574,208 | |||||||
Diversified Financials - 3.0% | |||||||
Apollo Commercial Real Estate Finance | 288,436 | b | 2,509,393 | ||||
ARMOUR Residential REIT | 133,713 | b | 1,275,622 | ||||
Blucora | 104,051 | a | 1,035,307 | ||||
Brightsphere Investment Group | 127,639 | 1,761,418 | |||||
Capstead Mortgage | 202,948 | b | 1,037,064 | ||||
Donnelley Financial Solutions | 61,615 | a | 778,197 | ||||
Encore Capital Group | 64,704 | a | 2,065,999 | ||||
12
Description | Shares | Value ($) | |||||
Common Stocks - 99.1% (continued) | |||||||
Diversified Financials - 3.0% (continued) | |||||||
Enova International | 74,164 | a | 1,138,417 | ||||
EZCORP, Cl. A | 113,458 | a | 506,023 | ||||
Granite Point Mortgage Trust | 117,525 | b | 792,119 | ||||
Green Dot, Cl. A | 111,079 | a | 5,922,732 | ||||
Greenhill & Co. | 30,570 | 395,270 | |||||
Invesco Mortgage Capital | 381,247 | b | 1,029,367 | ||||
KKR Real Estate Finance Trust | 56,077 | b | 937,047 | ||||
New York Mortgage Trust | 768,490 | b | 1,951,965 | ||||
PennyMac Mortgage Investment Trust | 210,076 | b | 3,144,838 | ||||
Piper Sandler | 28,053 | 2,341,023 | |||||
PRA Group | 96,302 | a | 3,286,787 | ||||
Ready Capital | 83,925 | b | 943,317 | ||||
Redwood Trust | 243,817 | b | 2,072,445 | ||||
StoneX Group | 34,756 | a | 1,841,373 | ||||
Virtus Investment Partners | 15,264 | 2,435,371 | |||||
Waddell & Reed Financial, Cl. A | 138,098 | 2,119,804 | |||||
WisdomTree Investments | 240,195 | 874,310 | |||||
World Acceptance | 9,718 | a | 816,215 | ||||
43,011,423 | |||||||
Energy - 2.8% | |||||||
Archrock | 276,066 | 1,637,071 | |||||
Bonanza Creek Energy | 38,659 | a | 684,651 | ||||
Bristow Group | 43,898 | a | 912,200 | ||||
Callon Petroleum | 86,101 | a | 450,308 | ||||
CONSOL Energy | 60,927 | a | 230,913 | ||||
Core Laboratories | 94,809 | 1,369,990 | |||||
DMC Global | 30,852 | 1,097,406 | |||||
Dorian LPG | 69,317 | a | 568,399 | ||||
Dril-Quip | 74,264 | a | 1,923,438 | ||||
Exterran | 54,395 | a | 230,091 | ||||
Geospace Technologies | 24,957 | a | 128,029 | ||||
Green Plains | 69,893 | a | 1,055,384 | ||||
Gulfport Energy | 346,385 | a | 88,675 | ||||
Helix Energy Solutions Group | 301,201 | a | 746,978 | ||||
Helmerich & Payne | 227,433 | 3,381,929 | |||||
Laredo Petroleum | 18,505 | a | 148,780 | ||||
Matador Resources | 234,278 | a | 1,656,345 | ||||
Matrix Service | 55,175 | a | 419,330 | ||||
Nabors Industries | 13,915 | 395,464 | |||||
Oceaneering International | 219,057 | a | 893,753 | ||||
Oil States International | 126,206 | a | 314,253 | ||||
Par Pacific Holdings | 84,212 | a | 542,325 | ||||
Patterson-UTI Energy | 396,046 | 1,013,878 | |||||
13
STATEMENT OF INVESTMENTS (continued)
Description | Shares | Value ($) | |||||
Common Stocks - 99.1% (continued) | |||||||
Energy - 2.8% (continued) | |||||||
PBF Energy, Cl. A | 182,550 | 852,509 | |||||
PDC Energy | 208,506 | a | 2,485,392 | ||||
Penn Virginia | 30,771 | a | 236,321 | ||||
ProPetro Holding | 171,862 | a | 678,855 | ||||
QEP Resources | 515,957 | 464,361 | |||||
Range Resources | 522,742 | 3,439,642 | |||||
Renewable Energy Group | 81,079 | a | 4,572,856 | ||||
REX American Resources | 11,840 | a | 860,650 | ||||
RPC | 118,657 | a | 282,404 | ||||
SEACOR Holdings | 39,281 | a | 1,203,177 | ||||
SM Energy | 231,832 | 373,250 | |||||
Southwestern Energy | 1,251,129 | a | 3,340,514 | ||||
Talos Energy | 48,400 | a | 318,472 | ||||
U.S. Silica Holdings | 149,010 | 405,307 | |||||
39,403,300 | |||||||
Food & Staples Retailing - .6% | |||||||
PriceSmart | 48,755 | 3,364,095 | |||||
SpartanNash | 76,929 | 1,416,263 | |||||
The Andersons | 65,148 | 1,413,060 | |||||
The Chefs' Warehouse | 67,633 | a | 914,398 | ||||
United Natural Foods | 114,412 | a | 1,666,983 | ||||
8,774,799 | |||||||
Food, Beverage & Tobacco - 1.8% | |||||||
B&G Foods | 131,971 | 3,505,150 | |||||
Calavo Growers | 34,455 | 2,312,964 | |||||
Cal-Maine Foods | 76,200 | a | 2,922,270 | ||||
Coca-Cola Consolidated | 9,853 | 2,255,844 | |||||
Fresh Del Monte Produce | 62,436 | 1,344,247 | |||||
J&J Snack Foods | 30,766 | 4,170,947 | |||||
John B. Sanfilippo & Son | 18,592 | 1,352,754 | |||||
MGP Ingredients | 26,966 | 1,133,111 | |||||
National Beverage | 24,129 | a | 1,889,059 | ||||
Seneca Foods, Cl. A | 13,950 | a | 514,058 | ||||
Universal | 51,746 | 2,062,078 | |||||
Vector Group | 265,900 | 2,443,621 | |||||
25,906,103 | |||||||
Health Care Equipment & Services - 8.6% | |||||||
Addus HomeCare | 30,816 | a | 3,006,717 | ||||
Allscripts Healthcare Solutions | 342,659 | a | 3,454,003 | ||||
AMN Healthcare Services | 98,074 | a | 6,402,271 | ||||
AngioDynamics | 75,379 | a | 779,419 | ||||
BioTelemetry | 70,862 | a | 3,017,304 | ||||
Cardiovascular Systems | 81,792 | a | 2,915,885 | ||||
14
Description | Shares | Value ($) | |||||
Common Stocks - 99.1% (continued) | |||||||
Health Care Equipment & Services - 8.6% (continued) | |||||||
Community Health Systems | 239,160 | a | 1,492,358 | ||||
Computer Programs & Systems | 25,549 | 712,562 | |||||
CONMED | 58,989 | 4,599,372 | |||||
CorVel | 19,207 | a | 1,752,063 | ||||
Covetrus | 204,744 | a | 5,055,129 | ||||
Cross Country Healthcare | 75,170 | a | 590,085 | ||||
CryoLife | 80,028 | a | 1,341,269 | ||||
Cutera | 38,788 | a | 734,257 | ||||
Fulgent Genetics | 24,862 | a | 808,761 | ||||
Glaukos | 92,271 | a | 5,159,794 | ||||
Hanger | 78,698 | a | 1,374,854 | ||||
HealthStream | 55,000 | a | 1,006,500 | ||||
Heska | 18,579 | a | 2,179,874 | ||||
HMS Holdings | 184,552 | a | 4,912,774 | ||||
Inogen | 39,059 | a | 1,140,913 | ||||
Integer Holdings | 68,443 | a | 4,000,493 | ||||
Invacare | 74,950 | 607,845 | |||||
Lantheus Holdings | 138,024 | a | 1,498,941 | ||||
LeMaitre Vascular | 35,752 | 1,161,225 | |||||
Magellan Health | 46,931 | a | 3,391,703 | ||||
Meridian Bioscience | 90,767 | a | 1,556,654 | ||||
Merit Medical Systems | 101,623 | a | 5,086,231 | ||||
Mesa Laboratories | 9,906 | 2,589,527 | |||||
Natus Medical | 69,572 | a | 1,266,906 | ||||
NextGen Healthcare | 114,091 | a | 1,551,638 | ||||
Omnicell | 89,283 | a | 7,727,444 | ||||
OraSure Technologies | 151,632 | a | 2,265,382 | ||||
Orthofix Medical | 39,683 | a | 1,240,491 | ||||
Owens & Minor | 150,394 | 3,777,897 | |||||
R1 RCM | 235,303 | a | 4,216,630 | ||||
RadNet | 89,576 | a | 1,299,748 | ||||
Select Medical Holdings | 223,448 | a | 4,687,939 | ||||
Simulations Plus | 30,806 | 1,996,845 | |||||
SurModics | 29,644 | a | 1,089,417 | ||||
Tabula Rasa HealthCare | 42,999 | a | 1,485,185 | ||||
Tactile Systems Technology | 40,267 | a | 1,472,967 | ||||
The Ensign Group | 105,464 | 6,205,502 | |||||
The Pennant Group | 53,647 | a | 2,234,934 | ||||
The Providence Service | 25,523 | a | 3,000,229 | ||||
Tivity Health | 80,882 | a | 1,112,128 | ||||
U.S. Physical Therapy | 27,195 | 2,157,379 | |||||
Varex Imaging | 83,081 | a | 1,113,285 | ||||
15
STATEMENT OF INVESTMENTS (continued)
Description | Shares | Value ($) | |||||
Common Stocks - 99.1% (continued) | |||||||
Health Care Equipment & Services - 8.6% (continued) | |||||||
Zynex | 39,608 | a | 507,378 | ||||
122,738,107 | |||||||
Household & Personal Products - 1.2% | |||||||
Central Garden & Pet | 19,814 | a | 771,953 | ||||
Central Garden & Pet, Cl. A | 80,681 | a | 2,855,301 | ||||
Inter Parfums | 36,374 | 1,493,516 | |||||
Medifast | 24,486 | 3,440,038 | |||||
USANA Health Sciences | 25,544 | a | 1,932,404 | ||||
WD-40 | 28,503 | 6,937,060 | |||||
17,430,272 | |||||||
Insurance - 3.6% | |||||||
Ambac Financial Group | 96,477 | a | 1,184,738 | ||||
American Equity Investment Life Holding | 191,753 | 4,759,309 | |||||
AMERISAFE | 40,609 | 2,395,119 | |||||
Assured Guaranty | 174,999 | 4,467,724 | |||||
eHealth | 53,359 | a | 3,580,923 | ||||
Employers Holdings | 62,217 | 1,991,566 | |||||
HCI Group | 13,034 | 612,337 | |||||
Horace Mann Educators | 85,911 | 2,913,242 | |||||
James River Group Holdings | 64,497 | 3,013,945 | |||||
Kinsale Captial Group | 44,018 | 8,252,054 | |||||
Palomar Holdings | 44,337 | a | 3,953,530 | ||||
ProAssurance | 114,536 | 1,767,291 | |||||
Safety Insurance Group | 30,366 | 2,125,620 | |||||
Stewart Information Services | 55,054 | 2,333,739 | |||||
Third Point Reinsurance | 167,890 | a | 1,306,184 | ||||
Trupanion | 67,529 | a | 4,831,025 | ||||
United Fire Group | 46,204 | 949,030 | |||||
United Insurance Holdings | 43,585 | 191,338 | |||||
Universal Insurance Holdings | 62,711 | 782,006 | |||||
51,410,720 | |||||||
Materials - 5.5% | |||||||
AdvanSix | 56,564 | a | 860,904 | ||||
Allegheny Technologies | 252,092 | a | 2,321,767 | ||||
American Vanguard | 55,671 | 719,269 | |||||
Arconic | 200,178 | a | 4,351,870 | ||||
Balchem | 67,537 | 6,750,323 | |||||
Boise Cascade | 81,480 | 3,127,202 | |||||
Carpenter Technology | 100,069 | 1,749,206 | |||||
Century Aluminum | 108,460 | a | 713,667 | ||||
Clearwater Paper | 34,938 | a | 1,297,947 | ||||
Cleveland-Cliffs | 833,214 | 6,899,012 | |||||
16
Description | Shares | Value ($) | |||||
Common Stocks - 99.1% (continued) | |||||||
Materials - 5.5% (continued) | |||||||
Ferro | 172,710 | a | 2,221,051 | ||||
FutureFuel | 56,342 | 669,906 | |||||
GCP Applied Technologies | 99,798 | a | 2,176,594 | ||||
Glatfelter | 95,412 | 1,361,529 | |||||
H.B. Fuller | 106,466 | 4,817,587 | |||||
Hawkins | 19,876 | 928,408 | |||||
Haynes International | 25,974 | 421,039 | |||||
Innospec | 51,090 | 3,379,093 | |||||
Kaiser Aluminum | 33,558 | 2,111,805 | |||||
Koppers Holdings | 44,285 | a | 993,313 | ||||
Kraton | 64,452 | a | 1,823,992 | ||||
Livent | 307,774 | a | 3,308,571 | ||||
Materion | 43,055 | 2,203,985 | |||||
Mercer International | 87,870 | 552,702 | |||||
Myers Industries | 75,261 | 1,079,243 | |||||
Neenah | 34,551 | 1,300,154 | |||||
Olympic Steel | 20,388 | 232,627 | |||||
Quaker Chemical | 27,213 | 5,191,968 | |||||
Rayonier Advanced Materials | 130,561 | a | 447,824 | ||||
Schweitzer-Mauduit International | 65,946 | 2,189,407 | |||||
Stepan | 44,414 | 5,171,566 | |||||
SunCoke Energy | 182,962 | 638,537 | |||||
TimkenSteel | 78,286 | a | 302,967 | ||||
Tredegar | 55,704 | 812,164 | |||||
Trinseo | 80,193 | 2,551,741 | |||||
U.S. Concrete | 33,609 | a | 1,141,362 | ||||
Warrior Met Coal | 108,400 | 1,626,000 | |||||
78,446,302 | |||||||
Media & Entertainment - .7% | |||||||
Gannett | 291,031 | 334,686 | |||||
Glu Mobile | 304,102 | a | 2,177,370 | ||||
Meredith | 87,797 | 965,767 | |||||
QuinStreet | 101,905 | a | 1,630,990 | ||||
Scholastic | 64,223 | 1,269,047 | |||||
TechTarget | 48,582 | a | 2,127,892 | ||||
The E.W. Scripps Company, Cl. A | 116,387 | 1,056,794 | |||||
The Marcus | 46,714 | 342,414 | |||||
9,904,960 | |||||||
Pharmaceuticals Biotechnology & Life Sciences - 3.3% | |||||||
AMAG Pharmaceuticals | 65,220 | a | 894,818 | ||||
Amphastar Pharmaceuticals | 76,533 | a | 1,499,281 | ||||
ANI Pharmaceuticals | 19,578 | a | 499,043 | ||||
Anika Therapeutics | 30,047 | a | 980,133 | ||||
17
STATEMENT OF INVESTMENTS (continued)
Description | Shares | Value ($) | |||||
Common Stocks - 99.1% (continued) | |||||||
Pharmaceuticals Biotechnology & Life Sciences - 3.3% (continued) | |||||||
Coherus Biosciences | 131,853 | a | 2,197,990 | ||||
Corcept Therapeutics | 216,488 | a | 3,632,669 | ||||
Cytokinetics | 147,455 | a | 2,266,383 | ||||
Eagle Pharmaceuticals | 24,970 | a | 1,161,604 | ||||
Enanta Pharmaceuticals | 36,915 | a | 1,610,601 | ||||
Endo International | 472,450 | a | 2,159,097 | ||||
Innoviva | 134,067 | a | 1,449,264 | ||||
Lannett | 68,005 | a | 437,272 | ||||
Luminex | 89,160 | 1,965,086 | |||||
Myriad Genetics | 158,190 | a | 1,966,302 | ||||
NeoGenomics | 231,146 | a | 9,067,858 | ||||
Pacira Biosciences | 88,205 | a | 4,613,122 | ||||
Phibro Animal Health, Cl. A | 41,656 | 684,825 | |||||
REGENXBIO | 63,691 | a | 1,831,753 | ||||
Spectrum Pharmaceuticals | 295,997 | a | 1,015,270 | ||||
Supernus Pharmaceuticals | 112,374 | a | 2,063,187 | ||||
Vanda Pharmaceuticals | 115,965 | a | 1,239,666 | ||||
Xencor | 117,633 | a | 4,514,755 | ||||
47,749,979 | |||||||
Real Estate - 7.7% | |||||||
Acadia Realty Trust | 180,642 | b | 1,685,390 | ||||
Agree Realty | 112,444 | b | 6,979,399 | ||||
Alexander & Baldwin | 151,003 | b | 1,940,389 | ||||
American Assets Trust | 103,922 | b | 2,175,087 | ||||
Armada Hoffler Properties | 122,004 | b | 1,099,256 | ||||
Brandywine Realty Trust | 354,866 | b | 3,108,626 | ||||
CareTrust REIT | 199,151 | b | 3,405,482 | ||||
Chatham Lodging Trust | 94,439 | b | 694,127 | ||||
Community Healthcare Trust | 44,828 | b | 2,075,536 | ||||
CoreCivic | 251,173 | b | 1,610,019 | ||||
DiamondRock Hospitality | 418,719 | b | 2,068,472 | ||||
Diversified Healthcare Trust | 498,270 | b | 1,442,492 | ||||
Easterly Government Properties | 166,931 | b | 3,488,858 | ||||
Essential Properties Realty Trust | 212,717 | b | 3,514,085 | ||||
Four Corners Property Trust | 146,429 | b | 3,710,511 | ||||
Franklin Street Properties | 207,130 | b | 869,946 | ||||
Getty Realty | 74,075 | b | 1,946,691 | ||||
Global Net Lease | 189,227 | b | 2,692,700 | ||||
Hersha Hospitality Trust | 82,648 | b | 404,975 | ||||
Independence Realty Trust | 196,323 | b | 2,385,324 | ||||
Industrial Logistics Properties Trust | 135,110 | b | 2,591,410 | ||||
Innovative Industrial Properties | 44,843 | b | 5,230,039 | ||||
18
Description | Shares | Value ($) | |||||
Common Stocks - 99.1% (continued) | |||||||
Real Estate - 7.7% (continued) | |||||||
Investors Real Estate Trust | 26,737 | b | 1,802,341 | ||||
iStar | 154,860 | b | 1,827,348 | ||||
Kite Realty Group Trust | 176,249 | b | 1,825,940 | ||||
Lexington Realty Trust | 578,184 | b | 5,741,367 | ||||
LTC Properties | 82,825 | b | 2,734,053 | ||||
Mack-Cali Realty | 171,728 | a,b | 1,887,291 | ||||
Marcus & Millichap | 50,677 | a | 1,582,643 | ||||
National Storage Affiliates Trust | 127,666 | b | 4,326,601 | ||||
NexPoint Residential Trust | 45,772 | b | 2,028,615 | ||||
Office Properties Income Trust | 102,218 | b | 1,881,833 | ||||
RE/MAX Holdings, Cl. A | 36,706 | 1,187,072 | |||||
Realogy Holdings | 244,139 | 2,724,591 | |||||
Retail Opportunity Investments | 249,928 | b | 2,431,799 | ||||
Retail Properties of America, Cl. A | 453,567 | b | 2,376,691 | ||||
RPT Realty | 175,351 | b | 857,466 | ||||
Safehold | 28,907 | b | 1,989,380 | ||||
Saul Centers | 26,882 | b | 665,330 | ||||
SITE Centers | 320,768 | a,b | 2,184,430 | ||||
Summit Hotel Properties | 228,172 | b | 1,204,748 | ||||
Tanger Factory Outlet Centers | 198,246 | a,b | 1,227,143 | ||||
The St. Joe Company | 65,974 | 1,783,937 | |||||
Uniti Group | 399,547 | b | 3,524,005 | ||||
Universal Health Realty Income Trust | 27,380 | b | 1,464,009 | ||||
Urstadt Biddle Properties, Cl. A | 64,130 | b | 609,876 | ||||
Washington Prime Group | 420,748 | b | 246,348 | ||||
Washington Real Estate Investment Trust | 174,466 | b | 3,049,666 | ||||
Whitestone REIT | 85,069 | b | 507,011 | ||||
Xenia Hotels & Resorts | 240,793 | b | 1,984,134 | ||||
110,774,482 | |||||||
Retailing - 5.2% | |||||||
Abercrombie & Fitch, Cl. A | 129,012 | 1,834,551 | |||||
America's Car-Mart | 13,002 | a | 1,124,933 | ||||
Asbury Automotive Group | 39,745 | a | 4,092,940 | ||||
Barnes & Noble Education | 78,981 | a | 181,656 | ||||
Bed Bath & Beyond | 263,061 | 5,208,608 | |||||
Big Lots | 74,068 | 3,525,637 | |||||
Boot Barn Holdings | 60,162 | a | 1,926,387 | ||||
Caleres | 81,748 | 627,825 | |||||
Chico's FAS | 283,074 | 302,889 | |||||
Conn's | 38,307 | a | 358,937 | ||||
Core-Mark Holding | 95,432 | 2,610,065 | |||||
Designer Brands, Cl. A | 116,606 | 504,904 | |||||
19
STATEMENT OF INVESTMENTS (continued)
Description | Shares | Value ($) | |||||
Common Stocks - 99.1% (continued) | |||||||
Retailing - 5.2% (continued) | |||||||
GameStop, Cl. A | 116,956 | a | 1,224,529 | ||||
Genesco | 30,002 | a | 531,635 | ||||
Group 1 Automotive | 35,751 | 3,792,466 | |||||
Guess? | 80,825 | 952,119 | |||||
Haverty Furniture | 36,615 | 916,107 | |||||
Hibbett Sports | 35,071 | a | 1,326,035 | ||||
Liquidity Services | 52,513 | a | 447,936 | ||||
Lumber Liquidators Holdings | 60,610 | a | 1,340,693 | ||||
Macy's | 639,007 | 3,968,233 | |||||
MarineMax | 44,458 | a | 1,332,851 | ||||
Monro | 69,135 | 2,907,818 | |||||
PetMed Express | 41,642 | 1,231,770 | |||||
Rent-A-Center | 99,495 | 3,074,396 | |||||
Sally Beauty Holdings | 237,753 | a | 1,989,993 | ||||
Shoe Carnival | 17,392 | 538,804 | |||||
Shutterstock | 45,474 | 2,976,273 | |||||
Signet Jewelers | 109,588 | 2,441,621 | |||||
Sleep Number | 58,257 | a | 3,691,164 | ||||
Sonic Automotive, Cl. A | 51,244 | 1,847,859 | |||||
Stamps.com | 36,636 | a | 8,178,621 | ||||
The Buckle | 60,019 | 1,438,055 | |||||
The Cato, Cl. A | 46,110 | 282,193 | |||||
The Children's Place | 32,205 | 813,820 | |||||
The Michaels Companies | 156,894 | a | 1,272,410 | ||||
The ODP | 111,468 | 2,173,626 | |||||
Zumiez | 43,477 | a | 1,217,356 | ||||
74,207,715 | |||||||
Semiconductors & Semiconductor Equipment - 4.0% | |||||||
Advanced Energy Industries | 79,970 | a | 5,395,576 | ||||
Axcelis Technologies | 69,878 | a | 1,542,207 | ||||
Brooks Automation | 154,037 | 7,193,528 | |||||
CEVA | 46,101 | a | 1,858,792 | ||||
Cohu | 84,886 | 1,844,573 | |||||
Diodes | 87,560 | a | 5,063,595 | ||||
DSP Group | 46,966 | a | 618,542 | ||||
FormFactor | 160,601 | a | 4,553,038 | ||||
Ichor Holdings | 47,070 | a | 1,094,848 | ||||
Kulicke & Soffa Industries | 128,638 | 3,362,597 | |||||
MaxLinear | 140,335 | a | 3,710,457 | ||||
Onto Innovation | 101,311 | a | 3,249,044 | ||||
PDF Solutions | 62,237 | a | 1,166,321 | ||||
Photronics | 137,055 | a | 1,336,286 | ||||
Power Integrations | 124,818 | 7,515,292 | |||||
20
Description | Shares | Value ($) | |||||
Common Stocks - 99.1% (continued) | |||||||
Semiconductors & Semiconductor Equipment - 4.0% (continued) | |||||||
Rambus | 236,561 | a | 3,262,176 | ||||
SMART Global Holdings | 30,483 | a | 804,446 | ||||
Ultra Clean Holdings | 85,355 | a | 1,817,208 | ||||
Veeco Instruments | 103,172 | a | 1,313,380 | ||||
56,701,906 | |||||||
Software & Services - 4.9% | |||||||
8x8 | 219,488 | a | 3,792,753 | ||||
Agilysys | 42,986 | a | 1,164,061 | ||||
Alarm.com Holdings | 93,187 | a | 5,435,598 | ||||
Bottomline Technologies | 80,412 | a | 3,193,965 | ||||
Cardtronics, Cl. A | 75,571 | a | 1,345,920 | ||||
CSG Systems International | 68,713 | 2,602,848 | |||||
Ebix | 49,545 | 894,783 | |||||
EVERTEC | 122,953 | 4,091,876 | |||||
ExlService Holdings | 71,260 | a | 5,397,232 | ||||
LivePerson | 128,520 | a | 6,870,679 | ||||
ManTech International, Cl. A | 55,836 | 3,622,640 | |||||
MicroStrategy, Cl. A | 15,343 | a | 2,563,355 | ||||
NIC | 141,460 | 3,171,533 | |||||
OneSpan | 71,732 | a | 1,573,083 | ||||
Perficient | 69,706 | a | 2,729,687 | ||||
Progress Software | 92,546 | 3,365,898 | |||||
SPS Commerce | 72,681 | a | 6,220,767 | ||||
Sykes Enterprises | 83,605 | a | 2,862,635 | ||||
TTEC Holdings | 37,605 | 2,060,002 | |||||
Unisys | 128,212 | a | 1,684,706 | ||||
Virtusa | 58,300 | a | 2,932,490 | ||||
Xperi Holding | 222,322 | 2,756,793 | |||||
70,333,304 | |||||||
Technology Hardware & Equipment - 4.9% | |||||||
3D Systems | 256,999 | a | 1,462,324 | ||||
ADTRAN | 101,908 | 1,089,397 | |||||
Applied Optoelectronics | 45,454 | a | 399,086 | ||||
Arlo Technologies | 162,540 | a | 724,928 | ||||
Badger Meter | 60,052 | 4,404,214 | |||||
Bel Fuse, Cl. B | 24,869 | 291,216 | |||||
Benchmark Electronics | 76,662 | 1,596,869 | |||||
CalAmp | 71,104 | a | 503,416 | ||||
Comtech Telecommunications | 52,627 | 757,829 | |||||
CTS | 68,376 | 1,889,913 | |||||
Daktronics | 81,350 | 317,265 | |||||
Diebold Nixdorf | 157,375 | a | 980,446 | ||||
21
STATEMENT OF INVESTMENTS (continued)
Description | Shares | Value ($) | |||||
Common Stocks - 99.1% (continued) | |||||||
Technology Hardware & Equipment - 4.9% (continued) | |||||||
Digi International | 57,932 | a | 853,338 | ||||
ePlus | 28,850 | a | 1,947,664 | ||||
Extreme Networks | 247,398 | a | 1,004,436 | ||||
Fabrinet | 75,815 | a | 4,550,416 | ||||
FARO Technologies | 37,872 | a | 2,281,409 | ||||
Harmonic | 203,569 | a | 1,209,200 | ||||
Insight Enterprises | 73,078 | a | 3,898,711 | ||||
Itron | 83,360 | a | 5,664,312 | ||||
Knowles | 191,499 | a | 2,728,861 | ||||
Methode Electronics | 77,801 | 2,393,937 | |||||
MTS Systems | 40,076 | 973,045 | |||||
NETGEAR | 61,835 | a | 1,905,755 | ||||
OSI Systems | 35,258 | a | 2,720,507 | ||||
PC Connection | 22,448 | a | 1,022,506 | ||||
Plantronics | 76,542 | 1,494,100 | |||||
Plexus | 60,266 | a | 4,190,898 | ||||
Rogers | 38,465 | a | 4,662,727 | ||||
Sanmina | 139,295 | a | 3,404,370 | ||||
ScanSource | 54,272 | a | 1,090,867 | ||||
TTM Technologies | 204,615 | a | 2,428,780 | ||||
Viavi Solutions | 476,308 | a | 5,882,404 | ||||
70,725,146 | |||||||
Telecommunication Services - 1.7% | |||||||
ATN International | 22,898 | 1,023,541 | |||||
Cincinnati Bell | 107,407 | a | 1,616,475 | ||||
Cogent Communications Holdings | 86,892 | 4,848,574 | |||||
Consolidated Communications Holdings | 158,405 | a | 739,751 | ||||
Iridium Communications | 240,994 | a | 6,364,652 | ||||
Shenandoah Telecommunication | 104,197 | 4,545,073 | |||||
Spok Holdings | 36,977 | 335,751 | |||||
Vonage Holdings | 481,342 | a | 5,092,598 | ||||
24,566,415 | |||||||
Transportation - 2.7% | |||||||
Allegiant Travel | 27,036 | 3,643,371 | |||||
ArcBest | 51,994 | 1,586,857 | |||||
Atlas Air Worldwide Holdings | 55,103 | a | 3,259,894 | ||||
Echo Global Logistics | 55,454 | a | 1,495,594 | ||||
Forward Air | 57,545 | 3,623,609 | |||||
Hawaiian Holdings | 98,933 | 1,370,222 | |||||
Heartland Express | 103,226 | 1,890,068 | |||||
Hub Group, Cl. A | 70,875 | a | 3,552,964 | ||||
Marten Transport | 121,410 | 1,863,036 | |||||
Matson | 88,904 | 4,618,563 | |||||
22
Description | Shares | Value ($) | |||||
Common Stocks - 99.1% (continued) | |||||||
Transportation - 2.7% (continued) | |||||||
Saia | 54,611 | a | 8,063,860 | ||||
SkyWest | 106,077 | 3,079,415 | |||||
38,047,453 | |||||||
Utilities - 1.8% | |||||||
American States Water | 77,013 | 5,752,101 | |||||
Avista | 141,539 | 4,701,926 | |||||
California Water Service Group | 101,928 | 4,542,931 | |||||
Chesapeake Utilities | 34,726 | 3,375,714 | |||||
Northwest Natural Holding | 63,219 | 2,809,452 | |||||
South Jersey Industries | 209,013 | 4,027,681 | |||||
25,209,805 | |||||||
Total Common Stocks (cost $1,139,447,657) | 1,417,271,687 | ||||||
Exchange-Traded Funds - .5% | |||||||
Registered Investment Companies - .5% | |||||||
iShares Core S&P Small-Cap ETF | 99,489 | 7,165,198 | |||||
Principal Amount ($) | |||||||
Short-Term Investments - .0% | |||||||
U.S. Treasury Bills - .0% | |||||||
0.10%, 2/25/21 | 636,000 | c,d | 635,807 | ||||
1-Day | Shares | ||||||
Investment Companies - .3% | |||||||
Registered Investment Companies - .3% | |||||||
Dreyfus Institutional Preferred Government Plus Money Market Fund | 0.10 | 3,856,863 | e | 3,856,863 | |||
Total Investments (cost $1,151,118,717) | 99.9% | 1,428,929,555 | |||||
Cash and Receivables (Net) | .1% | 1,374,380 | |||||
Net Assets | 100.0% | 1,430,303,935 | |||||
ETF—Exchange-Traded Fund
REIT—Real Estate Investment Trust
a Non-income producing security.
b Investment in real estate investment trust within the United States.
c Held by a counterparty for open exchange traded derivative contracts.
d Security is a discount security. Income is recognized through the accretion of discount.
e Investment in affiliated issuer. The investment objective of this investment company is publicly available and can be found within the investment company’s prospectus.
23
STATEMENT OF INVESTMENTS (continued)
Portfolio Summary (Unaudited) † | Value (%) |
Industrials | 17.4 |
Financials | 17.3 |
Consumer Discretionary | 14.9 |
Information Technology | 13.8 |
Health Care | 11.9 |
Real Estate | 7.7 |
Materials | 5.5 |
Consumer Staples | 3.6 |
Energy | 2.8 |
Communication Services | 2.4 |
Utilities | 1.8 |
Investment Companies | .8 |
Government | .0 |
99.9 |
† Based on net assets.
See notes to financial statements.
24
STATEMENT OF INVESTMENTS IN AFFILIATED ISSUERS
Investment Companies | Value | Purchases($)† | Sales($) | Value | Net | Dividend/ |
Registered Investment Companies; | ||||||
Dreyfus Institutional Preferred Government Plus Money Market Fund | 3,167,182 | 260,962,704 | (260,273,023) | 3,856,863 | .3 | 28,831 |
Investment of Cash Collateral for Securities Loaned; | ||||||
Dreyfus Institutional Preferred Government Plus Money Market Fund | 42,315,486 | 68,278,163 | (110,593,649) | - | - | - |
Total | 45,482,668 | 329,240,867 | (370,866,672) | 3,856,863 | .3 | 28,831 |
† Includes reinvested dividends/distributions.
See notes to financial statements.
25
STATEMENT OF FUTURES
October 31, 2020
Description | Number of | Expiration | Notional | Market | Unrealized (Depreciation) ($) | |
Futures Long | ||||||
E-mini Russell 2000 | 92 | 12/18/2020 | 7,259,580 | 7,069,280 | (190,300) | |
Gross Unrealized Depreciation | (190,300) | |||||
See notes to financial statements.
26
STATEMENT OF ASSETS AND LIABILITIES
October 31, 2020
|
|
|
|
|
|
|
|
|
| Cost |
| Value |
|
Assets ($): |
|
|
|
| ||
Investments in securities—See Statement of Investments |
|
|
| |||
Unaffiliated issuers | 1,147,261,854 |
| 1,425,072,692 |
| ||
Affiliated issuers |
| 3,856,863 |
| 3,856,863 |
| |
Cash |
|
|
|
| 88,320 |
|
Receivable for investment securities sold |
| 8,722,704 |
| |||
Receivable for shares of Common Stock subscribed |
| 829,863 |
| |||
Dividends receivable |
| 654,663 |
| |||
|
|
|
|
| 1,439,225,105 |
|
Liabilities ($): |
|
|
|
| ||
Due to BNY Mellon Investment Adviser, Inc. and affiliates—Note 3(b) |
| 555,744 |
| |||
Payable for investment securities purchased |
| 6,539,643 |
| |||
Payable for shares of Common Stock redeemed |
| 1,635,341 |
| |||
Payable for futures variation margin—Note 4 |
| 99,360 |
| |||
Directors’ fees and expenses payable |
| 87,642 |
| |||
Interest payable—Note 2 |
| 124 |
| |||
Other accrued expenses |
|
|
|
| 3,316 |
|
|
|
|
|
| 8,921,170 |
|
Net Assets ($) |
|
| 1,430,303,935 |
| ||
Composition of Net Assets ($): |
|
|
|
| ||
Paid-in capital |
|
|
|
| 1,059,450,917 |
|
Total distributable earnings (loss) |
|
|
|
| 370,853,018 |
|
Net Assets ($) |
|
| 1,430,303,935 |
| ||
Net Asset Value Per Share | Investor Shares | Class I |
|
Net Assets ($) | 1,159,850,269 | 270,453,666 |
|
Shares Outstanding | 46,825,740 | 10,923,453 |
|
Net Asset Value Per Share ($) | 24.77 | 24.76 |
|
|
|
|
|
See notes to financial statements. |
|
|
|
27
STATEMENT OF OPERATIONS
Year Ended October 31, 2020
|
|
|
|
|
|
|
|
|
|
|
|
|
|
Investment Income ($): |
|
|
|
| ||
Income: |
|
|
|
| ||
Cash dividends (net of $29,129 foreign taxes withheld at source): |
| |||||
Unaffiliated issuers |
|
| 23,089,285 |
| ||
Affiliated issuers |
|
| 28,358 |
| ||
Income from securities lending—Note 1(c) |
|
| 538,698 |
| ||
Interest |
|
| 22,254 |
| ||
Total Income |
|
| 23,678,595 |
| ||
Expenses: |
|
|
|
| ||
Management fee—Note 3(a) |
|
| 3,972,593 |
| ||
Shareholder servicing costs—Note 3(b) |
|
| 3,337,809 |
| ||
Directors’ fees—Note 3(a,c) |
|
| 210,540 |
| ||
Loan commitment fees—Note 2 |
|
| 51,532 |
| ||
Interest expense—Note 2 |
|
| 12,990 |
| ||
Registration fees |
|
| 3,316 |
| ||
Total Expenses |
|
| 7,588,780 |
| ||
Less—Directors’ fees reimbursed by |
|
| (210,540) |
| ||
Net Expenses |
|
| 7,378,240 |
| ||
Investment Income—Net |
|
| 16,300,355 |
| ||
Realized and Unrealized Gain (Loss) on Investments—Note 4 ($): |
|
| ||||
Net realized gain (loss) on investments | 101,877,811 |
| ||||
Net realized gain (loss) on futures | 966,471 |
| ||||
Capital gain distributions from affiliated issuers | 473 |
| ||||
Net Realized Gain (Loss) |
|
| 102,844,755 |
| ||
Net change in unrealized appreciation (depreciation) on investments | (261,014,525) |
| ||||
Net change in unrealized appreciation (depreciation) on futures | (224,942) |
| ||||
Net Change in Unrealized Appreciation (Depreciation) |
|
| (261,239,467) |
| ||
Net Realized and Unrealized Gain (Loss) on Investments |
|
| (158,394,712) |
| ||
Net (Decrease) in Net Assets Resulting from Operations |
| (142,094,357) |
| |||
|
|
|
|
|
|
|
See notes to financial statements. | ||||||
28
STATEMENT OF CHANGES IN NET ASSETS
|
|
|
| Year Ended October 31, | |||||
|
|
|
| 2020 |
| 2019 |
| ||
Operations ($): |
|
|
|
|
|
|
|
| |
Investment income—net |
|
| 16,300,355 |
|
|
| 22,397,217 |
| |
Net realized gain (loss) on investments |
| 102,844,755 |
|
|
| 129,921,508 |
| ||
Net change in unrealized appreciation |
| (261,239,467) |
|
|
| (104,979,394) |
| ||
Net Increase (Decrease) in Net Assets | (142,094,357) |
|
|
| 47,339,331 |
| |||
Distributions ($): |
| ||||||||
Distributions to shareholders: |
|
|
|
|
|
|
|
| |
Investor Shares |
|
| (132,474,664) |
|
|
| (207,838,354) |
| |
Class I |
|
| (21,966,599) |
|
|
| (29,388,024) |
| |
Total Distributions |
|
| (154,441,263) |
|
|
| (237,226,378) |
| |
Capital Stock Transactions ($): |
| ||||||||
Net proceeds from shares sold: |
|
|
|
|
|
|
|
| |
Investor Shares |
|
| 186,415,982 |
|
|
| 285,166,351 |
| |
Class I |
|
| 142,367,613 |
|
|
| 110,939,600 |
| |
Distributions reinvested: |
|
|
|
|
|
|
|
| |
Investor Shares |
|
| 131,758,469 |
|
|
| 206,717,158 |
| |
Class I |
|
| 14,939,131 |
|
|
| 21,077,321 |
| |
Cost of shares redeemed: |
|
|
|
|
|
|
|
| |
Investor Shares |
|
| (611,682,003) |
|
|
| (637,306,925) |
| |
Class I |
|
| (112,245,126) |
|
|
| (141,540,514) |
| |
Increase (Decrease) in Net Assets | (248,445,934) |
|
|
| (154,947,009) |
| |||
Total Increase (Decrease) in Net Assets | (544,981,554) |
|
|
| (344,834,056) |
| |||
Net Assets ($): |
| ||||||||
Beginning of Period |
|
| 1,975,285,489 |
|
|
| 2,320,119,545 |
| |
End of Period |
|
| 1,430,303,935 |
|
|
| 1,975,285,489 |
| |
Capital Share Transactions (Shares): |
| ||||||||
Investor Sharesa |
|
|
|
|
|
|
|
| |
Shares sold |
|
| 7,785,564 |
|
|
| 9,926,716 |
| |
Shares issued for distributions reinvested |
|
| 4,616,292 |
|
|
| 8,289,409 |
| |
Shares redeemed |
|
| (24,399,724) |
|
|
| (22,402,182) |
| |
Net Increase (Decrease) in Shares Outstanding | (11,997,868) |
|
|
| (4,186,057) |
| |||
Class Ia |
|
|
|
|
|
|
|
| |
Shares sold |
|
| 6,284,091 |
|
|
| 3,967,855 |
| |
Shares issued for distributions reinvested |
|
| 524,825 |
|
|
| 847,255 |
| |
Shares redeemed |
|
| (4,734,812) |
|
|
| (5,041,475) |
| |
Net Increase (Decrease) in Shares Outstanding | 2,074,104 |
|
|
| (226,365) |
| |||
|
|
|
|
|
|
|
|
|
|
aDuring the period ended October 31, 2020, 7,856 Investor shares representing $240,757 were exchanged for 7,854 Class I shares and during the period ended October 31, 2019, 176,429 Investor shares representing $5,141,155 were exchanged for 176,490 Class I shares. | |||||||||
See notes to financial statements. | |||||||||
29
FINANCIAL HIGHLIGHTS
The following tables describe the performance for each share class for the fiscal periods indicated. All information (except portfolio turnover rate) reflects financial results for a single fund share. Total return shows how much your investment in the fund would have increased (or decreased) during each period, assuming you had reinvested all dividends and distributions. These figures have been derived from the fund’s financial statements.
Year Ended October 31, | ||||||
Investor Shares | 2020 | 2019 | 2018 | 2017 | 2016a | |
Per Share Data ($): | ||||||
Net asset value, | 29.19 | 32.18 | 32.89 | 27.55 | 28.94 | |
Investment Operations: | ||||||
Investment income—netb | .25 | .30 | .28 | .27 | .29 | |
Net realized and unrealized | (2.27) | .05 | 1.34 | 7.02 | 1.20 | |
Total from Investment Operations | (2.02) | .35 | 1.62 | 7.29 | 1.49 | |
Distributions: | ||||||
Dividends from | (.33) | (.29) | (.28) | (.28) | (.28) | |
Dividends from net realized | (2.07) | (3.05) | (2.05) | (1.67) | (2.60) | |
Total Distributions | (2.40) | (3.34) | (2.33) | (1.95) | (2.88) | |
Net asset value, end of period | 24.77 | 29.19 | 32.18 | 32.89 | 27.55 | |
Total Return (%) | (8.01) | 2.83 | 5.07 | 27.11 | 5.73 | |
Ratios/Supplemental Data (%): | ||||||
Ratio of total expenses | .52 | .51 | .51 | .51 | .51 | |
Ratio of net expenses | .50 | .50 | .50 | .50 | .50 | |
Ratio of net investment income | 1.00 | 1.03 | .85 | .89 | 1.06 | |
Portfolio Turnover Rate | 40.49 | 23.24 | 19.60 | 20.63 | 23.86 | |
Net Assets, | 1,159,850 | 1,717,003 | 2,027,831 | 2,214,225 | 1,992,196 | |
a On August 31, 2016, the fund redesignated existing shares as Investor shares.
b Based on average shares outstanding.
See notes to financial statements.
30
Year Ended October 31, | ||||||
Class I Shares | 2020 | 2019 | 2018 | 2017 | 2016a | |
Per Share Data ($): | ||||||
Net asset value, beginning of period | 29.19 | 32.21 | 32.91 | 27.57 | 28.69 | |
Investment Operations: | ||||||
Investment income—netb | .29 | .37 | .35 | .35 | .01 | |
Net realized and unrealized | (2.24) | .03 | 1.37 | 7.01 | (1.13) | |
Total from Investment Operations | (1.95) | .40 | 1.72 | 7.36 | (1.12) | |
Dividends from | (.41) | (.37) | (.37) | (.35) | - | |
Dividends from net realized | (2.07) | (3.05) | (2.05) | (1.67) | - | |
Total Distributions | (2.48) | (3.42) | (2.42) | (2.02) | - | |
Net asset value, end of period | 24.76 | 29.19 | 32.21 | 32.91 | 27.57 | |
Total Return (%) | (7.79) | 3.08 | 5.37 | 27.38 | (3.91)c | |
Ratios/Supplemental Data (%): | ||||||
Ratio of total expenses | .27 | .26 | .26 | .26 | .27d | |
Ratio of net expenses | .25 | .25 | .25 | .25 | .26d | |
Ratio of net investment income | 1.17 | 1.28 | 1.05 | 1.10 | .55d | |
Portfolio Turnover Rate | 40.49 | 23.24 | 19.60 | 20.63 | 23.86 | |
Net Assets, end of period ($ x 1,000) | 270,454 | 258,282 | 292,289 | 187,334 | 2,594 | |
a From August 31, 2016 (commencement of initial offering) to October 31, 2016.
b Based on average shares outstanding.
c Not annualized.
d Annualized.
See notes to financial statements.
31
NOTES TO FINANCIAL STATEMENTS
NOTE 1—Significant Accounting Policies:
BNY Mellon Smallcap Stock Index Fund (the “fund”) is a separate non-diversified series of BNY Mellon Index Funds, Inc. (the “Company”), which is registered under the Investment Company Act of 1940, as amended (the “Act”), as an open-end management investment company and operates as a series company currently offering three series, including the fund. The fund’s investment objective is to seek to match the performance of the S&P SmallCap 600® Index. BNY Mellon Investment Adviser, Inc. (the “Adviser”), a wholly-owned subsidiary of The Bank of New York Mellon Corporation (“BNY Mellon”), serves as the fund’s investment adviser.
BNY Mellon Securities Corporation (the “Distributor”), a wholly-owned subsidiary of the Adviser, is the distributor of the fund’s shares, which are sold to the public without a sales charge. The fund is authorized to issue 300 million shares of $.001 par value Common Stock. The fund currently has authorized two classes of shares: Investor shares (200 million shares authorized) and Class I (100 million shares authorized). Investor shares are sold primarily to retail investors through financial intermediaries and bear Shareholder Services Plan fees. Class I shares are sold at net asset value per share generally to institutional investors. Other differences between the classes include the services offered to and the expenses borne by each class, and certain voting rights. Income, expenses (other than expenses attributable to a specific class), and realized and unrealized gains or losses on investments are allocated to each class of shares based on its relative net assets.
The Company accounts separately for the assets, liabilities and operations of each series. Expenses directly attributable to each series are charged to that series’ operations; expenses which are applicable to all series are allocated among them on a pro rata basis.
The Financial Accounting Standards Board (“FASB”) Accounting Standards Codification (“ASC”) is the exclusive reference of authoritative U.S. generally accepted accounting principles (“GAAP”) recognized by the FASB to be applied by nongovernmental entities. Rules and interpretive releases of the Securities and Exchange Commission (“SEC”) under authority of federal laws are also sources of authoritative GAAP for SEC registrants. The fund is an investment company and applies the accounting and reporting guidance of the FASB ASC Topic 946 Financial Services-Investment Companies. The fund’s financial statements are prepared in accordance with GAAP, which may require the use of management
32
estimates and assumptions. Actual results could differ from those estimates.
The Company enters into contracts that contain a variety of indemnifications. The fund’s maximum exposure under these arrangements is unknown. The fund does not anticipate recognizing any loss related to these arrangements.
(a) Portfolio valuation: The fair value of a financial instrument is the amount that would be received to sell an asset or paid to transfer a liability in an orderly transaction between market participants at the measurement date (i.e., the exit price). GAAP establishes a fair value hierarchy that prioritizes the inputs of valuation techniques used to measure fair value. This hierarchy gives the highest priority to unadjusted quoted prices in active markets for identical assets or liabilities (Level 1 measurements) and the lowest priority to unobservable inputs (Level 3 measurements).
Additionally, GAAP provides guidance on determining whether the volume and activity in a market has decreased significantly and whether such a decrease in activity results in transactions that are not orderly. GAAP requires enhanced disclosures around valuation inputs and techniques used during annual and interim periods.
Various inputs are used in determining the value of the fund’s investments relating to fair value measurements. These inputs are summarized in the three broad levels listed below:
Level 1—unadjusted quoted prices in active markets for identical investments.
Level 2—other significant observable inputs (including quoted prices for similar investments, interest rates, prepayment speeds, credit risk, etc.).
Level 3—significant unobservable inputs (including the fund’s own assumptions in determining the fair value of investments).
The inputs or methodology used for valuing securities are not necessarily an indication of the risk associated with investing in those securities.
Changes in valuation techniques may result in transfers in or out of an assigned level within the disclosure hierarchy. Valuation techniques used to value the fund’s investments are as follows:
Investments in equity securities are valued at the last sales price on the securities exchange or national securities market on which such securities are primarily traded. Securities listed on the National Market System for which market quotations are available are valued at the official closing
33
NOTES TO FINANCIAL STATEMENTS (continued)
price or, if there is no official closing price that day, at the last sales price. For open short positions, asked prices are used for valuation purposes. Bid price is used when no asked price is available. Registered investment companies that are not traded on an exchange are valued at their net asset value. All of the preceding securities are generally categorized within Level 1 of the fair value hierarchy.
Securities not listed on an exchange or the national securities market, or securities for which there were no transactions, are valued at the average of the most recent bid and asked prices. U.S. Treasury Bills are valued at the mean price between quoted bid prices and asked prices by an independent pricing service (the “Service”) approved by the Company’s Board of Directors (the “Board”). These securities are generally categorized within Level 2 of the fair value hierarchy.
The Service is engaged under the general oversight of the Board.
Fair valuing of securities may be determined with the assistance of a pricing service using calculations based on indices of domestic securities and other appropriate indicators, such as prices of relevant American Depository Receipts and futures. Utilizing these techniques may result in transfers between Level 1 and Level 2 of the fair value hierarchy.
When market quotations or official closing prices are not readily available, or are determined not to accurately reflect fair value, such as when the value of a security has been significantly affected by events after the close of the exchange or market on which the security is principally traded (for example, a foreign exchange or market), but before the fund calculates its net asset value, the fund may value these investments at fair value as determined in accordance with the procedures approved by the Board. Certain factors may be considered when fair valuing investments such as: fundamental analytical data, the nature and duration of restrictions on disposition, an evaluation of the forces that influence the market in which the securities are purchased and sold, and public trading in similar securities of the issuer or comparable issuers. These securities are either categorized within Level 2 or 3 of the fair value hierarchy depending on the relevant inputs used.
For securities where observable inputs are limited, assumptions about market activity and risk are used and such securities are generally categorized within Level 3 of the fair value hierarchy.
Futures, which are traded on an exchange, are valued at the last sales price on the securities exchange on which such securities are primarily traded or at the last sales price on the national securities market on each business day and are generally categorized within Level 1 of the fair value hierarchy.
34
The following is a summary of the inputs used as of October 31, 2020 in valuing the fund’s investments:
Level 1 - Unadjusted Quoted Prices | Level 2 - Other Significant Observable Inputs | Level 3 -Significant Unobservable Inputs | Total | |
Assets ($) | ||||
Investments in Securities: † | ||||
Equity Securities— | 1,417,271,687 | - | - | 1,417,271,687 |
Exchange-Traded Funds | 7,165,198 | - | - | 7,165,198 |
Investment Companies | 3,856,863 | - | - | 3,856,863 |
U.S. Treasury Securities | - | 635,807 | - | 635,807 |
Liabilities ($) | ||||
Other Financial | ||||
Futures†† | (190,300) | - | - | (190,300) |
† See Statement of Investments for additional detailed categorizations, if any.
†† Amount shown represents unrealized appreciation (depreciation) at period end, but only variation margin on exchanged traded and centrally cleared derivatives, if any, are reported in the Statement of Assets and Liabilities.
(b) Foreign Taxes: The fund may be subject to foreign taxes (a portion of which may be reclaimable) on income, stock dividends, realized and unrealized capital gains on investments or certain foreign currency transactions. Foreign taxes are recorded in accordance with the fund’s understanding of the applicable foreign tax regulations and rates that exist in the foreign jurisdictions in which the fund invests. These foreign taxes, if any, are paid by the fund and are reflected in the Statement of Operations. Foreign taxes payable or deferred as of October 31, 2020, if any, are disclosed in the fund’s Statement of Assets and Liabilities.
(c) Securities transactions and investment income: Securities transactions are recorded on a trade date basis. Realized gains and losses from securities transactions are recorded on the identified cost basis. Dividend income is recognized on the ex-dividend date and interest income, including, where applicable, accretion of discount and amortization of premium on investments, is recognized on the accrual basis.
Pursuant to a securities lending agreement with The Bank of New York Mellon, a subsidiary of BNY Mellon and an affiliate of the Adviser, the fund may lend securities to qualified institutions. It is the fund’s policy that, at origination, all loans are secured by collateral of at least 102% of the value of U.S. securities loaned and 105% of the value of foreign securities loaned. Collateral equivalent to at least 100% of the market value
35
NOTES TO FINANCIAL STATEMENTS (continued)
of securities on loan is maintained at all times. Collateral is either in the form of cash, which can be invested in certain money market mutual funds managed by the Adviser, or U.S. Government and Agency securities. The fund is entitled to receive all dividends, interest and distributions on securities loaned, in addition to income earned as a result of the lending transaction. Should a borrower fail to return the securities in a timely manner, The Bank of New York Mellon is required to replace the securities for the benefit of the fund or credit the fund with the market value of the unreturned securities and is subrogated to the fund’s rights against the borrower and the collateral. Additionally, the contractual maturity of security lending transactions are on an overnight and continuous basis. During the period ended October 31, 2020, The Bank of New York Mellon earned $113,036 from the lending of the fund’s portfolio securities, pursuant to the securities lending agreement.
(d) Affiliated issuers: Investments in other investment companies advised by the Adviser are considered “affiliated” under the Act.
(e) Risk: Certain events particular to the industries in which the fund’s investments conduct their operations, as well as general economic, political and public health conditions, may have a significant negative impact on the investee’s operations and profitability. In addition, turbulence in financial markets and reduced liquidity in equity, credit and/or fixed income markets may negatively affect many issuers, which could adversely affect the fund. Global economies and financial markets are becoming increasingly interconnected, and conditions and events in one country, region or financial market may adversely impact issuers in a different country, region or financial market. These risks may be magnified if certain events or developments adversely interrupt the global supply chain; in these and other circumstances, such risks might affect companies world-wide. Recent examples include pandemic risks related to COVID-19 and aggressive measures taken world-wide in response by governments, including closing borders, restricting international and domestic travel, and the imposition of prolonged quarantines of large populations, and by businesses, including changes to operations and reducing staff. To the extent the fund may overweight its investments in certain countries, companies, industries or market sectors, such positions will increase the fund’s exposure to risk of loss from adverse developments affecting those countries, companies, industries or sectors.
(f) Dividends and distributions to shareholders: Dividends and distributions are recorded on the ex-dividend date. Dividends from investment income-net and dividends from net realized capital gains, if any, are normally declared and paid annually, but the fund may make
36
distributions on a more frequent basis to comply with the distribution requirements of the Internal Revenue Code of 1986, as amended (the “Code”). To the extent that net realized capital gains can be offset by capital loss carryovers, it is the policy of the fund not to distribute such gains. Income and capital gain distributions are determined in accordance with income tax regulations, which may differ from GAAP.
(g) Federal income taxes: It is the policy of the fund to continue to qualify as a regulated investment company, if such qualification is in the best interests of its shareholders, by complying with the applicable provisions of the Code, and to make distributions of taxable income and net realized capital gain sufficient to relieve it from substantially all federal income and excise taxes.
As of and during the period ended October 31, 2020, the fund did not have any liabilities for any uncertain tax positions. The fund recognizes interest and penalties, if any, related to uncertain tax positions as income tax expense in the Statement of Operations. During the period ended October 31, 2020, the fund did not incur any interest or penalties.
Each tax year in the four-year period ended October 31, 2020 remains subject to examination by the Internal Revenue Service and state taxing authorities.
At October 31, 2020, the components of accumulated earnings on a tax basis were as follows: undistributed ordinary income $17,764,349, undistributed capital gains $100,894,396 and unrealized appreciation $252,194,273.
The tax character of distributions paid to shareholders during the fiscal periods ended October 31, 2020 and October 31, 2019 were as follows: ordinary income $21,752,147 and $32,256,611, and long-term capital gains $132,689,116 and $204,969,767, respectively.
NOTE 2—Bank Lines of Credit:
The fund participates with other long-term open-end funds managed by the Adviser in a $823.5 million unsecured credit facility led by Citibank, N.A. (the “Citibank Credit Facility”) and a $300 million unsecured credit facility provided by The Bank of New York Mellon (the “BNYM Credit Facility”), each to be utilized primarily for temporary or emergency purposes, including the financing of redemptions (each, a “Facility”). The Citibank Credit Facility is available in two tranches: (i) Tranche A is in an amount equal to $688.5 million and is available to all long-term open-ended funds, including the fund, and (ii) Tranche B is an amount equal to $135 million and is available only to BNY Mellon Floating Rate Income
37
NOTES TO FINANCIAL STATEMENTS (continued)
Fund, a series of BNY Mellon Investment Funds IV, Inc. Prior to September 30, 2020, the Citibank Credit Facility was $927 million with Tranche A available in an amount equal to $747 million and Tranche B available in an amount equal to $180 million. Prior to March 11, 2020, the Citibank Credit Facility was $1.030 billion with Tranche A available in an amount equal to $830 million and Tranche B available in an amount equal to $200 million. In connection therewith, the fund has agreed to pay its pro rata portion of commitment fees for Tranche A of the Citibank Credit Facility and the BNYM Credit Facility. Interest is charged to the fund based on rates determined pursuant to the terms of the respective Facility at the time of borrowing.
The average amount of borrowings outstanding under the Facilities during the period ended October 31, 2020 was approximately $531,967 with a related weighted average annualized interest rate of 2.44%.
NOTE 3—Management Fee and Other Transactions with Affiliates:
(a) Pursuant to a management agreement (the “Agreement”) with the Adviser, the management fee is computed at the annual rate of .25% of the value of the fund’s average daily net assets and is payable monthly. Out of its fee, the Adviser pays all of the expenses of the fund, except management fees, Shareholder Services Plan fees, brokerage fees and commissions, taxes, interest expense, commitment fees on borrowings, fees and expenses of interested Directors (including counsel fees) and extraordinary expenses. In addition, the Adviser is required to reduce its fee in an amount equal to the fund’s allocable portion of fees and expenses of the non-interested Directors (including counsel fees). During the period ended October 31, 2020, fees reimbursed by the Adviser amounted to $210,540.
(b) Under the Shareholder Services Plan, Investor shares pay the Distributor at an annual rate of .25% of the value of its average daily net assets for the provision of certain services. The services provided may include personal services relating to shareholder accounts, such as answering shareholder inquiries regarding the fund and providing reports and other information, and services related to the maintenance of shareholder accounts, such as recordkeeping and sub-accounting services. The Distributor may make payments to Service Agents (securities dealers, financial institutions or other industry professionals) with respect to these services. The Distributor determines the amounts to be paid to Service Agents. During the period ended October 31, 2020, the fund was charged $3,337,809 pursuant to the Shareholder Services Plan.
38
The fund has an arrangement with the custodian whereby the fund will receive interest income or be charged an overdraft fees when cash balances are maintained. For financial reporting purposes, the fund includes this interest income and overdraft fees, if any, as interest income in the Statement of Operations.
The components of “Due to BNY Mellon Investment Adviser, Inc. and affiliates” in the Statement of Assets and Liabilities consist of: management fees of $316,696 and Shareholder Services Plan fees of $257,288, which are offset against an expense reimbursement currently in effect in the amount of $18,240.
(c) Each Board member also serves as a Board member of other funds in the BNY Mellon Family of Funds complex. Annual retainer fees and attendance fees are allocated to each fund based on net assets.
NOTE 4—Securities Transactions:
The aggregate amount of purchases and sales of investment securities, excluding short-term securities and futures, during the period ended October 31, 2020, amounted to $642,549,990 and $1,027,795,366, respectively.
Derivatives: A derivative is a financial instrument whose performance is derived from the performance of another asset. Each type of derivative instrument that was held by the fund during the period ended October 31, 2020 is discussed below.
Futures: In the normal course of pursuing its investment objective, the fund is exposed to market risk, including equity price risk as a result of changes in value of underlying financial instruments. The fund invests in futures in order to manage its exposure to or protect against changes in the market. A futures contract represents a commitment for the future purchase or a sale of an asset at a specified date. Upon entering into such contracts, these investments require initial margin deposits with a counterparty, which consist of cash or cash equivalents. The amount of these deposits is determined by the exchange or Board of Trade on which the contract is traded and is subject to change. Accordingly, variation margin payments are received or made to reflect daily unrealized gains or losses which are recorded in the Statement of Operations. When the contracts are closed, the fund recognizes a realized gain or loss which is reflected in the Statement of Operations. There is minimal counterparty credit risk to the fund with futures since they are exchange traded, and the exchange guarantees the futures against default. Futures open at October 31, 2020 are set forth in the Statement of Futures.
39
NOTES TO FINANCIAL STATEMENTS (continued)
The following summarizes the average market value of derivatives outstanding during the period ended October 31, 2020:
|
| Average Market Value ($) |
Equity futures |
| 7,008,215 |
|
|
|
At October 31, 2020, the cost of investments for federal income tax purposes was $1,176,735,282; accordingly, accumulated net unrealized appreciation on investments was $252,194,273, consisting of $495,316,038 gross unrealized appreciation and $243,121,765 gross unrealized depreciation.
40
REPORT OF INDEPENDENT REGISTERED PUBLIC ACCOUNTING FIRM
To the Shareholders and the Board of Directors of BNY Mellon Smallcap Stock Index Fund
Opinion on the Financial Statements
We have audited the accompanying statement of assets and liabilities of BNY Mellon Smallcap Stock Index Fund (the “Fund”) (one of the funds constituting BNY Mellon Index Funds, Inc.), including the statements of investments, investments in affiliated issuers and futures, as of October 31, 2020, and the related statement of operations for the year then ended, the statements of changes in net assets for each of the two years in the period then ended, the financial highlights for each of the five years in the period then ended and the related notes (collectively referred to as the “financial statements”). In our opinion, the financial statements present fairly, in all material respects, the financial position of the Fund (one of the funds constituting BNY Mellon Index Funds, Inc.) at October 31, 2020, the results of its operations for the year then ended, the changes in its net assets for each of the two years in the period then ended and its financial highlights for each of the five years in the period then ended, in conformity with U.S. generally accepted accounting principles.
Basis for Opinion
These financial statements are the responsibility of the Fund’s management. Our responsibility is to express an opinion on the Fund’s financial statements based on our audits. We are a public accounting firm registered with the Public Company Accounting Oversight Board (United States) (“PCAOB”) and are required to be independent with respect to the Fund in accordance with the U.S. federal securities laws and the applicable rules and regulations of the Securities and Exchange Commission and the PCAOB.
We conducted our audits in accordance with the standards of the PCAOB. Those standards require that we plan and perform the audit to obtain reasonable assurance about whether the financial statements are free of material misstatement, whether due to error or fraud. The Fund is not required to have, nor were we engaged to perform, an audit of the Fund’s internal control over financial reporting. As part of our audits, we are required to obtain an understanding of internal control over financial reporting, but not for the purpose of expressing an opinion on the effectiveness of the Fund’s internal control over financial reporting. Accordingly, we express no such opinion.
Our audits included performing procedures to assess the risks of material misstatement of the financial statements, whether due to error or fraud, and performing procedures that respond to those risks. Such procedures included examining, on a test basis, evidence regarding the amounts and disclosures in the financial statements. Our procedures included confirmation of securities owned as of October 31, 2020, by correspondence with the custodian and others or by other appropriate auditing procedures where replies from others were not received. Our audits also included evaluating the accounting principles used and significant estimates made by management, as well as evaluating the overall presentation of the financial statements. We believe that our audits provide a reasonable basis for our opinion.

We have served as the auditor of one or more investment companies in the BNY Mellon Family of Funds since at least 1957, but we are unable to determine the specific year.
New York, New York
December 23, 2020
41
IMPORTANT TAX INFORMATION (Unaudited)
For federal tax purposes, the fund hereby reports 75.07% of the ordinary dividends paid during the fiscal year ended October 31, 2020 as qualifying for the corporate dividends received deduction. Also certain dividends paid by the fund may be subject to a maximum tax rate of 15%, as provided for by the Jobs and Growth Tax Relief Reconciliation Act of 2003. Of the distributions paid during the fiscal year, $10,294,447 represents the maximum amount that may be considered qualified dividend income. Shareholders will receive notification in early 2021 of the percentage applicable to the preparation of their 2020 income tax returns. The fund also hereby reports $.0146 per share as a long-term capital gain distribution paid on March 24, 2020 and also $2.0531 per share as a long-term capital gain distribution paid on December 26, 2019.
42
LIQUIDITY RISK MANAGEMENT PROGRAM (Unaudited)
Effective June 1, 2019, the fund adopted a liquidity risk management program (the “Liquidity Risk Management Program”) pursuant to the requirements of Rule 22e-4 under the Investment Company Act of 1940, as amended. Rule 22e-4 requires registered open-end funds, including mutual funds and exchange-traded funds but not money market funds, to establish liquidity risk management programs in order to effectively manage fund liquidity and shareholder redemptions. The rule is designed to mitigate the risk that a fund could not meet redemption requests without significantly diluting the interests of remaining investors.
The rule requires the funds to assess, manage and review their liquidity risk at least annually considering applicable factors such as investment strategy and liquidity during normal and foreseeable stressed conditions, including whether the strategy is appropriate for an open-end fund and whether the fund has a relatively concentrated portfolio or large positions in particular issuers. The fund must also assess its use of borrowings and derivatives, short-term and long-term cash flow projections in normal and stressed conditions, holdings of cash and cash equivalents, and borrowing arrangements and other funding sources.
The rule also requires the fund to classify its investments as highly liquid, moderately liquid, less liquid or illiquid based on the number of days the fund expects it would take to liquidate the investment, and to review these classifications at least monthly or more often under certain conditions. The periods range from three or fewer business days for a highly liquid investment to greater than seven calendar days for settlement of a less liquid investment. Illiquid investments are those a fund does not expect to be able to sell or dispose of within seven calendar days without significantly changing the market value. The fund is prohibited from acquiring an investment if, after the acquisition, its holdings of illiquid assets will exceed 15% of its net assets. In addition, if a fund permits redemptions in-kind, the rule requires the fund to establish redemption in-kind policies and procedures governing how and when it will engage in such redemptions.
Pursuant to the rule’s requirements, the Liquidity Risk Management Program has been reviewed and approved by the fund’s board. Furthermore, the board has received a written report prepared by the Program’s Administrator that addresses the operation of the Program, assesses its adequacy and effectiveness and describes any material changes made to the Program.
Assessment of Program
In the opinion of the Program Administrator, the Program approved by the fund board continues to be adequate for the fund and the Program has been implemented effectively. The Program Administrator has monitored the fund’s liquidity risk and the liquidity classification of the securities held by the fund and has determined that the Program is operating effectively.
During the period from June 1, 2019 to March 31, 2020, there were no material changes to the Program and no material liquidity events that impacted the fund. During the period, the fund held sufficient highly liquid assets to meet fund redemptions.
43
LIQUIDITY RISK MANAGEMENT PROGRAM (Unaudited) (continued)
Under normal expected foreseeable fund redemption forecasts and foreseeable stressed fund redemption forecasts, the Program Administrator believes that the fund maintains sufficient highly liquid assets to meet expected fund redemptions.
44
BOARD MEMBERS INFORMATION (Unaudited)
INDEPENDENT BOARD MEMBERS
Chairman of the Board (1995)
Principal Occupation During Past 5 Years:
· Director or Trustee of funds in the BNY Mellon Family of Funds and certain other entities (as described in the fund’s Statement of Additional Information) (1995-Present)
Other Public Company Board Memberships During Past 5 Years:
· CBIZ, Inc., a public company providing professional business services, products and solutions, Director (1997-Present)
No. of Portfolios for which Board Member Serves: 110
———————
Peggy C. Davis (77)
Board Member (71)
Principal Occupation During Past 5 Years:
· Shad Professor of Law, New York University School of Law (1983-present)
No. of Portfolios for which Board Member Serves: 39
———————
Gina D. France (62)
Board Member (2019)
Principal Occupation During Past 5 Years:
· Founder, President and Chief Executive Officer, France Strategic Partners, a strategy and advisory firm serving corporate clients across the United States (2003 –Present)
· Corporate Director and Trustee (2004 – Present)
Other Public Company Board Memberships During Past 5 Years:
· Huntington Bancshares, a bank holding company headquartered in Columbus, Ohio, Director (2016 – Present)
· Cedar Fair, L.P., a publicly-traded partnership that owns and operates amusement parks and hotels in the U.S. and Canada, Director (2011 – Present)
· CBIZ, Inc., a public company providing professional business services, products and solutions, Director (2015 – Present)
· Baldwin Wallace University, Trustee (2013- 2019)
· FirstMerit Corporation, a diversified financial services company, Director (2004 – 2016)
No. of Portfolios for which Board Member Serves: 25
———————
45
BOARD MEMBERS INFORMATION (Unaudited) (continued)
INDEPENDENT BOARD MEMBERS (continued)
Joan Gulley (73)
Board Member (2017)
Principal Occupation During Past 5 Years:
· PNC Financial Services Group, Inc.(1993-2014), Executive Vice President and Chief Human Resources Officer and Executive Committee Member (2008-2014)
· Director, Nantucket Library (2015-Present)
No. of Portfolios for which Board Member Serves: 43
———————
Robin A. Melvin (57)
Board Member (2012)
Principal Occupation During Past 5 Years:
· Trustee, Westover School, a private girls’ boarding school in Middlebury, Connecticut (2019 – Present); Co-chairman, Mentor Illinois, a non-profit organization dedicated to increasing the quality of mentoring services in Illinois (2014 – 2020); Board member, Mentor Illinois (2013 – 2020)
No. of Portfolios for which Board Member Serves: 88
———————
Once elected all Board Members serve for an indefinite term, but achieve Emeritus status upon reaching age 80. The address of the Board Members and Officers is c/o BNY Mellon Investment Adviser, Inc. 240 Greenwich Street, New York, New York 10286. Additional information about the Board Members is available in the fund’s Statement of Additional Information which can be obtained from the Adviser free of charge by calling this toll free number: 1-800-373-9387.
David P. Feldman, Emeritus Board Member
James F. Henry, Emeritus Board Member
Ehud Houminer, Emeritus Board Member
Lynn Martin, Emeritus Board Member
Dr. Martin Peretz, Emeritus Board Member
Philip L. Toia, Emeritus Board Member
46
OFFICERS OF THE FUND (Unaudited)
RENEE LAROCHE-MORRIS, President since May 2019.
President and a director of BNY Mellon Investment Adviser, Inc. since January 2018. She is an officer of 61 investment companies (comprised of 110 portfolios) managed by the Adviser. She is 49 years old and has been an employee of BNY Mellon since 2003.
JAMES WINDELS, Treasurer since November 2001.
Director-BNY Mellon Fund Administration, and an officer of 63 investment companies (comprised of 141 portfolios) managed by the Adviser or an affiliate of the Adviser. He is 62 years old and has been an employee of the Adviser since April 1985.
BENNETT A. MACDOUGALL, Chief Legal Officer since October 2015.
Chief Legal Officer of the Adviser and Associate General Counsel and Managing Director of BNY Mellon since June 2015; Director and Associate General Counsel of Deutsche Bank–Asset & Wealth Management Division from June 2005 to June 2015, and as Chief Legal Officer of Deutsche Investment Management Americas Inc. from June 2012 to May 2015. He is an officer of 63 investment companies (comprised of 141 portfolios) managed by the Adviser or an affiliate of the Adviser. He is 49 years old and has been an employee of the Adviser since June 2015.
DAVID DIPETRILLO, Vice President since May 2019.
Head of North America Product, BNY Mellon Investment Management since January 2018, Director of Product Strategy, BNY Mellon Investment Management from January 2016 to December 2017; Head of US Retail Product and Channel Marketing, BNY Mellon Investment Management from January 2014 to December 2015. He is an officer of 62 investment companies (comprised of 118 portfolios) managed by the Adviser or an affiliate of the Adviser. He is 42 years old and has been an employee of BNY Mellon since 2005.
JAMES BITETTO, Vice President since August 2005 and Secretary since February 2018.
Senior Managing Counsel of BNY Mellon since December 2019; Managing Counsel of BNY Mellon from April 2014 to December 2019; Secretary of the Adviser, and an officer of 63 investment companies (comprised of 141 portfolios) managed by the Adviser or an affiliate of the Adviser. He is 54 years old and has been an employee of the Adviser since December 1996.
SONALEE CROSS, Vice President and Assistant Secretary since March 2018.
Counsel of BNY Mellon since October 2016; Associate at Proskauer Rose LLP from April 2016 to September 2016; Attorney at EnTrust Capital from August 2015 to February 2016; Associate at Sidley Austin LLP from September 2013 to August 2015. She is an officer of 63 investment companies (comprised of 141 portfolios) managed by the Adviser or an affiliate of the Adviser. She is 33 years old and has been an employee of the Adviser since October 2016.
DEIRDRE CUNNANE, Vice President and Assistant Secretary since March 2019.
Counsel of BNY Mellon since August 2018; Senior Regulatory Specialist at BNY Mellon Investment Management Services from February 2016 to August 2018; Trustee Associate at BNY Mellon Trust Company (Ireland) Limited from August 2013 to February 2016. She is an officer of 63 investment companies (comprised of 141 portfolios) managed by the Adviser or an affiliate of the Adviser. She is 30 years old and has been an employee of the Adviser since August 2018.
SARAH S. KELLEHER, Vice President and Assistant Secretary since April 2014.
Managing Counsel of BNY Mellon since December 2017, Senior Counsel of BNY Mellon from March 2013 to December 2017. She is an officer of 63 investment companies (comprised of 141 portfolios) managed by the Adviser or an affiliate of the Adviser. She is 45 years old and has been an employee of the Adviser since March 2013.
JEFF PRUSNOFSKY, Vice President and Assistant Secretary since August 2005.
Senior Managing Counsel of BNY Mellon, and an officer of 63 investment companies (comprised of 141 portfolios) managed by the Adviser or an affiliate of the Adviser. He is 55 years old and has been an employee of the Adviser since October 1990.
AMANDA QUINN, Vice President and Assistant Secretary since March 2020.
Counsel of BNY Mellon since June 2019; Regulatory Administration Manager at BNY Mellon Investment Management Services from September 2018 to May 2019; Senior Regulatory Specialist at BNY Mellon Investment Management Services from April 2015 to August 2018. She is an officer of 63 investment companies (comprised of 141 portfolios) managed by the Adviser or an affiliate of the Adviser. She is 35 years old and has been an employee of the Adviser since June 2019.
47
OFFICERS OF THE FUND (Unaudited) (continued)
PETER M. SULLIVAN, Vice President and Assistant Secretary since March 2019.
Managing Counsel of BNY Mellon since March 2009, Senior Counsel of BNY Mellon from April 2004 to March 2009, and an officer of 63 investment companies (comprised of 141 portfolios) managed by the Adviser or an affiliate of the Adviser. He is 52 years old and has been an employee of the Adviser since January 2019.
NATALYA ZELENSKY, Vice President and Assistant Secretary since March 2017.
Managing Counsel of BNY Mellon since December 2019; Counsel of BNY Mellon from May 2016 to December 2019; Attorney at Wildermuth Endowment Strategy Fund/Wildermuth Advisory, LLC from November 2015 to May 2016 and Assistant General Counsel at RCS Advisory Services from July 2014 to November 2015. She is an officer of 63 investment companies (comprised of 141 portfolios) managed by the Adviser or an affiliate of the Adviser. She is 35 years old and has been an employee of the Adviser since May 2016.
GAVIN C. REILLY, Assistant Treasurer since December 2005.
Tax Manager-BNY Mellon Fund Administration, and an officer of 63 investment companies (comprised of 141 portfolios) managed by the Adviser or an affiliate of the Adviser. He is 52 years old and has been an employee of the Adviser since April 1991.
ROBERT S. ROBOL, Assistant Treasurer since August 2005.
Senior Accounting Manager-BNY Mellon Fund Administration, and an officer of 63 investment companies (comprised of 141 portfolios) managed by the Adviser or an affiliate of the Adviser. He is 56 years old and has been an employee of the Adviser since October 1988.
ROBERT SALVIOLO, Assistant Treasurer since July 2007.
Senior Accounting Manager–BNY Mellon Fund Administration, and an officer of 63 investment companies (comprised of 141 portfolios) managed by the Adviser or an affiliate of the Adviser. He is 53 years old and has been an employee of the Adviser since June 1989.
ROBERT SVAGNA, Assistant Treasurer since December 2002.
Senior Accounting Manager–BNY Mellon Fund Administration, and an officer of 63 investment companies (comprised of 141 portfolios) managed by the Adviser or an affiliate of the Adviser. He is 53 years old and has been an employee of the Adviser since November 1990.
JOSEPH W. CONNOLLY, Chief Compliance Officer since October 2004.
Chief Compliance Officer of the Adviser, the BNY Mellon Family of Funds and BNY Mellon Funds Trust (62 investment companies, comprised of 133 portfolios). He is 63 years old and has served in various capacities with the Adviser since 1980, including manager of the firm’s Fund Accounting Department from 1997 through October 2001.
CARIDAD M. CAROSELLA, Anti-Money Laundering Compliance Officer since January 2016.
Anti-Money Laundering Compliance Officer of the BNY Mellon Family of Funds and BNY Mellon Funds Trust since January 2016; from May 2015 to December 2015, Interim Anti-Money Laundering Compliance Officer of the BNY Mellon Family of Funds and BNY Mellon Funds Trust and the Distributor; from January 2012 to May 2015, AML Surveillance Officer of the Distributor. She is an officer of 56 investment companies (comprised of 134 portfolios) managed by the Adviser or an affiliate of the Adviser. She is 52 years old and has been an employee of the Distributor since 1997.
48
This page intentionally left blank.
49
BNY Mellon Smallcap Stock Index Fund
240 Greenwich Street
New York, NY 10286
Adviser
BNY Mellon Investment Adviser, Inc.
240 Greenwich Street
New York, NY 10286
Custodian
The Bank of New York Mellon
240 Greenwich Street
New York, NY 10286
Transfer Agent &
Dividend Disbursing Agent
BNY Mellon Transfer, Inc.
240 Greenwich Street
New York, NY 10286
Distributor
BNY Mellon Securities Corporation
240 Greenwich Street
New York, NY 10286
Ticker Symbols: | Investor: DISSX Class I: DISIX |
Telephone Call your financial representative or 1-800-373-9387
Mail The BNY Mellon Family of Funds, 144 Glenn Curtiss Boulevard, Uniondale, NY 11556-0144
E-mail Send your request to info@bnymellon.com
Internet Information can be viewed online or downloaded at www.bnymellonim.com/us
The fund files its complete schedule of portfolio holdings with the Securities and Exchange Commission (“SEC”) for the first and third quarters of each fiscal year on Form N-PORT. The fund’s Forms N-PORT are available on the SEC’s website at www.sec.gov.
A description of the policies and procedures that the fund uses to determine how to vote proxies relating to portfolio securities and information regarding how the fund voted these proxies for the most recent 12-month period ended June 30 is available at www.bnymellonim.com/us and on the SEC’s website at www.sec.gov and without charge, upon request, by calling 1-800-373-9387.
© 2020 BNY Mellon Securities Corporation |
|

Item 2. Code of Ethics.
The Registrant has adopted a code of ethics that applies to the Registrant's principal executive officer, principal financial officer, principal accounting officer or controller, or persons performing similar functions. There have been no amendments to, or waivers in connection with, the Code of Ethics during the period covered by this Report.
Item 3. Audit Committee Financial Expert.
The Registrant's Board has determined that Joseph S. DiMartino, a member of the Audit Committee of the Board, is an audit committee financial expert as defined by the Securities and Exchange Commission (the "SEC"). Mr. DiMartino is "independent" as defined by the SEC for purposes of audit committee financial expert determinations.
Item 4. Principal Accountant Fees and Services.
(a) Audit Fees. The aggregate fees billed for each of the last two fiscal years (the "Reporting Periods") for professional services rendered by the Registrant's principal accountant (the "Auditor") for the audit of the Registrant's annual financial statements or services that are normally provided by the Auditor in connection with the statutory and regulatory filings or engagements for the Reporting Periods, were $121,474 in 2019 and $117,206 in 2020.
(b) Audit-Related Fees. The aggregate fees billed in the Reporting Periods for assurance and related services by the Auditor that are reasonably related to the performance of the audit of the Registrant's financial statements and are not reported under paragraph (a) of this Item 4 were $24,500 in 2019 and $23,506 in 2020. These services consisted of one or more of the following: (i) agreed upon procedures related to compliance with Internal Revenue Code section 817(h), (ii) security counts required by Rule 17f-2 under the Investment Company Act of 1940, as amended, (iii) advisory services as to the accounting or disclosure treatment of Registrant transactions or events and (iv) advisory services to the accounting or disclosure treatment of the actual or potential impact to the Registrant of final or proposed rules, standards or interpretations by the Securities and Exchange Commission, the Financial Accounting Standards Boards or other regulatory or standard-setting bodies.
The aggregate fees billed in the Reporting Periods for non-audit assurance and related services by the Auditor to the Registrant's investment adviser (not including any sub-investment adviser whose role is primarily portfolio management and is subcontracted with or overseen by another investment adviser), and any entity controlling, controlled by or under common control with the investment adviser that provides ongoing services to the Registrant ("Service Affiliates"), that were reasonably related to the performance of the annual audit of the Service Affiliate, which required pre-approval by the Audit Committee were $0 in 2019 and $0 in 2020.
(c) Tax Fees. The aggregate fees billed in the Reporting Periods for professional services rendered by the Auditor for tax compliance, tax advice, and tax planning ("Tax Services") were $40,941 in 2019 and $40,026 in 2020. These services consisted of: (i) review or preparation of U.S. federal, state, local and excise tax returns; (ii) U.S. federal, state and local tax planning, advice and assistance regarding statutory, regulatory or administrative developments; (iii) tax advice regarding tax qualification matters and/or treatment of various financial instruments held or proposed to be acquired or held, and (iv) determination of Passive Foreign Investment Companies. The aggregate fees billed in the Reporting Periods for Tax Services by the Auditor to Service Affiliates, which required pre-approval by the Audit Committee were $0 in 2019 and $0 in 2020.
(d) All Other Fees. The aggregate fees billed in the Reporting Periods for products and services provided by the Auditor, other than the services reported in paragraphs (a) through (c) of this Item, were $3,829 in 2019 and $0 in 2020. These services consisted of a review of the Registrant's anti-money laundering program.
The aggregate fees billed in the Reporting Periods for Non-Audit Services by the Auditor to Service Affiliates, other than the services reported in paragraphs (b) through (c) of this Item, which required pre-approval by the Audit Committee, were $0 in 2019 and $0 in 2020.
(e)(1) Audit Committee Pre-Approval Policies and Procedures. The Registrant's Audit Committee has established policies and procedures (the "Policy") for pre-approval (within specified fee limits) of the Auditor's engagements for non-audit services to the Registrant and Service Affiliates without specific case-by-case consideration. The pre-approved services in the Policy can include pre-approved audit services, pre-approved audit-related services, pre-approved tax services and pre-approved all other services. Pre-approval considerations include whether the proposed services are compatible with maintaining the Auditor's independence. Pre-approvals pursuant to the Policy are considered annually.
(e)(2) Note. None of the services described in paragraphs (b) through (d) of this Item 4 were approved by the Audit Committee pursuant to paragraph (c)(7)(i)(C) of Rule 2-01 of Regulation S-X.
(f) None of the hours expended on the principal accountant's engagement to audit the registrant's financial statements for the most recent fiscal year were attributed to work performed by persons other than the principal accountant's full-time, permanent employees.
Non-Audit Fees. The aggregate non-audit fees billed by the Auditor for services rendered to the Registrant, and rendered to Service Affiliates, for the Reporting Periods were $616,767 in 2019 and $1,174,149 in 2020.
Auditor Independence. The Registrant's Audit Committee has considered whether the provision of non-audit services that were rendered to Service Affiliates, which were not pre-approved (not requiring pre-approval), is compatible with maintaining the Auditor's independence.
Item 5. Audit Committee of Listed Registrants.
Not applicable.
Item 6. Investments.
(a) Not applicable.
Item 7. Disclosure of Proxy Voting Policies and Procedures for Closed-End Management Investment Companies.
Not applicable.
Item 8. Portfolio Managers of Closed-End Management Investment Companies.
Not applicable.
Item 9. Purchases of Equity Securities by Closed-End Management Investment Companies and Affiliated Purchasers.
Not applicable.
Item 10. Submission of Matters to a Vote of Security Holders.
There have been no material changes to the procedures applicable to Item 10.
Item 11. Controls and Procedures.
(a) The Registrant's principal executive and principal financial officers have concluded, based on their evaluation of the Registrant's disclosure controls and procedures as of a date within 90 days of the filing date of this report, that the Registrant's disclosure controls and procedures are reasonably designed to ensure that information required to be disclosed by the Registrant on Form N-CSR is recorded, processed, summarized and reported within the required time periods and that information required to be disclosed by the Registrant in the reports that it files or submits on Form N-CSR is accumulated and communicated to the Registrant's management, including its principal executive and principal financial officers, as appropriate to allow timely decisions regarding required disclosure.
(b) There were no changes to the Registrant's internal control over financial reporting that occurred during the second fiscal quarter of the period covered by this report that have materially affected, or are reasonably likely to materially affect, the Registrant's internal control over financial reporting.
Item 12. Disclosure of Securities Lending Activities for Closed-End Management Investment Companies.
Not applicable.
Item 13. Exhibits.
(a)(1) Code of ethics referred to in Item 2.
(a)(3) Not applicable.
SIGNATURES
Pursuant to the requirements of the Securities Exchange Act of 1934 and the Investment Company Act of 1940, the Registrant has duly caused this Report to be signed on its behalf by the undersigned, thereunto duly authorized.
BNY Mellon Index Funds, Inc.
By: /s/ Renee LaRoche-Morris
Renee LaRoche-Morris
President (Principal Executive Officer)
Date: December 22, 2020
Pursuant to the requirements of the Securities Exchange Act of 1934 and the Investment Company Act of 1940, this Report has been signed below by the following persons on behalf of the Registrant and in the capacities and on the dates indicated.
By: /s/ Renee LaRoche-Morris
Renee LaRoche-Morris
President (Principal Executive Officer)
Date: December 22, 2020
By: /s/ James Windels
James Windels
Treasurer (Principal Financial Officer)
Date: December 22, 2020
EXHIBIT INDEX
(a)(1) Code of ethics referred to in Item 2.
(a)(2) Certifications of principal executive and principal financial officers as required by Rule 30a-2(a) under the Investment Company Act of 1940. (EX-99.CERT)
(b) Certification of principal executive and principal financial officers as required by Rule 30a-2(b) under the Investment Company Act of 1940. (EX-99.906CERT)