UNITED STATES
SECURITIES AND EXCHANGE COMMISSION
Washington, D.C. 20549
FORM N-CSR
CERTIFIED SHAREHOLDER REPORT OF REGISTERED MANAGEMENT
INVESTMENT COMPANIES
| Investment Company Act file number | 811-05883 |
| | |
| | BNY Mellon Index Funds, Inc. | |
| | (Exact name of Registrant as specified in charter) | |
| | | |
| | c/o BNY Mellon Investment Adviser, Inc. 240 Greenwich Street New York, New York 10286 | |
| | (Address of principal executive offices) (Zip code) | |
| | | |
| | Deirdre Cunnane, Esq. 240 Greenwich Street New York, New York 10286 | |
| | (Name and address of agent for service) | |
| |
| Registrant's telephone number, including area code: | (212) 922-6400 |
| | |
Date of fiscal year end: | 10/31 | |
| Date of reporting period: | 10/31/22 | |
| | | | | | | |
FORM N-CSR
Item 1. Reports to Stockholders.
BNY Mellon International Stock Index Fund
| |
ANNUAL REPORT October 31, 2022 |
| |
Save time. Save paper. View your next shareholder report online as soon as it’s available. Log into www.im.bnymellon.com and sign up for eCommunications. It’s simple and only takes a few minutes. |
| |
The views expressed in this report reflect those of the portfolio manager(s) only through the end of the period covered and do not necessarily represent the views of BNY Mellon Investment Adviser, Inc. or any other person in the BNY Mellon Investment Adviser, Inc. organization. Any such views are subject to change at any time based upon market or other conditions and BNY Mellon Investment Adviser, Inc. disclaims any responsibility to update such views. These views may not be relied on as investment advice and, because investment decisions for a fund in the BNY Mellon Family of Funds are based on numerous factors, may not be relied on as an indication of trading intent on behalf of any fund in the BNY Mellon Family of Funds. |
| |
Not FDIC-Insured • Not Bank-Guaranteed • May Lose Value |
Contents
T H E F U N D
F O R M O R E I N F O R M AT I O N
Back Cover
DISCUSSION OF FUND PERFORMANCE (Unaudited)
For the period from November 1, 2021, through October 31, 2022, as provided by David France, CFA, Todd Frysinger, CFA, Vlasta Sheremeta, CFA, Michael Stoll and Marlene Walker Smith, Portfolio Managers.
Market and Fund Performance Overview
For the 12-month period ended October 31, 2022, BNY Mellon International Stock Index Fund’s (the “fund”) Investor shares produced a total return of −23.36%, and its Class I shares returned −23.18%.1 This compares with a −23.00% total return for the fund’s benchmark, the MSCI EAFE® Index (the “Index”), during the same period.2
International equities declined during the reporting period under pressure from increasing inflation, tightening central bank policies and uncertainties related to Russia’s invasion of Ukraine. The difference in returns between the fund and the Index resulted primarily from transaction costs and operating expenses that are not reflected in Index results.
The Fund’s Investment Approach
The fund seeks to match the performance of the Index. To pursue its goal, the fund generally is fully invested in stocks included in the Index and in futures whose performance is tied to certain countries included in the Index. The fund generally invests in all stocks included in the Index. The fund’s investments are selected to match the benchmark composition along individual name, country and industry weighting, and other benchmark characteristics. Under these circumstances, the fund maintains approximately the same weighting for each stock as the Index does.
Because the fund has expenses, performance will tend to be slightly lower than that of the Index. The fund attempts to have a correlation between its performance and that of the Index of at least .95, before fees and expenses. A correlation of 1.00 would mean that the fund and the Index were perfectly correlated.
The Index is an unmanaged, free float-adjusted, market capitalization-weighted index that is designed to measure the equity market performance of developed markets, excluding the United States and Canada. Each stock in the Index is weighted by its float-adjusted market capitalization.
Equities Decline as Inflation Mounts
International developed-market equities encountered challenging conditions from the start of the reporting period as inflationary pressures put a damper on markets. Commodity prices rose in response to wage increases and pandemic-related supply-chain bottlenecks, while government stimulus and accommodative monetary policies pressured prices as well. Central banks responded with increasingly hawkish rhetoric regarding interest-rate increases. The Bank of England took the lead in December 2021 with a .15% increase of the base rate to .25%. That same month, the U.S. Federal Reserve (the “Fed”) announced its intention to scale back its asset purchases earlier in
2
2022 than previously planned and signaled a more rapid increase in interest rates in the coming year.
Inflationary forces were exacerbated by the Russian invasion of Ukraine in early 2022. As the largest land war in Europe since World War II continued with no sign of an early resolution, European markets began contemplating the possibility of reduced or curtailed oil and natural gas exports from Russia, a leading source of energy commodities to the continent. Energy costs, already at elevated levels, spiked higher, along with prices of crucial agricultural chemicals and industrial metals. As inflation heated up, central banks responded with increasingly tight monetary policies, raising the specter of a possible global recession. While stocks in energy producers surged along with oil and gas prices, all other sectors lost ground. Growth-oriented shares suffered particularly sharp losses as rising interest rates caused investors to question the pace of future growth and the relative value of future earnings. Information technology, consumer discretionary and real estate stocks experienced the most significant declines, while the traditionally more defensive health care and consumer staples sectors outperformed the market average.
Economic Ties to Russia and China Detract
From a regional perspective, Western European stocks broadly lost ground due to the region’s proximity to the Russia/Ukraine conflict and its dependence on Russian energy exports. Austria, the Netherlands and Germany were hit particularly hard by the impact of the war on their domestic economies. Most Asian markets were hard hit as well. Japan saw its currency decline as the country continued to experience long-standing structural difficulties caused by its aging population and anemic growth rate. Hong Kong and South Korea were negatively affected by the prevailing, global inflationary environment and by their proximity and economic ties to China, which experienced sharply slowing economic growth due to extensive COVID-19 lockdowns and government regulatory crackdowns on several key industries.
On the other hand, a few individual country markets performed relatively well. The Norway market included a large component of energy producers, bolstering the country’s average returns. Australian shares were buoyed by the country’s significant commodity exports. Portugal saw relatively little impact from the Russia-Ukraine conflict compared with its European neighbors.
The fund’s use of derivatives during the period was limited to futures contracts employed solely to offset the impact of cash positions, which the fund holds pursuant to its operations. These derivatives helped the fund more closely match the performance of the Index.
Replicating the Performance of the Index
In seeking to match the performance of the Index, we do not actively manage investments in response to macroeconomic trends. We note, however, that rising inflation, tightening central bank policy and geopolitical uncertainties related to the war in Ukraine are likely to continue posing challenges for equity investors for the
3
DISCUSSION OF FUND PERFORMANCE (Unaudited) (continued)
foreseeable future. With global inflation running higher than most central banks are willing to tolerate, the question remains open as to how soon monetary authorities can bring inflation under control, and to what extent their actions will slow economic growth. As always, we continue to monitor factors that affect the fund’s investments.
November 15, 2022
1 Total return includes reinvestment of dividends and any capital gains paid. The fund’s return reflects the absorption of certain fund expenses by BNY Mellon Investment Adviser, Inc. pursuant to an agreement. Had these expenses not been absorbed, returns would have been lower. Past performance is no guarantee of future results. Share price, yield and investment return fluctuate such that upon redemption, fund shares may be worth more or less than their original cost.
2 Source: Lipper Inc. — The MSCI EAFE® Index (Europe, Australasia, Far East) is a free float-adjusted, market capitalization-weighted index that is designed to measure the equity market performance of developed markets, excluding the U.S. and Canada. It reflects reinvestment of net dividends and, where applicable, capital gain distributions. Investors cannot invest directly in any index.
Equities are subject generally to market, market sector, market liquidity, issuer and investment style risks, among other factors, to varying degrees, all of which are more fully described in the fund’s prospectus. The fund uses an indexing strategy. It does not attempt to manage market volatility, use defensive strategies or reduce the effects of any long-term periods of poor stock performance.
Recent market risks include pandemic risks related to COVID-19. The effects of COVID-19 have contributed to increased volatility in global markets and will likely affect certain countries, companies, industries and market sectors more dramatically than others. To the extent the fund may overweight its investments in certain countries, companies, industries or market sectors, such positions will increase the fund’s exposure to risk of loss from adverse developments affecting those countries, companies, industries or sectors.
Currencies are subject to the risk that those currencies will decline in value relative to a local currency, or, in the case of hedged positions, that the local currency will decline relative to the currency being hedged. Each of these risks could increase the fund’s volatility.
Investing in foreign-denominated and/or domiciled securities involves special risks, including changes in currency exchange rates, political, economic and social instability, limited company information, differing auditing and legal standards and less market liquidity. These risks generally are greater with emerging-market countries. Diversification cannot assure a profit or protect against loss.
The fund may, but is not required, to use derivative instruments. A small investment in derivatives could have a potentially large impact on the fund’s performance. The use of derivatives involves risks different from, or possibly greater than, the risks associated with investing directly in the underlying assets.
4
FUND PERFORMANCE (Unaudited)
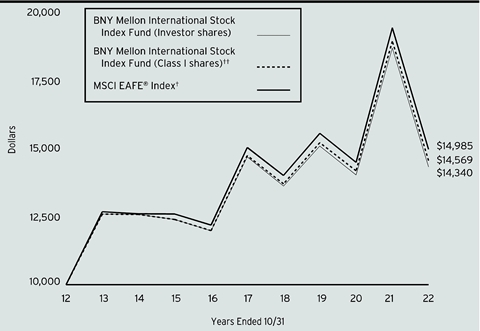
Comparison of change in value of a $10,000 investment in Investor shares and Class I shares of BNY Mellon International Stock Index Fund with a hypothetical investment of $10,000 in the MSCI EAFE® Index (the “Index”).
† Source: Lipper Inc.
†† The total return figures presented for Class I shares of the fund reflect the performance of the fund’s Investor shares for the period prior to 8/31/16 (the inception date for Class I shares).
Past performance is not predictive of future performance.
The above graph compares a hypothetical investment of $10,000 made in each of the Investor shares and Class I shares of BNY Mellon International Stock Index Fund on 10/31/12 to a hypothetical investment of $10,000 made in the Index on that date. All dividends and capital gain distributions are reinvested.
The fund’s performance shown in the line graph above takes into account all applicable fees and expenses. The Index (Europe, Australasia, Far East) is a free float-adjusted market capitalization-weighted index that is designed to measure the equity market performance of developed markets, excluding the U.S. and Canada. Unlike a mutual fund, the Index is not subject to charges, fees and other expenses. Investors cannot invest directly in any index. Further information relating to fund performance, including expense reimbursements, if applicable, is contained in the Financial Highlights section of the prospectus and elsewhere in this report.
5
FUND PERFORMANCE (Unaudited) (continued)
| | | | | | |
| | Average Annual Total Returns as of 10/31/2022 |
| Inception Date | 1 Year | 5 Years | 10 Years |
Investor Shares | 6/30/97 | -23.36% | -.50% | 3.67% |
Class I Shares | 8/31/16 | -23.18% | -.25% | 3.84%† |
MSCI EAFE® Index | | -23.00% | -.09% | 4.13% |
† The total return performance figures presented for Class I shares of the fund reflect the performance of the fund’s Investor shares for the period prior to 8/31/16 (the inception date for Class I shares).
The performance data quoted represents past performance, which is no guarantee of future results. Share price and investment return fluctuate and an investor’s shares may be worth more or less than original cost upon redemption. Current performance may be lower or higher than the performance quoted. Go to www.im.bnymellon.com for the fund’s most recent month-end returns.
The fund’s performance shown in the graph and table does not reflect the deduction of taxes that a shareholder would pay on fund distributions or the redemption of fund shares.
6
UNDERSTANDING YOUR FUND’S EXPENSES (Unaudited)
As a mutual fund investor, you pay ongoing expenses, such as management fees and other expenses. Using the information below, you can estimate how these expenses affect your investment and compare them with the expenses of other funds. You also may pay one-time transaction expenses, including sales charges (loads) and redemption fees, which are not shown in this section and would have resulted in higher total expenses. For more information, see your fund’s prospectus or talk to your financial adviser.
Review your fund’s expenses
The table below shows the expenses you would have paid on a $1,000 investment in BNY Mellon International Stock Index Fund from May 1, 2022 to October 31, 2022. It also shows how much a $1,000 investment would be worth at the close of the period, assuming actual returns and expenses.
| | | | | |
Expenses and Value of a $1,000 Investment | |
Assume actual returns for the six months ended October 31, 2022 | |
| | | | |
| | Investor Shares | Class I | |
Expenses paid per $1,000† | $2.84 | $1.66 | |
Ending value (after expenses) | $879.50 | $880.60 | |
COMPARING YOUR FUND’S EXPENSES WITH THOSE OF OTHER FUNDS (Unaudited)
Using the SEC’s method to compare expenses
The Securities and Exchange Commission (“SEC”) has established guidelines to help investors assess fund expenses. Per these guidelines, the table below shows your fund’s expenses based on a $1,000 investment, assuming a hypothetical 5% annualized return. You can use this information to compare the ongoing expenses (but not transaction expenses or total cost) of investing in the fund with those of other funds. All mutual fund shareholder reports will provide this information to help you make this comparison. Please note that you cannot use this information to estimate your actual ending account balance and expenses paid during the period.
| | | | | |
Expenses and Value of a $1,000 Investment | |
Assuming a hypothetical 5% annualized return for the six months ended October 31, 2022 | |
| | | | |
| | Investor Shares | Class I | |
Expenses paid per $1,000† | $3.06 | $1.79 | |
Ending value (after expenses) | $1,022.18 | $1,023.44 | |
† | Expenses are equal to the fund’s annualized expense ratio of .60% for Investor Shares and .35% for Class I, multiplied by the average account value over the period, multiplied by 184/365 (to reflect the one-half year period). |
7
STATEMENT OF INVESTMENTS
October 31, 2022
| | | | | | | | |
| |
Description | | | | Shares | | Value ($) | |
Common Stocks - 98.0% | | | | | |
Australia - 7.7% | | | | | |
Ampol Ltd. | | | | 6,055 | | 105,704 | |
APA Group | | | | 31,566 | | 211,662 | |
Aristocrat Leisure Ltd. | | | | 16,129 | | 380,608 | |
ASX Ltd. | | | | 5,181 | | 223,887 | |
Aurizon Holdings Ltd. | | | | 49,262 | | 113,799 | |
Australia & New Zealand Banking Group Ltd. | | | | 79,763 | | 1,300,253 | |
BHP Group Ltd. | | | | 63,529 | | 1,512,835 | |
BHP Group Ltd. | | | | 71,953 | | 1,722,830 | |
BlueScope Steel Ltd. | | | | 12,774 | | 127,548 | |
Brambles Ltd. | | | | 38,422 | | 286,572 | |
Cochlear Ltd. | | | | 1,760 | | 225,207 | |
Coles Group Ltd. | | | | 35,760 | | 373,172 | |
Commonwealth Bank of Australia | | | | 45,668 | | 3,048,406 | |
Computershare Ltd. | | | | 14,542 | | 235,211 | |
CSL Ltd. | | | | 12,892 | | 2,310,385 | |
Dexus | | | | 28,785 | | 143,504 | |
Domino's Pizza Enterprises Ltd. | | | | 1,655 | | 67,250 | |
Endeavour Group Ltd. | | | | 35,949 | | 164,171 | |
Evolution Mining Ltd. | | | | 50,473 | a | 66,731 | |
Fortescue Metals Group Ltd. | | | | 45,321 | | 422,932 | |
Goodman Group | | | | 44,999 | | 490,129 | |
IDP Education Ltd. | | | | 5,587 | | 105,092 | |
Insurance Australia Group Ltd. | | | | 65,973 | | 206,215 | |
LendLease Corp. | | | | 18,816 | | 104,217 | |
Macquarie Group Ltd. | | | | 9,754 | | 1,051,519 | |
Medibank Private Ltd. | | | | 75,777 | | 136,280 | |
Mineral Resources Ltd. | | | | 4,445 | | 206,012 | |
Mirvac Group | | | | 101,973 | | 134,579 | |
National Australia Bank Ltd. | | | | 85,905 | | 1,776,570 | |
Newcrest Mining Ltd. | | | | 23,902 | | 263,959 | |
Northern Star Resources Ltd. | | | | 31,441 | | 174,641 | |
Orica Ltd. | | | | 11,650 | | 102,893 | |
Origin Energy Ltd. | | | | 47,135 | | 167,301 | |
Qantas Airways Ltd. | | | | 24,733 | b | 92,234 | |
QBE Insurance Group Ltd. | | | | 39,696 | | 309,923 | |
Ramsay Health Care Ltd. | | | | 4,894 | | 183,450 | |
REA Group Ltd. | | | | 1,409 | | 109,128 | |
Reece Ltd. | | | | 6,116 | a | 60,456 | |
Rio Tinto Ltd. | | | | 9,935 | | 556,609 | |
Santos Ltd. | | | | 86,111 | | 425,475 | |
8
| | | | | | | | |
| |
Description | | | | Shares | | Value ($) | |
Common Stocks - 98.0% (continued) | | | | | |
Australia - 7.7% (continued) | | | | | |
Scentre Group | | | | 138,909 | | 256,901 | |
SEEK Ltd. | | | | 8,998 | | 123,679 | |
Sonic Healthcare Ltd. | | | | 12,206 | | 255,255 | |
South32 Ltd. | | | | 124,294 | | 283,984 | |
Stockland | | | | 63,887 | | 147,139 | |
Suncorp Group Ltd. | | | | 33,791 | | 245,540 | |
Telstra Group Ltd. | | | | 108,684 | b | 272,517 | |
The GPT Group | | | | 50,995 | | 140,754 | |
The Lottery Corp. | | | | 59,568 | b | 163,148 | |
Transurban Group | | | | 82,181 | | 695,475 | |
Treasury Wine Estates Ltd. | | | | 19,682 | | 162,686 | |
Vicinity Ltd. | | | | 103,557 | | 128,829 | |
Washington H Soul Pattinson & Co. | | | | 5,769 | | 102,834 | |
Wesfarmers Ltd. | | | | 30,353 | | 879,106 | |
Westpac Banking Corp. | | | | 93,700 | | 1,440,935 | |
WiseTech Global Ltd. | | | | 3,923 | | 145,158 | |
Woodside Energy Group Ltd. | | | | 39,337 | | 911,318 | |
Woodside Energy Group Ltd. | | | | 11,479 | | 264,804 | |
Woolworths Group Ltd. | | | | 32,487 | | 685,115 | |
| | | | | 27,004,526 | |
Austria - .2% | | | | | |
Erste Group Bank AG | | | | 9,202 | | 226,697 | |
OMV AG | | | | 3,905 | | 179,791 | |
Verbund AG | | | | 1,811 | | 141,870 | |
Voestalpine AG | | | | 3,196 | | 69,339 | |
| | | | | 617,697 | |
Belgium - .8% | | | | | |
Ageas SA | | | | 4,316 | | 149,263 | |
Anheuser-Busch InBev SA | | | | 23,246 | | 1,164,356 | |
D'ieteren Group | | | | 666 | | 110,661 | |
Elia Group SA | | | | 848 | | 107,211 | |
Groupe Bruxelles Lambert NV | | | | 1,232 | | 90,737 | |
Groupe Bruxelles Lambert NV | | | | 1,430 | | 105,320 | |
KBC Group NV | | | | 6,694 | | 334,999 | |
Proximus SADP | | | | 4,133 | | 43,344 | |
Sofina SA | | | | 409 | | 79,722 | |
Solvay SA | | | | 1,983 | | 178,510 | |
UCB SA | | | | 3,384 | | 255,170 | |
Umicore SA | | | | 5,605 | | 184,511 | |
Warehouses De Pauw, CVA | | | | 4,051 | | 103,964 | |
| | | | | 2,907,768 | |
Chile - .0% | | | | | |
Antofagasta PLC | | | | 10,554 | | 142,047 | |
9
STATEMENT OF INVESTMENTS (continued)
| | | | | | | | |
| |
Description | | | | Shares | | Value ($) | |
Common Stocks - 98.0% (continued) | | | | | |
Denmark - 2.7% | | | | | |
AP Moller - Maersk A/S, Cl. A | | | | 83 | | 165,871 | |
AP Moller - Maersk A/S, Cl. B | | | | 134 | | 279,793 | |
Carlsberg AS, Cl. B | | | | 2,659 | | 313,088 | |
Chr. Hansen Holding A/S | | | | 2,808 | | 155,741 | |
Coloplast A/S, Cl. B | | | | 3,179 | | 354,222 | |
Danske Bank A/S | | | | 18,460 | | 297,592 | |
Demant A/S | | | | 2,466 | b | 67,299 | |
DSV A/S | | | | 5,010 | | 677,201 | |
Genmab A/S | | | | 1,760 | b | 678,762 | |
GN Store Nord AS | | | | 3,451 | a | 73,322 | |
Novo Nordisk A/S, Cl. B | | | | 44,304 | | 4,814,749 | |
Novozymes A/S, Cl. B | | | | 5,474 | | 287,167 | |
Orsted AS | | | | 5,063 | c | 417,175 | |
Pandora A/S | | | | 2,414 | | 126,978 | |
Rockwool A/S, Cl. B | | | | 238 | | 47,298 | |
Tryg A/S | | | | 9,636 | | 208,372 | |
Vestas Wind Systems A/S | | | | 27,027 | | 531,197 | |
| | | | | 9,495,827 | |
Finland - 1.2% | | | | | |
Elisa OYJ | | | | 3,800 | | 183,626 | |
Fortum OYJ | | | | 11,752 | | 165,440 | |
Kesko OYJ, Cl. B | | | | 7,310 | | 142,208 | |
Kone OYJ, Cl. B | | | | 9,096 | | 372,253 | |
Neste OYJ | | | | 11,555 | | 505,848 | |
Nokia OYJ | | | | 144,825 | | 642,959 | |
Nordea Bank Abp | | | | 91,276 | | 872,319 | |
Orion OYJ, Cl. B | | | | 2,812 | | 129,361 | |
Sampo OYJ, Cl. A | | | | 12,815 | a | 585,674 | |
Stora Enso OYJ, Cl. R | | | | 14,674 | | 191,082 | |
UPM-Kymmene OYJ | | | | 14,284 | | 478,282 | |
Wartsila OYJ Abp | | | | 12,669 | | 86,229 | |
| | | | | 4,355,281 | |
France - 11.2% | | | | | |
Accor SA | | | | 4,409 | | 105,483 | |
Aeroports de Paris | | | | 794 | | 107,383 | |
Air Liquide SA | | | | 13,995 | | 1,828,010 | |
Airbus SE | | | | 15,819 | | 1,713,078 | |
Alstom SA | | | | 8,617 | | 177,363 | |
Amundi SA | | | | 1,656 | c | 78,075 | |
Arkema SA | | | | 1,596 | | 126,190 | |
AXA SA | | | | 50,020 | | 1,234,495 | |
BioMerieux | | | | 1,121 | | 99,160 | |
BNP Paribas SA | | | | 29,731 | | 1,392,835 | |
10
| | | | | | | | |
| |
Description | | | | Shares | | Value ($) | |
Common Stocks - 98.0% (continued) | | | | | |
France - 11.2% (continued) | | | | | |
Bollore SE | | | | 23,446 | | 117,255 | |
Bouygues SA | | | | 6,142 | | 175,159 | |
Bureau Veritas SA | | | | 7,869 | | 194,790 | |
Capgemini SE | | | | 4,383 | | 719,128 | |
Carrefour SA | | | | 16,157 | | 259,884 | |
Cie de Saint-Gobain | | | | 13,323 | | 544,293 | |
Cie Generale des Etablissements Michelin SCA | | | | 18,156 | | 462,467 | |
Covivio | | | | 1,215 | | 65,019 | |
Credit Agricole SA | | | | 32,393 | | 293,689 | |
Danone SA | | | | 17,182 | | 854,249 | |
Dassault Aviation SA | | | | 670 | | 99,501 | |
Dassault Systemes SE | | | | 17,838 | | 597,223 | |
Edenred | | | | 6,763 | | 347,030 | |
Eiffage SA | | | | 2,226 | | 201,187 | |
Electricite de France SA | | | | 14,890 | | 175,854 | |
Engie SA | | | | 48,881 | | 634,942 | |
EssilorLuxottica SA | | | | 7,699 | | 1,219,526 | |
Eurazeo SE | | | | 1,155 | | 65,906 | |
Gecina SA | | | | 1,255 | | 111,826 | |
Getlink SE | | | | 11,773 | | 186,373 | |
Hermes International | | | | 848 | | 1,098,246 | |
Ipsen SA | | | | 1,004 | | 103,127 | |
Kering SA | | | | 2,002 | | 916,387 | |
Klepierre SA | | | | 5,840 | | 117,319 | |
La Francaise des Jeux SAEM | | | | 2,871 | c | 93,552 | |
Legrand SA | | | | 7,158 | | 545,078 | |
L'Oreal SA | | | | 6,459 | | 2,027,894 | |
LVMH SE | | | | 7,430 | | 4,687,409 | |
Orange SA | | | | 53,393 | | 509,438 | |
Pernod Ricard SA | | | | 5,607 | | 983,734 | |
Publicis Groupe SA | | | | 6,105 | | 341,954 | |
Remy Cointreau SA | | | | 642 | | 98,326 | |
Renault SA | | | | 5,144 | b | 158,455 | |
Safran SA | | | | 9,147 | | 1,017,009 | |
Sanofi | | | | 30,475 | | 2,631,415 | |
Sartorius Stedim Biotech | | | | 740 | | 234,791 | |
Schneider Electric SE | | | | 14,520 | | 1,837,578 | |
SEB SA | | | | 594 | | 38,637 | |
Societe Generale SA | | | | 21,284 | | 487,869 | |
Sodexo SA | | | | 2,368 | | 209,843 | |
Teleperformance | | | | 1,572 | | 421,096 | |
Thales SA | | | | 2,856 | | 362,975 | |
11
STATEMENT OF INVESTMENTS (continued)
| | | | | | | | |
| |
Description | | | | Shares | | Value ($) | |
Common Stocks - 98.0% (continued) | | | | | |
France - 11.2% (continued) | | | | | |
TotalEnergies SE | | | | 66,352 | | 3,626,156 | |
Ubisoft Entertainment SA | | | | 2,586 | b | 70,896 | |
Unibail-Rodamco-Westfield | | | | 3,137 | b | 148,165 | |
Valeo | | | | 5,642 | | 92,887 | |
Veolia Environnement SA | | | | 17,812 | | 397,144 | |
Vinci SA | | | | 14,280 | | 1,312,300 | |
Vivendi SE | | | | 19,260 | | 157,564 | |
Wendel SE | | | | 714 | | 55,875 | |
Worldline SA | | | | 6,390 | b,c | 279,470 | |
| | | | | 39,249,962 | |
Germany - 7.2% | | | | | |
adidas AG | | | | 4,627 | | 452,598 | |
Allianz SE | | | | 10,931 | | 1,967,984 | |
BASF SE | | | | 24,581 | | 1,103,453 | |
Bayer AG | | | | 26,292 | | 1,383,144 | |
Bayerische Motoren Werke AG | | | | 8,861 | | 696,347 | |
Bechtle AG | | | | 2,259 | | 78,137 | |
Beiersdorf AG | | | | 2,698 | | 259,111 | |
Brenntag SE | | | | 4,135 | | 251,021 | |
Carl Zeiss Meditec AG-BR | | | | 1,070 | | 129,599 | |
Commerzbank AG | | | | 28,489 | b | 227,898 | |
Continental AG | | | | 2,916 | | 151,233 | |
Covestro AG | | | | 5,171 | c | 176,062 | |
Daimler Truck Holding AG | | | | 12,113 | b | 323,203 | |
Delivery Hero SE | | | | 4,344 | b,c | 143,174 | |
Deutsche Bank AG | | | | 55,312 | | 527,981 | |
Deutsche Boerse AG | | | | 5,085 | | 827,327 | |
Deutsche Lufthansa AG | | | | 16,326 | b | 112,023 | |
Deutsche Post AG | | | | 26,528 | | 941,215 | |
Deutsche Telekom AG | | | | 86,743 | | 1,643,049 | |
E.ON SE | | | | 60,086 | | 503,422 | |
Evonik Industries AG | | | | 5,612 | | 103,462 | |
Fresenius Medical Care AG & Co. KGaA | | | | 5,490 | | 151,856 | |
Fresenius SE & Co. KGaA | | | | 11,210 | | 258,097 | |
GEA Group AG | | | | 4,034 | | 141,123 | |
Hannover Rueck SE | | | | 1,614 | | 262,846 | |
HeidelbergCement AG | | | | 3,876 | | 178,700 | |
HelloFresh SE | | | | 4,422 | b | 88,540 | |
Henkel AG & Co. KGaA | | | | 2,856 | | 167,794 | |
Infineon Technologies AG | | | | 34,950 | | 850,925 | |
KION Group AG | | | | 1,993 | | 44,253 | |
Knorr-Bremse AG | | | | 1,966 | | 88,503 | |
LEG Immobilien SE | | | | 1,949 | | 127,348 | |
12
| | | | | | | | |
| |
Description | | | | Shares | | Value ($) | |
Common Stocks - 98.0% (continued) | | | | | |
Germany - 7.2% (continued) | | | | | |
Mercedes-Benz Group AG | | | | 21,474 | | 1,243,587 | |
Merck KGaA | | | | 3,459 | | 564,062 | |
MTU Aero Engines AG | | | | 1,427 | | 255,556 | |
Muenchener Rueckversicherungs-Gesellschaft AG | | | | 3,749 | | 990,489 | |
Nemetschek SE | | | | 1,559 | | 74,497 | |
Puma SE | | | | 2,843 | | 125,898 | |
Rational AG | | | | 141 | | 79,583 | |
Rheinmetall AG | | | | 1,161 | | 188,756 | |
RWE AG | | | | 17,193 | | 662,661 | |
SAP SE | | | | 27,946 | | 2,698,172 | |
Scout24 SE | | | | 2,172 | c | 111,362 | |
Siemens AG | | | | 20,473 | | 2,238,079 | |
Siemens Energy AG | | | | 11,816 | | 137,961 | |
Siemens Healthineers AG | | | | 7,547 | c | 347,436 | |
Symrise AG | | | | 3,554 | | 362,995 | |
Telefonica Deutschland Holding AG | | | | 28,851 | | 62,895 | |
Uniper SE | | | | 2,650 | a | 7,946 | |
United Internet AG | | | | 2,609 | | 48,794 | |
Volkswagen AG | | | | 790 | | 135,064 | |
Vonovia SE | | | | 19,231 | | 425,720 | |
Zalando SE | | | | 6,013 | b,c | 138,635 | |
| | | | | 25,261,576 | |
Hong Kong - 2.5% | | | | | |
AIA Group Ltd. | | | | 322,400 | | 2,434,668 | |
BOC Hong Kong Holdings Ltd. | | | | 99,000 | | 307,999 | |
Budweiser Brewing Co. APAC | | | | 47,400 | c | 99,795 | |
Chow Tai Fook Jewellery Group Ltd. | | | | 51,200 | | 87,684 | |
CK Asset Holdings Ltd. | | | | 53,475 | | 295,740 | |
CK Hutchison Holdings Ltd. | | | | 71,975 | | 356,848 | |
CK Infrastructure Holdings Ltd. | | | | 17,500 | | 83,202 | |
CLP Holdings Ltd. | | | | 43,788 | | 293,768 | |
ESR Group Ltd. | | | | 53,200 | c | 90,926 | |
Futu Holdings Ltd., ADR | | | | 1,571 | a,b | 53,194 | |
Galaxy Entertainment Group Ltd. | | | | 58,277 | a | 265,548 | |
Hang Lung Properties Ltd. | | | | 54,000 | | 67,786 | |
Hang Seng Bank Ltd. | | | | 20,500 | | 288,226 | |
Henderson Land Development Co. | | | | 38,138 | | 93,399 | |
HK Electric Investments Ltd. | | | | 71,500 | | 45,488 | |
HKT Trust & HKT Ltd. | | | | 101,660 | | 114,941 | |
Hong Kong & China Gas Co. | | | | 299,267 | a | 230,769 | |
Hong Kong Exchanges & Clearing Ltd. | | | | 32,242 | | 856,012 | |
Hongkong Land Holdings Ltd. | | | | 31,400 | | 120,978 | |
13
STATEMENT OF INVESTMENTS (continued)
| | | | | | | | |
| |
Description | | | | Shares | | Value ($) | |
Common Stocks - 98.0% (continued) | | | | | |
Hong Kong - 2.5% (continued) | | | | | |
Jardine Matheson Holdings Ltd. | | | | 4,346 | | 200,092 | |
Link REIT | | | | 56,522 | | 334,391 | |
MTR Corp. | | | | 41,756 | | 183,850 | |
New World Development Co. | | | | 40,141 | | 81,955 | |
Power Assets Holdings Ltd. | | | | 37,500 | | 179,424 | |
Sino Land Co. | | | | 93,730 | a | 100,265 | |
SITC International Holdings Co. | | | | 34,000 | | 55,748 | |
Sun Hung Kai Properties Ltd. | | | | 38,699 | | 416,692 | |
Swire Pacific Ltd., Cl. A | | | | 13,500 | | 89,370 | |
Swire Properties Ltd. | | | | 31,200 | | 59,989 | |
Techtronic Industries Co. | | | | 36,865 | | 347,749 | |
WH Group Ltd. | | | | 228,885 | c | 115,478 | |
Wharf Real Estate Investment Co. | | | | 44,311 | | 174,400 | |
Xinyi Glass Holdings Ltd. | | | | 48,000 | | 61,792 | |
| | | | | 8,588,166 | |
Ireland - 1.0% | | | | | |
AerCap Holdings NV | | | | 3,539 | b | 189,018 | |
CRH PLC | | | | 20,424 | | 734,851 | |
DCC PLC | | | | 2,640 | | 146,421 | |
Experian PLC | | | | 24,643 | | 783,282 | |
Flutter Entertainment PLC | | | | 4,469 | b | 590,423 | |
James Hardie Industries PLC-CDI | | | | 11,919 | | 261,848 | |
Kerry Group PLC, Cl. A | | | | 4,338 | | 377,016 | |
Kingspan Group PLC | | | | 4,132 | | 208,376 | |
Smurfit Kappa Group PLC | | | | 6,606 | | 218,565 | |
| | | | | 3,509,800 | |
Israel - .9% | | | | | |
Azrieli Group Ltd. | | | | 1,136 | | 84,160 | |
Bank Hapoalim BM | | | | 33,989 | | 327,461 | |
Bank Leumi Le-Israel BM | | | | 41,316 | | 393,941 | |
Bezeq The Israeli Telecommunication Corporation | | | | 55,260 | | 97,797 | |
Check Point Software Technologies Ltd. | | | | 2,743 | b | 354,478 | |
CyberArk Software Ltd. | | | | 1,090 | b | 171,032 | |
Elbit Systems Ltd. | | | | 710 | | 143,547 | |
ICL Group Ltd. | | | | 18,946 | | 170,412 | |
Israel Discount Bank Ltd., Cl. A | | | | 33,106 | | 188,169 | |
Mizrahi Tefahot Bank Ltd. | | | | 4,120 | | 155,669 | |
NICE Ltd. | | | | 1,699 | b | 321,712 | |
Teva Pharmaceutical Industries Ltd., ADR | | | | 29,716 | b | 265,067 | |
Tower Semiconductor Ltd. | | | | 2,919 | b | 124,907 | |
Wix.com Ltd. | | | | 1,532 | b | 128,841 | |
14
| | | | | | | | |
| |
Description | | | | Shares | | Value ($) | |
Common Stocks - 98.0% (continued) | | | | | |
Israel - .9% (continued) | | | | | |
Zim Integrated Shipping Services Ltd. | | | | 2,256 | a | 52,993 | |
| | | | | 2,980,186 | |
Italy - 2.0% | | | | | |
Amplifon SPA | | | | 3,401 | | 84,542 | |
Assicurazioni Generali SPA | | | | 29,723 | a | 446,205 | |
Atlantia SPA | | | | 13,260 | | 295,918 | |
Davide Campari-Milano NV | | | | 13,989 | | 125,812 | |
DiaSorin SPA | | | | 614 | | 80,313 | |
Enel SPA | | | | 217,670 | | 973,393 | |
Eni SPA | | | | 67,547 | | 888,892 | |
Ferrari NV | | | | 3,373 | | 665,622 | |
FinecoBank Banca Fineco SPA | | | | 16,558 | | 223,617 | |
Infrastrutture Wireless Italiane SPA | | | | 9,313 | c | 82,273 | |
Intesa Sanpaolo SPA | | | | 442,010 | | 843,995 | |
Mediobanca Banca Di Credito Finanziario SPA | | | | 15,945 | | 144,728 | |
Moncler SPA | | | | 5,493 | | 237,187 | |
Nexi SPA | | | | 14,148 | b,c | 122,815 | |
Poste Italiane SPA | | | | 13,982 | c | 122,036 | |
Prysmian SPA | | | | 6,817 | | 222,263 | |
Recordati Industria Chimica E Farmaceutica SPA | | | | 2,809 | | 105,622 | |
Snam SPA | | | | 53,967 | | 240,348 | |
Telecom Italia SPA | | | | 266,668 | a,b | 52,284 | |
Terna Rete Elettrica Nazionale | | | | 37,655 | | 249,868 | |
UniCredit SPA | | | | 55,538 | | 689,775 | |
| | | | | 6,897,508 | |
Japan - 21.8% | | | | | |
Advantest Corp. | | | | 5,100 | | 268,099 | |
Aeon Co. | | | | 17,500 | | 326,627 | |
AGC Inc. | | | | 5,260 | | 164,932 | |
Aisin Corp. | | | | 3,900 | | 99,995 | |
Ajinomoto Co. | | | | 12,200 | | 335,444 | |
ANA Holdings Inc. | | | | 4,300 | | 83,448 | |
Asahi Group Holdings Ltd. | | | | 12,400 | | 347,095 | |
Asahi Intecc Co. | | | | 5,800 | | 98,760 | |
Asahi Kasei Corp. | | | | 33,600 | | 215,574 | |
Astellas Pharma Inc. | | | | 49,095 | | 675,376 | |
Azbil Corp. | | | | 2,900 | | 78,832 | |
Bandai Namco Holdings Inc. | | | | 5,350 | | 353,899 | |
Bridgestone Corp. | | | | 15,300 | | 551,397 | |
Brother Industries Ltd. | | | | 6,000 | | 102,069 | |
Canon Inc. | | | | 26,817 | | 570,579 | |
15
STATEMENT OF INVESTMENTS (continued)
| | | | | | | | |
| |
Description | | | | Shares | | Value ($) | |
Common Stocks - 98.0% (continued) | | | | | |
Japan - 21.8% (continued) | | | | | |
Capcom Co. | | | | 4,700 | | 131,221 | |
Central Japan Railway Co. | | | | 3,900 | | 452,034 | |
Chubu Electric Power Co. | | | | 17,100 | | 138,779 | |
Chugai Pharmaceutical Co. | | | | 17,984 | | 416,997 | |
Concordia Financial Group Ltd. | | | | 30,200 | | 91,976 | |
CyberAgent Inc. | | | | 11,800 | | 96,767 | |
Dai Nippon Printing Co. | | | | 5,800 | | 116,137 | |
Daifuku Co. | | | | 2,700 | | 123,728 | |
Dai-ichi Life Holdings Inc. | | | | 26,200 | | 414,509 | |
Daiichi Sankyo Co. | | | | 46,849 | | 1,502,237 | |
Daikin Industries Ltd. | | | | 6,700 | | 1,007,697 | |
Daito Trust Construction Co. | | | | 1,600 | | 158,234 | |
Daiwa House Industry Co. | | | | 16,000 | | 323,919 | |
Daiwa House REIT Investment Corp. | | | | 58 | | 117,005 | |
Daiwa Securities Group Inc. | | | | 35,700 | | 138,966 | |
Denso Corp. | | | | 11,600 | | 575,985 | |
Dentsu Group Inc. | | | | 5,800 | | 180,664 | |
Disco Corp. | | | | 700 | | 167,509 | |
East Japan Railway Co. | | | | 8,100 | | 437,309 | |
Eisai Co. | | | | 6,700 | | 404,065 | |
ENEOS Holdings Inc. | | | | 82,126 | | 270,398 | |
FANUC Corp. | | | | 5,129 | | 674,102 | |
Fast Retailing Co. | | | | 1,558 | | 868,865 | |
Fuji Electric Co. | | | | 3,400 | | 131,591 | |
FUJIFILM Holdings Corp. | | | | 9,600 | | 438,904 | |
Fujitsu Ltd. | | | | 5,280 | | 607,632 | |
GLP J-REIT | | | | 117 | | 121,322 | |
GMO Payment Gateway Inc. | | | | 1,100 | | 78,934 | |
Hakuhodo DY Holdings Inc. | | | | 6,400 | | 54,016 | |
Hamamatsu Photonics K.K. | | | | 3,800 | | 171,660 | |
Hankyu Hanshin Holdings Inc. | | | | 6,100 | | 181,059 | |
Hikari Tsushin Inc. | | | | 500 | | 60,286 | |
Hirose Electric Co. | | | | 733 | | 95,138 | |
Hitachi Construction Machinery Co. | | | | 3,000 | | 58,545 | |
Hitachi Ltd. | | | | 25,880 | | 1,172,296 | |
Hitachi Metals Ltd. | | | | 6,000 | | 87,637 | |
Honda Motor Co. | | | | 43,659 | | 989,833 | |
Hoshizaki Corp. | | | | 3,000 | | 85,829 | |
Hoya Corp. | | | | 9,800 | | 913,723 | |
Hulic Co. | | | | 10,600 | | 76,959 | |
Ibiden Co. | | | | 3,000 | | 101,383 | |
Idemitsu Kosan Co. | | | | 5,575 | | 121,783 | |
Iida Group Holdings Co. | | | | 4,000 | | 55,545 | |
16
| | | | | | | | |
| |
Description | | | | Shares | | Value ($) | |
Common Stocks - 98.0% (continued) | | | | | |
Japan - 21.8% (continued) | | | | | |
Inpex Corp. | | | | 27,800 | | 283,989 | |
Isuzu Motors Ltd. | | | | 15,600 | | 182,863 | |
Ito En Ltd. | | | | 1,500 | | 52,839 | |
ITOCHU Corp. | | | | 31,800 | | 822,627 | |
Itochu Techno-Solutions Corp. | | | | 2,200 | | 50,959 | |
Japan Airlines Co. | | | | 4,000 | | 74,528 | |
Japan Exchange Group Inc. | | | | 13,400 | | 175,939 | |
Japan Metropolitan Fund Investment Corp. | | | | 187 | | 137,667 | |
Japan Post Bank Co. | | | | 11,400 | | 75,857 | |
Japan Post Holdings Co. | | | | 63,600 | | 427,230 | |
Japan Post Insurance Co. | | | | 5,500 | | 81,237 | |
Japan Real Estate Investment Corp. | | | | 33 | | 138,238 | |
Japan Tobacco Inc. | | | | 32,100 | | 531,816 | |
JFE Holdings Inc. | | | | 13,160 | | 120,272 | |
JSR Corp. | | | | 4,900 | | 93,303 | |
Kajima Corp. | | | | 11,300 | | 106,388 | |
Kakaku.com Inc. | | | | 3,700 | | 62,488 | |
Kao Corp. | | | | 12,700 | | 476,597 | |
KDDI Corp. | | | | 43,163 | | 1,274,545 | |
Keio Corp. | | | | 2,800 | | 98,252 | |
Keisei Electric Railway Co. | | | | 3,500 | | 92,787 | |
Keyence Corp. | | | | 5,140 | | 1,937,149 | |
Kikkoman Corp. | | | | 3,900 | | 211,309 | |
Kintetsu Group Holdings Co. | | | | 4,635 | | 156,548 | |
Kirin Holdings Co. | | | | 22,000 | | 323,537 | |
Kobayashi Pharmaceutical Co. | | | | 1,500 | | 79,781 | |
Kobe Bussan Co. | | | | 4,000 | | 86,793 | |
Koei Tecmo Holdings Co. | | | | 3,240 | | 48,954 | |
Koito Manufacturing Co. | | | | 5,800 | | 82,385 | |
Komatsu Ltd. | | | | 24,700 | | 472,777 | |
Konami Group Corp. | | | | 2,500 | | 109,825 | |
Kose Corp. | | | | 900 | | 89,667 | |
Kubota Corp. | | | | 27,300 | | 380,849 | |
Kurita Water Industries Ltd. | | | | 2,800 | | 102,444 | |
Kyocera Corp. | | | | 8,600 | | 429,227 | |
Kyowa Kirin Co. | | | | 7,205 | | 169,819 | |
Lasertec Corp. | | | | 2,000 | | 284,895 | |
LIXIL Corp. | | | | 7,824 | | 118,354 | |
M3 Inc. | | | | 11,800 | | 352,441 | |
Makita Corp. | | | | 6,000 | | 109,667 | |
Marubeni Corp. | | | | 41,400 | | 362,534 | |
Mazda Motor Corp. | | | | 15,200 | | 102,462 | |
17
STATEMENT OF INVESTMENTS (continued)
| | | | | | | | |
| |
Description | | | | Shares | | Value ($) | |
Common Stocks - 98.0% (continued) | | | | | |
Japan - 21.8% (continued) | | | | | |
McDonald's Holdings Co. | | | | 2,400 | | 83,281 | |
MEIJI Holdings Co. | | | | 3,042 | | 125,121 | |
Minebea Mitsumi Inc. | | | | 9,900 | | 146,589 | |
MISUMI Group Inc. | | | | 7,738 | | 164,564 | |
Mitsubishi Chemical Group Corp. | | | | 34,280 | | 154,418 | |
Mitsubishi Corp. | | | | 33,798 | | 915,669 | |
Mitsubishi Electric Corp. | | | | 51,700 | | 455,183 | |
Mitsubishi Estate Co. | | | | 31,700 | | 398,566 | |
Mitsubishi HC Capital Inc. | | | | 18,300 | | 78,420 | |
Mitsubishi Heavy Industries Ltd. | | | | 8,570 | | 294,924 | |
Mitsubishi UFJ Financial Group Inc. | | | | 319,890 | | 1,516,471 | |
Mitsui & Co. | | | | 37,400 | | 827,719 | |
Mitsui Chemicals Inc. | | | | 5,000 | | 92,575 | |
Mitsui Fudosan Co. | | | | 24,286 | | 465,190 | |
Mitsui O.S.K. Lines Ltd. | | | | 9,200 | | 182,158 | |
Mizuho Financial Group Inc. | | | | 64,550 | | 696,553 | |
MonotaRO Co. | | | | 6,700 | | 102,101 | |
MS&AD Insurance Group Holdings Inc. | | | | 11,857 | | 314,136 | |
Murata Manufacturing Co. | | | | 15,400 | | 755,469 | |
NEC Corp. | | | | 6,580 | | 217,841 | |
NEXON Co. | | | | 13,300 | | 222,720 | |
NGK Insulators Ltd. | | | | 6,000 | | 69,891 | |
Nidec Corp. | | | | 12,000 | | 661,707 | |
Nihon M&A Center Holdings Inc. | | | | 8,100 | | 91,589 | |
Nintendo Co. | | | | 29,250 | | 1,191,933 | |
Nippon Building Fund Inc. | | | | 41 | | 182,444 | |
Nippon Express Holdings Inc. | | | | 2,052 | | 102,883 | |
Nippon Paint Holdings Co. | | | | 21,000 | | 133,668 | |
Nippon Prologis REIT Inc. | | | | 57 | | 119,385 | |
Nippon Sanso Holdings Corp. | | | | 4,700 | | 74,922 | |
Nippon Shinyaku Co. | | | | 1,300 | | 71,857 | |
Nippon Steel Corp. | | | | 21,661 | | 296,799 | |
Nippon Telegraph & Telephone Corp. | | | | 32,000 | | 880,869 | |
Nippon Yusen KK | | | | 12,940 | | 234,449 | |
Nissan Chemical Corp. | | | | 3,400 | | 152,052 | |
Nissan Motor Co. | | | | 62,100 | | 197,979 | |
Nisshin Seifun Group Inc. | | | | 5,438 | | 58,738 | |
Nissin Foods Holdings Co. | | | | 1,600 | | 103,604 | |
Nitori Holdings Co. | | | | 2,100 | | 190,128 | |
Nitto Denko Corp. | | | | 3,800 | | 199,952 | |
Nomura Holdings Inc. | | | | 77,900 | | 252,625 | |
Nomura Real Estate Holdings Inc. | | | | 3,300 | | 74,641 | |
Nomura Real Estate Master Fund Inc. | | | | 114 | | 129,856 | |
18
| | | | | | | | |
| |
Description | | | | Shares | | Value ($) | |
Common Stocks - 98.0% (continued) | | | | | |
Japan - 21.8% (continued) | | | | | |
Nomura Research Institute Ltd. | | | | 9,149 | | 202,719 | |
NTT Data Corp. | | | | 16,900 | | 244,992 | |
Obayashi Corp. | | | | 17,900 | | 114,751 | |
OBIC Co. | | | | 1,900 | | 284,980 | |
Odakyu Electric Railway Co. | | | | 7,900 | | 93,792 | |
Oji Holdings Corp. | | | | 22,200 | | 76,900 | |
Olympus Corp. | | | | 33,000 | | 696,291 | |
Omron Corp. | | | | 5,000 | | 232,399 | |
Ono Pharmaceutical Co. | | | | 9,700 | | 227,993 | |
Open House Group Co. | | | | 2,200 | | 78,355 | |
Oracle Corp. | | | | 1,000 | | 53,340 | |
Oriental Land Co. | | | | 5,400 | | 722,760 | |
ORIX Corp. | | | | 32,000 | | 468,622 | |
Osaka Gas Co. | | | | 10,200 | | 150,377 | |
Otsuka Corp. | | | | 3,100 | | 97,593 | |
Otsuka Holdings Co. | | | | 10,400 | | 333,295 | |
Pan Pacific International Holdings Corp. | | | | 10,200 | | 167,032 | |
Panasonic Holdings Corp. | | | | 59,095 | | 422,810 | |
Persol Holdings Co. | | | | 4,800 | | 95,929 | |
Rakuten Group Inc. | | | | 24,100 | | 107,366 | |
Recruit Holdings Co. | | | | 38,600 | | 1,184,721 | |
Renesas Electronics Corp. | | | | 31,200 | b | 261,282 | |
Resona Holdings Inc. | | | | 57,800 | | 217,485 | |
Ricoh Co. | | | | 15,700 | | 115,015 | |
Rohm Co. | | | | 2,300 | | 161,795 | |
SBI Holdings Inc. | | | | 6,430 | | 116,183 | |
SCSK Corp. | | | | 4,400 | | 64,824 | |
Secom Co. | | | | 5,600 | | 319,058 | |
Seiko Epson Corp. | | | | 7,800 | | 106,210 | |
Sekisui Chemical Co. | | | | 10,100 | | 125,956 | |
Sekisui House Ltd. | | | | 16,500 | | 274,196 | |
Seven & i Holdings Co. | | | | 20,160 | | 752,582 | |
SG Holdings Co. | | | | 7,900 | | 104,552 | |
Sharp Corp. | | | | 6,600 | | 39,523 | |
Shimadzu Corp. | | | | 6,500 | | 170,620 | |
Shimano Inc. | | | | 1,900 | | 294,622 | |
Shimizu Corp. | | | | 14,800 | | 73,785 | |
Shin-Etsu Chemical Co. | | | | 10,000 | | 1,044,201 | |
Shionogi & Co. | | | | 7,100 | | 328,903 | |
Shiseido Co. | | | | 10,700 | | 370,726 | |
Shizuoka Financial Group Inc. | | | | 11,900 | | 75,068 | |
SMC Corp. | | | | 1,500 | | 603,809 | |
Softbank Corp. | | | | 76,900 | | 758,148 | |
19
STATEMENT OF INVESTMENTS (continued)
| | | | | | | | |
| |
Description | | | | Shares | | Value ($) | |
Common Stocks - 98.0% (continued) | | | | | |
Japan - 21.8% (continued) | | | | | |
SoftBank Group Corp. | | | | 32,240 | | 1,386,489 | |
Sompo Holdings Inc. | | | | 8,370 | | 348,477 | |
Sony Group Corp. | | | | 33,780 | | 2,287,333 | |
Square Enix Holdings Co. | | | | 2,300 | | 102,841 | |
Subaru Corp. | | | | 16,600 | | 258,330 | |
Sumco Corp. | | | | 9,400 | | 119,047 | |
Sumitomo Chemical Co. | | | | 40,700 | | 136,657 | |
Sumitomo Corp. | | | | 30,100 | | 383,475 | |
Sumitomo Electric Industries Ltd. | | | | 19,100 | | 199,477 | |
Sumitomo Metal Mining Co. | | | | 6,700 | | 188,294 | |
Sumitomo Mitsui Financial Group Inc. | | | | 34,900 | | 979,124 | |
Sumitomo Mitsui Trust Holdings Inc. | | | | 9,064 | | 260,626 | |
Sumitomo Realty & Development Co. | | | | 8,400 | | 192,796 | |
Suntory Beverage & Food Ltd. | | | | 3,700 | | 123,875 | |
Suzuki Motor Corp. | | | | 10,000 | | 337,404 | |
Sysmex Corp. | | | | 4,500 | | 242,753 | |
T&D Holdings Inc. | | | | 14,200 | | 140,017 | |
Taisei Corp. | | | | 4,900 | | 133,396 | |
Takeda Pharmaceutical Co. | | | | 40,223 | | 1,065,613 | |
TDK Corp. | | | | 10,400 | | 323,789 | |
Terumo Corp. | | | | 17,300 | | 525,796 | |
The Chiba Bank Ltd. | | | | 14,200 | | 77,530 | |
The Kansai Electric Power Company | | | | 18,799 | | 141,945 | |
TIS Inc. | | | | 6,000 | | 161,551 | |
Tobu Railway Co. | | | | 5,100 | | 117,795 | |
Toho Co. | | | | 3,000 | | 106,667 | |
Tokio Marine Holdings Inc. | | | | 49,100 | | 887,015 | |
Tokyo Electric Power Co. Holdings Inc. | | | | 40,872 | b | 132,555 | |
Tokyo Electron Ltd. | | | | 4,000 | | 1,057,852 | |
Tokyo Gas Co. | | | | 10,600 | | 188,534 | |
Tokyu Corp. | | | | 14,210 | | 163,713 | |
Toppan Inc. | | | | 7,200 | | 107,347 | |
Toray Industries Inc. | | | | 37,100 | | 179,717 | |
Toshiba Corp. | | | | 10,400 | | 362,236 | |
Tosoh Corp. | | | | 6,900 | | 75,091 | |
TOTO Ltd. | | | | 3,800 | | 108,529 | |
Toyota Industries Corp. | | | | 3,900 | | 200,766 | |
Toyota Motor Corp. | | | | 283,775 | | 3,936,148 | |
Toyota Tsusho Corp. | | | | 5,700 | | 191,391 | |
Trend Micro Inc. | | | | 3,600 | | 181,258 | |
Unicharm Corp. | | | | 10,800 | | 329,034 | |
USS Co. | | | | 5,600 | | 84,404 | |
Welcia Holdings Co. | | | | 2,600 | | 54,354 | |
20
| | | | | | | | |
| |
Description | | | | Shares | | Value ($) | |
Common Stocks - 98.0% (continued) | | | | | |
Japan - 21.8% (continued) | | | | | |
West Japan Railway Co. | | | | 5,900 | | 233,810 | |
Yakult Honsha Co. | | | | 3,500 | | 193,734 | |
Yamaha Corp. | | | | 3,800 | | 143,499 | |
Yamaha Motor Co. | | | | 8,000 | | 165,081 | |
Yamato Holdings Co. | | | | 7,800 | | 115,429 | |
Yaskawa Electric Corp. | | | | 6,400 | | 176,952 | |
Yokogawa Electric Corp. | | | | 5,800 | | 97,094 | |
Z Holdings Corp. | | | | 71,200 | | 183,489 | |
ZOZO Inc. | | | | 3,500 | | 74,243 | |
| | | | | 76,138,713 | |
Jordan - .0% | | | | | |
Hikma Pharmaceuticals PLC | | | | 4,512 | | 64,558 | |
Luxembourg - .2% | | | | | |
ArcelorMittal SA | | | | 14,096 | | 315,593 | |
Aroundtown SA | | | | 26,317 | | 52,234 | |
Eurofins Scientific SE | | | | 3,602 | | 230,340 | |
Tenaris SA | | | | 12,482 | | 193,783 | |
| | | | | 791,950 | |
Macau - .0% | | | | | |
Sands China Ltd. | | | | 65,013 | b | 113,507 | |
Netherlands - 4.4% | | | | | |
ABN AMRO Bank NV-CVA | | | | 11,324 | c | 111,291 | |
Adyen NV | | | | 580 | b,c | 830,860 | |
Aegon NV | | | | 47,915 | | 221,546 | |
Akzo Nobel NV | | | | 4,860 | | 299,586 | |
argenx SE | | | | 1,474 | b | 573,441 | |
ASM International NV | | | | 1,277 | | 282,830 | |
ASML Holding NV | | | | 10,878 | | 5,128,084 | |
Euronext NV | | | | 2,293 | c | 145,497 | |
EXOR NV | | | | 2,902 | b | 194,904 | |
Heineken Holding NV | | | | 2,698 | | 184,231 | |
Heineken NV | | | | 6,937 | | 579,949 | |
IMCD NV | | | | 1,521 | | 197,091 | |
ING Groep NV | | | | 104,560 | | 1,027,018 | |
JDE Peet's NV | | | | 2,691 | | 77,027 | |
Just Eat Takeaway.com NV | | | | 5,031 | a,b,c | 86,143 | |
Koninklijke Ahold Delhaize NV | | | | 27,986 | | 780,997 | |
Koninklijke DSM NV | | | | 4,678 | | 550,852 | |
Koninklijke KPN NV | | | | 88,406 | | 247,309 | |
Koninklijke Philips NV | | | | 23,656 | | 299,519 | |
NN Group NV | | | | 7,467 | | 315,893 | |
OCI NV | | | | 2,820 | | 107,907 | |
Prosus NV | | | | 22,199 | | 966,157 | |
21
STATEMENT OF INVESTMENTS (continued)
| | | | | | | | |
| |
Description | | | | Shares | | Value ($) | |
Common Stocks - 98.0% (continued) | | | | | |
Netherlands - 4.4% (continued) | | | | | |
QIAGEN NV | | | | 6,087 | b | 262,895 | |
Randstad NV | | | | 3,200 | | 159,333 | |
Stellantis NV | | | | 44,733 | | 603,912 | |
Stellantis NV | | | | 14,164 | | 190,705 | |
Universal Music Group NV | | | | 19,412 | | 380,392 | |
Wolters Kluwer NV | | | | 7,026 | | 746,767 | |
| | | | | 15,552,136 | |
New Zealand - .2% | | | | | |
Auckland International Airport Ltd. | | | | 34,041 | b | 152,234 | |
Fisher & Paykel Healthcare Corp. | | | | 15,380 | | 175,062 | |
Mercury NZ Ltd. | | | | 19,121 | | 64,658 | |
Meridian Energy Ltd. | | | | 34,491 | | 97,851 | |
Spark New Zealand Ltd. | | | | 50,650 | | 150,636 | |
Xero Ltd. | | | | 3,649 | b | 181,154 | |
| | | | | 821,595 | |
Norway - .8% | | | | | |
Adevinta ASA | | | | 7,205 | b | 49,228 | |
Aker BP ASA | | | | 8,457 | | 268,385 | |
DNB Bank ASA | | | | 24,895 | | 439,230 | |
Equinor ASA | | | | 26,155 | | 952,740 | |
Gjensidige Forsikring ASA | | | | 5,067 | | 92,487 | |
Kongsberg Gruppen ASA | | | | 2,462 | | 88,174 | |
Mowi ASA | | | | 11,279 | | 168,028 | |
Norsk Hydro ASA | | | | 35,992 | | 227,974 | |
Orkla ASA | | | | 20,514 | | 138,218 | |
Salmar ASA | | | | 1,653 | | 55,947 | |
Telenor ASA | | | | 18,683 | | 169,751 | |
Yara International ASA | | | | 4,431 | | 197,572 | |
| | | | | 2,847,734 | |
Portugal - .2% | | | | | |
EDP - Energias de Portugal SA | | | | 74,293 | | 324,573 | |
Galp Energia SGPS SA | | | | 13,164 | a | 133,671 | |
Jeronimo Martins SGPS SA | | | | 7,734 | | 160,319 | |
| | | | | 618,563 | |
Singapore - 1.5% | | | | | |
Capitaland Ascendas REIT | | | | 89,327 | | 165,278 | |
CapitaLand Integrated Commercial Trust | | | | 140,777 | | 186,886 | |
Capitaland Investment Ltd. | | | | 69,300 | | 147,556 | |
City Developments Ltd. | | | | 10,900 | | 58,833 | |
DBS Group Holdings Ltd. | | | | 48,448 | | 1,169,809 | |
Genting Singapore Ltd. | | | | 161,827 | | 92,033 | |
Grab Holdings Ltd., Cl. A | | | | 30,464 | b | 79,206 | |
Keppel Corp. | | | | 38,800 | | 190,948 | |
22
| | | | | | | | |
| |
Description | | | | Shares | | Value ($) | |
Common Stocks - 98.0% (continued) | | | | | |
Singapore - 1.5% (continued) | | | | | |
Mapletree Logistics Trust | | | | 87,111 | a | 93,496 | |
Mapletree Pan Asia Commercial Trust | | | | 63,900 | | 71,746 | |
Oversea-Chinese Banking Corp. | | | | 90,624 | | 776,079 | |
Sea Ltd., ADR | | | | 9,873 | b | 490,491 | |
Singapore Airlines Ltd. | | | | 35,633 | a | 132,359 | |
Singapore Exchange Ltd. | | | | 22,900 | | 136,168 | |
Singapore Technologies Engineering Ltd. | | | | 43,000 | | 100,213 | |
Singapore Telecommunications Ltd. | | | | 220,951 | | 390,070 | |
United Overseas Bank Ltd. | | | | 31,563 | | 618,744 | |
UOL Group Ltd. | | | | 12,911 | | 56,433 | |
Venture Corp. | | | | 7,600 | | 85,665 | |
Wilmar International Ltd. | | | | 51,400 | | 141,010 | |
| | | | | 5,183,023 | |
Spain - 2.5% | | | | | |
Acciona SA | | | | 674 | | 121,213 | |
ACS Actividades de Construccion y Servicios SA | | | | 6,180 | | 158,327 | |
Aena SME SA | | | | 2,007 | b,c | 236,120 | |
Amadeus IT Group SA | | | | 12,061 | b | 627,847 | |
Banco Bilbao Vizcaya Argentaria SA | | | | 178,451 | | 917,029 | |
Banco Santander SA | | | | 457,126 | | 1,182,589 | |
CaixaBank SA | | | | 118,649 | | 393,156 | |
Cellnex Telecom SA | | | | 14,545 | c | 475,311 | |
EDP Renovaveis SA | | | | 7,768 | | 163,465 | |
Enagas SA | | | | 6,661 | | 108,148 | |
Endesa SA | | | | 8,501 | | 141,901 | |
Ferrovial SA | | | | 12,908 | | 315,568 | |
Grifols SA | | | | 8,044 | a,b | 68,386 | |
Iberdrola SA | | | | 159,365 | | 1,618,865 | |
Industria de Diseno Textil SA | | | | 29,194 | | 661,221 | |
Natural Energy Group SA | | | | 3,888 | a | 99,747 | |
Red Electrica Corp. | | | | 10,828 | | 175,000 | |
Repsol SA | | | | 38,833 | | 528,343 | |
Siemens Gamesa Renewable Energy SA | | | | 6,424 | b | 114,019 | |
Telefonica SA | | | | 140,224 | b | 484,669 | |
| | | | | 8,590,924 | |
Sweden - 3.2% | | | | | |
Alfa Laval AB | | | | 7,754 | | 190,646 | |
Assa Abloy AB, Cl. B | | | | 26,824 | a | 541,236 | |
Atlas Copco AB, Cl. A | | | | 71,886 | | 767,481 | |
Atlas Copco AB, Cl. B | | | | 41,773 | | 404,594 | |
Boliden AB | | | | 7,320 | | 212,897 | |
Electrolux AB, Cl. B | | | | 5,885 | a | 72,552 | |
23
STATEMENT OF INVESTMENTS (continued)
| | | | | | | | |
| |
Description | | | | Shares | | Value ($) | |
Common Stocks - 98.0% (continued) | | | | | |
Sweden - 3.2% (continued) | | | | | |
Embracer Group AB | | | | 18,483 | a,b | 88,939 | |
Epiroc AB, Cl. A | | | | 17,953 | | 274,505 | |
Epiroc AB, Cl. B | | | | 10,515 | | 141,151 | |
EQT AB | | | | 7,973 | | 156,770 | |
Essity AB, Cl. B | | | | 16,633 | | 351,387 | |
Evolution AB | | | | 4,893 | c | 457,321 | |
Fastighets AB Balder, Cl. B | | | | 17,486 | b | 65,614 | |
Getinge AB, Cl. B | | | | 5,860 | | 118,895 | |
Hennes & Mauritz AB, Cl. B | | | | 19,546 | a | 196,658 | |
Hexagon AB, Cl. B | | | | 52,092 | | 514,506 | |
Holmen AB, Cl. B | | | | 2,511 | | 91,105 | |
Husqvarna AB, Cl. B | | | | 11,315 | | 67,129 | |
Industrivarden AB, Cl. A | | | | 3,529 | | 79,888 | |
Industrivarden AB, Cl. C | | | | 4,196 | | 94,187 | |
Indutrade AB | | | | 7,463 | | 130,504 | |
Investment AB Latour, Cl. B | | | | 4,044 | | 68,297 | |
Investor AB, Cl. A | | | | 13,347 | | 226,804 | |
Investor AB, Cl. B | | | | 48,760 | | 795,660 | |
Kinnevik AB, Cl. B | | | | 6,540 | b | 80,716 | |
L E Lundbergforetagen AB, Cl. B | | | | 2,034 | | 80,274 | |
Lifco AB, Cl. B | | | | 6,460 | | 93,244 | |
Nibe Industrier AB, Cl. B | | | | 40,559 | | 323,209 | |
Sagax AB, Cl. B | | | | 4,739 | | 87,308 | |
Sandvik AB | | | | 28,535 | | 446,069 | |
Securitas AB, Cl. B | | | | 8,788 | a | 71,904 | |
Skandinaviska Enskilda Banken AB, Cl. A | | | | 43,557 | | 459,147 | |
Skanska AB, Cl. B | | | | 9,105 | a | 141,516 | |
SKF AB, Cl. B | | | | 10,260 | | 148,383 | |
Svenska Cellulosa AB SCA, Cl. B | | | | 16,356 | | 192,811 | |
Svenska Handelsbanken AB, Cl. A | | | | 39,435 | | 366,288 | |
Swedbank AB, Cl. A | | | | 24,236 | | 361,107 | |
Swedish Match AB | | | | 40,813 | | 419,914 | |
Swedish Orphan Biovitrum AB | | | | 4,568 | b | 84,085 | |
Tele2 AB, Cl. B | | | | 14,779 | | 121,131 | |
Telefonaktiebolaget LM Ericsson, Cl. B | | | | 78,114 | | 433,998 | |
Telia Co. | | | | 71,142 | a | 188,390 | |
Volvo AB, Cl. A | | | | 5,578 | | 95,187 | |
Volvo AB, Cl. B | | | | 40,386 | | 660,360 | |
Volvo Car AB, Cl. B | | | | 16,514 | b | 70,031 | |
| | | | | 11,033,798 | |
Switzerland - 11.0% | | | | | |
ABB Ltd. | | | | 43,874 | | 1,217,967 | |
Adecco Group AG | | | | 4,409 | | 137,829 | |
24
| | | | | | | | |
| |
Description | | | | Shares | | Value ($) | |
Common Stocks - 98.0% (continued) | | | | | |
Switzerland - 11.0% (continued) | | | | | |
Alcon Inc. | | | | 13,396 | | 814,856 | |
Bachem Holding AG | | | | 853 | | 61,159 | |
Baloise Holding AG | | | | 1,243 | | 169,691 | |
Barry Callebaut AG | | | | 98 | | 185,259 | |
Chocoladefabriken Lindt & Spruengli AG | | | | 3 | | 291,799 | |
Chocoladefabriken Lindt & Spruengli AG-PC | | | | 29 | | 278,330 | |
Cie Financiere Richemont SA, CI. A | | | | 14,019 | | 1,371,170 | |
Clariant AG | | | | 5,531 | | 88,887 | |
Coca-Cola HBC AG | | | | 5,485 | | 119,600 | |
Credit Suisse Group AG | | | | 70,752 | a | 291,018 | |
EMS-Chemie Holding AG | | | | 194 | | 122,170 | |
Geberit AG | | | | 962 | | 427,267 | |
Givaudan SA | | | | 247 | | 736,741 | |
Glencore PLC | | | | 263,861 | | 1,508,103 | |
Holcim AG | | | | 14,800 | | 671,337 | |
Julius Baer Group Ltd. | | | | 5,908 | | 283,451 | |
Kuehne + Nagel International AG | | | | 1,473 | | 313,620 | |
Logitech International SA | | | | 4,722 | | 234,427 | |
Lonza Group AG | | | | 1,990 | | 1,023,036 | |
Nestle SA | | | | 75,223 | | 8,187,375 | |
Novartis AG | | | | 57,821 | | 4,686,426 | |
Partners Group Holding AG | | | | 610 | | 546,777 | |
Roche Holding AG | | | | 18,852 | | 6,265,482 | |
Roche Holding AG-BR | | | | 727 | | 295,107 | |
Schindler Holding AG | | | | 590 | | 92,981 | |
Schindler Holding AG-PC | | | | 1,107 | | 180,288 | |
SGS SA | | | | 173 | | 381,310 | |
Sig Group AG | | | | 8,436 | b | 161,956 | |
Sika AG | | | | 3,907 | | 879,569 | |
Sonova Holding AG | | | | 1,427 | | 336,998 | |
STMicroelectronics NV | | | | 18,291 | | 570,195 | |
Straumann Holding AG | | | | 3,056 | | 290,541 | |
Swiss Life Holding AG | | | | 843 | | 407,821 | |
Swiss Prime Site AG | | | | 2,113 | | 170,407 | |
Swiss Re AG | | | | 8,072 | | 598,944 | |
Swisscom AG | | | | 694 | | 342,635 | |
Temenos AG | | | | 1,713 | | 101,969 | |
The Swatch Group AG | | | | 1,447 | | 60,404 | |
The Swatch Group AG-BR | | | | 796 | | 178,968 | |
UBS Group AG | | | | 93,970 | | 1,487,830 | |
VAT Group AG | | | | 723 | c | 164,863 | |
25
STATEMENT OF INVESTMENTS (continued)
| | | | | | | | |
| |
Description | | | | Shares | | Value ($) | |
Common Stocks - 98.0% (continued) | | | | | |
Switzerland - 11.0% (continued) | | | | | |
Zurich Insurance Group AG | | | | 4,031 | | 1,718,736 | |
| | | | | 38,455,299 | |
United Arab Emirates - .0% | | | | | |
NMC Health PLC | | | | 4,176 | b,d | 0 | |
United Kingdom - 14.8% | | | | | |
3i Group PLC | | | | 26,047 | | 346,273 | |
abrdn PLC | | | | 58,339 | | 106,238 | |
Admiral Group PLC | | | | 4,816 | | 111,281 | |
Anglo American PLC | | | | 34,007 | | 1,017,295 | |
Ashtead Group PLC | | | | 11,852 | | 616,788 | |
Associated British Foods PLC | | | | 9,596 | | 148,176 | |
AstraZeneca PLC | | | | 41,468 | | 4,865,048 | |
Auto Trader Group PLC | | | | 24,997 | c | 149,377 | |
AVEVA Group PLC | | | | 3,224 | | 115,355 | |
Aviva PLC | | | | 75,717 | | 362,690 | |
BAE Systems PLC | | | | 84,497 | | 789,163 | |
Barclays PLC | | | | 448,101 | | 762,919 | |
Barratt Developments PLC | | | | 27,366 | | 118,064 | |
BP PLC | | | | 517,089 | | 2,868,679 | |
British American Tobacco PLC | | | | 57,645 | | 2,277,304 | |
BT Group PLC | | | | 183,882 | | 273,335 | |
Bunzl PLC | | | | 9,030 | | 293,941 | |
Burberry Group PLC | | | | 10,617 | | 220,987 | |
CNH Industrial NV | | | | 27,386 | | 354,146 | |
Coca-Cola Europacific Partners PLC | | | | 5,501 | | 258,822 | |
Compass Group PLC | | | | 47,742 | | 1,005,493 | |
Croda International PLC | | | | 3,734 | | 289,220 | |
Diageo PLC | | | | 61,211 | | 2,523,490 | |
Entain PLC | | | | 15,744 | | 227,869 | |
Ferguson PLC | | | | 5,739 | | 625,328 | |
GSK PLC | | | | 108,849 | | 1,783,675 | |
Haleon PLC | | | | 135,928 | b | 417,484 | |
Halma PLC | | | | 10,160 | | 246,144 | |
Hargreaves Lansdown PLC | | | | 9,521 | | 83,225 | |
HSBC Holdings PLC | | | | 537,919 | | 2,759,127 | |
Imperial Brands PLC | | | | 24,164 | | 588,288 | |
Informa PLC | | | | 39,218 | | 249,882 | |
InterContinental Hotels Group PLC | | | | 4,925 | | 264,963 | |
Intertek Group PLC | | | | 4,319 | | 180,870 | |
J Sainsbury PLC | | | | 48,179 | | 107,341 | |
JD Sports Fashion PLC | | | | 70,441 | | 78,579 | |
Johnson Matthey PLC | | | | 4,937 | | 109,414 | |
Kingfisher PLC | | | | 53,492 | | 134,154 | |
26
| | | | | | | | |
| |
Description | | | | Shares | | Value ($) | |
Common Stocks - 98.0% (continued) | | | | | |
United Kingdom - 14.8% (continued) | | | | | |
Land Securities Group PLC | | | | 19,240 | | 125,719 | |
Legal & General Group PLC | | | | 159,787 | | 426,229 | |
Lloyds Banking Group PLC | | | | 1,863,739 | | 897,013 | |
London Stock Exchange Group PLC | | | | 8,820 | | 764,765 | |
M&G PLC | | | | 68,543 | | 137,608 | |
Melrose Industries PLC | | | | 118,904 | | 159,181 | |
Mondi PLC | | | | 12,995 | | 217,951 | |
National Grid PLC | | | | 97,593 | | 1,061,877 | |
NatWest Group PLC | | | | 143,243 | | 384,668 | |
Next PLC | | | | 3,491 | | 197,182 | |
Ocado Group PLC | | | | 14,319 | b | 77,474 | |
Pearson PLC | | | | 17,933 | | 197,512 | |
Persimmon PLC | | | | 8,545 | | 127,882 | |
Phoenix Group Holdings PLC | | | | 19,827 | | 123,224 | |
Prudential PLC | | | | 73,579 | | 682,904 | |
Reckitt Benckiser Group PLC | | | | 19,137 | | 1,267,855 | |
RELX PLC | | | | 51,519 | | 1,384,844 | |
Rentokil Initial PLC | | | | 65,405 | | 408,007 | |
Rio Tinto PLC | | | | 30,091 | | 1,565,644 | |
Rolls-Royce Holdings PLC | | | | 223,820 | b | 200,265 | |
Schroders PLC | | | | 19,282 | | 86,615 | |
Segro PLC | | | | 32,335 | | 290,806 | |
Severn Trent PLC | | | | 6,599 | | 189,340 | |
Shell PLC | | | | 199,072 | | 5,517,900 | |
Smith & Nephew PLC | | | | 23,347 | | 276,328 | |
Smiths Group PLC | | | | 10,242 | | 183,289 | |
Spirax-Sarco Engineering PLC | | | | 1,974 | | 243,085 | |
SSE PLC | | | | 28,574 | | 510,108 | |
St. James's Place PLC | | | | 14,548 | | 177,335 | |
Standard Chartered PLC | | | | 67,513 | | 402,759 | |
Taylor Wimpey PLC | | | | 97,335 | | 104,575 | |
Tesco PLC | | | | 202,031 | | 498,029 | |
The Berkeley Group Holdings PLC | | | | 2,980 | | 118,620 | |
The British Land Company PLC | | | | 24,049 | | 100,810 | |
The Sage Group PLC | | | | 27,596 | | 229,761 | |
Unilever PLC | | | | 16,340 | | 743,256 | |
Unilever PLC | | | | 51,955 | | 2,371,701 | |
United Utilities Group PLC | | | | 18,249 | | 196,631 | |
Vodafone Group PLC | | | | 714,994 | | 833,222 | |
Whitbread PLC | | | | 5,407 | | 159,347 | |
WPP PLC | | | | 29,227 | | 256,460 | |
| | | | | 51,628,208 | |
Total Common Stocks (cost $247,532,714) | | | | 342,850,352 | |
27
STATEMENT OF INVESTMENTS (continued)
| | | | | | | | |
| |
Description | | Preferred Dividend
Yield (%) | | Shares | | Value ($) | |
Preferred Stocks - .5% | | | | | |
Germany - .5% | | | | | |
Bayerische Motoren Werke AG | | 7.24 | | 1,586 | | 117,082 | |
Dr Ing hc F Porsche AG | | | | 2,909 | b | 297,544 | |
Henkel AG & Co. KGaA | | 2.71 | | 4,768 | | 300,530 | |
Porsche Automobil Holding SE | | 4.26 | | 4,098 | | 229,221 | |
Sartorius AG | | 0.30 | | 651 | | 229,762 | |
Volkswagen AG | | 5.29 | | 4,967 | | 634,882 | |
Total Preferred Stocks (cost $1,323,633) | | | | 1,809,021 | |
| | | 1-Day
Yield (%) | | | | | |
Investment Companies - .4% | | | | | |
Registered Investment Companies - .4% | | | | | |
Dreyfus Institutional Preferred Government Plus Money Market Fund, Institutional Shares
(cost $1,310,432) | | 3.23 | | 1,310,432 | e | 1,310,432 | |
| | | | | | | | |
Investment of Cash Collateral for Securities Loaned - 1.0% | | | | | |
Registered Investment Companies - 1.0% | | | | | |
Dreyfus Institutional Preferred Government Plus Money Market Fund, SL Shares
(cost $3,310,149) | | 3.23 | | 3,310,149 | e | 3,310,149 | |
Total Investments (cost $253,476,928) | | 99.9% | | 349,279,954 | |
Cash and Receivables (Net) | | .1% | | 460,145 | |
Net Assets | | 100.0% | | 349,740,099 | |
ADR—American Depository Receipt
BR—Bearer Certificate
CDI—Chess Depository Interest
CVA—Company Voluntary Arrangement
PC—Participation Certificate
REIT—Real Estate Investment Trust
a Security, or portion thereof, on loan. At October 31, 2022, the value of the fund’s securities on loan was $3,136,797 and the value of the collateral was $3,319,333, consisting of cash collateral of $3,310,149 and U.S. Government & Agency securities valued at $9,184. In addition, the value of collateral may include pending sales that are also on loan.
b Non-income producing security.
c Security exempt from registration pursuant to Rule 144A under the Securities Act of 1933. These securities may be resold in transactions exempt from registration, normally to qualified institutional buyers. At October 31, 2022, these securities were valued at $5,075,047 or 1.45% of net assets.
d The fund held Level 3 securities at October 31, 2022. These securities were valued at $0 or .0% of net assets.
e Investment in affiliated issuer. The investment objective of this investment company is publicly available and can be found within the investment company’s prospectus.
28
| | |
Portfolio Summary (Unaudited) † | Value (%) |
Pharmaceuticals Biotechnology & Life Sciences | 11.1 |
Capital Goods | 10.8 |
Banks | 9.2 |
Materials | 7.2 |
Food, Beverage & Tobacco | 6.7 |
Energy | 5.2 |
Insurance | 4.9 |
Consumer Durables & Apparel | 4.0 |
Automobiles & Components | 3.8 |
Diversified Financials | 3.3 |
Utilities | 3.3 |
Telecommunication Services | 3.2 |
Software & Services | 3.0 |
Semiconductors & Semiconductor Equipment | 2.7 |
Household & Personal Products | 2.7 |
Real Estate | 2.6 |
Health Care Equipment & Services | 2.5 |
Technology Hardware & Equipment | 2.3 |
Transportation | 2.2 |
Commercial & Professional Services | 2.0 |
Media & Entertainment | 1.5 |
Retailing | 1.5 |
Consumer Services | 1.5 |
Investment Companies | 1.4 |
Food & Staples Retailing | 1.3 |
| | 99.9 |
† Based on net assets.
See notes to financial statements.
29
STATEMENT OF INVESTMENTS (continued)
| | | | | | | |
Affiliated Issuers | | | |
Description | Value ($) 10/31/2021 | Purchases ($)† | Sales ($) | Value ($) 10/31/2022 | Dividends/
Distributions ($) | |
Registered Investment Companies - .4% | | |
Dreyfus Institutional Preferred Government Plus Money Market Fund, Institutional Shares - .4% | 469,072 | 81,337,819 | (80,496,459) | 1,310,432 | 39,136 | |
Investment of Cash Collateral for Securities Loaned – 1.0% | | |
Dreyfus Institutional Preferred Government Plus Money Market Fund, SL Shares – 1.0% | 610,011 | 19,226,727 | (16,526,589) | 3,310,149 | 11,219 | †† |
Total - 1.4% | 1,079,083 | 100,564,546 | (97,023,048) | 4,620,581 | 50,355 | |
† Includes reinvested dividends/distributions.
†† Represents securities lending income earned from the reinvestment of cash collateral from loaned securities, net of fees and collateral investment expenses, and other payments to and from borrowers of securities.
See notes to financial statements.
| | | | | | | |
Futures | | | |
Description | Number of
Contracts | Expiration | Notional
Value ($) | Market
Value ($) | Unrealized Appreciation ($) | |
Futures Long | | |
MSCI EAFE Index | 28 | 12/16/2022 | 2,402,250 | 2,458,260 | 56,010 | |
Gross Unrealized Appreciation | | 56,010 | |
See notes to financial statements.
30
STATEMENT OF ASSETS AND LIABILITIES
October 31, 2022
| | | | | | | |
| | | | | | |
| | | Cost | | Value | |
Assets ($): | | | | |
Investments in securities—See Statement of Investments
(including securities on loan, valued at $3,136,797)—Note 1(c): | | | |
Unaffiliated issuers | 248,856,347 | | 344,659,373 | |
Affiliated issuers | | 4,620,581 | | 4,620,581 | |
Cash denominated in foreign currency | | | 117,304 | | 116,807 | |
Tax reclaim receivable—Note 1(b) | | 2,748,094 | |
Dividends and securities lending income receivable | | 653,852 | |
Receivable for shares of Common Stock subscribed | | 435,706 | |
Cash collateral held by broker—Note 4 | | 160,000 | |
| | | | | 353,394,413 | |
Liabilities ($): | | | | |
Due to BNY Mellon Investment Adviser, Inc. and affiliates—Note 3(b) | | 139,719 | |
Cash overdraft due to Custodian | | | | | 24,762 | |
Liability for securities on loan—Note 1(c) | | 3,310,149 | |
Payable for shares of Common Stock redeemed | | 145,939 | |
Payable for futures variation margin—Note 4 | | 20,693 | |
Directors’ fees and expenses payable | | 11,868 | |
Interest payable—Note 2 | | 1,184 | |
| | | | | 3,654,314 | |
Net Assets ($) | | | 349,740,099 | |
Composition of Net Assets ($): | | | | |
Paid-in capital | | | | | 317,675,802 | |
Total distributable earnings (loss) | | | | | 32,064,297 | |
Net Assets ($) | | | 349,740,099 | |
| | | | |
Net Asset Value Per Share | Investor Shares | Class I | |
Net Assets ($) | 229,027,668 | 120,712,431 | |
Shares Outstanding | 14,875,418 | 7,834,839 | |
Net Asset Value Per Share ($) | 15.40 | 15.41 | |
| | | |
See notes to financial statements. | | | |
31
STATEMENT OF OPERATIONS
Year Ended October 31, 2022
| | | | | | | |
| | | | | | |
| | | | | | |
Investment Income ($): | | | | |
Income: | | | | |
Cash dividends (net of $1,320,248 foreign taxes withheld at source): | |
Unaffiliated issuers | | | 13,119,885 | |
Affiliated issuers | | | 39,136 | |
Income from securities lending—Note 1(c) | | | 11,219 | |
Total Income | | | 13,170,240 | |
Expenses: | | | | |
Management fee—Note 3(a) | | | 1,585,859 | |
Shareholder servicing costs—Note 3(b) | | | 664,584 | |
Directors’ fees—Note 3(a,c) | | | 30,167 | |
Loan commitment fees—Note 2 | | | 9,223 | |
Interest expense—Note 2 | | | 4,962 | |
Total Expenses | | | 2,294,795 | |
Less—Directors’ fees reimbursed by
BNY Mellon Investment Adviser, Inc.—Note 3(a) | | | (30,167) | |
Net Expenses | | | 2,264,628 | |
Net Investment Income | | | 10,905,612 | |
Realized and Unrealized Gain (Loss) on Investments—Note 4 ($): | | |
Net realized gain (loss) on investments and foreign currency transactions | 12,986,292 | |
Net realized gain (loss) on futures | (2,397,517) | |
Net realized gain (loss) on forward foreign currency exchange contracts | 8,469 | |
Net Realized Gain (Loss) | | | 10,597,244 | |
Net change in unrealized appreciation (depreciation) on investments
and foreign currency transactions | (141,143,466) | |
Net change in unrealized appreciation (depreciation) on futures | 37,511 | |
Net change in unrealized appreciation (depreciation) on
forward foreign currency exchange contracts | (9,822) | |
Net Change in Unrealized Appreciation (Depreciation) | | | (141,115,777) | |
Net Realized and Unrealized Gain (Loss) on Investments | | | (130,518,533) | |
Net (Decrease) in Net Assets Resulting from Operations | | (119,612,921) | |
| | | | | | |
See notes to financial statements. | | | | | |
32
STATEMENT OF CHANGES IN NET ASSETS
| | | | | | | | | | |
| | | | Year Ended October 31, |
| | | | 2022 | | 2021 | |
Operations ($): | | | | | | | | |
Net investment income | | | 10,905,612 | | | | 11,759,344 | |
Net realized gain (loss) on investments | | 10,597,244 | | | | 22,269,777 | |
Net change in unrealized appreciation
(depreciation) on investments | | (141,115,777) | | | | 120,246,105 | |
Net Increase (Decrease) in Net Assets
Resulting from Operations | (119,612,921) | | | | 154,275,226 | |
Distributions ($): | |
Distributions to shareholders: | | | | | | | | |
Investor Shares | | | (9,959,393) | | | | (5,282,901) | |
Class I | | | (8,541,436) | | | | (4,218,841) | |
Total Distributions | | | (18,500,829) | | | | (9,501,742) | |
Capital Stock Transactions ($): | |
Net proceeds from shares sold: | | | | | | | | |
Investor Shares | | | 72,954,932 | | | | 62,897,358 | |
Class I | | | 28,259,851 | | | | 38,174,747 | |
Distributions reinvested: | | | | | | | | |
Investor Shares | | | 9,802,576 | | | | 5,214,308 | |
Class I | | | 3,188,659 | | | | 1,550,599 | |
Cost of shares redeemed: | | | | | | | | |
Investor Shares | | | (76,999,464) | | | | (140,275,557) | |
Class I | | | (95,386,078) | | | | (51,038,776) | |
Increase (Decrease) in Net Assets
from Capital Stock Transactions | (58,179,524) | | | | (83,477,321) | |
Total Increase (Decrease) in Net Assets | (196,293,274) | | | | 61,296,163 | |
Net Assets ($): | |
Beginning of Period | | | 546,033,373 | | | | 484,737,210 | |
End of Period | | | 349,740,099 | | | | 546,033,373 | |
Capital Share Transactions (Shares): | |
Investor Sharesa | | | | | | | | |
Shares sold | | | 4,154,204 | | | | 3,160,369 | |
Shares issued for distributions reinvested | | | 486,722 | | | | 275,889 | |
Shares redeemed | | | (4,381,681) | | | | (7,150,523) | |
Net Increase (Decrease) in Shares Outstanding | 259,245 | | | | (3,714,265) | |
Class Ia | | | | | | | | |
Shares sold | | | 1,639,092 | | | | 1,929,266 | |
Shares issued for distributions reinvested | | | 158,561 | | | | 82,129 | |
Shares redeemed | | | (5,615,878) | | | | (2,597,454) | |
Net Increase (Decrease) in Shares Outstanding | (3,818,225) | | | | (586,059) | |
| | | | | | | | | |
a | During the period ended October 31, 2022, 10,956 Class I shares representing $219,658 were exchanged for 10,959 Investor shares and during the period ended October 31, 2021, 30,028 Class I shares representing $600,030 were exchanged for 30,019 Investor shares. | |
See notes to financial statements. | | | | | | | | |
33
FINANCIAL HIGHLIGHTS
The following tables describe the performance for each share class for the fiscal periods indicated. All information (except portfolio turnover rate) reflects financial results for a single fund share. Net asset value total return is calculated assuming an initial investment made at the net asset value at the beginning of the period, reinvestment of all dividends and distributions at net asset value during the period, and redemption at net asset value on the last day of the period. Net asset value total return includes adjustments in accordance with accounting principles generally accepted in the United States of America and as such, the net asset value for financial reporting purposes and the returns based upon those net asset values may differ from the net asset value and returns for shareholder transactions. These figures have been derived from the fund’s financial statements.
| | | | | | | |
| | |
| | | Year Ended October 31, |
Investor Shares | | 2022 | 2021 | 2020 | 2019 | 2018 |
Per Share Data ($): | | | | | | |
Net asset value, beginning of period | | 20.78 | 15.85 | 17.52 | 16.24 | 17.90 |
Investment Operations: | | | | | | |
Net investment incomea | | .41 | .39 | .29 | .46 | .40 |
Net realized and unrealized
gain (loss) on investments | | (5.10) | 4.85 | (1.46) | 1.22 | (1.67) |
Total from Investment Operations | | (4.69) | 5.24 | (1.17) | 1.68 | (1.27) |
Distributions: | | | | | | |
Dividends from net
investment income | | (.69) | (.31) | (.50) | (.40) | (.39) |
Net asset value, end of period | | 15.40 | 20.78 | 15.85 | 17.52 | 16.24 |
Total Return (%) | | (23.36) | 33.21 | (7.01) | 10.79 | (7.30) |
Ratios/Supplemental Data (%): | | | | | | |
Ratio of total expenses
to average net assets | | .61 | .61 | .61 | .61 | .61 |
Ratio of net expenses
to average net assets | | .60 | .60 | .60 | .60 | .60 |
Ratio of net investment income
to average net assets | | 2.27 | 2.00 | 1.80 | 2.76 | 2.24 |
Portfolio Turnover Rate | | 3.41 | 2.99 | 3.15 | 7.58 | 7.48 |
Net Assets, end of period ($ x 1,000) | | 229,028 | 303,693 | 290,572 | 366,092 | 338,147 |
a Based on average shares outstanding.
See notes to financial statements.
34
| | | | | | | |
| | |
| | | Year Ended October 31, |
Class I Shares | | 2022 | 2021 | 2020 | 2019 | 2018 |
Per Share Data ($): | | | | | | |
Net asset value, beginning of period | | 20.80 | 15.86 | 17.53 | 16.26 | 17.92 |
Investment Operations: | | | | | | |
Net investment incomea | | .47 | .45 | .33 | .50 | .46 |
Net realized and unrealized
gain (loss) on investments | | (5.12) | 4.84 | (1.46) | 1.22 | (1.69) |
Total from Investment Operations | | (4.65) | 5.29 | (1.13) | 1.72 | (1.23) |
Distributions: | | | | | | |
Dividends from net
investment income | | (.74) | (.35) | (.54) | (.45) | (.43) |
Net asset value, end of period | | 15.41 | 20.80 | 15.86 | 17.53 | 16.26 |
Total Return (%) | | (23.18) | 33.58 | (6.78) | 11.06 | (7.06) |
Ratios/Supplemental Data (%): | | | | | | |
Ratio of total expenses
to average net assets | | .36 | .36 | .36 | .36 | .36 |
Ratio of net expenses
to average net assets | | .35 | .35 | .35 | .35 | .35 |
Ratio of net investment income
to average net assets | | 2.60 | 2.26 | 2.04 | 3.02 | 2.55 |
Portfolio Turnover Rate | | 3.41 | 2.99 | 3.15 | 7.58 | 7.48 |
Net Assets, end of period ($ x 1,000) | | 120,712 | 242,341 | 194,165 | 266,216 | 215,019 |
a Based on average shares outstanding.
See notes to financial statements.
35
NOTES TO FINANCIAL STATEMENTS
NOTE 1—Significant Accounting Policies:
BNY Mellon International Stock Index Fund (the “fund”) is a separate diversified series of BNY Mellon Index Funds, Inc. (the “Company”), which is registered under the Investment Company Act of 1940, as amended (the “Act”), as an open-end management investment company and operates as a series company currently offering three series, including the fund. The fund’s investment objective is to seek to match the performance of the Morgan Stanley Capital International Europe, Australasia, Far East Index (MSCI EAFE®). BNY Mellon Investment Adviser, Inc. (the “Adviser”), a wholly-owned subsidiary of The Bank of New York Mellon Corporation (“BNY Mellon”), serves as the fund’s investment adviser.
BNY Mellon Securities Corporation (the “Distributor”), a wholly-owned subsidiary of the Adviser, is the distributor of the fund’s shares, which are sold to the public without a sales charge. The fund is authorized to issue 300 million shares of $.001 par value Common Stock. The fund currently has authorized two classes of shares: Investor shares (200 million shares authorized) and Class I (100 million shares authorized). Investor shares are sold primarily to retail investors through financial intermediaries and bear Shareholder Services Plan fees. Class I shares are sold primarily to bank trust departments and other financial service providers (including BNY Mellon and its affiliates), acting on behalf of customers having a qualified trust or an investment account or relationship at such institution, and bear no Shareholder Services Plan fees. Other differences between the classes include the services offered to and the expenses borne by each class, and certain voting rights. Income, expenses (other than expenses attributable to a specific class), and realized and unrealized gains or losses on investments are allocated to each class of shares based on its relative net assets.
The Company accounts separately for the assets, liabilities and operations of each series. Expenses directly attributable to each series are charged to that series’ operations; expenses which are applicable to all series are allocated among them on a pro rata basis.
The Financial Accounting Standards Board (“FASB”) Accounting Standards Codification (“ASC”) is the exclusive reference of authoritative U.S. generally accepted accounting principles (“GAAP”) recognized by the FASB to be applied by nongovernmental entities. Rules and interpretive releases of the SEC under authority of federal laws are also sources of authoritative GAAP for SEC registrants. The fund is an investment company and applies the accounting and reporting guidance of the FASB
36
ASC Topic 946 Financial Services-Investment Companies. The fund’s financial statements are prepared in accordance with GAAP, which may require the use of management estimates and assumptions. Actual results could differ from those estimates.
The Company enters into contracts that contain a variety of indemnifications. The fund’s maximum exposure under these arrangements is unknown. The fund does not anticipate recognizing any loss related to these arrangements.
(a) Portfolio valuation: The fair value of a financial instrument is the amount that would be received to sell an asset or paid to transfer a liability in an orderly transaction between market participants at the measurement date (i.e., the exit price). GAAP establishes a fair value hierarchy that prioritizes the inputs of valuation techniques used to measure fair value. This hierarchy gives the highest priority to unadjusted quoted prices in active markets for identical assets or liabilities (Level 1 measurements) and the lowest priority to unobservable inputs (Level 3 measurements).
Additionally, GAAP provides guidance on determining whether the volume and activity in a market has decreased significantly and whether such a decrease in activity results in transactions that are not orderly. GAAP requires enhanced disclosures around valuation inputs and techniques used during annual and interim periods.
Various inputs are used in determining the value of the fund’s investments relating to fair value measurements. These inputs are summarized in the three broad levels listed below:
Level 1—unadjusted quoted prices in active markets for identical investments.
Level 2—other significant observable inputs (including quoted prices for similar investments, interest rates, prepayment speeds, credit risk, etc.).
Level 3—significant unobservable inputs (including the fund’s own assumptions in determining the fair value of investments).
The inputs or methodology used for valuing securities are not necessarily an indication of the risk associated with investing in those securities.
Changes in valuation techniques may result in transfers in or out of an assigned level within the disclosure hierarchy. Valuation techniques used to value the fund’s investments are as follows:
The Company’s Board of Directors (the “Board”) has designated the Adviser as the fund’s valuation designee, effective September 8, 2022, to
37
NOTES TO FINANCIAL STATEMENTS (continued)
make all fair value determinations with respect to the fund’s portfolio investments, subject to the Board’s oversight and pursuant to Rule 2a-5 under the Act.
Investments in equity securities are valued at the last sales price on the securities exchange or national securities market on which such securities are primarily traded. Securities listed on the National Market System for which market quotations are available are valued at the official closing price or, if there is no official closing price that day, at the last sales price. For open short positions, asked prices are used for valuation purposes. Bid price is used when no asked price is available. Registered investment companies that are not traded on an exchange are valued at their net asset value. All of the preceding securities are generally categorized within Level 1 of the fair value hierarchy.
Securities not listed on an exchange or the national securities market, or securities for which there were no transactions, are valued at the average of the most recent bid and asked prices. These securities are generally categorized within Level 2 of the fair value hierarchy.
Fair valuing of securities may be determined with the assistance of a pricing service using calculations based on indices of domestic securities and other appropriate indicators, such as prices of relevant ADRs and futures. Utilizing these techniques may result in transfers between Level 1 and Level 2 of the fair value hierarchy.
When market quotations or official closing prices are not readily available, or are determined not to accurately reflect fair value, such as when the value of a security has been significantly affected by events after the close of the exchange or market on which the security is principally traded (for example, a foreign exchange or market), but before the fund calculates its net asset value, the fund may value these investments at fair value as determined in accordance with the procedures approved by the Board. Certain factors may be considered when fair valuing investments such as: fundamental analytical data, the nature and duration of restrictions on disposition, an evaluation of the forces that influence the market in which the securities are purchased and sold, and public trading in similar securities of the issuer or comparable issuers. These securities are either categorized within Level 2 or 3 of the fair value hierarchy depending on the relevant inputs used.
For securities where observable inputs are limited, assumptions about market activity and risk are used and such securities are generally categorized within Level 3 of the fair value hierarchy.
38
Investments denominated in foreign currencies are translated to U.S. dollars at the prevailing rates of exchange.
Futures, which are traded on an exchange, are valued at the last sales price on the securities exchange on which such securities are primarily traded or at the last sales price on the national securities market on each business day and are generally categorized within Level 1 of the fair value hierarchy.
The following is a summary of the inputs used as of October 31, 2022 in valuing the fund’s investments:
| | | | | | | |
| | Level 1-Unadjusted Quoted Prices | Level 2- Other Significant Observable Inputs | | Level 3-Significant Unobservable Inputs | Total | |
Assets ($) | | |
Investments in Securities:† | | |
Equity Securities - Common Stocks | 2,043,142 | 340,807,210 | †† | 0 | 342,850,352 | |
Equity Securities - Preferred Stocks | - | 1,809,021 | †† | - | 1,809,021 | |
Investment Companies | 4,620,581 | - | | - | 4,620,581 | |
Other Financial Instruments: | | |
Futures††† | 56,010 | - | | - | 56,010 | |
† See Statement of Investments for additional detailed categorizations, if any.
†† Securities classified within Level 2 at period end as the values were determined pursuant to the fund’s fair valuation procedures.
††† Amount shown represents unrealized appreciation (depreciation) at period end, but only variation margin on exchange-traded and centrally cleared derivatives, if any, are reported in the Statement of Assets and Liabilities.
The following is a reconciliation of Level 3 assets for which significant unobservable inputs were used to determine fair value:
| | |
| Equity Securities—
Common Stock ($) |
Balance as of 10/31/2021† | 1 |
Realized gain (loss) | - |
Change in unrealized appreciation (depreciation) | (1) |
Purchases/Issuances | - |
Sales/Dispositions | - |
Transfers into Level 3 | - |
Transfers out of Level 3 | - |
Balance as of 10/31/2022† | 0 |
The amount of total net gain (loss) for the period included in earnings attributable to the change in unrealized appreciation (depreciation) relating to investments still held at 10/31/2022 | (1) |
† Securities deemed as Level 3 due to the lack of significant observable inputs by management assessment.
39
NOTES TO FINANCIAL STATEMENTS (continued)
(b) Foreign currency transactions: The fund does not isolate that portion of the results of operations resulting from changes in foreign exchange rates on investments from the fluctuations arising from changes in the market prices of securities held. Such fluctuations are included with the net realized and unrealized gain or loss on investments.
Net realized foreign exchange gains or losses arise from sales of foreign currencies, currency gains or losses realized on securities transactions between trade and settlement date, and the difference between the amounts of dividends, interest and foreign withholding taxes recorded on the fund’s books and the U.S. dollar equivalent of the amounts actually received or paid. Net unrealized foreign exchange gains and losses arise from changes in the value of assets and liabilities other than investments resulting from changes in exchange rates. Foreign currency gains and losses on foreign currency transactions are also included with net realized and unrealized gain or loss on investments.
Foreign taxes: The fund may be subject to foreign taxes (a portion of which may be reclaimable) on income, stock dividends, realized and unrealized capital gains on investments or certain foreign currency transactions. Foreign taxes are recorded in accordance with the applicable foreign tax regulations and rates that exist in the foreign jurisdictions in which the fund invests. These foreign taxes, if any, are paid by the fund and are reflected in the Statement of Operations, if applicable. Foreign taxes payable or deferred or those subject to reclaims as of October 31, 2022, if any, are disclosed in the fund’s Statement of Assets and Liabilities.
(c) Securities transactions and investment income: Securities transactions are recorded on a trade date basis. Realized gains and losses from securities transactions are recorded on the identified cost basis. Dividend income is recognized on the ex-dividend date and interest income, including, where applicable, accretion of discount and amortization of premium on investments, is recognized on the accrual basis.
Pursuant to a securities lending agreement with BNY Mellon, the fund may lend securities to qualified institutions. It is the fund’s policy that, at origination, all loans are secured by collateral of at least 102% of the value of U.S. securities loaned and 105% of the value of foreign securities loaned. Collateral equivalent to at least 100% of the market value of securities on loan is maintained at all times. Collateral is either in the form of cash, which can be invested in certain money market mutual funds managed by the Adviser, or U.S. Government and Agency securities. The fund is entitled to receive all dividends, interest and distributions on securities loaned, in addition to income earned as a result of the lending
40
transaction. Should a borrower fail to return the securities in a timely manner, BNY Mellon is required to replace the securities for the benefit of the fund or credit the fund with the market value of the unreturned securities and is subrogated to the fund’s rights against the borrower and the collateral. Additionally, the contractual maturity of security lending transactions are on an overnight and continuous basis. During the period ended October 31, 2022, BNY Mellon earned $1,528 from the lending of the fund’s portfolio securities, pursuant to the securities lending agreement.
(d) Affiliated issuers: Investments in other investment companies advised by the Adviser are considered “affiliated” under the Act.
(e) Market Risk: The value of the securities in which the fund invests may be affected by political, regulatory, economic and social developments, and developments that impact specific economic sectors, industries or segments of the market. The value of a security may also decline due to general market conditions that are not specifically related to a particular company or industry, such as real or perceived adverse economic conditions, changes in the general outlook for corporate earnings, changes in interest or currency rates, changes to inflation, adverse changes to credit markets or adverse investor sentiment generally. In addition, turbulence in financial markets and reduced liquidity in equity, credit and/or fixed income markets may negatively affect many issuers, which could adversely affect the fund. Global economies and financial markets are becoming increasingly interconnected, and conditions and events in one country, region or financial market may adversely impact issuers in a different country, region or financial market. These risks may be magnified if certain events or developments adversely interrupt the global supply chain; in these and other circumstances, such risks might affect companies world-wide. Recent examples include pandemic risks related to COVID-19 and aggressive measures taken world-wide in response by governments, including closing borders, restricting international and domestic travel, and the imposition of prolonged quarantines of large populations, and by businesses, including changes to operations and reducing staff.
Foreign Investment Risk: To the extent the fund invests in foreign securities, the fund’s performance will be influenced by political, social and economic factors affecting investments in foreign issuers. Special risk associated with investments in foreign issuers include exposure to currency fluctuations, less liquidity, less developed or less efficient trading markets, lack of comprehensive company information, political and economic instability and differing auditing and legal standards.
(f) Dividends and distributions to shareholders: Dividends and distributions are recorded on the ex-dividend date. Dividends from net
41
NOTES TO FINANCIAL STATEMENTS (continued)
investment income and dividends from net realized capital gains, if any, are normally declared and paid annually, but the fund may make distributions on a more frequent basis to comply with the distribution requirements of the Internal Revenue Code of 1986, as amended (the “Code”). To the extent that net realized capital gains can be offset by capital loss carryovers, it is the policy of the fund not to distribute such gains. Income and capital gain distributions are determined in accordance with income tax regulations, which may differ from GAAP.
(g) Federal income taxes: It is the policy of the fund to continue to qualify as a regulated investment company, if such qualification is in the best interests of its shareholders, by complying with the applicable provisions of the Code, and to make distributions of taxable income and net realized capital gain sufficient to relieve it from substantially all federal income and excise taxes.
As of and during the period ended October 31, 2022, the fund did not have any liabilities for any uncertain tax positions. The fund recognizes interest and penalties, if any, related to uncertain tax positions as income tax expense in the Statement of Operations. During the period ended October 31, 2022, the fund did not incur any interest or penalties.
Each tax year in the four-year period ended October 31, 2022 remains subject to examination by the Internal Revenue Service and state taxing authorities.
At October 31, 2022, the components of accumulated earnings on a tax basis were as follows: undistributed ordinary income $7,844,999, accumulated capital losses $46,374,292 and unrealized appreciation $70,593,590.
The fund is permitted to carry forward capital losses for an unlimited period. Furthermore, capital loss carryovers retain their character as either short-term or long-term capital losses.
The accumulated capital loss carryover is available for federal income tax purposes to be applied against future net realized capital gains, if any, realized subsequent to October 31, 2022. The fund has $2,403,309 of short-term capital losses and $43,970,983 of long-term capital losses which can be carried forward for an unlimited period.
The tax character of distributions paid to shareholders during the fiscal years ended October 31, 2022 and October 31, 2021 were as follows: ordinary income $18,500,829 and $9,501,742, respectively.
42
NOTE 2—Bank Lines of Credit:
The fund participates with other long-term open-end funds managed by the Adviser in a $823.5 million unsecured credit facility led by Citibank, N.A. (the “Citibank Credit Facility”) and a $300 million unsecured credit facility provided by BNY Mellon (the “BNYM Credit Facility”), each to be utilized primarily for temporary or emergency purposes, including the financing of redemptions (each, a “Facility”). The Citibank Credit Facility is available in two tranches: (i) Tranche A is in an amount equal to $688.5 million and is available to all long-term open-ended funds, including the fund, and (ii) Tranche B is an amount equal to $135 million and is available only to BNY Mellon Floating Rate Income Fund, a series of BNY Mellon Investment Funds IV, Inc. In connection therewith, the fund has agreed to pay its pro rata portion of commitment fees for Tranche A of the Citibank Credit Facility and the BNYM Credit Facility. Interest is charged to the fund based on rates determined pursuant to the terms of the respective Facility at the time of borrowing.
The average amount of borrowings outstanding under the Facilities during the period ended October 31, 2022 was approximately $192,329 with a related weighted average annualized interest rate of 2.58%.
NOTE 3—Management Fee and Other Transactions with Affiliates:
(a) Pursuant to a management agreement with the Adviser, the management fee is computed at the annual rate of .35% of the value of the fund’s average daily net assets and is payable monthly. Out of its fee, the Adviser pays all of the expenses of the fund, except management fees, Shareholder Services Plan fees, brokerage fees and commissions, taxes, interest expense, commitment fees on borrowings, fees and expenses of non-interested Board Members (including counsel fees) and extraordinary expenses. In addition, the Adviser is required to reduce its fee in an amount equal to the fund’s allocable portion of fees and expenses of the non-interested Board Members (including counsel fees). During the period ended October 31, 2022, fees reimbursed by the Adviser amounted to $30,167.
(b) Under the Shareholder Services Plan, Investor shares pay the Distributor at an annual rate of .25% of the value of its average daily net assets for the provision of certain services. The services provided may include personal services relating to shareholder accounts, such as answering shareholder inquiries regarding the fund, and services related to the maintenance of shareholder accounts. The Distributor may make payments to Service Agents (securities dealers, financial institutions or
43
NOTES TO FINANCIAL STATEMENTS (continued)
other industry professionals) with respect to these services. The Distributor determines the amounts to be paid to Service Agents. During the period ended October 31, 2022, the fund was charged $664,584 pursuant to the Shareholder Services Plan.
The fund has an arrangement with The Bank of New York Mellon (the “Custodian”), a subsidiary of BNY Mellon and an affiliate of the Adviser, whereby the fund will receive interest income or be charged overdraft fees when cash balances are maintained. For financial reporting purposes, the fund includes this interest income and overdraft fees, if any, as interest income in the Statement of Operations.
The components of “Due to BNY Mellon Investment Adviser, Inc. and affiliates” in the Statement of Assets and Liabilities consist of: management fee of $102,878 and Shareholder Services Plan fees of $47,876, which are offset against an expense reimbursement currently in effect in the amount of $11,035.
(c) Each Board member also serves as a Board member of other funds in the BNY Mellon Family of Funds complex. Annual retainer fees and attendance fees are allocated to each fund based on net assets.
NOTE 4—Securities Transactions:
The aggregate amount of purchases and sales of investment securities, excluding short-term securities, futures and forward foreign currency exchange contracts (“forward contracts”), during the period ended October 31, 2022, amounted to $15,137,299 and $82,748,252, respectively.
Derivatives: A derivative is a financial instrument whose performance is derived from the performance of another asset. The fund enters into International Swaps and Derivatives Association, Inc. Master Agreements or similar agreements (collectively, “Master Agreements”) with its over-the-counter (“OTC”) derivative contract counterparties in order to, among other things, reduce its credit risk to counterparties. Master Agreements include provisions for general obligations, representations, collateral and events of default or termination. Under a Master Agreement, the fund may offset with the counterparty certain derivative financial instruments’ payables and/or receivables with collateral held and/or posted and create one single net payment in the event of default or termination. The SEC recently adopted Rule 18f-4 under the Act, which, effective August 18, 2022, regulates the use of derivatives transactions for certain funds registered under the Act. The fund is deemed a “limited” derivatives user under the rule and is required to limit its derivatives exposure so that the total notional value of derivatives does not exceed 10% of fund’s net assets, and is subject to certain reporting requirements.
44
Each type of derivative instrument that was held by the fund during the period ended October 31, 2022 is discussed below.
Futures: In the normal course of pursuing its investment objective, the fund is exposed to market risk, including equity price risk, as a result of changes in value of underlying financial instruments. The fund invests in futures in order to manage its exposure to or protect against changes in the market. A futures contract represents a commitment for the future purchase or a sale of an asset at a specified date. Upon entering into such contracts, these investments require initial margin deposits with a counterparty, which consist of cash or cash equivalents. The amount of these deposits is determined by the exchange or Board of Trade on which the contract is traded and is subject to change. Accordingly, variation margin payments are received or made to reflect daily unrealized gains or losses which are recorded in the Statement of Operations. When the contracts are closed, the fund recognizes a realized gain or loss which is reflected in the Statement of Operations. There is minimal counterparty credit risk to the fund with futures since they are exchange traded, and the exchange guarantees the futures against default. Futures open at October 31, 2022 are set forth in the Statement of Investments.
Forward Foreign Currency Exchange Contracts: The fund enters into forward contracts in order to hedge its exposure to changes in foreign currency exchange rates on its foreign portfolio holdings, to settle foreign currency transactions or as a part of its investment strategy. When executing forward contracts, the fund is obligated to buy or sell a foreign currency at a specified rate on a certain date in the future. With respect to sales of forward contracts, the fund incurs a loss if the value of the contract increases between the date the forward contract is opened and the date the forward contract is closed. The fund realizes a gain if the value of the contract decreases between those dates. With respect to purchases of forward contracts, the fund incurs a loss if the value of the contract decreases between the date the forward contract is opened and the date the forward contract is closed. The fund realizes a gain if the value of the contract increases between those dates. Any realized or unrealized gains or losses which occurred during the period are reflected in the Statement of Operations. The fund is exposed to foreign currency risk as a result of changes in value of underlying financial instruments. The fund is also exposed to credit risk associated with counterparty non-performance on these forward contracts, which is generally limited to the unrealized gain on each open contract. This risk may be mitigated by Master Agreements, if any, between the fund and the counterparty and the posting of collateral, if any, by the counterparty to the fund to cover the fund’s exposure to the
45
NOTES TO FINANCIAL STATEMENTS (continued)
counterparty. As of October 31, 2022 there were no forward contracts outstanding.
The following tables show the fund’s exposure to different types of market risk as it relates to the Statement of Assets and Liabilities and the Statement of Operations, respectively.
Fair value of derivative instruments as of October 31, 2022 is shown below:
| | | | | | | | |
| | Derivative
Assets ($) | | | | Derivative
Liabilities ($) | |
Equity risk | 56,010 | 1 | Equity risk | - | |
Gross fair value of
derivative contracts | 56,010 | | | | - | |
| | | | | | |
| Statement of Assets and Liabilities location: | |
1 | Includes cumulative appreciation (depreciation) on futures as reported in the Statement of Futures, but only the
unpaid variation margin is reported in the Statement of Assets and Liabilities. |
The effect of derivative instruments in the Statement of Operations during the period ended October 31, 2022 is shown below:
| | | | | | | | |
Amount of realized gain (loss) on derivatives recognized in income ($) | |
Underlying risk | Futures | 1 | Forward Contracts | 2 | Total | |
Equity | (2,397,517) | | - | | (2,397,517) | |
Foreign exchange | - | | 8,469 | | 8,469 | |
Total | (2,397,517) | | 8,469 | | (2,389,048) | |
| | | | | | |
Net change in unrealized appreciation (depreciation)
on derivatives recognized in income ($) | |
Underlying risk | Futures | 3 | Forward Contracts | 4 | Total | |
Equity | 37,511 | | - | | 37,511 | |
Foreign exchange | - | | (9,822) | | (9,822) | |
Total | 37,511 | | (9,822) | | 27,689 | |
| | | | | | | |
| Statement of Operations location: | |
1 | Net realized gain (loss) on futures. |
2 | Net realized gain (loss) on forward foreign currency exchange contracts. |
3 | Net change in unrealized appreciation (depreciation) on futures. |
4 | Net change in unrealized appreciation (depreciation) on forward foreign currency exchange contracts. |
The following summarizes the average market value of derivatives outstanding during the period ended October 31, 2022:
| | | |
| | Average Market Value ($) |
Equity futures | | 7,303,762 |
Forward contracts | | 84,161 |
46
At October 31, 2022, the cost of investments for federal income tax purposes was $278,394,850; accordingly, accumulated net unrealized appreciation on investments was $70,885,104 consisting of $131,603,303 gross unrealized appreciation and $60,718,199 gross unrealized depreciation.
47
REPORT OF INDEPENDENT REGISTERED PUBLIC ACCOUNTING FIRM
To the Shareholders and the Board of Directors of BNY Mellon International Stock Index Fund
Opinion on the Financial Statements
We have audited the accompanying statement of assets and liabilities of BNY Mellon International Stock Index Fund (the “Fund”) (one of the funds constituting BNY Mellon Index Funds, Inc.), including the statement of investments, as of October 31, 2022, and the related statement of operations for the year then ended, the statements of changes in net assets for each of the two years in the period then ended, the financial highlights for each of the five years in the period then ended and the related notes (collectively referred to as the “financial statements”). In our opinion, the financial statements present fairly, in all material respects, the financial position of the Fund (one of the funds constituting BNY Mellon Index Funds, Inc.) at October 31, 2022, the results of its operations for the year then ended, the changes in its net assets for each of the two years in the period then ended and its financial highlights for each of the five years in the period then ended, in conformity with U.S. generally accepted accounting principles.
Basis for Opinion
These financial statements are the responsibility of the Fund’s management. Our responsibility is to express an opinion on the Fund’s financial statements based on our audits. We are a public accounting firm registered with the Public Company Accounting Oversight Board (United States) (“PCAOB”) and are required to be independent with respect to the Fund in accordance with the U.S. federal securities laws and the applicable rules and regulations of the Securities and Exchange Commission and the PCAOB.
We conducted our audits in accordance with the standards of the PCAOB. Those standards require that we plan and perform the audit to obtain reasonable assurance about whether the financial statements are free of material misstatement, whether due to error or fraud. The Fund is not required to have, nor were we engaged to perform, an audit of the Fund’s internal control over financial reporting. As part of our audits, we are required to obtain an understanding of internal control over financial reporting, but not for the purpose of expressing an opinion on the effectiveness of the Fund’s internal control over financial reporting. Accordingly, we express no such opinion.
Our audits included performing procedures to assess the risks of material misstatement of the financial statements, whether due to error or fraud, and performing procedures that respond to those risks. Such procedures included examining, on a test basis, evidence regarding the amounts and disclosures in the financial statements. Our procedures included confirmation of securities owned as of October 31, 2022, by correspondence with the custodian, brokers and others; when replies were not received from brokers and others, we performed other auditing procedures. Our audits also included evaluating the accounting principles used and significant estimates made by management, as well as evaluating the overall presentation of the financial statements. We believe that our audits provide a reasonable basis for our opinion.

We have served as the auditor of one or more investment companies in the BNY Mellon Family of Funds since at least 1957, but we are unable to determine the specific year.
New York, New York
December 22, 2022
48
IMPORTANT TAX INFORMATION (Unaudited)
In accordance with federal tax law, the fund elects to provide each shareholder with their portion of the fund’s foreign taxes paid and the income sourced from foreign countries. Accordingly, the fund hereby reports the following information regarding its fiscal year ended October 31, 2022:
- the total amount of taxes paid to foreign countries was $1,302,788
- the total amount of income sourced from foreign countries was $15,595,771
Where required by Federal tax law rules, shareholders will receive notification of their proportionate share of foreign taxes paid and foreign sourced income for the 2021 calendar year with Form 1099-DIV which will be mailed in early 2023. For the fiscal year ended October 31, 2022, certain dividends paid by the fund may be subject to a maximum tax rate of 15%, as provided for by the Jobs and Growth Tax Relief Reconciliation Act of 2003. Of the distributions paid during the fiscal year, $16,070,825 represents the maximum amount that may be considered qualified dividend income.
49
LIQUIDITY RISK MANAGEMENT PROGRAM (Unaudited)
Effective June 1, 2019, the fund adopted a liquidity risk management program (the “Liquidity Risk Management Program”) pursuant to the requirements of Rule 22e-4 under the Investment Company Act of 1940, as amended. Rule 22e-4 requires registered open-end funds, including mutual funds and exchange-traded funds but not money market funds, to establish liquidity risk management programs in order to effectively manage fund liquidity and shareholder redemptions. The rule is designed to mitigate the risk that a fund could not meet redemption requests without significantly diluting the interests of remaining investors.
The rule requires the fund to assess, manage and review their liquidity risk at least annually considering applicable factors such as investment strategy and liquidity during normal and foreseeable stressed conditions, including whether the strategy is appropriate for an open-end fund and whether the fund has a relatively concentrated portfolio or large positions in particular issuers. The fund must also assess its use of borrowings and derivatives, short-term and long-term cash flow projections in normal and stressed conditions, holdings of cash and cash equivalents, and borrowing arrangements and other funding sources.
The rule also requires the fund to classify its investments as highly liquid, moderately liquid, less liquid or illiquid based on the number of days the fund expects it would take to liquidate the investment, and to review these classifications at least monthly or more often under certain conditions. The periods range from three or fewer business days for a highly liquid investment to greater than seven calendar days for settlement of a less liquid investment. Illiquid investments are those a fund does not expect to be able to sell or dispose of within seven calendar days without significantly changing the market value. The fund is prohibited from acquiring an investment if, after the acquisition, its holdings of illiquid assets will exceed 15% of its net assets. In addition, if a fund permits redemptions in-kind, the rule requires the fund to establish redemption in-kind policies and procedures governing how and when it will engage in such redemptions.
Pursuant to the rule’s requirements, the Liquidity Risk Management Program has been reviewed and approved by the Board. Furthermore, the Board has received a written report prepared by the Program’s Administrator that addresses the operation of the Program, assesses its adequacy and effectiveness and describes any material changes made to the Program.
Assessment of Program
In the opinion of the Program Administrator, the Program approved by the Board continues to be adequate for the fund and the Program has been implemented effectively. The Program Administrator has monitored the fund’s liquidity risk and the liquidity classification of the securities held by the fund and has determined that the Program is operating effectively.
During the period from January 1, 2021 to December 31, 2021, there were no material changes to the Program and no material liquidity events that impacted the fund. During the period, the fund held sufficient highly liquid assets to meet fund redemptions.
Under normal expected foreseeable fund redemption forecasts and foreseeable stressed fund redemption forecasts, the Program Administrator believes that the fund maintains sufficient highly liquid assets to meet expected fund redemptions.
50
BOARD MEMBERS INFORMATION (Unaudited)
Independent Board Members
Joseph S. DiMartino (79)
Chairman of the Board (1995)
Principal Occupation During Past 5 Years:
· Director or Trustee of funds in the BNY Mellon Family of Funds and certain other entities (as described in the fund’s Statement of Additional Information) (1995-Present)
Other Public Company Board Memberships During Past 5 Years:
· CBIZ, Inc., a public company providing professional business services, products and solutions, Director (1997-Present)
No. of Portfolios for which Board Member Serves: 94
———————
Peggy C. Davis (79)
Board Member (2006)
Principal Occupation During Past 5 Years:
· Shad Professor of Law, New York University School of Law (1983-Present)
No. of Portfolios for which Board Member Serves: 33
———————
Gina D. France (64)
Board Member (2019)
Principal Occupation During Past 5 Years:
· France Strategic Partners, a strategy and advisory firm serving corporate clients across the United States, Founder, President and Chief Executive Officer (2003-Present)
Other Public Company Board Memberships During Past 5 Years:
· Huntington Bancshares, a bank holding company headquartered in Columbus, Ohio, Director (2016-Present)
· Cedar Fair, L.P., a publicly-traded partnership that owns and operates amusement parks and hotels in the U.S. and Canada, Director (2011-Present)
· CBIZ, Inc., a public company providing professional business services, products and solutions, Director (2015-Present)
· FirstMerit Corporation, a diversified financial services company, Director (2004-2016)
No. of Portfolios for which Board Member Serves: 23
———————
Joan Gulley (75)
Board Member (2017)
Principal Occupation During Past 5 Years:
· Nantucket Atheneum, public library, Chair (2018-June 2021) and Director (2015-June 2021)
· Orchard Island Club, golf and beach club, Governor (2016-Present)
No. of Portfolios for which Board Member Serves: 40
———————
51
BOARD MEMBERS INFORMATION (Unaudited) (continued)
Robin A. Melvin (59)
Board Member (2012)
Principal Occupation During Past 5 Years:
· Westover School, a private girls’ boarding school in Middlebury, Connecticut, Trustee (2019-Present)
· Mentor Illinois, a non-profit organization dedicated to increasing the quality of mentoring services in Illinois, Co-Chair (2014–2020); Board Member, Mentor Illinois (2013-2020)
· JDRF, a non-profit juvenile diabetes research foundation, Board Member (June 2021-June 2022)
Other Public Company Board Memberships During Past 5 Years:
· HPS Corporate Lending Fund, a closed-end management investment company regulated as a business development company, Trustee (August 2021-Present)
No. of Portfolios for which Board Member Serves: 72
———————
Michael D. DiLecce (60)
Advisory Board Member (2022)
Principal Occupation During Past 5 Years:
· Retired since July 2022. Global Asset Management Assurance Leader, Ernst & Young LLP (2015-2022)
· Americas Regional Talent Managing Partner for Ernst & Young’s Financial Service Practice (2017-2021)
· Partner, Ernst & Young LLP (1997-2022)
No. of Portfolios for which Board Member Serves: 23
———————
The address of the Board Members and Officers is c/o BNY Mellon Investment Adviser, Inc., 240 Greenwich Street, New York, New York 10286. Additional information about each Board Member is available in the fund’s Statement of Additional Information which can be obtained from the Adviser free of charge by calling this toll free number: 1-800-373-9387.
52
OFFICERS OF THE FUND (Unaudited)
DAVID DIPETRILLO, President since January 2021.
Vice President and Director of the Adviser since February 2021; Head of North America Product, BNY Mellon Investment Management since January 2018; and Director of Product Strategy, BNY Mellon Investment Management from January 2016 to December 2017. He is an officer of 55 investment companies (comprised of 109 portfolios) managed by the Adviser or an affiliate of the Adviser. He is 44 years old and has been an employee of BNY Mellon since 2005.
JAMES WINDELS, Treasurer since November 2001.
Vice President of the Adviser since September 2020; and Director–BNY Mellon Fund Administration. He is an officer of 56 investment companies (comprised of 130 portfolios) managed by the Adviser or an affiliate of the Adviser. He is 64 years old and has been an employee of the Adviser since April 1985.
PETER M. SULLIVAN, Chief Legal Officer since July 2021 and Vice President and Assistant Secretary since March 2019.
Chief Legal Officer of the Adviser and Associate General Counsel of BNY Mellon since July 2021; Senior Managing Counsel of BNY Mellon from December 2020 to July 2021; and Managing Counsel of BNY Mellon from March 2009 to December 2020. He is an officer of 56 investment companies (comprised of 130 portfolios) managed by the Adviser or an affiliate of the Adviser. He is 54 years old and has been an employee of BNY Mellon since April 2004.
JAMES BITETTO, Vice President since August 2005 and Secretary since February 2018.
Senior Managing Counsel of BNY Mellon since December 2019; Managing Counsel of BNY Mellon from April 2014 to December 2019; and Secretary of the Adviser. He is an officer of 56 investment companies (comprised of 130 portfolios) managed by the Adviser or an affiliate of the Adviser. He is 56 years old and has been an employee of the Adviser since December 1996.
DEIRDRE CUNNANE, Vice President and Assistant Secretary since March 2019.
Managing Counsel of BNY Mellon since December 2021, Counsel of BNY Mellon from August 2018 to December 2021; and Senior Regulatory Specialist at BNY Mellon Investment Management Services from February 2016 to August 2018. She is an officer of 56 investment companies (comprised of 130 portfolios) managed by the Adviser or an affiliate of the Adviser. She is 32 years old and has been an employee of the Adviser since August 2018.
SARAH S. KELLEHER, Vice President and Assistant Secretary since April 2014.
Vice President of BNY Mellon ETF Investment Adviser; LLC since February 2020; Senior Managing Counsel of BNY Mellon since September 2021; Managing Counsel of BNY Mellon from December 2017 to September 2021; and Senior Counsel of BNY Mellon from March 2013 to December 2017. She is an officer of 56 investment companies (comprised of 130 portfolios) managed by the Adviser or an affiliate of the Adviser. She is 47 years old and has been an employee of the Adviser since March 2013.
JEFF PRUSNOFSKY, Vice President and Assistant Secretary since August 2005.
Senior Managing Counsel of BNY Mellon. He is an officer of 56 investment companies (comprised of 130 portfolios) managed by the Adviser or an affiliate of the Adviser. He is 57 years old and has been an employee of the Adviser since October 1990.
AMANDA QUINN, Vice President and Assistant Secretary since March 2020.
Counsel of BNY Mellon since June 2019; Regulatory Administration Manager at BNY Mellon Investment Management Services from September 2018 to May 2019; and Senior Regulatory Specialist at BNY Mellon Investment Management Services from April 2015 to August 2018. She is an officer of 56 investment companies (comprised of 130 portfolios) managed by the Adviser or an affiliate of the Adviser. She is 37 years old and has been an employee of the Adviser since June 2019.
53
OFFICERS OF THE FUND (Unaudited) (continued)
NATALYA ZELENSKY, Vice President and Assistant Secretary since March 2017.
Chief Compliance Officer since August 2021 and Vice President since February 2020 of BNY Mellon ETF Investment Adviser, LLC; Chief Compliance Officer since August 2021 and Vice President and Assistant Secretary since February 2020 of BNY Mellon ETF Trust; Managing Counsel of BNY Mellon from December 2019 to August 2021; Counsel of BNY Mellon from May 2016 to December 2019; and Assistant Secretary of the Adviser from April 2018 to August 2021. She is an officer of 55 investment companies (comprised of 129 portfolios) managed by the Adviser or an affiliate of the Adviser. She is 37 years old and has been an employee of BNY Mellon since May 2016.
DANIEL GOLDSTEIN, Vice President since March 2022.
Vice President and Head of Product Development of North America Product, BNY Mellon Investment Management since January 2018; Co-Head of Product Management, Development & Oversight of North America Product, BNY Mellon Investment Management from January 2010 to January 2018; and Senior Vice President, Development & Oversight of North America Product, BNY Mellon Investment Management since 2010. He is an officer of 55 investment companies (comprised of 109 portfolios) managed by the Adviser or an affiliate of the Adviser. He is 53 years old and has been an employee of the Distributor since 1991.
JOSEPH MARTELLA, Vice President since March 2022.
Vice President and Head of Product Management of North America Product, BNY Mellon Investment Management since January 2018; Director of Product Research and Analytics of North America Product, BNY Mellon Investment Management from January 2010 to January 2018; and Senior Vice President of North America Product, BNY Mellon Investment Management since 2010. He is an officer of 55 investment companies (comprised of 109 portfolios) managed by the Adviser or an affiliate of the Adviser. He is 46 years old and has been an employee of the Distributor since 1999.
GAVIN C. REILLY, Assistant Treasurer since December 2005.
Tax Manager–BNY Mellon Fund Administration. He is an officer of 56 investment companies (comprised of 130 portfolios) managed by the Adviser or an affiliate of the Adviser. He is 54 years old and has been an employee of the Adviser since April 1991.
ROBERT SALVIOLO, Assistant Treasurer since July 2007.
Senior Accounting Manager–BNY Mellon Fund Administration. He is an officer of 56 investment companies (comprised of 130 portfolios) managed by the Adviser or an affiliate of the Adviser. He is 55 years old and has been an employee of the Adviser since June 1989.
ROBERT SVAGNA, Assistant Treasurer since December 2002.
Senior Accounting Manager–BNY Mellon Fund Administration. He is an officer of 56 investment companies (comprised of 130 portfolios) managed by the Adviser or an affiliate of the Adviser. He is 55 years old and has been an employee of the Adviser since November 1990.
JOSEPH W. CONNOLLY, Chief Compliance Officer since October 2004.
Chief Compliance Officer of the BNY Mellon Family of Funds and BNY Mellon Funds Trust since 2004; and Chief Compliance Officer of the Adviser from 2004 until June 2021. He is an officer of 55 investment companies (comprised of 115 portfolios) managed by the Adviser. He is 65 years old.
CARIDAD M. CAROSELLA, Anti-Money Laundering Compliance Officer since January 2016.
Anti-Money Laundering Compliance Officer of the BNY Mellon Family of Funds and BNY Mellon Funds Trust. She is an officer of 48 investment companies (comprised of 122 portfolios) managed by the Adviser or an affiliate of the Adviser. She is 54 years old and has been an employee of the Distributor since 1997.
54
This page intentionally left blank.
55
This page intentionally left blank.
56
This page intentionally left blank.
57
BNY Mellon International Stock Index Fund
240 Greenwich Street
New York, NY 10286
Adviser
BNY Mellon Investment Adviser, Inc.
240 Greenwich Street
New York, NY 10286
Custodian
The Bank of New York Mellon
240 Greenwich Street
New York, NY 10286
Transfer Agent &
Dividend Disbursing Agent
BNY Mellon Transfer, Inc.
240 Greenwich Street
New York, NY 10286
Distributor
BNY Mellon Securities Corporation
240 Greenwich Street
New York, NY 10286
| | |
Ticker Symbols: | Investor: DIISX Class I: DINIX |
Telephone Call your financial representative or 1-800-373-9387
Mail The BNY Mellon Family of Funds, 144 Glenn Curtiss Boulevard, Uniondale, NY 11556-0144
E-mail Send your request to info@bnymellon.com
Internet Information can be viewed online or downloaded at www.im.bnymellon.com
The fund files its complete schedule of portfolio holdings with the Securities and Exchange Commission (“SEC”) for the first and third quarters of each fiscal year on Form N-PORT. The fund’s Forms N-PORT are available on the SEC’s website at www.sec.gov.
A description of the policies and procedures that the fund uses to determine how to vote proxies relating to portfolio securities and information regarding how the fund voted these proxies for the most recent 12-month period ended June 30 is available at www.im.bnymellon.com and on the SEC’s website at www.sec.gov and without charge, upon request, by calling 1-800-373-9387.
| | |
© 2022 BNY Mellon Securities Corporation
0079AR1022 | 
|
BNY Mellon S&P 500 Index Fund
| |
ANNUAL REPORT October 31, 2022 |
| |
Save time. Save paper. View your next shareholder report online as soon as it’s available. Log into www.im.bnymellon.com and sign up for eCommunications. It’s simple and only takes a few minutes. |
| |
The views expressed in this report reflect those of the portfolio manager(s) only through the end of the period covered and do not necessarily represent the views of BNY Mellon Investment Adviser, Inc. or any other person in the BNY Mellon Investment Adviser, Inc. organization. Any such views are subject to change at any time based upon market or other conditions and BNY Mellon Investment Adviser, Inc. disclaims any responsibility to update such views. These views may not be relied on as investment advice and, because investment decisions for a fund in the BNY Mellon Family of Funds are based on numerous factors, may not be relied on as an indication of trading intent on behalf of any fund in the BNY Mellon Family of Funds. |
| |
Not FDIC-Insured • Not Bank-Guaranteed • May Lose Value |
Contents
T H E F U N D
F O R M O R E I N F O R M AT I O N
Back Cover
DISCUSSION OF FUND PERFORMANCE (Unaudited)
For the period from November 1, 2021, through October 31, 2022, as provided by David France, CFA, Todd Frysinger, CFA, Vlasta Sheremeta, CFA, Michael Stoll and Marlene Walker Smith, Portfolio Managers
Market and Fund Performance Overview
For the 12-month period ended October 31, 2022, the BNY Mellon S&P 500 Index Fund (the “fund”) produced a total return of −15.03%.1 In comparison, the S&P 500® Index (the “Index”), the fund’s benchmark, returned −14.60% for the same period.2
Equities declined during the reporting period under pressure from increasing inflation, tightening central bank policies and uncertainties related to Russia’s invasion of Ukraine. The difference in returns between the fund and the Index resulted primarily from transaction costs and operating expenses that are not reflected in Index results.
The Fund’s Investment Approach
The fund seeks to match the performance of the Index. To pursue its goal, the fund generally is fully invested in stocks included in the Index and in futures whose performance is tied to the Index. The fund generally invests in all 500 stocks in the Index in proportion to their weighting in the Index.
Because the fund has expenses, performance will tend to be slightly lower than that of the Index. The fund attempts to have a correlation between its performance and that of the Index of at least 0.95, before fees and expenses. A correlation of 1.00 would mean that the fund and the Index were perfectly correlated.
The Index is an unmanaged index of 500 common stocks, chosen to reflect the industries of the U.S. economy, and is often considered a proxy for the stock market in general. S&P weights each company’s stock in the Index by its market capitalization (i.e., the share price times the number of shares outstanding), adjusted by the number of available float shares (i.e., those shares available to public investors). Companies included in the Index generally must have market capitalizations in excess of $14.6 billion, to the extent consistent with market conditions.
Increasing Inflation and Slowing Economic Growth Pressure Equities
U.S. equities started the reporting period on a mixed note. Concerns regarding the new COVID-19 Omicron variant came to the fore in November 2021. Markets recovered in December on continued economic growth and strong corporate earnings reports, despite increasingly hawkish rhetoric from the U.S. Federal Reserve (the “Fed”) regarding the tapering of the Fed’s asset-purchase program in the face of rising inflation. The start of 2022 saw increasingly aggressive comments from the Fed regarding monetary tightening, along with rising tensions between Russia and Ukraine, two major suppliers of energy, agricultural products and other natural resources. As a result, equity markets weakened in January, then plunged in early February as Russia invaded its neighbor, while commodity prices rose, led by soaring energy prices.
Rapidly rising inflation marked the second half of the period. The Fed attempted to dampen the trend by raising rates five times between March and September, from a range of 0.00 – 0.25% at the beginning of the period to 3.00% – 3.25% as of October 31, 2022—its most aggressive series of rate increases in decades, with further increases projected by the end of the year. Rising rates heightened concerns that economic growth could be undermined by anti-inflationary moves. The resulting risk-off sentiment broadly undermined equity markets, with defensive, value-oriented stocks strongly outperforming more cyclical, growth-oriented shares.
2
Communication Services Lead the Equity Market Lower
Communications services led the market lower as the sector was viewed as both cyclical and interest-rate sensitive, with companies subject to supply-chain disruptions and discretionary spending constraints. Consumer discretionary shares suffered as well due to rising input prices and seemingly intractable supply-chain bottlenecks. Real estate underperformed as rising interest rates increased mortgage expenses and dampened property sales.
On the positive side, shares in oil & gas exploration & production companies soared as commodity prices climbed. Consumer staples shares advanced mildly as a value-oriented sector that typically tends to perform relatively well during times of increasing economic stress and uncertainty. Utility stocks also generated slight gains due to their value-oriented investment proposition and the ability of power generators to insulate profits from rising input expenses by hedging energy costs.
The fund’s use of derivatives during the period was limited to futures contracts employed solely to offset the impact of cash positions, which the fund holds pursuant to its operations. These derivatives helped the fund more closely match the performance of the Index.
Replicating the Performance of the Index
In seeking to match the performance of the Index, we do not actively manage investments in response to macroeconomic trends. We note, however, that rising inflation, tightening Fed policy and geopolitical uncertainties related to the war in Ukraine are likely to continue posing challenges for equity investors for the foreseeable future. With inflation in the United States currently running well above the Fed’s 2% target rate, the question remains open as to how soon the Fed can bring inflation under control and to what extent its actions will slow economic growth. As always, we continue to monitor factors that affect the fund’s investments.
November 15, 2022
¹ Total return includes reinvestment of dividends and any capital gains paid. The fund’s return reflects the absorption of certain fund expenses by BNY Mellon Investment Adviser, Inc. pursuant to an agreement. Had these expenses not been absorbed, returns would have been lower. Past performance is no guarantee of future results. Share price and investment return fluctuate such that upon redemption, fund shares may be worth more or less than their original cost.
² Source: Lipper Inc. — The S&P 500® Index is widely regarded as the best single gauge of large-cap U.S. equities. The Index includes 500 leading companies and captures approximately 80% coverage of available market capitalization. Investors cannot invest directly in any index.
“Standard & Poor’s®,” “S&P®,” “Standard & Poor’s® 500,” and “S&P 500®” are registered trademarks of Standard & Poor’s Financial Services LLC and have been licensed for use on behalf of the fund. The fund is not sponsored, managed, advised, sold or promoted by Standard & Poor’s and its affiliates, and Standard & Poor’s and its affiliates make no representation regarding the advisability of investing in the fund
Equities are subject generally to market, market sector, market liquidity, issuer and investment style risks, among other factors, to varying degrees, all of which are more fully described in the fund’s prospectus.
Recent market risks include pandemic risks related to COVID-19. The effects of COVID-19 have contributed to increased volatility in global markets and will likely affect certain countries, companies, industries and market sectors more dramatically than others. To the extent the fund may overweight its investments in certain countries, companies, industries or market sectors, such positions will increase the fund’s exposure to risk of loss from adverse developments affecting those countries, companies, industries or sectors.
The fund may, but is not required, to use derivative instruments. A small investment in derivatives could have a potentially large impact on the fund’s performance. The use of derivatives involves risks different from, or possibly greater than, the risks associated with investing directly in the underlying assets.
3
FUND PERFORMANCE (Unaudited)
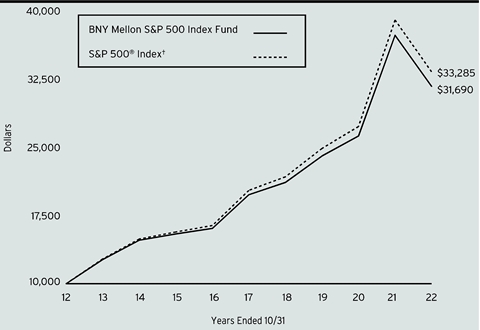
Comparison of change in value of a $10,000 investment in BNY Mellon S&P 500 Index Fund with a hypothetical investment of $10,000 in the S&P 500® Index (the “Index”).
† Source: Lipper Inc.
Past performance is not predictive of future performance.
The above graph compares a hypothetical $10,000 investment made in BNY Mellon S&P 500 Index Fund on 10/31/12 to a hypothetical investment of $10,000 made in the Index on that date. All dividends and capital gain distributions are reinvested.
The fund’s performance shown in the line graph above takes into account all applicable fees and expenses. The Index is widely regarded as the best single gauge of large-cap U.S. equities. The index includes 500 leading companies and captures approximately 80% coverage of available market capitalization. Unlike a mutual fund, the Index is not subject to charges, fees and other expenses. Investors cannot invest directly in any index. Further information relating to fund performance, including expense reimbursements, if applicable, is contained in the Financial Highlights section of the prospectus and elsewhere in this report.
| | | | |
Average Annual Total Returns as of 10/31/2022 | |
| 1 Year | 5 Years | 10 Years |
Fund | -15.03% | 9.89% | 12.23% |
S&P 500® Index | -14.60% | 10.44% | 12.78% |
The performance data quoted represents past performance, which is no guarantee of future results. Share price and investment return fluctuate and an investor’s shares may be worth more or less than original cost upon redemption. Current performance may be lower or higher than the performance quoted. Go to www.im.bnymellon.com for the fund’s most recent month-end returns.
The fund’s performance shown in the graph and table does not reflect the deduction of taxes that a shareholder would pay on fund distributions or the redemption of fund shares.
4
UNDERSTANDING YOUR FUND’S EXPENSES (Unaudited)
As a mutual fund investor, you pay ongoing expenses, such as management fees and other expenses. Using the information below, you can estimate how these expenses affect your investment and compare them with the expenses of other funds. You also may pay one-time transaction expenses, including sales charges (loads) and redemption fees, which are not shown in this section and would have resulted in higher total expenses. For more information, see your fund’s prospectus or talk to your financial adviser.
Review your fund’s expenses
The table below shows the expenses you would have paid on a $1,000 investment in BNY Mellon S&P 500 Index Fund from May 1, 2022 to October 31, 2022. It also shows how much a $1,000 investment would be worth at the close of the period, assuming actual returns and expenses.
| | | | |
Expenses and Value of a $1,000 Investment | |
Assume actual returns for the six months ended October 31, 2022 | |
| | | |
| | | |
Expenses paid per $1,000† | $2.45 | |
Ending value (after expenses) | $942.60 | |
COMPARING YOUR FUND’S EXPENSES WITH THOSE OF OTHER FUNDS (Unaudited)
Using the SEC’s method to compare expenses
The Securities and Exchange Commission (“SEC”) has established guidelines to help investors assess fund expenses. Per these guidelines, the table below shows your fund’s expenses based on a $1,000 investment, assuming a hypothetical 5% annualized return. You can use this information to compare the ongoing expenses (but not transaction expenses or total cost) of investing in the fund with those of other funds. All mutual fund shareholder reports will provide this information to help you make this comparison. Please note that you cannot use this information to estimate your actual ending account balance and expenses paid during the period.
| | | | |
Expenses and Value of a $1,000 Investment | |
Assuming a hypothetical 5% annualized return for the six months ended October 31, 2022 | |
| | | |
| | | |
Expenses paid per $1,000† | $2.55 | |
Ending value (after expenses) | $1,022.68 | |
† | Expenses are equal to the fund’s annualized expense ratio of .50%, multiplied by the average account value over the period, multiplied by 184/365 (to reflect the one-half year period). |
5
STATEMENT OF INVESTMENTS
October 31, 2022
| | | | | | | | |
| |
Description | | | | Shares | | Value ($) | |
Common Stocks - 99.6% | | | | | |
Automobiles & Components - 2.3% | | | | | |
Aptiv PLC | | | | 16,295 | a | 1,483,986 | |
BorgWarner Inc. | | | | 14,881 | | 558,484 | |
Ford Motor Co. | | | | 230,349 | | 3,079,766 | |
General Motors Co. | | | | 85,493 | | 3,355,600 | |
Tesla Inc. | | | | 156,516 | a | 35,613,651 | |
| | | | | 44,091,487 | |
Banks - 3.9% | | | | | |
Bank of America Corp. | | | | 410,802 | | 14,805,304 | |
Citigroup Inc. | | | | 113,705 | | 5,214,511 | |
Citizens Financial Group Inc. | | | | 28,146 | | 1,151,171 | |
Comerica Inc. | | | | 8,091 | | 570,416 | |
Fifth Third Bancorp | | | | 39,658 | | 1,415,394 | |
First Republic Bank | | | | 10,589 | | 1,271,739 | |
Huntington Bancshares Inc. | | | | 83,822 | | 1,272,418 | |
JPMorgan Chase & Co. | | | | 172,331 | | 21,693,026 | |
KeyCorp | | | | 55,615 | | 993,840 | |
M&T Bank Corp. | | | | 10,320 | | 1,737,578 | |
Regions Financial Corp. | | | | 56,328 | | 1,236,400 | |
Signature Bank | | | | 3,540 | | 561,196 | |
SVB Financial Group | | | | 3,439 | a | 794,271 | |
The PNC Financial Services Group Inc. | | | | 24,101 | | 3,900,265 | |
Truist Financial Corp. | | | | 77,417 | | 3,467,507 | |
U.S. Bancorp | | | | 79,533 | | 3,376,176 | |
Wells Fargo & Co. | | | | 222,896 | | 10,250,987 | |
Zions Bancorp NA | | | | 8,354 | | 433,907 | |
| | | | | 74,146,106 | |
Capital Goods - 5.7% | | | | | |
3M Co. | | | | 32,377 | | 4,072,703 | |
A.O. Smith Corp. | | | | 7,659 | | 419,560 | |
Allegion PLC | | | | 4,919 | | 515,364 | |
AMETEK Inc. | | | | 13,423 | | 1,740,426 | |
Carrier Global Corp. | | | | 49,961 | | 1,986,449 | |
Caterpillar Inc. | | | | 31,109 | | 6,733,854 | |
Cummins Inc. | | | | 8,245 | | 2,015,985 | |
Deere & Co. | | | | 16,344 | | 6,469,282 | |
Dover Corp. | | | | 8,661 | | 1,131,906 | |
Eaton Corp. | | | | 23,423 | | 3,515,090 | |
Emerson Electric Co. | | | | 34,488 | | 2,986,661 | |
Fastenal Co. | | | | 33,353 | | 1,611,950 | |
Fortive Corp. | | | | 20,637 | | 1,318,704 | |
Fortune Brands Home & Security Inc. | | | | 8,036 | | 484,732 | |
6
| | | | | | | | |
| |
Description | | | | Shares | | Value ($) | |
Common Stocks - 99.6% (continued) | | | | | |
Capital Goods - 5.7% (continued) | | | | | |
Generac Holdings Inc. | | | | 3,844 | a | 445,558 | |
General Dynamics Corp. | | | | 13,112 | | 3,275,378 | |
General Electric Co. | | | | 64,204 | | 4,995,713 | |
Honeywell International Inc. | | | | 39,589 | | 8,076,948 | |
Howmet Aerospace Inc. | | | | 22,357 | | 794,791 | |
Huntington Ingalls Industries Inc. | | | | 2,391 | | 614,654 | |
IDEX Corp. | | | | 4,311 | | 958,378 | |
Illinois Tool Works Inc. | | | | 16,491 | | 3,521,323 | |
Ingersoll Rand Inc. | | | | 23,236 | | 1,173,418 | |
Johnson Controls International PLC | | | | 40,332 | | 2,332,803 | |
L3Harris Technologies Inc. | | | | 11,185 | | 2,756,767 | |
Lockheed Martin Corp. | | | | 13,867 | | 6,748,792 | |
Masco Corp. | | | | 13,253 | | 613,216 | |
Nordson Corp. | | | | 3,241 | | 729,225 | |
Northrop Grumman Corp. | | | | 8,541 | | 4,689,094 | |
Otis Worldwide Corp. | | | | 24,500 | | 1,730,680 | |
PACCAR Inc. | | | | 20,474 | | 1,982,497 | |
Parker-Hannifin Corp. | | | | 7,546 | | 2,193,019 | |
Pentair PLC | | | | 9,594 | | 412,062 | |
Quanta Services Inc. | | | | 8,532 | | 1,211,885 | |
Raytheon Technologies Corp. | | | | 86,766 | | 8,227,152 | |
Rockwell Automation Inc. | | | | 6,746 | | 1,722,254 | |
Snap-on Inc. | | | | 3,184 | | 707,007 | |
Stanley Black & Decker Inc. | | | | 8,777 | | 688,907 | |
Textron Inc. | | | | 12,556 | | 859,333 | |
The Boeing Company | | | | 32,917 | a | 4,691,002 | |
Trane Technologies PLC | | | | 13,477 | | 2,151,334 | |
TransDigm Group Inc. | | | | 3,044 | | 1,752,613 | |
United Rentals Inc. | | | | 4,213 | a | 1,330,086 | |
W.W. Grainger Inc. | | | | 2,602 | | 1,520,479 | |
Westinghouse Air Brake Technologies Corp. | | | | 10,923 | | 1,018,897 | |
Xylem Inc. | | | | 10,410 | | 1,066,296 | |
| | | | | 109,994,227 | |
Commercial & Professional Services - .9% | | | | | |
Cintas Corp. | | | | 5,116 | | 2,187,346 | |
Copart Inc. | | | | 12,786 | a | 1,470,646 | |
CoStar Group Inc. | | | | 23,298 | a | 1,927,211 | |
Equifax Inc. | | | | 7,234 | | 1,226,452 | |
Jacobs Solutions Inc. | | | | 7,392 | | 851,706 | |
Leidos Holdings Inc. | | | | 7,788 | | 791,183 | |
Republic Services Inc. | | | | 12,154 | | 1,611,863 | |
Robert Half International Inc. | | | | 6,500 | | 496,990 | |
7
STATEMENT OF INVESTMENTS (continued)
| | | | | | | | |
| |
Description | | | | Shares | | Value ($) | |
Common Stocks - 99.6% (continued) | | | | | |
Commercial & Professional Services - .9% (continued) | | | | | |
Rollins Inc. | | | | 13,215 | | 556,087 | |
Verisk Analytics Inc. | | | | 9,304 | | 1,701,050 | |
Waste Management Inc. | | | | 22,103 | | 3,500,452 | |
| | | | | 16,320,986 | |
Consumer Durables & Apparel - .7% | | | | | |
D.R. Horton Inc. | | | | 18,361 | | 1,411,594 | |
Garmin Ltd. | | | | 8,944 | | 787,430 | |
Hasbro Inc. | | | | 7,493 | | 488,918 | |
Lennar Corp., Cl. A | | | | 14,819 | | 1,195,893 | |
Mohawk Industries Inc. | | | | 2,847 | a | 269,753 | |
Newell Brands Inc. | | | | 23,773 | | 328,305 | |
NIKE Inc., Cl. B | | | | 74,258 | | 6,882,231 | |
NVR Inc. | | | | 181 | a | 767,033 | |
PulteGroup Inc. | | | | 14,056 | | 562,099 | |
Ralph Lauren Corp. | | | | 2,448 | | 226,905 | |
Tapestry Inc. | | | | 14,644 | | 463,922 | |
VF Corp. | | | | 19,505 | | 551,016 | |
Whirlpool Corp. | | | | 3,044 | | 420,803 | |
| | | | | 14,355,902 | |
Consumer Services - 2.0% | | | | | |
Booking Holdings Inc. | | | | 2,325 | a | 4,346,541 | |
Caesars Entertainment Inc. | | | | 12,568 | a | 549,599 | |
Carnival Corp. | | | | 55,187 | a,b | 499,994 | |
Chipotle Mexican Grill Inc. | | | | 1,617 | a | 2,422,800 | |
Darden Restaurants Inc. | | | | 7,122 | | 1,019,443 | |
Domino's Pizza Inc. | | | | 2,165 | | 719,300 | |
Expedia Group Inc. | | | | 8,991 | a | 840,389 | |
Hilton Worldwide Holdings Inc. | | | | 16,287 | | 2,202,980 | |
Las Vegas Sands Corp. | | | | 20,061 | a | 762,519 | |
Marriott International Inc., Cl. A | | | | 16,100 | | 2,577,771 | |
McDonald's Corp. | | | | 43,234 | | 11,788,182 | |
MGM Resorts International | | | | 18,720 | | 665,870 | |
Norwegian Cruise Line Holdings Ltd. | | | | 23,855 | a | 402,911 | |
Royal Caribbean Cruises Ltd. | | | | 13,455 | a | 718,228 | |
Starbucks Corp. | | | | 67,267 | | 5,824,650 | |
Wynn Resorts Ltd. | | | | 5,843 | a,b | 373,368 | |
Yum! Brands Inc. | | | | 16,637 | | 1,967,325 | |
| | | | | 37,681,870 | |
Diversified Financials - 5.2% | | | | | |
American Express Co. | | | | 35,231 | | 5,230,042 | |
Ameriprise Financial Inc. | | | | 6,302 | | 1,948,074 | |
Berkshire Hathaway Inc., Cl. B | | | | 106,060 | a | 31,297,245 | |
BlackRock Inc. | | | | 8,841 | | 5,710,490 | |
8
| | | | | | | | |
| |
Description | | | | Shares | | Value ($) | |
Common Stocks - 99.6% (continued) | | | | | |
Diversified Financials - 5.2% (continued) | | | | | |
Capital One Financial Corp. | | | | 22,576 | | 2,393,508 | |
Cboe Global Markets Inc. | | | | 6,064 | | 754,968 | |
CME Group Inc. | | | | 21,275 | | 3,686,957 | |
Discover Financial Services | | | | 16,328 | | 1,705,623 | |
FactSet Research Systems Inc. | | | | 2,277 | | 968,841 | |
Franklin Resources Inc. | | | | 17,323 | | 406,224 | |
Intercontinental Exchange Inc. | | | | 33,045 | | 3,158,111 | |
Invesco Ltd. | | | | 24,999 | | 382,985 | |
MarketAxess Holdings Inc. | | | | 2,291 | | 559,096 | |
Moody's Corp. | | | | 9,274 | | 2,456,404 | |
Morgan Stanley | | | | 78,693 | | 6,466,204 | |
MSCI Inc. | | | | 4,797 | | 2,249,121 | |
Nasdaq Inc. | | | | 20,239 | | 1,259,675 | |
Northern Trust Corp. | | | | 12,322 | | 1,039,361 | |
Raymond James Financial Inc. | | | | 11,022 | | 1,302,139 | |
S&P Global Inc. | | | | 20,021 | | 6,431,746 | |
State Street Corp. | | | | 21,795 | | 1,612,830 | |
Synchrony Financial | | | | 28,014 | | 996,178 | |
T. Rowe Price Group Inc. | | | | 13,144 | | 1,395,367 | |
The Bank of New York Mellon Corp. | | | | 42,607 | | 1,794,181 | |
The Charles Schwab Corp. | | | | 89,730 | | 7,148,789 | |
The Goldman Sachs Group Inc. | | | | 20,060 | | 6,910,871 | |
| | | | | 99,265,030 | |
Energy - 5.3% | | | | | |
APA Corp. | | | | 20,367 | | 925,884 | |
Baker Hughes Co. | | | | 59,899 | | 1,656,806 | |
Chevron Corp. | | | | 105,825 | | 19,143,742 | |
ConocoPhillips | | | | 74,809 | | 9,432,667 | |
Coterra Energy Inc. | | | | 46,753 | | 1,455,421 | |
Devon Energy Corp. | | | | 38,857 | | 3,005,589 | |
Diamondback Energy Inc. | | | | 10,391 | | 1,632,530 | |
EOG Resources Inc. | | | | 34,426 | | 4,699,838 | |
EQT Corp. | | | | 19,661 | | 822,616 | |
Exxon Mobil Corp. | | | | 244,909 | | 27,138,366 | |
Halliburton Co. | | | | 53,189 | | 1,937,143 | |
Hess Corp. | | | | 16,295 | | 2,298,899 | |
Kinder Morgan Inc. | | | | 115,662 | | 2,095,795 | |
Marathon Oil Corp. | | | | 39,503 | | 1,202,866 | |
Marathon Petroleum Corp. | | | | 29,375 | | 3,337,587 | |
Occidental Petroleum Corp. | | | | 44,210 | | 3,209,646 | |
ONEOK Inc. | | | | 26,722 | | 1,585,149 | |
Phillips 66 | | | | 28,115 | | 2,932,113 | |
Pioneer Natural Resources Co. | | | | 14,174 | | 3,634,355 | |
9
STATEMENT OF INVESTMENTS (continued)
| | | | | | | | |
| |
Description | | | | Shares | | Value ($) | |
Common Stocks - 99.6% (continued) | | | | | |
Energy - 5.3% (continued) | | | | | |
Schlumberger Ltd. | | | | 82,910 | | 4,313,807 | |
Targa Resources Corp. | | | | 12,022 | | 821,944 | |
The Williams Companies | | | | 72,187 | | 2,362,681 | |
Valero Energy Corp. | | | | 23,371 | | 2,934,229 | |
| | | | | 102,579,673 | |
Food & Staples Retailing - 1.6% | | | | | |
Costco Wholesale Corp. | | | | 26,030 | | 13,054,045 | |
Sysco Corp. | | | | 29,739 | | 2,574,208 | |
The Kroger Company | | | | 38,130 | | 1,803,168 | |
Walgreens Boots Alliance Inc. | | | | 42,676 | | 1,557,674 | |
Walmart Inc. | | | | 83,763 | | 11,921,988 | |
| | | | | 30,911,083 | |
Food, Beverage & Tobacco - 3.7% | | | | | |
Altria Group Inc. | | | | 105,824 | | 4,896,476 | |
Archer-Daniels-Midland Co. | | | | 32,941 | | 3,194,618 | |
Brown-Forman Corp., Cl. B | | | | 10,814 | | 735,352 | |
Campbell Soup Co. | | | | 11,789 | | 623,756 | |
Conagra Brands Inc. | | | | 27,739 | | 1,018,021 | |
Constellation Brands Inc., Cl. A | | | | 9,293 | | 2,296,114 | |
General Mills Inc. | | | | 35,304 | | 2,880,100 | |
Hormel Foods Corp. | | | | 16,907 | | 785,330 | |
Kellogg Co. | | | | 14,717 | | 1,130,560 | |
Keurig Dr. Pepper Inc. | | | | 49,373 | | 1,917,647 | |
Lamb Weston Holdings Inc. | | | | 8,822 | | 760,633 | |
McCormick & Co. | | | | 14,687 | | 1,154,986 | |
Molson Coors Beverage Co., Cl. B | | | | 11,017 | | 555,587 | |
Mondelez International Inc., Cl. A | | | | 80,540 | | 4,951,599 | |
Monster Beverage Corp. | | | | 22,966 | a | 2,152,374 | |
PepsiCo Inc. | | | | 81,100 | | 14,726,138 | |
Philip Morris International Inc. | | | | 91,094 | | 8,366,984 | |
The Coca-Cola Company | | | | 228,721 | | 13,688,952 | |
The Hershey Company | | | | 8,641 | | 2,063,212 | |
The J.M. Smucker Company | | | | 6,262 | | 943,433 | |
The Kraft Heinz Company | | | | 46,379 | | 1,784,200 | |
Tyson Foods Inc., Cl. A | | | | 17,153 | | 1,172,408 | |
| | | | | 71,798,480 | |
Health Care Equipment & Services - 6.4% | | | | | |
Abbott Laboratories | | | | 102,909 | | 10,181,816 | |
ABIOMED Inc. | | | | 2,762 | a | 696,245 | |
Align Technology Inc. | | | | 4,271 | a | 829,855 | |
AmerisourceBergen Corp. | | | | 9,193 | | 1,445,323 | |
Baxter International Inc. | | | | 29,491 | | 1,602,836 | |
Becton Dickinson & Co. | | | | 16,759 | | 3,954,621 | |
10
| | | | | | | | |
| |
Description | | | | Shares | | Value ($) | |
Common Stocks - 99.6% (continued) | | | | | |
Health Care Equipment & Services - 6.4% (continued) | | | | | |
Boston Scientific Corp. | | | | 84,354 | a | 3,636,501 | |
Cardinal Health Inc. | | | | 15,524 | | 1,178,272 | |
Centene Corp. | | | | 33,678 | a | 2,867,008 | |
Cigna Corp. | | | | 17,930 | | 5,792,466 | |
CVS Health Corp. | | | | 77,018 | | 7,293,605 | |
DaVita Inc. | | | | 3,169 | a | 231,369 | |
Dentsply Sirona Inc. | | | | 12,936 | | 398,688 | |
DexCom Inc. | | | | 23,133 | a | 2,794,004 | |
Edwards Lifesciences Corp. | | | | 36,165 | a | 2,619,431 | |
Elevance Health Inc. | | | | 14,104 | | 7,711,644 | |
HCA Healthcare Inc. | | | | 12,734 | | 2,769,263 | |
Henry Schein Inc. | | | | 7,726 | a | 528,922 | |
Hologic Inc. | | | | 14,876 | a | 1,008,593 | |
Humana Inc. | | | | 7,446 | | 4,155,464 | |
IDEXX Laboratories Inc. | | | | 4,812 | a | 1,730,780 | |
Intuitive Surgical Inc. | | | | 20,965 | a | 5,167,244 | |
Laboratory Corp. of America Holdings | | | | 5,230 | | 1,160,328 | |
McKesson Corp. | | | | 8,421 | | 3,278,885 | |
Medtronic PLC | | | | 78,081 | | 6,819,595 | |
Molina Healthcare Inc. | | | | 3,497 | a | 1,254,933 | |
Quest Diagnostics Inc. | | | | 6,748 | | 969,350 | |
ResMed Inc. | | | | 8,498 | | 1,900,918 | |
Steris PLC | | | | 6,000 | | 1,035,480 | |
Stryker Corp. | | | | 19,665 | | 4,508,005 | |
Teleflex Inc. | | | | 2,731 | | 585,963 | |
The Cooper Companies | | | | 2,928 | | 800,486 | |
UnitedHealth Group Inc. | | | | 54,967 | | 30,514,930 | |
Universal Health Services Inc., Cl. B | | | | 3,821 | | 442,739 | |
Zimmer Biomet Holdings Inc. | | | | 12,532 | | 1,420,502 | |
| | | | | 123,286,064 | |
Household & Personal Products - 1.6% | | | | | |
Church & Dwight Co. | | | | 14,684 | | 1,088,525 | |
Colgate-Palmolive Co. | | | | 48,847 | | 3,606,862 | |
Kimberly-Clark Corp. | | | | 19,803 | | 2,464,681 | |
The Clorox Company | | | | 7,221 | | 1,054,555 | |
The Estee Lauder Companies, Cl. A | | | | 13,682 | | 2,743,104 | |
The Procter & Gamble Company | | | | 140,421 | | 18,910,496 | |
| | | | | 29,868,223 | |
Insurance - 2.4% | | | | | |
Aflac Inc. | | | | 33,792 | | 2,200,197 | |
American International Group Inc. | | | | 44,869 | | 2,557,533 | |
Aon PLC, Cl. A | | | | 12,376 | | 3,483,720 | |
Arch Capital Group Ltd. | | | | 21,679 | a | 1,246,543 | |
11
STATEMENT OF INVESTMENTS (continued)
| | | | | | | | |
| |
Description | | | | Shares | | Value ($) | |
Common Stocks - 99.6% (continued) | | | | | |
Insurance - 2.4% (continued) | | | | | |
Arthur J. Gallagher & Co. | | | | 12,409 | | 2,321,476 | |
Assurant Inc. | | | | 3,051 | | 414,509 | |
Brown & Brown Inc. | | | | 13,451 | | 790,784 | |
Chubb Ltd. | | | | 24,542 | | 5,273,830 | |
Cincinnati Financial Corp. | | | | 9,147 | | 945,068 | |
Everest Re Group Ltd. | | | | 2,357 | | 760,510 | |
Globe Life Inc. | | | | 5,527 | | 638,479 | |
Lincoln National Corp. | | | | 9,397 | | 506,216 | |
Loews Corp. | | | | 11,133 | | 634,804 | |
Marsh & McLennan Cos. | | | | 29,324 | | 4,735,533 | |
MetLife Inc. | | | | 39,389 | | 2,883,669 | |
Principal Financial Group Inc. | | | | 13,858 | | 1,221,306 | |
Prudential Financial Inc. | | | | 21,860 | | 2,299,453 | |
The Allstate Corp. | | | | 15,865 | | 2,002,956 | |
The Hartford Financial Services Group Inc. | | | | 18,989 | | 1,374,993 | |
The Progressive Corp. | | | | 34,620 | | 4,445,208 | |
The Travelers Companies | | | | 14,106 | | 2,601,993 | |
W.R. Berkley Corp. | | | | 12,416 | | 923,502 | |
Willis Towers Watson PLC | | | | 6,394 | | 1,395,235 | |
| | | | | 45,657,517 | |
Materials - 2.5% | | | | | |
Air Products & Chemicals Inc. | | | | 13,100 | | 3,280,240 | |
Albemarle Corp. | | | | 6,913 | | 1,934,741 | |
Amcor PLC | | | | 90,128 | | 1,043,682 | |
Avery Dennison Corp. | | | | 4,785 | | 811,297 | |
Ball Corp. | | | | 18,753 | | 926,211 | |
Celanese Corp. | | | | 5,858 | | 563,071 | |
CF Industries Holdings Inc. | | | | 11,731 | | 1,246,536 | |
Corteva Inc. | | | | 42,407 | | 2,770,873 | |
Dow Inc. | | | | 42,203 | | 1,972,568 | |
DuPont de Nemours Inc. | | | | 29,109 | | 1,665,035 | |
Eastman Chemical Co. | | | | 7,502 | | 576,229 | |
Ecolab Inc. | | | | 14,628 | | 2,297,620 | |
FMC Corp. | | | | 7,698 | | 915,292 | |
Freeport-McMoRan Inc. | | | | 83,665 | | 2,651,344 | |
International Flavors & Fragrances Inc. | | | | 14,952 | | 1,459,465 | |
International Paper Co. | | | | 21,740 | | 730,681 | |
Linde PLC | | | | 29,245 | | 8,696,001 | |
LyondellBasell Industries NV, Cl. A | | | | 14,480 | | 1,106,996 | |
Martin Marietta Materials Inc. | | | | 3,619 | | 1,215,912 | |
Newmont Corp. | | | | 46,693 | | 1,976,048 | |
Nucor Corp. | | | | 15,310 | | 2,011,428 | |
12
| | �� | | | | | | |
| |
Description | | | | Shares | | Value ($) | |
Common Stocks - 99.6% (continued) | | | | | |
Materials - 2.5% (continued) | | | | | |
Packaging Corp. of America | | | | 5,623 | | 675,941 | |
PPG Industries Inc. | | | | 13,648 | | 1,558,329 | |
Sealed Air Corp. | | | | 9,129 | | 434,723 | |
The Mosaic Company | | | | 20,290 | | 1,090,588 | |
The Sherwin-Williams Company | | | | 13,860 | | 3,118,916 | |
Vulcan Materials Co. | | | | 7,766 | | 1,271,294 | |
WestRock Co. | | | | 13,947 | | 475,035 | |
| | | | | 48,476,096 | |
Media & Entertainment - 6.1% | | | | | |
Activision Blizzard Inc. | | | | 41,551 | | 3,024,913 | |
Alphabet Inc., Cl. A | | | | 352,351 | a | 33,300,693 | |
Alphabet Inc., Cl. C | | | | 315,083 | a | 29,825,757 | |
Charter Communications Inc., Cl. A | | | | 6,457 | a | 2,373,722 | |
Comcast Corp., Cl. A | | | | 258,786 | | 8,213,868 | |
DISH Network Corp., Cl. A | | | | 15,713 | a | 234,281 | |
Electronic Arts Inc. | | | | 15,722 | | 1,980,343 | |
Fox Corp., Cl. A | | | | 18,108 | | 522,778 | |
Fox Corp., Cl. B | | | | 8,667 | | 235,742 | |
Live Nation Entertainment Inc. | | | | 8,270 | a | 658,375 | |
Match Group Inc. | | | | 16,582 | a | 716,342 | |
Meta Platforms Inc., Cl. A | | | | 134,022 | a | 12,485,490 | |
Netflix Inc. | | | | 26,068 | a | 7,608,728 | |
News Corporation, Cl. A | | | | 23,170 | | 390,878 | |
News Corporation, Cl. B | | | | 8,556 | b | 146,564 | |
Omnicom Group Inc. | | | | 12,179 | | 886,022 | |
Paramount Global, Cl. B | | | | 29,711 | b | 544,306 | |
Take-Two Interactive Software Inc. | | | | 9,505 | a | 1,126,152 | |
The Interpublic Group of Companies | | | | 22,301 | | 664,347 | |
The Walt Disney Company | | | | 107,131 | a | 11,413,737 | |
Warner Bros Discovery Inc. | | | | 128,361 | a | 1,668,693 | |
| | | | | 118,021,731 | |
Pharmaceuticals Biotechnology & Life Sciences - 8.8% | | | | | |
AbbVie Inc. | | | | 103,901 | | 15,211,106 | |
Agilent Technologies Inc. | | | | 17,641 | | 2,440,632 | |
Amgen Inc. | | | | 31,402 | | 8,489,531 | |
Biogen Inc. | | | | 8,610 | a | 2,440,418 | |
Bio-Rad Laboratories Inc., Cl. A | | | | 1,294 | a | 455,113 | |
Bio-Techne Corp. | | | | 2,216 | | 656,512 | |
Bristol-Myers Squibb Co. | | | | 125,477 | | 9,720,703 | |
Catalent Inc. | | | | 10,332 | a | 679,122 | |
Charles River Laboratories International Inc. | | | | 3,058 | a | 649,061 | |
Danaher Corp. | | | | 38,473 | | 9,682,500 | |
13
STATEMENT OF INVESTMENTS (continued)
| | | | | | | | |
| |
Description | | | | Shares | | Value ($) | |
Common Stocks - 99.6% (continued) | | | | | |
Pharmaceuticals Biotechnology & Life Sciences - 8.8% (continued) | | | | | |
Eli Lilly & Co. | | | | 46,344 | | 16,780,699 | |
Gilead Sciences Inc. | | | | 73,423 | | 5,760,769 | |
Illumina Inc. | | | | 9,207 | a | 2,106,746 | |
Incyte Corp. | | | | 11,228 | a | 834,690 | |
IQVIA Holdings Inc. | | | | 10,867 | a | 2,278,484 | |
Johnson & Johnson | | | | 154,502 | | 26,878,713 | |
Merck & Co. Inc. | | | | 148,867 | | 15,065,340 | |
Mettler-Toledo International Inc. | | | | 1,343 | a | 1,698,801 | |
Moderna Inc. | | | | 19,974 | a | 3,002,691 | |
Organon & Co. | | | | 14,390 | | 376,730 | |
PerkinElmer Inc. | | | | 7,217 | | 964,047 | |
Pfizer Inc. | | | | 329,806 | | 15,352,469 | |
Regeneron Pharmaceuticals Inc. | | | | 6,299 | a | 4,716,376 | |
Thermo Fisher Scientific Inc. | | | | 23,023 | | 11,833,131 | |
Vertex Pharmaceuticals Inc. | | | | 15,057 | a | 4,697,784 | |
Viatris Inc. | | | | 71,951 | | 728,864 | |
Waters Corp. | | | | 3,566 | a | 1,066,840 | |
West Pharmaceutical Services Inc. | | | | 4,285 | | 985,979 | |
Zoetis Inc. | | | | 27,510 | | 4,147,958 | |
| | | | | 169,701,809 | |
Real Estate - 2.6% | | | | | |
Alexandria Real Estate Equities Inc. | | | | 8,928 | c | 1,297,238 | |
American Tower Corp. | | | | 27,506 | c | 5,698,968 | |
AvalonBay Communities Inc. | | | | 8,291 | c | 1,451,920 | |
Boston Properties Inc. | | | | 8,556 | c | 622,021 | |
Camden Property Trust | | | | 6,185 | c | 714,677 | |
CBRE Group Inc., Cl. A | | | | 18,569 | a | 1,317,285 | |
Crown Castle Inc. | | | | 25,632 | c | 3,415,720 | |
Digital Realty Trust Inc. | | | | 17,007 | c | 1,704,952 | |
Equinix Inc. | | | | 5,313 | c | 3,009,496 | |
Equity Residential | | | | 19,619 | c | 1,236,389 | |
Essex Property Trust Inc. | | | | 3,784 | c | 840,956 | |
Extra Space Storage Inc. | | | | 8,018 | c | 1,422,714 | |
Federal Realty Investment Trust | | | | 4,235 | c | 419,180 | |
Healthpeak Properties Inc. | | | | 30,864 | c | 732,403 | |
Host Hotels & Resorts Inc. | | | | 41,345 | c | 780,594 | |
Invitation Homes Inc. | | | | 33,887 | c | 1,073,879 | |
Iron Mountain Inc. | | | | 17,157 | c | 859,051 | |
Kimco Realty Corp. | | | | 35,531 | c | 759,653 | |
Mid-America Apartment Communities Inc. | | | | 6,849 | c | 1,078,375 | |
Prologis Inc. | | | | 54,152 | c | 5,997,334 | |
14
| | | | | | | | |
| |
Description | | | | Shares | | Value ($) | |
Common Stocks - 99.6% (continued) | | | | | |
Real Estate - 2.6% (continued) | | | | | |
Public Storage | | | | 9,267 | c | 2,870,453 | |
Realty Income Corp. | | | | 36,292 | c | 2,259,903 | |
Regency Centers Corp. | | | | 8,808 | c | 532,972 | |
SBA Communications Corp. | | | | 6,383 | c | 1,722,772 | |
Simon Property Group Inc. | | | | 19,067 | c | 2,077,922 | |
UDR Inc. | | | | 17,484 | c | 695,164 | |
Ventas Inc. | | | | 23,077 | c | 903,003 | |
VICI Properties Inc. | | | | 56,539 | c | 1,810,379 | |
Vornado Realty Trust | | | | 9,934 | b,c | 234,343 | |
Welltower Inc. | | | | 27,277 | c | 1,664,988 | |
Weyerhaeuser Co. | | | | 44,393 | c | 1,373,075 | |
| | | | | 50,577,779 | |
Retailing - 5.8% | | | | | |
Advance Auto Parts Inc. | | | | 3,494 | | 663,580 | |
Amazon.com Inc. | | | | 520,839 | a | 53,354,747 | |
AutoZone Inc. | | | | 1,143 | a | 2,895,082 | |
Bath & Body Works Inc. | | | | 13,832 | | 461,712 | |
Best Buy Co. | | | | 12,031 | | 823,041 | |
CarMax Inc. | | | | 9,758 | a,b | 614,852 | |
Dollar General Corp. | | | | 13,339 | | 3,402,112 | |
Dollar Tree Inc. | | | | 12,448 | a | 1,973,008 | |
eBay Inc. | | | | 31,913 | | 1,271,414 | |
Etsy Inc. | | | | 7,510 | a | 705,264 | |
Genuine Parts Co. | | | | 8,336 | | 1,482,641 | |
LKQ Corp. | | | | 14,809 | | 823,973 | |
Lowe's Cos. | | | | 37,798 | | 7,368,720 | |
O'Reilly Automotive Inc. | | | | 3,747 | a | 3,136,876 | |
Pool Corp. | | | | 2,278 | | 693,036 | |
Ross Stores Inc. | | | | 20,718 | | 1,982,505 | |
Target Corp. | | | | 27,369 | | 4,495,358 | |
The Home Depot Inc. | | | | 60,395 | | 17,884,771 | |
The TJX Companies | | | | 68,695 | | 4,952,909 | |
Tractor Supply Co. | | | | 6,519 | | 1,432,681 | |
Ulta Beauty Inc. | | | | 3,085 | a | 1,293,756 | |
| | | | | 111,712,038 | |
Semiconductors & Semiconductor Equipment - 4.7% | | | | | |
Advanced Micro Devices Inc. | | | | 94,865 | a | 5,697,592 | |
Analog Devices Inc. | | | | 30,546 | | 4,356,471 | |
Applied Materials Inc. | | | | 51,122 | | 4,513,561 | |
Broadcom Inc. | | | | 23,730 | | 11,155,948 | |
Enphase Energy Inc. | | | | 7,886 | a | 2,421,002 | |
Intel Corp. | | | | 242,020 | | 6,880,629 | |
KLA Corp. | | | | 8,290 | | 2,623,370 | |
15
STATEMENT OF INVESTMENTS (continued)
| | | | | | | | |
| |
Description | | | | Shares | | Value ($) | |
Common Stocks - 99.6% (continued) | | | | | |
Semiconductors & Semiconductor Equipment - 4.7% (continued) | | | | | |
Lam Research Corp. | | | | 8,041 | | 3,254,836 | |
Microchip Technology Inc. | | | | 32,649 | | 2,015,749 | |
Micron Technology Inc. | | | | 64,510 | | 3,489,991 | |
Monolithic Power Systems Inc. | | | | 2,560 | | 868,992 | |
NVIDIA Corp. | | | | 147,147 | | 19,860,431 | |
NXP Semiconductors NV | | | | 15,506 | | 2,265,116 | |
ON Semiconductor Corp. | | | | 25,254 | a | 1,551,353 | |
Qorvo Inc. | | | | 6,222 | a | 535,590 | |
Qualcomm Inc. | | | | 65,796 | | 7,741,557 | |
Skyworks Solutions Inc. | | | | 9,504 | | 817,439 | |
SolarEdge Technologies Inc. | | | | 3,302 | a | 759,559 | |
Teradyne Inc. | | | | 9,479 | | 771,117 | |
Texas Instruments Inc. | | | | 53,693 | | 8,624,707 | |
| | | | | 90,205,010 | |
Software & Services - 12.7% | | | | | |
Accenture PLC, Cl. A | | | | 37,171 | | 10,552,847 | |
Adobe Inc. | | | | 27,502 | a | 8,759,387 | |
Akamai Technologies Inc. | | | | 9,446 | a | 834,365 | |
Ansys Inc. | | | | 5,241 | a | 1,159,099 | |
Autodesk Inc. | | | | 12,877 | a | 2,759,541 | |
Automatic Data Processing Inc. | | | | 24,418 | | 5,901,831 | |
Broadridge Financial Solutions Inc. | | | | 6,778 | | 1,017,107 | |
Cadence Design Systems Inc. | | | | 15,970 | a | 2,417,698 | |
Ceridian HCM Holding Inc. | | | | 8,993 | a | 595,247 | |
Cognizant Technology Solutions Corp., Cl. A | | | | 30,707 | | 1,911,511 | |
DXC Technology Co. | | | | 13,294 | a | 382,203 | |
EPAM Systems Inc. | | | | 3,434 | a | 1,201,900 | |
Fidelity National Information Services Inc. | | | | 35,463 | | 2,943,074 | |
Fiserv Inc. | | | | 37,882 | a | 3,891,997 | |
FLEETCOR Technologies Inc. | | | | 4,581 | a | 852,616 | |
Fortinet Inc. | | | | 38,376 | a | 2,193,572 | |
Gartner Inc. | | | | 4,574 | a | 1,380,982 | |
Global Payments Inc. | | | | 16,087 | | 1,838,101 | |
International Business Machines Corp. | | | | 53,236 | | 7,362,006 | |
Intuit Inc. | | | | 16,576 | | 7,086,240 | |
Jack Henry & Associates Inc. | | | | 4,242 | | 844,413 | |
Mastercard Inc., Cl. A | | | | 50,139 | | 16,454,617 | |
Microsoft Corp. | | | | 438,258 | | 101,732,830 | |
NortonLifeLock Inc. | | | | 33,822 | | 762,010 | |
Oracle Corp. | | | | 89,264 | | 6,968,840 | |
Paychex Inc. | | | | 19,021 | | 2,250,375 | |
16
| | | | | | | | |
| |
Description | | | | Shares | | Value ($) | |
Common Stocks - 99.6% (continued) | | | | | |
Software & Services - 12.7% (continued) | | | | | |
Paycom Software Inc. | | | | 2,927 | a | 1,012,742 | |
PayPal Holdings Inc. | | | | 67,903 | a | 5,675,333 | |
PTC Inc. | | | | 6,142 | a | 723,712 | |
Roper Technologies Inc. | | | | 6,144 | | 2,546,934 | |
Salesforce Inc. | | | | 58,448 | a | 9,503,060 | |
ServiceNow Inc. | | | | 11,841 | a | 4,981,982 | |
Synopsys Inc. | | | | 8,919 | a | 2,609,253 | |
Tyler Technologies Inc. | | | | 2,439 | a | 788,602 | |
Verisign Inc. | | | | 5,485 | a | 1,099,523 | |
Visa Inc., Cl. A | | | | 96,081 | b | 19,904,140 | |
| | | | | 242,899,690 | |
Technology Hardware & Equipment - 8.8% | | | | | |
Amphenol Corp., Cl. A | | | | 34,911 | | 2,647,301 | |
Apple Inc. | | | | 887,724 | | 136,123,598 | |
Arista Networks Inc. | | | | 14,538 | a | 1,757,063 | |
CDW Corp. | | | | 7,892 | | 1,363,817 | |
Cisco Systems Inc. | | | | 243,341 | | 11,054,982 | |
Corning Inc. | | | | 44,012 | | 1,415,866 | |
F5 Inc. | | | | 3,627 | a | 518,335 | |
Hewlett Packard Enterprise Co. | | | | 76,105 | | 1,086,018 | |
HP Inc. | | | | 53,079 | | 1,466,042 | |
Juniper Networks Inc. | | | | 18,260 | | 558,756 | |
Keysight Technologies Inc. | | | | 10,690 | a | 1,861,663 | |
Motorola Solutions Inc. | | | | 9,886 | | 2,468,633 | |
NetApp Inc. | | | | 12,729 | | 881,738 | |
Seagate Technology Holdings PLC | | | | 11,579 | | 575,013 | |
TE Connectivity Ltd. | | | | 18,584 | | 2,271,522 | |
Teledyne Technologies Inc. | | | | 2,781 | a | 1,106,782 | |
Trimble Inc. | | | | 14,820 | a | 891,571 | |
Western Digital Corp. | | | | 18,708 | a | 642,994 | |
Zebra Technologies Corp., Cl. A | | | | 3,063 | a | 867,503 | |
| | | | | 169,559,197 | |
Telecommunication Services - 1.2% | | | | | |
AT&T Inc. | | | | 418,755 | | 7,633,904 | |
Lumen Technologies Inc. | | | | 53,418 | | 393,156 | |
T-Mobile US Inc. | | | | 35,373 | a | 5,361,132 | |
Verizon Communications Inc. | | | | 246,794 | | 9,222,692 | |
| | | | | 22,610,884 | |
Transportation - 1.7% | | | | | |
Alaska Air Group Inc. | | | | 7,750 | a | 344,565 | |
American Airlines Group Inc. | | | | 37,613 | a | 533,352 | |
C.H. Robinson Worldwide Inc. | | | | 7,056 | | 689,512 | |
CSX Corp. | | | | 125,254 | | 3,639,881 | |
17
STATEMENT OF INVESTMENTS (continued)
| | | | | | | | |
| |
Description | | | | Shares | | Value ($) | |
Common Stocks - 99.6% (continued) | | | | | |
Transportation - 1.7% (continued) | | | | | |
Delta Air Lines Inc. | | | | 37,482 | a | 1,271,764 | |
Expeditors International of Washington Inc. | | | | 9,671 | | 946,307 | |
FedEx Corp. | | | | 14,188 | | 2,274,053 | |
J.B. Hunt Transport Services Inc. | | | | 5,008 | | 856,719 | |
Norfolk Southern Corp. | | | | 13,802 | | 3,147,822 | |
Old Dominion Freight Line Inc. | | | | 5,425 | | 1,489,705 | |
Southwest Airlines Co. | | | | 35,486 | a | 1,289,916 | |
Union Pacific Corp. | | | | 36,697 | | 7,234,447 | |
United Airlines Holdings Inc. | | | | 19,537 | a | 841,654 | |
United Parcel Service Inc., Cl. B | | | | 43,007 | | 7,215,284 | |
| | | | | 31,774,981 | |
Utilities - 3.0% | | | | | |
Alliant Energy Corp. | | | | 14,836 | | 773,994 | |
Ameren Corp. | | | | 14,922 | | 1,216,441 | |
American Electric Power Co. | | | | 30,398 | | 2,672,592 | |
American Water Works Co. | | | | 10,891 | | 1,582,898 | |
Atmos Energy Corp. | | | | 8,065 | | 859,326 | |
CenterPoint Energy Inc. | | | | 37,656 | | 1,077,338 | |
CMS Energy Corp. | | | | 17,482 | | 997,348 | |
Consolidated Edison Inc. | | | | 20,529 | | 1,805,731 | |
Constellation Energy Corp. | | | | 19,461 | | 1,839,843 | |
Dominion Energy Inc. | | | | 48,922 | | 3,423,072 | |
DTE Energy Co. | | | | 11,292 | | 1,265,946 | |
Duke Energy Corp. | | | | 45,489 | | 4,238,665 | |
Edison International | | | | 22,413 | | 1,345,677 | |
Entergy Corp. | | | | 12,031 | | 1,289,001 | |
Evergy Inc. | | | | 13,776 | | 842,127 | |
Eversource Energy | | | | 20,608 | | 1,571,978 | |
Exelon Corp. | | | | 58,373 | | 2,252,614 | |
FirstEnergy Corp. | | | | 32,718 | | 1,233,796 | |
NextEra Energy Inc. | | | | 115,459 | | 8,948,072 | |
NiSource Inc. | | | | 23,675 | | 608,211 | |
NRG Energy Inc. | | | | 13,543 | | 601,309 | |
PG&E Corp. | | | | 88,130 | a | 1,315,781 | |
Pinnacle West Capital Corp. | | | | 6,640 | | 446,274 | |
PPL Corp. | | | | 43,245 | | 1,145,560 | |
Public Service Enterprise Group Inc. | | | | 29,396 | | 1,648,234 | |
Sempra Energy | | | | 18,604 | | 2,808,088 | |
The AES Corp. | | | | 38,060 | | 995,650 | |
The Southern Company | | | | 62,049 | | 4,062,969 | |
WEC Energy Group Inc. | | | | 18,286 | | 1,670,060 | |
18
| | | | | | | | |
| |
Description | | | | Shares | | Value ($) | |
Common Stocks - 99.6% (continued) | | | | | |
Utilities - 3.0% (continued) | | | | | |
Xcel Energy Inc. | | | | 31,970 | | 2,081,567 | |
| | | | | 56,620,162 | |
Total Common Stocks (cost $446,745,926) | | | | 1,912,116,025 | |
| | | 1-Day
Yield (%) | | | | | |
Investment Companies - .4% | | | | | |
Registered Investment Companies - .4% | | | | | |
Dreyfus Institutional Preferred Government Plus Money Market Fund, Institutional Shares
(cost $6,395,291) | | 3.23 | | 6,395,291 | d | 6,395,291 | |
| | | | | | | | |
Investment of Cash Collateral for Securities Loaned - .0% | | | | | |
Registered Investment Companies - .0% | | | | | |
Dreyfus Institutional Preferred Government Plus Money Market Fund, SL Shares
(cost $505,374) | | 3.23 | | 505,374 | d | 505,374 | |
Total Investments (cost $453,646,591) | | 100.0% | | 1,919,016,690 | |
Cash and Receivables (Net) | | .0% | | 547,066 | |
Net Assets | | 100.0% | | 1,919,563,756 | |
a Non-income producing security.
b Security, or portion thereof, on loan. At October 31, 2022, the value of the fund’s securities on loan was $19,291,520 and the value of the collateral was $19,852,411, consisting of cash collateral of $505,374 and U.S. Government & Agency securities valued at $19,347,037. In addition, the value of collateral may include pending sales that are also on loan.
c Investment in real estate investment trust within the United States.
d Investment in affiliated issuer. The investment objective of this investment company is publicly available and can be found within the investment company’s prospectus.
| | |
Portfolio Summary (Unaudited) † | Value (%) |
Information Technology | 26.2 |
Health Care | 15.3 |
Financials | 11.4 |
Consumer Discretionary | 10.8 |
Industrials | 8.2 |
Communication Services | 7.3 |
Consumer Staples | 6.9 |
Energy | 5.4 |
Utilities | 3.0 |
Real Estate | 2.6 |
Materials | 2.5 |
Investment Companies | .4 |
| | 100.0 |
† Based on net assets.
See notes to financial statements.
19
STATEMENT OF INVESTMENTS (continued)
| | | | | | | |
Affiliated Issuers | | | |
Description | Value ($) 10/31/2021 | Purchases ($)† | Sales ($) | Value ($) 10/31/2022 | Dividends/
Distributions ($) | |
Registered Investment Companies - .4% | | |
Dreyfus Institutional Preferred Government Plus Money Market Fund, Institutional Shares - .4% | 14,232,745 | 244,064,116 | (251,901,570) | 6,395,291 | 115,464 | |
Investment of Cash Collateral for Securities Loaned - .0% | | |
Dreyfus Institutional Preferred Government Plus Money Market Fund, SL Shares - .0% | 67,416 | 26,883,259 | (26,445,301) | 505,374 | 39,731 | †† |
Total - .4% | 14,300,161 | 270,947,375 | (278,346,871) | 6,900,665 | 155,195 | |
† Includes reinvested dividends/distributions.
†† Represents securities lending income earned from the reinvestment of cash collateral from loaned securities, net of fees and collateral investment expenses, and other payments to and from borrowers of securities.
See notes to financial statements.
| | | | | | | |
Futures | | | |
Description | Number of
Contracts | Expiration | Notional
Value ($) | Market
Value ($) | Unrealized Appreciation ($) | |
Futures Long | | |
Standard & Poor's 500 E-mini | 46 | 12/16/2022 | 8,440,097 | 8,930,900 | 490,803 | |
Gross Unrealized Appreciation | | 490,803 | |
See notes to financial statements.
20
STATEMENT OF ASSETS AND LIABILITIES
October 31, 2022
| | | | | | | |
| | | | | | |
| | | Cost | | Value | |
Assets ($): | | | | |
Investments in securities—See Statement of Investments
(including securities on loan, valued at $19,291,520)—Note 1(c): | | | |
Unaffiliated issuers | 446,745,926 | | 1,912,116,025 | |
Affiliated issuers | | 6,900,665 | | 6,900,665 | |
Cash | | | | | 2,167,024 | |
Dividends and securities lending income receivable | | 1,442,826 | |
Cash collateral held by broker—Note 4 | | 740,000 | |
Receivable for shares of Common Stock subscribed | | 432,244 | |
| | | | | 1,923,798,784 | |
Liabilities ($): | | | | |
Due to BNY Mellon Investment Adviser, Inc. and affiliates—Note 3(b) | | 781,246 | |
Payable for shares of Common Stock redeemed | | 1,481,708 | |
Payable for investment securities purchased | | 1,246,477 | |
Liability for securities on loan—Note 1(c) | | 505,374 | |
Directors’ fees and expenses payable | | 129,295 | |
Payable for futures variation margin—Note 4 | | 88,999 | |
Interest payable—Note 2 | | 1,929 | |
| | | | | 4,235,028 | |
Net Assets ($) | | | 1,919,563,756 | |
Composition of Net Assets ($): | | | | |
Paid-in capital | | | | | 276,819,510 | |
Total distributable earnings (loss) | | | | | 1,642,744,246 | |
Net Assets ($) | | | 1,919,563,756 | |
| | | | | |
Shares Outstanding | | |
(200 million shares of $.001 par value Common Stock authorized) | 39,122,009 | |
Net Asset Value Per Share ($) | | 49.07 | |
| | | | |
See notes to financial statements. | | | | |
21
STATEMENT OF OPERATIONS
Year Ended October 31, 2022
| | | | | | | |
| | | | | | |
| | | | | | |
Investment Income ($): | | | | |
Income: | | | | |
Cash dividends (net of $7,578 foreign taxes withheld at source): | |
Unaffiliated issuers | | | 34,075,935 | |
Affiliated issuers | | | 115,464 | |
Income from securities lending—Note 1(c) | | | 39,731 | |
Interest | | | 5,646 | |
Total Income | | | 34,236,776 | |
Expenses: | | | | |
Management fee—Note 3(a) | | | 5,582,630 | |
Shareholder servicing costs—Note 3(b) | | | 5,582,630 | |
Directors’ fees—Note 3(a,c) | | | 165,600 | |
Loan commitment fees—Note 2 | | | 46,644 | |
Interest expense—Note 2 | | | 8,523 | |
Total Expenses | | | 11,386,027 | |
Less—Directors’ fees reimbursed by
BNY Mellon Investment Adviser, Inc.—Note 3(a) | | | (165,600) | |
Net Expenses | | | 11,220,427 | |
Net Investment Income | | | 23,016,349 | |
Realized and Unrealized Gain (Loss) on Investments—Note 4 ($): | | |
Net realized gain (loss) on investments | 202,176,852 | |
Net realized gain (loss) on futures | (3,095,858) | |
Net Realized Gain (Loss) | | | 199,080,994 | |
Net change in unrealized appreciation (depreciation) on investments | (585,967,188) | |
Net change in unrealized appreciation (depreciation) on futures | (310,865) | |
Net Change in Unrealized Appreciation (Depreciation) | | | (586,278,053) | |
Net Realized and Unrealized Gain (Loss) on Investments | | | (387,197,059) | |
Net (Decrease) in Net Assets Resulting from Operations | | (364,180,710) | |
| | | | | | |
See notes to financial statements. | | | | | |
22
STATEMENT OF CHANGES IN NET ASSETS
| | | | | | | | | | |
| | | | Year Ended October 31, |
| | | | 2022 | | 2021 | |
Operations ($): | | | | | | | | |
Net investment income | | | 23,016,349 | | | | 22,999,842 | |
Net realized gain (loss) on investments | | 199,080,994 | | | | 307,456,018 | |
Net change in unrealized appreciation
(depreciation) on investments | | (586,278,053) | | | | 498,798,243 | |
Net Increase (Decrease) in Net Assets
Resulting from Operations | (364,180,710) | | | | 829,254,103 | |
Distributions ($): | |
Distributions to shareholders | | | (295,559,138) | | | | (252,882,658) | |
Capital Stock Transactions ($): | |
Net proceeds from shares sold | | | 216,279,637 | | | | 267,327,204 | |
Distributions reinvested | | | 286,737,423 | | | | 246,115,792 | |
Cost of shares redeemed | | | (477,214,418) | | | | (615,301,976) | |
Increase (Decrease) in Net Assets
from Capital Stock Transactions | 25,802,642 | | | | (101,858,980) | |
Total Increase (Decrease) in Net Assets | (633,937,206) | | | | 474,512,465 | |
Net Assets ($): | |
Beginning of Period | | | 2,553,500,962 | | | | 2,078,988,497 | |
End of Period | | | 1,919,563,756 | | | | 2,553,500,962 | |
Capital Share Transactions (Shares): | |
Shares sold | | | 3,945,295 | | | | 4,624,629 | |
Shares issued for distributions reinvested | | | 4,859,956 | | | | 4,722,099 | |
Shares redeemed | | | (8,781,762) | | | | (10,632,400) | |
Net Increase (Decrease) in Shares Outstanding | 23,489 | | | | (1,285,672) | |
| | | | | | | | | |
See notes to financial statements. | | | | | | | | |
23
FINANCIAL HIGHLIGHTS
The following table describes the performance for the fiscal periods indicated. Net asset value total return is calculated assuming an initial investment made at the net asset value at the beginning of the period, reinvestment of all dividends and distributions at net asset value during the period, and redemption at net asset value on the last day of the period. Net asset value total return includes adjustments in accordance with accounting principles generally accepted in the United States of America and as such, the net asset value for financial reporting purposes and the returns based upon those net asset values may differ from the net asset value and returns for shareholder transactions. These figures have been derived from the fund’s financial statements.
| | | | | | | | | |
| | |
| | Year Ended October 31, |
| | | | 2022 | 2021 | 2020 | 2019 | 2018 |
Per Share Data ($): | | | | | | |
Net asset value,
beginning of period | | 65.31 | 51.48 | 53.93 | 55.44 | 56.66 |
Investment Operations: | | | | | | |
Net investment incomea | | .56 | .56 | .71 | .79 | .78 |
Net realized and unrealized gain
(loss) on investments | | (9.08) | 19.58 | 4.07 | 5.03 | 2.97 |
Total from Investment Operations | | (8.52) | 20.14 | 4.78 | 5.82 | 3.75 |
Distributions: | | | | | | |
Dividends from net
investment income | | (.58) | (.75) | (.85) | (.84) | (.86) |
Dividends from net realized gain
on investments | | (7.14) | (5.56) | (6.38) | (6.49) | (4.11) |
Total Distributions | | (7.72) | (6.31) | (7.23) | (7.33) | (4.97) |
Net asset value, end of period | | 49.07 | 65.31 | 51.48 | 53.93 | 55.44 |
Total Return (%) | | (15.03) | 42.21 | 9.13 | 13.76 | 6.83 |
Ratios/Supplemental Data (%): | | | | | |
Ratio of total expenses to
average net assets | | .51 | .51 | .51 | .51 | .51 |
Ratio of net expenses to
average net assets | | .50 | .50 | .50 | .50 | .50 |
Ratio of net investment
income to average net assets | | 1.03 | .95 | 1.41 | 1.55 | 1.39 |
Portfolio Turnover Rate | | 1.89 | 3.31 | 2.43 | 2.81 | 3.06 |
Net Assets,
end of period ($ x 1,000) | | 1,919,564 | 2,553,501 | 2,078,988 | 2,272,556 | 2,428,012 |
a Based on average shares outstanding.
See notes to financial statements.
24
NOTES TO FINANCIAL STATEMENTS
NOTE 1—Significant Accounting Policies:
BNY Mellon S&P 500 Index Fund (the “fund”) is a separate diversified series of BNY Mellon Index Funds, Inc. (the “Company”), which is registered under the Investment Company Act of 1940, as amended (the “Act”), as an open-end management investment company and operates as a series company currently offering three series, including the fund. The fund’s investment objective is to seek to match the performance of the S&P 500® Index. BNY Mellon Investment Adviser, Inc. (the “Adviser”), a wholly-owned subsidiary of The Bank of New York Mellon Corporation (“BNY Mellon”), serves as the fund’s investment adviser. BNY Mellon Securities Corporation (the “Distributor”), a wholly-owned subsidiary of the Adviser, is the distributor of the fund’s shares, which are sold to the public without a sales charge.
The Company accounts separately for the assets, liabilities and operations of each series. Expenses directly attributable to each series are charged to that series’ operations; expenses which are applicable to all series are allocated among them on a pro rata basis.
The Financial Accounting Standards Board (“FASB”) Accounting Standards Codification (“ASC”) is the exclusive reference of authoritative U.S. generally accepted accounting principles (“GAAP”) recognized by the FASB to be applied by nongovernmental entities. Rules and interpretive releases of the SEC under authority of federal laws are also sources of authoritative GAAP for SEC registrants. The fund is an investment company and applies the accounting and reporting guidance of the FASB ASC Topic 946 Financial Services-Investment Companies. The fund’s financial statements are prepared in accordance with GAAP, which may require the use of management estimates and assumptions. Actual results could differ from those estimates.
The Company enters into contracts that contain a variety of indemnifications. The fund’s maximum exposure under these arrangements is unknown. The fund does not anticipate recognizing any loss related to these arrangements.
(a) Portfolio valuation: The fair value of a financial instrument is the amount that would be received to sell an asset or paid to transfer a liability in an orderly transaction between market participants at the measurement date (i.e., the exit price). GAAP establishes a fair value hierarchy that prioritizes the inputs of valuation techniques used to measure fair value. This hierarchy gives the highest priority to unadjusted quoted prices in
25
NOTES TO FINANCIAL STATEMENTS (continued)
active markets for identical assets or liabilities (Level 1 measurements) and the lowest priority to unobservable inputs (Level 3 measurements).
Additionally, GAAP provides guidance on determining whether the volume and activity in a market has decreased significantly and whether such a decrease in activity results in transactions that are not orderly. GAAP requires enhanced disclosures around valuation inputs and techniques used during annual and interim periods.
Various inputs are used in determining the value of the fund’s investments relating to fair value measurements. These inputs are summarized in the three broad levels listed below:
Level 1—unadjusted quoted prices in active markets for identical investments.
Level 2—other significant observable inputs (including quoted prices for similar investments, interest rates, prepayment speeds, credit risk, etc.).
Level 3—significant unobservable inputs (including the fund’s own assumptions in determining the fair value of investments).
The inputs or methodology used for valuing securities are not necessarily an indication of the risk associated with investing in those securities.
Changes in valuation techniques may result in transfers in or out of an assigned level within the disclosure hierarchy. Valuation techniques used to value the fund’s investments are as follows:
The Company’s Board of Directors (the “Board”) has designated the Adviser as the fund’s valuation designee, effective September 8, 2022, to make all fair value determinations with respect to the fund’s portfolio investments, subject to the Board’s oversight and pursuant to Rule 2a-5 under the Act.
Investments in equity securities are valued at the last sales price on the securities exchange or national securities market on which such securities are primarily traded. Securities listed on the National Market System for which market quotations are available are valued at the official closing price or, if there is no official closing price that day, at the last sales price. For open short positions, asked prices are used for valuation purposes. Bid price is used when no asked price is available. Registered investment companies that are not traded on an exchange are valued at their net asset value. All of the preceding securities are generally categorized within Level 1 of the fair value hierarchy.
26
Securities not listed on an exchange or the national securities market, or securities for which there were no transactions, are valued at the average of the most recent bid and asked prices. These securities are generally categorized within Level 2 of the fair value hierarchy.
Fair valuing of securities may be determined with the assistance of a pricing service using calculations based on indices of domestic securities and other appropriate indicators, such as prices of relevant American Depository Receipts and futures. Utilizing these techniques may result in transfers between Level 1 and Level 2 of the fair value hierarchy.
When market quotations or official closing prices are not readily available, or are determined not to accurately reflect fair value, such as when the value of a security has been significantly affected by events after the close of the exchange or market on which the security is principally traded, but before the fund calculates its net asset value, the fund may value these investments at fair value as determined in accordance with the procedures approved by the Board. Certain factors may be considered when fair valuing investments such as: fundamental analytical data, the nature and duration of restrictions on disposition, an evaluation of the forces that influence the market in which the securities are purchased and sold, and public trading in similar securities of the issuer or comparable issuers. These securities are either categorized within Level 2 or 3 of the fair value hierarchy depending on the relevant inputs used.
For securities where observable inputs are limited, assumptions about market activity and risk are used and such securities are generally categorized within Level 3 of the fair value hierarchy.
Futures, which are traded on an exchange, are valued at the last sales price on the securities exchange on which such securities are primarily traded or at the last sales price on the national securities market on each business day and are generally categorized within Level 1 of the fair value hierarchy.
The following is a summary of the inputs used as of October 31, 2022 in valuing the fund’s investments:
| | | | | | | |
| | Level 1-Unadjusted Quoted Prices | Level 2- Other Significant Observable Inputs | | Level 3-Significant Unobservable Inputs | Total | |
Assets ($) | | |
Investments in Securities:† | | |
Equity Securities - Common Stocks | 1,912,116,025 | - | | - | 1,912,116,025 | |
Investment Companies | 6,900,665 | - | | - | 6,900,665 | |
27
NOTES TO FINANCIAL STATEMENTS (continued)
| | | | | | | | |
| | Level 1-Unadjusted Quoted Prices | Level 2- Other Significant Observable Inputs | | Level 3-Significant Unobservable Inputs | Total | |
Assets ($)(continued) | | |
Other Financial Instruments: | | |
Futures†† | 490,803 | - | | - | 490,803 | |
† See Statement of Investments for additional detailed categorizations, if any.
†† Amount shown represents unrealized appreciation (depreciation) at period end, but only variation margin on exchange-traded and centrally cleared derivatives, if any, are reported in the Statement of Assets and Liabilities.
(b) Foreign taxes: The fund may be subject to foreign taxes (a portion of which may be reclaimable) on income, stock dividends, realized and unrealized capital gains on investments or certain foreign currency transactions. Foreign taxes are recorded in accordance with the applicable foreign tax regulations and rates that exist in the foreign jurisdictions in which the fund invests. These foreign taxes, if any, are paid by the fund and are reflected in the Statement of Operations, if applicable. Foreign taxes payable or deferred or those subject to reclaims as of October 31, 2022, if any, are disclosed in the fund’s Statement of Assets and Liabilities.
(c) Securities transactions and investment income: Securities transactions are recorded on a trade date basis. Realized gains and losses from securities transactions are recorded on the identified cost basis. Dividend income is recognized on the ex-dividend date and interest income, including, where applicable, accretion of discount and amortization of premium on investments, is recognized on the accrual basis.
Pursuant to a securities lending agreement with BNY Mellon, the fund may lend securities to qualified institutions. It is the fund’s policy that, at origination, all loans are secured by collateral of at least 102% of the value of U.S. securities loaned and 105% of the value of foreign securities loaned. Collateral equivalent to at least 100% of the market value of securities on loan is maintained at all times. Collateral is either in the form of cash, which can be invested in certain money market mutual funds managed by the Adviser, or U.S. Government and Agency securities. The fund is entitled to receive all dividends, interest and distributions on securities loaned, in addition to income earned as a result of the lending transaction. Should a borrower fail to return the securities in a timely manner, BNY Mellon is required to replace the securities for the benefit of the fund or credit the fund with the market value of the unreturned securities and is subrogated to the fund’s rights against the borrower and the collateral. Additionally, the contractual maturity of security lending transactions are on an overnight and continuous basis. During the period
28
ended October 31, 2022, BNY Mellon earned $5,417 from the lending of the fund’s portfolio securities, pursuant to the securities lending agreement.
(d) Affiliated issuers: Investments in other investment companies advised by the Adviser are considered “affiliated” under the Act.
(e) Market Risk: The value of the securities in which the fund invests may be affected by political, regulatory, economic and social developments, and developments that impact specific economic sectors, industries or segments of the market. The value of a security may also decline due to general market conditions that are not specifically related to a particular company or industry, such as real or perceived adverse economic conditions, changes in the general outlook for corporate earnings, changes in interest or currency rates, changes to inflation, adverse changes to credit markets or adverse investor sentiment generally. In addition, turbulence in financial markets and reduced liquidity in equity, credit and/or fixed income markets may negatively affect many issuers, which could adversely affect the fund. Global economies and financial markets are becoming increasingly interconnected, and conditions and events in one country, region or financial market may adversely impact issuers in a different country, region or financial market. These risks may be magnified if certain events or developments adversely interrupt the global supply chain; in these and other circumstances, such risks might affect companies world-wide. Recent examples include pandemic risks related to COVID-19 and aggressive measures taken world-wide in response by governments, including closing borders, restricting international and domestic travel, and the imposition of prolonged quarantines of large populations, and by businesses, including changes to operations and reducing staff.
(f) Dividends and distributions to shareholders: Dividends and distributions are recorded on the ex-dividend date. Dividends from net investment income and dividends from net realized capital gains, if any, are normally declared and paid annually, but the fund may make distributions on a more frequent basis to comply with the distribution requirements of the Internal Revenue Code of 1986, as amended (the “Code”). To the extent that net realized capital gains can be offset by capital loss carryovers, it is the policy of the fund not to distribute such gains. Income and capital gain distributions are determined in accordance with income tax regulations, which may differ from GAAP.
(g) Federal income taxes: It is the policy of the fund to continue to qualify as a regulated investment company, if such qualification is in the best interests of its shareholders, by complying with the applicable provisions of the Code, and to make distributions of taxable income and
29
NOTES TO FINANCIAL STATEMENTS (continued)
net realized capital gain sufficient to relieve it from substantially all federal income and excise taxes.
As of and during the period ended October 31, 2022, the fund did not have any liabilities for any uncertain tax positions. The fund recognizes interest and penalties, if any, related to uncertain tax positions as income tax expense in the Statement of Operations. During the period ended October 31, 2022, the fund did not incur any interest or penalties.
Each tax year in the four-year period ended October 31, 2022 remains subject to examination by the Internal Revenue Service and state taxing authorities.
At October 31, 2022, the components of accumulated earnings on a tax basis were as follows: undistributed ordinary income $18,339,325, undistributed capital gains $174,836,326 and unrealized appreciation $1,449,568,595.
The tax character of distributions paid to shareholders during the fiscal years ended October 31, 2022 and October 31, 2021 were as follows: ordinary income $26,336,928 and $31,640,973, and long-term capital gains $269,222,210 and $221,241,685, respectively.
During the period ended October 31, 2022, as a result of permanent book to tax differences, primarily due to the tax treatment for treating a portion of the proceeds from redemptions as a distribution for tax purposes, the fund decreased total distributable earnings (loss) by $22,067,441 and increased paid-in capital by the same amount. Net assets and net asset value per share were not affected by this reclassification.
NOTE 2—Bank Lines of Credit:
The fund participates with other long-term open-end funds managed by the Adviser in a $823.5 million unsecured credit facility led by Citibank, N.A. (the “Citibank Credit Facility”) and a $300 million unsecured credit facility provided by BNY Mellon (the “BNYM Credit Facility”), each to be utilized primarily for temporary or emergency purposes, including the financing of redemptions (each, a “Facility”). The Citibank Credit Facility is available in two tranches: (i) Tranche A is in an amount equal to $688.5 million and is available to all long-term open-ended funds, including the fund, and (ii) Tranche B is an amount equal to $135 million and is available only to BNY Mellon Floating Rate Income Fund, a series of BNY Mellon Investment Funds IV, Inc. In connection therewith, the fund has agreed to pay its pro rata portion of commitment fees for Tranche A of the Citibank Credit Facility and the BNYM Credit Facility. Interest is charged to the
30
fund based on rates determined pursuant to the terms of the respective Facility at the time of borrowing.
The average amount of borrowings outstanding under the Facilities during the period ended October 31, 2022 was approximately $457,534 with a related weighted average annualized interest rate of 1.86%.
NOTE 3—Management Fee and Other Transactions with Affiliates:
(a) Pursuant to a management agreement (the “Agreement”) with the Adviser, the management fee is computed at the annual rate of ..25% of the value of the fund’s average daily net assets and is payable monthly. Out of its fee, the Adviser pays all of the expenses of the fund except management fees, Shareholder Services Plan fees, brokerage fees and commissions, taxes, interest expense, commitment fees on borrowings, fees and expenses of non-interested Board Members (including counsel fees) and extraordinary expenses. In addition, the Adviser is required to reduce its fee in an amount equal to the fund’s allocable portion of fees and expenses of the non-interested Board Members (including counsel fees). During the period ended October 31, 2022, fees reimbursed by the Adviser amounted to $165,600.
(b) Under the Shareholder Services Plan, the fund pays the Distributor for the provision of certain services, at an annual rate of .25% of the value of the fund’s average daily net assets. The services provided may include personal services relating to shareholder accounts, such as answering shareholder inquiries regarding the fund and providing reports and other information, and services related to the maintenance of shareholder accounts such as recordkeeping and sub-accounting services. The Distributor may make payments to Service Agents (securities dealers, financial institutions or other industry professionals) with respect to these services. The Distributor determines the amounts to be paid to Service Agents. During the period ended October 31, 2022, the fund was charged $5,582,630 pursuant to the Shareholder Services Plan.
The fund has an arrangement with The Bank of New York Mellon (the “Custodian”), a subsidiary of BNY Mellon and an affiliate of the Adviser, whereby the fund will receive interest income or be charged overdraft fees when cash balances are maintained. For financial reporting purposes, the fund includes this interest income and overdraft fees, if any, as interest income in the Statement of Operations.
The components of “Due to BNY Mellon Investment Adviser, Inc. and affiliates” in the Statement of Assets and Liabilities consist of: management fee of $396,048 and Shareholder Services Plan fees of $396,048, which are
31
NOTES TO FINANCIAL STATEMENTS (continued)
offset against an expense reimbursement currently in effect in the amount of $10,850.
(c) Each Board member also serves as a Board member of other funds in the BNY Mellon Family of Funds complex. Annual retainer fees and attendance fees are allocated to each fund based on net assets.
NOTE 4—Securities Transactions:
The aggregate amount of purchases and sales of investment securities, excluding short-term securities and futures, during the period ended October 31, 2022, amounted to $42,003,074 and $284,475,956, respectively.
Derivatives: A derivative is a financial instrument whose performance is derived from the performance of another asset. The SEC recently adopted Rule 18f-4 under the Act, which, effective August 18, 2022, regulates the use of derivatives transactions for certain funds registered under the Act. The fund is deemed a “limited” derivatives user under the rule and is required to limit its derivatives exposure so that the total notional value of derivatives does not exceed 10% of fund’s net assets, and is subject to certain reporting requirements. Each type of derivative instrument that was held by the fund during the period ended October 31, 2022 is discussed below.
Futures: In the normal course of pursuing its investment objective, the fund is exposed to market risk, including equity price risk, as a result of changes in value of underlying financial instruments. The fund invests in futures in order to manage its exposure to or protect against changes in the market. A futures contract represents a commitment for the future purchase or a sale of an asset at a specified date. Upon entering into such contracts, these investments require initial margin deposits with a counterparty, which consist of cash or cash equivalents. The amount of these deposits is determined by the exchange or Board of Trade on which the contract is traded and is subject to change. Accordingly, variation margin payments are received or made to reflect daily unrealized gains or losses which are recorded in the Statement of Operations. When the contracts are closed, the fund recognizes a realized gain or loss which is reflected in the Statement of Operations. There is minimal counterparty credit risk to the fund with futures since they are exchange traded, and the exchange guarantees the futures against default. Futures open at October 31, 2022 are set forth in the Statement of Investments.
32
The following summarizes the average market value of derivatives outstanding during the period ended October 31, 2022:
| | | |
| | Average Market Value ($) |
Equity futures | | 15,531,278 |
At October 31, 2022, the cost of investments for federal income tax purposes was $469,448,095; accordingly, accumulated net unrealized appreciation on investments was $1,449,568,595, consisting of $1,490,637,089 gross unrealized appreciation and $41,068,494 gross unrealized depreciation.
33
REPORT OF INDEPENDENT REGISTERED PUBLIC ACCOUNTING FIRM
To the Shareholders and the Board of Directors of BNY Mellon S&P 500 Index Fund
Opinion on the Financial Statements
We have audited the accompanying statement of assets and liabilities of BNY Mellon S&P 500 Index Fund (the “Fund”) (one of the funds constituting BNY Mellon Index Funds, Inc.), including the statement of investments, as of October 31, 2022, and the related statement of operations for the year then ended, the statements of changes in net assets for each of the two years in the period then ended, the financial highlights for each of the five years in the period then ended and the related notes (collectively referred to as the “financial statements”). In our opinion, the financial statements present fairly, in all material respects, the financial position of the Fund (one of the funds constituting BNY Mellon Index Funds, Inc.) at October 31, 2022, the results of its operations for the year then ended, the changes in its net assets for each of the two years in the period then ended and its financial highlights for each of the five years in the period then ended, in conformity with U.S. generally accepted accounting principles.
Basis for Opinion
These financial statements are the responsibility of the Fund’s management. Our responsibility is to express an opinion on the Fund’s financial statements based on our audits. We are a public accounting firm registered with the Public Company Accounting Oversight Board (United States) (“PCAOB”) and are required to be independent with respect to the Fund in accordance with the U.S. federal securities laws and the applicable rules and regulations of the Securities and Exchange Commission and the PCAOB.
We conducted our audits in accordance with the standards of the PCAOB. Those standards require that we plan and perform the audit to obtain reasonable assurance about whether the financial statements are free of material misstatement, whether due to error or fraud. The Fund is not required to have, nor were we engaged to perform, an audit of the Fund’s internal control over financial reporting. As part of our audits, we are required to obtain an understanding of internal control over financial reporting, but not for the purpose of expressing an opinion on the effectiveness of the Fund’s internal control over financial reporting. Accordingly, we express no such opinion.
Our audits included performing procedures to assess the risks of material misstatement of the financial statements, whether due to error or fraud, and performing procedures that respond to those risks. Such procedures included examining, on a test basis, evidence regarding the amounts and disclosures in the financial statements. Our procedures included confirmation of securities owned as of October 31, 2022, by correspondence with the custodian, brokers and others; when replies were not received from brokers and others, we performed other auditing procedures. Our audits also included evaluating the accounting principles used and significant estimates made by management, as well as evaluating the overall presentation of the financial statements. We believe that our audits provide a reasonable basis for our opinion.

We have served as the auditor of one or more investment companies in the BNY Mellon Family of Funds since at least 1957, but we are unable to determine the specific year.
New York, New York
December 22, 2022
34
IMPORTANT TAX INFORMATION (Unaudited)
For federal tax purposes, the fund hereby reports 100% of the ordinary dividends paid during the fiscal year ended October 31, 2022 as qualifying for the corporate dividends received deduction. Also, certain dividends paid by the fund may be subject to a maximum tax rate of 15%, as provided for by the Jobs and Growth Tax Relief Reconciliation Act of 2003. Of the distributions paid during the fiscal year, $26,336,928 represents the maximum amount that may be considered qualified dividend income. Shareholders will receive notification in early 2023 of the percentage applicable to the preparation of their 2022 income tax returns. The fund also hereby reports $7.0314 per share as a long-term capital gain distribution and $.1065 per share as a short-term capital gain distribution paid on December 22, 2021.
35
LIQUIDITY RISK MANAGEMENT PROGRAM (Unaudited)
Effective June 1, 2019, the fund adopted a liquidity risk management program (the “Liquidity Risk Management Program”) pursuant to the requirements of Rule 22e-4 under the Investment Company Act of 1940, as amended. Rule 22e-4 requires registered open-end funds, including mutual funds and exchange-traded funds but not money market funds, to establish liquidity risk management programs in order to effectively manage fund liquidity and shareholder redemptions. The rule is designed to mitigate the risk that a fund could not meet redemption requests without significantly diluting the interests of remaining investors.
The rule requires the fund to assess, manage and review their liquidity risk at least annually considering applicable factors such as investment strategy and liquidity during normal and foreseeable stressed conditions, including whether the strategy is appropriate for an open-end fund and whether the fund has a relatively concentrated portfolio or large positions in particular issuers. The fund must also assess its use of borrowings and derivatives, short-term and long-term cash flow projections in normal and stressed conditions, holdings of cash and cash equivalents, and borrowing arrangements and other funding sources.
The rule also requires the fund to classify its investments as highly liquid, moderately liquid, less liquid or illiquid based on the number of days the fund expects it would take to liquidate the investment, and to review these classifications at least monthly or more often under certain conditions. The periods range from three or fewer business days for a highly liquid investment to greater than seven calendar days for settlement of a less liquid investment. Illiquid investments are those a fund does not expect to be able to sell or dispose of within seven calendar days without significantly changing the market value. The fund is prohibited from acquiring an investment if, after the acquisition, its holdings of illiquid assets will exceed 15% of its net assets. In addition, if a fund permits redemptions in-kind, the rule requires the fund to establish redemption in-kind policies and procedures governing how and when it will engage in such redemptions.
Pursuant to the rule’s requirements, the Liquidity Risk Management Program has been reviewed and approved by the Board. Furthermore, the Board has received a written report prepared by the Program’s Administrator that addresses the operation of the Program, assesses its adequacy and effectiveness and describes any material changes made to the Program.
Assessment of Program
In the opinion of the Program Administrator, the Program approved by the Board continues to be adequate for the fund and the Program has been implemented effectively. The Program Administrator has monitored the fund’s liquidity risk and the liquidity classification of the securities held by the fund and has determined that the Program is operating effectively.
During the period from January 1, 2021 to December 31, 2021, there were no material changes to the Program and no material liquidity events that impacted the fund. During the period, the fund held sufficient highly liquid assets to meet fund redemptions.
Under normal expected foreseeable fund redemption forecasts and foreseeable stressed fund redemption forecasts, the Program Administrator believes that the fund maintains sufficient highly liquid assets to meet expected fund redemptions.
36
BOARD MEMBERS INFORMATION (Unaudited)
Independent Board Members
Joseph S. DiMartino (79)
Chairman of the Board (1995)
Principal Occupation During Past 5 Years:
· Director or Trustee of funds in the BNY Mellon Family of Funds and certain other entities (as described in the fund’s Statement of Additional Information) (1995-Present)
Other Public Company Board Memberships During Past 5 Years:
· CBIZ, Inc., a public company providing professional business services, products and solutions, Director (1997-Present)
No. of Portfolios for which Board Member Serves: 94
———————
Peggy C. Davis (79)
Board Member (2006)
Principal Occupation During Past 5 Years:
· Shad Professor of Law, New York University School of Law (1983-Present)
No. of Portfolios for which Board Member Serves: 33
———————
Gina D. France (64)
Board Member (2019)
Principal Occupation During Past 5 Years:
· France Strategic Partners, a strategy and advisory firm serving corporate clients across the United States, Founder, President and Chief Executive Officer (2003-Present)
Other Public Company Board Memberships During Past 5 Years:
· Huntington Bancshares, a bank holding company headquartered in Columbus, Ohio, Director (2016-Present)
· Cedar Fair, L.P., a publicly-traded partnership that owns and operates amusement parks and hotels in the U.S. and Canada, Director (2011-Present)
· CBIZ, Inc., a public company providing professional business services, products and solutions, Director (2015-Present)
· FirstMerit Corporation, a diversified financial services company, Director (2004-2016)
No. of Portfolios for which Board Member Serves: 23
———————
Joan Gulley (75)
Board Member (2017)
Principal Occupation During Past 5 Years:
· Nantucket Atheneum, public library, Chair (2018-June 2021) and Director (2015-June 2021)
· Orchard Island Club, golf and beach club, Governor (2016-Present)
No. of Portfolios for which Board Member Serves: 40
———————
37
BOARD MEMBERS INFORMATION (Unaudited) (continued)
Robin A. Melvin (59)
Board Member (2012)
Principal Occupation During Past 5 Years:
· Westover School, a private girls’ boarding school in Middlebury, Connecticut, Trustee (2019-Present)
· Mentor Illinois, a non-profit organization dedicated to increasing the quality of mentoring services in Illinois, Co-Chair (2014–2020); Board Member, Mentor Illinois (2013-2020)
· JDRF, a non-profit juvenile diabetes research foundation, Board Member (June 2021-June 2022)
Other Public Company Board Memberships During Past 5 Years:
· HPS Corporate Lending Fund, a closed-end management investment company regulated as a business development company, Trustee (August 2021-Present)
No. of Portfolios for which Board Member Serves: 72
———————
Michael D. DiLecce (60)
Advisory Board Member (2022)
Principal Occupation During Past 5 Years:
· Retired since July 2022. Global Asset Management Assurance Leader, Ernst & Young LLP (2015-2022)
· Americas Regional Talent Managing Partner for Ernst & Young’s Financial Service Practice (2017-2021)
· Partner, Ernst & Young LLP (1997-2022)
No. of Portfolios for which Board Member Serves: 23
———————
The address of the Board Members and Officers is c/o BNY Mellon Investment Adviser, Inc., 240 Greenwich Street, New York, New York 10286. Additional information about each Board Member is available in the fund’s Statement of Additional Information which can be obtained from the Adviser free of charge by calling this toll free number: 1-800-373-9387.
38
OFFICERS OF THE FUND (Unaudited)
DAVID DIPETRILLO, President since January 2021.
Vice President and Director of the Adviser since February 2021; Head of North America Product, BNY Mellon Investment Management since January 2018; and Director of Product Strategy, BNY Mellon Investment Management from January 2016 to December 2017. He is an officer of 55 investment companies (comprised of 109 portfolios) managed by the Adviser or an affiliate of the Adviser. He is 44 years old and has been an employee of BNY Mellon since 2005.
JAMES WINDELS, Treasurer since November 2001.
Vice President of the Adviser since September 2020; and Director–BNY Mellon Fund Administration. He is an officer of 56 investment companies (comprised of 130 portfolios) managed by the Adviser or an affiliate of the Adviser. He is 64 years old and has been an employee of the Adviser since April 1985.
PETER M. SULLIVAN, Chief Legal Officer since July 2021 and Vice President and Assistant Secretary since March 2019.
Chief Legal Officer of the Adviser and Associate General Counsel of BNY Mellon since July 2021; Senior Managing Counsel of BNY Mellon from December 2020 to July 2021; and Managing Counsel of BNY Mellon from March 2009 to December 2020. He is an officer of 56 investment companies (comprised of 130 portfolios) managed by the Adviser or an affiliate of the Adviser. He is 54 years old and has been an employee of BNY Mellon since April 2004.
JAMES BITETTO, Vice President since August 2005 and Secretary since February 2018.
Senior Managing Counsel of BNY Mellon since December 2019; Managing Counsel of BNY Mellon from April 2014 to December 2019; and Secretary of the Adviser. He is an officer of 56 investment companies (comprised of 130 portfolios) managed by the Adviser or an affiliate of the Adviser. He is 56 years old and has been an employee of the Adviser since December 1996.
DEIRDRE CUNNANE, Vice President and Assistant Secretary since March 2019.
Managing Counsel of BNY Mellon since December 2021, Counsel of BNY Mellon from August 2018 to December 2021; and Senior Regulatory Specialist at BNY Mellon Investment Management Services from February 2016 to August 2018. She is an officer of 56 investment companies (comprised of 130 portfolios) managed by the Adviser or an affiliate of the Adviser. She is 32 years old and has been an employee of the Adviser since August 2018.
SARAH S. KELLEHER, Vice President and Assistant Secretary since April 2014.
Vice President of BNY Mellon ETF Investment Adviser; LLC since February 2020; Senior Managing Counsel of BNY Mellon since September 2021; Managing Counsel of BNY Mellon from December 2017 to September 2021; and Senior Counsel of BNY Mellon from March 2013 to December 2017. She is an officer of 56 investment companies (comprised of 130 portfolios) managed by the Adviser or an affiliate of the Adviser. She is 47 years old and has been an employee of the Adviser since March 2013.
JEFF PRUSNOFSKY, Vice President and Assistant Secretary since August 2005.
Senior Managing Counsel of BNY Mellon. He is an officer of 56 investment companies (comprised of 130 portfolios) managed by the Adviser or an affiliate of the Adviser. He is 57 years old and has been an employee of the Adviser since October 1990.
AMANDA QUINN, Vice President and Assistant Secretary since March 2020.
Counsel of BNY Mellon since June 2019; Regulatory Administration Manager at BNY Mellon Investment Management Services from September 2018 to May 2019; and Senior Regulatory Specialist at BNY Mellon Investment Management Services from April 2015 to August 2018. She is an officer of 56 investment companies (comprised of 130 portfolios) managed by the Adviser or an affiliate of the Adviser. She is 37 years old and has been an employee of the Adviser since June 2019.
39
OFFICERS OF THE FUND (Unaudited) (continued)
NATALYA ZELENSKY, Vice President and Assistant Secretary since March 2017.
Chief Compliance Officer since August 2021 and Vice President since February 2020 of BNY Mellon ETF Investment Adviser, LLC; Chief Compliance Officer since August 2021 and Vice President and Assistant Secretary since February 2020 of BNY Mellon ETF Trust; Managing Counsel of BNY Mellon from December 2019 to August 2021; Counsel of BNY Mellon from May 2016 to December 2019; and Assistant Secretary of the Adviser from April 2018 to August 2021. She is an officer of 55 investment companies (comprised of 129 portfolios) managed by the Adviser or an affiliate of the Adviser. She is 37 years old and has been an employee of BNY Mellon since May 2016.
DANIEL GOLDSTEIN, Vice President since March 2022.
Vice President and Head of Product Development of North America Product, BNY Mellon Investment Management since January 2018; Co-Head of Product Management, Development & Oversight of North America Product, BNY Mellon Investment Management from January 2010 to January 2018; and Senior Vice President, Development & Oversight of North America Product, BNY Mellon Investment Management since 2010. He is an officer of 55 investment companies (comprised of 109 portfolios) managed by the Adviser or an affiliate of the Adviser. He is 53 years old and has been an employee of the Distributor since 1991.
JOSEPH MARTELLA, Vice President since March 2022.
Vice President and Head of Product Management of North America Product, BNY Mellon Investment Management since January 2018; Director of Product Research and Analytics of North America Product, BNY Mellon Investment Management from January 2010 to January 2018; and Senior Vice President of North America Product, BNY Mellon Investment Management since 2010. He is an officer of 55 investment companies (comprised of 109 portfolios) managed by the Adviser or an affiliate of the Adviser. He is 46 years old and has been an employee of the Distributor since 1999.
GAVIN C. REILLY, Assistant Treasurer since December 2005.
Tax Manager–BNY Mellon Fund Administration. He is an officer of 56 investment companies (comprised of 130 portfolios) managed by the Adviser or an affiliate of the Adviser. He is 54 years old and has been an employee of the Adviser since April 1991.
ROBERT SALVIOLO, Assistant Treasurer since July 2007.
Senior Accounting Manager–BNY Mellon Fund Administration. He is an officer of 56 investment companies (comprised of 130 portfolios) managed by the Adviser or an affiliate of the Adviser. He is 55 years old and has been an employee of the Adviser since June 1989.
ROBERT SVAGNA, Assistant Treasurer since December 2002.
Senior Accounting Manager–BNY Mellon Fund Administration. He is an officer of 56 investment companies (comprised of 130 portfolios) managed by the Adviser or an affiliate of the Adviser. He is 55 years old and has been an employee of the Adviser since November 1990.
JOSEPH W. CONNOLLY, Chief Compliance Officer since October 2004.
Chief Compliance Officer of the BNY Mellon Family of Funds and BNY Mellon Funds Trust since 2004; and Chief Compliance Officer of the Adviser from 2004 until June 2021. He is an officer of 55 investment companies (comprised of 115 portfolios) managed by the Adviser. He is 65 years old.
CARIDAD M. CAROSELLA, Anti-Money Laundering Compliance Officer since January 2016.
Anti-Money Laundering Compliance Officer of the BNY Mellon Family of Funds and BNY Mellon Funds Trust. She is an officer of 48 investment companies (comprised of 122 portfolios) managed by the Adviser or an affiliate of the Adviser. She is 54 years old and has been an employee of the Distributor since 1997.
40
This page intentionally left blank.
41
BNY Mellon S&P 500 Index Fund
240 Greenwich Street
New York, NY 10286
Adviser
BNY Mellon Investment Adviser, Inc.
240 Greenwich Street
New York, NY 10286
Custodian
The Bank of New York Mellon
240 Greenwich Street
New York, NY 10286
Transfer Agent &
Dividend Disbursing Agent
BNY Mellon Transfer, Inc.
240 Greenwich Street
New York, NY 10286
Distributor
BNY Mellon Securities Corporation
240 Greenwich Street
New York, NY 10286
Telephone Call your financial representative or 1-800-373-9387
Mail The BNY Mellon Family of Funds, 144 Glenn Curtiss Boulevard, Uniondale, NY 11556-0144
E-mail Send your request to info@bnymellon.com
Internet Information can be viewed online or downloaded at www.im.bnymellon.com
The fund files its complete schedule of portfolio holdings with the Securities and Exchange Commission (“SEC”) for the first and third quarters of each fiscal year on Form N-PORT. The fund’s Forms N-PORT are available on the SEC’s website at www.sec.gov.
A description of the policies and procedures that the fund uses to determine how to vote proxies relating to portfolio securities and information regarding how the fund voted these proxies for the most recent 12-month period ended June 30 is available at www.im.bnymellon.com and on the SEC’s website at www.sec.gov and without charge, upon request, by calling 1-800-373-9387.
| | |
© 2022 BNY Mellon Securities Corporation
0078AR1022 | 
|
BNY Mellon Smallcap Stock Index Fund
| |
ANNUAL REPORT October 31, 2022 |
| |
Save time. Save paper. View your next shareholder report online as soon as it’s available. Log into www.im.bnymellon.com and sign up for eCommunications. It’s simple and only takes a few minutes. |
| |
The views expressed in this report reflect those of the portfolio manager(s) only through the end of the period covered and do not necessarily represent the views of BNY Mellon Investment Adviser, Inc. or any other person in the BNY Mellon Investment Adviser, Inc. organization. Any such views are subject to change at any time based upon market or other conditions and BNY Mellon Investment Adviser, Inc. disclaims any responsibility to update such views. These views may not be relied on as investment advice and, because investment decisions for a fund in the BNY Mellon Family of Funds are based on numerous factors, may not be relied on as an indication of trading intent on behalf of any fund in the BNY Mellon Family of Funds. |
| |
Not FDIC-Insured • Not Bank-Guaranteed • May Lose Value |
Contents
T H E F U N D
F O R M O R E I N F O R M AT I O N
Back Cover
DISCUSSION OF FUND PERFORMANCE (Unaudited)
For the period from November 1, 2021, through October 31, 2022, as provided by David France, CFA, Todd Frysinger, CFA, Vlasta Sheremeta, CFA, Michael Stoll and Marlene Walker Smith, Portfolio Managers.
Market and Fund Performance Overview
For the 12-month period ended October 31, 2022, the BNY Mellon Smallcap Stock Index Fund’s (the “fund”) Investor shares produced a total return of −12.29%, and its Class I shares returned −12.08%.1 In comparison, the S&P SmallCap 600® Index (the “Index”), the fund’s benchmark, produced a −11.81% total return for the same period.2,3
Equities declined during the reporting period under pressure from increasing inflation, tightening central bank policies and uncertainties related to Russia’s invasion of Ukraine. The difference in returns between the fund and the Index resulted primarily from transaction costs and operating expenses that are not reflected in Index results.
The Fund’s Investment Approach
The fund seeks to match the performance of the Index. To pursue its goal, the fund generally is fully invested in all of the stocks that comprise the Index and in futures whose performance is tied to the Index. The fund generally invests in all 600 stocks in the Index in proportion to their weighting in the Index; however, at times, the fund may invest in a representative sample of stocks included in the Index and in futures whose performance is tied to the Index. Under these circumstances, the fund expects to invest in approximately 500 or more of the stocks in the Index.
Because the fund has expenses, performance will tend to be slightly lower than that of the Index. The fund attempts to have a correlation between its performance and that of the Index of at least 0.95, before fees and expenses. A correlation of 1.00 would mean that the fund and the Index were perfectly correlated.
The Index is an unmanaged index composed of 601 domestic stocks. S&P weights each company’s stock in the Index by its market capitalization (i.e., the share price times the number of shares outstanding), adjusted by the number of available float shares (i.e., those shares available to public investors). Companies included in the Index generally have market capitalizations ranging between approximately $850 million and $3.7 billion, to the extent consistent with market conditions.
Increasing Inflation and Slowing Economic Growth Pressure Equities
U.S. equities started the reporting period on a mixed note. Concerns regarding the new COVID-19 Omicron variant came to the fore in November 2021. Markets recovered in December on continued economic growth and strong corporate earnings reports, despite increasingly hawkish rhetoric from the U.S. Federal Reserve (the “Fed”) regarding the tapering of the Fed’s asset-purchase program in the face of rising inflation. The start of 2022 saw increasingly aggressive comments from the Fed regarding monetary tightening, along with rising tensions between Russia and Ukraine, two major suppliers of energy, agricultural products and other natural resources. As a result, equity markets weakened in January, then plunged in early February as Russia invaded its neighbor, while commodity prices rose, led by soaring energy prices.
2
Rapidly rising inflation marked the second half of the period. The Fed attempted to dampen the trend by raising rates five times between March and September, from a range of 0.00% – 0.25% at the beginning of the period to 3.00% – 3.25% as of October 31, 2022, its most aggressive series of rate increases in decades, with further increases projected by the end of the year. Rising rates heightened concerns that economic growth could be undermined by anti-inflationary moves. The resulting risk-off sentiment broadly undermined equity markets, with defensive, value-oriented stocks strongly outperforming more cyclical, growth-oriented shares.
Communication Services Lead the Equity Market Lower
Communications services led the market lower as the sector was viewed as both cyclical and interest-rate sensitive, with companies subject to supply-chain disruptions and discretionary spending constraints. Consumer discretionary shares suffered as well due to rising input prices and seemingly intractable supply-chain bottlenecks. Real estate underperformed as rising interest rates increased mortgage expenses and dampened property sales.
On the positive side, shares in oil & gas exploration & production companies soared as commodity prices climbed. Utility stocks generated more modest gains due to their value-oriented investment proposition and the ability of power generators to insulate profits from rising input expenses by hedging energy costs. Consumer staples shares also advanced slightly as a value-oriented sector that typically tends to perform relatively well during times of increasing economic stress and uncertainty.
The fund’s use of derivatives during the period was limited to futures contracts employed solely to offset the impact of cash positions, which the fund holds pursuant to its operations. These derivatives helped the fund more closely match the performance of the Index.
Replicating the Performance of the Index
In seeking to match the performance of the Index, we do not actively manage investments in response to macroeconomic trends. We note, however, that rising inflation, tightening Fed policy and geopolitical uncertainties related to the war in Ukraine are likely to continue posing challenges for equity investors for the foreseeable future. With inflation in the United States currently running well above the Fed’s 2% target rate, the question remains open as to how soon the Fed can bring inflation under control, and to what extent its actions will slow
3
DISCUSSION OF FUND PERFORMANCE (Unaudited) (continued)
economic growth. As always, we continue to monitor factors that affect the fund’s investments.
November 15, 2022
1 Total return includes reinvestment of dividends and any capital gains paid. The fund’s return reflects the absorption of certain fund expenses by BNY Mellon Investment Adviser, Inc. pursuant to an agreement. Had these expenses not been absorbed, returns would have been lower. Past performance is no guarantee of future results. Share price and investment return fluctuate such that upon redemption, fund shares may be worth more or less than their original cost.
2 Source: Lipper Inc. — The S&P SmallCap 600® Index measures the small-cap segment of the U.S. equity market. The Index is designed to track companies that meet specific inclusion criteria to ensure that they are liquid and financially viable. Investors cannot invest directly in any index.
3 “Standard & Poor’s®,” “S&P®,” and “S&P SmallCap 600®” are registered trademarks of Standard & Poor’s Financial Services LLC and have been licensed for use on behalf of the fund. The fund is not sponsored, endorsed, managed, advised, sold or promoted by Standard & Poor’s and its affiliates, and Standard & Poor’s and its affiliates make no representation regarding the advisability of investing in the fund.
Equities are subject generally to market, market sector, market liquidity, issuer and investment style risks, among other factors, to varying degrees, all of which are more fully described in the fund’s prospectus.
The fund uses an indexing strategy. It does not attempt to manage market volatility, use defensive strategies or reduce the effects of any long-term periods of poor stock performance.
Recent market risks include pandemic risks related to COVID-19. The effects of COVID-19 have contributed to increased volatility in global markets and will likely affect certain countries, companies, industries and market sectors more dramatically than others. To the extent the fund may overweight its investments in certain countries, companies, industries or market sectors, such positions will increase the fund’s exposure to risk of loss from adverse developments affecting those countries, companies, industries or sectors.
The prices of small company stocks tend to be more volatile than the prices of large company stocks, mainly because these companies have less established and more volatile earnings histories. They also tend to be less liquid than larger company stocks.
The fund may, but is not required, to use derivative instruments. A small investment in derivatives could have a potentially large impact on the fund’s performance. The use of derivatives involves risks different from, or possibly greater than, the risks associated with investing directly in the underlying assets.
4
FUND PERFORMANCE (Unaudited)
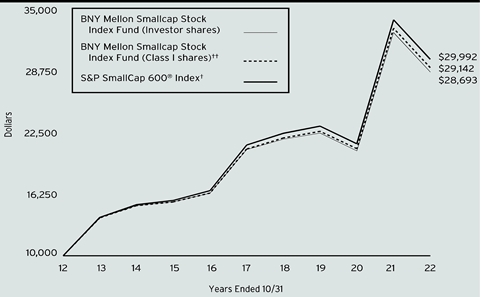
Comparison of change in value of a $10,000 investment in the Investor shares and Class I shares of BNY Mellon Smallcap Stock Index Fund with a hypothetical investment of $10,000 in the S&P SmallCap 600® Index (the “Index”).
† Source: Lipper Inc.
†† The total return figures presented for Class I shares of the fund reflect the performance of the fund’s Investor shares for the period prior to 8/31/16 (the inception date for Class I shares).
Past performance is not predictive of future performance.
The above graph compares a hypothetical $10,000 investment made in the Investor shares and Class I shares of BNY Mellon Smallcap Stock Index Fund on 10/31/12 to a hypothetical investment of $10,000 made in the Index on that date. All dividends and capital gain distributions are reinvested.
The fund’s performance shown in the line graph above takes into account all applicable fees and expenses. The Index measures the small-cap segment of the U.S. equity market. The index is designed to track companies that meet specific inclusion criteria to ensure that they are liquid and financially viable. Unlike a mutual fund, the Index is not subject to charges, fees and other expenses. Investors cannot invest directly in any index. Further information relating to fund performance, including expense reimbursements, if applicable, is contained in the Financial Highlights section of the prospectus and elsewhere in this report.
| | | | | |
Average Annual Total Returns as of 10/31/2022 | |
| | Inception
Date | 1 Year | 5 Years | 10 Years |
Investor shares | 6/30/97 | -12.29% | 6.64% | 11.12% |
Class I Shares | 8/31/16 | -12.08% | 6.91% | 11.29%† |
S&P SmallCap 600® Index | | -11.81% | 7.11% | 11.61% |
† The total return performance figures presented for Class I shares of the fund reflect the performance of the fund’s Investor shares for the period prior to 8/31/16 (the inception date for Class I shares).
The performance data quoted represents past performance, which is no guarantee of future results. Share price and investment return fluctuate and an investor’s shares may be worth more or less than original cost upon redemption. Current performance may be lower or higher than the performance quoted. Go to www.im.bnymellon.com for the fund’s most recent month-end returns.
The fund’s performance shown in the graph and table does not reflect the deduction of taxes that a shareholder would pay on fund distributions or the redemption of fund shares.
5
UNDERSTANDING YOUR FUND’S EXPENSES (Unaudited)
As a mutual fund investor, you pay ongoing expenses, such as management fees and other expenses. Using the information below, you can estimate how these expenses affect your investment and compare them with the expenses of other funds. You also may pay one-time transaction expenses, including sales charges (loads) and redemption fees, which are not shown in this section and would have resulted in higher total expenses. For more information, see your fund’s prospectus or talk to your financial adviser.
Review your fund’s expenses
The table below shows the expenses you would have paid on a $1,000 investment in BNY Mellon Smallcap Stock Index Fund from May 1, 2022 to October 31, 2022. It also shows how much a $1,000 investment would be worth at the close of the period, assuming actual returns and expenses.
| | | | | |
Expenses and Value of a $1,000 Investment | |
Assume actual returns for the six months ended October 31, 2022 | |
| | | | |
| | Investor Shares | Class I | |
Expenses paid per $1,000† | $2.51 | $1.25 | |
Ending value (after expenses) | $989.70 | $991.10 | |
COMPARING YOUR FUND’S EXPENSES WITH THOSE OF OTHER FUNDS (Unaudited)
Using the SEC’s method to compare expenses
The Securities and Exchange Commission (“SEC”) has established guidelines to help investors assess fund expenses. Per these guidelines, the table below shows your fund’s expenses based on a $1,000 investment, assuming a hypothetical 5% annualized return. You can use this information to compare the ongoing expenses (but not transaction expenses or total cost) of investing in the fund with those of other funds. All mutual fund shareholder reports will provide this information to help you make this comparison. Please note that you cannot use this information to estimate your actual ending account balance and expenses paid during the period.
| | | | | |
Expenses and Value of a $1,000 Investment | |
Assuming a hypothetical 5% annualized return for the six months ended October 31, 2022 | |
| | | | |
| | Investor Shares | Class I | |
Expenses paid per $1,000† | $2.55 | $1.28 | |
Ending value (after expenses) | $1,022.68 | $1,023.95 | |
† | Expenses are equal to the fund’s annualized expense ratio of .50% for Investor Shares and .25% for Class I, multiplied by the average account value over the period, multiplied by 184/365 (to reflect the one-half year period). |
6
STATEMENT OF INVESTMENTS
October 31, 2022
| | | | | | | | |
| |
Description | | | | Shares | | Value ($) | |
Common Stocks - 99.1% | | | | | |
Automobiles & Components - 1.5% | | | | | |
American Axle & Manufacturing Holdings Inc. | | | | 178,476 | a | 1,729,432 | |
Dorman Products Inc. | | | | 44,075 | a | 3,597,401 | |
Gentherm Inc. | | | | 51,673 | a | 3,018,737 | |
LCI Industries | | | | 39,621 | | 4,204,184 | |
Motorcar Parts of America Inc. | | | | 30,344 | a | 576,536 | |
Patrick Industries Inc. | | | | 33,842 | | 1,546,918 | |
Standard Motor Products Inc. | | | | 29,550 | | 1,120,831 | |
Winnebago Industries Inc. | | | | 49,474 | | 2,953,103 | |
XPEL Inc. | | | | 30,549 | a,b | 2,113,685 | |
| | | | | 20,860,827 | |
Banks - 13.0% | | | | | |
Ameris Bancorp | | | | 101,582 | | 5,232,489 | |
Axos Financial Inc. | | | | 82,892 | a | 3,229,472 | |
Banc of California Inc. | | | | 86,404 | | 1,441,219 | |
BancFirst Corp. | | | | 27,075 | b | 2,594,326 | |
BankUnited Inc. | | | | 121,408 | | 4,364,618 | |
Banner Corp. | | | | 53,271 | | 3,982,007 | |
Berkshire Hills Bancorp Inc. | | | | 71,340 | | 2,086,695 | |
Brookline Bancorp Inc. | | | | 119,478 | | 1,642,822 | |
Capitol Federal Financial Inc. | | | | 201,198 | | 1,645,800 | |
Central Pacific Financial Corp. | | | | 41,437 | | 850,287 | |
City Holding Co. | | | | 23,145 | | 2,334,173 | |
Columbia Banking System Inc. | | | | 122,539 | | 4,101,380 | |
Community Bank System Inc. | | | | 83,717 | | 5,226,452 | |
Customers Bancorp Inc. | | | | 47,524 | a | 1,601,084 | |
CVB Financial Corp. | | | | 204,742 | | 5,880,190 | |
Dime Community Bancshares Inc. | | | | 50,374 | | 1,739,414 | |
Eagle Bancorp Inc. | | | | 49,990 | | 2,263,547 | |
FB Financial Corp. | | | | 54,786 | | 2,298,821 | |
First Bancorp/NC | | | | 55,597 | | 2,477,958 | |
First Bancorp/Puerto Rico | | | | 292,892 | | 4,624,765 | |
First Commonwealth Financial Corp. | | | | 145,489 | | 2,086,312 | |
First Financial Bancorp | | | | 147,818 | | 3,853,615 | |
First Hawaiian Inc. | | | | 198,961 | | 5,089,422 | |
Flagstar Bancorp Inc. | | | | 83,091 | | 3,215,622 | |
Hanmi Financial Corp. | | | | 47,497 | | 1,271,970 | |
Heritage Financial Corp. | | | | 54,694 | | 1,842,641 | |
Hilltop Holdings Inc. | | | | 71,435 | | 2,068,043 | |
HomeStreet Inc. | | | | 27,532 | | 714,731 | |
Hope Bancorp Inc. | | | | 186,150 | | 2,526,055 | |
7
STATEMENT OF INVESTMENTS (continued)
| | | | | | | | |
| |
Description | | | | Shares | | Value ($) | |
Common Stocks - 99.1% (continued) | | | | | |
Banks - 13.0% (continued) | | | | | |
Independent Bank Corp. | | | | 71,515 | | 6,222,520 | |
Independent Bank Group Inc. | | | | 55,163 | | 3,480,234 | |
Lakeland Financial Corp. | | | | 39,500 | | 3,264,675 | |
Mr. Cooper Group Inc. | | | | 111,634 | a | 4,408,427 | |
National Bank Holdings Corp., Cl. A | | | | 46,863 | | 2,053,537 | |
NBT Bancorp Inc. | | | | 66,745 | | 3,163,046 | |
NMI Holdings Inc., Cl. A | | | | 131,972 | a | 2,894,146 | |
Northfield Bancorp Inc. | | | | 65,986 | | 1,058,415 | |
Northwest Bancshares Inc. | | | | 197,679 | | 2,977,046 | |
OFG Bancorp | | | | 74,092 | | 2,065,685 | |
Pacific Premier Bancorp Inc. | | | | 147,954 | | 5,387,005 | |
Park National Corp. | | | | 22,539 | | 3,324,502 | |
Pathward Financial Inc. | | | | 45,268 | | 1,902,614 | |
Preferred Bank | | | | 21,230 | | 1,631,950 | |
Provident Financial Services Inc. | | | | 116,916 | | 2,621,257 | |
Renasant Corp. | | | | 87,171 | | 3,519,093 | |
S&T Bancorp Inc. | | | | 60,991 | | 2,306,070 | |
Seacoast Banking Corp. of Florida | | | | 95,680 | | 2,956,512 | |
ServisFirst Bancshares Inc. | | | | 76,155 | | 5,736,756 | |
Simmons First National Corp., Cl. A | | | | 199,926 | | 4,772,234 | |
Southside Bancshares Inc. | | | | 47,519 | | 1,627,051 | |
Stellar Bancorp Inc. | | | | 69,968 | b | 2,297,749 | |
The Bancorp Inc. | | | | 88,119 | a | 2,430,322 | |
Tompkins Financial Corp. | | | | 19,643 | | 1,627,226 | |
Triumph Bancorp Inc. | | | | 35,831 | a | 1,845,296 | |
TrustCo Bank Corp. | | | | 29,431 | | 1,098,365 | |
Trustmark Corp. | | | | 95,354 | | 3,487,096 | |
United Community Bank Inc. | | | | 165,251 | | 6,362,163 | |
Veritex Holdings Inc. | | | | 84,099 | | 2,655,846 | |
Walker & Dunlop Inc. | | | | 47,860 | | 4,305,486 | |
Westamerica Bancorporation | | | | 41,929 | | 2,630,206 | |
WSFS Financial Corp. | | | | 98,956 | | 4,607,391 | |
| | | | | 183,005,851 | |
Capital Goods - 11.4% | | | | | |
3D Systems Corp. | | | | 202,984 | a,b | 1,792,349 | |
AAON Inc. | | | | 65,431 | | 4,219,645 | |
AAR Corp. | | | | 52,405 | a | 2,322,590 | |
Aerojet Rocketdyne Holdings Inc. | | | | 117,807 | a | 5,707,749 | |
AeroVironment Inc. | | | | 38,937 | a | 3,562,735 | |
Alamo Group Inc. | | | | 16,034 | | 2,438,451 | |
Albany International Corp., Cl. A | | | | 48,455 | | 4,439,447 | |
American Woodmark Corp. | | | | 25,854 | a | 1,172,479 | |
Apogee Enterprises Inc. | | | | 34,522 | | 1,583,869 | |
8
| | | | | | | | |
| |
Description | | | | Shares | | Value ($) | |
Common Stocks - 99.1% (continued) | | | | | |
Capital Goods - 11.4% (continued) | | | | | |
Applied Industrial Technologies Inc. | | | | 59,898 | | 7,450,113 | |
Arcosa Inc. | | | | 75,343 | | 4,837,021 | |
Astec Industries Inc. | | | | 35,533 | | 1,551,015 | |
AZZ Inc. | | | | 38,623 | | 1,552,645 | |
Barnes Group Inc. | | | | 78,710 | | 2,783,973 | |
Boise Cascade Co. | | | | 61,462 | | 4,103,818 | |
CIRCOR International Inc. | | | | 32,241 | a | 666,421 | |
Comfort Systems USA Inc. | | | | 55,741 | | 6,871,750 | |
DXP Enterprises Inc. | | | | 24,132 | a | 690,417 | |
Encore Wire Corp. | | | | 29,799 | b | 4,100,044 | |
Enerpac Tool Group Corp. | | | | 90,588 | | 2,301,841 | |
EnPro Industries Inc. | | | | 32,411 | | 3,451,771 | |
ESCO Technologies Inc. | | | | 40,280 | | 3,470,928 | |
Federal Signal Corp. | | | | 94,460 | | 4,406,559 | |
Franklin Electric Co. | | | | 60,585 | | 4,964,335 | |
Gibraltar Industries Inc. | | | | 49,278 | a | 2,517,120 | |
GMS Inc. | | | | 66,446 | a | 3,136,251 | |
Granite Construction Inc. | | | | 68,687 | | 2,316,812 | |
Griffon Corp. | | | | 73,794 | | 2,371,739 | |
Hillenbrand Inc. | | | | 108,217 | | 4,781,027 | |
Insteel Industries Inc. | | | | 30,907 | | 814,399 | |
John Bean Technologies Corp. | | | | 49,643 | | 4,527,442 | |
Kaman Corp. | | | | 43,641 | | 1,400,876 | |
Lindsay Corp. | | | | 17,106 | | 2,896,046 | |
Moog Inc., Cl. A | | | | 45,123 | | 3,824,174 | |
Mueller Industries Inc. | | | | 88,317 | | 5,532,177 | |
MYR Group Inc. | | | | 25,952 | a | 2,271,060 | |
National Presto Industries Inc. | | | | 8,088 | | 570,123 | |
NOW Inc. | | | | 172,711 | a | 2,198,611 | |
NV5 Global Inc. | | | | 19,381 | a | 2,809,276 | |
Park Aerospace Corp. | | | | 31,536 | | 392,308 | |
PGT Innovations Inc. | | | | 93,400 | a | 1,990,354 | |
Powell Industries Inc. | | | | 14,115 | | 348,217 | |
Proto Labs Inc. | | | | 42,851 | a | 1,636,480 | |
Quanex Building Products Corp. | | | | 51,911 | | 1,150,348 | |
Resideo Technologies Inc. | | | | 226,988 | a | 5,361,457 | |
SPX Technologies Inc. | | | | 70,444 | a | 4,638,033 | |
Standex International Corp. | | | | 18,642 | | 1,846,490 | |
Tennant Co. | | | | 28,964 | | 1,687,153 | |
The Greenbrier Companies | | | | 50,600 | | 1,786,686 | |
Titan International Inc. | | | | 80,408 | a | 1,202,904 | |
Trinity Industries Inc. | | | | 127,773 | | 3,645,364 | |
Triumph Group Inc. | | | | 101,227 | a | 916,104 | |
9
STATEMENT OF INVESTMENTS (continued)
| | | | | | | | |
| |
Description | | | | Shares | | Value ($) | |
Common Stocks - 99.1% (continued) | | | | | |
Capital Goods - 11.4% (continued) | | | | | |
UFP Industries Inc. | | | | 96,012 | | 6,838,935 | |
Veritiv Corp. | | | | 21,758 | a | 2,529,585 | |
Wabash National Corp. | | | | 75,643 | | 1,637,671 | |
| | | | | 160,017,187 | |
Commercial & Professional Services - 3.4% | | | | | |
ABM Industries Inc. | | | | 104,059 | | 4,631,666 | |
Brady Corp., Cl. A | | | | 72,741 | | 3,327,901 | |
CoreCivic Inc. | | | | 183,256 | a | 1,918,690 | |
Deluxe Corp. | | | | 67,129 | | 1,233,831 | |
Exponent Inc. | | | | 79,643 | | 7,586,792 | |
Forrester Research Inc. | | | | 17,434 | a | 737,807 | |
Harsco Corp. | | | | 125,275 | a | 662,705 | |
Healthcare Services Group Inc. | | | | 115,380 | | 1,610,705 | |
Heidrick & Struggles International Inc. | | | | 30,751 | | 865,948 | |
HNI Corp. | | | | 64,399 | | 1,866,927 | |
Interface Inc. | | | | 93,295 | | 1,055,166 | |
KAR Auction Services Inc. | | | | 180,469 | a | 2,622,215 | |
Kelly Services Inc., Cl. A | | | | 53,891 | | 880,579 | |
Korn Ferry | | | | 85,082 | | 4,729,708 | |
Matthews International Corp., Cl. A | | | | 47,686 | | 1,281,800 | |
MillerKnoll Inc. | | | | 118,167 | | 2,502,777 | |
Pitney Bowes Inc. | | | | 250,600 | | 779,366 | |
Resources Connection Inc. | | | | 48,810 | | 891,759 | |
The GEO Group Inc. | | | | 193,338 | a,b | 1,635,639 | |
TrueBlue Inc. | | | | 50,313 | a | 989,154 | |
UniFirst Corp. | | | | 23,516 | | 4,327,179 | |
Viad Corp. | | | | 32,129 | a | 1,197,769 | |
| | | | | 47,336,083 | |
Consumer Durables & Apparel - 3.5% | | | | | |
Cavco Industries Inc. | | | | 12,889 | a | 2,921,550 | |
Century Communities Inc. | | | | 44,752 | | 1,991,912 | |
Ethan Allen Interiors Inc. | | | | 35,193 | | 900,589 | |
G-III Apparel Group Ltd. | | | | 67,623 | a | 1,318,648 | |
Green Brick Partners Inc. | | | | 42,321 | a | 978,885 | |
Installed Building Products Inc. | | | | 36,726 | | 3,158,436 | |
iRobot Corp. | | | | 42,426 | a,b | 2,397,069 | |
Kontoor Brands Inc. | | | | 76,800 | | 2,741,760 | |
La-Z-Boy Inc. | | | | 67,610 | | 1,674,700 | |
LGI Homes Inc. | | | | 31,909 | a,b | 2,937,223 | |
M.D.C. Holdings Inc. | | | | 88,692 | | 2,701,558 | |
M/I Homes Inc. | | | | 43,253 | a | 1,794,567 | |
Meritage Homes Corp. | | | | 56,973 | a | 4,339,064 | |
Movado Group Inc. | | | | 24,979 | | 826,056 | |
10
| | | | | | | | |
| |
Description | | | | Shares | | Value ($) | |
Common Stocks - 99.1% (continued) | | | | | |
Consumer Durables & Apparel - 3.5% (continued) | | | | | |
Oxford Industries Inc. | | | | 23,329 | | 2,373,259 | |
Sonos Inc. | | | | 198,265 | a,b | 3,196,032 | |
Steven Madden Ltd. | | | | 115,701 | | 3,455,989 | |
Sturm Ruger & Co. | | | | 27,529 | b | 1,545,203 | |
Tri Pointe Homes Inc. | | | | 158,357 | a | 2,652,480 | |
Tupperware Brands Corp. | | | | 62,507 | a | 483,179 | |
Unifi Inc. | | | | 19,250 | a | 175,560 | |
Universal Electronics Inc. | | | | 18,204 | a | 371,544 | |
Vista Outdoor Inc. | | | | 88,077 | a,b | 2,557,756 | |
Wolverine World Wide Inc. | | | | 122,675 | | 2,101,423 | |
| | | | | 49,594,442 | |
Consumer Services - 2.9% | | | | | |
Adtalem Global Education Inc. | | | | 70,430 | a | 2,936,931 | |
BJ's Restaurants Inc. | | | | 36,543 | a | 1,200,438 | |
Bloomin' Brands Inc. | | | | 139,129 | | 3,340,487 | |
Brinker International Inc. | | | | 68,306 | a | 2,280,737 | |
Chuy's Holdings Inc. | | | | 28,694 | a | 840,734 | |
Dave & Buster's Entertainment Inc. | | | | 66,332 | a | 2,643,330 | |
Dine Brands Global Inc. | | | | 24,432 | b | 1,761,303 | |
El Pollo Loco Holdings Inc. | | | | 30,479 | | 306,009 | |
Frontdoor Inc. | | | | 126,966 | a | 2,800,870 | |
Golden Entertainment Inc. | | | | 34,039 | a | 1,437,127 | |
Jack in the Box Inc. | | | | 32,808 | | 2,894,650 | |
Mister Car Wash Inc. | | | | 122,936 | a,b | 1,085,525 | |
Monarch Casino & Resort Inc. | | | | 20,600 | a | 1,635,846 | |
Perdoceo Education Corp. | | | | 104,171 | a | 1,190,675 | |
Ruth's Hospitality Group Inc. | | | | 48,897 | | 1,016,080 | |
Shake Shack Inc., Cl. A | | | | 58,133 | a | 3,230,451 | |
Six Flags Entertainment Corp. | | | | 115,244 | a,b | 2,569,941 | |
Strategic Education Inc. | | | | 34,931 | | 2,410,239 | |
Stride Inc. | | | | 63,307 | a | 2,121,418 | |
The Cheesecake Factory Inc. | | | | 75,678 | b | 2,710,029 | |
WW International Inc. | | | | 80,583 | a | 364,235 | |
| | | | | 40,777,055 | |
Diversified Financials - 2.9% | | | | | |
Apollo Commercial Real Estate Finance Inc. | | | | 201,531 | c | 2,269,239 | |
ARMOUR Residential REIT Inc. | | | | 181,847 | b,c | 967,426 | |
B. Riley Financial Inc. | | | | 24,478 | | 995,765 | |
Blucora Inc. | | | | 73,983 | a | 1,629,845 | |
Brightsphere Investment Group Inc. | | | | 50,087 | | 942,637 | |
Donnelley Financial Solutions Inc. | | | | 39,817 | a | 1,609,801 | |
Ellington Financial Inc. | | | | 88,686 | c | 1,186,619 | |
11
STATEMENT OF INVESTMENTS (continued)
| | | | | | | | |
| |
Description | | | | Shares | | Value ($) | |
Common Stocks - 99.1% (continued) | | | | | |
Diversified Financials - 2.9% (continued) | | | | | |
Encore Capital Group Inc. | | | | 37,208 | a | 1,894,631 | |
Enova International Inc. | | | | 49,875 | a | 1,869,814 | |
EZCORP Inc., Cl. A | | | | 83,644 | a | 808,001 | |
Franklin BSP Realty Trust Inc. | | | | 130,529 | c | 1,839,154 | |
Granite Point Mortgage Trust Inc. | | | | 83,101 | c | 653,174 | |
Green Dot Corp., Cl. A | | | | 74,533 | a | 1,418,363 | |
Invesco Mortgage Capital Inc. | | | | 49,897 | b,c | 584,294 | |
KKR Real Estate Finance Trust Inc. | | | | 90,636 | b,c | 1,578,879 | |
LendingTree Inc. | | | | 17,671 | a | 445,839 | |
New York Mortgage Trust Inc. | | | | 588,511 | c | 1,583,095 | |
PennyMac Mortgage Investment Trust | | | | 141,114 | b,c | 1,957,251 | |
Piper Sandler Cos. | | | | 21,359 | | 2,733,311 | |
PRA Group Inc. | | | | 60,727 | a | 2,034,354 | |
PROG Holdings Inc. | | | | 78,633 | a | 1,299,017 | |
Ready Capital Corp. | | | | 158,639 | b,c | 1,922,705 | |
Redwood Trust Inc. | | | | 181,927 | c | 1,297,139 | |
StoneX Group Inc. | | | | 26,834 | a | 2,504,149 | |
Two Harbors Investment Corp. | | | | 536,656 | c | 1,910,495 | |
Virtus Investment Partners Inc. | | | | 10,655 | | 1,827,226 | |
WisdomTree Investments Inc. | | | | 177,039 | | 961,322 | |
World Acceptance Corp. | | | | 5,857 | a | 475,706 | |
| | | | | 41,199,251 | |
Energy - 5.2% | | | | | |
Archrock Inc. | | | | 208,526 | | 1,566,030 | |
Bristow Group Inc. | | | | 36,308 | a | 1,087,062 | |
Callon Petroleum Co. | | | | 79,802 | a,b | 3,508,096 | |
Civitas Resources Inc. | | | | 80,815 | b | 5,649,777 | |
CONSOL Energy Inc. | | | | 51,067 | | 3,218,242 | |
Core Laboratories NV | | | | 72,177 | | 1,404,564 | |
DMC Global Inc. | | | | 28,017 | a | 606,288 | |
Dorian LPG Ltd. | | | | 49,860 | | 900,970 | |
Dril-Quip Inc. | | | | 53,233 | a | 1,324,437 | |
Green Plains Inc. | | | | 90,510 | a,b | 2,614,834 | |
Helix Energy Solutions Group Inc. | | | | 226,827 | a | 1,587,789 | |
Helmerich & Payne Inc. | | | | 164,047 | | 8,121,967 | |
Laredo Petroleum Inc. | | | | 26,649 | a | 1,722,858 | |
Nabors Industries Ltd. | | | | 13,940 | a | 2,425,978 | |
Oceaneering International Inc. | | | | 156,210 | a | 2,185,378 | |
Oil States International Inc. | | | | 95,769 | a,b | 619,625 | |
Par Pacific Holdings Inc. | | | | 86,261 | a | 1,973,652 | |
Patterson-UTI Energy Inc. | | | | 337,820 | | 5,962,523 | |
PBF Energy Inc., Cl. A | | | | 167,168 | | 7,397,184 | |
ProPetro Holding Corp. | | | | 136,351 | a | 1,614,396 | |
12
| | | | | | | | |
| |
Description | | | | Shares | | Value ($) | |
Common Stocks - 99.1% (continued) | | | | | |
Energy - 5.2% (continued) | | | | | |
Ranger Oil Corp., Cl. A | | | | 30,865 | | 1,262,378 | |
REX American Resources Corp. | | | | 23,803 | a | 713,852 | |
RPC Inc. | | | | 132,705 | | 1,477,007 | |
SM Energy Co. | | | | 191,008 | | 8,591,540 | |
Talos Energy Inc. | | | | 101,596 | a | 2,161,963 | |
U.S. Silica Holdings Inc. | | | | 117,720 | a | 1,693,991 | |
World Fuel Services Corp. | | | | 96,470 | | 2,459,020 | |
| | | | | 73,851,401 | |
Food & Staples Retailing - .9% | | | | | |
PriceSmart Inc. | | | | 39,037 | | 2,497,197 | |
SpartanNash Co. | | | | 56,286 | | 2,009,973 | |
The Andersons Inc. | | | | 49,592 | | 1,749,110 | |
The Chefs' Warehouse Inc. | | | | 53,055 | a | 1,943,405 | |
United Natural Foods Inc. | | | | 90,822 | a | 3,851,761 | |
| | | | | 12,051,446 | |
Food, Beverage & Tobacco - 2.8% | | | | | |
B&G Foods Inc. | | | | 111,665 | b | 1,829,073 | |
Calavo Growers Inc. | | | | 27,643 | | 956,171 | |
Cal-Maine Foods Inc. | | | | 59,144 | | 3,342,227 | |
Fresh Del Monte Produce Inc. | | | | 47,697 | | 1,243,938 | |
Hostess Brands Inc. | | | | 212,669 | a | 5,631,475 | |
J&J Snack Foods Corp. | | | | 23,324 | | 3,442,856 | |
John B. Sanfilippo & Son Inc. | | | | 13,912 | | 1,160,400 | |
MGP Ingredients Inc. | | | | 23,986 | | 2,687,631 | |
National Beverage Corp. | | | | 36,356 | | 1,724,002 | |
Seneca Foods Corp., Cl. A | | | | 8,883 | a | 560,606 | |
The Hain Celestial Group Inc. | | | | 139,908 | a | 2,617,679 | |
The Simply Good Foods Company | | | | 132,926 | a | 5,091,066 | |
Tootsie Roll Industries Inc. | | | | 27,682 | b | 1,118,076 | |
TreeHouse Foods Inc. | | | | 78,586 | a | 3,948,161 | |
Universal Corp. | | | | 38,331 | | 1,939,932 | |
Vector Group Ltd. | | | | 205,003 | | 2,177,132 | |
| | | | | 39,470,425 | |
Health Care Equipment & Services - 6.3% | | | | | |
AdaptHealth Corp. | | | | 119,450 | a,b | 2,723,460 | |
Addus HomeCare Corp. | | | | 25,053 | a | 2,565,928 | |
Allscripts Healthcare Solutions Inc. | | | | 172,621 | a | 2,537,529 | |
AMN Healthcare Services Inc. | | | | 67,422 | a | 8,461,461 | |
AngioDynamics Inc. | | | | 60,564 | a | 853,347 | |
Apollo Medical Holdings Inc. | | | | 61,129 | a,b | 2,167,634 | |
Artivion Inc. | | | | 62,204 | a | 694,197 | |
Avanos Medical Inc. | | | | 72,429 | a | 1,604,302 | |
Cardiovascular Systems Inc. | | | | 63,545 | a | 917,590 | |
13
STATEMENT OF INVESTMENTS (continued)
| | | | | | | | |
| |
Description | | | | Shares | | Value ($) | |
Common Stocks - 99.1% (continued) | | | | | |
Health Care Equipment & Services - 6.3% (continued) | | | | | |
Community Health Systems Inc. | | | | 200,169 | a | 574,485 | |
Computer Programs & Systems Inc. | | | | 22,536 | a | 727,913 | |
CONMED Corp. | | | | 47,468 | | 3,784,624 | |
CorVel Corp. | | | | 14,372 | a | 2,360,026 | |
Cross Country Healthcare Inc. | | | | 56,588 | a | 2,098,849 | |
Cutera Inc. | | | | 27,754 | a,b | 1,275,851 | |
Embecta Corp. | | | | 90,052 | | 2,784,408 | |
Enhabit Inc. | | | | 77,307 | a | 960,153 | |
Fulgent Genetics Inc. | | | | 31,451 | a,b | 1,246,403 | |
Glaukos Corp. | | | | 74,159 | a | 4,158,095 | |
HealthStream Inc. | | | | 38,190 | a | 943,293 | |
Heska Corp. | | | | 15,845 | a | 1,137,037 | |
Inogen Inc. | | | | 36,288 | a | 822,286 | |
Integer Holdings Corp. | | | | 51,607 | a,b | 3,216,664 | |
LeMaitre Vascular Inc. | | | | 30,113 | b | 1,306,904 | |
Meridian Bioscience Inc. | | | | 68,162 | a | 2,179,139 | |
Merit Medical Systems Inc. | | | | 88,441 | a | 6,082,088 | |
Mesa Laboratories Inc. | | | | 7,787 | b | 1,029,519 | |
ModivCare Inc. | | | | 19,703 | a | 1,915,920 | |
NextGen Healthcare Inc. | | | | 85,841 | a | 1,720,254 | |
OptimizeRx Corp. | | | | 29,011 | a | 447,205 | |
OraSure Technologies Inc. | | | | 114,484 | a | 499,150 | |
Orthofix Medical Inc. | | | | 29,808 | a | 478,716 | |
Owens & Minor Inc. | | | | 118,798 | | 2,019,566 | |
Pediatrix Medical Group Inc. | | | | 131,428 | a | 2,549,703 | |
RadNet Inc. | | | | 75,898 | a | 1,451,170 | |
Select Medical Holdings Corp. | | | | 160,870 | | 4,131,142 | |
Simulations Plus Inc. | | | | 24,908 | b | 1,033,682 | |
SurModics Inc. | | | | 22,339 | a | 762,653 | |
The Ensign Group Inc. | | | | 86,145 | | 7,734,098 | |
The Joint Corp. | | | | 23,174 | a | 382,834 | |
The Pennant Group Inc. | | | | 44,048 | a | 542,231 | |
U.S. Physical Therapy Inc. | | | | 20,261 | | 1,799,177 | |
Varex Imaging Corp. | | | | 62,166 | a | 1,374,490 | |
Zimvie Inc. | | | | 29,469 | a | 258,443 | |
Zynex Inc. | | | | 35,348 | b | 402,967 | |
| | | | | 88,716,586 | |
Household & Personal Products - 1.3% | | | | | |
Central Garden & Pet Co. | | | | 15,535 | a | 641,129 | |
Central Garden & Pet Co., Cl. A | | | | 64,580 | a | 2,527,661 | |
e.l.f. Beauty Inc. | | | | 77,595 | a | 3,356,760 | |
Edgewell Personal Care Co. | | | | 80,748 | | 3,164,514 | |
Inter Parfums Inc. | | | | 27,797 | | 2,248,221 | |
14
| | | | | | | | |
| |
Description | | | | Shares | | Value ($) | |
Common Stocks - 99.1% (continued) | | | | | |
Household & Personal Products - 1.3% (continued) | | | | | |
Medifast Inc. | | | | 17,167 | | 2,008,367 | |
USANA Health Sciences Inc. | | | | 17,317 | a | 909,316 | |
WD-40 Co. | | | | 21,232 | b | 3,400,517 | |
| | | | | 18,256,485 | |
Insurance - 2.7% | | | | | |
Ambac Financial Group Inc. | | | | 71,217 | a | 1,000,599 | |
American Equity Investment Life Holding Co. | | | | 110,601 | | 4,764,691 | |
AMERISAFE Inc. | | | | 30,045 | | 1,754,928 | |
Assured Guaranty Ltd. | | | | 96,453 | | 5,709,053 | |
Employers Holdings Inc. | | | | 42,543 | | 1,855,300 | |
Genworth Financial Inc., Cl. A | | | | 784,815 | a | 3,665,086 | |
HCI Group Inc. | | | | 11,557 | b | 423,448 | |
Horace Mann Educators Corp. | | | | 63,720 | | 2,514,391 | |
James River Group Holdings Ltd. | | | | 58,349 | | 1,474,479 | |
Mercury General Corp. | | | | 41,410 | | 1,200,890 | |
Palomar Holdings Inc. | | | | 39,335 | a | 3,499,242 | |
ProAssurance Corp. | | | | 84,077 | | 1,867,350 | |
Safety Insurance Group Inc. | | | | 22,966 | | 1,996,894 | |
SiriusPoint Ltd. | | | | 129,999 | a | 834,594 | |
Stewart Information Services Corp. | | | | 42,237 | | 1,645,554 | |
Trupanion Inc. | | | | 54,597 | a,b | 2,755,511 | |
United Fire Group Inc. | | | | 33,374 | | 904,435 | |
Universal Insurance Holdings Inc. | | | | 44,694 | | 448,728 | |
| | | | | 38,315,173 | |
Materials - 5.7% | | | | | |
AdvanSix Inc. | | | | 44,779 | | 1,629,060 | |
American Vanguard Corp. | | | | 46,086 | | 1,072,421 | |
Arconic Corp. | | | | 159,956 | a | 3,320,687 | |
ATI Inc. | | | | 202,394 | a | 6,023,245 | |
Balchem Corp. | | | | 50,046 | | 6,996,431 | |
Carpenter Technology Corp. | | | | 75,221 | | 2,813,265 | |
Century Aluminum Co. | | | | 81,243 | a | 585,762 | |
Clearwater Paper Corp. | | | | 25,941 | a | 1,153,856 | |
Compass Minerals International Inc. | | | | 53,225 | | 2,104,516 | |
FutureFuel Corp. | | | | 40,884 | | 279,647 | |
H.B. Fuller Co. | | | | 82,831 | | 5,774,149 | |
Hawkins Inc. | | | | 29,276 | | 1,318,298 | |
Haynes International Inc. | | | | 19,416 | | 949,637 | |
Innospec Inc. | | | | 38,626 | | 3,862,214 | |
Kaiser Aluminum Corp. | | | | 24,837 | | 2,006,581 | |
Koppers Holdings Inc. | | | | 32,108 | | 801,416 | |
Livent Corp. | | | | 279,273 | a,b | 8,816,649 | |
15
STATEMENT OF INVESTMENTS (continued)
| | | | | | | | |
| |
Description | | | | Shares | | Value ($) | |
Common Stocks - 99.1% (continued) | | | | | |
Materials - 5.7% (continued) | | | | | |
Materion Corp. | | | | 31,977 | | 2,740,749 | |
Mativ Holdings Inc. | | | | 85,186 | | 2,022,316 | |
Mercer International Inc. | | | | 61,978 | b | 831,745 | |
Minerals Technologies Inc. | | | | 50,785 | | 2,793,683 | |
Myers Industries Inc. | | | | 56,819 | | 1,152,857 | |
O-I Glass Inc. | | | | 242,613 | a | 3,957,018 | |
Olympic Steel Inc. | | | | 14,202 | | 386,436 | |
Quaker Chemical Corp. | | | | 21,230 | b | 3,452,847 | |
Rayonier Advanced Materials Inc. | | | | 97,780 | a | 444,899 | |
Stepan Co. | | | | 33,015 | | 3,448,087 | |
SunCoke Energy Inc. | | | | 129,927 | | 943,270 | |
Sylvamo Corp. | | | | 51,564 | | 2,483,838 | |
TimkenSteel Corp. | | | | 64,099 | a | 1,117,887 | |
Tredegar Corp. | | | | 38,680 | | 421,225 | |
Trinseo PLC | | | | 54,096 | | 1,018,087 | |
Warrior Met Coal Inc. | | | | 80,480 | | 2,989,027 | |
| | | | | 79,711,805 | |
Media & Entertainment - 1.3% | | | | | |
AMC Networks Inc., Cl. A | | | | 43,240 | a | 973,332 | |
Cars.com Inc. | | | | 98,334 | a | 1,364,876 | |
Cinemark Holdings Inc. | | | | 167,175 | a,b | 1,773,727 | |
Gannett Co. | | | | 206,971 | a | 300,108 | |
QuinStreet Inc. | | | | 81,349 | a | 928,192 | |
Scholastic Corp. | | | | 46,892 | | 1,788,461 | |
Shutterstock Inc. | | | | 37,547 | | 1,878,476 | |
TechTarget Inc. | | | | 42,296 | a | 2,730,207 | |
The E.W. Scripps Company, Cl. A | | | | 90,213 | a | 1,280,122 | |
The Marcus Corp. | | | | 37,529 | b | 564,436 | |
Thryv Holdings Inc. | | | | 47,754 | a | 977,047 | |
Yelp Inc. | | | | 109,490 | a | 4,205,511 | |
| | | | | 18,764,495 | |
Pharmaceuticals Biotechnology & Life Sciences - 4.6% | | | | | |
Amphastar Pharmaceuticals Inc. | | | | 59,567 | a | 1,840,620 | |
ANI Pharmaceuticals Inc. | | | | 18,595 | a,b | 717,581 | |
Anika Therapeutics Inc. | | | | 23,161 | a | 658,236 | |
Arcus Biosciences Inc. | | | | 80,949 | a,b | 2,062,581 | |
Avid Bioservices Inc. | | | | 96,342 | a,b | 1,632,033 | |
BioLife Solutions Inc. | | | | 52,876 | a,b | 1,243,644 | |
Cara Therapeutics Inc. | | | | 68,413 | a | 643,082 | |
Catalyst Pharmaceuticals Inc. | | | | 147,383 | a | 2,044,202 | |
Coherus Biosciences Inc. | | | | 100,513 | a | 874,463 | |
Collegium Pharmaceutical Inc. | | | | 52,185 | a | 936,199 | |
Corcept Therapeutics Inc. | | | | 148,519 | a | 4,247,643 | |
16
| | | | | | | | |
| |
Description | | | | Shares | | Value ($) | |
Common Stocks - 99.1% (continued) | | | | | |
Pharmaceuticals Biotechnology & Life Sciences - 4.6% (continued) | | | | | |
Cytokinetics Inc. | | | | 146,681 | a,b | 6,404,092 | |
Dynavax Technologies Corp. | | | | 183,259 | a,b | 2,098,316 | |
Eagle Pharmaceuticals Inc. | | | | 17,029 | a | 535,903 | |
Emergent BioSolutions Inc. | | | | 69,142 | a | 1,442,302 | |
Enanta Pharmaceuticals Inc. | | | | 30,353 | a | 1,369,224 | |
Harmony Biosciences Holdings Inc. | | | | 46,088 | a | 2,396,576 | |
Innoviva Inc. | | | | 97,294 | a,b | 1,319,307 | |
Ironwood Pharmaceuticals Inc. | | | | 207,705 | a | 2,272,293 | |
iTeos Therapeutics Inc. | | | | 39,119 | a | 762,038 | |
Ligand Pharmaceuticals Inc. | | | | 24,989 | a | 2,190,286 | |
Myriad Genetics Inc. | | | | 125,633 | a | 2,605,628 | |
Nektar Therapeutics | | | | 286,623 | a | 1,077,702 | |
NeoGenomics Inc. | | | | 195,325 | a | 1,485,447 | |
Organogenesis Holdings Inc. | | | | 112,401 | a | 368,675 | |
Pacira Biosciences Inc. | | | | 71,396 | a | 3,695,457 | |
Phibro Animal Health Corp., Cl. A | | | | 31,308 | | 459,915 | |
Prestige Consumer Healthcare Inc. | | | | 77,533 | a | 4,223,998 | |
REGENXBIO Inc. | | | | 58,598 | a | 1,387,015 | |
Supernus Pharmaceuticals Inc. | | | | 83,348 | a | 2,856,336 | |
uniQure NV | | | | 63,821 | a | 1,188,347 | |
Vanda Pharmaceuticals Inc. | | | | 88,125 | a | 922,669 | |
Vericel Corp. | | | | 73,506 | a,b | 1,975,841 | |
Vir Biotechnology Inc. | | | | 117,794 | a | 2,589,112 | |
Xencor Inc. | | | | 93,012 | a,b | 2,604,336 | |
| | | | | 65,131,099 | |
Real Estate - 7.6% | | | | | |
Acadia Realty Trust | | | | 147,909 | c | 2,066,289 | |
Agree Realty Corp. | | | | 124,384 | c | 8,545,181 | |
Alexander & Baldwin Inc. | | | | 113,270 | c | 2,206,500 | |
American Assets Trust Inc. | | | | 81,103 | c | 2,228,710 | |
Anywhere Real Estate Inc. | | | | 178,204 | a | 1,324,056 | |
Armada Hoffler Properties Inc. | | | | 105,491 | c | 1,233,190 | |
Brandywine Realty Trust | | | | 267,315 | c | 1,753,586 | |
CareTrust REIT Inc. | | | | 151,176 | c | 2,823,968 | |
Centerspace | | | | 23,950 | c | 1,659,735 | |
Chatham Lodging Trust | | | | 77,637 | a,c | 1,006,952 | |
Community Healthcare Trust Inc. | | | | 36,197 | c | 1,252,416 | |
DiamondRock Hospitality Co. | | | | 328,629 | c | 3,069,395 | |
Diversified Healthcare Trust | | | | 365,507 | c | 497,090 | |
Douglas Elliman Inc. | | | | 106,677 | | 492,848 | |
Easterly Government Properties Inc. | | | | 141,497 | c | 2,460,633 | |
Elme Communities | | | | 136,177 | c | 2,599,619 | |
17
STATEMENT OF INVESTMENTS (continued)
| | | | | | | | |
| |
Description | | | | Shares | | Value ($) | |
Common Stocks - 99.1% (continued) | | | | | |
Real Estate - 7.6% (continued) | | | | | |
Essential Properties Realty Trust Inc. | | | | 220,031 | c | 4,735,067 | |
Four Corners Property Trust Inc. | | | | 126,919 | c | 3,251,665 | |
Franklin Street Properties Corp. | | | | 148,036 | c | 426,344 | |
Getty Realty Corp. | | | | 66,261 | c | 2,086,559 | |
Global Net Lease Inc. | | | | 161,551 | c | 1,979,000 | |
Hersha Hospitality Trust, Cl. A | | | | 50,362 | c | 460,812 | |
Hudson Pacific Properties Inc. | | | | 200,846 | c | 2,217,340 | |
Industrial Logistics Properties Trust | | | | 97,495 | c | 456,277 | |
Innovative Industrial Properties Inc. | | | | 43,583 | c | 4,711,322 | |
iStar Inc. | | | | 132,374 | c | 1,387,280 | |
LTC Properties Inc. | | | | 63,109 | c | 2,440,425 | |
LXP Industrial Trust | | | | 436,090 | c | 4,221,351 | |
Marcus & Millichap Inc. | | | | 39,228 | b | 1,445,160 | |
NexPoint Residential Trust Inc. | | | | 35,565 | c | 1,621,764 | |
Office Properties Income Trust | | | | 74,657 | c | 1,142,252 | |
Orion Office REIT Inc. | | | | 85,896 | b,c | 804,846 | |
Outfront Media Inc. | | | | 227,477 | c | 4,105,960 | |
RE/MAX Holdings Inc., Cl. A | | | | 30,078 | | 585,318 | |
Retail Opportunity Investments Corp. | | | | 194,043 | c | 2,809,743 | |
RPT Realty | | | | 132,705 | c | 1,234,156 | |
Safehold Inc. | | | | 27,514 | c | 804,784 | |
Saul Centers Inc. | | | | 20,092 | c | 822,767 | |
Service Properties Trust | | | | 257,293 | c | 2,086,646 | |
SITE Centers Corp. | | | | 290,135 | c | 3,591,871 | |
Summit Hotel Properties Inc. | | | | 166,358 | c | 1,437,333 | |
Sunstone Hotel Investors Inc. | | | | 330,799 | c | 3,688,409 | |
Tanger Factory Outlet Centers Inc. | | | | 162,615 | c | 2,928,696 | |
The St. Joe Company | | | | 53,233 | | 1,891,368 | |
Uniti Group Inc. | | | | 369,649 | c | 2,868,476 | |
Universal Health Realty Income Trust | | | | 19,782 | c | 962,790 | |
Urban Edge Properties | | | | 182,982 | c | 2,583,706 | |
Urstadt Biddle Properties Inc., Cl. A | | | | 46,994 | c | 880,668 | |
Veris Residential Inc. | | | | 123,459 | a,c | 1,954,356 | |
Whitestone REIT | | | | 74,003 | c | 696,368 | |
Xenia Hotels & Resorts Inc. | | | | 178,168 | c | 3,043,109 | |
| | | | | 107,584,156 | |
Retailing - 4.7% | | | | | |
Abercrombie & Fitch Co., Cl. A | | | | 77,951 | a | 1,370,379 | |
Academy Sports & Outdoors Inc. | | | | 132,585 | | 5,837,718 | |
American Eagle Outfitters Inc. | | | | 245,461 | a | 2,788,437 | |
America's Car-Mart Inc. | | | | 9,128 | a | 623,990 | |
Asbury Automotive Group Inc. | | | | 34,483 | a | 5,439,693 | |
Bed Bath & Beyond Inc. | | | | 111,957 | a,b | 511,643 | |
18
| | | | | | | | |
| |
Description | | | | Shares | | Value ($) | |
Common Stocks - 99.1% (continued) | | | | | |
Retailing - 4.7% (continued) | | | | | |
Big Lots Inc. | | | | 44,071 | b | 831,620 | |
Boot Barn Holdings Inc. | | | | 46,439 | a | 2,637,735 | |
Caleres Inc. | | | | 57,240 | | 1,564,369 | |
Chico's FAS Inc. | | | | 194,979 | a | 1,146,477 | |
Conn's Inc. | | | | 20,956 | a | 172,049 | |
Designer Brands Inc., Cl. A | | | | 87,810 | | 1,337,346 | |
Genesco Inc. | | | | 20,183 | a | 949,408 | |
Group 1 Automotive Inc. | | | | 24,598 | b | 4,255,454 | |
Guess? Inc. | | | | 51,363 | b | 872,144 | |
Haverty Furniture Cos. | | | | 21,365 | | 567,882 | |
Hibbett Inc. | | | | 20,135 | | 1,256,827 | |
Leslie's Inc. | | | | 230,985 | a,b | 3,243,029 | |
Liquidity Services Inc. | | | | 42,487 | a | 729,927 | |
Ll Flooring Holdings Inc. | | | | 44,738 | a | 372,220 | |
MarineMax Inc. | | | | 33,551 | a | 1,084,033 | |
Monro Inc. | | | | 50,165 | | 2,395,379 | |
National Vision Holdings Inc. | | | | 122,910 | a | 4,552,586 | |
PetMed Express Inc. | | | | 33,509 | b | 714,412 | |
Rent-A-Center Inc. | | | | 82,930 | b | 1,729,090 | |
Sally Beauty Holdings Inc. | | | | 166,738 | a | 2,119,240 | |
Shoe Carnival Inc. | | | | 26,383 | | 632,664 | |
Signet Jewelers Ltd. | | | | 72,471 | b | 4,728,008 | |
Sleep Number Corp. | | | | 34,167 | a | 947,793 | |
Sonic Automotive Inc., Cl. A | | | | 28,856 | | 1,349,018 | |
The Aaron's Company | | | | 48,177 | | 502,004 | |
The Buckle Inc. | | | | 46,050 | | 1,811,146 | |
The Cato Corp., Cl. A | | | | 25,026 | | 298,060 | |
The Children's Place Inc. | | | | 20,912 | a | 846,518 | |
The ODP Corp. | | | | 66,661 | a | 2,637,776 | |
Urban Outfitters Inc. | | | | 93,845 | a,b | 2,239,142 | |
Zumiez Inc. | | | | 24,924 | a,b | 559,045 | |
| | | | | 65,654,261 | |
Semiconductors & Semiconductor Equipment - 2.9% | | | | | |
Alpha & Omega Semiconductor Ltd. | | | | 35,380 | a | 1,158,695 | |
Axcelis Technologies Inc. | | | | 51,469 | a | 2,985,202 | |
CEVA Inc. | | | | 36,197 | a | 1,001,209 | |
Cohu Inc. | | | | 75,140 | a | 2,473,609 | |
Diodes Inc. | | | | 70,862 | a | 5,078,680 | |
FormFactor Inc. | | | | 120,177 | a | 2,428,777 | |
Ichor Holdings Ltd. | | | | 44,778 | a | 1,139,152 | |
Kulicke & Soffa Industries Inc. | | | | 90,473 | b | 3,794,438 | |
MaxLinear Inc. | | | | 112,284 | a | 3,467,330 | |
Onto Innovation Inc. | | | | 77,405 | a | 5,173,750 | |
19
STATEMENT OF INVESTMENTS (continued)
| | | | | | | | |
| |
Description | | | | Shares | | Value ($) | |
Common Stocks - 99.1% (continued) | | | | | |
Semiconductors & Semiconductor Equipment - 2.9% (continued) | | | | | |
PDF Solutions Inc. | | | | 47,046 | a | 1,109,345 | |
Photronics Inc. | | | | 95,977 | a | 1,556,747 | |
Rambus Inc. | | | | 172,210 | a | 5,193,854 | |
SMART Global Holdings Inc. | | | | 76,841 | a | 1,039,659 | |
Ultra Clean Holdings Inc. | | | | 70,784 | a | 2,202,090 | |
Veeco Instruments Inc. | | | | 80,123 | a | 1,460,642 | |
| | | | | 41,263,179 | |
Software & Services - 3.5% | | | | | |
8x8 Inc. | | | | 185,064 | a,b | 782,821 | |
A10 Networks Inc. | | | | 103,251 | | 1,734,617 | |
Adeia Inc. | | | | 162,341 | | 1,814,972 | |
Agilysys Inc. | | | | 30,812 | a | 1,977,206 | |
Alarm.com Holdings Inc. | | | | 77,497 | a | 4,559,923 | |
Cerence Inc. | | | | 61,361 | a | 1,055,409 | |
Consensus Cloud Solutions Inc. | | | | 27,327 | a | 1,534,138 | |
CSG Systems International Inc. | | | | 49,985 | | 3,232,530 | |
Digital Turbine Inc. | | | | 140,142 | a,b | 2,046,073 | |
Ebix Inc. | | | | 36,043 | | 713,291 | |
EVERTEC Inc. | | | | 102,792 | | 3,680,981 | |
InterDigital Inc. | | | | 46,207 | | 2,304,343 | |
LivePerson Inc. | | | | 107,595 | a | 1,137,279 | |
Liveramp Holdings Inc. | | | | 104,611 | a | 1,920,658 | |
OneSpan Inc. | | | | 53,198 | a | 584,646 | |
Payoneer Global Inc. | | | | 307,669 | a | 2,384,435 | |
Perficient Inc. | | | | 53,913 | a | 3,610,554 | |
Progress Software Corp. | | | | 67,716 | | 3,455,547 | |
SPS Commerce Inc. | | | | 56,113 | a | 7,099,417 | |
TTEC Holdings Inc. | | | | 29,300 | | 1,302,971 | |
Unisys Corp. | | | | 105,614 | a | 897,719 | |
Xperi Inc. | | | | 64,320 | a | 898,550 | |
| | | | | 48,728,080 | |
Technology Hardware & Equipment - 6.0% | | | | | |
ADTRAN Holdings Inc. | | | | 109,768 | | 2,465,389 | |
Advanced Energy Industries Inc. | | | | 58,207 | | 4,577,981 | |
Arlo Technologies Inc. | | | | 139,804 | a | 719,991 | |
Avid Technology Inc. | | | | 52,857 | a,b | 1,453,039 | |
Badger Meter Inc. | | | | 45,603 | | 5,129,425 | |
Benchmark Electronics Inc. | | | | 54,781 | | 1,555,233 | |
Clearfield Inc. | | | | 17,817 | a,b | 2,164,231 | |
Comtech Telecommunications Corp. | | | | 40,851 | | 451,404 | |
Corsair Gaming Inc. | | | | 60,286 | a | 831,947 | |
CTS Corp. | | | | 49,647 | | 1,962,049 | |
20
| | | | | | | | |
| |
Description | | | | Shares | | Value ($) | |
Common Stocks - 99.1% (continued) | | | | | |
Technology Hardware & Equipment - 6.0% (continued) | | | | | |
Diebold Nixdorf Inc. | | | | 123,972 | a | 308,690 | |
Digi International Inc. | | | | 54,664 | a | 2,204,599 | |
ePlus Inc. | | | | 41,899 | a | 2,041,319 | |
Extreme Networks Inc. | | | | 201,398 | a | 3,613,080 | |
Fabrinet | | | | 57,313 | a | 6,556,607 | |
FARO Technologies Inc. | | | | 28,129 | a | 821,648 | |
Harmonic Inc. | | | | 163,689 | a | 2,528,995 | |
Insight Enterprises Inc. | | | | 47,571 | a | 4,495,935 | |
Itron Inc. | | | | 70,329 | a | 3,438,385 | |
Knowles Corp. | | | | 142,781 | a,b | 1,963,239 | |
Methode Electronics Inc. | | | | 57,257 | | 2,360,706 | |
NETGEAR Inc. | | | | 44,561 | a | 875,624 | |
NETSCOUT Systems Inc. | | | | 105,807 | a | 3,800,587 | |
OSI Systems Inc. | | | | 24,697 | a | 2,029,599 | |
PC Connection Inc. | | | | 17,990 | | 955,989 | |
Plexus Corp. | | | | 43,177 | a | 4,248,617 | |
Rogers Corp. | | | | 29,182 | a | 6,867,400 | |
Sanmina Corp. | | | | 90,062 | a | 5,047,975 | |
ScanSource Inc. | | | | 39,313 | a | 1,217,917 | |
TTM Technologies Inc. | | | | 159,223 | a | 2,437,704 | |
Viavi Solutions Inc. | | | | 354,972 | a | 5,360,077 | |
| | | | | 84,485,381 | |
Telecommunication Services - .8% | | | | | |
ATN International Inc. | | | | 16,374 | | 706,047 | |
Cogent Communications Holdings Inc. | | | | 66,470 | | 3,490,340 | |
Consolidated Communications Holdings Inc. | | | | 118,523 | a | 612,764 | |
Gogo Inc. | | | | 102,256 | a | 1,454,080 | |
Shenandoah Telecommunications Co. | | | | 78,022 | | 1,767,979 | |
Telephone and Data Systems Inc. | | | | 156,019 | | 2,652,323 | |
| | | | | 10,683,533 | |
Transportation - 2.0% | | | | | |
Allegiant Travel Co. | | | | 24,078 | a | 1,807,054 | |
ArcBest Corp. | | | | 38,217 | | 3,035,576 | |
Atlas Air Worldwide Holdings Inc. | | | | 40,156 | a | 4,061,378 | |
Forward Air Corp. | | | | 41,835 | | 4,429,071 | |
Hawaiian Holdings Inc. | | | | 80,062 | a | 1,155,295 | |
Heartland Express Inc. | | | | 71,465 | | 1,063,399 | |
Hub Group Inc., Cl. A | | | | 52,955 | a | 4,109,308 | |
Marten Transport Ltd. | | | | 89,624 | | 1,682,242 | |
Matson Inc. | | | | 60,734 | | 4,468,808 | |
SkyWest Inc. | | | | 78,819 | a | 1,393,520 | |
21
STATEMENT OF INVESTMENTS (continued)
| | | | | | | | |
| |
Description | | | | Shares | | Value ($) | |
Common Stocks - 99.1% (continued) | | | | | |
Transportation - 2.0% (continued) | | | | | |
Sun Country Airlines Holdings Inc. | | | | 50,132 | a | 816,149 | |
| | | | | 28,021,800 | |
Utilities - 2.2% | | | | | |
American States Water Co. | | | | 57,581 | | 5,208,777 | |
Avista Corp. | | | | 113,702 | | 4,665,193 | |
California Water Service Group | | | | 84,689 | | 5,255,799 | |
Chesapeake Utilities Corp. | | | | 27,637 | | 3,437,490 | |
Middlesex Water Co. | | | | 27,437 | | 2,454,788 | |
Northwest Natural Holding Co. | | | | 54,247 | | 2,608,738 | |
South Jersey Industries Inc. | | | | 190,807 | | 6,615,279 | |
Unitil Corp. | | | | 25,512 | | 1,344,738 | |
| | | | | 31,590,802 | |
Total Common Stocks (cost $963,234,986) | | | | 1,395,070,803 | |
| | | | | | | | |
Exchange-Traded Funds - .4% | | | | | |
Registered Investment Companies - .4% | | | | | |
iShares Core S&P Small-Cap ETF
(cost $5,336,029) | | | | 60,006 | b | 5,875,787 | |
| | | 1-Day
Yield (%) | | | | | |
Investment Companies - .0% | | | | | |
Registered Investment Companies - .0% | | | | | |
Dreyfus Institutional Preferred Government Plus Money Market Fund, Institutional Shares
(cost $97,911) | | 3.23 | | 97,911 | d | 97,911 | |
| | | | | | | | |
Investment of Cash Collateral for Securities Loaned - .9% | | | | | |
Registered Investment Companies - .9% | | | | | |
Dreyfus Institutional Preferred Government Plus Money Market Fund, SL Shares
(cost $11,683,186) | | 3.23 | | 11,683,186 | d | 11,683,186 | |
Total Investments (cost $980,352,112) | | 100.4% | | 1,412,727,687 | |
Liabilities, Less Cash and Receivables | | (.4%) | | (5,110,525) | |
Net Assets | | 100.0% | | 1,407,617,162 | |
ETF—Exchange-Traded Fund
REIT—Real Estate Investment Trust
a Non-income producing security.
b Security, or portion thereof, on loan. At October 31, 2022, the value of the fund’s securities on loan was $91,817,829 and the value of the collateral was $95,857,551, consisting of cash collateral of $11,683,186 and U.S. Government & Agency securities valued at $84,174,365. In addition, the value of collateral may include pending sales that are also on loan.
c Investment in real estate investment trust within the United States.
d Investment in affiliated issuer. The investment objective of this investment company is publicly available and can be found within the investment company’s prospectus.
22
| | |
Portfolio Summary (Unaudited) † | Value (%) |
Financials | 18.7 |
Industrials | 16.7 |
Consumer Discretionary | 12.6 |
Information Technology | 12.4 |
Health Care | 10.9 |
Real Estate | 7.6 |
Materials | 5.7 |
Energy | 5.2 |
Consumer Staples | 5.0 |
Utilities | 2.2 |
Communication Services | 2.1 |
Investment Companies | 1.3 |
| | 100.4 |
† Based on net assets.
See notes to financial statements.
| | | | | | | |
Affiliated Issuers | | | |
Description | Value ($) 10/31/2021 | Purchases ($)† | Sales ($) | Value ($) 10/31/2022 | Dividends/
Distributions ($) | |
Registered Investment Companies - .0% | | |
Dreyfus Institutional Preferred Government Plus Money Market Fund, Institutional Shares - .0% | 8,132,181 | 199,491,291 | (207,525,561) | 97,911 | 46,438 | |
Investment of Cash Collateral for Securities Loaned - .9% | | |
Dreyfus Institutional Preferred Government Plus Money Market Fund, SL Shares - .9% | - | 212,416,775 | (200,733,589) | 11,683,186 | 182,019 | †† |
Total - .9% | 8,132,181 | 411,908,066 | (408,259,150) | 11,781,097 | 228,457 | |
† Includes reinvested dividends/distributions.
†† Represents securities lending income earned from the reinvestment of cash collateral from loaned securities, net of fees and collateral investment expenses, and other payments to and from borrowers of securities.
See notes to financial statements.
23
STATEMENT OF INVESTMENTS (continued)
| | | | | | | |
Futures | | | |
Description | Number of
Contracts | Expiration | Notional
Value ($) | Market
Value ($) | Unrealized (Depreciation) ($) | |
Futures Long | | |
E-mini Russell 2000 | 78 | 12/16/2022 | 7,269,327 | 7,226,700 | (42,627) | |
Gross Unrealized Depreciation | | (42,627) | |
See notes to financial statements.
24
STATEMENT OF ASSETS AND LIABILITIES
October 31, 2022
| | | | | | | |
| | | | | | |
| | | Cost | | Value | |
Assets ($): | | | | |
Investments in securities—See Statement of Investments
(including securities on loan, valued at $91,817,829)—Note 1(c): | | | |
Unaffiliated issuers | 968,571,015 | | 1,400,946,590 | |
Affiliated issuers | | 11,781,097 | | 11,781,097 | |
Receivable for investment securities sold | | 48,691,473 | |
Receivable for shares of Common Stock subscribed | | 1,154,282 | |
Dividends and securities lending income receivable | | 683,640 | |
Cash collateral held by broker—Note 4 | | 467,000 | |
Receivable for futures variation margin—Note 4 | | 5,460 | |
| | | | | 1,463,729,542 | |
Liabilities ($): | | | | |
Due to BNY Mellon Investment Adviser, Inc. and affiliates—Note 3(b) | | 517,346 | |
Cash overdraft due to Custodian | | | | | 36,275 | |
Note payable—Note 2 | | 42,600,000 | |
Liability for securities on loan—Note 1(c) | | 11,683,186 | |
Payable for shares of Common Stock redeemed | | 1,087,626 | |
Directors’ fees and expenses payable | | 162,397 | |
Interest payable—Note 2 | | 25,550 | |
| | | | | 56,112,380 | |
Net Assets ($) | | | 1,407,617,162 | |
Composition of Net Assets ($): | | | | |
Paid-in capital | | | | | 835,058,838 | |
Total distributable earnings (loss) | | | | | 572,558,324 | |
Net Assets ($) | | | 1,407,617,162 | |
| | | | |
Net Asset Value Per Share | Investor Shares | Class I | |
Net Assets ($) | 1,110,002,048 | 297,615,114 | |
Shares Outstanding | 38,508,793 | 10,332,875 | |
Net Asset Value Per Share ($) | 28.82 | 28.80 | |
| | | |
See notes to financial statements. | | | |
25
STATEMENT OF OPERATIONS
Year Ended October 31, 2022
| | | | | | | |
| | | | | | |
| | | | | | |
Investment Income ($): | | | | |
Income: | | | | |
Cash dividends (net of $20,815 foreign taxes withheld at source): | |
Unaffiliated issuers | | | 24,436,218 | |
Affiliated issuers | | | 46,438 | |
Income from securities lending—Note 1(c) | | | 182,019 | |
Interest | | | 5,246 | |
Total Income | | | 24,669,921 | |
Expenses: | | | | |
Management fee—Note 3(a) | | | 4,131,741 | |
Shareholder servicing costs—Note 3(b) | | | 3,279,632 | |
Directors’ fees—Note 3(a,c) | | | 105,960 | |
Interest expense—Note 2 | | | 42,186 | |
Loan commitment fees—Note 2 | | | 34,516 | |
Total Expenses | | | 7,594,035 | |
Less—Directors’ fees reimbursed by
BNY Mellon Investment Adviser, Inc.—Note 3(a) | | | (105,960) | |
Net Expenses | | | 7,488,075 | |
Net Investment Income | | | 17,181,846 | |
Realized and Unrealized Gain (Loss) on Investments—Note 4 ($): | | |
Net realized gain (loss) on investments | 177,646,828 | |
Net realized gain (loss) on futures | (1,193,556) | |
Net Realized Gain (Loss) | | | 176,453,272 | |
Net change in unrealized appreciation (depreciation) on investments | (419,163,269) | |
Net change in unrealized appreciation (depreciation) on futures | (319,062) | |
Net Change in Unrealized Appreciation (Depreciation) | | | (419,482,331) | |
Net Realized and Unrealized Gain (Loss) on Investments | | | (243,029,059) | |
Net (Decrease) in Net Assets Resulting from Operations | | (225,847,213) | |
| | | | | | |
See notes to financial statements. | | | | | |
26
STATEMENT OF CHANGES IN NET ASSETS
| | | | | | | | | | |
| | | | Year Ended October 31, |
| | | | 2022 | | 2021 | |
Operations ($): | | | | | | | | |
Net investment income | | | 17,181,846 | | | | 15,839,379 | |
Net realized gain (loss) on investments | | 176,453,272 | | | | 198,480,644 | |
Net change in unrealized appreciation
(depreciation) on investments | | (419,482,331) | | | | 574,194,741 | |
Net Increase (Decrease) in Net Assets
Resulting from Operations | (225,847,213) | | | | 788,514,764 | |
Distributions ($): | |
Distributions to shareholders: | | | | | | | | |
Investor Shares | | | (147,534,958) | | | | (98,151,521) | |
Class I | | | (41,386,096) | | | | (24,760,861) | |
Total Distributions | | | (188,921,054) | | | | (122,912,382) | |
Capital Stock Transactions ($): | |
Net proceeds from shares sold: | | | | | | | | |
Investor Shares | | | 139,875,439 | | | | 179,787,708 | |
Class I | | | 74,875,335 | | | | 86,646,000 | |
Distributions reinvested: | | | | | | | | |
Investor Shares | | | 146,340,664 | | | | 97,515,532 | |
Class I | | | 31,348,320 | | | | 18,714,336 | |
Cost of shares redeemed: | | | | | | | | |
Investor Shares | | | (368,672,581) | | | | (453,497,358) | |
Class I | | | (135,133,922) | | | | (91,320,361) | |
Increase (Decrease) in Net Assets
from Capital Stock Transactions | (111,366,745) | | | | (162,154,143) | |
Total Increase (Decrease) in Net Assets | (526,135,012) | | | | 503,448,239 | |
Net Assets ($): | |
Beginning of Period | | | 1,933,752,174 | | | | 1,430,303,935 | |
End of Period | | | 1,407,617,162 | | | | 1,933,752,174 | |
Capital Share Transactions (Shares): | |
Investor Sharesa | | | | | | | | |
Shares sold | | | 4,538,253 | | | | 5,278,887 | |
Shares issued for distributions reinvested | | | 4,437,255 | | | | 3,303,372 | |
Shares redeemed | | | (12,172,687) | | | | (13,702,027) | |
Net Increase (Decrease) in Shares Outstanding | (3,197,179) | | | | (5,119,768) | |
Class Ia | | | | | | | | |
Shares sold | | | 2,490,189 | | | | 2,536,985 | |
Shares issued for distributions reinvested | | | 953,416 | | | | 635,677 | |
Shares redeemed | | | (4,470,641) | | | | (2,736,204) | |
Net Increase (Decrease) in Shares Outstanding | (1,027,036) | | | | 436,458 | |
| | | | | | | | | |
a | During the period ended October 31, 2022, 134,284 Investor shares representing $3,900,688 were exchanged for 134,467 Class I shares. | |
See notes to financial statements. | | | | | | | | |
27
FINANCIAL HIGHLIGHTS
The following tables describe the performance for each share class for the fiscal periods indicated. All information (except portfolio turnover rate) reflects financial results for a single fund share. Net asset value total return is calculated assuming an initial investment made at the net asset value at the beginning of the period, reinvestment of all dividends and distributions at net asset value during the period, and redemption at net asset value on the last day of the period. Net asset value total return includes adjustments in accordance with accounting principles generally accepted in the United States of America and as such, the net asset value for financial reporting purposes and the returns based upon those net asset values may differ from the net asset value and returns for shareholder transactions. These figures have been derived from the fund’s financial statements.
| | | | | | | |
| | |
| | Year Ended October 31, |
Investor Shares | | 2022 | 2021 | 2020 | 2019 | 2018 |
Per Share Data ($): | | | | | | |
Net asset value,
beginning of period | | 36.44 | 24.77 | 29.19 | 32.18 | 32.89 |
Investment Operations: | | | | | | |
Net investment incomea | | .30 | .27 | .25 | .30 | .28 |
Net realized and unrealized
gain (loss) on investments | | (4.32) | 13.63 | (2.27) | .05 | 1.34 |
Total from Investment Operations | | (4.02) | 13.90 | (2.02) | .35 | 1.62 |
Distributions: | | | | | | |
Dividends from
net investment income | | (.30) | (.27) | (.33) | (.29) | (.28) |
Dividends from net realized
gain on investments | | (3.30) | (1.96) | (2.07) | (3.05) | (2.05) |
Total Distributions | | (3.60) | (2.23) | (2.40) | (3.34) | (2.33) |
Net asset value, end of period | | 28.82 | 36.44 | 24.77 | 29.19 | 32.18 |
Total Return (%) | | (12.29) | 58.22 | (8.01) | 2.83 | 5.07 |
Ratios/Supplemental Data (%): | | | | | |
Ratio of total expenses
to average net assets | | .51 | .51 | .52 | .51 | .51 |
Ratio of net expenses
to average net assets | | .50 | .50 | .50 | .50 | .50 |
Ratio of net investment income
to average net assets | | .99 | .79 | 1.00 | 1.03 | .85 |
Portfolio Turnover Rate | | 25.75 | 26.70 | 40.49 | 23.24 | 19.60 |
Net Assets,
end of period ($ x 1,000) | | 1,110,002 | 1,519,919 | 1,159,850 | 1,717,003 | 2,027,831 |
a Based on average shares outstanding.
See notes to financial statements.
28
| | | | | | | |
| | |
| | Year Ended October 31, |
Class I Shares | | 2022 | 2021 | 2020 | 2019 | 2018 |
Per Share Data ($): | | | | | | |
Net asset value, beginning of period | | 36.43 | 24.76 | 29.19 | 32.21 | 32.91 |
Investment Operations: | | | | | | |
Net investment incomea | | .38 | .35 | .29 | .37 | .35 |
Net realized and unrealized
gain (loss) on investments | | (4.32) | 13.62 | (2.24) | .03 | 1.37 |
Total from Investment Operations | | (3.94) | 13.97 | (1.95) | .40 | 1.72 |
Distributions: | | | | | | |
Dividends from
net investment income | | (.39) | (.34) | (.41) | (.37) | (.37) |
Dividends from net realized
gain on investments | | (3.30) | (1.96) | (2.07) | (3.05) | (2.05) |
Total Distributions | | (3.69) | (2.30) | (2.48) | (3.42) | (2.42) |
Net asset value, end of period | | 28.80 | 36.43 | 24.76 | 29.19 | 32.21 |
Total Return (%) | | (12.08) | 58.63 | (7.79) | 3.08 | 5.37 |
Ratios/Supplemental Data (%): | | | | | | |
Ratio of total expenses
to average net assets | | .26 | .26 | .27 | .26 | .26 |
Ratio of net expenses
to average net assets | | .25 | .25 | .25 | .25 | .25 |
Ratio of net investment income
to average net assets | | 1.24 | 1.03 | 1.17 | 1.28 | 1.05 |
Portfolio Turnover Rate | | 25.75 | 26.70 | 40.49 | 23.24 | 19.60 |
Net Assets, end of period ($ x 1,000) | | 297,615 | 413,833 | 270,454 | 258,282 | 292,289 |
a Based on average shares outstanding.
See notes to financial statements.
29
NOTES TO FINANCIAL STATEMENTS
NOTE 1—Significant Accounting Policies:
BNY Mellon Smallcap Stock Index Fund (the “fund”) is a separate diversified series of BNY Mellon Index Funds, Inc. (the “Company”), which is registered under the Investment Company Act of 1940, as amended (the “Act”), as an open-end management investment company and operates as a series company currently offering three series, including the fund. The fund’s investment objective is to seek to match the performance of the S&P SmallCap 600® Index. BNY Mellon Investment Adviser, Inc. (the “Adviser”), a wholly-owned subsidiary of The Bank of New York Mellon Corporation (“BNY Mellon”), serves as the fund’s investment adviser.
BNY Mellon Securities Corporation (the “Distributor”), a wholly-owned subsidiary of the Adviser, is the distributor of the fund’s shares, which are sold to the public without a sales charge. The fund is authorized to issue 300 million shares of $.001 par value Common Stock. The fund currently has authorized two classes of shares: Investor shares (200 million shares authorized) and Class I (100 million shares authorized). Investor shares are sold primarily to retail investors through financial intermediaries and bear Shareholder Services Plan fees. Class I shares are sold primarily to bank trust departments and other financial service providers (including BNY Mellon and its affiliates), acting on behalf of customers having a qualified trust or an investment account or relationship at such institution, and bear no Shareholder Services Plan fees. Other differences between the classes include the services offered to and the expenses borne by each class, and certain voting rights. Income, expenses (other than expenses attributable to a specific class), and realized and unrealized gains or losses on investments are allocated to each class of shares based on its relative net assets.
The Company accounts separately for the assets, liabilities and operations of each series. Expenses directly attributable to each series are charged to that series’ operations; expenses which are applicable to all series are allocated among them on a pro rata basis.
The Financial Accounting Standards Board (“FASB”) Accounting Standards Codification (“ASC”) is the exclusive reference of authoritative U.S. generally accepted accounting principles (“GAAP”) recognized by the FASB to be applied by nongovernmental entities. Rules and interpretive releases of the SEC under authority of federal laws are also sources of authoritative GAAP for SEC registrants. The fund is an investment company and applies the accounting and reporting guidance of the FASB ASC Topic 946 Financial Services-Investment Companies. The fund’s
30
financial statements are prepared in accordance with GAAP, which may require the use of management estimates and assumptions. Actual results could differ from those estimates.
The Company enters into contracts that contain a variety of indemnifications. The fund’s maximum exposure under these arrangements is unknown. The fund does not anticipate recognizing any loss related to these arrangements.
(a) Portfolio valuation: The fair value of a financial instrument is the amount that would be received to sell an asset or paid to transfer a liability in an orderly transaction between market participants at the measurement date (i.e., the exit price). GAAP establishes a fair value hierarchy that prioritizes the inputs of valuation techniques used to measure fair value. This hierarchy gives the highest priority to unadjusted quoted prices in active markets for identical assets or liabilities (Level 1 measurements) and the lowest priority to unobservable inputs (Level 3 measurements).
Additionally, GAAP provides guidance on determining whether the volume and activity in a market has decreased significantly and whether such a decrease in activity results in transactions that are not orderly. GAAP requires enhanced disclosures around valuation inputs and techniques used during annual and interim periods.
Various inputs are used in determining the value of the fund’s investments relating to fair value measurements. These inputs are summarized in the three broad levels listed below:
Level 1—unadjusted quoted prices in active markets for identical investments.
Level 2—other significant observable inputs (including quoted prices for similar investments, interest rates, prepayment speeds, credit risk, etc.).
Level 3—significant unobservable inputs (including the fund’s own assumptions in determining the fair value of investments).
The inputs or methodology used for valuing securities are not necessarily an indication of the risk associated with investing in those securities.
Changes in valuation techniques may result in transfers in or out of an assigned level within the disclosure hierarchy. Valuation techniques used to value the fund’s investments are as follows:
The Company’s Board of Directors (the “Board”) has designated the Adviser as the fund’s valuation designee, effective September 8, 2022, to make all fair value determinations with respect to the fund’s portfolio
31
NOTES TO FINANCIAL STATEMENTS (continued)
investments, subject to the Board’s oversight and pursuant to Rule 2a-5 under the Act.
Investments in equity securities are valued at the last sales price on the securities exchange or national securities market on which such securities are primarily traded. Securities listed on the National Market System for which market quotations are available are valued at the official closing price or, if there is no official closing price that day, at the last sales price. For open short positions, asked prices are used for valuation purposes. Bid price is used when no asked price is available. Registered investment companies that are not traded on an exchange are valued at their net asset value. All of the preceding securities are generally categorized within Level 1 of the fair value hierarchy.
Securities not listed on an exchange or the national securities market, or securities for which there were no transactions, are valued at the average of the most recent bid and asked prices. These securities are generally categorized within Level 2 of the fair value hierarchy.
Fair valuing of securities may be determined with the assistance of a pricing service using calculations based on indices of domestic securities and other appropriate indicators, such as prices of relevant American Depository Receipts and futures. Utilizing these techniques may result in transfers between Level 1 and Level 2 of the fair value hierarchy.
When market quotations or official closing prices are not readily available, or are determined not to accurately reflect fair value, such as when the value of a security has been significantly affected by events after the close of the exchange or market on which the security is principally traded, but before the fund calculates its net asset value, the fund may value these investments at fair value as determined in accordance with the procedures approved by the Board. Certain factors may be considered when fair valuing investments such as: fundamental analytical data, the nature and duration of restrictions on disposition, an evaluation of the forces that influence the market in which the securities are purchased and sold, and public trading in similar securities of the issuer or comparable issuers. These securities are either categorized within Level 2 or 3 of the fair value hierarchy depending on the relevant inputs used.
For securities where observable inputs are limited, assumptions about market activity and risk are used and such securities are generally categorized within Level 3 of the fair value hierarchy.
Futures, which are traded on an exchange, are valued at the last sales price on the securities exchange on which such securities are primarily traded or
32
at the last sales price on the national securities market on each business day and are generally categorized within Level 1 of the fair value hierarchy.
The following is a summary of the inputs used as of October 31, 2022 in valuing the fund’s investments:
| | | | | | | |
| | Level 1-Unadjusted Quoted Prices | Level 2- Other Significant Observable Inputs | | Level 3-Significant Unobservable Inputs | Total | |
Assets ($) | | |
Investments in Securities:† | | |
Equity Securities - Common Stocks | 1,395,070,803 | - | | - | 1,395,070,803 | |
Exchange-Traded Funds | 5,875,787 | - | | - | 5,875,787 | |
Investment Companies | 11,781,097 | - | | - | 11,781,097 | |
Liabilities ($) | | |
Other Financial Instruments: | | |
Futures†† | (42,627) | - | | - | (42,627) | |
† See Statement of Investments for additional detailed categorizations, if any.
†† Amount shown represents unrealized appreciation (depreciation) at period end, but only variation margin on exchange-traded and centrally cleared derivatives, if any, are reported in the Statement of Assets and Liabilities.
(b) Foreign taxes: The fund may be subject to foreign taxes (a portion of which may be reclaimable) on income, stock dividends, realized and unrealized capital gains on investments or certain foreign currency transactions. Foreign taxes are recorded in accordance with the applicable foreign tax regulations and rates that exist in the foreign jurisdictions in which the fund invests. These foreign taxes, if any, are paid by the fund and are reflected in the Statement of Operations, if applicable. Foreign taxes payable or deferred or those subject to reclaims as of October 31, 2022, if any, are disclosed in the fund’s Statement of Assets and Liabilities.
(c) Securities transactions and investment income: Securities transactions are recorded on a trade date basis. Realized gains and losses from securities transactions are recorded on the identified cost basis. Dividend income is recognized on the ex-dividend date and interest income, including, where applicable, accretion of discount and amortization of premium on investments, is recognized on the accrual basis.
Pursuant to a securities lending agreement with BNY Mellon, the fund may lend securities to qualified institutions. It is the fund’s policy that, at origination, all loans are secured by collateral of at least 102% of the value of U.S. securities loaned and 105% of the value of foreign securities
33
NOTES TO FINANCIAL STATEMENTS (continued)
loaned. Collateral equivalent to at least 100% of the market value of securities on loan is maintained at all times. Collateral is either in the form of cash, which can be invested in certain money market mutual funds managed by the Adviser, or U.S. Government and Agency securities. The fund is entitled to receive all dividends, interest and distributions on securities loaned, in addition to income earned as a result of the lending transaction. Should a borrower fail to return the securities in a timely manner, BNY Mellon is required to replace the securities for the benefit of the fund or credit the fund with the market value of the unreturned securities and is subrogated to the fund’s rights against the borrower and the collateral. Additionally, the contractual maturity of security lending transactions are on an overnight and continuous basis. During the period ended October 31, 2022, BNY Mellon earned $24,805 from the lending of the fund’s portfolio securities, pursuant to the securities lending agreement.
(d) Affiliated issuers: Investments in other investment companies advised by the Adviser are considered “affiliated” under the Act.
(e) Market Risk: The value of the securities in which the fund invests may be affected by political, regulatory, economic and social developments, and developments that impact specific economic sectors, industries or segments of the market. The value of a security may also decline due to general market conditions that are not specifically related to a particular company or industry, such as real or perceived adverse economic conditions, changes in the general outlook for corporate earnings, changes in interest or currency rates, changes to inflation, adverse changes to credit markets or adverse investor sentiment generally. In addition, turbulence in financial markets and reduced liquidity in equity, credit and/or fixed income markets may negatively affect many issuers, which could adversely affect the fund. Global economies and financial markets are becoming increasingly interconnected, and conditions and events in one country, region or financial market may adversely impact issuers in a different country, region or financial market. These risks may be magnified if certain events or developments adversely interrupt the global supply chain; in these and other circumstances, such risks might affect companies world-wide. Recent examples include pandemic risks related to COVID-19 and aggressive measures taken world-wide in response by governments, including closing borders, restricting international and domestic travel, and the imposition of prolonged quarantines of large populations, and by businesses, including changes to operations and reducing staff.
(f) Dividends and distributions to shareholders: Dividends and distributions are recorded on the ex-dividend date. Dividends from net investment income and dividends from net realized capital gains, if any, are
34
normally declared and paid annually, but the fund may make distributions on a more frequent basis to comply with the distribution requirements of the Internal Revenue Code of 1986, as amended (the “Code”). To the extent that net realized capital gains can be offset by capital loss carryovers, it is the policy of the fund not to distribute such gains. Income and capital gain distributions are determined in accordance with income tax regulations, which may differ from GAAP.
(g) Federal income taxes: It is the policy of the fund to continue to qualify as a regulated investment company, if such qualification is in the best interests of its shareholders, by complying with the applicable provisions of the Code, and to make distributions of taxable income and net realized capital gain sufficient to relieve it from substantially all federal income and excise taxes.
As of and during the period ended October 31, 2022, the fund did not have any liabilities for any uncertain tax positions. The fund recognizes interest and penalties, if any, related to uncertain tax positions as income tax expense in the Statement of Operations. During the period ended October 31, 2022, the fund did not incur any interest or penalties.
Each tax year in the four-year period ended October 31, 2022 remains subject to examination by the Internal Revenue Service and state taxing authorities.
At October 31, 2022, the components of accumulated earnings on a tax basis were as follows: undistributed ordinary income $12,279,192, undistributed capital gains $145,850,828 and unrealized appreciation $414,428,304.
The tax character of distributions paid to shareholders during the fiscal years ended October 31, 2022 and October 31, 2021 were as follows: ordinary income $44,402,526 and $22,008,550, and long-term capital gains $144,518,528 and $100,903,832, respectively.
During the period ended October 31, 2022, as a result of permanent book to tax differences, primarily due to treating a portion of the proceeds from redemptions as a distribution for tax purposes, the fund decreased total distributable earnings (loss) by $26,814,051 and increased paid-in capital by the same amount. Net assets and net asset value per share were not affected by this reclassification.
NOTE 2—Bank Lines of Credit:
The fund participates with other long-term open-end funds managed by the Adviser in a $823.5 million unsecured credit facility led by Citibank, N.A. (the “Citibank Credit Facility”) and a $300 million unsecured credit
35
NOTES TO FINANCIAL STATEMENTS (continued)
facility provided by BNY Mellon (the “BNYM Credit Facility”), each to be utilized primarily for temporary or emergency purposes, including the financing of redemptions (each, a “Facility”). The Citibank Credit Facility is available in two tranches: (i) Tranche A is in an amount equal to $688.5 million and is available to all long-term open-ended funds, including the fund, and (ii) Tranche B is an amount equal to $135 million and is available only to BNY Mellon Floating Rate Income Fund, a series of BNY Mellon Investment Funds IV, Inc. In connection therewith, the fund has agreed to pay its pro rata portion of commitment fees for Tranche A of the Citibank Credit Facility and the BNYM Credit Facility. Interest is charged to the fund based on rates determined pursuant to the terms of the respective Facility at the time of borrowing.
The average amount of borrowings outstanding under the Facilities during the period ended October 31, 2022 was approximately $1,307,123 with a related weighted average annualized interest rate of 3.23%.
NOTE 3—Management Fee and Other Transactions with Affiliates:
(a) Pursuant to a management agreement (the “Agreement”) with the Adviser, the management fee is computed at the annual rate of .25% of the value of the fund’s average daily net assets and is payable monthly. Out of its fee, the Adviser pays all of the expenses of the fund, except management fees, Shareholder Services Plan fees, brokerage fees and commissions, taxes, interest expense, commitment fees on borrowings, fees and expenses of non-interested Board Members (including counsel fees) and extraordinary expenses. In addition, the Adviser is required to reduce its fee in an amount equal to the fund’s allocable portion of fees and expenses of the non-interested Board Members (including counsel fees). During the period ended October 31, 2022, fees reimbursed by the Adviser amounted to $105,960.
(b) Under the Shareholder Services Plan, Investor shares pay the Distributor at an annual rate of .25% of the value of its average daily net assets for the provision of certain services. The services provided may include personal services relating to shareholder accounts, such as answering shareholder inquiries regarding the fund, and services related to the maintenance of shareholder accounts. The Distributor may make payments to Service Agents (securities dealers, financial institutions or other industry professionals) with respect to these services. The Distributor determines the amounts to be paid to Service Agents. During the period ended October 31, 2022, the fund was charged $3,279,632 pursuant to the Shareholder Services Plan.
36
The fund has an arrangement with The Bank of New York Mellon (the “Custodian”), a subsidiary of BNY Mellon and an affiliate of the Adviser, whereby the fund will receive interest income or be charged overdraft fees when cash balances are maintained. For financial reporting purposes, the fund includes this interest income and overdraft fees, if any, as interest income in the Statement of Operations.
The components of “Due to BNY Mellon Investment Adviser, Inc. and affiliates” in the Statement of Assets and Liabilities consist of: management fee of $291,224 and Shareholder Services Plan fees of $231,702, which are offset against an expense reimbursement currently in effect in the amount of $5,580.
(c) Each Board member also serves as a Board member of other funds in the BNY Mellon Family of Funds complex. Annual retainer fees and attendance fees are allocated to each fund based on net assets.
NOTE 4—Securities Transactions:
The aggregate amount of purchases and sales of investment securities, excluding short-term securities and futures, during the period ended October 31, 2022, amounted to $422,949,026 and $703,089,991, respectively.
Derivatives: A derivative is a financial instrument whose performance is derived from the performance of another asset. The SEC recently adopted Rule 18f-4 under the Act, which, effective August 18, 2022, regulates the use of derivatives transactions for certain funds registered under the Act. The fund is deemed a “limited” derivatives user under the rule and is required to limit its derivatives exposure so that the total notional value of derivatives does not exceed 10% of fund’s net assets, and is subject to certain reporting requirements. Each type of derivative instrument that was held by the fund during the period ended October 31, 2022 is discussed below.
Futures: In the normal course of pursuing its investment objective, the fund is exposed to market risk, including equity price risk as a result of changes in value of underlying financial instruments. The fund invests in futures in order to manage its exposure to or protect against changes in the market. A futures contract represents a commitment for the future purchase or a sale of an asset at a specified date. Upon entering into such contracts, these investments require initial margin deposits with a counterparty, which consist of cash or cash equivalents. The amount of these deposits is determined by the exchange or Board of Trade on which the contract is traded and is subject to change. Accordingly, variation margin payments are received or made to reflect daily unrealized gains or
37
NOTES TO FINANCIAL STATEMENTS (continued)
losses which are recorded in the Statement of Operations. When the contracts are closed, the fund recognizes a realized gain or loss which is reflected in the Statement of Operations. There is minimal counterparty credit risk to the fund with futures since they are exchange traded, and the exchange guarantees the futures against default. Futures open at October 31, 2022 are set forth in the Statement of Investments.
The following summarizes the average market value of derivatives outstanding during the period ended October 31, 2022:
| | | |
| | Average Market Value ($) |
Equity futures | | 8,413,662 |
At October 31, 2022, the cost of investments for federal income tax purposes was $998,299,383; accordingly, accumulated net unrealized appreciation on investments was $414,428,304, consisting of $564,547,313 gross unrealized appreciation and $150,119,009 gross unrealized depreciation.
38
REPORT OF INDEPENDENT REGISTERED PUBLIC ACCOUNTING FIRM
To the Shareholders and the Board of Directors of BNY Mellon Smallcap Stock Index Fund
Opinion on the Financial Statements
We have audited the accompanying statement of assets and liabilities of BNY Mellon Smallcap Stock Index Fund (the “Fund”) (one of the funds constituting BNY Mellon Index Funds, Inc.), including the statement of investments, as of October 31, 2022, and the related statement of operations for the year then ended, the statements of changes in net assets for each of the two years in the period then ended, the financial highlights for each of the five years in the period then ended and the related notes (collectively referred to as the “financial statements”). In our opinion, the financial statements present fairly, in all material respects, the financial position of the Fund (one of the funds constituting BNY Mellon Index Funds, Inc.) at October 31, 2022, the results of its operations for the year then ended, the changes in its net assets for each of the two years in the period then ended and its financial highlights for each of the five years in the period then ended, in conformity with U.S. generally accepted accounting principles.
Basis for Opinion
These financial statements are the responsibility of the Fund’s management. Our responsibility is to express an opinion on the Fund’s financial statements based on our audits. We are a public accounting firm registered with the Public Company Accounting Oversight Board (United States) (“PCAOB”) and are required to be independent with respect to the Fund in accordance with the U.S. federal securities laws and the applicable rules and regulations of the Securities and Exchange Commission and the PCAOB.
We conducted our audits in accordance with the standards of the PCAOB. Those standards require that we plan and perform the audit to obtain reasonable assurance about whether the financial statements are free of material misstatement, whether due to error or fraud. The Fund is not required to have, nor were we engaged to perform, an audit of the Fund’s internal control over financial reporting. As part of our audits, we are required to obtain an understanding of internal control over financial reporting, but not for the purpose of expressing an opinion on the effectiveness of the Fund’s internal control over financial reporting. Accordingly, we express no such opinion.
Our audits included performing procedures to assess the risks of material misstatement of the financial statements, whether due to error or fraud, and performing procedures that respond to those risks. Such procedures included examining, on a test basis, evidence regarding the amounts and disclosures in the financial statements. Our procedures included confirmation of securities owned as of October 31, 2022, by correspondence with the custodian, brokers and others; when replies were not received from brokers and others, we performed other auditing procedures. Our audits also included evaluating the accounting principles used and significant estimates made by management, as well as evaluating the overall presentation of the financial statements. We believe that our audits provide a reasonable basis for our opinion.

We have served as the auditor of one or more investment companies in the BNY Mellon Family of Funds since at least 1957, but we are unable to determine the specific year.
New York, New York
December 22, 2022
39
IMPORTANT TAX INFORMATION (Unaudited)
For federal tax purposes, the fund hereby reports 46.60% of the ordinary dividends paid during the fiscal year ended October 31, 2022 as qualifying for the corporate dividends received deduction. Also certain dividends paid by the fund may be subject to a maximum tax rate of 15%, as provided for by the Jobs and Growth Tax Relief Reconciliation Act of 2003. Of the distributions paid during the fiscal year, $21,228,085 represents the maximum amount that may be considered qualified dividend income. Shareholders will receive notification in early 2023 of the percentage applicable to the preparation of their 2022 income tax returns. The fund also hereby reports $2.7648 per share as a long-term capital gain distribution and also $.5338 per share as a short-term capital gain distribution paid on December 22, 2021.
40
LIQUIDITY RISK MANAGEMENT PROGRAM (Unaudited)
Effective June 1, 2019, the fund adopted a liquidity risk management program (the “Liquidity Risk Management Program”) pursuant to the requirements of Rule 22e-4 under the Investment Company Act of 1940, as amended. Rule 22e-4 requires registered open-end funds, including mutual funds and exchange-traded funds but not money market funds, to establish liquidity risk management programs in order to effectively manage fund liquidity and shareholder redemptions. The rule is designed to mitigate the risk that a fund could not meet redemption requests without significantly diluting the interests of remaining investors.
The rule requires the fund to assess, manage and review their liquidity risk at least annually considering applicable factors such as investment strategy and liquidity during normal and foreseeable stressed conditions, including whether the strategy is appropriate for an open-end fund and whether the fund has a relatively concentrated portfolio or large positions in particular issuers. The fund must also assess its use of borrowings and derivatives, short-term and long-term cash flow projections in normal and stressed conditions, holdings of cash and cash equivalents, and borrowing arrangements and other funding sources.
The rule also requires the fund to classify its investments as highly liquid, moderately liquid, less liquid or illiquid based on the number of days the fund expects it would take to liquidate the investment, and to review these classifications at least monthly or more often under certain conditions. The periods range from three or fewer business days for a highly liquid investment to greater than seven calendar days for settlement of a less liquid investment. Illiquid investments are those a fund does not expect to be able to sell or dispose of within seven calendar days without significantly changing the market value. The fund is prohibited from acquiring an investment if, after the acquisition, its holdings of illiquid assets will exceed 15% of its net assets. In addition, if a fund permits redemptions in-kind, the rule requires the fund to establish redemption in-kind policies and procedures governing how and when it will engage in such redemptions.
Pursuant to the rule’s requirements, the Liquidity Risk Management Program has been reviewed and approved by the Board. Furthermore, the Board has received a written report prepared by the Program’s Administrator that addresses the operation of the Program, assesses its adequacy and effectiveness and describes any material changes made to the Program.
Assessment of Program
In the opinion of the Program Administrator, the Program approved by the Board continues to be adequate for the fund and the Program has been implemented effectively. The Program Administrator has monitored the fund’s liquidity risk and the liquidity classification of the securities held by the fund and has determined that the Program is operating effectively.
During the period from January 1, 2021 to December 31, 2021, there were no material changes to the Program and no material liquidity events that impacted the fund. During the period, the fund held sufficient highly liquid assets to meet fund redemptions.
Under normal expected foreseeable fund redemption forecasts and foreseeable stressed fund redemption forecasts, the Program Administrator believes that the fund maintains sufficient highly liquid assets to meet expected fund redemptions.
41
BOARD MEMBERS INFORMATION (Unaudited)
Independent Board Members
Joseph S. DiMartino (79)
Chairman of the Board (1995)
Principal Occupation During Past 5 Years:
· Director or Trustee of funds in the BNY Mellon Family of Funds and certain other entities (as described in the fund’s Statement of Additional Information) (1995-Present)
Other Public Company Board Memberships During Past 5 Years:
· CBIZ, Inc., a public company providing professional business services, products and solutions, Director (1997-Present)
No. of Portfolios for which Board Member Serves: 94
———————
Peggy C. Davis (79)
Board Member (2006)
Principal Occupation During Past 5 Years:
· Shad Professor of Law, New York University School of Law (1983-Present)
No. of Portfolios for which Board Member Serves: 33
———————
Gina D. France (64)
Board Member (2019)
Principal Occupation During Past 5 Years:
· France Strategic Partners, a strategy and advisory firm serving corporate clients across the United States, Founder, President and Chief Executive Officer (2003-Present)
Other Public Company Board Memberships During Past 5 Years:
· Huntington Bancshares, a bank holding company headquartered in Columbus, Ohio, Director (2016-Present)
· Cedar Fair, L.P., a publicly-traded partnership that owns and operates amusement parks and hotels in the U.S. and Canada, Director (2011-Present)
· CBIZ, Inc., a public company providing professional business services, products and solutions, Director (2015-Present)
· FirstMerit Corporation, a diversified financial services company, Director (2004-2016)
No. of Portfolios for which Board Member Serves: 23
———————
Joan Gulley (75)
Board Member (2017)
Principal Occupation During Past 5 Years:
· Nantucket Atheneum, public library, Chair (2018-June 2021) and Director (2015-June 2021)
· Orchard Island Club, golf and beach club, Governor (2016-Present)
No. of Portfolios for which Board Member Serves: 40
———————
42
Robin A. Melvin (59)
Board Member (2012)
Principal Occupation During Past 5 Years:
· Westover School, a private girls’ boarding school in Middlebury, Connecticut, Trustee (2019-Present)
· Mentor Illinois, a non-profit organization dedicated to increasing the quality of mentoring services in Illinois, Co-Chair (2014–2020); Board Member, Mentor Illinois (2013-2020)
· JDRF, a non-profit juvenile diabetes research foundation, Board Member (June 2021-June 2022)
Other Public Company Board Memberships During Past 5 Years:
· HPS Corporate Lending Fund, a closed-end management investment company regulated as a business development company, Trustee (August 2021-Present)
No. of Portfolios for which Board Member Serves: 72
———————
Michael D. DiLecce (60)
Advisory Board Member (2022)
Principal Occupation During Past 5 Years:
· Retired since July 2022. Global Asset Management Assurance Leader, Ernst & Young LLP (2015-2022)
· Americas Regional Talent Managing Partner for Ernst & Young’s Financial Service Practice (2017-2021)
· Partner, Ernst & Young LLP (1997-2022)
No. of Portfolios for which Board Member Serves: 23
———————
The address of the Board Members and Officers is c/o BNY Mellon Investment Adviser, Inc., 240 Greenwich Street, New York, New York 10286. Additional information about each Board Member is available in the fund’s Statement of Additional Information which can be obtained from the Adviser free of charge by calling this toll free number: 1-800-373-9387.
43
OFFICERS OF THE FUND (Unaudited)
DAVID DIPETRILLO, President since January 2021.
Vice President and Director of the Adviser since February 2021; Head of North America Product, BNY Mellon Investment Management since January 2018; and Director of Product Strategy, BNY Mellon Investment Management from January 2016 to December 2017. He is an officer of 55 investment companies (comprised of 109 portfolios) managed by the Adviser or an affiliate of the Adviser. He is 44 years old and has been an employee of BNY Mellon since 2005.
JAMES WINDELS, Treasurer since November 2001.
Vice President of the Adviser since September 2020; and Director–BNY Mellon Fund Administration. He is an officer of 56 investment companies (comprised of 130 portfolios) managed by the Adviser or an affiliate of the Adviser. He is 64 years old and has been an employee of the Adviser since April 1985.
PETER M. SULLIVAN, Chief Legal Officer since July 2021 and Vice President and Assistant Secretary since March 2019.
Chief Legal Officer of the Adviser and Associate General Counsel of BNY Mellon since July 2021; Senior Managing Counsel of BNY Mellon from December 2020 to July 2021; and Managing Counsel of BNY Mellon from March 2009 to December 2020. He is an officer of 56 investment companies (comprised of 130 portfolios) managed by the Adviser or an affiliate of the Adviser. He is 54 years old and has been an employee of BNY Mellon since April 2004.
JAMES BITETTO, Vice President since August 2005 and Secretary since February 2018.
Senior Managing Counsel of BNY Mellon since December 2019; Managing Counsel of BNY Mellon from April 2014 to December 2019; and Secretary of the Adviser. He is an officer of 56 investment companies (comprised of 130 portfolios) managed by the Adviser or an affiliate of the Adviser. He is 56 years old and has been an employee of the Adviser since December 1996.
DEIRDRE CUNNANE, Vice President and Assistant Secretary since March 2019.
Managing Counsel of BNY Mellon since December 2021, Counsel of BNY Mellon from August 2018 to December 2021; and Senior Regulatory Specialist at BNY Mellon Investment Management Services from February 2016 to August 2018. She is an officer of 56 investment companies (comprised of 130 portfolios) managed by the Adviser or an affiliate of the Adviser. She is 32 years old and has been an employee of the Adviser since August 2018.
SARAH S. KELLEHER, Vice President and Assistant Secretary since April 2014.
Vice President of BNY Mellon ETF Investment Adviser; LLC since February 2020; Senior Managing Counsel of BNY Mellon since September 2021; Managing Counsel of BNY Mellon from December 2017 to September 2021; and Senior Counsel of BNY Mellon from March 2013 to December 2017. She is an officer of 56 investment companies (comprised of 130 portfolios) managed by the Adviser or an affiliate of the Adviser. She is 47 years old and has been an employee of the Adviser since March 2013.
JEFF PRUSNOFSKY, Vice President and Assistant Secretary since August 2005.
Senior Managing Counsel of BNY Mellon. He is an officer of 56 investment companies (comprised of 130 portfolios) managed by the Adviser or an affiliate of the Adviser. He is 57 years old and has been an employee of the Adviser since October 1990.
AMANDA QUINN, Vice President and Assistant Secretary since March 2020.
Counsel of BNY Mellon since June 2019; Regulatory Administration Manager at BNY Mellon Investment Management Services from September 2018 to May 2019; and Senior Regulatory Specialist at BNY Mellon Investment Management Services from April 2015 to August 2018. She is an officer of 56 investment companies (comprised of 130 portfolios) managed by the Adviser or an affiliate of the Adviser. She is 37 years old and has been an employee of the Adviser since June 2019.
44
NATALYA ZELENSKY, Vice President and Assistant Secretary since March 2017.
Chief Compliance Officer since August 2021 and Vice President since February 2020 of BNY Mellon ETF Investment Adviser, LLC; Chief Compliance Officer since August 2021 and Vice President and Assistant Secretary since February 2020 of BNY Mellon ETF Trust; Managing Counsel of BNY Mellon from December 2019 to August 2021; Counsel of BNY Mellon from May 2016 to December 2019; and Assistant Secretary of the Adviser from April 2018 to August 2021. She is an officer of 55 investment companies (comprised of 129 portfolios) managed by the Adviser or an affiliate of the Adviser. She is 37 years old and has been an employee of BNY Mellon since May 2016.
DANIEL GOLDSTEIN, Vice President since March 2022.
Vice President and Head of Product Development of North America Product, BNY Mellon Investment Management since January 2018; Co-Head of Product Management, Development & Oversight of North America Product, BNY Mellon Investment Management from January 2010 to January 2018; and Senior Vice President, Development & Oversight of North America Product, BNY Mellon Investment Management since 2010. He is an officer of 55 investment companies (comprised of 109 portfolios) managed by the Adviser or an affiliate of the Adviser. He is 53 years old and has been an employee of the Distributor since 1991.
JOSEPH MARTELLA, Vice President since March 2022.
Vice President and Head of Product Management of North America Product, BNY Mellon Investment Management since January 2018; Director of Product Research and Analytics of North America Product, BNY Mellon Investment Management from January 2010 to January 2018; and Senior Vice President of North America Product, BNY Mellon Investment Management since 2010. He is an officer of 55 investment companies (comprised of 109 portfolios) managed by the Adviser or an affiliate of the Adviser. He is 46 years old and has been an employee of the Distributor since 1999.
GAVIN C. REILLY, Assistant Treasurer since December 2005.
Tax Manager–BNY Mellon Fund Administration. He is an officer of 56 investment companies (comprised of 130 portfolios) managed by the Adviser or an affiliate of the Adviser. He is 54 years old and has been an employee of the Adviser since April 1991.
ROBERT SALVIOLO, Assistant Treasurer since July 2007.
Senior Accounting Manager–BNY Mellon Fund Administration. He is an officer of 56 investment companies (comprised of 130 portfolios) managed by the Adviser or an affiliate of the Adviser. He is 55 years old and has been an employee of the Adviser since June 1989.
ROBERT SVAGNA, Assistant Treasurer since December 2002.
Senior Accounting Manager–BNY Mellon Fund Administration. He is an officer of 56 investment companies (comprised of 130 portfolios) managed by the Adviser or an affiliate of the Adviser. He is 55 years old and has been an employee of the Adviser since November 1990.
JOSEPH W. CONNOLLY, Chief Compliance Officer since October 2004.
Chief Compliance Officer of the BNY Mellon Family of Funds and BNY Mellon Funds Trust since 2004; and Chief Compliance Officer of the Adviser from 2004 until June 2021. He is an officer of 55 investment companies (comprised of 115 portfolios) managed by the Adviser. He is 65 years old.
CARIDAD M. CAROSELLA, Anti-Money Laundering Compliance Officer since January 2016.
Anti-Money Laundering Compliance Officer of the BNY Mellon Family of Funds and BNY Mellon Funds Trust. She is an officer of 48 investment companies (comprised of 122 portfolios) managed by the Adviser or an affiliate of the Adviser. She is 54 years old and has been an employee of the Distributor since 1997.
45
BNY Mellon Smallcap Stock Index Fund
240 Greenwich Street
New York, NY 10286
Adviser
BNY Mellon Investment Adviser, Inc.
240 Greenwich Street
New York, NY 10286
Custodian
The Bank of New York Mellon
240 Greenwich Street
New York, NY 10286
Transfer Agent &
Dividend Disbursing Agent
BNY Mellon Transfer, Inc.
240 Greenwich Street
New York, NY 10286
Distributor
BNY Mellon Securities Corporation
240 Greenwich Street
New York, NY 10286
| | |
Ticker Symbols: | Investor: DISSX Class I: DISIX |
Telephone Call your financial representative or 1-800-373-9387
Mail The BNY Mellon Family of Funds, 144 Glenn Curtiss Boulevard, Uniondale, NY 11556-0144
E-mail Send your request to info@bnymellon.com
Internet Information can be viewed online or downloaded at www.im.bnymellon.com
The fund files its complete schedule of portfolio holdings with the Securities and Exchange Commission (“SEC”) for the first and third quarters of each fiscal year on Form N-PORT. The fund’s Forms N-PORT are available on the SEC’s website at www.sec.gov.
A description of the policies and procedures that the fund uses to determine how to vote proxies relating to portfolio securities and information regarding how the fund voted these proxies for the most recent 12-month period ended June 30 is available at www.im.bnymellon.com and on the SEC’s website at www.sec.gov and without charge, upon request, by calling 1-800-373-9387.
| | |
© 2022 BNY Mellon Securities Corporation
0077AR1022 | 
|
Item 2. Code of Ethics.
The Registrant has adopted a code of ethics that applies to the Registrant's principal executive officer, principal financial officer, principal accounting officer or controller, or persons performing similar functions. There have been no amendments to, or waivers in connection with, the Code of Ethics during the period covered by this Report.
Item 3. Audit Committee Financial Expert.
The Registrant's Board has determined that Gina France, a member of the Audit Committee of the Board, is an audit committee financial expert as defined by the Securities and Exchange Commission (the "SEC"). Ms. France is "independent" as defined by the SEC for purposes of audit committee financial expert determinations.
Item 4. Principal Accountant Fees and Services.
(a) Audit Fees. The aggregate fees billed for each of the last two fiscal years (the "Reporting Periods") for professional services rendered by the Registrant's principal accountant (the "Auditor") for the audit of the Registrant's annual financial statements or services that are normally provided by the Auditor in connection with the statutory and regulatory filings or engagements for the Reporting Periods, were $117,206 in 2021 and $119,550 in 2022.
(b) Audit-Related Fees. The aggregate fees billed in the Reporting Periods for assurance and related services by the Auditor that are reasonably related to the performance of the audit of the Registrant's financial statements and are not reported under paragraph (a) of this Item 4 were $23,536 in 2021 and $24,325 in 2022. These services consisted of one or more of the following: (i) agreed upon procedures related to compliance with Internal Revenue Code section 817(h), (ii) security counts required by Rule 17f-2 under the Investment Company Act of 1940, as amended, (iii) advisory services as to the accounting or disclosure treatment of Registrant transactions or events and (iv) advisory services to the accounting or disclosure treatment of the actual or potential impact to the Registrant of final or proposed rules, standards or interpretations by the Securities and Exchange Commission, the Financial Accounting Standards Boards or other regulatory or standard-setting bodies.
The aggregate fees billed in the Reporting Periods for non-audit assurance and related services by the Auditor to the Registrant's investment adviser (not including any sub-investment adviser whose role is primarily portfolio management and is subcontracted with or overseen by another investment adviser), and any entity controlling, controlled by or under common control with the investment adviser that provides ongoing services to the Registrant ("Service Affiliates"), that were reasonably related to the performance of the annual audit of the Service Affiliate, which required pre-approval by the Audit Committee were $0 in 2021 and $0 in 2022.
(c) Tax Fees. The aggregate fees billed in the Reporting Periods for professional services rendered by the Auditor for tax compliance, tax advice, and tax planning ("Tax Services") were $9,985 in 2021 and $14,289 in 2022. These services consisted of: (i) review or preparation of U.S. federal, state, local and excise tax returns; (ii) U.S. federal, state and local tax planning, advice and assistance regarding statutory, regulatory or administrative developments; (iii) tax advice regarding tax qualification matters and/or treatment of various financial instruments held or proposed to be acquired or held, and (iv) determination of Passive Foreign Investment Companies. The aggregate fees billed in the Reporting Periods for Tax Services by the Auditor to Service Affiliates, which required pre-approval by the Audit Committee were $8,220 in 2021 and $20,211 in 2022.
(d) All Other Fees. The aggregate fees billed in the Reporting Periods for products and services provided by the Auditor, other than the services reported in paragraphs (a) through (c) of this Item, were $8,789 in 2021 and $4,450 in 2022. These services consisted of a review of the Registrant's anti-money laundering program.
The aggregate fees billed in the Reporting Periods for Non-Audit Services by the Auditor to Service Affiliates, other than the services reported in paragraphs (b) through (c) of this Item, which required pre-approval by the Audit Committee, were $0 in 2021 and $0 in 2022.
(e)(1) Audit Committee Pre-Approval Policies and Procedures. The Registrant's Audit Committee has established policies and procedures (the "Policy") for pre-approval (within specified fee limits) of the Auditor's engagements for non-audit services to the Registrant and Service Affiliates without specific case-by-case consideration. The pre-approved services in the Policy can include pre-approved audit services, pre-approved audit-related services, pre-approved tax services and pre-approved all other services. Pre-approval considerations include whether the proposed services are compatible with maintaining the Auditor's independence. Pre-approvals pursuant to the Policy are considered annually.
(e)(2) Note. None of the services described in paragraphs (b) through (d) of this Item 4 were approved by the Audit Committee pursuant to paragraph (c)(7)(i)(C) of Rule 2-01 of Regulation S-X.
(f) None of the hours expended on the principal accountant's engagement to audit the registrant's financial statements for the most recent fiscal year were attributed to work performed by persons other than the principal accountant's full-time, permanent employees.
Non-Audit Fees. The aggregate non-audit fees billed by the Auditor for services rendered to the Registrant, and rendered to Service Affiliates, for the Reporting Periods were $2,476,929 in 2021 and $2,189,735 in 2022.
Auditor Independence. The Registrant's Audit Committee has considered whether the provision of non-audit services that were rendered to Service Affiliates, which were not pre-approved (not requiring pre-approval), is compatible with maintaining the Auditor's independence.
(j) Not applicable.
Item 5. Audit Committee of Listed Registrants.
Not applicable.
Item 6. Investments.
(a) Not applicable.
| Item 7. | Disclosure of Proxy Voting Policies and Procedures for Closed-End Management Investment Companies. |
Not applicable.
Item 8. Portfolio Managers of Closed-End Management Investment Companies.
Not applicable.
| Item 9. | Purchases of Equity Securities by Closed-End Management Investment Companies and Affiliated Purchasers. |
Not applicable.
| Item 10. | Submission of Matters to a Vote of Security Holders. |
There have been no material changes to the procedures applicable to Item 10.
| Item 11. | Controls and Procedures. |
(a) The Registrant's principal executive and principal financial officers have concluded, based on their evaluation of the Registrant's disclosure controls and procedures as of a date within 90 days of the filing date of this report, that the Registrant's disclosure controls and procedures are reasonably designed to ensure that information required to be disclosed by the Registrant on Form N-CSR is recorded, processed, summarized and reported within the required time periods and that information required to be disclosed by the Registrant in the reports that it files or submits on Form N-CSR is accumulated and communicated to the Registrant's management, including its principal executive and principal financial officers, as appropriate to allow timely decisions regarding required disclosure.
(b) There were no changes to the Registrant's internal control over financial reporting that occurred during the period covered by this report that have materially affected, or are reasonably likely to materially affect, the Registrant's internal control over financial reporting.
| Item 12. | Disclosure of Securities Lending Activities for Closed-End Management Investment Companies. |
Not applicable.
(a)(1) Code of ethics referred to in Item 2.
(a)(2) Certifications of principal executive and principal financial officers as required by Rule 30a-2(a) under the Investment Company Act of 1940.
(a)(3) Not applicable.
(b) Certification of principal executive and principal financial officers as required by Rule 30a-2(b) under the Investment Company Act of 1940.
SIGNATURES
Pursuant to the requirements of the Securities Exchange Act of 1934 and the Investment Company Act of 1940, the Registrant has duly caused this Report to be signed on its behalf by the undersigned, thereunto duly authorized.
BNY Mellon Index Funds, Inc.
By: /s/ David J. DiPetrillo
David J. DiPetrillo
President (Principal Executive Officer)
Date: December 21 , 2022
Pursuant to the requirements of the Securities Exchange Act of 1934 and the Investment Company Act of 1940, this Report has been signed below by the following persons on behalf of the Registrant and in the capacities and on the dates indicated.
By: /s/ David J. DiPetrillo
David J. DiPetrillo
President (Principal Executive Officer)
Date: December 21, 2022
By: /s/ James Windels
James Windels
Treasurer (Principal Financial Officer)
Date: December 21, 2022
EXHIBIT INDEX
(a)(1) Code of ethics referred to in Item 2.
(a)(2) Certifications of principal executive and principal financial officers as required by Rule 30a-2(a) under the Investment Company Act of 1940. (EX-99.CERT)
(b) Certification of principal executive and principal financial officers as required by Rule 30a-2(b) under the Investment Company Act of 1940. (EX-99.906CERT)