
GTECH Holdings Corporation
W. Bruce Turner
President & Chief Executive Officer
Jaymin B. Patel
Sr. Vice President & Chief Financial Officer
Fiscal Year 2006
First Quarter Earnings Conference Call
June 22, 2005
8:30 AM

Safe Harbor Act. . .
Comments made during this presentation may contain forward-looking
statements, including, without limitation, statements relating to the
future operations and financial performance of the Company and the
Company’s future strategies. Such forward-looking statements reflect
management’s assessment based on information currently available,
but are not guarantees and are subject to risks and uncertainties, which
would cause the results to differ materially from those contemplated in
the forward-looking statements. These risks and uncertainties include,
but are not limited to, those set forth here and in the Company’s filings
with the SEC.
Fiscal Year 2006 – First Quarter Earnings Conference Call
2

Agenda. . .
W. Bruce Turner, Chief Executive Officer
Welcome
Q1 Performance Review
Strategy Update
Jaymin B. Patel, Chief Financial Officer
Review of Q1 Financial Results
Guidance for Fiscal Year 2006 and Guidance for Q2
Fiscal Year 2006 – First Quarter Earnings Conference Call
3

First Quarter Business Review. . .
Fiscal Year 2006 – First Quarter Earnings Conference Call
* G3 is a trademark owned by the Minnesota State Lottery Agency
4
Financial Performance
Strength in same store sales
G3TM - Minnesota
Keno - Michigan
Instant Ticket Vending Machines - Illinois
Growth in instant ticket sales
Significant financial flexibility to fund new growth
Free cash flow
$ 79M
Cash balances & short term investments
$335M
Credit facility
$500M

Returning Value to Shareholders. . .
Share Repurchase Program
Repurchased 1.3M shares at a cost of $32M
Approximately $47M remaining on authorization
Dividend Payment
$9.8M paid in April 2005
Fiscal Year 2006 – First Quarter Earnings Conference Call
5

Q1 FY’06 Strategic Progress. . .
Key wins
Content
15 new games developed in Q1
Branded game initiatives
MonopolyTM-themed e-scratch & Instant on-line
BattleshipTM
Instant game initiatives
Pick ’n PlayTM
Fiscal Year 2006 – First Quarter Earnings Conference Call
Louisiana – Video Central
Indiana – ITVM
Pennsylvania – ITVM
Barbados – 18 year license
Denmark – Online extension
Pennsylvania – Video Central
* MONOPOLY and BATTLESHIP are trademarks of Hasbro and are used with permission.
© 2005 Hasbro. All Rights reserved.
6

New products
GamePointTM
WinwaveTM
Commercial Services – steady growth
Revenues up 15%* quarter over quarter on a constant
currency basis
Introducing new applications in LILHCo jurisdictions
Strategic alliances
Harrah’s Entertainment, Inc.
Veikkaus Oy
Q1 FY’06 Strategic Progress. . .
Fiscal Year 2006 – First Quarter Earnings Conference Call
* Excluding partial release of FY’05 revenues previously held in escrow in Brazil
7

(1)All percentage points are rounded to the nearest percent
(2)Reflects impact of contract wins/losses, jackpot activity, contractual rate changes, foreign exchange changes, the
impact of acquisitions, and partial release of FY’05 revenues previously held in escrow in Brazil.
Fiscal Year 2006 – First Quarter Earnings Conference Call
31.9 +50%
9.0 +42%
1.7 +8%
21.2
Commercial
Svcs. / Other
$M % (1)
253.3
5.6
98.4
128.1
FY’05
25.4 +10%
1.9 +35%
6.9 +7%
7.6 +6%
Net, All
Other(2)
291.4 +15%
8.0 +44%
108.4 +10%
143.1 +12%
FY’06
12.7 +5%
0.5 +9%
3.1 +3%
7.4 +6%
Same
Store
Sales
GTECH
Total
$M % (1)
Gaming
Solutions
$M % (1)
International
Lottery
$M % (1)
U.S.
Lottery
$M % (1)
Service Revenue Analysis. . .
Q1 FY’06 vs. Q1 FY’05
8
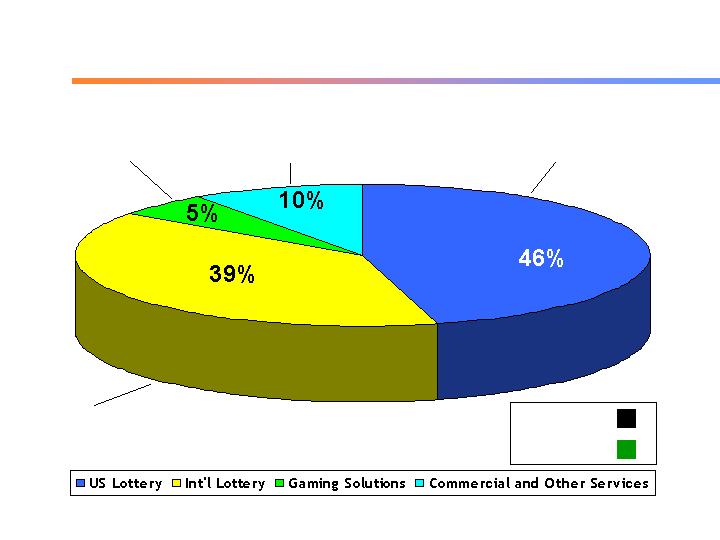
Total Revenue. . .
Q1 FY’06
$32M
$21M
$17M
$7M
$149M
$133M
$128M
$119M
Q1 FY’06
Q1 FY’05
Fiscal Year 2006 – First Quarter Earnings Conference Call
9

Key Financial Highlights. . .
Q1 FY’06 vs. Q1 FY’05
Fiscal Year 2006 – First Quarter Earnings Conference Call
+11% excluding one-time benefit of
release of FY’05 Brazil revenues
previously held in escrow
10
Total Revenue
+17%
Service Revenues
+15%
Same Store Sales
+5%
Operating Expense Ratio
14%
Diluted Earnings Per Share
+7%
Excluding one-time gain
+23%
recorded in Q1 FY’05
Free Cash Flow
$79M
Stock Repurchases
(1.3M shares)
$32M
Fiscal Year 2006 – First Quarter Earnings Conference Call
(1)
For a calculation, explanation, and reconciliation to GAAP measure, see Supplemental Financial Data
in the Investor Presentation section of our Website www.gtech.com
Cash Flow. . .
Q1 FY’06
Cash from
Operations
Maintenance
Capital (1)
Investing for
Growth (1)
Recurring Free
Cash Flow
Free Cash Flow
$122M
$33M
$89M
$10M
$10M Dividends
$32M Share Repurchases
$42M Total
$79M
Cash Returned
to Shareholders
11
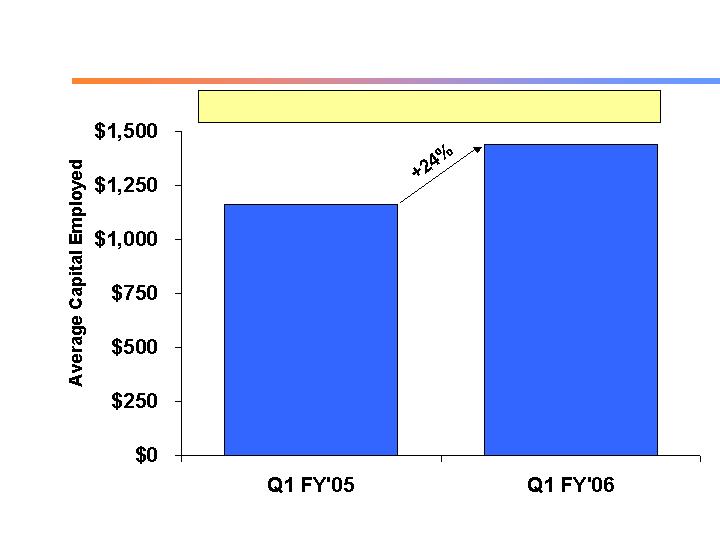
Fiscal Year 2006 – First Quarter Earnings Conference Call
For a calculation and an explanation of ROCE, see Supplemental Financial Data in the Investor Presentation
section of our Website www.gtech.com
Return on Capital Employed. . .
Q1 FY’06 vs. Q1 FY’05
$M
ROCE 19.4% 16.5%
12

FY’06
(1) Based on a diluted share estimate of 131M shares
FY’06 Guidance. . .
As of June 22, 2005
Fiscal Year 2006 – First Quarter Earnings Conference Call
13
Service Revenue Growth
11% - 13%
Product Sales
$180M - $210M
Service Margins
40% - 42%
Product Margins
38% - 40%
Full-Year Effective Tax Rate
35%
Earnings per Share(1); Excluding impact of SFAS 123R
$1.64 - $1.70
Net Cash Invested
$230M - $240M
Free Cash Flow
$180M - $200M
EBITDA
$530M - $540M

$420M - $430M
Cash from
Operations
Capital
Expenditures
$230M - $240M
$180M - $200M
Free Cash Flow
Cash Flow. . .
FY’06 Guidance
Fiscal Year 2006 – First Quarter Earnings Conference Call
14

Q2 FY’06
(1) Based on Diluted Share Estimate of 130M Shares
Q2 FY’06 Guidance. . .
As of June 22, 2005
Fiscal Year 2006 – First Quarter Earnings Conference Call
15
Service Revenue Growth
10% - 12%
Product Sales
$30M - $35M
Service Margins
38% - 40%
Product Margins
38% - 40%
Earnings per Share (1)
$0.37 - $0.40
Q&A. . .
Fiscal Year 2006 – First Quarter Earnings Conference Call
16

Summary. . .
Solid business growth continues
Long-term strategy remains on track
Driving new growth through acquisitions and
partnerships
Focused on M&A transactions to enhance
offerings in all verticals
Focused on becoming a fully diversified, world-class
gaming company
Fiscal Year 2006 – First Quarter Earnings Conference Call
17