
GTECH Holdings Corporation
W. Bruce Turner
President & Chief Executive Officer
Jaymin B. Patel
Sr. Vice President & Chief Financial Officer
Fiscal Year 2006
Second Quarter Earnings Conference Call
September 23, 2005
8:30 AM

Safe Harbor Act. . .
Comments made during this presentation may contain forward-
looking statements, including, without limitation, statements relating
to the future operations and financial performance of the Company
and the Company’s future strategies. Such forward-looking
statements reflect management’s assessment based on information
currently available, but are not guarantees and are subject to risks and
uncertainties, which would cause the results to differ materially from
those contemplated in the forward-looking statements. These risks
and uncertainties include, but are not limited to, those set forth here
and in the Company’s filings with the SEC.
Fiscal Year 2006 – Second Quarter Earnings Conference Call
2
Agenda. . .
W. Bruce Turner, Chief Executive Officer
Welcome
Q2 Performance Review
Strategy Update
Jaymin B. Patel, Chief Financial Officer
Review of Q2 Financial Results
Guidance for Fiscal Year 2006 and Guidance for Q3
Fiscal Year 2006 – Second Quarter Earnings Conference Call
3

Second Quarter Business Review. . .
Financial Performance
Service revenue growth
Florida
Virginia
LILHCo
Same store sales growth
Significant free cash flow
Fiscal Year 2006 – Second Quarter Earnings Conference Call
4
Q2 FY’06 Strategic Progress. . .
Key wins / Extensions
Content
+15 new games developed in Q2, +30 games YTD
California – MegaMillions
Washington State – Instant Online Bingo
Fiscal Year 2006 – Second Quarter Earnings Conference Call
ONCE
New Zealand
Germany – WestLotto
Washington State
Ohio – Online & ITVM
Swiss Loro
5
New Games
Wisconsin – Cash game
Trinidad & Tobago – Extra
Licensed content
BattleshipTM – Minnesota
Universal Studios’ KING KONG motion picture – Instant ticket markets
New products
WinWaveTM
Dynamic floor management system
19 new games for Class III and Native American markets
Q2 FY’06 Strategic Progress. . .
Fiscal Year 2006 – Second Quarter Earnings Conference Call
* BATTLESHIP is a trademark of Hasbro and is used with permission. © 2005 Hasbro. All Rights Reserved.
**Universal Studios’ KING KONG movie © Universal Studios. Licensed by Universal Studios
Licensing LLLP. All Rights Reserved.
6
New contract opportunities
Arizona
Maryland
New Jersey
Greece
Further expansion opportunities
North Carolina
Pennsylvania
Massachusetts
New Jersey
Rhode Island
Q2 FY’06 Strategic Progress. . .
Fiscal Year 2006 – Second Quarter Earnings Conference Call
Awards pending
7

(1)All percentage points are rounded to the nearest percent
(2)Reflects impact of contract wins/losses, jackpot activity, contractual rate changes, foreign exchange changes, the
impact of acquisitions, and the net change of revenue withholdings and new contract terms in Brazil.
Fiscal Year 2006 – Second Quarter Earnings Conference Call
28.7 +42%
6.2 +31%
2.3 +11%
20.2
Commercial
Svcs. / Other
$M % (1)
248.1
7.6
91.2
129.1
FY’05
9.0 +3%
0.1 +2%
(4.1) -4%
6.8 +5%
Net, All
Other(2)
266.3 +7%
8.1 +7%
90.3 -1%
139.2 +8%
FY’06
9.2 +4%
0.4 +5%
3.2 +3%
3.3 +3%
Same
Store
Sales
GTECH
Total
$M % (1)
Gaming
Solutions
$M % (1)
International
Lottery
$M % (1)
U.S.
Lottery
$M % (1)
Service Revenue Analysis. . .
Q2 FY’06 vs. Q2 FY’05
8

Service Revenue +$18M
Product Sales $44M
Gross Profit Margins 40%
Service Margins 39%
Product Margins 43%
Operating Expenses $41M
Operating Expense Ratio 13%
Net Income $49M
Diluted Earnings Per Share $0.38
Cash from Operations $94M
Key Financial Highlights. . .
Q2 FY’06
Fiscal Year 2006 – Second Quarter Earnings Conference Call
9
Fiscal Year 2006 – Second Quarter Earnings Conference Call
(1)
For a calculation, explanation, and reconciliation to the GAAP measure, see Supplemental Financial
Data in the Investor Presentation section of our Website www.gtech.com
Cash Flow. . .
Q2 FY’06
Cash from
Operations
Maintenance
Capital (1)
Investing for
Growth (1)
Recurring Free
Cash Flow
Free Cash Flow
$94M
$19M
$75M
$4M
$71M
Cash Returned
to Shareholders
$10M Dividends
10
(1)All percentage points are rounded to the nearest percent
(2)Reflects impact of contract wins/losses, jackpot activity, contractual rate changes, foreign exchange changes, the
impact of acquisitions, and the net change of revenue withholdings and new contract terms in Brazil.
Fiscal Year 2006 – Second Quarter Earnings Conference Call
60.6 +46%
14.5 +35%
4.7 +11%
41.4
Commercial
Svcs. / Other
$M % (1)
501.4
13.1
189.6
257.3
FY’05
32.8 +6%
2.1 +16%
2.2 +1%
14.0 +6%
Net, All
Other(2)
557.7 +11%
16.1 +23%
198.7 +5%
282.3 +10%
FY’06
23.5 +5%
0.9 +7%
6.9 +4%
11.0 +4%
Same
Store
Sales
GTECH
Total
$M % (1)
Gaming
Solutions
$M % (1)
International
Lottery
$M % (1)
U.S.
Lottery
$M % (1)
Service Revenue Analysis. . .
FY’06 YTD vs. FY’05
11
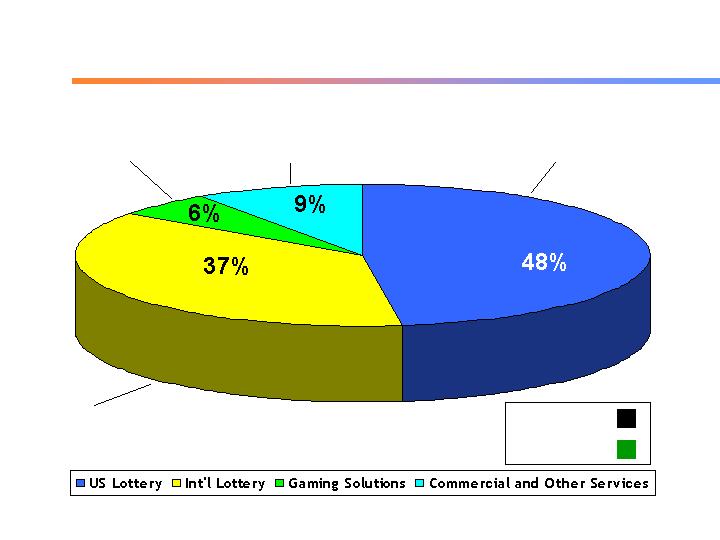
Total Revenue. . .
FY’06 YTD
$60M
$41M
$36M
$31M
$304M
$269M
$236M
$263M
FY’06 YTD
FY’05 YTD
Fiscal Year 2006 – Second Quarter Earnings Conference Call
12

Fiscal Year 2006 – Second Quarter Earnings Conference Call
(1)
For a calculation, explanation, and reconciliation to the GAAP measure, see Supplemental Financial
Data in the Investor Presentation section of our Website www.gtech.com
Cash Flow. . .
FY’06 YTD
Cash from
Operations
Maintenance
Capital (1)
Investing for
Growth (1)
Recurring Free
Cash Flow
Free Cash Flow
$215M
$52M
$163M
$13M
$20M Dividends
$32M Share Repurchases
$52M Total
$150M
Cash Returned
to Shareholders
13

Return on Capital Employed. . .
FY’06 YTD vs. FY’05
Average Capital Employed +$300M
+26% year over year
ROCE 15.5%
ROCE (Excluding cash balances) 19.0%
Fiscal Year 2006 – Second Quarter Earnings Conference Call
For a calculation and an explanation of ROCE, see Supplemental Financial Data in the Investor Presentation
section of our Website www.gtech.com
14

Service Revenue Growth 10% - 12%
Product Sales $190M - $210M
Service Margins 40% - 42%
Product Margins 38% - 40%
Full-Year Effective Tax Rate 34% - 35%
Earnings per Share(1); Excluding impact of SFAS 123R $1.64 - $1.70
Net Cash Invested $190M - $200M
Free Cash Flow $210M - $230M
EBITDA ; $530M - $540M
FY’06
(1) Based on a diluted share estimate of 130.7M shares
FY’06 Guidance. . .
As of September 23, 2005
Fiscal Year 2006 – Second Quarter Earnings Conference Call
15
$410M - $420M
Cash from
Operations
Capital
Expenditures
$190M - $200M
$210M - $230M
Free Cash Flow
Cash Flow. . .
FY’06 Guidance
Fiscal Year 2006 – Second Quarter Earnings Conference Call
16

Service Revenue Growth 9% - 10%
Product Sales $30M - $40M
Service Margins ~ 40%
Product Margins 38% - 40%
Tax Rate 29% - 30%
Earnings per Share (1) $0.34 - $0.37
Q3 FY’06
(1) Based on Diluted Share Estimate of 130.8M Shares
Q3 FY’06 Guidance. . .
As of September 23, 2005
Fiscal Year 2006 – Second Quarter Earnings Conference Call
17
Q&A. . .
Fiscal Year 2006 – Second Quarter Earnings Conference Call
18

Summary. . .
Business growth continues
Development of new content
Long-term strategy remains on track
Creating value for shareholders
Confident in our ability to meet objectives for FY’06
and beyond
Fiscal Year 2006 – Second Quarter Earnings Conference Call
19