| | | |
| Vanguard® International | | |
| Stock Index Funds | | |
| | | |
| | | |
| > Semiannual Report | | |
| | | |
| | | |
| | | |
| April 30, 2007 | | |
| | | |
| 
|
| | |
| | |
| Vanguard European Stock Index Fund | |
| | |
| Vanguard Pacific Stock Index Fund | |
| | |
| Vanguard Emerging Markets Stock Index Fund | |
| | |
| Vanguard Total International Stock Index Fund | |
| | |
| Vanguard Developed Markets Index Fund | |
| | |
| Vanguard Institutional Developed Markets Index Fund | |
| | |
| | |
| | |
| | |
| | |
| | |
| | |
| | |
| | |
| | | | |
> | Vanguard’s international stock index funds benefited from the broad-based strength of international stock markets, which rose a collective 16.1% during the fiscal six months, compared with 9.1% for U.S. stocks overall. |
> | Emerging markets were among the strongest performers, as was reflected in the 19.2% return of the Emerging Markets Stock Index Fund’s Investor Shares. |
> | The returns of the other funds’ Investor Shares ranged from 17.3% for the European Stock Index Fund to 8.9% for the Pacific Stock Index Fund. |
Contents | |
| |
Your Fund’s Total Returns | 1 |
Chairman’s Letter | 4 |
European Stock Index Fund | 10 |
Pacific Stock Index Fund | 32 |
Emerging Markets Stock Index Fund | 52 |
Total International Stock Index Fund | 81 |
Developed Markets Index Fund | 89 |
Institutional Developed Markets Index Fund | 97 |
About Your Fund’s Expenses | 105 |
Trustees Approve Advisory Arrangement | 108 |
Glossary | 109 |

European Stock Index Fund |
Pacific Stock Index Fund |
Emerging Markets Stock Index Fund |
Developed Markets Index Fund |
Institutional Developed Markets Index Fund |
Please note: The opinions expressed in this report are just that—informed opinions. They should not be considered promises or advice. Also, please keep in mind that the information and opinions cover the period through the date on the cover of this report. Of course, the risks of investing in your fund are spelled out in the prospectus.
Your Fund’s Total Returns
Six Months Ended April 30, 2007 | | |
| Ticker | Total |
| Symbol | Returns |
Vanguard European Stock Index Fund | | |
Investor Shares | VEURX | 17.3% |
Admiral™ Shares1 | VEUSX | 17.4 |
Signal™ Shares2 | VESSX | 17.4 |
Institutional Shares3 | VESIX | 17.4 |
ETF Shares4 | VGK | |
Market Price | | 17.8 |
Net Asset Value | | 17.4 |
MSCI Europe Index | | 18.2 |
Average European Region Fund5 | | 18.5 |
| | |
Vanguard Pacific Stock Index Fund | | |
Investor Shares | VPACX | 8.9% |
Admiral Shares1 | VPADX | 9.0 |
Institutional Shares3 | VPKIX | 9.0 |
ETF Shares4 | VPL | |
Market Price | | 8.8 |
Net Asset Value | | 9.0 |
MSCI Pacific Index | | 9.6 |
Average Japan/Pacific Region Fund5 | | 5.6 |
1 A lower-cost class of shares available to many longtime shareholders and to those with significant investments in the fund.
2 Signal Shares also carry lower costs and are available to certain institutional shareholders who meet specific administrative, service, and account-size criteria.
3 This class of shares carries low expenses and is available for a minimum initial investment of $5 million.
4 ETF shares are traded on the American Stock Exchange and are available only through brokers. The table shows ETF returns based on both the AMEX market price and the net asset value for a share. U.S. Pat. No. 6,879,964 B2.
5 Derived from data provided by Lipper Inc.
1
Your Fund’s Total Returns
Six Months Ended April 30, 2007 | | |
| Ticker | Total |
| Symbol | Returns |
Vanguard Emerging Markets Stock Index Fund | | |
Investor Shares | VEIEX | 19.2% |
Admiral Shares1 | VEMAX | 19.2 |
Signal Shares2 | VERSX | 7.83 |
Institutional Shares4 | VEMIX | 19.3 |
ETF Shares5 | VWO | |
Market Price | | 17.7 |
Net Asset Value | | 19.2 |
MSCI Emerging Markets Index | | 20.1 |
Average Emerging Markets Fund6 | | 19.5 |
| | |
Vanguard Total International Stock Index Fund | VGTSX | 15.4% |
Total International Composite Index7 | | 16.2 |
Average International Fund6 | | 14.6 |
| | |
Vanguard Developed Markets Index Fund | VDMIX | 14.7% |
MSCI EAFE Index | | 15.5 |
Average International Fund6 | | 14.6 |
| | |
Vanguard Institutional Developed Markets Index Fund | VIDMX | 14.8% |
MSCI EAFE Index | | 15.5 |
Average International Fund6 | | 14.6 |
1 A lower-cost class of shares available to many longtime shareholders and to those with significant investments in the fund.
2 Signal Shares also carry lower costs and are available to certain institutional shareholders who meet specific administrative, service, and account-size criteria.
3 Since inception: January 19, 2007.
4 This class of shares carries low expenses and is available for a minimum initial investment of $5 million.
5 ETF shares are traded on the American Stock Exchange and are available only through brokers. The table shows ETF returns based on both the AMEX market price and the net asset value for a share. U.S. Pat. No. 6,879,964 B2.
6 Derived from data provided by Lipper Inc.
7 Consists of the MSCI Europe Index (59%), the MSCI Pacific Index (25%), and the MSCI Emerging Markets Index (16%) as of April 30, 2007.
2
Your Fund’s Performance at a Glance
October 31, 2006–April 30, 2007 | | | | |
| | | Distributions Per Share |
| Starting | Ending | Income | Capital |
| Share Price | Share Price | Dividends | Gains |
European Stock | | | | |
Investor Shares | $34.67 | $39.66 | $0.924 | $0.000 |
Admiral Shares | 81.50 | 93.20 | 2.242 | 0.000 |
Signal Shares | 31.51 | 36.06 | 0.842 | 0.000 |
Institutional Shares | 34.74 | 39.72 | 0.970 | 0.000 |
ETF Shares | 65.21 | 74.54 | 1.809 | 0.000 |
Pacific Stock | | | | |
Investor Shares | $12.13 | $12.93 | $0.267 | $0.000 |
Admiral Shares | 79.43 | 84.65 | 1.817 | 0.000 |
Institutional Shares | 12.15 | 12.95 | 0.283 | 0.000 |
ETF Shares | 64.24 | 68.46 | 1.473 | 0.000 |
Emerging Markets Stock | | | | |
Investor Shares | $22.05 | $25.85 | $0.396 | $0.000 |
Admiral Shares | 29.03 | 34.03 | 0.534 | 0.000 |
Signal Shares | 30.381 | 32.74 | 0.000 | 0.000 |
Institutional Shares | 22.11 | 25.91 | 0.429 | 0.000 |
ETF Shares | 69.91 | 81.90 | 1.339 | 0.000 |
Total International Stock | $16.90 | $19.07 | $0.402 | $0.000 |
Developed Markets | $12.15 | $13.61 | $0.299 | $0.005 |
Institutional Developed Markets | $12.05 | $13.49 | $0.316 | $0.000 |
1 Share price at inception: January 19, 2007.
3

Chairman’s Letter
Dear Shareholder,
International stocks outpaced U.S. stocks during the fiscal half-year ended April 30, 2007, with the strongest returns in European and emerging market stocks. Vanguard’s international stock funds successfully captured the performance of their respective indexes.
Vanguard Emerging Markets Stock Index Fund and Vanguard European Stock Index Fund returned 19.2% and 17.3%, respectively. (All returns are for Investor Shares.) Vanguard Developed Markets Index Fund and Vanguard Institutional Developed Markets Index Fund, which invest in both European and Pacific markets, gained just under 15%, and Vanguard Total International Stock Index Fund, which invests in Europe, the Pacific, and emerging markets, gained 15.4%. Vanguard Pacific Stock Index Fund earned an 8.9% return.
International stocks climb, U.S. stocks reach a new high
International stocks outperformed U.S. equities, rising 16.1% as a group, compared with 9.1% for domestic stocks. Emerging markets continued to perform well, underpinned by the now-strengthened economic position of many developing nations since the Asian financial crises of a decade ago. European stocks reflected the sustained economic growth of that region, which included a high level of merger-and-acquisition activity.
4
A generally declining dollar helped bolster returns for U.S. investors (although the dollar appreciated compared with the Japanese yen). The U.S. stock market was particularly volatile during the six-month period, which saw the Dow Jones Industrial Average close above 13,000 for the first time on April 25.
Interest rate trends differ in the United States and abroad
Solid economic growth abroad has been spurring foreign central banks in Japan, Europe, and the United Kingdom to raise interest rates, with the expectation that higher rates are to come. By contrast, economic reports suggest that U.S. economic growth is moderating, and many investors expect the Federal Reserve Board to reduce interest rates.
The Fed maintained its target for the federal funds rate at 5.25% throughout the six-month period. The inversion of the yield curve continued, with yields of long-term bonds remaining lower than short-term yields. Returns in the U.S. bond market were generally consistent with bond coupons.
The world’s stock markets were on the upswing
The performance of our international stock funds during the past six months reflected the broad-based strength in most of the world’s developed and emerging stock markets.
Market Barometer | | | |
| | | Total Returns |
| | Periods Ended April 30, 2007 |
| Six Months | One Year | Five Years1 |
Stocks | | | |
MSCI All Country World Index ex USA (International) | 16.1% | 19.7% | 18.3% |
Russell 1000 Index (Large-caps) | 9.1 | 15.2 | 9.1 |
Russell 2000 Index (Small-caps) | 6.9 | 7.8 | 11.1 |
Dow Jones Wilshire 5000 Index (Entire market) | 9.1 | 14.5 | 9.7 |
| | | |
Bonds | | | |
Lehman Aggregate Bond Index (Broad taxable market) | 2.6% | 7.4% | 5.1% |
Lehman Municipal Bond Index | 1.6 | 5.8 | 5.2 |
Citigroup 3-Month Treasury Bill Index | 2.5 | 5.0 | 2.6 |
| | | |
CPI | | | |
Consumer Price Index | 2.4% | 2.6% | 2.8% |
1 Annualized.
5
The European Stock Index Fund returned 17.3%, benefiting from excellent returns in the region’s largest markets—the United Kingdom, Germany, and France. Germany was home to two of the fund’s top-performing stocks, Siemens and DaimlerChrysler.
Returns from Japan and Australia dominated the contribution to the Pacific Stock Index Fund’s 8.9% return. This is understandable: Japan alone accounted for slightly over 70% of the fund’s assets, and Australia slightly under 20%. Financials and industrials, two of the fund’s largest sectors, provided almost half of the fund’s returns.
Annualized Expense Ratios1 | | | |
Your fund compared with its peer group | | | |
| Fund | Acquired | Peer-Group |
| Expense | Fund Fees and | Expense |
| Ratio | Expenses2 | Ratio |
European Stock | | | |
Investor Shares | 0.25% | — | 1.44% |
Admiral Shares | 0.15 | — | 1.44 |
Signal Shares | 0.15 | — | 1.44 |
Institutional Shares | 0.12 | — | 1.44 |
ETF Shares | 0.15 | — | 1.44 |
Pacific Stock | | | |
Investor Shares | 0.24% | — | 1.65% |
Admiral Shares | 0.15 | — | 1.65 |
Institutional Shares | 0.12 | — | 1.65 |
ETF Shares | 0.15 | — | 1.65 |
Emerging Markets Stock | | | |
Investor Shares | 0.40% | — | 1.88% |
Admiral Shares | 0.30 | — | 1.88 |
Signal Shares | 0.30 | — | 1.88 |
Institutional Shares | 0.25 | — | 1.88 |
ETF Shares | 0.30 | — | 1.88 |
Total International Stock | — | 0.28% | 1.57% |
Developed Markets | — | 0.25% | 1.57% |
Institutional Developed Markets | — | 0.12% | 1.57% |
1 Fund expense ratios reflect the six months ended April 30, 2007. Peer groups are: for the European Stock Index Fund, the Average European Region Fund; for the Pacific Stock Index Fund, the Average Japan/Pacific Region Fund; for the Emerging Markets Stock Index Fund, the Average Emerging Markets Fund; for the other funds, the Average International Fund. Peer-group expense ratios are derived from data provided by Lipper Inc. and capture information through year-end 2006.
2 This figure represents a weighted average of the expense ratios and any fees charged by the underlying mutual funds in which the fund invests. The fund does not have any expenses of its own. Acquired is a term that the Securities and Exchange Commission applies to any mutual fund whose shares are owned by another fund.
6
Emerging markets continued to produce extraordinary returns. About half of the 19.2% return of the Emerging Markets Stock Index Fund came from countries as geographically far-flung as Brazil, South Africa, South Korea, and China. Top-performing stocks reflected this diversity: They included Companhia Vale do Rio Doce (Brazil), POSCO (South Korea), America Movil (Mexico), MTN Group (South Africa), and China Life Insurance.
Returns were excellent for our funds-of-funds
As a “fund of funds”—a mutual fund that invests in other mutual funds—the Total International Stock Index Fund seeks to track the performance of the Total International Composite Index, which comprises the target indexes of the European, Pacific, and Emerging Markets Stock Index Funds. It invests in each of these funds in proportions determined by their weightings in the composite index. The Total International Stock Index Fund produced a total return of 15.4% during the six months.
The Developed Markets Index Fund and the Institutional Developed Markets Index Fund, which are also funds-of-funds, invest in the European and Pacific Stock Index Funds. Over the period, about 70% of the funds’ assets were invested in Europe and about 30% in the Pacific region, and the funds’ returns of just under 15%—a bit below that of European stocks’ returns—reflected the Pacific weighting.
Fair-value pricing skews short-term fund returns
Consistent with their objectives, the Vanguard International Stock Index Funds captured most of the return of their target indexes during the six months, even though the total return table on pages 1 and 2 appears to suggest otherwise.
Much of the funds’ apparent shortfall resulted from fair-value pricing, a practice that adjusts fund net asset values for market-moving events that occur after the close of international stock markets, but before the close of U.S. markets. When fair-value pricing occurs at the beginning or end of a reporting period, it can produce temporary differences between fund and index returns. These discrepancies typically correct themselves when the international markets reopen.
During the six months, the Pacific, Total International, and two Developed Markets funds outperformed the average returns of their peer groups, while the European and Emerging Markets funds trailed their peer-group averages. Of course, six-month comparisons have little meaning (although we are required, and expected, to report short-term results). Over time, we expect the low-cost index approach to be a fierce competitor for actively managed international funds.
7
International stocks offer a wider world of opportunities
The U.S. market represents only about 45% of the global market for stocks—meaning that a sizable set of investment opportunities lies beyond U.S. borders. Our international equity funds offer you the chance to benefit from those opportunities and, even more important, to temper the risk of a U.S.-only portfolio.
How much of an exposure to international stocks is right for you? As with much of investing, the answer is “it depends”—it’s a unique decision that depends on your goals, time horizon, personal situation, and risk comfort level.
Thank you for entrusting your assets to Vanguard.
Sincerely,

John J. Brennan
Chairman and Chief Executive Officer
May 14, 2007
8
Vanguard European Stock Index ETF
Premium/Discount: March 4, 20051–April 30, 2007
| Market Price Above or | Market Price Below |
| Equal to Net Asset Value | | Net Asset Value |
| Number | Percentage | Number | Percentage |
Basis Point Differential2 | of Days | of Total Days | of Days | of Total Days |
0–24.9 | 93 | 17.13% | 17 | 3.13% |
25–49.9 | 161 | 29.65 | 2 | 0.37 |
50–74.9 | 141 | 25.97 | 1 | 0.18 |
75–100.0 | 78 | 14.36 | 0 | 0.00 |
>100.0 | 50 | 9.21 | 0 | 0.00 |
Total | 523 | 96.32% | 20 | 3.68% |
Vanguard Pacific Stock Index ETF
Premium/Discount: March 4, 20051–April 30, 2007
| Market Price Above or | Market Price Below |
| Equal to Net Asset Value | | Net Asset Value |
| Number | Percentage | Number | Percentage |
Basis Point Differential2 | of Days | of Total Days | of Days | of Total Days |
0–24.9 | 93 | 17.13% | 25 | 4.61% |
25–49.9 | 145 | 26.69 | 10 | 1.84 |
50–74.9 | 129 | 23.69 | 0 | 0.00 |
75–100.0 | 76 | 14.00 | 1 | 0.18 |
>100.0 | 64 | 11.79 | 0 | 0.00 |
Total | 507 | 93.37% | 36 | 6.63% |
Vanguard Emerging Markets Stock Index ETF
Premium/Discount: March 4, 20051–April 30, 2007
| Market Price Above or | Market Price Below |
| Equal to Net Asset Value | | Net Asset Value |
| Number | Percentage | Number | Percentage |
Basis Point Differential2 | of Days | of Total Days | of Days | of Total Days |
0–24.9 | 93 | 17.13% | 50 | 9.21% |
25–49.9 | 114 | 20.99 | 24 | 4.42 |
50–74.9 | 105 | 19.34 | 14 | 2.58 |
75–100.0 | 66 | 12.15 | 10 | 1.84 |
>100.0 | 48 | 8.84 | 19 | 3.50 |
Total | 426 | 78.45% | 117 | 21.55% |
1 Inception.
2 One basis point equals 1/100 of a percentage point.
9
European Stock Index Fund
Fund Profile
As of April 30, 2007
Portfolio Characteristics | | |
| | Target | Broad |
| Fund | Index1 | Index2 |
Number of Stocks | 608 | 592 | 2,107 |
Turnover Rate | 3%3 | — | — |
Expense Ratio | | — | — |
Investor Shares | 0.25%3 | | |
Admiral Shares | 0.15%3 | | |
Signal Shares | 0.15%3 | | |
Institutional Shares | 0.12%3 | | |
ETF Shares | 0.15%3 | | |
Short-Term Reserves | 0% | — | — |
Sector Diversification (% of portfolio) | |
| | Target | Broad |
| Fund | Index1 | Index2 |
Consumer Discretionary | 10% | 10% | 11% |
Consumer Staples | 9 | 9 | 8 |
Energy | 9 | 10 | 9 |
Financials | 30 | 30 | 27 |
Health Care | 8 | 8 | 7 |
Industrials | 10 | 9 | 11 |
Information Technology | 4 | 4 | 9 |
Materials | 8 | 7 | 8 |
Telecommunication Services | 6 | 7 | 5 |
Utilities | 6 | 6 | 5 |
Volatility Measures4 | |
| Fund Versus | Fund Versus |
| Target Index1 | Broad Index2 |
R-Squared | 0.99 | 0.89 |
Beta | 0.98 | 0.89 |
Ten Largest Holdings5 (% of total net assets) | |
| | |
BP PLC | integrated oil and gas | 2.3% |
HSBC Holdings PLC | diversified banks | 2.2 |
GlaxoSmithKline PLC | pharmaceuticals | 1.7 |
Total SA | integrated oil and gas | 1.7 |
Nestle SA (Registered) | packaged foods and meats | 1.6 |
Vodafone Group PLC | wireless telecommunication services | 1.6 |
Novartis AG (Registered) | pharmaceuticals | 1.4 |
Roche Holdings AG | pharmaceuticals | 1.4 |
UBS AG | diversified capital markets | 1.4 |
Royal Bank of Scotland Group PLC | diversified banks | 1.3 |
Top Ten | | 16.6% |
Market Diversification (% of portfolio) | |
| | Target |
| Fund | Index1 |
United Kingdom | 33% | 33% |
France | 14 | 15 |
Germany | 11 | 11 |
Switzerland | 10 | 10 |
Netherlands | 6 | 5 |
Spain | 6 | 6 |
Italy | 6 | 6 |
Sweden | 4 | 4 |
Finland | 2 | 2 |
Belgium | 2 | 2 |
Norway | 1 | 1 |
Denmark | 1 | 1 |
Ireland | 1 | 1 |
Greece | 1 | 1 |
Austria | 1 | 1 |
Portugal | 1 | 1 |
1 MSCI Europe Index.
2 MSCI All Country World Index ex USA.
3 Annualized.
4 For an explanation of R-squared, beta, and other terms used here, see the Glossary on page 109.
5 “Ten Largest Holdings” excludes any temporary cash investments and equity index products.
10
European Stock Index Fund
Performance Summary
All of the returns in this report represent past performance, which is not a guarantee of future results that may be achieved by the fund. (Current performance may be lower or higher than the performance data cited. For performance data current to the most recent month-end, visit our website at www.vanguard.com/performance.) Note, too, that both investment returns and principal value can fluctuate widely, so an investor’s shares, when sold, could be worth more or less than their original cost. The returns shown do not reflect taxes that a shareholder would pay on fund distributions or on the sale of fund shares.
Fiscal-Year Total Returns (%): October 31, 1996–April 30, 2007
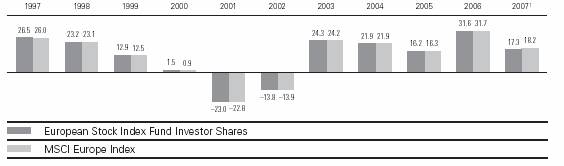
Average Annual Total Returns: Periods Ended March 31, 2007
This table presents average annual total returns through the latest calendar quarter—rather than through the end of the fiscal period. Securities and Exchange Commission rules require that we provide this information.
| Inception Date | One Year | Five Years | Ten Years |
European Stock Index Fund | | | | |
Investor Shares2 | 6/18/1990 | 25.61% | 15.85% | 10.52% |
Admiral Shares2 | 8/13/2001 | 25.78 | 15.96 | 13.493 |
Signal Shares2 | 10/6/2006 | 15.063 | — | — |
Institutional Shares2 | 5/15/2000 | 25.81 | 16.02 | 7.373 |
ETF Shares | 3/4/2005 | | | |
Market Price | | 25.76 | 19.953 | — |
Net Asset Value | | 25.66 | 20.293 | — |
1 Six months ended April 30, 2007.
2 Total returns do not reflect the 0.5% transaction fee on purchases through March 31, 2000; the 2% fee assessed on redemptions of shares purchased on or after June 27, 2003, and held for less than two months; or, for Investor Shares, the $10 annual account maintenance fee applied on balances under $10,000.
3 Return since inception.
Note: See Financial Highlights tables on pages 23 through 27 for dividend and capital gains information.
11
European Stock Index Fund
Financial Statements (unaudited)
Statement of Net Assets
As of April 30, 2007
The fund provides a complete list of its holdings four times in each fiscal year, at the quarter-ends. For the second and fourth fiscal quarters, the lists appear in the fund’s semiannual and annual reports to shareholders. For the first and third fiscal quarters, the fund files the lists with the Securities and Exchange Commission on Form N-Q. Shareholders can look up the fund’s Forms N-Q on the SEC’s website at www.sec.gov. Forms N-Q may also be reviewed and copied at the SEC’s Public Reference Room (see the back cover of this report for further information).
| | | Market |
| | | Value• |
| | Shares | ($000) |
Common Stocks (99.4%)1 | | |
Austria (0.9%) | | |
| Erste Bank der | | |
| Oesterreichischen | | |
| Sparkassen AG | 613,108 | 49,091 |
| Telekom Austria AG | 1,240,233 | 35,075 |
| OMV AG | 545,776 | 34,545 |
* | Meinl European Land Ltd. | 991,921 | 28,736 |
* | Immofinanz Immobilien | | |
| Anlagen AG | 1,480,589 | 24,066 |
| Voestalpine AG | 287,977 | 19,344 |
* | Wienerberger AG | 233,159 | 16,767 |
| Raiffeisen International | | |
| Bank-Holding AG | 117,983 | 16,301 |
^ | Oesterreichische | | |
| Elektrizitaetswirtschafts | | |
| AG Class A | 255,441 | 13,141 |
| Boehler-Uddeholm AG | 134,280 | 13,097 |
*^ | IMMOEAST Immobilien | | |
| Anlagen AG | 914,574 | 12,934 |
| Andritz AG | 32,167 | 8,263 |
| Wiener Staedtische | | |
| Allgemeine | | |
| Versicherung AG | 103,779 | 7,789 |
* | RHI AG | 85,380 | 4,524 |
* | Flughafen Wien AG | 34,789 | 3,778 |
*^ | BETandWIN.com Interactive | | |
| Entertainment AG | 76,940 | 3,301 |
| Mayr-Melnhof Karton AG | 13,973 | 3,271 |
| | | 294,023 |
Belgium (1.8%) | | |
| Fortis | 3,878,531 | 174,296 |
| KBC Bank & | | |
| Verzekerings Holding | 606,144 | 80,195 |
| Dexia | 1,899,624 | 61,959 |
| InBev | 606,524 | 47,280 |
| Solvay SA | 210,106 | 33,264 |
| Groupe Bruxelles | | |
| Lambert SA | 243,385 | 29,419 |
| | | Market |
| | | Value• |
| | Shares | ($000) |
| Delhaize Group | 255,372 | 24,519 |
| Belgacom SA | 538,420 | 23,664 |
| UCB SA | 372,987 | 22,233 |
| Umicore | 81,677 | 16,449 |
| Colruyt NV | 52,598 | 12,398 |
| Mobistar SA | 104,963 | 9,080 |
| Agfa Gevaert NV | 319,322 | 7,722 |
| Bekaert NV | 42,972 | 6,107 |
| Omega Pharma SA | 62,046 | 5,018 |
| Cofinimmo | 21,444 | 4,398 |
| D’Ieteren SA | 9,156 | 3,999 |
| Compagnie Maritime | | |
| Belge SA | 52,385 | 3,635 |
| Barco NV | 37,197 | 3,355 |
| Euronav SA | 60,705 | 2,042 |
| | | 571,032 |
Denmark (1.2%) | | |
| Novo Nordisk A/S B Shares | 796,210 | 77,943 |
| Danske Bank A/S | 1,617,849 | 75,551 |
*^ | AP Moller-Maersk A/S | 3,634 | 41,042 |
* | Vestas Wind Systems A/S | 612,634 | 39,610 |
| Novozymes A/S | 152,713 | 15,959 |
* | Jyske Bank A/S | 194,858 | 15,645 |
^ | DSV, De Sammensluttede | | |
| Vognmaend A/S | 66,901 | 13,726 |
^ | Danisco A/S | 161,856 | 13,054 |
| Carlsberg A/S B Shares | 105,220 | 11,785 |
* | Topdanmark A/S | 59,456 | 11,658 |
| Sydbank A/S | 207,488 | 11,626 |
^ | FLS Industries A/S | | |
| B Shares | 140,127 | 10,565 |
* | William Demant A/S | 94,495 | 9,109 |
* ^ | GN Store Nord A/S | 671,698 | 7,675 |
| Trygvesta A/S | 89,542 | 7,587 |
^ | Coloplast A/S B Shares | 87,897 | 7,564 |
| NKT Holding A/S | 61,773 | 5,423 |
^ | Bang & Olufsen A/S | | |
| B Shares | 35,375 | 4,584 |
| Codan A/S | 45,011 | 4,350 |
12
European Stock Index Fund
| | | Market |
| | | Value• |
| | Shares | ($000) |
^ | H. Lundbeck A/S | 173,684 | 4,180 |
^ | D/S Torm A/S | 48,301 | 3,386 |
| East Asiatic Co. A/S | 55,900 | 2,911 |
| | | 394,933 |
Finland (2.2%) | | |
* ^ | Nokia Oyj | 13,541,982 | 341,610 |
| Fortum Oyj | 1,460,798 | 45,228 |
^ | Sampo Oyj A Shares | 1,405,067 | 43,774 |
| UPM-Kymmene Oyj | 1,730,562 | 42,650 |
| Stora Enso Oyj R Shares | 1,921,083 | 35,056 |
^ | Metso Oyj | 421,673 | 23,062 |
| Kone Oyj | 252,734 | 15,236 |
^ | Kesko Oyj | 217,688 | 15,103 |
^ | Neste Oil Oyj | 424,734 | 14,996 |
| Rautaruuki Oyj | 276,523 | 14,911 |
^ | YIT Oyj | 416,280 | 14,755 |
| Elisa Oyj Class A | 495,083 | 14,407 |
| Wartsila Oyj B Shares | 212,005 | 14,175 |
| Outokumpu Oyj A Shares | 328,572 | 10,918 |
^ | Nokian Renkaat Oyj | 342,395 | 10,513 |
| TietoEnator Oyj B Shares | 251,927 | 7,941 |
| Cargotec Corp. | 126,241 | 7,810 |
| Uponor Oyj | 180,831 | 7,464 |
| KCI Konecranes Oyj | 186,996 | 6,721 |
| Orion Oyj | 282,316 | 6,707 |
| SanomaWSOY Oyj | 211,312 | 6,239 |
| OKO Bank (Osuuspankkien | |
| Keskuspankki Oyj) | 312,823 | 5,936 |
| Amer Sports Oyj A Shares | 235,099 | 5,213 |
| | | 710,425 |
France (14.3%) | | |
| Total SA | 7,217,311 | 532,046 |
| BNP Paribas SA | 2,769,374 | 321,276 |
| Sanofi-Aventis | 3,367,002 | 308,205 |
| Societe Generale Class A | 1,219,732 | 258,490 |
| AXA | 5,529,492 | 253,879 |
^ | Suez SA | 3,367,108 | 191,896 |
| France Telecom SA | 5,595,373 | 163,621 |
^ | Vivendi SA | 3,819,395 | 157,547 |
^ | Carrefour SA | 1,981,489 | 152,299 |
| Groupe Danone | 784,196 | 128,937 |
^ | L’Oreal SA | 951,825 | 113,908 |
| Cie. de St. Gobain SA | 1,043,717 | 111,448 |
^ | Schneider Electric SA | 751,387 | 105,976 |
^ | Vinci SA | 658,588 | 105,936 |
| L’Air Liquide SA | | |
| (Registered) | 399,155 | 98,955 |
| LVMH Louis Vuitton | | |
| Moet Hennessy | 810,106 | 94,427 |
| Credit Agricole SA | 2,178,896 | 91,752 |
| Alcatel-Lucent | 6,537,802 | 86,343 |
| Lafarge SA | 495,495 | 80,442 |
| Renault SA | 612,504 | 79,512 |
| Veolia Environnement | 944,255 | 77,931 |
| | | Market |
| | | Value• |
| | Shares | ($000) |
| Pernod Ricard SA | 298,651 | 63,594 |
| Accor SA | 666,618 | 62,790 |
| Compagnie Generale | | |
| des Etablissements | | |
| Michelin SA | 474,245 | 60,423 |
* | Alstom | 365,826 | 54,394 |
^ | Bouygues SA | 675,280 | 53,807 |
| STMicroelectronics NV | 2,257,573 | 44,058 |
^ | Unibail Co. | 151,858 | 42,093 |
| PSA Peugeot Citroen | 504,269 | 40,915 |
| Essilor International SA | 325,202 | 39,200 |
| Pinault-Printemps- | | |
| Redoute SA | 218,823 | 38,029 |
| Vallourec SA | 131,448 | 35,800 |
^ | Cap Gemini SA | 452,339 | 34,214 |
^ | Lagardere S.C.A. | 400,252 | 31,458 |
| Hermes International | 211,972 | 30,608 |
| Gaz de France | 650,791 | 30,539 |
^ | Technip SA | 349,545 | 27,566 |
| Sodexho Alliance SA | 315,607 | 25,016 |
| Publicis Groupe SA | 460,667 | 21,918 |
| Air France | 400,703 | 20,436 |
^ | CNP Assurances | 147,298 | 18,777 |
| Thales SA | 293,441 | 17,830 |
| Thomson SA | 858,267 | 16,539 |
* | Atos Origin SA | 224,193 | 16,074 |
| Etablissements | | |
| Economiques du Casino | | |
| Guichard-Perrachon SA | 144,137 | 15,484 |
| Neopost SA | 105,926 | 15,351 |
| Alcatel-Lucent ADR | 1,093,439 | 14,488 |
^ | Societe Television | | |
| Francaise 1 | 393,916 | 13,538 |
^ | Safran SA | 549,146 | 13,266 |
| Valeo SA | 230,870 | 13,265 |
* | Business Objects SA | 318,378 | 11,916 |
| Klepierre | 60,840 | 11,732 |
| SCOR SA | 391,927 | 11,499 |
| Dassault Systemes SA | 189,406 | 11,213 |
| Zodiac SA | 136,797 | 10,500 |
| Imerys SA | 105,740 | 10,113 |
^ | PagesJaunes SA | 416,700 | 9,646 |
^ | Gecina SA | 41,212 | 7,792 |
*^ | M6 Metropole Television | 216,330 | 7,690 |
| Societe des Autoroutes | | |
| Paris-Rhin-Rhone | 74,868 | 7,374 |
| Societe BIC SA | 89,537 | 6,542 |
* | Schneider Electric SA New | 42,174 | 5,762 |
| | | 4,538,075 |
Germany (11.5%) | | |
^ | Allianz AG | 1,496,500 | 340,434 |
| Siemens AG | 2,799,499 | 337,774 |
^ | E.On AG | 2,059,630 | 308,081 |
| Deutsche Bank AG | 1,717,702 | 263,480 |
13
European Stock Index Fund
| | | Market |
| | | Value• |
| | Shares | ($000) |
| DaimlerChrysler AG | | |
| (Registered) | 2,703,189 | 218,825 |
^ | BASF AG | 1,616,074 | 192,816 |
^ | Deutsche Telekom AG | 9,374,327 | 170,702 |
^ | Bayer AG | 2,401,280 | 165,189 |
^ | RWE AG | 1,471,301 | 155,079 |
^ | SAP AG | 2,933,056 | 141,144 |
^ | Muenchener | | |
| Rueckversicherungs- | | |
| Gesellschaft AG | | |
| (Registered) | 683,309 | 121,379 |
^ | Commerzbank AG | 2,064,737 | 103,087 |
| Deutsche Post AG | 2,566,136 | 88,343 |
^ | Volkswagen AG | 563,879 | 85,192 |
^ | Deutsche Boerse AG | 337,305 | 79,168 |
| ThyssenKrupp AG | 1,191,130 | 63,633 |
^ | Continental AG | 434,162 | 60,434 |
^ | Man AG | 419,612 | 55,712 |
| Porsche AG | 26,045 | 43,491 |
| Metro AG | 535,939 | 41,226 |
| Linde AG | 363,316 | 40,645 |
^ | Adidas AG | 671,529 | 39,948 |
* | Infineon Technologies AG | 2,472,551 | 38,356 |
^ | Volkswagen AG Pfd. | 348,086 | 35,227 |
^ | Fresenius Medical Care AG | 208,110 | 31,155 |
| Henkel KGaA | 196,437 | 30,812 |
| Hypo Real Estate | | |
| Holding AG | 443,316 | 29,532 |
^ | Merck KGaA | 213,722 | 28,330 |
^ | Deutsche Postbank AG | 271,200 | 26,458 |
| DaimlerChrysler AG | 327,337 | 26,354 |
^ | Deutsche Lufthansa AG | 757,289 | 22,636 |
| Salzgitter AG | 135,830 | 22,336 |
| Depfa Bank PLC | 1,167,735 | 21,650 |
^ | Beiersdorf AG | 291,547 | 20,941 |
^ | Celesio AG | 281,134 | 20,075 |
| TUI AG | 705,150 | 19,361 |
^ | Puma AG | 39,725 | 18,041 |
^ | Altana AG | 231,827 | 17,237 |
| Hochtief AG | 139,096 | 14,613 |
^ | IVG Immobilien AG | 286,841 | 12,859 |
^ | RWE AG Pfd. | 128,422 | 12,595 |
^ | Rheinmetall AG | 118,712 | 11,746 |
^ | Bilfinger Berger AG | 122,550 | 11,509 |
| Wincor Nixdorf AG | 103,714 | 10,109 |
^ | Solarworld AG | 120,177 | 10,029 |
| ProSieben Sat.1 Media AG | 270,714 | 9,831 |
| Heidelberger | | |
| Druckmaschinen AG | 193,223 | 9,115 |
* ^ | Qiagen NV | 471,152 | 8,416 |
* | Karstadt Quelle AG | 209,152 | 8,043 |
| Douglas Holding AG | 104,156 | 6,587 |
^ | MLP AG | 199,114 | 4,934 |
*^ | Premier AG | 216,587 | 4,551 |
| Suedzucker AG | 217,923 | 4,458 |
| | | 3,663,678 |
| | | Market |
| | | Value• |
| | Shares | ($000) |
Greece (0.9%) | | |
| National Bank of Greece SA | 1,066,989 | 59,767 |
| Alpha Credit Bank SA | 1,280,230 | 38,963 |
| EFG Eurobank Ergasias | 759,975 | 31,624 |
| Greek Organization of | | |
| Football Prognostics | 738,118 | 27,929 |
| Bank of Piraeus | 710,256 | 25,738 |
* | Hellenic Telecommunication | | |
| Organization SA | 876,037 | 25,180 |
| Coca-Cola Hellenic | | |
| Bottling Co. SA | 358,030 | 15,523 |
| National Bank of Greece | | |
| SA ADR | 951,610 | 10,867 |
| Titan Cement Co. SA | 190,300 | 10,832 |
| Cosmote Mobile | | |
| Communications SA | 330,946 | 10,401 |
| Public Power Corp. | 343,530 | 9,004 |
| Viohalco, Hellenic Copper & | | |
| Aluminum Industry SA | 329,678 | 5,595 |
| Hellenic Technodomiki | | |
| Tev SA | 390,794 | 5,361 |
| Hellenic Petroleum SA | 354,650 | 5,356 |
* | Hellenic | | |
| Telecommunications | | |
| Organization SA ADR | 356,798 | 5,227 |
| Motor Oil (Hellas) Corinth | | |
| Refineries SA | 147,703 | 4,214 |
| Hellenic Exchanges SA | 149,950 | 3,551 |
| Folli-Follie SA | 54,580 | 2,205 |
* | Intracom SA | 290,080 | 1,640 |
| Technical Olympic SA | 251,589 | 561 |
| | | 299,538 |
Ireland (1.2%) | | |
| Allied Irish Banks PLC | 2,910,496 | 88,146 |
| CRH PLC | 1,787,846 | 78,360 |
| Bank of Ireland | 3,227,153 | 69,262 |
| Irish Life & Permanent PLC | 908,061 | 24,040 |
* | Elan Corp. PLC | 1,376,810 | 18,903 |
| C&C Group PLC | 1,028,393 | 17,240 |
| Kerry Group PLC A Shares | 431,870 | 12,906 |
| Kingspan Group PLC | 419,557 | 11,752 |
* | Grafton Group PLC | 747,007 | 11,069 |
| DCC PLC | 265,705 | 8,897 |
| IAWS Group PLC | 356,480 | 8,837 |
| Independent News & | | |
| Media PLC | 1,893,099 | 8,816 |
* | Ryanair Holdings PLC | 874,950 | 7,178 |
| Paddy Power PLC | 151,600 | 4,219 |
* | Ryanair Holdings PLC ADR | 80,107 | 3,739 |
| Greencore Group PLC | 521,725 | 3,264 |
* | Total Produce PLC | 1,028,731 | 1,081 |
* | Elan Corp. PLC ADR | 45,229 | 628 |
| | | 378,337 |
14
European Stock Index Fund
| | | Market |
| | | Value• |
| | Shares | ($000) |
Italy (5.6%) | | |
| Eni SpA | 8,609,899 | 285,536 |
| Unicredito Italiano SpA | 25,836,141 | 265,449 |
* | Intesa Sanpaolo SpA | 23,512,129 | 197,009 |
| Enel SpA | 14,288,658 | 162,383 |
| Assicurazioni Generali SpA | 3,168,517 | 145,738 |
| Telecom Italia SpA | 35,400,012 | 106,214 |
| Unione Di Banche | | |
| Italiane ScpA | 2,008,193 | 60,766 |
| Capitalia SpA | 5,579,612 | 53,126 |
* | Fiat SpA | 1,806,253 | 53,064 |
| Telecom Italia SpA RNC | 19,929,834 | 48,688 |
| Banco Popolare di Verona | | |
| e Novara Scarl SpA | 1,241,388 | 41,445 |
| Mediobanca Banca di | | |
| Credito Finanziaria SpA | 1,616,391 | 37,414 |
| Autostrade SpA | 946,613 | 31,254 |
| Finmeccanica SpA | 982,502 | 30,203 |
| Mediaset SpA | 2,539,309 | 28,715 |
* | Intesa Sanpaolo SpA | | |
| Non Convertible Risp. | 3,082,365 | 24,843 |
| Banca Monte dei Paschi | | |
| di Siena SpA | 3,644,569 | 24,644 |
| Banca Popolare di | | |
| Milano SpA | 1,372,851 | 23,080 |
| Snam Rete Gas SpA | 3,232,725 | 20,648 |
| Alleanza Assicurazioni SpA | 1,399,725 | 19,656 |
| Luxottica Group SpA | 457,672 | 15,886 |
| Terna SpA | 3,969,953 | 14,805 |
| Fondiaria - Sai SpA | 243,298 | 12,885 |
| Pirelli & C. Accomandita | | |
| per Azioni SpA | 9,522,623 | 11,879 |
| Compagnia Assicuratrice | | |
| Unipol SpA | 2,965,325 | 10,999 |
| Seat Pagine Gialle SpA | 13,583,772 | 8,857 |
* | Lottomatica SpA | 198,075 | 8,108 |
| Bulgari SpA | 492,545 | 7,526 |
| Italcementi SpA | 235,230 | 7,515 |
^ | Mediolanum SpA | 842,360 | 7,322 |
| Autogrill SpA | 336,265 | 6,690 |
^ | Mondadori (Arnoldo) | | |
| Editore SpA | 382,998 | 4,216 |
| Benetton Group SpA | 211,190 | 3,663 |
* | Tiscali SpA | 919,260 | 3,412 |
^ | Gruppo Editoriale | | |
| L’Espresso SpA | 578,015 | 3,016 |
* | Parmalat Finanziaria SpA | 569,830 | — |
| | | 1,786,654 |
Netherlands (5.8%) | | |
^ | ABN-AMRO Holding NV | 5,999,767 | 291,102 |
| ING Groep NV | 6,198,357 | 282,328 |
| Unilever NV | 5,670,743 | 173,054 |
| Koninklijke (Royal) Philips | | |
| Electronics NV | 3,862,208 | 158,606 |
| Arcelor Mittal | 2,619,418 | 140,011 |
| | | Market |
| | | Value• |
| | Shares | ($000) |
| Koninklijke KPN NV | 6,397,092 | 108,612 |
| Aegon NV | 4,657,488 | 96,127 |
| Akzo Nobel NV | 899,047 | 72,153 |
* | Koninklijke Ahold NV | 5,144,842 | 65,531 |
| TNT NV | 1,443,826 | 64,930 |
| Reed Elsevier NV | 2,347,929 | 44,134 |
| Heineken NV | 810,290 | 43,374 |
* | ASML Holding NV | 1,566,057 | 42,543 |
| European Aeronautic | | |
| Defence and Space Co. | 1,078,644 | 34,524 |
^ | Koninklijke Numico NV | 567,013 | 31,246 |
^ | Wolters Kluwer NV | 970,485 | 28,746 |
| Rodamco Europe NV | 177,859 | 26,193 |
| Koninklijke DSM NV | 501,001 | 23,899 |
| SBM Offshore NV | 464,531 | 16,645 |
| Vedior NV | 566,298 | 15,041 |
| Randstad Holding NV | 153,186 | 11,976 |
| Corio NV | 132,853 | 11,769 |
| Fugro NV | 191,414 | 10,376 |
| Wereldhave NV | 68,890 | 9,966 |
| Hagemeyer NV | 1,706,978 | 8,076 |
| Oce NV | 261,233 | 4,918 |
^ | Corporate Express | 354,292 | 4,760 |
*^ | Getronics NV | 403,603 | 3,687 |
| Aegon NV (New York) ARS | 172,787 | 3,573 |
* | ASML Holding (New York) | 38,580 | 1,051 |
| | | 1,828,951 |
Norway (1.4%) | | |
| Norsk Hydro ASA | 2,340,091 | 80,659 |
| Statoil ASA | 2,149,290 | 60,151 |
| Orkla ASA | 3,100,080 | 49,420 |
| Telenor ASA | 2,500,783 | 46,539 |
| DnB NOR ASA | 2,210,876 | 31,543 |
| Yara International ASA | 678,121 | 19,777 |
* | Petroleum | | |
| Geo-Services ASA | 565,805 | 15,476 |
* | Acergy SA | 643,445 | 13,762 |
| Aker Kvaerner ASA | 545,705 | 12,788 |
| Storebrand ASA | 741,345 | 12,552 |
* | SeaDrill Ltd. | 759,909 | 12,343 |
| Prosafe ASA | 682,350 | 10,483 |
* | Marine Harvest | 8,620,988 | 9,206 |
| Norske Skogindustrier ASA | 562,552 | 8,608 |
| Tandberg ASA | 401,250 | 8,479 |
* | TGS Nopec | | |
| Geophysical Co. ASA | 352,906 | 8,071 |
| Schibsted ASA | 160,487 | 7,347 |
^ | Frontline Ltd. | 171,584 | 6,420 |
*^ | Det Norske Oljeselskap | | |
| (DNO) ASA | 2,706,379 | 5,260 |
^ | Tomra Systems ASA | 568,453 | 4,583 |
*^ | Ocean Rig ASA | 588,991 | 3,944 |
| Stolt-Nielsen SA | 129,505 | 3,909 |
| | | 431,320 |
15
European Stock Index Fund
| | | Market |
| | | Value• |
| | Shares | ($000) |
Portugal (0.5%) | | |
| Portugal Telecom SGPS SA | 2,613,736 | 37,311 |
| Electricidade de | | |
| Portugal SA | 6,651,932 | 36,401 |
| Banco Comercial | | |
| Portugues SA | 7,166,932 | 30,080 |
| Banco Espirito Santo SA | 663,396 | 13,308 |
| Brisa-Auto Estradas de | | |
| Portugal SA | 987,589 | 13,039 |
| Banco BPI SA | 1,007,028 | 8,642 |
| Sonae SGPS SA | 2,629,103 | 7,147 |
| Cimpor-Cimento | | |
| de Portugal SA | 774,504 | 7,072 |
| PT Multimedia-Servicos | | |
| de Telecomunicacoes | | |
| e Multimedia, SGPS, SA | 256,162 | 4,282 |
| Jeronimo Martins & | | |
| Filho, SGPS, SA | 125,776 | 3,600 |
* | Sonae Industria-SGPS SA | 231,833 | 2,954 |
| | | 163,836 |
Spain (5.7%) | | |
| Banco Santander Central | | |
| Hispano SA | 19,649,227 | 353,680 |
| Telefonica SA | 14,488,367 | 325,429 |
| Banco Bilbao Vizcaya | | |
| Argentaria SA | 11,746,491 | 280,864 |
| Endesa SA | 2,451,064 | 133,904 |
| Iberdrola SA | 2,323,069 | 115,058 |
| Repsol YPF SA | 2,624,598 | 86,469 |
| Banco Popular Espanol SA | 2,813,763 | 55,733 |
| Altadis SA | 847,112 | 55,309 |
| ACS, Actividades | | |
| de Contruccion y | | |
| Servisios, SA | 816,832 | 50,632 |
| Industria de Diseno | | |
| Textil SA | 721,548 | 44,389 |
| Iberdrola SA | | |
| (London Shares) | 711,016 | 35,232 |
| Gas Natural SDG SA | 592,414 | 29,804 |
| Abertis Infraestructuras SA | 755,353 | 24,167 |
| Grupo Ferrovial, SA | 208,883 | 22,682 |
| Acciona SA | 94,598 | 21,102 |
| Gamesa Corporacion | | |
| Tecnologica, SA | 562,962 | 19,395 |
| Union Fenosa SA | 352,645 | 19,269 |
| Sacyr Vallehermoso SA | 329,304 | 17,197 |
| Acerinox SA | 601,402 | 14,199 |
| Fomento de Construc | | |
| y Contra SA | 151,374 | 14,076 |
| Cintra Concesiones de | | |
| Infraestructuras de | | |
| Transport SA | 682,737 | 12,227 |
| Indra Sistemas, SA | 407,816 | 10,039 |
| Corporacion Mapfre SA | 1,880,280 | 9,793 |
| | | Market |
| | | Value• |
| | Shares | ($000) |
| Iberia (Linea Aerea Espana) | 1,570,283 | 8,075 |
| Sociedad General de Aguas | | |
| de Barcelona SA | 197,554 | 7,191 |
| Ebro Puleva SA | 277,384 | 6,422 |
| Telefonica SA ADR | 87,308 | 5,906 |
| NH Hoteles SA | 254,624 | 5,717 |
| Promotora de | | |
| Informaciones SA | 253,883 | 5,695 |
* | Antena 3 Television | 262,087 | 5,618 |
* | Sogecable SA | 136,303 | 5,545 |
* | Zeltia SA | 532,979 | 4,596 |
| | | 1,805,414 |
| Sweden (3.9%) | | |
| Telefonaktiebolaget | | |
| LM Ericsson AB Class B | 49,022,969 | 187,322 |
| Nordea Bank AB | 6,863,100 | 118,675 |
| Hennes & Mauritz AB | | |
| B Shares | 1,569,882 | 103,781 |
| Volvo AB-B Shares | 3,598,520 | 70,647 |
^ | Sandvik AB | 3,334,845 | 63,606 |
| Skandinaviska Enskilda | | |
| Banken AB A Shares | 1,535,017 | 56,216 |
^ | TeliaSonera AB | 6,682,562 | 54,084 |
^ | Svenska Handelsbanken AB | | |
| A Shares | 1,685,380 | 51,381 |
^ | Atlas Copco AB A Shares | 1,110,456 | 42,154 |
| Svenska Cellulosa AB | | |
| B Shares | 620,276 | 31,901 |
| Scania AB Class B | 330,813 | 31,607 |
| Volvo AB-A Shares | 1,568,900 | 31,124 |
^ | SKF AB B Shares | 1,341,861 | 29,239 |
| Skanska AB B Shares | 1,244,748 | 28,798 |
^ | Atlas Copco AB Class | | |
| B Shares | 691,655 | 24,827 |
| Boliden AB | 957,417 | 23,796 |
^ | Electrolux AB Series B | 890,765 | 23,156 |
^ | Assa Abloy AB | 1,032,211 | 23,096 |
^ | Alfa Laval AB | 313,776 | 19,073 |
| Tele2 AB B Shares | 1,074,981 | 18,401 |
^ | Swedish Match AB | 995,427 | 18,375 |
| SSAB Svenskt Stal AB | | |
| Series A | 499,965 | 17,640 |
^ | Husqvarna AB-B Shares | 882,086 | 16,131 |
^ | Securitas AB B Shares | 1,031,982 | 15,675 |
^ | Getinge AB B Shares | 593,743 | 13,598 |
* | Modern Times Group AB | | |
| B Shares | 169,918 | 9,901 |
^ | Trelleborg AB B Shares | 270,044 | 8,327 |
* ^ | Lundin Petroleum AB | 726,454 | 7,999 |
| Holmen AB | 173,538 | 7,733 |
| Castellum AB | 508,404 | 7,719 |
^ | Eniro AB | 571,133 | 7,614 |
^ | Kungsleden AB | 453,604 | 7,321 |
16
European Stock Index Fund
| | | Market |
| | | Value• |
| | Shares | ($000) |
| SSAB Svenskt Stal AB | | |
| Series B | 218,509 | 7,221 |
| Oriflame Cosmetics SA | 132,626 | 6,962 |
| Fabege AB | 256,252 | 6,826 |
| Nobia AB | 483,894 | 6,609 |
| OMX AB | 256,043 | 6,112 |
* | SAS AB | 245,733 | 5,557 |
| Elekta AB B Shares | 280,355 | 4,947 |
| D. Carnegie & Co. AB | 228,040 | 4,510 |
| Axfood AB | 99,764 | 4,036 |
* | Securitas Systems AB | | |
| B Shares | 1,018,915 | 3,766 |
* | Securitas Direct AB | | |
| B Shares | 1,046,804 | 3,259 |
* | Volvo AB- | | |
| B Redemption Shares | 714,294 | 2,666 |
^ | Hoganas AB B Shares | 85,074 | 2,557 |
| Wihlborgs Fastigheter AB | 105,954 | 2,293 |
^ | Billerud Aktiebolag | 143,302 | 2,175 |
* | Telelogic AB | 826,100 | 2,135 |
* | Volvo AB- | | |
| A Redemption Shares | 311,135 | 1,161 |
| | | 1,243,709 |
Switzerland (9.9%) | | |
| Nestle SA (Registered) | 1,325,273 | 524,634 |
| Novartis AG (Registered) | 7,699,773 | 447,324 |
| Roche Holdings AG | 2,323,403 | 437,513 |
| UBS AG | 6,543,019 | 425,224 |
| Credit Suisse Group | | |
| (Registered) | 3,814,163 | 299,346 |
| Zurich Financial Services AG | 478,344 | 138,801 |
| ABB Ltd. | 6,855,094 | 136,983 |
| Swiss Re (Registered) | 1,114,379 | 104,752 |
| Cie. Financiere | | |
| Richemont AG | 1,726,338 | 104,036 |
| Holcim Ltd. (Registered) | 663,654 | 71,091 |
| Syngenta AG | 344,107 | 68,357 |
| Swatch Group AG (Bearer) | 107,056 | 30,675 |
| Adecco SA (Registered) | 436,583 | 30,019 |
| Nobel Biocare Holding AG | 78,097 | 28,118 |
| Geberit AG | 13,079 | 23,227 |
| Swisscom AG | 65,643 | 23,181 |
| Synthes, Inc. | 157,000 | 20,507 |
| Givaudan SA | 20,289 | 19,003 |
| SGS Societe Generale de | | |
| Surveillance Holding SA | | |
| (Registered) | 14,204 | 18,042 |
| Kuehne & | | |
| Nagel International AG | 178,906 | 16,340 |
| Sulzer AG (Registered) | 12,028 | 15,811 |
* | Logitech International SA | 570,503 | 15,486 |
| CIBA Specialty | | |
| Chemicals AG | | |
| (Registered) | 234,323 | 15,482 |
| | | Market |
| | | Value• |
| | Shares | ($000) |
| Phonak Holding AG | 154,090 | 13,631 |
| Clariant AG | 759,632 | 12,560 |
| Lonza AG (Registered) | 124,623 | 12,179 |
* | OC Oerlikon Corp AG | 20,965 | 11,280 |
| Schindler Holding AG | 169,492 | 10,821 |
| Swatch Group AG | | |
| (Registered) | 173,573 | 10,092 |
| PSP Swiss Property AG | 155,035 | 9,269 |
| Rieter Holding AG | 14,797 | 8,179 |
| Straumann Holding AG | 25,485 | 7,442 |
* | SIG Holding AG- | | |
| (Registered) | 19,741 | 7,061 |
| Kuoni Reisen Holding AG | | |
| (Registered) | 9,403 | 5,887 |
| UBS AG | | |
| (New York Shares) | 70,740 | 4,591 |
^ | Kudelski SA | 108,324 | 4,154 |
^ | Micronas Semiconductor | | |
| Holding AG | 109,661 | 2,264 |
| | | 3,133,362 |
| United Kingdom (32.6%) | | |
| HSBC Holdings PLC | 38,263,599 | 706,004 |
| BP PLC | 60,871,793 | 682,897 |
| GlaxoSmithKline PLC | 19,034,801 | 549,026 |
| Vodafone Group PLC | 164,091,169 | 466,832 |
| Royal Bank of | | |
| Scotland Group PLC | 10,451,565 | 400,177 |
| Royal Dutch Shell PLC | | |
| Class B | 9,125,268 | 321,349 |
| Barclays PLC | 21,524,574 | 310,744 |
| Royal Dutch Shell PLC | | |
| Class A | | |
| (Amsterdam Shares) | 8,492,604 | 294,934 |
| AstraZeneca Group PLC | 5,066,237 | 275,533 |
| HBOS PLC | 12,438,423 | 266,924 |
| Anglo American PLC | 4,700,175 | 247,513 |
| Tesco PLC | 26,321,421 | 242,045 |
| Lloyds TSB Group PLC | 18,626,984 | 215,092 |
| Rio Tinto PLC | 3,394,782 | 206,284 |
| Diageo PLC | 8,996,452 | 189,644 |
| BHP Billiton PLC | 7,866,574 | 175,773 |
| BT Group PLC | 27,449,927 | 172,670 |
| BG Group PLC | 11,276,116 | 162,489 |
| British American | | |
| Tobacco PLC | 5,118,859 | 158,431 |
| National Grid Transco PLC | 8,991,910 | 141,185 |
| Aviva PLC | 8,473,649 | 132,942 |
| Royal Dutch Shell PLC | | |
| Class A | 3,755,582 | 130,450 |
| Unilever PLC | 4,116,098 | 128,780 |
| Prudential PLC | 8,083,129 | 120,109 |
| Reckitt Benckiser PLC | 2,011,257 | 110,029 |
| Xstrata PLC | 2,027,486 | 105,504 |
17
European Stock Index Fund
| | | Market |
| | | Value• |
| | Shares | ($000) |
| Imperial | | |
| Tobacco Group PLC | 2,240,716 | 97,666 |
| BAE Systems PLC | 10,668,896 | 96,713 |
| Centrica PLC | 12,108,003 | 93,299 |
| Cadbury Schweppes PLC | 6,924,390 | 91,546 |
| Scottish & | | |
| Southern Energy PLC | 2,845,247 | 85,057 |
| Marks & | | |
| Spencer Group PLC | 5,580,522 | 82,317 |
| SABMiller PLC | 2,977,447 | 70,381 |
| Man Group PLC | 5,939,985 | 66,510 |
| Legal & | | |
| General Group PLC | 21,590,024 | 66,211 |
| Old Mutual PLC | 17,243,946 | 61,199 |
| Alliance Boots PLC | 2,719,573 | 60,679 |
| Land Securities Group PLC | 1,549,990 | 60,341 |
| Rolls-Royce Group PLC | 5,864,637 | 55,866 |
| J. Sainsbury PLC | 4,817,713 | 54,896 |
| Reed Elsevier PLC | 4,169,632 | 52,800 |
| Wolseley PLC | 2,173,767 | 52,297 |
| WPP Group PLC | 3,496,973 | 51,776 |
| British Land Co., PLC | 1,717,147 | 50,156 |
| Compass Group PLC | 6,900,807 | 49,907 |
| Pearson PLC | 2,664,714 | 45,581 |
| Standard Life PLC | 6,964,196 | 44,986 |
| United Utilities PLC | 2,899,667 | 43,222 |
| British Sky | | |
| Broadcasting Group PLC | 3,767,693 | 43,153 |
| International Power PLC | 4,930,666 | 43,112 |
| Kingfisher PLC | 7,792,814 | 42,196 |
| Imperial Chemical | | |
| Industries PLC | 3,944,946 | 41,771 |
| Smiths Group PLC | 1,883,134 | 40,606 |
| Reuters Group PLC | 4,272,909 | 40,599 |
| Hanson Building | | |
| Materials PLC | 2,355,956 | 40,101 |
| Smith & Nephew PLC | 3,114,205 | 38,858 |
| BP PLC ADR | 575,360 | 38,733 |
| Experian Group Ltd. | 3,367,886 | 38,051 |
| 3i Group PLC | 1,538,239 | 35,335 |
| Next PLC | 751,001 | 35,029 |
| Royal & Sun Alliance | | |
| Insurance Group PLC | 9,866,636 | 32,536 |
| Scottish & Newcastle PLC | 2,646,133 | 32,472 |
| ITV PLC | 12,861,294 | 30,613 |
| Cable and Wireless PLC | 8,101,725 | 29,817 |
| Vodafone Group PLC ADR | 1,030,225 | 29,598 |
| Resolution PLC | 2,266,208 | 29,172 |
| Amvescap PLC | 2,468,728 | 28,968 |
| Capita Group PLC | 2,036,887 | 28,615 |
| Hammerson PLC | 943,241 | 28,526 |
| Carnival PLC | 565,467 | 28,478 |
| Intercontinental | | |
| Hotels Group, PLC | 1,174,873 | 28,345 |
| | | Market |
| | | Value• |
| | Shares | ($000) |
| Home Retail Group | 2,902,417 | 26,346 |
| Persimmon PLC | 938,930 | 25,109 |
| Enterprise Inns PLC | 1,961,456 | 24,985 |
| Yell Group PLC | 2,569,808 | 24,880 |
| Whitbread PLC | 648,723 | 24,360 |
| Slough Estates PLC | 1,560,033 | 23,889 |
| Severn Trent PLC | 770,304 | 22,784 |
| Johnson Matthey PLC | 725,394 | 22,709 |
| Punch Taverns PLC | 876,895 | 22,646 |
| The Sage Group PLC | 4,279,893 | 22,462 |
| Kelda Group PLC | 1,185,874 | 21,942 |
| Liberty International PLC | 899,959 | 21,579 |
| Mitchells & Butlers PLC | 1,336,025 | 21,128 |
| Friends Provident PLC | 5,599,886 | 21,084 |
| Barratt Developments PLC | 966,327 | 20,803 |
| Rentokil Initial PLC | 6,004,920 | 20,696 |
| Rexam PLC | 1,931,106 | 20,215 |
| Tate & Lyle PLC | 1,620,929 | 20,100 |
| Burberry Group PLC | 1,460,029 | 20,058 |
| DSG International PLC | 6,066,020 | 19,418 |
* | British Airways PLC | 1,888,181 | 18,995 |
| FirstGroup PLC | 1,439,060 | 18,895 |
| Taylor Woodrow PLC | 1,910,653 | 18,409 |
| GKN PLC | 2,333,893 | 17,843 |
| LogicaCMG PLC | 4,827,659 | 17,609 |
| Group 4 Securicor PLC | 3,788,596 | 17,302 |
* | Invensys PLC | 2,633,285 | 17,286 |
| Ladbrokes PLC | 2,077,265 | 16,839 |
| Daily Mail and | | |
| General Trust PLC | 984,785 | 16,403 |
| Inchcape PLC | 1,455,659 | 16,394 |
| Hays PLC | 4,830,380 | 16,320 |
| ICAP PLC | 1,592,219 | 16,024 |
| Investec PLC | 1,128,435 | 15,969 |
| Bunzl PLC | 1,124,945 | 15,902 |
| Serco Group PLC | 1,577,362 | 15,477 |
| Cobham PLC | 3,722,164 | 15,424 |
| George Wimpey PLC | 1,319,796 | 15,289 |
| Travis Perkins PLC | 382,395 | 15,243 |
| Tomkins PLC | 2,835,279 | 14,948 |
| Signet Group PLC | 5,681,388 | 13,950 |
| William Hill PLC | 1,171,488 | 13,947 |
| United Business | | |
| Media PLC | 836,390 | 13,454 |
| London Stock | | |
| Exchange PLC | 526,383 | 13,145 |
| Meggitt PLC | 2,152,234 | 13,096 |
| Balfour Beatty PLC | 1,415,470 | 13,092 |
| Provident Financial PLC | 847,296 | 13,032 |
| IMI PLC | 1,119,007 | 12,646 |
| Michael Page | | |
| International PLC | 1,093,699 | 12,519 |
| EMI Group PLC | 2,650,398 | 12,311 |
| Amec PLC | 1,103,447 | 12,249 |
18
European Stock Index Fund
| | | Market |
| | | Value• |
| | Shares | ($000) |
| ARM Holdings PLC | 4,450,913 | 11,842 |
| Kesa Electricals PLC | 1,747,638 | 11,743 |
| EMAP PLC | 716,001 | 11,485 |
* | Charter PLC | 551,012 | 11,254 |
| Bellway PLC | 373,386 | 11,244 |
| National | | |
| Express Group PLC | 450,547 | 10,948 |
| Schroders PLC | 407,342 | 10,428 |
* | The Berkeley Group | | |
| Holdings PLC | 300,469 | 10,344 |
| Trinity Mirror PLC | 965,976 | 10,283 |
| Arriva PLC | 655,407 | 9,852 |
| Stagecoach Group PLC | 2,666,306 | 9,845 |
| Intertek Testing | | |
| Services PLC | 518,585 | 9,601 |
| First Choice Holidays PLC | 1,665,051 | 9,532 |
| Cattles PLC | 1,195,215 | 9,485 |
| Aggreko PLC | 844,411 | 9,436 |
| Bovis Homes Group PLC | 399,969 | 8,962 |
| Electrocomponents PLC | 1,437,573 | 8,775 |
| Close Brothers Group PLC | 437,095 | 8,467 |
| Cookson Group PLC | 639,012 | 8,394 |
| Misys PLC | 1,656,552 | 8,233 |
| Brixton PLC | 845,348 | 8,046 |
^ | Carphone Warehouse PLC | 1,324,762 | 7,936 |
| Aegis Group PLC | 2,837,089 | 7,870 |
| Great Portland Estates PLC | 544,471 | 7,790 |
| BBA Aviation PLC | 1,367,540 | 7,689 |
| De La Rue Group PLC | 537,113 | 7,598 |
| Biffa PLC | 1,149,451 | 7,473 |
| The Davis | | |
| Service Group PLC | 558,263 | 7,049 |
| Tullett Prebon PLC | 701,290 | 7,039 |
* | CSR PLC | 425,522 | 6,463 |
* | Galiform PLC | 1,967,645 | 6,437 |
| WPP Group PLC ADR | 78,406 | 5,822 |
| SSL International PLC | 630,127 | 5,444 |
| Premier Farnell PLC | 1,195,523 | 5,189 |
| Rank Group PLC | 1,279,678 | 5,111 |
| FKI PLC | 1,919,181 | 4,596 |
* | Collins Stewart PLC | 696,403 | 3,548 |
* | PartyGaming PLC | 3,258,237 | 3,101 |
| HMV Group PLC | 1,323,364 | 2,969 |
| | | 10,375,978 |
Total Common Stocks | | |
(Cost $20,769,240) | | 31,619,265 |
| | | Market |
| | | Value• |
| | Shares | ($000) |
Temporary Cash Investments (12.2%)1 | | |
Money Market Fund (12.2%) | | |
2 | Vanguard Market | | |
| Liquidity Fund, | | |
| 5.259%—Note E | 3,823,255,535 | 3,823,256 |
2 | Vanguard Market | | |
| Liquidity Fund, 5.259% | 40,672,951 | 40,673 |
| | | 3,863,929 |
| | | |
| | Face | |
| | Amount | |
| | ($000) | |
U.S. Agency Obligations (0.0%) | | |
3 | Federal Home Loan | | |
| Mortgage Corp. | | |
4 | 5.197%, 7/9/07 | 5,000 | 4,951 |
3 | Federal National | | |
| Mortgage Association | | |
4 | 5.189%, 7/25/07 | 2,000 | 1,976 |
| | | 6,927 |
Total Temporary Cash Investments | | |
(Cost $3,870,856) | | 3,870,856 |
Total Investments (111.6%) | | |
(Cost $24,640,096) | | 35,490,121 |
Other Assets and Liabilities (–11.6%) | | |
Other Assets—Note B | | 800,477 |
Security Lending Collateral | | |
| Payable to Brokers—Note E | | (3,823,256) |
Other Liabilities | | (669,530) |
| | | (3,692,309) |
Net Assets (100%) | | 31,797,812 |
19
European Stock Index Fund
At April 30, 2007, net assets consisted of:5 | |
| Amount |
| ($000) |
Paid-in Capital | 20,630,283 |
Undistributed Net Investment Income | 276,501 |
Accumulated Net Realized Gains | 28,064 |
Unrealized Appreciation | |
Investment Securities | 10,850,025 |
Futures Contracts | 7,956 |
Foreign Currencies and | |
Forward Currency Contracts | 4,983 |
Net Assets | 31,797,812 |
| |
Investor Shares—Net Assets | |
Applicable to 562,036,123 outstanding | |
$.001 par value shares of beneficial | |
interest (unlimited authorization) | 22,292,569 |
Net Asset Value Per Share— | |
Investor Shares | $39.66 |
| |
Admiral Shares—Net Assets | |
Applicable to 30,952,102 outstanding | |
$.001 par value shares of beneficial | |
interest (unlimited authorization) | 2,884,653 |
Net Asset Value Per Share— | |
Admiral Shares | $93.20 |
| Amount |
| ($000) |
Signal Shares—Net Assets | |
Applicable to 406,564 outstanding | |
$.001 par value shares of beneficial | |
interest (unlimited authorization) | 14,662 |
Net Asset Value Per Share— | |
Signal Shares | $36.06 |
| |
Institutional Shares—Net Assets | |
Applicable to 109,894,535 outstanding | |
$.001 par value shares of beneficial | |
interest (unlimited authorization) | 4,364,694 |
Net Asset Value Per Share— | |
Institutional Shares | $39.72 |
| |
ETF Shares—Net Assets | |
Applicable to 30,066,716 outstanding | |
$.001 par value shares of beneficial | |
interest (unlimited authorization) | 2,241,234 |
Net Asset Value Per Share— | |
ETF Shares | $74.54 |
• | See Note A in Notes to Financial Statements. |
* | Non-income-producing security. |
^ | Part of security position is on loan to broker-dealers. See Note E in Notes to Financial Statements. |
1 The fund invests a portion of its cash reserves in equity markets through the use of index futures contracts. After giving effect to futures investments, the fund’s effective common stock and temporary cash investment positions represent 99.9% and 11.7%, respectively, of net assets. See Note C in Notes to Financial Statements.
2 Affiliated money market fund available only to Vanguard funds and certain trusts and accounts managed by Vanguard. Rate shown is the 7-day yield.
3 The issuer operates under a congressional charter; its securities are neither issued nor guaranteed by the U.S. government. If needed, access to additional funding from the U.S. Treasury (beyond the issuer’s line of credit) would require congressional action.
4 Securities with a value of $6,927,000 have been segregated as initial margin for open futures contracts.
5 See Note C in Notes to Financial Statements for the tax-basis components of net assets.
ADR—American Depositary Receipt.
20
European Stock Index Fund
Statement of Operations
| Six Months Ended |
| April 30, 2007 |
| ($000) |
Investment Income | |
Income | |
Dividends1 | 396,735 |
Interest2 | 3,204 |
Security Lending | 2,435 |
Total Income | 402,374 |
Expenses | |
The Vanguard Group—Note B | |
Investment Advisory Services | 446 |
Management and Administrative—Investor Shares | 18,710 |
Management and Administrative—Admiral Shares | 1,331 |
Management and Administrative—Signal Shares | 8 |
Management and Administrative—Institutional Shares | 1,162 |
Management and Administrative—ETF Shares | 823 |
Marketing and Distribution—Investor Shares | 2,249 |
Marketing and Distribution—Admiral Shares | 184 |
Marketing and Distribution—Signal Shares | — |
Marketing and Distribution—Institutional Shares | 457 |
Marketing and Distribution—ETF Shares | 189 |
Custodian Fees | 3,045 |
Shareholders’ Reports—Investor Shares | 69 |
Shareholders’ Reports—Admiral Shares | 4 |
Shareholders’ Reports—Signal Shares | — |
Shareholders’ Reports—Institutional Shares | 1 |
Shareholders’ Reports—ETF Shares | 16 |
Trustees’ Fees and Expenses | 14 |
Total Expenses | 28,708 |
Net Investment Income | 373,666 |
Realized Net Gain (Loss) | |
Investment Securities Sold | 99,281 |
Futures Contracts | 4,167 |
Foreign Currencies and Forward Currency Contracts | 5,478 |
Realized Net Gain (Loss) | 108,926 |
Change in Unrealized Appreciation (Depreciation) | |
Investment Securities | 3,891,320 |
Futures Contracts | 3,775 |
Foreign Currencies and Forward Currency Contracts | 4,368 |
Change in Unrealized Appreciation (Depreciation) | 3,899,463 |
Net Increase (Decrease) in Net Assets Resulting from Operations | 4,382,055 |
1 Dividends are net of foreign withholding taxes of $37,680,000.
2 Interest income from an affiliated company of the fund was $2,756,000.
21
European Stock Index Fund
Statement of Changes in Net Assets
| Six Months Ended | Year Ended |
| April 30, | October 31, |
| 2007 | 2006 |
| ($000) | ($000) |
Increase (Decrease) in Net Assets | | |
Operations | | |
Net Investment Income | 373,666 | 618,399 |
Realized Net Gain (Loss) | 108,926 | 436,790 |
Change in Unrealized Appreciation (Depreciation) | 3,899,463 | 3,893,796 |
Net Increase (Decrease) in Net Assets Resulting from Operations | 4,382,055 | 4,948,985 |
Distributions | | |
Net Investment Income | | |
Investor Shares | (460,764) | (283,561) |
Admiral Shares | (62,628) | (37,265) |
Signal Shares | (341) | — |
Institutional Shares | (90,854) | (50,291) |
ETF Shares | (39,981) | (7,061) |
Realized Capital Gain | | |
Investor Shares | — | — |
Admiral Shares | — | — |
Signal Shares | — | — |
Institutional Shares | — | — |
ETF Shares | — | — |
Total Distributions | (654,568) | (378,178) |
Capital Share Transactions—Note F | | |
Investor Shares | 2,792,496 | 2,675,066 |
Admiral Shares | 367,528 | 374,593 |
Signal Shares | 671 | 11,714 |
Institutional Shares | 744,522 | 708,374 |
ETF Shares | 809,813 | 890,919 |
Net Increase (Decrease) from Capital Share Transactions | 4,715,030 | 4,660,666 |
Total Increase (Decrease) | 8,442,517 | 9,231,473 |
Net Assets | | |
Beginning of Period | 23,355,295 | 14,123,822 |
End of Period1 | 31,797,812 | 23,355,295 |
1 Net Assets—End of Period includes undistributed net investment income of $276,501,000 and $554,797,000.
22
European Stock Index Fund
Financial Highlights
Investor Shares | | | | | | |
| Six Months | | | | | |
| Ended | | | | |
For a Share Outstanding | April 30, | Year Ended October 31, |
Throughout Each Period | 2007 | 2006 | 2005 | 2004 | 2003 | 2002 |
Net Asset Value, Beginning of Period | $34.67 | $27.00 | $23.77 | $19.93 | $16.44 | $19.50 |
Investment Operations | | | | | | |
Net Investment Income | .4961 | .92 | .67 | .54 | .44 | .39 |
Net Realized and Unrealized Gain (Loss) | | | | | | |
on Investments | 5.418 | 7.45 | 3.14 | 3.76 | 3.45 | (3.01) |
Total from Investment Operations | 5.914 | 8.37 | 3.81 | 4.30 | 3.89 | (2.62) |
Distributions | | | | | | |
Dividends from Net Investment Income | (.924) | (.70) | (.58) | (.46) | (.40) | (.44) |
Distributions from Realized Capital Gains | — | — | — | — | — | — |
Total Distributions | (.924) | (.70) | (.58) | (.46) | (.40) | (.44) |
Net Asset Value, End of Period | $39.66 | $34.67 | $27.00 | $23.77 | $19.93 | $16.44 |
| | | | | | |
Total Return2 | 17.34% | 31.63% | 16.21% | 21.89% |
| –13.81% |
| | | | | | |
Ratios/Supplemental Data | | | | | | |
Net Assets, End of Period (Millions) | $22,293 | $16,850 | $10,759 | $7,904 | $5,339 | $3,870 |
Ratio of Total Expenses to | | | | | | |
Average Net Assets | 0.25%* | 0.27% | 0.27% | 0.27% | 0.32% | 0.33% |
Ratio of Net Investment Income to | | | | | | |
Average Net Assets | 2.73%* | 3.35% | 2.84% | 2.67% | 2.76% | 2.24% |
Portfolio Turnover Rate3 | 3%* | 6% | 5% | 5% | 6% | 15% |
1 Calculated based on average shares outstanding.
2Total returns do not reflect the 2% fee assessed on redemptions of shares purchased on or after June 27, 2003, and held for less than two months or the $10 annual account maintenance fee applied on balances under $10,000.
3 Excludes the value of portfolio securities received or delivered as a result of in-kind purchases or redemptions of the fund’s capital shares, including ETF Creation Units.
23
European Stock Index Fund
Admiral Shares | | | | | | |
| Six Months | | | | | |
| Ended | | | | |
For a Share Outstanding | April 30, | Year Ended October 31, |
Throughout Each Period | 2007 | 2006 | 2005 | 2004 | 2003 | 2002 |
Net Asset Value, Beginning of Period | $81.50 | $63.44 | $55.84 | $46.82 | $38.61 | $45.77 |
Investment Operations | | | | | | |
Net Investment Income | 1.2081 | 2.23 | 1.611 | 1.308 | 1.070 | .96 |
Net Realized and Unrealized Gain (Loss) | | | | | | |
on Investments | 12.734 | 17.51 | 7.396 | 8.830 | 8.115 | (7.08) |
Total from Investment Operations | 13.942 | 19.74 | 9.007 | 10.138 | 9.185 | (6.12) |
Distributions | | | | | | |
Dividends from Net Investment Income | (2.242) | (1.68) | (1.407) | (1.118) | (.975) | (1.04) |
Distributions from Realized Capital Gains | — | — | — | — | — | — |
Total Distributions | (2.242) | (1.68) | (1.407) | (1.118) | (.975) | (1.04) |
Net Asset Value, End of Period | $93.20 | $81.50 | $63.44 | $55.84 | $46.82 | $38.61 |
| | | | | | |
Total Return2 | 17.40% | 31.77% | 16.32% | 21.98% | 24.42% | –13.74% |
| | | | | | |
Ratios/Supplemental Data | | | | | | |
Net Assets, End of Period (Millions) | $2,885 | $2,175 | $1,360 | $628 | $447 | $335 |
Ratio of Total Expenses to | | | | | | |
Average Net Assets | 0.15%* | 0.17% | 0.18% | 0.18% | 0.23% | 0.23% |
Ratio of Net Investment Income to | | | | | | |
Average Net Assets | 2.83%* | 3.45% | 2.93% | 2.76% | 2.84% | 2.41 |
Portfolio Turnover Rate3 | 3%* | 6% | 5% | 5% | 6% | 15% |
1 Calculated based on average shares outstanding.
2 Total returns do not reflect the 2% fee assessed on redemptions of shares purchased on or after June 27, 2003, and held for less than two months.
3 Excludes the value of portfolio securities received or delivered as a result of in-kind purchases or redemptions of the fund’s capital shares, including ETF Creation Units.
24
European Stock Index Fund
Signal Shares | | |
| Six Months | Oct. 6, |
| Ended | 20061 to |
| April 30, | Oct. 31, |
For a Share Outstanding Throughout Each Period | 2007 | 2006 |
Net Asset Value, Beginning of Period | $31.51 | $30.41 |
Investment Operations | | |
Net Investment Income | .4562 | .012 |
Net Realized and Unrealized Gain (Loss) on Investments | 4.936 | 1.09 |
Total from Investment Operations | 5.392 | 1.10 |
Distributions | | |
Dividends from Net Investment Income | (.842) | — |
Distributions from Realized Capital Gains | — | — |
Total Distributions | (.842) | — |
Net Asset Value, End of Period | $36.06 | $31.51 |
| | |
Total Return3 | 17.39% | 3.62% |
| | |
Ratios/Supplemental Data | | |
Net Assets, End of Period (Millions) | $15 | $12 |
Ratio of Total Expenses to Average Net Assets | 0.15%* | 0.17%* |
Ratio of Net Investment Income to Average Net Assets | 2.83%* | 3.45%* |
Portfolio Turnover Rate4 | 3%* | 6% |
1 Inception.
2 Calculated based on average shares outstanding.
3 Total returns do not reflect the 2% fee assessed on redemptions of shares held for less than two months.
4 Excludes the value of portfolio securities received or delivered as a result of in-kind purchases or redemptions of the fund’s capital shares, including ETF Creation Units.
25
European Stock Index Fund
Institutional Shares | | | | | | |
| Six Months | | | | | |
| Ended | | | | |
For a Share Outstanding | April 30, | Year Ended October 31, |
Throughout Each Period | 2007 | 2006 | 2005 | 2004 | 2003 | 2002 |
Net Asset Value, Beginning of Period | $34.74 | $27.05 | $23.80 | $19.96 | $16.46 | $19.52 |
Investment Operations | | | | | | |
Net Investment Income | .5261 | .978 | .721 | .57 | .471 | .414 |
Net Realized and Unrealized Gain (Loss) | | | | | | |
on Investments | 5.424 | 7.450 | 3.140 | 3.76 | 3.454 | (3.015) |
Total from Investment Operations | 5.950 | 8.428 | 3.861 | 4.33 | 3.925 | (2.601) |
Distributions | | | | | | |
Dividends from Net Investment Income | (.970) | (.738) | (.611) | (.49) | (.425) | (.459) |
Distributions from Realized Capital Gains | — | — | — | — | — | — |
Total Distributions | (.970) | (.738) | (.611) | (.49) | (.425) | (.459) |
Net Asset Value, End of Period | $39.72 | $34.74 | $27.05 | $23.80 | $19.96 | $16.46 |
| | | | | | |
Total Return2 | 17.42% | 31.83% | 16.42% | 22.03% | 24.49% | –13.71% |
| | | | | | |
Ratios/Supplemental Data | | | | | | |
Net Assets, End of Period (Millions) | $4,365 | $3,113 | $1,827 | $988 | $649 | $311 |
Ratio of Total Expenses to | | | | | | |
Average Net Assets | 0.12%* | 0.12% | 0.12% | 0.12% | 0.17% | 0.18% |
Ratio of Net Investment Income to | | | | | | |
Average Net Assets | 2.86%* | 3.50% | 2.99% | 2.77% | 2.96% | 2.46% |
Portfolio Turnover Rate3 | 3%* | 6% | 5% | 5% | 6% | 15% |
1 Calculated based on average shares outstanding.
2 Total returns do not reflect the 2% fee assessed on redemptions of shares purchased on or after June 27, 2003, and held for less than two months.
3 Excludes the value of portfolio securities received or delivered as a result of in-kind purchases or redemptions of the fund’s capital shares, including ETF Creation Units.
26
European Stock Index Fund
ETF Shares | | | |
| Six Months | Year | March 4, |
| Ended | Ended | 20051 to |
| April 30, | Oct. 31, | Oct. 31, |
For a Share Outstanding Throughout Each Period | 2007 | 2006 | 2005 |
Net Asset Value, Beginning of Period | $65.21 | $50.80 | $50.96 |
Investment Operations | | | |
Net Investment Income | 1.0212 | 1.80 | 1.04 |
Net Realized and Unrealized Gain (Loss) on Investments | 10.118 | 13.99 | (1.20) |
Total from Investment Operations | 11.139 | 15.79 | (.16) |
Distributions | | | |
Dividends from Net Investment Income | (1.809) | (1.38) | — |
Distributions from Realized Capital Gains | — | — | — |
Total Distributions | (1.809) | (1.38) | — |
Net Asset Value, End of Period | $74.54 | $65.21 | $50.80 |
| | | |
Total Return | 17.39% | 31.75% | –0.31% |
| | | |
Ratios/Supplemental Data | | | |
Net Assets, End of Period (Millions) | $2,241 | $1,205 | $178 |
Ratio of Total Expenses to Average Net Assets | 0.15%* | 0.18% | 0.18%* |
Ratio of Net Investment Income to Average Net Assets | 2.83%* | 3.44% | 2.93%* |
Portfolio Turnover Rate3 | 3%* | 6% | 5% |
1 Inception.
2 Calculated based on average shares outstanding.
3 Excludes the value of portfolio securities received or delivered as a result of in-kind purchases or redemptions of the fund’s capital shares, including ETF Creation Units.
See accompanying Notes, which are an integral part of the Financial Statements.
27
European Stock Index Fund
Notes to Financial Statements
Vanguard European Stock Index Fund is registered under the Investment Company Act of 1940 as an open-end investment company, or mutual fund. The fund files reports with the SEC under the company name Vanguard International Equity Index Funds. The fund invests in securities of foreign issuers, which may subject it to investment risks not normally associated with investing in securities of U.S. corporations. The fund offers five classes of shares: Investor Shares, Admiral Shares, Signal Shares, Institutional Shares, and ETF Shares. Investor Shares are available to any investor who meets the fund’s minimum purchase requirements. Admiral Shares are designed for investors who meet certain administrative, service, tenure, and account-size criteria. Signal Shares are designed for institutional investors who meet certain administrative, service, and account-size criteria. Institutional Shares are designed for investors who meet certain administrative and service criteria and invest a minimum of $5 million. ETF Shares are listed for trading on the American Stock Exchange; they can be purchased and sold through a broker.
A. The following significant accounting policies conform to generally accepted accounting principles for U.S. mutual funds. The fund consistently follows such policies in preparing its financial statements.
1. Security Valuation: Securities are valued as of the close of trading on the New York Stock Exchange (generally 4 p.m., Eastern time) on the valuation date. Equity securities are valued at the latest quoted sales prices or official closing prices taken from the primary market in which each security trades; such securities not traded on the valuation date are valued at the mean of the latest quoted bid and asked prices. Securities for which market quotations are not readily available, or whose values have been affected by events occurring before the fund’s pricing time but after the close of the securities’ primary markets, are valued at their fair values calculated according to procedures adopted by the board of trustees. These procedures include obtaining quotations from an independent pricing service, monitoring news to identify significant market- or security-specific events, and evaluating changes in the values of foreign market proxies (for example, ADRs, futures contracts, or exchange-traded funds), between the time the foreign markets close and the fund’s pricing time. When fair-value pricing is employed, the prices of securities used by a fund to calculate its net asset value may differ from quoted or published prices for the same securities. Investments in Vanguard Market Liquidity Fund are valued at that fund’s net asset value. Temporary cash investments acquired over 60 days to maturity are valued using the latest bid prices or using valuations based on a matrix system (which considers such factors as security prices, yields, maturities, and ratings), both as furnished by independent pricing services. Other temporary cash investments are valued at amortized cost, which approximates market value.
2. Foreign Currency: Securities and other assets and liabilities denominated in foreign currencies are translated into U.S. dollars using exchange rates obtained from an independent third party as of the fund’s pricing time on the valuation date. Realized gains (losses) and unrealized appreciation (depreciation) on investment securities include the effects of changes in exchange rates since the securities were purchased, combined with the effects of changes in security prices. Fluctuations in the value of other assets and liabilities resulting from changes in exchange rates are recorded as unrealized foreign currency gains (losses) until the assets or liabilities are settled in cash, at which time they are recorded as realized foreign currency gains (losses).
3. Futures and Forward Currency Contracts: The fund uses index futures contracts to a limited extent, with the objectives of maintaining full exposure to the stock market, enhancing returns, maintaining liquidity, and minimizing transaction costs. The fund may purchase futures contracts to immediately invest incoming cash in the market, or sell futures in response to cash outflows, thereby simulating a fully invested position in the underlying index while maintaining a cash balance for liquidity. The fund may seek to enhance returns by using futures contracts instead of the underlying securities when
28
European Stock Index Fund
futures are believed to be priced more attractively than the underlying securities. The primary risks associated with the use of futures contracts are imperfect correlation between changes in market values of stocks held by the fund and the prices of futures contracts, and the possibility of an illiquid market.
The fund also may enter into forward currency contracts to provide the appropriate currency exposure related to any open futures contracts. The fund’s risks in using these contracts include movement in the values of the foreign currencies relative to the U.S. dollar and the ability of the counterparties to fulfill their obligations under the contracts.
Futures and forward currency contracts are valued at their quoted daily settlement prices. The aggregate principal amounts of the contracts are not recorded in the Statement of Net Assets. Fluctuations in the value of the contracts are recorded in the Statement of Net Assets as an asset (liability) and in the Statement of Operations as unrealized appreciation (depreciation) until the contracts are closed, when they are recorded as realized gains (losses) on futures or forward currency contracts.
4. Federal Income Taxes: The fund intends to continue to qualify as a regulated investment company and distribute all of its taxable income. Accordingly, no provision for federal income taxes is required in the financial statements.
5. Distributions: Distributions to shareholders are recorded on the ex-dividend date.
6. Security Lending: The fund may lend its securities to qualified institutional borrowers to earn additional income. Security loans are required to be secured at all times by collateral at least equal to the market value of securities loaned. The fund invests cash collateral received in Vanguard Market Liquidity Fund, and records a liability for the return of the collateral, during the period the securities are on loan. Security lending income represents the income earned on investing cash collateral, less expenses associated with the loan.
7. Other: Dividend income is recorded on the ex-dividend date. Interest income includes income distributions received from Vanguard Market Liquidity Fund and is accrued daily. Security transactions are accounted for on the date securities are bought or sold. Costs used to determine realized gains (losses) on the sale of investment securities are those of the specific securities sold. Fees assessed on redemptions of capital shares are credited to paid-in capital.
Each class of shares has equal rights as to assets and earnings, except that each class separately bears certain class-specific expenses related to maintenance of shareholder accounts (included in Management and Administrative expenses) and shareholder reporting. Marketing and distribution expenses are allocated to each class of shares based on a method approved by the board of trustees. Income, other non-class-specific expenses, and gains and losses on investments are allocated to each class of shares based on its relative net assets.
B. The Vanguard Group furnishes at cost investment advisory, corporate management, administrative, marketing, and distribution services. The costs of such services are allocated to the fund under methods approved by the board of trustees. The fund has committed to provide up to 0.40% of its net assets in capital contributions to Vanguard. At April 30, 2007, the fund had contributed capital of $2,718,000 to Vanguard (included in Other Assets), representing 0.01% of the fund’s net assets and 2.72% of Vanguard’s capitalization. The fund’s trustees and officers are also directors and officers of Vanguard.
C. Distributions are determined on a tax basis and may differ from net investment income and realized capital gains for financial reporting purposes. Differences may be permanent or temporary. Permanent differences are reclassified among capital accounts in the financial statements to reflect their tax character. Temporary differences arise when certain items of income, expense, gain, or loss are recognized in
29
European Stock Index Fund
different periods for financial statement and tax purposes; these differences will reverse at some time in the future. Differences in classification may also result from the treatment of short-term gains as ordinary income for tax purposes.
During the six months ended April 30, 2007, the fund realized net foreign currency gains of $2,606,000, which increased distributable net income for tax purposes; accordingly, such gains have been reclassified from accumulated net realized gains to undistributed net investment income.
Certain of the fund’s investments are in securities considered to be “passive foreign investment companies,” for which any unrealized appreciation and/or realized gains are required to be included in distributable net income for tax purposes. Unrealized appreciation through October 31, 2006, on passive foreign investment company holdings at April 30, 2007, was $17,126,000, all of which has been distributed and is reflected in the balance of undistributed net investment income.
The fund’s tax-basis capital gains and losses are determined only at the end of each fiscal year. For tax purposes, at October 31, 2006, the fund had available realized losses of $75,315,000 to offset future net capital gains of $30,493,000 through October 31, 2010, and $44,822,000 through October 31, 2011. The fund will use these capital losses to offset net taxable capital gains, if any, realized during the year ending October 31, 2007; should the fund realize net capital losses for the year, the losses will be added to the loss carryforward balances above.
At April 30, 2007, the cost of investment securities for tax purposes was $24,657,222,000. Net unrealized appreciation of investment securities for tax purposes was $10,832,899,000, consisting of unrealized gains of $11,006,637,000 on securities that had risen in value since their purchase and $173,738,000 in unrealized losses on securities that had fallen in value since their purchase.
At April 30, 2007, the aggregate settlement value of open futures contracts expiring in June 2007 and the related unrealized appreciation (depreciation) were:
| | | ($000) |
| | Aggregate | Unrealized |
| Number of | Settlement | Appreciation |
Futures Contracts | Long Contracts | Value | (Depreciation) |
MSCI Pan-Euro Index | 4,425 | 154,164 | 7,956 |
At April 30, 2007, the fund had open forward currency contracts to receive and deliver currencies as follows:
| | | | | Unrealized |
| | | | | Appreciation |
| | | Contract Amount (000) | (Depreciation) |
Contract Settlement Date | | Receive | | Deliver | ($000) |
6/20/2007 | EUR | 107,068 | USD | 143,668 | 2,746 |
EUR—Euro. | | | | | |
USD—U.S. dollar. | | | | | |
Unrealized appreciation (depreciation) on open forward currency contracts is treated as realized gain (loss) for tax purposes.
The fund had net unrealized foreign currency gains of $2,237,000 resulting from the translation of other assets and liabilities at April 30, 2007.
30
European Stock Index Fund
D. During the six months ended April 30, 2007, the fund purchased $4,773,912,000 of investment securities and sold $443,008,000 of investment securities, other than temporary cash investments.
E. The market value of securities on loan to broker-dealers at April 30, 2007, was $3,645,410,000, for which the fund received cash collateral of $3,823,256,000.
F. Capital share transactions for each class of shares were:
| Six Months Ended | Year Ended |
| April 30, 2007 | October 31, 2006 |
| Amount | Shares | Amount | Shares |
| ($000) | (000) | ($000) | (000) |
Investor Shares | | | | |
Issued | 2,956,117 | 80,246 | 3,520,497 | 114,339 |
Issued in Lieu of Cash Distributions | 454,610 | 12,663 | 277,433 | 9,958 |
Redeemed1 | (618,231) | (16,813) | (1,122,864) | (36,806) |
Net Increase (Decrease)—Investor Shares | 2,792,496 | 76,096 | 2,675,066 | 87,491 |
Admiral Shares | | | | |
Issued | 479,313 | 5,545 | 575,431 | 8,005 |
Issued in Lieu of Cash Distributions | 51,856 | 615 | 31,004 | 474 |
Redeemed1 | (163,641) | (1,897) | (231,842) | (3,224) |
Net Increase (Decrease)—Admiral Shares | 367,528 | 4,263 | 374,593 | 5,255 |
Signal Shares | | | | |
Issued | 1,619 | 49 | 11,828 | 389 |
Issued in Lieu of Cash Distributions | 341 | 10 | — | — |
Redeemed1 | (1,289) | (38) | (114) | (4) |
Net Increase (Decrease)—Signal Shares | 671 | 21 | 11,714 | 385 |
Institutional Shares | | | | |
Issued | 969,957 | 26,415 | 1,421,711 | 45,135 |
Issued in Lieu of Cash Distributions | 80,880 | 2,251 | 43,746 | 1,569 |
Redeemed1 | (306,315) | (8,391) | (757,083) | (24,631) |
Net Increase (Decrease)—Institutional Shares | 744,522 | 20,275 | 708,374 | 22,073 |
ETF Shares | | | | |
Issued | 809,813 | 11,595 | 890,919 | 14,968 |
Issued in Lieu of Cash Distributions | — | — | — | — |
Redeemed | — | — | — | — |
Net Increase (Decrease)—ETF Shares | 809,813 | 11,595 | 890,919 | 14,968 |
G. In June 2006, the Financial Accounting Standards Board issued Interpretation No. 48 (“FIN 48”), “Accounting for Uncertainty in Income Taxes.” FIN 48 establishes the minimum threshold for recognizing, and a system for measuring, the benefits of tax-return positions in financial statements. FIN 48 will be effective for the fund’s fiscal year beginning November 1, 2007. Management is in the process of analyzing the fund’s tax positions for purposes of implementing FIN 48; based on the analysis completed to date, management does not believe the adoption of FIN 48 will result in any material impact to the fund’s financial statements.
1 Net of redemption fees of $414,000 and $712,000 (fund totals).
31
Pacific Stock Index Fund
Fund Profile
As of April 30, 2007
Portfolio Characteristics | | |
| | Target | Broad |
| Fund | Index1 | Index2 |
Number of Stocks | 563 | 562 | 2,107 |
Turnover Rate | 1%3 | — | — |
Expense Ratio | | — | — |
Investor Shares | 0.24%3 | | |
Admiral Shares | 0.15%3 | | |
Institutional Shares | 0.12%3 | | |
ETF Shares | 0.15%3 | | |
Short-Term Reserves | 0% | — | — |
Sector Diversification (% of portfolio) | |
| | Target | Broad |
| Fund | Index1 | Index2 |
Consumer Discretionary | 16% | 17% | 11% |
Consumer Staples | 5 | 5 | 8 |
Energy | 2 | 2 | 9 |
Financials | 29 | 29 | 27 |
Health Care | 5 | 5 | 7 |
Industrials | 16 | 15 | 11 |
Information Technology | 9 | 9 | 9 |
Materials | 11 | 11 | 8 |
Telecommunication Services | 3 | 3 | 5 |
Utilities | 4 | 4 | 5 |
Volatility Measures4 | |
| Fund Versus | Fund Versus |
| Target Index1 | Broad Index2 |
R-Squared | 0.98 | 0.67 |
Beta | 1.00 | 0.92 |
Ten Largest Holdings5 (% of total net assets) |
| | |
Toyota Motor Corp. | automobile manufacturers | 4.2% |
Mitsubishi UFJ Financial Group | diversified banks | 2.2 |
BHP Billiton Ltd. | diversified metals and mining | 2.1 |
Canon, Inc. | office electronics | 1.4 |
National Australia Bank Ltd. | diversified banks | 1.4 |
Takeda Pharmaceutical Co. Ltd. | pharmaceuticals | 1.4 |
Sumitomo Mitsui Financial Group, Inc. | diversified banks | 1.4 |
Mizuho Financial Group, Inc. | diversified banks | 1.4 |
Commonwealth Bank of Australia | diversified banks | 1.4 |
Honda Motor Co., Ltd. | automobile manufacturers | 1.3 |
Top Ten | | 18.2% |
Market Diversification (% of portfolio) | |
| | Target |
| Fund | Index1 |
Japan | 70% | 70% |
Australia | 20 | 20 |
Hong Kong | 6 | 6 |
Singapore | 3 | 3 |
New Zealand | 1 | 1 |
1 MSCI Pacific Index.
2 MSCI All Country World Index ex USA.
3 Annualized.
4 For an explanation of R-squared, beta, and other terms used here, see the Glossary on page 109.
5 “Ten Largest Holdings” excludes any temporary cash investments and equity index products.
32
Pacific Stock Index Fund
Performance Summary
All of the returns in this report represent past performance, which is not a guarantee of future results that may be achieved by the fund. (Current performance may be lower or higher than the performance data cited. For performance data current to the most recent month-end, visit our website at www.vanguard.com/performance.) Note, too, that both investment returns and principal value can fluctuate widely, so an investor’s shares, when sold, could be worth more or less than their original cost. The returns shown do not reflect taxes that a shareholder would pay on fund distributions or on the sale of fund shares.
Fiscal-Year Total Returns (%): October 31, 1996–April 30, 2007
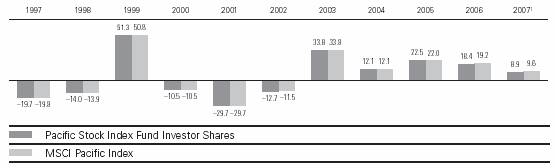
Average Annual Total Returns: Periods Ended March 31, 2007
This table presents average annual total returns through the latest calendar quarter—rather than through the end of the fiscal period. Securities and Exchange Commission rules require that we provide this information.
| Inception Date | One Year | Five Years | Ten Years |
Pacific Stock Index Fund | | | | |
Investor Shares2 | 6/18/1990 | 9.78% | 15.62% | 4.48% |
Admiral Shares2 | 8/13/2001 | 9.93 | 15.75 | 11.603 |
Institutional Shares2 | 5/15/2000 | 9.90 | 15.82 | 3.903 |
ETF Shares | 3/4/2005 | | | |
Market Price | | 9.93 | 17.943 | -— |
Net Asset Value | | 9.20 | 18.053 | — |
1 Six months ended April 30, 2007.
2 Total returns do not reflect the 0.5% transaction fee on purchases through March 31, 2000; the 2% fee assessed on redemptions of shares purchased on or after June 27, 2003, and held for less than two months; or, for Investors Shares, the $10 annual account maintenance fee applied on balances under $10,000.
3 Return since inception.
Note: See Financial Highlights tables on pages 44 through 47 for dividend and capital gains information.
33
Pacific Stock Index Fund
Financial Statements (unaudited)
Statement of Net Assets
As of April 30, 2007
The fund provides a complete list of its holdings four times in each fiscal year, at the quarter-ends. For the second and fourth fiscal quarters, the lists appear in the fund’s semiannual and annual reports to shareholders. For the first and third fiscal quarters, the fund files the lists with the Securities and Exchange Commission on Form N-Q. Shareholders can look up the fund’s Forms N-Q on the SEC’s website at www.sec.gov. Forms N-Q may also be reviewed and copied at the SEC’s Public Reference Room (see the back cover of this report for further information).
| | | Market |
| | | Value• |
| | Shares | ($000) |
Common Stocks (99.3%)1 | | |
Australia (19.9%) | | |
| BHP Billiton Ltd. | 12,040,212 | 293,954 |
| National Australia | | |
| Bank Ltd. | 5,609,358 | 199,258 |
| Commonwealth Bank of | | |
| Australia | 4,443,162 | 193,749 |
| Australia & New Zealand | | |
| Bank Group Ltd. | 6,333,580 | 160,026 |
| Westpac | | |
| Banking Corp., Ltd. | 6,334,763 | 141,430 |
| Woolworths Ltd. | 4,147,890 | 97,149 |
| Westfield Group | 5,187,030 | 89,810 |
| QBE Insurance Group Ltd. | 2,868,415 | 72,741 |
^ | Rio Tinto Ltd. | 984,207 | 67,215 |
| Macquarie Bank Ltd. | 863,924 | 61,907 |
| Brambles Ltd. | 5,345,640 | 58,314 |
| AMP Ltd. | 6,457,483 | 57,313 |
^ | Suncorp-Metway Ltd. | 3,168,958 | 56,097 |
| Coles Group Ltd. | 3,920,192 | 55,943 |
| Woodside Petroleum Ltd. | 1,607,323 | 52,262 |
| Rinker Group Ltd. | 3,086,816 | 47,497 |
| CSL Ltd. | 628,975 | 45,306 |
| Wesfarmers Ltd. | 1,302,078 | 42,167 |
| Telstra Corp. Ltd. | 9,879,039 | 38,165 |
| Foster’s Group Ltd. | 6,980,525 | 36,852 |
| Stockland | 4,939,735 | 35,173 |
| Toll Holdings Ltd. | 1,849,863 | 33,694 |
| Insurance | | |
| Australia Group Ltd. | 5,963,378 | 29,478 |
| Macquarie | | |
| Infrastucture Group | 9,174,461 | 28,752 |
| Macquarie Goodman Group | 4,858,744 | 28,498 |
| Orica Ltd. | 1,068,994 | 27,816 |
| GPT Group | 6,679,991 | 27,359 |
| Tabcorp Holdings Ltd. | 1,807,987 | 27,093 |
| BlueScope Steel Ltd. | 2,502,440 | 24,847 |
| Alumina Ltd. | 4,001,443 | 23,624 |
| Australian Stock | | |
| Exchange Ltd. | 588,220 | 23,303 |
| | | Market |
| | | Value• |
| | Shares | ($000) |
| Zinifex Ltd. | 1,677,051 | 22,905 |
| Centro Properties Group | 2,910,802 | 22,523 |
| Origin Energy Ltd. | 2,949,539 | 22,220 |
| Newcrest Mining Ltd. | 1,150,942 | 22,218 |
^ | Alinta Ltd. | 1,698,501 | 21,112 |
| Lend Lease Corp. | 1,240,409 | 20,437 |
^ | Transurban Group | 2,872,244 | 19,156 |
| Babcock & Brown Ltd. | 783,592 | 19,121 |
| Santos Ltd. | 2,061,280 | 19,090 |
| AGL Energy Ltd. | 1,493,279 | 18,978 |
| Amcor Ltd. | 2,986,159 | 18,394 |
| AXA Asia Pacific | | |
| Holdings Ltd. | 3,002,150 | 18,291 |
^ | John Fairfax Holdings Ltd. | 4,109,391 | 17,778 |
^ | Aristocrat Leisure Ltd. | 1,208,196 | 16,557 |
| Tattersall’s Ltd. | 3,704,484 | 15,787 |
*^ | Paladin Resources Ltd. | 1,917,521 | 15,005 |
| Mirvac Group | 3,390,145 | 14,720 |
| Qantas Airways Ltd. | 3,348,421 | 14,709 |
| Boral Ltd. | 2,048,418 | 14,284 |
| Coca-Cola Amatil Ltd. | 1,804,999 | 14,181 |
| DB RREEF Trust | 9,333,437 | 13,893 |
| Leighton Holdings Ltd. | 478,835 | 13,783 |
| Telstra Corp. Installment | | |
| Receipt Exp. 3/31/08 | 5,121,695 | 13,530 |
| Computershare Ltd. | 1,544,170 | 13,313 |
| WorleyParsons Ltd. | 549,036 | 12,469 |
| James Hardie Industries NV | 1,603,039 | 11,759 |
| Investa Property Group | 5,254,346 | 11,601 |
| Sonic Healthcare Ltd. | 915,498 | 10,817 |
| Cochlear Ltd. | 189,170 | 9,908 |
^ | Perpetual Trustees | | |
| Australia Ltd. | 141,226 | 9,441 |
^ | OneSteel Ltd. | 1,968,153 | 9,299 |
| Caltex Australia Ltd. | 463,239 | 9,282 |
| CSR Ltd. | 3,024,571 | 9,174 |
| Macquarie Office Trust | 6,836,763 | 9,076 |
| CFS Gandel Retail Trust | 4,676,949 | 8,944 |
| Multiplex Group | 2,152,996 | 8,282 |
| Publishing & | | |
| Broadcasting Ltd. | 471,823 | 7,988 |
34
Pacific Stock Index Fund
| | | Market |
| | | Value• |
| | Shares | ($000) |
| JFE Holdings, Inc. | 1,921,500 | 105,621 |
| Mitsubishi Corp. | 4,653,500 | 99,196 |
| Mitsui & Co., Ltd. | 5,347,600 | 96,159 |
| East Japan Railway Co. | 11,710 | 94,956 |
| Millea Holdings, Inc. | 2,469,500 | 91,505 |
| Nippon Telegraph and | | |
| Telephone Corp. | 17,892 | 88,834 |
| Hitachi Ltd. | 11,601,000 | 88,107 |
| Shin-Etsu | | |
| Chemical Co., Ltd. | 1,339,500 | 86,456 |
| Mitsui Fudosan Co., Ltd. | 2,883,573 | 84,170 |
| Orix Corp. | 311,876 | 83,158 |
| Seven and | | |
| I Holdings Co., Ltd. | 2,833,240 | 81,699 |
| Astellas Pharma Inc. | 1,845,298 | 80,722 |
| Nissan Motor Co., Ltd. | 7,785,220 | 78,307 |
| Japan Tobacco, Inc. | 15,499 | 75,702 |
| Toshiba Corp. | 9,978,000 | 74,300 |
| Kansai Electric | | |
| Power Co., Inc. | 2,652,600 | 74,237 |
| Chubu Electric Power Co. | 2,289,900 | 73,576 |
| Komatsu Ltd. | 3,095,968 | 73,262 |
| Daiichi Sankyo Co., Ltd. | 2,405,036 | 71,751 |
| Sumitomo Metal | | |
| Industries Ltd. | 14,070,000 | 71,439 |
| Fuji Photo Film Co., Ltd. | 1,683,866 | 69,363 |
| Mitsubishi Heavy | | |
| Industries Ltd. | 11,039,000 | 67,945 |
| KDDI Corp. | 8,387 | 65,911 |
| Mitsubishi Electric Corp. | 6,656,000 | 64,520 |
| Sharp Corp. | 3,443,000 | 63,183 |
| Sumitomo Corp. | 3,661,000 | 62,703 |
| Fanuc Co., Ltd. | 618,700 | 60,588 |
| Central Japan Railway Co. | 5,401 | 59,470 |
| Denso Corp. | 1,674,700 | 59,212 |
^ | Softbank Corp. | 2,544,618 | 54,702 |
| Kyocera Corp. | 560,100 | 54,436 |
| Mitsui Sumitomo Insurance Co. | 4,169,552 | 51,741 |
| Murata | | |
| Manufacturing Co., Ltd. | 698,255 | 51,457 |
| Daiwa Securities Group Inc. | 4,595,850 | 51,189 |
| Itochu Corp. | 5,186,000 | 51,060 |
| T & D Holdings, Inc. | 806,000 | 51,045 |
| Ricoh Co. | 2,309,386 | 50,687 |
| Sumitomo Realty & Development Co. | 1,311,672 | 48,415 |
| Mitsui OSK Lines Ltd. | 3,737,000 | 47,095 |
| Kao Corp. | 1,703,661 | 46,765 |
| Asahi Glass Co., Ltd. | 3,268,200 | 43,963 |
| Hoya Corp. | 1,423,394 | 43,740 |
| Bridgestone Corp. | 2,100,859 | 42,606 |
| Sumitomo Trust & Banking Co., Ltd. | 4,325,959 | 42,247 |
| Eisai Co., Ltd. | 868,200 | 41,235 |
| | | Market |
| | | Value• |
| | Shares | ($000) |
| Nikko Securities Co., Ltd. | 2,856,253 | 41,081 |
| Kirin Brewery Co., Ltd. | 2,713,048 | 41,010 |
| Fujitsu Ltd. | 6,417,000 | 40,335 |
| Aeon Co., Ltd. | 2,191,700 | 40,088 |
| Tokyo Gas Co., Ltd. | 7,743,000 | 38,913 |
| Tokyo Electron Ltd. | 559,830 | 38,825 |
| TDK Corp. | 435,800 | 37,584 |
| NEC Corp. | 6,990,812 | 37,125 |
| Kyushu Electric | | |
| Power Co., Inc. | 1,306,600 | 36,805 |
| Kubota Corp. | 3,806,000 | 35,971 |
^ | Resona Holdings Inc. | 15,705 | 35,443 |
| Sompo Japan | | |
| Insurance Inc. | 2,892,000 | 35,320 |
| Tohoku Electric Power Co. | 1,472,200 | 35,156 |
| Sumitomo Electric | | |
| Industries Ltd. | 2,484,700 | 35,138 |
| Sumitomo Metal | | |
| Mining Co. | 1,876,000 | 34,851 |
| Dai-Nippon | | |
| Printing Co., Ltd. | 2,138,741 | 34,091 |
| Kobe Steel Ltd. | 9,656,095 | 34,049 |
| Sumitomo Chemical Co. | 5,132,000 | 33,896 |
| Rohm Co., Ltd. | 368,300 | 33,266 |
| Nippon Oil Corp. | 4,287,479 | 32,924 |
| Secom Co., Ltd. | 723,000 | 32,672 |
| Mitsubishi Chemical | | |
| Holdings Corp. | 4,044,000 | 32,542 |
| Marubeni Corp. | 5,368,000 | 32,233 |
| Toyoda Automatic Loom | | |
| Works Ltd. | 673,400 | 31,729 |
| Toray Industries, Inc. | 4,585,740 | 31,451 |
| Nippon Yusen Kabushiki | | |
| Kaisha Co. | 3,602,000 | 30,977 |
| Bank of Yokohama Ltd. | 4,116,000 | 30,133 |
| Asahi Kasei Corp. | 4,223,000 | 29,862 |
| Daiwa House | | |
| Industry Co., Ltd. | 1,860,000 | 29,156 |
| Keyence Corp. | 129,799 | 28,853 |
| Olympus Corp. | 794,312 | 27,783 |
| Daikin Industries Ltd. | 817,800 | 27,639 |
| Yamada Denki Co., Ltd. | 293,176 | 27,089 |
| Sekisui House Ltd. | 1,832,858 | 27,050 |
| Tokyu Corp. | 3,680,000 | 26,763 |
| Shiseido Co., Ltd. | 1,242,828 | 26,661 |
| West Japan Railway Co. | 5,855 | 26,496 |
| Ibiden Co., Ltd. | 463,839 | 26,365 |
| Ajinomoto Co., Inc. | 2,127,000 | 26,167 |
| Osaka Gas Co., Ltd. | 6,930,000 | 25,985 |
| Office Building Fund of | | |
| Japan Inc. | 1,575 | 25,459 |
| Nitto Denko Corp. | 568,500 | 25,090 |
| Chugai | | |
| Pharmaceutical Co., Ltd. | 963,500 | 24,569 |
36
Pacific Stock Index Fund
| | | Market |
| | | Value• |
| | Shares | ($000) |
| Nippon Mining | | |
| Holdings Inc. | 3,038,000 | 24,398 |
| Advantest Corp. | 549,936 | 24,340 |
| Inpex Holdings, Inc. | 2,844 | 24,001 |
| Electric Power | | |
| Development Co., Ltd. | 545,040 | 23,865 |
| SMC Corp. | 185,677 | 23,737 |
| Hankyu Corp. | 4,159,958 | 23,635 |
| Nidec Corp. | 373,800 | 23,582 |
| Nikon Corp. | 1,024,126 | 23,496 |
| Terumo Corp. | 581,059 | 23,481 |
| Asahi Breweries Ltd. | 1,415,800 | 23,069 |
| Konica Minolta | | |
| Holdings, Inc. | 1,648,000 | 22,549 |
| Shinsei Bank, Ltd. | 5,075,046 | 21,884 |
| Aisin Seiki Co., Ltd. | 659,738 | 21,693 |
| Chiba Bank Ltd. | 2,622,000 | 21,672 |
| NTT Data Corp. | 4,348 | 21,327 |
| Mitsui Trust Holding Inc. | 2,342,400 | 21,162 |
| Shizuoka Bank Ltd. | 1,984,000 | 20,894 |
| JS Group Corp. | 916,508 | 20,697 |
| Omron Corp. | 772,200 | 20,687 |
| Sumitomo Heavy | | |
| Industries Ltd. | 1,982,000 | 20,402 |
| NGK Insulators Ltd. | 920,858 | 20,099 |
| Shionogi & Co., Ltd. | 1,028,294 | 20,039 |
| Nippon Electric | | |
| Glass Co., Ltd. | 1,156,097 | 19,786 |
| Toppan Printing Co., Ltd. | 1,927,000 | 19,547 |
^ | Kawasaki Kisen Kaisha Ltd. | 1,738,000 | 18,876 |
| Yamato Holdings Co., Ltd. | 1,260,000 | 18,241 |
| Kawasaki Heavy | | |
| Industries Ltd. | 4,570,000 | 18,192 |
| Mitsui Chemicals, Inc. | 2,182,000 | 18,108 |
| Yahoo Japan Corp. | 52,070 | 18,004 |
| Japan Real Estate | | |
| Investment Corp. | 1,342 | 17,989 |
| Dentsu Inc. | 6,228 | 17,735 |
| Ishikawajima-Harima Heavy | | |
| Industries Co. | 4,481,000 | 17,462 |
| Toyota Tsusho Corp. | 716,804 | 17,412 |
| Nippon Express Co., Ltd. | 2,746,000 | 16,999 |
| Yamaha Motor Co., Ltd. | 640,800 | 16,928 |
| Kintetsu Corp. | 5,599,150 | 16,711 |
| Mitsubishi Materials Corp. | 3,420,000 | 16,686 |
| Casio Computer Co. | 816,900 | 16,490 |
* | Fukuoka | | |
| Financial Group, Inc. | 2,126,000 | 16,192 |
| Hokkaido Electric | | |
| Power Co., Ltd. | 630,261 | 15,982 |
| Credit Saison Co., Ltd. | 561,652 | 15,969 |
| Tokyu Land Corp. | 1,378,000 | 15,586 |
| Kajima Corp. | 3,095,000 | 15,236 |
| Sumco Corp. | 348,716 | 15,153 |
| Odakyu Electric | | |
| Railway Co. | 2,153,000 | 15,054 |
| | | Market |
| | | Value• |
| | Shares | ($000) |
| Teijin Ltd. | 2,878,000 | 14,823 |
| NSK Ltd. | 1,519,000 | 14,700 |
| Leopalace21 Corp. | 439,600 | 14,413 |
| Sega Sammy Holdings Inc. | 634,132 | 14,351 |
| Seiko Epson Corp. | 473,500 | 14,341 |
| Makita Corp. | 371,900 | 14,150 |
| Joyo Bank Ltd. | 2,308,000 | 14,150 |
| Ohbayashi Corp. | 2,238,000 | 14,105 |
| Amada Co., Ltd. | 1,260,000 | 14,070 |
* | Elpida Memory Inc. | 333,500 | 14,051 |
| Yamaha Corp. | 605,400 | 13,999 |
| Hokuhoku | | |
| Financial Group, Inc. | 4,313,400 | 13,972 |
| Kuraray Co., Ltd. | 1,253,500 | 13,930 |
| JSR Corp. | 617,500 | 13,813 |
| Tokyo Tatemono Co., Ltd. | 986,000 | 13,781 |
| Japan Steel Works Ltd. | 1,151,832 | 13,581 |
| Furukawa Electric Co. | 2,189,000 | 13,362 |
| Taiheiyo Cement Corp. | 3,109,000 | 13,320 |
| Keio Electric | | |
| Railway Co., Ltd. | 1,883,000 | 13,249 |
| Matsushita Electric | | |
| Works, Ltd. | 1,164,000 | 13,166 |
| OJI Paper Co., Ltd. | 2,565,740 | 13,109 |
| Daito Trust | | |
| Construction Co., Ltd. | 283,684 | 13,031 |
| Mitsubishi Rayon Co., Ltd. | 1,860,000 | 12,928 |
| Tobu Railway Co., Ltd. | 2,810,000 | 12,849 |
| Marui Co., Ltd. | 1,081,300 | 12,846 |
| Takefuji Corp. | 380,490 | 12,788 |
| Shimizu Corp. | 2,037,000 | 12,629 |
| Hirose Electric Co., Ltd. | 103,600 | 12,587 |
| Fast Retailing Co., Ltd. | 182,700 | 12,550 |
| JTEKT Corp. | 660,923 | 12,269 |
| Sekisui Chemical Co. | 1,580,000 | 12,259 |
| Tokuyama Corp. | 807,000 | 12,099 |
| Japan Retail Fund | | |
| Investment Corp. | 1,198 | 12,059 |
| Showa Denko K.K. | 3,644,000 | 11,937 |
| Nisshin Steel Co. | 2,915,000 | 11,762 |
| Namco Bandai | | |
| Holdings Inc. | 718,100 | 11,669 |
| Nissin Food | | |
| Products Co., Ltd. | 307,300 | 11,538 |
| Mitsubishi Gas | | |
| Chemical Co. | 1,332,000 | 11,501 |
| Chiyoda Corp. | 499,000 | 11,449 |
| Taisei Corp. | 3,301,000 | 11,382 |
| Takashimaya Co. | 958,972 | 11,260 |
| NTN Corp. | 1,357,000 | 11,259 |
^ | Keihin Electric Express | | |
| Railway Co., Ltd. | 1,464,000 | 11,229 |
| Toyo Seikan Kaisha Ltd. | 559,500 | 11,134 |
| Citizen Watch Co., Ltd. | 1,244,500 | 11,109 |
| JGC Corp. | 714,000 | 10,968 |
| Yokogawa Electric Corp. | 740,197 | 10,913 |
37
Pacific Stock Index Fund
| | | Market |
| | | Value• |
| | Shares | ($000) |
| Mitsui Engineering & | | |
| Shipbuilding Co., Ltd. | 2,433,000 | 10,898 |
^ | TonenGeneral Sekiyu K.K. | 1,006,000 | 10,823 |
| Taisho Pharmaceutical Co. | 551,000 | 10,813 |
| Isetan Co. | 657,900 | 10,762 |
| MEDICEO | | |
| Holdings Co., Ltd. | 584,861 | 10,665 |
| Hitachi Construction | | |
| Machinery Co. | 338,378 | 10,560 |
| Bank of Kyoto Ltd. | 910,000 | 10,511 |
| Kyowa Hakko Kogyo Co. | 1,123,000 | 10,488 |
| NGK Spark Plug Co. | 594,682 | 10,487 |
* | Haseko Corp. | 3,147,155 | 10,422 |
| Nomura Research | | |
| Institute, Ltd. | 388,380 | 10,382 |
| Stanley Electric Co. | 519,500 | 10,319 |
| Nippon Paper Group, Inc. | 3,049 | 10,318 |
| Trend Micro Inc. | 331,500 | 10,309 |
| Nomura Real Estate | | |
| Office Fund, Inc. | 825 | 10,238 |
| SBI Holdings, Inc. | 31,916 | 10,212 |
| Tanabe Seiyaku Co., Ltd. | 784,000 | 10,144 |
| THK Co., Inc. | 411,900 | 10,037 |
| Sapporo Hokuyo | | |
| Holdings, Inc. | 1,033 | 9,981 |
| Ube Industries Ltd. | 3,131,000 | 9,929 |
| Oriental Land Co., Ltd. | 172,500 | 9,746 |
| Yakult Honsha Co., Ltd. | 364,000 | 9,715 |
| Kurita Water Industries Ltd. | 389,000 | 9,711 |
| Toho Co., Ltd. | 488,200 | 9,579 |
| Kaneka Corp. | 1,046,982 | 9,545 |
| Mitsui Mining & | | |
| Smelting Co., Ltd. | 1,976,000 | 9,530 |
| NTT Urban | | |
| Development Corp. | 3,976 | 9,444 |
| Nippon Sheet | | |
| Glass Co., Ltd. | 1,772,000 | 9,353 |
| Sojitz Holdings Corp. | 2,464,500 | 9,313 |
| Mitsubishi | | |
| Securities Co., Ltd. | 878,000 | 9,246 |
^ | Toto Ltd. | 961,000 | 9,081 |
| Rakuten, Inc. | 22,377 | 8,989 |
| Fuji Electric | | |
| Holdings Co., Ltd. | 1,930,000 | 8,964 |
| Acom Co., Ltd. | 247,410 | 8,931 |
| Daimaru, Inc. | 747,000 | 8,871 |
| Dowa Mining Co. Ltd. | 942,000 | 8,841 |
| CSK Corp. | 228,700 | 8,836 |
| The Nishi-Nippon City | | |
| Bank, Ltd. | 2,055,307 | 8,834 |
*^ | Sanyo Electric Co., Ltd. | 5,491,000 | 8,775 |
| Gunma Bank Ltd. | 1,304,000 | 8,685 |
| All Nippon | | |
| Airways Co., Ltd. | 2,216,000 | 8,579 |
| Susuken Co., Ltd. | 243,220 | 8,532 |
| Konami Corp. | 320,749 | 8,510 |
| | | Market |
| | | Value• |
| | Shares | ($000) |
| Promise Co., Ltd. | 278,750 | 8,385 |
| Uni-Charm Corp. | 142,300 | 8,381 |
| The Suruga Bank, Ltd. | 684,000 | 8,269 |
| Dai-Nippon Ink & | | |
| Chemicals, Inc. | 2,190,000 | 8,211 |
| Benesse Corp. | 220,157 | 8,199 |
| Sankyo Co., Ltd. | 184,900 | 8,104 |
| Lawson Inc. | 215,800 | 7,958 |
| Mitsumi Electric Co., Ltd. | 237,400 | 7,918 |
| Fujikura Ltd. | 1,231,000 | 7,901 |
| Nippon Sanso Corp. | 907,000 | 7,883 |
| Hitachi Chemical Co., Ltd. | 357,400 | 7,853 |
| Kamigumi Co., Ltd. | 896,000 | 7,852 |
| Showa Shell Sekiyu K.K. | 649,700 | 7,801 |
| Japan Prime Realty | | |
| Investment Corp. | 1,711 | 7,786 |
| Taiyo Yuden Co., Ltd. | 353,000 | 7,757 |
| Shimano, Inc. | 235,400 | 7,726 |
| Shinko Securities Co., Ltd. | 1,681,000 | 7,625 |
| Tosoh Corp. | 1,653,000 | 7,558 |
| Ushio Inc. | 385,700 | 7,556 |
| Shimamura Co., Ltd. | 69,100 | 7,535 |
| Kikkoman Corp. | 509,000 | 7,424 |
| 77 Bank Ltd. | 1,124,000 | 7,369 |
| Yaskawa Electric Corp. | 643,380 | 7,353 |
| Meiji Dairies Corp. | 906,000 | 7,244 |
| NOK Corp. | 387,000 | 7,200 |
| Nippon Meat Packers, Inc. | 589,000 | 7,174 |
| Nisshin Seifun Group Inc. | 662,100 | 7,147 |
| Denki Kagaku Kogyo K.K. | 1,608,000 | 7,002 |
| Santen | | |
| Pharmaceutical Co., Ltd. | 254,400 | 6,963 |
| Mitsubishi Logistics Corp. | 394,000 | 6,954 |
| Asics Corp. | 550,139 | 6,927 |
^ | Daido Steel Co., Ltd. | 1,202,000 | 6,927 |
| Minebea Co., Ltd. | 1,169,000 | 6,840 |
^ | Ito En, Ltd. | 204,800 | 6,818 |
^ | Mitsukoshi, Ltd. | 1,422,000 | 6,811 |
^ | Sumitomo Titanium Corp. | 63,226 | 6,771 |
| Nisshinbo Industries, Inc. | 521,000 | 6,754 |
^ | Pioneer Corp. | 527,900 | 6,732 |
| Aiful Corp. | 269,950 | 6,720 |
| Ebara Corp. | 1,303,000 | 6,705 |
| Uny Co., Ltd. | 554,000 | 6,625 |
| Toyobo Ltd. | 2,166,000 | 6,555 |
| Keisei Electric | | |
| Railway Co., Ltd. | 1,012,000 | 6,542 |
| Daicel Chemical | | |
| Industries Ltd. | 945,000 | 6,365 |
^ | Sapporo Holdings Ltd. | 886,000 | 6,349 |
| Onward Kashiyama Co., Ltd. | 475,000 | 6,343 |
| Sumitomo Rubber | | |
| Industries Ltd. | 590,000 | 6,332 |
| Dai-Nippon Screen | | |
| Manufacturing Co., Ltd. | 746,000 | 6,279 |
38
Pacific Stock Index Fund
| | | Market |
| | | Value• |
| | Shares | ($000) |
| Nissan Chemical | | |
| Industries, Ltd. | 548,000 | 6,208 |
| Alps Electric Co., Ltd. | 596,900 | 6,167 |
*^ | Japan Airlines System Co. | 3,117,000 | 6,128 |
| Toyo Suisan Kaisha, Ltd. | 306,000 | 6,093 |
| Kansai Paint Co., Ltd. | 751,000 | 6,058 |
| Mabuchi Motor Co. | 97,400 | 6,052 |
| Nitori Co., Ltd. | 126,668 | 6,050 |
| Aoyama Trading Co., Ltd. | 196,900 | 6,021 |
| ZEON Corp. | 584,527 | 6,017 |
| Hakuhodo DY Holdings Inc. | 86,800 | 5,887 |
| Okuma Corp. | 492,711 | 5,884 |
| SBI E*Trade | | |
| Securities Co., Ltd. | 5,440 | 5,859 |
| Shinko Electric | | |
| Industries Co., Ltd. | 232,453 | 5,592 |
| FamilyMart Co., Ltd. | 219,700 | 5,565 |
| Hitachi | | |
| High-Technologies Corp. | 213,475 | 5,527 |
| Toyoda Gosei Co., Ltd. | 223,600 | 5,526 |
| Tokyo Steel | | |
| Manufacturing Co. | 373,400 | 5,419 |
| USS Co., Ltd. | 84,280 | 5,317 |
| Otsuka Corp. | 54,464 | 5,253 |
| Alfresa Holdings Corp. | 83,300 | 5,116 |
| Nichirei Corp. | 854,000 | 5,106 |
| Canon Sales Co. Inc. | 261,000 | 5,079 |
| JAFCO Co., Ltd. | 117,000 | 5,042 |
| Meiji Seika Kaisha Ltd. | 1,057,000 | 5,021 |
^ | Toho Titanium Co., Ltd. | 104,842 | 4,995 |
^ | Oracle Corp. Japan | 109,800 | 4,973 |
| Aeon Credit | | |
| Service Co. Ltd. | 297,390 | 4,938 |
| Hino Motors, Ltd. | 895,000 | 4,929 |
| Sumitomo Bakelite Co. Ltd. | 685,000 | 4,849 |
| Itochu | | |
| Techno-Science Corp. | 105,900 | 4,832 |
| NHK Spring Co. | 549,000 | 4,718 |
| Seino | | |
| Transportation Co., Ltd. | 502,000 | 4,702 |
| Komori Corp. | 198,000 | 4,573 |
| Ryohin Keikaku Co., Ltd. | 81,700 | 4,550 |
| Tokai Rika Co., Ltd. | 194,424 | 4,467 |
| Comsys Holdings Corp. | 399,000 | 4,456 |
^ | Tokyo Broadcasting | | |
| System, Inc. | 131,500 | 4,447 |
| Obic Co., Ltd. | 23,950 | 4,445 |
| Nippon Shokubai Co., Ltd. | 435,000 | 4,436 |
^ | Takara Holdings Inc. | 598,000 | 4,429 |
| Kinden Corp. | 460,000 | 4,348 |
| Nippon Light Metal Co. | 1,580,000 | 4,342 |
| Shimachu Co. | 159,536 | 4,328 |
| Wacoal Corp. | 347,000 | 4,325 |
| Glory Ltd. | 216,500 | 4,312 |
| Sanwa Shutter Corp. | 692,000 | 4,265 |
| | | Market |
| | | Value• |
| | Shares | ($000) |
| Hankyu Department | | |
| Stores, Inc. | 480,000 | 4,261 |
| Nippon Kayaku Co., Ltd. | 529,000 | 4,251 |
| Coca-Cola West | | |
| Japan Co., Ltd. | 192,300 | 4,194 |
| House Foods | | |
| Industry Corp. | 246,300 | 4,166 |
^ | Park24 Co., Ltd. | 328,974 | 4,098 |
| Central Glass Co., Ltd. | 587,000 | 4,093 |
^ | Tokyo Seimitsu Co., Ltd. | 116,466 | 4,024 |
| Meitec Corp. | 119,600 | 3,901 |
| Sumitomo Osaka | | |
| Cement Co., Ltd. | 1,324,000 | 3,862 |
| Fuji Television | | |
| Network, Inc. | 1,639 | 3,840 |
^ | OSG Corp. | 270,811 | 3,798 |
| Gunze Ltd. | 663,000 | 3,764 |
| Asatsu-DK Inc. | 115,400 | 3,686 |
| Kokuyo Co., Ltd. | 287,100 | 3,654 |
^ | Yamazaki Baking Co., Ltd. | 380,000 | 3,530 |
| EDION Corp. | 253,545 | 3,514 |
* | K.K. DaVinci Advisors | 3,465 | 3,491 |
| Toda Corp. | 716,000 | 3,486 |
| Okumura Corp. | 623,000 | 3,473 |
*^ | Oki Electric | | |
| Industry Co. Ltd. | 1,998,000 | 3,436 |
| Daifuku Co., Ltd. | 271,427 | 3,417 |
| Hitachi Cable Ltd. | 578,000 | 3,377 |
| SFCG Co., Ltd. | 19,010 | 3,343 |
| Rinnai Corp. | 121,600 | 3,335 |
| Sanken Electric Co., Ltd. | 364,000 | 3,274 |
| Autobacs Seven Co., Ltd. | 94,300 | 3,268 |
| Matsumotokiyoshi Co., Ltd. | 138,500 | 3,254 |
| Q.P. Corp. | 349,200 | 3,234 |
| Hikari Tsushin, Inc. | 80,800 | 3,219 |
^ | Kose Corp. | 114,770 | 3,198 |
*^ | NEC Electronics Corp. | 127,600 | 3,123 |
| Matsui Securities Co., Ltd. | 418,800 | 3,086 |
| Fuji Soft ABC Inc. | 102,300 | 2,939 |
^ | Nishimatsu | | |
| Construction Co. | 914,000 | 2,841 |
| TIS Inc. | 123,300 | 2,821 |
^ | eAccess Ltd. | 4,498 | 2,788 |
^ | Amano Corp. | 209,700 | 2,748 |
^ | The Goodwill Group, Inc. | 4,359 | 2,736 |
| Katokichi Co., Ltd. | 419,400 | 2,734 |
| Tokyo Style Co. | 229,000 | 2,728 |
| Aderans Co. Ltd. | 121,300 | 2,710 |
*^ | Access Co., Ltd. | 739 | 2,698 |
| Circle K Sunkus Co., Ltd. | 149,100 | 2,563 |
| Hitachi Capital Corp. | 151,900 | 2,540 |
| Round One Corp. | 1,184 | 2,447 |
| Kaken Pharmaceutical Co. | 310,000 | 2,387 |
| ARRK Corp. | 199,867 | 2,328 |
^ | Net One Systems Co., Ltd. | 1,790 | 1,873 |
| Uniden Corp. | 195,000 | 1,387 |
39
Pacific Stock Index Fund
| | | Market |
| | | Value• |
| | Shares | ($000) |
^ | Index Holdings | 3,618 | 1,228 |
* | Dowa Mining Co., Ltd. | | |
| Rights Exp. 1/29/10 | 805,000 | 382 |
| | | 9,999,334 |
New Zealand (0.5%) | | |
| Telecom Corp. of | | |
| New Zealand Ltd. | 6,831,856 | 24,362 |
| Fletcher Building Ltd. | 1,626,161 | 13,712 |
| Contact Energy Ltd. | 997,886 | 6,724 |
| Auckland International | | |
| Airport Ltd. | 3,388,443 | 6,210 |
| Sky City | | |
| Entertainment Group Ltd. | 1,523,643 | 5,442 |
^ | Fisher & Paykel | | |
| Healthcare Corp. Ltd. | 1,744,253 | 4,808 |
| Sky Network Television Ltd. | 670,915 | 3,017 |
| Kiwi Income Property Trust | 2,437,012 | 2,922 |
| Fisher & Paykel | | |
| Appliances Holdings Ltd. | 916,603 | 2,391 |
| The Warehouse Group Ltd. | 365,714 | 1,885 |
| Vector Ltd. | 853,124 | 1,804 |
*^ | Tower Ltd. | 505,432 | 825 |
| | | 74,102 |
Singapore (3.3%) | | |
| United Overseas Bank Ltd. | 3,934,567 | 55,003 |
| DBS Group Holdings Ltd. | 3,897,161 | 54,071 |
| Singapore | | |
| Telecommunications Ltd. | 24,624,590 | 53,471 |
| Oversea-Chinese | | |
| Banking Corp., Ltd. | 8,615,068 | 50,618 |
| Keppel Corp., Ltd. | 1,899,750 | 26,550 |
| Capitaland Ltd. | 4,305,895 | 23,817 |
| Singapore Airlines Ltd. | 1,917,362 | 22,828 |
| City Developments Ltd. | 1,722,412 | 18,036 |
| Singapore Press | | |
| Holdings Ltd. | 5,174,833 | 14,773 |
| Singapore Exchange Ltd. | 2,727,000 | 13,072 |
| Singapore Technologies | | |
| Engineering Ltd. | 4,564,407 | 10,744 |
| Fraser & Neave Ltd. | 2,851,500 | 10,042 |
| ComfortDelGro Corp. Ltd. | 6,044,586 | 9,043 |
| Sembcorp Industries Ltd. | 2,733,393 | 8,712 |
| Venture Corp. Ltd. | 846,250 | 8,666 |
| CapitaMall Trust | 3,227,148 | 8,406 |
| Keppel Land Ltd. | 1,238,000 | 7,149 |
| Capitacommercial Trust | 3,333,365 | 6,152 |
| Ascendas REIT | 3,409,000 | 5,806 |
* | United Overseas Land Ltd. | 1,777,556 | 5,615 |
| Parkway Holdings Ltd. | 2,118,072 | 5,472 |
| Cosco Corp. | | |
| Singapore Ltd. | 2,680,000 | 4,952 |
| Suntec REIT | 3,412,142 | 4,560 |
| Olam International Ltd. | 2,137,000 | 4,402 |
| SembCorp Marine Ltd. | 1,768,000 | 4,187 |
| | | Market |
| | | Value• |
| | Shares | ($000) |
| Jardine Cycle N | | |
| Carriage Ltd. | 467,128 | 4,053 |
| Singapore Post Ltd. | 4,641,800 | 3,645 |
| Neptune Orient Lines Ltd. | 1,515,000 | 3,561 |
| Wing Tai Holdings Ltd. | 1,608,000 | 3,524 |
| Noble Group Ltd. | 3,317,000 | 3,441 |
* | Chartered Semiconductor | | |
| Manufacturing Ltd. | 3,493,000 | 3,260 |
| Want Want Holdings Ltd. | 1,553,160 | 3,084 |
| Singapore Land Ltd. | 426,000 | 2,917 |
| Allgreen Properties Ltd. | 2,191,500 | 2,604 |
| SMRT Corp. Ltd. | 2,067,000 | 2,531 |
| Haw Par Brothers | | |
| International Ltd. | 358,193 | 1,829 |
| Singapore | | |
| Petroleum Co. Ltd. | 441,000 | 1,394 |
| Creative Technology Ltd. | 192,350 | 1,146 |
| | | 473,136 |
Total Common Stocks | | |
(Cost $11,152,322) | | 14,188,372 |
Temporary Cash Investments (2.6%)1 | | |
Money Market Fund (2.6%) | | |
2 | Vanguard Market | | |
| Liquidity Fund, 5.259% | 103,172,606 | 103,173 |
2 | Vanguard Market | | |
| Liquidity Fund, | | |
| 5.259%—Note E | 261,822,759 | 261,823 |
| | | 364,996 |
| | Face | |
| | Amount | |
| | ($000) | |
U.S. Agency Obligation (0.0%) | | |
3 | Federal Home Loan | | |
| Mortgage Corp. | | |
4 | 5.197%, 7/9/07 | 3,000 | 2,971 |
Total Temporary Cash Investments | | |
(Cost $367,967) | | 367,967 |
Total Investments (101.9%) | | |
(Cost $11,520,289) | | 14,556,339 |
Other Assets and Liabilities (–1.9%) | | |
Other Assets—Note B | | 222,050 |
Security Lending Collateral | | |
| Payable to Brokers—Note E | | (261,823) |
Other Liabilities | | (232,956) |
| | | (272,729) |
Net Assets (100%) | | 14,283,610 |
40
Pacific Stock Index Fund
At April 30, 2007, net assets consisted of:5 | |
| Amount |
| ($000) |
Paid-in Capital | 11,358,679 |
Overdistributed Net Investment Income | (24,419) |
Accumulated Net Realized Losses | (87,304) |
Unrealized Appreciation | |
Investment Securities | 3,036,050 |
Futures Contracts | 309 |
Foreign Currencies and | |
Forward Currency Contracts | 295 |
Net Assets | 14,283,610 |
| |
Investor Shares—Net Assets | |
Applicable to 742,855,283 outstanding | |
$.001 par value shares of beneficial | |
interest (unlimited authorization) | 9,602,457 |
Net Asset Value Per Share— | |
Investor Shares | $12.93 |
| |
Admiral Shares—Net Assets | |
Applicable to 15,496,162 outstanding | |
$.001 par value shares of beneficial | |
interest (unlimited authorization) | 1,311,676 |
Net Asset Value Per Share— | |
Admiral Shares | $84.65 |
| Amount |
| ($000) |
Institutional Shares—Net Assets | |
Applicable to 174,833,722 outstanding | |
$.001 par value shares of beneficial | |
interest (unlimited authorization) | 2,263,551 |
Net Asset Value Per Share— | |
Institutional Shares | $12.95 |
| |
ETF Shares—Net Assets | |
Applicable to 16,154,668 outstanding | |
$.001 par value shares of beneficial | |
interest (unlimited authorization) | 1,105,926 |
Net Asset Value Per Share— | |
ETF Shares | $68.46 |
• | See Note A in Notes to Financial Statements. |
* | Non-income-producing security. |
^ | Part of security position is on loan to broker-dealers. See Note E in Notes to Financial Statements. |
1 The fund invests a portion of its cash reserves in equity markets through the use of index futures contracts. After giving effect to futures investments, the fund’s effective common stock and temporary cash investment positions represent 99.8% and 2.1%, respectively, of net assets. See Note C in Notes to Financial Statements.
2 Affiliated money market fund available only to Vanguard funds and certain trusts and accounts managed by Vanguard. Rate shown is the 7-day yield.
3 The issuer operates under a congressional charter; its securities are neither issued nor guaranteed by the U.S. government. If needed, access to additional funding from the U.S. Treasury (beyond the issuer’s line of credit) would require congressional action.
4 Securities with a value of $2,971,000 have been segregated as initial margin for open futures contracts.
5 See Note C in Notes to Financial Statements for the tax-basis components of net assets.
REIT—Real Estate Investment Trust.
41
Pacific Stock Index Fund
Statement of Operations
| Six Months Ended |
| April 30, 2007 |
| ($000) |
Investment Income | |
Income | |
Dividends1 | 120,066 |
Interest2 | 1,775 |
Security Lending | 2,042 |
Total Income | 123,883 |
Expenses | |
The Vanguard Group—Note B | |
Investment Advisory Services | 243 |
Management and Administrative—Investor Shares | 8,488 |
Management and Administrative—Admiral Shares | 670 |
Management and Administrative—Institutional Shares | 681 |
Management and Administrative—ETF Shares | 463 |
Marketing and Distribution—Investor Shares | 1,124 |
Marketing and Distribution—Admiral Shares | 102 |
Marketing and Distribution—Institutional Shares | 257 |
Marketing and Distribution—ETF Shares | 109 |
Custodian Fees | 1,118 |
Shareholders’ Reports—Investor Shares | 82 |
Shareholders’ Reports—Admiral Shares | 2 |
Shareholders’ Reports—Institutional Shares | 1 |
Shareholders’ Reports—ETF Shares | 10 |
Trustees’ Fees and Expenses | 7 |
Total Expenses | 13,357 |
Net Investment Income | 110,526 |
Realized Net Gain (Loss) | |
Investment Securities Sold | 4,366 |
Futures Contracts | 2,918 |
Foreign Currencies and Forward Currency Contracts | 766 |
Realized Net Gain (Loss) | 8,050 |
Change in Unrealized Appreciation (Depreciation) | |
Investment Securities | 939,557 |
Futures Contracts | 351 |
Foreign Currencies and Forward Currency Contracts | 47 |
Change in Unrealized Appreciation (Depreciation) | 939,955 |
Net Increase (Decrease) in Net Assets Resulting from Operations | 1,058,531 |
1 Dividends are net of foreign withholding taxes of $5,936,000.
2 Interest income from an affiliated company of the fund was $1,699,000.
42
Pacific Stock Index Fund
Statement of Changes in Net Assets
| Six Months Ended | Year Ended |
| April 30, | October 31, |
| 2007 | 2006 |
| ($000) | ($000) |
Increase (Decrease) in Net Assets | | |
Operations | | |
Net Investment Income | 110,526 | 172,443 |
Realized Net Gain (Loss) | 8,050 | 386,020 |
Change in Unrealized Appreciation (Depreciation) | 939,955 | 899,705 |
Net Increase (Decrease) in Net Assets Resulting from Operations | 1,058,531 | 1,458,168 |
Distributions | | |
Net Investment Income | | |
Investor Shares | (176,611) | (82,959) |
Admiral Shares | (25,966) | (13,155) |
Institutional Shares | (42,680) | (22,834) |
ETF Shares | (18,129) | (4,454) |
Realized Capital Gain | | |
Investor Shares | — | — |
Admiral Shares | — | — |
Institutional Shares | — | — |
ETF Shares | — | — |
Total Distributions | (263,386) | (123,402) |
Capital Share Transactions—Note F | | |
Investor Shares | 1,246,289 | 1,678,857 |
Admiral Shares | 107,847 | 272,087 |
Institutional Shares | 352,995 | 289,594 |
ETF Shares | 358,486 | 481,727 |
Net Increase (Decrease) from Capital Share Transactions | 2,065,617 | 2,722,265 |
Total Increase (Decrease) | 2,860,762 | 4,057,031 |
Net Assets | | |
Beginning of Period | 11,422,848 | 7,365,817 |
End of Period1 | 14,283,610 | 11,422,848 |
1 Net Assets—End of Period includes undistributed (overdistributed) net investment income of ($24,419,000) and $127,047,000.
43
Pacific Stock Index Fund
Financial Highlights
Investor Shares | | | | | | |
| Six Months | | | | | |
| Ended | | | | |
For a Share Outstanding | April 30, | Year Ended October 31, |
Throughout Each Period | 2007 | 2006 | 2005 | 2004 | 2003 | 2002 |
Net Asset Value, Beginning of Period | $12.13 | $10.39 | $8.63 | $7.80 | $5.90 | $6.79 |
Investment Operations | | | | | | |
Net Investment Income | .1051 | .19 | .156 | .121 | .082 | .065 |
Net Realized and Unrealized Gain (Loss) | | | | | | |
on Investments | .962 | 1.71 | 1.761 | .814 | 1.885 | (.923) |
Total from Investment Operations | 1.067 | 1.90 | 1.917 | .935 | 1.967 | (.858) |
Distributions | | | | | | |
Dividends from Net Investment Income | (.267) | (.16) | (.157) | (.105) | (.067) | (.032) |
Distributions from Realized Capital Gains | — | — | — | — | — | — |
Total Distributions | (.267) | (.16) | (.157) | (.105) | (.067) | (.032) |
Net Asset Value, End of Period | $12.93 | $12.13 | $10.39 | $8.63 | $7.80 | $5.90 |
| | | | | | |
Total Return2 | 8.91% | 18.39% | 22.48% | 12.15% | 33.75% | –12.67% |
| | | | | | |
Ratios/Supplemental Data | | | | | | |
Net Assets, End of Period (Millions) | $9,602 | $7,814 | $5,202 | $3,471 | $2,265 | $1,386 |
Ratio of Total Expenses to | | | | | | |
Average Net Assets | 0.24%* | 0.27% | 0.32% | 0.34% | 0.39% | 0.40% |
Ratio of Net Investment Income to | | | | | | |
Average Net Assets | 1.69%* | 1.73% | 1.76% | 1.57% | 1.49% | 1.04% |
Portfolio Turnover Rate3 | 1%* | 2% | 7% | 3% | 3% | 20% |
1 Calculated based on average shares outstanding.
2 Total returns do not reflect the 2% fee assessed on redemptions of shares purchased on or after June 27, 2003, and held for less than two months or the $10 annual account maintenance fee applied on balances under $10,000.
3 Excludes the value of portfolio securities received or delivered as a result of in-kind purchases or redemptions of the fund’s capital shares, including ETF Creation Units.
44
Pacific Stock Index Fund
Admiral Shares | | | | | | |
| Six Months | | | | | |
| Ended | | | | |
For a Share Outstanding | April 30, | Year Ended October 31, |
Throughout Each Period | 2007 | 2006 | 2005 | 2004 | 2003 | 2002 |
Net Asset Value, Beginning of Period | $79.43 | $68.05 | $56.47 | $51.05 | $38.63 | $44.40 |
Investment Operations | | | | | | |
Net Investment Income | .7301 | 1.302 | 1.069 | .835 | .575 | .461 |
Net Realized and Unrealized Gain (Loss) | | | | | | |
on Investments | 6.307 | 11.185 | 11.583 | 5.318 | 12.318 | (6.016) |
Total from Investment Operations | 7.037 | 12.487 | 12.652 | 6.153 | 12.893 | (5.555) |
Distributions | | | | | | |
Dividends from Net Investment Income | (1.817) | (1.107) | (1.072) | (.733) | (.473) | (.215) |
Distributions from Realized Capital Gains | — | — | — | — | — | — |
Total Distributions | (1.817) | (1.107) | (1.072) | (.733) | (.473) | (.215) |
Net Asset Value, End of Period | $84.65 | $79.43 | $68.05 | $56.47 | $51.05 | $38.63 |
| | | | | | |
Total Return2 | 8.97% | 18.46% | 22.68% | 12.23% | 33.82% | –12.55% |
| | | | | | |
Ratios/Supplemental Data | | | | | | |
Net Assets, End of Period (Millions) | $1,312 | $1,128 | $720 | $314 | $198 | $102 |
Ratio of Total Expenses to | | | | | | |
Average Net Assets | 0.15%* | 0.17% | 0.20% | 0.25% | 0.30% | 0.30% |
Ratio of Net Investment Income to | | | | | | |
Average Net Assets | 1.78%* | 1.83% | 1.90% | 1.69% | 1.59% | 1.16% |
Portfolio Turnover Rate3 | 1%* | 2% | 7% | 3% | 3% | 20% |
1 Calculated based on average shares outstanding.
2 Total returns do not reflect the 2% fee assessed on redemptions of shares purchased on or after June 27, 2003, and held for less than two months.
3 Excludes the value of portfolio securities received or delivered as a result of in-kind purchases or redemptions of the fund’s capital shares, including ETF Creation Units.
45
Pacific Stock Index Fund
Institutional Shares | | | | | | |
| Six Months | | | | | |
| Ended | | | | |
For a Share Outstanding | April 30, | Year Ended October 31, |
Throughout Each Period | 2007 | 2006 | 2005 | 2004 | 2003 | 2002 |
Net Asset Value, Beginning of Period | $12.15 | $10.41 | $8.64 | $7.81 | $5.91 | $6.79 |
Investment Operations | | | | | | |
Net Investment Income | .1151 | .206 | .18 | .134 | .090 | .081 |
Net Realized and Unrealized Gain (Loss) | | | | | | |
on Investments | .968 | 1.710 | 1.76 | .814 | 1.885 | (.923) |
Total from Investment Operations | 1.083 | 1.916 | 1.94 | .948 | 1.975 | (.842) |
Distributions | | | | | | |
Dividends from Net Investment Income | (.283) | (.176) | (.17) | (.118) | (.075) | (.038) |
Distributions from Realized Capital Gains | — | — | — | — | — | — |
Total Distributions | (.283) | (.176) | (.17) | (.118) | (.075) | (.038) |
Net Asset Value, End of Period | $12.95 | $12.15 | $10.41 | $8.64 | $7.81 | $5.91 |
| | | | | | |
Total Return2 | 9.03% | 18.52% | 22.74% | 12.32% | 33.88% | –12.44% |
| | | | | | |
Ratios/Supplemental Data | | | | | | |
Net Assets, End of Period (Millions) | $2,264 | $1,788 | $1,280 | $754 | $369 | $131 |
Ratio of Total Expenses to | | | | | | |
Average Net Assets | 0.12%* | 0.12% | 0.14% | 0.17% | 0.22% | 0.25% |
Ratio of Net Investment Income to | | | | | | |
Average Net Assets | 1.81%* | 1.88% | 1.95% | 1.76% | 1.70% | 1.20% |
Portfolio Turnover Rate3 | 1%* | 2% | 7% | 3% | 3% | 20% |
| | | | | | | |
1 Calculated based on average shares outstanding.
2 Total returns do not reflect the 2% fee assessed on redemptions of shares purchased on or after June 27, 2003, and held for less than two months.
3 Excludes the value of portfolio securities received or delivered as a result of in-kind purchases or redemptions of the fund’s capital shares, including ETF Creation Units.
46
Pacific Stock Index Fund
ETF Shares | | | |
| Six Months | Year | March 4, |
| Ended | Ended | 20051 to |
| April 30, | Oct. 31, | Oct. 31, |
For a Share Outstanding Throughout Each Period | 2007 | 2006 | 2005 |
Net Asset Value, Beginning of Period | $64.24 | $55.09 | $50.71 |
Investment Operations | | | |
Net Investment Income | .6132 | 1.06 | .75 |
Net Realized and Unrealized Gain (Loss) on Investments | 5.080 | 9.02 | 3.63 |
Total from Investment Operations | 5.693 | 10.08 | 4.38 |
Distributions | | | |
Dividends from Net Investment Income | (1.473) | (.93) | — |
Distributions from Realized Capital Gains | — | — | — |
Total Distributions | (1.473) | (.93) | — |
Net Asset Value, End of Period | $68.46 | $64.24 | $55.09 |
| | | |
Total Return | 8.97% | 18.43% | 8.64% |
| | | |
Ratios/Supplemental Data | | | |
Net Assets, End of Period (Millions) | $1,106 | $693 | $164 |
Ratio of Total Expenses to Average Net Assets | 0.15%* | 0.18% | 0.18%* |
Ratio of Net Investment Income to Average Net Assets | 1.78%* | 1.82% | 1.89%* |
Portfolio Turnover Rate3 | 1%* | 2% | 7% |
1 Inception.
2 Calculated based on average shares outstanding.
3 Excludes the value of portfolio securities received or delivered as a result of in-kind purchases or redemptions of the fund’s capital shares, including ETF Creation Units.
See accompanying Notes, which are an integral part of the Financial Statements.
47
Pacific Stock Index Fund
Notes to Financial Statements
Vanguard Pacific Stock Index Fund is registered under the Investment Company Act of 1940 as an open-end investment company, or mutual fund. The fund files reports with the SEC under the company name Vanguard International Equity Index Funds. The fund invests in securities of foreign issuers, which may subject it to investment risks not normally associated with investing in securities of U.S. corporations. The fund offers five classes of shares: Investor Shares, Admiral Shares, Signal Shares, Institutional Shares, and ETF Shares. Investor Shares are available to any investor who meets the fund’s minimum purchase requirements. Admiral Shares are designed for investors who meet certain administrative, service, tenure, and account-size criteria. Signal Shares are designed for institutional investors who meet certain administrative, service, and account-size criteria. The fund has not issued any Signal Shares through April 30, 2007. Institutional Shares are designed for investors who meet certain administrative and service criteria and invest a minimum of $5 million. ETF Shares are listed for trading on the American Stock Exchange; they can be purchased and sold through a broker.
A. The following significant accounting policies conform to generally accepted accounting principles for U.S. mutual funds. The fund consistently follows such policies in preparing its financial statements.
1. Security Valuation: Securities are valued as of the close of trading on the New York Stock Exchange (generally 4 p.m., Eastern time) on the valuation date. Equity securities are valued at the latest quoted sales prices or official closing prices taken from the primary market in which each security trades; such securities not traded on the valuation date are valued at the mean of the latest quoted bid and asked prices. Securities for which market quotations are not readily available, or whose values have been affected by events occurring before the fund’s pricing time but after the close of the securities’ primary markets, are valued at their fair values calculated according to procedures adopted by the board of trustees. These procedures include obtaining quotations from an independent pricing service, monitoring news to identify significant market- or security-specific events, and evaluating changes in the values of foreign market proxies (for example, ADRs, futures contracts, or exchange-traded funds), between the time the foreign markets close and the fund’s pricing time. When fair-value pricing is employed, the prices of securities used by a fund to calculate its net asset value may differ from quoted or published prices for the same securities. Investments in Vanguard Market Liquidity Fund are valued at that fund’s net asset value. Temporary cash investments acquired over 60 days to maturity are valued using the latest bid prices or using valuations based on a matrix system (which considers such factors as security prices, yields, maturities, and ratings), both as furnished by independent pricing services. Other temporary cash investments are valued at amortized cost, which approximates market value.
2. Foreign Currency: Securities and other assets and liabilities denominated in foreign currencies are translated into U.S. dollars using exchange rates obtained from an independent third party as of the fund’s pricing time on the valuation date. Realized gains (losses) and unrealized appreciation (depreciation) on investment securities include the effects of changes in exchange rates since the securities were purchased, combined with the effects of changes in security prices. Fluctuations in the value of other assets and liabilities resulting from changes in exchange rates are recorded as unrealized foreign currency gains (losses) until the assets or liabilities are settled in cash, at which time they are recorded as realized foreign currency gains (losses).
3. Futures and Forward Currency Contracts: The fund uses index futures contracts to a limited extent, with the objectives of maintaining full exposure to the stock market, enhancing returns, maintaining liquidity, and minimizing transaction costs. The fund may purchase futures contracts to immediately invest incoming cash in the market, or sell futures in response to cash outflows, thereby simulating a fully invested position in the underlying index while maintaining a cash balance for liquidity. The fund may seek to enhance returns by using futures contracts instead of the underlying securities when futures
48
Pacific Stock Index Fund
are believed to be priced more attractively than the underlying securities. The primary risks associated with the use of futures contracts are imperfect correlation between changes in market values of stocks held by the fund and the prices of futures contracts, and the possibility of an illiquid market.
The fund also may enter into forward currency contracts to provide the appropriate currency exposure related to any open futures contracts. The fund’s risks in using these contracts include movement in the values of the foreign currencies relative to the U.S. dollar and the ability of the counterparties to fulfill their obligations under the contracts.
Futures and forward currency contracts are valued at their quoted daily settlement prices. The aggregate principal amounts of the contracts are not recorded in the Statement of Net Assets. Fluctuations in the value of the contracts are recorded in the Statement of Net Assets as an asset (liability) and in the Statement of Operations as unrealized appreciation (depreciation) until the contracts are closed, when they are recorded as realized gains (losses) on futures or forward currency contracts.
4. Federal Income Taxes: The fund intends to continue to qualify as a regulated investment company and distribute all of its taxable income. Accordingly, no provision for federal income taxes is required in the financial statements.
5. | Distributions: Distributions to shareholders are recorded on the ex-dividend date. |
6. Security Lending: The fund may lend its securities to qualified institutional borrowers to earn additional income. Security loans are required to be secured at all times by collateral at least equal to the market value of securities loaned. The fund invests cash collateral received in Vanguard Market Liquidity Fund, and records a liability for the return of the collateral, during the period the securities are on loan. Security lending income represents the income earned on investing cash collateral, less expenses associated with the loan.
7. Other: Dividend income is recorded on the ex-dividend date. Interest income includes income distributions received from Vanguard Market Liquidity Fund and is accrued daily. Security transactions are accounted for on the date securities are bought or sold. Costs used to determine realized gains (losses) on the sale of investment securities are those of the specific securities sold. Fees assessed on redemptions of capital shares are credited to paid-in capital.
Each class of shares has equal rights as to assets and earnings, except that each class separately bears certain class-specific expenses related to maintenance of shareholder accounts (included in Management and Administrative expenses) and shareholder reporting. Marketing and distribution expenses are allocated to each class of shares based on a method approved by the board of trustees Income, other non-class-specific expenses, and gains and losses on investments are allocated to each class of shares based on its relative net assets.
B. The Vanguard Group furnishes at cost investment advisory, corporate management, administrative, marketing, and distribution services. The costs of such services are allocated to the fund under methods approved by the board of trustees. The fund has committed to provide up to 0.40% of its net assets in capital contributions to Vanguard. At April 30, 2007, the fund had contributed capital of $1,290,000 to Vanguard (included in Other Assets), representing 0.01% of the fund’s net assets and 1.29% of Vanguard’s capitalization. The fund’s trustees and officers are also directors and officers of Vanguard.
C. Distributions are determined on a tax basis and may differ from net investment income and realized capital gains for financial reporting purposes. Differences may be permanent or temporary. Permanent differences are reclassified among capital accounts in the financial statements to reflect their tax character. Temporary differences arise when certain items of income, expense, gain, or loss are recognized in
49
Pacific Stock Index Fund
different periods for financial statement and tax purposes; these differences will reverse at some time in the future. Differences in classification may also result from the treatment of short-term gains as ordinary income for tax purposes.
During the six months ended April 30, 2007, the fund realized net foreign currency gains of $1,325,000, which increased distributable net income for tax purposes; accordingly, such gains have been reclassified from accumulated net realized losses to overdistributed net investment income.
Certain of the fund’s investments are in securities considered to be “passive foreign investment companies,” for which any unrealized appreciation and/or realized gains are required to be included in distributable net income for tax purposes. Unrealized appreciation through October 31, 2006, on passive foreign investment company holdings at April 30, 2007, was $104,173,000, all of which has been distributed and is reflected in the balance of overdistributed net investment income.
The fund’s tax-basis capital gains and losses are determined only at the end of each fiscal year. For tax purposes, at October 31, 2006, the fund had available realized losses of $93,776,000 to offset future net capital gains of $15,971,000 through October 31, 2009, $68,660,000 through October 31, 2010, $4,471,000 through October 31, 2011, and $4,674,000 through October 31, 2013. The fund will use these capital losses to offset net taxable capital gains, if any, realized during the year ending October 31, 2007; should the fund realize net capital losses for the year, the losses will be added to the loss carryforward balances above.
At April 30, 2007, the cost of investment securities for tax purposes was $11,624,462,000. Net unrealized appreciation of investment securities for tax purposes was $2,931,877,000, consisting of unrealized gains of $3,369,555,000 on securities that had risen in value since their purchase and $437,678,000 in unrealized losses on securities that had fallen in value since their purchase.
At April 30, 2007, the aggregate settlement value of open futures contracts expiring in June 2007 and the related unrealized appreciation (depreciation) were:
| | | ($000) |
| | Aggregate | Unrealized |
| Number of | Settlement | Appreciation |
Futures Contracts | Long Contracts | Value | (Depreciation) |
Topix Index | 371 | 52,776 | (303) |
ASX 200 Index | 134 | 17,215 | 612 |
At April 30, 2007, the fund had open forward currency contracts to receive and deliver currencies as follows:
| | | | | Unrealized |
| | | | | Appreciation |
| | | Contract Amount (000) | (Depreciation) |
Contract Settlement Date | | Receive | | Deliver | ($000) |
6/13/2007 | JPY | 461,486 | USD | 3,901 | (16) |
6/27/2007 | AUD | 19,948 | USD | 15,791 | 787 |
AUD—Australian dollar. | | | | | |
JPY—Japanese yen. | | | | | |
USD—U.S. dollar. | | | | | |
50
Pacific Stock Index Fund
Unrealized appreciation (depreciation) on open forward currency contracts is treated as realized gain (loss) for tax purposes.
The fund had net unrealized foreign currency losses of $476,000 resulting from the translation of other assets and liabilities at April 30, 2007.
D. During the six months ended April 30, 2007, the fund purchased $1,927,905,000 of investment securities and sold $49,801,000 of investment securities, other than temporary cash investments.
E. The market value of securities on loan to broker-dealers at April 30, 2007, was $247,634,000, for which the fund received cash collateral of $261,823,000.
F. Capital share transactions for each class of shares were:
| Six Months Ended | Year Ended |
| April 30, 2007 | October 31, 2006 |
| Amount | Shares | Amount | Shares |
| ($000) | (000) | ($000) | (000) |
Investor Shares | | | | |
Issued | 1,359,003 | 107,139 | 2,349,884 | 201,048 |
Issued in Lieu of Cash Distributions | 174,133 | 14,134 | 80,759 | 7,090 |
Redeemed1 | (286,847) | (22,798) | (751,786) | (64,382) |
Net Increase (Decrease)—Investor Shares | 1,246,289 | 98,475 | 1,678,857 | 143,756 |
Admiral Shares | | | | |
Issued | 188,787 | 2,272 | 465,655 | 6,139 |
Issued in Lieu of Cash Distributions | 22,198 | 275 | 11,005 | 148 |
Redeemed1 | (103,138) | (1,247) | (204,573) | (2,672) |
Net Increase (Decrease)—Admiral Shares | 107,847 | 1,300 | 272,087 | 3,615 |
Institutional Shares | | | | |
Issued | 414,433 | 32,516 | 1,168,762 | 99,284 |
Issued in Lieu of Cash Distributions | 36,590 | 2,965 | 20,167 | 1,769 |
Redeemed1 | (98,028) | (7,817) | (899,335) | (76,780) |
Net Increase (Decrease)—Institutional Shares | 352,995 | 27,664 | 289,594 | 24,273 |
ETF Shares | | | | |
Issued | 358,486 | 5,365 | 481,727 | 7,812 |
Issued in Lieu of Cash Distributions | — | — | — | — |
Redeemed | — | — | — | — |
Net Increase (Decrease)—ETF Shares | 358,486 | 5,365 | 481,727 | 7,812 |
G. In June 2006, the Financial Accounting Standards Board issued Interpretation No. 48 (“FIN 48”), “Accounting for Uncertainty in Income Taxes.” FIN 48 establishes the minimum threshold for recognizing, and a system for measuring, the benefits of tax-return positions in financial statements. FIN 48 will be effective for the fund’s fiscal year beginning November 1, 2007. Management is in the process of analyzing the fund’s tax positions for purposes of implementing FIN 48; based on the analysis completed to date, management does not believe the adoption of FIN 48 will result in any material impact to the fund’s financial statements.
1 Net of redemption fees of $203,000 and $548,000 (fund totals).
51
Emerging Markets Stock Index Fund
Fund Profile
As of April 30, 2007
Portfolio Characteristics | | |
| | Target | Broad |
| Fund | Index1 | Index2 |
Number of Stocks | 865 | 842 | 2,107 |
Turnover Rate | 8%3 | — | — |
Expense Ratio | | — | — |
Investor Shares | 0.40%3 | | |
Admiral Shares | 0.30%3 | | |
Signal Shares | 0.30%3 | | |
Institutional Shares | 0.25%3 | | |
ETF Shares | 0.30%3 | | |
Short-Term Reserves | 0% | — | — |
Sector Diversification (% of portfolio) | |
| | Target | Broad |
| Fund | Index1 | Index2 |
Consumer Discretionary | 6% | 6% | 11% |
Consumer Staples | 6 | 5 | 8 |
Energy | 15 | 16 | 9 |
Financials | 20 | 21 | 27 |
Health Care | 2 | 2 | 7 |
Industrials | 9 | 8 | 11 |
Information Technology | 13 | 14 | 9 |
Materials | 14 | 13 | 8 |
Telecommunication Services | 11 | 11 | 5 |
Utilities | 4 | 4 | 5 |
Volatility Measures4 | |
| Fund Versus | Fund Versus |
| Target Index1 | Broad Index2 |
R-Squared | 1.00 | 0.84 |
Beta | 0.99 | 1.54 |
Ten Largest Holdings5 (% of total net assets) | |
| | |
OAO Gazprom ADR | integrated oil and gas | 3.7% |
Samsung Electronics Co., Ltd. | semiconductors | 3.2 |
Petroleo Brasileiro | integrated oil and gas | 2.3 |
Companhia Vale do Rio Doce Pfd. | steel | 2.2 |
America Movil SA de CV | wireless telecommunication services | 1.9 |
China Mobile (Hong Kong) Ltd. | wireless telecommunication services | 1.8 |
Taiwan Semiconductor Manufacturing Co., Ltd. | semiconductors | 1.7 |
Lukoil Sponsored ADR | integrated oil and gas | 1.5 |
Kookmin Bank | diversified banks | 1.2 |
Hon Hai Precision Industry Co., Ltd. | electronic manufacturing services | 1.0 |
Top Ten | | 20.5% |
1 MSCI Emerging Markets Index.
2 MSCI All Country World Index ex USA.
3 Annualized.
4 For an explanation of R-squared, beta, and other terms used here, see the Glossary on page 109.
5 “Ten Largest Holdings” excludes any temporary cash investments and equity index products.
52
Emerging Markets Stock Index Fund
Market Diversification (% of portfolio) | |
| | Target |
| Fund | Index1 |
South Korea | 15% | 15% |
Taiwan | 11 | 11 |
China | 11 | 11 |
Brazil | 11 | 11 |
Russia | 9 | 10 |
South Africa | 9 | 9 |
India | 6 | 6 |
Mexico | 6 | 6 |
Malaysia | 3 | 3 |
Israel | 3 | 2 |
Poland | 2 | 2 |
Chile | 2 | 2 |
Turkey | 2 | 2 |
Indonesia | 2 | 2 |
Thailand | 2 | 2 |
Hungary | 1 | 1 |
Czech Republic | 1 | 1 |
Argentina | 1 | 1 |
Egypt | 1 | 1 |
Peru | 1 | 1 |
Philippines | 1 | 1 |
1 MSCI Emerging Markets Index.
53
Emerging Markets Stock Index Fund
Performance Summary
All of the returns in this report represent past performance, which is not a guarantee of future results that may be achieved by the fund. (Current performance may be lower or higher than the performance data cited. For performance data current to the most recent month-end, visit our website at www.vanguard.com/performance.) Note, too, that both investment returns and principal value can fluctuate widely, so an investor’s shares, when sold, could be worth more or less than their original cost. The returns shown do not reflect taxes that a shareholder would pay on fund distributions or on the sale of fund shares.
Fiscal-Year Total Returns (%): October 31, 1996–April 30, 2007
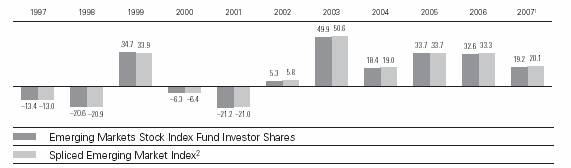
Average Annual Total Returns: Periods Ended March 31, 2007
This table presents average annual total returns through the latest calendar quarter—rather than through the end of the fiscal period. Securities and Exchange Commission rules require that we provide this information.
| Inception Date | One Year | Five Years | Ten Years |
Emerging Markets Stock Index Fund | | | | |
Investor Shares3 | 5/4/1994 | 18.88% | 23.82% | 9.02% |
Fee-Adjusted Returns4 | | 17.70 | 23.59 | 8.92 |
Admiral Shares | 6/23/2006 | 32.835 | — | — |
Fee-Adjusted Returns4 | | 31.525 | — | — |
Signal Shares | 1/19/2007 | 3.395 | | |
Fee-Adjusted Returns4 | | 2.365 | | |
Institutional Shares | 6/22/2000 | 19.11 | 24.01 | 14.885 |
Fee-Adjusted Returns4 | | 17.93 | 23.78 | 14.725 |
ETF Shares | 3/4/2005 | | | |
Market Price | | 19.05 | 25.835 | — |
Net Asset Value | | 19.15 | 25.985 | — |
1 Six months ended April 30, 2007.
2 Select Emerging Markets Index through August 23, 2006; MSCI Emerging Markets Index thereafter.
3 Returns do not reflect the $10 annual account maintenance fee applied on balances under $10,000.
4 Performance figures are adjusted for the 0.5% transaction fee on purchases and redemptions.
5 Return since inception.
Note: See Financial Highlights tables on pages 72 through 76 for dividend and capital gains information.
54
Emerging Markets Stock Index Fund
Financial Statements (unaudited)
Statement of Net Assets
As of April 30, 2007
The fund provides a complete list of its holdings four times in each fiscal year, at the quarter-ends. For the second and fourth fiscal quarters, the lists appear in the fund’s semiannual and annual reports to shareholders. For the first and third fiscal quarters, the fund files the lists with the Securities and Exchange Commission on Form N-Q. Shareholders can look up the fund’s Forms N-Q on the SEC’s website at www.sec.gov. Forms N-Q may also be reviewed and copied at the SEC’s Public Reference Room (see the back cover of this report for further information).
| | | Market |
| | | Value• |
| | Shares | ($000) |
Common Stocks (99.9%)1 | | |
Argentina (0.8%) | | |
| Tenaris SA | 1,531,436 | 35,045 |
| Tenaris SA ADR | 675,105 | 31,298 |
| Banco Macro Bansud | | |
| SA ADR | 217,967 | 7,890 |
* | Telecom Argentina SA | 1,507,786 | 6,735 |
| Siderar SA Class A | 883,933 | 6,080 |
* | Grupo Financiero Galicia | | |
| SA ADR | 486,345 | 5,068 |
* | Petrobras Energia | | |
| Participaciones SA ADR | 471,705 | 5,010 |
* | Telecom Argentina | | |
| SA ADR | 189,437 | 4,274 |
* | Petrobras Energia | | |
| Participaciones SA | 3,164,909 | 3,299 |
* | IRSA Inversiones y | | |
| Representaciones | | |
| SA GDR | 135,865 | 2,842 |
^ | Cresud SA ADR | 88,585 | 2,149 |
| BBVA Banco Frances SA | 424,248 | 1,648 |
* | Transportadora de | | |
| Gas Sur SA | 953,920 | 1,337 |
| BBVA Banco Frances | | |
| SA ADR | 108,231 | 1,264 |
* | Transportadora de | | |
| Gas del SA ADR | 170,550 | 1,185 |
* | Irsa Inversiones y | | |
| Representaciones SA | 563,918 | 1,177 |
| Solvay Indupa S.A.I.C. | 782,532 | 851 |
* | Molinos Rio de la Plata SA | 506,396 | 698 |
| Cresud SA | 209,663 | 502 |
| | | 118,352 |
Brazil (11.1%) | | |
| Petroleo Brasileiro SA Pfd. | 8,051,707 | 181,164 |
| Companhia Vale do | | |
| Rio Doce Pfd. Class A | 4,980,998 | 171,543 |
| | | Market |
| | | Value• |
| | Shares | ($000) |
| Petroleo Brasileiro SA | 5,843,307 | 149,168 |
| Companhia Vale do | | |
| Rio Doce | 3,443,145 | 141,126 |
| Banco Bradesco SA | 5,003,832 | 106,674 |
| Banco Itau Holding | | |
| Financeira SA | 2,738,823 | 106,527 |
| Companhia de Bebidas | | |
| das Americas Pfd. | 104,402,288 | 61,404 |
| Unibanco-Uniao de | | |
| Bancos Brasileiros SA | 5,511,183 | 53,861 |
| Gerdau SA Pfd. | 1,610,728 | 32,514 |
| Usiminas-Usinas | | |
| Siderugicas de | | |
| Minas Gerais SA Pfd. | 678,633 | 31,742 |
| Petroleo Brasileiro | | |
| Series A ADR | 330,181 | 29,459 |
| Companhia Siderurgica | | |
| Nacional SA | 616,218 | 26,698 |
| Companhia Vale do | | |
| Rio Doce ADR | 774,141 | 26,468 |
| Companhia Energetica de | | |
| Minas Gerais Pfd. | 721,735,989 | 25,141 |
| All America Latina | | |
| Logistica | 2,028,913 | 23,974 |
| Petroleo Brasileiro ADR | 235,763 | 23,866 |
| Empresa Brasileira de | | |
| Aeronautica SA | 1,991,649 | 23,534 |
| Tele Norte Leste | | |
| Participacoes SA Pfd. | 1,412,763 | 23,336 |
| Cia Vale do Rio Doce ADR | 556,640 | 22,605 |
| Banco Bradesco SA ADR | 735,010 | 15,597 |
* | Centrais Electricas | | |
| Brasileiras SA | 659,217,588 | 14,946 |
| Banco Itau Holding | | |
| Financeira SA ADR | 383,968 | 14,814 |
* | CESP-Companhia | | |
| Energetica de | | |
| Sao Paulo | 960,508,159 | 14,371 |
55
Emerging Markets Stock Index Fund
| | | Market |
| | | Value• |
| | Shares | ($000) |
| Vivo Participacoes | | |
| SA Pfd. | 2,913,723 | 13,313 |
| Companhia de | | |
| Concessoes | | |
| Rodoviarias | 826,165 | 12,874 |
| Aracruz Celulose SA Pfd. | | |
| B Shares | 2,320,505 | 12,819 |
* | Centrais Electricas | | |
| Brasileiras SA Pfd. | | |
| B Shares | 539,728,326 | 12,702 |
| Votorantim Celulose e | | |
| Papel SA Pfd. | 606,295 | 12,179 |
| Tele Norte Leste | | |
| Participacoes SA | 374,798 | 12,142 |
| Brasil Telecom | | |
| Participacoes SA Pfd. | 1,133,157,236 | 12,095 |
| Klabin SA | 3,802,270 | 11,850 |
| Tim Participacoes SA | 3,099,734,005 | 11,110 |
| Cyrela Brazil Realty SA | 986,232 | 10,634 |
| Tam SA | 401,573 | 10,431 |
| Souza Cruz SA | 467,363 | 10,244 |
| Companhia de | | |
| Saneamento Basico do | | |
| Estado de Sao Paulo | 71,735,261 | 9,929 |
| Submarino SA | 271,685 | 9,857 |
| Companhia de Bebidas | | |
| das Americas ADR | 165,014 | 9,640 |
| Lojas Renner SA | 692,958 | 9,563 |
| Lojas | | |
| Americanas SA Pfd. | 149,880,020 | 9,521 |
| Uniao de Bancos | | |
| Brasileiros SA GDR | 93,701 | 9,095 |
| Gol-Linhas Aereas | | |
| Inteligentes SA Pfd. | 308,967 | 8,868 |
| Duratex SA Pfd. | 396,250 | 8,845 |
| Sadia SA Pfd. | 1,983,877 | 8,537 |
| Braskem SA | 992,560 | 8,405 |
| Arcelor Brasil SA | 345,254 | 8,363 |
| Natura Cosmeticos SA | 650,571 | 7,719 |
| Perdigao SA | 498,779 | 7,588 |
| Tractebel Energia SA | 857,091 | 7,532 |
| Brasil Telecom | | |
| Participacoes SA | 354,925,117 | 7,514 |
| Weg SA Pfd. | 901,918 | 7,442 |
| Electropaulo | | |
| Metropolitana SA | 131,302,437 | 6,759 |
| Companhia Paranaense | | |
| de Energia-COPEL | 515,651,850 | 6,408 |
* | Cosan SA Industria e | | |
| Comercio | 314,377 | 6,306 |
| Gerdau SA | 368,310 | 6,238 |
| Diagnosticos da America | 268,853 | 5,824 |
| | | Market |
| | | Value• |
| | Shares | ($000) |
| Embraer-Empresa | | |
| Brasileira de | | |
| Aeronautica SA ADR | 118,198 | 5,545 |
| Energias do Brasil SA | 308,637 | 4,939 |
| Gerdau SA ADR | 226,419 | 4,535 |
| Gafisa SA | 308,852 | 4,352 |
* | Companhia Brasileira de | | |
| Distribuicao Grupo Pao | | |
| de Acucar | 134,943,648 | 4,311 |
^ | Companhia Siderurgica | | |
| Nacional SA ADR | 100,138 | 4,307 |
| Companhia Energetica | | |
| de Minas Gerais ADR | 76,041 | 3,944 |
| Aracruz Celulose | | |
| SA ADR | 68,001 | 3,739 |
| Companhia de Gas de | | |
| Sao Paulo-Comgas | 17,352,999 | 3,631 |
* | Net Servicos de | | |
| Comunicacao SA | 229,641 | 3,464 |
| Banco Nossa Caixa SA | 189,132 | 2,954 |
| Companhia de | | |
| Tecidos Norte de | | |
| Minas Pfd. | 17,779,868 | 2,898 |
| Tele Norte Leste | | |
| Participacoes ADR | 170,970 | 2,799 |
| Telemig Celular | | |
| Participacoes SA Pfd. | 1,107,586,562 | 2,383 |
^ | Sadia SA ADR | 55,762 | 2,377 |
| Brasil Telecom | | |
| Participacoes ADR | 43,073 | 2,284 |
| Companhia de | | |
| Saneamento Basico | | |
| do Estado de | | |
| Sao Paulo ADR | 62,705 | 2,166 |
* | Companhia Brasileira | | |
| de Distribuicao Grupo | | |
| Pao de | 59,233 | 1,887 |
| Tim Participacoes | | |
| SA ADR | 49,336 | 1,779 |
| Companhia Paranaense | | |
| de Energia-COPEL | | |
| ADR | 114,820 | 1,412 |
* | Telemig Celular | | |
| Participacoes ADR | 25,267 | 1,079 |
* | Vivo Participacoes | | |
| SA ADR | 9,939 | 45 |
| Votorantim Celulose e | | |
| Papel SA ADR | 2,038 | 41 |
| Braskem SA ADR | 2,279 | 38 |
* | Companhia De Bebidas | | |
| da Americas Pfd. Rights | | |
| Exp. 12/31/07 | 490,589 | 27 |
56
Emerging Markets Stock Index Fund
| | | Market |
| | | Value• |
| | Shares | ($000) |
* | Gol-Linhas Aereas | | |
| Inteligentes S.A. Rights | | |
| Exp. 5/21/07 | 13,025 | 23 |
* | Companhia de Gas de | | |
| Sao Paulo-Comgas Rights | | |
| Exp. 5/31/07 | 282,320 | 11 |
| | | 1,699,848 |
Chile (1.7%) | | |
| Empresas Copec SA | 2,520,291 | 36,772 |
| Empresa Nacional de | | |
| Electricidad SA | 14,958,957 | 24,336 |
| Enersis SA | 58,556,779 | 22,284 |
| Empresas CMPC SA | 566,732 | 20,274 |
| Cencosud SA | 4,551,851 | 17,582 |
| Sociedad Quimica y | | |
| Minera de Chile SA | 648,457 | 10,315 |
| Empresa Nacional de | | |
| Telecomunicaciones SA | 556,685 | 8,845 |
| CAP SA | 472,243 | 8,716 |
| Banco Santander Chile | | |
| SA | 180,259,481 | 8,643 |
| Colburn SA | 32,814,258 | 7,336 |
| Empresa Nacional de | | |
| Electricidad SA ADR | 148,670 | 7,215 |
| Lan Airlines SA | 471,421 | 6,907 |
| Enersis SA ADR | 363,721 | 6,889 |
| Banco de Credito e | | |
| Inversiones | 185,598 | 6,021 |
| Masisa SA | 24,112,337 | 5,964 |
| Compania de | | |
| Telecomunicaciones de | | |
| Chile SA | 2,530,341 | 5,849 |
| Compania Cervecerias Uni | | |
| das SA | 759,354 | 5,346 |
| Distribucion y | | |
| Servicio D&S SA | 12,209,607 | 4,809 |
| Embotelladora Andina SA | 1,326,373 | 4,341 |
* | Banco Santander Chile | | |
| SA ADR | 86,769 | 4,286 |
| Vina Concha y Toro SA | 2,157,508 | 3,982 |
| Parque Arauco SA | 3,730,316 | 3,868 |
| Corpbanca | 715,786,824 | 3,789 |
| Cristalerias de Chile | 292,345 | 3,638 |
| Inversiones Aguas | | |
| Metropolitanas SA | 2,818,129 | 3,485 |
| Embotelladora Andina | | |
| SA Pfd. Class B | 1,009,779 | 3,478 |
* | Compania SudAmericana | | |
| de Vapores SA | 2,011,067 | 3,207 |
* | Madeco SA | 15,260,612 | 1,930 |
| Sociedad Quimica y | | |
| Minera de Chile ADR | 11,360 | 1,791 |
| | | Market |
| | | Value• |
| | Shares | ($000) |
| Compania de | | |
| Telecomunicaciones de | | |
| Chile SA ADR | 168,160 | 1,524 |
| Distribucion y Servicio | | |
| SA ADR | 45,745 | 1,075 |
| Empresas Iansa SA | 7,756,599 | 1,048 |
| S.A.C.I. Falabella, SA | 11,000 | 54 |
| | | 255,599 |
China (11.1%) | | |
| China Mobile | | |
| (Hong Kong) Ltd. | 29,869,017 | 269,031 |
| China Life | | |
| Insurance Co., Ltd. | 42,257,300 | 130,363 |
| PetroChina Co. Ltd. | 113,974,524 | 127,986 |
* | Industrial and | | |
| Commercial Bank of | | |
| China | 174,712,979 | 94,937 |
| China Construction Bank | 147,061,124 | 89,001 |
| China Petroleum & | | |
| Chemical Corp. | 100,716,580 | 87,822 |
| CNOOC Ltd. | 92,598,552 | 79,535 |
* | Bank of China | 93,369,375 | 46,048 |
| Ping An Insurance | | |
| (Group) Co. of China Ltd. | 8,384,886 | 44,332 |
| China Telecom Corp. Ltd. | 83,006,030 | 39,324 |
| Bank of | | |
| Communications Ltd. | | |
| Class H | 34,296,052 | 35,989 |
* | China Communications | | |
| Construction Co., Ltd. | 26,297,734 | 34,493 |
| China Merchants Holdings | | |
| International Co. Ltd. | 6,138,612 | 27,130 |
| China Overseas Land & | | |
| Investment Ltd. | 20,739,808 | 25,155 |
| CITIC Pacific Ltd. | 6,527,068 | 24,470 |
| China Resources | | |
| Enterprise Ltd. | 7,065,441 | 23,817 |
| Aluminum Corp. of | | |
| China Ltd. | 18,496,680 | 21,465 |
| Huaneng Power | | |
| International, Inc. | | |
| H Shares | 18,124,412 | 18,305 |
| Cosco Pacific Ltd. | 6,585,592 | 15,930 |
| China Mengniu | | |
| Dairy Co., Ltd. | 5,207,836 | 15,790 |
* | China Shipping | | |
| Development Co. | 7,679,984 | 14,444 |
| China Resources Power | | |
| Holdings Co., Ltd. | 8,073,240 | 14,283 |
| Guangzhou R&F | | |
| Properties Co. Ltd. | 5,950,000 | 14,251 |
| Fujian Zijin Mining | | |
| Industry Co., Ltd. | 23,594,120 | 13,666 |
57
Emerging Markets Stock Index Fund
| | | Market |
| | | Value• |
| | Shares | ($000) |
| Nine Dragons Paper | | |
| Holdings Ltd. | 6,402,000 | 12,908 |
| Yanzhou Coal | | |
| Mining Co. Ltd. | | |
| H Shares | 11,611,732 | 11,880 |
| Denway Motors Ltd. | 29,241,243 | 11,627 |
| Jiangxi Copper Co. Ltd. | 8,206,662 | 11,556 |
| Shimao Property | | |
| Holdings Ltd. | 5,033,764 | 10,640 |
* | Semiconductor | | |
| Manufacturing | | |
| International Corp. | 71,892,540 | 10,609 |
| Agile Property | | |
| Holdings, Inc. | 9,929,361 | 10,402 |
| Anhui Conch | | |
| Cement Co. Ltd. | 2,552,678 | 10,279 |
| Angang Steel Co., Ltd. | 5,255,826 | 10,055 |
| Beijing Datang Power | | |
| Generation Co., Ltd. | 8,566,343 | 9,812 |
| Air China Ltd. | 14,247,443 | 9,623 |
| Li Ning Co., Ltd. | 4,876,474 | 9,527 |
| GOME Electrical | | |
| Appliances Holdings Ltd. | 6,097,060 | 9,407 |
| China International | | |
| Marine Containers | | |
| (Group) Co.,Ltd. | 3,630,060 | 9,162 |
| Hopson Development | | |
| Holdings Ltd. | 3,869,000 | 9,071 |
| China COSCO | | |
| Holdings Co., Ltd. | 9,731,500 | 8,829 |
| Chaoda Modern | | |
| Agriculture Holdings Ltd. | 10,635,530 | 8,785 |
* | PICC Property and | | |
| Casualty Co., Ltd. | 14,234,901 | 8,468 |
| Lenovo Group Ltd. | 20,337,722 | 8,115 |
| China Resources Land Ltd. | 6,686,000 | 8,020 |
| Guangdong | | |
| Investment Ltd. | 14,743,104 | 7,927 |
| Sinopec Shanghai | | |
| Petrochemical Co. Ltd. | 13,857,768 | 7,885 |
* | Dongfeng Motor Corp. | 14,210,482 | 7,558 |
| Beijing Capital | | |
| International Airport Co., Ltd. | 7,681,924 | 7,469 |
| China Travel International | 17,373,960 | 7,433 |
| Shanghai Electric | | |
| Group Co., Ltd. Class H | 17,026,012 | 7,309 |
| TPV Technology Ltd. | 10,733,674 | 7,204 |
| Zhejiang | | |
| Expressway Co., Ltd. | 8,574,128 | 7,019 |
| Xinao Gas Holdings Ltd. | 5,847,865 | 6,629 |
| Maanshan Iron and | | |
| Steel Co. Ltd. | 9,518,572 | 6,570 |
| | | Market |
| | | Value• |
| | Shares | ($000) |
| Shanghai Industrial | | |
| Holding Ltd. | 2,449,165 | 6,409 |
* | The Guangshen | | |
| Railway Co., Ltd. | 8,668,995 | 6,366 |
| Jiangsu | | |
| Expressway Co. Ltd. | | |
| H Shares | 7,156,302 | 6,072 |
* | BYD Co. Ltd. | 966,070 | 5,968 |
| China Shipping Container | | |
| Lines Co. Ltd. | 11,657,821 | 5,608 |
| Shenzhen Investment Ltd. | 9,471,000 | 5,600 |
* | China Everbright Ltd. | 4,217,820 | 5,353 |
| Sinochem Hong Kong | | |
| Holdings Ltd. | 9,892,000 | 5,026 |
| ZTE Corp. | 1,016,388 | 4,725 |
| Weiqiao Textile Co. Ltd. | 2,596,307 | 4,662 |
| Weichai Power Co., Ltd. | | |
| Class H | 796,920 | 4,546 |
| Beijing Enterprises | | |
| Holdings Ltd. | 1,758,000 | 4,538 |
* | Hunan Non-Ferrous | | |
| Metal Corp., Ltd. | 7,420,000 | 4,469 |
| FU JI Food & | | |
| Catering Services | 1,441,000 | 4,386 |
| Zhejiang Southeast | | |
| Electric Power Co., Ltd. | 4,180,291 | 4,373 |
| Guangzhou | | |
| Investment Co. Ltd. | 18,020,000 | 4,210 |
| Global Bio-chem | | |
| Technology | | |
| Group Co. Ltd. | 9,636,866 | 4,111 |
* | Huadian Power | | |
| International Corp. Ltd. | 8,992,668 | 3,887 |
| Tsingtao Brewery Co., Ltd. | 2,066,468 | 3,638 |
| Sinotrans Ltd. | 9,164,190 | 3,600 |
| Guangdong Electric Power | | |
| Development Co., Ltd. | 3,596,067 | 3,587 |
* | China Southern | | |
| Airlines Co. Ltd. | 7,547,658 | 3,295 |
* | Brilliance China | | |
| Automotive | | |
| Holdings Ltd. | 15,325,562 | 3,215 |
| COFCO International Ltd. | 4,778,750 | 3,057 |
| Shenzhen | | |
| Expressway Co. Ltd. | 4,407,138 | 3,022 |
* | Travelsky Technology Ltd. | 1,734,624 | 2,950 |
* | Sinopec Yizheng | | |
| Chemical Fibre Co., Ltd. | 7,786,000 | 2,869 |
* | China Eastern | | |
| Airlines Corp. Ltd. | 9,559,626 | 2,839 |
| Shanghai Forte | | |
| Land Co., Ltd. | 5,946,000 | 2,706 |
* | China Citic Bank | 1,308,100 | 1,099 |
58
Emerging Markets Stock Index Fund
| | | Market |
| | | Value• |
| | Shares | ($000) |
* | China Agri-Industries | | |
| Holdings Ltd. | 287,000 | 234 |
| | | 1,705,765 |
Colombia (0.2%) | | |
| Bancolombia SA ADR | 991,373 | 27,818 |
| | | |
Czech Republic (0.9%) | | |
| Ceske Energeticke | | |
| Zavody a.s. | 1,301,012 | 62,928 |
| Cesky Telecom a.s. | 711,117 | 21,242 |
| Komercni Banka a.s. | 108,304 | 20,189 |
* | Central European Media | | |
| Enterprises Ltd. | 221,009 | 19,920 |
| Zentiva NV | 123,598 | 8,842 |
* | Unipetrol a.s. | 276,625 | 3,173 |
* | Philip Morris CR a.s. | 110 | 54 |
| | | 136,348 |
Egypt (0.6%) | | |
| Orascom Telecom | | |
| Holding SAE GDR | 778,509 | 52,076 |
| Orascom Construction | | |
| Industries GDR | 389,327 | 45,420 |
| | | 97,496 |
Hungary (1.2%) | | |
| OTP Bank Rt. | 1,862,720 | 94,591 |
| MOL Hungarian Oil and | | |
| Gas Nyrt. | 437,189 | 53,220 |
| Richter Gedeon Rt. | 92,646 | 19,010 |
| Magyar Tavkozlesi Rt. | 2,725,115 | 15,786 |
| | | 182,607 |
India (6.6%) | | |
| Reliance Industries Ltd. | 3,810,574 | 143,440 |
| Infosys Technologies Ltd. | 2,673,619 | 131,978 |
| ICICI Bank Ltd. | 2,368,729 | 49,330 |
| Housing Development | | |
| Finance Corp. Ltd. | 1,112,132 | 44,574 |
* | Reliance Communication | | |
| Ventures | 3,703,272 | 42,578 |
| Oil and Natural | | |
| Gas Corp. Ltd. | 1,598,626 | 35,241 |
^ | ICICI Bank Ltd. ADR | 703,249 | 28,777 |
| Satyam Computer | | |
| Services Ltd. | 2,397,945 | 27,318 |
| HDFC Bank Ltd. | 1,104,275 | 27,093 |
| ITC Ltd. | 6,767,333 | 26,108 |
| Larsen & Toubro Ltd. | 623,462 | 25,482 |
| Tata Consultancy | | |
| Services Ltd. | 765,229 | 23,328 |
| Hindustan Lever Ltd. | 4,785,348 | 23,017 |
| Bharat Heavy | | |
| Electricals Ltd. | 349,193 | 20,955 |
| Tata Motors Ltd. | 1,143,119 | 20,685 |
| Mahindra & Mahindra Ltd. | 847,318 | 15,881 |
| | | Market |
| | | Value• |
| | Shares | ($000) |
| Wipro Ltd. | 1,065,657 | 14,647 |
| Grasim Industries Ltd. | 212,975 | 12,569 |
| Reliance Capital Ltd. | 697,772 | 11,971 |
| Bajaj Auto Ltd. | 185,487 | 10,938 |
| Dr. Reddy’s | | |
| Laboratories Ltd. | 618,662 | 10,558 |
| Hindalco Industries Ltd. | 2,973,631 | 10,470 |
| Tata Iron and | | |
| Steel Co. Ltd. | 775,098 | 10,266 |
| Gail India Ltd. | 1,435,474 | 10,252 |
| Cipla Ltd. | 2,000,779 | 10,177 |
| Gujarat Ambuja | | |
| Cements Ltd. | 3,301,161 | 9,381 |
| Ranbaxy Laboratories Ltd. | 999,503 | 8,969 |
| Kotak Mahindra Bank | 661,722 | 8,645 |
| Indiabulls Financial | | |
| Services Ltd. | 718,741 | 8,305 |
| Hero Honda Motors Ltd. | 490,803 | 8,165 |
| Maruti Udyog Ltd. | 415,061 | 8,055 |
| Sun Pharmaceutical | | |
| Industries Ltd. | 324,923 | 8,050 |
| Zee Entertainment | | |
| Enterprises | 1,136,746 | 8,022 |
| Reliance Energy Ltd. | 631,370 | 7,758 |
| UTI Bank Ltd. | 652,622 | 7,336 |
| Siemens India Ltd. | 234,977 | 6,651 |
| Indian Hotels Co. Ltd. | 1,840,807 | 6,288 |
| Associated | | |
| Cement Cos. Ltd. | 303,152 | 6,138 |
| ABB (India) Ltd. | 58,211 | 5,733 |
| State Bank of India | 214,796 | 5,703 |
* | Indiabulls Real Estate Ltd. | 643,713 | 5,327 |
| Tata Power Co. Ltd. | 369,651 | 5,276 |
| Bharat Forge Ltd. | 628,312 | 4,890 |
| Jindal Steel & Power Ltd. | 70,273 | 4,884 |
| Satyam Computer | | |
| Services Ltd. ADR | 192,310 | 4,785 |
| GlaxoSmithKline | | |
| Pharmaceuticals | | |
| (India) Ltd. | 167,954 | 4,736 |
| Glenmark | | |
| Pharmaceuticals Ltd. | 294,712 | 4,679 |
| HDFC Bank Ltd. ADR | 59,931 | 4,353 |
| Bharat | | |
| Petroleum Corp. Ltd. | 536,772 | 4,323 |
| Nestle India Ltd. | 168,052 | 4,092 |
| Jaiprakash Associates Ltd. | 259,646 | 3,766 |
| Bharat Electronics Ltd. | 90,497 | 3,731 |
| Tata Tea Ltd. | 198,962 | 3,716 |
| Mahanagar Telephone | | |
| Nigam Ltd. | 1,002,989 | 3,585 |
| Hindustan | | |
| Petroleum Corp., Ltd. | 548,342 | 3,574 |
59
Emerging Markets Stock Index Fund
| | | Market |
| | | Value• |
| | Shares | ($000) |
| Indian | | |
| Petrochemicals Corp., Ltd. | 474,955 | 3,557 |
| Infrastructure | | |
| Development | | |
| Finance Co., Ltd. | 1,538,291 | 3,557 |
| Ultratech Cemco Ltd. | 180,657 | 3,550 |
| Asian Paints (India) Ltd. | 182,087 | 3,475 |
| State Bank of India GDR | 49,983 | 3,394 |
| Videsh Sanchar Nigam Ltd. | 296,150 | 3,118 |
| Biocon Ltd. | 254,152 | 2,944 |
| Moser Baer India Ltd. | 288,094 | 2,463 |
| Nicholas Piramal India Ltd. | 396,360 | 2,456 |
^ | Wipro Ltd. ADR | 139,977 | 2,311 |
| Bank of Baroda | 396,705 | 2,255 |
| Ashok Leyland Ltd. | 2,073,700 | 1,940 |
| Bajaj Hindusthan Ltd. | 492,832 | 1,917 |
| Colgate-Palmolive | | |
| (India) Ltd. | 229,179 | 1,901 |
^ | Dr. Reddy’s | | |
| Laboratories Ltd. ADR | 109,786 | 1,878 |
| Jet Airways (India) Ltd. | 108,086 | 1,868 |
| Britannia Industries Ltd. | 55,158 | 1,680 |
* | Dish TV India Ltd. | 606,647 | 1,574 |
| Matrix Laboratories Ltd. | 288,308 | 1,333 |
| Arvind Mills Ltd. | 1,010,978 | 1,096 |
* | Sun Pharmaceutical | | |
| Advanced Research | 324,923 | 1,061 |
^ | Videsh Sanchar | | |
| Nigam Ltd. ADR | 35,622 | 746 |
| Mahanagar Telephone | | |
| Nigam Ltd. ADR | 58,134 | 414 |
| Infosys Technologies Ltd. | | |
| ADR | 5,765 | 302 |
| Reliance Industries Ltd. | | |
| GDR | 195 | 15 |
| | | 1,017,354 |
| Indonesia (1.6%) | | |
| PT Telekomunikasi | | |
| Indonesia Tbk | 60,130,479 | 68,785 |
| PT Bank Central Asia Tbk | 36,093,028 | 20,861 |
| PT Astra International Tbk | 12,461,148 | 19,571 |
| PT Bank Rakyat | | |
| Indonesia Tbk | 32,393,452 | 18,537 |
| PT Bumi Resources Tbk | 101,377,000 | 15,305 |
| PT Perusahaan Gas | | |
| Negara Tbk | 10,823,324 | 12,389 |
| PT Bank Mandiri Tbk | 35,495,808 | 11,843 |
| PT Indonesian | | |
| Satellite Corp. Tbk | 14,303,133 | 10,596 |
| PT Bank Danamon Tbk | 9,973,258 | 7,023 |
| PT International Nickel | | |
| Indonesia Tbk | 962,060 | 6,398 |
| PT Aneka Tambang Tbk | 3,763,815 | 6,383 |
| | | Market |
| | | Value• |
| | Shares | ($000) |
| PT United Tractors Tbk | 7,355,672 | 6,326 |
| PT Unilever Indonesia Tbk | 9,441,810 | 5,829 |
| PT Indofood Sukses | | |
| Makmur Tbk | 27,773,688 | 4,966 |
| PT Gudang Garam Tbk | 4,129,600 | 4,894 |
* | PT Kalbe Farma Tbk | 33,545,698 | 4,612 |
| PT Astra Agro Lestari Tbk | 2,106,680 | 3,620 |
| PT Semen Gresik Tbk | 850,732 | 3,574 |
| PT Indocement Tunggal | | |
| Prakarsa Tbk (Local) | 5,711,574 | 3,548 |
* | PT Bank Indonesia Tbk | 45,776,739 | 3,136 |
| PT Berlian Laju Tanker Tbk | 12,249,000 | 2,708 |
* | PT Energi Mega | | |
| Persada Tbk | 34,541,864 | 2,268 |
| PT Bank International | | |
| Indonesia Tbk | 102,385,500 | 2,099 |
| Ramayana Lestari | | |
| Sentosa PT Tbk | 16,810,120 | 1,469 |
* | Bank Pan Indonesia TBK | | |
| Warrants Exp. 7/10/09 | 7,066,431 | 171 |
| | | 246,911 |
Israel (2.7%) | | |
| Teva Pharmaceutical | | |
| Industries Ltd. | 4,086,730 | 156,849 |
| Bank Hapoalim Ltd. | 6,460,923 | 33,708 |
| Bank Leumi Le-Israel | 6,146,201 | 23,052 |
| Israel Chemicals Ltd. | 2,985,730 | 22,810 |
| Africa-Israel | | |
| Investments Ltd. | 91,745 | 12,546 |
* | Check Point Software | | |
| Technologies Ltd. | 525,053 | 12,365 |
| Bezeq Israeli | | |
| Telecommunication | | |
| Corp., Ltd. | 7,023,286 | 11,197 |
* | NICE Systems Ltd. | 297,290 | 10,938 |
| United Mizrahi Bank Ltd. | 1,314,109 | 9,736 |
* | Israel Discount Bank Ltd. | 4,430,468 | 9,280 |
| Makhteshim-Agan | | |
| Industries Ltd. | 1,138,595 | 8,270 |
| IDB | | |
| Development Corp. Ltd. | 220,490 | 8,113 |
| Clal Insurance Enterprise | | |
| Holdings Ltd. | 256,425 | 7,984 |
* | Alvarion Ltd. | 953,770 | 7,840 |
| Discount | | |
| Investment Corp. Ltd. | 248,867 | 7,484 |
* | Given Imaging Ltd. | 275,446 | 6,746 |
| Elbit Systems Ltd. | 150,090 | 6,087 |
| The Israel Corp. Ltd. | 9,494 | 6,036 |
| Partner | | |
| Communications Co. Ltd. | 369,388 | 6,033 |
* | Aladdin Knowledge | | |
| Systems | 270,321 | 5,661 |
60
Emerging Markets Stock Index Fund
| | | Market |
| | | Value• |
| | Shares | ($000) |
| Migdal Insurance | | |
| Holdings Ltd. | 3,358,861 | 5,509 |
| Harel Insurance | | |
| Investments Ltd. | 97,818 | 5,380 |
* | ECI Telecom Ltd. | 628,299 | 5,253 |
* | Super Sol Ltd. | 1,067,316 | 4,364 |
* | Retalix Ltd. | 178,791 | 3,928 |
* | Radware Ltd. | 279,161 | 3,615 |
| Clal Industries and | | |
| Investments Ltd. | 545,178 | 3,519 |
* | Orbotech Ltd. | 151,903 | 3,483 |
* | Syneron Medical Ltd. | 135,943 | 3,424 |
* | Koor Industries Ltd. | 53,013 | 3,368 |
| Tadiran Communications | | |
| Industries | 60,797 | 3,160 |
* | Audiocodes Ltd. | 312,929 | 2,097 |
| Strauss Group Ltd. | 85,342 | 1,012 |
| | | 420,847 |
Malaysia (3.3%) | | |
| Bumiputra-Commerce | | |
| Holdings Bhd. | 13,316,400 | 41,755 |
| Malayan Banking Bhd. | 11,747,300 | 40,967 |
| IOI Corp. Bhd. | 4,349,100 | 31,903 |
| Genting Bhd. | 10,871,200 | 26,884 |
| Sime Darby Bhd. | 9,128,500 | 24,474 |
| Tenaga Nasional Bhd. | 6,498,700 | 21,554 |
| Maxis | | |
| Communications Bhd. | 5,242,400 | 19,916 |
| Malaysia International | | |
| Shipping Corp., Bhd. | | |
| (Foreign) | 6,992,700 | 19,728 |
| Public Bank Bhd. | 6,219,500 | 18,130 |
| Telekom Malaysia Bhd. | 5,132,400 | 16,141 |
| Resorts World Bhd. | 15,275,500 | 14,493 |
| British American | | |
| Tobacco Bhd. | 972,600 | 13,051 |
| Malakoff Bhd. | 3,557,900 | 10,710 |
| Kuala Lumpur Kepong Bhd. | 2,587,050 | 9,812 |
| AMMB Holdings Bhd. | 8,342,600 | 9,706 |
| PLUS Expressways Bhd. | 9,586,400 | 8,485 |
| Petronas Gas Bhd. | 3,116,900 | 8,452 |
| YTL Corp., Bhd. | 3,946,700 | 8,380 |
| PPB Group Bhd. | 3,769,000 | 8,289 |
| IJM Corp. Bhd. | 3,113,950 | 7,885 |
| Gamuda Bhd. | 3,298,300 | 7,538 |
| Golden Hope | | |
| Plantations Bhd. | 3,189,900 | 7,398 |
| Tanjong Public Ltd. Co. | 1,468,600 | 7,182 |
| SP Setia Bhd. | 2,888,200 | 6,941 |
| Bursa Malaysia Bhd. | 1,809,000 | 6,074 |
| Berjaya Sports Toto Bhd. | 4,318,200 | 5,637 |
| Hong Leong Bank Bhd. | 2,937,000 | 5,465 |
| Magnum Corp., Bhd. | 5,163,100 | 5,257 |
| | | Market |
| | | Value• |
| | Shares | ($000) |
| Astro All Asia | | |
| Networks PLC | 3,447,200 | 5,069 |
| RHB Capital Bhd. | 3,590,200 | 4,929 |
| UMW Holdings | | |
| Malaysia Bhd. | 1,439,400 | 4,786 |
| Petronas Dagangan Bhd. | 2,197,300 | 4,506 |
| Highlands & | | |
| Lowlands Bhd. | 1,812,400 | 4,069 |
| Star Publications Bhd. | 3,781,500 | 3,986 |
| Shell Refining Co. | | |
| Malaysia Bhd. | 1,237,300 | 3,862 |
| Lafarge Malayan | | |
| Cement Bhd. | 7,409,600 | 3,792 |
| Malaysia | | |
| Mining Corp., Bhd. | 1,718,600 | 3,532 |
| Proton Holdings Bhd. | 1,766,300 | 3,283 |
| IGB Corp., Bhd. | 3,778,600 | 3,129 |
* | Airasia Bhd. | 5,526,400 | 3,120 |
| Media Prima Bhd. | 3,814,700 | 3,057 |
| Transmile Group Bhd. | 772,100 | 2,947 |
* | Malaysian | | |
| Resources Corp., Bhd. | 4,162,100 | 2,717 |
| KLCC Property | | |
| Holdings Bhd. | 2,409,100 | 2,690 |
| Pos Malaysia & | | |
| Services Holding Bhd. | 1,889,100 | 2,575 |
| Guinness Anchor Bhd. | 1,414,700 | 2,533 |
| IOI Properties Bhd. | 674,900 | 2,514 |
* | Multi-Purpose | | |
| Holdings Bhd. | 3,398,200 | 2,451 |
| DRB-Hicom Bhd. | 3,964,500 | 2,297 |
* | Malaysian Airline | | |
| System Bhd. | 1,341,900 | 2,260 |
* | Mulpha International Bhd. | 4,021,200 | 2,168 |
| Kurnia Asia Bhd | 6,580,300 | 2,154 |
| Scomi Group Bhd. | 5,250,800 | 2,134 |
| Hong Leong Financial | | |
| Group Bhd. | 1,182,900 | 1,996 |
| TA Enterprise Bhd. | 3,345,200 | 1,822 |
| Tan Chong Motor | | |
| Holdings Bhd. | 4,172,800 | 1,567 |
| Malaysian Pacific | | |
| Industries Bhd. | 498,300 | 1,494 |
| Malaysian Bulk | | |
| Carriers Bhd. | 1,215,900 | 1,401 |
| | | 501,047 |
Mexico (6.3%) | | |
| America Movil SA de CV | 110,066,545 | 289,239 |
* | Cemex SA CPO | 43,606,965 | 141,788 |
| Telefonos de Mexico SA | 50,985,604 | 87,242 |
| Grupo Televisa SA CPO | 14,133,585 | 79,367 |
| Wal-Mart de Mexico SA | 19,268,200 | 75,564 |
61
Emerging Markets Stock Index Fund
| | | Market |
| | | Value• |
| | Shares | ($000) |
| Fomento Economico | | |
| Mexicano UBD | 4,439,435 | 47,771 |
| Grupo Financerio | | |
| Banorte SA de CV | 8,461,049 | 36,743 |
| Grupo Mexico SA de CV | 6,577,502 | 35,128 |
| Grupo Modelo SA | 3,459,166 | 17,678 |
| Alfa SA de CV Series A | 2,233,866 | 16,654 |
| Grupo Carso SA de CV | | |
| Series A1 | 3,971,998 | 15,755 |
| Kimberly Clark de | | |
| Mexico SA de CV | | |
| Series A | 3,237,733 | 14,326 |
* | Corporacion GEO, SA | | |
| de CV | 2,580,325 | 14,139 |
| Grupo Bimbo SA | 2,107,752 | 11,395 |
* | Empresas ICA SAB | | |
| de CV | 2,436,170 | 9,636 |
| Grupo Aeroportuario del | | |
| Pacifico SA ADR | 200,593 | 9,071 |
* | Desarrolladora Homex SA | | |
| de CV | 902,080 | 8,747 |
* | Industrias Penoles SA | | |
| Series CP | 704,776 | 8,695 |
| Consorcio ARA SA de CV | 5,194,604 | 8,509 |
| Grupo Aeroportuario del | | |
| Sureste SA de CV | 1,726,089 | 8,326 |
| Coca-Cola Femsa SA | | |
| de CV | 2,026,825 | 7,871 |
| Controladora Comercial | | |
| Mexicana SA de CV | | |
| (Units) | 2,630,723 | 6,793 |
* | URBI Desarrollos | | |
| Urbanos SA de CV | 1,549,369 | 6,474 |
| TV Azteca SA CPO | 7,454,011 | 6,391 |
* | Carso Infraestructura y | | |
| Construccion, SA | 5,221,792 | 4,553 |
| Grupo Aeroportuario del | | |
| Pacifico SA | 793,107 | 3,600 |
* | Cemex SAB de CV ADR | 12,200 | 397 |
| | | 971,852 |
Peru (0.6%) | | |
^ | Southern Peru | | |
| Copper Corp. | | |
| (U.S. Shares) | 298,412 | 23,962 |
| Southern Peru | | |
| Copper Corp. | 233,969 | 19,216 |
| Credicorp Ltd. | 326,513 | 17,109 |
| Compania de Minas | | |
| Buenaventura S.A.u | 437,247 | 14,056 |
| Volcan Compania | | |
| Minera SA | 2,031,892 | 8,850 |
| Minsur SA | 2,648,377 | 8,789 |
| | | Market |
| | | Value• |
| | Shares | ($000) |
| Compania de Minas | | |
| Buenaventura S.A.u. ADR | 106,671 | 3,475 |
| | | 95,457 |
Philippines (0.6%) | | |
| Philippine Long Distance | | |
| Telephone Co. | 336,424 | 17,846 |
| Ayala Land, Inc. | 26,476,009 | 9,611 |
| Bank of Philippine Islands | 6,950,515 | 9,338 |
| Ayala Corp. | 655,065 | 8,197 |
| SM Investments Corp. | 962,987 | 7,179 |
| SM Prime Holdings, Inc. | 27,701,981 | 6,603 |
| San Miguel Corp. Class B | 3,754,509 | 5,745 |
| Metropolitan Bank & | | |
| Trust Co. | 3,713,341 | 4,827 |
| Globe Telecom, Inc. | 180,789 | 4,648 |
* | Megaworld Corp. | 63,802,573 | 4,301 |
| Jollibee Foods Corp. | 3,635,843 | 3,756 |
| Banco De Oro | 2,651,491 | 3,290 |
| Manila Electric Co. | 1,938,393 | 2,925 |
| Petron Corp. | 23,419,950 | 2,639 |
| First Philippine | | |
| Holdings Corp. | 1,655,003 | 2,638 |
* | Filinvest Land, Inc. | 30,207,058 | 1,110 |
| | | 94,653 |
Poland (1.9%) | | |
| Powszechna Kasa | | |
| Oszczednosci Bank | | |
| Polski SA | 2,812,352 | 51,286 |
| Bank Polska Kasa Opieki | | |
| Grupa Pekao SA | 458,587 | 43,037 |
| Telekomunikacja | | |
| Polska SA | 4,047,798 | 32,419 |
| Polski Koncern | | |
| Naftowy SA | 1,785,274 | 29,076 |
| KGHM Polska Miedz SA | 638,170 | 24,207 |
| Bank Przemyslowo | | |
| Handlowy PBK SA | 52,206 | 18,405 |
| Bank Zachodni WBK SA | 157,591 | 17,192 |
* | Globe Trade Centre SA | 809,998 | 14,310 |
* | Bank Rozwoju | | |
| Eksportu SA | 62,408 | 11,307 |
| Polish Oil & Gas | 6,902,727 | 10,311 |
* | TVN SA | 748,815 | 7,275 |
| Grupa Kety SA | 76,106 | 5,310 |
| Orbis SA | 172,875 | 5,190 |
* | Budimex SA | 106,753 | 4,815 |
| Asseco Poland SA | 162,330 | 4,785 |
| Mondi Packaging Paper | | |
| Swieci SA | 105,606 | 4,179 |
| Prokom Software SA | 64,768 | 3,800 |
| Polska Grupa | | |
| Farmaceutyczna | 107,399 | 3,315 |
| Agora SA | 179,889 | 2,911 |
62
Emerging Markets Stock Index Fund
| | | Market |
| | | Value• |
| | Shares | ($000) |
| Computerland SA | 78,052 | 2,761 |
| Debica SA | 55,949 | 1,940 |
* | Boryszew SA | 26,662 | 240 |
| | | 298,071 |
Russia (9.5%) | | |
* | OAO Gazprom ADR | 14,496,500 | 566,940 |
| Lukoil Sponsored ADR | 2,977,923 | 228,564 |
| Mining and | | |
| Metallurgical Co. | | |
| Norilsk Nickel ADR | 535,733 | 104,520 |
| RAO Unified Energy | | |
| System GDR | 578,469 | 75,490 |
* | Mobile TeleSystems ADR | 1,226,082 | 67,557 |
* | Surgutneftegaz | | |
| OJSC ADR | 1,017,763 | 65,179 |
* | OAO Vimpel- | | |
| Communications | | |
| Sponsored ADR | 669,350 | 64,766 |
* | Tatneft GDR | 466,992 | 45,481 |
| Novolipetsk Steel GDR | 1,262,476 | 35,067 |
* | Polyus Gold ADR | 714,253 | 32,749 |
| NovaTek OAO GDR | 633,012 | 32,561 |
^ | Rostelecom ADR | 568,010 | 30,019 |
| Cherepovets MK | | |
| Severstal GDR | 1,883,053 | 25,798 |
| Wimm-Bill-Dann Foods | | |
| ADR | 296,863 | 23,927 |
| Sistema JSFC GDR | 834,776 | 23,451 |
| Mechel OAO ADR | 533,703 | 17,431 |
| Comstar United | | |
| Telesystems GDR | 1,401,355 | 11,249 |
| | | 1,450,749 |
South Africa (8.9%) | | |
| Sasol Ltd. | 3,540,248 | 121,190 |
| Standard Bank Group Ltd. | 7,620,531 | 118,663 |
| MTN Group Ltd. | 7,831,017 | 114,283 |
| Impala Platinum | | |
| Holdings Ltd. | 2,846,860 | 91,821 |
| Anglo Platinum Ltd. | 406,208 | 65,247 |
| FirstRand Ltd. | 18,218,118 | 64,426 |
| Sanlan Ltd. | 16,617,999 | 55,772 |
| Gold Fields Ltd. | 2,998,249 | 53,615 |
| Telkom South Africa Ltd. | 1,888,282 | 46,108 |
| Naspers Ltd. | 1,517,744 | 38,093 |
| Barloworld Ltd. | 1,318,788 | 36,669 |
| Nedbank Group Ltd. | 1,642,410 | 34,988 |
| AngloGold Ltd. | 775,556 | 34,401 |
* | Harmony Gold | | |
| Mining Co., Ltd. | 2,029,738 | 32,253 |
| Bidvest Group Ltd. | 1,316,557 | 27,382 |
| Sappi Ltd. | 1,500,010 | 26,578 |
| Mittal Steel | | |
| South Africa Ltd. | 1,384,772 | 24,909 |
| | | Market |
| | | Value• |
| | Shares | ($000) |
| Imperial Holdings Ltd. | 1,020,192 | 22,944 |
| Steinhoff International | | |
| Holdings Ltd. | 5,806,399 | 20,453 |
| African Bank | | |
| Investments Ltd. | 4,116,046 | 19,733 |
| Network Healthcare | | |
| Holdings Ltd. | 9,149,305 | 19,178 |
| Murray & | | |
| Roberts Holdings Ltd. | 2,168,979 | 18,597 |
| Investec Ltd. | 1,302,740 | 18,319 |
| Aveng Ltd. | 2,690,327 | 18,259 |
| Tiger Brands Ltd. | 647,704 | 18,084 |
| Reunert Ltd. | 1,571,375 | 17,830 |
| JD Group Ltd. | 1,200,481 | 15,824 |
| Massmart Holdings Ltd. | 1,133,048 | 15,694 |
| Truworths International Ltd. | 2,534,951 | 14,011 |
| Woolworths Holdings Ltd. | 3,955,327 | 13,341 |
| Liberty Group Ltd. | 944,296 | 12,253 |
| Shoprite Holdings Ltd. | 2,676,441 | 12,028 |
| Metropolitan Holdings Ltd. | 4,457,395 | 10,565 |
| Foschini Ltd. | 1,005,441 | 10,444 |
| Nampak Ltd. | 3,219,957 | 10,431 |
| Kumba Iron Ore Ltd. | 474,083 | 10,267 |
| Tongaat-Hulett Group Ltd. | 493,333 | 9,683 |
| Alexander Forbes Ltd. | 3,722,402 | 8,688 |
| Aspen Pharmacare | | |
| Holdings Ltd. | 1,550,792 | 8,465 |
| Allan Gray Property Trust | 7,890,900 | 8,345 |
| AVI Ltd. | 2,668,006 | 8,307 |
| Spar Group Ltd. | 935,586 | 7,055 |
| Ellerine Holdings Ltd. | 507,502 | 6,875 |
| Lewis Group Ltd. | 670,680 | 6,874 |
| Grindrod Ltd. | 1,765,850 | 4,913 |
| Pick’n Pay Stores Ltd. | 940,143 | 4,678 |
| Super Group Ltd. | 1,922,845 | 3,918 |
| Pretoria Portland | | |
| Cement Co., Ltd. | 26,598 | 1,815 |
| | | 1,364,269 |
South Korea (15.6%) | | |
| Samsung | | |
| Electronics Co., Ltd. | 611,298 | 373,845 |
| Kookmin Bank | 1,756,981 | 157,232 |
| POSCO | 341,994 | 143,421 |
| SK Corp. | 670,715 | 73,058 |
| Hyundai Heavy | | |
| Industries Co., Inc. | 272,016 | 68,547 |
| Samsung | | |
| Electronics Co., Ltd. Pfd. | 131,913 | 62,050 |
| Shinhan | | |
| Financial Group Ltd. | 1,070,702 | 60,276 |
| Hyundai Motor Co. Ltd. | 940,002 | 59,451 |
| Shinsegae Co., Ltd. | 87,166 | 59,310 |
63
Emerging Markets Stock Index Fund
| | | Market |
| | | Value• |
| | Shares | ($000) |
2 | Samsung | | |
| Electronics Co., Ltd. GDR | 189,343 | 57,695 |
| Korea Electric Power Corp. | 1,395,481 | 56,907 |
| KT & G Corp. | 701,682 | 50,441 |
* | POSCO ADR | 432,072 | 45,255 |
| Samsung Fire & | | |
| Marine Insurance Co. | 220,201 | 39,033 |
| LG Electronics Inc. | 580,147 | 38,693 |
| SK Telecom Co., Ltd. | 181,550 | 38,291 |
| Hana Financial Group Inc. | 697,582 | 36,421 |
* | NHN Corp. | 226,087 | 35,364 |
| Samsung Heavy | | |
| Industries Co., Ltd. | 1,042,120 | 34,063 |
| Samsung Corp. | 794,660 | 33,422 |
| KT Corp. | 705,714 | 31,676 |
| Hyundai Mobis | 340,810 | 27,340 |
| Daewoo Shipbuilding & | | |
| Marine | | |
| Engineering Co., Ltd. | 573,720 | 23,154 |
* | LG. Philips LCD Co., Ltd. | 568,704 | 23,117 |
| Daewoo Engineering & | | |
| Construction Co., Ltd. | 915,065 | 22,799 |
| Hyundai Development Co. | 384,100 | 22,054 |
| S-Oil Corp. | 284,418 | 21,876 |
* | Kookmin Bank-Spon ADR | 234,954 | 21,104 |
| GS Engineering & | | |
| Construction Corp. | 207,501 | 20,574 |
| Lotte Shopping Co., Ltd. | 54,443 | 20,418 |
| Daelim Industrial Co. | 157,658 | 18,413 |
* | Samsung | | |
| Securities Co. Ltd. | 311,233 | 18,193 |
| Korea Telecom Freetel | 582,603 | 17,872 |
| LG Chem Ltd. | 282,132 | 16,416 |
* | Hyundai Engineering & | | |
| Construction Co., Ltd. | 262,868 | 15,642 |
* | Kia Motors | 1,206,740 | 14,286 |
| Hyundai Mipo | | |
| Dockyard Co., Ltd. | 69,824 | 14,147 |
| Kangwon Land Inc. | 673,588 | 13,907 |
| Samsung | | |
| Engineering Co., Ltd. | 189,155 | 13,888 |
* | Daewoo | | |
| Securities Co., Ltd. | 632,000 | 13,642 |
| Samsung | | |
| Electro-Mechanics Co. | 365,390 | 13,577 |
| Hanjin Shipping Co., Ltd. | 307,240 | 13,407 |
| CJ Corp. | 118,514 | 13,229 |
| Korea Investment | | |
| Holdings Co., Ltd. | 223,420 | 13,165 |
| Hanjin Heavy | | |
| Industries Co. Ltd. | 277,420 | 12,490 |
| Samsung SDI Co. Ltd. | 212,605 | 12,430 |
| Daegu Bank | 747,695 | 12,286 |
| Hankook Tire Co. Ltd. | 660,970 | 12,098 |
| | | Market |
| | | Value• |
| | Shares | ($000) |
| SK Telecom Co. Ltd. ADR | 475,434 | 11,805 |
| Daewoo International Corp. | 261,457 | 11,555 |
| Kumkang Korea | | |
| Chemical Co., Ltd. | 27,554 | 11,322 |
| Korea Zinc Co., Ltd. | 74,008 | 11,211 |
* | Woori Investment & | | |
| Securities Co., Ltd. | 478,899 | 11,063 |
| Pusan Bank | 749,435 | 10,982 |
*^ | Shinhan Financial | | |
| Group Co., Ltd. ADR | 97,198 | 10,902 |
| Doosan Infracore Co., Ltd. | 339,270 | 10,788 |
| Hite Brewery Co., Ltd. | 76,577 | 10,768 |
| Samsung | | |
| Techwin Co., Ltd. | 270,574 | 10,699 |
| Cheil Industrial, Inc. | 275,800 | 10,405 |
| Korean Air Co. Ltd. | 212,168 | 9,970 |
| Hyundai Department | | |
| Store Co., Ltd. | 94,468 | 9,667 |
| Woongjin Coway Co., Ltd. | 267,699 | 8,951 |
| LG Household & | | |
| Health Care Ltd. | 66,700 | 8,881 |
* | Korea Electric | | |
| Power Corp. ADR | 428,142 | 8,854 |
| Yuhan Corp. | 53,019 | 8,642 |
| Korea Exchange Bank | 531,640 | 8,622 |
| Hyundai Motor Co., Ltd. | 246,007 | 7,995 |
| Amorepacific Corp. | 12,390 | 7,986 |
* | Hyundai Securities Co. | 512,249 | 7,843 |
* | Tong Yang | | |
| Investment Bank | 544,818 | 7,501 |
| Honam | | |
| Petrochemical Corp. | 87,280 | 7,233 |
| Dongkuk | | |
| Steel Mill Co., Ltd. | 249,280 | 6,801 |
* | NCsoft Corp. | 90,541 | 6,791 |
| Lotte | | |
| Confectionery Co., Ltd. | 5,335 | 6,656 |
| Dongbu | | |
| Insurance Co., Ltd. | 212,665 | 6,192 |
| Mirae Asset | | |
| Securities Co., Ltd. | 95,042 | 6,171 |
| Cheil Communications Inc. | 23,070 | 6,030 |
| Hanwha Chemical Corp. | 354,840 | 5,973 |
| LS Cable Ltd. | 108,020 | 5,898 |
| Nong Shim Co. Ltd. | 22,060 | 5,894 |
* | Daishin Securities Co. | 243,447 | 5,889 |
| Hyundai Marine & | | |
| Fire Insurance Co., Ltd. | 435,776 | 5,842 |
| Hyosung Corp. | 140,673 | 5,836 |
| ORION Corp. | 21,270 | 5,789 |
| Hanmi Pharm Co., Ltd. | 43,193 | 5,689 |
| Lotte Chilsung | | |
| Beverage Co., Ltd. | 4,250 | 5,483 |
| LG International Corp. | 177,426 | 5,404 |
64
Emerging Markets Stock Index Fund
| | | Market |
| | | Value• |
| | Shares | ($000) |
| LG Petrochemical Co., Ltd. | 160,030 | 5,380 |
| Korean Reinsurance Co. | 420,588 | 5,351 |
* | KT Corp. ADR | 219,241 | 4,968 |
| S1 Corp. | 110,600 | 4,765 |
| Pacific Corp. | 25,134 | 4,712 |
| Hyundai Autonet Co., Ltd. | 629,092 | 4,616 |
* | Daum | | |
| Communications Corp. | 61,100 | 4,518 |
| Asiana Airlines | 537,160 | 4,349 |
| LG Electronics Inc. | 117,981 | 4,325 |
| Poongsan Corp. | 143,120 | 3,820 |
| LG Fashion Corp. | 131,163 | 3,635 |
| Samsung Fine | | |
| Chemicals Co., Ltd. | 112,000 | 3,445 |
| Dae Duck Electronics Co. | 223,983 | 1,828 |
| | | 2,391,670 |
Taiwan (11.5%) | | |
| Taiwan Semiconductor | | |
| Manufacturing Co., Ltd. | 108,531,669 | 220,943 |
| Hon Hai Precision | | |
| Industry Co., Ltd. | 24,396,053 | 160,892 |
| Cathay Financial | | |
| Holding Co. | 32,000,431 | 64,807 |
| MediaTek Inc. | 4,569,240 | 56,830 |
| China Steel Corp. | 48,639,482 | 55,020 |
| Nan Ya Plastic Corp. | 29,638,291 | 53,913 |
| United | | |
| Microelectronics Corp. | 91,055,485 | 52,480 |
| AU Optronics Corp. | 32,424,403 | 51,120 |
| Chunghwa | | |
| Telecom Co., Ltd. | 25,722,920 | 48,868 |
| Formosa Plastic Corp. | 24,037,289 | 45,881 |
| Asustek Computer Inc. | 14,867,663 | 33,904 |
| Taiwan Semiconductor | | |
| Manufacturing Co. Ltd. | | |
| ADR | 3,182,692 | 33,546 |
| Mega Financial | | |
| Holding Co. Ltd. | 49,281,224 | 31,408 |
| Formosa Chemicals & | | |
| Fibre Corp. | 16,581,276 | 30,787 |
| Chinatrust Financial | | |
| Holding | 35,531,185 | 27,838 |
| High Tech Computer Corp. | 1,818,720 | 27,096 |
| Delta Electronics Inc. | 8,213,369 | 25,657 |
| Acer Inc. | 13,192,270 | 25,027 |
| Formosa | | |
| Petrochemical Corp. | 11,519,000 | 24,652 |
| Siliconware Precision | | |
| Industries Co. | 13,035,218 | 24,530 |
* | Innolux Display Corp. | 8,440,000 | 24,094 |
| Chi Mei | | |
| Optoelectronics Corp. | 21,110,718 | 23,634 |
| | | Market |
| | | Value• |
| | Shares | ($000) |
| China Development | | |
| Financial Holding Corp. | 51,078,274 | 21,384 |
* | Advanced Semiconductor | | |
| Engineering Inc. | 17,331,670 | 19,961 |
| Fubon Financial | | |
| Holding Co., Ltd. | 20,652,100 | 17,928 |
| Foxconn | | |
| Technology Co., Ltd. | 1,912,090 | 17,927 |
| Powerchip | | |
| Semiconductor Corp. | 29,077,000 | 17,573 |
| Compal Electronics Inc. | 18,822,743 | 17,089 |
| First Financial | | |
| Holding Co., Ltd. | 24,596,707 | 16,924 |
| Lite-On Technology Corp. | 13,695,868 | 16,896 |
| Uni-President | | |
| Enterprises Co. | 15,092,590 | 14,828 |
| Taiwan Cellular Corp. | 13,848,360 | 14,349 |
| Quanta Computer Inc. | 9,755,180 | 13,981 |
| Taiwan Cement Corp. | 15,370,988 | 13,654 |
* | Fuhwa Financial | | |
| Holdings Co., Ltd. | 31,362,773 | 13,495 |
| SinoPac Holdings | 31,103,214 | 13,451 |
* | Chang Hwa | | |
| Commercial Bank | 22,782,094 | 13,327 |
| Catcher | | |
| Technology Co., Ltd. | 1,725,806 | 13,162 |
| Hau Nan Financial | | |
| Holdings Co., Ltd. | 19,056,695 | 13,134 |
* | Taishin Financial Holdings | 26,892,678 | 13,089 |
| Far Eastern Textile Ltd. | 13,931,173 | 12,669 |
| Novatek Microelectronics | | |
| Corp., Ltd. | 2,523,485 | 12,408 |
| Pou Chen Corp. | 10,669,646 | 11,132 |
| E.Sun Financial | | |
| Holding Co., Ltd. | 16,119,637 | 9,110 |
* | Chunghwa Picture | | |
| Tubes, Ltd. | 35,848,331 | 8,655 |
* | Tatung Co., Ltd. | 20,361,000 | 8,571 |
| Asia Cement Corp. | 7,993,533 | 8,295 |
| Realtek | | |
| Semiconductor Corp. | 4,034,103 | 8,135 |
^ | United Microelectronics | | |
| Corp. ADR | 2,441,314 | 8,008 |
| Shin Kong Financial | | |
| Holdings Co. | 8,332,856 | 7,706 |
| President Chain | | |
| Store Corp. | 2,978,985 | 7,640 |
* | Walsin Lihwa Corp. | 14,806,970 | 7,576 |
| Taiwan Fertilizer Co., Ltd. | 4,148,000 | 7,563 |
* | Macronix | | |
| International Co., Ltd. | 16,782,486 | 6,974 |
| D-Link Corp. | 3,772,195 | 6,960 |
| Largan Precision Co., Ltd. | 592,538 | 6,648 |
* | Winbond Electronics Corp. | 19,613,000 | 6,575 |
65
Emerging Markets Stock Index Fund
| | | Market |
| | | Value• |
| | Shares | ($000) |
| Mitac International Corp. | 5,863,634 | 6,200 |
| Nan Ya Printed Circuit | | |
| Board Corp. | 1,062,000 | 6,179 |
| AU Optronics Corp. ADR | 384,673 | 6,120 |
| Inventec Co., Ltd. | 8,167,535 | 6,017 |
* | Via Technologies Inc. | 5,767,379 | 5,598 |
* | HannStar Display Corp. | 29,476,132 | 5,567 |
* | Yageo Corp. | 13,907,520 | 5,470 |
| Chunghwa | | |
| Telecom Co., Ltd. ADR | 272,431 | 5,421 |
| Synnex Technology | | |
| International Corp. | 4,175,028 | 5,255 |
| Yulon Motor Co., Ltd. | 4,529,676 | 5,016 |
* | BENQ Corp. | 13,138,692 | 5,007 |
* | CMC Magnetics Corp. | 15,943,700 | 4,785 |
| Teco Electric & | | |
| Machinery Co., Ltd. | 9,105,000 | 4,684 |
| Asia Optical Co., Inc. | 1,087,330 | 4,610 |
| Eternal Chemical Co., Ltd. | 2,743,871 | 4,593 |
| Formosa Taffeta Co., Ltd. | 4,962,868 | 4,488 |
| U-Ming Marine | | |
| Transport Corp. | 2,426,600 | 4,477 |
| Advantech Co., Ltd. | 1,484,622 | 4,366 |
| Wintek Corp. | 5,456,607 | 4,204 |
| Compal | | |
| Communications, Inc. | 1,197,800 | 4,189 |
| Cheng Shin Rubber | | |
| Industry Co., Ltd. | 3,898,555 | 4,015 |
* | Polaris Securities Co., Ltd. | 9,567,502 | 4,013 |
| Phoenix Precision | | |
| Technology Corp. | 3,646,584 | 3,890 |
| Wan Hai Lines Ltd. | 5,849,370 | 3,875 |
| Yang Ming Marine | | |
| Transport | 5,699,985 | 3,726 |
| Cheng Uei Precision | | |
| Industry Co., Ltd. | 1,351,814 | 3,695 |
| Evergreen Marine Corp. | 5,629,879 | 3,439 |
| China Motor Co., Ltd. | 3,976,028 | 3,423 |
| Zyxel | | |
| Communications Corp. | 2,263,554 | 3,311 |
* | Ritek Corp. | 13,304,194 | 3,219 |
| Taiwan Glass | | |
| Industrial Corp. | 3,611,207 | 3,134 |
* | Cathay Construction Corp. | 5,486,779 | 3,092 |
| Fu Sheng | | |
| Industrial Co., Ltd. | 3,093,887 | 3,044 |
| Micro-Star | | |
| International Co., Ltd. | 4,130,797 | 3,030 |
* | China Airlines | 6,684,082 | 2,919 |
| Yuen Foong Yu Paper | | |
| Manufacturing Co., Ltd. | 6,698,172 | 2,683 |
| EVA Airways Corp. | 6,781,879 | 2,666 |
| Inventec Appliances Corp. | 1,383,900 | 2,553 |
| | | Market |
| | | Value• |
| | Shares | ($000) |
| Waterland Financial | | |
| Holdings | 8,235,000 | 2,515 |
| Taiwan Secom Corp., Ltd. | 1,365,846 | 2,350 |
*^ | Advanced | | |
| Semiconductor | | |
| Engineering Inc. ADR | 402,361 | 2,338 |
| Kinpo Electronics, Inc. | 6,160,477 | 2,309 |
* | Compeq | | |
| Manufacturing Co., Ltd. | 5,707,750 | 2,305 |
| Siliconware Precision | | |
| Industries Co. ADR | 234,395 | 2,274 |
| Giant | | |
| Manufacturing Co., Ltd. | 1,379,270 | 2,242 |
| Gigabyte | | |
| Technology Co., Ltd. | 3,356,626 | 2,232 |
| Yieh Phui Enterprise | 5,215,487 | 2,220 |
| Oriental Union | | |
| Chemical Corp. | 2,835,016 | 2,091 |
| Nien Made | | |
| Enterprise Co., Ltd. | 2,115,800 | 2,011 |
* | Accton Technology Corp. | 3,290,116 | 1,804 |
* | Optimax Technology Corp. | 2,895,220 | 1,626 |
| Phoenixtec Power Co., Ltd. | 1,791,430 | 1,621 |
| Ya Hsin Industrial Co., Ltd. | 5,306,018 | 1,177 |
| | | 1,762,792 |
Thailand (1.5%) | | |
| PTT Public Co., Ltd. | | |
| (Foreign) | 5,204,822 | 32,928 |
| PTT Exploration & | | |
| Production | | |
| Public Co. Ltd. (Foreign) | 7,131,455 | 19,277 |
| Kasikornbank | | |
| Public Co. Ltd. (Foreign) | 9,460,832 | 19,103 |
| Bangkok Bank | | |
| Public Co., Ltd. (Foreign) | 5,661,682 | 18,224 |
| Siam Cement | | |
| Public Co. Ltd. (Foreign) | 2,177,806 | 14,818 |
| Advanced Info Service | | |
| Public Co. Ltd. (Foreign) | 5,253,829 | 11,709 |
| Siam Commercial Bank | | |
| Public Co. Ltd. (Foreign) | 5,063,307 | 9,683 |
| IRPC PCL (Foreign) | 55,282,160 | 9,538 |
| Bangkok Bank | | |
| Public Co. Ltd. (Local) | 2,276,044 | 7,143 |
| Banpu Public Co. Ltd. | | |
| (Foreign) | 867,403 | 5,350 |
| Krung Thai Bank | | |
| Public Co. Ltd. (Foreign) | 15,898,141 | 4,975 |
| Rayong Refinery PCL | | |
| (Foreign) | 9,133,390 | 4,938 |
| Airports of Thailand | | |
| Public Co. Ltd. (Foreign) | 2,657,186 | 4,546 |
66
Emerging Markets Stock Index Fund
| | | Market |
| | | Value• |
| | Shares | ($000) |
| PTT Chemical PCL | | |
| (Foreign) | 1,796,883 | 4,185 |
| Thai Airways International | | |
| Public Co. Ltd. | 3,046,108 | 4,095 |
| BEC World Public Co. Ltd. | | |
| (Foreign) | 5,915,630 | 3,998 |
| Charoen Pokphand Foods | | |
| Public Co., Ltd. (Foreign) | 29,851,863 | 3,897 |
| Land and Houses | | |
| Public Co. Ltd. (Foreign) | 17,062,566 | 3,703 |
| Siam City Cement | | |
| Public Co. Ltd. (Foreign) | 433,442 | 3,490 |
| C.P. 7-Eleven | | |
| Public Co. Ltd. (Foreign) | 16,077,900 | 3,421 |
| Siam Cement | | |
| Public Co. Ltd. (Local) | 458,848 | 3,047 |
| Ratchaburi Electricity | | |
| Generating Holding | | |
| Public Co. Ltd. | 2,173,700 | 2,985 |
| Central Pattana | | |
| Public Co. Ltd. (Foreign) | 3,717,000 | 2,859 |
| Land and Houses | | |
| Public Co. Ltd. (Local) | 13,907,100 | 2,754 |
| Glow Energy | | |
| Public Co. Ltd. (Foreign) | 2,917,600 | 2,706 |
| Kasikornbank | | |
| Public Co., Ltd. (Local) | 1,395,670 | 2,683 |
| The Aromatics (Thailand) | | |
| PLC (Foreign) | 1,624,709 | 2,570 |
| Electricity Generating | | |
| Public Co. Ltd. (Foreign) | 767,548 | 2,373 |
| Precious Shipping | | |
| Public Co. Ltd. (Foreign) | 3,099,444 | 2,317 |
* | True Corp. Public Co. Ltd. | | |
| (Foreign) | 12,264,890 | 2,204 |
| Hana Microelectronics | | |
| Public Co. Ltd. (Foreign) | 2,929,800 | 2,169 |
| Thanachart Capital | | |
| Public Co. Ltd. (Foreign) | 4,242,300 | 1,769 |
| Siam Makro | | |
| Public Co. Ltd. (Foreign) | 649,000 | 1,577 |
* | Italian-Thai Development | | |
| Public Co. Ltd. (Foreign) | 9,647,546 | 1,443 |
| Bangkok Expressway | | |
| Public Co. Ltd. (Foreign) | 2,105,900 | 1,417 |
| Sahaviriya Steel Industries | | |
| Public Co., Ltd. | 43,421,692 | 1,349 |
| Delta Electronics | | |
| (Thailand) Public Co. Ltd. | | |
| (Foreign) | 2,699,850 | 1,203 |
| Thai Union Frozen | | |
| Products Public Co., Ltd. | | |
| (Foreign) | 1,630,000 | 1,033 |
| | | Market |
| | | Value• |
| | Shares | ($000) |
| Kiatnakin Finance | | |
| Public Co. Ltd. (Foreign) | 1,158,600 | 978 |
| TISCO Finance | | |
| Public Co. Ltd. (Foreign) | 1,279,613 | 827 |
| Kim Eng Securities | | |
| Thailand Public Co. Ltd. | | |
| (Foreign) | 1,432,300 | 643 |
| Electricity Generating | | |
| Public Co. Ltd. (Local) | 210,000 | 625 |
| Thai Union Frozen | | |
| Products Public Co. Ltd. | | |
| (Local) | 954,200 | 604 |
| Krung Thai Bank | | |
| Public Co. Ltd. (Local) | 1,240,101 | 385 |
| Banpu Public Co. Ltd. | | |
| (Local) | 49,260 | 302 |
| PTT Exploration and | | |
| Production Public Co. Ltd. | | |
| (Local) | 57,941 | 156 |
| PTT Public Co., Ltd. | | |
| (Local) | 23,480 | 148 |
| Advanced Info Service | | |
| Public Co., Ltd. (Local) | 66,645 | 144 |
| Aromatics (Thailand) | | |
| Public Co. Ltd. (Local) | 53,409 | 84 |
| Precious Shipping | | |
| Public Co., Ltd. (Local) | 82,536 | 61 |
* | Italian-Thai Development | | |
| Public Co. Ltd. (Local) | 342,394 | 51 |
| Charoen Pokphand Foods | | |
| Public Co. Ltd. (Local) | 308,143 | 40 |
| Siam Commercial Bank | | |
| Public Co. Ltd. (Local) | 12,296 | 23 |
| Sahaviriya Steel Industries | | |
| Public Co. Ltd. (Local) | 622,556 | 19 |
| Siam City Cement | | |
| Public Co. Ltd. (Local) | 1,816 | 15 |
| Airports of Thailand | | |
| Public Co. Ltd. (Local) | 8,516 | 14 |
* | True Corp. Public Co. Ltd. | | |
| (Local) | 67,140 | 12 |
| Thai Airways International | | |
| Public Co. Ltd. (Local) | 8,048 | 11 |
| PTT Chemical PCL (Local) | 4,008 | 9 |
| Thanachart Capital | | |
| Public Co. Ltd. (Local) | 20,072 | 8 |
^ | True Corp. Public Co. Ltd. | | |
| Warrants Exp. 4/30/10 | 1,020,789 | — |
| | | 232,638 |
Turkey (1.7%) | | |
| Akbank T.A.S. | 5,570,226 | 40,075 |
| Turkiye Is Bankasi A.S. | | |
| C Shares | 6,174,687 | 29,158 |
67
Emerging Markets Stock Index Fund
| | | Market |
| | | Value• |
| | Shares | ($000) |
| Turkiye Garanti | | |
| Bankasi A.S. | 5,661,993 | 27,407 |
| Eregli Demir ve Celik | | |
| Fabrikalari A.S. | 1,394,614 | 15,985 |
| Haci Omer Sabanci | | |
| Holding A.S. | 3,378,715 | 14,826 |
| Turkcell Iletisim | | |
| Hizmetleri A.S. | 2,662,557 | 14,625 |
| Tupras-Turkiye Petrol | | |
| Rafinerileri A.S. | 706,805 | 14,266 |
| Anadolu Efes Biracilik ve | | |
| Malt Sanayii A.S. | 360,289 | 12,208 |
| Migros Turk A.S. | 817,904 | 9,583 |
* | Yapi ve Kredi Bankasi A.S. | 3,397,076 | 7,416 |
| Turkiye Vakiflar | | |
| Bankasi TAO | 2,383,044 | 6,631 |
* | KOC Holding A.S. | 1,301,463 | 6,363 |
| Dogan Sirketler Grubu | | |
| Holding A.S. | 3,242,598 | 6,100 |
| Aksigorta A.S. | 1,212,382 | 5,611 |
| Arcelik A.S. | 709,200 | 5,228 |
* | Turkiye Vakiflar | | |
| Bankasi T.A.O | 1,923,916 | 5,020 |
| Tofas Turk Otomobil | | |
| Fabrikasi A.S. | 1,093,097 | 4,774 |
| Is Gayrimenkul Yatirim | | |
| Ortakligi A.S. | 1,827,570 | 3,994 |
| Hurriyet Azteccilik ve | | |
| Matbaacillik A.S. | 1,221,863 | 3,237 |
| Cimsa Cemento Sanayi ve | | |
| Ticaret A.S. | 441,198 | 3,085 |
| Adana Cimento | | |
| Sanayii T.A.S. | 512,202 | 2,937 |
* | Dogan Yayin Holding A.S. | 726,759 | 2,678 |
| Akcansa Cimento A.S. | 403,949 | 2,485 |
* | Dogus Otomotiv Servis ve | | |
| Ticaret A.S. | 474,982 | 2,209 |
| Trakya Cam Sanayii A.S. | 760,738 | 2,157 |
| Aygaz A.S. | 540,574 | 1,725 |
| Ulker Gida Sanayi ve | | |
| Ticaret A.S. | 429,530 | 1,718 |
* | Turk Sise ve Cam | | |
| Fabrikalari A.S. | 383,949 | 1,456 |
| Ford Otomotiv Sanayi A.S. | 107,647 | 912 |
* | Petkim Petrokimya | | |
| Holding A.S. | 136,644 | 759 |
* | Turk Hava Yollari Anonim | | |
| Ortakligi | 69,254 | 423 |
| Alarko Holdings A.S. | 20,001 | 48 |
* | Vestel Elektronik Sanayi | | |
| ve Ticaret A.S. | 18,000 | 45 |
| | | 255,144 |
Total Common Stocks | | |
(Cost $9,872,751) | | 15,327,287 |
| | | Market |
| | | Value• |
| | Shares | ($000) |
Temporary Cash Investment (0.8%)1 | | |
3 | Vanguard Market | | |
| Liquidity Fund, | | |
| 5.259%—Note F | 91,175,500 | 91,176 |
3 | Vanguard Market | | |
| Liquidity Fund, 5.259% | 29,526,579 | 29,527 |
Total Temporary Cash Investment | | |
(Cost $120,703) | | 120,703 |
Total Investments (100.7%) | | |
(Cost $9,993,454) | | 15,447,990 |
Other Assets and Liabilities (–0.7%) | | |
Other Assets—Note B | | 220,249 |
Liabilities—Note F | | (324,824) |
| | | (104,575) |
Net Assets (100%) | | 15,343,415 |
68
Emerging Markets Stock Index Fund
At April 30, 2007, net assets consisted of:4 | |
| Amount |
| ($000) |
Paid-in Capital | 10,096,997 |
Undistributed Net Investment Income | 80,691 |
Accumulated Net Realized Losses | (290,748) |
Unrealized Appreciation | |
Investment Securities | 5,454,536 |
Foreign Currencies | 264 |
Swap Contracts | 1,675 |
Net Assets | 15,343,415 |
| |
Investor Shares—Net Assets | |
Applicable to 352,344,477 outstanding | |
$.001 par value shares of beneficial | |
interest (unlimited authorization) | 9,107,527 |
Net Asset Value Per Share— | |
Investor Shares | $25.85 |
| |
Admiral Shares—Net Assets | |
Applicable to 63,987,639 outstanding | |
$.001 par value shares of beneficial | |
interest (unlimited authorization) | 2,177,760 |
Net Asset Value Per Share— | |
Admiral Shares | $34.03 |
| |
Signal Shares—Net Assets | |
Applicable to 351,606 outstanding | |
$.001 par value shares of beneficial | |
interest (unlimited authorization) | 11,510 |
Net Asset Value Per Share— | |
Signal Shares | $32.74 |
| |
Institutional Shares—Net Assets | |
Applicable to 37,205,938 outstanding | |
$.001 par value shares of beneficial | |
interest (unlimited authorization) | 963,844 |
Net Asset Value Per Share— | |
Institutional Shares | $25.91 |
| |
ETF Shares—Net Assets | |
Applicable to 37,641,558 outstanding | |
$.001 par value shares of beneficial | |
interest (unlimited authorization) | 3,082,774 |
Net Asset Value Per Share— | |
ETF Shares | $81.90 |
• | See Note A in Notes to Financial Statements. |
* | Non-income-producing security. |
^ | Part of security position is on loan to broker-dealers. See Note F in Notes to Financial Statements. |
1 The fund invests a portion of its cash reserves in equity markets through the use of equity swap contracts. Investments in swap contracts increased the fund’s equity investments in China and Taiwan to 11.3% and 11.5%, respectively, of net assets. After giving effect to swap investments, the fund’s effective common stock and temporary cash investment positions represent 100.1% and 0.6%, respectively, of net assets. See Note D in Notes to Financial Statements.
2 Security exempt from registration under Rule 144A of the Securities Act of 1933. Such securities may be sold in transactions exempt from registration, normally to qualified institutional buyers. At April 30, 2007, the value of this security represented 0.4% of net assets.
3 Affiliated money market fund available only to Vanguard funds and certain trusts and accounts managed by Vanguard. Rate shown is the 7-day yield.
4 See Note D in Notes to Financial Statements for the tax-basis components of net assets.
ADR—American Depositary Receipt.
GDR—Global Depositary Receipt.
69
Emerging Markets Stock Index Fund
Statement of Operations
| Six Months Ended |
| April 30, 2007 |
| ($000) |
Investment Income | |
Income | |
Dividends1 | 129,670 |
Interest2 | 935 |
Security Lending | 910 |
Total Income | 131,515 |
Expenses | |
The Vanguard Group—Note B | |
Investment Advisory Services | 243 |
Management and Administrative—Investor Shares | 11,633 |
Management and Administrative—Admiral Shares | 1,644 |
Management and Administrative—Signal Shares | 7 |
Management and Administrative—Institutional Shares | 526 |
Management and Administrative—ETF Shares | 2,183 |
Marketing and Distribution—Investor Shares | 1,045 |
Marketing and Distribution—Admiral Shares | 112 |
Marketing and Distribution—Signal Shares | — |
Marketing and Distribution—Institutional Shares | 77 |
Marketing and Distribution—ETF Shares | 263 |
Custodian Fees | 5,353 |
Shareholders’ Reports—Investor Shares | 93 |
Shareholders’ Reports—Admiral Shares | 3 |
Shareholders’ Reports—Signal Shares | — |
Shareholders’ Reports—Institutional Shares | — |
Shareholders’ Reports—ETF Shares | 36 |
Trustees’ Fees and Expenses | 8 |
Total Expenses | 23,226 |
Expenses Paid Indirectly—Note C | (98) |
Net Expenses | 23,128 |
Net Investment Income | 108,387 |
Realized Net Gain (Loss) | |
Investment Securities Sold | 50,908 |
Foreign Currencies | 216 |
Swap Contracts | 2,608 |
Realized Net Gain (Loss) | 53,732 |
Change in Unrealized Appreciation (Depreciation) | |
Investment Securities | 2,051,199 |
Foreign Currencies | 189 |
Swap Contracts | 784 |
Change in Unrealized Appreciation (Depreciation) | 2,052,172 |
Net Increase (Decrease) in Net Assets Resulting from Operations | 2,214,291 |
1 Dividends are net of foreign withholding taxes of $12,754,000.
2 Interest income from an affiliated company of the fund was $935,000.
70
Emerging Markets Stock Index Fund
Statement of Changes in Net Assets
| Six Months Ended | Year Ended |
| April 30, | October 31, |
| 2007 | 2006 |
| ($000) | ($000) |
Increase (Decrease) in Net Assets | | |
Operations | | |
Net Investment Income | 108,387 | 199,880 |
Realized Net Gain (Loss) | 53,732 | (148,471) |
Change in Unrealized Appreciation (Depreciation) | 2,052,172 | 1,974,410 |
Net Increase (Decrease) in Net Assets Resulting from Operations | 2,214,291 | 2,025,819 |
Distributions | | |
Net Investment Income | | |
Investor Shares | (130,073) | (96,914) |
Admiral Shares | (30,176) | — |
Signal Shares | — | — |
Institutional Shares | (11,028) | (9,315) |
ETF Shares | (34,662) | (9,827) |
Realized Capital Gain | | |
Investor Shares | — | — |
Admiral Shares | — | — |
Signal Shares | — | — |
Institutional Shares | — | — |
ETF Shares | — | — |
Total Distributions | (205,939) | (116,056) |
Capital Share Transactions—Note G | | |
Investor Shares | 640,994 | 746,446 |
Admiral Shares | 404,151 | 1,395,891 |
Signal Shares | 10,736 | — |
Institutional Shares | 288,909 | (42,144) |
ETF Shares | 1,157,156 | 1,042,686 |
Net Increase (Decrease) from Capital Share Transactions | 2,501,946 | 3,142,879 |
Total Increase (Decrease) | 4,510,298 | 5,052,642 |
Net Assets | | |
Beginning of Period | 10,833,117 | 5,780,475 |
End of Period1 | 15,343,415 | 10,833,117 |
1 Net Assets—End of Period includes undistributed net investment income of $80,691,000 and $178,233,000.
71
Emerging Markets Stock Index Fund
Financial Highlights
Investor Shares | | | | | | |
| Six Months | | | | | |
| Ended | | | | |
For a Share Outstanding | April 30, | Year Ended October 31, |
Throughout Each Period | 2007 | 2006 | 2005 | 2004 | 2003 | 2002 |
Net Asset Value, Beginning of Period | $22.05 | $16.91 | $12.88 | $11.04 | $7.48 | $7.28 |
Investment Operations | | | | | | |
Net Investment Income | .1921 | .396 | .307 | .263 | .170 | .15 |
Net Realized and Unrealized Gain (Loss) | | | | | | |
on Investments2 | 4.004 | 5.059 | 3.982 | 1.749 | 3.512 | .25 |
Total from Investment Operations | 4.196 | 5.455 | 4.289 | 2.012 | 3.682 | .40 |
Distributions | | | | | | |
Dividends from Net Investment Income | (.396) | (.315) | (.259) | (.172) | (.122) | (.20) |
Distributions from Realized Capital Gains | — | — | — | — | — | — |
Total Distributions | (.396) | (.315) | (.259) | (.172) | (.122) | (.20) |
Net Asset Value, End of Period | $25.85 | $22.05 | $16.91 | $12.88 | $11.04 | $7.48 |
| | | | | | |
Total Return3 | 19.19% | 32.55% | 33.66% | 18.43% | 49.88% | 5.27% |
| | | | | | |
Ratios/Supplemental Data | | | | | | |
Net Assets, End of Period (Millions) | $9,108 | $7,202 | $4,937 | $2,556 | $1,589 | $841 |
Ratio of Total Expenses to | | | | | | |
Average Net Assets | 0.40%* | 0.42% | 0.45% | 0.48% | 0.53% | 0.57% |
Ratio of Net Investment Income to | | | | | | |
Average Net Assets | 1.61%* | 2.20% | 2.48% | 2.44% | 2.26% | 1.67% |
Portfolio Turnover Rate4 | 8%* | 26% | 15% | 11% | 16% | 65% |
| | | | | | | |
1 Calculated based on average shares outstanding.
2 Includes increases from redemption fees of $.01, $.01, $.00, $.00, $.00, and $.00.
3 Total returns do not reflect the 0.5% transaction fee on purchases; the 2% fee assessed until March 23, 2005, on redemptions of shares purchased on or after June 27, 2003, and held for less than two months; the 0.5% fee on all other redemptions; or the $10 annual account maintenance fee applied on balances under $10,000.
4 Excludes the value of portfolio securities received or delivered as a result of in-kind purchases or redemptions of the fund’s capital shares, including ETF Creation Units.
72
Emerging Markets Stock Index Fund
Admiral Shares | | |
| Six Months | June 23, |
| Ended | 20061 to |
| April 30, | Oct. 31, |
For a Share Outstanding Throughout Each Period | 2007 | 2006 |
Net Asset Value, Beginning of Period | $29.03 | $25.00 |
Investment Operations | | |
Net Investment Income | .2722 | .222 |
Net Realized and Unrealized Gain (Loss) on Investments3 | 5.262 | 3.808 |
Total from Investment Operations | 5.534 | 4.030 |
Distributions | | |
Dividends from Net Investment Income | (.534) | — |
Distributions from Realized Capital Gains | — | — |
Total Distributions | (.534) | — |
Net Asset Value, End of Period | $34.03 | $29.03 |
| | |
Total Return4 | 19.23% | 16.12% |
| | |
Ratios/Supplemental Data | | |
Net Assets, End of Period (Millions) | $2,178 | $1,491 |
Ratio of Total Expenses to Average Net Assets | 0.30%* | 0.30%* |
Ratio of Net Investment Income to Average Net Assets | 1.71%* | 2.32%* |
Portfolio Turnover Rate5 | 8%* | 26% |
1 Inception.
2 Calculated based on average shares outstanding.
3 Includes increases from redemption fees of $.01 and $.01.
4 Total returns do not reflect the 0.5% transaction fee on purchases and redemptions.
5 Excludes the value of portfolio securities received or delivered as a result of in-kind purchases or redemptions of the fund’s capital shares, including ETF Creation Units.
73
Emerging Markets Stock Index Fund
Signal Shares | |
| Jan.19, |
| 20071 to |
| April 30, |
For a Share Outstanding Throughout the Period | 2007 |
Net Asset Value, Beginning of Period | $30.38 |
Investment Operations | |
Net Investment Income | .182 |
Net Realized and Unrealized Gain (Loss) on Investments | 2.18 |
Total from Investment Operations | 2.36 |
Distributions | |
Dividends from Net Investment Income | — |
Distributions from Realized Capital Gains | — |
Total Distributions | — |
Net Asset Value, End of Period | $32.74 |
| |
Total Return3 | 7.77% |
| |
Ratios/Supplemental Data | |
Net Assets, End of Period (Millions) | $12 |
Ratio of Total Expenses to Average Net Assets | 0.30%* |
Ratio of Net Investment Income to Average Net Assets | 1.71%* |
Portfolio Turnover Rate4 | 8%* |
1 Inception.
2 Calculated based on average shares outstanding.
3 Total returns do not reflect the 0.5% transaction fee on purchases and redemptions.
4 Excludes the value of portfolio securities received or delivered as a result of in-kind purchases or redemptions of the fund’s capital shares, including ETF Creation Units.
74
Emerging Markets Stock Index Fund
Institutional Shares | | | | | | |
| Six Months | | | | | |
| Ended | | | | |
For a Share Outstanding | April 30, | Year Ended October 31, |
Throughout Each Period | 2007 | 2006 | 2005 | 2004 | 2003 | 2002 |
Net Asset Value, Beginning of Period | $22.11 | $16.95 | $12.90 | $11.05 | $7.49 | $7.29 |
Investment Operations | | | | | | |
Net Investment Income | .2191 | .443 | .344 | .287 | .183 | .165 |
Net Realized and Unrealized Gain (Loss) | | | | | | |
on Investments2 | 4.010 | 5.059 | 3.982 | 1.749 | 3.512 | .246 |
Total from Investment Operations | 4.229 | 5.502 | 4.326 | 2.036 | 3.695 | .411 |
Distributions | | | | | | |
Dividends from Net Investment Income | (.429) | (.342) | (.276) | (.186) | (.135) | (.211) |
Distributions from Realized Capital Gains | — | — | — | — | — | — |
Total Distributions | (.429) | (.342) | (.276) | (.186) | (.135) | (.211) |
Net Asset Value, End of Period | $25.91 | $22.11 | $16.95 | $12.90 | $11.05 | $7.49 |
| | | | | | |
Total Return3 | 19.30% | 32.78% | 33.92% | 18.64% | 50.06% | 5.40% |
| | | | | | |
Ratios/Supplemental Data | | | | | | |
Net Assets, End of Period (Millions) | $964 | $559 | $468 | $245 | $137 | $76 |
Ratio of Total Expenses to | | | | | | |
Average Net Assets | 0.25%* | 0.25% | 0.25% | 0.33% | 0.38% | 0.41% |
Ratio of Net Investment Income to | | | | | | |
Average Net Assets | 1.76%* | 2.37% | 2.64% | 2.61% | 2.41% | 1.85% |
Portfolio Turnover Rate4 | 8%* | 26% | 15% | 11% | 16% | 65% |
| | | | | | | |
1 Calculated based on average shares outstanding.
2 Includes increases from redemption fees of $.00, $.01, $.00, $.00, $.00, and $.00.
3 Total returns do not reflect the 0.5% transaction fee on purchases; the 2% fee assessed until March 23, 2005, on redemptions of shares purchased on or after June 27, 2003, and held for less than two months; or the 0.5% fee on all other redemptions.
4 Excludes the value of portfolio securities received or delivered as a result of in-kind purchases or redemptions of the fund’s capital shares, including ETF Creation Units.
75
Emerging Markets Stock Index Fund
ETF Shares | | | |
| Six Months | Year | March 4, |
| Ended | Ended | 20051 to |
| April 30, | Oct. 31, | Oct. 31, |
For a Share Outstanding Throughout Each Period | 2007 | 2006 | 2005 |
Net Asset Value, Beginning of Period | $69.91 | $53.61 | $50.55 |
Investment Operations | | | |
Net Investment Income | .6822 | 1.333 | .87 |
Net Realized and Unrealized Gain (Loss) on Investments3 | 12.647 | 16.044 | 2.19 |
Total from Investment Operations | 13.329 | 17.377 | 3.06 |
Distributions | | | |
Dividends from Net Investment Income | (1.339) | (1.077) | — |
Distributions from Realized Capital Gains | — | — | — |
Total Distributions | (1.339) | (1.077) | — |
Net Asset Value, End of Period | $81.90 | $69.91 | $53.61 |
| | | |
Total Return | 19.23% | 32.74% | 6.05% |
| | | |
Ratios/Supplemental Data | | | |
Net Assets, End of Period (Millions) | $3,083 | $1,582 | $375 |
Ratio of Total Expenses to Average Net Assets | 0.30%* | 0.30% | 0.30%* |
Ratio of Net Investment Income to Average Net Assets | 1.71%* | 2.32% | 2.59%* |
Portfolio Turnover Rate4 | 8%* | 26% | 15% |
1 Inception.
2 Calculated based on average shares outstanding.
3 Includes increases from redemption fees of $.01, $.03, and $.00.
4 Excludes the value of portfolio securities received or delivered as a result of in-kind purchases or redemptions of the fund’s capital shares, including ETF Creation Units.
See accompanying Notes, which are an integral part of the Financial Statements.
76
Emerging Markets Stock Index Fund
Notes to Financial Statements
Vanguard Emerging Markets Stock Index Fund is registered under the Investment Company Act of 1940 as an open-end investment company, or mutual fund. The fund files reports with the SEC under the company name Vanguard International Equity Index Funds. The fund invests in securities of foreign issuers, which may subject it to investment risks not normally associated with investing in securities of U.S. corporations. The fund offers five classes of shares: Investor Shares, Admiral Shares, Signal Shares, Institutional Shares, and ETF Shares. Investor Shares are available to any investor who meets the fund’s minimum purchase requirements. Admiral Shares are designed for investors who meet certain administrative, service, tenure, and account-size criteria. Signal Shares are designed for institutional investors who meet certain administrative, service, and account-size criteria. Signal Shares were first issued on January 19, 2007. Institutional Shares are designed for investors who meet certain administrative and service criteria and invest a minimum of $5 million. ETF Shares are listed for trading on the American Stock Exchange; they can be purchased and sold through a broker.
A. The following significant accounting policies conform to generally accepted accounting principles for U.S. mutual funds. The fund consistently follows such policies in preparing its financial statements.
1. Security Valuation: Securities are valued as of the close of trading on the New York Stock Exchange (generally 4 p.m., Eastern time) on the valuation date. Equity securities are valued at the latest quoted sales prices or official closing prices taken from the primary market in which each security trades; such securities not traded on the valuation date are valued at the mean of the latest quoted bid and asked prices. Securities for which market quotations are not readily available, or whose values have been affected by events occurring before the fund’s pricing time but after the close of the securities’ primary markets, are valued at their fair values calculated according to procedures adopted by the board of trustees. These procedures include obtaining quotations from an independent pricing service, monitoring news to identify significant market- or security-specific events, and evaluating changes in the values of foreign market proxies (for example, ADRs, futures contracts, or exchange-traded funds), between the time the foreign markets close and the fund’s pricing time. When fair-value pricing is employed, the prices of securities used by a fund to calculate its net asset value may differ from quoted or published prices for the same securities. Investments in Vanguard Market Liquidity Fund are valued at that fund’s net asset value.
2. Foreign Currency: Securities and other assets and liabilities denominated in foreign currencies are translated into U.S. dollars using exchange rates obtained from an independent third party as of the fund’s pricing time on the valuation date. Realized gains (losses) and unrealized appreciation (depreciation) on investment securities include the effects of changes in exchange rates since the securities were purchased, combined with the effects of changes in security prices. Fluctuations in the value of other assets and liabilities resulting from changes in exchange rates are recorded as unrealized foreign currency gains (losses) until the assets or liabilities are settled in cash, at which time they are recorded as realized foreign currency gains (losses).
3. Swap Contracts: The fund has entered into equity swap contracts to earn the total return on selected stocks in the fund’s target index, when investing through a swap provides a return advantage over buying the individual stocks. Under the terms of each swap, the fund receives the total return (either receiving the increase or paying the decrease) on a reference stock, applied to a notional amount that is the value of a designated number of shares of the stock at the beginning of the swap. The fund agrees to pay the counterparty a floating rate that is reset periodically based on short-term interest rates, less a specified interest rate spread, applied to the notional amount. The primary risks
77
Emerging Markets Stock Index Fund
associated with the swaps are that a counterparty will default on its obligation to pay net amounts due to the fund, or that the fund will incur fees in the event it terminates a swap prior to the scheduled termination date.
The notional amounts of swap contracts are not recorded in the Statement of Net Assets. Swaps are valued daily and the change in value is recorded as unrealized appreciation (depreciation) until the termination of the swap, at which time realized gain (loss) is recorded.
4. Federal Income Taxes: The fund intends to continue to qualify as a regulated investment company and distribute all of its taxable income. Accordingly, no provision for federal income taxes is required in the financial statements.
5. Distributions: Distributions to shareholders are recorded on the ex-dividend date.
6. Security Lending: The fund may lend its securities to qualified institutional borrowers to earn additional income. Security loans are required to be secured at all times by collateral at least equal to the market value of securities loaned. The fund invests cash collateral received in Vanguard Market Liquidity Fund, and records a liability for the return of the collateral, during the period the securities are on loan. Security lending income represents the income earned on investing cash collateral, less expenses associated with the loan.
7. Other: Dividend income is recorded on the ex-dividend date. Interest income includes income distributions received from Vanguard Market Liquidity Fund and is accrued daily. Security transactions are accounted for on the date securities are bought or sold. Costs used to determine realized gains (losses) on the sale of investment securities are those of the specific securities sold. Fees assessed on capital share transactions are credited to paid-in capital.
Each class of shares has equal rights as to assets and earnings, except that each class separately bears certain class-specific expenses related to maintenance of shareholder accounts (included in Management and Administrative expenses) and shareholder reporting. Marketing and distribution expenses are allocated to each class of shares based on a method approved by the board of trustees. Income, other non-class-specific expenses, and gains and losses on investments are allocated to each class of shares based on its relative net assets.
B. The Vanguard Group furnishes at cost investment advisory, corporate management, administrative, marketing, and distribution services. The costs of such services are allocated to the fund under methods approved by the board of trustees. The fund has committed to provide up to 0.40% of its net assets in capital contributions to Vanguard. At April 30, 2007, the fund had contributed capital of $1,321,000 to Vanguard (included in Other Assets), representing 0.01% of the fund’s net assets and 1.32% of Vanguard’s capitalization. The fund’s trustees and officers are also directors and officers of Vanguard.
C. The fund’s custodian bank has agreed to reduce its fees when the fund maintains cash on deposit in the non-interest-bearing custody account. For the six months ended April 30, 2007, custodian fee offset arrangements reduced the fund’s expenses by $98,000.
D. Distributions are determined on a tax basis and may differ from net investment income and realized capital gains for financial reporting purposes. Differences may be permanent or temporary. Permanent differences are reclassified among capital accounts in the financial statements to reflect their tax character. Temporary differences arise when certain items of income, expense, gain, or loss are recognized in
78
Emerging Markets Stock Index Fund
different periods for financial statement and tax purposes; these differences will reverse at some time in the future. Differences in classification may also result from the treatment of short-term gains as ordinary income for tax purposes.
During the six months ended April 30, 2007, the fund realized net foreign currency gains of $216,000, which increased distributable net income for tax purposes; accordingly such gains have been reclassified from accumulated net realized losses to undistributed net investment income. The fund’s realized gains for the six months ended April 30, 2007, include realized losses on swaps of $206,000, which are treated as decreases to taxable income; accordingly this amount has been reclassified from accumulated net realized losses to undistributed net investment income.
Certain of the fund’s investments are in securities considered to be “passive foreign investment companies,” for which any unrealized appreciation and/or realized gains are required to be included in distributable net income for tax purposes. Unrealized appreciation through October 31, 2006, on the fund’s passive foreign investment company holdings at April 30, 2007, was $5,764,000, all of which has been distributed and is reflected in the balance of undistributed net investment income.
The fund’s tax-basis capital gains and losses are determined only at the end of each fiscal year. For tax purposes, at October 31, 2006, the fund had available realized losses of $341,021,000 to offset future net capital gains of $73,850,000 through October 31, 2007, $64,992,000 through October 31, 2010, $12,244,000 through October 31, 2011, $22,603,000 through October 31, 2012, and $167,332,000 through October 31, 2014. The fund will use these capital losses to offset net taxable capital gains, if any, realized during the year ending October 31, 2007; should the fund realize net capital losses for the year, the losses will be added to the loss carryforward balances above.
At April 30, 2007, the cost of investment securities for tax purposes was $9,999,218,000. Net unrealized appreciation of investment securities for tax purposes was $5,448,772,000, consisting of unrealized gains of $5,684,184,000 on securities that had risen in value since their purchase and $235,412,000 in unrealized losses on securities that had fallen in value since their purchase.
At April 30, 2007, the fund had the following open total return swap contracts with Merrill Lynch International as counterparty:
| | | | | Unrealized |
| | Notional | Interest Rate | Market | Appreciation |
| Termination | Amount | Received | Value | (Depreciation) |
Country/Reference Entity | Date | ($000) | (Paid)1 | ($000) | ($000) |
China | | | | | |
Bank of China | 08/14/07 | 19,481 | (1.36%) | 21,490 | 2,009 |
| | | | | 2,009 |
Taiwan | | | | | |
Shin Kong Financial | | | | | |
Holdings Co. | 06/26/07 | 7,754 | (2.36%) | 7,420 | (334) |
| | | | | (334) |
E. During the six months ended April 30, 2007, the fund purchased $2,974,958,000 of investment securities and sold $529,373,000 of investment securities, other than temporary cash investments.
1 Based on three-month London InterBank Offered Rate (LIBOR). Each contract provides for the payment of interest based on LIBOR less a fixed interest rate spread. If the spread is greater than LIBOR, the result is net interest received by the fund.
79
Emerging Markets Stock Index Fund
F. The market value of securities on loan to broker-dealers at April 30, 2007, was $85,428,000, for which the fund received cash collateral of $91,176,000.
G. Capital share transactions for each class of shares were:
| Six Months Ended | Year Ended |
| April 30, 2007 | October 31, 2006 |
| Amount | Shares | Amount | Shares |
| ($000) | (000) | ($000) | (000) |
Investor Shares | | | | |
Issued | 1,321,019 | 54,031 | 3,240,704 | 156,096 |
Issued in Lieu of Cash Distributions | 123,741 | 5,215 | 89,932 | 4,718 |
Redeemed1 | (803,766) | (33,471) | (2,584,190) | (126,252) |
Net Increase (Decrease)—Investor Shares | 640,994 | 25,775 | 746,446 | 34,562 |
Admiral Shares | | | | |
Issued | 536,624 | 16,797 | 1,441,290 | 53,000 |
Issued in Lieu of Cash Distributions | 26,534 | 849 | — | — |
Redeemed1 | (159,007) | (5,013) | (45,399) | (1,645) |
Net Increase (Decrease)—Admiral Shares | 404,151 | 12,633 | 1,395,891 | 51,355 |
Signal Shares | | | | |
Issued | 12,419 | 408 | — | — |
Issued in Lieu of Cash Distributions | — | — | — | — |
Redeemed1 | (1,683) | (56) | — | — |
Net Increase (Decrease)—Signal Shares | 10,736 | 352 | — | — |
Institutional Shares | | | | |
Issued | 349,259 | 14,478 | 105,839 | 5,028 |
Issued in Lieu of Cash Distributions | 9,287 | 391 | 7,301 | 382 |
Redeemed1 | (69,637) | (2,932) | (155,284) | (7,780) |
Net Increase (Decrease)—Institutional Shares | 288,909 | 11,937 | (42,144) | (2,370) |
ETF Shares | | | | |
Issued | 1,157,156 | 15,017 | 1,139,196 | 17,234 |
Issued in Lieu of Cash Distributions | — | — | — | — |
Redeemed | — | — | (96,510) | (1,600) |
Net Increase (Decrease)—ETF Shares | 1,157,156 | 15,017 | 1,042,686 | 15,634 |
H. In June 2006, the Financial Accounting Standards Board issued Interpretation No. 48 (“FIN 48”), “Accounting for Uncertainty in Income Taxes.” FIN 48 establishes the minimum threshold for recognizing, and a system for measuring, the benefits of tax-return positions in financial statements. FIN 48 will be effective for the fund’s fiscal year beginning November 1, 2007. Management is in the process of analyzing the fund’s tax positions for purposes of implementing FIN 48; based on the analysis completed to date, management does not believe the adoption of FIN 48 will result in any material impact to the fund’s financial statements.
1 Net of redemption fees of $2,921,000 and $6,249,000 (fund totals).
80
Total International Stock Index Fund
Fund Profile
As of April 30, 2007
Portfolio Characteristics | |
| Fund |
Expense Ratio | 0.00% |
Acquired Fund Fees and Expenses1 | 0.28% |
Sector Diversification (% of portfolio) | |
| | Target | Broad |
| Fund2 | Index3 | Index4 |
Consumer Discretionary | 11% | 11% | 11% |
Consumer Staples | 8 | 7 | 8 |
Energy | 9 | 9 | 9 |
Financials | 28 | 29 | 27 |
Health Care | 6 | 6 | 7 |
Industrials | 11 | 10 | 11 |
Information Technology | 7 | 7 | 9 |
Materials | 9 | 9 | 8 |
Telecommunication Services | 6 | 7 | 5 |
Utilities | 5 | 5 | 5 |
Volatility Measures5 | |
| Fund Versus | Fund Versus |
| Target Index3 | Broad Index4 |
R-Squared | 0.99 | 0.99 |
Beta | 0.98 | 0.99 |
Allocation to Underlying Vanguard Funds | |
| |
European Stock Index Fund Investor Shares | 58.9% |
Pacific Stock Index Fund Investor Shares | 25.3% |
Emerging Markets Stock Index Fund Investor Shares | 15.8% |
Total | 100% |
Market Diversification (% of portfolio) | |
| | | Target |
| | Fund2 | Index3 |
Europe | | |
| United Kingdom | 20% | 19% |
| France | 8 | 9 |
| Germany | 6 | 7 |
| Switzerland | 6 | 6 |
| Netherlands | 4 | 3 |
| Spain | 3 | 3 |
| Italy | 3 | 3 |
| Sweden | 2 | 2 |
| Finland | 1 | 1 |
| Belgium | 1 | 1 |
| Norway | 1 | 1 |
| Denmark | 1 | 1 |
| Ireland | 1 | 1 |
| Greece | 1 | 1 |
| Austria | 1 | 1 |
| Subtotal | 59% | 59% |
Pacific | | |
| Japan | 18% | 18% |
| Australia | 5 | 5 |
| Hong Kong | 2 | 1 |
| Singapore | 1 | 1 |
| Subtotal | 26% | 25% |
Emerging Markets | | |
| South Korea | 3% | 2% |
| Taiwan | 2 | 2 |
| Brazil | 2 | 2 |
| Russia | 2 | 2 |
| South Africa | 1 | 1 |
| China | 1 | 2 |
| India | 1 | 1 |
| Mexico | 1 | 1 |
| Other Emerging | 2 | 3 |
| Subtotal | 15% | 16% |
1 This figure represents an annualized weighted average of the expense ratios and any fees charged by the underlying mutual funds in which the fund invests. The fund does not charge any expenses or fees of its own. Acquired is a term that the Securities and Exchange Commission applies to any mutual fund whose shares are owned by another fund.
2 Reflects holdings of underlying funds.
3 Total International Composite Index.
4 MSCI All Country World Index ex USA.
5 For an explanation of R-squared, beta, and other terms used here, see the Glossary on page 109.
81
Total International Stock Index Fund
Performance Summary
All of the returns in this report represent past performance, which is not a guarantee of future results that may be achieved by the fund. (Current performance may be lower or higher than the performance data cited. For performance data current to the most recent month-end, visit our website at www.vanguard.com/performance.) Note, too, that both investment returns and principal value can fluctuate widely, so an investor’s shares, when sold, could be worth more or less than their original cost. The returns shown do not reflect taxes that a shareholder would pay on fund distributions or on the sale of fund shares.
Fiscal-Year Total Returns (%): October 31, 1996–April 30, 2007

Average Annual Total Returns: Periods Ended March 31, 2007
This table presents average annual total returns through the latest calendar quarter—rather than through the end of the fiscal period. Securities and Exchange Commission rules require that we provide this information.
| Inception Date | One Year | Five Years | Ten Years |
Total International Stock Index Fund3 | 4/29/1996 | 20.14% | 16.56% | 8.27% |
1 Six months ended April 30, 2007.
2 Consists of the MSCI Europe Index (59%), the MSCI Pacific Index (25%), and the MSCI Emerging Markets Index (16%) as of April 30, 2007.
3 Total returns do not reflect the 0.5% transaction fee on purchases through March 31, 2000; the 2% fee assessed on redemptions of shares purchased on or after June 27, 2003, and held for less than two months; or the $10 annual account maintenance fee applied on balances under $10,000.
Note: See Financial Highlights table on page 86 for dividend and capital gains information.
82
Total International Stock Index Fund
Financial Statements (unaudited)
Statement of Net Assets
As of April 30, 2007
The fund provides a complete list of its holdings four times in each fiscal year, at the quarter-ends. For the second and fourth fiscal quarters, the lists appear in the fund’s semiannual and annual reports to shareholders. For the first and third fiscal quarters, the fund files the lists with the Securities and Exchange Commission on Form N-Q. Shareholders can look up the fund’s Forms N-Q on the SEC’s website at www.sec.gov. Forms N-Q may also be reviewed and copied at the SEC’s Public Reference Room (see the back cover of this report for further information).
| | Market |
| | Value• |
| Shares | ($000) |
Investment Companies (100.0%) | | |
International Stock Funds (100.0%) | | |
Vanguard European Stock Index Fund Investor Shares | 352,889,922 | 13,999,142 |
Vanguard Pacific Stock Index Fund Investor Shares | 463,771,426 | 5,996,565 |
Vanguard Emerging Markets Stock Index Fund Investor Shares | 145,302,618 | 3,756,073 |
| | |
Money Market Fund (0.0%) | | |
1 Vanguard Market Liquidity Fund, 5.259% | 1,285,922 | 1,286 |
Total Investment Companies (Cost $15,909,021) | | 23,753,066 |
Other Assets and Liabilities (0.0%) | | |
Other Assets | | 51,598 |
Liabilities | | (48,883) |
| | 2,715 |
Net Assets (100%) | | |
Applicable to 1,246,033,179 outstanding $.001 par value shares of | | |
beneficial interest (unlimited authorization) | | 23,755,781 |
Net Asset Value Per Share | | $19.07 |
At April 30, 2007, net assets consisted of:2 | | |
| Amount | Per |
| ($000) | Share |
Paid-in Capital | 15,951,864 | $12.80 |
Undistributed Net Investment Income | 8,783 | .01 |
Accumulated Net Realized Losses | (48,911) | (.04) |
Unrealized Appreciation | 7,844,045 | 6.30 |
Net Assets | 23,755,781 | $19.07 |
• | See Note A in Notes to Financial Statements. |
1 Affiliated money market fund available only to Vanguard funds and certain trusts and accounts managed by Vanguard. Rate shown is the 7-day yield.
2 See Note C in Notes to Financial Statements for the tax-basis components of net assets.
83
Total International Stock Index Fund
Statement of Operations
| Six Months Ended |
| April 30, 2007 |
| ($000) |
Investment Income | |
Income | |
Income Distributions Received | 451,851 |
Net Investment Income—Note B | 451,851 |
Realized Net Gain (Loss) | |
Capital Gain Distributions Received | — |
Investment Securities Sold | 1,241 |
Realized Net Gain (Loss) | 1,241 |
Change in Unrealized Appreciation (Depreciation) of Investment Securities | 2,502,223 |
Net Increase (Decrease) in Net Assets Resulting from Operations | 2,955,315 |
84
Total International Stock Index Fund
Statement of Changes in Net Assets
| Six Months Ended | Year Ended |
| April 30, | October 31, |
| 2007 | 2006 |
| ($000) | ($000) |
Increase (Decrease) in Net Assets | | |
Operations | | |
Net Investment Income | 451,851 | 256,922 |
Realized Net Gain (Loss) | 1,241 | 1,573 |
Change in Unrealized Appreciation (Depreciation) | 2,502,223 | 3,233,656 |
Net Increase (Decrease) in Net Assets Resulting from Operations | 2,955,315 | 3,492,151 |
Distributions | | |
Net Investment Income | (446,153) | (254,606) |
Realized Capital Gain | — | — |
Total Distributions | (446,153) | (254,606) |
Capital Share Transactions—Note E | | |
Issued | 4,076,245 | 5,216,842 |
Issued in Lieu of Cash Distributions | 410,001 | 232,227 |
Redeemed1 | (1,439,696) | (1,817,473) |
Net Increase (Decrease) from Capital Share Transactions | 3,046,550 | 3,631,596 |
Total Increase (Decrease) | 5,555,712 | 6,869,141 |
Net Assets | | |
Beginning of Period | 18,200,069 | 11,330,928 |
End of Period2 | 23,755,781 | 18,200,069 |
1 The fund collected redemption fees of $346,000 and $719,000, which were reallocated proportionately to the funds in which it invests.
2 Net Assets—End of Period includes undistributed net investment income of $8,783,000 and $3,085,000.
85
Total International Stock Index Fund
Financial Highlights
| Six Months | | | | | |
| Ended | | | | |
For a Share Outstanding | April 30, | Year Ended October 31, |
Throughout Each Period | 2007 | 2006 | 2005 | 2004 | 2003 | 2002 |
Net Asset Value, Beginning of Period | $16.90 | $13.49 | $11.48 | $9.84 | $7.79 | $8.99 |
Investment Operations | | | | | | |
Net Investment Income | .3881 | .294 | .255 | .19 | .157 | .165 |
Capital Gain Distributions Received | — | — | — | — | — | — |
Net Realized and Unrealized Gain (Loss) | | | | | | |
on Investments | 2.184 | 3.410 | 2.010 | 1.64 | 2.050 | (1.200) |
Total from Investment Operations | 2.572 | 3.704 | 2.265 | 1.83 | 2.207 | (1.035) |
Distributions | | | | | | |
Dividends from Net Investment Income | (.402) | (.294) | (.255) | (.19) | (.157) | (.165) |
Distributions from Realized Capital Gains | — | — | — | — | — | — |
Total Distributions | (.402) | (.294) | (.255) | (.19) | (.157) | (.165) |
Net Asset Value, End of Period | $19.07 | $16.90 | $13.49 | $11.48 | $9.84 | $7.79 |
| | | | | | |
Total Return2 | 15.40% | 27.84% | 19.91% | 18.80% | 28.94% | –11.80% |
| | | | | | |
Ratios/Supplemental Data | | | | | | |
Net Assets, End of Period (Millions) | $23,756 | $18,200 | $11,331 | $7,317 | $4,538 | $2,884 |
Ratio of Expenses to | | | | | | |
Average Net Assets—Note B | 0%3 | 0% | 0% | 0% | 0% | 0% |
Ratio of Net Investment Income to | | | | | | |
Average Net Assets | 2.17% | 1.71% | 1.76% | 1.54% | 1.75% | 1.70% |
Portfolio Turnover Rate | 2%* | 2% | 3% | 3% | 2% | 5% |
| | | | | | | |
1 Calculated based on average shares outstanding.
2 Total returns do not reflect the 2% fee assessed on redemptions of shares purchased on or after June 27, 2003, and held for less than two months or the $10 annual account maintenance fee applied on balances under $10,000.
3 The acquired fund fees and expenses were 0.28% (annualized).
See accompanying Notes, which are an integral part of the Financial Statements.
86
Total International Stock Index Fund
Notes to Financial Statements
Vanguard Total International Stock Index Fund is registered under the Investment Company Act of 1940 as an open-end investment company, or mutual fund. The fund files reports with the SEC under the company name Vanguard STAR® Funds. The fund seeks to match the performance of its target index by investing in the European, Pacific, and Emerging Markets Stock Index Funds. The fund’s indirect investments in foreign securities involve investment risks not normally associated with investing in securities of U.S. corporations.
A. The following significant accounting policies conform to generally accepted accounting principles for U.S. mutual funds. The fund consistently follows such policies in preparing its financial statements.
1. Valuation: Investments are valued at the net asset value of each underlying Vanguard fund determined as of the close of the New York Stock Exchange (generally 4 p.m., Eastern time) on the valuation date.
2. Federal Income Taxes: The fund intends to continue to qualify as a regulated investment company and distribute all of its taxable income. Accordingly, no provision for federal income taxes is required in the financial statements.
3. Distributions: Distributions to shareholders are recorded on the ex-dividend date.
4. Other: Income and capital gain distributions received are recorded on the ex-dividend date. Security transactions are accounted for on the date securities are bought or sold. Costs used to determine realized gains (losses) on the sale of investment securities are those of the specific securities sold.
B. Under a service agreement, The Vanguard Group furnishes corporate management, administrative, marketing, and distribution services to the fund. The service agreement provides that Vanguard will reimburse the fund’s expenses to the extent of savings in administrative and marketing costs realized by Vanguard in the operation of the fund. Accordingly, all expenses incurred by the fund during the six months ended April 30, 2007, were reimbursed by Vanguard. The fund’s trustees and officers are also directors and officers of Vanguard.
C. Distributions are determined on a tax basis and may differ from net investment income and realized capital gains for financial reporting purposes. Differences may be permanent or temporary. Permanent differences are reclassified among capital accounts in the financial statements to reflect their tax character. Temporary differences arise when certain items of income, expense, gain, or loss are recognized in different periods for financial statement and tax purposes; these differences will reverse at some time in the future. Differences in classification may also result from the treatment of short-term gains as ordinary income for tax purposes.
The fund’s tax-basis capital gains and losses are determined only at the end of each fiscal year. For tax purposes, at October 31, 2006, the fund had available realized losses of $49,989,000 to offset future net capital gains of $6,119,000 through October 31, 2009, and $43,870,000 through October 31, 2010. The fund will use these capital losses to offset net taxable capital gains, if any, realized during the year ending October 31, 2007; should the fund realize net capital losses for the year, the losses will be added to the loss carryforward balances above.
At April 30, 2007, the cost of investment securities for tax purposes was $15,909,021,000. Net unrealized appreciation of investment securities for tax purposes was $7,844,045,000, consisting entirely of unrealized gains on securities that had risen in value since their purchase.
87
Total International Stock Index Fund
D. During the six months ended April 30, 2007, the fund purchased $3,209,176,000 of investment securities and sold $156,793,000 of investment securities, other than temporary cash investments.
E. Capital shares issued and redeemed were:
| Six Months Ended | Year Ended |
| April 30, 2007 | October 31, 2006 |
| Shares | Shares |
| (000) | (000) |
Issued | 226,235 | 338,604 |
Issued in Lieu of Cash Distributions | 23,151 | 16,161 |
Redeemed | (80,172) | (118,102) |
Net Increase (Decrease) in Shares Outstanding | 169,214 | 236,663 |
F. In June 2006, the Financial Accounting Standards Board issued Interpretation No. 48 (“FIN 48”), “Accounting for Uncertainty in Income Taxes.” FIN 48 establishes the minimum threshold for recognizing, and a system for measuring, the benefits of tax-return positions in financial statements. FIN 48 will be effective for the fund’s fiscal year beginning November 1, 2007. Management is in the process of analyzing the fund’s tax positions for purposes of implementing FIN 48; based on the analysis completed to date, management does not believe the adoption of FIN 48 will result in any material impact to the fund’s financial statements.
88
Developed Markets Index Fund
Fund Profile
As of April 30, 2007
Portfolio Characteristics | |
| Fund |
Expense Ratio | 0.00% |
Acquired Fund Fees and Expenses1 | 0.25% |
Sector Diversification (% of portfolio) | |
| | Target | Broad |
| Fund2 | Index3 | Index4 |
Consumer Discretionary | 12% | 12% | 11% |
Consumer Staples | 8 | 8 | 8 |
Energy | 7 | 7 | 9 |
Financials | 30 | 30 | 27 |
Health Care | 7 | 7 | 7 |
Industrials | 11 | 11 | 11 |
Information Technology | 5 | 6 | 9 |
Materials | 9 | 9 | 8 |
Telecommunication Services | 5 | 5 | 5 |
Utilities | 6 | 5 | 5 |
Volatility Measures5 | |
| Fund Versus | Fund Versus |
| Target Index3 | Broad Index4 |
R-Squared | 0.99 | 0.96 |
Beta | 0.99 | 0.90 |
Allocation to Underlying Vanguard Funds | |
| |
European Stock Index Fund Investor Shares | 70.0% |
Pacific Stock Index Fund Investor Shares | 30.0% |
Total | 100% |
Market Diversification (% of portfolio) | |
| | Target |
| Fund | Index3 |
United Kingdom | 23% | 23% |
Japan | 22 | 21 |
France | 10 | 10 |
Germany | 7 | 8 |
Switzerland | 7 | 7 |
Australia | 5 | 6 |
Netherlands | 5 | 4 |
Spain | 4 | 4 |
Italy | 4 | 4 |
Sweden | 3 | 3 |
Hong Kong | 2 | 2 |
Finland | 1 | 1 |
Belgium | 1 | 1 |
Norway | 1 | 1 |
Denmark | 1 | 1 |
Ireland | 1 | 1 |
Greece | 1 | 1 |
Austria | 1 | 1 |
Singapore | 1 | 1 |
1 This figure represents an annualized weighted average of the expense ratios and any fees charged by the underlying mutual funds in which the fund invests. The fund does not charge any expenses or fees of its own. Acquired is a term that the Securities and Exchange Commission applies to any mutual fund whose shares are owned by another fund.
2 Reflects holdings of underlying funds.
3 MSCI EAFE Index.
4 MSCI All Country World Index ex USA.
5 For an explanation of R-squared, beta, and other terms used here, see the Glossary on page 109.
89
Developed Markets Index Fund
Performance Summary
All of the returns in this report represent past performance, which is not a guarantee of future results that may be achieved by the fund. (Current performance may be lower or higher than the performance data cited. For performance data current to the most recent month-end, visit our website at www.vanguard.com/performance.) Note, too, that both investment returns and principal value can fluctuate widely, so an investor’s shares, when sold, could be worth more or less than their original cost. The returns shown do not reflect taxes that a shareholder would pay on fund distributions or on the sale of fund shares.
Fiscal-Year Total Returns (%): May 8, 2000–April 30, 2007
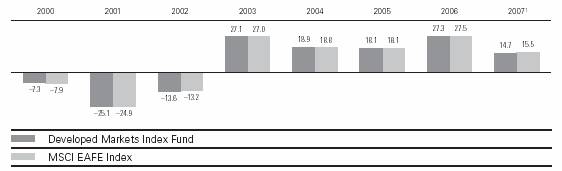
Average Annual Total Returns: Periods Ended March 31, 2007
This table presents average annual total returns through the latest calendar quarter—rather than through the end of the fiscal period. Securities and Exchange Commission rules require that we provide this information.
| | | | Since |
| Inception Date | One Year | Five Years | Inception |
Developed Markets Index Fund2 | 5/8/2000 | 20.30% | 15.70% | 6.11% |
1 Six months ended April 30, 2007.
2 Total returns do not reflect the 2% fee assessed on redemptions of shares purchased on or after June 27, 2003, and held for less than two months or the $10 annual account maintenance fee applied on balances under $10,000.
Note: See Financial Highlights table on page 94 for dividend and capital gains information.
90
Developed Markets Index Fund
Financial Statements (unaudited)
Statement of Net Assets
As of April 30, 2007
The fund provides a complete list of its holdings four times in each fiscal year, at the quarter-ends. For the second and fourth fiscal quarters, the lists appear in the fund’s semiannual and annual reports to shareholders. For the first and third fiscal quarters, the fund files the lists with the Securities and Exchange Commission on Form N-Q. Shareholders can look up the fund’s Forms N-Q on the SEC’s website at www.sec.gov. Forms N-Q may also be reviewed and copied at the SEC’s Public Reference Room (see the back cover of this report for further information).
| | Market |
| | Value• |
| Shares | ($000) |
Investment Companies (99.9%) | | |
International Stock Funds (99.8%) | | |
Vanguard European Stock Index Fund Investor Shares | 60,345,210 | 2,393,895 |
Vanguard Pacific Stock Index Fund Investor Shares | 79,306,660 | 1,025,435 |
| | |
Money Market Fund (0.1%) | | |
1 Vanguard Market Liquidity Fund, 5.259% | 4,935,924 | 4,936 |
Total Investment Companies (Cost $2,312,826) | | 3,424,266 |
Other Assets and Liabilities (0.1%) | | |
Other Assets | | 10,871 |
Liabilities | | (8,893) |
| | 1,978 |
Net Assets (100%) | | |
Applicable to 251,720,165 outstanding $.001 par value shares of | | |
beneficial interest (unlimited authorization) | | 3,426,244 |
Net Asset Value Per Share | | $13.61 |
At April 30, 2007, net assets consisted of:2 | | |
| Amount | Per |
| ($000) | Share |
Paid-in Capital | 2,313,425 | $9.19 |
Undistributed Net Investment Income | 1,355 | .01 |
Accumulated Net Realized Gains | 24 | — |
Unrealized Appreciation | 1,111,440 | 4.41 |
Net Assets | 3,426,244 | $13.61 |
• | See Note A in Notes to Financial Statements. |
1 Affiliated money market fund available only to Vanguard funds and certain trusts and accounts managed by Vanguard. Rate shown is the 7-day yield.
2 See Note C in Notes to Financial Statements for the tax-basis components of net assets.
91
Developed Markets Index Fund
Statement of Operations
| Six Months Ended |
| April 30, 2007 |
| ($000) |
Investment Income | |
Income | |
Income Distributions Received | 67,723 |
Net Investment Income—Note B | 67,723 |
Realized Net Gain (Loss) | |
Capital Gain Distributions Received | — |
Investment Securities Sold | 413 |
Realized Net Gain (Loss) | 413 |
Change in Unrealized Appreciation (Depreciation) of Investment Securities | 339,701 |
Net Increase (Decrease) in Net Assets Resulting from Operations | 407,837 |
92
Developed Markets Index Fund
Statement of Changes in Net Assets
| Six Months Ended | Year Ended |
| April 30, | October 31, |
| 2007 | 2006 |
| ($000) | ($000) |
Increase (Decrease) in Net Assets | | |
Operations | | |
Net Investment Income | 67,723 | 37,273 |
Realized Net Gain (Loss) | 413 | 1,323 |
Change in Unrealized Appreciation (Depreciation) | 339,701 | 440,326 |
Net Increase (Decrease) in Net Assets Resulting from Operations | 407,837 | 478,922 |
Distributions | | |
Net Investment Income | (66,260) | (37,455) |
Realized Capital Gain | (1,108) | — |
Total Distributions | (67,368) | (37,455) |
Capital Share Transactions—Note E | | |
Issued | 736,649 | 949,160 |
Issued in Lieu of Cash Distributions | 60,619 | 31,783 |
Redeemed1 | (283,400) | (473,513) |
Net Increase (Decrease) from Capital Share Transactions | 513,868 | 507,430 |
Total Increase (Decrease) | 854,337 | 948,897 |
Net Assets | | |
Beginning of Period | 2,571,907 | 1,623,010 |
End of Period2 | 3,426,244 | 2,571,907 |
1 The fund collected redemption fees of $3,000 and $22,000, which were reallocated proportionately to the funds in which it invests.
2 Net Assets—End of Period includes undistributed (overdistributed) net investment income of $1,355,000 and ($108,000).
93
Developed Markets Index Fund
Financial Highlights
| Six Months | | | | | |
| Ended | | | |
For a Share Outstanding | April 30, | Year Ended October 31, |
Throughout Each Period | 2007 | 2006 | 2005 | 2004 | 2003 | 2002 |
Net Asset Value, Beginning of Period | $12.15 | $9.75 | $8.43 | $7.22 | $5.80 | $6.83 |
Investment Operations | | | | | | |
Net Investment Income | .2901 | .219 | .19 | .143 | .116 | .12 |
Capital Gain Distributions Received | — | — | — | — | — | — |
Net Realized and Unrealized Gain (Loss) | | | | | | |
on Investments | 1.474 | 2.400 | 1.32 | 1.210 | 1.420 | (1.03) |
Total from Investment Operations | 1.764 | 2.619 | 1.51 | 1.353 | 1.536 | (.91) |
Distributions | | | | | | |
Dividends from Net Investment Income | (.299) | (.219) | (.19) | (.143) | (.116) | (.12) |
Distributions from Realized Capital Gains | (.005) | — | — | — | — | — |
Total Distributions | (.304) | (.219) | (.19) | (.143) | (.116) | (.12) |
Net Asset Value, End of Period | $13.61 | $12.15 | $9.75 | $8.43 | $7.22 | $5.80 |
| | | | | | |
Total Return2 | 14.71% | 27.27% | 18.07% | 18.94% | 27.06% | –13.61% |
| | | | | | |
Ratios/Supplemental Data | | | | | | |
Net Assets, End of Period (Millions) | $3,426 | $2,572 | $1,623 | $1,038 | $597 | $308 |
Ratio of Expenses to | | | | | | |
Average Net Assets—Note B | 0%3 | 0% | 0% | 0% | 0% | 0% |
Ratio of Net Investment Income to | | | | | | |
Average Net Assets | 2.26% | 1.82% | 1.77% | 1.52% | 1.48% | 1.30% |
Portfolio Turnover Rate | 5%* | 9% | 10% | 4% | 7% | 5% |
| | | | | | | | |
1 Calculated based on average shares outstanding.
2 Total returns do not reflect the 2% fee assessed on redemptions of shares purchased on or after June 27, 2003, and held for less than two months or the $10 annual account maintenance fee applied on balances under $10,000.
3 The acquired fund fees and expenses were 0.25% (annualized).
See accompanying Notes, which are an integral part of the Financial Statements.
94
Developed Markets Index Fund
Notes to Financial Statements
Vanguard Developed Markets Index Fund is registered under the Investment Company Act of 1940 as an open-end investment company, or mutual fund. The fund files reports with the SEC under the company name Vanguard STAR Funds. The fund seeks to match the performance of its target index by investing in the European and Pacific Stock Index Funds. The fund’s indirect investments in foreign securities involve investment risks not normally associated with investing in securities of U.S. corporations.
A. The following significant accounting policies conform to generally accepted accounting principles for U.S. mutual funds. The fund consistently follows such policies in preparing its financial statements.
1. Valuation: Investments are valued at the net asset value of each underlying Vanguard fund determined as of the close of the New York Stock Exchange (generally 4 p.m., Eastern time) on the valuation date.
2. Federal Income Taxes: The fund intends to continue to qualify as a regulated investment company and distribute all of its taxable income. Accordingly, no provision for federal income taxes is required in the financial statements.
3. Distributions: Distributions to shareholders are recorded on the ex-dividend date.
4. Other: Income and capital gain distributions received are recorded on the ex-dividend date. Security transactions are accounted for on the date securities are bought or sold. Costs used to determine realized gains (losses) on the sale of investment securities are those of the specific securities sold.
B. Under a service agreement, The Vanguard Group furnishes corporate management, administrative, marketing, and distribution services to the fund. The service agreement provides that Vanguard will reimburse the fund’s expenses to the extent of savings in administrative and marketing costs realized by Vanguard in the operation of the fund. Accordingly, all expenses incurred by the fund during the six months ended April 30, 2007, were reimbursed by Vanguard. The fund’s trustees and officers are also directors and officers of Vanguard.
C. Distributions are determined on a tax basis and may differ from net investment income and realized capital gains for financial reporting purposes. Differences may be permanent or temporary. Permanent differences are reclassified among capital accounts in the financial statements to reflect their tax character. Temporary differences arise when certain items of income, expense, gain, or loss are recognized in different periods for financial statement and tax purposes; these differences will reverse at some time in the future. Differences in classification may also result from the treatment of short-term gains as ordinary income for tax purposes. The fund’s tax-basis capital gains and losses are determined only at the end of each fiscal year.
At April 30, 2007, the cost of investment securities for tax purposes was $2,312,826,000. Net unrealized appreciation of investment securities for tax purposes was $1,111,440,000, consisting entirely of unrealized gains on securities that had risen in value since their purchase.
D. During the six months ended April 30, 2007, the fund purchased $588,568,000 of investment securities and sold $81,193,000 of investment securities, other than temporary cash investments.
95
Developed Markets Index Fund
E. Capital shares issued and redeemed were:
| Six Months Ended | Year Ended |
| April 30, 2007 | October 31, 2006 |
| Shares | Shares |
| (000) | (000) |
Issued | 57,456 | 85,083 |
Issued in Lieu of Cash Distributions | 4,803 | 3,089 |
Redeemed | (22,164) | (42,944) |
Net Increase (Decrease) in Shares Outstanding | 40,095 | 45,228 |
F. In June 2006, the Financial Accounting Standards Board issued Interpretation No. 48 (“FIN 48”), “Accounting for Uncertainty in Income Taxes.” FIN 48 establishes the minimum threshold for recognizing, and a system for measuring, the benefits of tax-return positions in financial statements. FIN 48 will be effective for the fund’s fiscal year beginning November 1, 2007. Management is in the process of analyzing the fund’s tax positions for purposes of implementing FIN 48; based on the analysis completed to date, management does not believe the adoption of FIN 48 will result in any material impact to the fund’s financial statements.
96
Institutional Developed Markets Index Fund
Fund Profile
As of April 30, 2007
Portfolio Characteristics | |
| Fund |
Expense Ratio | 0.00% |
Acquired Fund Fees and Expenses1 | 0.12% |
Sector Diversification (% of portfolio) | |
| | Target | Broad |
| Fund2 | Index3 | Index4 |
Consumer Discretionary | 12% | 12% | 11% |
Consumer Staples | 8 | 8 | 8 |
Energy | 7 | 7 | 9 |
Financials | 30 | 30 | 27 |
Health Care | 7 | 7 | 7 |
Industrials | 11 | 11 | 11 |
Information Technology | 5 | 6 | 9 |
Materials | 9 | 9 | 8 |
Telecommunication Services | 5 | 5 | 5 |
Utilities | 6 | 5 | 5 |
Volatility Measures5 | |
| Fund Versus | Fund Versus |
| Target Index3 | Broad Index4 |
R-Squared | 0.99 | 0.96 |
Beta | 0.99 | 0.90 |
Allocation to Underlying Vanguard Funds | |
| |
European Stock Index Fund | |
Institutional Shares | 70.0% |
Pacific Stock Index Fund Institutional Shares | 30.0% |
Total | 100% |
Market Diversification (% of portfolio) | |
| | Target |
| Fund | Index3 |
United Kingdom | 23% | 23% |
Japan | 22 | 21 |
France | 10 | 10 |
Germany | 7 | 8 |
Switzerland | 7 | 7 |
Australia | 5 | 6 |
Netherlands | 5 | 4 |
Spain | 4 | 4 |
Italy | 4 | 4 |
Sweden | 3 | 3 |
Hong Kong | 2 | 2 |
Finland | 1 | 1 |
Belgium | 1 | 1 |
Norway | 1 | 1 |
Denmark | 1 | 1 |
Ireland | 1 | 1 |
Greece | 1 | 1 |
Austria | 1 | 1 |
Singapore | 1 | 1 |
1 This figure represents an annualized weighted average of the expense ratios and any fees charged by the underlying mutual funds in which the fund invests. The fund does not charge any expenses or fees of its own. Acquired is a term that the Securities and Exchange Commission applies to any mutual fund whose shares are owned by another fund.
2 Reflects holdings of underlying funds.
3 MSCI EAFE Index.
4 MSCI All Country World Index ex USA.
5 For an explanation of R-squared, beta, and other terms used here, see the Glossary on page 109.
97
Institutional Developed Markets Index Fund
Performance Summary
All of the returns in this report represent past performance, which is not a guarantee of future results that may be achieved by the fund. (Current performance may be lower or higher than the performance data cited. For performance data current to the most recent month-end, visit our website at www.vanguard.com/performance.) Note, too, that both investment returns and principal value can fluctuate widely, so an investor’s shares, when sold, could be worth more or less than their original cost. The returns shown do not reflect taxes that a shareholder would pay on fund distributions or on the sale of fund shares.
Fiscal-Year Total Returns (%): June 1, 2000–April 30, 2007

Average Annual Total Returns: Periods Ended March 31, 2007
This table presents average annual total returns through the latest calendar quarter—rather than through the end of the fiscal period. Securities and Exchange Commission rules require that we provide this information.
| | | | Since |
| Inception Date | One Year | Five Years | Inception |
Institutional Developed Markets | | | | |
Index Fund2 | 6/1/2000 | 20.62% | 15.88% | 6.19% |
1 Six months ended April 30, 2007.
2 Total returns do not reflect the 2% fee assessed on redemptions of shares purchased on or after June 27, 2003, and held for less than two months.
Note: See Financial Highlights table on page 102 for dividend and capital gains information.
98
Institutional Developed Markets Index Fund
Financial Statements (unaudited)
Statement of Net Assets
As of April 30, 2007
The fund provides a complete list of its holdings four times in each fiscal year, at the quarter-ends. For the second and fourth fiscal quarters, the lists appear in the fund’s semiannual and annual reports to shareholders. For the first and third fiscal quarters, the fund files the lists with the Securities and Exchange Commission on Form N-Q. Shareholders can look up the fund’s Forms N-Q on the SEC’s website at www.sec.gov. Forms N-Q may also be reviewed and copied at the SEC’s Public Reference Room (see the back cover of this report for further information).
| | Market |
| | Value• |
| Shares | ($000) |
Investment Companies (99.9%) | | |
International Stock Funds (99.9%) | | |
Vanguard European Stock Index Fund Institutional Shares | 82,673,106 | 3,283,776 |
Vanguard Pacific Stock Index Fund Institutional Shares | 108,624,949 | 1,406,693 |
| | |
Money Market Fund (0.0%) | | |
1 Vanguard Market Liquidity Fund, 5.259% | 879,013 | 879 |
Total Investment Companies (Cost $3,397,665) | | 4,691,348 |
Other Assets and Liabilities (0.1%) | | |
Other Assets | | 18,567 |
Liabilities | | (16,513) |
| | 2,054 |
Net Assets (100%) | | |
Applicable to 347,817,028 outstanding $.001 par value shares of | | |
beneficial interest (unlimited authorization) | | 4,693,402 |
Net Asset Value Per Share | | $13.49 |
At April 30, 2007, net assets consisted of:2 | | |
| Amount | Per |
| ($000) | Share |
Paid-in Capital | 3,406,402 | $9.79 |
Undistributed Net Investment Income | 1,907 | .01 |
Accumulated Net Realized Losses | (8,590) | (.03) |
Unrealized Appreciation | 1,293,683 | 3.72 |
Net Assets | 4,693,402 | $13.49 |
• | See Note A in Notes to Financial Statements. |
1 Affiliated money market fund available only to Vanguard funds and certain trusts and accounts managed by Vanguard. Rate shown is the 7-day yield.
2 See Note C in Notes to Financial Statements for the tax-basis components of net assets.
99
Institutional Developed Markets Index Fund
Statement of Operations
| Six Months Ended |
| April 30, 2007 |
| ($000) |
Investment Income | |
Income | |
Income Distributions Received | 98,254 |
Net Investment Income—Note B | 98,254 |
Realized Net Gain (Loss) | |
Capital Gain Distributions Received | — |
Investment Securities Sold | 652 |
Realized Net Gain (Loss) | 652 |
Change in Unrealized Appreciation (Depreciation) of Investment Securities | 464,401 |
Net Increase (Decrease) in Net Assets Resulting from Operations | 563,307 |
100
Institutional Developed Markets Index Fund
Statement of Changes in Net Assets
| Six Months Ended | Year Ended |
| April 30, | October 31, |
| 2007 | 2006 |
| ($000) | ($000) |
Increase (Decrease) in Net Assets | | |
Operations | | |
Net Investment Income | 98,254 | 42,789 |
Realized Net Gain (Loss) | 652 | 736 |
Change in Unrealized Appreciation (Depreciation) | 464,401 | 523,353 |
Net Increase (Decrease) in Net Assets Resulting from Operations | 563,307 | 566,878 |
Distributions | | |
Net Investment Income | (97,353) | (41,783) |
Realized Capital Gain | — | — |
Total Distributions | (97,353) | (41,783) |
Capital Share Transactions—Note E | | |
Issued | 835,299 | 1,734,502 |
Issued in Lieu of Cash Distributions | 79,390 | 29,979 |
Redeemed1 | (294,127) | (430,784) |
Net Increase (Decrease) from Capital Share Transactions | 620,562 | 1,333,697 |
Total Increase (Decrease) | 1,086,516 | 1,858,792 |
Net Assets | | |
Beginning of Period | 3,606,886 | 1,748,094 |
End of Period2 | 4,693,402 | 3,606,886 |
1 The fund collected redemption fees of $14,000 and $119,000, which were reallocated proportionately to the funds in which it invests.
2 Net Assets—End of Period includes undistributed net investment income of $1,907,000 and $1,006,000.
101
Institutional Developed Markets Index Fund
Financial Highlights
| | | | | |
| Six Months | | | | | |
| Ended | | | |
For a Share Outstanding | April 30, | Year Ended October 31, |
Throughout Each Period | 2007 | 2006 | 2005 | 2004 | 2003 | 2002 |
Net Asset Value, Beginning of Period | $12.05 | $9.67 | $8.35 | $7.16 | $5.76 | $6.78 |
Investment Operations | | | | | | |
Net Investment Income | .3041 | .229 | .20 | .158 | .126 | .132 |
Capital Gain Distributions Received | — | — | — | — | — | — |
Net Realized and Unrealized Gain (Loss) | | | | | | |
on Investments | 1.452 | 2.380 | 1.32 | 1.190 | 1.400 | (1.020) |
Total from Investment Operations | 1.756 | 2.609 | 1.52 | 1.348 | 1.526 | (.888) |
Distributions | | | | | | |
Dividends from Net Investment Income | (.316) | (.229) | (.20) | (.158) | (.126) | (.132) |
Distributions from Realized Capital Gains | — | — | — | — | — | — |
Total Distributions | (.316) | (.229) | (.20) | (.158) | (.126) | (.132) |
Net Asset Value, End of Period | $13.49 | $12.05 | $9.67 | $8.35 | $7.16 | $5.76 |
| | | | | | |
Total Return2 | 14.78% | 27.41% | 18.37% | 19.05% | 27.13% | –13.41% |
| | | | | | |
Ratios/Supplemental Data | | | | | | |
Net Assets, End of Period (Millions) | $4,693 | $3,607 | $1,748 | $911 | $567 | $261 |
Ratio of Expenses to | | | | | | |
Average Net Assets—Note | 0%3 | 0% | 0% | 0% | 0% | 0% |
Ratio of Net Investment Income to | | | | | | |
Average Net Assets | 2.40% | 1.72% | 1.86% | 1.81% | 1.80% | 1.75% |
Portfolio Turnover Rate | 8%* | 14% | 6% | 19% | 11% | 9% |
1 Calculated based on average shares outstanding.
2 Total returns do not reflect the 2% fee assessed on redemptions of shares purchased on or after June 27, 2003, and held for less than two months.
3 The acquired fund fees and expenses were 0.12% (annualized).
See accompanying Notes, which are an integral part of the Financial Statements.
102
Institutional Developed Markets Index Fund
Notes to Financial Statements
Vanguard Institutional Developed Markets Index Fund is registered under the Investment Company Act of 1940 as an open-end investment company, or mutual fund. The fund files reports with the SEC under the company name Vanguard STAR Funds. The fund seeks to match the performance of its target index by investing in the European and Pacific Stock Index Funds. The fund’s indirect investments in foreign securities involve investment risks not normally associated with investing in securities of U.S. corporations.
A. The following significant accounting policies conform to generally accepted accounting principles for U.S. mutual funds. The fund consistently follows such policies in preparing its financial statements.
1. Valuation: Investments are valued at the net asset value of each underlying Vanguard fund determined as of the close of the New York Stock Exchange (generally 4:00 p.m., Eastern time) on the valuation date.
2. Federal Income Taxes: The fund intends to continue to qualify as a regulated investment company and distribute all of its taxable income. Accordingly, no provision for federal income taxes is required in the financial statements.
3. Distributions: Distributions to shareholders are recorded on the ex-dividend date.
4. Other: Income and capital gain distributions received are recorded on the ex-dividend date. Security transactions are accounted for on the date securities are bought or sold. Costs used to determine realized gains (losses) on the sale of investment securities are those of the specific securities sold.
B. Under a service agreement, The Vanguard Group furnishes corporate management, administrative, marketing, and distribution services to the fund. The service agreement provides that Vanguard will reimburse the fund’s expenses to the extent of savings in administrative and marketing costs realized by Vanguard in the operation of the fund. Accordingly, all expenses incurred by the fund during the six months ended April 30, 2007, were reimbursed by Vanguard. The fund’s trustees and officers are also directors and officers of Vanguard.
C. Distributions are determined on a tax basis and may differ from net investment income and realized capital gains for financial reporting purposes. Differences may be permanent or temporary. Permanent differences are reclassified among capital accounts in the financial statements to reflect their tax character. Temporary differences arise when certain items of income, expense, gain, or loss are recognized in different periods for financial statement and tax purposes; these differences will reverse at some time in the future. Differences in classification may also result from the treatment of short-term gains as ordinary income for tax purposes.
The fund’s tax-basis capital gains and losses are determined only at the end of each fiscal year. For tax purposes, at October 31, 2006, the fund had available realized losses of $8,789,000 to offset future net capital gains through October 31, 2011. The fund will use these capital losses to offset net taxable capital gains, if any, realized during the year ending October 31, 2007; should the fund realize net capital losses for the year, the losses will be added to the loss carryforward balance above.
At April 30, 2007, the cost of investment securities for tax purposes was $3,397,665,000. Net unrealized appreciation of investment securities for tax purposes was $1,293,683,000, consisting entirely of unrealized gains on securities that had risen in value since their purchase.
D. During the six months ended April 30, 2007, the fund purchased $791,253,000 of investment securities and sold $171,515,000 of investment securities, other than temporary cash investments.
103
Institutional Developed Markets Index Fund
E. Capital shares issued and redeemed were:
| Six Months Ended | Year Ended |
| April 30, 2007 | October 31, 2006 |
| Shares | Shares |
| (000) | (000) |
Issued | 65,401 | 155,289 |
Issued in Lieu of Cash Distributions | 6,351 | 2,939 |
Redeemed | (23,194) | (39,690) |
Net Increase (Decrease) in Shares Outstanding | 48,558 | 118,538 |
F. In June 2006, the Financial Accounting Standards Board issued Interpretation No. 48 (“FIN 48”), “Accounting for Uncertainty in Income Taxes.” FIN 48 establishes the minimum threshold for recognizing, and a system for measuring, the benefits of tax-return positions in financial statements. FIN 48 will be effective for the fund’s fiscal year beginning November 1, 2007. Management is in the process of analyzing the fund’s tax positions for purposes of implementing FIN 48; based on the analysis completed to date, management does not believe the adoption of FIN 48 will result in any material impact to the fund’s financial statements
104
About Your Fund’s Expenses
As a shareholder of the fund, you incur ongoing costs, which include costs for portfolio management, administrative services, and shareholder reports (like this one), among others. Operating expenses, which are deducted from a fund’s gross income, directly reduce the investment return of the fund.
A typical fund’s expenses are expressed as a percentage of its average net assets. This figure is known as the expense ratio. “Funds of funds,” such as the Developed Markets Index Fund, Institutional Developed Markets Index Fund, and Total International Stock Index Fund, have no direct expenses, but each fund bears its proportionate share of the expenses of the underlying funds in which it invests. These indirect expenses make up the fund’s acquired fund fees and expenses, also expressed as a percentage of average net assets.
The following examples are intended to help you understand the ongoing costs (in dollars) of investing in your fund and to compare these costs with those of other mutual funds. The examples are based on an investment of $1,000 made at the beginning of the period shown and held for the entire period. The costs are calculated using each fund’s acquired fund fees and expenses.
The table on pages 106 and 107 illustrates your fund’s costs in two ways:
• Based on actual fund return. This section helps you to estimate the actual expenses that you paid over the period. The “Ending Account Value” shown is derived from the fund’s actual return, and the third column shows the dollar amount that would have been paid by an investor who started with $1,000 in the fund. You may use the information here, together with the amount you invested, to estimate the expenses that you paid over the period.
To do so, simply divide your account value by $1,000 (for example, an $8,600 account value divided by $1,000 = 8.6), then multiply the result by the number given for your fund under the heading “Expenses Paid During Period.”
• Based on hypothetical 5% yearly return. This section is intended to help you compare your fund’s costs with those of other mutual funds. It assumes that the fund had a yearly return of 5% before expenses, but that the expense ratio is unchanged. In this case—because the return used is not the fund’s actual return—the results do not apply to your investment. The example is useful in making comparisons because the Securities and Exchange Commission requires all mutual funds to calculate expenses based on a 5% return. You can assess your fund’s costs by comparing this hypothetical example with the hypothetical examples that appear in shareholder reports of other funds.
Note that the expenses shown in the table are meant to highlight and help you compare ongoing costs only and do not reflect transaction costs incurred by the fund for buying and selling securities. Further, the expenses do not include the fees on redemptions of shares, nor do they include any account service fee. These fees are described in the prospectus. If such fees were applied to your account, your costs would be higher. Your fund does not carry a “sales load.”
The calculations assume no shares were bought or sold during the period. Your actual costs may have been higher or lower, depending on the amount of your investment and the timing of any purchases or redemptions.
You can find more information about the funds’ expenses, including annual expense ratios, in the Financial Statements sections of this report. For additional information on operating expenses and other shareholder costs, please refer to your fund’s current prospectus.
105
Six Months Ended April 30, 20071 | | | |
| Beginning | Ending | Expenses |
| Account Value | Account Value | Paid During |
International Stock Index Fund | 10/31/2006 | 4/30/2007 | Period2 |
Based on Actual Fund Return | | | |
European | | | |
Investor Shares | $1,000.00 | $1,173.37 | $1.35 |
Admiral Shares | 1,000.00 | 1,173.96 | 0.81 |
Signal Shares | 1,000.00 | 1,173.93 | 0.81 |
Institutional Shares | 1,000.00 | 1,174.22 | 0.65 |
ETF Shares | 1,000.00 | 1,173.87 | 0.81 |
Pacific | | | |
Investor Shares | $1,000.00 | $1,089.05 | $1.24 |
Admiral Shares | 1,000.00 | 1,089.73 | 0.78 |
Institutional Shares | 1,000.00 | 1,090.29 | 0.62 |
ETF Shares | 1,000.00 | 1,089.73 | 0.78 |
Emerging Markets | | | |
Investor Shares3 | $1,000.00 | $1,191.90 | $2.17 |
Admiral Shares3 | 1,000.00 | 1,192.27 | 1.63 |
nstitutional Shares3 | 1,000.00 | 1,193.02 | 1.36 |
ETF Shares | 1,000.00 | 1,192.34 | 1.63 |
Total International | $1,000.00 | $1,154.02 | $1.50 |
Developed Markets | $1,000.00 | $1,147.15 | $1.33 |
Institutional Developed Markets | $1,000.00 | $1,147.80 | $0.64 |
1 This table does not include data for funds or share classes of funds with fewer than six months of history.
2 The calculations are based on expenses incurred in the most recent six-month period. Annualized six-month expense ratios for the European, Pacific, and Emerging Markets funds are as follows: European Stock Index Fund—0.25% for Investor Shares, 0.15% for Admiral Shares, 0.15% for Signal Shares, 0.12% for Institutional Shares, and 0.15% for ETF Shares; Pacific Stock Index Fund—0.24% for Investor Shares, 0.15% for Admiral Shares, 0.12% for Institutional Shares, and 0.15% for ETF Shares; Emerging Markets Stock Index Fund—0.40% for Investor Shares, 0.30% for Admiral Shares, 0.25% for Institutional Shares, and 0.30% for ETF Shares. The other funds’ annualized acquired fund fees and expenses as of April 30, 2007, were (in top-to-bottom order as listed above) 0.28%, 0.25%, and 0.12%. The dollar amounts shown as “Expenses Paid” are equal to the annualized expense ratio multiplied by the average account value over the period, multiplied by the number of days in the most recent 6-month period, then divided by the number of days in the most recent 12-month period.
3 Calculations do not reflect the fund’s 0.5% purchase fee, which is deducted from all purchases (including exchanges from other Vanguard funds) but not from reinvested dividends and capital gains.
106
Six Months Ended April 30, 20071 | | | |
| Beginning | Ending | Expenses |
| Account Value | Account Value | Paid During |
International Stock Index Fund | 10/31/2006 | 4/30/2007 | Period |
Based on Hypothetical 5% Yearly Return | | | |
European | | | |
Investor Shares | $1,000.00 | $1,023.55 | $1.25 |
Admiral Shares | 1,000.00 | 1,024.05 | 0.75 |
Signal Shares | 1,000.00 | 1,024.05 | 0.75 |
Institutional Shares | 1,000.00 | 1,024.20 | 0.60 |
ETF Shares | 1,000.00 | 1,024.05 | 0.75 |
Pacific | | | |
Investor Shares | $1,000.00 | $1,023.60 | $1.20 |
Admiral Shares | 1,000.00 | 1,024.05 | 0.75 |
Institutional Shares | 1,000.00 | 1,024.20 | 0.60 |
ETF Shares | 1,000.00 | 1,024.05 | 0.75 |
Emerging Markets | | | |
Investor Shares | $1,000.00 | $1,022.81 | $2.01 |
Admiral Shares | 1,000.00 | 1,023.31 | 1.51 |
Institutional Shares | 1,000.00 | 1,023.55 | 1.25 |
ETF Shares | 1,000.00 | 1,023.31 | 1.51 |
Total International | $1,000.00 | $1,023.41 | $1.40 |
Developed Markets | $1,000.00 | $1,023.55 | $1.25 |
Institutional Developed Markets | $1,000.00 | $1,024.20 | $0.60 |
1 Amounts in this table are calculated in the manner described in the footnotes on page 106.
107
Trustees Approve Advisory Arrangement
The board of trustees of Vanguard International Stock Index Funds has renewed the funds’ investment advisory arrangement with The Vanguard Group, Inc. Vanguard—through its Quantitative Equity Group—serves as the investment advisor for the European, Pacific, and Emerging Markets Stock Index Funds. The Total International Stock Index Fund, Developed Markets Index Fund, and Institutional Developed Markets Index Fund do not employ an investment advisor but benefit from the investment advisory services provided to the underlying funds in which they invest. The board determined that continuing the funds’ internalized management structure was in the best interests of the funds and their shareholders.
The board based its decision upon an evaluation of the advisor’s investment staff, portfolio management process, and performance. The trustees considered the factors discussed below, among others. However, no single factor determined whether the board approved the arrangement. Rather, it was the totality of the circumstances that drove the board’s decision.
Nature, extent, and quality of services
The board considered the quality of the funds’ investment management over both short- and long-term periods and took into account the organizational depth and stability of the advisor. Vanguard has been managing investments for more than two decades. George U. Sauter, Vanguard managing director and chief investment officer, has been in the investment management business since 1985. Vanguard adheres to a sound, disciplined investment management process; the portfolio management team has considerable experience, stability, and depth.
The board concluded that Vanguard’s experience, stability, depth, and performance, among other factors, warranted continuation of the advisory arrangement.
Investment performance
The board considered the short- and long-term performance of the funds, including any periods of outperformance or underperformance of their target benchmarks and peer groups. The board concluded that the funds have performed in line with expectations and that their results have been consistent with their investment strategies. Information about the funds’ most recent performance can be found in the Performance Summary pages of this report.
Cost
The board concluded that the advisory expenses and the overall expense ratios for the European, Pacific, and Emerging Markets Stock Index Funds were far below the average advisory fees and expense ratios charged by funds in their respective peer groups. As previously noted, the other funds do not incur advisory expenses directly. Information about the funds’ expense ratios appears in the About Your Fund’s Expenses section of this report as well as in the Financial Statements sections.
The board does not conduct a profitability analysis of Vanguard because of Vanguard’s unique “at-cost” structure. Unlike most other mutual fund management companies, Vanguard is owned by the funds it oversees, and produces “profits” only in the form of reduced expenses for fund shareholders.
The benefit of economies of scale
The board concluded that Vanguard’s low-cost arrangement with the International Stock Index Funds ensures that the funds will realize economies of scale as they grow, with the cost to shareholders declining as fund assets increase.
The board will consider whether to renew the advisory arrangement again after a one-year period.
108
Glossary
Acquired Fund Fees and Expenses. Funds that invest in other Vanguard funds incur no direct expenses, but they do bear proportionate shares of the operating, administrative, and advisory expenses of the underlying funds, and they must pay any fees charged by those funds. The figure for acquired fund fees and expenses represents a weighted average of these underlying costs. Acquired is a term that the Securities and Exchange Commission applies to any mutual fund whose shares are owned by another fund.
Beta. A measure of the magnitude of a fund’s past share-price fluctuations in relation to the ups and downs of a given market index. The index is assigned a beta of 1.00. Compared with a given index, a fund with a beta of 1.20 typically would have seen its share price rise or fall by 12% when the index rose or fell by 10%. A fund’s beta should be reviewed in conjunction with its R-squared (see definition below). The lower the R-squared, the less correlation there is between the fund and the index, and the less reliable beta is as an indicator of volatility.
Expense Ratio. The percentage of a fund’s average net assets used to pay its annual administrative and advisory expenses. These expenses directly reduce returns to investors.
Inception Date. The date on which the assets of a fund (or one of its share classes) are first invested in accordance with the fund’s investment objective. For funds with a subscription period, the inception date is the day after that period ends. Investment performance is measured from the inception date.
R-Squared. A measure of how much of a fund’s past returns can be explained by the returns from the market in general, as measured by a given index. If a fund’s total returns were precisely synchronized with an index’s returns, its R-squared would be 1.00. If the fund’s returns bore no relationship to the index’s returns, its R-squared would be 0.
Short-Term Reserves. The percentage of a fund invested in highly liquid, short-term securities that can be readily converted to cash.
Turnover Rate. An indication of the fund’s trading activity. Funds with high turnover rates incur higher transaction costs and may be more likely to distribute capital gains (which may be taxable to investors). The turnover rate excludes in-kind transactions, which have minimal impact on costs.
109
This page intentionally left blank.
This page intentionally left blank.
The People Who Govern Your Fund
The trustees of your mutual fund are there to see that the fund is operated and managed in your best interests since, as a shareholder, you are a part owner of the fund. Your fund’s trustees also serve on the board of directors of The Vanguard Group, Inc., which is owned by the Vanguard funds and provides services to them on an at-cost basis.
A majority of Vanguard’s board members are independent, meaning that they have no affiliation with Vanguard or the funds they oversee, apart from the sizable personal investments they have made as private individuals.
Our independent board members bring distinguished backgrounds in business, academia, and public service to their task of working with Vanguard officers to establish the policies and oversee the activities of the funds. Among board members’ responsibilities are selecting investment advisors for the funds; monitoring fund operations, performance, and costs; reviewing contracts; nominating and selecting new trustees/directors; and electing Vanguard officers.
Each trustee serves a fund until its termination; or until the trustee’s retirement, resignation, or death; or otherwise as specified in the fund’s organizational documents. Any trustee may be removed at a shareholders’ meeting by a vote representing two-thirds of the net asset value of all shares of the fund together with shares of other Vanguard funds organized within the same trust. The table on these two pages shows information for each trustee and executive officer of the fund. The mailing address of the trustees and officers is P.O. Box 876, Valley Forge, PA 19482.
Chairman of the Board, Chief Executive Officer, and Trustee |
| |
John J. Brennan1 | |
Born 1954 | Principal Occupation(s) During the Past Five Years: Chairman of the Board, Chief Executive |
Trustee since May 1987; | Officer, and Director/Trustee of The Vanguard Group, Inc., and of each of the investment |
Chairman of the Board and | companies served by The Vanguard Group. |
Chief Executive Officer | |
147 Vanguard Funds Overseen | |
| |
Independent Trustees | |
| |
Charles D. Ellis | |
Born 1937 | Principal Occupation(s) During the Past Five Years: Applecore Partners (pro bono ventures |
Trustee since January 2001 | in education); Senior Advisor to Greenwich Associates (international business strategy |
147 Vanguard Funds Overseen | consulting); Successor Trustee of Yale University; Overseer of the Stern School of Business |
| at New York University; Trustee of the Whitehead Institute for Biomedical Research. |
| |
Rajiv L. Gupta | |
Born 1945 | Principal Occupation(s) During the Past Five Years: Chairman and Chief Executive Officer |
Trustee since December 20012 | of Rohm and Haas Co. (chemicals); Board Member of the American Chemistry Council; |
147 Vanguard Funds Overseen | Director of Tyco International, Ltd. (diversified manufacturing and services) since 2005; |
| Trustee of Drexel University and of the Chemical Heritage Foundation. |
| |
Amy Gutmann | |
Born 1949 | Principal Occupation(s) During the Past Five Years: President of the University of |
Trustee since June 2006 | Pennsylvania since 2004; Professor in the School of Arts and Sciences, Annenberg School |
147 Vanguard Funds Overseen | for Communication, and Graduate School of Education of the University of Pennsylvania |
| since 2004; Provost (2001–2004) and Laurance S. Rockefeller Professor of Politics and the |
| University Center for Human Values (1990–2004), Princeton University; Director of Carnegie |
| Corporation of New York since 2005 and of Schuylkill River Development Corporation and |
| Greater Philadelphia Chamber of Commerce since 2004. |
JoAnn Heffernan Heisen | |
Born 1950 | Principal Occupation(s) During the Past Five Years: Corporate Vice President and Chief |
Trustee since July 1998 | Global Diversity Officer since 2006, Vice President and Chief Information Officer |
147 Vanguard Funds Overseen | (1997–2005), and Member of the Executive Committee of Johnson & Johnson |
| (pharmaceuticals/consumer products); Director of the University Medical Center |
| at Princeton and Women’s Research and Education Institute. |
| |
André F. Perold | |
Born 1952 | Principal Occupation(s) During the Past Five Years: George Gund Professor of Finance |
Trustee since December 2004 | and Banking, Harvard Business School; Senior Associate Dean, Director of Faculty |
147 Vanguard Funds Overseen | Recruiting, and Chair of Finance Faculty, Harvard Business School; Director and Chairman |
| of UNX, Inc. (equities trading firm) since 2003; Chair of the Investment Committee of |
| HighVista Strategies LLC (private investment firm) since 2005; Director of registered |
| investment companies advised by Merrill Lynch Investment Managers and affiliates |
| (1985–2004), Genbel Securities Limited (South African financial services firm) |
| (1999–2003), Gensec Bank (1999–2003), Sanlam, Ltd. (South African insurance |
| company) (2001–2003), and Stockback, Inc. (credit card firm) (2000–2002). |
| |
Alfred M. Rankin, Jr. | |
Born 1941 | Principal Occupation(s) During the Past Five Years: Chairman, President, Chief Executive |
Trustee since January 1993 | Officer, and Director of NACCO Industries, Inc. (forklift trucks/housewares/lignite); Director |
147 Vanguard Funds Overseen | of Goodrich Corporation (industrial products/aircraft systems and services). |
| |
J. Lawrence Wilson | |
Born 1936 | Principal Occupation(s) During the Past Five Years: Retired Chairman and Chief Executive |
Trustee since April 1985 | Officer of Rohm and Haas Co. (chemicals); Director of Cummins Inc. (diesel engines) and |
147 Vanguard Funds Overseen | AmerisourceBergen Corp. (pharmaceutical distribution); Trustee of Vanderbilt University |
| and of Culver Educational Foundation. |
| |
Executive Officers1 | |
| |
Heidi Stam | |
Born 1956 | Principal Occupation(s) During the Past Five Years: Managing Director of The Vanguard |
Secretary since July 2005 | Group, Inc., since 2006; General Counsel of The Vanguard Group since 2005; Secretary of |
147 Vanguard Funds Overseen | The Vanguard Group, and of each of the investment companies served by The Vanguard |
| Group, since 2005; Principal of The Vanguard Group (1997–2006). |
| |
Thomas J. Higgins | |
Born 1957 | Principal Occupation(s) During the Past Five Years: Principal of The Vanguard Group, Inc.; |
Treasurer since July 1998 | Treasurer of each of the investment companies served by The Vanguard Group. |
147 Vanguard Funds Overseen | |
Vanguard Senior Management Team | | |
| | |
R. Gregory Barton | Kathleen C. Gubanich | Michael S. Miller |
Mortimer J. Buckley | Paul A. Heller | Ralph K. Packard |
James H. Gately | F. William McNabb, III | George U. Sauter |
| | |
Founder | | |
| | |
John C. Bogle | | |
Chairman and Chief Executive Officer, 1974–1996 | |
1 Officers of the funds are “interested persons” as defined in the Investment Company Act of 1940.
2 December 2002 for Vanguard Equity Income Fund, Vanguard Growth Equity Fund, the Vanguard Municipal Bond Funds, and the Vanguard State Tax-Exempt Funds.
More information about the trustees is in the Statement of Additional Information, available from The Vanguard Group.
| 
|
| P.O. Box 2600 |
| Valley Forge, PA 19482-2600 |
Connect with Vanguard® > www.vanguard.com |
Fund Information > 800-662-7447 | Vanguard, Admiral, Signal, STAR, Connect with |
| Vanguard, and the ship logo are trademarks of |
Direct Investor Account Services > 800-662-2739 | The Vanguard Group, Inc. |
| |
Institutional Investor Services > 800-523-1036 | |
| All other marks are the exclusive property of their |
Text Telephone for People | respective owners. |
with Hearing Impairment > 800-952-3335 | |
| |
| All comparative mutual fund data are from Lipper Inc. |
| or Morningstar, Inc., unless otherwise noted. |
| |
| |
This material may be used in conjunction | You can obtain a free copy of Vanguard’s proxy voting |
with the offering of shares of any Vanguard | guidelines by visiting our website, www.vanguard.com, |
fund only if preceded or accompanied by | and searching for “proxy voting guidelines,” or by calling |
the fund’s current prospectus. | Vanguard at 800-662-2739. They are also available from |
| the SEC’s website, www.sec.gov. In addition, you may |
| obtain a free report on how your fund voted the proxies for |
The funds or securities referred to herein are not | securities it owned during the 12 months ended June 30. |
sponsored, endorsed, or promoted by MSCI, and | To get the report, visit either www.vanguard.com |
MSCI bears no liability with respect to any such funds | or www.sec.gov. |
or securities. For any such funds or securities, the | |
prospectus or the Statement of Additional Information | |
contains a more detailed description of the limited | You can review and copy information about your fund |
relationship MSCI has with The Vanguard Group and | at the SEC’s Public Reference Room in Washington, D.C. |
any related funds. | To find out more about this public service, call the SEC |
| at 202-551-8090. Information about your fund is also |
| available on the SEC’s website, and you can receive |
| copies of this information, for a fee, by sending a |
| request in either of two ways: via e-mail addressed to |
| publicinfo@sec.gov or via regular mail addressed to the |
| Public Reference Section, Securities and Exchange |
| Commission, Washington, DC 20549-0102. |
| |
| |
| |
| © 2007 The Vanguard Group, Inc. |
| All rights reserved. |
| Vanguard Marketing Corporation, Distributor. |
| |
| Q722 062007 |
| |
Vanguard® FTSE All-World ex-US | |
Index Fund | |
| |
| |
> Semiannual Report | |
| |
| |
| |
April 30, 2007 | |
| |
> | The Investor Shares of Vanguard FTSE All-World ex-US Index Fund became available to investors on March 8, 2007, and returned 7.3% through April 30. |
> | International markets performed very well during this brief period, with stocks in Europe and emerging markets providing most of the fund’s gain. |
> | Several of the fund’s top ten holdings produced healthy returns, including energy firms BP and Total and the multinational financial firm HSBC. |
Contents | |
| |
Your Fund’s Total Returns | 1 |
Chairman’s Letter | 2 |
Fund Profile | 6 |
Performance Summary | 8 |
Financial Statements | 9 |
Trustees Approve Advisory Arrangement | 36 |
Glossary | 37 |
Please note: The opinions expressed in this report are just that—informed opinions. They should not be considered promises or advice. Also, please keep in mind that the information and opinions cover the period through the date on the cover of this report. Of course, the risks of investing in your fund are spelled out in the prospectus.
Your Fund’s Total Returns
Periods Ended April 30, 2007 | | |
| | Return Since |
| Ticker | Share-Class |
| Symbol | Inception |
Vanguard FTSE All-World ex-US Index Fund | | |
Investor Shares (Inception: March 8, 2007) | VFWIX | 7.3% |
FTSE All-World ex US Index | | 8.3 |
Average International Fund1 | | 7.2 |
| | |
Vanguard FTSE All-World ex-US Index Fund | | |
ETF Shares2 (Inception: March 2, 2007) | VEU | |
Market | | 9.9% |
Net Asset Value | | 9.4 |
FTSE All-World ex US Index | | 9.3 |
Average International Fund1 | | 9.4 |
Your Fund’s Performance at a Glance | | | | |
Inception Through April 30, 2007 | | | | |
| | | Distributions Per Share |
| Share Price | Ending | Income | Capital |
| at Inception3 | Share Price | Dividends | Gains |
Vanguard FTSE All-World ex-US Index Fund | | | | |
Investor Shares | $20.00 | $21.45 | $0.000 | $0.000 |
ETF Shares | 49.80 | 54.50 | 0.000 | 0.000 |
These tables do not show performance of the fund’s Institutional Shares, which commenced operations on April 30, 2007.
1 Derived from data provided by Lipper Inc.
2 ETF Shares are traded on the American Stock Exchange and are available only through brokers. The table shows ETF returns based on both the AMEX market price and the net asset value for a share. U.S. Pat. No. 6,879,964 B2.
3 March 8, 2007, for Investor Shares; March 2, 2007, for ETF Shares.
1

Chairman’s Letter
Dear Shareholder,
Vanguard FTSE All-World ex-US Index Fund opened to investors early in March 2007. The fund is designed to capture returns from markets outside the United States, including Canada. More than half of the fund’s assets are invested in stocks in Europe, with equities in the Pacific region, emerging markets, and Canada making up the rest of the portfolio.
The ETF Shares of Vanguard FTSE All-World ex-US Index Fund produced a net-asset-value return of 9.4% during the period, tracking the fund’s benchmark index with precision. The fund’s Investor Shares finished the period slightly ahead of the average international fund, but behind the benchmark.
Much of the Investor Shares’ one-percentage-point shortfall in comparison to the index resulted from fair-value pricing, a practice that adjusts fund net asset values for market-moving events that occur after the close of international stock markets but before the close of U.S. markets. When fair-value pricing occurs at the beginning or end of a reporting period, it can temporarily exaggerate the difference between fund and index returns. Over time, these discrepancies generally are eliminated.
During the period, stocks in the United Kingdom, France, and Germany provided the largest share of the fund’s return. Companies in Australia and Canada also made significant contributions.
2
International stocks climbed, while U.S. stocks reached a new high
The six-month period in which the fund got its start saw strong performance from equities both domestically and abroad. International stocks did best, rising 16.1% as a group compared with 9.1% for U.S. stocks.
Returns from emerging markets continued to grow briskly, underpinned by the strengthened economic position of many developing nations since the Asian financial crises of a decade ago. European stocks reflected the sustained economic growth of that region, which included a high level of merger-and-acquisition activity.
A generally declining dollar helped bolster returns for U.S. investors (although the dollar appreciated compared with the Japanese yen). The U.S. stock market was particularly volatile during the period, which saw the Dow Jones Industrial Average close above 13,000 for the first time on April 25.
Interest rate trends differed in the United States and abroad
Solid economic growth has spurred central banks in Japan, Europe, and the United Kingdom to raise interest rates, with the expectation of still higher rates to come. By contrast, economic reports suggested that
Market Barometer | | | |
| | | Total Returns |
| | Periods Ended April 30, 2007 |
| Six Months | One Year | Five Years1 |
Stocks | | | |
MSCI All Country World Index ex USA (International) | 16.1% | 19.7% | 18.3% |
Russell 1000 Index (Large-caps) | 9.1 | 15.2 | 9.1 |
Russell 2000 Index (Small-caps) | 6.9 | 7.8 | 11.1 |
Dow Jones Wilshire 5000 Index (Entire market) | 9.1 | 14.5 | 9.7 |
| | | |
Bonds | | | |
Lehman Aggregate Bond Index (Broad taxable market) | 2.6% | 7.4% | 5.1% |
Lehman Municipal Bond Index | 1.6 | 5.8 | 5.2 |
Citigroup 3-Month Treasury Bill Index | 2.5 | 5.0 | 2.6 |
| | | |
CPI | | | |
Consumer Price Index | 2.4% | 2.6% | 2.8% |
1 Annualized.
3
U.S. growth was moderating, and the Federal Reserve Board maintained its target for the federal funds rate at 5.25% throughout the six-month period.
The inversion of the yield curve continued, with long-term bond yields remaining lower than short-term yields. Returns in the U.S. bond market were generally consistent with bond coupons.
World stock markets were on the upswing
The performance of Vanguard FTSE All-World ex-US Index Fund reflected the broad-based strength in most of the world’s developed and emerging stock markets. Japan was an exception during the period, which was, admittedly, quite short—about seven weeks from the fund’s inception through April 30, 2007.
Your fund benefited from excellent returns in Europe’s largest markets—the United Kingdom, Germany, and France. The region was home to two of the fund’s top performers: ABN AMRO, based in the Netherlands, and Britain’s BP.
Emerging markets made up about 15% of the fund’s holdings on average, and returns were strong in this group as well, with Brazil, South Africa, India, and China all contributing gains.
Returns from Canada and Australia were also healthy. In the Pacific region, on the other hand, returns from Japan were disappointing. The financials sector accounts for a large portion of the Japanese stock market, as it does throughout much of the developed world, and this was a difficult period for Japanese banks. Mitsubishi Financial and a number of other large Japanese financial institutions experienced negative returns. Toyota Motor, a top-ten holding, also declined.
As noted earlier, financial stocks were the fund’s largest sector holding at about 30% on average, and despite the sector’s poor performance in Japan, it contributed nicely to the fund’s overall return. Stocks in the industrials, materials, and energy sectors also made healthy contributions.
International stocks offer a world of opportunities
The U.S. market represents only about 45% of the global market for stocks—meaning that there are considerable investment opportunities beyond U.S. borders. Vanguard FTSE All-World ex-US Index Fund offers you the chance to participate in those opportunities and, arguably even more important, to temper the risk of a U.S.-only portfolio. How much you elect to invest in
4
international stocks depends in part on your goals, your time horizon, and your appetite for risk.
As part of such a balanced investment strategy, Vanguard FTSE All-World ex-US Index Fund can play an important role in helping you to move toward your financial goals.
Thank you for investing with Vanguard.
Sincerely,

John J. Brennan
Chairman and Chief Executive Officer
May 21, 2007
Vanguard FTSE All-World ex-US ETF |
Premium/Discount: March 2, 20071–April 30, 2007 |
| | | | |
| Market Price Above or | Market Price Below |
| Equal to Net Asset Value | | Net Asset Value |
| Number | Percentage | Number | Percentage |
Basis Point Differential2 | of Days | of Total Days | of Days | of Total Days |
0–24.9 | 6 | 14.63% | 0 | 0.00% |
25–49.9 | 24 | 58.54 | 0 | 0.00 |
50–74.9 | 10 | 24.39 | 0 | 0.00 |
75–100.0 | 0 | 0.00 | 0 | 0.00 |
>100.0 | 1 | 2.44 | 0 | 0.00 |
Total | 41 | 100.00% | 0 | 0.00% |
1 Inception.
2 One basis point equals 1/100 of a percentage point.
5
Fund Profile
As of April 30, 2007
Portfolio Characteristics | | |
| | Target |
| Fund | Index1 |
Number of Stocks | 1,530 | 2,185 |
Turnover Rate | 2%2 | — |
Expense Ratio | | — |
Investor Shares | 0.40%2 | |
Institutional Shares | NA3 | |
ETF Shares | 0.25%2 | |
Short-Term Reserves | 1% | — |
Sector Diversification (% of portfolio) | |
| | Target |
| Fund | Index1 |
Consumer Discretionary | 10% | 10% |
Consumer Staples | 7 | 8 |
Energy | 9 | 9 |
Financials | 31 | 31 |
Health Care | 5 | 5 |
Industrials | 10 | 10 |
Information Technology | 7 | 6 |
Materials | 9 | 10 |
Telecommunication Services | 6 | 6 |
Utilities | 5 | 5 |
Short-Term Reserves | 1% | — |
Ten Largest Holdings4 (% of total net assets) | |
| | |
Royal Dutch Shell PLC | integrated oil and gas | 1.2% |
BP PLC | integrated oil and gas | 1.1 |
HSBC Holdings PLC | diversified banks | 1.1 |
Total SA | integrated oil and gas | 0.9 |
GlaxoSmithKline PLC | pharmaceuticals | 0.9 |
Toyota Motor Corp. | automobile manufacturer | 0.9 |
Nestle SA (Registered) | packaged foods and meats | 0.8 |
Vodafone Group PLC | wireless telecommunication services | 0.8 |
Roche Holdings AG | pharmaceuticals | 0.7 |
UBS AG | diversified capital markets | 0.7 |
Top Ten | | 9.1% |
Allocation by Region (% of portfolio)
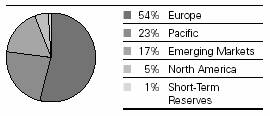
1 FTSE All-World ex US Index.
2 Annualized.
3 The inception date for the Institutional Shares was the last day of the reporting period. Therefore, an expense ratio is not applicable.
4 “Ten Largest Holdings” excludes any temporary cash investments and equity index products.
6
Market Diversification (% of portfolio) |
| | | Target |
| | Fund | Index1 |
Europe | | |
| United Kingdom | 17% | 17% |
| France | 8 | 9 |
| Germany | 6 | 6 |
| Switzerland | 5 | 5 |
| Spain | 4 | 3 |
| Italy | 3 | 3 |
| Netherlands | 3 | 3 |
| Sweden | 2 | 2 |
| Belgium | 1 | 1 |
| Finland | 1 | 1 |
| Denmark | 1 | 1 |
| Norway | 1 | 1 |
| Ireland | 1 | 1 |
| Greece | 1 | 1 |
Subtotal | 54% | 54% |
Pacific | | |
| Japan | 15% | 16% |
| Australia | 5 | 5 |
| Hong Kong | 2 | 2 |
| Singapore | 1 | 1 |
Subtotal | 23% | 24% |
Emerging Markets | | |
| South Korea | 3% | 3% |
| Taiwan | 2 | 2 |
| Brazil | 2 | 2 |
| China | 2 | 2 |
| South Africa | 2 | 2 |
| India | 1 | 1 |
| Mexico | 1 | 1 |
| Russia | 1 | 1 |
| Other Emerging Markets | 3 | 3 |
Subtotal | 17% | 17% |
North America | | |
| Canada | 5% | 5% |
| Short-Term Reserves | 1% | — |
1 FTSE All-World ex US Index.
See page 37 for a glossary of investment terms.
7
Performance Summary
All of the returns in this report represent past performance, which is not a guarantee of future results that may be achieved by the fund. (Current performance may be lower or higher than the performance data cited. For performance data current to the most recent month-end, visit our website at www.vanguard.com/performance.) Note, too, that both investment returns and principal value can fluctuate widely, so an investor’s shares, when sold, could be worth more or less than their original cost. The returns shown do not reflect taxes that a shareholder would pay on fund distributions or on the sale of fund shares.
Total Returns (%): March 8, 2007–April 30, 2007

Total Returns: Periods Ended March 31, 2007
This table presents total returns through the latest calendar quarter—rather than through the end of the fiscal period. Securities and Exchange Commission rules require that we provide this information.
FTSE All-World ex-US Index Fund | Inception Date | Since Inception |
Investor Shares2 | 3/8/2007 | 3.20% |
Fee-Adjusted Returns3 | | 0.89 |
Institutional Shares | 4/30/2007 | NA4 |
Fee-Adjusted Returns | | NA4 |
ETF Shares | 3/2/2007 | |
Market Price | | 5.77 |
Net Asset Value | | 5.28 |
1 Since the Investor Shares’ inception on March 8.
2 Total return figures do not reflect the $10 annual account maintenance fee applied on balances under $10,000.
3 Performance figures are adjusted for the 0.25% fee on purchases and the 2% fee assessed on redemptions of shares held in the fund for less than two months.
4 The inception date for the Institutional Shares was the last day of the reporting period. Therefore, there is no total return, and the column is not applicable.
Note: See Financial Highlights tables on pages 30–32 for dividend and capital gains information.
8
Financial Statements (unaudited)
Statement of Net Assets
As of April 30, 2007
The fund provides a complete list of its holdings four times in each fiscal year, at the quarter-ends. For the second and fourth fiscal quarters, the lists appear in the fund’s semiannual and annual reports to shareholders. For the first and third fiscal quarters, the fund files the lists with the Securities and Exchange Commission on Form N-Q. Shareholders can look up the fund’s Forms N-Q on the SEC’s website at www.sec.gov. Forms N-Q may also be reviewed and copied at the SEC’s Public Reference Room (see the back cover of this report for further information).
| | | Market |
| | | Value• |
| | Shares | ($000) |
Common Stocks (97.3%) | | |
Argentina (0.1%) | | |
| Tenaris SA ADR | 4,160 | 193 |
* | Petrobras Energia | | |
| Participaciones SA ADR | 5,811 | 62 |
| | | 255 |
Australia (4.8%) | | |
| BHP Billiton Ltd. | 49,251 | 1,202 |
| National Australia Bank Ltd. | 22,466 | 798 |
| Commonwealth | | |
| Bank of Australia | 18,163 | 792 |
| Australia & New Zealand | | |
| Bank Group Ltd. | 25,107 | 634 |
| Westpac Banking Corp., Ltd. | 25,197 | 563 |
| Westfield Group | 24,327 | 421 |
| Woolworths Ltd. | 16,098 | 377 |
| Rio Tinto Ltd. | 4,741 | 324 |
| QBE Insurance Group Ltd. | 10,942 | 277 |
| Macquarie Bank Ltd. | 3,419 | 245 |
| Suncorp-Metway Ltd. | 12,733 | 225 |
| Coles Group Ltd. | 15,722 | 224 |
| Woodside Petroleum Ltd. | 6,853 | 223 |
| AMP Ltd. | 24,746 | 220 |
| Telstra Corp. Ltd. | 56,851 | 220 |
| Brambles Ltd. | 20,128 | 220 |
| St. George Bank Ltd. | 7,061 | 210 |
| Stockland | 28,481 | 203 |
| Tabcorp Holdings Ltd. | 12,545 | 188 |
| Rinker Group Ltd. | 12,069 | 186 |
| CSL Ltd. | 2,447 | 176 |
| Toll Holdings Ltd. | 9,218 | 168 |
| Lend Lease Corp. | 9,948 | 164 |
| Wesfarmers Ltd. | 5,027 | 163 |
| Foster’s Group Ltd. | 28,609 | 151 |
| Mirvac Group | 33,519 | 146 |
| Multiplex Group | 37,262 | 143 |
| Tattersall’s Ltd. | 32,877 | 140 |
| Macquarie Goodman Group | 23,546 | 138 |
| | | Market |
| | | Value• |
| | Shares | ($000) |
| Aristocrat Leisure Ltd. | 9,178 | 126 |
| Macquarie | | |
| Infrastructure Group | 37,227 | 117 |
| Origin Energy Ltd. | 15,217 | 115 |
| Orica Ltd. | 4,292 | 112 |
| Insurance | | |
| Australia Group Ltd. | 22,055 | 109 |
| GPT Group | 26,406 | 108 |
| Zinifex Ltd. | 7,429 | 101 |
| BlueScope Steel Ltd. | 10,188 | 101 |
| Transurban Group | 15,153 | 101 |
| Computershare Ltd. | 11,598 | 100 |
| WorleyParsons Ltd. | 4,371 | 99 |
| AXA Asia Pacific Holdings Ltd. | 15,684 | 96 |
| Newcrest Mining Ltd. | 4,945 | 95 |
| Alumina Ltd. | 16,004 | 94 |
| Coca-Cola Amatil Ltd. | 11,726 | 92 |
| Australian Stock Exchange Ltd. | 2,315 | 92 |
| Alinta Ltd. | 7,334 | 91 |
| Metcash Ltd. | 19,158 | 83 |
| Harvey Norman Holdings Ltd. | 19,294 | 82 |
| Santos Ltd. | 8,796 | 81 |
| Leighton Holdings Ltd. | 2,754 | 79 |
| Amcor Ltd. | 12,759 | 79 |
| Lion Nathan Ltd. | 10,257 | 78 |
| Babcock & Brown Ltd. | 3,184 | 78 |
| AGL Energy Ltd. | 5,986 | 76 |
| Cochlear Ltd. | 1,428 | 75 |
| Oxiana Ltd. | 29,571 | 74 |
| Goodman Fielder Ltd. | 37,323 | 74 |
| Sonic Healthcare Ltd. | 6,058 | 72 |
| Centro Properties Group | 9,173 | 71 |
| Qantas Airways Ltd. | 15,847 | 70 |
| Oil Search Ltd. | 22,136 | 65 |
| Boral Ltd. | 9,347 | 65 |
| James Hardie Industries NV | 8,160 | 60 |
| DB RREEF Trust | 40,183 | 60 |
| Perpetual | | |
| Trustees Australia Ltd. | 847 | 57 |
9
| | | Market |
| | | Value• |
| | Shares | ($000) |
| CSR Ltd. | 16,913 | 51 |
| CFS Gandel Retail Trust | 22,432 | 43 |
| Investa Property Group | 17,074 | 38 |
* | Paladin Resources Ltd. | 4,564 | 36 |
* | Fortescue Metals Group Ltd. | 1,822 | 34 |
| Billabong International Ltd. | 1,742 | 24 |
| Publishing & Broadcasting Ltd. | 1,250 | 21 |
| Macquarie Airports Group | 6,217 | 20 |
| Minara Resources Ltd. | 3,183 | 19 |
| OneSteel Ltd. | 3,525 | 17 |
| Macquarie Office Trust | 12,097 | 16 |
| Caltex Australia Ltd. | 791 | 16 |
| Allco Finance Group Ltd. | 1,588 | 16 |
| Sims Group Ltd. | 771 | 16 |
| Macquarie CountryWide Trust | 8,496 | 15 |
| ABC Learning Centres Ltd. | 2,417 | 14 |
| Challenger Financial | | |
| Services Group Ltd. | 2,388 | 10 |
| Bank of Queensland Ltd. | 646 | 10 |
| Downer EDI Ltd. | 1,457 | 9 |
| Futuris Corp., Ltd. | 4,489 | 9 |
| Paperlinx Ltd. | 2,610 | 8 |
| Adelaide Bank Ltd. | 663 | 8 |
| John Fairfax Holdings Ltd. | 1,886 | 8 |
| Symbion Health Ltd. | 2,403 | 8 |
| Ansell Ltd. | 873 | 8 |
| Sigma Pharmaceuticals Ltd. | 3,541 | 7 |
| Commonwealth | | |
| Property Office Fund | 6,012 | 7 |
| Bendigo Bank Ltd. | 511 | 7 |
| Energy Resources of | | |
| Australia Ltd. | 273 | 6 |
| Nufarm Ltd. | 531 | 5 |
| SP Ausnet | 1,239 | 1 |
| Smorgon Steel Group Ltd. | 796 | 1 |
| Gunns Ltd. | 471 | 1 |
| Iluka Resources Ltd. | 276 | 1 |
| Sydney Roads Group | 1,106 | 1 |
| AWB Ltd. | 461 | 1 |
| GWA International Ltd. | 329 | 1 |
| Flight Centre Ltd. | 94 | 1 |
| West Australian | | |
| Newspaper Holdings Ltd. | 86 | 1 |
| Spotless Group Ltd. | 285 | 1 |
| Southern Cross Broadcasting | | |
| (Australia) Ltd. | 86 | 1 |
| Ten Network Holdings Ltd. | 468 | 1 |
| Australand Property Group | 608 | 1 |
| Australian Wealth | | |
| Management Ltd. | 564 | 1 |
| APN News & Media Ltd. | 217 | 1 |
* | Tower Australia Group Limited | 477 | 1 |
| | | 12,791 |
| | | Market |
| | | Value• |
| | Shares | ($000) |
Austria (0.4%) | | |
| Erste Bank der | | |
| Oesterreichischen | | |
| Sparkassen AG | 3,644 | 292 |
* | IMMOEAST Immobilien | | |
| Anlagen AG | 11,736 | 166 |
| Telekom Austria AG | 4,901 | 139 |
| OMV AG | 1,723 | 109 |
| Voestalpine AG | 1,615 | 108 |
| Raiffeisen International | | |
| Bank-Holding AG | 672 | 93 |
| Wiener Staedtische | | |
| Allgemeine Versicherung AG | 884 | 66 |
* | Immofinanz Immobilien | | |
| Anlagen AG | 2,751 | 45 |
| Oesterreichische | | |
| Elektrizitaetswirtschafts | | |
| AG Clas | 754 | 39 |
* | Wienerberger AG | 264 | 19 |
| | | 1,076 |
Belgium (1.0%) | | |
| Fortis | 9,694 | 436 |
| Dexia | 13,159 | 429 |
| Fortis (Amsterdam Shares) | 9,272 | 417 |
| KBC Bank & | | |
| Verzekerings Holding | 2,680 | 355 |
| Solvay SA | 1,079 | 171 |
| UCB SA | 2,808 | 167 |
| InBev | 1,751 | 136 |
| Delhaize Group | 1,351 | 130 |
| Colruyt NV | 377 | 89 |
| Belgacom SA | 1,919 | 84 |
| Groupe Bruxelles Lambert SA | 571 | 69 |
| Umicore | 160 | 32 |
| Compagnie Nationale | | |
| a Portefeuille | 221 | 14 |
| Agfa Gevaert NV | 465 | 11 |
| | | 2,540 |
Brazil (1.9%) | | |
| Petroleo Brasileiro | | |
| Series A ADR | 6,883 | 614 |
| Companhia Vale do Rio Doce | | |
| ADR | 13,609 | 465 |
| Cia Vale do Rio Doce ADR | 10,600 | 430 |
| Petroleo Brasileiro ADR | 3,955 | 400 |
| Banco Bradesco SA ADR | 17,458 | 370 |
| Banco Itau Holding Financeira | | |
| SA ADR | 8,217 | 317 |
| Companhia de Bebidas | | |
| das Americas ADR | 3,900 | 228 |
| Companhia Siderurgica | | |
| Nacional SA ADR | 3,900 | 168 |
10
| | | Market |
| | | Value• |
| | Shares | ($000) |
| Embraer-Empresa Brasileira | | |
| de Aeronautica SA ADR | 3,575 | 168 |
| Arcelor Brasil SA | 6,882 | 167 |
| Companhia Energetica de | | |
| Minas Gerais ADR | 2,600 | 135 |
| Itausa-Investimentos Itau SA | 24,570 | 134 |
| Banco do Brasil SA | 3,490 | 120 |
| Aracruz Celulose SA ADR | 1,950 | 107 |
| Gerdau SA ADR | 5,200 | 104 |
| Votorantim Celulose e Papel | | |
| SA ADR | 5,200 | 104 |
| Tele Norte Leste | | |
| Participacoes ADR | 5,200 | 85 |
| Tim Participacoes SA ADR | 2,159 | 78 |
| Sadia SA ADR | 1,820 | 78 |
| All America Latina Logistica | 6,291 | 74 |
| Usiminas-Usinas Siderugicas | | |
| de Minas Gerais SA Pfd. | 1,580 | 74 |
| Natura Cosmeticos SA | 6,021 | 71 |
| Brasil Telecom Participacoes | | |
| ADR | 1,300 | 69 |
| Companhia de Concessoes | | |
| Rodoviarias | 4,261 | 66 |
| Braskem SA ADR | 3,250 | 55 |
| Bradespar SA Pfd. | 1,600 | 53 |
* | Companhia Brasileira de | | |
| Distribuicao Grupo | | |
| Pao de Acucar | 1,560 | 50 |
| Companhia Paranaense de | | |
| Energia–COPEL ADR | 3,900 | 48 |
* | Centrais Electricas | | |
| Brasileiras SA | 1,913,481 | 43 |
* | Telemig Celular | | |
| Participacoes ADR | 975 | 42 |
| Metalurgica Gerdau SA | 1,372 | 36 |
* | Vivo Participacoes SA ADR | 7,800 | 36 |
| Almancora Comm. Va. | 42 | 7 |
| Usinas Siderurgicas de | | |
| Minas Gerais SA | 60 | 3 |
* | Itausa-Investimentos SA | | |
| Rights Exp. 12/31/07 | 228 | — |
| | | 4,999 |
Canada (4.8%) | | |
| Royal Bank of Canada | 17,903 | 933 |
| Manulife Financial Corp. | 21,593 | 780 |
| Bank of Nova Scotia, Halifax | 14,099 | 678 |
| Toronto-Dominion Bank | 9,872 | 603 |
| EnCana Corp. | 10,718 | 561 |
| Suncor Energy, Inc. | 6,204 | 498 |
| Bank of Montreal, Quebec | 7,400 | 463 |
| Canadian Imperial | | |
| Bank of Commerce | 5,243 | 462 |
| Canadian Natural | | |
| Resources Ltd. | 7,398 | 441 |
| Sun Life Financial | | |
| Services of Canada | 8,342 | 395 |
| | | Market |
| | | Value• |
| | Shares | ($000) |
| Canadian National Railway Co. | 7,054 | 353 |
* | Research in Motion Ltd. | 2,689 | 353 |
| Barrick Gold Corp. | 11,506 | 323 |
| Brookfield Asset | | |
| Management Inc. | 5,538 | 322 |
| Alcan Inc. | 5,000 | 294 |
* | Petro-Canada | 6,565 | 292 |
| Talisman Energy, Inc. | 14,711 | 279 |
* | Potash Corp. of Saskatchewan, Inc. | 1,477 | 265 |
| Rogers Communications, Inc. | | |
| Class B | 6,890 | 264 |
| TransCanada Corp. | 7,089 | 253 |
* | Nexen Inc. | 3,969 | 236 |
| Goldcorp Inc. | 9,702 | 235 |
| Power Corp. of Canada | 6,500 | 221 |
| Teck Cominco Ltd. Class B | 2,886 | 219 |
| National Bank of Canada | 3,900 | 218 |
* | Cameco Corp. | 4,501 | 210 |
| Imperial Oil Ltd. | 5,435 | 206 |
| Power Financial Corp. | 5,200 | 183 |
| Shoppers Drug Mart Corp. | 3,900 | 178 |
| Enbridge Inc. | 5,300 | 175 |
| Canadian Pacific Railway Ltd. | 2,600 | 165 |
* | Great-West Lifeco Inc. | 5,200 | 163 |
* | Nortel Networks Corp. | 5,753 | 131 |
| BCE Inc. | 3,815 | 128 |
| Husky Energy Inc. | 1,571 | 120 |
| Brookfield Properties Corp. | 2,900 | 119 |
| Loblaw Cos., Ltd. | 2,600 | 117 |
| Shaw Communications Inc. | 2,700 | 104 |
| Agrium, Inc. | 2,600 | 101 |
| Magna International | 1,200 | 95 |
* | Thomson Corp. | 2,121 | 93 |
| George Weston Ltd. | 1,300 | 89 |
| Canadian Tire Corp. Class A | 1,102 | 75 |
* | Bombardier Inc. Class B | 16,828 | 69 |
| Biovail Corp. | 2,600 | 64 |
| IGM Financial, Inc. | 992 | 48 |
* | Cognos Inc. | 1,000 | 43 |
| TransAlta Corp. | 1,800 | 42 |
| Finning International Inc. | 800 | 40 |
| MDS Inc. | 1,400 | 27 |
| Telus Communications Inc. | 422 | 23 |
| Canadian Utilities Ltd. | 421 | 17 |
* | CGI Group Inc. | 1,808 | 16 |
| Telus Corp.-Non Voting Shares | 298 | 16 |
| Nova Chemicals Corp. | 480 | 16 |
| Saputo Inc. | 195 | 8 |
* | Celestica, Inc. | 300 | 2 |
| | | 12,824 |
Chile (0.3%) | | |
* | Banco Santander Chile | | |
| SA ADR | 3,029 | 150 |
| Empresa Nacional de | | |
| Electricidad SA ADR | 2,951 | 143 |
11
| | | Market |
| | | Value• |
| | Shares | ($000) |
| Enersis SA ADR | 6,331 | 120 |
| Sociedad Quimica y Minera | | |
| de Chile ADR | 624 | 98 |
| Distribucion y Servicio | | |
| SA ADR | 3,809 | 90 |
| Compania de | | |
| Telecomunicaciones de | | |
| Chile SA ADR | 6,669 | 60 |
| Empresas Copec SA | 3,062 | 45 |
| Empresas CMPC SA | 190 | 7 |
| S.A.C.I. Falabella, SA | 1,300 | 6 |
| Antarchile SA | 92 | 2 |
| | | 721 |
China (1.8%) | | |
| China Mobile (Hong Kong) Ltd. | 74,500 | 671 |
| China Life Insurance Co., Ltd. | 102,000 | 315 |
| PetroChina Co. Ltd. | 278,000 | 312 |
| China Resources Enterprise Ltd. | 78,000 | 263 |
| CITIC Pacific Ltd. | 65,000 | 244 |
| China Merchants Holdings | | |
| International Co. Ltd. | 52,000 | 230 |
| China Construction Bank | 331,000 | 200 |
* | Bank of China | 402,000 | 198 |
| Cosco Pacific Ltd. | 78,000 | 189 |
| China Petroleum & | | |
| Chemical Corp. | 212,000 | 185 |
| Air China Ltd. | 234,000 | 158 |
| Huaneng Power | | |
| International, Inc. H Shares | 156,000 | 158 |
* | China Merchants | | |
| Bank Co., Ltd. Class H | 58,500 | 142 |
| Ping An Insurance | | |
| (Group) Co. of China Ltd. | 26,000 | 137 |
* | China Communications | | |
| Construction Co., Ltd. | 104,000 | 136 |
| China Shenhua | | |
| Energy Co. Ltd. H-Shares | 52,000 | 128 |
| Denway Motors Ltd. | 312,000 | 124 |
| Beijing Datang | | |
| Power Generation Co., Ltd. | 104,000 | 119 |
| Shanghai Electric | | |
| Group Co., Ltd. Class H | 260,000 | 112 |
| China Overseas Land & | | |
| Investment Ltd. | 78,000 | 95 |
* | China Coal Energy Co. | 91,000 | 90 |
| Tencent Holdings Ltd. | 26,000 | 89 |
| Bank of Communications Ltd. | | |
| Class H | 78,000 | 82 |
| Fujian Zijin Mining | | |
| Industry Co., Ltd. | 130,000 | 75 |
* | PICC Property and | | |
| Casualty Co., Ltd. | 104,000 | 62 |
| China Telecom Corp. Ltd. | 116,000 | 55 |
| Tingyi Holding Corp. | 52,000 | 51 |
| | | Market |
| | | Value• |
| | Shares | ($000) |
| China Unicom Ltd. | 24,000 | 35 |
| Angang Steel Co., Ltd. | 2,000 | 4 |
* | China Shipping Development Co. | 2,000 | 4 |
| China Resources Power Holdings Co., Ltd. | 2,000 | 4 |
| China International Marine | | |
| Containers (Group) Co., Ltd. | 1,400 | 4 |
| Aluminum Corp. of China Ltd. | 2,000 | 2 |
| China COSCO | | |
| Holdings Co., Ltd. | 2,300 | 2 |
| Yanzhou Coal Mining Co. Ltd. | | |
| H Shares | 2,000 | 2 |
| Beijing Capital International | | |
| Airport Co., Ltd. | 2,000 | 2 |
| Guangzhou R&F | | |
| Properties Co. Ltd. | 800 | 2 |
| China Travel International | 4,000 | 2 |
| Zhejiang Expressway Co., Ltd. | 2,000 | 2 |
* | Dongfeng Motor Corp. | 2,000 | 1 |
| | | 4,686 |
Colombia (0.1%) | | |
| Bancolombia SA ADR | 7,267 | 204 |
| | | |
Czech Republic (0.2%) | | |
| Komercni Banka a.s. | 1,339 | 250 |
| Cesky Telecom a.s. | 5,941 | 177 |
| | | 427 |
Denmark (0.7%) | | |
| Danske Bank A/S | 9,902 | 462 |
| Novo Nordisk A/S B Shares | 4,100 | 401 |
* | AP Moller-Maersk A/S | | |
| B Shares | 26 | 294 |
* | AP Moller-Maersk A/S | | |
| A Shares | 26 | 289 |
* | Vestas Wind Systems A/S | 2,600 | 168 |
* | Jyske Bank A/S | 622 | 50 |
| Carlsberg A/S B Shares | 250 | 28 |
| Novozymes A/S | 200 | 21 |
| Danisco A/S | 150 | 12 |
* | William Demant A/S | 100 | 10 |
| Coloplast A/S B Shares | 75 | 6 |
| | | 1,741 |
Egypt (0.1%) | | |
| Orascom Construction | | |
| Industries GDR | 1,144 | 133 |
| Orascom Telecom Holding | | |
| SAE GDR | 1,495 | 100 |
| | | 233 |
Finland (0.9%) | | |
* | Nokia Oyj | 54,655 | 1,379 |
| Sampo Oyj A Shares | 8,398 | 262 |
| Neste Oil Oyj | 6,062 | 214 |
| Fortum Oyj | 6,024 | 186 |
| UPM-Kymmene Oyj | 5,800 | 143 |
12
| | | Market |
| | | Value• |
| | Shares | ($000) |
| Kone Oyj | 2,314 | 139 |
| Stora Enso Oyj R Shares | 3,900 | 71 |
| Metso Oyj | 1,123 | 61 |
| Outokumpu Oyj A Shares | 464 | 15 |
| TietoEnator Oyj B Shares | 100 | 3 |
| SanomaWSOY Oyj | 65 | 2 |
| | | 2,475 |
France (8.4%) | | |
| Total SA | 33,714 | 2,485 |
| BNP Paribas SA | 13,021 | 1,511 |
| Societe Generale Class A | 6,493 | 1,376 |
| AXA | 29,401 | 1,350 |
| Sanofi-Aventis | 14,306 | 1,310 |
| Suez SA | 17,678 | 1,007 |
| France Telecom SA | 26,992 | 789 |
| Carrefour SA | 9,738 | 748 |
| Vivendi SA | 15,920 | 657 |
| LVMH Louis Vuitton Moet Hennessy | 5,178 | 604 |
| Groupe Danone | 3,570 | 587 |
| Cie. de St. Gobain SA | 5,080 | 542 |
| Vinci SA | 3,300 | 531 |
| L’Oreal SA | 4,325 | 518 |
| Schneider Electric SA | 3,271 | 461 |
| Veolia Environnement | 5,545 | 458 |
| L’Air Liquide SA (Registered) | 1,698 | 421 |
| Alcatel-Lucent | 30,500 | 403 |
| Lafarge SA | 2,455 | 399 |
| Credit Agricole SA | 9,104 | 383 |
| Renault SA | 2,779 | 361 |
| Pernod Ricard SA | 1,607 | 342 |
| Accor SA | 3,403 | 321 |
| Electricite de France | 3,393 | 295 |
| Bouygues SA | 3,464 | 276 |
* | Alstom | 1,829 | 272 |
| Pinault-Printemps-Redoute SA | 1,547 | 269 |
| Essilor International SA | 1,697 | 205 |
| Compagnie Generale des Etablissements Michelin SA | 1,493 | 190 |
| Unibail Co. | 646 | 179 |
| PSA Peugeot Citroen | 2,191 | 178 |
| STMicroelectronics NV | 8,809 | 172 |
| Air France | 3,198 | 163 |
| Hermes International | 1,129 | 163 |
| Lagardere S.C.A. | 2,061 | 162 |
| Vallourec SA | 571 | 155 |
| Christian Dior SA | 1,183 | 153 |
| Natixis | 5,551 | 151 |
| Cap Gemini SA | 1,906 | 144 |
| Eiffage SA | 1,040 | 139 |
| Technip SA | 1,755 | 138 |
| Sodexho Alliance SA | 1,681 | 133 |
| Gaz de France | 2,666 | 125 |
| Klepierre | 585 | 113 |
| CNP Assurances | 884 | 113 |
| Publicis Groupe SA | 2,262 | 108 |
| | | Market |
| | | Value• |
| | Shares | ($000) |
| Thales SA | 1,612 | 98 |
| Etablissements Economiques | | |
| du Casino Guichard-Perr | 780 | 84 |
| Thomson SA | 4,004 | 77 |
| Safran SA | 2,808 | 68 |
| Wendel Investissement | 391 | 67 |
| Valeo SA | 1,142 | 66 |
| Societe Television Francaise 1 | 1,816 | 62 |
| Eurazeo | 366 | 58 |
* | Atos Origin SA | 796 | 57 |
| Dassault Systemes SA | 713 | 42 |
| Societe BIC SA | 523 | 38 |
| Ciments Francais SA | 162 | 37 |
| Legrand SA | 992 | 34 |
* | Arkema | 565 | 34 |
* | Aeroports de Paris (ADP) | 334 | 33 |
| PagesJaunes SA | 1,282 | 30 |
| Imerys SA | 293 | 28 |
| Euler Hermes SA | 123 | 19 |
| JCDecaux SA | 482 | 15 |
| Gecina SA | 73 | 14 |
| Societe des Autoroutes | | |
| Paris-Rhin-Rhone | 139 | 14 |
* | Schneider Electric SA New | 12 | 2 |
| | | 22,537 |
Germany (6.2%) | | |
| Siemens AG | 12,576 | 1,517 |
| E.On AG | 9,291 | 1,390 |
| Allianz AG | 6,077 | 1,382 |
| DaimlerChrysler AG | | |
| (Registered) | 14,201 | 1,150 |
| Deutsche Bank AG | 7,268 | 1,115 |
| Deutsche Telekom AG | 45,273 | 824 |
| BASF AG | 6,886 | 822 |
| Bayer AG | 10,520 | 724 |
| SAP AG | 12,792 | 616 |
| RWE AG | 5,356 | 565 |
| Muenchener Rueckversicherungs-Gesellschaft AG (Registered) | 3,047 | 541 |
| Commerzbank AG | 9,162 | 457 |
| Volkswagen AG | 2,971 | 449 |
| Deutsche Post AG | 12,092 | 416 |
| Deutsche Boerse AG | 1,552 | 364 |
| ThyssenKrupp AG | 5,564 | 297 |
| Man AG | 2,084 | 277 |
| Continental AG | 1,901 | 265 |
| Bayerische Motoren Werke AG | 3,868 | 238 |
| Linde AG | 1,950 | 218 |
| Porsche AG | 126 | 210 |
| Adidas AG | 3,115 | 185 |
| Metro AG | 2,212 | 170 |
| Henkel KGaA | 1,001 | 157 |
| Fresenius Medical Care AG | 1,046 | 157 |
* | Infineon Technologies AG | 9,963 | 155 |
| Beiersdorf AG | 1,989 | 143 |
13
| | | Market |
| | | Value• |
| | Shares | ($000) |
| TUI AG | 5,176 | 142 |
| Volkswagen AG Pfd. | 1,392 | 141 |
| Deutsche Postbank AG | 1,300 | 127 |
| Salzgitter AG | 767 | 126 |
| Hypo Real Estate Holding AG | 1,822 | 121 |
| Henkel KGaA | 806 | 113 |
| Celesio AG | 1,437 | 103 |
| Puma AG | 221 | 100 |
| Fresenius AG Pfd. | 1,088 | 92 |
| Depfa Bank PLC | 4,838 | 90 |
| Deutsche Lufthansa AG | 2,515 | 75 |
* | Hannover | | |
| Rueckversicherung AG | 1,352 | 68 |
* | Karstadt Quelle AG | 1,612 | 62 |
| Fraport AG | 767 | 56 |
| Heidelberger | | |
| Druckmaschinen AG | 1,144 | 54 |
| Altana AG | 646 | 48 |
* | Wacker Chemie AG | 260 | 47 |
* | Lanxess | 778 | 42 |
| HeidelbergerCement AG | 260 | 42 |
| Fresenius AS | 180 | 15 |
| Merck KGaA | 72 | 10 |
| MLP AG | 304 | 8 |
| Suedzucker AG | 76 | 2 |
| | | 16,488 |
Greece (0.5%) | | |
| National Bank of | | |
| Greece SA ADR | 56,845 | 649 |
* | Hellenic Telecommunications | | |
| Organization SA ADR | 21,268 | 312 |
| EFG Eurobank Ergasias | 3,215 | 134 |
| Alpha Credit Bank SA | 2,966 | 90 |
| Bank of Piraeus | 2,224 | 81 |
| Greek Organization of | | |
| Football Prognostics | 1,474 | 56 |
| Cosmote Mobile | | |
| Communications SA | 160 | 5 |
| Coca-Cola | | |
| Hellenic Bottling Co. SA | 110 | 5 |
| Titan Cement Co. SA | 80 | 5 |
| | | 1,337 |
Hong Kong (1.8%) | | |
| Hutchison Whampoa Ltd. | 44,000 | 424 |
| Cheung Kong Holdings Ltd. | 26,000 | 337 |
| Sun Hung Kai Properties Ltd. | 27,000 | 315 |
* | Industrial and | | |
| Commercial Bank of China | 533,000 | 290 |
| CNOOC Ltd. | 325,000 | 279 |
| Swire Pacific Ltd. A Shares | 19,500 | 223 |
| CLP Holdings Ltd. | 26,500 | 194 |
| Hong Kong Exchanges & | | |
| Clearing Ltd. | 19,500 | 186 |
| Hongkong Land Holdings Ltd. | 39,000 | 181 |
| Hang Seng Bank Ltd. | 11,800 | 166 |
| Li & Fung Ltd. | 52,000 | 162 |
| | | Market |
| | | Value• |
| | Shares | ($000) |
| Bank of East Asia Ltd. | 26,000 | 160 |
| Esprit Holdings Ltd. | 13,000 | 158 |
| Henderson Land | | |
| Development Co. Ltd. | 26,000 | 155 |
| Hong Kong & China Gas Co., Ltd. | 65,000 | 155 |
| Hang Lung Properties Ltd. | 52,000 | 154 |
| Hang Lung | | |
| Development Co., Ltd. | 39,000 | 149 |
| Wharf Holdings Ltd. | 39,000 | 144 |
| Hong Kong Electric | | |
| Holdings Ltd. | 26,000 | 130 |
| Shangri-La Asia Ltd. | 52,000 | 127 |
* | Foxconn International | | |
| Holdings Ltd. | 39,000 | 117 |
| Boc Hong Kong Holdings Ltd. | 39,000 | 96 |
| Wing Hang Bank Ltd. | 6,500 | 78 |
| Kingboard Chemical | | |
| Holdings Ltd. | 13,000 | 61 |
| Techtronic Industries Co., Ltd. | 45,500 | 60 |
| New World | | |
| Development Co., Ltd. | 25,000 | 59 |
| Link REIT | 24,000 | 55 |
| Sino Land Co. | 26,000 | 55 |
| China Netcom Group Corp. | | |
| Hong Kong Ltd. | 13,000 | 32 |
| Hopewell Holdings Ltd. | 6,000 | 26 |
| Cathay Pacific Airways Ltd. | 10,000 | 26 |
| MTR Corp. | 9,500 | 23 |
| Henderson Investment Ltd. | 7,000 | 15 |
| Guoco Group | 1,000 | 14 |
| Hysan Development Co., Ltd. | 5,000 | 13 |
| Hengan International | | |
| Group Co. Ltd. | 4,000 | 13 |
| Wheelock and Co. Ltd. | 5,000 | 12 |
| PCCW Ltd. | 18,000 | 11 |
* | Hutchison Telecommunications International Ltd. | 5,000 | 10 |
| Orient Overseas | | |
| International Ltd. | 1,000 | 8 |
| Kerry Properties Ltd. | 1,500 | 7 |
| CITIC International | | |
| Financial Holdings Ltd. | 9,000 | 7 |
| Television Broadcasts Ltd. | 1,000 | 7 |
| Cheung Kong | | |
| Infrastructure Holdings Ltd. | 1,000 | 4 |
| Shun Tak Holdings Ltd. | 2,000 | 3 |
* | China Citic Bank | 2,700 | 2 |
| Yue Yuen Industrial | | |
| (Holdings) Ltd. | 500 | 2 |
| Johnson Electric Holdings Ltd. | 2,500 | 1 |
| First Pacific Co. Ltd. | 2,000 | 1 |
* | Galaxy Entertainment | | |
| Group Ltd. | 1,000 | 1 |
| | | 4,908 |
14
| | | Market |
| | | Value• |
| | Shares | ($000) |
Hungary (0.2%) | | |
| OTP Bank Rt. | 4,160 | 211 |
| MOL Hungarian Oil and | | |
| Gas Nyrt. | 1,043 | 127 |
| Richter Gedeon Rt. | 390 | 80 |
| Magyar Tavkozlesi Rt. | 3,989 | 23 |
| EGIS Nyrt. | 13 | 2 |
| Budapest Electricity Nyrt. | 6 | 1 |
| | | 444 |
India (1.4%) | | |
| Infosys Technologies Ltd. | | |
| ADR | 9,891 | 518 |
| Reliance Industries Ltd. GDR | 4,772 | 364 |
| State Bank of India GDR | 5,080 | 345 |
| Satyam Computer | | |
| Services Ltd. ADR | 12,200 | 304 |
| ICICI Bank Ltd. ADR | 6,911 | 283 |
| Wipro Ltd. ADR | 16,934 | 280 |
| HDFC Bank Ltd. ADR | 3,445 | 250 |
| Dr. Reddy’s | | |
| Laboratories Ltd. ADR | 12,951 | 222 |
| Mahanagar Telephone | | |
| Nigam Ltd. ADR | 30,840 | 220 |
* | Bharti Airtel Ltd. | 8,541 | 167 |
| Videsh Sanchar | | |
| Nigam Ltd. ADR | 7,765 | 163 |
| ITC Ltd. | 31,768 | 123 |
* | Reliance Communication | | |
| Ventures | 9,213 | 106 |
| Larsen & Toubro Ltd. | 2,365 | 97 |
| Housing Development | | |
| Finance Corp. Ltd. | 2,076 | 83 |
| Oil and Natural Gas Corp. Ltd. | 3,323 | 73 |
| Tata Iron and Steel Co. Ltd. | 5,300 | 70 |
| | | 3,668 |
Indonesia (0.2%) | | |
| PT Bank Central Asia Tbk | 409,500 | 237 |
| PT Astra International Tbk | 149,500 | 235 |
| PT Telekomunikasi | | |
| Indonesia Tbk | 39,500 | 45 |
| | | 517 |
Ireland (0.6%) | | |
| Allied Irish Banks PLC | 12,312 | 373 |
| CRH PLC | 7,583 | 332 |
| Bank of Ireland | 13,527 | 290 |
| Anglo Irish Bank Corp. PLC | 10,085 | 227 |
| Irish Life & Permanent PLC | 3,829 | 101 |
* | Elan Corp. PLC | 6,215 | 85 |
* | Ryanair Holdings PLC | 8,528 | 70 |
| Kerry Group PLC A Shares | 2,181 | 65 |
| | | 1,543 |
Israel (0.3%) | | |
| Teva Pharmaceutical | | |
| Industries Ltd. | 8,936 | 343 |
| Israel Chemicals Ltd. | 19,767 | 151 |
| | | Market |
| | | Value• |
| | Shares | ($000) |
| Bank Hapoalim Ltd. | 17,492 | 91 |
* | NICE Systems Ltd. | 1,846 | 68 |
| Bezeq Israeli Telecommunication Corp., Ltd. | 40,365 | 64 |
| Bank Leumi Le-Israel | 14,040 | 53 |
| Makhteshim-Agan | | |
| Industries Ltd. | 6,695 | 49 |
| Partner Communications | | |
| Co. Ltd. | 300 | 5 |
| Elbit Systems Ltd. | 100 | 4 |
| IDB Development Corp. Ltd. | 100 | 4 |
| Discount Investment Corp. Ltd. | 100 | 3 |
* | Retalix Ltd. | 100 | 2 |
| Osem Investment Ltd. | 200 | 2 |
* | Israel Discount Bank Ltd. | 1,000 | 2 |
| Delek Group, Ltd. | 8 | 2 |
| Blue Square-Israel Ltd. | 100 | 2 |
| IDB Holding Corp., Ltd. | 51 | 2 |
| Gazit Globe (1982) Ltd. | 117 | 2 |
| United Mizrahi Bank Ltd. | 200 | 1 |
| The Phoenix Holdings Ltd. | 278 | 1 |
| Ormat Industries Ltd. | 116 | 1 |
| Clal Industries and | | |
| Investments Ltd. | 200 | 1 |
| Property & Building Corp. | 7 | 1 |
* | Alvarion Ltd. | 151 | 1 |
* | Super Sol Ltd. | 300 | 1 |
* | Given Imaging Ltd. | 47 | 1 |
| Migdal Insurance Holdings Ltd. | 700 | 1 |
* | First International Bank of | | |
| Israel Ltd.-ILS .05 Par | 82 | 1 |
* | First International Bank of | | |
| Israel Ltd.-ILS .01 Par | 411 | 1 |
| Delek Automotive Systems Ltd. | 100 | 1 |
| | | 861 |
Italy (3.4%) | | |
| Eni SpA | 37,673 | 1,249 |
| Unicredito Italiano SpA | 105,828 | 1,087 |
* | Intesa Sanpaolo SpA | 120,412 | 1,009 |
| Assicurazioni Generali SpA | 17,648 | 812 |
| Enel SpA | 60,891 | 692 |
| Telecom Italia SpA | 183,215 | 550 |
* | Fiat SpA | 11,600 | 341 |
| Unione Di Banche Italiane | | |
| ScpA | 10,074 | 305 |
| Capitalia SpA | 25,802 | 246 |
| Banco Popolare di Verona e | | |
| Novara Scarl SpA | 6,239 | 208 |
| Saipem SpA | 6,526 | 204 |
| Telecom Italia SpA RNC | 76,826 | 188 |
| Finmeccanica SpA | 5,564 | 171 |
| Autostrade SpA | 5,174 | 171 |
| Banca Monte dei Paschi di | | |
| Siena SpA | 22,328 | 151 |
* | Banca Popolare Italiana | 8,757 | 146 |
15
| | | Market |
| | | Value• |
| | Shares | ($000) |
| Autogrill SpA | 6,658 | 132 |
| Terna SpA | 34,515 | 129 |
| Banca Popolare di Milano SpA | 7,423 | 125 |
| Italcementi SpA | 3,874 | 124 |
* | Parmalat SpA | 27,092 | 120 |
| AEM SpA | 29,562 | 116 |
| Fondiaria - Sai SpA | 2,002 | 106 |
| Mediobanca Banca di Credito | | |
| Finanziaria SpA | 4,544 | 105 |
* | Lottomatica SpA | 2,522 | 103 |
| Pirelli & C. Accomandita per | | |
| Azioni SpA | 73,398 | 92 |
| Mediaset SpA | 7,202 | 81 |
| Banca Popolare dell’Emilia | | |
| Romagna Scrl | 2,508 | 71 |
| Luxottica Group SpA | 1,536 | 53 |
| Alleanza Assicurazioni SpA | 3,440 | 48 |
| IFIL Investments SpA | 4,218 | 46 |
| Snam Rete Gas SpA | 6,441 | 41 |
* | Banca Carige SpA | 4,857 | 25 |
| Compagnia Assicuratrice | | |
| Unipol SpA | 3,349 | 12 |
| RCS Media Group SpA | 738 | 4 |
| Seat Pagine Gialle SpA | 5,405 | 4 |
* | Saras SpA Raffinerie Sarde | 507 | 3 |
| Bulgari SpA | 197 | 3 |
| | | 9,073 |
Japan (15.3%) | | |
| Toyota Motor Corp. | 38,200 | 2,320 |
| Mitsubishi UFJ | | |
| Financial Group | 147 | 1,529 |
| Canon, Inc. | 18,200 | 1,021 |
| Sumitomo Mitsui | | |
| Financial Group, Inc. | 106 | 926 |
| Matsushita Electric | | |
| Industrial Co., Ltd. | 39,000 | 752 |
| Mizuho Financial Group, Inc. | 124 | 746 |
| Sony Corp. | 13,900 | 739 |
| Honda Motor Co., Ltd. | 19,100 | 656 |
| Takeda Pharmaceutical Co. Ltd. | 8,900 | 577 |
| Nomura Holdings Inc. | 26,600 | 508 |
| Nintendo Co. | 1,500 | 469 |
| Mitsui & Co., Ltd. | 26,000 | 468 |
| Mitsubishi Estate Co., Ltd. | 15,000 | 465 |
| Tokyo Electric Power Co. | 13,800 | 459 |
| Nippon Steel Corp. | 71,000 | 458 |
| NTT DoCoMo, Inc. | 243 | 414 |
| Japan Tobacco, Inc. | 79 | 386 |
| Mitsui Fudosan Co., Ltd. | 13,000 | 379 |
| Nippon Telegraph and | | |
| Telephone Corp. | 72 | 357 |
| Mitsubishi Corp. | 16,600 | 354 |
| KDDI Corp. | 44 | 346 |
| Komatsu Ltd. | 14,600 | 345 |
| East Japan Railway Co. | 41 | 332 |
| Orix Corp. | 1,240 | 331 |
| | Market |
| | Value• |
| Shares | ($000) |
Millea Holdings, Inc. | 8,800 | 326 |
JFE Holdings, Inc. | 5,900 | 324 |
Mitsui Sumitomo Insurance Co. | 26,000 | 323 |
Mitsubishi Heavy Industries Ltd. | 52,000 | 320 |
Hitachi Ltd. | 39,000 | 296 |
Nissan Motor Co., Ltd. | 29,400 | 296 |
Toshiba Corp. | 39,000 | 290 |
Daiwa Securities Group Inc. | 26,000 | 290 |
Murata Manufacturing Co., Ltd. | 3,900 | 287 |
Central Japan Railway Co. | 26 | 286 |
Kansai Electric Power Co., Inc. | 10,000 | 280 |
Bank of Yokohama Ltd. | 38,000 | 278 |
Shin-Etsu Chemical Co., Ltd. | 4,300 | 278 |
Chubu Electric Power Co. | 8,400 | 270 |
Sumitomo Metal | | |
Industries Ltd. | 53,000 | 269 |
Kyocera Corp. | 2,700 | 262 |
Seven and I Holdings Co., Ltd. | 9,100 | 262 |
Sumitomo Realty & | | |
Development Co. | 7,000 | 258 |
Itochu Corp. | 26,000 | 256 |
Fanuc Co., Ltd. | 2,600 | 255 |
Sumitomo Trust & | | |
Banking Co., Ltd. | 26,000 | 254 |
Mitsubishi Electric Corp. | 26,000 | 252 |
Astellas Pharma Inc. | 5,700 | 249 |
Daiichi Sankyo Co., Ltd. | 7,900 | 236 |
Rohm Co., Ltd. | 2,600 | 235 |
Joyo Bank Ltd. | 37,000 | 227 |
TDK Corp. | 2,600 | 224 |
Nippon Yusen | | |
Kabushiki Kaisha Co. | 26,000 | 224 |
Sharp Corp. | 12,000 | 220 |
Fuji Photo Film Co., Ltd. | 5,300 | 218 |
Sumitomo Corp. | 12,400 | 212 |
NTT Urban Development Corp. | 87 | 207 |
T & D Holdings, Inc. | 3,250 | 206 |
The Hiroshima Bank, Ltd. | 37,000 | 199 |
Denso Corp. | 5,600 | 198 |
Benesse Corp. | 5,200 | 194 |
Tokyu Corp. | 26,000 | 189 |
Nikko Securities Co., Ltd. | 13,000 | 187 |
NTT Data Corp. | 38 | 186 |
Eisai Co., Ltd. | 3,900 | 185 |
Bridgestone Corp. | 9,100 | 185 |
Asahi Kasei Corp. | 26,000 | 184 |
Tokyo Electron Ltd. | 2,600 | 180 |
Toray Industries, Inc. | 26,000 | 178 |
Ricoh Co. | 8,000 | 176 |
Yamada Denki Co., Ltd. | 1,900 | 176 |
West Japan Railway Co. | 38 | 172 |
Sumitomo Chemical Co. | 26,000 | 172 |
Secom Co., Ltd. | 3,800 | 172 |
Softbank Corp. | 7,900 | 170 |
16
| | Market |
| | Value• |
| Shares | ($000) |
Aeon Co., Ltd. | 9,200 | 168 |
Sumitomo Metal Mining Co. | 9,000 | 167 |
Kao Corp. | 6,000 | 165 |
Leopalace21 Corp. | 5,000 | 164 |
Shinsei Bank, Ltd. | 38,000 | 164 |
Fujitsu Ltd. | 26,000 | 163 |
The Nishi-Nippon City Bank, Ltd. | 38,000 | 163 |
Hokuhoku Financial Group, Inc. | 50,000 | 162 |
Nippon Express Co., Ltd. | 26,000 | 161 |
Hoya Corp. | 5,200 | 160 |
Terumo Corp. | 3,900 | 158 |
Mitsubishi Chemical | | |
Holdings Corp. | 19,500 | 157 |
Suzuki Motor Corp. | 5,500 | 156 |
Marubeni Corp. | 26,000 | 156 |
Nippon Mining Holdings Inc. | 19,000 | 153 |
Kawasaki Heavy | | |
Industries Ltd. | 38,000 | 151 |
Kyushu Electric | | |
Power Co., Inc. | 5,300 | 149 |
Resona Holdings Inc. | 66 | 149 |
Ishikawajima-Harima Heavy | | |
Industries Co. | 38,000 | 148 |
Ibiden Co., Ltd. | 2,600 | 148 |
Hankyu Corp. | 26,000 | 148 |
CSK Corp. | 3,800 | 147 |
Dentsu Inc. | 51 | 145 |
Kuraray Co., Ltd. | 12,500 | 139 |
NEC Corp. | 26,000 | 138 |
Kobe Steel Ltd. | 39,000 | 138 |
Isuzu Motors Ltd. | 26,000 | 137 |
Tokyo Gas Co., Ltd. | 27,000 | 136 |
Asahi Glass Co., Ltd. | 10,000 | 134 |
Konami Corp. | 5,000 | 133 |
Daikin Industries Ltd. | 3,900 | 132 |
Mazda Motor Corp. | 26,000 | 130 |
Chugai | | |
Pharmaceutical Co., Ltd. | 5,100 | 130 |
Asahi Breweries Ltd. | 7,800 | 127 |
Mitsubishi Materials Corp. | 26,000 | 127 |
Tohoku Electric Power Co. | 5,300 | 127 |
Mitsui OSK Lines Ltd. | 10,000 | 126 |
Yahoo Japan Corp. | 360 | 124 |
Isetan Co. | 7,500 | 123 |
Toyoda Automatic | | |
Loom Works Ltd. | 2,600 | 122 |
Mizuho Trust & | | |
Banking Co., Ltd. | 62,000 | 122 |
THK Co., Inc. | 5,000 | 122 |
Kirin Brewery Co., Ltd. | 8,000 | 121 |
Daito Trust | | |
Construction Co., Ltd. | 2,600 | 119 |
Tobu Railway Co., Ltd. | 26,000 | 119 |
JTEKT Corp. | 6,400 | 119 |
| | | Market |
| | | Value• |
| | Shares | ($000) |
| Marui Co., Ltd. | 10,000 | 119 |
| Chugoku Electric Power Co., Ltd. | 5,200 | 115 |
| JS Group Corp. | 5,100 | 115 |
| Advantest Corp. | 2,600 | 115 |
| Nitto Denko Corp. | 2,600 | 115 |
| Sankyo Co., Ltd. | 2,600 | 114 |
| Electric Power Development Co., Ltd. | 2,600 | 114 |
| Kintetsu Corp. | 38,000 | 113 |
| Sumco Corp. | 2,600 | 113 |
| Sumitomo Electric | | |
| Industries Ltd. | 7,800 | 110 |
* | Elpida Memory Inc. | 2,600 | 110 |
| Credit Saison Co., Ltd. | 3,800 | 108 |
| Taiheiyo Cement Corp. | 25,000 | 107 |
| Nisshin Steel Co. | 26,000 | 105 |
| Omron Corp. | 3,900 | 104 |
| Yakult Honsha Co., Ltd. | 3,900 | 104 |
* | Mitsubishi Motors Corp. | 65,000 | 101 |
| Toho Co., Ltd. | 5,100 | 100 |
| Makita Corp. | 2,600 | 99 |
| Hokkaido Electric | | |
| Power Co., Ltd. | 3,900 | 99 |
| Urban Corp. | 7,500 | 98 |
| Sompo Japan Insurance Inc. | 8,000 | 98 |
| Nissin Food Products Co., Ltd. | 2,600 | 98 |
| Osaka Gas Co., Ltd. | 26,000 | 97 |
| Dai-Nippon Printing Co., Ltd. | 6,000 | 96 |
| MEDICEO Holdings Co., Ltd. | 5,200 | 95 |
| Toyota Tsusho Corp. | 3,800 | 92 |
| Mitsui Trust Holding Inc. | 10,000 | 90 |
| Yamaha Corp. | 3,900 | 90 |
| Taisei Corp. | 26,000 | 90 |
| SBI Holdings, Inc. | 280 | 90 |
| Hokuriku Electric Power Co. | 3,900 | 89 |
| Sega Sammy Holdings Inc. | 3,900 | 88 |
| Nippon Paper Group, Inc. | 26 | 88 |
| JSR Corp. | 3,900 | 87 |
* | Haseko Corp. | 26,000 | 86 |
| Shiseido Co., Ltd. | 4,000 | 86 |
| Aisin Seiki Co., Ltd. | 2,600 | 85 |
| Showa Denko K.K. | 26,000 | 85 |
| Namco Bandai Holdings Inc. | 5,200 | 84 |
| Seiko Epson Corp. | 2,600 | 79 |
| Casio Computer Co. | 3,900 | 79 |
| Daiwa House Industry Co., Ltd. | 5,000 | 78 |
| Toyo Seikan Kaisha Ltd. | 3,900 | 78 |
| Stanley Electric Co. | 3,900 | 77 |
| Yokogawa Electric Corp. | 5,200 | 77 |
| Sekisui House Ltd. | 5,000 | 74 |
| Olympus Corp. | 2,000 | 70 |
| Citizen Watch Co., Ltd. | 7,800 | 70 |
| Nippon Oil Corp. | 9,000 | 69 |
| Yamaha Motor Co., Ltd. | 2,600 | 69 |
| Keyence Corp. | 300 | 67 |
17
| | | Market |
| | | Value• |
| | Shares | ($000) |
| OJI Paper Co., Ltd. | 13,000 | 66 |
| Chiba Bank Ltd. | 8,000 | 66 |
| Fuji Heavy Industries Ltd. | 13,000 | 64 |
| SMC Corp. | 500 | 64 |
| Shizuoka Bank Ltd. | 6,000 | 63 |
* | Sanyo Electric Co., Ltd. | 39,000 | 62 |
| Ajinomoto Co., Inc. | 5,000 | 61 |
| Promise Co., Ltd. | 1,950 | 59 |
| Ono Pharmaceutical Co., Ltd. | 1,000 | 55 |
| Takefuji Corp. | 1,530 | 51 |
| Acom Co., Ltd. | 1,420 | 51 |
| Toppan Printing Co., Ltd. | 5,000 | 51 |
| Konica Minolta Holdings, Inc. | 3,500 | 48 |
| Kubota Corp. | 5,000 | 47 |
| Nikon Corp. | 2,000 | 46 |
| NGK Insulators Ltd. | 2,000 | 44 |
| Inpex Holdings, Inc. | 5 | 42 |
| Brother Industries Ltd. | 3,000 | 41 |
| Taisho Pharmaceutical Co. | 2,000 | 39 |
| Shionogi & Co., Ltd. | 2,000 | 39 |
| Aioi Insurance Co., Ltd. | 5,000 | 34 |
| Nipponkoa Insurance Co., Ltd. | 4,000 | 33 |
| Mitsui Chemicals, Inc. | 4,000 | 33 |
| Kawasaki Kisen Kaisha Ltd. | 3,000 | 33 |
| Sumitomo | | |
| Heavy Industries Ltd. | 3,000 | 31 |
| Keihin Electric | | |
| Express Railway Co., Ltd. | 4,000 | 31 |
| Shikoku Electric Power | 1,200 | 29 |
| Yamato Holdings Co., Ltd. | 2,000 | 29 |
| Nomura Research Institute, Ltd. | 1,000 | 27 |
| Nippon Electric Glass Co., Ltd. | 1,500 | 26 |
| Kajima Corp. | 5,000 | 25 |
| Sekisui Chemical Co. | 3,000 | 23 |
| Chiyoda Corp. | 1,000 | 23 |
* | Fukuoka Financial Group, Inc. | 3,000 | 23 |
| Tokyu Land Corp. | 2,000 | 23 |
| Taiyo Yuden Co., Ltd. | 1,000 | 22 |
| Nippon Sheet Glass Co., Ltd. | 4,000 | 21 |
| Keio Electric Railway Co., Ltd. | 3,000 | 21 |
| Odakyu Electric Railway Co. | 3,000 | 21 |
| Fast Retailing Co., Ltd. | 300 | 21 |
| Teijin Ltd. | 4,000 | 21 |
| NSK Ltd. | 2,000 | 19 |
| Nidec Corp. | 300 | 19 |
| Ohbayashi Corp. | 3,000 | 19 |
| Shimizu Corp. | 3,000 | 19 |
| Lawson Inc. | 500 | 18 |
| Furukawa Electric Co. | 3,000 | 18 |
| Shinko Securities Co., Ltd. | 4,000 | 18 |
| Mitsubishi Logistics Corp. | 1,000 | 18 |
| NGK Spark Plug Co. | 1,000 | 18 |
| Trend Micro Inc. | 500 | 16 |
| JGC Corp. | 1,000 | 15 |
| Tokuyama Corp. | 1,000 | 15 |
| Kurita Water Industries Ltd. | 600 | 15 |
| | Market |
| | Value• |
| Shares | ($000) |
Diamond Lease Co., Ltd. | 350 | 15 |
Mitsui Mining & Smelting Co., Ltd. | 3,000 | 14 |
Sapporo Holdings Ltd. | 2,000 | 14 |
Tokyo Tatemono Co., Ltd. | 1,000 | 14 |
Hakuhodo DY Holdings Inc. | 200 | 14 |
The Chugoku Bank, Ltd. | 1,000 | 13 |
Hitachi Chemical Co., Ltd. | 600 | 13 |
Nisshinbo Industries, Inc. | 1,000 | 13 |
Tanabe Seiyaku Co., Ltd. | 1,000 | 13 |
Yamaguchi Financial Group, Inc. | 1,000 | 13 |
Cosmo Oil Co., Ltd. | 3,000 | 12 |
Nippon Meat Packers, Inc. | 1,000 | 12 |
Hirose Electric Co., Ltd. | 100 | 12 |
The Suruga Bank, Ltd. | 1,000 | 12 |
Daimaru, Inc. | 1,000 | 12 |
Japan Steel Works Ltd. | 1,000 | 12 |
Uni-Charm Corp. | 200 | 12 |
Takashimaya Co. | 1,000 | 12 |
Bank of Kyoto Ltd. | 1,000 | 12 |
Yaskawa Electric Corp. | 1,000 | 11 |
Nissan Chemical Industries, Ltd. | 1,000 | 11 |
Matsushita Electric Works, Ltd. | 1,000 | 11 |
Amada Co., Ltd. | 1,000 | 11 |
Shimamura Co., Ltd. | 100 | 11 |
Nisshin Seifun Group Inc. | 1,000 | 11 |
TonenGeneral Sekiyu K.K. | 1,000 | 11 |
Mitsubishi Securities Co., Ltd. | 1,000 | 11 |
The Iyo Bank, Ltd. | 1,000 | 10 |
Sapporo Hokuyo Holdings, Inc. | 1 | 10 |
Toto Ltd. | 1,000 | 9 |
Dowa Mining Co. Ltd. | 1,000 | 9 |
Kyowa Hakko Kogyo Co. | 1,000 | 9 |
Nippon Sanso Corp. | 1,000 | 9 |
Mitsubishi Gas Chemical Co. | 1,000 | 9 |
Keihan Electric | | |
Railway Co., Ltd. | 2,000 | 8 |
NTN Corp. | 1,000 | 8 |
The Hachijuni Bank Ltd. | 1,000 | 7 |
Mitsubishi Rayon Co., Ltd. | 1,000 | 7 |
Gunma Bank Ltd. | 1,000 | 7 |
Fujikura Ltd. | 1,000 | 6 |
Mabuchi Motor Co. | 100 | 6 |
Maruichi Steel Tube Ltd. | 200 | 6 |
Minebea Co., Ltd. | 1,000 | 6 |
Daido Steel Co., Ltd. | 1,000 | 6 |
Oriental Land Co., Ltd. | 100 | 6 |
Toho Gas Co., Ltd. | 1,000 | 5 |
Mitsukoshi, Ltd. | 1,000 | 5 |
Fuji Electric Holdings Co., Ltd. | 1,000 | 5 |
Tosoh Corp. | 1,000 | 5 |
Mitsui Engineering & | | |
Shipbuilding Co., Ltd. | 1,000 | 4 |
Denki Kagaku Kogyo K.K. | 1,000 | 4 |
Ushio Inc. | 200 | 4 |
18
| | | Market |
| | | Value• |
| | Shares | ($000) |
| All Nippon Airways Co., Ltd. | 1,000 | 4 |
| Dai-Nippon Ink & | | |
| Chemicals, Inc. | 1,000 | 4 |
| NOK Corp. | 200 | 4 |
| Susuken Co., Ltd. | 100 | 3 |
| Tokyo Broadcasting System, Inc. | 100 | 3 |
| Ito En, Ltd. | 100 | 3 |
| Shimano, Inc. | 100 | 3 |
| Asatsu-DK Inc. | 100 | 3 |
| Ube Industries Ltd. | 1,000 | 3 |
| Hitachi Construction | | |
| Machinery Co. | 100 | 3 |
| Aoyama Trading Co., Ltd. | 100 | 3 |
| Nagoya Railroad Co., Ltd. | 1,000 | 3 |
| Toyobo Ltd. | 1,000 | 3 |
| Sumitomo Osaka | | |
| Cement Co., Ltd. | 1,000 | 3 |
| Tokyo Steel Manufacturing Co. | 200 | 3 |
| Fuji Soft ABC Inc. | 100 | 3 |
| Nippon Light Metal Co. | 1,000 | 3 |
| Rinnai Corp. | 100 | 3 |
| Santen Pharmaceutical Co., Ltd. | 100 | 3 |
| Shimachu Co. | 100 | 3 |
| Pioneer Corp. | 200 | 3 |
| Kokuyo Co., Ltd. | 200 | 3 |
| FamilyMart Co., Ltd. | 100 | 3 |
| Park24 Co., Ltd. | 200 | 2 |
| Aiful Corp. | 100 | 2 |
| Toyoda Gosei Co., Ltd. | 100 | 2 |
| Shinko Electric | | |
| Industries Co., Ltd. | 100 | 2 |
| Showa Shell Sekiyu K.K. | 200 | 2 |
| Nitori Co., Ltd. | 50 | 2 |
| Hitachi Software | | |
| Engineering Co., Ltd. | 100 | 2 |
| Matsumotokiyoshi Co., Ltd. | 100 | 2 |
| Fuji Television Network, Inc. | 1 | 2 |
| Tokai Rika Co., Ltd. | 100 | 2 |
| Coca-Cola West Japan Co., Ltd. | 100 | 2 |
| Yoshinoya D&C Co. Ltd. | 1 | 2 |
* | Japan Airlines System Co. | 1,000 | 2 |
| USS Co., Ltd. | 30 | 2 |
| Q.P. Corp. | 200 | 2 |
| SFCG Co., Ltd. | 10 | 2 |
* | Oki Electric Industry Co. Ltd. | 1,000 | 2 |
| Circle K Sunkus Co., Ltd. | 100 | 2 |
| House Foods Industry Corp. | 100 | 2 |
| Monex Beans Holdings, Inc. | 2 | 2 |
| Hitachi Capital Corp. | 100 | 2 |
| Aeon Credit Service Co. Ltd. | 100 | 2 |
| kabu.com Securities Co., Ltd. | 1 | 1 |
| EDION Corp. | 100 | 1 |
| Katokichi Co., Ltd. | 200 | 1 |
| Nissin Co., Ltd. | 2,500 | 1 |
| The Goodwill Group, Inc. | 2 | 1 |
| Net One Systems Co., Ltd. | 1 | 1 |
| | | Market |
| | | Value• |
| | Shares | ($000) |
| Sanyo Shinpan Finance Co., Ltd. | 40 | 1 |
* | Sky Perfect JSAT Corp. | 2 | 1 |
| Sumitomo Real Estate Sales Co., Ltd. | 10 | 1 |
| Tokyu Construction Co., Ltd. | 130 | 1 |
| Matsui Securities Co., Ltd. | 100 | 1 |
| OMC Card, Inc. | 100 | 1 |
| Gulliver International Co., Ltd. | 10 | 1 |
* | Daiei, Inc. | 50 | 1 |
| Culture Convenience | | |
| Club Co., Ltd. | 100 | 1 |
| | | 41,005 |
Luxembourg (0.0%) | | |
| SES Global FDR | 5,478 | 107 |
| RTL Group | 114 | 14 |
| | | 121 |
Malaysia (0.6%) | | |
| Malayan Banking Bhd. | 54,500 | 190 |
| Public Bank Bhd. | 49,200 | 143 |
| Bumiputra-Commerce Holdings Bhd. | 45,400 | 142 |
| IOI Corp. Bhd. | 13,300 | 98 |
| Genting Bhd. | 39,100 | 97 |
| Sime Darby Bhd. | 35,400 | 95 |
| Maxis Communications Bhd. | 17,700 | 67 |
| Malaysia International | | |
| Shipping Corp., Bhd. | | |
| (Foreign) | 21,000 | 59 |
| Tenaga Nasional Bhd. | 15,100 | 50 |
| Telekom Malaysia Bhd. | 14,300 | 45 |
| Resorts World Bhd. | 39,300 | 37 |
| Golden Hope Plantations Bhd. | 15,600 | 36 |
| Kuala Lumpur Kepong Bhd. | 7,600 | 29 |
| Malakoff Bhd. | 9,500 | 29 |
| British American Tobacco Bhd. | 2,100 | 28 |
| Gamuda Bhd. | 11,700 | 27 |
| AMMB Holdings Bhd. | 22,600 | 26 |
| Digi.com Bhd. | 4,358 | 26 |
| PLUS Expressways Bhd. | 28,200 | 25 |
| YTL Corp., Bhd. | 11,600 | 25 |
| Petronas Gas Bhd. | 9,000 | 24 |
| UMW Holdings Malaysia Bhd. | 7,300 | 24 |
| SP Setia Bhd. | 10,100 | 24 |
| IJM Corp. Bhd. | 9,400 | 24 |
| YTL Power International Bhd. | 29,800 | 19 |
| Berjaya Sports Toto Bhd. | 14,300 | 19 |
| PPB Group Bhd. | 8,400 | 18 |
| Magnum Corp., Bhd. | 16,500 | 17 |
| Tanjong Public Ltd. Co. | 3,300 | 16 |
| RHB Capital Bhd. | 11,700 | 16 |
| Astro All Asia Networks PLC | 7,600 | 11 |
| Hong Leong Bank Bhd. | 5,800 | 11 |
| Lafarge Malayan Cement Bhd. | 19,900 | 10 |
| PPB Oil Palms Bhd. | 1,900 | 8 |
| Star Publications Bhd. | 7,400 | 8 |
| Petronas Dagangan Bhd. | 3,700 | 8 |
19
| | | Market |
| | | Value• |
| | Shares | ($000) |
* | Malaysian Plantations Bhd. | 8,800 | 8 |
| Proton Holdings Bhd. | 3,900 | 7 |
| EON Capital Bhd. | 3,600 | 7 |
| Malaysia Airports | | |
| Holdings Bhd. | 1,500 | 1 |
| Carlsberg Brewery | | |
| Malaysia Bhd. | 600 | 1 |
| Malaysian Pacific | | |
| Industries Bhd. | 300 | 1 |
| | | 1,556 |
Mexico (1.2%) | | |
| America Movil SA de CV | 403,782 | 1,061 |
* | Cemex SAB de CV ADR | 12,870 | 418 |
| Telefonos de Mexico SA | 162,673 | 278 |
| Grupo Televisa SA CPO | 40,300 | 226 |
| Grupo Mexico SA de CV | 38,300 | 205 |
| Wal-Mart de Mexico SA | 51,400 | 202 |
| Grupo Carso SA de CV | | |
| Series A1 | 48,100 | 191 |
| Grupo Financerio | | |
| Banorte SA de CV | 32,500 | 141 |
| Grupo Elektra SA | 7,800 | 128 |
| Fomento Economico | | |
| Mexicano UBD | 11,700 | 126 |
* | Carso Global Telecom | | |
| SAB de CV | 22,100 | 101 |
* | Corporacion GEO, SA de CV | 16,900 | 93 |
| Grupo Modelo SA | 15,600 | 80 |
| Grupo Financiero Inbursa, | | |
| SA de CV | 31,200 | 62 |
| Kimberly Clark de Mexico | | |
| SA de CV Series A | 2,500 | 11 |
* | Desarrolladora Homex | | |
| SA de CV | 1,000 | 10 |
| Consorcio ARA SA de CV | 2,214 | 4 |
| Alfa SA de CV Series A | 400 | 3 |
| Grupo Aeroportuario | | |
| del Pacifico SA ADR | 64 | 3 |
| Grupo Bimbo SA | 500 | 3 |
* | Industrias Penoles | | |
| SA Series CP | 200 | 2 |
| | | 3,348 |
Netherlands (3.0%) | | |
| ING Groep NV | 30,466 | 1,388 |
| ABN-AMRO Holding NV | 26,116 | 1,267 |
| Arcelor Mittal | 13,956 | 746 |
| Unilever NV | 23,653 | 722 |
| Koninklijke (Royal) | | |
| Philips Electronics NV | 15,490 | 636 |
| Koninklijke KPN NV | 27,799 | 472 |
| Aegon NV | 21,297 | 440 |
| Akzo Nobel NV | 4,230 | 339 |
| TNT NV | 7,488 | 337 |
| Koninklijke Numico NV | 5,689 | 313 |
* | Koninklijke Ahold NV | 22,246 | 283 |
* | ASML Holding NV | 6,325 | 172 |
| | | Market |
| | | Value• |
| | Shares | ($000) |
| Reed Elsevier NV | 8,340 | 157 |
| Koninklijke DSM NV | 3,125 | 149 |
| Heineken NV | 2,742 | 147 |
| European Aeronautic | | |
| Defence and Space Co. | 4,021 | 129 |
| Rodamco Europe NV | 752 | 111 |
| Randstad Holding NV | 1,340 | 105 |
| Wolters Kluwer NV | 2,510 | 74 |
| Heineken Holding NV | 1,381 | 64 |
| Corio NV | 618 | 55 |
| SNS Reaal | 574 | 14 |
| | | 8,120 |
New Zealand (0.1%) | | |
| Telecom Corp. of | | |
| New Zealand Ltd. | 31,291 | 112 |
| Fletcher Building Ltd. | 9,405 | 79 |
| Contact Energy Ltd. | 3,258 | 22 |
| Auckland International Airport Ltd. | 10,341 | 19 |
| Sky City Entertainment Group Ltd. | 4,983 | 18 |
| Fisher & Paykel | | |
| Healthcare Corp. Ltd. | 5,766 | 16 |
| The Warehouse Group Ltd. | 1,731 | 9 |
| Fisher & Paykel | | |
| Appliances Holdings Ltd. | 2,273 | 6 |
| Sky Network Television Ltd. | 1,033 | 5 |
| Kiwi Income Property Trust | 3,479 | 4 |
| Vector Ltd. | 1,016 | 2 |
| | | 292 |
Norway (0.6%) | | |
| Norsk Hydro ASA | 12,099 | 417 |
| Telenor ASA | 14,300 | 266 |
| Orkla ASA | 15,600 | 249 |
| Statoil ASA | 8,416 | 236 |
| DnB NOR ASA | 9,923 | 142 |
| Yara International ASA | 3,900 | 114 |
| Aker Kvaerner ASA | 4,550 | 107 |
| Storebrand ASA | 5,200 | 88 |
* | SeaDrill Ltd. | 5,200 | 84 |
* | Renewable Energy Corp. AS | 517 | 15 |
| Norske Skogindustrier ASA | 681 | 10 |
| | | 1,728 |
Peru (0.0%) | | |
| Compania de Minas | | |
| Buenaventura S.A.u. ADR | 1,833 | 60 |
| Credicorp Ltd. | 361 | 19 |
| | | 79 |
Philippines (0.0%) | | |
| Bank of Philippine Islands | 12,000 | 16 |
| Ayala Land, Inc. | 42,000 | 15 |
| SM Investments Corp. | 2,000 | 15 |
| Ayala Corp. | 1,000 | 12 |
| Metropolitan Bank & Trust Co. | 6,000 | 8 |
| SM Prime Holdings, Inc. | 30,000 | 7 |
20
| | | Market |
| | | Value• |
| | Shares | ($000) |
| Philippine Long Distance | | |
| Telephone Co. | 130 | 7 |
| Jollibee Foods Corp. | 2,000 | 2 |
| Manila Electric Co. | 1,000 | 1 |
| Petron Corp. | 11,000 | 1 |
| | | 84 |
Poland (0.2%) | | |
| Powszechna Kasa | | |
| Oszczednosci Bank Polski SA | 7,163 | 131 |
| Bank Polska Kasa Opieki | | |
| Grupa Pekao SA | 1,222 | 115 |
| Polski Koncern Naftowy SA | 5,252 | 86 |
| Telekomunikacja Polska SA | 10,101 | 81 |
| KGHM Polska Miedz SA | 1,963 | 74 |
| Bank Przemyslowo | | |
| Handlowy PBK SA | 195 | 69 |
| Bank Zachodni WBK SA | 100 | 11 |
| Polish Oil & Gas | 7,254 | 11 |
| Bank Slaski w Katowicach SA | 22 | 6 |
* | TVN SA | 639 | 6 |
* | Bank Rozwoju Eksportu SA | 33 | 6 |
| | | 596 |
Portugal (0.3%) | | |
| Electricidade de Portugal SA | 45,060 | 247 |
| Portugal Telecom SGPS SA | 16,900 | 241 |
| Banco Comercial Portugues SA | 30,121 | 126 |
| Banco BPI SA | 5,624 | 48 |
| Brisa-Auto Estradas de | | |
| Portugal SA | 3,282 | 43 |
| Banco Espirito Santo SA | 733 | 15 |
| Cimpor-Cimento de Portugal SA | 1,299 | 12 |
| PT Multimedia-Servicos de | | |
| Telecomunicacoes e | | |
| Multimedia, SGPS, SA | 669 | 11 |
| | | 743 |
Russia (1.1%) | | |
* | OAO Gazprom ADR | 33,369 | 1,305 |
| Lukoil Sponsored ADR | 9,069 | 696 |
| Mining and Metallurgical Co. | | |
| Norilsk Nickel ADR | 1,280 | 250 |
| RAO Unified Energy System GDR | 1,563 | 204 |
* | Rosneft Oil Co. GDR | 15,496 | 134 |
* | Polyus Gold ADR | 2,421 | 111 |
| Rostelecom ADR | 2,050 | 108 |
| Wimm-Bill-Dann Foods ADR | 557 | 45 |
| Cherepovets MK Severstal | | |
| GDR | 539 | 7 |
| | | 2,860 |
Singapore (0.8%) | | |
| United Overseas Bank Ltd. | 26,000 | 363 |
| DBS Group Holdings Ltd. | 26,000 | 361 |
| | | Market |
| | | Value• |
| | Shares | ($000) |
| Oversea-Chinese | | |
| Banking Corp., Ltd. | 52,000 | 306 |
| Singapore | | |
| Telecommunications Ltd. | 104,000 | 226 |
| Capitaland Ltd. | 39,000 | 216 |
| Singapore Airlines Ltd. | 13,000 | 155 |
| Singapore Press Holdings Ltd. | 52,000 | 148 |
| Fraser & Neave Ltd. | 39,000 | 137 |
| Singapore Exchange Ltd. | 26,000 | 125 |
| ComfortDelGro Corp. Ltd. | 78,000 | 117 |
| City Developments Ltd. | 3,000 | 31 |
| Keppel Corp., Ltd. | 2,000 | 28 |
| Singapore Technologies | | |
| Engineering Ltd. | 2,000 | 5 |
| StarHub Ltd. | 2,000 | 4 |
* | United Overseas Land Ltd. | 1,000 | 3 |
| CapitaMall Trust | 1,000 | 3 |
| Parkway Holdings Ltd. | 1,000 | 3 |
| SembCorp Marine Ltd. | 1,000 | 2 |
| Neptune Orient Lines Ltd. | 1,000 | 2 |
| Wing Tai Holdings Ltd. | 1,000 | 2 |
| Want Want Holdings Ltd. | 1,000 | 2 |
| United Industrial Corp., Ltd. | 1,000 | 2 |
| Singapore Post Ltd. | 2,000 | 2 |
| People’s Food Holdings Ltd. | 1,000 | 1 |
| SMRT Corp. Ltd. | 1,000 | 1 |
| Allgreen Properties Ltd. | 1,000 | 1 |
* | Pacific Century Regional Developments Ltd. | 4,000 | 1 |
| Noble Group Ltd. | 1,000 | 1 |
* | Chartered Semiconductor | | |
| Manufacturing Ltd. | 1,000 | 1 |
| Creative Technology Ltd. | 150 | 1 |
* | Fortune Real Estate Investment Trust | 1,000 | 1 |
| | | 2,251 |
South Africa (1.6%) | | |
| MTN Group Ltd. | 24,389 | 356 |
| Standard Bank Group Ltd. | 20,532 | 320 |
| Impala Platinum Holdings Ltd. | 9,020 | 291 |
| Sasol Ltd. | 8,238 | 282 |
| Naspers Ltd. | 10,556 | 265 |
| Anglo Platinum Ltd. | 1,625 | 261 |
| Growthpoint Properties Ltd. | 102,694 | 230 |
| Reunert Ltd. | 17,160 | 195 |
| Remgro Ltd. | 6,874 | 183 |
| Barloworld Ltd. | 6,435 | 179 |
| FirstRand Ltd. | 47,080 | 166 |
| Gold Fields Ltd. | 8,891 | 159 |
| AngloGold Ltd. | 2,668 | 118 |
| Sanlan Ltd. | 33,231 | 112 |
| Steinhoff International | | |
| Holdings Ltd. | 30,888 | 109 |
| Nedbank Group Ltd. | 4,680 | 100 |
| JD Group Ltd. | 7,514 | 99 |
21
| | | Market |
| | | Value• |
| | Shares | ($000) |
| Aspen Pharmacare | | |
| Holdings Ltd. | 18,122 | 99 |
* | Harmony Gold | | |
| Mining Co., Ltd. | 5,950 | 95 |
| Telkom South Africa Ltd. | 3,172 | 77 |
| Bidvest Group Ltd. | 3,600 | 75 |
| ABSA Group Ltd. | 3,496 | 72 |
| Sappi Ltd. | 3,887 | 69 |
| Mittal Steel South Africa Ltd. | 2,498 | 45 |
| RMB Holdings Ltd. | 8,192 | 43 |
| Imperial Holdings Ltd. | 1,700 | 38 |
| Tiger Brands Ltd. | 1,300 | 36 |
| Truworths International Ltd. | 4,445 | 25 |
| Aveng Ltd. | 3,619 | 25 |
| Network Healthcare | | |
| Holdings Ltd. | 10,700 | 22 |
| Investec Ltd. | 1,400 | 20 |
| Woolworths Holdings Ltd. | 5,200 | 18 |
| Murray & Roberts | | |
| Holdings Ltd. | 2,000 | 17 |
| Liberty Group Ltd. | 900 | 12 |
| Ellerine Holdings Ltd. | 800 | 11 |
| Massmart Holdings Ltd. | 713 | 10 |
| Foschini Ltd. | 861 | 9 |
| Shoprite Holdings Ltd. | 1,947 | 9 |
| Sun International Ltd. | 422 | 9 |
* | African Rainbow Minerals Ltd. | 513 | 9 |
| African Bank Investments Ltd. | 1,785 | 9 |
| Nampak Ltd. | 2,423 | 8 |
| Kumba Iron Ore Ltd. | 350 | 8 |
| Alexander Forbes Ltd. | 2,900 | 7 |
| Pretoria Portland | | |
| Cement Co., Ltd. | 77 | 5 |
| Spar Group Ltd. | 627 | 5 |
| Johnnic Communications Ltd. | 139 | 2 |
| Metropolitan Holdings Ltd. | 800 | 2 |
| Northam Platinum Ltd. | 236 | 2 |
| AECI Ltd. | 157 | 2 |
| Pick’n Pay Stores Ltd. | 300 | 1 |
| | | 4,321 |
South Korea (2.6%) | | |
| Samsung Electronics Co., Ltd. | | |
| GDR | 5,015 | 1,528 |
* | POSCO ADR | 7,579 | 794 |
* | Kookmin Bank-Spon ADR | 8,289 | 744 |
* | Korea Electric Power Corp. | | |
| ADR | 30,751 | 636 |
* | Shinhan Financial | | |
| Group Co., Ltd. ADR | 5,647 | 633 |
| SK Telecom Co. Ltd. ADR | 14,442 | 359 |
* | KT Corp. ADR | 13,162 | 298 |
| Hyundai Heavy | | |
| Industries Co., Inc. | 640 | 161 |
| SK Corp. | 1,436 | 156 |
| Hyundai Motor Co. Ltd. | 2,316 | 146 |
| Shinsegae Co., Ltd. | 160 | 109 |
| | | Market |
| | | Value• |
| | Shares | ($000) |
| Samsung Heavy | | |
| Industries Co., Ltd. | 3,260 | 107 |
| Samsung Fire & | | |
| Marine Insurance Co. | 550 | 97 |
| S-Oil Corp. | 1,190 | 92 |
* | Hynix Semiconductor Inc. | 2,570 | 88 |
| Hana Financial Group Inc. | 1,460 | 76 |
* | NHN Corp. | 449 | 70 |
| LG Electronics Inc. | 969 | 65 |
| Hyundai Merchant | | |
| Marine Co., Ltd. | 1,880 | 60 |
| Daewoo Engineering & | | |
| Construction Co., Ltd. | 2,340 | 58 |
* | Hyundai Engineering & | | |
| Construction Co., Ltd. | 939 | 56 |
| Samsung Corp. | 1,260 | 53 |
| Woori Finance | | |
| Holdings Co., Ltd. | 1,970 | 49 |
| Hyundai Mobis | 589 | 47 |
| Daelim Industrial Co. | 320 | 37 |
| Hanwha Corp. | 690 | 33 |
| KT & G Corp. | 450 | 32 |
* | LG. Philips LCD Co., Ltd. | 630 | 26 |
| Hyundai Development Co. | 440 | 25 |
| Industrial Bank of Korea | 1,120 | 22 |
| Doosan Heavy Industries and | | |
| Construction Co., Ltd. | 256 | 20 |
| GS Holdings Corp. | 430 | 19 |
| Daewoo International Corp. | 420 | 19 |
* | Kia Motors | 1,550 | 18 |
* | LG Card Co., Ltd. | 341 | 16 |
| GS Engineering & Construction Corp. | 150 | 15 |
* | LG Telecom Ltd. | 1,369 | 14 |
| Hyundai Mipo Dockyard Co., Ltd. | 70 | 14 |
* | Samsung Securities Co. Ltd. | 220 | 13 |
| Daewoo Shipbuilding & | | |
| Marine Engineering Co., Ltd. | 280 | 11 |
* | Ssangyong Motor Co. | 1,140 | 8 |
* | Daishin Securities Co. | 400 | 6 |
| Halla Climate Control Corp. | 520 | 5 |
| CJ Corp. | 40 | 4 |
| Kangwon Land Inc. | 190 | 4 |
| Lotte Shopping Co., Ltd. | 10 | 4 |
| Korea Exchange Bank | 230 | 4 |
| LG Corp. | 100 | 4 |
| Samsung Techwin Co., Ltd. | 90 | 4 |
| Korea Investment Holdings Co., Ltd. | 60 | 4 |
| Hyundai Hysco | 110 | 1 |
| Glovis Co., Ltd. | 40 | 1 |
| SKC Co. Ltd. | 50 | 1 |
* | Lotte Midopa Co., Ltd. | 70 | 1 |
| Sindo Ricoh Co., Inc. | 18 | 1 |
| | | 6,868 |
22
| | | Market |
| | | Value• |
| | Shares | ($000) |
Spain (3.4%) | | |
| Telefonica SA | 69,855 | 1,569 |
| Banco Santander | | |
| Central Hispano SA | 87,066 | 1,567 |
| Banco Bilbao | | |
| Vizcaya Argentaria SA | 48,501 | 1,160 |
| Endesa SA | 14,560 | 795 |
| Iberdrola SA | 13,039 | 646 |
| Repsol YPF SA | 17,655 | 582 |
| Gamesa Corporacion | | |
| Tecnologica, SA | 11,492 | 396 |
| Banco Popular Espanol SA | 18,131 | 359 |
| Altadis SA | 3,989 | 260 |
| Grupo Ferrovial, SA | 2,263 | 246 |
| ACS, Actividades de | | |
| Contruccion y Servisios, SA | 3,203 | 199 |
| Banco de Sabadell SA | 4,313 | 195 |
| Gas Natural SDG SA | 3,526 | 177 |
| Abertis Infraestructuras SA | 5,447 | 174 |
| Industria de Diseno Textil SA | 2,791 | 172 |
| Iberdrola SA (London Shares) | 2,692 | 133 |
| Union Fenosa SA | 2,267 | 124 |
| Acerinox SA | 4,823 | 114 |
| Enagas SA | 3,159 | 77 |
| Sacyr Vallehermoso SA | 1,284 | 67 |
| Bankinter SA | 425 | 37 |
| Zardoya Otis SA | 968 | 37 |
| Acciona SA | 156 | 35 |
| Fomento de | | |
| Construc y Contra SA | 321 | 30 |
| Cintra Concesiones de | | |
| Infraestructuras de Transport SA | 768 | 14 |
* | Gestevision Telecinco SA | 384 | 12 |
| Corporacion Mapfre SA | 2,224 | 12 |
| Corporacion Financiera Alba SA | 39 | 3 |
* | Sogecable SA | 65 | 3 |
| Compania Espanola | | |
| de Petroleos SA | 29 | 3 |
| Banco Espanol de Credito, SA | 99 | 2 |
* | Antena 3 Television | 107 | 2 |
| Metrovacesa SA | 19 | 2 |
| Promotora de Informaciones SA | 81 | 2 |
| | | 9,206 |
Sweden (2.1%) | | |
| Telefonaktiebolaget LM | | |
| Ericsson AB Class B | 205,370 | 785 |
| Nordea Bank AB | 34,658 | 599 |
| Volvo AB B Shares | 21,000 | 414 |
| Skandinaviska Enskilda | | |
| Banken AB A Shares | 9,300 | 341 |
| Sandvik AB | 16,900 | 322 |
| Hennes & Mauritz | | |
| AB B Shares | 4,550 | 301 |
| TeliaSonera AB | 33,000 | 267 |
| | | Market |
| | | Value• |
| | Shares | ($000) |
| Svenska Handelsbanken | | |
| AB A Shares | 8,600 | 262 |
| Volvo AB A Shares | 13,000 | 259 |
| Swedbank AB A Shares | 6,500 | 251 |
| Investor AB B Shares | 7,800 | 209 |
| Investor AB A Shares | 7,800 | 205 |
| Atlas Copco AB A Shares | 5,200 | 197 |
| SSAB Svenskt Stal AB Series A | 5,200 | 183 |
| SKF AB B Shares | 7,800 | 170 |
| Electrolux AB Series B | 6,500 | 169 |
| Atlas Copco AB | | |
| Class B Shares | 3,900 | 140 |
| Scania AB Class B | 900 | 86 |
| Svenska Cellulosa AB B Shares | 1,600 | 82 |
| Securitas AB B Shares | 5,200 | 79 |
| Boliden AB | 2,943 | 73 |
| Skanska AB B Shares | 3,000 | 69 |
| Assa Abloy AB | 2,884 | 65 |
| Swedish Match AB | 2,500 | 46 |
| Tele2 AB B Shares | 2,300 | 39 |
| Industrivarden AB A Shares | 1,718 | 39 |
| Husqvarna AB B Shares | 1,555 | 28 |
* | Volvo AB B Shares— | | |
| Redemption Shares | 3,600 | 14 |
| Holmen AB | 200 | 9 |
| Industrivarden AB C Shares | 400 | 9 |
* | Volvo AB A Shares— | | |
| Redemption Shares | 2,200 | 8 |
| Scania AB Class A | 78 | 8 |
| SSAB Svenskt Stal AB Series B | 200 | 7 |
* | Securitas Systems AB B Shares | 1,000 | 4 |
* | Securitas Direct AB B Shares | 1,000 | 3 |
| | | 5,742 |
Switzerland (5.1%) | | |
| Nestle SA (Registered) | 5,402 | 2,138 |
| UBS AG | 29,179 | 1,896 |
| Novartis AG (Registered) | 32,572 | 1,892 |
| Roche Holdings AG | 9,861 | 1,857 |
| Credit Suisse Group | | |
| (Registered) | 16,795 | 1,318 |
| ABB Ltd. | 30,055 | 601 |
| Zurich Financial Services AG | 2,002 | 581 |
| Swiss Re (Registered) | 4,942 | 465 |
| Cie. Financiere Richemont AG | 6,837 | 412 |
| Holcim Ltd. (Registered) | 2,807 | 301 |
| Syngenta AG | 1,452 | 288 |
| Julius Baer Holding, Ltd. | 3,147 | 219 |
| Swatch Group AG (Bearer) | 702 | 201 |
| Nobel Biocare Holding AG | 475 | 171 |
| Swatch Group AG (Registered) | 2,769 | 161 |
| Swiss Life Holding | 558 | 144 |
| Swisscom AG | 403 | 142 |
| Lonza AG (Registered) | 1,287 | 126 |
23
| | | Market |
| | | Value• |
| | Shares | ($000) |
| Adecco SA (Registered) | 1,573 | 108 |
| Geberit AG | 59 | 105 |
| SGS Societe Generale de | | |
| Surveillance Holding SA | | |
| (Registered) | 79 | 100 |
| Roche Holdings AG (Bearer) | 451 | 97 |
| Givaudan SA | 81 | 76 |
| Clariant AG | 4,419 | 73 |
| Kuehne & Nagel International | | |
| AG | 672 | 61 |
| Baloise Holdings AG | 509 | 55 |
| Synthes, Inc. | 423 | 55 |
| CIBA Specialty Chemicals AG | | |
| (Registered) | 744 | 49 |
| Pargesa Holding SA | 346 | 38 |
| Straumann Holding AG | 29 | 8 |
| Schindler Holding AG | 39 | 3 |
| | | 13,741 |
Taiwan (1.9%) | | |
| Taiwan Semiconductor | | |
| Manufacturing Co. Ltd. ADR | 87,720 | 925 |
| AU Optronics Corp. ADR | 32,500 | 517 |
| Hon Hai Precision | | |
| Industry Co., Ltd. | 73,000 | 481 |
| United Microelectronics Corp. | | |
| ADR | 133,760 | 439 |
| Chunghwa Telecom Co., Ltd. | | |
| ADR | 18,920 | 376 |
| Siliconware Precision | | |
| Industries Co. ADR | 29,100 | 282 |
* | Advanced Semiconductor | | |
| Engineering Inc. ADR | 43,320 | 252 |
| Formosa Plastic Corp. | 81,000 | 155 |
| Nan Ya Plastic Corp. | 81,000 | 147 |
| China Steel Corp. | 93,000 | 105 |
| High Tech Computer Corp. | 7,000 | 104 |
| Cathay Financial Holding Co. | 51,000 | 103 |
| MediaTek Inc. | 8,000 | 99 |
| Asustek Computer Inc. | 38,000 | 87 |
| Formosa Chemicals & | | |
| Fibre Corp. | 46,000 | 85 |
| Mega Financial | | |
| Holding Co. Ltd. | 119,000 | 76 |
| Fubon Financial | | |
| Holding Co., Ltd. | 82,000 | 71 |
| Chinatrust Financial Holding | 89,000 | 70 |
| Foxconn Technology Co., Ltd. | 7,000 | 66 |
| Lite-On Technology Corp. | 41,000 | 51 |
| Compal Electronics Inc. | 54,000 | 49 |
| Chi Mei Optoelectronics Corp. | 40,000 | 45 |
| China Development | | |
| Financial Holding Corp. | 98,000 | 41 |
| Uni-President Enterprises Co. | 41,000 | 40 |
| Acer Inc. | 21,000 | 40 |
| Powerchip | | |
| Semiconductor Corp. | 63,000 | 38 |
| | | Market |
| | | Value• |
| | Shares | ($000) |
| Delta Electronics Inc. | 12,000 | 37 |
* | Fuhwa Financial | | |
| Holdings Co., Ltd. | 69,845 | 30 |
* | ProMOS Technologies Inc. | 60,000 | 24 |
| Quanta Computer Inc. | 15,000 | 21 |
| First Financial Holding Co., Ltd. | 28,000 | 19 |
| SinoPac Holdings | 42,000 | 18 |
* | Taishin Financial Holdings | 37,000 | 18 |
| Hau Nan Financial | | |
| Holdings Co., Ltd. | 26,000 | 18 |
| Shin Kong Financial | | |
| Holdings Co. | 19,000 | 18 |
| Far Eastern Textile Ltd. | 19,000 | 17 |
| Taiwan Cellular Corp. | 14,000 | 14 |
| Pou Chen Corp. | 13,000 | 14 |
| Inventec Co., Ltd. | 14,000 | 10 |
* | Walsin Lihwa Corp. | 20,000 | 10 |
| Nanya Technology Corp. | 12,000 | 10 |
| Taiwan Cooperative Bank | 12,000 | 8 |
| Far EasTone | | |
| Telecommunications Co., Ltd. | 7,000 | 8 |
| Catcher Technology Co., Ltd. | 1,000 | 8 |
* | Chang Hwa Commercial Bank | 12,000 | 7 |
* | Tatung Co., Ltd. | 16,000 | 7 |
| Formosa Petrochemical Corp. | 3,000 | 6 |
| Realtek Semiconductor Corp. | 3,000 | 6 |
| Nan Ya Printed Circuit Board Corp. | 1,000 | 6 |
| Novatek Microelectronics Corp., Ltd. | 1,000 | 5 |
| Hotai Motor Co. Ltd. | 2,000 | 5 |
* | Chunghwa Picture Tubes, Ltd. | 8,000 | 2 |
| D-Link Corp. | 1,000 | 2 |
| Taiwan Fertilizer Co., Ltd. | 1,000 | 2 |
| Formosa Taffeta Co., Ltd. | 2,000 | 2 |
| Taiwan Cement Corp. | 2,000 | 2 |
| Taiwan Glass Industrial Corp. | 2,000 | 2 |
| E.Sun Financial | | |
| Holding Co., Ltd. | 3,000 | 2 |
* | Macronix International Co., Ltd. | 4,000 | 2 |
| Teco Electric & Machinery Co., Ltd. | 3,000 | 2 |
| Wistron Corp. | 1,000 | 1 |
| Unimicron Technology Corp. | 1,000 | 1 |
* | Winbond Electronics Corp. | 4,000 | 1 |
| Synnex Technology | | |
| International Corp. | 1,000 | 1 |
| Evergreen Marine Corp. | 2,000 | 1 |
* | Yageo Corp. | 3,000 | 1 |
| Yulon Motor Co., Ltd. | 1,000 | 1 |
| Sunplus Technology Co., Ltd. | 500 | 1 |
| Mitac International Corp. | 1,000 | 1 |
| Asia Cement Corp. | 1,000 | 1 |
* | Via Technologies Inc. | 1,000 | 1 |
| Far Eastern International Bank | 2,000 | 1 |
| | | 5,118 |
24
| | | Market |
| | | Value• |
| | Shares | ($000) |
Thailand (0.4%) | | |
| Bangkok Bank | | |
| Public Co., Ltd. (Foreign) | 66,300 | 213 |
| Siam Cement Public Co. Ltd. (Foreign) | 29,900 | 203 |
| PTT Exploration and | | |
| Production Public Co. Ltd. | | |
| (Foreign) | 57,000 | 154 |
| Siam Commercial Bank | | |
| Public Co. Ltd. (Foreign) | 63,000 | 120 |
| IRPC PCL (Foreign) | 524,000 | 90 |
| Kasikornbank Public Co. Ltd. | | |
| (Foreign) | 44,200 | 89 |
| Advanced Info Service | | |
| Public Co. Ltd. (Foreign) | 21,000 | 47 |
| PTT Exploration and Production | | |
| Public Co. Ltd. (Local) | 17,100 | 46 |
| Advanced Info Service | | |
| Public Co., Ltd. (Local) | 18,000 | 39 |
| Siam Commercial Bank | | |
| Public Co. Ltd. (Local) | 18,900 | 36 |
| IRPC PCL (Local) | 157,200 | 27 |
* | Total Access Communication | | |
| Public Co., Ltd. | 200 | 1 |
| | | 1,065 |
Turkey (0.2%) | | |
| Anadolu Efes Biracilik ve | | |
| Malt Sanayii A.S. | 3,991 | 135 |
* | KOC Holding A.S. | 19,084 | 93 |
| Akbank T.A.S. | 12,467 | 90 |
* | Finansbank AS | 20,774 | 88 |
| Turkiye Garanti Bankasi A.S. | 8,143 | 39 |
| Turkiye Is Bankasi | | |
| A.S. C Shares | 7,939 | 37 |
| Eregli Demir ve | | |
| Celik Fabrikalari A.S. | 2,908 | 33 |
| Tupras-Turkiye | | |
| Petrol Rafinerileri A.S. | 359 | 7 |
* | Yapi ve Kredi Bankasi A.S. | 3,119 | 7 |
| Turkcell Iletisim Hizmetleri A.S. | 1,147 | 6 |
| Enka Insaat ve Sanayi A.S. | 406 | 6 |
| Dogan Sirketler Grubu Holding A.S. | 3,001 | 6 |
| Migros Turk A.S. | 457 | 5 |
| Haci Omer Sabanci | | |
| Holding A.S. | 1,216 | 5 |
| | | 557 |
United Kingdom (16.7%) | | |
| BP PLC | 273,429 | 3,067 |
| HSBC Holdings PLC | 163,292 | 3,013 |
| GlaxoSmithKline PLC | 81,221 | 2,343 |
| Vodafone Group PLC | 741,823 | 2,110 |
| Royal Dutch Shell PLC | | |
| Class A | 50,783 | 1,764 |
| | Market |
| | Value• |
| Shares | ($000) |
Royal Bank of | | |
Scotland Group PLC | 44,689 | 1,711 |
Royal Dutch Shell PLC | | |
Class B | 38,994 | 1,373 |
Barclays PLC | 89,546 | 1,293 |
AstraZeneca Group PLC | 21,211 | 1,154 |
HBOS PLC | 52,476 | 1,126 |
Anglo American PLC | 20,454 | 1,077 |
Tesco PLC | 108,956 | 1,002 |
Lloyds TSB Group PLC | 76,646 | 885 |
Rio Tinto PLC | 13,621 | 828 |
Diageo PLC | 37,591 | 792 |
BT Group PLC | 113,367 | 713 |
BHP Billiton PLC | 31,620 | 707 |
BG Group PLC | 46,406 | 669 |
British American Tobacco PLC | 21,569 | 668 |
National Grid Transco PLC | 36,541 | 574 |
Standard Chartered PLC | 18,429 | 570 |
Unilever PLC | 17,565 | 550 |
Aviva PLC | 34,077 | 535 |
Reckitt Benckiser PLC | 9,528 | 521 |
Xstrata PLC | 9,485 | 494 |
Prudential PLC | 32,787 | 487 |
BAE Systems PLC | 43,426 | 394 |
Imperial Tobacco Group PLC | 8,882 | 387 |
Marks & Spencer Group PLC | 26,243 | 387 |
Centrica PLC | 49,120 | 378 |
Cadbury Schweppes PLC | 28,394 | 375 |
SABMiller PLC | 14,560 | 344 |
Scottish & Southern Energy PLC | 11,231 | 336 |
Man Group PLC | 28,665 | 321 |
Alliance Boots PLC | 12,972 | 289 |
Land Securities Group PLC | 7,063 | 275 |
WPP Group PLC | 18,557 | 275 |
J. Sainsbury PLC | 23,995 | 273 |
Legal & General Group PLC | 87,691 | 269 |
Reed Elsevier PLC | 19,816 | 251 |
Pearson PLC | 14,332 | 245 |
Old Mutual PLC | 68,107 | 242 |
British Land Co., PLC | 8,214 | 240 |
British Sky | | |
Broadcasting Group PLC | 19,521 | 224 |
Rolls-Royce Group PLC | 22,862 | 218 |
Morrison Supermarkets PLC | 34,437 | 210 |
Compass Group PLC | 28,507 | 206 |
Reuters Group PLC | 21,116 | 201 |
Wolseley PLC | 8,337 | 201 |
Capita Group PLC | 14,243 | 200 |
3i Group PLC | 8,593 | 197 |
Next PLC | 4,212 | 196 |
Kingfisher PLC | 36,114 | 196 |
Hammerson PLC | 6,214 | 188 |
25
| | Market |
| | Value• |
| Shares | ($000) |
Scottish & Newcastle PLC | 15,002 | 184 |
Smiths Group PLC | 8,316 | 179 |
United Utilities PLC | 12,012 | 179 |
Experian Group Ltd. | 15,596 | 176 |
International Power PLC | 20,039 | 175 |
Shire PLC | 7,310 | 169 |
Hanson Building Materials | | |
PLC | 9,829 | 167 |
Smith & Nephew PLC | 13,161 | 164 |
Mitchells & Butlers PLC | 10,374 | 164 |
Carnival PLC | 3,103 | 156 |
Burberry Group PLC | 10,686 | 147 |
Alliance & Leicester PLC | 6,212 | 141 |
Imperial Chemical Industries | | |
PLC | 13,333 | 141 |
ITV PLC | 56,432 | 134 |
Rentokil Initial PLC | 38,081 | 131 |
Signet Group PLC | 52,169 | 128 |
Amvescap PLC | 10,885 | 128 |
Foreign and Colonial | | |
Investment Trust PLC | 21,398 | 126 |
Northern Rock PLC | 5,889 | 126 |
The Alliance Trust PLC | 16,887 | 125 |
Lonmin PLC | 1,880 | 123 |
Kelda Group PLC | 6,500 | 120 |
William Hill PLC | 9,706 | 116 |
Provident Financial PLC | 7,371 | 113 |
Yell Group PLC | 11,604 | 112 |
Persimmon PLC | 4,199 | 112 |
Home Retail Group | 12,343 | 112 |
Severn Trent PLC | 3,770 | 111 |
Friends Provident PLC | 29,381 | 111 |
Royal & Sun Alliance | | |
Insurance Group PLC | 33,137 | 109 |
ICAP PLC | 10,673 | 107 |
Johnson Matthey PLC | 3,354 | 105 |
Hays PLC | 31,005 | 105 |
Bunzl PLC | 7,397 | 105 |
United Business Media PLC | 6,436 | 104 |
Cable and Wireless PLC | 27,501 | 101 |
Associated British Foods PLC | 5,369 | 99 |
Liberty International PLC | 4,060 | 97 |
Scottish Mortgage | | |
Investment Trust PLC | 8,489 | 97 |
| | | Market |
| | | Value• |
| | Shares | ($000) |
| Intercontinental | | |
| Hotels Group, PLC | 3,993 | 96 |
| Cobham PLC | 22,841 | 95 |
| Tate & Lyle PLC | 7,553 | 94 |
| Daily Mail and | | |
| General Trust PLC | 5,387 | 90 |
| The Sage Group PLC | 16,783 | 88 |
| Whitbread PLC | 2,204 | 83 |
| Schroders PLC | 3,029 | 78 |
| Drax Group PLC | 4,817 | 77 |
* | Cairn Energy PLC | 2,197 | 74 |
| Trinity Mirror PLC | 6,862 | 73 |
| LogicaCMG PLC | 18,980 | 69 |
| Aegis Group PLC | 24,305 | 67 |
| EMI Group PLC | 14,437 | 67 |
| EMAP PLC | 4,173 | 67 |
| GKN PLC | 8,749 | 67 |
| Antofagasta PLC | 6,266 | 66 |
| Slough Estates PLC | 4,313 | 66 |
| Enterprise Inns PLC | 5,131 | 65 |
| Group 4 Securicor PLC | 14,307 | 65 |
| Tomkins PLC | 12,350 | 65 |
* | British Airways PLC | 6,434 | 65 |
| Kazakhmys PLC | 2,834 | 64 |
* | British Energy Group PLC | 5,891 | 61 |
| Rexam PLC | 5,362 | 56 |
| DSG International PLC | 16,798 | 54 |
| Ladbrokes PLC | 6,560 | 53 |
| Vedanta Resources PLC | 1,917 | 52 |
| Bradford & Bingley PLC | 5,834 | 51 |
| Electrocomponents PLC | 7,410 | 45 |
| Rank Group PLC | 9,982 | 40 |
| Kesa Electricals PLC | 4,869 | 33 |
| Travis Perkins PLC | 719 | 29 |
| Johnston Press PLC | 1,711 | 16 |
| Misys PLC | 3,070 | 15 |
| Witan Investment Trust PLC | 1,588 | 15 |
| BBA Aviation PLC | 2,531 | 14 |
| Biffa PLC | 2,151 | 14 |
| Carphone Warehouse PLC | 471 | 3 |
| | | 44,835 |
Total Common Stocks | | |
(Cost $255,430) | | 260,584 |
26
| | Market |
| | Value• |
| Shares | ($000) |
Temporary Cash Investment (1.0%) | | |
1 Vanguard Market Liquidity Fund, 5.259% | | |
(Cost $2,788) | 2,787,693 | 2,788 |
Total Investments (98.3%) | | |
(Cost $258,218) | | 263,372 |
Other Assets and Liabilities (1.7%) | | |
Receivables for Capital Shares Issued | | 6,943 |
Other Assets—Note B | | 6,665 |
Payables for Investment Securities Purchased | | (7,367) |
Other Liabilities | | (1,647) |
| | 4,594 |
Net Assets (100%) | | 267,966 |
At April 30, 2007, net assets consisted of:2 | |
| Amount |
| ($000) |
Paid-in Capital | 261,964 |
Undistributed Net Investment Income | 830 |
Accumulated Net Realized Gains | 14 |
Unrealized Appreciation | |
Investment Securities | 5,154 |
Foreign Currencies | 4 |
Net Assets | 267,966 |
| |
Investor Shares—Net Assets | |
Applicable to 2,325,732 outstanding | |
$.001 par value shares of beneficial | |
interest (unlimited authorization) | 49,896 |
Net Asset Value Per Share— | |
Investor Shares | $21.45 |
| |
Institutional Shares—Net Assets | |
Applicable to 51,245 outstanding | |
$.001 par value shares of beneficial | |
interest (unlimited authorization) | 5,500 |
Net Asset Value Per Share— | |
Institutional Shares | $107.33 |
| |
ETF Shares—Net Assets | |
Applicable to 3,900,205 outstanding | |
$.001 par value shares of beneficial | |
interest (unlimited authorization) | 212,570 |
Net Asset Value Per Share— | |
ETF Shares | $54.50 |
• | See Note A in Notes to Financial Statements. |
* | Non-income-producing security. |
1 Affiliated money market fund available only to Vanguard funds and certain trusts and accounts managed by Vanguard. Rate shown is the 7-day yield.
2 See Note C in Notes to Financial Statements for the tax-basis components of net assets.
ADR—American Depositary Receipt.
FDR—Fiduciary Depositary Receipt.
GDR—Global Depositary Receipt.
REIT—Real Estate Investment Trust.
27
Statement of Operations
| March 2, 20071 to |
| April 30, 2007 |
| ($000) |
Investment Income | |
Income | |
Dividends2 | 857 |
Interest3 | 26 |
Total Income | 883 |
Expenses | |
The Vanguard Group—Note B | |
Management and Administrative—Investor Shares | 12 |
Management and Administrative—Institutional Shares | — |
Management and Administrative—ETF Shares | 36 |
Marketing and Distribution—Investor Shares | — |
Marketing and Distribution—Institutional Shares | — |
Marketing and Distribution—ETF Shares | — |
Shareholders’ Reports—Investor Shares | 3 |
Shareholders’ Reports—Institutional Shares | — |
Shareholders’ Reports—ETF Shares | — |
Total Expenses | 51 |
Net Investment Income | 832 |
Realized Net Gain (Loss) | |
Investment Securities Sold | 14 |
Foreign Currencies | (2) |
Realized Net Gain (Loss) | 12 |
Unrealized Appreciation (Depreciation) | |
Investment Securities | 5,154 |
Foreign Currencies | 4 |
Unrealized Appreciation (Depreciation) | 5,158 |
Net Increase (Decrease) in Net Assets Resulting from Operations | 6,002 |
1 Inception.
2 Dividends are net of foreign withholding taxes of $101,000.
3 Interest income from an affiliated company of the fund was $26,000.
28
Statement of Changes in Net Assets
| March 2, 20071 to |
| April 30, 2007 |
| ($000) |
Increase (Decrease) in Net Assets | |
Operations | |
Net Investment Income | 832 |
Realized Net Gain (Loss) | 12 |
Unrealized Appreciation (Depreciation) | 5,158 |
Net Increase (Decrease) in Net Assets Resulting from Operations | 6,002 |
Distributions | |
Net Investment Income | |
Investor Shares | — |
Institutional Shares | — |
ETF Shares | — |
Realized Capital Gain | |
Investor Shares | — |
Institutional Shares | — |
ETF Shares | — |
Total Distributions | — |
Capital Share Transactions—Note E | |
Investor Shares | 48,577 |
Institutional Shares | 5,500 |
ETF Shares | 207,887 |
Net Increase (Decrease) from Capital Share Transactions | 261,964 |
Total Increase (Decrease) | 267,966 |
Net Assets | |
Beginning of Period | — |
End of Period2 | 267,966 |
1 Inception.
2 Net Assets—End of Period includes undistributed net investment income of $830,000.
29
Financial Highlights
FTSE All-World ex-US Index Fund Investor Shares | |
| March 8, 20071 to |
For a Share Outstanding Throughout the Period | April 30, 2007 |
Net Asset Value, Beginning of Period | $20.00 |
Investment Operations | |
Net Investment Income | .142 |
Net Realized and Unrealized Gain (Loss) on Investments | 1.31 |
Total from Investment Operations | 1.45 |
Distributions | |
Dividends from Net Investment Income | — |
Distributions from Realized Capital Gains | — |
Total Distributions | — |
Net Asset Value, End of Period | $21.45 |
| |
Total Return3 | 7.25% |
| |
Ratios/Supplemental Data | |
Net Assets, End of Period (Millions) | $50 |
Ratio of Total Expenses to Average Net Assets | 0.40%* |
Ratio of Net Investment Income to Average Net Assets | NA† |
Portfolio Turnover Rate4 | 2%* |
1 Inception.
2 Calculated based on average shares outstanding.
3 Total returns do not reflect the 0.25% transaction fee on purchases; the 2% fee assessed on redemptions of shares held for less than two months; or the $10 annual account maintenance fee applied on balances under $10,000.
4 Excludes the value of portfolio securities received or delivered as a result of in-kind purchases or redemptions of the fund’s capital shares, including ETF creation units.
† Not meaningful due to short reporting period.
30
FTSE All-World ex-US Index Fund Institutional Shares | |
| |
For a Share Outstanding Throughout the Period | April 30, 20071 |
Net Asset Value, Beginning of Period | $107.33 |
Investment Operations | |
Net Investment Income | — |
Net Realized and Unrealized Gain (Loss) on Investments | — |
Total from Investment Operations | — |
Distributions | |
Dividends from Net Investment Income | — |
Distributions from Realized Capital Gains | — |
Total Distributions | — |
Net Asset Value, End of Period | $107.33 |
| |
Total Return | —1 |
| |
Ratios/Supplemental Data | |
Net Assets, End of Period (Millions) | $6 |
Ratio of Total Expenses to Average Net Assets | NA1 |
Ratio of Net Investment Income to Average Net Assets | NA1 |
Portfolio Turnover Rate | NA1 |
1 Inception date for the Institutional Shares was the last day of the reporting period. There is no total return, and ratios are not applicable.
31
FTSE All-World ex-US Index Fund ETF Shares | |
| March 2, 20071 to |
For a Share Outstanding Throughout the Period | April 30, 2007 |
Net Asset Value, Beginning of Period | $49.80 |
Investment Operations | |
Net Investment Income | .352 |
Net Realized and Unrealized Gain (Loss) on Investments | 4.35 |
Total from Investment Operations | 4.70 |
Distributions | |
Dividends from Net Investment Income | — |
Distributions from Realized Capital Gains | — |
Total Distributions | — |
Net Asset Value, End of Period | $54.50 |
| |
Total Return | 9.44% |
| |
Ratios/Supplemental Data | |
Net Assets, End of Period (Millions) | $213 |
Ratio of Total Expenses to Average Net Assets | 0.25%* |
Ratio of Net Investment Income to Average Net Assets | NA† |
Portfolio Turnover Rate3 | 2%* |
1 Inception.
2 Calculated based on average shares outstanding.
3 Excludes the value of portfolio securities received or delivered as a result of in-kind purchases or redemptions of the fund’s capital shares, including ETF creation units.
† Not meaningful due to short reporting period.
See accompanying Notes, which are an integral part of the Financial Statements.
32
Notes to Financial Statements
Vanguard FTSE All-World ex-US Index Fund is registered under the Investment Company Act of 1940 as an open-end investment company, or mutual fund. The fund files reports with the SEC under the company name Vanguard International Equity Index Funds. The fund invests in securities of foreign issuers, which may subject it to investment risks not normally associated with investing in securities of U.S. corporations. The fund offers three classes of shares: Investor Shares, Institutional Shares, and ETF Shares. Investor Shares were first issued on March 8, 2007, and are available to any investor who meets the fund’s minimum purchase requirements. Institutional Shares were first issued on April 30, 2007, and are designed for investors who meet certain administrative and service criteria and invest a minimum of $5 million. ETF Shares were first issued on March 2, 2007, and first offered to the public on March 8, 2007, and are listed for trading on the American Stock Exchange; they can be purchased and sold through a broker.
A. The following significant accounting policies conform to generally accepted accounting principles for U.S. mutual funds. The fund consistently follows such policies in preparing its financial statements.
1. Security Valuation: Securities are valued as of the close of trading on the New York Stock Exchange (generally 4 p.m., Eastern time) on the valuation date. Equity securities are valued at the latest quoted sales prices or official closing prices taken from the primary market in which each security trades; such securities not traded on the valuation date are valued at the mean of the latest quoted bid and asked prices. Securities for which market quotations are not readily available, or whose values have been affected by events occurring before the fund’s pricing time but after the close of the securities’ primary markets, are valued at their fair values calculated according to procedures adopted by the board of trustees. These procedures include obtaining quotations from an independent pricing service, monitoring news to identify significant market- or security-specific events, and evaluating changes in the values of foreign market proxies (for example, ADRs, futures contracts, or exchange-traded funds), between the time the foreign markets close and the fund’s pricing time. When fair-value pricing is employed, the prices of securities used by a fund to calculate its net asset value may differ from quoted or published prices for the same securities. Investments in Vanguard Market Liquidity Fund are valued at that fund’s net asset value.
2. Foreign Currency: Securities and other assets and liabilities denominated in foreign currencies are translated into U.S. dollars using exchange rates obtained from an independent third party as of the fund’s pricing time on the valuation date. Realized gains (losses) and unrealized appreciation (depreciation) on investment securities include the effects of changes in exchange rates since the securities were purchased, combined with the effects of changes in security prices. Fluctuations in the value of other assets and liabilities resulting from changes in exchange rates are recorded as unrealized foreign currency gains (losses) until the assets or liabilities are settled in cash, at which time they are recorded as realized foreign currency gains (losses).
3. Federal Income Taxes: The fund intends to qualify as a regulated investment company and distribute all of its taxable income. Accordingly, no provision for federal income taxes is required in the financial statements.
33
4. Distributions: Distributions to shareholders are recorded on the ex-dividend date.
5. Other: Dividend income is recorded on the ex-dividend date. Interest income includes income distributions received from Vanguard Market Liquidity Fund and is accrued daily. Security transactions are accounted for on the date securities are bought or sold. Costs used to determine realized gains (losses) on the sale of investment securities are those of the specific securities sold. Fees assessed on purchases and redemptions of capital shares are credited to paid-in capital.
Each class of shares has equal rights as to assets and earnings, except that each class separately bears certain class-specific expenses related to maintenance of shareholder accounts (included in Management and Administrative expenses) and shareholder reporting. Marketing and distribution expenses are allocated to each class of shares based on a method approved by the board of trustees. Income, other non-class-specific expenses, and gains and losses on investments are allocated to each class of shares based on its relative net assets.
B. The Vanguard Group furnishes at cost investment advisory, corporate management, administrative, marketing, and distribution services. The costs of such services are allocated to the fund under methods approved by the board of trustees. The fund has committed to provide up to 0.40% of its net assets in capital contributions to Vanguard. At April 30, 2007, the fund had contributed capital of $9,000 to Vanguard (included in Other Assets), representing 0.00% of the fund’s net assets and 0.01% of Vanguard’s capitalization. The fund’s trustees and officers are also directors and officers of Vanguard.
C. Distributions are determined on a tax basis and may differ from net investment income and realized capital gains for financial reporting purposes. Differences may be permanent or temporary. Permanent differences are reclassified among capital accounts in the financial statements to reflect their tax character. Temporary differences arise when certain items of income, expense, gain, or loss are recognized in different periods for financial statement and tax purposes; these differences will reverse at some time in the future. Differences in classification may also result from the treatment of short-term gains as ordinary income for tax purposes. The fund’s tax-basis capital gains and losses are determined only at the end of each fiscal year.
During the period ended April 30, 2007, the fund realized net foreign currency losses of $2,000, which decreased distributable net income for tax purposes; accordingly, such losses have been reclassified from accumulated net realized gains to undistributed net investment income.
At April 30, 2007, the cost of investment securities for tax purposes was $258,218,000. Net unrealized appreciation of investment securities for tax purposes was $5,154,000, consisting of unrealized gains of $7,689,000 on securities that had risen in value since their purchase and $2,535,000 in unrealized losses on securities that had fallen in value since their purchase.
D. During the period ended April 30, 2007, the fund purchased $256,258,000 of investment securities and sold $710,000 of investment securities, other than temporary cash investments.
34
E. Capital share transactions for each class of shares were:
| Inception1 to |
| April 30, 2007 |
| Amount | Shares |
| ($000) | (000) |
Investor Shares | | |
Issued | 48,843 | 2,339 |
Issued in Lieu of Cash Distributions | — | — |
Redeemed2 | (266) | (13) |
Net Increase (Decrease)—Investor Shares | 48,577 | 2,326 |
Institutional Shares | | |
Issued | 5,500 | 51 |
Issued in Lieu of Cash Distributions | — | — |
Redeemed | — | — |
Net Increase (Decrease)—Institutional Shares | 5,500 | 51 |
ETF Shares | | |
Issued | 207,887 | 3,900 |
Issued in Lieu of Cash Distributions | — | — |
Redeemed | — | — |
Net Increase (Decrease)—ETF Shares | 207,887 | 3,900 |
1 Inception was March 2, 2007, for ETF Shares, March 8, 2007, for Investor Shares, and April 30, 2007, for Institutional Shares.
2 Net of redemption fees of $5,000.
35
Trustees Approve Advisory Arrangement
The board of trustees of Vanguard FTSE All-World ex-US Index Fund approved the launch of the fund in February 2007, utilizing an internalized management structure whereby The Vanguard Group, Inc.—through its Quantitative Equity Group (QEG)—provides investment advisory services at cost. The board determined prior to the fund’s launch that the investment advisory arrangement with Vanguard would be in the best interests of the fund and its prospective shareholders.
The board based its decision upon an evaluation of the advisor’s investment staff, portfolio management process, and performance with similar mandates. The trustees considered the factors discussed below, among others. However, no single factor determined whether the board approved the arrangement. Rather, it was the totality of the circumstances that drove the board’s decision.
Nature, extent, and quality of services
The board considered the benefits to shareholders of selecting QEG as an advisor to the fund, particularly in light of the nature, extent, and quality of services to be provided by QEG. The board noted that QEG’s strategy for the fund involves a direct application of Vanguard’s existing indexing processes, which have been successfully implemented for more than a quarter-century, and that Vanguard’s expense-ratio advantage and index-tracking capabilities should provide more income to investors after expenses. The board concluded that Vanguard’s experience, stability, depth, and performance, among other factors, warranted approval of the advisory arrangement.
Investment performance
The board determined that, in its management of other Vanguard funds, QEG has a track record of consistent performance and disciplined investment management processes.
Cost
The board evaluated the cost of services to be provided, including consideration of competitive fee rates, and concluded that, after the implementation of the arrangement with Vanguard, the fund’s advisory expense ratio would be well below the average advisory expense ratio for its peer group. Information about the fund’s expense ratio appears in the Financial Statements section of this report.
The board does not conduct a profitability analysis of Vanguard because of Vanguard’s unique “at-cost” structure. Unlike most other mutual fund management companies, Vanguard is owned by the funds it oversees, and produces “profits” only in the form of reduced expenses for fund shareholders.
The benefit of economies of scale
The board concluded that the fund’s low-cost arrangement with Vanguard ensures that the fund will realize economies of scale as it grows, with the cost to shareholders declining as the fund’s assets increase.
The board will consider whether to renew the advisory arrangement after a one-year period.
36
Glossary
Expense Ratio. The percentage of a fund’s average net assets used to pay its annual administrative and advisory expenses. These expenses directly reduce returns to investors.
Inception Date. The date on which the assets of a fund (or one of its share classes) are first invested in accordance with the fund’s investment objective. For funds with a subscription period, the inception date is the day after that period ends. Investment performance is measured from the inception date.
Short-Term Reserves. The percentage of a fund invested in highly liquid, short-term securities that can be readily converted to cash.
Turnover Rate. An indication of the fund’s trading activity. Funds with high turnover rates incur higher transaction costs and may be more likely to distribute capital gains (which may be taxable to investors). The turnover rate excludes in-kind transactions, which have minimal impact on costs.
37
This page intentionally left blank.
This page intentionally left blank.
The People Who Govern Your Fund
The trustees of your mutual fund are there to see that the fund is operated and managed in your best interests since, as a shareholder, you are a part owner of the fund. Your fund’s trustees also serve on the board of directors of The Vanguard Group, Inc., which is owned by the Vanguard funds and provides services to them on an at-cost basis.
A majority of Vanguard’s board members are independent, meaning that they have no affiliation with Vanguard or the funds they oversee, apart from the sizable personal investments they have made as private individuals.
Our independent board members bring distinguished backgrounds in business, academia, and public service to their task of working with Vanguard officers to establish the policies and oversee the activities of the funds. Among board members’ responsibilities are selecting investment advisors for the funds; monitoring fund operations, performance, and costs; reviewing contracts; nominating and selecting new trustees/directors; and electing Vanguard officers.
Each trustee serves a fund until its termination; or until the trustee’s retirement, resignation, or death; or otherwise as specified in the fund’s organizational documents. Any trustee may be removed at a shareholders’ meeting by a vote representing two-thirds of the net asset value of all shares of the fund together with shares of other Vanguard funds organized within the same trust. The table on these two pages shows information for each trustee and executive officer of the fund. The mailing address of the trustees and officers is P.O. Box 876, Valley Forge, PA 19482.
Chairman of the Board, Chief Executive Officer, and Trustee |
| |
John J. Brennan1 | |
Born 1954 | Principal Occupation(s) During the Past Five Years: Chairman of the Board, Chief Executive |
Trustee since May 1987; | Officer, and Director/Trustee of The Vanguard Group, Inc., and of each of the investment |
Chairman of the Board and | companies served by The Vanguard Group. |
Chief Executive Officer | |
147 Vanguard Funds Overseen | |
| |
Independent Trustees | |
| |
Charles D. Ellis | |
Born 1937 | Principal Occupation(s) During the Past Five Years: Applecore Partners (pro bono ventures |
Trustee since January 2001 | in education); Senior Advisor to Greenwich Associates (international business strategy |
147 Vanguard Funds Overseen | consulting); Successor Trustee of Yale University; Overseer of the Stern School of Business |
| at New York University; Trustee of the Whitehead Institute for Biomedical Research. |
| |
Rajiv L. Gupta | |
Born 1945 | Principal Occupation(s) During the Past Five Years: Chairman and Chief Executive Officer |
Trustee since December 20012 | of Rohm and Haas Co. (chemicals); Board Member of the American Chemistry Council; |
147 Vanguard Funds Overseen | Director of Tyco International, Ltd. (diversified manufacturing and services) since 2005; |
| Trustee of Drexel University and of the Chemical Heritage Foundation. |
| |
Amy Gutmann | |
Born 1949 | Principal Occupation(s) During the Past Five Years: President of the University of |
Trustee since June 2006 | Pennsylvania since 2004; Professor in the School of Arts and Sciences, Annenberg School |
147 Vanguard Funds Overseen | for Communication, and Graduate School of Education of the University of Pennsylvania |
| since 2004; Provost (2001–2004) and Laurance S. Rockefeller Professor of Politics and the |
| University Center for Human Values (1990–2004), Princeton University; Director of Carnegie |
| Corporation of New York since 2005 and of Schuylkill River Development Corporation and |
| Greater Philadelphia Chamber of Commerce since 2004. |
JoAnn Heffernan Heisen | |
Born 1950 | Principal Occupation(s) During the Past Five Years: Corporate Vice President and Chief |
Trustee since July 1998 | Global Diversity Officer since 2006, Vice President and Chief Information Officer |
147 Vanguard Funds Overseen | (1997–2005), and Member of the Executive Committee of Johnson & Johnson |
| (pharmaceuticals/consumer products); Director of the University Medical Center |
| at Princeton and Women’s Research and Education Institute. |
| |
André F. Perold | |
Born 1952 | Principal Occupation(s) During the Past Five Years: George Gund Professor of Finance |
Trustee since December 2004 | and Banking, Harvard Business School; Senior Associate Dean, Director of Faculty |
147 Vanguard Funds Overseen | Recruiting, and Chair of Finance Faculty, Harvard Business School; Director and Chairman |
| of UNX, Inc. (equities trading firm) since 2003; Chair of the Investment Committee of |
| HighVista Strategies LLC (private investment firm) since 2005; Director of registered |
| investment companies advised by Merrill Lynch Investment Managers and affiliates |
| (1985–2004), Genbel Securities Limited (South African financial services firm) |
| (1999–2003), Gensec Bank (1999–2003), Sanlam, Ltd. (South African insurance |
| company) (2001–2003), and Stockback, Inc. (credit card firm) (2000–2002). |
| |
Alfred M. Rankin, Jr. | |
Born 1941 | Principal Occupation(s) During the Past Five Years: Chairman, President, Chief Executive |
Trustee since January 1993 | Officer, and Director of NACCO Industries, Inc. (forklift trucks/housewares/lignite); Director |
147 Vanguard Funds Overseen | of Goodrich Corporation (industrial products/aircraft systems and services). |
| |
J. Lawrence Wilson | |
Born 1936 | Principal Occupation(s) During the Past Five Years: Retired Chairman and Chief Executive |
Trustee since April 1985 | Officer of Rohm and Haas Co. (chemicals); Director of Cummins Inc. (diesel engines) and |
147 Vanguard Funds Overseen | AmerisourceBergen Corp. (pharmaceutical distribution); Trustee of Vanderbilt University |
| and of Culver Educational Foundation. |
| |
Executive Officers1 | |
| |
Heidi Stam | |
Born 1956 | Principal Occupation(s) During the Past Five Years: Managing Director of The Vanguard |
Secretary since July 2005 | Group, Inc., since 2006; General Counsel of The Vanguard Group since 2005; Secretary of |
147 Vanguard Funds Overseen | The Vanguard Group, and of each of the investment companies served by The Vanguard |
| Group, since 2005; Principal of The Vanguard Group (1997–2006). |
| |
Thomas J. Higgins | |
Born 1957 | Principal Occupation(s) During the Past Five Years: Principal of The Vanguard Group, Inc.; |
Treasurer since July 1998 | Treasurer of each of the investment companies served by The Vanguard Group. |
147 Vanguard Funds Overseen | |
Vanguard Senior Management Team | | |
| | |
R. Gregory Barton | Kathleen C. Gubanich | Michael S. Miller |
Mortimer J. Buckley | Paul A. Heller | Ralph K. Packard |
James H. Gately | F. William McNabb, III | George U. Sauter |
| | |
Founder | | |
| | |
John C. Bogle | | |
Chairman and Chief Executive Officer, 1974–1996 | |
1 Officers of the funds are “interested persons” as defined in the Investment Company Act of 1940.
2 December 2002 for Vanguard Equity Income Fund, Vanguard Growth Equity Fund, the Vanguard Municipal Bond Funds, and the Vanguard State Tax-Exempt Funds.
More information about the trustees is in the Statement of Additional Information, available from The Vanguard Group.
| 
|
| P.O. Box 2600 |
| Valley Forge, PA 19482-2600 |
Connect with Vanguard® > www.vanguard.com |
Fund Information > 800-662-7447 | All comparative mutual fund data are from Lipper Inc. |
| or Morningstar, Inc., unless otherwise noted. |
Direct Investor Account Services > 800-662-2739 | |
| |
Institutional Investor Services > 800-523-1036 | You can obtain a free copy of Vanguard’s proxy voting |
| guidelines by visiting our website, www.vanguard.com, |
Text Telephone for People | and searching for “proxy voting guidelines,” or by calling |
With Hearing Impairment > 800-952-3335 | Vanguard at 800-662-2739. They are also available from |
| the SEC’s website, www.sec.gov. In addition, you may |
| obtain a free report on how your fund voted the proxies for |
| securities it owned during the 12 months ended June 30. |
This material may be used in conjunction | To get the report, visit either www.vanguard.com |
with the offering of shares of any Vanguard | or www.sec.gov. |
fund only if preceded or accompanied by | |
the fund’s current prospectus. | |
| |
| You can review and copy information about your fund |
| at the SEC’s Public Reference Room in Washington, D.C. |
Vanguard, Connect with Vanguard, and the ship logo | To find out more about this public service, call the SEC |
are trademarks of The Vanguard Group, Inc. | at 202-551-8090. Information about your fund is also |
| available on the SEC’s website, and you can receive |
| copies of this information, for a fee, by sending a |
“FTSE®” is a trademark jointly owned by the London | request in either of two ways: via e-mail addressed to |
Stock Exchange plc and The Financial Times Limited | publicinfo@sec.gov or via regular mail addressed to the |
and is used by FTSE International Limited under license. | Public Reference Section, Securities and Exchange |
“All-World” is a trademark of FTSE International Limited. | Commission, Washington, DC 20549-0102. |
The FTSE All-World ex US Index is calculated by FTSE | |
International Limited. FTSE International Limited does | |
not sponsor, endorse, or promote the fund; is not in any | |
way connected to it; and does not accept any liability | |
in relation to its issue, operation, and trading. | |
| |
All other marks are the exclusive property of their | |
respective owners. | |
| |
| © 2007 The Vanguard Group, Inc. |
| All rights reserved. |
| Vanguard Marketing Corporation, Distributor. |
| |
| Q7702 062007 |
(a) Disclosure Controls and Procedures. The Principal Executive and Financial Officers concluded that the Registrant's Disclosure Controls and Procedures are effective based on their evaluation of the Disclosure Controls and Procedures as of a date within 90 days of the filing date of this report.
(b) Internal Control Over Financial Reporting. There were no significant changes in Registrant‘s Internal Control Over Financial Reporting or in other factors that could significantly affect this control subsequent to the date of the evaluation, including any corrective actions with regard to significant deficiencies and material weaknesses.
Certifications.
Pursuant to the requirements of the Securities Exchange Act of 1934 and the Investment Company Act of 1940, the registrant has duly caused this report to be signed on its behalf by the undersigned, thereunto duly authorized.
Pursuant to the requirements of the Securities Exchange Act of 1934 and the Investment Company Act of 1940, this report has been signed below by the following persons on behalf of the registrant and in the capacities and on the dates indicated.
*By Power of Attorney. See File Number 002-65955-99, filed on July 27, 2006. Incorporated by Reference.
