UNITED STATES
SECURITIES AND EXCHANGE COMMISSION
Washington, D.C. 20549
FORM N-CSR
CERTIFIED SHAREHOLDER REPORT
OF
REGISTERED MANAGEMENT INVESTMENT COMPANIES
Investment Company Act file number: 811-5972
Name of Registrant:
Vanguard International Equity Index Funds
Address of Registrant:
P.O. Box 2600
Valley Forge, PA 19482
Name and address of agent for service:
Heidi Stam, Esquire
P.O. Box 876
Valley Forge, PA 19482
Registrant’s telephone number, including area code: (610) 669-1000
Date of fiscal year end: October 31
Date of reporting period: November 1, 2008 – October 31, 2009
Item 1: Reports to Shareholders
 |
| Vanguard International Stock |
| Index Funds Annual Report |
|
|
| October 31, 2009 |
|
|
 |
|
|
| Vanguard European Stock Index Fund |
| Vanguard Pacific Stock Index Fund |
| Vanguard Emerging Markets Stock Index Fund |
|
|
> Global equity markets began to recover in March and continued to climb as earnings reports improved and investor confidence revived.
> For the fiscal year ended October 31, 2009, returns for Vanguard International Stock Index Funds ranged from about 23% for the Pacific Stock Index Fund to about 60% for the Emerging Markets Stock Index Fund.
> Most industry sectors recorded gains, with materials, industrials, and financials among the better performers.
| |
| Contents | |
| Your Fund’s Total Returns | 1 |
| President’s Letter | 4 |
| Results of Proxy Voting | 11 |
| European Stock Index Fund | 13 |
| Pacific Stock Index Fund | 37 |
| Emerging Markets Stock Index Fund | 62 |
| Your Fund’s After-Tax Returns | 94 |
| About Your Fund’s Expenses | 95 |
| Glossary | 98 |

Please note: The opinions expressed in this report are just that—informed opinions. They should not be considered promises or advice. Also, please keep in mind that the information and opinions cover the period through the date on the front of this report. Of course, the risks of investing in your fund are spelled out in the prospectus.
Cover photograph: Veronica Coia.
| | |
| Your Fund’s Total Returns | | |
| |
| |
| |
| |
| Fiscal Year Ended October 31, 2009 | | |
| | Ticker | Total |
| | Symbol | Returns |
| Vanguard European Stock Index Fund | | |
| Investor Shares | VEURX | 26.25% |
| Admiral™ Shares1 | VEUSX | 26.33 |
| Signal® Shares2 | VESSX | 26.34 |
| Institutional Shares3 | VESIX | 26.45 |
| ETF Shares4 | VGK | |
| Market Price | | 24.83 |
| Net Asset Value | | 26.33 |
| MSCI Europe Index | | 27.48 |
| European Region Funds Average5 | | 29.06 |
| |
| Vanguard Pacific Stock Index Fund | | |
| Investor Shares | VPACX | 23.23% |
| Admiral Shares1 | VPADX | 23.38 |
| Signal Shares2 | VPASX | 23.38 |
| Institutional Shares3 | VPKIX | 23.46 |
| ETF Shares4 | VPL | |
| Market Price | | 22.09 |
| Net Asset Value | | 23.38 |
| MSCI Pacific Index | | 28.32 |
| Japan/Pacific Region Funds Average5 | | 22.47 |
1 A lower-cost class of shares available to many longtime shareholders and to those with significant investments in the fund.
2 Signal Shares also carry lower costs and are available to certain institutional shareholders who meet specific administrative, service, and account-size criteria.
3 This class of shares carries low expenses and is available for a minimum initial investment of $5 million.
4 These Vanguard ETF® Shares are traded on the NYSE Arca exchange and are available only through brokers. The table shows the ETF returns based on both the NYSE Arca market price and the net asset value for a share. U.S. Pat. No. 6,879,964 B2; 7,337,138.
5 Derived from data provided by Lipper Inc.
1
| | |
| Your Fund’s Total Returns | | |
| |
| |
| |
| |
| Fiscal Year Ended October 31, 2009 | | |
| | Ticker | Total |
| | Symbol | Returns |
| Vanguard Emerging Markets Stock Index Fund | | |
| Investor Shares | VEIEX | 60.07% |
| Admiral Shares1 | VEMAX | 60.29 |
| Signal Shares2 | VERSX | 60.33 |
| Institutional Shares3 | VEMIX | 60.41 |
| ETF Shares4 | VWO | |
| Market Price | | 58.93 |
| Net Asset Value | | 60.28 |
| MSCI Emerging Markets Index | | 64.13 |
| Emerging Markets Funds Average5 | | 56.47 |
1 A lower-cost class of shares available to many longtime shareholders and to those with significant investments in the fund.
2 Signal Shares also carry lower costs and are available to certain institutional shareholders who meet certain administrative, service, and account-size criteria.
3 This class of shares carries low expenses and is available for a minimum initial investment of $5 million.
4 These Vanguard ETF® Shares are traded on the NYSE Arca exchange and are available only through brokers. The table shows the ETF returns based on both the NYSE Arca market price and the net asset value for a share. U.S. Pat. No. 6,879,964 B2; 7,337,138.
5 Derived from data provided by Lipper Inc.
2
| | | | |
| Your Fund’s Performance at a Glance | | |
| |
| |
| |
| |
| October 31, 2008–October 31, 2009 | | | | |
| | | | Distributions Per Share |
| | Starting | Ending | Income | Capital |
| | Share Price | Share Price | Dividends | Gains |
| European Stock Index Fund | | | | |
| Investor Shares | $21.99 | $25.77 | $1.497 | $0.000 |
| Admiral Shares | 51.71 | 60.51 | 3.616 | 0.000 |
| Signal Shares | 20.01 | 23.42 | 1.397 | 0.000 |
| Institutional Shares | 22.04 | 25.80 | 1.553 | 0.000 |
| ETF Shares | 41.37 | 48.41 | 2.901 | 0.000 |
| Pacific Stock Index Fund | | | | |
| Investor Shares | $7.94 | $9.61 | $0.140 | $0.000 |
| Admiral Shares | 52.04 | 62.95 | 1.007 | 0.000 |
| Signal Shares | 18.08 | 21.87 | 0.349 | 0.000 |
| Institutional Shares | 7.96 | 9.63 | 0.158 | 0.000 |
| ETF Shares | 42.10 | 50.92 | 0.823 | 0.000 |
| Emerging Markets Stock Index Fund | | | | |
| Investor Shares | $15.66 | $23.90 | $0.700 | $0.000 |
| Admiral Shares | 20.63 | 31.45 | 0.969 | 0.000 |
| Signal Shares | 19.85 | 30.26 | 0.938 | 0.000 |
| Institutional Shares | 15.71 | 23.94 | 0.754 | 0.000 |
| ETF Shares | 24.83 | 37.84 | 1.178 | 0.000 |
3

President’s Letter
Dear Shareholder,
As the world emerged from the worst global financial crisis since the 1930s, international stocks outpaced U.S. equities for the 2009 fiscal year. Governments’ fiscal policy and stimulus programs played key roles in the recovery. The recession receded in several major European countries, while the developing world’s economies, which had avoided much of the financial crisis fallout, continued to expand.
For the fiscal year ended October 31, 2009, the Vanguard International Stock Index Funds rallied strongly. The funds include three separate index funds: European, Pacific, and Emerging Markets. Vanguard Developed Markets Index Fund and its institutional counterpart, which previously were included in this report and invest in both European and Pacific markets, now are covered in a separate report.
Most international bourses participated in the rally, with emerging markets leading the charge. Vanguard Emerging Markets Stock Index Fund climbed about 60%. Although not as dramatic, the results of the European and Pacific developed markets were also notable. Vanguard European Stock Index Fund rose about 26%, and Vanguard Pacific Stock Index Fund returned about 23%. Also during the period, the U.S. dollar depreciated 13% against the euro and 9% against the yen, an advantage for our funds’ U.S.-based investors in European and Pacific markets, respectively.
4
All three funds succeeded in capturing the returns of their respective target indexes. However, because of temporary price differences arising from fair-value pricing policies (please see the text box on page 9), the funds’ returns appear to have diverged from those of their benchmarks, which are not adjusted for fair value.
If you own one or more of the funds in a taxable account, you may wish to review the details of the funds’ after-tax returns on page 94.
A vicious bear market quickly turned bullish
A year ago, the global financial system stood on the brink of collapse as the expanding U.S. credit crisis precipitated the deepest worldwide recession since World War II. Since then, markets have pulled back from the depths and, in fact, have rallied impressively. Although U.S. unemployment has risen to double digits and signs of a robust recovery are hard to find, the global economy has begun to revive. For the first time in more than a year, U.S. gross domestic product registered growth, as reported by the Commerce Department for the third quarter of calendar 2009.
U.S. stocks recorded positive returns for the fiscal year ended October 31 as the market’s losses during the first four months of the period—marking the final plunge of a historic bear market—were erased by a remarkable rally beginning in March. Global stocks did even better, thanks to some renewed strength in
| | | |
| Market Barometer | | | |
| | | Average Annual Total Returns |
| | | Periods Ended October 31, 2009 |
| | One Year | Three Years | Five Years |
| Stocks | | | |
| MSCI All Country World Index ex USA (International) | 34.79% | –2.49% | 7.58% |
| Russell 1000 Index (Large-caps) | 11.20 | –6.84 | 0.71 |
| Russell 2000 Index (Small-caps) | 6.46 | –8.51 | 0.59 |
| Dow Jones U.S. Total Stock Market Index | 11.34 | –6.55 | 1.06 |
| |
| Bonds | | | |
| Barclays Capital U.S. Aggregate Bond Index | | | |
| (Broad taxable market) | 13.79% | 6.35% | 5.05% |
| Barclays Capital Municipal Bond Index | 13.60 | 4.17 | 4.15 |
| Citigroup 3-Month Treasury Bill Index | 0.28 | 2.50 | 2.94 |
| |
| CPI | | | |
| Consumer Price Index | –0.18% | 2.32% | 2.52% |
5
developed markets and a powerful upswing in emerging markets that actually had some prognosticators worrying about a new asset bubble. Reminders of the markets’ travails are nevertheless apparent in the index returns for the past three years, where negative figures are the rule. Even the five-year returns for U.S. stocks as of October 31 are barely positive, further evidence of the long-term damage done by the collapse of the real estate bubble.
The bond market experienced an equally dramatic turnaround
The stock market’s rapid fall and recovery were matched by an equally dramatic turnaround in the bond market. At the
| |
| Expense Ratios1 | |
| Your Fund Compared With Its Peer Group | |
| | Expense |
| | Ratio |
| European Stock Index Fund | |
| Investor Shares | 0.29% |
| Admiral Shares | 0.18 |
| Signal Shares | 0.18 |
| Institutional Shares | 0.13 |
| ETF Shares | 0.18 |
| European Region Funds Average | 1.34 |
| |
| Pacific Stock Index Fund | |
| Investor Shares | 0.29% |
| Admiral Shares | 0.18 |
| Signal Shares | 0.18 |
| Institutional Shares | 0.13 |
| ETF Shares | 0.18 |
| Japan/Pacific Region Funds Average | 1.57 |
| |
| Emerging Markets Stock Index Fund | |
| Investor Shares | 0.39% |
| Admiral Shares | 0.27 |
| Signal Shares | 0.27 |
| Institutional Shares | 0.20 |
| ETF Shares | 0.27 |
| Emerging Markets Funds Average | 1.73 |
1 The fund expense ratios shown are from the prospectuses dated February 27, 2009, and represent estimated costs for the current fiscal year based on each fund’s net assets as of the prospectus date. For the fiscal year ended October 31, 2009, the European Stock Index Fund’s expense ratios were 0.27% for Investor Shares, 0.16% for Admiral Shares, 0.16% for Signal Shares, 0.12% for Institutional Shares, and 0.16% for ETF Shares. The Pacific Stock Index Fund’s expense ratios were 0.27% for Investor Shares, 0.16% for Admiral Shares, 0.16% for Signal Shares, 0.12% for Institutional Shares, and 0.16% for ETF Shares. The Emerging Markets Stock Index Fund’s expense ratios were 0.40% for Investor Shares, 0.27% for Admiral Shares, 0.27% for Signal Shares, 0.23% for Institutional Shares, and 0.27% for ETF Shares.
The peer-group expense ratios are derived from data provided by Lipper Inc. and capture information through year-end 2008.
6
end of 2008, as the credit markets virtually shut down, risk-averse investors flocked to U.S. Treasury bonds. The effect was to widen the difference between the lower yields of Treasuries and the higher yields of corporate bonds to a margin not seen since the Great Depression.
Central banks around the world responded to the economic slowdown by lowering interest rates and implementing other aggressive stimulus programs. Meanwhile, governments boosted spending in hopes of reversing the recessionary tide. As fears of a worldwide depression eased, investors’ appetite for risk returned to more normal levels. The receding pessimism raised demand for corporate bonds, pushing up their prices and bringing down their yields. Over the past 12 months, both taxable and municipal bonds returned more than 13%.
However, the Fed’s easy-money campaign had a predictable effect on short-term savings vehicles such as money market funds, whose yields track prevailing short-term rates. In December 2008, the Fed reduced its target for the federal funds rate, a benchmark for the interest rates paid by money market instruments and other very short-term securities, to between 0% and 0.25%. The Fed has said it expects to maintain its target at this level “for an extended period.”
| |
| Total Returns | |
| Ten Years Ended October 31, 2009 | |
| | Average |
| | Annual Return |
| European Stock Index Fund Investor Shares | 2.83% |
| MSCI Europe Index | 2.80 |
| European Region Funds Average1 | 2.96 |
| Pacific Stock Index Fund Investor Shares | 0.08% |
| MSCI Pacific Index | 0.42 |
| Japan/Pacific Region Funds Average1 | –2.46 |
| Emerging Markets Stock Index Fund Investor Shares | 11.14% |
| Spliced Emerging Markets Index2 | 11.64 |
| Emerging Markets Funds Average1 | 10.64 |
The figures shown represent past performance, which is not a guarantee of future results. (Current performance may be lower or higher than the performance data cited. For performance data current to the most recent month-end, visit our website at www.vanguard.com/performance.) Note, too, that both investment returns and principal value can fluctuate widely, so an investor’s shares, when sold, could be worth more or less than their original cost.
1 Derived from data provided by Lipper Inc.
2 Select Emerging Markets Index through August 23, 2006; MSCI Emerging Markets Index thereafter.
7
Emerging markets pace strong global recovery
Emerging markets, the most volatile of international stocks, enjoyed the greatest gains during the fiscal period after sliding the most a year earlier.
The Emerging Markets Stock Index Fund returned about 60%, propelled by its holdings in China and Brazil, which represented, on average, approximately one-third of the fund’s assets. Stocks from China, the fund’s largest market, rose about 82%, while stocks from Brazil advanced about 92%. Brazil’s economic recovery was tied to commodities, where oil and iron ore drove returns.
China’s government stimulus and fiscal policy took hold with great speed and effect, compared with more developed parts of the world. Government spending was also an impetus in Brazil, where domestic demand was strong. Gains from India (about +77%), South Africa (about +62%), Taiwan (about +48%), and South Korea (about +56%) also sparked the fund.
The recovery in emerging markets was broad-based and encompassed all ten industry sectors. Financials, the fund’s most significant sector weighting, advanced nearly 82%. Banks, especially, contributed to the return, rebounding off their lows as the global economy showed signs of stabilization. The materials and energy sectors each contributed more than 10% to the fund’s return.
European markets shared in gains
European markets also produced significant returns for the fiscal year, although the increases lacked the breadth, depth, and speed of their emerging market counter- parts: The European Stock Index Fund returned about 26%.
In the United Kingdom, which has been slow to shake the global recession, stocks still advanced almost 24%. U.K. stocks, on average, accounted for more than 30% of the European Stock Index Fund’s country weighting during the period. France and Germany, which also account for hefty fund weightings, made strong contributions, as did Spain (returning nearly +56%) and Sweden (almost +70%).
All ten industry sectors in the fund had positive returns for the fiscal period. Financials, the largest sector, was a key driver, as banks, insurance companies, and investment firms all bounced back from the crisis. Industrials and materials each gained about 45%, reflecting demand in the improved economy.
Australia, Japan fuel improvement in Pacific
While the Pacific Stock Index Fund brought up the rear among the three geographic regions, its return of about 23% for the fiscal period was still a major improvement from the year earlier and an indication that a recovery is well underway.
8
|
| A note on fair-value pricing |
An index fund’s return sometimes may appear to diverge from the
return of its benchmark index a bit more than would be expected. This
may be the result of a fair-value pricing adjustment. |
|
|
|
|
|
| |
These adjustments address pricing discrepancies that may arise because
of time-zone differences among global stock markets. Foreign stocks
may trade on exchanges that close many hours before a fund’s closing
share price is calculated in the United States, generally at 4 p.m.,
Eastern time. In the hours between the foreign close and the U.S. close,
the value of these foreign securities may change—because of company-
specific announcements or market- wide developments, for example.
Such price changes are not immediately reflected in
international index values. |
|
|
|
|
|
|
|
|
|
|
|
|
|
|
|
|
| |
Fair-value pricing takes such changes into account in calculating the fund’s
daily net asset value, thus ensuring that the NAV doesn’t include “stale”
prices. The result can be a temporary divergence between the return of
the fund and that of its benchmark index—a difference that usually
corrects itself when the foreign markets reopen. |
|
|
|
|
|
|
|
|
|
Australia, which is dwarfed by Japan in terms of the Pacific Stock Index Fund’s country weightings, still made the greatest contribution to return. Signaling the Australian economy’s solid footing, the Reserve Bank of Australia has already begun increasing its key interest rates. Australian financial and materials stocks rose more than 70% for the fiscal year. Japan, which accounted for about 70% of the value of developed markets in the Pacific, on average, during the period, also saw a strong stock market performance. Its recovery was bolstered by the consumer discretionary, industrials, and information technology sectors.
Most of the Pacific region’s ten industry sectors saw positive gains. The performance of financial stocks, the heaviest weighting in the Pacific Stock Index Fund, reflected the role of banks and investment firms in the economic recovery. Materials stocks rose about 52%, proof of the strong demand for commodities.
The funds’ long-term results align with their benchmarks
During a decade that featured extra-ordinary turmoil and two savage bear markets, Vanguard International Stock Index Funds met their objectives of tracking their respective benchmarks. The Pacific Stock Index Fund and the Emerging Markets Stock Index Fund also exceeded the average annual returns of their respective peer groups for the decade ended October 31, 2009. The
9
European Stock Index Fund came within a fraction of matching the average returns of its respective peer group.
While the investment environment has been volatile and the future is unpredictable, we’re confident that Vanguard Quantitative Equity Group’s expert and disciplined index fund management will help the funds continue to capture the returns of their benchmark indexes. Our funds’ extremely low costs also ensure that you keep more of the funds’ returns.
International stocks have place in diversified program
Investors dealt with two market extremes over the past fiscal year. Through the final months of 2008 and the first months of 2009, stock markets around the world slid as the global financial crisis intensified and credit markets remained gridlocked. In March, however, markets found a bottom and began to rise on positive economic news and investors’ newfound optimism.
Investors who maintain a long-term view realize that financial markets inevitably experience volatility from time to time, and that the market’s inherent risk is, paradoxically, a source of its potential rewards. Although such uncertainty can be hard to live with, it can be managed. To that end, Vanguard has long counseled investors to create a broadly-diversified investment program that considers their time horizon, risk tolerance, and long-term goals. Such a program may include U.S. stock funds and international funds as well as bond and money market funds.
International stocks––and economies––often behave differently than their U.S. counterparts. Diversification can add value so long as a portfolio’s asset classes do not march completely in sync; Vanguard’s research furthermore indicates that international equities can diversify your portfolio over the long term. As part of a well-balanced portfolio, Vanguard International Stock Index Funds offer exposure to foreign economic opportunities, potentially helping you meet your long-term investing goals.
Thank you for your confidence in Vanguard.
Sincerely,

F. William McNabb III
President and Chief Executive Officer
November 17, 2009
10
Results of Proxy Voting
At a special meeting of shareholders on July 2, 2009, fund shareholders approved the following two proposals:
Proposal 1—Elect trustees for each fund.*
The individuals listed in the table below were elected as trustees for each fund. All trustees with the exception of Messrs. McNabb and Volanakis (both of whom already served as directors of The Vanguard Group, Inc.) served as trustees to the funds prior to the shareholder meeting.
European Stock Index Fund, Pacific Stock Index Fund, Emerging Markets Stock Index Fund
| | | |
| | | | Percentage |
| Trustee | For | Withheld | For |
| John J. Brennan | 1,604,062,236 | 36,846,078 | 97.8% |
| Charles D. Ellis | 1,594,488,732 | 46,419,583 | 97.2% |
| Emerson U. Fullwood | 1,603,672,430 | 37,235,884 | 97.7% |
| Rajiv L. Gupta | 1,604,092,353 | 36,815,961 | 97.8% |
| Amy Gutmann | 1,605,214,829 | 35,693,485 | 97.8% |
| JoAnn Heffernan Heisen | 1,605,059,287 | 35,849,028 | 97.8% |
| F. William McNabb III | 1,605,657,176 | 35,251,138 | 97.9% |
| André F. Perold | 1,602,313,073 | 38,595,241 | 97.6% |
| Alfred M. Rankin, Jr. | 1,604,909,324 | 35,998,991 | 97.8% |
| Peter F. Volanakis | 1,607,261,150 | 33,647,165 | 97.9% |
| * Results are for all funds within the same trust. | | | |
Proposal 2—Update and standardize the funds’ fundamental policies regarding:
(a) Purchasing and selling real estate.
(b) Issuing senior securities.
(c) Borrowing money.
(d) Making loans.
(e) Purchasing and selling commodities.
(f) Concentrating investments in a particular industry or group of industries.
(g) Eliminating outdated fundamental investment policies not required by law.
The revised fundamental policies are clearly stated and simple, yet comprehensive, making oversight and compliance more efficient than under the former policies. The revised fundamental policies will allow the funds to respond more quickly to regulatory and market changes, while avoiding the costs and delays associated with successive shareholder meetings.
11
| | | | | |
| | | | | Broker | Percentage |
| Vanguard Fund | For | Abstain | Against | Non-Votes | For |
| European Stock Index Fund | | | | | |
| 2a | 449,587,070 | 6,694,799 | 19,907,448 | 27,765,178 | 89.2% |
| 2b | 447,911,380 | 7,823,384 | 20,454,555 | 27,765,177 | 88.9% |
| 2c | 444,968,986 | 7,208,152 | 24,012,179 | 27,765,178 | 88.3% |
| 2d | 446,185,109 | 7,285,760 | 22,718,448 | 27,765,179 | 88.5% |
| 2e | 446,201,350 | 7,143,870 | 22,844,095 | 27,765,180 | 88.5% |
| 2f | 447,937,500 | 7,202,447 | 21,049,370 | 27,765,178 | 88.9% |
| 2g | 459,786,579 | 6,983,326 | 9,419,408 | 27,765,182 | 91.2% |
| |
| Pacific Stock Index Fund | | | | | |
| 2a | 540,963,604 | 7,690,230 | 12,221,364 | 28,821,242 | 91.7% |
| 2b | 538,425,086 | 8,992,002 | 13,458,112 | 28,821,241 | 91.3% |
| 2c | 535,901,138 | 8,417,072 | 16,556,989 | 28,821,241 | 90.9% |
| 2d | 533,579,704 | 8,646,478 | 18,649,016 | 28,821,242 | 90.5% |
| 2e | 537,546,205 | 8,027,864 | 15,301,130 | 28,821,241 | 91.2% |
| 2f | 536,227,575 | 8,254,408 | 16,393,220 | 28,821,237 | 90.9% |
| 2g | 540,280,493 | 7,996,449 | 12,598,259 | 28,821,239 | 91.6% |
| |
| Emerging Markets Stock Index Fund | | | | |
| 2a | 388,719,118 | 7,531,404 | 6,900,423 | 48,533,077 | 86.1% |
| 2b | 387,193,597 | 8,261,534 | 7,695,811 | 48,533,079 | 85.7% |
| 2c | 385,338,336 | 8,173,616 | 9,638,997 | 48,533,073 | 85.3% |
| 2d | 385,609,852 | 8,235,418 | 9,305,677 | 48,533,075 | 85.4% |
| 2e | 386,760,940 | 7,817,547 | 8,572,457 | 48,533,077 | 85.6% |
| 2f | 387,408,468 | 7,780,086 | 7,962,391 | 48,533,076 | 85.8% |
| 2g | 389,626,967 | 7,799,374 | 5,724,603 | 48,533,078 | 86.3% |
Fund shareholders did not approve this proposal:
Proposal 3—Institute procedures to prevent holding investments in companies that, in the judgment of the board, substantially contribute to genocide or crimes against humanity, the most egregious violations of human rights.
The trustees recommended a vote against the proposal because it called for procedures that duplicate existing practices and procedures of the Vanguard funds.
| | | | | |
| | | | | Broker | Percentage |
| Vanguard Fund | For | Abstain | Against | Non-Votes | For |
| European Stock Index Fund | 48,802,729 | 10,916,197 | 416,469,651 | 27,765,918 | 9.7% |
| Pacific Stock Index Fund | 51,017,822 | 13,812,709 | 496,044,659 | 28,821,251 | 8.7% |
| Emerging Markets | | | | | |
| Stock Index Fund | 32,187,780 | 16,796,684 | 354,081,177 | 48,618,380 | 7.1% |
12
European Stock Index Fund
Fund Profile
As of October 31, 2009
| | | |
| Portfolio Characteristics | | |
| | | Target | Broad |
| | Fund | Index1 | Index2 |
| Number of Stocks | 483 | 467 | 1,806 |
| Turnover Rate | 18% | — | — |
| Expense Ratio3 | | — | — |
| Investor Shares | 0.29% | | |
| Admiral Shares | 0.18% | | |
| Signal Shares | 0.18% | | |
| Institutional Shares | 0.13% | | |
| ETF Shares | 0.18% | | |
| Short-Term Reserves | 0.1% | — | — |
| | | |
| Sector Diversification (% of equity exposure) |
| | | Target | Broad |
| | Fund | Index1 | Index2 |
| Consumer Discretionary | 7.3% | 7.3% | 8.3% |
| Consumer Staples | 12.1 | 12.1 | 8.6 |
| Energy | 11.4 | 11.4 | 11.2 |
| Financials | 25.0 | 25.0 | 26.6 |
| Health Care | 10.1 | 10.1 | 6.4 |
| Industrials | 9.3 | 9.3 | 9.8 |
| Information Technology | 2.8 | 2.8 | 6.5 |
| Materials | 8.5 | 8.5 | 11.2 |
| Telecommunication | | | |
| Services | 7.2 | 7.2 | 6.4 |
| Utilities | 6.3 | 6.3 | 5.0 |
| | |
| Volatility Measures4 | |
| | Fund Versus | Fund Versus |
| | Target Index1 | Broad Index2 |
| R-Squared | 0.98 | 0.96 |
| Beta | 1.02 | 1.01 |
| | |
| Ten Largest Holdings5 (% of total net assets) |
| |
| HSBC Holdings PLC | diversified banks | 2.9% |
| Royal Dutch Shell PLC | integrated oil | |
| | and gas | 2.8 |
| BP PLC | integrated oil | |
| | and gas | 2.7 |
| Nestle SA | packaged foods | |
| | and meats | 2.6 |
| Banco Santander SA | diversified banks | 2.0 |
| Total SA | integrated oil | |
| | and gas | 1.9 |
| Telefonica SA | integrated | |
| | telecommunication | |
| | services | 1.8 |
| Vodafone Group PLC | wireless | |
| | telecommunication | |
| | services | 1.8 |
| Roche Holdings AG | pharmaceuticals | 1.7 |
| Novartis AG | pharmaceuticals | 1.7 |
| Top Ten | | 21.9% |
| | |
| Market Diversification (% of equity exposure) |
| | | Target |
| | Fund | Index1 |
| United Kingdom | 32.0% | 31.9% |
| France | 16.1 | 16.1 |
| Germany | 12.0 | 11.9 |
| Switzerland | 11.7 | 11.8 |
| Spain | 7.1 | 7.1 |
| Italy | 5.4 | 5.4 |
| Sweden | 3.9 | 4.0 |
| Netherlands | 3.8 | 3.8 |
| Finland | 1.7 | 1.7 |
| Belgium | 1.5 | 1.5 |
| Denmark | 1.3 | 1.3 |
| Norway | 1.1 | 1.1 |
| Greece | 1.0 | 1.0 |
| Other European Markets | 1.4 | 1.4 |
1 MSCI Europe Index.
2 MSCI All Country World Index ex USA.
3 The expense ratios shown are from the prospectuses dated February 27, 2009, and represent estimated costs for the current fiscal year based on the fund’s net assets as of the prospectus date. For the fiscal year ended October 31,2009, the expense ratios were 0.27% for Investor Shares, 0.16% for Admiral Shares, 0.16% for Signal Shares, 0.12% for Institutional Shares, and 0.16% for ETF Shares.
4 For an explanation of R-squared, beta, and other terms used here, see the Glossary.
5 The holdings listed exclude any temporary cash investments and equity index products.
13
European Stock Index Fund
Performance Summary
All of the returns in this report represent past performance, which is not a guarantee of future results that may be achieved by the fund. (Current performance may be lower or higher than the performance data cited. For performance data current to the most recent month-end, visit our website at www.vanguard.com/performance.) Note, too, that both investment returns and principal value can fluctuate widely, so an investor’s shares, when sold, could be worth more or less than their original cost. The returns shown do not reflect taxes that a shareholder would pay on fund distributions or on the sale of fund shares.
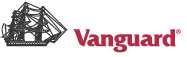
Cumulative Performance: October 31, 1999–October 31, 2009
Initial Investment of $10,000
| | | | |
| | | Average Annual Total Returns | Final Value |
| | | Periods Ended October 31, 2009 | of a $10,000 |
| | One Year | Five Years | Ten Years | Investment |
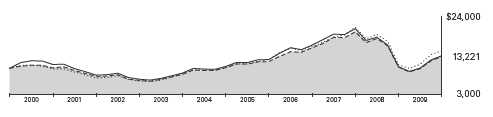
| European Stock Index Fund Investor Shares1 | 26.25% | 5.31% | 2.83% | $13,221 |
| MSCI All Country World Index ex USA | 34.79 | 7.58 | 3.95 | 14,733 |
| MSCI Europe Index | 27.48 | 5.36 | 2.80 | 13,181 |
| European Region Funds Average2 | 29.06 | 5.02 | 2.96 | 13,391 |
| | | | |
| | | | | Final Value of |
| | | | Since | a $100,000 |
| | One Year | Five Years | Inception3 | Investment |
| European Stock Index Fund Admiral Shares1 | 26.33% | 5.41% | 5.56% | $155,938 |
| MSCI All Country World Index ex USA | 34.79 | 7.58 | 7.53 | 181,578 |
| MSCI Europe Index | 27.48 | 5.36 | 5.48 | 155,046 |
| | | |
| | | | Final Value of |
| | | Since | a $10,000,000 |
| | One Year | Inception3 | Investment |
| European Stock Index Fund Signal Shares1 | 26.34% | –4.09% | $8,797,173 |
| MSCI All Country World Index ex USA | 34.79 | –1.44 | 9,565,146 |
| MSCI Europe Index | 27.48 | –4.08 | 8,799,042 |
1 Total returns do not reflect the 0.50% transaction fee on purchases through March 31, 2000; the 2% fee assessed on redemptions of shares purchased or after June 27, 2003, and held for less than two months; or, for the Investor Shares, the account service fee that may be applicable to certain accounts with balances below $10,000.
2 Derived from data provided by Lipper Inc.
3 Performance for the fund and its comparative standards is calculated since the following inception dates: August 13, 2001, for the Admiral
Shares and October 6, 2006, for the Signal Shares.
14
| | | | |
| European Stock Index Fund | | | | |
| |
| |
| |
| |
| | | | | Final Value of |
| | | | Since | a $5,000,000 |
| | One Year | Five Years | Inception1 | Investment |
| European Stock Index Fund Institutional Shares2 | 26.45% | 5.47% | 2.37% | $6,241,998 |
| MSCI All Country World Index ex USA | 34.79 | 7.58 | 3.66 | 7,025,394 |
| MSCI Europe Index | 27.48 | 5.36 | 2.26 | 6,179,231 |
| |
| | | | | Final Value of |
| | | | Since | a $10,000 |
| | One Year | | Inception1 | Investment |
| European Stock Index Fund ETF Shares | | | | |
| Net Asset Value3 | 26.33% | | 2.37% | $11,153 |
| MSCI All Country World Index ex USA | 34.79 | | 4.65 | 12,357 |
| MSCI Europe Index | 27.48 | | 2.31 | 11,125 |
| |
| |
| Cumulative Returns: ETF Shares, March 4, 2005–October 31, 2009 | | |
| | | | | Since |
| | | | One Year | Inception1 |
| European Stock Index Fund ETF Shares Market Price | | | 24.83% | 11.31% |
| European Stock Index Fund ETF Shares Net Asset Value | | 26.33 | 11.53 |
| MSCI Europe Index | | | 27.48 | 11.25 |
1 Performance for the fund and its comparative standards is calculated since the following inception dates: May 15, 2000, for the Institutional Shares and March 4, 2005, for the ETF Shares.
2 Total returns do not reflect the 2% fee assessed on redemptions of shares purchased on or after June 27, 2003, and held for less than two months.
3 For more information about how the ETF Shares’ market prices have compared with their net asset value, visit www.vanguard.com, select your ETF, and then select the Performance tab. The Premium/Discount table there shows the percentages of days on which the ETF Shares’ market price was above or below the NAV.
15
European Stock Index Fund
Fiscal-Year Total Returns (%): October 31, 1999–October 31, 2009
Average Annual Total Returns: Periods Ended September 30, 2009
This table presents average annual total returns through the latest calendar quarter—rather than through the end
of the fiscal period. Securities and Exchange Commission rules require that we provide this information.
| | | | |
| | Inception Date | One Year | Five Years | Ten Years |
| European Stock Index Fund | | | | |
| Investor Shares1 | 6/18/1990 | 0.91% | 6.51% | 3.42% |
| Admiral Shares1 | 8/13/2001 | 1.03 | 6.62 | 5.902 |
| Signal Shares1 | 10/6/2006 | 1.02 | –3.512 | — |
| Institutional Shares1 | 5/15/2000 | 1.12 | 6.67 | 2.632 |
| ETF Shares | 3/4/2005 | | | |
| Market Price | | –0.08 | 2.872 | — |
| Net Asset Value | | 1.04 | 2.902 | — |
1 Total returns do not reflect the 0.50% transaction fee on purchases through March 31, 2000; the 2% fee assessed on redemptions of shares purchased on or after June 27, 2003, and held for less than two months; or, for the Investor Shares, the account service fee that may be applicable to certain accounts with balances below $10,000.
2 Returns since inception.
Note: See Financial Highlights tables for dividend and capital gains information.
16
European Stock Index Fund
Financial Statements
Statement of Net Assets
As of October 31, 2009
The fund reports a complete list of its holdings in regulatory filings four times in each fiscal year, at the quarter-ends. For the second and fourth fiscal quarters, the lists appear in the fund’s semiannual and annual reports to shareholders. For the first and third fiscal quarters, the fund files the lists with the Securities and Exchange Commission on Form N-Q. Shareholders can look up the fund’s Forms N-Q on the SEC’s website at www.sec.gov. Forms N-Q may also be reviewed and copied at the SEC’s Public Reference Room (see the back cover of this report for further information).
| | | |
| | | | Market |
| | | | Value• |
| | | Shares | ($000) |
| Common Stocks (98.7%)1 | | |
| Austria (0.5%) | | |
| ^ | Erste Group Bank AG | 293,984 | 11,819 |
| | OMV AG | 250,980 | 10,342 |
| | Telekom Austria AG | 542,073 | 8,880 |
| | Voestalpine AG | 198,485 | 6,787 |
| | Verbund–Oesterreichische | | |
| | Elektrizitaetswirtschafts | | |
| | AG Class A | 131,244 | 5,892 |
| ^ | Raiffeisen International | | |
| | Bank Holding AG | 91,348 | 5,357 |
| | Vienna Insurance Group | 63,811 | 3,595 |
| | | | 52,672 |
| Belgium (1.5%) | | |
| | Anheuser-Busch InBev NV | 1,214,927 | 57,041 |
| * | Fortis | 3,741,094 | 16,175 |
| | Groupe Bruxelles | | |
| | Lambert SA | 136,404 | 12,022 |
| * | KBC Groep NV | 270,316 | 11,571 |
| | Delhaize Group SA | 169,324 | 11,502 |
| | Solvay SA Class A | 100,805 | 9,899 |
| | Belgacom SA | 255,659 | 9,575 |
| ^,* | Dexia SA | 898,673 | 7,470 |
| ^ | UCB SA | 171,442 | 7,319 |
| | Colruyt SA | 25,429 | 6,051 |
| | Umicore | 193,924 | 5,890 |
| | Mobistar SA | 50,221 | 3,450 |
| | Nationale A Portefeuille | 55,508 | 2,901 |
| | | | 160,866 |
| Denmark (1.3%) | | |
| | Novo Nordisk A/S Class B | 754,588 | 46,880 |
| * | Vestas Wind Systems A/S | 343,586 | 24,098 |
| * | Danske Bank A/S | 764,739 | 17,563 |
| | Carlsberg A/S Class B | 181,438 | 12,720 |
| | A P Moller - Maersk A/S | | |
| | Class B | 1,861 | 12,707 |
| | Novozymes A/S | 77,965 | 7,132 |
| | A P Moller–Maersk A/S | 910 | 6,051 |
| * | DSV A/S | 349,453 | 5,432 |
| * | Topdanmark A/S | 24,179 | 3,486 |
| | | |
| | | | Market |
| | | | Value• |
| | | Shares | ($000) |
| | Coloplast A/S Class B | 38,634 | 3,154 |
| | TrygVesta A/S | 39,243 | 2,828 |
| ^,* | William Demant Holding | 39,131 | 2,782 |
| | H Lundbeck A/S | 97,327 | 1,885 |
| | | | 146,718 |
| Finland (1.7%) | | |
| | Nokia Oyj | 6,304,831 | 79,638 |
| | Fortum Oyj | 751,563 | 17,789 |
| | Sampo Oyj | 708,275 | 16,953 |
| | UPM-Kymmene Oyj | 880,485 | 10,567 |
| | Kone Oyj Class B | 259,530 | 9,690 |
| | Stora Enso Oyj | 977,820 | 7,401 |
| | Metso Oyj | 215,974 | 6,031 |
| | Wartsila Oyj | 142,056 | 5,142 |
| | Elisa Oyj | 229,254 | 4,440 |
| ^ | Neste Oil Oyj | 215,268 | 3,807 |
| | Nokian Renkaat Oyj | 175,010 | 3,734 |
| | Kesko Oyj Class B | 108,888 | 3,624 |
| | Outokumpu Oyj | 199,831 | 3,304 |
| | Rautaruukki Oyj | 138,843 | 2,830 |
| | Orion Oyj Class B | 148,904 | 2,830 |
| | Pohjola Bank PLC | 227,417 | 2,527 |
| ^ | Sanoma Oyj | 134,457 | 2,482 |
| | | | 182,789 |
| France (15.9%) | | |
| | Total SA | 3,593,950 | 215,063 |
| | Sanofi-Aventis SA | 1,772,391 | 129,920 |
| ^ | BNP Paribas | 1,549,099 | 116,700 |
| | GDF Suez | 2,032,496 | 84,973 |
| | France Telecom SA | 3,080,536 | 76,332 |
| | AXA SA | 2,637,780 | 65,602 |
| ^ | Societe Generale | 955,134 | 63,440 |
| | Groupe Danone SA | 927,516 | 55,720 |
| | Vivendi | 1,973,995 | 54,763 |
| | ArcelorMittal | 1,448,273 | 49,013 |
| | Carrefour SA | 1,068,815 | 45,876 |
| | Air Liquide SA | 420,782 | 45,318 |
| | LVMH Moet Hennessy | | |
| | Louis Vuitton SA | 412,405 | 42,705 |
| | L’Oreal SA | 403,044 | 41,210 |
17
| | | |
| European Stock Index Fund | | |
| |
| |
| |
| | | | Market |
| | | | Value• |
| | | Shares | ($000) |
| | Schneider Electric SA | 393,253 | 40,894 |
| | Vinci SA | 710,982 | 37,105 |
| | Unibail-Rodamco SE | 137,118 | 30,364 |
| | Cie de Saint-Gobain | 619,833 | 30,204 |
| | Credit Agricole SA | 1,497,122 | 28,678 |
| | Lafarge SA | 337,684 | 27,410 |
| | Pernod-Ricard SA | 326,883 | 27,232 |
| | Alstom SA | 340,470 | 23,591 |
| | EDF SA | 398,463 | 22,209 |
| | Veolia Environnement | 634,824 | 20,739 |
| | Cie Generale d’Optique | | |
| | Essilor International SA | 337,223 | 18,881 |
| | Compagnie Generale | | |
| | des Etablissements | | |
| | Michelin Class B | 244,255 | 18,094 |
| | Bouygues SA | 375,847 | 17,699 |
| * | Alcatel-Lucent | 3,912,683 | 14,653 |
| | Vallourec SA | 90,995 | 14,327 |
| * | Renault SA | 311,822 | 13,954 |
| | PPR | 127,508 | 13,896 |
| | European Aeronautic | | |
| | Defence and | | |
| | Space Co. NV | 688,468 | 12,892 |
| ^ | Hermes International | 88,880 | 12,360 |
| | Accor SA | 241,645 | 11,572 |
| | Cap Gemini SA | 246,794 | 11,433 |
| | Technip SA | 176,782 | 11,091 |
| | Christian Dior SA | 106,556 | 10,627 |
| | SES SA | 479,836 | 10,397 |
| | Suez Environnement Co. | 454,321 | 10,096 |
| | STMicroelectronics NV | 1,144,740 | 9,187 |
| | Sodexo | 160,152 | 9,146 |
| | Lagardere SCA | 197,502 | 8,923 |
| * | Peugeot SA | 254,160 | 8,279 |
| * | Natixis | 1,473,762 | 8,279 |
| | Publicis Groupe | 200,650 | 7,624 |
| | Casino Guichard | | |
| | Perrachon SA | 92,826 | 7,376 |
| | Thales SA | 151,404 | 7,336 |
| | SCOR SE | 282,546 | 7,191 |
| | Klepierre | 153,049 | 6,344 |
| | Dassault Systemes SA | 108,667 | 6,271 |
| | CNP Assurances | 62,997 | 6,088 |
| | Eutelsat Communications | 166,028 | 5,277 |
| | Safran SA | 315,873 | 5,096 |
| * | Cie Generale de | | |
| | Geophysique-Veritas | 245,161 | 4,855 |
| | Legrand SA | 173,381 | 4,703 |
| | Neopost SA | 52,764 | 4,618 |
| | Bureau Veritas SA | 81,373 | 4,481 |
| | Fonciere Des Regions | 38,780 | 4,274 |
| | Aeroports de Paris | 48,939 | 3,715 |
| ^ | Eiffage SA | 68,098 | 3,710 |
| * | Atos Origin SA | 77,465 | 3,627 |
| | ICADE | 33,447 | 3,521 |
| * | Air France-KLM | 224,251 | 3,438 |
| | | |
| | | | Market |
| | | | Value• |
| | | Shares | ($000) |
| | Gecina SA | 31,492 | 3,350 |
| | Imerys SA | 56,457 | 3,095 |
| | Societe Television Francaise | 1195,868 | 3,075 |
| | Societe BIC SA | 43,936 | 3,049 |
| ^ | Iliad SA | 26,802 | 2,902 |
| | Eurazeo | 45,615 | 2,869 |
| | Societe Des Autoroutes | | |
| | Paris-Rhin-Rhone | 37,490 | 2,816 |
| ^ | Eramet | 8,941 | 2,784 |
| | PagesJaunes Groupe | 215,947 | 2,646 |
| | M6-Metropole Television | 106,342 | 2,561 |
| | BioMerieux | 22,413 | 2,488 |
| * | JC Decaux SA | 110,496 | 2,234 |
| | Ipsen SA | 41,635 | 2,121 |
| | | | 1,756,382 |
| Germany (11.8%) | | |
| | Siemens AG | 1,385,978 | 125,246 |
| | E.ON AG | 3,202,344 | 122,729 |
| | Bayer AG | 1,286,134 | 89,232 |
| | Allianz SE | 763,088 | 87,468 |
| | BASF SE | 1,553,779 | 83,174 |
| | Deutsche Bank AG | 996,344 | 72,386 |
| | Daimler AG | 1,349,920 | 65,570 |
| | SAP AG | 1,444,751 | 65,440 |
| | Deutsche Telekom AG | 4,773,422 | 65,231 |
| | RWE AG | 705,021 | 61,839 |
| | Muenchener | | |
| | Rueckversicherungs AG | 348,077 | 55,070 |
| | Bayerische Motoren | | |
| | Werke AG | 558,558 | 27,324 |
| | Linde AG | 256,540 | 26,926 |
| | Deutsche Boerse AG | 328,530 | 26,608 |
| ^ | Volkswagen AG | 149,727 | 24,346 |
| | Deutsche Post AG | 1,427,702 | 24,153 |
| | ThyssenKrupp AG | 563,668 | 18,157 |
| | Volkswagen AG Pfd. | 177,597 | 17,694 |
| | Fresenius Medical Care | | |
| | AG & Co. KGaA | 323,320 | 15,691 |
| | Adidas AG | 327,062 | 15,143 |
| | MAN SE | 177,733 | 14,636 |
| | HeidelbergCement AG | 236,392 | 14,140 |
| | Henkel AG & Co. | | |
| | KGaA Pfd. | 300,524 | 13,687 |
| | K&S AG | 248,612 | 13,571 |
| * | Commerzbank AG | 1,186,582 | 12,359 |
| | Porsche Automobil | | |
| | Holding SE | 147,323 | 11,269 |
| | Metro AG | 192,267 | 10,672 |
| | Merck KGaA | 108,597 | 10,209 |
| | Beiersdorf AG | 147,466 | 9,084 |
| | Henkel AG & Co. KGaA | 218,687 | 8,450 |
| * | Infineon Technologies AG | 1,788,003 | 8,051 |
| | Daimler AG | 166,896 | 8,049 |
| * | QIAGEN NV | 384,180 | 7,967 |
| | Fresenius SE Pfd. | 136,915 | 7,954 |
18
| | | |
| European Stock Index Fund | | |
| |
| |
| |
| | | | Market |
| | | | Value• |
| | | Shares | ($000) |
| | Deutsche Lufthansa AG | 385,290 | 5,949 |
| | Salzgitter AG | 66,145 | 5,946 |
| | Hochtief AG | 71,577 | 5,402 |
| | RWE AG | 64,321 | 5,047 |
| | GEA Group AG | 257,692 | 4,863 |
| * | Hannover | | |
| | Rueckversicherung AG | 102,776 | 4,633 |
| * | Deutsche Postbank AG | 147,242 | 4,560 |
| | Wacker Chemie AG | 25,765 | 3,702 |
| | Celesio AG | 145,602 | 3,612 |
| ^ | Solarworld AG | 138,509 | 2,998 |
| | Bayerische Motoren | | |
| | Werke AG Pfd. | 88,135 | 2,897 |
| | Fraport AG Frankfurt Airport | | |
| | Services Worldwide | 61,229 | 2,883 |
| * | United Internet AG | 209,668 | 2,730 |
| | Puma AG Rudolf | | |
| | Dassler Sport | 8,786 | 2,692 |
| | Fresenius SE | 46,652 | 2,324 |
| | Suedzucker AG | 109,658 | 2,267 |
| ^,* | TUI AG | 236,283 | 1,638 |
| | Hamburger Hafen | | |
| | und Logistik AG | 40,721 | 1,587 |
| | | | 1,305,255 |
| Greece (1.0%) | | |
| * | National Bank of Greece SA | 827,335 | 30,248 |
| * | Alpha Bank AE | 595,080 | 11,473 |
| | OPAP SA | 369,611 | 9,408 |
| * | Piraeus Bank SA | 507,184 | 8,744 |
| * | EFG Eurobank Ergasias SA | 539,272 | 8,542 |
| | Coca Cola Hellenic | | |
| | Bottling Co. SA | 306,492 | 7,988 |
| * | National Bank of | | |
| | Greece SA ADR | 1,024,141 | 7,446 |
| | Bank of Cyprus | | |
| | Public Co. Ltd. | 917,432 | 7,258 |
| | Marfin Investment | | |
| | Group SA | 1,045,511 | 4,166 |
| | Hellenic | | |
| | Telecommunications | | |
| | Organization SA | 234,997 | 3,953 |
| * | Public Power Corp. SA | 191,003 | 3,896 |
| | Hellenic | | |
| | Telecommunications | | |
| | Organization SA ADR | 408,133 | 3,461 |
| | Titan Cement Co. SA | 94,621 | 3,270 |
| | Hellenic Petroleum SA | 150,968 | 1,830 |
| | | | 111,683 |
| Ireland (0.4%) | | |
| | CRH PLC | 1,155,542 | 28,335 |
| | Kerry Group PLC | | |
| | Class A | 235,937 | 6,993 |
| * | Elan Corp. PLC | 845,582 | 4,431 |
| * | Ryanair Holdings | | |
| | PLC ADR | 94,531 | 2,577 |
| | | |
| | | | Market |
| | | | Value• |
| | | Shares | ($000) |
| ^,* | Anglo Irish Bank | | |
| | Corp. Ltd. | 2,503,596 | 800 |
| * | Ryanair Holdings PLC | 133,763 | 583 |
| | CRH PLC | 7,832 | 191 |
| | | | 43,910 |
| Italy (5.3%) | | |
| | ENI SPA | 4,385,511 | 108,615 |
| * | UniCredit SPA | 23,980,541 | 80,340 |
| | Enel SPA | 11,075,077 | 65,900 |
| * | Intesa Sanpaolo SPA | 12,994,638 | 54,688 |
| | Assicurazioni | | |
| | Generali SPA | 1,966,960 | 49,526 |
| | Telecom Italia SPA | 16,919,828 | 26,879 |
| * | Fiat SPA | 1,287,374 | 19,166 |
| | Tenaris SA | 796,390 | 14,173 |
| | Unione di Banche | | |
| | Italiane SCPA | 972,482 | 13,891 |
| | Saipem SPA | 444,266 | 13,108 |
| | Snam Rete Gas SPA | 2,524,641 | 12,245 |
| | Finmeccanica SPA | 682,725 | 11,456 |
| | Telecom Italia SPA RNC | 10,109,033 | 11,125 |
| | Atlantia SPA | 436,146 | 10,313 |
| | Mediobanca SPA | 807,470 | 10,300 |
| * | Banco Popolare SC | 1,074,727 | 9,336 |
| | Terna Rete Elettrica | | |
| | Nazionale SPA | 2,194,929 | 8,702 |
| | Parmalat SPA | 2,871,526 | 7,958 |
| | Mediaset SPA | 1,195,923 | 7,766 |
| | Banca Monte dei | | |
| | Paschi di Siena SPA | 3,666,212 | 6,966 |
| | Intesa Sanpaolo SPA | 1,577,165 | 5,143 |
| | Banca Popolare di | | |
| | Milano Scarl | 672,695 | 5,005 |
| * | Luxottica Group SPA | 193,239 | 4,704 |
| | A2A SPA | 1,850,150 | 3,411 |
| ^ | Banca Carige SPA | 1,086,484 | 3,063 |
| | Prysmian SPA | 167,981 | 2,954 |
| * | Pirelli & C SPA | 4,372,634 | 2,457 |
| ^ | Mediolanum SPA | 371,738 | 2,359 |
| | Exor SPA | 111,141 | 2,190 |
| * | Autogrill SPA | 170,560 | 1,918 |
| | Fondiaria-Sai SPA | 102,689 | 1,872 |
| * | Unipol Gruppo | | |
| | Finanziario SPA | 1,220,186 | 1,769 |
| ^ | Lottomatica SPA | 77,703 | 1,656 |
| ^ | Italcementi SPA | 114,045 | 1,642 |
| | Saras SPA | 470,450 | 1,527 |
| | ACEA SPA | 122,932 | 1,438 |
| | | | 585,561 |
| Netherlands (3.7%) | | |
| | Unilever NV | 2,741,998 | 84,489 |
| | Koninklijke KPN NV | 2,889,608 | 52,414 |
| * | ING Groep NV | 3,304,942 | 43,009 |
| | Koninklijke Philips | | |
| | Electronics NV | 1,639,187 | 41,178 |
| | Koninklijke Ahold NV | 2,011,336 | 25,335 |
19
| | | |
| European Stock Index Fund | | |
| |
| |
| |
| | | | Market |
| | | | Value• |
| | | Shares | ($000) |
| | Akzo Nobel NV | 390,951 | 23,083 |
| | ASML Holding NV | 709,133 | 19,124 |
| * | Aegon NV | 2,635,681 | 18,733 |
| | Heineken NV | 411,615 | 18,195 |
| | TNT NV | 622,414 | 16,506 |
| | Reed Elsevier NV | 1,214,536 | 14,154 |
| | Koninklijke DSM NV | 262,039 | 11,481 |
| | Wolters Kluwer NV | 469,555 | 10,468 |
| | Heineken Holding NV | 186,504 | 7,256 |
| * | Randstad Holding NV | 170,283 | 6,461 |
| | Fugro NV | 109,132 | 6,079 |
| | Corio NV | 87,806 | 5,954 |
| | SBM Offshore NV | 254,161 | 4,867 |
| | Koninklijke Boskalis | | |
| | Westminster NV | 92,056 | 3,231 |
| | ASML Holding NV | 17,494 | 471 |
| * | Aegon NV | 1,765 | 12 |
| | | | 412,500 |
| Norway (1.1%) | | |
| | StatoilHydro ASA | 1,892,078 | 44,585 |
| * | Telenor ASA | 1,417,638 | 18,279 |
| ^,* | DnB NOR ASA | 1,237,852 | 14,180 |
| | Orkla ASA | 1,300,893 | 12,026 |
| | Yara International ASA | 318,367 | 10,524 |
| * | Seadrill Ltd. | 476,687 | 9,899 |
| * | Norsk Hydro ASA | 1,166,536 | 7,646 |
| ^,* | Renewable | | |
| | Energy Corp. AS | 546,754 | 3,257 |
| | | | 120,396 |
| Portugal (0.5%) | | |
| | EDP–Energias | | |
| | de Portugal SA | 3,099,313 | 13,707 |
| | Portugal Telecom | | |
| | SGPS SA | 990,006 | 11,316 |
| | Banco Espirito Santo SA | 886,931 | 6,546 |
| | Banco Comercial | | |
| | Portugues SA | 3,996,934 | 5,698 |
| | Galp Energia SGPS SA | | |
| | Class B | 256,384 | 4,318 |
| * | EDP Renovaveis SA | 362,822 | 3,616 |
| | Jeronimo Martins | | |
| | SGPS SA | 369,400 | 3,291 |
| ^ | Cimpor Cimentos | | |
| | de Portugal SGPS SA | 397,744 | 3,100 |
| | Brisa Auto-Estradas | | |
| | de Portugal SA | 296,778 | 2,932 |
| | | | 54,524 |
| Spain (7.0%) | | |
| | Banco Santander SA | 13,444,108 | 216,346 |
| | Telefonica SA | 6,996,106 | 195,377 |
| | Banco Bilbao Vizcaya | | |
| | Argentaria SA | 5,998,074 | 107,216 |
| | Iberdrola SA | 6,196,772 | 56,134 |
| | Repsol YPF SA | 1,233,477 | 32,837 |
| | Inditex SA | 366,793 | 21,530 |
| | | |
| | | | Market |
| | | | Value• |
| | | Shares | ($000) |
| ^ | Banco Popular Espanol SA | 1,464,765 | 13,048 |
| ^ | ACS Actividades de | | |
| | Construccion y | | |
| | Servicios SA | 243,224 | 11,679 |
| ^ | Banco de Sabadell SA | 1,527,845 | 10,314 |
| | Abertis Infraestructuras SA | 474,330 | 10,086 |
| | Red Electrica Corp. SA | 183,979 | 9,502 |
| | Gas Natural SDG SA | 373,900 | 7,512 |
| | Criteria Caixacorp SA | 1,430,635 | 6,974 |
| | Iberdrola Renovables SA | 1,423,669 | 6,328 |
| | Enagas | 301,973 | 6,211 |
| | Gamesa Corp. | | |
| | Tecnologica SA | 310,257 | 5,669 |
| | Acciona SA | 43,177 | 5,260 |
| | Mapfre SA | 1,183,040 | 5,070 |
| | Banco Santander SA ADR | 314,353 | 5,048 |
| ^ | Bankinter SA | 472,595 | 4,981 |
| ^ | Acerinox SA | 237,968 | 4,732 |
| | Zardoya Otis SA | 219,462 | 4,405 |
| ^ | Grupo Ferrovial SA | 94,381 | 3,910 |
| | Indra Sistemas SA | 166,162 | 3,908 |
| | Telefonica SA ADR | 44,539 | 3,738 |
| ^ | Cintra Concesiones de | | |
| | Infraestructuras de | | |
| | Transporte SA | 333,918 | 3,436 |
| | Grifols SA | 210,632 | 3,403 |
| ^ | Banco de Valencia SA | 351,328 | 2,977 |
| ^ | Fomento de Construcciones | | |
| | y Contratas SA | 63,014 | 2,563 |
| * | Iberia Lineas Aereas | | |
| | de Espana | 829,002 | 2,286 |
| ^ | Sacyr Vallehermoso SA | 150,890 | 2,283 |
| ^ | Gestevision Telecinco SA | 162,721 | 1,682 |
| | | | 776,445 |
| Sweden (3.9%) | | |
| | Nordea Bank AB | 5,446,103 | 58,455 |
| | Telefonaktiebolaget LM | | |
| | Ericsson Class B | 5,019,839 | 52,446 |
| | Hennes & Mauritz AB | | |
| | Class B | 861,236 | 48,920 |
| | TeliaSonera AB | 3,769,584 | 24,984 |
| | Svenska Handelsbanken | | |
| | AB Class A | 823,036 | 21,269 |
| | Sandvik AB | 1,698,544 | 18,763 |
| | Volvo AB Class B | 1,836,061 | 17,388 |
| * | Skandinaviska Enskilda | | |
| | Banken AB Class A | 2,556,584 | 15,486 |
| | Atlas Copco AB Class A | 1,132,138 | 15,181 |
| | Investor AB Class B | 771,597 | 13,652 |
| | Svenska Cellulosa AB | | |
| | Class B | 954,565 | 13,117 |
| | SKF AB | 659,909 | 10,450 |
| | Skanska AB Class B | 673,804 | 9,888 |
| * | Electrolux AB Class B | 395,250 | 9,474 |
| | Assa Abloy AB Class B | 531,676 | 9,291 |
20
| | | |
| European Stock Index Fund | | |
| |
| |
| |
| | | | Market |
| | | | Value• |
| | | Shares | ($000) |
| | Swedish Match AB | 426,849 | 8,760 |
| * | Millicom International | | |
| | Cellular SA | 126,641 | 8,132 |
| | Atlas Copco AB Class B | 665,204 | 7,926 |
| | Tele2 AB | 520,502 | 7,587 |
| * | Swedbank AB Class A | 852,702 | 7,346 |
| | Alfa Laval AB | 584,378 | 7,137 |
| | Scania AB Class B | 542,050 | 6,954 |
| | Volvo AB Class A | 725,127 | 6,697 |
| | Getinge AB | 340,623 | 6,347 |
| | Securitas AB Class B | 525,787 | 4,906 |
| | SSAB AB Class A | 308,918 | 4,709 |
| * | Husqvarna AB | 673,863 | 4,243 |
| * | Lundin Petroleum AB | 362,866 | 3,073 |
| | Holmen AB | 86,960 | 2,347 |
| | SSAB AB Class B | 138,792 | 1,941 |
| | | | 426,869 |
| Switzerland (11.6%) | | |
| | Nestle SA | 6,126,666 | 284,900 |
| | Roche Holdings AG | 1,183,026 | 189,477 |
| | Novartis AG | 3,562,225 | 185,500 |
| | Credit Suisse Group AG | 1,895,003 | 101,301 |
| * | UBS AG | 5,938,697 | 99,026 |
| �� | ABB Ltd. | 3,714,298 | 69,091 |
| | Zurich Financial | | |
| | Services AG | 247,683 | 56,718 |
| | Syngenta AG | 163,196 | 38,642 |
| | Holcim Ltd. | 413,365 | 26,308 |
| | Compagnie Financiere | | |
| | Richemont SA | 876,299 | 24,531 |
| | Swiss Reinsurance Co. Ltd. | 580,449 | 23,636 |
| | Swisscom AG | 40,536 | 14,630 |
| | Julius Baer Group Ltd. | 353,174 | 13,295 |
| | Swatch Group AG (Bearer) | 51,858 | 12,109 |
| | Synthes Inc. | 99,905 | 11,852 |
| | Geberit AG | 68,898 | 11,398 |
| | SGS SA | 7,968 | 10,644 |
| | Givaudan SA | 12,879 | 9,561 |
| * | Actelion Ltd. | 170,702 | 9,410 |
| | Adecco SA | 205,762 | 9,194 |
| | Kuehne & Nagel | | |
| | International AG | 91,535 | 8,293 |
| | Sonova Holding AG | 78,314 | 8,060 |
| | Baloise Holding AG | 84,531 | 7,238 |
| | Swiss Life Holding AG | 50,740 | 6,078 |
| | Nobel Biocare Holding AG | 212,431 | 6,027 |
| | Lonza Group AG | 77,422 | 6,020 |
| | Schindler Holding AG | 81,555 | 5,575 |
| * | Logitech International SA | 309,968 | 5,291 |
| | Lindt & Spruengli AG | 188 | 4,773 |
| | GAM Holding Ltd. | 357,347 | 4,360 |
| | Pargesa Holding SA | 44,448 | 3,558 |
| | Swatch Group AG | | |
| | (Registered) | 71,585 | 3,210 |
| | Straumann Holding AG | 13,020 | 3,143 |
| | Lindt & Spruengli AG | 1,447 | 3,047 |
| | | |
| | | | Market |
| | | | Value• |
| | | Shares | ($000) |
| * | Aryzta AG | 76,814 | 3,015 |
| | Schindler Holding AG | 35,889 | 2,487 |
| * | Aryzta AG (Ireland Shares) | 59,634 | 2,308 |
| | BKW FMB Energie AG | 21,760 | 1,790 |
| * | UBS AG | 51,025 | 846 |
| | | | 1,286,342 |
| United Kingdom (31.5%) | | |
| | HSBC Holdings PLC | 29,155,890 | 322,176 |
| | BP PLC | 29,789,185 | 279,133 |
| | Vodafone Group PLC | 83,130,575 | 183,206 |
| | GlaxoSmithKline PLC | 8,734,439 | 179,167 |
| | Royal Dutch Shell PLC | | |
| | Class B | 4,538,062 | 130,640 |
| | Royal Dutch Shell PLC | | |
| | Class A | 4,328,822 | 128,344 |
| | AstraZeneca PLC | 2,436,414 | 109,375 |
| | British American | | |
| | Tobacco PLC | 3,361,173 | 107,107 |
| | Rio Tinto PLC | 2,308,217 | 102,046 |
| | BHP Billiton PLC | 3,716,368 | 100,137 |
| | BG Group PLC | 5,657,386 | 97,382 |
| * | Barclays PLC | 18,578,340 | 97,371 |
| | Tesco PLC | 13,298,932 | 88,673 |
| | Standard Chartered PLC | 3,382,137 | 82,971 |
| * | Anglo American PLC | 2,216,576 | 80,203 |
| | Diageo PLC | 4,202,660 | 68,453 |
| | Unilever PLC | 2,163,564 | 64,638 |
| | Reckitt Benckiser | | |
| | Group PLC | 1,021,098 | 50,723 |
| | Imperial Tobacco | | |
| | Group PLC | 1,711,508 | 50,437 |
| | Royal Dutch Shell PLC | | |
| | Class A | 1,641,308 | 48,457 |
| * | Xstrata PLC | 3,215,156 | 46,310 |
| | SABMiller PLC | 1,586,061 | 41,573 |
| | National Grid PLC | 4,092,457 | 40,539 |
| ^,* | Lloyds Banking | | |
| | Group PLC | 27,461,983 | 38,721 |
| | Prudential PLC | 4,249,147 | 38,597 |
| | Centrica PLC | 8,616,724 | 35,005 |
| | BAE Systems PLC | 5,957,878 | 30,636 |
| | Cadbury PLC | 2,295,678 | 29,023 |
| | Aviva PLC | 4,605,794 | 28,801 |
| | BT Group PLC | 13,002,069 | 27,863 |
| | Scottish & Southern | | |
| | Energy PLC | 1,550,528 | 27,367 |
| | Tullow Oil PLC | 1,352,339 | 26,198 |
| | Rolls-Royce Group PLC | 3,118,619 | 22,999 |
| | Compass Group PLC | 3,107,360 | 19,707 |
| * | Royal Bank of | | |
| | Scotland Group PLC | 28,420,712 | 19,388 |
| | Pearson PLC | 1,359,791 | 18,483 |
| | WPP PLC | 1,921,729 | 17,222 |
| | British Sky Broadcasting | | |
| | Group PLC | 1,919,063 | 16,733 |
| | Shire PLC | 943,358 | 16,684 |
21
| | | |
| European Stock Index Fund | | |
| |
| |
| |
| | | | Market |
| | | | Value• |
| | | Shares | ($000) |
| | BP PLC ADR | 293,298 | 16,607 |
| | WM Morrison | | |
| | Supermarkets PLC | 3,555,465 | 16,295 |
| | Experian PLC | 1,734,236 | 15,848 |
| | Old Mutual PLC | 8,945,910 | 15,527 |
| | Reed Elsevier PLC | 2,040,268 | 15,447 |
| | Marks & Spencer | | |
| | Group PLC | 2,672,142 | 14,966 |
| | Man Group PLC | 2,885,211 | 14,591 |
| | Kingfisher PLC | 3,955,375 | 14,457 |
| | Land Securities | | |
| | Group PLC | 1,278,614 | 13,835 |
| | Standard Life PLC | 3,738,319 | 13,326 |
| | Smith & Nephew PLC | 1,494,406 | 13,210 |
| | Capita Group PLC | 1,049,836 | 13,112 |
| | Legal & General | | |
| | Group PLC | 9,864,042 | 12,657 |
| | Vodafone Group PLC ADR | 525,198 | 11,654 |
| | British Land Co. PLC | 1,451,159 | 11,208 |
| | RSA Insurance Group PLC | 5,607,535 | 11,112 |
| | J Sainsbury PLC | 2,017,530 | 10,888 |
| | International Power PLC | 2,576,965 | 10,699 |
| | Cable & Wireless PLC | 4,265,991 | 10,122 |
| * | Cairn Energy PLC | 232,023 | 10,007 |
| ^ | Randgold Resources Ltd. | 150,646 | 9,931 |
| | Next PLC | 336,723 | 9,879 |
| * | Wolseley PLC | 475,251 | 9,613 |
| | Smiths Group PLC | 654,921 | 9,559 |
| | G4S PLC | 2,130,307 | 8,807 |
| | Carnival PLC | 276,001 | 8,556 |
| | Antofagasta PLC | 665,293 | 8,382 |
| | Johnson Matthey PLC | 360,141 | 8,294 |
| | United Utilities Group PLC | 1,143,803 | 8,246 |
| | Associated British | | |
| | Foods PLC | 595,624 | 8,066 |
| | Vedanta Resources PLC | 235,544 | 8,060 |
| * | Autonomy Corp. PLC | 363,000 | 7,981 |
| | Hammerson PLC | 1,161,320 | 7,703 |
| | Sage Group PLC | 2,200,708 | 7,685 |
| | AMEC PLC | 564,392 | 7,433 |
| | Segro PLC | 1,222,919 | 7,047 |
| | Home Retail Group PLC | 1,477,806 | 7,034 |
| | 3i Group PLC | 1,625,609 | 6,997 |
| | Cobham PLC | 1,922,893 | 6,910 |
| | Serco Group PLC | 824,230 | 6,819 |
| | Rexam PLC | 1,490,204 | 6,748 |
| | Burberry Group PLC | 737,580 | 6,505 |
| | Kazakhmys PLC | 356,875 | 6,351 |
| | Invensys PLC | 1,367,500 | 6,321 |
| | Liberty International PLC | 845,825 | 6,244 |
| * | Lonmin PLC | 260,819 | 6,239 |
| | Severn Trent PLC | 398,993 | 6,215 |
| | Whitbread PLC | 295,285 | 6,143 |
| | Bunzl PLC | 552,667 | 6,008 |
| | ICAP PLC | 880,954 | 5,855 |
| | Eurasian Natural | | |
| | Resources Corp. | 424,974 | 5,783 |
| | | |
| | | | Market |
| | | | Value• |
| | | Shares | ($000) |
| | Intercontinental Hotels | | |
| | Group PLC | 438,301 | 5,603 |
| | Admiral Group PLC | 315,972 | 5,311 |
| | Friends Provident | | |
| | Group PLC | 3,894,426 | 5,192 |
| | Petrofac Ltd. | 331,916 | 5,109 |
| | Balfour Beatty PLC | 1,144,354 | 4,975 |
| | Investec PLC | 695,990 | 4,968 |
| | Firstgroup PLC | 804,301 | 4,947 |
| | Drax Group PLC | 617,503 | 4,698 |
| | Tomkins PLC | 1,495,114 | 4,102 |
| | Schroders PLC | 206,471 | 3,713 |
| | Fresnillo PLC | 295,701 | 3,583 |
| | TUI Travel PLC | 918,205 | 3,499 |
| ^ | London Stock | | |
| | Exchange Group PLC | 243,506 | 3,387 |
| ^ | Ladbrokes PLC | 1,517,841 | 3,024 |
| ^,* | British Airways PLC | 996,029 | 2,958 |
| * | Berkeley Group | | |
| | Holdings PLC | 205,006 | 2,861 |
| | Thomas Cook Group PLC | 713,274 | 2,389 |
| ^ | Carphone Warehouse | | |
| | Group PLC | 680,135 | 2,051 |
| | WPP PLC ADR | 40,001 | 1,791 |
| * | Resolution Ltd. | 1,152,244 | 1,702 |
| | | | 3,485,333 |
| Total Common Stocks | | |
| (Cost $14,517,557) | | 10,908,245 |
| Temporary Cash Investments (3.0%)1 | |
| Money Market Fund (2.9%) | | |
| 2,3 | Vanguard Market | | |
| | Liquidity Fund, 0.225% | 318,103,762 | 318,104 |
| |
| | | Face | |
| | | Amount | |
| | | ($000) | |
| U.S. Government and Agency Obligations (0.1%) |
| 4,5 | Federal Home Loan | | |
| | Bank Discount Notes, | | |
| | 0.275%, 2/19/10 | 10,000 | 9,997 |
| 4 | Freddie Mac Discount | | |
| | Notes, 0.205%, 3/22/10 | 4,000 | 3,998 |
| | | | 13,995 |
| Total Temporary Cash Investments | |
| (Cost $332,092) | | 332,099 |
| Total Investments (101.7%) | | |
| (Cost $14,849,649) | | 11,240,344 |
| Other Assets and Liabilities (–1.7%) | |
| Other Assets | | 65,449 |
| Liabilities3 | | (254,547) |
| | | | (189,098) |
| Net Assets (100%) | | 11,051,246 |
22
European Stock Index Fund
| |
| At October 31, 2009, net assets consisted of: |
| | Amount |
| | ($000) |
| Paid-in Capital | 16,224,741 |
| Undistributed Net Investment Income | 378,916 |
| Accumulated Net Realized Losses | (1,940,639) |
| Unrealized Appreciation (Depreciation) | |
| Investment Securities | (3,609,305) |
| Futures Contracts | (4,749) |
| Foreign Currencies and | |
| Forward Currency Contracts | 2,282 |
| Net Assets | 11,051,246 |
| |
| Investor Shares—Net Assets | |
| Applicable to 224,681,131 outstanding | |
| $.001 par value shares of beneficial | |
| interest (unlimited authorization) | 5,789,137 |
| Net Asset Value Per Share— | |
| Investor Shares | $25.77 |
| |
| Admiral Shares—Net Assets | |
| Applicable to 28,099,506 outstanding | |
| $.001 par value shares of beneficial | |
| interest (unlimited authorization) | 1,700,354 |
| Net Asset Value Per Share— | |
| Admiral Shares | $60.51 |
| |
| | Amount |
| | ($000) |
| Signal Shares—Net Assets | |
| Applicable to 10,456,717 outstanding | |
| $.001 par value shares of beneficial | |
| interest (unlimited authorization) | 244,914 |
| Net Asset Value Per Share— | |
| Signal Shares | $23.42 |
| |
| Institutional Shares—Net Assets | |
| Applicable to 33,058,996 outstanding | |
| $.001 par value shares of beneficial | |
| interest (unlimited authorization) | 852,760 |
| Net Asset Value Per Share— | |
| Institutional Shares | $25.80 |
| |
| ETF Shares—Net Assets | |
| Applicable to 50,900,760 outstanding | |
| $.001 par value shares of beneficial | |
| interest (unlimited authorization) | 2,464,081 |
| Net Asset Value Per Share— | |
| ETF Shares | $48.41 |
• See Note A in Notes to Financial Statements.
^ Part of security position is on loan to broker-dealers. The total value of securities on loan is $197,803,000.
* Non-income-producing security.
1 The fund invests a portion of its cash reserves in equity markets through the use of index futures contracts. After giving effect to futures investments, the fund’s effective common stock and temporary cash investment positions represent 99.6% and 2.1%, respectively, of net assets.
2 Affiliated money market fund available only to Vanguard funds and certain trusts and accounts managed by Vanguard. Rate shown is the 7-day yield.
3 Includes $214,041,000 of collateral received for securities on loan.
4 The issuer operates under a congressional charter; its securities are not backed by the full faith and credit of the U.S. government.
5 Securities with a value of $9,997,000 have been segregated as initial margin for open futures contracts.
ADR—American Depositary Receipt.
See accompanying Notes, which are an integral part of the Financial Statements.
23
| |
| European Stock Index Fund | |
| |
| |
| |
| Statement of Operations | |
| |
| |
| | Year Ended |
| | October 31, 2009 |
| | ($000) |
| Investment Income | |
| Income | |
| Dividends1 | 482,378 |
| Interest2 | 528 |
| Security Lending | 27,470 |
| Total Income | 510,376 |
| Expenses | |
| The Vanguard Group—Note B | |
| Investment Advisory Services | 582 |
| Management and Administrative—Investor Shares | 14,229 |
| Management and Administrative—Admiral Shares | 1,605 |
| Management and Administrative—Signal Shares | 214 |
| Management and Administrative—Institutional Shares | 1,254 |
| Management and Administrative—ETF Shares | 1,681 |
| Marketing and Distribution—Investor Shares | 2,848 |
| Marketing and Distribution—Admiral Shares | 340 |
| Marketing and Distribution—Signal Shares | 65 |
| Marketing and Distribution—Institutional Shares | 954 |
| Marketing and Distribution—ETF Shares | 525 |
| Custodian Fees | 1,988 |
| Auditing Fees | 40 |
| Shareholders’ Reports and Proxies—Investor Shares | 228 |
| Shareholders’ Reports and Proxies—Admiral Shares | 17 |
| Shareholders’ Reports and Proxies—Signal Shares | 1 |
| Shareholders’ Reports and Proxies—Institutional Shares | 2 |
| Shareholders’ Reports and Proxies—ETF Shares | 210 |
| Trustees’ Fees and Expenses | 25 |
| Total Expenses | 26,808 |
| Expenses Paid Indirectly | (169) |
| Net Expenses | 26,639 |
| Net Investment Income | 483,737 |
| Realized Net Gain (Loss) | |
| Investment Securities Sold | (2,821,516) |
| Futures Contracts | (4,807) |
| Foreign Currencies and Forward Currency Contracts | 1,442 |
| Realized Net Gain (Loss) | (2,824,881) |
| Change in Unrealized Appreciation (Depreciation) | |
| Investment Securities | 3,882,960 |
| Futures Contracts | 9,698 |
| Foreign Currencies and Forward Currency Contracts | 14,586 |
| Change in Unrealized Appreciation (Depreciation) | 3,907,244 |
| Net Increase (Decrease) in Net Assets Resulting from Operations | 1,566,100 |
1 Dividends are net of foreign withholding taxes of $39,192,000.
2 Interest income from an affiliated company of the fund was $265,000.
See accompanying Notes, which are an integral part of the Financial Statements.
24
| | |
| European Stock Index Fund | | |
| |
| |
| Statement of Changes in Net Assets | | |
| |
| | Year Ended October 31, |
| | 2009 | 2008 |
| | ($000) | ($000) |
| Increase (Decrease) in Net Assets | | |
| Operations | | |
| Net Investment Income | 483,737 | 1,208,160 |
| Realized Net Gain (Loss) | (2,824,881) | 3,003,134 |
| Change in Unrealized Appreciation (Depreciation) | 3,907,244 | (20,976,281) |
| Net Increase (Decrease) in Net Assets Resulting from Operations | 1,566,100 | (16,764,987) |
| Distributions | | |
| Net Investment Income | | |
| Investor Shares | (708,975) | (743,072) |
| Admiral Shares | (100,154) | (87,518) |
| Signal Shares | (14,655) | (14,971) |
| Institutional Shares | (234,718) | (139,970) |
| ETF Shares | (124,097) | (97,010) |
| Realized Capital Gain | | |
| Investor Shares | — | — |
| Admiral Shares | — | — |
| Signal Shares | — | — |
| Institutional Shares | — | — |
| ETF Shares | — | — |
| Total Distributions | (1,182,599) | (1,082,541) |
| Capital Share Transactions | | |
| Investor Shares | (4,501,240) | (3,934,149) |
| Admiral Shares | (5,147) | 12,041 |
| Signal Shares | (10,851) | (29,856) |
| Institutional Shares | (2,518,693) | 815,638 |
| ETF Shares | 405,547 | 225,574 |
| Net Increase (Decrease) from Capital Share Transactions | (6,630,384) | (2,910,752) |
| Total Increase (Decrease) | (6,246,883) | (20,758,280) |
| Net Assets | | |
| Beginning of Period | 17,298,129 | 38,056,409 |
| End of Period1 | 11,051,246 | 17,298,129 |
| 1 Net Assets—End of Period includes undistributed net investment income of $378,916,000 and $1,073,239,000. | |
See accompanying Notes, which are an integral part of the Financial Statements.
25
| | | | | |
| European Stock Index Fund | | | | | |
| |
| |
| Financial Highlights | | | | | |
| |
| |
| Investor Shares | | | | | |
| |
| For a Share Outstanding | | | Year Ended October 31, |
| Throughout Each Period | 2009 | 2008 | 2007 | 2006 | 2005 |
| Net Asset Value, Beginning of Period | $21.99 | $43.43 | $34.67 | $27.00 | $23.77 |
| Investment Operations | | | | | |
| Net Investment Income | 1.008 | 1.3721 | 1.2981 | .920 | .670 |
| Net Realized and Unrealized Gain (Loss) | | | | | |
| on Investments | 4.269 | (21.597) | 8.386 | 7.450 | 3.140 |
| Total from Investment Operations | 5.277 | (20.225) | 9.684 | 8.370 | 3.810 |
| Distributions | | | | | |
| Dividends from Net Investment Income | (1.497) | (1.215) | (.924) | (.700) | (.580) |
| Distributions from Realized Capital Gains | — | — | — | — | — |
| Total Distributions | (1.497) | (1.215) | (.924) | (.700) | (.580) |
| Net Asset Value, End of Period | $25.77 | $21.99 | $43.43 | $34.67 | $27.00 |
| |
| Total Return2 | 26.25% | –47.80% | 28.49% | 31.63% | 16.21% |
| |
| Ratios/Supplemental Data | | | | | |
| Net Assets, End of Period (Millions) | $5,789 | $10,534 | $26,188 | $16,850 | $10,759 |
| Ratio of Total Expenses to | | | | | |
| Average Net Assets | 0.27% | 0.22% | 0.22% | 0.27% | 0.27% |
| Ratio of Net Investment Income to | | | | | |
| Average Net Assets | 3.80% | 3.82% | 3.35% | 3.35% | 2.84% |
| Portfolio Turnover Rate3 | 18% | 15% | 9% | 6% | 5% |
1 Calculated based on average shares outstanding.
2 Total returns do not reflect the 2% fee assessed on redemptions of shares held for less than two months or the account service fee that may be applicable to certain accounts with balances below $10,000.
3 Excludes the value of portfolio securities received or delivered as a result of in-kind purchases or redemptions of the fund’s capital shares, including ETF Creation Units.
See accompanying Notes, which are an integral part of the Financial Statements.
26
| | | | | |
| European Stock Index Fund | | | | | |
| |
| |
| Financial Highlights | | | | | |
| |
| |
| Admiral Shares | | | | | |
| |
| For a Share Outstanding | | | Year Ended October 31, |
| Throughout Each Period | 2009 | 2008 | 2007 | 2006 | 2005 |
| Net Asset Value, Beginning of Period | $51.71 | $102.09 | $81.50 | $63.44 | $55.84 |
| Investment Operations | | | | | |
| Net Investment Income | 2.448 | 3.1771 | 3.1401 | 2.230 | 1.611 |
| Net Realized and Unrealized Gain (Loss) | | | | | |
| on Investments | 9.968 | (50.618) | 19.692 | 17.510 | 7.396 |
| Total from Investment Operations | 12.416 | (47.441) | 22.832 | 19.740 | 9.007 |
| Distributions | | | | | |
| Dividends from Net Investment Income | (3.616) | (2.939) | (2.242) | (1.680) | (1.407) |
| Distributions from Realized Capital Gains | — | — | — | — | — |
| Total Distributions | (3.616) | (2.939) | (2.242) | (1.680) | (1.407) |
| Net Asset Value, End of Period | $60.51 | $51.71 | $102.09 | $81.50 | $63.44 |
| |
| Total Return2 | 26.33% | –47.74% | 28.59% | 31.77% | 16.32% |
| |
| Ratios/Supplemental Data | | | | | |
| Net Assets, End of Period (Millions) | $1,700 | $1,472 | $2,955 | $2,175 | $1,360 |
| Ratio of Total Expenses to | | | | | |
| Average Net Assets | 0.16% | 0.12% | 0.12% | 0.17% | 0.18% |
| Ratio of Net Investment Income to | | | | | |
| Average Net Assets | 3.91% | 3.92% | 3.45% | 3.45% | 2.93% |
| Portfolio Turnover Rate3 | 18% | 15% | 9% | 6% | 5% |
1 Calculated based on average shares outstanding.
2 Total returns do not reflect the 2% fee assessed on redemptions of shares held for less than two months.
3 Excludes the value of portfolio securities received or delivered as a result of in-kind purchases or redemptions of the fund’s capital shares, including ETF Creation Units.
See accompanying Notes, which are an integral part of the Financial Statements.
27
| | | | |
| European Stock Index Fund | | | | |
| |
| |
| Financial Highlights | | | | |
| |
| |
| Signal Shares | | | | |
| | | | | Oct. 6, |
| | | | | 20061 to |
| | Year Ended October 31, | Oct. 31, |
| For a Share Outstanding Throughout Each Period | 2009 | 2008 | 2007 | 2006 |
| Net Asset Value, Beginning of Period | $20.01 | $39.50 | $31.51 | $30.41 |
| Investment Operations | | | | |
| Net Investment Income | .947 | 1.2552 | 1.1512 | .0102 |
| Net Realized and Unrealized Gain (Loss) on Investments | 3.860 | (19.616) | 7.681 | 1.090 |
| Total from Investment Operations | 4.807 | (18.361) | 8.832 | 1.100 |
| Distributions | | | | |
| Dividends from Net Investment Income | (1.397) | (1.129) | (.842) | — |
| Distributions from Realized Capital Gains | — | — | — | — |
| Total Distributions | (1.397) | (1.129) | (.842) | — |
| Net Asset Value, End of Period | $23.42 | $20.01 | $39.50 | $31.51 |
| |
| Total Return3 | 26.34% | –47.74% | 28.59% | 3.62% |
| |
| Ratios/Supplemental Data | | | | |
| Net Assets, End of Period (Millions) | $245 | $223 | $502 | $12 |
| Ratio of Total Expenses to Average Net Assets | 0.16% | 0.12% | 0.12% | 0.17%4 |
| Ratio of Net Investment Income to Average Net Assets | 3.91% | 3.92% | 3.45% | 3.45%4 |
| Portfolio Turnover Rate5 | 18% | 15% | 9% | 6% |
1 Inception.
2 Calculated based on average shares outstanding.
3 Total returns do not reflect the 2% fee assessed on redemptions of shares held for less than two months.
4 Annualized.
5 Excludes the value of portfolio securities received or delivered as a result of in-kind purchases or redemptions of the fund’s capital shares, including ETF Creation Units.
See accompanying Notes, which are an integral part of the Financial Statements.
28
| | | | | |
| European Stock Index Fund | | | | | |
| |
| |
| Financial Highlights | | | | | |
| |
| |
| Institutional Shares | | | | | |
| |
| For a Share Outstanding | | | Year Ended October 31, |
| Throughout Each Period | 2009 | 2008 | 2007 | 2006 | 2005 |
| Net Asset Value, Beginning of Period | $22.04 | $43.51 | $34.74 | $27.05 | $23.80 |
| Investment Operations | | | | | |
| Net Investment Income | 1.036 | 1.3151 | 1.3501 | .978 | .721 |
| Net Realized and Unrealized Gain (Loss) | | | | | |
| on Investments | 4.277 | (21.524) | 8.390 | 7.450 | 3.140 |
| Total from Investment Operations | 5.313 | (20.209) | 9.740 | 8.428 | 3.861 |
| Distributions | | | | | |
| Dividends from Net Investment Income | (1.553) | (1.261) | (.970) | (.738) | (.611) |
| Distributions from Realized Capital Gains | — | — | — | — | — |
| Total Distributions | (1.553) | (1.261) | (.970) | (.738) | (.611) |
| Net Asset Value, End of Period | $25.80 | $22.04 | $43.51 | $34.74 | $27.05 |
| |
| Total Return2 | 26.45% | –47.72% | 28.63% | 31.83% | 16.42% |
| |
| Ratios/Supplemental Data | | | | | |
| Net Assets, End of Period (Millions) | $853 | $3,316 | $5,263 | $3,113 | $1,827 |
| Ratio of Total Expenses to | | | | | |
| Average Net Assets | 0.12% | 0.09% | 0.09% | 0.12% | 0.12% |
| Ratio of Net Investment Income to | | | | | |
| Average Net Assets | 3.95% | 3.95% | 3.48% | 3.50% | 2.99% |
| Portfolio Turnover Rate3 | 18% | 15% | 9% | 6% | 5% |
1 Calculated based on average shares outstanding.
2 Total returns do not reflect the 2% fee on redemptions of shares held for less than two months.
3 Excludes the value of portfolio securities received or delivered as a result of in-kind purchases or redemptions of the fund’s capital shares, including ETF Creation Units.
See accompanying Notes, which are an integral part of the Financial Statements.
29
| | | | | |
| European Stock Index Fund | | | | | |
| |
| |
| Financial Highlights | | | | | |
| |
| |
| ETF Shares | | | | | |
| | | | | | March 4, |
| | | | | | 20051 to |
| | | Year Ended October 31, | Oct. 31, |
| For a Share Outstanding Throughout Each Period | 2009 | 2008 | 2007 | 2006 | 2005 |
| Net Asset Value, Beginning of Period | $41.37 | $81.66 | $65.21 | $50.80 | $50.96 |
| Investment Operations | | | | | |
| Net Investment Income | 1.964 | 2.5302 | 2.5762 | 1.800 | 1.040 |
| Net Realized and Unrealized Gain (Loss) | | | | | |
| on Investments | 7.977 | (40.464) | 15.683 | 13.990 | (1.200) |
| Total from Investment Operations | 9.941 | (37.934) | 18.259 | 15.790 | (.160) |
| Distributions | | | | | |
| Dividends from Net Investment Income | (2.901) | (2.356) | (1.809) | (1.380) | — |
| Distributions from Realized Capital Gains | — | — | — | — | — |
| Total Distributions | (2.901) | (2.356) | (1.809) | (1.380) | — |
| Net Asset Value, End of Period | $48.41 | $41.37 | $81.66 | $65.21 | $50.80 |
| |
| Total Return | 26.33% | –47.73% | 28.60% | 31.75% | –0.31% |
| |
| Ratios/Supplemental Data | | | | | |
| Net Assets, End of Period (Millions) | $2,464 | $1,754 | $3,148 | $1,205 | $178 |
| Ratio of Total Expenses to Average Net Assets | 0.16% | 0.11% | 0.12% | 0.18% | 0.18%3 |
| Ratio of Net Investment Income to | | | | | |
| Average Net Assets | 3.91% | 3.93% | 3.45% | 3.44% | 2.93%3 |
| Portfolio Turnover Rate4 | 18% | 15% | 9% | 6% | 5% |
1 Inception.
2 Calculated based on average shares outstanding.
3 Annualized.
4 Excludes the value of portfolio securities received or delivered as a result of in-kind purchases or redemptions of the fund’s capital shares,
including ETF Creation Units.
See accompanying Notes, which are an integral part of the Financial Statements.
30
European Stock Index Fund
Notes to Financial Statements
Vanguard European Stock Index Fund is registered under the Investment Company Act of 1940 as an open-end investment company, or mutual fund. The fund invests in securities of foreign issuers, which may subject it to investment risks not normally associated with investing in securities of U.S. corporations. The fund offers five classes of shares: Investor Shares, Admiral Shares, Signal Shares, Institutional Shares, and ETF Shares. Investor Shares are available to any investor who meets the fund’s minimum purchase requirements. Admiral Shares are designed for investors who meet certain administrative, service, tenure, and account-size criteria. Signal Shares are designed for institutional investors who meet certain administrative, service, and account-size criteria. Institutional Shares are designed for investors who meet certain administrative and service criteria and invest a minimum of $5 million. ETF Shares are list ed for trading on the NYSE Arca, Inc.; they can be purchased and sold through a broker.
A. The following significant accounting policies conform to generally accepted accounting principles for U.S. mutual funds. The fund consistently follows such policies in preparing its financial statements.
1. Security Valuation: Securities are valued as of the close of trading on the New York Stock Exchange (generally 4 p.m., Eastern time) on the valuation date. Equity securities are valued at the latest quoted sales prices or official closing prices taken from the primary market in which each security trades; such securities not traded on the valuation date are valued at the mean of the latest quoted bid and asked prices. Securities for which market quotations are not readily available, or whose values have been affected by events occurring before the fund’s pricing time but after the close of the securities’ primary markets, are valued at their fair values calculated according to procedures adopted by the board of trustees. These procedures include obtaining quotations from an independent pricing service, monitoring news to identify significant market- or security-specific events, and evaluating changes in the va lues of foreign market proxies (for example, ADRs, futures contracts, or exchange-traded funds), between the time the foreign markets close and the fund’s pricing time. When fair-value pricing is employed, the prices of securities used by a fund to calculate its net asset value may differ from quoted or published prices for the same securities. Investments in Vanguard Market Liquidity Fund are valued at that fund’s net asset value. Temporary cash investments acquired over 60 days to maturity are valued using the latest bid prices or using valuations based on a matrix system (which considers such factors as security prices, yields, maturities, and ratings), both as furnished by independent pricing services. Other temporary cash investments are valued at amortized cost, which approximates market value.
2. Foreign Currency: Securities and other assets and liabilities denominated in foreign currencies are translated into U.S. dollars using exchange rates obtained from an independent third party as of the fund’s pricing time on the valuation date. Realized gains (losses) and unrealized appreciation (depreciation) on investment securities include the effects of changes in exchange rates since the securities were purchased, combined with the effects of changes in security prices. Fluctuations in the value of other assets and liabilities resulting from changes in exchange rates are recorded as unrealized foreign currency gains (losses) until the assets or liabilities are settled in cash, at which time they are recorded as realized foreign currency gains (losses).
3. Futures and Forward Currency Contracts: The fund uses index futures contracts to a limited extent, with the objectives of maintaining full exposure to the stock market, enhancing returns, maintaining liquidity, and minimizing transaction costs. The fund may purchase futures contracts to immediately invest incoming cash in the market, or sell futures in response to cash outflows, thereby simulating a fully invested position in the underlying index while maintaining a cash balance for liquidity. The fund may seek to enhance returns by using futures contracts instead of the underlying securities when
31
European Stock Index Fund
futures are believed to be priced more attractively than the underlying securities. The primary risks associated with the use of futures contracts are imperfect correlation between changes in market values of stocks held by the fund and the prices of futures contracts, and the possibility of an illiquid market.
The fund also may enter into forward currency contracts to provide the appropriate currency exposure related to any open futures contracts. The fund’s risks in using these contracts include movement in the values of the foreign currencies relative to the U.S. dollar and the ability of the counterparties to fulfill their obligations under the contracts. Counterparty risk is mitigated by entering into forward currency contracts only with highly rated counterparties, by a master netting arrangement between the fund and the counterparty, and by the posting of collateral by the counterparty. The forward currency contracts contain provisions whereby a counterparty may terminate open contracts if the fund’s net assets decline below a certain level, triggering a payment by the fund if the fund is in a net liability position at the time of the termination. The payment amount would be reduced by any collateral the fund has posted. Any securities posted as collateral for open contracts are noted in the Statement of Net Assets.
Futures and forward currency contracts are valued at their quoted daily settlement prices. The aggregate principal amounts of the contracts are not recorded in the Statement of Net Assets. Fluctuations in the value of the contracts are recorded in the Statement of Net Assets as an asset (liability) and in the Statement of Operations as unrealized appreciation (depreciation) until the contracts are closed, when they are recorded as realized gains (losses) on futures or forward currency contracts.
4. Federal Income Taxes: The fund intends to continue to qualify as a regulated investment company and distribute all of its taxable income. Management has analyzed the fund’s tax positions taken for all open federal income tax years (October 31, 2006–2009), and has concluded that no provision for federal income tax is required in the fund’s financial statements.
5. Distributions: Distributions to shareholders are recorded on the ex-dividend date.
6. Security Lending: The fund may lend its securities to qualified institutional borrowers to earn additional income. Security loans are required to be secured at all times by collateral at least equal to the market value of securities loaned. The fund invests cash collateral received in Vanguard Market Liquidity Fund, and records a liability for the return of the collateral, during the period the securities are on loan. Security lending income represents the income earned on investing cash collateral, less expenses associated with the loan.
7. Other: Dividend income is recorded on the ex-dividend date. Interest income includes income distributions received from Vanguard Market Liquidity Fund and is accrued daily. Security transactions are accounted for on the date securities are bought or sold. Costs used to determine realized gains (losses) on the sale of investment securities are those of the specific securities sold. Fees assessed on redemptions of capital shares are credited to paid-in capital.
Each class of shares has equal rights as to assets and earnings, except that each class separately bears certain class-specific expenses related to maintenance of shareholder accounts (included in Management and Administrative expenses), shareholder reporting, and proxies. Marketing and distribution expenses are allocated to each class of shares based on a method approved by the board of trustees. Income, other non-class-specific expenses, and gains and losses on investments are allocated to each class of shares based on its relative net assets.
32
European Stock Index Fund
B. The Vanguard Group furnishes at cost investment advisory, corporate management, administrative, marketing, and distribution services. The costs of such services are allocated to the fund under methods approved by the board of trustees. The fund has committed to provide up to 0.40% of its net assets in capital contributions to Vanguard. At October 31, 2009, the fund had contributed capital of $2,310,000 to Vanguard (included in Other Assets), representing 0.02% of the fund’s net assets and 0.92% of Vanguard’s capitalization. The fund’s trustees and officers are also directors and officers of Vanguard.
C. The fund’s custodian bank has agreed to reduce its fees when the fund maintains cash on deposit in the non-interest-bearing custody account. For the year ended October 31, 2009, custodian fee offset arrangements reduced the fund’s expenses by $169,000 (an annual rate of 0.00% of average net assets).
D. Various inputs may be used to determine the value of the fund’s investments. These inputs are summarized in three broad levels for financial statement purposes. The inputs or methodologies used to value securities are not necessarily an indication of the risk associated with investing in those securities.
Level 1—Quoted prices in active markets for identical securities.
Level 2—Other significant observable inputs (including quoted prices for similar securities, interest rates, prepayment speeds, credit risk, etc.).
Level 3—Significant unobservable inputs (including the fund’s own assumptions used to determine the fair value of investments).
The following table summarizes the fund’s investments as of October 31, 2009, based on the inputs used to value them:
| | | |
| | Level 1 | Level 2 | Level 3 |
| Investments | ($000) | ($000) | ($000) |
| Common Stocks | 61,703 | 10,845,742 | 800 |
| Temporary Cash Investments | 318,104 | 13,995 | — |
| Futures Contracts—Liabilities1 | (2,927) | — | — |
| Forward Currency Contracts—Assets | 624 | — | — |
| Total | 377,504 | 10,859,737 | 800 |
| 1 Represents variation margin on the last day of the reporting period. | | | |
The following table summarizes changes in investments valued based on Level 3 inputs during the year ended October 31, 2009:
| |
| | Investments in |
| | Securities |
| Amount Valued Based on Level 3 Inputs | ($000) |
| Balance as of October 31, 2008 | — |
| Transfers into Level 3 | 708 |
| Change in Unrealized Appreciation (Depreciation) | 92 |
| Balance as of October 31, 2009 | 800 |
33
European Stock Index Fund
E. At October 31, 2009, the fair values of derivatives were reflected in the Statement of Net Assets as follows:
| | | |
| | | Foreign | |
| | Equity | Exchange | |
| | Contracts1 | Contracts | Total |
| Statement of Net Assets Caption | ($000) | ($000) | ($000) |
| Other Assets | — | 624 | 624 |
| Liabilities | (2,927) | — | (2,927) |
| 1 Represents variation margin on the last day of the reporting period. | | | |
Realized net gain (loss) and the change in unrealized appreciation (depreciation) on derivatives for the year ended October 31, 2009, were:
| | | |
| | | Foreign | |
| | Equity | Exchange | |
| | Contracts | Contracts | Total |
| Realized Net Gain (Loss) on Derivatives | ($000) | ($000) | ($000) |
| Futures Contracts | (4,807) | — | (4,807) |
| Forward Currency Contracts | — | (1,072) | (1,072) |
| Realized Net Gain (Loss) on Derivatives | (4,807) | (1,072) | (5,879) |
| |
| Change in Unrealized Appreciation (Depreciation) on Derivatives | | | |
| Futures Contracts | 9,698 | — | 9,698 |
| Forward Currency Contracts | — | 10,702 | 10,702 |
| Change in Unrealized Appreciation (Depreciation) on Derivatives | 9,698 | 10,702 | 20,400 |
At October 31, 2009, the aggregate settlement value of open futures contracts and the related unrealized appreciation (depreciation) were:
| | | | |
| | | | | ($000) |
| | | Number of | Aggregate | Unrealized |
| | | Long (Short) | Settlement | Appreciation |
| Futures Contracts | Expiration | Contracts | Value | (Depreciation) |
| Dow Jones EURO STOXX 50 Index | December 2009 | 1,515 | 60,934 | (3,586) |
| FTSE 100 Index | December 2009 | 510 | 42,041 | (1,163) |
At October 31, 2009, the fund had open forward currency contracts to receive and deliver currencies as follows. Unrealized appreciation (depreciation) on open forward currency contracts is treated as realized gain (loss) for tax purposes.
| | | | | |
| | | | | | Unrealized |
| | | | | | Appreciation |
| | | | Contract Amount (000) | (Depreciation) |
| Contract Settlement Date | | Receive | | Deliver | ($000) |
| 12/23/09 | EUR | 43,729 | USD | 64,509 | 131 |
| 12/23/09 | GBP | 26,210 | USD | 43,191 | 493 |
| EUR—Euro. | | | | | |
| GBP—British pound. | | | | | |
| USD—U.S. dollar. | | | | | |
34
European Stock Index Fund
The fund had net unrealized foreign currency gains of $1,658,000 resulting from the translation of other assets and liabilities at October 31, 2009.
F. Distributions are determined on a tax basis and may differ from net investment income and realized capital gains for financial reporting purposes. Differences may be permanent or temporary. Permanent differences are reclassified among capital accounts in the financial statements to reflect their tax character. Temporary differences arise when certain items of income, expense, gain, or loss are recognized in different periods for financial statement and tax purposes; these differences will reverse at some time in the future. Differences in classification may also result from the treatment of short-term gains as ordinary income for tax purposes.
During the year ended October 31, 2009, the fund realized net foreign currency gains of $2,514,000, which increased distributable net income for tax purposes; accordingly, such gains have been reclassified from accumulated net realized losses to undistributed net investment income. Certain of the fund’s investments are in securities considered to be “passive foreign investment companies,” for which any unrealized appreciation and/or realized gains are required to be included in distributable net income for tax purposes. Unrealized appreciation of $4,496,000 on the fund’s passive foreign investment company holdings at October 31, 2008, has been distributed and is reflected in the balance of undistributed net investment income. During the year ended October 31, 2009, the fund realized gains on the sale of passive foreign investment companies of $2,025,000, which have been included in current and prior per iods’ taxable income; accordingly, such gains have been reclassified from accumulated net realized losses to undistributed net investment income. Unrealized appreciation on the fund’s passive foreign investment company holdings at October 31, 2009, was $3,089,000.
During the year ended October 31, 2009, the fund realized $1,505,062,000 of net capital losses resulting from in-kind redemptions—in which shareholders exchanged fund shares for securities held by the fund rather than for cash. Because such losses are not taxable losses to the fund, they have been reclassified from accumulated net realized losses to paid-in capital.
For tax purposes, at October 31, 2009, the fund had $407,810,000 of ordinary income available for distribution. The fund had available capital loss carryforwards totaling $1,880,835,000 to offset future net capital gains of $13,739,000 through October 31, 2011, $357,042,000 through October 31, 2016, and $1,510,054,000 through October 31, 2017.
At October 31, 2009, the cost of investment securities for tax purposes was $14,910,831,000. Net unrealized depreciation of investment securities for tax purposes was $3,670,487,000, consisting of unrealized gains of $322,066,000 on securities that had risen in value since their purchase and $3,992,553,000 in unrealized losses on securities that had fallen in value since their purchase.
G. During the year ended October 31, 2009, the fund purchased $2,771,676,000 of investment securities and sold $10,117,810,000 of investment securities, other than temporary cash investments.
35
European Stock Index Fund
| | | | |
| H. Capital share transactions for each class of shares were: | | | |
| | | | Year Ended October 31, |
| | | 2009 | | 2008 |
| | Amount | Shares | Amount | Shares |
| | ($000) | (000) | ($000) | (000) |
| Investor Shares | | | | |
| Issued | 1,139,617 | 59,184 | 4,845,905 | 141,072 |
| Issued in Lieu of Cash Distributions | 700,467 | 36,181 | 735,566 | 18,702 |
| Redeemed1 | (6,341,324) | (349,683) | (9,515,620) | (283,778) |
| Net Increase (Decrease)—Investor Shares | (4,501,240) | (254,318) | (3,934,149) | (124,004) |
| Admiral Shares | | | | |
| Issued | 197,387 | 3,957 | 414,328 | 4,886 |
| Issued in Lieu of Cash Distributions | 81,700 | 1,798 | 73,521 | 796 |
| Redeemed1 | (284,234) | (6,122) | (475,808) | (6,157) |
| Net Increase (Decrease)—Admiral Shares | (5,147) | (367) | 12,041 | (475) |
| Signal Shares | | | | |
| Issued | 71,159 | 3,811 | 155,336 | 4,630 |
| Issued in Lieu of Cash Distributions | 11,893 | 677 | 11,877 | 332 |
| Redeemed1 | (93,903) | (5,161) | (197,069) | (6,553) |
| Net Increase (Decrease)—Signal Shares | (10,851) | (673) | (29,856) | (1,591) |
| Institutional Shares | | | | |
| Issued | 891,860 | 44,118 | 2,001,811 | 62,248 |
| Issued in Lieu of Cash Distributions | 221,985 | 11,472 | 129,816 | 3,297 |
| Redeemed1 | (3,632,538) | (172,962) | (1,315,989) | (36,071) |
| Net Increase (Decrease)—Institutional Shares | (2,518,693) | (117,372) | 815,638 | 29,474 |
| ETF Shares | | | | |
| Issued | 503,833 | 10,810 | 454,883 | 7,234 |
| Issued in Lieu of Cash Distributions | — | — | — | — |
| Redeemed1 | (98,286) | (2,300) | (229,309) | (3,400) |
| Net Increase (Decrease)—ETF Shares | 405,547 | 8,510 | 225,574 | 3,834 |
| 1 Net of redemption fees for fiscal 2009 and 2008 of $633,000 and $1,724,000, respectively (fund totals). | | |
I. In preparing the financial statements as of October 31, 2009, management considered the impact of subsequent events occurring through December 15, 2009, for potential recognition or disclosure in these financial statements.
36
Pacific Stock Index Fund
Fund Profile
As of October 31, 2009
| | | |
| Portfolio Characteristics | | |
| | | Target | Broad |
| | Fund | Index1 | Index2 |
| Number of Stocks | 499 | 494 | 1,806 |
| Turnover Rate | 8% | — | — |
| Expense Ratio3 | | — | — |
| Investor Shares | 0.29% | | |
| Admiral Shares | 0.18% | | |
| Signal Shares | 0.18% | | |
| Institutional Shares | 0.13% | | |
| ETF Shares | 0.18% | | |
| Short-Term Reserves4 | –0.2% | — | — |
| | | |
| Sector Diversification (% of equity exposure) |
| | | Target | Broad |
| | Fund | Index1 | Index2 |
| Consumer Discretionary | 14.5% | 14.5% | 8.3% |
| Consumer Staples | 6.3 | 6.2 | 8.6 |
| Energy | 2.6 | 2.6 | 11.2 |
| Financials | 28.5 | 28.6 | 26.6 |
| Health Care | 4.6 | 4.5 | 6.4 |
| Industrials | 14.7 | 14.7 | 9.8 |
| Information Technology | 8.9 | 8.9 | 6.5 |
| Materials | 11.5 | 11.6 | 11.2 |
| Telecommunication | | | |
| Services | 3.5 | 3.5 | 6.4 |
| Utilities | 4.9 | 4.9 | 5.0 |
| | |
| Volatility Measures5 | |
| | Fund Versus | Fund Versus |
| | Target Index1 | Broad Index2 |
| R-Squared | 0.95 | 0.89 |
| Beta | 1.00 | 0.82 |
| | |
| Ten Largest Holdings6 (% of total net assets) |
| BHP Billiton Ltd. | diversified metals | |
| | and mining | 3.4% |
| Toyota Motor Corp. | automobile | |
| | manufacturers | 3.4 |
| Commonwealth | | |
| Bank of Australia | diversified banks | 2.2 |
| Westpac Banking Corp. | diversified banks | 2.1 |
| Honda Motor Co. Ltd. | automobile | |
| | manufacturers | 1.6 |
| National Australia | | |
| Bank Ltd. | diversified banks | 1.6 |
| Mitsubishi UFJ | | |
| Financial Group Inc. | diversified banks | 1.5 |
| Australia & New Zealand | | |
| Banking Group Ltd. | diversified banks | 1.5 |
| Canon Inc. | office electronics | 1.2 |
| Woolworths Ltd. | food retail | 1.0 |
| Top Ten | | 19.5% |
| | |
| Market Diversification (% of equity exposure) |
| | | Target |
| | Fund | Index1 |
| Japan | 63.6% | 63.6% |
| Australia | 24.8 | 24.8 |
| Hong Kong | 7.2 | 7.2 |
| Singapore | 4.1 | 4.1 |
| Other Pacific Markets | 0.3 | 0.3 |
1 MSCI Pacific Index.
2 MSCI All Country World Index ex USA.
3 The expense ratios shown are from the prospectuses dated February 27, 2009, and represent estimated costs for the current fiscal year
based on the fund’s net assets as of the prospectus date. For the fiscal year ended October 31, 2009, the expense ratios were 0.27% for
Investor Shares, 0.16% for Admiral Shares, 0.16% for Signal Shares, 0.12% for Institutional Shares, and 0.16% for ETF Shares.
4 The fund invested a portion of its cash reserves in equity markets through the use of index futures contracts. After the effect of the futures
investments, the fund’s temporary cash position was negative.
5 For an explanation of R-squared, beta, and other terms used here, see the Glossary.
6 The holdings listed exclude any temporary cash investments and equity index products.
37
Pacific Stock Index Fund
Performance Summary
All of the returns in this report represent past performance, which is not a guarantee of future results that may be achieved by the fund. (Current performance may be lower or higher than the performance data cited. For performance data current to the most recent month-end, visit our website at www.vanguard.com/performance.) Note, too, that both investment returns and principal value can fluctuate widely, so an investor’s shares, when sold, could be worth more or less than their original cost. The returns shown do not reflect taxes that a shareholder would pay on fund distributions or on the sale of fund shares.
Cumulative Performance: October 31, 1999–October 31, 2009
Initial Investment of $10,000
| | | | |
| | | Average Annual Total Returns | Final Value |
| | | Periods Ended October 31, 2009 | of a $10,000 |
| | One Year | Five Years | Ten Years | Investment |
| Pacific Stock Index Fund Investor Shares1 | 23.23% | 4.12% | 0.08% | $10,080 |
| MSCI All Country World Index ex USA | 34.79 | 7.58 | 3.95 | 14,733 |
| MSCI Pacific Index | 28.32 | 4.52 | 0.42 | 10,424 |
| Japan/Pacific Region Funds Average2 | 22.47 | 1.12 | –2.46 | 7,794 |
| | | | |
| | | | | Final Value of |
| | | | Since | a $100,000 |
| | One Year | Five Years | Inception3 | Investment |
| Pacific Stock Index Fund Admiral Shares1 | 23.38% | 4.24% | 4.50% | $143,575 |
| MSCI All Country World Index ex USA | 34.79 | 7.58 | 7.46 | 180,584 |
| MSCI Pacific Index | 28.32 | 4.52 | 4.79 | 146,905 |
| |
| | | | | Final Value of |
| | | | Since | a $10,000,000 |
| | One Year | | Inception3 | Investment |
| Pacific Stock Index Fund Signal Shares1 | 23.38% | | –11.33% | $7,486,007 |
| MSCI All Country World Index ex USA | 34.79 | | –10.56 | 7,643,407 |
| MSCI Pacific Index | 28.32 | | –10.78 | 7,598,170 |
1 Total returns do not reflect the 0.50% transaction fee on purchases through March 31, 2000; the 2% fee assessed on redemptions of shares purchased on or after June 27, 2003, and held for less than two months; or, for the Investor Shares, the account service fee that may be applicable to certain accounts with balances below $10,000.
2 Derived from data provided by Lipper Inc.
3 Performance for the fund and its comparative standards is calculated since the following inception dates: August 13, 2001, for the Admiral Shares and June 4, 2007, for the Signal Shares.
38
| | | | |
| Pacific Stock Index Fund | | | | |
| |
| |
| |
| |
| | | | | Final Value of |
| | | | Since | a $5,000,000 |
| | One Year | Five Years | Inception1 | Investment |
| Pacific Stock Index Fund Institutional Shares2 | 23.46% | 4.29% | 0.09% | $5,041,212 |
| MSCI All Country World Index ex USA | 34.79 | 7.58 | 3.17 | 6,716,547 |
| MSCI Pacific Index | 28.32 | 4.52 | 0.30 | 5,143,491 |
| |
| | | | | Final Value of |
| | | | Since | a $10,000 |
| | One Year | | Inception1 | Investment |
| Pacific Stock Index Fund ETF Shares | | | | |
| Net Asset Value3 | 23.38% | | 1.87% | $10,902 |
| MSCI All Country World Index ex USA | 34.79 | | 4.65 | 12,357 |
| MSCI Pacific Index | 28.32 | | 2.24 | 11,089 |
| |
| |
| Cumulative Returns: ETF Shares, March 4, 2005–October 31, 2009 | | |
| | | | | Since |
| | | | One Year | Inception1 |
| Pacific Stock Index Fund ETF Shares Market Price | | | 22.09% | 8.21% |
| Pacific Stock Index Fund ETF Shares Net Asset Value | | | 23.38 | 9.02 |
| MSCI Pacific Index | | | 28.32 | 10.89 |
1 Performance for the fund and its comparative standards is calculated since the following inception dates: May 15, 2000, for the Institutional Shares and March 4, 2005, for the ETF Shares.
2 Total returns do not reflect the 2% fee assessed on redemptions of shares purchased on or after June 27, 2003, and held for less than two months.
3 For more information about how the ETF Shares’ market prices have compared with their net asset value, visit www.vanguard.com, select your ETF, and then select the Performance tab. The Premium/Discount table there shows the percentages of days on which the ETF Shares’ market price was above or below the NAV.
39
Pacific Stock Index Fund
Fiscal-Year Total Returns (%): October 31, 1999–October 31, 2009
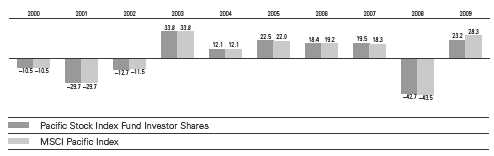
Average Annual Total Returns: Periods Ended September 30, 2009
This table presents average annual total returns through the latest calendar quarter—rather than through the end of the fiscal period. Securities and Exchange Commission rules require that we provide this information.
| | | | |
| | Inception Date | One Year | Five Years | Ten Years |
| Pacific Stock Index Fund | | | | |
| Investor Shares1 | 6/18/1990 | 3.49% | 5.33% | 0.76% |
| Admiral Shares1 | 8/13/2001 | 3.65 | 5.44 | 4.912 |
| Signal Shares1 | 6/4/2007 | 3.65 | –10.632 | — |
| Institutional Shares1 | 5/15/2000 | 3.73 | 5.48 | 0.392 |
| ETF Shares | 3/4/2005 | | | |
| Market Price | | 3.15 | 2.482 | — |
| Net Asset Value | | 3.65 | 2.542 | — |
1 Total returns do not reflect the 0.50% transaction fee on purchases through March 31, 2000; the 2% fee assessed on redemptions of shares purchased on or after June 27, 2003, and held for less than two months; or, for the Investor Shares, the account service fee that may be applicable to certain accounts with balances below $10,000.
2 Returns since inception.
Note: See Financial Highlights tables for dividend and capital gains information.
40
Pacific Stock Index Fund
Financial Statements
Statement of Net Assets
As of October 31, 2009
The fund reports a complete list of its holdings in regulatory filings four times in each fiscal year, at the quarter-ends. For the second and fourth fiscal quarters, the lists appear in the fund’s semiannual and annual reports to shareholders. For the first and third fiscal quarters, the fund files the lists with the Securities and Exchange Commission on Form N-Q. Shareholders can look up the fund’s Forms N-Q on the SEC’s website at www.sec.gov. Forms N-Q may also be reviewed and copied at the SEC’s Public Reference Room (see the back cover of this report for further information).
| | | |
| | | | Market |
| | | | Value• |
| | | Shares | ($000) |
| Common Stocks (99.5%)1 | | |
| Australia (24.6%) | | |
| | BHP Billiton Ltd. | 5,859,406 | 192,169 |
| | Commonwealth Bank | | |
| | of Australia | 2,651,756 | 122,541 |
| | Westpac Banking Corp. | 5,082,799 | 118,798 |
| | National Australia | | |
| | Bank Ltd. | 3,349,122 | 88,489 |
| | Australia & New Zealand | | |
| | Banking Group Ltd. | 4,070,843 | 83,029 |
| | Woolworths Ltd. | 2,145,633 | 54,919 |
| | Wesfarmers Ltd. | 1,754,824 | 43,789 |
| | Rio Tinto Ltd. | 760,502 | 42,155 |
| | Westfield Group | 3,577,175 | 38,755 |
| | Woodside Petroleum Ltd. | 866,794 | 36,358 |
| | QBE Insurance Group Ltd. | 1,750,355 | 35,250 |
| | CSL Ltd. | 1,053,603 | 29,583 |
| | Newcrest Mining Ltd. | 844,244 | 24,268 |
| ^ | Macquarie Group Ltd. | 530,511 | 23,234 |
| | Telstra Corp. Ltd. | 7,693,426 | 22,862 |
| | Origin Energy Ltd. | 1,524,585 | 21,861 |
| | Santos Ltd. | 1,433,246 | 19,105 |
| | AMP Ltd. | 3,517,199 | 18,532 |
| | Suncorp-Metway Ltd. | 2,196,845 | 17,183 |
| | Foster’s Group Ltd. | 3,365,767 | 16,507 |
| | Brambles Ltd. | 2,448,129 | 15,434 |
| | Orica Ltd. | 628,535 | 13,333 |
| | Stockland | 3,994,506 | 13,269 |
| | Insurance Australia | | |
| | Group Ltd. | 3,621,843 | 12,184 |
| | Amcor Ltd. | 2,125,211 | 10,944 |
| | AGL Energy Ltd. | 778,663 | 9,652 |
| | Coca-Cola Amatil Ltd. | 970,444 | 9,226 |
| | ASX Ltd. | 298,134 | 8,988 |
| | Toll Holdings Ltd. | 1,153,672 | 8,745 |
| | BlueScope Steel Ltd. | 3,186,454 | 8,445 |
| ^ | Leighton Holdings Ltd. | 259,555 | 8,242 |
| | Transurban Group | 2,009,381 | 8,153 |
| | Sonic Healthcare Ltd. | 635,020 | 7,928 |
| | GPT Group | 14,937,807 | 7,623 |
| | | |
| | | | Market |
| | | | Value• |
| | | Shares | ($000) |
| | Computershare Ltd. | 778,265 | 7,556 |
| * | Fortescue Metals | | |
| | Group Ltd. | 2,160,708 | 7,235 |
| | TABCORP Holdings Ltd. | 1,052,179 | 6,712 |
| | AXA Asia Pacific | | |
| | Holdings Ltd. | 1,772,990 | 6,637 |
| | Wesfarmers Ltd. | | |
| | Price Protected Shares | 264,579 | 6,629 |
| | WorleyParsons Ltd. | 285,549 | 6,588 |
| | Incitec Pivot Ltd. | 2,783,678 | 6,493 |
| * | Asciano Group | 4,699,989 | 6,293 |
| | Lend Lease Corp. Ltd. | 758,851 | 6,290 |
| | OneSteel Ltd. | 2,309,004 | 6,269 |
| * | Alumina Ltd. | 4,245,631 | 6,230 |
| | Crown Ltd. | 853,033 | 6,209 |
| | Dexus Property Group | 8,188,593 | 5,785 |
| | Mirvac Group | 4,409,000 | 5,773 |
| * | OZ Minerals Ltd. | 5,488,814 | 5,739 |
| | Cochlear Ltd. | 97,928 | 5,612 |
| | Goodman Group | 10,453,716 | 5,605 |
| | Metcash Ltd. | 1,326,873 | 5,579 |
| | Boral Ltd. | 1,035,318 | 5,281 |
| ^ | Fairfax Media Ltd. | 3,685,258 | 5,223 |
| | CFS Retail Property Trust | 3,014,636 | 5,180 |
| | Macquarie | | |
| | Infrastructure Group | 3,946,238 | 5,050 |
| | Bendigo and | | |
| | Adelaide Bank Ltd. | 610,406 | 4,947 |
| | Qantas Airways Ltd. | 1,937,403 | 4,817 |
| * | James Hardie | | |
| | Industries NV | 756,226 | 4,793 |
| | Tatts Group Ltd. | 2,094,044 | 4,637 |
| | Sims Metal | | |
| | Management Ltd. ADR | 235,750 | 4,168 |
| ^,* | Paladin Energy Ltd. | 1,126,395 | 4,075 |
| * | Arrow Energy Ltd. | 1,011,387 | 3,655 |
| | CSR Ltd. | 2,129,573 | 3,622 |
| | Harvey Norman | | |
| | Holdings Ltd. | 939,554 | 3,329 |
| | Goodman Fielder Ltd. | 2,246,416 | 3,222 |
| | Billabong International Ltd. | 344,769 | 3,190 |
41
| | | |
| Pacific Stock Index Fund | | |
| |
| |
| |
| | | | Market |
| | | | Value• |
| | | Shares | ($000) |
| | Macquarie Airports | 1,200,090 | 3,053 |
| | Nufarm Ltd. | 298,228 | 3,048 |
| | Aristocrat Leisure Ltd. | 680,835 | 2,718 |
| | Energy Resources of | | |
| | Australia Ltd. | 115,992 | 2,396 |
| | Perpetual Ltd. | 66,723 | 2,223 |
| * | Caltex Australia Ltd. | 232,911 | 2,112 |
| | SP AusNet | 2,371,254 | 1,863 |
| | Sims Metal | | |
| | Management Ltd. | 19,064 | 336 |
| * | CSR, Ltd. Rights | | |
| | Exp. 11/9/09 | 373,868 | 81 |
| | | | 1,387,806 |
| Hong Kong (7.2%) | | |
| | Sun Hung Kai | | |
| | Properties Ltd. | 2,461,781 | 37,297 |
| | Hong Kong Exchanges | | |
| | and Clearing Ltd. | 1,783,146 | 31,388 |
| | Cheung Kong | | |
| | Holdings Ltd. | 2,428,208 | 30,817 |
| | Hutchison Whampoa Ltd. | 3,719,599 | 26,108 |
| | CLP Holdings Ltd. | 3,567,547 | 23,910 |
| | Hang Seng Bank Ltd. | 1,334,769 | 18,856 |
| | Hong Kong & China | | |
| | Gas Co. Ltd. | 6,905,430 | 16,614 |
| | Swire Pacific Ltd. | 1,342,727 | 16,363 |
| | Li & Fung Ltd. | 3,928,681 | 16,339 |
| | BOC Hong Kong | | |
| | Holdings Ltd. | 6,453,992 | 14,856 |
| | Hang Lung Properties Ltd. | 3,630,242 | 13,719 |
| | Henderson Land | | |
| | Development Co. Ltd. | 1,870,034 | 13,221 |
| | Esprit Holdings Ltd. | 1,958,129 | 13,035 |
| | Wharf Holdings Ltd. | 2,411,792 | 13,031 |
| | Hongkong Electric | | |
| | Holdings Ltd. | 2,418,165 | 12,932 |
| | New World | | |
| | Development Ltd. | 4,361,545 | 9,388 |
| | Bank of East Asia Ltd. | 2,557,422 | 8,971 |
| | MTR Corp. | 2,479,603 | 8,782 |
| | Link REIT | 3,775,476 | 8,502 |
| | Hang Lung Group Ltd. | 1,403,181 | 7,034 |
| | Kerry Properties Ltd. | 1,238,040 | 6,903 |
| | Sino Land Co. Ltd. | 2,962,114 | 5,634 |
| | Wheelock & Co. Ltd. | 1,594,647 | 5,123 |
| | Shangri-La Asia Ltd. | 2,272,085 | 4,370 |
| * | Cathay Pacific | | |
| | Airways Ltd. | 2,043,220 | 3,311 |
| | Hysan Development | | |
| | Co. Ltd. | 1,106,187 | 3,267 |
| * | Foxconn International | | |
| | Holdings Ltd. | 3,684,816 | 3,236 |
| | Yue Yuen Industrial | | |
| | Holdings Ltd. | 1,146,717 | 3,195 |
| | Hopewell Holdings Ltd. | 997,323 | 3,138 |
| | Wing Hang Bank Ltd. | 307,893 | 2,987 |
| | | |
| | | | Market |
| | | | Value• |
| | | Shares | ($000) |
| | Cheung Kong Infrastructure | |
| | Holdings Ltd. | 786,854 | 2,798 |
| | NWS Holdings Ltd. | 1,472,015 | 2,795 |
| | ASM Pacific | | |
| | Technology Ltd. | 347,241 | 2,700 |
| | Television Broadcasts Ltd. | 485,897 | 2,296 |
| ^,* | Mongolia Energy Co. Ltd. | 5,273,219 | 2,216 |
| | Chinese Estates | | |
| | Holdings Ltd. | 1,217,357 | 2,087 |
| ^ | Orient Overseas | | |
| | International Ltd. | 389,065 | 1,898 |
| | Lifestyle International | | |
| | Holdings Ltd. | 1,052,544 | 1,692 |
| | PCCW Ltd. | 6,472,653 | 1,590 |
| | Hong Kong Aircraft | | |
| | Engineerg Co. Ltd. | 118,885 | 1,404 |
| | | | 403,803 |
| Japan (63.3%) | | |
| | Toyota Motor Corp. | 4,815,883 | 190,116 |
| | Honda Motor Co. Ltd. | 2,882,854 | 89,042 |
| | Mitsubishi UFJ Financial | | |
| | Group Inc. | 16,269,341 | 86,657 |
| | Canon Inc. | 1,862,859 | 70,235 |
| | Sumitomo Mitsui | | |
| | Financial Group Inc. | 1,585,242 | 53,883 |
| | Takeda | | |
| | Pharmaceutical Co. Ltd. | 1,308,817 | 52,344 |
| | Tokyo Electric | | |
| | Power Co. Inc. | 2,125,564 | 52,249 |
| | Sony Corp. | 1,753,829 | 51,788 |
| | Mitsubishi Corp. | 2,368,772 | 50,219 |
| | Panasonic Corp. | 3,426,611 | 48,367 |
| | Nomura Holdings Inc. | 6,226,254 | 43,884 |
| | Nintendo Co. Ltd. | 172,961 | 43,383 |
| | Mizuho Financial | | |
| | Group Inc. | 21,973,328 | 43,341 |
| | Mitsui & Co. Ltd. | 3,026,880 | 39,752 |
| | Toshiba Corp. | 6,848,214 | 39,140 |
| | NTT DoCoMo Inc. | 26,855 | 38,947 |
| | Shin-Etsu | | |
| | Chemical Co. Ltd. | 716,481 | 37,996 |
| | East Japan Railway Co. | 592,937 | 37,971 |
| | Nippon Telegraph & | | |
| | Telephone Corp. | 906,723 | 37,414 |
| | Nippon Steel Corp. | 8,912,270 | 34,001 |
| | Tokio Marine | | |
| | Holdings Inc. | 1,264,488 | 32,333 |
| | Komatsu Ltd. | 1,656,578 | 32,295 |
| | Nissan Motor Co. Ltd. | 4,341,532 | 31,416 |
| | Mitsubishi | | |
| | Estate Co. Ltd. | 2,063,005 | 31,162 |
| | Softbank Corp. | 1,320,431 | 31,114 |
| | Seven & I | | |
| | Holdings Co. Ltd. | 1,344,979 | 29,445 |
| | Astellas Pharma Inc. | 791,068 | 29,130 |
42
| | |
| Pacific Stock Index Fund | | |
| |
| |
| |
| | | Market |
| | | Value• |
| | Shares | ($000) |
| Kansai Electric | | |
| Power Co. Inc. | 1,332,965 | 28,801 |
| JFE Holdings Inc. | 856,526 | 27,901 |
| Fanuc Ltd. | 334,539 | 27,787 |
| KDDI Corp. | 5,089 | 27,010 |
| Chubu Electric | | |
| Power Co. Inc. | 1,156,333 | 25,816 |
| Mitsubishi Electric Corp. | 3,373,896 | 25,665 |
| FUJIFILM Holdings Corp. | 854,094 | 24,281 |
| Kirin Holdings Co. Ltd. | 1,460,261 | 23,836 |
| Kyocera Corp. | 283,344 | 23,768 |
| Mitsui Fudosan Co. Ltd. | 1,461,322 | 23,644 |
| Denso Corp. | 849,340 | 23,207 |
| Daiichi Sankyo Co. Ltd. | 1,176,704 | 22,988 |
| Japan Tobacco Inc. | 7,848 | 22,018 |
| Kao Corp. | 942,097 | 20,984 |
| Fujitsu Ltd. | 3,256,530 | 19,177 |
| Sumitomo Corp. | 1,962,507 | 19,051 |
| Hitachi Ltd. | 5,872,449 | 18,961 |
| Mitsubishi Heavy | | |
| Industries Ltd. | 5,303,617 | 18,754 |
| Sharp Corp. | 1,744,523 | 18,613 |
| Murata | | |
| Manufacturing Co. Ltd. | 372,767 | 18,188 |
| Bridgestone Corp. | 1,065,232 | 17,566 |
| Central Japan Railway Co. | 2,625 | 17,488 |
| Mitsui Sumitomo | | |
| Insurance Group | | |
| Holdings Inc. | 735,819 | 17,128 |
| Secom Co. Ltd. | 365,492 | 17,053 |
| Tokyo Electron Ltd. | 299,385 | 16,842 |
| ITOCHU Corp. | 2,628,527 | 16,614 |
| Nidec Corp. | 189,631 | 16,011 |
| Sumitomo Electric | | |
| Industries Ltd. | 1,315,991 | 15,969 |
| Tokyo Gas Co. Ltd. | 4,030,233 | 15,966 |
| Ricoh Co. Ltd. | 1,173,880 | 15,953 |
| Hoya Corp. | 721,365 | 15,875 |
| Eisai Co. Ltd. | 440,695 | 15,649 |
| Terumo Corp. | 294,206 | 15,485 |
| Tohoku Electric | | |
| Power Co. Inc. | 746,705 | 15,334 |
| Sumitomo Metal | | |
| Industries Ltd. | 5,865,423 | 14,985 |
| Suzuki Motor Corp. | 616,274 | 14,911 |
| Daiwa Securities | | |
| Group Inc. | 2,827,398 | 14,882 |
| Kubota Corp. | 1,905,452 | 14,807 |
| Asahi Glass Co. Ltd. | 1,754,824 | 14,784 |
| Sumitomo Metal | | |
| Mining Co. Ltd. | 912,122 | 14,425 |
| Keyence Corp. | 72,379 | 14,369 |
| Marubeni Corp. | 2,877,703 | 14,238 |
| Daikin Industries Ltd. | 409,040 | 13,865 |
| Fast Retailing Co. Ltd. | 83,021 | 13,665 |
| | | |
| | | | Market |
| | | | Value• |
| | | Shares | ($000) |
| | Kyushu Electric | | |
| | Power Co. Inc. | 660,851 | 13,493 |
| | Toray Industries Inc. | 2,331,172 | 13,280 |
| | Sumitomo Trust & | | |
| | Banking Co. Ltd. | 2,483,449 | 12,939 |
| | Sumitomo Realty & | | |
| | Development Co. Ltd. | 664,120 | 12,593 |
| | Dai Nippon | | |
| | Printing Co. Ltd. | 977,691 | 12,250 |
| | Asahi Breweries Ltd. | 676,611 | 11,962 |
| | ORIX Corp. | 183,070 | 11,825 |
| | Olympus Corp. | 378,487 | 11,814 |
| | Inpex Holdings, Inc. | 1,439 | 11,751 |
| | TDK Corp. | 203,584 | 11,705 |
| | Mitsui OSK Lines Ltd. | 2,000,308 | 11,615 |
| | Osaka Gas Co. Ltd. | 3,398,164 | 11,374 |
| | Rohm Co. Ltd. | 170,880 | 11,332 |
| | Shionogi & Co. Ltd. | 522,363 | 11,268 |
| | Shiseido Co. Ltd. | 609,192 | 11,122 |
| | Asahi Kasei Corp. | 2,206,989 | 10,936 |
| | Ajinomoto Co. Inc. | 1,164,475 | 10,929 |
| | Sumitomo | | |
| | Chemical Co. Ltd. | 2,738,177 | 10,910 |
| | SMC Corp. | 94,006 | 10,736 |
| | Nippon Oil Corp. | 2,176,708 | 10,726 |
| | West Japan Railway Co. | 2,966 | 10,511 |
| | Shizuoka Bank Ltd. | 1,055,162 | 10,484 |
| | T&D Holdings Inc. | 405,667 | 10,480 |
| | Bank of Yokohama Ltd. | 2,133,400 | 10,476 |
| | Nikon Corp. | 560,960 | 10,455 |
| | Resona Holdings Inc. | 848,529 | 10,103 |
| | Kintetsu Corp. | 2,832,138 | 10,072 |
| | Yamato Holdings Co. Ltd. | 678,714 | 10,012 |
| | Aeon Co. Ltd. | 1,117,395 | 9,967 |
| | NGK Insulators Ltd. | 440,978 | 9,891 |
| | Chugoku Electric | | |
| | Power Co. Inc. | 485,194 | 9,819 |
| ^,* | NEC Corp. | 3,373,035 | 9,587 |
| | Daiwa House | | |
| | Industry Co. Ltd. | 887,530 | 9,482 |
| ^,* | Mitsubishi Motors Corp. | 6,286,141 | 9,299 |
| | Yamada Denki Co. Ltd. | 151,439 | 9,228 |
| | Sompo Japan | | |
| | Insurance Inc. | 1,550,380 | 9,066 |
| | Odakyu Electric | | |
| | Railway Co. Ltd. | 1,095,915 | 8,927 |
| | Hankyu Hanshin | | |
| | Holdings Inc. | 1,996,467 | 8,894 |
| | Shikoku Electric | | |
| | Power Co. | 311,077 | 8,753 |
| | Toppan Printing Co. Ltd. | 976,764 | 8,730 |
| | Nitto Denko Corp. | 287,701 | 8,689 |
| | Tokyu Corp. | 1,983,850 | 8,670 |
| | Rakuten Inc. | 12,550 | 8,595 |
| | Aisin Seiki Co. Ltd. | 334,314 | 8,500 |
| | Toyota Industries Corp. | 312,835 | 8,473 |
43
| | | |
| Pacific Stock Index Fund | | |
| |
| |
| |
| | | | Market |
| | | | Value• |
| | | Shares | ($000) |
| | Panasonic Electric | | |
| | Works Co. Ltd. | 656,122 | 8,282 |
| | Chiba Bank Ltd. | 1,326,620 | 8,181 |
| | Ibiden Co. Ltd. | 223,569 | 8,004 |
| | Kobe Steel Ltd. | 4,331,025 | 7,871 |
| | Mitsubishi Chemical | | |
| | Holdings Corp. | 2,104,554 | 7,815 |
| | Konica Minolta | | |
| | Holdings Inc. | 831,468 | 7,811 |
| | Tobu Railway Co. Ltd. | 1,421,988 | 7,777 |
| | Yahoo! Japan Corp. | 25,322 | 7,761 |
| | Sekisui House Ltd. | 883,917 | 7,644 |
| | Chugai Pharmaceutical | | |
| | Co. Ltd. | 389,924 | 7,628 |
| | Hokuriku Electric | | |
| | Power Co. | 327,091 | 7,457 |
| | Nippon Building | | |
| | Fund Inc. Class A | 898 | 7,361 |
| ^,* | Sanyo Electric Co. Ltd. | 2,932,914 | 7,270 |
| | Electric Power | | |
| | Development Co. Ltd. | 232,834 | 7,179 |
| | Nippon Yusen KK | 1,930,747 | 7,127 |
| | JS Group Corp. | 434,639 | 7,094 |
| | Ono Pharmaceutical | | |
| | Co. Ltd. | 147,450 | 7,001 |
| | JGC Corp. | 361,396 | 6,908 |
| | Unicharm Corp. | 72,028 | 6,903 |
| | Nippon Mining | | |
| | Holdings Inc. | 1,539,382 | 6,868 |
| | Nippon Electric | | |
| | Glass Co. Ltd. | 609,006 | 6,558 |
| | Makita Corp. | 195,861 | 6,491 |
| | OJI Paper Co. Ltd. | 1,487,340 | 6,473 |
| | Japan Steel Works Ltd. | 584,632 | 6,448 |
| | NTT Data Corp. | 2,205 | 6,345 |
| | Trend Micro Inc. | 183,156 | 6,339 |
| | Keio Corp. | 1,006,085 | 6,335 |
| | Dentsu Inc. | 291,322 | 6,241 |
| | Chuo Mitsui Trust | | |
| | Holdings Inc. | 1,707,996 | 6,237 |
| | Kuraray Co. Ltd. | 602,465 | 6,219 |
| | Nipponkoa Insurance | | |
| | Co. Ltd. | 1,136,234 | 6,186 |
| | Advantest Corp. | 279,027 | 6,163 |
| | Japan Real Estate | | |
| | Investment Corp. | | |
| | Class A | 772 | 6,160 |
| | Kawasaki Heavy | | |
| | Industries Ltd. | 2,460,339 | 6,148 |
| | JSR Corp. | 313,851 | 6,121 |
| | Keihin Electric Express | | |
| | Railway Co. Ltd. | 767,193 | 6,107 |
| | Hokkaido Electric | | |
| | Power Co. Inc. | 317,131 | 6,106 |
| | Nippon Express Co. Ltd. | 1,481,712 | 6,067 |
| | | |
| | | | Market |
| | | | Value• |
| | | Shares | ($000) |
| | Kurita Water | | |
| | Industries Ltd. | 196,218 | 6,001 |
| | Omron Corp. | 354,655 | 5,972 |
| | Oriental Land Co. Ltd. | 87,202 | 5,911 |
| | Isetan Mitsukoshi | | |
| | Holdings Ltd. | 611,091 | 5,857 |
| | Mazda Motor Corp. | 2,579,482 | 5,822 |
| | Benesse Corp. | 131,029 | 5,777 |
| | Daito Trust | | |
| | Construction Co. Ltd. | 138,569 | 5,760 |
| ^,* | GS Yuasa Corp. | 641,998 | 5,530 |
| | Taiyo Nippon Sanso Corp. | 491,193 | 5,455 |
| | Hirose Electric Co. Ltd. | 52,522 | 5,414 |
| | Sankyo Co. Ltd. | 93,820 | 5,359 |
| | SBI Holdings Inc. | 29,115 | 5,350 |
| | Toyota Tsusho Corp. | 368,651 | 5,271 |
| | Nitori Co. Ltd. | 64,252 | 5,225 |
| | Kyowa Hakko Kirin Co. Ltd. | 451,854 | 5,223 |
| | Lawson Inc. | 113,634 | 5,080 |
| | Joyo Bank Ltd. | 1,147,017 | 5,046 |
| | Mitsubishi Tanabe | | |
| | Pharma Corp. | 391,608 | 5,000 |
| | Mitsubishi | | |
| | Materials Corp. | 1,888,805 | 4,981 |
| * | MEIJI Holdings Co. Ltd. | 121,504 | 4,949 |
| | Bank of Kyoto Ltd. | 544,188 | 4,938 |
| | Fukuoka Financial | | |
| | Group Inc. | 1,345,418 | 4,919 |
| | Stanley Electric Co. Ltd. | 245,555 | 4,808 |
| | Teijin Ltd. | 1,631,481 | 4,795 |
| | Hokuhoku Financial | | |
| | Group Inc. | 2,197,083 | 4,761 |
| | NSK Ltd. | 815,240 | 4,736 |
| | Showa Denko KK | 2,402,976 | 4,625 |
| | Sega Sammy Holdings Inc. | 320,498 | 4,551 |
| | Sumitomo Heavy | | |
| | Industries Ltd. | 1,000,274 | 4,538 |
| | Sekisui Chemical Co. Ltd. | 749,896 | 4,536 |
| | Shimano Inc. | 117,920 | 4,509 |
| | Ube Industries Ltd. | 1,746,684 | 4,501 |
| | Brother Industries Ltd. | 394,593 | 4,493 |
| | TonenGeneral Sekiyu KK | 492,300 | 4,493 |
| | Yamaha Motor Co. Ltd. | 375,421 | 4,471 |
| | Santen Pharmaceutical | | |
| | Co. Ltd. | 128,738 | 4,417 |
| | Toyo Seikan Kaisha Ltd. | 262,438 | 4,409 |
| ^ | Hitachi Construction | | |
| | Machinery Co. Ltd. | 188,538 | 4,394 |
| * | IHI Corp. | 2,300,195 | 4,387 |
| | Nisshin Seifun Group Inc. | 328,334 | 4,380 |
| | Yakult Honsha Co. Ltd. | 167,263 | 4,356 |
| | Isuzu Motors Ltd. | 2,059,729 | 4,355 |
| | Sony Financial | | |
| | Holdings Inc. | 1,514 | 4,345 |
| | Suzuken Co. Ltd. | 122,750 | 4,344 |
44
| | | |
| Pacific Stock Index Fund | | |
| |
| |
| |
| | | | Market |
| | | | Value• |
| | | Shares | ($000) |
| | Nissin Foods | | |
| | Holdings Co., Ltd. | 122,180 | 4,311 |
| | Nippon Paper Group Inc. | 162,203 | 4,304 |
| | Obayashi Corp. | 1,132,262 | 4,276 |
| | Fuji Heavy Industries Ltd. | 1,089,534 | 4,258 |
| | Furukawa Electric Co. Ltd. | 1,113,157 | 4,222 |
| | Hachijuni Bank Ltd. | 700,180 | 4,142 |
| | Toho Gas Co. Ltd. | 794,831 | 4,122 |
| | Chugoku Bank Ltd. | 303,088 | 4,093 |
| | Taisho Pharmaceutical | | |
| | Co. Ltd. | 223,761 | 4,078 |
| * | Elpida Memory Inc. | 308,109 | 4,025 |
| | Toyo Suisan Kaisha Ltd. | 153,498 | 4,017 |
| | All Nippon | | |
| | Airways Co. Ltd. | 1,427,688 | 3,983 |
| ^ | J Front Retailing Co. Ltd. | 839,113 | 3,977 |
| | Shimizu Corp. | 1,035,867 | 3,972 |
| | Hisamitsu | | |
| | Pharmaceutical Co. Inc. | 115,490 | 3,970 |
| | Sojitz Corp. | 2,139,078 | 3,949 |
| | Kawasaki Kisen | | |
| | Kaisha Ltd. | 1,063,270 | 3,874 |
| | Sumco Corp. | 202,145 | 3,858 |
| | Jupiter | | |
| | Telecommunications | | |
| | Co. Ltd. | 4,212 | 3,850 |
| | Nomura Research | | |
| | Institute Ltd. | 175,560 | 3,796 |
| | Iyo Bank Ltd. | 420,864 | 3,795 |
| | Aioi Insurance Co. Ltd. | 854,696 | 3,763 |
| | Seiko Epson Corp. | 241,594 | 3,735 |
| | Nippon Meat Packers Inc. | 318,426 | 3,733 |
| | Shimamura Co. Ltd. | 38,077 | 3,640 |
| | THK Co. Ltd. | 210,616 | 3,639 |
| | Amada Co. Ltd. | 590,398 | 3,612 |
| | Hitachi Chemical Co. Ltd. | 181,457 | 3,602 |
| | Yamaguchi Financial | | |
| | Group Inc. | 376,052 | 3,593 |
| | Tsumura & Co. | 104,313 | 3,590 |
| | Mediceo Paltac | | |
| | Holdings Co. Ltd. | 256,208 | 3,578 |
| | Gunma Bank Ltd. | 685,254 | 3,570 |
| | Mitsui Chemicals Inc. | 1,033,812 | 3,550 |
| | JTEKT Corp. | 334,317 | 3,532 |
| | Namco Bandai | | |
| | Holdings Inc. | 345,164 | 3,529 |
| | Takashimaya Co. Ltd. | 517,981 | 3,492 |
| | Kikkoman Corp. | 299,537 | 3,467 |
| | 77 Bank Ltd. | 600,424 | 3,455 |
| | Kajima Corp. | 1,468,173 | 3,437 |
| | Mizuho Securities Co. Ltd. | 992,149 | 3,424 |
| | Daihatsu Motor Co. Ltd. | 333,646 | 3,413 |
| | Kamigumi Co. Ltd. | 453,548 | 3,407 |
| | Yaskawa Electric Corp. | 428,873 | 3,374 |
| | Kaneka Corp. | 517,582 | 3,370 |
| | Taisei Corp. | 1,712,639 | 3,361 |
| | | |
| | | | Market |
| | | | Value• |
| | | Shares | ($000) |
| | Mitsui Engineering & | | |
| | Shipbuilding Co. Ltd. | 1,291,352 | 3,344 |
| | Suruga Bank Ltd. | 369,422 | 3,338 |
| | Hiroshima Bank Ltd. | 867,205 | 3,328 |
| | Nippon Sheet | | |
| | Glass Co. Ltd. | 1,106,696 | 3,261 |
| | Toyoda Gosei Co. Ltd. | 116,075 | 3,254 |
| | Showa Shell Sekiyu KK | 328,485 | 3,235 |
| | NGK Spark Plug Co. Ltd. | 284,963 | 3,230 |
| | Yokogawa Electric Corp. | 398,114 | 3,227 |
| | Kansai Paint Co. Ltd. | 377,664 | 3,196 |
| | Nissan Chemical | | |
| | Industries Ltd. | 246,840 | 3,181 |
| | Tokyu Land Corp. | 788,540 | 3,180 |
| | Tokuyama Corp. | 503,282 | 3,162 |
| | Ushio Inc. | 198,275 | 3,117 |
| | NTN Corp. | 824,901 | 3,115 |
| | Denki Kagaku Kogyo KK | 847,643 | 3,110 |
| | Mitsubishi UFJ Lease & | | |
| | Finance Co. Ltd. | 104,039 | 3,099 |
| | Mitsubishi Gas | | |
| | Chemical Co. Inc. | 669,093 | 3,086 |
| | Credit Saison Co. Ltd. | 275,012 | 3,074 |
| | FamilyMart Co. Ltd. | 102,322 | 3,048 |
| | Nomura Real Estate | | |
| | Office Fund Inc. Class A | 492 | 3,040 |
| | Mitsubishi Rayon Co. Ltd. | 879,746 | 3,039 |
| ^ | Casio Computer Co. Ltd. | 413,522 | 3,034 |
| | Aeon Mall Co. Ltd. | 144,420 | 3,026 |
| | Shimadzu Corp. | 435,941 | 3,019 |
| | Konami Corp. | 165,575 | 3,013 |
| | Dainippon Sumitomo | | |
| | Pharma Co. Ltd. | 287,447 | 2,988 |
| | Rinnai Corp. | 67,436 | 2,963 |
| | Toho Co. Ltd. | 196,274 | 2,950 |
| ^ | Oracle Corp. Japan | 66,487 | 2,930 |
| | Nishi-Nippon City | | |
| | Bank Ltd. | 1,179,688 | 2,918 |
| | Mitsumi Electric Co. Ltd. | 144,066 | 2,906 |
| | Idemitsu Kosan Co. Ltd. | 39,021 | 2,862 |
| | Daicel Chemical | | |
| | Industries Ltd. | 468,140 | 2,827 |
| | Yamaha Corp. | 273,426 | 2,825 |
| | Square Enix | | |
| | Holdings Co., Ltd. | 113,475 | 2,825 |
| | Hitachi Metals Ltd. | 295,331 | 2,818 |
| | Sumitomo Rubber | | |
| | Industries Ltd. | 305,645 | 2,818 |
| | Japan Retail Fund | | |
| | Investment Corp. Class A | 598 | 2,811 |
| | Citizen Holdings Co. Ltd. | 497,327 | 2,798 |
| | Alfresa Holdings Corp. | 64,279 | 2,779 |
| | Cosmo Oil Co. Ltd. | 1,055,406 | 2,772 |
| ^ | TOTO Ltd. | 463,738 | 2,748 |
| | Keisei Electric | | |
| | Railway Co. Ltd. | 477,950 | 2,687 |
45
| | | |
| Pacific Stock Index Fund | | |
| |
| |
| |
| | | | Market |
| | | | Value• |
| | | Shares | ($000) |
| | Yamazaki Baking Co. Ltd. | 217,113 | 2,664 |
| | Dowa Holdings Co., Ltd. | 452,845 | 2,644 |
| | Nomura Real Estate | | |
| | Holdings Inc. | 164,117 | 2,613 |
| | Minebea Co. Ltd. | 622,016 | 2,607 |
| | NOK Corp. | 193,842 | 2,572 |
| * | Mitsui Mining & | | |
| | Smelting Co. Ltd. | 997,223 | 2,570 |
| * | Mizuho Trust & | | |
| | Banking Co. Ltd. | 2,692,452 | 2,566 |
| | Asics Corp. | 286,772 | 2,556 |
| | Japan Petroleum | | |
| | Exploration Co. | 51,141 | 2,553 |
| | Tokyo Tatemono Co. Ltd. | 507,732 | 2,421 |
| | Mabuchi Motor Co. Ltd. | 50,433 | 2,413 |
| | Toyota Boshoku Corp. | 115,385 | 2,406 |
| ^ | Sapporo Holdings Ltd. | 458,117 | 2,392 |
| | UNY Co. Ltd. | 320,400 | 2,380 |
| | Seven Bank Ltd. | 972 | 2,375 |
| * | McDonald’s Holdings Co. | | |
| | Japan Ltd. | 117,399 | 2,373 |
| | Tosoh Corp. | 881,152 | 2,369 |
| | USS Co. Ltd. | 39,121 | 2,367 |
| | Tokyo Steel | | |
| | Manufacturing Co. Ltd. | 177,801 | 2,329 |
| | Yamato Kogyo Co. Ltd. | 76,252 | 2,288 |
| | Nisshinbo Holdings Inc. | 231,166 | 2,272 |
| | Marui Group Co. Ltd. | 388,687 | 2,233 |
| | NHK Spring Co. Ltd. | 285,269 | 2,227 |
| | Mitsubishi Logistics Corp. | 204,466 | 2,225 |
| | Japan Prime Realty | | |
| | Investment Corp. | | |
| | Class A | 991 | 2,158 |
| ^,* | Shinsei Bank Ltd. | 1,613,892 | 2,105 |
| ^,* | Japan Airlines Corp. | 1,611,136 | 2,087 |
| | Obic Co. Ltd. | 12,306 | 2,081 |
| | Hakuhodo DY Holdings Inc. | 40,517 | 2,035 |
| | Hitachi High-Technologies | | |
| | Corp. | 122,733 | 2,033 |
| | Nisshin Steel Co. Ltd. | 1,187,901 | 1,982 |
| | Kinden Corp. | 238,192 | 1,934 |
| | Canon Marketing Japan Inc. | 119,290 | 1,933 |
| * | Senshu Ikeda Holdings Inc. | 554,600 | 1,898 |
| | Ito En Ltd. | 112,254 | 1,888 |
| | Coca-Cola West Co. Ltd. | 99,071 | 1,840 |
| | Sapporo Hokuyo | | |
| | Holdings Inc. | 540,605 | 1,825 |
| | Shinko Electric | | |
| | Industries Co. Ltd. | 122,366 | 1,822 |
| | Fuji Electric | | |
| | Holdings Co. Ltd. | 971,927 | 1,806 |
| | Taiheiyo Cement Corp. | 1,467,576 | 1,704 |
| | DIC Corp. | 1,040,785 | 1,703 |
| | Hino Motors Ltd. | 453,656 | 1,677 |
| ^ | Dena Co. Ltd. | 483 | 1,670 |
| | Daido Steel Co. Ltd. | 485,706 | 1,653 |
| | | |
| | | | Market |
| | | | Value• |
| | | Shares | ($000) |
| | NTT Urban | | |
| | Development Corp. | 2,052 | 1,648 |
| * | Aozora Bank Ltd. | 1,338,514 | 1,583 |
| ^ | Matsui Securities Co. Ltd. | 215,498 | 1,551 |
| ^ | Jafco Co. Ltd. | 56,561 | 1,521 |
| | Otsuka Corp. | 28,432 | 1,499 |
| | Itochu Techno- | | |
| | Solutions Corp. | 50,327 | 1,383 |
| | Nissay Dowa General | | |
| | Insurance Co. Ltd. | 311,266 | 1,382 |
| | Aeon Credit Service Co. Ltd. | 141,503 | 1,362 |
| | Onward Holdings Co. Ltd. | 218,519 | 1,357 |
| | ABC-Mart Inc. | 44,336 | 1,285 |
| ^ | Maruichi Steel Tube Ltd. | 66,680 | 1,244 |
| | Fuji Media Holdings Inc. | 841 | 1,236 |
| | Leopalace21 Corp. | 217,393 | 1,176 |
| | Tokyo Broadcasting | | |
| | System Holdings Inc. | 67,242 | 1,003 |
| ^ | Acom Co. Ltd. | 69,883 | 893 |
| ^ | Hikari Tsushin Inc. | 46,374 | 870 |
| ^ | OSAKA Titanium | | |
| | Technologies Co. | 32,761 | 868 |
| ^ | Promise Co. Ltd. | 130,296 | 828 |
| * | Dowa Mining Co. Ltd. | | |
| | Rights Exp. 1/29/10 | 425,000 | 127 |
| | | | 3,563,175 |
| New Zealand (0.3%) | | |
| | Fletcher Building Ltd. | 1,052,394 | 6,216 |
| | Telecom Corp. of | | |
| | New Zealand Ltd. | 3,204,877 | 5,787 |
| | Sky City Entertainment | | |
| | Group Ltd. | 981,561 | 2,425 |
| | Contact Energy Ltd. | 523,571 | 2,332 |
| | Auckland International | | |
| | Airport Ltd. | 1,518,903 | 2,185 |
| | | | 18,945 |
| Singapore (4.1%) | | |
| | Singapore | | |
| | Telecommunications | | |
| | Ltd. | 13,911,220 | 28,848 |
| | DBS Group Holdings Ltd. | 2,984,727 | 27,333 |
| | United Overseas | | |
| | Bank Ltd. | 2,130,395 | 25,537 |
| | Oversea-Chinese | | |
| | Banking Corp. Ltd. | 4,371,869 | 23,560 |
| | CapitaLand Ltd. | 4,443,028 | 12,884 |
| | Keppel Corp. Ltd. | 2,229,123 | 12,811 |
| | Wilmar International Ltd. | 2,224,176 | 9,806 |
| | Singapore Airlines Ltd. | 928,290 | 8,902 |
| | Singapore Exchange Ltd. | 1,499,107 | 8,495 |
| | Singapore Press | | |
| | Holdings Ltd. | 2,765,084 | 7,572 |
| * | Genting Singapore PLC | 8,046,522 | 6,147 |
| | City Developments Ltd. | 866,551 | 6,071 |
| | Singapore Technologies | | |
| | Engineering Ltd. | 2,355,691 | 4,746 |
46
| | | |
| Pacific Stock Index Fund | | |
| |
| |
| |
| | | | Market |
| | | | Value• |
| | | Shares | ($000) |
| | Fraser and Neave Ltd. | 1,694,771 | 4,614 |
| | CapitaMall Trust | 3,887,977 | 4,367 |
| | Noble Group Ltd. | 2,372,741 | 4,336 |
| | SembCorp Industries Ltd. | 1,714,370 | 4,039 |
| | Olam International Ltd. | 2,072,126 | 3,978 |
| | Jardine Cycle & | | |
| | Carriage Ltd. | 217,229 | 3,568 |
| | ComfortDelgro Corp. Ltd. | 3,274,723 | 3,558 |
| * | Golden Agri- | | |
| | Resources Ltd. | 11,699,926 | 3,521 |
| | SembCorp Marine Ltd. | 1,436,414 | 3,504 |
| | Ascendas Real Estate | | |
| | Investment Trust | 2,614,826 | 3,399 |
| | UOL Group Ltd. | 901,345 | 2,150 |
| | Neptune Orient Lines Ltd. | 1,587,688 | 1,767 |
| | StarHub Ltd. | 1,079,945 | 1,446 |
| | Cosco Corp. | | |
| | Singapore Ltd. | 1,817,007 | 1,438 |
| * | Golden Agri-Resources | | |
| | Ltd. Warrants Exp. | | |
| | 7/23/12 | 699,582 | 58 |
| | | | 228,455 |
| Total Common Stocks | | |
| (Cost $7,372,447) | | 5,602,184 |
| Temporary Cash Investments (1.6%)1 | |
| Money Market Fund (1.5%) | | |
| 2,3 | Vanguard Market | | |
| | Liquidity Fund, 0.225% | 86,082,132 | 86,082 |
| |
| | | Face | |
| | | Amount | |
| | | ($000) | |
| U.S. Government and Agency Obligations (0.1%) |
| 4,5 | Federal Home Loan | | |
| | Bank Discount Notes, | | |
| | 0.275%, 2/19/10 | 4,000 | 3,999 |
| Total Temporary Cash Investments | |
| (Cost $90,079) | | 90,081 |
| Total Investments (101.1%) | | |
| (Cost $7,462,526) | | 5,692,265 |
| |
| | Market |
| | Value• |
| | ($000) |
| Other Assets and Liabilities (–1.1%) | |
| Other Assets | 59,919 |
| Liabilities3 | (123,471) |
| | (63,552) |
| Net Assets (100%) | 5,628,713 |
| |
| |
| At October 31, 2009, net assets consisted of: |
| | Amount |
| | ($000) |
| Paid-in Capital | 8,411,407 |
| Undistributed Net Investment Income | 126,000 |
| Accumulated Net Realized Losses | (1,138,246) |
| Unrealized Appreciation (Depreciation) | |
| Investment Securities | (1,770,261) |
| Futures Contracts | (259) |
| Foreign Currencies and | |
| Forward Currency Contracts | 72 |
| Net Assets | 5,628,713 |
| |
| Investor Shares—Net Assets | |
| Applicable to 295,978,414 outstanding | |
| $.001 par value shares of beneficial | |
| interest (unlimited authorization) | 2,845,721 |
| Net Asset Value Per Share— | |
| Investor Shares | $9.61 |
| |
| Admiral Shares—Net Assets | |
| Applicable to 13,486,989 outstanding | |
| $.001 par value shares of beneficial | |
| interest (unlimited authorization) | 849,073 |
| Net Asset Value Per Share— | |
| Admiral Shares | $62.95 |
47
| |
| Pacific Stock Index Fund | |
| |
| |
| |
| |
| | Amount |
| | ($000) |
| Signal Shares—Net Assets | |
| Applicable to 7,269,799 outstanding | |
| $.001 par value shares of beneficial | |
| interest (unlimited authorization) | 158,983 |
| Net Asset Value Per Share— | |
| Signal Shares | $21.87 |
| |
| Institutional Shares—Net Assets | |
| Applicable to 50,523,532 outstanding | |
| $.001 par value shares of beneficial | |
| interest (unlimited authorization) | 486,638 |
| Net Asset Value Per Share— | |
| Institutional Shares | $9.63 |
| |
| ETF Shares—Net Assets | |
| Applicable to 25,302,255 outstanding | |
| $.001 par value shares of beneficial | |
| interest (unlimited authorization) | 1,288,298 |
| Net Asset Value Per Share— | |
| ETF Shares | $50.92 |
• See Note A in Notes to Financial Statements.
^ Part of security position is on loan to broker-dealers. The total value of securities on loan is $81,024,000.
* Non-income-producing security.
1 The fund invests a portion of its cash reserves in equity markets through the use of index futures contracts. After giving effect to futures investments, the fund’s effective common stock and temporary cash investment positions represent 99.8% and 1.3%, respectively, of net assets.
2 Affiliated money market fund available only to Vanguard funds and certain trusts and accounts managed by Vanguard. Rate shown is the 7-day yield.
3 Includes $86,082,000 of collateral received for securities on loan.
4 The issuer operates under a congressional charter; its securities are not backed by the full faith and credit of the U.S. government.
5 Securities with a value of $3,999,000 have been segregated as initial margin for open futures contracts.
ADR—American Depositary Receipt.
REIT—Real Estate Investment Trust.
See accompanying Notes, which are an integral part of the Financial Statements.
48
| |
| Pacific Stock Index Fund | |
| |
| |
| |
| Statement of Operations | |
| |
| |
| | Year Ended |
| | October 31, 2009 |
| | ($000) |
| Investment Income | |
| Income | |
| Dividends1 | 176,360 |
| Interest2 | 394 |
| Security Lending | 5,190 |
| Total Income | 181,944 |
| Expenses | |
| The Vanguard Group—Note B | |
| Investment Advisory Services | 345 |
| Management and Administrative—Investor Shares | 7,156 |
| Management and Administrative—Admiral Shares | 825 |
| Management and Administrative—Signal Shares | 151 |
| Management and Administrative—Institutional Shares | 606 |
| Management and Administrative—ETF Shares | 1,034 |
| Marketing and Distribution—Investor Shares | 1,409 |
| Marketing and Distribution—Admiral Shares | 179 |
| Marketing and Distribution—Signal Shares | 48 |
| Marketing and Distribution—Institutional Shares | 477 |
| Marketing and Distribution—ETF Shares | 388 |
| Custodian Fees | 1,155 |
| Auditing Fees | 36 |
| Shareholders’ Reports and Proxies—Investor Shares | 163 |
| Shareholders’ Reports and Proxies—Admiral Shares | 10 |
| Shareholders’ Reports and Proxies—Signal Shares | 2 |
| Shareholders’ Reports and Proxies—Institutional Shares | 2 |
| Shareholders’ Reports and Proxies—ETF Shares | 224 |
| Trustees’ Fees and Expenses | 13 |
| Total Expenses | 14,223 |
| Expenses Paid Indirectly | (86) |
| Net Expenses | 14,137 |
| Net Investment Income | 167,807 |
| Realized Net Gain (Loss) | |
| Investment Securities Sold | (1,022,718) |
| Futures Contracts | (23,661) |
| Foreign Currencies and Forward Currency Contracts | 8,568 |
| Realized Net Gain (Loss) | (1,037,811) |
| Change in Unrealized Appreciation (Depreciation) | |
| Investment Securities | 1,863,207 |
| Futures Contracts | 25,173 |
| Foreign Currencies and Forward Currency Contracts | (1,523) |
| Change in Unrealized Appreciation (Depreciation) | 1,886,857 |
| Net Increase (Decrease) in Net Assets Resulting from Operations | 1,016,853 |
1 Dividends are net of foreign withholding taxes of $6,537,000.
2 Interest income from an affiliated company of the fund was $251,000.
See accompanying Notes, which are an integral part of the Financial Statements.
49
| | |
| Pacific Stock Index Fund | | |
| |
| |
| Statement of Changes in Net Assets | | |
| |
| | Year Ended October 31, |
| | 2009 | 2008 |
| | ($000) | ($000) |
| Increase (Decrease) in Net Assets | | |
| Operations | | |
| Net Investment Income | 167,807 | 344,567 |
| Realized Net Gain (Loss) | (1,037,811) | 597,304 |
| Change in Unrealized Appreciation (Depreciation) | 1,886,857 | (8,006,379) |
| Net Increase (Decrease) in Net Assets Resulting from Operations | 1,016,853 | (7,064,508) |
| Distributions | | |
| Net Investment Income | | |
| Investor Shares | (90,208) | (247,822) |
| Admiral Shares | (13,868) | (29,349) |
| Signal Shares | (2,869) | (6,128) |
| Institutional Shares | (32,221) | (59,339) |
| ETF Shares | (22,623) | (34,784) |
| Realized Capital Gain | | |
| Investor Shares | — | — |
| Admiral Shares | — | — |
| Signal Shares | — | — |
| Institutional Shares | — | — |
| ETF Shares | — | — |
| Total Distributions | (161,789) | (377,422) |
| Capital Share Transactions | | |
| Investor Shares | (2,494,500) | (1,532,226) |
| Admiral Shares | (30,359) | 34,355 |
| Signal Shares | (17,973) | 31,639 |
| Institutional Shares | (1,316,524) | 93,372 |
| ETF Shares | (114,249) | 519,132 |
| Net Increase (Decrease) from Capital Share Transactions | (3,973,605) | (853,728) |
| Total Increase (Decrease) | (3,118,541) | (8,295,658) |
| Net Assets | | |
| Beginning of Period | 8,747,254 | 17,042,912 |
| End of Period1 | 5,628,713 | 8,747,254 |
| 1 Net Assets—End of Period includes undistributed net investment income of $126,000,000 and $100,521,000. | |
See accompanying Notes, which are an integral part of the Financial Statements.
50
| | | | | |
| Pacific Stock Index Fund | | | | | |
| |
| |
| Financial Highlights | | | | | |
| |
| |
| Investor Shares | | | | | |
| |
| For a Share Outstanding | | | Year Ended October 31, |
| Throughout Each Period | 2009 | 2008 | 2007 | 2006 | 2005 |
| Net Asset Value, Beginning of Period | $7.94 | $14.19 | $12.13 | $10.39 | $8.63 |
| Investment Operations | | | | | |
| Net Investment Income | .1891 | .281 | .236 | .190 | .156 |
| Net Realized and Unrealized Gain (Loss) | | | | | |
| on Investments | 1.621 | (6.228) | 2.091 | 1.710 | 1.761 |
| Total from Investment Operations | 1.810 | (5.947) | 2.327 | 1.900 | 1.917 |
| Distributions | | | | | |
| Dividends from Net Investment Income | (.140) | (.303) | (.267) | (.160) | (.157) |
| Distributions from Realized Capital Gains | — | — | — | — | — |
| Total Distributions | (.140) | (.303) | (.267) | (.160) | (.157) |
| Net Asset Value, End of Period | $9.61 | $7.94 | $14.19 | $12.13 | $10.39 |
| |
| Total Return2 | 23.23% | –42.71% | 19.52% | 18.39% | 22.48% |
| |
| Ratios/Supplemental Data | | | | | |
| Net Assets, End of Period (Millions) | $2,846 | $5,065 | $11,281 | $7,814 | $5,202 |
| Ratio of Total Expenses to | | | | | |
| Average Net Assets | 0.27% | 0.22% | 0.22% | 0.27% | 0.32% |
| Ratio of Net Investment Income to | | | | | |
| Average Net Assets | 2.42% | 2.32% | 1.80% | 1.73% | 1.76% |
| Portfolio Turnover Rate3 | 8% | 9% | 3% | 2% | 7% |
1 Calculated based on average shares outstanding.
2 Total returns do not reflect the 2% fee assessed on redemptions of shares held for less than two months or the account service fee that may be applicable to certain accounts with balanced below $10,000.
3 Excludes the value of portfolio securities received or delivered as a result of in-kind purchases or redemptions of the fund’s capital shares, including ETF Creation Units.
See accompanying Notes, which are an integral part of the Financial Statements.
51
| | | | | |
| Pacific Stock Index Fund | | | | | |
| |
| |
| Financial Highlights | | | | | |
| |
| |
| Admiral Shares | | | | | |
| |
| For a Share Outstanding | | | Year Ended October 31, |
| Throughout Each Period | 2009 | 2008 | 2007 | 2006 | 2005 |
| Net Asset Value, Beginning of Period | $52.04 | $92.94 | $79.43 | $68.05 | $56.47 |
| Investment Operations | | | | | |
| Net Investment Income | 1.3861 | 1.933 | 1.613 | 1.302 | 1.069 |
| Net Realized and Unrealized Gain (Loss) | | | | | |
| on Investments | 10.531 | (40.773) | 13.714 | 11.185 | 11.583 |
| Total from Investment Operations | 11.917 | (38.840) | 15.327 | 12.487 | 12.652 |
| Distributions | | | | | |
| Dividends from Net Investment Income | (1.007) | (2.060) | (1.817) | (1.107) | (1.072) |
| Distributions from Realized Capital Gains | — | — | — | — | — |
| Total Distributions | (1.007) | (2.060) | (1.817) | (1.107) | (1.072) |
| Net Asset Value, End of Period | $62.95 | $52.04 | $92.94 | $79.43 | $68.05 |
| |
| Total Return2 | 23.38% | –42.62% | 19.64% | 18.46% | 22.68% |
| |
| Ratios/Supplemental Data | | | | | |
| Net Assets, End of Period (Millions) | $849 | $737 | $1,292 | $1,128 | $720 |
| Ratio of Total Expenses to | | | | | |
| Average Net Assets | 0.16% | 0.12% | 0.12% | 0.17% | 0.20% |
| Ratio of Net Investment Income to | | | | | |
| Average Net Assets | 2.53% | 2.42% | 1.90% | 1.83% | 1.90% |
| Portfolio Turnover Rate3 | 8% | 9% | 3% | 2% | 7% |
1 Calculated based on average shares outstanding.
2 Total returns do not reflect the 2% fee assessed on redemptions of shares held for less than two months.
3 Excludes the value of portfolio securities received or delivered as a result of in-kind purchases or redemptions of the fund’s capital shares, including ETF Creation Units.
See accompanying Notes, which are an integral part of the Financial Statements.
52
| | | |
| Pacific Stock Index Fund | | | |
| |
| |
| Financial Highlights | | | |
| |
| |
| Signal Shares | | | |
| | | | June 4, |
| | Year Ended | 20071 to |
| | October 31, | Oct. 31, |
| For a Share Outstanding Throughout Each Period | 2009 | 2008 | 2007 |
| Net Asset Value, Beginning of Period | $18.08 | $32.28 | $30.53 |
| Investment Operations | | | |
| Net Investment Income | .4812 | .667 | .250 |
| Net Realized and Unrealized Gain (Loss) on Investments | 3.658 | (14.158) | 1.500 |
| Total from Investment Operations | 4.139 | (13.491) | 1.750 |
| Distributions | | | |
| Dividends from Net Investment Income | (.349) | (.709) | — |
| Distributions from Realized Capital Gains | — | — | — |
| Total Distributions | (.349) | (.709) | — |
| Net Asset Value, End of Period | $21.87 | $18.08 | $32.28 |
| |
| Total Return3 | 23.38% | –42.61% | 5.73% |
| |
| Ratios/Supplemental Data | | | |
| Net Assets, End of Period (Millions) | $159 | $150 | $247 |
| Ratio of Total Expenses to Average Net Assets | 0.16% | 0.12% | 0.12%4 |
| Ratio of Net Investment Income to Average Net Assets | 2.53% | 2.42% | 1.90%4 |
| Portfolio Turnover Rate5 | 8% | 9% | 3% |
1 Inception.
2 Calculated based on average shares outstanding.
3 Total returns do not reflect the 2% fee assessed on redemptions of shares held for less than two months.
4 Annualized.
5 Excludes the value of portfolio securities received or delivered as a result of in-kind purchases or redemptions of the fund’s capital shares, including ETF Creation Units.
See accompanying Notes, which are an integral part of the Financial Statements.
53
| | | | | |
| Pacific Stock Index Fund | | | | | |
| |
| |
| Financial Highlights | | | | | |
| |
| |
| Institutional Shares | | | | | |
| |
| For a Share Outstanding | | | Year Ended October 31, |
| Throughout Each Period | 2009 | 2008 | 2007 | 2006 | 2005 |
| Net Asset Value, Beginning of Period | $7.96 | $14.22 | $12.15 | $10.41 | $8.64 |
| Investment Operations | | | | | |
| Net Investment Income | .2151 | .300 | .251 | .206 | .180 |
| Net Realized and Unrealized Gain (Loss) | | | | | |
| on Investments | 1.613 | (6.242) | 2.102 | 1.710 | 1.760 |
| Total from Investment Operations | 1.828 | (5.942) | 2.353 | 1.916 | 1.940 |
| Distributions | | | | | |
| Dividends from Net Investment Income | (.158) | (.318) | (.283) | (.176) | (.170) |
| Distributions from Realized Capital Gains | — | — | — | — | — |
| Total Distributions | (.158) | (.318) | (.283) | (.176) | (.170) |
| Net Asset Value, End of Period | $9.63 | $7.96 | $14.22 | $12.15 | $10.41 |
| |
| Total Return2 | 23.46% | –42.62% | 19.72% | 18.52% | 22.74% |
| |
| Ratios/Supplemental Data | | | | | |
| Net Assets, End of Period (Millions) | $487 | $1,610 | $2,720 | $1,788 | $1,280 |
| Ratio of Total Expenses to | | | | | |
| Average Net Assets | 0.12% | 0.09% | 0.09% | 0.12% | 0.14% |
| Ratio of Net Investment Income to | | | | | |
| Average Net Assets | 2.57% | 2.45% | 1.93% | 1.88% | 1.95% |
| Portfolio Turnover Rate3 | 8% | 9% | 3% | 2% | 7% |
1 Calculated based on average shares outstanding.
2 Total returns do not reflect the 2% fee assessed on redemptions of shares held for less than two months.
3 Excludes the value of portfolio securities received or delivered as a result of in-kind purchases or redemptions of the fund’s capital shares, including ETF Creation Units.
See accompanying Notes, which are an integral part of the Financial Statements.
54
| | | | | |
| Pacific Stock Index Fund | | | | | |
| |
| |
| Financial Highlights | | | | | |
| |
| |
| ETF Shares | | | | | |
| | | | | | March 4, |
| | | | | | 20051 to |
| | | Year Ended October 31, | Oct. 31, |
| For a Share Outstanding Throughout Each Period | 2009 | 2008 | 2007 | 2006 | 2005 |
| Net Asset Value, Beginning of Period | $42.10 | $75.17 | $64.24 | $55.09 | $50.71 |
| Investment Operations | | | | | |
| Net Investment Income | 1.1092 | 1.573 | 1.314 | 1.060 | .750 |
| Net Realized and Unrealized Gain (Loss) | | | | | |
| on Investments | 8.534 | (32.974) | 11.089 | 9.020 | 3.630 |
| Total from Investment Operations | 9.643 | (31.401) | 12.403 | 10.080 | 4.380 |
| Distributions | | | | | |
| Dividends from Net Investment Income | (.823) | (1.669) | (1.473) | (.930) | — |
| Distributions from Realized Capital Gains | — | — | — | — | — |
| Total Distributions | (.823) | (1.669) | (1.473) | (.930) | — |
| Net Asset Value, End of Period | $50.92 | $42.10 | $75.17 | $64.24 | $55.09 |
| |
| Total Return | 23.38% | –42.61% | 19.65% | 18.43% | 8.64% |
| |
| Ratios/Supplemental Data | | | | | |
| Net Assets, End of Period (Millions) | $1,288 | $1,186 | $1,503 | $693 | $164 |
| Ratio of Total Expenses to Average Net Assets | 0.16% | 0.11% | 0.12% | 0.18% | 0.18%3 |
| Ratio of Net Investment Income to | | | | | |
| Average Net Assets | 2.53% | 2.43% | 1.90% | 1.82% | 1.89%3 |
| Portfolio Turnover Rate4 | 8% | 9% | 3% | 2% | 7% |
1 Inception.
2 Calculated based on average shares outstanding.
3 Annualized.
4 Excludes the value of portfolio securities received or delivered as a result of in-kind purchases or redemptions of the fund’s capital shares, including ETF Creation Units.
See accompanying Notes, which are an integral part of the Financial Statements.
55
Pacific Stock Index Fund
Notes to Financial Statements
Vanguard Pacific Stock Index Fund is registered under the Investment Company Act of 1940 as an open-end investment company, or mutual fund. The fund invests in securities of foreign issuers, which may subject it to investment risks not normally associated with investing in securities of U.S. corporations. The fund offers five classes of shares: Investor Shares, Admiral Shares, Signal Shares, Institutional Shares, and ETF Shares. Investor Shares are available to any investor who meets the fund’s minimum purchase requirements. Admiral Shares are designed for investors who meet certain administrative, service, tenure, and account-size criteria. Signal Shares are designed for institutional investors who meet certain administrative, service, and account-size criteria. Institutional Shares are designed for investors who meet certain administrative and service criteria and invest a minimum of $5 million. ETF Shares are liste d for trading on the NYSE Arca, Inc.; they can be purchased and sold through a broker.
A. The following significant accounting policies conform to generally accepted accounting principles for U.S. mutual funds. The fund consistently follows such policies in preparing its financial statements.
1. Security Valuation: Securities are valued as of the close of trading on the New York Stock Exchange (generally 4 p.m., Eastern time) on the valuation date. Equity securities are valued at the latest quoted sales prices or official closing prices taken from the primary market in which each security trades; such securities not traded on the valuation date are valued at the mean of the latest quoted bid and asked prices. Securities for which market quotations are not readily available, or whose values have been affected by events occurring before the fund’s pricing time but after the close of the securities’ primary markets, are valued at their fair values calculated according to procedures adopted by the board of trustees. These procedures include obtaining quotations from an independent pricing service, monitoring news to identify significant market- or security-specific events, and evaluating changes in the va lues of foreign market proxies (for example, ADRs, futures contracts, or exchange-traded funds), between the time the foreign markets close and the fund’s pricing time. When fair-value pricing is employed, the prices of securities used by a fund to calculate its net asset value may differ from quoted or published prices for the same securities. Investments in Vanguard Market Liquidity Fund are valued at that fund’s net asset value. Temporary cash investments acquired over 60 days to maturity are valued using the latest bid prices or using valuations based on a matrix system (which considers such factors as security prices, yields, maturities, and ratings), both as furnished by independent pricing services. Other temporary cash investments are valued at amortized cost, which approximates market value.
2. Foreign Currency: Securities and other assets and liabilities denominated in foreign currencies are translated into U.S. dollars using exchange rates obtained from an independent third party as of the fund’s pricing time on the valuation date. Realized gains (losses) and unrealized appreciation (depreciation) on investment securities include the effects of changes in exchange rates since the securities were purchased, combined with the effects of changes in security prices. Fluctuations in the value of other assets and liabilities resulting from changes in exchange rates are recorded as unrealized foreign currency gains (losses) until the assets or liabilities are settled in cash, at which time they are recorded as realized foreign currency gains (losses).
3. Futures and Forward Currency Contracts: The fund uses index futures contracts to a limited extent, with the objectives of maintaining full exposure to the stock market, enhancing returns, maintaining liquidity, and minimizing transaction costs. The fund may purchase futures contracts to immediately invest incoming cash in the market, or sell futures in response to cash outflows, thereby simulating a fully invested position in the underlying index while maintaining a cash balance for liquidity. The fund may seek to enhance returns by using futures contracts instead of the underlying securities when
56
Pacific Stock Index Fund
futures are believed to be priced more attractively than the underlying securities. The primary risks associated with the use of futures contracts are imperfect correlation between changes in market values of stocks held by the fund and the prices of futures contracts, and the possibility of an illiquid market.
The fund also may enter into forward currency contracts to provide the appropriate currency exposure related to any open futures contracts. The fund’s risks in using these contracts include movement in the values of the foreign currencies relative to the U.S. dollar and the ability of the counterparties to fulfill their obligations under the contracts. Counterparty risk is mitigated by entering into forward currency contracts only with highly rated counterparties, by a master netting arrangement between the fund and the counterparty, and by the posting of collateral by the counterparty. The forward currency contracts contain provisions whereby a counterparty may terminate open contracts if the fund’s net assets decline below a certain level, triggering a payment by the fund if the fund is in a net liability position at the time of the termination. The payment amount would be reduced by any collateral the fund has posted. Any securities posted as collateral for open contracts are noted in the Statement of Net Assets
Futures and forward currency contracts are valued at their quoted daily settlement prices. The aggregate principal amounts of the contracts are not recorded in the Statement of Net Assets. Fluctuations in the value of the contracts are recorded in the Statement of Net Assets as an asset (liability) and in the Statement of Operations as unrealized appreciation (depreciation) until the contracts are closed, when they are recorded as realized gains (losses) on futures or forward currency contracts.
4. Federal Income Taxes: The fund intends to continue to qualify as a regulated investment company and distribute all of its taxable income. Management has analyzed the fund’s tax positions taken for all open federal income tax years (October 31, 2006–2009), and has concluded that no provision for federal income tax is required in the fund’s financial statements.
5. Distributions: Distributions to shareholders are recorded on the ex-dividend date.
6. Security Lending: The fund may lend its securities to qualified institutional borrowers to earn additional income. Security loans are required to be secured at all times by collateral at least equal to the market value of securities loaned. The fund invests cash collateral received in Vanguard Market Liquidity Fund, and records a liability for the return of the collateral, during the period the securities are on loan. Security lending income represents the income earned on investing cash collateral, less expenses associated with the loan.
7. Other: Dividend income is recorded on the ex-dividend date. Interest income includes income distributions received from Vanguard Market Liquidity Fund and is accrued daily. Security transactions are accounted for on the date securities are bought or sold. Costs used to determine realized gains (losses) on the sale of investment securities are those of the specific securities sold. Fees assessed on redemptions of capital shares are credited to paid-in capital.
Each class of shares has equal rights as to assets and earnings, except that each class separately bears certain class-specific expenses related to maintenance of shareholder accounts (included in Management and Administrative expenses), shareholder reporting, and proxies. Marketing and distribution expenses are allocated to each class of shares based on a method approved by the board of trustees. Income, other non-class-specific expenses, and gains and losses on investments are allocated to each class of shares based on its relative net assets.
57
Pacific Stock Index Fund
B. The Vanguard Group furnishes at cost investment advisory, corporate management, administrative, marketing, and distribution services. The costs of such services are allocated to the fund under methods approved by the board of trustees. The fund has committed to provide up to 0.40% of its net assets in capital contributions to Vanguard. At October 31, 2009, the fund had contributed capital of $1,210,000 to Vanguard (included in Other Assets), representing 0.02% of the fund’s net assets and 0.48% of Vanguard’s capitalization. The fund’s trustees and officers are also directors and officers of Vanguard.
C. The fund’s custodian bank has agreed to reduce its fees when the fund maintains cash on deposit in the non-interest-bearing custody account. For the year ended October 31, 2009, custodian fee offset arrangements reduced the fund’s expenses by $86,000 (an annual rate of 0.00% of average net assets).
D. Various inputs may be used to determine the value of the fund’s investments. These inputs are summarized in three broad levels for financial statement purposes. The inputs or methodologies used to value securities are not necessarily an indication of the risk associated with investing in those securities.
Level 1—Quoted prices in active markets for identical securities.
Level 2—Other significant observable inputs (including quoted prices for similar securities, interest rates, prepayment speeds, credit risk, etc.).
Level 3—Significant unobservable inputs (including the fund’s own assumptions used to determine the fair value of investments).
The following table summarizes the fund’s investments as of October 31, 2009, based on the inputs used to value them:
| | | |
| | Level 1 | Level 2 | Level 3 |
| Investments | ($000) | ($000) | ($000) |
| Common Stocks | 4,168 | 5,598,016 | — |
| Temporary Cash Investments | 86,082 | 3,999 | — |
| Futures Contracts—Assets1 | 271 | — | — |
| Forward Currency Contracts—Assets | 147 | — | — |
| Forward Currency Contracts—Liabilities | (71) | — | — |
| Total | 90,597 | 5,602,015 | — |
| 1 Represents variation margin on the last day of the reporting period. | | | |
E. At October 31, 2009, the fair values of derivatives were reflected in the Statement of Net Assets as follows:
| | | |
| | | Foreign | |
| | Equity | Exchange | |
| | Contracts1 | Contracts | Total |
| Statement of Net Assets Caption | ($000) | ($000) | ($000) |
| Other Assets | 271 | 147 | 418 |
| Liabilities | — | (71) | (71) |
| 1 Represents variation margin on the last day of the reporting period. | | | |
58
Pacific Stock Index Fund
Realized net gain (loss) and the change in unrealized appreciation (depreciation) on derivatives for the year ended October 31, 2009, were:
| | | |
| | | Foreign | |
| | Equity | Exchange | |
| | Contracts | Contracts | Total |
| Realized Net Gain (Loss) on Derivatives | ($000) | ($000) | ($000) |
| Futures Contracts | (23,661) | — | (23,661) |
| Forward Currency Contracts | — | (2,698) | (2,698) |
| Realized Net Gain (Loss) on Derivatives | (23,661) | (2,698) | (26,359) |
| |
| Change in Unrealized Appreciation (Depreciation) on Derivatives | | | |
| Futures Contracts | 25,173 | — | 25,173 |
| Forward Currency Contracts | — | 3,436 | 3,436 |
| Change in Unrealized Appreciation (Depreciation) on Derivatives | 25,173 | 3,436 | 28,609 |
At October 31, 2009, the aggregate settlement value of open futures contracts and the related unrealized appreciation (depreciation) were:
| | | | |
| | | | | ($000) |
| | | Number of | Aggregate | Unrealized |
| | | Long (Short) | Settlement | Appreciation |
| Futures Contracts | Expiration | Contracts | Value | (Depreciation) |
| Topix Index | December 2009 | 130 | 12,839 | (152) |
| S&P ASX 200 Index | December 2009 | 41 | 4,283 | (107) |
At October 31, 2009, the fund had open forward currency contracts to receive and deliver currencies as follows. Unrealized appreciation (depreciation) on open forward currency contracts is treated as realized gain (loss) for tax purposes.
| | | | |
| | | | | Unrealized |
| | | | | Appreciation |
| | Contract Amount (000) | (Depreciation) |
| Contract Settlement Date | | Receive | Deliver | ($000) |
| 12/16/2009 | USD | 12,514 | JPY 1,132,494 | (62) |
| 12/23/2009 | AUD | 4,631 | USD 4,163 | 138 |
| AUD—Australian dollar. | | | | |
| JPY—Japanese yen. | | | | |
| USD—U.S. dollar. | | | | |
The fund had net unrealized foreign currency losses of $4,000 resulting from the translation of other assets and liabilities at October 31, 2009.
59
Pacific Stock Index Fund
F. Distributions are determined on a tax basis and may differ from net investment income and realized capital gains for financial reporting purposes. Differences may be permanent or temporary. Permanent differences are reclassified among capital accounts in the financial statements to reflect their tax character. Temporary differences arise when certain items of income, expense, gain, or loss are recognized in different periods for financial statement and tax purposes; these differences will reverse at some time in the future. Differences in classification may also result from the treatment of short-term gains as ordinary income for tax purposes.
During the year ended October 31, 2009, the fund realized net foreign currency gains of $11,266,000, which increased distributable net income for tax purposes; accordingly, such gains have been reclassified from accumulated net realized losses to undistributed net investment income. Certain of the fund’s investments are in securities considered to be “passive foreign investment companies,” for which any unrealized appreciation and/or realized gains are required to be included in distributable net income for tax purposes. Unrealized appreciation of $9,510,000 on the fund’s passive foreign investment company holdings at October 31, 2008, has been distributed and is reflected in the balance of undistributed net investment income. During the year ended October 31, 2009, the fund realized gains on the sale of passive foreign investment companies of $8,195,000, which have been included in current and prior pe riods’ taxable income; accordingly, such gains have been reclassified from accumulated net realized losses to undistributed net investment income. Unrealized appreciation on the fund’s passive foreign investment company holdings at October 31, 2009, was $3,675,000.
During the year ended October 31, 2009, the fund realized $532,937,000 of net capital losses resulting from in-kind redemptions—in which shareholders exchanged fund shares for securities held by the fund rather than for cash. Because such losses are not taxable losses to the fund, they have been reclassified from accumulated net realized losses to paid-in capital.
For tax purposes, at October 31, 2009, the fund had $142,861,000 of ordinary income available for distribution. The fund had available capital loss carryforwards totaling $1,138,170,000 to offset future net capital gains of $68,660,000 through October 31, 2010, $4,471,000 through October 31, 2011, $4,674,000 through October 31, 2013, $453,022,000 through October 31, 2016, and $607,343,000 through October 31, 2017. Capital loss carryforwards of $1,920,000 expired on October 31, 2009; accordingly, such losses have been reclassified from accumulated net realized losses to paid-in capital.
At October 31, 2009, the cost of investment securities for tax purposes was $7,466,201,000. Net unrealized depreciation of investment securities for tax purposes was $1,773,936,000, consisting of unrealized gains of $218,393,000 on securities that had risen in value since their purchase and $1,992,329,000 in unrealized losses on securities that had fallen in value since their purchase.
G. During the year ended October 31, 2009, the fund purchased $815,024,000 of investment securities and sold $4,678,274,000 of investment securities, other than temporary cash investments.
60
Pacific Stock Index Fund
| | | | |
| H. Capital share transactions for each class of shares were: | | | |
| | | | Year Ended October 31, |
| | | 2009 | | 2008 |
| | Amount | Shares | Amount | Shares |
| | ($000) | (000) | ($000) | (000) |
| Investor Shares | | | | |
| Issued | 697,406 | 89,584 | 2,411,768 | 203,868 |
| Issued in Lieu of Cash Distributions | 89,093 | 11,571 | 244,964 | 19,319 |
| Redeemed1 | (3,280,999) | (442,815) | (4,188,958) | (380,723) |
| Net Increase (Decrease)—Investor Shares | (2,494,500) | (341,660) | (1,532,226) | (157,536) |
| Admiral Shares | | | | |
| Issued | 122,233 | 2,241 | 226,260 | 2,951 |
| Issued in Lieu of Cash Distributions | 11,409 | 227 | 24,546 | 296 |
| Redeemed1 | (164,001) | (3,133) | (216,451) | (2,998) |
| Net Increase (Decrease)—Admiral Shares | (30,359) | (665) | 34,355 | 249 |
| Signal Shares | | | | |
| Issued | 60,869 | 3,310 | 119,279 | 4,249 |
| Issued in Lieu of Cash Distributions | 2,555 | 146 | 5,089 | 176 |
| Redeemed1 | (81,397) | (4,472) | (92,729) | (3,794) |
| Net Increase (Decrease)—Signal Shares | (17,973) | (1,016) | 31,639 | 631 |
| Institutional Shares | | | | |
| Issued | 405,620 | 51,039 | 918,220 | 82,517 |
| Issued in Lieu of Cash Distributions | 29,986 | 3,894 | 51,874 | 4,047 |
| Redeemed1 | (1,752,130) | (206,617) | (876,722) | (75,668) |
| Net Increase (Decrease)—Institutional Shares | (1,316,524) | (151,684) | 93,372 | 10,896 |
| ETF Shares | | | | |
| Issued | 150,908 | 3,422 | 541,682 | 8,588 |
| Issued in Lieu of Cash Distributions | — | — | — | — |
| Redeemed1 | (265,157) | (6,300) | (22,550) | (400) |
| Net Increase (Decrease)—ETF Shares | (114,249) | (2,878) | 519,132 | 8,188 |
| 1 Net of redemption fees for fiscal 2009 and 2008 of $361,000 and $911,000, respectively (fund totals). | | |
I. In preparing the financial statements as of October 31, 2009, management considered the impact of subsequent events occurring through December 15, 2009, for potential recognition or disclosure in these financial statements.
61
Emerging Markets Stock Index Fund
Fund Profile
As of October 31, 2009
| | | |
| Portfolio Characteristics | | |
| | | Target | Broad |
| | Fund | Index1 | Index2 |
| Number of Stocks | 799 | 748 | 1,806 |
| Turnover Rate | 12% | — | — |
| Expense Ratio3 | | — | — |
| Investor Shares | 0.39% | | |
| Admiral Shares | 0.27% | | |
| Signal Shares | 0.27% | | |
| Institutional Shares | 0.20% | | |
| ETF Shares | 0.27% | | |
| Short-Term Reserves | 0.0% | — | — |
| | | |
| Sector Diversification (% of equity exposure) |
| | | Target | Broad |
| | Fund | Index1 | Index2 |
| Consumer Discretionary | 5.4% | 5.3% | 8.3% |
| Consumer Staples | 5.4 | 5.4 | 8.6 |
| Energy | 15.3 | 15.3 | 11.2 |
| Financials | 24.7 | 25.4 | 26.6 |
| Health Care | 2.2 | 2.1 | 6.4 |
| Industrials | 6.8 | 6.7 | 9.8 |
| Information Technology | 13.0 | 12.7 | 6.5 |
| Materials | 14.6 | 14.5 | 11.2 |
| Telecommunication | | | |
| Services | 9.1 | 9.1 | 6.4 |
| Utilities | 3.5 | 3.5 | 5.0 |
| | |
| Volatility Measures4 | |
| | Fund Versus | Fund Versus |
| | Target Index1 | Broad Index2 |
| R-Squared | 0.99 | 0.94 |
| Beta | 1.01 | 1.25 |
| | |
| Ten Largest Holdings5 (% of total net assets) |
| Petroleo Brasileiro SA | integrated oil | |
| | and gas | 4.0% |
| Vale SA | diversified metals | |
| | and mining | 2.9 |
| Samsung | | |
| Electronics Co. Ltd. | semiconductors | 2.6 |
| Gazprom OAO ADR | integrated oil | |
| | and gas | 2.0 |
| China Mobile Ltd. | wireless | |
| | telecommunication | |
| | services | 1.9 |
| Teva Pharmaceutical | | |
| Industries Ltd. | pharmaceuticals | 1.5 |
| Taiwan Semiconductor | | |
| Manufacturing Co. Ltd. | semiconductors | 1.5 |
| America Movil | wireless | |
| SAB de CV | telecommunication | |
| | services | 1.4 |
| Itau Unibanco Holding SA | diversified banks | 1.4 |
| China Construction | | |
| Bank Corp. | diversified banks | 1.3 |
| Top Ten | | 20.5% |
1 MSCI Emerging Markets Index.
2 MSCI All Country World Index ex USA.
3 The expense ratios shown are from the prospectuses dated February 27, 2009, and represent estimated costs for the current fiscal year based on the fund’s net assets as of the prospectus date. For the fiscal year ended October 31, 2009, the expense ratios were 0.40% for Investor Shares, 0.27% for Admiral Shares, 0.27% for Signal Shares, 0.23% for Institutional Shares, and 0.27% for ETF Shares.
4 For an explanation of R-squared, beta, and other terms used here, see the Glossary.
5 The holdings listed exclude any temporary cash investments and equity index products.
62
Emerging Markets Stock Index Fund
| | |
| Market Diversification (% of equity exposure) |
| | | Target |
| | Fund | Index1 |
| China | 18.5% | 18.6% |
| Brazil | 16.4 | 16.3 |
| South Korea | 12.8 | 12.8 |
| Taiwan | 11.3 | 11.1 |
| India | 7.3 | 7.2 |
| South Africa | 7.0 | 6.9 |
| Russia | 6.7 | 6.6 |
| Mexico | 4.4 | 4.3 |
| Malaysia | 2.8 | 2.8 |
| Israel | 2.8 | 2.7 |
| Indonesia | 1.8 | 1.8 |
| Turkey | 1.5 | 1.5 |
| Chile | 1.4 | 1.3 |
| Thailand | 1.3 | 1.3 |
| Poland | 1.3 | 1.2 |
| Other Emerging Markets | 2.7 | 3.6 |
1 MSCI Emerging Markets Index.
63
Emerging Markets Stock Index Fund
Performance Summary
All of the returns in this report represent past performance, which is not a guarantee of future results that may be achieved by the fund. (Current performance may be lower or higher than the performance data cited. For performance data current to the most recent month-end, visit our website at www.vanguard.com/performance.) Note, too, that both investment returns and principal value can fluctuate widely, so an investor’s shares, when sold, could be worth more or less than their original cost. The returns shown do not reflect taxes that a shareholder would pay on fund distributions or on the sale of fund shares.
Cumulative Performance: October 31, 1999–October 31, 2009
Initial Investment of $10,000
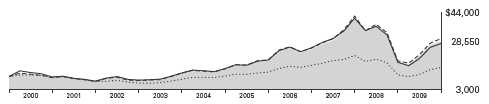
| | | | |
| | | Average Annual Total Returns | Final Value |
| | | Periods Ended October 31, 2009 | of a $10,000 |
| | One Year | Five Years | Ten Years | Investment |
| Emerging Markets Stock Index Fund | | | | |
| Investor Shares1 | 58.90% | 15.66% | 11.06% | $28,550 |
| MSCI All Country World Index ex USA | 34.79 | 7.58 | 3.95 | 14,733 |
| Spliced Emerging Markets Index2 | 64.13 | 16.47 | 11.64 | 30,087 |
| Emerging Markets Funds Average3 | 56.47 | 14.15 | 10.64 | 27,494 |
| |
| | | | | Final Value of |
| | | | Since | a $100,000 |
| | One Year | | Inception4 | Investment |
| Emerging Markets Stock Index Fund Admiral Shares1 | 59.11% | | 9.61% | $136,084 |
| MSCI All Country World Index ex USA | 34.79 | | 1.51 | 105,142 |
| Spliced Emerging Markets Index2 | 64.13 | | 10.48 | 139,711 |
1 Performance figures are adjusted for the 0.50% (0.25% prior to October 30, 2009, 0.50% prior to June 26, 2008) transaction fee on purchases and 0.25% (0.50% prior to June 26, 2008) transaction fee on redemptions. Total returns do not reflect the 2% fee assessed until March 23, 2005, on redemptions of shares purchased on or after June 27, 2003, and held for less than two months, or for Investor
Shares, the account service fee that may be applicable to certain accounts with balances below $10,000.
2 Select Emerging Markets Index through August 23, 2006; MSCI Emerging Markets Index thereafter.
3 Derived from data provided by Lipper Inc.
4 Performance for the fund’s Admiral Shares and comparative standards is calculated since the Admiral Shares’ inception: June 23, 2006.
64
| | | | |
| Emerging Markets Stock Index Fund | | | | |
| |
| |
| |
| |
| | | | | Final Value of |
| | | | Since | a $10,000,000 |
| | One Year | | Inception1 | Investment |
| Emerging Markets Stock Index Fund Signal Shares2 | 59.15% | | 2.08% | $10,589,045 |
| MSCI All Country World Index ex USA | 34.79 | | –4.92 | 8,691,755 |
| MSCI Emerging Markets Index | 64.13 | | 3.11 | 10,889,315 |
| |
| | | | | Final Value of |
| | | | Since | a $5,000,000 |
| | One Year | Five Years | Inception1 | Investment |
| Emerging Markets Stock Index Fund | | | | |
| Institutional Shares2 | 59.23% | 15.86% | 10.87% | $13,127,023 |
| MSCI All Country World Index ex USA | 34.79 | 7.58 | 3.35 | 6,803,220 |
| Spliced Emerging Markets Index3 | 64.13 | 16.47 | 11.29 | 13,609,219 |
| |
| | | | | Final Value of |
| | | | Since | a $10,000 |
| | One Year | | Inception1 | Investment |
| Emerging Markets Stock Index Fund ETF Shares | | | | |
| Net Asset Value4 | 60.28% | | 11.51% | $16,617 |
| MSCI All Country World Index ex USA | 34.79 | | 4.73 | 12,403 |
| Spliced Emerging Markets Index3 | 64.13 | | 12.09 | 17,024 |
| |
| |
| Cumulative Returns: ETF Shares, March 4, 2005–October 31, 2009 | | |
| | | | | Since |
| | | | One Year | Inception1 |
| Emerging Markets Stock Index Fund ETF Shares Market Price | | 58.93% | 64.99% |
| Emerging Markets Stock Index Fund Shares Net Asset Value | | 60.28 | 66.17 |
| Spliced Emerging Markets Index3 | | | 64.13 | 70.24 |
1 Performance for the fund and its comparative standards is calculated since the following inception dates: January 19, 2007, for the Signal Shares; June 22, 2000, for the Institutional Shares; and March 4, 2005, for the ETF Shares.
2 Performance figures are adjusted for the 0.50% (0.25% prior to October 30, 2009, 0.50% prior to June 26, 2008) transaction fee on purchases and 0.25% (0.50% prior to June 26, 2008) transaction fee on redemptions. Total returns do not reflect the 2% fee assessed until March 23, 2005, on redemptions of shares purchased on or after June 27, 2003, and held for less than two months.
3 Select Emerging Markets Index through August 23, 2006; MSCI Emerging Markets Index thereafter.
4 For more information about how the ETF Shares’ market prices have compared with their net asset value, visit www.vanguard.com, select your ETF, and then select the Performance tab. The Premium/Discount table there shows the percentages of days on which the ETF Shares’ market price was above or below the NAV.
65
Emerging Markets Stock Index Fund
Fiscal-Year Total Returns (%): October 31, 1999–October 31, 2009
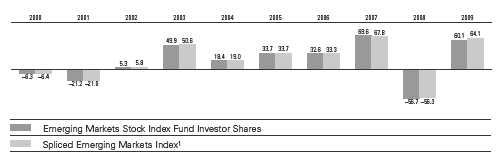
Average Annual Total Returns: Periods Ended September 30, 2009
This table presents average annual total returns through the latest calendar quarter—rather than through the end
of the fiscal period. Securities and Exchange Commission rules require that we provide this information.
| | | | |
| | Inception Date | One Year | Five Years | Ten Years |
| Emerging Markets Stock Index Fund | | | | |
| Investor Shares2 | 5/4/1994 | 17.38% | 16.67% | 11.71% |
| Fee-Adjusted Returns3 | | 16.81 | 16.56 | 11.66 |
| Admiral Shares | 6/23/2006 | 17.49 | 10.584 | — |
| Fee-Adjusted Returns3 | | 16.92 | 10.424 | — |
| Signal Shares | 1/19/2007 | 17.51 | 2.944 | — |
| Fee-Adjusted Returns3 | | 16.94 | 2.754 | — |
| Institutional Shares | 6/22/2000 | 17.57 | 16.87 | 11.214 |
| Fee-Adjusted Returns3 | | 17.00 | 16.76 | 11.164 |
| ETF Shares | 3/4/2005 | | | |
| Market Price | | 17.28 | 12.204 | — |
| Net Asset Value | | 17.52 | 12.074 | — |
1 Select Emerging Markets Index through August 23, 2006; MSCI Emerging Markets Index thereafter.
2 Returns do not reflect the $10 annual account maintenance fee applied on balances under $10,000.
3 Performance figures are adjusted for the 0.25% (0.50% prior to June 26, 2008) transaction fee on purchases and redemptions that were in effect as of September 30, 2009. Total returns do not reflect the 2% fee assessed until March 23, 2005.
4 Returns since inception.
Note: See Financial Highlights tables for dividend and capital gains information.
66
Emerging Markets Stock Index Fund
Financial Statements
Statement of Net Assets
As of October 31, 2009
The fund reports a complete list of its holdings in regulatory filings four times in each fiscal year, at the quarter-ends. For the second and fourth fiscal quarters, the lists appear in the fund’s semiannual and annual reports to shareholders. For the first and third fiscal quarters, the fund files the lists with the Securities and Exchange Commission on Form N-Q. Shareholders can look up the fund’s Forms N-Q on the SEC’s website at www.sec.gov. Forms N-Q may also be reviewed and copied at the SEC’s Public Reference Room (see the back cover of this report for further information).
| | | |
| | | | Market |
| | | | Value• |
| | | Shares | ($000) |
| Common Stocks (99.7%)1 | | |
| Brazil (16.4%) | | |
| | Petroleo Brasileiro | | |
| | SA Pfd. | 17,720,912 | 351,280 |
| | Petroleo Brasileiro SA | 12,701,496 | 292,013 |
| | Petroleo Brasileiro SA | | |
| | Series A ADR | 6,028,266 | 241,854 |
| | Vale SA | 10,233,577 | 230,337 |
| * | Vale SA Class B ADR | 9,860,918 | 227,787 |
| | Petroleo Brasileiro | | |
| | SA ADR | 4,456,295 | 205,970 |
| | Itau Unibanco Holding SA | 9,878,408 | 187,912 |
| | Itau Unibanco | | |
| | Holding SA ADR | 9,544,713 | 182,686 |
| | Vale SA | 6,981,638 | 177,355 |
| | Banco Bradesco SA | 8,711,900 | 170,420 |
| * | Vale SA Class B ADR | 6,665,271 | 169,898 |
| | Investimentos Itau SA | 20,693,452 | 118,292 |
| | Banco Bradesco SA ADR | 5,800,557 | 114,271 |
| | OGX Petroleo e | | |
| | Gas Participacoes SA | 117,073 | 94,371 |
| | Cia de Bebidas das | | |
| | Americas | 845,306 | 76,752 |
| | BRF - Brasil Foods SA | 3,034,000 | 73,146 |
| | BM&FBOVESPA SA | 11,312,020 | 72,883 |
| | Cia Siderurgica | | |
| | Nacional SA ADR | 2,002,498 | 66,403 |
| | Usinas Siderurgicas | | |
| | de Minas Gerais SA | 2,349,455 | 61,350 |
| | Cia Siderurgica | | |
| | Nacional SA | 1,790,860 | 59,157 |
| | Cia de Bebidas | | |
| | das Americas ADR | 583,580 | 52,569 |
| * | Banco Santander | | |
| | Brasil SA ADR | 4,418,424 | 52,402 |
| | Companhia Brasileira de | | |
| | Meios de Pagamento | 5,641,512 | 51,912 |
| | Banco do Brasil SA | 3,084,765 | 49,399 |
| | Gerdau SA Pfd. | 3,143,500 | 47,377 |
| | Gerdau SA | 3,108,446 | 46,938 |
| | | |
| | | | Market |
| | | | Value• |
| | | Shares | ($000) |
| | Metalurgica Gerdau | | |
| | SA Class A | 2,549,208 | 46,814 |
| | Redecard SA | 3,078,885 | 45,198 |
| | Bradespar SA | 2,108,971 | 43,278 |
| | Vivo Participacoes SA | 1,437,552 | 34,992 |
| | Cia de Concessoes | | |
| | Rodoviarias | 1,710,624 | 33,638 |
| | Cia Energetica de | | |
| | Minas Gerais | 1,997,632 | 31,355 |
| | Tele Norte Leste | | |
| | Participacoes SA | 1,587,863 | 30,196 |
| | Centrais Eletricas | | |
| | Brasileiras SA | 2,057,681 | 29,307 |
| | Ultrapar Participacoes SA | 666,516 | 29,190 |
| | Natura Cosmeticos SA | 1,580,965 | 28,414 |
| | Cia Brasileira de | | |
| | Distribuicao Grupo Pao | | |
| | de Acucar ADR | 463,049 | 28,010 |
| | All America Latina | | |
| | Logistica SA | 3,533,063 | 25,932 |
| | Usinas Siderurgicas | | |
| | de Minas Gerais SA | 1,045,883 | 25,708 |
| | Souza Cruz SA | 696,573 | 24,722 |
| * | Global Village Telecom | | |
| | Holding SA | 845,792 | 24,270 |
| | Cia Energetica de Minas | | |
| | Gerais ADR | 1,450,322 | 22,901 |
| | Centrais Eletricas | | |
| | Brasileiras SA Pfd. B | 1,770,359 | 22,511 |
| * | NET Servicos de | | |
| | Comunicacao SA | 1,688,791 | 20,813 |
| | Lojas Americanas SA | 2,983,798 | 19,462 |
| | Cia Energetica de | | |
| | Sao Paulo | 1,603,621 | 18,662 |
| | Cyrela Brazil Realty SA | 1,427,746 | 18,114 |
| | Tele Norte Leste | | |
| | Participacoes SA ADR | 923,045 | 17,593 |
| | JBS SA | 3,107,446 | 17,146 |
| * | Empresa Brasileira | | |
| | de Aeronautica SA ADR | 794,361 | 16,086 |
| | CPFL Energia SA | 905,339 | 15,855 |
67
| | | |
| Emerging Markets Stock Index Fund | |
| |
| |
| |
| | | | Market |
| | | | Value• |
| | | Shares | ($000) |
| | Eletropaulo Metropolitana | | |
| | Eletricidade de | | |
| | Sao Paulo SA | 834,813 | 15,747 |
| | Tractebel Energia SA | 1,287,597 | 15,715 |
| | MRV Engenharia e | | |
| | Participacoes SA | 791,627 | 14,874 |
| | B2W Cia Global Do Varejo | 493,134 | 14,293 |
| * | Marfrig Alimentos SA | 1,230,448 | 14,074 |
| | Tele Norte Leste | | |
| | Participacoes SA | 591,381 | 13,328 |
| | Cia de Saneamento | | |
| | Basico do Estado de | | |
| | Sao Paulo ADR | 345,752 | 13,318 |
| * | Duratex SA | 1,792,702 | 12,415 |
| | Cia Paranaense de | | |
| | Energia ADR | 700,030 | 12,320 |
| * | Votorantim Celulose | | |
| | e Papel SA | 880,416 | 12,060 |
| | Suzano Papel e | | |
| | Celulose SA | 1,334,227 | 11,596 |
| | Gerdau SA | 982,900 | 11,243 |
| | Banco do Estado do | | |
| | Rio Grande do Sul | 1,759,402 | 11,186 |
| | AES Tiete SA | 936,700 | 10,555 |
| | EDP - Energias do | | |
| | Brasil SA | 641,805 | 10,296 |
| | Klabin SA | 4,312,661 | 10,282 |
| * | Cosan SA Industria e | | |
| | Comercio | 959,050 | 10,153 |
| | Brasil Telecom | | |
| | Participacoes SA | 977,726 | 9,879 |
| | Cia de Saneamento | | |
| | Basico do Estado de | | |
| | Sao Paulo | 508,882 | 9,822 |
| * | Empresa Brasileira de | | |
| | Aeronautica SA | 1,888,649 | 9,628 |
| * | Braskem SA | 1,456,924 | 9,594 |
| | Brasil Telecom SA | 1,114,832 | 9,499 |
| *,^ | Aracruz Celulose SA ADR | 484,518 | 9,022 |
| * | Fertilizantes Fosfatados SA | 923,079 | 8,908 |
| | Porto Seguro SA | 823,524 | 8,691 |
| | Telemar Norte Leste SA | 261,350 | 8,225 |
| | Cia de Transmissao de | | |
| | Energia Eletrica Paulista | 286,000 | 7,923 |
| | Tim Participacoes SA | 3,297,732 | 7,806 |
| | Tim Participacoes SA ADR | 297,445 | 7,017 |
| * | Banco Santander Brasil SA | 577,500 | 6,819 |
| | Brasil Telecom | | |
| | Participacoes SA ADR | 132,666 | 6,677 |
| | Cia Paranaense de Energia | 360,439 | 6,279 |
| * | BRF–Brasil Foods SA ADR | 40,346 | 1,952 |
| * | Aracruz Celulose SA | 994,205 | 1,857 |
| | Cia Brasileira de | | |
| | Distribuicao Grupo | | |
| | Pao de Acucar | 48,619 | 1,467 |
| | Vivo Participacoes SA ADR | 57,000 | 1,382 |
| | | |
| | | | Market |
| | | | Value• |
| | | Shares | ($000) |
| | Centrais Eletricas | | |
| | Brasileiras SA ADR | 58,000 | 832 |
| * | NET Servicos de | | |
| | Comunicacao SA ADR | 36,796 | 452 |
| | | | 4,492,087 |
| Chile (1.4%) | | |
| | Empresas COPEC SA | 4,279,504 | 56,993 |
| | Empresas CMPC SA | 967,647 | 34,627 |
| | Centros Comerciales | | |
| | Sudamericanos SA | 8,096,141 | 24,931 |
| | Empresa Nacional de | | |
| | Electricidad SA | 15,839,753 | 24,344 |
| | Empresa Nacional de | | |
| | Electricidad SA ADR | 523,033 | 24,002 |
| | Enersis SA | 65,135,530 | 23,137 |
| | Sociedad Quimica y | | |
| | Minera de Chile SA ADR | 610,654 | 22,441 |
| | Banco Santander | | |
| | Chile ADR | 416,014 | 21,899 |
| | Enersis SA ADR | 1,208,948 | 21,374 |
| | CAP SA | 740,167 | 19,238 |
| | Lan Airlines SA | 1,284,298 | 17,055 |
| | Colbun SA | 68,869,010 | 16,214 |
| | ENTEL Chile SA | 1,083,766 | 14,411 |
| | SACI Falabella | 2,755,256 | 13,078 |
| | Sociedad Quimica y | | |
| | Minera de Chile SA | | |
| | Class B | 337,642 | 12,400 |
| | AES Gener SA | 24,584,231 | 10,418 |
| | Vina Concha y Toro SA | 4,677,503 | 9,911 |
| | Cia Cervecerias | | |
| | Unidas SA | 1,313,267 | 9,263 |
| | Banco de Credito | | |
| | e Inversiones | 302,311 | 8,774 |
| | Banco Santander Chile | 54,517,082 | 2,772 |
| | | | 387,282 |
| China (18.5%) | | |
| | China Mobile Ltd. | 56,862,967 | 533,058 |
| | China Construction | | |
| | Bank Corp. | 422,377,493 | 364,145 |
| | Industrial & Commercial | | |
| | Bank of China | 431,501,659 | 343,309 |
| | China Life Insurance | | |
| | Co. Ltd. | 70,287,470 | 323,170 |
| | Bank of China Ltd. | 538,683,525 | 312,486 |
| | CNOOC Ltd. | 168,975,952 | 253,065 |
| | PetroChina Co. Ltd. | 200,127,679 | 240,810 |
| | Tencent Holdings Ltd. | 8,531,980 | 148,564 |
| | China Shenhua | | |
| | Energy Co. Ltd. | 30,809,325 | 138,214 |
| | China Petroleum & | | |
| | Chemical Corp. | 151,841,540 | 128,773 |
| ^ | Ping An Insurance | | |
| | Group Co. of China Ltd. | 12,290,488 | 107,712 |
| | China Overseas Land | | |
| | & Investment Ltd. | 39,079,076 | 84,251 |
68
| | | |
| Emerging Markets Stock Index Fund | |
| |
| |
| |
| | | | Market |
| | | | Value• |
| | | Shares | ($000) |
| ^ | China Merchants | | |
| | Bank Co. Ltd. | 32,664,949 | 83,568 |
| | China Unicom | | |
| | Hong Kong Ltd. | 57,135,048 | 72,647 |
| ^ | Bank of Communications | | |
| | Co. Ltd. | 55,606,232 | 66,488 |
| | China Telecom | | |
| | Corp. Ltd. | 133,777,683 | 59,127 |
| | China Coal Energy Co. | 33,956,000 | 47,240 |
| | China Resources | | |
| | Land Ltd. | 19,458,000 | 46,971 |
| *,^ | Byd Co. Ltd. | 5,129,755 | 46,964 |
| | China Communications | | |
| | Construction Co. Ltd. | 40,946,834 | 44,021 |
| ^ | Aluminum Corp. of | | |
| | China Ltd. | 38,081,880 | 41,485 |
| | China Resources | | |
| | Enterprise | 12,065,460 | 40,410 |
| | Hengan International | | |
| | Group Co. Ltd. | 6,275,000 | 40,393 |
| | Zijin Mining | | |
| | Group Co. Ltd. | 39,558,120 | 38,290 |
| | Belle International | | |
| | Holdings Ltd. | 36,117,500 | 36,465 |
| | Tingyi Cayman Islands | | |
| | Holding Corp. | 16,112,752 | 35,951 |
| | China Citic Bank | 46,771,933 | 35,011 |
| | China Merchants | | |
| | Holdings International | | |
| | Co. Ltd. | 10,819,510 | 34,507 |
| | Dongfeng Motor | | |
| | Group Co. Ltd. | 27,126,044 | 32,251 |
| | China Resources Power | | |
| | Holdings Co. Ltd. | 15,462,548 | 32,033 |
| ^ | Jiangxi Copper Co. Ltd. | 13,853,992 | 31,390 |
| * | China Mengniu | | |
| | Dairy Co. Ltd. | 11,023,676 | 30,887 |
| | Yanzhou Coal | | |
| | Mining Co. Ltd. | 19,752,112 | 30,536 |
| ^ | China COSCO | | |
| | Holdings Co. Ltd. | 23,569,000 | 29,049 |
| | Shimao Property | | |
| | Holdings Ltd. | 15,435,772 | 28,673 |
| | Sino-Ocean Land | | |
| | Holdings Ltd. | 29,175,802 | 28,373 |
| * | China Railway | | |
| | Group Ltd. | 35,794,608 | 28,180 |
| | Beijing Enterprises | | |
| | Holdings Ltd. | 4,684,000 | 28,038 |
| | Citic Pacific Ltd. | 10,473,874 | 26,992 |
| ^ | Anhui Conch | | |
| | Cement Co. Ltd. | 4,156,698 | 26,895 |
| ^ | Alibaba.com Ltd. | 11,629,632 | 26,794 |
| *,^ | China Taiping Insurance | | |
| | Holdings Co. Ltd. | 7,024,007 | 24,756 |
| | | |
| | | | Market |
| | | | Value• |
| | | Shares | ($000) |
| | China National Building | | |
| | Material Co. Ltd. | 11,502,180 | 24,696 |
| | Shanghai Industrial | | |
| | Holdings Ltd. | 5,243,045 | 24,631 |
| | Lenovo Group Ltd. | 43,569,309 | 24,259 |
| | Denway Motors Ltd. | 49,130,893 | 23,517 |
| ^ | China Railway | | |
| | Construction Corp. Ltd. | 16,231,265 | 21,515 |
| ^ | Angang Steel Co. Ltd. | 11,036,396 | 20,344 |
| | Huaneng Power | | |
| | International Inc. | 31,383,992 | 20,033 |
| | Agile Property | | |
| | Holdings Ltd. | 15,571,245 | 19,930 |
| | Kingboard Chemical | | |
| | Holdings Ltd. | 4,934,626 | 19,861 |
| ^ | Li Ning Co. Ltd. | 7,140,068 | 19,372 |
| | Cnpc Hong Kong Ltd. | 18,344,330 | 19,366 |
| | Parkson Retail | | |
| | Group Ltd. | 11,810,779 | 19,121 |
| | Fushan International | | |
| | Energy Group Ltd. | 24,719,984 | 19,039 |
| | China Yurun Food | | |
| | Group Ltd. | 9,127,439 | 18,760 |
| *,^ | PICC Property & | | |
| | Casualty Co. Ltd. | 25,083,551 | 18,476 |
| | Inner Mongolia Yitai | | |
| | Coal Co. Class B | 2,844,050 | 18,240 |
| | Chaoda Modern | | |
| | Agriculture | | |
| | Holdings Ltd. | 23,187,067 | 17,915 |
| | China Shipping | | |
| | Development Co. Ltd. | 12,699,274 | 17,825 |
| ^ | Guangzhou R&F | | |
| | Properties Co. Ltd. | 9,462,400 | 17,731 |
| * | GOME Electrical | | |
| | Appliances | | |
| | Holdings Ltd. | 59,705,805 | 17,490 |
| ^ | China Everbright Ltd. | 7,200,010 | 16,973 |
| | China Oilfield | | |
| | Services Ltd. | 15,144,000 | 16,363 |
| ^ | ZTE Corp. | 2,913,849 | 16,146 |
| | COSCO Pacific Ltd. | 11,378,988 | 15,719 |
| ^ | Datang International | | |
| | Power Generation | | |
| | Co. Ltd. | 33,044,568 | 15,650 |
| ^ | China High Speed | | |
| | Transmission Equipment | | |
| | Group Co. | 7,703,280 | 15,449 |
| ^ | Country Garden | | |
| | Holdings Co. | 40,231,821 | 15,426 |
| *,^ | China Zhongwang | | |
| | Holdings Ltd. | 16,073,732 | 15,049 |
| | Shui On Land Ltd. | 24,266,737 | 14,709 |
| | Want Want China | | |
| | Holdings Ltd. | 24,778,285 | 14,557 |
69
Emerging Markets Stock Index Fund
| | | |
| | | | Market |
| | | | Value• |
| | | Shares | ($000) |
| * | Metallurgical Corp. of | | |
| | China Ltd. | 21,386,000 | 14,487 |
| | Guangdong | | |
| | Investment Ltd. | 26,826,464 | 14,019 |
| ^ | Renhe Commercial | | |
| | Holdings Co. Ltd. | 72,447,454 | 13,936 |
| | China Vanke Co. Ltd. | | |
| | Class B | 10,835,765 | 13,403 |
| | Shanghai Electric | | |
| | Group Co. Ltd. | 27,930,613 | 13,152 |
| | Zhejiang Expressway | | |
| | Co. Ltd. | 14,870,704 | 12,648 |
| | China Dongxiang | | |
| | Group Co. | 20,530,788 | 12,544 |
| *,^ | Air China Ltd. | 22,989,548 | 12,444 |
| | Shandong Weigao | | |
| | Group Medical | | |
| | Polymer Co. Ltd. | 3,473,550 | 12,277 |
| *,^ | Beijing Capital | | |
| | International Airport | | |
| | Co. Ltd. | 17,891,654 | 12,032 |
| | Hopson Development | | |
| | Holdings Ltd. | 6,651,840 | 11,640 |
| | Tsingtao Brewery | | |
| | Co. Ltd. | 2,860,000 | 11,619 |
| | China Agri-Industries | | |
| | Holdings Ltd. | 11,741,586 | 11,262 |
| | Yantai Changyu Pioneer | | |
| | Wine Co. Class B | 1,529,703 | 11,245 |
| | Huabao International | | |
| | Holdings Ltd. | 11,368,838 | 10,844 |
| | Jiangsu Expressway | | |
| | Co. Ltd. | 12,164,139 | 10,817 |
| *,^ | Maanshan Iron & Steel | 17,803,134 | 10,717 |
| ^ | Soho China Ltd. | 19,322,606 | 10,383 |
| ^ | Geely Automobile | | |
| | Holdings Ltd. | 28,121,000 | 10,168 |
| ^ | Fosun International | 14,897,237 | 10,091 |
| ^ | Sinofert Holdings Ltd. | 19,983,917 | 9,890 |
| *,^ | Hidili Industry | | |
| | International | | |
| | Development Ltd. | 9,627,913 | 9,853 |
| * | Sinopec Shanghai | | |
| | Petrochemical Co. Ltd. | 24,487,888 | 9,814 |
| | Weichai Power Co. Ltd. | 1,424,800 | 9,301 |
| *,^ | China Shipping | | |
| | Container Lines | | |
| | Co. Ltd. | 25,397,618 | 9,089 |
| | China Communications | | |
| | Services Corp. Ltd. | 17,058,311 | 8,824 |
| | Franshion Properties | | |
| | China Ltd. | 30,526,094 | 8,535 |
| | China BlueChemical Ltd. | 15,869,405 | 8,443 |
| ^ | China South Locomotive | | |
| | and Rolling Stock Corp. | 15,222,877 | 8,442 |
| | | |
| | | | Market |
| | | | Value• |
| | | Shares | ($000) |
| | Shanghai Lujiazui Finance & | |
| | Trade Zone Development | | |
| | Co. Ltd. Class B | 4,304,500 | 8,034 |
| | China Travel International | | |
| | Inv HK | 31,645,204 | 6,460 |
| | Sinotruk Hong Kong Ltd. | 5,122,500 | 6,091 |
| | Guangshen | | |
| | Railway Co. Ltd. | 14,713,975 | 5,978 |
| | Dongfang Electric | | |
| | Corp. Ltd. | 1,199,315 | 5,958 |
| | China International | | |
| | Marine Containers Co. | | |
| | Ltd. Class B | 5,432,359 | 5,417 |
| | Shanghai Zhenhua | | |
| | Heavy Industry Co. | | |
| | Ltd. Class B | 6,000,148 | 4,966 |
| | Harbin Power | | |
| | Equipment Co. Ltd. | 4,775,460 | 4,436 |
| | | | 5,079,363 |
| Colombia (0.2%) | | |
| | BanColombia SA ADR | 1,374,602 | 54,407 |
| |
| Czech Republic (0.5%) | | |
| | CEZ AS | 1,546,290 | 76,146 |
| | Komercni Banka AS | 151,825 | 29,773 |
| | Telefonica O2 Czech | | |
| | Republic AS | 1,095,199 | 25,804 |
| | | | 131,723 |
| Egypt (0.3%) | | |
| | Orascom Construction | | |
| | Industries GDR | 903,585 | 43,617 |
| | Orascom Telecom | | |
| | Holding SAE GDR | 899,821 | 30,597 |
| | | | 74,214 |
| Hungary (0.6%) | | |
| *,^ | OTP Bank PLC | 2,683,466 | 75,458 |
| *,^ | MOL Hungarian | | |
| | Oil and Gas NyRt | 504,566 | 42,154 |
| ^ | Richter Gedeon Nyrt. | 141,651 | 29,500 |
| | Magyar Telekom | | |
| | Telecommunications | | |
| | PLC | 4,604,066 | 19,849 |
| | | | 166,961 |
| India (7.3%) | | |
| | Reliance Industries Ltd. | 6,197,051 | 250,719 |
| | Infosys Technologies Ltd. | 4,319,545 | 200,602 |
| | Housing Development | | |
| | Finance Corp. | 1,981,489 | 110,877 |
| | ICICI Bank Ltd. | 5,168,882 | 85,359 |
| | Larsen & Toubro Ltd. | 1,871,295 | 61,769 |
| | Tata Consultancy | | |
| | Services Ltd. | 4,426,925 | 58,856 |
| | Oil & Natural Gas | | |
| | Corp. Ltd. | 2,455,572 | 58,510 |
70
| | | |
| Emerging Markets Stock Index Fund | |
| |
| |
| |
| | | | Market |
| | | | Value• |
| | | Shares | ($000) |
| | Sterlite Industries | | |
| | India Ltd. | 3,516,273 | 56,788 |
| | ITC Ltd. | 10,501,311 | 56,544 |
| | Bharat Heavy | | |
| | Electricals Ltd. | 1,104,528 | 51,656 |
| | HDFC Bank Ltd. | 1,441,322 | 49,085 |
| | Hindustan Unilever Ltd. | 8,189,832 | 48,965 |
| | Jindal Steel & Power Ltd. | 3,485,707 | 46,964 |
| | HDFC Bank Ltd. ADR | 386,916 | 42,797 |
| | Axis Bank Ltd. | 2,025,948 | 38,566 |
| | NTPC Ltd. | 7,720,840 | 34,653 |
| | ICICI Bank Ltd. ADR | 1,084,354 | 34,103 |
| | DLF Ltd. | 3,811,839 | 29,644 |
| | GAIL India Ltd. | 3,555,911 | 26,172 |
| | Mahindra & Mahindra Ltd. | 1,317,819 | 25,500 |
| | Hero Honda Motors Ltd. | 768,369 | 25,378 |
| | Wipro Ltd. | 1,881,847 | 23,984 |
| | Tata Motors Ltd. | 2,014,165 | 23,843 |
| | State Bank of India Ltd. | 498,607 | 23,006 |
| | Jaiprakash Associates Ltd. | 5,183,770 | 22,828 |
| | Tata Power Co. Ltd. | 786,724 | 22,117 |
| | Reliance | | |
| | Communications Ltd. | 5,800,483 | 21,380 |
| | Reliance | | |
| | Infrastructure Ltd. | 950,003 | 21,022 |
| | Sun Pharmaceutical | | |
| | Industries Ltd. | 673,101 | 19,587 |
| | Infrastructure Development | | |
| | Finance Co. Ltd. | 6,271,254 | 19,359 |
| | Maruti Suzuki India Ltd. | 652,470 | 19,283 |
| | Unitech Ltd. | 11,121,755 | 19,056 |
| | Sesa Goa Ltd. | 2,975,789 | 18,901 |
| | Kotak Mahindra Bank Ltd. | 1,261,913 | 18,842 |
| | Cipla Ltd. | 2,995,234 | 18,137 |
| | Tata Steel Ltd. | 1,803,404 | 17,824 |
| | Wipro Ltd. ADR | 950,747 | 16,305 |
| | Hindalco Industries Ltd. | 6,349,868 | 16,226 |
| * | Indiabulls Real Estate Ltd. | 2,985,568 | 15,618 |
| | United Spirits Ltd. | 674,388 | 15,158 |
| | Reliance Capital Ltd. | 943,223 | 14,775 |
| * | Cairn India Ltd. | 2,652,249 | 14,688 |
| ^ | Dr Reddys | | |
| | Laboratories Ltd. ADR | 670,562 | 14,571 |
| | Steel Authority Of | | |
| | India Ltd. | 4,210,837 | 14,513 |
| | Bajaj Auto Ltd. | 402,709 | 11,798 |
| | JSW Steel Ltd. | 688,479 | 10,908 |
| | Ambuja Cements Ltd. | 5,665,090 | 10,636 |
| | Satyam Computer | | |
| | Services Ltd. | 4,868,700 | 10,521 |
| | HCL Technologies Ltd. | 1,475,287 | 9,473 |
| | Power Grid Corp. of | | |
| | India Ltd. | 4,247,266 | 9,317 |
| * | GMR Infrastructure Ltd. | 7,019,658 | 9,075 |
| * | Reliance Natural | | |
| | Resources Ltd. | 6,728,278 | 9,025 |
| | | |
| | | | Market |
| | | | Value• |
| | | Shares | ($000) |
| | Grasim Industries Ltd. | 194,339 | 8,959 |
| | Zee Entertainment | | |
| | Enterprises Ltd. | 1,820,957 | 8,828 |
| | Bharat Petroleum | | |
| | Corp. Ltd. | 803,637 | 8,734 |
| | Dr Reddys | | |
| | Laboratories Ltd. | 393,566 | 8,428 |
| * | Ranbaxy Laboratories Ltd. 983,253 | 8,097 |
| | Siemens India Ltd. | 739,571 | 8,005 |
| | ABB Ltd. | 475,183 | 7,702 |
| | ACC Ltd. | 479,525 | 7,580 |
| * | Idea Cellular Ltd. | 5,828,930 | 6,372 |
| | United Phosphorus Ltd. | 1,941,274 | 5,859 |
| | Aditya Birla Nuvo Ltd. | 307,855 | 5,134 |
| | Glenmark | | |
| | Pharmaceuticals Ltd. | 983,453 | 4,644 |
| | State Bank of | | |
| | India Ltd. GDR | 47,357 | 4,325 |
| | | | 1,997,950 |
| Indonesia (1.8%) | | |
| | Telekomunikasi | | |
| | Indonesia Tbk PT | 96,309,479 | 82,933 |
| | Astra International | | |
| | Tbk PT | 19,617,590 | 63,116 |
| | Bank Central | | |
| | Asia Tbk PT | 118,063,724 | 55,596 |
| | Perusahaan Gas | | |
| | Negara PT | 115,359,980 | 42,923 |
| | Bumi Resources | | |
| | Tbk PT | 167,854,552 | 40,409 |
| | Bank Rakyat | | |
| | Indonesia | 52,717,800 | 38,363 |
| | Bank Mandiri Tbk PT | 71,996,524 | 34,548 |
| | United Tractors Tbk PT | 14,658,962 | 22,476 |
| | Indocement Tunggal | | |
| | Prakarsa Tbk PT | 14,783,603 | 16,834 |
| | Unilever Indonesia | | |
| | Tbk PT | 14,970,230 | 15,657 |
| | Tambang Batubara | | |
| | Bukit Asam Tbk PT | 9,192,786 | 14,321 |
| | Bank Danamon | | |
| | Indonesia Tbk PT | 27,742,349 | 12,942 |
| | Indofood Sukses | | |
| | Makmur Tbk PT | 38,837,796 | 12,274 |
| | Semen Gresik | | |
| | Persero Tbk PT | 14,990,820 | 10,594 |
| | Indosat Tbk PT | 16,244,773 | 8,629 |
| * | International Nickel | | |
| | Indonesia Tbk PT | 20,428,650 | 8,466 |
| | Astra Agro | | |
| | Lestari Tbk PT | 3,539,180 | 7,857 |
| | Aneka Tambang Tbk PT | 33,111,159 | 7,695 |
| * | Lippo Karawaci Tbk PT | 110,385,730 | 7,467 |
| | | | 503,100 |
71
| | | |
| Emerging Markets Stock Index Fund | |
| |
| |
| |
| | | | Market |
| | | | Value• |
| | | Shares | ($000) |
| Israel (2.8%) | | |
| | Teva Pharmaceutical | | |
| | Industries Ltd. | 7,823,886 | 394,445 |
| | Israel Chemicals Ltd. | 4,878,803 | 56,987 |
| * | Check Point Software | | |
| | Technologies | 1,641,051 | 50,987 |
| | Bank Leumi Le-Israel BM | 11,297,357 | 44,122 |
| * | Bank Hapoalim BM | 9,506,511 | 34,706 |
| | Teva Pharmaceutical | | |
| | Industries Ltd. ADR | 562,697 | 28,405 |
| | Bezeq Israeli | | |
| | Telecommunication | | |
| | Corp. Ltd. | 11,562,047 | 25,803 |
| * | Nice Systems Ltd. | 613,807 | 19,100 |
| | Partner | | |
| | Communications Co. Ltd. | 827,342 | 15,687 |
| | Cellcom Israel Ltd. | 509,121 | 15,319 |
| | Elbit Systems Ltd. | 232,181 | 14,067 |
| * | Israel Corp. Ltd. | 19,078 | 13,121 |
| | Makhteshim-Agan | | |
| | Industries Ltd. | 2,644,356 | 12,359 |
| * | Mizrahi Tefahot Bank Ltd. | 1,195,124 | 9,713 |
| | Israel Discount Bank Ltd. | | |
| | Class A | 4,840,432 | 9,240 |
| | Discount | | |
| | Investment Corp. | 361,214 | 8,488 |
| | Delek Group Ltd. | 37,035 | 6,119 |
| | Ormat Industries | 546,707 | 4,766 |
| | | | 763,434 |
| Malaysia (2.8%) | | |
| | Sime Darby Bhd. | 28,034,813 | 72,487 |
| | CIMB Group | | |
| | Holdings Bhd. | 18,697,432 | 67,833 |
| | Malayan Banking Bhd. | 33,293,158 | 64,479 |
| | IOI Corp. Bhd. | 32,252,955 | 50,009 |
| | Tenaga Nasional Bhd. | 18,658,446 | 45,732 |
| | Genting Bhd. | 21,267,890 | 44,708 |
| | Public Bank Bhd. | 10,172,547 | 31,689 |
| | MISC Bhd. | 10,039,465 | 26,100 |
| | Genting Malaysia Bhd. | 31,353,410 | 25,044 |
| | AMMB Holdings Bhd. | 17,360,058 | 23,869 |
| | PPB Group Bhd. | 5,179,944 | 22,875 |
| | Digi.Com Bhd. | 3,401,273 | 21,719 |
| * | Axiata Group Bhd. | 24,870,709 | 21,181 |
| | British American | | |
| | Tobacco Malaysia Bhd. | 1,403,705 | 18,435 |
| | Kuala Lumpur | | |
| | Kepong Bhd. | 4,186,608 | 18,284 |
| | YTL Corp. Bhd. | 7,410,353 | 15,759 |
| | IJM Corp. Bhd. | 10,774,250 | 15,028 |
| | Petronas Gas Bhd. | 4,976,228 | 14,224 |
| | PLUS Expressways Bhd. | 14,661,282 | 14,132 |
| | Gamuda Bhd. | 15,219,888 | 13,896 |
| | YTL Power | | |
| | International Bhd. | 20,856,627 | 13,106 |
| | Hong Leong Bank Bhd. | 4,932,036 | 10,785 |
| | | |
| | | | Market |
| | | | Value• |
| | | Shares | ($000) |
| | Berjaya Sports Toto Bhd. | 7,706,945 | 9,714 |
| | UMW Holdings Bhd. | 5,240,160 | 9,651 |
| | Telekom Malaysia Bhd. | 10,611,140 | 9,325 |
| | Tanjong PLC | 2,101,136 | 9,297 |
| | SP Setia Bhd. | 8,129,852 | 9,142 |
| | Bursa Malaysia Bhd. | 3,592,852 | 8,498 |
| | Parkson Holdings Bhd. | 5,149,616 | 7,640 |
| | Petronas Dagangan Bhd. | 2,651,600 | 6,898 |
| | RHB Capital Bhd. | 4,365,335 | 6,848 |
| | Alliance Financial | | |
| | Group Bhd. | 9,303,417 | 6,647 |
| | Lafarge Malayan | | |
| | Cement Bhd. | 3,325,820 | 5,869 |
| | MMC Corp. Bhd. | 7,532,800 | 5,459 |
| | Astro All Asia | | |
| | Networks PLC | 5,457,890 | 5,264 |
| | Hong Leong Financial | | |
| | Group Bhd. | 2,879,800 | 5,210 |
| * | IGB Corp. Bhd. | 8,836,900 | 5,019 |
| * | AirAsia Bhd. | 12,700,948 | 4,994 |
| | KLCC Property | | |
| | Holdings Bhd. | 4,981,100 | 4,758 |
| | Genting Plantations Bhd. | 2,020,400 | 3,612 |
| * | Malaysian Airline | | |
| | System Bhd. | 2,691,400 | 2,437 |
| | | | 777,656 |
| Mexico (4.4%) | | |
| | America Movil | | |
| | SAB de CV | 176,233,467 | 388,938 |
| | Wal-Mart de Mexico | | |
| | SAB de CV | 27,472,294 | 95,834 |
| * | Cemex SAB de CV | 87,075,125 | 90,414 |
| | Grupo Televisa SA | 23,163,526 | 89,645 |
| | Fomento Economico | | |
| | Mexicano SAB de CV | 20,341,668 | 88,045 |
| * | Grupo Mexico SAB | | |
| | de CV Class B | 36,448,768 | 73,153 |
| | Telefonos de Mexico | | |
| | SAB de CV | 52,293,789 | 43,526 |
| | Grupo Financiero | | |
| | Banorte SAB de CV | 13,546,930 | 43,297 |
| | Telmex Internacional | | |
| | SAB de CV | 51,393,580 | 34,564 |
| | Grupo Elektra SA de CV | 725,670 | 28,469 |
| * | Carso Global Telecom | | |
| | SAB de CV | 6,821,318 | 26,534 |
| * | Grupo Modelo SAB | | |
| | de CV | 4,939,747 | 22,421 |
| | Kimberly-Clark de | | |
| | Mexico SAB de CV | | |
| | Class A | 5,313,912 | 21,048 |
| | Grupo Bimbo SAB de | | |
| | CV Class A | 3,460,888 | 20,157 |
| | Industrias Penoles | | |
| | SAB de CV | 1,044,224 | 19,068 |
72
| | | |
| Emerging Markets Stock Index Fund | |
| |
| |
| |
| | | | Market |
| | | | Value• |
| | | Shares | ($000) |
| | Grupo Financiero | | |
| | Inbursa SA | 6,579,698 | 18,538 |
| | Grupo Carso SAB de CV | 5,574,166 | 16,464 |
| | Alfa SAB de CV Class A | 3,001,631 | 15,543 |
| | Coca-Cola Femsa SAB | | |
| | de CV | 2,734,213 | 14,748 |
| | Mexichem SAB de CV | 9,020,696 | 14,347 |
| * | Desarrolladora Homex | | |
| | SAB de CV | 2,188,490 | 13,019 |
| * | Urbi Desarrollos Urbanos | | |
| | SAB DE CV | 5,027,693 | 9,638 |
| | Grupo Aeroportuario del | | |
| | Pacifico SAB de CV | | |
| | Class B | 3,043,407 | 7,800 |
| | Grupo Aeroportuario | | |
| | del Pacifico SAB de | | |
| | CV ADR | 146,917 | 3,745 |
| | | | 1,198,955 |
| Peru (0.6%) | | |
| | Southern Copper Corp. | | |
| | (U.S. Shares) | 1,421,171 | 44,767 |
| | Cia de Minas | | |
| | Buenaventura SA ADR | 1,052,945 | 35,348 |
| | Credicorp Ltd. | 422,657 | 29,235 |
| | Cia de Minas | | |
| | Buenaventura SA | 750,871 | 25,812 |
| | Southern Copper Corp. | 628,667 | 19,803 |
| | Credicorp Ltd. | | |
| | (New York Shares) | 225,455 | 15,563 |
| | | | 170,528 |
| Philippines (0.5%) | | |
| | Philippine Long Distance | | |
| | Telephone Co. | 468,370 | 25,172 |
| | Manila Electric Co. | 4,403,532 | 17,121 |
| | Bank of the | | |
| | Philippine Islands | 14,637,395 | 14,242 |
| | SM Investments Corp. | 2,023,876 | 13,218 |
| | Ayala Corp. | 2,066,646 | 12,505 |
| | Ayala Land Inc. | 52,653,650 | 11,385 |
| | SM Prime Holdings Inc. | 41,050,286 | 8,512 |
| | Energy | | |
| | Development Corp. | 79,682,753 | 6,882 |
| | Globe Telecom Inc. | 348,773 | 6,687 |
| | Banco de Oro | | |
| | Unibank Inc. | 7,338,391 | 5,327 |
| | Jollibee Foods Corp. | 4,591,759 | 4,885 |
| | Metropolitan Bank | | |
| | & Trust | 5,198,710 | 4,398 |
| | | | 130,334 |
| Poland (1.3%) | | |
| ^ | Powszechna Kasa | | |
| | Oszczednosci Bank | | |
| | Polski SA | 6,018,454 | 71,313 |
| * | Bank Pekao SA | 1,127,005 | 60,491 |
| | KGHM Polska Miedz SA | 1,166,580 | 39,268 |
| | | | |
| | | | | Market |
| | | | | Value• |
| | | | Shares | ($000) |
| | Telekomunikacja | | | |
| | Polska SA | | 6,594,815 | 38,703 |
| * | Polski Koncern | | | |
| | Naftowy Orlen | | 3,230,109 | 33,621 |
| | Polskie Gornictwo Naftowe | | |
| | I Gazownictwo SA | | 11,836,570 | 14,413 |
| * | Bank Zachodni WBK SA | 258,200 | 13,784 |
| * | Globe Trade Centre SA | | 1,478,900 | 12,760 |
| | Asseco Poland SA | | 591,971 | 11,894 |
| * | BRE Bank SA | | 102,662 | 9,517 |
| * | Getin Holding SA | | 3,138,117 | 8,931 |
| | TVN SA | | 1,670,154 | 8,277 |
| * | ING Bank Slaski SA | | 33,261 | 7,464 |
| * | Bank Handlowy w | | | |
| | Warszawie SA | | 327,029 | 7,172 |
| * | PBG SA | | 89,881 | 7,001 |
| * | Bank Millennium SA | | 3,201,072 | 5,254 |
| * | Grupa Lotos SA | | 557,240 | 5,065 |
| | Cyfrowy Polsat SA | | 866,731 | 4,184 |
| | | | | 359,112 |
| Russia (6.7%) | | | |
| | Gazprom OAO ADR | | 22,426,568 | 537,835 |
| | Lukoil OAO ADR | | 4,438,902 | 257,508 |
| | Sberbank of Russian | | | |
| | Federation | | 77,187,472 | 168,293 |
| | MMC Norilsk Nickel ADR | 8,531,650 | 112,076 |
| | Rosneft Oil Co. GDR | | 12,335,536 | 93,797 |
| | Mobile Telesystems | | | |
| | OJSC ADR | | 1,913,250 | 86,670 |
| | Surgutneftegaz ADR | | 7,394,614 | 65,263 |
| * | Vimpel-Communications | | |
| | ADR | | 3,210,461 | 57,563 |
| | Tatneft ADR | | 2,094,609 | 54,244 |
| | NovaTek OAO GDR | | 877,129 | 44,033 |
| | Polyus Gold Co. ADR | | 1,463,602 | 39,540 |
| | VTB Bank OJSC GDR | | 9,293,849 | 36,992 |
| * | RusHydro | 894,208,332 | 30,969 |
| * | Uralkali | | 7,065,436 | 30,734 |
| * | Federal Grid Co. | | | |
| | Unified Energy | | | |
| | System JSC | 2,531,825,334 | 26,963 |
| | Surgutneftegaz | | 61,487,229 | 25,613 |
| | Mechel ADR | | 1,294,277 | 22,210 |
| | Novolipetsk Steel | | | |
| | OJSC GDR | | 767,773 | 19,998 |
| | Gazpromneft JSC | | 3,223,019 | 16,442 |
| | Severstal GDR | | 2,155,673 | 15,550 |
| * | Sistema JSFC GDR | | 879,052 | 14,264 |
| * | Wimm-Bill-Dann Foods | | | |
| | OJSC ADR | | 203,530 | 13,754 |
| * | Pharmstandard GDR | | 797,972 | 12,896 |
| | AK Transneft OAO | | 14,287 | 11,951 |
| | Rostelecom ADR | | 279,978 | 10,933 |
| | TMK OAO GDR | | 539,979 | 9,755 |
| | Comstar United | | | |
| | Telesystems OJSC GDR | 1,588,063 | 8,198 |
73
| | | |
| Emerging Markets Stock Index Fund | |
| |
| |
| |
| | | | Market |
| | | | Value• |
| | | Shares | ($000) |
| * | Polymetal | 678,573 | 5,833 |
| | Lukoil OAO ADR | 29,160 | 1,692 |
| | | | 1,831,569 |
| South Africa (7.0%) | | |
| | MTN Group Ltd. | 13,911,787 | 207,136 |
| | Sasol Ltd. | 5,441,714 | 203,875 |
| | Standard Bank | | |
| | Group Ltd. | 11,059,354 | 138,032 |
| | Naspers Ltd. | 3,636,400 | 131,268 |
| | Impala Platinum | | |
| | Holdings Ltd. | 5,105,181 | 112,332 |
| | AngloGold Ashanti Ltd. | 2,858,314 | 106,756 |
| | Gold Fields Ltd. | 6,365,508 | 81,440 |
| | FirstRand Ltd. | 26,822,966 | 60,416 |
| | Sanlam Ltd. | 19,471,813 | 53,460 |
| | Anglo Platinum Ltd. | 583,308 | 50,419 |
| | Remgro Ltd. | 4,193,832 | 49,095 |
| | ABSA Group Ltd. | 3,070,985 | 48,614 |
| | Bidvest Group Ltd. | 2,739,595 | 42,899 |
| | Harmony Gold | | |
| | Mining Co. Ltd. | 3,515,823 | 35,215 |
| | Shoprite Holdings Ltd. | 3,936,223 | 32,076 |
| | Tiger Brands Ltd. | 1,583,422 | 31,706 |
| | African Bank | | |
| | Investments Ltd. | 7,388,830 | 28,849 |
| | Nedbank Group Ltd. | 1,883,089 | 28,307 |
| | RMB Holdings Ltd. | 7,005,175 | 25,575 |
| | Steinhoff International | | |
| | Holdings Ltd. | 10,293,306 | 24,874 |
| * | Vodacom Group Pty Ltd. | 3,576,445 | 24,799 |
| | Truworths | | |
| | International Ltd. | 4,231,467 | 24,219 |
| | ArcelorMittal | | |
| | South Africa Ltd. | 1,794,817 | 24,154 |
| | Growthpoint | | |
| | Properties Ltd. | 13,603,320 | 24,075 |
| | Massmart Holdings Ltd. | 2,037,305 | 23,537 |
| | Kumba Iron Ore Ltd. | 787,022 | 23,498 |
| | Murray & Roberts | | |
| | Holdings Ltd. | 3,015,268 | 21,522 |
| * | Redefine Income | | |
| | Fund Ltd. | 23,174,569 | 21,301 |
| | Aveng Ltd. | 3,901,549 | 20,692 |
| | Pretoria Portland | | |
| | Cement Co. Ltd. | 4,905,575 | 20,536 |
| | African Rainbow | | |
| | Minerals Ltd. | 1,005,449 | 19,467 |
| * | Aspen Pharmacare | | |
| | Holdings Ltd. | 2,279,167 | 19,208 |
| | Sappi Ltd. | 4,974,979 | 18,384 |
| | Imperial Holdings Ltd. | 1,735,706 | 17,869 |
| | Investec Ltd. | 2,182,573 | 16,106 |
| | Foschini Ltd. | 1,902,407 | 15,056 |
| | Woolworths Holdings Ltd. | 6,702,780 | 14,965 |
| | Telkom SA Ltd. | 2,620,731 | 14,683 |
| | Netcare Ltd. | 9,226,441 | 13,588 |
| | | |
| | | | Market |
| | | | Value• |
| | | Shares | ($000) |
| | Exxaro Resources Ltd. | 1,169,424 | 13,136 |
| | Reunert Ltd. | 1,831,980 | 12,904 |
| | Pick n Pay Stores Ltd. | 2,262,990 | 11,764 |
| | Discovery Holdings Ltd. | 2,370,113 | 9,419 |
| | Liberty Holdings Ltd. | 1,023,216 | 8,847 |
| | Northam Platinum Ltd. | 1,447,770 | 6,766 |
| | | | 1,932,839 |
| South Korea (12.8%) | | |
| | Samsung Electronics | | |
| | Co. Ltd. | 638,760 | 384,363 |
| 2 | Samsung Electronics | | |
| | Co. Ltd. GDR | 809,571 | 245,515 |
| | POSCO ADR | 1,411,619 | 144,155 |
| | Hyundai Motor Co. | 1,422,428 | 129,021 |
| | POSCO | 265,340 | 109,964 |
| * | Shinhan Financial | | |
| | Group Co. Ltd. | 2,253,959 | 85,517 |
| | LG Electronics Inc. | 892,559 | 82,973 |
| * | KB Financial Group Inc. | 1,638,654 | 78,819 |
| | Hyundai Mobis | 586,614 | 78,221 |
| | Samsung Electronics | | |
| | Co. Ltd. Pfd. | 194,329 | 77,847 |
| | LG Chem Ltd. | 430,646 | 74,213 |
| * | KB Financial | | |
| | Group Inc. ADR | 1,449,101 | 68,745 |
| * | Hynix Semiconductor Inc. | 4,475,740 | 66,449 |
| | Samsung Fire & Marine | | |
| | Insurance Co. Ltd. | 353,358 | 64,337 |
| | KT&G Corp. | 1,047,166 | 60,985 |
| ^ | Shinhan Financial | | |
| | Group Co. Ltd. ADR | 762,778 | 57,704 |
| * | NHN Corp. | 384,171 | 56,661 |
| | Shinsegae Co. Ltd. | 130,568 | 56,371 |
| | Hana Financial Group Inc. | 1,796,620 | 53,284 |
| | SK Energy Co. Ltd. | 572,306 | 52,565 |
| | LG Display Co. Ltd. | 2,135,036 | 51,090 |
| | LG Corp. | 895,007 | 50,705 |
| ^ | Hyundai Heavy Industries | 360,084 | 49,322 |
| | Samsung C&T Corp. | 1,178,553 | 47,968 |
| | Samsung Electro- | | |
| | Mechanics Co. Ltd. | 556,663 | 46,284 |
| * | Korea Electric | | |
| | Power Corp. ADR | 2,814,124 | 39,060 |
| | Samsung SDI Co. Ltd. | 314,112 | 35,860 |
| | Hyundai Steel Co. | 506,283 | 32,162 |
| | SK Telecom Co. Ltd. ADR | 1,905,419 | 31,840 |
| * | Woori Finance | | |
| | Holdings Co. Ltd. | 2,314,280 | 31,150 |
| | GS Engineering & | | |
| | Construction Corp. | 346,301 | 30,368 |
| * | Korea Electric | | |
| | Power Corp. | 1,040,961 | 29,497 |
| * | Kia Motors Corp. | 1,956,944 | 29,068 |
| | Samsung Heavy | | |
| | Industries Co. Ltd. | 1,531,995 | 28,981 |
74
| | | |
| Emerging Markets Stock Index Fund | |
| |
| |
| |
| | | | Market |
| | | | Value• |
| | | Shares | ($000) |
| | Korea Exchange Bank | 2,493,310 | 28,334 |
| | Samsung Techwin Co. Ltd. | 353,715 | 27,085 |
| | Hyundai Engineering & | | |
| | Construction Co. Ltd. | 484,946 | 26,773 |
| | Samsung Engineering | | |
| | Co. Ltd. | 286,471 | 25,328 |
| | SK Telecom Co. Ltd. | 164,609 | 25,070 |
| | Samsung Securities | | |
| | Co. Ltd. | 487,841 | 23,912 |
| | KT Corp. | 688,196 | 22,433 |
| | Lotte Shopping Co. Ltd. | 77,336 | 21,842 |
| | S-Oil Corp. | 447,198 | 21,634 |
| | Amorepacific Corp. | 29,453 | 20,326 |
| | OCI Co. Ltd. | 115,057 | 20,214 |
| * | Industrial Bank Of Korea | 1,575,270 | 19,084 |
| | Daewoo Securities | | |
| | Co. Ltd. | 1,210,560 | 18,393 |
| | SK Holdings Co. Ltd. | 231,544 | 18,368 |
| | LG Household & | | |
| | Health Care Ltd. | 87,388 | 18,150 |
| | Busan Bank | 1,547,259 | 17,544 |
| | Daelim Industrial Co. Ltd. | 276,013 | 17,516 |
| | KT Corp. ADR | 1,088,607 | 17,472 |
| | Cheil Industries Inc. | 440,013 | 16,416 |
| | Hyundai Development Co. | 552,686 | 16,358 |
| | Doosan Heavy Industries | | |
| | and Construction Co. Ltd. | 304,235 | 16,327 |
| | Woongjin Coway Co. Ltd. | 475,869 | 15,908 |
| | Daegu Bank | 1,175,105 | 15,591 |
| ^ | NCSoft Corp. | 137,230 | 14,676 |
| | Samsung Card Co. | 367,233 | 14,550 |
| | LS Corp. | 176,261 | 14,401 |
| | Hankook Tire Co. Ltd. | 734,556 | 14,041 |
| * | Korean Air Lines Co. Ltd. | 364,914 | 13,887 |
| | Hyundai Department | | |
| | Store Co. Ltd. | 141,642 | 13,539 |
| | Hanwha Corp. | 422,876 | 13,513 |
| | Hyundai Securities Co. | 1,180,781 | 13,406 |
| ^ | Daewoo International Corp. | 481,637 | 13,155 |
| | KCC Corp. | 45,576 | 13,138 |
| | Kangwon Land Inc. | 969,678 | 12,957 |
| | Yuhan Corp. | 79,507 | 12,805 |
| | GS Holdings Corp. | 504,938 | 12,507 |
| | Daewoo Shipbuilding & | | |
| | Marine Engineering | | |
| | Co. Ltd. | 942,102 | 12,392 |
| | CJ CheilJedang Corp. | 72,971 | 12,340 |
| | Mirae Asset | | |
| | Securities Co. Ltd. | 230,739 | 12,061 |
| ^ | Daewoo Engineering & | | |
| | Construction Co. Ltd. | 1,153,314 | 11,749 |
| | LS Industrial | | |
| | Systems Co. Ltd. | 154,925 | 11,605 |
| ^ | Hyosung Corp. | 205,242 | 11,280 |
| | Korea Zinc Co. Ltd. | 71,954 | 11,121 |
| ^ | Doosan Infracore Co. Ltd. | 772,442 | 10,991 |
| | | | |
| | | | | Market |
| | | | | Value• |
| | | | Shares | ($000) |
| | Woori Investment & | | | |
| | Securities Co. Ltd. | | 871,841 | 10,960 |
| | Dongbu Insurance Co. Ltd. | 356,011 | 10,803 |
| | Hyundai Motor Co. Pfd. | | 324,427 | 10,558 |
| | LG Telecom Ltd. | | 1,395,142 | 10,453 |
| | Korea Investment | | | |
| | Holdings Co. Ltd. | | 378,485 | 10,094 |
| | Korea Gas Corp. | | 237,626 | 10,026 |
| ^ | Honam Petrochemical Corp. | 136,093 | 9,335 |
| | Hyundai Mipo Dockyard | | 113,070 | 9,315 |
| | STX Pan Ocean Co. Ltd. | | 997,530 | 9,090 |
| | Hanjin Shipping Co. Ltd. | | 569,570 | 7,741 |
| | LG Electronics Inc. | | 183,089 | 7,253 |
| | Dongkuk Steel Mill Co. Ltd. | 333,692 | 7,086 |
| | Hite Brewery Co. Ltd. | | 51,975 | 7,072 |
| | Lotte Confectionery Co. Ltd. | 6,927 | 6,966 |
| | LG Dacom Corp. | | 432,930 | 6,837 |
| | Doosan Corp. | | 98,051 | 6,800 |
| | SK Networks Co. Ltd. | | 718,620 | 6,792 |
| | Tong Yang Securities Inc. | | 733,436 | 6,720 |
| * | SK Broadband Co. Ltd. | | 1,539,848 | 6,331 |
| | Hanwha Chem Corp. | | 670,040 | 6,230 |
| | S1 Corp. | | 148,120 | 5,929 |
| | Hanjin Heavy Industries | | | |
| | & Construction Co. Ltd. | | 311,562 | 5,567 |
| ^ | Taewoong Co. Ltd. | | 78,578 | 5,358 |
| * | Celltrion Inc. | | 436,449 | 5,265 |
| ^ | STX Offshore & | | | |
| | Shipbuilding Co. Ltd. | | 440,957 | 4,706 |
| * | Korea Express Co. Ltd. | | 74,718 | 4,103 |
| | Taihan Electric | | | |
| | Wire Co. Ltd. | | 236,491 | 3,779 |
| | | | | 3,502,425 |
| Taiwan (11.0%) | | | |
| | HON HAI Precision | | | |
| | Industry Co. Ltd. | 70,951,633 | 277,905 |
| | Taiwan Semiconductor | | | |
| | Manufacturing Co. Ltd. | 127,718,045 | 231,680 |
| | Taiwan Semiconductor | | | |
| | Manufacturing Co. | | | |
| | Ltd. ADR | 19,650,545 | 187,466 |
| | MediaTek Inc. | | 8,401,186 | 117,583 |
| * | Cathay Financial | | | |
| | Holding Co. Ltd. | 54,346,202 | 93,197 |
| | China Steel Corp. | 91,269,869 | 81,033 |
| | Nan Ya Plastics Corp. | 47,473,439 | 75,520 |
| | Formosa Plastics Corp. | 36,973,458 | 70,918 |
| | Asustek Computer Inc. | 35,722,291 | 65,610 |
| | HTC Corp. | | 6,080,242 | 60,380 |
| | Acer Inc. | 23,749,014 | 55,980 |
| | Formosa Chemicals & | | | |
| | Fibre Corp. | 26,905,164 | 50,138 |
| | Chunghwa | | | |
| | Telecom Co. Ltd. | 27,143,319 | 47,644 |
| | Chinatrust Financial | | | |
| | Holding Co. Ltd. | 78,352,403 | 47,064 |
75
| | | |
| Emerging Markets Stock Index Fund | |
| |
| |
| |
| | | | Market |
| | | | Value• |
| | | Shares | ($000) |
| * | Fubon Financial | | |
| | Holding Co. Ltd. | 41,719,144 | 46,293 |
| | Yuanta Financial | | |
| | Holding Co. Ltd. | 68,423,773 | 45,155 |
| | Delta Electronics Inc. | 15,723,245 | 43,659 |
| | Compal Electronics Inc. | 34,919,083 | 43,656 |
| | Mega Financial | | |
| | Holding Co. Ltd. | 72,802,296 | 40,542 |
| | Quanta Computer Inc. | 20,415,880 | 38,620 |
| | Chunghwa | | |
| | Telecom Co. Ltd. ADR | 2,151,204 | 37,388 |
| *,^ | United Microelectronics | | |
| | Corp. ADR | 10,880,097 | 35,796 |
| | Uni-President | | |
| | Enterprises Corp. | 31,401,385 | 35,037 |
| | AU Optronics Corp. | 38,172,669 | 33,850 |
| | Far Eastern | | |
| | Textile Co. Ltd. | 26,730,400 | 31,521 |
| | Taiwan Mobile Co. Ltd. | 17,596,785 | 31,471 |
| * | United | | |
| | Microelectronics Corp. | 61,451,970 | 29,541 |
| | Taiwan Cement Corp. | 28,175,583 | 28,907 |
| | Formosa | | |
| | Petrochemical Corp. | 11,784,559 | 28,737 |
| | AU Optronics | | |
| | Corp. ADR | 3,093,195 | 27,313 |
| | First Financial | | |
| | Holding Co. Ltd. | 45,081,761 | 26,043 |
| | Lite-On | | |
| | Technology Corp. | 19,728,409 | 25,984 |
| | Wistron Corp. | 15,376,955 | 25,742 |
| | InnoLux Display Corp. | 19,500,578 | 25,684 |
| | Taiwan Fertilizer Co. Ltd. | 7,100,800 | 22,044 |
| * | China Development | | |
| | Financial Holding Corp. | 84,303,785 | 21,961 |
| * | Chi Mei | | |
| | Optoelectronics Corp. | 42,356,999 | 21,131 |
| | Chang Hwa | | |
| | Commercial Bank | 47,391,094 | 20,620 |
| | Taiwan Cooperative | | |
| | Bank | 34,090,450 | 20,115 |
| | Siliconware Precision | | |
| | Industries Co. | 14,820,860 | 19,486 |
| * | Shin Kong Financial | | |
| | Holding Co. Ltd. | 47,655,222 | 19,389 |
| | Synnex Technology | | |
| | International Corp. | 9,801,151 | 18,544 |
| * | SinoPac Financial | | |
| | Holdings Co. Ltd. | 49,774,113 | 18,382 |
| | Hua Nan Financial | | |
| | Holdings Co. Ltd. | 31,072,685 | 18,054 |
| | Foxconn Technology | | |
| | Co. Ltd. | 5,357,976 | 17,849 |
| | Far EasTone | | |
| | Telecommunications | | |
| | Co. Ltd. | 15,529,043 | 17,472 |
| | | |
| | | | Market |
| | | | Value• |
| | | Shares | ($000) |
| | Cheng Shin Rubber | | |
| | Industry Co. Ltd. | 8,279,344 | 17,013 |
| | Asia Cement Corp. | 15,896,508 | 16,691 |
| | Advanced Semiconductor | | |
| | Engineering Inc. | 21,161,400 | 16,678 |
| | Siliconware Precision | | |
| | Industries Co. ADR | 2,395,885 | 16,124 |
| | Macronix International | 31,714,944 | 16,076 |
| | Epistar Corp. | 5,431,732 | 15,817 |
| | Pou Chen Corp. | 21,625,100 | 14,827 |
| | Advanced Semiconductor | | |
| | Engineering Inc. ADR | 3,787,845 | 14,659 |
| * | Taishin Financial | | |
| | Holding Co. Ltd. | 33,835,678 | 13,242 |
| | Powertech | | |
| | Technology Inc. | 4,771,527 | 13,062 |
| | KGI Securities Co. Ltd. | 28,397,000 | 13,011 |
| | Catcher | | |
| | Technology Co. Ltd. | 5,333,663 | 12,912 |
| | President Chain | | |
| | Store Corp. | 5,405,539 | 12,230 |
| * | E.Sun Financial | | |
| | Holding Co. Ltd. | 30,472,591 | 11,862 |
| | Novatek Microelectronics | | |
| | Corp. Ltd. | 4,761,107 | 10,741 |
| | Largan Precision Co. Ltd. | 920,135 | 10,538 |
| * | Polaris Securities | | |
| | Co. Ltd. | 20,263,775 | 10,398 |
| | Richtek Technology Corp. | 1,268,930 | 9,736 |
| | Transcend | | |
| | Information Inc. | 3,011,981 | 9,420 |
| | Inventec Co. Ltd. | 17,015,175 | 9,413 |
| | Unimicron | | |
| | Technology Corp. | 8,239,754 | 9,401 |
| | Simplo Technology | | |
| | Co. Ltd. | 1,824,000 | 9,366 |
| | Yulon Motor Co. Ltd. | 8,263,280 | 9,243 |
| | Young Fast | | |
| | Optoelectronics Co. Ltd. | 801,000 | 9,165 |
| | WPG Holdings Co. Ltd. | 6,467,000 | 8,848 |
| | Tripod Technology Corp. | 3,460,657 | 8,660 |
| | Chicony Electronics | | |
| | Co. Ltd. | 3,888,399 | 8,503 |
| | Far Eastern Department | | |
| | Stores Co. Ltd. | 8,136,216 | 8,358 |
| * | Chunghwa Picture Tubes 78,362,331 | 8,039 |
| * | Ruentex Industries Ltd. | 4,741,226 | 7,739 |
| | Realtek | | |
| | Semiconductor Corp. | 3,634,887 | 7,727 |
| * | Walsin Lihwa Corp. | 23,830,170 | 7,722 |
| * | Inotera Memories Inc. | 12,470,424 | 7,368 |
| | Coretronic Corp. | 6,587,000 | 7,212 |
| | Taiwan Glass | | |
| | Industrial Corp. | 9,364,959 | 7,199 |
| | Giant Manufacturing | | |
| | Co. Ltd. | 2,775,200 | 7,196 |
76
| | | |
| Emerging Markets Stock Index Fund | |
| |
| |
| |
| | | | Market |
| | | | Value• |
| | | Shares | ($000) |
| | U-Ming Marine | | |
| | Transport Corp. | 3,958,988 | 7,181 |
| * | HannStar Display Corp. | 37,945,202 | 7,155 |
| | Everlight Electronics | | |
| | Co. Ltd. | 2,594,089 | 7,091 |
| * | Qisda Corp. | 12,731,928 | 7,062 |
| | Pixart Imaging Inc. | 989,278 | 6,974 |
| * | Tatung Co. Ltd. | 31,420,600 | 6,920 |
| | Phison Electronics Corp. | 1,021,315 | 6,837 |
| * | Powerchip | | |
| | Semiconductor Corp. | 60,254,716 | 6,719 |
| | Motech Industries Inc. | 2,481,928 | 6,571 |
| | Tung Ho Steel | | |
| | Enterprise Corp. | 6,897,144 | 6,556 |
| * | Clevo Co. | 5,231,938 | 6,530 |
| | Feng Hsin Iron & | | |
| | Steel Co. | 4,302,310 | 6,505 |
| * | Prime View | | |
| | International Co. Ltd. | 3,905,000 | 6,363 |
| | Teco Electric and | | |
| | Machinery Co. Ltd. | 15,001,000 | 5,972 |
| * | CMC Magnetics Corp. | 26,385,700 | 5,794 |
| | Eternal Chemical Co. Ltd. | 6,184,395 | 5,731 |
| | Advantech Co. Ltd. | 3,138,622 | 5,586 |
| | Formosa Taffeta Co. Ltd. | 8,233,868 | 5,582 |
| | Mitac International | 11,884,427 | 5,558 |
| | TSRC Corp. | 4,706,398 | 5,482 |
| | Cheng Uei Precision | | |
| | Industry Co. Ltd. | 2,858,365 | 5,430 |
| | Farglory Land | | |
| | Development Co. Ltd. | 2,685,688 | 5,396 |
| | Chinese Gamer | | |
| | International Corp. | 421,000 | 5,348 |
| | Kinsus Interconnect | | |
| | Technology Corp. | 2,105,029 | 5,277 |
| * | Evergreen Marine Corp. | | |
| | Taiwan Ltd. | 10,365,879 | 5,235 |
| | Nan Ya Printed Circuit | | |
| | Board Corp. | 1,680,623 | 5,230 |
| | Compal | | |
| | Communications Inc. | 3,458,374 | 5,104 |
| | Formosa International | | |
| | Hotels Corp. | 402,936 | 5,028 |
| | Formosa Sumco | | |
| | Technology Corp. | 2,157,450 | 4,982 |
| | Taiwan Secom Co. Ltd. | 3,169,745 | 4,845 |
| * | Capital Securities Corp. | 10,404,000 | 4,824 |
| * | Taiwan Business Bank | 19,601,000 | 4,786 |
| * | Nanya Technology Corp. | 6,693,655 | 4,730 |
| | Micro-Star | | |
| | International Co. Ltd. | 7,669,882 | 4,586 |
| * | Wan Hai Lines Ltd. | 9,606,128 | 4,419 |
| * | Wintek Corp. | 6,620,000 | 4,408 |
| * | Eva Airways Corp. | 11,441,891 | 4,292 |
| | Sino-American | | |
| | Silicon Products Inc. | 1,981,412 | 4,289 |
| | | |
| | | | Market |
| | | | Value• |
| | | Shares | ($000) |
| * | Winbond | | |
| | Electronics Corp. | 23,165,000 | 4,278 |
| | Global Unichip Corp. | 856,308 | 3,690 |
| | Vanguard International | | |
| | Semiconductor Corp. | 9,060,396 | 3,680 |
| * | China Airlines Ltd. | 11,307,765 | 3,515 |
| | Yang Ming Marine | | |
| | Transport Corp. | 9,941,450 | 3,512 |
| | CSBC Corp. Taiwan | 3,377,440 | 3,139 |
| * | Evergreen International | | |
| | Storage & | | |
| | Transport Corp. | 2,914,000 | 2,358 |
| | Sincere Navigation | 1,900,000 | 2,112 |
| * | Tatung Co. Ltd. GDR | 392,499 | 1,758 |
| * | Via Technologies Inc. | 1,160,400 | 702 |
| * | Shin Kong Financial | | |
| | Holding Co., Ltd. | | |
| | Rights Exp. 12/7/09 | 2,167,853 | 200 |
| * | Ya Hsin | | |
| | Industrial Co. Ltd. | 5,306,018 | — |
| | | | 3,019,622 |
| Thailand (1.3%) | | |
| | PTT PCL (Foreign) | 7,085,837 | 50,156 |
| | PTT Exploration & | | |
| | Production PCL | | |
| | (Foreign) | 11,372,618 | 48,557 |
| | Bangkok Bank PCL | | |
| | (Foreign) | 9,380,231 | 31,461 |
| | Kasikornbank PCL | | |
| | (Foreign) | 11,839,449 | 28,702 |
| | Siam Commercial | | |
| | Bank PCL (Foreign) | 11,657,057 | 26,587 |
| | Advanced Info Service | | |
| | PCL (Foreign) | 7,651,177 | 19,592 |
| | Banpu PCL (Foreign) | 1,197,417 | 15,395 |
| | Bangkok Bank | | |
| | PCL (Local) | 4,607,643 | 15,235 |
| | Siam Cement | | |
| | PCL (Foreign) | 2,456,707 | 15,221 |
| | Bank of Ayudhya | | |
| | PLC (Local) | 20,991,834 | 11,146 |
| | CP ALL PCL (Foreign) | 18,883,615 | 10,653 |
| | IRPC PCL (Foreign) | 91,786,660 | 10,399 |
| | Thai Oil PCL (Foreign) | 7,851,800 | 9,538 |
| | PTT PCL (Local) | 1,061,800 | 7,516 |
| | Krung Thai Bank | | |
| | PCL (Foreign) | 27,600,921 | 7,196 |
| | PTT Aromatics & | | |
| | Refining PCL (Foreign) | 10,679,011 | 6,699 |
| | PTT Chemical PCL | | |
| | (Foreign) | 3,556,238 | 6,527 |
| | BEC World | | |
| | PCL (Foreign) | 9,222,225 | 6,139 |
| * | TMB Bank | | |
| | PCL (Foreign) | 170,098,844 | 5,541 |
77
| | | |
| Emerging Markets Stock Index Fund | |
| |
| |
| |
| | | | Market |
| | | | Value• |
| | | Shares | ($000) |
| | Land and Houses | | |
| | PCL (Foreign) | 27,749,947 | 4,963 |
| | Siam Cement | | |
| | PCL (Local) | 815,410 | 4,925 |
| | Total Access | | |
| | Communication | | |
| | PCL (Foreign) | 4,189,891 | 4,834 |
| | Glow Energy | | |
| | PCL (Foreign) | 5,030,555 | 4,782 |
| | Ratchaburi Electricity | | |
| | Generating Holding PCL | 3,728,135 | 4,108 |
| | Advanced Info | | |
| | Service PCL (Local) | 1,242,000 | 3,180 |
| | Total Access | | |
| | Communication | | |
| | PCL (Local) | 2,108,400 | 2,433 |
| | Banpu PCL (Local) | 184,600 | 2,380 |
| | IRPC Public | | |
| | Co. Ltd. (Local) | 5,727,400 | 649 |
| | Thai Oil PCL (Local) | 419,200 | 509 |
| | PTT Aromatics & | | |
| | Refining PCL | 776,600 | 487 |
| | Glow Energy PCL | 241,100 | 229 |
| | | | 365,739 |
| Turkey (1.5%) | | |
| | Turkiye Garanti | | |
| | Bankasi AS | 20,019,775 | 72,703 |
| | Turkcell Iletisim | | |
| | Hizmet AS | 7,371,596 | 48,773 |
| | Akbank TAS | 7,277,345 | 39,311 |
| | Turkiye Is Bankasi | 10,324,272 | 39,101 |
| | Anadolu Efes Biracilik | | |
| | Ve Malt Sanayii AS | 1,927,797 | 22,025 |
| | Tupras Turkiye | | |
| | Petrol Rafine | 1,232,595 | 21,171 |
| * | Turkiye Vakiflar | | |
| | Bankasi Tao | 8,113,512 | 19,676 |
| | Turkiye Halk Bankasi AS | 3,102,792 | 18,569 |
| | Haci Omer Sabanci | | |
| | Holding AS | 4,905,568 | 17,935 |
| * | Yapi ve Kredi | | |
| | Bankasi AS | 8,551,727 | 17,583 |
| | Turk | | |
| | Telekomunikasyon AS | 5,311,652 | 16,122 |
| | BIM Birlesik | | |
| | Magazalar AS | 374,083 | 13,563 |
| * | KOC Holding AS | 5,139,260 | 13,092 |
| | | |
| | | | Market |
| | | | Value• |
| | | Shares | ($000) |
| * | Eregli Demir ve Celik | | |
| | Fabrikalari TAS | 4,442,781 | 12,061 |
| | Enka Insaat ve | | |
| | Sanayi AS | 2,493,073 | 10,060 |
| * | Asya Katilim Bankasi AS | 4,432,776 | 9,168 |
| | Dogan Sirketler | | |
| | Grubu Holdings | 8,209,672 | 5,401 |
| | Coca-Cola Icecek AS | 635,597 | 4,907 |
| * | Petkim | | |
| | Petrokimya Holding | 928,475 | 4,476 |
| * | Turk Sise ve Cam | | |
| | Fabrikalari AS | 4,053,452 | 4,254 |
| * | Tekfen Holding AS | 1,327,921 | 3,802 |
| | Aksigorta AS | 1,208,088 | 3,649 |
| | | | 417,402 |
| Total Common Stocks | | |
| (Cost $23,455,884) | | 27,356,702 |
| Temporary Cash Investments (2.5%)1 | |
| Money Market Fund (2.4%) | | |
| 3,4 | Vanguard Market | | |
| | Liquidity Fund, 0.225% | 668,769,055 | 668,769 |
| |
| | | Face | |
| | | Amount | |
| | | ($000) | |
| U.S. Government and Agency Obligations (0.1%) |
| 5,6,7 Federal Home Loan | | |
| | Bank Discount Notes, | | |
| | 0.220%, 3/26/10 | 7,000 | 6,996 |
| 5,6 | Fannie Mae Discount | | |
| | Notes, 0.200%, 3/24/10 | 4,000 | 3,998 |
| | | | 10,994 |
| Total Temporary Cash Investments | |
| (Cost $679,760) | | 679,763 |
| Total Investments (102.2%) | | |
| (Cost $24,135,644) | | 28,036,465 |
| Other Assets and Liabilities (–2.2%) | |
| Other Assets | | 96,280 |
| Liabilities4 | | (704,520) |
| | | | (608,240) |
| Net Assets (100%) | | 27,428,225 |
78
Emerging Markets Stock Index Fund
| |
| At October 31, 2009, net assets consisted of: |
| | Amount |
| | ($000) |
| Paid-in Capital | 25,466,974 |
| Undistributed Net Investment Income | 301,998 |
| Accumulated Net Realized Losses | (2,235,127) |
| Unrealized Appreciation (Depreciation) | |
| Investment Securities | 3,900,821 |
| Futures Contracts | (2,876) |
| Swap Contracts | (4,604) |
| Foreign Currencies | 1,039 |
| Net Assets | 27,428,225 |
| |
| Investor Shares—Net Assets | |
| Applicable to 293,888,902 outstanding | |
| $.001 par value shares of beneficial | |
| interest (unlimited authorization) | 7,024,208 |
| Net Asset Value Per Share— | |
| Investor Shares | $23.90 |
| |
| Admiral Shares—Net Assets | |
| Applicable to 84,997,277 outstanding | |
| $.001 par value shares of beneficial | |
| interest (unlimited authorization) | 2,673,583 |
| Net Asset Value Per Share— | |
| Admiral Shares | $31.45 |
| |
| Signal Shares—Net Assets | |
| Applicable to 15,309,730 outstanding | |
| $.001 par value shares of beneficial | |
| interest (unlimited authorization) | 463,272 |
| Net Asset Value Per Share— | |
| Signal Shares | $30.26 |
| |
| | Amount |
| | ($000) |
| Institutional Shares—Net Assets | |
| Applicable to 72,285,967 outstanding | |
| $.001 par value shares of beneficial | |
| interest (unlimited authorization) | 1,730,528 |
| Net Asset Value Per Share— | |
| Institutional Shares | $23.94 |
| |
| ETF Shares—Net Assets | |
| Applicable to 410,558,942 outstanding | |
| $.001 par value shares of beneficial | |
| interest (unlimited authorization) | 15,536,634 |
| Net Asset Value Per Share— | |
| ETF Shares | $37.84 |
• See Note A in Notes to Financial Statements.
* Non-income-producing security.
^ Part of security position is on loan to broker-dealers. The total value of securities on loan is $563,638,000.
1 The fund invests a portion of its cash reserves in equity markets through the use of index futures contracts and swap contracts. After giving effect to futures and swap investments, the fund’s effective common stock and temporary cash investment positions represent 100.1% and 2.1%, respectively, of net assets.
2 Security exempt from registration under Rule 144A of the Securities Act of 1933. Such securities may be sold in transactions exempt from registration, normally to qualified institutional buyers. At October 31, 2009, the value of this security represented 0.9% of net assets.
3 Affiliated money market fund available only to Vanguard funds and certain trusts and accounts managed by Vanguard. Rate shown is the 7-day yield.
4 Includes $617,087,000 of collateral received for securities on loan.
5 The issuer operates under a congressional charter; its securities are not backed by the full faith and credit of the U.S. government.
6 Securities with a value of $5,347,000 have been segregated as collateral for open swap contracts.
7 Securities with a value of $4,498,000 have been segregated as initial margin for open futures contracts.
ADR—American Depositary Receipt.
GDR—Global Depositary Receipt.
See accompanying Notes, which are an integral part of the Financial Statements.
79
| |
| Emerging Markets Stock Index Fund | |
| |
| |
| |
| Statement of Operations | |
| |
| |
| | Year Ended |
| | October 31, 2009 |
| | ($000) |
| Investment Income | |
| Income | |
| Dividends1 | 413,734 |
| Interest2 | 286 |
| Security Lending | 16,434 |
| Total Income | 430,454 |
| Expenses | |
| The Vanguard Group—Note B | |
| Investment Advisory Services | 512 |
| Management and Administrative—Investor Shares | 15,615 |
| Management and Administrative—Admiral Shares | 3,517 |
| Management and Administrative—Signal Shares | 605 |
| Management and Administrative—Institutional Shares | 1,588 |
| Management and Administrative—ETF Shares | 14,039 |
| Marketing and Distribution—Investor Shares | 1,752 |
| Marketing and Distribution—Admiral Shares | 410 |
| Marketing and Distribution—Signal Shares | 95 |
| Marketing and Distribution—Institutional Shares | 328 |
| Marketing and Distribution—ETF Shares | 2,115 |
| Custodian Fees | 9,955 |
| Auditing Fees | 40 |
| Shareholders’ Reports and Proxies—Investor Shares | 455 |
| Shareholders’ Reports and Proxies—Admiral Shares | 27 |
| Shareholders’ Reports and Proxies—Signal Shares | 3 |
| Shareholders’ Reports and Proxies—Institutional Shares | — |
| Shareholders’ Reports and Proxies—ETF Shares | 867 |
| Trustees’ Fees and Expenses | 28 |
| Total Expenses | 51,951 |
| Net Investment Income | 378,503 |
| Realized Net Gain (Loss) | |
| Investment Securities Sold | (1,269,893) |
| Futures Contracts | 25,109 |
| Foreign Currencies | (9,547) |
| Realized Net Gain (Loss) | (1,254,331) |
| Change in Unrealized Appreciation (Depreciation) | |
| Investment Securities | 8,594,820 |
| Futures Contracts | (4,676) |
| Swap Contracts | (4,604) |
| Foreign Currencies | 2,448 |
| Change in Unrealized Appreciation (Depreciation) | 8,587,988 |
| Net Increase (Decrease) in Net Assets Resulting from Operations | 7,712,160 |
1 Dividends are net of foreign withholding taxes of $48,944,000.
2 Interest income from an affiliated company of the fund was $229,000.
See accompanying Notes, which are an integral part of the Financial Statements.
80
| | |
| Emerging Markets Stock Index Fund | | |
| |
| |
| Statement of Changes in Net Assets | | |
| |
| | Year Ended October 31, |
| | 2009 | 2008 |
| | ($000) | ($000) |
| Increase (Decrease) in Net Assets | | |
| Operations | | |
| Net Investment Income | 378,503 | 649,638 |
| Realized Net Gain (Loss) | (1,254,331) | 163,245 |
| Change in Unrealized Appreciation (Depreciation) | 8,587,988 | (16,915,849) |
| Net Increase (Decrease) in Net Assets Resulting from Operations | 7,712,160 | (16,102,966) |
| Distributions | | |
| Net Investment Income | | |
| Investor Shares | (231,087) | (229,894) |
| Admiral Shares | (69,431) | (66,571) |
| Signal Shares | (12,807) | (8,343) |
| Institutional Shares | (45,949) | (24,830) |
| ETF Shares | (251,740) | (111,980) |
| Realized Capital Gain | | |
| Investor Shares | — | — |
| Admiral Shares | — | — |
| Signal Shares | — | — |
| Institutional Shares | — | — |
| ETF Shares | — | — |
| Total Distributions | (611,014) | (441,618) |
| Capital Share Transactions | | |
| Investor Shares | (309,416) | (954,191) |
| Admiral Shares | 333,668 | 218,311 |
| Signal Shares | 42,629 | 207,807 |
| Institutional Shares | 304,253 | 471,828 |
| ETF Shares | 7,449,732 | 3,320,651 |
| Net Increase (Decrease) from Capital Share Transactions | 7,820,866 | 3,264,406 |
| Total Increase (Decrease) | 14,922,012 | (13,280,178) |
| Net Assets | | |
| Beginning of Period | 12,506,213 | 25,786,391 |
| End of Period1 | 27,428,225 | 12,506,213 |
| 1 Net Assets—End of Period includes undistributed net investment income of $301,998,000 and $540,785,000. | |
See accompanying Notes, which are an integral part of the Financial Statements.
81
| | | | | |
| Emerging Markets Stock Index Fund | | | | | |
| |
| |
| Financial Highlights | | | | | |
| |
| |
| Investor Shares | | | | | |
| |
| For a Share Outstanding | | | Year Ended October 31, |
| Throughout Each Period | 2009 | 2008 | 2007 | 2006 | 2005 |
| Net Asset Value, Beginning of Period | $15.66 | $36.78 | $22.05 | $16.91 | $12.88 |
| Investment Operations | | | | | |
| Net Investment Income | .3981 | .780 | .6041 | .396 | .307 |
| Net Realized and Unrealized Gain (Loss) | | | | | |
| on Investments2 | 8.542 | (21.313) | 14.522 | 5.059 | 3.982 |
| Total from Investment Operations | 8.940 | (20.533) | 15.126 | 5.455 | 4.289 |
| Distributions | | | | | |
| Dividends from Net Investment Income | (.700) | (.587) | (.396) | (.315) | (.259) |
| Distributions from Realized Capital Gains | — | — | — | — | — |
| Total Distributions | (.700) | (.587) | (.396) | (.315) | (.259) |
| Net Asset Value, End of Period | $23.90 | $15.66 | $36.78 | $22.05 | $16.91 |
| |
| Total Return3 | 60.07% | –56.66% | 69.59% | 32.55% | 33.66% |
| |
| Ratios/Supplemental Data | | | | | |
| Net Assets, End of Period (Millions) | $7,024 | $5,345 | $14,150 | $7,202 | $4,937 |
| Ratio of Total Expenses to | | | | | |
| Average Net Assets | 0.40% | 0.32% | 0.37% | 0.42% | 0.45% |
| Ratio of Net Investment Income to | | | | | |
| Average Net Assets | 2.16% | 2.81% | 2.24% | 2.20% | 2.48% |
| Portfolio Turnover Rate4 | 12% | 20% | 9% | 26% | 15% |
1 Calculated based on average shares outstanding.
2 Includes increases from redemption fees of $.01, $.02, $.01, $.01, and $.00.
3 Total returns do not reflect the 0.50% (0.25% prior to October 30, 2009, 0.50% prior to June 26, 2008) transaction fee on purchases; the 2% fee assessed on redemptions until March 23, 2005, and held for less than two months; the 0.25% (0.50% prior to June 26, 2008) fee on all other redemptions; or the account service fee that may be applicable to certain accounts with balances below $10,000.
4 Excludes the value of portfolio securities received or delivered as a result of in-kind purchases or redemptions of the fund’s capital shares, including ETF Creation Units.
See accompanying Notes, which are an integral part of the Financial Statements.
82
| | | | |
| Emerging Markets Stock Index Fund | | | | |
| |
| |
| Financial Highlights | | | | |
| |
| |
| Admiral Shares | | | | |
| | | | | June 23, |
| | | | | 20061 to |
| | Year Ended October 31, | Oct. 31, |
| For a Share Outstanding Throughout Each Period | 2009 | 2008 | 2007 | 2006 |
| Net Asset Value, Beginning of Period | $20.63 | $48.47 | $29.03 | $25.00 |
| Investment Operations | | | | |
| Net Investment Income | .5672 | 1.079 | .8532 | .222 |
| Net Realized and Unrealized Gain (Loss) on Investments3 | 11.222 | (28.099) | 19.121 | 3.808 |
| Total from Investment Operations | 11.789 | (27.020) | 19.974 | 4.030 |
| Distributions | | | | |
| Dividends from Net Investment Income | (.969) | (.820) | (.534) | — |
| Distributions from Realized Capital Gains | — | — | — | — |
| Total Distributions | (.969) | (.820) | (.534) | — |
| Net Asset Value, End of Period | $31.45 | $20.63 | $48.47 | $29.03 |
| |
| Total Return4 | 60.29% | –56.63% | 69.82% | 16.12% |
| |
| Ratios/Supplemental Data | | | | |
| Net Assets, End of Period (Millions) | $2,674 | $1,508 | $3,514 | $1,491 |
| Ratio of Total Expenses to Average Net Assets | 0.27% | 0.20% | 0.25% | 0.30%5 |
| Ratio of Net Investment Income to Average Net Assets | 2.29% | 2.93% | 2.36% | 2.32%5 |
| Portfolio Turnover Rate6 | 12% | 20% | 9% | 26% |
1 Inception.
2 Calculated based on average shares outstanding.
3 Includes increases from redemption fees of $.01, $.03, $.01, and $.01.
4 Total returns do not reflect the 0.50% (0.25% prior to October 30, 2009, 0.50% prior to June 26, 2008) transaction fee on purchases and the 0.25% (0.50% prior to June 26, 2008) transaction fee on redemptions.
5 Annualized.
6 Excludes the value of portfolio securities received or delivered as a result of in-kind purchases or redemptions of the fund’s capital shares, including ETF Creation Units.
See accompanying Notes, which are an integral part of the Financial Statements.
83
| | | |
| Emerging Markets Stock Index Fund | | | |
| |
| |
| Financial Highlights | | | |
| |
| |
| Signal Shares | | | |
| | | | Jan. 19, |
| | Year Ended | 20071 to |
| | October 31, | Oct. 31, |
| For a Share Outstanding Throughout Each Period | 2009 | 2008 | 2007 |
| Net Asset Value, Beginning of Period | $19.85 | $46.61 | $30.38 |
| Investment Operations | | | |
| Net Investment Income | .5532 | 1.029 | .5802 |
| Net Realized and Unrealized Gain (Loss) on Investments3 | 10.795 | (27.029) | 15.650 |
| Total from Investment Operations | 11.348 | (26.000) | 16.230 |
| Distributions | | | |
| Dividends from Net Investment Income | (.938) | (.760) | — |
| Distributions from Realized Capital Gains | — | — | — |
| Total Distributions | (.938) | (.760) | — |
| Net Asset Value, End of Period | $30.26 | $19.85 | $46.61 |
| |
| Total Return4 | 60.33% | –56.64% | 53.42% |
| |
| Ratios/Supplemental Data | | | |
| Net Assets, End of Period (Millions) | $463 | $266 | $385 |
| Ratio of Total Expenses to Average Net Assets | 0.27% | 0.20% | 0.25%5 |
| Ratio of Net Investment Income to Average Net Assets | 2.29% | 2.93% | 2.36%5 |
| Portfolio Turnover Rate6 | 12% | 20% | 9% |
1 Inception.
2 Calculated based on average shares outstanding.
3 Includes increases from redemption fees of $.01, $.02, and $.00.
4 Total returns do not reflect the 0.50% (0.25% prior to October 30, 2009, 0.50% prior to June 26, 2008) transaction fee on purchases and the 0.25% (0.50% prior to June 26, 2008) transaction fee on redemptions.
5 Annualized.
6 Excludes the value of portfolio securities received or delivered as a result of in-kind purchases or redemptions of the fund’s capital shares, including ETF Creation Units.
See accompanying Notes, which are an integral part of the Financial Statements.
84
| | | | | |
| Emerging Markets Stock Index Fund | | | | | |
| |
| |
| Financial Highlights | | | | | |
| |
| |
| Institutional Shares | | | | | |
| |
| For a Share Outstanding | | | Year Ended October 31, |
| Throughout Each Period | 2009 | 2008 | 2007 | 2006 | 2005 |
| Net Asset Value, Beginning of Period | $15.71 | $36.90 | $22.11 | $16.95 | $12.90 |
| Investment Operations | | | | | |
| Net Investment Income | .4371 | .835 | .6861 | .443 | .344 |
| Net Realized and Unrealized Gain (Loss) | | | | | |
| on Investments2 | 8.547 | (21.393) | 14.533 | 5.059 | 3.982 |
| Total from Investment Operations | 8.984 | (20.558) | 15.219 | 5.502 | 4.326 |
| Distributions | | | | | |
| Dividends from Net Investment Income | (.754) | (.632) | (.429) | (.342) | (.276) |
| Distributions from Realized Capital Gains | — | — | — | — | — |
| Total Distributions | (.754) | (.632) | (.429) | (.342) | (.276) |
| Net Asset Value, End of Period | $23.94 | $15.71 | $36.90 | $22.11 | $16.95 |
| |
| Total Return3 | 60.41% | –56.61% | 69.90% | 32.78% | 33.92% |
| |
| Ratios/Supplemental Data | | | | | |
| Net Assets, End of Period (Millions) | $1,731 | $887 | $1,463 | $559 | $468 |
| Ratio of Total Expenses to | | | | | |
| Average Net Assets | 0.23% | 0.15% | 0.20% | 0.25% | 0.25% |
| Ratio of Net Investment Income to | | | | | |
| Average Net Assets | 2.33% | 2.98% | 2.41% | 2.37% | 2.64% |
| Portfolio Turnover Rate4 | 12% | 20% | 9% | 26% | 15% |
1 Calculated based on average shares outstanding.
2 Includes increases from redemption fees of $.01, $.01, $.01, $.01, and $.00.
3 Total returns do not reflect the 0.50% (0.25% prior to October 30, 2009, 0.50% prior to June 26, 2008) transaction fee on purchases; the 2% fee assessed on redemptions until March 23, 2005, and held for less than two months; or the 0.25% (0.50% prior to June 26, 2008) fee on all other redemptions.
4 Excludes the value of portfolio securities received or delivered as a result of in-kind purchases or redemptions of the fund’s capital shares, including ETF Creation Units.
See accompanying Notes, which are an integral part of the Financial Statements.
85
| | | | | |
| Emerging Markets Stock Index Fund | | | | | |
| |
| |
| Financial Highlights | | | | | |
| |
| |
| ETF Shares | | | | | |
| | | | | | March 4, |
| | | | | | 20051 to |
| | | Year Ended October 31, | Oct. 31, |
| For a Share Outstanding Throughout Each Period | 2009 | 20082 | 20072 | 20062 | 20052 |
| Net Asset Value, Beginning of Period | $24.83 | $58.31 | $34.96 | $26.81 | $25.28 |
| Investment Operations | | | | | |
| Net Investment Income | .6683 | 1.303 | 1.0653 | .667 | .435 |
| Net Realized and Unrealized Gain (Loss) | | | | | |
| on Investments4 | 13.520 | (33.798) | 22.955 | 8.022 | 1.095 |
| Total from Investment Operations | 14.188 | (32.495) | 24.020 | 8.689 | 1.530 |
| Distributions | | | | | |
| Dividends from Net Investment Income | (1.178) | (.985) | (.670) | (.539) | — |
| Distributions from Realized Capital Gains | — | — | — | — | — |
| Total Distributions | (1.178) | (.985) | (.670) | (.539) | — |
| Net Asset Value, End of Period | $37.84 | $24.83 | $58.31 | $34.96 | $26.81 |
| |
| Total Return | 60.28% | –56.62% | 69.78% | 32.74% | 6.05% |
| |
| Ratios/Supplemental Data | | | | | |
| Net Assets, End of Period (Millions) | $15,537 | $4,500 | $6,275 | $1,582 | $375 |
| Ratio of Total Expenses to | | | | | |
| Average Net Assets | 0.27% | 0.20% | 0.25% | 0.30% | 0.30%5 |
| Ratio of Net Investment Income to | | | | | |
| Average Net Assets | 2.29% | 2.93% | 2.36% | 2.32% | 2.59%5 |
| Portfolio Turnover Rate6 | 12% | 20% | 9% | 26% | 15% |
1 Inception.
2 Adjusted to reflect a 2-for-1 share split as of the close business on June 13, 2008.
3 Calculated based on average shares outstanding.
4 Includes increases from redemption fees of $.01, $.02, $.03, $.03 and $.00.
5 Annualized.
6 Excludes the value of portfolio securities received or delivered as a result of in-kind purchases or redemptions of the fund’s capital shares, including ETF Creation Units.
See accompanying Notes, which are an integral part of the Financial Statements.
86
Emerging Markets Stock Index Fund
Notes to Financial Statements
Vanguard Emerging Markets Stock Index Fund is registered under the Investment Company Act of 1940 as an open-end investment company, or mutual fund. The fund invests in securities of foreign issuers, which may subject it to investment risks not normally associated with investing in securities of U.S. corporations. The fund offers five classes of shares: Investor Shares, Admiral Shares, Signal Shares, Institutional Shares, and ETF Shares. Investor Shares are available to any investor who meets the fund’s minimum purchase requirements. Admiral Shares are designed for investors who meet certain administrative, service, tenure, and account-size criteria. Signal Shares are designed for institutional investors who meet certain administrative, service, and account-size criteria. Institutional Shares are designed for investors who meet certain administrative and service criteria and invest a minimum of $5 million. ETF Shares are listed for trading on the NYSE Arca, Inc.; they can be purchased and sold through a broker.
A. The following significant accounting policies conform to generally accepted accounting principles for U.S. mutual funds. The fund consistently follows such policies in preparing its financial statements.
1. Security Valuation: Securities are valued as of the close of trading on the New York Stock Exchange (generally 4 p.m., Eastern time) on the valuation date. Equity securities are valued at the latest quoted sales prices or official closing prices taken from the primary market in which each security trades; such securities not traded on the valuation date are valued at the mean of the latest quoted bid and asked prices. Securities for which market quotations are not readily available, or whose values have been affected by events occurring before the fund’s pricing time but after the close of the securities’ primary markets, are valued at their fair values calculated according to procedures adopted by the board of trustees. These procedures include obtaining quotations from an independent pricing service, monitoring news to identify significant market- or security-specific events, and evaluating changes in the va lues of foreign market proxies (for example, ADRs, futures contracts, or exchange-traded funds), between the time the foreign markets close and the fund’s pricing time. When fair-value pricing is employed, the prices of securities used by a fund to calculate its net asset value may differ from quoted or published prices for the same securities. Investments in Vanguard Market Liquidity Fund are valued at that fund’s net asset value. Temporary cash investments acquired over 60 days to maturity are valued using the latest bid prices or using valuations based on a matrix system (which considers such factors as security prices, yields, maturities, and ratings), both as furnished by independent pricing services. Other temporary cash investments are valued at amortized cost, which approximates market value.
2. Foreign Currency: Securities and other assets and liabilities denominated in foreign currencies are translated into U.S. dollars using exchange rates obtained from an independent third party as of the fund’s pricing time on the valuation date. Realized gains (losses) and unrealized appreciation (depreciation) on investment securities include the effects of changes in exchange rates since the securities were purchased, combined with the effects of changes in security prices. Fluctuations in the value of other assets and liabilities resulting from changes in exchange rates are recorded as unrealized foreign currency gains (losses) until the assets or liabilities are settled in cash, at which time they are recorded as realized foreign currency gains (losses).
3. Futures Contracts: The fund uses index futures contracts to a limited extent, with the objectives of maintaining full exposure to the stock market, enhancing returns, maintaining liquidity, and minimizing transaction costs. The fund may purchase futures contracts to immediately invest incoming cash in the market, or sell futures in response to cash outflows, thereby simulating a fully invested position in the underlying index while maintaining a cash balance for liquidity. The fund may seek to enhance returns by using futures contracts instead of the underlying securities when futures are believed to be priced
87
Emerging Markets Stock Index Fund
more attractively than the underlying securities. The primary risks associated with the use of futures contracts are imperfect correlation between changes in market values of stocks held by the fund and the prices of futures contracts, and the possibility of an illiquid market.
Futures contracts are valued at their quoted daily settlement prices. The aggregate principal amounts of the contracts are not recorded in the Statement of Net Assets. Fluctuations in the value of the contracts are recorded in the Statement of Net Assets as an asset (liability) and in the Statement of Operations as unrealized appreciation (depreciation) until the contracts are closed, when they are recorded as realized futures gains (losses).
4. Swap Contracts: The fund has entered into an equity swap contract to earn the total return on a selected stock in the fund’s target index. Investing through the swap provides a return advantage over buying the individual stock. Under the terms of the swap, the fund receives the total return (either receiving the increase or paying the decrease) on the reference stock, applied to a notional amount that is the value of a designated number of shares of the stock at the beginning of the swap. The counterparty pays the fund a fixed rate less a specified interest rate spread, that is based on short-term interest rates, applied to the notional amount. At the same time, the fund invests an amount equal to the notional amount of the swap in high-quality temporary cash investments.
The notional amounts of swap contracts are not recorded in the Statement of Net Assets. Swaps are valued daily and the change in value is recorded as unrealized appreciation (depreciation) until termination of the swap, at which time realized gain (loss) is recorded. The primary risks associated with the swaps are that a counterparty will default on its obligation to pay net amounts due to the fund, or that the fund will incur fees in the event it terminates a swap prior to the scheduled termination date. The fund’s maximum risk of loss from counterparty credit risk is the amount of unrealized appreciation on the swap contract. This risk is mitigated by entering into swaps only with highly rated counterparties, by a master netting arrangement between the fund and the counterparty, and by the posting of collateral by the counterparty. The swap contracts contain provisions whereby a counterparty may terminate open contr acts if the fund’s net assets decline below a certain level, triggering a payment by the fund if the fund is in a net liability position at the time of the termination. The payment amount would be reduced by any collateral the fund has posted. Any securities posted as collateral for open contracts are noted in the Statement of Net Assets.
5. Federal Income Taxes: The fund intends to continue to qualify as a regulated investment company and distribute all of its taxable income. Management has analyzed the fund’s tax positions taken for all open federal income tax years (October 31, 2006–2009), and has concluded that no provision for federal income tax is required in the fund’s financial statements.
6. Distributions: Distributions to shareholders are recorded on the ex-dividend date.
7. Security Lending: The fund may lend its securities to qualified institutional borrowers to earn additional income. Security loans are required to be secured at all times by collateral at least equal to the market value of securities loaned. The fund invests cash collateral received in Vanguard Market Liquidity Fund, and records a liability for the return of the collateral, during the period the securities are on loan. Security lending income represents the income earned on investing cash collateral, less expenses associated with the loan.
8. Other: Dividend income is recorded on the ex-dividend date. Interest income includes income distributions received from Vanguard Market Liquidity Fund and is accrued daily. Security transactions are accounted for on the date securities are bought or sold. Costs used to determine realized gains (losses) on the sale of investment securities are those of the specific securities sold. Fees assessed on capital share transactions are credited to paid-in capital.
88
Emerging Markets Stock Index Fund
Each class of shares has equal rights as to assets and earnings, except that each class separately bears certain class-specific expenses related to maintenance of shareholder accounts (included in Management and Administrative expenses), shareholder reporting, and proxies. Marketing and distribution expenses are allocated to each class of shares based on a method approved by the board of trustees. Income, other non-class-specific expenses, and gains and losses on investments are allocated to each class of shares based on its relative net assets.
B. The Vanguard Group furnishes at cost investment advisory, corporate management, administrative, marketing, and distribution services. The costs of such services are allocated to the fund under methods approved by the board of trustees. The fund has committed to provide up to 0.40% of its net assets in capital contributions to Vanguard. At October 31, 2009, the fund had contributed capital of $5,402,000 to Vanguard (included in Other Assets), representing 0.02% of the fund’s net assets and 2.16% of Vanguard’s capitalization. The fund’s trustees and officers are also directors and officers of Vanguard.
C. Various inputs may be used to determine the value of the fund’s investments. These inputs are summarized in three broad levels for financial statement purposes. The inputs or methodologies used to value securities are not necessarily an indication of the risk associated with investing in those securities.
Level 1—Quoted prices in active markets for identical securities.
Level 2—Other significant observable inputs (including quoted prices for similar securities, interest rates, prepayment speeds, credit risk, etc.).
Level 3—Significant unobservable inputs (including the fund’s own assumptions used to determine the fair value of investments).
The following table summarizes the fund’s investments as of October 31, 2009, based on the inputs used to value them:
| | | |
| | Level 1 | Level 2 | Level 3 |
| Investments | ($000) | ($000) | ($000) |
| Common Stocks—North and South America | 6,303,259 | — | — |
| Common Stocks—Other | 1,071,341 | 19,982,102 | — |
| Temporary Cash Investments | 668,769 | 10,994 | — |
| Futures Contracts—Assets1 | 135 | — | — |
| Swap Contracts—Liabilities | — | (4,604) | — |
| Total | 8,043,504 | 19,988,492 | — |
| 1 Represents variation margin on the last day of the reporting period. | | | |
D. At October 31, 2009, the aggregate settlement value of open futures contracts and the related unrealized appreciation (depreciation) were:
| | | | |
| | | | | ($000) |
| | | Number of | Aggregate | Unrealized |
| | | Long (Short) | Settlement | Appreciation |
| Futures Contracts | Expiration | Contracts | Value | (Depreciation) |
| MSCI Taiwan Index | November 2009 | 2,700 | 71,685 | (2,876) |
89
| | | | | |
| Emerging Markets Stock Index Fund | | | | |
| |
| |
| |
| |
| Total Return Swaps | | | | | |
| | | | | Floating | Unrealized |
| | | | Notional | Interest Rate | Appreciation |
| | Termination | | Amount | Received | (Depreciation) |
| Reference Entity | Date | Counterparty1 | ($000) | (Paid)2 | ($000) |
| Cyrela Brazil Realty SA | Jan. 21, 2010 | MSCS | 21,141 | 4.89% | (4,604) |
| 1 MSCS—Morgan Stanley Capital Services. | | | | |
| 2 Based on one-month Fed Funds rate as of October 31, 2009. | | | |
The fund had net unrealized foreign currency gains of $1,039,000 resulting from the translation of other assets and liabilities at October 31, 2009.
E. Distributions are determined on a tax basis and may differ from net investment income and realized capital gains for financial reporting purposes. Differences may be permanent or temporary. Permanent differences are reclassified among capital accounts in the financial statements to reflect their tax character. Temporary differences arise when certain items of income, expense, gain, or loss are recognized in different periods for financial statement and tax purposes; these differences will reverse at some time in the future. Differences in classification may also result from the treatment of short-term gains as ordinary income for tax purposes.
During the year ended October 31, 2009, the fund realized net foreign currency losses of $9,547,000, which decreased distributable net income for tax purposes; accordingly, such losses have been reclassified from accumulated net realized losses to undistributed net investment income.
Certain of the fund’s investments are in securities considered to be “passive foreign investment companies,” for which any unrealized appreciation and/or realized gains are required to be included in distributable net income for tax purposes. Unrealized appreciation of $3,107,000 on the fund’s passive foreign investment company holdings at October 31, 2008, has been distributed and is reflected in the balance of undistributed net investment income. During the year ended October 31, 2009, the fund realized gains on the sale of passive foreign investment companies of $3,271,000, which have been included in current and prior periods’ taxable income; accordingly, such gains have been reclassified from accumulated net realized losses to undistributed net investment income. Unrealized appreciation on the fund’s passive foreign investment company holdings at October 31, 2009, was $17,309,000.
During the year ended October 31, 2009, the fund realized $179,907,000 of net capital gains resulting from in-kind redemptions—in which shareholders exchanged fund shares for securities held by the fund rather than for cash. Because such gains are not taxable to the fund, and are not distributed to shareholders, they have been reclassified from accumulated net realized losses to paid-in capital.
For tax purposes, at October 31, 2009, the fund had $345,678,000 of ordinary income available for distribution. The fund had available capital loss carryforwards totaling $2,235,121,000 to offset future net capital gains of $15,143,000 through October 31, 2012, $167,331,000 through October 31, 2014, $460,853,000 through October 31, 2016, and $1,591,794,000 through October 31, 2017.
At October 31, 2009, the cost of investment securities for tax purposes was $24,152,956,000. Net unrealized appreciation of investment securities for tax purposes was $3,883,509,000, consisting of unrealized gains of $5,735,715,000 on securities that had risen in value since their purchase and $1,852,206,000 in unrealized losses on securities that had fallen in value since their purchase.
90
Emerging Markets Stock Index Fund
F. During the year ended October 31, 2009, the fund purchased $10,332,952,000 of investment securities and sold $2,765,237,000 of investment securities, other than temporary cash investments.
| | | | |
| G. Capital share transactions for each class of shares were: | | | |
| | | | Year Ended October 31, |
| | | 2009 | | 2008 |
| | Amount | Shares | Amount | Shares |
| | ($000) | (000) | ($000) | (000) |
| Investor Shares | | | | |
| Issued | 1,853,897 | 96,420 | 3,872,977 | 135,857 |
| Issued in Lieu of Cash Distributions | 223,214 | 15,577 | 222,748 | 6,777 |
| Redeemed1 | (2,386,527) | (159,509) | (5,049,916) | (185,897) |
| Net Increase (Decrease)—Investor Shares | (309,416) | (47,512) | (954,191) | (43,263) |
| Admiral Shares | | | | |
| Issued | 639,959 | 25,023 | 997,071 | 24,577 |
| Issued in Lieu of Cash Distributions | 60,382 | 3,205 | 58,820 | 1,359 |
| Redeemed1 | (366,673) | (16,316) | (837,580) | (25,354) |
| Net Increase (Decrease)—Admiral Shares | 333,668 | 11,912 | 218,311 | 582 |
| Signal Shares | | | | |
| Issued | 154,975 | 6,912 | 301,803 | 8,027 |
| Issued in Lieu of Cash Distributions | 11,476 | 633 | 7,172 | 172 |
| Redeemed1 | (123,822) | (5,646) | (101,168) | (3,051) |
| Net Increase (Decrease)—Signal Shares | 42,629 | 1,899 | 207,807 | 5,148 |
| Institutional Shares | | | | |
| Issued | 554,729 | 28,701 | 650,503 | 24,200 |
| Issued in Lieu of Cash Distributions | 28,341 | 1,978 | 16,639 | 505 |
| Redeemed1 | (278,817) | (14,848) | (195,314) | (7,891) |
| Net Increase (Decrease)—Institutional Shares | 304,253 | 15,831 | 471,828 | 16,814 |
| ETF Shares | | | | |
| Issued | 7,505,813 | 231,324 | 3,410,974 | 76,0252 |
| Issued in Lieu of Cash Distributions | — | — | — | — |
| Redeemed1 | (56,081) | (2,000) | (90,323) | (2,400)2 |
| Net Increase (Decrease)—ETF Shares | 7,449,732 | 229,324 | 3,320,651 | 73,6252 |
| 1 Net of redemption fees for fiscal 2009 and 2008 of $5,687,000 and $14,015,000, respectively (fund totals). | | |
| 2 Shares adjusted to reflect a 2-for-1 split as of the close of business on June 13, 2008. | | | |
H. In preparing the financial statements as of October 31, 2009, management considered the impact of subsequent events occurring through December 15, 2009, for potential recognition or disclosure in these financial statements.
91
Report of Independent Registered Public Accounting Firm
To the Trustees of Vanguard International Equity Index Funds and the Shareholders of Vanguard European Stock Index Fund, Vanguard Pacific Stock Index Fund and Vanguard Emerging Markets Stock Index Fund:
In our opinion, the accompanying statements of net assets and the related statements of operations and of changes in net assets and the financial highlights present fairly, in all material respects, the financial position of Vanguard European Stock Index Fund, Vanguard Pacific Stock Index Fund and Vanguard Emerging Markets Stock Index Fund (separate portfolios of Vanguard International Equity Index Funds, hereafter referred to as the “Funds”) at October 31, 2009, the results of each of their operations for the year then ended, the changes in each of their net assets for each of the two years in the period then ended and the financial highlights for each of the periods indicated, in conformity with accounting principles generally accepted in the United States of America. These financial statements and financial highlights (hereafter referred to as “financial statements”) are the responsibility of the Fun ds’ management; our responsibility is to express an opinion on these financial statements based on our audits. We conducted our audits of these financial statements in accordance with the standards of the Public Company Accounting Oversight Board (United States). Those standards require that we plan and perform the audit to obtain reasonable assurance about whether the financial statements are free of material misstatement. An audit includes examining, on a test basis, evidence supporting the amounts and disclosures in the financial statements, assessing the accounting principles used and significant estimates made by management, and evaluating the overall financial statement presentation. We believe that our audits, which included confirmation of securities at October 31, 2009 by correspondence with the custodians and brokers and by agreement to the underlying ownership records of the Vanguard funds, provide a reasonable basis for our opinion.
PricewaterhouseCoopers LLP
Philadelphia, Pennsylvania
December 15, 2009
92
|
| Special 2009 tax information (unaudited) for Vanguard European Stock Index Fund |
This information for the fiscal year ended October 31, 2009, is included pursuant to provisions of the Internal Revenue Code.
The fund distributed $902,560,000 of qualified dividend income to shareholders during the fiscal year.
The fund will pass through foreign source income of $521,510,000 and foreign taxes paid of $39,234,000 to shareholders. The pass-through of foreign taxes paid will affect only shareholders on the fund’s dividend record date in December 2009. Shareholders will receive more detailed information along with their Form 1099-DIV in January 2010.
|
| Special 2009 tax information (unaudited) for Vanguard Pacific Stock Index Fund |
This information for the fiscal year ended October 31, 2009, is included pursuant to provisions of the Internal Revenue Code.
The fund distributed $161,789,000 of qualified dividend income to shareholders during the fiscal year.
The fund will pass through foreign source income of $184,952,000 and foreign taxes paid of $9,313,000 to shareholders. The pass-through of foreign taxes paid will affect only shareholders on the fund’s dividend record date in December 2009. Shareholders will receive more detailed information along with their Form 1099-DIV in January 2010.
|
| Special 2009 tax information (unaudited) for Vanguard Emerging Markets Stock Index Fund |
This information for the fiscal year ended October 31, 2009, is included pursuant to provisions of the Internal Revenue Code.
The fund distributed $393,065,000 of qualified dividend income to shareholders during the fiscal year.
The fund will pass through foreign source income of $501,215,000 and foreign taxes paid of $49,564,000 to shareholders. The pass-through of foreign taxes paid will affect only shareholders on the fund’s dividend record date in December 2009. Shareholders will receive more detailed information along with their Form 1099-DIV in January 2010.
93
Your Fund’s After-Tax Returns
This table presents returns for your fund both before and after taxes. The after-tax returns are shown in two ways: (1) assuming that an investor owned the fund during the entire period and paid taxes on the fund’s distributions, and (2) assuming that an investor paid taxes on the fund’s distributions and sold all shares at the end of each period.
Calculations are based on the highest individual federal income tax and capital gains tax rates in effect at the times of the distributions and the hypothetical sales. State and local taxes were not considered. After-tax returns reflect any qualified dividend income, using actual prior-year figures and estimates for 2009. (In the example, returns after the sale of fund shares may be higher than those assuming no sale. This occurs when the sale would have produced a capital loss. The calculation assumes that the investor received a tax deduction for the loss.)
The table shows returns for Investor Shares only; returns for other share classes will differ. Please note that your actual after-tax returns will depend on your tax situation and may differ from those shown. Also note that if you own the fund in a tax-deferred account, such as an individual retirement account or a 401(k) plan, this information does not apply to you. Such accounts are not subject to current taxes.
Finally, keep in mind that a fund’s performance—whether before or after taxes—does not guarantee future results.
| | | |
| Average Annual Total Returns: International Stock Index Funds | | | |
| Periods Ended October 31, 2009 | | | |
| | One | Five | Ten |
| | Year | Years | Years |
| European Stock Index Fund Investor Shares1 | | | |
| Returns Before Taxes | 26.25% | 5.31% | 2.83% |
| Returns After Taxes on Distributions | 24.84 | 4.72 | 2.21 |
| Returns After Taxes on Distributions and Sale of Fund Shares | 18.16 | 4.47 | 2.22 |
| |
| Pacific Stock Index Fund Investor Shares1 | | | |
| Returns Before Taxes | 23.23% | 4.12% | 0.08% |
| Returns After Taxes on Distributions | 23.05 | 3.76 | –0.24 |
| Returns After Taxes on Distributions and Sale of Fund Shares | 15.54 | 3.48 | –0.04 |
| |
| Emerging Markets Stock Index Fund Investor Shares2 | | | |
| Returns Before Taxes | 58.90% | 15.66% | 11.06% |
| Returns After Taxes on Distributions | 57.78 | 15.27 | 10.52 |
| Returns After Taxes on Distributions and Sale of Fund Shares | 38.88 | 13.66 | 9.57 |
1 Total returns do not reflect the 0.50% transaction fee on purchases through March 31, 2000; the 2% fee assessed on redemptions of shares purchased on or after June 27, 2003, and held for less than two months; or the account service fee that may be applicable to certain accounts with balances below $10,000.
2 Performance figures are adjusted for the 0.50% (0.25% prior to October 30, 2009, 0.50% prior to June 26, 2008) transaction fee on purchases and 0.25% (0.50% prior to June 26, 2008) transaction fee on redemptions. Total returns do not reflect the 2% fee assessed until March 23, 2005, on redemptions of shares purchased on or after June 27, 2003, and held for less than two months, or the account service fee that may be applicable to certain accounts with balances below $10,000.
94
About Your Fund’s Expenses
As a shareholder of the fund, you incur ongoing costs, which include costs for portfolio management, administrative services, and shareholder reports (like this one), among others. Operating expenses, which are deducted from a fund’s gross income, directly reduce the investment return of the fund.
A fund’s expenses are expressed as a percentage of its average net assets. This figure is known as the expense ratio. The following examples are intended to help you understand the ongoing costs (in dollars) of investing in your fund and to compare these costs with those of other mutual funds. The examples are based on an investment of $1,000 made at the beginning of the period shown and held for the entire period.
The accompanying tables illustrate your fund’s costs in two ways:
• Based on actual fund return. This section helps you to estimate the actual expenses that you paid over the period. The “Ending Account Value” shown is derived from the fund’s actual return, and the third column shows the dollar amount that would have been paid by an investor who started with $1,000 in the fund. You may use the information here, together with the amount you invested, to estimate the expenses that you paid over the period.
To do so, simply divide your account value by $1,000 (for example, an $8,600 account value divided by $1,000 = 8.6), then multiply the result by the number given for your fund under the heading “Expenses Paid During Period.”
• Based on hypothetical 5% yearly return. This section is intended to help you compare your fund’s costs with those of other mutual funds. It assumes that the fund had a yearly return of 5% before expenses, but that the expense ratio is unchanged. In this case—because the return used is not the fund’s actual return—the results do not apply to your investment. The example is useful in making comparisons because the Securities and Exchange Commission requires all mutual funds to calculate expenses based on a 5% return. You can assess your fund’s costs by comparing this hypothetical example with the hypothetical examples that appear in shareholder reports of other funds.
Note that the expenses shown in the table are meant to highlight and help you compare ongoing costs only and do not reflect transaction costs incurred by the fund for buying and selling securities. Further, the expenses do not include the transaction fees or the account service fee described in the prospectus. If such fees were applied to your account, your costs would be higher. Your fund does not carry a “sales load.”
The calculations assume no shares were bought or sold during the period. Your actual costs may have been higher or lower, depending on the amount of your investment and the timing of any purchases or redemptions.
You can find more information about the fund’s expenses, including annual expense ratios, in the Financial Statements section of this report. For additional information on operating expenses and other shareholder costs, please refer to your fund’s current prospectus.
95
| | | |
| Six Months Ended October 31, 2009 | | | |
| | Beginning | Ending | Expenses |
| | Account Value | Account Value | Paid During |
| International Stock Index Fund | 4/30/2009 | 10/31/2009 | Period1 |
| Based on Actual Fund Return | | | |
| European | | | |
| Investor Shares | $1,000.00 | $1,340.79 | $1.48 |
| Admiral Shares | 1,000.00 | 1,341.39 | 0.89 |
| Signal Shares | 1,000.00 | 1,341.35 | 0.89 |
| Institutional Shares | 1,000.00 | 1,342.35 | 0.59 |
| ETF Shares | 1,000.00 | 1,341.74 | 0.89 |
| Pacific | | | |
| Investor Shares | $1,000.00 | $1,241.60 | $1.41 |
| Admiral Shares | 1,000.00 | 1,243.33 | 0.79 |
| Signal Shares | 1,000.00 | 1,243.32 | 0.79 |
| Institutional Shares | 1,000.00 | 1,244.19 | 0.57 |
| ETF Shares | 1,000.00 | 1,243.47 | 0.79 |
| Emerging Markets | | | |
| Investor Shares2 | $1,000.00 | $1,381.50 | $2.40 |
| Admiral Shares2 | 1,000.00 | 1,381.81 | 1.68 |
| Signal Shares2 | 1,000.00 | 1,382.37 | 1.68 |
| Institutional Shares2 | 1,000.00 | 1,382.22 | 1.44 |
| ETF Shares | 1,000.00 | 1,382.03 | 1.68 |
1 The calculations are based on expenses incurred in the most recent six-month period. The funds’ annualized six-month expense ratios for that period are 0.25% for European Stock Index Fund Investor Shares, 0.15% for Admiral Shares, 0.15% for Signal Shares, 0.10% for Institutional Shares, and 0.15% for ETF Shares; 0.25% for Pacific Stock Index Fund Investor Shares, 0.14% for Admiral Shares, 0.14% for Signal Shares, 0.10% for Institutional Shares, and 0.14% for ETF Shares; 0.40% for Emerging Markets Stock Index Fund Investor Shares, 0.28% for Admiral Shares, 0.28% for Signal Shares, 0.24% for Institutional Shares, a nd 0.28% for ETF Shares. The dollar amounts shown as “Expenses Paid” are equal to the annualized expense ratio multiplied by the average account value over the period, multiplied by the number of days in the most recent six-month period, then divided by the number of days in the most recent 12-month period.
2 Calculations do not reflect the fund’s 0.50% (0.25% between June 26, 2008 and October 29, 2009) purchase fee, which is deducted from all purchases (including exchanges from other Vanguard funds) but not from reinvested dividends and capital gains.
96
| | | |
| Six Months Ended October 31, 2009 | | | |
| | Beginning | Ending | Expenses |
| | Account Value | Account Value | Paid During |
| International Stock Index Fund | 4/30/2009 | 10/31/2009 | Period1 |
| Based on Hypothetical 5% Yearly Return | | | |
| European | | | |
| Investor Shares | $1,000.00 | $1,023.95 | $1.28 |
| Admiral Shares | 1,000.00 | 1,024.45 | 0.77 |
| Signal Shares | 1,000.00 | 1,024.45 | 0.77 |
| Institutional Shares | 1,000.00 | 1,024.70 | 0.51 |
| ETF Shares | 1,000.00 | 1,024.45 | 0.77 |
| Pacific | | | |
| Investor Shares | $1,000.00 | $1,023.95 | $1.28 |
| Admiral Shares | 1,000.00 | 1,024.50 | 0.71 |
| Signal Shares | 1,000.00 | 1,024.50 | 0.71 |
| Institutional Shares | 1,000.00 | 1,024.70 | 0.51 |
| ETF Shares | 1,000.00 | 1,024.50 | 0.71 |
| Emerging Markets | | | |
| Investor Shares2 | $1,000.00 | $1,023.19 | $2.04 |
| Admiral Shares2 | 1,000.00 | 1,023.79 | 1.43 |
| Signal Shares2 | 1,000.00 | 1,023.79 | 1.43 |
| Institutional Shares2 | 1,000.00 | 1,024.00 | 1.22 |
| ETF Shares | 1,000.00 | 1,023.79 | 1.43 |
1 The calculations are based on expenses incurred in the most recent six-month period. The funds’ annualized six-month expense ratios for that period are 0.25% for European Stock Index Fund Investor Shares, 0.15% for Admiral Shares, 0.15% for Signal Shares, 0.10% for Institutional Shares, and 0.15% for ETF Shares; 0.25% for Pacific Stock Index Fund nvestor Shares, 0.14% for Admiral Shares, 0.14% for Signal Shares, 0.10% for Institutional Shares, and 0.14% for ETF Shares; 0.40% for Emerging Markets Stock Index Fund Investor Shares, 0.28% for Admiral Shares, 0.28% for Signal Shares, 0.24% for Institutional Shares, an d 0.28% for ETF Shares. The dollar amounts shown as “Expenses Paid” are equal to the annualized expense ratio multiplied by the average account value over the period, multiplied by the number of days in the most recent six-month period, then divided by the number of days in the most recent 12-month period.
2 Calculations do not reflect the fund’s 0.50% (0.25% between June 26, 2008 and October 29, 2009) purchase fee, which is deducted from all purchases (including exchanges from other Vanguard funds) but not from reinvested dividends and capital gains.
97
Glossary
Beta. A measure of the magnitude of a fund’s past share-price fluctuations in relation to the ups and downs of a given market index. The index is assigned a beta of 1.00. Compared with a given index, a fund with a beta of 1.20 typically would have seen its share price rise or fall by 12% when the index rose or fell by 10%. For this report, beta is based on returns over the past 36 months for both the fund and the index. Note that a fund’s beta should be reviewed in conjunction with its R-squared (see definition). The lower the R-squared, the less correlation there is between the fund and the index, and the less reliable beta is as an indicator of volatility.
Equity Exposure. A measure that reflects a fund’s investments in stocks and stock futures. Any holdings in short-term reserves are excluded.
Expense Ratio. The percentage of a fund’s average net assets used to pay its annual administrative and advisory expenses. These expenses directly reduce returns to investors.
Inception Date. The date on which the assets of a fund (or one of its share classes) are first invested in accordance with the fund’s investment objective. For funds with a subscription period, the inception date is the day after that period ends. Investment performance is measured from the inception date.
R-Squared. A measure of how much of a fund’s past returns can be explained by the returns from the market in general, as measured by a given index. If a fund’s total returns were precisely synchronized with an index’s returns, its R-squared would be 1.00. If the fund’s returns bore no relationship to the index’s returns, its R-squared would be 0. For this report, R-squared is based on returns over the past 36 months for both the fund and the index.
Short-Term Reserves. The percentage of a fund invested in highly liquid, short-term securities that can be readily converted to cash.
Turnover Rate. An indication of the fund’s trading activity. Funds with high turnover rates incur higher transaction costs and may be more likely to distribute capital gains (which may be taxable to investors). The turnover rate excludes in-kind transactions, which have minimal impact on costs.
98
This page intentionally left blank.
The People Who Govern Your Fund
The trustees of your mutual fund are there to see that the fund is operated and managed in your best interests since, as a shareholder, you are a part owner of the fund. Your fund’s trustees also serve on the board of directors of The Vanguard Group, Inc., which is owned by the Vanguard funds and provides services to them on an at-cost basis.
A majority of Vanguard’s board members are independent, meaning that they have no affiliation with Vanguard or the funds they oversee, apart from the sizable personal investments they have made as private individuals. The independent board members have distinguished backgrounds in business, academia, and public service. Each of the trustees and executive officers oversees 156 Vanguard funds.
The following table provides information for each trustee and executive officer of the fund. More information about the trustees is in the Statement of Additional Information, which can be obtained, without charge, by contacting Vanguard at 800-662-7447, or online at www.vanguard.com.
| |
| Interested Trustees | Emerson U. Fullwood |
| | Born 1948. Trustee Since January 2008. Principal |
| John J. Brennan1 | Occupation(s) During the Past Five Years: Executive |
| Born 1954. Trustee Since May 1987. Chairman of | Chief Staff and Marketing Officer for North America |
| the Board. Principal Occupation(s) During the Past | and Corporate Vice President (retired 2008) of Xerox |
| Five Years: Chairman of the Board and Director/Trustee | Corporation (photocopiers and printers); Director of |
| of The Vanguard Group, Inc., and of each of the | SPX Corporation (multi-industry manufacturing), the |
| investment companies served by The Vanguard Group; | United Way of Rochester, the Boy Scouts of America, |
| Chief Executive Officer (1996–2008) and President | Amerigroup Corporation (direct health and medical |
| (1989–2008) of The Vanguard Group and of each of the | insurance carriers), and Monroe Community College |
| investment companies served by The Vanguard Group; | Foundation. |
| Chairman of the Financial Accounting Foundation; | |
| Governor of the Financial Industry Regulatory Authority | Rajiv L. Gupta |
| (FINRA); Director of United Way of Southeastern | Born 1945. Trustee Since December 2001.2 Principal |
| Pennsylvania. | Occupation(s) During the Past Five Years: Chairman |
| | and Chief Executive Officer (retired 2009) and President |
| F. William McNabb III1 | (2006–2008) of Rohm and Haas Co. (chemicals); Board |
| Born 1957. Trustee Since July 2009. Principal | Member of American Chemistry Council; Director of |
| Occupation(s) During the Past Five Years: Director of | Tyco International, Ltd. (diversified manufacturing and |
| The Vanguard Group, Inc., since 2008; Chief Executive | services) and Hewlett-Packard Co. (electronic computer |
| Officer and President of The Vanguard Group and of | manufacturing); Trustee of The Conference Board. |
| each of the investment companies served by The | |
| Vanguard Group since 2008; Director of Vanguard | Amy Gutmann |
| Marketing Corporation; Managing Director of The | Born 1949. Trustee Since June 2006. Principal |
| Vanguard Group (1995–2008). | Occupation(s) During the Past Five Years: President of |
| | the University of Pennsylvania; Christopher H. Browne |
| | Distinguished Professor of Political Science in the School |
| Independent Trustees | of Arts and Sciences with secondary appointments |
| | at the Annenberg School for Communication and the |
| Charles D. Ellis | Graduate School of Education of the University of |
| Born 1937. Trustee Since January 2001. Principal | Pennsylvania; Director of Carnegie Corporation of |
| Occupation(s) During the Past Five Years: Applecore | New York, Schuylkill River Development Corporation, |
| Partners (pro bono ventures in education); Senior | and Greater Philadelphia Chamber of Commerce; |
| Advisor to Greenwich Associates (international business | Trustee of the National Constitution Center. |
| strategy consulting); Successor Trustee of Yale University; | |
| Overseer of the Stern School of Business at New York | |
| University; Trustee of the Whitehead Institute for | |
| Biomedical Research. | |
| | |
| JoAnn Heffernan Heisen | Executive Officers | |
| Born 1950. Trustee Since July 1998. Principal | | |
| Occupation(s) During the Past Five Years: Corporate | Thomas J. Higgins1 | |
| Vice President and Chief Global Diversity Officer since | Born 1957. Chief Financial Officer Since September |
| 2006 (retired 2008) and Member of the Executive | 2008. Principal Occupation(s) During the Past Five |
| Committee (retired 2008) of Johnson & Johnson | Years: Principal of The Vanguard Group, Inc.; Chief |
| (pharmaceuticals/consumer products); Vice President | Financial Officer of each of the investment companies |
| and Chief Information Officer of Johnson & Johnson | served by The Vanguard Group since 2008; Treasurer |
| (1997–2005); Director of the University Medical Center | of each of the investment companies served by The |
| at Princeton and Women’s Research and Education | Vanguard Group (1998–2008). |
| Institute; Member of the Advisory Board of the Maxwell | | |
| School of Citizenship and Public Affairs at Syracuse | | |
| University. | Kathryn J. Hyatt1 | |
| | Born 1955. Treasurer Since November 2008. Principal |
| | Occupation(s) During the Past Five Years: Principal of |
| F. Joseph Loughrey | The Vanguard Group, Inc.; Treasurer of each of the |
| Born 1949. Trustee Since October 2009. Principal | investment companies served by The Vanguard |
| Occupation(s) During the Past Five Years: President and | Group since 2008; Assistant Treasurer of each of the |
| Chief Operating Officer since 2005 (retired 2009) and | investment companies served by The Vanguard Group |
| Vice Chairman of the Board (2008–2009) of Cummins | (1988–2008). | |
| Inc. (industrial machinery); Director of SKF AB (industrial | | |
| machinery), Hillenbrand, Inc. (specialized consumer | | |
| services), Sauer-Danfoss Inc. (machinery), the Lumina | Heidi Stam1 | |
| Foundation for Education, and the Columbus Community | Born 1956. Secretary Since July 2005. Principal |
| Education Coalition; Chairman of the Advisory Council | Occupation(s) During the Past Five Years: Managing |
| for the College of Arts and Letters at the University of | Director of The Vanguard Group, Inc., since 2006; |
| Notre Dame. | General Counsel of The Vanguard Group since 2005; |
| | Secretary of The Vanguard Group and of each of the |
| | investment companies served by The Vanguard Group |
| André F. Perold | since 2005; Director and Senior Vice President of |
| Born 1952. Trustee Since December 2004. Principal | Vanguard Marketing Corporation since 2005; Principal |
| Occupation(s) During the Past Five Years: George Gund | of The Vanguard Group (1997–2006). |
| Professor of Finance and Banking, Harvard Business | | |
| School; Chair of the Investment Committee of HighVista | | |
| Strategies LLC (private investment firm). | Vanguard Senior Management Team |
| |
| Alfred M. Rankin, Jr. | R. Gregory Barton | Michael S. Miller |
| Born 1941. Trustee Since January 1993. Principal | Mortimer J. Buckley | James M. Norris |
| Occupation(s) During the Past Five Years: Chairman, | Kathleen C. Gubanich | Glenn W. Reed |
| President, and Chief Executive Officer of NACCO | Paul A. Heller | George U. Sauter |
| Industries, Inc. (forklift trucks/housewares/lignite); | | |
| Director of Goodrich Corporation (industrial products/ | | |
| aircraft systems and services); Deputy Chairman of | Founder | |
| the Federal Reserve Bank of Cleveland; Trustee of | | |
| University Hospitals of Cleveland, The Cleveland | | |
| Museum of Art, and Case Western Reserve University. | John C. Bogle | |
| | Chairman and Chief Executive Officer, 1974–1996 |
| |
| Peter F. Volanakis | | |
| Born 1955. Trustee Since July 2009. Principal | | |
| Occupation(s) During the Past Five Years: President | | |
| since 2007 and Chief Operating Officer since 2005 | | |
| of Corning Incorporated (communications equipment); | | |
| President of Corning Technologies (2001–2005); Director | | |
| of Corning Incorporated and Dow Corning; Trustee of | | |
| the Corning Incorporated Foundation and the Corning | | |
| Museum of Glass; Overseer of the Amos Tuck School | | |
| of Business Administration at Dartmouth College. | | |
1 These individuals are “interested persons” as defined in the Investment Company Act of 1940.
2 December 2002 for Vanguard Equity Income Fund, Vanguard Growth Equity Fund, the Vanguard Municipal Bond Funds, and the Vanguard State Tax-Exempt Funds.
|  |
| P.O. Box 2600 |
| Valley Forge, PA 19482-2600 |
|
Connect with Vanguard® > www.vanguard.com
| |
| Fund Information > 800-662-7447 | All comparative mutual fund data are from Lipper Inc. |
| | or Morningstar, Inc., unless otherwise noted. |
| Direct Investor Account Services > 800-662-2739 | |
| | |
| Institutional Investor Services > 800-523-1036 | You can obtain a free copy of Vanguard’s proxy voting |
| | guidelines by visiting our website, www.vanguard.com, |
| Text Telephone for People | and searching for “proxy voting guidelines,” or by |
| With Hearing Impairment > 800-749-7273 | calling Vanguard at 800-662-2739. The guidelines are |
| | also available from the SEC’s website, www.sec.gov. |
| | In addition, you may obtain a free report on how your |
| | fund voted the proxies for securities it owned during |
| This material may be used in conjunction | the 12 months ended June 30. To get the report, visit |
| with the offering of shares of any Vanguard | either www.vanguard.com or www.sec.gov. |
| fund only if preceded or accompanied by | |
| the fund’s current prospectus. | You can review and copy information about your fund |
| | at the SEC’s Public Reference Room in Washington, D.C. |
| The funds or securities referred to herein are not | To find out more about this public service, call the SEC |
| sponsored, endorsed, or promoted by MSCI, and MSCI | at 202-551-8090. Information about your fund is also |
| bears no liability with respect to any such funds or | available on the SEC’s website, and you can receive |
| securities. For any such funds or securities, the | copies of this information, for a fee, by sending a |
| prospectus or the Statement of Additional Information | request in either of two ways: via e-mail addressed to |
| contains a more detailed description of the limited | publicinfo@sec.gov or via regular mail addressed to the |
| relationship MSCI has with The Vanguard Group and | Public Reference Section, Securities and Exchange |
| any related funds. | Commission, Washington, DC 20549-1520. |
| |
| |
| |
| |
| | © 2009 The Vanguard Group, Inc. |
| | All rights reserved. |
| | Vanguard Marketing Corporation, Distributor. |
| | Q720 122009 |
 |
| Vanguard Total World Stock Index Fund |
| Annual Report |
|
|
| October 31, 2009 |
|
|
 |
|
|
> For the fiscal year ended October 31, 2009, Vanguard Total World Stock Index Fund returned about 22%.
> The fund provides market-capitalization-weighted exposure to both developed and emerging markets from around the world.
> All regions posted positive results for the period. The strongest returns came from the emerging-markets countries.
| |
| Contents | |
| Your Fund’s Total Returns | 1 |
| President’s Letter | 2 |
| Results of Proxy Voting | 7 |
| Fund Profile | 8 |
| Performance Summary | 10 |
| Financial Statements | 12 |
| Your Fund’s After-Tax Returns | 55 |
| About Your Fund’s Expenses | 56 |
| Glossary | 58 |
Please note: The opinions expressed in this report are just that—informed opinions. They should not be considered promises or advice. Also, please keep in mind that the information and opinions cover the period through the date on the front of this report. Of course, the risks of investing in your fund are spelled out in the prospectus.
Cover photograph: Veronica Coia.
| | | | |
| Your Fund’s Total Returns | | | |
| |
| |
| |
| |
| Fiscal Year Ended October 31, 2009 | | | | |
| | | | Ticker | Total |
| | | | Symbol | Returns |
| Vanguard Total World Stock Index Fund | | | | |
| Investor Shares | | | VTWSX | 22.25% |
| Institutional Shares1 | | | VTWIX | 22.55 |
| ETF Shares2 | | | VT | |
| Market Price | | | | 20.33 |
| Net Asset Value | | | | 22.49 |
| FTSE All-World Index | | | | 23.86 |
| Global Funds Average3 | | | | 21.48 |
| |
| |
| Your Fund’s Performance at a Glance | | | | |
| October 31, 2008–October 31, 2009 | | | | |
| | | | Distributions Per Share |
| | Starting | Ending | Income | Capital |
| | Share Price | Share Price | Dividends | Gains |
| Vanguard Total World Stock Index Fund | | | | |
| Investor Shares | $13.71 | $16.66 | $0.076 | $0.000 |
| Institutional Shares | 68.63 | 83.54 | 0.431 | 0.000 |
| ETF Shares | 33.59 | 40.88 | 0.203 | 0.000 |
1 This class of shares carries lower expenses and is available for a minimum initial investment of $5 million.
2 These Vanguard ETF® shares are traded on the NYSE Arca exchange and are available only through brokers. The table shows ETF returns based on both the NYSE Arca market price and the net asset value for a share. U.S. Pat. No. 6,879,964 B2; 7,337,138.
3 Derived from data provided by Lipper Inc.
1

President’s Letter
Dear Shareholder,
Vanguard Total World Stock Index Fund is designed to closely track the FTSE All-World Index, a measure of global stock markets that includes about 2,700 stocks. The fund and index provide exposure to U.S. stocks, developed international markets, and emerging markets, with each group weighted in proportion to its market value.
For the fiscal year ended October 31, 2009, the fund returned about 22%, consistent with the benchmark’s return. (The apparent discrepancy between fund and index returns reflected fair-value pricing and, to a lesser extent, fund costs. The fund relies on fair-value pricing to account for any changes in the portfolio’s market value that occur after the close of international markets, but before the fund’s U.S. close at 4 p.m., Eastern time. These discrepancies typically disappear when the international markets reopen.)
A vicious bear market quickly turned bullish
A year ago, the global financial system stood on the brink of collapse as the expanding U.S. credit crisis precipitated the deepest worldwide recession since World War II. Since then, markets have pulled back from the depths and, in fact, have rallied impressively. Although U.S. unemployment has risen to double digits and signs of a robust recovery are hard to find, the global economy has begun to revive. For the first time in more than
2
a year, U.S. gross domestic product registered growth as reported by the Commerce Department for the third quarter of calendar 2009.
U.S. stocks recorded positive returns for the fiscal year ended October 31 as the market’s losses during the first four months of the period—marking the final plunge of a historic bear market—were erased by a remarkable rally beginning in March. Global stocks did even better, thanks to some renewed strength in developed markets and a powerful upswing in emerging markets that actually had some prognosticators worrying about a new asset bubble. Reminders of the markets’ travails are nevertheless apparent in the index returns for the past three years, where negative figures are the rule. Even the five-year returns for U.S. stocks as of October 31 were barely positive, further evidence of the long-term damage done by the collapse of the real estate bubble.
The bond market experienced an equally dramatic turnaround
The stock market’s rapid fall and recovery were matched by an equally dramatic turnaround in the bond market. At the end of 2008, as the credit markets virtually shut down, risk-averse investors flocked to U.S. Treasury bonds. The effect was to widen the difference between the lower yields of Treasuries and the higher yields of corporate bonds to a margin not seen since the Great Depression.
| | | |
| Market Barometer | | | |
| | | Average Annual Total Returns |
| | | Periods Ended October 31, 2009 |
| | One Year | Three Years | Five Years |
| Stocks | | | |
| MSCI All Country World Index ex USA (International) | 34.79% | –2.49% | 7.58% |
| Russell 1000 Index (Large-caps) | 11.20 | –6.84 | 0.71 |
| Russell 2000 Index (Small-caps) | 6.46 | –8.51 | 0.59 |
| Dow Jones U.S. Total Stock Market Index | 11.34 | –6.55 | 1.06 |
| |
| Bonds | | | |
| Barclays Capital U.S. Aggregate Bond Index | | | |
| (Broad taxable market) | 13.79% | 6.35% | 5.05% |
| Barclays Capital Municipal Bond Index | 13.60 | 4.17 | 4.15 |
| Citigroup 3-Month Treasury Bill Index | 0.28 | 2.50 | 2.94 |
| |
| CPI | | | |
| Consumer Price Index | –0.18% | 2.32% | 2.52% |
3
Central banks around the world responded to the economic slowdown by lowering interest rates and implementing other aggressive stimulus programs. Meanwhile, governments boosted spending in hopes of reversing the recessionary tide. As fears of a worldwide depression eased, investors’ appetite for risk returned to more normal levels. The receding pessimism raised demand for corporate bonds, raising their prices and bringing down their yields. Over the past 12 months, both taxable and municipal bonds returned more than 13%.
However, the Fed’s easy-money campaign had a predictable effect on short-term savings vehicles such as money market funds, whose yields track prevailing short-term rates. In December 2008, the Fed reduced its target for the federal funds rate, a benchmark for the interest rates paid by money market instruments and other very short-term securities, to between 0% and 0.25%. The Fed has said it expects to maintain its target at this level “for an extended period.”
An emerging markets rebound boosts fund returns
Global stock markets opened the fiscal year plagued by the credit crisis that began in the United States and the economic slowdown that followed. However, the markets rallied during the second half of the year, and all regions ended the 12-month period in positive territory. Results from all ten business sectors of the index were also positive,
| | | | |
| Expense Ratios1 | | | | |
| Your Fund Compared With Its Peer Group | | | | |
| | | | | Global |
| | Investor | Institutional | ETF | Funds |
| | Shares | Shares | Shares | Average |
| Total World Stock Index Fund | 0.50% | 0.25% | 0.30% | 1.49% |
1 The fund expense ratios shown are from the prospectuses dated February 27, 2009, and represent estimated costs for the current fiscal year based on the fund’s net assets as of the prospectus date. For the fiscal year ended October 31, 2009, the expense ratios were 0.50% for Investor Shares, 0.25% for Institutional Shares, and 0.30% for ETF Shares. The peer-group expense ratio is derived from data provided by Lipper Inc. and captures information through year-end 2008.
4
and contributed to Vanguard Total World Stock Index Fund’s return of about 22% for the period.
The strongest returns came from emerging markets, which recovered more quickly from the global financial crisis than developed markets. Despite accounting for the smallest portion of the index’s value (less than 14% of assets on average), these countries provided the biggest boost to the index’s return for the period, adding almost 8 percentage points.
The resource-rich emerging-markets countries—Brazil, in particular—experienced strong economic growth during the final six months of the fiscal year, as the demand for raw materials began to resume across the globe. In China, another emerging-markets stand-out, the government’s aggressive stimulus package allowed banks to provide capital to companies in a variety of industries, thus spurring the nation’s economy.
Consistent with the value of their stock markets, the countries in North America accounted for the heaviest regional weighting—nearly half of the index’s holdings. The United States and Canada were among the index’s weakest performers for the period. The United States, which constituted about 40% of the index’s holdings, has been recovering from the global recession at a slower pace than some nations. Still, some sectors in the United States were bright spots for the index, most importantly information technology, which has taken off since the stock market rally began in mid-March.
The European region represented an average of about 29% of the index’s holdings, making it the second-largest weighting. The countries in this region rebounded more quickly from the financial crisis than the United States, but not as swiftly and profoundly as the emerging-markets nations. The majority of the European countries posted positive results for the period, with the exception of Ireland. The United Kingdom was the region’s heaviest weighting, as well as its biggest contributor to returns. France, Spain, and Germany were also top contributors for the region.
On average, the Pacific region constituted the third-largest exposure for the fund and the index. Japan was the index’s biggest component in this region, while Australia was the greatest contributor to performance. The region’s other markets, which include Hong Kong (+65%), Singapore (+78%), and New Zealand (+4%), also notched positive returns for the 12-month period.
All the market’s ten industry sectors posted positive results for the period; however, financial stocks were the biggest standout. The market was heavily weighted in financial companies, including banks, capital market firms, and insurance agencies, which were
5
the top performers in the emerging markets and the European and Pacific regions. In addition to financials, information technology stocks––particularly communications equipment, computer hardware, and computer software––excelled across the major markets, including the United States, as corporations began spending again.
Stay focused on your future goals
Although recent months have brought good news for stock prices and investors both domestically and internationally, the hardships of the not-so-distant past won’t be easily forgotten. And, unfortunately, there’s no way to know what the future holds.
Uncertainty is the one thing that we can count on in the financial markets. That’s why Vanguard encourages investors to put these timeless rules of investing into practice: Maintain a long-term perspective, and stay focused on your future goals.
A well-balanced and diversified portfolio that is consistent with your tolerance for risk can be a powerful ally as you try to stick to these guidelines.
We believe that the Total World Stock Index Fund, with its low costs and broad diversification among global stocks, can play a valuable role in such a well-balanced portfolio.
As always, thank you for entrusting your assets to Vanguard.
Sincerely,
F. William McNabb III
President and Chief Executive Officer
November 18, 2009
Results of Proxy Voting
At a special meeting of shareholders on July 2, 2009, fund shareholders approved the following two proposals:
Proposal 1—Elect trustees for each fund.*
The individuals listed in the table below were elected as trustees for each fund. All trustees with the exception of Messrs. McNabb and Volanakis (both of whom already served as directors of The Vanguard Group, Inc.) served as trustees to the funds prior to the shareholder meeting.
| | | |
| | | | Percentage |
| Trustee | For | Withheld | For |
| John J. Brennan | 1,604,062,236 | 36,846,078 | 97.8% |
| Charles D. Ellis | 1,594,488,732 | 46,419,583 | 97.2% |
| Emerson U. Fullwood | 1,603,672,430 | 37,235,884 | 97.7% |
| Rajiv L. Gupta | 1,604,092,353 | 36,815,961 | 97.8% |
| Amy Gutmann | 1,605,214,829 | 35,693,485 | 97.8% |
| JoAnn Heffernan Heisen | 1,605,059,287�� | 35,849,028 | 97.8% |
| F. William McNabb III | 1,605,657,176 | 35,251,138 | 97.9% |
| Andre F. Perold | 1,602,313,073 | 38,595,241 | 97.6% |
| Alfred M. Rankin, Jr. | 1,604,909,324 | 35,998,991 | 97.8% |
| Peter F. Volanakis | 1,607,261,150 | 33,647,165 | 97.9% |
| * Results are for all funds within the same trust. | | | |
Proposal 2—Update and standardize the funds’ fundamental policies regarding:
(a) Purchasing and selling real estate.
(b) Issuing senior securities.
(c) Borrowing money.
(d) Making loans.
(e) Purchasing and selling commodities.
(f) Concentrating investments in a particular industry or group of industries.
(g) Eliminating outdated fundamental investment policies not required by law.
The revised fundamental policies are clearly stated and simple, yet comprehensive, making oversight and compliance more efficient than under the former policies. The revised fundamental policies will allow the funds to respond more quickly to regulatory and market changes, while avoiding the costs and delays associated with successive shareholder meetings.
| | | | | |
| | | | | Broker | Percentage |
| Total World Stock Index Fund | For | Abstain | Against | Non-Votes | For |
| 2a | 6,689,158 | 139,008 | 100,250 | 2,395,734 | 71.7% |
| 2b | 6,682,079 | 146,883 | 99,453 | 2,395,735 | 71.7% |
| 2c | 6,622,332 | 155,075 | 151,008 | 2,395,735 | 71.0% |
| 2d | 6,637,855 | 152,058 | 138,501 | 2,395,736 | 71.2% |
| 2e | 6,644,886 | 137,648 | 145,881 | 2,395,735 | 71.3% |
| 2f | 6,617,419 | 160,350 | 150,645 | 2,395,736 | 71.0% |
| 2g | 6,641,250 | 151,174 | 135,991 | 2,395,735 | 71.2% |
7
Total World Stock Index Fund
Fund Profile
As of October 31, 2009
| | |
| Portfolio Characteristics | | |
| | | Target |
| | Fund | Index1 |
| Number of Stocks | 2,741 | 2,751 |
| Turnover Rate | 18% | — |
| Expense Ratio2 | | — |
| Investor Shares | 0.50% | |
| Institutional Shares | 0.25% | |
| ETF Shares | 0.30% | |
| Short-Term Reserves | 0.3% | — |
| | |
| Sector Diversification (% of equity exposure) |
| | | Target |
| | Fund | Index1 |
| Consumer Discretionary | 8.8% | 8.8% |
| Consumer Staples | 9.9 | 9.9 |
| Energy | 11.5 | 11.4 |
| Financials | 22.2 | 22.4 |
| Health Care | 8.6 | 8.6 |
| Industrials | 10.0 | 10.0 |
| Information Technology | 11.6 | 11.5 |
| Materials | 7.9 | 7.9 |
| Telecommunication Services | 5.1 | 5.1 |
| Utilities | 4.4 | 4.4 |
| | |
| Ten Largest Holdings3 (% of total net assets) |
| Exxon Mobil Corp. | integrated oil | |
| | and gas | 1.4% |
| Microsoft Corp. | systems software | 1.0 |
| HSBC Holdings PLC | diversified banks | 0.8 |
| Royal Dutch Shell PLC | integrated oil | |
| | and gas | 0.7 |
| BP PLC | integrated oil | |
| | and gas | 0.7 |
| Nestle SA | packaged foods | |
| | and meats | 0.7 |
| Procter & Gamble Co. | household products | 0.7 |
| BHP Billiton | diversified metals | |
| | and mining | 0.7 |
| Apple Inc. | computer hardware | 0.7 |
| Johnson & Johnson | pharmaceuticals | 0.7 |
| Top Ten | | 8.1% |
Allocation by Region (% of equity exposure)
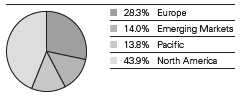
1 FTSE All-World Index.
2 The expense ratios shown are from the prospectuses dated February 27, 2009, and represent estimated costs for the current fiscal year based on the fund’s net assets as of the prospectus date. For the fiscal year ended October 31, 2009, the expense ratios were 0.50% for Investor Shares, 0.25% for Institutional Shares, and 0.30% for ETF Shares.
3 The holdings listed exclude any temporary cash investments and equity index products.
For explanations of investment terms used here, see the Glossary.
8
Total World Stock Index Fund
| | |
| Market Diversification (% of equity exposure) |
| | | Target |
| | Fund | Index1 |
| Europe | | |
| United Kingdom | 8.8% | 8.8% |
| France | 4.9 | 4.7 |
| Germany | 3.4 | 3.3 |
| Switzerland | 3.2 | 3.2 |
| Spain | 2.2 | 2.2 |
| Italy | 1.7 | 1.6 |
| Sweden | 1.1 | 1.1 |
| Netherlands | 1.0 | 1.2 |
| Other Europe | 2.0 | 2.4 |
| Subtotal | 28.3% | 28.5% |
| Pacific | | |
| Japan | 8.3% | 8.4% |
| Australia | 3.5 | 3.5 |
| Hong Kong | 1.2 | 1.6 |
| Other Pacific | 0.8 | 0.8 |
| Subtotal | 13.8% | 14.3% |
| Emerging Markets | | |
| China | 2.4% | 2.2% |
| Brazil | 2.3 | 2.3 |
| South Korea | 1.8 | 1.8 |
| Taiwan | 1.4 | 1.4 |
| India | 1.3 | 1.3 |
| South Africa | 1.1 | 1.1 |
| Other Emerging Markets | 3.7 | 3.4 |
| Subtotal | 14.0% | 13.5% |
| North America | | |
| United States | 40.6% | 40.4% |
| Canada | 3.3 | 3.3 |
| Subtotal | 43.9% | 43.7% |
1 FTSE All-World Index.
9
Total World Stock Index Fund
Performance Summary
All of the returns in this report represent past performance, which is not a guarantee of future results that may be achieved by the fund. (Current performance may be lower or higher than the performance data cited. For performance data current to the most recent month-end, visit our website at www.vanguard.com/performance.) Note, too, that both investment returns and principal value can fluctuate widely, so an investor’s shares, when sold, could be worth more or less than their original cost. The returns shown do not reflect taxes that a shareholder would pay on fund distributions or on the sale of fund shares.
Cumulative Performance: June 26, 2008–October 31, 2009
Initial Investment of $10,000
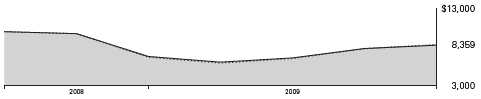
| | | |
| | | Average Annual Total Returns | Final Value |
| | | Periods Ended October 31, 2009 | of a $10,000 |
| | One Year | Since Inception1 | Investment |
| Total World Stock Index Fund | | | |
| Investor Shares2,3 | 21.94% | –12.46% | $8,359 |
| FTSE All-World Index | 23.86 | –13.04 | 8,285 |
| Global Funds Average4 | 21.48 | –13.32 | 8,249 |
| |
| | | | Final Value of |
| | | Since | a $5,000,000 |
| | One Year | Inception1 | Investment |
| Total World Stock Index Fund Institutional Shares2 | 22.25% | 23.98% | $6,278,804 |
| FTSE All-World Index | 23.86 | 21.10 | 6,124,527 |
| |
| | | | Final Value |
| | | Since | of a $10,000 |
| | One Year | Inception1 | Investment |
| Total World Stock Index Fund | | | |
| ETF Shares Net Asset Value5 | 22.49% | –13.09% | $8,272 |
| FTSE All-World Index | 23.86 | –13.60 | 8,206 |
1 Performance for the fund and its comparative standards is calculated since the following inception dates: June 26, 2008, for the Investor Shares; October 9, 2008, for the Institutional Shares; and June 24, 2008, for the ETF Shares.
2 Performance figures are adjusted for the 0.25% transaction fee on purchases but do not reflect the 2% fee assessed on redemptions of shares held for less than two months.
3 Total returns do not include the account service fee that may be applicable to certain accounts with balances below $10,000.
4 Derived from data provided by Lipper Inc.
5 For more information about how the ETF Shares’ market prices have compared with their net asset value, visit www.vanguard.com, select your ETF, and then select the Performance tab. The Premium/Discount table there shows the percentages of days on which the ETF Shares’ market price was above or below the NAV.
10
Total World Stock Index Fund
| | |
| Cumulative Returns—ETF Shares: June 24, 2008–October 31, 2009 | | |
| | | Cumulative |
| | | Since |
| | One Year | Inception |
| Total World Stock Index Fund ETF Shares Market Price | 20.33% | –17.25% |
| Total World Stock Index Fund ETF Shares Net Asset Value | 22.49 | –17.28 |
| FTSE All-World Index | 23.86 | –17.94 |
Fiscal-Year Total Returns (%): June 26, 2008–October 31, 2009
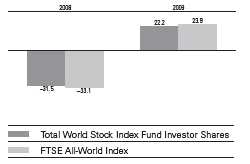
Average Annual Total Returns: Periods Ended September 30, 2009
This table presents average annual total returns through the latest calendar quarter—rather than through the end of the fiscal period. Securities and Exchange Commission rules require that we provide this information.
| | | |
| | | One | Since |
| | Inception Date | Year | Inception |
| Investor Shares1 | 6/26/2008 | 0.36% | –11.50% |
| Fee-Adjusted Returns2 | | 0.11 | –11.68 |
| Institutional Shares | 10/9/2008 | | 28.74 |
| Fee-Adjusted Returns2 | | | 28.42 |
| ETF Shares | 6/24/2008 | | |
| Market Price | | –2.79% | –12.14% |
| Net Asset Value | | 0.55 | –12.36 |
1 Total returns do not include the account service fee that may be applicable to certain accounts with balances below $10,000.
2 Performance figures are adjusted for the 0.25% transaction fee on purchases but do not reflect the 2% fee assessed on redemptions of shares held for less than two months.
Note: See Financial Highlights tables for dividend and capital gains information.
11
Total World Stock Index Fund
Financial Statements
Statement of Net Assets
As of October 31, 2009
The fund reports a complete list of its holdings in regulatory filings four times in each fiscal year, at the quarter-ends. For the second and fourth fiscal quarters, the lists appear in the fund’s semiannual and annual reports to shareholders. For the first and third fiscal quarters, the fund files the lists with the Securities and Exchange Commission on Form N-Q. Shareholders can look up the fund’s Forms N-Q on the SEC’s website at www.sec.gov. Forms N-Q may also be reviewed and copied at the SEC’s Public Reference Room (see the back cover of this report for further information).
| | | |
| | | | Market |
| | | | Value• |
| | | Shares | ($000) |
| Common Stocks (99.6%) | | |
| Argentina (0.1%) | | |
| * | Petrobras Energia | | |
| | Participaciones SA ADR | 2,198 | 37 |
| |
| Australia (3.5%) | | |
| | BHP Billiton Ltd. | 89,212 | 2,926 |
| | Commonwealth Bank | | |
| | of Australia | 40,449 | 1,869 |
| | Westpac Banking Corp. | 78,381 | 1,832 |
| | National Australia Bank Ltd. | 56,221 | 1,485 |
| | Australia & New Zealand | | |
| | Banking Group Ltd. | 63,280 | 1,291 |
| | Woolworths Ltd. | 33,656 | 861 |
| | Rio Tinto Ltd. | 13,364 | 741 |
| | Westfield Group | 61,468 | 666 |
| | Wesfarmers Ltd. | 26,519 | 662 |
| | QBE Insurance Group Ltd. | 31,832 | 641 |
| | Woodside Petroleum Ltd. | 14,849 | 623 |
| | CSL Ltd. | 15,885 | 446 |
| | Macquarie Group Ltd. | 9,228 | 404 |
| | Newcrest Mining Ltd. | 13,115 | 377 |
| | Origin Energy Ltd. | 26,211 | 376 |
| | Telstra Corp. Ltd. | 102,562 | 305 |
| | Santos Ltd. | 21,800 | 291 |
| | Brambles Ltd. | 42,147 | 266 |
| | AMP Ltd. | 47,503 | 250 |
| | Computershare Ltd. | 25,334 | 246 |
| | Orica Ltd. | 11,070 | 235 |
| | Suncorp-Metway Ltd. | 29,579 | 231 |
| | Foster’s Group Ltd. | 46,291 | 227 |
| * | Fortescue Metals | | |
| | Group Ltd. | 63,466 | 212 |
| | Stockland | 57,121 | 190 |
| | Oil Search Ltd. | 36,323 | 188 |
| | Insurance Australia | | |
| | Group Ltd. | 51,718 | 174 |
| | Leighton Holdings Ltd. | 5,185 | 165 |
| | WorleyParsons Ltd. | 6,649 | 153 |
| | | |
| | | | Market |
| | | | Value• |
| | | Shares | ($000) |
| | AXA Asia Pacific | | |
| | Holdings Ltd. | 39,087 | 146 |
| | Amcor Ltd. | 28,034 | 144 |
| | AGL Energy Ltd. | 11,129 | 138 |
| | BlueScope Steel Ltd. | 52,012 | 138 |
| | OneSteel Ltd. | 49,253 | 134 |
| | Transurban Group | 30,146 | 122 |
| | Coca-Cola Amatil Ltd. | 12,764 | 121 |
| | Wesfarmers Ltd. | 4,817 | 121 |
| | ASX Ltd. | 3,915 | 118 |
| | Toll Holdings Ltd. | 15,561 | 118 |
| | Sonic Healthcare Ltd. | 8,589 | 107 |
| * | Alumina Ltd. | 72,122 | 106 |
| | Incitec Pivot Ltd. | 45,140 | 105 |
| | GPT Group | 197,753 | 101 |
| | Crown Ltd. | 13,286 | 97 |
| | Mirvac Group | 69,072 | 90 |
| | TABCORP Holdings Ltd. | 14,043 | 90 |
| | Metcash Ltd. | 20,332 | 85 |
| | Lend Lease Corp. Ltd. | 10,223 | 85 |
| | Perpetual Ltd. | 2,477 | 83 |
| | Sims Metal | | |
| | Management Ltd. | 4,583 | 81 |
| * | Asciano Group | 60,183 | 81 |
| | Macquarie | | |
| | Infrastructure Group | 59,785 | 76 |
| | Tatts Group Ltd. | 33,877 | 75 |
| * | OZ Minerals Ltd. | 70,760 | 74 |
| | Boral Ltd. | 14,114 | 72 |
| | Cochlear Ltd. | 1,244 | 71 |
| | CFS Retail Property Trust | 39,154 | 67 |
| | Dexus Property Group | 92,194 | 65 |
| | Bendigo and | | |
| | Adelaide Bank Ltd. | 7,923 | 64 |
| * | James Hardie | | |
| | Industries NV | 9,962 | 63 |
| | Goodman Group | 116,711 | 63 |
| | Qantas Airways Ltd. | 24,831 | 62 |
| | Harvey Norman | | |
| | Holdings Ltd. | 15,035 | 53 |
12
| | | |
| Total World Stock Index Fund | | |
| |
| |
| |
| | | | Market |
| | | | Value• |
| | | Shares | ($000) |
| | Nufarm Ltd. | 5,047 | 52 |
| | CSR Ltd. | 30,128 | 51 |
| * | Paladin Energy Ltd. | 13,730 | 50 |
| | Downer EDI Ltd. | 6,330 | 48 |
| | Goodman Fielder Ltd. | 33,508 | 48 |
| | Energy Resources of | | |
| | Australia Ltd. | 2,196 | 45 |
| | Bank of Queensland Ltd. | 3,767 | 41 |
| | Aristocrat Leisure Ltd. | 9,329 | 37 |
| | Adelaide Brighton Ltd. | 14,606 | 37 |
| | Challenger Financial | | |
| | Services Group Ltd. | 10,934 | 36 |
| | Flight Centre Ltd. | 2,301 | 35 |
| | Macquarie Airports | 13,339 | 34 |
| | Billabong International Ltd. | 3,535 | 33 |
| | Consolidated Media | | |
| | Holdings Ltd. | 11,572 | 31 |
| | SP AusNet | 38,822 | 31 |
| * | Iluka Resources Ltd. | 9,367 | 29 |
| | Fairfax Media Ltd. | 19,902 | 28 |
| | Commonwealth Property | | |
| | Office Fund | 30,655 | 24 |
| | IOOF Holdings Ltd. | 4,540 | 21 |
| | Macquarie Office Trust | 75,546 | 21 |
| | Ansell Ltd. | 2,224 | 21 |
| | New Hope Corp. Ltd. | 4,725 | 18 |
| * | Caltex Australia Ltd. | 1,939 | 18 |
| | Ten Network Holdings Ltd. | 10,340 | 14 |
| | Australand Property Group | 26,246 | 12 |
| | Envestra Ltd. | 20,533 | 10 |
| | West Australian | | |
| | Newspapers Holdings Ltd. | 1,314 | 9 |
| | Tower Australia Group Ltd. | 2,952 | 8 |
| | Austereo Group Ltd. | 5,713 | 8 |
| | Corporate Express | | |
| | Australia Ltd. | 1,728 | 7 |
| | GWA International Ltd. | 2,486 | 6 |
| | APN News & Media Ltd. | 2,880 | 6 |
| | Spotless Group Ltd. | 2,468 | 6 |
| | Gunns Ltd. | 6,004 | 5 |
| * | PaperlinX Ltd. | 10,418 | 5 |
| | Sigma | | |
| | Pharmaceuticals Ltd. | 4,135 | 3 |
| | AWB Ltd. | 2,528 | 3 |
| * | CSR, Ltd. | | |
| | Rights Exp. 11/9/2009 | 5,272 | 1 |
| * | Elders Ltd. | 2,478 | — |
| | | | 22,441 |
| Austria (0.1%) | | |
| ^ | Erste Group Bank AG | 5,290 | 213 |
| | Voestalpine AG | 5,612 | 192 |
| | OMV AG | 3,128 | 129 |
| | Telekom Austria AG | 7,476 | 122 |
| | Vienna Insurance Group | 992 | 56 |
| | Raiffeisen International | | |
| | Bank Holding AG | 903 | 53 |
| | | |
| | | | Market |
| | | | Value• |
| | | Shares | ($000) |
| | Verbund-Oesterreichische | | |
| | Elektrizitaetswirtschafts | | |
| | AG Class A | 1,042 | 47 |
| * | Immoeast AG | 7,753 | 41 |
| | Strabag SE | 916 | 28 |
| | EVN AG | 326 | 6 |
| | | | 887 |
| Belgium (0.4%) | | |
| | Anheuser-Busch InBev NV | 21,162 | 993 |
| | Delhaize Group SA | 3,760 | 255 |
| * | Fortis | 54,096 | 234 |
| | Umicore | 6,913 | 210 |
| * | Dexia SA | 22,580 | 188 |
| * | KBC Groep NV | 3,971 | 170 |
| | Groupe Bruxelles Lambert | | |
| | SA | 1,715 | 151 |
| | Belgacom SA | 3,808 | 143 |
| | UCB SA | 3,136 | 134 |
| | Solvay SA Class A | 933 | 91 |
| | Colruyt SA | 280 | 67 |
| | Nationale A Portefeuille | 654 | 34 |
| | Mobistar SA | 131 | 9 |
| | | | 2,679 |
| Brazil (2.3%) | | |
| | Petroleo Brasileiro SA | | |
| | Series A ADR | 33,452 | 1,342 |
| | Itau Unibanco Holding | | |
| | SA ADR | 65,474 | 1,253 |
| * | Vale SA Class B ADR | 48,183 | 1,113 |
| | Petroleo Brasileiro SA ADR | 22,509 | 1,040 |
| * | Vale SA Class B ADR | 38,322 | 977 |
| | Banco Bradesco SA ADR | 43,610 | 859 |
| | Cia de Bebidas das | | |
| | Americas ADR | 7,787 | 701 |
| | Cia Siderurgica Nacional | | |
| | SA ADR | 19,448 | 645 |
| | Petroleo Brasileiro SA Pfd. | 25,537 | 506 |
| | Petroleo Brasileiro SA | 18,800 | 432 |
| | Gerdau SA ADR | 25,261 | 381 |
| | Investimentos Itau SA | 59,566 | 340 |
| | BM&FBOVESPA SA | 48,150 | 310 |
| | Banco do Brasil SA | 17,800 | 285 |
| | BRF-Brasil Foods SA | 9,462 | 228 |
| | Vale SA | 9,400 | 212 |
| * | Empresa Brasileira de | | |
| | Aeronautica SA ADR | 9,462 | 192 |
| | Tele Norte Leste | | |
| | Participacoes SA ADR | 9,843 | 188 |
| | Brasil Telecom | | |
| | Participacoes SA ADR | 3,549 | 179 |
| | Redecard SA | 11,488 | 169 |
| | Natura Cosmeticos SA | 9,300 | 167 |
| * | Banco Santander Brasil SA | 13,900 | 164 |
| | Usinas Siderurgicas de | | |
| | Minas Gerais SA | 5,600 | 146 |
| | Tim Participacoes SA ADR | 6,116 | 144 |
13
| | | |
| Total World Stock Index Fund | | |
| |
| |
| |
| | | | Market |
| | | | Value• |
| | | Shares | ($000) |
| | Cia de Concessoes | | |
| | Rodoviarias | 7,000 | 138 |
| | Companhia Brasileira de | | |
| | Meios de Pagamento | 13,689 | 126 |
| | Metalurgica Gerdau SA | | |
| | Class A | 6,600 | 121 |
| | OGX Petroleo e | | |
| | Gas Participacoes SA | 145 | 117 |
| | Bradespar SA | 5,400 | 111 |
| | Vale SA | 4,100 | 104 |
| | Centrais Eletricas | | |
| | Brasileiras SA | 7,000 | 100 |
| | All America Latina | | |
| | Logistica SA | 13,200 | 97 |
| | Ultrapar Participacoes SA | 2,168 | 95 |
| | Cia Brasileira de | | |
| | Distribuicao Grupo Pao | | |
| | de Acucar | 3,009 | 91 |
| | Cia Energetica de | | |
| | Minas Gerais ADR | 5,750 | 91 |
| | Cyrela Brazil Realty SA | 6,998 | 89 |
| | Tractebel Energia SA | 6,800 | 83 |
| * | Global Village Telecom | | |
| | Holding SA | 2,485 | 71 |
| | Souza Cruz SA | 1,900 | 67 |
| | JBS SA | 10,998 | 61 |
| | Cia de Bebidas das Americas | 738 | 56 |
| | Weg SA | 5,547 | 54 |
| * | NET Servicos de | | |
| | Comunicacao SA | 4,400 | 54 |
| | Cia Paranaense de Energia | 3,000 | 52 |
| | Lojas Americanas SA | 8,000 | 52 |
| | Usinas Siderurgicas de | | |
| | Minas Gerais SA | 2,000 | 49 |
| | Vivo Participacoes SA | 2,000 | 49 |
| | Gerdau SA | 3,700 | 42 |
| | B2W Cia Global Do Varejo | 1,444 | 42 |
| * | Braskem SA | 6,000 | 40 |
| | Cia Energetica de | | |
| | Minas Gerais | 2,500 | 39 |
| | Suzano Papel e Celulose SA | 4,427 | 38 |
| | Klabin SA | 16,000 | 38 |
| * | Tam SA | 2,669 | 38 |
| | Cia Energetica de Sao Paulo | 3,185 | 37 |
| | Eletropaulo Metropolitana | | |
| | Eletricidade de Sao Paulo | | |
| | SA | 1,908 | 36 |
| * | Fertilizantes Fosfatados SA | 3,692 | 36 |
| * | Tim Participacoes SA | 11,000 | 35 |
| | AES Tiete SA | 3,000 | 34 |
| | Telecomunicacoes de | | |
| | Sao Paulo SA | 1,300 | 32 |
| | Telemar Norte Leste SA | 1,000 | 31 |
| | Light SA | 1,973 | 27 |
| * | Hypermarcas SA | 1,156 | 23 |
| | | |
| | | | Market |
| | | | Value• |
| | | Shares | ($000) |
| | Tele Norte Leste | | |
| | Participacoes SA | 1,000 | 23 |
| | Cia de Saneamento Basico | | |
| | do Estado de Sao Paulo | 1,000 | 19 |
| | Cia de Gas de Sao Paulo | 1,000 | 19 |
| | Cia de Transmissao de | | |
| | Energia Eletrica Paulista | 673 | 19 |
| | AES Tiete SA | 1,149 | 12 |
| * | Cosan SA Industria e | | |
| | Comercio | 1,000 | 11 |
| | Porto Seguro SA | 872 | 9 |
| | Brasil Telecom SA | 1,000 | 9 |
| | EDP-Energias do Brasil SA | 500 | 8 |
| | Cia Energetica de | | |
| | Minas Gerais | 571 | 7 |
| | CPFL Energia SA | 400 | 7 |
| | Telecomunicacoes de | | |
| | Sao Paulo SA | 300 | 7 |
| | | | 14,619 |
| Canada (3.3%) | | |
| | Royal Bank of Canada | 37,300 | 1,889 |
| | Suncor Energy Inc. | 41,740 | 1,386 |
| | Toronto-Dominion Bank | 22,400 | 1,277 |
| | Bank of Nova Scotia | 26,960 | 1,127 |
| | EnCana Corp. | 20,100 | 1,115 |
| | Canadian Natural | | |
| | Resources Ltd. | 14,430 | 936 |
| * | Research In Motion Ltd. | 15,130 | 892 |
| | Barrick Gold Corp. | 24,130 | 869 |
| | Manulife Financial Corp. | 45,150 | 847 |
| | Potash Corp. of | | |
| | Saskatchewan Inc. | 7,910 | 738 |
| | Goldcorp Inc. | 19,920 | 732 |
| | Bank of Montreal | 14,652 | 678 |
| | Canadian Imperial Bank | | |
| | of Commerce | 11,000 | 630 |
| | Canadian National | | |
| | Railway Co. | 12,700 | 614 |
| | TransCanada Corp. | 16,550 | 507 |
| * | Teck Resources Ltd. | | |
| | Class B | 16,300 | 473 |
| | Sun Life Financial Inc. | 17,000 | 470 |
| | Talisman Energy Inc. | 27,000 | 461 |
| | Rogers Communications Inc. | | |
| | Class B | 13,100 | 384 |
| | Kinross Gold Corp. | 19,700 | 366 |
| | Enbridge Inc. | 9,290 | 361 |
| | Brookfield Asset | | |
| | Management Inc. | | |
| | Class A | 16,100 | 340 |
| | Cameco Corp. | 10,900 | 304 |
| | Thomson Reuters Corp. | 9,501 | 302 |
| | Imperial Oil Ltd. | 7,790 | 293 |
| | Nexen Inc. | 13,500 | 290 |
| | Canadian Pacific | | |
| | Railway Ltd. | 6,484 | 281 |
14
| | | | |
| Total World Stock Index Fund | | |
| |
| |
| |
| | | | | Market |
| | | | | Value• |
| | | | Shares | ($000) |
| | Power Corp. of Canada/ | | |
| | Canada | | 9,990 | 235 |
| | Agrium Inc. | | 5,000 | 233 |
| | Shoppers Drug Mart Corp. | 4,960 | 197 |
| | Agnico-Eagle Mines Ltd. | 3,559 | 190 |
| | National Bank of Canada | 3,530 | 184 |
| | Bombardier Inc. | | 42,700 | 173 |
| | Shaw Communications Inc. | | |
| | Class B | | 9,320 | 166 |
| | Power Financial Corp. | | 6,260 | 158 |
| | Husky Energy Inc. | | 5,660 | 149 |
| | BCE Inc. | | 5,900 | 141 |
| * | CGI Group Inc. Class A | | 11,300 | 138 |
| | Magna International Inc. | | |
| | Class A | | 2,530 | 100 |
| | Great-West Lifeco Inc. | | 4,300 | 94 |
| | Canadian Tire Corp. Ltd. | | |
| | Class A | | 1,800 | 91 |
| | TransAlta Corp. | | 4,860 | 91 |
| | Brookfield Properties Corp. | 8,500 | 88 |
| | Barrick Gold Corp. | | 2,400 | 86 |
| | IGM Financial Inc. | | 2,400 | 86 |
| | Canadian Utilities Ltd. | | | |
| | Class A | | 2,400 | 86 |
| | Loblaw Cos. Ltd. | | 2,800 | 77 |
| | Finning International Inc. | 3,500 | 52 |
| | Saputo Inc. | | 2,100 | 50 |
| | George Weston Ltd. | | 900 | 46 |
| | TELUS Corp. | | 1,400 | 44 |
| | TELUS Corp. Class A | | 1,100 | 33 |
| | Bombardier Inc. Class A | 415 | 2 |
| | | | | 21,552 |
| Chile (0.2%) | | | |
| | Empresa Nacional de | | | |
| | Electricidad SA ADR | | 5,728 | 263 |
| | Empresas COPEC SA | | 11,063 | 147 |
| | SACI Falabella | | 22,536 | 107 |
| | CAP SA | | 3,253 | 85 |
| | Sociedad Quimica y | | | |
| | Minera de Chile SA ADR | 2,300 | 85 |
| | Banco Santander Chile ADR | 1,442 | 76 |
| | Enersis SA ADR | | 3,266 | 58 |
| | Banco de Chile | | 648,443 | 51 |
| | Centros Comerciales | | | |
| | Sudamericanos SA | | 16,100 | 50 |
| | Colbun SA | | 177,600 | 42 |
| | Enersis SA | | 114,300 | 41 |
| | ENTEL Chile SA | | 2,800 | 37 |
| | Lan Airlines SA | | 2,800 | 37 |
| | AES Gener SA | | 46,956 | 20 |
| | Sociedad Quimica y | | | |
| | Minera de Chile SA | | | |
| | Class B | | 353 | 13 |
| | CorpBanca SA | 1,250,000 | 8 |
| | Banco Santander Chile | | 145,800 | 7 |
| | | |
| | | | Market |
| | | | Value• |
| | | Shares | ($000) |
| | Embotelladora Andina SA | 2,300 | 7 |
| | Cia Cervecerias Unidas SA | 900 | 6 |
| | | | 1,140 |
| China (2.4%) | | |
| | China Mobile Ltd. | 165,500 | 1,551 |
| | China Construction | | |
| | Bank Corp. | 1,754,000 | 1,512 |
| | Industrial & Commercial | | |
| | Bank of China | 1,172,000 | 932 |
| | China Life | | |
| | Insurance Co. Ltd. | 201,000 | 924 |
| | Bank of China Ltd. | 1,397,000 | 810 |
| | PetroChina Co. Ltd. | 588,000 | 708 |
| | CNOOC Ltd. | 438,000 | 656 |
| | Ping An Insurance | | |
| | Group Co. of China Ltd. | 64,000 | 561 |
| | China Shenhua | | |
| | Energy Co. Ltd. | 110,500 | 496 |
| | China Petroleum & | | |
| | Chemical Corp. | 506,000 | 429 |
| | Tencent Holdings Ltd. | 16,500 | 287 |
| | China Overseas Land & | | |
| | Investment Ltd. | 132,480 | 286 |
| | Bank of | | |
| | Communications Co. Ltd. | 232,000 | 277 |
| | China Unicom | | |
| | Hong Kong Ltd. | 212,770 | 271 |
| | China Merchants | | |
| | Bank Co. Ltd. | 103,700 | 265 |
| | China Coal Energy Co. | 157,000 | 218 |
| | China Telecom Corp. Ltd. | 490,000 | 217 |
| | Aluminum Corp. of | | |
| | China Ltd. | 160,000 | 174 |
| | China Communications | | |
| | Construction Co. Ltd. | 151,000 | 162 |
| | China Citic Bank | 209,509 | 157 |
| | Zijin Mining Group Co. Ltd. | 152,000 | 147 |
| | Citic Pacific Ltd. | 55,000 | 142 |
| *,^ | Byd Co. Ltd. | 14,000 | 128 |
| | Hengan International | | |
| | Group Co. Ltd. | 18,000 | 116 |
| | Tingyi Cayman Islands | | |
| | Holding Corp. | 50,000 | 112 |
| | China Resources | | |
| | Land Ltd. | 44,000 | 106 |
| | China Shipping | | |
| | Development Co. Ltd. | 70,000 | 98 |
| | China Resources Enterprise | 28,000 | 94 |
| | China National Building | | |
| | Material Co. Ltd. | 42,000 | 90 |
| | China Merchants Holdings | | |
| | International Co. Ltd. | 28,000 | 89 |
| | Lenovo Group Ltd. | 158,000 | 88 |
| ^ | Alibaba.com Ltd. | 36,500 | 84 |
15
| | | |
| Total World Stock Index Fund | | |
| |
| |
| |
| | | | Market |
| | | | Value• |
| | | Shares | ($000) |
| | Want Want China | | |
| | Holdings Ltd. | 137,000 | 80 |
| | Sino-Ocean Land | | |
| | Holdings Ltd. | 79,500 | 77 |
| * | GOME Electrical | | |
| | Appliances Holdings Ltd. | 257,720 | 75 |
| * | China Railway Group Ltd. | 94,000 | 74 |
| ^ | China COSCO | | |
| | Holdings Co. Ltd. | 55,000 | 68 |
| | Denway Motors Ltd. | 138,000 | 66 |
| | Anhui Conch | | |
| | Cement Co. Ltd. | 10,000 | 65 |
| | Guangzhou R&F | | |
| | Properties Co. Ltd. | 34,000 | 64 |
| *,^ | China Taiping Insurance | | |
| | Holdings Co. Ltd. | 18,000 | 63 |
| | China Railway | | |
| | Construction Corp. Ltd. | 47,626 | 63 |
| | Yanzhou Coal | | |
| | Mining Co. Ltd. | 40,000 | 62 |
| * | China Mengniu | | |
| | Dairy Co. Ltd. | 22,000 | 62 |
| | Jiangxi Copper Co. Ltd. | 27,000 | 61 |
| | China Resources Power | | |
| | Holdings Co. Ltd. | 29,400 | 61 |
| | Shimao Property | | |
| | Holdings Ltd. | 32,500 | 60 |
| | Dongfeng Motor | | |
| | Group Co. Ltd. | 50,000 | 59 |
| | Weiqiao Textile Co. | 83,500 | 58 |
| | China Yurun Food | | |
| | Group Ltd. | 28,000 | 58 |
| | Cnpc Hong Kong Ltd. | 50,000 | 53 |
| | Kingboard Chemical | | |
| | Holdings Ltd. | 13,000 | 52 |
| | Shanghai Industrial | | |
| | Holdings Ltd. | 11,000 | 52 |
| | Belle International | | |
| | Holdings Ltd. | 50,000 | 50 |
| | Tsingtao Brewery Co. Ltd. | 12,000 | 49 |
| | Nine Dragons Paper | | |
| | Holdings Ltd. | 34,000 | 48 |
| | Beijing Enterprises | | |
| | Holdings Ltd. | 8,000 | 48 |
| | Chaoda Modern | | |
| | Agriculture Holdings Ltd. | 60,000 | 46 |
| | Sinofert Holdings Ltd. | 84,000 | 42 |
| *,^ | PICC Property & | | |
| | Casualty Co. Ltd. | 56,000 | 41 |
| ^ | Angang Steel Co. Ltd. | 22,000 | 41 |
| | Inner Mongolia Yitai | | |
| | Coal Co. Class B | 6,300 | 40 |
| | Yantai Changyu Pioneer | | |
| | Wine Co. Class B | 5,400 | 40 |
| | ZTE Corp. | 7,140 | 40 |
| | | |
| | | | Market |
| | | | Value• |
| | | Shares | ($000) |
| | Agile Property | | |
| | Holdings Ltd. | 30,000 | 38 |
| | Huaneng Power | | |
| | International Inc. | 60,000 | 38 |
| | Li Ning Co. Ltd. | 14,000 | 38 |
| | China Everbright Ltd. | 16,000 | 38 |
| * | Air China Ltd. | 68,000 | 37 |
| * | Beijing Capital International | | |
| | Airport Co. Ltd. | 54,000 | 36 |
| | Yangzijiang Shipbuilding | | |
| | Holdings Ltd. | 50,036 | 35 |
| | Hopson Development | | |
| | Holdings Ltd. | 20,000 | 35 |
| | China Oilfield Services Ltd. | 32,000 | 35 |
| | Zhejiang | | |
| | Expressway Co. Ltd. | 40,000 | 34 |
| *,^ | China Shipping Container | | |
| | Lines Co. Ltd. | 95,000 | 34 |
| | Parkson Retail Group Ltd. | 21,000 | 34 |
| | Shanghai Zhenhua Heavy | | |
| | Industry Co. Ltd. Class B | 39,050 | 32 |
| | China Vanke Co. Ltd. | | |
| | Class B | 26,100 | 32 |
| | Jiangsu Expressway Co. Ltd. | 36,000 | 32 |
| * | Maanshan Iron & Steel | 52,000 | 31 |
| | COSCO Pacific Ltd. | 22,000 | 30 |
| | Fosun International | 44,500 | 30 |
| * | Sinopec Shanghai | | |
| | Petrochemical Co. Ltd. | 74,000 | 30 |
| | China BlueChemical Ltd. | 54,000 | 29 |
| | China International Marine | | |
| | Containers Co. Ltd. Cla | 28,500 | 28 |
| | China High Speed | | |
| | Transmission Equipment | | |
| | Group Co. | 14,000 | 28 |
| | Country Garden | | |
| | Holdings Co. | 73,000 | 28 |
| | Huabao International | | |
| | Holdings Ltd. | 28,000 | 27 |
| | China Agri-Industries | | |
| | Holdings Ltd. | 27,000 | 26 |
| | Datang | | |
| | International Power | | |
| | Generation Co. Ltd. | 48,000 | 23 |
| | Shanghai Electric | | |
| | Group Co. Ltd. | 48,000 | 23 |
| | China South Locomotive | | |
| | and Rolling Stock Corp. | 39,000 | 22 |
| | Soho China Ltd. | 40,000 | 21 |
| | China National | | |
| | Materials Co. Ltd. | 27,000 | 21 |
| * | Huadian Power | | |
| | International Co. | 72,000 | 20 |
| | Weichai Power Co. Ltd. | 3,000 | 20 |
| | China Huiyuan Juice | | |
| | Group Ltd. | 28,000 | 18 |
16
| | | |
| Total World Stock Index Fund | | |
| |
| |
| |
| | | | Market |
| | | | Value• |
| | | Shares | ($000) |
| | Great Wall Motor Co. Ltd. | 14,500 | 16 |
| | Greentown China | | |
| | Holdings Ltd. | 11,000 | 16 |
| * | Shenzhen Special | | |
| | Economic Zone | | |
| | Real Estate & | | |
| | Properties Group Co. Ltd. | | |
| | Class B | 29,400 | 15 |
| * | Hidili Industry International | | |
| | Development Ltd. | 14,000 | 14 |
| | Jiangling Motors Corp. Ltd. | | |
| | Class B | 9,600 | 14 |
| | Guangzhou | | |
| | Investment Co. Ltd. | 48,000 | 13 |
| | China Merchants Property | | |
| | Development Co. Ltd. | | |
| | Class B | 5,200 | 13 |
| | Anta Sports Products Ltd. | 10,000 | 12 |
| * | Double Coin Holdings Ltd. | | |
| | Class B | 22,200 | 12 |
| | KWG Property Holding Ltd. | 16,000 | 11 |
| | Weifu | | |
| | High-Technology Co. Ltd. | | |
| | Class B | 12,505 | 11 |
| | Shenzhen Investment Ltd. | 28,000 | 11 |
| * | Citic Resources | | |
| | Holdings Ltd. | 38,000 | 11 |
| | Zhaojin Mining | | |
| | Industry Co. Ltd. | 6,000 | 11 |
| | TPV Technology Ltd. | 16,000 | 11 |
| | Shanghai Lujiazui | | |
| | Finance & Trade Zone | | |
| | Development Co. Ltd. | | |
| | Class B | 5,600 | 10 |
| * | Sinopec Yizheng Chemical | | |
| | Fibre Co. Ltd. | 42,000 | 10 |
| | Beijing North Star Co. | 28,000 | 10 |
| * | Shanghai Waigaoqiao | | |
| | Free Trade Zone | | |
| | Development Co. Ltd. | | |
| | Class B | 12,200 | 10 |
| | Shanghai Jinjiang | | |
| | International Hotels | | |
| | Development Co. Ltd. | | |
| | Class B | 7,600 | 10 |
| | CSG Holding Co. Ltd. | | |
| | Class B | 10,400 | 10 |
| | Shui On Land Ltd. | 16,500 | 10 |
| | Travelsky Technology LTD. | 11,000 | 9 |
| | Shanghai Jinqiao Export | | |
| | Processing Zone | | |
| | Development Co. Ltd. | | |
| | Class B | 10,100 | 9 |
| | Foshan Electrical and | | |
| | Lighting Co. Ltd. Class B | 13,300 | 9 |
| | Dongfang Electric Corp. Ltd. | 1,800 | 9 |
| | | |
| | | | Market |
| | | | Value• |
| | | Shares | ($000) |
| | Shanghai Mechanical and | | |
| | Electrical Industry Co. Ltd. | | |
| | Class B | 8,500 | 9 |
| * | Shanghai Haixin Group Co. | | |
| | Class B | 25,000 | 9 |
| * | China Eastern Airlines | | |
| | Corp. Ltd. | 32,000 | 9 |
| | Shenzhen Chiwan Wharf | | |
| | Holdings Ltd. Class B | 5,800 | 9 |
| | Anhui Expressway Co. | 14,000 | 9 |
| | China Foods Ltd. | 12,000 | 9 |
| * | China Southern | | |
| | Airlines Co. Ltd. | 30,000 | 9 |
| * | BOE Technology | | |
| | Group Co. Ltd. Class B | 37,300 | 9 |
| | Chongqing Changan | | |
| | Automobile Co. Ltd. | | |
| | Class B | 11,700 | 9 |
| | Shandong Chenming | | |
| | Paper Holdings Ltd. | | |
| | Class B | 12,300 | 9 |
| | Lianhua Supermarket | | |
| | Holdings Co. Ltd. | 4,000 | 9 |
| | Shanghai Chlor-Alkali | | |
| | Chemical Co. Ltd. | | |
| | Class B | 21,800 | 9 |
| | Shanghai Friendship | | |
| | Group Inc. Ltd. Class B | 7,150 | 9 |
| * | Hainan Airlines Co. Ltd. | | |
| | Class B | 16,200 | 9 |
| | Guangdong Electric Power | | |
| | Development Co. Ltd. | | |
| | Class B | 15,300 | 8 |
| | Jinzhou Port Co. Ltd. | | |
| | Class B | 19,920 | 8 |
| | Dazhong Transportation | | |
| | Group Co. Ltd. Class B | 11,800 | 8 |
| | China | | |
| | Molybdenum Co. Ltd. | 10,000 | 8 |
| | Tianjin Capital Environmental | | |
| | Protection Group Co. Ltd. | 28,000 | 8 |
| | Global Bio-Chem Technology | | |
| | Group Co. Ltd. | 32,000 | 8 |
| | Bengang Steel Plates Co. | | |
| | Class B | 15,300 | 8 |
| * | Huadian Energy Co. Ltd. | 22,600 | 8 |
| | Shanghai Jinjiang | | |
| | International Investment | | |
| | Holdings Co. Class B | 7,900 | 7 |
| ^ | Guangzhou Shipyard | | |
| | International Co. Ltd. | 4,000 | 7 |
| | China Communications | | |
| | Services Corp. Ltd. | 14,000 | 7 |
| * | Zhejiang Southeast | | |
| | Electric Power Co. | | |
| | Class B | 12,800 | 7 |
17
| | | |
| Total World Stock Index Fund | | |
| |
| |
| |
| | | | Market |
| | | | Value• |
| | | Shares | ($000) |
| | Guangdong Provincial | | |
| | Expressway | | |
| | Development Co. Ltd. | | |
| | Class B | 14,400 | 7 |
| | Shenzhen | | |
| | Expressway Co. Ltd. | 14,000 | 7 |
| | Guangzhou | | |
| | Pharmaceutical Co. Ltd. | 14,000 | 7 |
| | Sinotrans Ltd. | 25,000 | 7 |
| | Inner Mongolia | | |
| | Eerduosi Cashmere | | |
| | Products Co. Ltd. | | |
| | Class B | 9,100 | 6 |
| | Guangdong Investment Ltd. | 12,000 | 6 |
| | New World China Land Ltd. | 15,600 | 6 |
| * | Semiconductor | | |
| | Manufacturing | | |
| | International Corp. | 121,000 | 6 |
| | Hopewell Highway | | |
| | Infrastructure Ltd. | 9,500 | 6 |
| | Guangshen Railway Co. Ltd. | 14,000 | 6 |
| | China Travel | | |
| | International Inv HK | 26,000 | 5 |
| | Harbin Power | | |
| | Equipment Co. Ltd. | 4,000 | 4 |
| | Shenzhen International | | |
| | Holdings | 32,500 | 2 |
| * | New World China Land | | |
| | Rights Exp. 11/6/2009 | 7,800 | 1 |
| | | | 15,579 |
| Colombia (0.0%) | | |
| | BanColombia SA ADR | 7,047 | 279 |
| |
| Czech Republic (0.1%) | | |
| | CEZ AS | 5,103 | 251 |
| | Telefonica O2 Czech | | |
| | Republic AS | 3,549 | 84 |
| | Komercni Banka AS | 388 | 76 |
| * | Unipetrol | 3,604 | 27 |
| | | | 438 |
| Denmark (0.4%) | | |
| | Novo Nordisk A/S Class B | 14,050 | 873 |
| * | Vestas Wind Systems A/S | 6,100 | 428 |
| * | Danske Bank A/S | 16,000 | 368 |
| | A P Moller-Maersk A/S | | |
| | Class B | 38 | 259 |
| | Carlsberg A/S Class B | 2,645 | 185 |
| | Danisco A/S | 2,626 | 164 |
| | Coloplast A/S Class B | 1,718 | 140 |
| | A P Moller-Maersk A/S | 21 | 140 |
| | Novozymes A/S | 1,050 | 96 |
| | FLSmidth & Co. A/S | 1,000 | 53 |
| | TrygVesta A/S | 600 | 43 |
| * | William Demant Holding | 500 | 36 |
| | |
| | | Market |
| | | Value• |
| | Shares | ($000) |
| H Lundbeck A/S | 1,400 | 27 |
| Rockwool International A/S | | |
| Class B | 83 | 7 |
| | | 2,819 |
| Egypt (0.0%) | | |
| Orascom Construction | | |
| Industries GDR | 3,538 | 171 |
| Orascom Telecom Holding | | |
| SAE GDR | 4,453 | 151 |
| | | 322 |
| Finland (0.4%) | | |
| Nokia Oyj | 98,127 | 1,240 |
| Sampo Oyj | 14,040 | 336 |
| Fortum Oyj | 10,440 | 247 |
| Stora Enso Oyj | 31,225 | 236 |
| Wartsila Oyj | 3,936 | 143 |
| UPM-Kymmene Oyj | 11,620 | 139 |
| Kone Oyj Class B | 3,680 | 137 |
| Metso Oyj | 4,579 | 128 |
| Rautaruukki Oyj | 2,800 | 57 |
| Outokumpu Oyj | 3,200 | 53 |
| Nokian Renkaat Oyj | 2,383 | 51 |
| Neste Oil Oyj | 2,500 | 44 |
| Kesko Oyj Class B | 1,300 | 43 |
| Sanoma Oyj | 1,520 | 28 |
| | | 2,882 |
| France (4.9%) | | |
| Total SA | 63,521 | 3,801 |
| BNP Paribas | 26,362 | 1,986 |
| Sanofi-Aventis SA | 26,108 | 1,914 |
| GDF Suez | 43,463 | 1,817 |
| AXA SA | 55,971 | 1,392 |
| France Telecom SA | 51,738 | 1,282 |
| Societe Generale | 18,896 | 1,255 |
| LVMH Moet Hennessy | | |
| Louis Vuitton SA | 9,943 | 1,030 |
| Groupe Danone SA | 16,768 | 1,007 |
| ArcelorMittal | 27,692 | 937 |
| Vivendi | 32,597 | 904 |
| L’Oreal SA | 8,063 | 824 |
| Carrefour SA | 18,747 | 805 |
| Air Liquide SA | 7,162 | 771 |
| Schneider Electric SA | 6,927 | 720 |
| Vinci SA | 13,432 | 701 |
| Cie de Saint-Gobain | 13,145 | 641 |
| Unibail-Rodamco SE | 2,774 | 614 |
| Pernod-Ricard SA | 6,301 | 525 |
| Alstom SA | 7,428 | 515 |
| Lafarge SA | 6,153 | 499 |
| Credit Agricole SA | 21,818 | 418 |
| Veolia Environnement | 12,790 | 418 |
| EDF SA | 6,285 | 350 |
| Bouygues SA | 7,163 | 337 |
| PPR | 2,980 | 325 |
18
| | | |
| Total World Stock Index Fund | | |
| |
| |
| |
| | | | Market |
| | | | Value• |
| | | Shares | ($000) |
| | Hermes International | 2,325 | 323 |
| | Accor SA | 6,447 | 309 |
| | Cap Gemini SA | 5,814 | 269 |
| * | Renault SA | 5,966 | 267 |
| | Cie Generale d’Optique | | |
| | Essilor International SA | 4,727 | 265 |
| | Suez Environnement Co. | 10,607 | 236 |
| * | Alcatel-Lucent | 62,338 | 233 |
| | Vallourec SA | 1,474 | 232 |
| | SES SA | 10,486 | 227 |
| | Technip SA | 3,152 | 198 |
| | Compagnie Generale des | | |
| | Etablissements Michelin | | |
| | Class B | 2,549 | 189 |
| * | Peugeot SA | 5,734 | 187 |
| | Sodexo | 2,891 | 165 |
| | Christian Dior SA | 1,622 | 162 |
| | Lagardere SCA | 3,008 | 136 |
| | European Aeronautic | | |
| | Defence and Space Co. | | |
| | NV | 7,197 | 135 |
| | STMicroelectronics NV | 15,656 | 126 |
| | Publicis Groupe | 3,284 | 125 |
| * | Natixis | 20,012 | 112 |
| | Eiffage SA | 1,988 | 108 |
| | Societe BIC SA | 1,538 | 107 |
| | SCOR SE | 4,167 | 106 |
| | Thales SA | 1,931 | 94 |
| | Klepierre | 2,112 | 88 |
| | Dassault Systemes SA | 1,502 | 87 |
| | Casino Guichard Perrachon | | |
| | SA | 1,031 | 82 |
| | Eramet | 256 | 80 |
| | CNP Assurances | 781 | 75 |
| | Safran SA | 4,313 | 70 |
| * | Atos Origin SA | 1,468 | 69 |
| | Eutelsat Communications | 2,036 | 65 |
| * | Cie Generale de | | |
| | Geophysique-Veritas | 3,041 | 60 |
| | Societe Television | | |
| | Francaise 1 | 3,698 | 58 |
| | Legrand SA | 2,124 | 58 |
| | Imerys SA | 989 | 54 |
| | Gecina SA | 502 | 53 |
| | Bureau Veritas SA | 953 | 52 |
| | BioMerieux | 450 | 50 |
| | Eurazeo | 773 | 49 |
| | ICADE | 449 | 47 |
| | Aeroports de Paris | 609 | 46 |
| | PagesJaunes Groupe | 3,300 | 40 |
| * | Air France-KLM | 2,389 | 37 |
| | Societe Des Autoroutes | | |
| | Paris-Rhin-Rhone | 463 | 35 |
| | Wendel | 579 | 32 |
| * | JC Decaux SA | 1,529 | 31 |
| | | |
| | | | Market |
| | | | Value• |
| | | Shares | ($000) |
| | Ciments Francais SA | 275 | 30 |
| | EDF Energies Nouvelles SA | 531 | 28 |
| | Iliad SA | 247 | 27 |
| | Ipsen SA | 383 | 19 |
| | Euler Hermes SA | 99 | 8 |
| | | | 31,529 |
| Germany (3.3%) | | |
| | Siemens AG | 24,170 | 2,184 |
| | E.ON AG | 52,769 | 2,022 |
| | Bayer AG | 21,995 | 1,526 |
| | Allianz SE | 11,926 | 1,367 |
| | BASF SE | 24,610 | 1,317 |
| | Daimler AG | 27,075 | 1,315 |
| | Deutsche Bank AG | 16,682 | 1,212 |
| | Deutsche Telekom AG | 86,433 | 1,181 |
| | SAP AG | 24,716 | 1,120 |
| | RWE AG | 10,625 | 932 |
| | Muenchener | | |
| | Rueckversicherungs AG | 5,733 | 907 |
| | Deutsche Boerse AG | 5,621 | 455 |
| | Deutsche Post AG | 26,599 | 450 |
| | MAN SE | 5,022 | 414 |
| | Volkswagen AG | 2,414 | 393 |
| | Bayerische Motoren Werke | | |
| | AG | 7,449 | 364 |
| | ThyssenKrupp AG | 10,356 | 334 |
| | Linde AG | 3,096 | 325 |
| | HeidelbergCement AG | 4,586 | 274 |
| | Volkswagen AG Pfd. | 2,712 | 270 |
| | Henkel AG & Co. KGaA | 5,657 | 258 |
| | K&S AG | 4,557 | 249 |
| | Fresenius Medical Care | | |
| | AG & Co. KGaA | 5,000 | 243 |
| * | Commerzbank AG | 23,041 | 240 |
| | Adidas AG | 4,904 | 227 |
| | Metro AG | 4,088 | 227 |
| | Porsche Automobil | | |
| | Holding SE | 2,340 | 179 |
| | Merck KGaA | 1,611 | 152 |
| * | Infineon Technologies AG | 31,359 | 141 |
| | Beiersdorf AG | 2,190 | 135 |
| * | QIAGEN NV | 5,893 | 122 |
| | Fresenius AG Pfd. | 2,023 | 118 |
| | Henkel AG & Co. KGaA | 3,011 | 116 |
| | Salzgitter AG | 966 | 87 |
| | Hochtief AG | 1,140 | 86 |
| | Deutsche Lufthansa AG | 5,506 | 85 |
| | GEA Group AG | 3,815 | 72 |
| * | Deutsche Postbank AG | 1,970 | 61 |
| | Lanxess AG | 1,944 | 61 |
| | Puma AG Rudolf | | |
| | Dassler Sport | 178 | 55 |
| * | Hannover | | |
| | Rueckversicherung AG | 1,174 | 53 |
| | Wacker Chemie AG | 302 | 43 |
19
| | | |
| Total World Stock Index Fund | | |
| |
| |
| |
| | | | Market |
| | | | Value• |
| | | Shares | ($000) |
| | Fresenius SE | 863 | 43 |
| | Celesio AG | 1,661 | 41 |
| ^ | Solarworld AG | 1,883 | 41 |
| *,^ | TUI AG | 5,250 | 36 |
| | Hamburger Hafen und | | |
| | Logistik AG | 830 | 32 |
| | Generali Deutschland | | |
| | Holding AG | 298 | 28 |
| | Suedzucker AG | 1,351 | 28 |
| | Fraport AG Frankfurt | | |
| | Airport Services | | |
| | Worldwide | 592 | 28 |
| * | Q-Cells SE | 208 | 3 |
| | | | 21,652 |
| Greece (0.3%) | | |
| * | National Bank of Greece | | |
| | SA ADR | 90,006 | 654 |
| | Hellenic | | |
| | Telecommunications | | |
| | Organization SA ADR | 22,804 | 193 |
| * | Alpha Bank AE | 9,570 | 184 |
| * | EFG Eurobank Ergasias SA | 9,774 | 155 |
| | OPAP SA | 6,000 | 153 |
| * | Piraeus Bank SA | 8,073 | 139 |
| | Coca-Cola Hellenic | | |
| | Bottling Co. SA | 2,800 | 73 |
| * | Public Power Corp. SA | 2,970 | 61 |
| | Marfin Investment Group | | |
| | SA | 10,863 | 43 |
| | Titan Cement Co. SA | 1,230 | 43 |
| | Hellenic Petroleum SA | 2,610 | 32 |
| | | | 1,730 |
| Hong Kong (1.2%) | | |
| | Sun Hung Kai | | |
| | Properties Ltd. | 56,000 | 848 |
| | Hutchison Whampoa Ltd. | 93,000 | 653 |
| | Cheung Kong Holdings Ltd. | 51,000 | 647 |
| | Hong Kong Exchanges | | |
| | and Clearing Ltd. | 29,100 | 512 |
| | Li & Fung Ltd. | 88,000 | 366 |
| | Hong Kong & | | |
| | China Gas Co. Ltd. | 136,000 | 327 |
| | Swire Pacific Ltd. | 25,500 | 311 |
| | Hang Seng Bank Ltd. | 21,400 | 302 |
| | CLP Holdings Ltd. | 44,500 | 298 |
| | Hang Lung Properties Ltd. | 61,000 | 231 |
| | Esprit Holdings Ltd. | 34,500 | 230 |
| | Bank of East Asia Ltd. | 65,040 | 228 |
| | BOC Hong Kong | | |
| | Holdings Ltd. | 94,500 | 218 |
| | New World | | |
| | Development Ltd. | 99,000 | 213 |
| | Hongkong Electric | | |
| | Holdings Ltd. | 36,500 | 195 |
| | Hang Lung Group Ltd. | 37,000 | 185 |
| | | |
| | | | Market |
| | | | Value• |
| | | Shares | ($000) |
| | Henderson Land | | |
| | Development Co. Ltd. | 25,000 | 177 |
| | Sino Land Co. Ltd. | 90,000 | 171 |
| | Wharf Holdings Ltd. | 29,000 | 157 |
| | MTR Corp. | 40,000 | 142 |
| | Link REIT | 53,000 | 119 |
| | Shangri-La Asia Ltd. | 61,930 | 119 |
| | Wheelock & Co. Ltd. | 20,000 | 64 |
| | Kerry Properties Ltd. | 11,000 | 61 |
| | Hopewell Holdings Ltd. | 19,000 | 60 |
| | Giordano International Ltd. | 222,000 | 55 |
| * | Cathay Pacific Airways Ltd. | 30,000 | 49 |
| | Guoco Group Ltd. | 4,000 | 45 |
| * | Foxconn International | | |
| | Holdings Ltd. | 45,000 | 39 |
| | Hysan | | |
| | Development Co. Ltd. | 12,000 | 35 |
| | ASM Pacific Technology Ltd. | 4,400 | 34 |
| | Wing Hang Bank Ltd. | 3,500 | 34 |
| | Chinese Estates | | |
| | Holdings Ltd. | 19,500 | 33 |
| | Hongkong & | | |
| | Shanghai Hotels | 22,500 | 32 |
| | Cheung Kong Infrastructure | | |
| | Holdings Ltd. | 9,000 | 32 |
| | Lifestyle International | | |
| | Holdings Ltd. | 19,500 | 31 |
| | First Pacific Co. | 52,000 | 31 |
| | Yue Yuen Industrial | | |
| | Holdings Ltd. | 11,000 | 31 |
| | Hong Kong Aircraft | | |
| | Engineerg Co. Ltd. | 2,400 | 28 |
| | Orient Overseas | | |
| | International Ltd. | 5,500 | 27 |
| | NWS Holdings Ltd. | 14,000 | 27 |
| | Techtronic Industries Co. | 32,000 | 26 |
| | Television Broadcasts Ltd. | 5,000 | 24 |
| | Shun Tak Holdings Ltd. | 34,000 | 23 |
| | PCCW Ltd. | 63,000 | 15 |
| * | Mongolia Energy Co. Ltd. | 35,000 | 15 |
| | Industrial & | | |
| | Commercial Bank of | | |
| | China Asia Ltd. | 5,000 | 12 |
| * | Dah Sing Banking Group Ltd. | 6,800 | 9 |
| | Hutchison | | |
| | Telecommunications | | |
| | Hong Kong Holdings Ltd. | 27,000 | 5 |
| | Cafe de Coral Holdings Ltd. | 2,000 | 4 |
| | Lee & Man Paper | | |
| | Manufacturing Ltd. | 2,000 | 4 |
| | Texwinca Holdings Ltd. | 4,000 | 3 |
| * | Johnson Electric | | |
| | Holdings Ltd. | 6,500 | 3 |
| | Hutchison | | |
| | Telecommunications | | |
| | International Ltd. | 14,000 | 3 |
20
| | | |
| Total World Stock Index Fund | | |
| |
| |
| |
| | | | Market |
| | | | Value• |
| | | Shares | ($000) |
| | C C Land Holdings Ltd. | 5,000 | 3 |
| | Great Eagle Holdings Ltd. | 1,000 | 3 |
| | Hutchison Harbour Ring Ltd. | 34,000 | 2 |
| * | Dah Sing Financial | | |
| | Holdings Ltd. | 400 | 2 |
| * | Galaxy Entertainment | | |
| | Group Ltd. | 5,000 | 2 |
| | Public Financial Holdings Ltd. | 4,000 | 2 |
| | Chong Hing Bank Ltd. | 1,000 | 2 |
| | Fubon Bank Hong Kong Ltd. | 4,000 | 2 |
| * | First Pacific Co., Ltd. | | |
| | Rights Exp. 11/19/2009 | 10,400 | 2 |
| * | Melco International | | |
| | Development Ltd. | 3,000 | 2 |
| | Kowloon | | |
| | Development Co. Ltd. | 1,000 | 1 |
| | | | 7,566 |
| Hungary (0.1%) | | |
| * | MOL Hungarian Oil and | | |
| | Gas NyRt | 2,675 | 224 |
| * | OTP Bank PLC | 7,414 | 208 |
| | Richter Gedeon Nyrt. | 350 | 73 |
| | Magyar Telekom | | |
| | Telecommunications PLC | 9,450 | 41 |
| | | | 546 |
| India (1.3%) | | |
| | Infosys Technologies Ltd. | | |
| | ADR | 19,478 | 896 |
| | Reliance Industries Ltd. | | |
| | GDR | 10,450 | 867 |
| | ICICI Bank Ltd. ADR | 17,225 | 542 |
| | HDFC Bank Ltd. ADR | 3,947 | 437 |
| | Larsen & Toubro Ltd. | 10,702 | 353 |
| | ITC Ltd. | 65,271 | 351 |
| | Housing Development | | |
| | Finance Corp. | 4,891 | 274 |
| | Bharti Airtel Ltd. | 35,158 | 217 |
| | Oil & Natural Gas Corp. Ltd. | 7,187 | 171 |
| | Bharat Heavy | | |
| | Electricals Ltd. | 3,611 | 169 |
| | Tata Steel Ltd. | 13,490 | 133 |
| | Axis Bank Ltd. | 6,816 | 130 |
| | Jindal Steel & Power Ltd. | 9,075 | 122 |
| | Hindustan Unilever Ltd. | 19,661 | 118 |
| | Jaiprakash Associates Ltd. | 26,422 | 116 |
| | NTPC Ltd. | 21,176 | 95 |
| | Sterlite Industries India Ltd. | 5,775 | 93 |
| | DLF Ltd. | 11,665 | 91 |
| | Tata Consultancy | | |
| | Services Ltd. | 6,643 | 88 |
| | Bajaj Auto Ltd. | 2,822 | 83 |
| * | Essar Oil Ltd. | 29,175 | 82 |
| | State Bank of India Ltd. | | |
| | GDR | 866 | 79 |
| | Hindalco Industries Ltd. | 30,397 | 78 |
| | Cipla Ltd. | 11,965 | 72 |
| | | |
| | | | Market |
| | | | Value• |
| | | Shares | ($000) |
| | Infrastructure Development | | |
| | Finance Co. Ltd. | 23,026 | 71 |
| | Reliance | | |
| | Communications Ltd. | 18,701 | 69 |
| | Wipro Ltd. | 5,392 | 69 |
| | Tata Power Co. Ltd. | 2,355 | 66 |
| | Punjab National Bank Ltd. | 3,563 | 64 |
| | GAIL India Ltd. | 8,500 | 63 |
| | Reliance Infrastructure Ltd. | 2,764 | 61 |
| | Unitech Ltd. | 35,546 | 61 |
| | Grasim Industries Ltd. | 1,297 | 60 |
| | Hero Honda Motors Ltd. | 1,785 | 59 |
| | Maruti Suzuki India Ltd. | 1,962 | 58 |
| | JSW Steel Ltd. | 3,635 | 58 |
| | Steel Authority of India Ltd. | 16,628 | 57 |
| | Sesa Goa Ltd. | 8,796 | 56 |
| | Kotak Mahindra Bank Ltd. | 3,703 | 55 |
| * | Cairn India Ltd. | 9,983 | 55 |
| | Reliance Industries Ltd. | 1,282 | 52 |
| | State Bank of India Ltd. | 1,105 | 51 |
| | Mahindra & Mahindra Ltd. | 2,547 | 49 |
| | Sun Pharmaceutical | | |
| | Industries Ltd. | 1,674 | 49 |
| | Tata Motors Ltd. | 4,073 | 48 |
| | Dr Reddys Laboratories Ltd. | 2,173 | 46 |
| | Lupin Ltd. | 1,735 | 45 |
| | Reliance Capital Ltd. | 2,825 | 44 |
| | Crompton Greaves Ltd. | 5,454 | 44 |
| * | Reliance Natural | | |
| | Resources Ltd. | 32,234 | 43 |
| * | Housing Development & | | |
| | Infrastructure Ltd. | 6,221 | 41 |
| | Piramal Healthcare Ltd. | 4,744 | 38 |
| | United Spirits Ltd. | 1,678 | 38 |
| | HCL Technologies Ltd. | 5,856 | 38 |
| | Siemens India Ltd. | 3,380 | 37 |
| | Adani Enterprises Ltd. | 2,411 | 36 |
| | Satyam Computer | | |
| | Services Ltd. ADR | 6,743 | 36 |
| * | Idea Cellular Ltd. | 32,485 | 35 |
| | Hindustan Petroleum | | |
| | Corp. Ltd. | 4,736 | 35 |
| | ABB Ltd. | 2,131 | 35 |
| | Bharat Petroleum Corp. Ltd. | 3,151 | 34 |
| | Power Grid Corp. of | | |
| | India Ltd. | 15,224 | 33 |
| * | Ranbaxy Laboratories Ltd. | 3,987 | 33 |
| | Bank of India | 4,536 | 32 |
| | Nestle India Ltd. | 558 | 30 |
| * | Reliance Power Ltd. | 10,393 | 30 |
| * | GMR Infrastructure Ltd. | 23,104 | 30 |
| | Punj Lloyd Ltd. | 6,563 | 28 |
| | Indian Oil Corp. Ltd. | 4,142 | 27 |
| * | NHPC Ltd. | 39,502 | 26 |
| * | Adani Power Ltd. | 11,943 | 25 |
| | Aditya Birla Nuvo Ltd. | 1,481 | 25 |
21
| | | |
| Total World Stock Index Fund | | |
| |
| |
| |
| | | | Market |
| | | | Value• |
| | | Shares | ($000) |
| | Tata Communications Ltd. | 3,012 | 25 |
| * | Oracle Financial Sevices | | |
| | Software Ltd. | 506 | 23 |
| | Wipro Ltd. ADR | 1,286 | 22 |
| | Union Bank of India | 3,919 | 22 |
| | Aban Offshore Ltd. | 801 | 21 |
| | Mphasis Ltd. | 1,471 | 21 |
| | Tech Mahindra Ltd. | 885 | 17 |
| * | Suzlon Energy Ltd. | 12,023 | 17 |
| * | Lanco Infratech Ltd. | 1,446 | 15 |
| | Bharat Forge Ltd. | 2,760 | 14 |
| | Ashok Leyland Ltd. | 14,952 | 14 |
| | Hindustan Zinc Ltd. | 678 | 13 |
| | Financial Technologies | | |
| | India Ltd. | 470 | 12 |
| | Corp Bank | 1,243 | 11 |
| | Godrej Industries Ltd. | 2,902 | 11 |
| | Bajaj Finserv Ltd. | 1,537 | 10 |
| | Ultratech Cement Ltd. | 628 | 10 |
| | Bajaj Holdings and | | |
| | Investment Ltd. | 965 | 10 |
| | Bharat Electronics Ltd. | 323 | 10 |
| * | Jet Airways India Ltd. | 1,168 | 9 |
| | Neyveli Lignite Corp. Ltd. | 3,390 | 9 |
| | Dabur India Ltd. | 2,859 | 9 |
| | Bank of Baroda | 847 | 9 |
| | Mangalore Refinery & | | |
| | Petrochemicals Ltd. | 5,750 | 9 |
| | Canara Bank | 1,238 | 9 |
| | National Aluminium Co. Ltd. | 1,179 | 9 |
| | Colgate-Palmolive India Ltd. | 595 | 9 |
| | Sun TV Network Ltd. | 1,307 | 9 |
| | Zee Entertainment | | |
| | Enterprises Ltd. | 1,759 | 8 |
| | Power Finance Corp. Ltd. | 1,785 | 8 |
| | Castrol India Ltd. | 742 | 8 |
| | IDBI Bank Ltd. | 3,367 | 8 |
| | Tata Chemicals Ltd. | 1,429 | 8 |
| | ACC Ltd. | 491 | 8 |
| | Mundra Port and | | |
| | Special Economic | | |
| | Zone Ltd. | 731 | 8 |
| | Shipping Corp. of | | |
| | India Ltd. | 2,795 | 8 |
| | Oriental Bank of | | |
| | Commerce | 1,490 | 8 |
| | Ambuja Cements Ltd. | 3,515 | 7 |
| * | Tata Teleservices | | |
| | Maharashtra Ltd. | 10,939 | 6 |
| | Great Eastern | | |
| | Shipping Co. Ltd. | 1,077 | 5 |
| | Indiabulls Financial | | |
| | Services Ltd. | 1,287 | 5 |
| | Mahanagar Telephone | | |
| | Nigam | 2,962 | 4 |
| | | |
| | | | Market |
| | | | Value• |
| | | Shares | ($000) |
| | Divi’s Laboratories Ltd. | 360 | 4 |
| | Glenmark | | |
| | Pharmaceuticals Ltd. | 216 | 1 |
| | | | 8,315 |
| Indonesia (0.2%) | | |
| | Astra International Tbk PT | 94,500 | 304 |
| | Telekomunikasi Indonesia | | |
| | Tbk PT | 284,000 | 245 |
| | Bank Central Asia Tbk PT | 494,000 | 233 |
| | Bank Rakyat Indonesia | 227,500 | 166 |
| | Bumi Resources Tbk PT | 547,500 | 132 |
| | United Tractors Tbk PT | 56,500 | 87 |
| | Perusahaan Gas Negara PT | 177,500 | 66 |
| | Bank Mandiri Tbk PT | 94,000 | 45 |
| | Tambang Batubara Bukit | | |
| | Asam Tbk PT | 24,000 | 37 |
| | Unilever Indonesia Tbk PT | 30,000 | 31 |
| | Indosat Tbk PT | 52,500 | 28 |
| | Gudang Garam Tbk PT | 13,000 | 19 |
| | Indofood Sukses Makmur | | |
| | Tbk PT | 58,500 | 18 |
| | Indocement Tunggal | | |
| | Prakarsa Tbk PT | 12,000 | 14 |
| | Bank Danamon Indonesia | | |
| | Tbk PT | 28,995 | 13 |
| | Astra Agro Lestari Tbk PT | 5,500 | 12 |
| | Aneka Tambang Tbk PT | 50,000 | 12 |
| * | International Nickel | | |
| | Indonesia Tbk PT | 28,000 | 12 |
| | Semen Gresik Persero | | |
| | Tbk PT | 13,000 | 9 |
| * | Bank Pan Indonesia Tbk PT | 94,000 | 7 |
| | | | 1,490 |
| Ireland (0.1%) | | |
| | CRH PLC | 19,516 | 478 |
| * | Governor & Co. of | | |
| | the Bank of Ireland | 36,194 | 91 |
| * | Elan Corp. PLC | 16,288 | 85 |
| | Kerry Group PLC Class A | 2,658 | 79 |
| * | Allied Irish Banks PLC | 28,487 | 79 |
| * | Ryanair Holdings PLC | 10,139 | 44 |
| * | Anglo Irish Bank Corp. Ltd. | 14,385 | 5 |
| | | | 861 |
| Israel (0.4%) | | |
| | Teva Pharmaceutical | | |
| | Industries Ltd. | 24,463 | 1,233 |
| * | Check Point Software | | |
| | Technologies | 6,800 | 211 |
| | Israel Chemicals Ltd. | 16,377 | 191 |
| | Bezeq Israeli | | |
| | Telecommunication | | |
| | Corp. Ltd. | 40,830 | 91 |
| * | Bank Hapoalim BM | 21,040 | 77 |
| | Perrigo Co. | 1,533 | 56 |
22
| | | |
| Total World Stock Index Fund | | |
| |
| |
| |
| | | | Market |
| | | | Value• |
| | | Shares | ($000) |
| | Bank Leumi Le-Israel BM | 13,800 | 54 |
| | Partner | | |
| | Communications Co. Ltd. | 1,900 | 36 |
| * | Nice Systems Ltd. | 1,000 | 31 |
| * | Israel Corp. Ltd. | 45 | 31 |
| | Elbit Systems Ltd. | 500 | 30 |
| | Makhteshim-Agan | | |
| | Industries Ltd. | 5,400 | 25 |
| | Cellcom Israel Ltd. | 748 | 22 |
| | Delek Group Ltd. | 129 | 21 |
| * | Clal Insurance | 900 | 19 |
| * | Elbit Imaging Ltd. | 579 | 14 |
| | Discount Investment Corp. | 600 | 14 |
| * | Mizrahi Tefahot Bank Ltd. | 1,500 | 12 |
| * | Clal Industries and | | |
| | Investments | 2,300 | 12 |
| | Koor Industries Ltd. | 400 | 12 |
| | Delek Automotive | | |
| | Systems Ltd. | 1,000 | 11 |
| | Oil Refineries Ltd. | 19,025 | 11 |
| * | First International Bank Of | | |
| | Israel Ltd. | 708 | 10 |
| | Israel Discount Bank Ltd. | | |
| | Class A | 5,200 | 10 |
| | Gazit-Globe Ltd. | 1,058 | 10 |
| | Property & Building Corp. | 137 | 10 |
| * | Harel Insurance | | |
| | Investments & | | |
| | Financial Services Ltd. | 200 | 10 |
| * | Hot Telecommunication | | |
| | System Ltd. | 900 | 9 |
| * | Migdal Insurance & | | |
| | Financial Holding Ltd. | 5,000 | 8 |
| | Paz Oil Co. Ltd. | 50 | 8 |
| * | Africa Israel | | |
| | Investments Ltd. | 600 | 8 |
| | IDB Holding Corp. Ltd. | 302 | 7 |
| | Shufersal Ltd. | 1,500 | 7 |
| | Ormat Industries | 762 | 7 |
| | Strauss Group Ltd. | 500 | 7 |
| | Osem Investments Ltd. | 400 | 5 |
| | | | 2,330 |
| Italy (1.6%) | | |
| | ENI SPA | 72,814 | 1,803 |
| * | UniCredit SPA | 448,534 | 1,503 |
| | Enel SPA | 195,423 | 1,163 |
| | Assicurazioni Generali SPA | 40,655 | 1,024 |
| * | Intesa Sanpaolo SPA | 238,312 | 1,003 |
| | Telecom Italia SPA | 358,680 | 570 |
| * | Fiat SPA | 23,135 | 344 |
| | Tenaris SA ADR | 8,784 | 313 |
| | Saipem SPA | 7,894 | 233 |
| | Atlantia SPA | 9,836 | 233 |
| | Unione di Banche Italiane | | |
| | SCPA | 14,255 | 204 |
| * | Banco Popolare SC | 19,824 | 172 |
| | | |
| | | | Market |
| | | | Value• |
| | | Shares | ($000) |
| | Snam Rete Gas SPA | 34,158 | 166 |
| | Finmeccanica SPA | 9,196 | 154 |
| | Telecom Italia SPA RNC | 138,625 | 152 |
| | Mediaset SPA | 19,820 | 129 |
| | Banca Monte dei Paschi | | |
| | di Siena SPA | 67,571 | 128 |
| | Terna Rete Elettrica | | |
| | Nazionale SPA | 32,070 | 127 |
| | Mediobanca SPA | 9,537 | 122 |
| ^ | Bulgari SPA | 13,803 | 113 |
| | Mediolanum SPA | 17,581 | 112 |
| | Parmalat SPA | 38,241 | 106 |
| * | Autogrill SPA | 8,082 | 91 |
| * | Unipol Gruppo Finanziario | | |
| | SPA | 90,640 | 86 |
| * | Luxottica Group SPA | 2,802 | 68 |
| | Banca Popolare di | | |
| | Milano Scarl | 8,822 | 66 |
| | Fondiaria-Sai SPA | 4,737 | 58 |
| | A2A SPA | 30,365 | 56 |
| | Banca Carige SPA | 18,844 | 53 |
| * | Pirelli & C SPA | 85,948 | 48 |
| | Exor SPA | 1,909 | 38 |
| | Fondiaria-Sai SPA | 2,001 | 36 |
| | Italcementi SPA | 4,726 | 36 |
| | Buzzi Unicem SPA | 1,855 | 31 |
| | Lottomatica SPA | 1,383 | 29 |
| | Italcementi SPA | 2,037 | 29 |
| | Saras SPA | 8,757 | 28 |
| | Edison SPA | 18,221 | 28 |
| | Exor SPA | 942 | 10 |
| | Benetton Group SPA | 588 | 6 |
| * | Unipol Gruppo Finanziario | | |
| | SPA | 3,259 | 5 |
| | | | 10,676 |
| Japan (8.3%) | | |
| | Toyota Motor Corp. | 68,900 | 2,720 |
| | Mitsubishi UFJ Financial | | |
| | Group Inc. | 309,400 | 1,648 |
| | Canon Inc. | 35,800 | 1,350 |
| | Honda Motor Co. Ltd. | 37,400 | 1,155 |
| | Panasonic Corp. | 66,000 | 932 |
| | Sumitomo Mitsui Financial | | |
| | Group Inc. | 27,200 | 925 |
| | Sony Corp. | 26,600 | 785 |
| | NTT DoCoMo Inc. | 520 | 754 |
| | Mitsubishi Corp. | 35,000 | 742 |
| | Tokyo Electric Power Co. Inc. | 29,100 | 715 |
| | Takeda | | |
| | Pharmaceutical Co. Ltd. | 17,500 | 700 |
| | Nomura Holdings Inc. | 94,400 | 665 |
| | Nippon Telegraph & | | |
| | Telephone Corp. | 16,000 | 660 |
| | Nintendo Co. Ltd. | 2,600 | 652 |
| | Nippon Steel Corp. | 151,000 | 576 |
| | East Japan Railway Co. | 8,800 | 564 |
23
| | |
| Total World Stock Index Fund | | |
| |
| |
| |
| | | Market |
| | | Value• |
| | Shares | ($000) |
| Mizuho Financial | | |
| Group Inc. | 281,200 | 555 |
| Komatsu Ltd. | 28,000 | 546 |
| Mitsui & Co. Ltd. | 41,200 | 541 |
| KDDI Corp. | 100 | 531 |
| Mitsubishi Estate Co. Ltd. | 33,000 | 498 |
| Shin-Etsu | | |
| Chemical Co. Ltd. | 9,300 | 493 |
| Toshiba Corp. | 83,000 | 474 |
| Kansai Electric | | |
| Power Co. Inc. | 21,500 | 465 |
| Nissan Motor Co. Ltd. | 63,500 | 459 |
| Fanuc Ltd. | 5,500 | 457 |
| Tokio Marine Holdings Inc. | 17,800 | 455 |
| Kyocera Corp. | 5,300 | 445 |
| Japan Tobacco Inc. | 155 | 435 |
| JFE Holdings Inc. | 13,300 | 433 |
| Astellas Pharma Inc. | 10,600 | 390 |
| Seven & I Holdings Co. Ltd. | 17,600 | 385 |
| Mitsubishi Heavy | | |
| Industries Ltd. | 104,000 | 368 |
| FUJIFILM Holdings Corp. | 12,900 | 367 |
| Softbank Corp. | 15,300 | 361 |
| Mitsui Fudosan Co. Ltd. | 22,000 | 356 |
| Murata | | |
| Manufacturing Co. Ltd. | 7,100 | 346 |
| Central Japan Railway Co. | 49 | 326 |
| Chubu Electric | | |
| Power Co. Inc. | 14,600 | 326 |
| Mitsui Sumitomo Insurance | | |
| Group Holdings Inc. | 13,600 | 317 |
| Suzuki Motor Corp. | 13,000 | 315 |
| Bridgestone Corp. | 18,900 | 312 |
| Daiichi Sankyo Co. Ltd. | 15,600 | 305 |
| Mitsubishi Electric Corp. | 39,000 | 297 |
| Fujitsu Ltd. | 50,000 | 294 |
| Sumitomo Corp. | 30,100 | 292 |
| Kao Corp. | 13,000 | 290 |
| Denso Corp. | 10,400 | 284 |
| Kirin Holdings Co. Ltd. | 17,000 | 277 |
| Rohm Co. Ltd. | 4,100 | 272 |
| Sumitomo Metal | | |
| Industries Ltd. | 102,000 | 261 |
| ITOCHU Corp. | 41,000 | 259 |
| Yamada Denki Co. Ltd. | 4,180 | 255 |
| Daikin Industries Ltd. | 7,000 | 237 |
| Yakult Honsha Co. Ltd. | 9,000 | 234 |
| ORIX Corp. | 3,530 | 228 |
| Hitachi Ltd. | 70,000 | 226 |
| Sumitomo Metal | | |
| Mining Co. Ltd. | 14,000 | 221 |
| Daiwa Securities Group Inc. | 41,000 | 216 |
| Fast Retailing Co. Ltd. | 1,300 | 214 |
| Sharp Corp. | 20,000 | 213 |
| Electric Power | | |
| Development Co. Ltd. | 6,800 | 210 |
| | | |
| | | | Market |
| | | | Value• |
| | | Shares | ($000) |
| | Sumitomo Realty & | | |
| | Development Co. Ltd. | 11,000 | 209 |
| | Nippon Oil Corp. | 41,000 | 202 |
| | Ibiden Co. Ltd. | 5,600 | 200 |
| | Marubeni Corp. | 40,000 | 198 |
| | Terumo Corp. | 3,700 | 195 |
| | Eisai Co. Ltd. | 5,400 | 192 |
| | Secom Co. Ltd. | 4,100 | 191 |
| | Keyence Corp. | 960 | 191 |
| | Nomura Research | | |
| | Institute Ltd. | 8,800 | 190 |
| | Ricoh Co. Ltd. | 14,000 | 190 |
| | Tokyo Gas Co. Ltd. | 48,000 | 190 |
| | Tohoku Electric | | |
| | Power Co. Inc. | 9,100 | 187 |
| | Tokyo Electron Ltd. | 3,200 | 180 |
| | Mitsui OSK Lines Ltd. | 31,000 | 180 |
| | Sumitomo Chemical Co. Ltd. | 45,000 | 179 |
| | Asahi Glass Co. Ltd. | 21,000 | 177 |
| | Sumitomo Electric | | |
| | Industries Ltd. | 14,400 | 175 |
| | Hoya Corp. | 7,900 | 174 |
| | Daito Trust | | |
| | Construction Co. Ltd. | 4,100 | 170 |
| | Kyushu Electric | | |
| | Power Co. Inc. | 8,300 | 169 |
| | Sumitomo Trust & | | |
| | Banking Co. Ltd. | 32,000 | 167 |
| | Dai Nippon Printing Co. Ltd. | 13,000 | 163 |
| | Mitsubishi Chemical | | |
| | Holdings Corp. | 42,500 | 158 |
| | Olympus Corp. | 4,900 | 153 |
| | SMC Corp. | 1,300 | 148 |
| | Isuzu Motors Ltd. | 69,000 | 146 |
| *,^ | Mitsubishi Motors Corp. | 96,000 | 142 |
| | Asahi Breweries Ltd. | 7,900 | 140 |
| | Resona Holdings Inc. | 11,600 | 138 |
| | Toray Industries Inc. | 24,000 | 137 |
| | Higo Bank Ltd. | 23,000 | 136 |
| | NGK Insulators Ltd. | 6,000 | 135 |
| | Seino Holdings Corp. | 18,000 | 133 |
| | INPEX Corp. | 16 | 131 |
| | Nikon Corp. | 7,000 | 130 |
| | Shionogi & Co. Ltd. | 6,000 | 129 |
| | Shiseido Co. Ltd. | 7,000 | 128 |
| | TDK Corp. | 2,200 | 126 |
| | Hankyu Hanshin | | |
| | Holdings Inc. | 28,000 | 125 |
| | Yahoo! Japan Corp. | 405 | 124 |
| | Osaka Gas Co. Ltd. | 37,000 | 124 |
| | Chugoku Electric | | |
| | Power Co. Inc. | 6,000 | 121 |
| | West Japan Railway Co. | 34 | 120 |
| | Fukuyama | | |
| | Transporting Co. Ltd. | 23,000 | 120 |
| | Shizuoka Bank Ltd. | 12,000 | 119 |
24
| | | |
| Total World Stock Index Fund | | |
| |
| |
| |
| | | | Market |
| | | | Value• |
| | | Shares | ($000) |
| | Aeon Co. Ltd. | 13,300 | 119 |
| | Nidec Corp. | 1,400 | 118 |
| | Yamato Holdings Co. Ltd. | 8,000 | 118 |
| | T&D Holdings Inc. | 4,550 | 118 |
| | Sotetsu Holdings Inc. | 27,000 | 116 |
| ^ | Casio Computer Co. Ltd. | 15,800 | 116 |
| | Asahi Kasei Corp. | 23,000 | 114 |
| | Mitsubishi Materials Corp. | 43,000 | 113 |
| | Bank of Yokohama Ltd. | 23,000 | 113 |
| | Ajinomoto Co. Inc. | 12,000 | 113 |
| | Shikoku Electric Power Co. | 3,900 | 110 |
| | Kubota Corp. | 14,000 | 109 |
| | Toppan Printing Co. Ltd. | 12,000 | 107 |
| | Daiwa House | | |
| | Industry Co. Ltd. | 10,000 | 107 |
| | Odakyu Electric | | |
| | Railway Co. Ltd. | 13,000 | 106 |
| | Sekisui House Ltd. | 12,000 | 104 |
| | Toho Gas Co. Ltd. | 20,000 | 104 |
| | Sojitz Corp. | 55,200 | 102 |
| | Kobe Steel Ltd. | 55,000 | 100 |
| | Chugai | | |
| | Pharmaceutical Co. Ltd. | 5,100 | 100 |
| | Ono | | |
| | Pharmaceutical Co. Ltd. | 2,100 | 100 |
| | Sompo Japan Insurance Inc. | 17,000 | 99 |
| | Kokuyo Co. Ltd. | 11,200 | 98 |
| | Kintetsu Corp. | 27,000 | 96 |
| | Chuo Mitsui Trust | | |
| | Holdings Inc. | 26,000 | 95 |
| | Omron Corp. | 5,600 | 94 |
| | Aisin Seiki Co. Ltd. | 3,700 | 94 |
| | Nitto Denko Corp. | 3,100 | 94 |
| | Kuraray Co. Ltd. | 9,000 | 93 |
| | Tokyu Corp. | 21,000 | 92 |
| | JS Group Corp. | 5,600 | 91 |
| | Taisho | | |
| | Pharmaceutical Co. Ltd. | 5,000 | 91 |
| * | NEC Corp. | 32,000 | 91 |
| | Nippon Paint Co. Ltd. | 15,000 | 90 |
| | JSR Corp. | 4,600 | 90 |
| | Makita Corp. | 2,700 | 89 |
| | Benesse Corp. | 2,000 | 88 |
| | JTEKT Corp. | 8,300 | 88 |
| | Toyota Industries Corp. | 3,200 | 87 |
| | Hokuriku Electric Power Co. | 3,800 | 87 |
| | Trend Micro Inc. | 2,500 | 87 |
| | Chiba Bank Ltd. | 14,000 | 86 |
| | Nippon Express Co. Ltd. | 21,000 | 86 |
| | Lawson Inc. | 1,900 | 85 |
| | Nissin Foods | | |
| | Holdings Co., Ltd. | 2,400 | 85 |
| | Konica Minolta | | |
| | Holdings Inc. | 9,000 | 85 |
| | OJI Paper Co. Ltd. | 19,000 | 83 |
| | Tobu Railway Co. Ltd. | 15,000 | 82 |
| | | |
| | | | Market |
| | | | Value• |
| | | Shares | ($000) |
| | Keio Corp. | 13,000 | 82 |
| *,^ | Sanyo Electric Co. Ltd. | 33,000 | 82 |
| | Nippon Yusen KK | 22,000 | 81 |
| | NTT Data Corp. | 28 | 81 |
| | Keihin Electric Express | | |
| | Railway Co. Ltd. | 10,000 | 80 |
| | Advantest Corp. | 3,600 | 79 |
| | Mazda Motor Corp. | 35,000 | 79 |
| | Brother Industries Ltd. | 6,900 | 79 |
| | Taiyo Nippon Sanso Corp. | 7,000 | 78 |
| | Hokkaido Electric | | |
| | Power Co. Inc. | 4,000 | 77 |
| | Fukuoka Financial Group Inc. | 21,000 | 77 |
| | JGC Corp. | 4,000 | 76 |
| | Nipponkoa | | |
| | Insurance Co. Ltd. | 14,000 | 76 |
| | Nippon Mining | | |
| | Holdings Inc. | 17,000 | 76 |
| | Panasonic Electric | | |
| | Works Co. Ltd. | 6,000 | 76 |
| | Nippon Electric | | |
| | Glass Co. Ltd. | 7,000 | 75 |
| | Stanley Electric Co. Ltd. | 3,800 | 74 |
| | TonenGeneral Sekiyu KK | 8,000 | 73 |
| | Hirose Electric Co. Ltd. | 700 | 72 |
| | SBI Holdings Inc. | 387 | 71 |
| | Joyo Bank Ltd. | 16,000 | 70 |
| | Kyowa Hakko Kirin Co. Ltd. | 6,000 | 69 |
| | Toyo Seikan Kaisha Ltd. | 4,100 | 69 |
| | Sony Financial Holdings Inc. | 24 | 69 |
| | Shimano Inc. | 1,800 | 69 |
| | Circle K Sunkus Co. Ltd. | 5,000 | 69 |
| | Unicharm Corp. | 700 | 67 |
| | Sekisui Chemical Co. Ltd. | 11,000 | 67 |
| | Japan Steel Works Ltd. | 6,000 | 66 |
| | NSK Ltd. | 11,000 | 64 |
| | Bank of Kyoto Ltd. | 7,000 | 64 |
| | Iyo Bank Ltd. | 7,000 | 63 |
| | Fuji Heavy Industries Ltd. | 16,000 | 63 |
| | THK Co. Ltd. | 3,600 | 62 |
| | Aioi Insurance Co. Ltd. | 14,000 | 62 |
| | Kurita Water | | |
| | Industries Ltd. | 2,000 | 61 |
| | Mitsumi Electric Co. Ltd. | 3,000 | 61 |
| *,^ | GS Yuasa Corp. | 7,000 | 60 |
| | Kawasaki Heavy | | |
| | Industries Ltd. | 24,000 | 60 |
| | Dentsu Inc. | 2,700 | 58 |
| | Sankyo Co. Ltd. | 1,000 | 57 |
| | Obayashi Corp. | 15,000 | 57 |
| | Isetan Mitsukoshi | | |
| | Holdings Ltd. | 5,800 | 56 |
| | Oriental Land Co. Ltd. | 800 | 54 |
| | All Nippon | | |
| | Airways Co. Ltd. | 19,000 | 53 |
| | Toyo Suisan Kaisha Ltd. | 2,000 | 52 |
25
| | | |
| Total World Stock Index Fund | | |
| |
| |
| |
| | | | Market |
| | | | Value• |
| | | Shares | ($000) |
| | Mediceo Paltac | | |
| | Holdings Co. Ltd. | 3,700 | 52 |
| | Nissan Chemical | | |
| | Industries Ltd. | 4,000 | 52 |
| | Nitori Co. Ltd. | 600 | 49 |
| | Nagoya Railroad Co. Ltd. | 16,000 | 49 |
| | Rinnai Corp. | 1,100 | 48 |
| | Konami Corp. | 2,600 | 47 |
| | Cosmo Oil Co. Ltd. | 18,000 | 47 |
| | Air Water Inc. | 4,000 | 47 |
| | Nisshin Seifun Group Inc. | 3,500 | 47 |
| | Keihan Electric | | |
| | Railway Co. Ltd. | 11,000 | 46 |
| | Kikkoman Corp. | 4,000 | 46 |
| | Dainippon Sumitomo | | |
| | Pharma Co. Ltd. | 4,400 | 46 |
| | Hokuhoku Financial | | |
| | Group Inc. | 21,000 | 45 |
| * | MEIJI Holdings Co. Ltd. | 1,117 | 45 |
| | Nippon Paper Group Inc. | 1,700 | 45 |
| | Toho Co. Ltd. | 3,000 | 45 |
| | Tsumura & Co. | 1,300 | 45 |
| | Hisamitsu | | |
| | Pharmaceutical Co. Inc. | 1,300 | 45 |
| | Santen | | |
| | Pharmaceutical Co. Ltd. | 1,300 | 45 |
| | Aeon Mall Co. Ltd. | 2,100 | 44 |
| | Kawasaki Kisen Kaisha Ltd. | 12,000 | 44 |
| | Hitachi Chemical Co. Ltd. | 2,200 | 44 |
| | Kansai Paint Co. Ltd. | 5,000 | 42 |
| | Shimizu Corp. | 11,000 | 42 |
| * | Kagome Co. Ltd. | 2,200 | 42 |
| | Hachijuni Bank Ltd. | 7,000 | 41 |
| | Teijin Ltd. | 14,000 | 41 |
| | Daihatsu Motor Co. Ltd. | 4,000 | 41 |
| | Dowa Holdings Co., Ltd. | 7,000 | 41 |
| | Chugoku Bank Ltd. | 3,000 | 40 |
| | Denki Kagaku Kogyo K K | 11,000 | 40 |
| | 77 Bank Ltd. | 7,000 | 40 |
| | Seiko Epson Corp. | 2,600 | 40 |
| * | IHI Corp. | 21,000 | 40 |
| | Hamamatsu Photonics KK | 1,600 | 40 |
| | Hitachi Construction | | |
| | Machinery Co. Ltd. | 1,700 | 40 |
| | Toyota Boshoku Corp. | 1,900 | 40 |
| | Keisei Electric | | |
| | Railway Co. Ltd. | 7,000 | 39 |
| | Yaskawa Electric Corp. | 5,000 | 39 |
| | Suzuken Co. Ltd. | 1,100 | 39 |
| | Yokogawa Electric Corp. | 4,800 | 39 |
| | FamilyMart Co. Ltd. | 1,300 | 39 |
| | NOK Corp. | 2,900 | 38 |
| | Sega Sammy Holdings Inc. | 2,700 | 38 |
| | Mitsubishi Tanabe | | |
| | Pharma Corp. | 3,000 | 38 |
| | Shimamura Co. Ltd. | 400 | 38 |
| | | |
| | | | Market |
| | | | Value• |
| | | Shares | ($000) |
| | Yamaguchi Financial | | |
| | Group Inc. | 4,000 | 38 |
| | Hitachi Metals Ltd. | 4,000 | 38 |
| * | Mizuho Trust & | | |
| | Banking Co. Ltd. | 40,000 | 38 |
| | Mizuho Securities Co. Ltd. | 11,000 | 38 |
| | J Front Retailing Co. Ltd. | 8,000 | 38 |
| | Mitsui Chemicals Inc. | 11,000 | 38 |
| | Tokuyama Corp. | 6,000 | 38 |
| | Kajima Corp. | 16,000 | 37 |
| | Yamazaki Baking Co. Ltd. | 3,000 | 37 |
| | Amada Co. Ltd. | 6,000 | 37 |
| | Toyoda Gosei Co. Ltd. | 1,300 | 36 |
| | Wacoal Holdings Corp. | 3,000 | 36 |
| | Sumitomo Heavy | | |
| | Industries Ltd. | 8,000 | 36 |
| | Daicel Chemical | | |
| | Industries Ltd. | 6,000 | 36 |
| | Ushio Inc. | 2,300 | 36 |
| | Suruga Bank Ltd. | 4,000 | 36 |
| | Nippon Kayaku Co. Ltd. | 4,000 | 36 |
| | Credit Saison Co. Ltd. | 3,200 | 36 |
| | Toyota Tsusho Corp. | 2,500 | 36 |
| | USS Co. Ltd. | 590 | 36 |
| | Asics Corp. | 4,000 | 36 |
| | Nippon Sheet Glass Co. Ltd. | 12,000 | 35 |
| *,^ | Shinsei Bank Ltd. | 27,000 | 35 |
| | Nippon Meat Packers Inc. | 3,000 | 35 |
| * | Ebara Corp. | 8,000 | 35 |
| | Yokohama Rubber Co. Ltd. | 8,000 | 35 |
| | San-In Godo Bank Ltd. | 4,000 | 35 |
| | Showa Denko KK | 18,000 | 35 |
| | Mitsubishi Rayon Co. Ltd. | 10,000 | 35 |
| | Hiroshima Bank Ltd. | 9,000 | 35 |
| | Sumco Corp. | 1,800 | 34 |
| | Furukawa Electric Co. Ltd. | 9,000 | 34 |
| | Tokyo Steel | | |
| | Manufacturing Co. Ltd. | 2,600 | 34 |
| | NGK Spark Plug Co. Ltd. | 3,000 | 34 |
| | Taiyo Yuden Co. Ltd. | 3,000 | 34 |
| | Fujikura Ltd. | 7,000 | 34 |
| | Takashimaya Co. Ltd. | 5,000 | 34 |
| | Mitsui Engineering & | | |
| | Shipbuilding Co. Ltd. | 13,000 | 34 |
| | Nippon Shokubai Co. Ltd. | 4,000 | 34 |
| | Ube Industries Ltd. | 13,000 | 33 |
| | Nissha Printing Co. Ltd. | 700 | 33 |
| | Citizen Holdings Co. Ltd. | 5,900 | 33 |
| | Namco Bandai Holdings Inc. | 3,200 | 33 |
| | Ezaki Glico Co. Ltd. | 3,000 | 33 |
| | Nanto Bank Ltd. | 6,000 | 33 |
| | Kinden Corp. | 4,000 | 32 |
| | Miraca Holdings Inc. | 1,000 | 32 |
| | QP Corp. | 2,800 | 32 |
| | Tokyu Land Corp. | 8,000 | 32 |
| | Ryohin Keikaku Co. Ltd. | 700 | 31 |
26
| | | |
| Total World Stock Index Fund | | |
| |
| |
| |
| | | | Market |
| | | | Value• |
| | | Shares | ($000) |
| | Hokkoku Bank Ltd. | 8,000 | 31 |
| * | Elpida Memory Inc. | 2,400 | 31 |
| | Sapporo Holdings Ltd. | 6,000 | 31 |
| | Gunma Bank Ltd. | 6,000 | 31 |
| | NHK Spring Co. Ltd. | 4,000 | 31 |
| | UNY Co. Ltd. | 4,200 | 31 |
| | Dena Co. Ltd. | 9 | 31 |
| | DIC Corp. | 19,000 | 31 |
| | Onward Holdings Co. Ltd. | 5,000 | 31 |
| | Shiga Bank Ltd. | 5,000 | 31 |
| | Yamaha Motor Co. Ltd. | 2,600 | 31 |
| * | Mitsui Mining & | | |
| | Smelting Co. Ltd. | 12,000 | 31 |
| | Oracle Corp. Japan | 700 | 31 |
| | Canon Marketing Japan Inc. | 1,900 | 31 |
| | Sumitomo Forestry Co. Ltd. | 4,000 | 31 |
| | Takara Holdings Inc. | 5,000 | 31 |
| | Obic Co. Ltd. | 180 | 30 |
| | Nishi-Nippon | | |
| | Railroad Co. Ltd. | 8,000 | 30 |
| | Komeri Co. Ltd. | 1,100 | 30 |
| | Autobacs Seven Co. Ltd. | 900 | 30 |
| | Alfresa Holdings Corp. | 700 | 30 |
| | NTN Corp. | 8,000 | 30 |
| | Kobayashi | | |
| | Pharmaceutical Co. Ltd. | 700 | 30 |
| | Pacific Metals Co. Ltd. | 4,000 | 30 |
| | Kamigumi Co. Ltd. | 4,000 | 30 |
| | Yamato Kogyo Co. Ltd. | 1,000 | 30 |
| | Alps Electric Co. Ltd. | 4,800 | 30 |
| | Japan Petroleum | | |
| | Exploration Co. | 600 | 30 |
| | Square Enix | | |
| | Holdings Co., Ltd. | 1,200 | 30 |
| | Maruichi Steel Tube Ltd. | 1,600 | 30 |
| | Fuji Electric | | |
| | Holdings Co. Ltd. | 16,000 | 30 |
| | Nishi-Nippon City Bank Ltd. | 12,000 | 30 |
| | TOTO Ltd. | 5,000 | 30 |
| | Tosoh Corp. | 11,000 | 30 |
| | Yamatake Corp. | 1,400 | 30 |
| | Kagoshima Bank Ltd. | 4,000 | 30 |
| | Sumitomo Rubber | | |
| | Industries Ltd. | 3,200 | 29 |
| | Nisshinbo Holdings Inc. | 3,000 | 29 |
| | Taisei Corp. | 15,000 | 29 |
| | Minebea Co. Ltd. | 7,000 | 29 |
| | Idemitsu Kosan Co. Ltd. | 400 | 29 |
| | Mitsubishi UFJ Lease & | | |
| | Finance Co. Ltd. | 980 | 29 |
| | Chiyoda Corp. | 4,000 | 29 |
| | ABC-Mart Inc. | 1,000 | 29 |
| | Tokai Carbon Co. Ltd. | 6,000 | 29 |
| | Mabuchi Motor Co. Ltd. | 600 | 29 |
| | Sapporo Hokuyo | | |
| | Holdings Inc. | 8,500 | 29 |
| | | |
| | | | Market |
| | | | Value• |
| | | Shares | ($000) |
| | House Foods Corp. | 1,800 | 29 |
| | Nomura Real Estate | | |
| | Holdings Inc. | 1,800 | 29 |
| | Hakuhodo DY | | |
| | Holdings Inc. | 570 | 29 |
| | Juroku Bank Ltd. | 8,000 | 29 |
| | Ito En Ltd. | 1,700 | 29 |
| | Showa Shell Sekiyu KK | 2,900 | 29 |
| | Sumitomo Bakelite Co. Ltd. | 6,000 | 28 |
| | Rengo Co. Ltd. | 5,000 | 28 |
| | Aeon Credit Service Co. Ltd. | 2,900 | 28 |
| | Shimadzu Corp. | 4,000 | 28 |
| | Mitsubishi Gas | | |
| | Chemical Co. Inc. | 6,000 | 28 |
| | Matsumotokiyoshi | | |
| | Holdings Co. Ltd. | 1,200 | 28 |
| | Ogaki Kyoritsu Bank Ltd. | 8,000 | 27 |
| | Aoyama Trading Co. Ltd. | 1,700 | 27 |
| | Daido Steel Co. Ltd. | 8,000 | 27 |
| | Marui Group Co. Ltd. | 4,700 | 27 |
| | Yamaha Corp. | 2,600 | 27 |
| | Shinko Electric | | |
| | Industries Co. Ltd. | 1,800 | 27 |
| | Toda Corp. | 8,000 | 27 |
| | Glory Ltd. | 1,200 | 26 |
| | Toyobo Co. Ltd. | 17,000 | 26 |
| | Sumitomo Osaka | | |
| | Cement Co. Ltd. | 15,000 | 26 |
| | Awa Bank Ltd. | 5,000 | 26 |
| | Kaneka Corp. | 4,000 | 26 |
| * | Aozora Bank Ltd. | 22,000 | 26 |
| | Nichirei Corp. | 7,000 | 26 |
| | Musashino Bank Ltd. | 900 | 26 |
| | NTT Urban | | |
| | Development Corp. | 32 | 26 |
| | Daishi Bank Ltd. | 7,000 | 25 |
| | Matsui Securities Co. Ltd. | 3,500 | 25 |
| | Jafco Co. Ltd. | 900 | 24 |
| | Izumi Co. Ltd. | 2,000 | 24 |
| | Tokyo Tatemono Co. Ltd. | 5,000 | 24 |
| | Capcom Co. Ltd. | 1,400 | 24 |
| * | Japan Airlines Corp. | 18,000 | 23 |
| | Kissei | | |
| | Pharmaceutical Co. Ltd. | 1,000 | 22 |
| | Mitsubishi Logistics Corp. | 2,000 | 22 |
| | Nisshin Steel Co. Ltd. | 13,000 | 22 |
| | Nipro Corp. | 1,000 | 22 |
| | COMSYS Holdings Corp. | 2,000 | 20 |
| | Taiheiyo Cement Corp. | 17,000 | 20 |
| | IT Holdings Corp. | 1,600 | 20 |
| * | Haseko Corp. | 25,500 | 20 |
| | Don Quijote Co. Ltd. | 700 | 19 |
| | Leopalace21 Corp. | 3,300 | 18 |
| | Lion Corp. | 3,000 | 15 |
| | Koito | | |
| | Manufacturing Co. Ltd. | 1,000 | 14 |
27
| | | |
| Total World Stock Index Fund | | |
| |
| |
| |
| | | | Market |
| | | | Value• |
| | | Shares | ($000) |
| | Shimachu Co. Ltd. | 600 | 14 |
| | Takata Corp. | 700 | 13 |
| | Coca-Cola West Co. Ltd. | 700 | 13 |
| * | Dainippon Screen | | |
| | Manufacturing Co. Ltd. | 3,000 | 13 |
| | Tokai Rika Co. Ltd. | 600 | 12 |
| | Hyakujushi Bank Ltd. | 3,000 | 12 |
| | Nagase & Co. Ltd. | 1,000 | 12 |
| | Nabtesco Corp. | 1,000 | 11 |
| | Disco Corp. | 200 | 11 |
| | Culture Convenience | | |
| | Club Co. Ltd. | 1,700 | 10 |
| | Mochida | | |
| | Pharmaceutical Co. Ltd. | 1,000 | 10 |
| | Sundrug Co. Ltd. | 400 | 10 |
| | Point Inc. | 170 | 10 |
| | Hyakugo Bank Ltd. | 2,000 | 10 |
| | Funai Electric Co. Ltd. | 200 | 9 |
| | Zeon Corp. | 2,000 | 9 |
| | Tokyo Style Co. Ltd. | 1,000 | 8 |
| | Toshiba TEC Corp. | 2,000 | 8 |
| | Gunze Ltd. | 2,000 | 8 |
| | Nidec Sankyo Corp. | 1,000 | 8 |
| | Mori Seiki Co. Ltd. | 700 | 8 |
| | Hino Motors Ltd. | 2,000 | 7 |
| | NS Solutions Corp. | 400 | 7 |
| | Lintec Corp. | 400 | 7 |
| | Tokai Rubber Industries Inc. | 600 | 7 |
| | Ulvac Inc. | 300 | 7 |
| | MISUMI Group Inc. | 400 | 7 |
| | Hitachi Koki Co. Ltd. | 600 | 7 |
| | Nippon Television | | |
| �� | Network Corp. | 50 | 7 |
| | PanaHome Corp. | 1,000 | 6 |
| | Toho Titanium Co. Ltd. | 500 | 6 |
| | Kandenko Co. Ltd. | 1,000 | 6 |
| * | Mizuho Investors | | |
| | Securities Co. Ltd. | 6,000 | 6 |
| | Shima Seiki | | |
| | Manufacturing Ltd. | 300 | 6 |
| | H2O Retailing Corp. | 1,000 | 6 |
| | Promise Co. Ltd. | 950 | 6 |
| | Sumitomo Real Estate | | |
| | Sales Co. Ltd. | 170 | 6 |
| | Monex Group Inc. | 15 | 6 |
| | Sohgo Security | | |
| | Services Co. Ltd. | 500 | 6 |
| | Acom Co. Ltd. | 450 | 6 |
| | Hikari Tsushin Inc. | 300 | 6 |
| | Toyota Auto Body Co. Ltd. | 300 | 6 |
| | Itochu Techno- | | |
| | Solutions Corp. | 200 | 5 |
| | Hitachi Cable Ltd. | 2,000 | 5 |
| | OSAKA Titanium | | |
| | Technologies Co. | 200 | 5 |
| | Otsuka Corp. | 100 | 5 |
| | | |
| | | | Market |
| | | | Value• |
| | | Shares | ($000) |
| | Hitachi Capital Corp. | 400 | 5 |
| | Hitachi High- | | |
| | Technologies Corp. | 300 | 5 |
| | Toppan Forms Co. Ltd. | 400 | 5 |
| | Heiwa Corp. | 500 | 5 |
| | OKUMA Corp. | 1,000 | 5 |
| | Keiyo Bank Ltd. | 1,000 | 5 |
| | Sumisho Computer | | |
| | Systems Corp. | 300 | 5 |
| | Okasan Securities Group Inc. | 1,000 | 5 |
| | SKY Perfect JSAT | | |
| | Holdings Inc. | 10 | 5 |
| | TV Asahi Corp. | 3 | 5 |
| | Tokyo Broadcasting System | | |
| | Holdings Inc. | 300 | 4 |
| | Sysmex Corp. | 100 | 4 |
| | Nissay Dowa General | | |
| | Insurance Co. Ltd. | 1,000 | 4 |
| | Fuji Media Holdings Inc. | 3 | 4 |
| | Kose Corp. | 200 | 4 |
| | kabu.com Securities Co. Ltd. | 4 | 4 |
| | Kansai Urban Banking Corp. | 3,000 | 4 |
| | Bank of Nagoya Ltd. | 1,000 | 4 |
| | Asatsu-DK Inc. | 200 | 4 |
| | Axell Corp. | 100 | 4 |
| * | NEC Electronics Corp. | 500 | 4 |
| | Takefuji Corp. | 630 | 2 |
| * | SFCG Co. Ltd. | 120 | — |
| | | | 53,398 |
| Luxembourg (0.0%) | | |
| * | Millicom International | | |
| | Cellular SA | 2,647 | 166 |
| | RTL Group SA | 436 | 27 |
| | | | 193 |
| Malaysia (0.4%) | | |
| | CIMB Group Holdings Bhd. | 84,700 | 307 |
| | Sime Darby Bhd. | 106,100 | 274 |
| | Public Bank Bhd. | 86,511 | 269 |
| | Malayan Banking Bhd. | 131,815 | 255 |
| | IOI Corp. Bhd. | 117,600 | 182 |
| | Genting Bhd. | 72,900 | 153 |
| * | Axiata Group Bhd. | 153,766 | 131 |
| | MISC Bhd. | 31,700 | 82 |
| | AMMB Holdings Bhd. | 50,200 | 69 |
| | PPB Group Bhd. | 14,300 | 63 |
| | Kuala Lumpur Kepong Bhd. | 13,100 | 57 |
| | British American Tobacco | | |
| | Malaysia Bhd. | 4,200 | 55 |
| | DiGi.com Bhd. | 8,500 | 54 |
| | Tenaga Nasional Bhd. | 22,100 | 54 |
| | IJM Corp. Bhd. | 36,260 | 51 |
| | YTL Power International Bhd. | 77,337 | 49 |
| | Genting Malaysia Bhd. | 58,900 | 47 |
| | UMW Holdings Bhd. | 24,600 | 45 |
| | PLUS Expressways Bhd. | 45,700 | 44 |
| | YTL Corp. Bhd. | 19,788 | 42 |
28
| | | |
| Total World Stock Index Fund | | |
| |
| |
| |
| | | | Market |
| | | | Value• |
| | | Shares | ($000) |
| | Hong Leong Bank Bhd. | 17,200 | 38 |
| | SP Setia Bhd. | 31,400 | 35 |
| | Gamuda Bhd. | 35,900 | 33 |
| | MMC Corp. Bhd. | 41,100 | 30 |
| | Petronas Dagangan Bhd. | 11,400 | 30 |
| | Tanjong PLC | 6,700 | 30 |
| | Petronas Gas Bhd. | 10,100 | 29 |
| | Astro All Asia Networks PLC | 29,600 | 29 |
| | Alliance Financial Group | | |
| | Bhd. | 39,200 | 28 |
| | Parkson Holdings Bhd. | 18,600 | 28 |
| | Telekom Malaysia Bhd. | 22,300 | 20 |
| | Berjaya Sports Toto Bhd. | 15,000 | 19 |
| | Proton Holdings Bhd. | 9,400 | 10 |
| | EON Capital Bhd. | 5,400 | 9 |
| | Lafarge Malayan Cement | | |
| | Bhd. | 4,300 | 8 |
| | RHB Capital Bhd. | 4,400 | 7 |
| | Puncak Niaga Holding Bhd. | 5,100 | 5 |
| | | | 2,671 |
| Mexico (0.6%) | | |
| | America Movil SAB de CV | 554,133 | 1,223 |
| * | Grupo Mexico SAB de CV | | |
| | Class B | 240,453 | 482 |
| | Fomento Economico | | |
| | Mexicano SAB de CV | 70,400 | 305 |
| | Wal-Mart de Mexico SAB | | |
| | de CV | 82,800 | 289 |
| * | Cemex SAB de CV ADR | 27,352 | 284 |
| | Grupo Televisa SA | 73,200 | 283 |
| | Telefonos de Mexico SAB | | |
| | de CV | 309,600 | 258 |
| | Grupo Financiero Banorte | | |
| | SAB de CV | 66,900 | 214 |
| | Telmex Internacional SAB | | |
| | de CV | 206,158 | 139 |
| * | Carso Global Telecom SAB | | |
| | de CV | 24,600 | 96 |
| * | Grupo Modelo SAB de CV | 14,700 | 67 |
| | Grupo Financiero Inbursa | | |
| | SA | 22,400 | 63 |
| | Grupo Elektra SA de CV | 1,600 | 63 |
| | Industrias Penoles SAB | | |
| | de CV | 2,850 | 52 |
| | Grupo Carso SAB de CV | 16,100 | 47 |
| | Grupo Bimbo SAB de CV | | |
| | Class A | 7,500 | 44 |
| | Kimberly-Clark de Mexico | | |
| | SAB de CV Class A | 10,800 | 43 |
| | Alfa SAB de CV Class A | 7,600 | 39 |
| * | Urbi Desarrollos Urbanos | | |
| | SAB de CV | 15,000 | 29 |
| | Grupo Aeroportuario del | | |
| | Pacifico SAB de CV | | |
| | Class B | 11,000 | 28 |
| | | |
| | | | Market |
| | | | Value• |
| | | Shares | ($000) |
| | Mexichem SAB de CV | 5,815 | 9 |
| * | Impulsora Del Desarrollo | | |
| | Y El Empleo en America | | |
| | Latina SAB de CV | 7,300 | 7 |
| * | Carso Infraestructura y | | |
| | Construccion SAB de CV | 9,700 | 5 |
| * | Organizacion Soriana SAB | | |
| | de CV Class B | 2,300 | 5 |
| | | | 4,074 |
| Netherlands (1.0%) | | |
| | Unilever NV | 42,162 | 1,299 |
| | Koninklijke KPN NV | 40,579 | 736 |
| * | ING Groep NV | 56,247 | 732 |
| | Koninklijke Philips | | |
| | Electronics NV | 26,519 | 666 |
| | Koninklijke Ahold NV | 33,504 | 422 |
| | Akzo Nobel NV | 6,526 | 385 |
| * | Aegon NV | 51,362 | 365 |
| | Reed Elsevier NV | 27,227 | 317 |
| | TNT NV | 11,597 | 308 |
| | ASML Holding NV | 9,845 | 266 |
| | Heineken NV | 5,620 | 248 |
| | Koninklijke DSM NV | 4,138 | 181 |
| | Wolters Kluwer NV | 6,585 | 147 |
| | Corio NV | 1,742 | 118 |
| | Heineken Holding NV | 2,818 | 110 |
| * | Randstad Holding NV | 2,650 | 101 |
| | Fugro NV | 1,747 | 97 |
| | SBM Offshore NV | 3,446 | 66 |
| | | | 6,564 |
| New Zealand (0.1%) | | |
| | Fletcher Building Ltd. | 13,771 | 81 |
| | Telecom Corp. of | | |
| | New Zealand Ltd. | 41,938 | 76 |
| | Auckland International | | |
| | Airport Ltd. | 35,852 | 52 |
| | Contact Energy Ltd. | 9,078 | 40 |
| | Sky City Entertainment | | |
| | Group Ltd. | 14,815 | 37 |
| | Kiwi Income Property Trust | 41,436 | 32 |
| | Fisher & Paykel | | |
| | Healthcare Corp. Ltd. | 11,541 | 25 |
| | Air New Zealand Ltd. | 8,903 | 8 |
| | Sky Network Television Ltd. | 2,309 | 8 |
| | Warehouse Group Ltd. | 2,427 | 8 |
| | Vector Ltd. | 4,251 | 6 |
| | | | 373 |
| Norway (0.4%) | | |
| | StatoilHydro ASA | 34,050 | 802 |
| * | Telenor ASA | 24,400 | 315 |
| | Orkla ASA | 29,450 | 272 |
| * | DnB NOR ASA | 22,700 | 260 |
| | Yara International ASA | 7,250 | 240 |
| * | Norsk Hydro ASA | 30,500 | 200 |
| * | Seadrill Ltd. | 8,800 | 183 |
29
| | | |
| Total World Stock Index Fund | | |
| |
| |
| |
| | | | Market |
| | | | Value• |
| | | Shares | ($000) |
| * | Storebrand ASA | 22,000 | 149 |
| | Aker Solutions ASA | 4,710 | 57 |
| * | Renewable Energy Corp. AS | 7,603 | 45 |
| | | | 2,523 |
| Peru (0.1%) | | |
| | Cia de Minas | | |
| | Buenaventura SA ADR | 7,678 | 258 |
| | Credicorp Ltd. | 800 | 55 |
| * | Volcan Cia Minera SAA | | |
| | Class B | 20,403 | 24 |
| | Sociedad Minera Cerro | | |
| | Verde SA | 543 | 12 |
| | | | 349 |
| Philippines (0.0%) | | |
| | Manila Electric Co. | 15,000 | 58 |
| | Philippine Long Distance | | |
| | Telephone Co. | 1,000 | 54 |
| | Bank of the | | |
| | Philippine Islands | 40,136 | 39 |
| | SM Investments Corp. | 5,000 | 33 |
| | SM Prime Holdings Inc. | 134,000 | 28 |
| | Ayala Land Inc. | 106,300 | 23 |
| | Jollibee Foods Corp. | 20,000 | 21 |
| | Globe Telecom Inc. | 1,000 | 19 |
| | Ayala Corp. | 2,000 | 12 |
| * | Petron Corp. | 47,000 | 5 |
| | Metropolitan Bank & Trust | 3,000 | 3 |
| | Banco de Oro Unibank Inc. | 3,000 | 2 |
| | | | 297 |
| Poland (0.1%) | | |
| | Powszechna Kasa | | |
| | Oszczednosci Bank Polski | | |
| | SA | 24,131 | 286 |
| * | Bank Pekao SA | 4,079 | 219 |
| | KGHM Polska Miedz SA | 3,126 | 105 |
| | Telekomunikacja Polska SA | 14,500 | 85 |
| * | Polski Koncern | | |
| | Naftowy Orlen | 6,193 | 64 |
| * | Getin Holding SA | 12,268 | 35 |
| | TVN SA | 6,300 | 31 |
| | Polskie Gornictwo | | |
| | Naftowe I Gazownictwo | | |
| | SA | 25,082 | 31 |
| * | Bank Zachodni WBK SA | 200 | 11 |
| * | BRE Bank SA | 100 | 9 |
| * | Globe Trade Centre SA | 1,000 | 9 |
| * | Bank Handlowy w | | |
| | Warszawie SA | 362 | 8 |
| | | | 893 |
| Portugal (0.2%) | | |
| | EDP-Energias de Portugal | | |
| | SA | 75,786 | 335 |
| | Portugal Telecom SGPS SA | 27,018 | 309 |
| | Banco Comercial | | |
| | Portugues SA | 90,214 | 129 |
| | | | |
| | | | | Market |
| | | | | Value• |
| | | | Shares | ($000) |
| | Zon Multimedia Servicos | | |
| | de Telecomunicacoes e | | |
| | Multimedia SGPS SA | 17,019 | 108 |
| | Brisa Auto-Estradas de | | |
| | Portugal SA | | 10,263 | 101 |
| | Galp Energia SGPS SA | | |
| | Class B | | 5,441 | 92 |
| * | EDP Renovaveis SA | | 5,968 | 59 |
| | Jeronimo Martins SGPS | | |
| | SA | | 5,743 | 51 |
| | Banco BPI SA | | 13,085 | 44 |
| | Banco Espirito Santo SA | 5,640 | 42 |
| | Cimpor Cimentos de | | | |
| | Portugal SGPS SA | | 4,605 | 36 |
| | | | | 1,306 |
| Russia (0.9%) | | | |
| | Lukoil OAO ADR | | 17,510 | 1,016 |
| | Gazprom OAO | | 149,807 | 891 |
| | Gazprom OAO ADR | | 30,565 | 733 |
| | Rosneft Oil Co. GDR | | 68,425 | 520 |
| | Surgutneftegaz ADR | | 54,490 | 481 |
| | Sberbank of | | | |
| | Russian Federation | | 196,932 | 429 |
| | MMC Norilsk Nickel ADR | 22,270 | 293 |
| * | Federal Grid Co. Unified | | |
| | Energy System JSC | 19,840,905 | 211 |
| | VTB Bank OJSC GDR | | 52,503 | 209 |
| | Tatneft ADR | | 7,257 | 188 |
| | Mobile Telesystems OJSC | 19,331 | 133 |
| * | Uralkali | | 22,779 | 99 |
| | Lukoil OAO | | 1,420 | 82 |
| * | Novolipetsk Steel OJSC | 17,769 | 46 |
| | Polyus Gold Co. | | 864 | 45 |
| | Rosneft Oil Co. | | 3,288 | 25 |
| | Rostelecom | | 3,672 | 24 |
| * | Magnitogorsk Iron & | | | |
| | Steel Works | | 33,131 | 24 |
| * | Sistema JSFC | | 32,701 | 21 |
| * | Polymetal | | 2,155 | 19 |
| * | Severstal | | 1,736 | 13 |
| | Gazpromneft JSC | | 2,355 | 12 |
| * | Wimm-Bill-Dann Foods | | |
| | OJSC ADR | | 155 | 10 |
| | Aeroflot-Russian | | | |
| | International Airlines | 5,336 | 7 |
| | | | | 5,531 |
| Singapore (0.7%) | | | |
| | Singapore | | | |
| | Telecommunications Ltd. | 183,000 | 380 |
| | DBS Group Holdings Ltd. | 38,000 | 348 |
| | United Overseas Bank Ltd. | 27,000 | 324 |
| | Oversea-Chinese Banking | | |
| | Corp. Ltd. | | 56,000 | 302 |
| | Wilmar International Ltd. | 67,972 | 300 |
| | Keppel Corp. Ltd. | | 39,984 | 230 |
30
| | | |
| Total World Stock Index Fund | | |
| |
| |
| |
| | | | Market |
| | | | Value• |
| | | Shares | ($000) |
| | Singapore Exchange Ltd. | 37,737 | 214 |
| | CapitaLand Ltd. | 72,500 | 210 |
| | Hongkong Land | | |
| | Holdings Ltd. | 39,000 | 184 |
| | Jardine Matheson | | |
| | Holdings Ltd. | 5,600 | 167 |
| | Fraser and Neave Ltd. | 51,000 | 139 |
| | Singapore Airlines Ltd. | 14,000 | 134 |
| | Cerebos Pacific Ltd. | 54,000 | 130 |
| | Parkway Holdings Ltd. | 67,455 | 120 |
| | City Developments Ltd. | 17,000 | 119 |
| | Noble Group Ltd. | 57,000 | 104 |
| | Venture Corp. Ltd. | 16,000 | 102 |
| | Singapore Press | | |
| | Holdings Ltd. | 37,000 | 101 |
| | Haw Par Corp. Ltd. | 23,000 | 91 |
| * | Golden Agri-Resources Ltd. | 277,831 | 84 |
| | Singapore Technologies | | |
| | Engineering Ltd. | 32,000 | 64 |
| | Olam International Ltd. | 33,000 | 63 |
| | Singapore Post Ltd. | 93,000 | 62 |
| | CapitaMall Trust | 50,600 | 57 |
| | Pacific Century Regional | | |
| | Developments Ltd. | 374,906 | 56 |
| | ComfortDelgro Corp. Ltd. | 47,000 | 51 |
| | Jardine Cycle & | | |
| | Carriage Ltd. | 3,000 | 49 |
| | MobileOne Ltd. | 38,000 | 47 |
| | SembCorp Industries Ltd. | 19,231 | 45 |
| * | Chartered Semiconductor | | |
| | Manufacturing Ltd. | 24,277 | 45 |
| | SembCorp Marine Ltd. | 18,389 | 45 |
| | CapitaCommercial Trust | 51,810 | 39 |
| | UOL Group Ltd. | 14,000 | 33 |
| | StarHub Ltd. | 21,000 | 28 |
| | Keppel Land Ltd. | 7,600 | 15 |
| | Allgreen Properties Ltd. | 16,000 | 13 |
| | Yanlord Land Group Ltd. | 8,000 | 13 |
| | Neptune Orient Lines Ltd. | 10,500 | 12 |
| | Wing Tai Holdings Ltd. | 8,000 | 9 |
| * | STATS ChipPAC Ltd. | 15,000 | 9 |
| | Hotel Properties Ltd. | 6,000 | 9 |
| | Wheelock Properties | | |
| | Singapore Ltd. | 7,000 | 9 |
| | Guocoland Ltd. | 6,000 | 8 |
| | Singapore Land Ltd. | 2,000 | 8 |
| | Cosco Corp. Singapore Ltd. | 8,000 | 6 |
| | SIA Engineering Co. Ltd. | 3,000 | 6 |
| | People’s Food Holdings Ltd. | 11,000 | 5 |
| | SMRT Corp. Ltd. | 4,000 | 5 |
| * | Golden Agri-Resources Ltd. | | |
| | Warrants Exp. 7/23/2012 | 18,588 | 2 |
| | | | 4,596 |
| South Africa (1.1%) | | |
| | MTN Group Ltd. | 50,601 | 753 |
| | Sasol Ltd. | 17,093 | 640 |
| | | |
| | | | Market |
| | | | Value• |
| | | Shares | ($000) |
| | Standard Bank Group Ltd. | 42,360 | 529 |
| | Naspers Ltd. | 11,991 | 433 |
| | Impala Platinum | | |
| | Holdings Ltd. | 17,010 | 374 |
| | AngloGold Ashanti Ltd. | 9,866 | 368 |
| | FirstRand Ltd. | 132,675 | 299 |
| | Gold Fields Ltd. | 19,764 | 253 |
| | Anglo Platinum Ltd. | 2,479 | 214 |
| | Bidvest Group Ltd. | 11,797 | 185 |
| | Sanlam Ltd. | 67,039 | 184 |
| | Shoprite Holdings Ltd. | 21,730 | 177 |
| | Remgro Ltd. | 13,822 | 162 |
| | Steinhoff International | | |
| | Holdings Ltd. | 56,242 | 136 |
| | ABSA Group Ltd. | 8,309 | 131 |
| | Harmony Gold | | |
| | Mining Co. Ltd. | 12,855 | 129 |
| | Kumba Iron Ore Ltd. | 2,931 | 87 |
| | Nedbank Group Ltd. | 5,380 | 81 |
| * | Vodacom Group Pty Ltd. | 11,531 | 80 |
| | ArcelorMittal | | |
| | South Africa Ltd. | 5,758 | 77 |
| * | Aspen Pharmacare | | |
| | Holdings Ltd. | 9,112 | 77 |
| | Murray & | | |
| | Roberts Holdings Ltd. | 10,671 | 76 |
| | RMB Holdings Ltd. | 20,726 | 76 |
| | Tiger Brands Ltd. | 3,750 | 75 |
| | African Bank | | |
| | Investments Ltd. | 18,001 | 70 |
| | Aveng Ltd. | 12,423 | 66 |
| | Truworths International Ltd. | 11,000 | 63 |
| | Growthpoint Properties Ltd. | 33,443 | 59 |
| | Imperial Holdings Ltd. | 5,300 | 55 |
| | Investec Ltd. | 7,000 | 52 |
| | Massmart Holdings Ltd. | 4,300 | 50 |
| | Pretoria Portland | | |
| | Cement Co. Ltd. | 10,728 | 45 |
| | Spar Group Ltd. | 4,900 | 43 |
| | Nampak Ltd. | 19,300 | 42 |
| | Barloworld Ltd. | 6,580 | 41 |
| | African Rainbow | | |
| | Minerals Ltd. | 2,043 | 40 |
| | Sappi Ltd. | 10,510 | 39 |
| | Reunert Ltd. | 5,500 | 39 |
| | Netcare Ltd. | 26,300 | 39 |
| | Tongaat Hulett Ltd. | 2,852 | 37 |
| | Foschini Ltd. | 4,500 | 36 |
| | Woolworths Holdings Ltd. | 15,400 | 34 |
| | Discovery Holdings Ltd. | 8,542 | 34 |
| | Adcock Ingram Holdings Ltd. | 4,808 | 33 |
| | Mr Price Group Ltd. | 7,108 | 32 |
| * | Sun International Ltd. | 2,760 | 32 |
| | Telkom SA Ltd. | 5,420 | 30 |
| | Aeci Ltd. | 3,756 | 29 |
| | Pick n Pay Stores Ltd. | 4,930 | 26 |
31
| | | |
| Total World Stock Index Fund | | |
| |
| |
| |
| | | | Market |
| | | | Value• |
| | | Shares | ($000) |
| | Exxaro Resources Ltd. | 2,225 | 25 |
| * | Mvelaphanda | | |
| | Resources Ltd. | 4,749 | 24 |
| | JD Group Ltd. | 3,307 | 18 |
| | JSE Ltd. | 1,262 | 10 |
| | Illovo Sugar Ltd. | 2,033 | 9 |
| | Clicks Group Ltd. | 2,834 | 9 |
| | Allied Technologies Ltd. | 878 | 9 |
| | Metropolitan Holdings Ltd. | 4,500 | 8 |
| | Santam Ltd. | 589 | 8 |
| | Medi-Clinic Corp. Ltd. | 2,303 | 7 |
| | Pick’n Pay Holdings Ltd. | 3,111 | 7 |
| | Lewis Group Ltd. | 974 | 7 |
| | Fountainhead Property Trust | 8,100 | 7 |
| | Gold Reef Resorts Ltd. | 2,597 | 6 |
| | Wilson Bayly Holmes- | | |
| | Ovcon Ltd. | 426 | 6 |
| | AVI Ltd. | 2,200 | 6 |
| | African Oxygen Ltd. | 1,948 | 6 |
| | Mondi Ltd. | 444 | 2 |
| | Grindrod Ltd. | 1,000 | 2 |
| | Northam Platinum Ltd. | 360 | 2 |
| | Group Five Ltd. | 300 | 1 |
| * | Highveld Steel and | | |
| | Vanadium Corp. Ltd. | 153 | 1 |
| | | | 6,842 |
| South Korea (1.8%) | | |
| 1 | Samsung | | |
| | Electronics Co. Ltd. GDR | 6,789 | 2,059 |
| | POSCO ADR | 10,208 | 1,042 |
| | Shinhan Financial | | |
| | Group Co. Ltd. ADR | 9,173 | 694 |
| * | KB Financial Group Inc. ADR | 11,944 | 567 |
| | Samsung | | |
| | Electronics Co. Ltd. | 675 | 406 |
| | Hyundai Motor Co. | 4,030 | 366 |
| | SK Telecom Co. Ltd. ADR | 20,314 | 339 |
| | KT Corp. ADR | 18,223 | 292 |
| | Hyundai Mobis | 1,764 | 235 |
| | LG Electronics Inc. | 2,518 | 234 |
| | Samsung Fire & | | |
| | Marine Insurance Co. Ltd. | 1,143 | 208 |
| | LG Chem Ltd. | 1,114 | 192 |
| | Hyundai Heavy Industries | 1,330 | 182 |
| * | Korea Electric Power Corp. | 6,180 | 175 |
| * | NHN Corp. | 1,092 | 161 |
| | SK Energy Co. Ltd. | 1,717 | 158 |
| | LG Display Co. Ltd. | 6,530 | 156 |
| * | Hynix Semiconductor Inc. | 10,380 | 154 |
| | Samsung C&T Corp. | 3,647 | 148 |
| | Shinsegae Co. Ltd. | 334 | 144 |
| | LG Corp. | 2,110 | 120 |
| | Hyundai Engineering & | | |
| | Construction Co. Ltd. | 2,030 | 112 |
| | Hana Financial Group Inc. | 3,750 | 111 |
| | | |
| | | | Market |
| | | | Value• |
| | | Shares | ($000) |
| | Samsung Electro- | | |
| | Mechanics Co. Ltd. | 1,230 | 102 |
| | Samsung Heavy | | |
| | Industries Co. Ltd. | 5,210 | 99 |
| | Samsung SDI Co. Ltd. | 829 | 95 |
| | KT&G Corp. | 1,595 | 93 |
| | GS Engineering & | | |
| | Construction Corp. | 1,040 | 91 |
| | S-Oil Corp. | 1,800 | 87 |
| | Samsung Techwin Co. Ltd. | 1,109 | 85 |
| | OCI Co. Ltd. | 480 | 84 |
| | SK Holdings Co. Ltd. | 1,060 | 84 |
| | Samsung Securities Co. Ltd. | 1,582 | 78 |
| * | Kia Motors Corp. | 5,220 | 78 |
| * | Woori Finance | | |
| | Holdings Co. Ltd. | 5,680 | 76 |
| | Amorepacific Corp. | 102 | 70 |
| | Korea Exchange Bank | 6,120 | 70 |
| | Samsung | | |
| | Engineering Co. Ltd. | 760 | 67 |
| | LG Household & | | |
| | Health Care Ltd. | 310 | 64 |
| | Lotte Shopping Co. Ltd. | 221 | 62 |
| | Kangwon Land Inc. | 4,250 | 57 |
| | Hankook Tire Co. Ltd. | 2,920 | 56 |
| | Daelim Industrial Co. Ltd. | 870 | 55 |
| | Hyundai Steel Co. | 860 | 55 |
| | Doosan Heavy Industries | | |
| | and Construction Co. Ltd. | 993 | 53 |
| | Busan Bank | 4,560 | 52 |
| | Cheil Industries Inc. | 1,360 | 51 |
| | Hyundai Development Co. | 1,680 | 50 |
| | Hyundai Securities Co. | 4,320 | 49 |
| | LS Corp. | 600 | 49 |
| | Hanwha Corp. | 1,520 | 49 |
| | Woongjin Coway Co. Ltd. | 1,430 | 48 |
| | Dongbu Insurance Co. Ltd. | 1,570 | 48 |
| | Daegu Bank | 3,420 | 45 |
| | Hyundai Department | | |
| | Store Co. Ltd. | 450 | 43 |
| | Daewoo Securities Co. Ltd. | 2,740 | 42 |
| | Hyosung Corp. | 750 | 41 |
| | CJ CheilJedang Corp. | 240 | 41 |
| | Doosan Corp. | 568 | 39 |
| * | Korean Air Lines Co. Ltd. | 1,000 | 38 |
| * | Industrial Bank of Korea | 3,140 | 38 |
| | Daewoo International Corp. | 1,388 | 38 |
| | Yuhan Corp. | 218 | 35 |
| | Samsung Card Co. | 860 | 34 |
| | Pacific Corp. | 277 | 34 |
| | Doosan Infracore Co. Ltd. | 2,330 | 33 |
| | LG Telecom Ltd. | 4,370 | 33 |
| | NCSoft Corp. | 300 | 32 |
| | KCC Corp. | 110 | 32 |
| | GS Holdings Corp. | 1,270 | 31 |
| | Lotte Confectionery Co. Ltd. | 31 | 31 |
32
| | | |
| Total World Stock Index Fund | | |
| |
| |
| |
| | | | Market |
| | | | Value• |
| | | Shares | ($000) |
| * | Samsung Digital | | |
| | Imaging Co. Ltd. | 763 | 31 |
| | Nong Shim Co. Ltd. | 150 | 30 |
| | Korea Gas Corp. | 700 | 30 |
| | Honam Petrochemical Corp. | 430 | 29 |
| | Daewoo Engineering & | | |
| | Construction Co. Ltd. | 2,880 | 29 |
| | Hyundai Merchant | | |
| | Marine Co. Ltd. | 1,410 | 29 |
| | Woori Investment & | | |
| | Securities Co. Ltd. | 2,280 | 29 |
| | Korea Investment | | |
| | Holdings Co. Ltd. | 1,060 | 28 |
| | Mirae Asset | | |
| | Securities Co. Ltd. | 511 | 27 |
| | Dongkuk Steel Mill Co. Ltd. | 1,250 | 27 |
| | Hanjin Shipping Co. Ltd. | 1,890 | 26 |
| | Hanjin Heavy Industries & | | |
| | Construction Co. Ltd. | 1,420 | 25 |
| | Hyundai Mipo Dockyard | 290 | 24 |
| | SKC Co. Ltd. | 1,560 | 24 |
| | Daewoo | | |
| | Shipbuilding & Marine | | |
| | Engineering Co. Ltd. | 1,480 | 19 |
| | S1 Corp. | 430 | 17 |
| | Hite Brewery Co. Ltd. | 111 | 15 |
| | Glovis Co. Ltd. | 150 | 13 |
| * | LG Hausys Ltd. | 125 | 12 |
| | Hyundai Hysco | 910 | 12 |
| * | Korea Express Co. Ltd. | 198 | 11 |
| | Halla Climate Control Corp. | 1,040 | 10 |
| * | Daum | | |
| | Communications Corp. | 220 | 10 |
| | Lotte Midopa Co. Ltd. | 1,020 | 10 |
| | Hanwha Chem Corp. | 960 | 9 |
| | Cheil Worldwide Inc. | 33 | 8 |
| | Daishin Securities Co. Ltd. | 950 | 8 |
| | SK Networks Co. Ltd. | 720 | 7 |
| | CJ Corp. | 170 | 7 |
| | Samsung Fine | | |
| | Chemicals Co. Ltd. | 170 | 7 |
| | STX Pan Ocean Co. Ltd. | 600 | 6 |
| | Daishin Securities Co. Ltd. | 440 | 6 |
| | LG Dacom Corp. | 340 | 5 |
| | STX Offshore & | | |
| | Shipbuilding Co. Ltd. | 470 | 5 |
| | STX Corp. Co. Ltd. | 360 | 5 |
| | Lotte Chilsung | | |
| | Beverage Co. Ltd. | 7 | 5 |
| | Kumho Industrial Co. Ltd. | 470 | 4 |
| | Sindoh Co. Ltd. | 48 | 2 |
| | | | 11,573 |
| Spain (2.2%) | | |
| | Banco Santander SA | 217,247 | 3,496 |
| | Telefonica SA | 122,158 | 3,411 |
| | | |
| | | | Market |
| | | | Value• |
| | | Shares | ($000) |
| | Banco Bilbao Vizcaya | | |
| | Argentaria SA | 100,085 | 1,789 |
| | Iberdrola SA | 137,590 | 1,246 |
| | Repsol YPF SA | 33,445 | 890 |
| | Inditex SA | 6,193 | 364 |
| | Banco Popular Espanol SA | 39,929 | 356 |
| ^ | Banco de Sabadell SA | 45,369 | 306 |
| | ACS Actividades de | | |
| | Construccion y Servicios | | |
| | SA | 6,163 | 296 |
| | Gas Natural SDG SA | 10,689 | 215 |
| | Acerinox SA | 9,269 | 184 |
| | Abertis Infraestructuras SA | 8,384 | 178 |
| | Gamesa Corp. Tecnologica | | |
| | SA | 7,040 | 129 |
| | Criteria Caixacorp SA | 22,724 | 111 |
| | Mapfre SA | 22,786 | 98 |
| | Enagas | 4,432 | 91 |
| | Iberdrola Renovables SA | 20,263 | 90 |
| | Indra Sistemas SA | 3,739 | 88 |
| | Bankinter SA | 8,181 | 86 |
| | Grifols SA | 4,998 | 81 |
| | Red Electrica Corp. SA | 1,477 | 76 |
| | Zardoya Otis SA | 3,501 | 70 |
| | Acciona SA | 569 | 69 |
| * | Endesa SA | 1,932 | 64 |
| ^ | Grupo Ferrovial SA | 1,374 | 57 |
| | Cintra Concesiones de | | |
| | Infraestructuras de | | |
| | Transporte SA | 5,122 | 53 |
| | Fomento de | | |
| | Construcciones y | | |
| | Contratas SA | 1,010 | 41 |
| | Sacyr Vallehermoso SA | 2,378 | 36 |
| | Banco de Valencia SA | 3,968 | 34 |
| | Corp Financiera Alba | 619 | 32 |
| | Gestevision Telecinco SA | 2,496 | 26 |
| | Banco Espanol de | | |
| | Credito SA | 1,960 | 25 |
| | Banco Santander SA ADR | 420 | 7 |
| | | | 14,095 |
| Sweden (1.1%) | | |
| | Nordea Bank AB | 105,770 | 1,135 |
| | Telefonaktiebolaget LM | | |
| | Ericsson Class B | 81,000 | 846 |
| | Sandvik AB | 41,260 | 456 |
| | Volvo AB Class B | 43,500 | 412 |
| | Hennes & Mauritz AB | | |
| | Class B | 7,150 | 406 |
| | Svenska Handelsbanken AB | | |
| | Class A | 14,100 | 364 |
| | TeliaSonera AB | 51,500 | 341 |
| * | Skandinaviska Enskilda | | |
| | Banken AB Class A | 51,960 | 315 |
| | Tele2 AB | 19,175 | 280 |
| | Atlas Copco AB Class A | 15,306 | 205 |
33
| | | |
| Total World Stock Index Fund | | |
| |
| |
| |
| | | | Market |
| | | | Value• |
| | | Shares | ($000) |
| | Svenska Cellulosa AB | | |
| | Class B | 13,500 | 186 |
| | Investor AB Class B | 10,243 | 181 |
| | Volvo AB Class A | 19,500 | 180 |
| * | Swedbank AB Class A | 18,682 | 161 |
| | Scania AB Class B | 12,100 | 155 |
| * | Electrolux AB Class B | 6,400 | 153 |
| | Assa Abloy AB Class B | 8,400 | 147 |
| | SKF AB | 9,246 | 146 |
| | Skanska AB Class B | 9,000 | 132 |
| | Swedish Match AB | 6,000 | 123 |
| | SSAB AB Class A | 7,500 | 114 |
| | Atlas Copco AB Class B | 8,988 | 107 |
| | Boliden AB | 8,250 | 99 |
| | Industrivarden AB | 9,084 | 99 |
| * | Husqvarna AB | 14,850 | 94 |
| | Alfa Laval AB | 6,288 | 77 |
| | Securitas AB Class B | 8,000 | 75 |
| | Industrivarden AB Class A | 5,300 | 63 |
| | Holmen AB | 1,400 | 38 |
| | SSAB AB Class B | 2,200 | 31 |
| | | | 7,121 |
| Switzerland (3.2%) | | |
| | Nestle SA | 97,424 | 4,530 |
| | Novartis AG | 60,324 | 3,141 |
| | Roche Holdings AG | 18,716 | 2,998 |
| | Credit Suisse Group AG | 30,419 | 1,626 |
| * | UBS AG | 93,988 | 1,567 |
| | ABB Ltd. | 62,291 | 1,159 |
| | Zurich Financial Services AG | 3,970 | 909 |
| | Syngenta AG | 2,694 | 638 |
| | Compagnie Financiere | | |
| | Richemont SA | 15,240 | 427 |
| | Holcim Ltd. | 6,669 | 425 |
| | Swiss Reinsurance Co. Ltd. | 9,883 | 402 |
| | Swatch Group AG | 1,286 | 300 |
| | Geberit AG | 1,220 | 202 |
| | Julius Baer Group Ltd. | 4,952 | 186 |
| | SGS SA | 132 | 176 |
| | Swisscom AG | 481 | 174 |
| | Adecco SA | 3,256 | 146 |
| | Givaudan SA | 189 | 140 |
| | Synthes Inc. | 1,130 | 134 |
| | Kuehne & | | |
| | Nagel International AG | 1,351 | 122 |
| | Sonova Holding AG | 1,170 | 120 |
| * | Actelion Ltd. | 2,147 | 118 |
| | Swiss Life Holding AG | 869 | 104 |
| | Baloise Holding AG | 1,175 | 101 |
| | Swatch Group AG | 2,082 | 93 |
| | Lonza Group AG | 1,129 | 88 |
| | Nobel Biocare Holding AG | 2,781 | 79 |
| | Lindt & Spruengli AG | 3 | 76 |
| | Pargesa Holding SA | 818 | 66 |
| | GAM Holding Ltd. | 4,952 | 60 |
| | Schindler Holding AG | 819 | 57 |
| | Lindt & Spruengli AG | 20 | 42 |
| | | |
| | | | Market |
| | | | Value• |
| | | Shares | ($000) |
| | BKW FMB Energie AG | 424 | 35 |
| | Schindler Holding AG | 464 | 32 |
| | Straumann Holding AG | 127 | 31 |
| | EFG International AG | 1,588 | 27 |
| | | | 20,531 |
| Taiwan (1.4%) | | |
| | Taiwan Semiconductor | | |
| | Manufacturing Co. Ltd. | | |
| | ADR | 155,407 | 1,483 |
| | HON HAI Precision | | |
| | Industry Co. Ltd. | 208,682 | 817 |
| | Chunghwa Telecom Co. Ltd. | | |
| | ADR | 25,977 | 451 |
| | AU Optronics Corp. ADR | 44,673 | 394 |
| | Formosa Plastics Corp. | 149,840 | 287 |
| | MediaTek Inc. | 20,042 | 281 |
| | Nan Ya Plastics Corp. | 133,330 | 212 |
| | China Steel Corp. | 235,951 | 210 |
| | Advanced Semiconductor | | |
| | Engineering Inc. ADR | 54,063 | 209 |
| | Formosa Chemicals & | | |
| | Fibre Corp. | 104,130 | 194 |
| * | Cathay Financial | | |
| | Holding Co. Ltd. | 111,400 | 191 |
| | HTC Corp. | 18,065 | 179 |
| | Asustek Computer Inc. | 91,980 | 169 |
| * | Fubon Financial | | |
| | Holding Co. Ltd. | 140,000 | 155 |
| | Acer Inc. | 58,490 | 138 |
| | Compal Electronics Inc. | 98,415 | 123 |
| | Chinatrust Financial | | |
| | Holding Co. Ltd. | 195,716 | 118 |
| | Yuanta Financial | | |
| | Holding Co. Ltd. | 172,000 | 114 |
| | Uni-President | | |
| | Enterprises Corp. | 100,613 | 112 |
| | Delta Electronics Inc. | 39,641 | 110 |
| | InnoLux Display Corp. | 82,521 | 109 |
| | Mega Financial | | |
| | Holding Co. Ltd. | 194,000 | 108 |
| | Far Eastern Textile Co. Ltd. | 90,462 | 107 |
| | Formosa | | |
| | Petrochemical Corp. | 39,140 | 95 |
| | Taiwan Mobile Co. Ltd. | 47,000 | 84 |
| | Siliconware Precision | | |
| | Industries Co. ADR | 11,700 | 79 |
| | Hua Nan Financial | | |
| | Holdings Co. Ltd. | 132,025 | 77 |
| | Lite-On Technology Corp. | 57,300 | 75 |
| | Quanta Computer Inc. | 39,450 | 75 |
| | Foxconn Technology Co. Ltd. | 21,888 | 73 |
| | Wistron Corp. | 38,547 | 65 |
| * | China Development | | |
| | Financial Holding Corp. | 245,525 | 64 |
| * | SinoPac Financial | | |
| | Holdings Co. Ltd. | 172,000 | 64 |
| | Taiwan Cooperative Bank | 102,900 | 61 |
34
| | | |
| Total World Stock Index Fund | | |
| |
| |
| |
| | | | Market |
| | | | Value• |
| | | Shares | ($000) |
| * | United | | |
| | Microelectronics Corp. ADR | 18,135 | 60 |
| | Synnex Technology | | |
| | International Corp. | 31,020 | 59 |
| * | United | | |
| | Microelectronics Corp. | 119,180 | 57 |
| | First Financial | | |
| | Holding Co. Ltd. | 95,423 | 55 |
| * | Shin Kong Financial | | |
| | Holding Co. Ltd. | 135,399 | 55 |
| | Pou Chen Corp. | 79,318 | 54 |
| * | Chi Mei | | |
| | Optoelectronics Corp. | 108,300 | 54 |
| | Far EasTone | | |
| | Telecommunications | | |
| | Co. Ltd. | 46,000 | 52 |
| | Taiwan Cement Corp. | 48,030 | 49 |
| | Macronix International | 95,721 | 49 |
| | Chang Hwa | | |
| | Commercial Bank | 108,000 | 47 |
| | Cheng Shin Rubber | | |
| | Industry Co. Ltd. | 20,900 | 43 |
| | Taiwan Fertilizer Co. Ltd. | 13,000 | 40 |
| | Yulon Motor Co. Ltd. | 36,000 | 40 |
| * | Inotera Memories Inc. | 63,000 | 37 |
| * | Taishin Financial | | |
| | Holding Co. Ltd. | 95,000 | 37 |
| | Chicony Electronics Co. Ltd. | 16,246 | 36 |
| | Unimicron Technology Corp. | 31,000 | 35 |
| * | E.Sun Financial | | |
| | Holding Co. Ltd. | 90,570 | 35 |
| | Advanced Semiconductor | | |
| | Engineering Inc. | 44,115 | 35 |
| | Largan Precision Co. Ltd. | 3,020 | 35 |
| | Realtek | | |
| | Semiconductor Corp. | 16,050 | 34 |
| | Novatek Microelectronics | | |
| | Corp. Ltd. | 15,025 | 34 |
| * | Walsin Lihwa Corp. | 100,000 | 32 |
| | Catcher Technology Co. Ltd. | 13,310 | 32 |
| | Inventec Co. Ltd. | 55,000 | 30 |
| * | Nanya Technology Corp. | 43,021 | 30 |
| | KGI Securities Co. Ltd. | 65,000 | 30 |
| * | Polaris Securities Co. Ltd. | 57,000 | 29 |
| | Siliconware Precision | | |
| | Industries Co. | 21,030 | 28 |
| | Feng Hsin Iron & Steel Co. | 17,000 | 26 |
| | Nan Ya Printed Circuit | | |
| | Board Corp. | 8,160 | 25 |
| | Asia Cement Corp. | 23,813 | 25 |
| * | Tatung Co. Ltd. | 112,000 | 25 |
| | Taiwan Glass Industrial Corp. | 27,810 | 21 |
| * | HannStar Display Corp. | 110,749 | 21 |
| | Formosa Taffeta Co. Ltd. | 29,000 | 20 |
| | President Chain Store Corp. | 7,952 | 18 |
| * | Chunghwa Picture Tubes | 165,000 | 17 |
| | | |
| | | | Market |
| | | | Value• |
| | | Shares | ($000) |
| * | Evergreen Marine Corp. | | |
| | Taiwan Ltd. | 31,000 | 16 |
| * | Powerchip | | |
| | Semiconductor Corp. | 127,000 | 14 |
| * | Qisda Corp. | 25,000 | 14 |
| | Compal | | |
| | Communications Inc. | 9,000 | 13 |
| * | China Motor Corp. | 19,000 | 13 |
| | Yageo Corp. | 40,000 | 11 |
| | Coretronic Corp. | 10,000 | 11 |
| | Transcend Information Inc. | 3,148 | 10 |
| * | Winbond Electronics Corp. | 53,000 | 10 |
| * | Capital Securities Corp. | 21,000 | 10 |
| * | Waterland Financial Holdings | 32,000 | 10 |
| | Cheng Uei Precision | | |
| | Industry Co. Ltd. | 5,100 | 10 |
| | LITE-ON IT Corp. | 12,060 | 9 |
| | Faraday Technology Corp. | 6,029 | 9 |
| | Eternal Chemical Co. Ltd. | 10,100 | 9 |
| * | Cathay Real Estate | | |
| | Development Co. Ltd. | 23,000 | 9 |
| * | Ritek Corp. | 38,000 | 9 |
| | Vanguard International | | |
| | Semiconductor Corp. | 22,000 | 9 |
| * | President Securities Corp. | 15,000 | 9 |
| | Oriental Union | | |
| | Chemical Corp. | 12,000 | 8 |
| * | Yuen Foong Yu Paper | | |
| | Manufacturing Co. Ltd. | 23,000 | 8 |
| | Inventec Appliances Corp. | 8,400 | 8 |
| * | Far Eastern | | |
| | International Bank | 23,952 | 8 |
| | D-Link Corp. | 7,980 | 7 |
| | U-Ming Marine | | |
| | Transport Corp. | 4,000 | 7 |
| * | CMC Magnetics Corp. | 32,000 | 7 |
| * | Tatung Co. Ltd. GDR | 1,475 | 7 |
| | Mitac International | 14,000 | 7 |
| | Asia Optical Co. Inc. | 4,040 | 7 |
| | Teco Electric and | | |
| | Machinery Co. Ltd. | 16,000 | 6 |
| | Micro-Star | | |
| | International Co. Ltd. | 10,499 | 6 |
| | Giant Manufacturing Co. Ltd. | 2,400 | 6 |
| | Ton Yi Industrial Corp. | 17,000 | 6 |
| * | Eva Airways Corp. | 15,749 | 6 |
| | Yang Ming Marine | | |
| | Transport Corp. | 16,000 | 6 |
| * | Taiwan Business Bank | 23,000 | 6 |
| * | Wan Hai Lines Ltd. | 12,000 | 6 |
| * | China Airlines Ltd. | 17,425 | 5 |
| | Advantech Co. Ltd. | 3,015 | 5 |
| * | Via Technologies Inc. | 8,400 | 5 |
| | Taiwan Secom Co. Ltd. | 3,000 | 5 |
| * | ProMOS Technologies Inc. | 68,000 | 4 |
35
| | | |
| Total World Stock Index Fund | | |
| |
| |
| |
| | | | Market |
| | | | Value• |
| | | Shares | ($000) |
| * | Shin Kong Financial | | |
| | Holding Co., Ltd. | | |
| | Rights Exp. 12/7/2009 | 6,920 | 1 |
| | | | 8,876 |
| Thailand (0.2%) | | |
| | Electricity Generating PCL | | |
| | (Foreign) | 89,600 | 203 |
| | PTT PCL (Foreign) | 17,700 | 125 |
| | PTT Exploration & | | |
| | Production PCL (Foreign) | 28,600 | 122 |
| | Bangkok Bank PCL (Foreign) | 24,000 | 81 |
| | Kasikornbank PCL (Foreign) | 21,400 | 52 |
| | Bank of Ayudhya PLC (Local) | 92,600 | 49 |
| | Siam Commercial Bank PCL | | |
| | (Foreign) | 21,400 | 49 |
| | Banpu PCL (Foreign) | 3,400 | 44 |
| | PTT Aromatics & | | |
| | Refining PCL (Foreign) | 65,200 | 41 |
| | Advanced Info Service PCL | | |
| | (Foreign) | 15,400 | 39 |
| | CP ALL PCL (Foreign) | 66,500 | 38 |
| | IRPC PCL (Foreign) | 329,400 | 37 |
| | Thai Oil PCL (Foreign) | 25,800 | 31 |
| | Siam City Cement PCL | | |
| | (Foreign) | 3,800 | 25 |
| | PTT PCL (Local) | 3,100 | 22 |
| | Siam City Bank PCL | | |
| | (Foreign) | 24,600 | 17 |
| | Total Access Communication | | |
| | PCL (Local) | 13,700 | 16 |
| | Charoen Pokphand Foods | | |
| | PCL (Foreign) | 54,600 | 16 |
| | Siam Cement PCL (Foreign) | 2,500 | 15 |
| * | Thai Airways International | | |
| | PCL (Foreign) | 22,400 | 13 |
| | Krung Thai Bank PCL | | |
| | (Foreign) | 45,700 | 12 |
| | Airports of Thailand PCL | | |
| | (Foreign) | 9,600 | 11 |
| | PTT Chemical PCL (Foreign) | 5,500 | 10 |
| * | TMB Bank PCL (Foreign) | 294,100 | 10 |
| | Thoresen Thai Agencies PCL | | |
| | (Foreign) | 11,330 | 9 |
| | Land and Houses PCL | | |
| | (Foreign) | 45,300 | 8 |
| | Central Pattana PCL | | |
| | (Foreign) | 12,200 | 8 |
| | Thai Union Frozen Products | | |
| | PCL | 9,000 | 7 |
| | Delta Electronics Thai PCL | | |
| | (Foreign) | 14,200 | 7 |
| | Siam Makro PCL (Foreign) | 2,600 | 6 |
| | BEC World PCL (Foreign) | 8,800 | 6 |
| | Ratchaburi Electricity | | |
| | Generating Holding PCL | 4,100 | 5 |
| | | | 1,134 |
| | | | |
| | | | | Market |
| | | | | Value• |
| | | | Shares | ($000) |
| Turkey (0.1%) | | | |
| | Akbank TAS | | 23,513 | 127 |
| | Turkiye Garanti Bankasi AS | 29,755 | 108 |
| * | Eregli Demir ve | | | |
| | Celik Fabrikalari TAS | | 30,948 | 84 |
| | Turkiye Is Bankasi | | 20,379 | 77 |
| | Dogan Sirketler | | | |
| | Grubu Holdings | | 97,171 | 64 |
| * | KOC Holding AS | | 23,109 | 59 |
| | Anadolu Efes Biracilik Ve | | |
| | Malt Sanayii AS | | 4,783 | 55 |
| | Turkiye Halk Bankasi AS | 7,971 | 48 |
| | Turk Telekomunikasyon AS | 15,598 | 47 |
| * | Turkiye Vakiflar Bankasi Tao | 18,184 | 44 |
| | Turkcell Iletisim Hizmet AS | 6,547 | 43 |
| | Tupras Turkiye Petrol Rafine | 2,256 | 39 |
| * | Yapi ve Kredi Bankasi AS | 18,480 | 38 |
| | Haci Omer Sabanci Holding | | |
| | AS | | 8,900 | 32 |
| | Enka Insaat ve Sanayi AS | 7,929 | 32 |
| | BIM Birlesik Magazalar AS | 736 | 27 |
| | Coca-Cola Icecek AS | | 1,480 | 11 |
| | Ford Otomotiv Sanayi AS | 1,724 | 11 |
| | | | | 946 |
| United Kingdom (8.7%) | | | |
| | HSBC Holdings PLC | | 461,012 | 5,094 |
| | BP PLC | | 500,647 | 4,691 |
| | Vodafone Group PLC | 1,399,228 | 3,084 |
| | GlaxoSmithKline PLC | | 139,621 | 2,864 |
| | Royal Dutch Shell PLC | | | |
| | Class A | | 94,412 | 2,787 |
| | Royal Dutch Shell PLC | | | |
| | Class B | | 71,719 | 2,065 |
| | Rio Tinto PLC | | 40,382 | 1,785 |
| | AstraZeneca PLC | | 38,576 | 1,732 |
| | British American Tobacco | | |
| | PLC | | 52,687 | 1,679 |
| * | Barclays PLC | | 301,550 | 1,580 |
| | BHP Billiton PLC | | 58,585 | 1,579 |
| | BG Group PLC | | 90,205 | 1,553 |
| | Tesco PLC | | 208,974 | 1,393 |
| | Standard Chartered PLC | 52,856 | 1,297 |
| * | Anglo American PLC | | 35,115 | 1,271 |
| | Diageo PLC | | 68,392 | 1,114 |
| | Unilever PLC | | 35,014 | 1,046 |
| | Reckitt Benckiser Group PLC | 18,909 | 939 |
| | Imperial Tobacco Group PLC | 28,183 | 831 |
| | SABMiller PLC | | 31,111 | 815 |
| * | Xstrata PLC | | 53,563 | 771 |
| | National Grid PLC | | 66,886 | 663 |
| | Prudential PLC | | 70,311 | 639 |
| *,^ | Lloyds Banking Group PLC | 411,633 | 580 |
| | Centrica PLC | | 135,506 | 550 |
| | BAE Systems PLC | | 93,531 | 481 |
| | Tullow Oil PLC | | 24,748 | 479 |
| | Aviva PLC | | 74,423 | 465 |
36
| | | |
| Total World Stock Index Fund | | |
| |
| |
| |
| | | | Market |
| | | | Value• |
| | | Shares | ($000) |
| | BT Group PLC | 208,872 | 448 |
| | Scottish & Southern Energy | | |
| | PLC | 24,498 | 432 |
| | Cadbury PLC | 33,508 | 424 |
| | Rolls-Royce Group PLC | 56,421 | 416 |
| | WM Morrison Supermarkets | | |
| | PLC | 73,707 | 338 |
| * | Royal Bank of | | |
| | Scotland Group PLC | 488,307 | 333 |
| | Compass Group PLC | 46,668 | 296 |
| | J Sainsbury PLC | 53,065 | 286 |
| | British Sky | | |
| | Broadcasting Group PLC | 32,210 | 281 |
| | Marks & Spencer Group PLC | 48,281 | 270 |
| | Kingfisher PLC | 72,733 | 266 |
| | WPP PLC | 29,612 | 265 |
| | Pearson PLC | 19,239 | 262 |
| | Old Mutual PLC | 150,256 | 261 |
| * | Cairn Energy PLC | 5,771 | 249 |
| | Shire PLC | 13,916 | 246 |
| | Reed Elsevier PLC | 31,027 | 235 |
| | Experian PLC | 25,046 | 229 |
| | Smith & Nephew PLC | 25,246 | 223 |
| | Land Securities Group PLC | 19,143 | 207 |
| | Man Group PLC | 40,024 | 202 |
| | Capita Group PLC | 15,581 | 195 |
| | Legal & General Group PLC | 147,313 | 189 |
| | Standard Life PLC | 52,631 | 188 |
| | International Power PLC | 43,288 | 180 |
| | Kazakhmys PLC | 9,574 | 170 |
| | Home Retail Group PLC | 35,494 | 169 |
| | British Land Co. PLC | 21,449 | 166 |
| | RSA Insurance Group PLC | 79,667 | 158 |
| | Next PLC | 5,031 | 148 |
| | Carnival PLC | 4,755 | 147 |
| * | Lonmin PLC | 5,667 | 136 |
| | Cable & Wireless PLC | 56,783 | 135 |
| | Intercontinental | | |
| | Hotels Group PLC | 10,272 | 131 |
| | Smiths Group PLC | 8,753 | 128 |
| | G4S PLC | 30,166 | 125 |
| * | Wolseley PLC | 6,158 | 125 |
| | Randgold Resources Ltd. | 1,888 | 124 |
| | Associated British Foods | | |
| | PLC | 9,105 | 123 |
| | Eurasian Natural | | |
| | Resources Corp. | 8,794 | 120 |
| * | Autonomy Corp. PLC | 5,417 | 119 |
| * | Amdocs Ltd. | 4,684 | 118 |
| | Antofagasta PLC | 8,897 | 112 |
| | Hammerson PLC | 16,566 | 110 |
| | Vedanta Resources PLC | 3,204 | 110 |
| | Johnson Matthey PLC | 4,671 | 108 |
| | Segro PLC | 18,634 | 107 |
| | AMEC PLC | 8,135 | 107 |
| | United Utilities Group PLC | 14,357 | 104 |
| | | |
| | | | Market |
| | | | Value• |
| | | Shares | ($000) |
| | Sage Group PLC | 29,276 | 102 |
| | 3i Group PLC | 23,062 | 99 |
| | Rexam PLC | 21,442 | 97 |
| | Inmarsat PLC | 10,416 | 96 |
| | Cobham PLC | 26,445 | 95 |
| | Whitbread PLC | 4,540 | 94 |
| | Bunzl PLC | 8,529 | 93 |
| | Liberty International PLC | 12,332 | 91 |
| | Petrofac Ltd. | 5,904 | 91 |
| | Tate & Lyle PLC | 12,262 | 90 |
| | Burberry Group PLC | 10,079 | 89 |
| | Invensys PLC | 18,817 | 87 |
| | Severn Trent PLC | 5,263 | 82 |
| | ICAP PLC | 12,229 | 81 |
| | Schroders PLC | 4,450 | 80 |
| | The Alliance Trust PLC | 16,136 | 80 |
| | Logica PLC | 41,447 | 79 |
| * | Rentokil Initial PLC | 45,918 | 78 |
| | Admiral Group PLC | 4,525 | 76 |
| | Friends Provident Group PLC | 56,844 | 76 |
| | Drax Group PLC | 9,503 | 72 |
| | Thomas Cook Group PLC | 21,028 | 70 |
| | ITV PLC | 93,995 | 66 |
| | Foreign & Colonial | | |
| | Investment Trust PLC | 15,609 | 64 |
| | Fresnillo PLC | 4,907 | 59 |
| | Daily Mail & General Trust | 7,792 | 51 |
| | TUI Travel PLC | 12,749 | 49 |
| * | British Airways PLC | 15,886 | 47 |
| | United Business Media Ltd.�� | 6,094 | 46 |
| | Ladbrokes PLC | 22,980 | 46 |
| | Tomkins PLC | 16,522 | 45 |
| | Hays PLC | 27,579 | 44 |
| | Scottish Mortgage | | |
| | Investment Trust PLC | 5,067 | 40 |
| | Provident Financial PLC | 2,455 | 37 |
| | William Hill PLC | 13,604 | 37 |
| | Aegis Group PLC | 20,557 | 37 |
| | Schroders PLC | 2,087 | 31 |
| * | PartyGaming PLC | 8,089 | 30 |
| | Carphone Warehouse Group | | |
| | PLC | 3,628 | 11 |
| | | | 56,486 |
| United States (40.4%) | | |
| | Consumer Discretionary (3.9%) | |
| | McDonald’s Corp. | 29,300 | 1,717 |
| | Walt Disney Co. | 50,800 | 1,390 |
| | Home Depot Inc. | 44,800 | 1,124 |
| * | Amazon.com Inc. | 8,720 | 1,036 |
| | Target Corp. | 20,200 | 978 |
| | Time Warner Inc. | 32,232 | 971 |
| | Comcast Corp. Class A | 55,400 | 803 |
| | Lowe’s Cos. Inc. | 39,086 | 765 |
| * | Ford Motor Co. | 85,550 | 599 |
| * | DIRECTV Group Inc. | 21,700 | 571 |
| | News Corp. Class A | 48,800 | 562 |
37
| | | |
| Total World Stock Index Fund | | |
| |
| |
| |
| | | | Market |
| | | | Value• |
| | | Shares | ($000) |
| * | Kohl’s Corp. | 8,900 | 509 |
| | Best Buy Co. Inc. | 12,400 | 473 |
| | Staples Inc. | 21,500 | 467 |
| | NIKE Inc. Class B | 7,100 | 441 |
| * | Viacom Inc. Class B | 15,521 | 428 |
| | Yum! Brands Inc. | 12,400 | 409 |
| * | Starbucks Corp. | 20,700 | 393 |
| | Johnson Controls Inc. | 16,380 | 392 |
| | TJX Cos. Inc. | 10,000 | 374 |
| * | Liberty Media Corp.- | | |
| | Entertainment Class A | 11,287 | 348 |
| | Comcast Corp. | 24,600 | 345 |
| | Time Warner Cable Inc. | 8,632 | 340 |
| | Coach Inc. | 10,200 | 336 |
| | Carnival Corp. | 11,400 | 332 |
| * | Apollo Group Inc. Class A | 5,475 | 313 |
| | VF Corp. | 4,309 | 306 |
| | News Corp. Class B | 20,700 | 282 |
| * | Liberty Media Corp.- | | |
| | Interactive | 23,920 | 271 |
| | Gap Inc. | 12,300 | 262 |
| | Nordstrom Inc. | 7,828 | 249 |
| | Omnicom Group Inc. | 7,200 | 247 |
| | Mattel Inc. | 12,500 | 237 |
| | Fortune Brands Inc. | 5,900 | 230 |
| * | Bed Bath & Beyond Inc. | 6,402 | 225 |
| | McGraw-Hill Cos. Inc. | 7,800 | 224 |
| | CBS Corp. Class B | 18,300 | 215 |
| | Macy’s Inc. | 12,200 | 214 |
| | Marriott International Inc. | | |
| | Class A | 8,449 | 212 |
| | JC Penney Co. Inc. | 6,100 | 202 |
| | Sherwin-Williams Co. | 2,700 | 154 |
| * | GameStop Corp. Class A | 6,100 | 148 |
| | H&R Block Inc. | 7,800 | 143 |
| | Leggett & Platt Inc. | 7,400 | 143 |
| | Harley-Davidson Inc. | 5,600 | 140 |
| *,^ | Sears Holdings Corp. | 2,051 | 139 |
| * | Expedia Inc. | 6,021 | 137 |
| | Garmin Ltd. | 4,429 | 134 |
| | Cablevision Systems Corp. | | |
| | Class A | 5,700 | 131 |
| | Ltd Brands Inc. | 7,400 | 130 |
| | Genuine Parts Co. | 3,700 | 129 |
| | Ross Stores Inc. | 2,900 | 128 |
| | Starwood Hotels & | | |
| | Resorts Worldwide Inc. | 4,300 | 125 |
| * | AutoZone Inc. | 900 | 122 |
| | Whirlpool Corp. | 1,700 | 122 |
| | International | | |
| | Game Technology | 6,800 | 121 |
| | PetSmart Inc. | 4,900 | 115 |
| * | Las Vegas Sands Corp. | 7,595 | 115 |
| | Tiffany & Co. | 2,900 | 114 |
| * | Wynn Resorts Ltd. | 2,100 | 114 |
| | Virgin Media Inc. | 7,700 | 108 |
| | | |
| | | | Market |
| | | | Value• |
| | | Shares | ($000) |
| | DR Horton Inc. | 9,200 | 101 |
| | Darden Restaurants Inc. | 3,200 | 97 |
| * | Dollar Tree Inc. | 2,066 | 93 |
| | Newell Rubbermaid Inc. | 6,400 | 93 |
| | Family Dollar Stores Inc. | 3,200 | 91 |
| | Scripps Networks | | |
| | Interactive Inc. Class A | 2,395 | 90 |
| * | Urban Outfitters Inc. | 2,874 | 90 |
| * | DISH Network Corp. Class A | 5,100 | 89 |
| | Pulte Homes Inc. | 9,457 | 85 |
| * | Discovery | | |
| | Communications Inc. | | |
| | Class A | 3,018 | 83 |
| * | Royal Caribbean Cruises Ltd. | 4,000 | 81 |
| * | Discovery | | |
| | Communications Inc. | 3,235 | 78 |
| | Hasbro Inc. | 2,800 | 76 |
| | Brinker International Inc. | 5,800 | 73 |
| | Wyndham Worldwide Corp. | 4,139 | 71 |
| | Abercrombie & Fitch Co. | 2,100 | 69 |
| * | Mohawk Industries Inc. | 1,600 | 69 |
| * | Interpublic Group of | | |
| | Cos. Inc. | 11,100 | 67 |
| * | NVR Inc. | 100 | 66 |
| | Autoliv Inc. | 1,958 | 66 |
| | Harman International | | |
| | Industries Inc. | 1,700 | 64 |
| * | Liberty Global Inc. | 3,037 | 63 |
| | Black & Decker Corp. | 1,300 | 61 |
| | Foot Locker Inc. | 5,600 | 59 |
| * | Sirius XM Radio Inc. | 99,620 | 58 |
| * | Liberty Global Inc. Class A | 2,700 | 55 |
| * | AutoNation Inc. | 3,200 | 55 |
| | American Eagle | | |
| | Outfitters Inc. | 3,049 | 53 |
| | Gannett Co. Inc. | 5,300 | 52 |
| | Gentex Corp. | 3,158 | 51 |
| | RadioShack Corp. | 2,900 | 49 |
| * | Toll Brothers Inc. | 2,800 | 49 |
| * | MGM Mirage | 5,000 | 46 |
| | Lennar Corp. Class A | 3,400 | 43 |
| * | Lamar Advertising Co. | | |
| | Class A | 1,700 | 41 |
| | WABCO Holdings Inc. | 1,472 | 35 |
| | Eastman Kodak Co. | 9,100 | 34 |
| | Wendy’s/Arby’s Group Inc. | | |
| | Class A | 8,148 | 32 |
| | New York Times Co. Class A | 2,000 | 16 |
| | Weight Watchers | | |
| | International Inc. | 500 | 13 |
| | Washington Post Co. Class B | 30 | 13 |
| |
| | Consumer Staples (4.7%) | | |
| | Procter & Gamble Co. | 78,037 | 4,526 |
| | Wal-Mart Stores Inc. | 77,720 | 3,861 |
| | Coca-Cola Co. | 61,100 | 3,257 |
38
| | | |
| Total World Stock Index Fund | | |
| |
| |
| |
| | | | Market |
| | | | Value• |
| | | Shares | ($000) |
| | PepsiCo Inc. | 41,850 | 2,534 |
| | Philip Morris | | |
| | International Inc. | 51,970 | 2,461 |
| | CVS Caremark Corp. | 38,500 | 1,359 |
| | Colgate-Palmolive Co. | 14,394 | 1,132 |
| | Kraft Foods Inc. | 40,025 | 1,101 |
| | Altria Group Inc. | 56,000 | 1,014 |
| | Walgreen Co. | 26,500 | 1,002 |
| | Kimberly-Clark Corp. | 11,900 | 728 |
| | Costco Wholesale Corp. | 12,400 | 705 |
| | Archer-Daniels-Midland Co. | 17,700 | 533 |
| | General Mills Inc. | 8,000 | 527 |
| | Kroger Co. | 20,400 | 472 |
| | Avon Products Inc. | 13,700 | 439 |
| | Sysco Corp. | 14,400 | 381 |
| | Kellogg Co. | 7,000 | 361 |
| | Lorillard Inc. | 3,855 | 300 |
| | HJ Heinz Co. | 7,200 | 290 |
| | Sara Lee Corp. | 24,900 | 281 |
| | Safeway Inc. | 12,500 | 279 |
| | Molson Coors Brewing Co. | | |
| | Class B | 5,597 | 274 |
| | Bunge Ltd. | 4,500 | 257 |
| | Reynolds American Inc. | 5,201 | 252 |
| | ConAgra Foods Inc. | 10,100 | 212 |
| | Clorox Co. | 3,300 | 195 |
| | Campbell Soup Co. | 5,900 | 187 |
| | SUPERVALU Inc. | 10,936 | 174 |
| | Coca-Cola Enterprises Inc. | 8,312 | 158 |
| * | Dr Pepper Snapple | | |
| | Group Inc. | 5,785 | 158 |
| | Hershey Co. | 3,800 | 144 |
| | Pepsi Bottling Group Inc. | 3,684 | 138 |
| * | Dean Foods Co. | 7,070 | 129 |
| | Estee Lauder Cos. Inc. | | |
| | Class A | 2,800 | 119 |
| * | Whole Foods Market Inc. | 3,400 | 109 |
| | Brown-Forman Corp. Class B | 2,170 | 106 |
| | McCormick & Co. Inc. | 2,700 | 95 |
| | Tyson Foods Inc. Class A | 7,100 | 89 |
| * | Energizer Holdings Inc. | 1,400 | 85 |
| | Hormel Foods Corp. | 2,006 | 73 |
| * | Constellation Brands Inc. | | |
| | Class A | 4,400 | 70 |
| | PepsiAmericas Inc. | 2,180 | 64 |
| | Alberto-Culver Co. Class B | 2,238 | 60 |
| * | Smithfield Foods Inc. | 2,812 | 38 |
| |
| | Energy (4.8%) | | |
| | Exxon Mobil Corp. | 127,502 | 9,138 |
| | Chevron Corp. | 53,000 | 4,057 |
| | ConocoPhillips | 39,445 | 1,979 |
| | Schlumberger Ltd. | 31,530 | 1,961 |
| | Occidental Petroleum Corp. | 21,600 | 1,639 |
| | Apache Corp. | 8,980 | 845 |
| | Anadarko Petroleum Corp. | 13,300 | 810 |
| | | |
| | | | Market |
| | | | Value• |
| | | Shares | ($000) |
| | Devon Energy Corp. | 12,100 | 783 |
| * | Transocean Ltd. | 8,530 | 716 |
| | Halliburton Co. | 24,400 | 713 |
| | XTO Energy Inc. | 16,500 | 686 |
| | Marathon Oil Corp. | 18,392 | 588 |
| | EOG Resources Inc. | 6,900 | 564 |
| * | National Oilwell Varco Inc. | 11,300 | 463 |
| | Chesapeake Energy Corp. | 17,150 | 420 |
| * | Southwestern Energy Co. | 8,412 | 367 |
| | Hess Corp. | 6,674 | 365 |
| | Baker Hughes Inc. | 8,440 | 355 |
| | Consol Energy Inc. | 7,150 | 306 |
| | Williams Cos. Inc. | 16,100 | 304 |
| | Peabody Energy Corp. | 7,270 | 288 |
| | Spectra Energy Corp. | 14,961 | 286 |
| * | Weatherford | | |
| | International Ltd. | 16,100 | 282 |
| | Murphy Oil Corp. | 4,381 | 268 |
| | Valero Energy Corp. | 14,630 | 265 |
| | Noble Energy Inc. | 3,900 | 256 |
| | Noble Corp. | 6,000 | 244 |
| * | Ultra Petroleum Corp. | 4,500 | 219 |
| * | Cameron International Corp. | 4,900 | 181 |
| | Range Resources Corp. | 3,518 | 176 |
| | Smith International Inc. | 6,100 | 169 |
| | El Paso Corp. | 15,900 | 156 |
| | ENSCO International Inc. | 3,300 | 151 |
| | Diamond Offshore | | |
| | Drilling Inc. | 1,578 | 150 |
| * | Nabors Industries Ltd. | 6,500 | 135 |
| | BJ Services Co. | 6,700 | 129 |
| * | Newfield Exploration Co. | 3,000 | 123 |
| * | Pride International Inc. | 3,981 | 118 |
| | Sunoco Inc. | 3,700 | 114 |
| | Pioneer Natural | | |
| | Resources Co. | 2,600 | 107 |
| * | Plains Exploration & | | |
| | Production Co. | 3,182 | 84 |
| | Rowan Cos. Inc. | 2,800 | 65 |
| | Patterson-UTI Energy Inc. | 3,950 | 62 |
| * | Continental Resources Inc. | 1,251 | 47 |
| | Teekay Corp. | 2,238 | 46 |
| * | Patriot Coal Corp. | 2,157 | 24 |
| * | Seahawk Drilling Inc. | 195 | 5 |
| |
| | Financials (6.4%) | | |
| | JPMorgan Chase & Co. | 103,500 | 4,323 |
| | Wells Fargo & Co. | 123,745 | 3,405 |
| | Bank of America Corp. | 226,644 | 3,304 |
| | Goldman Sachs Group Inc. | 13,458 | 2,290 |
| * | Berkshire Hathaway Inc. | | |
| | Class A | 19 | 1,881 |
| | Citigroup Inc. | 402,018 | 1,644 |
| | US Bancorp | 50,700 | 1,177 |
| | Morgan Stanley | 36,138 | 1,161 |
| | American Express Co. | 31,950 | 1,113 |
39
| | | |
| Total World Stock Index Fund | | |
| |
| |
| |
| | | | Market |
| | | | Value• |
| | | Shares | ($000) |
| * | Berkshire Hathaway Inc. | | |
| | Class B | 296 | 972 |
| | Bank of New York | | |
| | Mellon Corp. | 32,077 | 855 |
| | Travelers Cos. Inc. | 15,900 | 792 |
| | MetLife Inc. | 21,758 | 740 |
| | PNC Financial Services | | |
| | Group Inc. | 12,520 | 613 |
| | State Street Corp. | 13,500 | 567 |
| | Prudential Financial Inc. | 12,400 | 561 |
| | Charles Schwab Corp. | 31,200 | 541 |
| | Aflac Inc. | 12,700 | 527 |
| | Simon Property Group Inc. | 7,648 | 519 |
| | CME Group Inc. | 1,609 | 487 |
| | Loews Corp. | 13,798 | 457 |
| | Franklin Resources Inc. | 4,300 | 450 |
| | Allstate Corp. | 15,150 | 448 |
| | BB&T Corp. | 18,700 | 447 |
| | Capital One Financial Corp. | 12,200 | 447 |
| | ACE Ltd. | 8,200 | 421 |
| | Chubb Corp. | 8,600 | 417 |
| | T Rowe Price Group Inc. | 7,000 | 341 |
| | Northern Trust Corp. | 6,600 | 332 |
| | Marsh & | | |
| | McLennan Cos. Inc. | 12,200 | 286 |
| | Ameriprise Financial Inc. | 7,829 | 271 |
| | Vornado Realty Trust | 4,370 | 260 |
| | Invesco Ltd. | 12,200 | 258 |
| * | Progressive Corp. | 15,900 | 254 |
| | SunTrust Banks Inc. | 12,860 | 246 |
| | AON Corp. | 6,300 | 243 |
| | Hartford Financial Services | | |
| | Group Inc. | 9,400 | 231 |
| | Discover Financial Services | 15,251 | 216 |
| | Public Storage | 2,900 | 213 |
| | HCP Inc. | 7,000 | 207 |
| | Annaly Capital | | |
| | Management Inc. | 12,178 | 206 |
| | Boston Properties Inc. | 3,200 | 194 |
| | Equity Residential | 6,700 | 194 |
| | XL Capital Ltd. Class A | 11,330 | 186 |
| | NYSE Euronext | 7,171 | 185 |
| | Principal Financial Group Inc. | 7,321 | 183 |
| | Lincoln National Corp. | 7,000 | 167 |
| | M&T Bank Corp. | 2,600 | 163 |
| | Fifth Third Bancorp | 18,150 | 162 |
| | Moody’s Corp. | 6,724 | 159 |
| | Hudson City Bancorp Inc. | 11,938 | 157 |
| | Unum Group | 7,600 | 152 |
| | Regions Financial Corp. | 31,100 | 151 |
| | Ventas Inc. | 3,719 | 149 |
| | Host Hotels & Resorts Inc. | 13,900 | 141 |
| | Erie Indemnity Co. Class A | 3,938 | 139 |
| | Legg Mason Inc. | 4,700 | 137 |
| | Liberty Property Trust | 4,590 | 135 |
| | Brown & Brown Inc. | 7,205 | 132 |
| | | |
| | | | Market |
| | | | Value• |
| | | Shares | ($000) |
| * | TD Ameritrade Holding Corp. | 6,744 | 130 |
| | People’s United Financial Inc. | 7,930 | 127 |
| | AvalonBay Communities Inc. | 1,828 | 126 |
| * | IntercontinentalExchange Inc. | 1,246 | 125 |
| * | SLM Corp. | 12,860 | 125 |
| | Everest Re Group Ltd. | 1,400 | 122 |
| * | American International | | |
| | Group Inc. | 3,620 | 122 |
| | Plum Creek Timber Co. Inc. | 3,700 | 116 |
| | ProLogis | 10,200 | 116 |
| | Kimco Realty Corp. | 8,700 | 110 |
| | Keycorp | 20,200 | 109 |
| | Old Republic | | |
| | International Corp. | 10,100 | 108 |
| * | Genworth Financial Inc. | | |
| | Class A | 9,900 | 105 |
| | Willis Group Holdings Ltd. | 3,843 | 104 |
| | PartnerRe Ltd. | 1,300 | 99 |
| | Axis Capital Holdings Ltd. | 3,366 | 97 |
| | Comerica Inc. | 3,500 | 97 |
| | WR Berkley Corp. | 3,900 | 96 |
| * | Leucadia National Corp. | 4,204 | 94 |
| | Hospitality Properties Trust | 4,786 | 92 |
| | Mercury General Corp. | 2,406 | 88 |
| | Weingarten Realty Investors | 4,729 | 87 |
| * | Markel Corp. | 254 | 82 |
| | Torchmark Corp. | 2,000 | 81 |
| | Cincinnati Financial Corp. | 3,200 | 81 |
| | Duke Realty Corp. | 7,100 | 80 |
| | AMB Property Corp. | 3,537 | 78 |
| | Protective Life Corp. | 3,953 | 76 |
| | New York Community | | |
| | Bancorp Inc. | 6,700 | 72 |
| | First American Corp. | 2,372 | 72 |
| | Assurant Inc. | 2,339 | 70 |
| * | First Horizon National Corp. | 5,650 | 67 |
| | Transatlantic Holdings Inc. | 1,298 | 66 |
| | RenaissanceRe Holdings Ltd. | 1,200 | 63 |
| | White Mountains Insurance | | |
| | Group Ltd. | 203 | 63 |
| | Regency Centers Corp. | 1,836 | 62 |
| | Commerce Bancshares Inc. | 1,502 | 58 |
| | SEI Investments Co. | 3,279 | 57 |
| | Macerich Co. | 1,813 | 54 |
| | Arthur J Gallagher & Co. | 2,305 | 51 |
| * | St Joe Co. | 2,100 | 50 |
| | Associated Banc-Corp | 3,800 | 49 |
| | Valley National Bancorp | 3,512 | 47 |
| | City National Corp. | 1,174 | 44 |
| | Marshall & Ilsley Corp. | 8,200 | 44 |
| | Janus Capital Group Inc. | 3,200 | 42 |
| | Huntington Bancshares Inc. | 10,800 | 41 |
| | Zions Bancorporation | 2,900 | 41 |
| | Federated Investors Inc. | | |
| | Class B | 1,531 | 40 |
| | Fulton Financial Corp. | 4,203 | 35 |
40
| | | |
| Total World Stock Index Fund | | |
| |
| |
| |
| | | | Market |
| | | | Value• |
| | | Shares | ($000) |
| | Apartment Investment & | | |
| | Management Co. | 2,659 | 33 |
| | Developers Diversified | | |
| | Realty Corp. | 3,741 | 32 |
| | Popular Inc. | 14,712 | 32 |
| | TCF Financial Corp. | 2,500 | 30 |
| | Forest City Enterprises Inc. | | |
| | Class A | 3,076 | 27 |
| * | MBIA Inc. | 4,800 | 19 |
| | Synovus Financial Corp. | 8,400 | 19 |
| | Astoria Financial Corp. | 1,300 | 13 |
| * | CNA Financial Corp. | 330 | 7 |
| | Wesco Financial Corp. | 20 | 7 |
| | Student Loan Corp. | 54 | 2 |
| | Allied Capital Corp. | 300 | 1 |
| | CIT Group Inc. | 1,000 | 1 |
| |
| | Health Care (5.0%) | | |
| | Johnson & Johnson | 73,775 | 4,356 |
| | Pfizer Inc. | 213,792 | 3,641 |
| | Abbott Laboratories | 40,800 | 2,063 |
| | Merck & Co. Inc. | 56,030 | 1,733 |
| * | Amgen Inc. | 27,400 | 1,472 |
| | Schering-Plough Corp. | 43,090 | 1,215 |
| | Bristol-Myers Squibb Co. | 52,200 | 1,138 |
| | Medtronic Inc. | 30,600 | 1,092 |
| * | Gilead Sciences Inc. | 24,800 | 1,055 |
| | Eli Lilly & Co. | 30,400 | 1,034 |
| | Baxter International Inc. | 16,800 | 908 |
| | UnitedHealth Group Inc. | 31,610 | 820 |
| * | Medco Health Solutions Inc. | 13,800 | 774 |
| * | Celgene Corp. | 13,000 | 664 |
| | Covidien PLC | 14,446 | 609 |
| * | WellPoint Inc. | 12,800 | 599 |
| * | Express Scripts Inc. | 6,702 | 536 |
| * | Thermo Fisher Scientific Inc. | 11,300 | 509 |
| | Allergan Inc. | 8,740 | 492 |
| | Becton Dickinson and Co. | 5,900 | 403 |
| | McKesson Corp. | 6,200 | 364 |
| * | Genzyme Corp. | 7,100 | 359 |
| * | Boston Scientific Corp. | 43,500 | 353 |
| * | Zimmer Holdings Inc. | 6,220 | 327 |
| * | Biogen Idec Inc. | 7,760 | 327 |
| | Aetna Inc. | 12,400 | 323 |
| | Stryker Corp. | 6,800 | 313 |
| | Alcon Inc. | 2,052 | 293 |
| | Cardinal Health Inc. | 10,200 | 289 |
| * | St Jude Medical Inc. | 8,400 | 286 |
| * | Forest Laboratories Inc. | 10,000 | 277 |
| | CIGNA Corp. | 9,300 | 259 |
| * | Intuitive Surgical Inc. | 847 | 209 |
| * | Life Technologies Corp. | 4,216 | 199 |
| * | Humana Inc. | 4,869 | 183 |
| | Quest Diagnostics Inc. | 3,200 | 179 |
| * | Laboratory Corp. of | | |
| | America Holdings | 2,400 | 165 |
| | | |
| | | | Market |
| | | | Value• |
| | | Shares | ($000) |
| * | Hospira Inc. | 3,700 | 165 |
| | CR Bard Inc. | 2,200 | 165 |
| | AmerisourceBergen Corp. | | |
| | Class A | 6,807 | 151 |
| * | DaVita Inc. | 2,400 | 127 |
| * | Waters Corp. | 2,200 | 126 |
| * | Varian Medical Systems Inc. | 2,900 | 119 |
| * | Mylan Inc. | 6,956 | 113 |
| | DENTSPLY International Inc. | 3,400 | 112 |
| * | Lincare Holdings Inc. | 3,528 | 111 |
| | Beckman Coulter Inc. | 1,700 | 109 |
| * | Henry Schein Inc. | 2,060 | 109 |
| * | Cephalon Inc. | 1,717 | 94 |
| * | CareFusion Corp. | 4,111 | 92 |
| * | Patterson Cos. Inc. | 3,100 | 79 |
| * | Coventry Health Care Inc. | 3,800 | 75 |
| * | Millipore Corp. | 1,093 | 73 |
| * | Watson Pharmaceuticals Inc. | 2,049 | 71 |
| * | Community Health | | |
| | Systems Inc. | 2,146 | 67 |
| | Universal Health | | |
| | Services Inc. Class B | 1,067 | 59 |
| | Omnicare Inc. | 2,700 | 59 |
| * | King Pharmaceuticals Inc. | 5,644 | 57 |
| | IMS Health Inc. | 3,200 | 52 |
| * | Kinetic Concepts Inc. | 1,445 | 48 |
| | Hill-Rom Holdings Inc. | 2,400 | 47 |
| * | Health Net Inc. | 2,400 | 36 |
| |
| | Industrials (4.0%) | | |
| | General Electric Co. | 279,660 | 3,988 |
| | United Technologies Corp. | 25,700 | 1,579 |
| | 3M Co. | 18,900 | 1,390 |
| | United Parcel Service Inc. | | |
| | Class B | 18,470 | 991 |
| | Boeing Co. | 19,700 | 942 |
| | Caterpillar Inc. | 16,610 | 915 |
| | Emerson Electric Co. | 20,100 | 759 |
| | Union Pacific Corp. | 13,700 | 755 |
| | Lockheed Martin Corp. | 10,800 | 743 |
| | Honeywell International Inc. | 20,600 | 739 |
| | General Dynamics Corp. | 11,100 | 696 |
| | Burlington Northern | | |
| | Santa Fe Corp. | 9,050 | 682 |
| | Illinois Tool Works Inc. | 14,000 | 643 |
| | FedEx Corp. | 8,340 | 606 |
| | Deere & Co. | 11,600 | 528 |
| | Raytheon Co. | 11,500 | 521 |
| | Northrop Grumman Corp. | 9,300 | 466 |
| | Waste Management Inc. | 15,400 | 460 |
| | CSX Corp. | 10,900 | 460 |
| | Norfolk Southern Corp. | 9,845 | 459 |
| | Tyco International Ltd. | 13,500 | 453 |
| | Precision Castparts Corp. | 4,481 | 428 |
| | Danaher Corp. | 5,900 | 403 |
| | PACCAR Inc. | 10,300 | 385 |
41
| | | |
| Total World Stock Index Fund | | |
| |
| |
| |
| | | | Market |
| | | | Value• |
| | | Shares | ($000) |
| | Cummins Inc. | 7,594 | 327 |
| | Ingersoll-Rand PLC | 10,200 | 322 |
| | CH Robinson Worldwide Inc. | 4,860 | 268 |
| * | Jacobs Engineering | | |
| | Group Inc. | 5,403 | 228 |
| | ITT Corp. | 4,500 | 228 |
| | Eaton Corp. | 3,700 | 224 |
| | Republic Services Inc. | | |
| | Class A | 8,500 | 220 |
| | L-3 Communications | | |
| | Holdings Inc. | 2,900 | 210 |
| | Fluor Corp. | 4,400 | 195 |
| | Parker Hannifin Corp. | 3,600 | 191 |
| | Rockwell Collins Inc. | 3,600 | 181 |
| | Dover Corp. | 4,600 | 173 |
| | WW Grainger Inc. | 1,700 | 159 |
| | Stanley Works | 3,500 | 158 |
| | Expeditors International of | | |
| | Washington Inc. | 4,902 | 158 |
| | Robert Half International Inc. | 6,700 | 155 |
| | Textron Inc. | 8,500 | 151 |
| | Goodrich Corp. | 2,773 | 151 |
| * | Cooper Industries PLC | | |
| | Class A | 3,800 | 147 |
| | Southwest Airlines Co. | 16,900 | 142 |
| * | Alliant Techsystems Inc. | 1,747 | 136 |
| * | McDermott International Inc. | 6,100 | 136 |
| | Rockwell Automation Inc. | 3,300 | 135 |
| | RR Donnelley & Sons Co. | 6,700 | 135 |
| | Fastenal Co. | 3,500 | 121 |
| | Pitney Bowes Inc. | 4,800 | 118 |
| * | Iron Mountain Inc. | 4,623 | 113 |
| * | First Solar Inc. | 898 | 110 |
| | Masco Corp. | 8,800 | 103 |
| | Dun & Bradstreet Corp. | 1,200 | 92 |
| * | Foster Wheeler AG | 3,123 | 87 |
| | Pall Corp. | 2,700 | 86 |
| | Equifax Inc. | 3,100 | 85 |
| | Manpower Inc. | 1,700 | 81 |
| | Avery Dennison Corp. | 2,200 | 78 |
| | JB Hunt Transport | | |
| | Services Inc. | 2,129 | 64 |
| | Cintas Corp. | 2,300 | 64 |
| | Pentair Inc. | 2,000 | 58 |
| | Ryder System Inc. | 1,244 | 50 |
| * | Terex Corp. | 2,418 | 49 |
| | SPX Corp. | 900 | 48 |
| |
| | Information Technology (7.7%) | |
| | Microsoft Corp. | 237,168 | 6,577 |
| * | Apple Inc. | 23,691 | 4,466 |
| | International Business | | |
| | Machines Corp. | 35,331 | 4,261 |
| * | Cisco Systems Inc. | 154,811 | 3,537 |
| * | Google Inc. Class A | 6,431 | 3,448 |
| | Hewlett-Packard Co. | 63,960 | 3,036 |
| | Intel Corp. | 147,559 | 2,820 |
| | | |
| | | | Market |
| | | | Value• |
| | | Shares | ($000) |
| | Oracle Corp. | 132,608 | 2,798 |
| | QUALCOMM Inc. | 44,202 | 1,830 |
| * | EMC Corp. | 54,500 | 898 |
| | Visa Inc. Class A | 11,273 | 854 |
| | Texas Instruments Inc. | 34,300 | 804 |
| * | Dell Inc. | 52,053 | 754 |
| | Corning Inc. | 42,000 | 614 |
| | Mastercard Inc. Class A | 2,687 | 588 |
| * | eBay Inc. | 26,300 | 586 |
| | Automatic Data | | |
| | Processing Inc. | 14,400 | 573 |
| | Accenture PLC Class A | 15,000 | 556 |
| | Motorola Inc. | 61,900 | 530 |
| | Applied Materials Inc. | 39,100 | 477 |
| * | Adobe Systems Inc. | 14,100 | 464 |
| * | Juniper Networks Inc. | 18,010 | 459 |
| * | Yahoo! Inc. | 27,600 | 439 |
| | Western Union Co. | 21,500 | 391 |
| * | Symantec Corp. | 20,114 | 354 |
| * | Cognizant Technology | | |
| | Solutions Corp. Class A | 8,600 | 332 |
| * | Broadcom Corp. Class A | 12,200 | 325 |
| * | NetApp Inc. | 11,550 | 312 |
| | Paychex Inc. | 10,300 | 293 |
| * | Citrix Systems Inc. | 7,170 | 264 |
| | Tyco Electronics Ltd. | 10,900 | 232 |
| * | Intuit Inc. | 7,853 | 228 |
| * | SanDisk Corp. | 11,100 | 227 |
| * | Sun Microsystems Inc. | 24,400 | 200 |
| * | Agilent Technologies Inc. | 7,800 | 193 |
| * | Nvidia Corp. | 15,400 | 184 |
| | CA Inc. | 8,633 | 181 |
| * | Computer Sciences Corp. | 3,400 | 172 |
| * | Electronic Arts Inc. | 9,300 | 170 |
| | Analog Devices Inc. | 6,500 | 167 |
| * | Micron Technology Inc. | 24,300 | 165 |
| * | Fiserv Inc. | 3,551 | 163 |
| * | Activision Blizzard Inc. | 14,758 | 160 |
| | Seagate Technology | 11,300 | 158 |
| | Fidelity National Information | | |
| | Services Inc. | 7,197 | 157 |
| | Amphenol Corp. Class A | 3,900 | 156 |
| * | BMC Software Inc. | 4,200 | 156 |
| * | Flextronics International Ltd. | 23,500 | 152 |
| * | Autodesk Inc. | 6,100 | 152 |
| | Xerox Corp. | 19,600 | 147 |
| * | McAfee Inc. | 3,476 | 146 |
| * | Marvell Technology | | |
| | Group Ltd. | 10,404 | 143 |
| | Xilinx Inc. | 6,402 | 139 |
| * | VeriSign Inc. | 6,100 | 139 |
| | Harris Corp. | 3,279 | 137 |
| * | Akamai Technologies Inc. | 6,100 | 134 |
| | Altera Corp. | 6,740 | 133 |
| | Linear Technology Corp. | 5,100 | 132 |
| | KLA-Tencor Corp. | 3,900 | 127 |
| * | Teradata Corp. | 3,952 | 110 |
42
| | | |
| Total World Stock Index Fund | | |
| |
| |
| |
| | | | Market |
| | | | Value• |
| | | Shares | ($000) |
| * | Affiliated Computer | | |
| | Services Inc. Class A | 2,100 | 109 |
| | Microchip Technology Inc. | 4,200 | 101 |
| * | WebMD Health Corp. | | |
| | Class A | 2,841 | 97 |
| | Lender Processing | | |
| | Services Inc. | 2,242 | 89 |
| * | Avnet Inc. | 3,475 | 86 |
| * | Lam Research Corp. | 2,500 | 84 |
| * | Convergys Corp. | 7,600 | 82 |
| * | Arrow Electronics Inc. | 2,971 | 75 |
| * | Alliance Data Systems Corp. | 1,351 | 74 |
| * | Advanced Micro Devices Inc. | 16,100 | 74 |
| | Broadridge Financial | | |
| | Solutions Inc. | 3,522 | 73 |
| | Total System Services Inc. | 4,438 | 71 |
| | National | | |
| | Semiconductor Corp. | 5,400 | 70 |
| * | LSI Corp. | 12,800 | 66 |
| * | Synopsys Inc. | 2,800 | 62 |
| * | IAC/InterActiveCorp | 3,000 | 57 |
| | Jabil Circuit Inc. | 4,200 | 56 |
| * | MEMC Electronic | | |
| | Materials Inc. | 4,258 | 53 |
| * | Novellus Systems Inc. | 2,500 | 51 |
| * | Lexmark International Inc. | | |
| | Class A | 1,800 | 46 |
| | Diebold Inc. | 1,506 | 46 |
| * | DST Systems Inc. | 1,000 | 42 |
| * | NCR Corp. | 3,630 | 37 |
| * | JDS Uniphase Corp. | 6,200 | 35 |
| * | Compuware Corp. | 4,900 | 35 |
| * | Zebra Technologies Corp. | 900 | 22 |
| | Molex Inc. | 1,000 | 19 |
| | Molex Inc. Class A | 800 | 13 |
| |
| | Materials (1.3%) | | |
| | Monsanto Co. | 14,600 | 981 |
| | Freeport-McMoRan | | |
| | Copper & Gold Inc. | 10,940 | 803 |
| | EI du Pont de | | |
| | Nemours & Co. | 24,900 | 792 |
| | Dow Chemical Co. | 30,130 | 708 |
| | Praxair Inc. | 8,420 | 669 |
| | Newmont Mining Corp. | 13,100 | 569 |
| | Air Products & | | |
| | Chemicals Inc. | 6,200 | 478 |
| | Nucor Corp. | 8,420 | 336 |
| | Alcoa Inc. | 26,200 | 325 |
| | Ecolab Inc. | 5,400 | 237 |
| | Mosaic Co. | 5,048 | 236 |
| | International Paper Co. | 10,100 | 225 |
| | Weyerhaeuser Co. | 6,100 | 222 |
| | PPG Industries Inc. | 3,900 | 220 |
| | Southern Copper Corp. | 6,131 | 193 |
| | Sigma-Aldrich Corp. | 2,800 | 145 |
| | Vulcan Materials Co. | 2,800 | 129 |
| | | |
| | | | Market |
| | | | Value• |
| | | Shares | ($000) |
| | Bemis Co. Inc. | 4,464 | 115 |
| | Allegheny Technologies Inc. | 3,591 | 111 |
| | United States Steel Corp. | 3,200 | 110 |
| | Ball Corp. | 2,200 | 109 |
| | Eastman Chemical Co. | 1,760 | 92 |
| | MeadWestvaco Corp. | 3,800 | 87 |
| | International Flavors & | | |
| | Fragrances Inc. | 2,100 | 80 |
| | Sealed Air Corp. | 3,700 | 71 |
| * | Pactiv Corp. | 2,600 | 60 |
| | Ashland Inc. | 1,706 | 59 |
| | Cabot Corp. | 900 | 20 |
| |
| | Telecommunication Services (1.2%) | |
| | AT&T Inc. | 157,900 | 4,053 |
| | Verizon | | |
| | Communications Inc. | 75,400 | 2,231 |
| * | American Tower Corp. | | |
| | Class A | 10,950 | 403 |
| | CenturyTel Inc. | 6,795 | 221 |
| * | Sprint Nextel Corp. | 71,800 | 213 |
| * | Crown Castle | | |
| | International Corp. | 5,000 | 151 |
| | Qwest Communications | | |
| | International Inc. | 38,100 | 137 |
| * | NII Holdings Inc. | 4,800 | 129 |
| * | MetroPCS | | |
| | Communications Inc. | 10,800 | 67 |
| * | Level 3 | | |
| | Communications Inc. | 48,800 | 58 |
| | Frontier | | |
| | Communications Corp. | 7,161 | 51 |
| | Telephone & | | |
| | Data Systems Inc. | 700 | 21 |
| |
| | Utilities (1.4%) | | |
| | Exelon Corp. | 18,100 | 850 |
| | Southern Co. | 21,570 | 673 |
| | Duke Energy Corp. | 38,580 | 610 |
| | Dominion Resources Inc. | 14,500 | 494 |
| | FPL Group Inc. | 10,000 | 491 |
| | Public Service Enterprise | | |
| | Group Inc. | 12,500 | 373 |
| | PG&E Corp. | 9,100 | 372 |
| | Entergy Corp. | 4,800 | 368 |
| | American Electric | | |
| | Power Co. Inc. | 11,700 | 354 |
| | FirstEnergy Corp. | 7,000 | 303 |
| | Sempra Energy | 5,600 | 288 |
| | PPL Corp. | 8,800 | 259 |
| | Consolidated Edison Inc. | 6,300 | 256 |
| | Progress Energy Inc. | 6,500 | 244 |
| * | NRG Energy Inc. | 10,451 | 240 |
| | Edison International | 7,500 | 239 |
| | Centerpoint Energy Inc. | 16,359 | 206 |
| * | AES Corp. | 14,800 | 194 |
| | Xcel Energy Inc. | 10,200 | 192 |
43
| | | | |
| Total World Stock Index Fund | | |
| |
| |
| |
| | | | | Market |
| | | | | Value• |
| | | | Shares | ($000) |
| | NiSource Inc. | | 14,249 | 184 |
| | NSTAR | | 5,920 | 183 |
| | Questar Corp. | | 4,000 | 159 |
| | TECO Energy Inc. | | 9,853 | 141 |
| | DTE Energy Co. | | 3,800 | 141 |
| | Constellation Energy | | | |
| | Group Inc. | | 4,500 | 139 |
| | Ameren Corp. | | 5,300 | 129 |
| | Pinnacle West Capital Corp. | 4,113 | 129 |
| | EQT Corp. | | 3,000 | 126 |
| | Wisconsin Energy Corp. | 2,700 | 118 |
| | SCANA Corp. | | 2,800 | 95 |
| | Northeast Utilities | | 3,995 | 92 |
| | MDU Resources Group Inc. | 3,650 | 76 |
| | Allegheny Energy Inc. | | 3,291 | 75 |
| | Pepco Holdings Inc. | | 4,300 | 64 |
| * | RRI Energy Inc. | | 11,000 | 58 |
| | Alliant Energy Corp. | | 2,161 | 58 |
| * | Mirant Corp. | | 3,317 | 46 |
| | | | | 261,528 |
| Total Common Stocks | | | |
| (Cost $575,014) | | | 644,269 |
| Temporary Cash Investment (0.6%) | |
| Money Market Fund (0.6%) | | |
| 2,3 | Vanguard Market | | | |
| | Liquidity Fund, 0.225% | | |
| | (Cost $3,937) | 3,937,002 | 3,937 |
| Total Investments (100.2%) | | |
| (Cost $578,951) | | | 648,206 |
| Other Assets and Liabilities (–0.2%) | |
| Other Assets | | | 1,440 |
| Liabilities2 | | | (2,541) |
| | | | | (1,101) |
| Net Assets (100%) | | | 647,105 |
| |
| At October 31, 2009, net assets consisted of: |
| | Amount |
| | ($000) |
| Paid-in Capital | 577,804 |
| Undistributed Net Investment Income | 8,384 |
| Accumulated Net Realized Losses | (8,349) |
| Unrealized Appreciation (Depreciation) | |
| Investment Securities | 69,255 |
| Foreign Currencies | 11 |
| Net Assets | 647,105 |
| |
| Investor Shares—Net Assets | |
| Applicable to 7,863,905 outstanding | |
| $.001 par value shares of beneficial | |
| interest (unlimited authorization) | 130,985 |
| Net Asset Value Per Share— | |
| Investor Shares | $16.66 |
| |
| Institutional Shares—Net Assets | |
| Applicable to 204,878 outstanding | |
| $.001 par value shares of beneficial | |
| interest (unlimited authorization) | 17,116 |
| Net Asset Value Per Share— | |
| Institutional Shares | $83.54 |
| |
| ETF Shares—Net Assets | |
| Applicable to 12,205,839 outstanding | |
| $.001 par value shares of beneficial | |
| interest (unlimited authorization) | 499,004 |
| Net Asset Value Per Share— | |
| ETF Shares | $40.88 |
• See Note A in Notes to Financial Statements.
* Non-income-producing security.
^ Part of security position is on loan to broker-dealers. The total value of securities on loan is $1,814,000.
1 Security exempt from registration under Rule 144A of the Securities Act of 1933. Such securities may be sold in transactions exempt from registration, normally to qualified institutional buyers. At October 31, 2009, the value of this security represented 0.3% of net assets.
2 Includes $1,928,000 of collateral received for securities on loan.
3 Affiliated money market fund available only to Vanguard funds and certain trusts and accounts managed by Vanguard. Rate shown is the 7-day yield.
ADR—American Depositary Receipt.
GDR—Global Depositary Receipt.
REIT—Real Estate Investment Trust.
See accompanying Notes, which are an integral part of the Financial Statements.
44
| |
| Total World Stock Index Fund | |
| |
| |
| Statement of Operations | |
| |
| | Year Ended |
| | October 31, 2009 |
| | ($000) |
| Investment Income | |
| Income | |
| Dividends1 | 10,395 |
| Interest2 | 20 |
| Security Lending | 193 |
| Total Income | 10,608 |
| Expenses | |
| The Vanguard Group—Note B | |
| Investment Advisory Services | 49 |
| Management and Administrative—Investor Shares | 295 |
| Management and Administrative—Institutional Shares | 14 |
| Management and Administrative—ETF Shares | 466 |
| Marketing and Distribution—Investor Shares | 15 |
| Marketing and Distribution—Institutional Shares | 4 |
| Marketing and Distribution—ETF Shares | 66 |
| Custodian Fees | 318 |
| Auditing Fees | 36 |
| Shareholders’ Reports and Proxies—Investor Shares | 10 |
| Shareholders’ Reports and Proxies—Institutional Shares | — |
| Shareholders’ Reports and Proxies—ETF Shares | 29 |
| Trustees’ Fees and Expenses | 1 |
| Total Expenses | 1,303 |
| Net Investment Income | 9,305 |
| Realized Net Gain (Loss) | |
| Investment Securities Sold | (7,725) |
| Foreign Currencies | 60 |
| Realized Net Gain (Loss) | (7,665) |
| Change in Unrealized Appreciation (Depreciation) | |
| Investment Securities | 103,882 |
| Foreign Currencies | 4 |
| Change in Unrealized Appreciation (Depreciation) | 103,886 |
| Net Increase (Decrease) in Net Assets Resulting from Operations | 105,526 |
1 Dividends are net of foreign withholding taxes of $528,000.
2 Interest income from an affiliated company of the fund was $20,000.
See accompanying Notes, which are an integral part of the Financial Statements.
45
| | |
| Total World Stock Index Fund | | |
| |
| |
| Statement of Changes in Net Assets | | |
| |
| | Year Ended | June 24, 20081 |
| | October 31, | to October 31, |
| | 2009 | 2008 |
| | ($000) | ($000) |
| Increase (Decrease) in Net Assets | | |
| Operations | | |
| Net Investment Income | 9,305 | 655 |
| Realized Net Gain (Loss) | (7,665) | (543) |
| Change in Unrealized Appreciation (Depreciation) | 103,886 | (34,620) |
| Net Increase (Decrease) in Net Assets Resulting from Operations | 105,526 | (34,508) |
| Distributions | | |
| Net Investment Income | | |
| Investor Shares | (353) | — |
| Institutional Shares | (105) | — |
| ETF Shares | (1,259) | — |
| Realized Capital Gain | | |
| Investor Shares | — | — |
| Institutional Shares | — | — |
| ETF Shares | — | — |
| Total Distributions | (1,717) | — |
| Capital Share Transactions | | |
| Investor Shares | 68,202 | 51,939 |
| Institutional Shares | 6,213 | 6,987 |
| ETF Shares | 306,446 | 138,017 |
| Net Increase (Decrease) from Capital Share Transactions | 380,861 | 196,943 |
| Total Increase (Decrease) | 484,670 | 162,435 |
| Net Assets | | |
| Beginning of Period | 162,435 | — |
| End of Period2 | 647,105 | 162,435 |
1 Inception.
2 Net Assets—End of Period includes undistributed net investment income of $8,384,000 and $684,000.
See accompanying Notes, which are an integral part of the Financial Statements.
46
| | |
| Total World Stock Index Fund | | |
| |
| |
| Financial Highlights | | |
| |
| |
| Investor Shares | | |
| | Year | June 26, |
| | Ended | 20081 to |
| | Oct. 31, | Oct. 31, |
| For a Share Outstanding Throughout Each Period | 2009 | 2008 |
| Net Asset Value, Beginning of Period | $13.71 | $20.00 |
| Investment Operations | | |
| Net Investment Income | .3282 | .1602 |
| Net Realized and Unrealized Gain (Loss) on Investments | 2.698 | (6.450) |
| Total from Investment Operations | 3.026 | (6.290) |
| Distributions | | |
| Dividends from Net Investment Income | (.076) | — |
| Distributions from Realized Capital Gains | — | — |
| Total Distributions | (.076) | — |
| Net Asset Value, End of Period | $16.66 | $13.71 |
| |
| Total Return3 | 22.25% | –31.45% |
| |
| Ratios/Supplemental Data | | |
| Net Assets, End of Period (Millions) | $131 | $41 |
| Ratio of Total Expenses to Average Net Assets | 0.50% | 0.46%4 |
| Ratio of Net Investment Income to Average Net Assets | 2.28% | 2.32%4 |
| Portfolio Turnover Rate5 | 18% | 5% |
1 Inception.
2 Calculated based on average shares outstanding.
3 Total returns do not reflect the 0.25% transaction fee on purchases; the 2% fee assessed on redemptions of shares held for less than two months; or the account service fee that may be applicable to certain accounts with balances below $10,000.
4 Annualized.
5 Excludes the value of portfolio securities received or delivered as a result of in-kind purchases or redemptions of the fund’s capital shares, including ETF Creation Units.
See accompanying Notes, which are an integral part of the Financial Statements.
47
| | |
| Total World Stock Index Fund | | |
| |
| |
| Financial Highlights | | |
| |
| |
| Institutional Shares | | |
| | Year | Oct. 9, |
| | Ended | 20081 to |
| | Oct. 31, | Oct. 31, |
| For a Share Outstanding Throughout Each Period | 2009 | 2008 |
| Net Asset Value, Beginning of Period | $68.63 | $66.81 |
| Investment Operations | | |
| Net Investment Income | 1.8842 | .1242 |
| Net Realized and Unrealized Gain (Loss) on Investments | 13.457 | 1.696 |
| Total from Investment Operations | 15.341 | 1.820 |
| Distributions | | |
| Dividends from Net Investment Income | (.431) | — |
| Distributions from Realized Capital Gains | — | — |
| Total Distributions | (.431) | — |
| Net Asset Value, End of Period | $83.54 | $68.63 |
| |
| Total Return3 | 22.55% | 2.72% |
| |
| Ratios/Supplemental Data | | |
| Net Assets, End of Period (Millions) | $17 | $7 |
| Ratio of Total Expenses to Average Net Assets | 0.25% | 0.20%4 |
| Ratio of Net Investment Income to Average Net Assets | 2.53% | 2.58%4 |
| Portfolio Turnover Rate5 | 18% | 5% |
1 Inception.
2 Calculated based on average shares outstanding.
3 Total returns do not reflect the 0.25% transaction fee on purchases or the 2% fee assessed on redemptions of shares held for less than wo months.
4 Annualized.
5 Excludes the value of portfolio securities received or delivered as a result of in-kind purchases or redemptions of the fund’s capital shares, including ETF Creation Units.
See accompanying Notes, which are an integral part of the Financial Statements.
48
| | |
| Total World Stock Index Fund | | |
| |
| |
| Financial Highlights | | |
| |
| |
| ETF Shares | | |
| | Year | June 24, |
| | Ended | 20081 to |
| | Oct. 31, | Oct. 31, |
| For a Share Outstanding Throughout Each Period | 2009 | 2008 |
| Net Asset Value, Beginning of Period | $33.59 | $49.74 |
| Investment Operations | | |
| Net Investment Income | .8712 | .3402 |
| Net Realized and Unrealized Gain (Loss) on Investments | 6.622 | (16.490) |
| Total from Investment Operations | 7.493 | (16.150) |
| Distributions | | |
| Dividends from Net Investment Income | (.203) | — |
| Distributions from Realized Capital Gains | — | — |
| Total Distributions | (.203) | — |
| Net Asset Value, End of Period | $40.88 | $33.59 |
| |
| Total Return | 22.49% | –32.47% |
| |
| Ratios/Supplemental Data | | |
| Net Assets, End of Period (Millions) | $499 | $114 |
| Ratio of Total Expenses to Average Net Assets | 0.30% | 0.29%3 |
| Ratio of Net Investment Income to Average Net Assets | 2.48% | 2.49%3 |
| Portfolio Turnover Rate4 | 18% | 5% |
1 Inception.
2 Calculated based on average shares outstanding.
3 Annualized.
4 Excludes the value of portfolio securities received or delivered as a result of in-kind purchases or redemptions of the fund’s capital shares, including ETF Creation Units.
See accompanying Notes, which are an integral part of the Financial Statements.
49
Total World Stock Index Fund
Notes to Financial Statements
Vanguard Total World Stock Index Fund is registered under the Investment Company Act of 1940 as an open-end investment company, or mutual fund. The fund invests in securities of foreign issuers, which may subject it to investment risks not normally associated with investing in securities of U.S. corporations. The fund offers three classes of shares: Investor Shares, Institutional Shares, and ETF Shares. Investor Shares are available to any investor who meets the fund’s minimum purchase requirements. Institutional Shares are designed for investors who meet certain administrative and service criteria and invest a minimum of $5 million. ETF Shares are listed for trading on the NYSE Arca, Inc.; they can be purchased and sold through a broker.
A. The following significant accounting policies conform to generally accepted accounting principles for U.S. mutual funds. The fund consistently follows such policies in preparing its financial statements.
1. Security Valuation: Securities are valued as of the close of trading on the New York Stock Exchange (generally 4 p.m., Eastern time) on the valuation date. Equity securities are valued at the latest quoted sales prices or official closing prices taken from the primary market in which each security trades; such securities not traded on the valuation date are valued at the mean of the latest quoted bid and asked prices. Securities for which market quotations are not readily available, or whose values have been affected by events occurring before the fund’s pricing time but after the close of the securities’ primary markets, are valued at their fair values calculated according to procedures adopted by the board of trustees. These procedures include obtaining quotations from an independent pricing service, monitoring news to identify significant market- or security-specific events, and evaluating cha nges in the values of foreign market proxies (for example, ADRs, futures contracts, or exchange-traded funds), between the time the foreign markets close and the fund’s pricing time. When fair-value pricing is employed, the prices of securities used by a fund to calculate its net asset value may differ from quoted or published prices for the same securities. Investments in Vanguard Market Liquidity Fund are valued at that fund’s net asset value.
2. Foreign Currency: Securities and other assets and liabilities denominated in foreign currencies are translated into U.S. dollars using exchange rates obtained from an independent third party as of the fund’s pricing time on the valuation date. Realized gains (losses) and unrealized appreciation (depreciation) on investment securities include the effects of changes in exchange rates since the securities were purchased, combined with the effects of changes in security prices. Fluctuations in the value of other assets and liabilities resulting from changes in exchange rates are recorded as unrealized foreign currency gains (losses) until the assets or liabilities are settled in cash, at which time they are recorded as realized foreign currency gains (losses).
3. Federal Income Taxes: The fund intends to continue to qualify as a regulated investment company and distribute all of its taxable income. Management has analyzed the fund’s tax positions taken for all open federal income tax years (October 31, 2008–2009), and has concluded that no provision for federal income tax is required in the fund’s financial statements.
4. Distributions: Distributions to shareholders are recorded on the ex-dividend date.
5. Security Lending: The fund may lend its securities to qualified institutional borrowers to earn additional income. Security loans are required to be secured at all times by collateral at least equal to the market value of securities loaned. The fund invests cash collateral received in Vanguard Market Liquidity Fund, and records a liability for the return of the collateral, during the period the securities are on loan. Security lending income represents the income earned on investing cash collateral, less expenses associated with the loan.
50
6. Other: Dividend income is recorded on the ex-dividend date. Interest income includes income distributions received from Vanguard Market Liquidity Fund and is accrued daily. Security transactions are accounted for on the date securities are bought or sold. Costs used to determine realized gains (losses) on the sale of investment securities are those of the specific securities sold. Fees assessed on redemptions of capital shares are credited to paid-in capital.
Each class of shares has equal rights as to assets and earnings, except that each class separately bears certain class-specific expenses related to maintenance of shareholder accounts (included in Management and Administrative expenses), shareholder reporting, and proxies. Marketing and distribution expenses are allocated to each class of shares based on a method approved by the board of trustees. Income, other non-class-specific expenses, and gains and losses on investments are allocated to each class of shares based on its relative net assets.
B. The Vanguard Group furnishes at cost investment advisory, corporate management, administrative, marketing, and distribution services. The costs of such services are allocated to the fund under methods approved by the board of trustees. The fund has committed to provide up to 0.40% of its net assets in capital contributions to Vanguard. At October 31, 2009, the fund had contributed capital of $127,000 to Vanguard (included in Other Assets), representing 0.02% of the fund’s net assets and 0.05% of Vanguard’s capitalization. The fund’s trustees and officers are also directors and officers of Vanguard.
C. Various inputs may be used to determine the value of the fund’s investments. These inputs are summarized in three broad levels for financial statement purposes. The inputs or methodologies used to value securities are not necessarily an indication of the risk associated with investing in those securities.
Level 1—Quoted prices in active markets for identical securities.
Level 2—Other significant observable inputs (including quoted prices for similar securities, interest
rates, prepayment speeds, credit risk, etc.).
Level 3—Significant unobservable inputs (including the fund’s own assumptions used to determine
the fair value of investments).
The following table summarizes the fund’s investments as of October 31, 2009, based on the inputs used to value them:
| | | |
| | Level 1 | Level 2 | Level 3 |
| Investments | ($000) | ($000) | ($000) |
| Common Stocks—U.S. | 261,528 | — | — |
| Common Stocks—International | 51,267 | 331,469 | 5 |
| Temporary Cash Investments | 3,937 | — | — |
| Total | 316,732 | 331,469 | 5 |
51
Total World Stock Index Fund
The following table summarizes changes in investments valued based on Level 3 inputs during the year ended October 31, 2009:
| |
| | Investments in |
| | Common Stocks |
| Amount Valued Based on Level 3 Inputs | ($000) |
| Balance as of October 31, 2008 | — |
| Transfers into Level 3 | 4 |
| Change in Unrealized Appreciation (Depreciation) | 1 |
| Balance as of October 31, 2009 | 5 |
D. Distributions are determined on a tax basis and may differ from net investment income and realized capital gains for financial reporting purposes. Differences may be permanent or temporary. Permanent differences are reclassified among capital accounts in the financial statements to reflect their tax character. Temporary differences arise when certain items of income, expense, gain, or loss are recognized in different periods for financial statement and tax purposes; these differences will reverse at some time in the future. Differences in classification may also result from the treatment of short-term gains as ordinary income for tax purposes.
During the year ended October 31, 2009, the fund realized net foreign currency gains of $60,000, which increased distributable net income for tax purposes; accordingly, such gains have been reclassified from accumulated net realized losses to undistributed net investment income. Certain of the fund’s investments are in securities considered to be “passive foreign investment companies,” for which any unrealized appreciation and/or realized gains are required to be included in distributable net income for tax purposes. Unrealized appreciation of $9,000 on the fund’s passive foreign investment company holdings at October 31, 2008, has been distributed and is reflected in the balance of undistributed net investment income. During the year ended October 31, 2009, the fund realized gains on the sale of passive foreign investment companies of $52,000, which have been included in current and prior periods’ taxable income; accordingly, such gains have been reclassified from accumulated net realized losses to undistributed net investment income. Unrealized appreciation on the fund’s passive foreign investment company holdings at October 31, 2009, was $508,000.
For tax purposes, at October 31, 2009, the fund had $9,070,000 of ordinary income available for distribution. The fund had available capital loss carryforwards totaling $8,349,000 to offset future net capital gains of $572,000 through October 31, 2016, and $7,777,000 through October 31, 2017.
At October 31, 2009, the cost of investment securities for tax purposes was $579,459,000. Net unrealized appreciation of investment securities for tax purposes was $68,747,000, consisting of unrealized gains of $82,085,000 on securities that had risen in value since their purchase and $13,338,000 in unrealized losses on securities that had fallen in value since their purchase.
E. During the year ended October 31, 2009, the fund purchased $455,986,000 of investment securities and sold $67,620,000 of investment securities, other than temporary cash investments.
52
Total World Stock Index Fund
F. Capital share transactions for each class of shares were:
| | | | |
| | | Year Ended | Inception1 to |
| | October 31, 2009 | October 31, 2008 |
| | Amount | Shares | Amount | Shares |
| | ($000) | (000) | ($000) | (000) |
| Investor Shares | | | | |
| Issued | 103,347 | 7,649 | 56,750 | 3,304 |
| Issued in Lieu of Cash Distributions | 328 | 26 | — | — |
| Redeemed2 | (35,473) | (2,808) | (4,811) | (307) |
| Net Increase (Decrease)—Investor Shares | 68,202 | 4,867 | 51,939 | 2,997 |
| Institutional Shares | | | | |
| Issued | 16,006 | 238 | 6,987 | 105 |
| Issued in Lieu of Cash Distributions | 105 | 2 | — | — |
| Redeemed2 | (9,898) | (140) | — | — |
| Net Increase (Decrease)—Institutional Shares | 6,213 | 100 | 6,987 | 105 |
| ETF Shares | | | | |
| Issued | 306,446 | 8,806 | 138,017 | 3,400 |
| Issued in Lieu of Cash Distributions | — | — | — | — |
| Redeemed2 | — | — | — | — |
| Net Increase (Decrease)—ETF Shares | 306,446 | 8,806 | 138,017 | 3,400 |
| 1 Inception was June 24, 2008, for ETF Shares; June 26, 2008, for Investor Shares; and October 9, 2008, for Institutional Shares. | |
| 2 Net of redemption fees for fiscal 2009 and 2008 of $45,000 and $40,000, respectively (fund totals). | | |
G. In preparing the financial statements as of October 31, 2009, management considered the impact of subsequent events occurring through December 15, 2009, for potential recognition or disclosure in these financial statements.
Report of Independent Registered Public Accounting Firm
To the Trustees of Vanguard International Equity Index Funds and the Shareholders of Vanguard Total World Stock Index Fund:
In our opinion, the accompanying statement of net assets and the related statements of operations and of changes in net assets and the financial highlights present fairly, in all material respects, the financial position of Vanguard Total World Stock Index Fund (the “Fund”) at October 31, 2009, and the results of its operations, the changes in its net assets and the financial highlights for the year then ended and for the period June 24, 2008 (commencement of operations) through October 31, 2008, in conformity with accounting principles generally accepted in the United States of America. These financial statements and financial highlights (hereafter referred to as “financial statements”) are the responsibility of the Fund’s management; our responsibility is to express an opinion on these financial statements based on our audits. We conducted our audits of these financial statements in accordance with the standards of the Public Company Accounting Oversight Board (United States). Those standards require that we plan and perform the audit to obtain reasonable assurance about whether the financial statements are free of material misstatement. An audit includes examining, on a test basis, evidence supporting the amounts and disclosures in the financial statements, assessing the accounting principles used and significant estimates made by management, and evaluating the overall financial statement presentation. We believe that our audits, which included confirmation of securities at October 31, 2009 by correspondence with the custodian and by agreement to the underlying ownership records of Vanguard Market Liquidity Fund, provide a reasonable basis for our opinion.
PricewaterhouseCoopers LLP
Philadelphia, Pennsylvania
December 15, 2009
|
| Special 2009 tax information (unaudited) for Vanguard Total World Stock Index Fund |
This information for the fiscal year ended October 31, 2009, is included pursuant to provisions of the Internal Revenue Code.
The fund distributed $1,717,000 of qualified dividend income to shareholders during the fiscal year.
For corporate shareholders, 31.8% of investment income (dividend income plus short-term gains, if any) qualifies for the dividends-received deduction.
The fund will pass through foreign source income of $7,212,000 and foreign taxes paid of $495,000 to shareholders. The pass-through of foreign taxes paid will affect only shareholders on the fund’s dividend record date in December 2009. Shareholders will receive more detailed information along with their Form 1099-DIV in January 2010.
54
Your Fund’s After-Tax Returns
This table presents returns for your fund both before and after taxes. The after-tax returns are shown in two ways: (1) assuming that an investor owned the fund during the entire period and paid taxes on the fund’s distributions, and (2) assuming that an investor paid taxes on the fund’s distributions and sold all shares at the end of each period.
Calculations are based on the highest individual federal income tax and capital gains tax rates in effect at the times of the distributions and the hypothetical sales. State and local taxes were not considered. After-tax returns reflect any qualified dividend income, using actual prior-year figures and estimates for 2009. (In the example, returns after the sale of fund shares may be higher than those assuming no sale. This occurs when the sale would have produced a capital loss. The calculation assumes that the investor received a tax deduction for the loss.)
The table shows returns for Investor Shares only; returns for other share classes will differ. Please note that your actual after-tax returns will depend on your tax situation and may differ from those shown. Also note that if you own the fund in a tax-deferred account, such as an individual retirement account or a 401(k) plan, this information does not apply to you. Such accounts are not subject to current taxes.
Finally, keep in mind that a fund’s performance—whether before or after taxes—does not guarantee future results.
| | |
| Average Annual Total Returns: Total World Stock Index Fund1,2 | | |
| Periods Ended October 31, 2009 | | |
| | One | Since |
| | Year | Inception |
| Returns Before Taxes | 21.94% | –12.46% |
| Returns After Taxes on Distributions | 21.85 | –12.51 |
| Returns After Taxes on Distributions and Sale of Fund Shares | 14.37 | –10.56 |
1 Total returns do not include the account service fee that may be applicable to certain accounts with balances below $10,000.
2 Performance figures are adjusted for the 0.25% transaction fee on purchases but do not reflect the 2% fee assessed on redemptions of shares held for less than two months.
55
About Your Fund’s Expenses
As a shareholder of the fund, you incur ongoing costs, which include costs for portfolio management, administrative services, and shareholder reports (like this one), among others. Operating expenses, which are deducted from a fund’s gross income, directly reduce the investment return of the fund.
A fund’s expenses are expressed as a percentage of its average net assets. This figure is known as the expense ratio. The following examples are intended to help you understand the ongoing costs (in dollars) of investing in your fund and to compare these costs with those of other mutual funds. The examples are based on an investment of $1,000 made at the beginning of the period shown and held for the entire period.
The accompanying table illustrates your fund’s costs in two ways:
• Based on actual fund return. This section helps you to estimate the actual expenses that you paid over the period. The “Ending Account Value” shown is derived from the fund’s actual return, and the third column shows the dollar amount that would have been paid by an investor who started with $1,000 in the fund. You may use the information here, together with the amount you invested, to estimate the expenses that you paid over the period.
To do so, simply divide your account value by $1,000 (for example, an $8,600 account value divided by $1,000 = 8.6), then multiply the result by the number given for your fund under the heading “Expenses Paid During Period.”
• Based on hypothetical 5% yearly return. This section is intended to help you compare your fund’s costs with those of other mutual funds. It assumes that the fund had a yearly return of 5% before expenses, but that the expense ratio is unchanged. In this case—because the return used is not the fund’s actual return—the results do not apply to your investment. The example is useful in making comparisons because the Securities and Exchange Commission requires all mutual funds to calculate expenses based on a 5% return. You can assess your fund’s costs by comparing this hypothetical example with the hypothetical examples that appear in shareholder reports of other funds.
| | | |
| Six Months Ended October 31, 2009 | | | |
| | Beginning | Ending | Expenses |
| | Account Value | Account Value | Paid During |
| Total World Stock Index Fund | 4/30/2009 | 10/31/2009 | Period1 |
| Based on Actual Fund Return | | | |
| Investor Shares | $1,000.00 | $1,267.88 | $2.86 |
| Institutional Shares | 1,000.00 | 1,269.41 | 1.49 |
| ETF Shares | 1,000.00 | 1,269.17 | 1.72 |
| Based on Hypothetical 5% Yearly Return | | | |
| Investor Shares | $1,000.00 | $1,022.68 | $2.55 |
| Institutional Shares | 1,000.00 | 1,023.89 | 1.33 |
| ETF Shares | 1,000.00 | 1,023.69 | 1.53 |
1 The calculations are based on expenses incurred in the most recent six-month period. The fund’s annualized six-month expense ratios for that period are 0.50% for Investor Shares, 0.26% for Institutional Shares, and 0.30% for ETF Shares. The dollar amounts shown as “Expenses Paid” are equal to the annualized expense ratio multiplied by the average account value over the period, multiplied by the number of days in the most recent six-month period, then divided by the number of days in the most recent 12-month period.
56
Note that the expenses shown in the table are meant to highlight and help you compare ongoing costs only and do not reflect transaction costs incurred by the fund for buying and selling securities. Further, the expenses do not include the transaction fees or the account service fee described in the prospectus. If such fees were applied to your account, your costs would be higher. Your fund does not carry a “sales load.”
The calculations assume no shares were bought or sold during the period. Your actual costs may have been higher or lower, depending on the amount of your investment and the timing of any purchases or redemptions.
You can find more information about the fund’s expenses, including annual expense ratios, in the Financial Statements section of this report. For additional information on operating expenses and other shareholder costs, please refer to your fund’s current prospectus.
57
Glossary
Equity Exposure. A measure that reflects a fund’s investments in stocks and stock futures. Any holdings in short-term reserves are excluded.
Expense Ratio. The percentage of a fund’s average net assets used to pay its annual administrative and advisory expenses. These expenses directly reduce returns to investors.
Inception Date. The date on which the assets of a fund (or one of its share classes) are first invested in accordance with the fund’s investment objective. For funds with a subscription period, the inception date is the day after that period ends. Investment performance is measured from the inception date.
Short-Term Reserves. The percentage of a fund invested in highly liquid, short-term securities that can be readily converted to cash.
Turnover Rate. An indication of the fund’s trading activity. Funds with high turnover rates incur higher transaction costs and may be more likely to distribute capital gains (which may be taxable to investors). The turnover rate excludes in-kind transactions, which have minimal impact on costs.
58
This page intentionally left blank.
The People Who Govern Your Fund
The trustees of your mutual fund are there to see that the fund is operated and managed in your best interests since, as a shareholder, you are a part owner of the fund. Your fund’s trustees also serve on the board of directors of The Vanguard Group, Inc., which is owned by the Vanguard funds and provides services to them on an at-cost basis.
A majority of Vanguard’s board members are independent, meaning that they have no affiliation with Vanguard or the funds they oversee, apart from the sizable personal investments they have made as private individuals. The independent board members have distinguished backgrounds in business, academia, and public service. Each of the trustees and executive officers oversees 156 Vanguard funds.
The following table provides information for each trustee and executive officer of the fund. More information about the trustees is in the Statement of Additional Information, which can be obtained, without charge, by contacting Vanguard at 800-662-7447, or online at www.vanguard.com.
| |
| Interested Trustees | Emerson U. Fullwood |
| | Born 1948. Trustee Since January 2008. Principal |
| John J. Brennan1 | Occupation(s) During the Past Five Years: Executive |
| Born 1954. Trustee Since May 1987. Chairman of | Chief Staff and Marketing Officer for North America |
| the Board. Principal Occupation(s) During the Past | and Corporate Vice President (retired 2008) of Xerox |
| Five Years: Chairman of the Board and Director/Trustee | Corporation (photocopiers and printers); Director of |
| of The Vanguard Group, Inc., and of each of the | SPX Corporation (multi-industry manufacturing), the |
| investment companies served by The Vanguard Group; | United Way of Rochester, the Boy Scouts of America, |
| Chief Executive Officer (1996–2008) and President | Amerigroup Corporation (direct health and medical |
| (1989–2008) of The Vanguard Group and of each of the | insurance carriers), and Monroe Community College |
| investment companies served by The Vanguard Group; | Foundation. |
| Chairman of the Financial Accounting Foundation; | |
| Governor of the Financial Industry Regulatory Authority | Rajiv L. Gupta |
| (FINRA); Director of United Way of Southeastern | Born 1945. Trustee Since December 2001.2 Principal |
| Pennsylvania. | Occupation(s) During the Past Five Years: Chairman |
| | and Chief Executive Officer (retired 2009) and President |
| F. William McNabb III1 | (2006–2008) of Rohm and Haas Co. (chemicals); Board |
| Born 1957. Trustee Since July 2009. Principal | Member of American Chemistry Council; Director of |
| Occupation(s) During the Past Five Years: Director of | Tyco International, Ltd. (diversified manufacturing and |
| The Vanguard Group, Inc., since 2008; Chief Executive | services) and Hewlett-Packard Co. (electronic computer |
| Officer and President of The Vanguard Group and of | manufacturing); Trustee of The Conference Board. |
| each of the investment companies served by The | |
| Vanguard Group since 2008; Director of Vanguard | Amy Gutmann |
| Marketing Corporation; Managing Director of The | Born 1949. Trustee Since June 2006. Principal |
| Vanguard Group (1995–2008). | Occupation(s) During the Past Five Years: President of |
| | the University of Pennsylvania; Christopher H. Browne |
| | Distinguished Professor of Political Science in the School |
| Independent Trustees | of Arts and Sciences with secondary appointments |
| | at the Annenberg School for Communication and the |
| Charles D. Ellis | Graduate School of Education of the University of |
| Born 1937. Trustee Since January 2001. Principal | Pennsylvania; Director of Carnegie Corporation of |
| Occupation(s) During the Past Five Years: Applecore | New York, Schuylkill River Development Corporation, |
| Partners (pro bono ventures in education); Senior | and Greater Philadelphia Chamber of Commerce; |
| Advisor to Greenwich Associates (international business | Trustee of the National Constitution Center. |
| strategy consulting); Successor Trustee of Yale University; | |
| Overseer of the Stern School of Business at New York | |
| University; Trustee of the Whitehead Institute for | |
| Biomedical Research. | |
| | |
| JoAnn Heffernan Heisen | Executive Officers | |
| Born 1950. Trustee Since July 1998. Principal | | |
| Occupation(s) During the Past Five Years: Corporate | Thomas J. Higgins1 | |
| Vice President and Chief Global Diversity Officer since | Born 1957. Chief Financial Officer Since September |
| 2006 (retired 2008) and Member of the Executive | 2008. Principal Occupation(s) During the Past Five |
| Committee (retired 2008) of Johnson & Johnson | Years: Principal of The Vanguard Group, Inc.; Chief |
| (pharmaceuticals/consumer products); Vice President | Financial Officer of each of the investment companies |
| and Chief Information Officer of Johnson & Johnson | served by The Vanguard Group since 2008; Treasurer |
| (1997–2005); Director of the University Medical Center | of each of the investment companies served by The |
| at Princeton and Women’s Research and Education | Vanguard Group (1998–2008). |
| Institute; Member of the Advisory Board of the Maxwell | | |
| School of Citizenship and Public Affairs at Syracuse | | |
| University. | Kathryn J. Hyatt1 | |
| | Born 1955. Treasurer Since November 2008. Principal |
| | Occupation(s) During the Past Five Years: Principal of |
| F. Joseph Loughrey | The Vanguard Group, Inc.; Treasurer of each of the |
| Born 1949. Trustee Since October 2009. Principal | investment companies served by The Vanguard |
| Occupation(s) During the Past Five Years: President and | Group since 2008; Assistant Treasurer of each of the |
| Chief Operating Officer since 2005 (retired 2009) and | investment companies served by The Vanguard Group |
| Vice Chairman of the Board (2008–2009) of Cummins | (1988–2008). | |
| Inc. (industrial machinery); Director of SKF AB (industrial | | |
| machinery), Hillenbrand, Inc. (specialized consumer | | |
| services), Sauer-Danfoss Inc. (machinery), the Lumina | Heidi Stam1 | |
| Foundation for Education, and the Columbus Community | Born 1956. Secretary Since July 2005. Principal |
| Education Coalition; Chairman of the Advisory Council | Occupation(s) During the Past Five Years: Managing |
| for the College of Arts and Letters at the University of | Director of The Vanguard Group, Inc., since 2006; |
| Notre Dame. | General Counsel of The Vanguard Group since 2005; |
| | Secretary of The Vanguard Group and of each of the |
| | investment companies served by The Vanguard Group |
| André F. Perold | since 2005; Director and Senior Vice President of |
| Born 1952. Trustee Since December 2004. Principal | Vanguard Marketing Corporation since 2005; Principal |
| Occupation(s) During the Past Five Years: George Gund | of The Vanguard Group (1997–2006). |
| Professor of Finance and Banking, Harvard Business | | |
| School; Chair of the Investment Committee of HighVista | | |
| Strategies LLC (private investment firm). | Vanguard Senior Management Team |
| |
| Alfred M. Rankin, Jr. | R. Gregory Barton | Michael S. Miller |
| Born 1941. Trustee Since January 1993. Principal | Mortimer J. Buckley | James M. Norris |
| Occupation(s) During the Past Five Years: Chairman, | Kathleen C. Gubanich | Glenn W. Reed |
| President, and Chief Executive Officer of NACCO | Paul A. Heller | George U. Sauter |
| Industries, Inc. (forklift trucks/housewares/lignite); | | |
| Director of Goodrich Corporation (industrial products/ | | |
| aircraft systems and services); Deputy Chairman of | Founder | |
| the Federal Reserve Bank of Cleveland; Trustee of | | |
| University Hospitals of Cleveland, The Cleveland | | |
| Museum of Art, and Case Western Reserve University. | John C. Bogle | |
| | Chairman and Chief Executive Officer, 1974–1996 |
| |
| Peter F. Volanakis | | |
| Born 1955. Trustee Since July 2009. Principal | | |
| Occupation(s) During the Past Five Years: President | | |
| since 2007 and Chief Operating Officer since 2005 | | |
| of Corning Incorporated (communications equipment); | | |
| President of Corning Technologies (2001–2005); Director | | |
| of Corning Incorporated and Dow Corning; Trustee of | | |
| the Corning Incorporated Foundation and the Corning | | |
| Museum of Glass; Overseer of the Amos Tuck School | | |
| of Business Administration at Dartmouth College. | | |
1 These individuals are “interested persons” as defined in the Investment Company Act of 1940.
2 December 2002 for Vanguard Equity Income Fund, Vanguard Growth Equity Fund, the Vanguard Municipal Bond Funds, and the Vanguard State Tax-Exempt Funds.

P.O. Box 2600
Valley Forge, PA 19482-2600
Connect with Vanguard® > www.vanguard.com
| |
| Fund Information > 800-662-7447 | All comparative mutual fund data are from Lipper Inc. |
| | or Morningstar, Inc., unless otherwise noted. |
| Direct Investor Account Services > 800-662-2739 | |
| | |
| Institutional Investor Services > 800-523-1036 | You can obtain a free copy of Vanguard’s proxy voting |
| | guidelines by visiting our website, www.vanguard.com, |
| Text Telephone for People | and searching for “proxy voting guidelines,” or by |
| With Hearing Impairment > 800-749-7273 | calling Vanguard at 800-662-2739. The guidelines are |
| | also available from the SEC’s website, www.sec.gov. |
| | In addition, you may obtain a free report on how your |
| | fund voted the proxies for securities it owned during |
| This material may be used in conjunction | the 12 months ended June 30. To get the report, visit |
| with the offering of shares of any Vanguard | either www.vanguard.com or www.sec.gov. |
| fund only if preceded or accompanied by | |
| the fund’s current prospectus. | You can review and copy information about your fund |
| | at the SEC’s Public Reference Room in Washington, D.C. |
| “FTSE®” is a trademark jointly owned by the London | To find out more about this public service, call the SEC |
| Stock Exchange plc and The Financial Times Limited | at 202-551-8090. Information about your fund is also |
| and is used by FTSE International Limited under license. | available on the SEC’s website, and you can receive |
| “All-World” is a trademark of FTSE International Limited. | copies of this information, for a fee, by sending a |
| The FTSE All-World ex US Index is calculated by FTSE | request in either of two ways: via e-mail addressed to |
| International Limited. FTSE International Limited does not | publicinfo@sec.gov or via regular mail addressed to the |
| sponsor, endorse, or promote the fund; is not in any way | Public Reference Section, Securities and Exchange |
| connected to it; and does not accept any liability | Commission, Washington, DC 20549-1520. |
| in relation to its issue, operation, and trading. | |
| |
| |
| |
| |
| | © 2009 The Vanguard Group, Inc. |
| | All rights reserved. |
| | Vanguard Marketing Corporation, Distributor. |
| | Q6280 122009 |
 |
| Vanguard FTSE International |
| Index Funds Annual Report |
|
|
| October 31, 2009 |
|
|
 |
|
|
| FTSE All-World ex-US Index Fund |
| FTSE All-World ex-US Small-Cap Index Fund |
|
|
|
> For the fiscal year ended October 31, 2009, Vanguard FTSE All-World ex-US Index Fund returned about 32%, benefiting from a sharp rebound across global stock markets.
> From its inception in April 2009 through October, Vanguard FTSE All-World ex-US Small-Cap Index Fund returned about 49%. The fund was aided by its springtime launch date, arriving just in time to catch the surge in international returns.
> Both funds performed in line with their target indexes, although the use of fair-value pricing caused a transient discrepancy to appear at the fiscal year-end.
| |
| Contents | |
| Your Fund’s Total Returns | 1 |
| President’s Letter | 2 |
| Results of Proxy Voting | 8 |
| FTSE All-World ex-US Index Fund | 10 |
| FTSE All-World ex-US Small-Cap Index Fund | 51 |
| Your Fund’s After-Tax Returns | 94 |
| About Your Fund’s Expenses | 95 |
| Glossary | 97 |
Please note: The opinions expressed in this report are just that—informed opinions. They should not be considered promises or advice. Also, please keep in mind that the information and opinions cover the period through the date on the front of this report. Of course, the risks of investing in your fund are spelled out in the prospectus.
Cover photograph: Veronica Coia.
| | |
| Your Fund’s Total Returns | | |
| |
| |
| |
| |
| Fiscal Year Ended October 31, 2009 | | |
| | Ticker | Total |
| | Symbol | Returns |
| Vanguard FTSE All-World ex-US Index Fund | | |
| Investor Shares | VFWIX | 32.19% |
| Institutional Shares1 | VFWSX | 32.56 |
| ETF Shares2 | VEU | |
| Market Price | | 30.84 |
| Net Asset Value | | 32.41 |
| FTSE All-World ex US Index | | 35.97 |
| International Funds Average3 | | 26.69 |
| |
| | | Returns Since |
| | | Fund Inception |
| Vanguard FTSE All-World ex-US Small-Cap Index Fund (Inception: 4/2/2009) | | |
| Investor Shares | VFSVX | 49.15% |
| Institutional Shares1 | VFSNX | 49.40 |
| ETF Shares2 | VSS | |
| Market Price | | 49.10 |
| Net Asset Value | | 49.37 |
| FTSE Global Small Cap ex US Index | | 53.89 |
| International Small-Cap Funds Average3 | | 49.57 |
1 This class of shares carries lower expenses and is available for a minimum initial investment of $5 million.
2 Vanguard ETF® Shares are traded on the NYSE Arca exchange and are available only through brokers. The table shows ETF returns based on both the NYSE Arca market price and the net asset value for a share. U.S. Pat. No. 6,879,964 B2; 7,337,138.
3 Derived from data provided by Lipper Inc.
1

President’s Letter
Dear Shareholder,
Our two FTSE International Index Funds provided excellent returns in the fiscal year ended October 31, 2009, reflecting a strong rebound in stock markets abroad.
Vanguard FTSE All-World ex-US Index Fund, like its target index, provides broad exposure to stocks from emerging and developed markets around the world. For the 2009 fiscal year, the fund returned about 32%.
Vanguard FTSE All-World ex-US Small-Cap Index Fund is focused on smaller companies in these global markets. For the seven months following its inception in April, the fund returned about 49%.
Both funds performed in line with their target benchmarks during the period, although this is not apparent in the returns shown on page 1. The seeming discrepancy between the fund and index returns primarily reflects fair-value pricing—a method employed to account for any changes in a fund’s market value that occur after the close of international markets but before the U.S. market closes at 4 p.m. These discrepancies typically disappear when the international markets reopen, but they can show up in a snapshot of performance on a given day.
2
A vicious bear market quickly turned bullish
A year ago, the global financial system stood on the brink of collapse as the expanding U.S. credit crisis precipitated the deepest worldwide recession since World War II. Since then, markets have pulled back from the depths and, in fact, have rallied impressively. Although U.S. unemployment has risen to double digits and signs of a robust recovery are hard to find, the global economy has begun to revive. For the first time in more than a year, U.S. gross domestic product registered growth, as reported by the Commerce Department for the third quarter of calendar 2009.
U.S. stocks recorded positive returns for the fiscal year ended October 31 as the market’s losses during the first four months of the period—marking the final plunge of a historic bear market—were erased by a remarkable rally beginning in March. Global stocks did even better, thanks to some renewed strength in developed markets and a powerful upswing in emerging markets that actually had some prognosticators worrying about a new asset bubble. Reminders of the markets’ travails are nevertheless apparent in the index returns for the past three years, where negative figures are the rule. Even the five-year returns for U.S. stocks as of October 31 were barely positive, further evidence of the long-term damage done by the collapse of the real estate bubble.
| | | |
| Market Barometer | | | |
| | | Average Annual Total Returns |
| | | Periods Ended October 31, 2009 |
| | One Year | Three Years | Five Years |
| Stocks | | | |
| MSCI All Country World Index ex USA (International) | 34.79% | –2.49% | 7.58% |
| Russell 1000 Index (Large-caps) | 11.20 | –6.84 | 0.71 |
| Russell 2000 Index (Small-caps) | 6.46 | –8.51 | 0.59 |
| Dow Jones U.S. Total Stock Market Index | 11.34 | –6.55 | 1.06 |
| |
| Bonds | | | |
| Barclays Capital U.S. Aggregate Bond Index | | | |
| (Broad taxable market) | 13.79% | 6.35% | 5.05% |
| Barclays Capital Municipal Bond Index | 13.60 | 4.17 | 4.15 |
| Citigroup 3-Month Treasury Bill Index | 0.28 | 2.50 | 2.94 |
| |
| CPI | | | |
| Consumer Price Index | –0.18% | 2.32% | 2.52% |
3
The bond market experienced an equally dramatic turnaround
The stock market’s rapid fall and recovery were matched by an equally dramatic turnaround in the bond market. At the end of 2008, as the credit markets virtually shut down, risk-averse investors flocked to U.S. Treasury bonds. The effect was to widen the difference between the lower yields of Treasuries and the higher yields of corporate bonds to a margin not seen since the Great Depression.
Central banks around the world responded to the economic slowdown by lowering interest rates and implementing other aggressive stimulus programs. Meanwhile, governments boosted spending in hopes of reversing the recessionary tide. As fears of a worldwide depression eased, investors’ appetite for risk returned to more normal levels. The receding pessimism raised demand for corporate bonds, pushing up their prices and bringing down their yields. Over the past 12 months, both taxable and municipal bonds returned more than 13%.
However, the Fed’s easy-money campaign had a predictable effect on short-term savings vehicles such as money market funds, whose yields track prevailing short-term rates. In December 2008, the Fed reduced its target for the federal funds rate, a benchmark for the interest rates paid by money market instruments and other very short-term securities, to between 0% and 0.25%. The Fed has said it expects to maintain its target at this level “for an extended period.”
| | | | |
| Expense Ratios1 | | | | |
| Your Fund Compared With Its Peer Group | | | | |
| | Investor | Institutional | ETF | Peer-Group |
| | Shares | Shares | Shares | Average |
| FTSE All-World ex-US Index Fund | 0.40% | 0.15% | 0.25% | 1.44% |
| FTSE All-World ex-US Small-Cap Index Fund | 0.60 | 0.35 | 0.38 | 1.61 |
1 The fund expense ratios shown are from the prospectuses dated February 27, 2009, and represent estimated costs for the current fiscal year based on the funds’ net assets as of the prospectus date. For the fiscal year ended October 31, 2009, the FTSE All-World ex-US Index Fund’s expense ratios were 0.40% for Investor Shares, 0.15% for Institutional Shares, and 0.25% for ETF Shares. The FTSE All-World ex-US Small-Cap Index Fund’s expense ratios were 0.78% for Investor Shares, 0.52% for Institutional Shares, and 0.55% for ETF Shares. The peer-group expense ratios are derived from data provided by Lipper Inc. and capture information through year-end 2008. Peer groups are: for the FTSE All-World ex-US Index Fund, the International Funds Average, and for the FTSE All-World ex-US Small-Cap Index Fund, t he International Small-Cap Funds Average.
4
Emerging markets dominated the global recovery
International stock markets opened the fiscal year under a cloud, plagued by repercussions of the credit crisis that began in the United States and by the global economic slowdown that followed. However, the markets rallied during the second half of the year, and all regions ended the period in positive territory. Results from the ten industry sectors were also positive, contributing to the impressive returns of Vanguard FTSE All-World ex-US Index Fund and FTSE All-World ex-US Small-Cap Index Fund.
The small-cap fund returned about 49% in the seven months following its inception. This strong performance reflected both the success of small-capitalization stocks, which led large-caps during the period, and the timing of the small-cap fund’s inception: It began operations on April 2, missing the sharp market downturn of prior months. Indeed, the fund got started at almost the same time that the rebound began in global markets—a coincidence that greatly benefited returns.
Emerging markets, which returned about 63% in aggregate for the 12-month period, were top performers in both funds. These markets recovered more quickly from the global financial crisis than developed markets, and added almost 15 percentage points to the return of the FTSE All-World ex-US Index Fund. In the small-cap fund, despite their relatively modest weighting, emerging markets as a group were the second-largest contributor to the return, adding about 12 percentage points.
Among developing nations, those rich in resources—Brazil, in particular—experienced strong economic growth during the past six months as demand for raw materials began to pick up across the globe. In China, another emerging-markets standout, the government’s aggressive stimulus package directed capital to companies in a variety of industries, spurring the nation’s economy. Markets in Taiwan, India, and South Korea also helped boost returns in both funds.
Europe was also a top contributor in both portfolios, primarily because of its heavy weighting. European countries have rebounded significantly from the financial crisis, although not as swiftly and profoundly as emerging-markets nations. In both funds, the United Kingdom represented the greatest proportion of European assets and was the largest contributor to returns. Markets in France, Spain, Germany, Sweden, and Switzerland also turned in strong performances.
Among developed Pacific markets, Japan had the largest weighting in both funds, and it was also this group’s top performer for the FTSE All-World ex-US Small Cap Index Fund; Australia was the leader for the FTSE All-World ex-US Index Fund. The other developed Pacific markets—Hong Kong, Singapore, and New Zealand—also posted positive returns.
5
Both funds own stocks in Canada, which has endured considerable uncertainty owing to the troubled economy of the United States, its largest trading partner. The Canadian market posted gains for the period, but slightly trailed the returns from regions outside North America.
Both funds saw overall gains in all industry sectors. Across markets and regions, financial stocks were the biggest standout for the FTSE All-World ex-US Index Fund. Banks, capital-market firms, and insurance agencies were top performers. Materials and energy companies were also significant contributors for the fund, especially in the emerging-markets nations.
The industrial sector was the best performer in the FTSE All-World ex-US Small-Cap Index Fund. Machinery and construction companies in Europe performed particularly well. The small-cap fund also benefited notably from holdings in the financial, consumer discretionary, and materials sectors.
Keep your sights set on your long-term goals
Although recent months have brought good news for stock prices and investors both domestically and internationally, the hardships of the not-so-distant past won’t be easily forgotten. And, unfortunately, there is really no way to know what the future holds.
Uncertainty is the one thing that we can count on in the financial markets. Because of this, Vanguard encourages investors to put these timeless rules of investing into practice: Maintain a long-term perspective, stay focused on your goals, and develop a well-balanced and diversified portfolio that is consistent with your tolerance for risk.
We believe that the FTSE All-World ex-US Funds, with their low costs and broad diversification among international stocks, can play a valuable role in such a portfolio.
As always, thank you for entrusting your assets to Vanguard.
Sincerely,
F. William McNabb III
President and Chief Executive Officer
November 18, 2009
| | | | |
| Your Fund’s Performance at a Glance | | | | |
| October 31, 2008–October 31, 2009 | | | | |
| | | | Distributions Per Share |
| | Starting | Ending | Income | Capital |
| | Share Price | Share Price | Dividends | Gains |
| FTSE All-World ex-US Index Fund | | | | |
| Investor Shares | $12.77 | $16.48 | $0.290 | $0.000 |
| Institutional Shares | 64.06 | 82.71 | 1.593 | 0.000 |
| ETF Shares | 32.50 | 41.95 | 0.785 | 0.000 |
| FTSE All-World ex-US Small-Cap Index Fund | | | | |
| Investor Shares | $20.001 | $29.83 | $0.000 | $0.000 |
| Institutional Shares | 100.001 | 149.40 | 0.000 | 0.000 |
| ETF Shares | 52.361 | 78.21 | 0.000 | 0.000 |
1 At inception: April 2, 2009.
7
Results of Proxy Voting
At a special meeting of shareholders on July 2, 2009, fund shareholders approved the following two proposals:
Proposal 1—Elect trustees for each fund.*
The individuals listed in the table below were elected as trustees for each fund. All trustees with the exception of Messrs. McNabb and Volanakis (both of whom already served as directors of The Vanguard Group, Inc.) served as trustees to the funds prior to the shareholder meeting.
| | | |
| FTSE All-World ex-US Index Fund, FTSE All-World ex-US Small-Cap Index Fund | |
| | | | Percentage |
| Trustee | For | Withheld | For |
| John J. Brennan | 1,604,062,236 | 36,846,078 | 97.8% |
| Charles D. Ellis | 1,594,488,732 | 46,419,583 | 97.2% |
| Emerson U. Fullwood | 1,603,672,430 | 37,235,884 | 97.7% |
| Rajiv L. Gupta | 1,604,092,353 | 36,815,961 | 97.8% |
| Amy Gutmann | 1,605,214,829 | 35,693,485 | 97.8% |
| JoAnn Heffernan Heisen | 1,605,059,287 | 35,849,028 | 97.8% |
| F. William McNabb III | 1,605,657,176 | 35,251,138 | 97.9% |
| André F. Perold | 1,602,313,073 | 38,595,241 | 97.6% |
| Alfred M. Rankin, Jr. | 1,604,909,324 | 35,998,991 | 97.8% |
| Peter F. Volanakis | 1,607,261,150 | 33,647,165 | 97.9% |
| * Results are for all funds within the same trust. | | | |
Proposal 2—Update and standardize the funds’ fundamental policies regarding:
(a) Purchasing and selling real estate.
(b) Issuing senior securities.
(c) Borrowing money.
(d) Making loans.
(e) Purchasing and selling commodities.
(f) Concentrating investments in a particular industry or group of industries.
(g) Eliminating outdated fundamental investment policies not required by law.
The revised fundamental policies are clearly stated and simple, yet comprehensive, making oversight and compliance more efficient than under the former policies. The revised fundamental policies will allow the funds to respond more quickly to regulatory and market changes, while avoiding the costs and delays associated with successive shareholder meetings.
| | | | | |
| | | | | Broker | Percentage |
| Vanguard Fund | For | Abstain | Against | Non-Votes | For |
| FTSE All-World ex-US Index Fund | | | | | |
| 2a | 71,299,208 | 879,660 | 1,207,378 | 12,315,684 | 83.2% |
| 2b | 70,997,043 | 939,500 | 1,449,702 | 12,315,685 | 82.8% |
| 2c | 70,543,952 | 939,514 | 1,902,775 | 12,315,688 | 82.3% |
| 2d | 70,679,473 | 962,574 | 1,744,196 | 12,315,687 | 82.5% |
| 2e | 71,032,033 | 899,601 | 1,454,609 | 12,315,688 | 82.9% |
8
| | | | | |
| | | | | Broker | Percentage |
| Vanguard Fund | For | Abstain | Against | Non-Votes | For |
| FTSE All-World ex-US Index Fund (continued) | | | | |
| 2f | 70,984,627 | 924,048 | 1,477,567 | 12,315,688 | 82.8% |
| 2g | 71,052,343 | 907,440 | 1,426,460 | 12,315,688 | 82.9% |
| |
| FTSE All-World ex-US Small-Cap Index Fund | | | | |
| 2a | 534,250 | 2,467 | 9,064 | 1,497 | 97.6% |
| 2b | 530,752 | 3,821 | 11,208 | 1,497 | 97.0% |
| 2c | 526,165 | 4,426 | 15,189 | 1,497 | 96.1% |
| 2d | 530,822 | 2,467 | 12,492 | 1,497 | 97.0% |
| 2e | 528,609 | 3,445 | 13,727 | 1,497 | 96.6% |
| 2f | 535,183 | 3,083 | 7,515 | 1,497 | 97.8% |
| 2g | 533,548 | 3,279 | 8,954 | 1,497 | 97.5% |
9
FTSE All-World ex-US Index Fund
Fund Profile
As of October 31, 2009
| | |
| Portfolio Characteristics | | |
| | | Target |
| | Fund | Index1 |
| Number of Stocks | 2,151 | 2,140 |
| Turnover Rate | 9% | — |
| Expense Ratio2 | | — |
| Investor Shares | 0.40% | |
| Institutional Shares | 0.15% | |
| ETF Shares | 0.25% | |
| Short-Term Reserves | 0.0% | — |
| | |
| Sector Diversification (% of equity exposure) |
| | | Target |
| | Fund | Index1 |
| Consumer Discretionary | 8.3% | 8.3% |
| Consumer Staples | 8.8 | 8.8 |
| Energy | 11.0 | 11.0 |
| Financials | 26.7 | 26.8 |
| Health Care | 6.2 | 6.1 |
| Industrials | 10.2 | 10.2 |
| Information Technology | 6.3 | 6.3 |
| Materials | 11.0 | 11.1 |
| Telecommunication Services | 6.5 | 6.4 |
| Utilities | 5.0 | 5.0 |
| | |
| Ten Largest Holdings3 (% of total net assets) |
| HSBC Holdings PLC | diversified banks | 1.3% |
| Royal Dutch Shell | integrated oil | |
| | and gas | 1.3 |
| BP PLC | packaged foods | |
| | and meats | 1.2 |
| Nestle SA | diversified metals | |
| | and mining | 1.2 |
| BHP Billiton Ltd. | integrated oil | |
| | and gas | 1.2 |
| Total SA | integrated oil | |
| | and gas | 1.0 |
| Petroleo Brasileiro SA | integrated | |
| | telecommunication | |
| | services | 0.9 |
| Banco Santander SA | pharmaceuticals | 0.9 |
| Telefonica SA | wireless | |
| | telecommunication | |
| | services | 0.9 |
| Novartis AG | pharmaceuticals | 0.8 |
| Top Ten | | 10.7% |
Allocation by Region (% of equity exposure)
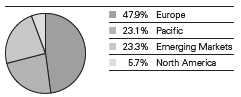
1 FTSE All-World ex US Index.
2 The expense ratios shown are from the prospectus dated February 27, 2009, and represent estimated costs for the current fiscal year based on the fund’s net assets as of the prospectus date. For the fiscal year ended October 31, 2009, the expense ratios were 0.40% for Investor Shares, 0.15% for Institutional Shares, and 0.25% for ETF Shares.
3 The holdings listed exclude temporary cash investments and equity index products.
See the Glossary for investment terms.
10
FTSE All-World ex-US Index Fund
| | |
| Market Diversification (% of equity exposure) |
| | | Target |
| | Fund | Index1 |
| Europe | | |
| United Kingdom | 14.4% | 14.5% |
| France | 8.3 | 7.9 |
| Germany | 5.7 | 5.6 |
| Switzerland | 5.4 | 5.3 |
| Spain | 3.7 | 3.7 |
| Italy | 2.8 | 2.8 |
| Sweden | 1.9 | 1.9 |
| Netherlands | 1.7 | 2.0 |
| Other Europe | 4.0 | 4.0 |
| Subtotal | 47.9% | 47.7% |
| Pacific | | |
| Japan | 14.0% | 14.1% |
| Australia | 5.9 | 5.9 |
| Hong Kong | 1.9 | 2.6 |
| Singapore | 1.2 | 1.1 |
| Other Pacific | 0.1 | 0.1 |
| Subtotal | 23.1% | 23.8% |
| Emerging Markets | | |
| China | 4.1% | 3.6% |
| Brazil | 3.9 | 3.8 |
| South Korea | 3.0 | 3.0 |
| Taiwan | 2.4 | 2.3 |
| India | 2.2 | 2.2 |
| South Africa | 1.8 | 1.8 |
| Russia | 1.4 | 1.4 |
| Mexico | 1.1 | 1.0 |
| Other Emerging Markets | 3.4 | 3.8 |
| Subtotal | 23.3% | 22.9% |
| North America | | |
| Canada | 5.7% | 5.6% |
1 FTSE All-World ex US Index.
See the Glossary for investment terms.
11
FTSE All-World ex-US Index Fund
Performance Summary
All of the returns in this report represent past performance, which is not a guarantee of future results that may be achieved by the fund. (Current performance may be lower or higher than the performance data cited. For performance data current to the most recent month-end, visit our website at www.vanguard.com/performance.) Note, too, that both investment returns and principal value can fluctuate widely, so an investor’s shares, when sold, could be worth more or less than their original cost. The returns shown do not reflect taxes that a shareholder would pay on fund distributions or on the sale of fund shares.
Cumulative Performance: March 8, 2007–October 31, 2009
Initial Investment of $10,000
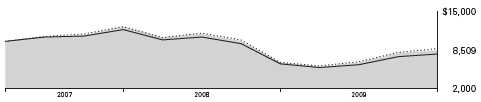
| | | |
| | | Average Annual Total Returns | Final Value |
| | | Periods Ended October 31, 2009 | of a $10,000 |
| | One Year | Since Inception1 | Investment |
| FTSE All-World ex-US Index Fund | | | |
| Investor Shares2 | 32.19% | –5.91% | $8,509 |
| FTSE All-World ex US Index | 35.97 | –4.82 | 8,773 |
| International Funds Average3 | 26.69 | –8.64 | 7,870 |
| |
| | | | Final Value of |
| | | Since | a $5,000,000 |
| | One Year | Inception1 | Investment |
| FTSE All-World ex-US Index Fund | | | |
| Institutional Shares2 | 32.56% | –8.60% | $3,992,114 |
| FTSE All-World ex US Index | 35.97 | –8.09 | 4,047,749 |
| |
| | | | Final Value |
| | | Since | of a $10,000 |
| | One Year | Inception1 | Investment |
| FTSE All-World ex-US Index Fund | | | |
| ETF Shares Net Asset Value4 | 32.41% | –5.02% | $8,717 |
| FTSE All-World ex US Index | 35.97 | –4.48 | 8,850 |
1 Performance for the fund and its comparative standards is calculated since the following inception dates: March 8, 2007, for the Investor Shares, April 30, 2007, for the Institutional Shares, and March 2, 2007, for the ETF Shares.
2 Total returns do not reflect the 2% fee assessed on redemptions of shares held for less than two months, nor for the Investor Shares do they include the account service fee that may be applicable to certain accounts with balances below $10,000.
3 Derived from data provided by Lipper Inc.
4 For more information about how the ETF Shares’ market prices have compared with their net asset value, visit www.vanguard.com, select your ETF, and then select the Performance tab. The Premium/Discount table there shows the percentages of days on which the ETF Shares’ market price was above or below the NAV.
12
FTSE All-World ex-US Index Fund
| |
| Cumulative Returns—ETF Shares: March 2, 2007–October 31, 2009 | |
| | Cumulative |
| | Since Inception |
| FTSE All-World ex-US Index Fund ETF Shares Market Price | –13.07% |
| FTSE All-World ex-US Index Fund ETF Shares Net Asset Value | –12.83 |
| FTSE All-World ex US Index | –11.50 |
Fiscal-Year Total Returns (%): March 8, 2007–October 31, 2009
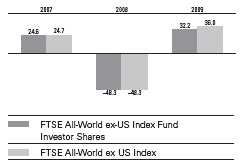
Average Annual Total Returns: Periods Ended September 30, 2009
This table presents average annual total returns through the latest calendar quarter—rather than through the end of the fiscal period. Securities and Exchange Commission rules require that we provide this information.
| | | |
| | | One | Since |
| | Inception Date | Year | Inception |
| FTSE All-World ex-US Index Fund | | | |
| Investor Shares1 | 3/8/2007 | 4.92% | –5.18% |
| Institutional Shares1 | 4/30/2007 | 5.19 | –7.95 |
| ETF Shares | 3/2/2007 | | |
| Market Price | | 5.27 | –4.14 |
| Net Asset Value | | 5.10 | –4.27 |
1 Total returns do not reflect the 2% fee assessed on redemptions of shares held for less than two months, nor for the Investor Shares do they include the account service fee that may be applicable to certain accounts with balances below $10,000.
Note: See Financial Highlights tables for dividend and capital gains information.
13
FTSE All-World ex-US Index Fund
Financial Statements
Statement of Net Assets
As of October 31, 2009
The fund reports a complete list of its holdings in regulatory filings four times in each fiscal year, at the quarter-ends. For the second and fourth fiscal quarters, the lists appear in the fund’s semiannual and annual reports to shareholders. For the first and third fiscal quarters, the fund files the lists with the Securities and Exchange Commission on Form N-Q. Shareholders can look up the fund’s Forms N-Q on the SEC’s website at www.sec.gov. Forms N-Q may also be reviewed and copied at the SEC’s Public Reference Room (see the back cover of this report for further information).
| | | |
| | | | Market |
| | | | Value• |
| | | Shares | ($000) |
| Common Stocks (99.5%) | | |
| Argentina (0.0%) | | |
| * | Petrobras Energia | | |
| | Participaciones SA ADR | 24,359 | 417 |
| |
| Australia (5.9%) | | |
| | BHP Billiton Ltd. | 1,556,994 | 51,064 |
| | Commonwealth Bank of | | |
| | Australia | 704,620 | 32,562 |
| | Westpac Banking Corp. | 1,364,252 | 31,886 |
| | National Australia Bank Ltd. | 972,214 | 25,687 |
| | Australia & New Zealand | | |
| | Banking Group Ltd. | 1,078,436 | 21,996 |
| | Woolworths Ltd. | 567,173 | 14,517 |
| | Rio Tinto Ltd. | 210,540 | 11,670 |
| | Wesfarmers Ltd. | 462,885 | 11,550 |
| | Westfield Group | 1,051,365 | 11,391 |
| | Woodside Petroleum Ltd. | 245,997 | 10,318 |
| | QBE Insurance Group Ltd. | 464,408 | 9,353 |
| | CSL Ltd. | 279,980 | 7,861 |
| ^ | Macquarie Group Ltd. | 154,676 | 6,774 |
| | Newcrest Mining Ltd. | 220,923 | 6,350 |
| | Telstra Corp. Ltd. | 2,009,706 | 5,972 |
| | Origin Energy Ltd. | 401,051 | 5,751 |
| | Santos Ltd. | 380,733 | 5,075 |
| | AMP Ltd. | 925,942 | 4,879 |
| | Suncorp-Metway Ltd. | 576,505 | 4,509 |
| | Foster’s Group Ltd. | 886,774 | 4,349 |
| | Brambles Ltd. | 650,457 | 4,101 |
| | Stockland | 1,093,355 | 3,632 |
| * | Fortescue Metals | | |
| | Group Ltd. | 1,077,926 | 3,609 |
| | Orica Ltd. | 167,649 | 3,556 |
| | Insurance Australia | | |
| | Group Ltd. | 965,612 | 3,248 |
| | Oil Search Ltd. | 579,381 | 3,005 |
| | Amcor Ltd. | 549,822 | 2,831 |
| | AXA Asia Pacific | | |
| | Holdings Ltd. | 698,918 | 2,616 |
| | WorleyParsons Ltd. | 109,646 | 2,530 |
| | | |
| | | | Market |
| | | | Value• |
| | | Shares | ($000) |
| | AGL Energy Ltd. | 202,046 | 2,504 |
| | Computershare Ltd. | 256,794 | 2,493 |
| | Coca-Cola Amatil Ltd. | 259,232 | 2,465 |
| | Toll Holdings Ltd. | 324,750 | 2,462 |
| | Transurban Group | 599,612 | 2,433 |
| | ASX Ltd. | 79,818 | 2,406 |
| | BlueScope Steel Ltd. | 849,226 | 2,251 |
| | Leighton Holdings Ltd. | 70,596 | 2,242 |
| | Sonic Healthcare Ltd. | 176,244 | 2,200 |
| | GPT Group | 4,246,330 | 2,167 |
| | Wesfarmers Ltd. | 77,077 | 1,931 |
| | Crown Ltd. | 254,690 | 1,854 |
| | Metcash Ltd. | 433,729 | 1,824 |
| | TABCORP Holdings Ltd. | 279,134 | 1,781 |
| | Lend Lease Corp. Ltd. | 212,702 | 1,763 |
| | Incitec Pivot Ltd. | 744,052 | 1,736 |
| * | Asciano Group | 1,285,184 | 1,721 |
| | Mirvac Group | 1,301,543 | 1,704 |
| * | Alumina Ltd. | 1,140,820 | 1,674 |
| | OneSteel Ltd. | 606,433 | 1,646 |
| | Cochlear Ltd. | 27,289 | 1,564 |
| | Dexus Property Group | 2,188,376 | 1,546 |
| | Sims Metal | | |
| | Management Ltd. | 84,791 | 1,495 |
| | Tatts Group Ltd. | 672,499 | 1,489 |
| * | OZ Minerals Ltd. | 1,423,456 | 1,488 |
| | Goodman Group | 2,724,010 | 1,461 |
| | Macquarie | | |
| | Infrastructure Group | 1,118,949 | 1,432 |
| | CFS Retail Property Trust | 821,481 | 1,412 |
| | Boral Ltd. | 275,268 | 1,404 |
| | Harvey Norman | | |
| | Holdings Ltd. | 378,903 | 1,342 |
| * | Paladin Energy Ltd. | 351,771 | 1,273 |
| * | James Hardie Industries | | |
| | NV | 200,293 | 1,269 |
| | Qantas Airways Ltd. | 497,940 | 1,238 |
| | Bendigo and | | |
| | Adelaide Bank Ltd. | 152,367 | 1,235 |
| | Nufarm Ltd. | 101,362 | 1,036 |
14
| | | | |
| FTSE All-World ex-US Index Fund | |
| |
| |
| |
| | | | | Market |
| | | | | Value• |
| | | | Shares | ($000) |
| | CSR Ltd. | | 602,214 | 1,024 |
| | Bank of Queensland Ltd. | 93,289 | 1,021 |
| | Aristocrat Leisure Ltd. | | 242,945 | 970 |
| | Goodman Fielder Ltd. | | 632,142 | 907 |
| | Downer EDI Ltd. | | 112,081 | 853 |
| | Billabong International Ltd. | 85,305 | 789 |
| | Macquarie Airports | | 299,411 | 762 |
| | Perpetual Ltd. | | 22,825 | 761 |
| | Energy Resources of | | | |
| | Australia Ltd. | | 34,582 | 714 |
| | Challenger Financial | | | |
| | Services Group Ltd. | | 204,318 | 672 |
| | Commonwealth Property | | |
| | Office Fund | | 804,319 | 631 |
| | Consolidated Media | | | |
| | Holdings Ltd. | | 218,569 | 593 |
| | Ansell Ltd. | | 64,144 | 593 |
| | Macquarie Office Trust | 2,057,188 | 576 |
| | Adelaide Brighton Ltd. | | 219,556 | 552 |
| * | Iluka Resources Ltd. | | 173,460 | 537 |
| | IOOF Holdings Ltd. | | 108,450 | 508 |
| * | Caltex Australia Ltd. | | 55,039 | 499 |
| | Flight Centre Ltd. | | 32,372 | 488 |
| | SP AusNet | | 561,969 | 442 |
| | Tower Australia Group Ltd. | 165,870 | 437 |
| | Sigma Pharmaceuticals Ltd. | 509,937 | 427 |
| | New Hope Corp. Ltd. | | 108,879 | 406 |
| ^ | Fairfax Media Ltd. | | 277,011 | 393 |
| | Ten Network Holdings Ltd. | 266,062 | 363 |
| | GWA International Ltd. | | 139,801 | 356 |
| | AWB Ltd. | | 301,006 | 329 |
| | Gunns Ltd. | | 352,041 | 317 |
| | Australand Property Group | 645,379 | 305 |
| | Spotless Group Ltd. | | 112,149 | 252 |
| ^ | West Australian | | | |
| | Newspapers Holdings Ltd. | 36,010 | 240 |
| | Envestra Ltd. | | 497,442 | 234 |
| | Corporate Express | | | |
| | Australia Ltd. | | 39,426 | 151 |
| | Austereo Group Ltd. | | 112,512 | 150 |
| | APN News & Media Ltd. | 73,168 | 146 |
| * | PaperlinX Ltd. | | 170,402 | 83 |
| * | Elders Ltd. | | 332,706 | 55 |
| * | CSR, Ltd. | | | |
| | Rights Exp. 11/9/2009 | 105,387 | 23 |
| * | ABC Learning Centres Ltd. | 44,287 | 22 |
| | | | | 393,164 |
| Austria (0.3%) | | | |
| ^ | Erste Group Bank AG | | 110,461 | 4,441 |
| | OMV AG | | 68,703 | 2,831 |
| | Telekom Austria AG | | 160,878 | 2,635 |
| | Voestalpine AG | | 74,420 | 2,545 |
| ^ | Raiffeisen International | | | |
| | Bank Holding AG | | 21,708 | 1,273 |
| *,^ | Immoeast AG | | 201,715 | 1,065 |
| | Vienna Insurance Group | 17,939 | 1,011 |
| | | |
| | | | Market |
| | | | Value• |
| | | Shares | ($000) |
| | Verbund - Oesterreichische | | |
| | Elektrizitaetswirtschafts | | |
| | AG Class A | 20,596 | 924 |
| | EVN AG | 25,566 | 483 |
| | Strabag SE | 14,858 | 457 |
| | | | 17,665 |
| Belgium (0.7%) | | |
| | Anheuser-Busch InBev NV | 369,499 | 17,348 |
| * | Fortis | 1,084,185 | 4,688 |
| * | KBC Groep NV | 80,575 | 3,449 |
| | Groupe Bruxelles Lambert | | |
| | SA | 36,526 | 3,219 |
| | Delhaize Group SA | 45,391 | 3,083 |
| | Belgacom SA | 76,821 | 2,877 |
| | UCB SA | 65,109 | 2,780 |
| * | Dexia SA | 259,038 | 2,153 |
| | Solvay SA Class A | 19,531 | 1,918 |
| | Umicore | 61,340 | 1,863 |
| | Colruyt SA | 6,877 | 1,636 |
| | Nationale A Portefeuille | 13,981 | 731 |
| | Mobistar SA | 7,594 | 522 |
| | | | 46,267 |
| Brazil (3.8%) | | |
| | Petroleo Brasileiro SA | | |
| | Series A ADR | 581,392 | 23,325 |
| | Petroleo Brasileiro SA ADR | 451,567 | 20,871 |
| | Itau Unibanco Holding | | |
| | SA ADR | 940,837 | 18,008 |
| * | Vale SA Class B ADR | 704,052 | 16,264 |
| | Banco Bradesco SA ADR | 689,087 | 13,575 |
| * | Vale SA Class B ADR | 491,828 | 12,537 |
| | Petroleo Brasileiro SA Pfd. | 552,546 | 10,953 |
| | Cia Siderurgica Nacional | | |
| | SA ADR | 269,139 | 8,925 |
| | Cia de Bebidas das | | |
| | Americas ADR | 93,155 | 8,391 |
| | Vale SA | 368,400 | 8,292 |
| | Investimentos Itau SA | 1,234,345 | 7,056 |
| | Petroleo Brasileiro SA | 279,600 | 6,428 |
| | BM&FBOVESPA SA | 951,459 | 6,130 |
| | Banco do Brasil SA | 353,823 | 5,666 |
| | Vale SA | 207,100 | 5,261 |
| | BRF-Brasil Foods SA | 193,101 | 4,655 |
| | Gerdau SA ADR | 274,333 | 4,142 |
| | Natura Cosmeticos SA | 199,123 | 3,579 |
| | Redecard SA | 234,159 | 3,437 |
| | Usinas Siderurgicas de | | |
| | Minas Gerais SA | 117,627 | 3,072 |
| * | Banco Santander Brasil SA | 238,200 | 2,813 |
| | Cia de Concessoes | | |
| | Rodoviarias | 137,376 | 2,701 |
| | OGX Petroleo e | | |
| | Gas Participacoes SA | 3,026 | 2,439 |
| | Cia Energetica de | | |
| | Minas Gerais ADR | 148,925 | 2,352 |
| | Itau Unibanco Holding SA | 123,255 | 2,345 |
15
| | | |
| FTSE All-World ex-US Index Fund | |
| |
| |
| |
| | | | Market |
| | | | Value• |
| | | Shares | ($000) |
| | Metalurgica Gerdau SA | | |
| | Class A | 125,518 | 2,305 |
| | Tele Norte Leste | | |
| | Participacoes SA ADR | 120,870 | 2,304 |
| | Companhia Brasileira de | | |
| | Meios de Pagamento | 247,305 | 2,276 |
| | Cia Brasileira de | | |
| | Distribuicao Grupo Pao de | | |
| | Acucar ADR | 35,766 | 2,163 |
| | Bradespar SA | 104,240 | 2,139 |
| | All America Latina Logistica | | |
| | SA | 262,216 | 1,925 |
| * | Empresa Brasileira de | | |
| | Aeronautica SA ADR | 92,937 | 1,882 |
| | Cyrela Brazil Realty SA | 143,927 | 1,826 |
| | Centrais Eletricas | | |
| | Brasileiras SA | 125,334 | 1,785 |
| | Ultrapar Participacoes SA | 40,166 | 1,759 |
| * | Global Village Telecom | | |
| | Holding SA | 59,936 | 1,720 |
| | Tim Participacoes SA ADR | 64,581 | 1,523 |
| | Souza Cruz SA | 41,200 | 1,462 |
| | Tractebel Energia SA | 117,970 | 1,440 |
| | Weg SA | 145,182 | 1,426 |
| | JBS SA | 256,129 | 1,413 |
| | Cia de Bebidas das | | |
| | Americas | 17,297 | 1,316 |
| * | NET Servicos de | | |
| | Comunicacao SA | 103,579 | 1,277 |
| | Usinas Siderurgicas de | | |
| | Minas Gerais SA | 47,210 | 1,160 |
| | Lojas Americanas SA | 168,500 | 1,099 |
| | Cia Paranaense de | | |
| | Energia ADR | 60,500 | 1,065 |
| | Brasil Telecom | | |
| | Participacoes SA ADR | 18,338 | 923 |
| | Gerdau SA Pfd. | 59,000 | 889 |
| * | Braskem SA ADR | 63,262 | 830 |
| | Eletropaulo Metropolitana | | |
| | Eletricidade de | | |
| | Sao Paulo SA | 42,504 | 802 |
| | Cia Energetica de | | |
| | Sao Paulo | 68,496 | 797 |
| | Suzano Papel e | | |
| | Celulose SA | 89,098 | 774 |
| | Vivo Participacoes SA ADR | 31,108 | 754 |
| | Gerdau SA | 64,684 | 740 |
| | B2W Cia Global Do Varejo | 24,617 | 714 |
| * | Tam SA | 48,281 | 682 |
| | AES Tiete SA Pfd. | 59,916 | 675 |
| | Tele Norte Leste | | |
| | Participacoes SA | 28,594 | 644 |
| | Light SA | 46,092 | 635 |
| | Klabin SA | 260,700 | 622 |
| * | BRF-Brasil Foods SA ADR | 12,208 | 591 |
| * | Fertilizantes Fosfatados SA | 61,154 | 590 |
| | | |
| | | | Market |
| | | | Value• |
| | | Shares | ($000) |
| * | Hypermarcas SA | 29,078 | 583 |
| | Telemar Norte Leste SA | 18,400 | 579 |
| | Cia de Saneamento Basico | | |
| | do Estado de Sao Paulo | 29,992 | 579 |
| * | Tim Participacoes SA | 177,168 | 556 |
| | Brasil Telecom SA | 60,390 | 515 |
| | Banco Bradesco SA | 25,500 | 499 |
| | Porto Seguro SA | 45,612 | 481 |
| | Telecomunicacoes de | | |
| | Sao Paulo SA Pfd. | 18,800 | 466 |
| | EDP-Energias do Brasil | | |
| | SA | 28,700 | 460 |
| | Vivo Participacoes SA | 18,000 | 438 |
| | CPFL Energia SA | 23,800 | 417 |
| | Cia de Transmissao de | | |
| | Energia Eletrica Paulista | 15,000 | 416 |
| | Telecomunicacoes de | | |
| | Sao Paulo SA | 16,500 | 365 |
| * | Cosan SA Industria e | | |
| | Comercio | 32,234 | 341 |
| | Cia Energetica de | | |
| | Minas Gerais | 23,620 | 294 |
| | AES Tiete SA | 23,000 | 245 |
| | Cia Energetica de | | |
| | Minas Gerais | 15,000 | 235 |
| | Cia de Gas de Sao Paulo | 11,000 | 206 |
| | Cia Siderurgica Nacional SA | 6,000 | 198 |
| | Tim Participacoes SA | 62,158 | 147 |
| | Cia de Bebidas das | | |
| | Americas | 1,000 | 91 |
| * | Votorantim Celulose e | | |
| | Papel SA ADR | 3,759 | 52 |
| | | | 258,307 |
| Canada (5.6%) | | |
| | Royal Bank of Canada | 655,896 | 33,218 |
| | Suncor Energy Inc. | 726,532 | 24,118 |
| | Toronto-Dominion Bank | 394,023 | 22,460 |
| | Bank of Nova Scotia | 472,009 | 19,739 |
| | EnCana Corp. | 349,980 | 19,406 |
| | Canadian Natural | | |
| | Resources Ltd. | 252,997 | 16,418 |
| * | Research In Motion Ltd. | 264,637 | 15,608 |
| | Barrick Gold Corp. | 407,415 | 14,669 |
| | Manulife Financial Corp. | 747,491 | 14,023 |
| | Potash Corp. of | | |
| | Saskatchewan Inc. | 137,751 | 12,846 |
| | Goldcorp Inc. | 339,823 | 12,493 |
| | Bank of Montreal | 255,200 | 11,807 |
| | Canadian National | | |
| | Railway Co. | 218,514 | 10,562 |
| | Canadian Imperial Bank | | |
| | of Commerce | 176,443 | 10,110 |
| | TransCanada Corp. | 317,059 | 9,716 |
| | Talisman Energy Inc. | 473,811 | 8,083 |
| * | Teck Resources Ltd. | | |
| | Class B | 268,872 | 7,805 |
16
| | | |
| FTSE All-World ex-US Index Fund | |
| |
| |
| |
| | | | Market |
| | | | Value• |
| | | Shares | ($000) |
| | Sun Life Financial Inc. | 261,042 | 7,220 |
| | Rogers | | |
| | Communications Inc. | | |
| | Class B | 234,884 | 6,892 |
| | Enbridge Inc. | 174,942 | 6,805 |
| | Thomson Reuters Corp. | 192,436 | 6,121 |
| | Kinross Gold Corp. | 321,155 | 5,966 |
| | Imperial Oil Ltd. | 157,035 | 5,907 |
| | Brookfield Asset | | |
| | Management Inc. | | |
| | Class A | 266,857 | 5,633 |
| | Nexen Inc. | 240,838 | 5,182 |
| | Cameco Corp. | 184,110 | 5,132 |
| | Power Corp. of Canada | 188,100 | 4,433 |
| | Shoppers Drug Mart Corp. | 101,300 | 4,025 |
| | Agnico-Eagle Mines Ltd. | 71,924 | 3,829 |
| | National Bank of Canada | 73,443 | 3,827 |
| | Canadian Pacific | | |
| | Railway Ltd. | 78,900 | 3,420 |
| | Shaw Communications Inc. | | |
| | Class B | 191,000 | 3,398 |
| | Agrium Inc. | 72,900 | 3,391 |
| | Power Financial Corp. | 129,500 | 3,259 |
| | Husky Energy Inc. | 117,842 | 3,104 |
| | BCE Inc. | 119,605 | 2,862 |
| | Bombardier Inc. | 659,015 | 2,674 |
| | Magna International Inc. | | |
| | Class A | 51,933 | 2,050 |
| | Great-West Lifeco Inc. | 89,166 | 1,953 |
| | Canadian Tire Corp. Ltd. | | |
| | Class A | 36,302 | 1,835 |
| | Brookfield Properties Corp. | 175,550 | 1,825 |
| | TransAlta Corp. | 97,743 | 1,824 |
| | IGM Financial Inc. | 48,666 | 1,734 |
| | Barrick Gold Corp. | | |
| | (New York Shares) | 44,500 | 1,599 |
| | Loblaw Cos. Ltd. | 55,697 | 1,537 |
| * | CGI Group Inc. Class A | 123,778 | 1,512 |
| | George Weston Ltd. | 25,800 | 1,315 |
| | Saputo Inc. | 48,990 | 1,176 |
| | Finning International Inc. | 76,960 | 1,135 |
| | Canadian Utilities Ltd. | | |
| | Class A | 29,421 | 1,048 |
| | TELUS Corp. | 26,837 | 843 |
| | TELUS Corp. Class A | 20,183 | 602 |
| | Bombardier Inc. Class A | 28,833 | 117 |
| | | | 378,266 |
| Chile (0.3%) | | |
| | Empresas COPEC SA | 241,942 | 3,222 |
| | Empresa Nacional de | | |
| | Electricidad SA ADR | 61,068 | 2,802 |
| | Sociedad Quimica y | | |
| | Minera de Chile SA ADR | 60,570 | 2,226 |
| | SACI Falabella | 443,948 | 2,107 |
| | Enersis SA ADR | 118,796 | 2,100 |
| | CAP SA | 56,767 | 1,475 |
| | | |
| | | | Market |
| | | | Value• |
| | | Shares | ($000) |
| | Banco Santander Chile | | |
| | ADR | 19,639 | 1,034 |
| | Centros Comerciales | | |
| | Sudamericanos SA | 285,007 | 878 |
| | Banco de Chile | 10,972,190 | 868 |
| | Colbun SA | 3,106,154 | 731 |
| | Lan Airlines SA | 46,848 | 622 |
| | ENTEL Chile SA | 43,970 | 585 |
| | AES Gener SA | 1,147,603 | 486 |
| | Cia Cervecerias Unidas | | |
| | SA | 55,300 | 390 |
| | CorpBanca SA | 33,738,924 | 229 |
| | Embotelladora Andina | | |
| | SA | 66,100 | 203 |
| | Enersis SA | 272,800 | 97 |
| | Empresa Nacional de | | |
| | Electricidad SA | 62,800 | 97 |
| | | | 20,152 |
| China (4.1%) | | |
| | China Construction | | |
| | Bank Corp. | 31,285,000 | 26,972 |
| | China Mobile Ltd. | 2,779,500 | 26,056 |
| | China Life | | |
| | Insurance Co. Ltd. | 3,440,000 | 15,817 |
| | Bank of China Ltd. | 26,322,000 | 15,269 |
| | Industrial & Commercial | | |
| | Bank of China | 19,175,000 | 15,256 |
| | CNOOC Ltd. | 8,289,000 | 12,414 |
| | PetroChina Co. Ltd. | 9,768,000 | 11,754 |
| | Ping An Insurance | | |
| | Group Co. of China Ltd. | 898,000 | 7,870 |
| | China Shenhua | | |
| | Energy Co. Ltd. | 1,588,000 | 7,124 |
| | China Petroleum & | | |
| | Chemical Corp. | 7,830,000 | 6,640 |
| | Tencent Holdings Ltd. | 328,100 | 5,713 |
| ^ | China Merchants | | |
| | Bank Co. Ltd. | 1,698,050 | 4,344 |
| | China Unicom | | |
| | Hong Kong Ltd. | 3,308,182 | 4,206 |
| | China Overseas Land & | | |
| | Investment Ltd. | 1,911,760 | 4,122 |
| | Bank of | | |
| | Communications Co. Ltd. | 3,181,000 | 3,803 |
| | China Citic Bank | 4,568,700 | 3,420 |
| | China Telecom Corp. Ltd. | 7,478,000 | 3,305 |
| *,^ | Byd Co. Ltd. | 318,100 | 2,912 |
| | China Coal Energy Co. | 1,894,000 | 2,635 |
| | Hengan International | | |
| | Group Co. Ltd. | 388,622 | 2,502 |
| | China Communications | | |
| | Construction Co. Ltd. | 2,247,000 | 2,416 |
| | Tingyi Cayman Islands | | |
| | Holding Corp. | 1,034,192 | 2,308 |
| ^ | Aluminum Corp. of | | |
| | China Ltd. | 2,026,000 | 2,207 |
17
| | | |
| FTSE All-World ex-US Index Fund | |
| |
| |
| |
| | | | Market |
| | | | Value• |
| | | Shares | ($000) |
| | China Resources Land Ltd. | 900,000 | 2,173 |
| | China Resources Enterprise | 584,000 | 1,956 |
| | China Merchants Holdings | | |
| | International Co. Ltd. | 592,000 | 1,888 |
| | Zijin Mining Group Co. Ltd. | 1,902,000 | 1,841 |
| | Lenovo Group Ltd. | 3,186,000 | 1,774 |
| ^ | Alibaba.com Ltd. | 705,500 | 1,625 |
| | Citic Pacific Ltd. | 613,000 | 1,580 |
| * | GOME Electrical | | |
| | Appliances Holdings Ltd. | 5,265,940 | 1,543 |
| * | China Mengniu | | |
| | Dairy Co. Ltd. | 529,000 | 1,482 |
| * | China Railway Group Ltd. | 1,875,000 | 1,476 |
| ^ | China COSCO | | |
| | Holdings Co. Ltd. | 1,197,300 | 1,476 |
| | Jiangxi Copper Co. Ltd. | 648,000 | 1,468 |
| | Sino-Ocean Land | | |
| | Holdings Ltd. | 1,509,000 | 1,468 |
| ^ | Want Want China | | |
| | Holdings Ltd. | 2,477,000 | 1,455 |
| | China Resources Power | | |
| | Holdings Co. Ltd. | 688,400 | 1,426 |
| | Dongfeng Motor | | |
| | Group Co. Ltd. | 1,198,000 | 1,424 |
| | Yanzhou Coal | | |
| | Mining Co. Ltd. | 906,000 | 1,401 |
| | Kingboard Chemical | | |
| | Holdings Ltd. | 346,000 | 1,393 |
| *,^ | PICC Property & | | |
| | Casualty Co. Ltd. | 1,782,000 | 1,313 |
| | Anhui Conch | | |
| | Cement Co. Ltd. | 202,000 | 1,307 |
| | China Railway Construction | | |
| | Corp. Ltd. | 942,574 | 1,249 |
| *,^ | China Taiping Insurance | | |
| | Holdings Co. Ltd. | 354,000 | 1,248 |
| | Shimao Property | | |
| | Holdings Ltd. | 663,094 | 1,232 |
| | China National Building | | |
| | Material Co. Ltd. | 570,200 | 1,224 |
| | Denway Motors Ltd. | 2,532,000 | 1,212 |
| | Belle International | | |
| | Holdings Ltd. | 1,194,000 | 1,206 |
| | China Yurun Food | | |
| | Group Ltd. | 586,000 | 1,204 |
| | Cnpc Hong Kong Ltd. | 1,100,000 | 1,161 |
| | Shanghai Industrial | | |
| | Holdings Ltd. | 239,000 | 1,123 |
| *,^ | Sinopharm Group Co. | 297,200 | 1,081 |
| | Inner Mongolia Yitai | | |
| | Coal Co. Class B | 164,610 | 1,056 |
| | Chaoda Modern Agriculture | | |
| | Holdings Ltd. | 1,343,884 | 1,038 |
| | Huaneng Power | | |
| | International Inc. | 1,490,000 | 951 |
| ^ | Angang Steel Co. Ltd. | 514,000 | 947 |
| | | |
| | | | Market |
| | | | Value• |
| | | Shares | ($000) |
| | Beijing Enterprises | | |
| | Holdings Ltd. | 156,000 | 934 |
| ^ | Li Ning Co. Ltd. | 341,000 | 925 |
| * | Metallurgical Corp. of | | |
| | China Ltd. | 1,295,000 | 877 |
| | Tsingtao Brewery Co. Ltd. | 212,000 | 861 |
| ^ | China Shipping | | |
| | Development Co. Ltd. | 600,000 | 842 |
| | Agile Property | | |
| | Holdings Ltd. | 656,000 | 840 |
| | China Everbright Ltd. | 346,000 | 816 |
| | COSCO Pacific Ltd. | 584,000 | 807 |
| | Nine Dragons Paper | | |
| | Holdings Ltd. | 560,000 | 797 |
| ^ | Guangzhou R&F | | |
| | Properties Co. Ltd. | 424,800 | 796 |
| * | Air China Ltd. | 1,470,000 | 796 |
| ^ | Datang | | |
| | International Power | | |
| | Generation Co. Ltd. | 1,638,000 | 776 |
| | China Oilfield Services Ltd. | 716,000 | 774 |
| | Shanghai Electric | | |
| | Group Co. Ltd. | 1,624,000 | 765 |
| | China Vanke Co. Ltd. | | |
| | Class B | 603,840 | 747 |
| ^ | ZTE Corp. | 124,948 | 692 |
| | Zhejiang | | |
| | Expressway Co. Ltd. | 812,000 | 691 |
| | China International Marine | | |
| | Containers Co. Ltd. | | |
| | Class B | 676,037 | 674 |
| ^ | Sinofert Holdings Ltd. | 1,344,000 | 665 |
| ^ | Guangzhou | | |
| | Investment Co. Ltd. | 2,420,000 | 642 |
| *,^ | China Shipping Container | | |
| | Lines Co. Ltd. | 1,789,700 | 640 |
| | Weichai Power Co. Ltd. | 96,000 | 627 |
| ^ | Fosun International | 917,000 | 621 |
| | China Agri-Industries | | |
| | Holdings Ltd. | 624,000 | 599 |
| | Parkson Retail Group Ltd. | 362,000 | 586 |
| | Yantai Changyu Pioneer | | |
| | Wine Co. Class B | 78,100 | 574 |
| | Yangzijiang Shipbuilding | | |
| | Holdings Ltd. | 792,964 | 555 |
| | China High Speed | | |
| | Transmission Equipment | | |
| | Group Co. | 266,000 | 533 |
| * | Beijing Capital International | | |
| | Airport Co. Ltd. | 784,000 | 527 |
| | Jiangsu | | |
| | Expressway Co. Ltd. | 588,000 | 523 |
| ^ | Country Garden | | |
| | Holdings Co. | 1,337,960 | 513 |
| | Hopson Development | | |
| | Holdings Ltd. | 292,000 | 511 |
18
| | | |
| FTSE All-World ex-US Index Fund | |
| |
| |
| |
| | | | Market |
| | | | Value• |
| | | Shares | ($000) |
| | Huabao International | | |
| | Holdings Ltd. | 533,000 | 508 |
| | China National | | |
| | Materials Co. Ltd. | 620,000 | 491 |
| | China South Locomotive | | |
| | and Rolling Stock Corp. | 879,000 | 487 |
| | Soho China Ltd. | 901,500 | 484 |
| *,^ | Maanshan Iron & Steel | 794,000 | 478 |
| | Shanghai Zhenhua Heavy | | |
| | Industry Co. Ltd. Class B | 549,970 | 455 |
| | TPV Technology Ltd. | 680,000 | 446 |
| * | Hidili Industry International | | |
| | Development Ltd. | 429,000 | 439 |
| | Anta Sports Products Ltd. | 352,000 | 424 |
| | Guangdong | | |
| | Investment Ltd. | 810,000 | 423 |
| ^ | China Huiyuan Juice | | |
| | Group Ltd. | 652,000 | 422 |
| *,^ | Sinopec Shanghai | | |
| | Petrochemical Co. Ltd. | 1,052,000 | 422 |
| | Shui On Land Ltd. | 683,900 | 415 |
| | Shanghai Lujiazui Finance | | |
| | & Trade Zone | | |
| | Development Co. Ltd. | | |
| | Class B | 221,390 | 413 |
| | China Communications | | |
| | Services Corp. Ltd. | 790,000 | 409 |
| | China BlueChemical Ltd. | 762,000 | 405 |
| | Greentown China | | |
| | Holdings Ltd. | 269,500 | 390 |
| | China Foods Ltd. | 534,000 | 389 |
| *,^ | Semiconductor | | |
| | Manufacturing | | |
| | International Corp. | 7,734,000 | 378 |
| | China | | |
| | Molybdenum Co. Ltd. | 452,000 | 372 |
| | Dongfang | | |
| | Electric Corp. Ltd. | 73,200 | 364 |
| | Zhaojin Mining | | |
| | Industry Co. Ltd. | 203,000 | 355 |
| | Shenzhen International | | |
| | Holdings | 5,077,500 | 355 |
| | Shenzhen Investment Ltd. | 870,808 | 343 |
| | KWG Property Holding Ltd. | 444,000 | 319 |
| ^ | New World China Land Ltd. | 793,600 | 315 |
| | Great Wall Motor Co. Ltd. | 218,000 | 245 |
| | Travelsky Technology Ltd. | 279,000 | 238 |
| | China Merchants Property | | |
| | Development Co. Ltd. | | |
| | Class B | 96,850 | 234 |
| ^ | Beijing North Star Co. | 620,000 | 229 |
| | Lianhua Supermarket | | |
| | Holdings Co. Ltd. | 105,000 | 225 |
| | Hopewell Highway | | |
| | Infrastructure Ltd. | 356,600 | 215 |
| | Sinotrans Ltd. | 794,000 | 208 |
| | | |
| | | | Market |
| | | | Value• |
| | | Shares | ($000) |
| * | China Eastern | | |
| | Airlines Corp. Ltd. | 748,000 | 205 |
| | Guangshen | | |
| | Railway Co. Ltd. | 498,000 | 202 |
| * | Citic Resources | | |
| | Holdings Ltd. | 719,300 | 202 |
| | China Travel | | |
| | International Inv HK | 990,000 | 202 |
| | Harbin Power | | |
| | Equipment Co. Ltd. | 216,000 | 201 |
| | Weiqiao Textile Co. | 287,500 | 201 |
| | Chongqing Changan | | |
| | Automobile Co. Ltd. | | |
| | Class B | 264,756 | 197 |
| *,^ | China Southern | | |
| | Airlines Co. Ltd. | 675,000 | 196 |
| ^ | Global Bio-Chem | | |
| | Technology Group Co. Ltd. | 746,000 | 182 |
| | CSG Holding Co. Ltd. | | |
| | Class B | 178,107 | 173 |
| | Shandong Chenming Paper | | |
| | Holdings Ltd. Class B | 239,700 | 167 |
| * | Zhejiang Southeast Electric | | |
| | Power Co. Class B | 299,200 | 167 |
| * | Sinopec Yizheng Chemical | | |
| | Fibre Co. Ltd. | 656,000 | 163 |
| | Shenzhen | | |
| | Expressway Co. Ltd. | 338,000 | 162 |
| | Dazhong Transportation | | |
| | Group Co. Ltd. Class B | 225,900 | 158 |
| | Guangdong Electric Power | | |
| | Development Co. Ltd. | | |
| | Class B | 283,660 | 155 |
| * | Huadian Power | | |
| | International Co. | 552,000 | 153 |
| ^ | Guangzhou Shipyard | | |
| | International Co. Ltd. | 76,000 | 140 |
| | Anhui Expressway Co. | 220,000 | 138 |
| | Shenzhen Chiwan Wharf | | |
| | Holdings Ltd. Class B | 72,200 | 109 |
| | Inner Mongolia | | |
| | Eerduosi Cashmere | | |
| | Products Co. Ltd. Class B | 153,000 | 109 |
| | Shanghai Jinjiang | | |
| | International Hotels | | |
| | Development Co. Ltd. | | |
| | Class B | 80,300 | 108 |
| | Shanghai Friendship | | |
| | Group Inc. Ltd. Class B | 90,790 | 108 |
| * | Shanghai Waigaoqiao | | |
| | Free Trade Zone | | |
| | Development Co. Ltd. | | |
| | Class B | 124,100 | 105 |
| | Shanghai Mechanical and | | |
| | Electrical Industry Co. Ltd. | | |
| | Class B | 99,640 | 104 |
19
| | | |
| FTSE All-World ex-US Index Fund | |
| |
| |
| |
| | | | Market |
| | | | Value• |
| | | Shares | ($000) |
| | Shanghai Jinjiang | | |
| | International Investment | | |
| | Holdings Co. Class B | 108,700 | 102 |
| * | Huadian Energy Co. Ltd. | 299,100 | 101 |
| * | Shanghai Haixin Group Co. | | |
| | Class B | 286,800 | 101 |
| | Guangdong Provincial | | |
| | Expressway | | |
| | Development Co. Ltd. | | |
| | Class B | 212,800 | 101 |
| | Shanghai Jinqiao Export | | |
| | Processing Zone | | |
| | Development Co. Ltd. | | |
| | Class B | 109,000 | 98 |
| | Shanghai Chlor-Alkali | | |
| | Chemical Co. Ltd. | | |
| | Class B | 243,435 | 96 |
| * | BOE Technology | | |
| | Group Co. Ltd. Class B | 378,500 | 88 |
| | Bengang Steel Plates Co. | | |
| | Class B | 172,200 | 86 |
| | Foshan Electrical and | | |
| | Lighting Co. Ltd. Class B | 85,820 | 58 |
| * | Hainan Airlines Co. Ltd. | | |
| | Class B | 35,200 | 18 |
| *,^ | New World China Land | | |
| | Rights Exp. 11/06/2009 | 222,000 | 15 |
| | Jiangling Motors Corp. Ltd. | | |
| | Class B | 1,800 | 3 |
| * | Double Coin Holdings Ltd. | | |
| | Class B | 4,300 | 2 |
| | Guangzhou | | |
| | Pharmaceutical Co. Ltd. | 4,000 | 2 |
| | Weifu | | |
| | High-Technology Co. Ltd. | | |
| | Class B | 2,000 | 2 |
| | Jinzhou Port Co. Ltd. | | |
| | Class B | 3,960 | 2 |
| | Tianjin Capital | | |
| | Environmental Protection | | |
| | Group Co. Ltd. | 4,000 | 1 |
| * | Shenzhen Special | | |
| | Economic Zone | | |
| | Real Estate & Properties | | |
| | Group Co. Ltd. Class B | 2,100 | 1 |
| | | | 276,171 |
| Colombia (0.0%) | | |
| | BanColombia SA ADR | 42,231 | 1,671 |
| |
| Czech Republic (0.1%) | | |
| | CEZ AS | 97,311 | 4,792 |
| | Komercni Banka AS | 7,538 | 1,478 |
| | Telefonica O2 Czech | | |
| | Republic AS | 58,340 | 1,375 |
| * | Unipetrol | 34,935 | 261 |
| | | | 7,906 |
| | | |
| | | | Market |
| | | | Value• |
| | | Shares | ($000) |
| Denmark (0.7%) | | |
| | Novo Nordisk A/S Class B | 243,154 | 15,106 |
| * | Danske Bank A/S | 319,568 | 7,339 |
| * | Vestas Wind Systems A/S | 91,713 | 6,432 |
| | A P Moller - Maersk A/S | | |
| | Class B | 682 | 4,657 |
| | Carlsberg A/S Class B | 53,918 | 3,780 |
| | A P Moller - Maersk A/S | 550 | 3,657 |
| | Novozymes A/S | 23,054 | 2,109 |
| | Danisco A/S | 20,720 | 1,292 |
| ^ | FLSmidth & Co. A/S | 23,300 | 1,233 |
| | Coloplast A/S Class B | 14,162 | 1,156 |
| | TrygVesta AS | 11,750 | 847 |
| * | William Demant Holding | 9,300 | 661 |
| | H Lundbeck A/S | 22,500 | 436 |
| | Rockwool International AS | | |
| | Class B | 1,437 | 122 |
| | | | 48,827 |
| Egypt (0.1%) | | |
| | Orascom Construction | | |
| | Industries GDR | 53,490 | 2,582 |
| | Orascom Telecom Holding | | |
| | SAE GDR | 43,950 | 1,494 |
| | | | 4,076 |
| Finland (0.7%) | | |
| | Nokia Oyj | 1,709,795 | 21,597 |
| | Sampo Oyj | 269,538 | 6,452 |
| | Fortum Oyj | 204,959 | 4,851 |
| | UPM-Kymmene Oyj | 243,161 | 2,918 |
| | Kone Oyj Class B | 76,421 | 2,853 |
| | Stora Enso Oyj | 280,033 | 2,120 |
| | Metso Oyj | 65,616 | 1,832 |
| | Wartsila Oyj | 45,380 | 1,643 |
| | Nokian Renkaat Oyj | 57,750 | 1,232 |
| ^ | Neste Oil Oyj | 66,164 | 1,170 |
| | Outokumpu Oyj | 60,124 | 994 |
| | Kesko Oyj Class B | 29,800 | 992 |
| | Rautaruukki Oyj | 46,400 | 946 |
| | Sanoma Oyj | 23,606 | 436 |
| | | | 50,036 |
| France (8.2%) | | |
| | Total SA | 1,109,674 | 66,403 |
| | BNP Paribas | 461,774 | 34,787 |
| | Sanofi-Aventis SA | 457,820 | 33,559 |
| | GDF Suez | 762,552 | 31,880 |
| | AXA SA | 969,227 | 24,105 |
| | France Telecom SA | 905,041 | 22,426 |
| ^ | Societe Generale | 329,628 | 21,894 |
| | ArcelorMittal | 523,252 | 17,708 |
| | Groupe Danone SA | 293,617 | 17,639 |
| | LVMH Moet Hennessy | | |
| | Louis Vuitton SA | 170,267 | 17,631 |
| | Vivendi | 567,505 | 15,744 |
| | L’Oreal SA | 140,041 | 14,319 |
| | Carrefour SA | 326,988 | 14,035 |
20
| | | |
| FTSE All-World ex-US Index Fund | |
| |
| |
| |
| | | | Market |
| | | | Value• |
| | | Shares | ($000) |
| | Air Liquide SA | 119,941 | 12,918 |
| | Vinci SA | 227,970 | 11,897 |
| | Schneider Electric SA | 113,345 | 11,787 |
| | Cie de Saint-Gobain | 227,310 | 11,077 |
| | Pernod-Ricard SA | 119,781 | 9,979 |
| | Alstom SA | 131,176 | 9,089 |
| | Unibail-Rodamco SE | 40,934 | 9,065 |
| | Lafarge SA | 99,337 | 8,063 |
| | Credit Agricole SA | 412,649 | 7,904 |
| | Veolia Environnement | 217,507 | 7,106 |
| | EDF SA | 119,297 | 6,649 |
| | Bouygues SA | 119,418 | 5,624 |
| | Cie Generale d’Optique | | |
| | Essilor International SA | 98,030 | 5,489 |
| ^ | Hermes International | 37,133 | 5,164 |
| | Accor SA | 104,584 | 5,009 |
| | PPR | 44,257 | 4,823 |
| * | Renault SA | 98,195 | 4,394 |
| * | Alcatel-Lucent | 1,079,348 | 4,042 |
| ^ | Vallourec SA | 24,795 | 3,904 |
| | Suez Environnement Co. | 169,960 | 3,777 |
| | Compagnie Generale des | | |
| | Etablissements Michelin | | |
| | Class B | 49,866 | 3,694 |
| | Christian Dior SA | 33,626 | 3,353 |
| | SES SA | 153,144 | 3,318 |
| | Sodexo | 55,009 | 3,141 |
| | Technip SA | 50,032 | 3,139 |
| | Cap Gemini SA | 66,613 | 3,086 |
| | European Aeronautic | | |
| | Defence and Space Co. | | |
| | NV | 149,519 | 2,800 |
| | Lagardere SCA | 61,015 | 2,757 |
| * | Peugeot SA | 82,027 | 2,672 |
| | Publicis Groupe | 67,833 | 2,577 |
| | STMicroelectronics NV | 314,133 | 2,521 |
| * | Natixis | 399,713 | 2,245 |
| | SCOR SE | 82,638 | 2,103 |
| | CNP Assurances | 20,333 | 1,965 |
| | Thales SA | 38,960 | 1,888 |
| ^ | Eiffage SA | 32,136 | 1,751 |
| | Klepierre | 40,330 | 1,672 |
| | Casino Guichard Perrachon | | |
| | SA | 20,530 | 1,631 |
| ^ | Eramet | 5,112 | 1,592 |
| * | Cie Generale de | | |
| | Geophysique-Veritas | 79,959 | 1,584 |
| | Safran SA | 97,982 | 1,581 |
| | Dassault Systemes SA | 26,776 | 1,545 |
| * | Atos Origin SA | 32,414 | 1,518 |
| | Bureau Veritas SA | 24,580 | 1,353 |
| | Legrand SA | 49,768 | 1,350 |
| | Eutelsat Communications | 40,276 | 1,280 |
| | Societe BIC SA | 16,755 | 1,163 |
| | Societe Television | | |
| | Francaise 1 | 72,122 | 1,132 |
| | | | |
| | | | | Market |
| | | | | Value• |
| | | | Shares | ($000) |
| | Aeroports de Paris | | 14,243 | 1,081 |
| * | Air France-KLM | | 70,190 | 1,076 |
| | BioMerieux | | 9,378 | 1,041 |
| | ICADE | | 9,410 | 991 |
| | Imerys SA | | 17,244 | 945 |
| | Gecina SA | | 8,509 | 905 |
| | Eurazeo | | 12,941 | 814 |
| | Societe Des Autoroutes | | |
| | Paris-Rhin-Rhone | | 10,791 | 810 |
| | PagesJaunes Groupe | | 64,152 | 786 |
| * | JC Decaux SA | | 32,212 | 651 |
| | Wendel | | 11,270 | 625 |
| | Ciments Francais SA | | 5,079 | 554 |
| | EDF Energies Nouvelles | | |
| | SA | | 10,058 | 537 |
| | Iliad SA | | 4,681 | 507 |
| | Euler Hermes SA | | 6,190 | 491 |
| | Ipsen SA | | 7,263 | 370 |
| | | | | 552,485 |
| Germany (5.6%) | | | |
| | Siemens AG | | 424,213 | 38,335 |
| | E.ON AG | | 928,328 | 35,578 |
| | Bayer AG | | 383,648 | 26,618 |
| | Allianz SE | | 208,839 | 23,938 |
| | Daimler AG | | 475,192 | 23,081 |
| | BASF SE | | 428,628 | 22,944 |
| | Deutsche Bank AG | | 287,045 | 20,854 |
| | Deutsche Telekom AG | 1,513,466 | 20,682 |
| | SAP AG | | 425,240 | 19,261 |
| | RWE AG | | 182,118 | 15,974 |
| | Muenchener | | | |
| | Rueckversicherungs AG | 91,143 | 14,420 |
| | Deutsche Boerse AG | | 90,201 | 7,306 |
| | Deutsche Post AG | | 418,693 | 7,083 |
| | Bayerische Motoren Werke | | |
| | AG | | 140,130 | 6,855 |
| ^ | Volkswagen AG | | 40,647 | 6,609 |
| | Linde AG | | 58,792 | 6,171 |
| | ThyssenKrupp AG | | 179,645 | 5,787 |
| | MAN SE | | 65,504 | 5,394 |
| | HeidelbergCement AG | | 86,987 | 5,203 |
| | Fresenius Medical Care AG | | |
| | & Co. KGaA | | 101,012 | 4,902 |
| | Volkswagen AG Pfd. | | 48,527 | 4,835 |
| | Adidas AG | | 92,500 | 4,283 |
| * | Commerzbank AG | | 406,066 | 4,229 |
| | Metro AG | | 74,514 | 4,136 |
| | K&S AG | | 75,663 | 4,130 |
| | Henkel AG & Co. KGaA Pfd. | 84,384 | 3,843 |
| | Porsche Automobil Holding | | |
| | SE | | 40,629 | 3,108 |
| | Merck KGaA | | 30,224 | 2,841 |
| | Beiersdorf AG | | 45,702 | 2,815 |
| | Henkel AG & Co. KGaA | 62,638 | 2,420 |
| * | Infineon Technologies AG | 512,349 | 2,307 |
| | Fresenius AG Pfd. | | 36,475 | 2,119 |
21
| | | |
| FTSE All-World ex-US Index Fund | |
| |
| |
| |
| | | | Market |
| | | | Value• |
| | | Shares | ($000) |
| *,^ | QIAGEN NV | 101,855 | 2,112 |
| | Salzgitter AG | 21,488 | 1,932 |
| | Hochtief AG | 24,342 | 1,837 |
| | Deutsche Lufthansa AG | 107,239 | 1,656 |
| | GEA Group AG | 83,260 | 1,571 |
| * | Hannover | | |
| | Rueckversicherung AG | 28,773 | 1,297 |
| * | Deutsche Postbank AG | 40,999 | 1,270 |
| | Lanxess AG | 36,721 | 1,151 |
| | Wacker Chemie AG | 7,285 | 1,047 |
| | Celesio AG | 37,891 | 940 |
| | Puma AG | | |
| | Rudolf Dassler Sport | 2,936 | 900 |
| *,^ | TUI AG | 125,819 | 872 |
| ^ | Solarworld AG | 37,154 | 804 |
| | Fraport AG Frankfurt Airport | | |
| | Services Worldwide | 17,068 | 804 |
| | Fresenius SE | 13,541 | 675 |
| | Suedzucker AG | 27,293 | 564 |
| | Hamburger Hafen und | | |
| | Logistik AG | 12,649 | 493 |
| | Generali Deutschland | | |
| | Holding AG | 3,981 | 378 |
| *,^ | Q-Cells SE | 17,397 | 288 |
| | | | 378,652 |
| Greece (0.5%) | | |
| * | National Bank of Greece | | |
| | SA ADR | 1,205,647 | 8,765 |
| | Hellenic | | |
| | Telecommunications | | |
| | Organization SA ADR | 434,730 | 3,687 |
| * | Alpha Bank AE | 182,685 | 3,522 |
| * | EFG Eurobank Ergasias SA | 180,650 | 2,862 |
| | OPAP SA | 104,265 | 2,654 |
| * | Piraeus Bank SA | 145,875 | 2,515 |
| | Coca Cola Hellenic | | |
| | Bottling Co. SA | 63,178 | 1,647 |
| * | National Bank of Greece SA | 42,318 | 1,547 |
| * | Public Power Corp. SA | 53,410 | 1,089 |
| | Marfin Investment Group | | |
| | SA | 247,673 | 987 |
| | Titan Cement Co. SA | 25,066 | 866 |
| | Hellenic Petroleum SA | 53,080 | 643 |
| | | | 30,784 |
| Hong Kong (1.9%) | | |
| | Sun Hung Kai | | |
| | Properties Ltd. | 891,409 | 13,505 |
| | Hutchison Whampoa Ltd. | 1,484,000 | 10,416 |
| | Cheung Kong Holdings Ltd. | 806,000 | 10,229 |
| | Hong Kong Exchanges and | | |
| | Clearing Ltd. | 492,300 | 8,666 |
| | CLP Holdings Ltd. | 841,000 | 5,636 |
| | Hong Kong & | | |
| | China Gas Co. Ltd. | 2,306,850 | 5,550 |
| | Li & Fung Ltd. | 1,272,000 | 5,290 |
| | Swire Pacific Ltd. | 426,000 | 5,191 |
| | | |
| | | | Market |
| | | | Value• |
| | | Shares | ($000) |
| | Hang Seng Bank Ltd. | 352,600 | 4,981 |
| | BOC Hong Kong | | |
| | Holdings Ltd. | 1,962,237 | 4,517 |
| | Hongkong Electric | | |
| | Holdings Ltd. | 744,000 | 3,979 |
| | Esprit Holdings Ltd. | 570,000 | 3,794 |
| | Hang Lung Properties Ltd. | 987,000 | 3,730 |
| | Wharf Holdings Ltd. | 660,250 | 3,567 |
| | Henderson Land | | |
| | Development Co. Ltd. | 497,466 | 3,517 |
| | Bank of East Asia Ltd. | 846,200 | 2,968 |
| | New World | | |
| | Development Ltd. | 1,347,000 | 2,899 |
| | MTR Corp. | 760,500 | 2,694 |
| | Hang Lung Group Ltd. | 463,000 | 2,321 |
| | Link REIT | 979,843 | 2,207 |
| | Sino Land Co. Ltd. | 1,114,000 | 2,119 |
| | Shangri-La Asia Ltd. | 808,514 | 1,555 |
| | Kerry Properties Ltd. | 264,500 | 1,475 |
| | Hopewell Holdings Ltd. | 416,000 | 1,309 |
| | Wheelock & Co. Ltd. | 384,000 | 1,234 |
| * | Cathay Pacific Airways Ltd. | 691,015 | 1,120 |
| | Hysan | | |
| | Development Co. Ltd. | 355,000 | 1,049 |
| | Wing Hang Bank Ltd. | 103,500 | 1,004 |
| * | Foxconn International | | |
| | Holdings Ltd. | 1,022,000 | 898 |
| | Cheung Kong | | |
| | Infrastructure | | |
| | Holdings Ltd. | 205,000 | 729 |
| | Television Broadcasts Ltd. | 149,000 | 704 |
| ^ | First Pacific Co. | 1,136,000 | 671 |
| | Yue Yuen Industrial | | |
| | Holdings Ltd. | 237,500 | 662 |
| | ASM Pacific | | |
| | Technology Ltd. | 84,500 | 657 |
| ^ | Guoco Group Ltd. | 57,000 | 639 |
| | Techtronic Industries Co. | 747,500 | 601 |
| | PCCW Ltd. | 2,314,000 | 568 |
| | Orient Overseas | | |
| | International Ltd. | 114,500 | 559 |
| | Industrial & Commercial | | |
| | Bank of China Asia Ltd. | 217,777 | 506 |
| | NWS Holdings Ltd. | 265,000 | 503 |
| | Hongkong & | | |
| | Shanghai Hotels | 349,500 | 498 |
| | Lifestyle International | | |
| | Holdings Ltd. | 303,000 | 487 |
| | Hong Kong Aircraft | | |
| | Engineerg Co. Ltd. | 37,200 | 439 |
| | Cafe de Coral Holdings Ltd. | 188,000 | 406 |
| *,^ | Johnson Electric | | |
| | Holdings Ltd. | 919,000 | 404 |
| | Great Eagle Holdings Ltd. | 146,000 | 385 |
| *,^ | Mongolia Energy Co. Ltd. | 912,000 | 383 |
| ^ | Shun Tak Holdings Ltd. | 531,000 | 357 |
22
| | | |
| FTSE All-World ex-US Index Fund | |
| |
| |
| |
| | | | Market |
| | | | Value• |
| | | Shares | ($000) |
| ^ | C C Land Holdings Ltd. | 620,000 | 337 |
| | Lee & Man Paper | | |
| | Manufacturing Ltd. | 150,400 | 297 |
| | Chinese Estates | | |
| | Holdings Ltd. | 169,500 | 291 |
| * | Dah Sing Financial | | |
| | Holdings Ltd. | 48,400 | 273 |
| | Kowloon | | |
| | Development Co. Ltd. | 216,000 | 230 |
| | Texwinca Holdings Ltd. | 248,000 | 210 |
| *,^ | Galaxy Entertainment | | |
| | Group Ltd. | 468,000 | 198 |
| ^ | Giordano International Ltd. | 606,000 | 150 |
| | Chong Hing Bank Ltd. | 72,000 | 140 |
| *,^ | Melco International | | |
| | Development Ltd. | 252,000 | 137 |
| | Fubon Bank | | |
| | Hong Kong Ltd. | 230,000 | 103 |
| | Hutchison Harbour | | |
| | Ring Ltd. | 1,352,000 | 99 |
| | Public Financial | | |
| | Holdings Ltd. | 190,000 | 98 |
| | Hutchison | | |
| | Telecommunications | | |
| | Hong Kong Holdings Ltd. | 543,000 | 94 |
| | Hutchison | | |
| | Telecommunications | | |
| | International Ltd. | 370,000 | 74 |
| * | Dah Sing Banking | | |
| | Group Ltd. | 42,800 | 59 |
| * | First Pacific Co., Ltd. | | |
| | Rights Exp. 11/19/2009 | 227,200 | 36 |
| | | | 130,404 |
| Hungary (0.1%) | | |
| *,^ | OTP Bank PLC | 131,270 | 3,691 |
| *,^ | MOL Hungarian Oil and | | |
| | Gas NyRt | 37,536 | 3,136 |
| | Richter Gedeon Nyrt. | 7,275 | 1,515 |
| | Magyar Telekom | | |
| | Telecommunications PLC | 179,268 | 773 |
| | | | 9,115 |
| India (2.2%) | | |
| | Infosys Technologies Ltd. | | |
| | ADR | 261,264 | 12,018 |
| | Reliance Industries Ltd. | | |
| | GDR | 130,419 | 10,816 |
| | ITC Ltd. | 1,308,346 | 7,045 |
| | Larsen & Toubro Ltd. | 197,148 | 6,508 |
| | Housing Development | | |
| | Finance Corp. | 93,070 | 5,208 |
| | Reliance Industries Ltd. | 118,038 | 4,776 |
| | Bharti Airtel Ltd. | 684,373 | 4,230 |
| | ICICI Bank Ltd. ADR | 131,877 | 4,148 |
| | HDFC Bank Ltd. ADR | 35,616 | 3,940 |
| | Oil & Natural Gas Corp. Ltd. | 136,444 | 3,251 |
| | | |
| | | | Market |
| | | | Value• |
| | | Shares | ($000) |
| | State Bank of India Ltd. | | |
| | GDR | 35,028 | 3,199 |
| | Bharat Heavy | | |
| | Electricals Ltd. | 66,901 | 3,129 |
| | Axis Bank Ltd. | 151,887 | 2,891 |
| | Wipro Ltd. ADR | 166,125 | 2,849 |
| | Tata Steel Ltd. | 248,133 | 2,452 |
| | Hindustan Unilever Ltd. | 401,297 | 2,399 |
| | Jindal Steel & Power Ltd. | 168,490 | 2,270 |
| | Jaiprakash Associates Ltd. | 476,702 | 2,099 |
| | Sterlite Industries India Ltd. | 129,459 | 2,091 |
| | DLF Ltd. | 231,907 | 1,804 |
| | NTPC Ltd. | 394,044 | 1,769 |
| | Tata Consultancy | | |
| | Services Ltd. | 126,890 | 1,687 |
| | Cipla Ltd. | 253,269 | 1,534 |
| | Dr Reddys | | |
| | Laboratories Ltd. ADR | 67,502 | 1,467 |
| * | Essar Oil Ltd. | 522,002 | 1,463 |
| | Grasim Industries Ltd. | 31,029 | 1,430 |
| | Hindalco Industries Ltd. | 557,080 | 1,424 |
| | Bajaj Auto Ltd. | 47,657 | 1,396 |
| | Reliance | | |
| | Communications Ltd. | 373,396 | 1,376 |
| | Unitech Ltd. | 778,357 | 1,334 |
| | Infrastructure Development | | |
| | Finance Co. Ltd. | 421,574 | 1,301 |
| | Tata Power Co. Ltd. | 45,137 | 1,269 |
| | GAIL India Ltd. | 165,326 | 1,217 |
| | Hero Honda Motors Ltd. | 34,946 | 1,154 |
| | Maruti Suzuki India Ltd. | 38,466 | 1,137 |
| | Punjab National Bank Ltd. | 62,947 | 1,131 |
| | Reliance Infrastructure Ltd. | 49,837 | 1,103 |
| | Sesa Goa Ltd. | 172,270 | 1,094 |
| | JSW Steel Ltd. | 63,333 | 1,003 |
| | Steel Authority of India Ltd. | 281,788 | 971 |
| * | Cairn India Ltd. | 172,983 | 958 |
| | Kotak Mahindra Bank Ltd. | 62,785 | 937 |
| | Mahanagar Telephone | | |
| | Nigam ADR | 321,292 | 935 |
| | Tata Motors Ltd. | 71,583 | 847 |
| | Siemens India Ltd. | 77,486 | 839 |
| | Reliance Capital Ltd. | 52,313 | 819 |
| * | Housing Development & | | |
| | Infrastructure Ltd. | 120,191 | 796 |
| | Sun Pharmaceutical | | |
| | Industries Ltd. | 25,961 | 755 |
| | Mahindra & Mahindra Ltd. | 37,952 | 734 |
| | Nestle India Ltd. | 13,352 | 726 |
| | Lupin Ltd. | 27,682 | 719 |
| * | Reliance Natural | | |
| | Resources Ltd. | 535,791 | 719 |
| | Indian Oil Corp. Ltd. | 99,090 | 654 |
| | Crompton Greaves Ltd. | 80,725 | 649 |
| | Mphasis Ltd. | 45,331 | 646 |
| | Adani Enterprises Ltd. | 42,834 | 644 |
23
| | | |
| FTSE All-World ex-US Index Fund | |
| |
| |
| |
| | | | Market |
| | | | Value• |
| | | Shares | ($000) |
| * | GMR Infrastructure Ltd. | 487,280 | 630 |
| | Piramal Healthcare Ltd. | 74,964 | 605 |
| | ABB Ltd. | 36,825 | 597 |
| | Tata Communications Ltd. | | |
| | ADR | 38,843 | 592 |
| * | Idea Cellular Ltd. | 535,531 | 585 |
| * | Reliance Power Ltd. | 199,120 | 581 |
| | Power Grid Corp. of | | |
| | India Ltd. | 264,322 | 580 |
| | Hindustan | | |
| | Petroleum Corp. Ltd. | 78,275 | 578 |
| | HCL Technologies Ltd. | 86,537 | 556 |
| | United Spirits Ltd. | 23,577 | 530 |
| | Bharat Petroleum Corp. Ltd. | 47,121 | 512 |
| | Aditya Birla Nuvo Ltd. | 30,403 | 507 |
| | Bank of India | 69,413 | 486 |
| | Colgate-Palmolive India Ltd. | 32,720 | 485 |
| | Zee Entertainment | | |
| | Enterprises Ltd. | 98,828 | 479 |
| * | NHPC Ltd. | 718,763 | 467 |
| | Satyam Computer | | |
| | Services Ltd. ADR | 86,551 | 458 |
| | Tata Chemicals Ltd. | 82,086 | 454 |
| * | Ranbaxy Laboratories Ltd. | 54,789 | 451 |
| | Punj Lloyd Ltd. | 103,374 | 439 |
| | Union Bank of India | 76,623 | 423 |
| | Canara Bank | 58,832 | 423 |
| | Dabur India Ltd. | 129,403 | 415 |
| | Ambuja Cements Ltd. | 211,056 | 396 |
| | Mundra Port and Special | | |
| | Economic Zone Ltd. | 37,614 | 396 |
| | Ultratech Cement Ltd. | 23,935 | 385 |
| | Bajaj Holdings and | | |
| | Investment Ltd. | 37,466 | 385 |
| * | Adani Power Ltd. | 181,323 | 378 |
| | Bharat Electronics Ltd. | 11,911 | 360 |
| | ACC Ltd. | 21,837 | 345 |
| | Bank of Baroda | 31,651 | 339 |
| | Bharat Forge Ltd. | 64,586 | 338 |
| | Indiabulls Financial | | |
| | Services Ltd. | 95,004 | 338 |
| | Divi’s Laboratories Ltd. | 27,520 | 309 |
| * | Oracle Financial Sevices | | |
| | Software Ltd. | 6,601 | 296 |
| | Aban Offshore Ltd. | 10,979 | 294 |
| * | Suzlon Energy Ltd. | 210,007 | 293 |
| | Bajaj Finserv Ltd. | 41,473 | 273 |
| * | Lanco Infratech Ltd. | 22,964 | 236 |
| | Oriental Bank of Commerce | 45,741 | 231 |
| | Glenmark | | |
| | Pharmaceuticals Ltd. | 48,507 | 229 |
| | IDBI Bank Ltd. | 90,684 | 218 |
| | Great Eastern | | |
| | Shipping Co. Ltd. | 42,250 | 213 |
| | Financial Technologies | | |
| | India Ltd. | 8,548 | 212 |
| | | |
| | | | Market |
| | | | Value• |
| | | Shares | ($000) |
| | Hindustan Zinc Ltd. | 11,075 | 210 |
| | National | | |
| | Aluminium Co. Ltd. | 27,594 | 208 |
| | Ashok Leyland Ltd. | 206,714 | 198 |
| | Infosys Technologies Ltd. | 4,132 | 192 |
| | Power Finance Corp. Ltd. | 40,963 | 191 |
| | Sun TV Network Ltd. | 24,986 | 166 |
| | Godrej Industries Ltd. | 41,676 | 157 |
| | Neyveli Lignite Corp. Ltd. | 57,061 | 155 |
| | Mangalore Refinery & | | |
| | Petrochemicals Ltd. | 90,687 | 142 |
| | Corp Bank | 14,895 | 134 |
| | Tech Mahindra Ltd. | 6,673 | 131 |
| | Castrol India Ltd. | 10,738 | 120 |
| * | Tata Teleservices | | |
| | Maharashtra Ltd. | 201,283 | 112 |
| | Shipping Corp. of India Ltd. | 38,874 | 106 |
| | ICICI Bank Ltd. | 5,626 | 93 |
| * | Jet Airways India Ltd. | 250 | 2 |
| | | | 146,374 |
| Indonesia (0.4%) | | |
| | Astra International Tbk PT | 1,383,500 | 4,451 |
| | Telekomunikasi Indonesia | | |
| | Tbk PT | 4,653,000 | 4,007 |
| | Bank Central Asia Tbk PT | 5,660,500 | 2,666 |
| | Bumi Resources Tbk PT | 9,549,000 | 2,299 |
| | Bank Rakyat Indonesia | 2,783,500 | 2,026 |
| | United Tractors Tbk PT | 1,173,500 | 1,799 |
| | Perusahaan Gas Negara | | |
| | PT | 4,120,500 | 1,533 |
| | Bank Mandiri Tbk PT | 2,192,500 | 1,052 |
| | Unilever Indonesia Tbk PT | 765,000 | 800 |
| | Tambang Batubara Bukit | | |
| | Asam Tbk PT | 401,500 | 625 |
| | Indocement Tunggal | | |
| | Prakarsa Tbk PT | 515,500 | 587 |
| | Indosat Tbk PT | 1,043,000 | 554 |
| | Semen Gresik Persero | | |
| | Tbk PT | 762,000 | 538 |
| | Indofood Sukses Makmur | | |
| | Tbk PT | 1,671,000 | 528 |
| | Astra Agro Lestari Tbk PT | 197,000 | 437 |
| | Aneka Tambang Tbk PT | 1,845,000 | 429 |
| | Gudang Garam Tbk PT | 249,500 | 367 |
| * | International Nickel | | |
| | Indonesia Tbk PT | 776,500 | 322 |
| | Bank Danamon Indonesia | | |
| | Tbk PT | 642,735 | 300 |
| * | Bank Pan Indonesia | | |
| | Tbk PT | 3,537,000 | 284 |
| | | | 25,604 |
| Ireland (0.2%) | | |
| | CRH PLC | 317,476 | 7,785 |
| | Kerry Group PLC Class A | 60,846 | 1,803 |
| * | Ryanair Holdings PLC ADR | 55,390 | 1,510 |
24
FTSE All-World ex-US Index Fund
| | | |
| | | | Market |
| | | | Value• |
| | | Shares | ($000) |
| * | Elan Corp. PLC | 268,259 | 1,406 |
| * | Allied Irish Banks PLC | 436,313 | 1,205 |
| * | Governor & Co. of the | | |
| | Bank of Ireland | 472,951 | 1,186 |
| * | Ryanair Holdings PLC | 58,749 | 256 |
| * | Anglo Irish Bank Corp. Ltd. | 236,607 | 76 |
| | | | 15,227 |
| Israel (0.6%) | | |
| | Teva Pharmaceutical | | |
| | Industries Ltd. | 411,636 | 20,753 |
| | Israel Chemicals Ltd. | 259,156 | 3,027 |
| | Bezeq Israeli | | |
| | Telecommunication | | |
| | Corp. Ltd. | 911,601 | 2,034 |
| * | Bank Hapoalim BM | 443,350 | 1,619 |
| | Bank Leumi Le-Israel BM | 279,448 | 1,091 |
| * | Nice Systems Ltd. | 32,132 | 1,000 |
| * | Israel Corp. Ltd. | 1,033 | 710 |
| | Perrigo Co. | 18,502 | 671 |
| | Perrigo Co. (U.S. Shares) | 16,896 | 628 |
| | Cellcom Israel Ltd. | 20,664 | 615 |
| | Partner | | |
| | Communications Co. Ltd. | 32,200 | 611 |
| | Elbit Systems Ltd. | 9,500 | 576 |
| | Makhteshim-Agan | | |
| | Industries Ltd. | 107,547 | 503 |
| * | Mizrahi Tefahot Bank Ltd. | 49,000 | 398 |
| | Israel Discount Bank Ltd. | | |
| | Class A | 151,600 | 289 |
| | Discount Investment Corp. | 10,600 | 249 |
| | Osem Investments Ltd. | 18,900 | 245 |
| | Delek Group Ltd. | 1,340 | 221 |
| | Koor Industries Ltd. | 7,600 | 218 |
| | Gazit-Globe Ltd. | 23,091 | 213 |
| * | Harel Insurance | | |
| | Investments & | | |
| | Financial Services Ltd. | 4,300 | 204 |
| | Oil Refineries Ltd. | 365,301 | 201 |
| | Paz Oil Co. Ltd. | 1,278 | 199 |
| | Strauss Group Ltd. | 14,800 | 192 |
| | IDB Holding Corp. Ltd. | 8,014 | 189 |
| * | Migdal Insurance & | | |
| | Financial Holding Ltd. | 119,900 | 188 |
| * | Clal Industries and | | |
| | Investments | 22,500 | 115 |
| * | Clal Insurance | 4,800 | 102 |
| | Delek Automotive | | |
| | Systems Ltd. | 8,600 | 98 |
| | Shufersal Ltd. | 20,400 | 97 |
| | Ormat Industries | 7,805 | 68 |
| * | Africa Israel | | |
| | Investments Ltd. | 5,300 | 67 |
| * | Elbit Imaging Ltd. | 2,156 | 53 |
| * | Hot Telecommunication | | |
| | System Ltd. | 4,100 | 42 |
| | | |
| | | | Market |
| | | | Value• |
| | | Shares | ($000) |
| * | First International Bank Of | | |
| | Israel Ltd. | 82 | 1 |
| | Property & Building Corp. | 7 | — |
| | | | 37,487 |
| Italy (2.8%) | | |
| | ENI SPA | 1,267,607 | 31,395 |
| * | UniCredit SPA | 7,805,912 | 26,151 |
| | Enel SPA | 3,244,646 | 19,307 |
| | Assicurazioni Generali SPA | 717,453 | 18,065 |
| * | Intesa Sanpaolo SPA | 4,122,889 | 17,351 |
| | Telecom Italia SPA RNC | 6,183,962 | 9,824 |
| * | Fiat SPA | 375,885 | 5,596 |
| | Atlantia SPA | 199,507 | 4,718 |
| | Saipem SPA | 153,611 | 4,532 |
| | Unione di Banche Italiane | | |
| | SCPA | 300,834 | 4,297 |
| | Tenaris SA ADR | 109,650 | 3,906 |
| | Snam Rete Gas SPA | 750,983 | 3,642 |
| | Finmeccanica SPA | 199,164 | 3,342 |
| | Telecom Italia | | |
| | SPA RNC RSP | 2,807,785 | 3,090 |
| | Terna Rete Elettrica | | |
| | Nazionale SPA | 680,829 | 2,699 |
| | Mediaset SPA | 413,621 | 2,686 |
| * | Banco Popolare SC | 296,596 | 2,577 |
| | Mediobanca SPA | 198,179 | 2,528 |
| | Banca Monte dei Paschi | | |
| | di Siena SPA | 1,250,411 | 2,376 |
| | Parmalat SPA | 772,249 | 2,140 |
| * | Luxottica Group SPA | 65,541 | 1,595 |
| | Banca Popolare di | | |
| | Milano Scarl | 197,123 | 1,467 |
| | A2A SPA | 705,279 | 1,300 |
| ^ | Banca Carige SPA | 370,565 | 1,045 |
| * | Pirelli & C SPA | 1,793,280 | 1,008 |
| | Fondiaria-Sai SPA | 45,450 | 828 |
| * | Autogrill SPA | 70,980 | 798 |
| ^ | Lottomatica SPA | 35,458 | 755 |
| | Exor SPA | 36,077 | 711 |
| | Mediolanum SPA | 92,710 | 588 |
| | Buzzi Unicem SPA | 34,994 | 587 |
| | Saras SPA | 180,270 | 585 |
| ^ | Italcementi SPA | 38,480 | 554 |
| ^ | Bulgari SPA | 64,466 | 528 |
| * | Unipol Gruppo Finanziario | | |
| | SPA | 334,270 | 485 |
| * | Unipol Gruppo Finanziario | | |
| | SPA Pfd. | 456,635 | 432 |
| | Italcementi SPA | 50,630 | 382 |
| | Benetton Group SPA | 34,000 | 329 |
| | Edison SPA | 205,766 | 316 |
| ^ | Fondiaria-Sai SPA | 20,747 | 255 |
| | Exor SPA Pfd. | 19,822 | 221 |
| | | | 184,991 |
25
| | |
| FTSE All-World ex-US Index Fund | |
| |
| |
| |
| | | Market |
| | | Value• |
| | Shares | ($000) |
| Japan (13.9%) | | |
| Toyota Motor Corp. | 1,199,700 | 47,360 |
| Mitsubishi UFJ Financial | | |
| Group Inc. | 5,370,560 | 28,606 |
| Canon Inc. | 616,000 | 23,225 |
| Honda Motor Co. Ltd. | 638,200 | 19,712 |
| Panasonic Corp. | 1,137,100 | 16,050 |
| Sumitomo Mitsui Financial | | |
| Group Inc. | 468,300 | 15,918 |
| Sony Corp. | 460,900 | 13,610 |
| Mitsubishi Corp. | 588,400 | 12,474 |
| Nintendo Co. Ltd. | 49,200 | 12,341 |
| NTT DoCoMo Inc. | 8,300 | 12,037 |
| Nomura Holdings Inc. | 1,654,800 | 11,663 |
| Tokyo Electric | | |
| Power Co. Inc. | 469,700 | 11,546 |
| Takeda | | |
| Pharmaceutical Co. Ltd. | 283,100 | 11,322 |
| Nippon Telegraph & | | |
| Telephone Corp. | 243,000 | 10,027 |
| Mizuho Financial | | |
| Group Inc. | 4,920,500 | 9,705 |
| Komatsu Ltd. | 467,900 | 9,122 |
| Nippon Steel Corp. | 2,369,000 | 9,038 |
| East Japan Railway Co. | 139,300 | 8,921 |
| Mitsui & Co. Ltd. | 635,800 | 8,350 |
| KDDI Corp. | 1,556 | 8,258 |
| Toshiba Corp. | 1,442,000 | 8,242 |
| Shin-Etsu | | |
| Chemical Co. Ltd. | 149,600 | 7,933 |
| Nissan Motor Co. Ltd. | 1,049,400 | 7,594 |
| Kyocera Corp. | 88,600 | 7,432 |
| Kansai Electric | | |
| Power Co. Inc. | 336,000 | 7,260 |
| Seven & I Holdings Co. Ltd. | 330,400 | 7,233 |
| Mitsubishi Estate Co. Ltd. | 478,000 | 7,220 |
| Tokio Marine Holdings Inc. | 278,600 | 7,124 |
| Fanuc Ltd. | 83,900 | 6,969 |
| JFE Holdings Inc. | 211,900 | 6,903 |
| Mitsui Fudosan Co. Ltd. | 408,000 | 6,601 |
| Japan Tobacco Inc. | 2,335 | 6,551 |
| Astellas Pharma Inc. | 173,900 | 6,404 |
| Chubu Electric | | |
| Power Co. Inc. | 269,600 | 6,019 |
| Softbank Corp. | 251,200 | 5,919 |
| Kao Corp. | 258,000 | 5,747 |
| Mitsubishi Electric Corp. | 751,000 | 5,713 |
| Kirin Holdings Co. Ltd. | 346,000 | 5,648 |
| Denso Corp. | 205,900 | 5,626 |
| Mitsubishi Heavy | | |
| Industries Ltd. | 1,579,000 | 5,583 |
| Central Japan Railway Co. | 780 | 5,197 |
| Murata | | |
| Manufacturing Co. Ltd. | 106,200 | 5,182 |
| FUJIFILM Holdings Corp. | 177,400 | 5,043 |
| Daiichi Sankyo Co. Ltd. | 255,600 | 4,993 |
| | | |
| | | | Market |
| | | | Value• |
| | | Shares | ($000) |
| | Bridgestone Corp. | 280,700 | 4,629 |
| | Mitsui Sumitomo | | |
| | Insurance Group | | |
| | Holdings Inc. | 193,700 | 4,509 |
| | Suzuki Motor Corp. | 186,300 | 4,508 |
| | Sumitomo Metal | | |
| | Industries Ltd. | 1,678,000 | 4,287 |
| | Sumitomo Realty & | | |
| | Development Co. Ltd. | 223,000 | 4,228 |
| | Fujitsu Ltd. | 716,000 | 4,216 |
| | Sumitomo Metal | | |
| | Mining Co. Ltd. | 266,000 | 4,207 |
| | Daiwa Securities | | |
| | Group Inc. | 799,000 | 4,205 |
| | Sumitomo Corp. | 430,500 | 4,179 |
| | Sharp Corp. | 387,000 | 4,129 |
| | Fast Retailing Co. Ltd. | 24,600 | 4,049 |
| | Secom Co. Ltd. | 82,700 | 3,859 |
| | Terumo Corp. | 73,200 | 3,853 |
| | Keyence Corp. | 19,310 | 3,833 |
| | Hitachi Ltd. | 1,163,000 | 3,755 |
| | Tokyo Gas Co. Ltd. | 945,000 | 3,744 |
| | Eisai Co. Ltd. | 103,800 | 3,686 |
| | Rohm Co. Ltd. | 55,300 | 3,667 |
| | Tohoku Electric | | |
| | Power Co. Inc. | 175,700 | 3,608 |
| | Tokyo Electron Ltd. | 63,600 | 3,578 |
| | ITOCHU Corp. | 562,000 | 3,552 |
| | Ricoh Co. Ltd. | 260,000 | 3,533 |
| | Daikin Industries Ltd. | 103,800 | 3,518 |
| | Asahi Glass Co. Ltd. | 410,000 | 3,454 |
| | Kyushu Electric | | |
| | Power Co. Inc. | 164,000 | 3,349 |
| | Hoya Corp. | 151,500 | 3,334 |
| | Sumitomo Electric | | |
| | Industries Ltd. | 273,700 | 3,321 |
| | ORIX Corp. | 50,090 | 3,236 |
| | Sumitomo Trust & | | |
| | Banking Co. Ltd. | 594,000 | 3,095 |
| | Dai Nippon | | |
| | Printing Co. Ltd. | 245,000 | 3,070 |
| | Marubeni Corp. | 615,000 | 3,043 |
| | Asahi Breweries Ltd. | 168,900 | 2,986 |
| | Olympus Corp. | 92,200 | 2,878 |
| | SMC Corp. | 24,900 | 2,844 |
| *,^ | Mitsubishi Motors Corp. | 1,881,000 | 2,783 |
| | Toray Industries Inc. | 488,000 | 2,780 |
| | INPEX Corp. | 331 | 2,703 |
| | Shionogi & Co. Ltd. | 124,000 | 2,675 |
| | Yamada Denki Co. Ltd. | 43,820 | 2,670 |
| | Yahoo! Japan Corp. | 8,564 | 2,625 |
| | Chugoku Electric | | |
| | Power Co. Inc. | 129,100 | 2,613 |
| | TDK Corp. | 45,400 | 2,610 |
| | Nikon Corp. | 140,000 | 2,609 |
26
| | | |
| FTSE All-World ex-US Index Fund | |
| |
| |
| |
| | | | Market |
| | | | Value• |
| | | Shares | ($000) |
| | Hankyu Hanshin | | |
| | Holdings Inc. | 580,000 | 2,584 |
| | NGK Insulators Ltd. | 115,000 | 2,579 |
| | Shiseido Co. Ltd. | 140,000 | 2,556 |
| | Nippon Oil Corp. | 515,000 | 2,538 |
| | Resona Holdings Inc. | 212,400 | 2,529 |
| | Osaka Gas Co. Ltd. | 754,000 | 2,524 |
| | West Japan Railway Co. | 700 | 2,481 |
| | Mitsui OSK Lines Ltd. | 424,000 | 2,462 |
| | Asahi Kasei Corp. | 493,000 | 2,443 |
| | T&D Holdings Inc. | 94,400 | 2,439 |
| | Aeon Co. Ltd. | 272,400 | 2,430 |
| | Shizuoka Bank Ltd. | 240,000 | 2,385 |
| | Bank of Yokohama Ltd. | 482,000 | 2,367 |
| | Electric Power | | |
| | Development Co. Ltd. | 76,000 | 2,343 |
| | Shikoku Electric Power Co. | 82,300 | 2,316 |
| | Yamato Holdings Co. Ltd. | 155,000 | 2,287 |
| | Sumitomo | | |
| | Chemical Co. Ltd. | 571,000 | 2,275 |
| | Kubota Corp. | 292,000 | 2,269 |
| | Ajinomoto Co. Inc. | 240,000 | 2,253 |
| | Nidec Corp. | 26,100 | 2,204 |
| | Kintetsu Corp. | 618,000 | 2,198 |
| | Daiwa House | | |
| | Industry Co. Ltd. | 205,000 | 2,190 |
| | Toppan Printing Co. Ltd. | 240,000 | 2,145 |
| | Chugai | | |
| | Pharmaceutical Co. Ltd. | 108,400 | 2,121 |
| | Yakult Honsha Co. Ltd. | 81,100 | 2,112 |
| * | NEC Corp. | 718,000 | 2,041 |
| | Odakyu Electric | | |
| | Railway Co. Ltd. | 249,000 | 2,028 |
| | Kobe Steel Ltd. | 1,095,000 | 1,990 |
| | Sekisui House Ltd. | 229,000 | 1,980 |
| | Mitsubishi Chemical | | |
| | Holdings Corp. | 533,000 | 1,979 |
| | Sompo Japan | | |
| | Insurance Inc. | 337,000 | 1,971 |
| | Taisho | | |
| | Pharmaceutical Co. Ltd. | 108,000 | 1,968 |
| | Ono | | |
| | Pharmaceutical Co. Ltd. | 41,300 | 1,961 |
| | Tokyu Corp. | 445,000 | 1,945 |
| | Chuo Mitsui Trust | | |
| | Holdings Inc. | 531,000 | 1,939 |
| | Chiba Bank Ltd. | 309,000 | 1,906 |
| | Kuraray Co. Ltd. | 182,500 | 1,884 |
| | Ibiden Co. Ltd. | 52,300 | 1,872 |
| | Omron Corp. | 110,800 | 1,866 |
| | Daito Trust | | |
| | Construction Co. Ltd. | 43,700 | 1,816 |
| | Nitto Denko Corp. | 59,700 | 1,803 |
| | JS Group Corp. | 108,300 | 1,767 |
| | Makita Corp. | 53,200 | 1,763 |
| | Aisin Seiki Co. Ltd. | 69,200 | 1,759 |
| | | |
| | | | Market |
| | | | Value• |
| | | Shares | ($000) |
| | Hokuriku Electric | | |
| | Power Co. | 76,500 | 1,744 |
| | JGC Corp. | 91,000 | 1,739 |
| | Tobu Railway Co. Ltd. | 317,000 | 1,734 |
| | Konica Minolta | | |
| | Holdings Inc. | 184,000 | 1,728 |
| | Nissin Foods | | |
| | Holdings Co., Ltd. | 48,900 | 1,726 |
| | JSR Corp. | 88,000 | 1,716 |
| | Nomura Research | | |
| | Institute Ltd. | 77,800 | 1,682 |
| | Trend Micro Inc. | 48,500 | 1,679 |
| | Benesse Corp. | 37,900 | 1,671 |
| *,^ | Sanyo Electric Co. Ltd. | 660,000 | 1,636 |
| | Toyota Industries Corp. | 59,700 | 1,617 |
| | OJI Paper Co. Ltd. | 369,000 | 1,606 |
| | Nippon Yusen KK | 434,000 | 1,602 |
| | Nipponkoa | | |
| | Insurance Co. Ltd. | 289,000 | 1,573 |
| | JTEKT Corp. | 147,000 | 1,553 |
| | Lawson Inc. | 34,700 | 1,551 |
| | NTT Data Corp. | 537 | 1,545 |
| | Nippon Express Co. Ltd. | 377,000 | 1,544 |
| | Hokkaido Electric | | |
| | Power Co. Inc. | 79,800 | 1,536 |
| | Advantest Corp. | 69,200 | 1,528 |
| | Taiyo Nippon Sanso Corp. | 137,000 | 1,521 |
| | Unicharm Corp. | 15,400 | 1,476 |
| | Kawasaki Heavy | | |
| | Industries Ltd. | 588,000 | 1,469 |
| | Fukuoka Financial | | |
| | Group Inc. | 400,000 | 1,463 |
| | Nippon Mining | | |
| | Holdings Inc. | 327,500 | 1,461 |
| | Keihin Electric Express | | |
| | Railway Co. Ltd. | 182,000 | 1,449 |
| | Brother Industries Ltd. | 126,500 | 1,440 |
| | Kurita Water Industries Ltd. | 46,900 | 1,434 |
| | Dentsu Inc. | 66,900 | 1,433 |
| | Stanley Electric Co. Ltd. | 72,800 | 1,425 |
| | Japan Steel Works Ltd. | 129,000 | 1,423 |
| | Hirose Electric Co. Ltd. | 13,800 | 1,422 |
| | Keio Corp. | 225,000 | 1,417 |
| | Sankyo Co. Ltd. | 24,600 | 1,405 |
| | SBI Holdings Inc. | 7,606 | 1,398 |
| | Mazda Motor Corp. | 598,000 | 1,350 |
| | Panasonic Electric | | |
| | Works Co. Ltd. | 106,000 | 1,338 |
| | Joyo Bank Ltd. | 301,000 | 1,324 |
| | Mediceo Paltac | | |
| | Holdings Co. Ltd. | 94,400 | 1,318 |
| | Mitsubishi Materials Corp. | 489,000 | 1,289 |
| | Isetan Mitsukoshi | | |
| | Holdings Ltd. | 133,140 | 1,276 |
| | Toyo Seikan Kaisha Ltd. | 75,300 | 1,265 |
| | Kyowa Hakko Kirin Co. Ltd. | 109,000 | 1,260 |
27
| | | |
| FTSE All-World ex-US Index Fund | |
| |
| |
| |
| | | | Market |
| | | | Value• |
| | | Shares | ($000) |
| | Isuzu Motors Ltd. | 592,000 | 1,252 |
| | Shimano Inc. | 32,500 | 1,243 |
| *,^ | GS Yuasa Corp. | 144,000 | 1,240 |
| | Oriental Land Co. Ltd. | 18,000 | 1,220 |
| | Aioi Insurance Co. Ltd. | 273,000 | 1,202 |
| | Nippon Electric | | |
| | Glass Co. Ltd. | 111,500 | 1,201 |
| | Nisshin Seifun Group Inc. | 89,000 | 1,187 |
| | Bank of Kyoto Ltd. | 128,000 | 1,162 |
| ^ | TonenGeneral Sekiyu KK | 126,000 | 1,150 |
| | Hachijuni Bank Ltd. | 190,000 | 1,124 |
| * | MEIJI Holdings Co. Ltd. | 27,545 | 1,122 |
| | NSK Ltd. | 193,000 | 1,121 |
| | Chugoku Bank Ltd. | 83,000 | 1,121 |
| | Sony Financial Holdings Inc. | 390 | 1,119 |
| | Nippon Paper Group Inc. | 41,500 | 1,101 |
| | THK Co. Ltd. | 63,400 | 1,096 |
| | Hokuhoku Financial | | |
| | Group Inc. | 502,000 | 1,088 |
| | Keihan Electric | | |
| | Railway Co. Ltd. | 258,000 | 1,086 |
| | Credit Saison Co. Ltd. | 95,900 | 1,072 |
| | Sekisui Chemical Co. Ltd. | 177,000 | 1,071 |
| | Seiko Epson Corp. | 69,200 | 1,070 |
| | Fuji Heavy Industries Ltd. | 271,000 | 1,059 |
| | Nissan Chemical | | |
| | Industries Ltd. | 81,000 | 1,044 |
| | All Nippon Airways Co. Ltd. | 371,000 | 1,035 |
| | Nitori Co. Ltd. | 12,650 | 1,029 |
| | Shimizu Corp. | 265,000 | 1,016 |
| | Toho Co. Ltd. | 67,400 | 1,013 |
| | Iyo Bank Ltd. | 112,000 | 1,010 |
| | Namco Bandai | | |
| | Holdings Inc. | 98,400 | 1,006 |
| * | IHI Corp. | 522,000 | 995 |
| | Toyo Suisan Kaisha Ltd. | 38,000 | 994 |
| | Sojitz Corp. | 536,000 | 990 |
| ^ | Konami Corp. | 53,300 | 970 |
| | Ube Industries Ltd. | 376,000 | 969 |
| | Santen | | |
| | Pharmaceutical Co. Ltd. | 28,200 | 968 |
| | Teijin Ltd. | 323,000 | 949 |
| | Toho Gas Co. Ltd. | 183,000 | 949 |
| | FamilyMart Co. Ltd. | 31,800 | 947 |
| | Toyota Tsusho Corp. | 66,000 | 944 |
| *,^ | Shinsei Bank Ltd. | 719,000 | 938 |
| | Mitsubishi Tanabe | | |
| | Pharma Corp. | 73,000 | 932 |
| ^ | Hitachi Construction | | |
| | Machinery Co. Ltd. | 39,800 | 928 |
| | Sumco Corp. | 48,000 | 916 |
| | Hiroshima Bank Ltd. | 236,000 | 906 |
| | Hitachi Chemical Co. Ltd. | 45,500 | 903 |
| | Sumitomo Heavy | | |
| | Industries Ltd. | 198,000 | 898 |
| | Sega Sammy Holdings Inc. | 62,800 | 892 |
| | | |
| | | | Market |
| | | | Value• |
| | | Shares | ($000) |
| | Mitsui Chemicals Inc. | 259,000 | 889 |
| | Shimamura Co. Ltd. | 9,300 | 889 |
| | Furukawa Electric Co. Ltd. | 234,000 | 887 |
| | Dowa Holdings Co., Ltd. | 152,000 | 887 |
| | Obayashi Corp. | 235,000 | 887 |
| | Nippon Meat Packers Inc. | 75,000 | 879 |
| * | Elpida Memory Inc. | 66,900 | 874 |
| | Nagoya Railroad Co. Ltd. | 287,000 | 872 |
| | Fujikura Ltd. | 180,000 | 868 |
| | Denki Kagaku Kogyo K K | 234,000 | 858 |
| | Nippon Sheet | | |
| | Glass Co. Ltd. | 291,000 | 857 |
| | Aeon Mall Co. Ltd. | 40,800 | 855 |
| | Taisei Corp. | 433,000 | 850 |
| | Daicel Chemical | | |
| | Industries Ltd. | 140,000 | 845 |
| | Showa Denko KK | 439,000 | 845 |
| | Gunma Bank Ltd. | 162,000 | 844 |
| | Ushio Inc. | 52,900 | 832 |
| | Takashimaya Co. Ltd. | 123,000 | 829 |
| | Tsumura & Co. | 24,100 | 829 |
| | Yamaha Motor Co. Ltd. | 69,200 | 824 |
| | J Front Retailing Co. Ltd. | 173,400 | 822 |
| | Yamaguchi Financial | | |
| | Group Inc. | 86,000 | 822 |
| | Mitsubishi Gas | | |
| | Chemical Co. Inc. | 178,000 | 821 |
| | Kansai Paint Co. Ltd. | 97,000 | 821 |
| | Yokogawa Electric Corp. | 101,200 | 820 |
| | Daihatsu Motor Co. Ltd. | 80,000 | 818 |
| | Mitsui Engineering & | | |
| | Shipbuilding Co. Ltd. | 316,000 | 818 |
| * | Kagome Co. Ltd. | 43,000 | 818 |
| | Kajima Corp. | 345,000 | 808 |
| | Amada Co. Ltd. | 132,000 | 808 |
| | Citizen Holdings Co. Ltd. | 143,400 | 807 |
| | NOK Corp. | 60,000 | 796 |
| | Nanto Bank Ltd. | 146,000 | 792 |
| | Kikkoman Corp. | 68,000 | 787 |
| | Dainippon Sumitomo | | |
| | Pharma Co. Ltd. | 75,700 | 787 |
| | Yaskawa Electric Corp. | 100,000 | 787 |
| | Rinnai Corp. | 17,900 | 787 |
| | Suruga Bank Ltd. | 87,000 | 786 |
| | Mitsumi Electric Co. Ltd. | 38,800 | 783 |
| | Kawasaki Kisen Kaisha Ltd. | 211,000 | 769 |
| | Yamato Kogyo Co. Ltd. | 25,600 | 768 |
| | Suzuken Co. Ltd. | 21,700 | 768 |
| | Mabuchi Motor Co. Ltd. | 16,000 | 766 |
| | Nishi-Nippon City Bank Ltd. | 309,000 | 764 |
| | Kinden Corp. | 94,000 | 763 |
| | Toyota Boshoku Corp. | 36,000 | 751 |
| | Hisamitsu | | |
| | Pharmaceutical Co. Inc. | 21,800 | 749 |
| | 77 Bank Ltd. | 130,000 | 748 |
| | Air Water Inc. | 63,000 | 743 |
28
FTSE All-World ex-US Index Fund
| | | |
| | | | Market |
| | | | Value• |
| | | Shares | ($000) |
| | Mizuho Securities Co. Ltd. | 215,000 | 742 |
| | Nissha Printing Co. Ltd. | 15,600 | 740 |
| | Cosmo Oil Co. Ltd. | 281,000 | 738 |
| | TOTO Ltd. | 124,000 | 735 |
| | Mitsubishi Rayon Co. Ltd. | 212,000 | 732 |
| | Minebea Co. Ltd. | 174,000 | 729 |
| | Alfresa Holdings Corp. | 16,700 | 722 |
| ^ | Sapporo Holdings Ltd. | 138,000 | 721 |
| | Yamaha Corp. | 69,000 | 713 |
| | Tokyo Steel | | |
| | Manufacturing Co. Ltd. | 54,300 | 711 |
| | Hakuhodo DY Holdings Inc. | 14,110 | 709 |
| | Kamigumi Co. Ltd. | 94,000 | 706 |
| | Tokyu Land Corp. | 175,000 | 706 |
| | Toyoda Gosei Co. Ltd. | 25,100 | 704 |
| | Tokuyama Corp. | 111,000 | 697 |
| * | Mitsui Mining & | | |
| | Smelting Co. Ltd. | 270,000 | 696 |
| | Nisshin Steel Co. Ltd. | 415,000 | 693 |
| * | Mizuho Trust & | | |
| | Banking Co. Ltd. | 722,000 | 688 |
| | Mitsubishi Logistics Corp. | 62,000 | 675 |
| | NTN Corp. | 178,000 | 672 |
| | Hamamatsu Photonics KK | 26,900 | 670 |
| | Chiyoda Corp. | 92,000 | 669 |
| | Nisshinbo Holdings Inc. | 68,000 | 668 |
| | Hitachi Metals Ltd. | 70,000 | 668 |
| ^ | Casio Computer Co. Ltd. | 90,000 | 660 |
| | Shimadzu Corp. | 95,000 | 658 |
| | Keisei Electric | | |
| | Railway Co. Ltd. | 117,000 | 658 |
| | Marui Group Co. Ltd. | 114,500 | 658 |
| ^ | Don Quijote Co. Ltd. | 24,600 | 657 |
| | Idemitsu Kosan Co. Ltd. | 8,900 | 653 |
| | Japan Petroleum | | |
| | Exploration Co. | 13,000 | 649 |
| | NHK Spring Co. Ltd. | 83,000 | 648 |
| | Sotetsu Holdings Inc. | 149,000 | 641 |
| | Miraca Holdings Inc. | 19,600 | 634 |
| | Asics Corp. | 71,000 | 633 |
| | Maruichi Steel Tube Ltd. | 33,400 | 623 |
| | Seino Holdings Corp. | 83,000 | 614 |
| | USS Co. Ltd. | 10,140 | 613 |
| * | Ebara Corp. | 136,000 | 597 |
| | NGK Spark Plug Co. Ltd. | 52,000 | 589 |
| | Tosoh Corp. | 218,000 | 586 |
| | Taiyo Yuden Co. Ltd. | 52,000 | 585 |
| | QP Corp. | 50,700 | 585 |
| | Wacoal Holdings Corp. | 47,000 | 569 |
| | Yamazaki Baking Co. Ltd. | 46,000 | 564 |
| | Nomura Real Estate | | |
| | Holdings Inc. | 35,400 | 564 |
| | Juroku Bank Ltd. | 156,000 | 558 |
| | Mitsubishi UFJ Lease & | | |
| | Finance Co. Ltd. | 18,700 | 557 |
| ^ | Dena Co. Ltd. | 159 | 550 |
| | | |
| | | | Market |
| | | | Value• |
| | | Shares | ($000) |
| | Ryohin Keikaku Co. Ltd. | 12,200 | 549 |
| | Tokyo Tatemono Co. Ltd. | 114,000 | 544 |
| | NTT Urban | | |
| | Development Corp. | 672 | 540 |
| | Rengo Co. Ltd. | 96,000 | 539 |
| | Shiga Bank Ltd. | 86,000 | 534 |
| | Canon Marketing Japan Inc. | 32,800 | 531 |
| | Komeri Co. Ltd. | 19,100 | 528 |
| | Nippon Kayaku Co. Ltd. | 59,000 | 528 |
| | Shimachu Co. Ltd. | 22,300 | 527 |
| | Sumitomo Rubber | | |
| | Industries Ltd. | 57,100 | 526 |
| | Matsumotokiyoshi | | |
| | Holdings Co. Ltd. | 22,800 | 523 |
| ^ | Nippon Paint Co. Ltd. | 87,000 | 522 |
| | Glory Ltd. | 23,600 | 519 |
| | Yamatake Corp. | 24,500 | 517 |
| | Ezaki Glico Co. Ltd. | 47,000 | 512 |
| | Kagoshima Bank Ltd. | 69,000 | 510 |
| ^ | Oracle Corp. Japan | 11,500 | 507 |
| | Koito | | |
| | Manufacturing Co. Ltd. | 35,000 | 502 |
| | Ito En Ltd. | 29,700 | 500 |
| | Obic Co. Ltd. | 2,940 | 497 |
| | San-In Godo Bank Ltd. | 57,000 | 496 |
| | Kaneka Corp. | 76,000 | 495 |
| | Nishi-Nippon | | |
| | Railroad Co. Ltd. | 130,000 | 494 |
| | Kokuyo Co. Ltd. | 56,400 | 492 |
| | Hino Motors Ltd. | 133,000 | 492 |
| *,^ | Japan Airlines Corp. | 379,000 | 491 |
| | Yokohama Rubber Co. Ltd. | 112,000 | 491 |
| | Nippon Shokubai Co. Ltd. | 58,000 | 487 |
| | Alps Electric Co. Ltd. | 77,700 | 485 |
| | Lion Corp. | 97,000 | 484 |
| | Zeon Corp. | 106,000 | 482 |
| | Daido Steel Co. Ltd. | 141,000 | 480 |
| | DIC Corp. | 291,000 | 476 |
| | Pacific Metals Co. Ltd. | 63,000 | 473 |
| | Square Enix | | |
| | Holdings Co., Ltd. | 18,800 | 468 |
| | Taiheiyo Cement Corp. | 403,000 | 468 |
| | Higo Bank Ltd. | 79,000 | 468 |
| | UNY Co. Ltd. | 62,900 | 467 |
| | Toda Corp. | 140,000 | 467 |
| | Showa Shell Sekiyu KK | 47,200 | 465 |
| | COMSYS Holdings Corp. | 47,000 | 465 |
| | Hokkoku Bank Ltd. | 118,000 | 463 |
| | Hyakujushi Bank Ltd. | 112,000 | 462 |
| | Fuji Electric | | |
| | Holdings Co. Ltd. | 246,000 | 457 |
| | Coca-Cola West Co. Ltd. | 24,400 | 453 |
| | Onward Holdings Co. Ltd. | 73,000 | 453 |
| | Sapporo Hokuyo | | |
| | Holdings Inc. | 133,000 | 449 |
| | Mori Seiki Co. Ltd. | 41,400 | 449 |
29
| | | |
| FTSE All-World ex-US Index Fund | |
| |
| |
| |
| | | | Market |
| | | | Value• |
| | | Shares | ($000) |
| | Daishi Bank Ltd. | 123,000 | 448 |
| | Sumitomo | | |
| | Forestry Co. Ltd. | 58,000 | 444 |
| | Mochida | | |
| | Pharmaceutical Co. Ltd. | 43,000 | 444 |
| * | Haseko Corp. | 575,000 | 441 |
| | Takara Holdings Inc. | 72,000 | 441 |
| | Izumi Co. Ltd. | 36,300 | 438 |
| | Aeon Credit | | |
| | Service Co. Ltd. | 45,400 | 437 |
| | Shinko Electric | | |
| | Industries Co. Ltd. | 29,000 | 432 |
| ^ | Autobacs Seven Co. Ltd. | 12,800 | 432 |
| * | Aozora Bank Ltd. | 358,000 | 423 |
| | Kissei | | |
| | Pharmaceutical Co. Ltd. | 19,000 | 423 |
| | Jafco Co. Ltd. | 15,700 | 422 |
| | Awa Bank Ltd. | 81,000 | 422 |
| | Hyakugo Bank Ltd. | 88,000 | 421 |
| | Sumitomo Bakelite Co. Ltd. | 89,000 | 420 |
| | Nichirei Corp. | 112,000 | 416 |
| | Disco Corp. | 7,500 | 414 |
| | Kobayashi | | |
| | Pharmaceutical Co. Ltd. | 9,600 | 413 |
| | House Foods Corp. | 25,300 | 403 |
| | Hitachi | | |
| | High-Technologies Corp. | 24,300 | 402 |
| | Tokai Rika Co. Ltd. | 18,500 | 382 |
| | Toyobo Co. Ltd. | 245,000 | 380 |
| | Capcom Co. Ltd. | 22,400 | 376 |
| | Tokai Carbon Co. Ltd. | 78,000 | 376 |
| | Takata Corp. | 19,800 | 369 |
| | Aoyama Trading Co. Ltd. | 23,000 | 369 |
| ^ | Acom Co. Ltd. | 28,700 | 367 |
| | Ogaki Kyoritsu Bank Ltd. | 106,000 | 363 |
| | IT Holdings Corp. | 29,300 | 361 |
| | Musashino Bank Ltd. | 12,600 | 360 |
| | Sumitomo Osaka | | |
| | Cement Co. Ltd. | 204,000 | 357 |
| | MISUMI Group Inc. | 20,700 | 353 |
| | Nagase & Co. Ltd. | 29,000 | 353 |
| | Hitachi Koki Co. Ltd. | 31,800 | 352 |
| ^ | Matsui Securities Co. Ltd. | 48,900 | 352 |
| | Itochu | | |
| | Techno-Solutions Corp. | 12,800 | 352 |
| | Leopalace21 Corp. | 64,600 | 350 |
| | Gunze Ltd. | 87,000 | 343 |
| ^ | Ulvac Inc. | 14,500 | 341 |
| | Keiyo Bank Ltd. | 70,000 | 336 |
| *,^ | Dainippon Screen | | |
| | Manufacturing Co. Ltd. | 79,000 | 336 |
| | Lintec Corp. | 18,800 | 333 |
| | Otsuka Corp. | 6,300 | 332 |
| | Fuji Media Holdings Inc. | 225 | 331 |
| ^ | Promise Co. Ltd. | 51,900 | 330 |
| | | |
| | | | Market |
| | | | Value• |
| | | Shares | ($000) |
| | Nissay Dowa General | | |
| | Insurance Co. Ltd. | 74,000 | 328 |
| | Tokyo Style Co. Ltd. | 39,000 | 328 |
| | Asatsu-DK Inc. | 16,600 | 327 |
| | Nippon Television | | |
| | Network Corp. | 2,500 | 326 |
| | Nipro Corp. | 15,000 | 324 |
| | OKUMA Corp. | 65,000 | 315 |
| | Bank of Nagoya Ltd. | 78,000 | 308 |
| | Circle K Sunkus Co. Ltd. | 22,200 | 305 |
| | Sohgo Security | | |
| | Services Co. Ltd. | 26,100 | 302 |
| | Fukuyama | | |
| | Transporting Co. Ltd. | 58,000 | 302 |
| | Shima Seiki | | |
| | Manufacturing Ltd. | 14,500 | 296 |
| | Heiwa Corp. | 29,700 | 291 |
| | ABC-Mart Inc. | 9,500 | 275 |
| | NS Solutions Corp. | 14,900 | 273 |
| | Sysmex Corp. | 5,800 | 259 |
| ^ | H2O Retailing Corp. | 42,000 | 255 |
| | Nabtesco Corp. | 21,000 | 242 |
| | Tokyo Broadcasting | | |
| | System Holdings Inc. | 16,000 | 239 |
| | Sundrug Co. Ltd. | 8,700 | 219 |
| | Kose Corp. | 9,400 | 206 |
| ^ | Culture Convenience | | |
| | Club Co. Ltd. | 33,100 | 204 |
| | Point Inc. | 3,360 | 199 |
| | Kandenko Co. Ltd. | 29,000 | 179 |
| | Funai Electric Co. Ltd. | 3,800 | 177 |
| | Nidec Sankyo Corp. | 23,000 | 175 |
| | Okasan Securities | | |
| | Group Inc. | 36,000 | 170 |
| | Toshiba TEC Corp. | 41,000 | 166 |
| | Hitachi Capital Corp. | 12,900 | 164 |
| | Monex Group Inc. | 413 | 163 |
| | Sumisho Computer | | |
| | Systems Corp. | 9,600 | 152 |
| | Toyota Auto Body Co. Ltd. | 8,100 | 150 |
| ^ | Kansai Urban Banking Corp. | 107,000 | 149 |
| | Toppan Forms Co. Ltd. | 11,900 | 146 |
| | Tokai Rubber Industries Inc. | 12,300 | 145 |
| | kabu.com | | |
| | Securities Co. Ltd. | 135 | 144 |
| | PanaHome Corp. | 23,000 | 144 |
| | Hitachi Cable Ltd. | 53,000 | 141 |
| ^ | Takefuji Corp. | 36,600 | 137 |
| ^ | OSAKA Titanium | | |
| | Technologies Co. | 5,100 | 135 |
| * | Mizuho Investors | | |
| | Securities Co. Ltd. | 130,000 | 133 |
| ^ | Toho Titanium Co. Ltd. | 10,500 | 131 |
| | TV Asahi Corp. | 86 | 131 |
| | Hikari Tsushin Inc. | 6,100 | 114 |
30
| | | |
| FTSE All-World ex-US Index Fund | |
| |
| |
| |
| | | | Market |
| | | | Value• |
| | | Shares | ($000) |
| | Sumitomo Real Estate | | |
| | Sales Co. Ltd. | 3,260 | 114 |
| | SKY Perfect JSAT | | |
| | Holdings Inc. | 248 | 113 |
| | Axell Corp. | 2,700 | 103 |
| * | NEC Electronics Corp. | 11,400 | 85 |
| * | SFCG Co. Ltd. | 140 | — |
| | | | 935,798 |
| Luxembourg (0.0%) | | |
| | RTL Group SA | 7,490 | 463 |
| |
| Malaysia (0.8%) | | |
| | CIMB Group Holdings Bhd. | 1,669,100 | 6,055 |
| | Sime Darby Bhd. | 2,086,994 | 5,396 |
| | Public Bank Bhd. | 1,638,608 | 5,104 |
| | Malayan Banking Bhd. | 2,462,696 | 4,770 |
| | IOI Corp. Bhd. | 2,175,755 | 3,374 |
| | Genting Bhd. | 1,298,900 | 2,731 |
| * | Axiata Group Bhd. | 2,971,237 | 2,530 |
| | MISC Bhd. | 706,200 | 1,836 |
| | AMMB Holdings Bhd. | 1,061,900 | 1,460 |
| | PPB Group Bhd. | 289,500 | 1,278 |
| | Tenaga Nasional Bhd. | 483,700 | 1,186 |
| | Kuala Lumpur Kepong Bhd. | 252,300 | 1,102 |
| | Genting Malaysia Bhd. | 1,310,000 | 1,046 |
| | YTL Corp. Bhd. | 452,518 | 962 |
| | DiGi.com Bhd. | 141,734 | 905 |
| | British American Tobacco | | |
| | Malaysia Bhd. | 68,600 | 901 |
| | Gamuda Bhd. | 973,200 | 889 |
| | PLUS Expressways Bhd. | 901,600 | 869 |
| | IJM Corp. Bhd. | 602,420 | 840 |
| | Petronas Gas Bhd. | 256,400 | 733 |
| | YTL Power | | |
| | International Bhd. | 1,113,802 | 700 |
| | UMW Holdings Bhd. | 356,300 | 656 |
| | Berjaya Sports Toto Bhd. | 450,857 | 568 |
| | SP Setia Bhd. | 441,450 | 496 |
| | Hong Leong Bank Bhd. | 212,500 | 465 |
| | Telekom Malaysia Bhd. | 527,300 | 463 |
| | Tanjong PLC | 92,100 | 408 |
| | Alliance Financial | | |
| | Group Bhd. | 563,700 | 403 |
| | MMC Corp. Bhd. | 528,000 | 383 |
| | Petronas Dagangan Bhd. | 139,700 | 363 |
| | RHB Capital Bhd. | 225,700 | 354 |
| | Parkson Holdings Bhd. | 219,800 | 326 |
| | Astro All Asia Networks | | |
| | PLC | 315,200 | 304 |
| | Lafarge Malayan | | |
| | Cement Bhd. | 169,310 | 299 |
| | EON Capital Bhd. | 118,100 | 193 |
| | Proton Holdings Bhd. | 159,000 | 175 |
| | Puncak Niaga Holding Bhd. | 133,700 | 125 |
| | | | 50,648 |
| | | |
| | | | Market |
| | | | Value• |
| | | Shares | ($000) |
| Mexico (1.0%) | | |
| | America Movil SAB de CV | 9,530,342 | 21,033 |
| * | Grupo Mexico SAB de CV | | |
| | Class B | 3,802,646 | 7,632 |
| | Wal-Mart de Mexico SAB | | |
| | de CV | 1,578,200 | 5,505 |
| | Grupo Televisa SA | 1,150,100 | 4,451 |
| | Fomento Economico | | |
| | Mexicano SAB de CV | 1,013,000 | 4,385 |
| | Telefonos de Mexico SAB | | |
| | de CV | 4,589,743 | 3,820 |
| * | Cemex SAB de CV ADR | 354,067 | 3,675 |
| | Telmex Internacional SAB | | |
| | de CV | 4,531,617 | 3,048 |
| | Grupo Financiero Banorte | | |
| | SAB de CV | 934,100 | 2,985 |
| * | Carso Global Telecom SAB | | |
| | de CV | 490,400 | 1,908 |
| | Industrias Penoles SAB | | |
| | de CV | 75,179 | 1,373 |
| | Grupo Elektra SA de CV | 34,500 | 1,353 |
| * | Grupo Modelo SAB de CV | 294,500 | 1,337 |
| | Grupo Financiero Inbursa | | |
| | SA | 456,500 | 1,286 |
| | Grupo Carso SAB de CV | 314,500 | 929 |
| | Grupo Bimbo SAB de CV | | |
| | Class A | 158,007 | 920 |
| * | Cemex SAB de CV | 803,896 | 835 |
| | Kimberly-Clark de Mexico | | |
| | SAB de CV Class A | 204,955 | 812 |
| | Alfa SAB de CV Class A | 137,570 | 712 |
| | Grupo Aeroportuario del | | |
| | Pacifico SAB de CV | | |
| | Class B | 210,395 | 539 |
| | Mexichem SAB de CV | 309,660 | 493 |
| * | Impulsora Del Desarrollo | | |
| | Y El Empleo en America | | |
| | Latina SAB de CV | 431,700 | 418 |
| * | Urbi Desarrollos Urbanos | | |
| | SAB de CV | 209,900 | 402 |
| * | Organizacion Soriana SAB | | |
| | de CV Class B | 149,600 | 331 |
| * | Carso Infraestructura y | | |
| | Construccion SAB de CV | 316,100 | 177 |
| | Grupo Aeroportuario del | | |
| | Pacifico SAB de CV ADR | 64 | 2 |
| | | | 70,361 |
| Netherlands (1.7%) | | |
| | Unilever NV | 717,471 | 22,108 |
| | Koninklijke KPN NV | 791,513 | 14,357 |
| * | ING Groep NV | 965,015 | 12,558 |
| | Koninklijke Philips | | |
| | Electronics NV | 449,643 | 11,295 |
| | Koninklijke Ahold NV | 555,218 | 6,994 |
| | Akzo Nobel NV | 106,783 | 6,305 |
| * | Aegon NV | 800,607 | 5,690 |
31
| | | |
| FTSE All-World ex-US Index Fund | |
| |
| |
| |
| | | | Market |
| | | | Value• |
| | | Shares | ($000) |
| | ASML Holding NV | 199,373 | 5,377 |
| | Heineken NV | 113,740 | 5,028 |
| | TNT NV | 171,808 | 4,556 |
| | Koninklijke DSM NV | 85,938 | 3,765 |
| | Reed Elsevier NV | 317,839 | 3,704 |
| | Wolters Kluwer NV | 134,108 | 2,990 |
| | Corio NV | 34,755 | 2,357 |
| * | Randstad Holding NV | 59,937 | 2,274 |
| | Heineken Holding NV | 55,880 | 2,174 |
| | Fugro NV | 34,575 | 1,926 |
| | SBM Offshore NV | 70,723 | 1,354 |
| | | | 114,812 |
| New Zealand (0.1%) | | |
| | Fletcher Building Ltd. | 279,626 | 1,652 |
| | Telecom Corp. of | | |
| | New Zealand Ltd. | 837,462 | 1,512 |
| | Contact Energy Ltd. | 133,969 | 597 |
| | Sky City Entertainment | | |
| | Group Ltd. | 240,991 | 595 |
| | Auckland International | | |
| | Airport Ltd. | 398,559 | 573 |
| | Fisher & Paykel | | |
| | Healthcare Corp. Ltd. | 197,263 | 437 |
| | Sky Network Television Ltd. | 92,349 | 316 |
| | Kiwi Income Property Trust | 398,722 | 310 |
| | Warehouse Group Ltd. | 72,339 | 234 |
| | Vector Ltd. | 158,657 | 220 |
| | Air New Zealand Ltd. | 205,295 | 191 |
| | | | 6,637 |
| Norway (0.6%) | | |
| | StatoilHydro ASA | 589,551 | 13,892 |
| *,^ | DnB NOR ASA | 457,286 | 5,239 |
| * | Telenor ASA | 388,200 | 5,005 |
| | Orkla ASA | 475,450 | 4,395 |
| | Yara International ASA | 103,800 | 3,431 |
| * | Seadrill Ltd. | 138,400 | 2,874 |
| * | Norsk Hydro ASA | 426,422 | 2,795 |
| * | Storebrand ASA | 208,600 | 1,418 |
| | Aker Solutions ASA | 93,690 | 1,126 |
| *,^ | Renewable Energy Corp. | | |
| | AS | 156,291 | 931 |
| | | | 41,106 |
| Peru (0.1%) | | |
| | Cia de Minas Buenaventura | | |
| | SA ADR | 97,572 | 3,275 |
| | Credicorp Ltd. | 14,961 | 1,035 |
| * | Volcan Cia Minera SAA | | |
| | Class B | 613,755 | 724 |
| | Sociedad Minera Cerro | | |
| | Verde SA | 11,744 | 268 |
| | | | 5,302 |
| Philippines (0.1%) | | |
| | Philippine Long Distance | | |
| | Telephone Co. | 15,130 | 813 |
| | | |
| | | | Market |
| | | | Value• |
| | | Shares | ($000) |
| | Bank of the | | |
| | Philippine Islands | 774,400 | 754 |
| | Ayala Land Inc. | 3,360,800 | 727 |
| | Manila Electric Co. | 175,700 | 683 |
| | SM Prime Holdings Inc. | 2,906,899 | 603 |
| | SM Investments Corp. | 89,170 | 582 |
| | Ayala Corp. | 74,280 | 449 |
| | Banco de Oro Unibank Inc. | 489,200 | 355 |
| | Globe Telecom Inc. | 12,000 | 230 |
| * | Petron Corp. | 1,973,650 | 206 |
| | Jollibee Foods Corp. | 187,000 | 199 |
| | Metropolitan Bank & Trust | 196,000 | 166 |
| | | | 5,767 |
| Poland (0.2%) | | |
| | Powszechna Kasa | | |
| | Oszczednosci Bank Polski | | |
| | SA | 347,318 | 4,115 |
| * | Bank Pekao SA | 48,666 | 2,612 |
| | Telekomunikacja Polska SA | 315,782 | 1,853 |
| * | Polski Koncern Naftowy | | |
| | Orlen | 169,350 | 1,763 |
| | KGHM Polska Miedz SA | 46,196 | 1,555 |
| | Polskie Gornictwo Naftowe | | |
| | I Gazownictwo SA | 512,648 | 624 |
| * | Bank Zachodni WBK SA | 9,234 | 493 |
| * | Getin Holding SA | 165,984 | 472 |
| * | Globe Trade Centre SA | 51,744 | 447 |
| | TVN SA | 80,791 | 400 |
| * | Bank Handlowy w | | |
| | Warszawie SA | 16,893 | 371 |
| * | BRE Bank SA | 3,816 | 354 |
| | | | 15,059 |
| Portugal (0.3%) | | |
| | EDP-Energias de | | |
| | Portugal SA | 1,259,239 | 5,569 |
| | Portugal Telecom | | |
| | SGPS SA | 416,537 | 4,761 |
| | Banco Comercial | | |
| | Portugues SA | 1,763,404 | 2,514 |
| | Brisa Auto-Estradas de | | |
| | Portugal SA | 206,020 | 2,035 |
| | Galp Energia SGPS SA | | |
| | Class B | 112,499 | 1,895 |
| * | EDP Renovaveis SA | 113,105 | 1,127 |
| | Jeronimo Martins | | |
| | SGPS SA | 108,838 | 970 |
| | Banco Espirito Santo SA | 122,276 | 902 |
| ^ | Zon Multimedia Servicos | | |
| | de Telecomunicacoes e | | |
| | Multimedia SGPS SA | 141,143 | 897 |
| | Banco BPI SA | 258,550 | 872 |
| | Cimpor Cimentos de | | |
| | Portugal SGPS SA | 84,104 | 656 |
| | | | 22,198 |
32
| | | |
| FTSE All-World ex-US Index Fund | |
| |
| |
| |
| | | | Market |
| | | | Value• |
| | | Shares | ($000) |
| Russia (1.4%) | | |
| | Gazprom OAO ADR | 1,094,548 | 26,250 |
| | Lukoil OAO ADR | 295,953 | 17,169 |
| | Sberbank of Russian | | |
| | Federation | 4,005,960 | 8,734 |
| | Rosneft Oil Co. GDR | 971,829 | 7,390 |
| | Surgutneftegaz ADR | 817,389 | 7,214 |
| | MMC Norilsk Nickel | | |
| | ADR | 353,341 | 4,642 |
| * | Federal Grid Co. | | |
| | Unified Energy System | | |
| | JSC | 400,141,367 | 4,261 |
| | Tatneft ADR | 132,153 | 3,422 |
| | Mobile Telesystems | | |
| | OJSC ADR | 67,094 | 3,039 |
| | Polyus Gold Co. ADR | 78,566 | 2,123 |
| * | Uralkali | 383,510 | 1,668 |
| | VTB Bank OJSC GDR | 324,235 | 1,291 |
| | Rostelecom ADR | 30,445 | 1,189 |
| * | Sistema JSFC GDR | 63,585 | 1,032 |
| * | Novolipetsk Steel OJSC | 323,307 | 846 |
| | Gazpromneft JSC | 154,876 | 790 |
| | Mobile Telesystems | | |
| | OJSC | 114,342 | 787 |
| | Severstal GDR | 87,559 | 632 |
| | VTB Bank OJSC | 276,599,217 | 550 |
| * | Wimm-Bill-Dann Foods | | |
| | OJSC ADR | 8,070 | 545 |
| * | Magnitogorsk Iron & | | |
| | Steel Works | 590,348 | 429 |
| * | Polymetal | 38,404 | 330 |
| | Aeroflot-Russian | | |
| | International Airlines | 150,372 | 205 |
| *,1 | IDGC Holding JSC GDR | 3,642 | 172 |
| *,1 | Yenisei Territorial | | |
| | Generating Co. | | |
| | OJSC GDR | 5,021 | 5 |
| | | | 94,715 |
| Singapore (1.2%) | | |
| | Singapore | | |
| | Telecommunications Ltd. | 3,652,000 | 7,573 |
| | DBS Group Holdings Ltd. | 795,200 | 7,282 |
| | United Overseas | | |
| | Bank Ltd. | 540,800 | 6,483 |
| | Oversea-Chinese | | |
| | Banking Corp. Ltd. | 1,100,600 | 5,931 |
| | Wilmar International Ltd. | 1,182,924 | 5,215 |
| | CapitaLand Ltd. | 1,533,998 | 4,448 |
| | Hongkong Land | | |
| | Holdings Ltd. | 819,000 | 3,866 |
| | Jardine Matheson | | |
| | Holdings Ltd. | 117,600 | 3,496 |
| | Keppel Corp. Ltd. | 552,000 | 3,172 |
| | Singapore Exchange Ltd. | 527,000 | 2,986 |
| | Singapore Airlines Ltd. | 273,670 | 2,624 |
| | City Developments Ltd. | 313,000 | 2,193 |
| | | |
| | | | Market |
| | | | Value• |
| | | Shares | ($000) |
| | Noble Group Ltd. | 1,135,400 | 2,075 |
| | Singapore Press | | |
| | Holdings Ltd. | 756,000 | 2,070 |
| | Fraser and Neave Ltd. | 712,000 | 1,939 |
| | Singapore Technologies | | |
| | Engineering Ltd. | 692,151 | 1,394 |
| | CapitaMall Trust | 1,215,800 | 1,366 |
| | ComfortDelgro Corp. Ltd. | 1,202,000 | 1,306 |
| | Olam International Ltd. | 656,000 | 1,259 |
| * | Golden | | |
| | Agri-Resources Ltd. | 4,006,251 | 1,206 |
| | Jardine Cycle & | | |
| | Carriage Ltd. | 64,000 | 1,051 |
| | SembCorp Industries Ltd. | 402,000 | 947 |
| | SembCorp Marine Ltd. | 379,600 | 926 |
| | Venture Corp. Ltd. | 128,000 | 817 |
| | CapitaCommercial Trust | 930,235 | 699 |
| | Parkway Holdings Ltd. | 376,266 | 671 |
| | UOL Group Ltd. | 265,000 | 632 |
| | Keppel Land Ltd. | 310,724 | 618 |
| | Neptune Orient Lines Ltd. | 468,750 | 522 |
| | Singapore Post Ltd. | 644,000 | 432 |
| | Yanlord Land Group Ltd. | 263,000 | 421 |
| | SMRT Corp. Ltd. | 347,000 | 414 |
| | StarHub Ltd. | 302,840 | 406 |
| | Wing Tai Holdings Ltd. | 268,000 | 314 |
| * | Chartered Semiconductor | | |
| | Manufacturing Ltd. | 153,550 | 285 |
| | Cosco Corp. | | |
| | Singapore Ltd. | 325,000 | 257 |
| | Allgreen Properties Ltd. | 311,000 | 251 |
| | Singapore Land Ltd. | 62,000 | 243 |
| | Shares | Market | |
| | Haw Par Corp. Ltd. | 58,000 | 230 |
| | Wheelock Properties | | |
| | Singapore Ltd. | 168,000 | 209 |
| | SIA Engineering Co. Ltd. | 87,000 | 173 |
| | People’s Food | | |
| | Holdings Ltd. | 327,000 | 154 |
| | Guocoland Ltd. | 99,000 | 133 |
| | MobileOne Ltd. | 103,900 | 129 |
| | Hotel Properties Ltd. | 82,000 | 121 |
| * | STATS ChipPAC Ltd. | 189,000 | 117 |
| * | Golden | | |
| | Agri-Resources Ltd. | | |
| | Warrants Exp. 07/23/2012 | 190,356 | 16 |
| | Cerebos Pacific Ltd. | 1,000 | 2 |
| | Pacific Century Regional | | |
| | Developments Ltd. | 4,000 | 1 |
| | | | 79,075 |
| South Africa (1.8%) | | |
| | MTN Group Ltd. | 854,689 | 12,726 |
| | Sasol Ltd. | 295,243 | 11,061 |
| | Standard Bank Group Ltd. | 717,060 | 8,950 |
| | Naspers Ltd. | 187,449 | 6,767 |
33
| | | |
| FTSE All-World ex-US Index Fund | |
| |
| |
| |
| | | | Market |
| | | | Value• |
| | | Shares | ($000) |
| | Impala Platinum | | |
| | Holdings Ltd. | 293,532 | 6,459 |
| | AngloGold Ashanti Ltd. | 162,976 | 6,087 |
| | FirstRand Ltd. | 1,935,614 | 4,360 |
| | Gold Fields Ltd. | 324,549 | 4,152 |
| | Anglo Platinum Ltd. | 44,250 | 3,825 |
| | Sanlam Ltd. | 1,002,725 | 2,753 |
| | ABSA Group Ltd. | 168,127 | 2,661 |
| | Bidvest Group Ltd. | 160,435 | 2,512 |
| | Remgro Ltd. | 205,214 | 2,402 |
| | Harmony Gold | | |
| | Mining Co. Ltd. | 210,450 | 2,108 |
| | Shoprite Holdings Ltd. | 253,330 | 2,064 |
| | Nedbank Group Ltd. | 124,560 | 1,872 |
| | Steinhoff International | | |
| | Holdings Ltd. | 750,894 | 1,815 |
| | Tiger Brands Ltd. | 78,900 | 1,580 |
| | RMB Holdings Ltd. | 426,960 | 1,559 |
| * | Aspen Pharmacare | | |
| | Holdings Ltd. | 178,407 | 1,504 |
| | African Bank | | |
| | Investments Ltd. | 359,655 | 1,404 |
| * | Vodacom Group Pty Ltd. | 197,581 | 1,370 |
| | ArcelorMittal | | |
| | South Africa Ltd. | 100,617 | 1,354 |
| | Kumba Iron Ore Ltd. | 42,470 | 1,268 |
| | Truworths International Ltd. | 212,645 | 1,217 |
| | Pretoria Portland | | |
| | Cement Co. Ltd. | 276,544 | 1,158 |
| | Growthpoint Properties Ltd. | 638,297 | 1,130 |
| | Murray & | | |
| | Roberts Holdings Ltd. | 153,498 | 1,096 |
| | Massmart Holdings Ltd. | 92,898 | 1,073 |
| | Imperial Holdings Ltd. | 100,200 | 1,032 |
| | Aveng Ltd. | 183,731 | 974 |
| | Netcare Ltd. | 653,100 | 962 |
| | Foschini Ltd. | 114,461 | 906 |
| | Sappi Ltd. | 244,182 | 902 |
| | Investec Ltd. | 119,062 | 879 |
| | Woolworths Holdings Ltd. | 359,022 | 802 |
| | African Rainbow | | |
| | Minerals Ltd. | 38,936 | 754 |
| | Reunert Ltd. | 105,252 | 741 |
| | Telkom SA Ltd. | 125,556 | 703 |
| | Nampak Ltd. | 308,123 | 668 |
| | Spar Group Ltd. | 74,127 | 654 |
| | Barloworld Ltd. | 102,154 | 637 |
| * | Sun International Ltd. | 49,128 | 570 |
| | Discovery Holdings Ltd. | 140,180 | 557 |
| | Tongaat Hulett Ltd. | 43,135 | 555 |
| | Clicks Group Ltd. | 175,309 | 555 |
| | Pick n Pay Stores Ltd. | 105,200 | 547 |
| | Adcock Ingram | | |
| | Holdings Ltd. | 75,110 | 511 |
| | Mr Price Group Ltd. | 103,815 | 475 |
| | Medi-Clinic Corp. Ltd. | 149,083 | 458 |
| | | |
| | | | Market |
| | | | Value• |
| | | Shares | ($000) |
| | JD Group Ltd. | 82,004 | 457 |
| | Illovo Sugar Ltd. | 95,220 | 432 |
| | Aeci Ltd. | 55,363 | 429 |
| | Metropolitan Holdings Ltd. | 250,450 | 424 |
| | Mondi Ltd. | 72,993 | 412 |
| | Exxaro Resources Ltd. | 34,439 | 387 |
| * | Mvelaphanda | | |
| | Resources Ltd. | 73,475 | 371 |
| | Grindrod Ltd. | 157,342 | 362 |
| | AVI Ltd. | 134,500 | 357 |
| | Lewis Group Ltd. | 45,290 | 317 |
| | Fountainhead | | |
| | Property Trust | 389,700 | 317 |
| | Santam Ltd. | 24,307 | 313 |
| | Wilson Bayly | | |
| | Holmes-Ovcon Ltd. | 21,492 | 311 |
| | JSE Ltd. | 37,684 | 290 |
| | Northam Platinum Ltd. | 55,103 | 257 |
| | Pick’n Pay Holdings Ltd. | 111,604 | 253 |
| | African Oxygen Ltd. | 77,238 | 227 |
| | Group Five Ltd. | 42,823 | 219 |
| | Allied Technologies Ltd. | 19,632 | 193 |
| * | Highveld Steel and | | |
| | Vanadium Corp. Ltd. | 21,948 | 182 |
| | Gold Reef Resorts Ltd. | 41,046 | 102 |
| | | | 119,741 |
| South Korea (3.0%) | | |
| 1 | Samsung | | |
| | Electronics Co. Ltd. GDR | 109,049 | 33,071 |
| | POSCO ADR | 160,283 | 16,368 |
| | Samsung | | |
| | Electronics Co. Ltd. | 13,274 | 7,987 |
| * | KB Financial Group Inc. | | |
| | ADR | 158,544 | 7,521 |
| ^ | Shinhan Financial | | |
| | Group Co. Ltd. ADR | 97,124 | 7,347 |
| | Hyundai Motor Co. | 76,234 | 6,915 |
| | LG Electronics Inc. | 50,335 | 4,679 |
| | Hyundai Mobis | 33,812 | 4,509 |
| | Samsung Fire & Marine | | |
| | Insurance Co. Ltd. | 22,027 | 4,011 |
| | LG Chem Ltd. | 23,109 | 3,982 |
| * | Korea Electric Power Corp. | | |
| | ADR | 282,526 | 3,921 |
| | Hyundai Heavy Industries | 25,874 | 3,544 |
| | SK Telecom Co. Ltd. ADR | 203,926 | 3,408 |
| * | NHN Corp. | 21,883 | 3,227 |
| * | Hynix Semiconductor Inc. | 200,730 | 2,980 |
| | LG Display Co. Ltd. | 121,820 | 2,915 |
| | SK Energy Co. Ltd. | 31,479 | 2,891 |
| | Samsung C&T Corp. | 70,555 | 2,872 |
| | Shinsegae Co. Ltd. | 6,421 | 2,772 |
| | KT Corp. ADR | 148,315 | 2,380 |
| | LG Corp. | 39,295 | 2,226 |
| | Hana Financial Group Inc. | 72,220 | 2,142 |
34
| | | |
| FTSE All-World ex-US Index Fund | |
| |
| |
| |
| | | | Market |
| | | | Value• |
| | | Shares | ($000) |
| | Samsung Electro- | | |
| | Mechanics Co. Ltd. | 25,700 | 2,137 |
| | Hyundai Engineering & | | |
| | Construction Co. Ltd. | 37,784 | 2,086 |
| | Samsung Heavy | | |
| | Industries Co. Ltd. | 105,170 | 1,989 |
| | KT&G Corp. | 32,512 | 1,893 |
| | S-Oil Corp. | 38,690 | 1,872 |
| | Samsung Techwin Co. Ltd. | 24,339 | 1,864 |
| | Samsung SDI Co. Ltd. | 15,675 | 1,789 |
| * | Kia Motors Corp. | 120,090 | 1,784 |
| | SK Holdings Co. Ltd. | 21,455 | 1,702 |
| | OCI Co. Ltd. | 9,559 | 1,679 |
| | Samsung | | |
| | Engineering Co. Ltd. | 17,781 | 1,572 |
| * | Woori Finance | | |
| | Holdings Co. Ltd. | 112,730 | 1,517 |
| | Samsung | | |
| | Securities Co. Ltd. | 30,835 | 1,511 |
| | GS Engineering & | | |
| | Construction Corp. | 17,147 | 1,504 |
| | Korea Exchange Bank | 120,450 | 1,369 |
| | Amorepacific Corp. | 1,905 | 1,315 |
| | Hyundai Steel Co. | 19,140 | 1,216 |
| | LS Corp. | 13,989 | 1,143 |
| | Woongjin Coway Co. Ltd. | 34,160 | 1,142 |
| | Lotte Shopping Co. Ltd. | 3,860 | 1,090 |
| | LG Household & | | |
| | Health Care Ltd. | 5,205 | 1,081 |
| | Hanwha Corp. | 33,230 | 1,062 |
| | Hyundai Development Co. | 33,830 | 1,001 |
| * | Shinhan Financial | | |
| | Group Co. Ltd. | 26,300 | 998 |
| | Dongbu Insurance Co. Ltd. | 32,740 | 993 |
| | Doosan Heavy Industries | | |
| | and Construction Co. Ltd. | 18,368 | 986 |
| | Hankook Tire Co. Ltd. | 51,540 | 985 |
| | Daewoo Securities Co. Ltd. | 63,970 | 972 |
| | Daelim Industrial Co. Ltd. | 15,120 | 960 |
| | Kangwon Land Inc. | 70,970 | 948 |
| | Hyundai Department | | |
| | Store Co. Ltd. | 9,845 | 941 |
| | Busan Bank | 79,640 | 903 |
| | Daewoo International Corp. | 33,056 | 903 |
| | Hyundai Securities Co. | 76,470 | 868 |
| ^ | Hyosung Corp. | 15,390 | 846 |
| | Daegu Bank | 61,110 | 811 |
| | Cheil Industries Inc. | 21,150 | 789 |
| | Doosan Corp. | 11,015 | 764 |
| | Yuhan Corp. | 4,686 | 755 |
| ^ | NCSoft Corp. | 6,860 | 734 |
| * | KB Financial Group Inc. | 14,759 | 710 |
| | CJ CheilJedang Corp. | 3,907 | 661 |
| | KCC Corp. | 2,285 | 659 |
| | Korea Investment | | |
| | Holdings Co. Ltd. | 23,100 | 616 |
| | | |
| | | | Market |
| | | | Value• |
| | | Shares | ($000) |
| * | Industrial Bank of Korea | 50,850 | 616 |
| | Hyundai Mipo Dockyard | 7,140 | 588 |
| * | Korean Air Lines Co. Ltd. | 15,300 | 582 |
| | Samsung Card Co. | 14,687 | 582 |
| | Hyundai Merchant | | |
| | Marine Co. Ltd. | 27,710 | 568 |
| | Woori Investment & | | |
| | Securities Co. Ltd. | 44,490 | 559 |
| | Doosan Infracore Co. Ltd. | 39,060 | 556 |
| | GS Holdings Corp. | 20,870 | 517 |
| | S1 Corp. | 12,110 | 485 |
| * | LG Hausys Ltd. | 4,817 | 482 |
| | Dongkuk Steel Mill Co. Ltd. | 21,700 | 461 |
| ^ | Honam | | |
| | Petrochemical Corp. | 6,690 | 459 |
| | Daewoo | | |
| | Shipbuilding & Marine | | |
| | Engineering Co. Ltd. | 34,560 | 455 |
| | Pacific Corp. | 3,620 | 443 |
| | STX Pan Ocean Co. Ltd. | 46,900 | 437 |
| | Korea Gas Corp. | 10,350 | 437 |
| | Lotte | | |
| | Confectionery Co. Ltd. | 431 | 433 |
| | Hite Brewery Co. Ltd. | 3,185 | 433 |
| | Nong Shim Co. Ltd. | 2,071 | 420 |
| * | Samsung Digital | | |
| | Imaging Co. Ltd. | 10,318 | 417 |
| | Hanjin Shipping Co. Ltd. | 30,250 | 411 |
| | LG Telecom Ltd. | 54,214 | 406 |
| ^ | Daewoo Engineering & | | |
| | Construction Co. Ltd. | 39,339 | 401 |
| | Mirae Asset | | |
| | Securities Co. Ltd. | 7,514 | 393 |
| | Samsung Fine | | |
| | Chemicals Co. Ltd. | 9,030 | 358 |
| | Cheil Worldwide Inc. | 1,364 | 350 |
| | SK Networks Co. Ltd. | 34,930 | 330 |
| | Daishin Securities Co. Ltd. | 24,990 | 313 |
| | Hanjin Heavy Industries & | | |
| | Construction Co. Ltd. | 17,257 | 308 |
| * | Daum | | |
| | Communications Corp. | 6,712 | 306 |
| | Hanwha Chem Corp. | 32,500 | 302 |
| | Glovis Co. Ltd. | 3,340 | 291 |
| | POSCO | 699 | 290 |
| | LG Dacom Corp. | 17,630 | 278 |
| | CJ Corp. | 6,826 | 273 |
| | Lotte Chilsung | | |
| | Beverage Co. Ltd. | 362 | 248 |
| * | Korea Express Co. Ltd. | 4,189 | 230 |
| ^ | STX Offshore & | | |
| | Shipbuilding Co. Ltd. | 21,030 | 224 |
| ^ | STX Corp. Co. Ltd. | 15,413 | 212 |
| | Sindoh Co. Ltd. | 3,815 | 192 |
| | Daishin | | |
| | Securities Co. Ltd. Pfd. | 21,130 | 167 |
35
| | | |
| FTSE All-World ex-US Index Fund | |
| |
| |
| |
| | | | Market |
| | | | Value• |
| | | Shares | ($000) |
| | Halla Climate Control Corp. | 15,910 | 155 |
| | KT Corp. | 3,941 | 128 |
| ^ | Kumho Industrial Co. Ltd. | 12,810 | 108 |
| | Lotte Midopa Co. Ltd. | 10,880 | 107 |
| | Hyundai Hysco | 7,010 | 89 |
| | SKC Co. Ltd. | 3,460 | 53 |
| | | | 201,641 |
| Spain (3.7%) | | |
| | Banco Santander SA | 3,797,560 | 61,111 |
| | Telefonica SA | 2,130,283 | 59,491 |
| | Banco Bilbao Vizcaya | | |
| | Argentaria SA | 1,726,688 | 30,865 |
| | Iberdrola SA | 2,384,989 | 21,605 |
| | Repsol YPF SA | 563,716 | 15,007 |
| | Inditex SA | 115,280 | 6,767 |
| | ACS Actividades de | | |
| | Construccion y Servicios | | |
| | SA | 115,786 | 5,560 |
| | Banco Popular Espanol SA | 584,596 | 5,207 |
| | Gas Natural SDG SA | 211,675 | 4,253 |
| ^ | Banco de Sabadell SA | 557,096 | 3,761 |
| | Abertis Infraestructuras SA | 159,988 | 3,402 |
| | Acerinox SA | 124,394 | 2,474 |
| | Criteria Caixacorp SA | 469,757 | 2,290 |
| | Gamesa Corp. Tecnologica | | |
| | SA | 119,387 | 2,182 |
| | Enagas | 87,568 | 1,801 |
| | Indra Sistemas SA | 74,842 | 1,760 |
| | Iberdrola Renovables SA | 391,637 | 1,741 |
| ^ | Bankinter SA | 158,644 | 1,672 |
| | Mapfre SA | 388,623 | 1,665 |
| ^ | Grupo Ferrovial SA | 36,768 | 1,523 |
| | Grifols SA | 93,282 | 1,507 |
| | Acciona SA | 11,967 | 1,458 |
| | Red Electrica Corp. SA | 27,437 | 1,417 |
| | Zardoya Otis SA | 62,081 | 1,246 |
| * | Endesa SA | 36,608 | 1,218 |
| | Cintra Concesiones de | | |
| | Infraestructuras de | | |
| | Transporte SA | 102,635 | 1,056 |
| | Sacyr Vallehermoso SA | 63,849 | 966 |
| ^ | Fomento de | | |
| | Construcciones y | | |
| | Contratas SA | 22,982 | 935 |
| | Banco de Valencia SA | 105,052 | 890 |
| | Corp Financiera Alba | 12,840 | 670 |
| | Banco Espanol de Credito | | |
| | SA | 35,072 | 444 |
| | Gestevision Telecinco SA | 41,464 | 428 |
| | | | 246,372 |
| Sweden (1.9%) | | |
| | Nordea Bank AB | 1,865,377 | 20,022 |
| | Telefonaktiebolaget LM | | |
| | Ericsson Class B | 1,376,774 | 14,384 |
| | Hennes & Mauritz AB | | |
| | Class B | 135,778 | 7,712 |
| | | |
| | | | Market |
| | | | Value• |
| | | Shares | ($000) |
| | Svenska Handelsbanken | | |
| | AB Class A | 287,442 | 7,428 |
| | TeliaSonera AB | 1,040,100 | 6,894 |
| | Volvo AB Class B | 667,025 | 6,317 |
| | Sandvik AB | 545,805 | 6,029 |
| * | Skandinaviska Enskilda | | |
| | Banken AB Class A | 994,700 | 6,025 |
| | Atlas Copco AB Class A | 302,400 | 4,055 |
| | Investor AB Class B | 214,000 | 3,786 |
| | Svenska Cellulosa AB | | |
| | Class B | 273,655 | 3,760 |
| * | Electrolux AB Class B | 137,907 | 3,305 |
| | SKF AB | 193,600 | 3,066 |
| | Assa Abloy AB Class B | 165,272 | 2,888 |
| | Volvo AB Class A | 311,534 | 2,877 |
| * | Swedbank AB Class A | 325,000 | 2,800 |
| | Tele2 AB | 185,890 | 2,709 |
| | Skanska AB Class B | 179,212 | 2,630 |
| | Swedish Match AB | 116,332 | 2,388 |
| | Atlas Copco AB Class B | 198,000 | 2,359 |
| | Scania AB Class B | 183,510 | 2,354 |
| ^ | Alfa Laval AB | 148,600 | 1,815 |
| | SSAB AB Class A | 110,777 | 1,689 |
| | Securitas AB Class B | 166,600 | 1,554 |
| | Boliden AB | 119,724 | 1,442 |
| | Industrivarden AB Class A | 121,152 | 1,439 |
| * | Husqvarna AB | 194,159 | 1,223 |
| | Holmen AB | 28,630 | 773 |
| ^ | Industrivarden AB | 51,502 | 560 |
| | SSAB AB Class B | 34,029 | 476 |
| | | | 124,759 |
| Switzerland (5.3%) | | |
| | Nestle SA | 1,693,352 | 78,744 |
| | Novartis AG | 1,050,017 | 54,679 |
| | Roche Holdings AG | 325,959 | 52,207 |
| | Credit Suisse Group AG | 526,149 | 28,126 |
| * | UBS AG | 1,629,832 | 27,177 |
| | ABB Ltd. | 1,074,575 | 19,989 |
| | Zurich Financial Services | | |
| | AG | 65,635 | 15,030 |
| | Syngenta AG | 44,824 | 10,613 |
| | Holcim Ltd. | 111,904 | 7,122 |
| | Compagnie Financiere | | |
| | Richemont SA | 240,743 | 6,739 |
| | Swiss Reinsurance Co. Ltd. | 162,507 | 6,617 |
| | Julius Baer Group Ltd. | 97,906 | 3,686 |
| | SGS SA | 2,733 | 3,651 |
| | Swisscom AG | 10,087 | 3,641 |
| | Swatch Group AG (Bearer) | 15,142 | 3,536 |
| | Geberit AG | 17,884 | 2,958 |
| | Adecco SA | 66,045 | 2,951 |
| | Givaudan SA | 3,812 | 2,830 |
| | Synthes Inc. | 21,424 | 2,542 |
| | Kuehne & Nagel | | |
| | International AG | 27,079 | 2,453 |
| * | Actelion Ltd. | 43,222 | 2,383 |
36
| | | |
| FTSE All-World ex-US Index Fund | |
| |
| |
| |
| | | | Market |
| | | | Value• |
| | | Shares | ($000) |
| | Sonova Holding AG | 22,561 | 2,322 |
| | Swiss Life Holding AG | 17,319 | 2,074 |
| | Swatch Group AG | | |
| | (Registered) | 44,461 | 1,994 |
| | Baloise Holding AG | 22,928 | 1,963 |
| | Lonza Group AG | 24,127 | 1,876 |
| | Nobel Biocare Holding AG | 60,946 | 1,729 |
| | Lindt & Spruengli AG | 63 | 1,599 |
| | Pargesa Holding SA | 17,350 | 1,389 |
| | GAM Holding Ltd. | 96,967 | 1,183 |
| | Schindler Holding AG | 13,202 | 915 |
| | Lindt & Spruengli AG | 411 | 865 |
| | Straumann Holding AG | 3,495 | 844 |
| | Schindler Holding AG | 9,321 | 637 |
| | BKW FMB Energie AG | 7,360 | 605 |
| | EFG International AG | 19,438 | 324 |
| | | | 357,993 |
| Taiwan (2.3%) | | |
| | Taiwan Semiconductor | | |
| | Manufacturing Co. Ltd. | | |
| | ADR | 2,216,321 | 21,144 |
| | HON HAI Precision | | |
| | Industry Co. Ltd. | 3,955,716 | 15,494 |
| | Formosa Plastics Corp. | 2,839,220 | 5,446 |
| | MediaTek Inc. | 379,798 | 5,316 |
| | Chunghwa | | |
| | Telecom Co. Ltd. ADR | 269,288 | 4,680 |
| | Nan Ya Plastics Corp. | 2,732,370 | 4,347 |
| | China Steel Corp. | 4,433,444 | 3,936 |
| | AU Optronics Corp. ADR | 438,156 | 3,869 |
| *,^ | United | | |
| | Microelectronics Corp. | | |
| | ADR | 1,156,610 | 3,805 |
| * | Cathay Financial | | |
| | Holding Co. Ltd. | 2,198,050 | 3,769 |
| | Formosa Chemicals & | | |
| | Fibre Corp. | 1,926,210 | 3,590 |
| | HTC Corp. | 358,997 | 3,565 |
| | Asustek Computer Inc. | 1,924,952 | 3,535 |
| * | Fubon Financial | | |
| | Holding Co. Ltd. | 2,750,000 | 3,052 |
| | Acer Inc. | 1,205,065 | 2,841 |
| | Siliconware Precision | | |
| | Industries Co. ADR | 393,271 | 2,647 |
| | Chinatrust Financial | | |
| | Holding Co. Ltd. | 4,140,241 | 2,487 |
| | Compal Electronics Inc. | 1,808,822 | 2,261 |
| | Advanced Semiconductor | | |
| | Engineering Inc. ADR | 557,215 | 2,156 |
| | Delta Electronics Inc. | 769,818 | 2,138 |
| | Mega Financial | | |
| | Holding Co. Ltd. | 3,797,000 | 2,114 |
| | Formosa | | |
| | Petrochemical Corp. | 862,580 | 2,103 |
| | Uni-President | | |
| | Enterprises Corp. | 1,782,091 | 1,988 |
| | | |
| | | | Market |
| | | | Value• |
| | | Shares | ($000) |
| | InnoLux Display Corp. | 1,486,126 | 1,957 |
| | Far Eastern | | |
| | Textile Co. Ltd. | 1,603,779 | 1,891 |
| | Yuanta Financial | | |
| | Holding Co. Ltd. | 2,774,845 | 1,831 |
| | Taiwan Semiconductor | | |
| | Manufacturing Co. Ltd. | 939,532 | 1,704 |
| | Quanta Computer Inc. | 848,480 | 1,605 |
| | Wistron Corp. | 859,373 | 1,439 |
| | Foxconn | | |
| | Technology Co. Ltd. | 419,978 | 1,399 |
| | Taiwan Mobile Co. Ltd. | 768,609 | 1,375 |
| | Lite-On Technology Corp. | 989,940 | 1,304 |
| * | China Development | | |
| | Financial Holding Corp. | 4,881,736 | 1,272 |
| | First Financial | | |
| | Holding Co. Ltd. | 2,059,493 | 1,190 |
| | Hua Nan Financial | | |
| | Holdings Co. Ltd. | 2,043,520 | 1,187 |
| * | Chi Mei | | |
| | Optoelectronics Corp. | 2,349,872 | 1,172 |
| * | SinoPac Financial | | |
| | Holdings Co. Ltd. | 3,036,000 | 1,121 |
| | Synnex Technology | | |
| | International Corp. | 582,989 | 1,103 |
| | Taiwan Cooperative Bank | 1,787,037 | 1,054 |
| | Taiwan Fertilizer Co. Ltd. | 330,000 | 1,024 |
| * | Shin Kong Financial | | |
| | Holding Co. Ltd. | 2,325,434 | 946 |
| | Pou Chen Corp. | 1,318,927 | 904 |
| * | Taishin Financial | | |
| | Holding Co. Ltd. | 2,222,000 | 870 |
| | Far EasTone | | |
| | Telecommunications | | |
| | Co. Ltd. | 734,643 | 827 |
| | Macronix International | 1,515,937 | 768 |
| | Cheng Shin Rubber | | |
| | Industry Co. Ltd. | 358,934 | 738 |
| | Chang Hwa Commercial | | |
| | Bank | 1,687,000 | 734 |
| | Taiwan Cement Corp. | 685,583 | 703 |
| | Asia Cement Corp. | 630,298 | 662 |
| | Inventec Co. Ltd. | 1,187,239 | 657 |
| | Yulon Motor Co. Ltd. | 508,898 | 569 |
| | Taiwan Glass | | |
| | Industrial Corp. | 718,302 | 552 |
| | KGI Securities Co. Ltd. | 1,203,000 | 551 |
| | Unimicron | | |
| | Technology Corp. | 474,975 | 542 |
| | Novatek Microelectronics | | |
| | Corp. Ltd. | 239,916 | 541 |
| | Chicony | | |
| | Electronics Co. Ltd. | 245,982 | 538 |
| | Catcher | | |
| | Technology Co. Ltd. | 213,153 | 516 |
| | Largan Precision Co. Ltd. | 44,068 | 505 |
37
| | | |
| FTSE All-World ex-US Index Fund | |
| |
| |
| |
| | | | Market |
| | | | Value• |
| | | Shares | ($000) |
| * | Inotera Memories Inc. | 829,320 | 490 |
| | Realtek | | |
| | Semiconductor Corp. | 228,415 | 486 |
| * | Polaris Securities Co. Ltd. | 929,359 | 477 |
| * | HannStar Display Corp. | 2,437,463 | 460 |
| | President Chain | | |
| | Store Corp. | 199,904 | 452 |
| * | Walsin Lihwa Corp. | 1,395,000 | 452 |
| | Feng Hsin Iron & Steel Co. | 297,790 | 450 |
| * | Tatung Co. Ltd. | 2,007,000 | 442 |
| * | Powerchip | | |
| | Semiconductor Corp. | 3,909,255 | 436 |
| * | E.Sun Financial | | |
| | Holding Co. Ltd. | 1,112,935 | 433 |
| | Formosa Taffeta Co. Ltd. | 594,000 | 403 |
| | U-Ming Marine | | |
| | Transport Corp. | 222,000 | 403 |
| * | Nanya Technology Corp. | 568,039 | 401 |
| | Transcend Information Inc. | 122,455 | 383 |
| * | Chunghwa Picture Tubes | 3,669,000 | 376 |
| * | Capital Securities Corp. | 780,055 | 362 |
| | Teco Electric and | | |
| | Machinery Co. Ltd. | 870,000 | 346 |
| * | Taiwan Business Bank | 1,407,000 | 344 |
| | Nan Ya Printed Circuit | | |
| | Board Corp. | 108,821 | 339 |
| * | Evergreen Marine Corp. | | |
| | Taiwan Ltd. | 599,000 | 303 |
| | D-Link Corp. | 323,870 | 302 |
| | Coretronic Corp. | 274,386 | 300 |
| | Giant | | |
| | Manufacturing Co. Ltd. | 115,020 | 298 |
| * | Qisda Corp. | 503,640 | 279 |
| | Micro-Star | | |
| | International Co. Ltd. | 463,929 | 277 |
| | Advantech Co. Ltd. | 154,641 | 275 |
| | Yageo Corp. | 970,000 | 267 |
| | Eternal Chemical Co. Ltd. | 284,262 | 263 |
| * | CMC Magnetics Corp. | 1,148,000 | 252 |
| | Cheng Uei Precision | | |
| | Industry Co. Ltd. | 132,107 | 251 |
| | Taiwan Secom Co. Ltd. | 157,000 | 240 |
| * | Wan Hai Lines Ltd. | 500,050 | 230 |
| * | Yuen Foong Yu Paper | | |
| | Manufacturing Co. Ltd. | 638,959 | 229 |
| | Yang Ming Marine | | |
| | Transport Corp. | 643,369 | 227 |
| * | Winbond Electronics Corp. | 1,217,000 | 225 |
| * | Ritek Corp. | 905,000 | 216 |
| * | China Motor Corp. | 302,105 | 207 |
| | Mitac International | 412,736 | 193 |
| * | President Securities Corp. | 329,289 | 193 |
| * | Waterland Financial | | |
| | Holdings | 628,971 | 191 |
| * | Far Eastern | | |
| | International Bank | 563,293 | 191 |
| | | |
| | | | Market |
| | | | Value• |
| | | Shares | ($000) |
| | Compal | | |
| | Communications Inc. | 124,520 | 184 |
| | Asia Optical Co. Inc. | 113,381 | 183 |
| | Faraday Technology Corp. | 116,897 | 182 |
| | Ton Yi Industrial Corp. | 510,000 | 178 |
| * | Cathay Real Estate | | |
| | Development Co. Ltd. | 443,000 | 175 |
| | Oriental Union | | |
| | Chemical Corp. | 242,083 | 166 |
| * | China Airlines Ltd. | 529,244 | 165 |
| * | ProMOS Technologies Inc. | 2,143,000 | 138 |
| * | Eva Airways Corp. | 337,201 | 127 |
| | Inventec Appliances Corp. | 123,963 | 120 |
| * | Tatung Co. Ltd. GDR | 26,447 | 118 |
| | Vanguard International | | |
| | Semiconductor Corp. | 277,466 | 113 |
| | Chunghwa | | |
| | Telecom Co. Ltd. | 57,000 | 100 |
| | LITE-ON IT Corp. | 120,054 | 94 |
| | AU Optronics Corp. | 99,000 | 88 |
| * | Via Technologies Inc. | 113,200 | 69 |
| * | Shin Kong Financial | | |
| | Holding Co., Ltd. | | |
| | Rights Exp. 12/7/2009 | 118,864 | 11 |
| | | | 157,589 |
| Thailand (0.3%) | | |
| | PTT Exploration & | | |
| | Production PCL (Foreign) | 722,272 | 3,084 |
| | PTT PCL (Foreign) | 341,100 | 2,414 |
| | Bangkok Bank PCL | | |
| | (Foreign) | 420,997 | 1,412 |
| | Kasikornbank PCL | | |
| | (Foreign) | 555,300 | 1,346 |
| | Advanced Info Service | | |
| | PCL (Foreign) | 506,500 | 1,297 |
| | Siam Commercial Bank | | |
| | PCL (Foreign) | 470,186 | 1,072 |
| | Siam Cement PCL | | |
| | (Foreign) | 148,762 | 922 |
| | Bank of Ayudhya PLC | | |
| | (Foreign) | 1,577,000 | 859 |
| | Bank of Ayudhya PLC | | |
| | (Local) | 1,327,900 | 705 |
| | Banpu PCL (Foreign) | 41,500 | 534 |
| | PTT Aromatics & | | |
| | Refining PCL (Foreign) | 816,361 | 512 |
| | CP ALL PCL (Foreign) | 845,500 | 477 |
| | Charoen Pokphand Foods | | |
| | PCL (Foreign) | 1,535,200 | 441 |
| | IRPC PCL (Foreign) | 3,515,200 | 398 |
| | Thai Oil PCL (Foreign) | 286,000 | 347 |
| | PTT Chemical PCL | | |
| | (Foreign) | 185,600 | 341 |
| | Krung Thai Bank PCL | | |
| | (Foreign) | 1,222,400 | 319 |
38
| | | |
| FTSE All-World ex-US Index Fund | |
| |
| |
| |
| | | | Market |
| | | | Value• |
| | | Shares | ($000) |
| | Total Access | | |
| | Communication PCL | | |
| | (Foreign) | 246,500 | 284 |
| | Airports of Thailand PCL | | |
| | (Foreign) | 247,000 | 282 |
| | PTT PCL (Local) | 38,600 | 273 |
| | BEC World PCL (Foreign) | 401,800 | 267 |
| | Central Pattana PCL | | |
| | (Foreign) | 330,100 | 212 |
| | Land and Houses PCL | | |
| | (Foreign) | 1,099,500 | 197 |
| | Siam City Cement PCL | | |
| | (Foreign) | 29,100 | 191 |
| | Electricity Generating PCL | | |
| | (Foreign) | 84,200 | 191 |
| | Delta Electronics Thai PCL | | |
| | (Foreign) | 339,900 | 175 |
| * | Thai Airways International | | |
| | PCL (Foreign) | 287,600 | 169 |
| | Siam Makro PCL (Foreign) | 53,100 | 126 |
| | Ratchaburi Electricity | | |
| | Generating Holding PCL | 95,800 | 106 |
| * | TMB Bank PCL (Foreign) | 2,736,800 | 89 |
| | Thoresen Thai Agencies | | |
| | PCL (Foreign) | 80,300 | 63 |
| | Thai Union Frozen Products | | |
| | PCL | 68,500 | 57 |
| | Siam City Bank PCL | | |
| | (Foreign) | 75,700 | 53 |
| | | | 19,215 |
| Turkey (0.3%) | | |
| | Akbank TAS | 421,659 | 2,278 |
| | Turkiye Garanti Bankasi AS | 581,759 | 2,113 |
| | Turkiye Is Bankasi | 433,721 | 1,643 |
| | Anadolu Efes Biracilik Ve | | |
| | Malt Sanayii AS | 114,282 | 1,306 |
| * | KOC Holding AS | 491,202 | 1,251 |
| | Turkcell Iletisim Hizmet AS | 154,762 | 1,024 |
| * | Eregli Demir ve | | |
| | Celik Fabrikalari TAS | 366,236 | 994 |
| | Turkiye Halk Bankasi AS | 162,918 | 975 |
| * | Turkiye Vakiflar Bankasi Tao | 353,315 | 857 |
| * | Yapi ve Kredi Bankasi AS | 396,300 | 815 |
| | Tupras Turkiye Petrol Rafine | 43,518 | 747 |
| | Turk Telekomunikasyon AS | 228,085 | 692 |
| | Haci Omer Sabanci Holding | | |
| | AS | 184,247 | 673 |
| | Enka Insaat ve Sanayi AS | 157,569 | 636 |
| | BIM Birlesik Magazalar AS | 17,092 | 620 |
| | Dogan Sirketler Grubu | | |
| | Holdings | 402,311 | 265 |
| | Coca-Cola Icecek AS | 29,094 | 224 |
| | Ford Otomotiv Sanayi AS | 33,241 | 209 |
| | | | 17,322 |
| | | | |
| | | | | Market |
| | | | | Value• |
| | | | Shares | ($000) |
| United Kingdom (14.7%) | | |
| | HSBC Holdings PLC | | 8,074,402 | 89,223 |
| | BP PLC | | 8,741,719 | 81,912 |
| | Vodafone Group PLC | 24,416,390 | 53,810 |
| | GlaxoSmithKline PLC | | 2,431,205 | 49,871 |
| | Royal Dutch Shell PLC | | |
| | Class A | | 1,645,746 | 48,588 |
| | Royal Dutch Shell PLC | | |
| | Class B | | 1,260,431 | 36,285 |
| | Rio Tinto PLC | | 708,551 | 31,325 |
| | AstraZeneca PLC | | 677,054 | 30,394 |
| | British American Tobacco | | |
| | PLC | | 926,393 | 29,520 |
| * | Barclays PLC | | 5,266,431 | 27,602 |
| | BHP Billiton PLC | | 1,023,901 | 27,589 |
| | BG Group PLC | | 1,563,456 | 26,912 |
| | Tesco PLC | | 3,643,227 | 24,292 |
| | Standard Chartered PLC | 934,140 | 22,916 |
| * | Anglo American PLC | | 613,887 | 22,212 |
| | Diageo PLC | | 1,166,986 | 19,008 |
| | Unilever PLC | | 595,688 | 17,797 |
| | Reckitt Benckiser Group | | |
| | PLC | | 328,662 | 16,326 |
| * | Xstrata PLC | | 1,015,189 | 14,622 |
| | SABMiller PLC | | 547,244 | 14,344 |
| | Imperial Tobacco Group | | |
| | PLC | | 472,709 | 13,930 |
| | National Grid PLC | | 1,131,427 | 11,208 |
| | Prudential PLC | | 1,166,959 | 10,600 |
| *,^ | Lloyds Banking Group PLC | 7,160,708 | 10,096 |
| | Centrica PLC | | 2,362,525 | 9,598 |
| | BAE Systems PLC | | 1,635,683 | 8,411 |
| | Cadbury PLC | | 631,903 | 7,989 |
| | Aviva PLC | | 1,268,605 | 7,933 |
| | BT Group PLC | | 3,595,451 | 7,705 |
| | Scottish & | | | |
| | Southern Energy PLC | 427,423 | 7,544 |
| | Tullow Oil PLC | | 368,812 | 7,145 |
| | Rolls-Royce Group PLC | 860,189 | 6,344 |
| | WM Morrison | | | |
| | Supermarkets PLC | | 1,226,665 | 5,622 |
| | Compass Group PLC | | 868,846 | 5,510 |
| * | Royal Bank of | | | |
| | Scotland Group PLC | | 7,850,342 | 5,355 |
| | British Sky | | | |
| | Broadcasting Group PLC | 613,498 | 5,349 |
| | WPP PLC | | 587,097 | 5,261 |
| | Pearson PLC | | 371,758 | 5,053 |
| | J Sainsbury PLC | | 854,448 | 4,611 |
| | Shire PLC | | 257,980 | 4,563 |
| | Experian PLC | | 470,993 | 4,304 |
| | Old Mutual PLC | | 2,465,424 | 4,279 |
| | Reed Elsevier PLC | | 555,620 | 4,207 |
| | Marks & | | | |
| | Spencer Group PLC | | 739,186 | 4,140 |
39
| | | |
| FTSE All-World ex-US Index Fund | |
| |
| |
| |
| | | | Market |
| | | | Value• |
| | | Shares | ($000) |
| | Man Group PLC | 791,133 | 4,001 |
| | Kingfisher PLC | 1,090,161 | 3,985 |
| | Land Securities Group PLC | 351,834 | 3,807 |
| | Capita Group PLC | 292,147 | 3,649 |
| | Standard Life PLC | 1,014,312 | 3,616 |
| | Smith & Nephew PLC | 408,144 | 3,608 |
| | Legal & General Group | | |
| | PLC | 2,707,433 | 3,474 |
| | British Land Co. PLC | 400,437 | 3,093 |
| | RSA Insurance Group PLC | 1,558,627 | 3,089 |
| | Carnival PLC | 98,748 | 3,061 |
| | International Power PLC | 705,130 | 2,927 |
| | Cable & Wireless PLC | 1,202,721 | 2,854 |
| * | Cairn Energy PLC | 63,929 | 2,757 |
| | Next PLC | 90,734 | 2,662 |
| | G4S PLC | 642,530 | 2,656 |
| | Smiths Group PLC | 181,651 | 2,651 |
| * | Wolseley PLC | 130,371 | 2,637 |
| ^ | Randgold Resources Ltd. | 38,720 | 2,552 |
| | Associated British Foods | | |
| | PLC | 183,062 | 2,479 |
| | Eurasian Natural | | |
| | Resources Corp. | 180,835 | 2,461 |
| * | Autonomy Corp. PLC | 111,438 | 2,450 |
| | Antofagasta PLC | 184,275 | 2,322 |
| | Johnson Matthey PLC | 100,509 | 2,315 |
| | United Utilities Group PLC | 314,686 | 2,269 |
| | Hammerson PLC | 324,467 | 2,152 |
| | Vedanta Resources PLC | 61,946 | 2,120 |
| * | Lonmin PLC | 88,381 | 2,114 |
| | Sage Group PLC | 599,943 | 2,095 |
| | AMEC PLC | 156,707 | 2,064 |
| | Liberty International PLC | 267,799 | 1,977 |
| | 3i Group PLC | 457,004 | 1,967 |
| | Segro PLC | 339,302 | 1,955 |
| | Home Retail Group PLC | 408,525 | 1,944 |
| | Inmarsat PLC | 208,722 | 1,914 |
| | Cobham PLC | 526,709 | 1,893 |
| | Rexam PLC | 409,715 | 1,855 |
| | Petrofac Ltd. | 118,217 | 1,819 |
| | Burberry Group PLC | 202,068 | 1,782 |
| | Kazakhmys PLC | 98,537 | 1,754 |
| | Whitbread PLC | 82,516 | 1,717 |
| | Invensys PLC | 369,102 | 1,706 |
| | Severn Trent PLC | 108,961 | 1,697 |
| | Bunzl PLC | 152,899 | 1,662 |
| | Intercontinental | | |
| | Hotels Group PLC | 129,136 | 1,651 |
| | Tate & Lyle PLC | 215,614 | 1,587 |
| | Admiral Group PLC | 91,336 | 1,535 |
| | ICAP PLC | 228,250 | 1,517 |
| | The Alliance Trust PLC | 303,768 | 1,500 |
| | | |
| | | | Market |
| | | | Value• |
| | | Shares | ($000) |
| | Friends Provident Group | | |
| | PLC | 1,102,421 | 1,470 |
| * | Rentokil Initial PLC | 847,501 | 1,440 |
| | Logica PLC | 733,826 | 1,391 |
| | Schroders PLC | 77,026 | 1,385 |
| | Thomas Cook Group PLC | 400,497 | 1,341 |
| | Foreign & Colonial | | |
| | Investment Trust PLC | 322,199 | 1,322 |
| | ITV PLC | 1,858,694 | 1,300 |
| | Drax Group PLC | 165,389 | 1,258 |
| | Fresnillo PLC | 100,522 | 1,218 |
| | Tomkins PLC | 409,541 | 1,124 |
| | Hays PLC | 647,119 | 1,037 |
| | Scottish Mortgage | | |
| | Investment Trust PLC | 128,417 | 1,025 |
| | TUI Travel PLC | 265,621 | 1,012 |
| | Aegis Group PLC | 542,221 | 975 |
| | Provident Financial PLC | 58,913 | 899 |
| | United Business | | |
| | Media Ltd. | 118,387 | 896 |
| | William Hill PLC | 307,267 | 844 |
| | Ladbrokes PLC | 412,323 | 821 |
| | Daily Mail & General Trust | 123,663 | 805 |
| *,^ | British Airways PLC | 269,664 | 801 |
| * | PartyGaming PLC | 141,281 | 529 |
| | Carphone | | |
| | Warehouse Group PLC | 171,364 | 517 |
| | Schroders PLC | 27,237 | 402 |
| * | Northern Rock PLC | 2,812 | — |
| | | | 990,469 |
| Total Common Stocks | | |
| (Cost $6,730,774) | | 6,691,090 |
| Temporary Cash Investment (1.5%) | |
| Money Market Fund (1.5%) | | |
| 2,3 | Vanguard Market | | |
| | Liquidity Fund, 0.225% | | |
| | (Cost $97,157) | 97,156,537 | 97,157 |
| Total Investments (101.0%) | | |
| (Cost $6,827,931) | | 6,788,247 |
| Other Assets and Liabilities (–1.0%) | |
| Other Assets | | 47,149 |
| Liabilities3 | | (112,889) |
| | | | (65,740) |
| Net Assets (100%) | | 6,722,507 |
40
FTSE All-World ex-US Index Fund
| |
| At October 31, 2009, net assets consisted of: |
| | Amount |
| | ($000) |
| Paid-in Capital | 6,822,369 |
| Undistributed Net Investment Income | 112,834 |
| Accumulated Net Realized Losses | (173,162) |
| Unrealized Appreciation (Depreciation) | |
| Investment Securities | (39,683) |
| Foreign Currencies | 149 |
| Net Assets | 6,722,507 |
| |
| Investor Shares—Net Assets | |
| Applicable to 45,377,941 outstanding | |
| $.001 par value shares of beneficial | |
| interest (unlimited authorization) | 748,023 |
| Net Asset Value Per Share— | |
| Investor Shares | $16.48 |
| |
| Institutional Shares—Net Assets | |
| Applicable to 19,446,827 outstanding | |
| $.001 par value shares of beneficial | |
| interest (unlimited authorization) | 1,608,427 |
| Net Asset Value Per Share— | |
| Institutional Shares | $82.71 |
| |
| ETF Shares—Net Assets | |
| Applicable to 104,084,963 outstanding | |
| $.001 par value shares of beneficial | |
| interest (unlimited authorization) | 4,366,057 |
| Net Asset Value Per Share— | |
| ETF Shares | $41.95 |
• See Note A in Notes to Financial Statements.
* Non-income-producing security.
^ Part of security position is on loan to broker-dealers. The total value of securities on loan is $89,690,000.
1 Security exempt from registration under Rule 144A of the Securities Act of 1933. Such securities may be sold in transactions exempt from registration, normally to qualified institutional buyers. At October 31, 2009, the aggregate value of these securities was $33,248,000, representing 0.5% of net assets.
2 Affiliated money market fund available only to Vanguard funds and certain trusts and accounts managed by Vanguard. Rate shown is the 7-day yield.
3 Includes $97,157,000 of collateral received for securities on loan.
ADR—American Depositary Receipt.
GDR—Global Depositary Receipt.
REIT—Real Estate Investment Trust.
See accompanying Notes, which are an integral part of the Financial Statements.
41
| |
| FTSE All-World ex-US Index Fund | |
| |
| |
| Statement of Operations | |
| |
| | Year Ended |
| | October 31, 2009 |
| | ($000) |
| Investment Income | |
| Income | |
| Dividends1 | 131,397 |
| Interest2 | 117 |
| Security Lending | 5,634 |
| Total Income | 137,148 |
| Expenses | |
| The Vanguard Group—Note B | |
| Investment Advisory Services | 181 |
| Management and Administrative—Investor Shares | 1,614 |
| Management and Administrative—Institutional Shares | 838 |
| Management and Administrative—ETF Shares | 5,279 |
| Marketing and Distribution—Investor Shares | 116 |
| Marketing and Distribution—Institutional Shares | 248 |
| Marketing and Distribution—ETF Shares | 782 |
| Custodian Fees | 1,284 |
| Auditing Fees | 28 |
| Shareholders’ Reports and Proxies—Investor Shares | 47 |
| Shareholders’ Reports and Proxies—Institutional Shares | 2 |
| Shareholders’ Reports and Proxies—ETF Shares | 183 |
| Trustees’ Fees and Expenses | 6 |
| Total Expenses | 10,608 |
| Net Investment Income | 126,540 |
| Realized Net Gain (Loss) | |
| Investment Securities Sold | (114,335) |
| Foreign Currencies | 1,016 |
| Realized Net Gain (Loss) | (113,319) |
| Change in Unrealized Appreciation (Depreciation) | |
| Investment Securities | 1,401,789 |
| Foreign Currencies | 132 |
| Change in Unrealized Appreciation (Depreciation) | 1,401,921 |
| Net Increase (Decrease) in Net Assets Resulting from Operations | 1,415,142 |
1 Dividends are net of foreign withholding taxes of $10,572,000.
2 Interest income from an affiliated company of the fund was $117,000.
See accompanying Notes, which are an integral part of the Financial Statements.
42
| | |
| FTSE All-World ex-US Index Fund | | |
| |
| |
| Statement of Changes in Net Assets | | |
| |
| | Year Ended October 31, |
| | 2009 | 2008 |
| | ($000) | ($000) |
| Increase (Decrease) in Net Assets | | |
| Operations | | |
| Net Investment Income | 126,540 | 76,544 |
| Realized Net Gain (Loss) | (113,319) | (37,449) |
| Change in Unrealized Appreciation (Depreciation) | 1,401,921 | (1,570,564) |
| Net Increase (Decrease) in Net Assets Resulting from Operations | 1,415,142 | (1,531,469) |
| Distributions | | |
| Net Investment Income | | |
| Investor Shares | (8,060) | (1,923) |
| Institutional Shares | (15,592) | (1,766) |
| ETF Shares | (61,830) | (11,212) |
| Realized Capital Gain | | |
| Investor Shares | — | — |
| Institutional Shares | — | — |
| ETF Shares | — | — |
| Total Distributions | (85,482) | (14,901) |
| Capital Share Transactions | | |
| Investor Shares | 299,138 | 279,974 |
| Institutional Shares | 834,242 | 563,511 |
| ETF Shares | 1,813,836 | 1,709,924 |
| Net Increase (Decrease) from Capital Share Transactions | 2,947,216 | 2,553,409 |
| Total Increase (Decrease) | 4,276,876 | 1,007,039 |
| Net Assets | | |
| Beginning of Period | 2,445,631 | 1,438,592 |
| End of Period1 | 6,722,507 | 2,445,631 |
| 1 Net Assets—End of Period includes undistributed net investment income of $112,834,000 and $70,234,000. | |
See accompanying Notes, which are an integral part of the Financial Statements.
43
| | | |
| FTSE All-World ex-US Index Fund | | | |
| |
| |
| Financial Highlights | | | |
| |
| |
| Investor Shares | | | |
| | | | March 8, |
| | Year Ended | 20071 to |
| | October 31, | Oct. 31, |
| For a Share Outstanding Throughout Each Period | 2009 | 2008 | 2007 |
| Net Asset Value, Beginning of Period | $12.77 | $24.91 | $20.00 |
| Investment Operations | | | |
| Net Investment Income | .3782 | .6372 | .4102 |
| Net Realized and Unrealized Gain (Loss) on Investments | 3.622 | (12.592) | 4.500 |
| Total from Investment Operations | 4.000 | (11.955) | 4.910 |
| Distributions | | | |
| Dividends from Net Investment Income | (.290) | (.185) | — |
| Distributions from Realized Capital Gains | — | — | — |
| Total Distributions | (.290) | (.185) | — |
| Net Asset Value, End of Period | $16.48 | $12.77 | $24.91 |
| |
| Total Return3 | 32.19% | –48.32% | 24.55% |
| |
| Ratios/Supplemental Data | | | |
| Net Assets, End of Period (Millions) | $748 | $296 | $213 |
| Ratio of Total Expenses to Average Net Assets | 0.40% | 0.35% | 0.40%4 |
| Ratio of Net Investment Income to Average Net Assets | 2.75% | 3.24% | 2.61%4 |
| Portfolio Turnover Rate5 | 9% | 7% | 10% |
1 Inception.
2 Calculated based on average shares outstanding.
3 Total returns do not reflect the 0.25% transaction fee assessed on purchases through June 26, 2008; the 2% fee assessed on redemptions of shares held for less than two months; or the account service fee that may be applicable to certain accounts with balances below $10,000.
4 Annualized.
5 Excludes the value of portfolio securities received or delivered as a result of in-kind purchases or redemptions of the fund’s capital shares, including ETF Creation Units.
See accompanying Notes, which are an integral part of the Financial Statements.
44
| | | |
| FTSE All-World ex-US Index Fund | | | |
| |
| |
| Financial Highlights | | | |
| |
| |
| Institutional Shares | | | |
| | | | April 30, |
| | Year Ended | 20071 to |
| | October 31, | Oct. 31, |
| For a Share Outstanding Throughout Each Period | 2009 | 2008 | 2007 |
| Net Asset Value, Beginning of Period | $64.06 | $124.76 | $107.33 |
| Investment Operations | | | |
| Net Investment Income | 2.1012 | 3.3232 | 1.1502 |
| Net Realized and Unrealized Gain (Loss) on Investments | 18.142 | (62.979) | 16.280 |
| Total from Investment Operations | 20.243 | (59.656) | 17.430 |
| Distributions | | | |
| Dividends from Net Investment Income | (1.593) | (1.044) | — |
| Distributions from Realized Capital Gains | — | — | — |
| Total Distributions | (1.593) | (1.044) | — |
| Net Asset Value, End of Period | $82.71 | $64.06 | $124.76 |
| |
| Total Return3 | 32.56% | –48.18% | 16.24% |
| |
| Ratios/Supplemental Data | | | |
| Net Assets, End of Period (Millions) | $1,608 | $448 | $157 |
| Ratio of Total Expenses to Average Net Assets | 0.15% | 0.10% | 0.15%4 |
| Ratio of Net Investment Income to Average Net Assets | 3.00% | 3.49% | 2.86%4 |
| Portfolio Turnover Rate5 | 9% | 7% | 10% |
1 Inception.
2 Calculated based on average shares outstanding.
3 Total returns do not reflect the 0.25% transaction fee on purchases through June 26, 2008, or the 2% fee assessed on redemptions of shares held for less than two months.
4 Annualized.
5 Excludes the value of portfolio securities received or delivered as a result of in-kind purchases or redemptions of the fund’s capital shares, including ETF Creation Units.
See accompanying Notes, which are an integral part of the Financial Statements.
45
| | | |
| FTSE All-World ex-US Index Fund | | | |
| |
| |
| Financial Highlights | | | |
| |
| |
| ETF Shares | | | |
| | | | March 2, |
| | Year Ended | 20071 to |
| | October 31, | Oct. 31, |
| For a Share Outstanding Throughout Each Period | 2009 | 2008 | 2007 |
| Net Asset Value, Beginning of Period | $32.50 | $63.32 | $49.80 |
| Investment Operations | | | |
| Net Investment Income | 1.0112 | 1.7052 | 1.0302 |
| Net Realized and Unrealized Gain (Loss) on Investments | 9.224 | (32.015) | 12.490 |
| Total from Investment Operations | 10.235 | (30.310) | 13.520 |
| Distributions | | | |
| Dividends from Net Investment Income | (.785) | (.510) | — |
| Distributions from Realized Capital Gains | — | — | — |
| Total Distributions | (.785) | (.510) | — |
| Net Asset Value, End of Period | $41.95 | $32.50 | $63.32 |
| |
| Total Return | 32.41% | –48.23% | 27.15% |
| |
| Ratios/Supplemental Data | | | |
| Net Assets, End of Period (Millions) | $4,366 | $1,701 | $1,068 |
| Ratio of Total Expenses to Average Net Assets | 0.25% | 0.20% | 0.25%3 |
| Ratio of Net Investment Income to Average Net Assets | 2.90% | 3.39% | 2.76%3 |
| Portfolio Turnover Rate4 | 9% | 7% | 10% |
1 Inception.
2 Calculated based on average shares outstanding.
3 Annualized.
4 Excludes the value of portfolio securities received or delivered as a result of in-kind purchases or redemptions of the fund’s capital shares, including ETF Creation Units.
See accompanying Notes, which are an integral part of the Financial Statements.
46
FTSE All-World ex-US Index Fund
Notes to Financial Statements
Vanguard FTSE All-World ex-US Index Fund is registered under the Investment Company Act of 1940 as an open-end investment company, or mutual fund. The fund invests in securities of foreign issuers, which may subject it to investment risks not normally associated with investing in securities of U.S. corporations. The fund offers three classes of shares: Investor Shares, Institutional Shares, and ETF Shares. Investor Shares are available to any investor who meets the fund’s minimum purchase requirements. Institutional Shares are designed for investors who meet certain administrative and service criteria and invest a minimum of $5 million. ETF Shares are listed for trading on the NYSE Arca, Inc.; they can be purchased and sold through a broker.
A. The following significant accounting policies conform to generally accepted accounting principles for U.S. mutual funds. The fund consistently follows such policies in preparing its financial statements.
1. Security Valuation: Securities are valued as of the close of trading on the New York Stock Exchange (generally 4 p.m., Eastern time) on the valuation date. Equity securities are valued at the latest quoted sales prices or official closing prices taken from the primary market in which each security trades; such securities not traded on the valuation date are valued at the mean of the latest quoted bid and asked prices. Securities for which market quotations are not readily available, or whose values have been affected by events occurring before the fund’s pricing time but after the close of the securities’ primary markets, are valued at their fair values calculated according to procedures adopted by the board of trustees. These procedures include obtaining quotations from an independent pricing service, monitoring news to identify significant market- or security-specific events, and evaluating cha nges in the values of foreign market proxies (for example, ADRs, futures contracts, or exchange-traded funds), between the time the foreign markets close and the fund’s pricing time. When fair-value pricing is employed, the prices of securities used by a fund to calculate its net asset value may differ from quoted or published prices for the same securities. Investments in Vanguard Market Liquidity Fund are valued at that fund’s net asset value.
2. Foreign Currency: Securities and other assets and liabilities denominated in foreign currencies are translated into U.S. dollars using exchange rates obtained from an independent third party as of the fund’s pricing time on the valuation date. Realized gains (losses) and unrealized appreciation (depreciation) on investment securities include the effects of changes in exchange rates since the securities were purchased, combined with the effects of changes in security prices. Fluctuations in the value of other assets and liabilities resulting from changes in exchange rates are recorded as unrealized foreign currency gains (losses) until the assets or liabilities are settled in cash, at which time they are recorded as realized foreign currency gains (losses).
3. Federal Income Taxes: The fund intends to continue to qualify as a regulated investment company and distribute all of its taxable income. Management has analyzed the fund’s tax positions taken for all open federal income tax years (October 31, 2007–2009), and has concluded that no provision for federal income tax is required in the fund’s financial statements.
4. Distributions: Distributions to shareholders are recorded on the ex-dividend date.
5. Security Lending: The fund may lend its securities to qualified institutional borrowers to earn additional income. Security loans are required to be secured at all times by collateral at least equal to the market value of securities loaned. The fund invests cash collateral received in Vanguard Market Liquidity Fund, and records a liability for the return of the collateral, during the period the securities are on loan. Security lending income represents the income earned on investing cash collateral, less expenses associated with the loan.
47
FTSE All-World ex-US Index Fund
6. Other: Dividend income is recorded on the ex-dividend date. Interest income includes income distributions received from Vanguard Market Liquidity Fund and is accrued daily. Security transactions are accounted for on the date securities are bought or sold. Costs used to determine realized gains (losses) on the sale of investment securities are those of the specific securities sold. Fees assessed on redemptions of capital shares are credited to paid-in capital.
Each class of shares has equal rights as to assets and earnings, except that each class separately bears certain class-specific expenses related to maintenance of shareholder accounts (included in Management and Administrative expenses), shareholder reporting, and proxies. Marketing and distribution expenses are allocated to each class of shares based on a method approved by the board of trustees. Income, other non-class-specific expenses, and gains and losses on investments are allocated to each class of shares based on its relative net assets.
B. The Vanguard Group furnishes at cost investment advisory, corporate management, administrative, marketing, and distribution services. The costs of such services are allocated to the fund under methods approved by the board of trustees. The fund has committed to provide up to 0.40% of its net assets in capital contributions to Vanguard. At October 31, 2009, the fund had contributed capital of $1,369,000 to Vanguard (included in Other Assets), representing 0.02% of the fund’s net assets and 0.55% of Vanguard’s capitalization. The fund’s trustees and officers are also directors and officers of Vanguard.
C. Various inputs may be used to determine the value of the fund’s investments. These inputs are summarized in three broad levels for financial statement purposes. The inputs or methodologies used to value securities are not necessarily an indication of the risk associated with investing in those securities.
Level 1—Quoted prices in active markets for identical securities.
Level 2—Other significant observable inputs (including quoted prices for similar securities, interest rates, prepayment speeds, credit risk, etc.).
Level 3—Significant unobservable inputs (including the fund’s own assumptions used to determine the fair value of investments).
The following table summarizes the fund’s investments as of October 31, 2009, based on the inputs used to value them:
| | | |
| | Level 1 | Level 2 | Level 3 |
| Investments | ($000) | ($000) | ($000) |
| Common Stocks | 863,577 | 5,827,415 | 98 |
| Temporary Cash Investments | 97,157 | — | — |
| Total | 960,734 | 5,827,415 | 98 |
48
FTSE All-World ex-US Index Fund
The following table summarizes changes in investments valued based on Level 3 inputs during the year ended October 31, 2009:
| |
| | Investments in |
| | Common Stocks |
| Amount Valued Based on Level 3 Inputs | ($000) |
| Balance as of October 31, 2008 | — |
| Transfers into Level 3 | 83 |
| Change in Unrealized Appreciation (Depreciation) | 15 |
| Balance as of October 31, 2009 | 98 |
D. Distributions are determined on a tax basis and may differ from net investment income and realized capital gains for financial reporting purposes. Differences may be permanent or temporary. Permanent differences are reclassified among capital accounts in the financial statements to reflect their tax character. Temporary differences arise when certain items of income, expense, gain, or loss are recognized in different periods for financial statement and tax purposes; these differences will reverse at some time in the future. Differences in classification may also result from the treatment of short-term gains as ordinary income for tax purposes.
During the year ended October 31, 2009, the fund realized net foreign currency gains of $1,016,000, which increased distributable net income for tax purposes; accordingly, such gains have been reclassified from accumulated net realized losses to undistributed net investment income. Certain of the fund’s investments are in securities considered to be “passive foreign investment companies,” for which any unrealized appreciation and/or realized gains are required to be included in distributable net income for tax purposes. Unrealized appreciation of $113,000 on the fund’s passive foreign investment company holdings at October 31, 2008, has been distributed and is reflected in the balance of undistributed net investment income. During the year ended October 31, 2009, the fund realized gains on the sale of passive foreign investment companies of $526,000, which have been included in current and prior periods’ taxable income; accordingly, such gains have been reclassified from accumulated net realized losses to undistributed net investment income. Unrealized appreciation of the fund’s passive foreign investment company holdings at October 31, 2009, was $8,625,000.
During the year ended October 31, 2009, the fund realized $22,538,000 of net capital gains resulting from in-kind redemptions—in which shareholders exchanged fund shares for securities held by the fund rather than for cash. Because such gains are not taxable to the fund, and are not distributed to shareholders, they have been reclassified from accumulated net realized losses to paid-in capital.
For tax purposes, at October 31, 2009, the fund had $124,114,000 of ordinary income available for distribution. The fund had available capital loss carryforwards totaling $169,416,000 to offset future net capital gains of $1,431,000 through October 31, 2015, $29,919,000 through October 31, 2016, and $138,066,000 through October 31, 2017.
At October 31, 2009, the cost of investment securities for tax purposes was $6,840,302,000. Net unrealized depreciation of investment securities for tax purposes was $52,055,000, consisting of unrealized gains of $479,501,000 on securities that had risen in value since their purchase and $531,556,000 in unrealized losses on securities that had fallen in value since their purchase.
49
FTSE All-World ex-US Index Fund
E. During the year ended October 31, 2009, the fund purchased $3,550,767,000 of investment securities and sold $560,890,000 of investment securities, other than temporary cash investments.
F. Capital share transactions for each class of shares were:
| | | | |
| | | | Year Ended October 31, |
| | | 2009 | | 2008 |
| | Amount | Shares | Amount | Shares |
| | ($000) | (000) | ($000) | (000) |
| Investor Shares | | | | |
| Issued | 453,982 | 34,011 | 379,549 | 20,129 |
| Issued in Lieu of Cash Distributions | 6,512 | 547 | 1,746 | 76 |
| Redeemed1 | (161,356) | (12,363) | (101,321) | (5,570) |
| Net Increase (Decrease)—Investor Shares | 299,138 | 22,195 | 279,974 | 14,635 |
| Institutional Shares | | | | |
| Issued | 1,042,403 | 15,798 | 617,923 | 6,448 |
| Issued in Lieu of Cash Distributions | 11,869 | 199 | 934 | 8 |
| Redeemed1 | (220,030) | (3,548) | (55,346) | (720) |
| Net Increase (Decrease)—Institutional Shares | 834,242 | 12,449 | 563,511 | 5,736 |
| ETF Shares | | | | |
| Issued | 1,968,655 | 56,827 | 1,761,621 | 37,286 |
| Issued in Lieu of Cash Distributions | — | — | — | — |
| Redeemed1 | (154,819) | (5,100) | (51,697) | (1,800) |
| Net Increase (Decrease)—ETF Shares | 1,813,836 | 51,727 | 1,709,924 | 35,486 |
| 1 Net of redemption fees for fiscal 2009 and 2008 of $154,000 and $164,000, respectively (fund totals). | | |
G. In preparing the financial statements as of October 31, 2009, management considered the impact of subsequent events occurring through December 15, 2009, for potential recognition or disclosure in these financial statements.
50
FTSE All-World ex-US Small-Cap Index Fund
Fund Profile
As of October 31, 2009
| | |
| Portfolio Characteristics | | |
| | | Target |
| | Fund | Index1 |
| Number of Stocks | 2,376 | 2,979 |
| Turnover Rate | 19% | — |
| Expense Ratio2 | | — |
| Investor Shares | 0.60% | |
| Institutional Shares | 0.35% | |
| ETF Shares | 0.38% | |
| Short-Term Reserves | 1.4% | — |
| | |
| Sector Diversification (% of equity exposure) |
| | | Target |
| | Fund | Index1 |
| Consumer Discretionary | 15.2% | 14.9% |
| Consumer Staples | 5.6 | 5.4 |
| Energy | 6.1 | 6.0 |
| Financials | 19.7 | 18.2 |
| Health Care | 4.9 | 4.8 |
| Industrials | 22.2 | 24.7 |
| Information Technology | 9.4 | 9.3 |
| Materials | 13.5 | 13.3 |
| Telecommunication Services | 0.7 | 0.8 |
| Utilities | 2.7 | 2.6 |
| | |
| Ten Largest Holdings3 (% of total net assets) |
| Yamana Gold Inc. | gold | 0.5% |
| Fairfax Financial | | |
| Holdings Ltd. | multi-line insurance | 0.4 |
| First Quantum | diversified metals | |
| Minerals Ltd. | and mining | 0.3 |
| SNC-Lavalin Group Inc. | construction and | |
| | engineering | 0.3 |
| Tim Hortons Inc. | restaurants | 0.3 |
| IAMGOLD Corp. | gold | 0.3 |
| Fortis Inc. | electric | 0.3 |
| Eldorado Gold Corp. | gold | 0.3 |
| Votorantim Celulose | | |
| e Papel SA | paper products | 0.3 |
| Serco Group PLC | environmental and | |
| | facilities services | 0.3 |
| Top Ten | | 3.3% |
Allocation by Region (% of equity exposure)
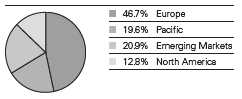
1 FTSE Global Small Cap ex US Index.
2 The expense ratios shown are from the prospectus dated February 27, 2009, and represent estimated costs for the current fiscal year based on the fund’s net assets as of the prospectus date. For the fiscal year ended October 31, 2009, the expense ratios were 0.78% for Investor Shares, 0.52% for Institutional Shares, and 0.55% for ETF Shares.
3 The holdings listed exclude temporary cash investments and equity index products.
See the Glossary for investment terms.
51
FTSE All-World ex-US Small-Cap Index Fund
| | |
| Market Diversification (% of equity exposure) |
| | | Target |
| | Fund | Index1 |
| Europe | | |
| United Kingdom | 16.1% | 16.3% |
| France | 4.4 | 4.2 |
| Switzerland | 4.2 | 4.2 |
| Germany | 3.5 | 3.7 |
| Sweden | 2.9 | 3.0 |
| Italy | 2.5 | 2.3 |
| Netherlands | 2.1 | 2.2 |
| Spain | 1.8 | 1.9 |
| Finland | 1.7 | 1.6 |
| Norway | 1.7 | 1.8 |
| Belgium | 1.4 | 1.4 |
| Austria | 1.2 | 1.1 |
| Denmark | 1.1 | 1.0 |
| Other Europe | 2.1 | 1.9 |
| Subtotal | 46.7% | 46.6% |
| Pacific | | |
| Japan | 12.5% | 12.9% |
| Australia | 4.4 | 4.5 |
| Singapore | 1.4 | 1.1 |
| Hong Kong | 1.1 | 2.5 |
| Other Pacific | 0.2 | 0.2 |
| Subtotal | 19.6% | 21.2% |
| Emerging Markets | | |
| Taiwan | 5.1% | 5.1% |
| South Korea | 3.0 | 3.0 |
| India | 2.7 | 2.6 |
| China | 2.6 | 1.3 |
| Brazil | 2.0 | 2.1 |
| Other Emerging Markets | 5.5 | 5.5 |
| Subtotal | 20.9% | 19.6% |
| North America | | |
| Canada | 12.8% | 12.6% |
1 FTSE Global Small Cap ex US Index.
See the Glossary for investment terms.
52
FTSE All-World ex-US Small-Cap Index Fund
Performance Summary
All of the returns in this report represent past performance, which is not a guarantee of future results that may be achieved by the fund. (Current performance may be lower or higher than the performance data cited. For performance data current to the most recent month-end, visit our website at www.vanguard.com/performance.) Note, too, that both investment returns and principal value can fluctuate widely, so an investor’s shares, when sold, could be worth more or less than their original cost. The returns shown do not reflect taxes that a shareholder would pay on fund distributions or on the sale of fund shares.
Cumulative Performance: April 2, 2009–October 31, 2009
Initial Investment of $10,000
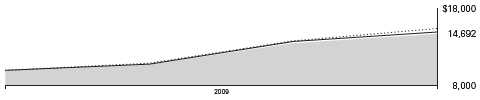
| | |
| Average Annual Total Returns | |
| Period Ended October 31, 2009 | Final Value |
| | Since | of a $10,000 |
| | Inception1 | Investment |
| FTSE All-World ex-US Small-Cap Index Fund | | |
| Investor Shares2 | 49.15% | $14,692 |
| FTSE Global Small Cap ex US Index | 53.89 | 15,389 |
| International Small-Cap Funds Average3 | 49.57 | 14,957 |
| |
| | | Final Value of |
| | Since | a $5,000,000 |
| | Inception1 | Investment |
| FTSE All-World ex-US Small-Cap Index Fund Institutional Shares2 | 49.40% | $7,358,787 |
| FTSE Global Small Cap ex US Index | 53.89 | 7,694,530 |
| |
| | | Final Value |
| | Since | of a $10,000 |
| | Inception1 | Investment |
| FTSE All-World ex-US Small-Cap Index Fund ETF Shares Net Asset Value4 | 49.37% | $14,937 |
| FTSE Global Small Cap ex US Index | 53.89 | 15,389 |
1 Performance for the fund and its comparative standards is calculated since the inception date: April 2, 2009.
2 Total returns do not reflect the 0.75% fee assessed on purchases and redemptions of shares held for less than two months, nor for the Investor Shares do they include the account service fee that may be applicable to certain accounts with balances below $10,000.
3 Derived from data provided by Lipper Inc.
4 For more information about how the ETF Shares’ market prices have compared with their net asset value, visit www.vanguard.com, select your ETF, and then select the Performance tab. The Premium/Discount table there shows the percentages of days on which the ETF Shares’ market price was above or below the NAV.
53
FTSE All-World ex-US Small-Cap Index Fund
| |
| Cumulative Returns—ETF Shares: April 2, 2009–October 31, 2009 | |
| | Cumulative |
| | Since Inception1 |
| FTSE All-World ex-US Index Small-Cap Fund ETF Shares Market Price | 49.10% |
| FTSE All-World ex-US Index Small-Cap Fund ETF Shares Net Asset Value | 49.37 |
| FTSE Global Small Cap ex US Index | 53.89 |
Fiscal-Year Total Returns (%): April 2, 2009–October 31, 2009
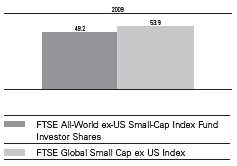
Average Annual Total Returns: Period Ended September 30, 2009
This table presents average annual total returns through the latest calendar quarter—rather than through the end
of the fiscal period. Securities and Exchange Commission rules require that we provide this information.
| | |
| | | Since |
| | Inception Date | Inception |
| FTSE All-World ex-US Small-Cap Index Fund | | |
| Investor Shares | 4/2/2009 | 52.45% |
| Fee-Adjusted Returns2 | | 50.18 |
| Institutional Shares | 4/2/2009 | 52.67 |
| Fee-Adjusted Returns2 | | 50.40 |
| ETF Shares | 4/2/2009 | |
| Market Price | | 53.16 |
| Net Asset Value | | 52.64 |
1 Total returns do not include the account service fee that may be applicable to certain accounts with balances below $10,000.
2 Total returns do not reflect the 0.75% transaction fee on purchases or redemptions of shares held for less than two months.
Note: See Financial Highlights tables for dividend and capital gains information.
54
FTSE All-World ex-US Small-Cap Index Fund
Financial Statements
Statement of Net Assets
As of October 31, 2009
The fund reports a complete list of its holdings in regulatory filings four times in each fiscal year, at the quarter-ends. For the second and fourth fiscal quarters, the lists appear in the fund’s semiannual and annual reports to shareholders. For the first and third fiscal quarters, the fund files the lists with the Securities and Exchange Commission on Form N-Q. Shareholders can look up the fund’s Forms N-Q on the SEC’s website at www.sec.gov. Forms N-Q may also be reviewed and copied at the SEC’s Public Reference Room (see the back cover of this report for further information).
| | | |
| | | | Market |
| | | | Value• |
| | | Shares | ($000) |
| Common Stocks (100.0%) | | |
| Argentina (0.1%) | | |
| * | Grupo Financiero Galicia | | |
| | SA ADR | 35,308 | 205 |
| |
| Australia (4.4%) | | |
| * | Arrow Energy Ltd. | 148,055 | 535 |
| | Primary Health Care Ltd. | 89,409 | 486 |
| | David Jones Ltd. | 97,626 | 462 |
| | JB Hi-Fi Ltd. | 21,468 | 395 |
| | Campbell Brothers Ltd. | 15,051 | 388 |
| | United Group Ltd. | 31,596 | 380 |
| | Transfield Services Ltd. | 98,054 | 370 |
| * | Sino Gold Mining Ltd. | 59,285 | 348 |
| | MacArthur Coal Ltd. | 40,578 | 304 |
| | APA Group | 105,457 | 298 |
| | ING Office Fund | 556,350 | 294 |
| | Infigen Energy | 207,054 | 264 |
| | Monadelphous Group Ltd. | 22,193 | 264 |
| | Felix Resources Ltd. | 16,851 | 257 |
| | Australian Worldwide | | |
| | Exploration Ltd. | 109,932 | 252 |
| | ConnectEast Group | 706,700 | 250 |
| | Ramsay Health Care Ltd. | 26,398 | 250 |
| | Platinum Asset | | |
| | Management Ltd. | 48,852 | 247 |
| | Iress Market Technology Ltd. | 35,225 | 243 |
| | Healthscope Ltd. | 56,594 | 240 |
| * | Mount Gibson Iron Ltd. | 222,446 | 235 |
| | Seek Ltd. | 43,666 | 235 |
| * | Pacific Brands Ltd. | 193,079 | 225 |
| | Centennial Coal Co. Ltd. | 78,990 | 221 |
| * | PanAust Ltd. | 526,235 | 215 |
| *,^ | Silex Systems Ltd. | 37,669 | 214 |
| * | Boart Longyear Group | 870,705 | 210 |
| | Wotif.com Holdings Ltd. | 37,751 | 203 |
| | Invocare Ltd. | 37,321 | 196 |
| * | Transpacific Industries | | |
| | Group Ltd. | 144,333 | 193 |
| | Crane Group Ltd. | 23,620 | 190 |
| | | |
| | | | Market |
| | | | Value• |
| | | Shares | ($000) |
| * | Karoon Gas Australia Ltd. | 27,911 | 189 |
| * | Riversdale Mining Ltd. | 38,717 | 183 |
| | Australian | | |
| | Infrastructure Fund | 111,942 | 177 |
| | Macquarie | | |
| | CountryWide Trust | 300,702 | 166 |
| * | GrainCorp Ltd. | 25,882 | 161 |
| | Kingsgate Consolidated Ltd. | 23,563 | 159 |
| | Beach Petroleum Ltd. | 225,611 | 158 |
| | Cromwell Group | 232,689 | 156 |
| ^ | Cabcharge Australia Ltd. | 29,431 | 155 |
| * | Aquila Resources Ltd. | 22,878 | 148 |
| * | Minara Resources Ltd. | 179,583 | 139 |
| | Bradken Ltd. | 24,929 | 137 |
| * | Andean Resources Ltd. | 67,551 | 133 |
| | Abacus Property Group | 343,703 | 131 |
| | iSOFT Group Ltd. | 178,369 | 128 |
| * | Mineral Deposits Ltd. | 143,289 | 124 |
| * | Mirabela Nickel Ltd. | 51,745 | 124 |
| | Bunnings Warehouse | | |
| | Property Trust | 80,905 | 120 |
| * | Atlas Iron Ltd. | 75,510 | 118 |
| | Seven Network Ltd. | 20,150 | 116 |
| * | Pharmaxis Ltd. | 49,538 | 112 |
| *,^ | Western Areas NL | 26,144 | 111 |
| | Emeco Holdings Ltd. | 142,982 | 111 |
| | FKP Property Group | 175,724 | 108 |
| *,^ | ING Industrial Fund | 237,164 | 107 |
| *,^ | Coal of Africa Ltd. | 63,136 | 104 |
| * | Murchison Metals Ltd. | 79,828 | 100 |
| * | Linc Energy Ltd. | 71,588 | 99 |
| *,^ | Lynas Corp. Ltd. | 233,012 | 98 |
| * | St Barbara Ltd. | 347,554 | 94 |
| | Independence Group NL | 23,925 | 91 |
| | GUD Holdings Ltd. | 11,459 | 88 |
| | SAI Global Ltd. | 28,274 | 88 |
| | Panoramic Resources Ltd. | 40,875 | 84 |
| | Alesco Corp. Ltd. | 18,610 | 83 |
| * | Gindalbie Metals Ltd. | 101,128 | 78 |
| | Ausenco Ltd. | 17,978 | 78 |
| | Fleetwood Corp. Ltd. | 11,221 | 76 |
55
FTSE All-World ex-US Small-Cap Index Fund
| | | |
| | | | Market |
| | | | Value• |
| | | Shares | ($000) |
| | Hastings Diversified | | |
| | Utilities Fund | 84,319 | 75 |
| * | Macmahon Holdings Ltd. | 150,067 | 75 |
| * | Roc Oil Co. Ltd. | 136,522 | 74 |
| | Hastie Group Ltd. | 43,356 | 73 |
| | Energy Developments Ltd. | 33,836 | 73 |
| | Centro Retail Group | 477,084 | 69 |
| | Straits Resources Ltd. | 48,378 | 68 |
| | Reject Shop Ltd. | 5,717 | 67 |
| * | Hills Industries Ltd. | 36,091 | 66 |
| | Mincor Resources NL | 34,650 | 66 |
| | Programmed Maintenance | | |
| | Services Ltd. | 16,876 | 65 |
| * | International Ferro | | |
| | Metals Ltd. | 94,788 | 65 |
| * | Carnarvon Petroleum Ltd. | 134,825 | 64 |
| | Macquarie Media Group Ltd. | 38,817 | 63 |
| | Austal Ltd. | 29,066 | 63 |
| | Dominion Mining Ltd. | 19,383 | 61 |
| | Oakton Ltd. | 17,953 | 56 |
| * | Sundance Resources Ltd. | 410,076 | 56 |
| | Skilled Group Ltd. | 27,487 | 55 |
| *,^ | Avoca Resources Ltd. | 40,364 | 55 |
| | SMS Management & | | |
| | Technology Ltd. | 11,621 | 54 |
| * | Nexus Energy Ltd. | 187,782 | 53 |
| | Challenger Diversified | | |
| | Property Group | 120,351 | 51 |
| | Clough Ltd. | 66,026 | 49 |
| | STW Communications | | |
| | Group Ltd. | 63,204 | 47 |
| | Ardent Leisure Group | 38,976 | 47 |
| * | Energy World Corp. Ltd. | 107,444 | 46 |
| ^ | WHK Group Ltd. | 46,616 | 43 |
| | Aspen Group | 94,711 | 43 |
| * | Lend Lease Primelife Ltd. | 152,320 | 41 |
| * | Platinum Australia Ltd. | 50,959 | 41 |
| | Ridley Corp. Ltd. | 42,562 | 41 |
| * | Sunland Group Ltd. | 57,928 | 38 |
| * | Australian | | |
| | Agricultural Co. Ltd. | 27,499 | 36 |
| | Astro Japan Property Trust | 90,360 | 35 |
| * | Alliance Resources Ltd. | 55,152 | 31 |
| | Australian Pharmaceutical | | |
| | Industries Ltd. | 44,158 | 29 |
| | Coffey International Ltd. | 14,670 | 29 |
| * | PMP Ltd. | 52,423 | 28 |
| * | Geodynamics Ltd. | 31,590 | 26 |
| | AJ Lucas Group Ltd. | 6,262 | 24 |
| * | Tap Oil Ltd. | 21,363 | 20 |
| * | Austar United | | |
| | Communications Ltd. | 17,132 | 20 |
| * | South Australian Coal Corp. | 15,191 | 1 |
| | | | 15,678 |
| | | |
| | | | Market |
| | | | Value• |
| | | Shares | ($000) |
| Austria (1.2%) | | |
| *,^ | Wienerberger AG | 27,280 | 493 |
| | Andritz AG | 7,895 | 435 |
| *,^ | Immofinanz AG | 97,038 | 333 |
| * | CA Immobilien Anlagen AG | 22,249 | 329 |
| *,^ | Atrium European | | |
| | Real Estate Ltd. | 48,312 | 316 |
| * | Intercell AG | 7,906 | 306 |
| * | Conwert Immobilien Invest | | |
| | SE | 21,233 | 259 |
| * | bwin Interactive | | |
| | Entertainment AG | 5,112 | 247 |
| *,^ | RHI AG | 8,135 | 226 |
| | Semperit AG Holding | 5,445 | 192 |
| | Mayr Melnhof Karton AG | 1,724 | 162 |
| | Oesterreichische Post AG | 5,478 | 160 |
| | Flughafen Wien AG | 3,126 | 157 |
| | Schoeller-Bleckmann Oilfield | | |
| | Equipment AG | 3,356 | 157 |
| * | Sparkassen Immobilien AG | 15,254 | 120 |
| | Agrana Beteiligungs AG | 945 | 89 |
| | BWT AG | 1,962 | 50 |
| * | CA Immo International AG | 5,991 | 49 |
| | Palfinger AG | 2,040 | 48 |
| | Kapsch TrafficCom AG | 1,302 | 46 |
| * | A-TEC Industries AG | 1,573 | 24 |
| | | | 4,198 |
| Belgium (1.4%) | | |
| | Telenet Group Holding NV | 15,924 | 425 |
| | Ackermans & van Haaren NV | 5,569 | 403 |
| | Sofina SA | 4,156 | 389 |
| | Bekaert SA | 2,847 | 366 |
| | Befimmo SCA Sicafi | 3,263 | 311 |
| * | Nyrstar | 21,654 | 252 |
| | D’ieteren SA | 687 | 249 |
| | Banque Nationale | | |
| | de Belgique | 47 | 238 |
| | Cofinimmo | 1,591 | 229 |
| | Omega Pharma SA | 4,400 | 216 |
| | EVS Broadcast Equipment | | |
| | SA | 2,473 | 182 |
| | Warehouses De Pauw SCA | 3,518 | 178 |
| * | AGFA-Gevaert NV | 29,115 | 175 |
| | Tessenderlo Chemie NV | 4,664 | 171 |
| | Compagnie Maritime Belge | | |
| | SA | 4,900 | 147 |
| * | RHJ International | 20,148 | 147 |
| | Sipef SA | 2,490 | 132 |
| | Elia System Operator SA/NV | 3,147 | 127 |
| ^ | Euronav NV | 6,220 | 121 |
| | Compagnie d’Entreprises | | |
| | CFE | 1,982 | 113 |
| | Gimv NV | 1,841 | 104 |
| * | KBC Ancora | 3,154 | 76 |
| | Van de Velde | 1,586 | 65 |
56
FTSE All-World ex-US Small-Cap Index Fund
| | | |
| | | | Market |
| | | | Value• |
| | | Shares | ($000) |
| | Melexis NV | 5,555 | 58 |
| * | Barco NV | 1,326 | 53 |
| | Ion Beam Applications | 2,799 | 38 |
| | Intervest Offices | 1,124 | 37 |
| | | | 5,002 |
| Brazil (2.0%) | | |
| * | Votorantim Celulose e | | |
| | Papel SA | 55,860 | 765 |
| | PDG Realty SA | | |
| | Empreendimentos e | | |
| | Participacoes | 51,600 | 431 |
| | Lojas Renner SA | 24,200 | 429 |
| | Gafisa SA | 27,400 | 406 |
| * | BR Malls Participacoes SA | 31,200 | 334 |
| | MRV Engenharia e | | |
| | Participacoes SA | 15,600 | 293 |
| * | Duratex SA | 41,362 | 286 |
| * | LLX Logistica SA | 69,000 | 270 |
| | Totvs SA | 4,600 | 251 |
| | Banco do Estado do | | |
| | Rio Grande do Sul | 38,100 | 242 |
| | Rossi Residencial SA | 32,400 | 214 |
| | Cia de Saneamento de | | |
| | Minas Gerais-COPASA | 11,700 | 206 |
| | Multiplan Empreendimentos | | |
| | Imobiliarios SA | 13,500 | 204 |
| | Localiza Rent a Car SA | 18,745 | 196 |
| * | MMX Mineracao e | | |
| | Metalicos SA | 29,926 | 196 |
| * | Gol Linhas Aereas | | |
| | Inteligentes SA | 19,100 | 195 |
| | M Dias Branco SA | 8,917 | 192 |
| * | Marfrig Alimentos SA | 16,000 | 183 |
| * | Amil Participacoes SA | 29,700 | 169 |
| | Randon Participacoes SA | 21,800 | 165 |
| | Confab Industrial SA | 55,944 | 164 |
| | Brookfield Incorporacoes SA | 38,147 | 145 |
| * | Votorantim Celulose e | | |
| | Papel SA ADR | 10,000 | 137 |
| | Cia Energetica de | | |
| | Minas Gerais ADR | 8,500 | 134 |
| * | Diagnosticos da America SA | 5,300 | 131 |
| | MPX Energia SA | 8,000 | 108 |
| * | Lupatech SA | 6,900 | 105 |
| | Marcopolo SA | 28,428 | 98 |
| | Cyrela Commercial | | |
| | Properties SA | | |
| | Empreendimentos e | 15,500 | 92 |
| | Contax Participacoes SA | 1,900 | 85 |
| | Santos Brasil Participacoes | | |
| | SA | 10,800 | 84 |
| * | LPS Brasil Consultoria de | | |
| | Imoveis SA | 7,700 | 81 |
| | Grendene SA | 15,400 | 69 |
| | Uniao de Industrias | | |
| | Petroquimicas SA | 111,400 | 67 |
| | | |
| | | | Market |
| | | | Value• |
| | | Shares | ($000) |
| | Guararapes Confeccoes SA | 2,200 | 53 |
| | Cia de Tecidos do Norte de | | |
| | Minas-Coteminas | 14,200 | 47 |
| | | | 7,227 |
| Canada (12.8%) | | |
| | Yamana Gold Inc. | 152,325 | 1,616 |
| | Fairfax Financial | | |
| | Holdings Ltd. | 3,966 | 1,419 |
| | First Quantum Minerals Ltd. | 16,156 | 1,105 |
| | SNC-Lavalin Group Inc. | 27,280 | 1,103 |
| | IAMGOLD Corp. | 76,480 | 1,014 |
| | Fortis Inc. | 41,654 | 974 |
| | Tim Hortons Inc. | 33,725 | 960 |
| * | Eldorado Gold Corp. | 83,155 | 927 |
| * | Petrobank Energy & | | |
| | Resources Ltd. | 20,165 | 882 |
| | Metro Inc. Class A | 26,180 | 817 |
| | RioCan Real Estate | | |
| | Investment Trust | 48,110 | 815 |
| * | Silver Wheaton Corp. | 64,600 | 812 |
| | Niko Resources Ltd. | 8,966 | 726 |
| * | Viterra Inc. | 73,294 | 698 |
| * | PetroBakken Energy Ltd. | | |
| | Class A | 23,930 | 690 |
| ^ | Emera Inc. | 33,320 | 678 |
| | Intact Financial Corp. | 22,100 | 672 |
| * | Sino-Forest Corp. | 46,339 | 652 |
| * | Ivanhoe Mines Ltd. | 60,100 | 648 |
| * | Red Back Mining Inc. | 48,399 | 627 |
| | Inmet Mining Corp. | 11,615 | 616 |
| | Franco-Nevada Corp. | 23,660 | 588 |
| *,^ | Pacific Rubiales Energy Corp. | 45,100 | 549 |
| * | Equinox Minerals Ltd. | 145,340 | 489 |
| | Alimentation Couche | | |
| | Tard Inc. Class B | 27,700 | 486 |
| | Progress Energy | | |
| | Resources Corp. | 36,600 | 468 |
| | TMX Group Inc. | 17,200 | 461 |
| * | Gildan Activewear Inc. | 25,300 | 446 |
| | Industrial Alliance Insurance | | |
| | and Financial Services Inc. | 17,000 | 436 |
| * | HudBay Minerals Inc. | 33,000 | 427 |
| | CAE Inc. | 53,100 | 414 |
| | Atco Ltd. | 10,400 | 408 |
| | Ensign Energy Services Inc. | 27,340 | 392 |
| | H&R Real Estate | | |
| | Investment Trust | 31,800 | 386 |
| | Sherritt International Corp. | 60,119 | 386 |
| * | Pan American Silver Corp. | 18,200 | 385 |
| * | RONA Inc. | 27,825 | 381 |
| * | Lundin Mining Corp. | 93,499 | 376 |
| | Boardwalk Real Estate | | |
| | Investment Trust | 10,150 | 347 |
| | Methanex Corp. | 20,100 | 347 |
| * | Celestica Inc. | 41,300 | 340 |
| | Astral Media Inc. Class A | 11,366 | 337 |
57
FTSE All-World ex-US Small-Cap Index Fund
| | | |
| | | | Market |
| | | | Value• |
| | | Shares | ($000) |
| | ShawCor Ltd. Class A | 12,700 | 331 |
| | Biovail Corp. | 24,129 | 326 |
| | Canadian Real Estate | | |
| | Investment Trust | 13,710 | 324 |
| | Calloway Real Estate | | |
| | Investment Trust | 19,400 | 317 |
| * | Open Text Corp. | 8,370 | 313 |
| | Canadian Western Bank | 15,700 | 310 |
| *,^ | Osisko Mining Corp. | 44,800 | 302 |
| | AGF Management Ltd. | | |
| | Class B | 20,220 | 301 |
| * | New Gold Inc. | 81,438 | 295 |
| * | Quadra Mining Ltd. | 21,100 | 294 |
| * | MacDonald Dettwiler & | | |
| | Associates Ltd. | 8,500 | 290 |
| | Jean Coutu Group PJC Inc. | 34,800 | 284 |
| | Groupe Aeroplan Inc. | 32,500 | 278 |
| | Home Capital Group Inc. | | |
| | Class B | 7,900 | 266 |
| | Gerdau Ameristeel Corp. | 37,300 | 254 |
| | Onex Corp. | 11,120 | 251 |
| | Manitoba Telecom | | |
| | Services Inc. | 8,640 | 251 |
| | Maple Leaf Foods Inc. | 23,700 | 246 |
| * | European Goldfields Ltd. | 43,400 | 245 |
| | Dundee Corp. Class A | 22,600 | 234 |
| * | Thompson Creek | | |
| | Metals Co. Inc. | 23,115 | 233 |
| | Russel Metals Inc. | 15,400 | 225 |
| * | MDS Inc. | 28,200 | 223 |
| * | Stantec Inc. | 9,120 | 220 |
| * | Gammon Gold Inc. | 25,500 | 207 |
| | Toromont Industries Ltd. | 9,040 | 207 |
| | Dorel Industries Inc. Class B | 7,700 | 207 |
| | Canadian Apartment | | |
| | Properties REIT | 15,910 | 198 |
| * | NuVista Energy Ltd. | 18,650 | 198 |
| * | UTS Energy Corp. | 104,800 | 198 |
| | Silvercorp Metals Inc. | 37,900 | 196 |
| | Primaris Retail Real Estate | | |
| | Investment Trust | 13,265 | 193 |
| | Cogeco Cable Inc. | 6,736 | 193 |
| | Trican Well Service Ltd. | 16,440 | 192 |
| *,^ | Uranium One Inc. | 67,100 | 190 |
| * | Birchcliff Energy Ltd. | 28,100 | 190 |
| | Cominar Real Estate | | |
| | Investment Trust | 11,405 | 190 |
| * | Alamos Gold Inc. | 23,700 | 189 |
| * | FNX Mining Co. Inc. | 20,100 | 187 |
| | Linamar Corp. | 13,080 | 183 |
| | Quebecor Inc. Class B | 8,905 | 182 |
| | Reitmans Canada Ltd. | | |
| | Class A | 12,046 | 182 |
| * | Celtic Exploration Ltd. | 9,955 | 179 |
| * | Western Canadian Coal Corp. | 66,922 | 173 |
| | | |
| | | | Market |
| | | | Value• |
| | | Shares | ($000) |
| * | Golden Star Resources Ltd. | 54,600 | 170 |
| * | Northgate Minerals Corp. | 66,400 | 170 |
| * | Silver Standard | | |
| | Resources Inc. | 9,000 | 169 |
| | First Capital Realty Inc. | 9,040 | 164 |
| | DundeeWealth Inc. | 14,164 | 164 |
| | Transcontinental Inc. Class A | 13,485 | 162 |
| | Laurentian Bank of Canada | 4,400 | 161 |
| | CCL Industries Class B | 7,600 | 158 |
| *,^ | Centerra Gold Inc. | 19,500 | 150 |
| | Trinidad Drilling Ltd. | 22,700 | 148 |
| | CML Healthcare | | |
| | Income Fund | 11,780 | 146 |
| | Pason Systems Inc. | 13,880 | 146 |
| * | Aurizon Mines Ltd. | 33,700 | 145 |
| * | Sears Canada Inc. | 7,069 | 145 |
| * | Uranium Participation Corp. | 22,000 | 137 |
| * | Viterra Inc. | 14,432 | 136 |
| * | Novagold Resources Inc. | 31,700 | 136 |
| * | Canfor Corp. | 23,800 | 133 |
| * | Canaccord Capital Inc. | 12,460 | 131 |
| | Corus Entertainment Inc. | | |
| | Class B | 7,699 | 127 |
| * | Tim Hortons Inc. | 4,368 | 125 |
| * | Storm Exploration Inc. | 9,950 | 124 |
| | West Fraser Timber Co. Ltd. | 5,100 | 123 |
| * | Detour Gold Corp. | 9,700 | 120 |
| * | Crew Energy Inc. | 12,989 | 119 |
| * | Eastern Platinum Ltd. | 173,000 | 115 |
| | Aecon Group Inc. | 11,030 | 114 |
| * | Kirkland Lake Gold Inc. | 14,700 | 114 |
| | Chartwell Seniors | | |
| | Housing Real Estate | | |
| | Investment Trust | 20,480 | 113 |
| * | Denison Mines Corp. | 73,800 | 113 |
| * | ATS Automation Tooling | | |
| | Systems Inc. | 18,738 | 108 |
| | Torstar Corp. Class B | 14,748 | 105 |
| | Morguard Real Estate | | |
| | Investment Trust | 9,380 | 103 |
| * | OPTI Canada Inc. | 56,600 | 99 |
| | Extendicare Real Estate | | |
| | Investment Trust | 14,015 | 98 |
| * | Great Canadian | | |
| | Gaming Corp. | 14,040 | 98 |
| * | Fronteer Development | | |
| | Group Inc. | 25,510 | 97 |
| * | Martinrea International Inc. | 14,599 | 97 |
| | Savanna Energy | | |
| | Services Corp. | 14,200 | 94 |
| | Major Drilling Group | | |
| | International | 4,720 | 94 |
| | Harry Winston | | |
| | Diamond Corp. | 11,000 | 90 |
| * | Gabriel Resources Ltd. | 46,300 | 89 |
58
FTSE All-World ex-US Small-Cap Index Fund
| | | |
| | | | Market |
| | | | Value• |
| | | Shares | ($000) |
| * | Petro Andina Resources Inc. | 8,730 | 86 |
| * | Taseko Mines Ltd. | 31,440 | 85 |
| | Evertz Technologies Ltd. | 6,295 | 85 |
| | Daylight Resources Trust | 10,542 | 84 |
| | Calfrac Well Services Ltd. | 5,250 | 83 |
| * | Hanfeng Evergreen Inc. | 15,100 | 83 |
| | Cascades Inc. | 12,200 | 79 |
| *,^ | Mercator Minerals Ltd. | 34,600 | 78 |
| * | Paramount Resources Ltd. | | |
| | Class A | 6,150 | 77 |
| * | Fairborne Energy Ltd. | 18,300 | 75 |
| | Forzani Group Ltd. Class A | 6,340 | 73 |
| * | Galleon Energy Inc. Class A | 13,500 | 68 |
| *,^ | First Uranium Corp. | 27,100 | 68 |
| * | Connacher Oil and Gas Ltd. | 73,600 | 67 |
| * | Transat AT Inc. Class B | 4,980 | 67 |
| * | Flint Energy Services Ltd. | 6,000 | 65 |
| * | Atrium Innovations Inc. | 4,825 | 63 |
| | Dundee Real Estate | | |
| | Investment Trust | 3,510 | 62 |
| * | Aura Minerals Inc. | 21,400 | 62 |
| | InnVest Real Estate | | |
| | Investment Trust | 13,730 | 57 |
| * | QLT Inc. | 16,700 | 56 |
| | Canam Group Inc. | 8,350 | 53 |
| * | Compton Petroleum Corp. | 51,200 | 52 |
| * | Sierra Wireless Inc. | 5,750 | 52 |
| | Empire Co. Ltd. Class A | 1,300 | 52 |
| * | Corridor Resources Inc. | 16,600 | 48 |
| | Sprott Inc. | 11,500 | 46 |
| * | Iteration Energy Ltd. | 41,100 | 43 |
| * | FirstService Corp. | 2,400 | 43 |
| * | Cardiome Pharma Corp. | 10,360 | 40 |
| * | Kingsway Financial | | |
| | Services Inc. | 10,300 | 39 |
| * | Absolute Software Corp. | 7,489 | 35 |
| * | Uex Corp. | 33,900 | 34 |
| * | Norbord Inc. | 2,460 | 34 |
| * | Ballard Power Systems Inc. | 13,120 | 28 |
| * | Timminco Ltd. | 14,700 | 25 |
| * | Cangene Corp. | 4,600 | 25 |
| | Melcor Developments Ltd. | 2,400 | 22 |
| * | Patheon Inc. | 8,300 | 20 |
| | | | 45,311 |
| Chile (0.2%) | | |
| | Empresas La Polar SA | 59,625 | 302 |
| | Inversiones Aguas | | |
| | Metropolitanas SA | 143,672 | 170 |
| | Masisa SA | 545,582 | 81 |
| * | Cia Sudamericana de | | |
| | Vapores SA | 85,488 | 70 |
| | Madeco SA | 722,080 | 47 |
| * | Empresas La Polar SA | | |
| | Rights Exp. 11/26/2009 | 7,752 | 3 |
| | | | 673 |
| | | |
| | | | Market |
| | | | Value• |
| | | Shares | ($000) |
| China (2.6%) | | |
| ^ | Geely Automobile | | |
| | Holdings Ltd. | 1,045,000 | 378 |
| | Fushan International Energy | |
| | Group Ltd. | 486,200 | 374 |
| | Tian An China Investment | 511,000 | 314 |
| | Xinao Gas Holdings Ltd. | 146,000 | 312 |
| | Poly Hong Kong | | |
| | Investment Ltd. | 273,000 | 312 |
| | Golden Eagle Retail | | |
| | Group Ltd. | 174,000 | 299 |
| | Minth Group Ltd. | 280,000 | 291 |
| ^ | Digital China Holdings Ltd. | 276,000 | 286 |
| ^ | China Everbright | | |
| | International Ltd. | 623,000 | 282 |
| | Zhuzhou CSR Times | | |
| | Electric Co. Ltd. | 155,000 | 281 |
| | China Dongxiang Group Co. | 450,500 | 275 |
| | Dalian Port PDA Co. Ltd. | 701,000 | 254 |
| | Sinotruk Hong Kong Ltd. | 208,500 | 248 |
| *,^ | BYD Electronic | | |
| | International Co. Ltd. | 261,000 | 243 |
| ^ | China Gas Holdings Ltd. | 598,600 | 240 |
| * | Hunan Non-Ferrous | | |
| | Metal Corp. Ltd. | 734,000 | 223 |
| * | AviChina Industry & | | |
| | Technology Co. | 648,000 | 209 |
| | China Green Holdings Ltd. | 216,000 | 189 |
| | Uni-President China | | |
| | Holdings Ltd. | 297,000 | 183 |
| | Shougang | | |
| | Concord International | | |
| | Enterprises Co. Ltd. | 942,000 | 162 |
| | China | | |
| | Pharmaceutical Group Ltd. | 288,000 | 162 |
| | China | | |
| | Resources Gas Group Ltd. | 158,000 | 153 |
| * | China Grand Forestry | | |
| | Green Resources | | |
| | Group Ltd. | 3,482,000 | 135 |
| | China Shanshui | | |
| | Cement Group Ltd. | 176,000 | 126 |
| | HKC Holdings Ltd. | 1,594,600 | 125 |
| | Franshion Properties | | |
| | China Ltd. | 422,400 | 118 |
| | New World Department | | |
| | Store China Ltd. | 130,000 | 116 |
| | China State Construction | | |
| | International Holdings Ltd. | 281,200 | 113 |
| | Intime Department Store | | |
| | Group Co. Ltd. | 154,000 | 108 |
| * | Lingbao Gold Co. Ltd. | 296,000 | 108 |
| *,^ | Tianjin Port Development | | |
| | Holdings Ltd. | 286,000 | 106 |
| * | China Power International | | |
| | Development Ltd. | 376,100 | 105 |
59
FTSE All-World ex-US Small-Cap Index Fund
| | | | |
| | | | | Market |
| | | | | Value• |
| | | | Shares | ($000) |
| | Sinolink Worldwide | | | |
| | Holdings Ltd. | | 536,000 | 103 |
| | Shanghai Jin Jiang | | | |
| | International Hotels | | | |
| | Group Co. | | 274,000 | 84 |
| | Baoye Group Co. Ltd. | | 106,000 | 81 |
| *,^ | Brilliance China Automotive | | |
| | Holdings Ltd. | | 424,000 | 78 |
| | Luthai Textile Co. Ltd. | | | |
| | Class B | | 106,000 | 76 |
| | Kingsoft Corp. Ltd. | | 75,000 | 70 |
| * | Nan Hai Corp. Ltd. | 4,850,000 | 69 |
| | Ajisen China Holdings Ltd. | 79,728 | 67 |
| | Jiangsu Future | | | |
| | Land Co. Ltd. Class B | 87,400 | 65 |
| | Sichuan | | | |
| | Expressway Co. Ltd. | | 150,000 | 65 |
| ^ | Shanghai Forte Land Co. | 210,000 | 64 |
| | AMVIG Holdings Ltd. | | 146,000 | 64 |
| *,^ | Sino Union Petroleum & | | |
| | Chemical International Ltd. | 740,000 | 63 |
| * | SRE Group Ltd. | | 552,000 | 63 |
| * | Pine Agritech Ltd. | | 485,000 | 60 |
| | Beijing Capital Land Ltd. | 142,000 | 60 |
| | Bosideng International | | | |
| | Holdings Ltd. | | 316,000 | 56 |
| | Lonking Holdings Ltd. | | 94,000 | 54 |
| * | TCL Multimedia Technology | | |
| | Holdings Ltd. | | 68,000 | 53 |
| | Huangshan Tourism | | | |
| | Development Co. Ltd. | | |
| | Class B | | 46,600 | 50 |
| | Hubei Sanonda Co. Ltd. | | |
| | Class B | | 114,100 | 47 |
| | Tomson Group Ltd. | | 102,000 | 46 |
| | Cosco International | | | |
| | Holdings Ltd. | | 106,000 | 45 |
| | China Hongxing Sports Ltd. | 316,000 | 44 |
| | Comba Telecom Systems | | |
| | Holdings Ltd. | | 41,800 | 43 |
| | Huaxin Cement Co. Ltd. | | |
| | Class B | | 21,800 | 42 |
| | Shanghai Prime | | | |
| | Machinery Co. Ltd. | | 230,000 | 41 |
| | Hangzhou Steam | | | |
| | Turbine Co. Class B | | 21,500 | 39 |
| | Haier Electronics | | | |
| | Group Co. Ltd. | | 106,000 | 39 |
| | Xiamen International | | | |
| | Port Co. Ltd. | | 196,000 | 36 |
| * | Minmetals Resources Ltd. | 136,000 | 36 |
| * | China Power New Energy | | |
| | Development Co. Ltd. | 540,000 | 36 |
| | Qingling Motors Co. Ltd. | 170,000 | 35 |
| * | China Mining Resources | | |
| | Group Ltd. | | 960,000 | 35 |
| | | |
| | | | Market |
| | | | Value• |
| | | Shares | ($000) |
| * | United Energy Group Ltd. | 626,000 | 33 |
| | Truly International Holdings | 30,000 | 31 |
| | Chongqing Iron & | | |
| | Steel Co. Ltd. | 82,000 | 30 |
| * | China Nickel Resources | | |
| | Holding Co. Ltd. | 156,000 | 28 |
| * | China Milk Products | | |
| | Group Ltd. | 78,000 | 25 |
| | Livzon Pharmaceutical Inc. | | |
| | Class B | 10,800 | 25 |
| | GZI Real Estate | | |
| | Investment Trust | 58,000 | 22 |
| | Shanghai Yaohua Pilkington | | |
| | Glass Co. Ltd. Class B | 39,800 | 18 |
| * | Shanghai Dajiang Group | | |
| | Class B | 55,100 | 18 |
| | Lao Feng Xiang Co. Ltd. | | |
| | Class B | 12,500 | 16 |
| * | SVA Electron Co. Ltd. | | |
| | Class B | 40,100 | 16 |
| | | | 9,001 |
| Denmark (1.1%) | | |
| * | DSV A/S | 43,449 | 675 |
| * | Topdanmark A/S | 3,484 | 502 |
| * | Jyske Bank A/S | 10,714 | 400 |
| * | Sydbank A/S | 13,592 | 332 |
| | SimCorp A/S | 1,430 | 275 |
| * | GN Store Nord | 48,704 | 273 |
| * | NKT Holding A/S | 4,505 | 256 |
| | ALK-Abello A/S | 2,466 | 209 |
| *,^ | Genmab A/S | 6,031 | 158 |
| | East Asiatic Co. Ltd. A/S | 4,032 | 146 |
| | Torm A/S | 13,147 | 141 |
| | Schouw & Co. | 4,210 | 82 |
| * | Bang & Olufsen A/S | 5,224 | 80 |
| | D/S Norden | 1,999 | 75 |
| * | Bavarian Nordic A/S | 1,681 | 67 |
| * | IC Companys A/S | 1,730 | 48 |
| | Auriga Industries Class B | 2,349 | 40 |
| * | Alm Brand A/S | 1,045 | 26 |
| | | | 3,785 |
| Finland (1.7%) | | |
| | Elisa Oyj | 33,628 | 651 |
| | YIT Oyj | 25,405 | 491 |
| | Pohjola Bank PLC | 39,827 | 443 |
| | Orion Oyj Class B | 17,375 | 330 |
| | Konecranes Oyj | 12,152 | 324 |
| | Tieto Oyj | 15,445 | 308 |
| | Uponor Oyj | 16,375 | 296 |
| | Huhtamaki Oyj | 21,594 | 292 |
| ^ | Amer Sports Oyj Class A | 31,097 | 272 |
| | Outotec Oyj | 8,248 | 261 |
| | Cargotec Corp. Class B | 10,854 | 233 |
| ^ | Kemira Oyj | 13,694 | 217 |
| * | Stockmann Oyj Abp Class B | 7,183 | 184 |
| * | Ramirent Oyj | 17,110 | 170 |
60
FTSE All-World ex-US Small-Cap Index Fund
| | | |
| | | | Market |
| | | | Value• |
| | | Shares | ($000) |
| *,^ | Talvivaara Mining Co. PLC | 28,509 | 168 |
| * | Sponda Oyj | 43,300 | 155 |
| ^ | Poyry Oyj | 10,364 | 153 |
| | Ruukki Group Oyj | 45,613 | 146 |
| * | Alma Media | 14,554 | 145 |
| | Citycon Oyj | 30,834 | 136 |
| | Lassila & Tikanoja Oyj | 5,548 | 124 |
| | Vacon PLC | 2,928 | 104 |
| | Oriola-KD Oyj | 18,942 | 100 |
| | Cramo Oyj | 4,180 | 68 |
| * | Finnair Oyj | 11,698 | 67 |
| | HKScan Oyj | 4,673 | 61 |
| * | M-real Oyj Class B | 36,124 | 53 |
| | | | 5,952 |
| France (4.4%) | | |
| | Groupe Eurotunnel SA | 82,074 | 811 |
| | Fonciere Des Regions | 7,249 | 799 |
| * | Gemalto NV | 17,839 | 750 |
| | Arkema SA | 14,908 | 569 |
| ^ | Bourbon SA | 12,637 | 526 |
| | M6-Metropole Television | 21,000 | 506 |
| | Etablissements Maurel | | |
| | et Prom | 24,528 | 493 |
| | Neopost SA | 5,013 | 439 |
| * | Valeo SA | 15,591 | 423 |
| | Nexans SA | 5,546 | 392 |
| | Mercialys SA | 9,515 | 383 |
| | Teleperformance | 10,872 | 349 |
| | Havas SA | 91,051 | 346 |
| | Societe Immobiliere de | | |
| | Location pour l’Industrie | | |
| | et le Commerce | 2,644 | 336 |
| * | Rhodia SA | 20,918 | 308 |
| | Sechilienne-Sidec | 6,836 | 276 |
| | SEB SA | 4,775 | 266 |
| | Zodiac Aerospace | 7,852 | 265 |
| | Saft Groupe SA | 5,029 | 261 |
| * | UBISOFT Entertainment | 16,228 | 256 |
| *,^ | SOITEC | 17,844 | 243 |
| * | Rexel SA | 16,339 | 218 |
| | SA des Ciments Vicat | 2,605 | 216 |
| | Canal & | 26,524 | 212 |
| ^ | Carbone Lorraine | 6,129 | 210 |
| | Remy Cointreau SA | 4,321 | 209 |
| | IPSOS | 6,200 | 190 |
| * | Alten Ltd. | 7,557 | 190 |
| | Derichebourg SA | 38,118 | 187 |
| | Nexity | 4,943 | 184 |
| | Rubis | 1,986 | 182 |
| | Beneteau SA | 11,581 | 181 |
| | Boiron SA | 4,101 | 169 |
| | April Group | 4,318 | 162 |
| | Ingenico | 6,499 | 160 |
| | Stallergenes | 1,864 | 157 |
| | Fimalac | 2,956 | 154 |
| | Pierre & Vacances | 1,776 | 146 |
| | | |
| | | | Market |
| | | | Value• |
| | | Shares | ($000) |
| * | Bongrain SA | 1,901 | 143 |
| | Rallye SA | 3,923 | 133 |
| | Societe Fonciere Financiere | | |
| | et de Participations FFP | 2,224 | 132 |
| | Esso SA Francaise | 952 | 130 |
| * | NicOx SA | 11,696 | 128 |
| * | Union Financiere de | | |
| | France BQE SA | 3,200 | 124 |
| | Groupe Steria SCA | 4,128 | 123 |
| | Delachaux SA | 1,778 | 123 |
| | Virbac SA | 1,305 | 123 |
| | Orpea | 2,721 | 123 |
| * | Altran Technologies SA | 22,619 | 109 |
| | Seche Environnement SA | 1,275 | 109 |
| | Guyenne et Gascogne SA | 1,051 | 105 |
| | Eurofins Scientific | 2,178 | 99 |
| | Bonduelle S.C.A. | 852 | 98 |
| * | Meetic | 3,219 | 94 |
| * | IMS-Intl Metal Service | 5,390 | 91 |
| * | Faurecia | 4,485 | 87 |
| * | Boursorama | 6,504 | 81 |
| * | Vilmorin & Cie | 727 | 80 |
| | Faiveley SA | 934 | 78 |
| * | Bull SA | 18,290 | 76 |
| | Sopra Group SA | 1,034 | 74 |
| *,^ | Thomson SA | 52,990 | 73 |
| * | SeLoger.com | 1,776 | 62 |
| | Laurent-Perrier | 692 | 55 |
| | Societe de la Tour Eiffel | 733 | 55 |
| | Guerbet | 310 | 51 |
| * | GameLoft | 10,402 | 50 |
| * | NRJ Group | 4,880 | 46 |
| | LISI | 985 | 45 |
| * | Kaufman & Broad SA | 1,842 | 45 |
| * | Club Mediterranee | 1,952 | 40 |
| * | Sequana | 3,258 | 39 |
| | GFI Informatique | 7,812 | 38 |
| * | Recylex SA | 2,955 | 38 |
| | GL Events | 1,625 | 38 |
| | Plastic Omnium SA | 1,297 | 37 |
| * | Assystem | 2,345 | 32 |
| * | Manitou BF SA | 1,979 | 29 |
| * | Etam Developpement SA | 1,241 | 27 |
| * | Parrot SA | 1,864 | 26 |
| *,^ | Theolia SA | 4,211 | 24 |
| | Sperian Protection | 288 | 20 |
| | Trigano SA | 1,154 | 17 |
| | | | 15,474 |
| Germany (3.5%) | | |
| | Aixtron AG | 20,141 | 602 |
| * | SGL Carbon SE | 13,024 | 492 |
| | Bilfinger Berger AG | 7,046 | 454 |
| | Symrise AG | 24,756 | 449 |
| | Software AG | 4,221 | 376 |
| | MTU Aero Engines Holding | | |
| | AG | 8,087 | 367 |
61
FTSE All-World ex-US Small-Cap Index Fund
| | | |
| | | | Market |
| | | | Value• |
| | | Shares | ($000) |
| | Douglas Holding AG | 7,765 | 346 |
| * | United Internet AG | 26,514 | 345 |
| | Aurubis AG | 8,500 | 339 |
| | Wincor Nixdorf AG | 5,488 | 321 |
| | Rhoen Klinikum AG | 13,185 | 320 |
| * | Sky Deutschland AG | 76,605 | 318 |
| | Tognum AG | 19,430 | 297 |
| | ElringKlinger AG | 14,574 | 289 |
| | Deutsche Euroshop AG | 8,307 | 284 |
| | Stada Arzneimittel AG | 10,422 | 279 |
| | Wirecard AG | 20,707 | 269 |
| | Fuchs Petrolub AG | 3,447 | 261 |
| | Fuchs Petrolub AG Pfd. | 2,729 | 224 |
| | Hugo Boss AG | 5,461 | 203 |
| | Vossloh AG | 1,982 | 198 |
| * | Deutsche Wohnen AG | 17,283 | 196 |
| * | Freenet AG | 14,450 | 191 |
| | Axel Springer AG | 1,793 | 187 |
| | Gerry Weber International AG | 5,734 | 182 |
| | Fielmann AG | 2,415 | 179 |
| | Praktiker Bau- und | | |
| | Heimwerkermaerkte AG | 14,181 | 172 |
| ^ | Rational AG | 1,173 | 165 |
| | Kontron AG | 13,841 | 164 |
| | Demag Cranes AG | 4,691 | 163 |
| | ProSiebenSat.1 Media AG | 15,494 | 161 |
| | Krones AG | 3,123 | 155 |
| * | IVG Immobilien AG | 16,883 | 151 |
| | MLP AG | 13,719 | 149 |
| | Bauer AG | 3,480 | 138 |
| | GFK SE | 4,317 | 137 |
| | Leoni AG | 6,360 | 130 |
| * | Aareal Bank AG | 5,932 | 128 |
| | Pfeiffer Vacuum Technology | | |
| | AG | 1,674 | 126 |
| | CTS Eventim AG | 2,434 | 122 |
| | Bechtle AG | 5,041 | 120 |
| | Gildemeister AG | 8,382 | 118 |
| | Phoenix Solar AG | 2,058 | 115 |
| ^ | MVV Energie AG | 2,539 | 114 |
| | KWS Saat AG | 681 | 113 |
| *,^ | Heidelberger | | |
| | Druckmaschinen AG | 15,301 | 113 |
| | Rheinmetall AG | 2,011 | 109 |
| * | Deutz AG | 22,988 | 108 |
| * | Nordex AG | 6,378 | 104 |
| ^ | BayWa AG | 3,170 | 103 |
| | H&R WASAG AG | 4,582 | 102 |
| * | Kloeckner & Co. SE | 4,249 | 93 |
| *,^ | KUKA AG | 5,919 | 87 |
| * | Solar Millennium AG | 2,364 | 76 |
| * | Morphosys AG | 2,881 | 75 |
| | Deutsche Beteiligungs AG | 2,928 | 67 |
| *,^ | Conergy AG | 55,204 | 59 |
| | Grenkeleasing AG | 1,422 | 55 |
| | Alstria Office REIT-AG | 4,417 | 49 |
| | | |
| | | | Market |
| | | | Value• |
| | | Shares | ($000) |
| | DIC Asset AG | 3,963 | 48 |
| | Jungheinrich AG | 2,425 | 45 |
| * | Jenoptik AG | 6,731 | 37 |
| | Carl Zeiss Meditec AG | 2,312 | 34 |
| * | Centrotherm Photovoltaics | | |
| | AG | 742 | 34 |
| | DAB Bank AG | 5,591 | 33 |
| * | CAT Oil AG | 3,012 | 33 |
| * | Pfleiderer AG | 3,282 | 33 |
| * | Manz Automation AG | 479 | 33 |
| | Draegerwerk AG & Co. KGaA | 880 | 32 |
| | Medion AG | 2,942 | 31 |
| * | QSC AG | 12,545 | 29 |
| | Interseroh SE | 368 | 26 |
| * | Air Berlin PLC | 5,173 | 26 |
| | Dyckerhoff AG | 420 | 26 |
| * | Koenig & Bauer AG | 1,394 | 24 |
| * | Solon SE | 1,405 | 16 |
| | | | 12,349 |
| Greece (0.9%) | | |
| | JUMBO SA | 21,131 | 264 |
| | Hellenic Exchanges SA | 17,435 | 248 |
| | Ellaktor SA | 26,705 | 229 |
| | Motor Oil Hellas Corinth | | |
| | Refineries SA | 10,164 | 179 |
| | Alapis Holding Industrial and | | |
| | Commercial SA | 201,933 | 171 |
| | Fourlis Holdings SA | 10,061 | 167 |
| | Intralot SA-Integrated Lottery | | |
| | Systems & Services | 25,774 | 164 |
| | Folli-Follie SA | 6,567 | 157 |
| | Mytilineos Holdings SA | 18,277 | 157 |
| * | TT Hellenic Postbank SA | 20,933 | 149 |
| | Viohalco | 20,069 | 140 |
| | GEK Terna Holding | | |
| | Real Estate Construction | | |
| | SA | 14,199 | 136 |
| * | Agricultural Bank of Greece | 32,236 | 92 |
| | Metka SA | 5,331 | 83 |
| | Diagnostic & | | |
| | Therapeutic Center of | | |
| | Athens Hygeia SA | 25,015 | 79 |
| | Athens Water Supply & | | |
| | Sewage Co. SA | 7,847 | 67 |
| * | Sidenor Steel Products | | |
| | Manufacturing Co. SA | 7,456 | 64 |
| | Athens Medical Center SA | 26,774 | 62 |
| | Eurobank Properties Real | | |
| | Estate Investment Co. | 4,867 | 61 |
| | Piraeus Port Authority | 2,249 | 55 |
| | J&P-Avax SA | 8,983 | 49 |
| * | Elval Aluminium Process Co. | 17,016 | 48 |
| | Frigoglass SA | 3,595 | 48 |
| * | Intracom Holdings SA | 20,112 | 47 |
| | Sarantis SA | 6,455 | 47 |
62
| | | |
| FTSE All-World ex-US Small-Cap Index Fund |
| |
| |
| |
| | | | Market |
| | | | Value• |
| | | Shares | ($000) |
| * | Babis Vovos International | | |
| | Construction SA | 5,581 | 42 |
| * | Geniki Bank | 29,173 | 41 |
| * | Anek Lines SA | 29,485 | 35 |
| * | Lambrakis Press SA | 7,833 | 32 |
| * | Attica Bank | 10,402 | 31 |
| * | Corinth Pipeworks SA | 10,128 | 28 |
| | Hellenic Duty Free Shops | | |
| | SA | 2,088 | 19 |
| | | | 3,191 |
| Hong Kong (1.1%) | | |
| | VTech Holdings Ltd. | 41,000 | 342 |
| | SJM Holdings Ltd. | 523,000 | 267 |
| | Ports Design Ltd. | 95,500 | 257 |
| ^ | Champion REIT | 598,000 | 252 |
| | AAC Acoustic Technologies | | |
| | Holdings Inc. | 200,000 | 251 |
| | Pacific Basin Shipping Ltd. | 324,300 | 238 |
| | Xinyi Glass | | |
| | Holdings Co. Ltd. | 222,000 | 175 |
| | Kingboard Laminates | | |
| | Holdings Ltd. | 248,000 | 173 |
| | Chow Sang Sang Holdings | 154,000 | 153 |
| | Stella International | | |
| | Holdings Ltd. | 73,500 | 139 |
| | REXLot Holdings Ltd. | 1,575,000 | 139 |
| | Sinotrans Shipping Ltd. | 306,000 | 137 |
| | Daphne International | | |
| | Holdings Ltd. | 176,000 | 133 |
| * | Hi Sun Technology | | |
| | China Ltd. | 342,000 | 132 |
| | Mandarin Oriental | | |
| | International Ltd. | 101,000 | 127 |
| | Midland Holdings Ltd. | 128,000 | 109 |
| * | China Merchants China | | |
| | Direct Investments Ltd. | 34,000 | 72 |
| | Sunlight Real Estate | | |
| | Investment Trust | 269,000 | 65 |
| ^ | Far East Consortium | 199,000 | 63 |
| | SmarTone | | |
| | Telecommunications | | |
| | Holding Ltd. | 79,500 | 61 |
| * | Apac Resources Ltd. | 880,000 | 61 |
| | TAI Cheung Holdings | 108,000 | 60 |
| | Prosperity REIT | 356,000 | 60 |
| * | HKR International Ltd. | 132,800 | 56 |
| | Xinyu Hengdeli | | |
| | Holdings Ltd. | 158,000 | 52 |
| | K Wah International | | |
| | Holdings Ltd. | 150,000 | 51 |
| | Shui On Construction and | | |
| | Materials Ltd. | 32,000 | 49 |
| | Sun Hung Kai & Co. Ltd. | 61,000 | 47 |
| ^ | Silver Grant International | 198,000 | 45 |
| | Tianjin Development Hldgs | 72,000 | 44 |
| | | |
| | | | Market |
| | | | Value• |
| | | Shares | ($000) |
| | China Water Affairs | | |
| | Group Ltd. | 146,000 | 43 |
| | Road King Infrastructure Ltd. | 45,000 | 36 |
| | Regal Hotels International | | |
| | Holdings Ltd. | 82,000 | 31 |
| * | China Fishery Group Ltd. | 34,000 | 29 |
| * | China Chengtong | | |
| | Development Group Ltd. | 318,000 | 25 |
| * | Mingyuan Medicare | | |
| | Development Co. Ltd. | 200,000 | 25 |
| * | TCC International | | |
| | Holdings Ltd. | 58,000 | 23 |
| * | eSun Holdings Ltd. | 142,000 | 21 |
| * | HKC Holdings Ltd. | | |
| | Warrants Exp. 05/26/2011 | 9,100 | — |
| * | Hong Kong | | |
| | Energy Holdings Ltd. | | |
| | Warrants Exp. 05/13/11 | 627 | — |
| | | | 4,043 |
| Hungary (0.0%) | | |
| * | FHB Mortgage Bank PLC | 2,778 | 18 |
| |
| India (2.7%) | | |
| * | Indiabulls Real Estate Ltd. | 62,143 | 325 |
| | CESC Ltd. | 31,909 | 250 |
| | Andhra Bank | 103,507 | 245 |
| | LIC Housing Finance Ltd. | 15,289 | 240 |
| | Cummins India Ltd. | 30,103 | 238 |
| | Patni Computer | | |
| | Systems Ltd. | 25,366 | 237 |
| | Indian Hotels Co. Ltd. | 151,352 | 234 |
| | IVRCL Infrastructures & | | |
| | Projects Ltd. | 29,490 | 215 |
| | Torrent Power Ltd. | 35,506 | 212 |
| | IFCI Ltd. | 227,104 | 211 |
| | Shree Renuka Sugars Ltd. | 52,442 | 206 |
| * | Yes Bank Ltd. | 41,127 | 205 |
| | Exide Industries Ltd. | 96,671 | 200 |
| | Federal Bank Ltd. | 38,342 | 193 |
| | United Phosphorus Ltd. | 63,498 | 192 |
| | Birla Corp. Ltd. | 30,104 | 190 |
| | Titan Industries Ltd. | 7,165 | 189 |
| | Century Textile & | | |
| | Industries Ltd. | 19,527 | 181 |
| | Tata Tea Ltd. | 9,785 | 177 |
| | Rural | | |
| | Electrification Corp. Ltd. | 41,507 | 174 |
| | Petronet LNG Ltd. | 124,879 | 170 |
| | GTL Ltd. | 23,360 | 165 |
| | Jain Irrigation Systems Ltd. | 8,969 | 145 |
| * | GVK Power & | | |
| | Infrastructure Ltd. | 153,774 | 143 |
| | IndusInd Bank Ltd. | 56,436 | 139 |
| * | Hindustan Oil Exploration | 20,257 | 123 |
| | Aurobindo Pharma Ltd. | 7,658 | 121 |
| | Educomp Solutions Ltd. | 6,855 | 115 |
63
FTSE All-World ex-US Small-Cap Index Fund
| | | |
| | | | Market |
| | | | Value• |
| | | Shares | ($000) |
| | India Cements Ltd. | 49,432 | 115 |
| | Nagarjuna Construction Co. | 35,950 | 112 |
| | Jindal Saw Ltd. | 7,572 | 111 |
| | Thermax Ltd. | 9,587 | 107 |
| | Balrampur Chini Mills Ltd. | 33,856 | 106 |
| | Bajaj Hindusthan Ltd. | 24,162 | 100 |
| | Allahabad Bank | 38,169 | 96 |
| * | Rolta India Ltd. | 25,223 | 92 |
| | India Infoline Ltd. | 33,411 | 90 |
| | Biocon Ltd. | 17,086 | 89 |
| | Nava Bharat Ventures Ltd. | 11,756 | 86 |
| | Hindustan Construction Co. | 31,744 | 84 |
| | IRB Infrastructure | | |
| | Developers Ltd. | 16,647 | 81 |
| | Finolex Industries Ltd. | 78,356 | 79 |
| | Videocon Industries Ltd. | 16,414 | 77 |
| | Great Offshore Ltd. | 6,965 | 76 |
| | Sterling Biotech Ltd. | 38,591 | 74 |
| | Gujarat NRE Coke Ltd. | 58,287 | 74 |
| | Welspun-Gujarat Stahl Ltd. | 13,496 | 73 |
| | Amtek Auto Ltd. | 19,702 | 72 |
| | BEML Ltd. | 3,417 | 67 |
| | Opto Circuits India Ltd. | 15,455 | 64 |
| * | Kesoram Industries Ltd. | 8,889 | 63 |
| | Karnataka Bank Ltd. | 22,811 | 63 |
| | Alstom Projects India Ltd. | 5,498 | 61 |
| | Indian Overseas Bank | 28,149 | 60 |
| | Patel Engineering Ltd. | 6,206 | 59 |
| * | Gujarat State Petronet Ltd. | 33,947 | 58 |
| * | Ispat Industries Ltd. | 142,772 | 56 |
| | Monnet Ispat & Energy Ltd. | 6,965 | 55 |
| | Apollo Tyres Ltd. | 54,390 | 55 |
| | Sintex Industries Ltd. | 12,420 | 55 |
| | Voltas Ltd. | 15,557 | 51 |
| * | Chennai Petroleum Corp. Ltd. | 11,394 | 51 |
| * | JSL Ltd. | 24,155 | 50 |
| | Gammon India Ltd. | 10,076 | 49 |
| | Gateway Distriparks Ltd. | 18,141 | 47 |
| | Deccan Chronicle | | |
| | Holdings Ltd. | 15,898 | 46 |
| | Usha Martin Ltd. | 34,624 | 46 |
| | Praj Industries Ltd. | 25,551 | 45 |
| * | HCL Infosystems Ltd. | 13,826 | 45 |
| | Indiabulls Securities Ltd. | 46,183 | 45 |
| | Mercator Lines Ltd. | 43,900 | 44 |
| | Bombay Dyeing & | | |
| | Manufacturing Co. Ltd. | 5,342 | 43 |
| | Torrent Pharmaceuticals Ltd. | 6,204 | 43 |
| | Gujarat Narmada Valley | | |
| | Fertilizers Co. Ltd. | 21,845 | 43 |
| | CMC Ltd. | 1,633 | 43 |
| | Maharashtra Seamless Ltd. | 5,830 | 40 |
| * | Ballarpur Industries Ltd. | 86,018 | 40 |
| | Moser Baer India Ltd. | 25,172 | 40 |
| | Gujarat State Fertilisers & | | |
| | Chemicals Ltd. | 10,562 | 39 |
| | | | |
| | | | | Market |
| | | | | Value• |
| | | | Shares | ($000) |
| * | Triveni Engineering & | | | |
| | Industries Ltd. | | 18,295 | 39 |
| | SREI Infrastructure | | | |
| | Finance Ltd. | | 25,877 | 39 |
| | Syndicate Bank | | 21,334 | 39 |
| | Radico Khaitan Ltd. | | 15,703 | 38 |
| | Indian Bank | | 11,381 | 37 |
| | UCO Bank | | 34,028 | 36 |
| | Bank of Rajasthan | | 21,811 | 36 |
| | Peninsula Land Ltd. | | 21,030 | 34 |
| | Ansal Properties & | | | |
| | Infrastructure Ltd. | | 24,013 | 33 |
| | Jaiprakash Hydro | | | |
| | Power Ltd. | | 23,652 | 31 |
| * | Nagarjuna Fertilizers & | | | |
| | Chemicals | | 53,928 | 31 |
| | Gujarat Mineral | | | |
| | Development Corp. Ltd. | | 14,040 | 30 |
| | Chambal Fertilizers & | | | |
| | Chemicals Ltd. | | 29,814 | 30 |
| | Everest Kanto Cylinder Ltd. | 9,820 | 29 |
| * | Parsvnath Developers Ltd. | | 12,821 | 28 |
| * | Prakash Industries Ltd. | | 9,146 | 26 |
| | Electrosteel Castings Ltd. | | 27,859 | 24 |
| | Tanla Solutions Ltd. | | 11,685 | 15 |
| * | Reliance MediaWorks Ltd. | | 2,226 | 12 |
| | | | | 9,382 |
| Indonesia (0.8%) | | | |
| | Adaro Energy PT | | 2,991,400 | 472 |
| | Kalbe Farma Tbk PT | | 1,896,200 | 238 |
| | Bank Negara Indonesia | | | |
| | Persero Tbk PT | | 1,227,000 | 233 |
| | Indo Tambangraya Megah | | | |
| | PT | | 89,500 | 209 |
| * | Barito Pacific Tbk PT | | 1,422,500 | 203 |
| * | Bakrie and Brothers | | | |
| | Tbk PT | 19,761,500 | 201 |
| * | Lippo Karawaci Tbk PT | | 2,392,800 | 162 |
| * | Bakrieland Development | | | |
| | Tbk PT | | 4,308,562 | 121 |
| | Medco Energi | | | |
| | Internasional Tbk PT | | 411,000 | 115 |
| * | Indah Kiat Pulp and | | | |
| | Paper Corp. Tbk PT | | 607,000 | 112 |
| | Jasa Marga PT | | 566,500 | 104 |
| * | Bisi International PT | | 471,500 | 82 |
| * | Ciputra Development | | | |
| | Tbk PT | | 1,253,000 | 81 |
| | Timah Tbk PT | | 368,500 | 74 |
| * | Holcim Indonesia Tbk PT | | 429,500 | 73 |
| | Summarecon Agung | | | |
| | Tbk PT | | 1,086,000 | 65 |
| * | Bakrie Telecom PT | | 4,421,500 | 51 |
| * | Smurfit Kappa Group PLC | | | |
| | (London Shares) | | 6,094 | 47 |
64
FTSE All-World ex-US Small-Cap Index Fund
| | | | |
| | | | | Market |
| | | | | Value• |
| | | | Shares | ($000) |
| | Perusahaan Perkebunan | | |
| | London Sumatra | | | |
| | Indonesia Tbk PT | | 57,000 | 47 |
| | Bakrie Sumatera | | | |
| | Plantations Tbk PT | | 567,000 | 40 |
| * | Energi Mega Persada | | | |
| | Tbk PT | 1,148,500 | 33 |
| | Berlian Laju Tanker Tbk PT | 359,000 | 26 |
| | | | | 2,789 |
| Ireland (0.8%) | | | |
| | DCC PLC | | 17,598 | 463 |
| | Irish Life & Permanent PLC | 57,887 | 419 |
| * | Kingspan Group PLC | | 38,138 | 322 |
| | Grafton Group PLC | | 54,412 | 272 |
| | Paddy Power PLC | | 7,821 | 250 |
| | C&C Group PLC | | 61,041 | 225 |
| | United Drug PLC | | 52,968 | 175 |
| | Glanbia PLC | | 35,798 | 143 |
| | Greencore Group PLC | | 54,533 | 123 |
| * | Smurfit Kappa Group PLC | 15,375 | 120 |
| | FBD Holdings PLC | | 7,622 | 75 |
| | Fyffes PLC | | 87,490 | 48 |
| | C&C Group PLC | | 11,196 | 42 |
| * | Aer Lingus | | 37,545 | 31 |
| | Total Produce PLC | | 58,232 | 30 |
| | Independent News & | | | |
| | Media PLC | | 62,517 | 19 |
| | Greencore Group PLC | | 7,024 | 16 |
| | | | | 2,773 |
| Israel (0.2%) | | | |
| | FMS Enterprises Migun Ltd. | 6,667 | 234 |
| | Frutarom Industries Ltd. | 17,387 | 141 |
| * | Hadera Paper Ltd. | | 978 | 62 |
| | Alony Hetz Properties & | | |
| | Investments Ltd. | | 14,881 | 53 |
| * | Gilat Satellite Networks Ltd. | 9,200 | 42 |
| | Given Imaging Ltd. | | 2,636 | 40 |
| | Ituran Location and | | | |
| | Control Ltd. | | 3,193 | 39 |
| * | Delek Real Estate Ltd. | | 34,811 | 38 |
| | Shikun & Binui Ltd. | | 21,529 | 38 |
| * | Alvarion Ltd. | | 8,451 | 34 |
| * | Retalix Ltd. | | 2,595 | 29 |
| | | | | 750 |
| Italy (2.5%) | | | |
| | Prysmian SPA | | 26,753 | 470 |
| * | Societa Cattolica di | | | |
| | Assicurazioni SCRL | | 14,276 | 458 |
| ^ | Piccolo Credito | | | |
| | Valtellinese Scarl | | 41,342 | 380 |
| | Azimut Holding SPA | | 24,617 | 297 |
| | Ansaldo STS SPA | | 14,137 | 271 |
| | Davide Campari-Milano SPA | 28,306 | 270 |
| | Impregilo SPA | | 78,943 | 270 |
| | Hera SPA | | 112,868 | 250 |
| | | |
| | | | Market |
| | | | Value• |
| | | Shares | ($000) |
| | Societa Iniziative | | |
| | Autostradali e Servizi SPA | 27,367 | 242 |
| ^ | Iride SPA | 129,954 | 240 |
| * | Cofide SPA | 252,064 | 227 |
| | ACEA SPA | 18,074 | 211 |
| | DiaSorin SPA | 5,709 | 209 |
| * | CIR-Compagnie Industriali | | |
| | Riunite SPA | 92,220 | 207 |
| * | Danieli & Co. SPA | 15,739 | 207 |
| * | Italmobiliare SPA | 6,180 | 204 |
| | Banca Popolare dell’Etruria | | |
| | e del Lazio | 30,318 | 198 |
| | Piaggio & C SPA | 75,829 | 193 |
| * | Permasteelisa SPA | 9,561 | 181 |
| | ERG SPA | 11,948 | 176 |
| * | Arnoldo Mondadori Editore | | |
| | SPA | 36,112 | 166 |
| | Milano Assicurazioni SPA | 48,821 | 161 |
| * | Credito Emiliano SPA | 24,500 | 160 |
| | Recordati SPA | 20,062 | 156 |
| * | Premafin Finanziaria SPA | 89,212 | 146 |
| | Tod’s SPA | 2,086 | 144 |
| * | Tiscali SPA | 514,093 | 143 |
| | Maire Tecnimont SPA | 33,941 | 141 |
| | Autostrada Torino-Milano | | |
| | SPA | 9,401 | 119 |
| | Banca Generali SPA | 10,182 | 117 |
| * | DeA Capital SPA | 54,287 | 111 |
| | Banco di Desio e della | | |
| | Brianza SPA | 16,738 | 111 |
| | MARR SPA | 12,538 | 110 |
| * | Fastweb | 3,707 | 105 |
| | Geox SPA | 12,927 | 99 |
| | Credito Artigiano SPA | 36,136 | 98 |
| | Trevi Finanziaria SPA | 5,668 | 96 |
| | Beni Stabili SPA | 101,650 | 92 |
| * | Gemina SPA | 98,894 | 83 |
| * | Sorin SPA | 44,356 | 81 |
| * | Indesit Co. SPA | 7,117 | 81 |
| * | Gruppo Editoriale L’Espresso | | |
| | SPA | 27,766 | 79 |
| * | Pirelli & C Real Estate SPA | 93,279 | 74 |
| * | Danieli & Co. SPA | 2,565 | 64 |
| *,^ | Banca Italease SPA | 20,815 | 64 |
| * | Amplifon SPA | 14,841 | 58 |
| | Cementir Holding SPA | 12,474 | 57 |
| * | Interpump Group SPA | 9,080 | 55 |
| | Enia SPA | 7,512 | 55 |
| * | Seat Pagine Gialle SPA | 186,470 | 53 |
| * | Italmobiliare SPA | 1,062 | 51 |
| | Industria Macchine | | |
| | Automatiche SPA | 2,645 | 50 |
| | Astaldi SPA | 5,143 | 48 |
| * | Telecom Italia Media SPA | 257,436 | 45 |
| * | RCS MediaGroup SPA | 23,692 | 43 |
| | Brembo SPA | 5,363 | 40 |
65
FTSE All-World ex-US Small-Cap Index Fund
| | | |
| | | | Market |
| | | | Value• |
| | | Shares | ($000) |
| * | IMMSI SPA | 27,863 | 37 |
| | Immobiliare Grande | | |
| | Distribuzione | 16,866 | 36 |
| | Esprinet SPA | 3,457 | 35 |
| *,^ | Digital Multimedia | | |
| | Technologies SPA | 1,427 | 30 |
| | Landi Renzo SPA | 7,126 | 29 |
| | Nice SPA | 6,290 | 29 |
| * | Safilo Group SPA | 36,850 | 28 |
| | SAES Getters SPA | 2,966 | 26 |
| * | Snai SPA | 3,916 | 18 |
| *,^ | Risanamento SPA | 15,837 | 10 |
| | | | 8,795 |
| Japan (12.5%) | | |
| | Kyorin Co. Ltd. | 25,000 | 400 |
| | Rohto | | |
| | Pharmaceutical Co. Ltd. | 29,000 | 371 |
| *,^ | Shochiku Co. Ltd. | 34,000 | 299 |
| | Miura Co. Ltd. | 9,800 | 274 |
| * | K’s Holdings Corp. | 8,200 | 266 |
| | Kyowa Exeo Corp. | 29,000 | 266 |
| | Japan Airport | | |
| | Terminal Co. Ltd. | 18,800 | 263 |
| | Takasago Thermal | | |
| | Engineering Co. Ltd. | 33,000 | 262 |
| | Nikkiso Co. Ltd. | 33,000 | 249 |
| | Fuji Oil Co. Ltd. | 16,100 | 243 |
| | Sanki Engineering Co. Ltd. | 33,000 | 242 |
| * | Sankyu Inc. | 55,000 | 241 |
| ^ | Park24 Co. Ltd. | 21,200 | 236 |
| *,^ | Joshin Denki Co. Ltd. | 33,000 | 231 |
| | Hosiden Corp. | 19,000 | 230 |
| * | Hitachi Zosen Corp. | 176,500 | 230 |
| * | Duskin Co. Ltd. | 12,300 | 222 |
| | Fancl Corp. | 12,300 | 220 |
| ^ | OSG Corp. | 22,300 | 219 |
| * | Iwatani Corp. | 73,000 | 219 |
| | Hitachi Kokusai Electric Inc. | 28,000 | 216 |
| | Kyudenko Corp. | 36,000 | 216 |
| | Hogy Medical Co. Ltd. | 4,000 | 215 |
| | Bank of Iwate Ltd. | 3,600 | 213 |
| | FP Corp. | 4,300 | 213 |
| * | Maeda Road | | |
| | Construction Co. Ltd. | 26,000 | 212 |
| * | Kadokawa Group | | |
| | Holdings Inc. | 8,900 | 211 |
| * | Accordia Golf Co. Ltd. | 225 | 209 |
| | Toei Co. Ltd. | 37,000 | 208 |
| | KUREHA CORP. | 38,000 | 205 |
| | Sanyo Chemical | | |
| | Industries Ltd. | 36,000 | 201 |
| | eAccess Ltd. | 287 | 201 |
| | Okinawa Electric | | |
| | Power Co. Inc. | 3,700 | 199 |
| | Yamagata Bank Ltd. | 41,000 | 197 |
| *,^ | Meidensha Corp. | 39,000 | 195 |
| | | |
| | | | Market |
| | | | Value• |
| | | Shares | ($000) |
| | Nisshin Oillio Group Ltd. | 37,000 | 195 |
| * | Kiyo Holdings Inc. | 161,000 | 193 |
| * | Morinaga Milk | | |
| | Industry Co. Ltd. | 41,000 | 191 |
| | Nippon Flour Mills Co. Ltd. | 37,000 | 188 |
| | Toyo Tanso Co. Ltd. | 3,800 | 188 |
| | Tokai Tokyo Financial | | |
| | Holdings | 57,000 | 185 |
| *,^ | NSD CO LTD. | 18,100 | 185 |
| | Ryosan Co. Ltd. | 7,700 | 184 |
| | Horiba Ltd. | 7,600 | 184 |
| * | Aderans Holdings Co. Ltd. | 14,700 | 182 |
| | Aichi Steel Corp. | 38,000 | 182 |
| | Kitz Corp. | 35,000 | 181 |
| | Izumiya Co. Ltd. | 35,000 | 181 |
| | Oiles Corp. | 11,000 | 180 |
| | Komori Corp. | 15,000 | 177 |
| * | Kayaba Industry Co. Ltd. | 61,000 | 176 |
| | Seikagaku Corp. | 13,900 | 176 |
| * | Inaba Denki Sangyo Co. Ltd. | 7,400 | 176 |
| | Meitec Corp. | 10,400 | 175 |
| | Tadano Ltd. | 37,000 | 175 |
| * | Furukawa Co. Ltd. | 131,000 | 173 |
| | Fujitec Co. Ltd. | 33,000 | 173 |
| | NOF Corp. | 38,000 | 172 |
| * | Nippon Denko Co. Ltd. | 24,000 | 171 |
| | Mizuno Corp. | 37,000 | 171 |
| * | Nakamuraya Co. Ltd. | 32,000 | 170 |
| * | Toho Zinc Co. Ltd. | 34,000 | 169 |
| * | Wacom Co. Ltd. | 76 | 169 |
| | Asahi Diamond | | |
| | Industrial Co. Ltd. | 24,000 | 169 |
| | Miyazaki Bank Ltd. | 37,000 | 169 |
| | Tsubakimoto Chain Co. | 39,000 | 169 |
| | Sumitomo | | |
| | Warehouse Co. Ltd. | 38,000 | 167 |
| | Toho Holdings Co. Ltd. | 11,300 | 166 |
| * | Kappa Create Co. Ltd. | 7,350 | 166 |
| | Sangetsu Co. Ltd. | 7,700 | 166 |
| | Fuyo General Lease Co. Ltd. | 7,500 | 166 |
| | Hokuto Corp. | 7,400 | 165 |
| * | Nachi-Fujikoshi Corp. | 74,000 | 164 |
| | Musashi Seimitsu | | |
| | Industry Co. Ltd. | 7,800 | 162 |
| * | Bank of the Ryukyus Ltd. | 15,000 | 161 |
| | Nifco Inc. | 7,800 | 160 |
| | Sawai | | |
| | Pharmaceutical Co. Ltd. | 2,800 | 159 |
| | Exedy Corp. | 7,700 | 158 |
| | Geo Corp. | 150 | 156 |
| | TS Tech Co. Ltd. | 8,100 | 155 |
| | Shimizu Bank Ltd. | 3,600 | 155 |
| | Japan Vilene Co. Ltd. | 29,000 | 154 |
| * | Central Glass Co. Ltd. | 38,000 | 153 |
| | Nichicon Corp. | 15,200 | 152 |
| ^ | Daiseki Co. Ltd. | 7,700 | 151 |
66
FTSE All-World ex-US Small-Cap Index Fund
| | | |
| | | | Market |
| | | | Value• |
| | | Shares | ($000) |
| | Saizeriya Co. Ltd. | 7,800 | 150 |
| * | Nippon Soda Co. Ltd. | 37,000 | 149 |
| *,^ | Akebono Brake | | |
| | Industry Co. Ltd. | 19,100 | 149 |
| | Tokyo Ohka Kogyo Co. Ltd. | 7,700 | 148 |
| | Ricoh Leasing Co. Ltd. | 7,200 | 147 |
| | Seiren Co. Ltd. | 22,300 | 147 |
| * | Okumura Corp. | 42,000 | 146 |
| | Akita Bank Ltd. | 37,000 | 144 |
| | Tsuruha Holdings Inc. | 3,700 | 144 |
| | Aica Kogyo Co. Ltd. | 15,000 | 144 |
| | Pigeon Corp. | 3,700 | 143 |
| | Hanwa Co. Ltd. | 41,000 | 143 |
| | ADEKA Corp. | 15,600 | 143 |
| * | Itoham Foods Inc. | 36,000 | 142 |
| *,^ | Iseki & Co. Ltd. | 38,000 | 142 |
| * | Makino Milling | | |
| | Machine Co. Ltd. | 36,000 | 141 |
| * | Tokyo Seimitsu Co. Ltd. | 11,200 | 141 |
| | Okamoto Industries Inc. | 37,000 | 141 |
| * | Unitika Ltd. | 178,000 | 140 |
| | Daio Paper Corp. | 16,736 | 140 |
| | Tomy Co. Ltd. | 15,900 | 140 |
| ^ | EDION Corp. | 17,300 | 140 |
| * | Kakaku.com Inc. | 38 | 139 |
| *,^ | Sanken Electric Co. Ltd. | 38,000 | 138 |
| | Toagosei Co. Ltd. | 39,000 | 136 |
| ^ | Mitsuboshi Belting Co. Ltd. | 36,000 | 136 |
| | Nippon Signal Co. Ltd. | 15,000 | 136 |
| | Mitsui Sugar Co. Ltd. | 38,000 | 135 |
| * | Anritsu Corp. | 38,000 | 134 |
| | Yamanashi Chuo Bank Ltd. | 29,000 | 133 |
| * | Daiwabo Holdings Co. Ltd. | 34,000 | 133 |
| | Toyo Ink | | |
| | Manufacturing Co. Ltd. | 38,000 | 132 |
| | FUJI SOFT INC. | 7,600 | 131 |
| | Bank of Okinawa Ltd. | 3,800 | 131 |
| | Unicharm Petcare Corp. | 3,700 | 131 |
| | FCC Co. Ltd. | 7,600 | 131 |
| * | San-A Co. Ltd. | 3,600 | 130 |
| | IBJ Leasing Co. Ltd. | 7,600 | 130 |
| | Kagawa Bank Ltd. | 36,000 | 130 |
| | Daihen Corp. | 37,000 | 129 |
| | Nihon Kohden Corp. | 7,700 | 129 |
| * | Sanyo Special Steel Co. Ltd. | 35,000 | 129 |
| | Oyo Corp. | 14,500 | 129 |
| | Resorttrust Inc. | 11,300 | 129 |
| | Mitsui-Soko Co. Ltd. | 37,000 | 128 |
| | Shikoku Bank Ltd. | 38,000 | 128 |
| | Nihon Unisys Ltd. | 15,000 | 128 |
| | Sakai Chemical | | |
| | Industry Co. Ltd. | 32,000 | 128 |
| | Heiwa Real Estate Co. Ltd. | 39,000 | 128 |
| | Daibiru Corp. | 15,000 | 127 |
| ^ | Toho Bank Ltd. | 38,000 | 127 |
| | Nippon Gas Co. Ltd. | 7,300 | 127 |
| | | |
| | | | Market |
| | | | Value• |
| | | Shares | ($000) |
| | Sugi Holdings Co. Ltd. | 5,800 | 126 |
| | Bank of Saga Ltd. | 37,000 | 126 |
| | Nissin Kogyo Co. Ltd. | 8,400 | 125 |
| | Nichi-iko | | |
| | Pharmaceutical Co. Ltd. | 4,200 | 125 |
| | Japan Securities | | |
| | Finance Co. Ltd. | 17,600 | 124 |
| * | Earth Chemical Co. Ltd. | 3,800 | 124 |
| *,^ | So-net M3 Inc. | 36 | 123 |
| | Toyo Engineering Corp. | 37,000 | 123 |
| | Fujimi Inc. | 7,500 | 123 |
| | MOS Food Services Inc. | 7,400 | 122 |
| * | Marudai Food Co. Ltd. | 37,000 | 122 |
| | Tamron Co. Ltd. | 11,200 | 122 |
| | Keihin Corp. | 8,000 | 122 |
| * | Maeda Corp. | 44,000 | 121 |
| | Daifuku Co. Ltd. | 19,500 | 121 |
| | Sakata Seed Corp. | 7,700 | 120 |
| * | MEGMILK SNOW | | |
| | BRAND Co. Ltd. | 6,100 | 120 |
| * | Tokyo Dome Corp. | 38,000 | 119 |
| | GMO internet Inc. | 26,100 | 119 |
| | Futaba Corp. | 7,700 | 119 |
| | Tokushima Bank Ltd. | 32,000 | 117 |
| | Ariake Japan Co. Ltd. | 7,500 | 117 |
| * | Sanyo Shokai Ltd. | 36,000 | 116 |
| * | Nippon Carbon Co. Ltd. | 34,000 | 116 |
| | Mars Engineering Corp. | 3,700 | 115 |
| * | Alpine Electronics Inc. | 11,700 | 115 |
| * | Shinko Plantech Co. Ltd. | 11,200 | 114 |
| * | Maruha Nichiro Holdings Inc. | 77,000 | 113 |
| | Mie Bank Ltd. | 36,000 | 113 |
| * | Megachips Corp. | 6,800 | 113 |
| | Yachiyo Bank Ltd. | 3,800 | 112 |
| | Shibusawa | | |
| | Warehouse Co. Ltd. | 36,000 | 112 |
| | Doutor Nichires | | |
| | Holdings Co. Ltd. | 7,700 | 111 |
| | Hitachi Transport System Ltd. | 8,400 | 110 |
| | CKD Corp. | 14,800 | 110 |
| | Nitta Corp. | 7,500 | 109 |
| | Tokyo Tomin Bank Ltd. | 7,500 | 109 |
| | Arcs Co. Ltd. | 7,400 | 109 |
| * | Nichiden Corp. | 3,700 | 109 |
| | Noritake Co. Ltd. | 37,000 | 108 |
| | Chudenko Corp. | 7,300 | 108 |
| * | Denki Kogyo Co. Ltd. | 22,400 | 107 |
| * | Sanwa Holdings Corp. | 39,000 | 107 |
| | Mandom Corp. | 4,100 | 107 |
| * | Topy Industries Ltd. | 55,000 | 107 |
| | Zensho Co. Ltd. | 15,100 | 105 |
| * | Daiei Inc. | 28,250 | 105 |
| | Aomori Bank Ltd. | 37,000 | 104 |
| | Ehime Bank Ltd. | 38,000 | 103 |
| * | Transcosmos Inc. | 11,700 | 103 |
| | Kyoei Steel Ltd. | 4,600 | 103 |
67
FTSE All-World ex-US Small-Cap Index Fund
| | | |
| | | | Market |
| | | | Value• |
| | | Shares | ($000) |
| | NET One Systems Co. Ltd. | 78 | 102 |
| | Eighteenth Bank Ltd. | 37,000 | 102 |
| *,^ | Sumitomo Light Metal | | |
| | Industries Ltd. | 113,000 | 101 |
| | Hokuetsu Paper Mills Ltd. | 19,500 | 101 |
| | Amano Corp. | 11,700 | 101 |
| | Parco Co. Ltd. | 11,500 | 101 |
| | Toyo Corp. | 11,100 | 100 |
| *,^ | Daikyo Inc. | 40,000 | 99 |
| | Noritz Corp. | 7,800 | 99 |
| | Nagaileben Co. Ltd. | 4,500 | 99 |
| | Ryoshoku Ltd. | 4,100 | 98 |
| * | Oki Electric Industry Co. Ltd. | 108,000 | 97 |
| * | Nippon Beet Sugar | | |
| | Manufacturing Co. Ltd. | 38,000 | 97 |
| | Heiwado Co. Ltd. | 7,400 | 97 |
| | Shoei Co. Ltd. | 11,600 | 97 |
| * | Mitsubishi Paper Mills Ltd. | 75,000 | 97 |
| * | Chiba Kogyo Bank Ltd. | 11,000 | 96 |
| * | Tokyo Rope | | |
| | Manufacturing Co. Ltd. | 34,000 | 96 |
| | Taikisha Ltd. | 7,600 | 96 |
| | Nippon Suisan Kaisha Ltd. | 33,400 | 96 |
| | Kato Sangyo Co. Ltd. | 5,500 | 95 |
| | PARIS MIKI HOLDINGS INC. | 11,500 | 95 |
| | Yodogawa Steel Works Ltd. | 22,800 | 94 |
| * | Mito Securities Co. Ltd. | 42,000 | 93 |
| | Okamura Corp. | 19,000 | 93 |
| | Goldcrest Co. Ltd. | 3,070 | 93 |
| | Asahi Organic Chemicals | | |
| | Industry Co. Ltd. | 37,000 | 93 |
| * | Atsugi Co. Ltd. | 74,000 | 93 |
| | Tokushu Tokai | | |
| | Holdings Co. Ltd. | 37,000 | 93 |
| | Xebio Co. Ltd. | 4,100 | 93 |
| | TOC Co. Ltd. | 19,700 | 92 |
| * | Minato Bank Ltd. | 73,000 | 92 |
| * | JVC KENWOOD | | |
| | Holdings Inc. | 192,500 | 92 |
| | TV Tokyo Corp. | 3,600 | 90 |
| * | Jaccs Co. Ltd. | 38,000 | 90 |
| | Mikuni Coca-Cola | | |
| | Bottling Co. Ltd. | 10,600 | 89 |
| * | Daisan Bank Ltd. | 37,000 | 89 |
| | Iwai Securities Co. Ltd. | 11,700 | 88 |
| | Yoshinoya Holdings Co. Ltd. | 75 | 88 |
| | So-net Entertainment Corp. | 40 | 87 |
| | Century Tokyo Leasing Corp. | 7,800 | 87 |
| * | Showa Sangyo Co. Ltd. | 26,000 | 87 |
| * | Toyo Securities Co. Ltd. | 43,000 | 85 |
| * | Prima Meat Packers Ltd. | 73,000 | 84 |
| | Marusan Securities Co. Ltd. | 14,200 | 84 |
| * | Sasebo Heavy | | |
| | Industries Co. Ltd. | 38,000 | 84 |
| * | Michinoku Bank Ltd. | 37,000 | 84 |
| | Sintokogio Ltd. | 11,800 | 84 |
| | | |
| | | | Market |
| | | | Value• |
| | | Shares | ($000) |
| | Kisoji Co. Ltd. | 3,800 | 83 |
| | Nitto Kohki Co. Ltd. | 4,000 | 83 |
| | Iino Kaiun Kaisha Ltd. | 18,600 | 83 |
| | Stella Chemifa Corp. | 1,500 | 83 |
| | HIS Co. Ltd. | 3,800 | 82 |
| | Canon Electronics Inc. | 4,100 | 82 |
| | DCM Japan | | |
| | Holdings Co. Ltd. | 12,600 | 81 |
| | Kaken | | |
| | Pharmaceutical Co. Ltd. | 9,000 | 81 |
| | Asahi Holdings Inc. | 4,800 | 81 |
| | Senshukai Co. Ltd. | 12,000 | 81 |
| | ASKUL Corp. | 4,100 | 81 |
| * | AOC Holdings Inc. | 12,000 | 80 |
| * | Higashi-Nippon Bank Ltd. | 37,000 | 80 |
| | Nagano Bank Ltd. | 38,000 | 80 |
| | Tomato Bank Ltd. | 38,000 | 80 |
| | T-Gaia Corp. | 41 | 78 |
| | Paramount Bed Co. Ltd. | 3,500 | 78 |
| * | Sanden Corp. | 27,000 | 78 |
| * | Toa Corp. | 74,000 | 78 |
| | Chofu Seisakusho Co. Ltd. | 3,900 | 77 |
| | Fuji Seal International Inc. | 3,800 | 77 |
| | Itochu Enex Co. Ltd. | 14,800 | 76 |
| * | Nissan Shatai Co. Ltd. | 9,000 | 76 |
| | Fuji Co. Ltd. | 3,800 | 76 |
| | WATAMI Co. Ltd. | 3,800 | 75 |
| | AOKI Holdings Inc. | 7,600 | 74 |
| | Kanto Auto Works Ltd. | 7,700 | 73 |
| * | Nippon Light Metal Co. Ltd. | 83,000 | 73 |
| | Aiphone Co. Ltd. | 4,100 | 73 |
| | Nihon Dempa Kogyo Co. Ltd. | 3,900 | 73 |
| * | Kurabo Industries Ltd. | 42,000 | 72 |
| | Foster Electric Co. Ltd. | 2,800 | 72 |
| * | Nitto Boseki Co. Ltd. | 39,000 | 70 |
| | Alpen Co. Ltd. | 3,800 | 70 |
| | Moshi Moshi Hotline Inc. | 3,850 | 70 |
| | Fukui Bank Ltd. | 21,000 | 70 |
| | Nippon Shinyaku Co. Ltd. | 5,000 | 69 |
| | Japan Pulp & Paper Co. Ltd. | 18,000 | 69 |
| | Osaka Steel Co. Ltd. | 3,700 | 68 |
| | Star Micronics Co. Ltd. | 8,300 | 68 |
| | SHO-BOND | | |
| | Holdings Co. Ltd. | 3,900 | 68 |
| | Ryoyo Electro Corp. | 8,300 | 68 |
| | Japan Wool Textile Co. Ltd. | 10,000 | 67 |
| *,^ | Pioneer Corp. | 26,800 | 66 |
| * | Kanematsu Corp. | 80,000 | 66 |
| | Toshiba Plant Systems & | | |
| | Services Corp. | 5,000 | 65 |
| * | Penta-Ocean | | |
| | Construction Co. Ltd. | 57,500 | 65 |
| * | Risa Partners Inc. | 82 | 65 |
| * | Sanrio Co. Ltd. | 7,800 | 64 |
| * | Sinanen Co. Ltd. | 12,000 | 64 |
| | Hokuetsu Bank Ltd. | 38,000 | 64 |
68
FTSE All-World ex-US Small-Cap Index Fund
| | | |
| | | | Market |
| | | | Value• |
| | | Shares | ($000) |
| * | SMK Corp. | 10,000 | 63 |
| | TKC | 3,100 | 63 |
| * | Max Co. Ltd. | 6,000 | 62 |
| * | Nippon Yakin Kogyo Co. Ltd. | 12,500 | 61 |
| * | Taihei Dengyo Kaisha Ltd. | 5,000 | 61 |
| * | Toyo Kanetsu KK | 36,000 | 60 |
| * | Daiichi Chuo KK | 25,000 | 60 |
| | Ichiyoshi Securities Co. Ltd. | 8,000 | 60 |
| | Nihon Parkerizing Co. Ltd. | 5,000 | 59 |
| * | Nippon Chemi-Con Corp. | 16,000 | 59 |
| * | Nippon Densetsu | | |
| | Kogyo Co. Ltd. | 7,000 | 59 |
| | Nippon Synthetic Chemical | | |
| | Industry Co. Ltd. | 8,000 | 59 |
| * | Toyo Tire & Rubber Co. Ltd. | 31,000 | 58 |
| * | Godo Steel Ltd. | 30,000 | 58 |
| * | Nichias Corp. | 16,000 | 58 |
| * | Takara Standard Co. Ltd. | 10,000 | 58 |
| | Toda Kogyo Corp. | 6,000 | 58 |
| | Kanto Denka Kogyo Co. Ltd. | 7,000 | 57 |
| | Round One Corp. | 7,700 | 56 |
| | Gulliver International Co. Ltd. | 760 | 56 |
| | Chugoku Marine Paints Ltd. | 8,000 | 56 |
| *,^ | Kenedix Inc. | 147 | 56 |
| | T Hasegawa Co. Ltd. | 3,600 | 55 |
| | Doshisha Co. Ltd. | 2,900 | 54 |
| * | FIDEA Holdings Co. Ltd. | 30,000 | 54 |
| * | Sankyo Seiko Co. Ltd. | 20,100 | 54 |
| * | Showa Corp. | 9,200 | 54 |
| | Nichii Gakkan Co. | 5,400 | 54 |
| | Oita Bank Ltd. | 13,000 | 53 |
| * | VITAL KSK HOLDINGS Inc. | 8,800 | 53 |
| * | Nishimatsu | | |
| | Construction Co. Ltd. | 34,000 | 52 |
| | Trusco Nakayama Corp. | 3,300 | 51 |
| | Coca-Cola Central | | |
| | Japan Co. Ltd. | 3,800 | 51 |
| * | Futaba Industrial Co. Ltd. | 9,700 | 51 |
| | Nippon Sharyo Ltd. | 8,000 | 51 |
| * | Information Services | | |
| | International-Dentsu Ltd. | 8,000 | 51 |
| | Mitsubishi Pencil Co. Ltd. | 4,200 | 50 |
| | Tochigi Bank Ltd. | 11,000 | 50 |
| | Aichi Bank Ltd. | 600 | 50 |
| * | Invoice Inc. | 3,309 | 50 |
| | Shin-Etsu Polymer Co. Ltd. | 7,700 | 50 |
| | Temp Holdings Co. Ltd. | 5,600 | 50 |
| | Japan Aviation Electronics | | |
| | Industry Ltd. | 8,000 | 49 |
| | Calsonic Kansei Corp. | 18,000 | 49 |
| * | Orient Corp. | 50,500 | 49 |
| | Koa Corp. | 6,000 | 48 |
| | Nihon Yamamura | | |
| | Glass Co. Ltd. | 15,000 | 48 |
| | Nippon Thompson Co. Ltd. | 9,000 | 47 |
| | Tsutsumi Jewelry Co. Ltd. | 2,000 | 47 |
| | | |
| | | | Market |
| | | | Value• |
| | | Shares | ($000) |
| * | Unipres Corp. | 3,400 | 47 |
| * | Nice Holdings Inc. | 22,000 | 47 |
| ^ | Nippon Metal | | |
| | Industry Co. Ltd. | 26,000 | 47 |
| | Chiyoda Co. Ltd. | 3,900 | 46 |
| * | Nippo Corp. | 6,000 | 46 |
| *,^ | CSK Holdings Corp. | 12,100 | 46 |
| | Kita-Nippon Bank Ltd. | 1,500 | 45 |
| | Avex Group Holdings Inc. | 5,000 | 45 |
| | Tokyo Rakutenchi Co. Ltd. | 11,000 | 45 |
| | ST Corp. | 4,000 | 45 |
| | Nihon Nohyaku Co. Ltd. | 7,000 | 45 |
| | Kyokuto Securities Co. Ltd. | 5,600 | 44 |
| | Union Tool Co. | 1,500 | 44 |
| | Ministop Co. Ltd. | 3,100 | 43 |
| * | Royal Holdings Co. Ltd. | 3,900 | 43 |
| | Zuken Inc. | 5,300 | 43 |
| | Enplas Corp. | 2,500 | 43 |
| | Maezawa Kyuso | | |
| | Industries Co. Ltd. | 2,900 | 42 |
| | Yokogawa Bridge | | |
| | Holdings Corp. | 5,000 | 42 |
| | Daimei Telecom | | |
| | Engineering Corp. | 5,000 | 42 |
| * | Kinki Sharyo Co. Ltd. | 5,000 | 42 |
| | Sanyo Denki Co. Ltd. | 9,000 | 42 |
| | NEC Fielding Ltd. | 2,800 | 41 |
| | Ines Corp. | 5,400 | 41 |
| | Pacific Golf Group | | |
| | International Holdings KK | 59 | 40 |
| | Topre Corp. | 4,500 | 40 |
| | Ryoden Trading Co. Ltd. | 7,000 | 40 |
| * | Gakken Holdings Co. Ltd. | 14,000 | 40 |
| | Fujimori Kogyo Co. Ltd. | 2,800 | 40 |
| | Modec Inc. | 2,000 | 40 |
| * | Fujita Kanko Inc. | 10,000 | 40 |
| | Hibiya Engineering Ltd. | 4,600 | 39 |
| | Shimojima Co. Ltd. | 2,700 | 39 |
| | Towa Pharmaceutical Co. Ltd. | 800 | 39 |
| * | Tamura Corp. | 12,000 | 39 |
| | Osaki Electric Co. Ltd. | 4,000 | 39 |
| * | Matsuya Co. Ltd. | 4,000 | 38 |
| | Tenma Corp. | 3,200 | 37 |
| | Saibu Gas Co. Ltd. | 13,000 | 37 |
| | Pronexus Inc. | 5,500 | 37 |
| *,^ | Cybozu Inc. | 82 | 36 |
| | Kanto Natural Gas | | |
| | Development Ltd. | 6,000 | 36 |
| | Dai-Dan Co. Ltd. | 7,000 | 36 |
| | Nitto Kogyo Corp. | 3,600 | 36 |
| | Tocalo Co. Ltd. | 2,200 | 36 |
| * | Yonekyu Corp. | 3,500 | 36 |
| * | Fuji Fire & | | |
| | Marine Insurance Co. Ltd. | 31,000 | 35 |
| * | Mitsui High-Tec Inc. | 3,500 | 35 |
69
FTSE All-World ex-US Small-Cap Index Fund
| | | |
| | | | Market |
| | | | Value• |
| | | Shares | ($000) |
| | NEC Networks & | | |
| | System Integration Corp. | 2,900 | 35 |
| | Kintetsu World Express Inc. | 1,500 | 35 |
| | Kuroda Electric Co. Ltd. | 2,400 | 35 |
| | Token Corp. | 1,100 | 35 |
| * | CMK Corp. | 4,800 | 34 |
| * | Ryobi Ltd. | 13,000 | 34 |
| | Okuwa Co. Ltd. | 3,000 | 33 |
| | Chukyo Bank Ltd. | 12,000 | 33 |
| * | Shindengen Electric | | |
| | Manufacturing Co. Ltd. | 13,000 | 31 |
| | Nippon Chemical | | |
| | Industrial Co. Ltd. | 13,000 | 31 |
| | DTS Corp. | 3,500 | 30 |
| | Nohmi Bosai Ltd. | 4,000 | 29 |
| | Internet Initiative Japan Inc. | 13 | 29 |
| * | SWCC Showa | | |
| | Holdings Co. Ltd. | 31,000 | 29 |
| * | Riken Corp. | 8,000 | 29 |
| * | Morinaga & Co. Ltd. | 13,000 | 28 |
| * | Ishihara Sangyo Kaisha Ltd. | 33,000 | 27 |
| * | Best Denki Co. Ltd. | 6,000 | 26 |
| * | Shinkawa Ltd. | 1,600 | 26 |
| | Inabata & Co. Ltd. | 6,600 | 25 |
| * | Nakayama Steel Works Ltd. | 16,000 | 24 |
| | Jeol Ltd. | 6,000 | 24 |
| | Nidec Copal Corp. | 1,600 | 24 |
| | Bic Camera Inc. | 63 | 24 |
| * | Kanto Tsukuba Bank Ltd. | 7,000 | 23 |
| * | Yoshimoto Kogyo Co. Ltd. | 1,600 | 23 |
| | Life Corp. | 1,300 | 23 |
| | Valor Co. Ltd. | 2,600 | 22 |
| | Nippon Konpo Unyu | | |
| | Soko Co. Ltd. | 2,000 | 22 |
| | Nippon Seiki Co. Ltd. | 2,000 | 21 |
| | Takihyo Co. Ltd. | 4,000 | 21 |
| | Hisaka Works Ltd. | 2,000 | 21 |
| ^ | Aiful Corp. | 14,500 | 21 |
| | Tachi-S Co. Ltd. | 2,500 | 20 |
| | Aeon Delight Co. Ltd. | 1,300 | 20 |
| * | Press Kogyo Co. Ltd. | 9,000 | 20 |
| | Japan Digital | | |
| | Laboratory Co. Ltd. | 1,500 | 19 |
| * | Cedyna Financial Corp. | 9,400 | 19 |
| * | JFE Shoji Holdings Inc. | 5,000 | 18 |
| | Shinmaywa Industries Ltd. | 5,000 | 18 |
| * | Hokuriku Electric | | |
| | Industry Co. Ltd. | 10,000 | 18 |
| | Sumikin Bussan Corp. | 8,000 | 18 |
| | Idec Corp. | 2,300 | 17 |
| * | Rhythm Watch Co. Ltd. | 13,000 | 17 |
| | Kyodo Printing Co. Ltd. | 6,000 | 17 |
| * | Sankyo-Tateyama | | |
| | Holdings Inc. | 17,000 | 17 |
| * | Seiko Holdings Corp. | 8,000 | 17 |
| | Sanshin Electronics Co. Ltd. | 2,100 | 17 |
| | | |
| | | | Market |
| | | | Value• |
| | | Shares | ($000) |
| * | Aida Engineering Ltd. | 5,500 | 16 |
| * | Towa Bank Ltd. | 25,000 | 16 |
| | Shinko Shoji Co. Ltd. | 2,100 | 16 |
| * | Fukushima Bank Ltd. | 28,000 | 16 |
| * | Seika Corp. | 7,000 | 16 |
| | Sekisui Jushi Corp. | 2,000 | 16 |
| | Kaga Electronics Co. Ltd. | 1,600 | 16 |
| * | Japan Radio Co. Ltd. | 8,000 | 16 |
| | Senko Co. Ltd. | 4,000 | 15 |
| | Cosel Co. Ltd. | 1,200 | 13 |
| * | Mitsubishi Steel | | |
| | Manufacturing Co. Ltd. | 6,000 | 12 |
| | | | 44,052 |
| Luxembourg (0.0%) | | |
| | GAGFAH SA | 16,896 | 161 |
| |
| Malaysia (0.9%) | | |
| | KFC Holdings Malaysia Bhd. | 232,200 | 518 |
| | Top Glove Corp. Bhd. | 95,500 | 227 |
| | Bursa Malaysia Bhd. | 81,900 | 194 |
| | Media Prima Bhd. | 324,700 | 161 |
| | KNM Group Bhd. | 640,600 | 145 |
| | Multi-Purpose Holdings Bhd. | 253,940 | 138 |
| * | IGB Corp. Bhd. | 221,300 | 126 |
| | Genting Plantations Bhd. | 67,400 | 120 |
| | Dialog Group Bhd. | 286,100 | 108 |
| * | Berjaya Corp. Bhd. | 310,000 | 106 |
| * | AirAsia Bhd. | 257,200 | 101 |
| | Boustead Holdings Bhd. | 88,320 | 88 |
| | SapuraCrest Petroleum Bhd. | 145,100 | 88 |
| | WCT Bhd. | 112,700 | 86 |
| | Kulim Malaysia Bhd. | 39,500 | 85 |
| | KLCC Property Holdings Bhd. | 81,600 | 78 |
| | Padiberas Nasional Bhd. | 129,600 | 77 |
| | Wah Seong Corp. Bhd. | 89,600 | 63 |
| | DRB-Hicom Bhd. | 184,900 | 59 |
| | Carlsberg | | |
| | Brewery-Malay Bhd. | 41,100 | 54 |
| * | Malaysian Airline | | |
| | System Bhd. | 57,000 | 52 |
| * | Samling Global Ltd. | 672,000 | 50 |
| | POS Malaysia Bhd. | 73,100 | 49 |
| * | Mulpha International Bhd. | 339,000 | 46 |
| | OSK Holdings Bhd. | 94,300 | 41 |
| | TAN Chong Motor | | |
| | Holdings Bhd. | 54,000 | 35 |
| * | Malaysian | | |
| | Resources Corp. Bhd. | 72,400 | 29 |
| | Petra Perdana Bhd. | 36,400 | 28 |
| | Uchi Technologies Bhd. | 53,200 | 21 |
| * | Sunrise Bhd. | 33,100 | 21 |
| | Malaysian Bulk Carriers Bhd. | 12,600 | 11 |
| * | OSK Ventures | | |
| | International Bhd. | 14,287 | 3 |
| | | | 3,008 |
70
FTSE All-World ex-US Small-Cap Index Fund
| | | |
| | | | Market |
| | | | Value• |
| | | Shares | ($000) |
| Mexico (0.8%) | | |
| * | Desarrolladora Homex SAB | | |
| | de CV | 55,200 | 328 |
| | Coca-Cola Femsa SAB de CV | 60,400 | 326 |
| * | Empresas ICA SAB de CV | 138,840 | 305 |
| | Banco Compartamos SA | | |
| | de CV | 70,300 | 288 |
| | Grupo Aeroportuario del | | |
| | Sureste SAB de CV Class B | 63,700 | 259 |
| * | Corp GEO SAB de CV | 90,300 | 238 |
| | TV Azteca SA de CV | 344,800 | 178 |
| * | Axtel SAB de CV | 208,290 | 154 |
| * | Consorcio ARA SAB de CV | 231,500 | 145 |
| * | Industrias CH SAB de CV | | |
| | Class B | 47,000 | 143 |
| | Grupo Aeroportuario del | | |
| | Centro Norte Sab de CV | 56,510 | 81 |
| * | Grupo Simec SAB de CV | | |
| | Class B | 24,275 | 59 |
| * | Grupo Famsa SAB de CV | | |
| | Class A | 31,357 | 54 |
| * | Controladora Comercial | | |
| | Mexicana SAB de CV | 68,900 | 52 |
| * | Gruma SAB de CV Class B | 26,300 | 48 |
| | | | 2,658 |
| Netherlands (2.1%) | | |
| | Koninklijke Boskalis | | |
| | Westminster NV | 13,007 | 457 |
| | Imtech NV | 16,695 | 424 |
| | Wereldhave NV | 4,109 | 401 |
| | CSM | 13,284 | 351 |
| | Nutreco Holding NV | 6,686 | 337 |
| | BinckBank N.V. | 16,945 | 335 |
| | Koninklijke Vopak NV | 4,895 | 330 |
| * | Eurocommercial | | |
| | Properties NV | 7,158 | 310 |
| * | ASM International NV | 13,211 | 268 |
| * | USG People NV | 15,037 | 262 |
| | Aalberts Industries NV | 20,821 | 261 |
| | Vastned Retail NV | 3,828 | 255 |
| | Koninklijke BAM Groep NV | 19,573 | 230 |
| | Smit Internationale NV | 2,678 | 210 |
| | Arcadis NV | 9,458 | 189 |
| * | SNS Reaal | 26,250 | 186 |
| * | Crucell NV | 9,178 | 182 |
| | Nieuwe Steen | | |
| | Investments Funds NV | 9,502 | 182 |
| | Mediq NV | 11,157 | 177 |
| | Wavin NV | 80,854 | 167 |
| | Exact Holding NV | 6,033 | 166 |
| | Ten Cate NV | 7,018 | 164 |
| * | OCE NV | 21,173 | 134 |
| * | Draka Holding | 6,860 | 128 |
| | Telegraaf Media Groep NV | 6,550 | 123 |
| * | Unit 4 Agresso NV | 5,103 | 121 |
| | Sligro Food Group NV | 3,927 | 121 |
| | | |
| | | | Market |
| | | | Value• |
| | | Shares | ($000) |
| * | Super De Boer NV | 16,520 | 116 |
| *,^ | TomTom NV | 11,730 | 112 |
| | TKH Group NV | 6,727 | 111 |
| | Grontmij NV | 3,472 | 96 |
| * | Koninklijke Wessanen NV | 13,592 | 75 |
| | Macintosh Retail Group NV | 3,144 | 65 |
| * | Kardan NV | 7,507 | 55 |
| | KAS Bank NV | 2,488 | 51 |
| * | Heijmans NV | 2,835 | 50 |
| | Beter BED Holding NV | 2,311 | 50 |
| | Vastned Offices | 2,860 | 50 |
| * | AMG Advanced | | |
| | Metallurgical Group NV | 3,606 | 48 |
| | Brunel International | 1,445 | 41 |
| * | Ordina NV | 6,267 | 39 |
| | | | 7,430 |
| New Zealand (0.2%) | | |
| | Goodman Property Trust | 213,226 | 159 |
| ^ | AMP NZ Office Trust | 226,871 | 136 |
| | Infratil Ltd. | 111,825 | 130 |
| | New Zealand Oil & Gas Ltd. | 103,190 | 126 |
| | Nuplex Industries Ltd. | 39,951 | 70 |
| | Fisher & Paykel Appliances | | |
| | Holdings Ltd. | 118,375 | 55 |
| | Freightways Ltd. | 25,623 | 55 |
| | Tower Ltd. | 43,325 | 53 |
| | Mainfreight Ltd. | 8,233 | 32 |
| | Pumpkin Patch Ltd. | 17,852 | 25 |
| | | | 841 |
| Norway (1.7%) | | |
| | Tandberg ASA | 23,700 | 634 |
| | Acergy SA | 32,200 | 402 |
| * | Petroleum Geo-Services | | |
| | ASA | 41,800 | 394 |
| *,^ | Marine Harvest | 536,900 | 390 |
| * | TGS Nopec Geophysical Co. | | |
| | ASA | 23,300 | 353 |
| *,^ | Subsea 7 Inc. | 23,700 | 332 |
| * | Schibsted ASA | 19,520 | 321 |
| ^ | Frontline Ltd. | 10,550 | 243 |
| | ProSafe SE | 45,100 | 235 |
| | Tomra Systems ASA | 40,000 | 201 |
| | SpareBank 1 SMN | 22,600 | 199 |
| | ABG Sundal Collier Holding | | |
| | ASA | 146,000 | 191 |
| ^ | Sparebank 1 SR Bank | 23,200 | 183 |
| * | Cermaq ASA | 19,600 | 170 |
| ^ | Aker ASA | 6,150 | 164 |
| * | Norwegian Property ASA | 84,000 | 159 |
| | Veidekke ASA | 20,000 | 153 |
| | Atea ASA | 19,164 | 126 |
| * | Songa Offshore SE | 25,000 | 125 |
| | Fred Olsen Energy ASA | 3,200 | 123 |
| * | DNO International ASA | 154,600 | 121 |
| * | Prosafe Production | | |
| | Public Ltd. | 48,464 | 109 |
71
| | | |
| FTSE All-World ex-US Small-Cap Index Fund |
| |
| |
| |
| | | | Market |
| | | | Value• |
| | | Shares | ($000) |
| * | Sevan Marine ASA | 67,200 | 108 |
| | Opera Software ASA | 20,000 | 86 |
| * | Norske Skogindustrier ASA | 47,000 | 78 |
| * | Golar LNG Ltd. | 6,200 | 77 |
| * | Dockwise Ltd. | 41,000 | 60 |
| * | Austevoll Seafood ASA | 9,500 | 56 |
| | Wilh Wilhelmsen ASA | 2,200 | 51 |
| * | Stolt-Nielsen SA | 3,500 | 48 |
| * | DOF ASA | 7,400 | 42 |
| * | Scorpion Offshore Ltd. | 9,000 | 36 |
| | Leroy Seafood Group ASA | 1,900 | 35 |
| * | EDB Business Partner ASA | 7,500 | 32 |
| | Rem Offshore ASA | 3,800 | 28 |
| | ODIM ASA | 3,800 | 21 |
| *,^ | Sparebank 1 SR Bank | | |
| | Rights Exp. 11/11/2009 | 2,196 | 4 |
| * | Dockwise, Ltd. | | |
| | Rights Exp. 11/20/09 | 22,140 | 3�� |
| | | | 6,093 |
| Peru (0.1%) | | |
| | Minsur SA | 90,181 | 223 |
| |
| Philippines (0.2%) | | |
| | Energy Development Corp. | 3,302,750 | 285 |
| | International Container | | |
| | Terminal Services Inc. | 181,764 | 77 |
| * | Alliance Global Group Inc. | 865,675 | 77 |
| | Aboitiz Power Corp. | 489,646 | 76 |
| | Manila Water Co. Inc. | 206,039 | 69 |
| | Robinsons Land Corp. | 201,975 | 51 |
| | Megaworld Corp. | 1,594,000 | 50 |
| * | First Gen Corp. | 146,181 | 48 |
| | Filinvest Land Inc. | 2,260,000 | 43 |
| * | Vista Land & | | |
| | Lifescapes Inc. | 996,000 | 41 |
| * | First Philippine | | |
| | Holdings Corp. | 20,000 | 20 |
| | | | 837 |
| Poland (0.6%) | | |
| | Asseco Poland SA | 12,252 | 246 |
| * | PBG SA | 2,836 | 221 |
| * | Orbis SA | 12,676 | 200 |
| | Polimex Mostostal SA | 123,336 | 159 |
| * | Grupa Lotos SA | 16,530 | 150 |
| * | Synthos SA | 281,200 | 115 |
| * | AmRest Holdings NV | 4,601 | 112 |
| | Emperia Holding SA | 4,620 | 104 |
| * | Bank Millennium SA | 60,821 | 100 |
| | Eurocash SA | 18,022 | 88 |
| * | Cersanit SA | 17,866 | 88 |
| * | Echo Investment SA | 60,903 | 87 |
| | Budimex SA | 2,346 | 64 |
| * | Grupa Kety SA | 1,676 | 61 |
| * | Bioton SA | 665,652 | 52 |
| * | Agora SA | 6,922 | 46 |
| | | | |
| | | | | Market |
| | | | | Value• |
| | | | Shares | ($000) |
| | Firma Oponiarska Debica | | |
| | SA | | 2,063 | 44 |
| * | Bank BPH SA | | 1,446 | 35 |
| * | Polnord SA | | 2,724 | 32 |
| * | Ciech SA | | 2,089 | 28 |
| | | | | 2,032 |
| Portugal (0.4%) | | | |
| ^ | Sonae | | 183,864 | 242 |
| | Mota Engil SGPS SA | 39,738 | 236 |
| | BANIF SGPS SA | | 92,460 | 178 |
| | Portucel Empresa Produtora | |
| | de Pasta e Papel SA | 53,002 | 150 |
| | Semapa-Sociedade de | | |
| | Investimento e Gestao | 13,356 | 148 |
| | REN - Redes Energeticas | | |
| | Nacionais SA | | 30,529 | 134 |
| *,^ | Altri SGPS SA | | 15,921 | 92 |
| * | Teixeira Duarte-Engenharia | | |
| | Construcoes SA | | 46,664 | 73 |
| *,^ | Sonae Industria SGPS SA | 15,627 | 56 |
| * | Sonaecom - SGPS SA | 11,962 | 34 |
| *,^ | Martifer SGPS SA | | 4,999 | 27 |
| | | | | 1,370 |
| Russia (0.2%) | | | |
| | AK Transneft OAO | | 343 | 287 |
| * | Inter Rao Ues OAO | 246,991,900 | 254 |
| | Uralsvyazinform | | 4,186,533 | 99 |
| | Sibirtelecom | | 1,596,300 | 55 |
| * | RBC Information Systems | 12,981 | 21 |
| | VolgaTelecom | | 4,324 | 9 |
| | | | | 725 |
| Singapore (1.4%) | | | |
| | Jardine Strategic | | | |
| | Holdings Ltd. | | 40,800 | 708 |
| | Ascendas Real Estate | | |
| | Investment Trust | | 385,000 | 501 |
| | Suntec Real Estate | | | |
| | Investment Trust | | 454,000 | 386 |
| | Mapletree Logistics Trust | 600,000 | 319 |
| | Singapore Airport | | | |
| | Terminal Services Ltd. | 179,000 | 313 |
| | Hyflux Ltd. | | 113,000 | 246 |
| | Kim Eng Holdings Ltd. | 146,000 | 207 |
| | Ascendas India Trust | 306,000 | 203 |
| | Straits Asia | | | |
| | Resources Ltd. | | 141,000 | 180 |
| * | Biosensors International | | |
| | Group Ltd. | | 343,000 | 170 |
| * | Ezra Holdings Ltd. | | 121,000 | 162 |
| | CDL Hospitality Trusts | 139,701 | 156 |
| | OM Holdings Ltd. | | 89,287 | 138 |
| | Macquarie International | | |
| | Infrastructure Fund Ltd. | 415,500 | 120 |
| * | Indofood Agri | | | |
| | Resources Ltd. | | 85,000 | 102 |
72
FTSE All-World ex-US Small-Cap Index Fund
| | | |
| | | | Market |
| | | | Value• |
| | | Shares | ($000) |
| | Raffles | | |
| | Education Corp. Ltd. | 277,100 | 97 |
| * | Midas Holdings Ltd. | 146,000 | 85 |
| | First Ship Lease Trust | 194,000 | 83 |
| * | Banyan Tree Holdings Ltd. | 121,000 | 70 |
| | Fortune Real Estate | | |
| | Investment Trust | 187,000 | 67 |
| * | Creative Technology Ltd. | 14,900 | 63 |
| | Ascott Residence Trust | 82,000 | 61 |
| | Cambridge Industrial Trust | 141,000 | 46 |
| | Frasers Commercial Trust | 451,000 | 46 |
| | CSE Global Ltd. | 80,000 | 45 |
| * | CH Offshore Ltd. | 83,000 | 40 |
| * | K1 Ventures Ltd. | 325,000 | 39 |
| * | Swiber Holdings Ltd. | 58,000 | 37 |
| * | Synear Food Holdings Ltd. | 165,000 | 36 |
| * | Jaya Holdings Ltd. | 103,000 | 33 |
| * | KS Energy Services Ltd. | 39,000 | 31 |
| * | Goodpack Ltd. | 33,000 | 30 |
| | | | 4,820 |
| South Africa (0.4%) | | |
| * | Aquarius Platinum Ltd. | 95,971 | 409 |
| | Astral Foods Ltd. | 17,608 | 225 |
| | DataTec Ltd. | 38,011 | 140 |
| | Capital Property Fund | 108,854 | 95 |
| | Emira Property Fund | 65,724 | 94 |
| * | Mvelaphanda Group Ltd. | 99,382 | 90 |
| | City Lodge Hotels Ltd. | 8,560 | 87 |
| | Avusa Ltd. | 25,160 | 71 |
| | Omnia Holdings Ltd. | 8,795 | 65 |
| | Afgri Ltd. | 70,839 | 54 |
| | DRDGOLD Ltd. | 87,932 | 52 |
| * | Blue Label Telecoms Ltd. | 61,997 | 44 |
| * | Simmer & Jack Mines Ltd. | 150,328 | 39 |
| * | Metorex Ltd. | 93,951 | 38 |
| | Peregrine Holdings Ltd. | 30,314 | 36 |
| | | | 1,539 |
| South Korea (3.0%) | | |
| | Korea Zinc Co. Ltd. | 2,865 | 443 |
| * | Seoul | | |
| | Semiconductor Co. Ltd. | 7,668 | 273 |
| | Hyundai Marine & | | |
| | Fire Insurance Co. Ltd. | 13,290 | 245 |
| | Macquarie Korea | | |
| | Infrastructure Fund | 57,800 | 243 |
| | Tong Yang Securities Inc. | 25,200 | 231 |
| | SK Chemicals Co. Ltd. | 4,219 | 230 |
| | Dong-A | | |
| | Pharmaceutical Co. Ltd. | 2,308 | 224 |
| | Korean Reinsurance Co. | 23,050 | 208 |
| | LG International Corp. | 8,170 | 200 |
| | LIG Insurance Co. Ltd. | 9,730 | 199 |
| * | Celltrion Inc. | 16,255 | 196 |
| * | LG Life Sciences Ltd. | 3,309 | 192 |
| | Orion Corp. | 917 | 185 |
| | MegaStudy Co. Ltd. | 887 | 184 |
| | | |
| | | | Market |
| | | | Value• |
| | | Shares | ($000) |
| | Hanmi Pharm Co. Ltd. | 1,880 | 182 |
| | Taekwang Industrial Co. Ltd. | 257 | 162 |
| | LG Fashion Corp. | 6,860 | 155 |
| * | Poongsan Corp. | 7,470 | 155 |
| | Taihan Electric Wire Co. Ltd. | 9,530 | 152 |
| | Meritz Fire & | | |
| | Marine Insurance Co. Ltd. | 20,970 | 145 |
| | LS Industrial | | |
| | Systems Co. Ltd. | 1,672 | 125 |
| | Samchully Co. Ltd. | 1,151 | 122 |
| * | Eugene Investment & | | |
| | Securities Co. Ltd. | 142,110 | 120 |
| * | Dongbu Securities Co. Ltd. | 24,040 | 120 |
| * | SK Broadband Co. Ltd. | 27,287 | 112 |
| | SK Gas Co. Ltd. | 2,478 | 107 |
| | Seah Besteel Corp. | 8,730 | 106 |
| | Hanwha Securities Co. | 15,930 | 106 |
| * | Ssangyong Cement | | |
| | Industrial Co. Ltd. | 14,310 | 102 |
| | Hotel Shilla Co. Ltd. | 6,700 | 98 |
| | Daewoong | | |
| | Pharmaceutical Co. Ltd. | 2,114 | 98 |
| | Hanil Cement Manufacturing | 1,550 | 97 |
| | KIWOOM Securities Co. Ltd. | 2,608 | 97 |
| | Kolon Industries Inc. | 3,340 | 96 |
| * | Komipharm | | |
| | International Co. Ltd. | 1,807 | 95 |
| | Green Cross Corp. | 698 | 94 |
| | Young Poong Corp. | 192 | 93 |
| * | Neowiz Games Corp. | 2,849 | 93 |
| | SODIFF Advanced | | |
| | Materials Co. Ltd. | 1,286 | 89 |
| | Dongsuh Co. Inc. | 3,163 | 89 |
| | Kyobo Securities Co. | 10,770 | 88 |
| | E1 Corp. | 1,526 | 88 |
| | Sung Kwang Bend Co. Ltd. | 4,190 | 87 |
| | Hana Tour Service Inc. | 2,844 | 86 |
| | Doosan Engineering & | | |
| | Construction Co. Ltd. | 13,820 | 85 |
| | Binggrae Co. Ltd. | 2,240 | 84 |
| * | Hyundai H&S Co. Ltd. | 1,182 | 84 |
| | Meritz Securities Co. Ltd. | 83,720 | 84 |
| * | Hansol Paper Co. | 9,390 | 82 |
| | Taewoong Co. Ltd. | 1,183 | 81 |
| * | TK Corp. | 2,828 | 80 |
| | Korea Kumho Petrochemical | 4,080 | 79 |
| | SK Securities Co. Ltd. | 36,330 | 78 |
| | CJ CGV Co. Ltd. | 4,710 | 77 |
| | Woongjin Thinkbig Co. Ltd. | 4,100 | 77 |
| | Hyundai Elevator Co. Ltd. | 1,552 | 74 |
| * | KTB Securities Co. Ltd. | 20,620 | 74 |
| | Samyang Corp. | 2,260 | 73 |
| | Namyang Dairy | | |
| | Products Co. Ltd. | 160 | 73 |
| | SFA Engineering Corp. | 2,281 | 72 |
| | NH Investment & | | |
| | Securities Co. Ltd. | 8,710 | 71 |
73
FTSE All-World ex-US Small-Cap Index Fund
| | | |
| | | | Market |
| | | | Value• |
| | | Shares | ($000) |
| * | Woongjin Chemical Co. Ltd. | 63,380 | 69 |
| | Hanjin Heavy Industries & | | |
| | Construction | | |
| | Holdings Co. Ltd. | 6,910 | 68 |
| | Korea Line Corp. | 1,663 | 68 |
| | KISCO Corp. | 1,706 | 67 |
| * | Woongjin Holdings Co. Ltd. | 7,320 | 66 |
| | S&T Dynamics Co. Ltd. | 5,240 | 65 |
| * | Daewoo Motor Sales | 7,768 | 64 |
| | STX Engine Co. Ltd. | 4,350 | 63 |
| | Taeyoung Engineering & | | |
| | Construction | 14,510 | 60 |
| * | POSDATA Co. Ltd. | 12,725 | 59 |
| | Jeonbuk Bank | 9,790 | 59 |
| | Kumho Electric Co. Ltd. | 1,387 | 59 |
| | Kwang Dong | | |
| | Pharmaceutical Co. Ltd. | 24,350 | 58 |
| | Namhae Chemical Corp. | 4,670 | 58 |
| * | S&T Daewoo Co. Ltd. | 2,620 | 57 |
| | Bukwang | | |
| | Pharmaceutical Co. Ltd. | 3,930 | 56 |
| | KISCO Holdings Co. Ltd. | 826 | 55 |
| * | Ilyang | | |
| | Pharmaceutical Co. Ltd. | 2,180 | 55 |
| * | Ssangyong Motor Co. | 24,720 | 55 |
| * | Humax Co., Ltd. | 4,435 | 54 |
| | Hanjin Transportation Co. Ltd. | 1,920 | 53 |
| | Huchems Fine | | |
| | Chemical Corp. | 2,090 | 52 |
| * | Jusung Engineering Co. Ltd. | 4,553 | 52 |
| | CJ O Shopping Co. Ltd. | 777 | 51 |
| | Hite Holdings Co. Ltd. | 1,950 | 50 |
| | Daekyo Co. Ltd. | 11,850 | 48 |
| | Dongbu Steel Co. Ltd. | 7,458 | 47 |
| * | Osstem Implant Co. Ltd. | 5,572 | 47 |
| | Korea Electric | | |
| | Terminal Co. Ltd. | 2,560 | 44 |
| | Sam Young | | |
| | Electronics Co. Ltd. | 4,620 | 43 |
| | Daeduck Electronics Co. | 9,890 | 42 |
| * | Tong Yang Major Corp. | 12,770 | 42 |
| * | Hyunjin Materials Co. Ltd. | 2,147 | 41 |
| * | SK Communications Co. Ltd. | 6,783 | 41 |
| | Kyeryong Construction | | |
| | Industrial Co. Ltd. | 2,140 | 40 |
| | CJ Internet Corp. | 3,722 | 39 |
| | INTOPS Co. Ltd. | 2,557 | 37 |
| * | Interpark Corp. | 7,058 | 36 |
| | Daeduck GDS Co. Ltd. | 4,220 | 36 |
| | Chong Kun Dang Pharm Corp. | 1,910 | 35 |
| * | Insun ENT Co. Ltd. | 7,314 | 35 |
| | Sewon Cellontech Co Ltd. | 4,910 | 34 |
| | Handsome Co. Ltd. | 2,790 | 34 |
| | Korea Plant Service & | | |
| | Engineering Co. Ltd. | 1,250 | 34 |
| * | KP Chemical Corp. | 5,590 | 32 |
| | | |
| | | | Market |
| | | | Value• |
| | | Shares | ($000) |
| * | Daesang Corp. | 4,520 | 32 |
| * | Pyeong San Co. Ltd. | 1,666 | 31 |
| | Unison Co. Ltd. | 1,751 | 31 |
| | Hankuk Electric | | |
| | Glass Co. Ltd. | 1,270 | 31 |
| * | ON*Media Corp. | 10,780 | 30 |
| | Dongbu Corp. | 4,780 | 30 |
| * | Forhuman Co. Ltd. | 3,753 | 30 |
| | Kolon Engineering & | | |
| | Construction Co. Ltd. | 5,380 | 29 |
| * | Kumho Tire Co. Inc. | 6,840 | 28 |
| * | SSCP Co. Ltd. | 4,248 | 28 |
| * | Dongbu HiTek Co. Ltd. | 4,890 | 25 |
| * | Hanwha Non-Life | | |
| | Insurance Co. Ltd. | 3,030 | 25 |
| | Dae Han Flour Mills Co. Ltd. | 212 | 24 |
| | GS Home Shopping Inc. | 350 | 24 |
| * | Keangnam Enterprises Ltd. | 2,120 | 19 |
| | LG Innotek Co. Ltd. | 210 | 19 |
| * | Youngone Corp. | 2,824 | 19 |
| * | Asiana Airlines | 5,520 | 17 |
| | Humax Holdings Co., Ltd. | 993 | 12 |
| | | | 10,684 |
| Spain (1.8%) | | |
| | Bolsas y Mercados | | |
| | Espanoles | 18,278 | 609 |
| | Ebro Puleva SA | 22,854 | 435 |
| | Obrascon Huarte Lain SA | 14,416 | 383 |
| * | Iberia Lineas Aereas de | | |
| | Espana SA | 137,299 | 379 |
| | Grupo Catalana Occidente | | |
| | SA | 13,786 | 334 |
| | Construcciones y Auxiliar de | | |
| | Ferrocarriles SA | 659 | 325 |
| | Tecnicas Reunidas SA | 5,671 | 299 |
| | Prosegur Cia de Seguridad | | |
| | SA | 6,468 | 272 |
| * | Zeltia SA | 43,879 | 259 |
| ^ | Banco Pastor SA | 34,355 | 257 |
| | Viscofan SA | 8,806 | 230 |
| | Abengoa SA | 8,377 | 221 |
| | Sol Melia SA | 22,690 | 201 |
| *,^ | NH Hoteles SA | 35,312 | 185 |
| | FAES FARMA SA | 32,570 | 181 |
| | Tubacex SA | 39,188 | 162 |
| ^ | Antena 3 de Television SA | 18,865 | 161 |
| | Duro Felguera SA | 15,316 | 152 |
| *,^ | Grupo Empresarial Ence SA | 34,720 | 140 |
| | Almirall SA | 9,408 | 124 |
| | Fersa Energias Renovables | | |
| | SA | 35,030 | 104 |
| * | Campofrio Food SA | 9,300 | 94 |
| * | Realia Business SA | 31,741 | 85 |
| * | Promotora de Informaciones | | |
| | SA | 16,421 | 78 |
| | Tubos Reunidos SA | 25,582 | 78 |
74
FTSE All-World ex-US Small-Cap Index Fund
| | | |
| | | | Market |
| | | | Value• |
| | | Shares | ($000) |
| ^ | Pescanova SA | 2,215 | 77 |
| *,^ | SOS Corp. Alimentaria SA | 24,805 | 75 |
| | Cementos Portland | | |
| | Valderrivas SA | 1,287 | 60 |
| * | Afirma Grupo Inmobiliario | | |
| | SA | 115,765 | 50 |
| | Laboratorios Farmaceuticos | | |
| | Rovi SA | 3,801 | 43 |
| | Miquel y Costas & | | |
| | Miquel SA | 1,880 | 41 |
| * | Avanzit SA | 33,540 | 37 |
| * | La Seda de Barcelona SA | | |
| | Class B | 68,850 | 34 |
| * | Ercros SA | 14,157 | 29 |
| | Fluidra SA | 5,461 | 26 |
| * | General de Alquiler de | | |
| | Maquinaria SA | 2,195 | 20 |
| * | Solaria Energia y | | |
| | Medio Ambiente SA | 4,895 | 18 |
| | | | 6,258 |
| Sweden (2.9%) | | |
| | Getinge AB | 46,374 | 864 |
| | Kinnevik Investment AB | 46,897 | 645 |
| ^ | Ratos AB | 25,891 | 602 |
| | Modern Times Group AB | | |
| | Class B | 10,844 | 470 |
| | Meda AB Class A | 47,683 | 432 |
| | Hexagon AB Class B | 32,489 | 425 |
| * | Lundin Petroleum AB | 44,024 | 373 |
| | Castellum AB | 35,128 | 327 |
| * | Trelleborg AB Class B | 49,874 | 303 |
| | Elekta AB Class B | 13,273 | 250 |
| | Peab AB | 38,926 | 244 |
| | NCC AB Class B | 15,901 | 240 |
| * | JM AB | 16,056 | 239 |
| | Hakon Invest AB | 13,411 | 224 |
| | Fabege AB | 37,592 | 218 |
| | Kungsleden AB | 30,185 | 210 |
| * | Husqvarna AB | 34,311 | 202 |
| | Wihlborgs Fastigheter AB | 10,738 | 201 |
| | Oresund Investment AB | 11,364 | 196 |
| | Lindab International AB | 17,998 | 191 |
| | Niscayah Group AB | 80,508 | 189 |
| | Lundbergforetagen AB | | |
| | Class B | 3,691 | 172 |
| | Wallenstam AB | 9,882 | 162 |
| * | SAS AB | 264,338 | 160 |
| | Avanza Bank Holding AB | 7,330 | 158 |
| | Axis Communications AB | 13,724 | 148 |
| | Hoganas AB Class B | 8,046 | 146 |
| * | Eniro AB | 31,449 | 145 |
| * | Nobia AB | 22,129 | 137 |
| | Loomis AB Class B | 12,179 | 131 |
| | Cardo AB | 4,623 | 125 |
| | HQ AB | 6,667 | 122 |
| | Hufvudstaden AB Class A | 15,182 | 120 |
| | | |
| | | | Market |
| | | | Value• |
| | | Shares | ($000) |
| | Axfood AB | 3,967 | 118 |
| | Saab AB Class B | 8,831 | 116 |
| | AarhusKarlshamn AB | 5,729 | 115 |
| | Clas Ohlson AB | 6,096 | 115 |
| *,^ | Bure Equity AB | 21,757 | 111 |
| | Intrum Justitia AB | 8,972 | 111 |
| * | Black Earth Farming Ltd. | 29,695 | 110 |
| * | Billerud AB | 18,717 | 104 |
| * | SkiStar AB | 5,304 | 100 |
| * | PA Resources AB | 20,000 | 78 |
| | Klovern AB | 23,984 | 76 |
| | Nordnet AB | 20,147 | 64 |
| * | Munters AB | 8,697 | 60 |
| * | Q-Med AB | 9,881 | 60 |
| * | Rezidor Hotel Group AB | 17,980 | 57 |
| | BE Group AB | 7,771 | 45 |
| *,^ | TradeDoubler AB | 5,768 | 44 |
| *,^ | Haldex AB | 2,252 | 19 |
| | | | 10,274 |
| Switzerland (4.2%) | | |
| | Basler Kantonalbank | 6,137 | 707 |
| * | Aryzta AG | 16,034 | 629 |
| * | Logitech International SA | 36,471 | 623 |
| * | Clariant AG | 57,743 | 552 |
| | Sulzer AG | 7,020 | 547 |
| | PSP Swiss Property AG | 9,094 | 510 |
| | Petroplus Holdings AG | 21,459 | 467 |
| | Valiant Holding | 2,343 | 462 |
| | Bank Sarasin & Cie AG | | |
| | Class B | 11,495 | 458 |
| ^ | Swiss Prime Site AG | 7,912 | 436 |
| | Helvetia Holding AG | 1,319 | 421 |
| | EMS-Chemie Holding AG | 3,348 | 372 |
| ^ | Galenica AG | 989 | 341 |
| | Sika AG | 221 | 300 |
| | Georg Fischer AG | 1,101 | 289 |
| | Partners Group Holding AG | 2,288 | 281 |
| | Panalpina Welttransport | | |
| | Holding AG | 3,968 | 278 |
| * | Temenos Group AG | 11,598 | 265 |
| | Bucher Industries AG | 2,449 | 257 |
| | Metall Zug AG | 109 | 257 |
| * | Dufry Group | 3,860 | 244 |
| | Valora Holding AG | 1,013 | 242 |
| * | Rieter Holding AG | 1,075 | 241 |
| | Kudelski SA | 11,667 | 238 |
| ^ | Kaba Holding AG Class B | 995 | 230 |
| | Banque Cantonale Vaudoise | 608 | 229 |
| | Vontobel Holding AG | 6,971 | 223 |
| | Barry Callebaut AG | 386 | 216 |
| | Solvalor 61 | 853 | 202 |
| | St Galler Kantonalbank | 415 | 189 |
| | Forbo Holding AG | 608 | 172 |
| | Flughafen Zuerich AG | 582 | 169 |
| | Mobimo Holding AG | 1,045 | 168 |
75
FTSE All-World ex-US Small-Cap Index Fund
| | | |
| | | | Market |
| | | | Value• |
| | | Shares | ($000) |
| ^ | Swissquote Group Holding | | |
| | SA | 3,216 | 166 |
| | Liechtenstein Landesbank | 2,434 | 159 |
| | Kuoni Reisen Holding AG | 462 | 157 |
| | Implenia AG | 5,636 | 156 |
| | Belimo Holding AG | 151 | 154 |
| | Vetropack Holding AG | 92 | 148 |
| | Tecan Group AG | 2,381 | 146 |
| | Schulthess Group | 2,459 | 142 |
| * | Meyer Burger Technology AG | 630 | 137 |
| | Schweiter Technologies AG | 276 | 136 |
| | Schmolz & Bickenbach AG | 4,905 | 133 |
| *,^ | OC Oerlikon Corp. AG | 2,036 | 129 |
| | Huber & Suhner AG | 2,878 | 115 |
| * | Basilea Pharmaceutica | 1,343 | 111 |
| | Burckhardt Compression | | |
| | Holding AG | 755 | 110 |
| | Von Roll Holding AG | 13,900 | 95 |
| | Allreal Holding AG | 775 | 94 |
| | Ypsomed Holding AG | 1,448 | 92 |
| * | Bobst Group AG | 2,475 | 92 |
| | Romande Energie Holding | | |
| | SA | 44 | 87 |
| | Verwaltungs- und | | |
| | Privat-Bank AG | 768 | 82 |
| * | Absolute Private Equity AG | 9,121 | 80 |
| | Intershop Holdings | 281 | 80 |
| | Charles Voegele Holding AG | 1,905 | 75 |
| * | Ascom Holding AG | 6,997 | 74 |
| * | Athris Holding AG | 72 | 74 |
| | VZ Holding AG | 833 | 64 |
| | Daetwyler Holding AG | 1,210 | 60 |
| * | AFG Arbonia-Forster Hldg | 2,281 | 49 |
| | Compagnie Financiere | | |
| | Tradition SA | 370 | 46 |
| | Bellevue Group AG | 1,117 | 45 |
| | Bachem Holding AG | 633 | 43 |
| | Bell Holding AG | 28 | 43 |
| | Emmi AG | 361 | 43 |
| | Gurit Holding AG | 75 | 41 |
| * | Zueblin Immobilien Holding | | |
| | AG | 8,366 | 37 |
| | Phoenix Mecano AG | 88 | 33 |
| * | PubliGroupe AG | 337 | 32 |
| | Zehnder Group AG | 25 | 27 |
| | Coltene Holding AG | 533 | 27 |
| | Siegfried Holding AG | 213 | 22 |
| | Gottex Fund Management | | |
| | Holdings Ltd. | 1,961 | 17 |
| | | | 14,868 |
| Taiwan (5.1%) | | |
| | Epistar Corp. | 154,000 | 448 |
| | Powertech Technology Inc. | 100,050 | 274 |
| | Richtek Technology Corp. | 30,600 | 235 |
| | Tripod Technology Corp. | 93,420 | 234 |
| | | |
| | | | Market |
| | | | Value• |
| | | Shares | ($000) |
| | Far Eastern Department | | |
| | Stores Co. Ltd. | 224,480 | 231 |
| | WPG Holdings Co. Ltd. | 168,000 | 230 |
| | Infortrend Technology Inc. | 150,760 | 226 |
| | Highwealth | | |
| | Construction Corp. | 175,582 | 218 |
| | Simplo Technology Co. Ltd. | 40,600 | 208 |
| * | China Life | | |
| | Insurance Co. Ltd. | 271,000 | 197 |
| | Phison Electronics Corp. | 29,074 | 195 |
| | Everlight | | |
| | Electronics Co. Ltd. | 71,000 | 194 |
| | Test-Rite International Co. | 425,755 | 192 |
| | Pixart Imaging Inc. | 27,177 | 192 |
| | National Petroleum Co. Ltd. | 185,000 | 191 |
| * | Prime View | | |
| | International Co. Ltd. | 108,318 | 176 |
| * | Clevo Co. | 131,773 | 164 |
| * | Ruentex Industries Ltd. | 97,000 | 158 |
| * | Jih Sun Financial | | |
| | Holdings Co. Ltd. | 1,017,000 | 157 |
| | AmTRAN | | |
| | Technology Co. Ltd. | 160,935 | 153 |
| | Greatek Electronics Inc. | 158,720 | 150 |
| | China Bills Finance Corp. | 556,000 | 150 |
| | Kenda Rubber | | |
| | Industrial Co. Ltd. | 126,800 | 150 |
| * | Masterlink Securities Corp. | 385,000 | 150 |
| * | Silicon Integrated | | |
| | Systems Corp. | 311,000 | 147 |
| | ALI Corp. | 74,047 | 146 |
| * | Wintek Corp. | 217,000 | 145 |
| * | Tainan Spinning Co. Ltd. | 386,000 | 142 |
| | TSRC Corp. | 122,000 | 142 |
| | Pan-International Industrial | 97,040 | 141 |
| | Feng TAY Enterprise Co. Ltd. | 170,000 | 140 |
| | Universal Scientific | | |
| | Industrial Co. Ltd. | 282,000 | 139 |
| | Shinkong Synthetic | | |
| | Fibers Corp. | 558,000 | 138 |
| | Tung Ho Steel | | |
| | Enterprise Corp. | 144,023 | 137 |
| | Altek Corp. | 76,338 | 129 |
| * | Wei Chuan Food Corp. | 99,000 | 129 |
| * | Nan Kang Rubber | | |
| | Tire Co. Ltd. | 128,000 | 127 |
| * | China Petrochemical | | |
| | Development Corp. | 350,000 | 125 |
| | Ruentex | | |
| | Development Co. Ltd. | 110,000 | 123 |
| | Yung Shin Pharmaceutical | | |
| | Industrial Co. Ltd. | 112,000 | 120 |
| * | Phoenix Precision | | |
| | Technology Corp. | 174,000 | 117 |
| | Huaku | | |
| | Development Co. Ltd. | 49,000 | 116 |
76
FTSE All-World ex-US Small-Cap Index Fund
| | | |
| | | | Market |
| | | | Value• |
| | | Shares | ($000) |
| | BES Engineering Corp. | 409,000 | 113 |
| | LEE Chang Yung Chem | | |
| | IND Corp. | 101,575 | 113 |
| | Farglory Land | | |
| | Development Co. Ltd. | 56,000 | 113 |
| | Ability Enterprise Co. Ltd. | 60,480 | 111 |
| | Zyxel Communications Corp. | 160,000 | 110 |
| | Shin Zu Shing Co. Ltd. | 23,942 | 109 |
| | Yieh Phui Enterprise | 337,160 | 109 |
| | Goldsun Development & | | |
| | Construction Co. Ltd. | 240,140 | 109 |
| | Sino-American Silicon | | |
| | Products Inc. | 49,994 | 108 |
| | Motech Industries Inc. | 40,796 | 108 |
| | Gigabyte | | |
| | Technology Co. Ltd. | 127,000 | 108 |
| | Soft-World | | |
| | International Corp. | 23,114 | 107 |
| | Chroma ATE Inc. | 55,106 | 106 |
| | Elan Microelectronics Corp. | 76,350 | 103 |
| | Kinsus Interconnect | | |
| | Technology Corp. | 41,000 | 103 |
| | Lien Hwa Industrial Corp. | 223,045 | 102 |
| | TXC Corp. | 75,300 | 102 |
| | China Steel Chemical Corp. | 40,000 | 102 |
| * | Ta Chong Bank Co. Ltd. | 508,000 | 100 |
| | CyberTAN Technology Inc. | 76,494 | 99 |
| * | Shihlin Paper Corp. | 50,000 | 98 |
| | Shihlin Electric & | | |
| | Engineering Corp. | 81,000 | 97 |
| | Solar Applied Materials | | |
| | Technology Co. | 46,540 | 97 |
| | Global Mixed Mode | | |
| | Technology Inc. | 23,199 | 96 |
| * | Chung Hung Steel Corp. | 252,000 | 95 |
| | St Shine Optical Co. Ltd. | 17,034 | 94 |
| | UPC Technology Corp. | 194,000 | 94 |
| | Tong Yang Industry Co. Ltd. | 65,990 | 93 |
| * | Huang Hsiang | | |
| | Construction Co. | 50,050 | 93 |
| | T JOIN Transportation Co. | 147,000 | 91 |
| * | Universal Cement Corp. | 192,000 | 91 |
| | Sonix Technology Co. Ltd. | 48,000 | 89 |
| * | USI Corp. | 190,000 | 89 |
| | King Yuan | | |
| | Electronics Co. Ltd. | 231,285 | 89 |
| | Cyberlink Corp. | 23,139 | 89 |
| | Taiwan Navigation Co. Ltd. | 65,000 | 88 |
| | Chung Hsin Electric & | | |
| | Machinery | | |
| | Manufacturing Corp. | 145,000 | 87 |
| | China Synthetic | | |
| | Rubber Corp. | 83,000 | 86 |
| | Radiant | | |
| | Opto-Electronics Corp. | 76,080 | 85 |
| * | Compeq Manufacturing Co. | 328,000 | 85 |
| | | |
| | | | Market |
| | | | Value• |
| | | Shares | ($000) |
| | Dynapack International | | |
| | Technology Corp. | 27,299 | 83 |
| | Sinyi Realty Co. | 50,000 | 83 |
| | Global Unichip Corp. | 19,278 | 83 |
| | CTCI Corp. | 95,000 | 83 |
| | Great Wall Enterprise Co. | 78,450 | 81 |
| | Wafer Works Corp. | 52,880 | 80 |
| | Standard Foods Corp. | 73,170 | 80 |
| * | Kinpo Electronics | 303,000 | 79 |
| | Gemtek Technology Corp. | 51,178 | 78 |
| | Sheng Yu Steel Co. Ltd. | 111,000 | 76 |
| * | Shining Building | | |
| | Business Co. Ltd. | 75,000 | 76 |
| | Opto Technology Corp. | 103,000 | 75 |
| | Yungtay Engineering Co. Ltd. | 100,000 | 74 |
| | Getac Technology Corp. | 83,000 | 74 |
| * | Gintech Energy Corp. | 49,903 | 74 |
| | Depo Auto Parts Ind Co. Ltd. | 34,000 | 74 |
| | Zinwell Corp. | 42,000 | 72 |
| | Quanta Storage Inc. | 40,160 | 72 |
| * | Walsin Technology Corp. | 186,000 | 72 |
| * | Sanyang Industry Co. Ltd. | 175,000 | 70 |
| | King Slide Works Co. Ltd. | 13,500 | 70 |
| | Wistron NeWeb Corp. | 52,700 | 70 |
| | International Games | | |
| | System Co. Ltd. | 9,299 | 69 |
| | Ralink Technology Corp. | 25,319 | 69 |
| | Elite Semiconductor Memory | | |
| | Technology Inc. | 49,000 | 68 |
| | Continental | | |
| | Engineering Corp. | 181,000 | 68 |
| | Sincere Navigation | 61,000 | 68 |
| | Taichung Commercial Bank | 273,000 | 68 |
| | Chun Yuan Steel | 201,280 | 67 |
| | First Steamship Co. Ltd. | 52,463 | 66 |
| * | Concord Securities Corp. | 210,000 | 66 |
| * | Evergreen International | | |
| | Storage & Transport Corp. | 81,000 | 66 |
| | Pihsiang Machinery | | |
| | Manufacturing Co. Ltd. | 31,000 | 64 |
| | Chong Hong | | |
| | Construction Co. | 34,800 | 63 |
| * | Sunplus Technology Co. Ltd. | 76,000 | 63 |
| | Hung Sheng | | |
| | Construction Co. Ltd. | 145,000 | 63 |
| * | Prince Housing & | | |
| | Development Corp. | 144,000 | 62 |
| * | King’s Town Bank | 257,000 | 61 |
| | Syncmold Enterprise Corp. | 33,000 | 61 |
| | Taiwan Cogeneration Corp. | 125,000 | 61 |
| | Etron Technology Inc. | 130,000 | 60 |
| * | Jess-Link Products Co. Ltd. | 28,000 | 59 |
| * | TA Chen Stainless Pipe | 86,000 | 59 |
| | Ambassador Hotel | 58,000 | 59 |
| | Firich Enterprises Co. Ltd. | 27,723 | 58 |
| | Aten International Co. Ltd. | 42,260 | 57 |
77
FTSE All-World ex-US Small-Cap Index Fund
| | | |
| | | | Market |
| | | | Value• |
| | | Shares | ($000) |
| | Alpha Networks Inc. | 76,739 | 57 |
| * | A-DATA Technology Co. Ltd. | 24,000 | 57 |
| | Yung Chi Paint & Varnish | | |
| | Manufacturing Co. Ltd. | 45,000 | 57 |
| * | Radium Life Tech Co. Ltd. | 76,479 | 57 |
| | Avermedia Technologies | 47,290 | 56 |
| | China Metal Products | 47,939 | 56 |
| * | Central Reinsurance Co. Ltd. | 143,000 | 56 |
| * | King’s Town | | |
| | Construction Co. Ltd. | 67,000 | 55 |
| * | Sintek Photronic Corp. | 104,445 | 54 |
| * | Grand Pacific Petrochemical | 107,000 | 54 |
| | Holystone Enterprise Co. Ltd. | 49,760 | 54 |
| | Basso Industry Corp. | 57,000 | 54 |
| | L&K Engineering Co. Ltd. | 63,000 | 54 |
| | Formosa International | | |
| | Hotels Corp. | 4,300 | 54 |
| | Systex Corp. | 43,000 | 53 |
| | Chin-Poon Industrial Co. | 72,072 | 53 |
| | Hsing TA Cement Co. | 173,000 | 53 |
| | Yeun Chyang | | |
| | Industrial Co. Ltd. | 69,159 | 53 |
| | AV Tech Corp. | 18,000 | 52 |
| | Wah Lee Industrial Corp. | 44,465 | 51 |
| | Phihong Technology Co. Ltd. | 59,000 | 50 |
| | Elitegroup Computer | | |
| | Systems Co. Ltd. | 130,000 | 49 |
| * | Taiwan Styrene Monomer | 118,000 | 49 |
| | Merida Industry Co. Ltd. | 29,700 | 48 |
| | Senao International Co. Ltd. | 35,000 | 47 |
| | Silitech Technology Corp. | 15,080 | 47 |
| | E-Ton Solar Tech Co. Ltd. | 24,477 | 47 |
| | Taiwan Hon Chuan | | |
| | Enterprise Co. Ltd. | 28,485 | 46 |
| | San Shing Fastech Corp. | 76,000 | 46 |
| | Kindom Construction Co. | 60,000 | 45 |
| | Formosan Rubber Group Inc. | 60,000 | 45 |
| * | Taiwan Life | | |
| | Insurance Co. Ltd. | 50,000 | 45 |
| * | Taiwan TEA Corp. | 78,470 | 45 |
| | Ardentec Corp. | 85,978 | 45 |
| * | Cheng Loong Corp. | 134,000 | 44 |
| | Sunrex Technology Corp. | 42,000 | 43 |
| | Shih Wei Navigation Co. Ltd. | 31,525 | 43 |
| * | Long Bon | | |
| | International Co. Ltd. | 122,000 | 43 |
| | Hsin Kuang Steel Co. Ltd. | 54,249 | 43 |
| * | Mosel Vitelic Inc. | 104,640 | 43 |
| | China Manmade | | |
| | Fibers Corp. | 230,000 | 42 |
| * | Kuoyang | | |
| | Construction Co. Ltd. | 84,000 | 40 |
| * | Chipbond Technology Corp. | 53,000 | 40 |
| | KYE Systems Corp. | 42,862 | 40 |
| * | Gloria Material | | |
| | Technology Corp. | 83,000 | 39 |
| | | |
| | | | Market |
| | | | Value• |
| | | Shares | ($000) |
| | Hung Poo Real Estate | | |
| | Development Corp. | 27,000 | 39 |
| | AcBel Polytech Inc. | 57,000 | 39 |
| * | Long Chen Paper Co. Ltd. | 122,000 | 39 |
| | Asia Vital | | |
| | Components Co. Ltd. | 37,000 | 38 |
| * | HUA ENG Wire & Cable | 118,000 | 37 |
| | Lite-On Semiconductor Corp. | 57,000 | 37 |
| | Sitronix Technology Corp. | 22,218 | 37 |
| | Merry Electronics Co. Ltd. | 22,000 | 37 |
| | Springsoft Inc. | 41,000 | 36 |
| | Chung Hwa Pulp Corp. | 87,000 | 36 |
| | Taiwan Mask Corp. | 104,000 | 36 |
| | ICP Electronics Inc. | 35,214 | 36 |
| | United Integrated | | |
| | Services Co. Ltd. | 69,000 | 36 |
| * | Shinkong Textile Co. Ltd. | 38,000 | 36 |
| * | Bank of Kaohsiung | 114,000 | 34 |
| | Everlight Chemical | | |
| | Industrial Corp. | 47,000 | 34 |
| * | Taiwan | | |
| | Semiconductor Co. Ltd. | 43,000 | 33 |
| | MIN AIK Technology Co. Ltd. | 29,900 | 33 |
| | Advanced International | | |
| | Multitech Co. Ltd. | 19,000 | 33 |
| | Asia Polymer | 45,000 | 33 |
| * | Weltrend Semiconductor | 43,000 | 32 |
| | Makalot Industrial Co. Ltd. | 18,000 | 32 |
| * | Sampo Corp. | 200,000 | 31 |
| * | Taiwan Fire & | | |
| | Marine Insurance Co. | 39,000 | 31 |
| * | Southeast Cement Co. Ltd. | 89,000 | 30 |
| | Holtek Semiconductor Inc. | 27,000 | 30 |
| * | Career Technology Co. Ltd. | 50,000 | 30 |
| | Topco Scientific Co. Ltd. | 30,600 | 30 |
| | Bright Led Electronics Corp. | 27,000 | 29 |
| * | Gold Circuit Electronics Ltd. | 76,000 | 27 |
| * | Federal Corp. | 36,000 | 27 |
| | GeoVision Inc. | 7,000 | 27 |
| | Globe Union Industrial Corp. | 29,000 | 26 |
| * | Ho Tung Chemical Corp. | 57,000 | 26 |
| | Nien Hsing Textile Co. Ltd. | 51,000 | 26 |
| * | Giantplus Technology Co. Ltd. | 46,000 | 26 |
| | Tsann Kuen | | |
| | Enterprise Co. Ltd. | 31,000 | 26 |
| | Kinik Co. | 25,000 | 25 |
| | Accton Technology Corp. | 64,000 | 24 |
| | O-TA Precision | | |
| | Industry Co. Ltd. | 17,000 | 23 |
| * | Chia Hsin Cement Corp. | 37,000 | 19 |
| | | | 17,941 |
| Thailand (0.3%) | | |
| | Glow Energy PCL (Foreign) | 263,600 | 251 |
| | Minor International PCL | | |
| | (Foreign) | 757,600 | 240 |
78
FTSE All-World ex-US Small-Cap Index Fund
| | | |
| | | | Market |
| | | | Value• |
| | | Shares | ($000) |
| | Thanachart Capital PCL | | |
| | (Foreign) | 188,300 | 110 |
| | Hana Microelectronics PCL | | |
| | (Foreign) | 137,200 | 76 |
| | Bumrungrad Hospital PCL | | |
| | (Foreign) | 80,143 | 67 |
| | Bangkok Expressway PCL | | |
| | (Foreign) | 120,800 | 66 |
| | Precious Shipping PCL | | |
| | (Foreign) | 87,700 | 48 |
| | Samart Corp. PCL | 240,400 | 43 |
| * | Sahaviriya Steel Industries | | |
| | PCL | 1,143,000 | 42 |
| * | Sahaviriya Steel Industries | | |
| | PCL (Local) | 1,058,200 | 39 |
| | Kim Eng Securities | | |
| | Thailand PCL | 85,800 | 33 |
| | Kiatnakin Bank PCL | 43,700 | 33 |
| | Tisco Financial Group PCL | | |
| | (Foreign) | 48,700 | 31 |
| | Glow Energy PCL | 32,000 | 31 |
| * | Minor International PCL | | |
| | (Local) | 92,000 | 29 |
| * | True Corp. Public Co. Ltd. | | |
| | (Foreign) | 276,400 | 28 |
| * | G J Steel PCL (Local) | 3,862,100 | 26 |
| * | G J Steel PCL | 2,815,100 | 19 |
| | Thai Plastic & | | |
| | Chemical PCL (Foreign) | 18,900 | 10 |
| | Bumrungrad Hospital PCL | | |
| | (Local) | 7,708 | 7 |
| * | Precious Shipping PCL | | |
| | (Local) | 9,600 | 5 |
| | | | 1,234 |
| Turkey (0.7%) | | |
| | Turk Hava Yollari | 173,010 | 483 |
| * | Asya Katilim Bankasi AS | 205,078 | 424 |
| * | Petkim Petrokimya Holding | | |
| | AS | 60,261 | 291 |
| | Ulker Biskuvi Sanayi AS | 116,525 | 273 |
| | Aksigorta AS | 58,889 | 178 |
| * | Arcelik AS | 45,034 | 147 |
| * | TAV Havalimanlari Holding | | |
| | AS | 49,453 | 135 |
| * | Turk Ekonomi Bankasi AS | 56,331 | 83 |
| * | Turk Sise ve Cam Fabrikalari | |
| | AS | 71,505 | 75 |
| * | Trakya Cam Sanayi AS | 61,825 | 73 |
| * | Fortis Bank AS | 51,253 | 69 |
| | Albaraka Turk Katilim | | |
| | Bankasi AS | 42,093 | 65 |
| | Yazicilar Holding AS Class A | 8,453 | 51 |
| | Tofas Turk Otomobil | | |
| | Fabrikasi AS | 19,528 | 49 |
| | | |
| | | | Market |
| | | | Value• |
| | | Shares | ($000) |
| * | Kardemir Karabuk Demir | | |
| | Celik Sanayi ve Ticaret AS | 113,539 | 45 |
| * | Dogan Yayin Holding AS | 48,899 | 34 |
| * | Sekerbank TAS | 20,139 | 33 |
| * | Hurriyet Gazetecilik AS | 29,344 | 31 |
| | | | 2,539 |
| United Kingdom (16.1%) | | |
| | Serco Group PLC | 108,137 | 895 |
| | Intertek Group PLC | 35,889 | 737 |
| | Aggreko PLC | 58,930 | 732 |
| | Investec PLC | 102,504 | 732 |
| | Amlin PLC | 125,751 | 728 |
| ^ | London Stock Exchange | | |
| | Group PLC | 51,711 | 719 |
| | ARM Holdings PLC | 286,709 | 696 |
| * | Petropavlovsk PLC | 38,067 | 654 |
| | Balfour Beatty PLC | 147,566 | 642 |
| | Firstgroup PLC | 103,082 | 634 |
| | Informa PLC | 129,042 | 619 |
| | Pennon Group PLC | 82,422 | 612 |
| | Babcock International Group | 60,614 | 602 |
| * | GKN PLC | 342,839 | 601 |
| | Meggitt PLC | 149,779 | 600 |
| | SSL International PLC | 53,756 | 558 |
| | Aberdeen Asset | | |
| | Management PLC | 244,716 | 530 |
| | Weir Group PLC | 45,617 | 523 |
| | Hiscox Ltd. | 97,163 | 510 |
| | Mondi PLC | 90,622 | 500 |
| * | Travis Perkins PLC | 39,917 | 492 |
| | IMI PLC | 69,425 | 490 |
| | Ultra Electronics Holdings | 22,606 | 488 |
| * | Dana Petroleum PLC | 22,933 | 480 |
| * | Premier Oil PLC | 24,538 | 473 |
| | VT Group PLC | 52,924 | 471 |
| | Croda International | 38,328 | 469 |
| | Carillion PLC | 96,944 | 467 |
| | Derwent London PLC | 22,907 | 467 |
| | Dimension Data Holdings | | |
| | PLC | 400,361 | 465 |
| * | easyJet PLC | 78,704 | 463 |
| * | Inchcape PLC | 960,485 | 461 |
| | John Wood Group PLC | 85,844 | 450 |
| *,^ | Barratt Developments PLC | 201,601 | 445 |
| | Arriva PLC | 61,533 | 443 |
| * | Taylor Wimpey PLC | 717,481 | 435 |
| | Spirax-Sarco Engineering | | |
| | PLC | 24,158 | 431 |
| | Catlin Group Ltd. | 79,707 | 430 |
| * | Misys PLC | 126,716 | 429 |
| * | Persimmon PLC | 64,850 | 428 |
| | Close Brothers Group PLC | 36,690 | 422 |
| | Lancashire Holdings Ltd. | 50,884 | 421 |
| * | Berkeley Group Holdings | | |
| | PLC | 30,018 | 419 |
79
FTSE All-World ex-US Small-Cap Index Fund
| | | |
| | | | Market |
| | | | Value• |
| | | Shares | ($000) |
| | Charter International PLC | 36,827 | 419 |
| | Homeserve PLC | 15,312 | 405 |
| | Rotork PLC | 21,576 | 401 |
| | Henderson Group PLC | 190,365 | 401 |
| | IG Group Holdings PLC | 81,158 | 401 |
| | Halfords Group PLC | 60,714 | 389 |
| | Intermediate Capital Group | | |
| | PLC | 93,060 | 388 |
| | Halma PLC | 103,657 | 387 |
| | Bellway PLC | 32,233 | 386 |
| * | DSG International PLC | 764,452 | 383 |
| * | Debenhams PLC | 297,854 | 380 |
| | Michael Page International | | |
| | PLC | 71,391 | 376 |
| | De La Rue PLC | 25,114 | 376 |
| | Chemring Group PLC | 8,600 | 372 |
| * | Soco International PLC | 17,460 | 368 |
| * | Cookson Group PLC | 59,595 | 356 |
| | Shaftesbury PLC | 56,545 | 348 |
| * | Ashmore Group PLC | 77,410 | 346 |
| | Jardine Lloyd Thompson | | |
| | Group PLC | 45,347 | 337 |
| | Britvic PLC | 57,646 | 330 |
| | Melrose PLC | 116,619 | 326 |
| | Mitie Group PLC | 82,474 | 323 |
| * | Heritage Oil PLC | 41,526 | 315 |
| | WH Smith PLC | 37,706 | 311 |
| | Greene King PLC | 47,732 | 308 |
| | Spectris PLC | 27,775 | 308 |
| * | Premier Foods PLC | 516,598 | 303 |
| | Great Portland Estates PLC | 74,740 | 302 |
| | Davis Service Group PLC | 43,922 | 301 |
| | Tullett Prebon PLC | 50,047 | 297 |
| | Hikma Pharmaceuticals PLC | 38,323 | 296 |
| | Electrocomponents PLC | 123,197 | 296 |
| | Regus PLC | 173,912 | 290 |
| * | CSR PLC | 39,757 | 290 |
| * | Mitchells & Butlers PLC | 73,181 | 281 |
| | Stagecoach Group PLC | 117,183 | 278 |
| | Hunting PLC | 32,303 | 277 |
| | International Personal | | |
| | Finance PLC | 79,912 | 268 |
| | Brit Insurance Holdings PLC | 78,297 | 267 |
| | Rightmove PLC | 30,858 | 266 |
| | Kesa Electricals PLC | 122,227 | 266 |
| | QinetiQ Group PLC | 98,527 | 265 |
| | Evolution Group PLC | 97,694 | 264 |
| | Victrex PLC | 20,800 | 259 |
| | BBA Aviation PLC | 102,316 | 258 |
| | Aveva Group PLC | 17,644 | 257 |
| | Beazley PLC | 145,961 | 256 |
| | Go-Ahead Group PLC | 10,893 | 254 |
| | Connaught PLC | 37,629 | 250 |
| | Spirent Communications | | |
| | PLC | 162,461 | 244 |
| | | |
| | | | Market |
| | | | Value• |
| | | Shares | ($000) |
| | Pace PLC | 65,963 | 239 |
| | Atkins WS PLC | 25,789 | 239 |
| | Wetherspoon (J.D.) PLC | 31,214 | 235 |
| * | BlueBay Asset Management | | |
| | PLC | 38,224 | 233 |
| | Northumbrian Water Group | | |
| | PLC | 60,958 | 230 |
| | Premier Farnell PLC | 97,314 | 229 |
| | St James’s Place PLC | 53,128 | 227 |
| | Mothercare PLC | 23,458 | 221 |
| | Rathbone Brothers | 14,325 | 217 |
| | Forth Ports PLC | 11,929 | 216 |
| | Dignity PLC | 22,379 | 214 |
| | N Brown Group PLC | 49,830 | 213 |
| | DS Smith PLC | 111,285 | 213 |
| | PZ Cussons PLC | 51,744 | 212 |
| | Hargreaves Lansdown PLC | 46,762 | 209 |
| | Enterprise Inns PLC | 107,646 | 208 |
| | SIG PLC | 103,865 | 202 |
| | Keller Group PLC | 17,251 | 202 |
| | Brewin Dolphin Holdings | | |
| | PLC | 76,865 | 202 |
| * | Bovis Homes Group PLC | 29,723 | 200 |
| | Millennium & | | |
| | Copthorne Hotels PLC | 36,139 | 200 |
| | Carpetright PLC | 13,813 | 199 |
| * | Big Yellow Group PLC | 30,991 | 198 |
| | Greggs PLC | 28,061 | 198 |
| | RPS Group PLC | 57,530 | 197 |
| | Micro Focus International | | |
| | PLC | 34,996 | 193 |
| * | BTG PLC | 61,436 | 192 |
| | Game Group PLC | 77,124 | 187 |
| | Morgan Crucible Co. | 72,434 | 186 |
| | Fidessa Group PLC | 9,447 | 185 |
| ^ | National Express Group PLC | 34,432 | 183 |
| * | Dechra Pharmaceuticals PLC | 24,272 | 183 |
| * | Genus PLC | 16,573 | 182 |
| * | Colt Telecom Group SA | 87,575 | 178 |
| *,^ | Redrow PLC | 75,697 | 175 |
| * | Rank Group PLC | 119,816 | 174 |
| | Helical Bar PLC | 31,833 | 173 |
| | Savills PLC | 32,887 | 173 |
| | Xchanging PLC | 47,144 | 172 |
| | Ashtead Group PLC | 127,703 | 168 |
| | Cranswick PLC | 14,153 | 163 |
| | Kier Group PLC | 10,204 | 161 |
| | Hochschild Mining PLC | 35,610 | 160 |
| | F&C Asset Management | | |
| | PLC | 131,466 | 159 |
| | Paragon Group of Cos. PLC | 66,619 | 158 |
| * | Galiform PLC | 128,898 | 158 |
| | Wellstream Holdings PLC | 18,366 | 154 |
| * | SDL PLC | 23,158 | 153 |
| | Restaurant Group PLC | 50,022 | 153 |
80
FTSE All-World ex-US Small-Cap Index Fund
| | | |
| | | | Market |
| | | | Value• |
| | | Shares | ($000) |
| | Mcbride PLC | 41,793 | 153 |
| * | Unite Group PLC | 34,715 | 151 |
| | Filtrona PLC | 54,907 | 150 |
| | Dairy Crest Group PLC | 22,808 | 150 |
| | Galliford Try PLC | 26,708 | 149 |
| * | Punch Taverns PLC | 107,916 | 147 |
| * | Telecity Group PLC | 26,577 | 146 |
| | Domino’s Pizza UK & | | |
| | IRL PLC | 29,129 | 146 |
| | JKX Oil & Gas PLC | 31,920 | 144 |
| | Synergy Health PLC | 14,361 | 143 |
| * | Trinity Mirror PLC | 54,214 | 142 |
| *,^ | Yell Group PLC | 167,876 | 141 |
| | Interserve PLC | 36,774 | 140 |
| | Mouchel Group PLC | 43,899 | 137 |
| | eaga PLC | 57,132 | 136 |
| | BSS Group PLC | 31,168 | 136 |
| * | Salamander Energy PLC | 33,714 | 136 |
| | Chaucer Holdings PLC | 172,280 | 130 |
| * | Shanks Group PLC | 92,289 | 130 |
| | Northern Foods PLC | 124,998 | 129 |
| * | Gem Diamonds Ltd. | 34,248 | 129 |
| | Marston’s PLC | 90,591 | 129 |
| | Computacenter PLC | 27,538 | 128 |
| * | ST Modwen Properties PLC | 34,614 | 127 |
| | Novae Group PLC | 24,917 | 127 |
| * | Bodycote PLC | 46,286 | 124 |
| * | Southern Cross | | |
| | Healthcare Ltd. | 60,974 | 123 |
| | ITE Group PLC | 59,961 | 119 |
| * | Sports Direct International | | |
| | PLC | 72,988 | 117 |
| | Chloride Group PLC | 43,740 | 115 |
| | Headlam Group PLC | 22,079 | 112 |
| * | Grainger PLC | 23,839 | 112 |
| | Collins Stewart PLC | 85,331 | 112 |
| | Wincanton PLC | 30,566 | 111 |
| | Spice PLC | 82,743 | 108 |
| | Development Securities PLC | 20,915 | 106 |
| | Elementis PLC | 101,341 | 105 |
| * | Lamprell PLC | 31,707 | 105 |
| | HMV Group PLC | 56,447 | 103 |
| | Care UK PLC | 17,431 | 101 |
| | Delta PLC | 36,612 | 100 |
| * | UK Coal PLC | 71,278 | 100 |
| | Dunelm Group PLC | 18,764 | 100 |
| | Fenner PLC | 37,590 | 99 |
| | Laird PLC | 41,179 | 98 |
| | PayPoint PLC | 13,116 | 96 |
| | Ferrexpo PLC | 39,100 | 95 |
| | Senior PLC | 93,830 | 94 |
| | Sthree PLC | 22,388 | 92 |
| | Chesnara PLC | 30,031 | 90 |
| | Moneysupermarket.com | | |
| | Group PLC | 68,267 | 87 |
| | | | |
| | | | | Market |
| | | | | Value• |
| | | | Shares | ($000) |
| | Severfield-Rowen PLC | 31,874 | 86 |
| | WSP Group PLC | | 17,567 | 86 |
| * | Renishaw PLC | | 9,598 | 86 |
| | Morgan Sindall PLC | | 9,212 | 85 |
| | Smiths News PLC | | 41,235 | 82 |
| | Marshalls PLC | | 49,182 | 77 |
| * | Wolfson Microelectronics | | |
| | PLC | | 37,548 | 75 |
| * | Yule Catto & Co. PLC | | 26,741 | 74 |
| | Workspace Group PLC | 215,816 | 72 |
| | Robert Wiseman Dairies | | |
| | PLC | | 9,875 | 72 |
| | Daejan Holdings PLC | | 1,645 | 72 |
| | Melrose Resources PLC | 12,688 | 71 |
| | PV Crystalox Solar PLC | 66,144 | 71 |
| | Speedy Hire PLC | | 116,058 | 69 |
| | Kcom Group PLC | | 101,454 | 67 |
| | Hampson Industries PLC | 56,686 | 67 |
| | Holidaybreak PLC | | 13,850 | 63 |
| * | Johnston Press PLC | | 137,109 | 63 |
| | Euromoney Institutional | | |
| | Investor PLC | | 9,606 | 60 |
| | Bloomsbury Publishing PLC | 27,945 | 57 |
| | Robert Walters PLC | | 18,869 | 55 |
| | Invista Foundation | | | |
| | Property Trust Ltd. | | 72,361 | 53 |
| * | Mucklow A & J Group PLC | 10,391 | 53 |
| * | CLS Holdings PLC | | 6,388 | 48 |
| | ROK PLC | | 50,862 | 39 |
| | 888 Holdings PLC | | 24,413 | 38 |
| * | JJB Sports PLC | | 71,677 | 35 |
| * | Arena Leisure PLC | | 52,763 | 24 |
| * | Laird PLC | | | |
| | Rights Exp. 11/13/2009 | 20,589 | 14 |
| * | JP Morgan Emerging | | | |
| | Markets Investment Trust | | |
| | PLC | | 1,864 | 2 |
| | | | | 56,780 |
| Total Common Stocks | | | |
| (Cost $312,583) | | | 352,963 |
| Temporary Cash Investment (5.4%) | |
| Money Market Fund (5.4%) | | |
| 1,2 | Vanguard Market | | | |
| | Liquidity Fund, 0.225% | | |
| | (Cost $19,144) | 19,143,855 | 19,144 |
| Total Investments (105.4%) | | |
| (Cost $331,727) | | | 372,107 |
| Other Assets and Liabilities (–5.4%) | |
| Other Assets | | | 4,822 |
| Liabilities2 | | | (23,906) |
| | | | | (19,084) |
| Net Assets (100%) | | | 353,023 |
81
FTSE All-World ex-US Small-Cap Index Fund
| |
| At October 31, 2009, net assets consisted of: |
| | Amount |
| | ($000) |
| Paid-in Capital | 308,213 |
| Undistributed Net Investment Income | 1,695 |
| Accumulated Net Realized Gains | 2,781 |
| Unrealized Appreciation (Depreciation) | |
| Investment Securities | 40,380 |
| Foreign Currencies | (46) |
| Net Assets | 353,023 |
| |
| Investor Shares—Net Assets | |
| Applicable to 2,092,068 outstanding | |
| $.001 par value shares of beneficial | |
| interest (unlimited authorization) | 62,416 |
| Net Asset Value Per Share— | |
| Investor Shares | $29.83 |
| |
| Institutional Shares—Net Assets | |
| Applicable to 50,001 outstanding | |
| $.001 par value shares of beneficial | |
| interest (unlimited authorization) | 7,470 |
| Net Asset Value Per Share— | |
| Institutional Shares | $149.40 |
| |
| ETF Shares—Net Assets | |
| Applicable to 3,620,251 outstanding | |
| $.001 par value shares of beneficial | |
| interest (unlimited authorization) | 283,137 |
| Net Asset Value Per Share— | |
| ETF Shares | $78.21 |
• See Note A in Notes to Financial Statements.
* Non-income-producing security.
^ Part of security position is on loan to broker-dealers. The total value of securities on loan is $13,040,000.
1 Affiliated money market fund available only to Vanguard funds and certain trusts and accounts managed by Vanguard. Rate shown is the 7-day yield.
2 Includes $14,150,000 of collateral received for securities on loan.
ADR—American Depositary Receipt.
REIT—Real Estate Investment Trust.
TAN—Tax Anticipation Note.
See accompanying Notes, which are an integral part of the Financial Statements.
82
| |
| FTSE All-World ex-US Small-Cap Index Fund | |
| |
| |
| Statement of Operations | |
| |
| | March 19, 20091 to |
| | October 31, 2009 |
| | ($000) |
| Investment Income | |
| Income | |
| Dividends2 | 2,229 |
| Interest3 | 6 |
| Security Lending | 46 |
| Total Income | 2,281 |
| Expenses | |
| The Vanguard Group—Note B | |
| Investment Advisory Services | 10 |
| Management and Administrative—Investor Shares | 37 |
| Management and Administrative—Institutional Shares | — |
| Management and Administrative—ETF Shares | 163 |
| Marketing and Distribution—Investor Shares | 1 |
| Marketing and Distribution—Institutional Shares | — |
| Marketing and Distribution—ETF Shares | 9 |
| Custodian Fees | 359 |
| Auditing Fees | 32 |
| Shareholders’ Reports and Proxies—Investor Shares | 3 |
| Shareholders’ Reports and Proxies—Institutional Shares | — |
| Shareholders’ Reports and Proxies—ETF Shares | — |
| Total Expenses | 614 |
| Net Investment Income | 1,667 |
| Realized Net Gain (Loss) | |
| Investment Securities Sold | 3,058 |
| Foreign Currencies | (218) |
| Realized Net Gain (Loss) | 2,840 |
| Change in Unrealized Appreciation (Depreciation) | |
| Investment Securities | 40,380 |
| Foreign Currencies | (46) |
| Change in Unrealized Appreciation (Depreciation) | 40,334 |
| Net Increase (Decrease) in Net Assets Resulting from Operations | 44,841 |
1 Commencement of subscription period for the fund.
2 Dividends are net of foreign withholding taxes of $213,000.
3 Interest income from an affiliated company of the fund was $6,000.
See accompanying Notes, which are an integral part of the Financial Statements.
83
| |
| FTSE All-World ex-US Small-Cap Index Fund | |
| |
| |
| Statement of Changes in Net Assets | |
| |
| | March 19, 20091 to |
| | October 31, 2009 |
| | ($000) |
| Increase (Decrease) in Net Assets | |
| Operations | |
| Net Investment Income | 1,667 |
| Realized Net Gain (Loss) | 2,840 |
| Change in Unrealized Appreciation (Depreciation) | 40,334 |
| Net Increase (Decrease) in Net Assets Resulting from Operations | 44,841 |
| Distributions | |
| Net Investment Income | |
| Investor Shares | — |
| Institutional Shares | — |
| ETF Shares | — |
| Realized Capital Gain | |
| Investor Shares | — |
| Institutional Shares | — |
| ETF Shares | — |
| Total Distributions | — |
| Capital Share Transactions | |
| Investor Shares | 51,752 |
| Institutional Shares | 5,029 |
| ETF Shares | 251,401 |
| Net Increase (Decrease) from Capital Share Transactions | 308,182 |
| Total Increase (Decrease) | 353,023 |
| Net Assets | |
| Beginning of Period | — |
| End of Period2 | 353,023 |
1 Commencement of subscription period for the fund.
2 Net Assets—End of Period includes undistributed net investment income of $1,695,000.
See accompanying Notes, which are an integral part of the Financial Statements.
84
| |
| FTSE All-World ex-US Small-Cap Index Fund | |
| |
| |
| Financial Highlights | |
| |
| |
| Investor Shares | |
| | March 19, 20091 to |
| For a Share Outstanding Throughout the Period | October 31, 2009 |
| Net Asset Value, Beginning of Period | $20.00 |
| Investment Operations | |
| Net Investment Income | .4182 |
| Net Realized and Unrealized Gain (Loss) on Investments | 9.412 |
| Total from Investment Operations | 9.830 |
| Distributions | |
| Dividends from Net Investment Income | — |
| Distributions from Realized Capital Gains | — |
| Total Distributions | — |
| Net Asset Value, End of Period | $29.83 |
| |
| Total Return3 | 49.15% |
| |
| Ratios/Supplemental Data | |
| Net Assets, End of Period (Millions) | $62 |
| Ratio of Total Expenses to Average Net Assets | 0.78%4 |
| Ratio of Net Investment Income to Average Net Assets | 1.49%4 |
| Portfolio Turnover Rate5 | 19% |
1 Subscription period for the fund was March 19, 2009, to April 2, 2009, during which time all assets were held in money market instruments. Performance measurement began April 2, 2009, at a net asset value of $20.00.
2 Calculated based on average shares outstanding.
3 Total returns do not reflect the 0.75% fee on purchases and redemptions; nor the account service fee that may be applicable to certain accounts with balances below $10,000.
4 Annualized.
5 Excludes the value of portfolio securities received or delivered as a result of in-kind purchases or redemptions of the fund’s capital shares, including ETF Creation Units.
See accompanying Notes, which are an integral part of the Financial Statements.
85
| |
| FTSE All-World ex-US Small-Cap Index Fund | |
| |
| |
| Financial Highlights | |
| |
| |
| Institutional Shares | |
| | April 2, 20091 to |
| For a Share Outstanding Throughout the Period | October 31, 2009 |
| Net Asset Value, Beginning of Period | $100.00 |
| Investment Operations | |
| Net Investment Income | 2.6412 |
| Net Realized and Unrealized Gain (Loss) on Investments | 46.759 |
| Total from Investment Operations | 49.400 |
| Distributions | |
| Dividends from Net Investment Income | — |
| Distributions from Realized Capital Gains | — |
| Total Distributions | — |
| Net Asset Value, End of Period | $149.40 |
| |
| Total Return3 | 49.40% |
| |
| Ratios/Supplemental Data | |
| Net Assets, End of Period (Millions) | $7 |
| Ratio of Total Expenses to Average Net Assets | 0.52%4 |
| Ratio of Net Investment Income to Average Net Assets | 1.75%4 |
| Portfolio Turnover Rate5 | 19% |
1 Inception.
2 Calculated based on average shares outstanding.
3 Total returns do not reflect the 0.75% fee on purchases and redemptions.
4 Annualized.
5 Excludes the value of portfolio securities received or delivered as a result of in-kind purchases or redemptions of the fund’s capital shares, including ETF Creation Units.
See accompanying Notes, which are an integral part of the Financial Statements.
86
| |
| FTSE All-World ex-US Small-Cap Index Fund | |
| |
| |
| Financial Highlights | |
| |
| |
| ETF Shares | |
| | April 2, 20091 to |
| For a Share Outstanding Throughout the Period | October 31, 2009 |
| Net Asset Value, Beginning of Period | $52.36 |
| Investment Operations | |
| Net Investment Income | 1.1602 |
| Net Realized and Unrealized Gain (Loss) on Investments | 24.690 |
| Total from Investment Operations | 25.850 |
| Distributions | |
| Dividends from Net Investment Income | — |
| Distributions from Realized Capital Gains | — |
| Total Distributions | — |
| Net Asset Value, End of Period | $78.21 |
| |
| Total Return | 49.37% |
| |
| Ratios/Supplemental Data | |
| Net Assets, End of Period (Millions) | $283 |
| Ratio of Total Expenses to Average Net Assets | 0.55%3 |
| Ratio of Net Investment Income to Average Net Assets | 1.72%3 |
| Portfolio Turnover Rate4 | 19% |
1 Inception.
2 Calculated based on average shares outstanding.
3 Annualized.
4 Excludes the value of portfolio securities received or delivered as a result of in-kind purchases or redemptions of the fund’s capital shares,
including ETF Creation Units.
See accompanying Notes, which are an integral part of the Financial Statements.
87
FTSE All-World ex-US Small-Cap Index Fund
Notes to Financial Statements
Vanguard FTSE All-World ex-US Small-Cap Index Fund is registered under the Investment Company Act of 1940 as an open-end investment company, or mutual fund. The fund invests in securities of foreign issuers, which may subject it to investment risks not normally associated with investing in securities of U.S. corporations. The fund offers three classes of shares: Investor Shares, Institutional Shares, and ETF Shares. Investor Shares are available to any investor who meets the fund’s minimum purchase requirements. Institutional Shares are designed for investors who meet certain administrative and service criteria and invest a minimum of $5 million. ETF Shares are listed for trading on the NYSE Arca, Inc.; they can be purchased and sold through a broker.
A. The following significant accounting policies conform to generally accepted accounting principles for U.S. mutual funds. The fund consistently follows such policies in preparing its financial statements.
1. Security Valuation: Securities are valued as of the close of trading on the New York Stock Exchange (generally 4 p.m., Eastern time) on the valuation date. Equity securities are valued at the latest quoted sales prices or official closing prices taken from the primary market in which each security trades; such securities not traded on the valuation date are valued at the mean of the latest quoted bid and asked prices. Securities for which market quotations are not readily available, or whose values have been affected by events occurring before the fund’s pricing time but after the close of the securities’ primary markets, are valued at their fair values calculated according to procedures adopted by the board of trustees. These procedures include obtaining quotations from an independent pricing service, monitoring news to identify significant market- or security-specific events, and evaluating cha nges in the values of foreign market proxies (for example, ADRs, futures contracts, or exchange-traded funds), between the time the foreign markets close and the fund’s pricing time. When fair-value pricing is employed, the prices of securities used by a fund to calculate its net asset value may differ from quoted or published prices for the same securities. Investments in Vanguard Market Liquidity Fund are valued at that fund’s net asset value.
2. Foreign Currency: Securities and other assets and liabilities denominated in foreign currencies are translated into U.S. dollars using exchange rates obtained from an independent third party as of the fund’s pricing time on the valuation date. Realized gains (losses) and unrealized appreciation (depreciation) on investment securities include the effects of changes in exchange rates since the securities were purchased, combined with the effects of changes in security prices. Fluctuations in the value of other assets and liabilities resulting from changes in exchange rates are recorded as unrealized foreign currency gains (losses) until the assets or liabilities are settled in cash, at which time they are recorded as realized foreign currency gains (losses).
3. Federal Income Taxes: The fund intends to qualify as a regulated investment company and distribute all of its taxable income. Management has analyzed the fund’s tax positions taken for its open federal income tax period ended October 31, 2009, and has concluded that no provision for federal income taxes is required in the financial statements.
4. Distributions: Distributions to shareholders are recorded on the ex-dividend date.
88
FTSE All-World ex-US Small-Cap Index Fund
5. Security Lending: The fund may lend its securities to qualified institutional borrowers to earn additional income. Security loans are required to be secured at all times by collateral at least equal to the market value of securities loaned. The fund invests cash collateral received in Vanguard Market Liquidity Fund, and records a liability for the return of the collateral, during the period the securities are on loan. Security lending income represents the income earned on investing cash collateral, less expenses associated with the loan.
6. Other: Dividend income is recorded on the ex-dividend date. Interest income includes income distributions received from Vanguard Market Liquidity Fund and is accrued daily. Security transactions are accounted for on the date securities are bought or sold. Costs used to determine realized gains (losses) on the sale of investment securities are those of the specific securities sold. Fees assessed on redemptions of capital shares are credited to paid-in capital.
Each class of shares has equal rights as to assets and earnings, except that each class separately bears certain class-specific expenses related to maintenance of shareholder accounts (included in Management and Administrative expenses), shareholder reporting, and proxies. Marketing and distribution expenses are allocated to each class of shares based on a method approved by the board of trustees. Income, other non-class-specific expenses, and gains and losses on investments are allocated to each class of shares based on its relative net assets.
B. The Vanguard Group furnishes at cost investment advisory, corporate management, administrative, marketing, and distribution services. The costs of such services are allocated to the fund under methods approved by the board of trustees. The fund has committed to provide up to 0.40% of its net assets in capital contributions to Vanguard. At October 31, 2009, the fund had contributed capital of $59,000 to Vanguard (included in Other Assets), representing 0.02% of the fund’s net assets and 0.02% of Vanguard’s capitalization. The fund’s trustees and officers are also directors and officers of Vanguard.
C. Various inputs may be used to determine the value of the fund’s investments. These inputs are summarized in three broad levels for financial statement purposes. The inputs or methodologies used to value securities are not necessarily an indication of the risk associated with investing in those securities.
Level 1—Quoted prices in active markets for identical securities.
Level 2—Other significant observable inputs (including quoted prices for similar securities, interest rates, prepayment speeds, credit risk, etc.).
Level 3—Significant unobservable inputs (including the fund’s own assumptions used to determine the fair value of investments).
The following table summarizes the fund’s investments as of October 31, 2009, based on the inputs used to value them:
| | | |
| | Level 1 | Level 2 | Level 3 |
| Investments | ($000) | ($000) | ($000) |
| Common Stocks | 56,338 | 296,625 | — |
| Temporary Cash Investments | 19,144 | — | — |
| Total | 75,482 | 296,625 | — |
89
FTSE All-World ex-US Small-Cap Index Fund
D. Distributions are determined on a tax basis and may differ from net investment income and realized capital gains for financial reporting purposes. Differences may be permanent or temporary. Permanent differences are reclassified among capital accounts in the financial statements to reflect their tax character. Temporary differences arise when certain items of income, expense, gain, or loss are recognized in different periods for financial statement and tax purposes; these differences will reverse at some time in the future. Differences in classification may also result from the treatment of short-term gains as ordinary income for tax purposes.
The fund used a tax accounting practice to treat a portion of the price of capital shares redeemed during the year as distributions from net investment income and realized capital gains. Accordingly, the fund has reclassified $18,000 from undistributed net investment income, and $13,000 from accumulated net realized gains, to paid-in capital.
During the year ended October 31, 2009, the fund realized net foreign currency losses of $218,000, which decreased distributable net income for tax purposes; accordingly, such losses have been reclassified from accumulated net realized gains to undistributed net investment income. The fund’s realized gains for the period ended October 31, 2009, include $16,000 of capital gain tax paid on sales of Indian securities; this tax is treated as a decrease to taxable income; accordingly this amount as been reclassified from accumulated net realized gains to undistributed net investment income.
Certain of the fund’s investments are in securities considered to be “passive foreign investment companies,” for which any unrealized appreciation and/or realized gains are required to be included in distributable net income for tax purposes. During the period ended October 31, 2009, the fund realized gains on the sale of passive foreign investment companies of $280,000, which have been included in current period taxable income; accordingly, such gains have been reclassified from accumulated net realized gains to undistributed net investment income. Unrealized appreciation on the fund’s passive foreign investment company holdings at October 31, 2009, was $2,154,000.
For tax purposes, at October 31, 2009, the fund had $6,757,000 of ordinary income available for distribution.
At October 31, 2009, the cost of investment securities for tax purposes was $333,949,000. Net unrealized appreciation of investment securities for tax purposes was $38,158,000, consisting of unrealized gains of $42,456,000 on securities that had risen in value since their purchase and $4,298,000 in unrealized losses on securities that had fallen in value since their purchase.
E. During the period ended October 31, 2009, the fund purchased $345,378,000 of investment securities and sold $35,662,000 of investment securities, other than temporary cash investments.
90
FTSE All-World ex-US Small-Cap Index Fund
F. Capital share transactions for each class of shares were:
| | |
| | Inception1 to October 31, 2009 |
| | Amount | Shares |
| | ($000) | (000) |
| Investor Shares | | |
| Issued | 56,570 | 2,278 |
| Issued in Lieu of Cash Distributions | — | — |
| Redeemed2 | (4,818) | (186) |
| Net Increase (Decrease)—Investor Shares | 51,752 | 2,092 |
| Institutional Shares | | |
| Issued | 5,029 | 50 |
| Issued in Lieu of Cash Distributions | — | — |
| Redeemed2 | — | — |
| Net Increase (Decrease)—Institutional Shares | 5,029 | 50 |
| ETF Shares | | |
| Issued | 251,402 | 3,620 |
| Issued in Lieu of Cash Distributions | — | — |
| Redeemed2 | (1) | — |
| Net Increase (Decrease)—ETF Shares | 251,401 | 3,620 |
| 1 Inception was March 19, 2009, for Investor Shares, April 2, 2009, for Institutional Shares, and April 2, 2009, for ETF Shares. | |
| 2 Net of redemption fees for fiscal 2009 of $27,000. | | |
G. In preparing the financial statements as of October 31, 2009, management considered the impact of subsequent events occurring through December 15, 2009, for potential recognition or disclosure in these financial statements.
91
Report of Independent Registered Public Accounting Firm
To the Trustees of Vanguard International Equity Index Funds and the Shareholders of Vanguard FTSE All-World ex-US Index Fund and Vanguard FTSE All-World ex-US Small-Cap Index Fund:
In our opinion, the accompanying statements of net assets and the related statements of operations and of changes in net assets and the financial highlights present fairly, in all material respects, the financial position of Vanguard FTSE All-World ex-US Index Fund and Vanguard FTSE All-World ex-US Small-Cap Index Fund (separate portfolios of Vanguard International Equity Index Funds, hereafter referred to as the “Funds”) at October 31, 2009, the results of each of their operations, and the changes in each of their net assets for each of the periods indicated and the financial highlights for each of the periods indicated, in conformity with accounting principles generally accepted in the United States of America. These financial statements and financial highlights (hereafter referred to as “financial statements”) are the responsibility of the Funds’ management; our responsibility is t o express an opinion on these financial statements based on our audits. We conducted our audits of these financial statements in accordance with the standards of the Public Company Accounting Oversight Board (United States). Those standards require that we plan and perform the audit to obtain reasonable assurance about whether the financial statements are free of material misstatement. An audit includes examining, on a test basis, evidence supporting the amounts and disclosures in the financial statements, assessing the accounting principles used and significant estimates made by management, and evaluating the overall financial statement presentation. We believe that our audits, which included confirmation of securities at October 31, 2009 by correspondence with the custodian and by agreement to the underlying ownership records of Vanguard Market Liquidity Fund, provide a reasonable basis for our opinion.
PricewaterhouseCoopers LLP
Philadelphia, Pennsylvania
December 15, 2009
92
|
| Special 2009 tax information (unaudited) for Vanguard FTSE All-World ex-US Index Fund |
This information for the fiscal year ended October 31, 2009, is included pursuant to provisions of the Internal Revenue Code.
The fund distributed $63,103,000 of qualified dividend income to shareholders during the fiscal year.
The fund will pass through foreign source income of $144,523,000 and foreign taxes paid of $10,210,000 to shareholders. The pass-through of foreign taxes paid will affect only shareholders on the fund’s dividend record date in December 2009. Shareholders will receive more detailed information along with their Form 1099-DIV in January 2010.
| Special 2009 tax information (unaudited) for Vanguard FTSE All-World ex-US Small-Cap Index Fund |
This information for the fiscal year ended October 31, 2009, is included pursuant to provisions of the Internal Revenue Code.
The fund will pass through foreign source income of $2,416,000 and foreign taxes paid of $187,000 to shareholders. The pass-through of foreign taxes paid will affect only shareholders on the fund’s dividend record date in December 2009. Shareholders will receive more detailed information along with their Form 1099-DIV in January 2010.
93
Your Fund’s After-Tax Returns
This table presents returns for your fund both before and after taxes. The after-tax returns are shown in two ways: (1) assuming that an investor owned the fund during the entire period and paid taxes on the fund’s distributions, and (2) assuming that an investor paid taxes on the fund’s distributions and sold all shares at the end of each period.
Calculations are based on the highest individual federal income tax and capital gains tax rates in effect at the times of the distributions and the hypothetical sales. State and local taxes were not considered. After-tax returns reflect any qualified dividend income, using actual prior-year figures and estimates for 2009. (In the example, returns after the sale of fund shares may be higher than those assuming no sale. This occurs when the sale would have produced a capital loss. The calculation assumes that the investor received a tax deduction for the loss.)
The table shows returns for Investor Shares only; returns for other share classes will differ. Please note that your actual after-tax returns will depend on your tax situation and may differ from those shown. Also note that if you own the fund in a tax-deferred account, such as an individual retirement account or a 401(k) plan, this information does not apply to you. Such accounts are not subject to current taxes.
Finally, keep in mind that a fund’s performance—whether before or after taxes—does not guarantee future results.
Note: The table does not include returns for the FTSE All-World ex-US Small-Cap Index Fund, because the fund lacks a full year of history.
| | |
| Average Annual Total Returns: FTSE All-World Ex-US Index Fund Investor Shares1 | | |
| Periods Ended October 31, 2009 | | |
| | One | Since |
| | Year | Inception2 |
| Returns Before Taxes | 32.19% | –5.91% |
| Returns After Taxes on Distributions | 31.68 | –6.09 |
| Returns After Taxes on Distributions and Sale of Fund Shares | 21.26 | –5.01 |
1 Total returns do not reflect the 2% fee assessed on redemptions of shares held for less than two months, nor do they include the account service fee that may be applicable to certain accounts with balances below $10,000.
2 Inception date for Investor Shares is March 8, 2007.
94
About Your Fund’s Expenses
As a shareholder of the fund, you incur ongoing costs, which include costs for portfolio management, administrative services, and shareholder reports (like this one), among others. Operating expenses, which are deducted from a fund’s gross income, directly reduce the investment return of the fund.
A fund’s expenses are expressed as a percentage of its average net assets. This figure is known as the expense ratio. The following examples are intended to help you understand the ongoing costs (in dollars) of investing in your fund and to compare these costs with those of other mutual funds. The examples are based on an investment of $1,000 made at the beginning of the period shown and held for the entire period.
The accompanying table illustrates your fund’s costs in two ways:
• Based on actual fund return. This section helps you to estimate the actual expenses that you paid over the period. The “Ending Account Value” shown is derived from the fund’s actual return, and the third column shows the dollar amount that would have been paid by an investor who started with $1,000 in the fund. You may use the information here, together with the amount you invested, to estimate the expenses that you paid over the period.
To do so, simply divide your account value by $1,000 (for example, an $8,600 account value divided by $1,000 = 8.6), then multiply the result by the number given for your fund under the heading “Expenses Paid During Period.”
• Based on hypothetical 5% yearly return. This section is intended to help you compare your fund’s costs with those of other mutual funds. It assumes that the fund had a yearly return of 5% before expenses, but that the expense ratio is unchanged. In this case—because the return used is not the fund’s actual return—the results do not apply to your investment. The example is useful in making comparisons because the Securities and Exchange Commission requires all mutual funds to calculate expenses based on a 5% return. You can assess your fund’s costs by comparing this hypothetical example with the hypothetical examples that appear in shareholder reports of other funds.
Note that the expenses shown in the table are meant to highlight and help you compare ongoing costs only and do not reflect transaction costs incurred by the fund for buying and selling securities. Further, the expenses do not include the transaction fees or the account service fee described in the prospectus. If such fees were applied to your account, your costs would be higher. Your fund does not carry a “sales load.”
The calculations assume no shares were bought or sold during the period. Your actual costs may have been higher or lower, depending on the amount of your investment and the timing of any purchases or redemptions.
You can find more information about the fund’s expenses, including annual expense ratios, in the Financial Statements section of this report. For additional information on operating expenses and other shareholder costs, please refer to your fund’s current prospectus.
95
| | | |
| Six Months Ended October 31, 2009 | | | |
| | Beginning | Ending | Expenses |
| | Account Value | Account Value | Paid During |
| FTSE International Index Fund | 4/30/2009 | 10/31/2009 | Period1 |
| Based on Actual Fund Return | | | |
| FTSE All-World ex-US Index Fund | | | |
| Investor Shares | $1,000.00 | $1,322.63 | $2.40 |
| Institutional Shares | 1,000.00 | 1,324.63 | 0.88 |
| ETF Shares | 1,000.00 | 1,324.18 | 1.46 |
| FTSE All-World ex-US Small-Cap Index Fund | | | |
| Investor Shares | $1,000.00 | $1,381.02 | $2.94 |
| Institutional Shares | 1,000.00 | 1,383.08 | 2.04 |
| ETF Shares | 1,000.00 | 1,382.78 | 2.10 |
| Based on Hypothetical 5% Yearly Return | | | |
| FTSE All-World ex-US Index Fund | | | |
| Investor Shares | $1,000.00 | $1,023.14 | $2.09 |
| Institutional Shares | 1,000.00 | 1,024.45 | 0.77 |
| ETF Shares | 1,000.00 | 1,023.95 | 1.28 |
| FTSE All-World ex-US Small-Cap Index Fund | | | |
| Investor Shares | $1,000.00 | $1,022.74 | $2.50 |
| Institutional Shares | 1,000.00 | 1,023.49 | 1.73 |
| ETF Shares | 1,000.00 | 1,023.44 | 1.79 |
1 The calculations are based on expenses incurred in the most recent six-month period. For the FTSE All-World ex-US Index Fund, the annualized six-month expense ratios for that period are 0.41% for Investor Shares, 0.15% for Institutional Shares, and 0.25% for ETF Shares. For the FTSE All-World ex-US Small-Cap Index Fund, the annualized six-month expense ratios are 0.49% for Investor Shares, 0.34% for Institutional Shares, and 0.35% for ETF Shares. The dollar amounts shown as “Expenses Paid” are equal to the annualized expense ratio multiplied by the average account value over the period, multiplied by the number of days in the most recent six-month period, then divided by the number of days in the most recent 12-month period.
96
Glossary
Equity Exposure. A measure that reflects a fund’s investments in stocks and stock futures. Any holdings in short-term reserves are excluded.
Expense Ratio. The percentage of a fund’s average net assets used to pay its annual administrative and advisory expenses. These expenses directly reduce returns to investors.
Inception Date. The date on which the assets of a fund (or one of its share classes) are first invested in accordance with the fund’s investment objective. For funds with a subscription period, the inception date is the day after that period ends. Investment performance is measured from the inception date.
Short-Term Reserves. The percentage of a fund invested in highly liquid, short-term securities that can be readily converted to cash.
Turnover Rate. An indication of the fund’s trading activity. Funds with high turnover rates incur higher transaction costs and may be more likely to distribute capital gains (which may be taxable to investors). The turnover rate excludes in-kind transactions, which have minimal impact on costs.
97
This page intentionally left blank.
This page intentionally left blank.
The People Who Govern Your Fund
The trustees of your mutual fund are there to see that the fund is operated and managed in your best interests since, as a shareholder, you are a part owner of the fund. Your fund’s trustees also serve on the board of directors of The Vanguard Group, Inc., which is owned by the Vanguard funds and provides services to them on an at-cost basis.
A majority of Vanguard’s board members are independent, meaning that they have no affiliation with Vanguard or the funds they oversee, apart from the sizable personal investments they have made as private individuals. The independent board members have distinguished backgrounds in business, academia, and public service. Each of the trustees and executive officers oversees 156 Vanguard funds.
The following table provides information for each trustee and executive officer of the fund. More information about the trustees is in the Statement of Additional Information, which can be obtained, without charge, by contacting Vanguard at 800-662-7447, or online at www.vanguard.com.
| |
| Interested Trustees | Emerson U. Fullwood |
| | Born 1948. Trustee Since January 2008. Principal |
| John J. Brennan1 | Occupation(s) During the Past Five Years: Executive |
| Born 1954. Trustee Since May 1987. Chairman of | Chief Staff and Marketing Officer for North America |
| the Board. Principal Occupation(s) During the Past | and Corporate Vice President (retired 2008) of Xerox |
| Five Years: Chairman of the Board and Director/Trustee | Corporation (photocopiers and printers); Director of |
| of The Vanguard Group, Inc., and of each of the | SPX Corporation (multi-industry manufacturing), the |
| investment companies served by The Vanguard Group; | United Way of Rochester, the Boy Scouts of America, |
| Chief Executive Officer (1996–2008) and President | Amerigroup Corporation (direct health and medical |
| (1989–2008) of The Vanguard Group and of each of the | insurance carriers), and Monroe Community College |
| investment companies served by The Vanguard Group; | Foundation. |
| Chairman of the Financial Accounting Foundation; | |
| Governor of the Financial Industry Regulatory Authority | Rajiv L. Gupta |
| (FINRA); Director of United Way of Southeastern | Born 1945. Trustee Since December 2001.2 Principal |
| Pennsylvania. | Occupation(s) During the Past Five Years: Chairman |
| | and Chief Executive Officer (retired 2009) and President |
| F. William McNabb III1 | (2006–2008) of Rohm and Haas Co. (chemicals); Board |
| Born 1957. Trustee Since July 2009. Principal | Member of American Chemistry Council; Director of |
| Occupation(s) During the Past Five Years: Director of | Tyco International, Ltd. (diversified manufacturing and |
| The Vanguard Group, Inc., since 2008; Chief Executive | services) and Hewlett-Packard Co. (electronic computer |
| Officer and President of The Vanguard Group and of | manufacturing); Trustee of The Conference Board. |
| each of the investment companies served by The | |
| Vanguard Group since 2008; Director of Vanguard | Amy Gutmann |
| Marketing Corporation; Managing Director of The | Born 1949. Trustee Since June 2006. Principal |
| Vanguard Group (1995–2008). | Occupation(s) During the Past Five Years: President of |
| | the University of Pennsylvania; Christopher H. Browne |
| | Distinguished Professor of Political Science in the School |
| Independent Trustees | of Arts and Sciences with secondary appointments |
| | at the Annenberg School for Communication and the |
| Charles D. Ellis | Graduate School of Education of the University of |
| Born 1937. Trustee Since January 2001. Principal | Pennsylvania; Director of Carnegie Corporation of |
| Occupation(s) During the Past Five Years: Applecore | New York, Schuylkill River Development Corporation, |
| Partners (pro bono ventures in education); Senior | and Greater Philadelphia Chamber of Commerce; |
| Advisor to Greenwich Associates (international business | Trustee of the National Constitution Center. |
| strategy consulting); Successor Trustee of Yale University; | |
| Overseer of the Stern School of Business at New York | |
| University; Trustee of the Whitehead Institute for | |
| Biomedical Research. | |
| | |
| JoAnn Heffernan Heisen | Executive Officers | |
| Born 1950. Trustee Since July 1998. Principal | | |
| Occupation(s) During the Past Five Years: Corporate | Thomas J. Higgins1 | |
| Vice President and Chief Global Diversity Officer since | Born 1957. Chief Financial Officer Since September |
| 2006 (retired 2008) and Member of the Executive | 2008. Principal Occupation(s) During the Past Five |
| Committee (retired 2008) of Johnson & Johnson | Years: Principal of The Vanguard Group, Inc.; Chief |
| (pharmaceuticals/consumer products); Vice President | Financial Officer of each of the investment companies |
| and Chief Information Officer of Johnson & Johnson | served by The Vanguard Group since 2008; Treasurer |
| (1997–2005); Director of the University Medical Center | of each of the investment companies served by The |
| at Princeton and Women’s Research and Education | Vanguard Group (1998–2008). |
| Institute; Member of the Advisory Board of the Maxwell | | |
| School of Citizenship and Public Affairs at Syracuse | | |
| University. | Kathryn J. Hyatt1 | |
| | Born 1955. Treasurer Since November 2008. Principal |
| | Occupation(s) During the Past Five Years: Principal of |
| F. Joseph Loughrey | The Vanguard Group, Inc.; Treasurer of each of the |
| Born 1949. Trustee Since October 2009. Principal | investment companies served by The Vanguard |
| Occupation(s) During the Past Five Years: President and | Group since 2008; Assistant Treasurer of each of the |
| Chief Operating Officer since 2005 (retired 2009) and | investment companies served by The Vanguard Group |
| Vice Chairman of the Board (2008–2009) of Cummins | (1988–2008). | |
| Inc. (industrial machinery); Director of SKF AB (industrial | | |
| machinery), Hillenbrand, Inc. (specialized consumer | | |
| services), Sauer-Danfoss Inc. (machinery), the Lumina | Heidi Stam1 | |
| Foundation for Education, and the Columbus Community | Born 1956. Secretary Since July 2005. Principal |
| Education Coalition; Chairman of the Advisory Council | Occupation(s) During the Past Five Years: Managing |
| for the College of Arts and Letters at the University of | Director of The Vanguard Group, Inc., since 2006; |
| Notre Dame. | General Counsel of The Vanguard Group since 2005; |
| | Secretary of The Vanguard Group and of each of the |
| | investment companies served by The Vanguard Group |
| André F. Perold | since 2005; Director and Senior Vice President of |
| Born 1952. Trustee Since December 2004. Principal | Vanguard Marketing Corporation since 2005; Principal |
| Occupation(s) During the Past Five Years: George Gund | of The Vanguard Group (1997–2006). |
| Professor of Finance and Banking, Harvard Business | | |
| School; Chair of the Investment Committee of HighVista | | |
| Strategies LLC (private investment firm). | Vanguard Senior Management Team |
| |
| Alfred M. Rankin, Jr. | R. Gregory Barton | Michael S. Miller |
| Born 1941. Trustee Since January 1993. Principal | Mortimer J. Buckley | James M. Norris |
| Occupation(s) During the Past Five Years: Chairman, | Kathleen C. Gubanich | Glenn W. Reed |
| President, and Chief Executive Officer of NACCO | Paul A. Heller | George U. Sauter |
| Industries, Inc. (forklift trucks/housewares/lignite); | | |
| Director of Goodrich Corporation (industrial products/ | | |
| aircraft systems and services); Deputy Chairman of | Founder | |
| the Federal Reserve Bank of Cleveland; Trustee of | | |
| University Hospitals of Cleveland, The Cleveland | | |
| Museum of Art, and Case Western Reserve University. | John C. Bogle | |
| | Chairman and Chief Executive Officer, 1974–1996 |
| |
| Peter F. Volanakis | | |
| Born 1955. Trustee Since July 2009. Principal | | |
| Occupation(s) During the Past Five Years: President | | |
| since 2007 and Chief Operating Officer since 2005 | | |
| of Corning Incorporated (communications equipment); | | |
| President of Corning Technologies (2001–2005); Director | | |
| of Corning Incorporated and Dow Corning; Trustee of | | |
| the Corning Incorporated Foundation and the Corning | | |
| Museum of Glass; Overseer of the Amos Tuck School | | |
| of Business Administration at Dartmouth College. | | |
1 These individuals are “interested persons” as defined in the Investment Company Act of 1940.
2 December 2002 for Vanguard Equity Income Fund, Vanguard Growth Equity Fund, the Vanguard Municipal Bond Funds, and the Vanguard State Tax-Exempt Funds.
|  |
| P.O. Box 2600 |
| Valley Forge, PA 19482-2600 |
|
Connect with Vanguard® > www.vanguard.com
| |
| Fund Information > 800-662-7447 | All comparative mutual fund data are from Lipper Inc. |
| | or Morningstar, Inc., unless otherwise noted. |
| Direct Investor Account Services > 800-662-2739 | |
| | |
| Institutional Investor Services > 800-523-1036 | You can obtain a free copy of Vanguard’s proxy voting |
| | guidelines by visiting our website, www.vanguard.com, |
| Text Telephone for People | and searching for “proxy voting guidelines,” or by |
| With Hearing Impairment > 800-749-7273 | calling Vanguard at 800-662-2739. The guidelines are |
| | also available from the SEC’s website, www.sec.gov. |
| | In addition, you may obtain a free report on how your |
| | fund voted the proxies for securities it owned during |
| This material may be used in conjunction | the 12 months ended June 30. To get the report, visit |
| with the offering of shares of any Vanguard | either www.vanguard.com or www.sec.gov. |
| fund only if preceded or accompanied by | |
| the fund’s current prospectus. | You can review and copy information about your fund |
| | at the SEC’s Public Reference Room in Washington, D.C. |
| “FTSE®” is a trademark jointly owned by the London | To find out more about this public service, call the SEC |
| Stock Exchange plc and The Financial Times Limited | at 202-551-8090. Information about your fund is also |
| and is used by FTSE International Limited under license. | available on the SEC’s website, and you can receive |
| “All-World” is a trademark of FTSE International Limited. | copies of this information, for a fee, by sending a |
| The FTSE All-World ex US Index and FTSE Global Small | request in either of two ways: via e-mail addressed to |
| Cap ex US Index are calculated by FTSE International | publicinfo@sec.gov or via regular mail addressed to the |
| Limited. FTSE International Limited does not sponsor, | Public Reference Section, Securities and Exchange |
| endorse, or promote the fund; is not in any way | Commission, Washington, DC 20549-1520. |
| connected to it; and does not accept any liability | |
| in relation to its issue, operation, and trading. | |
| |
| |
| |
| |
| | © 2009 The Vanguard Group, Inc. |
| | All rights reserved. |
| | Vanguard Marketing Corporation, Distributor. |
| | Q7700 122009 |
Item 2: Code of Ethics. The Registrant has adopted a code of ethics that applies to the Registrant’s principal executive officer, principal financial officer, principal accounting officer or controller or persons performing similar functions. The Code of Ethics was amended during the reporting period covered by this report to make certain technical, non-material changes.
Item 3: Audit Committee Financial Expert. The following members of the Audit Committee have been determined by the Registrant’s Board of Trustees to be Audit Committee Financial Experts serving on its Audit Committee, and to be independent: Charles D. Ellis, Rajiv L. Gupta, JoAnn Heffernan Heisen, André F. Perold, and Alfred M. Rankin, Jr.
Item 4: Principal Accountant Fees and Services.
(a) Audit Fees.
Audit Fees of the Registrant
Fiscal Year Ended October 31, 2009: $212,000
Fiscal Year Ended October 31, 2008: $178,000
Aggregate Audit Fees of Registered Investment Companies in the Vanguard Group.
Fiscal Year Ended October 31, 2009: $3,354,640
Fiscal Year Ended October 31, 2008: $3,055,590
(b) Audit-Related Fees.
Fiscal Year Ended October 31, 2009: $876,210
Fiscal Year Ended October 31, 2008: $626,240
Includes fees billed in connection with assurance and related services provided to the Registrant, The Vanguard Group, Inc., Vanguard Marketing Corporation, and other registered investment companies in the Vanguard Group.
(c) Tax Fees.
Fiscal Year Ended October 31, 2009: $423,070
Fiscal Year Ended October 31, 2008: $230,400
Includes fees billed in connection with tax compliance, planning and advice services provided to the Registrant, The Vanguard Group, Inc., Vanguard Marketing Corporation, and other registered investment companies in the Vanguard Group and related to income and excise taxes.
(d) All Other Fees.
Fiscal Year Ended October 31, 2009: $0
Fiscal Year Ended October 31, 2008: $0
Includes fees billed for services related to risk management and privacy matters. Services were provided to the Registrant, The Vanguard Group, Inc., Vanguard Marketing Corporation, and other registered investment companies in the Vanguard Group.
(e) (1) Pre-Approval Policies. The policy of the Registrant’s Audit Committee is to consider and, if appropriate, approve before the principal accountant is engaged for such services, all specific audit and non-audit services provided to: (1) the Registrant; (2) The Vanguard Group, Inc.; (3) other entities controlled by The Vanguard Group, Inc. that provide ongoing services to the Registrant; and (4) other registered investment companies in the Vanguard Group. In making a determination, the Audit Committee considers whether the services are consistent with maintaining the principal accountant’s independence.
In the event of a contingency situation in which the principal accountant is needed to provide services in between scheduled Audit Committee meetings, the Chairman of the Audit Committee would be called on to consider and, if appropriate, pre-approve audit or permitted non-audit services in an amount sufficient to complete services through the next Audit Committee meeting, and to determine if such services would be consistent with maintaining the accountant’s independence. At the next scheduled Audit Committee meeting, services and fees would be presented to the Audit Committee for formal consideration, and, if appropriate, approval by the entire Audit Committee. The Audit Committee would again consider whether such services and fees are consistent with maintaining the principal accountant’s independence.
The Registrant’s Audit Committee is informed at least annually of all audit and non-audit services provided by the principal accountant to the Vanguard complex, whether such services are provided to: (1) the Registrant; (2) The Vanguard Group, Inc.; (3) other entities controlled by The Vanguard Group, Inc. that provide ongoing services to the Registrant; or (4) other registered investment companies in the Vanguard Group.
(2) No percentage of the principal accountant’s fees or services were approved pursuant to the waiver provision of paragraph (c)(7)(i)(C) of Rule 2-01 of Regulation S-X.
(f) For the most recent fiscal year, over 50% of the hours worked under the principal accountant’s engagement were not performed by persons other than full-time, permanent employees of the principal accountant.
(g) Aggregate Non-Audit Fees.
Fiscal Year Ended October 31, 2009: $423,070
Fiscal Year Ended October 31, 2008: $230,400
Includes fees billed for non-audit services provided to the Registrant, The Vanguard Group, Inc., Vanguard Marketing Corporation, and other registered investment companies in the Vanguard Group.
(h) For the most recent fiscal year, the Audit Committee has determined that the provision of all non-audit services was consistent with maintaining the principal accountant’s independence.
Item 5: Not Applicable.
Item 6: Not Applicable.
Item 7: Not Applicable.
Item 8: Not Applicable.
Item 9: Not Applicable.
Item 10: Not Applicable.
Item 11: Controls and Procedures.
(a) Disclosure Controls and Procedures. The Principal Executive and Financial Officers concluded that the Registrant's Disclosure Controls and Procedures are effective based on their evaluation of the Disclosure Controls and Procedures as of a date within 90 days of the filing date of this report.
(b) Internal Control Over Financial Reporting. There were no significant changes in Registrant’s Internal Control Over Financial Reporting or in other factors that could significantly affect this control subsequent to the date of the evaluation, including any corrective actions with regard to significant deficiencies and material weaknesses.
Item 12: Exhibits.
(a) Code of Ethics.
(b) Certifications.
Pursuant to the requirements of the Securities Exchange Act of 1934 and the Investment Company Act of 1940, the registrant has duly caused this report to be signed on its behalf by the undersigned, thereunto duly authorized.
| |
| | VANGUARD INTERNATIONAL EQUITY INDEX FUNDS |
| |
| By: | /s/ F. WILLIAM MCNABB III* |
| | F. WILLIAM MCNABB III |
| | CHIEF EXECUTIVE OFFICER |
| |
| Date: December 18, 2009 |
Pursuant to the requirements of the Securities Exchange Act of 1934 and the Investment Company Act of 1940, this report has been signed below by the following persons on behalf of the registrant and in the capacities and on the dates indicated.
| |
| | VANGUARD INTERNATIONAL EQUITY INDEX FUNDS |
| |
| By: | /s/ F. WILLIAM MCNABB III* |
| | F. WILLIAM MCNABB III |
| | CHIEF EXECUTIVE OFFICER |
| |
| Date: December 18, 2009 |
| |
| | VANGUARD INTERNATIONAL EQUITY INDEX FUNDS |
| |
| By: | /s/ THOMAS J. HIGGINS* |
| | THOMAS J. HIGGINS |
| | CHIEF FINANCIAL OFFICER |
| |
| Date: December 18, 2009 |
*By: /s/ Heidi Stam
Heidi Stam, pursuant to a Power of Attorney filed on July 24, 2009, see File Number 2-88373,
and a Power of Attorney filed on October 16, 2009, see File Number 2-52698,
both Incorporated by Reference.