UNITED STATES
SECURITIES AND EXCHANGE COMMISSION
Washington, D.C. 20549
FORM N-CSR
CERTIFIED SHAREHOLDER REPORT
OF
REGISTERED MANAGEMENT INVESTMENT COMPANIES
Investment Company Act file number: 811-5972
Name of Registrant: Vanguard International Equity Index Funds
Address of Registrant:
P.O. Box 2600
Valley Forge, PA 19482
Name and address of agent for service:
Heidi Stam, Esquire
P.O. Box 876
Valley Forge, PA 19482
Registrant’s telephone number, including area code: (610) 669-1000
Date of fiscal year end: October 31
Date of reporting period: November 1, 2009 – October 31, 2010
Item 1: Reports to Shareholders
 |
| Vanguard International Stock |
| Index Funds Annual Report |
|
| October 31, 2010 |
 |
| |
| Vanguard European Stock Index Fund |
| Vanguard Pacific Stock Index Fund |
| Vanguard Emerging Markets Stock Index Fund |
> For the fiscal year ended October 31, 2010, returns for Vanguard International Stock Index Funds ranged from about 9% for the European Stock Index Fund to about 25% for the Emerging Markets Stock Index Fund.
> As global equity markets continued to recover, stocks in the materials, industrial, and consumer-oriented sectors were among the top performers.
> For the decade ended October 31, the average annual returns of all three funds closely tracked their benchmarks and outperformed the average annual returns of their respective peer funds.
| |
| Contents | |
| Your Fund’s Total Returns. | 1 |
| Chairman’s Letter. | 4 |
| European Stock Index Fund. | 11 |
| Pacific Stock Index Fund. | 34 |
| Emerging Markets Stock Index Fund. | 55 |
| Your Fund’s After-Tax Returns. | 79 |
| About Your Fund’s Expenses. | 80 |
| Glossary. | 83 |
The figures shown represent past performance, which is not a guarantee of future results. (Current performance may be lower or higher than the performance data cited. For performance data current to the most recent month-end, visit our website at vanguard.com/performance.)

European Stock Index Fund
Pacific Stock Index Fund
Emerging Markets Stock Index Fund
Please note: The opinions expressed in this report are just that—informed opinions. They should not be considered promises or advice. Also, please keep in mind that the information and opinions cover the period through the date on the front of this report. Of course, the risks of investing in your fund are spelled out in the prospectus.
See the Glossary for definitions of investment terms used in this report.
Cover photograph: Jean Maher.
| |
| Your Fund’s Total Returns | |
| |
| |
| |
| |
| Fiscal Year Ended October 31, 2010 | |
| | Total |
| | Returns |
| Vanguard Emerging Markets Stock Index Fund | |
| Investor Shares | 24.92% |
| Admiral™ Shares | 25.08 |
| Signal® Shares | 25.04 |
| Institutional Shares | 25.13 |
| ETF Shares | |
| Market Price | 26.34 |
| Net Asset Value | 25.07 |
| MSCI Emerging Markets Index | 23.56 |
| Emerging Markets Funds Average | 25.61 |
| Emerging Markets Funds Average: Derived from data provided by Lipper Inc. | |
Admiral Shares carry lower expenses and are available to investors who meet certain account-balance requirements. Signal Shares and Institutional Shares are available to certain institutional investors who meet specific administrative, service, and account-size criteria. The Vanguard ETF® Shares shown are traded on the NYSE Arca exchange and are available only through brokers. The table provides ETF returns based on both the NYSE Arca market price and the net asset value for a share. U.S. Pat. No. 6,879,964 B2; 7,337,138.
For the ETF Shares, the market price is determined by the midpoint of the bid-offer spread as of the closing time of the New York Stock Exchange (generally 4 p.m., Eastern time). The net asset value is also determined as of the NYSE closing time. For more information about how the ETF Shares' market prices have compared with their net asset value, visit vanguard.com, select your ETF, and then select the Price and Performance tab. The ETF premium/discount analysis there shows the percentages of days on which the ETF Shares' market price was above or below the NAV.
1
| |
| Your Fund’s Total Returns | |
| |
| |
| |
| |
| Fiscal Year Ended October 31, 2010 | |
| | Total |
| | Returns |
| Vanguard Emerging Markets Stock Index Fund | |
| Investor Shares | 24.92% |
| Admiral™ Shares | 25.08 |
| Signal® Shares | 25.04 |
| Institutional Shares | 25.13 |
| ETF Shares | |
| Market Price | 26.34 |
| Net Asset Value | 25.07 |
| MSCI Emerging Markets Index | 23.56 |
| Emerging Markets Funds Average | 25.61 |
| Emerging Markets Funds Average: Derived from data provided by Lipper Inc. | |
Admiral Shares carry lower expenses and are available to investors who meet certain account-balance requirements. Signal Shares and Institutional Shares are available to certain institutional investors who meet specific administrative, service, and account-size criteria. The Vanguard ETF® Shares shown are traded on the NYSE Arca exchange and are available only through brokers. The table provides ETF returns based on both the NYSE Arca market price and the net asset value for a share. U.S. Pat. No. 6,879,964 B2; 7,337,138.
For more information about how the ETF Shares' market prices have compared with their net asset value, visit vanguard.com, select your ETF, and then select the Performance tab. The Premium/Discount table there shows the percentages of days on which the ETF Shares' market price was above or below the NAV.
2
| | | | |
| Your Fund’s Performance at a Glance | | |
| |
| |
| |
| |
| October 31, 2009, Through October 31, 2010 | | | | |
| | | | Distributions Per Share |
| | Starting | Ending | Income | Capital |
| | Share Price | Share Price | Dividends | Gains |
| Vanguard European Stock Index Fund | | | | |
| Investor Shares | $25.77 | $27.15 | $0.982 | $0.000 |
| Admiral Shares | 60.51 | 63.75 | 2.382 | 0.000 |
| Signal Shares | 23.42 | 24.68 | 0.923 | 0.000 |
| Institutional Shares | 25.80 | 27.20 | 1.008 | 0.000 |
| ETF Shares | 48.41 | 51.00 | 1.912 | 0.000 |
| Vanguard Pacific Stock Index Fund | | | | |
| Investor Shares | $9.61 | $10.40 | $0.256 | $0.000 |
| Admiral Shares | 62.95 | 68.06 | 1.760 | 0.000 |
| Signal Shares | 21.87 | 23.64 | 0.611 | 0.000 |
| Institutional Shares | 9.63 | 10.42 | 0.269 | 0.000 |
| ETF Shares | 50.92 | 55.06 | 1.421 | 0.000 |
| Vanguard Emerging Markets Stock Index Fund | | | | |
| Investor Shares | $23.90 | $29.49 | $0.314 | $0.000 |
| Admiral Shares | 31.45 | 38.82 | 0.445 | 0.000 |
| Signal Shares | 30.26 | 37.34 | 0.428 | 0.000 |
| Institutional Shares | 23.94 | 29.55 | 0.349 | 0.000 |
| ETF Shares | 37.84 | 46.70 | 0.545 | 0.000 |
3

Chairman’s Letter
Dear Shareholder,
After a bumpy ride, international markets bounced back in September and October, delivering solid returns for the fiscal year ended October 31, 2010. Emerging markets again surpassed developed European and Pacific markets, although results were less extraordinary than those of a year ago.
The three Vanguard international index funds in this report posted positive results for the fiscal year. The Emerging Markets Stock Index Fund took the lead, climbing about 25% for the period and outperforming the broad U.S. stock market, which returned about 19%. The Pacific Stock Index Fund was next in line, with a return of about 11%, while the European Stock Index Fund brought up the rear, returning about 9%.
All three funds succeeded in closely tracking their respective benchmark indexes. However, because of temporary differences arising from fairvalue pricing policies, the funds’ returns appear to have diverged from those of their benchmarks, which are not adjusted for fair value. The concept and its rationale are explained on page 8.
On another matter, in October Vanguard broadened the availability of our Admiral Shares. We reduced the Admiral minimums for most of our index funds to $10,000 from $100,000, as part of our ongoing efforts to lower the cost
4
of investing for our clients. We also announced plans to introduce Institutional Plus Shares for the International Stock Index Funds. These lowercost shares would require a minimum investment of $100 million.
Note: If you own one or more of the funds in a taxable account, you may wish to review the details of the funds’ aftertax returns on page 79. Also, each fund’s Statement of Net Assets has been abbreviated to include its 50 largest holdings and any other holdings that represent 1% or more of fund assets. The shorter list helps us reduce printing and postage costs. A complete list of your fund’s securities is available on our website at vanguard.com.
Stock market performance was better than it felt
Global stock prices rallied at the start of the period, but struggled through the spring and summer, weighed down by Europe’s sovereign debt crisis and the slow pace of economic recovery in the United States. In the fiscal year’s final months, the mood turned. Stock prices climbed on continued strength in corporate earnings. In the United States, stocks also seemed to get a boost from the Federal Reserve Board’s hints that it would try to stimulate the economy with a second round of U.S. Treasury bond purchases. (In early November, the Fed announced that it would buy as much as $600 billion in Treasuries.)
| | | |
| Market Barometer | | | |
| |
| | | Average Annual Total Returns |
| | | Periods Ended October 31, 2010 |
| | One | Three | Five |
| | Year | Years | Years |
| Stocks | | | |
| Russell 1000 Index (Large-caps) | 17.67% | -6.14% | 1.99% |
| Russell 2000 Index (Small-caps) | 26.58 | -3.91 | 3.07 |
| Dow Jones U.S. Total Stock Market Index | 19.04 | -5.55 | 2.52 |
| MSCI All Country World Index ex USA (International) | 13.08 | -7.62 | 6.21 |
| |
| Bonds | | | |
| Barclays Capital U.S. Aggregate Bond Index (Broad | | | |
| taxable market) | 8.01% | 7.23% | 6.45% |
| Barclays Capital Municipal Bond Index (Broad | | | |
| tax-exempt market) | 7.78 | 5.79 | 5.20 |
| Citigroup Three-Month U.S. Treasury Bill Index | 0.12 | 0.89 | 2.41 |
| |
| CPI | | | |
| Consumer Price Index | 1.17% | 1.54% | 1.89% |
5
For the 12 months, the broad U.S. stock market returned about 19%, a performance that was better than it felt in a year of ups and downs. Smallcapitalization stocks did even better. International stocks returned about 13% on the strength of a powerful rally in emerging markets and solid singledigit gains in developed markets in Europe and the Pacific region.
Despite shrinking yields, bonds attracted investor dollars
Although fixed income yields have fallen to generational lows, investors continued to bid up bond prices. The broad U.S. bond market produced a 12month return of about 8% as the yield of the 10year U.S. Treasury note fell from 3.39% at the start of the period to 2.61% at the close. Taxexempt municipal bonds also rallied.
Bond prices and yields move in opposite directions, of course, so abundant returns built on rising prices could mean leaner pickings in the years ahead.
The yields of money market securities hovered near 0%, consistent with the Federal Reserve Board’s target for shortterm rates.
Emerging markets outperform again
For the second year in a row, emerging markets recorded the largest gains for the 12month period, besting stocks in Europe, the Pacific region, and the United States. The Emerging Markets Stock Index Fund returned about 25% for the period, benefiting from a general rally in the emerging markets countries.
Expense Ratios
Your Fund Compared With Its Peer Group
| | | | | | |
| | | | | | | Peer |
| | Investor | Admiral | Signal | Institutional | ETF | Group |
| | Shares | Shares | Shares | Shares | Shares | Average |
| European Stock Index Fund | 0.27% | 0.16% | 0.16% | 0.12% | 0.16% | 1.44% |
| Pacific Stock Index Fund | 0.27 | 0.16 | 0.16 | 0.12 | 0.16 | 1.62 |
| Emerging Markets Stock Index Fund | 0.40 | 0.27 | 0.27 | 0.23 | 0.27 | 1.74 |
The fund expense ratios shown are from the prospectus dated February 26, 2010, and represent estimated costs for the current fiscal year. For the fiscal year ended October 31, 2010, the funds’ expense ratios were: for the European Stock Index Fund, 0.26% for Investor Shares, 0.14% for Admiral Shares, 0.14% for Signal Shares, 0.10% for Institutional Shares, and 0.14% for ETF Shares; for the Pacific Stock Index Fund, 0.26% for Investor Shares, 0.14% for Admiral Shares, 0.14% for Signal Shares, 0.10% for Institutional Shares, and 0.14% for ETF Shares; and for the Emerging Markets Stock Index Fund, 0.35% for Investor Shares, 0.22% for Admiral Shares, 0.22% for Signal Shares, 0.15% for Institutional Shares, and 0.22% for ETF Shares.
Peer groups: For the European Stock Index Fund, European Region Funds; for the Pacific Stock Index Fund, Japan/Pacific Region Funds; for the Emerging Markets Stock Index Fund, Emerging Markets Funds.
6
Brazil was the index’s biggest contributor for the period, accounting for more than 3 percentage points of the total return. Meanwhile, five other countries, South Korea, India, South Africa, China, and Taiwan, each contributed more than 2 percentage points to returns. The Czech Republic and Egypt were the only countries in the index that posted negative results for the period.
The rally included all areas of the market, and each of the ten industry sectors gained. Financials, which accounted for about 25% of the index’s capitalization, on average during the period, contributed most significantly to returns. Commercial banks alone made up more than 5 percentage points of the index’s total return. Materials, consumer discretionary, and consumer staples were also important contributors to performance.
A solid year for Pacific Rim countries
The countries in the Pacific region failed to keep pace with the United States and emerging markets countries for the 12 months ended October 31. However, the region still posted a strong showing for the period, and the Pacific Stock Index Fund gained about 11%.
Total Returns
Ten Years Ended October 31, 2010
| |
| | Average |
| | Annual Return |
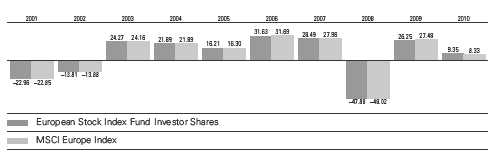
| European Stock Index Fund Investor Shares | 3.60% |
| MSCI Europe Index | 3.53 |
| European Region Funds Average | 3.03 |
| European Region Funds Average: Derived from data provided by Lipper Inc. | |
| Pacific Stock Index Fund Investor Shares | 2.26% |
| MSCI Pacific Index | 2.40 |
| Japan/Pacific Region Funds Average | -0.03 |
| Japan/Pacific Region Funds Average: Derived from data provided by Lipper Inc. | |
| Emerging Markets Stock Index Fund Investor Shares | 14.38% |
| Spliced Emerging Markets Index | 14.78 |
| Emerging Markets Funds Average | 13.48 |
Spliced Emerging Markets Index: Select Emerging Markets Index, administered exclusively for Vanguard by MSCI, through August 23, 2006; MSCI Emerging Markets Index thereafter. Index returns are adjusted for withholding taxes applicable to Luxembourg holding companies.
Emerging Markets Funds Average: Derived from data provided by Lipper Inc.
The figures shown represent past performance, which is not a guarantee of future results. (Current performance may be lower or higher than the performance data cited. For performance data current to the most recent month-end, visit our website at vanguard.com/performance.) Note, too, that both investment returns and principal value can fluctuate widely, so an investor’s shares, when sold, could be worth more or less than their original cost.
7
Australia, which represented an average of about 24% of the index’s value during the fiscal year, contributed most significantly to returns. The country’s strong economic growth made up almost 4 percentage points of the index’s total return. Meanwhile, Japan, which accounted for more than 60% of assets, on average, during the period, added just over 2 percentage points to the index’s returns. The region’s remaining countries—Hong Kong, Singapore, and New Zealand—also saw economic growth during the year.
All ten market sectors posted positive returns in the Pacific region. Industrials, materials, and financials were the largest contributors to performance. Stocks in these sectors benefited from continued growth in China.
European region overcomes debt crisis
European markets generated solid results for the 12 months, returning about 9%. This is impressive, considering that the beginning of the period was marred by fears about the sovereign debt crisis in several European countries, most notably Greece.
The United Kingdom, Europe’s largest market, gained almost 13% for the 12-month period. Economic growth
| Investment insight | |
| A note on fair-value pricing |
| The reported return of a fund that tracks an index sometimes may diverge from |
| the index’s return a bit more than would be expected. This may be the result of |
| a fair-value pricing adjustment. |
| |
| These adjustments, which are required by the Securities and Exchange Commission, |
| address pricing discrepancies that may arise because of time-zone differences among |
| global stock markets. Foreign stocks may trade on exchanges that close many hours |
| before a fund’s closing share price is calculated in the United States, generally at 4 p.m., |
| Eastern time. In the hours between the foreign close and the U.S. close, the value of |
| these foreign securities may change—because of company-specific announcements |
| or market-wide developments, for example. Such price changes are not immediately |
| reflected in international index values. |
| |
| Fair-value pricing takes such changes into account in calculating the fund’s daily net |
| asset value, thus ensuring that the NAV doesn’t include “stale” prices. The result can |
| be a temporary divergence between the return of the fund and that of its benchmark |
| index—a difference that usually corrects itself when the foreign markets reopen. |
8
was stronger than expected in the third calendar quarter, and the country added almost 4 percentage points to the index’s total returns. Germany and Switzerland were also key contributors to the index’s performance. A handful of countries posted negative results for the period, but Greece was the most significant detractor. The country’s stock market value dropped almost 50% over concerns that the government would default on its debts.
The index posted gains in nine out of ten industry sectors for the fiscal period. The most significant contributors were stocks in the consumeroriented, materials, and industrials sectors. Financials, the largest sector in the index—accounting for an average of 22% of assets—was the only sector to post negative results. The sector was hit hard, again mostly because of concerns over the debt crisis.
Funds’ long-term performance aligns with respective benchmarks
For the ten years ended October 31, the Vanguard International Stock Index Funds met their shared objective of closely tracking their respective benchmarks. The funds also outperformed the average annual returns of their respective peer groups.
At first glance, tenyear returns for the Pacific Stock Index Fund and the European Stock Index Fund may not appear all that impressive. However, it’s important to keep in mind that these returns reflect a decade in which global stock markets endured more than their fair share of ups and downs. Over the tenyear period, all three of the funds significantly outperformed the broad U.S. stock market, which returned an average of 1.02% per year.
The funds’ solid longterm performance is a tribute to the indexmanagement skills of the funds’ advisor, Vanguard Quantitative Equity Group. The funds’ extremely low costs also help you keep a larger proportion of the funds’ returns.
International investing can help provide diversification
The ups and downs of the global stock markets have become all too familiar these days. The variation in performance from region to region highlights the value of a diversified portfolio. Markets around the globe may be affected by similar events, but their response to those shifts often differs. Our research suggests that, over time, those differences can become more pronounced. As the impact of a global shock such as the recent financial crisis recedes, stock markets once again take their cues from developments in local economies, enhancing the riskreturn properties of a globally diversified portfolio.
For these reasons, Vanguard encourages you to create a plan that includes a mix of stocks, bonds, and shortterm investments appropriate for your goals and risk tolerance—and to stick with that plan, regardless of market conditions.
9
A wellbalanced portfolio can help provide some cushion during the market’s downward swings, while allowing you to participate in its longterm potential for growth. Vanguard’s lowcost International Stock Index Funds offer broad exposure to international markets and can help diversify such an investment plan.
Thank you for entrusting your assets to Vanguard.
Sincerely,

F. William McNabb III
Chairman and Chief Executive Officer
November 10, 2010
10
European Stock Index Fund
Fund Profile
As of October 31, 2010
| | | | | |
| Share-Class Characteristics | | | | | |
| | Investor | Admiral | Signal | Institutional | ETF |
| | Shares | Shares | Shares | Shares | Shares |
| Ticker Symbol | VEURX | VEUSX | VESSX | VESIX | VGK |
| Expense Ratio1 | 0.27% | 0.16% | 0.16% | 0.12% | 0.16% |
| | | |
| Portfolio Characteristics | | |
| | | | MSCI AC |
| | | MSCI | World |
| | | Europe | Index |
| Fund | Index | ex USA |
| Number of Stocks | 477 | 462 | 1,811 |
| Median Market Cap $50.2B | $50.2B | $29.9B |
| Price/Earnings Ratio | 15.6x | 15.7x | 16.2x |
| Price/Book Ratio | 1.7x | 1.7x | 1.7x |
| Return on Equity | 19.8% | 19.8% | 18.2% |
| Earnings Growth Rate | 2.3% | 2.3% | 4.4% |
| Dividend Yield | 3.3% | 3.2% | 2.8% |
| Turnover Rate | 11% | — | — |
| Short-Term Reserves | -0.3% | — | — |
| | | |
| Sector Diversification (% of equity exposure) |
| | | | MSCI AC |
| | | MSCI | World |
| | | Europe | Index |
| | Fund | Index | ex USA |
| Consumer | | | |
| Discretionary | 8.7% | 8.7% | 8.7% |
| Consumer Staples | 12.4 | 12.4 | 8.5 |
| Energy | 10.2 | 10.2 | 10.9 |
| Financials | 22.8 | 22.8 | 25.7 |
| Health Care | 9.9 | 9.9 | 6.1 |
| Industrials | 10.5 | 10.5 | 10.3 |
| Information | | | |
| Technology | 2.8 | 2.8 | 7.1 |
| Materials | 9.9 | 9.9 | 12.1 |
| Telecommunication | | | |
| Services | 7.1 | 7.1 | 5.9 |
| Utilities | 5.7 | 5.7 | 4.7 |
| | |
| Volatility Measures | | |
| | | MSCI AC |
| | MSCI Europe | World Index |
| | Index | ex USA |
| R-Squared | 0.99 | 0.96 |
| Beta | 1.03 | 1.05 |
These measures show the degree and timing of the fund’s fluctuations compared with the indexes over 36 months.
| | |
| Ten Largest Holdings (% of total net assets) |
| Royal Dutch Shell plc | Integrated Oil & | |
| | Gas | 2.9% |
| Nestle SA | Packaged Foods & | |
| | Meats | 2.7 |
| HSBC Holdings plc | Diversified Banks | 2.6 |
| Vodafone Group plc | Wireless | |
| | Telecommunication | |
| | Services | 2.0 |
| BP plc | Integrated Oil & | |
| | Gas | 1.8 |
| Novartis AG | Pharmaceuticals | 1.7 |
| Total SA | Integrated Oil & | |
| | Gas | 1.6 |
| Telefonica SA | Integrated | |
| | Telecommunication | |
| | Services | 1.5 |
| Banco Santander SA | Diversified Banks | 1.5 |
| Roche Holding AG | Pharmaceuticals | 1.5 |
| Top Ten | | 19.8% |
The holdings listed exclude any temporary cash investments and equity index products.
1 The expense ratios shown are from the prospectus dated February 26, 2010, and represent estimated costs for the current fiscal year. For the fiscal year ended October 31, 2010, the expense ratios were 0.26% for Investor Shares, 0.14% for Admiral Shares, 0.14% for Signal Shares, 0.10% for Institutional Shares, and 0.14% for ETF Shares.
11
European Stock Index Fund
| | | |
| Market Diversification (% of equity exposure) |
| | | | MSCI AC |
| | | MSCI | World |
| | | Europe | Index |
| | Fund | Index | ex USA |
| Europe | | | |
| United Kingdom | 33.1% | 33.1% | 14.9% |
| France | 15.7 | 15.7 | 7.1 |
| Germany | 12.7 | 12.7 | 5.7 |
| Switzerland | 11.7 | 11.8 | 5.3 |
| Spain | 5.8 | 5.8 | 2.6 |
| Netherlands | 4.0 | 4.0 | 1.8 |
| Sweden | 4.7 | 4.7 | 2.1 |
| Italy | 4.5 | 4.5 | 2.0 |
| Finland | 1.7 | 1.7 | 0.8 |
| Denmark | 1.5 | 1.5 | 0.7 |
| Belgium | 1.5 | 1.5 | 0.7 |
| Norway | 1.2 | 1.2 | 0.6 |
| Other | 1.9 | 1.8 | 0.8 |
| Subtotal | 100.0% | 100.0% | 45.1% |
| Pacific | 0.0% | 0.0% | 23.3% |
| Emerging Markets | 0.0% | 0.0% | 24.0% |
| North America | 0.0% | 0.0% | 7.6% |
12
European Stock Index Fund
Performance Summary
All of the returns in this report represent past performance, which is not a guarantee of future results that may be achieved by the fund. (Current performance may be lower or higher than the performance data cited. For performance data current to the most recent month-end, visit our website at vanguard.com/performance.) Note, too, that both investment returns and principal value can fluctuate widely, so an investor’s shares, when sold, could be worth more or less than their original cost. The returns shown do not reflect taxes that a shareholder would pay on fund distributions or on the sale of fund shares.
Cumulative Performance: October 31, 2000, Through October 31, 2010
Initial Investment of $10,000

| | | | |
| | Average Annual Total Returns | |
| | Periods Ended October 31, 2010 | |
| | | | | Final Value |
| | One | Five | Ten | of a $10,000 |
| | Year | Years | Years | Investment |
| European Stock Index Fund Investor | | | | |
| Shares | 9.35% | 4.04% | 3.60% | $14,247 |
| MSCI All Country World Index ex USA | 13.08 | 6.21 | 5.46 | 17,012 |
| MSCI Europe Index | 8.33 | 3.88 | 3.53 | 14,146 |
| European Region Funds Average | 10.83 | 3.73 | 3.03 | 13,477 |
European Region Funds Average: Derived from data provided by Lipper Inc.
| | | | |
| | | | Since | Final Value |
| | One | Five | Inception | of a $10,000 |
| | Year | Years | (8/13/2001) | Investment |
| European Stock Index Fund Admiral | | | | |
| Shares | 9.49% | 4.14% | 5.98% | $17,073 |
| MSCI All Country World Index ex | | | | |
| USA | 13.08 | 6.21 | 8.12 | 20,533 |
| MSCI Europe Index | 8.33 | 3.88 | 5.79 | 16,796 |
"Since Inception" performance is calculated from the Admiral Shares’ inception date for both the fund and its comparative standards.
Vanguard fund returns do not reflect the 2% fee on redemptions of shares held for less than two months.
See Financial Highlights for dividend and capital gains information.
13
| | | |
| European Stock Index Fund | | | |
| |
| |
| |
| |
| | Average Annual Total Returns | |
| | Period Ended: October 31, 2010 | |
| | | Since | Final Value |
| | One | Inception | of a $1,000,000 |
| | Year | (10/6/2006) | Investment |
| European Stock Index Fund Signal | | | |
| Shares | 9.52% | -0.91% | $963,442 |
| MSCI All Country World Index ex | | | |
| USA | 13.08 | 1.95 | 1,081,621 |
| MSCI Europe Index | 8.33 | -1.17 | 953,207 |
| "Since Inception" performance is calculated from the Signal Shares’ inception date for both the fund and its comparative standards. |
| | | | |
| | | | | Final Value |
| | One | Five | Ten | of a $5,000,000 |
| | Year | Years | Years | Investment |
| European Stock Index Fund | | | | |
| Institutional Shares | 9.53% | 4.19% | 3.75% | $7,227,018 |
| MSCI All Country World Index ex | | | | |
| USA | 13.08 | 6.21 | 5.46 | 8,506,155 |
| MSCI Europe Index | 8.33 | 3.88 | 3.53 | 7,073,178 |
| |
| |
| | | | Since | Final Value |
| | One | Five | Inception | of a $10,000 |
| | Year | Years | (3/4/2005) | Investment |
| European Stock Index Fund | | | | |
| ETF Shares Net Asset Value | 9.48% | 4.14% | 3.59% | $12,210 |
| MSCI All Country World Index ex USA | 13.08 | 6.21 | 6.09 | 13,974 |
| MSCI Europe Index | 8.33 | 3.88 | 3.35 | 12,052 |
| "Since Inception" performance is calculated from the ETF Shares’ inception date for both the fund and its comparative standards. |
| | | |
| Cumulative Returns of ETF Shares: March 4, 2005, Through October 31, 2010 | | |
| | | | Since |
| | One | Five | Inception |
| | Year | Years | (3/4/2005) |
| European Stock Index Fund | | | |
| ETF Shares Market Price | 9.88% | 21.25% | 22.31% |
| European Stock Index Fund | | | |
| ETF Shares Net Asset Value | 9.48 | 22.48 | 22.10 |
| MSCI Europe Index | 8.33 | 20.96 | 20.52 |
| "Since Inception" performance is calculated from the ETF Shares’ inception date for both the fund and its comparative standards. | |
Vanguard fund returns do not reflect the 2% fee on redemptions of shares held for less than two months.
14
European Stock Index Fund
Fiscal-Year Total Returns (%): October 31, 2000, Through October 31, 2010
Average Annual Total Returns: Periods Ended September 30, 2010
This table presents average annual total returns through the latest calendar quarter—rather than through the end of the fiscal period. Securities and Exchange Commission rules require that we provide this information.
| | | | |
| | Inception | One | Five | Ten |
| | Date | Year | Years | Years |
| Investor Shares | 6/18/1990 | 2.25% | 2.42% | 3.05% |
| Admiral Shares | 8/13/2001 | 2.39 | 2.53 | 5.511 |
| Signal Shares | 10/6/2006 | 2.41 | — | -2.061 |
| Institutional Shares | 5/15/2000 | 2.39 | 2.56 | 3.20 |
| ETF Shares | 3/4/2005 | | | |
| Market Price | | 2.33 | 2.49 | 2.781 |
| Net Asset Value | | 2.38 | 2.53 | 2.811 |
| 1 Return since inception. | | | | |
Vanguard fund returns do not reflect the 2% fee on redemptions of shares held for less than two months.
15
European Stock Index Fund
Financial Statements
Statement of Net Assets—Investments Summary
As of October 31, 2010
This Statement summarizes the fund’s holdings by asset type. Details are reported for each of the fund’s 50 largest individual holdings and for investments that, in total for any issuer, represent more than 1% of the fund’s net assets. The total value of smaller holdings is reported as a single amount within each category.
The fund reports a complete list of its holdings in regulatory filings four times in each fiscal year, at the quarter-ends. For the second and fourth fiscal quarters, the complete listing of the fund’s holdings is available electronically on vanguard.com and on the Securities and Exchange Commission’s website (sec.gov), or you can have it mailed to you without charge by calling 800-662-7447. For the first and third fiscal quarters, the fund files the lists with the SEC on Form N-Q. Shareholders can look up the fund’s Forms N-Q on the SEC’s website. Forms N-Q may also be reviewed and copied at the SEC’s Public Reference Room (see the back cover of this report for further information).
| | | |
| | | Market | Percentage |
| | | Value | of Net |
| | Shares | ($000) | Assets |
| Common Stocks | | | |
| Austria † | | 42,859 | 0.5% |
| |
| Belgium | | | |
| Anheuser-Busch InBev NV | 865,975 | 54,387 | 0.6% |
| Belgium—Other † | | 72,370 | 0.9% |
| | | 126,757 | 1.5% |
| Denmark | | | |
| Novo Nordisk A/S Class B | 522,644 | 54,879 | 0.6% |
| Denmark—Other † | | 75,271 | 0.9% |
| | | 130,150 | 1.5% |
| Finland | | | |
| Nokia Oyj | 4,490,238 | 48,223 | 0.6% |
| Finland—Other † | | 96,463 | 1.1% |
| | | 144,686 | 1.7% |
| France | | | |
| Total SA | 2,535,712 | 138,029 | 1.6% |
| Sanofi-Aventis SA | 1,258,027 | 88,140 | 1.0% |
| BNP Paribas | 1,137,034 | 83,169 | 1.0% |
| ^ GDF Suez | 1,491,784 | 59,607 | 0.7% |
| France Telecom SA | 2,223,387 | 53,346 | 0.6% |
| LVMH Moet Hennessy Louis Vuitton SA | 293,656 | 46,072 | 0.6% |
| Societe Generale | 753,786 | 45,201 | 0.5% |
| France—Other † | | 806,657 | 9.6% |
| | | 1,320,221 | 15.6% |
16
| | | |
| European Stock Index Fund | | | |
| |
| |
| |
| | | Market | Percentage |
| | | Value | of Net |
| | Shares | ($000) | Assets |
| Germany | | | |
| Siemens AG | 987,113 | 112,645 | 1.3% |
| BASF SE | 1,101,921 | 80,123 | 0.9% |
| Bayer AG | 992,110 | 73,999 | 0.9% |
| Allianz SE | 544,556 | 68,194 | 0.8% |
| E.ON AG | 2,160,582 | 67,627 | 0.8% |
| Deutsche Bank AG | 1,116,948 | 64,343 | 0.8% |
| * Daimler AG | 976,641 | 64,316 | 0.8% |
| SAP AG | 1,029,637 | 53,643 | 0.6% |
| Deutsche Telekom AG | 3,398,307 | 49,229 | 0.6% |
| Germany—Other † | | 428,500 | 5.1% |
| | | 1,062,619 | 12.6% |
| |
| Greece † | | 41,246 | 0.5% |
| �� |
| Ireland † | | 32,236 | 0.4% |
| |
| Italy | | | |
| ENI SPA | 3,123,459 | 70,332 | 0.9% |
| Italy—Other † | | 306,302 | 3.6% |
| | | 376,634 | 4.5% |
| Netherlands | | | |
| Unilever NV | 1,954,339 | 58,039 | 0.7% |
| * ING Groep NV | 4,595,675 | 49,168 | 0.6% |
| Netherlands—Other † | | 227,198 | 2.7% |
| | | 334,405 | 4.0% |
| |
| Norway † | | 104,318 | 1.2% |
| |
| Portugal † | | 38,558 | 0.4% |
| |
| Spain | | | |
| ^ Telefonica SA | 4,843,528 | 130,885 | 1.5% |
| Banco Santander SA | 9,874,828 | 126,749 | 1.5% |
| Banco Bilbao Vizcaya Argentaria SA | 4,271,698 | 56,278 | 0.7% |
| Spain—Other † | | 174,142 | 2.1% |
| | | 488,054 | 5.8% |
| |
| Sweden † | | 396,982 | 4.7% |
| |
| Switzerland | | | |
| Nestle SA | 4,160,039 | 227,864 | 2.7% |
| Novartis AG | 2,531,534 | 146,684 | 1.7% |
| Roche Holding AG | 842,882 | 123,781 | 1.5% |
| * UBS AG | 4,333,745 | 73,620 | 0.9% |
| Credit Suisse Group AG | 1,351,422 | 55,947 | 0.7% |
| ABB Ltd. | 2,654,818 | 54,991 | 0.6% |
| Switzerland—Other † | | 307,202 | 3.6% |
| | | 990,089 | 11.7% |
17
| | | | | |
| European Stock Index Fund | | | | |
| |
| |
| |
| | | | | Market | Percentage |
| | | | | Value | of Net |
| | | | Shares | ($000) | Assets |
| United Kingdom | | | | |
| | HSBC Holdings plc | | 21,006,718 | 218,632 | 2.6% |
| | Vodafone Group plc | | 59,868,615 | 163,658 | 1.9% |
| | BP plc | | 21,428,329 | 145,653 | 1.7% |
| | GlaxoSmithKline plc | | 6,229,610 | 121,650 | 1.5% |
| | Rio Tinto plc | | 1,739,117 | 112,957 | 1.3% |
| | Royal Dutch Shell plc Class B | | 3,234,223 | 103,501 | 1.2% |
| | BHP Billiton plc | | 2,647,798 | 93,799 | 1.1% |
| | British American Tobacco plc | | 2,395,542 | 91,262 | 1.1% |
| ^ | Royal Dutch Shell plc Class A | | 2,737,417 | 88,795 | 1.0% |
| | AstraZeneca plc | | 1,729,917 | 87,019 | 1.0% |
| | Standard Chartered plc | | 2,764,460 | 79,962 | 1.0% |
| | BG Group plc | | 4,056,707 | 78,969 | 0.9% |
| | Anglo American plc | | 1,582,133 | 73,717 | 0.9% |
| | Tesco plc | | 9,623,553 | 65,860 | 0.8% |
| | Barclays plc | | 13,727,055 | 60,323 | 0.7% |
| | Diageo plc | | 3,005,056 | 55,436 | 0.7% |
| * | Lloyds Banking Group plc | | 48,998,665 | 53,856 | 0.6% |
| | Royal Dutch Shell plc Class A | | 1,516,398 | 49,212 | 0.6% |
| | Xstrata plc | | 2,467,241 | 47,799 | 0.6% |
| | Unilever plc | | 1,539,031 | 44,371 | 0.5% |
| | Vodafone Group plc ADR | | 332,128 | 9,137 | 0.1% |
| | BP plc ADR | | 185,483 | 7,573 | 0.1% |
| | United Kingdom—Other † | | | 927,822 | 11.0% |
| | | | | 2,780,963 | 32.9% |
| Total Common Stocks (Cost $11,071,505) | | | 8,410,777 | 99.5%1 |
| |
| | | Coupon | | | |
| Temporary Cash Investments | | | | |
| Money Market Fund | | | | |
| 2,3 | Vanguard Market Liquidity Fund | 0.237% | 246,272,247 | 246,272 | 2.9% |
| |
| 4U.S. Government and Agency Obligations † | | | 20,997 | 0.3% |
| Total Temporary Cash Investments (Cost $267,268) | | | 267,269 | 3.2%1 |
| Total Investments (Cost $11,338,773) | | | 8,678,046 | 102.7% |
| Other Assets and Liabilities | | | | |
| Other Assets | | | 49,239 | 0.6% |
| Liabilities3 | | | (277,465) | (3.3%) |
| | | | | (228,226) | (2.7%) |
| Net Assets | | | 8,449,820 | 100.0% |
18
| |
| European Stock Index Fund | |
| |
| |
| At October 31, 2010, net assets consisted of: | |
| | Amount |
| | ($000) |
| Paid-in Capital | 12,997,002 |
| Undistributed Net Investment Income | 289,637 |
| Accumulated Net Realized Losses | (2,180,832) |
| Unrealized Appreciation (Depreciation) | |
| Investment Securities | (2,660,727) |
| Futures Contracts | 833 |
| Foreign Currencies and Forward Currency Contracts | 3,907 |
| Net Assets | 8,449,820 |
| |
| Investor Shares—Net Assets | |
| Applicable to 69,396,997 outstanding $.001 par value shares of | |
| beneficial interest (unlimited authorization) | 1,883,924 |
| Net Asset Value Per Share—Investor Shares | $27.15 |
| |
| Admiral Shares—Net Assets | |
| Applicable to 32,728,502 outstanding $.001 par value shares of | |
| beneficial interest (unlimited authorization) | 2,086,567 |
| Net Asset Value Per Share—Admiral Shares | $63.75 |
| |
| Signal Shares—Net Assets | |
| Applicable to 11,038,031 outstanding $.001 par value shares of | |
| beneficial interest (unlimited authorization) | 272,364 |
| Net Asset Value Per Share—Signal Shares | $24.68 |
| |
| Institutional Shares—Net Assets | |
| Applicable to 49,614,518 outstanding $.001 par value shares of | |
| beneficial interest (unlimited authorization) | 1,349,283 |
| Net Asset Value Per Share—Institutional Shares | $27.20 |
| |
| ETF Shares—Net Assets | |
| Applicable to 56,028,281 outstanding $.001 par value shares of | |
| beneficial interest (unlimited authorization) | 2,857,682 |
| Net Asset Value Per Share—ETF Shares | $51.00 |
See Note A in Notes to Financial Statements.
* Non-income-producing security.
^ Part of security position is on loan to broker-dealers. The total value of securities on loan is $231,881,000.
† Represents the aggregate value, by category, of securities that are not among the 50 largest holdings and, in total for any issuer, represent 1% or less of net assets.
1 The fund invests a portion of its cash reserves in equity markets through the use of index futures contracts. After giving effect to futures investments, the fund’s effective common stock and temporary cash investment positions represent 100.1% and 2.6%, respectively, of net assets.
2 Affiliated money market fund available only to Vanguard funds and certain trusts and accounts managed by Vanguard. Rate shown is the 7-day yield.
3 Includes $241,640,000 of collateral received for securities on loan.
4 Securities with a value of $5,000,000 have been segregated as initial margin for open futures contracts.
ADR—American Depositary Receipt.
See accompanying Notes, which are an integral part of the Financial Statements.
19
| |
| European Stock Index Fund | |
| |
| |
| |
| Statement of Operations | |
| |
| |
| | Year Ended |
| | October 31, 2010 |
| | ($000) |
| Investment Income | |
| Income | |
| Dividends1 | 363,012 |
| Interest2 | 237 |
| Security Lending | 15,695 |
| Total Income | 378,944 |
| Expenses | |
| The Vanguard Group—Note B | |
| Investment Advisory Services | 728 |
| Management and Administrative—Investor Shares | 13,213 |
| Management and Administrative—Admiral Shares | 1,706 |
| Management and Administrative—Signal Shares | 233 |
| Management and Administrative—Institutional Shares | 548 |
| Management and Administrative—ETF Shares | 2,353 |
| Marketing and Distribution—Investor Shares | 1,881 |
| Marketing and Distribution—Admiral Shares | 296 |
| Marketing and Distribution—Signal Shares | 68 |
| Marketing and Distribution—Institutional Shares | 279 |
| Marketing and Distribution—ETF Shares | 664 |
| Custodian Fees | 1,258 |
| Auditing Fees | 39 |
| Shareholders’ Reports—Investor Shares | 9 |
| Shareholders’ Reports—Admiral Shares | — |
| Shareholders’ Reports—Signal Shares | 1 |
| Shareholders’ Reports—Institutional Shares | 2 |
| Shareholders’ Reports—ETF Shares | 84 |
| Trustees’ Fees and Expenses | 21 |
| Total Expenses | 23,383 |
| Net Investment Income | 355,561 |
| Realized Net Gain (Loss) | |
| Investment Securities Sold | (171,464) |
| Futures Contracts | 2,973 |
| Swap Contracts | (7,197) |
| Foreign Currencies and Forward Currency Contracts | (12,424) |
| Realized Net Gain (Loss) | (188,112) |
| Change in Unrealized Appreciation (Depreciation) | |
| Investment Securities | 948,578 |
| Futures Contracts | 5,582 |
| Foreign Currencies and Forward Currency Contracts | 1,625 |
| Change in Unrealized Appreciation (Depreciation) | 955,785 |
| Net Increase (Decrease) in Net Assets Resulting from Operations | 1,123,234 |
1 Dividends are net of foreign withholding taxes of $36,394,000.
2 Interest income from an affiliated company of the fund was $175,000.
See accompanying Notes, which are an integral part of the Financial Statements.
20
| | |
| European Stock Index Fund | | |
| |
| |
| Statement of Changes in Net Assets | | |
| |
| | Year Ended October 31, |
| | 2010 | 2009 |
| | ($000) | ($000) |
| Increase (Decrease) in Net Assets | | |
| Operations | | |
| Net Investment Income | 355,561 | 483,737 |
| Realized Net Gain (Loss) | (188,112) | (2,824,881) |
| Change in Unrealized Appreciation (Depreciation) | 955,785 | 3,907,244 |
| Net Increase (Decrease) in Net Assets Resulting from Operations | 1,123,234 | 1,566,100 |
| Distributions | | |
| Net Investment Income | | |
| Investor Shares | (233,922) | (708,975) |
| Admiral Shares | (66,666) | (100,154) |
| Signal Shares | (9,876) | (14,655) |
| Institutional Shares | (34,019) | (234,718) |
| ETF Shares | (99,626) | (124,097) |
| Realized Capital Gain | | |
| Investor Shares | — | — |
| Admiral Shares | — | — |
| Signal Shares | — | — |
| Institutional Shares | — | — |
| ETF Shares | — | — |
| Total Distributions | (444,109) | (1,182,599) |
| Capital Share Transactions | | |
| Investor Shares | (4,250,540) | (4,501,240) |
| Admiral Shares | 300,622 | (5,147) |
| Signal Shares | 12,318 | (10,851) |
| Institutional Shares | 406,075 | (2,518,693) |
| ETF Shares | 250,974 | 405,547 |
| Net Increase (Decrease) from Capital Share Transactions | (3,280,551) | (6,630,384) |
| Total Increase (Decrease) | (2,601,426) | (6,246,883) |
| Net Assets | | |
| Beginning of Period | 11,051,246 | 17,298,129 |
| End of Period1 | 8,449,820 | 11,051,246 |
1 Net Assets—End of Period includes undistributed net investment income of $289,637,000 and $378,916,000.
See accompanying Notes, which are an integral part of the Financial Statements.
21
| | | | | |
| European Stock Index Fund | | | | | |
| |
| |
| Financial Highlights | | | | | |
| |
| Investor Shares | | | | | |
| |
| For a Share Outstanding | | | Year Ended October 31, |
| Throughout Each Period | 2010 | 2009 | 2008 | 2007 | 2006 |
| Net Asset Value, Beginning of Period | $25.77 | $21.99 | $43.43 | $34.67 | $27.00 |
| Investment Operations | | | | | |
| Net Investment Income | .7681 | 1.008 | 1.3721 | 1.2981 | .920 |
| Net Realized and Unrealized Gain (Loss) | | | | | |
| on Investments | 1.594 | 4.269 | (21.597) | 8.386 | 7.450 |
| Total from Investment Operations | 2.362 | 5.277 | (20.225) | 9.684 | 8.370 |
| Distributions | | | | | |
| Dividends from Net Investment Income | (.982) | (1.497) | (1.215) | (.924) | (.700) |
| Distributions from Realized Capital Gains | — | — | — | — | — |
| Total Distributions | (.982) | (1.497) | (1.215) | (.924) | (.700) |
| Net Asset Value, End of Period | $27.15 | $25.77 | $21.99 | $43.43 | $34.67 |
| |
| Total Return2 | 9.35% | 26.25% | -47.80% | 28.49% | 31.63% |
| |
| Ratios/Supplemental Data | | | | | |
| Net Assets, End of Period (Millions) | $1,884 | $5,789 | $10,534 | $26,188 | $16,850 |
| Ratio of Total Expenses to | | | | | |
| Average Net Assets | 0.26% | 0.27% | 0.22% | 0.22% | 0.27% |
| Ratio of Net Investment Income to | | | | | |
| Average Net Assets | 2.98% | 3.80% | 3.82% | 3.35% | 3.35% |
| Portfolio Turnover Rate3 | 11% | 18% | 15% | 9% | 6% |
1 Calculated based on average shares outstanding.
2 Total returns do not include transaction or account service fees that may have applied in the periods shown. Fund prospectuses provide information about any applicable transaction and account service fees.
3 Excludes the value of portfolio securities received or delivered as a result of in-kind purchases or redemptions of the fund’s capital shares, including ETF Creation Units.
See accompanying Notes, which are an integral part of the Financial Statements.
22
| | | | | |
| European Stock Index Fund | | | | | |
| |
| |
| Financial Highlights | | | | | |
| |
| Admiral Shares | | | | | |
| |
| For a Share Outstanding | | | Year Ended October 31, |
| Throughout Each Period | 2010 | 2009 | 2008 | 2007 | 2006 |
| Net Asset Value, Beginning of Period | $60.51 | $51.71 | $102.09 | $81.50 | $63.44 |
| Investment Operations | | | | | |
| Net Investment Income | 1.7581 | 2.448 | 3.1771 | 3.1401 | 2.230 |
| Net Realized and Unrealized Gain (Loss) | | | | | |
| on Investments | 3.864 | 9.968 | (50.618) | 19.692 | 17.510 |
| Total from Investment Operations | 5.622 | 12.416 | (47.441) | 22.832 | 19.740 |
| Distributions | | | | | |
| Dividends from Net Investment Income | (2.382) | (3.616) | (2.939) | (2.242) | (1.680) |
| Distributions from Realized Capital Gains | — | — | — | — | — |
| Total Distributions | (2.382) | (3.616) | (2.939) | (2.242) | (1.680) |
| Net Asset Value, End of Period | $63.75 | $60.51 | $51.71 | $102.09 | $81.50 |
| |
| Total Return2 | 9.49% | 26.33% | -47.74% | 28.59% | 31.77% |
| |
| Ratios/Supplemental Data | | | | | |
| Net Assets, End of Period (Millions) | $2,087 | $1,700 | $1,472 | $2,955 | $2,175 |
| Ratio of Total Expenses to | | | | | |
| Average Net Assets | 0.14% | 0.16% | 0.12% | 0.12% | 0.17% |
| Ratio of Net Investment Income to | | | | | |
| Average Net Assets | 3.10% | 3.91% | 3.92% | 3.45% | 3.45% |
| Portfolio Turnover Rate3 | 11% | 18% | 15% | 9% | 6% |
1 Calculated based on average shares outstanding.
2 Total returns do not include transaction fees that may have applied in the periods shown. Fund prospectuses provide information about any applicable transaction fees.
3 Excludes the value of portfolio securities received or delivered as a result of in-kind purchases or redemptions of the fund’s capital shares, including ETF Creation Units.
See accompanying Notes, which are an integral part of the Financial Statements.
23
| | | | | |
| European Stock Index Fund | | | | | |
| |
| |
| Financial Highlights | | | | | |
| |
| Signal Shares | | | | | |
| | | | | | |
| | | | | | Oct. 6, |
| | | | 20061 to |
| For a Share Outstanding | | | Year Ended October 31, | Oct. 31, |
| Throughout Each Period | 2010 | 2009 | 2008 | 2007 | 2006 |
| Net Asset Value, Beginning of Period | $23.42 | $20.01 | $39.50 | $31.51 | $30.41 |
| Investment Operations | | | | | |
| Net Investment Income | .6862 | .947 | 1.2552 | 1.1512 | .0102 |
| Net Realized and Unrealized Gain (Loss) | | | | | |
| on Investments | 1.497 | 3.860 | (19.616) | 7.681 | 1.090 |
| Total from Investment Operations | 2.183 | 4.807 | (18.361) | 8.832 | 1.100 |
| Distributions | | | | | |
| Dividends from Net Investment Income | (.923) | (1.397) | (1.129) | (.842) | — |
| Distributions from Realized Capital Gains | — | — | — | — | — |
| Total Distributions | (.923) | (1.397) | (1.129) | (.842) | — |
| Net Asset Value, End of Period | $24.68 | $23.42 | $20.01 | $39.50 | $31.51 |
| |
| Total Return3 | 9.52% | 26.34% | -47.74% | 28.59% | 3.62% |
| |
| Ratios/Supplemental Data | | | | | |
| Net Assets, End of Period (Millions) | $272 | $245 | $223 | $502 | $12 |
| Ratio of Total Expenses to | | | | | |
| Average Net Assets | 0.14% | 0.16% | 0.12% | 0.12% | 0.17%4 |
| Ratio of Net Investment Income to | | | | | |
| Average Net Assets | 3.10% | 3.91% | 3.92% | 3.45% | 3.45%4 |
| Portfolio Turnover Rate5 | 11% | 18% | 15% | 9% | 6% |
1 Inception.
2 Calculated based on average shares outstanding.
3 Total returns do not include transaction fees that may have applied in the periods shown. Fund prospectuses provide information about any applicable transaction fees.
4 Annualized.
5 Excludes the value of portfolio securities received or delivered as a result of in-kind purchases or redemptions of the fund’s capital shares, including ETF Creation Units.
See accompanying Notes, which are an integral part of the Financial Statements.
24
| | | | | |
| European Stock Index Fund | | | | | |
| |
| |
| Financial Highlights | | | | | |
| |
| Institutional Shares | | | | | |
| |
| For a Share Outstanding | | | Year Ended October 31, |
| Throughout Each Period | 2010 | 2009 | 2008 | 2007 | 2006 |
| Net Asset Value, Beginning of Period | $25.80 | $22.04 | $43.51 | $34.74 | $27.05 |
| Investment Operations | | | | | |
| Net Investment Income | .7641 | 1.036 | 1.3151 | 1.3501 | .978 |
| Net Realized and Unrealized Gain (Loss) | | | | | |
| on Investments | 1.644 | 4.277 | (21.524) | 8.390 | 7.450 |
| Total from Investment Operations | 2.408 | 5.313 | (20.209) | 9.740 | 8.428 |
| Distributions | | | | | |
| Dividends from Net Investment Income | (1.008) | (1.553) | (1.261) | (.970) | (.738) |
| Distributions from Realized Capital Gains | — | — | — | — | — |
| Total Distributions | (1.008) | (1.553) | (1.261) | (.970) | (.738) |
| Net Asset Value, End of Period | $27.20 | $25.80 | $22.04 | $43.51 | $34.74 |
| |
| Total Return2 | 9.53% | 26.45% | -47.72% | 28.63% | 31.83% |
| |
| Ratios/Supplemental Data | | | | | |
| Net Assets, End of Period (Millions) | $1,349 | $853 | $3,316 | $5,263 | $3,113 |
| Ratio of Total Expenses to | | | | | |
| Average Net Assets | 0.10% | 0.12% | 0.09% | 0.09% | 0.12% |
| Ratio of Net Investment Income to | | | | | |
| Average Net Assets | 3.14% | 3.95% | 3.95% | 3.48% | 3.50% |
| Portfolio Turnover Rate3 | 11% | 18% | 15% | 9% | 6% |
1 Calculated based on average shares outstanding.
2 Total returns do not include transaction fees that may have applied in the periods shown. Fund prospectuses provide information about any applicable transaction fees.
3 Excludes the value of portfolio securities received or delivered as a result of in-kind purchases or redemptions of the fund’s capital shares, including ETF Creation Units.
See accompanying Notes, which are an integral part of the Financial Statements.
25
| | | | | |
| European Stock Index Fund | | | | | |
| |
| |
| Financial Highlights | | | | | |
| |
| ETF Shares | | | | | |
| |
| For a Share Outstanding | | | Year Ended October 31, |
| Throughout Each Period | 2010 | 2009 | 2008 | 2007 | 2006 |
| Net Asset Value, Beginning of Period | $48.41 | $41.37 | $81.66 | $65.21 | $50.80 |
| Investment Operations | | | | | |
| Net Investment Income | 1.4201 | 1.964 | 2.5301 | 2.5761 | 1.800 |
| Net Realized and Unrealized Gain (Loss) | | | | | |
| on Investments | 3.082 | 7.977 | (40.464) | 15.683 | 13.990 |
| Total from Investment Operations | 4.502 | 9.941 | (37.934) | 18.259 | 15.790 |
| Distributions | | | | | |
| Dividends from Net Investment Income | (1.912) | (2.901) | (2.356) | (1.809) | (1.380) |
| Distributions from Realized Capital Gains | — | — | — | — | — |
| Total Distributions | (1.912) | (2.901) | (2.356) | (1.809) | (1.380) |
| Net Asset Value, End of Period | $51.00 | $48.41 | $41.37 | $81.66 | $65.21 |
| |
| Total Return | 9.48% | 26.33% | -47.73% | 28.60% | 31.75% |
| |
| Ratios/Supplemental Data | | | | | |
| Net Assets, End of Period (Millions) | $2,858 | $2,464 | $1,754 | $3,148 | $1,205 |
| Ratio of Total Expenses to | | | | | |
| Average Net Assets | 0.14% | 0.16% | 0.11% | 0.12% | 0.18% |
| Ratio of Net Investment Income to | | | | | |
| Average Net Assets | 3.10% | 3.91% | 3.93% | 3.45% | 3.44% |
| Portfolio Turnover Rate2 | 11% | 18% | 15% | 9% | 6% |
1 Calculated based on average shares outstanding.
2 Excludes the value of portfolio securities received or delivered as a result of in-kind purchases or redemptions of the fund’s capital shares, including ETF Creation Units.
See accompanying Notes, which are an integral part of the Financial Statements.
26
European Stock Index Fund
Notes to Financial Statements
Vanguard European Stock Index Fund is registered under the Investment Company Act of 1940 as an open-end investment company, or mutual fund. The fund invests in securities of foreign issuers, which may subject it to investment risks not normally associated with investing in securities of U.S. corporations. The fund offers five classes of shares: Investor Shares, Admiral Shares, Signal Shares, Institutional Shares, and ETF Shares. Investor Shares are available to any investor who meets the fund’s minimum purchase requirements. Admiral Shares, Signal Shares, and Institutional Shares are designed for investors who meet certain administrative, service, and account-size criteria. ETF Shares are listed for trading on the NYSE Arca, Inc.; they can be purchased and sold through a broker.
A. The following significant accounting policies conform to generally accepted accounting principles for U.S. mutual funds. The fund consistently follows such policies in preparing its financial statements.
1. Security Valuation: Securities are valued as of the close of trading on the New York Stock Exchange (generally 4 p.m., Eastern time) on the valuation date. Equity securities are valued at the latest quoted sales prices or official closing prices taken from the primary market in which each security trades; such securities not traded on the valuation date are valued at the mean of the latest quoted bid and asked prices. Securities for which market quotations are not readily available, or whose values have been affected by events occurring before the fund’s pricing time but after the close of the securities’ primary markets, are valued at their fair values calculated according to procedures adopted by the board of trustees. These procedures include obtaining quotations from an independent pricing service, monitoring news to identify significant market- or security-specific events, and evaluating changes in the values of foreign market proxies (for example, A DRs, futures contracts, or exchange-traded funds), between the time the foreign markets close and the fund’s pricing time. When fair-value pricing is employed, the prices of securities used by a fund to calculate its net asset value may differ from quoted or published prices for the same securities. Investments in Vanguard Market Liquidity Fund are valued at that fund’s net asset value. Temporary cash investments acquired over 60 days to maturity are valued using the latest bid prices or using valuations based on a matrix system (which considers such factors as security prices, yields, maturities, and ratings), both as furnished by independent pricing services. Other temporary cash investments are valued at amortized cost, which approximates market value.
2. Foreign Currency: Securities and other assets and liabilities denominated in foreign currencies are translated into U.S. dollars using exchange rates obtained from an independent third party as of the fund’s pricing time on the valuation date. Realized gains (losses) and unrealized appreciation (depreciation) on investment securities include the effects of changes in exchange rates since the securities were purchased, combined with the effects of changes in security prices. Fluctuations in the value of other assets and liabilities resulting from changes in exchange rates are recorded as unrealized foreign currency gains (losses) until the assets or liabilities are settled in cash, at which time they are recorded as realized foreign currency gains (losses).
3. Futures and Forward Currency Contracts: The fund uses index futures contracts to a limited extent, with the objectives of maintaining full exposure to the stock market, enhancing returns, maintaining liquidity, and minimizing transaction costs. The fund may purchase futures contracts to immediately invest incoming cash in the market, or sell futures in response to cash outflows, thereby simulating a fully invested position in the underlying index while maintaining a cash balance for liquidity. The fund may seek to enhance returns by using futures contracts instead of the underlying securities when futures are believed to be priced more attractively than the underlying securities. The primary risks associated with the use of futures contracts are imperfect correlation between changes in market values of stocks held by the fund and the prices of futures contracts, and the possibility of an illiquid market.
27
European Stock Index Fund
The fund also enters into forward currency contracts to provide the appropriate currency exposure related to any open futures contracts. The fund’s risks in using these contracts include movement in the values of the foreign currencies relative to the U.S. dollar and the ability of the counterparties to fulfill their obligations under the contracts. Counterparty risk is mitigated by entering into forward currency contracts only with highly rated counterparties, by a master netting arrangement between the fund and the counterparty, and by the posting of collateral by the counterparty. The forward currency contracts contain provisions whereby a counterparty may terminate open contracts if the fund’s net assets decline below a certain level, triggering a payment by the fund if the fund is in a net liability position at the time of the termination. The payment amount would be reduced by any collateral the fund has posted. Any securities poste d as collateral for open contracts are noted in the Statement of Net Assets.
Futures contracts are valued at their quoted daily settlement prices. Forward currency contracts are valued at their quoted daily prices obtained from an independent third party, adjusted for currency risk based on the expiration date of each contract. The aggregate principal amounts of the contracts are not recorded in the Statement of Net Assets. Fluctuations in the value of the contracts are recorded in the Statement of Net Assets as an asset (liability) and in the Statement of Operations as unrealized appreciation (depreciation) until the contracts are closed, when they are recorded as realized gains (losses) on futures or forward currency contracts.
4. Swap Contracts: The fund has entered into equity swap contracts to earn the total return on selected stocks in the fund’s target index when investing through a swap provides a return advantage over buying the individual stocks. Under the terms of each swap, the fund receives the total return (either receiving the increase or paying the decrease) on a reference stock, applied to a notional amount that is the value of a designated number of shares of the stock at the beginning of the swap. The counterparty pays the fund a fixed rate less a specified interest rate spread that is based on short-term interest rates, applied to the notional amount. At the same time, the fund invests an amount approximating the notional amount of the swap in high-quality temporary cash investments.
The notional amounts of swap contracts are not recorded in the Statement of Net Assets. Swaps are valued daily and the change in value is recorded as unrealized appreciation (depreciation) until termination of the swap, at which time realized gain (loss) is recorded. The primary risks associated with the swaps are that a counterparty will default on its obligation to pay net amounts due to the fund, or that the fund will incur fees in the event it terminates a swap prior to the scheduled termination date. The fund’s maximum risk of loss from counterparty credit risk is the amount of unrealized appreciation on the swap contract. This risk is mitigated by entering into swaps only with highly rated counterparties, by a master netting arrangement between the fund and the counterparty, and by the posting of collateral by the counterparty. The swap contracts contain provisions whereby a counterparty may terminate open contracts if the fund’s net assets decline bel ow a certain level, triggering a payment by the fund if the fund is in a net liability position at the time of the termination. The payment amount would be reduced by any collateral the fund has posted. Any securities posted as collateral for open contracts are noted in the Statement of Net Assets.
The fund has no open swap contracts at October 31, 2010.
5. Federal Income Taxes: The fund intends to continue to qualify as a regulated investment company and distribute all of its taxable income. Management has analyzed the fund’s tax positions taken for all open federal income tax years (October 31, 2007–2010), and has concluded that no provision for federal income tax is required in the fund’s financial statements.
28
European Stock Index Fund
6. Distributions: Distributions to shareholders are recorded on the ex-dividend date.
7. Security Lending: The fund may lend its securities to qualified institutional borrowers to earn additional income. Security loans are required to be secured at all times by collateral at least equal to the market value of securities loaned. The fund invests cash collateral received in Vanguard Market Liquidity Fund, and records a liability for the return of the collateral, during the period the securities are on loan. Security lending income represents fees charged to borrowers plus income earned on investing cash collateral, less expenses associated with the loan.
8. Other: Dividend income is recorded on the ex-dividend date. Interest income includes income distributions received from Vanguard Market Liquidity Fund and is accrued daily. Security transactions are accounted for on the date securities are bought or sold. Costs used to determine realized gains (losses) on the sale of investment securities are those of the specific securities sold. Fees assessed on redemptions of capital shares are credited to paid-in capital.
Each class of shares has equal rights as to assets and earnings, except that each class separately bears certain class-specific expenses related to maintenance of shareholder accounts (included in Management and Administrative expenses) and shareholder reporting. Marketing and distribution expenses are allocated to each class of shares based on a method approved by the board of trustees. Income, other non-class-specific expenses, and gains and losses on investments are allocated to each class of shares based on its relative net assets.
B. The Vanguard Group furnishes at cost investment advisory, corporate management, administrative, marketing, and distribution services. The costs of such services are allocated to the fund under methods approved by the board of trustees. The fund has committed to provide up to 0.40% of its net assets in capital contributions to Vanguard. At October 31, 2010, the fund had contributed capital of $2,325,000 to Vanguard (included in Other Assets), representing 0.03% of the fund’s net assets and 0.93% of Vanguard’s capitalization. The fund’s trustees and officers are also directors and officers of Vanguard.
C. Various inputs may be used to determine the value of the fund’s investments. These inputs are summarized in three broad levels for financial statement purposes. The inputs or methodologies used to value securities are not necessarily an indication of the risk associated with investing in those securities.
Level 1—Quoted prices in active markets for identical securities.
Level 2—Other significant observable inputs (including quoted prices for similar securities, interest rates, prepayment speeds, credit risk, etc.).
Level 3—Significant unobservable inputs (including the fund’s own assumptions used to determine the fair value of investments).
The following table summarizes the fund’s investments as of October 31, 2010, based on the inputs used to value them:
| | | |
| | Level 1 | Level 2 | Level 3 |
| Investments | ($000) | ($000) | ($000) |
| Common Stocks | 33,886 | 8,376,135 | 756 |
| Temporary Cash Investments | 246,272 | 20,997 | — |
| Futures Contracts—Liabilities1 | (5) | — | — |
| Forward Currency Contracts—Assets | — | 2,787 | — |
| Total | 280,153 | 8,399,919 | 756 |
| 1 Represents variation margin on the last day of the reporting period. | | | |
29
European Stock Index Fund
The following table summarizes changes in investments valued based on Level 3 inputs during the year ended October 31, 2010:
| |
| | Investments in |
| | Common Stocks |
| Amount Valued Based on Level 3 Inputs | ($000) |
| Balance as of October 31, 2009 | 800 |
| Change in Unrealized Appreciation (Depreciation) | (44) |
| Balance as of October 31, 2010 | 756 |
D. At October 31, 2010, the fair values of derivatives were reflected in the Statement of Net Assets as follows:
| | | |
| | | Foreign | |
| | Equity | Exchange | |
| | Contracts | Contracts | Total |
| Statement of Net Assets Caption | ($000) | ($000) | ($000) |
| Other Assets | — | 2,787 | 2,787 |
| Liabilities | (5) | — | (5) |
Realized net gain (loss) and the change in unrealized appreciation (depreciation) on derivatives for the year ended October 31, 2010, were:
| | | |
| | | Foreign | |
| | Equity | Exchange | |
| | Contracts | Contracts | Total |
| Realized Net Gain (Loss) on Derivatives | ($000) | ($000) | ($000) |
| Futures Contracts | 2,973 | — | 2,973 |
| Forward Currency Contracts | — | (11,109) | (11,109) |
| Swap Contracts | (7,197) | — | (7,197) |
| Realized Net Gain (Loss) on Derivatives | (4,224) | (11,109) | (15,333) |
| |
| Change in Unrealized Appreciation (Depreciation) on Derivatives | | | |
| Futures Contracts | 5,582 | — | 5,582 |
| Forward Currency Contracts | — | 2,163 | 2,163 |
| Change in Unrealized Appreciation (Depreciation) on Derivatives | 5,582 | 2,163 | 7,745 |
30
European Stock Index Fund
At October 31, 2010, the aggregate settlement value of open futures contracts and the related unrealized appreciation (depreciation) were:
| | | | |
| | | | | ($000) |
| | | | Aggregate | |
| | | Number of | Settlement | Unrealized |
| | | Long (Short) | Value | Appreciation |
| Futures Contracts | Expiration | Contracts | Long (Short) | (Depreciation) |
| Dow Jones EURO STOXX 50 Index | December 2010 | 704 | 27,779 | 433 |
| FTSE 100 Index | December 2010 | 217 | 19,640 | 400 |
Unrealized appreciation (depreciation) on open FTSE 100 Index futures contracts is required to be treated as realized gain (loss) for tax purposes.
At October 31, 2010, the fund had open forward currency contracts to receive and deliver currencies as follows. Unrealized appreciation (depreciation) on open forward currency contracts is treated as realized gain (loss) for tax purposes.
| | | | | | | |
| | | | | | |
| | | | | | | Unrealized |
| | Contract | | | | | Appreciation |
| | Settlement | | | | Contract Amount (000) | (Depreciation) |
| Counterparty | Date | | Receive | | Deliver | ($000) |
| UBS AG | 12/22/10 | EUR | 19,607 | USD | 27,289 | 2,056 |
| UBS AG | 12/22/10 | GBP | 11,860 | USD | 19,004 | 731 |
EUR—Euro.
GBP—British pound.
USD—U.S. dollar.
At October 31, 2010, the counterparty had deposited in segregated accounts securities with a value sufficient to cover substantially all amounts due to the fund in connection with open forward currency contracts.
The fund had net unrealized foreign currency gains of $1,120,000 resulting from the translation of other assets and liabilities at October 31, 2010.
E. Distributions are determined on a tax basis and may differ from net investment income and realized capital gains for financial reporting purposes. Differences may be permanent or temporary. Permanent differences are reclassified among capital accounts in the financial statements to reflect their tax character. Temporary differences arise when certain items of income, expense, gain, or loss are recognized in different periods for financial statement and tax purposes; these differences will reverse at some time in the future. Differences in classification may also result from the treatment of short-term gains as ordinary income for tax purposes.
31
European Stock Index Fund
During the year ended October 31, 2010, the fund realized net foreign currency losses of $1,315,000, which decreased distributable net income for tax purposes; accordingly, such losses have been reclassified from accumulated net realized losses to undistributed net investment income. Certain of the fund’s investments are in securities considered to be “passive foreign investment companies,” for which any unrealized appreciation and/or realized gains are required to be included in distributable net income for tax purposes. Unrealized appreciation of $3,089,000 on the fund’s passive foreign investment company holdings at October 31, 2009, has been distributed and is reflected in the balance of undistributed net investment income. During the year ended October 31, 2010, the fund realized gains on the sale of passive foreign investment companies of $584,000, which have been included in current and prior periods’ taxable income; accordingly, such g ains have been reclassified from accumulated net realized losses to undistributed net investment income. Unrealized appreciation on the fund’s passive foreign investment company holdings at October 31, 2010, was $2,530,000.
During the year ended October 31, 2010, the fund realized $52,812,000 of net capital gains resulting from in-kind redemptions—in which shareholders exchanged fund shares for securities held by the fund rather than for cash. Because such gains are not taxable to the fund, and are not distributed to shareholders, they have been reclassified from accumulated net realized losses to paid-in capital.
For tax purposes, at October 31, 2010, the fund had $310,080,000 of ordinary income available for distribution. The fund had available capital loss carryforwards totaling $2,163,720,000 to offset future net capital gains of $13,739,000 through October 31, 2011, $357,042,000 through October 31, 2016, $1,510,054,000 through October 31, 2017, and $282,885,000 through October 31, 2018.
At October 31, 2010, the cost of investment securities for tax purposes was $11,354,141,000. Net unrealized depreciation of investment securities for tax purposes was $2,676,095,000, consisting of unrealized gains of $495,348,000 on securities that had risen in value since their purchase and $3,171,443,000 in unrealized losses on securities that had fallen in value since their purchase.
F. During the year ended October 31, 2010, the fund purchased $3,520,374,000 of investment securities and sold $6,798,214,000 of investment securities, other than temporary cash investments.
32
European Stock Index Fund
G. Capital share transactions for each class of shares were:
| | | | | |
| | | | |
| | | | Year Ended October 31, |
| | | 2010 | | | 2009 |
| | Amount | Shares | Amount | Shares |
| | ($000) | (000) | ($000) | (000) |
| Investor Shares | | | | |
| Issued | 1,740,600 | 70,744 | 1,139,617 | 59,184 |
| Issued in Lieu of Cash Distributions | 228,168 | 8,810 | 700,467 | 36,181 |
| Redeemed1 | (6,219,308) | (234,838) | (6,341,324) | (349,683) |
| Net Increase (Decrease)—Investor Shares | (4,250,540) | (155,284) | (4,501,240) | (254,318) |
| Admiral Shares | | | | |
| Issued | 506,330 | 8,208 | 197,387 | 3,957 |
| Issued in Lieu of Cash Distributions | 53,881 | 887 | 81,700 | 1,798 |
| Redeemed1 | (259,589) | (4,466) | (284,234) | (6,122) |
| Net Increase (Decrease)—Admiral Shares | 300,622 | 4,629 | (5,147) | (367) |
| Signal Shares | | | | |
| Issued | 64,066 | 2,849 | 71,159 | 3,811 |
| Issued in Lieu of Cash Distributions | 7,863 | 334 | 11,893 | 677 |
| Redeemed1 | (59,611) | (2,602) | (93,903) | (5,161) |
| Net Increase (Decrease)—Signal Shares | 12,318 | 581 | (10,851) | (673) |
| Institutional Shares | | | | |
| Issued | 495,957 | 20,114 | 891,860 | 44,118 |
| Issued in Lieu of Cash Distributions | 25,396 | 980 | 221,985 | 11,472 |
| Redeemed1 | (115,278) | (4,538) | (3,632,538) | (172,962) |
| Net Increase (Decrease)—Institutional Shares | 406,075 | 16,556 | (2,518,693) | (117,372) |
| ETF Shares | | | | |
| Issued | 889,512 | 20,028 | 503,833 | 10,810 |
| Issued in Lieu of Cash Distributions | — | — | — | — |
| Redeemed1 | (638,538) | (14,900) | (98,286) | (2,300) |
| Net Increase (Decrease)—ETF Shares | 250,974 | 5,128 | 405,547 | 8,510 |
| 1 Net of redemption fees for fiscal 2010 and 2009 of $150,000 and $633,000, respectively (fund totals). | | |
H. In preparing the financial statements as of October 31, 2010, management considered the impact of subsequent events for potential recognition or disclosure in these financial statements.
33
Pacific Stock Index Fund
Fund Profile
As of October 31, 2010
| | | | | |
| Share-Class Characteristics | | | | | |
| | Investor | Admiral | Signal | Institutional | ETF |
| | Shares | Shares | Shares | Shares | Shares |
| Ticker Symbol | VPACX | VPADX | VPASX | VPKIX | VPL |
| Expense Ratio1 | 0.27% | 0.16% | 0.16% | 0.12% | 0.16% |
| | | |
| Portfolio Characteristics | | |
| | | | MSCI AC |
| | | MSCI | World |
| | | Pacific | Index |
| | Fund | Index | ex USA |
| Number of Stocks | 495 | 487 | 1,811 |
| Median Market Cap $19.3B | $19.3B | $29.9B |
| Price/Earnings Ratio | 17.2x | 17.2x | 16.2x |
| Price/Book Ratio | 1.3x | 1.3x | 1.7x |
| Return on Equity | 12.9% | 12.9% | 18.2% |
| Earnings Growth Rate | -3.3% | -3.3% | 4.4% |
| Dividend Yield | 2.6% | 2.6% | 2.8% |
| Turnover Rate | 3% | — | — |
| Short-Term Reserves | 0.0% | — | — |
| | | |
| Sector Diversification (% of equity exposure) |
| | | | MSCI AC |
| | | MSCI | World |
| | | Pacific | Index |
| | Fund | Index | ex USA |
| Consumer | | | |
| Discretionary | 13.9% | 13.9% | 8.7% |
| Consumer Staples | 6.3 | 6.3 | 8.5 |
| Energy | 2.5 | 2.5 | 10.9 |
| Financials | 28.6 | 28.3 | 25.7 |
| Health Care | 4.2 | 4.3 | 6.1 |
| Industrials | 15.5 | 15.6 | 10.3 |
| Information | | | |
| Technology | 8.5 | 8.5 | 7.1 |
| Materials | 12.1 | 12.1 | 12.1 |
| Telecommunication | | | |
| Services | 3.5 | 3.5 | 5.9 |
| Utilities | 4.9 | 5.0 | 4.7 |
| | |
| Volatility Measures | | |
| | MSCI | MSCI AC |
| | Pacific | World Index |
| | Index | ex USA |
| R-Squared | 0.96 | 0.92 |
| Beta | 1.01 | 0.82 |
These measures show the degree and timing of the fund’s fluctuations compared with the indexes over 36 months.
| | |
| Ten Largest Holdings (% of total net assets) |
| BHP Billiton Ltd. | Diversified Metals | |
| | & Mining | 3.8% |
| Toyota Motor Corp. | Automobile | |
| | Manufacturers | 2.7 |
| Commonwealth Bank of | Diversified Banks | |
| Australia | | 2.0 |
| Westpac Banking Corp. | Diversified Banks | 1.8 |
| Australia & New Zealand | Diversified Banks | |
| Banking Group Ltd. | | 1.7 |
| Honda Motor Co. Ltd. | Automobile | |
| | Manufacturers | 1.6 |
| Mitsubishi UFJ Financial | Diversified Banks | |
| Group Inc. | | 1.6 |
| National Australia Bank | Diversified Banks | |
| Ltd. | | 1.5 |
| Canon Inc. | Office Electronics | 1.4 |
| Sumitomo Mitsui | Diversified Banks | |
| Financial Group Inc. | | 1.1 |
| Top Ten | | 19.2% |
The holdings listed exclude any temporary cash investments and equity index products.
1 The expense ratios shown are from the prospectus dated February 26, 2010, and represent estimated costs for the current fiscal year. For the fiscal year ended October 31, 2010, the expense ratios were 0.26% for Investor Shares, 0.14% for Admiral Shares, 0.14% for Signal Shares, 0.10% for Institutional Shares, and 0.14% for ETF Shares.
34
Pacific Stock Index Fund
| | | |
| Market Diversification (% of equity exposure) |
| | | | MSCI AC |
| | | MSCI | World |
| | | Pacific | Index |
| | Fund | Index | ex USA |
| Europe | 0.0% | 0.0% | 45.1% |
| Pacific | | | |
| Japan | 61.4% | 61.6% | 14.3% |
| Australia | 25.4 | 25.2 | 5.9 |
| Hong Kong | 7.8 | 7.8 | 1.8 |
| Singapore | 5.1 | 5.1 | 1.2 |
| Other | 0.3 | 0.3 | 0.1 |
| Subtotal | 100.0% | 100.0% | 23.3% |
| Emerging Markets | 0.0% | 0.0% | 24.0% |
| North America | 0.0% | 0.0% | 7.6% |
35
Pacific Stock Index Fund
Performance Summary
All of the returns in this report represent past performance, which is not a guarantee of future results that may be achieved by the fund. (Current performance may be lower or higher than the performance data cited. For performance data current to the most recent month-end, visit our website at vanguard.com/performance.) Note, too, that both investment returns and principal value can fluctuate widely, so an investor’s shares, when sold, could be worth more or less than their original cost. The returns shown do not reflect taxes that a shareholder would pay on fund distributions or on the sale of fund shares.
Cumulative Performance: October 31, 2000, Through October 31, 2010
Initial Investment of $10,000
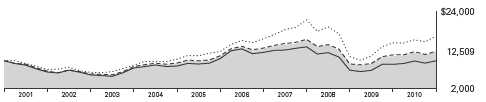
| | | | |
| | Average Annual Total Returns | |
| | Periods Ended October 31, 2010 | |
| | | | | Final Value |
| | One | Five | Ten | of a $10,000 |
| | Year | Years | Years | Investment |
| Pacific Stock Index Fund Investor | | | | |
| Shares | 11.09% | 2.11% | 2.26% | $12,509 |
| MSCI All Country World Index ex USA | 13.08 | 6.21 | 5.46 | 17,012 |
| MSCI Pacific Index | 8.86 | 2.17 | 2.40 | 12,680 |
| Japan/Pacific Region Funds Average | 11.40 | -1.19 | -0.03 | 9,971 |
Japan/Pacific Region Funds Average: Derived from data provided by Lipper Inc.
| | | | |
| | | | Since | Final Value |
| | One | Five | Inception | of a $10,000 |
| | Year | Years | (8/13/2001) | Investment |
| Pacific Stock Index Fund Admiral | | | | |
| Shares | 11.13% | 2.20% | 5.20% | $15,956 |
| MSCI All Country World Index ex | | | | |
| USA | 13.08 | 6.21 | 8.05 | 20,420 |
| MSCI Pacific Index | 8.86 | 2.17 | 5.23 | 15,992 |
"Since Inception" performance is calculated from the Admiral Shares’ inception date for both the fund and its comparative standards.
Vanguard fund returns do not reflect the 2% fee on redemptions of shares held for less than two months.
See Financial Highlights for dividend and capital gains information.
36
| | | |
| Pacific Stock Index Fund | | | |
| |
| |
| |
| |
| | Average Annual Total Returns | |
| | Period Ended: October 31, 2010 | |
| | | Since | Final Value |
| | One | Inception | of a $1,000,000 |
| | Year | (6/4/2007) | Investment |
| Pacific Stock Index Fund Signal | | | |
| Shares | 11.10% | -5.26% | $831,732 |
| MSCI All Country World Index ex | | | |
| USA | 13.08 | -4.19 | 864,312 |
| MSCI Pacific Index | 8.86 | -5.42 | 827,116 |
| "Since Inception" performance is calculated from the Signal Shares’ inception date for both the fund and its comparative standards. |
| | | | |
| | | | | Final Value |
| | One | Five | Ten | of a $5,000,000 |
| | Year | Years | Years | Investment |
| Pacific Stock Index Fund | | | | |
| Institutional Shares | 11.22% | 2.25% | 2.41% | $6,343,935 |
| MSCI All Country World Index ex | | | | |
| USA | 13.08 | 6.21 | 5.46 | 8,506,155 |
| MSCI Pacific Index | 8.86 | 2.17 | 2.40 | 6,339,853 |
| |
| |
| | | | Since | Final Value |
| | One | Five | Inception | of a $10,000 |
| | Year | Years | (3/4/2005) | Investment |
| Pacific Stock Index Fund | | | | |
| ETF Shares Net Asset Value | 11.11% | 2.20% | 3.44% | $12,113 |
| MSCI All Country World Index ex USA | 13.08 | 6.21 | 6.09 | 13,974 |
| MSCI Pacific Index | 8.86 | 2.17 | 3.38 | 12,071 |
| "Since Inception" performance is calculated from the ETF Shares’ inception date for both the fund and its comparative standards. |
| | | |
| Cumulative Returns of ETF Shares: March 4, 2005, Through October 31, 2010 | | |
| | | | Since |
| | One | Five | Inception |
| | Year | Years | (3/4/2005) |
| Pacific Stock Index Fund | | | |
| ETF Shares Market Price | 11.65% | 9.91% | 20.81% |
| Pacific Stock Index Fund | | | |
| ETF Shares Net Asset Value | 11.11 | 11.50 | 21.13 |
| MSCI Pacific Index | 8.86 | 11.33 | 20.71 |
| "Since Inception" performance is calculated from the ETF Shares’ inception date for both the fund and its comparative standards. | |
Vanguard fund returns do not reflect the 2% fee on redemptions of shares held for less than two months.
37
Pacific Stock Index Fund
Fiscal-Year Total Returns (%): October 31, 2000, Through October 31, 2010
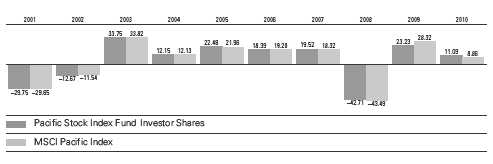
Average Annual Total Returns: Periods Ended September 30, 2010
This table presents average annual total returns through the latest calendar quarter—rather than through the end of the fiscal period. Securities and Exchange Commission rules require that we provide this information.
| | | | |
| | Inception | One | Five | Ten |
| | Date | Year | Years | Years |
| Investor Shares | 6/18/1990 | 5.46% | 1.17% | 1.41% |
| Admiral Shares | 8/13/2001 | 5.57 | 1.28 | 4.981 |
| Signal Shares | 6/4/2007 | 5.53 | — | -6.051 |
| Institutional Shares | 5/15/2000 | 5.59 | 1.32 | 1.57 |
| ETF Shares | 3/4/2005 | | | |
| Market Price | | 5.85 | 1.01 | 3.081 |
| Net Asset Value | | 5.56 | 1.28 | 3.071 |
| 1 Return since inception. | | | | |
Vanguard fund returns do not reflect the 2% fee on redemptions of shares held for less than two months.
38
Pacific Stock Index Fund
Financial Statements
Statement of Net Assets—Investments Summary
As of October 31, 2010
This Statement summarizes the fund’s holdings by asset type. Details are reported for each of the fund’s 50 largest individual holdings and for investments that, in total for any issuer, represent more than 1% of the fund’s net assets. The total value of smaller holdings is reported as a single amount within each category.
The fund reports a complete list of its holdings in regulatory filings four times in each fiscal year, at the quarter-ends. For the second and fourth fiscal quarters, the complete listing of the fund’s holdings is available electronically on vanguard.com and on the Securities and Exchange Commission’s website (sec.gov), or you can have it mailed to you without charge by calling 800-662-7447. For the first and third fiscal quarters, the fund files the lists with the SEC on Form N-Q. Shareholders can look up the fund’s Forms N-Q on the SEC’s website. Forms N-Q may also be reviewed and copied at the SEC’s Public Reference Room (see the back cover of this report for further information).
| | | |
| | | Market | Percentage |
| | | Value | of Net |
| | Shares | ($000) | Assets |
| Common Stocks | | | |
| Australia | | | |
| BHP Billiton Ltd. | 4,123,151 | 170,375 | 3.8% |
| Commonwealth Bank of Australia | 1,902,707 | 91,470 | 2.0% |
| Westpac Banking Corp. | 3,657,726 | 81,447 | 1.8% |
| Australia & New Zealand Banking Group Ltd. | 3,112,568 | 75,937 | 1.7% |
| National Australia Bank Ltd. | 2,605,865 | 65,221 | 1.5% |
| Rio Tinto Ltd. | 535,356 | 43,569 | 1.0% |
| Woolworths Ltd. | 1,524,337 | 42,317 | 0.9% |
| Wesfarmers Ltd. | 1,234,895 | 40,180 | 0.9% |
| Newcrest Mining Ltd. | 882,218 | 34,719 | 0.8% |
| Westfield Group | 2,693,405 | 32,758 | 0.7% |
| Woodside Petroleum Ltd. | 668,414 | 28,584 | 0.6% |
| CSL Ltd. | 706,891 | 22,797 | 0.5% |
| QBE Insurance Group Ltd. | 1,271,650 | 21,390 | 0.5% |
| Australia—Other † | | 371,617 | 8.3% |
| | | 1,122,381 | 25.0% |
| Hong Kong | | | |
| Sun Hung Kai Properties Ltd. | 1,738,121 | 29,899 | 0.7% |
| Hong Kong Exchanges and Clearing Ltd. | 1,258,246 | 27,774 | 0.6% |
| Cheung Kong Holdings Ltd. | 1,708,408 | 26,095 | 0.6% |
| Hutchison Whampoa Ltd. | 2,621,599 | 25,891 | 0.6% |
| Hong Kong—Other † | | 239,719 | 5.3% |
| | | 349,378 | 7.8% |
| Japan | | | |
| Toyota Motor Corp. | 3,388,983 | 120,039 | 2.7% |
| Honda Motor Co. Ltd. | 2,028,954 | 73,141 | 1.6% |
| Mitsubishi UFJ Financial Group Inc. | 15,644,420 | 72,606 | 1.6% |
| Canon Inc. | 1,392,959 | 64,122 | 1.4% |
| Sumitomo Mitsui Financial Group Inc. | 1,650,561 | 49,266 | 1.1% |
| Takeda Pharmaceutical Co. Ltd. | 921,817 | 43,211 | 1.0% |
| Tokyo Electric Power Co. Inc. | 1,757,164 | 41,958 | 0.9% |
39
| | | | |
| Pacific Stock Index Fund | | | | |
| |
| |
| |
| | | | Market | Percentage |
| | | | Value | of Net |
| | | Shares | ($000) | Assets |
| Sony Corp. | | 1,234,429 | 41,708 | 0.9% |
| Mitsubishi Corp. | | 1,667,772 | 40,059 | 0.9% |
| Mizuho Financial Group Inc. | | 24,637,413 | 35,732 | 0.8% |
| Panasonic Corp. | | 2,411,011 | 35,146 | 0.8% |
| Fanuc Ltd. | | 235,439 | 34,084 | 0.8% |
| Mitsui & Co. Ltd. | | 2,134,880 | 33,576 | 0.7% |
| Softbank Corp. | | 997,531 | 32,036 | 0.7% |
| NTT DoCoMo Inc. | | 18,837 | 31,753 | 0.7% |
| Nintendo Co. Ltd. | | 121,961 | 31,492 | 0.7% |
| Nippon Telegraph & Telephone Corp. | | 638,323 | 28,789 | 0.6% |
| Komatsu Ltd. | | 1,165,778 | 28,493 | 0.6% |
| Nissan Motor Co. Ltd. | | 3,054,632 | 26,847 | 0.6% |
| East Japan Railway Co. | | 417,837 | 25,803 | 0.6% |
| Shin-Etsu Chemical Co. Ltd. | | 504,481 | 25,510 | 0.6% |
| Mitsubishi Estate Co. Ltd. | | 1,453,005 | 25,454 | 0.6% |
| Hitachi Ltd. | | 5,551,404 | 25,090 | 0.6% |
| Tokio Marine Holdings Inc. | | 889,688 | 25,014 | 0.6% |
| Toshiba Corp. | | 4,947,214 | 24,762 | 0.6% |
| Kansai Electric Power Co. Inc. | | 930,165 | 23,543 | 0.5% |
| Nomura Holdings Inc. | | 4,340,854 | 22,307 | 0.5% |
| Mitsubishi Electric Corp. | | 2,374,896 | 22,258 | 0.5% |
| Seven & I Holdings Co. Ltd. | | 926,079 | 21,497 | 0.5% |
| Canon Marketing Japan Inc. | | 73,590 | 917 | 0.0% |
| Japan—Other † | | | 1,624,652 | 36.2% |
| | | | 2,730,865 | 60.9% |
| |
| New Zealand † | | | 13,456 | 0.3% |
| |
| Singapore | | | | |
| Singapore Telecommunications Ltd. | | 9,789,220 | 23,455 | 0.5% |
| DBS Group Holdings Ltd. | | 2,104,727 | 22,669 | 0.5% |
| United Overseas Bank Ltd. | | 1,499,395 | 21,642 | 0.5% |
| Oversea-Chinese Banking Corp. Ltd. | | 2,991,983 | 20,900 | 0.5% |
| Singapore—Other † | | | 138,772 | 3.1% |
| | | | 227,438 | 5.1% |
| Total Common Stocks (Cost $5,769,764) | | | 4,443,518 | 99.1%1 |
| |
| | Coupon | | | |
| Temporary Cash Investments | | | | |
| Money Market Fund | | | | |
| 2,3 Vanguard Market Liquidity Fund | 0.237% | 44,964,886 | 44,965 | 1.0% |
| |
| 4U.S. Government and Agency Obligations † | | | 8,999 | 0.2% |
| Total Temporary Cash Investments (Cost $53,964) | | | 53,964 | 1.2%1 |
| 5Total Investments (Cost $5,823,728) | | | 4,497,482 | 100.3% |
| Other Assets and Liabilities | | | | |
| Other Assets | | | 42,728 | 0.9% |
| Liabilities3 | | | (55,056) | (1.2%) |
| | | | (12,328) | (0.3%) |
| Net Assets | | | 4,485,154 | 100.0% |
40
| |
| Pacific Stock Index Fund | |
| |
| |
| At October 31, 2010, net assets consisted of: | |
| | Amount |
| | ($000) |
| Paid-in Capital | 6,782,061 |
| Undistributed Net Investment Income | 128,317 |
| Accumulated Net Realized Losses | (1,100,153) |
| Unrealized Appreciation (Depreciation) | |
| Investment Securities | (1,326,246) |
| Futures Contracts | (1,219) |
| Foreign Currencies and Forward Currency Contracts | 2,394 |
| Net Assets | 4,485,154 |
| |
| Investor Shares—Net Assets | |
| Applicable to 83,479,364 outstanding $.001 par value shares of | |
| beneficial interest (unlimited authorization) | 867,811 |
| Net Asset Value Per Share—Investor Shares | $10.40 |
| |
| Admiral Shares—Net Assets | |
| Applicable to 17,112,171 outstanding $.001 par value shares of | |
| beneficial interest (unlimited authorization) | 1,164,660 |
| Net Asset Value Per Share—Admiral Shares | $68.06 |
| |
| Signal Shares—Net Assets | |
| Applicable to 7,235,456 outstanding $.001 par value shares of | |
| beneficial interest (unlimited authorization) | 171,065 |
| Net Asset Value Per Share—Signal Shares | $23.64 |
| |
| Institutional Shares—Net Assets | |
| Applicable to 76,724,476 outstanding $.001 par value shares of | |
| beneficial interest (unlimited authorization) | 799,270 |
| Net Asset Value Per Share—Institutional Shares | $10.42 |
| |
| ETF Shares—Net Assets | |
| Applicable to 26,922,177 outstanding $.001 par value shares of | |
| beneficial interest (unlimited authorization) | 1,482,348 |
| Net Asset Value Per Share—ETF Shares | $55.06 |
See Note A in Notes to Financial Statements.
† Represents the aggregate value, by category, of securities that are not among the 50 largest holdings and, in total for any issuer, represent 1% or less of net assets.
1 The fund invests a portion of its cash reserves in equity markets through the use of index futures contracts. After giving effect to futures investments, the fund’s effective common stock and temporary cash investment positions represent 100.2% and 0.1%, respectively, of net assets.
2 Affiliated money market fund available only to Vanguard funds and certain trusts and accounts managed by Vanguard. Rate shown is the 7-day yield.
3 Includes $36,394,000 of collateral received for securities on loan.
4 Securities with a value of $3,000,000 have been segregated as initial margin for open futures contracts.
5 The total value of securities on loan is $34,391,000.
See accompanying Notes, which are an integral part of the Financial Statements.
41
| |
| Pacific Stock Index Fund | |
| |
| |
| |
| Statement of Operations | |
| |
| |
| | Year Ended |
| | October 31, 2010 |
| | ($000) |
| Investment Income | |
| Income | |
| Dividends1 | 163,454 |
| Interest2 | 121 |
| Security Lending | 1,071 |
| Total Income | 164,646 |
| Expenses | |
| The Vanguard Group—Note B | |
| Investment Advisory Services | 417 |
| Management and Administrative—Investor Shares | 6,638 |
| Management and Administrative—Admiral Shares | 884 |
| Management and Administrative—Signal Shares | 145 |
| Management and Administrative—Institutional Shares | 301 |
| Management and Administrative—ETF Shares | 1,173 |
| Marketing and Distribution—Investor Shares | 969 |
| Marketing and Distribution—Admiral Shares | 164 |
| Marketing and Distribution—Signal Shares | 45 |
| Marketing and Distribution—Institutional Shares | 168 |
| Marketing and Distribution—ETF Shares | 367 |
| Custodian Fees | 956 |
| Auditing Fees | 39 |
| Shareholders’ Reports—Investor Shares | 17 |
| Shareholders’ Reports—Admiral Shares | — |
| Shareholders’ Reports—Signal Shares | 1 |
| Shareholders’ Reports—Institutional Shares | 2 |
| Shareholders’ Reports—ETF Shares | 69 |
| Trustees’ Fees and Expenses | 11 |
| Total Expenses | 12,366 |
| Net Investment Income | 152,280 |
| Realized Net Gain (Loss) | |
| Investment Securities Sold | 80,767 |
| Futures Contracts | (6,181) |
| Foreign Currencies and Forward Currency Contracts | 6,846 |
| Realized Net Gain (Loss) | 81,432 |
| Change in Unrealized Appreciation (Depreciation) | |
| Investment Securities | 444,015 |
| Futures Contracts | (960) |
| Foreign Currencies and Forward Currency Contracts | 2,322 |
| Change in Unrealized Appreciation (Depreciation) | 445,377 |
| Net Increase (Decrease) in Net Assets Resulting from Operations | 679,089 |
1 Dividends are net of foreign withholding taxes of $6,575,000.
2 Interest income from an affiliated company of the fund was $101,000.
See accompanying Notes, which are an integral part of the Financial Statements.
42
| | |
| Pacific Stock Index Fund | | |
| |
| |
| Statement of Changes in Net Assets | | |
| |
| | Year Ended October 31, |
| | 2010 | 2009 |
| | ($000) | ($000) |
| Increase (Decrease) in Net Assets | | |
| Operations | | |
| Net Investment Income | 152,280 | 167,807 |
| Realized Net Gain (Loss) | 81,432 | (1,037,811) |
| Change in Unrealized Appreciation (Depreciation) | 445,377 | 1,886,857 |
| Net Increase (Decrease) in Net Assets Resulting from Operations | 679,089 | 1,016,853 |
| Distributions | | |
| Net Investment Income | | |
| Investor Shares | (79,032) | (90,208) |
| Admiral Shares | (23,652) | (13,868) |
| Signal Shares | (4,529) | (2,869) |
| Institutional Shares | (14,225) | (32,221) |
| ETF Shares | (35,958) | (22,623) |
| Realized Capital Gain | | |
| Investor Shares | — | — |
| Admiral Shares | — | — |
| Signal Shares | — | — |
| Institutional Shares | — | — |
| ETF Shares | — | — |
| Total Distributions | (157,396) | (161,789) |
| Capital Share Transactions | | |
| Investor Shares | (2,261,374) | (2,494,500) |
| Admiral Shares | 246,250 | (30,359) |
| Signal Shares | (984) | (17,973) |
| Institutional Shares | 259,478 | (1,316,524) |
| ETF Shares | 91,378 | (114,249) |
| Net Increase (Decrease) from Capital Share Transactions | (1,665,252) | (3,973,605) |
| Total Increase (Decrease) | (1,143,559) | (3,118,541) |
| Net Assets | | |
| Beginning of Period | 5,628,713 | 8,747,254 |
| End of Period1 | 4,485,154 | 5,628,713 |
1 Net Assets—End of Period includes undistributed net investment income of $128,317,000 and $126,000,000.
See accompanying Notes, which are an integral part of the Financial Statements.
43
| | | | | |
| Pacific Stock Index Fund | | | | | |
| |
| |
| Financial Highlights | | | | | |
| |
| Investor Shares | | | | | |
| |
| For a Share Outstanding | | | Year Ended October 31, |
| Throughout Each Period | 2010 | 2009 | 2008 | 2007 | 2006 |
| Net Asset Value, Beginning of Period | $9.61 | $7.94 | $14.19 | $12.13 | $10.39 |
| Investment Operations | | | | | |
| Net Investment Income | .2431 | .1891 | .281 | .236 | .190 |
| Net Realized and Unrealized Gain (Loss) | | | | | |
| on Investments | .803 | 1.621 | (6.228) | 2.091 | 1.710 |
| Total from Investment Operations | 1.046 | 1.810 | (5.947) | 2.327 | 1.900 |
| Distributions | | | | | |
| Dividends from Net Investment Income | (.256) | (.140) | (.303) | (.267) | (.160) |
| Distributions from Realized Capital Gains | — | — | — | — | — |
| Total Distributions | (.256) | (.140) | (.303) | (.267) | (.160) |
| Net Asset Value, End of Period | $10.40 | $9.61 | $7.94 | $14.19 | $12.13 |
| |
| Total Return2 | 11.09% | 23.23% | -42.71% | 19.52% | 18.39% |
| |
| Ratios/Supplemental Data | | | | | |
| Net Assets, End of Period (Millions) | $868 | $2,846 | $5,065 | $11,281 | $7,814 |
| Ratio of Total Expenses to | | | | | |
| Average Net Assets | 0.26% | 0.27% | 0.22% | 0.22% | 0.27% |
| Ratio of Net Investment Income to | | | | | |
| Average Net Assets | 2.37% | 2.42% | 2.32% | 1.80% | 1.73% |
| Portfolio Turnover Rate3 | 3% | 8% | 9% | 3% | 2% |
1 Calculated based on average shares outstanding.
2 Total returns do not include transaction or account service fees that may have applied in the periods shown. Fund prospectuses provide information about any applicable transaction and account service fees.
3 Excludes the value of portfolio securities received or delivered as a result of in-kind purchases or redemptions of the fund’s capital shares, including ETF Creation Units.
See accompanying Notes, which are an integral part of the Financial Statements.
44
| | | | | |
| Pacific Stock Index Fund | | | | | |
| |
| |
| Financial Highlights | | | | | |
| |
| Admiral Shares | | | | | |
| |
| For a Share Outstanding | | | Year Ended October 31, |
| Throughout Each Period | 2010 | 2009 | 2008 | 2007 | 2006 |
| Net Asset Value, Beginning of Period | $62.95 | $52.04 | $92.94 | $79.43 | $68.05 |
| Investment Operations | | | | | |
| Net Investment Income | 1.5331 | 1.3861 | 1.933 | 1.613 | 1.302 |
| Net Realized and Unrealized Gain (Loss) | | | | | |
| on Investments | 5.337 | 10.531 | (40.773) | 13.714 | 11.185 |
| Total from Investment Operations | 6.870 | 11.917 | (38.840) | 15.327 | 12.487 |
| Distributions | | | | | |
| Dividends from Net Investment Income | (1.760) | (1.007) | (2.060) | (1.817) | (1.107) |
| Distributions from Realized Capital Gains | — | — | — | — | — |
| Total Distributions | (1.760) | (1.007) | (2.060) | (1.817) | (1.107) |
| Net Asset Value, End of Period | $68.06 | $62.95 | $52.04 | $92.94 | $79.43 |
| |
| Total Return2 | 11.13% | 23.38% | -42.62% | 19.64% | 18.46% |
| |
| Ratios/Supplemental Data | | | | | |
| Net Assets, End of Period (Millions) | $1,165 | $849 | $737 | $1,292 | $1,128 |
| Ratio of Total Expenses to | | | | | |
| Average Net Assets | 0.14% | 0.16% | 0.12% | 0.12% | 0.17% |
| Ratio of Net Investment Income | | | | | |
| to Average Net Assets | 2.49% | 2.53% | 2.42% | 1.90% | 1.83% |
| Portfolio Turnover Rate3 | 3% | 8% | 9% | 3% | 2% |
1 Calculated based on average shares outstanding.
2 Total returns do not include transaction fees that may have applied in the periods shown. Fund prospectuses provide information about any applicable transaction fees.
3 Excludes the value of portfolio securities received or delivered as a result of in-kind purchases or redemptions of the fund’s capital shares, including ETF Creation Units.
See accompanying Notes, which are an integral part of the Financial Statements.
45
| | | | |
| Pacific Stock Index Fund | | | | |
| |
| |
| Financial Highlights | | | | |
| |
| Signal Shares | | | | |
| | | | | June 4, |
| | | | | 20071, to |
| | Year Ended October 31, | Oct. 31, |
| For a Share Outstanding Throughout Each Period | 2010 | 2009 | 2008 | 2007 |
| Net Asset Value, Beginning of Period | $21.87 | $18.08 | $32.28 | $30.53 |
| Investment Operations | | | | |
| Net Investment Income | .5412 | .4812 | .667 | .250 |
| Net Realized and Unrealized Gain (Loss) on Investments | 1.840 | 3.658 | (14.158) | 1.500 |
| Total from Investment Operations | 2.381 | 4.139 | (13.491) | 1.750 |
| Distributions | | | | |
| Dividends from Net Investment Income | (.611) | (.349) | (.709) | — |
| Distributions from Realized Capital Gains | — | — | — | — |
| Total Distributions | (.611) | (.349) | (.709) | — |
| Net Asset Value, End of Period | $23.64 | $21.87 | $18.08 | $32.28 |
| |
| Total Return3 | 11.10% | 23.38% | -42.61% | 5.73% |
| |
| Ratios/Supplemental Data | | | | |
| Net Assets, End of Period (Millions) | $171 | $159 | $150 | $247 |
| Ratio of Total Expenses to Average Net Assets | 0.14% | 0.16% | 0.12% | 0.12%4 |
| Ratio of Net Investment Income to Average Net Assets | 2.49% | 2.53% | 2.42% | 1.90%4 |
| Portfolio Turnover Rate5 | 3% | 8% | 9% | 3% |
1 Inception.
2 Calculated based on average shares outstanding.
3 Total returns do not include transaction fees that may have applied in the periods shown. Fund prospectuses provide information about any applicable transaction fees.
4 Annualized.
5 Excludes the value of portfolio securities received or delivered as a result of in-kind purchases or redemptions of the fund’s capital shares, including ETF Creation Units.
See accompanying Notes, which are an integral part of the Financial Statements.
46
| | | | | |
| Pacific Stock Index Fund | | | | | |
| |
| |
| Financial Highlights | | | | | |
| |
| Institutional Shares | | | | | |
| |
| For a Share Outstanding | | | Year Ended October 31, |
| Throughout Each Period | 2010 | 2009 | 2008 | 2007 | 2006 |
| Net Asset Value, Beginning of Period | $9.63 | $7.96 | $14.22 | $12.15 | $10.41 |
| Investment Operations | | | | | |
| Net Investment Income | .2431 | .2151 | .300 | .251 | .206 |
| Net Realized and Unrealized Gain (Loss) | | | | | |
| on Investments | .816 | 1.613 | (6.242) | 2.102 | 1.710 |
| Total from Investment Operations | 1.059 | 1.828 | (5.942) | 2.353 | 1.916 |
| Distributions | | | | | |
| Dividends from Net Investment Income | (.269) | (.158) | (.318) | (.283) | (.176) |
| Distributions from Realized Capital Gains | — | — | — | — | — |
| Total Distributions | (.269) | (.158) | (.318) | (.283) | (.176) |
| Net Asset Value, End of Period | $10.42 | $9.63 | $7.96 | $14.22 | $12.15 |
| |
| Total Return2 | 11.22% | 23.46% | -42.62% | 19.72% | 18.52% |
| |
| Ratios/Supplemental Data | | | | | |
| Net Assets, End of Period (Millions) | $799 | $487 | $1,610 | $2,720 | $1,788 |
| Ratio of Total Expenses to | | | | | |
| Average Net Assets | 0.10% | 0.12% | 0.09% | 0.09% | 0.12% |
| Ratio of Net Investment Income to | | | | | |
| Average Net Assets | 2.53% | 2.57% | 2.45% | 1.93% | 1.88% |
| Portfolio Turnover Rate3 | 3% | 8% | 9% | 3% | 2% |
1 Calculated based on average shares outstanding.
2 Total returns do not include transaction fees that may have applied in the periods shown. Fund prospectuses provide information about any applicable transaction fees.
3 Excludes the value of portfolio securities received or delivered as a result of in-kind purchases or redemptions of the fund’s capital shares, including ETF Creation Units.
See accompanying Notes, which are an integral part of the Financial Statements.
47
| | | | | |
| Pacific Stock Index Fund | | | | | |
| |
| |
| Financial Highlights | | | | | |
| |
| ETF Shares | | | | | |
| |
| For a Share Outstanding | | | Year Ended October 31, |
| Throughout Each Period | 2010 | 2009 | 2008 | 2007 | 2006 |
| Net Asset Value, Beginning of Period | $50.92 | $42.10 | $75.17 | $64.24 | $55.09 |
| Investment Operations | | | | | |
| Net Investment Income | 1.2651 | 1.1091 | 1.573 | 1.314 | 1.060 |
| Net Realized and Unrealized Gain (Loss) | | | | | |
| on Investments | 4.296 | 8.534 | (32.974) | 11.089 | 9.020 |
| Total from Investment Operations | 5.561 | 9.643 | (31.401) | 12.403 | 10.080 |
| Distributions | | | | | |
| Dividends from Net Investment Income | (1.421) | (.823) | (1.669) | (1.473) | (.930) |
| Distributions from Realized Capital Gains | — | — | — | — | — |
| Total Distributions | (1.421) | (.823) | (1.669) | (1.473) | (.930) |
| Net Asset Value, End of Period | $55.06 | $50.92 | $42.10 | $75.17 | $64.24 |
| |
| Total Return | 11.11% | 23.38% | -42.61% | 19.65% | 18.43% |
| |
| Ratios/Supplemental Data | | | | | |
| Net Assets, End of Period (Millions) | $1,482 | $1,288 | $1,186 | $1,503 | $693 |
| Ratio of Total Expenses to | | | | | |
| Average Net Assets | 0.14% | 0.16% | 0.11% | 0.12% | 0.18% |
| Ratio of Net Investment Income to | | | | | |
| Average Net Assets | 2.49% | 2.53% | 2.43% | 1.90% | 1.82% |
| Portfolio Turnover Rate2 | 3% | 8% | 9% | 3% | 2% |
1 Calculated based on average shares outstanding.
2 Excludes the value of portfolio securities received or delivered as a result of in-kind purchases or redemptions of the fund’s capital shares, including ETF Creation Units.
See accompanying Notes, which are an integral part of the Financial Statements.
48
Pacific Stock Index Fund
Notes to Financial Statements
Vanguard Pacific Stock Index Fund is registered under the Investment Company Act of 1940 as an open-end investment company, or mutual fund. The fund invests in securities of foreign issuers, which may subject it to investment risks not normally associated with investing in securities of U.S. corporations. The fund offers five classes of shares: Investor Shares, Admiral Shares, Signal Shares, Institutional Shares, and ETF Shares. Investor Shares are available to any investor who meets the fund’s minimum purchase requirements. Admiral Shares, Signal Shares, and Institutional Shares are designed for investors who meet certain administrative, service, and account-size criteria. ETF Shares are listed for trading on the NYSE Arca, Inc.; they can be purchased and sold through a broker.
A. The following significant accounting policies conform to generally accepted accounting principles for U.S. mutual funds. The fund consistently follows such policies in preparing its financial statements.
1. Security Valuation: Securities are valued as of the close of trading on the New York Stock Exchange (generally 4 p.m., Eastern time) on the valuation date. Equity securities are valued at the latest quoted sales prices or official closing prices taken from the primary market in which each security trades; such securities not traded on the valuation date are valued at the mean of the latest quoted bid and asked prices. Securities for which market quotations are not readily available, or whose values have been affected by events occurring before the fund’s pricing time but after the close of the securities’ primary markets, are valued at their fair values calculated according to procedures adopted by the board of trustees. These procedures include obtaining quotations from an independent pricing service, monitoring news to identify significant market- or security-specific events, and evaluating changes in the values of foreign market proxies (for example, A DRs, futures contracts, or exchange-traded funds), between the time the foreign markets close and the fund’s pricing time. When fair-value pricing is employed, the prices of securities used by a fund to calculate its net asset value may differ from quoted or published prices for the same securities. Investments in Vanguard Market Liquidity Fund are valued at that fund’s net asset value. Temporary cash investments acquired over 60 days to maturity are valued using the latest bid prices or using valuations based on a matrix system (which considers such factors as security prices, yields, maturities, and ratings), both as furnished by independent pricing services. Other temporary cash investments are valued at amortized cost, which approximates market value.
2. Foreign Currency: Securities and other assets and liabilities denominated in foreign currencies are translated into U.S. dollars using exchange rates obtained from an independent third party as of the fund’s pricing time on the valuation date. Realized gains (losses) and unrealized appreciation (depreciation) on investment securities include the effects of changes in exchange rates since the securities were purchased, combined with the effects of changes in security prices. Fluctuations in the value of other assets and liabilities resulting from changes in exchange rates are recorded as unrealized foreign currency gains (losses) until the assets or liabilities are settled in cash, at which time they are recorded as realized foreign currency gains (losses).
3. Futures and Forward Currency Contracts: The fund uses index futures contracts to a limited extent, with the objectives of maintaining full exposure to the stock market, enhancing returns, maintaining liquidity, and minimizing transaction costs. The fund may purchase futures contracts to immediately invest incoming cash in the market, or sell futures in response to cash outflows, thereby simulating a fully invested position in the underlying index while maintaining a cash balance for liquidity. The fund may seek to enhance returns by using futures contracts instead of the underlying securities when futures are believed to be priced more attractively than the underlying securities. The primary risks
49
Pacific Stock Index Fund
associated with the use of futures contracts are imperfect correlation between changes in market values of stocks held by the fund and the prices of futures contracts, and the possibility of an illiquid market.
The fund also enters into forward currency contracts to provide the appropriate currency exposure related to any open futures contracts. The fund’s risks in using these contracts include movement in the values of the foreign currencies relative to the U.S. dollar and the ability of the counterparties to fulfill their obligations under the contracts. Counterparty risk is mitigated by entering into forward currency contracts only with highly rated counterparties, by a master netting arrangement between the fund and the counterparty, and by the posting of collateral by the counterparty. The forward currency contracts contain provisions whereby a counterparty may terminate open contracts if the fund’s net assets decline below a certain level, triggering a payment by the fund if the fund is in a net liability position at the time of the termination. The payment amount would be reduced by any collateral the fund has posted. Any securities posted as collateral for open contracts are noted in the Statement of Net Assets.
Futures contracts are valued at their quoted daily settlement prices. Forward currency contracts are valued at their quoted daily prices obtained from an independent third party, adjusted for currency risk based on the expiration date of each contract. The aggregate principal amounts of the contracts are not recorded in the Statement of Net Assets. Fluctuations in the value of the contracts are recorded in the Statement of Net Assets as an asset (liability) and in the Statement of Operations as unrealized appreciation (depreciation) until the contracts are closed, when they are recorded as realized gains (losses) on futures or forward currency contracts.
4. Federal Income Taxes: The fund intends to continue to qualify as a regulated investment company and distribute all of its taxable income. Management has analyzed the fund’s tax positions taken for all open federal income tax years (October 31, 2007–2010), and has concluded that no provision for federal income tax is required in the fund’s financial statements.
5. Distributions: Distributions to shareholders are recorded on the ex-dividend date.
6. Security Lending: The fund may lend its securities to qualified institutional borrowers to earn additional income. Security loans are required to be secured at all times by collateral at least equal to the market value of securities loaned. The fund invests cash collateral received in Vanguard Market Liquidity Fund, and records a liability for the return of the collateral, during the period the securities are on loan. Security lending income represents fees charged to borrowers plus income earned on investing cash collateral, less expenses associated with the loan.
7. Other: Dividend income is recorded on the ex-dividend date. Interest income includes income distributions received from Vanguard Market Liquidity Fund and is accrued daily. Security transactions are accounted for on the date securities are bought or sold. Costs used to determine realized gains (losses) on the sale of investment securities are those of the specific securities sold. Fees assessed on redemptions of capital shares are credited to paid-in capital.
Each class of shares has equal rights as to assets and earnings, except that each class separately bears certain class-specific expenses related to maintenance of shareholder accounts (included in Management and Administrative expenses) and shareholder reporting. Marketing and distribution expenses are allocated to each class of shares based on a method approved by the board of trustees. Income, other non-class-specific expenses, and gains and losses on investments are allocated to each class of shares based on its relative net assets.
50
Pacific Stock Index Fund
B. The Vanguard Group furnishes at cost investment advisory, corporate management, administrative, marketing, and distribution services. The costs of such services are allocated to the fund under methods approved by the board of trustees. The fund has committed to provide up to 0.40% of its net assets in capital contributions to Vanguard. At October 31, 2010, the fund had contributed capital of $1,253,000 to Vanguard (included in Other Assets), representing 0.03% of the fund’s net assets and 0.50% of Vanguard’s capitalization. The fund’s trustees and officers are also directors and officers of Vanguard.
C. Various inputs may be used to determine the value of the fund’s investments. These inputs are summarized in three broad levels for financial statement purposes. The inputs or methodologies used to value securities are not necessarily an indication of the risk associated with investing in those securities.
Level 1—Quoted prices in active markets for identical securities.
Level 2—Other significant observable inputs (including quoted prices for similar securities, interest rates, prepayment speeds, credit risk, etc.).
Level 3—Significant unobservable inputs (including the fund’s own assumptions used to determine the fair value of investments).
The following table summarizes the fund’s investments as of October 31, 2010, based on the inputs used to value them:
| | | |
| | Level 1 | Level 2 | Level 3 |
| Investments | ($000) | ($000) | ($000) |
| Common Stocks | 4,604 | 4,438,914 | — |
| Temporary Cash Investments | 44,965 | 8,999 | — |
| Futures Contracts—Liabilities1 | (524) | — | — |
| Forward Currency Contracts—Assets | — | 886 | — |
| Total | 49,045 | 4,448,799 | — |
| 1 Represents variation margin on the last day of the reporting period. | | | |
D. At October 31, 2010, the fair values of derivatives were reflected in the Statement of Net Assets as follows:
| | | |
| | | Foreign | |
| | Equity | Exchange | |
| | Contracts | Contracts | Total |
| Statement of Net Assets Caption | ($000) | ($000) | ($000) |
| Other Assets | — | 886 | 886 |
| Liabilities | (524) | — | (524) |
51
Pacific Stock Index Fund
Realized net gain (loss) and the change in unrealized appreciation (depreciation) on derivatives for the year ended October 31, 2010, were:
| | | |
| | | Foreign | |
| | Equity | Exchange | |
| | Contracts | Contracts | Total |
| Realized Net Gain (Loss) on Derivatives | ($000) | ($000) | ($000) |
| Futures Contracts | (6,181) | — | (6,181) |
| Forward Currency Contracts | — | 2,394 | 2,394 |
| Realized Net Gain (Loss) on Derivatives | (6,181) | 2,394 | (3,787) |
| |
| Change in Unrealized Appreciation (Depreciation) on Derivatives | | | |
| Futures Contracts | (960) | — | (960) |
| Forward Currency Contracts | — | 810 | 810 |
| Change in Unrealized Appreciation (Depreciation) on Derivatives | (960) | 810 | (150) |
At October 31, 2010, the aggregate settlement value of open futures contracts and the related unrealized appreciation (depreciation) were:
| | | | |
| | | | | ($000) |
| | | | Aggregate | |
| | | Number of | Settlement | Unrealized |
| | | Long (Short) | Value | Appreciation |
| Futures Contracts | Expiration | Contracts | Long (Short) | (Depreciation) |
| Topix Index | December 2010 | 348 | 34,822 | (1,102) |
| S&P ASX 200 Index | December 2010 | 154 | 17,536 | (117) |
At October 31, 2010, the fund had open forward currency contracts to receive and deliver currencies as follows. Unrealized appreciation (depreciation) on open forward currency contracts is treated as realized gain (loss) for tax purposes.
| | | | | | |
| | | | | | | Unrealized |
| | Contract | | | | | Appreciation |
| | Settlement | | | Contract Amount (000) | (Depreciation) |
| Counterparty | Date | | Receive | | Deliver | ($000) |
| UBS AG | 12/15/10 | JPY | 462,540 | USD | 5,748 | 229 |
| UBS AG | 12/22/10 | AUD | 18,003 | USD | 17,635 | 657 |
AUD—Australian dollar.
JPY—Japanese yen.
USD—U.S. dollar.
52
Pacific Stock Index Fund
At October 31, 2010, the counterparty had deposited in segregated accounts securities with a value sufficient to cover substantially all amounts due to the fund in connection with open forward currency contracts.
The fund had net unrealized foreign currency gains of $1,508,000 resulting from the translation of other assets and liabilities at October 31, 2010.
E. Distributions are determined on a tax basis and may differ from net investment income and realized capital gains for financial reporting purposes. Differences may be permanent or temporary. Permanent differences are reclassified among capital accounts in the financial statements to reflect their tax character. Temporary differences arise when certain items of income, expense, gain, or loss are recognized in different periods for financial statement and tax purposes; these differences will reverse at some time in the future. Differences in classification may also result from the treatment of short-term gains as ordinary income for tax purposes.
During the year ended October 31, 2010, the fund realized net foreign currency gains of $4,452,000, which increased distributable net income for tax purposes; accordingly, such gains have been reclassified from accumulated net realized losses to undistributed net investment income. Certain of the fund’s investments are in securities considered to be “passive foreign investment companies,” for which any unrealized appreciation and/or realized gains are required to be included in distributable net income for tax purposes. Unrealized appreciation of $3,675,000 on the fund’s passive foreign investment company holdings at October 31, 2009, has been distributed and is reflected in the balance of undistributed net investment income. During the year ended October 31, 2010, the fund realized gains on the sale of passive foreign investment companies of $2,981,000, which have been included in current and prior periods’ taxable income; accordingly, such g ains have been reclassified from accumulated net realized losses to undistributed net investment income. Unrealized appreciation on the fund’s passive foreign investment company holdings at October 31, 2010, was $3,098,000.
During the year ended October 31, 2010, the fund realized $104,566,000 of net capital gains resulting from in-kind redemptions—in which shareholders exchanged fund shares for securities held by the fund rather than for cash. Because such gains are not taxable to the fund, and are not distributed to shareholders, they have been reclassified from accumulated net realized losses to paid-in capital.
For tax purposes, at October 31, 2010, the fund had $141,815,000 of ordinary income available for distribution. The fund had available capital loss carryforwards totaling $1,099,252,000 to offset future net capital gains of $4,471,000 through October 31, 2011, $4,674,000 through October 31, 2013, $453,022,000 through October 31, 2016, $607,343,000 through October 31, 2017, and $29,742,000 through October 31, 2018. Capital loss carryforwards of $68,660,000 expired on October 31, 2010; accordingly, such losses have been reclassified from accumulated net realized losses to paid-in capital.
At October 31, 2010, the cost of investment securities for tax purposes was $5,826,841,000. Net unrealized depreciation of investment securities for tax purposes was $1,329,359,000, consisting of unrealized gains of $237,367,000 on securities that had risen in value since their purchase and $1,566,726,000 in unrealized losses on securities that had fallen in value since their purchase.
53
Pacific Stock Index Fund
F. During the year ended October 31, 2010, the fund purchased $1,184,952,000 of investment securities and sold $2,871,527,000 of investment securities, other than temporary cash investments.
G. Capital share transactions for each class of shares were:
| | | | | |
| | | | |
| | | | Year Ended October 31, |
| | | 2010 | | | 2009 |
| | Amount | Shares | Amount | Shares |
| | ($000) | (000) | ($000) | (000) |
| Investor Shares | | | | |
| Issued | 928,036 | 95,562 | 697,406 | 89,584 |
| Issued in Lieu of Cash Distributions | 77,181 | 7,998 | 89,093 | 11,571 |
| Redeemed1 | (3,266,591) | (316,059) | (3,280,999) | (442,815) |
| Net Increase (Decrease)—Investor Shares | (2,261,374) | (212,499) | (2,494,500) | (341,660) |
| Admiral Shares | | | | |
| Issued | 357,184 | 5,342 | 122,233 | 2,241 |
| Issued in Lieu of Cash Distributions | 19,195 | 304 | 11,409 | 227 |
| Redeemed1 | (130,129) | (2,021) | (164,001) | (3,133) |
| Net Increase (Decrease)—Admiral Shares | 246,250 | 3,625 | (30,359) | (665) |
| Signal Shares | | | | |
| Issued | 38,562 | 1,730 | 60,869 | 3,310 |
| Issued in Lieu of Cash Distributions | 3,686 | 168 | 2,555 | 146 |
| Redeemed1 | (43,232) | (1,932) | (81,397) | (4,472) |
| Net Increase (Decrease)—Signal Shares | (984) | (34) | (17,973) | (1,016) |
| Institutional Shares | | | | |
| Issued | 320,724 | 32,370 | 405,620 | 51,039 |
| Issued in Lieu of Cash Distributions | 10,557 | 1,093 | 29,986 | 3,894 |
| Redeemed1 | (71,803) | (7,262) | (1,752,130) | (206,617) |
| Net Increase (Decrease)—Institutional Shares | 259,478 | 26,201 | (1,316,524) | (151,684) |
| ETF Shares | | | | |
| Issued | 142,992 | 2,720 | 150,908 | 3,422 |
| Issued in Lieu of Cash Distributions | — | — | — | — |
| Redeemed1 | (51,614) | (1,100) | (265,157) | (6,300) |
| Net Increase (Decrease)—ETF Shares | 91,378 | 1,620 | (114,249) | (2,878) |
| 1 Net of redemption fees for fiscal 2010 and 2009 of $186,000 and $361,000, respectively (fund totals). | | |
H. In preparing the financial statements as of October 31, 2010, management considered the impact of subsequent events for potential recognition or disclosure in these financial statements.
54
Emerging Markets Stock Index Fund
Fund Profile
As of October 31, 2010
| | | | | |
| Share-Class Characteristics | | | | | |
| | Investor | Admiral | Signal | Institutional | ETF |
| | Shares | Shares | Shares | Shares | Shares |
| Ticker Symbol | VEIEX | VEMAX | VERSX | VEMIX | VWO |
| Expense Ratio1 | 0.40% | 0.27% | 0.27% | 0.23% | 0.27% |
| | | |
| Portfolio Characteristics | | |
| | | MSCI | MSCI AC |
| | | Emerging | World |
| | | Markets | Index |
| | Fund | Index | ex USA |
| Number of Stocks | 837 | 748 | 1,811 |
| Median Market Cap $17.9B | $18.0B | $29.9B |
| Price/Earnings Ratio | 16.0x | 15.3x | 16.2x |
| Price/Book Ratio | 2.3x | 2.2x | 1.7x |
| Return on Equity | 22.0% | 21.2% | 18.2% |
| Earnings Growth Rate 15.4% | 14.8% | 4.4% |
| Dividend Yield | 1.9% | 2.2% | 2.8% |
| Turnover Rate | 12% | — | — |
| Short-Term Reserves | -0.1% | — | — |
| | | |
| Sector Diversification (% of equity exposure) |
| | | MSCI | MSCI AC |
| | | Emerging | World |
| | | Markets | Index |
| | Fund | Index | ex USA |
| Consumer | | | |
| Discretionary | 6.9% | 6.8% | 8.7% |
| Consumer Staples | 6.8 | 6.9 | 8.5 |
| Energy | 14.1 | 14.2 | 10.9 |
| Financials | 26.1 | 26.0 | 25.7 |
| Health Care | 0.8 | 0.8 | 6.1 |
| Industrials | 7.3 | 7.4 | 10.3 |
| Information | | | |
| Technology | 12.3 | 11.9 | 7.1 |
| Materials | 14.4 | 14.5 | 12.1 |
| Telecommunication | | | |
| Services | 7.9 | 8.0 | 5.9 |
| Utilities | 3.4 | 3.5 | 4.7 |
| | |
| Volatility Measures | | |
| | MSCI | MSCI AC |
| | Emerging | World Index |
| | Markets Index | ex USA |
| R-Squared | 0.99 | 0.95 |
| Beta | 1.01 | 1.20 |
These measures show the degree and timing of the fund’s fluctuations compared with the indexes over 36 months.
| | |
| Ten Largest Holdings (% of total net assets) |
| |
| Petroleo Brasileiro SA | Integrated Oil & | |
| ADR | Gas | 3.1% |
| Vale SA | Steel | 2.7 |
| Samsung Electronics Co. | Semiconductors | |
| Ltd. | | 2.3 |
| China Mobile Ltd. | Wireless | |
| | Telecommunication | |
| | Services | 1.7 |
| Gazprom OAO | Integrated Oil & | |
| | Gas | 1.6 |
| America Movil SAB de | Wireless | |
| CV | Telecommunication | |
| | Services | 1.6 |
| Itau Unibanco Holding | Diversified Banks | |
| SA | | 1.5 |
| Industrial & Commercial | Diversified Banks | |
| Bank of China | | 1.2 |
| China Construction Bank | Diversified Banks | |
| Corp. | | 1.2 |
| CNOOC Ltd. | Oil & Gas | |
| | Exploration & | |
| | Production | 1.0 |
| Top Ten | | 17.9% |
The holdings listed exclude any temporary cash investments and equity index products.
1 The expense ratios shown are from the prospectus dated February 26, 2010, and represent estimated costs for the current fiscal year. For the fiscal year ended October 31, 2010, the expense ratios were 0.35% for Investor Shares, 0.22% for Admiral Shares, 0.22% for Signal Shares, 0.15% for Institutional Shares, and 0.22% for ETF Shares.
55
Emerging Markets Stock Index Fund
| | | |
| Market Diversification (% of equity exposure) |
| | | MSCI | MSCI AC |
| | | Emerging | World |
| | | Markets | Index |
| | Fund | Index | ex USA |
| Europe | 0.0% | 0.0% | 45.1% |
| Pacific | 0.0% | 0.0% | 23.3% |
| Emerging Markets | | | |
| China | 18.4% | 18.2% | 4.3% |
| Brazil | 16.3 | 16.3 | 3.8 |
| South Korea | 13.2 | 13.2 | 3.1 |
| Taiwan | 10.6 | 10.6 | 2.5 |
| India | 8.1 | 8.1 | 1.9 |
| South Africa | 7.4 | 7.4 | 1.8 |
| Russia | 6.2 | 6.1 | 1.4 |
| Mexico | 4.4 | 4.4 | 1.0 |
| Malaysia | 2.9 | 2.9 | 0.7 |
| Indonesia | 2.5 | 2.4 | 0.6 |
| Turkey | 1.9 | 1.9 | 0.4 |
| Thailand | 1.7 | 1.7 | 0.4 |
| Chile | 1.7 | 1.7 | 0.4 |
| Poland | 1.6 | 1.6 | 0.4 |
| Other | 3.1 | 3.5 | 1.3 |
| Subtotal | 100.0% | 100.0% | 24.0% |
| North America | 0.0% | 0.0% | 7.6% |
56
Emerging Markets Stock Index Fund
Performance Summary
All of the returns in this report represent past performance, which is not a guarantee of future results that may be achieved by the fund. (Current performance may be lower or higher than the performance data cited. For performance data current to the most recent month-end, visit our website at vanguard.com/performance.) Note, too, that both investment returns and principal value can fluctuate widely, so an investor’s shares, when sold, could be worth more or less than their original cost. The returns shown do not reflect taxes that a shareholder would pay on fund distributions or on the sale of fund shares.
Cumulative Performance: October 31, 2000, Through October 31, 2010
Initial Investment of $10,000
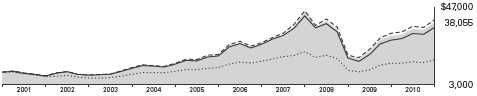
| | | | |
| | Average Annual Total Returns | |
| | Periods Ended October 31, 2010 | |
| | | | | Final Value |
| | One | Five | Ten | of a $10,000 |
| | Year | Years | Years | Investment |
| Emerging Markets Stock Index Fund | | | | |
| Investor Shares | 23.98% | 14.10% | 14.30% | $38,055 |
| MSCI All Country World Index ex USA | 13.08 | 6.21 | 5.46 | 17,012 |
| Spliced Emerging Markets Index | 23.56 | 14.64 | 14.78 | 39,702 |
| Emerging Markets Funds Average | 25.61 | 12.98 | 13.48 | 35,422 |
Spliced Emerging Markets Index: Select Emerging Markets Index, administered exclusively for Vanguard by MSCI, through August 23, 2006; MSCI Emerging Markets Index thereafter. Index returns are adjusted for withholding taxes applicable to Luxembourg holding companies.
Emerging Markets Funds Average: Derived from data provided by Lipper Inc.
Vanguard fund returns are adjusted to reflect the 0.50% purchase fee and the 0.25% redemption fee. The fees do not apply to the ETF Shares. In the final table, non-adjusted returns are shown along with the fee-adjusted returns.
See Financial Highlights for dividend and capital gains information.
57
| | | |
| Emerging Markets Stock Index Fund | | | |
| |
| |
| |
| |
| | Average Annual Total Returns | |
| | Periods Ended October 31, 2010 | |
| | | Since | Final Value |
| | One | Inception | of a $10,000 |
| | Year | (6/23/2006) | Investment |
| Emerging Markets Stock Index | | | |
| Fund Admiral Shares | 24.15% | 13.18% | $17,146 |
| MSCI All Country World Index ex | | | |
| USA | 13.08 | 4.05 | 11,889 |
| Spliced Emerging Markets Index | 23.56 | 13.35 | 17,262 |
| "Since Inception" performance is calculated from the Admiral Shares’ inception date for both the fund and its comparative standards. |
| | | |
| | | Since | Final Value |
| | One | Inception | of a $1,000,000 |
| | Year | (1/19/2007) | Investment |
| Emerging Markets Stock Index | | | |
| Fund Signal Shares | 24.11% | 7.92% | $1,333,838 |
| MSCI All Country World Index ex | | | |
| USA | 13.08 | -0.46 | 982,859 |
| MSCI Emerging Markets Index | 23.56 | 8.16 | 1,345,443 |
| "Since Inception" performance is calculated from the Signal Shares’ inception date for both the fund and its comparative standards. |
| | | | |
| | | | | Final Value |
| | One | Five | Ten | of a $5,000,000 |
| | Year | Years | Years | Investment |
| Emerging Markets Stock Index | | | | |
| Fund Institutional Shares | 24.20% | 14.30% | 14.48% | $19,337,231 |
| MSCI All Country World Index ex | | | | |
| USA | 13.08 | 6.21 | 5.46 | 8,506,155 |
| Spliced Emerging Markets Index | 23.56 | 14.64 | 14.78 | 19,851,204 |
| | | | |
| | | | Since | Final Value |
| | One | Five | Inception | of a $10,000 |
| | Year | Years | (3/4/2005) | Investment |
| Emerging Markets Stock Index Fund | | | | |
| ETF Shares Net Asset Value | 25.07% | 14.40% | 13.80% | $20,784 |
| MSCI All Country World Index ex USA | 13.08 | 6.21 | 6.16 | 14,025 |
| Spliced Emerging Markets Index | 23.56 | 14.64 | 14.04 | 21,034 |
| "Since Inception" performance is calculated from the ETF Shares’ inception date for both the fund and its comparative standards. |
Vanguard fund returns are adjusted to reflect the 0.50% purchase fee and the 0.25% redemption fee. The fees do not apply to the ETF Shares.
In the final table, non-adjusted returns are shown along with the fee-adjusted returns.
58
| | | |
| Emerging Markets Stock Index Fund | | | |
| |
| |
| |
| |
| Cumulative Returns of ETF Shares: March 4, 2005, Through October 31, 2010 | | |
| | | | Since |
| | One | Five | Inception |
| | Year | Years | (3/4/2005) |
| Emerging Markets Stock Index Fund | | | |
| ETF Shares Market Price | 26.34% | 93.86% | 108.45% |
| Emerging Markets Stock Index Fund | | | |
| ETF Shares Net Asset Value | 25.07 | 95.97 | 107.84 |
| Spliced Emerging Markets Index | 23.56 | 98.04 | 110.34 |
| "Since Inception" performance is calculated from the ETF Shares’ inception date for both the fund and its comparative standards. | |
Fiscal-Year Total Returns (%): October 31, 2000, Through October 31, 2010
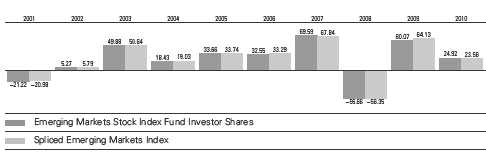
Vanguard fund returns are adjusted to reflect the 0.50% purchase fee and the 0.25% redemption fee. The fees do not apply to the ETF Shares.
In the final table, non-adjusted returns are shown along with the fee-adjusted returns.
59
Emerging Markets Stock Index Fund
Average Annual Total Returns: Periods Ended September 30, 2010
This table presents average annual total returns through the latest calendar quarter—rather than through the end of the fiscal period. Securities and Exchange Commission rules require that we provide this information.
| | | | |
| | Inception | One | Five | Ten |
| | Date | Year | Years | Years |
| Investor Shares | 5/4/1994 | 19.66% | 12.06% | 13.15% |
| Fee-Adjusted Returns | | 18.77 | 11.90 | 13.07 |
| Admiral Shares | 6/23/2006 | 19.83 | — | 12.681 |
| Fee-Adjusted Returns | | 18.94 | — | 12.681 |
| Signal Shares | 1/19/2007 | 19.84 | — | 7.261 |
| Fee-Adjusted Returns | | 18.94 | — | 7.261 |
| Institutional Shares | 6/22/2000 | 19.93 | 12.26 | 13.33 |
| Fee-Adjusted Returns | | 19.03 | 12.10 | 13.25 |
| ETF Shares | 3/4/2005 | | | |
| Market Price | | 19.34 | 12.14 | 13.451 |
| Net Asset Value | | 19.81 | 12.20 | 13.421 |
| 1 Return since inception. | | | | |
Vanguard fund returns are adjusted to reflect the 0.50% purchase fee and the 0.25% redemption fee. The fees do not apply to the ETF Shares.
In the final table, non-adjusted returns are shown along with the fee-adjusted returns.
60
Emerging Markets Stock Index Fund
Financial Statements
Statement of Net Assets—Investments Summary
As of October 31, 2010
This Statement summarizes the fund’s holdings by asset type. Details are reported for each of the fund’s 50 largest individual holdings and for investments that, in total for any issuer, represent more than 1% of the fund’s net assets. The total value of smaller holdings is reported as a single amount within each category.
The fund reports a complete list of its holdings in regulatory filings four times in each fiscal year, at the quarter-ends. For the second and fourth fiscal quarters, the complete listing of the fund’s holdings is available electronically on vanguard.com and on the Securities and Exchange Commission’s website (sec.gov), or you can have it mailed to you without charge by calling 800-662-7447. For the first and third fiscal quarters, the fund files the lists with the SEC on Form N-Q. Shareholders can look up the fund’s Forms N-Q on the SEC’s website. Forms N-Q may also be reviewed and copied at the SEC’s Public Reference Room (see the back cover of this report for further information).
| | | |
| | | Market | Percentage |
| | | Value | of Net |
| | Shares | ($000) | Assets |
| Common Stocks | | | |
| Brazil | | | |
| Itau Unibanco Holding SA ADR | 23,714,644 | 582,432 | 1.0% |
| Vale SA Class B Pfd. ADR | 20,271,783 | 582,408 | 1.0% |
| Petroleo Brasileiro SA ADR Type A | 17,282,179 | 539,031 | 1.0% |
| Petroleo Brasileiro SA ADR | 12,812,721 | 437,170 | 0.8% |
| Petroleo Brasileiro SA Prior Pfd. | 27,963,628 | 425,794 | 0.8% |
| Vale SA Class B ADR | 12,891,533 | 414,334 | 0.7% |
| Banco Bradesco SA ADR | 17,583,082 | 365,728 | 0.7% |
| Petroleo Brasileiro SA | 19,207,388 | 321,836 | 0.6% |
| Vale SA Prior Pfd. | 10,227,777 | 287,230 | 0.5% |
| Itau Unibanco Holding SA Prior Pfd. | 10,971,176 | 265,198 | 0.5% |
| Itausa - Investimentos Itau SA Prior Pfd. | 33,842,634 | 264,921 | 0.5% |
| OGX Petroleo e Gas Participacoes SA | 19,250,552 | 251,685 | 0.5% |
| BM&FBovespa SA | 29,176,743 | 243,325 | 0.4% |
| Banco Bradesco SA Prior Pfd. | 11,088,731 | 227,214 | 0.4% |
| Vale SA | 6,971,838 | 219,574 | 0.4% |
| Brazil—Other † | | 3,576,818 | 6.5% |
| | | 9,004,698 | 16.3% |
| |
| Chile † | | 940,317 | 1.7% |
| |
| China | | | |
| China Mobile Ltd. | 90,936,667 | 928,674 | 1.7% |
| Industrial & Commercial Bank of China | 816,874,659 | 659,948 | 1.2% |
| China Construction Bank Corp. | 679,549,493 | 649,652 | 1.2% |
| CNOOC Ltd. | 270,663,552 | 565,069 | 1.0% |
| Bank of China Ltd. | 860,144,525 | 516,630 | 0.9% |
| China Life Insurance Co. Ltd. | 112,980,470 | 496,694 | 0.9% |
61
| | | |
| Emerging Markets Stock Index Fund | | | |
| |
| |
| |
| | | Market | Percentage |
| | | Value | of Net |
| | Shares | ($000) | Assets |
| PetroChina Co. Ltd. | 320,201,679 | 394,147 | 0.7% |
| Tencent Holdings Ltd. | 15,187,372 | 349,118 | 0.6% |
| Ping An Insurance Group Co. of China Ltd. | 25,272,488 | 273,239 | 0.5% |
| China Shenhua Energy Co. Ltd. | 51,666,825 | 230,654 | 0.4% |
| China Petroleum & Chemical Corp. | 242,217,540 | 230,461 | 0.4% |
| China—Other † | | 4,834,673 | 8.8% |
| | | 10,128,959 | 18.3% |
| Colombia�� | | | |
| BanColombia SA ADR | 4,267,557 | 287,847 | 0.5% |
| Colombia—Other † | | 64,181 | 0.1% |
| | | 352,028 | 0.6% |
| |
| Czech Republic † | | 215,937 | 0.4% |
| |
| Egypt † | | 147,918 | 0.3% |
| |
| Hungary † | | 249,483 | 0.5% |
| |
| India | | | |
| Reliance Industries Ltd. | 19,567,613 | 483,248 | 0.9% |
| Infosys Technologies Ltd. | 6,866,715 | 460,483 | 0.8% |
| ICICI Bank Ltd. | 9,903,835 | 260,759 | 0.5% |
| Housing Development Finance Corp. | 15,986,525 | 247,755 | 0.4% |
| India—Other † | | 3,037,229 | 5.5% |
| | | 4,489,474 | 8.1% |
| |
| Indonesia † | | 1,351,955 | 2.4% |
| |
| Malaysia † | | 1,581,704 | 2.9% |
| |
| Mexico | | | |
| America Movil SAB de CV | 300,677,798 | 862,001 | 1.5% |
| Wal-Mart de Mexico SAB de CV | 93,882,592 | 256,831 | 0.5% |
| Mexico—Other † | | 1,330,020 | 2.4% |
| | | 2,448,852 | 4.4% |
| |
| Morocco † | | 16,692 | 0.0% |
| |
| Peru † | | 425,072 | 0.8% |
| |
| Philippines † | | 302,230 | 0.6% |
| |
| Poland † | | 891,194 | 1.6% |
| |
| Russia | | | |
| Gazprom OAO ADR | 35,670,340 | 781,004 | 1.4% |
| Sberbank of Russia | 128,160,315 | 420,755 | 0.8% |
| Lukoil OAO ADR | 7,090,228 | 395,386 | 0.7% |
| MMC Norilsk Nickel ADR | 11,827,090 | 220,106 | 0.4% |
| Russia—Other † | | 1,611,582 | 2.9% |
| | | 3,428,833 | 6.2% |
62
| | | | |
| Emerging Markets Stock Index Fund | | | | |
| |
| |
| |
| | | | Market | Percentage |
| | | | Value | of Net |
| | | Shares | ($000) | Assets |
| South Africa | | | | |
| MTN Group Ltd. | | 24,980,303 | 449,395 | 0.8% |
| Sasol Ltd. | | 8,679,097 | 390,840 | 0.7% |
| Naspers Ltd. | | 5,844,423 | 306,553 | 0.5% |
| AngloGold Ashanti Ltd. | | 5,724,840 | 268,497 | 0.5% |
| Standard Bank Group Ltd. | | 17,800,168 | 261,943 | 0.5% |
| South Africa—Other † | | | 2,422,416 | 4.4% |
| | | | 4,099,644 | 7.4% |
| South Korea | | | | |
| Samsung Electronics Co. Ltd. GDR | | 1,966,103 | 656,234 | 1.2% |
| Samsung Electronics Co. Ltd. | | 688,157 | 456,541 | 0.8% |
| Hyundai Motor Co. | | 2,303,694 | 348,744 | 0.6% |
| POSCO ADR | | 2,819,855 | 293,096 | 0.5% |
| Hyundai Mobis | | 1,016,507 | 253,142 | 0.5% |
| Samsung Electronics Co. Ltd. Prior Pfd. | | 305,925 | 150,327 | 0.3% |
| South Korea—Other † | | | 5,107,275 | 9.2% |
| | | | 7,265,359 | 13.1% |
| Taiwan | | | | |
| Taiwan Semiconductor Manufacturing Co. Ltd. ADR | | 44,642,101 | 487,045 | 0.9% |
| Hon Hai Precision Industry Co. Ltd. | | 127,464,588 | 482,076 | 0.9% |
| Taiwan Semiconductor Manufacturing Co. Ltd. | | 144,474,045 | 297,228 | 0.5% |
| HTC Corp. | | 10,153,480 | 230,254 | 0.4% |
| Taiwan—Other † | | | 4,267,406 | 7.7% |
| | | | 5,764,009 | 10.4% |
| |
| Thailand † | | | 945,609 | 1.7% |
| |
| Turkey † | | | 1,036,068 | 1.9% |
| Total Common Stocks (Cost $43,265,508) | | | 55,086,035 | 99.6%1 |
| |
| | Coupon | | | |
| Temporary Cash Investments | | | | |
| Money Market Fund | | | | |
| 2,3 Vanguard Market Liquidity Fund | 0.237% | 667,070,820 | 667,071 | 1.2% |
| |
| 4U.S. Government and Agency Obligations † | | | 5,197 | 0.0% |
| Total Temporary Cash Investments (Cost $672,268) | | | 672,268 | 1.2%1 |
| 5Total Investments (Cost $43,937,776) | | | 55,758,303 | 100.8% |
| Other Assets and Liabilities | | | | |
| Other Assets | | | 296,135 | 0.5% |
| Liabilities3 | | | (762,138) | (1.3%) |
| | | | (466,003) | (0.8%) |
| Net Assets | | | 55,292,300 | 100.0% |
63
| |
| Emerging Markets Stock Index Fund | |
| |
| |
| At October 31, 2010, net assets consisted of: | |
| | Amount |
| | ($000) |
| Paid-in Capital | 45,438,627 |
| Undistributed Net Investment Income | 651,499 |
| Accumulated Net Realized Losses | (2,618,276) |
| Unrealized Appreciation (Depreciation) | |
| Investment Securities | 11,820,527 |
| Futures Contracts | 101 |
| Foreign Currencies | (178) |
| Net Assets | 55,292,300 |
| |
| Investor Shares—Net Assets | |
| Applicable to 189,826,680 outstanding $.001 par value shares of | |
| beneficial interest (unlimited authorization) | 5,597,066 |
| Net Asset Value Per Share—Investor Shares | $29.49 |
| |
| Admiral Shares—Net Assets | |
| Applicable to 122,652,135 outstanding $.001 par value shares of | |
| beneficial interest (unlimited authorization) | 4,761,105 |
| Net Asset Value Per Share—Admiral Shares | $38.82 |
| |
| Signal Shares—Net Assets | |
| Applicable to 17,238,508 outstanding $.001 par value shares of | |
| beneficial interest (unlimited authorization) | 643,739 |
| Net Asset Value Per Share—Signal Shares | $37.34 |
| |
| Institutional Shares—Net Assets | |
| Applicable to 117,532,591 outstanding $.001 par value shares of | |
| beneficial interest (unlimited authorization) | 3,473,373 |
| Net Asset Value Per Share—Institutional Shares | $29.55 |
| |
| ETF Shares—Net Assets | |
| Applicable to 874,114,996 outstanding $.001 par value shares of | |
| beneficial interest (unlimited authorization) | 40,817,017 |
| Net Asset Value Per Share—ETF Shares | $46.70 |
See Note A in Notes to Financial Statements.
† Represents the aggregate value, by category, of securities that are not among the 50 largest holdings and, in total for any issuer, represent 1% or less of net assets.
1 The fund invests a portion of its cash reserves in equity markets through the use of index futures contracts. After giving effect to futures investments, the fund’s effective common stock and temporary cash investment positions represent 99.7% and 1.1%, respectively, of net assets.
2 Affiliated money market fund available only to Vanguard funds and certain trusts and accounts managed by Vanguard. Rate shown is the 7-day yield.
3 Includes $628,018,000 of collateral received for securities on loan.
4 Securities with a value of $3,438,000 have been segregated as initial margin for open futures contracts.
5 The total value of securities on loan is $585,466,000.
ADR—American Depositary Receipt.
GDR—Global Depositary Receipt.
See accompanying Notes, which are an integral part of the Financial Statements.
64
| |
| Emerging Markets Stock Index Fund | |
| |
| |
| |
| Statement of Operations | |
| |
| |
| | Year Ended |
| | October 31, 2010 |
| | ($000) |
| Investment Income | |
| Income | |
| Dividends1 | 896,585 |
| Interest2 | 261 |
| Security Lending | 11,419 |
| Total Income | 908,265 |
| Expenses | |
| The Vanguard Group—Note B | |
| Investment Advisory Services | 1,741 |
| Management and Administrative—Investor Shares | 20,389 |
| Management and Administrative—Admiral Shares | 4,328 |
| Management and Administrative—Signal Shares | 716 |
| Management and Administrative—Institutional Shares | 1,576 |
| Management and Administrative—ETF Shares | 33,369 |
| Marketing and Distribution—Investor Shares | 2,093 |
| Marketing and Distribution—Admiral Shares | 541 |
| Marketing and Distribution—Signal Shares | 142 |
| Marketing and Distribution—Institutional Shares | 608 |
| Marketing and Distribution—ETF Shares | 6,133 |
| Custodian Fees | 22,018 |
| Auditing Fees | 39 |
| Shareholders’ Reports—Investor Shares | 86 |
| Shareholders’ Reports—Admiral Shares | 2 |
| Shareholders’ Reports—Signal Shares | 1 |
| Shareholders’ Reports—Institutional Shares | — |
| Shareholders’ Reports—ETF Shares | 536 |
| Trustees’ Fees and Expenses | 57 |
| Total Expenses | 94,375 |
| Net Investment Income | 813,890 |
| Realized Net Gain (Loss) | |
| Investment Securities Sold | 563,457 |
| Futures Contracts | 9,459 |
| Swap Contracts | (5,222) |
| Foreign Currencies | (42,895) |
| Realized Net Gain (Loss) | 524,799 |
| Change in Unrealized Appreciation (Depreciation) | |
| Investment Securities | 7,919,706 |
| Futures Contracts | 2,977 |
| Swap Contracts | 4,604 |
| Foreign Currencies | (1,217) |
| Change in Unrealized Appreciation (Depreciation) | 7,926,070 |
| Net Increase (Decrease) in Net Assets Resulting from Operations | 9,264,759 |
1 Dividends are net of foreign withholding taxes of $107,342,000.
2 Interest income from an affiliated company of the fund was $241,000.
See accompanying Notes, which are an integral part of the Financial Statements.
65
| | |
| Emerging Markets Stock Index Fund | | |
| |
| |
| Statement of Changes in Net Assets | | |
| |
| | Year Ended October 31, |
| | 2010 | 2009 |
| | ($000) | ($000) |
| Increase (Decrease) in Net Assets | | |
| Operations | | |
| Net Investment Income | 813,890 | 378,503 |
| Realized Net Gain (Loss) | 524,799 | (1,254,331) |
| Change in Unrealized Appreciation (Depreciation) | 7,926,070 | 8,587,988 |
| Net Increase (Decrease) in Net Assets Resulting from Operations | 9,264,759 | 7,712,160 |
| Distributions | | |
| Net Investment Income | | |
| Investor Shares | (92,803) | (231,087) |
| Admiral Shares | (38,489) | (69,431) |
| Signal Shares | (6,752) | (12,807) |
| Institutional Shares | (26,615) | (45,949) |
| ETF Shares | (258,615) | (251,740) |
| Realized Capital Gain | | |
| Investor Shares | — | — |
| Admiral Shares | — | — |
| Signal Shares | — | — |
| Institutional Shares | — | — |
| ETF Shares | — | — |
| Total Distributions | (423,274) | (611,014) |
| Capital Share Transactions | | |
| Investor Shares | (3,150,495) | (309,416) |
| Admiral Shares | 1,436,817 | 333,668 |
| Signal Shares | 62,406 | 42,629 |
| Institutional Shares | 1,174,368 | 304,253 |
| ETF Shares | 19,499,494 | 7,449,732 |
| Net Increase (Decrease) from Capital Share Transactions | 19,022,590 | 7,820,866 |
| Total Increase (Decrease) | 27,864,075 | 14,922,012 |
| Net Assets | | |
| Beginning of Period | 27,428,225 | 12,506,213 |
| End of Period1 | 55,292,300 | 27,428,225 |
1 Net Assets—End of Period includes undistributed net investment income of $651,499,000 and $301,998,000.
See accompanying Notes, which are an integral part of the Financial Statements.
66
| | | | | |
| Emerging Markets Stock Index Fund | | | | | |
| |
| |
| Financial Highlights | | | | | |
| |
| Investor Shares | | | | | |
| |
| For a Share Outstanding | | | Year Ended October 31, |
| Throughout Each Period | 2010 | 2009 | 2008 | 2007 | 2006 |
| Net Asset Value, Beginning of Period | $23.90 | $15.66 | $36.78 | $22.05 | $16.91 |
| Investment Operations | | | | | |
| Net Investment Income | .5211 | .3981 | .780 | .6041 | .396 |
| Net Realized and Unrealized Gain (Loss) | | | | | |
| on Investments2 | 5.383 | 8.542 | (21.313) | 14.522 | 5.059 |
| Total from Investment Operations | 5.904 | 8.940 | (20.533) | 15.126 | 5.455 |
| Distributions | | | | | |
| Dividends from Net Investment Income | (.314) | (.700) | (.587) | (.396) | (.315) |
| Distributions from Realized Capital Gains | — | — | — | — | — |
| Total Distributions | (.314) | (.700) | (.587) | (.396) | (.315) |
| Net Asset Value, End of Period | $29.49 | $23.90 | $15.66 | $36.78 | $22.05 |
| |
| Total Return3 | 24.92% | 60.07% | -56.66% | 69.59% | 32.55% |
| |
| Ratios/Supplemental Data | | | | | |
| Net Assets, End of Period (Millions) | $5,597 | $7,024 | $5,345 | $14,150 | $7,202 |
| Ratio of Total Expenses to | | | | | |
| Average Net Assets | 0.35% | 0.40% | 0.32% | 0.37% | 0.42% |
| Ratio of Net Investment Income to | | | | | |
| Average Net Assets | 1.97% | 2.16% | 2.81% | 2.24% | 2.20% |
| Portfolio Turnover Rate4 | 12% | 12% | 20% | 9% | 26% |
1 Calculated based on average shares outstanding.
2 Includes increases from purchase and redemption fees of $.04, $.01, $.05, $.04, and $.05.
3 Total returns do not include transaction or account service fees that may have applied in the periods shown. Fund prospectuses provide information about any applicable transaction and account service fees.
4 Excludes the value of portfolio securities received or delivered as a result of in-kind purchases or redemptions of the fund’s capital shares, including ETF Creation Units.
See accompanying Notes, which are an integral part of the Financial Statements.
67
| | | | | |
| Emerging Markets Stock Index Fund | | | | | |
| |
| |
| Financial Highlights | | | | | |
| |
| Admiral Shares | | | | | |
| | | | | | |
| | | | | | June 23, |
| | | | 20061 to |
| For a Share Outstanding | | | Year Ended October 31, | Oct. 31, |
| Throughout Each Period | 2010 | 2009 | 2008 | 2007 | 2006 |
| Net Asset Value, Beginning of Period | $31.45 | $20.63 | $48.47 | $29.03 | $25.00 |
| Investment Operations | | | | | |
| Net Investment Income | .6962 | .5672 | 1.079 | .8532 | .222 |
| Net Realized and Unrealized Gain (Loss) | | | | | |
| on Investments3 | 7.119 | 11.222 | (28.099) | 19.121 | 3.808 |
| Total from Investment Operations | 7.815 | 11.789 | (27.020) | 19.974 | 4.030 |
| Distributions | | | | | |
| Dividends from Net Investment Income | (.445) | (.969) | (.820) | (.534) | — |
| Distributions from Realized Capital Gains | — | — | — | — | — |
| Total Distributions | (.445) | (.969) | (.820) | (.534) | — |
| Net Asset Value, End of Period | $38.82 | $31.45 | $20.63 | $48.47 | $29.03 |
| |
| Total Return4 | 25.08% | 60.29% | -56.63% | 69.82% | 16.12% |
| |
| Ratios/Supplemental Data | | | | | |
| Net Assets, End of Period (Millions) | $4,761 | $2,674 | $1,508 | $3,514 | $1,491 |
| Ratio of Total Expenses to | | | | | |
| Average Net Assets | 0.22% | 0.27% | 0.20% | 0.25% | 0.30%5 |
| Ratio of Net Investment Income to | | | | | |
| Average Net Assets | 2.10% | 2.29% | 2.93% | 2.36% | 2.32%5 |
| Portfolio Turnover Rate6 | 12% | 12% | 20% | 9% | 26% |
1 Inception.
2 Calculated based on average shares outstanding.
3 Includes increases from purchase and redemption fees of $.03, $.01, $.06, $.05, and $.04.
4 Total returns do not include transaction fees that may have applied in the periods shown. Fund prospectuses provide information about any applicable transaction fees.
5 Annualized.
6 Excludes the value of portfolio securities received or delivered as a result of in-kind purchases or redemptions of the fund’s capital shares, including ETF Creation Units.
See accompanying Notes, which are an integral part of the Financial Statements.
68
| | | | |
| Emerging Markets Stock Index Fund | | | | |
| |
| |
| Financial Highlights | | | | |
| |
| Signal Shares | | | | |
| | | | | Jan. 19, |
| | | | | 20071, to |
| | Year Ended October 31, | Oct. 31, |
| For a Share Outstanding Throughout Each Period | 2010 | 2009 | 2008 | 2007 |
| Net Asset Value, Beginning of Period | $30.26 | $19.85 | $46.61 | $30.38 |
| Investment Operations | | | | |
| Net Investment Income | .6902 | .5532 | 1.029 | .5802 |
| Net Realized and Unrealized Gain (Loss) on Investments3 | 6.818 | 10.795 | (27.029) | 15.650 |
| Total from Investment Operations | 7.508 | 11.348 | (26.000) | 16.230 |
| Distributions | | | | |
| Dividends from Net Investment Income | (.428) | (.938) | (.760) | — |
| Distributions from Realized Capital Gains | — | — | — | — |
| Total Distributions | (.428) | (.938) | (.760) | — |
| Net Asset Value, End of Period | $37.34 | $30.26 | $19.85 | $46.61 |
| |
| Total Return4 | 25.04% | 60.33% | -56.64% | 53.42% |
| |
| Ratios/Supplemental Data | | | | |
| Net Assets, End of Period (Millions) | $644 | $463 | $266 | $385 |
| Ratio of Total Expenses to Average Net Assets | 0.22% | 0.27% | 0.20% | 0.25%5 |
| Ratio of Net Investment Income to Average Net Assets | 2.10% | 2.29% | 2.93% | 2.36%5 |
| Portfolio Turnover Rate6 | 12% | 12% | 20% | 9% |
1 Inception.
2 Calculated based on average shares outstanding.
3 Includes increases from purchase and redemption fees of $.03, $.01, $.05, and $.01.
4 Total returns do not include transaction fees that may have applied in the periods shown. Fund prospectuses provide information about any applicable transaction fees.
5 Annualized.
6 Excludes the value of portfolio securities received or delivered as a result of in-kind purchases or redemptions of the fund’s capital shares, including ETF Creation Units.
See accompanying Notes, which are an integral part of the Financial Statements.
69
| | | | | |
| Emerging Markets Stock Index Fund | | | | | |
| |
| |
| Financial Highlights | | | | | |
| |
| Institutional Shares | | | | | |
| |
| For a Share Outstanding | | | Year Ended October 31, |
| Throughout Each Period | 2010 | 2009 | 2008 | 2007 | 2006 |
| Net Asset Value, Beginning of Period | $23.94 | $15.71 | $36.90 | $22.11 | $16.95 |
| Investment Operations | | | | | |
| Net Investment Income | .5711 | .4371 | .835 | .6861 | .443 |
| Net Realized and Unrealized Gain (Loss) | | | | | |
| on Investments2 | 5.388 | 8.547 | (21.393) | 14.533 | 5.059 |
| Total from Investment Operations | 5.959 | 8.984 | (20.558) | 15.219 | 5.502 |
| Distributions | | | | | |
| Dividends from Net Investment Income | (.349) | (.754) | (.632) | (.429) | (.342) |
| Distributions from Realized Capital Gains | — | — | — | — | — |
| Total Distributions | (.349) | (.754) | (.632) | (.429) | (.342) |
| Net Asset Value, End of Period | $29.55 | $23.94 | $15.71 | $36.90 | $22.11 |
| |
| Total Return3 | 25.13% | 60.41% | -56.61% | 69.90% | 32.78% |
| |
| Ratios/Supplemental Data | | | | | |
| Net Assets, End of Period (Millions) | $3,473 | $1,731 | $887 | $1,463 | $559 |
| Ratio of Total Expenses to | | | | | |
| Average Net Assets | 0.15% | 0.23% | 0.15% | 0.20% | 0.25% |
| Ratio of Net Investment Income to | | | | | |
| Average Net Assets | 2.17% | 2.33% | 2.98% | 2.41% | 2.37% |
| Portfolio Turnover Rate4 | 12% | 12% | 20% | 9% | 26% |
1 Calculated based on average shares outstanding.
2 Includes increases from purchase and redemption fees of $.02, $.01, $.03, $.04, and $.05.
3 Total returns do not include transaction fees that may have applied in the periods shown. Fund prospectuses provide information about any applicable transaction fees.
4 Excludes the value of portfolio securities received or delivered as a result of in-kind purchases or redemptions of the fund’s capital shares, including ETF Creation Units.
See accompanying Notes, which are an integral part of the Financial Statements.
70
| | | | | |
| Emerging Markets Stock Index Fund | | | | | |
| |
| |
| Financial Highlights | | | | | |
| |
| ETF Shares | | | | | |
| |
| For a Share Outstanding | | | Year Ended October 31, |
| Throughout Each Period | 2010 | 2009 | 20081 | 20071 | 20061 |
| Net Asset Value, Beginning of Period | $37.84 | $24.83 | $58.31 | $34.96 | $26.81 |
| Investment Operations | | | | | |
| Net Investment Income | .8702 | .6682 | 1.303 | 1.0652 | .667 |
| Net Realized and Unrealized Gain (Loss) | | | | | |
| on Investments3 | 8.535 | 13.520 | (33.798) | 22.955 | 8.022 |
| Total from Investment Operations | 9.405 | 14.188 | (32.495) | 24.020 | 8.689 |
| Distributions | | | | | |
| Dividends from Net Investment Income | (.545) | (1.178) | (.985) | (.670) | (.539) |
| Distributions from Realized Capital Gains | — | — | — | — | — |
| Total Distributions | (.545) | (1.178) | (.985) | (.670) | (.539) |
| Net Asset Value, End of Period | $46.70 | $37.84 | $24.83 | $58.31 | $34.96 |
| |
| Total Return | 25.07% | 60.28% | -56.62% | 69.78% | 32.74% |
| |
| Ratios/Supplemental Data | | | | | |
| Net Assets, End of Period (Millions) | $40,817 | $15,537 | $4,500 | $6,275 | $1,582 |
| Ratio of Total Expenses to | | | | | |
| Average Net Assets | 0.22% | 0.27% | 0.20% | 0.25% | 0.30% |
| Ratio of Net Investment Income to | | | | | |
| Average Net Assets | 2.10% | 2.29% | 2.93% | 2.36% | 2.32% |
| Portfolio Turnover Rate4 | 12% | 12% | 20% | 9% | 26% |
1 Adjusted to reflect a 2-for-1 share split as of the close of business on June 13, 2008.
2 Calculated based on average shares outstanding.
3 Includes increases from purchase and redemption fees of $.03, $.01, $.05, $.10 and $.10.
4 Excludes the value of portfolio securities received or delivered as a result of in-kind purchases or redemptions of the fund’s capital shares, including ETF Creation Units.
See accompanying Notes, which are an integral part of the Financial Statements.
71
Emerging Markets Stock Index Fund
Notes to Financial Statements
Vanguard Emerging Markets Stock Index Fund is registered under the Investment Company Act of 1940 as an open-end investment company, or mutual fund. The fund invests in securities of foreign issuers, which may subject it to investment risks not normally associated with investing in securities of U.S. corporations. The fund offers five classes of shares: Investor Shares, Admiral Shares, Signal Shares, Institutional Shares, and ETF Shares. Investor Shares are available to any investor who meets the fund’s minimum purchase requirements. Admiral Shares, Signal Shares, and Institutional Shares are designed for investors who meet certain administrative, service, and account-size criteria. ETF Shares are listed for trading on the NYSE Arca, Inc.; they can be purchased and sold through a broker.
A. The following significant accounting policies conform to generally accepted accounting principles for U.S. mutual funds. The fund consistently follows such policies in preparing its financial statements.
1. Security Valuation: Securities are valued as of the close of trading on the New York Stock Exchange (generally 4 p.m., Eastern time) on the valuation date. Equity securities are valued at the latest quoted sales prices or official closing prices taken from the primary market in which each security trades; such securities not traded on the valuation date are valued at the mean of the latest quoted bid and asked prices. Securities for which market quotations are not readily available, or whose values have been affected by events occurring before the fund’s pricing time but after the close of the securities’ primary markets, are valued at their fair values calculated according to procedures adopted by the board of trustees. These procedures include obtaining quotations from an independent pricing service, monitoring news to identify significant market- or security-specific events, and evaluating changes in the values of foreign market proxies (for example, A DRs, futures contracts, or exchange-traded funds), between the time the foreign markets close and the fund’s pricing time. When fair-value pricing is employed, the prices of securities used by a fund to calculate its net asset value may differ from quoted or published prices for the same securities. Investments in Vanguard Market Liquidity Fund are valued at that fund’s net asset value. Temporary cash investments acquired over 60 days to maturity are valued using the latest bid prices or using valuations based on a matrix system (which considers such factors as security prices, yields, maturities, and ratings), both as furnished by independent pricing services. Other temporary cash investments are valued at amortized cost, which approximates market value.
2. Foreign Currency: Securities and other assets and liabilities denominated in foreign currencies are translated into U.S. dollars using exchange rates obtained from an independent third party as of the fund’s pricing time on the valuation date. Realized gains (losses) and unrealized appreciation (depreciation) on investment securities include the effects of changes in exchange rates since the securities were purchased, combined with the effects of changes in security prices. Fluctuations in the value of other assets and liabilities resulting from changes in exchange rates are recorded as unrealized foreign currency gains (losses) until the assets or liabilities are settled in cash, at which time they are recorded as realized foreign currency gains (losses).
3. Futures Contracts: The fund uses index futures contracts to a limited extent, with the objectives of maintaining full exposure to the stock market, enhancing returns, maintaining liquidity, and minimizing transaction costs. The fund may purchase futures contracts to immediately invest incoming cash in the market, or sell futures in response to cash outflows, thereby simulating a fully invested position in the underlying index while maintaining a cash balance for liquidity. The fund may seek to enhance returns by using futures contracts instead of the underlying securities when futures are believed to be priced more attractively than the underlying securities. The primary risks associated with the use of futures contracts are imperfect correlation between changes in market values of stocks held by the fund and the prices of futures contracts, and the possibility of an illiquid market.
72
Emerging Markets Stock Index Fund
Futures contracts are valued at their quoted daily settlement prices. The aggregate principal amounts of the contracts are not recorded in the Statement of Net Assets. Fluctuations in the value of the contracts are recorded in the Statement of Net Assets as an asset (liability) and in the Statement of Operations as unrealized appreciation (depreciation) until the contracts are closed, when they are recorded as realized futures gains (losses).
4. Swap Contracts: The fund has entered into equity swap contracts to earn the total return on selected stocks in the fund’s target index when investing through a swap provides a return advantage over buying the individual stocks. Under the terms of each swap, the fund receives the total return (either receiving the increase or paying the decrease) on a reference stock, applied to a notional amount that is the value of a designated number of shares of the stock at the beginning of the swap. The counterparty pays the fund a fixed rate less a specified interest rate spread that is based on short-term interest rates, applied to the notional amount. At the same time, the fund invests an amount approximating the notional amount of the swap in high-quality temporary cash investments.
The notional amounts of swap contracts are not recorded in the Statement of Net Assets. Swaps are valued daily and the change in value is recorded as unrealized appreciation (depreciation) until termination of the swap, at which time realized gain (loss) is recorded. The primary risks associated with the swaps are that a counterparty will default on its obligation to pay net amounts due to the fund, or that the fund will incur fees in the event it terminates a swap prior to the scheduled termination date. The fund’s maximum risk of loss from counterparty credit risk is the amount of unrealized appreciation on the swap contract. This risk is mitigated by entering into swaps only with highly rated counterparties, by a master netting arrangement between the fund and the counterparty, and by the posting of collateral by the counterparty. The swap contracts contain provisions whereby a counterparty may terminate open contracts if the fund’s net assets decline bel ow a certain level, triggering a payment by the fund if the fund is in a net liability position at the time of the termination. The payment amount would be reduced by any collateral the fund has posted. Any securities posted as collateral for open contracts are noted in the Statement of Net Assets.
The fund has no open swap contracts at October 31, 2010.
5. Federal Income Taxes: The fund intends to continue to qualify as a regulated investment company and distribute all of its taxable income. Management has analyzed the fund’s tax positions taken for all open federal income tax years (October 31, 2007–2010), and has concluded that no provision for federal income tax is required in the fund’s financial statements.
6. Distributions: Distributions to shareholders are recorded on the ex-dividend date.
7. Security Lending: The fund may lend its securities to qualified institutional borrowers to earn additional income. Security loans are required to be secured at all times by collateral at least equal to the market value of securities loaned. The fund invests cash collateral received in Vanguard Market Liquidity Fund, and records a liability for the return of the collateral, during the period the securities are on loan. Security lending income represents fees charged to borrowers plus income earned on investing cash collateral, less expenses associated with the loan.
8. Other: Dividend income is recorded on the ex-dividend date. Interest income includes income distributions received from Vanguard Market Liquidity Fund and is accrued daily. Security transactions are accounted for on the date securities are bought or sold. Costs used to determine realized gains (losses) on the sale of investment securities are those of the specific securities sold. Fees assessed on capital share transactions are credited to paid-in capital.
73
Emerging Markets Stock Index Fund
Each class of shares has equal rights as to assets and earnings, except that each class separately bears certain class-specific expenses related to maintenance of shareholder accounts (included in Management and Administrative expenses) and shareholder reporting. Marketing and distribution expenses are allocated to each class of shares based on a method approved by the board of trustees. Income, other non-class-specific expenses, and gains and losses on investments are allocated to each class of shares based on its relative net assets.
B. The Vanguard Group furnishes at cost investment advisory, corporate management, administrative, marketing, and distribution services. The costs of such services are allocated to the fund under methods approved by the board of trustees. The fund has committed to provide up to 0.40% of its net assets in capital contributions to Vanguard. At October 31, 2010, the fund had contributed capital of $9,466,000 to Vanguard (included in Other Assets), representing 0.02% of the fund’s net assets and 3.79% of Vanguard’s capitalization. The fund’s trustees and officers are also directors and officers of Vanguard.
C. Various inputs may be used to determine the value of the fund’s investments. These inputs are summarized in three broad levels for financial statement purposes. The inputs or methodologies used to value securities are not necessarily an indication of the risk associated with investing in those securities.
Level 1—Quoted prices in active markets for identical securities.
Level 2—Other significant observable inputs (including quoted prices for similar securities, interest rates, prepayment speeds, credit risk, etc.).
Level 3—Significant unobservable inputs (including the fund’s own assumptions used to determine the fair value of investments).
The following table summarizes the fund’s investments as of October 31, 2010, based on the inputs used to value them:
| | | |
| | Level 1 | Level 2 | Level 3 |
| Investments | ($000) | ($000) | ($000) |
| Common Stocks—North and South America | 13,170,967 | — | — |
| Common Stocks--Other | 2,116,606 | 39,798,462 | — |
| Temporary Cash Investments | 667,071 | 5,197 | — |
| Futures Contracts—Liabilities1 | (135) | — | — |
| Total | 15,954,509 | 39,803,659 | — |
| 1 Represents variation margin on the last day of the reporting period. | | | |
D. At October 31, 2010, the aggregate settlement value of open futures contracts and the related unrealized appreciation (depreciation) were:
| | | | |
| | | | | ($000) |
| | | | Aggregate | |
| | | Number of | Settlement | Unrealized |
| | | Long (Short) | Value | Appreciation |
| Futures Contracts | Expiration | Contracts | Long (Short) | (Depreciation) |
| MSCI Taiwan Index | November 2010 | 2,700 | 79,353 | 101 |
74
Emerging Markets Stock Index Fund
E. Distributions are determined on a tax basis and may differ from net investment income and realized capital gains for financial reporting purposes. Differences may be permanent or temporary. Permanent differences are reclassified among capital accounts in the financial statements to reflect their tax character. Temporary differences arise when certain items of income, expense, gain, or loss are recognized in different periods for financial statement and tax purposes; these differences will reverse at some time in the future. Differences in classification may also result from the treatment of short-term gains as ordinary income for tax purposes.
During the year ended October 31, 2010, the fund realized net foreign currency losses of $42,895,000, which decreased distributable net income for tax purposes; accordingly, such losses have been reclassified from accumulated net realized losses to undistributed net investment income.
Certain of the fund’s investments are in securities considered to be “passive foreign investment companies,” for which any unrealized appreciation and/or realized gains are required to be included in distributable net income for tax purposes. Unrealized appreciation of $17,309,000 on the fund’s passive foreign investment company holdings at October 31, 2009, has been distributed and is reflected in the balance of undistributed net investment income. During the year ended October 31, 2010, the fund realized gains on the sale of passive foreign investment companies of $1,782,0000, which have been included in current and prior periods’ taxable income; accordingly, such gains have been reclassified from accumulated net realized losses to undistributed net investment income. Since October 31, 2009, the fund’s passive foreign investment company holdings have appreciated in value, increasing the amount of taxable income available for distributio n as of October 31, 2010, by $111,764,000. Unrealized appreciation on the fund’s passive foreign investment company holdings at October 31, 2010, was $129,073,000.
The fund’s realized losses for the year ended October 31, 2010, include $2,000 of capital gain tax paid on sales of Peruvian securities. This tax is treated as a decrease to taxable income; accordingly, this amount has been reclassified from accumulated net realized losses to undistributed net investment income.
During the year ended October 31, 2010, the fund realized $949,063,000 of net capital gains resulting from in-kind redemptions—in which shareholders exchanged fund shares for securities held by the fund rather than for cash. Because such gains are not taxable to the fund, and are not distributed to shareholders, they have been reclassified from accumulated net realized losses to paid-in capital.
For tax purposes, at October 31, 2010, the fund had $824,940,000 of ordinary income available for distribution. The fund had available capital loss carryforwards totaling $2,447,495,000 to offset future net capital gains of $15,143,000 through October 31, 2012, $167,331,000 through October 31, 2014, $460,853,000 through October 31, 2016, $1,591,794,000 through October 31, 2017, and $212,374,000 through October 31, 2018.
At October 31, 2010, the cost of investment securities for tax purposes was $44,237,626,000. Net unrealized appreciation of investment securities for tax purposes was $11,520,677,000, consisting of unrealized gains of $13,042,472,000 on securities that had risen in value since their purchase and $1,521,795,000 in unrealized losses on securities that had fallen in value since their purchase.
F. During the year ended October 31, 2010, the fund purchased $25,709,777,000 of investment securities and sold $6,487,233,000 of investment securities, other than temporary cash investments.
75
Emerging Markets Stock Index Fund
G. Capital share transactions for each class of shares were:
| | | | | |
| | | | |
| | | | Year Ended October 31, |
| | | 2010 | | | 2009 |
| | Amount | Shares | Amount | Shares |
| | ($000) | (000) | ($000) | (000) |
| Investor Shares | | | | |
| Issued1 | 2,083,356 | 80,442 | 1,853,897 | 96,420 |
| Issued in Lieu of Cash Distributions | 88,603 | 3,492 | 223,214 | 15,577 |
| Redeemed2 | (5,322,454) | (187,996) | (2,386,527) | (159,509) |
| Net Increase (Decrease)—Investor Shares | (3,150,495) | (104,062) | (309,416) | (47,512) |
| Admiral Shares | | | | |
| Issued1 | 1,917,883 | 51,857 | 639,959 | 25,023 |
| Issued in Lieu of Cash Distributions | 33,549 | 1,006 | 60,382 | 3,205 |
| Redeemed2 | (514,615) | (15,208) | (366,673) | (16,316) |
| Net Increase (Decrease)—Admiral Shares | 1,436,817 | 37,655 | 333,668 | 11,912 |
| Signal Shares | | | | |
| Issued1 | 209,068 | 6,390 | 154,975 | 6,912 |
| Issued in Lieu of Cash Distributions | 5,772 | 180 | 11,476 | 633 |
| Redeemed2 | (152,434) | (4,641) | (123,822) | (5,646) |
| Net Increase (Decrease)—Signal Shares | 62,406 | 1,929 | 42,629 | 1,899 |
| Institutional Shares | | | | |
| Issued1 | 1,427,756 | 54,632 | 554,729 | 28,701 |
| Issued in Lieu of Cash Distributions | 16,645 | 656 | 28,341 | 1,978 |
| Redeemed2 | (270,033) | (10,041) | (278,817) | (14,848) |
| Net Increase (Decrease)—Institutional Shares | 1,174,368 | 45,247 | 304,253 | 15,831 |
| ETF Shares | | | | |
| Issued1 | 19,778,543 | 470,556 | 7,505,813 | 231,324 |
| Issued in Lieu of Cash Distributions | — | — | — | — |
| Redeemed2 | (279,049) | (7,000) | (56,081) | (2,000) |
| Net Increase (Decrease)—ETF Shares | 19,499,494 | 463,556 | 7,449,732 | 229,324 |
1 Includes purchase fees for fiscal 2010 and 2009 of $31,994,000 and $7,040,000, respectively (fund totals).
2 Net of redemption fees for fiscal 2010 and 2009 of $7,682,000 and $5,687,000, respectively (fund totals).
H. In preparing the financial statements as of October 31, 2010, management considered the impact of subsequent events for potential recognition or disclosure in these financial statements.
76
Report of Independent Registered Public Accounting Firm
To the Trustees of Vanguard International Equity Index Funds and the Shareholders of Vanguard European Stock Index Fund, Vanguard Pacific Stock Index Fund and Vanguard Emerging Markets Stock Index Fund:
In our opinion, the accompanying statements of net assets–investment summaries, and the related statements of operations and of changes in net assets and the financial highlights present fairly, in all material respects, the financial position of Vanguard European Stock Index Fund, Vanguard Pacific Stock Index Fund and Vanguard Emerging Markets Stock Index Fund (constituting three separate portfolios of Vanguard International Equity Index Funds, hereafter referred to as the “Funds”) at October 31, 2010, the results of each of their operations for the year then ended, the changes in each of their net assets for each of the two years in the period then ended and the financial highlights for each of the periods then ended, in conformity with accounting principles generally accepted in the United States of America. These financial statements and financial highlights (hereafter referred to as “financial statements”) are the responsibility of the Fu nds’ management; our responsibility is to express an opinion on these financial statements based on our audits. We conducted our audits of these financial statements in accordance with the standards of the Public Company Accounting Oversight Board (United States). Those standards require that we plan and perform the audit to obtain reasonable assurance about whether the financial statements are free of material misstatement. An audit includes examining, on a test basis, evidence supporting the amounts and disclosures in the financial statements, assessing the accounting principles used and significant estimates made by management, and evaluating the overall financial statement presentation. We believe that our audits, which included confirmation of securities at October 31, 2010 by correspondence with the custodian and brokers and by agreement to the underlying ownership records of Vanguard Market Liquidity Fund, provide a reasonable basis for our opinion.
PricewaterhouseCoopers LLP
Philadelphia, Pennsylvania
December 9, 2010
77
|
| Special 2010 tax information (unaudited) for Vanguard European Stock Index Fund |
This information for the fiscal year ended October 31, 2010, is included pursuant to provisions of the Internal Revenue Code.
The fund distributed $366,213,000 of qualified dividend income to shareholders during the fiscal year.
The fund designates to shareholders foreign source income of $382,738,000 and foreign taxes paid of $36,378,000. Shareholders will receive more detailed information with their Form 1099-DIV in January 2011 to determine the calendar year amounts to be included on their 2010 tax returns.
|
| Special 2010 tax information (unaudited) for Vanguard Pacific Stock Index Fund |
This information for the fiscal year ended October 31, 2010, is included pursuant to provisions of the Internal Revenue Code.
The fund distributed $121,966,000 of qualified dividend income to shareholders during the fiscal year.
The fund designates to shareholders foreign source income $168,838,000 and foreign taxes paid of $5,798,000. Shareholders will receive more detailed information with their Form 1099-DIV in January 2011 to determine the calendar year amounts to be included on their 2010 tax returns.
|
| Special 2010 tax information (unaudited) for Vanguard Emerging Markets Stock Index Fund |
This information for the fiscal year ended October 31, 2010, is included pursuant to provisions of the Internal Revenue Code.
The fund distributed $259,805,000 of qualified dividend income to shareholders during the fiscal year.
The fund designates to shareholders foreign source income $1,001,105,000 and foreign taxes paid of $104,896,000. Shareholders will receive more detailed information with their Form 1099-DIV in January 2011 to determine the calendar year amounts to be included on their 2010 tax returns.
78
Your Fund’s After-Tax Returns
This table presents returns for your fund both before and after taxes. The after-tax returns are shown in two ways: (1) assuming that an investor owned the fund during the entire period and paid taxes on the fund’s distributions, and (2) assuming that an investor paid taxes on the fund’s distributions and sold all shares at the end of each period.
Calculations are based on the highest individual federal income tax and capital gains tax rates in effect at the times of the distributions and the hypothetical sales. State and local taxes were not considered. After-tax returns reflect any qualified dividend income , using actual prior-year figures and estimates for 2010. (In the example, returns after the sale of fund shares may be higher than those assuming no sale. This occurs when the sale would have produced a capital loss. The calculation assumes that the investor received a tax deduction for the loss.)
The table shows returns for Investor Shares only; returns for other share classes will differ. Please note that your actual after-tax returns will depend on your tax situation and may differ from those shown. Also note that if you own the fund in a tax-deferred account, such as an individual retirement account or a 401(k) plan, this information does not apply to you. Such accounts are not subject to current taxes.
Finally, keep in mind that a fund’s performance—whether before or after taxes—does not guarantee future results.
Average Annual Total Returns: International Stock Index Funds
Periods Ended October 31, 2010
| | | |
| | One | Five | Ten |
| | Year | Years | Years |
| European Stock Index Fund Investor Shares | | | |
| Returns Before Taxes | 9.35% | 4.04% | 3.60% |
| Returns After Taxes on Distributions | 8.82 | 3.45 | 3.00 |
| Returns After Taxes on Distributions and Sale of Fund Shares | 6.89 | 3.43 | 2.91 |
| |
| | One | Five | Ten |
| | Year | Years | Years |
| Pacific Stock Index Fund Investor Shares | | | |
| Returns Before Taxes | 11.09% | 2.11% | 2.26% |
| Returns After Taxes on Distributions | 10.61 | 1.74 | 1.92 |
| Returns After Taxes on Distributions and Sale of Fund Shares | 7.67 | 1.75 | 1.82 |
| |
| | One | Five | Ten |
| | Year | Years | Years |
| Emerging Markets Stock Index Fund Investor Shares | | | |
| Returns Before Taxes | 23.98% | 14.10% | 14.30% |
| Returns After Taxes on Distributions | 23.76 | 13.73 | 13.82 |
| Returns After Taxes on Distributions and Sale of Fund Shares | 15.83 | 12.28 | 12.67 |
Returns for the Emerging Markets Stock Index Fund are adjusted to reflect the 0.50% purchase fee and the 0.25% redemption fee. Returns for the European and Pacific Stock Index Funds do not reflect the 2% fee on redemptions of shares held for less than two months.
79
About Your Fund’s Expenses
As a shareholder of the fund, you incur ongoing costs, which include costs for portfolio management, administrative services, and shareholder reports (like this one), among others. Operating expenses, which are deducted from a fund’s gross income, directly reduce the investment return of the fund.
A fund’s expenses are expressed as a percentage of its average net assets. This figure is known as the expense ratio. The following examples are intended to help you understand the ongoing costs (in dollars) of investing in your fund and to compare these costs with those of other mutual funds. The examples are based on an investment of $1,000 made at the beginning of the period shown and held for the entire period.
The accompanying table illustrates your fund’s costs in two ways:
• Based on actual fund return. This section helps you to estimate the actual expenses that you paid over the period. The ”Ending Account Value“ shown is derived from the fund‘s actual return, and the third column shows the dollar amount that would have been paid by an investor who started with $1,000 in the fund. You may use the information here, together with the amount you invested, to estimate the expenses that you paid over the period.
To do so, simply divide your account value by $1,000 (for example, an $8,600 account value divided by $1,000 = 8.6), then multiply the result by the number given for your fund under the heading ”Expenses Paid During Period.“
• Based on hypothetical 5% yearly return. This section is intended to help you compare your fund‘s costs with those of other mutual funds. It assumes that the fund had a yearly return of 5% before expenses, but that the expense ratio is unchanged. In this case—because the return used is not the fund’s actual return—the results do not apply to your investment. The example is useful in making comparisons because the Securities and Exchange Commission requires all mutual funds to calculate expenses based on a 5% return. You can assess your fund’s costs by comparing this hypothetical example with the hypothetical examples that appear in shareholder reports of other funds.
Note that the expenses shown in the table are meant to highlight and help you compare ongoing costs only and do not reflect transaction costs incurred by the fund for buying and selling securities. Further, the expenses do not include the transaction fees or the account service fee described in the prospectus. If such fees were applied to your account, your costs would be higher. Your fund does not carry a “sales load.”
The calculations assume no shares were bought or sold during the period. Your actual costs may have been higher or lower, depending on the amount of your investment and the timing of any purchases or redemptions.
You can find more information about the fund’s expenses, including annual expense ratios, in the Financial Statements section of this report. For additional information on operating expenses and other shareholder costs, please refer to your fund’s current prospectus.
80
| | | |
| Six Months Ended October 31, 2010 | | | |
| | Beginning | Ending | Expenses |
| | Account Value | Account Value | Paid During |
| | 4/30/2010 | 10/31/2010 | Period |
| Based on Actual Fund Return | | | |
| European Stock Index Fund | | | |
| Investor Shares | $1,000.00 | $1,093.00 | $1.37 |
| Admiral Shares | 1,000.00 | 1,093.67 | 0.74 |
| Signal Shares | 1,000.00 | 1,093.97 | 0.74 |
| Institutional Shares | 1,000.00 | 1,094.13 | 0.53 |
| ETF Shares | 1,000.00 | 1,093.48 | 0.74 |
| Pacific Stock Index Fund | | | |
| Investor Shares | $1,000.00 | $1,020.61 | $1.32 |
| Admiral Shares | 1,000.00 | 1,021.16 | 0.71 |
| Signal Shares | 1,000.00 | 1,021.17 | 0.71 |
| Institutional Shares | 1,000.00 | 1,021.57 | 0.51 |
| ETF Shares | 1,000.00 | 1,021.14 | 0.71 |
| Emerging Markets Stock Index Fund | | | |
| Investor Shares | $1,000.00 | $1,108.23 | $1.86 |
| Admiral Shares | 1,000.00 | 1,108.83 | 1.17 |
| Signal Shares | 1,000.00 | 1,108.67 | 1.17 |
| Institutional Shares | 1,000.00 | 1,108.82 | 0.80 |
| ETF Shares | 1,000.00 | 1,108.74 | 1.17 |
81
| | | |
| Six Months Ended October 31, 2010 | | | |
| | Beginning | Ending | Expenses |
| | Account Value | Account Value | Paid During |
| | 4/30/2010 | 10/31/2010 | Period |
| Based on Hypothetical 5% Yearly Return | | | |
| European Stock Index Fund | | | |
| Investor Shares | $1,000.00 | $1,023.89 | $1.33 |
| Admiral Shares | 1,000.00 | 1,024.50 | 0.71 |
| Signal Shares | 1,000.00 | 1,024.50 | 0.71 |
| Institutional Shares | 1,000.00 | 1,024.70 | 0.51 |
| ETF Shares | 1,000.00 | 1,024.50 | 0.71 |
| Pacific Stock Index Fund | | | |
| Investor Shares | $1,000.00 | $1,023.89 | $1.33 |
| Admiral Shares | 1,000.00 | 1,024.50 | 0.71 |
| Signal Shares | 1,000.00 | 1,024.50 | 0.71 |
| Institutional Shares | 1,000.00 | 1,024.70 | 0.51 |
| ETF Shares | 1,000.00 | 1,024.50 | 0.71 |
| Emerging Markets Stock Index Fund | | | |
| Investor Shares | $1,000.00 | $1,023.44 | $1.79 |
| Admiral Shares | 1,000.00 | 1,024.10 | 1.12 |
| Signal Shares | 1,000.00 | 1,024.10 | 1.12 |
| Institutional Shares | 1,000.00 | 1,024.45 | 0.77 |
| ETF Shares | 1,000.00 | 1,024.10 | 1.12 |
The calculations are based on expenses incurred in the most recent six-month period. The funds’ annualized six-month expense ratios for that period are: for the European Stock Index Fund, 0.26% for Investor Shares, 0.14% for Admiral Shares, 0.14% for Signal Shares, 0.10% for Institutional Shares, and 0.14% for ETF Shares; for the Pacific Stock Index Fund, 0.26% for Investor Shares, 0.14% for Admiral Shares, 0.14% for Signal Shares, 0.10% for Institutional Shares, and 0.14% for ETF Shares; and for the Emerging Markets Stock Index Fund, 0.35% for Investor Shares, 0.22% for Admiral Shares, 0.22% for Signal Shares, 0.15% for Institutional Shares, and 0.22% for ETF Shares. The dollar amounts shown as “Expenses Paid” are equal to the annualized expense ratio multiplied by the average account value over the period, multiplied by the number of days in the most recent six-month period, then divided by the number of days in the most recent 12-month period.
82
Glossary
Beta. A measure of the magnitude of a fund’s past share-price fluctuations in relation to the ups and downs of a given market index. The index is assigned a beta of 1.00. Compared with a given index, a fund with a beta of 1.20 typically would have seen its share price rise or fall by 12% when the index rose or fell by 10%. For this report, beta is based on returns over the past 36 months for both the fund and the index. Note that a fund’s beta should be reviewed in conjunction with its R-squared (see definition). The lower the R-squared, the less correlation there is between the fund and the index, and the less reliable beta is as an indicator of volatility.
Dividend Yield. Dividend income earned by stocks, expressed as a percentage of the aggregate market value (or of net asset value, for a fund). The yield is determined by dividing the amount of the annual dividends by the aggregate value (or net asset value) at the end of the period. For a fund, the dividend yield is based solely on stock holdings and does not include any income produced by other investments.
Equity Exposure. A measure that reflects a fund’s investments in stocks and stock futures. Any holdings in short-term reserves are excluded.
Expense Ratio. The percentage of a fund’s average net assets used to pay its annual administrative and advisory expenses. These expenses directly reduce returns to investors.
Inception Date. The date on which the assets of a fund (or one of its share classes) are first invested in accordance with the fund’s investment objective. For funds with a subscription period, the inception date is the day after that period ends. Investment performance is measured from the inception date.
Median Market Cap. An indicator of the size of companies in which a fund invests; the midpoint of market capitalization (market price x shares outstanding) of a fund’s stocks, weighted by the proportion of the fund’s assets invested in each stock. Stocks representing half of the fund’s assets have market capitalizations above the median, and the rest are below it.
Price/Book Ratio. The share price of a stock divided by its net worth, or book value, per share. For a fund, the weighted average price/book ratio of the stocks it holds.
Price/Earnings Ratio. The ratio of a stock’s current price to its per-share earnings over the past year. For a fund, the weighted average P/E of the stocks it holds. P/E is an indicator of market expectations about corporate prospects; the higher the P/E, the greater the expectations for a company’s future growth.
R-Squared. A measure of how much of a fund’s past returns can be explained by the returns from the market in general, as measured by a given index. If a fund’s total returns were precisely synchronized with an index’s returns, its R-squared would be 1.00. If the fund’s returns bore no relationship to the index’s returns, its R-squared would be 0. For this report, R-squared is based on returns over the past 36 months for both the fund and the index.
Return on Equity. The annual average rate of return generated by a company during the past five years for each dollar of shareholder’s equity (net income divided by shareholder’s equity). For a fund, the weighted average return on equity for the companies whose stocks it holds.
Short-Term Reserves. The percentage of a fund invested in highly liquid, short-term securities that can be readily converted to cash.
83
Turnover Rate. An indication of the fund’s trading activity. Funds with high turnover rates incur higher transaction costs and may be more likely to distribute capital gains (which may be taxable to investors). The turnover rate excludes in-kind transactions, which have minimal impact on costs.
84
This page intentionally left blank.
This page intentionally left blank.
This page intentionally left blank.
The People Who Govern Your Fund
The trustees of your mutual fund are there to see that the fund is operated and managed in your best interests since, as a shareholder, you are a part owner of the fund. Your fund’s trustees also serve on the board of directors of The Vanguard Group, Inc., which is owned by the Vanguard funds and provides services to them on an at-cost basis.
A majority of Vanguard’s board members are independent, meaning that they have no affiliation with Vanguard or the funds they oversee, apart from the sizable personal investments they have made as private individuals. The independent board members have distinguished backgrounds in business, academia, and public service. Each of the trustees and executive officers oversees 178 Vanguard funds.
The following table provides information for each trustee and executive officer of the fund. More information about the trustees is in the Statement of Additional Information, which can be obtained, without charge, by contacting Vanguard at 800-662-7447, or online at vanguard.com.
| |
| Interested Trustee1 | Amy Gutmann |
| | Born 1949. Trustee Since June 2006. Principal |
| F. William McNabb III | Occupation(s) During the Past Five Years: President |
| Born 1957. Trustee Since July 2009. Chairman of the | of the University of Pennsylvania; Christopher H. |
| Board. Principal Occupation(s) During the Past Five | Browne Distinguished Professor of Political Science |
| Years: Chairman of the Board of The Vanguard Group, | in the School of Arts and Sciences with secondary |
| Inc., and of each of the investment companies served | appointments at the Annenberg School for Commu- |
| by The Vanguard Group, since January 2010; Director | nication and the Graduate School of Education |
| of The Vanguard Group since 2008; Chief Executive | of the University of Pennsylvania; Director of |
| Officer and President of The Vanguard Group and of | Carnegie Corporation of New York, Schuylkill River |
| each of the investment companies served by The | Development Corporation, and Greater Philadelphia |
| Vanguard Group since 2008; Director of Vanguard | Chamber of Commerce; Trustee of the National |
| Marketing Corporation; Managing Director of The | Constitution Center; Chair of the Presidential |
| Vanguard Group (1995–2008) . | Commission for the Study of Bioethical Issues. |
| |
| | JoAnn Heffernan Heisen |
| Independent Trustees | Born 1950. Trustee Since July 1998. Principal |
| | Occupation(s) During the Past Five Years: Corporate |
| Emerson U. Fullwood | Vice President and Chief Global Diversity Officer |
| Born 1948. Trustee Since January 2008. Principal | since 2006 (retired 2008) and Member of the |
| Occupation(s) During the Past Five Years: Executive | Executive Committee (retired 2008) of Johnson & |
| Chief Staff and Marketing Officer for North America | Johnson (pharmaceuticals/consumer products); Vice |
| and Corporate Vice President (retired 2008) of Xerox | President and Chief Information Officer of Johnson & |
| Corporation (document management products and | Johnson (1997–2005); Director of the University |
| services); Director of SPX Corporation (multi-industry | Medical Center at Princeton and Women’s Research |
| manufacturing), the United Way of Rochester, | and Education Institute; Member of the Advisory |
| Amerigroup Corporation (managed health care), | Board of the Maxwell School of Citizenship and Public |
| the University of Rochester Medical Center, and | Affairs at Syracuse University. |
| Monroe Community College Foundation. | |
| | F. Joseph Loughrey |
| Rajiv L. Gupta | Born 1949. Trustee Since October 2009. Principal |
| Born 1945. Trustee Since December 2001.2 | Occupation(s) During the Past Five Years: President |
| Principal Occupation(s) During the Past Five Years: | and Chief Operating Officer since 2005 (retired 2009) |
| Chairman and Chief Executive Officer (retired 2009) | and Vice Chairman of the Board (2008–2009) of |
| and President (2006–2008) of Rohm and Haas Co. | Cummins Inc. (industrial machinery); Director of |
| (chemicals); Director of Tyco International, Ltd. | SKF AB (industrial machinery), Hillenbrand, Inc. |
| (diversified manufacturing and services) and Hewlett- | (specialized consumer services), Sauer-Danfoss Inc. |
| Packard Co. (electronic computer manufacturing); | (machinery), the Lumina Foundation for Education, |
| Trustee of The Conference Board; Member of the | and Oxfam America; Chairman of the Advisory |
| Board of Managers of Delphi Automotive LLP | Council for the College of Arts and Letters at the |
| (automotive components) . | University of Notre Dame. |
| | |
| André F. Perold | Kathryn J. Hyatt | |
| Born 1952. Trustee Since December 2004. Principal | Born 1955. Treasurer Since November 2008. Principal |
| Occupation(s) During the Past Five Years: George | Occupation(s) During the Past Five Years: Principal |
| Gund Professor of Finance and Banking at the Harvard | of The Vanguard Group, Inc.; Treasurer of each of |
| Business School; Chair of the Investment Committee | the investment companies served by The Vanguard |
| of HighVista Strategies LLC (private investment firm) . | Group since 2008; Assistant Treasurer of each of the |
| | investment companies served by The Vanguard Group |
| Alfred M. Rankin, Jr. | (1988–2008) . | |
| Born 1941. Trustee Since January 1993. Principal | | |
| Occupation(s) During the Past Five Years: Chairman, | Heidi Stam | |
| President, and Chief Executive Officer of NACCO | Born 1956. Secretary Since July 2005. Principal |
| Industries, Inc. (forklift trucks/housewares/lignite); | Occupation(s) During the Past Five Years: Managing |
| Director of Goodrich Corporation (industrial products/ | Director of The Vanguard Group, Inc., since 2006; |
| aircraft systems and services); Chairman of the | General Counsel of The Vanguard Group since 2005; |
| Federal Reserve Bank of Cleveland; Trustee of The | Secretary of The Vanguard Group and of each of the |
| Cleveland Museum of Art. | investment companies served by The Vanguard Group |
| | since 2005; Director and Senior Vice President of |
| Peter F. Volanakis | Vanguard Marketing Corporation since 2005; |
| Born 1955. Trustee Since July 2009. Principal | Principal of The Vanguard Group (1997–2006). |
| Occupation(s) During the Past Five Years: President | | |
| since 2007 and Chief Operating Officer since 2005 | | |
| of Corning Incorporated (communications equipment); | Vanguard Senior Management Team |
| President of Corning Technologies (2001–2005); | | |
| Director of Corning Incorporated and Dow Corning; | R. Gregory Barton | Michael S. Miller |
| Trustee of the Corning Incorporated Foundation and | Mortimer J. Buckley | James M. Norris |
| the Corning Museum of Glass; Overseer of the | Kathleen C. Gubanich | Glenn W. Reed |
| Amos Tuck School of Business Administration at | Paul A. Heller | George U. Sauter |
| Dartmouth College. | | |
| |
| | Chairman Emeritus and Senior Advisor |
| Executive Officers | | |
| | John J. Brennan | |
| Glenn Booraem | Chairman, 1996–2009 | |
| Born 1967. Controller Since July 2010. Principal | Chief Executive Officer and President, 1996–2008 |
| Occupation(s) During the Past Five Years: Principal | | |
| of The Vanguard Group, Inc.; Controller of each of | | |
| the investment companies served by The Vanguard | Founder | |
| Group since 2010; Assistant Controller of each of | | |
| the investment companies served by The Vanguard | John C. Bogle | |
| Group (2001–2010) . | Chairman and Chief Executive Officer, 1974–1996 |
| |
| Thomas J. Higgins | | |
| Born 1957. Chief Financial Officer Since September | | |
| 2008. Principal Occupation(s) During the Past Five | | |
| Years: Principal of The Vanguard Group, Inc.; Chief | | |
| Financial Officer of each of the investment companies | | |
| served by The Vanguard Group since 2008; Treasurer | | |
| of each of the investment companies served by The | | |
| Vanguard Group (1998–2008) . | | |
1 Mr. McNabb is considered an “interested person,” as defined in the Investment Company Act of 1940, because he is an officer of the Vanguard funds.
2 December 2002 for Vanguard Equity Income Fund, Vanguard Growth Equity Fund, the Vanguard Municipal Bond Funds, and the Vanguard State Tax-Exempt Funds.
| |
| P.O. Box 2600 |
| Valley Forge, PA 19482-2600 |
Connect with Vanguard® > vanguard.com
| |
| Fund Information > 800-662-7447 | The funds or securities referred to herein are not |
| Direct Investor Account Services > 800-662-2739 | sponsored, endorsed, or promoted by MSCI, and MSCI |
| Institutional Investor Services > 800-523-1036 | bears no liability with respect to any such funds or |
| Text Telephone for People | securities. For any such funds or securities, the |
| With Hearing Impairment > 800-749-7273 | prospectus or the Statement of Additional Information |
| | contains a more detailed description of the limited |
| | relationship MSCI has with The Vanguard Group and |
| This material may be used in conjunction | any related funds. |
| with the offering of shares of any Vanguard | |
| fund only if preceded or accompanied by | |
| the fund’s current prospectus. | |
| |
| All comparative mutual fund data are from Lipper Inc. or | |
| Morningstar, Inc., unless otherwise noted. | |
| |
| You can obtain a free copy of Vanguard’s proxy voting | |
| guidelines by visiting vanguard.com/proxyreporting or by | |
| calling Vanguard at 800-662-2739. The guidelines are | |
| also available from the SEC’s website, sec.gov. In | |
| addition, you may obtain a free report on how your fund | |
| voted the proxies for securities it owned during the 12 | |
| months ended June 30. To get the report, visit either | |
| vanguard.com/proxyreporting or sec.gov. | |
| |
| You can review and copy information about your fund at | |
| the SEC’s Public Reference Room in Washington, D.C. To | |
| find out more about this public service, call the SEC at | |
| 202-551-8090. Information about your fund is also | |
| available on the SEC’s website, and you can receive | |
| copies of this information, for a fee, by sending a | |
| request in either of two ways: via e-mail addressed to | |
| publicinfo@sec.gov or via regular mail addressed to the | |
| Public Reference Section, Securities and Exchange | |
| Commission, Washington, DC 20549-1520. | |
| |
| |
| | © 2010 The Vanguard Group, Inc. |
| | All rights reserved. |
| | Vanguard Marketing Corporation, Distributor. |
| |
| | Q720 122010 |
 |
| Vanguard Total World Stock Index Fund |
| Annual Report |
|
| October 31, 2010 |
 |
> For the fiscal year ended October 31, 2010, Vanguard Total World Stock Index Fund returned about 15%, in line with the average return of its global peer group.
> Stock markets around the world wrapped up the period with a strong rally. Emerging markets again outpaced developed markets, including the United States.
> As the global economic recovery continued, the consumer discretionary, industrial, and materials sectors were among the best performers. All ten sectors posted gains.
| |
| Contents | |
| Your Fund’s Total Returns. | 1 |
| Chairman’s Letter. | 2 |
| Fund Profile. | 8 |
| Performance Summary. | 10 |
| Financial Statements. | 13 |
| Your Fund’s After-Tax Returns. | 57 |
| About Your Fund’s Expenses. | 58 |
| Glossary. | 60 |
Please note: The opinions expressed in this report are just that—informed opinions. They should not be considered promises or advice. Also, please keep in mind that the information and opinions cover the period through the date on the front of this report. Of course, the risks of investing in your fund are spelled out in the prospectus.
See the Glossary for definitions of investment terms used in this report.
Cover photograph: Jean Maher.
| |
| Your Fund’s Total Returns | |
| |
| |
| |
| |
| Fiscal Year Ended October 31, 2010 | |
| | Total |
| | Returns |
| Vanguard Total World Stock Index Fund | |
| Investor Shares | 14.73% |
| Institutional Shares | 15.01 |
| ETF Shares | |
| Market Price | 15.27 |
| Net Asset Value | 15.00 |
| FTSE All-World Index | 14.51 |
| Global Funds Average | 15.04 |
| Global Funds Average: Derived from data provided by Lipper Inc. | |
Institutional Shares are available to certain institutional investors who meet specific administrative, service, and account-size criteria. The Vanguard ETF® Shares shown are traded on the NYSE Arca exchange and are available only through brokers. The table provides ETF returns based on both the NYSE Arca market price and the net asset value for a share. U.S. Pat. No. 6,879,964 B2; 7,337,138.
For the ETF Shares, the market price is determined by the midpoint of the bid-offer spread as of the closing time of the New York Stock Exchange (generally 4 p.m., Eastern time). The net asset value is also determined as of the NYSE closing time. For more information about how the ETF Shares' market prices have compared with their net asset value, visit vanguard.com, select your ETF, and then select the Price and Performance tab. The ETF premium/discount analysis there shows the percentages of days on which the ETF Shares' market price was above or below the NAV.
Your Fund’s Performance at a Glance
October 31, 2009, Through October 31, 2010
| | | | |
| | | | Distributions Per Share |
| | Starting | Ending | Income | Capital |
| | Share Price | Share Price | Dividends | Gains |
| Vanguard Total World Stock Index Fund | | | | |
| Investor Shares | $16.66 | $18.85 | $0.245 | $0.000 |
| Institutional Shares | 83.54 | 94.62 | 1.351 | 0.000 |
| ETF Shares | 40.88 | 46.30 | 0.662 | 0.000 |
1

Chairman’s Letter
Dear Shareholder,
Despite some intermittent setbacks earlier in the period, a rally in September and October helped global markets finish the 2010 fiscal year with a double-digit gain that, while less than the previous year’s rebound, was still respectable. Emerging markets again had the best results, while North American equities—the largest slice of the fund—contributed about half of the total return worldwide.
Vanguard Total World Stock Index Fund, which holds almost 2,800 large- and mid-capitalization stocks of companies located around the world, returned about 15%, in line with the average return of global peer funds. The fund met its objective of capturing the return of its target, the FTSE All-World Index, in the period. Although their reported returns diverged slightly at the fiscal year-end on October 31, this was a result of temporary price differences arising from fair-value pricing policies, which are required by the Securities and Exchange Commission. (The note on page 6 provides more information on fair-value pricing.)
If you own the fund in a taxable account, you may wish to review the information about after-tax returns presented later in this report.
Stock market performance was better than it felt
Global stock prices rallied at the start of the period, but struggled through the spring and summer, weighed down by
2
Europe’s sovereign-debt crisis and the slow pace of economic recovery in the United States. In the fiscal year’s final months, the mood turned. Stock prices climbed on continued strength in corporate earnings. In the United States, stocks also seemed to get a boost from the Federal Reserve Board’s hints that it would try to stimulate the economy with a second round of U.S. Treasury bond purchases. (In early November, the Fed announced that it would buy as much as $600 billion in Treasuries over the next several months.)
For the 12 months, the broad U.S. stock market returned about 19%, a performance that was better than it felt in a year of ups and downs. Small-capitalization stocks did even better.
International stocks returned about 13% on the strength of a powerful rally in emerging markets and solid single-digit gains in developed markets in Europe and the Pacific region. Large currency swings played a role in international returns for U.S.-dollar-based investors.
Despite shrinking yields, bonds attracted investors’ cash
Although fixed income yields have fallen to generational lows, investors continued to bid up bond prices. The broad U.S. bond market produced a 12-month return of about 8% as the yield of the 10-year U.S. Treasury note fell from 3.39% at the start of the period to 2.61% at the close. Tax-exempt municipal bonds also rallied. Bond prices and yields move in opposite
| | | |
| Market Barometer | | | |
| |
| | | Average Annual Total Returns |
| | | Periods Ended October 31, 2010 |
| | One | Three | Five |
| | Year | Years | Years |
| Stocks | | | |
| Russell 1000 Index (Large-caps) | 17.67% | -6.14% | 1.99% |
| Russell 2000 Index (Small-caps) | 26.58 | -3.91 | 3.07 |
| Dow Jones U.S. Total Stock Market Index | 19.04 | -5.55 | 2.52 |
| MSCI All Country World Index ex USA (International) | 13.08 | -7.62 | 6.21 |
| |
| Bonds | | | |
| Barclays Capital U.S. Aggregate Bond Index (Broad | | | |
| taxable market) | 8.01% | 7.23% | 6.45% |
| Barclays Capital Municipal Bond Index (Broad | | | |
| tax-exempt market) | 7.78 | 5.79 | 5.20 |
| Citigroup Three-Month U.S. Treasury Bill Index | 0.12 | 0.89 | 2.41 |
| |
| CPI | | | |
| Consumer Price Index | 1.17% | 1.54% | 1.89% |
3
directions, of course, so abundant returns built on rising prices could mean leaner pickings in the years ahead.
The yields of money market securities hovered near 0%, consistent with the Federal Reserve Board’s target for short-term rates. While the Fed has kept target interest rates low to stimulate the U.S. economy, rates have risen elsewhere. For example, in October, China’s central bank raised interest rates for the first time in three years, and rates were lifted several times in Australia and India. All three economies have been growing faster than the U.S. economy.
Almost all markets advanced, led by developing countries
By virtue of the sheer size of its market, the United States was the biggest single-country contributor to the results of Vanguard Total World Stock Index Fund (whose holdings, like those of its target benchmark, are market-capitalization weighted). The fund’s U.S. equities, which represented about 40% of its assets, returned more than 16% and contributed more than 6 percentage points to the overall return. Canadian stocks returned even more, about 21%, benefiting from rising prices for Canada’s vast natural resources.
Expense Ratios
Your Fund Compared With Its Peer Group
| | | | |
| | Investor | Institutional | ETF | Peer Group |
| | Shares | Shares | Shares | Average |
| Total World Stock Index Fund | 0.50% | 0.25% | 0.30% | 1.49% |
The fund expense ratios shown are from the prospectus dated February 26, 2010, and represent estimated costs for the current fiscal year. For the fiscal year ended October 31, 2010, the fund’s expense ratios were 0.45% for Investor Shares, 0.23% for Institutional Shares, and 0.25% for ETF Shares. The peer-group expense ratio is derived from data provided by Lipper Inc. and captures information through year-end 2009.
Peer group: Global Funds.
4
With a gain of almost 24%, emerging markets eclipsed the developed-country returns from North America, Europe, and the Pacific Rim. In part, this outperformance reflected the reality that developing nations are often a step or two removed from the disruptions—such as Europe’s current fiscal woes—that affect investors’ perceptions of major industrialized countries. And even though emerging markets represented a relatively small share of the fund’s market value, they made the second-highest contribution to its total return. Some of the best results came from smaller markets in Latin America, while India (+37%), Brazil (+14%), and China (+12%) added more to the fund’s overall gain.
Developed markets in Europe and the Pacific Rim traveled divergent paths to reach similar returns of about 9% (measured in U.S. dollars). During the period, investors began to regain confidence in Europe after governments took several steps—including unpopular cuts in public-sector payrolls and services—to help regain fiscal stability. Scandinavian economies, more insulated from the market turmoil, had some of the region’s best returns. Still, the United Kingdom, Europe’s largest market, gained more than 12%. Its economic growth was stronger than expected in the third calendar quarter, and in late October the recently elected government announced dramatic spending cuts. In contrast, peripheral countries that had become the center of the debt-default storm finished the year in the red: Greece was the outlier, losing more than half of its market value.
For U.S.-based investors, currency effects masked some European markets’ strength. During the height of Europe’s fiscal uncertainty, the U.S. dollar appreciated significantly against the euro and the British pound. Although these currencies recovered somewhat later in the year, their relative weakness trimmed European returns when translated into U.S. dollars.
Compared with market performance in Europe, Pacific Rim returns differed in two respects: Results weakened in the second half, and currency translation worked to the advantage of U.S.-based investors as the Australian dollar and Japanese yen reached highs not seen for many years. Singapore and Hong Kong, which are relatively smaller markets, outperformed both Australia (+13%) and Japan (+5%). In September, after several years of maintaining a hands-off currency policy, the Bank of Japan intervened to try to rein in the rising yen, which was making Japan’s exports less competitive in the global marketplace and threatening its still-fragile economy.
Sectors sensitive to the economy delivered winning performances
All ten industry sectors posted gains for the year, with some of the highest returns coming from the consumer discretionary, industrial, and materials sectors. The fortunes of companies in these sectors tend to be more exposed to the ups and downs of the business cycle, and given its generally upward trend, they fared well. Together, these three sectors contributed almost half of the fund’s total return.
5
|
|
|
| A note on fair-value pricing |
| The reported return of a fund that |
| tracks an index sometimes may |
| diverge from the index’s return a |
| bit more than would be expected. |
| This may be the result of a fair-value |
| pricing adjustment. |
| |
| These adjustments, which are |
| required by the Securities and |
| Exchange Commission, address |
| pricing discrepancies that may arise |
| because of time-zone differences |
| among global stock markets. Foreign |
| stocks may trade on exchanges that |
| close many hours before a fund’s |
| closing share price is calculated in |
| the United States, generally at 4 p.m., |
| Eastern time. In the hours between |
| the foreign close and the U.S. close, |
| the value of these foreign securities |
| may change—because of company- |
| specific announcements or |
| market-wide developments, for |
| example. Such price changes are |
| not immediately reflected in |
| international index values. |
| |
| Fair-value pricing takes such changes |
| into account in calculating the fund’s |
| daily net asset value, thus ensuring |
| that the NAV doesn’t include “stale” |
| prices. The result can be a temporary |
| divergence between the return of |
| the fund and that of its benchmark |
| index—a difference that usually |
| corrects itself when the foreign |
| markets reopen. |
Financial stocks, the largest sector weighting, were among the weaker performers, held back by concerns about European banks.
Spread your nest egg across multiple baskets
Since late 2007, stocks have taken investors on a roller-coaster ride with painful losses and soaring gains, especially in emerging markets. Much of the time, it appeared that news traveled quickly around the globe, leading markets to rise and fall together—as was the case during the Greek sovereign debt crisis. But when global financial crises subside, we can expect that the economic and financial performance of various countries will differ. We may be seeing some signs of divergence: For example, while U.S. economic growth has been tepid, Britain’s economy has grown faster, and China’s has achieved double-digit growth rates.
Vanguard research has shown that, over longer periods, a portfolio that includes both U.S. and non-U.S. stocks would have experienced lower average volatility than an all-U.S. portfolio. While this long-term benefit may not be as visible to you as other portfolio measures, it is no less real.
There is no magic number for how much of your equity portfolio to invest outside the United States. As with other portfolio decisions you make, your allocation to international stocks should be based on your investment goals, time horizon, and tolerance for risk.
6
Vanguard Total World Stock Index Fund provides a convenient approach to this decision, as it invests in large- and mid-cap companies around the world in proportions consistent with their market-capitalization weightings. As part of a well-balanced portfolio that also includes bonds and money market funds, the fund can be an efficient, low-cost core holding.
Thank you for entrusting your assets to Vanguard.
Sincerely,

F. William McNabb III
Chairman and Chief Executive Officer
November 16, 2010
7
Total World Stock Index Fund
Fund Profile
As of October 31, 2010
| | | |
| Share-Class Characteristics | |
| |
| | Investor | Institutional | ETF |
| | Shares | Shares | Shares |
| Ticker Symbol | VTWSX | VTWIX | VT |
| Expense Ratio1 | 0.50% | 0.25% | 0.30% |
| |
| Portfolio Characteristics | | |
| | | | FTSE |
| | | | All-World |
| | | Fund | Index |
| Number of Stocks | | 2,784 | 2,771 |
| Median Market Cap | $33.5B | $33.5B |
| Price/Earnings Ratio | | 16.0x | 15.9x |
| Price/Book Ratio | | 1.8x | 1.8x |
| Return on Equity | | 19.3% | 19.1% |
| Earnings Growth Rate | 5.4% | 5.3% |
| Dividend Yield | | 2.4% | 2.4% |
| Turnover Rate | | 7% | — |
| Short-Term Reserves | | 0.2% | — |
| | |
| Sector Diversification (% of equity exposure) |
| | | FTSE |
| | | All-World |
| | Fund | Index |
| Consumer Discretionary | 9.8% | 9.8% |
| Consumer Staples | 9.8 | 9.8 |
| Energy | 10.5 | 10.6 |
| Financials | 21.7 | 21.7 |
| Health Care | 8.1 | 8.1 |
| Industrials | 10.7 | 10.7 |
| Information Technology | 11.7 | 11.6 |
| Materials | 8.7 | 8.7 |
| Telecommunication | | |
| Services | 4.9 | 4.9 |
| Utilities | 4.1 | 4.1 |
| | |
| Ten Largest Holdings (% of total net assets) |
| Exxon Mobil Corp. | Integrated Oil & | |
| | Gas | 1.2% |
| Apple Inc. | Computer | |
| | Hardware | 1.0 |
| Microsoft Corp. | Systems Software | 0.8 |
| BHP Billiton | Diversified Metals | |
| | & Mining | 0.8 |
| Royal Dutch Shell plc | Integrated Oil & | |
| | Gas | 0.7 |
| Nestle SA | Packaged Foods & | |
| | Meats | 0.7 |
| HSBC Holdings plc | Diversified Banks | 0.6 |
| International Business | IT Consulting & | |
| Machines Corp. | Other Services | 0.6 |
| Procter & Gamble Co. | Household | |
| | Products | 0.6 |
| Johnson & Johnson | Pharmaceuticals | 0.6 |
| Top Ten | | 7.6% |
| The holdings listed exclude any temporary cash investments and equity index products. |
| | |
Allocation by Region (% of equity exposure)
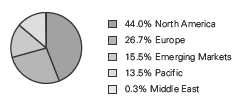
1 The expense ratios shown are from the prospectus dated February 26, 2010, and represent estimated costs for the current fiscal year. For the fiscal year ended October 31, 2010, the expense ratios were 0.45% for Investor Shares, 0.23% for Institutional Shares, and 0.25% for ETF Shares.
8
Total World Stock Index Fund
| | |
| Market Diversification (% of equity exposure) |
| | | FTSE |
| | | All-World |
| | Fund | Index |
| Europe | | |
| United Kingdom | 8.4% | 8.4% |
| France | 4.5 | 4.4 |
| Germany | 3.3 | 3.3 |
| Switzerland | 3.0 | 3.0 |
| Spain | 1.7 | 1.7 |
| Italy | 1.3 | 1.3 |
| Sweden | 1.3 | 1.3 |
| Netherlands | 1.0 | 1.1 |
| Other | 2.2 | 2.2 |
| Subtotal | 26.7% | 26.7% |
| Pacific | | |
| Japan | 7.9% | 7.9% |
| Australia | 3.4 | 3.4 |
| Hong Kong | 1.9 | 1.9 |
| Other | 0.8 | 0.9 |
| Subtotal | 14.0% | 14.1% |
| Emerging Markets | | |
| China | 2.2% | 2.2% |
| Brazil | 2.5 | 2.5 |
| South Korea | 2.0 | 2.0 |
| India | 1.6 | 1.5 |
| Taiwan | 1.5 | 1.5 |
| South Africa | 1.2 | 1.2 |
| Russia | 1.0 | 1.0 |
| Other | 3.0 | 3.0 |
| Subtotal | 15.0% | 14.9% |
| Middle East | 0.3% | 0.3% |
| North America | | |
| United States | 40.4% | 40.4% |
| Canada | 3.6 | 3.6 |
| Subtotal | 44.0% | 44.0% |
The country classifications for the fund in this table and those in the Statement of Net Assets (SNA) differ slightly. The SNA is based on the MSCI classifications used in our financial reporting system, while the table reflects the FTSE classifications used in the index. The discrepancies largely reflect differences in the way FTSE and MSCI classify Hong Kong-listed stocks. There is no material difference between the fund's economic exposures and those of the benchmark.
9
Total World Stock Index Fund
Performance Summary
All of the returns in this report represent past performance, which is not a guarantee of future results that may be achieved by the fund. (Current performance may be lower or higher than the performance data cited. For performance data current to the most recent month-end, visit our website at vanguard.com/performance.) Note, too, that both investment returns and principal value can fluctuate widely, so an investor’s shares, when sold, could be worth more or less than their original cost. The returns shown do not reflect taxes that a shareholder would pay on fund distributions or on the sale of fund shares.
Cumulative Performance: June 26, 2008, Through October 31, 2010
Initial Investment of $10,000
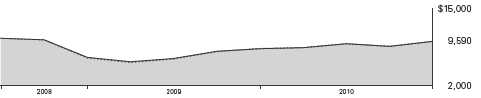
| | | |
| | Average Annual Total Returns | |
| | Periods Ended October 31, 2010 | |
| | | Since | Final Value |
| | One | Inception | of a $10,000 |
| | Year | (6/26/2008) | Investment |
| Total World Stock Index Fund Investor | | | |
| Shares | 14.44% | -1.77% | $9,590 |
| FTSE All-World Index | 14.51 | -2.22 | 9,487 |
| Global Funds Average | 15.04 | -2.21 | 9,489 |
Global Funds Average: Derived from data provided by Lipper Inc.
"Since Inception" performance is calculated from the Investor Shares’ inception date for both the fund and its comparative standards.
| | | |
| | | Since | Final Value |
| | One | Inception | of a $5,000,000 |
| | Year | (10/9/2008) | Investment |
| Total World Stock Index Fund | | | |
| Institutional Shares | 14.72% | 19.54% | $7,221,258 |
| FTSE All-World Index | 14.51 | 17.86 | 7,013,448 |
"Since Inception" performance is calculated from the Institutional Shares’ inception date for both the fund and its comparative standards.
Vanguard fund returns in most tables are adjusted to reflect the 0.25% fee on purchases but not the 2% fee on redemptions of shares held for less than two months. The fees do not apply to the ETF Shares. The Fiscal-Year Total Returns chart shows non-adjusted returns, and the final table includes non-adjusted returns along with the fee-adjusted returns.
See Financial Highlights for dividend and capital gains information.
10
Total World Stock Index Fund
| | | |
| | Average Annual Total Returns | |
| | Periods Ended October 31, 2010 | |
| | | Since | Final Value |
| | One | Inception | of a $10,000 |
| | Year | (6/24/2008) | Investment |
| Total World Stock Index Fund | | | |
| ETF Shares Net Asset Value | 15.00% | -2.10% | $9,513 |
| FTSE All-World Index | 14.51 | -2.61 | 9,397 |
"Since Inception" performance is calculated from the ETF Shares’ inception date for both the fund and its comparative standard.
| | |
| Cumulative Returns of ETF Shares: June 24, 2008, Through October 31, 2010 | |
| |
| | | Since |
| | One | Inception |
| | Year | (6/24/2008) |
| Total World Stock Index Fund | | |
| ETF Shares Market Price | 15.27% | -4.62% |
| Total World Stock Index Fund | | |
| ETF Shares Net Asset Value | 15.00 | -4.87 |
| FTSE All-World Index | 14.51 | -6.03 |
"Since Inception" performance is calculated from the ETF Shares’ inception date for both the fund and its comparative standard.
Fiscal-Year Total Returns (%): June 26, 2008, Through October 31, 2010

Index returns are adjusted for withholding taxes applicable to U.S.-based mutual funds organized as Delaware statutory trusts.
Vanguard fund returns in most tables are adjusted to reflect the 0.25% fee on purchases but not the 2% fee on redemptions of shares held for less than two months. The fees do not apply to the ETF Shares. The Fiscal-Year Total Returns chart shows non-adjusted returns, and the final table includes non-adjusted returns along with the fee-adjusted returns.
11
Total World Stock Index Fund
Average Annual Total Returns: Periods Ended September 30, 2010
This table presents average annual total returns through the latest calendar quarter—rather than through the end of the fiscal period. Securities and Exchange Commission rules require that we provide this information.
| | | |
| | Inception | One | Since |
| | Date | Year | Inception |
| Investor Shares | 6/26/2008 | 8.25% | -3.26% |
| Fee-Adjusted Returns | | 7.97 | -3.37 |
| Institutional Shares | 10/9/2008 | 8.51 | 18.44 |
| Fee-Adjusted Returns | | 8.24 | 18.29 |
| ETF Shares | 6/24/2008 | | |
| Market Price | | 8.30 | -3.65 |
| Net Asset Value | | 8.48 | -3.71 |
Vanguard fund returns in most tables are adjusted to reflect the 0.25% fee on purchases but not the 2% fee on redemptions of shares held for less than two months. The fees do not apply to the ETF Shares. The Fiscal-Year Total Returns chart shows non-adjusted returns, and the final table includes non-adjusted returns along with the fee-adjusted returns.
12
Total World Stock Index Fund
Financial Statements
Statement of Net Assets
As of October 31, 2010
The fund reports a complete list of its holdings in regulatory filings four times in each fiscal year, at the quarter-ends. For the second and fourth fiscal quarters, the lists appear in the fund’s semiannual and annual reports to shareholders. For the first and third fiscal quarters, the fund files the lists with the Securities and Exchange Commission on Form N-Q. Shareholders can look up the fund’s Forms N-Q on the SEC’s website at sec.gov. Forms N-Q may also be reviewed and copied at the SEC’s Public Reference Room (see the back cover of this report for further information).
| | | |
| | | | Market |
| | | | Value |
| | | Shares | ($000) |
| Common Stocks (99.7%) | | |
| Australia (3.4%) | | |
| | BHP Billiton Ltd. | 123,473 | 5,102 |
| | Commonwealth Bank | | |
| | of Australia | 56,531 | 2,718 |
| | Westpac Banking Corp. | 108,908 | 2,425 |
| | Australia & New Zealand | | |
| | Banking Group Ltd. | 94,318 | 2,301 |
| | National Australia Bank Ltd. | 77,504 | 1,940 |
| | Rio Tinto Ltd. | 16,777 | 1,365 |
| | Woolworths Ltd. | 45,540 | 1,264 |
| | Wesfarmers Ltd. | 37,053 | 1,206 |
| | Newcrest Mining Ltd. | 28,092 | 1,106 |
| | Westfield Group | 85,619 | 1,041 |
| | Woodside Petroleum Ltd. | 21,473 | 918 |
| | CSL Ltd. | 21,131 | 681 |
| | QBE Insurance Group Ltd. | 38,649 | 650 |
| | Origin Energy Ltd. | 33,753 | 528 |
| | Macquarie Group Ltd. | 12,737 | 453 |
| | Suncorp-Metway Ltd. | 44,297 | 400 |
| | Telstra Corp. Ltd. | 151,798 | 398 |
| | Foster’s Group Ltd. | 67,704 | 388 |
| | Brambles Ltd. | 61,097 | 382 |
| | Santos Ltd. | 30,563 | 378 |
| | AMP Ltd. | 71,405 | 374 |
| | Orica Ltd. | 14,540 | 359 |
| | Stockland | 88,094 | 326 |
| | Oil Search Ltd. | 48,293 | 302 |
| * | Fortescue Metals | | |
| | Group Ltd. | 47,377 | 291 |
| | AXA Asia Pacific | | |
| | Holdings Ltd. | 54,587 | 291 |
| | Amcor Ltd. | 43,132 | 284 |
| | Insurance Australia | | |
| | Group Ltd. | 75,244 | 281 |
| | Transurban Group | 50,792 | 260 |
| | Computershare Ltd. | 26,002 | 258 |
| | AGL Energy Ltd. | 16,257 | 257 |
| | Incitec Pivot Ltd. | 68,630 | 251 |
| | Coca-Cola Amatil Ltd. | 20,318 | 242 |
| ^ | Leighton Holdings Ltd. | 6,715 | 242 |
| | | |
| | | | Market |
| | | | Value |
| | | Shares | ($000) |
| | Wesfarmers Ltd. Price | | |
| | Protected Shares | 7,247 | 237 |
| | ASX Ltd. | 6,018 | 219 |
| | Alumina Ltd. | 106,502 | 213 |
| | WorleyParsons Ltd. | 9,349 | 211 |
| | GPT Group | 65,044 | 178 |
| | TABCORP Holdings Ltd. | 23,514 | 170 |
| | Mirvac Group | 126,612 | 161 |
| | OZ Minerals Ltd. | 101,412 | 156 |
| * | Asciano Group | 100,250 | 154 |
| | Dexus Property Group | 184,598 | 150 |
| | Toll Holdings Ltd. | 24,612 | 150 |
| | Sonic Healthcare Ltd. | 13,677 | 146 |
| | Crown Ltd. | 17,087 | 140 |
| | BlueScope Steel Ltd. | 70,012 | 138 |
| | OneSteel Ltd. | 49,963 | 133 |
| | CFS Retail Property Trust | 72,376 | 132 |
| | Goodman Group | 212,611 | 132 |
| | Cochlear Ltd. | 1,858 | 129 |
| | Lend Lease Group | 18,220 | 129 |
| | Intoll Group | 79,737 | 118 |
| | Metcash Ltd. | 26,944 | 115 |
| | Tatts Group Ltd. | 46,412 | 114 |
| * | Paladin Energy Ltd. | 27,467 | 111 |
| * | Qantas Airways Ltd. | 37,665 | 105 |
| | Bendigo and Adelaide | | |
| | Bank Ltd. | 11,810 | 105 |
| | Sims Metal | | |
| | Management Ltd. | 6,492 | 104 |
| | Boral Ltd. | 24,144 | 104 |
| | Harvey Norman | | |
| | Holdings Ltd. | 30,328 | 99 |
| * | Iluka Resources Ltd. | 14,756 | 98 |
| | CSR Ltd. | 53,018 | 95 |
| | Goodman Fielder Ltd. | 55,147 | 80 |
| * | James Hardie Industries SE | 14,810 | 79 |
| | MAp Group | 25,619 | 77 |
| | Bank of Queensland Ltd. | 6,984 | 71 |
| | Perpetual Ltd. | 1,737 | 65 |
| | Commonwealth Property | | |
| | Office Fund | 68,416 | 61 |
13
| | | |
| Total World Stock Index Fund | | |
| |
| |
| |
| | | | Market |
| | | | Value |
| | | Shares | ($000) |
| | IOOF Holdings Ltd. | 8,692 | 61 |
| | Ansell Ltd. | 4,554 | 61 |
| | Aristocrat Leisure Ltd. | 17,415 | 60 |
| | Caltex Australia Ltd. | 4,908 | 56 |
| | Billabong International Ltd. | 6,476 | 52 |
| | Flight Centre Ltd. | 2,301 | 52 |
| | Adelaide Brighton Ltd. | 14,606 | 51 |
| | Challenger Financial | | |
| | Services Group Ltd. | 10,934 | 49 |
| | Ten Network Holdings Ltd. | 34,205 | 48 |
| | New Hope Corp. Ltd. | 10,034 | 48 |
| * | AWB Ltd. | 32,097 | 47 |
| | Charter Hall Office REIT | 17,571 | 45 |
| | Tower Australia Group Ltd. | 16,746 | 40 |
| * | Aquila Resources Ltd. | 4,519 | 38 |
| | Consolidated Media | | |
| | Holdings Ltd. | 11,572 | 38 |
| * | DuluxGroup Ltd. | 13,950 | 37 |
| | SP AusNet | 38,822 | 35 |
| | GWA Group Ltd. | 11,242 | 34 |
| | Downer EDI Ltd. | 6,330 | 31 |
| | Fairfax Media Ltd. | 19,902 | 28 |
| | Energy Resources of | | |
| | Australia Ltd. | 2,196 | 28 |
| | Sigma Pharmaceuticals Ltd. | 60,271 | 27 |
| | Nufarm Ltd. | 4,786 | 21 |
| * | Macquarie Atlas | | |
| | Roads Group | 11,957 | 17 |
| | Australand Property Group | 5,249 | 14 |
| | Envestra Ltd. | 20,533 | 11 |
| | West Australian | | |
| | Newspapers Holdings Ltd. | 1,314 | 9 |
| | Spotless Group Ltd. | 2,468 | 6 |
| | APN News & Media Ltd. | 2,880 | 5 |
| * | Gunns Ltd. | 6,004 | 4 |
| | | | 35,394 |
| Austria (0.1%) | | |
| | Erste Group Bank AG | 9,812 | 443 |
| | Voestalpine AG | 7,992 | 317 |
| | OMV AG | 5,423 | 203 |
| | Telekom Austria AG | 10,977 | 168 |
| * | IMMOFINANZ AG | 34,881 | 138 |
| | Raiffeisen Bank | | |
| | International AG | 1,913 | 108 |
| | Vienna Insurance Group AG | | |
| | Wiener Versicherung Gruppe | 1,514 | 82 |
| | Verbund AG | 1,653 | 66 |
| | Strabag SE | 916 | 24 |
| | | | 1,549 |
| Belgium (0.4%) | | |
| | Anheuser-Busch InBev NV | 29,350 | 1,843 |
| | Ageas | 93,049 | 287 |
| * | KBC Groep NV | 6,401 | 279 |
| | Delhaize Group SA | 3,824 | 267 |
| | Groupe Bruxelles Lambert SA | 2,954 | 262 |
| | Belgacom SA | 6,095 | 239 |
| | | |
| | | | Market |
| | | | Value |
| | | Shares | ($000) |
| | Umicore | 4,839 | 228 |
| | UCB SA | 4,930 | 191 |
| | Solvay SA Class A | 1,518 | 161 |
| | Colruyt SA | 2,045 | 115 |
| * | Dexia SA | 21,224 | 95 |
| | Cie Nationale a Portefeuille | 1,168 | 62 |
| | Mobistar SA | 649 | 43 |
| | | | 4,072 |
| Brazil (2.5%) | | |
| | Petroleo Brasileiro SA | | |
| | ADR Type A | 78,928 | 2,462 |
| | Itau Unibanco | | |
| | Holding SA ADR | 84,899 | 2,085 |
| | Vale SA Class B Pfd. ADR | 68,183 | 1,959 |
| | Petroleo Brasileiro SA ADR | 53,222 | 1,816 |
| | Vale SA Class B ADR | 55,758 | 1,792 |
| | Banco Bradesco SA ADR | 70,136 | 1,459 |
| | Cia de Bebidas | | |
| | das Americas ADR | 7,976 | 1,111 |
| | Banco do Brasil SA | 40,693 | 788 |
| | Itausa–Investimentos | | |
| | Itau SA Prior Pfd. | 96,397 | 755 |
| | Cia Siderurgica | | |
| | Nacional SA ADR | 43,878 | 741 |
| | BM&FBovespa SA | 74,750 | 623 |
| | Petroleo Brasileiro SA | | |
| | Prior Pfd. | 34,292 | 522 |
| | BRF–Brasil Foods SA | 32,324 | 467 |
| | Natura Cosmeticos SA | 15,900 | 454 |
| | Petroleo Brasileiro SA | 25,246 | 423 |
| | Banco Santander Brasil SA | 28,200 | 398 |
| | Gerdau SA ADR | 26,309 | 343 |
| | Cia de Concessoes | | |
| | Rodoviarias | 11,700 | 317 |
| * | OGX Petroleo e Gas | | |
| | Participacoes SA | 23,200 | 303 |
| | Vale SA Prior Pfd. | 9,400 | 264 |
| | PDG Realty SA | | |
| | Empreendimentos | | |
| | e Participacoes | 21,000 | 260 |
| * | All America Latina | | |
| | Logistica SA | 24,800 | 235 |
| | Redecard SA | 17,788 | 230 |
| | Usinas Siderurgicas | | |
| | de Minas Gerais SA | | |
| | Prior Pfd. | 17,800 | 223 |
| | Cia Brasileira de | | |
| | Distribuicao Grupo Pao | | |
| | de Acucar Prior Pfd. | 5,609 | 220 |
| | Empresa Brasileira | | |
| | de Aeronautica SA ADR | 7,481 | 216 |
| | Bradespar SA Prior Pfd. | 7,900 | 200 |
| | Cia Energetica | | |
| | de Minas Gerais ADR | 10,615 | 189 |
| | Ultrapar Participacoes SA | | |
| | Prior Pfd. | 2,968 | 180 |
14
| | | |
| Total World Stock Index Fund | | |
| |
| |
| |
| | | | Market |
| | | | Value |
| | | Shares | ($000) |
| | Souza Cruz SA | 3,200 | 167 |
| | Cielo SA | 18,889 | 163 |
| | Lojas Renner SA | 4,100 | 163 |
| | Tele Norte Leste | | |
| | Participacoes SA ADR | 10,078 | 155 |
| | Cia de Bebidas das Americas | 1,338 | 151 |
| | Cyrela Brazil Realty SA | | |
| | Empreendimentos | | |
| | e Participacoes | 10,998 | 151 |
| * | Hypermarcas SA | 9,112 | 151 |
| | Metalurgica Gerdau SA | | |
| | Prior Pfd. Class A | 9,500 | 145 |
| | Weg SA | 10,647 | 139 |
| | Tractebel Energia SA | 9,000 | 136 |
| | Lojas Americanas SA | | |
| | Prior Pfd. | 12,200 | 131 |
| | Centrais Eletricas | | |
| | Brasileiras SA | 9,500 | 130 |
| | Vale SA | 4,100 | 129 |
| | Centrais Eletricas | | |
| | Brasileiras SA Prior Pfd. | 7,800 | 125 |
| * | Fibria Celulose SA | 6,400 | 114 |
| | Vivo Participacoes | | |
| | SA Prior Pfd. | 3,600 | 103 |
| | Cia Paranaense de | | |
| | Energia Prior Pfd. | 4,400 | 102 |
| | Usinas Siderurgicas de | | |
| | Minas Gerais SA | 7,000 | 102 |
| | Braskem SA Prior Pfd. | 9,400 | 96 |
| | Tim Participacoes SA ADR | 2,963 | 96 |
| | TAM SA Prior Pfd. | 3,869 | 94 |
| | Duratex SA | 7,800 | 90 |
| | Cia Energetica de | | |
| | Sao Paulo Prior Pfd. | 5,385 | 84 |
| | Suzano Papel e Celulose | | |
| | SA Prior Pfd. | 8,834 | 83 |
| | MRV Engenharia e | | |
| | Participacoes SA | 8,200 | 80 |
| | Banco do Estado do | | |
| | Rio Grande do Sul Prior Pfd. | 6,800 | 74 |
| * | Vale Fertilizantes SA Prior Pfd. | 6,292 | 71 |
| | AES Tiete SA Prior Pfd. | 5,100 | 71 |
| | Klabin SA Prior Pfd. | 25,200 | 70 |
| | JBS SA | 17,398 | 67 |
| | Porto Seguro SA | 4,572 | 67 |
| * | MMX Mineracao | | |
| | e Metalicos SA | 8,100 | 65 |
| * | LLX Logistica SA | 11,800 | 65 |
| | Gerdau SA | 6,200 | 61 |
| | Eletropaulo Metropolitana | | |
| | Eletricidade de Sao Paulo | | |
| | SA Prior Pfd. | 3,408 | 59 |
| | Cia de Saneamento | | |
| | Basico do Estado | | |
| | de Sao Paulo | 2,400 | 54 |
| | | |
| | | | Market |
| | | | Value |
| | | Shares | ($000) |
| | Telemar Norte Leste SA | | |
| | Prior Pfd. | 1,900 | 54 |
| | Marfrig Alimentos SA | 5,900 | 53 |
| | B2W Cia Global Do Varejo | 2,844 | 52 |
| * | Brasil Telecom SA Prior Pfd. | 7,000 | 51 |
| | Light SA | 3,973 | 50 |
| | Amil Participacoes SA | 4,900 | 50 |
| | Cia de Transmissao de | | |
| | Energia Electrica Paulista | | |
| | Prior Pfd. | 1,573 | 49 |
| | Cia Energetica de Minas | | |
| | Gerais Prior Pfd. | 2,750 | 48 |
| | EDP - Energias do Brasil SA | 2,200 | 48 |
| | Cosan SA Industria | | |
| | e Comercio | 2,900 | 46 |
| * | Tim Participacoes SA | 11,000 | 44 |
| | Tele Norte Leste | | |
| | Participacoes SA | 2,200 | 44 |
| | CPFL Energia SA | 1,800 | 42 |
| | AES Tiete SA | 3,549 | 41 |
| | M Dias Branco SA | 1,600 | 40 |
| | Multiplan Empreendimentos | | |
| | Imobiliarios SA | 1,700 | 40 |
| | Cia Energetica | | |
| | de Minas Gerais | 2,928 | 38 |
| | Telecomunicacoes de | | |
| | Sao Paulo SA Prior Pfd. | 1,300 | 31 |
| * | Brasil Telecom SA ADR | 3,052 | 28 |
| | Cia de Gas de Sao Paulo | | |
| | Prior Pfd. | 1,000 | 21 |
| * | Brasil Telecom SA ADR | 800 | 18 |
| | | | 25,727 |
| Canada (3.6%) | | |
| | Royal Bank of Canada | 52,448 | 2,797 |
| | Toronto-Dominion Bank | 31,900 | 2,297 |
| | Bank of Nova Scotia | 37,660 | 2,019 |
| | Suncor Energy Inc. | 56,996 | 1,826 |
| | Barrick Gold Corp. | 36,130 | 1,740 |
| | Potash Corp. of | | |
| | Saskatchewan Inc. | 10,890 | 1,575 |
| | Canadian Natural | | |
| | Resources Ltd. | 39,660 | 1,444 |
| | Bank of Montreal | 20,690 | 1,222 |
| | Goldcorp Inc. | 27,321 | 1,220 |
| * | Research In Motion Ltd. | 20,446 | 1,163 |
| | Canadian National | | |
| | Railway Co. | 17,400 | 1,127 |
| | Canadian Imperial | | |
| | Bank of Commerce | 14,600 | 1,120 |
| | Teck Resources Ltd. Class B | 21,700 | 970 |
| | TransCanada Corp. | 25,050 | 925 |
| | Manulife Financial Corp. | 63,650 | 806 |
| | Encana Corp. | 27,500 | 777 |
| | Enbridge Inc. | 13,590 | 752 |
| | Cenovus Energy Inc. | 26,974 | 751 |
| | Kinross Gold Corp. | 40,400 | 727 |
15
| | | |
| Total World Stock Index Fund | | |
| |
| |
| |
| | | | Market |
| | | | Value |
| | | Shares | ($000) |
| | Talisman Energy Inc. | 38,000 | 689 |
| | Brookfield Asset | | |
| | Management Inc. Class A | 21,500 | 638 |
| | Rogers Communications Inc. | | |
| | Class B | 17,400 | 634 |
| | Sun Life Financial Inc. | 22,400 | 634 |
| | Thomson Reuters Corp. | 15,201 | 580 |
| | Agrium Inc. | 5,851 | 518 |
| | Imperial Oil Ltd. | 12,490 | 480 |
| | Agnico-Eagle Mines Ltd. | 6,059 | 470 |
| | Cameco Corp. | 14,830 | 459 |
| | Nexen Inc. | 20,464 | 435 |
| | Canadian Pacific Railway Ltd. | 6,384 | 416 |
| | Power Corp. of Canada | 14,390 | 402 |
| | National Bank of Canada | 5,630 | 371 |
| | Magna International Inc. | 3,930 | 355 |
| | Shaw Communications Inc. | | |
| | Class B | 15,220 | 326 |
| | Yamana Gold Inc. | 27,400 | 301 |
| | Power Financial Corp. | 9,860 | 297 |
| | BCE Inc. | 8,700 | 292 |
| | Shoppers Drug Mart Corp. | 7,660 | 291 |
| | Fairfax Financial Holdings Ltd. | 700 | 286 |
| | Bombardier Inc. Class B | 55,300 | 275 |
| | SNC-Lavalin Group Inc. | 5,300 | 271 |
| | Great-West Lifeco Inc. | 9,900 | 259 |
| | Brookfield Properties Corp. | 13,200 | 228 |
| | Husky Energy Inc. | 8,560 | 212 |
| | Saputo Inc. | 5,300 | 203 |
| | Canadian Utilities Ltd. | | |
| | Class A | 4,200 | 202 |
| | IGM Financial Inc. | 4,600 | 195 |
| * | CGI Group Inc. Class A | 11,138 | 171 |
| | Loblaw Cos. Ltd. | 3,800 | 162 |
| | Canadian Tire Corp. Ltd. | | |
| | Class A | 2,700 | 158 |
| | TransAlta Corp. | 7,160 | 145 |
| | George Weston Ltd. | 1,700 | 137 |
| | Finning International Inc. | 5,800 | 136 |
| | TELUS Corp. | 2,100 | 93 |
| | TELUS Corp. Class A | 1,700 | 72 |
| | Bombardier Inc. Class A | 415 | 2 |
| | | | 37,053 |
| Chile (0.3%) | | |
| | Empresas COPEC SA | 18,171 | 342 |
| | SACI Falabella | 33,705 | 337 |
| | Empresa Nacional de | | |
| | Electricidad SA ADR | 5,655 | 302 |
| | Sociedad Quimica y Minera | | |
| | de Chile SA ADR | 3,995 | 207 |
| | CAP SA | 4,003 | 205 |
| | Empresas CMPC SA | 3,758 | 202 |
| | Centros Comerciales | | |
| | Sudamericanos SA | 23,501 | 183 |
| | Enersis SA ADR | 7,122 | 162 |
| | | |
| | | Market |
| | | Value |
| | Shares | ($000) |
| Banco Santander | | |
| Chile ADR | 1,442 | 134 |
| Banco de Chile | 895,678 | 128 |
| Lan Airlines SA | 3,727 | 116 |
| Colbun SA | 265,292 | 73 |
| Corpbanca | 4,158,795 | 65 |
| Banco de Credito | | |
| e Inversiones | 1,050 | 63 |
| Enersis SA | 114,300 | 52 |
| AES Gener SA | 92,643 | 51 |
| Cia Cervecerias Unidas SA | 4,054 | 45 |
| ENTEL Chile SA | 2,800 | 45 |
| Embotelladora Andina | | |
| SA Prior Pfd. | 7,625 | 38 |
| Sociedad Quimica y Minera | | |
| de Chile SA Class B | 353 | 18 |
| Banco Santander Chile | 145,800 | 13 |
| | | 2,781 |
| China (2.7%) | | |
| China Construction | | |
| Bank Corp. | 2,477,000 | 2,368 |
| China Mobile Ltd. | 223,500 | 2,282 |
| Industrial & Commercial | | |
| Bank of China | 2,283,000 | 1,844 |
| CNOOC Ltd. | 640,000 | 1,336 |
| Bank of China Ltd. | 2,068,000 | 1,242 |
| China Life | | |
| Insurance Co. Ltd. | 278,000 | 1,222 |
| PetroChina Co. Ltd. | 790,000 | 972 |
| Ping An Insurance Group | | |
| Co. of China Ltd. | 76,500 | 827 |
| Tencent Holdings Ltd. | 32,700 | 752 |
| China Petroleum & | | |
| Chemical Corp. | 621,319 | 591 |
| China Shenhua | | |
| Energy Co. Ltd. | 125,500 | 560 |
| Belle International | | |
| Holdings Ltd. | 229,000 | 415 |
| China Merchants | | |
| Bank Co. Ltd. | 145,131 | 414 |
| China Unicom | | |
| Hong Kong Ltd. | 264,574 | 372 |
| Hengan International | | |
| Group Co. Ltd. | 37,000 | 349 |
| China Overseas Land & | | |
| Investment Ltd. | 160,480 | 338 |
| Bank of | | |
| Communications Co. Ltd. | 297,144 | 326 |
| China Telecom Corp. Ltd. | 604,034 | 315 |
| * | Agricultural Bank of | | |
| China Ltd. | 549,500 | 290 |
| China Coal Energy Co. Ltd. | 154,000 | 268 |
| China Citic Bank Corp. Ltd. | 321,509 | 234 |
| Yanzhou Coal | | |
| Mining Co. Ltd. | 76,000 | 220 |
16
| | | |
| Total World Stock Index Fund | | |
| |
| |
| |
| | | | Market |
| | | | Value |
| | | Shares | ($000) |
| | Tingyi Cayman Islands | | |
| | Holding Corp. | 78,000 | 213 |
| | Want Want China | | |
| | Holdings Ltd. | 227,000 | 210 |
| | Dongfeng Motor | | |
| | Group Co. Ltd. | 90,000 | 196 |
| | China Yurun Food | | |
| | Group Ltd. | 50,000 | 195 |
| * | PICC Property & | | |
| | Casualty Co. Ltd. | 126,000 | 186 |
| | Inner Mongolia Yitai | | |
| | Coal Co. Class B | 25,400 | 179 |
| | China Resources | | |
| | Enterprise Ltd. | 42,000 | 178 |
| ^ | Byd Co. Ltd. | 28,000 | 171 |
| | Lenovo Group Ltd. | 258,000 | 168 |
| | China Communications | | |
| | Construction Co. Ltd. | 169,375 | 162 |
| | China Resources Land Ltd. | 78,000 | 154 |
| * | Air China Ltd. | 114,000 | 154 |
| | China Merchants Holdings | | |
| | International Co. Ltd. | 42,000 | 148 |
| | Guangzhou Automobile | | |
| | Group Co. Ltd. | 93,857 | 143 |
| *,^ | Aluminum Corp. of | | |
| | China Ltd. | 149,331 | 142 |
| | China Resources Power | | |
| | Holdings Co. Ltd. | 73,400 | 141 |
| | Zijin Mining Group Co. Ltd. | 143,534 | 136 |
| | China Minsheng | | |
| | Banking Corp. Ltd. | 144,800 | 135 |
| | China Pacific Insurance | | |
| | Group Co. Ltd. | 32,400 | 135 |
| | Jiangxi Copper Co. Ltd. | 48,000 | 134 |
| | Beijing Enterprises | | |
| | Holdings Ltd. | 19,500 | 134 |
| * | GOME Electrical Appliances | | |
| | Holdings Ltd. | 390,720 | 132 |
| | China Mengniu | | |
| | Dairy Co. Ltd. | 45,000 | 129 |
| | Anhui Conch | | |
| | Cement Co. Ltd. | 30,000 | 126 |
| | Citic Pacific Ltd. | 46,000 | 123 |
| | China Railway Group Ltd. | 146,000 | 118 |
| | Tsingtao Brewery Co. Ltd. | 22,000 | 118 |
| | Sino-Ocean Land | | |
| | Holdings Ltd. | 158,500 | 109 |
| * | China Taiping Insurance | | |
| | Holdings Co. Ltd. | 29,600 | 109 |
| | Chaoda Modern Agriculture | | |
| | Holdings Ltd. | 132,000 | 108 |
| | Kingboard Chemical | | |
| | Holdings Ltd. | 22,000 | 107 |
| | Kunlun Energy Co. Ltd. | 84,000 | 107 |
| * | China COSCO | | |
| | Holdings Co. Ltd. | 89,500 | 105 |
| | | |
| | | | Market |
| | | | Value |
| | | Shares | ($000) |
| | China National Building | | |
| | Material Co. Ltd. | 42,000 | 103 |
| *,^ | Alibaba.com Ltd. | 52,500 | 103 |
| | China International Marine | | |
| | Containers Group Co. Ltd. | | |
| | Class B | 50,200 | 102 |
| | Weichai Power Co. Ltd. | 7,000 | 92 |
| | Sinopharm Group Co. | 23,200 | 91 |
| | China Railway | | |
| | Construction Corp. Ltd. | 72,626 | 91 |
| | China High Speed | | |
| | Transmission Equipment | | |
| | Group Co. Ltd. | 43,000 | 88 |
| | Parkson Retail Group Ltd. | 48,500 | 88 |
| | Shanghai Industrial | | |
| | Holdings Ltd. | 19,000 | 88 |
| * | GCL Poly Energy | | |
| | Holdings Ltd. | 271,000 | 86 |
| | China Oilfield Services Ltd. | 52,000 | 85 |
| | Nine Dragons Paper | | |
| | Holdings Ltd. | 51,000 | 82 |
| | Shimao Property | | |
| | Holdings Ltd. | 49,500 | 82 |
| | Anta Sports Products Ltd. | 38,000 | 79 |
| | BBMG Corp. | 54,500 | 77 |
| | Li Ning Co. Ltd. | 27,000 | 77 |
| | Poly Hong Kong | | |
| | Investments Ltd. | 74,000 | 76 |
| | China Agri-Industries | | |
| | Holdings Ltd. | 51,000 | 75 |
| | China Shipping | | |
| | Development Co. Ltd. | 50,442 | 74 |
| | Geely Automobile | | |
| | Holdings Ltd. | 130,000 | 73 |
| | CSR Corp. Ltd. | 72,000 | 73 |
| | China Everbright Ltd. | 28,000 | 73 |
| | Guangzhou R&F | | |
| | Properties Co. Ltd. | 50,800 | 73 |
| | COSCO Pacific Ltd. | 46,000 | 72 |
| | Shanghai Electric | | |
| | Group Co. Ltd. | 106,000 | 71 |
| | Yantai Changyu Pioneer | | |
| | Wine Co. Class B | 5,400 | 70 |
| | ZTE Corp. | 18,510 | 69 |
| | Zhejiang | | |
| | Expressway Co. Ltd. | 68,000 | 69 |
| | Huabao International | | |
| | Holdings Ltd. | 45,000 | 68 |
| * | Sinofert Holdings Ltd. | 128,000 | 68 |
| | Lee & Man Paper | | |
| | Manufacturing Ltd. | 80,000 | 67 |
| | China Vanke Co. Ltd. | | |
| | Class B | 46,700 | 67 |
| | Agile Property Holdings Ltd. | 50,000 | 66 |
| * | China Shipping Container | | |
| | Lines Co. Ltd. | 161,000 | 66 |
17
| | | |
| Total World Stock Index Fund | | |
| |
| |
| |
| | | | Market |
| | | | Value |
| | | Shares | ($000) |
| | Soho China Ltd. | 76,000 | 65 |
| | Fushan International | | |
| | Energy Group Ltd. | 94,000 | 63 |
| | Fosun International Ltd. | 76,000 | 62 |
| | Huaneng Power | | |
| | International Inc. | 106,000 | 61 |
| * | Metallurgical Corp. of | | |
| | China Ltd. | 125,000 | 61 |
| | Angang Steel Co. Ltd. | 38,000 | 60 |
| * | China Southern | | |
| | Airlines Co. Ltd. | 88,000 | 60 |
| | Renhe Commercial | | |
| | Holdings Co. Ltd. | 308,000 | 59 |
| | Dongfang Electric Corp. Ltd. | 12,000 | 58 |
| | China Dongxiang Group Co. | 99,000 | 55 |
| * | China Longyuan | | |
| | Power Group Corp. | 53,000 | 55 |
| | Golden Eagle | | |
| | Retail Group Ltd. | 20,000 | 53 |
| | Country Garden | | |
| | Holdings Co. | 147,000 | 52 |
| | Zhaojin Mining | | |
| | Industry Co. Ltd. | 16,500 | 51 |
| | China National | | |
| | Materials Co. Ltd. | 57,000 | 51 |
| * | Semiconductor | | |
| | Manufacturing | | |
| | International Corp. | 580,000 | 49 |
| * | China Eastern | | |
| | Airlines Corp. Ltd. | 74,000 | 47 |
| | Datang International Power | | |
| | Generation Co. Ltd. | 114,000 | 46 |
| | Great Wall Motor Co. Ltd. | 14,500 | 46 |
| | Hidili Industry International | | |
| | Development Ltd. | 42,000 | 45 |
| | Yuexiu Property Co. Ltd. | 187,200 | 45 |
| | China Molybdenum Co. Ltd. | 46,000 | 44 |
| | Jiangsu Expressway Co. Ltd. | 36,000 | 44 |
| | Shui On Land Ltd. | 86,500 | 43 |
| | China BlueChemical Ltd. | 54,000 | 43 |
| | Lianhua Supermarket | | |
| | Holdings Co. Ltd. | 10,000 | 43 |
| | China Foods Ltd. | 46,000 | 38 |
| | KWG Property Holding Ltd. | 47,500 | 38 |
| | China Communications | | |
| | Services Corp. Ltd. | 64,000 | 37 |
| | TPV Technology Ltd. | 60,000 | 37 |
| | Shenzhen Investment Ltd. | 100,000 | 36 |
| | Travelsky Technology Ltd. | 37,000 | 36 |
| | Harbin Power | | |
| | Equipment Co. Ltd. | 26,000 | 35 |
| | Weifu High-Technology | | |
| | Group Co. Ltd. Class B | 12,505 | 35 |
| | Shanghai Lujiazui Finance | | |
| | & Trade Zone Development | | |
| | Co. Ltd. Class B | 21,900 | 34 |
| | | |
| | | | Market |
| | | | Value |
| | | Shares | ($000) |
| ^ | China Zhongwang | | |
| | Holdings Ltd. | 56,800 | 34 |
| | New World China Land Ltd. | 91,400 | 34 |
| | Sinopec Shanghai | | |
| | Petrochemical Co. Ltd. | 74,000 | 33 |
| | Guangdong Investment Ltd. | 66,000 | 33 |
| | Shenzhen International | | |
| | Holdings Ltd. | 412,500 | 32 |
| | Hopewell Highway | | |
| | Infrastructure Ltd. | 42,500 | 32 |
| | Jiangling Motors Corp. Ltd. | | |
| | Class B | 9,600 | 32 |
| ^ | Huadian Power | | |
| | International Co. | 136,000 | 31 |
| | Franshion Properties | | |
| | China Ltd. | 96,000 | 31 |
| * | China Travel | | |
| | International Inv HK | 128,000 | 31 |
| | Maanshan Iron & Steel | 52,000 | 30 |
| | Beijing Capital International | | |
| | Airport Co. Ltd. | 54,000 | 30 |
| | Weiqiao Textile Co. | 35,401 | 28 |
| * | Shanghai Zhenhua Heavy | | |
| | Industries Co. Ltd. Class B | 39,050 | 26 |
| | CSG Holding Co. Ltd. | | |
| | Class B | 17,680 | 25 |
| | Hopson Development | | |
| | Holdings Ltd. | 20,000 | 22 |
| | Sichuan Expressway Co. Ltd. | 32,000 | 21 |
| * | Double Coin Holdings Ltd. | | |
| | Class B | 22,200 | 20 |
| | China Huiyuan | | |
| | Juice Group Ltd. | 28,000 | 19 |
| | Foshan Electrical and | | |
| | Lighting Co. Ltd. Class B | 13,300 | 17 |
| * | Hainan Airlines Co. Ltd. | | |
| | Class B | 16,200 | 17 |
| * | Sinopec Yizheng Chemical | | |
| | Fibre Co. Ltd. | 42,000 | 16 |
| | Guangzhou | | |
| | Pharmaceutical Co. Ltd. | 14,000 | 15 |
| | Inner Mongolia Eerduosi | | |
| | Cashmere Products Co. Ltd. | |
| | Class B | 9,100 | 14 |
| | Shanghai Jinjiang | | |
| | International Hotels | | |
| | Development Co. Ltd. | | |
| | Class B | 7,600 | 13 |
| * | Shenzhen Special Economic | | |
| | Zone Real Estate & | | |
| | Properties Group Co. Ltd. | | |
| | Class B | 29,400 | 13 |
| | Greentown China | | |
| | Holdings Ltd. | 11,000 | 13 |
| | Chongqing Changan | | |
| | Automobile Co. Ltd. | | |
| | Class B | 11,700 | 12 |
18
| | | |
| Total World Stock Index Fund | | |
| |
| |
| |
| | | | Market |
| | | | Value |
| | | Shares | ($000) |
| * | Shanghai Haixin Group Co. | | |
| | Class B | 25,000 | 11 |
| * | Shanghai Waigaoqiao | | |
| | Free Trade Zone | | |
| | Development Co. Ltd. | | |
| | Class B | 12,200 | 11 |
| | Anhui Expressway Co. | 14,000 | 11 |
| | China Merchants Property | | |
| | Development Co. Ltd. | | |
| | Class B | 5,200 | 11 |
| | Shandong Chenming Paper | | |
| | Holdings Ltd. Class B | 12,300 | 11 |
| * | Shanghai Chlor-Alkali | | |
| | Chemical Co. Ltd. Class B | 21,800 | 11 |
| | Shanghai Friendship Group | | |
| | Inc. Ltd. Class B | 7,150 | 10 |
| * | BOE Technology Group Co. | | |
| | Ltd. Class B | 37,300 | 10 |
| * | Jinzhou Port Co. Ltd. | | |
| | Class B | 19,920 | 10 |
| | Shenzhen Chiwan Wharf | | |
| | Holdings Ltd. Class B | 5,800 | 10 |
| * | Citic Resources Holdings Ltd. | 38,000 | 10 |
| | Tianjin Capital Environmental | | |
| | Protection Group Co. Ltd. | 28,000 | 10 |
| | Shanghai Jinqiao Export | | |
| | Processing Zone | | |
| | Development Co. Ltd. | | |
| | Class B | 11,110 | 9 |
| | Shanghai Mechanical and | | |
| | Electrical Industry Co. Ltd. | | |
| | Class B | 8,500 | 9 |
| | Guangdong Electric Power | | |
| | Development Co. Ltd. | | |
| | Class B | 15,300 | 9 |
| | Dazhong Transportation | | |
| | Group Co. Ltd. Class B | 11,800 | 9 |
| | Bengang Steel Plates Co. | | |
| | Class B | 15,300 | 9 |
| | Shanghai Jinjiang International | | |
| | Investment Holdings Co. | | |
| | Class B | 7,900 | 8 |
| | Guangzhou Shipyard | | |
| | International Co. Ltd. | 4,000 | 8 |
| * | Huadian Energy Co. Ltd. | | |
| | Class B | 22,600 | 8 |
| | Zhejiang Southeast Electric | | |
| | Power Co. Class B | 12,800 | 8 |
| | Shenzhen | | |
| | Expressway Co. Ltd. | 14,000 | 8 |
| | Beijing North Star Co. Ltd. | 28,000 | 8 |
| | Guangdong Provincial | | |
| | Expressway Development | | |
| | Co. Ltd. Class B | 14,400 | 7 |
| * | Global Bio-Chem Technology | | |
| | Group Co. Ltd. | 44,800 | 7 |
| | | |
| | | | Market |
| | | | Value |
| | | Shares | ($000) |
| | Sinotrans Ltd. | 25,000 | 7 |
| | People’s Food Holdings Ltd. | 11,000 | 6 |
| | Guangshen Railway Co. Ltd. | 14,000 | 6 |
| * | Kingboard Chemical | | |
| | Holdings Ltd. | | |
| | Warrants Exp. 10/31/2012 | 2,200 | 1 |
| | | | 27,640 |
| Colombia (0.1%) | | |
| | Ecopetrol SA | 168,681 | 405 |
| | BanColombia SA ADR | 2,879 | 194 |
| | Grupo de Inversiones | | |
| | Suramericana SA | 8,066 | 180 |
| | Inversiones Argos SA | 11,316 | 135 |
| | BanColombia SA | 7,150 | 115 |
| | Interconexion Electrica SA | 11,504 | 91 |
| | Almacenes Exito SA | 6,752 | 88 |
| | Cementos Argos SA | 12,116 | 84 |
| | Corp Financiera | | |
| | Colombiana SA | 2,932 | 54 |
| | Isagen SA ESP | 28,143 | 40 |
| | | | 1,386 |
| Czech Republic (0.1%) | | |
| | CEZ AS | 7,643 | 338 |
| | Komercni Banka AS | 388 | 88 |
| | Telefonica O2 Czech | | |
| | Republic AS | 3,549 | 78 |
| * | Unipetrol | 4,746 | 54 |
| | | | 558 |
| Denmark (0.5%) | | |
| | Novo Nordisk A/S Class B | 18,204 | 1,911 |
| * | Danske Bank A/S | 25,200 | 669 |
| | Carlsberg A/S Class B | 4,168 | 456 |
| | AP Moller–Maersk A/S | | |
| | Class B | 39 | 338 |
| * | Vestas Wind Systems A/S | 7,900 | 252 |
| | Novozymes A/S | 1,867 | 249 |
| | AP Moller–Maersk A/S | 21 | 176 |
| | Danisco A/S | 1,942 | 168 |
| | Coloplast A/S Class B | 1,314 | 163 |
| | FLSmidth & Co. A/S | 1,919 | 142 |
| * | William Demant Holding A/S | 842 | 63 |
| | Tryg A/S | 1,023 | 52 |
| | H Lundbeck A/S | 1,400 | 28 |
| | Rockwool International A/S | | |
| | Class B | 83 | 9 |
| | | | 4,676 |
| Egypt (0.1%) | | |
| | Orascom Construction | | |
| | Industries GDR | 4,582 | 213 |
| | Commercial International | | |
| | Bank Egypt SAE | 20,514 | 154 |
| * | Orascom Telecom | | |
| | Holding SAE GDR | 34,836 | 135 |
| * | Talaat Moustafa Group | 53,395 | 70 |
19
| | | |
| Total World Stock Index Fund | | |
| |
| |
| |
| | | | Market |
| | | | Value |
| | | Shares | ($000) |
| | Egyptian Financial Group- | | |
| | Hermes Holding | 13,601 | 68 |
| | Egyptian Kuwaiti Holding Co. | 29,640 | 49 |
| * | Ezz Steel | 14,391 | 47 |
| | Egyptian Co. for | | |
| | Mobile Services | 1,403 | 42 |
| | Telecom Egypt | 11,972 | 37 |
| * | National Societe Generale | | |
| | Bank SAE | 4,054 | 28 |
| * | ElSewedy Electric Co. | 2,748 | 26 |
| | | | 869 |
| Finland (0.4%) | | |
| | Nokia Oyj | 136,780 | 1,469 |
| | Sampo Oyj | 20,201 | 566 |
| | Fortum Oyj | 16,060 | 455 |
| | UPM-Kymmene Oyj | 18,751 | 312 |
| | Kone Oyj Class B | 5,736 | 307 |
| | Metso Oyj | 5,667 | 269 |
| | Wartsila Oyj | 3,772 | 264 |
| | Stora Enso Oyj | 26,134 | 260 |
| | Nokian Renkaat Oyj | 4,813 | 167 |
| | Kesko Oyj Class B | 2,066 | 103 |
| | Outokumpu Oyj | 4,902 | 88 |
| | Rautaruukki Oyj | 4,065 | 81 |
| | Neste Oil Oyj | 4,229 | 70 |
| | Sanoma Oyj | 1,520 | 34 |
| | | | 4,445 |
| France (4.5%) | | |
| | Total SA | 81,919 | 4,459 |
| | Sanofi-Aventis SA | 47,726 | 3,344 |
| | BNP Paribas | 38,212 | 2,795 |
| | GDF Suez | 61,093 | 2,441 |
| | LVMH Moet Hennessy | | |
| | Louis Vuitton SA | 13,446 | 2,110 |
| | France Telecom SA | 72,536 | 1,740 |
| | Societe Generale | 27,015 | 1,620 |
| | AXA SA | 83,615 | 1,525 |
| | Danone | 23,678 | 1,501 |
| | Schneider Electric SA | 9,954 | 1,414 |
| | Carrefour SA | 25,766 | 1,395 |
| | ArcelorMittal | 41,997 | 1,359 |
| | Air Liquide SA | 10,351 | 1,340 |
| | L’Oreal SA | 11,025 | 1,295 |
| | Vivendi SA | 45,169 | 1,291 |
| | Vinci SA | 17,893 | 959 |
| | Cie de St-Gobain | 19,508 | 917 |
| | Pernod-Ricard SA | 9,468 | 842 |
| | Unibail-Rodamco SE | 3,401 | 710 |
| | Hermes International | 3,117 | 662 |
| | PPR | 3,606 | 593 |
| | Credit Agricole SA | 35,315 | 579 |
| | Alstom SA | 10,870 | 549 |
| | Veolia Environnement | 18,346 | 540 |
| | Cie Generale d’Optique | | |
| | Essilor International SA | 7,842 | 524 |
| | | |
| | | | Market |
| | | | Value |
| | | Shares | ($000) |
| * | Renault SA | 8,367 | 467 |
| | Vallourec SA | 4,374 | 455 |
| | Bouygues SA | 10,089 | 446 |
| | Lafarge SA | 7,735 | 442 |
| | EDF SA | 8,996 | 413 |
| | Christian Dior SA | 2,702 | 391 |
| | Cie Generale des | | |
| | Etablissements Michelin | | |
| | Class B | 4,580 | 366 |
| | Technip SA | 4,340 | 366 |
| | SES SA | 14,086 | 362 |
| | Accor SA | 8,607 | 353 |
| | Cap Gemini SA | 6,197 | 316 |
| * | European Aeronautic | | |
| | Defence and Space Co. NV | 11,704 | 308 |
| * | Alcatel-Lucent | 84,730 | 298 |
| * | Peugeot SA | 7,426 | 297 |
| | Suez Environnement Co. | 14,598 | 286 |
| | Sodexo | 4,201 | 273 |
| | Legrand SA | 7,072 | 273 |
| | Publicis Groupe SA | 5,134 | 256 |
| | Safran SA | 7,675 | 243 |
| | STMicroelectronics NV | 24,981 | 219 |
| | Lagardere SCA | 4,450 | 190 |
| * | Natixis | 30,102 | 185 |
| * | Edenred | 8,367 | 175 |
| | Societe BIC SA | 1,907 | 169 |
| | SCOR SE | 6,405 | 157 |
| | Dassault Systemes SA | 2,008 | 154 |
| | Fonciere Des Regions | 1,306 | 149 |
| | Klepierre | 3,684 | 143 |
| | Casino Guichard Perrachon SA | 1,498 | 141 |
| | Bureau Veritas SA | 1,896 | 140 |
| | Eiffage SA | 2,744 | 136 |
| * | Cie Generale de | | |
| | Geophysique-Veritas | 5,280 | 123 |
| | Eramet | 355 | 123 |
| | CNP Assurances | 6,072 | 121 |
| | Eutelsat Communications | 2,965 | 112 |
| | Thales SA | 2,699 | 110 |
| * | Atos Origin SA | 2,281 | 106 |
| * | Air France-KLM | 5,631 | 103 |
| | Eurazeo | 1,211 | 92 |
| | Gecina SA | 744 | 90 |
| | Societe Television Francaise 1 | 5,471 | 90 |
| | Aeroports de Paris | 1,007 | 86 |
| | Imerys SA | 1,412 | 84 |
| | ICADE | 725 | 80 |
| | Wendel | 992 | 77 |
| * | JCDecaux SA | 2,471 | 73 |
| | BioMerieux | 692 | 67 |
| | PagesJaunes Groupe | 5,585 | 62 |
| * | Rexel SA | 2,791 | 53 |
| * | Euler Hermes SA | 460 | 43 |
| | Bollore | 178 | 40 |
| | Iliad SA | 247 | 28 |
20
| | | |
| Total World Stock Index Fund | | |
| |
| |
| |
| | | | Market |
| | | | Value |
| | | Shares | ($000) |
| | Ciments Francais SA | 275 | 25 |
| | EDF Energies Nouvelles SA | 531 | 23 |
| | Ipsen SA | 383 | 14 |
| | | | 46,898 |
| Germany (3.3%) | | |
| | Siemens AG | 33,618 | 3,836 |
| * | Daimler AG | 38,948 | 2,565 |
| | BASF SE | 33,832 | 2,460 |
| | E.ON AG | 73,313 | 2,295 |
| | Bayer AG | 30,434 | 2,270 |
| | Allianz SE | 16,545 | 2,072 |
| | Deutsche Bank AG | 34,350 | 1,979 |
| | SAP AG | 33,804 | 1,761 |
| | Deutsche Telekom AG | 119,576 | 1,732 |
| | Muenchener | | |
| | Rueckversicherungs AG | 6,935 | 1,084 |
| | RWE AG | 14,535 | 1,042 |
| | Volkswagen AG Prior Pfd. | 6,284 | 942 |
| | Bayerische Motoren | | |
| | Werke AG | 10,966 | 786 |
| | Linde AG | 4,595 | 661 |
| | Deutsche Post AG | 32,989 | 615 |
| | MAN SE | 5,238 | 575 |
| | ThyssenKrupp AG | 14,459 | 532 |
| | Deutsche Boerse AG | 7,439 | 523 |
| | Fresenius Medical | | |
| | Care AG & Co. KGaA | 8,015 | 510 |
| | K&S AG | 7,219 | 502 |
| | Adidas AG | 7,464 | 486 |
| | Metro AG | 5,994 | 420 |
| | Henkel AG & Co. | | |
| | KGaA Prior Pfd. | 6,397 | 377 |
| | HeidelbergCement AG | 6,535 | 341 |
| * | Infineon Technologies AG | 42,771 | 337 |
| * | Commerzbank AG | 32,897 | 296 |
| | Fresenius SE Prior Pfd. | 2,947 | 264 |
| | Henkel AG & Co. KGaA | 4,749 | 235 |
| | Beiersdorf AG | 3,359 | 219 |
| | Lanxess AG | 2,917 | 203 |
| | Merck KGaA | 2,357 | 196 |
| * | Continental AG | 2,150 | 187 |
| | GEA Group AG | 7,055 | 185 |
| | Hochtief AG | 2,044 | 177 |
| | Volkswagen AG | 1,336 | 175 |
| * | Deutsche Lufthansa AG | 8,024 | 172 |
| * | QIAGEN NV | 8,463 | 160 |
| | Porsche Automobil | | |
| | Holding SE Prior Pfd. | 3,078 | 158 |
| | Hannover | | |
| | Rueckversicherung AG | 2,259 | 114 |
| | Wacker Chemie AG | 531 | 110 |
| | Fresenius SE | 1,224 | 108 |
| | Salzgitter AG | 1,452 | 104 |
| * | Deutsche Postbank AG | 2,968 | 103 |
| * | TUI AG | 8,737 | 102 |
| | | |
| | | | Market |
| | | | Value |
| | | Shares | ($000) |
| | Fraport AG Frankfurt Airport | | |
| | Services Worldwide | 1,283 | 81 |
| | Celesio AG | 2,981 | 71 |
| | Puma AG Rudolf Dassler Sport | 178 | 59 |
| | SMA Solar Technology AG | 373 | 44 |
| | Generali Deutschland | | |
| | Holding AG | 298 | 39 |
| | Hamburger Hafen und | | |
| | Logistik AG | 830 | 36 |
| | Suedzucker AG | 1,351 | 32 |
| * | Q-Cells SE | 104 | 1 |
| | | | 34,334 |
| Greece (0.1%) | | |
| | National Bank of | | |
| | Greece SA ADR | 167,534 | 379 |
| | OPAP SA | 8,261 | 155 |
| | Hellenic Telecommunications | | |
| | Organization SA ADR | 34,948 | 140 |
| | Coca Cola Hellenic | | |
| | Bottling Co. SA | 4,864 | 126 |
| * | Alpha Bank AE | 17,266 | 114 |
| * | EFG Eurobank Ergasias SA | 12,766 | 79 |
| | Public Power Corp. SA | 4,703 | 79 |
| | Hellenic Petroleum SA | 5,771 | 46 |
| | | | 1,118 |
| |
| Hong Kong (1.4%) | | |
| | Sun Hung Kai Properties Ltd. | 72,000 | 1,239 |
| | Hutchison Whampoa Ltd. | 119,000 | 1,175 |
| | Cheung Kong Holdings Ltd. | 65,000 | 993 |
| * | AIA Group Ltd. | 331,000 | 984 |
| | Hong Kong Exchanges and | | |
| | Clearing Ltd. | 39,700 | 876 |
| | Li & Fung Ltd. | 106,000 | 561 |
| | CLP Holdings Ltd. | 66,000 | 537 |
| | Swire Pacific Ltd. Class A | 34,500 | 491 |
| | BOC Hong Kong | | |
| | Holdings Ltd. | 155,000 | 487 |
| | Hong Kong & China | | |
| | Gas Co. Ltd. | 200,800 | 485 |
| | Hang Seng Bank Ltd. | 29,200 | 428 |
| | Hongkong Land | | |
| | Holdings Ltd. | 61,000 | 421 |
| | Jardine Matheson | | |
| | Holdings Ltd. | 9,200 | 415 |
| | Hang Lung Properties Ltd. | 79,000 | 387 |
| | Hongkong Electric | | |
| | Holdings Ltd. | 55,500 | 353 |
| | Wharf Holdings Ltd. | 51,000 | 336 |
| | Bank of East Asia Ltd. | 75,072 | 322 |
| | Henderson Land | | |
| | Development Co. Ltd. | 39,000 | 278 |
| | Esprit Holdings Ltd. | 49,831 | 269 |
| | New World | | |
| | Development Ltd. | 135,000 | 268 |
| | Hang Lung Group Ltd. | 37,937 | 252 |
21
| | | |
| Total World Stock Index Fund | | |
| |
| |
| |
| | | | Market |
| | | | Value |
| | | Shares | ($000) |
| | Link REIT | 80,000 | 247 |
| | MTR Corp. | 60,000 | 229 |
| | Jardine Strategic | | |
| | Holdings Ltd. | 7,500 | 196 |
| | Sino Land Co. Ltd. | 91,527 | 192 |
| * | Sands China Ltd. | 84,800 | 185 |
| | Cathay Pacific Airways Ltd. | 60,000 | 162 |
| | Kerry Properties Ltd. | 25,000 | 139 |
| | Shangri-La Asia Ltd. | 55,556 | 125 |
| | Yue Yuen Industrial | | |
| | Holdings Ltd. | 30,000 | 108 |
| | Wheelock & Co. Ltd. | 29,000 | 102 |
| | Hysan Development Co. Ltd. | 26,000 | 101 |
| | First Pacific Co. Ltd. | 102,400 | 95 |
| | Hopewell Holdings Ltd. | 30,000 | 94 |
| | Wing Hang Bank Ltd. | 7,000 | 82 |
| | Orient Overseas | | |
| | International Ltd. | 9,000 | 79 |
| | Cheung Kong Infrastructure | | |
| | Holdings Ltd. | 16,000 | 67 |
| | ASM Pacific Technology Ltd. | 7,300 | 66 |
| | NWS Holdings Ltd. | 27,000 | 64 |
| | PCCW Ltd. | 165,000 | 63 |
| | Industrial & Commercial | | |
| | Bank of China Asia Ltd. | 17,000 | 63 |
| * | Mongolia Energy Co. Ltd. | 156,000 | 60 |
| | Television Broadcasts Ltd. | 11,000 | 59 |
| * | Foxconn International | | |
| | Holdings Ltd. | 79,000 | 58 |
| | Guoco Group Ltd. | 4,000 | 49 |
| | Hong Kong Aircraft | | |
| | Engineering Co. Ltd. | 2,800 | 47 |
| | Lifestyle International | | |
| | Holdings Ltd. | 19,500 | 45 |
| * | Galaxy Entertainment | | |
| | Group Ltd. | 42,000 | 40 |
| | Hongkong & | | |
| | Shanghai Hotels | 22,500 | 40 |
| | Cafe de Coral Holdings Ltd. | 14,000 | 39 |
| | Chinese Estates | | |
| | Holdings Ltd. | 19,500 | 33 |
| | Great Eagle Holdings Ltd. | 11,000 | 33 |
| | Techtronic Industries Co. | 32,000 | 32 |
| | Johnson Electric | | |
| | Holdings Ltd. | 60,000 | 32 |
| | Dah Sing Financial | | |
| | Holdings Ltd. | 4,400 | 31 |
| * | Melco International | | |
| | Development Ltd. | 50,000 | 28 |
| | Texwinca Holdings Ltd. | 26,000 | 28 |
| | C C Land Holdings Ltd. | 61,000 | 24 |
| | Shun Tak Holdings Ltd. | 34,000 | 22 |
| | Dah Sing Banking Group Ltd. | 6,800 | 12 |
| | Hutchison | | |
| | Telecommunications | | |
| | Hong Kong Holdings Ltd. | 27,000 | 8 |
| | Hutchison Harbour Ring Ltd. | 34,000 | 4 |
| | | |
| | | | Market |
| | | | Value |
| | | Shares | ($000) |
| * | Henderson Land | | |
| | Development Co. Ltd. | | |
| | Warrants Exp. 06/01/2011 | 7,000 | 3 |
| | Public Financial Holdings Ltd. | 4,000 | 3 |
| | Fubon Bank Hong Kong Ltd. | 4,000 | 2 |
| | Kowloon | | |
| | Development Co. Ltd. | 1,000 | 1 |
| | | | 14,749 |
| Hungary (0.1%) | | |
| * | MOL Hungarian | | |
| | Oil and Gas plc | 2,960 | 315 |
| *,^ | OTP Bank plc | 9,916 | 294 |
| | Richter Gedeon Nyrt. | 504 | 120 |
| | Magyar Telekom | | |
| | Telecommunications plc | 17,328 | 50 |
| | | | 779 |
| India (1.5%) | | |
| 1 | Reliance | | |
| | Industries Ltd. GDR | 30,397 | 1,514 |
| | Infosys Technologies | | |
| | Ltd. ADR | 22,004 | 1,484 |
| | ITC Ltd. | 203,930 | 787 |
| | Larsen & Toubro Ltd. | 16,201 | 741 |
| | Housing Development | | |
| | Finance Corp. | 37,728 | 585 |
| | ICICI Bank Ltd. ADR | 9,855 | 518 |
| | HDFC Bank Ltd. ADR | 2,995 | 518 |
| | Bharti Airtel Ltd. | 53,392 | 393 |
| | Axis Bank Ltd. | 11,180 | 371 |
| | Oil & Natural Gas Corp. Ltd. | 10,625 | 312 |
| | Bharat Heavy Electricals Ltd. | 5,118 | 282 |
| | Bajaj Auto Ltd. | 7,984 | 272 |
| | NTPC Ltd. | 59,094 | 260 |
| | Tata Consultancy | | |
| | Services Ltd. | 10,766 | 256 |
| | Hindalco Industries Ltd. | 53,380 | 254 |
| | Tata Steel Ltd. | 19,097 | 254 |
| | State Bank of India GDR | 1,637 | 226 |
| | Hindustan Unilever Ltd. | 32,397 | 216 |
| | Jindal Steel & Power Ltd. | 13,643 | 215 |
| | Cipla Ltd. | 22,750 | 181 |
| | Infrastructure Development | | |
| | Finance Co. Ltd. | 37,144 | 168 |
| | Sterlite Industries India Ltd. | 42,619 | 163 |
| | Jaiprakash Associates Ltd. | 59,965 | 163 |
| | GAIL India Ltd. | 14,684 | 163 |
| * | Essar Oil Ltd. | 46,803 | 155 |
| | DLF Ltd. | 19,457 | 154 |
| | Punjab National Bank Ltd. | 5,016 | 146 |
| | Tata Motors Ltd. | 5,564 | 146 |
| | JSW Steel Ltd. | 4,652 | 141 |
| | Unitech Ltd. | 70,580 | 138 |
| | Adani Enterprises Ltd. | 7,501 | 119 |
| | Mahindra & Mahindra Ltd. | 7,152 | 118 |
| | Lupin Ltd. | 11,840 | 117 |
| | Sesa Goa Ltd. | 15,895 | 115 |
22
| | | |
| Total World Stock Index Fund | | |
| |
| |
| |
| | | | Market |
| | | | Value |
| | | Shares | ($000) |
| | Dr Reddy’s Laboratories Ltd. | 3,066 | 115 |
| | Sun Pharmaceutical | | |
| | Industries Ltd. | 2,324 | 110 |
| | Grasim Industries Ltd. | 2,188 | 110 |
| | Kotak Mahindra Bank Ltd. | 10,448 | 109 |
| | Hero Honda Motors Ltd. | 2,541 | 107 |
| | Reliance | | |
| | Communications Ltd. | 26,022 | 106 |
| | Tata Power Co. Ltd. | 3,306 | 104 |
| | Ultratech Cement Ltd. | 4,115 | 102 |
| * | Cairn India Ltd. | 13,752 | 99 |
| | Siemens India Ltd. | 5,364 | 99 |
| | Maruti Suzuki India Ltd. | 2,758 | 96 |
| | Steel Authority of India Ltd. | 21,511 | 94 |
| | Wipro Ltd. ADR | 6,483 | 93 |
| | Reliance Infrastructure Ltd. | 3,745 | 88 |
| | Wipro Ltd. | 8,986 | 85 |
| | United Spirits Ltd. | 2,514 | 85 |
| | NMDC Ltd. | 13,454 | 84 |
| | Nestle India Ltd. | 1,005 | 79 |
| | State Bank of India | 1,105 | 79 |
| | Hindustan | | |
| | Petroleum Corp. Ltd. | 6,992 | 77 |
| | Reliance Capital Ltd. | 4,116 | 76 |
| * | Idea Cellular Ltd. | 49,411 | 75 |
| | Indian Oil Corp. Ltd. | 7,740 | 73 |
| | Crompton Greaves Ltd. | 9,544 | 68 |
| | Bank of Baroda | 2,961 | 68 |
| | Union Bank of India | 7,723 | 66 |
| | Canara Bank | 4,018 | 65 |
| | Reliance Industries Ltd. | 2,564 | 63 |
| * | Reliance Power Ltd. | 17,448 | 62 |
| | Bharat Forge Ltd. | 7,216 | 61 |
| * | Housing Development & | | |
| | Infrastructure Ltd. | 10,114 | 57 |
| | Oriental Bank of Commerce | 5,026 | 57 |
| | NHPC Ltd. | 77,106 | 54 |
| | Bajaj Holdings and | | |
| | Investment Ltd. | 2,743 | 54 |
| | HCL Technologies Ltd. | 5,856 | 53 |
| * | Ranbaxy Laboratories Ltd. | 3,987 | 52 |
| | Bharat Petroleum Corp. Ltd. | 3,151 | 52 |
| | Piramal Healthcare Ltd. | 4,744 | 51 |
| | Aditya Birla Nuvo Ltd. | 2,744 | 51 |
| | Rural Electrification Corp. Ltd. | 6,020 | 50 |
| | Bank of India | 4,536 | 50 |
| | Tata Chemicals Ltd. | 5,612 | 49 |
| * | GMR Infrastructure Ltd. | 40,149 | 48 |
| | Ambuja Cements Ltd. | 14,479 | 46 |
| | Mphasis Ltd. | 3,320 | 46 |
| | Mundra Port and Special | | |
| | Economic Zone Ltd. | 13,075 | 45 |
| | Colgate-Palmolive India Ltd. | 2,243 | 44 |
| | Dabur India Ltd. | 19,658 | 44 |
| | Power Finance Corp. Ltd. | 5,389 | 44 |
| | | |
| | | | Market |
| | | | Value |
| | | Shares | ($000) |
| | Indiabulls Financial | | |
| | Services Ltd. | 8,744 | 44 |
| | Torrent Power Ltd. | 6,625 | 44 |
| | Zee Entertainment | | |
| | Enterprises Ltd. | 6,758 | 42 |
| | ACC Ltd. | 1,743 | 39 |
| | National Aluminium Co. Ltd. | 3,887 | 35 |
| | Oil India Ltd. | 1,071 | 35 |
| * | Adani Power Ltd. | 11,943 | 35 |
| | Power Grid Corp. of | | |
| | India Ltd. | 15,224 | 34 |
| | Bharat Electronics Ltd. | 915 | 34 |
| | Great Eastern | | |
| | Shipping Co. Ltd. | 4,651 | 33 |
| | Divi’s Laboratories Ltd. | 2,113 | 33 |
| | Glenmark | | |
| | Pharmaceuticals Ltd. | 4,289 | 33 |
| * | Suzlon Energy Ltd. | 24,455 | 30 |
| * | Reliance Natural | | |
| | Resources Ltd. | 32,234 | 28 |
| | Ashok Leyland Ltd. | 14,952 | 26 |
| * | Oracle Financial | | |
| | Sevices Software Ltd. | 506 | 25 |
| * | Satyam Computer | | |
| | Services Ltd. ADR | 6,743 | 24 |
| * | Jet Airways India Ltd. | 1,168 | 21 |
| | Corp Bank | 1,243 | 21 |
| * | Tata Communications Ltd. | 3,012 | 21 |
| * | Lanco Infratech Ltd. | 14,460 | 21 |
| | Hindustan Zinc Ltd. | 678 | 19 |
| | Punj Lloyd Ltd. | 6,563 | 17 |
| | Castrol India Ltd. | 1,484 | 16 |
| | Sun TV Network Ltd. | 1,307 | 15 |
| | Tech Mahindra Ltd. | 885 | 15 |
| | Aban Offshore Ltd. | 801 | 14 |
| | Godrej Industries Ltd. | 2,902 | 14 |
| | IDBI Bank Ltd. | 3,367 | 14 |
| | Shipping Corp. of India Ltd. | 2,795 | 11 |
| | Mangalore Refinery & | | |
| | Petrochemicals Ltd. | 5,750 | 11 |
| | Financial Technologies | | |
| | India Ltd. | 470 | 10 |
| * | Tata Teleservices | | |
| | Maharashtra Ltd. | 10,939 | 6 |
| * | Mahanagar Telephone Nigam | 2,962 | 4 |
| | ABB Ltd. | 51 | 1 |
| | | | 16,015 |
| Indonesia (0.3%) | | |
| | Astra International Tbk PT | 112,003 | 717 |
| | Telekomunikasi | | |
| | Indonesia Tbk PT | 363,008 | 369 |
| | Bank Central Asia Tbk PT | 467,228 | 367 |
| | Bank Rakyat Indonesia | | |
| | Persero Tbk PT | 226,689 | 290 |
| | United Tractors Tbk PT | 89,500 | 223 |
| | Bumi Resources Tbk PT | 736,500 | 184 |
23
| | | |
| Total World Stock Index Fund | | |
| |
| |
| |
| | | | Market |
| | | | Value |
| | | Shares | ($000) |
| | Perusahaan Gas Negara PT | 327,000 | 149 |
| | Semen Gresik | | |
| | Persero Tbk PT | 107,000 | 118 |
| | Bank Mandiri Tbk PT | 147,500 | 116 |
| | Unilever Indonesia Tbk PT | 57,500 | 113 |
| | Gudang Garam Tbk PT | 21,000 | 112 |
| | Adaro Energy Tbk PT | 448,500 | 106 |
| | Indocement Tunggal | | |
| | Prakarsa Tbk PT | 40,000 | 82 |
| | Tambang Batubara Bukit | | |
| | Asam Tbk PT | 36,000 | 79 |
| | Indofood Sukses | | |
| | Makmur Tbk PT | 135,500 | 79 |
| | Bank Negara Indonesia | | |
| | Persero Tbk PT | 159,000 | 70 |
| | Indo Tambangraya | | |
| | Megah PT | 12,000 | 61 |
| | Bank Danamon | | |
| | Indonesia Tbk PT | 67,495 | 51 |
| | Astra Agro Lestari Tbk PT | 17,000 | 48 |
| | Aneka Tambang Tbk PT | 147,500 | 42 |
| | International Nickel | | |
| | Indonesia Tbk PT | 77,000 | 41 |
| | Indosat Tbk PT | 52,500 | 35 |
| | | | 3,452 |
| Ireland (0.1%) | | |
| | CRH plc | 25,366 | 438 |
| | Kerry Group plc Class A | 5,070 | 187 |
| * | Elan Corp. plc | 23,632 | 131 |
| | Ryanair Holdings plc | 20,014 | 115 |
| * | Governor & Co. of the | | |
| | Bank of Ireland | 138,455 | 104 |
| | Ryanair Holdings plc ADR | 1,145 | 37 |
| * | Anglo Irish Bank Corp. Ltd. | 14,385 | 4 |
| | | | 1,016 |
| Israel (0.3%) | | |
| | Teva Pharmaceutical | | |
| | Industries Ltd. | 33,111 | 1,717 |
| * | Check Point Software | | |
| | Technologies Ltd. | 8,300 | 355 |
| | Israel Chemicals Ltd. | 18,864 | 288 |
| | Bezeq Israeli | | |
| | Telecommunication | | |
| | Corp. Ltd. | 67,721 | 178 |
| * | Bank Hapoalim BM | 33,833 | 153 |
| * | Bank Leumi Le-Israel BM | 19,230 | 89 |
| * | Israel Corp. Ltd. | 76 | 82 |
| | Partner | | |
| | Communications Co. Ltd. | 3,295 | 67 |
| * | Israel Discount Bank Ltd. | | |
| | Class A | 30,251 | 61 |
| * | NICE Systems Ltd. | 1,817 | 60 |
| | Elbit Systems Ltd. | 985 | 52 |
| | Cellcom Israel Ltd. | | |
| | (Registered) | 1,472 | 50 |
| | Mizrahi Tefahot Bank Ltd. | 4,660 | 44 |
| | | |
| | | | Market |
| | | | Value |
| | | Shares | ($000) |
| | Delek Group Ltd. | 129 | 36 |
| | Osem Investments Ltd. | 2,167 | 34 |
| * | Delek Drilling - LP | 7,474 | 33 |
| | Makhteshim-Agan | | |
| | Industries Ltd. | 5,400 | 27 |
| * | Clal Insurance Enterprise | | |
| | Holdings Ltd. | 900 | 24 |
| | Clal Industries and | | |
| | Investments Ltd. | 2,300 | 17 |
| | Discount Investment Corp. | 600 | 14 |
| | Property & Building Corp. | 137 | 13 |
| | Gazit-Globe Ltd. | 1,058 | 13 |
| | Delek Automotive | | |
| | Systems Ltd. | 1,000 | 12 |
| * | Hot Telecommunication | | |
| | System Ltd. | 900 | 12 |
| * | Menorah Mivtachim | | |
| | Holdings Ltd. | 865 | 12 |
| | Harel Insurance Investments | | |
| | & Financial Services Ltd. | 200 | 11 |
| | Oil Refineries Ltd. | 19,025 | 11 |
| | IDB Holding Corp. Ltd. | 302 | 11 |
| | Migdal Insurance & Financial | | |
| | Holding Ltd. | 5,000 | 10 |
| | Koor Industries Ltd. | 400 | 10 |
| | First International Bank Of | | |
| | Israel Ltd. | 708 | 10 |
| * | Elbit Imaging Ltd. | 579 | 8 |
| | Paz Oil Co. Ltd. | 50 | 8 |
| | Strauss Group Ltd. | 500 | 8 |
| | Ormat Industries | 762 | 6 |
| * | Africa Israel Investments Ltd. | 720 | 5 |
| | Shufersal Ltd. | 680 | 4 |
| | | | 3,545 |
| Italy (1.3%) | | |
| | ENI SPA | 102,223 | 2,302 |
| | UniCredit SPA | 711,918 | 1,856 |
| | Enel SPA | 259,283 | 1,481 |
| | Assicurazioni Generali SPA | 55,989 | 1,227 |
| | Intesa Sanpaolo SPA | | |
| | (Registered) | 327,253 | 1,151 |
| | Telecom Italia SPA | | |
| | (Registered) | 488,923 | 750 |
| | Fiat SPA | 30,821 | 522 |
| | Saipem SPA | 11,264 | 500 |
| | Atlantia SPA | 15,471 | 354 |
| | Tenaris SA ADR | 8,484 | 352 |
| | Snam Rete Gas SPA | 60,861 | 330 |
| | Terna Rete Elettrica | | |
| | Nazionale SPA | 55,260 | 255 |
| | Telecom Italia SPA (Bearer) | 198,803 | 244 |
| | Unione di Banche I | | |
| | taliane SCPA | 22,568 | 238 |
| * | Mediobanca SPA | 22,004 | 228 |
| | Mediaset SPA | 30,736 | 227 |
| | Finmeccanica SPA | 14,822 | 207 |
24
| | | |
| Total World Stock Index Fund | | |
| |
| |
| |
| | | | Market |
| | | | Value |
| | | Shares | ($000) |
| | Parmalat SPA | 60,990 | 168 |
| | Luxottica Group SPA | 4,950 | 146 |
| | Banco Popolare SC | 26,736 | 144 |
| * | Banca Monte dei Paschi | | |
| | di Siena SPA | 99,044 | 139 |
| | Pirelli & C SPA | 12,867 | 110 |
| ^ | Mediolanum SPA | 20,160 | 95 |
| | A2A SPA | 56,489 | 92 |
| | Exor SPA | 3,073 | 79 |
| * | Autogrill SPA | 5,595 | 75 |
| | Banca Carige SPA | 29,835 | 72 |
| | Bulgari SPA | 6,651 | 71 |
| | Banca Popolare | | |
| | di Milano Scarl | 14,967 | 70 |
| | Italcementi SPA RSP | 8,902 | 43 |
| | Unipol Gruppo Finanziario | | |
| | SPA Prior Pfd. | 53,503 | 32 |
| | Unipol Gruppo | | |
| | Finanziario SPA | 39,488 | 31 |
| | Lottomatica SPA | 1,383 | 23 |
| | Edison SPA | 18,221 | 23 |
| | Buzzi Unicem SPA | 1,855 | 21 |
| * | Saras SPA | 8,757 | 19 |
| | Exor SPA Prior Pfd. | 942 | 19 |
| | Italcementi SPA | 2,037 | 17 |
| | | | 13,713 |
| Japan (7.8%) | | |
| | Toyota Motor Corp. | 95,100 | 3,368 |
| | Mitsubishi UFJ Financial | | |
| | Group Inc. | 521,851 | 2,422 |
| | Canon Inc. | 48,900 | 2,251 |
| | Honda Motor Co. Ltd. | 50,300 | 1,813 |
| | Sumitomo Mitsui | | |
| | Financial Group Inc. | 52,348 | 1,562 |
| | Panasonic Corp. | 89,800 | 1,309 |
| | Sony Corp. | 36,700 | 1,240 |
| | Mitsubishi Corp. | 46,900 | 1,127 |
| | Mizuho Financial | | |
| | Group Inc. | 768,667 | 1,115 |
| | NTT DoCoMo Inc. | 649 | 1,094 |
| | Tokyo Electric | | |
| | Power Co. Inc. | 43,500 | 1,039 |
| | Takeda | | |
| | Pharmaceutical Co. Ltd. | 22,000 | 1,031 |
| | Nintendo Co. Ltd. | 3,800 | 981 |
| | Fanuc Ltd. | 6,700 | 970 |
| | Softbank Corp. | 29,600 | 951 |
| | Komatsu Ltd. | 37,000 | 904 |
| | Nippon Telegraph & | | |
| | Telephone Corp. | 19,800 | 893 |
| | Mitsui & Co. Ltd. | 51,500 | 810 |
| | Nissan Motor Co. Ltd. | 84,000 | 738 |
| | Kyocera Corp. | 7,100 | 708 |
| | East Japan Railway Co. | 11,200 | 692 |
| | Nomura Holdings Inc. | 134,200 | 690 |
| | KDDI Corp. | 127 | 685 |
| | | |
| | | | Market |
| | | | Value |
| | | Shares | ($000) |
| | Mitsubishi Estate Co. Ltd. | 39,000 | 683 |
| | Kansai Electric | | |
| | Power Co. Inc. | 26,900 | 681 |
| | Shin-Etsu Chemical Co. Ltd. | 12,900 | 652 |
| | Tokio Marine Holdings Inc. | 22,600 | 635 |
| | Mitsui Fudosan Co. Ltd. | 33,000 | 624 |
| | Nippon Steel Corp. | 192,000 | 603 |
| | Toshiba Corp. | 119,000 | 596 |
| | Japan Tobacco Inc. | 191 | 593 |
| | Hitachi Ltd. | 127,000 | 574 |
| | MS&AD Insurance | | |
| | Group Holdings | 23,891 | 572 |
| | Seven & I Holdings Co. Ltd. | 24,500 | 569 |
| | Mitsubishi Electric Corp. | 59,000 | 553 |
| | Astellas Pharma Inc. | 14,200 | 528 |
| | JFE Holdings Inc. | 16,900 | 527 |
| | Chubu Electric | | |
| | Power Co. Inc. | 20,300 | 513 |
| | Denso Corp. | 16,200 | 504 |
| | Kao Corp. | 19,700 | 501 |
| | Inpex Corp. | 95 | 495 |
| | FUJIFILM Holdings Corp. | 14,300 | 477 |
| | Murata | | |
| | Manufacturing Co. Ltd. | 8,300 | 466 |
| | Central Japan Railway Co. | 61 | 461 |
| | Mitsubishi Heavy | | |
| | Industries Ltd. | 124,870 | 454 |
| | Sumitomo Corp. | 35,400 | 448 |
| | Daiichi Sankyo Co. Ltd. | 21,000 | 445 |
| | Dai-ichi Life | | |
| | Insurance Co. Ltd. | 363 | 440 |
| | Bridgestone Corp. | 23,500 | 421 |
| | JX Holdings Inc. | 69,507 | 410 |
| * | NKSJ Holdings Inc. | 58,900 | 404 |
| | ITOCHU Corp. | 46,000 | 403 |
| | Fujitsu Ltd. | 57,634 | 393 |
| | Suzuki Motor Corp. | 15,581 | 380 |
| | Sumitomo Realty & | | |
| | Development Co. Ltd. | 17,316 | 377 |
| | ORIX Corp. | 4,121 | 375 |
| | Nidec Corp. | 3,800 | 375 |
| | Hoya Corp. | 15,500 | 362 |
| | Keyence Corp. | 1,460 | 362 |
| | Kirin Holdings Co. Ltd. | 26,000 | 356 |
| | Sumitomo Metal | | |
| | Mining Co. Ltd. | 22,000 | 350 |
| | Tokyo Gas Co. Ltd. | 71,000 | 334 |
| | Sumitomo Metal | | |
| | Industries Ltd. | 138,000 | 320 |
| | Kyushu Electric | | |
| | Power Co. Inc. | 13,400 | 317 |
| | Marubeni Corp. | 48,628 | 305 |
| | Tohoku Electric | | |
| | Power Co. Inc. | 13,400 | 301 |
| | Asahi Glass Co. Ltd. | 31,000 | 297 |
| | SMC Corp. | 1,900 | 290 |
25
| | | |
| Total World Stock Index Fund | | |
| |
| |
| |
| | | Market |
| | | Value |
| | Shares | ($000) |
| Daikin Industries Ltd. | 8,279 | 288 |
| Sharp Corp. | 29,000 | 286 |
| Ricoh Co. Ltd. | 20,000 | 280 |
| Terumo Corp. | 5,500 | 279 |
| Secom Co. Ltd. | 6,100 | 278 |
| NEC Corp. | 99,000 | 275 |
| Yamada Denki Co. Ltd. | 4,160 | 270 |
| Sumitomo Electric | | |
| Industries Ltd. | 21,200 | 270 |
| Rohm Co. Ltd. | 4,300 | 268 |
| Toray Industries Inc. | 46,000 | 267 |
| Tokyo Electron Ltd. | 4,700 | 265 |
| Eisai Co. Ltd. | 7,700 | 265 |
| Fast Retailing Co. Ltd. | 2,000 | 262 |
| Asahi Breweries Ltd. | 12,600 | 254 |
| Daiwa Securities Group Inc. | 62,000 | 253 |
| Aeon Co. Ltd. | 20,700 | 244 |
| Yakult Honsha Co. Ltd. | 8,100 | 237 |
| Sumitomo Trust & | | |
| Banking Co. Ltd. | 43,000 | 235 |
| Isuzu Motors Ltd. | 60,000 | 230 |
| Asahi Kasei Corp. | 39,000 | 229 |
| Dai Nippon Printing Co. Ltd. | 18,000 | 227 |
| Daito Trust | | |
| Construction Co. Ltd. | 3,700 | 224 |
| Electric Power | | |
| Development Co. Ltd. | 7,500 | 222 |
| Shiseido Co. Ltd. | 10,600 | 221 |
| Hankyu Hanshin | | |
| Holdings Inc. | 46,000 | 221 |
| Mitsui OSK Lines Ltd. | 34,397 | 220 |
| Mitsubishi Chemical | | |
| Holdings Corp. | 42,484 | 219 |
| Kubota Corp. | 24,000 | 213 |
| Osaka Gas Co. Ltd. | 56,000 | 211 |
| Yahoo Japan Corp. | 604 | 211 |
| Sumitomo | | |
| Chemical Co. Ltd. | 46,492 | 203 |
| Nikon Corp. | 10,400 | 196 |
| TDK Corp. | 3,400 | 194 |
| Chugoku Electric | | |
| Power Co. Inc. | 9,600 | 193 |
| Kuraray Co. Ltd. | 13,500 | 193 |
| West Japan Railway Co. | 52 | 193 |
| Nippon Yusen KK | 46,000 | 193 |
| Omron Corp. | 8,300 | 192 |
| Olympus Corp. | 7,000 | 183 |
| Shikoku Electric | | |
| Power Co. Inc. | 6,200 | 183 |
| Kobe Steel Ltd. | 81,000 | 178 |
| T&D Holdings Inc. | 8,700 | 178 |
| Bank of Yokohama Ltd. | 36,000 | 177 |
| Odakyu Electric | | |
| Railway Co. Ltd. | 19,000 | 175 |
| Daiwa House | | |
| Industry Co. Ltd. | 16,000 | 172 |
| | | |
| | | | Market |
| | | | Value |
| | | Shares | ($000) |
| | Ajinomoto Co. Inc. | 18,000 | 172 |
| * | Mitsubishi Motors Corp. | 143,000 | 170 |
| | Sekisui House Ltd. | 18,000 | 169 |
| | Taisho | | |
| | Pharmaceutical Co. Ltd. | 8,000 | 168 |
| | Nitto Denko Corp. | 4,500 | 168 |
| | Nippon Electric | | |
| | Glass Co. Ltd. | 13,000 | 167 |
| | Nomura Research | | |
| | Institute Ltd. | 8,800 | 166 |
| | Shizuoka Bank Ltd. | 19,000 | 163 |
| | Aisin Seiki Co. Ltd. | 5,100 | 160 |
| | JS Group Corp. | 8,100 | 159 |
| | Shionogi & Co. Ltd. | 9,100 | 159 |
| | Chuo Mitsui Trust | | |
| | Holdings Inc. | 43,000 | 155 |
| | Oriental Land Co. Ltd. | 1,600 | 155 |
| | Yamato Holdings Co. Ltd. | 12,200 | 154 |
| | Tokyu Corp. | 33,000 | 148 |
| | Toppan Printing Co. Ltd. | 18,000 | 145 |
| | Chiba Bank Ltd. | 23,000 | 142 |
| ^ | Kintetsu Corp. | 44,000 | 139 |
| | Hokuriku Electric Power Co. | 5,700 | 138 |
| | Fuji Heavy Industries Ltd. | 20,000 | 138 |
| | Unicharm Corp. | 3,600 | 138 |
| | JTEKT Corp. | 13,700 | 137 |
| | NGK Insulators Ltd. | 9,000 | 136 |
| | Konica Minolta Holdings Inc. | 14,000 | 135 |
| | Chugai Pharmaceutical | | |
| | Co. Ltd. | 7,700 | 135 |
| | Benesse Holdings Inc. | 2,800 | 134 |
| | JGC Corp. | 7,000 | 134 |
| ^ | Resona Holdings Inc. | 16,800 | 134 |
| * | Yamaha Motor Co. Ltd. | 8,700 | 133 |
| | Keikyu Corp. | 14,000 | 132 |
| | Ono Pharmaceutical Co. Ltd. | 3,100 | 132 |
| | OJI Paper Co. Ltd. | 28,000 | 129 |
| | Ibiden Co. Ltd. | 5,200 | 128 |
| | Toyota Industries Corp. | 4,500 | 127 |
| | Makita Corp. | 3,600 | 126 |
| | Shimano Inc. | 2,500 | 125 |
| | Tobu Railway Co. Ltd. | 22,000 | 124 |
| | Brother Industries Ltd. | 9,600 | 123 |
| | NTT Data Corp. | 39 | 120 |
| | Nissin Foods | | |
| | Holdings Co. Ltd. | 3,300 | 120 |
| | Mazda Motor Corp. | 47,000 | 119 |
| | Keio Corp. | 17,000 | 119 |
| | Kawasaki Heavy | | |
| | Industries Ltd. | 43,000 | 119 |
| | Lawson Inc. | 2,600 | 118 |
| | Hokkaido Electric | | |
| | Power Co. Inc. | 5,600 | 118 |
| * | Mitsubishi Materials Corp. | 37,340 | 117 |
| | Fukuoka Financial Group Inc. | 30,000 | 116 |
| | JSR Corp. | 6,600 | 114 |
26
| | | |
| Total World Stock Index Fund | | |
| |
| |
| |
| | | Market |
| | | Value |
| | Shares | ($000) |
| Dentsu Inc. | 4,800 | 113 |
| Isetan Mitsukoshi | | |
| Holdings Ltd. | 10,200 | 113 |
| Nippon Express Co. Ltd. | 28,000 | 111 |
| * | All Nippon Airways Co. Ltd. | 29,000 | 110 |
| Sony Financial Holdings Inc. | 31 | 108 |
| NSK Ltd. | 14,000 | 106 |
| Trend Micro Inc. | 3,600 | 102 |
| Dena Co. Ltd. | 3,900 | 101 |
| Hirose Electric Co. Ltd. | 1,000 | 101 |
| Toho Gas Co. Ltd. | 19,000 | 100 |
| Advantest Corp. | 5,200 | 99 |
| Mitsubishi Tanabe | | |
| Pharma Corp. | 6,000 | 98 |
| TonenGeneral Sekiyu KK | 11,000 | 98 |
| Toyo Seikan Kaisha Ltd. | 5,700 | 97 |
| Teijin Ltd. | 26,000 | 96 |
| Joyo Bank Ltd. | 22,000 | 96 |
| Japan Steel Works Ltd. | 10,000 | 95 |
| Sekisui Chemical Co. Ltd. | 15,000 | 95 |
| SBI Holdings Inc. | 772 | 94 |
| MEIJI Holdings Co. Ltd. | 2,017 | 93 |
| THK Co. Ltd. | 4,800 | 92 |
| Panasonic Electric | | |
| Works Co. Ltd. | 7,000 | 92 |
| Rinnai Corp. | 1,500 | 91 |
| Sumitomo Heavy | | |
| Industries Ltd. | 16,000 | 91 |
| Credit Saison Co. Ltd. | 6,400 | 91 |
| Sankyo Co. Ltd. | 1,700 | 91 |
| Bank of Kyoto Ltd. | 10,000 | 89 |
| Stanley Electric Co. Ltd. | 5,300 | 89 |
| FamilyMart Co. Ltd. | 2,500 | 89 |
| Kyowa Hakko Kirin Co. Ltd. | 9,000 | 88 |
| Taiyo Nippon Sanso Corp. | 11,000 | 88 |
| Kurita Water Industries Ltd. | 3,400 | 88 |
| Keihan Electric | | |
| Railway Co. Ltd. | 20,000 | 88 |
| Nitori Holdings Co. Ltd. | 1,000 | 88 |
| Sojitz Corp. | 47,448 | 87 |
| Obayashi Corp. | 21,000 | 86 |
| Mitsumi Electric Co. Ltd. | 5,000 | 85 |
| Seiko Epson Corp. | 5,200 | 83 |
| Daihatsu Motor Co. Ltd. | 6,000 | 81 |
| Nisshin Seifun Group Inc. | 6,500 | 80 |
| Mitsubishi Gas | | |
| Chemical Co. Inc. | 13,000 | 80 |
| NOK Corp. | 4,500 | 80 |
| Sega Sammy Holdings Inc. | 4,900 | 80 |
| Santen Pharmaceutical | | |
| Co. Ltd. | 2,300 | 79 |
| Denki Kagaku Kogyo KK | 18,000 | 79 |
| Hisamitsu | | |
| Pharmaceutical Co. Inc. | 1,900 | 78 |
| Hamamatsu Photonics KK | 2,400 | 78 |
| Aeon Mall Co. Ltd. | 3,300 | 77 |
| | | |
| | | | Market |
| | | | Value |
| | | Shares | ($000) |
| | Shimizu Corp. | 20,000 | 77 |
| | Minebea Co. Ltd. | 14,000 | 77 |
| | Nippon Paper Group Inc. | 3,000 | 76 |
| | Mitsui Chemicals Inc. | 26,000 | 76 |
| | Toyota Tsusho Corp. | 4,900 | 76 |
| | Toho Co. Ltd. | 4,900 | 76 |
| | Cosmo Oil Co. Ltd. | 28,000 | 75 |
| | Kansai Paint Co. Ltd. | 8,000 | 75 |
| | Iyo Bank Ltd. | 10,000 | 74 |
| | IHI Corp. | 39,000 | 74 |
| | Nippon Paint Co. Ltd. | 10,000 | 74 |
| | Kawasaki Kisen Kaisha Ltd. | 19,000 | 74 |
| | MediPal Holdings Corp. | 6,300 | 73 |
| | Keisei Electric | | |
| | Railway Co. Ltd. | 11,000 | 73 |
| ^ | GS Yuasa Corp. | 11,000 | 73 |
| | Konami Corp. | 4,100 | 72 |
| | Hachijuni Bank Ltd. | 14,000 | 72 |
| | J Front Retailing Co. Ltd. | 14,000 | 72 |
| | USS Co. Ltd. | 920 | 71 |
| | Air Water Inc. | 6,000 | 70 |
| | Nippon Meat Packers Inc. | 6,000 | 70 |
| | Chugoku Bank Ltd. | 6,000 | 70 |
| | NGK Spark Plug Co. Ltd. | 5,000 | 70 |
| | Showa Denko KK | 38,000 | 69 |
| | Daicel Chemical | | |
| | Industries Ltd. | 10,000 | 69 |
| | Nissan Chemical | | |
| | Industries Ltd. | 6,000 | 69 |
| | Tokyu Land Corp. | 15,000 | 68 |
| * | Sanyo Electric Co. Ltd. | 42,000 | 68 |
| | Hitachi Metals Ltd. | 6,000 | 68 |
| | Kagome Co. Ltd. | 3,600 | 68 |
| | Takashimaya Co. Ltd. | 9,000 | 68 |
| | Shimamura Co. Ltd. | 700 | 67 |
| | Furukawa Electric Co. Ltd. | 18,000 | 67 |
| | Dowa Holdings Co. Ltd. | 11,000 | 67 |
| | Hitachi Chemical Co. Ltd. | 3,600 | 67 |
| | Hokuhoku Financial | | |
| | Group Inc. | 36,000 | 67 |
| | TOTO Ltd. | 10,000 | 66 |
| | Daido Steel Co. Ltd. | 13,000 | 66 |
| | Nagoya Railroad Co. Ltd. | 24,000 | 66 |
| | Amada Co. Ltd. | 10,000 | 66 |
| | Kajima Corp. | 28,000 | 66 |
| | Hiroshima Bank Ltd. | 16,000 | 65 |
| | Gunma Bank Ltd. | 13,000 | 65 |
| | Ushio Inc. | 3,900 | 65 |
| | Kikkoman Corp. | 6,000 | 65 |
| | Asics Corp. | 6,000 | 65 |
| | Miraca Holdings Inc. | 1,800 | 65 |
| | Tsumura & Co. | 2,100 | 65 |
| | Toyo Suisan Kaisha Ltd. | 3,000 | 64 |
| | Taiyo Yuden Co. Ltd. | 5,000 | 64 |
| | Mitsui Mining & | | |
| | Smelting Co. Ltd. | 21,000 | 64 |
27
| | | |
| Total World Stock Index Fund | | |
| |
| |
| |
| | | | Market |
| | | | Value |
| | | Shares | ($000) |
| | Hitachi Construction | | |
| | Machinery Co. Ltd. | 3,000 | 64 |
| | Ube Industries Ltd. | 26,000 | 64 |
| | Marui Group Co. Ltd. | 8,100 | 64 |
| | Yamaguchi Financial | | |
| | Group Inc. | 7,000 | 63 |
| | NTN Corp. | 14,000 | 63 |
| | Suruga Bank Ltd. | 7,000 | 63 |
| * | Mizuho Trust & | | |
| | Banking Co. Ltd. | 70,000 | 63 |
| | Yaskawa Electric Corp. | 8,000 | 62 |
| | Yamaha Corp. | 5,100 | 62 |
| | Taisei Corp. | 29,000 | 62 |
| | Sumitomo Rubber | | |
| | Industries Ltd. | 5,700 | 61 |
| | Kewpie Corp. | 4,800 | 61 |
| | Casio Computer Co. Ltd. | 8,700 | 61 |
| | Yamazaki Baking Co. Ltd. | 5,000 | 61 |
| | Fujikura Ltd. | 13,000 | 61 |
| | Mitsubishi Logistics Corp. | 5,000 | 60 |
| | Tokuyama Corp. | 11,000 | 60 |
| | Kinden Corp. | 7,000 | 60 |
| | Shimadzu Corp. | 8,000 | 60 |
| | Nishi-Nippon | | |
| | Railroad Co. Ltd. | 14,000 | 60 |
| | Namco Bandai Holdings Inc. | 6,500 | 60 |
| | Idemitsu Kosan Co. Ltd. | 700 | 59 |
| | Yamatake Corp. | 2,400 | 58 |
| | Mabuchi Motor Co. Ltd. | 1,100 | 58 |
| | Chiyoda Corp. | 7,000 | 58 |
| | Toyota Boshoku Corp. | 3,400 | 58 |
| | Nanto Bank Ltd. | 11,000 | 58 |
| | Rengo Co. Ltd. | 9,000 | 57 |
| | Nishi-Nippon City Bank Ltd. | 21,000 | 57 |
| | Yokogawa Electric Corp. | 8,700 | 57 |
| | Mitsubishi UFJ Lease & | | |
| | Finance Co. Ltd. | 1,710 | 57 |
| | Citizen Holdings Co. Ltd. | 9,900 | 57 |
| | Nomura Real Estate | | |
| | Holdings Inc. | 3,700 | 57 |
| | Suzuken Co. Ltd. | 1,800 | 57 |
| | 77 Bank Ltd. | 12,000 | 57 |
| | Nippon Sheet Glass Co. Ltd. | 25,742 | 57 |
| * | Ebara Corp. | 13,000 | 56 |
| * | Sumco Corp. | 3,600 | 56 |
| | Maruichi Steel Tube Ltd. | 2,800 | 55 |
| | Kamigumi Co. Ltd. | 7,000 | 55 |
| | Alfresa Holdings Corp. | 1,300 | 55 |
| | Oracle Corp. Japan | 1,200 | 54 |
| | Mitsui Engineering & | | |
| | Shipbuilding Co. Ltd. | 24,000 | 54 |
| | Tosoh Corp. | 20,000 | 54 |
| | Nabtesco Corp. | 3,000 | 53 |
| | Ito En Ltd. | 3,300 | 53 |
| *,^ | Elpida Memory Inc. | 5,100 | 52 |
| | Don Quijote Co. Ltd. | 1,900 | 52 |
| | | |
| | | | Market |
| | | | Value |
| | | Shares | ($000) |
| | Toyoda Gosei Co. Ltd. | 2,400 | 52 |
| | Higo Bank Ltd. | 11,000 | 51 |
| | Hakuhodo DY Holdings Inc. | 1,020 | 51 |
| | NHK Spring Co. Ltd. | 6,000 | 51 |
| | Glory Ltd. | 2,300 | 51 |
| | Nisshinbo Holdings Inc. | 5,000 | 51 |
| | Zeon Corp. | 6,000 | 50 |
| | Kaneka Corp. | 8,000 | 49 |
| | Takata Corp. | 2,000 | 49 |
| | Seino Holdings Corp. | 8,000 | 49 |
| | Yamato Kogyo Co. Ltd. | 1,900 | 49 |
| | Tokyo Steel | | |
| | Manufacturing Co. Ltd. | 4,800 | 48 |
| | Shiga Bank Ltd. | 9,000 | 47 |
| | Circle K Sunkus Co. Ltd. | 3,300 | 47 |
| | Japan Petroleum | | |
| | Exploration Co. | 1,200 | 46 |
| * | Dainippon Screen | | |
| | Manufacturing Co. Ltd. | 8,000 | 46 |
| * | Haseko Corp. | 53,000 | 45 |
| | Nisshin Steel Co. Ltd. | 25,000 | 45 |
| | Mizuho Securities Co. Ltd. | 21,000 | 45 |
| | Sotetsu Holdings Inc. | 14,000 | 44 |
| | Tokyo Tatemono Co. Ltd. | 11,000 | 44 |
| | Wacoal Holdings Corp. | 3,000 | 44 |
| | Mochida | | |
| | Pharmaceutical Co. Ltd. | 4,000 | 43 |
| | Sapporo Holdings Ltd. | 11,000 | 43 |
| | Lion Corp. | 8,000 | 43 |
| | Alps Electric Co. Ltd. | 4,800 | 43 |
| | Senshu Ikeda Holdings Inc. | 32,000 | 43 |
| *,^ | Shinsei Bank Ltd. | 53,000 | 42 |
| | Kokuyo Co. Ltd. | 5,400 | 41 |
| | Yokohama Rubber Co. Ltd. | 8,000 | 40 |
| | COMSYS Holdings Corp. | 4,500 | 40 |
| | Tokyo Style Co. Ltd. | 5,000 | 40 |
| | Dainippon Sumitomo | | |
| | Pharma Co. Ltd. | 4,400 | 40 |
| | Nissha Printing Co. Ltd. | 1,800 | 40 |
| | Fukuyama | | |
| | Transporting Co. Ltd. | 7,998 | 40 |
| | Koito Manufacturing Co. Ltd. | 3,000 | 39 |
| | Nippon Kayaku Co. Ltd. | 4,000 | 39 |
| | Park24 Co. Ltd. | 4,000 | 39 |
| | Lintec Corp. | 1,700 | 38 |
| | Fuji Electric | | |
| | Holdings Co. Ltd. | 16,000 | 38 |
| * | Gree Inc. | 3,000 | 38 |
| | Nippon Shokubai Co. Ltd. | 4,000 | 38 |
| | Onward Holdings Co. Ltd. | 5,000 | 37 |
| | Rohto Pharmaceutical Co. Ltd. | 3,000 | 37 |
| | Shimachu Co. Ltd. | 1,800 | 37 |
| | Ezaki Glico Co. Ltd. | 3,000 | 37 |
| | Aozora Bank Ltd. | 22,000 | 37 |
| | MISUMI Group Inc. | 1,700 | 36 |
| | Toho Titanium Co. Ltd. | 1,400 | 36 |
28
| | | |
| Total World Stock Index Fund | | |
| |
| |
| |
| | | Market |
| | | Value |
| | Shares | ($000) |
| Hyakujushi Bank Ltd. | 10,000 | 36 |
| Tokai Carbon Co. Ltd. | 6,000 | 35 |
| DIC Corp. | 19,000 | 35 |
| Tokai Rika Co. Ltd. | 2,100 | 35 |
| Nagase & Co. Ltd. | 3,000 | 35 |
| Sapporo Hokuyo | | |
| Holdings Inc. | 8,500 | 35 |
| UNY Co. Ltd. | 4,200 | 35 |
| Sawai Pharmaceutical Co. Ltd. | 400 | 35 |
| Disco Corp. | 600 | 35 |
| Hino Motors Ltd. | 8,000 | 35 |
| Sysmex Corp. | 500 | 34 |
| Awa Bank Ltd. | 5,000 | 34 |
| ABC-Mart Inc. | 1,000 | 34 |
| Autobacs Seven Co. Ltd. | 900 | 34 |
| Hyakugo Bank Ltd. | 8,000 | 34 |
| Aeon Credit Service Co. Ltd. | 2,900 | 33 |
| Pacific Metals Co. Ltd. | 4,000 | 33 |
| Obic Co. Ltd. | 180 | 33 |
| H2O Retailing Corp. | 5,000 | 33 |
| OSAKA Titanium | | |
| Technologies Co. | 700 | 33 |
| Kobayashi | | |
| Pharmaceutical Co. Ltd. | 700 | 33 |
| Sumitomo Bakelite Co. Ltd. | 6,000 | 33 |
| Sohgo Security | | |
| Services Co. Ltd. | 3,100 | 32 |
| Ulvac Inc. | 1,600 | 32 |
| Hokkoku Bank Ltd. | 8,000 | 32 |
| Coca-Cola West Co. Ltd. | 2,100 | 32 |
| Otsuka Corp. | 500 | 32 |
| Heiwa Corp. | 2,500 | 31 |
| Kose Corp. | 1,300 | 31 |
| Kansai Urban Banking Corp. | 20,000 | 31 |
| Itochu Techno-Solutions Corp. | 900 | 31 |
| Nichirei Corp. | 7,000 | 30 |
| Nippon Television | | |
| Network Corp. | 230 | 30 |
| * | OKUMA Corp. | 5,000 | 30 |
| Sumitomo Forestry Co. Ltd. | 4,000 | 30 |
| NTT Urban | | |
| Development Corp. | 32 | 29 |
| Mori Seiki Co. Ltd. | 3,000 | 29 |
| Hitachi Capital Corp. | 2,200 | 29 |
| Sumitomo Osaka | | |
| Cement Co. Ltd. | 15,000 | 29 |
| Shima Seiki | | |
| Manufacturing Ltd. | 1,500 | 29 |
| Takara Holdings Inc. | 5,000 | 28 |
| Tokyo Broadcasting System | | |
| Holdings Inc. | 2,300 | 28 |
| Toyobo Co. Ltd. | 17,000 | 28 |
| Aoyama Trading Co. Ltd. | 1,700 | 28 |
| San-In Godo Bank Ltd. | 4,000 | 28 |
| Asatsu-DK Inc. | 1,200 | 28 |
| Hitachi High- | | |
| Technologies Corp. | 1,400 | 27 |
| | | |
| | | | Market |
| | | | Value |
| | | Shares | ($000) |
| | Keiyo Bank Ltd. | 6,000 | 27 |
| | Toda Corp. | 8,000 | 27 |
| | House Foods Corp. | 1,800 | 27 |
| | Fuji Media Holdings Inc. | 20 | 26 |
| | Izumi Co. Ltd. | 2,000 | 26 |
| | Hitachi Transport System Ltd. | 1,700 | 26 |
| | Musashino Bank Ltd. | 900 | 26 |
| | Square Enix Holdings Co. Ltd. | 1,200 | 25 |
| | Ryohin Keikaku Co. Ltd. | 700 | 25 |
| | Showa Shell Sekiyu KK | 2,900 | 24 |
| | Juroku Bank Ltd. | 8,000 | 24 |
| | Kagoshima Bank Ltd. | 4,000 | 24 |
| | Canon Marketing Japan Inc. | 1,900 | 24 |
| | Komeri Co. Ltd. | 1,100 | 23 |
| | Matsumotokiyoshi | | |
| | Holdings Co. Ltd. | 1,200 | 23 |
| | Ogaki Kyoritsu Bank Ltd. | 8,000 | 22 |
| | Capcom Co. Ltd. | 1,400 | 22 |
| | Daishi Bank Ltd. | 7,000 | 22 |
| | Acom Co. Ltd. | 1,830 | 21 |
| | Nipro Corp. | 1,000 | 20 |
| | Kissei Pharmaceutical | | |
| | Co. Ltd. | 1,000 | 20 |
| | Matsui Securities Co. Ltd. | 3,500 | 20 |
| | Jafco Co. Ltd. | 900 | 19 |
| * | Taiheiyo Cement Corp. | 17,000 | 18 |
| | Monex Group Inc. | 77 | 18 |
| | IT Holdings Corp. | 1,600 | 18 |
| | Shinko Electric | | |
| | Industries Co. Ltd. | 1,800 | 18 |
| | Promise Co. Ltd. | 3,500 | 15 |
| | Sundrug Co. Ltd. | 400 | 11 |
| | Toshiba TEC Corp. | 2,000 | 8 |
| | Sumitomo Real Estate | | |
| | Sales Co. Ltd. | 170 | 8 |
| | Culture Convenience | | |
| | Club Co. Ltd. | 1,700 | 8 |
| | NS Solutions Corp. | 400 | 7 |
| | Point Inc. | 170 | 7 |
| | Nidec Sankyo Corp. | 1,000 | 7 |
| | Tokai Rubber Industries Ltd. | 600 | 7 |
| | Funai Electric Co. Ltd. | 200 | 6 |
| | PanaHome Corp. | 1,000 | 6 |
| | Kandenko Co. Ltd. | 1,000 | 6 |
| | Hikari Tsushin Inc. | 300 | 6 |
| * | Mizuho Investors | | |
| | Securities Co. Ltd. | 6,000 | 6 |
| | Hitachi Koki Co. Ltd. | 600 | 5 |
| | Hitachi Cable Ltd. | 2,000 | 5 |
| | Toyota Auto Body Co. Ltd. | 300 | 5 |
| | TV Asahi Corp. | 3 | 4 |
| | Toppan Forms Co. Ltd. | 400 | 4 |
| | SKY Perfect JSAT | | |
| | Holdings Inc. | 10 | 3 |
| | Okasan Securities Group Inc. | 1,000 | 3 |
| | kabu.com Securities Co. Ltd. | 800 | 3 |
| | | | 81,161 |
29
| | | |
| Total World Stock Index Fund | | |
| |
| |
| |
| | | | Market |
| | | | Value |
| | | Shares | ($000) |
| Luxembourg (0.0%) | | |
| | Millicom International | | |
| | Cellular SA | 3,989 | 377 |
| | RTL Group SA | 795 | 72 |
| | | | 449 |
| Malaysia (0.5%) | | |
| | Malayan Banking Bhd. | 186,015 | 539 |
| | CIMB Group Holdings Bhd. | 197,042 | 526 |
| | Public Bank Bhd. (Foreign) | 126,711 | 520 |
| | Sime Darby Bhd. | 158,300 | 450 |
| | IOI Corp. Bhd. | 180,940 | 339 |
| * | Axiata Group Bhd. | 232,566 | 336 |
| | Genting Bhd. | 96,600 | 325 |
| | DiGi.Com Bhd. | 21,900 | 179 |
| | MISC Bhd. | 61,200 | 173 |
| | AMMB Holdings Bhd. | 84,700 | 172 |
| | Genting Malaysia Bhd. | 119,900 | 135 |
| | Maxis Bhd. | 76,600 | 130 |
| | Tenaga Nasional Bhd. | 43,000 | 122 |
| | PPB Group Bhd. | 19,600 | 121 |
| | Kuala Lumpur Kepong Bhd. | 18,300 | 117 |
| | PLUS Expressways Bhd. | 71,500 | 101 |
| | IJM Corp. Bhd. | 54,960 | 100 |
| | YTL Power | | |
| | International Bhd. | 110,437 | 83 |
| | YTL Corp. Bhd. | 31,388 | 80 |
| | Gamuda Bhd. | 63,300 | 77 |
| | Petronas Gas Bhd. | 18,900 | 68 |
| | British American Tobacco | | |
| | Malaysia Bhd. | 4,200 | 63 |
| | Telekom Malaysia Bhd. | 49,500 | 54 |
| | UMW Holdings Bhd. | 24,600 | 54 |
| | RHB Capital Bhd. | 20,300 | 52 |
| | SP Setia Bhd. | 31,400 | 52 |
| | Hong Leong Bank Bhd. | 17,200 | 51 |
| | Berjaya Sports Toto Bhd. | 34,800 | 47 |
| | Lafarge Malayan | | |
| | Cement Bhd. | 17,900 | 46 |
| | Alliance Financial Group Bhd. | 39,200 | 41 |
| | MMC Corp. Bhd. | 41,100 | 41 |
| | Petronas Dagangan Bhd. | 11,400 | 40 |
| | Parkson Holdings Bhd. | 18,786 | 36 |
| | Proton Holdings Bhd. | 9,400 | 15 |
| * | EON Capital Bhd. | 5,400 | 12 |
| | Public Bank Bhd. (Local) | 1,614 | 7 |
| | | | 5,304 |
| Mexico (0.7%) | | |
| | America Movil SAB de CV | 792,041 | 2,271 |
| | Grupo Mexico SAB de CV | | |
| | Class B | 305,055 | 1,003 |
| | Wal-Mart de Mexico | | |
| | SAB de CV | 261,700 | 716 |
| | Grupo Televisa SA | 101,300 | 455 |
| | Fomento Economico | | |
| | Mexicano SAB de CV | 80,246 | 442 |
| | | |
| | | | Market |
| | | | Value |
| | | Shares | ($000) |
| * | Cemex SAB de CV ADR | 39,555 | 347 |
| | Grupo Financiero | | |
| | Banorte SAB de CV | 76,314 | 325 |
| | Telefonos de Mexico | | |
| | SAB de CV | 364,354 | 282 |
| | Industrias Penoles | | |
| | SAB de CV | 5,890 | 167 |
| | Grupo Financiero | | |
| | Inbursa SA | 34,300 | 148 |
| | Grupo Carso SAB de CV | 24,700 | 142 |
| | Grupo Modelo SAB de CV | 24,200 | 135 |
| | Grupo Elektra SA de CV | 2,745 | 103 |
| | Grupo Bimbo SAB de CV | | |
| | Class A | 12,500 | 96 |
| | Kimberly-Clark de Mexico | | |
| | SAB de CV Class A | 15,100 | 95 |
| | Alfa SAB de CV Class A | 10,900 | 90 |
| | Mexichem SAB de CV | 23,615 | 75 |
| | Grupo Aeroportuario del | | |
| | Pacifico SAB de CV Class B | 18,500 | 69 |
| * | Impulsora del Desarrollo y | | |
| | El Empleo en America | | |
| | Latina SAB de CV | 32,200 | 42 |
| | Organizacion Soriana SAB | | |
| | de CV Class B | 13,000 | 40 |
| * | Urbi Desarrollos Urbanos | | |
| | SAB de CV | 15,000 | 32 |
| * | Carso Infraestructura y | | |
| | Construccion SAB de CV | 9,700 | 7 |
| | | | 7,082 |
| Morocco (0.0%) | | |
| | Maroc Telecom | 6,027 | 112 |
| | Douja Promotion Groupe | | |
| | Addoha SA | 4,418 | 59 |
| | | | 171 |
| Netherlands (1.0%) | | |
| | Unilever NV | 57,014 | 1,693 |
| * | ING Groep NV | 142,616 | 1,526 |
| | Koninklijke Philips | | |
| | Electronics NV | 35,802 | 1,092 |
| | Koninklijke KPN NV | 56,917 | 951 |
| | Koninklijke Ahold NV | 44,880 | 620 |
| | Heineken NV | 10,404 | 528 |
| | Akzo Nobel NV | 8,592 | 510 |
| | ASML Holding NV | 15,053 | 499 |
| * | Aegon NV | 69,730 | 442 |
| | TNT NV | 14,015 | 373 |
| | Reed Elsevier NV | 28,203 | 368 |
| | Koninklijke DSM NV | 6,362 | 340 |
| | Corio NV | 3,319 | 244 |
| | Wolters Kluwer NV | 10,695 | 244 |
| * | Randstad Holding NV | 4,724 | 225 |
| | Fugro NV | 2,762 | 196 |
| | Heineken Holding NV | 3,960 | 171 |
| | SBM Offshore NV | 6,079 | 124 |
30
| | | |
| Total World Stock Index Fund | | |
| |
| |
| |
| | | | Market |
| | | | Value |
| | | Shares | ($000) |
| | Koninklijke Boskalis | | |
| | Westminster NV | 2,714 | 110 |
| | Koninklijke Vopak NV | 1,832 | 92 |
| | | | 10,348 |
| New Zealand (0.1%) | | |
| | Fletcher Building Ltd. | 22,984 | 144 |
| | Telecom Corp. of | | |
| | New Zealand Ltd. | 70,656 | 110 |
| | Sky City Entertainment | | |
| | Group Ltd. | 26,543 | 61 |
| | Auckland International | | |
| | Airport Ltd. | 35,852 | 58 |
| | Fisher & Paykel | | |
| | Healthcare Corp. Ltd. | 21,665 | 54 |
| | Contact Energy Ltd. | 9,078 | 41 |
| | Sky Network Television Ltd. | 8,760 | 36 |
| | Kiwi Income Property Trust | 41,436 | 33 |
| | Air New Zealand Ltd. | 8,903 | 9 |
| | Vector Ltd. | 4,251 | 8 |
| | Warehouse Group Ltd. | 2,427 | 7 |
| | | | 561 |
| Norway (0.4%) | | |
| | Statoil ASA | 46,075 | 1,006 |
| | DnB NOR ASA | 43,089 | 592 |
| | Telenor ASA | 29,069 | 469 |
| | Yara International ASA | 8,050 | 425 |
| | Orkla ASA | 40,250 | 390 |
| | Seadrill Ltd. | 12,400 | 376 |
| | Norsk Hydro ASA | 45,774 | 281 |
| * | Storebrand ASA | 20,000 | 146 |
| | Aker Solutions ASA | 7,070 | 108 |
| * | Renewable Energy | | |
| | Corp. ASA | 19,813 | 69 |
| | | | 3,862 |
| Peru (0.1%) | | |
| | Cia de Minas | | |
| | Buenaventura SA ADR | 8,319 | 441 |
| | Southern Copper Corp. | 9,431 | 404 |
| | Credicorp Ltd. | 2,059 | 258 |
| | Volcan Cia Minera SAA | | |
| | Class B | 48,494 | 57 |
| | | | 1,160 |
| Philippines (0.1%) | | |
| | SM Investments Corp. | 8,714 | 111 |
| | Philippine Long Distance | | |
| | Telephone Co. | 1,450 | 90 |
| | Ayala Land Inc. | 208,100 | 81 |
| | Manila Electric Co. | 15,000 | 77 |
| | Bank of the | | |
| | Philippine Islands | 43,938 | 60 |
| | Ayala Corp. | 6,000 | 56 |
| | Banco de Oro Unibank Inc. | 37,000 | 53 |
| | Metropolitan Bank & Trust | 27,500 | 50 |
| | Jollibee Foods Corp. | 20,000 | 41 |
| | | |
| | | | Market |
| | | | Value |
| | | Shares | ($000) |
| | SM Prime Holdings Inc. | 134,000 | 37 |
| | Globe Telecom Inc. | 1,000 | 21 |
| | | | 677 |
| Poland (0.2%) | | |
| | Powszechna Kasa | | |
| | Oszczednosci Bank | | |
| | Polski SA | 26,001 | 410 |
| | Bank Pekao SA | 3,977 | 259 |
| | KGHM Polska Miedz SA | 5,381 | 242 |
| | Powszechny Zaklad | | |
| | Ubezpieczen SA | 1,500 | 199 |
| * | Polski Koncern | | |
| | Naftowy Orlen | 10,655 | 150 |
| | Telekomunikacja Polska SA | 22,396 | 143 |
| | Polska Grupa | | |
| | Energetyczna SA | 10,202 | 78 |
| | Polskie Gornictwo Naftowe | | |
| | i Gazownictwo SA | 46,234 | 60 |
| * | Getin Holding SA | 12,268 | 46 |
| * | BRE Bank SA | 453 | 46 |
| | Bank Zachodni WBK SA | 596 | 44 |
| | Bank Handlowy w | | |
| | Warszawie SA | 1,389 | 44 |
| * | ING Bank Slaski SA | 133 | 40 |
| | TVN SA | 6,300 | 40 |
| * | Globe Trade Centre SA | 4,314 | 35 |
| | | | 1,836 |
| Portugal (0.2%) | | |
| | Portugal Telecom SGPS SA | 36,846 | 532 |
| | EDP–Energias | | |
| | de Portugal SA | 99,618 | 381 |
| | Galp Energia SGPS SA | | |
| | Class B | 8,429 | 163 |
| | Jeronimo Martins SGPS SA | 8,083 | 121 |
| | Banco Comercial | | |
| | Portugues SA | 127,546 | 116 |
| | Brisa Auto-Estradas | | |
| | de Portugal SA | 14,365 | 109 |
| | Banco Espirito Santo SA | 11,232 | 56 |
| | Banco BPI SA | 20,861 | 46 |
| * | EDP Renovaveis SA | 5,968 | 35 |
| | Cimpor Cimentos | | |
| | de Portugal SGPS SA | 4,605 | 32 |
| | | | 1,591 |
| Russia (1.0%) | | |
| | Lukoil OAO ADR | 23,754 | 1,325 |
| | Surgutneftegas OJSC ADR | 129,291 | 1,266 |
| | Gazprom OAO ADR | 48,276 | 1,057 |
| | Sberbank of Russia | 302,798 | 994 |
| | Gazprom OAO | 149,807 | 801 |
| | MMC Norilsk Nickel ADR | 31,858 | 593 |
| | Rosneft Oil Co. GDR | 85,125 | 592 |
| | NovaTek OAO | 51,859 | 418 |
| * | Federal Grid Co. Unified | | |
| | Energy System JSC | 32,443,105 | 390 |
31
| | | |
| Total World Stock Index Fund | | |
| |
| |
| |
| | | | Market |
| | | | Value |
| | | Shares | ($000) |
| | Tatneft ADR | 9,988 | 315 |
| | Mobile Telesystems OJSC | 34,297 | 275 |
| | VTB Bank OJSC GDR | 32,898 | 218 |
| | Novolipetsk Steel OJSC | 58,869 | 204 |
| �� | Gazprom Neft JSC | 49,861 | 195 |
| * | Federal | | |
| | Hydrogenerating Co. | 3,685,100 | 189 |
| | Uralkali | 30,430 | 151 |
| | Polyus Gold OJSC | 2,640 | 132 |
| * | IDGC Holding JSC | 560,785 | 97 |
| * | Severstal OAO | 6,977 | 92 |
| | Sistema JSFC | 101,482 | 89 |
| | Lukoil OAO | 1,420 | 80 |
| * | Polymetal JSC | 4,298 | 69 |
| * | Inter Rao Ues OAO | 38,841,200 | 58 |
| * | OGK-4 OJSC | 646,100 | 54 |
| * | Raspadskaya | 8,000 | 46 |
| * | TMK OAO | 8,946 | 44 |
| * | Mosenergo OAO | 410,351 | 44 |
| * | OGK-3 OJSC | 666,100 | 35 |
| | Magnitogorsk Iron & | | |
| | Steel Works | 33,131 | 32 |
| * | TGK-1 OAO | 41,408,000 | 29 |
| | Rosneft Oil Co. | 3,288 | 23 |
| | Rostelecom OJSC | 3,672 | 16 |
| | Wimm-Bill-Dann | | |
| | Foods OJSC ADR | 620 | 16 |
| | Aeroflot–Russian | | |
| | Airlines OJSC | 5,336 | 13 |
| * | PIK Group | 2,527 | 9 |
| | | | 9,961 |
| Singapore (0.7%) | | |
| | Singapore | | |
| | Telecommunications Ltd. | 285,000 | 683 |
| | DBS Group Holdings Ltd. | 62,000 | 668 |
| | Oversea-Chinese | | |
| | Banking Corp. Ltd. | 89,000 | 622 |
| | United Overseas Bank Ltd. | 42,000 | 606 |
| | Wilmar International Ltd. | 97,972 | 487 |
| * | Genting Singapore plc | 217,000 | 365 |
| | Keppel Corp. Ltd. | 45,012 | 348 |
| | CapitaLand Ltd. | 111,500 | 336 |
| | Singapore Airlines Ltd. | 23,000 | 282 |
| | Singapore Exchange Ltd. | 40,311 | 275 |
| | Fraser and Neave Ltd. | 53,925 | 261 |
| | City Developments Ltd. | 25,000 | 247 |
| | Noble Group Ltd. | 162,272 | 234 |
| | Golden Agri-Resources Ltd. | 391,831 | 198 |
| | Singapore Press | | |
| | Holdings Ltd. | 60,000 | 193 |
| | Jardine Cycle & Carriage Ltd. | 5,000 | 152 |
| | Olam International Ltd. | 56,000 | 136 |
| | CapitaMall Trust | 84,600 | 130 |
| | Singapore Technologies | | |
| | Engineering Ltd. | 49,000 | 126 |
| | SembCorp Industries Ltd. | 32,231 | 114 |
| | | |
| | | | Market |
| | | | Value |
| | | Shares | ($000) |
| | Ascendas Real Estate | | |
| | Investment Trust | 66,000 | 105 |
| | SembCorp Marine Ltd. | 29,389 | 105 |
| | Yangzijiang Shipbuilding | | |
| | Holdings Ltd. | 69,036 | 100 |
| | Venture Corp. Ltd. | 13,000 | 91 |
| | CapitaCommercial Trust | 75,810 | 88 |
| | ComfortDelGro Corp. Ltd. | 75,000 | 86 |
| | Keppel Land Ltd. | 23,600 | 81 |
| | UOL Group Ltd. | 22,000 | 77 |
| *,^ | Neptune Orient Lines Ltd. | 36,500 | 61 |
| | Singapore Post Ltd. | 63,625 | 58 |
| | Cosco Corp. Singapore Ltd. | 32,000 | 46 |
| | StarHub Ltd. | 21,000 | 43 |
| | SMRT Corp. Ltd. | 27,000 | 43 |
| | Singapore Land Ltd. | 7,000 | 38 |
| | SIA Engineering Co. Ltd. | 11,000 | 37 |
| | Wing Tai Holdings Ltd. | 27,000 | 37 |
| | Yanlord Land Group Ltd. | 26,000 | 35 |
| | M1 Ltd. | 18,771 | 32 |
| | Haw Par Corp. Ltd. | 5,328 | 25 |
| | Allgreen Properties Ltd. | 16,000 | 15 |
| | Hotel Properties Ltd. | 6,000 | 13 |
| ^ | Guocoland Ltd. | 6,000 | 11 |
| | STATS ChipPAC Ltd. | 15,000 | 11 |
| | Wheelock Properties | | |
| | Singapore Ltd. | 7,000 | 10 |
| * | Golden Agri-Resources Ltd. | | |
| | Warrants Exp. 07/23/2012 | 18,588 | 2 |
| | | | 7,713 |
| South Africa (1.2%) | | |
| | MTN Group Ltd. | 67,861 | 1,221 |
| | Sasol Ltd. | 23,060 | 1,038 |
| | Standard Bank Group Ltd. | 57,347 | 844 |
| | Naspers Ltd. | 15,429 | 809 |
| | Impala Platinum | | |
| | Holdings Ltd. | 23,389 | 660 |
| | AngloGold Ashanti Ltd. | 13,370 | 627 |
| | FirstRand Ltd. | 171,825 | 504 |
| | Gold Fields Ltd. | 28,991 | 455 |
| * | Anglo Platinum Ltd. | 4,002 | 395 |
| | Bidvest Group Ltd. | 15,487 | 330 |
| | Sanlam Ltd. | 86,821 | 325 |
| | Shoprite Holdings Ltd. | 21,470 | 304 |
| | Remgro Ltd. | 19,222 | 298 |
| | ABSA Group Ltd. | 13,057 | 253 |
| | Kumba Iron Ore Ltd. | 4,209 | 239 |
| | Steinhoff International | | |
| | Holdings Ltd. | 73,356 | 230 |
| | Harmony Gold | | |
| | Mining Co. Ltd. | 17,445 | 200 |
| | Aspen Pharmacare | | |
| | Holdings Ltd. | 13,124 | 175 |
| | RMB Holdings Ltd. | 33,433 | 172 |
| | Nedbank Group Ltd. | 8,480 | 158 |
| | Truworths International Ltd. | 15,950 | 157 |
32
| | | |
| Total World Stock Index Fund | | |
| |
| |
| |
| | | | Market |
| | | | Value |
| | | Shares | ($000) |
| | Vodacom Group Ltd. | 15,717 | 151 |
| | African Bank | | |
| | Investments Ltd. | 28,029 | 144 |
| | Massmart Holdings Ltd. | 7,053 | 144 |
| | Tiger Brands Ltd. | 4,994 | 134 |
| | Growthpoint Properties Ltd. | 49,859 | 123 |
| | Imperial Holdings Ltd. | 7,439 | 122 |
| | Aveng Ltd. | 18,597 | 117 |
| | Woolworths Holdings Ltd. | 29,006 | 114 |
| | ArcelorMittal South | | |
| | Africa Ltd. | 9,538 | 109 |
| | Murray & Roberts | | |
| | Holdings Ltd. | 16,269 | 101 |
| | Foschini Group Ltd. | 8,042 | 97 |
| | Netcare Ltd. | 43,269 | 90 |
| * | Sappi Ltd. | 17,305 | 86 |
| | Investec Ltd. | 10,112 | 83 |
| | Pretoria Portland | | |
| | Cement Co. Ltd. | 16,828 | 80 |
| | African Rainbow | | |
| | Minerals Ltd. | 3,123 | 79 |
| | Spar Group Ltd. | 4,900 | 67 |
| | Mr Price Group Ltd. | 7,108 | 65 |
| | Clicks Group Ltd. | 9,646 | 63 |
| | Pick n Pay Stores Ltd. | 9,221 | 61 |
| | Nampak Ltd. | 19,300 | 54 |
| | Liberty Holdings Ltd. | 4,885 | 52 |
| | Reunert Ltd. | 5,500 | 50 |
| | Barloworld Ltd. | 6,580 | 49 |
| | Discovery Holdings Ltd. | 8,542 | 48 |
| | Adcock Ingram Holdings Ltd. | 4,808 | 45 |
| | AVI Ltd. | 11,213 | 45 |
| | Metropolitan Holdings Ltd. | 18,085 | 44 |
| | Medi-Clinic Corp. Ltd. | 11,175 | 43 |
| | Exxaro Resources Ltd. | 2,225 | 42 |
| | Aeci Ltd. | 3,756 | 42 |
| | Lewis Group Ltd. | 3,986 | 41 |
| | Tongaat Hulett Ltd. | 2,852 | 40 |
| | Mondi Ltd. | 4,735 | 39 |
| | Wilson Bayly | | |
| | Holmes-Ovcon Ltd. | 2,031 | 39 |
| | Sun International Ltd. | 2,760 | 39 |
| | Fountainhead Property Trust | 37,574 | 37 |
| | Grindrod Ltd. | 13,901 | 34 |
| | Northam Platinum Ltd. | 4,708 | 32 |
| | Illovo Sugar Ltd. | 8,512 | 32 |
| * | Mvelaphanda Resources Ltd. | 4,749 | 31 |
| | Telkom SA Ltd. | 5,420 | 28 |
| | JD Group Ltd. | 3,307 | 23 |
| | JSE Ltd. | 1,262 | 14 |
| | Santam Ltd. | 589 | 10 |
| | Pick’n Pay Holdings Ltd. | 3,111 | 8 |
| | Allied Technologies Ltd. | 878 | 8 |
| | African Oxygen Ltd. | 1,948 | 6 |
| | | |
| | | | Market |
| | | | Value |
| | | Shares | ($000) |
| * | Evraz Highveld Steel and | | |
| | Vanadium Ltd. | 153 | 2 |
| | Group Five Ltd. | 300 | 2 |
| | | | 12,403 |
| South Korea (2.0%) | | |
| 1 | Samsung Electronics Co. | | |
| | Ltd. GDR | 9,459 | 3,157 |
| | POSCO ADR | 13,087 | 1,360 |
| | Hyundai Motor Co. | 5,891 | 892 |
| | Shinhan Financial | | |
| | Group Co. Ltd. ADR | 9,965 | 775 |
| | KB Financial Group Inc. ADR | 15,183 | 682 |
| | Hyundai Heavy | | |
| | Industries Co. Ltd. | 2,085 | 680 |
| | Hyundai Mobis | 2,662 | 663 |
| | LG Chem Ltd. | 1,808 | 559 |
| | Samsung Electronics Co. Ltd. | 719 | 477 |
| | Kia Motors Corp. | 10,580 | 423 |
| | SK Energy Co. Ltd. | 2,484 | 334 |
| | LG Electronics Inc. | 3,756 | 331 |
| | LG Display Co. Ltd. | 9,310 | 319 |
| | Samsung C&T Corp. | 5,436 | 319 |
| * | Hynix Semiconductor Inc. | 15,390 | 317 |
| * | NHN Corp. | 1,689 | 299 |
| | SK Telecom Co. Ltd. ADR | 16,110 | 297 |
| | Samsung Fire & Marine | | |
| | Insurance Co. Ltd. | 1,663 | 285 |
| | Shinsegae Co. Ltd. | 507 | 257 |
| | OCI Co. Ltd. | 835 | 246 |
| | Samsung Engineering | | |
| | Co. Ltd. | 1,518 | 243 |
| | Samsung Heavy | | |
| | Industries Co. Ltd. | 8,540 | 240 |
| * | Korea Electric Power Corp. | 8,880 | 234 |
| | LG Corp. | 3,193 | 228 |
| | Samsung Electro- | | |
| | Mechanics Co. Ltd. | 2,075 | 228 |
| | Hyundai Engineering & | | |
| | Construction Co. Ltd. | 3,127 | 210 |
| * | Samsung Life | | |
| | Insurance Co. Ltd. | 2,276 | 204 |
| | S-Oil Corp. | 3,220 | 199 |
| | SK Holdings Co. Ltd. | 1,792 | 187 |
| | KT Corp. ADR | 8,960 | 185 |
| | Samsung Techwin Co. Ltd. | 1,951 | 182 |
| | Woori Finance | | |
| | Holdings Co. Ltd. | 13,810 | 174 |
| | Samsung SDI Co. Ltd. | 1,250 | 172 |
| | Hana Financial Group Inc. | 5,970 | 170 |
| | KT&G Corp. | 2,679 | 165 |
| | Hyundai Steel Co. | 1,615 | 157 |
| | Cheil Industries Inc. | 1,860 | 156 |
| | Amorepacific Corp. | 167 | 154 |
| | Samsung Securities Co. Ltd. | 2,615 | 150 |
| | Honam Petrochemical Corp. | 673 | 149 |
33
| | | |
| Total World Stock Index Fund | | |
| |
| |
| |
| | | | Market |
| | | | Value |
| | | Shares | ($000) |
| | Kangwon Land Inc. | 6,110 | 144 |
| | LG Household & | | |
| | Health Care Ltd. | 412 | 138 |
| | Lotte Shopping Co. Ltd. | 314 | 129 |
| | Korea Zinc Co. Ltd. | 496 | 125 |
| | Hyosung Corp. | 1,107 | 123 |
| | GS Engineering & | | |
| | Construction Corp. | 1,360 | 116 |
| | NCSoft Corp. | 519 | 114 |
| | Doosan Corp. | 822 | 111 |
| | Hankook Tire Co. Ltd. | 4,230 | 110 |
| | Doosan Heavy Industries and | | |
| | Construction Co. Ltd. | 1,328 | 105 |
| | LS Corp. | 1,025 | 104 |
| | Daelim Industrial Co. Ltd. | 1,243 | 101 |
| | GS Holdings | 1,890 | 99 |
| | Daewoo Securities Co. Ltd. | 4,540 | 99 |
| | Korea Exchange Bank | 8,210 | 98 |
| | Hanwha Corp. | 2,380 | 90 |
| | Woongjin Coway Co. Ltd. | 2,450 | 89 |
| | Busan Bank | 7,060 | 88 |
| * | Korean Air Lines Co. Ltd. | 1,371 | 87 |
| | Hyundai Merchant | | |
| | Marine Co. Ltd. | 2,440 | 86 |
| | Hyundai Mipo Dockyard | 512 | 86 |
| | Hyundai Securities Co. | 6,470 | 85 |
| | Dongbu Insurance Co. Ltd. | 2,370 | 84 |
| | Hyundai Department | | |
| | Store Co. Ltd. | 721 | 80 |
| | Daewoo Shipbuilding & | | |
| | Marine Engineering Co. Ltd. | 3,000 | 80 |
| | Hanwha Chem Corp. | 2,900 | 79 |
| | Daewoo International Corp. | 2,399 | 75 |
| | Industrial Bank of Korea | 5,190 | 75 |
| | Woori Investment & | | |
| | Securities Co. Ltd. | 4,160 | 74 |
| | CJ CheilJedang Corp. | 378 | 73 |
| | STX Offshore & | | |
| | Shipbuilding Co. Ltd. | 2,900 | 70 |
| | Daegu Bank Ltd. | 5,310 | 70 |
| | Hyundai Development Co. | 2,450 | 69 |
| * | STX Corp. Co. Ltd. | 2,204 | 68 |
| | Samsung Card Co. | 1,413 | 68 |
| | Korea Investment | | |
| | Holdings Co. Ltd. | 2,010 | 63 |
| | KCC Corp. | 180 | 60 |
| * | Doosan Infracore Co. Ltd. | 2,330 | 58 |
| | Yuhan Corp. | 400 | 57 |
| | LG Uplus Corp. | 8,730 | 57 |
| | S1 Corp. | 1,020 | 56 |
| | Hanjin Heavy Industries & | | |
| | Construction Co. Ltd. | 1,420 | 54 |
| | SKC Co. Ltd. | 1,560 | 53 |
| | Glovis Co. Ltd. | 355 | 50 |
| | | |
| | | | Market |
| | | | Value |
| | | Shares | ($000) |
| * | Hanjin Shipping Co. Ltd. | 1,802 | 50 |
| * | Daum Communications Corp. | 630 | 44 |
| | Pacific Corp. | 277 | 43 |
| | CJ Corp. | 601 | 42 |
| | Samsung Fine | | |
| | Chemicals Co. Ltd. | 700 | 42 |
| | STX Pan Ocean Co. Ltd. | 3,610 | 38 |
| | Cheil Worldwide Inc. | 3,175 | 34 |
| | Lotte Confectionery Co. Ltd. | 31 | 34 |
| | Hite Brewery Co. Ltd. | 298 | 33 |
| | SK Networks Co. Ltd. | 3,440 | 33 |
| | Daishin Securities Co. Ltd. | 2,300 | 31 |
| | Dongkuk Steel Mill Co. Ltd. | 1,250 | 29 |
| | Lotte Chilsung | | |
| | Beverage Co. Ltd. | 42 | 29 |
| | Korea Gas Corp. | 700 | 29 |
| | Nong Shim Co. Ltd. | 150 | 28 |
| | Daewoo Engineering & | | |
| | Construction Co. Ltd. | 2,880 | 27 |
| | Mirae Asset | | |
| | Securities Co. Ltd. | 511 | 27 |
| | Halla Climate Control Corp. | 1,040 | 19 |
| | Hyundai Hysco | 910 | 18 |
| | Lotte Midopa Co. Ltd. | 1,020 | 13 |
| * | Korea Express Co. Ltd. | 198 | 12 |
| | LG Hausys Ltd. | 125 | 10 |
| | Daishin Securities Co. Ltd. | | |
| | Prior Pfd. | 950 | 9 |
| * | Hanjin Shipping | | |
| | Holdings Co. Ltd. | 305 | 4 |
| | Sindoh Co. Ltd. | 48 | 2 |
| | | | 20,939 |
| Spain (1.7%) | | |
| | Telefonica SA | 168,878 | 4,564 |
| | Banco Santander SA | 298,689 | 3,834 |
| | Banco Bilbao Vizcaya | | |
| | Argentaria SA | 137,290 | 1,809 |
| | Iberdrola SA | 195,530 | 1,652 |
| | Repsol YPF SA | 45,031 | 1,249 |
| | Inditex SA | 9,007 | 752 |
| ^ | ACS Actividades de | | |
| | Construccion y | | |
| | Servicios SA | 8,767 | 460 |
| ^ | Banco de Sabadell SA | 54,302 | 264 |
| | Abertis Infraestructuras SA | 13,296 | 263 |
| | Banco Popular Espanol SA | 38,733 | 251 |
| | Gas Natural SDG SA | 16,064 | 235 |
| | Ferrovial SA | 19,285 | 220 |
| | Criteria Caixacorp SA | 34,109 | 193 |
| | Acerinox SA | 11,626 | 191 |
| | Enagas | 5,769 | 127 |
| | Indra Sistemas SA | 6,330 | 124 |
| | Grifols SA | 6,865 | 111 |
| | Mapfre SA | 31,014 | 103 |
34
| | | |
| Total World Stock Index Fund | | |
| |
| |
| |
| | | | Market |
| | | | Value |
| | | Shares | ($000) |
| | Red Electrica Corp. SA | 2,040 | 103 |
| | Iberdrola Renovables SA | 27,219 | 92 |
| | Zardoya Otis SA | 5,187 | 86 |
| | Endesa SA | 2,969 | 82 |
| | Bankinter SA | 11,325 | 76 |
| | Acciona SA | 819 | 72 |
| * | Gamesa Corp. | | |
| | Tecnologica SA | 9,722 | 68 |
| | Corp Financiera Alba | 1,198 | 63 |
| | Fomento de Construcciones | | |
| | y Contratas SA | 1,728 | 47 |
| ^ | Banco de Valencia SA | 8,063 | 45 |
| | Gestevision Telecinco SA | 2,496 | 32 |
| | Banco Espanol de Credito SA | 1,960 | 20 |
| | Banco Santander SA ADR | 420 | 5 |
| | | | 17,193 |
| Sweden (1.3%) | | |
| | Nordea Bank AB | 147,831 | 1,628 |
| | Telefonaktiebolaget LM | | |
| | Ericsson Class B | 110,728 | 1,218 |
| * | Volvo AB Class B | 56,100 | 760 |
| | Hennes & Mauritz AB | | |
| | Class B | 21,024 | 740 |
| | Svenska Handelsbanken AB | | |
| | Class A | 22,228 | 727 |
| | TeliaSonera AB | 80,968 | 676 |
| | Sandvik AB | 44,670 | 673 |
| | Skandinaviska Enskilda | | |
| | Banken AB Class A | 76,096 | 590 |
| | Atlas Copco AB Class A | 21,794 | 455 |
| | SKF AB | 14,999 | 388 |
| | Tele2 AB | 16,331 | 359 |
| * | Volvo AB Class A | 26,700 | 353 |
| * | Swedbank AB Class A | 24,969 | 349 |
| | Svenska Cellulosa AB | | |
| | Class B | 22,103 | 343 |
| | Scania AB Class B | 15,337 | 326 |
| | Assa Abloy AB Class B | 12,667 | 325 |
| | Investor AB Class B | 15,661 | 321 |
| | Atlas Copco AB Class B | 13,974 | 267 |
| | Skanska AB Class B | 13,803 | 264 |
| | Electrolux AB Class B | 10,365 | 251 |
| | Swedish Match AB | 8,637 | 242 |
| | Boliden AB | 13,135 | 223 |
| | Alfa Laval AB | 11,711 | 203 |
| | Getinge AB | 7,969 | 169 |
| | Kinnevik Investment AB | | |
| | Class B | 7,661 | 158 |
| | SSAB AB Class A | 11,100 | 156 |
| | Ratos AB | 4,283 | 153 |
| | Modern Times Group AB | | |
| | Class B | 2,124 | 153 |
| | Industrivarden AB Class A | 9,417 | 143 |
| | Securitas AB Class B | 11,812 | 129 |
| | Husqvarna AB | 16,855 | 119 |
| | | |
| | | | Market |
| | | | Value |
| | | Shares | ($000) |
| | Industrivarden AB | 6,303 | 93 |
| | Holmen AB | 2,364 | 75 |
| | SSAB AB Class B | 2,200 | 27 |
| | | | 13,056 |
| Switzerland (3.0%) | | |
| | Nestle SA | 127,435 | 6,980 |
| | Novartis AG | 83,199 | 4,821 |
| | Roche Holding AG | 25,777 | 3,785 |
| * | UBS AG | 139,877 | 2,376 |
| | ABB Ltd. | 84,898 | 1,759 |
| | Credit Suisse Group AG | 41,703 | 1,726 |
| | Zurich Financial Services AG | 5,431 | 1,329 |
| | Cie Financiere Richemont SA | 19,668 | 981 |
| | Syngenta AG | 3,530 | 977 |
| | Swiss Reinsurance Co. Ltd. | 13,921 | 669 |
| | Holcim Ltd. | 9,279 | 578 |
| | Swatch Group AG (Bearer) | 1,190 | 455 |
| | SGS SA | 213 | 341 |
| | Givaudan SA | 310 | 319 |
| | Swisscom AG | 745 | 311 |
| | Julius Baer Group Ltd. | 7,230 | 305 |
| | Geberit AG | 1,580 | 303 |
| | Adecco SA | 5,039 | 282 |
| | Kuehne & Nagel | | |
| | International AG | 2,066 | 256 |
| | Swatch Group AG | | |
| | (Registered) | 3,422 | 238 |
| | Sonova Holding AG | 1,717 | 199 |
| | Synthes Inc. | 1,665 | 199 |
| * | Actelion Ltd. | 3,542 | 177 |
| | Baloise Holding AG | 1,906 | 176 |
| | Lonza Group AG | 1,768 | 155 |
| | Lindt & Spruengli AG | 5 | 143 |
| | Swiss Life Holding AG | 1,099 | 135 |
| | Schindler Holding AG | | |
| | (Registered) | 1,082 | 118 |
| * | GAM Holding AG | 7,230 | 114 |
| | Pargesa Holding SA | 1,345 | 107 |
| | Lindt & Spruengli AG | 31 | 84 |
| | Schindler Holding AG (Bearer) | 738 | 79 |
| | Sika AG | 39 | 77 |
| | Nobel Biocare Holding AG | 4,005 | 66 |
| | Straumann Holding AG | 263 | 55 |
| | BKW FMB Energie AG | 424 | 29 |
| * | Transocean Ltd. | 415 | 26 |
| | EFG International AG | 1,588 | 20 |
| | | | 30,750 |
| Taiwan (1.5%) | | |
| | Taiwan Semiconductor | | |
| | Manufacturing Co. | | |
| | Ltd. ADR | 195,037 | 2,128 |
| | Hon Hai Precision | | |
| | Industry Co. Ltd. | 344,883 | 1,304 |
| | HTC Corp. | 29,468 | 668 |
35
| | | |
| Total World Stock Index Fund | | |
| |
| |
| |
| | | | Market |
| | | | Value |
| | | Shares | ($000) |
| | Nan Ya Plastics Corp. | 287,330 | 638 |
| | Formosa Plastics Corp. | 218,840 | 627 |
| | MediaTek Inc. | 40,118 | 505 |
| | Chunghwa Telecom | | |
| | Co. Ltd. ADR | 20,141 | 471 |
| | Formosa Chemicals & | | |
| | Fibre Corp. | 149,130 | 426 |
| | Cathay Financial | | |
| | Holding Co. Ltd. | 269,220 | 412 |
| * | AU Optronics Corp. ADR | 36,740 | 368 |
| | China Steel Corp. | 355,301 | 360 |
| * | Chimei Innolux Corp. | 242,294 | 325 |
| | Fubon Financial | | |
| | Holding Co. Ltd. | 225,738 | 276 |
| | Acer Inc. | 93,583 | 273 |
| | Delta Electronics Inc. | 61,641 | 255 |
| | Chinatrust Financial | | |
| | Holding Co. Ltd. | 361,457 | 226 |
| | Mega Financial | | |
| | Holding Co. Ltd. | 309,000 | 214 |
| | Uni-President | | |
| | Enterprises Corp. | 160,174 | 208 |
| | United Microelectronics | | |
| | Corp. ADR | 67,335 | 208 |
| | Far Eastern | | |
| | New Century Corp. | 134,091 | 193 |
| | Compal Electronics Inc. | 150,323 | 192 |
| | Formosa | | |
| | Petrochemical Corp. | 70,140 | 191 |
| | Asustek Computer Inc. | 22,647 | 184 |
| | Quanta Computer Inc. | 99,450 | 183 |
| | Yuanta Financial | | |
| | Holding Co. Ltd. | 284,000 | 178 |
| | Taiwan Mobile Co. Ltd. | 72,000 | 160 |
| | Wistron Corp. | 77,494 | 159 |
| | Advanced Semiconductor | | |
| | Engineering Inc. ADR | 32,457 | 144 |
| | Synnex Technology | | |
| | International Corp. | 57,189 | 140 |
| | Foxconn Technology | | |
| | Co. Ltd. | 43,212 | 135 |
| | China Development | | |
| | Financial Holding Corp. | 449,100 | 133 |
| | First Financial | | |
| | Holding Co. Ltd. | 194,183 | 128 |
| | Taiwan Cement Corp. | 115,030 | 122 |
| | Hua Nan Financial | | |
| | Holdings Co. Ltd. | 181,486 | 120 |
| | Siliconware Precision | | |
| | Industries Co. ADR | 20,700 | 115 |
| | Taiwan Cooperative Bank | 157,190 | 112 |
| | President Chain Store Corp. | 26,952 | 107 |
| | Pou Chen Corp. | 112,524 | 107 |
| | Lite-On Technology Corp. | 74,671 | 99 |
| | Chang Hwa | | |
| | Commercial Bank | 148,000 | 98 |
| | | |
| | | | Market |
| | | | Value |
| | | Shares | ($000) |
| | Cheng Shin Rubber | | |
| | Industry Co. Ltd. | 41,125 | 92 |
| | Far EasTone | | |
| | Telecommunications | | |
| | Co. Ltd. | 63,000 | 91 |
| | SinoPac Financial | | |
| | Holdings Co. Ltd. | 235,000 | 89 |
| | Epistar Corp. | 27,000 | 86 |
| | Asia Cement Corp. | 81,177 | 84 |
| | Unimicron Technology Corp. | 49,000 | 83 |
| | Macronix International | 134,721 | 83 |
| * | Pegatron Corp. | 60,954 | 83 |
| | Taiwan Fertilizer Co. Ltd. | 23,000 | 78 |
| * | Shin Kong Financial | | |
| | Holding Co. Ltd. | 209,319 | 77 |
| * | Taishin Financial | | |
| | Holding Co. Ltd. | 162,475 | 71 |
| | Taiwan Glass | | |
| | Industrial Corp. | 58,514 | 71 |
| | Yulon Motor Co. Ltd. | 36,000 | 71 |
| * | China Airlines Ltd. | 87,425 | 68 |
| | Largan Precision Co. Ltd. | 3,020 | 60 |
| * | Walsin Lihwa Corp. | 100,000 | 60 |
| | United | | |
| | Microelectronics Corp. | 119,180 | 57 |
| * | Evergreen Marine Corp. | | |
| | Taiwan Ltd. | 66,000 | 55 |
| | Formosa Taffeta Co. Ltd. | 60,000 | 55 |
| | Inventec Co. Ltd. | 101,850 | 54 |
| * | Eva Airways Corp. | 48,749 | 49 |
| | E.Sun Financial | | |
| | Holding Co. Ltd. | 94,172 | 48 |
| | Giant Manufacturing Co. Ltd. | 11,881 | 47 |
| * | Powerchip Technology | | |
| | Corp. | 182,900 | 45 |
| * | Qisda Corp. | 65,000 | 45 |
| | Teco Electric and | | |
| | Machinery Co. Ltd. | 72,000 | 45 |
| * | Yang Ming Marine | | |
| | Transport Corp. | 58,000 | 44 |
| | Novatek Microelectronics | | |
| | Corp. Ltd. | 15,025 | 44 |
| | Advanced Semiconductor | | |
| | Engineering Inc. | 48,522 | 42 |
| | Yuen Foong Yu Paper | | |
| | Manufacturing Co. Ltd. | 84,460 | 42 |
| * | HannStar Display Corp. | 206,749 | 41 |
| | Coretronic Corp. | 27,000 | 41 |
| | Eternal Chemical Co. Ltd. | 35,605 | 41 |
| * | Taiwan Business Bank | 122,720 | 41 |
| * | Yageo Corp. | 93,000 | 40 |
| | Cheng Uei Precision | | |
| | Industry Co. Ltd. | 19,151 | 39 |
| | Realtek Semiconductor Corp. | 16,210 | 38 |
| | Advantech Co. Ltd. | 14,015 | 38 |
| * | Wan Hai Lines Ltd. | 52,000 | 38 |
36
| | | |
| Total World Stock Index Fund | | |
| |
| |
| |
| | | | Market |
| | | | Value |
| | | Shares | ($000) |
| | Chicony Electronics Co. Ltd. | 17,058 | 38 |
| | Far Eastern | | |
| | International Bank | 80,787 | 36 |
| * | Ritek Corp. | 126,039 | 35 |
| | Catcher Technology Co. Ltd. | 13,310 | 35 |
| * | Inotera Memories Inc. | 71,109 | 35 |
| * | CMC Magnetics Corp. | 129,000 | 34 |
| | Nan Ya Printed | | |
| | Circuit Board Corp. | 8,160 | 33 |
| | U-Ming Marine | | |
| | Transport Corp. | 16,000 | 33 |
| | Taiwan Secom Co. Ltd. | 18,000 | 32 |
| | D-Link Corp. | 31,980 | 32 |
| * | Nanya Technology Corp. | 53,591 | 32 |
| | Polaris Securities Co. Ltd. | 57,000 | 32 |
| | KGI Securities Co. Ltd. | 65,000 | 31 |
| | Capital Securities Corp. | 67,208 | 31 |
| | Feng Hsin Iron & Steel Co. | 17,000 | 28 |
| * | Tatung Co. Ltd. | 112,000 | 26 |
| | Transcend Information Inc. | 10,148 | 25 |
| | Siliconware Precision | | |
| | Industries Co. | 21,030 | 23 |
| * | Chunghwa Picture Tubes | 140,688 | 21 |
| | China Motor Corp. | 19,000 | 15 |
| * | Winbond Electronics Corp. | 53,000 | 14 |
| | LITE-ON IT Corp. | 12,120 | 13 |
| | Cathay Real Estate | | |
| | Development Co. Ltd. | 23,000 | 13 |
| | Oriental Union | | |
| | Chemical Corp. | 12,000 | 13 |
| | Faraday Technology Corp. | 6,029 | 12 |
| | Waterland Financial Holdings | 34,080 | 11 |
| | Vanguard International | | |
| | Semiconductor Corp. | 22,000 | 10 |
| | President Securities Corp. | 15,600 | 9 |
| | Ton Yi Industrial Corp. | 17,000 | 9 |
| | Compal Communications Inc. | 9,000 | 8 |
| * | Tatung Co. Ltd. GDR | 1,475 | 7 |
| * | Asia Optical Co. Inc. | 4,040 | 7 |
| | Inventec Appliances Corp. | 8,400 | 7 |
| | Mitac International Corp. | 14,000 | 6 |
| | Micro-Star | | |
| | International Co. Ltd. | 10,499 | 6 |
| | | | 15,920 |
| Thailand (0.2%) | | |
| | PTT PCL (Foreign) | 30,300 | 307 |
| | PTT Exploration & | | |
| | Production PCL (Foreign) | 42,000 | 240 |
| | Siam Commercial | | |
| | Bank PCL (Foreign) | 49,400 | 169 |
| | Bank of Ayudhya | | |
| | PCL(Local) | 208,000 | 168 |
| | Kasikornbank PCL | | |
| | (Foreign) | 37,100 | 156 |
| | Advanced Info Service PCL | | |
| | (Foreign) | 42,800 | 129 |
| | | |
| | | | Market |
| | | | Value |
| | | Shares | ($000) |
| | CP ALL PCL (Foreign) | 66,500 | 99 |
| | Charoen Pokphand Foods | | |
| | PCL (Foreign) | 124,300 | 97 |
| | Banpu PCL | 3,400 | 89 |
| | Bangkok Bank PCL (Foreign) | 17,098 | 88 |
| | Electricity Generating PCL | | |
| | (Foreign) | 21,100 | 69 |
| | Siam Cement PCL (Foreign) | 6,100 | 67 |
| | PTT Aromatics & Refining | | |
| | PCL (Foreign) | 65,200 | 65 |
| | PTT Chemical PCL (Foreign) | 13,200 | 62 |
| | BEC World PCL (Foreign) | 43,200 | 48 |
| | IRPC PCL (Foreign) | 329,400 | 47 |
| | Thai Oil PCL (Foreign) | 25,800 | 46 |
| | Thai Airways International | | |
| | PCL (Foreign) | 28,374 | 44 |
| * | TMB Bank PCL | 490,800 | 37 |
| * | PTT Exploration and | | |
| | Production PCL (Local) | 5,600 | 32 |
| * | Krung Thai Bank PCL | 55,200 | 31 |
| | Siam City Cement PCL | | |
| | (Foreign) | 3,800 | 29 |
| * | Siam Commercial | | |
| | Bank PCL (Local) | 8,200 | 28 |
| | Krung Thai Bank PCL | | |
| | (Foreign) | 45,700 | 26 |
| * | TMB Bank PCL | 294,100 | 22 |
| | Total Access Communication | | |
| | PCL (Foreign) | 13,700 | 19 |
| | Thai Union Frozen | | |
| | Products PCL (Foreign) | 9,450 | 18 |
| * | Siam City Cement | | |
| | PCL (Local) | 2,100 | 16 |
| | Delta Electronics | | |
| | Thai PCL (Foreign) | 14,200 | 15 |
| | Airports of Thailand | | |
| | PCL (Foreign) | 9,600 | 13 |
| | Siam Makro PCL (Foreign) | 2,600 | 12 |
| | Central Pattana PCL | 12,200 | 11 |
| | Land and Houses | | |
| | PCL (Foreign) | 45,300 | 11 |
| | Thoresen Thai Agencies PCL | 11,330 | 9 |
| | Ratchaburi Electricity | | |
| | Generating Holding PCL | 4,100 | 5 |
| | | | 2,324 |
| Turkey (0.2%) | | |
| | Turkiye Garanti Bankasi AS | 46,827 | 283 |
| | Akbank TAS | 43,053 | 267 |
| | Turkiye Is Bankasi | 47,050 | 208 |
| | KOC Holding AS | 36,743 | 173 |
| | Anadolu Efes Biracilik | | |
| | Ve Malt Sanayii AS | 9,782 | 154 |
| | Turkiye Halk Bankasi AS | 14,760 | 146 |
| * | Eregli Demir ve Celik | | |
| | Fabrikalari TAS | 31,208 | 115 |
| * | Turk Hava Yollari | 25,621 | 105 |
37
| | | |
| Total World Stock Index Fund | |
| |
| |
| |
| | | | Market |
| | | | Value |
| | | Shares | ($000) |
| * | Yapi ve Kredi Bankasi AS | 27,267 | 103 |
| | Turk Telekomunikasyon AS | 21,571 | 101 |
| | Tupras Turkiye Petrol | | |
| | Rafinerileri AS | 3,468 | 92 |
| | Turkiye Vakiflar Bankasi Tao | 27,047 | 86 |
| | BIM Birlesik Magazalar AS | 2,409 | 83 |
| | Asya Katilim Bankasi AS | 30,743 | 78 |
| | Haci Omer Sabanci | | |
| | Holding AS (Bearer) | 14,385 | 78 |
| | Enka Insaat ve Sanayi AS | 15,912 | 72 |
| | Turkcell Iletisim Hizmet AS | 9,761 | 70 |
| | Coca-Cola Icecek AS | 3,689 | 46 |
| | Arcelik AS | 6,925 | 38 |
| * | Dogan Sirketler | | |
| | Grubu Holdings | 50,082 | 36 |
| | Ford Otomotiv Sanayi AS | 1,724 | 15 |
| | | | 2,349 |
| United Kingdom (8.4%) | | |
| | HSBC Holdings plc | 647,032 | 6,734 |
| | Vodafone Group plc | 1,928,483 | 5,272 |
| | BP plc | 690,769 | 4,695 |
| | Royal Dutch Shell plc | | |
| | Class A | 130,426 | 4,233 |
| | GlaxoSmithKline plc | 192,611 | 3,761 |
| | Rio Tinto plc | 56,235 | 3,653 |
| | Royal Dutch Shell plc | | |
| | Class B | 100,110 | 3,204 |
| | BHP Billiton plc | 81,480 | 2,886 |
| | British American | | |
| | Tobacco plc | 73,610 | 2,804 |
| | AstraZeneca plc | 53,187 | 2,675 |
| | Standard Chartered plc | 85,815 | 2,482 |
| | BG Group plc | 123,240 | 2,399 |
| | Anglo American plc | 48,706 | 2,269 |
| | Tesco plc | 290,559 | 1,989 |
| | Barclays plc | 440,616 | 1,936 |
| | Diageo plc | 92,218 | 1,701 |
| * | Lloyds Banking Group plc | 1,478,264 | 1,625 |
| | Xstrata plc | 78,925 | 1,529 |
| | Reckitt Benckiser | | |
| | Group plc | 26,482 | 1,480 |
| | SABMiller plc | 43,063 | 1,397 |
| | Unilever plc | 47,109 | 1,358 |
| | National Grid plc | 128,412 | 1,214 |
| | Imperial Tobacco Group plc | 37,298 | 1,195 |
| | Centrica plc | 190,093 | 1,012 |
| | Prudential plc | 93,987 | 951 |
| | Rolls-Royce Group plc | 68,333 | 709 |
| | BT Group plc | 281,265 | 694 |
| | BAE Systems plc | 125,531 | 693 |
| | Aviva plc | 102,302 | 652 |
| | Scottish & Southern | | |
| | Energy plc | 34,477 | 637 |
| | Tullow Oil plc | 33,152 | 630 |
| | Compass Group plc | 68,380 | 560 |
| | WPP plc | 45,947 | 534 |
| | | |
| | | | Market |
| | | | Value |
| | | Shares | ($000) |
| | British Sky Broadcasting | | |
| | Group plc | 46,830 | 530 |
| | WM Morrison | | |
| | Supermarkets plc | 98,421 | 463 |
| | Shire plc | 19,607 | 460 |
| * | Royal Bank of | | |
| | Scotland Group plc | 637,887 | 456 |
| | Marks & Spencer | | |
| | Group plc | 66,119 | 453 |
| | Pearson plc | 29,473 | 451 |
| | J Sainsbury plc | 67,663 | 422 |
| | Old Mutual plc | 202,384 | 422 |
| | Experian plc | 35,725 | 415 |
| | Reed Elsevier plc | 46,846 | 402 |
| | International Power plc | 58,858 | 393 |
| * | Cairn Energy plc | 60,896 | 376 |
| | Legal & General Group plc | 216,740 | 348 |
| | Kingfisher plc | 88,835 | 338 |
| | Carnival plc | 7,614 | 329 |
| | Randgold Resources Ltd. | 3,338 | 313 |
| | Smith & Nephew plc | 34,246 | 301 |
| | Standard Life plc | 80,658 | 293 |
| | Antofagasta plc | 13,745 | 291 |
| | Land Securities Group plc | 26,617 | 289 |
| | ARM Holdings plc | 46,937 | 274 |
| * | Wolseley plc | 10,161 | 270 |
| | Capita Group plc | 21,688 | 266 |
| | RSA Insurance Group plc | 123,367 | 259 |
| | Burberry Group plc | 15,768 | 258 |
| | British Land Co. plc | 31,538 | 258 |
| | Smiths Group plc | 13,423 | 256 |
| | Man Group plc | 60,861 | 254 |
| | Aggreko plc | 9,810 | 248 |
| | Next plc | 6,365 | 233 |
| | Associated British Foods plc | 13,802 | 232 |
| | United Utilities Group plc | 23,528 | 230 |
| | Johnson Matthey plc | 7,482 | 229 |
| * | Lonmin plc | 8,043 | 225 |
| | Petrofac Ltd. | 9,502 | 223 |
| | Intercontinental | | |
| | Hotels Group plc | 11,456 | 221 |
| | Amdocs Ltd. | 7,048 | 216 |
| | Resolution Ltd. | 51,268 | 215 |
| | G4S plc | 49,082 | 206 |
| | AMEC plc | 11,555 | 201 |
| | Sage Group plc | 46,076 | 199 |
| | Severn Trent plc | 8,845 | 198 |
| * | Autonomy Corp. plc | 8,243 | 193 |
| | Eurasian Natural | | |
| | Resources Corp. plc | 13,465 | 188 |
| | Kazakhmys plc | 8,849 | 186 |
| | Hammerson plc | 26,998 | 181 |
| | Admiral Group plc | 6,915 | 180 |
| | Inmarsat plc | 17,184 | 179 |
| | 3i Group plc | 37,023 | 178 |
38
| | | |
| Total World Stock Index Fund | | |
| |
| |
| |
| | | | Market |
| | | | Value |
| | | Shares | ($000) |
| | Fresnillo plc | 8,619 | 173 |
| | Serco Group plc | 17,522 | 172 |
| | Whitbread plc | 6,159 | 167 |
| | Cobham plc | 43,838 | 163 |
| | Vedanta Resources plc | 4,887 | 163 |
| | ICAP plc | 22,187 | 162 |
| | Rexam plc | 30,509 | 155 |
| * | ITV plc | 136,936 | 150 |
| | Schroders plc | 5,753 | 145 |
| | Capital Shopping Centres | | |
| | Group plc | 21,674 | 133 |
| | Bunzl plc | 11,135 | 132 |
| | Tate & Lyle plc | 15,978 | 129 |
| | Home Retail Group plc | 34,961 | 123 |
| | Segro plc | 25,739 | 122 |
| | Invensys plc | 25,988 | 120 |
| | Logica plc | 54,761 | 114 |
| *,^ | British Airways plc | 23,393 | 101 |
| * | Rentokil Initial plc | 63,452 | 101 |
| | Cable & Wireless | | |
| | Worldwide plc | 89,570 | 101 |
| | United Business Media Ltd. | 9,254 | 98 |
| | Daily Mail & General | | |
| | Trust plc | 11,139 | 96 |
| | Aegis Group plc | 46,353 | 93 |
| | Hays plc | 48,697 | 86 |
| | Drax Group plc | 13,862 | 85 |
| | Thomas Cook Group plc | 29,127 | 84 |
| | Cable & Wireless | | |
| | Communications plc | 89,570 | 77 |
| | Ladbrokes plc | 35,029 | 74 |
| | TUI Travel plc | 19,152 | 65 |
| | William Hill plc | 24,548 | 63 |
| | Provident Financial plc | 4,680 | 59 |
| | Schroders plc | 2,087 | 42 |
| | African Barrick Gold Ltd. | 4,409 | 39 |
| * | TalkTalk Telecom Group plc | 16,002 | 34 |
| | | | 87,385 |
| United States (40.3%) | | |
| | Consumer Discretionary (4.4%) | |
| | McDonald’s Corp. | 39,585 | 3,078 |
| | Walt Disney Co. | 71,305 | 2,575 |
| * | Amazon.com Inc. | 12,352 | 2,040 |
| | Home Depot Inc. | 61,886 | 1,911 |
| * | Ford Motor Co. | 122,284 | 1,728 |
| | Comcast Corp. Class A | 75,721 | 1,558 |
| | Target Corp. | 27,068 | 1,406 |
| * | DIRECTV Class A | 32,062 | 1,393 |
| | Time Warner Inc. | 42,345 | 1,377 |
| | Lowe’s Cos. Inc. | 51,913 | 1,107 |
| | News Corp. Class A | 66,954 | 968 |
| | Yum! Brands Inc. | 17,365 | 861 |
| | NIKE Inc. Class B | 10,566 | 860 |
| | Johnson Controls Inc. | 24,439 | 858 |
| | Viacom Inc. Class B | 20,921 | 807 |
| | Starbucks Corp. | 27,900 | 795 |
| | | |
| | | | Market |
| | | | Value |
| | | Shares | ($000) |
| | Time Warner Cable Inc. | 12,519 | 724 |
| | Carnival Corp. | 16,777 | 724 |
| | Best Buy Co. Inc. | 16,000 | 688 |
| | TJX Cos. Inc. | 14,924 | 685 |
| * | priceline.com Inc. | 1,745 | 658 |
| * | Kohl’s Corp. | 11,672 | 598 |
| | Coach Inc. | 11,373 | 569 |
| | Staples Inc. | 26,653 | 546 |
| | Comcast Corp. Class A | | |
| | Special Shares | 27,848 | 538 |
| * | Las Vegas Sands Corp. | 11,508 | 528 |
| | Omnicom Group Inc. | 10,943 | 481 |
| | Marriott International Inc. | | |
| | Class A | 12,671 | 469 |
| | CBS Corp. Class B | 25,500 | 432 |
| | McGraw-Hill Cos. Inc. | 11,137 | 419 |
| * | Bed Bath & Beyond Inc. | 9,184 | 403 |
| | Stanley Black & Decker Inc. | 6,242 | 387 |
| | Starwood Hotels & Resorts | | |
| | Worldwide Inc. | 6,955 | 377 |
| | Wynn Resorts Ltd. | 3,511 | 376 |
| | VF Corp. | 4,517 | 376 |
| | Macy’s Inc. | 15,800 | 373 |
| | News Corp. Class B | 23,034 | 370 |
| | Gap Inc. | 18,227 | 346 |
| * | AutoZone Inc. | 1,421 | 338 |
| * | Liberty Media Corp.– | | |
| | Interactive | 22,422 | 331 |
| | Limited Brands Inc. | 11,151 | 328 |
| | Fortune Brands Inc. | 5,829 | 315 |
| | Mattel Inc. | 13,361 | 312 |
| | Nordstrom Inc. | 7,887 | 304 |
| | Virgin Media Inc. | 11,481 | 292 |
| | JC Penney Co. Inc. | 9,058 | 282 |
| | Genuine Parts Co. | 5,519 | 264 |
| | Expedia Inc. | 9,061 | 262 |
| | Ross Stores Inc. | 4,331 | 255 |
| | Activision Blizzard Inc. | 22,009 | 252 |
| | Hasbro Inc. | 5,394 | 249 |
| | Harley-Davidson Inc. | 8,115 | 249 |
| * | Dollar Tree Inc. | 4,662 | 239 |
| | Autoliv Inc. | 3,290 | 235 |
| | Cablevision Systems Corp. | | |
| | Class A | 8,584 | 230 |
| | Tiffany & Co. | 4,322 | 229 |
| | Family Dollar Stores Inc. | 4,865 | 225 |
| | Darden Restaurants Inc. | 4,827 | 221 |
| | Whirlpool Corp. | 2,864 | 217 |
| * | Apollo Group Inc. Class A | 5,783 | 217 |
| * | Royal Caribbean Cruises Ltd. | 5,428 | 215 |
| * | Discovery Communications | | |
| | Inc. Class A | 4,697 | 209 |
| *,^ | Garmin Ltd. | 6,229 | 205 |
| * | Sirius XM Radio Inc. | 132,152 | 198 |
| | PetSmart Inc. | 5,199 | 195 |
39
| | | |
| Total World Stock Index Fund | | |
| |
| |
| |
| | | | Market |
| | | | Value |
| | | Shares | ($000) |
| * | Discovery | | |
| | Communications Inc. | 4,772 | 185 |
| | Wyndham Worldwide Corp. | 6,076 | 175 |
| * | Liberty Global Inc. Class A | 4,573 | 173 |
| * | Interpublic Group of Cos. Inc. 16,496 | 171 |
| * | Sears Holdings Corp. | 2,363 | 170 |
| | Scripps Networks | | |
| | Interactive Inc. Class A | 3,322 | 169 |
| | Newell Rubbermaid Inc. | 9,397 | 166 |
| | International Game | | |
| | Technology | 10,278 | 160 |
| * | Liberty Global Inc. | 4,345 | 157 |
| * | GameStop Corp. Class A | 7,900 | 155 |
| | Foot Locker Inc. | 9,200 | 147 |
| | DISH Network Corp. Class A | 7,080 | 141 |
| | Leggett & Platt Inc. | 6,736 | 137 |
| | H&R Block Inc. | 11,567 | 136 |
| | DR Horton Inc. | 12,800 | 134 |
| * | Mohawk Industries Inc. | 2,321 | 133 |
| * | Urban Outfitters Inc. | 4,289 | 132 |
| | Abercrombie & Fitch Co. | 2,981 | 128 |
| * | NVR Inc. | 200 | 125 |
| * | MGM Resorts International | 11,451 | 125 |
| * | Liberty Media Corp.–Starz | 1,768 | 116 |
| | American Eagle Outfitters Inc. 7,179 | 115 |
| * | Pulte Group Inc. | 13,011 | 102 |
| * | AutoNation Inc. | 4,219 | 98 |
| | Gentex Corp. | 4,891 | 98 |
| | Gannett Co. Inc. | 8,017 | 95 |
| * | Lamar Advertising Co. | | |
| | Class A | 2,704 | 92 |
| | RadioShack Corp. | 4,386 | 88 |
| * | Harman International | | |
| | Industries Inc. | 2,537 | 85 |
| * | Toll Brothers Inc. | 4,386 | 79 |
| | Lennar Corp. Class A | 5,263 | 76 |
| | Wendy’s/Arby’s Group Inc. | | |
| | Class A | 15,848 | 73 |
| | Weight Watchers | | |
| | International Inc. | 1,362 | 46 |
| * | Madison Square Garden Inc. | | |
| | Class A | 2,137 | 44 |
| | Washington Post Co. Class B 96 | 39 |
| |
| | Consumer Staples (4.5%) | | |
| | Procter & Gamble Co. | 104,499 | 6,643 |
| | Wal-Mart Stores Inc. | 102,193 | 5,536 |
| | Coca-Cola Co. | 84,945 | 5,209 |
| | Philip Morris | | |
| | International Inc. | 67,995 | 3,978 |
| | PepsiCo Inc. | 58,567 | 3,824 |
| | Kraft Foods Inc. | 63,260 | 2,041 |
| | Altria Group Inc. | 76,573 | 1,946 |
| | CVS Caremark Corp. | 49,789 | 1,500 |
| | Colgate-Palmolive Co. | 18,147 | 1,399 |
| | | |
| | | | Market |
| | | | Value |
| | | Shares | ($000) |
| | Walgreen Co. | 36,285 | 1,229 |
| | Costco Wholesale Corp. | 16,000 | 1,004 |
| | Kimberly-Clark Corp. | 15,338 | 972 |
| | General Mills Inc. | 23,502 | 882 |
| | Archer-Daniels-Midland Co. | 23,881 | 796 |
| | Sysco Corp. | 21,273 | 627 |
| | HJ Heinz Co. | 11,051 | 543 |
| | Kroger Co. | 24,200 | 532 |
| | Reynolds American Inc. | 8,002 | 519 |
| | Kellogg Co. | 9,963 | 501 |
| | Avon Products Inc. | 15,716 | 479 |
| | Lorillard Inc. | 5,561 | 475 |
| | Sara Lee Corp. | 25,080 | 359 |
| | ConAgra Foods Inc. | 15,503 | 349 |
| | Safeway Inc. | 14,733 | 337 |
| | Campbell Soup Co. | 9,039 | 328 |
| | Bunge Ltd. | 5,392 | 324 |
| | Clorox Co. | 4,840 | 322 |
| * | Coca-Cola Enterprises Inc. | 13,401 | 322 |
| | Estee Lauder Cos. Inc. | | |
| | Class A | 4,518 | 322 |
| | Dr Pepper Snapple Group Inc. 8,731 | 319 |
| | Molson Coors Brewing Co. | | |
| | Class B | 6,219 | 294 |
| | Hershey Co. | 5,807 | 287 |
| | JM Smucker Co. | 4,445 | 286 |
| * | Whole Foods Market Inc. | 5,897 | 234 |
| | Brown-Forman Corp. Class B | 3,221 | 196 |
| * | Energizer Holdings Inc. | 2,574 | 192 |
| | McCormick & Co. Inc. | 4,120 | 182 |
| | Tyson Foods Inc. Class A | 10,722 | 167 |
| | Hormel Foods Corp. | 3,524 | 162 |
| * | Constellation Brands Inc. | | |
| | Class A | 6,694 | 132 |
| | Alberto-Culver Co. Class B | 3,450 | 129 |
| * | Smithfield Foods Inc. | 5,818 | 97 |
| | SUPERVALU Inc. | 7,839 | 85 |
| * | Dean Foods Co. | 7,989 | 83 |
| |
| | Energy (4.4%) | | |
| | Exxon Mobil Corp. | 187,612 | 12,471 |
| | Chevron Corp. | 73,509 | 6,073 |
| | Schlumberger Ltd. | 49,736 | 3,476 |
| | ConocoPhillips | 54,609 | 3,244 |
| | Occidental Petroleum Corp. | 29,706 | 2,336 |
| | Apache Corp. | 13,411 | 1,355 |
| | Anadarko Petroleum Corp. | 18,081 | 1,113 |
| | Halliburton Co. | 33,361 | 1,063 |
| | Devon Energy Corp. | 16,137 | 1,049 |
| | Marathon Oil Corp. | 25,534 | 908 |
| | EOG Resources Inc. | 9,312 | 891 |
| | National Oilwell Varco Inc. | 15,538 | 835 |
| | Hess Corp. | 11,927 | 752 |
| | Baker Hughes Inc. | 16,094 | 746 |
| * | Transocean Ltd. | 11,427 | 724 |
| | Spectra Energy Corp. | 22,560 | 536 |
40
| | | |
| Total World Stock Index Fund | | |
| |
| |
| |
| | | | Market |
| | | | Value |
| | | Shares | ($000) |
| | Peabody Energy Corp. | 9,764 | 516 |
| | Noble Energy Inc. | 6,314 | 514 |
| | Chesapeake Energy Corp. | 23,326 | 506 |
| | Williams Cos. Inc. | 21,500 | 463 |
| | Murphy Oil Corp. | 7,008 | 457 |
| * | Weatherford | | |
| | International Ltd. | 25,852 | 435 |
| * | Southwestern Energy Co. | 12,040 | 408 |
| * | Cameron International Corp. | 9,019 | 395 |
| | Valero Energy Corp. | 20,174 | 362 |
| | Consol Energy Inc. | 8,878 | 326 |
| * | FMC Technologies Inc. | 4,521 | 326 |
| | El Paso Corp. | 24,175 | 321 |
| | Noble Corp. | 9,116 | 315 |
| | Pioneer Natural | | |
| | Resources Co. | 3,973 | 277 |
| * | Newfield Exploration Co. | 4,578 | 273 |
| * | Ultra Petroleum Corp. | 6,300 | 259 |
| | Sunoco Inc. | 5,500 | 206 |
| * | Nabors Industries Ltd. | 9,851 | 206 |
| | Range Resources Corp. | 5,445 | 204 |
| | QEP Resources Inc. | 5,999 | 198 |
| | EQT Corp. | 5,134 | 192 |
| * | Pride International Inc. | 5,991 | 182 |
| * | Petrohawk Energy Corp. | 10,549 | 179 |
| | Diamond Offshore | | |
| | Drilling Inc. | 2,395 | 158 |
| * | McDermott International Inc. | 9,743 | 150 |
| * | Plains Exploration & | | |
| | Production Co. | 4,890 | 136 |
| * | Rowan Cos. Inc. | 3,989 | 131 |
| | Patterson-UTI Energy Inc. | 5,501 | 107 |
| * | Continental Resources Inc. | 1,805 | 86 |
| |
| | Financials (6.4%) | | |
| | JPMorgan Chase & Co. | 145,713 | 5,483 |
| | Wells Fargo & Co. | 191,748 | 5,001 |
| | Bank of America Corp. | 364,670 | 4,172 |
| * | Citigroup Inc. | 935,064 | 3,899 |
| * | Berkshire Hathaway Inc. | | |
| | Class A | 28 | 3,340 |
| | Goldman Sachs Group Inc. | 18,861 | 3,036 |
| * | Berkshire Hathaway Inc. | | |
| | Class B | 36,887 | 2,935 |
| | American Express Co. | 44,153 | 1,831 |
| | US Bancorp | 70,292 | 1,700 |
| | MetLife Inc. | 33,067 | 1,334 |
| | Morgan Stanley | 51,250 | 1,275 |
| | Bank of New York | | |
| | Mellon Corp. | 45,359 | 1,137 |
| | Simon Property Group Inc. | 10,751 | 1,032 |
| | PNC Financial Services | | |
| | Group Inc. | 19,006 | 1,024 |
| | Travelers Cos. Inc. | 17,443 | 963 |
| | Aflac Inc. | 16,910 | 945 |
| | Prudential Financial Inc. | 17,015 | 895 |
| | | |
| | | | Market |
| | | | Value |
| | | Shares | ($000) |
| | State Street Corp. | 18,653 | 779 |
| | ACE Ltd. | 12,081 | 718 |
| | CME Group Inc. | 2,424 | 702 |
| | Franklin Resources Inc. | 6,121 | 702 |
| | Chubb Corp. | 11,825 | 686 |
| | Charles Schwab Corp. | 44,471 | 685 |
| | Allstate Corp. | 20,370 | 621 |
| | Capital One Financial Corp. | 16,570 | 618 |
| | Loews Corp. | 15,562 | 614 |
| | BB&T Corp. | 25,092 | 587 |
| | Vornado Realty Trust | 6,546 | 572 |
| | T Rowe Price Group Inc. | 9,373 | 518 |
| | Ameriprise Financial Inc. | 9,633 | 498 |
| | Progressive Corp. | 23,510 | 497 |
| | Equity Residential | 10,131 | 493 |
| | Marsh & McLennan Cos. Inc. | 19,170 | 479 |
| | AON Corp. | 11,855 | 471 |
| | SunTrust Banks Inc. | 17,892 | 448 |
| | Public Storage | 4,476 | 444 |
| | Northern Trust Corp. | 8,912 | 442 |
| | Boston Properties Inc. | 5,081 | 438 |
| | HCP Inc. | 11,180 | 403 |
| | Annaly Capital | | |
| | Management Inc. | 22,588 | 400 |
| | Hartford Financial | | |
| | Services Group Inc. | 16,648 | 399 |
| | Invesco Ltd. | 17,336 | 399 |
| | Host Hotels & Resorts Inc. | 23,135 | 368 |
| | Discover Financial Services | 20,651 | 364 |
| | Fifth Third Bancorp | 27,532 | 346 |
| | AvalonBay Communities Inc. | 3,045 | 324 |
| * | IntercontinentalExchange Inc. | 2,749 | 316 |
| | XL Group plc Class A | 14,750 | 312 |
| | Weyerhaeuser Co. | 19,114 | 310 |
| | M&T Bank Corp. | 4,083 | 305 |
| | BlackRock Inc. | 1,770 | 303 |
| | Principal Financial Group Inc. | 11,157 | 299 |
| | Regions Financial Corp. | 46,542 | 293 |
| | Ventas Inc. | 5,418 | 290 |
| | Lincoln National Corp. | 11,456 | 280 |
| | NYSE Euronext | 9,151 | 280 |
| | New York Community | | |
| | Bancorp Inc. | 15,270 | 259 |
| | Unum Group | 11,463 | 257 |
| | Moody’s Corp. | 9,496 | 257 |
| | KeyCorp | 30,410 | 249 |
| | Kimco Realty Corp. | 13,908 | 240 |
| | PartnerRe Ltd. | 2,893 | 229 |
| | ProLogis | 16,382 | 224 |
| | Comerica Inc. | 6,183 | 221 |
| * | SLM Corp. | 18,440 | 219 |
| | Legg Mason Inc. | 6,820 | 212 |
| | Hudson City Bancorp Inc. | 18,016 | 210 |
| * | American International | | |
| | Group Inc. | 4,970 | 209 |
| | Plum Creek Timber Co. Inc. | 5,636 | 208 |
41
| | | |
| Total World Stock Index Fund | | |
| |
| |
| |
| | | | Market |
| | | | Value |
| | | Shares | ($000) |
| | Macerich Co. | 4,409 | 197 |
| * | Genworth Financial Inc. | | |
| | Class A | 17,125 | 194 |
| | Willis Group Holdings plc | 5,856 | 186 |
| | Everest Re Group Ltd. | 2,105 | 177 |
| * | TD Ameritrade Holding Corp. | 10,218 | 175 |
| | People’s United Financial Inc. 13,907 | 171 |
| | Hospitality Properties Trust | 7,466 | 170 |
| | Cincinnati Financial Corp. | 5,648 | 166 |
| * | Leucadia National Corp. | 6,435 | 164 |
| | Assurant Inc. | 4,133 | 163 |
| | Torchmark Corp. | 2,808 | 161 |
| | AMB Property Corp. | 5,705 | 161 |
| | Axis Capital Holdings Ltd. | 4,520 | 154 |
| | Liberty Property Trust | 4,481 | 150 |
| | WR Berkley Corp. | 5,235 | 144 |
| | Huntington Bancshares Inc. | 24,473 | 139 |
| | Duke Realty Corp. | 10,700 | 133 |
| | RenaissanceRe Holdings Ltd. | 2,185 | 132 |
| | Zions Bancorporation | 6,263 | 129 |
| | Brown & Brown Inc. | 5,697 | 127 |
| | Commerce Bancshares Inc. | 3,349 | 123 |
| | Transatlantic Holdings Inc. | 2,333 | 123 |
| | Old Republic | | |
| | International Corp. | 9,221 | 122 |
| | Regency Centers Corp. | 2,794 | 118 |
| * | Markel Corp. | 346 | 116 |
| | Weingarten Realty Investors | 4,687 | 113 |
| | Marshall & Ilsley Corp. | 18,400 | 109 |
| | SEI Investments Co. | 4,897 | 108 |
| | Arthur J Gallagher & Co. | 3,633 | 102 |
| | White Mountains | | |
| | Insurance Group Ltd. | 306 | 98 |
| * | Popular Inc. | 35,199 | 96 |
| | City National Corp. | 1,749 | 90 |
| | Federated Investors Inc. | | |
| | Class B | 3,606 | 90 |
| * | First Horizon National Corp. | 8,274 | 83 |
| | Protective Life Corp. | 3,468 | 83 |
| | Valley National Bancorp | 5,921 | 79 |
| | Erie Indemnity Co. Class A | 1,304 | 75 |
| * | Forest City Enterprises Inc. | | |
| | Class A | 5,105 | 74 |
| | Mercury General Corp. | 1,681 | 71 |
| * | St. Joe Co. | 3,250 | 66 |
| | Janus Capital Group Inc. | 6,180 | 65 |
| | First American Financial Corp. 3,445 | 48 |
| * | CNA Financial Corp. | 1,216 | 34 |
| | Wesco Financial Corp. | 20 | 7 |
| |
| | Health Care (4.6%) | | |
| | Johnson & Johnson | 102,126 | 6,502 |
| | Pfizer Inc. | 295,725 | 5,146 |
| | Merck & Co. Inc. | 113,340 | 4,112 |
| | Abbott Laboratories | 56,543 | 2,902 |
| * | Amgen Inc. | 35,228 | 2,015 |
| | | |
| | | | Market |
| | | | Value |
| | | Shares | ($000) |
| | Bristol-Myers Squibb Co. | 62,917 | 1,692 |
| | UnitedHealth Group Inc. | 41,727 | 1,504 |
| | Eli Lilly & Co. | 41,697 | 1,468 |
| | Medtronic Inc. | 40,778 | 1,436 |
| * | Gilead Sciences Inc. | 30,853 | 1,224 |
| | Baxter International Inc. | 21,726 | 1,106 |
| * | Celgene Corp. | 17,069 | 1,059 |
| * | Express Scripts Inc. | 21,100 | 1,024 |
| * | Medco Health Solutions Inc. | 16,686 | 877 |
| | Allergan Inc. | 11,260 | 815 |
| * | WellPoint Inc. | 14,725 | 800 |
| * | Thermo Fisher Scientific Inc. | 14,900 | 766 |
| | Covidien plc | 18,446 | 735 |
| * | Genzyme Corp. | 9,620 | 694 |
| | McKesson Corp. | 9,682 | 639 |
| | Becton Dickinson and Co. | 8,298 | 627 |
| * | Biogen Idec Inc. | 9,740 | 611 |
| | Stryker Corp. | 10,731 | 531 |
| | Alcon Inc. | 3,137 | 526 |
| | Cardinal Health Inc. | 13,800 | 479 |
| | Aetna Inc. | 16,000 | 478 |
| * | St. Jude Medical Inc. | 12,346 | 473 |
| * | Forest Laboratories Inc. | 12,422 | 411 |
| * | Humana Inc. | 6,669 | 389 |
| * | Intuitive Surgical Inc. | 1,477 | 388 |
| | CIGNA Corp. | 10,717 | 377 |
| * | Boston Scientific Corp. | 56,108 | 358 |
| * | Zimmer Holdings Inc. | 7,528 | 357 |
| * | Hospira Inc. | 5,817 | 346 |
| | AmerisourceBergen Corp. | | |
| | Class A | 9,973 | 327 |
| * | Life Technologies Corp. | 6,341 | 318 |
| | Quest Diagnostics Inc. | 6,274 | 308 |
| * | Laboratory Corp. of | | |
| | America Holdings | 3,702 | 301 |
| * | Vertex Pharmaceuticals Inc. | 7,497 | 287 |
| | CR Bard Inc. | 3,342 | 278 |
| * | Varian Medical Systems Inc. | 4,306 | 272 |
| * | Cerner Corp. | 3,080 | 271 |
| * | DaVita Inc. | 3,538 | 254 |
| * | Waters Corp. | 3,278 | 243 |
| * | Mylan Inc. | 10,468 | 213 |
| * | CareFusion Corp. | 8,242 | 199 |
| * | Henry Schein Inc. | 3,121 | 175 |
| * | Cephalon Inc. | 2,602 | 173 |
| * | Watson Pharmaceuticals Inc. | 3,674 | 171 |
| | DENTSPLY International Inc. | 5,263 | 165 |
| | Universal Health | | |
| | Services Inc. Class B | 3,070 | 127 |
| | Beckman Coulter Inc. | 2,375 | 126 |
| * | King Pharmaceuticals Inc. | 8,754 | 124 |
| * | Coventry Health Care Inc. | 5,194 | 122 |
| | Patterson Cos. Inc. | 4,305 | 119 |
| | Lincare Holdings Inc. | 4,057 | 106 |
| * | Community Health | | |
| | Systems Inc. | 3,165 | 95 |
42
| | | |
| Total World Stock Index Fund | | |
| |
| |
| |
| | | | Market |
| | | | Value |
| | | Shares | ($000) |
| * | Kinetic Concepts Inc. | 2,421 | 92 |
| | Omnicare Inc. | 3,681 | 89 |
| |
| | Industrials (4.2%) | | |
| | General Electric Co. | 392,407 | 6,286 |
| | United Technologies Corp. | 34,495 | 2,579 |
| | 3M Co. | 26,044 | 2,193 |
| | Boeing Co. | 26,820 | 1,895 |
| | Caterpillar Inc. | 23,037 | 1,811 |
| | United Parcel Service Inc. | | |
| | Class B | 26,658 | 1,795 |
| | Union Pacific Corp. | 18,484 | 1,621 |
| | Emerson Electric Co. | 27,704 | 1,521 |
| | Honeywell International Inc. | 28,210 | 1,329 |
| | Deere & Co. | 15,591 | 1,197 |
| | Danaher Corp. | 23,524 | 1,020 |
| | FedEx Corp. | 11,583 | 1,016 |
| | General Dynamics Corp. | 14,037 | 956 |
| | Lockheed Martin Corp. | 13,364 | 953 |
| | CSX Corp. | 14,500 | 891 |
| | Norfolk Southern Corp. | 14,175 | 872 |
| | Illinois Tool Works Inc. | 18,148 | 829 |
| | Precision Castparts Corp. | 5,360 | 732 |
| | Tyco International Ltd. | 18,944 | 725 |
| | PACCAR Inc. | 13,900 | 713 |
| | Northrop Grumman Corp. | 11,172 | 706 |
| | Cummins Inc. | 7,670 | 676 |
| | Raytheon Co. | 13,827 | 637 |
| | Waste Management Inc. | 17,737 | 634 |
| | Eaton Corp. | 6,025 | 535 |
| | Ingersoll-Rand plc | 12,120 | 476 |
| | CH Robinson Worldwide Inc. | 6,660 | 469 |
| | Parker Hannifin Corp. | 5,651 | 433 |
| | Republic Services Inc. | | |
| | Class A | 13,894 | 414 |
| * | Delta Air Lines Inc. | 29,141 | 405 |
| | Goodrich Corp. | 4,633 | 380 |
| | Expeditors International of | | |
| | Washington Inc. | 7,384 | 364 |
| | Southwest Airlines Co. | 26,261 | 361 |
| | Dover Corp. | 6,438 | 342 |
| | Rockwell Collins Inc. | 5,473 | 331 |
| | WW Grainger Inc. | 2,573 | 319 |
| | Rockwell Automation Inc. | 4,898 | 306 |
| | Cooper Industries plc | 5,772 | 303 |
| | Fluor Corp. | 6,196 | 299 |
| | L-3 Communications | | |
| | Holdings Inc. | 4,128 | 298 |
| | ITT Corp. | 6,293 | 297 |
| | Fastenal Co. | 5,194 | 267 |
| | Textron Inc. | 12,100 | 252 |
| * | Jacobs Engineering | | |
| | Group Inc. | 5,148 | 199 |
| | RR Donnelley & Sons Co. | 10,300 | 190 |
| | Pall Corp. | 4,116 | 176 |
| | | |
| | | | Market |
| | | | Value |
| | | Shares | ($000) |
| | Robert Half International Inc. | 6,137 | 166 |
| | Pitney Bowes Inc. | 7,276 | 160 |
| | Iron Mountain Inc. | 7,128 | 155 |
| | Manpower Inc. | 2,733 | 150 |
| | Cintas Corp. | 5,320 | 146 |
| | Equifax Inc. | 4,286 | 142 |
| | Avery Dennison Corp. | 3,873 | 141 |
| | Masco Corp. | 12,676 | 135 |
| | Dun & Bradstreet Corp. | 1,747 | 130 |
| | JB Hunt Transport | | |
| | Services Inc. | 3,270 | 118 |
| | SPX Corp. | 1,691 | 113 |
| | Pentair Inc. | 3,347 | 110 |
| * | Babcock & Wilcox Co. | 4,750 | 108 |
| * | Foster Wheeler AG | 4,331 | 101 |
| * | Alliant Techsystems Inc. | 1,264 | 96 |
| * | Terex Corp. | 3,825 | 86 |
| | Ryder System Inc. | 1,892 | 83 |
| |
| | Information Technology (7.9%) | |
| * | Apple Inc. | 33,454 | 10,065 |
| | Microsoft Corp. | 317,771 | 8,465 |
| | International Business | | |
| | Machines Corp. | 46,518 | 6,680 |
| * | Google Inc. Class A | 8,796 | 5,392 |
| | Oracle Corp. | 183,312 | 5,389 |
| * | Cisco Systems Inc. | 210,325 | 4,802 |
| | Intel Corp. | 203,377 | 4,082 |
| | Hewlett-Packard Co. | 85,471 | 3,595 |
| | QUALCOMM Inc. | 59,296 | 2,676 |
| * | EMC Corp. | 74,910 | 1,574 |
| * | eBay Inc. | 48,002 | 1,431 |
| | Visa Inc. Class A | 17,877 | 1,397 |
| | Texas Instruments Inc. | 45,318 | 1,340 |
| | Corning Inc. | 57,177 | 1,045 |
| * | Dell Inc. | 72,061 | 1,036 |
| | Accenture PLC Class A | 23,165 | 1,036 |
| | Mastercard Inc. Class A | 4,258 | 1,022 |
| | Automatic Data | | |
| | Processing Inc. | 18,815 | 836 |
| * | Yahoo! Inc. | 50,404 | 832 |
| * | Cognizant Technology | | |
| | Solutions Corp. Class A | 11,300 | 737 |
| * | NetApp Inc. | 13,701 | 730 |
| * | Motorola Inc. | 86,448 | 705 |
| | Broadcom Corp. Class A | 16,567 | 675 |
| * | Juniper Networks Inc. | 20,277 | 657 |
| | Applied Materials Inc. | 48,859 | 604 |
| | Xerox Corp. | 48,844 | 571 |
| * | Adobe Systems Inc. | 19,533 | 550 |
| * | Intuit Inc. | 11,108 | 533 |
| | Tyco Electronics Ltd. | 16,801 | 532 |
| * | Citrix Systems Inc. | 7,516 | 482 |
| * | Symantec Corp. | 28,060 | 454 |
43
| | | |
| Total World Stock Index Fund | | |
| |
| |
| |
| | | | Market |
| | | | Value |
| | | Shares | ($000) |
| * | Marvell Technology | | |
| | Group Ltd. | 23,163 | 447 |
| | Western Union Co. | 24,456 | 430 |
| * | Agilent Technologies Inc. | 12,233 | 426 |
| * | Salesforce.com Inc. | 3,423 | 397 |
| | Paychex Inc. | 13,900 | 385 |
| | Analog Devices Inc. | 10,888 | 367 |
| * | SanDisk Corp. | 9,368 | 352 |
| * | Akamai Technologies Inc. | 6,709 | 347 |
| | Altera Corp. | 11,085 | 346 |
| | Amphenol Corp. Class A | 6,450 | 323 |
| | CA Inc. | 13,918 | 323 |
| * | Autodesk Inc. | 8,733 | 316 |
| * | First Solar Inc. | 2,221 | 306 |
| * | Micron Technology Inc. | 36,598 | 303 |
| * | Fiserv Inc. | 5,386 | 294 |
| * | BMC Software Inc. | 6,392 | 291 |
| | Fidelity National | | |
| | Information Services Inc. | 10,407 | 282 |
| * | VeriSign Inc. | 7,900 | 274 |
| * | Seagate Technology plc | 18,279 | 268 |
| * | McAfee Inc. | 5,535 | 262 |
| | Computer Sciences Corp. | 5,268 | 258 |
| | Xilinx Inc. | 9,570 | 257 |
| * | Western Digital Corp. | 7,876 | 252 |
| * | NVIDIA Corp. | 20,800 | 250 |
| | Linear Technology Corp. | 7,649 | 246 |
| * | Teradata Corp. | 5,988 | 236 |
| | KLA-Tencor Corp. | 5,950 | 213 |
| * | Flextronics International Ltd. | 29,513 | 211 |
| | Harris Corp. | 4,614 | 208 |
| * | Electronic Arts Inc. | 12,900 | 204 |
| | Microchip Technology Inc. | 6,340 | 204 |
| * | Lam Research Corp. | 4,401 | 201 |
| * | Advanced Micro | | |
| | Devices Inc. | 23,248 | 170 |
| * | Avnet Inc. | 5,319 | 158 |
| * | Synopsys Inc. | 5,132 | 131 |
| * | Arrow Electronics Inc. | 4,195 | 124 |
| * | LSI Corp. | 22,852 | 120 |
| | Jabil Circuit Inc. | 7,542 | 116 |
| * | Alliance Data Systems Corp. | 1,871 | 114 |
| * | AOL Inc. | 4,198 | 112 |
| | National Semiconductor Corp. | 8,106 | 111 |
| | Broadridge Financial | | |
| | Solutions Inc. | 4,824 | 106 |
| | Total System Services Inc. | 6,751 | 105 |
| * | Novellus Systems Inc. | 3,445 | 101 |
| * | MEMC Electronic | | |
| | Materials Inc. | 7,584 | 97 |
| | Lender Processing | | |
| | Services Inc. | 3,294 | 95 |
| * | WebMD Health Corp. | 1,755 | 92 |
| * | IAC/InterActiveCorp | 3,000 | 84 |
| * | Compuware Corp. | 7,975 | 80 |
| | | |
| | | | Market |
| | | | Value |
| | | Shares | ($000) |
| * | NCR Corp. | 5,678 | 78 |
| | Diebold Inc. | 2,371 | 73 |
| | DST Systems Inc. | 1,655 | 72 |
| * | CoreLogic Inc. | 3,445 | 61 |
| | Molex Inc. | 2,513 | 51 |
| | Molex Inc. Class A | 2,658 | 45 |
| |
| | Materials (1.3%) | | |
| | Freeport-McMoRan | | |
| | Copper & Gold Inc. | 17,181 | 1,627 |
| | EI du Pont de | | |
| | Nemours & Co. | 33,083 | 1,564 |
| | Dow Chemical Co. | 42,818 | 1,320 |
| | Monsanto Co. | 19,767 | 1,174 |
| | Newmont Mining Corp. | 17,375 | 1,058 |
| | Praxair Inc. | 11,342 | 1,036 |
| | Air Products & | | |
| | Chemicals Inc. | 8,000 | 680 |
| | Mosaic Co. | 6,848 | 501 |
| | Alcoa Inc. | 36,578 | 480 |
| | PPG Industries Inc. | 6,070 | 466 |
| | Nucor Corp. | 11,346 | 434 |
| | International Paper Co. | 15,990 | 404 |
| | Ecolab Inc. | 8,184 | 404 |
| | Sherwin-Williams Co. | 3,924 | 286 |
| | Sigma-Aldrich Corp. | 4,226 | 268 |
| | United States Steel Corp. | 5,132 | 220 |
| | Ball Corp. | 3,297 | 212 |
| | Allegheny Technologies Inc. | 3,732 | 197 |
| | Eastman Chemical Co. | 2,462 | 193 |
| * | Owens-Illinois Inc. | 5,677 | 159 |
| | Vulcan Materials Co. | 4,285 | 156 |
| | MeadWestvaco Corp. | 6,014 | 155 |
| * | Pactiv Corp. | 4,477 | 148 |
| | Bemis Co. Inc. | 4,464 | 142 |
| | International Flavors & | | |
| | Fragrances Inc. | 2,789 | 140 |
| | Ashland Inc. | 2,649 | 137 |
| | Sealed Air Corp. | 5,416 | 125 |
| |
| | Telecommunication Services (1.2%) | |
| | AT&T Inc. | 217,971 | 6,212 |
| | Verizon | | |
| | Communications Inc. | 104,450 | 3,392 |
| * | American Tower Corp. | | |
| | Class A | 14,888 | 768 |
| * | Crown Castle | | |
| | International Corp. | 10,746 | 463 |
| * | Sprint Nextel Corp. | 107,996 | 445 |
| | CenturyLink Inc. | 10,534 | 436 |
| | Qwest Communications | | |
| | International Inc. | 60,449 | 399 |
| | Frontier | | |
| | Communications Corp. | 34,708 | 305 |
| * | NII Holdings Inc. | 6,600 | 276 |
44
| | | |
| Total World Stock Index Fund | | |
| |
| |
| |
| | | | Market |
| | | | Value |
| | | Shares | ($000) |
| * | MetroPCS | | |
| | Communications Inc. | 14,400 | 150 |
| * | Level 3 | | |
| | Communications Inc. | 65,200 | 63 |
| | Telephone & | | |
| | Data Systems Inc. | 1,719 | 60 |
| |
| | Utilities (1.4%) | | |
| | Southern Co. | 30,156 | 1,142 |
| | Exelon Corp. | 24,093 | 983 |
| | Dominion Resources Inc. | 21,255 | 924 |
| | Duke Energy Corp. | 49,289 | 898 |
| | NextEra Energy Inc. | 14,703 | 809 |
| | PG&E Corp. | 14,091 | 674 |
| | American Electric | | |
| | Power Co. Inc. | 17,134 | 641 |
| | Public Service | | |
| | Enterprise Group Inc. | 18,278 | 591 |
| | Entergy Corp. | 6,854 | 511 |
| | Consolidated Edison Inc. | 9,840 | 489 |
| | Progress Energy Inc. | 10,454 | 470 |
| | Sempra Energy | 8,642 | 462 |
| | PPL Corp. | 17,031 | 458 |
| | Xcel Energy Inc. | 18,818 | 449 |
| | Edison International | 11,425 | 422 |
| | FirstEnergy Corp. | 10,689 | 388 |
| * | AES Corp. | 32,054 | 383 |
| | DTE Energy Co. | 6,193 | 290 |
| | CenterPoint Energy Inc. | 17,059 | 282 |
| | Wisconsin Energy Corp. | 4,050 | 241 |
| | Ameren Corp. | 8,182 | 237 |
| | NSTAR | 5,201 | 217 |
| | Constellation Energy | | |
| | Group Inc. | 6,933 | 210 |
| | SCANA Corp. | 4,911 | 201 |
| * | NRG Energy Inc. | 10,055 | 200 |
| | NiSource Inc. | 11,206 | 194 |
| | Northeast Utilities | 6,139 | 192 |
| | Pinnacle West Capital Corp. | 4,087 | 168 |
| | Pepco Holdings Inc. | 7,712 | 149 |
| | TECO Energy Inc. | 8,119 | 143 |
| | | |
| | | | Market |
| | | | Value |
| | | Shares | ($000) |
| | Alliant Energy Corp. | 3,867 | 141 |
| | Allegheny Energy Inc. | 5,857 | 136 |
| | MDU Resources Group Inc. | 6,544 | 130 |
| | Questar Corp. | 5,999 | 102 |
| * | RRI Energy Inc. | 16,400 | 62 |
| * | Mirant Corp. | 5,592 | 59 |
| | | | 417,178 |
| Total Common Stocks | | |
| (Cost $897,369) | | 1,033,142 |
| Temporary Cash Investment (0.4%) | |
| Money Market Fund (0.4%) | | |
| 2,3 | Vanguard Market Liquidity | | |
| | Fund, 0.237% | | |
| | (Cost $4,390) | 4,389,860 | 4,390 |
| Total Investments (100.1%) | | |
| (Cost $901,759) | | 1,037,532 |
| Other Assets and Liabilities (-0.1%) | |
| Other Assets | | 2,873 |
| Liabilities3 | | (4,039) |
| | | | (1,166) |
| Net Assets (100%) | | 1,036,366 |
45
Total World Stock Index Fund
| |
| At October 31, 2010, net assets consisted of: |
| | Amount |
| | ($000) |
| Paid-in Capital | 893,933 |
| Undistributed Net Investment Income | 16,075 |
| Accumulated Net Realized Losses | (9,463) |
| Unrealized Appreciation (Depreciation) | |
| Investment Securities | 135,773 |
| Foreign Currencies | 48 |
| Net Assets | 1,036,366 |
| |
| |
| Investor Shares—Net Assets | |
| Applicable to 13,526,427 outstanding | |
| $.001 par value shares of beneficial | |
| interest (unlimited authorization) | 254,966 |
| Net Asset Value Per Share— | |
| Investor Shares | $18.85 |
| |
| |
| Institutional Shares—Net Assets | |
| Applicable to 506,504 outstanding | |
| $.001 par value shares of beneficial | |
| interest (unlimited authorization) | 47,924 |
| Net Asset Value Per Share— | |
| Institutional Shares | $94.62 |
| |
| |
| ETF Shares—Net Assets | |
| Applicable to 15,843,001 outstanding | |
| $.001 par value shares of beneficial | |
| interest (unlimited authorization) | 733,476 |
| Net Asset Value Per Share— | |
| ETF Shares | $46.30 |
See Note A in Notes to Financial Statements.
* Non-income-producing security.
^ Part of security position is on loan to broker-dealers. The total value of securities on loan is $2,084,000.
1 Security exempt from registration under Rule 144A of the Securities Act of 1933. Such securities may be sold in transactions exempt from registration, normally to qualified institutional buyers. At October 31, 2010, the aggregate value of these securities was $4,671,000, representing 0.5% of net assets.
2 Affiliated money market fund available only to Vanguard funds and certain trusts and accounts managed by Vanguard. Rate shown is the 7-day yield.
3 Includes $2,185,000 of collateral received for securities on loan.
ADR—American Depositary Receipt.
GDR—Global Depositary Receipt.
REIT—Real Estate Investment Trust.
See accompanying Notes, which are an integral part of the Financial Statements.
46
| |
| Total World Stock Index Fund | |
| |
| |
| Statement of Operations | |
| |
| | Year Ended |
| | October 31, 2010 |
| | ($000) |
| Investment Income | |
| Income | |
| Dividends1 | 21,201 |
| Interest2 | 7 |
| Security Lending | 347 |
| Total Income | 21,555 |
| Expenses | |
| The Vanguard Group—Note B | |
| Investment Advisory Services | 116 |
| Management and Administrative—Investor Shares | 715 |
| Management and Administrative—Institutional Shares | 47 |
| Management and Administrative—ETF Shares | 1,128 |
| Marketing and Distribution—Investor Shares | 46 |
| Marketing and Distribution—Institutional Shares | 7 |
| Marketing and Distribution—ETF Shares | 178 |
| Custodian Fees | 245 |
| Auditing Fees | 35 |
| Shareholders’ Reports—Investor Shares | 4 |
| Shareholders’ Reports—Institutional Shares | — |
| Shareholders’ Reports—ETF Shares | 13 |
| Trustees’ Fees and Expenses | 1 |
| Total Expenses | 2,535 |
| Net Investment Income | 19,020 |
| Realized Net Gain (Loss) | |
| Investment Securities Sold | 29,567 |
| Foreign Currencies | (65) |
| Realized Net Gain (Loss) | 29,502 |
| Change in Unrealized Appreciation (Depreciation) | |
| Investment Securities | 66,518 |
| Foreign Currencies | 37 |
| Change in Unrealized Appreciation (Depreciation) | 66,555 |
| Net Increase (Decrease) in Net Assets Resulting from Operations | 115,077 |
1 Dividends are net of foreign withholding taxes of $1,276,000.
2 Interest income from an affiliated company of the fund was $7,000.
See accompanying Notes, which are an integral part of the Financial Statements.
47
| | |
| Total World Stock Index Fund | | |
| |
| |
| Statement of Changes in Net Assets | | |
| |
| | Year Ended October 31, |
| | 2010 | 2009 |
| | ($000) | ($000) |
| Increase (Decrease) in Net Assets | | |
| Operations | | |
| Net Investment Income | 19,020 | 9,305 |
| Realized Net Gain (Loss) | 29,502 | (7,665) |
| Change in Unrealized Appreciation (Depreciation) | 66,555 | 103,886 |
| Net Increase (Decrease) in Net Assets Resulting from Operations | 115,077 | 105,526 |
| Distributions | | |
| Net Investment Income | | |
| Investor Shares | (2,072) | (353) |
| Institutional Shares | (292) | (105) |
| ETF Shares | (9,007) | (1,259) |
| Realized Capital Gain | | |
| Investor Shares | — | — |
| Institutional Shares | — | — |
| ETF Shares | — | — |
| Total Distributions | (11,371) | (1,717) |
| Capital Share Transactions | | |
| Investor Shares | 99,427 | 68,202 |
| Institutional Shares | 25,727 | 6,213 |
| ETF Shares | 160,401 | 306,446 |
| Net Increase (Decrease) from Capital Share Transactions | 285,555 | 380,861 |
| Total Increase (Decrease) | 389,261 | 484,670 |
| Net Assets | | |
| Beginning of Period | 647,105 | 162,435 |
| End of Period1 | 1,036,366 | 647,105 |
1 Net Assets—End of Period includes undistributed net investment income of $16,075,000 and $8,384,000.
See accompanying Notes, which are an integral part of the Financial Statements.
48
| | | |
| Total World Stock Index Fund | | | |
| |
| |
| Financial Highlights | | | |
| |
| Investor Shares | | | |
| | | | June 26, |
| | Year Ended | 20081 to |
| | October 31, | Oct. 31, |
| For a Share Outstanding Throughout Each Period | 2010 | 2009 | 2008 |
| Net Asset Value, Beginning of Period | $16.66 | $13.71 | $20.00 |
| Investment Operations | | | |
| Net Investment Income | .3592 | .3282 | .1602 |
| Net Realized and Unrealized Gain (Loss) on Investments | 2.076 | 2.698 | (6.450) |
| Total from Investment Operations | 2.435 | 3.026 | (6.290) |
| Distributions | | | |
| Dividends from Net Investment Income | (.245) | (.076) | — |
| Distributions from Realized Capital Gains | — | — | — |
| Total Distributions | (.245) | (.076) | — |
| Net Asset Value, End of Period | $18.85 | $16.66 | $13.71 |
| |
| Total Return3 | 14.73% | 22.25% | -31.45% |
| |
| Ratios/Supplemental Data | | | |
| Net Assets, End of Period (Millions) | $255 | $131 | $41 |
| Ratio of Total Expenses to Average Net Assets | 0.45% | 0.50% | 0.46%4 |
| Ratio of Net Investment Income to Average Net Assets | 2.03% | 2.28% | 2.32%4 |
| Portfolio Turnover Rate5 | 7% | 18% | 5% |
1 Inception.
2 Calculated based on average shares outstanding.
3 Total returns do not include transaction or account service fees that may have applied in the periods shown. Fund prospectuses provide information about any applicable transaction or account service fees.
4 Annualized.
5 Excludes the value of portfolio securities received or delivered as a result of in-kind purchases or redemptions of the fund’s capital shares, including ETF Creation Units.
See accompanying Notes, which are an integral part of the Financial Statements.
49
| | | |
| Total World Stock Index Fund | | | |
| |
| |
| Financial Highlights | | | |
| |
| Institutional Shares | | | |
| | | | Oct. 9, |
| | Year Ended | 20081 to |
| | October 31, | Oct. 31, |
| For a Share Outstanding Throughout Each Period | 2010 | 2009 | 2008 |
| Net Asset Value, Beginning of Period | $83.54 | $68.63 | $66.81 |
| Investment Operations | | | |
| Net Investment Income | 1.8932 | 1.8842 | .1242 |
| Net Realized and Unrealized Gain (Loss) on Investments3 | 10.538 | 13.457 | 1.696 |
| Total from Investment Operations | 12.431 | 15.341 | 1.820 |
| Distributions | | | |
| Dividends from Net Investment Income | (1.351) | (.431) | — |
| Distributions from Realized Capital Gains | — | — | — |
| Total Distributions | (1.351) | (.431) | — |
| Net Asset Value, End of Period | $94.62 | $83.54 | $68.63 |
| |
| Total Return4 | 15.01% | 22.55% | 2.72% |
| |
| Ratios/Supplemental Data | | | |
| Net Assets, End of Period (Millions) | $48 | $17 | $7 |
| Ratio of Total Expenses to Average Net Assets | 0.23% | 0.25% | 0.20%5 |
| Ratio of Net Investment Income to Average Net Assets | 2.25% | 2.53% | 2.58%5 |
| Portfolio Turnover Rate6 | 7% | 18% | 5% |
1 Inception.
2 Calculated based on average shares outstanding.
3 Includes increases from purchase and redemption fees of $.03, $.05, and $.01.
4 Total returns do not include transaction fees that may have applied in the periods shown. Fund prospectuses provide information about any applicable transaction fees.
5 Annualized.
6 Excludes the value of portfolio securities received or delivered as a result of in-kind purchases or redemptions of the fund’s capital shares, including ETF Creation Units.
See accompanying Notes, which are an integral part of the Financial Statements.
50
| | | |
| Total World Stock Index Fund | | | |
| |
| |
| Financial Highlights | | | |
| |
| ETF Shares | | | |
| | | | June 24, |
| | Year Ended | 20081 to |
| | October 31, | Oct. 31, |
| For a Share Outstanding Throughout Each Period | 2010 | 2009 | 2008 |
| Net Asset Value, Beginning of Period | $40.88 | $33.59 | $49.74 |
| Investment Operations | | | |
| Net Investment Income | .9642 | .8712 | .3402 |
| Net Realized and Unrealized Gain (Loss) on Investments3 | 5.118 | 6.622 | (16.490) |
| Total from Investment Operations | 6.082 | 7.493 | (16.150) |
| Distributions | | | |
| Dividends from Net Investment Income | (.662) | (.203) | — |
| Distributions from Realized Capital Gains | — | — | — |
| Total Distributions | (.662) | (.203) | — |
| Net Asset Value, End of Period | $46.30 | $40.88 | $33.59 |
| |
| Total Return | 15.00% | 22.49% | -32.47% |
| |
| Ratios/Supplemental Data | | | |
| Net Assets, End of Period (Millions) | $733 | $499 | $114 |
| Ratio of Total Expenses to Average Net Assets | 0.25% | 0.30% | 0.29%4 |
| Ratio of Net Investment Income to Average Net Assets | 2.23% | 2.48% | 2.49%4 |
| Portfolio Turnover Rate5 | 7% | 18% | 5% |
1 Inception.
2 Calculated based on average shares outstanding.
3 Includes increases from purchase and redemption fees of $.02, $.02, and $.01.
4 Annualized.
5 Excludes the value of portfolio securities received or delivered as a result of in-kind purchases or redemptions of the fund’s capital shares, including ETF Creation Units.
See accompanying Notes, which are an integral part of the Financial Statements.
51
Total World Stock Index Fund
Notes to Financial Statements
Vanguard Total World Stock Index Fund is registered under the Investment Company Act of 1940 as an open-end investment company, or mutual fund. The fund invests in securities of foreign issuers, which may subject it to investment risks not normally associated with investing in securities of U.S. corporations. The fund offers three classes of shares: Investor Shares, Institutional Shares, and ETF Shares. Investor Shares are available to any investor who meets the fund’s minimum purchase requirements. Institutional Shares are designed for investors who meet certain administrative, service, and account-size criteria. ETF Shares are listed for trading on the NYSE Arca, Inc.; they can be purchased and sold through a broker.
A. The following significant accounting policies conform to generally accepted accounting principles for U.S. mutual funds. The fund consistently follows such policies in preparing its financial statements.
1. Security Valuation: Securities are valued as of the close of trading on the New York Stock Exchange (generally 4 p.m., Eastern time) on the valuation date. Equity securities are valued at the latest quoted sales prices or official closing prices taken from the primary market in which each security trades; such securities not traded on the valuation date are valued at the mean of the latest quoted bid and asked prices. Securities for which market quotations are not readily available, or whose values have been affected by events occurring before the fund’s pricing time but after the close of the securities’ primary markets, are valued at their fair values calculated according to procedures adopted by the board of trustees. These procedures include obtaining quotations from an independent pricing service, monitoring news to identify significant market- or security-specific events, and evaluating changes in the values of foreign market proxies (for example, A DRs, futures contracts, or exchange-traded funds), between the time the foreign markets close and the fund’s pricing time. When fair-value pricing is employed, the prices of securities used by a fund to calculate its net asset value may differ from quoted or published prices for the same securities. Investments in Vanguard Market Liquidity Fund are valued at that fund’s net asset value.
2. Foreign Currency: Securities and other assets and liabilities denominated in foreign currencies are translated into U.S. dollars using exchange rates obtained from an independent third party as of the fund’s pricing time on the valuation date. Realized gains (losses) and unrealized appreciation (depreciation) on investment securities include the effects of changes in exchange rates since the securities were purchased, combined with the effects of changes in security prices. Fluctuations in the value of other assets and liabilities resulting from changes in exchange rates are recorded as unrealized foreign currency gains (losses) until the assets or liabilities are settled in cash, at which time they are recorded as realized foreign currency gains (losses).
3. Federal Income Taxes: The fund intends to continue to qualify as a regulated investment company and distribute all of its taxable income. Management has analyzed the fund’s tax positions taken for all open federal income tax years (October 31, 2008–2010), and has concluded that no provision for federal income tax is required in the fund’s financial statements.
4. Distributions: Distributions to shareholders are recorded on the ex-dividend date.
5. Security Lending: The fund may lend its securities to qualified institutional borrowers to earn additional income. Security loans are required to be secured at all times by collateral at least equal to the market value of securities loaned. The fund invests cash collateral received in Vanguard Market Liquidity Fund, and records a liability for the return of the collateral, during the period the securities are on loan. Security lending income represents fees charged to borrowers plus income earned on investing cash collateral, less expenses associated with the loan.
52
Total World Stock Index Fund
6. Other: Dividend income is recorded on the ex-dividend date. Interest income includes income distributions received from Vanguard Market Liquidity Fund and is accrued daily. Security transactions are accounted for on the date securities are bought or sold. Costs used to determine realized gains (losses) on the sale of investment securities are those of the specific securities sold. Fees assessed on capital share transactions are credited to paid-in capital.
Each class of shares has equal rights as to assets and earnings, except that each class separately bears certain class-specific expenses related to maintenance of shareholder accounts (included in Management and Administrative expenses) and shareholder reporting. Marketing and distribution expenses are allocated to each class of shares based on a method approved by the board of trustees. Income, other non-class-specific expenses, and gains and losses on investments are allocated to each class of shares based on its relative net assets.
B. The Vanguard Group furnishes at cost investment advisory, corporate management, administrative, marketing, and distribution services. The costs of such services are allocated to the fund under methods approved by the board of trustees. The fund has committed to provide up to 0.40% of its net assets in capital contributions to Vanguard. At October 31, 2010, the fund had contributed capital of $176,000 to Vanguard (included in Other Assets), representing 0.02% of the fund’s net assets and 0.07% of Vanguard’s capitalization. The fund’s trustees and officers are also directors and officers of Vanguard.
C. Various inputs may be used to determine the value of the fund’s investments. These inputs are summarized in three broad levels for financial statement purposes. The inputs or methodologies used to value securities are not necessarily an indication of the risk associated with investing in those securities.
Level 1—Quoted prices in active markets for identical securities.
Level 2—Other significant observable inputs (including quoted prices for similar securities, interest rates, prepayment speeds, credit risk, etc.).
Level 3—Significant unobservable inputs (including the fund’s own assumptions used to determine the fair value of investments).
The following table summarizes the fund’s investments as of October 31, 2010, based on the inputs used to value them:
| | | |
| | Level 1 | Level 2 | Level 3 |
| Investments | ($000) | ($000) | ($000) |
| Common Stocks—U.S. | 417,178 | — | — |
| Common Stocks—International | 86,436 | 529,524 | 4 |
| Temporary Cash Investments | 4,390 | — | — |
| Total | 508,004 | 529,524 | 4 |
53
Total World Stock Index Fund
The following table summarizes changes in investments valued based on Level 3 inputs during the year ended October 31, 2010:
| |
| | Investments in |
| | Common Stocks— |
| | International |
| Amount Valued Based on Level 3 Inputs | ($000) |
| Balance as of October 31, 2009 | 5 |
| Change in Unrealized Appreciation (Depreciation) | (1) |
| Balance as of October 31, 2010 | 4 |
D. Distributions are determined on a tax basis and may differ from net investment income and realized capital gains for financial reporting purposes. Differences may be permanent or temporary. Permanent differences are reclassified among capital accounts in the financial statements to reflect their tax character. Temporary differences arise when certain items of income, expense, gain, or loss are recognized in different periods for financial statement and tax purposes; these differences will reverse at some time in the future. Differences in classification may also result from the treatment of short-term gains as ordinary income for tax purposes.
During the year ended October 31, 2010, the fund realized net foreign currency losses of $65,000, which decreased distributable net income for tax purposes; accordingly, such losses have been reclassified from accumulated net realized losses to undistributed net investment income. Certain of the fund’s investments are in securities considered to be “passive foreign investment companies,” for which any unrealized appreciation and/or realized gains are required to be included in distributable net income for tax purposes. Unrealized appreciation of $508,000 on the fund’s passive foreign investment company holdings at October 31, 2009, has been distributed and is reflected in the balance of undistributed net investment income. During the year ended October 31, 2010, the fund realized gains on the sale of passive foreign investment companies of $107,000, which have been included in current and prior periods’ taxable income; accordingly, such gains have been reclassified from accumulated net realized losses to undistributed net investment income. Since October 31, 2009, the fund’s passive foreign investment company holdings have appreciated in value, increasing the amount of the taxable income available for distribution as of October 31, 2010, by $606,000. Unrealized appreciation on the fund’s passive foreign investment company holdings at October 31, 2010, was $1,114,000.
During the year ended October 31, 2010, the fund realized $30,574,000 of net capital gains resulting from in-kind redemptions—in which shareholders exchanged fund shares for securities held by the fund rather than for cash. Because such gains are not taxable to the fund, and are not distributed to shareholders, they have been reclassified from accumulated net realized losses to paid-in capital.
54
Total World Stock Index Fund
For tax purposes, at October 31, 2010, the fund had $17,610,000 of ordinary income available for distribution. The fund had available capital loss carryforwards totaling $9,435,000 to offset future net capital gains of $572,000 through October 31, 2016, $7,777,000 through October 31, 2017, and $1,086,000 through October 31, 2018.
At October 31, 2010, the cost of investment securities for tax purposes was $902,902,000. Net unrealized appreciation of investment securities for tax purposes was $134,630,000, consisting of unrealized gains of $163,541,000 on securities that had risen in value since their purchase and $28,911,000 in unrealized losses on securities that had fallen in value since their purchase.
E. During the year ended October 31, 2010, the fund purchased $432,279,000 of investment securities and sold $139,714,000 of investment securities, other than temporary cash investments.
F. Capital share transactions for each class of shares were:
| | | | | |
| | | | |
| | | | Year Ended October 31, |
| | | 2010 | | | 2009 |
| | Amount | Shares | Amount | Shares |
| | ($000) | (000) | ($000) | (000) |
| Investor Shares | | | | |
| Issued1 | 149,093 | 8,519 | 103,347 | 7,649 |
| Issued in Lieu of Cash Distributions | 1,883 | 108 | 328 | 26 |
| Redeemed2 | (51,549) | (2,964) | (35,473) | (2,808) |
| Net Increase (Decrease)—Investor Shares | 99,427 | 5,663 | 68,202 | 4,867 |
| Institutional Shares | | | | |
| Issued1 | 29,459 | 343 | 16,006 | 238 |
| Issued in Lieu of Cash Distributions | 292 | 3 | 105 | 2 |
| Redeemed2 | (4,024) | (44) | (9,898) | (140) |
| Net Increase (Decrease)—Institutional Shares | 25,727 | 302 | 6,213 | 100 |
| ETF Shares | | | | |
| Issued1 | 240,124 | 5,437 | 306,446 | 8,806 |
| Issued in Lieu of Cash Distributions | — | — | — | — |
| Redeemed2 | (79,723) | (1,800) | — | — |
| Net Increase (Decrease)—ETF Shares | 160,401 | 3,637 | 306,446 | 8,806 |
1 Includes purchase fees for fiscal 2010 and 2009 of $422,000 and $255,000, respectively (fund totals).
2 Net of redemption fees for fiscal 2010 and 2009 of $41,000 and $45,000, respectively (fund totals).
G. In preparing the financial statements as of October 31, 2010, management considered the impact of subsequent events for potential recognition or disclosure in these financial statements.
55
Report of Independent Registered Public Accounting Firm
To the Trustees of Vanguard International Equity Index Funds and the Shareholders of Vanguard Total World Stock Index Fund:
In our opinion, the accompanying statement of net assets and the related statements of operations and of changes in net assets and the financial highlights present fairly, in all material respects, the financial position of Vanguard Total World Stock Index Fund (constituting a separate portfolio of Vanguard International Equity Index Funds, hereafter referred to as the “Fund”) at October 31, 2010, the results of its operations for the year then ended, the changes in its net assets for each of the two years in the period then ended and the financial highlights for each of the periods indicated in conformity with accounting principles generally accepted in the United States of America. These financial statements and financial highlights (hereafter referred to as “financial statements”) are the responsibility of the Fund’s management; our responsibility is to express an opinion on these financial statements based on our audits. We conducted our a udits of these financial statements in accordance with the standards of the Public Company Accounting Oversight Board (United States). Those standards require that we plan and perform the audit to obtain reasonable assurance about whether the financial statements are free of material misstatement. An audit includes examining, on a test basis, evidence supporting the amounts and disclosures in the financial statements, assessing the accounting principles used and significant estimates made by management, and evaluating the overall financial statement presentation. We believe that our audits, which included confirmation of securities at October 31, 2010 by correspondence with the custodian and by agreement to the underlying ownership records of Vanguard Market Liquidity Fund, provide a reasonable basis for our opinion.
PricewaterhouseCoopers LLP
Philadelphia, Pennsylvania
December 14, 2010
|
| Special 2010 tax information (unaudited) for Vanguard Total World Stock Index Fund |
This information for the fiscal year ended October 31, 2010, is included pursuant to provisions of the Internal Revenue Code.
The fund distributed $10,092,000 of qualified dividend income to shareholders during the fiscal year.
For corporate shareholders, 36.7% of investment income (dividend income plus short-term gains, if any) qualifies for the dividends-received deduction.
The fund will pass through foreign source income of $15,545,000 and foreign taxes paid of $2,110,000 to shareholders. The pass-through of foreign taxes paid will affect only shareholders on the fund’s dividend record date in December 2010. Shareholders will receive more detailed information along with their Form 1099-DIV in January 2011.
56
Your Fund’s After-Tax Returns
This table presents returns for your fund both before and after taxes. The after-tax returns are shown in two ways: (1) assuming that an investor owned the fund during the entire period and paid taxes on the fund’s distributions, and (2) assuming that an investor paid taxes on the fund’s distributions and sold all shares at the end of each period.
Calculations are based on the highest individual federal income tax and capital gains tax rates in effect at the times of the distributions and the hypothetical sales. State and local taxes were not considered. After-tax returns reflect any qualified dividend income , using actual prior-year figures and estimates for 2010. (In the example, returns after the sale of fund shares may be higher than those assuming no sale. This occurs when the sale would have produced a capital loss. The calculation assumes that the investor received a tax deduction for the loss.)
The table shows returns for Investor Shares only; returns for other share classes will differ. Please note that your actual after-tax returns will depend on your tax situation and may differ from those shown. Also note that if you own the fund in a tax-deferred account, such as an individual retirement account or a 401(k) plan, this information does not apply to you. Such accounts are not subject to current taxes.
Finally, keep in mind that a fund’s performance—whether before or after taxes—does not guarantee future results.
Average Annual Total Returns: Total World Stock Index Fund Investor Shares
Periods Ended October 31, 2010
| | |
| | | Since |
| | One | Inception |
| | Year | (6/26/2008) |
| Returns Before Taxes | 14.44% | -1.77% |
| Returns After Taxes on Distributions | 14.22 | -1.88 |
| Returns After Taxes on Distributions and Sale of Fund Shares | 9.69 | -1.50 |
Returns are adjusted to reflect the 0.25% fee on purchases but not the 2% fee on redemptions of shares held for less than two months.
57
About Your Fund’s Expenses
As a shareholder of the fund, you incur ongoing costs, which include costs for portfolio management, administrative services, and shareholder reports (like this one), among others. Operating expenses, which are deducted from a fund’s gross income, directly reduce the investment return of the fund.
A fund’s expenses are expressed as a percentage of its average net assets. This figure is known as the expense ratio. The following examples are intended to help you understand the ongoing costs (in dollars) of investing in your fund and to compare these costs with those of other mutual funds. The examples are based on an investment of $1,000 made at the beginning of the period shown and held for the entire period.
The accompanying table illustrates your fund’s costs in two ways:
• Based on actual fund return. This section helps you to estimate the actual expenses that you paid over the period. The ”Ending Account Value“ shown is derived from the fund‘s actual return, and the third column shows the dollar amount that would have been paid by an investor who started with $1,000 in the fund. You may use the information here, together with the amount you invested, to estimate the expenses that you paid over the period.
To do so, simply divide your account value by $1,000 (for example, an $8,600 account value divided by $1,000 = 8.6), then multiply the result by the number given for your fund under the heading ”Expenses Paid During Period.“
• Based on hypothetical 5% yearly return. This section is intended to help you compare your fund‘s costs with those of other mutual funds. It assumes that the fund had a yearly return of 5% before expenses, but that the expense ratio is unchanged. In this case—because the return used is not the fund’s actual return—the results do not apply to your investment. The example is useful in making comparisons because the Securities and Exchange Commission requires all mutual funds to calculate expenses based on a 5% return. You can assess your fund’s costs by comparing this hypothetical example with the hypothetical examples that appear in shareholder reports of other funds.
Note that the expenses shown in the table are meant to highlight and help you compare ongoing costs only and do not reflect transaction costs incurred by the fund for buying and selling securities. Further, the expenses do not include the transaction fees or the account service fee described in the prospectus. If such fees were applied to your account, your costs would be higher. Your fund does not carry a “sales load.”
The calculations assume no shares were bought or sold during the period. Your actual costs may have been higher or lower, depending on the amount of your investment and the timing of any purchases or redemptions.
You can find more information about the fund’s expenses, including annual expense ratios, in the Financial Statements section of this report. For additional information on operating expenses and other shareholder costs, please refer to your fund’s current prospectus.
58
| | | |
| Six Months Ended October 31, 2010 | | | |
| | Beginning | Ending | Expenses |
| | Account Value | Account Value | Paid During |
| Total World Stock Index Fund | 4/30/2010 | 10/31/2010 | Period |
| Based on Actual Fund Return | | | |
| Investor Shares | $1,000.00 | $1,044.90 | $2.16 |
| Institutional Shares | 1,000.00 | 1,045.99 | 1.19 |
| ETF Shares | 1,000.00 | 1,046.09 | 1.19 |
| Based on Hypothetical 5% Yearly Return | | | |
| Investor Shares | $1,000.00 | $1,023.09 | $2.14 |
| Institutional Shares | 1,000.00 | 1,024.05 | 1.17 |
| ETF Shares | 1,000.00 | 1,024.05 | 1.17 |
The calculations are based on expenses incurred in the most recent six-month period. The fund’s annualized six-month expense ratios for that period are 0.42% for Investor Shares, 0.23% for Institutional Shares, and 0.23% for ETF Shares. The dollar amounts shown as “Expenses Paid” are equal to the annualized expense ratio multiplied by the average account value over the period, multiplied by the number of days in the most recent six-month period, then divided by the number of days in the most recent 12-month period.
59
Glossary
Dividend Yield. Dividend income earned by stocks, expressed as a percentage of the aggregate market value (or of net asset value, for a fund). The yield is determined by dividing the amount of the annual dividends by the aggregate value (or net asset value) at the end of the period. For a fund, the dividend yield is based solely on stock holdings and does not include any income produced by other investments.
Earnings Growth Rate. The average annual rate of growth in earnings over the past five years for the stocks now in a fund.
Equity Exposure. A measure that reflects a fund’s investments in stocks and stock futures. Any holdings in short-term reserves are excluded.
Expense Ratio. The percentage of a fund’s average net assets used to pay its annual administrative and advisory expenses. These expenses directly reduce returns to investors.
Inception Date. The date on which the assets of a fund (or one of its share classes) are first invested in accordance with the fund’s investment objective. For funds with a subscription period, the inception date is the day after that period ends. Investment performance is measured from the inception date.
Median Market Cap. An indicator of the size of companies in which a fund invests; the midpoint of market capitalization (market price x shares outstanding) of a fund’s stocks, weighted by the proportion of the fund’s assets invested in each stock. Stocks representing half of the fund’s assets have market capitalizations above the median, and the rest are below it.
Price/Book Ratio. The share price of a stock divided by its net worth, or book value, per share. For a fund, the weighted average price/book ratio of the stocks it holds.
Price/Earnings Ratio. The ratio of a stock’s current price to its per-share earnings over the past year. For a fund, the weighted average P/E of the stocks it holds. P/E is an indicator of market expectations about corporate prospects; the higher the P/E, the greater the expectations for a company’s future growth.
Return on Equity. The annual average rate of return generated by a company during the past five years for each dollar of shareholder’s equity (net income divided by shareholder’s equity). For a fund, the weighted average return on equity for the companies whose stocks it holds.
Short-Term Reserves. The percentage of a fund invested in highly liquid, short-term securities that can be readily converted to cash.
Turnover Rate. An indication of the fund’s trading activity. Funds with high turnover rates incur higher transaction costs and may be more likely to distribute capital gains (which may be taxable to investors). The turnover rate excludes in-kind transactions, which have minimal impact on costs.
60
This page intentionally left blank.
This page intentionally left blank.
This page intentionally left blank.
The People Who Govern Your Fund
The trustees of your mutual fund are there to see that the fund is operated and managed in your best interests since, as a shareholder, you are a part owner of the fund. Your fund’s trustees also serve on the board of directors of The Vanguard Group, Inc., which is owned by the Vanguard funds and provides services to them on an at-cost basis.
A majority of Vanguard’s board members are independent, meaning that they have no affiliation with Vanguard or the funds they oversee, apart from the sizable personal investments they have made as private individuals. The independent board members have distinguished backgrounds in business, academia, and public service. Each of the trustees and executive officers oversees 178 Vanguard funds.
The following table provides information for each trustee and executive officer of the fund. More information about the trustees is in the Statement of Additional Information, which can be obtained, without charge, by contacting Vanguard at 800-662-7447, or online at vanguard.com.
| |
| Interested Trustee1 | Amy Gutmann |
| | Born 1949. Trustee Since June 2006. Principal |
| F. William McNabb III | Occupation(s) During the Past Five Years: President |
| Born 1957. Trustee Since July 2009. Chairman of the | of the University of Pennsylvania; Christopher H. |
| Board. Principal Occupation(s) During the Past Five | Browne Distinguished Professor of Political Science |
| Years: Chairman of the Board of The Vanguard Group, | in the School of Arts and Sciences with secondary |
| Inc., and of each of the investment companies served | appointments at the Annenberg School for Commu- |
| by The Vanguard Group, since January 2010; Director | nication and the Graduate School of Education |
| of The Vanguard Group since 2008; Chief Executive | of the University of Pennsylvania; Director of |
| Officer and President of The Vanguard Group and of | Carnegie Corporation of New York, Schuylkill River |
| each of the investment companies served by The | Development Corporation, and Greater Philadelphia |
| Vanguard Group since 2008; Director of Vanguard | Chamber of Commerce; Trustee of the National |
| Marketing Corporation; Managing Director of The | Constitution Center; Chair of the Presidential |
| Vanguard Group (1995–2008) . | Commission for the Study of Bioethical Issues. |
| |
| | JoAnn Heffernan Heisen |
| Independent Trustees | Born 1950. Trustee Since July 1998. Principal |
| | Occupation(s) During the Past Five Years: Corporate |
| Emerson U. Fullwood | Vice President and Chief Global Diversity Officer |
| Born 1948. Trustee Since January 2008. Principal | since 2006 (retired 2008) and Member of the |
| Occupation(s) During the Past Five Years: Executive | Executive Committee (retired 2008) of Johnson & |
| Chief Staff and Marketing Officer for North America | Johnson (pharmaceuticals/consumer products); Vice |
| and Corporate Vice President (retired 2008) of Xerox | President and Chief Information Officer of Johnson & |
| Corporation (document management products and | Johnson (1997–2005); Director of the University |
| services); Director of SPX Corporation (multi-industry | Medical Center at Princeton and Women’s Research |
| manufacturing), the United Way of Rochester, | and Education Institute; Member of the Advisory |
| Amerigroup Corporation (managed health care), | Board of the Maxwell School of Citizenship and Public |
| the University of Rochester Medical Center, and | Affairs at Syracuse University. |
| Monroe Community College Foundation. | |
| | F. Joseph Loughrey |
| Rajiv L. Gupta | Born 1949. Trustee Since October 2009. Principal |
| Born 1945. Trustee Since December 2001.2 | Occupation(s) During the Past Five Years: President |
| Principal Occupation(s) During the Past Five Years: | and Chief Operating Officer since 2005 (retired 2009) |
| Chairman and Chief Executive Officer (retired 2009) | and Vice Chairman of the Board (2008–2009) of |
| and President (2006–2008) of Rohm and Haas Co. | Cummins Inc. (industrial machinery); Director of |
| (chemicals); Director of Tyco International, Ltd. | SKF AB (industrial machinery), Hillenbrand, Inc. |
| (diversified manufacturing and services) and Hewlett- | (specialized consumer services), Sauer-Danfoss Inc. |
| Packard Co. (electronic computer manufacturing); | (machinery), the Lumina Foundation for Education, |
| Trustee of The Conference Board; Member of the | and Oxfam America; Chairman of the Advisory |
| Board of Managers of Delphi Automotive LLP | Council for the College of Arts and Letters at the |
| (automotive components) . | University of Notre Dame. |
| | |
| André F. Perold | Kathryn J. Hyatt | |
| Born 1952. Trustee Since December 2004. Principal | Born 1955. Treasurer Since November 2008. Principal |
| Occupation(s) During the Past Five Years: George | Occupation(s) During the Past Five Years: Principal |
| Gund Professor of Finance and Banking at the Harvard | of The Vanguard Group, Inc.; Treasurer of each of |
| Business School; Chair of the Investment Committee | the investment companies served by The Vanguard |
| of HighVista Strategies LLC (private investment firm) . | Group since 2008; Assistant Treasurer of each of the |
| | investment companies served by The Vanguard Group |
| Alfred M. Rankin, Jr. | (1988–2008) . | |
| Born 1941. Trustee Since January 1993. Principal | | |
| Occupation(s) During the Past Five Years: Chairman, | Heidi Stam | |
| President, and Chief Executive Officer of NACCO | Born 1956. Secretary Since July 2005. Principal |
| Industries, Inc. (forklift trucks/housewares/lignite); | Occupation(s) During the Past Five Years: Managing |
| Director of Goodrich Corporation (industrial products/ | Director of The Vanguard Group, Inc., since 2006; |
| aircraft systems and services); Chairman of the | General Counsel of The Vanguard Group since 2005; |
| Federal Reserve Bank of Cleveland; Trustee of The | Secretary of The Vanguard Group and of each of the |
| Cleveland Museum of Art. | investment companies served by The Vanguard Group |
| | since 2005; Director and Senior Vice President of |
| Peter F. Volanakis | Vanguard Marketing Corporation since 2005; |
| Born 1955. Trustee Since July 2009. Principal | Principal of The Vanguard Group (1997–2006). |
| Occupation(s) During the Past Five Years: President | | |
| since 2007 and Chief Operating Officer since 2005 | | |
| of Corning Incorporated (communications equipment); | Vanguard Senior Management Team |
| President of Corning Technologies (2001–2005); | | |
| Director of Corning Incorporated and Dow Corning; | R. Gregory Barton | Michael S. Miller |
| Trustee of the Corning Incorporated Foundation and | Mortimer J. Buckley | James M. Norris |
| the Corning Museum of Glass; Overseer of the | Kathleen C. Gubanich | Glenn W. Reed |
| Amos Tuck School of Business Administration at | Paul A. Heller | George U. Sauter |
| Dartmouth College. | | |
| |
| | Chairman Emeritus and Senior Advisor |
| Executive Officers | | |
| | John J. Brennan | |
| Glenn Booraem | Chairman, 1996–2009 | |
| Born 1967. Controller Since July 2010. Principal | Chief Executive Officer and President, 1996–2008 |
| Occupation(s) During the Past Five Years: Principal | | |
| of The Vanguard Group, Inc.; Controller of each of | | |
| the investment companies served by The Vanguard | Founder | |
| Group since 2010; Assistant Controller of each of | | |
| the investment companies served by The Vanguard | John C. Bogle | |
| Group (2001–2010) . | Chairman and Chief Executive Officer, 1974–1996 |
| |
| Thomas J. Higgins | | |
| Born 1957. Chief Financial Officer Since September | | |
| 2008. Principal Occupation(s) During the Past Five | | |
| Years: Principal of The Vanguard Group, Inc.; Chief | | |
| Financial Officer of each of the investment companies | | |
| served by The Vanguard Group since 2008; Treasurer | | |
| of each of the investment companies served by The | | |
| Vanguard Group (1998–2008) . | | |
1 Mr. McNabb is considered an “interested person,” as defined in the Investment Company Act of 1940, because he is an officer of the Vanguard funds.
2 December 2002 for Vanguard Equity Income Fund, Vanguard Growth Equity Fund, the Vanguard Municipal Bond Funds, and the Vanguard State Tax-Exempt Funds.
|
|
| P.O. Box 2600 |
| Valley Forge, PA 19482-2600 |
Connect with Vanguard® > vanguard.com
| |
| Fund Information > 800-662-7447 | “FTSE®” is a trademark jointly owned by the London |
| Direct Investor Account Services > 800-662-2739 | Stock Exchange plc and The Financial Times Limited |
| Institutional Investor Services > 800-523-1036 | and is used by FTSE International Limited under license. |
| Text Telephone for People | ”All-World” is a trademark of FTSE International |
| With Hearing Impairment > 800-749-7273 | Limited. The FTSE All-World ex US Index is calculated |
| by FTSE International Limited. FTSE International |
| | Limited does not sponsor, endorse, or promote the |
| This material may be used in conjunction | fund; is not in any way connected to it; and does not |
| with the offering of shares of any Vanguard | accept any liability in relation to its issue, operation, |
| fund only if preceded or accompanied by | and trading. |
| the fund’s current prospectus. | |
| |
| All comparative mutual fund data are from Lipper Inc. or | |
| Morningstar, Inc., unless otherwise noted. | |
| |
| You can obtain a free copy of Vanguard’s proxy voting | |
| guidelines by visiting vanguard.com/proxyreporting or by | |
| calling Vanguard at 800-662-2739. The guidelines are | |
| also available from the SEC’s website, sec.gov. In | |
| addition, you may obtain a free report on how your fund | |
| voted the proxies for securities it owned during the 12 | |
| months ended June 30. To get the report, visit either | |
| vanguard.com/proxyreporting or sec.gov. | |
| |
| You can review and copy information about your fund at | |
| the SEC’s Public Reference Room in Washington, D.C. To | |
| find out more about this public service, call the SEC at | |
| 202-551-8090. Information about your fund is also | |
| available on the SEC’s website, and you can receive | |
| copies of this information, for a fee, by sending a | |
| request in either of two ways: via e-mail addressed to | |
| publicinfo@sec.gov or via regular mail addressed to the | |
| Public Reference Section, Securities and Exchange | |
| Commission, Washington, DC 20549-1520. | |
| |
| |
| | © 2010 The Vanguard Group, Inc. |
| | All rights reserved. |
| | Vanguard Marketing Corporation, Distributor. |
| |
| | Q6280 122010 |

|
| Vanguard FTSE International |
| Index Funds Annual Report |
|
| October 31, 2010 |
 |
| |
| FTSE All-World ex-US Index Fund |
| FTSE All-World ex-US Small-Cap Index Fund |
> For the fiscal year ended October 31, 2010, Vanguard FTSE All-World ex-US Index Fund returned about 14%, lagging the broad U.S. stock market’s 19% return. Vanguard FTSE All-World ex-US Small-Cap Index Fund returned about 24%.
> Both funds achieved the objective of tracking their target indexes, before fair-value pricing adjustments.
> As the global economic recovery continued, international small-company stocks held their lead over their large-capitalization counterparts. Emerging markets again outperformed developed markets.
| |
| Contents | |
| Your Fund’s Total Returns. | 1 |
| Chairman’s Letter. | 2 |
| FTSE All-World ex-US Index Fund. | 10 |
| FTSE All-World ex-US Small-Cap Index Fund. | 29 |
| Your Fund’s After-Tax Returns. | 50 |
| About Your Fund’s Expenses. | 51 |
| Glossary. | 53 |
Please note: The opinions expressed in this report are just that—informed opinions. They should not be considered promises or advice. Also, please keep in mind that the information and opinions cover the period through the date on the front of this report. Of course, the risks of investing in your fund are spelled out in the prospectus.
See the Glossary for definitions of investment terms used in this report.
Cover photograph: Jean Maher.
| |
| Your Fund’s Total Returns | |
| |
| |
| |
| |
| Fiscal Year Ended October 31, 2010 | |
| | Total |
| | Returns |
| Vanguard FTSE All-World ex-US Index Fund | |
| Investor Shares | 13.94% |
| Institutional Shares | 14.15 |
| ETF Shares | |
| Market Price | 14.56 |
| Net Asset Value | 14.07 |
| FTSE All-World ex US Index | 13.05 |
| International Funds Average | 12.88 |
| International Funds Average: Derived from data provided by Lipper Inc. | |
| Vanguard FTSE All-World ex-US Small-Cap Index Fund | |
| Investor Shares | 23.90% |
| Institutional Shares | 24.21 |
| ETF Shares | |
| Market Price | 25.13 |
| Net Asset Value | 24.17 |
| FTSE Global Small Cap ex US Index | 23.10 |
| International Small-Cap Funds Average | 21.54 |
| International Small-Cap Funds Average: Derived from data provided by Lipper Inc. | |
Institutional Shares are available to certain institutional investors who meet specific administrative, service, and account-size criteria. The Vanguard ETF® Shares shown are traded on the NYSE Arca exchange and are available only through brokers. The table provides ETF returns based on both the NYSE Arca market price and the net asset value for a share. U.S. Pat. No. 6,879,964 B2; 7,337,138.
For the ETF Shares, the market price is determined by the midpoint of the bid-offer spread as of the closing time of the New York Stock Exchange (generally 4 p.m., Eastern time). The net asset value is also determined as of the NYSE closing time. For more information about how the ETF Shares' market prices have compared with their net asset value, visit vanguard.com, select your ETF, and then select the Price and Performance tab. The ETF premium/discount analysis there shows the percentages of days on which the ETF Shares' market price was above or below the NAV.
1

Chairman’s Letter
Dear Shareholder,
Despite intermittent setbacks earlier in the period, strong returns in September and October generally helped stock markets outside the United States post double-digit gains for the fiscal year ended October 31, 2010.
Vanguard FTSE All-World ex-US Index Fund—which provides broad exposure to non-U.S. large- and medium-sized companies—returned about 14%, ahead of the average return of international peer funds but behind the broad U.S. stock market’s return of about 19%. Its small-company complement, Vanguard FTSE All-World ex-US Small-Cap Index Fund, returned about 24%, more than 2 percentage points ahead of the average return of its international small-cap peers. We expect the fund to distribute a small capital gain at the end of 2010.
Both funds accomplished their objective of capturing the returns of their respective target indexes. However, because of temporary price differences arising from fair-value pricing policies required by the Securities and Exchange Commission (please see the text box on page 6), the funds’ reported returns diverged from their benchmarks’ results.
2
Please note that in October we announced plans to offer Institutional Plus Shares of Vanguard FTSE All-World ex-US Index Fund; these shares, which require a minimum initial investment of $100 million, are expected to be available in December.
Also, each fund’s Statement of Net Assets has been abbreviated to include its 50 largest holdings and any other holdings of issuers that represent 1% or more of fund assets. The shorter list helps us reduce printing and postage costs. A complete list of your fund’s securities is available on our website at vanguard.com.
Stock market performance was better than it felt
Global stock prices rallied at the start of the period, but struggled through the spring and summer, weighed down by Europe’s sovereign debt crisis and the slow pace of economic recovery in the United States. In the fiscal year’s final months, the mood turned. Stock prices climbed on continued strength in corporate earnings. In the United States, stocks also seemed to get a boost from the Federal Reserve Board’s hints that it would try to stimulate the economy with a second round of U.S. Treasury bond purchases. (In early November, the Fed announced that it would buy as much as $600 billion in Treasuries over the next several months.)
| | | |
| Market Barometer | | | |
| |
| | | Average Annual Total Returns |
| | | Periods Ended October 31, 2010 |
| | One | Three | Five |
| | Year | Years | Years |
| Stocks | | | |
| Russell 1000 Index (Large-caps) | 17.67% | -6.14% | 1.99% |
| Russell 2000 Index (Small-caps) | 26.58 | -3.91 | 3.07 |
| Dow Jones U.S. Total Stock Market Index | 19.04 | -5.55 | 2.52 |
| MSCI All Country World Index ex USA (International) | 13.08 | -7.62 | 6.21 |
| |
| Bonds | | | |
| Barclays Capital U.S. Aggregate Bond Index (Broad | | | |
| taxable market) | 8.01% | 7.23% | 6.45% |
| Barclays Capital Municipal Bond Index (Broad | | | |
| tax-exempt market) | 7.78 | 5.79 | 5.20 |
| Citigroup Three-Month U.S. Treasury Bill Index | 0.12 | 0.89 | 2.41 |
| |
| CPI | | | |
| Consumer Price Index | 1.17% | 1.54% | 1.89% |
3
For the 12 months, the broad U.S. stock market returned about 19%, a performance that was better than it felt in a year of ups and downs. Small-capitalization stocks did even better. International stocks returned about 13% on the strength of a powerful rally in emerging markets and solid single-digit gains in developed markets in Europe and the Pacific region. Large currency swings played a role in international returns for U.S.-based investors.
Despite shrinking yields, bonds attracted investors
Although fixed income yields have fallen to generational lows, investors continued to bid up bond prices. The broad U.S. bond market produced a 12-month return of about 8% as the yield of the 10-year U.S. Treasury note fell from 3.39% at the start of the period to 2.61% at the close. Tax-exempt municipal bonds also rallied. Bond prices and yields move in opposite directions, of course, so abundant returns built on rising prices could mean leaner pickings in the years ahead.
The yields of money market securities hovered near 0%, consistent with the Federal Reserve Board’s target for short-term rates. While the Fed has kept target interest rates low to stimulate the economy, rates have risen elsewhere. For example, in October, China’s central bank raised interest rates for the first time in three years, while rates were lifted
Expense Ratios
Your Fund Compared With Its Peer Group
| | | | |
| | Investor | Institutional | ETF | Peer Group |
| | Shares | Shares | Shares | Average |
| FTSE All-World ex-US Index Fund | 0.40% | 0.15% | 0.25% | 1.44% |
| FTSE All-World ex-US Small-Cap Index | | | | |
| Fund | 0.63 | 0.37 | 0.40 | 1.60 |
The fund expense ratios shown are from the prospectus dated February 26, 2010, and represent estimated costs for the current fiscal year. For the fiscal year ended October 31, 2010, the funds’ expense ratios were: for the FTSE All-World ex-US Index Fund, 0.35% for Investor Shares, 0.15% for Institutional Shares, and 0.22% for ETF Shares; and for the FTSE All-World ex-US Small-Cap Index Fund, 0.55% for Investor Shares, 0.30% for Institutional Shares, and 0.33% for ETF Shares. The peer-group expense ratios are derived from data provided by Lipper Inc. and capture information through year-end 2009.
Peer groups: For the FTSE All-World ex-US Index Fund, International Funds; and for the FTSE All-World ex-US Small-Cap Index Fund, International Small-Cap Funds.
4
several times in Australia and India. All three economies have been growing faster than the U.S. economy.
Emerging markets bested most developed countries again
Taking a bird’s-eye view, emerging markets again broadly outperformed developed markets for the period, although returns came back down to earth from their dramatic rebound a year ago. Emerging markets were among the best performers in both funds, returning about 35% for Vanguard FTSE All-World ex-US Small-Cap Index Fund and about 24% for its large- and mid-cap counterpart. In part, this reflects the reality that developing nations are often a step removed from the disruptions—such as Europe’s fiscal woes—that affect investors’ perceptions of major industrialized countries. Developed markets in Europe and the Pacific Rim lagged, but Canadian small-cap stocks had an exceptional return of more than 40%, more than double the returns of that country’s large-and mid-cap stocks.
In Vanguard FTSE All-World ex-US Index Fund, emerging markets contributed the most to total return even though they represented only about one-quarter of the fund’s total market value. Some of the best results came from smaller markets in Latin America, while powerhouses India (+36%), Brazil (+15%), and China (+13%) made strong contributions. Even as its government applied the brakes to try to manage inflation, China reached a milestone:
Total Returns
Inception Through October 31, 2010
| |
| | Average |
| | Annual Return |
| FTSE All-World ex-US Index Fund Investor Shares (Returns since inception: 3/8/2007) | -0.84% |
| FTSE All-World ex US Index | -0.23 |
| International Funds Average | -3.19 |
| International Funds Average: Derived from data provided by Lipper Inc. | |
The figures shown represent past performance, which is not a guarantee of future results. (Current performance may be lower or higher than the performance data cited. For performance data current to the most recent month-end, visit our website at vanguard.com/performance.) Note, too, that both investment returns and principal value can fluctuate widely, so an investor’s shares, when sold, could be worth more or less than their original cost.
5
|
|
|
| A note on fair-value pricing |
| The reported return of a fund that |
| tracks an index sometimes may |
| diverge from the index’s return a bit |
| more than would be expected. This |
| may be the result of a fair-value |
| pricing adjustment. |
| |
| These adjustments, which are |
| required by the Securities and |
| Exchange Commission, address |
| pricing discrepancies that may arise |
| because of time-zone differences |
| among global stock markets. Foreign |
| stocks may trade on exchanges that |
| close many hours before a fund’s |
| closing share price is calculated in the |
| United States, generally at 4 p.m., |
| Eastern time. In the hours between |
| the foreign close and the U.S. close, |
| the value of these foreign securities |
| may change—because of company- |
| specific announcements or market- |
| wide developments, for example. |
| Such price changes are not immed- |
| iately reflected in international |
| index values. |
| |
| Fair-value pricing takes such changes |
| into account in calculating the fund’s |
| daily net asset value, thus ensuring |
| that the NAV doesn’t include “stale” |
| prices. The result can be a temporary |
| divergence between the return of |
| the fund and that of its benchmark |
| index—a difference that usually |
| corrects itself when the foreign |
| markets reopen. |
Reported gross domestic product for the second calendar quarter showed that the country had surpassed Japan to become the world’s second-largest economy.
During the period, investors began to regain confidence in Europe—which represented about 45% of the large- and mid-cap fund’s market value—after several steps (including unpopular cuts in public sector payrolls and services) were taken to help regain fiscal stability. Scandinavian economies, more insulated from the market turmoil, had some of the best returns. Still, the United Kingdom, Europe’s largest market, gained approximately 13%. U.K. economic growth was stronger than expected in the third calendar quarter, and in October the recently elected government announced dramatic spending cuts. In contrast, peripheral countries that had become the center of the debt-default storm finished the year in the red; Greece was the outlier, losing more than half of its market value.
For U.S.-based investors, currency effects masked the strength of some European markets. During the height of Europe’s fiscal uncertainty, the U.S. dollar appreciated significantly against the euro and the British pound. Although these currencies recovered somewhat later in the year, their relative weakness trimmed European returns when translated into U.S. dollars.
Pacific Rim returns differed from Europe’s in two respects: Results weakened in the second half, and currency translation worked to the advantage of U.S. investors as the Australian dollar and Japanese yen
6
reached highs not seen for many years. Singapore and Hong Kong eclipsed the dollar-based returns of the region’s largest markets, Australia (+13%) and Japan (+4%).
Many of the same market and regional dynamics were reflected in Vanguard FTSE All-World ex-US Small-Cap Index Fund. However, this fund earned significantly higher returns in emerging markets as well as in the developed world except the Pacific Rim. Small-cap stocks in Brazil and China, for example, advanced more than 58% and 29%, respectively—well ahead of their larger brethren. Also, Canada represented a larger slice (about 15%, on average) of the small-cap fund; many of the fund’s ten largest holdings are Canadian energy and mining companies with far-flung operations in remote corners of the world. Propelled by rising commodity prices and strong demand, especially from resource-hungry China, the stock prices of some of these companies more than doubled.
Sectors sensitive to the economy delivered winning performances
In both funds, the materials, consumer discretionary, and industrial sectors had some of the highest returns for the fiscal year. The fortunes of companies in these sectors tend to be more exposed to the ups and downs of the business cycle, and amid a generally upward trend they fared well. Together, these three sectors contributed about half of the total return of Vanguard FTSE All-World ex-US Index Fund and almost 60% of the return of the small-cap fund. Financials were among the weaker performers, but all sectors posted gains.
Spread your nest egg across multiple baskets
Since late 2007, stocks have taken investors on a roller-coaster ride with painful losses and soaring gains, especially in emerging markets. Much of the time, it appeared that “news” traveled quickly around the globe, leading markets to rise and fall together—as was the case during the Greek sovereign debt crisis. But when global financial crises subside, we can expect the economic and financial performance of various countries to differ. We may be seeing some signs of divergence. For example, while U.S. economic growth has been tepid, Britain’s economy has grown faster, and China has achieved double-digit growth rates.
7
Vanguard research has shown that, over longer time periods, a portfolio that included both U.S. and non-U.S. stocks would have experienced lower average volatility than an all-U.S. portfolio. While this long-term risk-reduction benefit may not be as visible to you as other measures, it is no less real. A word of caution, however, about the allure of emerging markets: Don’t assume that strong economic growth will lead to exceptional stock returns.
Of course, when it comes to deciding how much of your equity portfolio to invest outside the United States, there is no magic formula. As with other portfolio decisions you make, your allocation to international stocks should be based on your investment goals, time horizon, and tolerance for risk. Vanguard research suggests that a typical U.S. investor would benefit from allocating about 20%–40% of an equity portfolio to non-U.S. stocks.
As part of a well-balanced portfolio that includes U.S. stock, bond, and money market funds, Vanguard FTSE All-World ex-US Index Fund and Vanguard FTSE All-World ex-US Small-Cap Index Fund can provide an efficient, low-cost way for you to gain exposure to growth opportunities outside the United States.
As always, thank you for entrusting your assets to Vanguard.
Sincerely,

F. William McNabb III
Chairman and Chief Executive Officer
November 16, 2010
8
Your Fund’s Performance at a Glance
October 31, 2009, Through October 31, 2010
| | | | |
| | | | Distributions Per Share |
| | Starting | Ending | Income | Capital |
| | Share Price | Share Price | Dividends | Gains |
| Vanguard FTSE All-World ex-US Index Fund | | | | |
| Investor Shares | $16.48 | $18.43 | $0.321 | $0.000 |
| Institutional Shares | 82.71 | 92.50 | 1.758 | 0.000 |
| ETF Shares | 41.95 | 46.92 | 0.863 | 0.000 |
| Vanguard FTSE All-World ex-US Small-Cap | | | | |
| Index Fund | | | | |
| Investor Shares | $29.83 | $36.34 | $0.314 | $0.209 |
| Institutional Shares | 149.40 | 182.36 | 1.655 | 1.046 |
| ETF Shares | 78.21 | 95.38 | 0.917 | 0.547 |
9
FTSE All-World ex-US Index Fund
Fund Profile
As of October 31, 2010
| | | |
| Share-Class Characteristics | |
| |
| | Investor | Institutional | ETF |
| | Shares | Shares | Shares |
| Ticker Symbol | VFWIX | VFWSX | VEU |
| Expense Ratio1 | 0.40% | 0.15% | 0.25% |
| | |
| Portfolio Characteristics | | |
| | | FTSE |
| | | All-World |
| | Fund | ex US Index |
| Number of Stocks | 2,252 | 2,183 |
| Median Market Cap | $28.9B | $29.0B |
| Price/Earnings Ratio | 16.3x | 16.1x |
| Price/Book Ratio | 1.7x | 1.7x |
| Return on Equity | 18.3% | 18.2% |
| Earnings Growth Rate | 4.6% | 4.6% |
| Dividend Yield | 2.7% | 2.8% |
| Turnover Rate | 6% | — |
| Short-Term Reserves | 0.1% | — |
| | |
| Sector Diversification (% of equity exposure) |
| | | FTSE |
| | | All-World |
| | Fund | ex US Index |
| Consumer Discretionary | 9.0% | 9.1% |
| Consumer Staples | 9.0 | 9.0 |
| Energy | 10.3 | 10.3 |
| Financials | 25.7 | 25.6 |
| Health Care | 5.8 | 5.8 |
| Industrials | 11.0 | 11.0 |
| Information Technology | 6.2 | 6.2 |
| Materials | 12.3 | 12.2 |
| Telecommunication | | |
| Services | 6.1 | 6.1 |
| Utilities | 4.6 | 4.7 |
| |
| Volatility Measures | |
| | FTSE |
| | All-World |
| | ex US Index |
| R-Squared | 0.98 |
| Beta | 1.02 |
These measures show the degree and timing of the fund’s fluctuations compared with the index over 36 months.
| | |
| Ten Largest Holdings (% of total net assets) |
| BHP Billiton Ltd. | Diversified Metals | |
| | & Mining | 1.3% |
| Royal Dutch Shell plc | Integrated Oil & | |
| | Gas | 1.2 |
| Nestle SA | Packaged Foods & | |
| | Meats | 1.1 |
| HSBC Holdings plc | Diversified Banks | 1.1 |
| Vodafone Group plc | Wireless | |
| | Telecommunication | |
| | Services | 0.9 |
| Novartis AG | Pharmaceuticals | 0.8 |
| BP plc | Integrated Oil & | |
| | Gas | 0.8 |
| Telefonica SA | Integrated | |
| | Telecommunication | |
| | Services | 0.7 |
| Total SA | Integrated Oil & | |
| | Gas | 0.7 |
| Banco Santander SA | Diversified Banks | 0.6 |
| Top Ten | | 9.2% |
The holdings listed exclude any temporary cash investments and equity index products.
Allocation by Region (% of portfolio)

1 The expense ratios shown are from the prospectus dated February 26, 2010, and represent estimated costs for the current fiscal year. For the fiscal year ended October 31, 2010, the expense ratios were 0.35% for Investor Shares, 0.15% for Institutional Shares, and 0.22% for ETF Shares.
10
FTSE All-World ex-US Index Fund
| | |
| Market Diversification (% of equity exposure) |
| | | FTSE |
| | | All-World |
| | | ex US |
| | Fund | Index |
| Europe | | |
| United Kingdom | 14.1% | 14.5% |
| France | 7.6 | 7.4 |
| Germany | 5.6 | 5.6 |
| Switzerland | 5.1 | 5.1 |
| Spain | 2.8 | 2.8 |
| Italy | 2.2 | 2.2 |
| Sweden | 2.1 | 2.1 |
| Netherlands | 1.7 | 1.9 |
| Other | 3.8 | 3.7 |
| Subtotal | 45.0% | 45.3% |
| Pacific | | |
| Japan | 13.2% | 13.2% |
| Australia | 5.7 | 5.7 |
| Hong Kong | 3.1 | 3.1 |
| Singapore | 1.3 | 1.4 |
| Other | 0.1 | 0.1 |
| Subtotal | 23.4% | 23.5% |
| Emerging Markets | | |
| China | 3.8% | 3.7% |
| Brazil | 4.2 | 4.2 |
| South Korea | 3.4 | 3.4 |
| India | 2.6 | 2.6 |
| Taiwan | 2.6 | 2.6 |
| South Africa | 2.0 | 2.0 |
| Russia | 1.6 | 1.6 |
| Mexico | 1.1 | 1.2 |
| Other | 3.7 | 3.3 |
| Subtotal | 25.0% | 24.6% |
| Middle East | 0.6% | 0.5% |
| North America | | |
| Canada | 6.0% | 6.1% |
The country classifications for the fund in this table and those in the Statement of Net Assets (SNA) differ slightly. The SNA is based on the MSCI classifications used in our financial reporting system, while the table reflects the FTSE classifications used in the index. The discrepancies largely reflect differences in the way FTSE and MSCI classify Hong Kong-listed stocks. There is no material difference between the fund's economic exposures and those of the benchmark.
11
FTSE All-World ex-US Index Fund
Performance Summary
All of the returns in this report represent past performance, which is not a guarantee of future results that may be achieved by the fund. (Current performance may be lower or higher than the performance data cited. For performance data current to the most recent month-end, visit our website at vanguard.com/performance.) Note, too, that both investment returns and principal value can fluctuate widely, so an investor’s shares, when sold, could be worth more or less than their original cost. The returns shown do not reflect taxes that a shareholder would pay on fund distributions or on the sale of fund shares.
Cumulative Performance: March 8, 2007, Through October 31, 2010
Initial Investment of $10,000
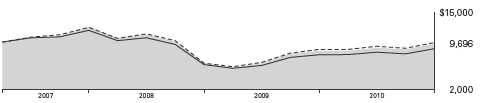
| | | |
| | Average Annual Total Returns | |
| | Periods Ended October 31, 2010 | |
| | | Since | Final Value |
| | One | Inception | of a $10,000 |
| | Year | (3/8/2007) | Investment |
| FTSE All-World ex-US Index Fund | | | |
| Investor Shares | 13.94% | -0.84% | $9,696 |
| FTSE All-World ex US Index | 13.05 | -0.23 | 9,917 |
| International Funds Average | 12.88 | -3.19 | 8,884 |
International Funds Average: Derived from data provided by Lipper Inc.
"Since Inception" performance is calculated from the Investor Shares’ inception date for both the fund and its comparative standards.
| | | |
| | | Since | Final Value |
| | One | Inception | of a $5,000,000 |
| | Year | (4/30/2007) | Investment |
| FTSE All-World ex-US Index Fund | | | |
| Institutional Shares | 14.15% | -2.61% | $4,556,807 |
| FTSE All-World ex US Index | 13.05 | -2.50 | 4,575,906 |
"Since Inception" performance is calculated from the Institutional Shares’ inception date for both the fund and its comparative standards.
Vanguard fund returns do not reflect the 2% fee on redemptions of shares held for less than two months.
See Financial Highlights for dividend and capital gains information.
12
| | | |
| FTSE All-World ex-US Index Fund | | | |
| |
| |
| |
| |
| | Average Annual Total Returns | |
| | Periods Ended October 31, 2010 | |
| | | Since | Final Value |
| | One | Inception | of a $10,000 |
| | Year | (3/2/2007) | Investment |
| FTSE All-World ex-US Index Fund | | | |
| ETF Shares Net Asset Value | 14.07% | -0.16% | $9,943 |
| FTSE All-World ex US Index | 13.05 | 0.01 | 10,005 |
| "Since Inception" performance is calculated from the ETF Shares’ inception date for both the fund and its comparative standard. |
| | |
| Cumulative Returns of ETF Shares: March 2, 2007, Through October 31, 2010 | |
| | | Since |
| | One | Inception |
| | Year | (3/2/2007) |
| FTSE All-World ex-US Index Fund | | |
| ETF Shares Market Price | 14.56% | -0.41% |
| FTSE All-World ex-US Index Fund | | |
| ETF Shares Net Asset Value | 14.07 | -0.57 |
| FTSE All-World ex US Index | 13.05 | 0.05 |
| "Since Inception" performance is calculated from the ETF Shares’ inception date for both the fund and its comparative standard. | |
Fiscal-Year Total Returns (%): March 8, 2007, Through October 31, 2010
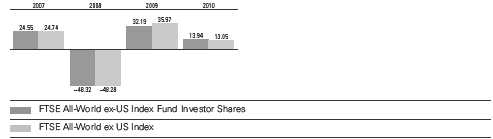
Index returns are adjusted for withholding taxes applicable to U.S.-based mutual funds organized as Delaware statutory trusts.
Vanguard fund returns do not reflect the 2% fee on redemptions of shares held for less than two months.
13
FTSE All-World ex-US Index Fund
Average Annual Total Returns: Periods Ended September 30, 2010
This table presents average annual total returns through the latest calendar quarter—rather than through the end of the fiscal period. Securities and Exchange Commission rules require that we provide this information.
| | | |
| | Inception | One | Since |
| | Date | Year | Inception |
| Investor Shares | 3/8/2007 | 7.37% | -1.81% |
| Institutional Shares | 4/30/2007 | 7.60 | -3.65 |
| ETF Shares | 3/2/2007 | | |
| Market Price | | 7.19 | -1.10 |
| Net Asset Value | | 7.51 | -1.12 |
Vanguard fund returns do not reflect the 2% fee on redemptions of shares held for less than two months.
14
FTSE All-World ex-US Index Fund
Financial Statements
Statement of Net Assets—Investments Summary
As of October 31, 2010
This Statement summarizes the fund’s holdings by asset type. Details are reported for each of the fund’s 50 largest individual holdings and for investments that, in total for any issuer, represent more than 1% of the fund’s net assets. The total value of smaller holdings is reported as a single amount within each category.
The fund reports a complete list of its holdings in regulatory filings four times in each fiscal year, at the quarter-ends. For the second and fourth fiscal quarters, the complete listing of the fund’s holdings is available electronically on vanguard.com and on the Securities and Exchange Commission’s website (sec.gov), or you can have it mailed to you without charge by calling 800-662-7447. For the first and third fiscal quarters, the fund files the lists with the SEC on Form N-Q. Shareholders can look up the fund’s Forms N-Q on the SEC’s website. Forms N-Q may also be reviewed and copied at the SEC’s Public Reference Room (see the back cover of this report for further information).
| | | |
| | | Market | Percentage |
| | | Value | of Net |
| | Shares | ($000) | Assets |
| Common Stocks | | | |
| Australia | | | |
| BHP Billiton Ltd. | 2,381,208 | 98,395 | 0.8% |
| Commonwealth Bank of Australia | 1,088,579 | 52,332 | 0.5% |
| Westpac Banking Corp. | 2,112,273 | 47,034 | 0.4% |
| Australia & New Zealand Banking Group Ltd. | 1,813,794 | 44,251 | 0.4% |
| National Australia Bank Ltd. | 1,502,040 | 37,594 | 0.3% |
| Australia—Other † | | 404,208 | 3.4% |
| | | 683,814 | 5.8% |
| |
| Austria † | | 30,152 | 0.3% |
| |
| Belgium † | | 78,701 | 0.7% |
| |
| Brazil | | | |
| Itau Unibanco Holding SA ADR | 1,497,577 | 36,780 | 0.3% |
| Brazil—Other † | | 461,918 | 3.9% |
| | | 498,698 | 4.2% |
| Canada | | | |
| ^ Royal Bank of Canada | 1,009,491 | 53,835 | 0.4% |
| Toronto-Dominion Bank | 619,514 | 44,615 | 0.4% |
| Bank of Nova Scotia | 728,966 | 39,075 | 0.3% |
| Canada—Other † | | 578,480 | 4.9% |
| | | 716,005 | 6.0% |
| |
| Chile † | | 54,003 | 0.5% |
15
| | | |
| FTSE All-World ex-US Index Fund | | | |
| |
| |
| |
| | | Market | Percentage |
| | | Value | of Net |
| | Shares | ($000) | Assets |
| China | | | |
| China Construction Bank Corp. | 47,856,770 | 45,751 | 0.4% |
| China Mobile Ltd. | 4,263,351 | 43,539 | 0.4% |
| China—Other † | | 447,052 | 3.7% |
| | | 536,342 | 4.5% |
| |
| Colombia † | | 26,739 | 0.2% |
| |
| Czech Republic † | | 11,732 | 0.1% |
| |
| Denmark † | | 90,624 | 0.8% |
| |
| Egypt † | | 16,854 | 0.1% |
| |
| Finland † | | 86,238 | 0.7% |
| |
| France | | | |
| Total SA | 1,584,607 | 86,257 | 0.7% |
| Sanofi-Aventis SA | 922,804 | 64,653 | 0.5% |
| BNP Paribas | 739,618 | 54,100 | 0.5% |
| ^ GDF Suez | 1,180,126 | 47,155 | 0.4% |
| LVMH Moet Hennessy Louis Vuitton SA | 260,968 | 40,944 | 0.3% |
| France—Other † | | 613,015 | 5.2% |
| | | 906,124 | 7.6% |
| Germany | | | |
| Siemens AG | 648,882 | 74,047 | 0.6% |
| * Daimler AG | 753,262 | 49,606 | 0.4% |
| BASF SE | 655,381 | 47,654 | 0.4% |
| E.ON AG | 1,420,812 | 44,472 | 0.4% |
| Bayer AG | 587,123 | 43,792 | 0.4% |
| Allianz SE | 319,010 | 39,949 | 0.3% |
| Deutsche Bank AG | 659,757 | 38,006 | 0.3% |
| Germany—Other † | | 326,227 | 2.8% |
| | | 663,753 | 5.6% |
| |
| Greece † | | 21,884 | 0.2% |
| |
| Hong Kong † | | 285,135 | 2.4% |
| |
| Hungary † | | 15,074 | 0.1% |
| |
| 1India † | | 311,357 | 2.6% |
| |
| Indonesia † | | 66,692 | 0.6% |
| |
| Ireland † | | 19,576 | 0.2% |
| |
| Israel † | | 62,474 | 0.5% |
16
| | | |
| FTSE All-World ex-US Index Fund | | | |
| |
| |
| | | Market | Percentage |
| | | Value | of Net |
| | Shares | ($000) | Assets |
| Italy | | | |
| ENI SPA | 1,963,559 | 44,214 | 0.4% |
| Italy—Other † | | 221,518 | 1.8% |
| | | 265,732 | 2.2% |
| Japan | | | |
| Toyota Motor Corp. | 1,835,968 | 65,030 | 0.5% |
| Mitsubishi UFJ Financial Group Inc. | 10,041,337 | 46,602 | 0.4% |
| Canon Inc. | 945,079 | 43,505 | 0.4% |
| Japan—Other † | | 1,415,093 | 11.9% |
| | | 1,570,230 | 13.2% |
| |
| Luxembourg † | | 928 | 0.0% |
| |
| Malaysia † | | 105,486 | 0.9% |
| |
| Mexico | | | |
| America Movil SAB de CV | 15,483,253 | 44,388 | 0.4% |
| Mexico—Other † | | 92,413 | 0.8% |
| | | 136,801 | 1.2% |
| |
| Morocco † | | 2,978 | 0.0% |
| |
| Netherlands † | | 200,099 | 1.7% |
| |
| New Zealand † | | 10,754 | 0.1% |
| |
| Norway † | | 74,047 | 0.6% |
| |
| Peru † | | 13,737 | 0.1% |
| |
| Philippines † | | 12,760 | 0.1% |
| |
| Poland † | | 35,515 | 0.3% |
| |
| Portugal † | | 31,076 | 0.3% |
| |
| 1Russia † | | 194,207 | 1.6% |
| |
| Singapore † | | 148,906 | 1.3% |
| |
| South Africa † | | 239,827 | 2.0% |
| |
| South Korea | | | |
| 1 Samsung Electronics Co. Ltd. GDR | 135,091 | 45,090 | 0.4% |
| South Korea—Other † | | 359,022 | 3.0% |
| | | 404,112 | 3.4% |
| Spain | | | |
| ^ Telefonica SA | 3,257,976 | 88,039 | 0.8% |
| Banco Santander SA | 5,808,375 | 74,554 | 0.6% |
| Spain—Other † | | 169,755 | 1.4% |
| | | 332,348 | 2.8% |
17
| | | | |
| FTSE All-World ex-US Index Fund | | | | |
| |
| |
| |
| | | | Market | Percentage |
| | | | Value | of Net |
| | | Shares | ($000) | Assets |
| Sweden † | | | 252,413 | 2.1% |
| |
| Switzerland | | | | |
| Nestle SA | | 2,458,488 | 134,662 | 1.1% |
| Novartis AG | | 1,605,858 | 93,048 | 0.8% |
| Roche Holding AG | | 498,653 | 73,229 | 0.6% |
| * UBS AG | | 2,692,577 | 45,740 | 0.4% |
| Switzerland—Other † | | | 261,186 | 2.2% |
| | | | 607,865 | 5.1% |
| |
| Taiwan † | | | 307,826 | 2.6% |
| |
| Thailand † | | | 45,261 | 0.4% |
| |
| Turkey † | | | 45,726 | 0.4% |
| |
| United Kingdom | | | | |
| HSBC Holdings plc | | 12,493,458 | 130,028 | 1.1% |
| Vodafone Group plc | | 37,341,519 | 102,077 | 0.9% |
| BP plc | | 13,369,261 | 90,874 | 0.8% |
| Royal Dutch Shell plc Class A | | 2,517,083 | 81,688 | 0.7% |
| GlaxoSmithKline plc | | 3,718,554 | 72,615 | 0.6% |
| Rio Tinto plc | | 1,084,227 | 70,421 | 0.6% |
| Royal Dutch Shell plc Class B | | 1,926,765 | 61,660 | 0.5% |
| BHP Billiton plc | | 1,565,917 | 55,473 | 0.5% |
| British American Tobacco plc | | 1,416,585 | 53,967 | 0.4% |
| AstraZeneca plc | | 1,023,259 | 51,472 | 0.4% |
| Standard Chartered plc | | 1,655,875 | 47,896 | 0.4% |
| BG Group plc | | 2,391,888 | 46,561 | 0.4% |
| Anglo American plc | | 939,669 | 43,782 | 0.4% |
| Tesco plc | | 5,635,469 | 38,567 | 0.3% |
| Barclays plc | | 8,552,146 | 37,582 | 0.3% |
| United Kingdom—Other † | | | 700,949 | 5.9% |
| | | | 1,685,612 | 14.2% |
| Total Common Stocks (Cost $10,873,406) | | | 11,906,217 | 100.3% |
| |
| | Coupon | | | |
| Temporary Cash Investments | | | | |
| Money Market Fund | | | | |
| 2,3 Vanguard Market Liquidity Fund | 0.237% | 196,751,762 | 196,752 | 1.6% |
| |
| U.S. Government and Agency Obligations † | | | 6,499 | 0.1% |
| Total Temporary Cash Investments (Cost $203,250) | | | 203,251 | 1.7% |
| Total Investments (Cost $11,076,656) | | | 12,109,468 | 102.0% |
| Other Assets and Liabilities | | | | |
| Other Assets | | | 37,903 | 0.3% |
| Liabilities3 | | | (270,850) | (2.3%) |
| | | | (232,947) | (2.0%) |
| Net Assets | | | 11,876,521 | 100.0% |
18
| |
| FTSE All-World ex-US Index Fund | |
| |
| |
| At October 31, 2010, net assets consisted of: | |
| | Amount |
| | ($000) |
| Paid-in Capital | 10,847,574 |
| Undistributed Net Investment Income | 198,157 |
| Accumulated Net Realized Losses | (203,093) |
| Unrealized Appreciation (Depreciation) | |
| Investment Securities | 1,032,812 |
| Foreign Currencies | 1,071 |
| Net Assets | 11,876,521 |
| |
| Investor Shares—Net Assets | |
| Applicable to 79,112,398 outstanding $.001 par value shares of | |
| beneficial interest (unlimited authorization) | 1,458,117 |
| Net Asset Value Per Share—Investor Shares | $18.43 |
| |
| Institutional Shares—Net Assets | |
| Applicable to 44,820,080 outstanding $.001 par value shares of | |
| beneficial interest (unlimited authorization) | 4,145,924 |
| Net Asset Value Per Share—Institutional Shares | $92.50 |
| |
| ETF Shares—Net Assets | |
| Applicable to 133,690,655 outstanding $.001 par value shares of | |
| beneficial interest (unlimited authorization) | 6,272,480 |
| Net Asset Value Per Share—ETF Shares | $46.92 |
See Note A in Notes to Financial Statements.
* Non-income-producing security.
^ Part of security position is on loan to broker-dealers. The total value of securities on loan is $185,816,000.
† Represents the aggregate value, by category, of securities that are not among the 50 largest holdings and, in total for any issuer, represent 1% or less of net assets.
1 Certain of the fund’s securities are exempt from registration under Rule 144A of the Securities Act of 1933. Such securities may be sold in transactions exempt from registration, normally to qualified institutional buyers. At October 31, 2010, the aggregate value of these securities was $61,607,000, representing 0.5% of net assets.
2 Affiliated money market fund available only to Vanguard funds and certain trusts and accounts managed by Vanguard. Rate shown is the 7-day yield.
3 Includes $196,752,000 of collateral received for securities on loan.
ADR—American Depositary Receipt.
GDR—Global Depositary Receipt.
See accompanying Notes, which are an integral part of the Financial Statements.
19
| |
| FTSE All-World ex-US Index Fund | |
| |
| |
| Statement of Operations | |
| |
| | Year Ended |
| | October 31, 2010 |
| | ($000) |
| Investment Income | |
| Income | |
| Dividends1 | 248,429 |
| Interest2 | 57 |
| Security Lending | 6,863 |
| Total Income | 255,349 |
| Expenses | |
| The Vanguard Group—Note B | |
| Investment Advisory Services | 497 |
| Management and Administrative—Investor Shares | 3,151 |
| Management and Administrative—Institutional Shares | 2,524 |
| Management and Administrative—ETF Shares | 8,224 |
| Marketing and Distribution—Investor Shares | 261 |
| Marketing and Distribution—Institutional Shares | 659 |
| Marketing and Distribution—ETF Shares | 1,477 |
| Custodian Fees | 2,428 |
| Auditing Fees | 27 |
| Shareholders’ Reports—Investor Shares | 13 |
| Shareholders’ Reports—Institutional Shares | 3 |
| Shareholders’ Reports—ETF Shares | 223 |
| Trustees’ Fees and Expenses | 13 |
| Total Expenses | 19,500 |
| Net Investment Income | 235,849 |
| Realized Net Gain (Loss) | |
| Investment Securities Sold | (20,634) |
| Foreign Currencies | (1,541) |
| Realized Net Gain (Loss) | (22,175) |
| Change in Unrealized Appreciation (Depreciation) | |
| Investment Securities | 1,072,495 |
| Foreign Currencies | 922 |
| Change in Unrealized Appreciation (Depreciation) | 1,073,417 |
| Net Increase (Decrease) in Net Assets Resulting from Operations | 1,287,091 |
1 Dividends are net of foreign withholding taxes of $17,323,000.
2 Interest income from an affiliated company of the fund was $47,000.
See accompanying Notes, which are an integral part of the Financial Statements.
20
| | |
| FTSE All-World ex-US Index Fund | | |
| |
| |
| Statement of Changes in Net Assets | | |
| |
| | Year Ended October 31, |
| | 2010 | 2009 |
| | ($000) | ($000) |
| Increase (Decrease) in Net Assets | | |
| Operations | | |
| Net Investment Income | 235,849 | 126,540 |
| Realized Net Gain (Loss) | (22,175) | (113,319) |
| Change in Unrealized Appreciation (Depreciation) | 1,073,417 | 1,401,921 |
| Net Increase (Decrease) in Net Assets Resulting from Operations | 1,287,091 | 1,415,142 |
| Distributions | | |
| Net Investment Income | | |
| Investor Shares | (15,131) | (8,060) |
| Institutional Shares | (39,424) | (15,592) |
| ETF Shares | (95,039) | (61,830) |
| Realized Capital Gain | | |
| Investor Shares | — | — |
| Institutional Shares | — | — |
| ETF Shares | ��� | — |
| Total Distributions | (149,594) | (85,482) |
| Capital Share Transactions | | |
| Investor Shares | 586,032 | 299,138 |
| Institutional Shares | 2,117,722 | 834,242 |
| ETF Shares | 1,312,763 | 1,813,836 |
| Net Increase (Decrease) from Capital Share Transactions | 4,016,517 | 2,947,216 |
| Total Increase (Decrease) | 5,154,014 | 4,276,876 |
| Net Assets | | |
| Beginning of Period | 6,722,507 | 2,445,631 |
| End of Period1 | 11,876,521 | 6,722,507 |
1 Net Assets—End of Period includes undistributed net investment income of $198,157,000 and $112,834,000.
See accompanying Notes, which are an integral part of the Financial Statements.
21
| | | | |
| FTSE All-World ex-US Index Fund | | | | |
| |
| |
| Financial Highlights | | | | |
| |
| Investor Shares | | | | |
| | | | | March 8, |
| | | | | 20071 to |
| | Year Ended October 31, | Oct. 31, |
| For a Share Outstanding Throughout Each Period | 2010 | 2009 | 2008 | 2007 |
| Net Asset Value, Beginning of Period | $16.48 | $12.77 | $24.91 | $20.00 |
| Investment Operations | | | | |
| Net Investment Income | .4182 | .3782 | .6372 | .4102 |
| Net Realized and Unrealized Gain (Loss) on Investments | 1.853 | 3.622 | (12.592) | 4.500 |
| Total from Investment Operations | 2.271 | 4.000 | (11.955) | 4.910 |
| Distributions | | | | |
| Dividends from Net Investment Income | (.321) | (.290) | (.185) | — |
| Distributions from Realized Capital Gains | — | — | — | — |
| Total Distributions | (.321) | (.290) | (.185) | — |
| Net Asset Value, End of Period | $18.43 | $16.48 | $12.77 | $24.91 |
| |
| Total Return3 | 13.94% | 32.19% | -48.32% | 24.55% |
| |
| Ratios/Supplemental Data | | | | |
| Net Assets, End of Period (Millions) | $1,458 | $748 | $296 | $213 |
| Ratio of Total Expenses to Average Net Assets | 0.35% | 0.40% | 0.35% | 0.40%4 |
| Ratio of Net Investment Income to Average Net Assets | 2.45% | 2.75% | 3.24% | 2.61%4 |
| Portfolio Turnover Rate5 | 6% | 9% | 7% | 10% |
1 Inception.
2 Calculated based on average shares outstanding.
3 Total returns do not include transaction or account service fees that may have applied in the periods shown. Fund prospectuses provide information about any applicable transaction and account service fees.
4 Annualized.
5 Excludes the value of portfolio securities received or delivered as a result of in-kind purchases or redemptions of the fund’s capital shares, including ETF Creation Units.
See accompanying Notes, which are an integral part of the Financial Statements.
22
| | | | |
| FTSE All-World ex-US Index Fund | | | | |
| |
| |
| Financial Highlights | | | | |
| |
| Institutional Shares | | | | |
| | | | | April 30, |
| | | | | 20071 to |
| | Year Ended October 31, | Oct. 31, |
| For a Share Outstanding Throughout Each Period | 2010 | 2009 | 2008 | 2007 |
| Net Asset Value, Beginning of Period | $82.71 | $64.06 | $124.76 | $107.33 |
| Investment Operations | | | | |
| Net Investment Income | 2.2262 | 2.1012 | 3.3232 | 1.1502 |
| Net Realized and Unrealized Gain (Loss) on Investments | 9.322 | 18.142 | (62.979) | 16.280 |
| Total from Investment Operations | 11.548 | 20.243 | (59.656) | 17.430 |
| Distributions | | | | |
| Dividends from Net Investment Income | (1.758) | (1.593) | (1.044) | — |
| Distributions from Realized Capital Gains | — | — | — | — |
| Total Distributions | (1.758) | (1.593) | (1.044) | — |
| Net Asset Value, End of Period | $92.50 | $82.71 | $64.06 | $124.76 |
| |
| Total Return3 | 14.15% | 32.56% | -48.18% | 16.24% |
| |
| Ratios/Supplemental Data | | | | |
| Net Assets, End of Period (Millions) | $4,146 | $1,608 | $448 | $157 |
| Ratio of Total Expenses to Average Net Assets | 0.15% | 0.15% | 0.10% | 0.15%4 |
| Ratio of Net Investment Income to Average Net Assets | 2.65% | 3.00% | 3.49% | 2.86%4 |
| Portfolio Turnover Rate5 | 6% | 9% | 7% | 10% |
1 Inception.
2 Calculated based on average shares outstanding.
3 Total returns do not include transaction fees that may have applied in the periods shown. Fund prospectuses provide information about any applicable transaction fees.
4 Annualized.
5 Excludes the value of portfolio securities received or delivered as a result of in-kind purchases or redemptions of the fund’s capital shares, including ETF Creation Units.
See accompanying Notes, which are an integral part of the Financial Statements.
23
| | | | |
| FTSE All-World ex-US Index Fund | | | | |
| |
| |
| Financial Highlights | | | | |
| |
| ETF Shares | | | | |
| | | | | March 2, |
| | | | | 20071 to |
| | Year Ended October 31, | Oct. 31, |
| For a Share Outstanding Throughout Each Period | 2010 | 2009 | 2008 | 2007 |
| Net Asset Value, Beginning of Period | $41.95 | $32.50 | $63.32 | $49.80 |
| Investment Operations | | | | |
| Net Investment Income | 1.1182 | 1.0112 | 1.7052 | 1.0302 |
| Net Realized and Unrealized Gain (Loss) on Investments | 4.715 | 9.224 | (32.015) | 12.490 |
| Total from Investment Operations | 5.833 | 10.235 | (30.310) | 13.520 |
| Distributions | | | | |
| Dividends from Net Investment Income | (.863) | (.785) | (.510) | — |
| Distributions from Realized Capital Gains | — | — | — | — |
| Total Distributions | (.863) | (.785) | (.510) | — |
| Net Asset Value, End of Period | $46.92 | $41.95 | $32.50 | $63.32 |
| |
| Total Return | 14.07% | 32.41% | -48.23% | 27.15% |
| |
| Ratios/Supplemental Data | | | | |
| Net Assets, End of Period (Millions) | $6,272 | $4,366 | $1,701 | $1,068 |
| Ratio of Total Expenses to Average Net Assets | 0.22% | 0.25% | 0.20% | 0.25%3 |
| Ratio of Net Investment Income to Average Net Assets | 2.58% | 2.90% | 3.39% | 2.76%3 |
| Portfolio Turnover Rate4 | 6% | 9% | 7% | 10% |
1 Inception.
2 Calculated based on average shares outstanding.
3 Annualized.
4 Excludes the value of portfolio securities received or delivered as a result of in-kind purchases or redemptions of the fund’s capital shares, including ETF Creation Units.
See accompanying Notes, which are an integral part of the Financial Statements.
24
FTSE All-World ex-US Index Fund
Notes to Financial Statements
Vanguard FTSE All-World ex-US Index Fund is registered under the Investment Company Act of 1940 as an open-end investment company, or mutual fund. The fund invests in securities of foreign issuers, which may subject it to investment risks not normally associated with investing in securities of U.S. corporations. The fund offers three classes of shares: Investor Shares, Institutional Shares, and ETF Shares. Investor Shares are available to any investor who meets the fund’s minimum purchase requirements. Institutional Shares are designed for investors who meet certain administrative, service, and account-size criteria. ETF Shares are listed for trading on the NYSE Arca, Inc.; they can be purchased and sold through a broker.
A. The following significant accounting policies conform to generally accepted accounting principles for U.S. mutual funds. The fund consistently follows such policies in preparing its financial statements.
1. Security Valuation: Securities are valued as of the close of trading on the New York Stock Exchange (generally 4 p.m., Eastern time) on the valuation date. Equity securities are valued at the latest quoted sales prices or official closing prices taken from the primary market in which each security trades; such securities not traded on the valuation date are valued at the mean of the latest quoted bid and asked prices. Securities for which market quotations are not readily available, or whose values have been affected by events occurring before the fund’s pricing time but after the close of the securities’ primary markets, are valued at their fair values calculated according to procedures adopted by the board of trustees. These procedures include obtaining quotations from an independent pricing service, monitoring news to identify significant market- or security-specific events, and evaluating changes in the values of foreign market proxies (for example, A DRs, futures contracts, or exchange-traded funds), between the time the foreign markets close and the fund’s pricing time. When fair-value pricing is employed, the prices of securities used by a fund to calculate its net asset value may differ from quoted or published prices for the same securities. Investments in Vanguard Market Liquidity Fund are valued at that fund’s net asset value. Temporary cash investments acquired over 60 days to maturity are valued using the latest bid prices or using valuations based on a matrix system (which considers such factors as security prices, yields, maturities, and ratings), both as furnished by independent pricing services. Other temporary cash investments are valued at amortized cost, which approximates market value.
2. Foreign Currency: Securities and other assets and liabilities denominated in foreign currencies are translated into U.S. dollars using exchange rates obtained from an independent third party as of the fund’s pricing time on the valuation date. Realized gains (losses) and unrealized appreciation (depreciation) on investment securities include the effects of changes in exchange rates since the securities were purchased, combined with the effects of changes in security prices. Fluctuations in the value of other assets and liabilities resulting from changes in exchange rates are recorded as unrealized foreign currency gains (losses) until the assets or liabilities are settled in cash, at which time they are recorded as realized foreign currency gains (losses).
3. Federal Income Taxes: The fund intends to continue to qualify as a regulated investment company and distribute all of its taxable income. Management has analyzed the fund’s tax positions taken for all open federal income tax years (October 31, 2007–2010), and has concluded that no provision for federal income tax is required in the fund’s financial statements.
4. Distributions: Distributions to shareholders are recorded on the ex-dividend date.
25
FTSE All-World ex-US Index Fund
5. Security Lending: The fund may lend its securities to qualified institutional borrowers to earn additional income. Security loans are required to be secured at all times by collateral at least equal to the market value of securities loaned. The fund invests cash collateral received in Vanguard Market Liquidity Fund, and records a liability for the return of the collateral, during the period the securities are on loan. Security lending income represents fees charged to borrowers plus income earned on investing cash collateral, less expenses associated with the loan.
6. Other: Dividend income is recorded on the ex-dividend date. Interest income includes income distributions received from Vanguard Market Liquidity Fund and is accrued daily. Security transactions are accounted for on the date securities are bought or sold. Costs used to determine realized gains (losses) on the sale of investment securities are those of the specific securities sold. Fees assessed on redemptions of capital shares are credited to paid-in capital.
Each class of shares has equal rights as to assets and earnings, except that each class separately bears certain class-specific expenses related to maintenance of shareholder accounts (included in Management and Administrative expenses) and shareholder reporting. Marketing and distribution expenses are allocated to each class of shares based on a method approved by the board of trustees. Income, other non-class-specific expenses, and gains and losses on investments are allocated to each class of shares based on its relative net assets.
B. The Vanguard Group furnishes at cost investment advisory, corporate management, administrative, marketing, and distribution services. The costs of such services are allocated to the fund under methods approved by the board of trustees. The fund has committed to provide up to 0.40% of its net assets in capital contributions to Vanguard. At October 31, 2010, the fund had contributed capital of $2,041,000 to Vanguard (included in Other Assets), representing 0.02% of the fund’s net assets and 0.82% of Vanguard’s capitalization. The fund’s trustees and officers are also directors and officers of Vanguard.
C. Various inputs may be used to determine the value of the fund’s investments. These inputs are summarized in three broad levels for financial statement purposes. The inputs or methodologies used to value securities are not necessarily an indication of the risk associated with investing in those securities.
Level 1—Quoted prices in active markets for identical securities.
Level 2—Other significant observable inputs (including quoted prices for similar securities, interest rates, prepayment speeds, credit risk, etc.).
Level 3—Significant unobservable inputs (including the fund’s own assumptions used to determine the fair value of investments).
The following table summarizes the fund’s investments as of October 31, 2010, based on the inputs used to value them:
| | | |
| | Level 1 | Level 2 | Level 3 |
| Investments | ($000) | ($000) | ($000) |
| Common Stocks—North and South America | 1,445,983 | — | — |
| Common Stocks—Other | 182,158 | 10,277,981 | 95 |
| Temporary Cash Investments | 196,752 | 6,499 | — |
| Total | 1,824,893 | 10,284,480 | 95 |
26
FTSE All-World ex-US Index Fund
The following table summarizes changes in investments valued based on Level 3 inputs during the year ended October 31, 2010:
| |
| | Investments in |
| | Common Stocks—Other |
| Amount Valued Based on Level 3 Inputs | ($000) |
| Balance as of October 31, 2009 | 98 |
| Net Realized Gain (Loss) | (4) |
| Change in Unrealized Appreciation (Depreciation) | 1 |
| Balance as of October 31, 2010 | 95 |
D. Distributions are determined on a tax basis and may differ from net investment income and realized capital gains for financial reporting purposes. Differences may be permanent or temporary. Permanent differences are reclassified among capital accounts in the financial statements to reflect their tax character. Temporary differences arise when certain items of income, expense, gain, or loss are recognized in different periods for financial statement and tax purposes; these differences will reverse at some time in the future. Differences in classification may also result from the treatment of short-term gains as ordinary income for tax purposes.
During the year ended October 31, 2010, the fund realized net foreign currency losses of $1,541,000, which decreased distributable net income for tax purposes; accordingly, such losses have been reclassified from accumulated net realized losses to undistributed net investment income.
Certain of the fund’s investments are in securities considered to be “passive foreign investment companies,” for which any unrealized appreciation and/or realized gains are required to be included in distributable net income for tax purposes. Unrealized appreciation of $8,625,000 on the fund’s passive foreign investment company holdings at October 31, 2009, has been distributed and is reflected in the balance of undistributed net investment income. During the year ended October 31, 2010, the fund realized gains on the sale of passive foreign investment companies of $609,000, which have been included in current and prior periods’ taxable income; accordingly, such gains have been reclassified from accumulated net realized losses to undistributed net investment income. Since October 31, 2009, the fund’s passive foreign investment company holdings have appreciated in value, increasing the amount of taxable income available for distribution as of October 31, 2010, by $11,072,000. Unrealized appreciation on the fund’s passive foreign investment company holdings at October 31, 2010, was $19,697,000.
During the year ended October 31, 2010, the fund realized $8,688,000 of net capital gains resulting from in-kind redemptions—in which shareholders exchanged fund shares for securities held by the fund rather than for cash. Because such gains are not taxable to the fund, and are not distributed to shareholders, they have been reclassified from accumulated net realized losses to paid-in capital.
For tax purposes, at October 31, 2010, the fund had $224,961,000 of ordinary income available for distribution. The fund had available capital loss carryforwards totaling $201,976,000 to offset future net capital gains of $1,431,000 through October 31, 2015, $29,919,000 through October 31, 2016, $138,066,000 through October 31, 2017, and $32,560,000 through October 31, 2018.
27
FTSE All-World ex-US Index Fund
At October 31, 2010, the cost of investment securities for tax purposes was $11,097,470,000. Net unrealized appreciation of investment securities for tax purposes was $1,011,998,000, consisting of unrealized gains of $1,645,686,000 on securities that had risen in value since their purchase and $633,688,000 in unrealized losses on securities that had fallen in value since their purchase.
E. During the year ended October 31, 2010, the fund purchased $4,678,745,000 of investment securities and sold $522,099,000 of investment securities, other than temporary cash investments.
F. Capital share transactions for each class of shares were:
| | | | | |
| | | | |
| | | | Year Ended October 31, |
| | | 2010 | | | 2009 |
| | Amount | Shares | Amount | Shares |
| | ($000) | (000) | ($000) | (000) |
| Investor Shares | | | | |
| Issued | 839,537 | 48,812 | 453,982 | 34,011 |
| Issued in Lieu of Cash Distributions | 12,188 | 717 | 6,512 | 547 |
| Redeemed1 | (265,693) | (15,795) | (161,356) | (12,363) |
| Net Increase (Decrease)—Investor Shares | 586,032 | 33,734 | 299,138 | 22,195 |
| Institutional Shares | | | | |
| Issued | 2,540,049 | 30,296 | 1,042,403 | 15,798 |
| Issued in Lieu of Cash Distributions | 32,086 | 377 | 11,869 | 199 |
| Redeemed1 | (454,413) | (5,300) | (220,030) | (3,548) |
| Net Increase (Decrease)—Institutional Shares | 2,117,722 | 25,373 | 834,242 | 12,449 |
| ETF Shares | | | | |
| Issued | 1,337,408 | 30,206 | 1,968,655 | 56,827 |
| Issued in Lieu of Cash Distributions | — | — | — | — |
| Redeemed1 | (24,645) | (600) | (154,819) | (5,100) |
| Net Increase (Decrease)—ETF Shares | 1,312,763 | 29,606 | 1,813,836 | 51,727 |
| 1 Net of redemption fees for fiscal 2010 and 2009 of $131,000 and $154,000, respectively (fund totals). | | |
G. In preparing the financial statements as of October 31, 2010, management considered the impact of subsequent events for potential recognition or disclosure in these financial statements.
28
FTSE All-World ex-US Small-Cap Index Fund
Fund Profile
As of October 31, 2010
| | | |
| Share-Class Characteristics | |
| |
| | Investor | Institutional | ETF |
| | Shares | Shares | Shares |
| Ticker Symbol | VFSVX | VFSNX | VSS |
| Expense Ratio1 | 0.63% | 0.37% | 0.40% |
| | |
| Portfolio Characteristics | | |
| | | FTSE Global |
| | | Small Cap |
| | Fund | ex US Index |
| Number of Stocks | 2,692 | 3,022 |
| Median Market Cap | $1.6B | $1.6B |
| Price/Earnings Ratio | 20.5x | 20.4x |
| Price/Book Ratio | 1.5x | 1.5x |
| Return on Equity | 13.5% | 13.3% |
| Earnings Growth Rate | 7.8% | 7.9% |
| Dividend Yield | 2.1% | 2.1% |
| Turnover Rate | 19% | — |
| Short-Term Reserves | 0.5% | — |
| | |
| Sector Diversification (% of equity exposure) |
| | | FTSE Global |
| | | Small Cap |
| | Fund | ex US Index |
| Consumer Discretionary | 15.3% | 15.4% |
| Consumer Staples | 5.6 | 5.6 |
| Energy | 6.6 | 6.6 |
| Financials | 17.6 | 17.4 |
| Health Care | 5.0 | 5.0 |
| Industrials | 20.9 | 21.0 |
| Information Technology | 9.6 | 9.7 |
| Materials | 15.8 | 15.7 |
| Telecommunication | | |
| Services | 0.9 | 0.9 |
| Utilities | 2.7 | 2.7 |
| | |
| Ten Largest Holdings (% of total net assets) |
| Eldorado Gold Corp. | Gold | 0.5% |
| Crescent Point Energy | Oil & Gas | |
| Corp. | Exploration & | |
| | Production | 0.5 |
| Silver Wheaton Corp. | Precious Metals & | |
| | Minerals | 0.5 |
| Ivanhoe Mines Ltd. | Diversified Metals | |
| | & Mining | 0.4 |
| Pacific Rubiales Energy | Oil & Gas | |
| Corp. | Exploration & | |
| | Production | 0.4 |
| Valeant Pharmaceuticals | Pharmaceuticals | |
| International Inc. | | 0.4 |
| First Quantum Minerals | Diversified Metals | |
| Ltd. | & Mining | 0.3 |
| IAMGOLD Corp. | Gold | 0.3 |
| RioCan Real Estate | Retail REITs | |
| Investment Trust | | 0.3 |
| Fortis Inc. | Electric Utilities | 0.3 |
| Top Ten | | 3.9% |
The holdings listed exclude any temporary cash investments and equity index products.
Allocation by Region (% of portfolio)
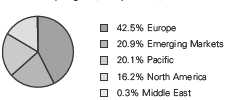
1 The expense ratios shown are from the prospectus dated February 26, 2010, and represent estimated costs for the current fiscal year. For the fiscal year ended October 31, 2010, the expense ratios were 0.55% for Investor Shares, 0.30% for Institutional Shares, and 0.33% for ETF Shares.
29
FTSE All-World ex-US Small-Cap Index Fund
| | |
| Market Diversification (% of equity exposure) |
| | | FTSE |
| | | Global |
| | | Small Cap |
| | | ex US |
| | Fund | Index |
| Europe | | |
| United Kingdom | 13.9% | 13.8% |
| Germany | 4.1 | 4.2 |
| France | 4.0 | 4.0 |
| Switzerland | 4.0 | 4.0 |
| Sweden | 2.5 | 2.5 |
| Italy | 2.4 | 2.3 |
| Netherlands | 1.8 | 1.8 |
| Norway | 1.8 | 1.8 |
| Finland | 1.7 | 1.7 |
| Spain | 1.6 | 1.6 |
| Belgium | 1.4 | 1.4 |
| Denmark | 1.0 | 0.9 |
| Other | 2.3 | 2.4 |
| Subtotal | 42.5% | 42.4% |
| Pacific | | |
| Japan | 10.7% | 10.6% |
| Australia | 4.8 | 4.8 |
| Hong Kong | 3.3 | 3.3 |
| Singapore | 1.1 | 1.1 |
| Other | 0.2 | 0.2 |
| Subtotal | 20.1% | 20.0% |
| Emerging Markets | | |
| Taiwan | 5.4% | 5.7% |
| China | 1.4 | 1.3 |
| India | 3.2 | 3.3 |
| South Korea | 3.1 | 3.2 |
| Brazil | 1.7 | 1.8 |
| Other | 6.1 | 5.8 |
| Subtotal | 20.9% | 21.1% |
| Middle East | 0.3% | 0.3% |
| North America | | |
| Canada | 16.2% | 16.2% |
The country classifications for the fund in this table and those in the Statement of Net Assets (SNA) differ slightly. The SNA is based on the MSCI classifications used in our financial reporting system, while the table reflects the FTSE classifications used in the index. The discrepancies largely reflect differences in the way FTSE and MSCI classify Hong Kong-listed stocks. There is no material difference between the fund's economic exposures and those of the benchmark.
30
FTSE All-World ex-US Small-Cap Index Fund
Performance Summary
All of the returns in this report represent past performance, which is not a guarantee of future results that may be achieved by the fund. (Current performance may be lower or higher than the performance data cited. For performance data current to the most recent month-end, visit our website at vanguard.com/performance.) Note, too, that both investment returns and principal value can fluctuate widely, so an investor’s shares, when sold, could be worth more or less than their original cost. The returns shown do not reflect taxes that a shareholder would pay on fund distributions or on the sale of fund shares.
Cumulative Performance: April 2, 2009, Through October 31, 2010
Initial Investment of $10,000
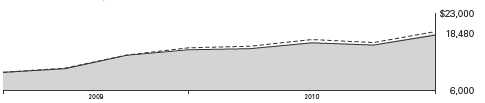
| | | |
| | Average Annual Total Returns | |
| | Periods Ended October 31, 2010 | |
| | | Since | Final Value |
| | One | Inception | of a $10,000 |
| | Year | (4/2/2009) | Investment |
| FTSE All-World ex-US Small-Cap Index | | | |
| Fund Investor Shares | 22.07% | 47.47% | $18,480 |
| FTSE Global Small Cap ex US Index | 23.10 | 49.81 | 18,944 |
| International Small-Cap Funds Average | 21.54 | 45.95 | 18,179 |
International Small-Cap Funds Average: Derived from data provided by Lipper Inc.
"Since Inception" performance is calculated from the Investor Shares’ inception date for both the fund and its comparative standards.
| | | |
| | | Since | Final Value |
| | One | Inception | of a $5,000,000 |
| | Year | (4/2/2009) | Investment |
| FTSE All-World ex-US Small-Cap | | | |
| Index Fund Institutional Shares | 22.37% | 47.86% | $9,278,410 |
| FTSE Global Small Cap ex US Index | 23.10 | 49.81 | 9,472,104 |
"Since Inception" performance is calculated from the Institutional Shares’ inception date for both the fund and its comparative standards.
Vanguard fund returns in most tables are adjusted to reflect the 0.75% fee on purchases and redemptions. The fees do not apply to the ETF Shares. The Fiscal-Year Total Returns chart shows non-adjusted returns, and the final table includes non-adjusted returns along with the fee-adjusted returns.
See Financial Highlights for dividend and capital gains information.
31
| | | |
| FTSE All-World ex-US Small-Cap Index Fund | | | |
| |
| |
| |
| |
| | Average Annual Total Returns | |
| | Periods Ended October 31, 2010 | |
| | | Since | Final Value |
| | One | Inception | of a $10,000 |
| | Year | (4/2/2009) | Investment |
| FTSE All-World ex-US Small-Cap Index Fund | | | |
| ETF Shares Net Asset Value | 24.17% | 47.81% | $18,546 |
| FTSE Global Small Cap ex US Index | 23.10 | 49.81 | 18,944 |
| "Since Inception" performance is calculated from the ETF Shares’ inception date for both the fund and its comparative standard. |
| | |
| Cumulative Returns of ETF Shares: April 2, 2009, Through October 31, 2010 | |
| | | Since |
| | One | Inception |
| | Year | (4/2/2009) |
| FTSE All-World ex-US Small-Cap Index Fund | | |
| ETF Shares Market Price | 25.13% | 86.57% |
| FTSE All-World ex-US Small-Cap Index Fund | | |
| ETF Shares Net Asset Value | 24.17 | 85.46 |
| FTSE Global Small Cap ex US Index | 23.10 | 89.44 |
| "Since Inception" performance is calculated from the ETF Shares’ inception date for both the fund and its comparative standard. | |
Fiscal-Year Total Returns (%): April 2, 2009, Through October 31, 2010
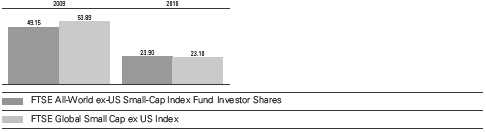
Index returns are adjusted for withholding taxes applicable to U.S.-based mutual funds organized as Delaware statutory trusts.
Vanguard fund returns in most tables are adjusted to reflect the 0.75% fee on purchases and redemptions. The fees do not apply to the ETF Shares. The Fiscal-Year Total Returns chart shows non-adjusted returns, and the final table includes non-adjusted returns along with the fee-adjusted returns.
32
FTSE All-World ex-US Small-Cap Index Fund
Average Annual Total Returns: Periods Ended September 30, 2010
This table presents average annual total returns through the latest calendar quarter—rather than through the end of the fiscal period. Securities and Exchange Commission rules require that we provide this information.
| | | |
| | Inception | One | Since |
| | Date | Year | Inception |
| Investor Shares | 4/2/2009 | 16.15% | 46.52% |
| Fee-Adjusted Returns | | 14.43 | 46.52 |
| Institutional Shares | 4/2/2009 | 16.42 | 46.88 |
| Fee-Adjusted Returns | | 14.69 | 46.88 |
| ETF Shares | 4/2/2009 | | |
| Market Price | | 16.36 | 47.15 |
| Net Asset Value | | 16.37 | 46.82 |
Vanguard fund returns in most tables are adjusted to reflect the 0.75% fee on purchases and redemptions. The fees do not apply to the ETF Shares. The Fiscal-Year Total Returns chart shows non-adjusted returns, and the final table includes non-adjusted returns along with the fee-adjusted returns.
33
FTSE All-World ex-US Small-Cap Index Fund
Financial Statements
Statement of Net Assets—Investments Summary
As of October 31, 2010
This Statement summarizes the fund’s holdings by asset type. Details are reported for each of the fund’s 50 largest individual holdings and for investments that, in total for any issuer, represent more than 1% of the fund’s net assets. The total value of smaller holdings is reported as a single amount within each category.
The fund reports a complete list of its holdings in regulatory filings four times in each fiscal year, at the quarter-ends. For the second and fourth fiscal quarters, the complete listing of the fund’s holdings is available electronically on vanguard.com and on the Securities and Exchange Commission’s website (sec.gov), or you can have it mailed to you without charge by calling 800-662-7447. For the first and third fiscal quarters, the fund files the lists with the SEC on Form N-Q. Shareholders can look up the fund’s Forms N-Q on the SEC’s website. Forms N-Q may also be reviewed and copied at the SEC’s Public Reference Room (see the back cover of this report for further information).
| | | |
| | | Market | Percentage |
| | | Value | of Net |
| | Shares | ($000) | Assets |
| Common Stocks | | | |
| Australia † | | 38,139 | 4.7% |
| |
| Austria † | | 7,375 | 0.9% |
| |
| Belgium | | | |
| Bekaert SA | 5,457 | 1,673 | 0.2% |
| Belgium—Other † | | 9,499 | 1.2% |
| | | 11,172 | 1.4% |
| |
| Brazil † | | 13,613 | 1.7% |
| |
| Canada | | | |
| Crescent Point Energy Corp. | 94,959 | 3,761 | 0.5% |
| * Silver Wheaton Corp. | 130,667 | 3,756 | 0.5% |
| * Ivanhoe Mines Ltd. | 139,416 | 3,338 | 0.4% |
| Eldorado Gold Corp. | 194,636 | 3,296 | 0.4% |
| * Pacific Rubiales Energy Corp. | 100,319 | 3,198 | 0.4% |
| * Valeant Pharmaceuticals International Inc. | 112,547 | 3,114 | 0.4% |
| First Quantum Minerals Ltd. | 31,128 | 2,726 | 0.3% |
| IAMGOLD Corp. | 142,280 | 2,596 | 0.3% |
| RioCan Real Estate Investment Trust | 93,326 | 2,109 | 0.3% |
| ^ Fortis Inc. | 65,028 | 2,064 | 0.2% |
| Intact Financial Corp. | 44,600 | 2,020 | 0.2% |
| Niko Resources Ltd. | 19,887 | 1,897 | 0.2% |
| Metro Inc. Class A | 40,680 | 1,867 | 0.2% |
| * Sino-Forest Corp. | 94,199 | 1,862 | 0.2% |
34
| | | |
| FTSE All-World ex-US Small-Cap Index Fund | | | |
| |
| |
| |
| | | Market | Percentage |
| | | Value | of Net |
| | Shares | ($000) | Assets |
| CI Financial Corp. | 88,062 | 1,843 | 0.2% |
| Tim Hortons Inc. | 45,532 | 1,712 | 0.2% |
| * Petrobank Energy & Resources Ltd. | 41,873 | 1,666 | 0.2% |
| Franco-Nevada Corp. | 43,820 | 1,512 | 0.2% |
| * Equinox Minerals Ltd. | 270,391 | 1,469 | 0.2% |
| * Osisko Mining Corp. | 103,105 | 1,429 | 0.2% |
| Emera Inc. | 48,786 | 1,420 | 0.2% |
| Onex Corp. | 46,078 | 1,349 | 0.2% |
| * Gildan Activewear Inc. | 46,500 | 1,340 | 0.2% |
| Pan American Silver Corp. | 41,080 | 1,314 | 0.2% |
| Centerra Gold Inc. | 65,402 | 1,305 | 0.2% |
| * Viterra Inc. | 134,977 | 1,293 | 0.1% |
| Canada—Other † | | 73,843 | 9.2% |
| | | 129,099 | 16.0% |
| |
| Chile † | | 2,162 | 0.3% |
| |
| China † | | 27,745 | 3.5% |
| |
| Denmark | | | |
| DSV A/S | 78,386 | 1,607 | 0.2% |
| Denmark—Other † | | 5,820 | 0.7% |
| | | 7,427 | 0.9% |
| |
| Egypt † | | 1,180 | 0.2% |
| |
| Finland | | | |
| Elisa Oyj | 63,726 | 1,363 | 0.2% |
| Finland—Other † | | 12,276 | 1.5% |
| | | 13,639 | 1.7% |
| France | | | |
| Groupe Eurotunnel SA | 182,540 | 1,816 | 0.2% |
| * Valeo SA | 29,420 | 1,590 | 0.2% |
| Arkema SA | 23,976 | 1,549 | 0.2% |
| Gemalto NV | 33,638 | 1,533 | 0.2% |
| France—Other † | | 25,244 | 3.1% |
| | | 31,732 | 3.9% |
| Germany | | | |
| Symrise AG | 45,457 | 1,381 | 0.2% |
| Germany—Other † | | 31,128 | 3.8% |
| | | 32,509 | 4.0% |
| |
| Greece † | | 4,234 | 0.5% |
| |
| Hong Kong † | | 9,538 | 1.2% |
| |
| Hungary † | | 222 | 0.0% |
35
| | | |
| FTSE All-World ex-US Small-Cap Index Fund | | | |
| |
| | | Market | Percentage |
| | | Value | of Net |
| | Shares | ($000) | Assets |
| India † | | 25,701 | 3.2% |
| Indonesia † | | 5,780 | 0.7% |
| Ireland † | | 4,945 | 0.6% |
| Israel † | | 2,524 | 0.3% |
| Italy | | | |
| Prysmian SPA | 67,934 | 1,317 | 0.2% |
| Italy—Other † | | 17,816 | 2.2% |
| | | 19,133 | 2.4% |
| Japan † | | 84,679 | 10.5% |
| Malaysia † | | 6,915 | 0.9% |
| Mexico † | | 6,380 | 0.8% |
| Netherlands † | | 14,177 | 1.8% |
| New Zealand † | | 1,407 | 0.2% |
| Norway † | | 14,049 | 1.7% |
| Philippines † | | 3,769 | 0.5% |
| Poland † | | 3,801 | 0.5% |
| Portugal † | | 2,650 | 0.3% |
| Russia † | | 3,603 | 0.5% |
| Singapore † | | 8,643 | 1.1% |
| South Africa † | | 4,024 | 0.5% |
| South Korea † | | 23,390 | 2.9% |
| Spain † | | 12,574 | 1.6% |
| Sweden | | | |
| ^ Hexagon AB Class B | 71,519 | 1,455 | 0.2% |
| Sweden—Other † | | 18,128 | 2.2% |
| | | 19,583 | 2.4% |
| Switzerland | | | |
| * Clariant AG | 95,028 | 1,607 | 0.2% |
36
| | | | |
| FTSE All-World ex-US Small-Cap Index Fund | | | | |
| |
| |
| |
| | | | Market | Percentage |
| | | | Value | of Net |
| | | Shares | ($000) | Assets |
| Sulzer AG | | 12,716 | 1,548 | 0.2% |
| Aryzta AG | | 31,639 | 1,402 | 0.2% |
| *,^ Logitech International SA | | 72,212 | 1,369 | 0.2% |
| PSP Swiss Property AG | | 17,739 | 1,363 | 0.1% |
| Switzerland—Other † | | | 24,298 | 3.0% |
| | | | 31,587 | 3.9% |
| |
| Taiwan † | | | 43,039 | 5.4% |
| |
| Thailand † | | | 4,922 | 0.6% |
| |
| Turkey † | | | 5,011 | 0.6% |
| |
| United Kingdom | | | | |
| Weir Group plc | | 80,271 | 2,003 | 0.2% |
| Intertek Group plc | | 60,997 | 1,813 | 0.2% |
| GKN plc | | 600,553 | 1,706 | 0.2% |
| Investec plc | | 208,203 | 1,662 | 0.2% |
| Informa plc | | 229,727 | 1,606 | 0.2% |
| IMI plc | | 122,481 | 1,549 | 0.2% |
| SSL International plc | | 79,829 | 1,482 | 0.2% |
| Meggitt plc | | 265,466 | 1,403 | 0.2% |
| Pennon Group plc | | 137,932 | 1,377 | 0.2% |
| United Kingdom—Other † | | | 94,982 | 11.8% |
| | | | 109,583 | 13.6% |
| Total Common Stocks (Cost $651,774) | | | 791,655 | 98.4% |
| |
| | Coupon | | | |
| Temporary Cash Investment | | | | |
| Money Market Fund | | | | |
| 1,2 Vanguard Market Liquidity Fund (Cost $36,386) | 0.237% | 36,386,192 | 36,386 | 4.5% |
| Total Investments (Cost $688,160) | | | 828,041 | 102.9% |
| Other Assets and Liabilities | | | | |
| Other Assets | | | 9,399 | 1.2% |
| Liabilities2 | | | (32,516) | (4.1%) |
| | | | (23,117) | (2.9%) |
| Net Assets | | | 804,924 | 100.0% |
37
| |
| FTSE All-World ex-US Small-Cap Index Fund | |
| |
| |
| At October 31, 2010, net assets consisted of: | |
| | Amount |
| | ($000) |
| Paid-in Capital | 649,292 |
| Undistributed Net Investment Income | 8,706 |
| Accumulated Net Realized Gains | 6,983 |
| Unrealized Appreciation (Depreciation) | |
| Investment Securities | 139,881 |
| Foreign Currencies | 62 |
| Net Assets | 804,924 |
| |
| Investor Shares—Net Assets | |
| Applicable to 4,680,835 outstanding $.001 par value shares of | |
| beneficial interest (unlimited authorization) | 170,120 |
| Net Asset Value Per Share—Investor Shares | $36.34 |
| |
| Institutional Shares—Net Assets | |
| Applicable to 50,881 outstanding $.001 par value shares of | |
| beneficial interest (unlimited authorization) | 9,279 |
| Net Asset Value Per Share—Institutional Shares | $182.36 |
| |
| ETF Shares—Net Assets | |
| Applicable to 6,558,021 outstanding $.001 par value shares of | |
| beneficial interest (unlimited authorization) | 625,525 |
| Net Asset Value Per Share—ETF Shares | $95.38 |
See Note A in Notes to Financial Statements.
* Non-income-producing security.
^ Part of security position is on loan to broker-dealers. The total value of securities on loan is $29,670,000.
† Represents the aggregate value, by category, of securities that are not among the 50 largest holdings and, in total for any issuer, represent 1% or less of net assets.
1 Affiliated money market fund available only to Vanguard funds and certain trusts and accounts managed by Vanguard. Rate shown is the 7-day yield.
2 Includes $32,057,000 of collateral received for securities on loan.
See accompanying Notes, which are an integral part of the Financial Statements.
38
| |
| FTSE All-World ex-US Small-Cap Index Fund | |
| |
| |
| Statement of Operations | |
| |
| | Year Ended |
| | October 31, 2010 |
| | ($000) |
| Investment Income | |
| Income | |
| Dividends1 | 12,997 |
| Interest2 | 5 |
| Security Lending | 641 |
| Total Income | 13,643 |
| Expenses | |
| The Vanguard Group—Note B | |
| Investment Advisory Services | 59 |
| Management and Administrative—Investor Shares | 479 |
| Management and Administrative—Institutional Shares | 16 |
| Management and Administrative—ETF Shares | 876 |
| Marketing and Distribution—Investor Shares | 25 |
| Marketing and Distribution—Institutional Shares | — |
| Marketing and Distribution—ETF Shares | 112 |
| Custodian Fees | 442 |
| Auditing Fees | 35 |
| Shareholders’ Reports—Investor Shares | 3 |
| Shareholders’ Reports—Institutional Shares | — |
| Shareholders’ Reports—ETF Shares | 25 |
| Trustees’ Fees and Expenses | 1 |
| Total Expenses | 2,073 |
| Net Investment Income | 11,570 |
| Realized Net Gain (Loss) | |
| Investment Securities Sold | 7,647 |
| Foreign Currencies | (170) |
| Realized Net Gain (Loss) | 7,477 |
| Change in Unrealized Appreciation (Depreciation) | |
| Investment Securities | 99,501 |
| Foreign Currencies | 108 |
| Change in Unrealized Appreciation (Depreciation) | 99,609 |
| Net Increase (Decrease) in Net Assets Resulting from Operations | 118,656 |
1 Dividends are net of foreign withholding taxes of $1,061,000.
2 Interest income from an affiliated company of the fund was $5,000.
See accompanying Notes, which are an integral part of the Financial Statements.
39
| | |
| FTSE All-World ex-US Small-Cap Index Fund | | |
| |
| |
| Statement of Changes in Net Assets | | |
| |
| | | March 19, |
| | Year Ended | 20091 to |
| | October 31, | October 31, |
| | 2010 | 2009 |
| | ($000) | ($000) |
| Increase (Decrease) in Net Assets | | |
| Operations | | |
| Net Investment Income | 11,570 | 1,667 |
| Realized Net Gain (Loss) | 7,477 | 2,840 |
| Change in Unrealized Appreciation (Depreciation) | 99,609 | 40,334 |
| Net Increase (Decrease) in Net Assets Resulting from Operations | 118,656 | 44,841 |
| Distributions | | |
| Net Investment Income | | |
| Investor Shares | (739) | — |
| Institutional Shares | (83) | — |
| ETF Shares | (3,872) | — |
| Realized Capital Gain2 | | |
| Investor Shares | (492) | — |
| Institutional Shares | (52) | — |
| ETF Shares | (2,310) | — |
| Total Distributions | (7,548) | — |
| Capital Share Transactions | | |
| Investor Shares | 84,367 | 51,752 |
| Institutional Shares | 155 | 5,029 |
| ETF Shares | 256,271 | 251,401 |
| Net Increase (Decrease) from Capital Share Transactions | 340,793 | 308,182 |
| Total Increase (Decrease) | 451,901 | 353,023 |
| Net Assets | | |
| Beginning of Period | 353,023 | — |
| End of Period3 | 804,924 | 353,023 |
1 Commencement of subscription period for the fund.
2 Includes fiscal 2010 short-term gain distributions totaling $2,854,000. Short-term gain distributions are treated as ordinary income dividends for tax purposes.
3 Net Assets—End of Period includes undistributed net investment income of $8,706,000 and $1,695,000.
See accompanying Notes, which are an integral part of the Financial Statements.
40
| | |
| FTSE All-World ex-US Small-Cap Index Fund | | |
| |
| |
| Financial Highlights | | |
| |
| Investor Shares | | |
| | Year | March 19, |
| | Ended | 20091 to |
| | October 31, | Oct. 31, |
| For a Share Outstanding Throughout Each Period | 2010 | 2009 |
| Net Asset Value, Beginning of Period | $29.83 | $20.00 |
| Investment Operations | | |
| Net Investment Income | .6032 | .2572 |
| Net Realized and Unrealized Gain (Loss) on Investments3 | 6.430 | 9.573 |
| Total from Investment Operations | 7.033 | 9.830 |
| Distributions | | |
| Dividends from Net Investment Income | (.314) | — |
| Distributions from Realized Capital Gains | (.209) | — |
| Total Distributions | (.523) | — |
| Net Asset Value, End of Period | $36.34 | $29.83 |
| |
| Total Return4 | 23.90% | 49.15% |
| |
| Ratios/Supplemental Data | | |
| Net Assets, End of Period (Millions) | $170 | $62 |
| Ratio of Total Expenses to Average Net Assets | 0.55% | 0.78%5 |
| Ratio of Net Investment Income to Average Net Assets | 1.89% | 1.49%5 |
| Portfolio Turnover Rate6 | 19% | 19% |
1 Subscription period for the fund was March 19, 2009, to April 2, 2009, during which time all assets were held in money market instruments. Performance measurement began April 2, 2009, at a net asset value of $20.00.
2 Calculated based on average shares outstanding.
3 Includes increases from purchase and redemption fees of $.05 and $.04.
4 Total returns do not include transaction or account service fees that may have applied in the periods shown. Fund prospectuses provide information about any applicable transaction and account service fees.
5 Annualized.
6 Excludes the value of portfolio securities received or delivered as a result of in-kind purchases or redemptions of the fund’s capital shares, including ETF Creation Units.
See accompanying Notes, which are an integral part of the Financial Statements.
41
| | |
| FTSE All-World ex-US Small-Cap Index Fund | | |
| |
| |
| Financial Highlights | | |
| |
| Institutional Shares | | |
| | Year | April 2, |
| | Ended | 20091 to |
| | October 31, | Oct. 31, |
| For a Share Outstanding Throughout Each Period | 2010 | 2009 |
| Net Asset Value, Beginning of Period | $149.40 | $100.00 |
| Investment Operations | | |
| Net Investment Income | 3.2842 | 1.6252 |
| Net Realized and Unrealized Gain (Loss) on Investments3 | 32.377 | 47.775 |
| Total from Investment Operations | 35.661 | 49.400 |
| Distributions | | |
| Dividends from Net Investment Income | (1.655) | — |
| Distributions from Realized Capital Gains | (1.046) | — |
| Total Distributions | (2.701) | — |
| Net Asset Value, End of Period | $182.36 | $149.40 |
| |
| Total Return4 | 24.21% | 49.40% |
| |
| Ratios/Supplemental Data | | |
| Net Assets, End of Period (Millions) | $9 | $7 |
| Ratio of Total Expenses to Average Net Assets | 0.30% | 0.52%5 |
| Ratio of Net Investment Income to Average Net Assets | 2.14% | 1.75%5 |
| Portfolio Turnover Rate6 | 19% | 19% |
1 Inception.
2 Calculated based on average shares outstanding.
3 Includes increases from purchase and redemption fees of $.32 and $.27.
4 Total returns do not include transaction fees that may have applied in the periods shown. Fund prospectuses provide information about any applicable transaction fees.
5 Annualized.
6 Excludes the value of portfolio securities received or delivered as a result of in-kind purchases or redemptions of the fund’s capital shares, including ETF Creation Units.
See accompanying Notes, which are an integral part of the Financial Statements.
42
| | |
| FTSE All-World ex-US Small-Cap Index Fund | | |
| |
| |
| Financial Highlights | | |
| |
| ETF Shares | | |
| | Year | April 2, |
| | Ended | 20091 to |
| | October 31, | Oct. 31, |
| For a Share Outstanding Throughout Each Period | 2010 | 2009 |
| Net Asset Value, Beginning of Period | $78.21 | $52.36 |
| Investment Operations | | |
| Net Investment Income | 1.7502 | .7142 |
| Net Realized and Unrealized Gain (Loss) on Investments3 | 16.884 | 25.136 |
| Total from Investment Operations | 18.634 | 25.850 |
| Distributions | | |
| Dividends from Net Investment Income | (.917) | — |
| Distributions from Realized Capital Gains | (.547) | — |
| Total Distributions | (1.464) | — |
| Net Asset Value, End of Period | $95.38 | $78.21 |
| |
| Total Return | 24.17% | 49.37% |
| |
| Ratios/Supplemental Data | | |
| Net Assets, End of Period (Millions) | $626 | $283 |
| Ratio of Total Expenses to Average Net Assets | 0.33% | 0.55%4 |
| Ratio of Net Investment Income to Average Net Assets | 2.11% | 1.72%4 |
| Portfolio Turnover Rate5 | 19% | 19% |
1 Inception.
2 Calculated based on average shares outstanding.
3 Includes increases from purchase and redemption fees of $.14 and $.07.
4 Annualized.
5 Excludes the value of portfolio securities received or delivered as a result of in-kind purchases or redemptions of the fund’s capital shares, including ETF Creation Units.
See accompanying Notes, which are an integral part of the Financial Statements.
43
FTSE All-World ex-US Small-Cap Index Fund
Notes to Financial Statements
Vanguard FTSE All-World ex-US Small-Cap Index Fund is registered under the Investment Company Act of 1940 as an open-end investment company, or mutual fund. The fund invests in securities of foreign issuers, which may subject it to investment risks not normally associated with investing in securities of U.S. corporations. The fund offers three classes of shares: Investor Shares, Institutional Shares, and ETF Shares. Investor Shares are available to any investor who meets the fund’s minimum purchase requirements. Institutional Shares are designed for investors who meet certain administrative, service, and account-size criteria. ETF Shares are listed for trading on the NYSE Arca, Inc.; they can be purchased and sold through a broker.
A. The following significant accounting policies conform to generally accepted accounting principles for U.S. mutual funds. The fund consistently follows such policies in preparing its financial statements.
1. Security Valuation: Securities are valued as of the close of trading on the New York Stock Exchange (generally 4 p.m., Eastern time) on the valuation date. Equity securities are valued at the latest quoted sales prices or official closing prices taken from the primary market in which each security trades; such securities not traded on the valuation date are valued at the mean of the latest quoted bid and asked prices. Securities for which market quotations are not readily available, or whose values have been affected by events occurring before the fund’s pricing time but after the close of the securities’ primary markets, are valued at their fair values calculated according to procedures adopted by the board of trustees. These procedures include obtaining quotations from an independent pricing service, monitoring news to identify significant market- or security-specific events, and evaluating changes in the values of foreign market proxies (for example, A DRs, futures contracts, or exchange-traded funds), between the time the foreign markets close and the fund’s pricing time. When fair-value pricing is employed, the prices of securities used by a fund to calculate its net asset value may differ from quoted or published prices for the same securities. Investments in Vanguard Market Liquidity Fund are valued at that fund’s net asset value.
2. Foreign Currency: Securities and other assets and liabilities denominated in foreign currencies are translated into U.S. dollars using exchange rates obtained from an independent third party as of the fund’s pricing time on the valuation date. Realized gains (losses) and unrealized appreciation (depreciation) on investment securities include the effects of changes in exchange rates since the securities were purchased, combined with the effects of changes in security prices. Fluctuations in the value of other assets and liabilities resulting from changes in exchange rates are recorded as unrealized foreign currency gains (losses) until the assets or liabilities are settled in cash, at which time they are recorded as realized foreign currency gains (losses).
3. Federal Income Taxes: The fund intends to continue to qualify as a regulated investment company and distribute all of its taxable income. Management has analyzed the fund’s tax positions taken for all open federal income tax years (October 31, 2009–2010), and has concluded that no provision for federal income tax is required in the fund’s financial statements.
4. Distributions: Distributions to shareholders are recorded on the ex-dividend date.
5. Security Lending: The fund may lend its securities to qualified institutional borrowers to earn additional income. Security loans are required to be secured at all times by collateral at least equal to the market value of securities loaned. The fund invests cash collateral received in Vanguard Market
44
FTSE All-World ex-US Small-Cap Index Fund
Liquidity Fund, and records a liability for the return of the collateral, during the period the securities are on loan. Security lending income represents fees charged to borrowers plus income earned on investing cash collateral, less expenses associated with the loan.
6. Other: Dividend income is recorded on the ex-dividend date. Interest income includes income distributions received from Vanguard Market Liquidity Fund and is accrued daily. Security transactions are accounted for on the date securities are bought or sold. Costs used to determine realized gains (losses) on the sale of investment securities are those of the specific securities sold. Fees assessed on capital share transactions are credited to paid-in capital.
Each class of shares has equal rights as to assets and earnings, except that each class separately bears certain class-specific expenses related to maintenance of shareholder accounts (included in Management and Administrative expenses) and shareholder reporting. Marketing and distribution expenses are allocated to each class of shares based on a method approved by the board of trustees. Income, other non-class-specific expenses, and gains and losses on investments are allocated to each class of shares based on its relative net assets.
B. The Vanguard Group furnishes at cost investment advisory, corporate management, administrative, marketing, and distribution services. The costs of such services are allocated to the fund under methods approved by the board of trustees. The fund has committed to provide up to 0.40% of its net assets in capital contributions to Vanguard. At October 31, 2010, the fund had contributed capital of $125,000 to Vanguard (included in Other Assets), representing 0.02% of the fund’s net assets and 0.05% of Vanguard’s capitalization. The fund’s trustees and officers are also directors and officers of Vanguard.
C. Various inputs may be used to determine the value of the fund’s investments. These inputs are summarized in three broad levels for financial statement purposes. The inputs or methodologies used to value securities are not necessarily an indication of the risk associated with investing in those securities.
Level 1—Quoted prices in active markets for identical securities.
Level 2—Other significant observable inputs (including quoted prices for similar securities, interest rates, prepayment speeds, credit risk, etc.).
Level 3—Significant unobservable inputs (including the fund’s own assumptions used to determine the fair value of investments).
The following table summarizes the fund’s investments as of October 31, 2010, based on the inputs used to value them:
| | | |
| | Level 1 | Level 2 | Level 3 |
| Investments | ($000) | ($000) | ($000) |
| Common Stocks—North and South America | 151,254 | — | — |
| Common Stocks—Other | — | 640,375 | 26 |
| Temporary Cash Investments | 36,386 | — | — |
| Total | 187,640 | 640,375 | 26 |
45
FTSE All-World ex-US Small-Cap Index Fund
The following table summarizes changes in investments valued based on Level 3 inputs during the year ended October 31, 2010:
| |
| | Investments in |
| | Common Stocks—Other |
| Amount Valued Based on Level 3 Inputs | ($000) |
| Balance as of October 31, 2009 | — |
| Transfers in and/or out of Level 3 | 28 |
| Change in Unrealized Appreciation (Depreciation) | (2) |
| Balance as of October 31, 2010 | 26 |
D. Distributions are determined on a tax basis and may differ from net investment income and realized capital gains for financial reporting purposes. Differences may be permanent or temporary. Permanent differences are reclassified among capital accounts in the financial statements to reflect their tax character. Temporary differences arise when certain items of income, expense, gain, or loss are recognized in different periods for financial statement and tax purposes; these differences will reverse at some time in the future. Differences in classification may also result from the treatment of short-term gains as ordinary income for tax purposes.
During the year ended October 31, 2010, the fund realized net foreign currency losses of $170,000, which decreased distributable net income for tax purposes; accordingly, such losses have been reclassified from accumulated net realized gains to undistributed net investment income
Certain of the fund’s investments are in securities considered to be “passive foreign investment companies,” for which any unrealized appreciation and/or realized gains are required to be included in distributable net income for tax purposes. Unrealized appreciation of $2,154,000 on the fund’s passive foreign investment company holdings at October 31, 2009, has been distributed and is reflected in the balance of undistributed net investment income. During the year ended October 31, 2010, the fund realized gains on the sale of passive foreign investment companies of $575,000, which have been included in current and prior periods’ taxable income; accordingly, such gains have been reclassified from accumulated net realized gains to undistributed net investment income. Since October 31, 2009, the fund’s passive foreign investment company holdings have appreciated in value, increasing the amount of taxable income available for distribution as of October 31, 2010, by $7,049,000. Unrealized appreciation on the fund’s passive foreign investment company holdings at October 31, 2010, was $9,203,000.
The fund’s realized gains for the year ended October 31, 2010, include $59,000 of capital gain tax paid on sales of Indian securities. This tax is treated as a decrease in taxable income; accordingly, this amount has been reclassified from accumulated net realized gains to undistributed net investment income.
The fund used a tax accounting practice to treat a portion of the price of capital shares redeemed during the year as distributions from net investment income and realized capital gains. Accordingly, the fund has reclassified $211,000 from undistributed net investment income, and $75,000 from accumulated net realized gains, to paid-in capital.
46
FTSE All-World ex-US Small-Cap Index Fund
For tax purposes, at October 31, 2010, the fund had $21,371,000 of ordinary income and $3,901,000 of long-term capital gains available for distribution.
At October 31, 2010, the cost of investment securities for tax purposes was $697,524,000. Net unrealized appreciation of investment securities for tax purposes was $130,517,000, consisting of unrealized gains of $150,025,000 on securities that had risen in value since their purchase and $19,508,000 in unrealized losses on securities that had fallen in value since their purchase.
E. During the year ended October 31, 2010, the fund purchased $436,639,000 of investment securities and sold $105,742,000 of investment securities, other than temporary cash investments.
F. Capital share transactions for each class of shares were:
| | | | | |
| | | | |
| | | Year Ended | March 19, 20091 to |
| | October 31, 2010 | | | October 31, 2009 |
| | Amount | Shares | Amount | Shares |
| | ($000) | (000) | ($000) | (000) |
| Investor Shares | | | | |
| Issued2 | 106,128 | 3,290 | 56,570 | 2,278 |
| Issued in Lieu of Cash Distributions | 1,070 | 35 | — | — |
| Redeemed3 | (22,831) | (736) | (4,818) | (186) |
| Net Increase (Decrease)—Investor Shares | 84,367 | 2,589 | 51,752 | 2,092 |
| Institutional Shares | | | | |
| Issued2 | — | — | 5,029 | 50 |
| Issued in Lieu of Cash Distributions | 155 | 1 | — | — |
| Redeemed3 | — | — | — | — |
| Net Increase (Decrease)—Institutional Shares | 155 | 1 | 5,029 | 50 |
| ETF Shares | | | | |
| Issued2 | 256,271 | 2,938 | 251,401 | 3,620 |
| Issued in Lieu of Cash Distributions | — | — | — | — |
| Redeemed3 | — | — | — | — |
| Net Increase (Decrease)—ETF Shares | 256,271 | 2,938 | 251,401 | 3,620 |
1 Commencement of subscription period for the fund.
2 Includes purchase fees for fiscal 2010 and 2009 of $737,000 and $331,000, respectively (fund totals).
3 Net redemption fees for fiscal 2010 and 2009 of $404,000 and $27,000, respectively (fund totals).
G. In preparing the financial statements as of October 31, 2010, management considered the impact of subsequent events for potential recognition or disclosure in these financial statements.
47
Report of Independent Registered Public Accounting Firm
To the Trustees of Vanguard International Equity Index Funds and the Shareholders of Vanguard FTSE All-World ex-US Index Fund and Vanguard FTSE All-World ex-US Small-Cap Index Fund:
In our opinion, the accompanying statements of net assets—investment summaries and the related statements of operations and of changes in net assets and the financial highlights present fairly, in all material respects, the financial position of Vanguard FTSE All-World ex-US Index Fund and Vanguard FTSE All-World ex-US Small-Cap Index Fund (constituting two separate portfolios of Vanguard International Equity Index Funds, hereafter referred to as the “Funds”) at October 31, 2010, the results of each of their operations for the year then ended, the changes in each of their net assets for each of the two years in the period then ended and the financial highlights for each of the periods indicated, in conformity with accounting principles generally accepted in the United States of America. These financial statements and financial highlights (hereafter referred to as “financial statements”) are the responsibility of the Funds’ management; our responsibility is to express an opinion on these financial statements based on our audits. We conducted our audits of these financial statements in accordance with the standards of the Public Company Accounting Oversight Board (United States). Those standards require that we plan and perform the audit to obtain reasonable assurance about whether the financial statements are free of material misstatement. An audit includes examining, on a test basis, evidence supporting the amounts and disclosures in the financial statements, assessing the accounting principles used and significant estimates made by management, and evaluating the overall financial statement present-ation. We believe that our audits, which included confirmation of securities at October 31, 2010 by correspondence with the custodian and broker and by agreement to the underlying ownership records of Vanguard Market Liquidity Fund, provide a reasonable basis for our opinion.
PricewaterhouseCoopers LLP
Philadelphia, Pennsylvania
December 14, 2010
48
|
| Special 2010 tax information (unaudited) for Vanguard FTSE All-World ex-US Index Fund |
This information for the fiscal year ended October 31, 2010, is included pursuant to provisions of the Internal Revenue Code.
The fund distributed $114,514,000 of qualified dividend income to shareholders during the fiscal year.
The fund designates to shareholders foreign source income of $226,899,000 and foreign taxes paid of $16,623,000. Shareholders will receive more detailed information with their Form 1099-DIV in January 2011 to determine the calendar year amounts to be included on their 2010 tax returns.
|
| Special 2010 tax information (unaudited) for Vanguard FTSE All-World ex-US |
| Small-Cap Index Fund |
This information for the fiscal year ended October 31, 2010, is included pursuant to provisions of the Internal Revenue Code.
The fund distributed $2,342,000 of qualified dividend income to shareholders during the fiscal year.
The fund designates to shareholders foreign source income of $12,638,000 and foreign taxes paid of $1,024,000. Shareholders will receive more detailed information with their Form 1099-DIV in January 2011 to determine the calendar year amounts to be included on their 2010 tax returns.
49
Your Fund’s After-Tax Returns
This table presents returns for your fund both before and after taxes. The after-tax returns are shown in two ways: (1) assuming that an investor owned the fund during the entire period and paid taxes on the fund’s distributions, and (2) assuming that an investor paid taxes on the fund’s distributions and sold all shares at the end of each period.
Calculations are based on the highest individual federal income tax and capital gains tax rates in effect at the times of the distributions and the hypothetical sales. State and local taxes were not considered. After-tax returns reflect any qualified dividend income , using actual prior-year figures and estimates for 2010. (In the example, returns after the sale of fund shares may be higher than those assuming no sale. This occurs when the sale would have produced a capital loss. The calculation assumes that the investor received a tax deduction for the loss.)
The table shows returns for Investor Shares only; returns for other share classes will differ. Please note that your actual after-tax returns will depend on your tax situation and may differ from those shown. Also note that if you own the fund in a tax-deferred account, such as an individual retirement account or a 401(k) plan, this information does not apply to you. Such accounts are not subject to current taxes.
Finally, keep in mind that a fund’s performance—whether before or after taxes—does not guarantee future results.
Average Annual Total Returns: FTSE International Index Funds
Periods Ended October 31, 2010
| | |
| | | Since |
| | One | Inception |
| | Year | (3/8/2007) |
| FTSE All-World ex-US Index Fund Investor Shares | | |
| Returns Before Taxes | 13.94% | -0.84% |
| Returns After Taxes on Distributions | 13.63 | -1.05 |
| Returns After Taxes on Distributions and Sale of Fund Shares | 9.44 | -0.75 |
| |
| | | Since |
| | One | Inception |
| | Year | (4/2/2009) |
| FTSE All-World ex-US Small-Cap Index Fund Investor Shares | | |
| Returns Before Taxes | 22.07% | 47.47% |
| Returns After Taxes on Distributions | 21.50 | 45.65 |
| Returns After Taxes on Distributions and Sale of Fund Shares | 14.42 | 39.50 |
Returns for the FTSE All-World ex-US Small-Cap Index Fund are adjusted to reflect the 0.75% fee on purchases and redeptions. Returns for the FTSE All-World ex-US Index Fund do not reflect the 2% fee on redemptions of shares held for less than two months.
50
About Your Fund’s Expenses
As a shareholder of the fund, you incur ongoing costs, which include costs for portfolio management, administrative services, and shareholder reports (like this one), among others. Operating expenses, which are deducted from a fund’s gross income, directly reduce the investment return of the fund.
A fund’s expenses are expressed as a percentage of its average net assets. This figure is known as the expense ratio. The following examples are intended to help you understand the ongoing costs (in dollars) of investing in your fund and to compare these costs with those of other mutual funds. The examples are based on an investment of $1,000 made at the beginning of the period shown and held for the entire period.
The accompanying table illustrates your fund’s costs in two ways:
• Based on actual fund return. This section helps you to estimate the actual expenses that you paid over the period. The ”Ending Account Value“ shown is derived from the fund‘s actual return, and the third column shows the dollar amount that would have been paid by an investor who started with $1,000 in the fund. You may use the information here, together with the amount you invested, to estimate the expenses that you paid over the period.
To do so, simply divide your account value by $1,000 (for example, an $8,600 account value divided by $1,000 = 8.6), then multiply the result by the number given for your fund under the heading ”Expenses Paid During Period.“
• Based on hypothetical 5% yearly return. This section is intended to help you compare your fund‘s costs with those of other mutual funds. It assumes that the fund had a yearly return of 5% before expenses, but that the expense ratio is unchanged. In this case—because the return used is not the fund’s actual return—the results do not apply to your investment. The example is useful in making comparisons because the Securities and Exchange Commission requires all mutual funds to calculate expenses based on a 5% return. You can assess your fund’s costs by comparing this hypothetical example with the hypothetical examples that appear in shareholder reports of other funds.
Note that the expenses shown in the table are meant to highlight and help you compare ongoing costs only and do not reflect transaction costs incurred by the fund for buying and selling securities. Further, the expenses do not include the transaction fees or the account service fee described in the prospectus. If such fees were applied to your account, your costs would be higher. Your fund does not carry a “sales load.”
The calculations assume no shares were bought or sold during the period. Your actual costs may have been higher or lower, depending on the amount of your investment and the timing of any purchases or redemptions.
You can find more information about the fund’s expenses, including annual expense ratios, in the Financial Statements section of this report. For additional information on operating expenses and other shareholder costs, please refer to your fund’s current prospectus.
51
| | | |
| Six Months Ended October 31, 2010 | | | |
| | Beginning | Ending | Expenses |
| | Account Value | Account Value | Paid During |
| | 4/30/2010 | 10/31/2010 | Period |
| Based on Actual Fund Return | | | |
| FTSE All-World ex-US Index Fund | | | |
| Investor Shares | $1,000.00 | $1,074.01 | $1.83 |
| Institutional Shares | 1,000.00 | 1,074.96 | 0.78 |
| ETF Shares | 1,000.00 | 1,074.67 | 1.15 |
| FTSE All-World ex-US Small-Cap Index Fund | | | |
| Investor Shares | $1,000.00 | $1,105.23 | $2.65 |
| Institutional Shares | 1,000.00 | 1,106.69 | 1.33 |
| ETF Shares | 1,000.00 | 1,106.50 | 1.54 |
| Based on Hypothetical 5% Yearly Return | | | |
| FTSE All-World ex-US Index Fund | | | |
| Investor Shares | $1,000.00 | $1,023.44 | $1.79 |
| Institutional Shares | 1,000.00 | 1,024.45 | 0.77 |
| ETF Shares | 1,000.00 | 1,024.10 | 1.12 |
| FTSE All-World ex-US Small-Cap Index Fund | | | |
| Investor Shares | $1,000.00 | $1,022.68 | $2.55 |
| Institutional Shares | 1,000.00 | 1,023.95 | 1.28 |
| ETF Shares | 1,000.00 | 1,023.74 | 1.48 |
The calculations are based on expenses incurred in the most recent six-month period. The funds’ annualized six-month expense ratios for that period are: for the FTSE All-World ex-US Index Fund, 0.35% for Investor Shares, 0.15% for Institutional Shares, and 0.22% for ETF Shares; and for the FTSE All-World ex-US Small-Cap Index Fund, 0.50% for Investor Shares, 0.25% for Institutional Shares, and 0.29% for ETF Shares. The dollar amounts shown as “Expenses Paid” are equal to the annualized expense ratio multiplied by the average account value over the period, multiplied by the number of days in the most recent six-month period, then divided by the number of days in the most recent 12-month period.
52
Glossary
Beta. A measure of the magnitude of a fund’s past share-price fluctuations in relation to the ups and downs of a given market index. The index is assigned a beta of 1.00. Compared with a given index, a fund with a beta of 1.20 typically would have seen its share price rise or fall by 12% when the index rose or fell by 10%. For this report, beta is based on returns over the past 36 months for both the fund and the index. Note that a fund’s beta should be reviewed in conjunction with its R-squared (see definition). The lower the R-squared, the less correlation there is between the fund and the index, and the less reliable beta is as an indicator of volatility.
Dividend Yield. Dividend income earned by stocks, expressed as a percentage of the aggregate market value (or of net asset value, for a fund). The yield is determined by dividing the amount of the annual dividends by the aggregate value (or net asset value) at the end of the period. For a fund, the dividend yield is based solely on stock holdings and does not include any income produced by other investments.
Earnings Growth Rate. The average annual rate of growth in earnings over the past five years for the stocks now in a fund.
Equity Exposure. A measure that reflects a fund’s investments in stocks and stock futures. Any holdings in short-term reserves are excluded.
Expense Ratio. The percentage of a fund’s average net assets used to pay its annual administrative and advisory expenses. These expenses directly reduce returns to investors.
Inception Date. The date on which the assets of a fund (or one of its share classes) are first invested in accordance with the fund’s investment objective. For funds with a subscription period, the inception date is the day after that period ends. Investment performance is measured from the inception date.
Median Market Cap. An indicator of the size of companies in which a fund invests; the midpoint of market capitalization (market price x shares outstanding) of a fund’s stocks, weighted by the proportion of the fund’s assets invested in each stock. Stocks representing half of the fund’s assets have market capitalizations above the median, and the rest are below it.
Price/Book Ratio. The share price of a stock divided by its net worth, or book value, per share. For a fund, the weighted average price/book ratio of the stocks it holds.
Price/Earnings Ratio. The ratio of a stock’s current price to its per-share earnings over the past year. For a fund, the weighted average P/E of the stocks it holds. P/E is an indicator of market expectations about corporate prospects; the higher the P/E, the greater the expectations for a company’s future growth.
R-Squared. A measure of how much of a fund’s past returns can be explained by the returns from the market in general, as measured by a given index. If a fund’s total returns were precisely synchronized with an index’s returns, its R-squared would be 1.00. If the fund’s returns bore no relationship to the index’s returns, its R-squared would be 0. For this report, R-squared is based on returns over the past 36 months for both the fund and the index.
Return on Equity. The annual average rate of return generated by a company during the past five years for each dollar of shareholder’s equity (net income divided by shareholder’s equity). For a fund, the weighted average return on equity for the companies whose stocks it holds.
53
Short-Term Reserves. The percentage of a fund invested in highly liquid, short-term securities that can be readily converted to cash.
Turnover Rate. An indication of the fund’s trading activity. Funds with high turnover rates incur higher transaction costs and may be more likely to distribute capital gains (which may be taxable to investors). The turnover rate excludes in-kind transactions, which have minimal impact on costs.
54
This page intentionally left blank.
The People Who Govern Your Fund
The trustees of your mutual fund are there to see that the fund is operated and managed in your best interests since, as a shareholder, you are a part owner of the fund. Your fund’s trustees also serve on the board of directors of The Vanguard Group, Inc., which is owned by the Vanguard funds and provides services to them on an at-cost basis.
A majority of Vanguard’s board members are independent, meaning that they have no affiliation with Vanguard or the funds they oversee, apart from the sizable personal investments they have made as private individuals. The independent board members have distinguished backgrounds in business, academia, and public service. Each of the trustees and executive officers oversees 178 Vanguard funds.
The following table provides information for each trustee and executive officer of the fund. More information about the trustees is in the Statement of Additional Information, which can be obtained, without charge, by contacting Vanguard at 800-662-7447, or online at vanguard.com.
| |
| Interested Trustee1 | Amy Gutmann |
| | Born 1949. Trustee Since June 2006. Principal |
| F. William McNabb III | Occupation(s) During the Past Five Years: President |
| Born 1957. Trustee Since July 2009. Chairman of the | of the University of Pennsylvania; Christopher H. |
| Board. Principal Occupation(s) During the Past Five | Browne Distinguished Professor of Political Science |
| Years: Chairman of the Board of The Vanguard Group, | in the School of Arts and Sciences with secondary |
| Inc., and of each of the investment companies served | appointments at the Annenberg School for Commu- |
| by The Vanguard Group, since January 2010; Director | nication and the Graduate School of Education |
| of The Vanguard Group since 2008; Chief Executive | of the University of Pennsylvania; Director of |
| Officer and President of The Vanguard Group and of | Carnegie Corporation of New York, Schuylkill River |
| each of the investment companies served by The | Development Corporation, and Greater Philadelphia |
| Vanguard Group since 2008; Director of Vanguard | Chamber of Commerce; Trustee of the National |
| Marketing Corporation; Managing Director of The | Constitution Center; Chair of the Presidential |
| Vanguard Group (1995–2008) . | Commission for the Study of Bioethical Issues. |
| |
| | JoAnn Heffernan Heisen |
| Independent Trustees | Born 1950. Trustee Since July 1998. Principal |
| | Occupation(s) During the Past Five Years: Corporate |
| Emerson U. Fullwood | Vice President and Chief Global Diversity Officer |
| Born 1948. Trustee Since January 2008. Principal | since 2006 (retired 2008) and Member of the |
| Occupation(s) During the Past Five Years: Executive | Executive Committee (retired 2008) of Johnson & |
| Chief Staff and Marketing Officer for North America | Johnson (pharmaceuticals/consumer products); Vice |
| and Corporate Vice President (retired 2008) of Xerox | President and Chief Information Officer of Johnson & |
| Corporation (document management products and | Johnson (1997–2005); Director of the University |
| services); Director of SPX Corporation (multi-industry | Medical Center at Princeton and Women’s Research |
| manufacturing), the United Way of Rochester, | and Education Institute; Member of the Advisory |
| Amerigroup Corporation (managed health care), | Board of the Maxwell School of Citizenship and Public |
| the University of Rochester Medical Center, and | Affairs at Syracuse University. |
| Monroe Community College Foundation. | |
| | F. Joseph Loughrey |
| Rajiv L. Gupta | Born 1949. Trustee Since October 2009. Principal |
| Born 1945. Trustee Since December 2001.2 | Occupation(s) During the Past Five Years: President |
| Principal Occupation(s) During the Past Five Years: | and Chief Operating Officer since 2005 (retired 2009) |
| Chairman and Chief Executive Officer (retired 2009) | and Vice Chairman of the Board (2008–2009) of |
| and President (2006–2008) of Rohm and Haas Co. | Cummins Inc. (industrial machinery); Director of |
| (chemicals); Director of Tyco International, Ltd. | SKF AB (industrial machinery), Hillenbrand, Inc. |
| (diversified manufacturing and services) and Hewlett- | (specialized consumer services), Sauer-Danfoss Inc. |
| Packard Co. (electronic computer manufacturing); | (machinery), the Lumina Foundation for Education, |
| Trustee of The Conference Board; Member of the | and Oxfam America; Chairman of the Advisory |
| Board of Managers of Delphi Automotive LLP | Council for the College of Arts and Letters at the |
| (automotive components) . | University of Notre Dame. |
| | |
| André F. Perold | Kathryn J. Hyatt | |
| Born 1952. Trustee Since December 2004. Principal | Born 1955. Treasurer Since November 2008. Principal |
| Occupation(s) During the Past Five Years: George | Occupation(s) During the Past Five Years: Principal |
| Gund Professor of Finance and Banking at the Harvard | of The Vanguard Group, Inc.; Treasurer of each of |
| Business School; Chair of the Investment Committee | the investment companies served by The Vanguard |
| of HighVista Strategies LLC (private investment firm) . | Group since 2008; Assistant Treasurer of each of the |
| | investment companies served by The Vanguard Group |
| Alfred M. Rankin, Jr. | (1988–2008) . | |
| Born 1941. Trustee Since January 1993. Principal | | |
| Occupation(s) During the Past Five Years: Chairman, | Heidi Stam | |
| President, and Chief Executive Officer of NACCO | Born 1956. Secretary Since July 2005. Principal |
| Industries, Inc. (forklift trucks/housewares/lignite); | Occupation(s) During the Past Five Years: Managing |
| Director of Goodrich Corporation (industrial products/ | Director of The Vanguard Group, Inc., since 2006; |
| aircraft systems and services); Chairman of the | General Counsel of The Vanguard Group since 2005; |
| Federal Reserve Bank of Cleveland; Trustee of The | Secretary of The Vanguard Group and of each of the |
| Cleveland Museum of Art. | investment companies served by The Vanguard Group |
| | since 2005; Director and Senior Vice President of |
| Peter F. Volanakis | Vanguard Marketing Corporation since 2005; |
| Born 1955. Trustee Since July 2009. Principal | Principal of The Vanguard Group (1997–2006). |
| Occupation(s) During the Past Five Years: President | | |
| since 2007 and Chief Operating Officer since 2005 | | |
| of Corning Incorporated (communications equipment); | Vanguard Senior Management Team |
| President of Corning Technologies (2001–2005); | | |
| Director of Corning Incorporated and Dow Corning; | R. Gregory Barton | Michael S. Miller |
| Trustee of the Corning Incorporated Foundation and | Mortimer J. Buckley | James M. Norris |
| the Corning Museum of Glass; Overseer of the | Kathleen C. Gubanich | Glenn W. Reed |
| Amos Tuck School of Business Administration at | Paul A. Heller | George U. Sauter |
| Dartmouth College. | | |
| |
| | Chairman Emeritus and Senior Advisor |
| Executive Officers | | |
| | John J. Brennan | |
| Glenn Booraem | Chairman, 1996–2009 | |
| Born 1967. Controller Since July 2010. Principal | Chief Executive Officer and President, 1996–2008 |
| Occupation(s) During the Past Five Years: Principal | | |
| of The Vanguard Group, Inc.; Controller of each of | | |
| the investment companies served by The Vanguard | Founder | |
| Group since 2010; Assistant Controller of each of | | |
| the investment companies served by The Vanguard | John C. Bogle | |
| Group (2001–2010) . | Chairman and Chief Executive Officer, 1974–1996 |
| |
| Thomas J. Higgins | | |
| Born 1957. Chief Financial Officer Since September | | |
| 2008. Principal Occupation(s) During the Past Five | | |
| Years: Principal of The Vanguard Group, Inc.; Chief | | |
| Financial Officer of each of the investment companies | | |
| served by The Vanguard Group since 2008; Treasurer | | |
| of each of the investment companies served by The | | |
| Vanguard Group (1998–2008) . | | |
1 Mr. McNabb is considered an “interested person,” as defined in the Investment Company Act of 1940, because he is an officer of the Vanguard funds.
2 December 2002 for Vanguard Equity Income Fund, Vanguard Growth Equity Fund, the Vanguard Municipal Bond Funds, and the Vanguard State Tax-Exempt Funds.
| |
| P.O. Box 2600 |
| Valley Forge, PA 19482-2600 |
Connect with Vanguard® > vanguard.com
| |
| Fund Information > 800-662-7447 | “FTSE®” is a trademark jointly owned by the London |
| Direct Investor Account Services > 800-662-2739 | Stock Exchange plc and The Financial Times Limited |
| Institutional Investor Services > 800-523-1036 | and is used by FTSE International Limited under license. |
| Text Telephone for People | ”All-World” is a trademark of FTSE International |
| With Hearing Impairment > 800-749-7273 | Limited. The FTSE All-World ex US Index and FTSE |
| Global Small Cap ex US Index are calculated by FTSE |
| | International Limited. FTSE International Limited does |
| This material may be used in conjunction | not sponsor, endorse, or promote the funds; is not in |
| with the offering of shares of any Vanguard | any way connected to them; and does not accept any |
| fund only if preceded or accompanied by | liability in relation to their issue, operation, and |
| the fund’s current prospectus. | trading. |
| |
| All comparative mutual fund data are from Lipper Inc. or | |
| Morningstar, Inc., unless otherwise noted. | |
| |
| You can obtain a free copy of Vanguard’s proxy voting | |
| guidelines by visiting vanguard.com/proxyreporting or by | |
| calling Vanguard at 800-662-2739. The guidelines are | |
| also available from the SEC’s website, sec.gov. In | |
| addition, you may obtain a free report on how your fund | |
| voted the proxies for securities it owned during the 12 | |
| months ended June 30. To get the report, visit either | |
| vanguard.com/proxyreporting or sec.gov. | |
| |
| You can review and copy information about your fund at | |
| the SEC’s Public Reference Room in Washington, D.C. To | |
| find out more about this public service, call the SEC at | |
| 202-551-8090. Information about your fund is also | |
| available on the SEC’s website, and you can receive | |
| copies of this information, for a fee, by sending a | |
| request in either of two ways: via e-mail addressed to | |
| publicinfo@sec.gov or via regular mail addressed to the | |
| Public Reference Section, Securities and Exchange | |
| Commission, Washington, DC 20549-1520. | |
| |
| |
| | © 2010 The Vanguard Group, Inc. |
| | All rights reserved. |
| | Vanguard Marketing Corporation, Distributor. |
| |
| | Q7700 122010 |
Item 2: Code of Ethics. The Registrant has adopted a code of ethics that applies to the Registrant’s principal executive officer, principal financial officer, principal accounting officer or controller or persons performing similar functions. The Code of Ethics was amended during the reporting period covered by this report to make certain technical, non-material changes.
Item 3: Audit Committee Financial Expert. The following members of the Audit Committee have been determined by the Registrant’s Board of Trustees to be Audit Committee Financial Experts serving on its Audit Committee, and to be independent: Charles D. Ellis, Rajiv L. Gupta, JoAnn Heffernan Heisen, André F. Perold, and Alfred M. Rankin, Jr.
Item 4: Principal Accountant Fees and Services.
(a) Audit Fees.
Audit Fees of the Registrant
Fiscal Year Ended October 31, 2010: $214,000
Fiscal Year Ended October 31, 2009: $212,000
Aggregate Audit Fees of Registered Investment Companies in the Vanguard Group.
Fiscal Year Ended October 31, 2010: $3,607,060
Fiscal Year Ended October 31, 2009: $3,354,640
(b) Audit-Related Fees.
Fiscal Year Ended October 31, 2010: $791,350
Fiscal Year Ended October 31, 2009: $876,210
Includes fees billed in connection with assurance and related services provided to the Registrant, The Vanguard Group, Inc., Vanguard Marketing Corporation, and other registered investment companies in the Vanguard Group.
(c) Tax Fees.
Fiscal Year Ended October 31, 2010: $336,090
Fiscal Year Ended October 31, 2009: $423,070
Includes fees billed in connection with tax compliance, planning and advice services provided to the Registrant, The Vanguard Group, Inc., Vanguard Marketing Corporation, and other registered investment companies in the Vanguard Group and related to income and excise taxes.
(d) All Other Fees.
Fiscal Year Ended October 31, 2010: $16,000
Fiscal Year Ended October 31, 2009: $0
Includes fees billed for services related to risk management and privacy matters. Services were provided to the Registrant, The Vanguard Group, Inc., Vanguard Marketing Corporation, and other registered investment companies in the Vanguard Group.
(e) (1) Pre-Approval Policies. The policy of the Registrant’s Audit Committee is to consider and, if appropriate, approve before the principal accountant is engaged for such services, all specific audit and non-audit services provided to: (1) the Registrant; (2) The Vanguard Group, Inc.; (3) other entities controlled by The Vanguard Group, Inc. that provide ongoing services to the Registrant; and (4) other registered investment companies in the Vanguard Group. In making a determination, the Audit Committee considers whether the services are consistent with maintaining the principal accountant’s independence.
In the event of a contingency situation in which the principal accountant is needed to provide services in between scheduled Audit Committee meetings, the Chairman of the Audit Committee would be called on to consider and, if appropriate, pre-approve audit or permitted non-audit services in an amount sufficient to complete services through the next Audit Committee meeting, and to determine if such services would be consistent with maintaining the accountant’s independence. At the next scheduled Audit Committee meeting, services and fees would be presented to the Audit Committee for formal consideration, and, if appropriate, approval by the entire Audit Committee. The Audit Committee would again consider whether such services and fees are consistent with maintaining the principal accountant’s independence.
The Registrant’s Audit Committee is informed at least annually of all audit and non-audit services provided by the principal accountant to the Vanguard complex, whether such services are provided to: (1) the Registrant; (2) The Vanguard Group, Inc.; (3) other entities controlled by The Vanguard Group, Inc. that provide ongoing services to the Registrant; or (4) other registered investment companies in the Vanguard Group.
(2) No percentage of the principal accountant’s fees or services were approved pursuant to the waiver provision of paragraph (c)(7)(i)(C) of Rule 2-01 of Regulation S-X.
(f) For the most recent fiscal year, over 50% of the hours worked under the principal accountant’s engagement were not performed by persons other than full-time, permanent employees of the principal accountant.
(g) Aggregate Non-Audit Fees.
Fiscal Year Ended October 31, 2010: $352,090
Fiscal Year Ended October 31, 2009: $423,070
Includes fees billed for non-audit services provided to the Registrant, The Vanguard Group, Inc., Vanguard Marketing Corporation, and other registered investment companies in the Vanguard Group.
(h) For the most recent fiscal year, the Audit Committee has determined that the provision of all non-audit services was consistent with maintaining the principal accountant’s independence.
Item 5: Audit Committee of Listed Registrants. The Registrant is a listed issuer as defined in Rule 10A-3 under the Securities Exchange Act of 1934 (“Exchange Act”). The Registrant has a separately-designated standing audit committee established in accordance with Section 3(a)(58)(A) of the Exchange Act. The Registrant’s audit committee members are: Emerson U. Fullwood, Rajiv L. Gupta, Amy Gutmann, JoAnn Heffernan Heisen, F. Joseph Loughrey, André F. Perold, Alfred M. Rankin, Jr., and Peter F. Volanakis.
Item 6: Investments.
Not Applicable.
Item 7: Disclosure of Proxy Voting Policies and Procedures for Closed-End Management Investment Companies.
Not Applicable.
Item 8: Portfolio Managers of Closed-End Management Investment Companies.
Not Applicable.
Item 9: Purchase of Equity Securities by Closed-End Management Investment Company and Affiliated Purchasers.
Not Applicable.
Item 10: Submission of Matters to a Vote of Security Holders.
Not Applicable.
Item 11: Controls and Procedures.
(a) Disclosure Controls and Procedures. The Principal Executive and Financial Officers concluded that the Registrant's Disclosure Controls and Procedures are effective based on their evaluation of the Disclosure Controls and Procedures as of a date within 90 days of the filing date of this report.
(b) Internal Control Over Financial Reporting. There were no significant changes in Registrant’s Internal Control Over Financial Reporting or in other factors that could significantly affect this control subsequent to the date of the evaluation, including any corrective actions with regard to significant deficiencies and material weaknesses.
Item 12: Exhibits.
(a) Code of Ethics.
(b) Certifications.
Pursuant to the requirements of the Securities Exchange Act of 1934 and the Investment Company Act of 1940, the registrant has duly caused this report to be signed on its behalf by the undersigned, thereunto duly authorized.
| |
| | VANGUARD INTERNATIONAL EQUITY INDEX FUNDS |
| |
| By: | /s/ F. WILLIAM MCNABB III* |
| | F. WILLIAM MCNABB III |
| | CHIEF EXECUTIVE OFFICER |
| |
| Date: December 20, 2010 |
Pursuant to the requirements of the Securities Exchange Act of 1934 and the Investment Company Act of 1940, this report has been signed below by the following persons on behalf of the registrant and in the capacities and on the dates indicated.
| |
| | VANGUARD INTERNATIONAL EQUITY INDEX FUNDS |
| |
| By: | /s/ F. WILLIAM MCNABB III* |
| | F. WILLIAM MCNABB III |
| | CHIEF EXECUTIVE OFFICER |
| |
| Date: December 20, 2010 |
| |
| | VANGUARD INTERNATIONAL EQUITY INDEX FUNDS |
| |
| By: | /s/ THOMAS J. HIGGINS* |
| | THOMAS J. HIGGINS |
| | CHIEF FINANCIAL OFFICER |
| |
| Date: December 20, 2010 |
* By: /s/ Heidi Stam
Heidi Stam, pursuant to a Power of Attorney filed on April 26, 2010, see file Number
33-53683, Incorporated by Reference.