UNITED STATES
SECURITIES AND EXCHANGE COMMISSION
Washington, D.C. 20549
FORM N-CSR
CERTIFIED SHAREHOLDER REPORT
OF
REGISTERED MANAGEMENT INVESTMENT COMPANIES
Investment Company Act file number: 811-5972
Name of Registrant: Vanguard International Equity Index Funds
Address of Registrant:
P.O. Box 2600
Valley Forge, PA 19482
Name and address of agent for service:
Heidi Stam, Esquire
P.O. Box 876
Valley Forge, PA 19482
Registrant’s telephone number, including area code: (610) 669-1000
Date of fiscal year end: October 31
Date of reporting period: November 1, 2010 – April 30, 2011
Item 1: Reports to Shareholders
 |
| Vanguard International Stock |
| Index Funds Semiannual Report |
|
| April 30, 2011 |
| |
 |
| |
| |
| Vanguard European Stock Index Fund |
| Vanguard Pacific Stock Index Fund |
| Vanguard Emerging Markets Stock Index Fund |
> For the six months ended April 30, returns for the Vanguard International Stock Index Funds ranged from almost 9% for the Pacific Stock Index Fund to about 15% for the European Stock Index Fund.
> Amid unsettling news about economic challenges, political upheavals, and the Japanese disasters, returns from international markets generally lagged that of the broad U.S. stock market.
> Stocks in the materials, energy, and industrial sectors were among the top performers in both developed and emerging markets.
| |
| Contents | |
| Your Fund’s Total Returns. | 1 |
| Chairman’s Letter. | 4 |
| European Stock Index Fund. | 10 |
| Pacific Stock Index Fund. | 30 |
| Emerging Markets Stock Index Fund. | 49 |
| About Your Fund’s Expenses. | 71 |
| Trustees Approve Advisory Arrangements. | 74 |
| Glossary. | 75 |
European Stock Index Fund
Pacific Stock Index Fund
Emerging Markets Stock Index Fund
Please note: The opinions expressed in this report are just that—informed opinions. They should not be considered promises or advice. Also, please keep in mind that the information and opinions cover the period through the date on the front of this report. Of course, the risks of investing in your fund are spelled out in the prospectus.
See the Glossary for definitions of investment terms used in this report.
Cover photograph: Jean Maher.
Your Fund’s Total Returns
| |
| Six Months Ended April 30, 2011 | |
| | Total |
| | Returns |
| Vanguard European Stock Index Fund | |
| Investor Shares | 15.00% |
| Admiral™ Shares | 15.07 |
| Signal® Shares | 15.02 |
| Institutional Shares | 15.07 |
| ETF Shares | |
| Market Price | 15.22 |
| Net Asset Value | 15.08 |
| MSCI Europe Index | 15.16 |
| European Region Funds Average | 14.64 |
| European Region Funds Average: Derived from data provided by Lipper Inc. | |
| Vanguard Pacific Stock Index Fund | |
| Investor Shares | 8.64% |
| Admiral™ Shares | 8.74 |
| Signal® Shares | 8.74 |
| Institutional Shares | 8.69 |
| ETF Shares | |
| Market Price | 9.30 |
| Net Asset Value | 8.73 |
| MSCI Pacific Index | 8.30 |
| Japan/Pacific Region Funds Average | 8.57 |
| Japan/Pacific Region Funds Average: Derived from data provided by Lipper Inc. | |
Admiral Shares carry lower expenses and are available to investors who meet certain account-balance requirements. Signal, Institutional, and Institutional Plus Shares are available to certain institutional investors who meet specific administrative, service, and account-size criteria. The Vanguard ETF® Shares shown are traded on the NYSE Arca exchange and are available only through brokers. The table provides ETF returns based on both the NYSE Arca market price and the net asset value for a share. U.S. Pat. No. 6,879,964 B2; 7,337,138.
1
Your Fund’s Total Returns
| |
| Six Months Ended April 30, 2011 | |
| | Total |
| | Returns |
| Vanguard Emerging Markets Stock Index Fund | |
| Investor Shares | 9.93% |
| Admiral™ Shares | 10.01 |
| Signal® Shares | 10.03 |
| Institutional Shares | 10.05 |
| Institutional Plus Shares (Inception: 12/15/2010) | 8.91 |
| ETF Shares | |
| Market Price | 9.82 |
| Net Asset Value | 10.02 |
| MSCI Emerging Markets Index | 9.74 |
| Emerging Markets Funds Average | 7.68 |
| Emerging Markets Funds Average: Derived from data provided by Lipper Inc. | |
Admiral Shares carry lower expenses and are available to investors who meet certain account-balance requirements. Signal, Institutional, and Institutional Plus Shares are available to certain institutional investors who meet specific administrative, service, and account-size criteria. The Vanguard ETF® Shares shown are traded on the NYSE Arca exchange and are available only through brokers. The table provides ETF returns based on both the NYSE Arca market price and the net asset value for a share. U.S. Pat. No. 6,879,964 B2; 7,337,138.
For the ETF Shares, the market price is determined by the midpoint of the bid-offer spread as of the closing time of the New York Stock Exchange (generally 4 p.m., Eastern time). The net asset value is also determined as of the NYSE closing time. For more information about how the ETF Shares' market prices have compared with their net asset value, visit vanguard.com, select your ETF, and then select the Price and Performance tab. The ETF premium/discount analysis there shows the percentages of days on which the ETF Shares' market price was above or below the NAV.
2
Your Fund’s Performance at a Glance
| | | | |
| October 31, 2010 , Through April 30, 2011 | | | | |
| | | | Distributions Per Share |
| | Starting | Ending | Income | Capital |
| | Share Price | Share Price | Dividends | Gains |
| Vanguard European Stock Index Fund | | | | |
| Investor Shares | $27.15 | $30.06 | $1.007 | $0.000 |
| Admiral Shares | 63.75 | 70.05 | 2.862 | 0.000 |
| Signal Shares | 24.68 | 27.10 | 1.115 | 0.000 |
| Institutional Shares | 27.20 | 29.88 | 1.228 | 0.000 |
| ETF Shares | 51.00 | 56.03 | 2.306 | 0.000 |
| Vanguard Pacific Stock Index Fund | | | | |
| Investor Shares | $10.40 | $10.96 | $0.330 | $0.000 |
| Admiral Shares | 68.06 | 71.18 | 2.751 | 0.000 |
| Signal Shares | 23.64 | 24.72 | 0.961 | 0.000 |
| Institutional Shares | 10.42 | 10.89 | 0.424 | 0.000 |
| ETF Shares | 55.06 | 57.57 | 2.243 | 0.000 |
| Vanguard Emerging Markets Stock Index Fund | | | | |
| Investor Shares | $29.49 | $31.95 | $0.434 | $0.000 |
| Admiral Shares | 38.82 | 42.00 | 0.653 | 0.000 |
| Signal Shares | 37.34 | 40.39 | 0.644 | 0.000 |
| Institutional Shares | 29.55 | 31.95 | 0.528 | 0.000 |
| Institutional Plus Shares | 99.35 | 106.31 | 1.754 | 0.000 |
| (Inception: 12/15/2010) | | | | |
| ETF Shares | 46.70 | 50.50 | 0.815 | 0.000 |
3

Chairman’s Letter
Dear Shareholder,
Although international stocks lagged the returns of their U.S. counterparts, they still performed well during a period plagued by tribulations. Despite political turmoil in North Africa and the Middle East, natural and nuclear disasters in Japan, and ongoing debt worries in Europe, international markets generally produced gains for the six months ended April 30, 2011.
All three of Vanguard’s International Stock Index Funds posted solid returns for the period. The European Index Fund was the top performer of the group, returning about 15%. Vanguard Emerging Markets Index Fund was next in line with a gain of about 10%, while Vanguard Pacific Index Fund returned almost 9%. All three funds closely tracked their target indexes for the period.
For U.S.-based investors, the dollar’s six-month decline against most major currencies enhanced returns from international markets. (See the box on page 7 for more information about how currency exchange rates affected returns.)
In the face of tumultuous news, global markets held strong
International stock markets in aggregate produced a robust six-month return of more than 12% in U.S. dollars. For U.S.-based investors, almost half of this return reflected exchange-rate gains produced by strength in the euro and currencies in emerging markets.
4
The U.S. stock market was better able to shrug off the headlines about political upheaval, the Japanese nuclear crisis, and economic distress abroad, as well as continuing worries at home. The broad U.S. market gained more than 17% for the six months. Although rising food and gasoline prices put pressure on consumer budgets, corporate earnings growth remained strong, and the pace of new job creation bounced back from extremely depressed levels.
Outside the United States, global stock markets in aggregate produced a smaller but still robust six-month return of 12.44%.
As the economy found its footing, U.S. interest rates edged higher
Rising longer-term interest rates put pressure on bond prices, restraining fixed income returns for the six-month period. The broad taxable U.S. bond market had a flat return, while the broad municipal market returned –1.68%. The climb in rates reflected both confidence that the economic recovery would prove self-sustaining and anxiety that higher rates would be necessary to help curb inflation. Even so, inflation expectations remained subdued, as measured by the difference between the yields of nominal and inflation-protected U.S. Treasury bonds.
| | | |
| Market Barometer | | | |
| |
| | | | Total Returns |
| | | Periods Ended April 30, 2011 |
| | Six | One | Five Years |
| | Months | Year | (Annualized) |
| Stocks | | | |
| Russell 1000 Index (Large-caps) | 17.12% | 18.02% | 3.30% |
| Russell 2000 Index (Small-caps) | 23.73 | 22.20 | 3.89 |
| Dow Jones U.S. Total Stock Market Index | 17.28 | 18.40 | 3.65 |
| MSCI All Country World Index ex USA (International) | 12.44 | 19.73 | 3.55 |
| |
| Bonds | | | |
| Barclays Capital U.S. Aggregate Bond Index (Broad | | | |
| taxable market) | 0.02% | 5.36% | 6.33% |
| Barclays Capital Municipal Bond Index (Broad | | | |
| tax-exempt market) | -1.68 | 2.20 | 4.52 |
| Citigroup Three-Month U.S. Treasury Bill Index | 0.06 | 0.15 | 2.02 |
| |
| CPI | | | |
| Consumer Price Index | 2.83% | 3.16% | 2.22% |
5
The return from short-term money market instruments such as the 3-month U.S. Treasury bill remained near 0%, consistent with the Federal Reserve’s target for short-term rates.
Returns from Europe trumped emerging and Pacific markets
European stocks produced impressive returns for the half-year. Despite ongoing debt concerns in some of the region’s troubled economies, investors seemed to have priced in the worry, and every developed market but one posted gains—mostly in the double digits. In this environment, the European Stock Index Fund returned about 15%. The United Kingdom, which made up about one-third of the target index’s capitalization, added the most to the fund’s total return. Markets in Germany, France, and Switzerland were also large contributors.
Greece—which is still struggling with severe sovereign-debt issues—was the sole market to record a loss for the period. However, since the Greek market accounts for less than 1% of the value of the MSCI Europe Index, the effect on the overall return was minimal.
All ten industry sectors in the index posted gains for the period. Industrial, energy, materials, and financial stocks
| | | | | | | |
| Expense Ratios | | | | | | | |
| Your Fund Compared With Its Peer Group | | | | | | |
| | | | | | | | Peer |
| | Investor | Admiral | Signal | Institutional | Institutional | ETF | Group |
| | Shares | Shares | Shares | Shares | Plus Shares | Shares | Average |
| European Stock Index Fund | 0.26% | 0.14% | 0.14% | 0.10% | — | 0.14% | 1.43% |
| Pacific Stock Index Fund | 0.26 | 0.14 | 0.14 | 0.10 | — | 0.14 | 1.61 |
| Emerging Markets Stock Index | | | | | | | |
| Fund | 0.35 | 0.22 | 0.22 | 0.15 | 0.12% | 0.22 | 1.68 |
The fund expense ratios shown are from the prospectus dated February 25, 2011, and represent estimated costs for the current fiscal year. For the six months ended April 30, 2011, the funds’ annualized expense ratios were: for the European Stock Index Fund, 0.26% for Investor Shares, 0.14% for Admiral Shares, 0.14% for Signal Shares, 0.10% for Institutional Shares, and 0.14% for ETF Shares; for the Pacific Stock Index Fund, 0.26% for Investor Shares, 0.14% for Admiral Shares, 0.14% for Signal Shares, 0.10% for Institutional Shares, and 0.14% for ETF Shares; and for the Emerging Markets Stock Index Fund, 0.35% for Investor Shares, 0.22% for Admiral Shares, 0.22% for Signal Shares, 0.15% for Institutional Shares, 0.12% for Institutional Plus Shares (for the period since inception), and 0.22% for ETF Shares.
Peer groups: For the European Stock Index Fund, European Region Funds; for the Pacific Stock Index Fund, Japan/Pacific Region Funds; for the Emerging Markets Stock Index Fund, Emerging Markets Funds.
6
were the biggest contributors to performance, benefiting from a sharp rise in crude oil and commodity prices and from growth opportunities in emerging markets. Together, these four sectors contributed almost 10 percentage points to the index’s total return.
Australia’s strong returns boosted overall Pacific performance
The Pacific Stock Index Fund returned almost 9% for the six months, lagging the gains of the European and emerging markets funds in large part because of weak results from Japan. The Australian
|
| Investment insight |
| A note on foreign currency translation effects |
| When you buy stocks of companies based outside of your home country, you gain |
| exposure to a wider array of economic and market forces, including the dynamics |
| of the foreign exchange markets. |
| |
| The exchange rate of the U.S. dollar versus another currency is the price at which |
| the dollar can be converted into that currency. For example, if the exchange rate |
| of the U.S. dollar versus Britain’s pound sterling is $1.50, it takes 1.5 dollars to |
| purchase 1 pound. If the U.S. dollar weakens—say, to a rate of $2.00—then you’ll |
| need 2 dollars to buy 1 pound. Conversely, if the dollar strengthens to $1.25, it will |
| take fewer dollars to buy a pound. |
| |
| The price of one currency relative to another is determined by supply and demand |
| factors—including interest rates, the strength of the two economies, and geopolitical |
| risks. In the long run, the portfolio effects of exchange-rate movements tend to |
| balance out. But a rise or fall in the dollar’s value versus other currencies can influence |
| short-term returns. Exchange-rate changes also affect the purchasing power of each |
| new dollar you invest in foreign stocks, just as they affect the prices of foreign goods. |
| And they can have a less immediately visible impact on a company’s profits, |
| ultimately driving its stock price. |
| |
| Performance during the period |
| From October 31, 2010, through April 30, 2011, most major currencies rose in value |
| against the U.S. dollar. In part, this reflected the Federal Reserve’s policy of holding |
| short-term interest rates near zero while some foreign central banks raised rates. For |
| U.S.-based investors, the shrinking dollar boosted returns earned in markets abroad. |
| For example: The MSCI Europe Index returned more than 15% when translated into |
| U.S. dollars, and the MSCI Emerging Markets Index returned nearly 10% in dollars— |
| both nearly double the indexes’ local-currency returns. |
7
market, which accounted for about a quarter of the MSCI Pacific Index’s capitalization, was the biggest contributor to performance. It returned about 18% for the period and added more than 4 percentage points to the index’s total return.
Japan, of course, suffered a series of disasters starting with the March 11 earthquake and tsunami that led to a continuing nuclear crisis. Nonetheless, the Japanese market—which represented almost two-thirds of the index—returned about 5% for the period. The other three countries in the Pacific index, Hong Kong, Singapore, and New Zealand, also posted gains.
The index recorded positive results in nine of ten market sectors; utilities declined Stocks in the financial, materials, and industrial sectors benefited the region’s return the most.
Inflation fears in China and India hindered emerging markets’ results
Although returns from developing countries were more muted than they’ve been in the recent past, the Emerging Markets Stock Index Fund posted a solid gain of about 10% for the six months.
Investors’ concern about inflation hurt several emerging markets, most significantly China, the largest component in the target index, and India. Both countries have tightened their monetary policies to counter rising food and energy prices. Although the Chinese market mustered a small gain of about 1%, Indian stocks declined by almost 6% for the period.
South Korea and Russia were the top performers in the MSCI Emerging Markets Index. Auto and information technology stocks lifted South Korea’s return, while the Russian market’s robust gains came from oil, natural gas, and mining.
Across all emerging markets, the index posted gains in nine of ten market sectors, led by double-digit returns for energy, materials, information technology, and consumer discretionary stocks. Health care stocks declined.
International funds offer an opportunity to diversify
Most markets abroad lagged the broad U.S. market for the six-month span covered in this letter. As investors, we know to expect periods like this—when domestic stocks outperform international stocks, or vice versa. And then there are times when one asset class does better than another, as well as times when both stocks and bonds perform exceptionally well, quite poorly, or somewhere in between. The financial markets are, in a word, unpredictable.
8
At Vanguard, we believe that the best way to deal with the market’s short-term volatility is to tune it out and, instead, focus on the long term. We counsel investors to create an investment plan that includes a mix of stock funds (both domestic and international), bond funds, and money market funds that are appropriate for their goals and risk tolerance—and to stick with that plan regardless of market conditions.
Each of Vanguard’s International Stock Index Funds offers broad exposure to a specific segment of the international markets at a low cost. Any one of these funds can help diversify a well-balanced portfolio.
Thank you for entrusting your assets to Vanguard.
Sincerely,
F. William McNabb III
Chairman and Chief Executive Officer
May 13, 2011
9
European Stock Index Fund
Fund Profile
As of April 30, 2011
| | | | | |
| Share-Class Characteristics | | | | | |
| | Investor | Admiral | Signal | Institutional | ETF |
| | Shares | Shares | Shares | Shares | Shares |
| Ticker Symbol | VEURX | VEUSX | VESSX | VESIX | VGK |
| Expense Ratio1 | 0.26% | 0.14% | 0.14% | 0.10% | 0.14% |
| | | |
| Portfolio Characteristics | | |
| | | | MSCI AC |
| | | MSCI | World |
| | | Europe | Index |
| | Fund | Index | ex USA |
| Number of Stocks | 482 | 465 | 1,869 |
| Median Market Cap | $57.9B | $57.9B | $33.8B |
| Price/Earnings Ratio | 12.9x | 12.9x | 13.8x |
| Price/Book Ratio | 1.7x | 1.7x | 1.7x |
| Return on Equity | 19.3% | 19.3% | 17.8% |
| Earnings Growth Rate | -0.7% | -0.7% | 2.8% |
| Dividend Yield | 3.3% | 3.3% | 2.9% |
| Turnover Rate | | | |
| (Annualized) | 6% | — | — |
| Short-Term Reserves | 0.1% | — | — |
| | | |
| Sector Diversification (% of equity exposure) |
| | | | MSCI AC |
| | | MSCI | World |
| | | Europe | Index |
| | Fund | Index | ex USA |
| Consumer | | | |
| Discretionary | 8.6% | 8.7% | 9.0% |
| Consumer Staples | 11.8 | 11.8 | 8.5 |
| Energy | 11.2 | 11.2 | 11.6 |
| Financials | 21.7 | 21.6 | 24.8 |
| Health Care | 9.6 | 9.6 | 5.9 |
| Industrials | 11.5 | 11.5 | 11.0 |
| Information | | | |
| Technology | 3.1 | 3.1 | 6.3 |
| Materials | 10.6 | 10.6 | 13.0 |
| Telecommunication | | | |
| Services | 6.5 | 6.5 | 5.7 |
| Utilities | 5.4 | 5.4 | 4.2 |
| | |
| Volatility Measures | | |
| | | MSCI AC |
| | MSCI Europe | World Index |
| | Index | ex USA |
| R-Squared | 0.99 | 0.96 |
| Beta | 1.04 | 1.09 |
These measures show the degree and timing of the fund’s fluctuations compared with the indexes over 36 months.
| | |
| Ten Largest Holdings (% of total net assets) |
| Royal Dutch Shell plc | Integrated Oil & | |
| | Gas | 3.0% |
| Nestle SA | Packaged Foods & | |
| | Meats | 2.7 |
| HSBC Holdings plc | Diversified Banks | 2.4 |
| Vodafone Group plc | Wireless | |
| | Telecommunication | |
| | Services | 1.9 |
| BP plc | Integrated Oil & | |
| | Gas | 1.8 |
| Total SA | Integrated Oil & | |
| | Gas | 1.7 |
| Novartis AG | Pharmaceuticals | 1.5 |
| Siemens AG | Industrial | |
| | Conglomerates | 1.5 |
| Roche Holding AG | Pharmaceuticals | 1.4 |
| GlaxoSmithKline plc | Pharmaceuticals | 1.4 |
| Top Ten | | 19.3% |
The holdings listed exclude any temporary cash investments and equity index products.
1 The expense ratios shown are from the prospectus dated February 25, 2011, and represent estimated costs for the current fiscal year. For the six months ended April 30, 2011, the annualized expense ratios were 0.26% for Investor Shares, 0.14% for Admiral Shares, 0.14% for Signal Shares, 0.10% for Institutional Shares, and 0.14% for ETF Shares.
10
European Stock Index Fund
| | | |
| Market Diversification (% of equity exposure) |
| | | | MSCI AC |
| | | MSCI | World |
| | | Europe | Index |
| | Fund | Index | ex USA |
| Europe | | | |
| United Kingdom | 32.4% | 32.3% | 14.7% |
| France | 15.5 | 15.6 | 7.1 |
| Germany | 13.5 | 13.5 | 6.2 |
| Switzerland | 12.0 | 12.1 | 5.5 |
| Spain | 5.5 | 5.5 | 2.5 |
| Sweden | 4.9 | 4.9 | 2.3 |
| Italy | 4.5 | 4.5 | 2.0 |
| Netherlands | 3.9 | 3.9 | 1.8 |
| Finland | 1.6 | 1.6 | 0.7 |
| Denmark | 1.6 | 1.6 | 0.7 |
| Belgium | 1.5 | 1.4 | 0.7 |
| Norway | 1.4 | 1.4 | 0.6 |
| Other | 1.7 | 1.7 | 0.8 |
| Subtotal | 100.0% | 100.0% | 45.6% |
| Pacific | 0.0% | 0.0% | 22.3% |
| Emerging Markets | 0.0% | 0.0% | 23.5% |
| Middle East | 0.0% | 0.0% | 0.5% |
| North America | 0.0% | 0.0% | 8.1% |
11
European Stock Index Fund
Performance Summary
All of the returns in this report represent past performance, which is not a guarantee of future results that may be achieved by the fund. (Current performance may be lower or higher than the performance data cited. For performance data current to the most recent month-end, visit our website at vanguard.com/performance.) Note, too, that both investment returns and principal value can fluctuate widely, so an investor’s shares, when sold, could be worth more or less than their original cost. The returns shown do not reflect taxes that a shareholder would pay on fund distributions or on the sale of fund shares.
Fiscal-Year Total Returns (%): October 31, 2000, Through April 30, 2011
Average Annual Total Returns: Periods Ended March 31, 2011
This table presents returns through the latest calendar quarter—rather than through the end of the fiscal period.
Securities and Exchange Commission rules require that we provide this information.
| | | | |
| | Inception | One | Five | Ten |
| | Date | Year | Years | Years |
| Investor Shares | 6/18/1990 | 12.80% | 2.18% | 5.75% |
| Admiral Shares | 8/13/2001 | 12.92 | 2.29 | 6.391 |
| Signal Shares | 10/6/2006 | 12.91 | — | 0.541 |
| Institutional Shares | 5/15/2000 | 12.97 | 2.33 | 5.90 |
| ETF Shares | 3/4/2005 | | | |
| Market Price | | 13.05 | 2.19 | 4.421 |
| Net Asset Value | | 12.93 | 2.29 | 4.391 |
| 1 Return since inception. | | | | |
Vanguard fund returns do not reflect the 2% fee on redemptions of shares held for less than two months.
See Financial Highlights for dividend and capital gains information.
12
European Stock Index Fund
Financial Statements (unaudited)
Statement of Net Assets—Investments Summary
As of April 30, 2011
This Statement summarizes the fund’s holdings by asset type. Details are reported for each of the fund’s 50 largest individual holdings and for investments that, in total for any issuer, represent more than 1% of the fund’s net assets. The total value of smaller holdings is reported as a single amount within each category.
The fund reports a complete list of its holdings in regulatory filings four times in each fiscal year, at the quarter-ends. For the second and fourth fiscal quarters, the complete listing of the fund’s holdings is available electronically on vanguard.com and on the Securities and Exchange Commission’s website (sec.gov), or you can have it mailed to you without charge by calling 800-662-7447. For the first and third fiscal quarters, the fund files the lists with the SEC on Form N-Q. Shareholders can look up the fund’s Forms N-Q on the SEC’s website. Forms N-Q may also be reviewed and copied at the SEC’s Public Reference Room (see the back cover of this report for further information).
| | | |
| | | Market | Percentage |
| | | Value | of Net |
| | Shares | ($000) | Assets |
| Common Stocks | | | |
| Austria † | | 43,786 | 0.5% |
| |
| Belgium | | | |
| ^ Anheuser-Busch InBev NV | 797,093 | 50,869 | 0.5% |
| Belgium—Other † | | 78,756 | 0.9% |
| | | 129,625 | 1.4% |
| Denmark | | | |
| Novo Nordisk A/S Class B | 461,347 | 58,403 | 0.7% |
| Denmark—Other † | | 84,381 | 0.9% |
| | | 142,784 | 1.6% |
| |
| Finland † | | 143,890 | 1.6% |
| |
| France | | | |
| Total SA | 2,330,419 | 149,243 | 1.7% |
| Sanofi-Aventis SA | 1,156,828 | 91,525 | 1.0% |
| BNP Paribas | 1,057,450 | 83,596 | 0.9% |
| ^ GDF Suez | 1,364,697 | 55,802 | 0.6% |
| LVMH Moet Hennessy Louis Vuitton SA | 270,274 | 48,524 | 0.6% |
| France Telecom SA | 2,044,026 | 47,900 | 0.6% |
| ^ Schneider Electric SA | 268,080 | 47,363 | 0.5% |
| France—Other † | | 849,951 | 9.5% |
| | | 1,373,904 | 15.4% |
| Germany | | | |
| Siemens AG | 907,949 | 132,069 | 1.5% |
| * BASF SE | 1,012,025 | 103,919 | 1.2% |
| Bayer AG | 912,463 | 80,109 | 0.9% |
| Allianz SE | 500,622 | 78,653 | 0.9% |
| Daimler AG | 899,007 | 69,481 | 0.8% |
| E.ON AG | 1,987,143 | 67,919 | 0.7% |
| Deutsche Bank AG | 1,026,136 | 66,832 | 0.7% |
13
European Stock Index Fund
| | | | |
| | | | Market | Percentage |
| | | | Value• | of Net |
| | | Shares | ($000) | Assets |
| | SAP AG | 947,291 | 61,025 | 0.7% |
| | Deutsche Telekom AG | 3,126,215 | 51,665 | 0.6% |
| | Germany—Other † | | 486,150 | 5.4% |
| | | | 1,197,822 | 13.4% |
| |
| Greece † | | 32,897 | 0.4% |
| |
| Ireland † | | 35,736 | 0.4% |
| |
| Italy | | | |
| | ENI SPA | 2,874,153 | 76,952 | 0.8% |
| | Enel SPA | 7,252,949 | 51,723 | 0.6% |
| | Italy—Other † | | 265,520 | 3.0% |
| | | | 394,195 | 4.4% |
| Netherlands | | | |
| | Unilever NV | 1,799,275 | 59,233 | 0.7% |
| * | ING Groep NV | 4,225,778 | 55,671 | 0.6% |
| | Unilever plc | 1,414,927 | 45,966 | 0.6% |
| | Netherlands—Other † | | 183,813 | 2.0% |
| | | | 344,683 | 3.9% |
| |
| Norway † | | 124,233 | 1.4% |
| |
| Portugal † | | 35,919 | 0.4% |
| |
| Spain | | | |
| | Telefonica SA | 4,455,503 | 119,698 | 1.3% |
| | Banco Santander SA | 9,186,870 | 117,321 | 1.3% |
| | Banco Bilbao Vizcaya Argentaria SA | 4,696,231 | 60,157 | 0.7% |
| | Spain—Other † | | 188,541 | 2.1% |
| | | | 485,717 | 5.4% |
| Sweden | | | |
| | Telefonaktiebolaget LM Ericsson Class B | 3,322,845 | 50,419 | 0.6% |
| | Sweden—Other † | | 386,227 | 4.3% |
| | | | 436,646 | 4.9% |
| Switzerland | | | |
| | Nestle SA | 3,821,146 | 237,172 | 2.7% |
| | Novartis AG | 2,327,473 | 138,020 | 1.6% |
| | Roche Holding AG | 775,049 | 125,806 | 1.4% |
| * | UBS AG | 3,989,354 | 79,837 | 0.9% |
| | ABB Ltd. | 2,412,494 | 66,622 | 0.7% |
| | Credit Suisse Group AG | 1,240,409 | 56,459 | 0.6% |
| ** | Switzerland—Other † | | 368,712 | 4.1% |
| | | | 1,072,628 | 12.0% |
| United Kingdom | | | |
| | HSBC Holdings plc | 19,500,933 | 212,717 | 2.4% |
| | Vodafone Group plc | 54,559,727 | 157,723 | 1.8% |
| | BP plc | 19,723,683 | 151,623 | 1.7% |
| | GlaxoSmithKline plc | 5,730,566 | 125,186 | 1.4% |
| | Rio Tinto plc | 1,598,947 | 116,669 | 1.3% |
| | Royal Dutch Shell plc Class B | 2,971,799 | 115,618 | 1.3% |
| | BHP Billiton plc | 2,429,519 | 102,721 | 1.1% |
| | British American Tobacco plc | 2,202,883 | 96,261 | 1.1% |
| | BG Group plc | 3,735,667 | 96,201 | 1.1% |
14
European Stock Index Fund
| | | | |
| | | | Market | Percentage |
| | | | Value | of Net |
| | | Shares | ($000) | Assets |
| Royal Dutch Shell plc Class A | | 2,470,510 | 95,434 | 1.1% |
| AstraZeneca plc | | 1,557,938 | 77,303 | 0.9% |
| Anglo American plc | | 1,456,166 | 76,332 | 0.8% |
| Standard Chartered plc | | 2,587,721 | 71,919 | 0.8% |
| Barclays plc | | 12,753,526 | 60,631 | 0.7% |
| Tesco plc | | 8,854,132 | 59,694 | 0.7% |
| Xstrata plc | | 2,288,819 | 58,707 | 0.6% |
| Diageo plc | | 2,759,096 | 56,130 | 0.6% |
| Royal Dutch Shell plc Class A | | 1,438,643 | 56,038 | 0.6% |
| Vodafone Group plc ADR | | 299,744 | 8,729 | 0.1% |
| BP plc ADR | | 167,389 | 7,723 | 0.1% |
| United Kingdom—Other † | | | 1,060,366 | 11.9% |
| | | | 2,863,725 | 32.1% |
| Total Common Stocks (Cost $10,260,375) | | 8,858,190 | 99.2%1 |
| |
| | Coupon | | | |
| Temporary Cash Investments | | | | |
| Money Market Fund | | | | |
| 2,3 Vanguard Market Liquidity Fund | 0.179% | 514,948,598 | 514,949 | 5.8% |
| 4U.S. Government and Agency Obligations † | | 6,999 | 0.1% |
| Total Temporary Cash Investments (Cost $521,947) | | 521,948 | 5.9%1 |
| Total Investments (Cost $10,782,322) | | 9,380,138 | 105.1% |
| Other Assets and Liabilities | | | | |
| Other Assets | | | 65,359 | 0.7% |
| Liabilities3 | | | (520,022) | (5.8%) |
| | | | (454,663) | (5.1%) |
| Net Assets | | | 8,925,475 | 100.0% |
| |
| At April 30, 2011, net assets consisted of: | |
| | Amount |
| | ($000) |
| Paid-in Capital | 12,552,141 |
| Undistributed Net Investment Income | 73,292 |
| Accumulated Net Realized Losses | (2,303,822) |
| Unrealized Appreciation (Depreciation) | |
| Investment Securities | (1,402,184) |
| Futures Contracts | 2,345 |
| Forward Currency Contracts | 2,335 |
| Foreign Currencies | 1,368 |
| Net Assets | 8,925,475 |
| |
| Investor Shares—Net Assets | |
| Applicable to 38,255,838 outstanding $.001 par value shares of | |
| beneficial interest (unlimited authorization) | 1,149,792 |
| Net Asset Value Per Share—Investor Shares | $30.06 |
15
European Stock Index Fund
| |
| | Amount |
| | ($000) |
| Admiral Shares—Net Assets | |
| Applicable to 45,902,169 outstanding $.001 par value shares of | |
| beneficial interest (unlimited authorization) | 3,215,535 |
| Net Asset Value Per Share—Admiral Shares | $70.05 |
| |
| Signal Shares—Net Assets | |
| Applicable to 11,014,572 outstanding $.001 par value shares of | |
| beneficial interest (unlimited authorization) | 298,541 |
| Net Asset Value Per Share—Signal Shares | $27.10 |
| |
| Institutional Shares—Net Assets | |
| Applicable to 23,224,194 outstanding $.001 par value shares of | |
| beneficial interest (unlimited authorization) | 693,930 |
| Net Asset Value Per Share—Institutional Shares | $29.88 |
| |
| ETF Shares—Net Assets | |
| Applicable to 63,679,848 outstanding $.001 par value shares of | |
| beneficial interest (unlimited authorization) | 3,567,677 |
| Net Asset Value Per Share—ETF Shares | $56.03 |
• See Note A in Notes to Financial Statements.
^ Part of security position is on loan to broker-dealers. The total value of securities on loan is $432,508,000.
* Non-income-producing security.
† Represents the aggregate value, by category, of securities that are not among the 50 largest holdings and, in total for any issuer, represent 1% or less of net assets.
**Certain of the fund’s securities are exempt from registration under Rule 144A of the Securities Act of 1933. Such securities may be sold in transactions exempt from registration, normally to qualified institutional buyers. At April 30, 2011, the aggregate value of these securities was $11,350,000, representing 0.1% of net assets.
1 The fund invests a portion of its cash reserves in equity markets through the use of index futures contracts. After giving effect to futures investments, the fund’s effective common stock and temporary cash investment positions represent 99.8% and 5.3%, respectively, of net assets.
2 Affiliated money market fund available only to Vanguard funds and certain trusts and accounts managed by Vanguard. Rate shown is the 7-day yield.
3 Includes $459,199,000 of collateral received for securities on loan.
4 Securities with a value of $3,500,000 have been segregated as initial margin for open futures contracts.
ADR—American Depositary Receipt.
See accompanying Notes, which are an integral part of the Financial Statements.
16
European Stock Index Fund
| |
| Statement of Operations | |
| |
| |
| | Six Months Ended |
| | April 30, 2011 |
| | ($000) |
| Investment Income | |
| Income | |
| Dividends1 | 123,143 |
| Interest2 | 61 |
| Security Lending | 1,536 |
| Total Income | 124,740 |
| Expenses | |
| The Vanguard Group—Note B | |
| Investment Advisory Services | 366 |
| Management and Administrative—Investor Shares | 837 |
| Management and Administrative—Admiral Shares | 1,475 |
| Management and Administrative—Signal Shares | 119 |
| Management and Administrative—Institutional Shares | 103 |
| Management and Administrative—ETF Shares | 1,292 |
| Marketing and Distribution—Investor Shares | 518 |
| Marketing and Distribution—Admiral Shares | 207 |
| Marketing and Distribution—Signal Shares | 38 |
| Marketing and Distribution—Institutional Shares | 148 |
| Marketing and Distribution—ETF Shares | 452 |
| Custodian Fees | 410 |
| Shareholders’ Reports—Investor Shares | 13 |
| Shareholders’ Reports—Admiral Shares | 11 |
| Shareholders’ Reports—Signal Shares | 2 |
| Shareholders’ Reports—Institutional Shares | 1 |
| Shareholders’ Reports—ETF Shares | 38 |
| Trustees’ Fees and Expenses | 5 |
| Total Expenses | 6,035 |
| Net Investment Income | 118,705 |
| Realized Net Gain (Loss) | |
| Investment Securities Sold | (231,795) |
| Futures Contracts | 1,946 |
| Foreign Currencies and Forward Currency Contracts | 3,623 |
| Realized Net Gain (Loss) | (226,226) |
| Change in Unrealized Appreciation (Depreciation) | |
| Investment Securities | 1,258,543 |
| Futures Contracts | 1,512 |
| Foreign Currencies and Forward Currency Contracts | (204) |
| Change in Unrealized Appreciation (Depreciation) | 1,259,851 |
| Net Increase (Decrease) in Net Assets Resulting from Operations | 1,152,330 |
1 Dividends are net of foreign withholding taxes of $12,509,000.
2 Interest income from an affiliated company of the fund was $53,000.
See accompanying Notes, which are an integral part of the Financial Statements.
17
European Stock Index Fund
| | |
| Statement of Changes in Net Assets | | |
| |
| | Six Months Ended | Year Ended |
| | April 30, | October 31, |
| | 2011 | 2010 |
| | ($000) | ($000) |
| Increase (Decrease) in Net Assets | | |
| Operations | | |
| Net Investment Income | 118,705 | 355,561 |
| Realized Net Gain (Loss) | (226,226) | (188,112) |
| Change in Unrealized Appreciation (Depreciation) | 1,259,851 | 955,785 |
| Net Increase (Decrease) in Net Assets Resulting from Operations | 1,152,330 | 1,123,234 |
| Distributions | | |
| Net Investment Income | | |
| Investor Shares | (39,214) | (233,922) |
| Admiral Shares | (127,944) | (66,666) |
| Signal Shares | (11,677) | (9,876) |
| Institutional Shares | (24,552) | (34,019) |
| ETF Shares | (130,385) | (99,626) |
| Realized Capital Gain | | |
| Investor Shares | — | — |
| Admiral Shares | — | — |
| Signal Shares | — | — |
| Institutional Shares | — | — |
| ETF Shares | — | — |
| Total Distributions | (333,772) | (444,109) |
| Capital Share Transactions | | |
| Investor Shares | (842,369) | (4,250,540) |
| Admiral Shares | 831,949 | 300,622 |
| Signal Shares | (555) | 12,318 |
| Institutional Shares | (732,961) | 406,075 |
| ETF Shares | 401,033 | 250,974 |
| Net Increase (Decrease) from Capital Share Transactions | (342,903) | (3,280,551) |
| Total Increase (Decrease) | 475,655 | (2,601,426) |
| Net Assets | | |
| Beginning of Period | 8,449,820 | 11,051,246 |
| End of Period1 | 8,925,475 | 8,449,820 |
| 1 Net Assets—End of Period includes undistributed net investment income of $73,292,000 and $289,637,000. | |
See accompanying Notes, which are an integral part of the Financial Statements.
18
European Stock Index Fund
Financial Highlights
| | | | | | |
| Investor Shares | | | | | | |
| Six Months | | | | | |
| | Ended | | | | | |
| For a Share Outstanding | April 30, | | | Year Ended October 31, |
| Throughout Each Period | 2011 | 2010 | 2009 | 2008 | 2007 | 2006 |
| Net Asset Value, Beginning of Period | $27.15 | $25.77 | $21.99 | $43.43 | $34.67 | $27.00 |
| Investment Operations | | | | | | |
| Net Investment Income | .3761 | .7681 | 1.008 | 1.3721 | 1.2981 | .920 |
| Net Realized and Unrealized Gain (Loss) | | | | | | |
| on Investments | 3.541 | 1.594 | 4.269 | (21.597) | 8.386 | 7.450 |
| Total from Investment Operations | 3.917 | 2.362 | 5.277 | (20.225) | 9.684 | 8.370 |
| Distributions | | | | | | |
| Dividends from Net Investment Income | (1.007) | (.982) | (1.497) | (1.215) | (.924) | (.700) |
| Distributions from Realized Capital Gains | — | — | — | — | — | — |
| Total Distributions | (1.007) | (.982) | (1.497) | (1.215) | (.924) | (.700) |
| Net Asset Value, End of Period | $30.06 | $27.15 | $25.77 | $21.99 | $43.43 | $34.67 |
| |
| Total Return2 | 15.00% | 9.35% | 26.25% | -47.80% | 28.49% | 31.63% |
| |
| Ratios/Supplemental Data | | | | | | |
| Net Assets, End of Period (Millions) | $1,150 | $1,884 | $5,789 | $10,534 | $26,188 | $16,850 |
| Ratio of Total Expenses to | | | | | | |
| Average Net Assets | 0.26% | 0.26% | 0.27% | 0.22% | 0.22% | 0.27% |
| Ratio of Net Investment Income to | | | | | | |
| Average Net Assets | 2.93% | 2.98% | 3.80% | 3.82% | 3.35% | 3.35% |
| Portfolio Turnover Rate3 | 6% | 11% | 18% | 15% | 9% | 6% |
The expense ratio, net income ratio, and turnover rate for the current period have been annualized.
1 Calculated based on average shares outstanding.
2 Total returns do not include transaction or account service fees that may have applied in the periods shown. Fund prospectuses provide information about any applicable transaction and account service fees.
3 Excludes the value of portfolio securities received or delivered as a result of in-kind purchases or redemptions of the fund’s capital shares, including ETF Creation Units.
See accompanying Notes, which are an integral part of the Financial Statements.
19
European Stock Index Fund
Financial Highlights
| | | | | | |
| Admiral Shares | | | | | | |
| Six Months | | | | | |
| | Ended | | | | | |
| For a Share Outstanding | April 30, | | | Year Ended October 31, |
| Throughout Each Period | 2011 | 2010 | 2009 | 2008 | 2007 | 2006 |
| Net Asset Value, Beginning of Period | $63.75 | $60.51 | $51.71 | $102.09 | $81.50 | $63.44 |
| Investment Operations | | | | | | |
| Net Investment Income | .9701 | 1.7581 | 2.448 | 3.1771 | 3.1401 | 2.230 |
| Net Realized and Unrealized Gain (Loss) | | | | | | |
| on Investments | 8.192 | 3.864 | 9.968 | (50.618) | 19.692 | 17.510 |
| Total from Investment Operations | 9.162 | 5.622 | 12.416 | (47.441) | 22.832 | 19.740 |
| Distributions | | | | | | |
| Dividends from Net Investment Income | (2.862) | (2.382) | (3.616) | (2.939) | (2.242) | (1.680) |
| Distributions from Realized Capital Gains | — | — | — | — | — | — |
| Total Distributions | (2.862) | (2.382) | (3.616) | (2.939) | (2.242) | (1.680) |
| Net Asset Value, End of Period | $70.05 | $63.75 | $60.51 | $51.71 | $102.09 | $81.50 |
| |
| Total Return2 | 15.07% | 9.49% | 26.33% | -47.74% | 28.59% | 31.77% |
| |
| Ratios/Supplemental Data | | | | | | |
| Net Assets, End of Period (Millions) | $3,216 | $2,087 | $1,700 | $1,472 | $2,955 | $2,175 |
| Ratio of Total Expenses to | | | | | | |
| Average Net Assets | 0.14% | 0.14% | 0.16% | 0.12% | 0.12% | 0.17% |
| Ratio of Net Investment Income to | | | | | | |
| Average Net Assets | 3.05% | 3.10% | 3.91% | 3.92% | 3.45% | 3.45% |
| Portfolio Turnover Rate3 | 6% | 11% | 18% | 15% | 9% | 6% |
The expense ratio, net income ratio, and turnover rate for the current period have been annualized.
1 Calculated based on average shares outstanding.
2 Total returns do not include transaction fees that may have applied in the periods shown. Fund prospectuses provide information about any applicable transaction fees.
3 Excludes the value of portfolio securities received or delivered as a result of in-kind purchases or redemptions of the fund’s capital shares, including ETF Creation Units.
See accompanying Notes, which are an integral part of the Financial Statements.
20
European Stock Index Fund
Financial Highlights
| | | | | | |
| Signal Shares | | | | | | |
| Six Months | | | | | Oct. 6, |
| | Ended | | | | | 20061 to |
| For a Share Outstanding | April 30, | Year Ended October 31, | Oct. 31, |
| Throughout Each Period | 2011 | 2010 | 2009 | 2008 | 2007 | 2006 |
| Net Asset Value, Beginning of Period | $24.68 | $23.42 | $20.01 | $39.50 | $31.51 | $30.41 |
| Investment Operations | | | | | | |
| Net Investment Income | .3712 | .6862 | .947 | 1.2552 | 1.1512 | .0102 |
| Net Realized and Unrealized Gain (Loss) | | | | | | |
| on Investments | 3.164 | 1.497 | 3.860 | (19.616) | 7.681 | 1.090 |
| Total from Investment Operations | 3.535 | 2.183 | 4.807 | (18.361) | 8.832 | 1.100 |
| Distributions | | | | | | |
| Dividends from Net Investment Income | (1.115) | (.923) | (1.397) | (1.129) | (.842) | — |
| Distributions from Realized Capital Gains | — | — | — | — | — | — |
| Total Distributions | (1.115) | (.923) | (1.397) | (1.129) | (.842) | — |
| Net Asset Value, End of Period | $27.10 | $24.68 | $23.42 | $20.01 | $39.50 | $31.51 |
| |
| Total Return3 | 15.02% | 9.52% | 26.34% | -47.74% | 28.59% | 3.62% |
| |
| Ratios/Supplemental Data | | | | | | |
| Net Assets, End of Period (Millions) | $299 | $272 | $245 | $223 | $502 | $12 |
| Ratio of Total Expenses to | | | | | | |
| Average Net Assets | 0.14% | 0.14% | 0.16% | 0.12% | 0.12% | 0.17%4 |
| Ratio of Net Investment Income to | | | | | | |
| Average Net Assets | 3.05% | 3.10% | 3.91% | 3.92% | 3.45% | 3.45%4 |
| Portfolio Turnover Rate5 | 6% | 11% | 18% | 15% | 9% | 6% |
The expense ratio, net income ratio, and turnover rate for the current period have been annualized.
1 Inception.
2 Calculated based on average shares outstanding.
3 Total returns do not include transaction fees that may have applied in the periods shown. Fund prospectuses provide information about any applicable transaction fees.
4 Annualized.
5 Excludes the value of portfolio securities received or delivered as a result of in-kind purchases or redemptions of the fund’s capital shares, including ETF Creation Units.
See accompanying Notes, which are an integral part of the Financial Statements.
21
European Stock Index Fund
Financial Highlights
| | | | | | |
| Institutional Shares | | | | | | |
| Six Months | | | | | |
| | Ended | | | | | |
| For a Share Outstanding | April 30, | | | Year Ended October 31, |
| Throughout Each Period | 2011 | 2010 | 2009 | 2008 | 2007 | 2006 |
| Net Asset Value, Beginning of Period | $27.20 | $25.80 | $22.04 | $43.51 | $34.74 | $27.05 |
| Investment Operations | | | | | | |
| Net Investment Income | .3881 | .7641 | 1.036 | 1.3151 | 1.3501 | .978 |
| Net Realized and Unrealized Gain (Loss) | | | | | | |
| on Investments | 3.520 | 1.644 | 4.277 | (21.524) | 8.390 | 7.450 |
| Total from Investment Operations | 3.908 | 2.408 | 5.313 | (20.209) | 9.740 | 8.428 |
| Distributions | | | | | | |
| Dividends from Net Investment Income | (1.228) | (1.008) | (1.553) | (1.261) | (.970) | (.738) |
| Distributions from Realized Capital Gains | — | — | — | — | — | — |
| Total Distributions | (1.228) | (1.008) | (1.553) | (1.261) | (.970) | (.738) |
| Net Asset Value, End of Period | $29.88 | $27.20 | $25.80 | $22.04 | $43.51 | $34.74 |
| |
| Total Return2 | 15.07% | 9.53% | 26.45% | -47.72% | 28.63% | 31.83% |
| |
| Ratios/Supplemental Data | | | | | | |
| Net Assets, End of Period (Millions) | $694 | $1,349 | $853 | $3,316 | $5,263 | $3,113 |
| Ratio of Total Expenses to | | | | | | |
| Average Net Assets | 0.10% | 0.10% | 0.12% | 0.09% | 0.09% | 0.12% |
| Ratio of Net Investment Income to | | | | | | |
| Average Net Assets | 3.09% | 3.14% | 3.95% | 3.95% | 3.48% | 3.50% |
| Portfolio Turnover Rate3 | 6% | 11% | 18% | 15% | 9% | 6% |
The expense ratio, net income ratio, and turnover rate for the current period have been annualized.
1 Calculated based on average shares outstanding.
2 Total returns do not include transaction fees that may have applied in the periods shown. Fund prospectuses provide information about any applicable transaction fees.
3 Excludes the value of portfolio securities received or delivered as a result of in-kind purchases or redemptions of the fund’s capital shares, including ETF Creation Units.
See accompanying Notes, which are an integral part of the Financial Statements.
22
European Stock Index Fund
Financial Highlights
| | | | | | |
| MSCI Europe ETF Shares | | | | | | |
| Six Months | | | | | |
| | Ended | | | | | |
| For a Share Outstanding | April 30, | | | Year Ended October 31, |
| Throughout Each Period | 2011 | 2010 | 2009 | 2008 | 2007 | 2006 |
| Net Asset Value, Beginning of Period | $51.00 | $48.41 | $41.37 | $81.66 | $65.21 | $50.80 |
| Investment Operations | | | | | | |
| Net Investment Income | .7731 | 1.4201 | 1.964 | 2.5301 | 2.5761 | 1.800 |
| Net Realized and Unrealized Gain (Loss) | | | | | | |
| on Investments | 6.563 | 3.082 | 7.977 | (40.464) | 15.683 | 13.990 |
| Total from Investment Operations | 7.336 | 4.502 | 9.941 | (37.934) | 18.259 | 15.790 |
| Distributions | | | | | | |
| Dividends from Net Investment Income | (2.306) | (1.912) | (2.901) | (2.356) | (1.809) | (1.380) |
| Distributions from Realized Capital Gains | — | — | — | — | — | — |
| Total Distributions | (2.306) | (1.912) | (2.901) | (2.356) | (1.809) | (1.380) |
| Net Asset Value, End of Period | $56.03 | $51.00 | $48.41 | $41.37 | $81.66 | $65.21 |
| |
| Total Return | 15.08% | 9.48% | 26.33% | -47.73% | 28.60% | 31.75% |
| |
| Ratios/Supplemental Data | | | | | | |
| Net Assets, End of Period (Millions) | $3,568 | $2,858 | $2,464 | $1,754 | $3,148 | $1,205 |
| Ratio of Total Expenses to | | | | | | |
| Average Net Assets | 0.14% | 0.14% | 0.16% | 0.11% | 0.12% | 0.18% |
| Ratio of Net Investment Income to | | | | | | |
| Average Net Assets | 3.05% | 3.10% | 3.91% | 3.93% | 3.45% | 3.44% |
| Portfolio Turnover Rate2 | 6% | 11% | 18% | 15% | 9% | 6% |
The expense ratio, net income ratio, and turnover rate for the current period have been annualized.
1 Calculated based on average shares outstanding.
2 Excludes the value of portfolio securities received or delivered as a result of in-kind purchases or redemptions of the fund’s capital shares, including ETF Creation Units.
See accompanying Notes, which are an integral part of the Financial Statements.
23
European Stock Index Fund
Notes to Financial Statements
Vanguard European Stock Index Fund is registered under the Investment Company Act of 1940 as an open-end investment company, or mutual fund. The fund invests in securities of foreign issuers, which may subject it to investment risks not normally associated with investing in securities of U.S. corporations. The fund offers six classes of shares: Investor Shares, Admiral Shares, Signal Shares, Institutional Shares, Institutional Plus Shares, and ETF Shares. Investor Shares are available to any investor who meets the fund’s minimum purchase requirements. Admiral Shares, Signal Shares, Institutional Shares, and Institutional Plus Shares are designed for investors who meet certain administrative, service, and account-size criteria. The fund has not issued any Institutional Plus Shares through April 30, 2011. ETF Shares, known as Vanguard MSCI Europe ETF Shares, are listed for trading on the NYSE Arca, Inc.; they can be purchased and sold through a broker.
A. The following significant accounting policies conform to generally accepted accounting principles for U.S. mutual funds. The fund consistently follows such policies in preparing its financial statements.
1. Security Valuation: Securities are valued as of the close of trading on the New York Stock Exchange (generally 4 p.m., Eastern time) on the valuation date. Equity securities are valued at the latest quoted sales prices or official closing prices taken from the primary market in which each security trades; such securities not traded on the valuation date are valued at the mean of the latest quoted bid and asked prices. Securities for which market quotations are not readily available, or whose values have been affected by events occurring before the fund’s pricing time but after the close of the securities’ primary markets, are valued at their fair values calculated according to procedures adopted by the board of trustees. These procedures include obtaining quotations from an independent pricing service, monitoring news to identify significant market- or security-specific events, and evaluating changes in the values of foreign market proxies (for example, ADRs, futures contracts, or exchange-traded funds), between the time the foreign markets close and the fund’s pricing time. When fair-value pricing is employed, the prices of securities used by a fund to calculate its net asset value may differ from quoted or published prices for the same securities. Investments in Vanguard Market Liquidity Fund are valued at that fund’s net asset value. Temporary cash investments acquired over 60 days to maturity are valued using the latest bid prices or using valuations based on a matrix system (which considers such factors as security prices, yields, maturities, and ratings), both as furnished by independent pricing services. Other temporary cash investments are valued at amortized cost, which approximates market value.
2. Foreign Currency: Securities and other assets and liabilities denominated in foreign currencies are translated into U.S. dollars using exchange rates obtained from an independent third party as of the fund’s pricing time on the valuation date. Realized gains (losses) and unrealized appreciation (depreciation) on investment securities include the effects of changes in exchange rates since the securities were purchased, combined with the effects of changes in security prices. Fluctuations in the value of other assets and liabilities resulting from changes in exchange rates are recorded as unrealized foreign currency gains (losses) until the assets or liabilities are settled in cash, at which time they are recorded as realized foreign currency gains (losses).
3. Futures and Forward Currency Contracts: The fund uses index futures contracts to a limited extent, with the objectives of maintaining full exposure to the stock market, enhancing returns, maintaining liquidity, and minimizing transaction costs. The fund may purchase futures contracts to immediately invest incoming cash in the market, or sell futures in response to cash outflows, thereby simulating
24
European Stock Index Fund
a fully invested position in the underlying index while maintaining a cash balance for liquidity. The fund may seek to enhance returns by using futures contracts instead of the underlying securities when futures are believed to be priced more attractively than the underlying securities. The primary risks associated with the use of futures contracts are imperfect correlation between changes in market values of stocks held by the fund and the prices of futures contracts, and the possibility of an illiquid market.
The fund also enters into forward currency contracts to provide the appropriate currency exposure related to any open futures contracts. The fund’s risks in using these contracts include movement in the values of the foreign currencies relative to the U.S. dollar and the ability of the counterparties to fulfill their obligations under the contracts. Counterparty risk is mitigated by entering into forward currency contracts only with highly rated counterparties, by a master netting arrangement between the fund and the counterparty, and by the posting of collateral by the counterparty. The forward currency contracts contain provisions whereby a counterparty may terminate open contracts if the fund’s net assets decline below a certain level, triggering a payment by the fund if the fund is in a net liability position at the time of the termination. The payment amount would be reduced by any collateral the fund has posted. Any securities posted as collateral for open contracts are noted in the Statement of Net Assets.
Futures contracts are valued at their quoted daily settlement prices. Forward currency contracts are valued at their quoted daily prices obtained from an independent third party, adjusted for currency risk based on the expiration date of each contract. The aggregate principal amounts of the contracts are not recorded in the Statement of Net Assets. Fluctuations in the value of the contracts are recorded in the Statement of Net Assets as an asset (liability) and in the Statement of Operations as unrealized appreciation (depreciation) until the contracts are closed, when they are recorded as realized gains (losses) on futures or forward currency contracts.
4. Federal Income Taxes: The fund intends to continue to qualify as a regulated investment company and distribute all of its taxable income. Management has analyzed the fund’s tax positions taken for all open federal income tax years (October 31, 2007–2010), and for the period ended April 30, 2011, and has concluded that no provision for federal income tax is required in the fund’s financial statements.
5. Distributions: Distributions to shareholders are recorded on the ex-dividend date.
6. Security Lending: The fund may lend its securities to qualified institutional borrowers to earn additional income. Security loans are required to be secured at all times by collateral at least equal to the market value of securities loaned. The fund invests cash collateral received in Vanguard Market Liquidity Fund, and records a liability for the return of the collateral, during the period the securities are on loan. Security lending income represents fees charged to borrowers plus income earned on investing cash collateral, less expenses associated with the loan.
7. Other: Dividend income is recorded on the ex-dividend date. Interest income includes income distributions received from Vanguard Market Liquidity Fund and is accrued daily. Security transactions are accounted for on the date securities are bought or sold. Costs used to determine realized gains (losses) on the sale of investment securities are those of the specific securities sold. Fees assessed on redemptions of capital shares are credited to paid-in capital.
25
European Stock Index Fund
Each class of shares has equal rights as to assets and earnings, except that each class separately bears certain class-specific expenses related to maintenance of shareholder accounts (included in Management and Administrative expenses) and shareholder reporting. Marketing and distribution expenses are allocated to each class of shares based on a method approved by the board of trustees. Income, other non-class-specific expenses, and gains and losses on investments are allocated to each class of shares based on its relative net assets.
B. The Vanguard Group furnishes at cost investment advisory, corporate management, administrative, marketing, and distribution services. The costs of such services are allocated to the fund under methods approved by the board of trustees. The fund has committed to provide up to 0.40% of its net assets in capital contributions to Vanguard. At April 30, 2011, the fund had contributed capital of $1,309,000 to Vanguard (included in Other Assets), representing 0.01% of the fund’s net assets and 0.52% of Vanguard’s capitalization. The fund’s trustees and officers are also directors and officers of Vanguard.
C. Various inputs may be used to determine the value of the fund’s investments. These inputs are summarized in three broad levels for financial statement purposes. The inputs or methodologies used to value securities are not necessarily an indication of the risk associated with investing in those securities.
Level 1—Quoted prices in active markets for identical securities.
Level 2—Other significant observable inputs (including quoted prices for similar securities, interest rates, prepayment speeds, credit risk, etc.).
Level 3—Significant unobservable inputs (including the fund’s own assumptions used to determine the fair value of investments).
The following table summarizes the fund’s investments as of April 30, 2011, based on the inputs used to value them:
| | | |
| | Level 1 | Level 2 | Level 3 |
| Investments | ($000) | ($000) | ($000) |
| Common Stocks | 33,649 | 8,824,541 | — |
| Temporary Cash Investments | 514,949 | 6,999 | — |
| Futures Contracts—Assets1 | 66 | — | — |
| Forward Currency Contracts—Assets | 2,335 | — | — |
| Total | 550,999 | 8,831,540 | — |
| 1 Represents variation margin on the last day of the reporting period. | | | |
The following table summarizes changes in investments valued based on Level 3 inputs during the six months ended April 30, 2011:
| |
| | Investments in |
| | Common Stocks |
| Amount Valued Based on Level 3 Inputs | ($000) |
| Balance as of October 31, 2010 | 756 |
| Change in Unrealized Appreciation (Depreciation) | (756) |
| Balance as of April 31, 2011 | — |
26
European Stock Index Fund
D. At April 30, 2011, the fair values of derivatives were reflected in the Statement of Net Assets as follows:
| | | |
| | | Foreign | |
| | Equity | Exchange | |
| | Contracts | Contracts | Total |
| Statement of Net Assets Caption | ($000) | ($000) | ($000) |
| Other Assets | 66 | 2,335 | 2,401 |
Realized net gain (loss) and the change in unrealized appreciation (depreciation) on derivatives for the six months ended April 30, 2011, were:
| | | |
| | | Foreign | |
| | Equity | Exchange | |
| | Contracts | Contracts | Total |
| Realized Net Gain (Loss) on Derivatives | ($000) | ($000) | ($000) |
| Futures Contracts | 1,946 | — | 1,946 |
| Forward Currency Contracts | — | 4,902 | 4,902 |
| Realized Net Gain (Loss) on Derivatives | 1,946 | 4,902 | 6,848 |
| |
| Change in Unrealized Appreciation (Depreciation) on Derivatives | | | |
| Futures Contracts | 1,512 | — | 1,512 |
| Forward Currency Contracts | — | (453) | (453) |
| Change in Unrealized Appreciation (Depreciation) on Derivatives | 1,512 | (453) | 1,059 |
At April 30, 2011, the aggregate settlement value of open futures contracts and the related unrealized appreciation (depreciation) were:
| | | | |
| | | | | ($000) |
| | | | Aggregate | |
| | | Number of | Settlement | Unrealized |
| | | Long (Short) | Value | Appreciation |
| Futures Contracts | Expiration | Contracts | Long (Short) | (Depreciation) |
| Dow Jones EURO STOXX 50 Index | June 2011 | 704 | 30,780 | 1,440 |
| FTSE 100 Index | June 2011 | 217 | 21,836 | 905 |
Unrealized appreciation (depreciation) on open FTSE 100 Index futures contracts is required to be treated as realized gain (loss) for tax purposes.
27
European Stock Index Fund
At April 30, 2011, the fund had open forward currency contracts to receive and deliver currencies as follows. Unrealized appreciation (depreciation) on open forward currency contracts is treated as realized gain (loss) for tax purposes.
| | | | | | |
| | | | | | | Unrealized |
| | Contract | | | | | Appreciation |
| | Settlement | | | Contract Amount (000) | (Depreciation) |
| Counterparty | Date | | Receive | | Deliver | ($000) |
| UBS AG | 6/22/11 | EUR | 19,776 | USD | 29,296 | 1,700 |
| UBS AG | 6/22/11 | GBP | 12,549 | USD | 20,916 | 635 |
| EUR—Euro. | | | | | | |
| GBP—British pound. | | | | | | |
| USD—U.S. dollar. | | | | | | |
At April 30, 2011, the counterparty had deposited in segregated accounts securities with a value sufficient to cover substantially all amounts due to the fund in connection with open forward currency contracts.
E. Distributions are determined on a tax basis and may differ from net investment income and realized capital gains for financial reporting purposes. Differences may be permanent or temporary. Permanent differences are reclassified among capital accounts in the financial statements to reflect their tax character. Temporary differences arise when certain items of income, expense, gain, or loss are recognized in different periods for financial statement and tax purposes; these differences will reverse at some time in the future. Differences in classification may also result from the treatment of short-term gains as ordinary income for tax purposes.
During the six months ended April 30, 2011, the fund realized net foreign currency losses of $1,278,000, which decreased distributable net income for tax purposes; accordingly, such losses have been reclassified from accumulated net realized losses to undistributed net investment income. Certain of the fund’s investments are in securities considered to be “passive foreign investment companies,” for which any unrealized appreciation and/or realized gains are required to be included in distributable net income for tax purposes. Unrealized appreciation through the most recent mark-to-market date for tax purposes on passive foreign investment company holdings at April 30, 2011, was $2,530,000, all of which has been distributed and is reflected in the balance of undistributed net investment income.
During the six months ended April 30, 2011, the fund realized $101,958,000 of net capital losses resulting from in-kind redemptions—in which shareholders exchanged fund shares for securities held by the fund rather than for cash. Because such losses are not taxable losses to the fund, they have been reclassified from accumulated net realized losses to paid-in capital.
The fund’s tax-basis capital gains and losses are determined only at the end of each fiscal year. For tax purposes, at October 31, 2010, the fund had available capital loss carryforwards totaling $2,163,720,000 to offset future net capital gains of $13,739,000 through October 31, 2011, $357,042,000 through October 31, 2016, $1,510,054,000 through October 31, 2017, and $282,885,000 through October 31, 2018. The fund will use these capital losses to offset net taxable capital gains, if any, realized during the year ending October 31, 2011; should the fund realize net capital losses for the year, the losses will be added to the loss carryforward balance above.
28
European Stock Index Fund
At April 30, 2011, the cost of investment securities for tax purposes was $10,784,852,000. Net unrealized depreciation of investment securities for tax purposes was $1,404,714,000, consisting of unrealized gains of $937,021,000 on securities that had risen in value since their purchase and $2,341,735,000 in unrealized losses on securities that had fallen in value since their purchase.
F. During the six months ended April 30, 2011, the fund purchased $622,825,000 of investment securities and sold $1,202,136,000 of investment securities, other than temporary cash investments.
G. Capital share transactions for each class of shares were:
| | | | |
| | Six Months Ended | | Year Ended |
| | | April 30, 2011 | October 31, 2010 |
| | Amount | Shares | Amount | Shares |
| | ($000) | (000) | ($000) | (000) |
| Investor Shares | | | | |
| Issued | 74,188 | 2,720 | 1,740,600 | 70,744 |
| Issued in Lieu of Cash Distributions | 36,112 | 1,387 | 228,168 | 8,810 |
| Redeemed1 | (952,669) | (35,248) | (6,219,308) | (234,838) |
| Net Increase (Decrease)—Investor Shares | (842,369) | (31,141) | (4,250,540) | (155,284) |
| Admiral Shares | | | | |
| Issued | 932,197 | 14,691 | 506,330 | 8,208 |
| Issued in Lieu of Cash Distributions | 109,473 | 1,806 | 53,881 | 887 |
| Redeemed1 | (209,721) | (3,323) | (259,589) | (4,466) |
| Net Increase (Decrease)—Admiral Shares | 831,949 | 13,174 | 300,622 | 4,629 |
| Signal Shares | | | | |
| Issued | 48,564 | 1,978 | 64,066 | 2,849 |
| Issued in Lieu of Cash Distributions | 9,978 | 425 | 7,863 | 334 |
| Redeemed1 | (59,097) | (2,426) | (59,611) | (2,602) |
| Net Increase (Decrease)—Signal Shares | (555) | (23) | 12,318 | 581 |
| Institutional Shares | | | | |
| Issued | 136,300 | 5,123 | 495,957 | 20,114 |
| Issued in Lieu of Cash Distributions | 13,369 | 517 | 25,396 | 980 |
| Redeemed1 | (882,630) | (32,030) | (115,278) | (4,538) |
| Net Increase (Decrease)—Institutional Shares | (732,961) | (26,390) | 406,075 | 16,556 |
| ETF Shares | | | | |
| Issued | 401,033 | 7,652 | 889,512 | 20,028 |
| Issued in Lieu of Cash Distributions | — | — | — | — |
| Redeemed1 | — | — | (638,538) | (14,900) |
| Net Increase (Decrease)—ETF Shares | 401,033 | 7,652 | 250,974 | 5,128 |
| 1 Net of redemption fees for fiscal 2011 and 2010 of $33,000 and $150,000, respectively (fund totals). | | |
H. In preparing the financial statements as of April 30, 2011, management considered the impact of subsequent events for potential recognition or disclosure in these financial statements.
29
Pacific Stock Index Fund
Fund Profile
As of April 30, 2011
| | | | | |
| Share-Class Characteristics | | | | | |
| | Investor | Admiral | Signal | Institutional | ETF |
| | Shares | Shares | Shares | Shares | Shares |
| Ticker Symbol | VPACX | VPADX | VPASX | VPKIX | VPL |
| Expense Ratio1 | 0.26% | 0.14% | 0.14% | 0.10% | 0.14% |
| | | |
| Portfolio Characteristics | | |
| | | | MSCI AC |
| | | MSCI | World |
| | | Pacific | Index |
| | Fund | Index | ex USA |
| Number of Stocks | 491 | 487 | 1,869 |
| Median Market Cap $20.1B | $20.6B | $33.8B |
| Price/Earnings Ratio | 14.4x | 14.4x | 13.8x |
| Price/Book Ratio | 1.3x | 1.3x | 1.7x |
| Return on Equity | 12.8% | 12.9% | 17.8% |
| Earnings Growth Rate | -3.2% | -3.2% | 2.8% |
| Dividend Yield | 2.7% | 2.7% | 2.9% |
| Turnover Rate | | | |
| (Annualized) | 5% | — | — |
| Short-Term Reserves | -0.5% | — | — |
| | | |
| Sector Diversification (% of equity exposure) |
| | | | MSCI AC |
| | | MSCI | World |
| | | Pacific | Index |
| | Fund | Index | ex USA |
| Consumer | | | |
| Discretionary | 13.5% | 13.6% | 9.0% |
| Consumer Staples | 6.1 | 6.1 | 8.5 |
| Energy | 3.1 | 3.0 | 11.6 |
| Financials | 29.0 | 29.1 | 24.8 |
| Health Care | 4.4 | 4.4 | 5.9 |
| Industrials | 16.0 | 16.0 | 11.0 |
| Information | | | |
| Technology | 8.1 | 8.1 | 6.3 |
| Materials | 12.6 | 12.5 | 13.0 |
| Telecommunication | | | |
| Services | 3.7 | 3.7 | 5.7 |
| Utilities | 3.5 | 3.5 | 4.2 |
| | |
| Volatility Measures | | |
| | MSCI | MSCI AC |
| | Pacific | World Index |
| | Index | ex USA |
| R-Squared | 0.97 | 0.91 |
| Beta | 1.02 | 0.83 |
These measures show the degree and timing of the fund’s fluctuations compared with the indexes over 36 months.
| | |
| Ten Largest Holdings (% of total net assets) |
| BHP Billiton Ltd. | Diversified Metals | |
| | & Mining | 4.1% |
| Toyota Motor Corp. | Automobile | |
| | Manufacturers | 2.8 |
| Commonwealth Bank of | | |
| Australia | Diversified Banks | 2.3 |
| Westpac Banking Corp. | Diversified Banks | 2.1 |
| Australia & New Zealand | | |
| Banking Group Ltd. | Diversified Banks | 1.7 |
| National Australia Bank | | |
| Ltd. | Diversified Banks | 1.6 |
| Honda Motor Co Ltd. | Automobile | |
| | Manufacturers | 1.6 |
| Mitsubishi UFJ Financial | | |
| Group Inc. | Diversified Banks | 1.5 |
| Canon Inc. | Office Electronics | 1.3 |
| Wesfarmers Ltd. | Hypermarkets & | |
| | Super Centers | 1.1 |
| Top Ten | | 20.1% |
The holdings listed exclude any temporary cash investments and equity index products.
1 The expense ratios shown are from the prospectus dated February 25, 2011, and represent estimated costs for the current fiscal year. For the six months ended April 30, 2011, the annualized expense ratios were 0.26% for Investor Shares, 0.14% for Admiral Shares, 0.14% for Signal Shares, 0.10% for Institutional Shares, and 0.14% for ETF Shares.
30
Pacific Stock Index Fund
| | | |
| Market Diversification (% of equity exposure) |
| | | | MSCI AC |
| | | MSCI | World |
| | | Pacific | Index |
| | Fund | Index | ex USA |
| Europe | 0.0% | 0.0% | 45.6% |
| Pacific | | | |
| Japan | 59.4% | 59.2% | 13.2% |
| Australia | 27.0 | 26.9 | 6.0 |
| Hong Kong | 8.1 | 8.3 | 1.8 |
| Singapore | 5.2 | 5.3 | 1.2 |
| Other | 0.3 | 0.3 | 0.1 |
| Subtotal | 100.0% | 100.0% | 22.3% |
| Emerging Markets | 0.0% | 0.0% | 23.5% |
| Middle East | 0.0% | 0.0% | 0.5% |
| North America | 0.0% | 0.0% | 8.1% |
31
Pacific Stock Index Fund
Performance Summary
All of the returns in this report represent past performance, which is not a guarantee of future results that may be achieved by the fund. (Current performance may be lower or higher than the performance data cited. For performance data current to the most recent month-end, visit our website at vanguard.com/performance.) Note, too, that both investment returns and principal value can fluctuate widely, so an investor’s shares, when sold, could be worth more or less than their original cost. The returns shown do not reflect taxes that a shareholder would pay on fund distributions or on the sale of fund shares.
Fiscal-Year Total Returns (%): October 31, 2000, Through April 30, 2011

Average Annual Total Returns: Periods Ended March 31, 2011
This table presents returns through the latest calendar quarter—rather than through the end of the fiscal period.
Securities and Exchange Commission rules require that we provide this information.
| | | | |
| | Inception | One | Five | Ten |
| | Date | Year | Years | Years |
| Investor Shares | 6/18/1990 | 6.40% | -0.16% | 4.58% |
| Admiral Shares | 8/13/2001 | 6.50 | -0.06 | 5.551 |
| Signal Shares | 6/4/2007 | 6.48 | — | -3.381 |
| Institutional Shares | 5/15/2000 | 6.52 | -0.04 | 4.74 |
| ETF Shares | 3/4/2005 | | | |
| Market Price | | 6.35 | -0.25 | 4.101 |
| Net Asset Value | | 6.49 | -0.06 | 4.111 |
| 1 Return since inception. | | | | |
Vanguard fund returns do not reflect the 2% fee on redemptions of shares held for less than two months.
See Financial Highlights for dividend and capital gains information.
32
Pacific Stock Index Fund
Financial Statements (unaudited)
Statement of Net Assets—Investments Summary
As of April 30, 2011
This Statement summarizes the fund’s holdings by asset type. Details are reported for each of the fund’s 50 largest individual holdings and for investments that, in total for any issuer, represent more than 1% of the fund’s net assets. The total value of smaller holdings is reported as a single amount within each category.
The fund reports a complete list of its holdings in regulatory filings four times in each fiscal year, at the quarter-ends. For the second and fourth fiscal quarters, the complete listing of the fund’s holdings is available electronically on vanguard.com and on the Securities and Exchange Commission’s website (sec.gov), or you can have it mailed to you without charge by calling 800-662-7447. For the first and third fiscal quarters, the fund files the lists with the SEC on Form N-Q. Shareholders can look up the fund’s Forms N-Q on the SEC’s website. Forms N-Q may also be reviewed and copied at the SEC’s Public Reference Room (see the back cover of this report for further information).
| | | |
| | | Market | Percentage |
| | | Value | of Net |
| | Shares | ($000) | Assets |
| Common Stocks | | | |
| Australia | | | |
| BHP Billiton Ltd. | 3,568,781 | 180,687 | 4.1% |
| Commonwealth Bank of Australia | 1,721,166 | 101,606 | 2.3% |
| Westpac Banking Corp. | 3,322,292 | 90,700 | 2.1% |
| Australia & New Zealand Banking Group Ltd | . 2,846,262 | 75,817 | 1.7% |
| National Australia Bank Ltd. | 2,375,413 | 70,723 | 1.6% |
| Rio Tinto Ltd. | 484,229 | 43,835 | 1.0% |
| Wesfarmers Ltd. | 1,116,990 | 40,920 | 0.9% |
| Woolworths Ltd. | 1,347,339 | 39,209 | 0.9% |
| Newcrest Mining Ltd. | 798,939 | 36,388 | 0.8% |
| Woodside Petroleum Ltd. | 692,925 | 35,632 | 0.8% |
| Westfield Group | 2,433,891 | 24,119 | 0.5% |
| QBE Insurance Group Ltd. | 1,168,594 | 24,008 | 0.5% |
| CSL Ltd. | 609,151 | 22,987 | 0.5% |
| Origin Energy Ltd. | 1,179,585 | 21,161 | 0.5% |
| Australia—Other † | | 370,484 | 8.4% |
| | | 1,178,276 | 26.6% |
| Hong Kong | | | |
| * AIA Group Ltd. | 8,699,304 | 29,338 | 0.7% |
| Hutchison Whampoa Ltd. | 2,368,599 | 27,089 | 0.6% |
| Hong Kong Exchanges and Clearing Ltd. | 1,137,646 | 26,016 | 0.6% |
| Sun Hung Kai Properties Ltd. | 1,571,121 | 24,608 | 0.6% |
| Cheung Kong Holdings Ltd. | 1,546,008 | 24,400 | 0.5% |
| Hong Kong—Other † | | 228,978 | 5.2% |
| | | 360,429 | 8.2% |
| Japan | | | |
| Toyota Motor Corp. | 3,065,183 | 122,274 | 2.8% |
| Honda Motor Co. Ltd. | 1,811,654 | 69,647 | 1.6% |
| Mitsubishi UFJ Financial Group Inc. | 14,152,320 | 67,925 | 1.5% |
| Canon Inc. | 1,259,759 | 59,325 | 1.3% |
| Sumitomo Mitsui Financial Group Inc. | 1,492,761 | 46,368 | 1.1% |
33
Pacific Stock Index Fund
| | | | |
| | | | Market | Percentage |
| | | | Value | of Net |
| | | Shares | ($000) | Assets |
| Mitsubishi Corp. | | 1,508,472 | 40,921 | 0.9% |
| Takeda Pharmaceutical Co. Ltd. | | 833,617 | 40,399 | 0.9% |
| Softbank Corp. | | 901,031 | 38,021 | 0.9% |
| Komatsu Ltd. | | 1,054,378 | 37,177 | 0.8% |
| Mizuho Financial Group Inc. | | 22,745,713 | 36,037 | 0.8% |
| FANUC Corp. | | 212,939 | 35,646 | 0.8% |
| Mitsui & Co. Ltd. | | 1,930,980 | 34,362 | 0.8% |
| NTT DoCoMo Inc. | | 17,031 | 31,599 | 0.7% |
| Sony Corp. | | 1,116,329 | 31,520 | 0.7% |
| Panasonic Corp. | | 2,453,311 | 30,167 | 0.7% |
| Hitachi Ltd. | | 5,019,404 | 27,244 | 0.6% |
| Nissan Motor Co. Ltd. | | 2,762,932 | 26,584 | 0.6% |
| Nintendo Co. Ltd. | | 110,461 | 26,137 | 0.6% |
| Nippon Telegraph & Telephone Corp. | 530,823 | 24,735 | 0.6% |
| Mitsubishi Electric Corp. | | 2,147,896 | 23,913 | 0.5% |
| Toshiba Corp. | | 4,469,214 | 23,798 | 0.5% |
| Shin-Etsu Chemical Co. Ltd. | | 455,481 | 23,696 | 0.5% |
| Mitsubishi Estate Co. Ltd. | | 1,313,005 | 22,977 | 0.5% |
| Tokio Marine Holdings Inc. | | 803,988 | 22,491 | 0.5% |
| KDDI Corp. | | 3,239 | 21,624 | 0.5% |
| Seven & I Holdings Co. Ltd. | | 835,979 | 21,038 | 0.5% |
| East Japan Railway Co. | | 377,337 | 20,973 | 0.5% |
| Canon Marketing Japan Inc. | | 62,890 | 696 | 0.0% |
| Japan—Other † | | | 1,590,397 | 36.0% |
| | | | 2,597,691 | 58.7% |
| |
| New Zealand † | | | 14,716 | 0.3% |
| |
| Singapore | | | | |
| DBS Group Holdings Ltd. | | 1,924,727 | 23,582 | 0.5% |
| Singapore Telecommunications Ltd. | 8,845,220 | 22,579 | 0.5% |
| United Overseas Bank Ltd. | | 1,369,395 | 21,972 | 0.5% |
| Oversea-Chinese Banking Corp. Ltd. | 2,784,983 | 21,749 | 0.5% |
| Singapore—Other † | | | 140,114 | 3.2% |
| | | | 229,996 | 5.2% |
| Total Common Stocks (Cost $5,348,589) | | 4,381,108 | 99.0%1 |
| |
| | Coupon | | | |
| Temporary Cash Investments | | | | |
| Money Market Fund | | | | |
| 2,3 Vanguard Market Liquidity Fund | 0.179% | 40,243,288 | 40,243 | 0.9% |
| 4U.S. Government and Agency Obligations † | | 3,700 | 0.1% |
| Total Temporary Cash Investments (Cost $43,943) | | 43,943 | 1.0%1 |
| 5Total Investments (Cost $5,392,532) | | 4,425,051 | 100.0% |
| Other Assets and Liabilities | | | | |
| Other Assets | | | 41,357 | 1.0% |
| Liabilities3 | | | (43,024) | (1.0%) |
| | | | (1,667) | 0.0% |
| Net Assets | | | 4,423,384 | 100.0% |
34
Pacific Stock Index Fund
| |
| At April 30, 2011, net assets consisted of: | |
| | Amount |
| | ($000) |
| Paid-in Capital | 6,482,022 |
| Undistributed Net Investment Income | 30,242 |
| Accumulated Net Realized Losses | (1,122,880) |
| Unrealized Appreciation (Depreciation) | |
| Investment Securities | (967,481) |
| Futures Contracts | 46 |
| Forward Currency Contracts | 978 |
| Foreign Currencies | 457 |
| Net Assets | 4,423,384 |
| |
| Investor Shares—Net Assets | |
| Applicable to 48,697,998 outstanding $.001 par value shares of | |
| beneficial interest (unlimited authorization) | 533,625 |
| Net Asset Value Per Share—Investor Shares | $10.96 |
| |
| Admiral Shares—Net Assets | |
| Applicable to 23,501,431 outstanding $.001 par value shares of | |
| beneficial interest (unlimited authorization) | 1,672,805 |
| Net Asset Value Per Share—Admiral Shares | $71.18 |
| |
| Signal Shares—Net Assets | |
| Applicable to 6,665,673 outstanding $.001 par value shares of | |
| beneficial interest (unlimited authorization) | 164,779 |
| Net Asset Value Per Share—Signal Shares | $24.72 |
| |
| Institutional Shares—Net Assets | |
| Applicable to 37,501,926 outstanding $.001 par value shares of | |
| beneficial interest (unlimited authorization) | 408,543 |
| Net Asset Value Per Share—Institutional Shares | $10.89 |
| |
| ETF Shares—Net Assets | |
| Applicable to 28,550,093 outstanding $.001 par value shares of | |
| beneficial interest (unlimited authorization) | 1,643,632 |
| Net Asset Value Per Share—ETF Shares | $57.57 |
See Note A in Notes to Financial Statements.
* Non-income-producing security.
† Represents the aggregate value, by category, of securities that are not among the 50 largest holdings and, in total for any issuer, represent 1% or less of net assets.
1 The fund invests a portion of its cash reserves in equity markets through the use of index futures contracts. After giving effect to futures investments, the fund’s effective common stock and temporary cash investment positions represent 100.0% and 0.0%, respectively, of net assets.
2 Affiliated money market fund available only to Vanguard funds and certain trusts and accounts managed by Vanguard. Rate shown is the 7-day yield.
3 Includes $20,272,000 of collateral received for securities on loan.
4 Securities with a value of $3,700,000 have been segregated as initial margin for open futures contracts.
5 The total value of securities on loan is $19,231,000.
See accompanying Notes, which are an integral part of the Financial Statements.
35
Pacific Stock Index Fund
| |
| Statement of Operations | |
| |
| |
| | Six Months Ended |
| | April 30, 2011 |
| | ($000) |
| Investment Income | |
| Income | |
| Dividends1 | 63,037 |
| Interest2 | 20 |
| Security Lending | 415 |
| Total Income | 63,472 |
| Expenses | |
| The Vanguard Group—Note B | |
| Investment Advisory Services | 223 |
| Management and Administrative—Investor Shares | 370 |
| Management and Administrative—Admiral Shares | 740 |
| Management and Administrative—Signal Shares | 67 |
| Management and Administrative—Institutional Shares | 51 |
| Management and Administrative—ETF Shares | 652 |
| Marketing and Distribution—Investor Shares | 270 |
| Marketing and Distribution—Admiral Shares | 120 |
| Marketing and Distribution—Signal Shares | 22 |
| Marketing and Distribution—Institutional Shares | 93 |
| Marketing and Distribution—ETF Shares | 175 |
| Custodian Fees | 405 |
| Shareholders’ Reports—Investor Shares | 11 |
| Shareholders’ Reports—Admiral Shares | 7 |
| Shareholders’ Reports—Signal Shares | 1 |
| Shareholders’ Reports—Institutional Shares | 1 |
| Shareholders’ Reports—ETF Shares | 29 |
| Trustees’ Fees and Expenses | 3 |
| Total Expenses | 3,240 |
| Net Investment Income | 60,232 |
| Realized Net Gain (Loss) | |
| Investment Securities Sold | (51,379) |
| Futures Contracts | (257) |
| Foreign Currencies and Forward Currency Contracts | 2,648 |
| Realized Net Gain (Loss) | (48,988) |
| Change in Unrealized Appreciation (Depreciation) | |
| Investment Securities | 358,765 |
| Futures Contracts | 1,265 |
| Foreign Currencies and Forward Currency Contracts | (959) |
| Change in Unrealized Appreciation (Depreciation) | 359,071 |
| Net Increase (Decrease) in Net Assets Resulting from Operations | 370,315 |
1 Dividends are net of foreign withholding taxes of $2,250,000.
2 Interest income from an affiliated company of the fund was $15,000.
See accompanying Notes, which are an integral part of the Financial Statements.
36
Pacific Stock Index Fund
| | |
| Statement of Changes in Net Assets | | |
| |
| | Six Months Ended | Year Ended |
| | April 30, | October 31, |
| | 2011 | 2010 |
| | ($000) | ($000) |
| Increase (Decrease) in Net Assets | | |
| Operations | | |
| Net Investment Income | 60,232 | 152,280 |
| Realized Net Gain (Loss) | (48,988) | 81,432 |
| Change in Unrealized Appreciation (Depreciation) | 359,071 | 445,377 |
| Net Increase (Decrease) in Net Assets Resulting from Operations | 370,315 | 679,089 |
| Distributions | | |
| Net Investment Income | | |
| Investor Shares | (16,209) | (79,032) |
| Admiral Shares | (61,136) | (23,652) |
| Signal Shares | (6,438) | (4,529) |
| Institutional Shares | (15,525) | (14,225) |
| ETF Shares | (60,868) | (35,958) |
| Realized Capital Gain | | |
| Investor Shares | — | — |
| Admiral Shares | — | — |
| Signal Shares | — | — |
| Institutional Shares | — | — |
| ETF Shares | — | — |
| Total Distributions | (160,176) | (157,396) |
| Capital Share Transactions | | |
| Investor Shares | (371,338) | (2,261,374) |
| Admiral Shares | 445,269 | 246,250 |
| Signal Shares | (12,787) | (984) |
| Institutional Shares | (422,733) | 259,478 |
| ETF Shares | 89,680 | 91,378 |
| Net Increase (Decrease) from Capital Share Transactions | (271,909) | (1,665,252) |
| Total Increase (Decrease) | (61,770) | (1,143,559) |
| Net Assets | | |
| Beginning of Period | 4,485,154 | 5,628,713 |
| End of Period1 | 4,423,384 | 4,485,154 |
| 1 Net Assets—End of Period includes undistributed net investment income of $30,242,000 and $128,317,000. | |
See accompanying Notes, which are an integral part of the Financial Statements.
37
Pacific Stock Index Fund
Financial Highlights
| | | | | | |
| Investor Shares | | | | | | |
| Six Months | | | | | |
| | Ended | | | | | |
| For a Share Outstanding | April 30, | | | Year Ended October 31, |
| Throughout Each Period | 2011 | 2010 | 2009 | 2008 | 2007 | 2006 |
| Net Asset Value, Beginning of Period | $10.40 | $9.61 | $7.94 | $14.19 | $12.13 | $10.39 |
| Investment Operations | | | | | | |
| Net Investment Income | .1371 | .2431 | .1891 | .281 | .236 | .190 |
| Net Realized and Unrealized Gain (Loss) | | | | | | |
| on Investments | .753 | .803 | 1.621 | (6.228) | 2.091 | 1.710 |
| Total from Investment Operations | .890 | 1.046 | 1.810 | (5.947) | 2.327 | 1.900 |
| Distributions | | | | | | |
| Dividends from Net Investment Income | (.330) | (.256) | (.140) | (.303) | (.267) | (.160) |
| Distributions from Realized Capital Gains | — | — | — | — | — | — |
| Total Distributions | (.330) | (.256) | (.140) | (.303) | (.267) | (.160) |
| Net Asset Value, End of Period | $10.96 | $10.40 | $9.61 | $7.94 | $14.19 | $12.13 |
| |
| Total Return2 | 8.64% | 11.09% | 23.23% | -42.71% | 19.52% | 18.39% |
| |
| Ratios/Supplemental Data | | | | | | |
| Net Assets, End of Period (Millions) | $534 | $868 | $2,846 | $5,065 | $11,281 | $7,814 |
| Ratio of Total Expenses to | | | | | | |
| Average Net Assets | 0.26% | 0.26% | 0.27% | 0.22% | 0.22% | 0.27% |
| Ratio of Net Investment Income to | | | | | | |
| Average Net Assets | 2.72% | 2.37% | 2.42% | 2.32% | 1.80% | 1.73% |
| Portfolio Turnover Rate3 | 5% | 3% | 8% | 9% | 3% | 2% |
The expense ratio, net income ratio, and turnover rate for the current period have been annualized.
1 Calculated based on average shares outstanding.
2 Total returns do not include transaction or account service fees that may have applied in the periods shown. Fund prospectuses provide information about any applicable transaction and account service fees.
3 Excludes the value of portfolio securities received or delivered as a result of in-kind purchases or redemptions of the fund’s capital shares, including ETF Creation Units.
See accompanying Notes, which are an integral part of the Financial Statements.
38
Pacific Stock Index Fund
Financial Highlights
| | | | | | |
| Admiral Shares | | | | | | |
| Six Months | | | | | |
| | Ended | | | | | |
| For a Share Outstanding | April 30, | | | Year Ended October 31, |
| Throughout Each Period | 2011 | 2010 | 2009 | 2008 | 2007 | 2006 |
| Net Asset Value, Beginning of Period | $68.06 | $62.95 | $52.04 | $92.94 | $79.43 | $68.05 |
| Investment Operations | | | | | | |
| Net Investment Income | 1.0041 | 1.5331 | 1.3861 | 1.933 | 1.613 | 1.302 |
| Net Realized and Unrealized Gain (Loss) | | | | | | |
| on Investments | 4.867 | 5.337 | 10.531 | (40.773) | 13.714 | 11.185 |
| Total from Investment Operations | 5.871 | 6.870 | 11.917 | (38.840) | 15.327 | 12.487 |
| Distributions | | | | | | |
| Dividends from Net Investment Income | (2.751) | (1.760) | (1.007) | (2.060) | (1.817) | (1.107) |
| Distributions from Realized Capital Gains | — | — | — | — | — | — |
| Total Distributions | (2.751) | (1.760) | (1.007) | (2.060) | (1.817) | (1.107) |
| Net Asset Value, End of Period | $71.18 | $68.06 | $62.95 | $52.04 | $92.94 | $79.43 |
| |
| Total Return2 | 8.74% | 11.13% | 23.38% | -42.62% | 19.64% | 18.46% |
| |
| Ratios/Supplemental Data | | | | | | |
| Net Assets, End of Period (Millions) | $1,673 | $1,165 | $849 | $737 | $1,292 | $1,128 |
| Ratio of Total Expenses to | | | | | | |
| Average Net Assets | 0.14% | 0.14% | 0.16% | 0.12% | 0.12% | 0.17% |
| Ratio of Net Investment Income to | | | | | | |
| Average Net Assets | 2.84% | 2.49% | 2.53% | 2.42% | 1.90% | 1.83% |
| Portfolio Turnover Rate3 | 5% | 3% | 8% | 9% | 3% | 2% |
The expense ratio, net income ratio, and turnover rate for the current period have been annualized.
1 Calculated based on average shares outstanding.
2 Total returns do not include transaction fees that may have applied in the periods shown. Fund prospectuses provide information about any applicable transaction fees.
3 Excludes the value of portfolio securities received or delivered as a result of in-kind purchases or redemptions of the fund’s capital shares, including ETF Creation Units.
See accompanying Notes, which are an integral part of the Financial Statements.
39
Pacific Stock Index Fund
Financial Highlights
| | | | | |
| Signal Shares | | | | | |
| | Six Months | | | | June 4, |
| | Ended | | | | 20071 to |
| | April 30, | Year Ended October 31, | Oct. 31, |
| For a Share Outstanding Throughout Each Period | 2011 | 2010 | 2009 | 2008 | 2007 |
| Net Asset Value, Beginning of Period | $23.64 | $21.87 | $18.08 | $32.28 | $30.53 |
| Investment Operations | | | | | |
| Net Investment Income | .3392 | .5412 | .4812 | .667 | .250 |
| Net Realized and Unrealized Gain (Loss) | | | | | |
| on Investments | 1.702 | 1.840 | 3.658 | (14.158) | 1.500 |
| Total from Investment Operations | 2.041 | 2.381 | 4.139 | (13.491) | 1.750 |
| Distributions | | | | | |
| Dividends from Net Investment Income | (.961) | (.611) | (.349) | (.709) | — |
| Distributions from Realized Capital Gains | — | — | — | — | — |
| Total Distributions | (.961) | (.611) | (.349) | (.709) | — |
| Net Asset Value, End of Period | $24.72 | $23.64 | $21.87 | $18.08 | $32.28 |
| |
| Total Return3 | 8.74% | 11.10% | 23.38% | -42.61% | 5.73% |
| |
| Ratios/Supplemental Data | | | | | |
| Net Assets, End of Period (Millions) | $165 | $171 | $159 | $150 | $247 |
| Ratio of Total Expenses to | | | | | |
| Average Net Assets | 0.14% | 0.14% | 0.16% | 0.12% | 0.12%4 |
| Ratio of Net Investment Income to | | | | | |
| Average Net Assets | 2.84% | 2.49% | 2.53% | 2.42% | 1.90%4 |
| Portfolio Turnover Rate5 | 5% | 3% | 8% | 9% | 3% |
The expense ratio, net income ratio, and turnover rate for the current period have been annualized.
1 Inception.
2 Calculated based on average shares outstanding.
3 Total returns do not include transaction fees that may have applied in the periods shown. Fund prospectuses provide information about any applicable transaction fees.
4 Annualized.
5 Excludes the value of portfolio securities received or delivered as a result of in-kind purchases or redemptions of the fund’s capital shares, including ETF Creation Units.
See accompanying Notes, which are an integral part of the Financial Statements.
40
Pacific Stock Index Fund
Financial Highlights
| | | | | | |
| Institutional Shares | | | | | | |
| Six Months | | | | | |
| | Ended | | | | | |
| For a Share Outstanding | April 30, | | | Year Ended October 31, |
| Throughout Each Period | 2011 | 2010 | 2009 | 2008 | 2007 | 2006 |
| Net Asset Value, Beginning of Period | $10.42 | $9.63 | $7.96 | $14.22 | $12.15 | $10.41 |
| Investment Operations | | | | | | |
| Net Investment Income | .1441 | .2431 | .2151 | .300 | .251 | .206 |
| Net Realized and Unrealized Gain (Loss) | | | | | | |
| on Investments | .750 | .816 | 1.613 | (6.242) | 2.102 | 1.710 |
| Total from Investment Operations | .894 | 1.059 | 1.828 | (5.942) | 2.353 | 1.916 |
| Distributions | | | | | | |
| Dividends from Net Investment Income | (.424) | (.269) | (.158) | (.318) | (.283) | (.176) |
| Distributions from Realized Capital Gains | — | — | — | — | — | — |
| Total Distributions | (.424) | (.269) | (.158) | (.318) | (.283) | (.176) |
| Net Asset Value, End of Period | $10.89 | $10.42 | $9.63 | $7.96 | $14.22 | $12.15 |
| |
| Total Return2 | 8.69% | 11.22% | 23.46% | -42.62% | 19.72% | 18.52% |
| |
| Ratios/Supplemental Data | | | | | | |
| Net Assets, End of Period (Millions) | $409 | $799 | $487 | $1,610 | $2,720 | $1,788 |
| Ratio of Total Expenses to | | | | | | |
| Average Net Assets | 0.10% | 0.10% | 0.12% | 0.09% | 0.09% | 0.12% |
| Ratio of Net Investment Income to | | | | | | |
| Average Net Assets | 2.88% | 2.53% | 2.57% | 2.45% | 1.93% | 1.88% |
| Portfolio Turnover Rate3 | 5% | 3% | 8% | 9% | 3% | 2% |
The expense ratio, net income ratio, and turnover rate for the current period have been annualized.
1 Calculated based on average shares outstanding.
2 Total returns do not include transaction fees that may have applied in the periods shown. Fund prospectuses provide information about any applicable transaction fees.
3 Excludes the value of portfolio securities received or delivered as a result of in-kind purchases or redemptions of the fund’s capital shares, including ETF Creation Units.
See accompanying Notes, which are an integral part of the Financial Statements.
41
Pacific Stock Index Fund
Financial Highlights
| | | | | | |
| MSCI Pacific ETF Shares | | | | | | |
| Six Months | | | | | |
| | Ended | | | | | |
| For a Share Outstanding | April 30, | | | Year Ended October 31, |
| Throughout Each Period | 2011 | 2010 | 2009 | 2008 | 2007 | 2006 |
| Net Asset Value, Beginning of Period | $55.06 | $50.92 | $42.10 | $75.17 | $64.24 | $55.09 |
| Investment Operations | | | | | | |
| Net Investment Income | .7991 | 1.2651 | 1.1091 | 1.573 | 1.314 | 1.060 |
| Net Realized and Unrealized Gain (Loss) | | | | | | |
| on Investments | 3.954 | 4.296 | 8.534 | (32.974) | 11.089 | 9.020 |
| Total from Investment Operations | 4.753 | 5.561 | 9.643 | (31.401) | 12.403 | 10.080 |
| Distributions | | | | | | |
| Dividends from Net Investment Income | (2.243) | (1.421) | (.823) | (1.669) | (1.473) | (.930) |
| Distributions from Realized Capital Gains | — | — | — | — | — | — |
| Total Distributions | (2.243) | (1.421) | (.823) | (1.669) | (1.473) | (.930) |
| Net Asset Value, End of Period | $57.57 | $55.06 | $50.92 | $42.10 | $75.17 | $64.24 |
| |
| Total Return | 8.73% | 11.11% | 23.38% | -42.61% | 19.65% | 18.43% |
| |
| Ratios/Supplemental Data | | | | | | |
| Net Assets, End of Period (Millions) | $1,644 | $1,482 | $1,288 | $1,186 | $1,503 | $693 |
| Ratio of Total Expenses to | | | | | | |
| Average Net Assets | 0.14% | 0.14% | 0.16% | 0.11% | 0.12% | 0.18% |
| Ratio of Net Investment Income to | | | | | | |
| Average Net Assets | 2.84% | 2.49% | 2.53% | 2.43% | 1.90% | 1.82% |
| Portfolio Turnover Rate2 | 5% | 3% | 8% | 9% | 3% | 2% |
The expense ratio, net income ratio, and turnover rate for the current period have been annualized.
1 Calculated based on average shares outstanding.
2 Excludes the value of portfolio securities received or delivered as a result of in-kind purchases or redemptions of the fund’s capital shares, including ETF Creation Units.
See accompanying Notes, which are an integral part of the Financial Statements.
42
Pacific Stock Index Fund
Notes to Financial Statements
Vanguard Pacific Stock Index Fund is registered under the Investment Company Act of 1940 as an open-end investment company, or mutual fund. The fund invests in securities of foreign issuers, which may subject it to investment risks not normally associated with investing in securities of U.S. corporations. The fund offers six classes of shares: Investor Shares, Admiral Shares, Signal Shares, Institutional Shares, Institutional Plus Shares, and ETF Shares. Investor Shares are available to any investor who meets the fund’s minimum purchase requirements. Admiral Shares, Signal Shares, Institutional Shares, and Institutional Plus Shares are designed for investors who meet certain administrative, service, and account-size criteria. The fund has not issued any Institutional Plus Shares through April 30, 2011. ETF Shares, known as Vanguard MSCI Pacific ETF Shares, are listed for trading on the NYSE Arca, Inc.; they can be purchased and sold through a broker.
A. The following significant accounting policies conform to generally accepted accounting principles for U.S. mutual funds. The fund consistently follows such policies in preparing its financial statements.
1. Security Valuation: Securities are valued as of the close of trading on the New York Stock Exchange (generally 4 p.m., Eastern time) on the valuation date. Equity securities are valued at the latest quoted sales prices or official closing prices taken from the primary market in which each security trades; such securities not traded on the valuation date are valued at the mean of the latest quoted bid and asked prices. Securities for which market quotations are not readily available, or whose values have been affected by events occurring before the fund’s pricing time but after the close of the securities’ primary markets, are valued at their fair values calculated according to procedures adopted by the board of trustees. These procedures include obtaining quotations from an independent pricing service, monitoring news to identify significant market- or security-specific events, and evaluating changes in the values of foreign market proxies (for example, ADRs, futures contracts, or exchange-traded funds), between the time the foreign markets close and the fund’s pricing time. When fair-value pricing is employed, the prices of securities used by a fund to calculate its net asset value may differ from quoted or published prices for the same securities. Investments in Vanguard Market Liquidity Fund are valued at that fund’s net asset value. Temporary cash investments acquired over 60 days to maturity are valued using the latest bid prices or using valuations based on a matrix system (which considers such factors as security prices, yields, maturities, and ratings), both as furnished by independent pricing services. Other temporary cash investments are valued at amortized cost, which approximates market value.
2. Foreign Currency: Securities and other assets and liabilities denominated in foreign currencies are translated into U.S. dollars using exchange rates obtained from an independent third party as of the fund’s pricing time on the valuation date. Realized gains (losses) and unrealized appreciation (depreciation) on investment securities include the effects of changes in exchange rates since the securities were purchased, combined with the effects of changes in security prices. Fluctuations in the value of other assets and liabilities resulting from changes in exchange rates are recorded as unrealized foreign currency gains (losses) until the assets or liabilities are settled in cash, at which time they are recorded as realized foreign currency gains (losses).
3. Futures and Forward Currency Contracts: The fund uses index futures contracts to a limited extent, with the objectives of maintaining full exposure to the stock market, enhancing returns, maintaining liquidity, and minimizing transaction costs. The fund may purchase futures contracts to immediately invest incoming cash in the market, or sell futures in response to cash outflows, thereby simulating a fully invested position in the underlying index while maintaining a cash balance for liquidity. The fund may seek to enhance returns by using futures contracts instead of the underlying securities when futures are believed to be priced more attractively than the underlying securities. The primary
43
Pacific Stock Index Fund
risks associated with the use of futures contracts are imperfect correlation between changes in market values of stocks held by the fund and the prices of futures contracts, and the possibility of an illiquid market.
The fund also enters into forward currency contracts to provide the appropriate currency exposure related to any open futures contracts. The fund’s risks in using these contracts include movement in the values of the foreign currencies relative to the U.S. dollar and the ability of the counterparties to fulfill their obligations under the contracts. Counterparty risk is mitigated by entering into forward currency contracts only with highly rated counterparties, by a master netting arrangement between the fund and the counterparty, and by the posting of collateral by the counterparty. The forward currency contracts contain provisions whereby a counterparty may terminate open contracts if the fund’s net assets decline below a certain level, triggering a payment by the fund if the fund is in a net liability position at the time of the termination. The payment amount would be reduced by any collateral the fund has posted. Any securities posted as collateral for open contracts are noted in the Statement of Net Assets.
Futures contracts are valued at their quoted daily settlement prices. Forward currency contracts are valued at their quoted daily prices obtained from an independent third party, adjusted for currency risk based on the expiration date of each contract. The aggregate principal amounts of the contracts are not recorded in the Statement of Net Assets. Fluctuations in the value of the contracts are recorded in the Statement of Net Assets as an asset (liability) and in the Statement of Operations as unrealized appreciation (depreciation) until the contracts are closed, when they are recorded as realized gains (losses) on futures or forward currency contracts.
4. Federal Income Taxes: The fund intends to continue to qualify as a regulated investment company and distribute all of its taxable income. Management has analyzed the fund’s tax positions taken for all open federal income tax years (October 31, 2007–2010), and for the period ended April 30, 2011, and has concluded that no provision for federal income tax is required in the fund’s financial statements.
5. Distributions: Distributions to shareholders are recorded on the ex-dividend date.
6. Security Lending: The fund may lend its securities to qualified institutional borrowers to earn additional income. Security loans are required to be secured at all times by collateral at least equal to the market value of securities loaned. The fund invests cash collateral received in Vanguard Market Liquidity Fund, and records a liability for the return of the collateral, during the period the securities are on loan. Security lending income represents fees charged to borrowers plus income earned on investing cash collateral, less expenses associated with the loan.
7. Other: Dividend income is recorded on the ex-dividend date. Interest income includes income distributions received from Vanguard Market Liquidity Fund and is accrued daily. Security transactions are accounted for on the date securities are bought or sold. Costs used to determine realized gains (losses) on the sale of investment securities are those of the specific securities sold. Fees assessed on redemptions of capital shares are credited to paid-in capital.
Each class of shares has equal rights as to assets and earnings, except that each class separately bears certain class-specific expenses related to maintenance of shareholder accounts (included in Management and Administrative expenses) and shareholder reporting. Marketing and distribution expenses are allocated to each class of shares based on a method approved by the board of trustees. Income, other non-class-specific expenses, and gains and losses on investments are allocated to each class of shares based on its relative net assets.
44
Pacific Stock Index Fund
B. The Vanguard Group furnishes at cost investment advisory, corporate management, administrative, marketing, and distribution services. The costs of such services are allocated to the fund under methods approved by the board of trustees. The fund has committed to provide up to 0.40% of its net assets in capital contributions to Vanguard. At April 30, 2011, the fund had contributed capital of $689,000 to Vanguard (included in Other Assets), representing 0.02% of the fund’s net assets and 0.28% of Vanguard’s capitalization. The fund’s trustees and officers are also directors and officers of Vanguard.
C. Various inputs may be used to determine the value of the fund’s investments. These inputs are summarized in three broad levels for financial statement purposes. The inputs or methodologies used to value securities are not necessarily an indication of the risk associated with investing in those securities.
Level 1—Quoted prices in active markets for identical securities.
Level 2—Other significant observable inputs (including quoted prices for similar securities, interest rates, prepayment speeds, credit risk, etc.).
Level 3—Significant unobservable inputs (including the fund’s own assumptions used to determine the fair value of investments).
The following table summarizes the fund’s investments as of April 30, 2011, based on the inputs used to value them:
| | | |
| | Level 1 | Level 2 | Level 3 |
| Investments | ($000) | ($000) | ($000) |
| Common Stocks | 4,791 | 4,376,317 | — |
| Temporary Cash Investments | 40,243 | 3,700 | — |
| Futures Contracts—Liabilities1 | (199) | — | — |
| Forward Currency Contracts—Assets | — | 980 | — |
| Forward Currency Contracts—Liabilities | — | (2) | — |
| Total | 44,835 | 4,380,995 | — |
| 1 Represents variation margin on the last day of the reporting period. |
D. At April 30, 2011, the fair values of derivatives were reflected in the Statement of Net Assets as follows:
| | | |
| | | Foreign | |
| | Equity | Exchange | |
| | Contracts1 | Contracts | Total |
| Statement of Net Assets Caption | ($000) | ($000) | ($000) |
| Other Assets | — | 980 | 980 |
| Liabilities | (199) | (2) | (201) |
| 1 Represents variation margin on the last day of the reporting period. |
45
Pacific Stock Index Fund
Realized net gain (loss) and the change in unrealized appreciation (depreciation) on derivatives for the six months ended April 30, 2011, were:
| | | |
| | | Foreign | |
| | Equity | Exchange | |
| | Contracts | Contracts | Total |
| Realized Net Gain (Loss) on Derivatives | ($000) | ($000) | ($000) |
| Futures Contracts | (257) | — | (257) |
| Forward Currency Contracts | — | 1,353 | 1,353 |
| Realized Net Gain (Loss) on Derivatives | (257) | 1,353 | 1,096 |
| |
| Change in Unrealized Appreciation (Depreciation) on Derivatives | | | |
| Futures Contracts | 1,265 | — | 1,265 |
| Forward Currency Contracts | — | 92 | 92 |
| Change in Unrealized Appreciation (Depreciation) on Derivatives | 1,265 | 92 | 1,357 |
At April 30, 2011, the aggregate settlement value of open futures contracts and the related unrealized appreciation (depreciation) were:
| | | | |
| | | | | ($000) |
| | | | Aggregate | |
| | | Number of | Settlement | Unrealized |
| | | Long (Short) | Value | Appreciation |
| Futures Contracts | Expiration | Contracts | Long (Short) | (Depreciation) |
| Topix Index | June 2011 | 282 | 29,663 | (126) |
| S&P ASX 200 Index | June 2011 | 112 | 14,733 | 172 |
At April 30, 2011, the fund had open forward currency contracts to receive and deliver currencies as follows. Unrealized appreciation (depreciation) on open forward currency contracts is treated as realized gain (loss) for tax purposes.
| | | | | | |
| | | | | | | Unrealized |
| | Contract | | | | | Appreciation |
| | Settlement | | | Contract Amount (000) | (Depreciation) |
| Counterparty | Date | | Receive | | Deliver | ($000) |
| UBS AG | 6/22/11 | AUD | 13,216 | USD | 14,361 | 980 |
| UBS AG | 6/15/11 | JPY | 327,610 | USD | 4,039 | (2) |
| AUD—Australian dollar. |
| JPY—Japanese yen. |
| USD—U.S. dollar. |
At April 30, 2011, the counterparty had deposited in a segregated account securities with a value sufficient to cover substantially all amounts due to the fund in connection with open forward currency contracts.
46
Pacific Stock Index Fund
The fund had net unrealized foreign currency gains of $457,000 resulting from the translation of other assets and liabilities at April 30, 2011.
E. Distributions are determined on a tax basis and may differ from net investment income and realized capital gains for financial reporting purposes. Differences may be permanent or temporary. Permanent differences are reclassified among capital accounts in the financial statements to reflect their tax character. Temporary differences arise when certain items of income, expense, gain, or loss are recognized in different periods for financial statement and tax purposes; these differences will reverse at some time in the future. Differences in classification may also result from the treatment of short-term gains as ordinary income for tax purposes.
During the six months ended April 30, 2011, the fund realized net foreign currency gains of $1,295,000, which increased distributable net income for tax purposes; accordingly, such gains have been reclassified from accumulated net realized losses to undistributed net investment income.
Certain of the fund’s investments are in securities considered to be “passive foreign investment companies,” for which any unrealized appreciation and/or realized gains are required to be included in distributable net income for tax purposes. During the six months ended April 30, 2011, the fund realized gains on the sale of passive foreign investment companies of $574,000, which have been included in current and prior periods’ taxable income; accordingly, such gains have been reclassified from accumulated net realized losses to undistributed net investment income. Unrealized appreciation through the most recent mark-to-market date for tax purposes on passive foreign investment company holdings at April 30, 2011, was $2,510,000, all of which has been distributed and is reflected in the balance of undistributed net investment income.
During the six months ended April 30, 2011, the fund realized $28,130,000 of net capital losses resulting from in-kind redemptions—in which shareholders exchanged fund shares for securities held by the fund rather than for cash. Because such losses are not taxable losses to the fund, they have been reclassified from accumulated net realized losses to paid-in capital.
The fund’s tax-basis capital gains and losses are determined only at the end of each fiscal year. For tax purposes, at October 31, 2010, the fund had available capital loss carryforwards totaling $1,099,252,000 to offset future net capital gains of $4,471,000 through October 31, 2011, $4,674,000 through October 31, 2013, $453,022,000 through October 31, 2016, $607,343,000 through October 31, 2017, and $29,742,000 through October 31, 2018. The fund will use these capital losses to offset net taxable capital gains, if any, realized during the year ending October 31, 2011; should the fund realize net capital losses for the year, the losses will be added to the loss carryforward balance above.
At April 30, 2011, the cost of investment securities for tax purposes was $5,395,042,000. Net unrealized depreciation of investment securities for tax purposes was $969,991,000, consisting of unrealized gains of $382,698,000 on securities that had risen in value since their purchase and $1,352,689,000 in unrealized losses on securities that had fallen in value since their purchase.
F. During the six months ended April 30, 2011, the fund purchased $202,129,000 of investment securities and sold $577,852,000 of investment securities, other than temporary cash investments.
47
Pacific Stock Index Fund
G. Capital share transactions for each class of shares were:
| | | | |
| | Six Months Ended | | Year Ended |
| | | April 30, 2011 | October 31, 2010 |
| | Amount | Shares | Amount | Shares |
| | ($000) | (000) | ($000) | (000) |
| Investor Shares | | | | |
| Issued | 68,516 | 6,385 | 928,036 | 95,562 |
| Issued in Lieu of Cash Distributions | 15,293 | 1,433 | 77,181 | 7,998 |
| Redeemed1 | (455,147) | (42,599) | (3,266,591) | (316,059) |
| Net Increase (Decrease)—Investor Shares | (371,338) | (34,781) | (2,261,374) | (212,499) |
| Admiral Shares | | | | |
| Issued | 510,070 | 7,310 | 357,184 | 5,342 |
| Issued in Lieu of Cash Distributions | 52,036 | 751 | 19,195 | 304 |
| Redeemed1 | (116,837) | (1,672) | (130,129) | (2,021) |
| Net Increase (Decrease)—Admiral Shares | 445,269 | 6,389 | 246,250 | 3,625 |
| Signal Shares | | | | |
| Issued | 25,588 | 1,045 | 38,562 | 1,730 |
| Issued in Lieu of Cash Distributions | 5,823 | 242 | 3,686 | 168 |
| Redeemed1 | (44,198) | (1,857) | (43,232) | (1,932) |
| Net Increase (Decrease)—Signal Shares | (12,787) | (570) | (984) | (34) |
| Institutional Shares | | | | |
| Issued | 36,153 | 3,390 | 320,724 | 32,370 |
| Issued in Lieu of Cash Distributions | 10,333 | 974 | 10,557 | 1,093 |
| Redeemed1 | (469,219) | (43,587) | (71,803) | (7,262) |
| Net Increase (Decrease)—Institutional Shares | (422,733) | (39,223) | 259,478 | 26,201 |
| ETF Shares | | | | |
| Issued | 100,513 | 1,828 | 142,992 | 2,720 |
| Issued in Lieu of Cash Distributions | — | — | — | — |
| Redeemed1 | (10,833) | (200) | (51,614) | (1,100) |
| Net Increase (Decrease)—ETF Shares | 89,680 | 1,628 | 91,378 | 1,620 |
| 1 Net of redemption fees for fiscal 2011 and 2010 of $126,000 and $186,000, respectively (fund totals). |
H. In preparing the financial statements as of April 30, 2011, management considered the impact of subsequent events for potential recognition or disclosure in these financial statements.
48
Emerging Markets Stock Index Fund
Fund Profile
As of April 30, 2011
| | | | | | |
| Share-Class Characteristics | | | | | | |
| | Investor | Admiral | Signal | Institutional | Institutional | ETF |
| | Shares | Shares | Shares | Shares | Plus Shares | Shares |
| Ticker Symbol | VEIEX | VEMAX | VERSX | VEMIX | VEMRX | VWO |
| Expense Ratio1 | 0.35% | 0.22% | 0.22% | 0.15% | 0.12% | 0.22% |
| | | |
| Portfolio Characteristics | | |
| | | MSCI | MSCI AC |
| | | Emerging | World |
| | | Markets | Index |
| | Fund | Index | ex USA |
| Number of Stocks | 896 | 803 | 1,869 |
| Median Market Cap $19.7B | $19.9B | $33.8B |
| Price/Earnings Ratio | 14.2x | 13.7x | 13.8x |
| Price/Book Ratio | 2.2x | 2.0x | 1.7x |
| Return on Equity | 21.2% | 20.4% | 17.8% |
| Earnings Growth Rate 14.5% | 14.4% | 2.8% |
| Dividend Yield | 2.1% | 2.4% | 2.9% |
| Turnover Rate | | | |
| (Annualized) | 11% | — | — |
| Short-Term Reserves | 0.0% | — | — |
| | | |
| Sector Diversification (% of equity exposure) |
| | | MSCI | MSCI AC |
| | | Emerging | World |
| | | Markets | Index |
| | Fund | Index | ex USA |
| Consumer | | | |
| Discretionary | 7.2% | 7.1% | 9.0% |
| Consumer Staples | 6.6 | 6.6 | 8.5 |
| Energy | 15.1 | 15.1 | 11.6 |
| Financials | 24.6 | 24.8 | 24.8 |
| Health Care | 0.9 | 0.9 | 5.9 |
| Industrials | 7.3 | 7.3 | 11.0 |
| Information | | | |
| Technology | 12.7 | 12.4 | 6.3 |
| Materials | 15.0 | 15.0 | 13.0 |
| Telecommunication | | | |
| Services | 7.2 | 7.3 | 5.7 |
| Utilities | 3.4 | 3.5 | 4.2 |
| | |
| Volatility Measures | | |
| | MSCI | MSCI AC |
| | Emerging | World Index |
| | Markets Index | ex USA |
| R-Squared | 0.99 | 0.93 |
| Beta | 1.03 | 1.16 |
These measures show the degree and timing of the fund’s fluctuations compared with the indexes over 36 months.
| | |
| Ten Largest Holdings (% of total net assets) |
| |
| Petroleo Brasileiro SA | Integrated Oil & | |
| | Gas | 3.0% |
| Samsung Electronics Co | | |
| Ltd. | Semiconductors | 2.5 |
| Vale SA | Steel | 2.5 |
| Gazprom OAO | Integrated Oil & | |
| | Gas | 2.2 |
| Taiwan Semiconductor | Electronic | |
| Manufacturing Co Ltd. | Equipment & | |
| | Instruments | 1.5 |
| America Movil SAB de | Wireless | |
| CV | Telecommunication | |
| | Services | 1.4 |
| China Mobile Ltd. | Wireless | |
| | Telecommunication | |
| | Services | 1.3 |
| Itau Unibanco Holding | | |
| SA | Diversified Banks | 1.3 |
| Industrial & Commercial | | |
| Bank of China | Diversified Banks | 1.2 |
| China Construction Bank | | |
| Corp. | Diversified Banks | 1.1 |
| Top Ten | | 18.0% |
The holdings listed exclude any temporary cash investments and equity index products.
1 The expense ratios shown are from the prospectus dated February 25, 2011, and represent estimated costs for the current fiscal year. For the six months ended April 30, 2011, the annualized expense ratios were 0.35% for Investor Shares, 0.22% for Admiral Shares, 0.22% for Signal Shares, 0.15% for Institutional Shares, 0.12% for Institutional Plus Shares (for the period since inception), and 0.22% for ETF Shares.
49
Emerging Markets Stock Index Fund
| | | |
| Market Diversification (% of equity exposure) |
| | | MSCI | MSCI AC |
| | | Emerging | World |
| | | Markets | Index |
| | Fund | Index | ex USA |
| Europe | 0.0% | 0.0% | 45.6% |
| Pacific | 0.0% | 0.0% | 22.3% |
| Emerging Markets | | | |
| China | 17.2% | 17.2% | 4.0% |
| Brazil | 15.5 | 15.5 | 3.6 |
| South Korea | 14.9 | 14.8 | 3.5 |
| Taiwan | 11.3 | 11.3 | 2.7 |
| South Africa | 7.6 | 7.6 | 1.8 |
| India | 7.2 | 7.1 | 1.7 |
| Russia | 7.1 | 7.1 | 1.7 |
| Mexico | 4.3 | 4.3 | 1.0 |
| Malaysia | 2.9 | 2.8 | 0.7 |
| Indonesia | 2.5 | 2.4 | 0.6 |
| Thailand | 1.8 | 1.8 | 0.4 |
| Poland | 1.8 | 1.8 | 0.4 |
| Chile | 1.6 | 1.6 | 0.4 |
| Turkey | 1.5 | 1.5 | 0.3 |
| Other | 2.8 | 3.2 | 0.7 |
| Subtotal | 100.0% | 100.0% | 23.5% |
| Middle East | 0.0% | 0.0% | 0.5% |
| North America | 0.0% | 0.0% | 8.1% |
50
Emerging Markets Stock Index Fund
Performance Summary
All of the returns in this report represent past performance, which is not a guarantee of future results that may be achieved by the fund. (Current performance may be lower or higher than the performance data cited. For performance data current to the most recent month-end, visit our website at vanguard.com/performance.) Note, too, that both investment returns and principal value can fluctuate widely, so an investor’s shares, when sold, could be worth more or less than their original cost. The returns shown do not reflect taxes that a shareholder would pay on fund distributions or on the sale of fund shares.
Fiscal-Year Total Returns (%): October 31, 2000, Through April 30, 2011
Spliced Emerging Markets Index: Select Emerging Markets Index, administered exclusively for Vanguard by MSCI, through August 23, 2006;
MSCI Emerging Markets Index thereafter. Index returns are adjusted for withholding taxes applicable to Luxembourg holding companies.
Note: For 2011, performance data reflect the six months ended April 30, 2011.
The Fiscal-Year Total Returns chart is not adjusted for fees. In the final table, fee-adjusted returns reflect the 0.50% purchase fee and 0.25%
redemption fee. The fees do not apply to the ETF Shares.
See Financial Highlights for dividend and capital gains information.
51
Emerging Markets Stock Index Fund
Average Annual Total Returns: Periods Ended March 31, 2011
This table presents returns through the latest calendar quarter—rather than through the end of the fiscal period.
Securities and Exchange Commission rules require that we provide this information.
| | | | |
| | Inception | One | Five | Ten |
| | Date | Year | Years | Years |
| Investor Shares | 5/4/1994 | 18.06% | 10.17% | 16.64% |
| Fee-Adjusted Returns | | 17.18 | 10.01 | 16.56 |
| Admiral Shares | 6/23/2006 | 18.22 | — | 13.421 |
| Fee-Adjusted Returns | | 17.34 | — | 13.251 |
| Signal Shares | 1/19/2007 | 18.23 | — | 8.691 |
| Fee-Adjusted Returns | | 17.35 | — | 8.501 |
| Institutional Shares | 6/22/2000 | 18.30 | 10.38 | 16.85 |
| Fee-Adjusted Returns | | 17.41 | 10.22 | 16.76 |
| Institutional Plus Shares | 12/15/2010 | — | — | 5.251 |
| Fee-Adjusted Returns | | — | — | 4.471 |
| ETF Shares | 3/4/2005 | | | |
| Market Price | | 18.11 | 10.33 | 13.991 |
| Net Asset Value | | 18.23 | 10.32 | 13.951 |
| 1 Return since inception. |
The Fiscal-Year Total Returns chart is not adjusted for fees. In the final table, fee-adjusted returns reflect the 0.50% purchase fee and 0.25% redemption fee. The fees do not apply to the ETF Shares.
52
Emerging Markets Stock Index Fund
Financial Statements (unaudited)
Statement of Net Assets—Investments Summary
As of April 30, 2011
This Statement summarizes the fund’s holdings by asset type. Details are reported for each of the fund’s 50 largest individual holdings and for investments that, in total for any issuer, represent more than 1% of the fund’s net assets. The total value of smaller holdings is reported as a single amount within each category.
The fund reports a complete list of its holdings in regulatory filings four times in each fiscal year, at the quarter-ends. For the second and fourth fiscal quarters, the complete listing of the fund’s holdings is available electronically on vanguard.com and on the Securities and Exchange Commission’s website (sec.gov), or you can have it mailed to you without charge by calling 800-662-7447. For the first and third fiscal quarters, the fund files the lists with the SEC on Form N-Q. Shareholders can look up the fund’s Forms N-Q on the SEC’s website. Forms N-Q may also be reviewed and copied at the SEC’s Public Reference Room (see the back cover of this report for further information).
| | | |
| | | Market | Percentage |
| | | Value | of Net |
| | Shares | ($000) | Assets |
| Common Stocks | | | |
| Brazil | | | |
| Petroleo Brasileiro SA ADR Type A | 19,241,180 | 642,078 | 1.0% |
| Vale SA Class B Pfd. ADR | 21,466,529 | 641,849 | 1.0% |
| Itau Unibanco Holding SA ADR | 25,321,875 | 601,395 | 0.9% |
| Petroleo Brasileiro SA ADR | 13,980,117 | 521,878 | 0.8% |
| Vale SA Class B ADR | 13,748,994 | 459,216 | 0.7% |
| Petroleo Brasileiro SA Prior Pfd. | 27,963,628 | 454,329 | 0.7% |
| Banco Bradesco SA ADR | 19,114,852 | 386,694 | 0.6% |
| Petroleo Brasileiro SA | 19,207,388 | 351,256 | 0.5% |
| Vale SA Prior Pfd. | 10,321,777 | 302,528 | 0.5% |
| Itausa - Investimentos Itau SA Prior Pfd. | 35,677,934 | 273,504 | 0.4% |
| Itau Unibanco Holding SA Prior Pfd. | 10,971,176 | 256,287 | 0.4% |
| Vale SA | 7,033,938 | 230,754 | 0.3% |
| Brazil—Other † | | 5,009,982 | 7.7% |
| | | 10,131,750 | 15.5% |
| |
| Chile † | | 1,058,334 | 1.6% |
| |
| China | | | |
| China Mobile Ltd. | 94,535,667 | 869,585 | 1.3% |
| Industrial & Commercial Bank of China | 955,560,003 | 810,519 | 1.3% |
| China Construction Bank Corp. | 756,250,857 | 716,111 | 1.1% |
| CNOOC Ltd. | 280,612,152 | 697,483 | 1.1% |
| Bank of China Ltd. | 986,400,277 | 545,956 | 0.8% |
| PetroChina Co. Ltd. | 331,841,679 | 481,701 | 0.7% |
| Tencent Holdings Ltd. | 15,803,572 | 451,257 | 0.7% |
| China Life Insurance Co. Ltd. | 116,742,470 | 417,287 | 0.6% |
| Ping An Insurance Group Co. | 26,949,988 | 293,835 | 0.5% |
| China Petroleum & Chemical Corp. | 249,905,540 | 251,897 | 0.4% |
| China—Other † | | 5,664,036 | 8.7% |
| | | 11,199,667 | 17.2% |
53
Emerging Markets Stock Index Fund
| | | |
| | | Market | Percentage |
| | | Value | of Net |
| | Shares | ($000) | Assets |
| Colombia | | | |
| BanColombia SA ADR | 4,919,477 | 325,915 | 0.5% |
| Colombia—Other † | | 64,364 | 0.1% |
| | | 390,279 | 0.6% |
| |
| Czech Republic † | | 261,487 | 0.4% |
| |
| Egypt † | | 122,398 | 0.2% |
| |
| Hungary † | | 302,358 | 0.5% |
| |
| India | | | |
| Infosys Technologies Ltd. | 7,251,368 | 476,716 | 0.8% |
| Reliance Industries Ltd. | 20,660,192 | 459,431 | 0.7% |
| ICICI Bank Ltd. | 10,947,492 | 276,659 | 0.4% |
| Housing Development Finance Corp. | 17,066,678 | 273,022 | 0.4% |
| India—Other † | | 3,216,566 | 4.9% |
| | | 4,702,394 | 7.2% |
| |
| Indonesia † | | 1,601,259 | 2.5% |
| |
| Malaysia † | | 1,879,006 | 2.9% |
| |
| Mexico | | | |
| America Movil SAB de CV | 309,524,298 | 887,029 | 1.3% |
| Wal-Mart de Mexico SAB de CV | 97,533,592 | 305,521 | 0.5% |
| Mexico—Other † | | 1,643,773 | 2.5% |
| | | 2,836,323 | 4.3% |
| |
| Morocco † | | 17,201 | 0.0% |
| |
| Peru † | | 357,588 | 0.5% |
| |
| Philippines † | | 382,149 | 0.6% |
| |
| Poland † | | 1,164,949 | 1.8% |
| |
| Russia | | | |
| Gazprom OAO ADR | 73,353,352 | 1,242,880 | 1.9% |
| Lukoil OAO ADR | 7,225,717 | 502,201 | 0.8% |
| Sberbank of Russia | 134,563,489 | 491,936 | 0.7% |
| MMC Norilsk Nickel OJSC ADR | 10,313,906 | 285,502 | 0.4% |
| Gazprom OAO | 20,821,266 | 179,276 | 0.3% |
| Russia—Other † | | 1,939,003 | 3.0% |
| | | 4,640,798 | 7.1% |
| South Africa | | | |
| MTN Group Ltd. | 26,630,396 | 592,323 | 0.9% |
| Sasol Ltd. | 9,074,162 | 524,359 | 0.8% |
| Naspers Ltd. | 6,034,148 | 363,390 | 0.6% |
| AngloGold Ashanti Ltd. | 5,963,389 | 303,686 | 0.5% |
| Standard Bank Group Ltd. | 18,539,233 | 291,168 | 0.4% |
| South Africa—Other † | | 2,884,655 | 4.4% |
| | | 4,959,581 | 7.6% |
54
Emerging Markets Stock Index Fund
| | | | | |
| | | | | Market | Percentage |
| | | | | Value | of Net |
| | | | Shares | ($000) | Assets |
| South Korea | | | | |
| 1 | Samsung Electronics Co. Ltd. GDR | 2,075,319 | 866,361 | 1.3% |
| | Samsung Electronics Co. Ltd. | | 699,870 | 584,588 | 0.9% |
| | Hyundai Motor Co. | | 2,425,137 | 559,356 | 0.9% |
| | LG Chem Ltd. | | 729,612 | 362,484 | 0.5% |
| | Hyundai Mobis | | 1,071,709 | 359,460 | 0.5% |
| | POSCO ADR | | 2,922,321 | 322,332 | 0.5% |
| ^ | Hyundai Heavy Industries Co. Ltd. | 597,659 | 298,916 | 0.5% |
| | Kia Motors Corp. | | 3,737,114 | 268,843 | 0.4% |
| | Samsung Electronics Co. Ltd. Prior Pfd | . 322,541 | 189,883 | 0.3% |
| | Hyundai Motor Co. 2nd Pfd. | | 592,701 | 47,703 | 0.1% |
| | Hyundai Motor Co. Prior Pfd. | | 357,108 | 26,887 | 0.0% |
| | South Korea—Other † | | | 5,808,394 | 8.9% |
| | | | | 9,695,207 | 14.8% |
| Taiwan | | | | |
| | Taiwan Semiconductor Manufacturing Co. Ltd. ADR | 46,820,694 | 632,079 | 0.9% |
| | Hon Hai Precision Industry Co. Ltd. | 134,733,588 | 511,654 | 0.8% |
| | HTC Corp. | | 10,785,850 | 490,936 | 0.7% |
| | Taiwan Semiconductor Manufacturing Co. Ltd. | 146,060,045 | 377,782 | 0.6% |
| | Formosa Plastics Corp. | | 62,227,458 | 254,830 | 0.4% |
| | Taiwan—Other † | | | 5,008,340 | 7.7% |
| | | | | 7,275,621 | 11.1% |
| |
| Thailand † | | | 1,168,715 | 1.8% |
| |
| Turkey † | | | 979,086 | 1.5% |
| Total Common Stocks (Cost $48,639,592) | | 65,126,150 | 99.7%2 |
| |
| | | Coupon | | | |
| Temporary Cash Investments | | | | |
| Money Market Fund | | | | |
| 3,4 | Vanguard Market Liquidity Fund | 0.179% | 831,468,281 | 831,468 | 1.3% |
| |
| 5U.S. Government and Agency Obligations † | | 5,799 | 0.0% |
| Total Temporary Cash Investments (Cost $837,267) | | 837,267 | 1.3%2 |
| Total Investments (Cost $49,476,859) | | 65,963,417 | 101.0% |
| Other Assets and Liabilities | | | | |
| Other Assets | | | 275,966 | 0.4% |
| Liabilities4 | | | (951,317) | (1.4%) |
| | | | | (675,351) | (1.0%) |
| Net Assets | | | 65,288,066 | 100.0% |
55
Emerging Markets Stock Index Fund
| |
| At April 30, 2011, net assets consisted of: | |
| | Amount |
| | ($000) |
| Paid-in Capital | 51,509,134 |
| Undistributed Net Investment Income | 101,363 |
| Accumulated Net Realized Losses | (2,811,171) |
| Unrealized Appreciation (Depreciation) | |
| Investment Securities | 16,486,558 |
| Futures Contracts | (83) |
| Foreign Currencies | 2,265 |
| Net Assets | 65,288,066 |
| |
| Investor Shares—Net Assets | |
| Applicable to 104,823,123 outstanding $.001 par value shares of | |
| beneficial interest (unlimited authorization) | 3,349,071 |
| Net Asset Value Per Share—Investor Shares | $31.95 |
| |
| Admiral Shares—Net Assets | |
| Applicable to 193,432,369 outstanding $.001 par value shares of | |
| beneficial interest (unlimited authorization) | 8,124,511 |
| Net Asset Value Per Share—Admiral Shares | $42.00 |
| |
| Signal Shares—Net Assets | |
| Applicable to 19,141,588 outstanding $.001 par value shares of | |
| beneficial interest (unlimited authorization) | 773,109 |
| Net Asset Value Per Share—Signal Shares | $40.39 |
| |
| Institutional Shares—Net Assets | |
| Applicable to 52,921,018 outstanding $.001 par value shares of | |
| beneficial interest (unlimited authorization) | 1,691,070 |
| Net Asset Value Per Share—Institutional Shares | $31.95 |
| |
| Institutional Plus Shares—Net Assets | |
| Applicable to 18,839,678 outstanding $.001 par value shares of | |
| beneficial interest (unlimited authorization) | 2,002,839 |
| Net Asset Value Per Share—Institutional Plus Shares | $106.31 |
56
Emerging Markets Stock Index Fund
| |
| | Amount |
| | ($000) |
| ETF Shares—Net Assets | |
| Applicable to 977,262,614 outstanding $.001 par value shares of | |
| beneficial interest (unlimited authorization) | 49,347,466 |
| Net Asset Value Per Share—ETF Shares | $50.50 |
• See Note A in Notes to Financial Statements.
^ Part of security position is on loan to broker-dealers. The total value of securities on loan is $679,483,000.
† Represents the aggregate value, by category, of securities that are not among the 50 largest holdings and, in total for any issuer, represent 1% or less of net assets.
1 Security exempt from registration under Rule 144A of the Securities Act of 1933. Such securities may be sold in transactions exempt from registration, normally to qualified institutional buyers. At April 30, 2011, the value of this security represented 1.3% of net assets.
2 The fund invests a portion of its cash reserves in equity markets through the use of index futures contracts. After giving effect to futures investments, the fund’s effective common stock and temporary cash investment positions represent 99.9% and 1.1%, respectively, of net assets.
3 Affiliated money market fund available only to Vanguard funds and certain trusts and accounts managed by Vanguard. Rate shown is the 7-day yield.
4 Includes $727,731,000 of collateral received for securities on loan.
5 Securities with a value of $5,499,000 have been segregated as initial margin for open futures contracts.
ADR—American Depositary Receipt.
GDR—Global Depositary Receipt.
See accompanying Notes, which are an integral part of the Financial Statements.
57
Emerging Markets Stock Index Fund
| |
| Statement of Operations | |
| |
| |
| | Six Months Ended |
| | April 30, 2011 |
| | ($000) |
| Investment Income | |
| Income | |
| Dividends1 | 511,283 |
| Interest2 | 160 |
| Security Lending | 5,446 |
| Total Income | 516,889 |
| Expenses | |
| The Vanguard Group—Note B | |
| Investment Advisory Services | 2,071 |
| Management and Administrative—Investor Shares | 3,968 |
| Management and Administrative—Admiral Shares | 5,059 |
| Management and Administrative—Signal Shares | 421 |
| Management and Administrative—Institutional Shares | 388 |
| Management and Administrative—Institutional Plus Shares | 450 |
| Management and Administrative—ETF Shares | 27,206 |
| Marketing and Distribution—Investor Shares | 836 |
| Marketing and Distribution—Admiral Shares | 518 |
| Marketing and Distribution—Signal Shares | 101 |
| Marketing and Distribution—Institutional Shares | 452 |
| Marketing and Distribution—Institutional Plus Shares | 62 |
| Marketing and Distribution—ETF Shares | 6,554 |
| Custodian Fees | 17,371 |
| Shareholders’ Reports—Investor Shares | 37 |
| Shareholders’ Reports—Admiral Shares | 33 |
| Shareholders’ Reports—Signal Shares | 2 |
| Shareholders’ Reports—Institutional Shares | 1 |
| Shareholders’ Reports—Institutional Plus Shares | — |
| Shareholders’ Reports—ETF Shares | 272 |
| Trustees’ Fees and Expenses | 30 |
| Total Expenses | 65,832 |
| Net Investment Income | 451,057 |
| Realized Net Gain (Loss) | |
| Investment Securities Sold | 575,988 |
| Futures Contracts | 9,126 |
| Foreign Currencies | (11,066) |
| Realized Net Gain (Loss) | 574,048 |
| Change in Unrealized Appreciation (Depreciation) | |
| Investment Securities | 4,666,031 |
| Futures Contracts | (184) |
| Foreign Currencies | 2,443 |
| Change in Unrealized Appreciation (Depreciation) | 4,668,290 |
| Net Increase (Decrease) in Net Assets Resulting from Operations | 5,693,395 |
1 Dividends are net of foreign withholding taxes of $48,488,000.
2 Interest income from an affiliated company of the fund was $160,000.
See accompanying Notes, which are an integral part of the Financial Statements.
58
Emerging Markets Stock Index Fund
| | |
| Statement of Changes in Net Assets | | |
| |
| | Six Months Ended | Year Ended |
| | April 30, | October 31, |
| | 2011 | 2010 |
| | ($000) | ($000) |
| Increase (Decrease) in Net Assets | | |
| Operations | | |
| Net Investment Income | 451,057 | 813,890 |
| Realized Net Gain (Loss) | 574,048 | 524,799 |
| Change in Unrealized Appreciation (Depreciation) | 4,668,290 | 7,926,070 |
| Net Increase (Decrease) in Net Assets Resulting from Operations | 5,693,395 | 9,264,759 |
| Distributions | | |
| Net Investment Income | | |
| Investor Shares | (45,629) | (92,803) |
| Admiral Shares | (125,032) | (38,489) |
| Signal Shares | (11,188) | (6,752) |
| Institutional Shares | (54,245) | (26,615) |
| Institutional Plus Shares | (1,323) | — |
| ETF Shares | (754,418) | (258,615) |
| Realized Capital Gain | | |
| Investor Shares | — | — |
| Admiral Shares | — | — |
| Signal Shares | — | — |
| Institutional Shares | — | — |
| Institutional Plus Shares | — | — |
| ETF Shares | — | — |
| Total Distributions | (991,835) | (423,274) |
| Capital Share Transactions | | |
| Investor Shares | (2,537,835) | (3,150,495) |
| Admiral Shares | 2,794,974 | 1,436,817 |
| Signal Shares | 72,615 | 62,406 |
| Institutional Shares | (1,939,422) | 1,174,368 |
| Institutional Plus Shares | 1,873,233 | — |
| ETF Shares | 5,030,641 | 19,499,494 |
| Net Increase (Decrease) from Capital Share Transactions | 5,294,206 | 19,022,590 |
| Total Increase (Decrease) | 9,995,766 | 27,864,075 |
| Net Assets | | |
| Beginning of Period | 55,292,300 | 27,428,225 |
| End of Period1 | 65,288,066 | 55,292,300 |
| 1 Net Assets—End of Period includes undistributed net investment income of $101,363,000 and $651,499,000. |
See accompanying Notes, which are an integral part of the Financial Statements.
59
Emerging Markets Stock Index Fund
Financial Highlights
| | | | | | |
| Investor Shares | | | | | | |
| Six Months | | | | | |
| | Ended | | | | | |
| For a Share Outstanding | April 30, | | | Year Ended October 31, |
| Throughout Each Period | 2011 | 2010 | 2009 | 2008 | 2007 | 2006 |
| Net Asset Value, Beginning of Period | $29.49 | $23.90 | $15.66 | $36.78 | $22.05 | $16.91 |
| Investment Operations | | | | | | |
| Net Investment Income | .184 | .5211 | .3981 | .780 | .6041 | .396 |
| Net Realized and Unrealized Gain (Loss) | | | | | | |
| on Investments2 | 2.710 | 5.383 | 8.542 | (21.313) | 14.522 | 5.059 |
| Total from Investment Operations | 2.894 | 5.904 | 8.940 | (20.533) | 15.126 | 5.455 |
| Distributions | | | | | | |
| Dividends from Net Investment Income | (.434) | (.314) | (.700) | (.587) | (.396) | (.315) |
| Distributions from Realized Capital Gains | — | — | — | — | — | — |
| Total Distributions | (.434) | (.314) | (.700) | (.587) | (.396) | (.315) |
| Net Asset Value, End of Period | $31.95 | $29.49 | $23.90 | $15.66 | $36.78 | $22.05 |
| |
| Total Return3 | 9.93% | 24.92% | 60.07% | -56.66% | 69.59% | 32.55% |
| |
| Ratios/Supplemental Data | | | | | | |
| Net Assets, End of Period (Millions) | $3,349 | $5,597 | $7,024 | $5,345 | $14,150 | $7,202 |
| Ratio of Total Expenses to | | | | | | |
| Average Net Assets | 0.35% | 0.35% | 0.40% | 0.32% | 0.37% | 0.42% |
| Ratio of Net Investment Income to | | | | | | |
| Average Net Assets | 1.40% | 1.97% | 2.16% | 2.81% | 2.24% | 2.20% |
| Portfolio Turnover Rate4 | 11% | 12% | 12% | 20% | 9% | 26% |
The expense ratio, net income ratio, and turnover rate for the current period have been annualized.
1 Calculated based on average shares outstanding.
2 Includes increases from purchase and redemption fees of $.01, $.04, $.01, $.05, $.04, and $.05.
3 Total returns do not include transaction or account service fees that may have applied in the periods shown. Fund prospectuses provide information about any applicable transaction and account service fees.
4 Excludes the value of portfolio securities received or delivered as a result of in-kind purchases or redemptions of the fund’s capital shares, including ETF Creation Units.
See accompanying Notes, which are an integral part of the Financial Statements.
60
Emerging Markets Stock Index Fund
Financial Highlights
| | | | | | |
| Admiral Shares | | | | | | |
| Six Months | | | | | June 23, |
| | Ended | | | | | 20061 to |
| For a Share Outstanding | April 30, | | | Year Ended October 31, | Oct. 31, |
| Throughout Each Period | 2011 | 2010 | 2009 | 2008 | 2007 | 2006 |
| Net Asset Value, Beginning of Period | $38.82 | $31.45 | $20.63 | $48.47 | $29.03 | $25.00 |
| Investment Operations | | | | | | |
| Net Investment Income | .261 | .6962 | .5672 | 1.079 | .8532 | .222 |
| Net Realized and Unrealized Gain (Loss) | | | | | | |
| on Investments3 | 3.572 | 7.119 | 11.222 | (28.099) | 19.121 | 3.808 |
| Total from Investment Operations | 3.833 | 7.815 | 11.789 | (27.020) | 19.974 | 4.030 |
| Distributions | | | | | | |
| Dividends from Net Investment Income | (.653) | (.445) | (.969) | (.820) | (.534) | — |
| Distributions from Realized Capital Gains | — | — | — | — | — | — |
| Total Distributions | (.653) | (.445) | (.969) | (.820) | (.534) | — |
| Net Asset Value, End of Period | $42.00 | $38.82 | $31.45 | $20.63 | $48.47 | $29.03 |
| |
| Total Return4 | 10.01% | 25.08% | 60.29% | -56.63% | 69.82% | 16.12% |
| |
| Ratios/Supplemental Data | | | | | | |
| Net Assets, End of Period (Millions) | $8,125 | $4,761 | $2,674 | $1,508 | $3,514 | $1,491 |
| Ratio of Total Expenses to | | | | | | |
| Average Net Assets | 0.22% | 0.22% | 0.27% | 0.20% | 0.25% | 0.30%5 |
| Ratio of Net Investment Income to | | | | | | |
| Average Net Assets | 1.53% | 2.10% | 2.29% | 2.93% | 2.36% | 2.32%5 |
| Portfolio Turnover Rate6 | 11% | 12% | 12% | 20% | 9% | 26% |
The expense ratio, net income ratio, and turnover rate for the current period have been annualized.
1 Inception.
2 Calculated based on average shares outstanding.
3 Includes increases from purchase and redemption fees of $.01, $.03, $.01, $.06, $.05, and $.04.
4 Total returns do not include transaction fees that may have applied in the periods shown. Fund prospectuses provide information about any applicable transaction fees.
5 Annualized.
6 Excludes the value of portfolio securities received or delivered as a result of in-kind purchases or redemptions of the fund’s capital shares, including ETF Creation Units.
See accompanying Notes, which are an integral part of the Financial Statements.
61
Emerging Markets Stock Index Fund
Financial Highlights
| | | | | |
| Signal Shares | | | | | |
| | Six Months | | | | Jan. 19, |
| | Ended | | | | 20071 to |
| | April 30, | | Year Ended October 31, | Oct. 31, |
| For a Share Outstanding Throughout Each Period | 2011 | 2010 | 2009 | 2008 | 2007 |
| Net Asset Value, Beginning of Period | $37.34 | $30.26 | $19.85 | $46.61 | $30.38 |
| Investment Operations | | | | | |
| Net Investment Income | .273 | .6902 | .5532 | 1.029 | .5802 |
| Net Realized and Unrealized Gain (Loss) | | | | | |
| on Investments3 | 3.421 | 6.818 | 10.795 | (27.029) | 15.650 |
| Total from Investment Operations | 3.694 | 7.508 | 11.348 | (26.000) | 16.230 |
| Distributions | | | | | |
| Dividends from Net Investment Income | (.644) | (.428) | (.938) | (.760) | — |
| Distributions from Realized Capital Gains | — | — | — | — | — |
| Total Distributions | (.644) | (.428) | (.938) | (.760) | — |
| Net Asset Value, End of Period | $40.39 | $37.34 | $30.26 | $19.85 | $46.61 |
| |
| Total Return4 | 10.03% | 25.04% | 60.33% | -56.64% | 53.42% |
| |
| Ratios/Supplemental Data | | | | | |
| Net Assets, End of Period (Millions) | $773 | $644 | $463 | $266 | $385 |
| Ratio of Total Expenses to | | | | | |
| Average Net Assets | 0.22% | 0.22% | 0.27% | 0.20% | 0.25%5 |
| Ratio of Net Investment Income to | | | | | |
| Average Net Assets | 1.53% | 2.10% | 2.29% | 2.93% | 2.36%5 |
| Portfolio Turnover Rate6 | 11% | 12% | 12% | 20% | 9% |
The expense ratio, net income ratio, and turnover rate for the current period have been annualized.
1 Inception.
2 Calculated based on average shares outstanding.
3 Includes increases from purchase and redemption fees of $.01, $.03, $.01, $.05, and $.01.
4 Total returns do not include transaction fees that may have applied in the periods shown. Fund prospectuses provide information about any applicable transaction fees.
5 Annualized.
6 Excludes the value of portfolio securities received or delivered as a result of in-kind purchases or redemptions of the fund’s capital shares, including ETF Creation Units.
See accompanying Notes, which are an integral part of the Financial Statements.
62
Emerging Markets Stock Index Fund
Financial Highlights
| | | | | | |
| Institutional Shares | | | | | | |
| Six Months | | | | | |
| | Ended | | | | | |
| For a Share Outstanding | April 30, | | | Year Ended October 31, |
| Throughout Each Period | 2011 | 2010 | 2009 | 2008 | 2007 | 2006 |
| Net Asset Value, Beginning of Period | $29.55 | $23.94 | $15.71 | $36.90 | $22.11 | $16.95 |
| Investment Operations | | | | | | |
| Net Investment Income | .221 | .5711 | .4371 | .835 | .6861 | .443 |
| Net Realized and Unrealized Gain (Loss) | | | | | | |
| on Investments2 | 2.707 | 5.388 | 8.547 | (21.393) | 14.533 | 5.059 |
| Total from Investment Operations | 2.928 | 5.959 | 8.984 | (20.558) | 15.219 | 5.502 |
| Distributions | | | | | | |
| Dividends from Net Investment Income | (.528) | (.349) | (.754) | (.632) | (.429) | (.342) |
| Distributions from Realized Capital Gains | — | — | — | — | — | — |
| Total Distributions | (.528) | (.349) | (.754) | (.632) | (.429) | (.342) |
| Net Asset Value, End of Period | $31.95 | $29.55 | $23.94 | $15.71 | $36.90 | $22.11 |
| |
| Total Return3 | 10.05% | 25.13% | 60.41% | -56.61% | 69.90% | 32.78% |
| |
| Ratios/Supplemental Data | | | | | | |
| Net Assets, End of Period (Millions) | $1,691 | $3,473 | $1,731 | $887 | $1,463 | $559 |
| Ratio of Total Expenses to | | | | | | |
| Average Net Assets | 0.15% | 0.15% | 0.23% | 0.15% | 0.20% | 0.25% |
| Ratio of Net Investment Income to | | | | | | |
| Average Net Assets | 1.60% | 2.17% | 2.33% | 2.98% | 2.41% | 2.37% |
| Portfolio Turnover Rate4 | 11% | 12% | 12% | 20% | 9% | 26% |
The expense ratio, net income ratio, and turnover rate for the current period have been annualized.
1 Calculated based on average shares outstanding.
2 Includes increases from purchase and redemption fees of $.01, $.02, $.01, $.03, $.04, and $.05.
3 Total returns do not include transaction fees that may have applied in the periods shown. Fund prospectuses provide information about any applicable transaction fees.
4 Excludes the value of portfolio securities received or delivered as a result of in-kind purchases or redemptions of the fund’s capital shares, including ETF Creation Units.
See accompanying Notes, which are an integral part of the Financial Statements.
63
Emerging Markets Stock Index Fund
Financial Highlights
| |
| Institutional Plus Shares | |
| | December 15, 20101 to |
| For a Share Outstanding Throughout the Period | April 30, 2011 |
| Net Asset Value, Beginning of Period | $99.35 |
| Investment Operations | |
| Net Investment Income | .750 |
| Net Realized and Unrealized Gain (Loss) on Investments | 7.964 |
| Total from Investment Operations | 8.714 |
| Distributions | |
| Dividends from Net Investment Income | (1.754) |
| Distributions from Realized Capital Gains | — |
| Total Distributions | (1.754) |
| Net Asset Value, End of Period | $106.31 |
| |
| Total Return2 | 8.91% |
| |
| Ratios/Supplemental Data | |
| Net Assets, End of Period (Millions) | $2,003 |
| Ratio of Total Expenses to Average Net Assets | 0.12% |
| Ratio of Net Investment Income to Average Net Assets | 1.63% |
| Portfolio Turnover Rate3 | 11% |
The expense ratio, net income ratio, and turnover rate for the current period have been annualized.
1 Inception.
2 Total returns do not include transaction fees that may have applied in the periods shown. Fund prospectuses provide information about any applicable transaction fees.
3 Excludes the value of portfolio securities received or delivered as a result of in-kind purchases or redemptions of the fund’s capital shares, including ETF Creation Units.
See accompanying Notes, which are an integral part of the Financial Statements.
64
Emerging Markets Stock Index Fund
Financial Highlights
| | | | | | |
| MSCI Emerging Markets ETF Shares | | | | | | |
| Six Months | | | | | |
| | Ended | | | | | |
| For a Share Outstanding | April 30, | | | Year Ended October 31, |
| Throughout Each Period | 2011 | 2010 | 2009 | 20081 | 20071 | 20061 |
| Net Asset Value, Beginning of Period | $46.70 | $37.84 | $24.83 | $58.31 | $34.96 | $26.81 |
| Investment Operations | | | | | | |
| Net Investment Income | .341 | .8702 | .6682 | 1.303 | 1.0652 | .667 |
| Net Realized and Unrealized Gain (Loss) | | | | | | |
| on Investments3 | 4.274 | 8.535 | 13.520 | (33.798) | 22.955 | 8.022 |
| Total from Investment Operations | 4.615 | 9.405 | 14.188 | (32.495) | 24.020 | 8.689 |
| Distributions | | | | | | |
| Dividends from Net Investment Income | (.815) | (.545) | (1.178) | (.985) | (.670) | (.539) |
| Distributions from Realized Capital Gains | — | — | — | — | — | — |
| Total Distributions | (.815) | (.545) | (1.178) | (.985) | (.670) | (.539) |
| Net Asset Value, End of Period | $50.50 | $46.70 | $37.84 | $24.83 | $58.31 | $34.96 |
| |
| Total Return | 10.02% | 25.07% | 60.28% | -56.62% | 69.78% | 32.74% |
| |
| Ratios/Supplemental Data | | | | | | |
| Net Assets, End of Period (Millions) | $49,347 | $40,817 | $15,537 | $4,500 | $6,275 | $1,582 |
| Ratio of Total Expenses to | | | | | | |
| Average Net Assets | 0.22% | 0.22% | 0.27% | 0.20% | 0.25% | 0.30% |
| Ratio of Net Investment Income to | | | | | | |
| Average Net Assets | 1.53% | 2.10% | 2.29% | 2.93% | 2.36% | 2.32% |
| Portfolio Turnover Rate4 | 11% | 12% | 12% | 20% | 9% | 26% |
The expense ratio, net income ratio, and turnover rate for the current period have been annualized.
1 Adjusted to reflect a 2-for-1 share split as of the close of business on June 13, 2008.
2 Calculated based on average shares outstanding.
3 Includes increases from purchase and redemption fees of $.01, $.03, $.01, $.05, $.10, and $.10.
4 Excludes the value of portfolio securities received or delivered as a result of in-kind purchases or redemptions of the fund’s capital shares, including ETF Creation Units.
See accompanying Notes, which are an integral part of the Financial Statements.
65
Emerging Markets Stock Index Fund
Notes to Financial Statements
Vanguard Emerging Markets Stock Index Fund is registered under the Investment Company Act of 1940 as an open-end investment company, or mutual fund. The fund invests in securities of foreign issuers, which may subject it to investment risks not normally associated with investing in securities of U.S. corporations. The fund offers six classes of shares: Investor Shares, Admiral Shares, Signal Shares, Institutional Shares, Institutional Plus Shares, and ETF Shares. Investor Shares are available to any investor who meets the fund’s minimum purchase requirements. Admiral Shares, Signal Shares, Institutional Shares, and Institutional Plus Shares are designed for investors who meet certain administrative, service, and account-size criteria. Institutional Plus Shares were first issued on December 15, 2010. ETF Shares, known as Vanguard MSCI Emerging Markets ETF Shares, are listed for trading on the NYSE Arca, Inc.; they can be purchased and sold through a broker.
A. The following significant accounting policies conform to generally accepted accounting principles for U.S. mutual funds. The fund consistently follows such policies in preparing its financial statements.
1. Security Valuation: Securities are valued as of the close of trading on the New York Stock Exchange (generally 4 p.m., Eastern time) on the valuation date. Equity securities are valued at the latest quoted sales prices or official closing prices taken from the primary market in which each security trades; such securities not traded on the valuation date are valued at the mean of the latest quoted bid and asked prices. Securities for which market quotations are not readily available, or whose values have been affected by events occurring before the fund’s pricing time but after the close of the securities’ primary markets, are valued at their fair values calculated according to procedures adopted by the board of trustees. These procedures include obtaining quotations from an independent pricing service, monitoring news to identify significant market- or security-specific events, and evaluating changes in the values of foreign market proxies (for example, ADRs, futures contracts, or exchange-traded funds), between the time the foreign markets close and the fund’s pricing time. When fair-value pricing is employed, the prices of securities used by a fund to calculate its net asset value may differ from quoted or published prices for the same securities. Investments in Vanguard Market Liquidity Fund are valued at that fund’s net asset value. Temporary cash investments acquired over 60 days to maturity are valued using the latest bid prices or using valuations based on a matrix system (which considers such factors as security prices, yields, maturities, and ratings), both as furnished by independent pricing services. Other temporary cash investments are valued at amortized cost, which approximates market value.
2. Foreign Currency: Securities and other assets and liabilities denominated in foreign currencies are translated into U.S. dollars using exchange rates obtained from an independent third party as of the fund’s pricing time on the valuation date. Realized gains (losses) and unrealized appreciation (depreciation) on investment securities include the effects of changes in exchange rates since the securities were purchased, combined with the effects of changes in security prices. Fluctuations in the value of other assets and liabilities resulting from changes in exchange rates are recorded as unrealized foreign currency gains (losses) until the assets or liabilities are settled in cash, at which time they are recorded as realized foreign currency gains (losses).
3. Futures Contracts: The fund uses index futures contracts to a limited extent, with the objectives of maintaining full exposure to the stock market, enhancing returns, maintaining liquidity, and minimizing transaction costs. The fund may purchase futures contracts to immediately invest incoming cash in the market, or sell futures in response to cash outflows, thereby simulating a fully invested position in the underlying index while maintaining a cash balance for liquidity. The fund may seek to enhance returns by using futures contracts instead of the underlying securities when futures are believed to be priced more attractively than the underlying securities. The primary risks associated with the use of futures contracts are imperfect correlation between changes in market values of stocks held by the fund and the prices of futures contracts, and the possibility of an illiquid market.
66
Emerging Markets Stock Index Fund
Futures contracts are valued at their quoted daily settlement prices. The aggregate principal amounts of the contracts are not recorded in the Statement of Net Assets. Fluctuations in the value of the contracts are recorded in the Statement of Net Assets as an asset (liability) and in the Statement of Operations as unrealized appreciation (depreciation) until the contracts are closed, when they are recorded as realized futures gains (losses).
4. Federal Income Taxes: The fund intends to continue to qualify as a regulated investment company and distribute all of its taxable income. Management has analyzed the fund’s tax positions taken for all open federal income tax years (October 31, 2007–2010), and for the period ended April 30, 2011, and has concluded that no provision for federal income tax is required in the fund’s financial statements.
5. Distributions: Distributions to shareholders are recorded on the ex-dividend date.
6. Security Lending: The fund may lend its securities to qualified institutional borrowers to earn additional income. Security loans are required to be secured at all times by collateral at least equal to the market value of securities loaned. The fund invests cash collateral received in Vanguard Market Liquidity Fund, and records a liability for the return of the collateral, during the period the securities are on loan. Security lending income represents fees charged to borrowers plus income earned on investing cash collateral, less expenses associated with the loan.
7. Other: Dividend income is recorded on the ex-dividend date. Interest income includes income distributions received from Vanguard Market Liquidity Fund and is accrued daily. Security transactions are accounted for on the date securities are bought or sold. Costs used to determine realized gains (losses) on the sale of investment securities are those of the specific securities sold. Fees assessed on capital share transactions are credited to paid-in capital.
Each class of shares has equal rights as to assets and earnings, except that each class separately bears certain class-specific expenses related to maintenance of shareholder accounts (included in Management and Administrative expenses) and shareholder reporting. Marketing and distribution expenses are allocated to each class of shares based on a method approved by the board of trustees. Income, other non-class-specific expenses, and gains and losses on investments are allocated to each class of shares based on its relative net assets.
B. The Vanguard Group furnishes at cost investment advisory, corporate management, administrative, marketing, and distribution services. The costs of such services are allocated to the fund under methods approved by the board of trustees. The fund has committed to provide up to 0.40% of its net assets in capital contributions to Vanguard. At April 30, 2011, the fund had contributed capital of $10,101,000 to Vanguard (included in Other Assets), representing 0.02% of the fund’s net assets and 4.04% of Vanguard’s capitalization. The fund’s trustees and officers are also directors and officers of Vanguard.
C. Various inputs may be used to determine the value of the fund’s investments. These inputs are summarized in three broad levels for financial statement purposes. The inputs or methodologies used to value securities are not necessarily an indication of the risk associated with investing in those securities.
Level 1—Quoted prices in active markets for identical securities.
Level 2—Other significant observable inputs (including quoted prices for similar securities, interest rates, prepayment speeds, credit risk, etc.).
Level 3—Significant unobservable inputs (including the fund’s own assumptions used to determine the fair value of investments).
67
Emerging Markets Stock Index Fund
The following table summarizes the fund’s investments as of April 30, 2011, based on the inputs used to value them:
| | | |
| | Level 1 | Level 2 | Level 3 |
| Investments | ($000) | ($000) | ($000) |
| Common Stocks—North and South America | 14,774,274 | — | — |
| Common Stocks—Other | 2,438,358 | 47,913,518 | — |
| Temporary Cash Investments | 831,468 | 5,799 | — |
| Total | 18,044,100 | 47,919,317 | — |
D. At April 30, 2011, the aggregate settlement value of open futures contracts and the related unrealized appreciation (depreciation) were:
| | | | |
| | | | | ($000) |
| | | | Aggregate | |
| | | Number of | Settlement | Unrealized |
| | | Long (Short) | Value | Appreciation |
| Futures Contracts | Expiration | Contracts | Long (Short) | (Depreciation) |
| MSCI Taiwan Index | May 2011 | 3,900 | 124,761 | (83) |
E. Distributions are determined on a tax basis and may differ from net investment income and realized capital gains for financial reporting purposes. Differences may be permanent or temporary. Permanent differences are reclassified among capital accounts in the financial statements to reflect their tax character. Temporary differences arise when certain items of income, expense, gain, or loss are recognized in different periods for financial statement and tax purposes; these differences will reverse at some time in the future. Differences in classification may also result from the treatment of short-term gains as ordinary income for tax purposes.
During the six months ended April 30, 2011, the fund realized net foreign currency losses of $11,066,000, which decreased distributable net income for tax purposes; accordingly, such losses have been reclassified from accumulated net realized losses to undistributed net investment income.
Certain of the fund’s investments are in securities considered to be “passive foreign investment companies,” for which any unrealized appreciation and/or realized gains are required to be included in distributable net income for tax purposes. During the six months ended April 30, 2011, the fund realized gains on the sale of passive foreign investment companies of $1,847,000, which have been included in current and prior periods’ taxable income; accordingly, such gains have been reclassified from accumulated net realized losses to undistributed net investment income. Unrealized appreciation through the most recent mark-to-market date for tax purposes on passive foreign investment company holdings at April 30, 2011, was $126,896,000, all of which has been distributed and is reflected in the balance of undistributed net investment income.
The fund’s realized losses for the six months ended April 30, 2011, include $136,000 of capital gain tax paid on sales of Peruvian securities. This tax is treated as a decrease in taxable income; accordingly, this amount has been reclassified from accumulated net realized losses to undistributed net investment income.
68
Emerging Markets Stock Index Fund
During the six months ended April 30, 2011, the fund realized $776,301,000 of net capital gains resulting from in-kind redemptions—in which shareholders exchanged fund shares for securities held by the fund rather than for cash. Because such gains are not taxable to the fund, and are not distributed to shareholders, they have been reclassified from accumulated net realized losses to paid-in capital.
The fund’s tax-basis capital gains and losses are determined only at the end of each fiscal year. For tax purposes, at October 31, 2010, the fund had available capital loss carryforwards totaling $2,447,495,000 to offset future net capital gains of $15,143,000 through October 31, 2012, $167,331,000 through October 31, 2014, $460,853,000 through October 31, 2016, $1,591,794,000 though October 31, 2017, and $212,374,000 through October 31, 2018. The fund will use these capital losses to offset net taxable capital gains, if any, realized during the year ending October 31, 2011; should the fund realize net capital losses for the year, the losses will be added to the loss carryforward balance above.
At April 30, 2011, the cost of investment securities for tax purposes was $49,603,755,000. Net unrealized appreciation of investment securities for tax purposes was $16,359,662,000, consisting of unrealized gains of $17,661,365,000 on securities that had risen in value since their purchase and $1,301,703,000 in unrealized losses on securities that had fallen in value since their purchase.
F. During the six months ended April 30, 2011, the fund purchased $9,807,709,000 of investment securities and sold $5,033,700,000 of investment securities, other than temporary cash investments.
G. Capital share transactions for each class of shares were:
| | | | |
| | Six Months Ended | | Year Ended |
| | | April 30, 2011 | October 31, 2010 |
| | Amount | Shares | Amount | Shares |
| | ($000) | (000) | ($000) | (000) |
| Investor Shares | | | | |
| Issued1 | 567,250 | 18,819 | 2,083,356 | 80,442 |
| Issued in Lieu of Cash Distributions | 42,733 | 1,443 | 88,603 | 3,492 |
| Redeemed2 | (3,147,818) | (105,266) | (5,322,454) | (187,996) |
| Net Increase (Decrease)—Investor Shares | (2,537,835) | (85,004) | (3,150,495) | (104,062) |
| Admiral Shares | | | | |
| Issued1 | 3,382,281 | 85,747 | 1,917,883 | 51,857 |
| Issued in Lieu of Cash Distributions | 113,656 | 2,921 | 33,549 | 1,006 |
| Redeemed2 | (700,963) | (17,888) | (514,615) | (15,208) |
| Net Increase (Decrease)—Admiral Shares | 2,794,974 | 70,780 | 1,436,817 | 37,655 |
| Signal Shares | | | | |
| Issued1 | 184,336 | 4,854 | 209,068 | 6,390 |
| Issued in Lieu of Cash Distributions | 9,808 | 262 | 5,772 | 180 |
| Redeemed2 | (121,529) | (3,213) | (152,434) | (4,641) |
| Net Increase (Decrease)—Signal Shares | 72,615 | 1,903 | 62,406 | 1,929 |
69
Emerging Markets Stock Index Fund
| | | | |
| | Six Months Ended | | Year Ended |
| | | April 30, 2011 | October 31, 2010 |
| | Amount | Shares | Amount | Shares |
| | ($000) | (000) | ($000) | (000) |
| Institutional Shares | | | | |
| Issued1 | 258,506 | 8,618 | 1,427,756 | 54,632 |
| Issued in Lieu of Cash Distributions | 41,282 | 1,395 | 16,645 | 656 |
| Redeemed2 | (2,239,210) | (74,625) | (270,033) | (10,041) |
| Net Increase (Decrease)—Institutional Shares | (1,939,422) | (64,612) | 1,174,368 | 45,247 |
| Institutional Plus Shares3 | | | | |
| Issued1 | 1,938,900 | 19,525 | — | — |
| Issued in Lieu of Cash Distributions | 1,323 | 13 | — | — |
| Redeemed2 | (66,990) | (698) | — | — |
| Net Increase (Decrease)—Institutional Plus Shares | 1,873,233 | 18,840 | — | — |
| ETF Shares | | | | |
| Issued1 | 6,971,519 | 144,748 | 19,778,543 | 470,556 |
| Issued in Lieu of Cash Distributions | — | — | — | — |
| Redeemed2 | (1,940,878) | (41,600) | (279,049) | (7,000) |
| Net Increase (Decrease)—ETF Shares | 5,030,641 | 103,148 | 19,499,494 | 463,556 |
1 Includes purchase fees for fiscal 2011 and 2010 of $15,511,000 and $31,994,000, respectively (fund totals).
2 Net of redemption fees for fiscal 2011 and 2010 of $2,383,000 and $7,682,000, respectively (fund totals).
3 Inception was December 15, 2010, for Institutional Plus Shares.
H. In preparing the financial statements as of April 30, 2011, management considered the impact of subsequent events for potential recognition or disclosure in these financial statements.
70
About Your Fund’s Expenses
As a shareholder of the fund, you incur ongoing costs, which include costs for portfolio management, administrative services, and shareholder reports (like this one), among others. Operating expenses, which are deducted from a fund’s gross income, directly reduce the investment return of the fund.
A fund’s expenses are expressed as a percentage of its average net assets. This figure is known as the expense ratio. The following examples are intended to help you understand the ongoing costs (in dollars) of investing in your fund and to compare these costs with those of other mutual funds. The examples are based on an investment of $1,000 made at the beginning of the period shown and held for the entire period.
The accompanying table illustrates your fund’s costs in two ways:
• Based on actual fund return. This section helps you to estimate the actual expenses that you paid over the period. The ”Ending Account Value“ shown is derived from the fund‘s actual return, and the third column shows the dollar amount that would have been paid by an investor who started with $1,000 in the fund. You may use the information here, together with the amount you invested, to estimate the expenses that you paid over the period.
To do so, simply divide your account value by $1,000 (for example, an $8,600 account value divided by $1,000 = 8.6), then multiply the result by the number given for your fund under the heading ”Expenses Paid During Period.“
• Based on hypothetical 5% yearly return. This section is intended to help you compare your fund‘s costs with those of other mutual funds. It assumes that the fund had a yearly return of 5% before expenses, but that the expense ratio is unchanged. In this case—because the return used is not the fund’s actual return—the results do not apply to your investment. The example is useful in making comparisons because the Securities and Exchange Commission requires all mutual funds to calculate expenses based on a 5% return. You can assess your fund’s costs by comparing this hypothetical example with the hypothetical examples that appear in shareholder reports of other funds.
Note that the expenses shown in the table are meant to highlight and help you compare ongoing costs only and do not reflect transaction costs incurred by the fund for buying and selling securities. Further, the expenses do not include any purchase, redemption, or account service fees described in the fund prospectus. If such fees were applied to your account, your costs would be higher. Your fund does not carry a “sales load.”
The calculations assume no shares were bought or sold during the period. Your actual costs may have been higher or lower, depending on the amount of your investment and the timing of any purchases or redemptions.
You can find more information about the fund’s expenses, including annual expense ratios, in the Financial Statements section of this report. For additional information on operating expenses and other shareholder costs, please refer to your fund’s current prospectus.
71
| | | |
| Six Months Ended April 30, 2011 | | | |
| | Beginning | Ending | Expenses |
| | Account Value | Account Value | Paid During |
| | 10/31/2010 | 4/30/2011 | Period |
| Based on Actual Fund Return | | | |
| European Stock Index Fund | | | |
| Investor Shares | $1,000.00 | $1,150.01 | $1.39 |
| Admiral Shares | 1,000.00 | 1,150.69 | 0.75 |
| Signal Shares | 1,000.00 | 1,150.24 | 0.75 |
| Institutional Shares | 1,000.00 | 1,150.69 | 0.53 |
| ETF Shares | 1,000.00 | 1,150.84 | 0.75 |
| Pacific Stock Index Fund | | | |
| Investor Shares | $1,000.00 | $1,086.44 | $1.35 |
| Admiral Shares | 1,000.00 | 1,087.35 | 0.72 |
| Signal Shares | 1,000.00 | 1,087.43 | 0.72 |
| Institutional Shares | 1,000.00 | 1,086.87 | 0.52 |
| ETF Shares | 1,000.00 | 1,087.34 | 0.72 |
| Emerging Markets Stock Index Fund | | | |
| Investor Shares | $1,000.00 | $1,099.30 | $1.82 |
| Admiral Shares | 1,000.00 | 1,100.07 | 1.15 |
| Signal Shares | 1,000.00 | 1,100.30 | 1.15 |
| Institutional Shares | 1,000.00 | 1,100.51 | 0.78 |
| ETF Shares | 1,000.00 | 1,100.17 | 1.15 |
72
| | | |
| Six Months Ended April 30, 2011 | | | |
| | Beginning | Ending | Expenses |
| | Account Value | Account Value | Paid During |
| | 10/31/2010 | 4/30/2011 | Period |
| Based on Hypothetical 5% Yearly Return | | | |
| European Stock Index Fund | | | |
| Investor Shares | $1,000.00 | $1,023.51 | $1.30 |
| Admiral Shares | 1,000.00 | 1,024.10 | 0.70 |
| Signal Shares | 1,000.00 | 1,024.10 | 0.70 |
| Institutional Shares | 1,000.00 | 1,024.30 | 0.50 |
| ETF Shares | 1,000.00 | 1,024.10 | 0.70 |
| Pacific Stock Index Fund | | | |
| Investor Shares | $1,000.00 | $1,023.51 | $1.30 |
| Admiral Shares | 1,000.00 | 1,024.10 | 0.70 |
| Signal Shares | 1,000.00 | 1,024.10 | 0.70 |
| Institutional Shares | 1,000.00 | 1,024.30 | 0.50 |
| ETF Shares | 1,000.00 | 1,024.10 | 0.70 |
| Emerging Markets Stock Index Fund | | | |
| Investor Shares | $1,000.00 | $1,023.06 | $1.76 |
| Admiral Shares | 1,000.00 | 1,023.70 | 1.10 |
| Signal Shares | 1,000.00 | 1,023.70 | 1.10 |
| Institutional Shares | 1,000.00 | 1,024.05 | 0.75 |
| ETF Shares | 1,000.00 | 1,023.70 | 1.10 |
The calculations are based on expenses incurred in the most recent six-month period. The funds’ annualized six-month expense ratios for that period are: for the European Stock Index Fund, 0.26% for Investor Shares, 0.14% for Admiral Shares, 0.14% for Signal Shares, 0.10% for Institutional Shares, and 0.14% for ETF Shares; for the Pacific Stock Index Fund, 0.26% for Investor Shares, 0.14% for Admiral Shares, 0.14% for Signal Shares, 0.10% for Institutional Shares, and 0.14% for ETF Shares; and for the Emerging Markets Stock Index Fund, 0.35% for Investor Shares, 0.22% for Admiral Shares, 0.22% for Signal Shares, 0.15% for Institutional Shares, and 0.22% for ETF Shares. The dollar amounts shown as “Expenses Paid” are equal to the annualized expense ratio multiplied by the average account value over the period, multiplied by the number of days in the most recent six-month period, then divided by the number of days in the most recent 12-month period. The table does not include data for share classes with less than six months of history.
73
Trustees Approve Advisory Arrangements
The board of trustees of Vanguard European, Pacific, and Emerging Markets Stock Index Funds has renewed the funds’ investment advisory arrangements with The Vanguard Group, Inc. Vanguard—through its Quantitative Equity Group—serves as the investment advisor for each of the funds. The board determined that continuing the funds’ internalized management structure was in the best interests of the funds and their shareholders.
The board based its decision upon an evaluation of the advisor’s investment staff, portfolio management process, and performance. The trustees considered the factors discussed below, among others. However, no single factor determined whether the board approved the arrangements. Rather, it was the totality of the circumstances that drove the board’s decision.
Nature, extent, and quality of services
The board considered the quality of the investment management services provided to the European, Pacific, and Emerging Markets Stock Index Funds over both the short and long term, and took into account the organizational depth and stability of the advisor. Vanguard has been managing investments for more than three decades. The Quantitative Equity Group adheres to a sound, disciplined investment management process; the team has considerable experience, stability, and depth.
The board concluded that Vanguard’s experience, stability, depth, and performance, among other factors, warranted continuation of the advisory arrangements.
Investment performance
The board considered the performance of the European, Pacific, and Emerging Markets Stock Index Funds, including any periods of outperformance or underperformance of each fund’s target index and peer group. The board concluded that the funds have performed in line with expectations and that their results have been consistent with their investment strategies. Information about the funds’ most recent performance can be found in the Performance Summary sections of this report.
Cost
The board concluded that each fund’s expense ratio was well below the average expense ratio charged by funds in its peer group and that each fund’s advisory fee rate was also well below its peer-group average. Information about the funds’ expenses appears in the About Your Fund’s Expenses section of this report as well as in the Financial Statements sections.
The board does not conduct a profitability analysis of Vanguard because of Vanguard’s unique “at-cost” structure. Unlike most other mutual fund management companies, Vanguard is owned by the funds it oversees, and produces “profits” only in the form of reduced expenses for fund shareholders.
The benefit of economies of scale
The board concluded that the funds’ low-cost arrangements with Vanguard ensure that the funds will realize economies of scale as they grow, with the cost to shareholders declining as fund assets increase.
The board will consider whether to renew the advisory arrangements after a one-year period.
74
Glossary
Beta. A measure of the magnitude of a fund’s past share-price fluctuations in relation to the ups and downs of a given market index. The index is assigned a beta of 1.00. Compared with a given index, a fund with a beta of 1.20 typically would have seen its share price rise or fall by 12% when the index rose or fell by 10%. For this report, beta is based on returns over the past 36 months for both the fund and the index. Note that a fund’s beta should be reviewed in conjunction with its R-squared (see definition). The lower the R-squared, the less correlation there is between the fund and the index, and the less reliable beta is as an indicator of volatility.
Dividend Yield. Dividend income earned by stocks, expressed as a percentage of the aggregate market value (or of net asset value, for a fund). The yield is determined by dividing the amount of the annual dividends by the aggregate value (or net asset value) at the end of the period. For a fund, the dividend yield is based solely on stock holdings and does not include any income produced by other investments.
Equity Exposure. A measure that reflects a fund’s investments in stocks and stock futures. Any holdings in short-term reserves are excluded.
Expense Ratio. The percentage of a fund’s average net assets used to pay its annual administrative and advisory expenses. These expenses directly reduce returns to investors.
Inception Date. The date on which the assets of a fund (or one of its share classes) are first invested in accordance with the fund’s investment objective. For funds with a subscription period, the inception date is the day after that period ends. Investment performance is measured from the inception date.
Median Market Cap. An indicator of the size of companies in which a fund invests; the midpoint of market capitalization (market price x shares outstanding) of a fund’s stocks, weighted by the proportion of the fund’s assets invested in each stock. Stocks representing half of the fund’s assets have market capitalizations above the median, and the rest are below it.
Price/Book Ratio. The share price of a stock divided by its net worth, or book value, per share. For a fund, the weighted average price/book ratio of the stocks it holds.
Price/Earnings Ratio. The ratio of a stock’s current price to its per-share earnings over the past year. For a fund, the weighted average P/E of the stocks it holds. P/E is an indicator of market expectations about corporate prospects; the higher the P/E, the greater the expectations for a company’s future growth.
R-Squared. A measure of how much of a fund’s past returns can be explained by the returns from the market in general, as measured by a given index. If a fund’s total returns were precisely synchronized with an index’s returns, its R-squared would be 1.00. If the fund’s returns bore no relationship to the index’s returns, its R-squared would be 0. For this report, R-squared is based on returns over the past 36 months for both the fund and the index.
Return on Equity. The annual average rate of return generated by a company during the past five years for each dollar of shareholder’s equity (net income divided by shareholder’s equity). For a fund, the weighted average return on equity for the companies whose stocks it holds.
Short-Term Reserves. The percentage of a fund invested in highly liquid, short-term securities that can be readily converted to cash.
75
Turnover Rate. An indication of the fund’s trading activity. Funds with high turnover rates incur higher transaction costs and may be more likely to distribute capital gains (which may be taxable to investors). The turnover rate excludes in-kind transactions, which have minimal impact on costs.
76
This page intentionally left blank.
This page intentionally left blank.
This page intentionally left blank.
The People Who Govern Your Fund
The trustees of your mutual fund are there to see that the fund is operated and managed in your best interests since, as a shareholder, you are a part owner of the fund. Your fund’s trustees also serve on the board of directors of The Vanguard Group, Inc., which is owned by the Vanguard funds and provides services to them on an at-cost basis.
A majority of Vanguard’s board members are independent, meaning that they have no affiliation with Vanguard or the funds they oversee, apart from the sizable personal investments they have made as private individuals. The independent board members have distinguished backgrounds in business, academia, and public service. Each of the trustees and executive officers oversees 179 Vanguard funds.
The following table provides information for each trustee and executive officer of the fund. More information about the trustees is in the Statement of Additional Information, which can be obtained, without charge, by contacting Vanguard at 800-662-7447, or online at vanguard.com.
| |
| Interested Trustee1 | and President (2006–2008) of Rohm and Haas Co. |
| | (chemicals); Director of Tyco International, Ltd. |
| F. William McNabb III | (diversified manufacturing and services) and Hewlett- |
| Born 1957. Trustee Since July 2009. Chairman of the | Packard Co. (electronic computer manufacturing); |
| Board. Principal Occupation(s) During the Past Five | Senior Advisor at New Mountain Capital; Trustee |
| Years: Chairman of the Board of The Vanguard Group, | of The Conference Board; Member of the Board of |
| Inc., and of each of the investment companies served | Managers of Delphi Automotive LLP (automotive |
| by The Vanguard Group, since January 2010; Director | components). |
| of The Vanguard Group since 2008; Chief Executive | |
| Officer and President of The Vanguard Group and of | Amy Gutmann |
| each of the investment companies served by The | Born 1949. Trustee Since June 2006. Principal |
| Vanguard Group since 2008; Director of Vanguard | Occupation(s) During the Past Five Years: President |
| Marketing Corporation; Managing Director of The | of the University of Pennsylvania; Christopher H. |
| Vanguard Group (1995–2008). | Browne Distinguished Professor of Political Science |
| | in the School of Arts and Sciences with secondary |
| | appointments at the Annenberg School for Commu- |
| Independent Trustees | nication and the Graduate School of Education |
| | of the University of Pennsylvania; Director of |
| Emerson U. Fullwood | Carnegie Corporation of New York, Schuylkill River |
| Born 1948. Trustee Since January 2008. Principal | Development Corporation, and Greater Philadelphia |
| Occupation(s) During the Past Five Years: Executive | Chamber of Commerce; Trustee of the National |
| Chief Staff and Marketing Officer for North America | Constitution Center; Chair of the Presidential |
| and Corporate Vice President (retired 2008) of Xerox | Commission for the Study of Bioethical Issues. |
| Corporation (document management products and | |
| services); Executive in Residence and 2010 | JoAnn Heffernan Heisen |
| Distinguished Minett Professor at the Rochester | Born 1950. Trustee Since July 1998. Principal |
| Institute of Technology; Director of SPX Corporation | Occupation(s) During the Past Five Years: Corporate |
| (multi-industry manufacturing), the United Way of | Vice President and Chief Global Diversity Officer |
| Rochester, Amerigroup Corporation (managed health | (retired 2008) and Member of the Executive |
| care), the University of Rochester Medical Center, | Committee (1997–2008) of Johnson & Johnson |
| Monroe Community College Foundation, and North | (pharmaceuticals/consumer products); Director of |
| Carolina A&T University. | Skytop Lodge Corporation (hotels), the University |
| | Medical Center at Princeton, the Robert Wood |
| Rajiv L. Gupta | Johnson Foundation, and the Center for Work Life |
| Born 1945. Trustee Since December 2001. 2 | Policy; Member of the Advisory Board of the |
| Principal Occupation(s) During the Past Five Years: | Maxwell School of Citizenship and Public Affairs |
| Chairman and Chief Executive Officer (retired 2009) | at Syracuse University. |
| | |
| F. Joseph Loughrey | Thomas J. Higgins | |
| Born 1949. Trustee Since October 2009. Principal | Born 1957. Chief Financial Officer Since September |
| Occupation(s) During the Past Five Years: President | 2008. Principal Occupation(s) During the Past Five |
| and Chief Operating Officer (retired 2009) and Vice | Years: Principal of The Vanguard Group, Inc.; Chief |
| Chairman of the Board (2008–2009) of Cummins Inc. | Financial Officer of each of the investment companies |
| (industrial machinery); Director of SKF AB (industrial | served by The Vanguard Group since 2008; Treasurer |
| machinery), Hillenbrand, Inc. (specialized consumer | of each of the investment companies served by The |
| services), the Lumina Foundation for Education, and | Vanguard Group (1998–2008). |
| Oxfam America; Chairman of the Advisory Council | | |
| for the College of Arts and Letters and Member | Kathryn J. Hyatt | |
| of the Advisory Board to the Kellogg Institute for | Born 1955. Treasurer Since November 2008. Principal |
| International Studies at the University of Notre Dame. | Occupation(s) During the Past Five Years: Principal |
| | of The Vanguard Group, Inc.; Treasurer of each of |
| André F. Perold | the investment companies served by The Vanguard |
| Born 1952. Trustee Since December 2004. Principal | Group since 2008; Assistant Treasurer of each of the |
| Occupation(s) During the Past Five Years: George | investment companies served by The Vanguard Group |
| Gund Professor of Finance and Banking at the Harvard | (1988–2008). | |
| Business School; Chair of the Investment Committee | | |
| of HighVista Strategies LLC (private investment firm). | Heidi Stam | |
| | Born 1956. Secretary Since July 2005. Principal |
| Alfred M. Rankin, Jr. | Occupation(s) During the Past Five Years: Managing |
| Born 1941. Trustee Since January 1993. Principal | Director of The Vanguard Group, Inc., since 2006; |
| Occupation(s) During the Past Five Years: Chairman, | General Counsel of The Vanguard Group since 2005; |
| President, and Chief Executive Officer of NACCO | Secretary of The Vanguard Group and of each of the |
| Industries, Inc. (forklift trucks/housewares/lignite); | investment companies served by The Vanguard Group |
| Director of Goodrich Corporation (industrial products/ | since 2005; Director and Senior Vice President of |
| aircraft systems and services) and the National | Vanguard Marketing Corporation since 2005; |
| Association of Manufacturers; Chairman of the | Principal of The Vanguard Group (1997–2006). |
| Federal Reserve Bank of Cleveland; Vice Chairman | | |
| of University Hospitals of Cleveland; President of | | |
| the Board of The Cleveland Museum of Art. | Vanguard Senior Management Team |
| |
| Peter F. Volanakis | R. Gregory Barton | Michael S. Miller |
| Born 1955. Trustee Since July 2009. Principal | Mortimer J. Buckley | James M. Norris |
| Occupation(s) During the Past Five Years: President | Kathleen C. Gubanich | Glenn W. Reed |
| and Chief Operating Officer (retired 2010) of Corning | Paul A. Heller | George U. Sauter |
| Incorporated (communications equipment); Director of | Martha G. King | |
| Corning Incorporated (2000–2010) and Dow Corning | | |
| (2001–2010); Overseer of the Amos Tuck School of | | |
| Business Administration at Dartmouth College. | Chairman Emeritus and Senior Advisor |
| |
| | John J. Brennan | |
| Executive Officers | Chairman, 1996–2009 | |
| | Chief Executive Officer and President, 1996–2008 |
| Glenn Booraem | | |
| Born 1967. Controller Since July 2010. Principal | | |
| Occupation(s) During the Past Five Years: Principal | Founder | |
| of The Vanguard Group, Inc.; Controller of each of | | |
| the investment companies served by The Vanguard | John C. Bogle | |
| Group since 2010; Assistant Controller of each of | Chairman and Chief Executive Officer, 1974–1996 |
| the investment companies served by The Vanguard | | |
| Group (2001–2010). | | |
1 Mr. McNabb is considered an “interested person,” as defined in the Investment Company Act of 1940, because he is an officer of the Vanguard funds.
2 December 2002 for Vanguard Equity Income Fund, Vanguard Growth Equity Fund, the Vanguard Municipal Bond Funds, and the Vanguard State Tax-Exempt Funds.
|  |
| P.O. Box 2600 |
| Valley Forge, PA 19482-2600 |
Connect with Vanguard® > vanguard.com
| |
| Fund Information > 800-662-7447 | The funds or securities referred to herein are not |
| Direct Investor Account Services > 800-662-2739 | sponsored, endorsed, or promoted by MSCI, and MSCI |
| | bears no liability with respect to any such funds or |
| Institutional Investor Services > 800-523-1036 | securities. For any such funds or securities, the |
| Text Telephone for People | prospectus or the Statement of Additional Information |
| With Hearing Impairment > 800-749-7273 | contains a more detailed description of the limited |
| | relationship MSCI has with The Vanguard Group and |
| This material may be used in conjunction | any related funds. |
| with the offering of shares of any Vanguard | |
| fund only if preceded or accompanied by | |
| the fund’s current prospectus. | |
| |
| All comparative mutual fund data are from Lipper Inc. or | |
| Morningstar, Inc., unless otherwise noted. | |
| |
| You can obtain a free copy of Vanguard’s proxy voting | |
| guidelines by visiting vanguard.com/proxyreporting or by | |
| calling Vanguard at 800-662-2739. The guidelines are | |
| also available from the SEC’s website, sec.gov. In | |
| addition, you may obtain a free report on how your fund | |
| voted the proxies for securities it owned during the 12 | |
| months ended June 30. To get the report, visit either | |
| vanguard.com/proxyreporting or sec.gov. | |
| |
| You can review and copy information about your fund at | |
| the SEC’s Public Reference Room in Washington, D.C. To | |
| find out more about this public service, call the SEC at | |
| 202-551-8090. Information about your fund is also | |
| available on the SEC’s website, and you can receive | |
| copies of this information, for a fee, by sending a | |
| request in either of two ways: via e-mail addressed to | |
| publicinfo@sec.gov or via regular mail addressed to the | |
| Public Reference Section, Securities and Exchange | |
| Commission, Washington, DC 20549-1520. | |
| |
| |
| | © 2011 The Vanguard Group, Inc. |
| | All rights reserved. |
| | Vanguard Marketing Corporation, Distributor. |
| |
| | Q722 062011 |
Vanguard® European Stock Index Fund
Schedule of Investments
April 30, 2011
| | | |
| | | | Market |
| | | | Value |
| | | Shares | ($000) |
| Common Stocks (99.2%)1 | | |
| Austria (0.5%) | | |
| | Erste Group Bank AG | 209,702 | 10,587 |
| | OMV AG | 165,799 | 7,559 |
| | Voestalpine AG | 119,788 | 5,893 |
| | Telekom Austria AG | 367,074 | 5,674 |
| ^,* | IMMOFINANZ AG | 1,093,453 | 5,197 |
| | Verbund AG | 75,956 | 3,434 |
| ^ | Raiffeisen Bank International AG | 54,230 | 2,989 |
| | Vienna Insurance Group AG Wiener Versicherung Gruppe | 41,127 | 2,453 |
| | | | 43,786 |
| Belgium (1.4%) | | |
| ^ | Anheuser-Busch InBev NV | 797,093 | 50,869 |
| | Delhaize Group SA | 111,362 | 9,635 |
| | Solvay SA Class A | 65,472 | 9,440 |
| | Groupe Bruxelles Lambert SA | 89,113 | 8,831 |
| | Ageas | 2,468,741 | 7,484 |
| * | KBC Groep NV | 178,107 | 7,250 |
| | Umicore SA | 126,081 | 7,227 |
| ^ | Belgacom SA | 167,600 | 6,590 |
| | UCB SA | 112,373 | 5,429 |
| | Bekaert SA | 42,037 | 5,259 |
| | Colruyt SA | 83,715 | 4,829 |
| * | Dexia SA | 610,113 | 2,430 |
| | Mobistar SA | 30,500 | 2,263 |
| * | Cie Nationale a Portefeuille | 28,917 | 2,089 |
| | | | 129,625 |
| Denmark (1.6%) | | |
| | Novo Nordisk A/S Class B | 461,347 | 58,403 |
| * | Danske Bank A/S | 669,173 | 16,070 |
| | AP Moller - Maersk A/S Class B | 1,453 | 14,726 |
| | Carlsberg A/S Class B | 117,951 | 13,995 |
| | Novozymes A/S | 51,411 | 8,890 |
| * | Vestas Wind Systems A/S | 224,592 | 7,958 |
| | DSV A/S | 235,795 | 6,166 |
| | AP Moller - Maersk A/S | 606 | 5,960 |
| | Coloplast A/S Class B | 24,906 | 3,664 |
| ^ | Pandora A/S | 63,328 | 2,856 |
| * | William Demant Holding A/S | 24,998 | 2,331 |
| | Tryg A/S | 27,612 | 1,765 |
| | | | 142,784 |
| Finland (1.6%) | | |
| | Nokia Oyj | 4,141,112 | 38,150 |
| | Fortum Oyj | 490,884 | 16,900 |
| | Sampo Oyj | 464,003 | 15,621 |
| | UPM-Kymmene Oyj | 576,190 | 11,818 |
| | Kone Oyj Class B | 170,890 | 10,704 |
| | Metso Oyj | 140,150 | 8,607 |
| | Stora Enso Oyj | 648,951 | 7,824 |
| | Wartsila Oyj | 175,776 | 6,910 |
| | Nokian Renkaat Oyj | 118,602 | 6,147 |
| | Kesko Oyj Class B | 73,153 | 3,796 |
| | Elisa Oyj | 149,171 | 3,591 |
| | Neste Oil Oyj | 137,163 | 2,596 |
| | Orion Oyj Class B | 99,535 | 2,475 |
| | Rautaruukki Oyj | 91,551 | 2,375 |
| | Outokumpu Oyj | 138,496 | 2,307 |
| | Pohjola Bank plc | 151,345 | 2,246 |
| ^ | Sanoma Oyj | 87,692 | 1,823 |
| | | | 143,890 |
| France (15.4%) | | |
| | Total SA | 2,330,419 | 149,243 |
| | Sanofi-Aventis SA | 1,156,828 | 91,525 |
| | | |
| Vanguard® European Stock Index Fund | | |
| Schedule of Investments | | |
| April 30, 2011 | | |
| |
| | | | Market |
| | | | Value |
| | | Shares | ($000) |
| | BNP Paribas | 1,057,450 | 83,596 |
| ^ | GDF Suez | 1,364,697 | 55,802 |
| | LVMH Moet Hennessy Louis Vuitton SA | 270,274 | 48,524 |
| | France Telecom SA | 2,044,026 | 47,900 |
| ^ | Schneider Electric SA | 268,080 | 47,363 |
| | Danone | 642,574 | 47,047 |
| | Societe Generale | 700,134 | 46,788 |
| | Air Liquide SA | 312,323 | 46,147 |
| | Vivendi SA | 1,364,452 | 42,782 |
| ^ | AXA SA | 1,894,089 | 42,462 |
| | ArcelorMittal | 948,115 | 35,038 |
| ^ | L'Oreal SA | 264,204 | 33,492 |
| | Vinci SA | 487,649 | 32,551 |
| | Carrefour SA | 662,480 | 31,390 |
| | Cie de St-Gobain | 439,775 | 30,344 |
| ^ | Unibail-Rodamco SE | 101,087 | 23,650 |
| | Pernod-Ricard SA | 219,257 | 22,023 |
| | Cie Generale des Etablissements Michelin Class B | 194,856 | 19,531 |
| | Cie Generale d'Optique Essilor International SA | 223,267 | 18,695 |
| | Credit Agricole SA | 1,054,329 | 17,538 |
| * | Alcatel-Lucent | 2,569,393 | 16,650 |
| | Lafarge SA | 219,606 | 15,549 |
| | Vallourec SA | 121,883 | 15,206 |
| | Alstom SA | 227,508 | 15,126 |
| | PPR | 83,455 | 14,921 |
| * | European Aeronautic Defence and Space Co. NV | 452,097 | 13,988 |
| * | Renault SA | 212,079 | 12,914 |
| | Veolia Environnement SA | 383,253 | 12,801 |
| ^ | Bouygues SA | 254,906 | 12,685 |
| | Technip SA | 108,999 | 12,298 |
| | EDF SA | 285,947 | 12,028 |
| | Christian Dior SA | 69,840 | 11,204 |
| | Cap Gemini SA | 163,740 | 9,918 |
| | SES SA | 330,946 | 8,691 |
| | STMicroelectronics NV | 696,040 | 8,237 |
| | Sodexo | 104,255 | 8,122 |
| | Legrand SA | 173,953 | 7,942 |
| | Publicis Groupe SA | 137,632 | 7,797 |
| * | Peugeot SA | 165,879 | 7,528 |
| | Accor SA | 164,176 | 7,296 |
| ^ | Safran SA | 186,064 | 7,218 |
| | Suez Environnement Co. | 299,368 | 6,898 |
| | Groupe Eurotunnel SA | 586,967 | 6,382 |
| | Casino Guichard Perrachon SA | 60,341 | 6,349 |
| | SCOR SE | 187,966 | 5,738 |
| | Lagardere SCA | 129,929 | 5,705 |
| * | Cie Generale de Geophysique - Veritas | 160,713 | 5,662 |
| * | Natixis | 972,312 | 5,589 |
| | Edenred | 171,414 | 5,315 |
| | Dassault Systemes SA | 64,785 | 5,269 |
| | Eutelsat Communications SA | 109,990 | 4,746 |
| | Bureau Veritas SA | 54,912 | 4,736 |
| | Thales SA | 99,608 | 4,400 |
| | Klepierre | 104,853 | 4,309 |
| | CNP Assurances | 158,995 | 3,649 |
| | Neopost SA | 35,205 | 3,360 |
| | ICADE | 25,915 | 3,322 |
| | Fonciere Des Regions | 28,637 | 3,250 |
| | Aeroports de Paris | 32,874 | 3,151 |
| | Imerys SA | 40,361 | 3,126 |
| * | Atos Origin SA | 50,620 | 3,119 |
| | Gecina SA | 20,934 | 3,017 |
| ^ | Eiffage SA | 43,376 | 2,998 |
| | Societe BIC SA | 28,599 | 2,780 |
| | | |
| Vanguard® European Stock Index Fund | | |
| Schedule of Investments | | |
| April 30, 2011 | | |
| |
| | | | Market |
| | | | Value |
| | | Shares | ($000) |
| | Eurazeo | 31,054 | 2,584 |
| * | Air France-KLM | 144,657 | 2,553 |
| * | JCDecaux SA | 72,078 | 2,517 |
| | Societe Television Francaise 1 | 131,677 | 2,472 |
| | Iliad SA | 17,810 | 2,290 |
| | Eramet | 5,791 | 2,279 |
| | Metropole Television SA | 70,996 | 1,884 |
| ^ | PagesJaunes Groupe | 143,105 | 1,492 |
| | BioMerieux | 12,999 | 1,413 |
| | | | 1,373,904 |
| Germany (13.4%) | | |
| | Siemens AG | 907,949 | 132,069 |
| * | BASF SE | 1,012,025 | 103,919 |
| | Bayer AG | 912,463 | 80,109 |
| | Allianz SE | 500,622 | 78,653 |
| | Daimler AG | 899,007 | 69,481 |
| | E.ON AG | 1,987,143 | 67,919 |
| | Deutsche Bank AG | 1,026,136 | 66,832 |
| | SAP AG | 947,291 | 61,025 |
| | Deutsche Telekom AG | 3,126,215 | 51,665 |
| * | Volkswagen AG Prior Pfd. | 187,808 | 36,964 |
| | Bayerische Motoren Werke AG | 364,932 | 34,358 |
| | Muenchener Rueckversicherungs AG | 207,794 | 34,277 |
| | Linde AG | 186,445 | 33,554 |
| | RWE AG | 462,425 | 30,168 |
| * | Deutsche Post AG | 930,598 | 18,392 |
| | Deutsche Boerse AG | 215,825 | 17,918 |
| | Adidas AG | 231,158 | 17,227 |
| | ThyssenKrupp AG | 368,085 | 16,923 |
| | Fresenius Medical Care AG & Co. KGaA | 214,775 | 16,891 |
| * | MAN SE | 116,196 | 16,188 |
| | Infineon Technologies AG | 1,202,049 | 13,628 |
| | Henkel AG & Co. KGaA Prior Pfd. | 195,509 | 13,329 |
| | K&S AG | 159,217 | 12,859 |
| | Fresenius SE & Co. KGaA | 119,897 | 12,592 |
| | Porsche Automobil Holding SE Prior Pfd. | 168,459 | 12,177 |
| | HeidelbergCement AG | 155,074 | 11,858 |
| | Metro AG | 143,715 | 10,547 |
| | Lanxess AG | 90,744 | 8,303 |
| | Henkel AG & Co. KGaA | 142,429 | 8,089 |
| | Merck KGaA | 71,934 | 7,618 |
| | Daimler AG | 95,233 | 7,322 |
| ^ | Beiersdorf AG | 111,916 | 7,289 |
| | GEA Group AG | 185,317 | 6,768 |
| ^,* | Commerzbank AG | 922,935 | 5,873 |
| * | Volkswagen AG | 32,949 | 5,868 |
| ^,* | Deutsche Lufthansa AG | 248,629 | 5,641 |
| * | Continental AG | 55,007 | 5,515 |
| * | QIAGEN NV | 255,841 | 5,470 |
| | Hochtief AG | 47,794 | 4,528 |
| | Brenntag AG | 36,198 | 4,447 |
| | Wacker Chemie AG | 17,275 | 4,277 |
| | Hannover Rueckversicherung AG | 65,975 | 3,986 |
| | Salzgitter AG | 47,031 | 3,688 |
| * | Kabel Deutschland Holding AG | 57,833 | 3,613 |
| | Bayerische Motoren Werke AG Prior Pfd. | 56,057 | 3,495 |
| | Fraport AG Frankfurt Airport Services Worldwide | 39,682 | 3,169 |
| * | Commerzbank AG | 456,689 | 2,848 |
| ^ | RWE AG Prior Pfd. | 44,271 | 2,693 |
| | Axel Springer AG | 15,894 | 2,605 |
| | United Internet AG | 130,714 | 2,557 |
| | ProSiebenSat.1 Media AG Prior Pfd. | 82,015 | 2,350 |
| | Suedzucker AG | 72,485 | 2,235 |
| | Celesio AG | 86,303 | 2,096 |
| | | |
| Vanguard® European Stock Index Fund | | |
| Schedule of Investments | | |
| April 30, 2011 | | |
| |
| | | | Market |
| | | | Value |
| | | Shares | ($000) |
| * | TUI AG | 161,161 | 2,057 |
| | Puma AG Rudolf Dassler Sport | 5,700 | 1,900 |
| | | | 1,197,822 |
| Greece (0.4%) | | |
| | National Bank of Greece SA | 895,091 | 6,921 |
| | Coca Cola Hellenic Bottling Co. SA | 201,089 | 5,561 |
| | OPAP SA | 243,701 | 5,160 |
| | Bank of Cyprus plc | 911,113 | 3,322 |
| * | Alpha Bank AE | 543,584 | 3,169 |
| | Public Power Corp. SA | 126,100 | 2,087 |
| * | EFG Eurobank Ergasias SA | 344,016 | 1,936 |
| | Hellenic Telecommunications Organization SA ADR | 328,477 | 1,922 |
| | Hellenic Telecommunications Organization SA | 127,206 | 1,509 |
| | National Bank of Greece SA ADR | 823,772 | 1,310 |
| | | | 32,897 |
| Ireland (0.4%) | | |
| | CRH plc | 780,279 | 19,369 |
| | Kerry Group plc Class A | 156,489 | 6,482 |
| * | Elan Corp. plc | 561,132 | 4,511 |
| | Ryanair Holdings plc ADR | 68,443 | 2,086 |
| * | Governor & Co. of the Bank of Ireland | 3,762,356 | 1,532 |
| | WPP plc ADR | 22,861 | 1,492 |
| | Ryanair Holdings plc | 51,347 | 264 |
| ^,* | Anglo Irish Bank Corp. Ltd. | 2,503,596 | — |
| | | | 35,736 |
| Italy (4.4%) | | |
| | ENI SPA | 2,874,153 | 76,952 |
| | Enel SPA | 7,252,949 | 51,723 |
| | UniCredit SPA | 14,896,878 | 38,364 |
| | Assicurazioni Generali SPA | 1,283,704 | 30,763 |
| | Intesa Sanpaolo SPA (Registered) | 8,481,241 | 28,170 |
| | Saipem SPA | 291,140 | 16,537 |
| | Telecom Italia SPA (Registered) | 10,317,324 | 15,513 |
| | Tenaris SA | 522,266 | 13,189 |
| * | Fiat Industrial SPA | 842,850 | 12,521 |
| | Snam Rete Gas SPA | 1,582,015 | 9,840 |
| | Fiat SPA | 842,850 | 9,000 |
| | Telecom Italia SPA (Bearer) | 6,665,308 | 8,595 |
| | Atlantia SPA | 328,064 | 8,074 |
| * | Parmalat SPA | 1,931,935 | 7,315 |
| | Terna Rete Elettrica Nazionale SPA | 1,438,057 | 7,200 |
| | Mediobanca SPA | 527,199 | 6,004 |
| | Finmeccanica SPA | 437,519 | 5,912 |
| ^ | Unione di Banche Italiane SCPA | 659,127 | 5,908 |
| | Enel Green Power SPA | 1,892,354 | 5,611 |
| | Prysmian SPA | 224,218 | 5,293 |
| | Mediaset SPA | 766,234 | 5,105 |
| | Banco Popolare SC | 1,694,404 | 5,026 |
| | Luxottica Group SPA | 131,001 | 4,331 |
| ^,* | Banca Monte dei Paschi di Siena SPA | 2,488,483 | 3,372 |
| | Intesa Sanpaolo SPA (Bearer) | 1,043,014 | 2,991 |
| | Pirelli & C SPA | 275,050 | 2,864 |
| | Exor SPA | 69,318 | 2,501 |
| | A2A SPA | 1,230,028 | 2,222 |
| * | Autogrill SPA | 125,202 | 1,795 |
| ^ | Banca Carige SPA | 620,311 | 1,504 |
| | | | 394,195 |
| Netherlands (3.9%) | | |
| | Unilever NV | 1,799,275 | 59,233 |
| * | ING Groep NV | 4,225,778 | 55,671 |
| | Koninklijke Philips Electronics NV | 1,088,482 | 32,239 |
| | Koninklijke KPN NV | 1,730,650 | 27,460 |
| | Akzo Nobel NV | 254,557 | 19,738 |
| | | |
| Vanguard® European Stock Index Fund | | |
| Schedule of Investments | | |
| April 30, 2011 | | |
| |
| | | | Market |
| | | | Value |
| | | Shares | ($000) |
| | ASML Holding NV | 465,193 | 19,390 |
| | Koninklijke Ahold NV | 1,316,721 | 18,491 |
| | Heineken NV | 285,877 | 17,105 |
| * | Aegon NV | 1,883,469 | 14,971 |
| | Koninklijke DSM NV | 170,893 | 11,779 |
| | TNT NV | 411,018 | 10,115 |
| | Reed Elsevier NV | 751,626 | 9,807 |
| | Wolters Kluwer NV | 327,103 | 7,621 |
| | Randstad Holding NV | 124,268 | 6,991 |
| | Fugro NV | 75,244 | 6,897 |
| | Heineken Holding NV | 125,914 | 6,644 |
| * | SBM Offshore NV | 184,968 | 5,409 |
| | Corio NV | 65,612 | 4,646 |
| | Koninklijke Boskalis Westminster NV | 79,004 | 4,199 |
| | Koninklijke Vopak NV | 77,324 | 3,705 |
| ^ | Delta Lloyd NV | 81,566 | 2,146 |
| | ASML Holding NV ADR | 10,028 | 419 |
| * | Aegon NV | 843 | 7 |
| | | | 344,683 |
| Norway (1.4%) | | |
| | Statoil ASA | 1,235,350 | 36,188 |
| ^ | DnB NOR ASA | 1,079,791 | 17,558 |
| | Telenor ASA | 911,558 | 15,748 |
| | Yara International ASA | 210,396 | 12,318 |
| | Seadrill Ltd. | 305,370 | 10,834 |
| ^ | Norsk Hydro ASA | 993,877 | 8,815 |
| ^ | Orkla ASA | 845,116 | 8,553 |
| | Subsea 7 SA | 306,210 | 8,066 |
| ^,* | Aker Solutions ASA | 175,830 | 4,238 |
| ^,* | Renewable Energy Corp. ASA | 542,371 | 1,915 |
| | | | 124,233 |
| Portugal (0.4%) | | |
| | EDP - Energias de Portugal SA | 2,083,227 | 8,511 |
| | Portugal Telecom SGPS SA | 633,983 | 7,759 |
| | Galp Energia SGPS SA Class B | 257,752 | 5,765 |
| | Jeronimo Martins SGPS SA | 236,252 | 3,875 |
| ^,* | Banco Comercial Portugues SA | 3,324,271 | 2,652 |
| ^ | Banco Espirito Santo SA | 601,214 | 2,532 |
| * | EDP Renovaveis SA | 237,114 | 1,826 |
| | Cimpor Cimentos de Portugal SGPS SA | 227,369 | 1,571 |
| * | Brisa Auto-Estradas de Portugal SA | 213,424 | 1,428 |
| | | | 35,919 |
| Spain (5.4%) | | |
| | Telefonica SA | 4,455,503 | 119,698 |
| | Banco Santander SA | 9,186,870 | 117,321 |
| | Banco Bilbao Vizcaya Argentaria SA | 4,696,231 | 60,157 |
| | Iberdrola SA | 4,167,373 | 38,646 |
| | Repsol YPF SA | 806,399 | 28,788 |
| | Inditex SA | 241,710 | 21,676 |
| | ACS Actividades de Construccion y Servicios SA | 154,795 | 7,788 |
| | Abertis Infraestructuras SA | 323,577 | 7,665 |
| | Red Electrica Corp. SA | 118,046 | 7,521 |
| | Gas Natural SDG SA | 352,719 | 7,253 |
| | Criteria Caixacorp SA | 926,215 | 6,832 |
| | Ferrovial SA | 477,619 | 6,585 |
| | Banco Popular Espanol SA | 985,552 | 5,904 |
| | Banco de Sabadell SA | 1,241,337 | 5,498 |
| | Enagas SA | 200,239 | 4,951 |
| * | Amadeus IT Holding SA | 217,796 | 4,565 |
| | Iberdrola Renovables SA | 957,297 | 4,381 |
| | Mapfre SA | 806,491 | 3,366 |
| | Acciona SA | 28,488 | 3,314 |
| | Grifols SA | 149,758 | 2,964 |
| | | |
| Vanguard® European Stock Index Fund | | |
| Schedule of Investments | | |
| April 30, 2011 | | |
| |
| | | | Market |
| | | | Value |
| | | Shares | ($000) |
| | Zardoya Otis SA | 149,692 | 2,548 |
| | Bankinter SA | 326,762 | 2,437 |
| | Acerinox SA | 114,668 | 2,304 |
| | Indra Sistemas SA | 101,100 | 2,293 |
| * | International Consolidated Airlines Group SA | 569,536 | 2,271 |
| | Telefonica SA ADR | 76,227 | 2,055 |
| ^ | Fomento de Construcciones y Contratas SA | 59,324 | 2,016 |
| * | Gestevision Telecinco SA | 179,244 | 2,015 |
| * | International Consolidated Airlines Group SA | 477,511 | 1,900 |
| ^,* | Banco de Valencia SA | 243,909 | 986 |
| ^,* | Banco de Valencia SA Rights Exp. 05/09/2011 | 243,911 | 19 |
| | | | 485,717 |
| Sweden (4.9%) | | |
| | Telefonaktiebolaget LM Ericsson Class B | 3,322,845 | 50,419 |
| ^ | Hennes & Mauritz AB Class B | 1,124,952 | 39,758 |
| | Nordea Bank AB | 2,891,161 | 32,964 |
| | Volvo AB Class B | 1,521,389 | 29,899 |
| ^ | Sandvik AB | 1,112,989 | 23,595 |
| ^ | Atlas Copco AB Class A | 738,588 | 21,692 |
| | TeliaSonera AB | 2,460,210 | 20,078 |
| | Svenska Handelsbanken AB Class A | 540,452 | 18,742 |
| | Swedbank AB Class A | 790,196 | 14,987 |
| | Skandinaviska Enskilda Banken AB Class A | 1,557,918 | 14,976 |
| ^ | SKF AB | 430,835 | 13,603 |
| | Investor AB Class B | 503,708 | 12,546 |
| | Atlas Copco AB Class B | 432,133 | 11,454 |
| ^,* | Assa Abloy AB Class B | 341,732 | 10,266 |
| | Svenska Cellulosa AB Class B | 628,671 | 9,638 |
| | Skanska AB Class B | 441,714 | 9,496 |
| | Scania AB Class B | 354,882 | 9,220 |
| ^ | Swedish Match AB | 257,498 | 9,139 |
| | Millicom International Cellular SA | 84,129 | 9,126 |
| | Tele2 AB | 347,083 | 8,716 |
| ^ | Alfa Laval AB | 375,234 | 8,400 |
| ^ | Hexagon AB Class B | 276,771 | 7,191 |
| | Electrolux AB Class B | 266,585 | 6,784 |
| ^ | Boliden AB | 298,826 | 6,740 |
| ^ | Kinnevik Investment AB Class B | 238,672 | 6,163 |
| ^ | Getinge AB | 223,054 | 5,934 |
| | Ratos AB | 113,475 | 4,690 |
| ^ | Securitas AB Class B | 342,671 | 4,295 |
| ^ | Modern Times Group AB Class B | 55,626 | 4,267 |
| | Husqvarna AB | 462,625 | 3,640 |
| | SSAB AB Class A | 201,258 | 3,597 |
| | Industrivarden AB | 126,080 | 2,516 |
| | Holmen AB | 57,317 | 2,115 |
| | | | 436,646 |
| Switzerland (12.0%) | | |
| | Nestle SA | 3,821,146 | 237,172 |
| | Novartis AG | 2,327,473 | 138,020 |
| | Roche Holding AG | 775,049 | 125,806 |
| * | UBS AG | 3,989,354 | 79,837 |
| | ABB Ltd. | 2,412,494 | 66,622 |
| | Credit Suisse Group AG | 1,240,409 | 56,459 |
| | Zurich Financial Services AG | 160,812 | 45,217 |
| | Cie Financiere Richemont SA | 576,506 | 37,288 |
| | Syngenta AG | 104,171 | 36,841 |
| * | Transocean Ltd. | 351,433 | 25,985 |
| | Holcim Ltd. | 269,651 | 23,495 |
| | Swiss Reinsurance Co. Ltd. | 388,554 | 23,184 |
| | Swatch Group AG (Bearer) | 34,138 | 16,811 |
| | SGS SA | 6,011 | 11,944 |
| | Swisscom AG | 25,703 | 11,797 |
| 2 | Synthes Inc. | 65,858 | 11,350 |
| | | |
| Vanguard® European Stock Index Fund | | |
| Schedule of Investments | | |
| April 30, 2011 | | |
| |
| | | | Market |
| | | | Value |
| | | Shares | ($000) |
| | Julius Baer Group Ltd. | 227,475 | 10,645 |
| | Givaudan SA | 9,188 | 10,223 |
| | Geberit AG | 43,290 | 10,129 |
| | Adecco SA | 136,436 | 9,750 |
| | Kuehne & Nagel International AG | 59,869 | 9,574 |
| | Schindler Holding AG (Bearer) | 53,915 | 6,978 |
| * | Actelion Ltd. | 113,930 | 6,713 |
| | Swiss Life Holding AG | 34,188 | 6,242 |
| * | Baloise Holding AG | 55,994 | 6,197 |
| | Sika AG | 2,242 | 5,727 |
| | Sonova Holding AG | 50,238 | 5,076 |
| | GAM Holding AG | 232,394 | 4,581 |
| * | Lindt & Spruengli AG | 122 | 4,543 |
| | Lonza Group AG | 52,307 | 4,498 |
| | Swatch Group AG (Registered) | 47,047 | 4,179 |
| | Aryzta AG | 65,730 | 3,666 |
| * | Lindt & Spruengli AG | 948 | 3,143 |
| | Pargesa Holding SA | 28,944 | 2,977 |
| | Schindler Holding AG (Registered) | 22,992 | 2,961 |
| ^,* | Logitech International SA | 197,885 | 2,744 |
| | Straumann Holding AG | 8,540 | 2,234 |
| | Aryzta AG | 26,121 | 1,436 |
| * | UBS AG | 29,191 | 584 |
| | | | 1,072,628 |
| United Kingdom (32.1%) | | |
| | HSBC Holdings plc | 19,500,933 | 212,717 |
| | Vodafone Group plc | 54,559,727 | 157,723 |
| | BP plc | 19,723,683 | 151,623 |
| | GlaxoSmithKline plc | 5,730,566 | 125,186 |
| | Rio Tinto plc | 1,598,947 | 116,669 |
| | Royal Dutch Shell plc Class B | 2,971,799 | 115,618 |
| | BHP Billiton plc | 2,429,519 | 102,721 |
| | British American Tobacco plc | 2,202,883 | 96,261 |
| | BG Group plc | 3,735,667 | 96,201 |
| | Royal Dutch Shell plc Class A | 2,470,510 | 95,434 |
| | AstraZeneca plc | 1,557,938 | 77,303 |
| | Anglo American plc | 1,456,166 | 76,332 |
| | Standard Chartered plc | 2,587,721 | 71,919 |
| | Barclays plc | 12,753,526 | 60,631 |
| | Tesco plc | 8,854,132 | 59,694 |
| | Xstrata plc | 2,288,819 | 58,707 |
| | Diageo plc | 2,759,096 | 56,130 |
| | Royal Dutch Shell plc Class A | 1,438,643 | 56,038 |
| | Unilever plc | 1,414,927 | 45,967 |
| * | Lloyds Banking Group plc | 45,038,128 | 44,717 |
| | Imperial Tobacco Group plc | 1,124,618 | 39,669 |
| | National Grid plc | 3,856,283 | 39,566 |
| | SABMiller plc | 1,049,167 | 39,195 |
| | Reckitt Benckiser Group plc | 680,533 | 37,870 |
| | Prudential plc | 2,804,423 | 36,282 |
| | Centrica plc | 5,675,531 | 30,480 |
| | BT Group plc | 8,559,607 | 28,102 |
| | Tullow Oil plc | 983,817 | 23,605 |
| | Scottish & Southern Energy plc | 1,022,731 | 23,203 |
| | Aviva plc | 3,094,903 | 23,163 |
| | Rolls-Royce Group plc | 2,062,939 | 22,187 |
| | BAE Systems plc | 3,742,402 | 20,543 |
| | Compass Group plc | 2,076,595 | 20,321 |
| | Shire plc | 621,248 | 19,279 |
| | British Sky Broadcasting Group plc | 1,253,563 | 17,653 |
| | Pearson plc | 896,215 | 17,177 |
| | WPP plc | 1,281,461 | 16,785 |
| | ARM Holdings plc | 1,460,029 | 15,133 |
| | Experian plc | 1,109,653 | 14,974 |
| | | |
| Vanguard® European Stock Index Fund | | |
| Schedule of Investments | | |
| April 30, 2011 | | |
| |
| | | | Market |
| | | | Value |
| | | Shares | ($000) |
| | Old Mutual plc | 6,018,716 | 14,031 |
| | Legal & General Group plc | 6,474,058 | 13,316 |
| * | Royal Bank of Scotland Group plc | 19,078,241 | 13,297 |
| | Kingfisher plc | 2,619,457 | 12,035 |
| | Reed Elsevier plc | 1,338,555 | 11,859 |
| * | Cairn Energy plc | 1,536,046 | 11,621 |
| | WM Morrison Supermarkets plc | 2,345,166 | 11,570 |
| | Wolseley plc | 311,882 | 11,329 |
| | Marks & Spencer Group plc | 1,737,444 | 11,289 |
| | Land Securities Group plc | 841,895 | 11,067 |
| | Smith & Nephew plc | 980,732 | 10,771 |
| | Burberry Group plc | 483,162 | 10,484 |
| | Antofagasta plc | 436,736 | 10,044 |
| | British Land Co. plc | 975,880 | 9,826 |
| | Smiths Group plc | 433,773 | 9,672 |
| | Standard Life plc | 2,509,959 | 9,512 |
| | International Power plc | 1,697,110 | 9,393 |
| | RSA Insurance Group plc | 3,831,351 | 8,829 |
| * | Randgold Resources Ltd. | 101,006 | 8,783 |
| | Vodafone Group plc ADR | 299,744 | 8,729 |
| | Capita Group plc | 681,998 | 8,395 |
| | Aggreko plc | 280,195 | 8,383 |
| | Man Group plc | 1,976,206 | 8,270 |
| | Carnival plc | 201,098 | 8,097 |
| | Resolution Ltd. | 1,597,839 | 8,092 |
| | United Utilities Group plc | 751,599 | 7,942 |
| | Johnson Matthey plc | 235,034 | 7,873 |
| | J Sainsbury plc | 1,339,174 | 7,801 |
| | BP plc ADR | 167,389 | 7,723 |
| | Next plc | 204,756 | 7,672 |
| | Weir Group plc | 230,937 | 7,438 |
| | AMEC plc | 369,358 | 7,415 |
| | Petrofac Ltd. | 288,989 | 7,306 |
| | G4S plc | 1,566,436 | 7,234 |
| | Intercontinental Hotels Group plc | 321,423 | 7,056 |
| | Sage Group plc | 1,458,407 | 6,960 |
| | Severn Trent plc | 264,033 | 6,638 |
| | Associated British Foods plc | 389,166 | 6,554 |
| * | Autonomy Corp. plc | 239,862 | 6,474 |
| | Admiral Group plc | 225,182 | 6,371 |
| | Rexam plc | 973,248 | 6,361 |
| | Intertek Group plc | 175,088 | 6,220 |
| | Hammerson plc | 772,465 | 6,073 |
| | Whitbread plc | 197,461 | 5,551 |
| | ICAP plc | 622,113 | 5,398 |
| | Kazakhmys plc | 231,730 | 5,383 |
| | Fresnillo plc | 194,197 | 5,352 |
| | Vedanta Resources plc | 133,704 | 5,221 |
| | Serco Group plc | 545,518 | 5,160 |
| | Invensys plc | 906,064 | 5,159 |
| * | ITV plc | 4,048,085 | 5,155 |
| | 3i Group plc | 1,086,124 | 5,094 |
| | Lonmin plc | 179,721 | 4,923 |
| | Cobham plc | 1,288,496 | 4,922 |
| | Inmarsat plc | 476,039 | 4,848 |
| | Segro plc | 824,343 | 4,487 |
| | Bunzl plc | 356,088 | 4,434 |
| | Eurasian Natural Resources Corp. plc | 288,353 | 4,419 |
| | Investec plc | 533,500 | 4,296 |
| | Babcock International Group plc | 395,295 | 4,235 |
| | Balfour Beatty plc | 765,670 | 4,201 |
| | Capital Shopping Centres Group plc | 614,824 | 4,178 |
| | Schroders plc | 122,372 | 3,888 |
| | Home Retail Group plc | 892,944 | 3,296 |
| | | | |
| Vanguard® European Stock Index Fund | | | | |
| Schedule of Investments | | | | |
| April 30, 2011 | | | | |
| |
| | | | | Market |
| | | | | Value |
| | | | Shares | ($000) |
| Firstgroup plc | | | 535,674 | 2,911 |
| Thomas Cook Group plc | | | 957,677 | 2,748 |
| * Essar Energy plc | | | 349,455 | 2,697 |
| Cable & Wireless Worldwide plc | | | 3,027,349 | 2,436 |
| TUI Travel plc | | | 598,685 | 2,401 |
| London Stock Exchange Group plc | | | 160,957 | 2,349 |
| |
| | | | | 2,863,725 |
| |
| Total Common Stocks (Cost $10,260,375) | | | | 8,858,190 |
| |
| |
| | Coupon | | | |
| Temporary Cash Investments (5.9%)1 | | | | |
| Money Market Fund (5.8%) | | | | |
| 3,4 Vanguard Market Liquidity Fund | 0.179% | | 514,948,598 | 514,949 |
| |
| |
| | | | Face | |
| | | Maturity | Amount | |
| | Coupon | Date | ($000) | |
| U.S. Government and Agency Obligations (0.1%) | | | | |
| 5,6 Federal Home Loan Bank Discount Notes | 0.210% | 6/3/11 | 5,000 | 4,999 |
| United States Treasury Bill | 0.200% | 6/30/11 | 2,000 | 2,000 |
| |
| | | | | 6,999 |
| |
| Total Temporary Cash Investments (Cost $521,947) | | | | 521,948 |
| |
| Total Investments (105.1%) (Cost $10,782,322) | | | | 9,380,138 |
| Other Assets and Liabilities—Net (-5.1%)4 | | | | (454,663) |
| |
| Net Assets (100%) | | | | 8,925,475 |
^ Part of security position is on loan to broker-dealers. The total value of securities on loan is $432,508,000.
* Non-income-producing security.
1 The fund invests a portion of its cash reserves in equity markets through the use of index futures contracts. After giving effect to futures investments, the fund's effective common stock and temporary cash investment positions represent 99.8% and 5.3%, respectively, of net assets.
2 Security exempt from registration under Rule 144A of the Securities Act of 1933. Such securities may be sold in transactions exempt from registration, normally to qualified institutional buyers. At April 30, 2011, the value of this security represented 0.1% of net assets.
3 Affiliated money market fund available only to Vanguard funds and certain trusts and accounts managed by Vanguard. Rate shown is the 7-day yield.
4 Includes $459,199,000 of collateral received for securities on loan.
5 The issuer operates under a congressional charter; its securities are not backed by the full faith and credit of the government.
6 Securities with a value of $3,500,000 have been segregated as initial margin for open futures contracts.
ADR—American Depositary Receipt.
| | | |
| Vanguard® Pacific Stock Index Fund | | |
| Schedule of Investments | | |
| April 30, 2011 | | |
| |
| | | | Market |
| | | | Value |
| | | Shares | ($000) |
| |
| Common Stocks (99.0%)1 | | |
| Australia (26.6%) | | |
| | BHP Billiton Ltd. | 3,568,781 | 180,687 |
| | Commonwealth Bank of Australia | 1,721,166 | 101,606 |
| | Westpac Banking Corp. | 3,322,292 | 90,700 |
| | Australia & New Zealand Banking Group Ltd. | 2,846,262 | 75,817 |
| | National Australia Bank Ltd. | 2,375,413 | 70,723 |
| | Rio Tinto Ltd. | 484,229 | 43,835 |
| | Wesfarmers Ltd. | 1,116,990 | 40,920 |
| | Woolworths Ltd. | 1,347,339 | 39,209 |
| | Newcrest Mining Ltd. | 798,939 | 36,388 |
| | Woodside Petroleum Ltd. | 692,925 | 35,632 |
| | Westfield Group | 2,433,891 | 24,119 |
| | QBE Insurance Group Ltd. | 1,168,594 | 24,008 |
| | CSL Ltd. | 609,151 | 22,987 |
| | Origin Energy Ltd. | 1,179,585 | 21,161 |
| | AMP Ltd. | 3,158,403 | 18,999 |
| | Telstra Corp. Ltd. | 4,841,726 | 15,465 |
| | Santos Ltd. | 928,483 | 15,430 |
| | Macquarie Group Ltd. | 383,631 | 14,832 |
| | Foster's Group Ltd. | 2,144,824 | 13,238 |
| | Suncorp Group Ltd. | 1,421,756 | 13,010 |
| | Brambles Ltd. | 1,594,022 | 11,806 |
| | Orica Ltd. | 401,220 | 11,721 |
| | Stockland | 2,650,082 | 11,002 |
| | Amcor Ltd. | 1,360,912 | 10,461 |
| | Fortescue Metals Group Ltd. | 1,383,346 | 9,376 |
| | Westfield Retail Trust | 3,211,274 | 9,328 |
| | Insurance Australia Group Ltd. | 2,302,417 | 9,027 |
| | Transurban Group | 1,442,420 | 8,394 |
| | Coca-Cola Amatil Ltd. | 630,123 | 8,260 |
| | AGL Energy Ltd. | 509,914 | 8,138 |
| | Incitec Pivot Ltd. | 1,810,257 | 7,492 |
| * | QR National Ltd. | 1,900,472 | 7,161 |
| | WorleyParsons Ltd. | 213,293 | 7,123 |
| | ASX Ltd. | 193,662 | 6,830 |
| | GPT Group | 1,962,830 | 6,819 |
| | Alumina Ltd. | 2,698,403 | 6,758 |
| | TABCORP Holdings Ltd. | 761,103 | 6,380 |
| | Wesfarmers Ltd. Price Protected Shares | 168,180 | 6,218 |
| | Asciano Ltd. | 3,248,012 | 5,897 |
| | Lend Lease Group | 597,491 | 5,714 |
| | OZ Minerals Ltd. | 3,576,932 | 5,677 |
| | Sonic Healthcare Ltd. | 409,809 | 5,637 |
| | Cochlear Ltd. | 63,035 | 5,573 |
| | Goodman Group | 7,104,498 | 5,542 |
| | Mirvac Group | 3,791,784 | 5,291 |
| | Computershare Ltd. | 492,093 | 5,237 |
| | Dexus Property Group | 5,377,376 | 5,200 |
| | Crown Ltd. | 498,873 | 4,627 |
| | Toll Holdings Ltd. | 745,913 | 4,618 |
| | CFS Retail Property Trust | 2,336,210 | 4,587 |
| ^ | Leighton Holdings Ltd. | 168,328 | 4,485 |
| | Boral Ltd. | 806,232 | 4,355 |
| | Bendigo and Adelaide Bank Ltd. | 411,075 | 4,219 |
| | BlueScope Steel Ltd. | 2,047,119 | 3,899 |
| | Metcash Ltd. | 854,049 | 3,805 |
| | Tatts Group Ltd. | 1,434,114 | 3,653 |
| | OneSteel Ltd. | 1,470,670 | 3,448 |
| ^ | Fairfax Media Ltd. | 2,349,900 | 3,409 |
| * | James Hardie Industries SE | 486,169 | 3,161 |
| | Ramsay Health Care Ltd. | 146,408 | 2,905 |
| * | Qantas Airways Ltd. | 1,236,690 | 2,866 |
| | | |
| Vanguard® Pacific Stock Index Fund | | |
| Schedule of Investments | | |
| April 30, 2011 | | |
| |
| | | | Market |
| | | | Value |
| | | Shares | ($000) |
| *,^ | Paladin Energy Ltd. | 761,917 | 2,754 |
| | MacArthur Coal Ltd. | 196,963 | 2,514 |
| | Sims Metal Management Ltd. ADR | 127,682 | 2,437 |
| | Caltex Australia Ltd. | 151,770 | 2,365 |
| | Newcrest Mining Ltd. ADR | 51,388 | 2,354 |
| | CSR Ltd. | 556,766 | 1,835 |
| | Goodman Fielder Ltd. | 1,551,952 | 1,832 |
| | Harvey Norman Holdings Ltd. | 590,959 | 1,741 |
| | Billabong International Ltd. | 227,988 | 1,695 |
| | SP AusNet | 1,537,843 | 1,478 |
| | MAp Group | 420,342 | 1,362 |
| | Sims Metal Management Ltd. | 54,421 | 1,044 |
| | | | 1,178,276 |
| Hong Kong (8.2%) | | |
| * | AIA Group Ltd. | 8,699,304 | 29,338 |
| | Hutchison Whampoa Ltd. | 2,368,599 | 27,089 |
| | Hong Kong Exchanges and Clearing Ltd. | 1,137,646 | 26,016 |
| | Sun Hung Kai Properties Ltd. | 1,571,121 | 24,608 |
| | Cheung Kong Holdings Ltd. | 1,546,008 | 24,400 |
| | CLP Holdings Ltd. | 2,138,547 | 17,590 |
| | Li & Fung Ltd. | 3,128,681 | 16,012 |
| | Hang Seng Bank Ltd. | 849,669 | 13,280 |
| | Swire Pacific Ltd. Class A | 856,227 | 13,105 |
| | BOC Hong Kong Holdings Ltd. | 4,120,992 | 12,954 |
| | Wharf Holdings Ltd. | 1,678,871 | 12,320 |
| | Hang Lung Properties Ltd. | 2,728,242 | 12,166 |
| | Hong Kong & China Gas Co. Ltd. | 4,792,173 | 11,902 |
| | Power Assets Holdings Ltd. | 1,546,165 | 10,827 |
| | Henderson Land Development Co. Ltd. | 1,208,034 | 8,292 |
| | Link REIT | 2,464,476 | 7,767 |
| * | Sands China Ltd. | 2,681,600 | 7,535 |
| | Bank of East Asia Ltd. | 1,697,622 | 7,029 |
| | Wynn Macau Ltd. | 1,732,000 | 6,181 |
| | Hang Lung Group Ltd. | 898,181 | 6,052 |
| | MTR Corp. | 1,605,603 | 5,862 |
| | Esprit Holdings Ltd. | 1,287,900 | 5,375 |
| | Sino Land Co. Ltd. | 2,878,114 | 5,076 |
| | New World Development Ltd. | 2,830,545 | 4,982 |
| | Shangri-La Asia Ltd. | 1,562,092 | 4,361 |
| | Kerry Properties Ltd. | 800,040 | 4,278 |
| | Wheelock & Co. Ltd. | 1,024,647 | 4,231 |
| | SJM Holdings Ltd. | 1,807,000 | 3,904 |
| | Cathay Pacific Airways Ltd. | 1,314,220 | 3,284 |
| | Hysan Development Co. Ltd. | 702,187 | 3,283 |
| | ASM Pacific Technology Ltd. | 219,041 | 2,951 |
| | Yue Yuen Industrial Holdings Ltd. | 815,717 | 2,818 |
| | Cheung Kong Infrastructure Holdings Ltd. | 505,854 | 2,468 |
| | Wing Hang Bank Ltd. | 197,893 | 2,206 |
| | NWS Holdings Ltd. | 1,431,022 | 2,110 |
| | Hopewell Holdings Ltd. | 621,323 | 1,879 |
| | Lifestyle International Holdings Ltd. | 653,044 | 1,871 |
| | Orient Overseas International Ltd. | 243,565 | 1,869 |
| | PCCW Ltd. | 4,399,653 | 1,747 |
| *,^ | Foxconn International Holdings Ltd. | 2,367,816 | 1,400 |
| * | Henderson Land Development Co. Ltd. Warrants Exp. 06/01/2011 | 399,606 | 11 |
| | | | 360,429 |
| Japan (58.7%) | | |
| | Toyota Motor Corp. | 3,065,183 | 122,274 |
| | Honda Motor Co. Ltd. | 1,811,654 | 69,647 |
| | Mitsubishi UFJ Financial Group Inc. | 14,152,320 | 67,925 |
| | Canon Inc. | 1,259,759 | 59,325 |
| | Sumitomo Mitsui Financial Group Inc. | 1,492,761 | 46,368 |
| | Mitsubishi Corp. | 1,508,472 | 40,921 |
| | Takeda Pharmaceutical Co. Ltd. | 833,617 | 40,399 |
| | |
| Vanguard® Pacific Stock Index Fund | | |
| Schedule of Investments | | |
| April 30, 2011 | | |
| |
| | | Market |
| | | Value |
| | Shares | ($000) |
| Softbank Corp. | 901,031 | 38,021 |
| Komatsu Ltd. | 1,054,378 | 37,177 |
| Mizuho Financial Group Inc. | 22,745,713 | 36,037 |
| FANUC Corp. | 212,939 | 35,646 |
| Mitsui & Co. Ltd. | 1,930,980 | 34,362 |
| NTT DoCoMo Inc. | 17,031 | 31,599 |
| Sony Corp. | 1,116,329 | 31,520 |
| Panasonic Corp. | 2,453,311 | 30,167 |
| Hitachi Ltd. | 5,019,404 | 27,244 |
| Nissan Motor Co. Ltd. | 2,762,932 | 26,584 |
| Nintendo Co. Ltd. | 110,461 | 26,137 |
| Nippon Telegraph & Telephone Corp. | 530,823 | 24,735 |
| Mitsubishi Electric Corp. | 2,147,896 | 23,913 |
| Toshiba Corp. | 4,469,214 | 23,798 |
| Shin-Etsu Chemical Co. Ltd. | 455,481 | 23,696 |
| Mitsubishi Estate Co. Ltd. | 1,313,005 | 22,977 |
| Tokio Marine Holdings Inc. | 803,988 | 22,491 |
| KDDI Corp. | 3,239 | 21,624 |
| Seven & I Holdings Co. Ltd. | 835,979 | 21,038 |
| East Japan Railway Co. | 377,337 | 20,973 |
| Nomura Holdings Inc. | 3,926,154 | 20,057 |
| Kyocera Corp. | 180,844 | 19,953 |
| Japan Tobacco Inc. | 5,014 | 19,486 |
| Astellas Pharma Inc. | 494,068 | 18,870 |
| Inpex Corp. | 2,437 | 18,735 |
| Denso Corp. | 540,840 | 18,100 |
| Nippon Steel Corp. | 5,672,270 | 17,743 |
| Kansai Electric Power Co. Inc. | 833,265 | 17,551 |
| JX Holdings Inc. | 2,491,139 | 17,544 |
| ITOCHU Corp. | 1,673,127 | 17,429 |
| Sumitomo Corp. | 1,248,207 | 17,219 |
| Murata Manufacturing Co. Ltd. | 225,067 | 16,255 |
| Mitsui Fudosan Co. Ltd. | 930,322 | 16,146 |
| Mitsubishi Heavy Industries Ltd. | 3,377,617 | 16,139 |
| FUJIFILM Holdings Corp. | 514,294 | 15,988 |
| Bridgestone Corp. | 722,432 | 15,956 |
| Chubu Electric Power Co. Inc. | 720,333 | 15,784 |
| Kao Corp. | 599,497 | 15,007 |
| Daiichi Sankyo Co. Ltd. | 747,604 | 14,690 |
| Dai-ichi Life Insurance Co. Ltd. | 8,868 | 14,648 |
| Asahi Glass Co. Ltd. | 1,120,824 | 14,230 |
| JFE Holdings Inc. | 511,716 | 14,007 |
| MS&AD Insurance Group Holdings | 597,462 | 13,991 |
| Marubeni Corp. | 1,840,703 | 13,447 |
| Kirin Holdings Co. Ltd. | 938,261 | 13,203 |
| Tokyo Gas Co. Ltd. | 2,834,233 | 12,645 |
| Central Japan Railway Co. | 1,669 | 12,619 |
| Kubota Corp. | 1,289,452 | 12,363 |
| Keyence Corp. | 46,379 | 12,256 |
| Toray Industries Inc. | 1,628,172 | 12,077 |
| Sumitomo Mitsui Trust Holdings Inc. | 3,466,455 | 11,934 |
| Fujitsu Ltd. | 2,071,530 | 11,869 |
| Sumitomo Electric Industries Ltd. | 838,291 | 11,672 |
| Secom Co. Ltd. | 234,292 | 11,622 |
| ORIX Corp. | 116,290 | 11,425 |
| Tokyo Electron Ltd. | 191,185 | 11,068 |
| SMC Corp. | 59,906 | 10,943 |
| Nidec Corp. | 121,431 | 10,614 |
| Terumo Corp. | 188,006 | 10,485 |
| Hoya Corp. | 483,665 | 10,417 |
| Sumitomo Metal Mining Co. Ltd. | 582,122 | 10,394 |
| Sharp Corp. | 1,110,523 | 10,218 |
| Eisai Co. Ltd. | 280,195 | 10,189 |
| NKSJ Holdings Inc. | 1,567,190 | 10,101 |
| | | |
| Vanguard® Pacific Stock Index Fund | | |
| Schedule of Investments | | |
| April 30, 2011 | | |
| |
| | | | Market |
| | | | Value |
| | | Shares | ($000) |
| | Nitto Denko Corp. | 184,101 | 9,860 |
| | Asahi Kasei Corp. | 1,403,989 | 9,705 |
| | Resona Holdings Inc. | 2,043,516 | 9,688 |
| | Mitsubishi Chemical Holdings Corp. | 1,422,554 | 9,633 |
| | Fast Retailing Co. Ltd. | 59,221 | 9,338 |
| | Sumitomo Chemical Co. Ltd. | 1,755,177 | 9,334 |
| | Suzuki Motor Corp. | 375,074 | 8,929 |
| | Tokyo Electric Power Co. Inc. | 1,600,764 | 8,585 |
| | Daikin Industries Ltd. | 261,040 | 8,315 |
| | Ajinomoto Co. Inc. | 739,475 | 8,224 |
| | Ricoh Co. Ltd. | 744,880 | 8,220 |
| | Sumitomo Realty & Development Co. Ltd. | 396,720 | 8,212 |
| | Asahi Breweries Ltd. | 429,811 | 8,074 |
| | Aeon Co. Ltd. | 667,895 | 8,047 |
| | Daiwa Securities Group Inc. | 1,852,398 | 7,995 |
| | Osaka Gas Co. Ltd. | 2,158,164 | 7,964 |
| | Sumitomo Metal Industries Ltd. | 3,748,423 | 7,930 |
| | Kyushu Electric Power Co. Inc. | 422,951 | 7,820 |
| | Aisin Seiki Co. Ltd. | 212,914 | 7,510 |
| | Dai Nippon Printing Co. Ltd. | 625,691 | 7,506 |
| | Nikon Corp. | 357,760 | 7,498 |
| | T&D Holdings Inc. | 302,520 | 7,470 |
| | Rakuten Inc. | 8,017 | 7,444 |
| | Otsuka Holdings Co. Ltd. | 277,600 | 7,433 |
| | Mitsui OSK Lines Ltd. | 1,277,308 | 7,124 |
| | Yamato Holdings Co. Ltd. | 443,114 | 7,075 |
| | TDK Corp. | 136,984 | 7,068 |
| | Tohoku Electric Power Co. Inc. | 475,405 | 6,982 |
| | West Japan Railway Co. | 1,895 | 6,911 |
| | Kobe Steel Ltd. | 2,771,025 | 6,876 |
| | Olympus Corp. | 242,087 | 6,852 |
| | Bank of Yokohama Ltd. | 1,363,400 | 6,754 |
| | JS Group Corp. | 279,839 | 6,745 |
| | Rohm Co. Ltd. | 109,580 | 6,600 |
| | Kawasaki Heavy Industries Ltd. | 1,588,339 | 6,564 |
| | Daiwa House Industry Co. Ltd. | 537,530 | 6,513 |
| | Daito Trust Construction Co. Ltd. | 80,469 | 6,438 |
| | Yamada Denki Co. Ltd. | 91,289 | 6,414 |
| | Shiseido Co. Ltd. | 378,792 | 6,301 |
| | Nippon Yusen KK | 1,695,747 | 6,269 |
| | Omron Corp. | 227,055 | 6,245 |
| | Sekisui House Ltd. | 641,495 | 6,218 |
| | Nippon Building Fund Inc. | 610 | 6,139 |
| | NEC Corp. | 2,894,035 | 6,104 |
| | Shizuoka Bank Ltd. | 668,162 | 6,088 |
| | Toyota Industries Corp. | 199,435 | 6,045 |
| | Nippon Electric Glass Co. Ltd. | 394,006 | 5,966 |
| | Yahoo Japan Corp. | 16,147 | 5,940 |
| | Chugoku Electric Power Co. Inc. | 330,394 | 5,868 |
| | JGC Corp. | 230,396 | 5,768 |
| | Makita Corp. | 124,861 | 5,741 |
| | Isuzu Motors Ltd. | 1,322,729 | 5,673 |
| | Hankyu Hanshin Holdings Inc. | 1,275,467 | 5,650 |
| | Odakyu Electric Railway Co. Ltd. | 696,915 | 5,632 |
| * | Yamaha Motor Co. Ltd. | 291,321 | 5,600 |
| | Kuraray Co. Ltd. | 382,865 | 5,577 |
| | Japan Real Estate Investment Corp. | 549 | 5,435 |
| ^ | Kintetsu Corp. | 1,813,138 | 5,429 |
| | Unicharm Corp. | 136,684 | 5,414 |
| | Shionogi & Co. Ltd. | 330,763 | 5,362 |
| * | Mitsubishi Motors Corp. | 4,306,141 | 5,283 |
| | Tokyu Corp. | 1,267,850 | 5,245 |
| | Teijin Ltd. | 1,047,481 | 5,020 |
| | Chiba Bank Ltd. | 843,620 | 4,995 |
| | | |
| Vanguard® Pacific Stock Index Fund | | |
| Schedule of Investments | | |
| April 30, 2011 | | |
| |
| | | | Market |
| | | | Value |
| | | Shares | ($000) |
| | Dentsu Inc. | 186,022 | 4,947 |
| | Shikoku Electric Power Co. Inc. | 194,677 | 4,941 |
| | Toppan Printing Co. Ltd. | 624,764 | 4,911 |
| | NGK Insulators Ltd. | 280,978 | 4,875 |
| | Fuji Heavy Industries Ltd. | 654,534 | 4,872 |
| | Ono Pharmaceutical Co. Ltd. | 95,050 | 4,825 |
| | Ibiden Co. Ltd. | 142,569 | 4,813 |
| | Oriental Land Co. Ltd. | 56,002 | 4,755 |
| | Konica Minolta Holdings Inc. | 535,468 | 4,715 |
| | NTT Data Corp. | 1,405 | 4,656 |
| | NSK Ltd. | 490,240 | 4,350 |
| | Mitsubishi Materials Corp. | 1,245,805 | 4,325 |
| | Tobu Railway Co. Ltd. | 1,099,988 | 4,295 |
| | OJI Paper Co. Ltd. | 942,340 | 4,231 |
| | JSR Corp. | 199,351 | 4,194 |
| | Mitsubishi Tanabe Pharma Corp. | 249,608 | 4,141 |
| | Chugai Pharmaceutical Co. Ltd. | 249,524 | 4,137 |
| | Sekisui Chemical Co. Ltd. | 484,896 | 4,068 |
| | Sumitomo Heavy Industries Ltd. | 608,274 | 4,011 |
| | Isetan Mitsukoshi Holdings Ltd. | 413,891 | 3,996 |
| | Hokuriku Electric Power Co. | 196,291 | 3,981 |
| | Brother Industries Ltd. | 259,793 | 3,978 |
| | Shimano Inc. | 73,820 | 3,962 |
| | Toyota Tsusho Corp. | 237,051 | 3,953 |
| | TonenGeneral Sekiyu KK | 314,300 | 3,899 |
| | Sega Sammy Holdings Inc. | 221,598 | 3,882 |
| | Mazda Motor Corp. | 1,676,482 | 3,850 |
| | Nippon Express Co. Ltd. | 954,712 | 3,804 |
| | Hirose Electric Co. Ltd. | 36,322 | 3,786 |
| | IHI Corp. | 1,467,195 | 3,733 |
| | Hokkaido Electric Power Co. Inc. | 203,531 | 3,690 |
| | Keikyu Corp. | 525,193 | 3,666 |
| | Kurita Water Industries Ltd. | 124,418 | 3,644 |
| | Nitori Holdings Co. Ltd. | 41,952 | 3,628 |
| | Keio Corp. | 645,085 | 3,623 |
| | Sony Financial Holdings Inc. | 192,600 | 3,580 |
| | Fukuoka Financial Group Inc. | 857,418 | 3,563 |
| | Advantest Corp. | 178,127 | 3,540 |
| | Taisho Pharmaceutical Co. Ltd. | 149,761 | 3,532 |
| | Mitsui Chemicals Inc. | 960,812 | 3,520 |
| | THK Co. Ltd. | 134,116 | 3,447 |
| | Dena Co. Ltd. | 91,700 | 3,442 |
| | Ube Industries Ltd. | 1,072,684 | 3,431 |
| | Mitsubishi Gas Chemical Co. Inc. | 436,093 | 3,417 |
| | Electric Power Development Co. Ltd. | 129,834 | 3,406 |
| | Daihatsu Motor Co. Ltd. | 210,646 | 3,403 |
| | Bank of Kyoto Ltd. | 366,188 | 3,393 |
| | Lawson Inc. | 66,934 | 3,284 |
| | MEIJI Holdings Co. Ltd. | 76,304 | 3,259 |
| | Amada Co. Ltd. | 403,398 | 3,240 |
| | Santen Pharmaceutical Co. Ltd. | 83,438 | 3,227 |
| | JTEKT Corp. | 246,417 | 3,201 |
| | Benesse Holdings Inc. | 76,829 | 3,196 |
| | Showa Denko KK | 1,577,976 | 3,149 |
| | Sankyo Co. Ltd. | 59,920 | 3,116 |
| | Trend Micro Inc. | 108,456 | 3,096 |
| | Hisamitsu Pharmaceutical Co. Inc. | 74,090 | 3,092 |
| *,^ | Elpida Memory Inc. | 204,009 | 3,057 |
| | Obayashi Corp. | 722,262 | 3,047 |
| | Yakult Honsha Co. Ltd. | 108,263 | 3,007 |
| | Nippon Sheet Glass Co. Ltd. | 1,004,146 | 2,957 |
| | Joyo Bank Ltd. | 731,017 | 2,950 |
| | Yaskawa Electric Corp. | 247,873 | 2,902 |
| | Japan Retail Fund Investment Corp. Class A | 1,790 | 2,894 |
| | | |
| Vanguard® Pacific Stock Index Fund | | |
| Schedule of Investments | | |
| April 30, 2011 | | |
| |
| | | | Market |
| | | | Value |
| | | Shares | ($000) |
| | Toyo Seikan Kaisha Ltd. | 169,438 | 2,880 |
| | Jupiter Telecommunications Co. Ltd. | 2,678 | 2,878 |
| | Hamamatsu Photonics KK | 73,100 | 2,876 |
| | Idemitsu Kosan Co. Ltd. | 24,021 | 2,841 |
| | Kyowa Hakko Kirin Co. Ltd. | 283,854 | 2,832 |
| | Furukawa Electric Co. Ltd. | 707,157 | 2,810 |
| | Hachijuni Bank Ltd. | 468,180 | 2,795 |
| | Shimizu Corp. | 658,867 | 2,784 |
| | Japan Steel Works Ltd. | 344,632 | 2,783 |
| | Credit Saison Co. Ltd. | 165,812 | 2,780 |
| ^ | GS Yuasa Corp. | 405,998 | 2,778 |
| | Nippon Meat Packers Inc. | 200,426 | 2,776 |
| | Stanley Electric Co. Ltd. | 163,055 | 2,740 |
| | Kajima Corp. | 950,173 | 2,725 |
| | All Nippon Airways Co. Ltd. | 921,688 | 2,709 |
| | Denki Kagaku Kogyo KK | 524,643 | 2,695 |
| | Nabtesco Corp. | 105,000 | 2,688 |
| | Taisei Corp. | 1,146,639 | 2,686 |
| | Hokuhoku Financial Group Inc. | 1,393,083 | 2,659 |
| | Sojitz Corp. | 1,372,778 | 2,649 |
| | Hitachi Construction Machinery Co. Ltd. | 108,338 | 2,641 |
| | Nisshin Seifun Group Inc. | 209,834 | 2,627 |
| | Sysmex Corp. | 74,300 | 2,602 |
| | Mitsubishi UFJ Lease & Finance Co. Ltd. | 64,679 | 2,586 |
| | NTN Corp. | 536,901 | 2,578 |
| | Kawasaki Kisen Kaisha Ltd. | 765,270 | 2,566 |
| | Rinnai Corp. | 38,436 | 2,551 |
| | Nissin Foods Holdings Co. Ltd. | 71,880 | 2,548 |
| | FamilyMart Co. Ltd. | 70,122 | 2,545 |
| | Seiko Epson Corp. | 145,694 | 2,535 |
| * | Sumco Corp. | 129,445 | 2,497 |
| | NGK Spark Plug Co. Ltd. | 175,963 | 2,449 |
| | TOTO Ltd. | 309,738 | 2,432 |
| | Gunma Bank Ltd. | 446,254 | 2,416 |
| | Nomura Research Institute Ltd. | 111,760 | 2,403 |
| | Hitachi Chemical Co. Ltd. | 116,157 | 2,394 |
| | Shimadzu Corp. | 274,941 | 2,389 |
| | Toyo Suisan Kaisha Ltd. | 103,498 | 2,384 |
| | Hiroshima Bank Ltd. | 545,205 | 2,383 |
| | Asics Corp. | 164,772 | 2,383 |
| | Hitachi Metals Ltd. | 180,331 | 2,375 |
| | Kaneka Corp. | 323,582 | 2,362 |
| | SBI Holdings Inc. | 21,899 | 2,361 |
| | Miraca Holdings Inc. | 61,700 | 2,349 |
| | Ushio Inc. | 114,575 | 2,333 |
| | Namco Bandai Holdings Inc. | 209,864 | 2,318 |
| | Taiyo Nippon Sanso Corp. | 285,193 | 2,304 |
| | Showa Shell Sekiyu KK | 210,885 | 2,301 |
| | Kamigumi Co. Ltd. | 268,548 | 2,300 |
| | Mitsui Mining & Smelting Co. Ltd. | 639,223 | 2,288 |
| | J Front Retailing Co. Ltd. | 525,113 | 2,282 |
| | Shimamura Co. Ltd. | 24,177 | 2,277 |
| | Chugoku Bank Ltd. | 191,088 | 2,227 |
| | Iyo Bank Ltd. | 265,864 | 2,223 |
| | Nippon Paper Group Inc. | 110,503 | 2,220 |
| | Yamaha Corp. | 176,026 | 2,202 |
| | Tokyu Land Corp. | 508,540 | 2,197 |
| | Nomura Real Estate Office Fund Inc. Class A | 301 | 2,179 |
| | Cosmo Oil Co. Ltd. | 659,406 | 2,177 |
| | Nishi-Nippon City Bank Ltd. | 765,688 | 2,169 |
| | Tosoh Corp. | 560,152 | 2,167 |
| | Aeon Mall Co. Ltd. | 89,620 | 2,155 |
| | Kansai Paint Co. Ltd. | 238,664 | 2,153 |
| | Japan Prime Realty Investment Corp. | 755 | 2,147 |
| | | |
| Vanguard® Pacific Stock Index Fund | | |
| Schedule of Investments | | |
| April 30, 2011 | | |
| |
| | | | Market |
| | | | Value |
| | | Shares | ($000) |
| | Sumitomo Rubber Industries Ltd. | 188,145 | 2,132 |
| | Toho Gas Co. Ltd. | 452,831 | 2,121 |
| | Casio Computer Co. Ltd. | 265,322 | 2,110 |
| * | Gree Inc. | 101,100 | 2,082 |
| | Minebea Co. Ltd. | 384,016 | 2,078 |
| | Tsumura & Co. | 66,813 | 2,078 |
| | Yamaguchi Financial Group Inc. | 230,052 | 2,078 |
| | Takashimaya Co. Ltd. | 302,981 | 2,072 |
| | Konami Corp. | 103,675 | 2,066 |
| | Daicel Chemical Industries Ltd. | 313,140 | 2,020 |
| | NOK Corp. | 117,442 | 2,007 |
| | Mitsui Engineering & Shipbuilding Co. Ltd. | 797,352 | 1,980 |
| | Fuji Electric Co. Ltd. | 621,927 | 1,959 |
| | Yokogawa Electric Corp. | 239,614 | 1,941 |
| | Air Water Inc. | 160,107 | 1,936 |
| | McDonald's Holdings Co. Japan Ltd. | 73,899 | 1,894 |
| | USS Co. Ltd. | 24,411 | 1,876 |
| | Suruga Bank Ltd. | 224,422 | 1,873 |
| | Oracle Corp. Japan | 42,987 | 1,863 |
| | Suzuken Co. Ltd. | 74,450 | 1,861 |
| | Shinsei Bank Ltd. | 1,535,144 | 1,846 |
| | Daido Steel Co. Ltd. | 322,706 | 1,845 |
| | Dowa Holdings Co. Ltd. | 280,095 | 1,837 |
| | UNY Co. Ltd. | 209,300 | 1,834 |
| | 77 Bank Ltd. | 390,424 | 1,804 |
| | Tokuyama Corp. | 341,282 | 1,774 |
| | Toho Co. Ltd. | 115,474 | 1,748 |
| | Keisei Electric Railway Co. Ltd. | 299,950 | 1,740 |
| | Marui Group Co. Ltd. | 250,787 | 1,733 |
| | Yamazaki Baking Co. Ltd. | 132,113 | 1,704 |
| | Chiyoda Corp. | 171,000 | 1,702 |
| | Dainippon Sumitomo Pharma Co. Ltd. | 176,847 | 1,701 |
| | Kikkoman Corp. | 170,537 | 1,693 |
| | Koito Manufacturing Co. Ltd. | 106,000 | 1,667 |
| | Citizen Holdings Co. Ltd. | 274,827 | 1,664 |
| | Nomura Real Estate Holdings Inc. | 105,817 | 1,635 |
| | Mizuho Securities Co. Ltd. | 635,149 | 1,616 |
| | Hitachi High-Technologies Corp. | 76,533 | 1,611 |
| | Nisshin Steel Co. Ltd. | 786,901 | 1,571 |
| | Nissan Chemical Industries Ltd. | 150,240 | 1,559 |
| | Japan Petroleum Exploration Co. | 31,741 | 1,556 |
| | Sapporo Hokuyo Holdings Inc. | 346,105 | 1,535 |
| | Tokyo Tatemono Co. Ltd. | 422,732 | 1,529 |
| | Alfresa Holdings Corp. | 43,279 | 1,528 |
| | Toyoda Gosei Co. Ltd. | 69,875 | 1,527 |
| | NHK Spring Co. Ltd. | 160,269 | 1,524 |
| | Yamato Kogyo Co. Ltd. | 45,952 | 1,517 |
| | Obic Co. Ltd. | 7,746 | 1,436 |
| | Mizuho Trust & Banking Co. Ltd. | 1,692,452 | 1,431 |
| | Hino Motors Ltd. | 294,656 | 1,397 |
| | Mitsubishi Logistics Corp. | 123,466 | 1,366 |
| | Hakuhodo DY Holdings Inc. | 26,057 | 1,364 |
| | MediPal Holdings Corp. | 163,008 | 1,356 |
| | Nisshinbo Holdings Inc. | 136,166 | 1,348 |
| | Mabuchi Motor Co. Ltd. | 27,033 | 1,341 |
| | Maruichi Steel Tube Ltd. | 52,180 | 1,299 |
| | Seven Bank Ltd. | 678 | 1,285 |
| | Coca-Cola West Co. Ltd. | 61,771 | 1,279 |
| | Kinden Corp. | 143,192 | 1,221 |
| | Tokyo Steel Manufacturing Co. Ltd. | 112,001 | 1,214 |
| | Aozora Bank Ltd. | 550,514 | 1,192 |
| | Square Enix Holdings Co. Ltd. | 70,475 | 1,174 |
| | Itochu Techno-Solutions Corp. | 32,827 | 1,164 |
| | Aeon Credit Service Co. Ltd. | 84,803 | 1,150 |
| | | |
| Vanguard® Pacific Stock Index Fund | | |
| Schedule of Investments | | |
| April 30, 2011 | | |
| |
| | | | Market |
| | | | Value |
| | | Shares | ($000) |
| | Sapporo Holdings Ltd. | 284,117 | 1,142 |
| | Toyota Boshoku Corp. | 72,585 | 1,131 |
| | ABC-Mart Inc. | 29,236 | 1,095 |
| | Ito En Ltd. | 60,854 | 1,080 |
| | Mitsumi Electric Co. Ltd. | 84,066 | 1,078 |
| | NTT Urban Development Corp. | 1,280 | 1,062 |
| | Otsuka Corp. | 16,832 | 1,057 |
| | Senshu Ikeda Holdings Inc. | 705,600 | 1,054 |
| | Shinko Electric Industries Co. Ltd. | 75,066 | 771 |
| | Canon Marketing Japan Inc. | 62,890 | 696 |
| | Fuji Media Holdings Inc. | 517 | 691 |
| | Matsui Securities Co. Ltd. | 126,098 | 622 |
| | | | 2,597,691 |
| New Zealand (0.3%) | | |
| | Fletcher Building Ltd. | 751,483 | 5,602 |
| | Telecom Corp. of New Zealand Ltd. | 2,138,914 | 3,751 |
| | Auckland International Airport Ltd. | 1,029,931 | 1,853 |
| | Sky City Entertainment Group Ltd. | 632,928 | 1,826 |
| | Contact Energy Ltd. | 349,057 | 1,684 |
| | | | 14,716 |
| Singapore (5.2%) | | |
| | DBS Group Holdings Ltd. | 1,924,727 | 23,582 |
| | Singapore Telecommunications Ltd. | 8,845,220 | 22,579 |
| | United Overseas Bank Ltd. | 1,369,395 | 21,972 |
| | Oversea-Chinese Banking Corp. Ltd. | 2,784,983 | 21,749 |
| | Keppel Corp. Ltd. | 1,565,435 | 15,244 |
| * | Genting Singapore plc | 6,768,522 | 12,022 |
| | Wilmar International Ltd. | 2,131,176 | 9,185 |
| | CapitaLand Ltd. | 2,843,028 | 7,907 |
| | Noble Group Ltd. | 4,216,054 | 7,703 |
| | Singapore Airlines Ltd. | 600,290 | 6,915 |
| | Singapore Exchange Ltd. | 948,107 | 6,049 |
| | City Developments Ltd. | 609,551 | 5,904 |
| | Fraser and Neave Ltd. | 1,096,771 | 5,623 |
| | Singapore Press Holdings Ltd. | 1,707,084 | 5,555 |
| * | Hutchison Port Holdings Trust | 5,814,197 | 5,349 |
| | SembCorp Industries Ltd. | 1,098,370 | 4,853 |
| | Singapore Technologies Engineering Ltd. | 1,844,691 | 4,754 |
| | SembCorp Marine Ltd. | 919,414 | 4,266 |
| | Golden Agri-Resources Ltd. | 7,466,926 | 4,067 |
| | CapitaMall Trust | 2,483,977 | 3,842 |
| | Jardine Cycle & Carriage Ltd. | 119,229 | 3,598 |
| | Olam International Ltd. | 1,404,126 | 3,299 |
| | Ascendas Real Estate Investment Trust | 1,958,826 | 3,253 |
| | Yangzijiang Shipbuilding Holdings Ltd. | 2,138,000 | 3,167 |
| * | Global Logistic Properties Ltd. | 1,733,000 | 2,734 |
| | Keppel Land Ltd. | 797,000 | 2,720 |
| | ComfortDelGro Corp. Ltd. | 2,103,723 | 2,634 |
| | CapitaMalls Asia Ltd. | 1,494,000 | 2,164 |
| | UOL Group Ltd. | 518,345 | 2,052 |
| ^ | Cosco Corp. Singapore Ltd. | 1,120,007 | 2,039 |
| | StarHub Ltd. | 671,945 | 1,577 |
| ^ | Neptune Orient Lines Ltd. | 1,004,688 | 1,548 |
| * | Golden Agri-Resources Ltd. Warrants Exp. 07/23/2012 | 699,582 | 91 |
| |
| | | | 229,996 |
| Total Common Stocks (Cost $5,348,589) | | 4,381,108 |
| | | | | |
| Vanguard® Pacific Stock Index Fund | | | | |
| Schedule of Investments | | | | |
| April 30, 2011 | | | | |
| |
| | | | | | Market |
| | | | | | Value |
| | | Coupon | | Shares | ($000) |
| Temporary Cash Investments (1.0%)1 | | | | |
| Money Market Fund (0.9%) | | | | |
| 2,3 | Vanguard Market Liquidity Fund | 0.179% | | 40,243,288 | 40,243 |
| |
| | | | | Face | Market |
| | | | Maturity | Amount | Value |
| | | Coupon | Date | ($000) | ($000) |
| U.S. Government and Agency Obligations (0.1%) | | | | |
| 4,5 | Fannie Mae Discount Notes | 0.140% | 6/22/11 | 1,700 | 1,700 |
| 4,5 | Federal Home Loan Bank Discount Notes | 0.150% | 5/25/11 | 2,000 | 2,000 |
| | | | | | 3,700 |
| Total Temporary Cash Investments (Cost $43,943) | | | | 43,943 |
| Total Investments (100.0%) (Cost $5,392,532) | | | | 4,425,051 |
| Other Assets and Liabilities—Net (0.0%)3 | | | | (1,667) |
| Net Assets (100%) | | | | 4,423,384 |
* Non-income-producing security.
^ Part of security position is on loan to broker-dealers. The total value of securities on loan is $19,231,000.
1 The fund invests a portion of its cash reserves in equity markets through the use of index futures contracts. After giving effect to futures investments, the fund's effective common stock and temporary cash investment positions represent 100.0% and 0.0%, respectively, of net assets.
2 Affiliated money market fund available only to Vanguard funds and certain trusts and accounts managed by Vanguard. Rate shown is the 7-day yield.
3 Includes $20,272,000 of collateral received for securities on loan.
4 Securities with a value of $3,700,000 have been segregated as initial margin for open futures contracts.
5 The issuer operates under a congressional charter; its securities are not backed by the full faith and credit of the U.S. government.
ADR—American Depositary Receipt.
REIT—Real Estate Investment Trust.
| | | |
| Vanguard® Emerging Markets Stock Index Fund | | |
| Schedule of Investments | | |
| April 30, 2011 | | |
| |
| | | | Market |
| | | | Value |
| | | Shares | ($000) |
| Common Stocks (99.7%)1 | | |
| Brazil (15.5%) | | |
| | Petroleo Brasileiro SA ADR Type A | 19,241,180 | 642,078 |
| | Vale SA Class B Pfd. ADR | 21,466,529 | 641,849 |
| | Itau Unibanco Holding SA ADR | 25,321,875 | 601,395 |
| | Petroleo Brasileiro SA ADR | 13,980,117 | 521,878 |
| | Vale SA Class B ADR | 13,748,994 | 459,216 |
| | Petroleo Brasileiro SA Prior Pfd. | 27,963,628 | 454,329 |
| | Banco Bradesco SA ADR | 19,114,852 | 386,694 |
| | Petroleo Brasileiro SA | 19,207,388 | 351,256 |
| | Vale SA Prior Pfd. | 10,321,777 | 302,528 |
| | Itausa - Investimentos Itau SA Prior Pfd. | 35,677,934 | 273,504 |
| | Itau Unibanco Holding SA Prior Pfd. | 10,971,176 | 256,287 |
| | Cia de Bebidas das Americas ADR | 7,710,000 | 251,192 |
| | Vale SA | 7,033,938 | 230,754 |
| | BM&FBovespa SA | 30,260,343 | 227,164 |
| | Banco Bradesco SA Prior Pfd. | 11,272,472 | 223,415 |
| * | OGX Petroleo e Gas Participacoes SA | 20,150,252 | 212,876 |
| | Banco do Brasil SA | 8,998,662 | 165,307 |
| | Cia de Bebidas das Americas Prior Pfd. | 4,220,970 | 134,474 |
| | Cia Siderurgica Nacional SA ADR | 8,169,083 | 130,134 |
| | BRF - Brasil Foods SA | 6,290,180 | 127,547 |
| | CCR SA | 3,464,374 | 107,574 |
| | Banco Santander Brasil SA ADR | 8,447,733 | 98,078 |
| | PDG Realty SA Empreendimentos e Participacoes | 16,011,252 | 94,244 |
| | Bradespar SA Prior Pfd. | 3,563,701 | 92,309 |
| | Cielo SA | 9,659,345 | 90,318 |
| | Gerdau SA ADR | 7,296,051 | 88,136 |
| | BRF - Brasil Foods SA ADR | 4,152,422 | 85,997 |
| | Cia Energetica de Minas Gerais ADR | 3,972,060 | 82,897 |
| | Ultrapar Participacoes SA Prior Pfd. | 4,491,952 | 78,521 |
| | Redecard SA | 5,167,964 | 75,095 |
| | Natura Cosmeticos SA | 2,645,115 | 74,232 |
| | Gerdau SA Prior Pfd. | 6,168,600 | 73,520 |
| | Usinas Siderurgicas de Minas Gerais SA Prior Pfd. | 7,005,810 | 71,697 |
| | Cia Brasileira de Distribuicao Grupo Pao de Acucar ADR | 1,532,454 | 69,665 |
| | Lojas Renner SA | 1,879,171 | 69,639 |
| | Souza Cruz SA | 5,874,865 | 66,845 |
| * | HRT Participacoes em Petroleo SA | 59,773 | 61,171 |
| | Metalurgica Gerdau SA Prior Pfd. Class A | 4,144,648 | 59,672 |
| | Vivo Participacoes SA Prior Pfd. | 1,440,152 | 58,432 |
| | Cia Siderurgica Nacional SA | 3,640,220 | 56,829 |
| | Hypermarcas SA | 4,226,648 | 56,662 |
| | All America Latina Logistica SA | 6,863,527 | 56,542 |
| | Embraer SA ADR | 1,654,420 | 53,736 |
| | Centrais Eletricas Brasileiras SA | 3,642,761 | 53,164 |
| | Centrais Eletricas Brasileiras SA Prior Pfd. | 2,761,719 | 50,575 |
| | BR Malls Participacoes SA | 4,724,412 | 49,911 |
| | Diagnosticos da America SA | 3,562,000 | 47,819 |
| | CETIP SA - Balcao Organizado de Ativos e Derivativos | 2,824,600 | 46,430 |
| | Cyrela Brazil Realty SA Empreendimentos e Participacoes | 4,367,159 | 46,275 |
| | Cia Energetica de Sao Paulo Prior Pfd. | 2,375,671 | 45,786 |
| | Vivo Participacoes SA ADR | 1,079,044 | 45,115 |
| | Cia Energetica de Minas Gerais Prior Pfd. | 2,183,195 | 44,436 |
| | Cia Hering | 2,047,433 | 44,314 |
| | Usinas Siderurgicas de Minas Gerais SA | 2,664,666 | 43,276 |
| | Anhanguera Educacional Participacoes SA | 1,886,428 | 42,125 |
| | Duratex SA | 3,925,262 | 41,294 |
| | Lojas Americanas SA Prior Pfd. | 4,552,438 | 40,512 |
| | Cia de Saneamento Basico do Estado de Sao Paulo ADR | 659,121 | 38,572 |
| | Tele Norte Leste Participacoes SA ADR | 2,218,193 | 37,820 |
| | MRV Engenharia e Participacoes SA | 4,289,351 | 37,435 |
| | Tractebel Energia SA | 2,052,687 | 36,338 |
| | | |
| Vanguard® Emerging Markets Stock Index Fund | | |
| Schedule of Investments | | |
| April 30, 2011 | | |
| |
| | | | Market |
| | | | Value |
| | | Shares | ($000) |
| | CPFL Energia SA | 1,209,649 | 35,062 |
| | Cia Paranaense de Energia ADR | 1,270,527 | 35,028 |
| | Eletropaulo Metropolitana Eletricidade de Sao Paulo SA Prior Pfd. | 1,405,423 | 34,296 |
| | Totvs SA | 1,680,000 | 32,154 |
| | Fibria Celulose SA | 2,038,016 | 31,933 |
| | Banco do Estado do Rio Grande do Sul Prior Pfd. | 2,601,722 | 30,926 |
| | Gafisa SA | 5,006,120 | 30,421 |
| | Tele Norte Leste Participacoes SA Prior Pfd. | 1,729,323 | 28,899 |
| | Porto Seguro SA | 1,662,704 | 27,627 |
| | Localiza Rent a Car SA | 1,600,559 | 27,520 |
| | Tim Participacoes SA ADR | 572,622 | 27,016 |
| | Cosan SA Industria e Comercio | 1,756,950 | 26,870 |
| | AES Tiete SA Prior Pfd. | 1,615,020 | 26,640 |
| | Suzano Papel e Celulose SA Prior Pfd. | 2,704,409 | 26,611 |
| | Klabin SA Prior Pfd. | 6,865,661 | 26,578 |
| * | Braskem SA Prior Pfd. | 1,783,624 | 25,793 |
| | JBS SA | 7,482,450 | 25,303 |
| | Rossi Residencial SA | 2,675,519 | 24,881 |
| | Brasil Telecom SA Prior Pfd. | 2,485,268 | 22,970 |
| | Odontoprev SA | 1,422,941 | 22,739 |
| | Multiplan Empreendimentos Imobiliarios SA | 1,069,619 | 22,355 |
| * | MMX Mineracao e Metalicos SA | 3,388,500 | 21,539 |
| | Marfrig Alimentos SA | 2,091,395 | 21,430 |
| | Amil Participacoes SA | 1,756,700 | 21,328 |
| | Banco Santander Brasil SA | 1,818,690 | 21,040 |
| | EcoRodovias Infraestrutura e Logistica SA | 2,374,697 | 20,936 |
| | Sul America SA | 1,590,300 | 20,682 |
| | EDP - Energias do Brasil SA | 812,705 | 20,204 |
| | TAM SA Prior Pfd. | 981,708 | 19,975 |
| | Telemar Norte Leste SA Prior Pfd. | 553,250 | 19,215 |
| | Brookfield Incorporacoes SA | 3,268,100 | 18,405 |
| | Tele Norte Leste Participacoes SA | 846,881 | 18,131 |
| * | Gol Linhas Aereas Inteligentes SA Prior Pfd. | 1,292,900 | 17,965 |
| | Embraer SA | 2,239,149 | 17,720 |
| | Vale Fertilizantes SA Prior Pfd. | 1,592,467 | 16,540 |
| | Cia de Transmissao de Energia Electrica Paulista Prior Pfd. | 503,400 | 16,246 |
| | Brasil Telecom SA ADR | 569,002 | 16,046 |
| | Tim Participacoes SA Prior Pfd. | 3,532,082 | 16,030 |
| | Cia de Saneamento Basico do Estado de Sao Paulo | 513,582 | 14,958 |
| * | Centrais Eletricas Brasileiras SA ADR | 786,830 | 14,745 |
| | B2W Cia Global Do Varejo | 952,499 | 13,302 |
| * | Braskem SA ADR | 350,421 | 10,453 |
| | Cia Paranaense de Energia Prior Pfd. | 360,739 | 9,784 |
| | CPFL Energia SA ADR | 106,923 | 9,456 |
| | Centrais Eletricas Brasileiras SA ADR | 623,224 | 9,236 |
| | Gafisa SA ADR | 582,181 | 7,196 |
| | Fibria Celulose SA ADR | 429,806 | 6,941 |
| * | Gol Linhas Aereas Inteligentes SA ADR | 418,753 | 5,967 |
| | TAM SA ADR | 234,192 | 4,890 |
| | Cia Brasileira de Distribuicao Grupo Pao de Acucar Prior Pfd. | 62,445 | 2,771 |
| * | HRT Participacoes em Petroleo SA Rights Exp. 05/20/2011 | 17,226 | 110 |
| | Cia de Transmissao de Energia Electrica Paulista Prior Pfd. Rights Exp. 05/26/11 | 5,001 | 2 |
| * | Tim Participacoes SA Rights Exp. 05/12/2011 | 2,953 | — |
| | | | 10,131,750 |
| Chile (1.6%) | | |
| | Empresas COPEC SA | 7,194,804 | 139,549 |
| | Cencosud SA | 14,544,213 | 114,863 |
| | Empresas CMPC SA | 1,770,748 | 98,269 |
| | Empresa Nacional de Electricidad SA ADR | 1,211,107 | 68,282 |
| | Sociedad Quimica y Minera de Chile SA ADR | 1,108,442 | 67,648 |
| | CAP SA | 1,192,928 | 64,117 |
| | Banco Santander Chile ADR | 680,196 | 62,299 |
| | Lan Airlines SA | 2,192,180 | 61,716 |
| | Enersis SA ADR | 2,648,895 | 56,580 |
| | | |
| Vanguard® Emerging Markets Stock Index Fund | | |
| Schedule of Investments | | |
| April 30, 2011 | | |
| |
| | | | Market |
| | | | Value |
| | | Shares | ($000) |
| | SACI Falabella | 4,707,608 | 51,372 |
| | ENTEL Chile SA | 1,760,702 | 35,577 |
| | Colbun SA | 117,074,036 | 35,274 |
| | Enersis SA | 77,487,386 | 33,141 |
| | Empresa Nacional de Electricidad SA | 17,220,915 | 32,610 |
| | Banco de Credito e Inversiones | 446,739 | 30,272 |
| | AES Gener SA | 38,999,849 | 23,879 |
| | Cia Cervecerias Unidas SA | 1,876,580 | 22,651 |
| | Sociedad Quimica y Minera de Chile SA Prior Pfd. Class B | 344,350 | 20,790 |
| | Vina Concha y Toro SA | 7,914,325 | 19,842 |
| | Corpbanca | 932,337,623 | 14,808 |
| | Banco Santander Chile | 54,277,121 | 4,795 |
| | | | 1,058,334 |
| China (17.2%) | | |
| | China Mobile Ltd. | 94,535,667 | 869,585 |
| | Industrial & Commercial Bank of China | 955,560,003 | 810,519 |
| | China Construction Bank Corp. | 756,250,857 | 716,111 |
| | CNOOC Ltd. | 280,612,152 | 697,483 |
| | Bank of China Ltd. | 986,400,277 | 545,956 |
| | PetroChina Co. Ltd. | 331,841,679 | 481,701 |
| | Tencent Holdings Ltd. | 15,803,572 | 451,257 |
| | China Life Insurance Co. Ltd. | 116,742,470 | 417,287 |
| | Ping An Insurance Group Co. | 26,949,988 | 293,835 |
| | China Petroleum & Chemical Corp. | 249,905,540 | 251,897 |
| | China Shenhua Energy Co. Ltd. | 53,288,325 | 248,893 |
| | China Unicom Hong Kong Ltd. | 92,917,048 | 190,042 |
| | China Merchants Bank Co. Ltd. | 61,232,502 | 158,180 |
| | Agricultural Bank of China Ltd. | 263,099,005 | 155,795 |
| | Belle International Holdings Ltd. | 66,516,500 | 130,190 |
| | China Telecom Corp. Ltd. | 218,343,683 | 127,042 |
| | China Overseas Land & Investment Ltd. | 64,345,076 | 124,156 |
| | Yanzhou Coal Mining Co. Ltd. | 30,896,720 | 121,533 |
| | Bank of Communications Co. Ltd. | 104,073,950 | 110,493 |
| | China National Building Material Co. Ltd. | 45,216,360 | 95,687 |
| | China Pacific Insurance Group Co. Ltd. | 21,574,994 | 93,391 |
| | Anhui Conch Cement Co. Ltd. | 19,300,152 | 91,507 |
| | Hengan International Group Co. Ltd. | 11,530,000 | 90,118 |
| | Want Want China Holdings Ltd. | 93,509,285 | 84,054 |
| | China Merchants Holdings International Co. Ltd. | 17,589,510 | 81,105 |
| | China Yurun Food Group Ltd. | 21,287,149 | 78,213 |
| | China Coal Energy Co. Ltd. | 55,639,000 | 77,924 |
| | China Resources Enterprise Ltd. | 18,993,460 | 76,699 |
| * | GCL-Poly Energy Holdings Ltd. | 106,657,000 | 76,416 |
| ^ | Jiangxi Copper Co. Ltd. | 22,082,598 | 75,235 |
| | Tingyi Cayman Islands Holding Corp. | 26,642,634 | 70,713 |
| | China Citic Bank Corp. Ltd. | 97,130,933 | 69,705 |
| | Kunlun Energy Co. Ltd. | 38,710,330 | 68,700 |
| | Dongfeng Motor Group Co. Ltd. | 42,728,044 | 66,870 |
| | Inner Mongolia Yitai Coal Co. Class B | 9,380,823 | 65,576 |
| | China Communications Construction Co. Ltd. | 66,149,704 | 61,268 |
| ^ | Aluminum Corp. of China Ltd. | 62,011,720 | 58,362 |
| ^ | China Minsheng Banking Corp. Ltd. | 60,734,600 | 58,334 |
| | Evergrande Real Estate Group Ltd. | 81,236,885 | 58,090 |
| * | GOME Electrical Appliances Holding Ltd. | 154,941,805 | 55,720 |
| | Lenovo Group Ltd. | 93,783,309 | 54,730 |
| | China Mengniu Dairy Co. Ltd. | 17,714,356 | 54,482 |
| | COSCO Pacific Ltd. | 26,016,988 | 54,006 |
| | Kingboard Chemical Holdings Ltd. | 9,528,626 | 52,290 |
| | Citic Pacific Ltd. | 17,186,874 | 51,492 |
| | China Resources Land Ltd. | 29,736,000 | 51,399 |
| * | PICC Property & Casualty Co. Ltd. | 38,763,551 | 49,866 |
| | Zijin Mining Group Co. Ltd. | 62,048,120 | 48,913 |
| | China Resources Power Holdings Co. Ltd. | 26,496,548 | 48,854 |
| | China Oilfield Services Ltd. | 24,052,000 | 47,727 |
| | | |
| Vanguard® Emerging Markets Stock Index Fund | | |
| Schedule of Investments | | |
| April 30, 2011 | | |
| |
| | | | Market |
| | | | Value |
| | | Shares | ($000) |
| | Beijing Enterprises Holdings Ltd. | 8,059,000 | 42,920 |
| | Weichai Power Co. Ltd. | 6,133,600 | 42,029 |
| * | Changsha Zoomlion Heavy Industry Science and Technology Development Co. Ltd. | 15,248,593 | 40,447 |
| | ENN Energy Holdings Ltd. | 11,540,000 | 39,725 |
| *,^ | China COSCO Holdings Co. Ltd. | 40,895,000 | 39,393 |
| | Guangzhou Automobile Group Co. Ltd. | 34,749,084 | 39,315 |
| | Huabao International Holdings Ltd. | 25,390,838 | 37,708 |
| | Air China Ltd. | 36,567,548 | 37,157 |
| ^ | Alibaba.com Ltd. | 20,339,632 | 36,160 |
| ^ | Agile Property Holdings Ltd. | 21,857,245 | 35,651 |
| | CSR Corp. Ltd. | 31,879,877 | 35,232 |
| | Shimao Property Holdings Ltd. | 25,487,257 | 34,725 |
| ^ | ZTE Corp. | 9,585,328 | 34,605 |
| | China Railway Group Ltd. | 63,950,608 | 34,357 |
| | Shanghai Industrial Holdings Ltd. | 8,568,045 | 33,886 |
| *,^ | Brilliance China Automotive Holdings Ltd. | 34,580,000 | 33,774 |
| * | China Taiping Insurance Holdings Co. Ltd. | 12,144,607 | 33,413 |
| | Sinopharm Group Co. | 9,395,600 | 32,609 |
| | Fushan International Energy Group Ltd. | 46,439,984 | 32,598 |
| | Parkson Retail Group Ltd. | 20,805,779 | 32,010 |
| ^ | Longfor Properties Co. Ltd. | 19,950,280 | 31,822 |
| ^ | China Longyuan Power Group Corp. | 30,440,000 | 31,367 |
| | China Resources Cement Holdings Ltd. | 30,158,686 | 30,764 |
| | Shandong Weigao Group Medical Polymer Co. Ltd. | 11,179,100 | 30,692 |
| | Zhaojin Mining Industry Co. Ltd. | 6,597,500 | 30,607 |
| | Nine Dragons Paper Holdings Ltd. | 26,570,000 | 30,430 |
| ^ | Byd Co. Ltd. | 8,358,255 | 30,341 |
| | China Everbright Ltd. | 13,400,010 | 29,655 |
| | China Shanshui Cement Group Ltd. | 26,430,000 | 29,640 |
| | Golden Eagle Retail Group Ltd. | 11,162,000 | 29,332 |
| ^ | Soho China Ltd. | 33,635,606 | 29,131 |
| ^ | Sino-Ocean Land Holdings Ltd. | 49,383,302 | 28,087 |
| | China Agri-Industries Holdings Ltd. | 24,487,586 | 28,024 |
| | Country Garden Holdings Co. | 67,140,821 | 27,268 |
| * | Semiconductor Manufacturing International Corp. | 303,904,000 | 27,253 |
| | Huaneng Power International Inc. | 49,285,978 | 27,219 |
| | Zhuzhou CSR Times Electric Co. Ltd. | 6,841,000 | 27,133 |
| | Chaoda Modern Agriculture Holdings Ltd. | 43,419,067 | 27,108 |
| | China Railway Construction Corp. Ltd. | 29,973,765 | 26,574 |
| ^ | Great Wall Motor Co. Ltd. | 14,417,000 | 25,908 |
| ^ | Poly Hong Kong Investments Ltd. | 31,996,000 | 25,626 |
| ^ | China High Speed Transmission Equipment Group Co. Ltd. | 19,274,280 | 25,578 |
| | China Vanke Co. Ltd. Class B | 17,894,656 | 25,343 |
| ^ | Geely Automobile Holdings Ltd. | 60,803,000 | 24,464 |
| | Tsingtao Brewery Co. Ltd. | 4,564,000 | 24,305 |
| | Shanghai Electric Group Co. Ltd. | 46,516,285 | 23,112 |
| | China Shipping Development Co. Ltd. | 21,640,162 | 22,852 |
| ^ | Anta Sports Products Ltd. | 14,077,000 | 22,824 |
| | China International Marine Containers Group Co. Ltd. Class B | 10,546,598 | 22,582 |
| ^ | Angang Steel Co. Ltd. | 17,442,374 | 22,468 |
| | Lonking Holdings Ltd. | 30,240,000 | 22,353 |
| | BBMG Corp. | 13,533,000 | 22,334 |
| | China BlueChemical Ltd. | 26,517,405 | 21,609 |
| ^ | China Rongsheng Heavy Industry Group Co. Ltd. | 25,359,969 | 21,446 |
| * | China Shipping Container Lines Co. Ltd. | 53,393,618 | 21,372 |
| ^ | Shui On Land Ltd. | 47,958,237 | 21,258 |
| ^ | Guangzhou R&F Properties Co. Ltd. | 15,439,600 | 21,106 |
| | Guangdong Investment Ltd. | 40,585,056 | 21,059 |
| ^ | Renhe Commercial Holdings Co. Ltd. | 118,333,454 | 20,304 |
| ^ | Datang International Power Generation Co. Ltd. | 53,682,568 | 20,288 |
| | Jiangsu Expressway Co. Ltd. | 18,584,139 | 19,712 |
| ^ | Li Ning Co. Ltd. | 11,390,568 | 19,549 |
| | Fosun International Ltd. | 24,554,737 | 19,414 |
| | Zhejiang Expressway Co. Ltd. | 23,198,704 | 19,181 |
| | | |
| Vanguard® Emerging Markets Stock Index Fund | | |
| Schedule of Investments | | |
| April 30, 2011 | | |
| |
| | | | Market |
| | | | Value |
| | | Shares | ($000) |
| ^ | Hengdeli Holdings Ltd. | 31,028,000 | 18,635 |
| | Wumart Stores Inc. | 7,951,000 | 18,262 |
| | Sinopec Shanghai Petrochemical Co. Ltd. | 37,439,952 | 18,178 |
| | Lee & Man Paper Manufacturing Ltd. | 24,945,000 | 17,963 |
| ^ | Dongfang Electric Corp. Ltd. | 5,363,630 | 17,618 |
| | China Communications Services Corp. Ltd. | 28,413,311 | 17,370 |
| *,^ | Metallurgical Corp. of China Ltd. | 40,545,000 | 17,222 |
| | China Dongxiang Group Co. | 48,145,788 | 16,851 |
| | Franshion Properties China Ltd. | 53,452,094 | 16,680 |
| | China National Materials Co. Ltd. | 16,542,000 | 16,332 |
| | Beijing Capital International Airport Co. Ltd. | 32,029,654 | 15,815 |
| ^ | China Shineway Pharmaceutical Group Ltd. | 6,493,937 | 15,750 |
| ^ | Skyworth Digital Holdings Ltd. | 24,566,610 | 15,724 |
| | KWG Property Holding Ltd. | 21,276,500 | 15,403 |
| ^ | Maanshan Iron & Steel | 27,947,134 | 14,776 |
| | Hidili Industry International Development Ltd. | 14,447,913 | 14,634 |
| ^ | China Gas Holdings Ltd. | 37,718,000 | 14,620 |
| *,^ | China Southern Airlines Co. Ltd. | 26,306,000 | 13,801 |
| * | Sinofert Holdings Ltd. | 32,429,917 | 13,580 |
| * | Yuexiu Property Co. Ltd. | 63,516,000 | 13,369 |
| ^ | China Zhongwang Holdings Ltd. | 24,862,932 | 12,800 |
| | Bosideng International Holdings Ltd. | 38,402,000 | 12,192 |
| | Greentown China Holdings Ltd. | 10,885,000 | 10,925 |
| | Shanghai Lujiazui Finance & Trade Zone Development Co. Ltd. Class B | 6,638,021 | 9,445 |
| * | China Travel International Inv HK | 43,317,895 | 8,890 |
| *,^ | Hopson Development Holdings Ltd. | 8,897,840 | 8,793 |
| ^ | Sinotruk Hong Kong Ltd. | 9,443,500 | 7,847 |
| * | Kingboard Chemical Holdings Ltd. Warrants Exp. 10/31/2012 | 696,212 | 583 |
| | | | 11,199,667 |
| Colombia (0.6%) | | |
| | BanColombia SA ADR | 4,919,477 | 325,915 |
| | Ecopetrol SA | 12,867,353 | 27,645 |
| | Grupo de Inversiones Suramericana SA | 476,534 | 9,899 |
| | Almacenes Exito SA | 414,237 | 6,370 |
| | Corp Financiera Colombiana SA | 293,652 | 5,662 |
| | Cementos Argos SA | 909,298 | 5,501 |
| | Inversiones Argos SA | 504,109 | 5,262 |
| | Interconexion Electrica SA ESP | 567,759 | 4,025 |
| | | | 390,279 |
| Czech Republic (0.4%) | | |
| | CEZ AS | 2,581,774 | 148,104 |
| | Komercni Banka AS | 247,087 | 65,140 |
| | Telefonica O2 Czech Republic AS | 1,879,399 | 48,243 |
| | | | 261,487 |
| Egypt (0.2%) | | |
| | Orascom Construction Industries GDR | 1,536,745 | 63,042 |
| * | Orascom Telecom Holding SAE GDR | 9,008,338 | 31,174 |
| | Commercial International Bank Egypt SAE | 1,681,514 | 7,753 |
| | Telecom Egypt | 1,443,930 | 3,970 |
| | Egyptian Financial Group-Hermes Holding | 1,068,078 | 3,141 |
| | Egyptian Kuwaiti Holding Co. | 2,456,711 | 3,124 |
| * | Talaat Moustafa Group | 4,105,576 | 2,492 |
| | National Societe Generale Bank SAE | 400,000 | 2,489 |
| | Egyptian Co. for Mobile Services | 95,739 | 2,304 |
| * | Ezz Steel | 1,155,019 | 1,558 |
| * | ElSwedy Electric Co. | 190,736 | 1,351 |
| | | | 122,398 |
| Hungary (0.5%) | | |
| *,^ | OTP Bank plc | 3,764,933 | 133,664 |
| * | MOL Hungarian Oil and Gas plc | 676,715 | 94,579 |
| | Richter Gedeon Nyrt | 222,434 | 46,546 |
| | Magyar Telekom Telecommunications plc | 8,079,551 | 27,569 |
302,358
| | | |
| Vanguard® Emerging Markets Stock Index Fund | | |
| Schedule of Investments | | |
| April 30, 2011 | | |
| |
| | | | Market |
| | | | Value |
| | | Shares | ($000) |
| India (7.2%) | | |
| | Infosys Technologies Ltd. | 7,251,368 | 476,716 |
| | Reliance Industries Ltd. | 20,660,192 | 459,431 |
| | ICICI Bank Ltd. | 10,947,492 | 276,659 |
| | Housing Development Finance Corp. | 17,066,678 | 273,022 |
| | Tata Consultancy Services Ltd. | 7,414,596 | 195,527 |
| | HDFC Bank Ltd. ADR | 922,853 | 158,823 |
| | ITC Ltd. | 35,278,006 | 153,767 |
| | Larsen & Toubro Ltd. | 3,260,561 | 117,816 |
| | Tata Motors Ltd. | 4,122,583 | 115,424 |
| | Axis Bank Ltd. | 3,249,644 | 94,639 |
| | Hindustan Unilever Ltd. | 13,902,219 | 89,727 |
| | Sterlite Industries India Ltd. | 21,468,112 | 88,467 |
| | Jindal Steel & Power Ltd. | 5,929,961 | 87,985 |
| | Hindalco Industries Ltd. | 17,602,221 | 86,168 |
| | Oil & Natural Gas Corp. Ltd. | 12,219,848 | 85,194 |
| | Bharat Heavy Electricals Ltd. | 1,863,546 | 84,415 |
| | HDFC Bank Ltd. | 1,598,391 | 82,989 |
| | Mahindra & Mahindra Ltd. | 4,151,567 | 71,112 |
| | Tata Steel Ltd. | 4,830,434 | 67,502 |
| | Coal India Ltd. | 7,740,279 | 66,710 |
| | GAIL India Ltd. | 6,023,570 | 64,835 |
| | NTPC Ltd. | 14,404,195 | 59,416 |
| | State Bank of India | 924,217 | 58,731 |
| | Wipro Ltd. ADR | 4,020,829 | 55,367 |
| | Sun Pharmaceutical Industries Ltd. | 4,925,370 | 51,943 |
| | Adani Enterprises Ltd. | 3,510,583 | 49,721 |
| | Infrastructure Development Finance Co. Ltd. | 15,022,594 | 49,481 |
| | Hero Honda Motors Ltd. | 1,274,201 | 49,298 |
| | Dr Reddy's Laboratories Ltd. ADR | 1,237,747 | 48,569 |
| * | Cairn India Ltd. | 5,947,502 | 46,991 |
| | Tata Power Co. Ltd. | 1,564,448 | 46,190 |
| | Bajaj Auto Ltd. | 1,371,783 | 45,819 |
| | ICICI Bank Ltd. ADR | 873,108 | 44,005 |
| | Kotak Mahindra Bank Ltd. | 4,355,526 | 42,413 |
| | Power Grid Corp. of India Ltd. | 16,753,918 | 39,643 |
| | Sesa Goa Ltd. | 5,537,666 | 39,409 |
| | Wipro Ltd. | 3,757,640 | 38,237 |
| | Cipla Ltd. | 5,353,670 | 37,527 |
| | Ambuja Cements Ltd. | 9,762,023 | 34,980 |
| | DLF Ltd. | 6,521,378 | 32,900 |
| | Maruti Suzuki India Ltd. | 1,100,642 | 32,858 |
| | Jaiprakash Associates Ltd. | 15,493,347 | 32,528 |
| | United Spirits Ltd. | 1,275,161 | 29,914 |
| | JSW Steel Ltd. | 1,375,438 | 29,536 |
| | HCL Technologies Ltd. | 2,492,596 | 29,430 |
| | Steel Authority of India Ltd. | 7,237,488 | 26,142 |
| | Reliance Infrastructure Ltd. | 1,745,595 | 26,098 |
| | Ultratech Cement Ltd. | 1,026,712 | 25,322 |
| * | Reliance Power Ltd. | 8,522,884 | 25,207 |
| | Rural Electrification Corp. Ltd. | 4,500,753 | 24,320 |
| | Lupin Ltd. | 2,245,299 | 22,415 |
| | Zee Entertainment Enterprises Ltd. | 7,304,653 | 22,287 |
| | ACC Ltd. | 860,590 | 21,681 |
| | Reliance Capital Ltd. | 1,647,651 | 21,019 |
| | Siemens India Ltd. | 1,062,324 | 20,832 |
| | LIC Housing Finance Ltd. | 4,179,375 | 20,775 |
| | Bharat Petroleum Corp. Ltd. | 1,410,318 | 20,101 |
| | Canara Bank | 1,347,449 | 19,280 |
| | Reliance Communications Ltd. | 8,268,725 | 18,731 |
| | Ranbaxy Laboratories Ltd. | 1,695,211 | 17,566 |
| | Unitech Ltd. | 20,412,633 | 17,093 |
| * | Indiabulls Real Estate Ltd. | 5,423,049 | 15,343 |
| * | Satyam Computer Services Ltd. | 8,520,297 | 14,531 |
| | | |
| Vanguard® Emerging Markets Stock Index Fund | | |
| Schedule of Investments | | |
| April 30, 2011 | | |
| |
| | | | Market |
| | | | Value |
| | | Shares | ($000) |
| | Dr Reddy's Laboratories Ltd. | 375,561 | 14,213 |
| | IndusInd Bank Ltd. | 2,382,167 | 14,022 |
| * | Suzlon Energy Ltd. | 10,606,184 | 12,755 |
| * | GMR Infrastructure Ltd. | 14,358,800 | 12,306 |
| | United Phosphorus Ltd. | 3,423,120 | 11,724 |
| | Piramal Healthcare Ltd. | 1,007,023 | 10,465 |
| * | Housing Development & Infrastructure Ltd. | 2,802,927 | 10,219 |
| | Aditya Birla Nuvo Ltd. | 518,167 | 10,180 |
| | State Bank of India GDR | 43,236 | 5,933 |
| | | | 4,702,394 |
| Indonesia (2.5%) | | |
| | Astra International Tbk PT | 32,376,590 | 212,790 |
| | Bank Central Asia Tbk PT | 196,496,224 | 170,186 |
| | Telekomunikasi Indonesia Tbk PT | 160,778,479 | 144,917 |
| | Bank Rakyat Indonesia Persero Tbk PT | 177,165,600 | 133,765 |
| | Bank Mandiri Tbk PT | 145,937,980 | 122,059 |
| | Bumi Resources Tbk PT | 280,431,052 | 112,685 |
| | Perusahaan Gas Negara PT | 175,514,480 | 82,198 |
| | United Tractors Tbk PT | 24,397,169 | 66,362 |
| | Semen Gresik Persero Tbk PT | 48,497,820 | 53,884 |
| | Bank Negara Indonesia Persero Tbk PT | 105,913,314 | 50,176 |
| | Indofood Sukses Makmur Tbk PT | 75,634,796 | 49,088 |
| | Indocement Tunggal Prakarsa Tbk PT | 24,419,603 | 48,570 |
| | Unilever Indonesia Tbk PT | 25,277,230 | 45,236 |
| | Gudang Garam Tbk PT | 9,153,000 | 43,479 |
| | Adaro Energy Tbk PT | 162,890,250 | 42,044 |
| | Tambang Batubara Bukit Asam Tbk PT | 13,920,857 | 36,329 |
| | Indo Tambangraya Megah PT | 6,426,300 | 35,210 |
| | Bank Danamon Indonesia Tbk PT | 42,659,349 | 30,970 |
| | Charoen Pokphand Indonesia Tbk PT | 120,027,425 | 27,091 |
| | Kalbe Farma Tbk PT | 61,733,938 | 25,829 |
| | International Nickel Indonesia Tbk PT | 39,377,150 | 22,967 |
| | Indosat Tbk PT | 24,419,273 | 15,315 |
| | Aneka Tambang Tbk PT | 57,023,659 | 15,207 |
| | Astra Agro Lestari Tbk PT | 5,494,180 | 14,902 |
| | | | 1,601,259 |
| Malaysia (2.9%) | | |
| | CIMB Group Holdings Bhd. | 62,909,248 | 174,159 |
| | Malayan Banking Bhd. | 49,993,898 | 147,834 |
| | Genting Bhd. | 35,601,390 | 139,615 |
| | Sime Darby Bhd. | 42,719,613 | 130,149 |
| | IOI Corp. Bhd. | 53,749,478 | 96,094 |
| | Tenaga Nasional Bhd. | 39,193,807 | 79,599 |
| * | Petronas Chemicals Group Bhd. | 30,990,270 | 75,645 |
| | Public Bank Bhd. (Foreign) | 16,367,147 | 72,424 |
| * | Axiata Group Bhd. | 41,005,994 | 67,924 |
| | Maxis Bhd. | 36,577,150 | 66,368 |
| | AMMB Holdings Bhd. | 29,371,128 | 63,338 |
| | Genting Malaysia Bhd. | 47,833,690 | 59,528 |
| | DiGi.Com Bhd. | 5,675,873 | 55,807 |
| | Kuala Lumpur Kepong Bhd. | 7,791,970 | 55,617 |
| | MISC Bhd. | 17,967,590 | 47,370 |
| | PPB Group Bhd. | 6,854,408 | 39,322 |
| | IJM Corp. Bhd. | 17,615,850 | 36,892 |
| | PLUS Expressways Bhd. | 23,458,182 | 35,618 |
| | British American Tobacco Malaysia Bhd. | 2,064,272 | 33,475 |
| | Gamuda Bhd. | 26,266,516 | 33,185 |
| | Petronas Gas Bhd. | 8,203,024 | 31,199 |
| | YTL Corp. Bhd. | 54,678,540 | 30,676 |
| | YTL Power International Bhd. | 36,029,727 | 27,495 |
| | Hong Leong Bank Bhd. | 7,462,071 | 26,200 |
| | SP Setia Bhd. | 17,920,878 | 25,279 |
| | Telekom Malaysia Bhd. | 17,689,740 | 23,848 |
| | UMW Holdings Bhd. | 9,471,520 | 22,473 |
| | | |
| Vanguard® Emerging Markets Stock Index Fund | | |
| Schedule of Investments | | |
| April 30, 2011 | | |
| |
| | | | Market |
| | | | Value |
| | | Shares | ($000) |
| | Petronas Dagangan Bhd. | 4,063,900 | 21,253 |
| * | AirAsia Bhd. | 21,724,848 | 21,096 |
| | RHB Capital Bhd. | 6,147,035 | 18,412 |
| | Berjaya Sports Toto Bhd. | 11,613,396 | 16,562 |
| | Bursa Malaysia Bhd. | 5,542,214 | 15,031 |
| | Alliance Financial Group Bhd. | 13,136,217 | 13,803 |
| | Lafarge Malayan Cement Bhd. | 5,615,720 | 13,742 |
| | Parkson Holdings Bhd. | 6,716,323 | 12,999 |
| | MMC Corp. Bhd. | 11,691,500 | 10,600 |
| | Hong Leong Financial Group Bhd. | 2,929,000 | 10,155 |
| | Berjaya Corp. Bhd. | 24,595,400 | 9,484 |
| | Genting Plantations Bhd. | 3,385,500 | 9,150 |
| * | Malaysian Airline System Bhd. | 14,441,000 | 8,891 |
| | Public Bank Bhd. (Local) | 157,228 | 695 |
| | | | 1,879,006 |
| Mexico (4.3%) | | |
| | America Movil SAB de CV | 309,524,298 | 887,029 |
| | Wal-Mart de Mexico SAB de CV | 97,533,592 | 305,521 |
| | Fomento Economico Mexicano SAB de CV | 33,836,708 | 212,955 |
| | Grupo Mexico SAB de CV Class B | 59,453,658 | 205,862 |
| * | Grupo Televisa SA | 36,716,614 | 173,860 |
| * | Cemex SAB de CV | 151,107,034 | 131,001 |
| | Grupo Financiero Banorte SAB de CV | 25,220,890 | 127,006 |
| | Telefonos de Mexico SAB de CV | 85,010,699 | 79,829 |
| | Grupo Financiero Inbursa SA | 13,454,830 | 71,752 |
| | Alfa SAB de CV Class A | 4,597,631 | 68,854 |
| | Grupo Modelo SAB de CV | 9,885,687 | 61,813 |
| | Industrias Penoles SAB de CV | 1,549,205 | 60,325 |
| | Grupo Elektra SA de CV | 1,158,860 | 52,770 |
| | Kimberly-Clark de Mexico SAB de CV Class A | 8,306,008 | 51,394 |
| | Grupo Bimbo SAB de CV Class A | 22,939,952 | 50,616 |
| | Mexichem SAB de CV | 13,175,754 | 50,074 |
| * | Minera Frisco SAB de CV | 9,017,108 | 38,875 |
| | Embotelladoras Arca SAB de CV | 6,330,192 | 38,443 |
| | Grupo Carso SAB de CV | 9,276,366 | 36,077 |
| | Coca-Cola Femsa SAB de CV | 4,498,945 | 35,846 |
| | Grupo Aeroportuario del Pacifico SAB de CV Class B | 6,638,807 | 27,612 |
| | Banco Compartamos SA de CV | 3,712,600 | 25,801 |
| * | Urbi Desarrollos Urbanos SAB de CV | 8,432,593 | 20,203 |
| * | Desarrolladora Homex SAB de CV | 3,766,190 | 17,732 |
| | Grupo Aeroportuario del Pacifico SAB de CV ADR | 121,617 | 5,073 |
| | | | 2,836,323 |
| Morocco (0.0%) | | |
| | Maroc Telecom | 407,304 | 8,061 |
| | Douja Promotion Groupe Addoha SA | 399,586 | 4,915 |
| | Attijariwafa Bank | 88,455 | 4,225 |
| | | | 17,201 |
| Peru (0.5%) | | |
| | Southern Copper Corp. | 3,089,801 | 115,744 |
| | Cia de Minas Buenaventura SA ADR | 2,499,426 | 104,151 |
| | Credicorp Ltd. | 702,503 | 67,806 |
| | Credicorp Ltd. | 371,083 | 35,861 |
| | Cia de Minas Buenaventura SA | 548,411 | 22,507 |
| | Southern Copper Corp. | 305,551 | 11,519 |
| | | | 357,588 |
| Philippines (0.6%) | | |
| | Philippine Long Distance Telephone Co. | 767,825 | 44,630 |
| | SM Investments Corp. | 3,081,976 | 41,711 |
| | Ayala Land Inc. | 93,377,750 | 35,915 |
| | Bank of the Philippine Islands | 24,657,366 | 33,915 |
| | Manila Electric Co. | 5,764,547 | 33,028 |
| | Ayala Corp. | 2,941,046 | 26,902 |
| | Aboitiz Equity Ventures Inc. | 28,936,190 | 26,825 |
| | | |
| Vanguard® Emerging Markets Stock Index Fund | | |
| Schedule of Investments | | |
| April 30, 2011 | | |
| |
| | | | Market |
| | | | Value |
| | | Shares | ($000) |
| | SM Prime Holdings Inc. | 83,607,062 | 23,469 |
| | Alliance Global Group Inc. | 69,458,798 | 19,276 |
| | Aboitiz Power Corp. | 25,973,326 | 19,190 |
| * | Metropolitan Bank & Trust | 11,918,805 | 19,126 |
| | Energy Development Corp. | 103,837,853 | 16,403 |
| | Jollibee Foods Corp. | 7,277,019 | 16,082 |
| | Banco de Oro Unibank Inc. | 10,825,891 | 13,751 |
| | Globe Telecom Inc. | 566,823 | 11,926 |
| | | | 382,149 |
| Poland (1.8%) | | |
| ^ | Powszechna Kasa Oszczednosci Bank Polski SA | 9,917,514 | 170,667 |
| ^ | KGHM Polska Miedz SA | 2,221,897 | 163,442 |
| ^ | Bank Pekao SA | 1,870,123 | 122,577 |
| *,^ | Polski Koncern Naftowy Orlen SA | 5,161,273 | 107,577 |
| | Powszechny Zaklad Ubezpieczen SA | 755,063 | 106,106 |
| ^ | PGE SA | 10,551,950 | 95,232 |
| | Telekomunikacja Polska SA | 11,820,278 | 78,143 |
| | Polskie Gornictwo Naftowe i Gazownictwo SA | 29,088,586 | 42,604 |
| | Tauron Polska Energia SA | 17,055,740 | 39,838 |
| * | Getin Holding SA | 5,865,832 | 32,963 |
| *,^ | BRE Bank SA | 246,840 | 32,160 |
| *,^ | Kernel Holding SA | 797,741 | 21,660 |
| ^ | Asseco Poland SA | 1,079,527 | 21,598 |
| * | Grupa Lotos SA | 1,068,484 | 19,114 |
| *,^ | Globe Trade Centre SA | 2,427,330 | 18,930 |
| ^ | TVN SA | 2,714,248 | 17,986 |
| | Bank Handlowy w Warszawie SA | 452,531 | 17,043 |
| | Enea SA | 1,827,817 | 13,429 |
| * | ING Bank Slaski SA | 38,977 | 12,865 |
| * | Bank Millennium SA | 5,181,195 | 10,619 |
| ^ | PBG SA | 167,085 | 10,328 |
| ^ | Cyfrowy Polsat SA | 1,646,921 | 10,068 |
| | | | 1,164,949 |
| Russia (7.1%) | | |
| | Gazprom OAO ADR | 73,353,352 | 1,242,880 |
| | Lukoil OAO ADR | 7,225,717 | 502,201 |
| | Sberbank of Russia | 134,563,489 | 491,936 |
| | MMC Norilsk Nickel OJSC ADR | 10,313,906 | 285,502 |
| | NovaTek OAO GDR | 1,446,500 | 203,988 |
| | Rosneft Oil Co. GDR | 21,542,866 | 192,942 |
| | Gazprom OAO | 20,821,266 | 179,276 |
| | Mobile Telesystems OJSC ADR | 8,142,892 | 172,222 |
| | VTB Bank OJSC GDR | 20,680,107 | 134,254 |
| | Tatneft ADR | 2,972,023 | 134,254 |
| | Surgutneftegas OJSC ADR | 11,189,655 | 119,655 |
| | Magnit OJSC GDR | 3,350,926 | 94,207 |
| | Uralkali | 11,201,047 | 93,449 |
| * | Federal Hydrogenerating Co. JSC | 1,739,627,056 | 88,251 |
| | Mechel ADR | 2,247,614 | 64,214 |
| | Surgutneftegas OJSC Prior Pfd. | 107,255,874 | 62,670 |
| * | Federal Grid Co. Unified Energy System JSC | 4,527,614,653 | 59,810 |
| | Novolipetsk Steel OJSC GDR | 1,465,161 | 56,127 |
| | Polyus Gold OJSC ADR | 1,207,310 | 43,527 |
| | Sistema JSFC GDR | 1,489,467 | 42,179 |
| | Wimm-Bill-Dann Foods OJSC ADR | 1,084,353 | 38,267 |
| | AK Transneft OAO Prior Pfd. | 24,519 | 36,187 |
| | Sberbank of Russia Prior Pfd. | 14,530,894 | 35,611 |
| | Severstal OAO GDR | 1,925,285 | 34,827 |
| | Rosneft Oil Co. | 3,662,063 | 32,557 |
| * | Polymetal JSC | 1,530,381 | 30,104 |
| | Tatneft | 4,266,590 | 27,865 |
| | Severstal OAO | 1,417,762 | 26,044 |
| * | OGK-4 OJSC | 246,999,305 | 21,995 |
| * | TMK OAO GDR | 946,915 | 19,466 |
| | | |
| Vanguard® Emerging Markets Stock Index Fund | | |
| Schedule of Investments | | |
| April 30, 2011 | | |
| |
| | | | Market |
| | | | Value |
| | | Shares | ($000) |
| * | Raspadskaya | 2,517,862 | 16,754 |
| * | Inter Rao Ues OAO | 12,540,031,536 | 16,177 |
| | Polyus Gold OJSC | 191,061 | 13,625 |
| | Lukoil OAO | 187,732 | 12,984 |
| | MMC Norilsk Nickel OJSC | 30,127 | 8,575 |
| | Surgutneftegas OJSC | 4,067,284 | 4,260 |
| | VTB Bank OJSC | 442,200,349 | 1,428 |
| * | RusHydro JSC | 10,398,901 | 528 |
| | | | 4,640,798 |
| South Africa (7.6%) | | |
| | MTN Group Ltd. | 26,630,396 | 592,323 |
| | Sasol Ltd. | 9,074,162 | 524,359 |
| | Naspers Ltd. | 6,034,148 | 363,390 |
| | AngloGold Ashanti Ltd. | 5,963,389 | 303,686 |
| | Standard Bank Group Ltd. | 18,539,233 | 291,168 |
| | Impala Platinum Holdings Ltd. | 7,882,761 | 246,516 |
| | Gold Fields Ltd. | 11,168,027 | 199,755 |
| | FirstRand Ltd. | 44,567,555 | 140,354 |
| | Sanlam Ltd. | 29,619,160 | 127,049 |
| | Remgro Ltd. | 6,798,029 | 117,882 |
| | Bidvest Group Ltd. | 4,649,441 | 107,194 |
| | ABSA Group Ltd. | 5,138,504 | 106,505 |
| | Anglo Platinum Ltd. | 1,027,198 | 104,537 |
| | Shoprite Holdings Ltd. | 6,447,074 | 101,755 |
| | Harmony Gold Mining Co. Ltd. | 6,180,141 | 94,877 |
| | Kumba Iron Ore Ltd. | 1,263,442 | 92,452 |
| | Truworths International Ltd. | 6,975,108 | 80,684 |
| | Tiger Brands Ltd. | 2,589,785 | 76,024 |
| | Steinhoff International Holdings Ltd. | 19,376,211 | 74,717 |
| | Vodacom Group Ltd. | 5,939,728 | 72,749 |
| | Growthpoint Properties Ltd. | 24,887,017 | 69,092 |
| | Massmart Holdings Ltd. | 3,078,050 | 67,390 |
| | African Bank Investments Ltd. | 11,447,809 | 66,830 |
| | Nedbank Group Ltd. | 2,848,759 | 63,474 |
| | African Rainbow Minerals Ltd. | 1,706,309 | 55,574 |
| | Exxaro Resources Ltd. | 2,022,233 | 54,737 |
| | Woolworths Holdings Ltd. | 11,397,764 | 52,021 |
| | Aspen Pharmacare Holdings Ltd. | 4,093,732 | 50,537 |
| | Redefine Properties Ltd. | 41,457,578 | 49,458 |
| | RMB Holdings Ltd. | 10,973,739 | 47,411 |
| * | Sappi Ltd. | 8,609,230 | 46,963 |
| | Imperial Holdings Ltd. | 2,604,931 | 46,870 |
| | Foschini Group Ltd. | 3,225,288 | 44,519 |
| | MMI Holdings Ltd. | 16,207,053 | 42,042 |
| | Spar Group Ltd. | 2,653,941 | 39,372 |
| | ArcelorMittal South Africa Ltd. | 2,874,411 | 39,365 |
| | Netcare Ltd. | 17,294,799 | 37,342 |
| | Pretoria Portland Cement Co. Ltd. | 8,539,827 | 32,551 |
| | Aveng Ltd. | 6,057,777 | 32,189 |
| | Investec Ltd. | 3,695,438 | 29,907 |
| | Reunert Ltd. | 2,892,755 | 27,455 |
| | Discovery Holdings Ltd. | 4,305,029 | 24,835 |
| | Telkom SA Ltd. | 4,148,199 | 24,173 |
| | Pick n Pay Stores Ltd. | 3,394,048 | 21,963 |
| | Murray & Roberts Holdings Ltd. | 5,152,553 | 19,776 |
| | RMI Holdings | 10,657,389 | 19,253 |
| | Northam Platinum Ltd. | 2,792,249 | 18,451 |
| | Liberty Holdings Ltd. | 1,646,458 | 18,055 |
| | | | 4,959,581 |
| South Korea (14.8%) | | |
| 2 | Samsung Electronics Co. Ltd. GDR | 2,075,319 | 866,361 |
| | Samsung Electronics Co. Ltd. | 699,870 | 584,588 |
| | Hyundai Motor Co. | 2,425,137 | 559,356 |
| | LG Chem Ltd. | 729,612 | 362,484 |
| | | |
| Vanguard® Emerging Markets Stock Index Fund | | |
| Schedule of Investments | | |
| April 30, 2011 | | |
| |
| | | | Market |
| | | | Value |
| | | Shares | ($000) |
| | Hyundai Mobis | 1,071,709 | 359,460 |
| | POSCO ADR | 2,922,321 | 322,332 |
| ^ | Hyundai Heavy Industries Co. Ltd. | 597,659 | 298,916 |
| | Kia Motors Corp. | 3,737,114 | 268,843 |
| ^ | Hynix Semiconductor Inc. | 7,872,550 | 248,930 |
| | SK Innovation Co. Ltd. | 942,855 | 205,109 |
| | Samsung Electronics Co. Ltd. Prior Pfd. | 322,541 | 189,883 |
| | Shinhan Financial Group Co. Ltd. ADR | 1,924,459 | 186,711 |
| | KB Financial Group Inc. ADR | 3,292,186 | 175,441 |
| | Hana Financial Group Inc. | 3,431,280 | 145,585 |
| | Samsung C&T Corp. | 1,961,518 | 142,098 |
| | LG Electronics Inc. | 1,474,571 | 141,958 |
| | OCI Co. Ltd. | 236,193 | 141,287 |
| | LG Corp. | 1,493,207 | 137,473 |
| | LG Display Co. Ltd. | 3,648,806 | 130,886 |
| | POSCO | 296,355 | 130,051 |
| * | NHN Corp. | 645,193 | 127,997 |
| | Shinhan Financial Group Co. Ltd. | 2,490,509 | 122,180 |
| | Samsung Fire & Marine Insurance Co. Ltd. | 560,601 | 120,423 |
| | Samsung Heavy Industries Co. Ltd. | 2,548,405 | 115,533 |
| | Shinsegae Co. Ltd. | 446,315 | 112,448 |
| | Hyundai Steel Co. | 870,656 | 110,915 |
| | S-Oil Corp. | 710,268 | 106,194 |
| | Samsung Engineering Co. Ltd. | 473,085 | 105,213 |
| | KT&G Corp. | 1,728,823 | 102,323 |
| | KB Financial Group Inc. | 1,872,833 | 100,394 |
| | Samsung SDI Co. Ltd. | 537,204 | 96,262 |
| | Samsung Electro-Mechanics Co. Ltd. | 939,983 | 90,991 |
| | Hyundai Engineering & Construction Co. Ltd. | 1,052,025 | 88,374 |
| ^ | Honam Petrochemical Corp. | 225,991 | 80,018 |
| | Cheil Industries Inc. | 710,126 | 78,295 |
| | SK Holdings Co. Ltd. | 408,848 | 73,476 |
| | SK Telecom Co. Ltd. ADR | 3,857,871 | 73,222 |
| | Lotte Shopping Co. Ltd. | 160,458 | 73,179 |
| | Samsung Life Insurance Co. Ltd. | 788,446 | 71,581 |
| | GS Engineering & Construction Corp. | 562,981 | 67,854 |
| | GS Holdings | 801,964 | 67,238 |
| | Korea Electric Power Corp. ADR | 5,491,108 | 66,442 |
| | Samsung Securities Co. Ltd. | 786,790 | 65,786 |
| | Daewoo Shipbuilding & Marine Engineering Co. Ltd. | 1,495,502 | 64,094 |
| | Woori Finance Holdings Co. Ltd. | 4,426,192 | 60,485 |
| | NCSoft Corp. | 222,660 | 59,048 |
| | Hanwha Chem Corp. | 1,316,780 | 58,766 |
| ^ | LG Household & Health Care Ltd. | 136,236 | 54,799 |
| | Korea Zinc Co. Ltd. | 134,027 | 52,931 |
| | Amorepacific Corp. | 50,104 | 50,504 |
| | Daelim Industrial Co. Ltd. | 441,690 | 49,957 |
| | Industrial Bank of Korea | 2,556,280 | 49,126 |
| | Samsung Techwin Co. Ltd. | 590,624 | 48,680 |
| | Hyundai Motor Co. 2nd Pfd. | 592,701 | 47,703 |
| | Hankook Tire Co. Ltd. | 1,187,566 | 47,698 |
| | KT Corp. ADR | 2,346,092 | 47,626 |
| | Daewoo Securities Co. Ltd. | 1,959,060 | 41,337 |
| | Doosan Heavy Industries and Construction Co. Ltd. | 662,068 | 36,970 |
| * | Doosan Infracore Co. Ltd. | 1,321,992 | 36,655 |
| | Korean Air Lines Co. Ltd. | 568,100 | 34,729 |
| | Hyundai Department Store Co. Ltd. | 235,806 | 34,597 |
| | Korea Exchange Bank | 4,033,350 | 34,374 |
| | Kangwon Land Inc. | 1,508,178 | 34,289 |
| * | BS Financial Group Inc. | 2,340,685 | 34,073 |
| | Samsung Card Co. | 674,315 | 33,504 |
| | Daegu Bank Ltd. | 1,978,435 | 33,088 |
| | Hanwha Corp. | 699,946 | 32,224 |
| | Dongbu Insurance Co. Ltd. | 663,191 | 31,623 |
| | | |
| Vanguard® Emerging Markets Stock Index Fund | | |
| Schedule of Investments | | |
| April 30, 2011 | | |
| |
| | | | Market |
| | | | Value |
| | | Shares | ($000) |
| ^ | LS Corp. | 282,647 | 31,330 |
| | Hyundai Mipo Dockyard | 175,224 | 31,122 |
| * | Korea Electric Power Corp. | 1,284,531 | 30,776 |
| | CJ CheilJedang Corp. | 130,708 | 30,341 |
| | Hyosung Corp. | 363,383 | 29,827 |
| | KT Corp. | 811,396 | 29,132 |
| | SK Telecom Co. Ltd. | 190,067 | 28,798 |
| | Celltrion Inc. | 839,033 | 28,786 |
| | Woori Investment & Securities Co. Ltd. | 1,366,101 | 27,424 |
| | Hyundai Motor Co. Prior Pfd. | 357,108 | 26,887 |
| | Woongjin Coway Co. Ltd. | 789,039 | 26,369 |
| | Hyundai Glovis Co. Ltd. | 179,477 | 25,649 |
| | KCC Corp. | 74,426 | 25,238 |
| | Mando Corp. | 140,474 | 24,704 |
| | SK C&C Co. Ltd. | 237,160 | 24,390 |
| | Hyundai Securities Co. | 1,914,631 | 24,286 |
| | Hyundai Development Co. | 885,936 | 24,265 |
| | Korea Investment Holdings Co. Ltd. | 612,793 | 24,061 |
| | Dongkuk Steel Mill Co. Ltd. | 588,562 | 23,468 |
| | LG Uplus Corp. | 3,680,578 | 22,361 |
| ^ | Daewoo International Corp. | 548,239 | 21,327 |
| | Hanjin Shipping Co. Ltd. | 794,290 | 20,670 |
| | LG Chem Ltd. Prior Pfd. | 119,116 | 20,526 |
| | Hyundai Merchant Marine Co. Ltd. | 654,310 | 19,981 |
| | Doosan Corp. | 157,513 | 19,355 |
| | Korea Life Insurance Co. Ltd. | 2,738,870 | 18,913 |
| | Yuhan Corp. | 131,269 | 17,574 |
| * | Daewoo Engineering & Construction Co. Ltd. | 1,637,044 | 17,444 |
| * | Hanjin Heavy Industries & Construction Co. Ltd. | 478,531 | 17,434 |
| ^ | LS Industrial Systems Co. Ltd. | 231,064 | 17,168 |
| | Lotte Confectionery Co. Ltd. | 11,059 | 16,369 |
| ^ | LG Innotek Co. Ltd. | 157,531 | 15,912 |
| | SK Networks Co. Ltd. | 1,409,080 | 15,615 |
| ^ | Seoul Semiconductor Co. Ltd. | 511,850 | 15,364 |
| | Mirae Asset Securities Co. Ltd. | 361,673 | 14,656 |
| ^ | STX Pan Ocean Co. Ltd. | 1,673,020 | 13,579 |
| | S1 Corp. | 264,124 | 12,900 |
| | Korea Gas Corp. | 366,376 | 11,687 |
| | LG Electronics Inc. Prior Pfd. | 270,016 | 9,088 |
| * | SK Broadband Co. Ltd. | 2,194,011 | 8,811 |
| | Tong Yang Securities Inc. | 1,174,816 | 8,650 |
| | Hite Holdings Co. Ltd. | 1 | — |
| | | | 9,695,207 |
| Taiwan (11.1%) | | |
| | Taiwan Semiconductor Manufacturing Co. Ltd. ADR | 46,820,694 | 632,079 |
| | Hon Hai Precision Industry Co. Ltd. | 134,733,588 | 511,654 |
| | HTC Corp. | 10,785,850 | 490,936 |
| | Taiwan Semiconductor Manufacturing Co. Ltd. | 146,060,045 | 377,782 |
| | Formosa Plastics Corp. | 62,227,458 | 254,830 |
| | Nan Ya Plastics Corp. | 73,529,439 | 225,852 |
| | China Steel Corp. | 158,180,543 | 195,880 |
| | Formosa Chemicals & Fibre Corp. | 44,376,164 | 179,452 |
| | Cathay Financial Holding Co. Ltd. | 102,472,212 | 171,331 |
| | MediaTek Inc. | 14,507,975 | 160,645 |
| | Chinatrust Financial Holding Co. Ltd. | 139,267,565 | 127,951 |
| | Delta Electronics Inc. | 27,869,245 | 124,752 |
| | Chunghwa Telecom Co. Ltd. ADR | 3,908,898 | 123,326 |
| | Fubon Financial Holding Co. Ltd. | 80,078,995 | 117,634 |
| | Mega Financial Holding Co. Ltd. | 120,936,128 | 105,660 |
| | Uni-President Enterprises Corp. | 57,323,375 | 82,622 |
| | Asustek Computer Inc. | 8,646,753 | 78,060 |
| * | Chimei Innolux Corp. | 74,764,699 | 76,960 |
| | Quanta Computer Inc. | 38,818,360 | 76,617 |
| | Taiwan Cement Corp. | 51,653,577 | 75,889 |
| | | |
| Vanguard® Emerging Markets Stock Index Fund | | |
| Schedule of Investments | | |
| April 30, 2011 | | |
| |
| | | | Market |
| | | | Value |
| | | Shares | ($000) |
| | Acer Inc. | 40,151,105 | 75,324 |
| | Taiwan Mobile Co. Ltd. | 28,979,585 | 74,839 |
| | Compal Electronics Inc. | 65,817,969 | 74,758 |
| | United Microelectronics Corp. ADR | 25,242,689 | 71,689 |
| | Far Eastern New Century Corp. | 45,265,923 | 71,264 |
| | First Financial Holding Co. Ltd. | 74,758,400 | 69,362 |
| | Yuanta Financial Holding Co. Ltd. | 94,965,773 | 66,091 |
| | Chunghwa Telecom Co. Ltd. | 20,157,613 | 64,124 |
| | Formosa Petrochemical Corp. | 17,841,423 | 62,761 |
| * | AU Optronics Corp. ADR | 7,418,835 | 60,093 |
| | China Development Financial Holding Corp. | 139,948,502 | 58,721 |
| | Advanced Semiconductor Engineering Inc. ADR | 9,930,750 | 58,591 |
| | Wistron Corp. | 29,418,911 | 53,016 |
| | Catcher Technology Co. Ltd. | 8,396,663 | 52,845 |
| | Chang Hwa Commercial Bank | 57,990,094 | 50,683 |
| | Foxconn Technology Co. Ltd. | 10,352,772 | 49,640 |
| | Hua Nan Financial Holdings Co. Ltd. | 60,657,050 | 48,572 |
| | Taiwan Cooperative Bank | 56,174,095 | 47,170 |
| | Synnex Technology International Corp. | 18,397,005 | 47,031 |
| | Cheng Shin Rubber Industry Co. Ltd. | 18,435,930 | 46,604 |
| | President Chain Store Corp. | 8,417,547 | 46,210 |
| | Largan Precision Co. Ltd. | 1,405,135 | 44,665 |
| * | MStar Semiconductor Inc. | 5,212,000 | 43,223 |
| | Lite-On Technology Corp. | 33,004,008 | 41,850 |
| | SinoPac Financial Holdings Co. Ltd. | 85,443,813 | 40,602 |
| | Taiwan Fertilizer Co. Ltd. | 11,876,600 | 40,073 |
| * | TPK Holding Co. Ltd. | 1,325,180 | 39,672 |
| | Siliconware Precision Industries Co. ADR | 5,802,121 | 39,338 |
| | Far EasTone Telecommunications Co. Ltd. | 25,366,043 | 38,484 |
| | Asia Cement Corp. | 28,655,833 | 38,420 |
| * | Taishin Financial Holding Co. Ltd. | 64,006,968 | 37,727 |
| * | Shin Kong Financial Holding Co. Ltd. | 85,533,775 | 37,553 |
| | E.Sun Financial Holding Co. Ltd. | 48,799,590 | 34,627 |
| | Macronix International | 52,059,318 | 34,227 |
| | Powertech Technology Inc. | 9,386,056 | 34,145 |
| * | AU Optronics Corp. | 41,986,669 | 33,845 |
| | Pou Chen Corp. | 35,255,021 | 33,310 |
| | United Microelectronics Corp. | 63,214,970 | 32,995 |
| | Epistar Corp. | 9,843,732 | 32,727 |
| | Unimicron Technology Corp. | 19,621,754 | 32,369 |
| | Advanced Semiconductor Engineering Inc. | 25,725,479 | 30,130 |
| | WPG Holdings Ltd. | 16,204,305 | 30,017 |
| * | China Petrochemical Development Corp. | 23,888,000 | 29,811 |
| * | Wintek Corp. | 20,149,000 | 29,483 |
| * | Walsin Lihwa Corp. | 48,996,770 | 28,441 |
| | Yulon Motor Co. Ltd. | 12,759,592 | 26,595 |
| | Tripod Technology Corp. | 5,595,657 | 26,515 |
| * | Pegatron Corp. | 24,191,045 | 25,595 |
| | Novatek Microelectronics Corp. | 7,877,467 | 24,145 |
| * | Hiwin Technologies Corp. | 2,405,000 | 24,015 |
| * | E Ink Holdings Inc. | 11,191,000 | 22,858 |
| | Far Eastern Department Stores Co. Ltd. | 12,782,371 | 22,629 |
| | Taiwan Glass Industrial Corp. | 13,810,410 | 22,578 |
| | Siliconware Precision Industries Co. | 16,727,860 | 22,432 |
| | KGI Securities Co. Ltd. | 41,569,000 | 21,831 |
| | Polaris Securities Co. Ltd. | 30,206,675 | 21,760 |
| * | China Airlines Ltd. | 32,830,765 | 21,017 |
| | Simplo Technology Co. Ltd. | 3,025,300 | 20,534 |
| | China Life Insurance Co. Ltd. | 17,351,500 | 20,321 |
| | TSRC Corp. | 6,765,398 | 20,234 |
| * | Eva Airways Corp. | 21,780,891 | 20,082 |
| | Sino-American Silicon Products Inc. | 5,128,000 | 19,044 |
| | LCY Chemical Corp. | 6,081,278 | 18,013 |
| | Ruentex Industries Ltd. | 6,348,115 | 17,948 |
| | | |
| Vanguard® Emerging Markets Stock Index Fund | | |
| Schedule of Investments | | |
| April 30, 2011 | | |
| |
| | | | Market |
| | | | Value |
| | | Shares | ($000) |
| | Giant Manufacturing Co. Ltd. | 4,269,121 | 17,079 |
| | Teco Electric and Machinery Co. Ltd. | 23,684,000 | 16,780 |
| * | Powerchip Technology Corp. | 76,789,023 | 16,615 |
| | Inventec Co. Ltd. | 30,622,033 | 16,488 |
| * | Evergreen Marine Corp. Taiwan Ltd. | 17,733,879 | 16,436 |
| | Clevo Co. | 7,120,938 | 16,322 |
| * | Yang Ming Marine Transport Corp. | 18,602,450 | 15,779 |
| | Advantech Co. Ltd. | 4,537,566 | 15,054 |
| | Kinsus Interconnect Technology Corp. | 4,304,029 | 15,037 |
| | U-Ming Marine Transport Corp. | 6,847,916 | 14,849 |
| | Coretronic Corp. | 9,363,000 | 14,362 |
| * | Tatung Co. Ltd. | 28,547,926 | 14,330 |
| * | Taiwan Business Bank | 34,672,480 | 14,114 |
| * | HannStar Display Corp. | 79,544,202 | 14,026 |
| * | Inotera Memories Inc. | 27,706,436 | 13,933 |
| | Motech Industries Inc. | 3,677,522 | 13,896 |
| | Richtek Technology Corp. | 2,001,626 | 13,406 |
| | Tung Ho Steel Enterprise Corp. | 10,843,144 | 12,839 |
| * | Qisda Corp. | 22,364,928 | 12,751 |
| | Highwealth Construction Corp. | 5,645,000 | 12,548 |
| | Eternal Chemical Co. Ltd. | 10,432,964 | 12,543 |
| | Formosa Taffeta Co. Ltd. | 11,553,868 | 12,530 |
| | Everlight Electronics Co. Ltd. | 4,363,742 | 12,493 |
| * | Winbond Electronics Corp. | 39,117,000 | 12,374 |
| | Feng Hsin Iron & Steel Co. | 6,691,310 | 12,230 |
| * | Wan Hai Lines Ltd. | 15,194,168 | 11,641 |
| | Chicony Electronics Co. Ltd. | 5,746,768 | 11,337 |
| | Ruentex Development Co. Ltd. | 6,708,000 | 11,189 |
| * | Nanya Technology Corp. | 22,008,479 | 11,181 |
| * | CMC Magnetics Corp. | 45,843,700 | 11,168 |
| | Realtek Semiconductor Corp. | 5,466,405 | 10,890 |
| | Nan Ya Printed Circuit Board Corp. | 3,096,623 | 10,135 |
| | Phison Electronics Corp. | 1,844,297 | 9,955 |
| | Farglory Land Development Co. Ltd. | 4,354,688 | 9,951 |
| | Cheng Uei Precision Industry Co. Ltd. | 4,795,148 | 9,645 |
| * | Nan Kang Rubber Tire Co. Ltd. | 6,055,000 | 9,617 |
| | Young Fast Optoelectronics Co. Ltd. | 1,351,078 | 9,266 |
| | Capital Securities Corp. | 17,361,140 | 8,468 |
| | Tainan Spinning Co. Ltd. | 12,462,000 | 8,374 |
| | Mitac International Corp. | 19,541,776 | 8,271 |
| | Formosa International Hotels Corp. | 416,229 | 7,758 |
| * | Chunghwa Picture Tubes | 57,326,710 | 7,710 |
| | Transcend Information Inc. | 2,521,981 | 7,421 |
| | Evergreen International Storage & Transport Corp. | 8,262,000 | 7,315 |
| | China Motor Corp. | 7,412,000 | 7,027 |
| | Pixart Imaging Inc. | 1,432,278 | 5,614 |
| | Vanguard International Semiconductor Corp. | 10,158,396 | 5,226 |
| * | Tatung Co. Ltd. GDR | 165,364 | 1,794 |
| * | China Life Insurance Rights EXP 05/12/11 | 2,284,946 | 674 |
| * | Ya Hsin Industrial Co. Ltd. | 5,306,018 | — |
| | | | 7,275,621 |
| Thailand (1.8%) | | |
| | PTT PCL (Foreign) | 10,648,337 | 134,022 |
| | PTT Exploration & Production PCL (Foreign) | 18,471,718 | 114,641 |
| | Siam Commercial Bank PCL (Foreign) | 24,133,457 | 93,923 |
| | Kasikornbank PCL (Foreign) | 18,969,249 | 82,780 |
| | Bangkok Bank PCL (Foreign) | 13,609,531 | 77,672 |
| | Siam Cement PCL (Foreign) | 5,474,317 | 75,968 |
| | Bangkok Bank PCL (Local) | 7,886,243 | 44,972 |
| | Banpu PCL (Local) | 1,672,800 | 41,895 |
| | Advanced Info Service PCL (Foreign) | 13,286,677 | 41,262 |
| | CP ALL PCL (Foreign) | 27,913,715 | 40,501 |
| | PTT PCL | 2,944,400 | 37,059 |
| | Kasikornbank PCL | 8,687,700 | 36,887 |
| | | | | |
| Vanguard® Emerging Markets Stock Index Fund | | | | |
| Schedule of Investments | | | | |
| April 30, 2011 | | | | |
| |
| | | | | | Market |
| | | | | | Value |
| | | | | Shares | ($000) |
| | Charoen Pokphand Foods PCL (Foreign) | | | 35,629,700 | 35,259 |
| | Indorama Ventures PCL | | | 19,164,164 | 34,261 |
| | Thai Oil PCL (Foreign) | | | 11,458,300 | 32,522 |
| | IRPC PCL (Foreign) | | | 138,017,360 | 28,715 |
| | Banpu PCL | | | 980,867 | 24,548 |
| | Krung Thai Bank PCL (Foreign) | | | 33,902,721 | 22,304 |
| | PTT Aromatics & Refining PCL (Foreign) | | | 14,433,911 | 19,997 |
| | PTT Chemical PCL (Foreign) | | | 3,666,938 | 19,735 |
| | Bank of Ayudhya PCL(Local) | | | 20,700,834 | 19,662 |
| | Thai Airways International PCL | | | 10,832,400 | 13,910 |
| | Charoen Pokphand Foods PCL | | | 14,046,100 | 13,900 |
| | BEC World PCL (Foreign) | | | 10,649,325 | 12,323 |
| | CP ALL PCL (Local) | | | 8,253,700 | 11,976 |
| | PTT Chemical PCL | | | 2,093,847 | 11,269 |
| | Bank of Ayudhya PCL (Local) | | | 10,308,800 | 9,943 |
| | Glow Energy PCL (Foreign) | | | 6,297,555 | 9,664 |
| | PTT Aromatics & Refining PCL | | | 3,219,000 | 4,460 |
| | Advanced Info Service PCL (Local) | | | 1,377,900 | 4,279 |
| | Thai Oil PCL | | | 1,430,300 | 4,060 |
| | BEC World PCL | | | 3,400,400 | 3,935 |
| | Krung Thai Bank PCL | | | 5,944,800 | 3,911 |
| | IRPC PCL | | | 18,449,200 | 3,838 |
| * | Glow Energy PCL | | | 1,183,000 | 1,815 |
| | PTT Exploration and Production PCL (Local) | | | 136,500 | 847 |
| | | | | | 1,168,715 |
| Turkey (1.5%) | | | | |
| | Turkiye Garanti Bankasi AS | | | 33,250,480 | 172,209 |
| | Akbank TAS | | | 18,929,711 | 98,408 |
| | Turkiye Is Bankasi | | | 25,071,649 | 88,654 |
| | Turkcell Iletisim Hizmetleri AS | | | 12,432,679 | 73,540 |
| | Tupras Turkiye Petrol Rafinerileri AS | | | 2,026,796 | 65,948 |
| | Haci Omer Sabanci Holding AS (Bearer) | | | 10,027,755 | 53,682 |
| | KOC Holding AS | | | 9,729,956 | 52,309 |
| | Anadolu Efes Biracilik Ve Malt Sanayii AS | | | 3,273,717 | 50,269 |
| ^ | BIM Birlesik Magazalar AS | | | 1,367,004 | 47,624 |
| | Turk Telekomunikasyon AS | | | 8,639,387 | 44,988 |
| | Turkiye Halk Bankasi AS | | | 5,123,836 | 44,413 |
| * | Yapi ve Kredi Bankasi AS | | | 14,026,462 | 44,106 |
| | Turkiye Vakiflar Bankasi Tao | | | 12,410,588 | 32,949 |
| * | Eregli Demir ve Celik Fabrikalari TAS | | | 8,699,365 | 26,488 |
| | Enka Insaat ve Sanayi AS | | | 4,831,123 | 21,134 |
| * | Turk Hava Yollari | | | 6,785,606 | 20,004 |
| | Coca-Cola Icecek AS | | | 1,072,890 | 16,145 |
| | Arcelik AS | | | 2,693,278 | 15,267 |
| | Asya Katilim Bankasi AS | | | 5,528,039 | 10,949 |
| | Tofas Turk Otomobil Fabrikasi AS | | | 1 | — |
| | Akcansa Cimento AS | | | | — |
| |
| | | | | | 979,086 |
| |
| Total Common Stocks (Cost $48,639,592) | | | | 65,126,150 |
| |
| | | Coupon | | | |
| |
| Temporary Cash Investments (1.3%)1 | | | | |
| Money Market Fund (1.3%) | | | | |
| 3,4 | Vanguard Market Liquidity Fund | 0.179% | | 831,468,281 | 831,468 |
| |
| |
| | | | | Face | |
| | | | Maturity | Amount | |
| | | | Date | ($000) | |
| U.S. Government and Agency Obligations (0.0%) | | | | |
| 5,6 | Fannie Mae Discount Notes | 0.175% | 5/25/11 | 500 | 500 |
| | | | | |
| Vanguard® Emerging Markets Stock Index Fund | | | | |
| Schedule of Investments | | | | |
| April 30, 2011 | | | | |
| | | | |
| 5,6 | Fannie Mae Discount Notes | 0.150% | 6/1/11 | 200 | 200 |
| 5,6 | Fannie Mae Discount Notes | 0.150% | 7/20/11 | 1,000 | 1,000 |
| 5,6 | Federal Home Loan Bank Discount Notes | 0.140% | 6/15/11 | 1,000 | 1,000 |
| 5 | Federal Home Loan Bank Discount Notes | 0.110% | 7/15/11 | 300 | 300 |
| 5,6 | Freddie Mac Discount Notes | 0.140% | 6/6/11 | 2,500 | 2,499 |
| 5,6 | Freddie Mac Discount Notes | 0.090% | 7/5/11 | 300 | 300 |
| | | | | | 5,799 |
| |
| Total Temporary Cash Investments (Cost $837,267) | | | | 837,267 |
| Total Investments (101.0%) (Cost $49,476,859) | | | | 65,963,417 |
| Other Assets and Liabilities—Net (-1.0%)4 | | | | (675,351) |
| |
| Net Assets (100%) | | | | 65,288,066 |
* Non-income-producing security.
^ Part of security position is on loan to broker-dealers. The total value of securities on loan is $679,483,000.
1 The fund invests a portion of its cash reserves in equity markets through the use of index futures contracts. After giving effect to futures investments, the fund's effective common stock and temporary cash investment positions represent 99.9% and 1.1%, respectively, of net assets.
2 Security exempt from registration under Rule 144A of the Securities Act of 1933. Such securities may be sold in transactions exempt from registration, normally to qualified institutional buyers. At April 30, 2011, the value of this security represented 1.3% of net assets.
3 Affiliated money market fund available only to Vanguard funds and certain trusts and accounts managed by Vanguard. Rate shown is the 7-day yield.
4 Includes $727,731,000 of collateral received for securities on loan.
5 The issuer operates under a congressional charter; its securities are not backed by the full faith and credit of the U.S. government.
6 Securities with a value of $5,499,000 have been segregated as initial margin for open futures contracts.
ADR—American Depositary Receipt.
GDR—Global Depositary Receipt.
© 2011 The Vanguard Group. Inc.
All rights reserved.
Vanguard Marketing Corporation, Distributor.
SNA 722_ 062011
 |
|
| Vanguard Total World Stock Index Fund |
| Semiannual Report |
|
| April 30, 2011 |
 |
> For the six months ended April 30, 2011, Vanguard Total World Stock Index Fund returned about 14%, in line with its target index and slightly ahead of the average result for its global peer group.
> Despite unsettling news about economic challenges, political upheavals, and the Japanese crisis, global stock markets rose notably.
> North American and European markets outperformed emerging and Pacific Rim markets.
| |
| Contents | |
| Your Fund’s Total Returns. | 1 |
| Chairman’s Letter. | 3 |
| Fund Profile. | 8 |
| Performance Summary. | 10 |
| Financial Statements. | 11 |
| About Your Fund’s Expenses. | 25 |
| Trustees Approve Advisory Arrangement. | 27 |
| Glossary. | 28 |
Please note: The opinions expressed in this report are just that—informed opinions. They should not be considered promises or advice. Also, please keep in mind that the information and opinions cover the period through the date on the front of this report. Of course, the risks of investing in your fund are spelled out in the prospectus.
See the Glossary for definitions of investment terms used in this report.
Cover photograph: Jean Maher.
Your Fund’s Total Returns
Six Months Ended April 30, 2011
| |
| | Total |
| | Returns |
| Vanguard Total World Stock Index Fund | |
| Investor Shares | 13.92% |
| Institutional Shares | 14.04 |
| ETF Shares | |
| Market Price | 14.05 |
| Net Asset Value | 14.03 |
| FTSE All-World Index | 14.12 |
| Global Funds Average | 13.65 |
| Global Funds Average: Derived from data provided by Lipper Inc. |
Institutional Shares are available to certain institutional investors who meet specific administrative, service, and account-size criteria. The Vanguard ETF® Shares shown are traded on the NYSE Arca exchange and are available only through brokers. The table provides ETF returns based on both the NYSE Arca market price and the net asset value for a share. U.S. Pat. No. 6,879,964 B2; 7,337,138.
For the ETF Shares, the market price is determined by the midpoint of the bid-offer spread as of the closing time of the New York Stock Exchange (generally 4 p.m., Eastern time). The net asset value is also determined as of the NYSE closing time. For more information about how the ETF Shares' market prices have compared with their net asset value, visit vanguard.com, select your ETF, and then select the Price and Performance tab. The ETF premium/discount analysis there shows the percentages of days on which the ETF Shares' market price was above or below the NAV.
Index returns are adjusted for withholding taxes applicable to U.S.-based mutual funds organized as Delaware statutory trusts.
1
Your Fund’s Total Returns
Your Fund’s Performance at a Glance
October 31, 2010 , Through April 30, 2011
| | | | |
| | | | Distributions Per Share |
| | Starting | Ending | Income | Capital |
| | Share Price | Share Price | Dividends | Gains |
| Vanguard Total World Stock Index Fund | | | | |
| Investor Shares | $18.85 | $21.09 | $0.350 | $0.000 |
| Institutional Shares | 94.62 | 105.79 | 1.925 | 0.000 |
| ETF Shares | 46.30 | 51.79 | 0.918 | 0.000 |
2

Chairman’s Letter
Dear Shareholder,
Vanguard Total World Stock Index Fund, which holds almost 2,900 large- and mid-capitalization stocks of companies from around the globe, returned about 14% for the six months ended April 30, 2011. This performance closely tracked that of the fund’s target, the FTSE All-World Index, and was slightly ahead of the average return of peer global funds.
Stocks from North America and Europe recorded the best results, although emerging market and Pacific holdings also had solid gains. Led by energy stocks, all ten industry sectors registered positive returns; all but the two smallest sectors, telecommunication services and utilities, notched double-digit gains.
The U.S. dollar weakened against the world’s major currencies, boosting returns from foreign stocks for U.S.-based investors. Most notably, the dollar depreciated significantly against the euro, the dominant foreign currency in the fund’s holdings. (For an explanation of how currency exchange rates can affect returns, see the box on page 6.)
Stock returns were strong around the globe
The headlines were dominated by political upheaval, natural and nuclear disaster, and economic distress, but global stock markets produced outstanding returns for the six months ended April 30. The broad U.S. stock market returned more than 17%.
3
Although rising food and gasoline prices put pressure on consumer budgets, corporate earnings growth remained strong and the pace of job creation bounced back from extremely depressed levels.
For U.S.-based investors, international stock markets produced a smaller but still robust six-month return of more than 12%. Almost half of this return reflected exchange-rate gains.
As the economy found its footing, rates edged higher
Rising longer-term interest rates put pressure on bond prices, restraining fixed income returns for the six-month period. The broad taxable U.S. bond market had a flat return, while the broad municipal market returned –1.68%. The rise in rates reflected both confidence that the economic recovery would prove self-sustaining and anxiety that higher rates would be necessary to help curb inflation. Even so, inflation expectations remained subdued, as measured by the difference between the yields of nominal and inflation-protected U.S. Treasury bonds.
The return from short-term money market instruments such as the 3-month U.S. Treasury bill remained near 0%, consistent with the Federal Reserve Board’s target for short-term rates.
North America and Europe drove most of the fund’s gain
Investors found reasons to applaud the global stock markets over the six months. Whenever it seemed that various
| | | |
| Market Barometer | | | |
| |
| | | | Total Returns |
| | | Periods Ended April 30, 2011 |
| | Six | One | Five Years |
| | Months | Year | (Annualized) |
| Stocks | | | |
| Russell 1000 Index (Large-caps) | 17.12% | 18.02% | 3.30% |
| Russell 2000 Index (Small-caps) | 23.73 | 22.20 | 3.89 |
| Dow Jones U.S. Total Stock Market Index | 17.28 | 18.40 | 3.65 |
| MSCI All Country World Index ex USA (International) | 12.44 | 19.73 | 3.55 |
| |
| Bonds | | | |
| Barclays Capital U.S. Aggregate Bond Index (Broad | | | |
| taxable market) | 0.02% | 5.36% | 6.33% |
| Barclays Capital Municipal Bond Index (Broad | | | |
| tax-exempt market) | -1.68 | 2.20 | 4.52 |
| Citigroup Three-Month U.S. Treasury Bill Index | 0.06 | 0.15 | 2.02 |
| |
| CPI | | | |
| Consumer Price Index | 2.83% | 3.16% | 2.22% |
4
calamities and turmoil around the world might restrain performance, higher corporate earnings and improved economic data sent stocks moving forward again.
North American markets led the productive pack. The stock markets of the United States and Canada, which represented close to half of the fund’s assets, together returned about 16% as measured in the FTSE All-World Index. Of course, most of that return came from the United States, which is by far the biggest single market represented in the fund, accounting for more than 40% of its assets.
Reflecting a growing economy and increased consumer confidence, all sectors aside from utilities produced double-digit returns. U.S.-based energy companies led the gains as rising oil prices sent the stocks of oil and gas companies higher, and equipment and service providers hopped on for the ride. Industrials and materials were also quite strong.
Canadian stocks, which climbed nearly 18%, can’t be overlooked. Among all the countries represented in the fund, Canada made the third-highest contribution to return. Energy, financial, and materials stocks were keys to the climb of Canada, which is also experiencing an economic rebound following the financial crisis.
Expense Ratios
Your Fund Compared With Its Peer Group
| | | | |
| | Investor | Institutional | ETF | Peer Group |
| | Shares | Shares | Shares | Average |
| Total World Stock Index Fund | 0.45% | 0.23% | 0.25% | 1.46% |
The fund expense ratios shown are from the prospectus dated February 25, 2011, and represent estimated costs for the current fiscal year. For the six months ended April 30, 2011, the fund’s annualized expense ratios were 0.43% for Investor Shares, 0.22% for Institutional Shares, and 0.24% for ETF Shares. The peer-group expense ratio is derived from data provided by Lipper Inc. and captures information through year-end 2010.
Peer group: International Funds.
5
Europe, the fund’s second-largest region at about 25% of assets on average, wasn’t far off the pace set by North America. European stocks advanced more than 15%. As I noted earlier, the dollar’s depreciation against the euro was partially responsible for this strong result.
Companies from the United Kingdom, Germany, France, and Switzerland provided most of the regional gain. Global economic expansion helped the industrial sector, while higher oil and commodity prices lifted the energy and materials sectors, respectively.
|
| Investment insight |
|
| A note on foreign currency translation effects |
| When you buy stocks of companies based outside of your home country, you gain |
| exposure to a wider array of economic and market forces, including the dynamics of |
| the foreign exchange markets. |
| |
| The exchange rate of the U.S. dollar versus another currency is the price at which |
| the dollar can be converted into that currency. For example, if the exchange rate |
| of the U.S. dollar versus Britain’s pound sterling is $1.50, it takes 1.5 dollars to |
| purchase 1 pound. If the U.S. dollar weakens—say, to a rate of $2.00—then you’ll |
| need 2 dollars to buy 1 pound. Conversely, if the dollar strengthens to $1.25, it will |
| take fewer dollars to buy a pound. |
| |
| The price of one currency relative to another is determined by supply and demand |
| factors—including interest rates, the strength of the two economies, and geopolitical |
| risks. In the long run, the portfolio effects of exchange rate movements tend to |
| balance out. But a rise or fall in the dollar’s value versus other currencies can |
| influence short-term returns. Exchange rate changes also affect the purchasing |
| power of each new dollar you invest in foreign stocks, just as they affect the prices of |
| foreign goods. And they can have a less immediately visible impact on a company’s |
| profits, ultimately driving its stock price. |
| |
| Performance during the period |
| From October 31, 2010, through April 30, 2011, most major currencies rose in value |
| against the U.S. dollar. In part, this reflected the Federal Reserve’s policy of holding |
| short-term interest rates near zero while some foreign central banks raised rates. For |
| U.S.-based investors, the shrinking dollar boosted returns earned in markets abroad. |
| Two widely used international benchmarks show the effect: the MSCI Europe Index |
| returned more than 15% when translated into U.S. dollars, and the MSCI Emerging |
| Markets Index returned nearly 10% in dollars––both nearly double the indexes’ |
| local-currency returns. |
6
Emerging markets, which had some of the best returns worldwide in recent years, downshifted over the six-month period as inflation concerns and unrest in the Middle East weighed on performance. Still, these markets’ aggregate return of about 10% is fairly impressive when viewed through a historical and long-term lens. Taiwan and Russia made strong contributions. The high-profile Indian market, beset by political and inflation worries, lost ground.
Of course, Japan’s tragic earthquake and nuclear crisis affected the overall performance of the Pacific region, which still notched a respectable return of about 8%. Japanese stocks, which had been climbing before the March catastrophes, finished the period with a gain of about 5%. The nation’s energy sector—which includes the firm in charge of the damaged nuclear plant—was responsible for much of the market’s weakness, but consumer discretionary and industrial firms offered some support. Australia provided the region’s best result, as its materials sector benefited from the rise in commodity prices.
Manage your portfolio with a long-term perspective
The recovery of global stocks has now stretched for more than two years, and memories of the financial crisis linger rather than loom. The latest six-month returns, outstanding on a historical basis, are especially impressive when you consider the many challenges the markets faced during the period. Investors tapped their brakes on bad news that might have sent them screeching to a halt a few years ago.
Indeed, emotions play a role in the short-term movements of stock markets, and anguish and elation have sent the markets to lows and highs they wouldn’t have reached on their own. At Vanguard, we believe that a long-term perspective is crucial and that investors should bring a logical approach to the short-term swings that will always plague stocks.
This means building and maintaining a well-balanced and diversified portfolio that matches your appetite for risk, long-term goals, and time horizon. Such a portfolio may include stocks from both the United States and abroad, as well as bonds and cash reserves. Vanguard research has shown that a combination of U.S. and international stocks has experienced lower volatility than an all-domestic portfolio over longer periods. The Total World Stock Index Fund, with its skilled management by Vanguard Quantitative Equity Group, its low expenses, and its diverse mix of stocks across the globe, can be a core asset in such a well-balanced portfolio.
Thank you for entrusting your assets to Vanguard.
Sincerely,

F. William McNabb III
Chairman and Chief Executive Officer
May 13, 2011
7
Total World Stock Index Fund
Fund Profile
As of April 30, 2011
| | | |
| Share-Class Characteristics | |
| |
| | Investor | Institutional | ETF |
| | Shares | Shares | Shares |
| Ticker Symbol | VTWSX | VTWIX | VT |
| Expense Ratio1 | 0.45% | 0.23% | 0.25% |
| |
| Portfolio Characteristics | | |
| | | | FTSE |
| | | | All-World |
| | | Fund | Index |
| Number of Stocks | | 2,894 | 2,854 |
| Median Market Cap | $37.0B | $37.1B |
| Price/Earnings Ratio | | 14.9x | 14.8x |
| Price/Book Ratio | | 1.9x | 1.9x |
| Return on Equity | | 18.9% | 18.7% |
| Earnings Growth Rate | 4.0% | 4.1% |
| Dividend Yield | | 2.4% | 2.5% |
| Turnover Rate | | | |
| (Annualized) | | 8% | — |
| Short-Term Reserves | | 0.0% | — |
| |
| Sector Diversification (% of equity exposure) |
| | | | FTSE |
| | | | All-World |
| | | Fund | Index |
| Consumer Discretionary | 9.8% | 9.8% |
| Consumer Staples | | 9.3 | 9.3 |
| Energy | | 11.9 | 11.9 |
| Financials | | 21.0 | 21.1 |
| Health Care | | 8.0 | 8.0 |
| Industrials | | 11.1 | 11.1 |
| Information Technology | 11.3 | 11.3 |
| Materials | | 9.2 | 9.1 |
| Telecommunication | | | |
| Services | | 4.7 | 4.6 |
| Utilities | | 3.7 | 3.8 |
| | |
| Ten Largest Holdings (% of total net assets) |
| Exxon Mobil Corp | Integrated Oil & | |
| | Gas | 1.4% |
| Apple Inc | Computer | |
| | Hardware | 1.0 |
| BHP Billiton | Diversified Metals | |
| | & Mining | 0.8 |
| Royal Dutch Shell plc | Integrated Oil & | |
| | Gas | 0.8 |
| Chevron Corp. | Integrated Oil & | |
| | Gas | 0.7 |
| Microsoft Corp. | Systems Software | 0.7 |
| General Electric Co. | Industrial | |
| | Conglomerates | 0.7 |
| Nestle SA | Packaged Foods & | |
| | Meats | 0.7 |
| International Business | IT Consulting & | |
| Machines Corp. | Other Services | 0.7 |
| HSBC Holdings plc | Diversified Banks | 0.6 |
| Top Ten | | 8.1% |
| The holdings listed exclude any temporary cash investments and equity index products. |
Allocation by Region (% of equity exposure)
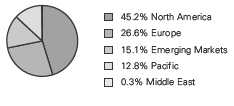
1 The expense ratios shown are from the prospectus dated February 25, 2011, and represent estimated costs for the current fiscal year. For the six months ended April 30, 2011, the annualized expense ratios were 0.43% for Investor Shares, 0.22% for Institutional Shares, and 0.24% for ETF Shares.
8
Total World Stock Index Fund
| | |
| Market Diversification (% of equity exposure) |
| | | FTSE |
| | | All-World |
| | Fund | Index |
| Europe | | |
| United Kingdom | 8.2% | 8.2% |
| France | 4.5 | 4.5 |
| Germany | 3.5 | 3.5 |
| Switzerland | 3.0 | 3.1 |
| Spain | 1.6 | 1.6 |
| Sweden | 1.3 | 1.3 |
| Italy | 1.3 | 1.3 |
| Netherlands | 1.0 | 1.0 |
| Other | 2.2 | 2.1 |
| Subtotal | 26.6% | 26.6% |
| Pacific | | |
| Japan | 7.2% | 7.2% |
| Australia | 3.4 | 3.4 |
| Hong Kong | 1.4 | 1.3 |
| Other | 0.8 | 0.8 |
| Subtotal | 12.8% | 12.7% |
| Emerging Markets | | |
| China | 2.5% | 2.5% |
| Brazil | 2.3 | 2.3 |
| South Korea | 2.3 | 2.3 |
| Taiwan | 1.6 | 1.6 |
| India | 1.3 | 1.3 |
| South Africa | 1.2 | 1.2 |
| Russia | 1.0 | 1.0 |
| Other | 2.9 | 2.8 |
| Subtotal | 15.1% | 15.0% |
| Middle East | 0.3% | 0.3% |
| North America | | |
| United States | 41.1% | 41.3% |
| Canada | 4.1 | 4.1 |
| Subtotal | 45.2% | 45.4% |
9
Total World Stock Index Fund
Performance Summary
All of the returns in this report represent past performance, which is not a guarantee of future results that may be achieved by the fund. (Current performance may be lower or higher than the performance data cited. For performance data current to the most recent month-end, visit our website at vanguard.com/performance.) Note, too, that both investment returns and principal value can fluctuate widely, so an investor’s shares, when sold, could be worth more or less than their original cost. The returns shown do not reflect taxes that a shareholder would pay on fund distributions or on the sale of fund shares.
Fiscal-Year Total Returns (%): June 26, 2008, Through April 30, 2011
Note: For 2011, performance data reflect the six months ended April 30, 2011.
Index returns are adjusted for withholding taxes applicable to U.S.-based mutual funds organized as Delaware statutory trusts.
Average Annual Total Returns: Periods Ended March 31, 2011
This table presents returns through the latest calendar quarter—rather than through the end of the fiscal period.
Securities and Exchange Commission rules require that we provide this information.
| | | |
| | Inception | One | Since |
| | Date | Year | Inception |
| Investor Shares | 6/26/2008 | 13.94% | 1.79% |
| Fee-Adjusted Returns | | 13.65 | 1.70 |
| Institutional Shares | 10/9/2008 | 14.13 | 20.40 |
| Fee-Adjusted Returns | | 13.85 | 20.27 |
| ETF Shares | 6/24/2008 | | |
| Market Price | | 14.17 | 1.53 |
| Net Asset Value | | 14.13 | 1.42 |
The Fiscal-Year Total Returns chart is not adjusted for fees. In the final table, fee-adjusted returns reflect the 0.25% purchase fee but not the 2% fee on redemptions of shares held for less than two months. The fees do not apply to the ETF Shares.
See Financial Highlights for dividend and capital gains information.
10
Total World Stock Index Fund
Financial Statements (unaudited)
Statement of Net Assets—Investments Summary
As of April 30, 2011
This Statement summarizes the fund’s holdings by asset type. Details are reported for each of the fund’s 50 largest individual holdings and for investments that, in total for any issuer, represent more than 1% of the fund’s net assets. The total value of smaller holdings is reported as a single amount within each category.
The fund reports a complete list of its holdings in regulatory filings four times in each fiscal year, at the quarter-ends. For the second and fourth fiscal quarters, the complete listing of the fund’s holdings is available electronically on vanguard.com and on the Securities and Exchange Commission’s website (sec.gov), or you can have it mailed to you without charge by calling 800-662-7447. For the first and third fiscal quarters, the fund files the lists with the SEC on Form N-Q. Shareholders can look up the fund’s Forms N-Q on the SEC’s website. Forms N-Q may also be reviewed and copied at the SEC’s Public Reference Room (see the back cover of this report for further information).
| | | |
| | | Market | Percentage |
| | | Value | of Net |
| | Shares | ($000) | Assets |
| Common Stocks | | | |
| Australia | | | |
| BHP Billiton Ltd. | 141,223 | 7,150 | 0.5% |
| Commonwealth Bank of Australia | 67,150 | 3,964 | 0.3% |
| Australia—Other † | | 37,656 | 2.6% |
| | | 48,770 | 3.4% |
| |
| Austria † | | 2,174 | 0.1% |
| |
| Belgium † | | 5,231 | 0.4% |
| |
| Brazil † | | 32,662 | 2.3% |
| |
| Canada | | | |
| Imperial Oil Ltd. | 14,490 | 766 | 0.1% |
| Canada—Other † | | 57,877 | 4.0% |
| | | 58,643 | 4.1% |
| |
| Chile † | | 3,516 | 0.2% |
| |
| China † | | 35,091 | 2.4% |
| |
| Colombia † | | 1,577 | 0.1% |
| |
| Czech Republic † | | 942 | 0.1% |
| |
| Denmark † | | 7,040 | 0.5% |
| |
| Egypt † | | 791 | 0.1% |
11
| | | |
| Total World Stock Index Fund | | | |
| |
| | | Market | Percentage |
| | | Value | of Net |
| | Shares | ($000) | Assets |
| Finland † | | 5,845 | 0.4% |
| France | | | |
| Total SA | 98,288 | 6,295 | 0.5% |
| Sanofi-Aventis SA | 57,279 | 4,532 | 0.3% |
| France—Other † | | 53,174 | 3.7% |
| | | 64,001 | 4.5% |
| Germany | | | |
| Siemens AG | 40,233 | 5,852 | 0.4% |
| *,^ BASF SE | 40,626 | 4,172 | 0.3% |
| Germany—Other † | | 39,705 | 2.8% |
| | | 49,729 | 3.5% |
| Greece † | | 1,321 | 0.1% |
| Hong Kong † | | 19,236 | 1.3% |
| Hungary † | | 1,201 | 0.1% |
| 1India † | | 18,640 | 1.3% |
| Indonesia † | | 4,879 | 0.3% |
| Ireland † | | 1,502 | 0.1% |
| Israel † | | 4,385 | 0.3% |
| Italy † | | 18,477 | 1.3% |
| Japan | | | |
| Toyota Motor Corp. | 103,130 | 4,114 | 0.3% |
| TonenGeneral Sekiyu KK | 11,000 | 136 | 0.0% |
| Japan—Other † | | 98,182 | 6.9% |
| | | 102,432 | 7.2% |
| Luxembourg † | | 602 | 0.0% |
| Malaysia † | | 7,197 | 0.5% |
| Mexico † | | 9,423 | 0.7% |
| Morocco † | | 224 | 0.0% |
| Netherlands † | | 13,984 | 1.0% |
| New Zealand † | | 766 | 0.1% |
| Norway † | | 5,604 | 0.4% |
| Peru † | | 1,189 | 0.1% |
12
| | | |
| Total World Stock Index Fund | | | |
| |
| |
| |
| | | Market | Percentage |
| | | Value | of Net |
| | Shares | ($000) | Assets |
| Philippines † | | 1,031 | 0.1% |
| |
| Poland † | | 2,726 | 0.2% |
| |
| Portugal † | | 1,908 | 0.1% |
| |
| Russia † | | 14,470 | 1.0% |
| |
| Singapore † | | 9,970 | 0.7% |
| |
| |
| South Africa † | | 16,995 | 1.2% |
| |
| South Korea | | | |
| 1 Samsung Electronics Co. Ltd. GDR | 12,756 | 5,325 | 0.4% |
| South Korea—Other † | | 26,986 | 1.9% |
| | | 32,311 | 2.3% |
| Spain | | | |
| Telefonica SA | 202,082 | 5,429 | 0.4% |
| Banco Santander SA | 363,730 | 4,645 | 0.3% |
| Spain—Other † | | 12,387 | 0.9% |
| | | 22,461 | 1.6% |
| |
| Sweden † | | 18,642 | 1.3% |
| |
| Switzerland | | | |
| Nestlé SA | 152,492 | 9,465 | 0.7% |
| Novartis AG | 99,022 | 5,872 | 0.4% |
| Roche Holding AG | 30,655 | 4,976 | 0.3% |
| 1 Switzerland—Other † | | 22,762 | 1.6% |
| | | 43,075 | 3.0% |
| |
| Taiwan † | | 22,722 | 1.6% |
| |
| Thailand † | | 3,269 | 0.2% |
| |
| Turkey † | | 2,642 | 0.2% |
| |
| United Kingdom | | | |
| HSBC Holdings plc | 772,406 | 8,425 | 0.6% |
| Vodafone Group plc | 2,284,336 | 6,604 | 0.5% |
| BP plc | 829,252 | 6,375 | 0.5% |
| Royal Dutch Shell plc Class A | 156,118 | 6,081 | 0.4% |
| GlaxoSmithKline plc | 228,283 | 4,987 | 0.4% |
| Rio Tinto plc | 67,214 | 4,904 | 0.3% |
| Royal Dutch Shell plc Class B | 118,942 | 4,627 | 0.3% |
| BHP Billiton plc | 95,666 | 4,045 | 0.3% |
| United Kingdom—Other † | | 70,499 | 4.9% |
| | | 116,547 | 8.2% |
13
| | | | | |
| Total World Stock Index Fund | | | | |
| |
| |
| |
| | | | | Market | Percentage |
| | | | | Value | of Net |
| | | | Shares | ($000) | Assets |
| United States | | | | |
| | Exxon Mobil Corp. | | 221,919 | 19,529 | 1.4% |
| * | Apple Inc. | | 40,252 | 14,017 | 1.0% |
| | Chevron Corp. | | 88,224 | 9,655 | 0.7% |
| | Microsoft Corp. | | 369,783 | 9,622 | 0.7% |
| | General Electric Co. | | 469,571 | 9,603 | 0.7% |
| | International Business Machines Corp. | | 54,554 | 9,306 | 0.6% |
| | AT&T Inc. | | 261,459 | 8,137 | 0.6% |
| | Procter & Gamble Co. | | 122,671 | 7,961 | 0.6% |
| | Johnson & Johnson | | 120,861 | 7,943 | 0.6% |
| | Oracle Corp. | | 218,211 | 7,867 | 0.5% |
| | JPMorgan Chase & Co. | | 172,040 | 7,850 | 0.5% |
| | Pfizer Inc. | | 354,805 | 7,437 | 0.5% |
| | Coca-Cola Co. | | 101,894 | 6,874 | 0.5% |
| | Wells Fargo & Co. | | 230,319 | 6,705 | 0.5% |
| | Wal-Mart Stores Inc. | | 117,203 | 6,444 | 0.4% |
| * | Citigroup Inc. | | 1,275,383 | 5,854 | 0.4% |
| * | Google Inc. Class A | | 10,478 | 5,701 | 0.4% |
| | Intel Corp. | | 241,523 | 5,601 | 0.4% |
| | Philip Morris International Inc. | | 79,642 | 5,530 | 0.4% |
| | Bank of America Corp. | | 443,840 | 5,450 | 0.4% |
| | Schlumberger Ltd. | | 60,047 | 5,389 | 0.4% |
| | ConocoPhillips | | 62,918 | 4,966 | 0.3% |
| | Merck & Co. Inc. | | 134,353 | 4,830 | 0.3% |
| | PepsiCo Inc. | | 69,709 | 4,802 | 0.3% |
| | Verizon Communications Inc. | | 124,613 | 4,708 | 0.3% |
| | Cisco Systems Inc. | | 242,217 | 4,253 | 0.3% |
| | Occidental Petroleum Corp. | | 35,485 | 4,056 | 0.3% |
| | QUALCOMM Inc. | | 70,243 | 3,993 | 0.3% |
| * | Berkshire Hathaway Inc. Class A | | 32 | 3,992 | 0.3% |
| | United States—Other † | | | 380,138 | 26.6% |
| | | | | 588,213 | 41.2% |
| Total Common Stocks (Cost $1,137,083) | | | 1,424,056 | 99.8% |
| |
| | | Coupon | | | |
| Temporary Cash Investment | | | | |
| Money Market Fund | | | | |
| 2,3 | Vanguard Market Liquidity | | | | |
| | Fund (Cost $38,484) | 0.179% | 38,483,970 | 38,484 | 2.7% |
| Total Investments (Cost $1,175,567) | | | 1,462,540 | 102.5% |
| Other Assets and Liabilities | | | | |
| Other Assets | | | 5,748 | 0.4% |
| Liabilities3 | | | (41,075) | (2.9%) |
| | | | | (35,327) | (2.5%) |
| Net Assets | | | 1,427,213 | 100.0% |
14
| |
| Total World Stock Index Fund | |
| |
| |
| At April 30, 2011, net assets consisted of: | |
| | Amount |
| | ($000) |
| Paid-in Capital | 1,143,780 |
| Undistributed Net Investment Income | 7,021 |
| Accumulated Net Realized Losses | (10,661) |
| Unrealized Appreciation (Depreciation) | |
| Investment Securities | 286,973 |
| Foreign Currencies | 100 |
| Net Assets | 1,427,213 |
| |
| Investor Shares—Net Assets | |
| Applicable to 15,560,372 outstanding $.001 par value shares of | |
| beneficial interest (unlimited authorization) | 328,171 |
| Net Asset Value Per Share—Investor Shares | $21.09 |
| |
| Institutional Shares—Net Assets | |
| Applicable to 861,302 outstanding $.001 par value shares of | |
| beneficial interest (unlimited authorization) | 91,119 |
| Net Asset Value Per Share—Institutional Shares | $105.79 |
| |
| ETF Shares—Net Assets | |
| Applicable to 19,462,475 outstanding $.001 par value shares of | |
| beneficial interest (unlimited authorization) | 1,007,923 |
| Net Asset Value Per Share—ETF Shares | $51.79 |
See Note A in Notes to Financial Statements.
* Non-income-producing security.
^ Part of security position is on loan to broker-dealers. The total value of securities on loan is $36,718,000.
† Represents the aggregate value, by category, of securities that are not among the 50 largest holdings and, in total for any issuer, represent 1% or less of net assets.
1 Certain of the fund’s securities are exempt from registration under Rule 144A of the Securities Act of 1933. Such securities may be sold in transactions exempt from registration, normally to qualified institutional buyers. At April 30, 2011, the aggregate value of these securities was $7,229,000, representing 0.5% of net assets.
2 Affiliated money market fund available only to Vanguard funds and certain trusts and accounts managed by Vanguard. Rate shown is the 7-day yield.
3 Includes $38,484,000 of collateral received for securities on loan.
GDR—Global Depositary Receipt.
See accompanying Notes, which are an integral part of the Financial Statements.
15
Total World Stock Index Fund
Statement of Operations
| |
| | Six Months Ended |
| | April 30, 2011 |
| | ($000) |
| Investment Income | |
| Income | |
| Dividends1 | 14,499 |
| Interest2 | 6 |
| Security Lending | 102 |
| Total Income | 14,607 |
| Expenses | |
| The Vanguard Group—Note B | |
| Investment Advisory Services | 88 |
| Management and Administrative—Investor Shares | 519 |
| Management and Administrative—Institutional Shares | 48 |
| Management and Administrative—ETF Shares | 731 |
| Marketing and Distribution—Investor Shares | 41 |
| Marketing and Distribution—Institutional Shares | 9 |
| Marketing and Distribution—ETF Shares | 126 |
| Custodian Fees | 128 |
| Shareholders’ Reports—Investor Shares | 3 |
| Shareholders’ Reports—Institutional Shares | — |
| Shareholders’ Reports—ETF Shares | 22 |
| Trustees’ Fees and Expenses | 1 |
| Total Expenses | 1,716 |
| Net Investment Income | 12,891 |
| Realized Net Gain (Loss) | |
| Investment Securities Sold | (1,171) |
| Foreign Currencies | (23) |
| Realized Net Gain (Loss) | (1,194) |
| Change in Unrealized Appreciation (Depreciation) | |
| Investment Securities | 151,200 |
| Foreign Currencies | 52 |
| Change in Unrealized Appreciation (Depreciation) | 151,252 |
| Net Increase (Decrease) in Net Assets Resulting from Operations | 162,949 |
| 1 Dividends are net of foreign withholding taxes of $852,000. |
| 2 Interest income from an affiliated company of the fund was $6,000. |
See accompanying Notes, which are an integral part of the Financial Statements.
16
Total World Stock Index Fund
Statement of Changes in Net Assets
| | |
| | Six Months Ended | Year Ended |
| | April 30, | October 31, |
| | 2011 | 2010 |
| | ($000) | ($000) |
| Increase (Decrease) in Net Assets | | |
| Operations | | |
| Net Investment Income | 12,891 | 19,020 |
| Realized Net Gain (Loss) | (1,194) | 29,502 |
| Change in Unrealized Appreciation (Depreciation) | 151,252 | 66,555 |
| Net Increase (Decrease) in Net Assets Resulting from Operations | 162,949 | 115,077 |
| Distributions | | |
| Net Investment Income | | |
| Investor Shares | (4,815) | (2,072) |
| Institutional Shares | (1,119) | (292) |
| ETF Shares | (16,015) | (9,007) |
| Realized Capital Gain | | |
| Investor Shares | — | — |
| Institutional Shares | — | — |
| ETF Shares | — | — |
| Total Distributions | (21,949) | (11,371) |
| Capital Share Transactions | | |
| Investor Shares | 40,248 | 99,427 |
| Institutional Shares | 34,957 | 25,727 |
| ETF Shares | 174,642 | 160,401 |
| Net Increase (Decrease) from Capital Share Transactions | 249,847 | 285,555 |
| Total Increase (Decrease) | 390,847 | 389,261 |
| Net Assets | | |
| Beginning of Period | 1,036,366 | 647,105 |
| End of Period1 | 1,427,213 | 1,036,366 |
| 1 Net Assets—End of Period includes undistributed net investment income of $7,021,000 and $16,075,000. |
See accompanying Notes, which are an integral part of the Financial Statements.
17
Total World Stock Index Fund
Financial Highlights
| | | | |
| Investor Shares | | | | |
| | Six Months | | | June 26, |
| | Ended | | 20081 to |
| | April 30, | Year Ended October 31, | Oct. 31, |
| For a Share Outstanding Throughout Each Period | 2011 | 2010 | 2009 | 2008 |
| Net Asset Value, Beginning of Period | $18.85 | $16.66 | $13.71 | $20.00 |
| Investment Operations | | | | |
| Net Investment Income | .165 | .3592 | .3282 | .1602 |
| Net Realized and Unrealized Gain (Loss) on Investments | 2.425 | 2.076 | 2.698 | (6.450) |
| Total from Investment Operations | 2.590 | 2.435 | 3.026 | (6.290) |
| Distributions | | | | |
| Dividends from Net Investment Income | (.350) | (.245) | (.076) | — |
| Distributions from Realized Capital Gains | — | — | — | — |
| Total Distributions | (.350) | (.245) | (.076) | — |
| Net Asset Value, End of Period | $21.09 | $18.85 | $16.66 | $13.71 |
| |
| Total Return3 | 13.92% | 14.73% | 22.25% | -31.45% |
| |
| Ratios/Supplemental Data | | | | |
| Net Assets, End of Period (Millions) | $328 | $255 | $131 | $41 |
| Ratio of Total Expenses to Average Net Assets | 0.43% | 0.45% | 0.50% | 0.46%4 |
| Ratio of Net Investment Income to Average Net Assets | 1.98% | 2.03% | 2.28% | 2.32%4 |
| Portfolio Turnover Rate5 | 8% | 7% | 18% | 5% |
The expense ratio, net income ratio, and turnover rate for the current period have been annualized.
1 Inception.
2 Calculated based on average shares outstanding.
3 Total returns do not include transaction or account service fees that may have applied in the periods shown. Fund prospectuses provide information about any applicable transaction or account service fees.
4 Annualized.
5 Excludes the value of portfolio securities received or delivered as a result of in-kind purchases or redemptions of the fund’s capital shares, including ETF Creation Units.
See accompanying Notes, which are an integral part of the Financial Statements.
18
Total World Stock Index Fund
Financial Highlights
| | | | |
| Institutional Shares | | | | |
| | Six Months | | | Oct. 9, |
| | Ended | | 20081 to |
| | April 30, | Year Ended October 31, | Oct. 31, |
| For a Share Outstanding Throughout Each Period | 2011 | 2010 | 2009 | 2008 |
| Net Asset Value, Beginning of Period | $94.62 | $83.54 | $68.63 | $66.81 |
| Investment Operations | | | | |
| Net Investment Income | .941 | 1.8932 | 1.8842 | .1242 |
| Net Realized and Unrealized Gain (Loss) on Investments3 | 12.154 | 10.538 | 13.457 | 1.696 |
| Total from Investment Operations | 13.095 | 12.431 | 15.341 | 1.820 |
| Distributions | | | | |
| Dividends from Net Investment Income | (1.925) | (1.351) | (.431) | — |
| Distributions from Realized Capital Gains | — | — | — | — |
| Total Distributions | (1.925) | (1.351) | (.431) | — |
| Net Asset Value, End of Period | $105.79 | $94.62 | $83.54 | $68.63 |
| |
| Total Return4 | 14.04% | 15.01% | 22.55% | 2.72% |
| |
| Ratios/Supplemental Data | | | | |
| Net Assets, End of Period (Millions) | $91 | $48 | $17 | $7 |
| Ratio of Total Expenses to Average Net Assets | 0.22% | 0.23% | 0.25% | 0.20%5 |
| Ratio of Net Investment Income to Average Net Assets | 2.19% | 2.25% | 2.53% | 2.58%5 |
| Portfolio Turnover Rate6 | 8% | 7% | 18% | 5% |
The expense ratio, net income ratio, and turnover rate for the current period have been annualized.
1 Inception.
2 Calculated based on average shares outstanding.
3 Includes increases from purchase and redemption fees of $.01, $.03, $.05, and $.01.
4 Total returns do not include transaction fees that may have applied in the periods shown. Fund prospectuses provide information about any applicable transaction fees.
5 Annualized.
6 Excludes the value of portfolio securities received or delivered as a result of in-kind purchases or redemptions of the fund’s capital shares, including ETF Creation Units.
See accompanying Notes, which are an integral part of the Financial Statements.
19
Total World Stock Index Fund
Financial Highlights
| | | | |
| ETF Shares | | | | |
| | Six Months | | | June 24, |
| | Ended | | 20081 to |
| | April 30, | Year Ended October 31, | Oct. 31, |
| For a Share Outstanding Throughout Each Period | 2011 | 2010 | 2009 | 2008 |
| Net Asset Value, Beginning of Period | $46.30 | $40.88 | $33.59 | $49.74 |
| Investment Operations | | | | |
| Net Investment Income | .451 | .9642 | .8712 | .3402 |
| Net Realized and Unrealized Gain (Loss) on Investments3 | 5.957 | 5.118 | 6.622 | (16.490) |
| Total from Investment Operations | 6.408 | 6.082 | 7.493 | (16.150) |
| Distributions | | | | |
| Dividends from Net Investment Income | (.918) | (.662) | (.203) | — |
| Distributions from Realized Capital Gains | — | — | — | — |
| Total Distributions | (.918) | (.662) | (.203) | — |
| Net Asset Value, End of Period | $51.79 | $46.30 | $40.88 | $33.59 |
| |
| Total Return | 14.03% | 15.00% | 22.49% | -32.47% |
| |
| Ratios/Supplemental Data | | | | |
| Net Assets, End of Period (Millions) | $1,008 | $733 | $499 | $114 |
| Ratio of Total Expenses to Average Net Assets | 0.24% | 0.25% | 0.30% | 0.29%4 |
| Ratio of Net Investment Income to Average Net Assets | 2.17% | 2.23% | 2.48% | 2.49%4 |
| Portfolio Turnover Rate5 | 8% | 7% | 18% | 5% |
The expense ratio, net income ratio, and turnover rate for the current period have been annualized.
1 Inception.
2 Calculated based on average shares outstanding.
3 Includes increases from purchase and redemption fees of $.01, $.02, $.02, and $.01.
4 Annualized.
5 Excludes the value of portfolio securities received or delivered as a result of in-kind purchases or redemptions of the fund’s capital shares, including ETF Creation Units.
See accompanying Notes, which are an integral part of the Financial Statements.
20
Total World Stock Index Fund
Notes to Financial Statements
Vanguard Total World Stock Index Fund is registered under the Investment Company Act of 1940 as an open-end investment company, or mutual fund. The fund invests in securities of foreign issuers, which may subject it to investment risks not normally associated with investing in securities of U.S. corporations. The fund offers three classes of shares: Investor Shares, Institutional Shares, and ETF Shares. Investor Shares are available to any investor who meets the fund’s minimum purchase requirements. Institutional Shares are designed for investors who meet certain administrative, service, and account-size criteria. ETF Shares are listed for trading on the NYSE Arca, Inc.; they can be purchased and sold through a broker.
A. The following significant accounting policies conform to generally accepted accounting principles for U.S. mutual funds. The fund consistently follows such policies in preparing its financial statements.
1. Security Valuation: Securities are valued as of the close of trading on the New York Stock Exchange (generally 4 p.m., Eastern time) on the valuation date. Equity securities are valued at the latest quoted sales prices or official closing prices taken from the primary market in which each security trades; such securities not traded on the valuation date are valued at the mean of the latest quoted bid and asked prices. Securities for which market quotations are not readily available, or whose values have been affected by events occurring before the fund’s pricing time but after the close of the securities’ primary markets, are valued at their fair values calculated according to procedures adopted by the board of trustees. These procedures include obtaining quotations from an independent pricing service, monitoring news to identify significant market- or security-specific events, and evaluating changes in the values of foreign market proxies (for example, ADRs, futures contracts, or exchange-traded funds), between the time the foreign markets close and the fund’s pricing time. When fair-value pricing is employed, the prices of securities used by a fund to calculate its net asset value may differ from quoted or published prices for the same securities. Investments in Vanguard Market Liquidity Fund are valued at that fund’s net asset value.
2. Foreign Currency: Securities and other assets and liabilities denominated in foreign currencies are translated into U.S. dollars using exchange rates obtained from an independent third party as of the fund’s pricing time on the valuation date. Realized gains (losses) and unrealized appreciation (depreciation) on investment securities include the effects of changes in exchange rates since the securities were purchased, combined with the effects of changes in security prices. Fluctuations in the value of other assets and liabilities resulting from changes in exchange rates are recorded as unrealized foreign currency gains (losses) until the assets or liabilities are settled in cash, at which time they are recorded as realized foreign currency gains (losses).
3. Federal Income Taxes: The fund intends to continue to qualify as a regulated investment company and distribute all of its taxable income. Management has analyzed the fund’s tax positions taken for all open federal income tax years (October 31, 2008–2010), and for the period ended April 30, 2011, and has concluded that no provision for federal income tax is required in the fund’s financial statements.
4. Distributions: Distributions to shareholders are recorded on the ex-dividend date.
5. Security Lending: The fund may lend its securities to qualified institutional borrowers to earn additional income. Security loans are required to be secured at all times by collateral at least equal to the market value of securities loaned. The fund invests cash collateral received in Vanguard Market Liquidity Fund, and records a liability for the return of the collateral, during the period the securities are on loan. Security lending income represents fees charged to borrowers plus income earned on investing cash collateral, less expenses associated with the loan.
21
Total World Stock Index Fund
6. Other: Dividend income is recorded on the ex-dividend date. Interest income includes income distributions received from Vanguard Market Liquidity Fund and is accrued daily. Security transactions are accounted for on the date securities are bought or sold. Costs used to determine realized gains (losses) on the sale of investment securities are those of the specific securities sold. Fees assessed on capital share transactions are credited to paid-in capital.
Each class of shares has equal rights as to assets and earnings, except that each class separately bears certain class-specific expenses related to maintenance of shareholder accounts (included in Management and Administrative expenses) and shareholder reporting. Marketing and distribution expenses are allocated to each class of shares based on a method approved by the board of trustees. Income, other non-class-specific expenses, and gains and losses on investments are allocated to each class of shares based on its relative net assets.
B. The Vanguard Group furnishes at cost investment advisory, corporate management, administrative, marketing, and distribution services. The costs of such services are allocated to the fund under methods approved by the board of trustees. The fund has committed to provide up to 0.40% of its net assets in capital contributions to Vanguard. At April 30, 2011, the fund had contributed capital of $215,000 to Vanguard (included in Other Assets), representing 0.02% of the fund’s net assets and 0.09% of Vanguard’s capitalization. The fund’s trustees and officers are also directors and officers of Vanguard.
C. Various inputs may be used to determine the value of the fund’s investments. These inputs are summarized in three broad levels for financial statement purposes. The inputs or methodologies used to value securities are not necessarily an indication of the risk associated with investing in those securities.
Level 1—Quoted prices in active markets for identical securities.
Level 2—Other significant observable inputs (including quoted prices for similar securities, interest rates, prepayment speeds, credit risk, etc.).
Level 3—Significant unobservable inputs (including the fund’s own assumptions used to determine the fair value of investments).
The following table summarizes the fund’s investments as of April 30, 2011, based on the inputs used to value them:
| | | |
| | Level 1 | Level 2 | Level 3 |
| Investments | ($000) | ($000) | ($000) |
| Common Stocks—U.S. | 588,213 | — | — |
| Common Stocks—International | 123,164 | 712,679 | — |
| Temporary Cash Investments | 38,484 | — | — |
| Total | 749,861 | 712,679 | — |
22
Total World Stock Index Fund
The following table summarizes changes in investments valued based on Level 3 inputs during the six months ended April 30, 2011:
| |
| | Investments in |
| | Common Stocks— |
| | International |
| Amount Valued Based on Level 3 Inputs | ($000) |
| Balance as of October 31, 2010 | 4 |
| Change in Unrealized Appreciation (Depreciation) | (4) |
| Balance as of April 30, 2011 | — |
D. Distributions are determined on a tax basis and may differ from net investment income and realized capital gains for financial reporting purposes. Differences may be permanent or temporary. Permanent differences are reclassified among capital accounts in the financial statements to reflect their tax character. Temporary differences arise when certain items of income, expense, gain, or loss are recognized in different periods for financial statement and tax purposes; these differences will reverse at some time in the future. Differences in classification may also result from the treatment of short-term gains as ordinary income for tax purposes.
During the six months ended April 30, 2011, the fund realized net foreign currency losses of $23,000, which decreased distributable net income for tax purposes; accordingly, such losses have been reclassified from accumulated net realized losses to undistributed net investment income. Certain of the fund’s investments are in securities considered to be “passive foreign investment companies,” for which any unrealized appreciation and/or realized gains are required to be included in distributable net income for tax purposes. During the six months ended April 30, 2011, the fund realized gains on the sale of passive foreign investment companies of $27,000, which have been included in current and prior periods’ taxable income; accordingly, such gains have been reclassified from accumulated net realized losses to undistributed net investment income. Unrealized appreciation through the most recent mark-to-market date for tax purposes on passive foreign investment company holdings at April 30, 2011, was $1,093,000, all of which has been distributed and is reflected in the balance of undistributed net investment income.
The fund’s tax-basis capital gains and losses are determined only at the end of each fiscal year. For tax purposes, at October 31, 2010, the fund had available capital loss carryforwards totaling $9,435,000 to offset future net capital gains of $572,000 through October 31, 2016, $7,777,000 through October 31, 2017, and $1,086,000 through October 31, 2018. The fund will use these capital losses to offset net taxable capital gains, if any, realized during the year ending October 31, 2011; should the fund realize net capital losses for the year, the losses will be added to the loss carryforward balance above.
23
Total World Stock Index Fund
At April 30, 2011, the cost of investment securities for tax purposes was $1,176,660,000. Net unrealized appreciation of investment securities for tax purposes was $285,880,000, consisting of unrealized gains of $307,863,000 on securities that had risen in value since their purchase and $21,983,000 in unrealized losses on securities that had fallen in value since their purchase.
E. During the six months ended April 30, 2011, the fund purchased $287,221,000 of investment securities and sold $46,653,000 of investment securities, other than temporary cash investments.
F. Capital share transactions for each class of shares were:
| | | | |
| | Six Months Ended | | Year Ended |
| | | April 30, 2011 | October 31, 2010 |
| | Amount | Shares | Amount | Shares |
| | ($000) | (000) | ($000) | (000) |
| Investor Shares | | | | |
| Issued1 | 68,932 | 3,487 | 149,093 | 8,519 |
| Issued in Lieu of Cash Distributions | 4,116 | 214 | 1,883 | 108 |
| Redeemed2 | (32,800) | (1,667) | (51,549) | (2,964) |
| Net Increase (Decrease)—Investor Shares | 40,248 | 2,034 | 99,427 | 5,663 |
| Institutional Shares | | | | |
| Issued1 | 38,002 | 385 | 29,459 | 343 |
| Issued in Lieu of Cash Distributions | 1,119 | 12 | 292 | 3 |
| Redeemed2 | (4,164) | (42) | (4,024) | (44) |
| Net Increase (Decrease)—Institutional Shares | 34,957 | 355 | 25,727 | 302 |
| ETF Shares | | | | |
| Issued1 | 174,642 | 3,619 | 240,124 | 5,437 |
| Issued in Lieu of Cash Distributions | — | — | — | — |
| Redeemed2 | — | — | (79,723) | (1,800) |
| Net Increase (Decrease)—ETF Shares | 174,642 | 3,619 | 160,401 | 3,637 |
| 1 Includes purchase fees for fiscal 2011 and 2010 of $171,000 and $422,000, respectively (fund totals). |
| 2 Net of redemption fees for fiscal 2011 and 2010 of $14,000 and $41,000, respectively (fund totals). |
G. In preparing the financial statements as of April 30, 2011, management considered the impact of subsequent events for potential recognition or disclosure in these financial statements.
24
About Your Fund’s Expenses
As a shareholder of the fund, you incur ongoing costs, which include costs for portfolio management, administrative services, and shareholder reports (like this one), among others. Operating expenses, which are deducted from a fund’s gross income, directly reduce the investment return of the fund.
A fund’s expenses are expressed as a percentage of its average net assets. This figure is known as the expense ratio. The following examples are intended to help you understand the ongoing costs (in dollars) of investing in your fund and to compare these costs with those of other mutual funds. The examples are based on an investment of $1,000 made at the beginning of the period shown and held for the entire period.
The accompanying table illustrates your fund’s costs in two ways:
• Based on actual fund return. This section helps you to estimate the actual expenses that you paid over the period. The ”Ending Account Value“ shown is derived from the fund‘s actual return, and the third column shows the dollar amount that would have been paid by an investor who started with $1,000 in the fund. You may use the information here, together with the amount you invested, to estimate the expenses that you paid over the period.
To do so, simply divide your account value by $1,000 (for example, an $8,600 account value divided by $1,000 = 8.6), then multiply the result by the number given for your fund under the heading ”Expenses Paid During Period.“
• Based on hypothetical 5% yearly return. This section is intended to help you compare your fund‘s costs with those of other mutual funds. It assumes that the fund had a yearly return of 5% before expenses, but that the expense ratio is unchanged. In this case—because the return used is not the fund’s actual return—the results do not apply to your investment. The example is useful in making comparisons because the Securities and Exchange Commission requires all mutual funds to calculate expenses based on a 5% return. You can assess your fund’s costs by comparing this hypothetical example with the hypothetical examples that appear in shareholder reports of other funds.
Note that the expenses shown in the table are meant to highlight and help you compare ongoing costs only and do not reflect transaction costs incurred by the fund for buying and selling securities. Further, the expenses do not include any purchase, redemption, or account service fees described in the fund prospectus. If such fees were applied to your account, your costs would be higher. Your fund does not carry a “sales load.”
The calculations assume no shares were bought or sold during the period. Your actual costs may have been higher or lower, depending on the amount of your investment and the timing of any purchases or redemptions.
You can find more information about the fund’s expenses, including annual expense ratios, in the Financial Statements section of this report. For additional information on operating expenses and other shareholder costs, please refer to your fund’s current prospectus.
25
| | | |
| Six Months Ended April 30, 2011 | | | |
| | Beginning | Ending | Expenses |
| | Account Value | Account Value | Paid During |
| Total World Stock Index Fund | 10/31/2010 | 4/30/2011 | Period |
| Based on Actual Fund Return | | | |
| Investor Shares | $1,000.00 | $1,139.23 | $2.28 |
| Institutional Shares | 1,000.00 | 1,140.41 | 1.17 |
| ETF Shares | 1,000.00 | 1,140.32 | 1.27 |
| Based on Hypothetical 5% Yearly Return | | | |
| Investor Shares | $1,000.00 | $1,022.66 | $2.16 |
| Institutional Shares | 1,000.00 | 1,023.70 | 1.10 |
| ETF Shares | 1,000.00 | 1,023.60 | 1.20 |
The calculations are based on expenses incurred in the most recent six-month period. The fund’s annualized six-month expense ratios for that period are 0.43% for Investor Shares, 0.22% for Institutional Shares, and 0.24% for ETF Shares. The dollar amounts shown as “Expenses Paid” are equal to the annualized expense ratio multiplied by the average account value over the period, multiplied by the number of days in the most recent six-month period, then divided by the number of days in the most recent 12-month period.
26
Trustees Approve Advisory Arrangement
The board of trustees of Vanguard Total World Stock Index Fund has renewed the fund’s investment advisory arrangement with The Vanguard Group, Inc. Vanguard—through its Quantitative Equity Group—serves as the investment advisor for the fund. The board determined that continuing the fund’s internalized management structure was in the best interest of the fund and its shareholders.
The board based its decision upon an evaluation of the advisor’s investment staff, portfolio management process, and performance. The trustees considered the factors discussed below, among others. However, no single factor determined whether the board approved the arrangement. Rather, it was the totality of the circumstances that drove the board’s decision.
Nature, extent, and quality of services
The board considered the quality of the fund’s investment management since the fund’s inception in 2008, and took into account the organizational depth and stability of the advisor. Vanguard has been managing investments for more than three decades. The Quantitative Equity Group adheres to a sound, disciplined investment management process; the team has considerable experience, stability, and depth.
The board concluded that Vanguard’s experience, stability, depth, and performance, among other factors, warranted continuation of the advisory arrangement.
Investment performance
The board considered the fund’s performance since its inception, including any periods of outperformance or underperformance of its target index and peer group. The board concluded that the fund has performed in line with expectations and that its results have been consistent with its investment strategy. Information about the fund’s most recent performance can be found in the Performance Summary section of this report.
Cost
The board concluded that the fund’s expense ratio was well below the average expense ratio charged by funds in its peer group and that the fund’s advisory fee rate is also well below its peer-group average. Information about the fund’s expenses appears in the About Your Fund’s Expenses section of this report as well as in the Financial Statements section.
The board does not conduct a profitability analysis of Vanguard because of Vanguard’s unique “at-cost” structure. Unlike most other mutual fund management companies, Vanguard is owned by the funds it oversees, and produces “profits” only in the form of reduced expenses for fund shareholders.
The benefit of economies of scale
The board concluded that the fund’s low-cost arrangement with Vanguard ensures that the fund will realize economies of scale as it grows, with the cost to shareholders declining as the fund’s assets increase.
The board will consider whether to renew the advisory arrangement again after a one-year period.
27
Glossary
Dividend Yield. Dividend income earned by stocks, expressed as a percentage of the aggregate market value (or of net asset value, for a fund). The yield is determined by dividing the amount of the annual dividends by the aggregate value (or net asset value) at the end of the period. For a fund, the dividend yield is based solely on stock holdings and does not include any income produced by other investments.
Earnings Growth Rate. The average annual rate of growth in earnings over the past five years for the stocks now in a fund.
Equity Exposure. A measure that reflects a fund’s investments in stocks and stock futures. Any holdings in short-term reserves are excluded.
Expense Ratio. The percentage of a fund’s average net assets used to pay its annual administrative and advisory expenses. These expenses directly reduce returns to investors.
Inception Date. The date on which the assets of a fund (or one of its share classes) are first invested in accordance with the fund’s investment objective. For funds with a subscription period, the inception date is the day after that period ends. Investment performance is measured from the inception date.
Median Market Cap. An indicator of the size of companies in which a fund invests; the midpoint of market capitalization (market price x shares outstanding) of a fund’s stocks, weighted by the proportion of the fund’s assets invested in each stock. Stocks representing half of the fund’s assets have market capitalizations above the median, and the rest are below it.
Price/Book Ratio. The share price of a stock divided by its net worth, or book value, per share. For a fund, the weighted average price/book ratio of the stocks it holds.
Price/Earnings Ratio. The ratio of a stock’s current price to its per-share earnings over the past year. For a fund, the weighted average P/E of the stocks it holds. P/E is an indicator of market expectations about corporate prospects; the higher the P/E, the greater the expectations for a company’s future growth.
Return on Equity. The annual average rate of return generated by a company during the past five years for each dollar of shareholder’s equity (net income divided by shareholder’s equity). For a fund, the weighted average return on equity for the companies whose stocks it holds.
Short-Term Reserves. The percentage of a fund invested in highly liquid, short-term securities that can be readily converted to cash.
Turnover Rate. An indication of the fund’s trading activity. Funds with high turnover rates incur higher transaction costs and may be more likely to distribute capital gains (which may be taxable to investors). The turnover rate excludes in-kind transactions, which have minimal impact on costs.
28
This page intentionally left blank.
This page intentionally left blank.
This page intentionally left blank.
The People Who Govern Your Fund
The trustees of your mutual fund are there to see that the fund is operated and managed in your best interests since, as a shareholder, you are a part owner of the fund. Your fund’s trustees also serve on the board of directors of The Vanguard Group, Inc., which is owned by the Vanguard funds and provides services to them on an at-cost basis.
A majority of Vanguard’s board members are independent, meaning that they have no affiliation with Vanguard or the funds they oversee, apart from the sizable personal investments they have made as private individuals. The independent board members have distinguished backgrounds in business, academia, and public service. Each of the trustees and executive officers oversees 179 Vanguard funds.
The following table provides information for each trustee and executive officer of the fund. More information about the trustees is in the Statement of Additional Information, which can be obtained, without charge, by contacting Vanguard at 800-662-7447, or online at vanguard.com.
| |
| Interested Trustee1 | and President (2006–2008) of Rohm and Haas Co. |
| | (chemicals); Director of Tyco International, Ltd. |
| F. William McNabb III | (diversified manufacturing and services) and Hewlett- |
| Born 1957. Trustee Since July 2009. Chairman of the | Packard Co. (electronic computer manufacturing); |
| Board. Principal Occupation(s) During the Past Five | Senior Advisor at New Mountain Capital; Trustee |
| Years: Chairman of the Board of The Vanguard Group, | of The Conference Board; Member of the Board of |
| Inc., and of each of the investment companies served | Managers of Delphi Automotive LLP (automotive |
| by The Vanguard Group, since January 2010; Director | components). |
| of The Vanguard Group since 2008; Chief Executive | |
| Officer and President of The Vanguard Group and of | Amy Gutmann |
| each of the investment companies served by The | Born 1949. Trustee Since June 2006. Principal |
| Vanguard Group since 2008; Director of Vanguard | Occupation(s) During the Past Five Years: President |
| Marketing Corporation; Managing Director of The | of the University of Pennsylvania; Christopher H. |
| Vanguard Group (1995–2008). | Browne Distinguished Professor of Political Science |
| | in the School of Arts and Sciences with secondary |
| | appointments at the Annenberg School for Commu- |
| Independent Trustees | nication and the Graduate School of Education |
| | of the University of Pennsylvania; Director of |
| Emerson U. Fullwood | Carnegie Corporation of New York, Schuylkill River |
| Born 1948. Trustee Since January 2008. Principal | Development Corporation, and Greater Philadelphia |
| Occupation(s) During the Past Five Years: Executive | Chamber of Commerce; Trustee of the National |
| Chief Staff and Marketing Officer for North America | Constitution Center; Chair of the Presidential |
| and Corporate Vice President (retired 2008) of Xerox | Commission for the Study of Bioethical Issues. |
| Corporation (document management products and | |
| services); Executive in Residence and 2010 | JoAnn Heffernan Heisen |
| Distinguished Minett Professor at the Rochester | Born 1950. Trustee Since July 1998. Principal |
| Institute of Technology; Director of SPX Corporation | Occupation(s) During the Past Five Years: Corporate |
| (multi-industry manufacturing), the United Way of | Vice President and Chief Global Diversity Officer |
| Rochester, Amerigroup Corporation (managed health | (retired 2008) and Member of the Executive |
| care), the University of Rochester Medical Center, | Committee (1997–2008) of Johnson & Johnson |
| Monroe Community College Foundation, and North | (pharmaceuticals/consumer products); Director of |
| Carolina A&T University. | Skytop Lodge Corporation (hotels), the University |
| | Medical Center at Princeton, the Robert Wood |
| Rajiv L. Gupta | Johnson Foundation, and the Center for Work Life |
| Born 1945. Trustee Since December 2001.2 | Policy; Member of the Advisory Board of the |
| Principal Occupation(s) During the Past Five Years: | Maxwell School of Citizenship and Public Affairs |
| Chairman and Chief Executive Officer (retired 2009) | at Syracuse University. |
| | |
| F. Joseph Loughrey | Thomas J. Higgins | |
| Born 1949. Trustee Since October 2009. Principal | Born 1957. Chief Financial Officer Since September |
| Occupation(s) During the Past Five Years: President | 2008. Principal Occupation(s) During the Past Five |
| and Chief Operating Officer (retired 2009) and Vice | Years: Principal of The Vanguard Group, Inc.; Chief |
| Chairman of the Board (2008–2009) of Cummins Inc. | Financial Officer of each of the investment companies |
| (industrial machinery); Director of SKF AB (industrial | served by The Vanguard Group since 2008; Treasurer |
| machinery), Hillenbrand, Inc. (specialized consumer | of each of the investment companies served by The |
| services), the Lumina Foundation for Education, and | Vanguard Group (1998–2008). |
| Oxfam America; Chairman of the Advisory Council | | |
| for the College of Arts and Letters and Member | Kathryn J. Hyatt | |
| of the Advisory Board to the Kellogg Institute for | Born 1955. Treasurer Since November 2008. Principal |
| International Studies at the University of Notre Dame. | Occupation(s) During the Past Five Years: Principal |
| | of The Vanguard Group, Inc.; Treasurer of each of |
| André F. Perold | the investment companies served by The Vanguard |
| Born 1952. Trustee Since December 2004. Principal | Group since 2008; Assistant Treasurer of each of the |
| Occupation(s) During the Past Five Years: George | investment companies served by The Vanguard Group |
| Gund Professor of Finance and Banking at the Harvard | (1988–2008). | |
| Business School; Chair of the Investment Committee | | |
| of HighVista Strategies LLC (private investment firm). | Heidi Stam | |
| | Born 1956. Secretary Since July 2005. Principal |
| Alfred M. Rankin, Jr. | Occupation(s) During the Past Five Years: Managing |
| Born 1941. Trustee Since January 1993. Principal | Director of The Vanguard Group, Inc., since 2006; |
| Occupation(s) During the Past Five Years: Chairman, | General Counsel of The Vanguard Group since 2005; |
| President, and Chief Executive Officer of NACCO | Secretary of The Vanguard Group and of each of the |
| Industries, Inc. (forklift trucks/housewares/lignite); | investment companies served by The Vanguard Group |
| Director of Goodrich Corporation (industrial products/ | since 2005; Director and Senior Vice President of |
| aircraft systems and services) and the National | Vanguard Marketing Corporation since 2005; |
| Association of Manufacturers; Chairman of the | Principal of The Vanguard Group (1997–2006). |
| Federal Reserve Bank of Cleveland; Vice Chairman | | |
| of University Hospitals of Cleveland; President of | | |
| the Board of The Cleveland Museum of Art. | Vanguard Senior Management Team |
| |
| Peter F. Volanakis | R. Gregory Barton | Michael S. Miller |
| Born 1955. Trustee Since July 2009. Principal | Mortimer J. Buckley | James M. Norris |
| Occupation(s) During the Past Five Years: President | Kathleen C. Gubanich | Glenn W. Reed |
| and Chief Operating Officer (retired 2010) of Corning | Paul A. Heller | George U. Sauter |
| Incorporated (communications equipment); Director of | Martha G. King | |
| Corning Incorporated (2000–2010) and Dow Corning | | |
| (2001–2010); Overseer of the Amos Tuck School of | | |
| Business Administration at Dartmouth College. | Chairman Emeritus and Senior Advisor |
| |
| | John J. Brennan | |
| Executive Officers | Chairman, 1996–2009 | |
| | Chief Executive Officer and President, 1996–2008 |
| Glenn Booraem | | |
| Born 1967. Controller Since July 2010. Principal | | |
| Occupation(s) During the Past Five Years: Principal | Founder | |
| of The Vanguard Group, Inc.; Controller of each of | | |
| the investment companies served by The Vanguard | John C. Bogle | |
| Group since 2010; Assistant Controller of each of | Chairman and Chief Executive Officer, 1974–1996 |
| the investment companies served by The Vanguard | | |
| Group (2001–2010). | | |
1 Mr. McNabb is considered an “interested person,” as defined in the Investment Company Act of 1940, because he is an officer of the Vanguard funds.
2 December 2002 for Vanguard Equity Income Fund, Vanguard Growth Equity Fund, the Vanguard Municipal Bond Funds, and the Vanguard State Tax-Exempt Funds.
|  |
| P.O. Box 2600 |
| Valley Forge, PA 19482-2600 |
Connect with Vanguard® > vanguard.com
| |
| Fund Information > 800-662-7447 | “FTSE®” is a trademark jointly owned by the London |
| Direct Investor Account Services > 800-662-2739 | Stock Exchange plc and The Financial Times Limited |
| | and is used by FTSE International Limited under license. |
| Institutional Investor Services > 800-523-1036 | ”All-World” is a trademark of FTSE International |
| Text Telephone for People | Limited. The FTSE All-World ex US Index is calculated |
| With Hearing Impairment > 800-749-7273 | by FTSE International Limited. FTSE International |
| | Limited does not sponsor, endorse, or promote the |
| This material may be used in conjunction | fund; is not in any way connected to it; and does not |
| with the offering of shares of any Vanguard | accept any liability in relation to its issue, operation, |
| fund only if preceded or accompanied by | and trading. |
| the fund’s current prospectus. | |
| |
| All comparative mutual fund data are from Lipper Inc. or | |
| Morningstar, Inc., unless otherwise noted. | |
| |
| You can obtain a free copy of Vanguard’s proxy voting | |
| guidelines by visiting vanguard.com/proxyreporting or by | |
| calling Vanguard at 800-662-2739. The guidelines are | |
| also available from the SEC’s website, sec.gov. In | |
| addition, you may obtain a free report on how your fund | |
| voted the proxies for securities it owned during the 12 | |
| months ended June 30. To get the report, visit either | |
| vanguard.com/proxyreporting or sec.gov. | |
| |
| You can review and copy information about your fund at | |
| the SEC’s Public Reference Room in Washington, D.C. To | |
| find out more about this public service, call the SEC at | |
| 202-551-8090. Information about your fund is also | |
| available on the SEC’s website, and you can receive | |
| copies of this information, for a fee, by sending a | |
| request in either of two ways: via e-mail addressed to | |
| publicinfo@sec.gov or via regular mail addressed to the | |
| Public Reference Section, Securities and Exchange | |
| Commission, Washington, DC 20549-1520. | |
| |
| |
| | © 2011 The Vanguard Group, Inc. |
| | All rights reserved. |
| | Vanguard Marketing Corporation, Distributor. |
| |
| | Q6282 062011 |
Vanguard® Total World Stock Index Fund
Schedule of Investments
April 30, 2011
| | |
| | | Market |
| | | Value |
| | Shares | ($000) |
| Common Stocks (99.8%) | | |
| Australia (3.4%) | | |
| BHP Billiton Ltd. | 141,223 | 7,150 |
| Commonwealth Bank of Australia | 67,150 | 3,964 |
| Westpac Banking Corp. | 130,990 | 3,576 |
| Australia & New Zealand Banking Group Ltd. | 113,894 | 3,034 |
| National Australia Bank Ltd. | 95,055 | 2,830 |
| Wesfarmers Ltd. | 44,046 | 1,614 |
| Woolworths Ltd. | 53,409 | 1,554 |
| Newcrest Mining Ltd. | 33,199 | 1,512 |
| Rio Tinto Ltd. | 14,402 | 1,304 |
| Woodside Petroleum Ltd. | 25,325 | 1,302 |
| QBE Insurance Group Ltd. | 50,547 | 1,038 |
| Westfield Group | 101,603 | 1,007 |
| CSL Ltd. | 23,715 | 895 |
| Origin Energy Ltd. | 49,303 | 884 |
| AMP Ltd. | 128,629 | 774 |
| Santos Ltd. | 37,313 | 620 |
| Brambles Ltd. | 82,599 | 612 |
| Telstra Corp. Ltd. | 187,253 | 598 |
| Macquarie Group Ltd. | 15,203 | 588 |
| Foster's Group Ltd. | 82,763 | 511 |
| Orica Ltd. | 17,406 | 509 |
| Suncorp Group Ltd. | 54,641 | 500 |
| Oil Search Ltd. | 61,253 | 474 |
| Stockland | 104,876 | 435 |
| Fortescue Metals Group Ltd. | 63,279 | 429 |
| Amcor Ltd. | 53,230 | 409 |
| WorleyParsons Ltd. | 12,049 | 402 |
| Incitec Pivot Ltd. | 92,120 | 381 |
| Westfield Retail Trust | 128,701 | 374 |
| Transurban Group | 61,549 | 358 |
| Insurance Australia Group Ltd. | 91,161 | 357 |
| Computershare Ltd. | 33,059 | 352 |
| Coca-Cola Amatil Ltd. | 24,908 | 327 |
| AGL Energy Ltd. | 19,654 | 314 |
| Alumina Ltd. | 113,461 | 284 |
| Wesfarmers Ltd. Price Protected Shares | 7,228 | 267 |
| ASX Ltd. | 7,453 | 263 |
| GPT Group | 74,953 | 260 |
| Iluka Resources Ltd. | 17,880 | 246 |
| Leighton Holdings Ltd. | 9,205 | 245 |
| Lend Lease Group | 24,890 | 238 |
| TABCORP Holdings Ltd. | 27,667 | 232 |
| Crown Ltd. | 24,364 | 226 |
| OZ Minerals Ltd. | 138,298 | 220 |
| Sonic Healthcare Ltd. | 15,789 | 217 |
| Asciano Ltd. | 117,762 | 214 |
| Mirvac Group | 147,033 | 205 |
| Goodman Group | 258,927 | 202 |
| Cochlear Ltd. | 2,186 | 193 |
| Toll Holdings Ltd. | 30,015 | 186 |
| Dexus Property Group | 184,598 | 179 |
| OneSteel Ltd. | 72,031 | 169 |
| CFS Retail Property Trust | 85,986 | 169 |
| BlueScope Steel Ltd. | 88,012 | 168 |
| Boral Ltd. | 30,698 | 166 |
| * Lynas Corp. Ltd. | 68,768 | 159 |
| Sims Metal Management Ltd. | 7,941 | 152 |
| Bendigo and Adelaide Bank Ltd. | 14,535 | 149 |
| Metcash Ltd. | 33,030 | 147 |
| Tatts Group Ltd. | 57,251 | 146 |
| Ramsay Health Care Ltd. | 6,298 | 125 |
| | | |
| Vanguard® Total World Stock Index Fund | | |
| Schedule of Investments | | |
| April 30, 2011 | | |
| |
| | | | Market |
| | | | Value |
| | | Shares | ($000) |
| * | James Hardie Industries SE | 18,778 | 122 |
| | MacArthur Coal Ltd. | 9,333 | 119 |
| | Challenger Ltd. | 21,706 | 115 |
| | Perpetual Ltd. | 3,357 | 106 |
| | Bank of Queensland Ltd. | 9,563 | 104 |
| * | Paladin Energy Ltd. | 27,467 | 99 |
| | Harvey Norman Holdings Ltd. | 30,328 | 89 |
| * | Qantas Airways Ltd. | 37,665 | 87 |
| | MAp Group | 25,619 | 83 |
| | Billabong International Ltd. | 10,795 | 80 |
| | Commonwealth Property Office Fund | 79,237 | 80 |
| | Caltex Australia Ltd. | 4,908 | 77 |
| | Whitehaven Coal Ltd. | 10,256 | 72 |
| | Downer EDI Ltd. | 17,239 | 70 |
| | Ansell Ltd. | 4,554 | 70 |
| | IOOF Holdings Ltd. | 8,692 | 68 |
| | Charter Hall Office REIT | 17,571 | 68 |
| | Coal & Allied Industries Ltd. | 540 | 66 |
| | Goodman Fielder Ltd. | 55,147 | 65 |
| | Flight Centre Ltd. | 2,301 | 60 |
| | CSR Ltd. | 17,672 | 58 |
| | New Hope Corp. Ltd. | 10,034 | 54 |
| | Ten Network Holdings Ltd. | 34,205 | 51 |
| | Adelaide Brighton Ltd. | 14,606 | 51 |
| | Aristocrat Leisure Ltd. | 17,415 | 50 |
| * | Aquila Resources Ltd. | 4,970 | 50 |
| | Platinum Asset Management Ltd. | 9,324 | 47 |
| | DuluxGroup Ltd. | 13,950 | 43 |
| | GWA Group Ltd. | 11,242 | 40 |
| | SP AusNet | 38,822 | 37 |
| | Consolidated Media Holdings Ltd. | 11,572 | 35 |
| | Fairfax Media Ltd. | 19,902 | 29 |
| * | Nufarm Ltd. | 4,786 | 25 |
| * | Macquarie Atlas Roads Group | 11,957 | 24 |
| | Australand Property Group | 5,249 | 18 |
| | Envestra Ltd. | 20,533 | 14 |
| | Energy Resources of Australia Ltd. | 2,196 | 13 |
| | West Australian Newspapers Holdings Ltd. | 1,314 | 7 |
| | APN News & Media Ltd. | 2,880 | 5 |
| * | Gunns Ltd. | 6,004 | 4 |
| | | | 48,770 |
| Austria (0.1%) | | |
| | Voestalpine AG | 11,865 | 584 |
| | Erste Group Bank AG | 11,494 | 580 |
| | OMV AG | 5,964 | 272 |
| | Telekom Austria AG | 12,886 | 199 |
| * | IMMOFINANZ AG | 40,627 | 193 |
| | Verbund AG | 2,641 | 119 |
| | Raiffeisen Bank International AG | 1,913 | 106 |
| | Vienna Insurance Group AG Wiener Versicherung Gruppe | 1,514 | 90 |
| | Strabag SE | 916 | 31 |
| | | | 2,174 |
| Belgium (0.4%) | | |
| ^ | Anheuser-Busch InBev NV | 34,701 | 2,215 |
| | Delhaize Group SA | 5,624 | 487 |
| | Umicore SA | 8,094 | 464 |
| ^ | Groupe Bruxelles Lambert SA | 3,424 | 339 |
| | Ageas | 101,450 | 308 |
| * | KBC Groep NV | 7,048 | 287 |
| ^ | Belgacom SA | 6,751 | 265 |
| | UCB SA | 4,930 | 238 |
| | Solvay SA Class A | 1,518 | 219 |
| | Colruyt SA | 2,487 | 143 |
| | | |
| Vanguard® Total World Stock Index Fund | | |
| Schedule of Investments | | |
| April 30, 2011 | | |
| |
| | | | Market |
| | | | Value |
| | | Shares | ($000) |
| * | Dexia SA | 33,590 | 134 |
| * | Cie Nationale a Portefeuille | 1,168 | 84 |
| | Mobistar SA | 649 | 48 |
| | | | 5,231 |
| Brazil (2.3%) | | |
| | Petroleo Brasileiro SA ADR Type A | 98,831 | 3,298 |
| | Vale SA Class B Pfd. ADR | 84,943 | 2,540 |
| | Itau Unibanco Holding SA ADR | 103,283 | 2,453 |
| | Petroleo Brasileiro SA ADR | 65,367 | 2,440 |
| | Vale SA Class B ADR | 67,044 | 2,239 |
| | Banco Bradesco SA ADR | 89,313 | 1,807 |
| | Cia de Bebidas das Americas ADR | 55,195 | 1,798 |
| | Cia Siderurgica Nacional SA ADR | 61,110 | 973 |
| | Banco do Brasil SA | 48,793 | 896 |
| | Itausa - Investimentos Itau SA Prior Pfd. | 114,297 | 876 |
| | Petroleo Brasileiro SA Prior Pfd. | 47,292 | 768 |
| | BRF - Brasil Foods SA | 35,424 | 718 |
| | BM&FBovespa SA | 87,150 | 654 |
| | Petroleo Brasileiro SA | 33,046 | 604 |
| | Embraer SA ADR | 16,459 | 535 |
| | Natura Cosmeticos SA | 18,200 | 511 |
| | Gerdau SA ADR | 40,994 | 495 |
| | Tim Participacoes SA ADR | 8,648 | 408 |
| | CCR SA | 12,800 | 397 |
| | Banco Santander Brasil SA | 32,600 | 377 |
| | Redecard SA | 21,588 | 314 |
| | Tele Norte Leste Participacoes SA ADR | 18,355 | 313 |
| * | OGX Petroleo e Gas Participacoes SA | 27,600 | 292 |
| | Cia Energetica de Minas Gerais ADR | 13,715 | 286 |
| | Cia Brasileira de Distribuicao Grupo Pao de Acucar Prior Pfd. | 5,638 | 250 |
| | PDG Realty SA Empreendimentos e Participacoes | 42,000 | 247 |
| | Brasil Telecom SA ADR | 8,255 | 233 |
| | Ultrapar Participacoes SA Prior Pfd. | 11,872 | 208 |
| | Centrais Eletricas Brasileiras SA Prior Pfd. | 11,300 | 207 |
| | Bradespar SA Prior Pfd. | 7,900 | 205 |
| | All America Latina Logistica SA | 24,800 | 204 |
| | Centrais Eletricas Brasileiras SA | 13,300 | 194 |
| | Usinas Siderurgicas de Minas Gerais SA Prior Pfd. | 17,800 | 182 |
| | Souza Cruz SA | 16,000 | 182 |
| | Vale SA Prior Pfd. | 6,200 | 182 |
| | Cia de Bebidas das Americas | 6,690 | 180 |
| | Cielo SA | 18,889 | 177 |
| | Hypermarcas SA | 12,512 | 168 |
| | Tractebel Energia SA | 9,000 | 159 |
| | Lojas Renner SA | 4,100 | 152 |
| | Vivo Participacoes SA Prior Pfd. | 3,600 | 146 |
| | Metalurgica Gerdau SA Prior Pfd. Class A | 9,500 | 137 |
| * | Braskem SA Prior Pfd. | 9,400 | 136 |
| | Vale SA | 4,100 | 135 |
| | Weg SA | 10,647 | 132 |
| | Cia Paranaense de Energia Prior Pfd. | 4,400 | 119 |
| | Cyrela Brazil Realty SA Empreendimentos e Participacoes | 10,998 | 117 |
| | Usinas Siderurgicas de Minas Gerais SA | 7,000 | 114 |
| | Lojas Americanas SA Prior Pfd. | 12,200 | 109 |
| | Cia Energetica de Sao Paulo Prior Pfd. | 5,385 | 104 |
| | Fibria Celulose SA | 6,400 | 100 |
| | Klabin SA Prior Pfd. | 25,200 | 98 |
| | Suzano Papel e Celulose SA Prior Pfd. | 8,834 | 87 |
| | AES Tiete SA Prior Pfd. | 5,100 | 84 |
| | Eletropaulo Metropolitana Eletricidade de Sao Paulo SA Prior Pfd. | 3,408 | 83 |
| * | NET Servicos de Comunicacao SA Prior Pfd. | 8,900 | 82 |
| | | |
| Vanguard® Total World Stock Index Fund | | |
| Schedule of Investments | | |
| April 30, 2011 | | |
| |
| | | | Market |
| | | | Value |
| | | Shares | ($000) |
| | Duratex SA | 7,800 | 82 |
| | Banco do Estado do Rio Grande do Sul Prior Pfd. | 6,800 | 81 |
| | TAM SA Prior Pfd. | 3,869 | 79 |
| | Porto Seguro SA | 4,572 | 76 |
| | MRV Engenharia e Participacoes SA | 8,200 | 72 |
| | Cia de Saneamento Basico do Estado de Sao Paulo | 2,400 | 70 |
| | Light SA | 3,973 | 67 |
| | Telemar Norte Leste SA Prior Pfd. | 1,900 | 66 |
| | Vale Fertilizantes SA Prior Pfd. | 6,292 | 65 |
| | Brasil Telecom SA Prior Pfd. | 7,000 | 65 |
| | Gerdau SA | 6,200 | 60 |
| | Marfrig Alimentos SA | 5,900 | 60 |
| | Tim Participacoes SA | 11,000 | 60 |
| | Amil Participacoes SA | 4,900 | 59 |
| | JBS SA | 17,398 | 59 |
| | B2W Cia Global Do Varejo | 4,036 | 56 |
| | Cia Energetica de Minas Gerais Prior Pfd. | 2,750 | 56 |
| | EDP - Energias do Brasil SA | 2,200 | 55 |
| | AES Tiete SA | 3,549 | 53 |
| | CPFL Energia SA | 1,800 | 52 |
| * | MMX Mineracao e Metalicos SA | 8,100 | 51 |
| | Cia de Transmissao de Energia Electrica Paulista Prior Pfd. | 1,573 | 51 |
| * | PortX Operacoes Portuarias SA | 22,608 | 50 |
| | Cia Energetica de Minas Gerais | 2,928 | 47 |
| | Tele Norte Leste Participacoes SA | 2,200 | 47 |
| | Cosan SA Industria e Comercio | 2,900 | 44 |
| | M Dias Branco SA | 1,600 | 41 |
| | Multiplan Empreendimentos Imobiliarios SA | 1,700 | 36 |
| | Telecomunicacoes de Sao Paulo SA Prior Pfd. | 1,300 | 35 |
| | LLX Logistica SA | 11,800 | 34 |
| | Cia de Gas de Sao Paulo Prior Pfd. | 1,000 | 28 |
| | | | 32,662 |
| Canada (4.1%) | | |
| | Royal Bank of Canada | 62,180 | 3,917 |
| ^ | Toronto-Dominion Bank | 38,600 | 3,342 |
| | Suncor Energy Inc. | 68,352 | 3,150 |
| | Bank of Nova Scotia | 46,999 | 2,866 |
| | Barrick Gold Corp. | 43,970 | 2,246 |
| | Canadian Natural Resources Ltd. | 47,660 | 2,242 |
| | Potash Corp. of Saskatchewan Inc. | 38,610 | 2,181 |
| | Goldcorp Inc. | 34,687 | 1,939 |
| | Bank of Montreal | 24,815 | 1,630 |
| | Canadian National Railway Co. | 19,940 | 1,547 |
| | Canadian Imperial Bank of Commerce | 17,152 | 1,485 |
| | Manulife Financial Corp. | 77,150 | 1,385 |
| | Teck Resources Ltd. Class B | 25,320 | 1,376 |
| | TransCanada Corp. | 29,850 | 1,284 |
| | Cenovus Energy Inc. | 33,074 | 1,272 |
| * | Research In Motion Ltd. | 22,862 | 1,114 |
| | Encana Corp. | 32,900 | 1,105 |
| | Talisman Energy Inc. | 45,200 | 1,092 |
| | Enbridge Inc. | 16,290 | 1,059 |
| | Brookfield Asset Management Inc. Class A | 27,320 | 920 |
| | Nexen Inc. | 34,104 | 902 |
| | Sun Life Financial Inc. | 25,000 | 818 |
| | Rogers Communications Inc. Class B | 21,000 | 795 |
| | Imperial Oil Ltd. | 14,490 | 766 |
| | Kinross Gold Corp. | 47,800 | 758 |
| | Thomson Reuters Corp. | 18,201 | 738 |
| | Agrium Inc. | 7,651 | 693 |
| | Valeant Pharmaceuticals International Inc. | 12,600 | 664 |
| | Silver Wheaton Corp. | 15,500 | 631 |
| | | |
| Vanguard® Total World Stock Index Fund | | |
| Schedule of Investments | | |
| April 30, 2011 | | |
| |
| | | | Market |
| | | | Value |
| | | Shares | ($000) |
| | Cameco Corp. | 20,628 | 609 |
| | National Bank of Canada | 6,930 | 574 |
| | Canadian Pacific Railway Ltd. | 8,414 | 558 |
| * | Ivanhoe Mines Ltd. | 20,479 | 537 |
| | Magna International Inc. | 10,360 | 532 |
| | Power Corp. of Canada | 17,090 | 514 |
| | First Quantum Minerals Ltd. | 3,600 | 513 |
| | Crescent Point Energy Corp. | 11,200 | 509 |
| | Bombardier Inc. Class B | 67,900 | 506 |
| | Agnico-Eagle Mines Ltd. | 7,159 | 499 |
| | Tim Hortons Inc. | 8,968 | 436 |
| | Eldorado Gold Corp. | 23,400 | 435 |
| * | MEG Energy Corp. | 8,100 | 428 |
| | Shoppers Drug Mart Corp. | 9,460 | 412 |
| * | CGI Group Inc. Class A | 18,730 | 410 |
| | BCE Inc. | 10,800 | 405 |
| | Power Financial Corp. | 12,060 | 401 |
| | SNC-Lavalin Group Inc. | 6,400 | 387 |
| | Yamana Gold Inc. | 30,100 | 384 |
| | Husky Energy Inc. | 11,460 | 358 |
| | Shaw Communications Inc. Class B | 16,720 | 353 |
| | Pacific Rubiales Energy Corp. | 11,400 | 346 |
| | IAMGOLD Corp. | 15,900 | 331 |
| | Great-West Lifeco Inc. | 11,400 | 328 |
| | Fairfax Financial Holdings Ltd. | 800 | 323 |
| | Brookfield Properties Corp. | 15,300 | 303 |
| | Saputo Inc. | 6,300 | 300 |
| | RioCan Real Estate Investment Trust | 11,100 | 297 |
| | IGM Financial Inc. | 5,300 | 273 |
| | Fortis Inc. | 7,600 | 261 |
| | Intact Financial Corp. | 5,000 | 254 |
| | Canadian Utilities Ltd. Class A | 4,400 | 249 |
| | Canadian Tire Corp. Ltd. Class A | 3,300 | 210 |
| | CI Financial Corp. | 8,300 | 203 |
| | Finning International Inc. | 6,900 | 202 |
| | Loblaw Cos. Ltd. | 4,800 | 202 |
| | TransAlta Corp. | 8,860 | 197 |
| | Niko Resources Ltd. | 2,000 | 169 |
| * | Osisko Mining Corp. | 10,900 | 160 |
| | George Weston Ltd. | 2,200 | 158 |
| | TELUS Corp. | 2,100 | 111 |
| | TELUS Corp. Class A | 1,700 | 86 |
| | Bombardier Inc. Class A | 415 | 3 |
| | | | 58,643 |
| Chile (0.2%) | | |
| | Empresa Nacional de Electricidad SA ADR | 10,679 | 602 |
| | SACI Falabella | 40,874 | 446 |
| | Empresas COPEC SA | 22,788 | 442 |
| | Sociedad Quimica y Minera de Chile SA ADR | 4,510 | 275 |
| | CAP SA | 4,556 | 245 |
| | Empresas CMPC SA | 4,266 | 237 |
| | Cencosud SA | 26,791 | 212 |
| | Enersis SA ADR | 8,341 | 178 |
| | Banco de Chile | 949,277 | 142 |
| | Banco Santander Chile ADR | 1,442 | 132 |
| | Lan Airlines SA | 3,727 | 105 |
| | Colbun SA | 265,292 | 80 |
| | Banco de Credito e Inversiones | 1,050 | 71 |
| | Corpbanca | 4,158,795 | 66 |
| | AES Gener SA | 92,643 | 57 |
| | ENTEL Chile SA | 2,800 | 57 |
| | Cia Cervecerias Unidas SA | 4,054 | 49 |
| | Enersis SA | 114,300 | 49 |
| | Embotelladora Andina SA Prior Pfd. | 7,625 | 37 |
| | Sociedad Quimica y Minera de Chile SA Prior Pfd. Class B | 353 | 21 |
| | | |
| Vanguard® Total World Stock Index Fund | | |
| Schedule of Investments | | |
| April 30, 2011 | | |
| |
| | | | Market |
| | | | Value |
| | | Shares | ($000) |
| | Banco Santander Chile | 145,800 | 13 |
| | | | 3,516 |
| China (2.4%) | | |
| | China Construction Bank Corp. | 3,167,060 | 2,999 |
| | China Mobile Ltd. | 265,500 | 2,442 |
| | Industrial & Commercial Bank of China | 2,844,245 | 2,413 |
| | CNOOC Ltd. | 786,000 | 1,954 |
| | Bank of China Ltd. | 2,759,800 | 1,528 |
| | PetroChina Co. Ltd. | 936,000 | 1,359 |
| | China Life Insurance Co. Ltd. | 329,000 | 1,176 |
| | Tencent Holdings Ltd. | 40,400 | 1,154 |
| | Ping An Insurance Group Co. | 94,500 | 1,030 |
| | China Petroleum & Chemical Corp. | 801,319 | 808 |
| | China Shenhua Energy Co. Ltd. | 170,500 | 796 |
| | China Unicom Hong Kong Ltd. | 354,574 | 725 |
| | Belle International Holdings Ltd. | 270,000 | 528 |
| | China Merchants Bank Co. Ltd. | 190,131 | 491 |
| | China Telecom Corp. Ltd. | 820,034 | 477 |
| | Bank of Communications Co. Ltd. | 405,144 | 430 |
| | Hengan International Group Co. Ltd. | 54,500 | 426 |
| | Agricultural Bank of China Ltd. | 656,500 | 389 |
| | China Overseas Land & Investment Ltd. | 200,480 | 387 |
| | Yanzhou Coal Mining Co. Ltd. | 84,000 | 330 |
| | China Coal Energy Co. Ltd. | 226,000 | 317 |
| | China Pacific Insurance Group Co. Ltd. | 70,200 | 304 |
| | China Citic Bank Corp. Ltd. | 398,509 | 286 |
| | Want Want China Holdings Ltd. | 291,000 | 262 |
| | Anhui Conch Cement Co. Ltd. | 54,000 | 256 |
| ^ | Byd Co. Ltd. | 68,000 | 247 |
| | China Communications Construction Co. Ltd. | 259,375 | 240 |
| * | GCL-Poly Energy Holdings Ltd. | 330,000 | 236 |
| | Tsingtao Brewery Co. Ltd. | 44,000 | 234 |
| | Tingyi Cayman Islands Holding Corp. | 88,000 | 234 |
| | China Merchants Holdings International Co. Ltd. | 50,000 | 231 |
| | China National Building Material Co. Ltd. | 104,000 | 220 |
| | Citic Pacific Ltd. | 73,000 | 219 |
| | China Yurun Food Group Ltd. | 58,000 | 213 |
| | Aluminum Corp. of China Ltd. | 221,331 | 208 |
| | Inner Mongolia Yitai Coal Co. Class B | 29,600 | 207 |
| | China Resources Enterprise Ltd. | 48,000 | 194 |
| | Jiangxi Copper Co. Ltd. | 56,000 | 191 |
| | Lenovo Group Ltd. | 306,000 | 179 |
| | Evergrande Real Estate Group Ltd. | 249,000 | 178 |
| | Kunlun Energy Co. Ltd. | 100,000 | 177 |
| * | GOME Electrical Appliances Holding Ltd. | 485,720 | 175 |
| | China Minsheng Banking Corp. Ltd. | 176,300 | 169 |
| | Dongfeng Motor Group Co. Ltd. | 106,000 | 166 |
| | China Mengniu Dairy Co. Ltd. | 53,000 | 163 |
| * | PICC Property & Casualty Co. Ltd. | 126,000 | 162 |
| | China Resources Land Ltd. | 92,000 | 159 |
| | Air China Ltd. | 146,000 | 148 |
| | Kingboard Chemical Holdings Ltd. | 27,000 | 148 |
| | Beijing Enterprises Holdings Ltd. | 27,500 | 146 |
| | Weiqiao Textile Co. | 161,401 | 146 |
| | Zijin Mining Group Co. Ltd. | 175,534 | 138 |
| | China Resources Power Holdings Co. Ltd. | 73,400 | 135 |
| | China International Marine Containers Group Co. Ltd. Class B | 61,500 | 132 |
| | China Oilfield Services Ltd. | 66,000 | 131 |
| ^ | Guangzhou R&F Properties Co. Ltd. | 94,000 | 129 |
| | COSCO Pacific Ltd. | 60,000 | 125 |
| | ENN Energy Holdings Ltd. | 32,000 | 110 |
| | Guangzhou Automobile Group Co. Ltd. | 93,857 | 106 |
| * | Changsha Zoomlion Heavy Industry Science and Technology Development Co. Ltd. | 38,600 | 102 |
| * | Brilliance China Automotive Holdings Ltd. | 102,000 | 100 |
| | | |
| Vanguard® Total World Stock Index Fund | | |
| Schedule of Investments | | |
| April 30, 2011 | | |
| |
| | | | Market |
| | | | Value |
| | | Shares | ($000) |
| | China Railway Group Ltd. | 184,000 | 99 |
| | Weichai Power Co. Ltd. | 14,000 | 96 |
| ^ | Alibaba.com Ltd. | 52,500 | 93 |
| | China Shipping Development Co. Ltd. | 86,442 | 91 |
| | Sino-Ocean Land Holdings Ltd. | 158,500 | 90 |
| | BBMG Corp. | 54,500 | 90 |
| | Shandong Weigao Group Medical Polymer Co. Ltd. | 32,000 | 88 |
| | Zhuzhou CSR Times Electric Co. Ltd. | 22,000 | 87 |
| * | China COSCO Holdings Co. Ltd. | 89,500 | 86 |
| | Yantai Changyu Pioneer Wine Co. Ltd. Class B | 7,771 | 86 |
| | Huaneng Power International Inc. | 152,000 | 84 |
| | Chaoda Modern Agriculture Holdings Ltd. | 132,000 | 82 |
| | China Resources Cement Holdings Ltd. | 80,000 | 82 |
| | Agile Property Holdings Ltd. | 50,000 | 82 |
| * | China Taiping Insurance Holdings Co. Ltd. | 29,600 | 81 |
| * | Semiconductor Manufacturing International Corp. | 905,000 | 81 |
| | Sinopharm Group Co. | 23,200 | 81 |
| | ZTE Corp. | 22,212 | 80 |
| | CSR Corp. Ltd. | 72,000 | 80 |
| | China High Speed Transmission Equipment Group Co. Ltd. | 59,000 | 78 |
| | Zhaojin Mining Industry Co. Ltd. | 16,500 | 77 |
| | Shanghai Industrial Holdings Ltd. | 19,000 | 75 |
| | Parkson Retail Group Ltd. | 48,500 | 75 |
| * | Chongqing Rural Commercial Bank | 104,000 | 72 |
| | Longfor Properties Co. Ltd. | 42,500 | 68 |
| | Shimao Property Holdings Ltd. | 49,500 | 67 |
| | Huabao International Holdings Ltd. | 45,000 | 67 |
| | China Rongsheng Heavy Industry Group Co. Ltd. | 79,000 | 67 |
| | China Vanke Co. Ltd. Class B | 46,700 | 66 |
| | Fushan International Energy Group Ltd. | 94,000 | 66 |
| | Soho China Ltd. | 76,000 | 66 |
| | Great Wall Motor Co. Ltd. | 36,250 | 65 |
| * | China Shipping Container Lines Co. Ltd. | 161,000 | 64 |
| | China Railway Construction Corp. Ltd. | 72,626 | 64 |
| | China Everbright Ltd. | 28,000 | 62 |
| | Anta Sports Products Ltd. | 38,000 | 62 |
| | Fosun International Ltd. | 76,000 | 60 |
| | Country Garden Holdings Co. | 147,000 | 60 |
| * | Yuexiu Property Co. Ltd. | 283,200 | 60 |
| | Poly Hong Kong Investments Ltd. | 74,000 | 59 |
| | Nine Dragons Paper Holdings Ltd. | 51,000 | 58 |
| | China Agri-Industries Holdings Ltd. | 51,000 | 58 |
| | Lee & Man Paper Manufacturing Ltd. | 80,000 | 58 |
| | China National Materials Co. Ltd. | 57,000 | 56 |
| | Zhejiang Expressway Co. Ltd. | 68,000 | 56 |
| | China Longyuan Power Group Corp. | 53,000 | 55 |
| * | Sinofert Holdings Ltd. | 128,000 | 54 |
| * | Metallurgical Corp. of China Ltd. | 125,000 | 53 |
| | Renhe Commercial Holdings Co. Ltd. | 308,000 | 53 |
| | Shanghai Electric Group Co. Ltd. | 106,000 | 53 |
| | Golden Eagle Retail Group Ltd. | 20,000 | 53 |
| | Geely Automobile Holdings Ltd. | 130,000 | 52 |
| | Angang Steel Co. Ltd. | 38,000 | 49 |
| | Li Ning Co. Ltd. | 27,000 | 46 |
| * | China Southern Airlines Co. Ltd. | 88,000 | 46 |
| | Weifu High-Technology Group Co. Ltd. Class B | 12,505 | 46 |
| | CSG Holding Co. Ltd. Class B | 34,880 | 45 |
| | Sany Heavy Equipment International Holdings Co. Ltd. | 25,000 | 44 |
| | China BlueChemical Ltd. | 54,000 | 44 |
| | Datang International Power Generation Co. Ltd. | 114,000 | 43 |
| | Hidili Industry International Development Ltd. | 42,000 | 43 |
| | China Molybdenum Co. Ltd. | 46,000 | 41 |
| | Lianhua Supermarket Holdings Co. Ltd. | 10,000 | 41 |
| | Dongfang Electric Corp. Ltd. | 12,000 | 39 |
| | | |
| Vanguard® Total World Stock Index Fund | | |
| Schedule of Investments | | |
| April 30, 2011 | | |
| |
| | | | Market |
| | | | Value |
| | | Shares | ($000) |
| | China Communications Services Corp. Ltd. | 64,000 | 39 |
| | Shui On Land Ltd. | 86,500 | 38 |
| | Shenzhen International Holdings Ltd. | 412,500 | 38 |
| | Jiangsu Expressway Co. Ltd. | 36,000 | 38 |
| | Travelsky Technology Ltd. | 37,000 | 37 |
| | Sinopec Shanghai Petrochemical Co. Ltd. | 74,000 | 36 |
| | China Dongxiang Group Co. | 99,000 | 35 |
| | TPV Technology Ltd. | 60,000 | 35 |
| | KWG Property Holding Ltd. | 47,500 | 34 |
| | Guangdong Investment Ltd. | 66,000 | 34 |
| | New World China Land Ltd. | 91,400 | 33 |
| | Kingboard Laminates Holdings Ltd. | 37,000 | 33 |
| *,^ | China Eastern Airlines Corp. Ltd. | 74,000 | 33 |
| | China Foods Ltd. | 46,000 | 32 |
| | Shenzhen Investment Ltd. | 100,000 | 31 |
| | Shanghai Lujiazui Finance & Trade Zone Development Co. Ltd. Class B | 21,900 | 31 |
| | Bosideng International Holdings Ltd. | 96,000 | 31 |
| | Franshion Properties China Ltd. | 96,000 | 30 |
| ^ | Huadian Power International Co. | 136,000 | 29 |
| ^ | China Zhongwang Holdings Ltd. | 56,800 | 29 |
| | Jiangling Motors Corp. Ltd. Class B | 9,600 | 29 |
| * | Zhongsheng Group Holdings Ltd. | 15,500 | 29 |
| | Sinotruk Hong Kong Ltd. | 34,000 | 28 |
| | Hopewell Highway Infrastructure Ltd. | 42,500 | 28 |
| | Maanshan Iron & Steel | 52,000 | 28 |
| | Beijing Capital International Airport Co. Ltd. | 54,000 | 27 |
| * | China Travel International Inv HK | 128,000 | 26 |
| | Harbin Power Equipment Co. Ltd. | 26,000 | 25 |
| * | Shanghai Zhenhua Heavy Industries Co. Ltd. Class B | 39,050 | 24 |
| | C C Land Holdings Ltd. | 61,000 | 24 |
| * | Hopson Development Holdings Ltd. | 20,000 | 20 |
| | Sichuan Expressway Co. Ltd. | 32,000 | 19 |
| | China Huiyuan Juice Group Ltd. | 28,000 | 18 |
| * | Sinopec Yizheng Chemical Fibre Co. Ltd. | 42,000 | 18 |
| * | Double Coin Holdings Ltd. Class B | 22,200 | 18 |
| * | Hainan Airlines Co. Ltd. Class B | 16,200 | 17 |
| * | Xinjiang Goldwind Science & Technology Co. Ltd. | 12,200 | 17 |
| ^ | Guangzhou Pharmaceutical Co. Ltd. | 14,000 | 16 |
| * | Shanghai Haixin Group Co. Class B | 25,000 | 15 |
| | Shanghai Friendship Group Inc. Ltd. Class B | 7,150 | 15 |
| | Inner Mongolia Eerduosi Cashmere Products Co. Ltd. Class B | 9,100 | 14 |
| | Foshan Electrical and Lighting Co. Ltd. Class B | 13,300 | 13 |
| * | Shanghai Chlor-Alkali Chemical Co. Ltd. Class B | 21,800 | 13 |
| | Shanghai Jinjiang International Hotels Development Co. Ltd. Class B | 7,600 | 13 |
| | Anhui Expressway Co. | 14,000 | 12 |
| | Greentown China Holdings Ltd. | 11,000 | 11 |
| * | Shanghai Waigaoqiao Free Trade Zone Development Co. Ltd. Class B | 12,200 | 11 |
| * | Jinzhou Port Co. Ltd. Class B | 19,920 | 11 |
| | Shandong Chenming Paper Holdings Ltd. Class B | 12,300 | 10 |
| | Shanghai Mechanical and Electrical Industry Co. Ltd. Class B | 8,500 | 10 |
| | Chongqing Changan Automobile Co. Ltd. Class B | 11,700 | 10 |
| | Shenzhen Chiwan Wharf Holdings Ltd. Class B | 5,800 | 10 |
| * | Citic Resources Holdings Ltd. | 38,000 | 9 |
| | Shenzhen Expressway Co. Ltd. | 14,000 | 9 |
| | Shanghai Jinqiao Export Processing Zone Development Co. Ltd. Class B | 11,110 | 9 |
| | China Merchants Property Development Co. Ltd. Class B | 5,200 | 9 |
| | Tianjin Capital Environmental Protection Group Co. Ltd. | 28,000 | 9 |
| | Bengang Steel Plates Co. Class B | 15,300 | 9 |
| * | BOE Technology Group Co. Ltd. Class B | 37,300 | 9 |
| * | Huadian Energy Co. Ltd. Class B | 22,600 | 9 |
| | Shanghai Jinjiang International Industrial Investment Co. Ltd. Class B | 7,900 | 8 |
| | Dazhong Transportation Group Co. Ltd. Class B | 11,800 | 8 |
| | Zhejiang Southeast Electric Power Co. Class B | 12,800 | 8 |
| | Guangdong Electric Power Development Co. Ltd. Class B | 15,300 | 8 |
| | | |
| Vanguard® Total World Stock Index Fund | | |
| Schedule of Investments | | |
| April 30, 2011 | | |
| |
| | | | Market |
| | | | Value |
| | | Shares | ($000) |
| | People's Food Holdings Ltd. | 11,000 | 7 |
| | Guangzhou Shipyard International Co. Ltd. | 4,000 | 7 |
| | Guangdong Provincial Expressway Development Co. Ltd. Class B | 14,400 | 7 |
| | Beijing North Star Co. Ltd. | 28,000 | 7 |
| | Sinotrans Ltd. | 25,000 | 6 |
| | Guangshen Railway Co. Ltd. | 14,000 | 6 |
| * | Kingboard Chemical Holdings Ltd. Warrants Exp. 10/31/2012 | 2,200 | 2 |
| | | | 35,091 |
| Colombia (0.1%) | | |
| | BanColombia SA ADR | 6,173 | 409 |
| | Ecopetrol SA | 180,911 | 389 |
| | Grupo de Inversiones Suramericana SA | 9,162 | 190 |
| | Inversiones Argos SA | 11,316 | 118 |
| | BanColombia SA | 7,150 | 117 |
| | Almacenes Exito SA | 6,752 | 104 |
| | Interconexion Electrica SA ESP | 11,504 | 82 |
| | Cementos Argos SA | 12,116 | 73 |
| | Corp Financiera Colombiana SA | 3,021 | 58 |
| | Isagen SA ESP | 28,143 | 37 |
| | | | 1,577 |
| Czech Republic (0.1%) | | |
| | CEZ AS | 7,643 | 438 |
| | Komercni Banka AS | 888 | 234 |
| * | Unipetrol AS | 15,024 | 179 |
| | Telefonica O2 Czech Republic AS | 3,549 | 91 |
| | | | 942 |
| Denmark (0.5%) | | |
| | Novo Nordisk A/S Class B | 21,254 | 2,691 |
| * | Danske Bank A/S | 39,789 | 955 |
| | AP Moller - Maersk A/S Class B | 68 | 689 |
| | Carlsberg A/S Class B | 4,623 | 549 |
| | Danisco A/S | 3,472 | 460 |
| | Novozymes A/S | 2,305 | 399 |
| | Coloplast A/S Class B | 2,490 | 366 |
| * | Vestas Wind Systems A/S | 9,700 | 344 |
| | AP Moller - Maersk A/S | 23 | 226 |
| * | FLSmidth & Co. A/S | 1,919 | 173 |
| * | William Demant Holding A/S | 842 | 78 |
| | Tryg A/S | 1,023 | 65 |
| | H Lundbeck A/S | 1,400 | 34 |
| | Rockwool International A/S Class B | 83 | 11 |
| | | | 7,040 |
| Egypt (0.1%) | | |
| | Orascom Construction Industries GDR | 5,626 | 231 |
| * | Orascom Telecom Holding SAE GDR | 38,940 | 135 |
| | Commercial International Bank Egypt SAE | 23,974 | 111 |
| | Egyptian Financial Group-Hermes Holding | 13,601 | 40 |
| | Egyptian Kuwaiti Holding Co. | 29,640 | 38 |
| | Egyptian Co. for Mobile Services | 1,403 | 34 |
| | Telecom Egypt | 11,972 | 33 |
| * | Talaat Moustafa Group | 53,395 | 32 |
| | National Societe Generale Bank SAE | 4,054 | 25 |
| * | ElSwedy Electric Co. | 2,748 | 19 |
| * | Ezz Steel | 14,391 | 19 |
| | South Valley Cement | 26,077 | 19 |
| | Sidi Kerir Petrochemcials Co. | 6,032 | 14 |
| * | Egyptian Iron & Steel Co. | 7,482 | 9 |
| * | Medinet Nasr Housing | 1,915 | 7 |
| * | Oriental Weavers | 1,379 | 7 |
| | Delta Sugar Co. | 1,894 | 7 |
| | Credit Agricole Egypt SAE | 3,297 | 6 |
| | Heliopolis Housing | 1,278 | 4 |
| * | Asek Co. for Mining | 402 | 1 |
791
| | | |
| Vanguard® Total World Stock Index Fund | | |
| Schedule of Investments | | |
| April 30, 2011 | | |
| |
| | | | Market |
| | | | Value |
| | | Shares | ($000) |
| Finland (0.4%) | | |
| | Nokia Oyj | 159,478 | 1,469 |
| | Sampo Oyj | 23,482 | 791 |
| | Fortum Oyj | 18,415 | 634 |
| | Metso Oyj | 8,247 | 506 |
| ^ | Stora Enso Oyj | 39,484 | 476 |
| | Wartsila Oyj | 11,828 | 465 |
| | UPM-Kymmene Oyj | 22,205 | 455 |
| | Kone Oyj Class B | 6,271 | 393 |
| | Nokian Renkaat Oyj | 4,813 | 249 |
| | Kesko Oyj Class B | 2,066 | 107 |
| | Rautaruukki Oyj | 4,065 | 106 |
| | Outokumpu Oyj | 4,902 | 82 |
| | Neste Oil Oyj | 4,229 | 80 |
| | Sanoma Oyj | 1,520 | 32 |
| | | | 5,845 |
| France (4.5%) | | |
| | Total SA | 98,288 | 6,295 |
| | Sanofi-Aventis SA | 57,279 | 4,532 |
| | BNP Paribas | 45,876 | 3,627 |
| ^ | GDF Suez | 74,264 | 3,037 |
| | LVMH Moet Hennessy Louis Vuitton SA | 16,124 | 2,895 |
| ^ | AXA SA | 101,492 | 2,275 |
| | Societe Generale | 32,376 | 2,164 |
| ^ | Schneider Electric SA | 11,855 | 2,094 |
| | Danone | 28,383 | 2,078 |
| | France Telecom SA | 86,929 | 2,037 |
| | ArcelorMittal | 50,731 | 1,875 |
| | Air Liquide SA | 12,375 | 1,828 |
| | Vivendi SA | 53,946 | 1,692 |
| ^ | L'Oreal SA | 13,239 | 1,678 |
| | Cie de St-Gobain | 23,224 | 1,602 |
| | Vinci SA | 23,820 | 1,590 |
| | Carrefour SA | 30,446 | 1,443 |
| | Pernod-Ricard SA | 11,544 | 1,160 |
| ^ | Unibail-Rodamco SE | 4,193 | 981 |
| | Alstom SA | 13,084 | 870 |
| | PPR | 4,312 | 771 |
| | Cie Generale d'Optique Essilor International SA | 9,089 | 761 |
| | Veolia Environnement SA | 21,820 | 729 |
| * | Alcatel-Lucent | 107,122 | 694 |
| | Credit Agricole SA | 41,024 | 682 |
| | Lafarge SA | 9,499 | 673 |
| | Vallourec SA | 5,388 | 672 |
| ^ | Bouygues SA | 12,131 | 604 |
| * | Renault SA | 9,598 | 584 |
| | Cie Generale des Etablissements Michelin Class B | 5,669 | 568 |
| ^ | Technip SA | 4,962 | 560 |
| | Suez Environnement Co. | 21,884 | 504 |
| | Christian Dior SA | 3,110 | 499 |
| | Hermes International | 2,075 | 486 |
| | Accor SA | 10,767 | 478 |
| | Cap Gemini SA | 7,841 | 475 |
| | EDF SA | 10,981 | 462 |
| * | European Aeronautic Defence and Space Co. NV | 13,968 | 432 |
| | Sodexo | 5,040 | 393 |
| | SES SA | 14,878 | 391 |
| | Legrand SA | 8,386 | 383 |
| ^ | Safran SA | 9,177 | 356 |
| * | Peugeot SA | 7,730 | 351 |
| | STMicroelectronics NV | 29,597 | 350 |
| | Publicis Groupe SA | 6,088 | 345 |
| | Societe BIC SA | 3,120 | 303 |
| | Edenred | 9,582 | 297 |
| | | |
| Vanguard® Total World Stock Index Fund | | |
| Schedule of Investments | | |
| April 30, 2011 | | |
| |
| | | | Market |
| | | | Value |
| | | Shares | ($000) |
| | SCOR SE | 8,282 | 253 |
| | Lagardere SCA | 5,691 | 250 |
| ^ | Eiffage SA | 3,527 | 244 |
| * | Cie Generale de Geophysique - Veritas | 6,084 | 214 |
| * | Natixis | 35,242 | 203 |
| | Bureau Veritas SA | 2,242 | 193 |
| | Dassault Systemes SA | 2,337 | 190 |
| | Casino Guichard Perrachon SA | 1,752 | 184 |
| | Eramet | 431 | 170 |
| * | Atos Origin SA | 2,751 | 170 |
| | CNP Assurances | 7,205 | 165 |
| | Eutelsat Communications SA | 3,636 | 157 |
| | Klepierre | 3,684 | 151 |
| | Thales SA | 3,400 | 150 |
| | Fonciere Des Regions | 1,180 | 134 |
| | Societe Television Francaise 1 | 6,694 | 126 |
| | Wendel SA | 992 | 124 |
| | Aeroports de Paris | 1,290 | 124 |
| | Iliad SA | 904 | 116 |
| | Imerys SA | 1,412 | 109 |
| | Gecina SA | 744 | 107 |
| | Eurazeo | 1,211 | 101 |
| | APERAM | 2,364 | 100 |
| * | Air France-KLM | 5,631 | 99 |
| | ICADE | 725 | 93 |
| * | JCDecaux SA | 2,471 | 86 |
| * | Rexel SA | 2,791 | 76 |
| | BioMerieux | 692 | 75 |
| | EDF Energies Nouvelles SA | 997 | 59 |
| ^ | PagesJaunes Groupe | 5,585 | 58 |
| | Ciments Francais SA | 523 | 55 |
| * | Euler Hermes SA | 460 | 49 |
| | Bollore | 178 | 45 |
| | Ipsen SA | 383 | 15 |
| | | | 64,001 |
| Germany (3.5%) | | |
| | Siemens AG | 40,233 | 5,852 |
| *,^ | BASF SE | 40,626 | 4,172 |
| | Daimler AG | 46,465 | 3,591 |
| ^ | Bayer AG | 36,301 | 3,187 |
| ^ | Allianz SE | 19,703 | 3,096 |
| ^ | E.ON AG | 83,542 | 2,855 |
| | Deutsche Bank AG | 40,914 | 2,665 |
| | SAP AG | 40,459 | 2,606 |
| | Deutsche Telekom AG | 143,345 | 2,369 |
| *,^ | Volkswagen AG Prior Pfd. | 7,418 | 1,460 |
| | Muenchener Rueckversicherungs AG | 8,354 | 1,378 |
| | Bayerische Motoren Werke AG | 13,247 | 1,247 |
| | RWE AG | 17,037 | 1,111 |
| | Linde AG | 5,561 | 1,001 |
| * | MAN SE | 6,451 | 899 |
| * | Deutsche Post AG | 41,845 | 827 |
| | ThyssenKrupp AG | 16,703 | 768 |
| | Fresenius Medical Care AG & Co. KGaA | 9,472 | 745 |
| ^ | K&S AG | 8,833 | 713 |
| | Deutsche Boerse AG | 8,552 | 710 |
| | Adidas AG | 8,934 | 666 |
| ^ | HeidelbergCement AG | 8,007 | 612 |
| | Henkel AG & Co. KGaA Prior Pfd. | 8,449 | 576 |
| | Fresenius SE & Co. KGaA | 5,477 | 575 |
| | Porsche Automobil Holding SE Prior Pfd. | 7,604 | 550 |
| | Infineon Technologies AG | 47,939 | 544 |
| ^ | Metro AG | 7,032 | 516 |
| * | Continental AG | 3,459 | 347 |
| | | |
| Vanguard® Total World Stock Index Fund | | |
| Schedule of Investments | | |
| April 30, 2011 | | |
| |
| | | | Market |
| | | | Value |
| | | Shares | ($000) |
| | Lanxess AG | 3,594 | 329 |
| | Henkel AG & Co. KGaA | 5,693 | 323 |
| * | Commerzbank AG | 45,533 | 290 |
| | GEA Group AG | 7,857 | 287 |
| | Merck KGaA | 2,645 | 280 |
| * | Commerzbank AG | 43,427 | 271 |
| *,^ | Volkswagen AG | 1,510 | 269 |
| ^ | Beiersdorf AG | 3,874 | 252 |
| *,^ | Deutsche Lufthansa AG | 10,248 | 233 |
| | Hochtief AG | 2,409 | 228 |
| * | QIAGEN NV | 9,927 | 212 |
| | Wacker Chemie AG | 668 | 165 |
| ^ | Hannover Rueckversicherung AG | 2,724 | 165 |
| | Salzgitter AG | 1,803 | 141 |
| * | TUI AG | 10,506 | 134 |
| | Fraport AG Frankfurt Airport Services Worldwide | 1,634 | 131 |
| | Puma AG Rudolf Dassler Sport | 256 | 85 |
| | Suedzucker AG | 2,380 | 73 |
| | Celesio AG | 2,981 | 72 |
| | Hamburger Hafen und Logistik AG | 1,374 | 67 |
| ^ | SMA Solar Technology AG | 373 | 45 |
| | Generali Deutschland Holding AG | 298 | 39 |
| | | | 49,729 |
| Greece (0.1%) | | |
| | Hellenic Telecommunications Organization SA ADR | 57,844 | 338 |
| | National Bank of Greece SA ADR | 211,346 | 336 |
| | OPAP SA | 8,261 | 175 |
| | Coca Cola Hellenic Bottling Co. SA | 5,778 | 160 |
| * | Alpha Bank AE | 17,266 | 101 |
| | Public Power Corp. SA | 4,703 | 78 |
| * | EFG Eurobank Ergasias SA | 12,766 | 72 |
| | Hellenic Petroleum SA | 5,771 | 61 |
| | | | 1,321 |
| Hong Kong (1.3%) | | |
| | Hutchison Whampoa Ltd. | 141,000 | 1,613 |
| | Sun Hung Kai Properties Ltd. | 85,000 | 1,331 |
| * | AIA Group Ltd. | 385,800 | 1,301 |
| | Cheung Kong Holdings Ltd. | 76,800 | 1,212 |
| | Hong Kong Exchanges and Clearing Ltd. | 46,900 | 1,072 |
| | Li & Fung Ltd. | 142,000 | 727 |
| | Swire Pacific Ltd. Class A | 44,244 | 677 |
| | CLP Holdings Ltd. | 78,000 | 642 |
| | Hong Kong & China Gas Co. Ltd. | 254,800 | 633 |
| | Hang Lung Group Ltd. | 88,913 | 599 |
| | BOC Hong Kong Holdings Ltd. | 180,500 | 567 |
| | Hang Seng Bank Ltd. | 35,200 | 550 |
| | Hongkong Land Holdings Ltd. | 73,000 | 547 |
| | Jardine Matheson Holdings Ltd. | 11,200 | 539 |
| | Power Assets Holdings Ltd. | 68,500 | 480 |
| | Wharf Holdings Ltd. | 61,600 | 452 |
| | Hang Lung Properties Ltd. | 97,000 | 433 |
| | Bank of East Asia Ltd. | 100,272 | 415 |
| | Henderson Land Development Co. Ltd. | 44,000 | 302 |
| | New World Development Ltd. | 171,000 | 301 |
| | Link REIT | 94,500 | 298 |
| * | Sands China Ltd. | 103,200 | 290 |
| | Shangri-La Asia Ltd. | 97,519 | 272 |
| | Esprit Holdings Ltd. | 64,231 | 268 |
| | MTR Corp. | 66,500 | 243 |
| | Jardine Strategic Holdings Ltd. | 8,500 | 241 |
| | Wynn Macau Ltd. | 64,400 | 230 |
| | Sino Land Co. Ltd. | 127,527 | 225 |
| | SJM Holdings Ltd. | 91,000 | 197 |
| | Kerry Properties Ltd. | 35,000 | 187 |
| | | |
| Vanguard® Total World Stock Index Fund | | |
| Schedule of Investments | | |
| April 30, 2011 | | |
| |
| | | | Market |
| | | | Value |
| | | Shares | ($000) |
| | Hysan Development Co. Ltd. | 34,000 | 159 |
| | Cathay Pacific Airways Ltd. | 60,000 | 150 |
| | Xinyi Glass Holdings Ltd. | 110,000 | 133 |
| | Wheelock & Co. Ltd. | 29,000 | 120 |
| | Wing Hang Bank Ltd. | 9,500 | 106 |
| | Yue Yuen Industrial Holdings Ltd. | 30,000 | 104 |
| | AAC Acoustic Technologies Holdings Inc. | 38,000 | 100 |
| | ASM Pacific Technology Ltd. | 7,300 | 98 |
| | First Pacific Co. Ltd./Hong Kong | 102,400 | 96 |
| | PCCW Ltd. | 233,000 | 92 |
| | Hopewell Holdings Ltd. | 30,000 | 91 |
| | VTech Holdings Ltd. | 7,600 | 87 |
| | Cheung Kong Infrastructure Holdings Ltd. | 16,000 | 78 |
| *,^ | Galaxy Entertainment Group Ltd. | 42,000 | 76 |
| | Orient Overseas International Ltd. | 9,000 | 69 |
| | Television Broadcasts Ltd. | 11,000 | 65 |
| | NWS Holdings Ltd. | 40,500 | 60 |
| | Champion REIT | 102,000 | 59 |
| | Lifestyle International Holdings Ltd. | 19,500 | 56 |
| | Guoco Group Ltd. | 4,000 | 50 |
| * | Foxconn International Holdings Ltd. | 79,000 | 47 |
| | Techtronic Industries Co. | 32,000 | 44 |
| | Melco International Development Ltd. | 50,000 | 43 |
| | Hong Kong Aircraft Engineering Co. Ltd. | 2,800 | 41 |
| | Hongkong & Shanghai Hotels | 22,500 | 40 |
| | Great Eagle Holdings Ltd. | 11,000 | 39 |
| | Brightoil Petroleum Holdings Ltd. | 84,000 | 37 |
| | Chinese Estates Holdings Ltd. | 19,500 | 37 |
| | Johnson Electric Holdings Ltd. | 60,000 | 37 |
| * | Mongolia Energy Corp. Ltd. | 156,000 | 37 |
| | Cafe de Coral Holdings Ltd. | 14,000 | 33 |
| | Dah Sing Financial Holdings Ltd. | 4,950 | 31 |
| | Texwinca Holdings Ltd. | 26,000 | 29 |
| | Shun Tak Holdings Ltd. | 34,000 | 21 |
| | Dah Sing Banking Group Ltd. | 7,480 | 12 |
| | Hutchison Telecommunications Hong Kong Holdings Ltd. | 27,000 | 8 |
| | Hutchison Harbour Ring Ltd. | 34,000 | 4 |
| | Public Financial Holdings Ltd. | 4,000 | 2 |
| | Kowloon Development Co. Ltd. | 1,000 | 1 |
| | | | 19,236 |
| Hungary (0.1%) | | |
| * | MOL Hungarian Oil and Gas plc | 4,259 | 595 |
| * | OTP Bank plc | 12,418 | 441 |
| | Richter Gedeon Nyrt | 504 | 106 |
| | Magyar Telekom Telecommunications plc | 17,328 | 59 |
| | | | 1,201 |
| India (1.3%) | | |
| | Infosys Technologies Ltd. ADR | 24,453 | 1,594 |
| 1 | Reliance Industries Ltd. GDR | 35,189 | 1,552 |
| | ITC Ltd. | 252,814 | 1,102 |
| | Housing Development Finance Corp. | 46,905 | 750 |
| | Larsen & Toubro Ltd. | 19,967 | 721 |
| | HDFC Bank Ltd. ADR | 4,191 | 721 |
| | Bharti Airtel Ltd. | 66,735 | 574 |
| | ICICI Bank Ltd. ADR | 10,364 | 522 |
| | Axis Bank Ltd. | 13,320 | 388 |
| | Oil & Natural Gas Corp. Ltd. | 52,828 | 368 |
| | Tata Steel Ltd. | 23,128 | 323 |
| | Tata Consultancy Services Ltd. | 12,247 | 323 |
| | Bajaj Auto Ltd. | 9,053 | 302 |
| | Bharat Heavy Electricals Ltd. | 6,509 | 295 |
| | Hindalco Industries Ltd. | 59,864 | 293 |
| | NTPC Ltd. | 68,792 | 284 |
| | | |
| Vanguard® Total World Stock Index Fund | | |
| Schedule of Investments | | |
| April 30, 2011 | | |
| |
| | | | Market |
| | | | Value |
| | | Shares | ($000) |
| | State Bank of India GDR | 1,843 | 253 |
| | Coal India Ltd. | 27,812 | 240 |
| | Hindustan Unilever Ltd. | 36,638 | 236 |
| | Jindal Steel & Power Ltd. | 15,584 | 231 |
| | Sterlite Industries India Ltd. | 49,658 | 205 |
| | Cipla Ltd. | 26,661 | 187 |
| | GAIL India Ltd. | 17,162 | 185 |
| | Tata Motors Ltd. | 6,568 | 184 |
| | Mahindra & Mahindra Ltd. | 8,981 | 154 |
| | Jaiprakash Associates Ltd. | 73,221 | 154 |
| | Power Grid Corp. of India Ltd. | 64,740 | 153 |
| | Infrastructure Development Finance Co. Ltd. | 44,902 | 148 |
| | Lupin Ltd. | 14,627 | 146 |
| | Dr Reddy's Laboratories Ltd. | 3,799 | 144 |
| | Sesa Goa Ltd. | 20,167 | 144 |
| | Punjab National Bank | 5,016 | 135 |
| * | Cairn India Ltd. | 16,973 | 134 |
| | Infosys Technologies Ltd. | 2,004 | 132 |
| | Hero Honda Motors Ltd. | 3,332 | 129 |
| | Ultratech Cement Ltd. | 5,215 | 129 |
| | Kotak Mahindra Bank Ltd. | 13,122 | 128 |
| | JSW Steel Ltd. | 5,939 | 128 |
| | Titan Industries Ltd. | 1,383 | 126 |
| | Sun Pharmaceutical Industries Ltd. | 11,620 | 123 |
| | Grasim Industries Ltd. | 2,188 | 121 |
| | DLF Ltd. | 23,878 | 120 |
| | Nestle India Ltd. | 1,322 | 119 |
| | Maruti Suzuki India Ltd. | 3,755 | 112 |
| | NMDC Ltd. | 17,463 | 108 |
| | Adani Enterprises Ltd. | 7,501 | 106 |
| | Reliance Industries Ltd. | 4,665 | 104 |
| | Steel Authority of India Ltd. | 28,550 | 103 |
| | State Bank of India | 1,589 | 101 |
| | HCL Technologies Ltd. | 8,548 | 101 |
| | Tata Power Co. Ltd. | 3,306 | 98 |
| | Wipro Ltd. | 8,986 | 91 |
| | Wipro Ltd. ADR | 6,483 | 89 |
| | Canara Bank | 5,870 | 84 |
| | Ambuja Cements Ltd. | 23,209 | 83 |
| | Reliance Infrastructure Ltd. | 5,548 | 83 |
| | Crompton Greaves Ltd. | 13,789 | 79 |
| | Tata Chemicals Ltd. | 9,174 | 78 |
| | Reliance Capital Ltd. | 6,077 | 78 |
| * | Idea Cellular Ltd. | 49,411 | 77 |
| | ICICI Bank Ltd. | 3,023 | 76 |
| * | Reliance Power Ltd. | 25,506 | 75 |
| | Asian Paints Ltd. | 1,196 | 75 |
| | Bank of India | 7,083 | 73 |
| | Bharat Petroleum Corp. Ltd. | 5,147 | 73 |
| | Zee Entertainment Enterprises Ltd. | 22,944 | 70 |
| | Ranbaxy Laboratories Ltd. | 6,568 | 68 |
| | Cummins India Ltd. | 4,114 | 66 |
| | Rural Electrification Corp. Ltd. | 11,656 | 63 |
| | Piramal Healthcare Ltd. | 5,925 | 62 |
| | Bank of Baroda | 2,961 | 61 |
| | Exide Industries Ltd. | 17,659 | 61 |
| | Indian Oil Corp. Ltd. | 7,740 | 60 |
| | Unitech Ltd. | 70,580 | 59 |
| | Hindustan Petroleum Corp. Ltd. | 6,992 | 59 |
| | United Spirits Ltd. | 2,514 | 59 |
| | Reliance Communications Ltd. | 26,022 | 59 |
| * | Suzlon Energy Ltd. | 48,944 | 59 |
| | Bharat Forge Ltd. | 7,216 | 57 |
| | Union Bank of India | 7,723 | 56 |
| | | |
| Vanguard® Total World Stock Index Fund | | |
| Schedule of Investments | | |
| April 30, 2011 | | |
| |
| | | | Market |
| | | | Value |
| | | Shares | ($000) |
| | Aditya Birla Nuvo Ltd. | 2,744 | 54 |
| | Bajaj Holdings and Investment Ltd. | 2,743 | 49 |
| | Colgate-Palmolive India Ltd. | 2,243 | 46 |
| | NHPC Ltd. | 77,106 | 45 |
| | Dabur India Ltd. | 19,658 | 45 |
| | Siemens India Ltd. | 2,293 | 45 |
| | ACC Ltd. | 1,743 | 44 |
| * | GlaxoSmithKline Pharmaceuticals Ltd. | 845 | 43 |
| | Mundra Port and Special Economic Zone Ltd. | 13,075 | 43 |
| | Container Corp. Of India | 1,627 | 42 |
| | Cadila Healthcare Ltd. | 2,042 | 40 |
| | Shriram Transport Finance Co. Ltd. | 2,255 | 40 |
| | Oriental Bank of Commerce | 5,026 | 39 |
| | IDBI Bank Ltd. | 11,843 | 38 |
| | Bharat Electronics Ltd. | 915 | 38 |
| | Torrent Power Ltd. | 6,625 | 37 |
| * | Housing Development & Infrastructure Ltd. | 10,114 | 37 |
| | Indiabulls Financial Services Ltd. | 8,744 | 35 |
| | Mphasis Ltd. | 3,320 | 35 |
| * | GMR Infrastructure Ltd. | 40,149 | 34 |
| | Oil India Ltd. | 1,071 | 34 |
| | Divi's Laboratories Ltd. | 2,113 | 34 |
| * | Essar Oil Ltd. | 11,045 | 33 |
| | National Aluminium Co. Ltd. | 15,548 | 33 |
| * | Adani Power Ltd. | 11,943 | 30 |
| | Great Eastern Shipping Co. Ltd. | 4,651 | 30 |
| | Glenmark Pharmaceuticals Ltd. | 4,289 | 29 |
| * | Satyam Computer Services Ltd. | 16,745 | 29 |
| | Power Finance Corp. Ltd. | 5,389 | 28 |
| * | Satyam Computer Services Ltd. ADR | 6,743 | 23 |
| * | Oracle Financial Sevices Software Ltd. | 506 | 23 |
| | JSW Energy Ltd. | 13,650 | 23 |
| | Hindustan Zinc Ltd. | 6,780 | 22 |
| | Ashok Leyland Ltd. | 14,952 | 18 |
| | Corp Bank | 1,243 | 16 |
| * | Tata Communications Ltd. | 3,012 | 16 |
| | Castrol India Ltd. | 1,484 | 16 |
| * | Lanco Infratech Ltd. | 14,460 | 13 |
| * | Jet Airways India Ltd. | 1,168 | 13 |
| | Sun TV Network Ltd. | 1,307 | 13 |
| | Godrej Industries Ltd. | 2,902 | 13 |
| | Aban Offshore Ltd. | 801 | 11 |
| | Punj Lloyd Ltd. | 6,563 | 10 |
| | Mangalore Refinery & Petrochemicals Ltd. | 5,750 | 10 |
| | Financial Technologies India Ltd. | 470 | 9 |
| | Shipping Corp. of India Ltd. | 2,795 | 7 |
| * | Tata Teleservices Maharashtra Ltd. | 10,939 | 5 |
| * | Mahanagar Telephone Nigam | 2,962 | 3 |
| | ABB Ltd. | 51 | 1 |
| | | | 18,640 |
| Indonesia (0.3%) | | |
| | Astra International Tbk PT | 148,003 | 973 |
| | Bank Central Asia Tbk PT | 719,228 | 623 |
| | Bank Rakyat Indonesia Persero Tbk PT | 633,378 | 478 |
| | Telekomunikasi Indonesia Tbk PT | 426,080 | 384 |
| | Bumi Resources Tbk PT | 925,500 | 372 |
| | Bank Mandiri Tbk PT | 383,416 | 321 |
| | United Tractors Tbk PT | 99,500 | 270 |
| | Perusahaan Gas Negara PT | 327,000 | 153 |
| | Kalbe Farma Tbk PT | 316,000 | 132 |
| | Semen Gresik Persero Tbk PT | 107,000 | 119 |
| | Bank Negara Indonesia Persero Tbk PT | 250,630 | 119 |
| | Adaro Energy Tbk PT | 448,500 | 116 |
| | | |
| Vanguard® Total World Stock Index Fund | | |
| Schedule of Investments | | |
| April 30, 2011 | | |
| |
| | | | Market |
| | | | Value |
| | | Shares | ($000) |
| | Unilever Indonesia Tbk PT | 57,500 | 103 |
| | Gudang Garam Tbk PT | 21,000 | 100 |
| | Tambang Batubara Bukit Asam Tbk PT | 36,000 | 94 |
| | Indofood Sukses Makmur Tbk PT | 135,500 | 88 |
| | Indocement Tunggal Prakarsa Tbk PT | 40,000 | 79 |
| | Charoen Pokphand Indonesia Tbk PT | 341,000 | 77 |
| | Indo Tambangraya Megah PT | 12,000 | 66 |
| | Bank Danamon Indonesia Tbk PT | 67,495 | 49 |
| | Astra Agro Lestari Tbk PT | 17,000 | 46 |
| | International Nickel Indonesia Tbk PT | 77,000 | 45 |
| | Aneka Tambang Tbk PT | 147,500 | 39 |
| | Indosat Tbk PT | 52,500 | 33 |
| | | | 4,879 |
| Ireland (0.1%) | | |
| | CRH plc | 31,216 | 775 |
| * | Elan Corp. plc | 30,976 | 249 |
| | Kerry Group plc Class A | 5,070 | 210 |
| | Ryanair Holdings plc | 30,515 | 157 |
| * | Governor & Co. of the Bank of Ireland | 186,425 | 76 |
| | Ryanair Holdings plc ADR | 1,145 | 35 |
| * | Anglo Irish Bank Corp. Ltd. | 14,385 | — |
| | | | 1,502 |
| Israel (0.3%) | | |
| | Teva Pharmaceutical Industries Ltd. | 39,205 | 1,801 |
| * | Check Point Software Technologies Ltd. | 11,900 | 654 |
| | Israel Chemicals Ltd. | 25,290 | 449 |
| | Bezeq The Israeli Telecommunication Corp. Ltd. | 85,735 | 255 |
| * | Bank Hapoalim BM | 38,616 | 203 |
| | Bank Leumi Le-Israel BM | 25,094 | 131 |
| | Israel Corp. Ltd. | 97 | 121 |
| * | NICE Systems Ltd. | 2,573 | 98 |
| * | Israel Discount Bank Ltd. Class A | 31,461 | 67 |
| | Partner Communications Co. Ltd. | 3,295 | 63 |
| | Elbit Systems Ltd. | 985 | 56 |
| | Mizrahi Tefahot Bank Ltd. | 4,660 | 52 |
| | Cellcom Israel Ltd. (Registered) | 1,472 | 47 |
| | Gazit-Globe Ltd. | 3,085 | 42 |
| | Osem Investments Ltd. | 2,167 | 38 |
| | Delek Group Ltd. | 129 | 34 |
| * | Delek Drilling - LP | 7,474 | 30 |
| * | Makhteshim-Agan Industries Ltd. | 5,400 | 29 |
| | Clal Insurance Enterprises Holdings Ltd. | 900 | 26 |
| | Clal Industries and Investments Ltd. | 2,300 | 18 |
| * | Hot Telecommunication System Ltd. | 900 | 16 |
| * | Oil Refineries Ltd. | 19,025 | 14 |
| | Delek Automotive Systems Ltd. | 1,000 | 13 |
| | Property & Building Corp. | 137 | 13 |
| | Discount Investment Corp. | 600 | 12 |
| | Harel Insurance Investments & Financial Services Ltd. | 200 | 12 |
| * | Menorah Mivtachim Holdings Ltd. | 865 | 12 |
| | First International Bank Of Israel Ltd. | 708 | 11 |
| * | Koor Industries Ltd. | 400 | 10 |
| | Migdal Insurance & Financial Holding Ltd. | 5,000 | 9 |
| | IDB Holding Corp. Ltd. | 302 | 9 |
| | Paz Oil Co. Ltd. | 50 | 9 |
| | Strauss Group Ltd. | 500 | 8 |
| * | Elbit Imaging Ltd. | 579 | 7 |
| * | Africa Israel Investments Ltd. | 720 | 6 |
| | Ormat Industries | 762 | 6 |
| | Shufersal Ltd. | 680 | 4 |
| | | | 4,385 |
| Italy (1.3%) | | |
| | ENI SPA | 121,691 | 3,258 |
| | | |
| Vanguard® Total World Stock Index Fund | | |
| Schedule of Investments | | |
| April 30, 2011 | | |
| |
| | | | Market |
| | | | Value |
| | | Shares | ($000) |
| | Enel SPA | 308,495 | 2,200 |
| | UniCredit SPA | 850,020 | 2,189 |
| | Assicurazioni Generali SPA | 67,391 | 1,615 |
| | Intesa Sanpaolo SPA (Registered) | 388,237 | 1,290 |
| | Telecom Italia SPA (Registered) | 580,471 | 873 |
| | Saipem SPA | 13,932 | 791 |
| * | Fiat Industrial SPA | 34,830 | 517 |
| | Atlantia SPA | 18,840 | 464 |
| �� | Snam Rete Gas SPA | 72,672 | 452 |
| | Tenaris SA ADR | 8,484 | 431 |
| | Fiat SPA | 34,830 | 372 |
| | Telecom Italia SPA (Bearer) | 257,339 | 332 |
| | Terna Rete Elettrica Nazionale SPA | 61,174 | 306 |
| | Mediobanca SPA | 25,830 | 294 |
| | Banco Popolare SC | 92,100 | 273 |
| * | Parmalat SPA | 71,047 | 269 |
| | Mediaset SPA | 36,397 | 243 |
| | Finmeccanica SPA | 17,586 | 238 |
| | Unione di Banche Italiane SCPA | 25,901 | 232 |
| | Bulgari SPA | 12,204 | 222 |
| | Luxottica Group SPA | 5,862 | 194 |
| | Pirelli & C SPA | 15,703 | 163 |
| *,^ | Banca Monte dei Paschi di Siena SPA | 117,838 | 160 |
| | Mediolanum SPA | 24,820 | 146 |
| * | Autogrill SPA | 10,101 | 145 |
| | Exor SPA | 3,073 | 111 |
| | A2A SPA | 56,489 | 102 |
| | Tenaris SA | 3,197 | 81 |
| | Italcementi SPA RSP | 13,078 | 74 |
| | Banca Carige SPA | 29,835 | 72 |
| | Unipol Gruppo Finanziario SPA Prior Pfd. | 115,045 | 71 |
| | Exor SPA Prior Pfd. | 1,965 | 61 |
| | Buzzi Unicem SPA | 3,588 | 55 |
| | Banca Popolare di Milano Scarl | 14,967 | 51 |
| | Unipol Gruppo Finanziario SPA | 39,488 | 32 |
| | Lottomatica SPA | 1,383 | 31 |
| * | Edison SPA | 18,221 | 23 |
| | Italcementi SPA | 2,037 | 22 |
| * | Saras SPA | 8,757 | 22 |
| | | | 18,477 |
| Japan (7.2%) | | |
| | Toyota Motor Corp. | 103,130 | 4,114 |
| | Mitsubishi UFJ Financial Group Inc. | 622,651 | 2,988 |
| | Canon Inc. | 58,400 | 2,750 |
| | Honda Motor Co. Ltd. | 59,500 | 2,287 |
| | Sumitomo Mitsui Financial Group Inc. | 62,148 | 1,930 |
| | Komatsu Ltd. | 46,000 | 1,622 |
| | Mitsubishi Corp. | 57,400 | 1,557 |
| | Panasonic Corp. | 123,155 | 1,514 |
| | Softbank Corp. | 35,700 | 1,506 |
| | Mizuho Financial Group Inc. | 938,367 | 1,487 |
| | NTT DoCoMo Inc. | 796 | 1,477 |
| | FANUC Corp. | 8,000 | 1,339 |
| | Takeda Pharmaceutical Co. Ltd. | 25,900 | 1,255 |
| | Sony Corp. | 43,900 | 1,240 |
| | Nippon Telegraph & Telephone Corp. | 25,300 | 1,179 |
| | Mitsui & Co. Ltd. | 62,900 | 1,119 |
| | Nintendo Co. Ltd. | 4,700 | 1,112 |
| | KDDI Corp. | 152 | 1,015 |
| | Kyocera Corp. | 8,900 | 982 |
| | Nissan Motor Co. Ltd. | 99,430 | 957 |
| | Inpex Corp. | 121 | 930 |
| | Japan Tobacco Inc. | 235 | 913 |
| | Mitsubishi Estate Co. Ltd. | 51,000 | 892 |
| | |
| Vanguard® Total World Stock Index Fund | | |
| Schedule of Investments | | |
| April 30, 2011 | | |
| |
| | | Market |
| | | Value |
| | Shares | ($000) |
| Hitachi Ltd. | 163,000 | 885 |
| Toshiba Corp. | 155,000 | 825 |
| Nomura Holdings Inc. | 161,200 | 824 |
| Murata Manufacturing Co. Ltd. | 10,800 | 780 |
| Shin-Etsu Chemical Co. Ltd. | 14,900 | 775 |
| Nippon Steel Corp. | 246,000 | 770 |
| Mitsubishi Heavy Industries Ltd. | 160,870 | 769 |
| Mitsubishi Electric Corp. | 69,000 | 768 |
| Tokio Marine Holdings Inc. | 27,400 | 767 |
| East Japan Railway Co. | 13,700 | 761 |
| MS&AD Insurance Group Holdings | 31,091 | 728 |
| Seven & I Holdings Co. Ltd. | 28,400 | 715 |
| Dai-ichi Life Insurance Co. Ltd. | 427 | 705 |
| Kansai Electric Power Co. Inc. | 32,500 | 685 |
| Sumitomo Corp. | 48,000 | 662 |
| Mitsui Fudosan Co. Ltd. | 38,000 | 660 |
| Bridgestone Corp. | 28,960 | 640 |
| Denso Corp. | 18,900 | 633 |
| FUJIFILM Holdings Corp. | 19,700 | 612 |
| Astellas Pharma Inc. | 15,700 | 600 |
| Central Japan Railway Co. | 79 | 597 |
| ITOCHU Corp. | 57,000 | 594 |
| Kao Corp. | 23,100 | 578 |
| JFE Holdings Inc. | 20,500 | 561 |
| JX Holdings Inc. | 79,507 | 560 |
| ORIX Corp. | 5,651 | 555 |
| Chubu Electric Power Co. Inc. | 24,400 | 535 |
| Daiichi Sankyo Co. Ltd. | 26,400 | 519 |
| Suzuki Motor Corp. | 20,981 | 499 |
| Marubeni Corp. | 66,628 | 487 |
| Asahi Glass Co. Ltd. | 38,000 | 482 |
| Daito Trust Construction Co. Ltd. | 6,000 | 480 |
| Otsuka Holdings Co. Ltd. | 17,900 | 479 |
| Keyence Corp. | 1,760 | 465 |
| NKSJ Holdings Inc. | 70,900 | 457 |
| Sumitomo Mitsui Trust Holdings Inc. | 130,460 | 449 |
| Yamada Denki Co. Ltd. | 6,300 | 443 |
| Fujitsu Ltd. | 75,634 | 433 |
| Sumitomo Metal Mining Co. Ltd. | 24,000 | 429 |
| Kirin Holdings Co. Ltd. | 30,000 | 422 |
| SMC Corp. | 2,300 | 420 |
| Nidec Corp. | 4,800 | 420 |
| Sumitomo Realty & Development Co. Ltd. | 20,160 | 417 |
| Hoya Corp. | 19,100 | 411 |
| Mitsubishi Chemical Holdings Corp. | 60,484 | 410 |
| Toray Industries Inc. | 54,000 | 401 |
| Terumo Corp. | 6,800 | 379 |
| Tokyo Gas Co. Ltd. | 85,000 | 379 |
| Daikin Industries Ltd. | 11,879 | 378 |
| Isuzu Motors Ltd. | 88,000 | 377 |
| Resona Holdings Inc. | 78,806 | 374 |
| Sumitomo Metal Industries Ltd. | 174,000 | 368 |
| Rohm Co. Ltd. | 6,100 | 367 |
| Fast Retailing Co. Ltd. | 2,300 | 363 |
| Secom Co. Ltd. | 7,300 | 362 |
| Sumitomo Electric Industries Ltd. | 25,300 | 352 |
| Sumitomo Chemical Co. Ltd. | 64,492 | 343 |
| Eisai Co. Ltd. | 9,300 | 338 |
| Sharp Corp. | 36,000 | 331 |
| Yakult Honsha Co. Ltd. | 11,900 | 331 |
| Daiwa Securities Group Inc. | 75,000 | 324 |
| Tokyo Electron Ltd. | 5,500 | 318 |
| Aeon Co. Ltd. | 25,500 | 307 |
| Electric Power Development Co. Ltd. | 11,600 | 304 |
| | | |
| Vanguard® Total World Stock Index Fund | | |
| Schedule of Investments | | |
| April 30, 2011 | | |
| |
| | | | Market |
| | | | Value |
| | | Shares | ($000) |
| | Nitto Denko Corp. | 5,600 | 300 |
| | Asahi Kasei Corp. | 43,000 | 297 |
| | Mitsui OSK Lines Ltd. | 52,397 | 292 |
| | Tokyo Electric Power Co. Inc. | 54,300 | 291 |
| | Asahi Breweries Ltd. | 15,500 | 291 |
| | Omron Corp. | 10,200 | 281 |
| | Ricoh Co. Ltd. | 25,000 | 276 |
| | Yahoo Japan Corp. | 746 | 274 |
| | Kyushu Electric Power Co. Inc. | 14,800 | 274 |
| | Nikon Corp. | 13,000 | 272 |
| | T&D Holdings Inc. | 10,900 | 269 |
| | Dai Nippon Printing Co. Ltd. | 22,000 | 264 |
| | Ibiden Co. Ltd. | 7,725 | 261 |
| | Kubota Corp. | 27,000 | 259 |
| | Olympus Corp. | 9,000 | 255 |
| | Osaka Gas Co. Ltd. | 69,000 | 255 |
| | Kobe Steel Ltd. | 101,000 | 251 |
| | West Japan Railway Co. | 66 | 241 |
| | Hankyu Hanshin Holdings Inc. | 54,000 | 239 |
| | Tohoku Electric Power Co. Inc. | 16,100 | 236 |
| | NEC Corp. | 112,000 | 236 |
| | Ajinomoto Co. Inc. | 21,000 | 234 |
| | JS Group Corp. | 9,500 | 229 |
| | Nippon Electric Glass Co. Ltd. | 15,000 | 227 |
| | Yamato Holdings Co. Ltd. | 14,200 | 227 |
| | Kuraray Co. Ltd. | 15,500 | 226 |
| | Nomura Research Institute Ltd. | 10,400 | 224 |
| | TDK Corp. | 4,300 | 222 |
| | Shiseido Co. Ltd. | 13,200 | 220 |
| | Daiwa House Industry Co. Ltd. | 18,000 | 218 |
| | Taisho Pharmaceutical Co. Ltd. | 9,000 | 212 |
| | Aisin Seiki Co. Ltd. | 6,000 | 212 |
| | Kawasaki Heavy Industries Ltd. | 51,000 | 211 |
| | Shizuoka Bank Ltd. | 23,000 | 210 |
| | Bank of Yokohama Ltd. | 42,000 | 208 |
| | Aeon Mall Co. Ltd. | 8,600 | 207 |
| | Sekisui House Ltd. | 21,000 | 204 |
| | JGC Corp. | 8,000 | 200 |
| * | Mitsubishi Motors Corp. | 161,000 | 198 |
| * | Yamaha Motor Co. Ltd. | 10,200 | 196 |
| | Chugoku Electric Power Co. Inc. | 10,900 | 194 |
| | Makita Corp. | 4,200 | 193 |
| | Nippon Yusen KK | 52,000 | 192 |
| | Mitsubishi Materials Corp. | 55,340 | 192 |
| | NGK Insulators Ltd. | 11,000 | 191 |
| | Ono Pharmaceutical Co. Ltd. | 3,700 | 188 |
| | Shikoku Electric Power Co. Inc. | 7,100 | 180 |
| | Dena Co. Ltd. | 4,800 | 180 |
| | Fuji Heavy Industries Ltd. | 24,000 | 179 |
| | JTEKT Corp. | 13,700 | 178 |
| | Odakyu Electric Railway Co. Ltd. | 22,000 | 178 |
| | Tobu Railway Co. Ltd. | 45,000 | 176 |
| | Unicharm Corp. | 4,400 | 174 |
| | Toho Gas Co. Ltd. | 37,000 | 173 |
| | Brother Industries Ltd. | 11,300 | 173 |
| | JSR Corp. | 8,200 | 173 |
| | Shionogi & Co. Ltd. | 10,600 | 172 |
| | Toyota Industries Corp. | 5,600 | 170 |
| | Higo Bank Ltd. | 29,000 | 167 |
| | Tokyu Corp. | 40,000 | 165 |
| | Seino Holdings Corp. | 22,000 | 165 |
| | Toppan Printing Co. Ltd. | 21,000 | 165 |
| ^ | Kintetsu Corp. | 55,000 | 165 |
| | Oriental Land Co. Ltd. | 1,900 | 161 |
| | |
| Vanguard® Total World Stock Index Fund | | |
| Schedule of Investments | | |
| April 30, 2011 | | |
| |
| | | Market |
| | | Value |
| | Shares | ($000) |
| Shimano Inc. | 3,000 | 161 |
| Chiba Bank Ltd. | 27,000 | 160 |
| NTT Data Corp. | 48 | 159 |
| Chugai Pharmaceutical Co. Ltd. | 9,500 | 158 |
| Lawson Inc. | 3,200 | 157 |
| Fukuoka Financial Group Inc. | 37,000 | 154 |
| Teijin Ltd. | 32,000 | 153 |
| Casio Computer Co. Ltd. | 19,200 | 153 |
| OJI Paper Co. Ltd. | 34,000 | 153 |
| Dentsu Inc. | 5,700 | 152 |
| NSK Ltd. | 17,000 | 151 |
| Konica Minolta Holdings Inc. | 17,000 | 150 |
| Hokuriku Electric Power Co. | 7,100 | 144 |
| Benesse Holdings Inc. | 3,400 | 141 |
| Nippon Express Co. Ltd. | 35,000 | 139 |
| Sony Financial Holdings Inc. | 7,400 | 138 |
| Sotetsu Holdings Inc. | 50,000 | 137 |
| Sojitz Corp. | 70,848 | 137 |
| TonenGeneral Sekiyu KK | 11,000 | 136 |
| Hirose Electric Co. Ltd. | 1,300 | 135 |
| Nippon Paint Co. Ltd. | 19,000 | 133 |
| Credit Saison Co. Ltd. | 7,900 | 132 |
| Sumitomo Heavy Industries Ltd. | 20,000 | 132 |
| Trend Micro Inc. | 4,500 | 128 |
| Kurita Water Industries Ltd. | 4,300 | 126 |
| Sekisui Chemical Co. Ltd. | 15,000 | 126 |
| Keikyu Corp. | 18,000 | 126 |
| Isetan Mitsukoshi Holdings Ltd. | 13,000 | 125 |
| Hokkaido Electric Power Co. Inc. | 6,900 | 125 |
| THK Co. Ltd. | 4,800 | 123 |
| Mitsui Chemicals Inc. | 33,000 | 121 |
| Fukuyama Transporting Co. Ltd. | 24,998 | 121 |
| Nissin Foods Holdings Co. Ltd. | 3,300 | 117 |
| FamilyMart Co. Ltd. | 3,200 | 116 |
| Mitsumi Electric Co. Ltd. | 8,600 | 110 |
| Mazda Motor Corp. | 47,000 | 108 |
| Shinsei Bank Ltd. | 88,000 | 106 |
| Shimizu Corp. | 25,000 | 106 |
| Circle K Sunkus Co. Ltd. | 6,800 | 105 |
| Amada Co. Ltd. | 13,000 | 104 |
| Advantest Corp. | 5,200 | 103 |
| Nippon Sheet Glass Co. Ltd. | 34,742 | 102 |
| Mitsubishi Gas Chemical Co. Inc. | 13,000 | 102 |
| Rinnai Corp. | 1,500 | 100 |
| Mitsubishi Tanabe Pharma Corp. | 6,000 | 100 |
| IHI Corp. | 39,000 | 99 |
| Daihatsu Motor Co. Ltd. | 6,000 | 97 |
| Toyo Seikan Kaisha Ltd. | 5,700 | 97 |
| Keio Corp. | 17,000 | 95 |
| Kokuyo Co. Ltd. | 12,900 | 95 |
| Hamamatsu Photonics KK | 2,400 | 94 |
| Yaskawa Electric Corp. | 8,000 | 94 |
| Bank of Kyoto Ltd. | 10,000 | 93 |
| Denki Kagaku Kogyo KK | 18,000 | 92 |
| Cosmo Oil Co. Ltd. | 28,000 | 92 |
| Seiko Epson Corp. | 5,200 | 90 |
| Kyowa Hakko Kirin Co. Ltd. | 9,000 | 90 |
| Stanley Electric Co. Ltd. | 5,300 | 89 |
| Santen Pharmaceutical Co. Ltd. | 2,300 | 89 |
| Taiyo Nippon Sanso Corp. | 11,000 | 89 |
| Joyo Bank Ltd. | 22,000 | 89 |
| Obayashi Corp. | 21,000 | 89 |
| Sankyo Co. Ltd. | 1,700 | 88 |
| Asics Corp. | 6,000 | 87 |
| | | |
| Vanguard® Total World Stock Index Fund | | |
| Schedule of Investments | | |
| April 30, 2011 | | |
| |
| | | | Market |
| | | | Value |
| | | Shares | ($000) |
| | Nitori Holdings Co. Ltd. | 1,000 | 86 |
| | MEIJI Holdings Co. Ltd. | 2,017 | 86 |
| | Sega Sammy Holdings Inc. | 4,900 | 86 |
| | All Nippon Airways Co. Ltd. | 29,000 | 85 |
| | Iyo Bank Ltd. | 10,000 | 84 |
| | Hachijuni Bank Ltd. | 14,000 | 84 |
| | SBI Holdings Inc. | 772 | 83 |
| | Ube Industries Ltd. | 26,000 | 83 |
| | Nippon Meat Packers Inc. | 6,000 | 83 |
| | Keihan Electric Railway Co. Ltd. | 20,000 | 83 |
| | Idemitsu Kosan Co. Ltd. | 700 | 83 |
| | Konami Corp. | 4,100 | 82 |
| | Toyota Tsusho Corp. | 4,900 | 82 |
| | Nisshin Seifun Group Inc. | 6,500 | 81 |
| | Japan Steel Works Ltd. | 10,000 | 81 |
| | Kajima Corp. | 28,000 | 80 |
| | Ushio Inc. | 3,900 | 79 |
| | Hisamitsu Pharmaceutical Co. Inc. | 1,900 | 79 |
| | Hitachi Metals Ltd. | 6,000 | 79 |
| | Nippon Shokubai Co. Ltd. | 6,000 | 79 |
| | TOTO Ltd. | 10,000 | 79 |
| | Tosoh Corp. | 20,000 | 77 |
| | NOK Corp. | 4,500 | 77 |
| | Nabtesco Corp. | 3,000 | 77 |
| * | Elpida Memory Inc. | 5,100 | 76 |
| | Showa Denko KK | 38,000 | 76 |
| | Minebea Co. Ltd. | 14,000 | 76 |
| | Fuji Electric Co. Ltd. | 24,000 | 76 |
| | GS Yuasa Corp. | 11,000 | 75 |
| | Mitsui Mining & Smelting Co. Ltd. | 21,000 | 75 |
| | Daido Steel Co. Ltd. | 13,000 | 74 |
| | Dainippon Screen Manufacturing Co. Ltd. | 8,000 | 74 |
| | Hitachi Chemical Co. Ltd. | 3,600 | 74 |
| | Toho Co. Ltd. | 4,900 | 74 |
| | Aozora Bank Ltd. | 34,000 | 74 |
| | Ebara Corp. | 13,000 | 73 |
| | Hitachi Construction Machinery Co. Ltd. | 3,000 | 73 |
| | Air Water Inc. | 6,000 | 73 |
| | Kansai Paint Co. Ltd. | 8,000 | 72 |
| | Dowa Holdings Co. Ltd. | 11,000 | 72 |
| | DIC Corp. | 30,000 | 72 |
| | Namco Bandai Holdings Inc. | 6,500 | 72 |
| | Furukawa Electric Co. Ltd. | 18,000 | 72 |
| | Don Quijote Co. Ltd. | 1,900 | 71 |
| | USS Co. Ltd. | 920 | 71 |
| | Yokogawa Electric Corp. | 8,700 | 70 |
| | Taiyo Yuden Co. Ltd. | 5,000 | 70 |
| | Gunma Bank Ltd. | 13,000 | 70 |
| | Hiroshima Bank Ltd. | 16,000 | 70 |
| | Chugoku Bank Ltd. | 6,000 | 70 |
| | Chiyoda Corp. | 7,000 | 70 |
| | Maruichi Steel Tube Ltd. | 2,800 | 70 |
| | NGK Spark Plug Co. Ltd. | 5,000 | 70 |
| | Shimadzu Corp. | 8,000 | 70 |
| * | Sumco Corp. | 3,600 | 69 |
| | Toyo Suisan Kaisha Ltd. | 3,000 | 69 |
| | Hokuhoku Financial Group Inc. | 36,000 | 69 |
| | Miraca Holdings Inc. | 1,800 | 69 |
| | Mitsubishi UFJ Lease & Finance Co. Ltd. | 1,710 | 68 |
| | Taisei Corp. | 29,000 | 68 |
| | Fujikura Ltd. | 13,000 | 67 |
| | NTN Corp. | 14,000 | 67 |
| | Shimamura Co. Ltd. | 700 | 66 |
| | Tsumura & Co. | 2,100 | 65 |
| | | |
| Vanguard® Total World Stock Index Fund | | |
| Schedule of Investments | | |
| April 30, 2011 | | |
| |
| | | | Market |
| | | | Value |
| | | Shares | ($000) |
| | Tokyu Land Corp. | 15,000 | 65 |
| | Sumitomo Rubber Industries Ltd. | 5,700 | 65 |
| | Daicel Chemical Industries Ltd. | 10,000 | 65 |
| | Yamazaki Baking Co. Ltd. | 5,000 | 64 |
| | Keisei Electric Railway Co. Ltd. | 11,000 | 64 |
| | Yamaha Corp. | 5,100 | 64 |
| | Kawasaki Kisen Kaisha Ltd. | 19,000 | 64 |
| | Yamaguchi Financial Group Inc. | 7,000 | 63 |
| | Nagoya Railroad Co. Ltd. | 24,000 | 63 |
| | Yamato Kogyo Co. Ltd. | 1,900 | 63 |
| | Kagome Co. Ltd. | 3,600 | 63 |
| | Nissan Chemical Industries Ltd. | 6,000 | 62 |
| * | Gree Inc. | 3,000 | 62 |
| | Takashimaya Co. Ltd. | 9,000 | 62 |
| | Yamatake Corp. | 2,400 | 61 |
| | J Front Retailing Co. Ltd. | 14,000 | 61 |
| | Takata Corp. | 2,000 | 61 |
| | Nishi-Nippon Railroad Co. Ltd. | 14,000 | 61 |
| | Nippon Paper Group Inc. | 3,000 | 60 |
| | Toyobo Co. Ltd. | 38,000 | 60 |
| | Kamigumi Co. Ltd. | 7,000 | 60 |
| | Citizen Holdings Co. Ltd. | 9,900 | 60 |
| | Kinden Corp. | 7,000 | 60 |
| | Mitsui Engineering & Shipbuilding Co. Ltd. | 24,000 | 60 |
| | Kikkoman Corp. | 6,000 | 60 |
| | Nishi-Nippon City Bank Ltd. | 21,000 | 59 |
| | Mizuho Trust & Banking Co. Ltd. | 70,000 | 59 |
| | Japan Petroleum Exploration Co. | 1,200 | 59 |
| | Ito En Ltd. | 3,300 | 59 |
| | Suruga Bank Ltd. | 7,000 | 58 |
| | Kaneka Corp. | 8,000 | 58 |
| | Kewpie Corp. | 4,800 | 57 |
| | Tokuyama Corp. | 11,000 | 57 |
| | Nomura Real Estate Holdings Inc. | 3,700 | 57 |
| | NHK Spring Co. Ltd. | 6,000 | 57 |
| | Marui Group Co. Ltd. | 8,100 | 56 |
| | 77 Bank Ltd. | 12,000 | 55 |
| | Mitsubishi Logistics Corp. | 5,000 | 55 |
| | Mabuchi Motor Co. Ltd. | 1,100 | 55 |
| | OSAKA Titanium Technologies Co. | 700 | 54 |
| | Zeon Corp. | 6,000 | 54 |
| | Rengo Co. Ltd. | 9,000 | 54 |
| | Nanto Bank Ltd. | 11,000 | 54 |
| | Mizuho Securities Co. Ltd. | 21,000 | 53 |
| | Hakuhodo DY Holdings Inc. | 1,020 | 53 |
| ^ | Taiheiyo Cement Corp. | 31,000 | 53 |
| | Toyota Boshoku Corp. | 3,400 | 53 |
| | Toyoda Gosei Co. Ltd. | 2,400 | 52 |
| | MediPal Holdings Corp. | 6,300 | 52 |
| | Tokyo Steel Manufacturing Co. Ltd. | 4,800 | 52 |
| | Oracle Corp. Japan | 1,200 | 52 |
| | Glory Ltd. | 2,300 | 51 |
| | Lintec Corp. | 1,700 | 50 |
| | Nisshin Steel Co. Ltd. | 25,000 | 50 |
| | Nisshinbo Holdings Inc. | 5,000 | 49 |
| | Shiga Bank Ltd. | 9,000 | 48 |
| | Alps Electric Co. Ltd. | 4,800 | 48 |
| | Senshu Ikeda Holdings Inc. | 32,000 | 48 |
| | Koito Manufacturing Co. Ltd. | 3,000 | 47 |
| | OKUMA Corp. | 5,000 | 47 |
| | COMSYS Holdings Corp. | 4,500 | 47 |
| | Alfresa Holdings Corp. | 1,300 | 46 |
| | Suzuken Co. Ltd. | 1,800 | 45 |
| | Mochida Pharmaceutical Co. Ltd. | 4,000 | 44 |
| | | |
| Vanguard® Total World Stock Index Fund | | |
| Schedule of Investments | | |
| April 30, 2011 | | |
| |
| | | | Market |
| | | | Value |
| | | Shares | ($000) |
| | Sapporo Holdings Ltd. | 11,000 | 44 |
| | Coca-Cola West Co. Ltd. | 2,100 | 43 |
| | MISUMI Group Inc. | 1,700 | 43 |
| | Dainippon Sumitomo Pharma Co. Ltd. | 4,400 | 42 |
| | Shimachu Co. Ltd. | 1,800 | 42 |
| | Lion Corp. | 8,000 | 42 |
| | Park24 Co. Ltd. | 4,000 | 42 |
| | Disco Corp. | 600 | 41 |
| | Yokohama Rubber Co. Ltd. | 8,000 | 41 |
| | Sumitomo Osaka Cement Co. Ltd. | 15,000 | 41 |
| | Shima Seiki Manufacturing Ltd. | 1,500 | 40 |
| | Tokyo Tatemono Co. Ltd. | 11,000 | 40 |
| | Toho Titanium Co. Ltd. | 1,400 | 39 |
| | Aeon Credit Service Co. Ltd. | 2,900 | 39 |
| | Wacoal Holdings Corp. | 3,000 | 39 |
| | Heiwa Corp. | 2,500 | 39 |
| | Nippon Kayaku Co. Ltd. | 4,000 | 39 |
| | Mori Seiki Co. Ltd. | 3,000 | 39 |
| | Sumitomo Bakelite Co. Ltd. | 6,000 | 38 |
| | Nagase & Co. Ltd. | 3,000 | 38 |
| | Hino Motors Ltd. | 8,000 | 38 |
| | Sapporo Hokuyo Holdings Inc. | 8,500 | 38 |
| | ABC-Mart Inc. | 1,000 | 37 |
| | Hyakujushi Bank Ltd. | 10,000 | 37 |
| | Onward Holdings Co. Ltd. | 5,000 | 37 |
| | UNY Co. Ltd. | 4,200 | 37 |
| | Tokai Rika Co. Ltd. | 2,100 | 37 |
| | Nissha Printing Co. Ltd. | 1,800 | 37 |
| | H2O Retailing Corp. | 5,000 | 36 |
| | Sawai Pharmaceutical Co. Ltd. | 400 | 36 |
| | Ezaki Glico Co. Ltd. | 3,000 | 36 |
| | Ulvac Inc. | 1,600 | 36 |
| | Kansai Urban Banking Corp. | 20,000 | 36 |
| | Sohgo Security Services Co. Ltd. | 3,100 | 36 |
| * | Haseko Corp. | 53,000 | 36 |
| | Sumitomo Forestry Co. Ltd. | 4,000 | 35 |
| | Sysmex Corp. | 1,000 | 35 |
| | Hyakugo Bank Ltd. | 8,000 | 35 |
| | Kose Corp. | 1,300 | 34 |
| | Tokyo Style Co. Ltd. | 5,000 | 34 |
| | Obic Co. Ltd. | 180 | 33 |
| | Autobacs Seven Co. Ltd. | 900 | 33 |
| | Kobayashi Pharmaceutical Co. Ltd. | 700 | 33 |
| | Nippon Television Network Corp. | 230 | 33 |
| | Ryohin Keikaku Co. Ltd. | 700 | 32 |
| | Itochu Techno-Solutions Corp. | 900 | 32 |
| | Tokai Carbon Co. Ltd. | 6,000 | 32 |
| | Showa Shell Sekiyu KK | 2,900 | 32 |
| | Asatsu-DK Inc. | 1,200 | 31 |
| | Otsuka Corp. | 500 | 31 |
| | Hitachi Capital Corp. | 2,200 | 31 |
| | Awa Bank Ltd. | 5,000 | 31 |
| | Nichirei Corp. | 7,000 | 31 |
| | Rohto Pharmaceutical Co. Ltd. | 3,000 | 31 |
| | Pacific Metals Co. Ltd. | 4,000 | 30 |
| | Komeri Co. Ltd. | 1,100 | 30 |
| | Promise Co. Ltd. | 3,500 | 30 |
| | Toda Corp. | 8,000 | 30 |
| | San-In Godo Bank Ltd. | 4,000 | 30 |
| | Keiyo Bank Ltd. | 6,000 | 30 |
| | House Foods Corp. | 1,800 | 29 |
| | Hitachi High-Technologies Corp. | 1,400 | 29 |
| | Izumi Co. Ltd. | 2,000 | 29 |
| | Musashino Bank Ltd. | 900 | 29 |
| | | |
| Vanguard® Total World Stock Index Fund | | |
| Schedule of Investments | | |
| April 30, 2011 | | |
| |
| | | | Market |
| | | | Value |
| | | Shares | ($000) |
| | Aoyama Trading Co. Ltd. | 1,700 | 28 |
| | Hokkoku Bank Ltd. | 8,000 | 27 |
| | Tokyo Broadcasting System Holdings Inc. | 2,300 | 27 |
| | Kagoshima Bank Ltd. | 4,000 | 27 |
| | Acom Co. Ltd. | 1,830 | 27 |
| | Fuji Media Holdings Inc. | 20 | 27 |
| | NTT Urban Development Corp. | 32 | 27 |
| | Capcom Co. Ltd. | 1,400 | 26 |
| | Ogaki Kyoritsu Bank Ltd. | 8,000 | 26 |
| | Matsumotokiyoshi Holdings Co. Ltd. | 1,200 | 26 |
| | Juroku Bank Ltd. | 8,000 | 25 |
| | Takara Holdings Inc. | 5,000 | 24 |
| | Hitachi Transport System Ltd. | 1,700 | 24 |
| | Jafco Co. Ltd. | 900 | 23 |
| | Daishi Bank Ltd. | 7,000 | 22 |
| | Canon Marketing Japan Inc. | 1,900 | 21 |
| | Nipro Corp. | 1,000 | 20 |
| | Square Enix Holdings Co. Ltd. | 1,200 | 20 |
| | Kissei Pharmaceutical Co. Ltd. | 1,000 | 19 |
| | Shinko Electric Industries Co. Ltd. | 1,800 | 18 |
| | Matsui Securities Co. Ltd. | 3,500 | 17 |
| | IT Holdings Corp. | 1,600 | 16 |
| | Monex Group Inc. | 77 | 15 |
| | Sundrug Co. Ltd. | 400 | 11 |
| | Toshiba TEC Corp. | 2,000 | 9 |
| | Point Inc. | 170 | 8 |
| | NS Solutions Corp. | 400 | 8 |
| | Tokai Rubber Industries Ltd. | 600 | 7 |
| | Sumitomo Real Estate Sales Co. Ltd. | 170 | 7 |
| | PanaHome Corp. | 1,000 | 7 |
| | Nidec Sankyo Corp. | 1,000 | 7 |
| | Funai Electric Co. Ltd. | 200 | 6 |
| | Hikari Tsushin Inc. | 300 | 6 |
| | Mizuho Investors Securities Co. Ltd. | 6,000 | 6 |
| | Hitachi Koki Co. Ltd. | 600 | 5 |
| | Toyota Auto Body Co. Ltd. | 300 | 5 |
| | Kandenko Co. Ltd. | 1,000 | 5 |
| | Hitachi Cable Ltd. | 2,000 | 5 |
| | TV Asahi Corp. | 3 | 5 |
| | SKY Perfect JSAT Holdings Inc. | 10 | 4 |
| | Okasan Securities Group Inc. | 1,000 | 4 |
| | Toppan Forms Co. Ltd. | 400 | 3 |
| | kabu.com Securities Co. Ltd. | 800 | 3 |
| * | SFCG Co. Ltd. | 120 | — |
| | | | 102,432 |
| Luxembourg (0.0%) | | |
| | Millicom International Cellular SA | 4,392 | 476 |
| | RTL Group SA | 795 | 82 |
| * | L'Occitane International SA | 18,250 | 44 |
| | | | 602 |
| Malaysia (0.5%) | | |
| | Malayan Banking Bhd. | 237,815 | 703 |
| | CIMB Group Holdings Bhd. | 245,342 | 679 |
| | Public Bank Bhd. (Foreign) | 152,611 | 675 |
| | Sime Darby Bhd. | 198,400 | 604 |
| | Genting Bhd. | 119,200 | 467 |
| * | Axiata Group Bhd. | 281,166 | 466 |
| | IOI Corp. Bhd. | 220,140 | 394 |
| * | Petronas Chemicals Group Bhd. | 103,200 | 252 |
| | DiGi.Com Bhd. | 24,900 | 245 |
| | MISC Bhd. | 79,700 | 210 |
| | AMMB Holdings Bhd. | 95,600 | 206 |
| | Maxis Bhd. | 105,300 | 191 |
| | Genting Malaysia Bhd. | 140,100 | 174 |
| | | |
| Vanguard® Total World Stock Index Fund | | |
| Schedule of Investments | | |
| April 30, 2011 | | |
| |
| | | | Market |
| | | | Value |
| | | Shares | ($000) |
| | PPB Group Bhd. | 28,000 | 161 |
| | Kuala Lumpur Kepong Bhd. | 21,900 | 156 |
| | PLUS Expressways Bhd. | 88,600 | 135 |
| | Petronas Gas Bhd. | 32,600 | 124 |
| | IJM Corp. Bhd. | 54,960 | 115 |
| | SP Setia Bhd. | 81,000 | 114 |
| | YTL Power International Bhd. | 144,037 | 110 |
| | Tenaga Nasional Bhd. | 53,750 | 109 |
| | Gamuda Bhd. | 83,600 | 106 |
| | British American Tobacco Malaysia Bhd. | 5,800 | 94 |
| | Hong Leong Bank Bhd. | 24,500 | 86 |
| | UMW Holdings Bhd. | 35,800 | 85 |
| | Berjaya Sports Toto Bhd. | 52,700 | 75 |
| | Alliance Financial Group Bhd. | 63,600 | 67 |
| | Telekom Malaysia Bhd. | 49,500 | 67 |
| | MMC Corp. Bhd. | 68,800 | 62 |
| | RHB Capital Bhd. | 20,300 | 61 |
| | Petronas Dagangan Bhd. | 11,400 | 60 |
| * | UEM Land Holdings Bhd. | 50,000 | 45 |
| | Lafarge Malayan Cement Bhd. | 17,900 | 44 |
| | Parkson Holdings Bhd. | 18,973 | 37 |
| | Proton Holdings Bhd. | 9,400 | 11 |
| | Public Bank Bhd. (Local) | 1,614 | 7 |
| | | | 7,197 |
| Mexico (0.7%) | | |
| | America Movil SAB de CV | 959,637 | 2,750 |
| | Grupo Mexico SAB de CV Class B | 364,157 | 1,261 |
| | Wal-Mart de Mexico SAB de CV | 315,500 | 988 |
| | Fomento Economico Mexicano SAB de CV | 105,446 | 664 |
| * | Grupo Televisa SA | 122,900 | 582 |
| | Grupo Financiero Banorte SAB de CV | 98,914 | 498 |
| | Telefonos de Mexico SAB de CV | 513,754 | 482 |
| * | Cemex SAB de CV ADR | 46,211 | 401 |
| | Industrias Penoles SAB de CV | 6,790 | 264 |
| | Grupo Financiero Inbursa SA | 40,700 | 217 |
| | Grupo Modelo SAB de CV | 28,100 | 176 |
| | Alfa SAB de CV Class A | 10,900 | 163 |
| | Grupo Elektra SA de CV | 3,320 | 151 |
| | Grupo Bimbo SAB de CV Class A | 62,400 | 138 |
| * | Minera Frisco SAB de CV | 30,472 | 131 |
| | Mexichem SAB de CV | 30,415 | 116 |
| | Grupo Carso SAB de CV | 24,700 | 96 |
| | Kimberly-Clark de Mexico SAB de CV Class A | 15,100 | 93 |
| | Grupo Aeroportuario del Pacifico SAB de CV Class B | 18,500 | 77 |
| * | Impulsora del Desarrollo y El Empleo en America Latina SAB de CV | 32,200 | 59 |
| | Organizacion Soriana SAB de CV Class B | 13,000 | 45 |
| * | Urbi Desarrollos Urbanos SAB de CV | 15,000 | 36 |
| * | Inmuebles Carso SAB de CV | 24,700 | 28 |
| * | Carso Infraestructura y Construccion SAB de CV | 9,700 | 7 |
| | | | 9,423 |
| Morocco (0.0%) | | |
| | Maroc Telecom | 7,387 | 146 |
| | Douja Promotion Groupe Addoha SA | 6,322 | 78 |
| | | | 224 |
| Netherlands (1.0%) | | |
| | Unilever NV | 68,355 | 2,250 |
| * | ING Groep NV | 169,941 | 2,239 |
| | Koninklijke Philips Electronics NV | 42,292 | 1,253 |
| | Koninklijke KPN NV | 67,157 | 1,065 |
| | Koninklijke Ahold NV | 56,754 | 797 |
| * | Aegon NV | 100,097 | 796 |
| | Akzo Nobel NV | 10,187 | 790 |
| | ASML Holding NV | 18,007 | 751 |
| | | |
| Vanguard® Total World Stock Index Fund | | |
| Schedule of Investments | | |
| April 30, 2011 | | |
| |
| | | | Market |
| | | | Value |
| | | Shares | ($000) |
| | Heineken NV | 12,388 | 741 |
| | Reed Elsevier NV | 42,459 | 554 |
| | Koninklijke DSM NV | 7,748 | 534 |
| | TNT NV | 19,925 | 490 |
| | Fugro NV | 3,348 | 307 |
| | Wolters Kluwer NV | 12,754 | 297 |
| | Randstad Holding NV | 4,724 | 266 |
| | Corio NV | 3,319 | 235 |
| | Heineken Holding NV | 3,960 | 209 |
| * | SBM Offshore NV | 6,079 | 178 |
| | Koninklijke Boskalis Westminster NV | 2,714 | 144 |
| | Koninklijke Vopak NV | 1,832 | 88 |
| | | | 13,984 |
| New Zealand (0.1%) | | |
| | Fletcher Building Ltd. | 30,328 | 226 |
| | Telecom Corp. of New Zealand Ltd. | 84,863 | 149 |
| | Sky City Entertainment Group Ltd. | 26,543 | 77 |
| | Contact Energy Ltd. | 14,369 | 69 |
| | Auckland International Airport Ltd. | 35,852 | 64 |
| | Fisher & Paykel Healthcare Corp. Ltd. | 21,665 | 54 |
| | Sky Network Television Ltd. | 8,760 | 41 |
| | Vector Ltd. | 17,206 | 36 |
| | Kiwi Income Property Trust | 41,436 | 35 |
| | Air New Zealand Ltd. | 8,903 | 8 |
| | Warehouse Group Ltd. | 2,427 | 7 |
| | | | 766 |
| Norway (0.4%) | | |
| | Statoil ASA | 55,075 | 1,613 |
| ^ | DnB NOR ASA | 51,951 | 845 |
| | Telenor ASA | 34,142 | 590 |
| | Yara International ASA | 9,580 | 561 |
| ^ | Norsk Hydro ASA | 57,474 | 510 |
| | Seadrill Ltd. | 13,959 | 495 |
| ^ | Orkla ASA | 47,256 | 478 |
| ^ | Storebrand ASA | 23,566 | 245 |
| *,^ | Aker Solutions ASA | 8,191 | 197 |
| * | Renewable Energy Corp. ASA | 19,813 | 70 |
| | | | 5,604 |
| Peru (0.1%) | | |
| | Cia de Minas Buenaventura SA ADR | 13,683 | 570 |
| | Southern Copper Corp. | 9,431 | 353 |
| | Credicorp Ltd. | 2,059 | 199 |
| | Volcan Cia Minera SAA Class B | 60,898 | 67 |
| | | | 1,189 |
| Philippines (0.1%) | | |
| | SM Investments Corp. | 21,260 | 288 |
| | Aboitiz Equity Ventures Inc. | 94,640 | 88 |
| | Manila Electric Co. | 15,000 | 86 |
| | Philippine Long Distance Telephone Co. | 1,450 | 84 |
| | Ayala Land Inc. | 208,100 | 80 |
| | Aboitiz Power Corp. | 91,720 | 68 |
| | Bank of the Philippine Islands | 43,938 | 60 |
| | Ayala Corp. | 6,000 | 55 |
| * | Metropolitan Bank & Trust | 30,377 | 49 |
| | Banco de Oro Unibank Inc. | 37,000 | 47 |
| | Jollibee Foods Corp. | 20,000 | 44 |
| | SM Prime Holdings Inc. | 134,000 | 38 |
| | Petron Corp. | 72,000 | 23 |
| | Globe Telecom Inc. | 1,000 | 21 |
| | | | 1,031 |
| Poland (0.2%) | | |
| | Powszechna Kasa Oszczednosci Bank Polski SA | 31,932 | 549 |
| | KGHM Polska Miedz SA | 7,271 | 535 |
| | | |
| Vanguard® Total World Stock Index Fund | | |
| Schedule of Investments | | |
| April 30, 2011 | | |
| |
| | | | Market |
| | | | Value |
| | | Shares | ($000) |
| | Bank Pekao SA | 5,849 | 383 |
| * | Polski Koncern Naftowy Orlen SA | 12,289 | 256 |
| | Powszechny Zaklad Ubezpieczen SA | 1,710 | 240 |
| | PGE SA | 22,669 | 205 |
| | Telekomunikacja Polska SA | 28,519 | 188 |
| * | Getin Holding SA | 12,577 | 71 |
| | Polskie Gornictwo Naftowe i Gazownictwo SA | 46,234 | 68 |
| * | BRE Bank SA | 453 | 59 |
| | Bank Handlowy w Warszawie SA | 1,389 | 52 |
| * | ING Bank Slaski SA | 133 | 44 |
| | TVN SA | 6,300 | 42 |
| * | Globe Trade Centre SA | 4,314 | 34 |
| | | | 2,726 |
| Portugal (0.1%) | | |
| | Portugal Telecom SGPS SA | 46,674 | 571 |
| | EDP - Energias de Portugal SA | 123,450 | 504 |
| | Galp Energia SGPS SA Class B | 9,804 | 219 |
| | Jeronimo Martins SGPS SA | 9,665 | 159 |
| *,^ | Banco Comercial Portugues SA | 172,131 | 137 |
| * | Brisa Auto-Estradas de Portugal SA | 18,074 | 121 |
| * | EDP Renovaveis SA | 10,385 | 80 |
| | Banco Espirito Santo SA | 11,232 | 47 |
| | Banco BPI SA | 20,861 | 38 |
| | Cimpor Cimentos de Portugal SGPS SA | 4,605 | 32 |
| | | | 1,908 |
| Russia (1.0%) | | |
| | Gazprom OAO ADR | 121,696 | 2,062 |
| | Lukoil OAO ADR | 27,944 | 1,942 |
| | Gazprom OAO | 164,357 | 1,415 |
| | Sberbank of Russia | 380,011 | 1,389 |
| | NovaTek OAO | 94,623 | 1,236 |
| | MMC Norilsk Nickel OJSC ADR | 37,636 | 1,042 |
| | Rosneft Oil Co. GDR | 103,097 | 923 |
| | Tatneft ADR | 12,091 | 546 |
| | VTB Bank OJSC GDR | 68,164 | 443 |
| | Surgutneftegas OJSC ADR | 39,041 | 418 |
| | Mobile Telesystems OJSC | 41,412 | 387 |
| | Gazprom Neft JSC | 60,927 | 306 |
| | Novolipetsk Steel OJSC | 76,769 | 299 |
| | Uralkali | 30,430 | 254 |
| * | Federal Hydrogenerating Co. JSC | 4,951,600 | 251 |
| | Polyus Gold OJSC | 2,640 | 188 |
| * | Federal Grid Co. Unified Energy System JSC | 13,443,105 | 178 |
| | Wimm-Bill-Dann Foods OJSC | 1,172 | 164 |
| | Severstal OAO | 6,977 | 128 |
| | Sistema JSFC | 101,482 | 118 |
| | Wimm-Bill-Dann Foods OJSC ADR | 2,816 | 99 |
| | Lukoil OAO | 1,420 | 98 |
| * | IDGC Holding JSC | 560,785 | 85 |
| * | Polymetal JSC | 4,298 | 85 |
| * | OGK-4 OJSC | 646,100 | 58 |
| * | Raspadskaya | 8,000 | 53 |
| * | Inter Rao Ues OAO | 38,841,200 | 50 |
| * | TMK OAO | 8,946 | 45 |
| | Mosenergo OAO | 410,351 | 41 |
| | Magnitogorsk Iron & Steel Works | 33,131 | 33 |
| * | WGC-3 OJSC | 666,100 | 32 |
| | Rosneft Oil Co. | 3,288 | 29 |
| * | TGK-1 OAO | 41,408,000 | 25 |
| | Rostelecom OJSC | 3,672 | 22 |
| | Aeroflot - Russian Airlines OJSC | 5,336 | 14 |
| * | PIK Group | 2,527 | 11 |
| | | |
| Vanguard® Total World Stock Index Fund | | |
| Schedule of Investments | | |
| April 30, 2011 | | |
| |
| | | | Market |
| | | | Value |
| | | Shares | ($000) |
| * | RusHydro JSC | 23,742 | 1 |
| | | | 14,470 |
| Singapore (0.7%) | | |
| | Singapore Telecommunications Ltd. | 340,000 | 868 |
| | DBS Group Holdings Ltd. | 70,000 | 858 |
| | Oversea-Chinese Banking Corp. Ltd. | 104,000 | 812 |
| | United Overseas Bank Ltd. | 48,000 | 770 |
| | Keppel Corp. Ltd. | 69,313 | 675 |
| | Wilmar International Ltd. | 115,602 | 498 |
| * | Genting Singapore plc | 260,000 | 462 |
| | Fraser and Neave Ltd. | 87,999 | 451 |
| | Singapore Airlines Ltd. | 34,420 | 397 |
| | Singapore Exchange Ltd. | 58,311 | 372 |
| | CapitaLand Ltd. | 124,500 | 346 |
| | Golden Agri-Resources Ltd. | 571,831 | 311 |
| | Noble Group Ltd. | 162,272 | 297 |
| | Venture Corp. Ltd. | 32,875 | 259 |
| | City Developments Ltd. | 25,000 | 242 |
| | Singapore Press Holdings Ltd. | 60,000 | 195 |
| | Singapore Post Ltd. | 171,625 | 163 |
| | Jardine Cycle & Carriage Ltd. | 5,000 | 151 |
| | SembCorp Industries Ltd. | 32,231 | 142 |
| | SembCorp Marine Ltd. | 29,389 | 136 |
| | Olam International Ltd. | 56,000 | 132 |
| | CapitaMall Trust | 84,600 | 131 |
| | Singapore Technologies Engineering Ltd. | 49,000 | 126 |
| | M1 Ltd. | 58,893 | 115 |
| | Ascendas Real Estate Investment Trust | 66,000 | 110 |
| | Yangzijiang Shipbuilding Holdings Ltd. | 69,036 | 102 |
| | ComfortDelGro Corp. Ltd. | 75,000 | 94 |
| | CapitaMalls Asia Ltd. | 64,000 | 93 |
| | CapitaCommercial Trust | 75,810 | 89 |
| | UOL Group Ltd. | 22,000 | 87 |
| | Keppel Land Ltd. | 23,600 | 81 |
| | Cosco Corp. Singapore Ltd. | 32,000 | 58 |
| | Neptune Orient Lines Ltd. | 36,500 | 56 |
| | StarHub Ltd. | 21,000 | 49 |
| | SMRT Corp. Ltd. | 27,000 | 42 |
| | SIA Engineering Co. Ltd. | 11,000 | 38 |
| | Wing Tai Holdings Ltd. | 27,000 | 35 |
| | Yanlord Land Group Ltd. | 26,000 | 31 |
| * | Indofood Agri Resources Ltd. | 18,000 | 31 |
| | GuocoLand Ltd. | 7,999 | 16 |
| | Allgreen Properties Ltd. | 16,000 | 15 |
| | Hotel Properties Ltd. | 6,000 | 12 |
| | Wheelock Properties Singapore Ltd. | 7,000 | 11 |
| | STATS ChipPAC Ltd. | 15,000 | 9 |
| * | Golden Agri-Resources Ltd. Warrants Exp. 07/23/2012 | 18,588 | 2 |
| | | | 9,970 |
| South Africa (1.2%) | | |
| | MTN Group Ltd. | 82,873 | 1,843 |
| | Sasol Ltd. | 27,614 | 1,596 |
| | Naspers Ltd. | 17,807 | 1,072 |
| | Standard Bank Group Ltd. | 68,147 | 1,070 |
| | Impala Platinum Holdings Ltd. | 28,753 | 899 |
| | AngloGold Ashanti Ltd. | 16,286 | 829 |
| | Gold Fields Ltd. | 38,749 | 693 |
| | FirstRand Ltd. | 210,975 | 664 |
| | Shoprite Holdings Ltd. | 30,750 | 485 |
| | Sanlam Ltd. | 106,603 | 457 |
| | Remgro Ltd. | 24,622 | 427 |
| | Kumba Iron Ore Ltd. | 5,322 | 389 |
| | Bidvest Group Ltd. | 15,792 | 364 |
| | Anglo Platinum Ltd. | 3,366 | 343 |
| | | |
| Vanguard® Total World Stock Index Fund | | |
| Schedule of Investments | | |
| April 30, 2011 | | |
| |
| | | | Market |
| | | | Value |
| | | Shares | ($000) |
| | Harmony Gold Mining Co. Ltd. | 22,035 | 338 |
| | ABSA Group Ltd. | 14,506 | 301 |
| | Steinhoff International Holdings Ltd. | 69,019 | 266 |
| | Truworths International Ltd. | 19,625 | 227 |
| | Vodacom Group Ltd. | 18,145 | 222 |
| | Nedbank Group Ltd. | 9,961 | 222 |
| | African Bank Investments Ltd. | 34,341 | 201 |
| | Massmart Holdings Ltd. | 8,694 | 190 |
| | RMB Holdings Ltd. | 43,279 | 187 |
| | ArcelorMittal South Africa Ltd. | 13,318 | 182 |
| | Tiger Brands Ltd. | 6,100 | 179 |
| | Growthpoint Properties Ltd. | 60,200 | 167 |
| | Woolworths Holdings Ltd. | 36,172 | 165 |
| | Aspen Pharmacare Holdings Ltd. | 13,124 | 162 |
| | Imperial Holdings Ltd. | 8,777 | 158 |
| | MMI Holdings Ltd. | 57,942 | 150 |
| | Foschini Group Ltd. | 10,584 | 146 |
| | Aveng Ltd. | 24,771 | 132 |
| * | Sappi Ltd. | 22,937 | 125 |
| | Exxaro Resources Ltd. | 4,441 | 120 |
| | Netcare Ltd. | 55,336 | 120 |
| | Barloworld Ltd. | 9,368 | 106 |
| | Spar Group Ltd. | 6,888 | 102 |
| | Mr Price Group Ltd. | 9,935 | 102 |
| | African Rainbow Minerals Ltd. | 3,123 | 102 |
| | Nampak Ltd. | 29,619 | 101 |
| | Telkom SA Ltd. | 16,822 | 98 |
| | Pretoria Portland Cement Co. Ltd. | 22,209 | 85 |
| | Murray & Roberts Holdings Ltd. | 21,867 | 84 |
| | Investec Ltd. | 10,112 | 82 |
| | Clicks Group Ltd. | 9,646 | 65 |
| | Sun International Ltd. | 4,518 | 63 |
| | RMI Holdings | 33,433 | 60 |
| | Pick n Pay Stores Ltd. | 9,221 | 60 |
| | Northam Platinum Ltd. | 8,675 | 57 |
| | Liberty Holdings Ltd. | 4,885 | 54 |
| | AVI Ltd. | 11,213 | 53 |
| | Reunert Ltd. | 5,500 | 52 |
| | Medi-Clinic Corp. Ltd. | 11,175 | 49 |
| | Discovery Holdings Ltd. | 8,542 | 49 |
| | Aeci Ltd. | 3,756 | 49 |
| | JD Group Ltd. | 6,633 | 49 |
| | Lewis Group Ltd. | 3,986 | 48 |
| | Mondi Ltd. | 4,735 | 46 |
| | Adcock Ingram Holdings Ltd. | 4,808 | 45 |
| | Fountainhead Property Trust | 43,861 | 44 |
| | Tongaat Hulett Ltd. | 2,852 | 42 |
| | Illovo Sugar Ltd. | 8,512 | 37 |
| | Wilson Bayly Holmes-Ovcon Ltd. | 2,031 | 35 |
| | Grindrod Ltd. | 13,901 | 31 |
| | JSE Ltd. | 1,262 | 13 |
| | Santam Ltd. | 589 | 12 |
| | Allied Technologies Ltd. | 878 | 9 |
| | Pick'n Pay Holdings Ltd. | 3,111 | 9 |
| | African Oxygen Ltd. | 1,948 | 6 |
| | Mvelaphanda Resources Ltd. | 4,749 | 3 |
| | Group Five Ltd. | 300 | 1 |
| * | Evraz Highveld Steel and Vanadium Ltd. | 153 | 1 |
| | | | 16,995 |
| South Korea (2.3%) | | |
| 1 | Samsung Electronics Co. Ltd. GDR | 12,756 | 5,325 |
| | POSCO ADR | 17,517 | 1,932 |
| | Hyundai Motor Co. | 7,231 | 1,668 |
| | Hyundai Heavy Industries Co. Ltd. | 2,509 | 1,255 |
| | | |
| Vanguard® Total World Stock Index Fund | | |
| Schedule of Investments | | |
| April 30, 2011 | | |
| |
| | | | Market |
| | | | Value |
| | | Shares | ($000) |
| | Shinhan Financial Group Co. Ltd. ADR | 12,909 | 1,252 |
| | KB Financial Group Inc. ADR | 21,607 | 1,151 |
| | LG Chem Ltd. | 2,122 | 1,054 |
| | Hyundai Mobis | 3,130 | 1,050 |
| | Kia Motors Corp. | 13,140 | 945 |
| | SK Innovation Co. Ltd. | 3,052 | 664 |
| | Hynix Semiconductor Inc. | 19,460 | 615 |
| | OCI Co. Ltd. | 991 | 593 |
| | S-Oil Corp. | 3,522 | 527 |
| | SK Telecom Co. Ltd. ADR | 27,166 | 516 |
| | Samsung C&T Corp. | 6,485 | 470 |
| | Samsung Heavy Industries Co. Ltd. | 10,160 | 461 |
| | LG Electronics Inc. | 4,671 | 450 |
| | Hana Financial Group Inc. | 10,410 | 442 |
| | Samsung Fire & Marine Insurance Co. Ltd. | 1,976 | 424 |
| * | NHN Corp. | 2,043 | 405 |
| | LG Display Co. Ltd. | 11,200 | 402 |
| | Samsung Engineering Co. Ltd. | 1,669 | 371 |
| | SK Holdings Co. Ltd. | 2,004 | 360 |
| | LG Corp. | 3,599 | 331 |
| | Hyundai Engineering & Construction Co. Ltd. | 3,543 | 298 |
| | Shinsegae Co. Ltd. | 1,142 | 288 |
| * | Korea Electric Power Corp. | 10,990 | 263 |
| | Samsung SDI Co. Ltd. | 1,425 | 255 |
| | Honam Petrochemical Corp. | 673 | 238 |
| | Cheil Industries Inc. | 2,135 | 235 |
| | Korea Zinc Co. Ltd. | 590 | 233 |
| | Samsung Life Insurance Co. Ltd. | 2,562 | 233 |
| | Hyundai Steel Co. | 1,817 | 232 |
| | Samsung Electro-Mechanics Co. Ltd. | 2,337 | 226 |
| | Woori Finance Holdings Co. Ltd. | 16,280 | 222 |
| | Samsung Securities Co. Ltd. | 2,615 | 219 |
| | KT Corp. ADR | 10,700 | 217 |
| | GS Engineering & Construction Corp. | 1,633 | 197 |
| | LG Household & Health Care Ltd. | 489 | 197 |
| | Samsung Techwin Co. Ltd. | 2,320 | 191 |
| | NCSoft Corp. | 679 | 180 |
| | Lotte Shopping Co. Ltd. | 378 | 172 |
| | Daelim Industrial Co. Ltd. | 1,515 | 171 |
| | Hankook Tire Co. Ltd. | 4,230 | 170 |
| | Amorepacific Corp. | 167 | 168 |
| | KT&G Corp. | 2,679 | 159 |
| | GS Holdings | 1,890 | 158 |
| | LS Corp. | 1,343 | 149 |
| | Dongbu Insurance Co. Ltd. | 3,020 | 144 |
| | Hyundai Department Store Co. Ltd. | 950 | 139 |
| | Hanwha Corp. | 3,020 | 139 |
| | Kangwon Land Inc. | 6,110 | 139 |
| | Industrial Bank of Korea | 6,800 | 131 |
| | Hanwha Chem Corp. | 2,900 | 129 |
| | Daewoo Shipbuilding & Marine Engineering Co. Ltd. | 3,000 | 129 |
| | Doosan Corp. | 1,036 | 127 |
| | Celltrion Inc. | 3,615 | 124 |
| | Daewoo Securities Co. Ltd. | 5,800 | 122 |
| | Hyosung Corp. | 1,451 | 119 |
| | Woongjin Coway Co. Ltd. | 3,290 | 110 |
| * | BS Financial Group Inc. | 7,060 | 103 |
| | Doosan Heavy Industries and Construction Co. Ltd. | 1,764 | 99 |
| * | Doosan Infracore Co. Ltd. | 3,500 | 97 |
| | Korea Exchange Bank | 11,150 | 95 |
| ^ | Daewoo International Corp. | 2,399 | 93 |
| | Hyundai Mipo Dockyard | 512 | 91 |
| | SKC Co. Ltd. | 1,560 | 90 |
| | Daegu Bank Ltd. | 5,310 | 89 |
| | | |
| Vanguard® Total World Stock Index Fund | | |
| Schedule of Investments | | |
| April 30, 2011 | | |
| |
| | | | Market |
| | | | Value |
| | | Shares | ($000) |
| | CJ CheilJedang Corp. | 378 | 88 |
| | STX Offshore & Shipbuilding Co. Ltd. | 2,900 | 86 |
| | SK C&C Co. Ltd. | 831 | 85 |
| | Korean Air Lines Co. Ltd. | 1,371 | 84 |
| | Woori Investment & Securities Co. Ltd. | 4,160 | 84 |
| | Hyundai Securities Co. | 6,470 | 82 |
| | Dongkuk Steel Mill Co. Ltd. | 2,050 | 82 |
| | Korea Investment Holdings Co. Ltd. | 2,010 | 79 |
| | Hyundai Merchant Marine Co. Ltd. | 2,581 | 79 |
| | Samsung Electronics Co. Ltd. | 93 | 78 |
| | Korea Life Insurance Co. Ltd. | 10,820 | 75 |
| | Samsung Card Co. | 1,413 | 70 |
| | Hanjin Shipping Co. Ltd. | 2,662 | 69 |
| | Hyundai Development Co. | 2,450 | 67 |
| | Daum Communications Corp. | 630 | 65 |
| | KCC Corp. | 180 | 61 |
| * | Daewoo Engineering & Construction Co. Ltd. | 5,350 | 57 |
| | Yuhan Corp. | 420 | 56 |
| | STX Corp. Co. Ltd. | 2,204 | 55 |
| | AMOREPACIFIC Group | 277 | 55 |
| | LG Uplus Corp. | 8,730 | 53 |
| * | Hanjin Heavy Industries & Construction Co. Ltd. | 1,434 | 52 |
| | Samsung Fine Chemicals Co. Ltd. | 700 | 52 |
| | Hyundai Glovis Co. Ltd. | 355 | 51 |
| | S1 Corp. | 1,020 | 50 |
| * | Korea Express Co. Ltd. | 489 | 48 |
| | Lotte Confectionery Co. Ltd. | 31 | 46 |
| | CJ Corp. | 601 | 45 |
| | Lotte Chilsung Beverage Co. Ltd. | 42 | 45 |
| | Cheil Worldwide Inc. | 3,175 | 41 |
| | SK Networks Co. Ltd. | 3,440 | 38 |
| | Hyundai Hysco | 910 | 37 |
| | NongShim Co. Ltd. | 150 | 35 |
| | Hite Brewery Co. Ltd. | 298 | 33 |
| | Daishin Securities Co. Ltd. | 2,300 | 31 |
| | STX Pan Ocean Co. Ltd. | 3,610 | 29 |
| | Korea Gas Corp. | 700 | 22 |
| | Halla Climate Control Corp. | 1,040 | 21 |
| | KEPCO Engineering & Construction Co. Inc. | 318 | 21 |
| | Mirae Asset Securities Co. Ltd. | 511 | 21 |
| | Lotte Midopa Co. Ltd. | 1,020 | 15 |
| | LG Hausys Ltd. | 125 | 9 |
| | Daishin Securities Co. Ltd. Prior Pfd. | 950 | 8 |
| | KT Corp. | 119 | 4 |
| | Hanjin Shipping Holdings Co. Ltd. | 305 | 4 |
| | | | 32,311 |
| Spain (1.6%) | | |
| | Telefonica SA | 202,082 | 5,429 |
| | Banco Santander SA | 363,730 | 4,645 |
| | Banco Bilbao Vizcaya Argentaria SA | 196,197 | 2,513 |
| | Iberdrola SA | 239,327 | 2,220 |
| | Repsol YPF SA | 54,409 | 1,942 |
| | Inditex SA | 10,973 | 984 |
| | ACS Actividades de Construccion y Servicios SA | 10,109 | 509 |
| | Abertis Infraestructuras SA | 16,262 | 385 |
| | Banco Popular Espanol SA | 55,643 | 333 |
| | Gas Natural SDG SA | 16,064 | 330 |
| | Ferrovial SA | 23,729 | 327 |
| | Criteria Caixacorp SA | 43,083 | 318 |
| | Acerinox SA | 14,632 | 294 |
| | Banco de Sabadell SA | 66,014 | 292 |
| | Enagas SA | 7,033 | 174 |
| | Grifols SA | 8,661 | 172 |
| * | Gamesa Corp. Tecnologica SA | 17,404 | 164 |
| | | |
| Vanguard® Total World Stock Index Fund | | |
| Schedule of Investments | | |
| April 30, 2011 | | |
| |
| | | | Market |
| | | | Value |
| | | Shares | ($000) |
| | Mapfre SA | 38,801 | 162 |
| | Iberdrola Renovables SA | 35,242 | 161 |
| * | International Consolidated Airlines Group SA | 37,493 | 149 |
| | Indra Sistemas SA | 6,330 | 144 |
| | Red Electrica Corp. SA | 2,040 | 130 |
| | Acciona SA | 1,086 | 126 |
| | Bankinter SA | 15,164 | 113 |
| | Endesa SA | 2,969 | 104 |
| | Zardoya Otis SA | 5,187 | 88 |
| | Corp Financiera Alba | 1,198 | 74 |
| * | Gestevision Telecinco SA | 5,585 | 63 |
| | Fomento de Construcciones y Contratas SA | 1,728 | 59 |
| *,^ | Banco de Valencia SA | 8,226 | 33 |
| | Banco Espanol de Credito SA | 1,960 | 18 |
| | Banco Santander SA ADR | 431 | 5 |
| *,^ | Banco de Valencia SA Rights Exp. 05/09/2011 | 8,228 | 1 |
| | | | 22,461 |
| Sweden (1.3%) | | |
| | Telefonaktiebolaget LM Ericsson Class B | 130,806 | 1,985 |
| | Nordea Bank AB | 129,551 | 1,477 |
| ^ | Sandvik AB | 59,564 | 1,263 |
| | Volvo AB Class B | 63,103 | 1,240 |
| | Svenska Handelsbanken AB Class A | 25,062 | 869 |
| ^ | Hennes & Mauritz AB Class B | 24,517 | 866 |
| | Skandinaviska Enskilda Banken AB Class A | 87,982 | 846 |
| | Swedbank AB Class A | 40,668 | 771 |
| | Atlas Copco AB Class A | 26,208 | 770 |
| | TeliaSonera AB | 90,696 | 740 |
| | Volvo AB Class A | 35,868 | 703 |
| ^ | Scania AB Class B | 25,200 | 655 |
| ^ | Tele2 AB | 23,933 | 601 |
| ^ | SKF AB | 17,506 | 553 |
| | Boliden AB | 21,282 | 480 |
| | Investor AB Class B | 18,274 | 455 |
| ^ | Atlas Copco AB Class B | 16,664 | 442 |
| *,^ | Assa Abloy AB Class B | 12,667 | 380 |
| | Skanska AB Class B | 16,911 | 364 |
| | Svenska Cellulosa AB Class B | 22,103 | 339 |
| | Electrolux AB Class B | 12,786 | 325 |
| ^ | Swedish Match AB | 8,637 | 306 |
| | SSAB AB Class A | 14,700 | 263 |
| ^ | Alfa Laval AB | 11,711 | 262 |
| ^ | Husqvarna AB | 29,815 | 235 |
| ^ | Getinge AB | 7,969 | 212 |
| | Industrivarden AB Class A | 9,417 | 211 |
| | Kinnevik Investment AB Class B | 7,661 | 198 |
| | Industrivarden AB | 9,230 | 184 |
| | Ratos AB | 4,283 | 177 |
| ^ | Modern Times Group AB Class B | 2,124 | 163 |
| ^ | Securitas AB Class B | 11,812 | 148 |
| | Holmen AB | 2,364 | 87 |
| | SSAB AB Class B | 2,200 | 34 |
| * | Scania AB Class A | 919 | 24 |
| * | CDON Group AB | 2,124 | 14 |
| | | | 18,642 |
| Switzerland (3.0%) | | |
| | Nestle SA | 152,492 | 9,465 |
| | Novartis AG | 99,022 | 5,872 |
| | Roche Holding AG | 30,655 | 4,976 |
| * | UBS AG | 165,752 | 3,317 |
| | ABB Ltd. | 101,769 | 2,810 |
| | Credit Suisse Group AG | 52,028 | 2,368 |
| | Zurich Financial Services AG | 6,451 | 1,814 |
| | Syngenta AG | 4,184 | 1,480 |
| | | |
| Vanguard® Total World Stock Index Fund | | |
| Schedule of Investments | | |
| April 30, 2011 | | |
| |
| | | | Market |
| | | | Value |
| | | Shares | ($000) |
| | Cie Financiere Richemont SA | 22,576 | 1,460 |
| | Swiss Reinsurance Co. Ltd. | 17,017 | 1,015 |
| | Holcim Ltd. | 11,518 | 1,004 |
| | Swatch Group AG (Bearer) | 1,615 | 795 |
| | Novartis AG ADR | 11,340 | 671 |
| | SGS SA | 251 | 499 |
| | Geberit AG | 1,978 | 463 |
| | Givaudan SA | 394 | 439 |
| | Adecco SA | 6,062 | 433 |
| | Swisscom AG | 885 | 406 |
| | Kuehne & Nagel International AG | 2,466 | 394 |
| | Julius Baer Group Ltd. | 8,383 | 392 |
| 1 | Synthes Inc. | 2,041 | 352 |
| | Swatch Group AG (Registered) | 3,758 | 334 |
| * | Actelion Ltd. | 3,993 | 235 |
| | Swiss Life Holding AG | 1,272 | 232 |
| * | Lindt & Spruengli AG | 6 | 224 |
| * | Baloise Holding AG | 1,906 | 211 |
| | Sonova Holding AG | 1,914 | 193 |
| | Lonza Group AG | 2,048 | 176 |
| | GAM Holding AG | 8,628 | 170 |
| | Pargesa Holding SA | 1,644 | 169 |
| | Schindler Holding AG (Registered) | 1,082 | 139 |
| | Nobel Biocare Holding AG | 5,234 | 116 |
| * | Lindt & Spruengli AG | 31 | 103 |
| | Sika AG | 39 | 100 |
| | Schindler Holding AG (Bearer) | 738 | 96 |
| | Straumann Holding AG | 263 | 69 |
| * | Transocean Ltd. | 415 | 31 |
| * | BKW FMB Energie AG | 424 | 28 |
| | EFG International AG | 1,588 | 24 |
| | | | 43,075 |
| Taiwan (1.6%) | | |
| | Taiwan Semiconductor Manufacturing Co. Ltd. ADR | 232,667 | 3,141 |
| | HTC Corp. | 35,468 | 1,614 |
| | Hon Hai Precision Industry Co. Ltd. | 419,883 | 1,595 |
| | Formosa Plastics Corp. | 261,840 | 1,072 |
| | Nan Ya Plastics Corp. | 345,330 | 1,061 |
| | Formosa Chemicals & Fibre Corp. | 182,130 | 737 |
| | Chunghwa Telecom Co. Ltd. ADR | 23,304 | 735 |
| | China Steel Corp. | 446,301 | 553 |
| | Cathay Financial Holding Co. Ltd. | 328,220 | 549 |
| | MediaTek Inc. | 47,118 | 522 |
| * | AU Optronics Corp. ADR | 60,772 | 492 |
| | Fubon Financial Holding Co. Ltd. | 267,738 | 393 |
| | Chinatrust Financial Holding Co. Ltd. | 416,457 | 383 |
| | Delta Electronics Inc. | 75,641 | 339 |
| | Advanced Semiconductor Engineering Inc. ADR | 54,557 | 322 |
| * | Chimei Innolux Corp. | 298,294 | 307 |
| | Mega Financial Holding Co. Ltd. | 349,000 | 305 |
| | Formosa Petrochemical Corp. | 79,140 | 278 |
| | Uni-President Enterprises Corp. | 180,174 | 260 |
| | United Microelectronics Corp. ADR | 90,935 | 258 |
| | Asustek Computer Inc. | 26,647 | 241 |
| | Far Eastern New Century Corp. | 151,091 | 238 |
| | Quanta Computer Inc. | 119,450 | 236 |
| | Yuanta Financial Holding Co. Ltd. | 338,000 | 235 |
| | Taiwan Cement Corp. | 154,210 | 227 |
| | Acer Inc. | 119,583 | 224 |
| | Taiwan Mobile Co. Ltd. | 83,000 | 214 |
| | Foxconn Technology Co. Ltd. | 43,212 | 207 |
| | Compal Electronics Inc. | 179,323 | 204 |
| | China Development Financial Holding Corp. | 449,100 | 188 |
| | President Chain Store Corp. | 32,952 | 181 |
| | | |
| Vanguard® Total World Stock Index Fund | | |
| Schedule of Investments | | |
| April 30, 2011 | | |
| |
| | | | Market |
| | | | Value |
| | | Shares | ($000) |
| | First Financial Holding Co. Ltd. | 194,183 | 180 |
| | Synnex Technology International Corp. | 68,189 | 174 |
| * | MStar Semiconductor Inc. | 21,000 | 174 |
| | Hua Nan Financial Holdings Co. Ltd. | 216,486 | 173 |
| | Taiwan Cooperative Bank | 190,190 | 160 |
| | Siliconware Precision Industries Co. ADR | 20,700 | 140 |
| | Asia Cement Corp. | 104,177 | 140 |
| | Wistron Corp. | 77,494 | 140 |
| | SinoPac Financial Holdings Co. Ltd. | 292,000 | 139 |
| | Chang Hwa Commercial Bank | 148,000 | 129 |
| | Catcher Technology Co. Ltd. | 20,310 | 128 |
| | Largan Precision Co. Ltd. | 4,020 | 128 |
| * | Taishin Financial Holding Co. Ltd. | 210,475 | 124 |
| | Lite-On Technology Corp. | 95,671 | 121 |
| | Epistar Corp. | 35,000 | 116 |
| | Unimicron Technology Corp. | 65,000 | 107 |
| | Pou Chen Corp. | 112,524 | 106 |
| | Taiwan Fertilizer Co. Ltd. | 31,000 | 105 |
| | Yulon Motor Co. Ltd. | 50,000 | 104 |
| | Cheng Shin Rubber Industry Co. Ltd. | 41,125 | 104 |
| * | Shin Kong Financial Holding Co. Ltd. | 221,339 | 97 |
| | E.Sun Financial Holding Co. Ltd. | 136,172 | 97 |
| | Taiwan Glass Industrial Corp. | 58,514 | 96 |
| | Far EasTone Telecommunications Co. Ltd. | 63,000 | 96 |
| | Macronix International | 134,721 | 89 |
| * | Walsin Lihwa Corp. | 151,000 | 88 |
| | KGI Securities Co. Ltd. | 134,000 | 70 |
| | Polaris Securities Co. Ltd. | 97,000 | 70 |
| | Formosa Taffeta Co. Ltd. | 60,000 | 65 |
| * | Pegatron Corp. | 60,954 | 64 |
| | United Microelectronics Corp. | 119,180 | 62 |
| | Chicony Electronics Co. Ltd. | 31,058 | 61 |
| * | Evergreen Marine Corp. Taiwan Ltd. | 66,000 | 61 |
| * | Nanya Technology Corp. | 112,083 | 57 |
| | Advanced Semiconductor Engineering Inc. | 48,522 | 57 |
| * | China Airlines Ltd. | 87,425 | 56 |
| | Inventec Co. Ltd. | 101,850 | 55 |
| | Teco Electric and Machinery Co. Ltd. | 72,000 | 51 |
| | Yageo Corp. | 93,000 | 50 |
| * | Taiwan Business Bank | 122,720 | 50 |
| * | Yang Ming Marine Transport Corp. | 58,000 | 49 |
| * | Tatung Co. Ltd. | 95,638 | 48 |
| | Giant Manufacturing Co. Ltd. | 11,881 | 48 |
| | Advantech Co. Ltd. | 14,015 | 46 |
| | Novatek Microelectronics Corp. | 15,025 | 46 |
| * | Eva Airways Corp. | 48,749 | 45 |
| * | Winbond Electronics Corp. | 136,000 | 43 |
| | Eternal Chemical Co. Ltd. | 35,605 | 43 |
| | Oriental Union Chemical Corp. | 29,000 | 43 |
| | Coretronic Corp. | 27,000 | 41 |
| * | Wan Hai Lines Ltd. | 52,000 | 40 |
| * | Powerchip Technology Corp. | 182,900 | 40 |
| | Ton Yi Industrial Corp. | 65,000 | 39 |
| | Yuen Foong Yu Paper Manufacturing Co. Ltd. | 84,460 | 39 |
| | Far Eastern International Bank | 80,787 | 39 |
| | Cheng Uei Precision Industry Co. Ltd. | 19,151 | 39 |
| | Waterland Financial Holdings Co. Ltd. | 80,080 | 38 |
| * | Qisda Corp. | 65,000 | 37 |
| * | HannStar Display Corp. | 206,749 | 36 |
| * | Ritek Corp. | 126,039 | 36 |
| * | Inotera Memories Inc. | 71,109 | 36 |
| | U-Ming Marine Transport Corp. | 16,000 | 35 |
| | Taiwan Secom Co. Ltd. | 18,000 | 35 |
| | Capital Securities Corp. | 67,208 | 33 |
| | | |
| Vanguard® Total World Stock Index Fund | | |
| Schedule of Investments | | |
| April 30, 2011 | | |
| |
| | | | Market |
| | | | Value |
| | | Shares | ($000) |
| | Realtek Semiconductor Corp. | 16,210 | 32 |
| * | CMC Magnetics Corp. | 129,000 | 31 |
| | Mitac International Corp. | 74,000 | 31 |
| | Feng Hsin Iron & Steel Co. | 17,000 | 31 |
| | D-Link Corp. | 31,980 | 31 |
| | Transcend Information Inc. | 10,148 | 30 |
| | Siliconware Precision Industries Co. | 21,030 | 28 |
| | Nan Ya Printed Circuit Board Corp. | 8,160 | 27 |
| * | Chunghwa Picture Tubes | 140,688 | 19 |
| | China Motor Corp. | 19,000 | 18 |
| | LITE-ON IT Corp. | 12,120 | 13 |
| | Cathay Real Estate Development Co. Ltd. | 23,000 | 12 |
| | Vanguard International Semiconductor Corp. | 22,000 | 11 |
| | President Securities Corp. | 15,600 | 10 |
| | Faraday Technology Corp. | 6,029 | 9 |
| | Compal Communications Inc. | 9,000 | 8 |
| * | Tatung Co. Ltd. GDR | 621 | 7 |
| | Micro-Star International Co. Ltd. | 10,499 | 5 |
| | | | 22,722 |
| Thailand (0.2%) | | |
| | PTT PCL (Foreign) | 30,300 | 381 |
| | PTT Exploration & Production PCL (Foreign) | 42,000 | 261 |
| | Kasikornbank PCL (Foreign) | 49,300 | 215 |
| | Bank of Ayudhya PCL(Local) | 208,000 | 198 |
| | Siam Commercial Bank PCL (Foreign) | 49,400 | 192 |
| | Advanced Info Service PCL (Foreign) | 51,400 | 160 |
| | Electricity Generating PCL (Foreign) | 44,500 | 145 |
| | Bangkok Bank PCL (Foreign) | 21,698 | 124 |
| | Charoen Pokphand Foods PCL (Foreign) | 124,300 | 123 |
| | Siam Cement PCL (Foreign) | 8,700 | 121 |
| | Banpu PCL | 4,500 | 113 |
| | Indorama Ventures PCL | 54,200 | 97 |
| | CP ALL PCL (Foreign) | 66,500 | 96 |
| | PTT PCL | 7,300 | 92 |
| | PTT Aromatics & Refining PCL (Foreign) | 65,200 | 90 |
| | PTT Exploration and Production PCL (Local) | 13,000 | 81 |
| | Thai Oil PCL (Foreign) | 25,800 | 73 |
| | PTT Chemical PCL (Foreign) | 13,200 | 71 |
| | IRPC PCL (Foreign) | 329,400 | 69 |
| | Siam Commercial Bank PCL (Local) | 15,500 | 60 |
| | BEC World PCL (Foreign) | 43,200 | 50 |
| | TMB Bank PCL | 490,800 | 38 |
| | CP ALL PCL (Local) | 25,300 | 37 |
| | Thai Airways International PCL (Foreign) | 28,374 | 36 |
| | Krung Thai Bank PCL | 55,200 | 36 |
| | Land and Houses PCL (Foreign) | 162,900 | 36 |
| | Krung Thai Bank PCL (Foreign) | 45,700 | 30 |
| | Total Access Communication PCL (Local) | 17,600 | 30 |
| | Siam City Cement PCL (Foreign) | 3,800 | 28 |
| | IRPC PCL | 129,200 | 27 |
| | Thai Oil PCL | 9,300 | 26 |
| | Total Access Communication PCL (Foreign) | 13,700 | 23 |
| | TMB Bank PCL | 294,100 | 23 |
| | Siam City Cement PCL (Local) | 2,100 | 15 |
| | Thai Union Frozen Products PCL (Foreign) | 9,450 | 15 |
| | Siam Makro PCL (Foreign) | 2,600 | 14 |
| | Delta Electronics Thai PCL (Foreign) | 14,200 | 13 |
| | Central Pattana PCL | 12,200 | 12 |
| | Airports of Thailand PCL (Foreign) | 9,600 | 12 |
| | Ratchaburi Electricity Generating Holding PCL (Foreign) | 4,100 | 6 |
| | | | 3,269 |
| Turkey (0.2%) | | |
| | Anadolu Efes Biracilik Ve Malt Sanayii AS | 21,410 | 329 |
| | Akbank TAS | 48,083 | 250 |
| | | |
| Vanguard® Total World Stock Index Fund | | |
| Schedule of Investments | | |
| April 30, 2011 | | |
| |
| | | | Market |
| | | | Value |
| | | Shares | ($000) |
| | Turkiye Garanti Bankasi AS | 46,827 | 242 |
| * | Eregli Demir ve Celik Fabrikalari TAS | 72,655 | 221 |
| | KOC Holding AS | 36,743 | 198 |
| | Turkiye Is Bankasi | 53,140 | 188 |
| * | Dogan Sirketler Grubu Holdings | 184,758 | 147 |
| | Turkiye Halk Bankasi AS | 14,760 | 128 |
| | Tupras Turkiye Petrol Rafinerileri AS | 3,468 | 113 |
| | Turk Telekomunikasyon AS | 21,571 | 112 |
| * | Yapi ve Kredi Bankasi AS | 33,445 | 105 |
| | BIM Birlesik Magazalar AS | 2,409 | 84 |
| | Haci Omer Sabanci Holding AS (Bearer) | 14,385 | 77 |
| * | Turk Hava Yollari | 25,621 | 76 |
| | Turkiye Vakiflar Bankasi Tao | 27,047 | 72 |
| | Enka Insaat ve Sanayi AS | 15,912 | 70 |
| | Asya Katilim Bankasi AS | 30,743 | 61 |
| | Turkcell Iletisim Hizmetleri AS | 9,761 | 58 |
| | Coca-Cola Icecek AS | 3,689 | 55 |
| | Arcelik AS | 6,925 | 39 |
| | Ford Otomotiv Sanayi AS | 1,724 | 17 |
| | | | 2,642 |
| United Kingdom (8.2%) | | |
| | HSBC Holdings plc | 772,406 | 8,425 |
| | Vodafone Group plc | 2,284,336 | 6,604 |
| | BP plc | 829,252 | 6,375 |
| | Royal Dutch Shell plc Class A | 156,118 | 6,081 |
| | GlaxoSmithKline plc | 228,283 | 4,987 |
| | Rio Tinto plc | 67,214 | 4,904 |
| | Royal Dutch Shell plc Class B | 118,942 | 4,627 |
| | BHP Billiton plc | 95,666 | 4,045 |
| | British American Tobacco plc | 87,423 | 3,820 |
| | BG Group plc | 148,277 | 3,818 |
| | AstraZeneca plc | 61,238 | 3,039 |
| | Anglo American plc | 57,907 | 3,036 |
| | Standard Chartered plc | 102,159 | 2,839 |
| | Barclays plc | 532,683 | 2,532 |
| | Xstrata plc | 97,855 | 2,510 |
| | Tesco plc | 348,272 | 2,348 |
| | Diageo plc | 109,683 | 2,231 |
| | SABMiller plc | 52,175 | 1,949 |
| | Unilever plc | 57,506 | 1,868 |
| | Reckitt Benckiser Group plc | 31,734 | 1,766 |
| * | Lloyds Banking Group plc | 1,759,965 | 1,747 |
| | National Grid plc | 154,388 | 1,584 |
| | Imperial Tobacco Group plc | 43,994 | 1,552 |
| | Prudential plc | 110,772 | 1,433 |
| | Centrica plc | 226,462 | 1,216 |
| | BT Group plc | 341,835 | 1,122 |
| | Tullow Oil plc | 40,714 | 977 |
| | Aviva plc | 126,080 | 944 |
| | Scottish & Southern Energy plc | 41,497 | 941 |
| | Rolls-Royce Group plc | 83,380 | 897 |
| | BAE Systems plc | 152,639 | 838 |
| | British Sky Broadcasting Group plc | 56,140 | 791 |
| | Compass Group plc | 80,261 | 785 |
| | Shire plc | 23,886 | 741 |
| | WPP plc | 53,743 | 704 |
| | Pearson plc | 35,784 | 686 |
| | Reed Elsevier plc | 76,103 | 674 |
| | ARM Holdings plc | 59,180 | 613 |
| | WM Morrison Supermarkets plc | 123,135 | 608 |
| * | Cairn Energy plc | 79,597 | 602 |
| | Experian plc | 44,007 | 594 |
| | Old Mutual plc | 254,512 | 593 |
| * | Royal Bank of Scotland Group plc | 787,467 | 549 |
| | | |
| Vanguard® Total World Stock Index Fund | | |
| Schedule of Investments | | |
| April 30, 2011 | | |
| |
| | | | Market |
| | | | Value |
| | | Shares | ($000) |
| | Legal & General Group plc | 250,309 | 515 |
| | Kingfisher plc | 109,888 | 505 |
| | Smith & Nephew plc | 43,798 | 481 |
| | J Sainsbury plc | 82,261 | 479 |
| | Marks & Spencer Group plc | 71,259 | 463 |
| | Wolseley plc | 12,056 | 438 |
| | Land Securities Group plc | 31,866 | 419 |
| | Burberry Group plc | 19,038 | 413 |
| | Fresnillo plc | 14,911 | 411 |
| | Antofagasta plc | 17,355 | 399 |
| | British Land Co. plc | 37,783 | 380 |
| | International Power plc | 67,835 | 375 |
| | Intercontinental Hotels Group plc | 17,076 | 375 |
| | Standard Life plc | 97,489 | 369 |
| | Kazakhmys plc | 15,805 | 367 |
| | Carnival plc | 9,076 | 365 |
| | Smiths Group plc | 16,354 | 365 |
| | Aggreko plc | 11,903 | 356 |
| | RSA Insurance Group plc | 149,017 | 343 |
| | Man Group plc | 80,102 | 335 |
| | Capita Group plc | 26,185 | 322 |
| * | Randgold Resources Ltd. | 3,672 | 319 |
| | Johnson Matthey plc | 9,182 | 308 |
| | United Utilities Group plc | 28,914 | 306 |
| | Resolution Ltd. | 58,470 | 296 |
| | Next plc | 7,845 | 294 |
| | AMEC plc | 14,301 | 287 |
| | G4S plc | 61,973 | 286 |
| | Associated British Foods plc | 16,967 | 286 |
| | Lonmin plc | 10,419 | 285 |
| * | Autonomy Corp. plc | 10,400 | 281 |
| | Petrofac Ltd. | 10,523 | 266 |
| | Eurasian Natural Resources Corp. plc | 16,642 | 255 |
| | Severn Trent plc | 10,058 | 253 |
| | Sage Group plc | 51,907 | 248 |
| | ICAP plc | 28,350 | 246 |
| | Hammerson plc | 30,466 | 240 |
| | Rexam plc | 35,581 | 233 |
| | Admiral Group plc | 7,905 | 224 |
| | Vedanta Resources plc | 5,658 | 221 |
| | Schroders plc | 6,665 | 212 |
| | Inmarsat plc | 19,769 | 201 |
| * | ITV plc | 158,091 | 201 |
| | Invensys plc | 35,318 | 201 |
| | Whitbread plc | 7,098 | 200 |
| | Serco Group plc | 20,881 | 198 |
| | Tate & Lyle plc | 18,942 | 188 |
| | Home Retail Group plc | 50,819 | 188 |
| | Capital Shopping Centres Group plc | 26,905 | 183 |
| | 3i Group plc | 37,023 | 174 |
| | Segro plc | 31,355 | 171 |
| | Cobham plc | 43,838 | 167 |
| | Bunzl plc | 13,338 | 166 |
| | Logica plc | 68,256 | 154 |
| | Aegis Group plc | 46,353 | 109 |
| | Drax Group plc | 13,862 | 102 |
| * | Rentokil Initial plc | 63,452 | 100 |
| | Hays plc | 48,697 | 97 |
| | United Business Media Ltd. | 9,254 | 94 |
| | Daily Mail & General Trust plc | 11,139 | 93 |
| | Cable & Wireless Worldwide plc | 114,361 | 92 |
| | William Hill plc | 24,548 | 92 |
| | Ladbrokes plc | 35,029 | 89 |
| | Thomas Cook Group plc | 29,127 | 84 |
| | | |
| Vanguard® Total World Stock Index Fund | | |
| Schedule of Investments | | |
| April 30, 2011 | | |
| |
| | | | Market |
| | | | Value |
| | | Shares | ($000) |
| | Provident Financial plc | 4,680 | 79 |
| | TUI Travel plc | 19,152 | 77 |
| | Cable & Wireless Communications plc | 89,570 | 70 |
| | TalkTalk Telecom Group plc | 29,073 | 68 |
| | Schroders plc | 2,087 | 54 |
| | African Barrick Gold Ltd. | 4,409 | 39 |
| | | | 116,547 |
| United States (41.2%) | | |
| | Exxon Mobil Corp. | 221,919 | 19,529 |
| * | Apple Inc. | 40,252 | 14,017 |
| | Chevron Corp. | 88,224 | 9,655 |
| | Microsoft Corp. | 369,783 | 9,622 |
| | General Electric Co. | 469,571 | 9,603 |
| | International Business Machines Corp. | 54,554 | 9,306 |
| | AT&T Inc. | 261,459 | 8,137 |
| | Procter & Gamble Co. | 122,671 | 7,961 |
| | Johnson & Johnson | 120,861 | 7,943 |
| | Oracle Corp. | 218,211 | 7,867 |
| | JPMorgan Chase & Co. | 172,040 | 7,850 |
| | Pfizer Inc. | 354,805 | 7,437 |
| | Coca-Cola Co. | 101,894 | 6,874 |
| | Wells Fargo & Co. | 230,319 | 6,705 |
| | Wal-Mart Stores Inc. | 117,203 | 6,444 |
| * | Citigroup Inc. | 1,275,383 | 5,854 |
| * | Google Inc. Class A | 10,478 | 5,701 |
| | Intel Corp. | 241,523 | 5,601 |
| | Philip Morris International Inc. | 79,642 | 5,530 |
| | Bank of America Corp. | 443,840 | 5,450 |
| | Schlumberger Ltd. | 60,047 | 5,389 |
| | ConocoPhillips | 62,918 | 4,966 |
| | Merck & Co. Inc. | 134,353 | 4,830 |
| | PepsiCo Inc. | 69,709 | 4,802 |
| | Verizon Communications Inc. | 124,613 | 4,708 |
| | Cisco Systems Inc. | 242,217 | 4,253 |
| | Occidental Petroleum Corp. | 35,485 | 4,056 |
| | QUALCOMM Inc. | 70,243 | 3,993 |
| * | Berkshire Hathaway Inc. Class A | 32 | 3,992 |
| | Hewlett-Packard Co. | 96,399 | 3,892 |
| * | Berkshire Hathaway Inc. Class B | 45,673 | 3,805 |
| | United Technologies Corp. | 40,633 | 3,640 |
| | Walt Disney Co. | 84,076 | 3,624 |
| | McDonald's Corp. | 45,665 | 3,576 |
| | Abbott Laboratories | 67,281 | 3,501 |
| | Goldman Sachs Group Inc. | 22,523 | 3,401 |
| | Caterpillar Inc. | 27,933 | 3,224 |
| | 3M Co. | 31,133 | 3,026 |
| * | Amazon.com Inc. | 14,703 | 2,889 |
| | Home Depot Inc. | 71,294 | 2,648 |
| | American Express Co. | 52,768 | 2,590 |
| | Kraft Foods Inc. | 76,394 | 2,565 |
| | Boeing Co. | 31,756 | 2,534 |
| * | EMC Corp. | 89,343 | 2,532 |
| * | Ford Motor Co. | 160,571 | 2,484 |
| | Altria Group Inc. | 91,547 | 2,457 |
| | United Parcel Service Inc. Class B | 31,823 | 2,386 |
| | UnitedHealth Group Inc. | 48,187 | 2,372 |
| | Comcast Corp. Class A | 90,058 | 2,363 |
| * | Amgen Inc. | 40,537 | 2,305 |
| | Freeport-McMoRan Copper & Gold Inc. | 41,181 | 2,266 |
| | EI du Pont de Nemours & Co. | 39,524 | 2,245 |
| | Union Pacific Corp. | 21,632 | 2,238 |
| | Apache Corp. | 16,666 | 2,223 |
| | US Bancorp | 84,208 | 2,174 |
| | CVS Caremark Corp. | 59,891 | 2,170 |
| | | |
| Vanguard® Total World Stock Index Fund | | |
| Schedule of Investments | | |
| April 30, 2011 | | |
| |
| | | | Market |
| | | | Value |
| | | Shares | ($000) |
| | Bristol-Myers Squibb Co. | 75,196 | 2,113 |
| | Honeywell International Inc. | 33,928 | 2,077 |
| | Dow Chemical Co. | 50,018 | 2,050 |
| | Halliburton Co. | 39,851 | 2,012 |
| | Emerson Electric Co. | 32,816 | 1,994 |
| * | eBay Inc. | 57,272 | 1,970 |
| | Medtronic Inc. | 47,096 | 1,966 |
| * | DIRECTV Class A | 38,431 | 1,867 |
| | Colgate-Palmolive Co. | 21,867 | 1,844 |
| | Eli Lilly & Co. | 49,670 | 1,838 |
| | Texas Instruments Inc. | 51,469 | 1,829 |
| | Deere & Co. | 18,705 | 1,824 |
| | Time Warner Inc. | 47,927 | 1,815 |
| | Morgan Stanley | 67,510 | 1,765 |
| | Devon Energy Corp. | 19,233 | 1,750 |
| | Walgreen Co. | 40,808 | 1,743 |
| | Anadarko Petroleum Corp. | 21,681 | 1,712 |
| | Visa Inc. Class A | 21,784 | 1,702 |
| | Marathon Oil Corp. | 30,430 | 1,644 |
| | MetLife Inc. | 34,797 | 1,628 |
| | Monsanto Co. | 23,785 | 1,618 |
| | Accenture plc Class A | 28,035 | 1,602 |
| | Danaher Corp. | 28,780 | 1,590 |
| | Lowe's Cos. Inc. | 60,110 | 1,578 |
| | Bank of New York Mellon Corp. | 54,454 | 1,577 |
| | Target Corp. | 30,899 | 1,517 |
| | Costco Wholesale Corp. | 18,720 | 1,515 |
| | Baker Hughes Inc. | 19,298 | 1,494 |
| | Mastercard Inc. Class A | 5,392 | 1,488 |
| | Simon Property Group Inc. | 12,731 | 1,458 |
| | Baxter International Inc. | 25,599 | 1,457 |
| | Praxair Inc. | 13,502 | 1,437 |
| | News Corp. Class A | 79,554 | 1,418 |
| | Southern Co. | 36,221 | 1,414 |
| | National Oilwell Varco Inc. | 18,418 | 1,412 |
| | PNC Financial Services Group Inc. | 22,644 | 1,412 |
| | Corning Inc. | 66,356 | 1,390 |
| * | Gilead Sciences Inc. | 35,396 | 1,375 |
| | Travelers Cos. Inc. | 21,481 | 1,359 |
| | Prudential Financial Inc. | 21,358 | 1,355 |
| | WellPoint Inc. | 17,222 | 1,322 |
| | EOG Resources Inc. | 11,664 | 1,317 |
| | FedEx Corp. | 13,743 | 1,315 |
| * | Dell Inc. | 84,661 | 1,313 |
| | CSX Corp. | 16,471 | 1,296 |
| * | Express Scripts Inc. | 22,471 | 1,275 |
| | Hess Corp. | 14,828 | 1,275 |
| | Illinois Tool Works Inc. | 21,748 | 1,270 |
| | Norfolk Southern Corp. | 16,875 | 1,260 |
| | Viacom Inc. Class B | 24,463 | 1,252 |
| | Johnson Controls Inc. | 30,379 | 1,246 |
| | Exelon Corp. | 29,493 | 1,243 |
| | Covidien plc | 22,150 | 1,234 |
| | Lockheed Martin Corp. | 15,480 | 1,227 |
| * | Celgene Corp. | 20,669 | 1,217 |
| | Newmont Mining Corp. | 20,646 | 1,210 |
| | Automatic Data Processing Inc. | 22,028 | 1,197 |
| * | Medco Health Solutions Inc. | 20,155 | 1,196 |
| | Starbucks Corp. | 32,729 | 1,184 |
| | Time Warner Cable Inc. | 15,112 | 1,181 |
| | Kimberly-Clark Corp. | 17,830 | 1,178 |
| | General Dynamics Corp. | 16,111 | 1,173 |
| | Aflac Inc. | 20,510 | 1,152 |
| | Dominion Resources Inc. | 24,790 | 1,151 |
| | | |
| Vanguard® Total World Stock Index Fund | | |
| Schedule of Investments | | |
| April 30, 2011 | | |
| |
| | | | Market |
| | | | Value |
| | | Shares | ($000) |
| * | priceline.com Inc. | 2,097 | 1,147 |
| * | Cognizant Technology Solutions Corp. Class A | 13,737 | 1,139 |
| | Yum! Brands Inc. | 20,965 | 1,125 |
| | Duke Energy Corp. | 59,779 | 1,115 |
| | Capital One Financial Corp. | 20,170 | 1,104 |
| | Allergan Inc. | 13,780 | 1,096 |
| | Archer-Daniels-Midland Co. | 29,281 | 1,084 |
| | General Mills Inc. | 27,343 | 1,055 |
| * | Thermo Fisher Scientific Inc. | 17,372 | 1,042 |
| | State Street Corp. | 22,253 | 1,036 |
| | Cummins Inc. | 8,589 | 1,032 |
| | NIKE Inc. Class B | 12,519 | 1,031 |
| | CenturyLink Inc. | 25,211 | 1,028 |
| * | Biogen Idec Inc. | 10,557 | 1,028 |
| | Tyco International Ltd. | 20,928 | 1,020 |
| | NextEra Energy Inc. | 17,976 | 1,017 |
| | Applied Materials Inc. | 64,699 | 1,015 |
| | Precision Castparts Corp. | 6,481 | 1,001 |
| * | Juniper Networks Inc. | 26,107 | 1,001 |
| * | Transocean Ltd. | 13,587 | 988 |
| * | Yahoo! Inc. | 55,397 | 983 |
| | Charles Schwab Corp. | 53,471 | 979 |
| * | NetApp Inc. | 18,577 | 966 |
| | ACE Ltd. | 14,329 | 964 |
| * | American Tower Corp. Class A | 18,308 | 958 |
| | Chesapeake Energy Corp. | 27,826 | 937 |
| | Air Products & Chemicals Inc. | 9,800 | 936 |
| * | Citrix Systems Inc. | 11,092 | 936 |
| | Franklin Resources Inc. | 7,209 | 931 |
| | St. Jude Medical Inc. | 17,358 | 928 |
| | TJX Cos. Inc. | 16,902 | 906 |
| | McKesson Corp. | 10,807 | 897 |
| | Williams Cos. Inc. | 26,900 | 892 |
| * | General Motors Co. | 27,104 | 870 |
| | PACCAR Inc. | 16,122 | 856 |
| | Chubb Corp. | 13,084 | 853 |
| | Northrop Grumman Corp. | 13,379 | 851 |
| | CME Group Inc. | 2,870 | 849 |
| | Waste Management Inc. | 21,464 | 847 |
| | Loews Corp. | 19,096 | 845 |
| | BlackRock Inc. | 4,201 | 823 |
| | Wynn Resorts Ltd. | 5,590 | 823 |
| | BB&T Corp. | 30,492 | 821 |
| | Coach Inc. | 13,502 | 808 |
| | PG&E Corp. | 17,439 | 804 |
| | Allstate Corp. | 23,627 | 800 |
| | Becton Dickinson and Co. | 9,289 | 798 |
| | Comcast Corp. Class A Special Shares | 32,498 | 798 |
| | Spectra Energy Corp. | 27,473 | 798 |
| | Alcoa Inc. | 46,581 | 792 |
| | Peabody Energy Corp. | 11,744 | 785 |
| | Raytheon Co. | 16,098 | 782 |
| * | Adobe Systems Inc. | 23,133 | 776 |
| | Eaton Corp. | 14,314 | 766 |
| | AON Corp. | 14,659 | 765 |
| | Vornado Realty Trust | 7,768 | 751 |
| * | AES Corp. | 56,208 | 744 |
| * | Agilent Technologies Inc. | 14,896 | 743 |
| | American Electric Power Co. Inc. | 20,360 | 743 |
| | Carnival Corp. | 19,427 | 740 |
| | Stryker Corp. | 12,531 | 739 |
| | Kohl's Corp. | 13,909 | 733 |
| | Equity Residential | 12,263 | 732 |
| | Ingersoll-Rand plc | 14,417 | 728 |
| | | |
| Vanguard® Total World Stock Index Fund | | |
| Schedule of Investments | | |
| April 30, 2011 | | |
| |
| | | | Market |
| | | | Value |
| | | Shares | ($000) |
| | Aetna Inc. | 17,473 | 723 |
| | Sysco Corp. | 24,884 | 719 |
| | Ameriprise Financial Inc. | 11,590 | 719 |
| | T Rowe Price Group Inc. | 11,173 | 718 |
| | Noble Energy Inc. | 7,449 | 717 |
| | Staples Inc. | 33,853 | 716 |
| * | Intuit Inc. | 12,876 | 715 |
| | CBS Corp. Class B | 28,188 | 711 |
| | Broadcom Corp. Class A | 20,167 | 709 |
| * | Las Vegas Sands Corp. | 15,067 | 708 |
| | HJ Heinz Co. | 13,739 | 704 |
| | Marsh & McLennan Cos. Inc. | 23,113 | 700 |
| | Public Service Enterprise Group Inc. | 21,718 | 699 |
| * | Intuitive Surgical Inc. | 1,996 | 698 |
| | FirstEnergy Corp. | 17,443 | 697 |
| | Kroger Co. | 28,662 | 697 |
| | Cardinal Health Inc. | 15,871 | 693 |
| | Reynolds American Inc. | 18,669 | 693 |
| | Altera Corp. | 14,081 | 686 |
| | TE Connectivity Ltd. | 19,087 | 684 |
| | Valero Energy Corp. | 24,134 | 683 |
| * | Weatherford International Ltd. | 31,482 | 679 |
| | Xcel Energy Inc. | 27,827 | 677 |
| | Kellogg Co. | 11,793 | 675 |
| | CF Industries Holdings Inc. | 4,766 | 675 |
| * | Motorola Solutions Inc. | 14,668 | 673 |
| | Western Union Co. | 31,656 | 673 |
| | PPG Industries Inc. | 7,067 | 669 |
| * | Sprint Nextel Corp. | 128,246 | 664 |
| * | FMC Technologies Inc. | 14,242 | 662 |
| | Public Storage | 5,617 | 659 |
| * | Southwestern Energy Co. | 14,809 | 650 |
| | Parker Hannifin Corp. | 6,882 | 649 |
| | Consolidated Edison Inc. | 12,445 | 649 |
| | Lorillard Inc. | 6,082 | 648 |
| | Mosaic Co. | 8,648 | 647 |
| | Discover Financial Services | 26,051 | 647 |
| * | Humana Inc. | 8,469 | 645 |
| * | Zimmer Holdings Inc. | 9,868 | 644 |
| | VF Corp. | 6,400 | 644 |
| * | Symantec Corp. | 32,693 | 642 |
| | Murphy Oil Corp. | 8,215 | 637 |
| | Nucor Corp. | 13,506 | 634 |
| | Boston Properties Inc. | 6,058 | 633 |
| | Omnicom Group Inc. | 12,869 | 633 |
| | HCP Inc. | 15,839 | 628 |
| | CIGNA Corp. | 13,307 | 623 |
| | Progressive Corp. | 28,328 | 622 |
| | Avon Products Inc. | 21,116 | 620 |
| | Annaly Capital Management Inc. | 34,358 | 613 |
| * | Bed Bath & Beyond Inc. | 10,911 | 612 |
| * | AutoZone Inc. | 2,162 | 611 |
| | SunTrust Banks Inc. | 21,492 | 606 |
| | Consol Energy Inc. | 11,169 | 604 |
| | Xerox Corp. | 59,762 | 603 |
| | CH Robinson Worldwide Inc. | 7,417 | 595 |
| | International Paper Co. | 19,214 | 593 |
| | Progress Energy Inc. | 12,494 | 593 |
| | Fortune Brands Inc. | 9,071 | 590 |
| | Sara Lee Corp. | 30,721 | 590 |
| | Hartford Financial Services Group Inc. | 20,248 | 587 |
| | Stanley Black & Decker Inc. | 8,042 | 584 |
| | Mead Johnson Nutrition Co. | 8,733 | 584 |
| * | Salesforce.com Inc. | 4,208 | 583 |
| | | |
| Vanguard® Total World Stock Index Fund | | |
| Schedule of Investments | | |
| April 30, 2011 | | |
| |
| | | | Market |
| | | | Value |
| | | Shares | ($000) |
| | El Paso Corp. | 29,822 | 579 |
| * | Forest Laboratories Inc. | 17,323 | 574 |
| | Paychex Inc. | 17,500 | 572 |
| | Sempra Energy | 10,282 | 567 |
| | Limited Brands Inc. | 13,756 | 566 |
| | PPL Corp. | 20,614 | 565 |
| | Entergy Corp. | 7,962 | 555 |
| | Marriott International Inc. Class A | 15,712 | 555 |
| * | Crown Castle International Corp. | 12,890 | 552 |
| * | Cameron International Corp. | 10,469 | 552 |
| | Edison International | 13,913 | 546 |
| | Nordstrom Inc. | 11,487 | 546 |
| | Invesco Ltd. | 21,942 | 546 |
| | Best Buy Co. Inc. | 17,386 | 543 |
| | Bunge Ltd. | 7,192 | 543 |
| * | SanDisk Corp. | 11,015 | 541 |
| | Cliffs Natural Resources Inc. | 5,775 | 541 |
| | Dover Corp. | 7,941 | 540 |
| | Weyerhaeuser Co. | 23,337 | 537 |
| | Northern Trust Corp. | 10,712 | 536 |
| | McGraw-Hill Cos. Inc. | 13,200 | 534 |
| | Republic Services Inc. Class A | 16,856 | 533 |
| | News Corp. Class B | 28,160 | 532 |
| | Analog Devices Inc. | 13,101 | 528 |
| | Fluor Corp. | 7,539 | 527 |
| | Rockwell Automation Inc. | 6,043 | 527 |
| | Ecolab Inc. | 9,966 | 526 |
| * | Netflix Inc. | 2,259 | 526 |
| * | Boston Scientific Corp. | 69,968 | 524 |
| * | NVIDIA Corp. | 26,200 | 524 |
| | Fifth Third Bancorp | 39,309 | 522 |
| | Estee Lauder Cos. Inc. Class A | 5,334 | 517 |
| * | Micron Technology Inc. | 45,598 | 515 |
| * | SLM Corp. | 30,856 | 512 |
| | Host Hotels & Resorts Inc. | 28,384 | 505 |
| | Pioneer Natural Resources Co. | 4,934 | 504 |
| | Starwood Hotels & Resorts Worldwide Inc. | 8,457 | 504 |
| | Mattel Inc. | 18,761 | 501 |
| | Expeditors International of Washington Inc. | 9,108 | 494 |
| | CenterPoint Energy Inc. | 26,552 | 494 |
| | Safeway Inc. | 20,133 | 489 |
| * | Liberty Media Corp. - Interactive | 27,696 | 484 |
| | Moody's Corp. | 12,268 | 480 |
| | AvalonBay Communities Inc. | 3,789 | 480 |
| * | Vertex Pharmaceuticals Inc. | 8,662 | 477 |
| * | Autodesk Inc. | 10,533 | 474 |
| | Cooper Industries plc | 7,042 | 464 |
| | Macy's Inc. | 19,400 | 464 |
| | Whole Foods Market Inc. | 7,386 | 464 |
| * | Mylan Inc. | 18,586 | 463 |
| * | Concho Resources Inc. | 4,298 | 459 |
| | Principal Financial Group Inc. | 13,591 | 459 |
| | AmerisourceBergen Corp. Class A | 11,264 | 458 |
| | ConAgra Foods Inc. | 18,663 | 456 |
| | M&T Bank Corp. | 5,098 | 451 |
| | ITT Corp. | 7,763 | 449 |
| | WW Grainger Inc. | 2,949 | 447 |
| | Goodrich Corp. | 5,056 | 447 |
| | NYSE Euronext | 11,131 | 446 |
| | Joy Global Inc. | 4,406 | 445 |
| | Noble Corp. | 10,191 | 438 |
| * | Life Technologies Corp. | 7,922 | 437 |
| | Rockwell Collins Inc. | 6,811 | 430 |
| | | |
| Vanguard® Total World Stock Index Fund | | |
| Schedule of Investments | | |
| April 30, 2011 | | |
| |
| | | | Market |
| | | | Value |
| | | Shares | ($000) |
| | Fidelity National Information Services Inc. | 12,852 | 425 |
| * | Marvell Technology Group Ltd. | 27,523 | 425 |
| | Regions Financial Corp. | 57,792 | 424 |
| | Gap Inc. | 18,227 | 424 |
| | Coca-Cola Enterprises Inc. | 14,910 | 424 |
| * | Cerner Corp. | 3,522 | 423 |
| | Fastenal Co. | 6,296 | 422 |
| | Clorox Co. | 6,056 | 422 |
| * | Edwards Lifesciences Corp. | 4,876 | 421 |
| | JC Penney Co. Inc. | 10,858 | 418 |
| | Hershey Co. | 7,164 | 413 |
| * | Terex Corp. | 11,833 | 412 |
| * | Newfield Exploration Co. | 5,705 | 404 |
| | Cimarex Energy Co. | 3,652 | 404 |
| | CR Bard Inc. | 3,783 | 404 |
| * | Hospira Inc. | 7,105 | 403 |
| | Molson Coors Brewing Co. Class B | 8,203 | 400 |
| | Lincoln National Corp. | 12,791 | 399 |
| | Allegheny Technologies Inc. | 5,532 | 398 |
| * | Laboratory Corp. of America Holdings | 4,108 | 396 |
| | NiSource Inc. | 20,352 | 396 |
| | ProLogis | 24,299 | 396 |
| * | Western Digital Corp. | 9,893 | 394 |
| | Amphenol Corp. Class A | 7,042 | 394 |
| | Virgin Media Inc. | 12,912 | 391 |
| | Quest Diagnostics Inc. | 6,927 | 391 |
| | Ventas Inc. | 6,957 | 389 |
| | Tiffany & Co. | 5,596 | 389 |
| | NSTAR | 8,388 | 388 |
| * | Ultra Petroleum Corp. | 7,628 | 387 |
| | Dr Pepper Snapple Group Inc. | 9,857 | 386 |
| | Health Care REIT Inc. | 7,179 | 386 |
| | Xilinx Inc. | 11,053 | 385 |
| | Range Resources Corp. | 6,817 | 385 |
| * | Denbury Resources Inc. | 17,049 | 385 |
| | CA Inc. | 15,568 | 383 |
| *,^ | First Solar Inc. | 2,740 | 382 |
| | JM Smucker Co. | 5,087 | 382 |
| | Lubrizol Corp. | 2,820 | 379 |
| | Sigma-Aldrich Corp. | 5,373 | 379 |
| * | Teradata Corp. | 6,777 | 379 |
| * | Illumina Inc. | 5,324 | 378 |
| * | Alexion Pharmaceuticals Inc. | 3,899 | 378 |
| * | IntercontinentalExchange Inc. | 3,124 | 376 |
| | Harley-Davidson Inc. | 10,055 | 375 |
| | Southwest Airlines Co. | 31,663 | 372 |
| | Perrigo Co. | 4,117 | 372 |
| * | Fiserv Inc. | 6,063 | 372 |
| * | Delta Air Lines Inc. | 35,650 | 370 |
| | XL Group plc Class A | 15,135 | 370 |
| | L-3 Communications Holdings Inc. | 4,601 | 369 |
| * | CB Richard Ellis Group Inc. Class A | 13,741 | 367 |
| * | DaVita Inc. | 4,151 | 366 |
| | Polo Ralph Lauren Corp. Class A | 2,791 | 365 |
| | Sherwin-Williams Co. | 4,426 | 364 |
| * | Waters Corp. | 3,713 | 364 |
| | DTE Energy Co. | 7,192 | 363 |
| | Genuine Parts Co. | 6,751 | 363 |
| * | BMC Software Inc. | 7,216 | 362 |
| * | CIT Group Inc. | 8,500 | 361 |
| | Ross Stores Inc. | 4,897 | 361 |
| * | Jacobs Engineering Group Inc. | 7,264 | 360 |
| * | VMware Inc. Class A | 3,776 | 360 |
| | Frontier Communications Corp. | 43,559 | 360 |
| | | |
| Vanguard® Total World Stock Index Fund | | |
| Schedule of Investments | | |
| April 30, 2011 | | |
| |
| | | | Market |
| | | | Value |
| | | Shares | ($000) |
| * | O'Reilly Automotive Inc. | 6,027 | 356 |
| * | Chipotle Mexican Grill Inc. Class A | 1,332 | 355 |
| * | Nabors Industries Ltd. | 11,568 | 354 |
| | Roper Industries Inc. | 4,043 | 350 |
| * | F5 Networks Inc. | 3,447 | 349 |
| | Maxim Integrated Products Inc. | 12,779 | 349 |
| * | NII Holdings Inc. | 8,400 | 349 |
| | Cablevision Systems Corp. Class A | 9,774 | 344 |
| | Legg Mason Inc. | 9,241 | 343 |
| | Campbell Soup Co. | 10,179 | 342 |
| | Unum Group | 12,892 | 341 |
| * | Varian Medical Systems Inc. | 4,837 | 340 |
| | Linear Technology Corp. | 9,717 | 338 |
| * | NRG Energy Inc. | 13,961 | 338 |
| * | BorgWarner Inc. | 4,367 | 337 |
| | KeyCorp | 38,659 | 335 |
| * | Motorola Mobility Holdings Inc. | 12,836 | 335 |
| * | CarMax Inc. | 9,632 | 334 |
| * | Stericycle Inc. | 3,654 | 334 |
| * | Electronic Arts Inc. | 16,500 | 333 |
| | Celanese Corp. Class A | 6,637 | 331 |
| * | Petrohawk Energy Corp. | 12,228 | 330 |
| | Interpublic Group of Cos. Inc. | 28,014 | 329 |
| | Bucyrus International Inc. Class A | 3,565 | 326 |
| | Seagate Technology plc | 18,279 | 322 |
| *,^ | Sears Holdings Corp. | 3,701 | 318 |
| | EQT Corp. | 6,024 | 317 |
| | Eastman Chemical Co. | 2,930 | 314 |
| | Flowserve Corp. | 2,466 | 312 |
| | Textron Inc. | 11,944 | 312 |
| * | Pride International Inc. | 7,092 | 311 |
| | VeriSign Inc. | 8,409 | 311 |
| * | Apollo Group Inc. Class A | 7,688 | 308 |
| | Kimco Realty Corp. | 15,740 | 308 |
| * | Dollar Tree Inc. | 5,347 | 307 |
| | Computer Sciences Corp. | 5,958 | 304 |
| | Autoliv Inc. | 3,790 | 304 |
| | QEP Resources Inc. | 7,099 | 303 |
| * | Sirius XM Radio Inc. | 152,262 | 303 |
| | KLA-Tencor Corp. | 6,822 | 299 |
| | Microchip Technology Inc. | 7,246 | 297 |
| | Constellation Energy Group Inc. | 8,141 | 297 |
| | Wisconsin Energy Corp. | 9,450 | 295 |
| * | Red Hat Inc. | 6,199 | 294 |
| * | Akamai Technologies Inc. | 8,509 | 293 |
| | New York Community Bancorp Inc. | 17,590 | 292 |
| * | Flextronics International Ltd. | 41,807 | 291 |
| | Harris Corp. | 5,478 | 291 |
| | Pall Corp. | 4,935 | 288 |
| | Activision Blizzard Inc. | 25,320 | 288 |
| | Whirlpool Corp. | 3,345 | 288 |
| | Leucadia National Corp. | 7,430 | 287 |
| | Willis Group Holdings plc | 6,890 | 285 |
| | Liberty Property Trust | 8,081 | 284 |
| | AMETEK Inc. | 6,171 | 284 |
| | Plum Creek Timber Co. Inc. | 6,577 | 283 |
| | Ball Corp. | 7,566 | 282 |
| * | CareFusion Corp. | 9,483 | 279 |
| | United States Steel Corp. | 5,825 | 278 |
| | Macerich Co. | 5,254 | 278 |
| | PetSmart Inc. | 6,578 | 277 |
| * | McDermott International Inc. | 11,921 | 275 |
| * | Garmin Ltd. | 8,029 | 275 |
| * | Henry Schein Inc. | 3,727 | 272 |
| | | |
| Vanguard® Total World Stock Index Fund | | |
| Schedule of Investments | | |
| April 30, 2011 | | |
| |
| | | | Market |
| | | | Value |
| | | Shares | ($000) |
| | Iron Mountain Inc. | 8,546 | 272 |
| | Ameren Corp. | 9,278 | 272 |
| | Brown-Forman Corp. Class B | 3,782 | 272 |
| | Comerica Inc. | 7,122 | 270 |
| * | Alpha Natural Resources Inc. | 4,632 | 269 |
| * | Watson Pharmaceuticals Inc. | 4,315 | 268 |
| | Expedia Inc. | 10,643 | 266 |
| | Darden Restaurants Inc. | 5,668 | 266 |
| | Abercrombie & Fitch Co. | 3,751 | 266 |
| | TD Ameritrade Holding Corp. | 12,300 | 265 |
| | Family Dollar Stores Inc. | 4,865 | 264 |
| | Tyson Foods Inc. Class A | 13,136 | 261 |
| | Wyndham Worldwide Corp. | 7,472 | 259 |
| * | Amdocs Ltd. | 8,361 | 257 |
| | Pinnacle West Capital Corp. | 5,887 | 255 |
| | TECO Energy Inc. | 13,228 | 255 |
| | National Semiconductor Corp. | 10,532 | 254 |
| | Northeast Utilities | 7,119 | 253 |
| | Hasbro Inc. | 5,394 | 253 |
| * | Advanced Micro Devices Inc. | 27,713 | 252 |
| | Robert Half International Inc. | 8,310 | 252 |
| | Hormel Foods Corp. | 8,535 | 251 |
| | Hospitality Properties Trust | 10,316 | 249 |
| | AMB Property Corp. | 6,834 | 249 |
| * | Cephalon Inc. | 3,234 | 248 |
| * | SAIC Inc. | 14,235 | 248 |
| | Windstream Corp. | 19,314 | 247 |
| * | Royal Caribbean Cruises Ltd. | 6,203 | 247 |
| | Brown & Brown Inc. | 9,494 | 245 |
| * | Discovery Communications Inc. Class A | 5,527 | 245 |
| * | Kinder Morgan Management LLC | 3,578 | 244 |
| * | Lam Research Corp. | 5,048 | 244 |
| | MeadWestvaco Corp. | 7,207 | 243 |
| * | Genworth Financial Inc. Class A | 19,859 | 242 |
| | Sunoco Inc. | 5,664 | 242 |
| * | Dendreon Corp. | 5,514 | 239 |
| | McCormick & Co. Inc. | 4,867 | 239 |
| | Commerce Bancshares Inc. | 5,610 | 239 |
| * | Avnet Inc. | 6,520 | 237 |
| | Vulcan Materials Co. | 5,191 | 235 |
| | Avago Technologies Ltd. | 7,000 | 234 |
| | Beckman Coulter Inc. | 2,815 | 233 |
| | PartnerRe Ltd. | 2,893 | 232 |
| | Torchmark Corp. | 3,452 | 231 |
| * | Rovi Corp. | 4,725 | 229 |
| | Huntington Bancshares Inc. | 33,481 | 227 |
| * | Plains Exploration & Production Co. | 5,957 | 227 |
| | Duke Realty Corp. | 14,828 | 226 |
| * | Discovery Communications Inc. | 5,717 | 226 |
| | International Game Technology | 12,679 | 224 |
| | Diamond Offshore Drilling Inc. | 2,954 | 224 |
| | Manpower Inc. | 3,307 | 219 |
| | Weingarten Realty Investors | 8,287 | 219 |
| * | DISH Network Corp. Class A | 8,738 | 219 |
| | International Flavors & Fragrances Inc. | 3,396 | 216 |
| | Newell Rubbermaid Inc. | 11,256 | 215 |
| | Lincare Holdings Inc. | 6,814 | 214 |
| | Pitney Bowes Inc. | 8,710 | 214 |
| * | Calpine Corp. | 12,700 | 213 |
| * | Liberty Global Inc. Class A | 4,573 | 213 |
| * | Rowan Cos. Inc. | 5,099 | 213 |
| | SUPERVALU Inc. | 18,819 | 212 |
| * | Human Genome Sciences Inc. | 7,175 | 211 |
| | Cincinnati Financial Corp. | 6,632 | 210 |
| | | |
| Vanguard® Total World Stock Index Fund | | |
| Schedule of Investments | | |
| April 30, 2011 | | |
| |
| | | | Market |
| | | | Value |
| | | Shares | ($000) |
| | Universal Health Services Inc. Class B | 3,827 | 210 |
| * | Owens-Illinois Inc. | 7,045 | 209 |
| | Digital Realty Trust Inc. | 3,464 | 209 |
| * | Coventry Health Care Inc. | 6,396 | 206 |
| | Masco Corp. | 15,373 | 206 |
| * | MetroPCS Communications Inc. | 12,205 | 205 |
| | Scripps Networks Interactive Inc. Class A | 3,981 | 205 |
| | Federal Realty Investment Trust | 2,333 | 204 |
| | DR Horton Inc. | 16,400 | 204 |
| | SCANA Corp. | 4,911 | 204 |
| | Leggett & Platt Inc. | 7,665 | 202 |
| | H&R Block Inc. | 11,567 | 200 |
| | Ashland Inc. | 3,205 | 199 |
| | Avery Dennison Corp. | 4,764 | 199 |
| | Equifax Inc. | 5,270 | 198 |
| | DENTSPLY International Inc. | 5,263 | 198 |
| | American International Group Inc. | 6,320 | 197 |
| | Bemis Co. Inc. | 6,222 | 195 |
| | Hudson City Bancorp Inc. | 20,420 | 195 |
| * | Energizer Holdings Inc. | 2,574 | 194 |
| * | Liberty Global Inc. | 4,345 | 193 |
| | MDU Resources Group Inc. | 8,042 | 192 |
| | Everest Re Group Ltd. | 2,105 | 192 |
| | Gentex Corp. | 6,103 | 191 |
| * | Arrow Electronics Inc. | 4,195 | 191 |
| | People's United Financial Inc. | 13,907 | 190 |
| * | Foster Wheeler AG | 5,333 | 190 |
| | RR Donnelley & Sons Co. | 9,929 | 187 |
| | SPX Corp. | 2,160 | 187 |
| * | NVR Inc. | 252 | 186 |
| | Pepco Holdings Inc. | 9,644 | 186 |
| | Old Republic International Corp. | 14,621 | 185 |
| | Jabil Circuit Inc. | 9,293 | 184 |
| | Foot Locker Inc. | 8,562 | 184 |
| * | MGM Resorts International | 14,252 | 180 |
| * | Kinetic Concepts Inc. | 3,055 | 180 |
| * | Alliance Data Systems Corp. | 1,871 | 178 |
| * | Mohawk Industries Inc. | 2,930 | 176 |
| | Sealed Air Corp. | 6,819 | 176 |
| * | GameStop Corp. Class A | 6,816 | 175 |
| | Alliant Techsystems Inc. | 2,433 | 172 |
| | Patterson-UTI Energy Inc. | 5,501 | 171 |
| | WR Berkley Corp. | 5,235 | 171 |
| * | Cree Inc. | 4,116 | 168 |
| * | LSI Corp. | 22,852 | 168 |
| | Airgas Inc. | 2,398 | 167 |
| | Cintas Corp. | 5,320 | 165 |
| | Assurant Inc. | 4,133 | 164 |
| | Axis Capital Holdings Ltd. | 4,520 | 160 |
| * | Continental Resources Inc. | 2,308 | 159 |
| | Omnicare Inc. | 4,966 | 156 |
| | JB Hunt Transport Services Inc. | 3,270 | 156 |
| | Gannett Co. Inc. | 10,267 | 155 |
| | RenaissanceRe Holdings Ltd. | 2,185 | 154 |
| | Zions Bancorporation | 6,263 | 153 |
| | Alliant Energy Corp. | 3,867 | 153 |
| | Marshall & Ilsley Corp. | 18,400 | 150 |
| * | Constellation Brands Inc. Class A | 6,694 | 150 |
| | Patterson Cos. Inc. | 4,305 | 149 |
| * | Babcock & Wilcox Co. | 4,750 | 149 |
| * | Markel Corp. | 346 | 144 |
| | Dun & Bradstreet Corp. | 1,747 | 144 |
| * | AutoNation Inc. | 4,219 | 143 |
| * | Synopsys Inc. | 5,132 | 141 |
| | | |
| Vanguard® Total World Stock Index Fund | | |
| Schedule of Investments | | |
| April 30, 2011 | | |
| |
| | | | Market |
| | | | Value |
| | | Shares | ($000) |
| * | Dollar General Corp. | 4,300 | 140 |
| * | Smithfield Foods Inc. | 5,818 | 137 |
| * | Liberty Media Corp. - Starz | 1,768 | 136 |
| * | Urban Outfitters Inc. | 4,289 | 135 |
| | Pentair Inc. | 3,347 | 134 |
| | Regency Centers Corp. | 2,794 | 131 |
| | Alberto-Culver Co. Class B | 3,450 | 129 |
| | Total System Services Inc. | 6,751 | 127 |
| | Harman International Industries Inc. | 2,537 | 123 |
| | Transatlantic Holdings Inc. | 2,333 | 115 |
| * | NCR Corp. | 5,678 | 112 |
| | Broadridge Financial Solutions Inc. | 4,824 | 112 |
| | American Eagle Outfitters Inc. | 7,179 | 112 |
| * | Popular Inc. | 35,199 | 111 |
| * | Novellus Systems Inc. | 3,445 | 111 |
| | White Mountains Insurance Group Ltd. | 306 | 109 |
| | SEI Investments Co. | 4,897 | 109 |
| * | IAC/InterActiveCorp | 3,000 | 108 |
| | Arthur J Gallagher & Co. | 3,633 | 108 |
| | Weight Watchers International Inc. | 1,362 | 106 |
| * | Pulte Group Inc. | 13,011 | 106 |
| | Questar Corp. | 5,999 | 105 |
| * | WebMD Health Corp. | 1,755 | 102 |
| | Ryder System Inc. | 1,892 | 101 |
| | Lennar Corp. Class A | 5,263 | 100 |
| | City National Corp. | 1,749 | 100 |
| * | Forest City Enterprises Inc. Class A | 5,105 | 98 |
| * | Community Health Systems Inc. | 3,165 | 97 |
| | Lender Processing Services Inc. | 3,294 | 97 |
| | Erie Indemnity Co. Class A | 1,304 | 94 |
| | Federated Investors Inc. Class B | 3,606 | 93 |
| | First Horizon National Corp. | 8,423 | 92 |
| * | Toll Brothers Inc. | 4,386 | 92 |
| * | Compuware Corp. | 7,975 | 90 |
| * | MEMC Electronic Materials Inc. | 7,584 | 90 |
| | Warner Chilcott plc Class A | 3,838 | 88 |
| * | Lamar Advertising Co. Class A | 2,704 | 88 |
| * | AOL Inc. | 4,198 | 86 |
| * | Huntington Ingalls Industries Inc. | 2,129 | 85 |
| * | St. Joe Co. | 3,250 | 85 |
| | Valley National Bancorp | 5,921 | 85 |
| | DST Systems Inc. | 1,655 | 82 |
| | Mercury General Corp. | 2,053 | 82 |
| | Diebold Inc. | 2,371 | 80 |
| | Wendy's/Arby's Group Inc. Class A | 15,848 | 76 |
| | Janus Capital Group Inc. | 6,180 | 75 |
| | RadioShack Corp. | 4,386 | 69 |
| | Molex Inc. | 2,513 | 68 |
| * | CoreLogic Inc. | 3,445 | 63 |
| | Molex Inc. Class A | 2,658 | 60 |
| | Telephone & Data Systems Inc. | 1,719 | 58 |
| | Washington Post Co. Class B | 96 | 42 |
| | CNA Financial Corp. | 1,216 | 38 |
| | Wesco Financial Corp. | 20 | 8 |
| |
| | | | 588,213 |
| Total Common Stocks (Cost $1,137,083) | | 1,424,056 |
| | | |
| Vanguard® Total World Stock Index Fund | | | |
| Schedule of Investments | | | |
| April 30, 2011 | | | |
| |
| | | | Market |
| | | | Value |
| | Coupon | Shares | ($000) |
| Temporary Cash Investment (2.7%) | | | |
| Money Market Fund (2.7%) | | | |
| 2,3 Vanguard Market Liquidity Fund (Cost $38,484) | 0.179% | 38,483,970 | 38,484 |
| |
| Total Investments (102.5%) (Cost $1,175,567) | | | 1,462,540 |
| Other Assets and Liabilities—Net (-2.5%)3 | | | (35,327) |
| Net Assets (100%) | | | 1,427,213 |
* Non-income-producing security.
^ Part of security position is on loan to broker-dealers. The total value of securities on loan is $36,718,000.
1 Security exempt from registration under Rule 144A of the Securities Act of 1933. Such securities may be sold in transactions exempt from registration, normally to qualified institutional buyers. At April 30, 2011, the aggregate value of these securities was $7,229,000, representing 0.5% of net assets.
2 Affiliated money market fund available only to Vanguard funds and certain trusts and accounts managed by Vanguard. Rate shown is the 7-day yield.
3 Includes $38,484,000 of collateral received for securities on loan.
ADR—American Depositary Receipt.
GDR—Global Depositary Receipt.
REIT—Real Estate Investment Trust.
© 2011 The Vanguard Group. Inc.
All rights reserved.
Vanguard Marketing Corporation, Distributor.
SNA 6282_ 062011
 |
|
| Vanguard FTSE International |
| Index Funds Semiannual Report |
|
| April 30, 2011 |
 |
| |
| FTSE All-World ex-US Index Fund |
| FTSE All-World ex-US Small-Cap Index Fund |
|
> For the six months ended April 30, 2011, Vanguard FTSE All-World ex-US Index Fund trailed the broad U.S. stock market, returning about 13%; its small-capitalization counterpart, Vanguard FTSE All-World ex-US Small-Cap Index Fund, returned about 15%.
> Small-company stocks continued to outperform their large-cap counterparts in markets around the world.
> Emerging markets cooled off a bit, while European and Canadian markets provided the biggest gains.
| |
| Contents | |
| Your Fund’s Total Returns. | 1 |
| Chairman’s Letter. | 2 |
| FTSE All-World ex-US Index Fund. | 9 |
| FTSE All-World ex-US Small-Cap Index Fund. | 27 |
| About Your Fund’s Expenses. | 44 |
| Trustees Approve Advisory Arrangements. | 46 |
| Glossary. | 47 |
Please note: The opinions expressed in this report are just that—informed opinions. They should not be considered promises or advice. Also, please keep in mind that the information and opinions cover the period through the date on the front of this report. Of course, the risks of investing in your fund are spelled out in the prospectus.
See the Glossary for definitions of investment terms used in this report.
Cover photograph: Jean Maher.
Your Fund’s Total Returns
Six Months Ended April 30, 2011
| |
| | Total |
| | Returns |
| Vanguard FTSE All-World ex-US Index Fund | |
| Investor Shares | 12.55% |
| Institutional Shares | 12.68 |
| Institutional Plus Shares (Inception: 12/16/2010) | 10.96 |
| ETF Shares | |
| Market Price | 12.85 |
| Net Asset Value | 12.64 |
| FTSE All-World ex US Index | 12.70 |
| International Funds Average | 12.64 |
| International Funds Average: Derived from data provided by Lipper Inc. | |
| Vanguard FTSE All-World ex-US Small-Cap Index Fund | |
| Investor Shares | 14.87% |
| Institutional Shares | 15.00 |
| ETF Shares | |
| Market Price | 15.11 |
| Net Asset Value | 14.99 |
| FTSE Global Small Cap ex US Index | 15.11 |
| International Small-Cap Funds Average | 14.71 |
| International Small-Cap Funds Average: Derived from data provided by Lipper Inc. | |
Institutional and Institutional Plus Shares are available to certain institutional investors who meet specific administrative, service, and account-size criteria. The Vanguard ETF® Shares shown are traded on the NYSE Arca exchange and are available only through brokers. The table provides ETF returns based on both the NYSE Arca market price and the net asset value for a share. U.S. Pat. No. 6,879,964 B2; 7,337,138.
For the ETF Shares, the market price is determined by the midpoint of the bid-offer spread as of the closing time of the New York Stock Exchange (generally 4 p.m., Eastern time). The net asset value is also determined as of the NYSE closing time. For more information about how the ETF Shares' market prices have compared with their net asset value, visit vanguard.com, select your ETF, and then select the Price and Performance tab. The ETF premium/discount analysis there shows the percentages of days on which the ETF Shares' market price was above or below the NAV.
Index returns are adjusted for withholding taxes applicable to U.S.-based mutual funds organized as Delaware statutory trusts.
1

Chairman’s Letter
Dear Shareholder,
Though their returns lagged those of their U.S. counterparts, international stocks performed well during the six months ended April 30—a period marked by disaster and turmoil. Despite political unrest in North Africa and the Middle East, natural and nuclear calamities in Japan, and ongoing debt worries in Europe, international markets held strong, and the vast majority of countries produced positive returns.
Vanguard FTSE All-World ex-US Index Fund—which provides broad exposure to large- and medium-sized companies outside the United States—returned about 13%, in line with its benchmark index and the average return of international peer funds. Its small-company complement, Vanguard FTSE All-World ex-US Small-Cap Index Fund, captured most of its index’s performance with a return of about 15%, slightly ahead of the average return of its international small-cap peers.
Please note that on December 16 we began offering Institutional Plus Shares of Vanguard FTSE All-World ex-US Index Fund. These shares require a minimum initial investment of $100 million.
2
Strong returns around the globe
Global stock markets produced outstanding returns for the six months ended April 30. The broad U.S. stock market returned more than 17%; although rising food and gasoline prices put pressure on consumer budgets, corporate earnings growth remained strong and the pace of new job creation bounced back from extremely depressed levels.
For U.S.-based investors, international stock markets produced a smaller but still robust six-month return of 12.44% in U.S. dollars. Almost half of this return reflected exchange rate gains produced largely by strength in the euro and currencies in emerging economies.
For U.S.-based investors, the dollar’s six-month decline against most major currencies enhanced returns from the two FTSE All-World ex-US funds. (For more information on the effects of currency markets, see the text box on page 5 of this report.)
As the economy found its footing, rates edged higher
Rising longer-term interest rates put pressure on bond prices, which led to modest bond market returns for the six-month period. The broad taxable U.S. bond market returned about 0%. The broad municipal market returned –1.68%. The rise in rates reflected both confidence that the economic recovery would prove self-sustaining and thus nudge rates higher,
| | | |
| Market Barometer | | | |
| |
| | | | Total Returns |
| | | Periods Ended April 30, 2011 |
| | Six | One | Five Years |
| | Months | Year | (Annualized) |
| Stocks | | | |
| Russell 1000 Index (Large-caps) | 17.12% | 18.02% | 3.30% |
| Russell 2000 Index (Small-caps) | 23.73 | 22.20 | 3.89 |
| Dow Jones U.S. Total Stock Market Index | 17.28 | 18.40 | 3.65 |
| MSCI All Country World Index ex USA (International) | 12.44 | 19.73 | 3.55 |
| |
| Bonds | | | |
| Barclays Capital U.S. Aggregate Bond Index (Broad | | | |
| taxable market) | 0.02% | 5.36% | 6.33% |
| Barclays Capital Municipal Bond Index (Broad | | | |
| tax-exempt market) | -1.68 | 2.20 | 4.52 |
| Citigroup Three-Month U.S. Treasury Bill Index | 0.06 | 0.15 | 2.02 |
| |
| CPI | | | |
| Consumer Price Index | 2.83% | 3.16% | 2.22% |
3
and nervousness that higher rates would be necessary to provide some protection from inflation. Even so, inflation expectations remained subdued, as measured by the difference between the yields of inflation-protected and nominal U.S. Treasury bonds.
The return on short-term money market instruments such as the 3-month U.S. Treasury bill remained near 0%, consistent with the Federal Reserve Board’s target for short-term rates.
European markets showed the most strength
For the six-month period—and continuing a multiyear trend—small-company stocks outdistanced their large-cap counterparts.
European developed markets accounted for more than half of the funds’ gains, returning about 16% in Vanguard FTSE All-World ex-US Index Fund and 20% in Vanguard FTSE All-World ex-US Small-Cap Index Fund. Despite ongoing debt concerns from some of Europe’s troubled economies, the markets seemed to have priced in the uncertainty, and nearly every country in the region posted gains.
The United Kingdom, representing about 14% of the capitalization of the two benchmark indexes, posted double-digit returns (+13% for the larger-cap index and +18% for the small-cap index) and was the leading contributor in the larger-cap index and second-leading contributor in the small-cap index. Germany, France, and
Expense Ratios
Your Fund Compared With Its Peer Group
| | | | | |
| | Investor | Institutional | Institutional | ETF | Peer Group |
| | Shares | Shares | Plus Shares | Shares | Average |
| FTSE All-World ex-US Index Fund | 0.35% | 0.15% | 0.12% | 0.22% | 1.42% |
| FTSE All-World ex-US Small-Cap Index | | | | | |
| Fund | 0.55 | 0.30 | — | 0.33 | 1.57 |
The fund expense ratios shown are from the prospectus dated February 25, 2011, and represent estimated costs for the current fiscal year. For the six months ended April 30, 2011, the funds’ annualized expense ratios were: for the FTSE All-World ex-US Index Fund, 0.35% for Investor Shares, 0.14% for Institutional Shares, and 0.21% for ETF Shares; and for the FTSE All-World ex-US Small-Cap Index Fund, 0.53% for Investor Shares, 0.28% for Institutional Shares, and 0.31% for ETF Shares. For the FTSE All-World ex-US Index Fund Institutional Plus Shares, the annualized expense ratio from inception on December 16, 2010, was 0.11%. The peer-group expense ratios are derived from data provided by Lipper Inc. and capture information through year-end 2010.
Peer groups: For the FTSE All-World ex-US Index Fund, International Funds; and for the FTSE All-World ex-US Small-Cap Index Fund, International Small-Cap Funds.
4
Switzerland were also large contributors to the indexes’ performance. Not surprisingly, Greece—still struggling with severe sovereign debt issues—was the worst European performer for the six months. However, since Greece is one of Europe’s smaller markets, the impact on returns was minimal.
Canada proved to be a significant factor during the period: In the FTSE larger-cap index, its return of about 18% made it the second-largest contributor after the United Kingdom. The country returned 23% in the FTSE small-cap counterpart and was the largest contributor to that index’s advance. Not surprisingly, energy and materials stocks fueled Canada’s climb as rising global demand for energy and commodities helped the resource-rich nation.
Pacific region and emerging markets also managed respectable gains
The Pacific region turned in a respectable performance: up 9% in the larger-cap FTSE index and 10% in the small-cap index. Despite an initial selloff of Japanese stocks after the March 11 earthquake, tsunami, and subsequent nuclear disaster, the country—by far the region’s largest market— returned about 5% and 10%, respectively, in the two indexes. Australia, which benefited from its in-demand natural resources, posted the region’s highest returns (18% and 16%, respectively).
Emerging markets cooled off a bit, gaining about 10% in the larger-company FTSE index and just 5% in its small-company sibling. Investor concerns over inflation hurt several emerging markets countries, most significantly China, which was up a bit less than 1% in the larger-cap index and a bit more than 1% in the small-cap index, and India (–6% and –16%, respectively). Both countries have tightened their monetary policies to cope with rising food and energy prices. Meanwhile, South Korea (+28% and +10%), Taiwan (+17% and +10%), and Russia (+29% and +26%) advanced smartly.
All ten sectors logged gains for the six months. Rising energy prices boosted energy-related stocks, which powered their way to the highest returns in both FTSE indexes. The energy sector’s strong return of about 22% in the FTSE All-World ex-US Index was the most significant driver of that benchmark’s forward movement.
Industrials and materials also did particularly well during the period, as global economic expansion lifted their fortunes. Most other sectors turned in double-digit gains in both indexes.
5
International funds offer opportunities to diversify
Funds investing outside the United States lagged their U.S. counterparts for the six months covered in this report. As investors, we’ve come to expect periods like this—times when domestic stocks outperform international stocks and vice versa. And we also know that there are times when one asset class does better than another, as well as times when both stocks and bonds perform exceptionally well, quite poorly, or somewhere in between. The financial markets are, in a word, unpredictable.
|
| Investment insight |
|
| A note on foreign currency translation effects |
| When you buy stocks of companies based outside of your home country, you gain |
| exposure to a wider array of economic and market forces, including the dynamics of |
| the foreign exchange markets. |
| |
| The exchange rate of the U.S. dollar versus another currency is the price at which the |
| dollar can be converted into that currency. For example, if the exchange rate of the |
| U.S. dollar versus Britain’s pound sterling is $1.50, it takes 1.5 dollars to purchase 1 |
| pound. If the U.S. dollar weakens—say, to a rate of $2.00—then you’ll need 2 dollars |
| to buy 1 pound. Conversely, if the dollar strengthens to $1.25, it will take fewer |
| dollars to buy a pound. |
| |
| The price of one currency relative to another is determined by supply and demand |
| factors—including interest rates, the strength of the two economies, and geopolitical |
| risks. In the long run, the portfolio effects of exchange rate movements tend to |
| balance out. But a rise or fall in the dollar’s value versus other currencies can influence |
| short-term returns. Exchange rate changes also affect the purchasing power of each |
| new dollar you invest in foreign stocks, just as they affect the prices of foreign goods. |
| And they can have a less immediately visible impact on a company’s profits, ultimately |
| driving its stock price. |
| |
| Performance during the period |
| From October 31, 2010, through April 30, 2011, most major currencies rose in value |
| against the U.S. dollar. In part, this reflected the Federal Reserve’s policy of holding |
| short-term interest rates near zero while some foreign central banks raised rates. For |
| U.S.-based investors, the shrinking dollar boosted returns earned in local markets. For |
| example: The MSCI Europe Index returned more than 15% when translated into U.S. |
| dollars, and the MSCI Emerging Markets Index returned nearly 10% in dollars—both |
| nearly double the indexes’ local-currency returns. |
6
At Vanguard, we believe that the best way to deal with the market’s short-term volatility is to tune it out and, instead, focus on the long term. We counsel investors to create an investment plan that includes a mix of stock (both domestic and international), bond, and money market funds that are appropriate for their goals, investment horizon, and risk tolerance—and to stay with that plan regardless of market conditions.
Vanguard’s two FTSE All-World ex-US Index Funds offer broad exposure to international markets at a low cost. Whether you invest in one or both of these funds, each can help diversify a well-balanced portfolio.
As always, thank you for entrusting your assets to Vanguard.
Sincerely,

F. William McNabb III
Chairman and Chief Executive Officer
May 13, 2011
7
Your Fund’s Performance at a Glance
October 31, 2010 , Through April 30, 2011
| | | | |
| | | | Distributions Per Share |
| | Starting | Ending | Income | Capital |
| | Share Price | Share Price | Dividends | Gains |
| Vanguard FTSE All-World ex-US Index Fund | | | | |
| Investor Shares | $18.43 | $20.32 | $0.384 | $0.000 |
| Institutional Shares | 92.50 | 101.94 | 2.072 | 0.000 |
| Institutional Plus Shares | 99.48 | 107.98 | 2.177 | 0.000 |
| (Inception: 12/16/2010) | | | | |
| ETF Shares | 46.92 | 51.73 | 1.019 | 0.000 |
| Vanguard FTSE All-World ex-US Small-Cap | | | | |
| Index Fund | | | | |
| Investor Shares | $36.34 | $40.56 | $0.782 | $0.291 |
| Institutional Shares | 182.36 | 203.52 | 4.143 | 1.459 |
| ETF Shares | 95.38 | 106.42 | 2.182 | 0.763 |
8
FTSE All-World ex-US Index Fund
Fund Profile
As of April 30, 2011
| | | | |
| Share-Class Characteristics | | | | |
| | Investor | Institutional | Institutional | ETF |
| | Shares | Shares | Plus Shares | Shares |
| Ticker Symbol | VFWIX | VFWSX | VFWPX | VEU |
| Expense Ratio1 | 0.35% | 0.15% | 0.12% | 0.22% |
| | |
| Portfolio Characteristics | | |
| | | FTSE |
| | | All-World |
| | Fund | ex US Index |
| Number of Stocks | 2,301 | 2,231 |
| Median Market Cap | $32.8B | $33.2B |
| Price/Earnings Ratio | 13.8x | 13.8x |
| Price/Book Ratio | 1.7x | 1.7x |
| Return on Equity | 17.9% | 17.8% |
| Earnings Growth Rate | 2.8% | 3.0% |
| Dividend Yield | 2.8% | 2.9% |
| Turnover Rate | | |
| (Annualized) | 6% | — |
| Short-Term Reserves | 0.0% | — |
| |
| |
| Volatility Measures | | |
| | | FTSE |
| | | All-World |
| | | ex US Index |
| R-Squared | | 0.99 |
| Beta | | 1.04 |
| These measures show the degree and timing of the fund’s fluctuations compared with the index over 36 months. |
|
| | |
| Ten Largest Holdings (% of total net assets) |
| BHP Billiton Ltd. | Diversified Metals | |
| | & Mining | 1.3% |
| Royal Dutch Shell plc | Integrated Oil & | |
| | Gas | 1.3 |
| Nestle SA | Packaged Foods & | |
| | Meats | 1.1 |
| HSBC Holdings plc | Diversified Banks | 1.0 |
| Petroleo Brasileiro SA | Integrated Oil & | |
| | Gas | 0.9 |
| Vodafone Group plc | Wireless | |
| | Telecommunication | |
| | Services | 0.8 |
| Novartis AG | Pharmaceuticals | 0.8 |
| BP plc | Integrated Oil & | |
| | Gas | 0.8 |
| Total SA | Integrated Oil & | |
| | Gas | 0.8 |
| Rio Tinto plc | Diversified Metals | |
| | & Mining | 0.7 |
| Top Ten | | 9.5% |
| The holdings listed exclude any temporary cash investments and equity index products. |
1 The expense ratios shown are from the prospectus dated February 25, 2011, and represent estimated costs for the current fiscal year. For the six months ended April 30, 2011, the annualized expense ratios were 0.35% for Investor Shares, 0.14% for Institutional Shares, and 0.21% for ETF Shares. For the FTSE All-World ex-US Index Fund Institutional Plus Shares, the annualized expense ratio from inception on December 16, 2010, was 0.11%.
9
FTSE All-World ex-US Index Fund
| | |
| Sector Diversification (% of equity exposure) |
| | | FTSE |
| | | All-World |
| | Fund | ex US Index |
| Consumer Discretionary | 8.9% | 9.0% |
| Consumer Staples | 8.6 | 8.6 |
| Energy | 11.3 | 11.3 |
| Financials | 24.9 | 25.0 |
| Health Care | 5.8 | 5.8 |
| Industrials | 11.2 | 11.2 |
| Information Technology | 6.3 | 6.2 |
| Materials | 13.0 | 13.0 |
| Telecommunication | | |
| Services | 5.8 | 5.7 |
| Utilities | 4.2 | 4.2 |
Allocation by Region ( % of portfolio)
| | |
| Market Diversification (% of equity exposure) |
| | | FTSE |
| | | All-World |
| | | ex US |
| | Fund | Index |
| Europe | | |
| United Kingdom | 14.0% | 14.1% |
| France | 7.7 | 7.7 |
| Germany | 6.0 | 6.0 |
| Switzerland | 5.3 | 5.3 |
| Spain | 2.7 | 2.7 |
| Sweden | 2.2 | 2.2 |
| Italy | 2.2 | 2.2 |
| Netherlands | 1.7 | 1.7 |
| Other | 3.7 | 3.7 |
| Subtotal | 45.5% | 45.6% |
| Pacific | | |
| Japan | 12.3% | 12.2% |
| Australia | 5.8 | 5.8 |
| Hong Kong | 2.3 | 2.3 |
| Singapore | 1.2 | 1.2 |
| Other | 0.1 | 0.1 |
| Subtotal | 21.7% | 21.6% |
| Emerging Markets | | |
| China | 4.2% | 4.2% |
| Brazil | 3.9 | 3.9 |
| South Korea | 3.9 | 3.9 |
| Taiwan | 2.7 | 2.7 |
| India | 2.2 | 2.2 |
| South Africa | 2.0 | 2.0 |
| Russia | 1.7 | 1.7 |
| Mexico | 1.1 | 1.1 |
| Other | 3.6 | 3.6 |
| Subtotal | 25.3% | 25.3% |
| Middle East | 0.5% | 0.5% |
| North America | | |
| Canada | 7.0% | 7.0% |
10
FTSE All-World ex-US Index Fund
Performance Summary
All of the returns in this report represent past performance, which is not a guarantee of future results that may be achieved by the fund. (Current performance may be lower or higher than the performance data cited. For performance data current to the most recent month-end, visit our website at vanguard.com/performance.) Note, too, that both investment returns and principal value can fluctuate widely, so an investor’s shares, when sold, could be worth more or less than their original cost. The returns shown do not reflect taxes that a shareholder would pay on fund distributions or on the sale of fund shares.
Fiscal-Year Total Returns (%): March 8, 2007, Through April 30, 2011
Note: For 2011, performance data reflect the six months ended April 30, 2011.
Index returns are adjusted for withholding taxes applicable to U.S.-based mutual funds organized as Delaware statutory trusts.
Average Annual Total Returns: Periods Ended March 31, 2011
This table presents returns through the latest calendar quarter—rather than through the end of the fiscal period.
Securities and Exchange Commission rules require that we provide this information.
| | | |
| | Inception | One | Since |
| | Date | Year | Inception |
| Investor Shares | 3/8/2007 | 13.23% | 0.90% |
| Institutional Shares | 4/30/2007 | 13.47 | -0.63 |
| Institutional Plus Shares | 12/16/2010 | — | 5.41 |
| ETF Shares | 3/2/2007 | | |
| Market Price | | 13.44 | 1.61 |
| Net Asset Value | | 13.38 | 1.53 |
Vanguard fund returns do not reflect the 2% fee on redemptions of shares held for less than two months.
See Financial Highlights for dividend and capital gains information.
11
FTSE All-World ex-US Index Fund
Financial Statements (unaudited)
Statement of Net Assets—Investments Summary
As of April 30, 2011
This Statement summarizes the fund’s holdings by asset type. Details are reported for each of the fund’s 50 largest individual holdings and for investments that, in total for any issuer, represent more than 1% of the fund’s net assets. The total value of smaller holdings is reported as a single amount within each category.
The fund reports a complete list of its holdings in regulatory filings four times in each fiscal year, at the quarter-ends. For the second and fourth fiscal quarters, the complete listing of the fund’s holdings is available electronically on vanguard.com and on the Securities and Exchange Commission’s website (sec.gov), or you can have it mailed to you without charge by calling 800-662-7447. For the first and third fiscal quarters, the fund files the lists with the SEC on Form N-Q. Shareholders can look up the fund’s Forms N-Q on the SEC’s website. Forms N-Q may also be reviewed and copied at the SEC’s Public Reference Room (see the back cover of this report for further information).
| | | |
| | | Market | Percentage |
| | | Value | of Net |
| | Shares | ($000) | Assets |
| Common Stocks | | | |
| Australia | | | |
| BHP Billiton Ltd. | 2,506,616 | 126,910 | 0.8% |
| Commonwealth Bank of Australia | 1,198,363 | 70,743 | 0.5% |
| Westpac Banking Corp. | 2,324,814 | 63,468 | 0.4% |
| Australia & New Zealand Banking Group Ltd. | 2,028,881 | 54,044 | 0.4% |
| National Australia Bank Ltd. | 1,694,604 | 50,453 | 0.3% |
| Australia—Other † | | 500,192 | 3.4% |
| | | 865,810 | 5.8% |
| |
| Austria † | | 38,515 | 0.3% |
| |
| Belgium † | | 92,513 | 0.6% |
| |
| Brazil † | | 580,640 | 3.9% |
| |
| Canada | | | |
| Royal Bank of Canada | 1,111,307 | 70,004 | 0.5% |
| ^ Toronto-Dominion Bank | 689,875 | 59,731 | 0.4% |
| Suncor Energy Inc. | 1,217,215 | 56,104 | 0.4% |
| Bank of Nova Scotia | 838,366 | 51,118 | 0.3% |
| Canada—Other † | | 803,568 | 5.4% |
| | | 1,040,525 | 7.0% |
| |
| Chile † | | 62,561 | 0.4% |
| |
| China | | | |
| China Construction Bank Corp. | 56,335,463 | 53,345 | 0.4% |
| China—Other † | | 570,646 | 3.8% |
| | | 623,991 | 4.2% |
| |
| Colombia † | | 27,837 | 0.2% |
| |
| Czech Republic † | | 15,940 | 0.1% |
12
FTSE All-World ex-US Index Fund
| | | | |
| | | | Market | Percentage |
| | | | Value | of Net |
| | | Shares | ($000) | Assets |
| Denmark | | | |
| | Novo Nordisk A/S Class B | 384,543 | 48,681 | 0.3% |
| | Denmark—Other † | | 76,403 | 0.5% |
| | | | 125,084 | 0.8% |
| |
| Egypt † | | 13,612 | 0.1% |
| |
| Finland † | | 103,517 | 0.7% |
| |
| France | | | |
| | Total SA | 1,744,417 | 111,715 | 0.8% |
| | Sanofi-Aventis SA | 1,016,630 | 80,433 | 0.5% |
| | BNP Paribas | 814,210 | 64,367 | 0.4% |
| ^ | GDF Suez | 1,318,034 | 53,894 | 0.4% |
| | LVMH Moet Hennessy Louis Vuitton SA | 286,958 | 51,520 | 0.4% |
| | France—Other † | | 773,821 | 5.2% |
| | | | 1,135,750 | 7.7% |
| Germany | | | |
| | Siemens AG | 714,063 | 103,867 | 0.7% |
| *,^ | BASF SE | 721,034 | 74,039 | 0.5% |
| | Daimler AG | 829,016 | 64,072 | 0.4% |
| ^ | Bayer AG | 646,270 | 56,739 | 0.4% |
| ^ | Allianz SE | 351,601 | 55,240 | 0.4% |
| ^ | E.ON AG | 1,488,875 | 50,889 | 0.4% |
| | Deutsche Bank AG | 727,162 | 47,360 | 0.3% |
| | Germany—Other † | | 429,850 | 2.9% |
| | | | 882,056 | 6.0% |
| |
| Greece † | | 23,084 | 0.2% |
| |
| Hong Kong † | | 341,294 | 2.3% |
| |
| Hungary † | | 19,805 | 0.1% |
| |
| India † | | 331,756 | 2.2% |
| |
| Indonesia † | | 86,375 | 0.6% |
| |
| Ireland † | | 26,185 | 0.2% |
| |
| Israel † | | 68,430 | 0.5% |
| |
| Italy | | | |
| | ENI SPA | 2,170,156 | 58,103 | 0.4% |
| | Italy—Other † | | 270,276 | 1.8% |
| | | | 328,379 | 2.2% |
| Japan | | | |
| | Toyota Motor Corp. | 1,837,076 | 73,283 | 0.5% |
| | Mitsubishi UFJ Financial Group Inc. | 11,051,037 | 53,040 | 0.4% |
| | Canon Inc. | 1,039,779 | 48,966 | 0.3% |
| | Japan—Other † | | 1,643,012 | 11.1% |
| | | | 1,818,301 | 12.3% |
| |
| Luxembourg † | | 2,033 | 0.0% |
| |
| Malaysia † | | 127,947 | 0.9% |
13
| | | |
| FTSE All-World ex-US Index Fund | | | |
| |
| |
| | | Market | Percentage |
| | | Value | of Net |
| | Shares | ($000) | Assets |
| Mexico | | | |
| America Movil SAB de CV | 17,005,253 | 48,733 | 0.3% |
| Mexico—Other † | | 118,454 | 0.8% |
| | | 167,187 | 1.1% |
| |
| Morocco † | | 3,977 | 0.0% |
| |
| Netherlands † | | 248,162 | 1.7% |
| |
| New Zealand † | | 13,935 | 0.1% |
| |
| Norway † | | 99,108 | 0.7% |
| |
| Peru † | | 12,365 | 0.1% |
| |
| Philippines † | | 17,265 | 0.1% |
| |
| Poland † | | 47,659 | 0.3% |
| |
| Portugal † | | 33,698 | 0.2% |
| |
| Russia | | | |
| Gazprom OAO ADR | 3,696,262 | 62,628 | 0.4% |
| Russia—Other † | | 194,933 | 1.3% |
| | | 257,561 | 1.7% |
| |
| Singapore † | | 176,941 | 1.2% |
| |
| South Africa † | | 302,365 | 2.0% |
| |
| South Korea | | | |
| 1 Samsung Electronics Co. Ltd. GDR | 153,461 | 64,064 | 0.4% |
| South Korea—Other † | | 509,630 | 3.5% |
| | | 573,694 | 3.9% |
| Spain | | | |
| Telefonica SA | 3,586,546 | 96,353 | 0.6% |
| Banco Santander SA | 6,496,632 | 82,965 | 0.6% |
| Spain—Other † | | 219,927 | 1.5% |
| | | 399,245 | 2.7% |
| |
| Sweden † | | 330,184 | 2.2% |
| |
| Switzerland | | | |
| Nestle SA | 2,706,429 | 167,984 | 1.1% |
| Novartis AG | 1,919,685 | 113,838 | 0.8% |
| Roche Holding AG | 548,784 | 89,078 | 0.6% |
| * UBS AG | 2,963,326 | 59,304 | 0.4% |
| ABB Ltd. | 1,814,462 | 50,107 | 0.4% |
| Switzerland—Other † | | 301,318 | 2.0% |
| | | 781,629 | 5.3% |
| |
| Taiwan † | | 403,504 | 2.7% |
| |
| Thailand † | | 58,096 | 0.4% |
14
| | | | |
| FTSE All-World ex-US Index Fund | | | | |
| |
| |
| |
| | | | Market | Percentage |
| | | | Value | of Net |
| | | Shares | ($000) | Assets |
| Turkey † | | | 46,871 | 0.3% |
| United Kingdom | | | | |
| HSBC Holdings plc | | 13,753,436 | 150,023 | 1.0% |
| Vodafone Group plc | | 40,542,409 | 117,201 | 0.8% |
| BP plc | | 14,717,564 | 113,139 | 0.8% |
| Royal Dutch Shell plc Class A | | 2,770,779 | 107,928 | 0.7% |
| GlaxoSmithKline plc | | 4,051,568 | 88,508 | 0.6% |
| Rio Tinto plc | | 1,192,918 | 87,043 | 0.6% |
| Royal Dutch Shell plc Class B | | 2,122,062 | 82,559 | 0.5% |
| BHP Billiton plc | | 1,706,106 | 72,135 | 0.5% |
| British American Tobacco plc | | 1,559,449 | 68,144 | 0.5% |
| BG Group plc | | 2,631,619 | 67,769 | 0.5% |
| Anglo American plc | | 1,035,883 | 54,301 | 0.4% |
| AstraZeneca plc | | 1,087,078 | 53,939 | 0.4% |
| Standard Chartered plc | | 1,821,741 | 50,630 | 0.3% |
| United Kingdom—Other † | | | 955,704 | 6.4% |
| | | | 2,069,023 | 14.0% |
| Total Common Stocks (Cost $12,343,592) | | 14,824,409 | 100.0% |
| |
| | Coupon | | | |
| Temporary Cash Investments | | | | |
| Money Market Fund | | | | |
| 2,3 Vanguard Market Liquidity Fund | 0.179% | 830,251,873 | 830,252 | 5.6% |
| |
| U.S. Government and Agency Obligations † | | 300 | 0.0% |
| Total Temporary Cash Investments (Cost $830,552) | | 830,552 | 5.6% |
| Total Investments (Cost $13,174,144) | | 15,654,961 | 105.6% |
| Other Assets and Liabilities | | | | |
| Other Assets | | | 89,838 | 0.6% |
| Liabilities3 | | | (914,028) | (6.2%) |
| | | | (824,190) | (5.6%) |
| Net Assets | | | 14,830,771 | 100.0% |
15
| |
| FTSE All-World ex-US Index Fund | |
| |
| |
| At April 30, 2011, net assets consisted of: | |
| | Amount |
| | ($000) |
| Paid-in Capital | 12,472,851 |
| Undistributed Net Investment Income | 94,087 |
| Accumulated Net Realized Losses | (219,495) |
| Unrealized Appreciation (Depreciation) | |
| Investment Securities | 2,480,817 |
| Foreign Currencies | 2,511 |
| Net Assets | 14,830,771 |
| |
| Investor Shares—Net Assets | |
| Applicable to 87,057,692 outstanding $.001 par value shares of beneficial | |
| interest (unlimited authorization) | 1,769,314 |
| Net Asset Value Per Share—Investor Shares | $20.32 |
| |
| Institutional Shares—Net Assets | |
| Applicable to 44,753,066 outstanding $.001 par value shares of beneficial | |
| interest (unlimited authorization) | 4,562,342 |
| Net Asset Value Per Share—Institutional Shares | $101.94 |
| |
| Institutional Plus Shares—Net Assets | |
| Applicable to 5,371,582 outstanding $.001 par value shares of beneficial | |
| interest (unlimited authorization) | 580,042 |
| Net Asset Value Per Share—Institutional Plus Shares | $107.98 |
| |
| ETF Shares—Net Assets | |
| Applicable to 153,089,086 outstanding $.001 par value shares of beneficial | |
| interest (unlimited authorization) | 7,919,073 |
| Net Asset Value Per Share—ETF Shares | $51.73 |
See Note A in Notes to Financial Statements.
* Non-income-producing security.
^ Part of security position is on loan to broker-dealers. The total value of securities on loan is $788,530,000.
† Represents the aggregate value, by category, of securities that are not among the 50 largest holdings and, in total for any issuer, represent 1% or less of net assets.
1 Certain of the fund’s securities are exempt from registration under Rule 144A of the Securities Act of 1933. Such securities may be sold in transactions exempt from registration, normally to qualified institutional buyers. At April 30, 2011, the aggregate value of these securities was $87,354,000, representing 0.6% of net assets.
2 Affiliated money market fund available only to Vanguard funds and certain trusts and accounts managed by Vanguard. Rate shown is the 7-day yield.
3 Includes $830,252,000 of collateral received for securities on loan.
ADR—American Depositary Receipt.
GDR—Global Depositary Receipt.
See accompanying Notes, which are an integral part of the Financial Statements.
16
FTSE All-World ex-US Index Fund
Statement of Operations
| |
| | Six Months Ended |
| | April 30, 2011 |
| | ($000) |
| Investment Income | |
| Income | |
| Dividends1 | 175,822 |
| Interest2 | 16 |
| Security Lending | 2,307 |
| Total Income | 178,145 |
| Expenses | |
| The Vanguard Group—Note B | |
| Investment Advisory Services | 497 |
| Management and Administrative—Investor Shares | 2,240 |
| Management and Administrative—Institutional Shares | 1,617 |
| Management and Administrative—Institutional Plus Shares | 136 |
| Management and Administrative—ETF Shares | 4,814 |
| Marketing and Distribution—Investor Shares | 232 |
| Marketing and Distribution—Institutional Shares | 669 |
| Marketing and Distribution—Institutional Plus Shares | 10 |
| Marketing and Distribution—ETF Shares | 1,032 |
| Custodian Fees | 1,739 |
| Shareholders’ Reports—Investor Shares | 12 |
| Shareholders’ Reports—Institutional Shares | 9 |
| Shareholders’ Reports—Institutional Plus Shares | — |
| Shareholders’ Reports��ETF Shares | 68 |
| Trustees’ Fees and Expenses | 6 |
| Total Expenses | 13,081 |
| Net Investment Income | 165,064 |
| Realized Net Gain (Loss) | |
| Investment Securities Sold | (16,191) |
| Foreign Currencies | (105) |
| Realized Net Gain (Loss) | (16,296) |
| Change in Unrealized Appreciation (Depreciation) | |
| Investment Securities | 1,448,005 |
| Foreign Currencies | 1,440 |
| Change in Unrealized Appreciation (Depreciation) | 1,449,445 |
| Net Increase (Decrease) in Net Assets Resulting from Operations | 1,598,213 |
1 Dividends are net of foreign withholding taxes of $15,530,000.
2 Interest income from an affiliated company of the fund was $16,000.
See accompanying Notes, which are an integral part of the Financial Statements.
17
FTSE All-World ex-US Index Fund
Statement of Changes in Net Assets
| | |
| | Six Months Ended | Year Ended |
| | April 30, | October 31, |
| | 2011 | 2010 |
| | ($000) | ($000) |
| Increase (Decrease) in Net Assets | | |
| Operations | | |
| Net Investment Income | 165,064 | 235,849 |
| Realized Net Gain (Loss) | (16,296) | (22,175) |
| Change in Unrealized Appreciation (Depreciation) | 1,449,445 | 1,073,417 |
| Net Increase (Decrease) in Net Assets Resulting from Operations | 1,598,213 | 1,287,091 |
| Distributions | | |
| Net Investment Income | | |
| Investor Shares | (31,143) | (15,131) |
| Institutional Shares | (91,968) | (39,424) |
| Institutional Plus Shares | (3,069) | — |
| ETF Shares | (143,060) | (95,039) |
| Realized Capital Gain | | |
| Investor Shares | — | — |
| Institutional Shares | — | — |
| Institutional Plus Shares | — | — |
| ETF Shares | — | — |
| Total Distributions | (269,240) | (149,594) |
| Capital Share Transactions | | |
| Investor Shares | 150,452 | 586,032 |
| Institutional Shares | (8,694) | 2,117,722 |
| Institutional Plus Shares | 537,834 | — |
| ETF Shares | 945,685 | 1,312,763 |
| Net Increase (Decrease) from Capital Share Transactions | 1,625,277 | 4,016,517 |
| Total Increase (Decrease) | 2,954,250 | 5,154,014 |
| Net Assets | | |
| Beginning of Period | 11,876,521 | 6,722,507 |
| End of Period1 | 14,830,771 | 11,876,521 |
| 1 Net Assets—End of Period includes undistributed net investment income of $94,087,000 and $198,157,000. |
See accompanying Notes, which are an integral part of the Financial Statements.
18
FTSE All-World ex-US Index Fund
Financial Highlights
| | | | | |
| Investor Shares | | | | | |
| | Six Months | | | | March 8, |
| | Ended | | | | 20071 to |
| | April 30, | | Year Ended October 31, | Oct. 31, |
| For a Share Outstanding Throughout Each Period | 2011 | 2010 | 2009 | 2008 | 2007 |
| Net Asset Value, Beginning of Period | $18.43 | $16.48 | $12.77 | $24.91 | $20.00 |
| Investment Operations | | | | | |
| Net Investment Income | .211 | .4182 | .3782 | .6372 | .4102 |
| Net Realized and Unrealized Gain (Loss) | | | | | |
| on Investments | 2.063 | 1.853 | 3.622 | (12.592) | 4.500 |
| Total from Investment Operations | 2.274 | 2.271 | 4.000 | (11.955) | 4.910 |
| Distributions | | | | | |
| Dividends from Net Investment Income | (.384) | (.321) | (.290) | (.185) | — |
| Distributions from Realized Capital Gains | — | — | — | — | — |
| Total Distributions | (.384) | (.321) | (.290) | (.185) | — |
| Net Asset Value, End of Period | $20.32 | $18.43 | $16.48 | $12.77 | $24.91 |
| |
| Total Return3 | 12.55% | 13.94% | 32.19% | -48.32% | 24.55% |
| |
| Ratios/Supplemental Data | | | | | |
| Net Assets, End of Period (Millions) | $1,769 | $1,458 | $748 | $296 | $213 |
| Ratio of Total Expenses to | | | | | |
| Average Net Assets | 0.35% | 0.35% | 0.40% | 0.35% | 0.40%4 |
| Ratio of Net Investment Income to | | | | | |
| Average Net Assets | 2.38% | 2.45% | 2.75% | 3.24% | 2.61%4 |
| Portfolio Turnover Rate5 | 6% | 6% | 9% | 7% | 10% |
The expense ratio, net income ratio, and turnover rate for the current period have been annualized.
1 Inception.
2 Calculated based on average shares outstanding.
3 Total returns do not include transaction or account service fees that may have applied in the periods shown. Fund prospectuses provide information about any applicable transaction and account service fees.
4 Annualized.
5 Excludes the value of portfolio securities received or delivered as a result of in-kind purchases or redemptions of the fund’s capital shares, including ETF Creation Units.
See accompanying Notes, which are an integral part of the Financial Statements.
19
FTSE All-World ex-US Index Fund
Financial Highlights
| | | | | |
| Institutional Shares | | | | | |
| | Six Months | | | | April 30, |
| | Ended | | | | 20071 to |
| | April 30, | | Year Ended October 31, | Oct. 31, |
| For a Share Outstanding Throughout Each Period | 2011 | 2010 | 2009 | 2008 | 2007 |
| Net Asset Value, Beginning of Period | $92.50 | $82.71 | $64.06 | $124.76 | $107.33 |
| Investment Operations | | | | | |
| Net Investment Income | 1.147 | 2.2262 | 2.1012 | 3.3232 | 1.1502 |
| Net Realized and Unrealized Gain (Loss) | | | | | |
| on Investments | 10.365 | 9.322 | 18.142 | (62.979) | 16.280 |
| Total from Investment Operations | 11.512 | 11.548 | 20.243 | (59.656) | 17.430 |
| Distributions | | | | | |
| Dividends from Net Investment Income | (2.072) | (1.758) | (1.593) | (1.044) | — |
| Distributions from Realized Capital Gains | — | — | — | — | — |
| Total Distributions | (2.072) | (1.758) | (1.593) | (1.044) | — |
| Net Asset Value, End of Period | $101.94 | $92.50 | $82.71 | $64.06 | $124.76 |
| |
| Total Return3 | 12.68% | 14.15% | 32.56% | -48.18% | 16.24% |
| |
| Ratios/Supplemental Data | | | | | |
| Net Assets, End of Period (Millions) | $4,562 | $4,146 | $1,608 | $448 | $157 |
| Ratio of Total Expenses to | | | | | |
| Average Net Assets | 0.14% | 0.15% | 0.15% | 0.10% | 0.15%4 |
| Ratio of Net Investment Income to | | | | | |
| Average Net Assets | 2.59% | 2.65% | 3.00% | 3.49% | 2.86%4 |
| Portfolio Turnover Rate5 | 6% | 6% | 9% | 7% | 10% |
The expense ratio, net income ratio, and turnover rate for the current period have been annualized.
1 Inception.
2 Calculated based on average shares outstanding.
3 Total returns do not include transaction fees that may have applied in the periods shown. Fund prospectuses provide information about any applicable transaction fees.
4 Annualized.
5 Excludes the value of portfolio securities received or delivered as a result of in-kind purchases or redemptions of the fund’s capital shares, including ETF Creation Units.
See accompanying Notes, which are an integral part of the Financial Statements.
20
FTSE All-World ex-US Index Fund
Financial Highlights
| |
| Institutional Plus Shares | |
| | December 16, 20101, to |
| For a Share Outstanding Throughout the Period | April 30, 2011 |
| Net Asset Value, Beginning of Period | $99.48 |
| Investment Operations | |
| Net Investment Income | 1.049 |
| Net Realized and Unrealized Gain (Loss) on Investments | 9.628 |
| Total from Investment Operations | 10.677 |
| Distributions | |
| Dividends from Net Investment Income | (2.177) |
| Distributions from Realized Capital Gains | — |
| Total Distributions | (2.177) |
| Net Asset Value, End of Period | $107.98 |
| |
| Total Return2 | 10.96% |
| |
| Ratios/Supplemental Data | |
| Net Assets, End of Period (Millions) | $580 |
| Ratio of Total Expenses to Average Net Assets | 0.11% |
| Ratio of Net Investment Income to Average Net Assets | 2.62% |
| Portfolio Turnover Rate3 | 6% |
The expense ratio, net income ratio, and turnover rate for the current period have been annualized.
1 Inception.
2 Total returns do not include transaction fees that may have applied in the period shown. Fund prospectuses provide information about any applicable transaction fees.
3 Excludes the value of portfolio securities received or delivered as a result of in-kind purchases or redemptions of the fund’s capital shares, including ETF Creation Units.
See accompanying Notes, which are an integral part of the Financial Statements.
21
FTSE All-World ex-US Index Fund
Financial Highlights
| | | | | |
| ETF Shares | | | | | |
| | Six Months | | | | March 2, |
| | Ended | | | | 20071 to |
| | April 30, | | Year Ended October 31, | Oct. 31, |
| For a Share Outstanding Throughout Each Period | 2011 | 2010 | 2009 | 2008 | 2007 |
| Net Asset Value, Beginning of Period | $46.92 | $41.95 | $32.50 | $63.32 | $49.80 |
| Investment Operations | | | | | |
| Net Investment Income | .569 | 1.1182 | 1.0112 | 1.7052 | 1.0302 |
| Net Realized and Unrealized Gain (Loss) | | | | | |
| on Investments | 5.260 | 4.715 | 9.224 | (32.015) | 12.490 |
| Total from Investment Operations | 5.829 | 5.833 | 10.235 | (30.310) | 13.520 |
| Distributions | | | | | |
| Dividends from Net Investment Income | (1.019) | (.863) | (.785) | (.510) | — |
| Distributions from Realized Capital Gains | — | — | — | — | — |
| Total Distributions | (1.019) | (.863) | (.785) | (.510) | — |
| Net Asset Value, End of Period | $51.73 | $46.92 | $41.95 | $32.50 | $63.32 |
| |
| Total Return | 12.64% | 14.07% | 32.41% | -48.23% | 27.15% |
| |
| Ratios/Supplemental Data | | | | | |
| Net Assets, End of Period (Millions) | $7,919 | $6,272 | $4,366 | $1,701 | $1,068 |
| Ratio of Total Expenses to | | | | | |
| Average Net Assets | 0.21% | 0.22% | 0.25% | 0.20% | 0.25%3 |
| Ratio of Net Investment Income to | | | | | |
| Average Net Assets | 2.52% | 2.58% | 2.90% | 3.39% | 2.76%3 |
| Portfolio Turnover Rate4 | 6% | 6% | 9% | 7% | 10% |
The expense ratio, net income ratio, and turnover rate for the current period have been annualized.
1 Inception.
2 Calculated based on average shares outstanding.
3 Annualized.
4 Excludes the value of portfolio securities received or delivered as a result of in-kind purchases or redemptions of the fund’s capital shares, including ETF Creation Units.
See accompanying Notes, which are an integral part of the Financial Statements.
22
FTSE All-World ex-US Index Fund
Notes to Financial Statements
Vanguard FTSE All-World ex-US Index Fund is registered under the Investment Company Act of 1940 as an open-end investment company, or mutual fund. The fund invests in securities of foreign issuers, which may subject it to investment risks not normally associated with investing in securities of U.S. corporations. The fund offers four classes of shares: Investor Shares, Institutional Shares, Institutional Plus Shares, and ETF Shares. Investor Shares are available to any investor who meets the fund’s minimum purchase requirements. Institutional Shares and Institutional Plus Shares are designed for investors who meet certain administrative, service, and account-size criteria. Institutional Plus Shares were first issued on December 16, 2010. ETF Shares are listed for trading on the NYSE Arca, Inc.; they can be purchased and sold through a broker.
A. The following significant accounting policies conform to generally accepted accounting principles for U.S. mutual funds. The fund consistently follows such policies in preparing its financial statements.
1. Security Valuation: Securities are valued as of the close of trading on the New York Stock Exchange (generally 4 p.m., Eastern time) on the valuation date. Equity securities are valued at the latest quoted sales prices or official closing prices taken from the primary market in which each security trades; such securities not traded on the valuation date are valued at the mean of the latest quoted bid and asked prices. Securities for which market quotations are not readily available, or whose values have been affected by events occurring before the fund’s pricing time but after the close of the securities’ primary markets, are valued at their fair values calculated according to procedures adopted by the board of trustees. These procedures include obtaining quotations from an independent pricing service, monitoring news to identify significant market- or security-specific events, and evaluating changes in the values of foreign market proxies (for example, ADRs, futures contracts, or exchange-traded funds), between the time the foreign markets close and the fund’s pricing time. When fair-value pricing is employed, the prices of securities used by a fund to calculate its net asset value may differ from quoted or published prices for the same securities. Investments in Vanguard Market Liquidity Fund are valued at that fund’s net asset value. Temporary cash investments acquired over 60 days to maturity are valued using the latest bid prices or using valuations based on a matrix system (which considers such factors as security prices, yields, maturities, and ratings), both as furnished by independent pricing services. Other temporary cash investments are valued at amortized cost, which approximates market value.
2. Foreign Currency: Securities and other assets and liabilities denominated in foreign currencies are translated into U.S. dollars using exchange rates obtained from an independent third party as of the fund’s pricing time on the valuation date. Realized gains (losses) and unrealized appreciation (depreciation) on investment securities include the effects of changes in exchange rates since the securities were purchased, combined with the effects of changes in security prices. Fluctuations in the value of other assets and liabilities resulting from changes in exchange rates are recorded as unrealized foreign currency gains (losses) until the assets or liabilities are settled in cash, at which time they are recorded as realized foreign currency gains (losses).
3. Federal Income Taxes: The fund intends to continue to qualify as a regulated investment company and distribute all of its income. Management has analyzed the fund’s tax positions taken for all open federal income tax years (October 31, 2007–2010), and for the period ended April 30, 2011, and has concluded that no provision for federal income tax is required in the fund’s financial statements.
4. Distributions: Distributions to shareholders are recorded on the ex-dividend date.
5. Security Lending: The fund may lend its securities to qualified institutional borrowers to earn additional income. Security loans are required to be secured at all times by collateral at least equal to the market value of securities loaned. The fund invests cash collateral received in Vanguard Market
23
FTSE All-World ex-US Index Fund
Liquidity Fund, and records a liability for the return of the collateral, during the period the securities are on loan. Security lending income represents fees charged to borrowers plus income earned on investing cash collateral, less expenses associated with the loan.
6. Other: Dividend income is recorded on the ex-dividend date. Interest income includes income distributions received from Vanguard Market Liquidity Fund and is accrued daily. Security transactions are accounted for on the date securities are bought or sold. Costs used to determine realized gains (losses) on the sale of investment securities are those of the specific securities sold. Fees assessed on redemptions of capital shares are credited to paid-in capital.
Each class of shares has equal rights as to assets and earnings, except that each class separately bears certain class-specific expenses related to maintenance of shareholder accounts (included in Management and Administrative expenses) and shareholder reporting. Marketing and distribution expenses are allocated to each class of shares based on a method approved by the board of trustees. Income, other non-class-specific expenses, and gains and losses on investments are allocated to each class of shares based on its relative net assets.
B. The Vanguard Group furnishes at cost investment advisory, corporate management, administrative, marketing, and distribution services. The costs of such services are allocated to the fund under methods approved by the board of trustees. The fund has committed to provide up to 0.40% of its net assets in capital contributions to Vanguard. At April 30, 2011, the fund had contributed capital of $2,235,000 to Vanguard (included in Other Assets), representing 0.02% of the fund’s net assets and 0.89% of Vanguard’s capitalization. The fund’s trustees and officers are also directors and officers of Vanguard.
C. Various inputs may be used to determine the value of the fund’s investments. These inputs are summarized in three broad levels for financial statement purposes. The inputs or methodologies used to value securities are not necessarily an indication of the risk associated with investing in those securities.
Level 1—Quoted prices in active markets for identical securities.
Level 2—Other significant observable inputs (including quoted prices for similar securities, interest rates, prepayment speeds, credit risk, etc.).
Level 3—Significant unobservable inputs (including the fund’s own assumptions used to determine the fair value of investments).
The following table summarizes the fund’s investments as of April 30, 2011, based on the inputs used to value them:
| | | |
| | Level 1 | Level 2 | Level 3 |
| Investments | ($000) | ($000) | ($000) |
| Common Stocks—North and South America | 1,891,114 | — | — |
| Common Stocks—Other | 237,507 | 12,695,762 | 26 |
| Temporary Cash Investments | 830,252 | 300 | — |
| Total | 2,958,873 | 12,696,062 | 26 |
24
FTSE All-World ex-US Index Fund
The following table summarizes changes in investments valued based on Level 3 inputs during the six months ended April 30, 2011:
| |
| | Investments in |
| | Common Stocks—Other |
| Amount Valued Based on Level 3 Inputs | ($000) |
| Balance as of October 31, 2010 | 95 |
| Change in Unrealized Appreciation (Depreciation) | (69) |
| Balance as of April 30, 2011 | 26 |
D. Distributions are determined on a tax basis and may differ from net investment income and realized capital gains for financial reporting purposes. Differences may be permanent or temporary. Permanent differences are reclassified among capital accounts in the financial statements to reflect their tax character. Temporary differences arise when certain items of income, expense, gain, or loss are recognized in different periods for financial statement and tax purposes; these differences will reverse at some time in the future. Differences in classification may also result from the treatment of short-term gains as ordinary income for tax purposes.
During the six months ended April 30, 2011, the fund realized net foreign currency losses of $105,000, which decreased distributable net income for tax purposes; accordingly, such losses have been reclassified from accumulated net realized losses to undistributed net investment income.
Certain of the fund’s investments are in securities considered to be “passive foreign investment companies,” for which any unrealized appreciation and/or realized gains are required to be included in distributable net income for tax purposes. During the six months ended April 30, 2011, the fund realized gains on the sale of passive foreign investment companies of $224,000, which have been included in current and prior periods’ taxable income; accordingly, such gains have been reclassified from accumulated net realized losses to undistributed net investment income. Unrealized appreciation through the most recent mark-to-market date for tax purposes on passive foreign investment company holdings at April 30, 2011, was $19,427,000, all of which has been distributed and is reflected in the balance of undistributed net investment income.
The fund’s realized losses for the six months ended April 30, 2011, include $13,000 of capital gain tax paid on sales of Indian securities. This tax is treated as a decrease in taxable income; accordingly, this amount has been reclassified from accumulated net realized losses to undistributed net investment income.
The fund’s tax-basis capital gains and losses are determined only at the end of each fiscal year. For tax purposes, at October 31, 2010, the fund had available capital loss carryforwards totaling $201,976,000 to offset future net capital gains of $1,431,000 through October 31, 2015, $29,919,000 through October 31, 2016, $138,066,000 through October 31, 2017, and $32,560,000 through October 31, 2018. The fund will use these capital losses to offset net taxable capital gains, if any, realized during the year ending October 31, 2011; should the fund realize net capital losses for the year, the losses will be added to the loss carryforward balance above.
At April 30, 2011, the cost of investment securities for tax purposes was $13,193,571,000. Net unrealized appreciation of investment securities for tax purposes was $2,461,390,000, consisting of unrealized gains of $2,962,620,000 on securities that had risen in value since their purchase and $501,230,000 in unrealized losses on securities that had fallen in value since their purchase.
25
FTSE All-World ex-US Index Fund
E. During the six months ended April 30, 2011, the fund purchased $1,880,731,000 of investment securities and sold $401,305,000 of investment securities, other than temporary cash investments.
F. Capital share transactions for each class of shares were:
| | | | |
| | Six Months Ended | | Year Ended |
| | | April 30, 2011 | October 31, 2010 |
| | Amount | Shares | Amount | Shares |
| | ($000) | (000) | ($000) | (000) |
| Investor Shares | | | | |
| Issued | 319,599 | 16,854 | 839,537 | 48,812 |
| Issued in Lieu of Cash Distributions | 26,921 | 1,462 | 12,188 | 717 |
| Redeemed1 | (196,068) | (10,371) | (265,693) | (15,795) |
| Net Increase (Decrease)—Investor Shares | 150,452 | 7,945 | 586,032 | 33,734 |
| Institutional Shares | | | | |
| Issued | 730,629 | 7,720 | 2,540,049 | 30,296 |
| Issued in Lieu of Cash Distributions | 81,713 | 885 | 32,086 | 377 |
| Redeemed1 | (821,036) | (8,672) | (454,413) | (5,300) |
| Net Increase (Decrease)—Institutional Shares | (8,694) | (67) | 2,117,722 | 25,373 |
| Institutional Plus Shares2 | | | | |
| Issued | 542,904 | 5,421 | — | — |
| Issued in Lieu of Cash Distributions | — | — | — | — |
| Redeemed1 | (5,070) | (49) | — | — |
| Net Increase (Decrease)—Institutional Plus Shares | 537,834 | 5,372 | — | — |
| ETF Shares | | | | |
| Issued | 945,685 | 19,398 | 1,337,408 | 30,206 |
| Issued in Lieu of Cash Distributions | — | — | — | — |
| Redeemed1 | — | — | (24,645) | (600) |
| Net Increase (Decrease)—ETF Shares | 945,685 | 19,398 | 1,312,763 | 29,606 |
1 Net of redemption fees for fiscal 2011 and 2010 of $54,000 and $131,000, respectively (fund totals).
2 Inception was December 16, 2010, for Institutional Plus Shares.
G. In preparing the financial statements as of April 30, 2011, management considered the impact of subsequent events for potential recognition or disclosure in these financial statements.
26
FTSE All-World ex-US Small-Cap Index Fund
Fund Profile
As of April 30, 2011
| | | |
| Share-Class Characteristics | |
| |
| | Investor | Institutional | ETF |
| | Shares | Shares | Shares |
| Ticker Symbol | VFSVX | VFSNX | VSS |
| Expense Ratio1 | 0.55% | 0.30% | 0.33% |
| |
| Portfolio Characteristics | | |
| | | | FTSE Global |
| | | | Small Cap |
| | | Fund | ex US Index |
| Number of Stocks | | 2,742 | 3,183 |
| Median Market Cap | | $1.7B | $1.7B |
| Price/Earnings Ratio | | 17.8x | 17.9x |
| Price/Book Ratio | | 1.6x | 1.6x |
| Return on Equity | | 12.5% | 12.5% |
| Earnings Growth Rate | 6.6% | 6.5% |
| Dividend Yield | | 2.2% | 2.2% |
| Turnover Rate | | | |
| (Annualized) | | 26% | — |
| Short-Term Reserves | | 0.2% | — |
| |
| Sector Diversification (% of equity exposure) |
| | | | FTSE Global |
| | | | Small Cap |
| | | Fund | ex US Index |
| Consumer Discretionary | 15.2% | 15.2% |
| Consumer Staples | | 5.9 | 5.7 |
| Energy | | 7.2 | 7.4 |
| Financials | | 17.1 | 16.9 |
| Health Care | | 4.3 | 4.3 |
| Industrials | | 22.1 | 22.1 |
| Information Technology | 9.6 | 9.7 |
| Materials | | 15.4 | 15.4 |
| Telecommunication | | | |
| Services | | 1.0 | 1.0 |
| Utilities | | 2.2 | 2.3 |
| | |
| Ten Largest Holdings (% of total net assets) |
| |
| Subsea 7 SA | Oil & Gas | |
| | Equipment & | |
| | Services | 0.4% |
| Equinox Minerals Ltd. | Diversified Metals | |
| | & Mining | 0.3 |
| Weir Group plc | Industrial | |
| | Machinery | 0.3 |
| Hexagon AB Class B | Industrial | |
| | Machinery | 0.3 |
| Arkema SA | Commodity | |
| | Chemicals | 0.3 |
| Athabasca Oil Sands | Oil & Gas | |
| Corp. | Exploration & | |
| | Production | 0.3 |
| Sino-Forest Corp. | Forest Products | 0.3 |
| Sulzer AG | Industrial | |
| | Machinery | 0.3 |
| IMI plc | Industrial | |
| | Machinery | 0.3 |
| GKN plc | Auto Parts & | |
| | Equipment | 0.2 |
| Top Ten | | 3.0% |
| The holdings listed exclude any temporary cash investments and equity index products. |
Allocation by Region (% of portfolio)
1 The expense ratios shown are from the prospectus dated February 25, 2011, and represent estimated costs for the current fiscal year. For the six months ended April 30, 2011, the annualized expense ratios were 0.53% for Investor Shares, 0.28% for Institutional Shares, and 0.31% for ETF Shares.
27
FTSE All-World ex-US Small-Cap Index Fund
| | |
| Market Diversification (% of equity exposure) |
| | | FTSE |
| | | Global |
| | | Small Cap |
| | | ex US |
| | Fund | Index |
| Europe | | |
| United Kingdom | 13.9% | 13.6% |
| Germany | 4.7 | 4.7 |
| Switzerland | 4.5 | 4.4 |
| France | 4.4 | 4.4 |
| Sweden | 2.6 | 2.6 |
| Italy | 2.2 | 2.3 |
| Norway | 2.1 | 2.1 |
| Finland | 1.8 | 1.8 |
| Netherlands | 1.8 | 1.8 |
| Spain | 1.5 | 1.5 |
| Belgium | 1.5 | 1.5 |
| Denmark | 1.0 | 1.0 |
| Other | 2.4 | 2.3 |
| Subtotal | 44.4% | 44.0% |
| Pacific | | |
| Japan | 10.2% | 10.1% |
| Australia | 5.1 | 5.4 |
| Hong Kong | 1.1 | 1.1 |
| Singapore | 1.1 | 1.3 |
| Other | 0.2 | 0.2 |
| Subtotal | 17.7% | 18.1% |
| Emerging Markets | | |
| Taiwan | 6.2% | 6.2% |
| China | 3.9 | 3.9 |
| South Korea | 3.3 | 3.2 |
| India | 2.5 | 2.5 |
| Brazil | 1.8 | 1.9 |
| Malaysia | 1.0 | 1.1 |
| Other | 5.0 | 5.1 |
| Subtotal | 23.7% | 23.9% |
| Middle East | 0.3% | 0.3% |
| North America | | |
| Canada | 13.9% | 13.7% |
28
FTSE All-World ex-US Small-Cap Index Fund
Performance Summary
All of the returns in this report represent past performance, which is not a guarantee of future results that may be achieved by the fund. (Current performance may be lower or higher than the performance data cited. For performance data current to the most recent month-end, visit our website at vanguard.com/performance.) Note, too, that both investment returns and principal value can fluctuate widely, so an investor’s shares, when sold, could be worth more or less than their original cost. The returns shown do not reflect taxes that a shareholder would pay on fund distributions or on the sale of fund shares.
Fiscal-Year Total Returns (%): April 2, 2009, Through April 30, 2011
Note: For 2011, performance data reflect the six months ended April 30, 2011.
Index returns are adjusted for withholding taxes applicable to U.S.-based mutual funds organized as Delaware statutory trusts.
Average Annual Total Returns: Periods Ended March 31, 2011
This table presents returns through the latest calendar quarter—rather than through the end of the fiscal period.
Securities and Exchange Commission rules require that we provide this information.
| | | |
| | Inception | One | Since |
| | Date | Year | Inception |
| Investor Shares | 4/2/2009 | 22.45% | 42.22% |
| Fee-Adjusted Returns | | 20.64 | 41.17 |
| Institutional Shares | 4/2/2009 | 22.75 | 42.57 |
| Fee-Adjusted Returns | | 20.94 | 41.53 |
| ETF Shares | 4/2/2009 | | |
| Market Price | | 22.92 | 43.02 |
| Net Asset Value | | 22.71 | 42.52 |
Vanguard fund returns in most tables are adjusted to reflect the 0.75% fee on purchases and redemptions. The fees do not apply to the ETF Shares. The Fiscal-Year Total Returns chart shows non-adjusted returns, and the final table includes non-adjusted returns along with the fee-adjusted returns.
See Financial Highlights for dividend and capital gains information.
29
FTSE All-World ex-US Small-Cap Index Fund
Financial Statements (unaudited)
Statement of Net Assets—Investments Summary
As of April 30, 2011
This Statement summarizes the fund’s holdings by asset type. Details are reported for each of the fund’s 50 largest individual holdings and for investments that, in total for any issuer, represent more than 1% of the fund’s net assets. The total value of smaller holdings is reported as a single amount within each category.
The fund reports a complete list of its holdings in regulatory filings four times in each fiscal year, at the quarter-ends. For the second and fourth fiscal quarters, the complete listing of the fund’s holdings is available electronically on vanguard.com and on the Securities and Exchange Commission’s website (sec.gov), or you can have it mailed to you without charge by calling 800-662-7447. For the first and third fiscal quarters, the fund files the lists with the SEC on Form N-Q. Shareholders can look up the fund’s Forms N-Q on the SEC’s website. Forms N-Q may also be reviewed and copied at the SEC’s Public Reference Room (see the back cover of this report for further information).
| | | |
| | | Market | Percentage |
| | | Value | of Net |
| | Shares | ($000) | Assets |
| Common Stocks | | | |
| Australia † | | 65,940 | 5.0% |
| |
| Austria | | | |
| Andritz AG | 22,287 | 2,302 | 0.2% |
| Austria—Other † | | 9,221 | 0.7% |
| | | 11,523 | 0.9% |
| Belgium | | | |
| Bekaert SA | 24,532 | 3,069 | 0.2% |
| Telenet Group Holding NV | 46,134 | 2,293 | 0.2% |
| Belgium—Other † | | 13,762 | 1.1% |
| | | 19,124 | 1.5% |
| |
| Brazil | | | |
| Diagnosticos da America SA | 170,589 | 2,290 | 0.2% |
| CETIP SA - Balcao Organizado de Ativos e Derivativos | 136,159 | 2,238 | 0.2% |
| Brazil—Other † | | 18,600 | 1.4% |
| | | 23,128 | 1.8% |
| Canada | | | |
| * Equinox Minerals Ltd. | 483,908 | 4,143 | 0.3% |
| * Athabasca Oil Sands Corp. | 215,359 | 3,508 | 0.3% |
| * Sino-Forest Corp. | 140,606 | 3,494 | 0.2% |
| Metro Inc. Class A | 58,894 | 2,882 | 0.2% |
| Gildan Activewear Inc. | 71,725 | 2,671 | 0.2% |
| Onex Corp. | 68,907 | 2,585 | 0.2% |
| Franco-Nevada Corp. | 64,831 | 2,571 | 0.2% |
| Vermilion Energy Inc. | 47,819 | 2,567 | 0.2% |
| * New Gold Inc. | 217,986 | 2,449 | 0.2% |
| * Consolidated Thompson Iron Mines Ltd. | 130,531 | 2,362 | 0.2% |
| * Lundin Mining Corp. | 239,632 | 2,345 | 0.2% |
| Pan American Silver Corp. | 63,176 | 2,279 | 0.2% |
| * Precision Drilling Corp. | 149,737 | 2,268 | 0.2% |
30
| | | |
| FTSE All-World ex-US Small-Cap Index Fund | | | |
| |
| |
| |
| | | Market | Percentage |
| | | Value | of Net |
| | Shares | ($000) | Assets |
| Inmet Mining Corp. | 32,030 | 2,248 | 0.2% |
| Viterra Inc. | 184,292 | 2,215 | 0.2% |
| Canada—Other † | | 140,235 | 10.7% |
| | | 180,822 | 13.9% |
| |
| Chile † | | 2,227 | 0.2% |
| |
| China † | | 50,331 | 3.9% |
| |
| Czech Republic † | | 284 | 0.0% |
| |
| Denmark | | | |
| DSV A/S | 116,399 | 3,044 | 0.2% |
| Denmark—Other † | | 9,890 | 0.8% |
| | | 12,934 | 1.0% |
| |
| Egypt † | | 1,215 | 0.1% |
| |
| Finland | | | |
| ^ Elisa Oyj | 95,827 | 2,307 | 0.2% |
| Finland—Other † | | 20,924 | 1.6% |
| | | 23,231 | 1.8% |
| France | | | |
| Arkema SA | 34,579 | 3,601 | 0.3% |
| Groupe Eurotunnel SA | 288,935 | 3,141 | 0.2% |
| * Valeo SA | 42,910 | 2,733 | 0.2% |
| Rhodia SA | 56,370 | 2,624 | 0.2% |
| Gemalto NV | 48,594 | 2,489 | 0.2% |
| France—Other † | | 42,409 | 3.3% |
| | | 56,997 | 4.4% |
| Germany | | | |
| ^ Aixtron SE NA | 57,190 | 2,429 | 0.2% |
| * Kabel Deutschland Holding AG | 36,728 | 2,294 | 0.2% |
| ^ Software AG | 11,815 | 2,236 | 0.2% |
| Germany—Other † | | 53,813 | 4.1% |
| | | 60,772 | 4.7% |
| |
| Greece † | | 6,350 | 0.5% |
| |
| Hong Kong † | | 14,622 | 1.1% |
| |
| Hungary † | | 235 | 0.0% |
| |
| India † | | 31,943 | 2.4% |
| |
| Indonesia † | | 10,371 | 0.8% |
| |
| Ireland † | | 8,493 | 0.6% |
| |
| Israel † | | 3,851 | 0.3% |
| |
| Italy | | | |
| Prysmian SPA | 120,486 | 2,844 | 0.2% |
| Italy—Other † | | 26,009 | 2.0% |
| | | 28,853 | 2.2% |
31
| | | |
| FTSE All-World ex-US Small-Cap Index Fund | | | |
| |
| |
| | | Market | Percentage |
| | | Value | of Net |
| | Shares | ($000) | Assets |
| Japan † | | 132,819 | 10.2% |
| |
| Malaysia † | | 13,422 | 1.0% |
| |
| Mexico † | | 9,436 | 0.7% |
| |
| Netherlands † | | 23,128 | 1.8% |
| |
| New Zealand † | | 2,208 | 0.2% |
| |
| Norway | | | |
| Subsea 7 SA | 194,555 | 5,124 | 0.4% |
| Norway—Other † | | 22,424 | 1.7% |
| | | 27,548 | 2.1% |
| |
| Philippines † | | 6,964 | 0.5% |
| |
| Poland † | | 6,467 | 0.5% |
| |
| Portugal † | | 3,263 | 0.2% |
| |
| Russia † | | 6,428 | 0.5% |
| |
| Singapore † | | 14,460 | 1.1% |
| |
| South Africa † | | 6,353 | 0.5% |
| |
| South Korea † | | 42,299 | 3.2% |
| |
| Spain † | | 19,598 | 1.5% |
| |
| Sweden | | | |
| ^ Hexagon AB Class B | 140,183 | 3,642 | 0.3% |
| Sweden—Other † | | 30,338 | 2.3% |
| | | 33,980 | 2.6% |
| Switzerland | | | |
| Sulzer AG | 18,711 | 3,380 | 0.3% |
| * Clariant AG | 146,158 | 3,034 | 0.2% |
| Aryzta AG | 45,993 | 2,565 | 0.2% |
| PSP Swiss Property AG | 27,369 | 2,492 | 0.2% |
| Swiss Prime Site AG | 27,451 | 2,290 | 0.2% |
| Switzerland—Other † | | 44,638 | 3.4% |
| | | 58,399 | 4.5% |
| |
| Taiwan † | | 80,008 | 6.1% |
| |
| Thailand † | | 8,358 | 0.6% |
| |
| Turkey † | | 7,542 | 0.6% |
| |
| United Kingdom | | | |
| Weir Group plc | 114,365 | 3,684 | 0.3% |
| IMI plc | 178,736 | 3,271 | 0.2% |
| GKN plc | 859,013 | 3,205 | 0.2% |
| Intertek Group plc | 89,370 | 3,175 | 0.2% |
32
| | | | |
| FTSE All-World ex-US Small-Cap Index Fund | | | |
| |
| |
| |
| | | | Market | Percentage |
| | | | Value | of Net |
| | | Shares | ($000) | Assets |
| Travis Perkins plc | | 143,033 | 2,576 | 0.2% |
| John Wood Group plc | | 220,658 | 2,560 | 0.2% |
| Meggitt plc | | 423,290 | 2,547 | 0.2% |
| Aberdeen Asset Management plc | | 646,089 | 2,481 | 0.2% |
| Investec plc | | 306,921 | 2,472 | 0.2% |
| Croda International plc | | 75,286 | 2,366 | 0.2% |
| Informa plc | | 338,098 | 2,359 | 0.2% |
| Babcock International Group plc | | 210,671 | 2,257 | 0.2% |
| United Kingdom—Other † | | | 147,424 | 11.3% |
| | | | 180,377 | 13.8% |
| Total Common Stocks (Cost $1,038,602) | | 1,296,303 | 99.3% |
| |
| | Coupon | | | |
| Temporary Cash Investment | | | | |
| Money Market Fund | | | | |
| 1,2 Vanguard Market Liquidity | | | | |
| Fund (Cost $82,933) | 0.179% | 82,933,010 | 82,933 | 6.4% |
| Total Investments (Cost $1,121,535) | | | 1,379,236 | 105.7% |
| Other Assets and Liabilities | | | | |
| Other Assets | | | 8,949 | 0.7% |
| Liabilities2 | | | (82,990) | (6.4%) |
| | | | (74,041) | (5.7%) |
| Net Assets | | | 1,305,195 | 100.0% |
33
FTSE All-World ex-US Small-Cap Index Fund
| |
| At April 30, 2011, net assets consisted of: | |
| | Amount |
| | ($000) |
| Paid-in Capital | 1,024,551 |
| Undistributed Net Investment Income | 1,757 |
| Accumulated Net Realized Gains | 20,999 |
| Unrealized Appreciation (Depreciation) | |
| Investment Securities | 257,701 |
| Foreign Currencies | 187 |
| Net Assets | 1,305,195 |
| |
| Investor Shares—Net Assets | |
| Applicable to 6,364,989 outstanding $.001 par value shares of beneficial | |
| interest (unlimited authorization) | 258,148 |
| Net Asset Value Per Share—Investor Shares | $40.56 |
| |
| Institutional Shares—Net Assets | |
| Applicable to 137,541 outstanding $.001 par value shares of beneficial | |
| interest (unlimited authorization) | 27,993 |
| Net Asset Value Per Share—Institutional Shares | $203.52 |
| |
| ETF Shares—Net Assets | |
| Applicable to 9,575,941 outstanding $.001 par value shares of beneficial | |
| interest (unlimited authorization) | 1,019,054 |
| Net Asset Value Per Share—ETF Shares | $106.42 |
See Note A in Notes to Financial Statements.
* Non-income-producing security.
^ Part of security position is on loan to broker-dealers. The total value of securities on loan is $75,756,0000.
† Represents the aggregate value, by category, of securities that are not among the 50 largest holdings and, in total for any issuer, represent 1% or less of net assets.
1 Affiliated money market fund available only to Vanguard funds and certain trusts and accounts managed by Vanguard. Rate shown is the 7-day yield.
2 Includes $80,280,000 of collateral received for securities on loan.
See accompanying Notes, which are an integral part of the Financial Statements.
34
FTSE All-World ex-US Small-Cap Index Fund
Statement of Operations
| |
| | Six Months Ended |
| | April 30, 2011 |
| | ($000) |
| Investment Income | |
| Income | |
| Dividends1 | 11,688 |
| Interest2 | 7 |
| Security Lending | 595 |
| Total Income | 12,290 |
| Expenses | |
| The Vanguard Group—Note B | |
| Investment Advisory Services | 73 |
| Management and Administrative—Investor Shares | 454 |
| Management and Administrative—Institutional Shares | 20 |
| Management and Administrative—ETF Shares | 820 |
| Marketing and Distribution—Investor Shares | 25 |
| Marketing and Distribution—Institutional Shares | 2 |
| Marketing and Distribution—ETF Shares | 108 |
| Custodian Fees | 343 |
| Shareholders’ Reports—Investor Shares | 3 |
| Shareholders’ Reports—Institutional Shares | — |
| Shareholders’ Reports—ETF Shares | 13 |
| Trustees’ Fees and Expenses | 1 |
| Total Expenses | 1,862 |
| Net Investment Income | 10,428 |
| Realized Net Gain (Loss) | |
| Investment Securities Sold | 24,518 |
| Foreign Currencies | (118) |
| Realized Net Gain (Loss) | 24,400 |
| Change in Unrealized Appreciation (Depreciation) | |
| Investment Securities | 117,820 |
| Foreign Currencies | 125 |
| Change in Unrealized Appreciation (Depreciation) | 117,945 |
| Net Increase (Decrease) in Net Assets Resulting from Operations | 152,773 |
1 Dividends are net of foreign withholding taxes of $1,067,000.
2 Interest income from an affiliated company of the fund was $7,000.
See accompanying Notes, which are an integral part of the Financial Statements.
35
FTSE All-World ex-US Small-Cap Index Fund
Statement of Changes in Net Assets
| | |
| | Six Months Ended | Year Ended |
| | April 30, | October 31, |
| | 2011 | 2010 |
| | ($000) | ($000) |
| Increase (Decrease) in Net Assets | | |
| Operations | | |
| Net Investment Income | 10,428 | 11,570 |
| Realized Net Gain (Loss) | 24,400 | 7,477 |
| Change in Unrealized Appreciation (Depreciation) | 117,945 | 99,609 |
| Net Increase (Decrease) in Net Assets Resulting from Operations | 152,773 | 118,656 |
| Distributions | | |
| Net Investment Income | | |
| Investor Shares | (4,104) | (739) |
| Institutional Shares | (553) | (83) |
| ETF Shares | (15,842) | (3,872) |
| Realized Capital Gain1 | | |
| Investor Shares | (1,527) | (492) |
| Institutional Shares | (195) | (52) |
| ETF Shares | (5,540) | (2,310) |
| Total Distributions | (27,761) | (7,548) |
| Capital Share Transactions | | |
| Investor Shares | 63,566 | 84,367 |
| Institutional Shares | 16,358 | 155 |
| ETF Shares | 295,335 | 256,271 |
| Net Increase (Decrease) from Capital Share Transactions | 375,259 | 340,793 |
| Total Increase (Decrease) | 500,271 | 451,901 |
| Net Assets | | |
| Beginning of Period | 804,924 | 353,023 |
| End of Period2 | 1,305,195 | 804,924 |
1 Includes fiscal 2011 and 2010 short-term gain distributions totaling $3,294,000 and $2,854,000, respectively. Short-term gain distributions are treated as ordinary income dividends for tax purposes.
2 Net Assets- End of Period includes undistributed net investment income of $1,757,000 and $8,706,000.
See accompanying Notes, which are an integral part of the Financial Statements.
36
FTSE All-World ex-US Small-Cap Index Fund
Financial Highlights
| | | |
| Investor Shares | | | |
| | Six Months | Year | March 19, |
| | Ended | Ended | 20091 to |
| | April 30, | Oct. 31, | Oct. 31, |
| For a Share Outstanding Throughout Each Period | 2011 | 2010 | 2009 |
| Net Asset Value, Beginning of Period | $36.34 | $29.83 | $20.00 |
| Investment Operations | | | |
| Net Investment Income | .358 | .6032 | .2572 |
| Net Realized and Unrealized Gain (Loss) on Investments3 | 4.935 | 6.430 | 9.573 |
| Total from Investment Operations | 5.293 | 7.033 | 9.830 |
| Distributions | | | |
| Dividends from Net Investment Income | (.782) | (.314) | — |
| Distributions from Realized Capital Gains | (.291) | (.209) | — |
| Total Distributions | (1.073) | (.523) | — |
| Net Asset Value, End of Period | $40.56 | $36.34 | $29.83 |
| |
| Total Return4 | 14.87% | 23.90% | 49.15% |
| |
| Ratios/Supplemental Data | | | |
| Net Assets, End of Period (Millions) | $258 | $170 | $62 |
| Ratio of Total Expenses to Average Net Assets | 0.53% | 0.55% | 0.78%5 |
| Ratio of Net Investment Income to Average Net Assets | 1.81% | 1.89% | 1.49%5 |
| Portfolio Turnover Rate6 | 26% | 19% | 19% |
The expense ratio, net income ratio, and turnover rate for the current period have been annualized.
1 Subscription period for the fund was March 19, 2009, to April 2, 2009, during which time all assets were held in money market instruments.
Performance measurement began April 2, 2009, at a net asset value of $20.00.
2 Calculated based on average shares outstanding.
3 Includes increases from purchase and redemption fees of $.03, $.05, and $.04.
4 Total returns do not include transaction or account service fees that may have applied in the periods shown. Fund prospectuses provide information about any applicable transaction and account service fees.
5 Annualized.
6 Excludes the value of portfolio securities received or delivered as a result of in-kind purchases or redemptions of the fund's capital shares, including ETF Creation Units.
See accompanying Notes, which are an integral part of the Financial Statements.
37
FTSE All-World ex-US Small-Cap Index Fund
Financial Highlights
| | | |
| Institutional Shares | | | |
| | Six Months | Year | April 2, |
| | Ended | Ended | 20091 to |
| | April 30, | Oct. 31, | Oct. 31, |
| For a Share Outstanding Throughout Each Period | 2011 | 2010 | 2009 |
| Net Asset Value, Beginning of Period | $182.36 | $149.40 | $100.00 |
| Investment Operations | | | |
| Net Investment Income | 2.141 | 3.2842 | 1.6252 |
| Net Realized and Unrealized Gain (Loss) on Investments3 | 24.621 | 32.377 | 47.775 |
| Total from Investment Operations | 26.762 | 35.661 | 49.400 |
| Distributions | | | |
| Dividends from Net Investment Income | (4.143) | (1.655) | — |
| Distributions from Realized Capital Gains | (1.459) | (1.046) | — |
| Total Distributions | (5.602) | (2.701) | — |
| Net Asset Value, End of Period | $203.52 | $182.36 | $149.40 |
| |
| Total Return4 | 15.00% | 24.21% | 49.40% |
| |
| Ratios/Supplemental Data | | | |
| Net Assets, End of Period (Millions) | $28 | $9 | $7 |
| Ratio of Total Expenses to Average Net Assets | 0.28% | 0.30% | 0.52%5 |
| Ratio of Net Investment Income to Average Net Assets | 2.06% | 2.14% | 1.75%5 |
| Portfolio Turnover Rate6 | 26% | 19% | 19% |
The expense ratio, net income ratio, and turnover rate for the current period have been annualized.
1 Inception.
2 Calculated based on average shares outstanding.
3 Includes increases from purchase and redemption fees of $.16, $.32, and $.27.
4 Total returns do not include transaction or account service fees that may have applied in the periods shown. Fund prospectuses provide information about any applicable transaction and account service fees.
5 Annualized.
6 Excludes the value of portfolio securities received or delivered as a result of in-kind purchases or redemptions of the fund's capital shares, including ETF Creation Units.
See accompanying Notes, which are an integral part of the Financial Statements.
38
FTSE All-World ex-US Small-Cap Index Fund
Financial Highlights
| | | |
| ETF Shares | | | |
| | Six Months | Year | April 2, |
| | Ended | Ended | 20091 to |
| | April 30, | Oct. 31, | Oct. 31, |
| For a Share Outstanding Throughout Each Period | 2011 | 2010 | 2009 |
| Net Asset Value, Beginning of Period | $95.38 | $78.21 | $52.36 |
| Investment Operations | | | |
| Net Investment Income | 1.026 | 1.7502 | .7142 |
| Net Realized and Unrealized Gain (Loss) on Investments3 | 12.959 | 16.884 | 25.136 |
| Total from Investment Operations | 13.985 | 18.634 | 25.850 |
| Distributions | | | |
| Dividends from Net Investment Income | (2.182) | (.917) | — |
| Distributions from Realized Capital Gains | (.763) | (.547) | — |
| Total Distributions | (2.945) | (1.464) | — |
| Net Asset Value, End of Period | $106.42 | $95.38 | $78.21 |
| |
| Total Return | 14.99% | 24.17% | 49.37% |
| |
| Ratios/Supplemental Data | | | |
| Net Assets, End of Period (Millions) | $1,019 | $626 | $283 |
| Ratio of Total Expenses to Average Net Assets | 0.31% | 0.33% | 0.55%4 |
| Ratio of Net Investment Income to Average Net Assets | 2.03% | 2.11% | 1.72%4 |
| Portfolio Turnover Rate5 | 26% | 19% | 19% |
The expense ratio, net income ratio, and turnover rate for the current period have been annualized.
1 Inception.
2 Calculated based on average shares outstanding.
3 Includes increases from purchase and redemption fees of $.09, $.14, and $.07.
4 Annualized.
5 Excludes the value of portfolio securities received or delivered as a result of in-kind purchases or redemptions of the fund's capital shares, including ETF Creation Units.
See accompanying Notes, which are an integral part of the Financial Statements.
39
FTSE All-World ex-US Small-Cap Index Fund
Notes to Financial Statements
Vanguard FTSE All-World ex-US Small-Cap Index Fund is registered under the Investment Company Act of 1940 as an open-end investment company, or mutual fund. The fund invests in securities of foreign issuers, which may subject it to investment risks not normally associated with investing in securities of U.S. corporations. The fund offers three classes of shares: Investor Shares, Institutional Shares, and ETF Shares. Investor Shares are available to any investor who meets the fund’s minimum purchase requirements. Institutional Shares are designed for investors who meet certain administrative, service, and account-size criteria. ETF Shares are listed for trading on the NYSE Arca, Inc.; they can be purchased and sold through a broker.
A. The following significant accounting policies conform to generally accepted accounting principles for U.S. mutual funds. The fund consistently follows such policies in preparing its financial statements.
1. Security Valuation: Securities are valued as of the close of trading on the New York Stock Exchange (generally 4 p.m., Eastern time) on the valuation date. Equity securities are valued at the latest quoted sales prices or official closing prices taken from the primary market in which each security trades; such securities not traded on the valuation date are valued at the mean of the latest quoted bid and asked prices. Securities for which market quotations are not readily available, or whose values have been affected by events occurring before the fund’s pricing time but after the close of the securities’ primary markets, are valued at their fair values calculated according to procedures adopted by the board of trustees. These procedures include obtaining quotations from an independent pricing service, monitoring news to identify significant market- or security-specific events, and evaluating changes in the values of foreign market proxies (for example, ADRs, futures contracts, or exchange-traded funds), between the time the foreign markets close and the fund’s pricing time. When fair-value pricing is employed, the prices of securities used by a fund to calculate its net asset value may differ from quoted or published prices for the same securities. Investments in Vanguard Market Liquidity Fund are valued at that fund’s net asset value.
2. Foreign Currency: Securities and other assets and liabilities denominated in foreign currencies are translated into U.S. dollars using exchange rates obtained from an independent third party as of the fund’s pricing time on the valuation date. Realized gains (losses) and unrealized appreciation (depreciation) on investment securities include the effects of changes in exchange rates since the securities were purchased, combined with the effects of changes in security prices. Fluctuations in the value of other assets and liabilities resulting from changes in exchange rates are recorded as unrealized foreign currency gains (losses) until the assets or liabilities are settled in cash, at which time they are recorded as realized foreign currency gains (losses).
3. Federal Income Taxes: The fund intends to continue to qualify as a regulated investment company and distribute all of its income. Management has analyzed the fund’s tax positions taken for all open federal income tax years (October 31, 2009–2010), and for the period ended April 30, 2011, and has concluded that no provision for federal income tax is required in the fund’s financial statements.
4. Distributions: Distributions to shareholders are recorded on the ex-dividend date.
5. Security Lending: The fund may lend its securities to qualified institutional borrowers to earn additional income. Security loans are required to be secured at all times by collateral at least equal to the market value of securities loaned. The fund invests cash collateral received in Vanguard Market Liquidity Fund, and records a liability for the return of the collateral, during the period the securities are on loan. Security lending income represents fees charged to borrowers plus income earned on investing cash collateral, less expenses associated with the loan.
40
FTSE All-World ex-US Small-Cap Index Fund
6. Other: Dividend income is recorded on the ex-dividend date. Interest income includes income distributions received from Vanguard Market Liquidity Fund and is accrued daily. Security transactions are accounted for on the date securities are bought or sold. Costs used to determine realized gains (losses) on the sale of investment securities are those of the specific securities sold. Fees assessed on capital share transactions are credited to paid-in capital.
Each class of shares has equal rights as to assets and earnings, except that each class separately bears certain class-specific expenses related to maintenance of shareholder accounts (included in Management and Administrative expenses) and shareholder reporting. Marketing and distribution expenses are allocated to each class of shares based on a method approved by the board of trustees. Income, other non-class-specific expenses, and gains and losses on investments are allocated to each class of shares based on its relative net assets.
B. The Vanguard Group furnishes at cost investment advisory, corporate management, administrative, marketing, and distribution services. The costs of such services are allocated to the fund under methods approved by the board of trustees. The fund has committed to provide up to 0.40% of its net assets in capital contributions to Vanguard. At April 30, 2011, the fund had contributed capital of $199,000 to Vanguard (included in Other Assets), representing 0.02% of the fund’s net assets and 0.08% of Vanguard’s capitalization. The fund’s trustees and officers are also directors and officers of Vanguard.
C. Various inputs may be used to determine the value of the fund’s investments. These inputs are summarized in three broad levels for financial statement purposes. The inputs or methodologies used to value securities are not necessarily an indication of the risk associated with investing in those securities.
Level 1—Quoted prices in active markets for identical securities.
Level 2—Other significant observable inputs (including quoted prices for similar securities, interest rates, prepayment speeds, credit risk, etc.).
Level 3—Significant unobservable inputs (including the fund’s own assumptions used to determine the fair value of investments).
The following table summarizes the fund’s investments as of April 30, 2011, based on the inputs used to value them:
| | | |
| | Level 1 | Level 2 | Level 3 |
| Investments | ($000) | ($000) | ($000) |
| Common Stocks—North and South America | 215,161 | 452 | — |
| Common Stocks—Other | 539 | 1,080,124 | 27 |
| Temporary Cash Investments | 82,933 | — | — |
| Total | 298,633 | 1,080,576 | 27 |
41
FTSE All-World ex-US Small-Cap Index Fund
The following table summarizes changes in investments valued based on Level 3 inputs during the six months ended April 30, 2011:
| |
| | Investments in |
| | Common Stocks—Other |
| Amount Valued Based on Level 3 Inputs | ($000) |
| Balance as of October 31, 2010 | 26 |
| Change in Unrealized Appreciation (Depreciation) | 1 |
| Balance as of April 30, 2011 | 27 |
D. Distributions are determined on a tax basis and may differ from net investment income and realized capital gains for financial reporting purposes. Differences may be permanent or temporary. Permanent differences are reclassified among capital accounts in the financial statements to reflect their tax character. Temporary differences arise when certain items of income, expense, gain, or loss are recognized in different periods for financial statement and tax purposes; these differences will reverse at some time in the future. Differences in classification may also result from the treatment of short-term gains as ordinary income for tax purposes. The fund’s tax-basis capital gains and losses are determined only at the end of each fiscal year.
During the six months ended April 30, 2011, the fund realized net foreign currency losses of $118,000, which decreased distributable net income for tax purposes; accordingly, such losses have been reclassified from accumulated net realized gains to undistributed net investment income.
Certain of the fund’s investments are in securities considered to be “passive foreign investment companies,” for which any unrealized appreciation and/or realized gains are required to be included in distributable net income for tax purposes. During the six months ended April 30, 2011, the fund realized gains on the sale of passive foreign investment companies of $3,241,000, which have been included in current and prior periods’ taxable income; accordingly, such gains have been reclassified from accumulated net realized gains to undistributed net investment income. Unrealized appreciation through the most recent mark-to-market date for tax purposes on passive foreign investment company holdings at April 30, 2011, was $8,583,000, all of which has been distributed and is reflected in the balance of undistributed net investment income.
The fund’s realized losses for the six months ended April 30, 2011, include $1,000 of capital gain tax paid on sales of Indian securities. This tax is treated as a decrease in taxable income; accordingly, this amount has been reclassified from accumulated net realized gains to undistributed net investment income.
At April 30, 2011, the cost of investment securities for tax purposes was $1,130,118,000. Net unrealized appreciation of investment securities for tax purposes was $249,118,000, consisting of unrealized gains of $278,104,000 on securities that had risen in value since their purchase and $28,986,000 in unrealized losses on securities that had fallen in value since their purchase.
42
FTSE All-World ex-US Small-Cap Index Fund
E. During the six months ended April 30, 2011, the fund purchased $501,864,000 of investment securities and sold $138,228,000 of investment securities, other than temporary cash investments.
F. Capital share transactions for each class of shares were:
| | | | |
| | Six Months Ended | | Year Ended |
| | | April 30, 2011 | October 31, 2010 |
| | Amount | Shares | Amount | Shares |
| | ($000) | (000) | ($000) | (000) |
| Investor Shares | | | | |
| Issued1 | 83,084 | 2,203 | 106,128 | 3,290 |
| Issued in Lieu of Cash Distributions | 5,079 | 138 | 1,070 | 35 |
| Redeemed2 | (24,597) | (657) | (22,831) | (736) |
| Net Increase (Decrease)—Investor Shares | 63,566 | 1,684 | 84,367 | 2,589 |
| Institutional Shares | | | | |
| Issued1 | 15,610 | 83 | — | — |
| Issued in Lieu of Cash Distributions | 748 | 4 | 155 | 1 |
| Redeemed2 | — | — | — | — |
| Net Increase (Decrease)—Institutional Shares | 16,358 | 87 | 155 | 1 |
| ETF Shares | | | | |
| Issued1 | 295,335 | 3,018 | 256,271 | 2,938 |
| Issued in Lieu of Cash Distributions | — | — | — | — |
| Redeemed2 | — | — | — | — |
| Net Increase (Decrease)—ETF Shares | 295,335 | 3,018 | 256,271 | 2,938 |
1 Includes purchase fees for fiscal year 2011 and 2010 of $898,000 and $737,000, respectively (fund totals). |
2 Net of redemption fees for fiscal year 2011 and 2010 of $170,000 and $404,000, respectively (fund totals). |
G. In preparing the financial statements as of April 30, 2011, management considered the impact of subsequent events for potential recognition or disclosure in these financial statements.
43
About Your Fund’s Expenses
As a shareholder of the fund, you incur ongoing costs, which include costs for portfolio management, administrative services, and shareholder reports (like this one), among others. Operating expenses, which are deducted from a fund’s gross income, directly reduce the investment return of the fund.
A fund’s expenses are expressed as a percentage of its average net assets. This figure is known as the expense ratio. The following examples are intended to help you understand the ongoing costs (in dollars) of investing in your fund and to compare these costs with those of other mutual funds. The examples are based on an investment of $1,000 made at the beginning of the period shown and held for the entire period.
The accompanying table illustrates your fund’s costs in two ways:
• Based on actual fund return. This section helps you to estimate the actual expenses that you paid over the period. The ”Ending Account Value“ shown is derived from the fund‘s actual return, and the third column shows the dollar amount that would have been paid by an investor who started with $1,000 in the fund. You may use the information here, together with the amount you invested, to estimate the expenses that you paid over the period.
To do so, simply divide your account value by $1,000 (for example, an $8,600 account value divided by $1,000 = 8.6), then multiply the result by the number given for your fund under the heading ”Expenses Paid During Period.“
• Based on hypothetical 5% yearly return. This section is intended to help you compare your fund‘s costs with those of other mutual funds. It assumes that the fund had a yearly return of 5% before expenses, but that the expense ratio is unchanged. In this case—because the return used is not the fund’s actual return—the results do not apply to your investment. The example is useful in making comparisons because the Securities and Exchange Commission requires all mutual funds to calculate expenses based on a 5% return. You can assess your fund’s costs by comparing this hypothetical example with the hypothetical examples that appear in shareholder reports of other funds.
Note that the expenses shown in the table are meant to highlight and help you compare ongoing costs only and do not reflect transaction costs incurred by the fund for buying and selling securities. Further, the expenses do not include any purchase, redemption, or account service fees described in the fund prospectus. If such fees were applied to your account, your costs would be higher. Your fund does not carry a “sales load.”
The calculations assume no shares were bought or sold during the period. Your actual costs may have been higher or lower, depending on the amount of your investment and the timing of any purchases or redemptions.
You can find more information about the fund’s expenses, including annual expense ratios, in the Financial Statements section of this report. For additional information on operating expenses and other shareholder costs, please refer to your fund’s current prospectus.
44
| | | |
| Six Months Ended April 30, 2011 | | | |
| | Beginning | Ending | Expenses |
| | Account Value | Account Value | Paid During |
| | 10/31/2010 | 4/30/2011 | Period |
| Based on Actual Fund Return | | | |
| FTSE All-World ex-US Index Fund | | | |
| Investor Shares | $1,000.00 | $1,125.53 | $1.84 |
| Institutional Shares | 1,000.00 | 1,126.79 | 0.74 |
| ETF Shares | 1,000.00 | 1,126.45 | 1.11 |
| FTSE All-World ex-US Small-Cap Index Fund | | | |
| Investor Shares | $1,000.00 | $1,148.74 | $2.82 |
| Institutional Shares | 1,000.00 | 1,150.00 | 1.49 |
| ETF Shares | 1,000.00 | 1,149.86 | 1.65 |
| Based on Hypothetical 5% Yearly Return | | | |
| FTSE All-World ex-US Index Fund | | | |
| Investor Shares | $1,000.00 | $1,023.06 | $1.76 |
| Institutional Shares | 1,000.00 | 1,024.10 | 0.70 |
| ETF Shares | 1,000.00 | 1,023.75 | 1.05 |
| FTSE All-World ex-US Small-Cap Index Fund | | | |
| Investor Shares | $1,000.00 | $1,022.17 | $2.66 |
| Institutional Shares | 1,000.00 | 1,023.41 | 1.40 |
| ETF Shares | 1,000.00 | 1,023.26 | 1.56 |
The calculations are based on expenses incurred in the most recent six-month period. The funds’ annualized six-month expense ratios for that period are: for the FTSE All-World ex-US Index Fund, 0.35% for Investor Shares, 0.14% for Institutional Shares, and 0.21% for ETF Shares; and for the FTSE All-World ex-US Small-Cap Index Fund, 0.53% for Investor Shares, 0.28% for Institutional Shares, and 0.31% for ETF Shares. The dollar amounts shown as “Expenses Paid” are equal to the annualized expense ratio multiplied by the average account value over the period, multiplied by the number of days in the most recent six-month period, then divided by the number of days in the most recent 12-month period. This table does not include data for funds or share classes of funds with fewer than six months of history.
45
Trustees Approve Advisory Arrangements
The board of trustees of Vanguard FTSE All-World ex-US and FTSE All-World ex-US Small-Cap Index Funds has renewed the funds’ investment advisory arrangements with The Vanguard Group, Inc. Vanguard—through its Quantitative Equity Group—serves as the investment advisor for each of the funds. The board determined that continuing the funds’ internalized management structure was in the best interests of the funds and their shareholders.
The board based its decisions upon an evaluation of the advisor’s investment staff, portfolio management process, and performance. The trustees considered the factors discussed below, among others. However, no single factor determined whether the board approved the arrangements. Rather, it was the totality of the circumstances that drove the board’s decision.
Nature, extent, and quality of services
The board considered the quality of the investment management services provided to the FTSE All-World ex-US Index Fund since its inception in 2007 and to the FTSE All-World ex-US Small-Cap Index Fund since its inception in 2009, and took into account the organizational depth and stability of the advisor. Vanguard has been managing investments for more than three decades. The Quantitative Equity Group adheres to a sound, disciplined investment management process; the team has considerable experience, stability, and depth.
The board concluded that Vanguard’s experience, stability, depth, and performance, among other factors, warranted continuation of the advisory arrangements.
Investment performance
The board considered each fund’s performance since its inception, including any periods of outperformance or underperformance of its target index and peer group. The board concluded that the funds have performed in line with expectations and that their results have been consistent with their investment strategies. Information about the funds’ most recent performance can be found in the Performance Summary sections of this report.
Cost
The board concluded that each fund’s expense ratio was well below the average expense ratio charged by funds in its peer group and that each fund’s advisory fee rate was also well below its peer group average. Information about the funds’ expenses appears in the About Your Fund’s Expenses section of this report as well as in the Financial Statements sections.
The board does not conduct a profitability analysis of Vanguard because of Vanguard’s unique “at-cost” structure. Unlike most other mutual fund management companies, Vanguard is owned by the funds it oversees, and produces “profits” only in the form of reduced expenses for fund shareholders.
The benefit of economies of scale
The board concluded that the funds’ low-cost arrangements with Vanguard ensure that the funds will realize economies of scale as they grow, with the cost to shareholders declining as fund assets increase.
The board will consider whether to renew the advisory arrangements after a one-year period.
46
Glossary
Beta. A measure of the magnitude of a fund’s past share-price fluctuations in relation to the ups and downs of a given market index. The index is assigned a beta of 1.00. Compared with a given index, a fund with a beta of 1.20 typically would have seen its share price rise or fall by 12% when the index rose or fell by 10%. For this report, beta is based on returns over the past 36 months for both the fund and the index. Note that a fund’s beta should be reviewed in conjunction with its R-squared (see definition). The lower the R-squared, the less correlation there is between the fund and the index, and the less reliable beta is as an indicator of volatility.
Dividend Yield. Dividend income earned by stocks, expressed as a percentage of the aggregate market value (or of net asset value, for a fund). The yield is determined by dividing the amount of the annual dividends by the aggregate value (or net asset value) at the end of the period. For a fund, the dividend yield is based solely on stock holdings and does not include any income produced by other investments.
Earnings Growth Rate. The average annual rate of growth in earnings over the past five years for the stocks now in a fund.
Equity Exposure. A measure that reflects a fund’s investments in stocks and stock futures. Any holdings in short-term reserves are excluded.
Expense Ratio. The percentage of a fund’s average net assets used to pay its annual administrative and advisory expenses. These expenses directly reduce returns to investors.
Inception Date. The date on which the assets of a fund (or one of its share classes) are first invested in accordance with the fund’s investment objective. For funds with a subscription period, the inception date is the day after that period ends. Investment performance is measured from the inception date.
Median Market Cap. An indicator of the size of companies in which a fund invests; the midpoint of market capitalization (market price x shares outstanding) of a fund’s stocks, weighted by the proportion of the fund’s assets invested in each stock. Stocks representing half of the fund’s assets have market capitalizations above the median, and the rest are below it.
Price/Book Ratio. The share price of a stock divided by its net worth, or book value, per share. For a fund, the weighted average price/book ratio of the stocks it holds.
Price/Earnings Ratio. The ratio of a stock’s current price to its per-share earnings over the past year. For a fund, the weighted average P/E of the stocks it holds. P/E is an indicator of market expectations about corporate prospects; the higher the P/E, the greater the expectations for a company’s future growth.
R-Squared. A measure of how much of a fund’s past returns can be explained by the returns from the market in general, as measured by a given index. If a fund’s total returns were precisely synchronized with an index’s returns, its R-squared would be 1.00. If the fund’s returns bore no relationship to the index’s returns, its R-squared would be 0. For this report, R-squared is based on returns over the past 36 months for both the fund and the index.
Return on Equity. The annual average rate of return generated by a company during the past five years for each dollar of shareholder’s equity (net income divided by shareholder’s equity). For a fund, the weighted average return on equity for the companies whose stocks it holds.
47
Short-Term Reserves. The percentage of a fund invested in highly liquid, short-term securities that can be readily converted to cash.
Turnover Rate. An indication of the fund’s trading activity. Funds with high turnover rates incur higher transaction costs and may be more likely to distribute capital gains (which may be taxable to investors). The turnover rate excludes in-kind transactions, which have minimal impact on costs.
48
This page intentionally left blank.
This page intentionally left blank.
This page intentionally left blank.
The People Who Govern Your Fund
The trustees of your mutual fund are there to see that the fund is operated and managed in your best interests since, as a shareholder, you are a part owner of the fund. Your fund’s trustees also serve on the board of directors of The Vanguard Group, Inc., which is owned by the Vanguard funds and provides services to them on an at-cost basis.
A majority of Vanguard’s board members are independent, meaning that they have no affiliation with Vanguard or the funds they oversee, apart from the sizable personal investments they have made as private individuals. The independent board members have distinguished backgrounds in business, academia, and public service. Each of the trustees and executive officers oversees 179 Vanguard funds.
The following table provides information for each trustee and executive officer of the fund. More information about the trustees is in the Statement of Additional Information, which can be obtained, without charge, by contacting Vanguard at 800-662-7447, or online at vanguard.com.
| |
| Interested Trustee1 | and President (2006–2008) of Rohm and Haas Co. |
| | (chemicals); Director of Tyco International, Ltd. |
| F. William McNabb III | (diversified manufacturing and services) and Hewlett- |
| Born 1957. Trustee Since July 2009. Chairman of the | Packard Co. (electronic computer manufacturing); |
| Board. Principal Occupation(s) During the Past Five | Senior Advisor at New Mountain Capital; Trustee |
| Years: Chairman of the Board of The Vanguard Group, | of The Conference Board; Member of the Board of |
| Inc., and of each of the investment companies served | Managers of Delphi Automotive LLP (automotive |
| by The Vanguard Group, since January 2010; Director | components). |
| of The Vanguard Group since 2008; Chief Executive | |
| Officer and President of The Vanguard Group and of | Amy Gutmann |
| each of the investment companies served by The | Born 1949. Trustee Since June 2006. Principal |
| Vanguard Group since 2008; Director of Vanguard | Occupation(s) During the Past Five Years: President |
| Marketing Corporation; Managing Director of The | of the University of Pennsylvania; Christopher H. |
| Vanguard Group (1995–2008). | Browne Distinguished Professor of Political Science |
| | in the School of Arts and Sciences with secondary |
| | appointments at the Annenberg School for Commu- |
| Independent Trustees | nication and the Graduate School of Education |
| | of the University of Pennsylvania; Director of |
| Emerson U. Fullwood | Carnegie Corporation of New York, Schuylkill River |
| Born 1948. Trustee Since January 2008. Principal | Development Corporation, and Greater Philadelphia |
| Occupation(s) During the Past Five Years: Executive | Chamber of Commerce; Trustee of the National |
| Chief Staff and Marketing Officer for North America | Constitution Center; Chair of the Presidential |
| and Corporate Vice President (retired 2008) of Xerox | Commission for the Study of Bioethical Issues. |
| Corporation (document management products and | |
| services); Executive in Residence and 2010 | JoAnn Heffernan Heisen |
| Distinguished Minett Professor at the Rochester | Born 1950. Trustee Since July 1998. Principal |
| Institute of Technology; Director of SPX Corporation | Occupation(s) During the Past Five Years: Corporate |
| (multi-industry manufacturing), the United Way of | Vice President and Chief Global Diversity Officer |
| Rochester, Amerigroup Corporation (managed health | (retired 2008) and Member of the Executive |
| care), the University of Rochester Medical Center, | Committee (1997–2008) of Johnson & Johnson |
| Monroe Community College Foundation, and North | (pharmaceuticals/consumer products); Director of |
| Carolina A&T University. | Skytop Lodge Corporation (hotels), the University |
| | Medical Center at Princeton, the Robert Wood |
| Rajiv L. Gupta | Johnson Foundation, and the Center for Work Life |
| Born 1945. Trustee Since December 2001.2 | Policy; Member of the Advisory Board of the |
| Principal Occupation(s) During the Past Five Years: | Maxwell School of Citizenship and Public Affairs |
| Chairman and Chief Executive Officer (retired 2009) | at Syracuse University. |
| | |
| F. Joseph Loughrey | Thomas J. Higgins | |
| Born 1949. Trustee Since October 2009. Principal | Born 1957. Chief Financial Officer Since September |
| Occupation(s) During the Past Five Years: President | 2008. Principal Occupation(s) During the Past Five |
| and Chief Operating Officer (retired 2009) and Vice | Years: Principal of The Vanguard Group, Inc.; Chief |
| Chairman of the Board (2008–2009) of Cummins Inc. | Financial Officer of each of the investment companies |
| (industrial machinery); Director of SKF AB (industrial | served by The Vanguard Group since 2008; Treasurer |
| machinery), Hillenbrand, Inc. (specialized consumer | of each of the investment companies served by The |
| services), the Lumina Foundation for Education, and | Vanguard Group (1998–2008). |
| Oxfam America; Chairman of the Advisory Council | | |
| for the College of Arts and Letters and Member | Kathryn J. Hyatt | |
| of the Advisory Board to the Kellogg Institute for | Born 1955. Treasurer Since November 2008. Principal |
| International Studies at the University of Notre Dame. | Occupation(s) During the Past Five Years: Principal |
| | of The Vanguard Group, Inc.; Treasurer of each of |
| André F. Perold | the investment companies served by The Vanguard |
| Born 1952. Trustee Since December 2004. Principal | Group since 2008; Assistant Treasurer of each of the |
| Occupation(s) During the Past Five Years: George | investment companies served by The Vanguard Group |
| Gund Professor of Finance and Banking at the Harvard | (1988–2008). | |
| Business School; Chair of the Investment Committee | | |
| of HighVista Strategies LLC (private investment firm). | Heidi Stam | |
| | Born 1956. Secretary Since July 2005. Principal |
| Alfred M. Rankin, Jr. | Occupation(s) During the Past Five Years: Managing |
| Born 1941. Trustee Since January 1993. Principal | Director of The Vanguard Group, Inc., since 2006; |
| Occupation(s) During the Past Five Years: Chairman, | General Counsel of The Vanguard Group since 2005; |
| President, and Chief Executive Officer of NACCO | Secretary of The Vanguard Group and of each of the |
| Industries, Inc. (forklift trucks/housewares/lignite); | investment companies served by The Vanguard Group |
| Director of Goodrich Corporation (industrial products/ | since 2005; Director and Senior Vice President of |
| aircraft systems and services) and the National | Vanguard Marketing Corporation since 2005; |
| Association of Manufacturers; Chairman of the | Principal of The Vanguard Group (1997–2006). |
| Federal Reserve Bank of Cleveland; Vice Chairman | | |
| of University Hospitals of Cleveland; President of | | |
| the Board of The Cleveland Museum of Art. | Vanguard Senior Management Team |
| |
| Peter F. Volanakis | R. Gregory Barton | Michael S. Miller |
| Born 1955. Trustee Since July 2009. Principal | Mortimer J. Buckley | James M. Norris |
| Occupation(s) During the Past Five Years: President | Kathleen C. Gubanich | Glenn W. Reed |
| and Chief Operating Officer (retired 2010) of Corning | Paul A. Heller | George U. Sauter |
| Incorporated (communications equipment); Director of | Martha G. King | |
| Corning Incorporated (2000–2010) and Dow Corning | | |
| (2001–2010); Overseer of the Amos Tuck School of | | |
| Business Administration at Dartmouth College. | Chairman Emeritus and Senior Advisor |
| |
| | John J. Brennan | |
| Executive Officers | Chairman, 1996–2009 | |
| | Chief Executive Officer and President, 1996–2008 |
| Glenn Booraem | | |
| Born 1967. Controller Since July 2010. Principal | | |
| Occupation(s) During the Past Five Years: Principal | Founder | |
| of The Vanguard Group, Inc.; Controller of each of | | |
| the investment companies served by The Vanguard | John C. Bogle | |
| Group since 2010; Assistant Controller of each of | Chairman and Chief Executive Officer, 1974–1996 |
| the investment companies served by The Vanguard | | |
| Group (2001–2010). | | |
1 Mr. McNabb is considered an “interested person,” as defined in the Investment Company Act of 1940, because he is an officer of the Vanguard funds.
2 December 2002 for Vanguard Equity Income Fund, Vanguard Growth Equity Fund, the Vanguard Municipal Bond Funds, and the Vanguard State Tax-Exempt Funds.
|  |
| P.O. Box 2600 |
| Valley Forge, PA 19482-2600 |
Connect with Vanguard® > vanguard.com
| |
| Fund Information > 800-662-7447 | “FTSE®” is a trademark jointly owned by the London |
| Direct Investor Account Services > 800-662-2739 | Stock Exchange plc and The Financial Times Limited |
| Institutional Investor Services > 800-523-1036 | and is used by FTSE International Limited under license. |
| Text Telephone for People | ”All-World” is a trademark of FTSE International |
| With Hearing Impairment > 800-749-7273 | Limited. The FTSE All-World ex US Index and FTSE |
| Global Small Cap ex US Index are calculated by FTSE |
| | International Limited. FTSE International Limited does |
| This material may be used in conjunction | not sponsor, endorse, or promote the funds; is not in |
| with the offering of shares of any Vanguard | any way connected to them; and does not accept any |
| fund only if preceded or accompanied by | liability in relation to their issue, operation, and |
| the fund’s current prospectus. | trading. |
| |
| All comparative mutual fund data are from Lipper Inc. or | |
| Morningstar, Inc., unless otherwise noted. | |
| |
| You can obtain a free copy of Vanguard’s proxy voting | |
| guidelines by visiting vanguard.com/proxyreporting or by | |
| calling Vanguard at 800-662-2739. The guidelines are | |
| also available from the SEC’s website, sec.gov. In | |
| addition, you may obtain a free report on how your fund | |
| voted the proxies for securities it owned during the 12 | |
| months ended June 30. To get the report, visit either | |
| vanguard.com/proxyreporting or sec.gov. | |
| |
| You can review and copy information about your fund at | |
| the SEC’s Public Reference Room in Washington, D.C. To | |
| find out more about this public service, call the SEC at | |
| 202-551-8090. Information about your fund is also | |
| available on the SEC’s website, and you can receive | |
| copies of this information, for a fee, by sending a | |
| request in either of two ways: via e-mail addressed to | |
| publicinfo@sec.gov or via regular mail addressed to the | |
| Public Reference Section, Securities and Exchange | |
| Commission, Washington, DC 20549-1520. | |
| |
| |
| | © 2011 The Vanguard Group, Inc. |
| | All rights reserved. |
| | Vanguard Marketing Corporation, Distributor. |
| |
| | Q7702 062011 |
| | |
| Vanguard® FTSE All-World ex-US Index Fund | | |
| Schedule of Investments | | |
| April 30, 2011 | | |
| |
| | | Market |
| | | Value |
| | Shares | ($000) |
| Common Stocks (100.0%) | | |
| Australia (5.8%) | | |
| BHP Billiton Ltd. | 2,506,616 | 126,910 |
| Commonwealth Bank of Australia | 1,198,363 | 70,743 |
| Westpac Banking Corp. | 2,324,814 | 63,468 |
| Australia & New Zealand Banking Group Ltd. | 2,028,881 | 54,044 |
| National Australia Bank Ltd. | 1,694,604 | 50,453 |
| Wesfarmers Ltd. | 781,728 | 28,638 |
| Woolworths Ltd. | 947,034 | 27,560 |
| Newcrest Mining Ltd. | 596,252 | 27,156 |
| Woodside Petroleum Ltd. | 455,699 | 23,433 |
| Rio Tinto Ltd. | 254,824 | 23,068 |
| Westfield Group | 1,802,330 | 17,861 |
| QBE Insurance Group Ltd. | 818,616 | 16,818 |
| CSL Ltd. | 429,550 | 16,209 |
| Origin Energy Ltd. | 757,942 | 13,597 |
| AMP Ltd. | 2,175,783 | 13,088 |
| Santos Ltd. | 680,176 | 11,304 |
| Telstra Corp. Ltd. | 3,436,437 | 10,976 |
| Macquarie Group Ltd. | 270,951 | 10,475 |
| Foster's Group Ltd. | 1,505,425 | 9,291 |
| Suncorp Group Ltd. | 990,719 | 9,066 |
| Brambles Ltd. | 1,137,684 | 8,426 |
| Orica Ltd. | 281,222 | 8,216 |
| Oil Search Ltd. | 1,015,259 | 7,863 |
| Stockland | 1,860,421 | 7,724 |
| Amcor Ltd. | 952,347 | 7,320 |
| Westfield Retail Trust | 2,398,299 | 6,966 |
| Transurban Group | 1,135,259 | 6,607 |
| Fortescue Metals Group Ltd. | 965,949 | 6,547 |
| Insurance Australia Group Ltd. | 1,624,326 | 6,369 |
| WorleyParsons Ltd. | 187,579 | 6,264 |
| Coca-Cola Amatil Ltd. | 438,864 | 5,753 |
| AGL Energy Ltd. | 358,585 | 5,723 |
| Incitec Pivot Ltd. | 1,274,909 | 5,277 |
| GPT Group | 1,438,565 | 4,997 |
| Alumina Ltd. | 1,921,572 | 4,813 |
| ASX Ltd. | 134,685 | 4,750 |
| Computershare Ltd. | 433,496 | 4,613 |
| TABCORP Holdings Ltd. | 539,199 | 4,520 |
| Iluka Resources Ltd. | 327,164 | 4,502 |
| Wesfarmers Ltd. Price Protected Shares | 118,309 | 4,374 |
| Lend Lease Group | 445,196 | 4,257 |
| Sonic Healthcare Ltd. | 306,408 | 4,215 |
| Asciano Ltd. | 2,318,347 | 4,209 |
| Crown Ltd. | 440,426 | 4,085 |
| OZ Minerals Ltd. | 2,512,961 | 3,989 |
| Cochlear Ltd. | 44,549 | 3,939 |
| Goodman Group | 4,999,664 | 3,900 |
| Mirvac Group | 2,650,583 | 3,699 |
| Dexus Property Group | 3,740,051 | 3,617 |
| Toll Holdings Ltd. | 556,005 | 3,442 |
| Leighton Holdings Ltd. | 127,949 | 3,409 |
| CFS Retail Property Trust | 1,656,789 | 3,253 |
| Sims Metal Management Ltd. | 157,939 | 3,031 |
| Boral Ltd. | 558,498 | 3,017 |
| * Lynas Corp. Ltd. | 1,301,574 | 3,000 |
| Bendigo and Adelaide Bank Ltd. | 281,439 | 2,888 |
| BlueScope Steel Ltd. | 1,421,695 | 2,708 |
| Tatts Group Ltd. | 1,036,266 | 2,639 |
| Metcash Ltd. | 587,179 | 2,616 |
| OneSteel Ltd. | 1,043,258 | 2,446 |
| Ramsay Health Care Ltd. | 115,622 | 2,294 |
1
| | | |
| Vanguard® FTSE All-World ex-US Index Fund | | |
| Schedule of Investments | | |
| April 30, 2011 | | |
| | | | Market |
| | | | Value |
| | | Shares | ($000) |
| * | James Hardie Industries SE | 340,129 | 2,211 |
| | MacArthur Coal Ltd. | 171,347 | 2,187 |
| * | Paladin Energy Ltd. | 600,588 | 2,171 |
| * | Qantas Airways Ltd. | 892,426 | 2,068 |
| | Challenger Ltd. | 387,789 | 2,057 |
| | Commonwealth Property Office Fund | 1,908,462 | 1,919 |
| | Harvey Norman Holdings Ltd. | 630,912 | 1,859 |
| | Bank of Queensland Ltd. | 170,829 | 1,849 |
| | MAp Group | 565,368 | 1,833 |
| | Caltex Australia Ltd. | 104,446 | 1,628 |
| | Ansell Ltd. | 105,753 | 1,618 |
| ^ | Flight Centre Ltd. | 59,508 | 1,540 |
| | IOOF Holdings Ltd. | 184,056 | 1,449 |
| | Charter Hall Office REIT | 373,609 | 1,442 |
| | Billabong International Ltd. | 192,855 | 1,434 |
| | Whitehaven Coal Ltd. | 188,296 | 1,328 |
| | Goodman Fielder Ltd. | 1,123,761 | 1,326 |
| | CSR Ltd. | 396,456 | 1,307 |
| | Adelaide Brighton Ltd. | 361,904 | 1,256 |
| | Downer EDI Ltd. | 307,988 | 1,254 |
| | Coal & Allied Industries Ltd. | 9,908 | 1,214 |
| * | Aquila Resources Ltd. | 120,240 | 1,203 |
| | Aristocrat Leisure Ltd. | 414,441 | 1,194 |
| | Perpetual Ltd. | 36,380 | 1,153 |
| ^ | New Hope Corp. Ltd. | 199,017 | 1,071 |
| | SP AusNet | 1,074,209 | 1,032 |
| | Ten Network Holdings Ltd. | 598,967 | 889 |
| | Platinum Asset Management Ltd. | 171,189 | 868 |
| | GWA Group Ltd. | 243,475 | 855 |
| ^ | Fairfax Media Ltd. | 576,354 | 836 |
| | DuluxGroup Ltd. | 272,715 | 830 |
| * | Nufarm Ltd. | 143,366 | 762 |
| | Australand Property Group | 220,947 | 736 |
| * | Macquarie Atlas Roads Group | 331,895 | 673 |
| | Envestra Ltd. | 890,670 | 625 |
| | Consolidated Media Holdings Ltd. | 161,621 | 495 |
| * | Gunns Ltd. | 649,105 | 375 |
| | Energy Resources of Australia Ltd. | 54,149 | 323 |
| | West Australian Newspapers Holdings Ltd. | 50,188 | 276 |
| | APN News & Media Ltd. | 117,338 | 203 |
| * | ABC Learning Centres Ltd. | 44,287 | 26 |
| | | | 865,810 |
| Austria (0.3%) | | |
| | Erste Group Bank AG | 219,880 | 11,101 |
| | Voestalpine AG | 132,500 | 6,519 |
| | OMV AG | 117,516 | 5,358 |
| | Telekom Austria AG | 264,410 | 4,087 |
| *,^ | IMMOFINANZ AG | 840,300 | 3,994 |
| ^ | Raiffeisen Bank International AG | 44,888 | 2,474 |
| | Verbund AG | 51,428 | 2,325 |
| | Vienna Insurance Group AG Wiener Versicherung Gruppe | 29,763 | 1,775 |
| | Strabag SE | 26,268 | 882 |
| | | | 38,515 |
| Belgium (0.6%) | | |
| ^ | Anheuser-Busch InBev NV | 621,692 | 39,675 |
| | Delhaize Group SA | 79,043 | 6,839 |
| ^ | Groupe Bruxelles Lambert SA | 63,152 | 6,258 |
| | Ageas | 1,963,279 | 5,951 |
| ^ | Umicore SA | 98,984 | 5,674 |
| * | KBC Groep NV | 136,977 | 5,576 |
| ^ | Belgacom SA | 131,619 | 5,175 |
| | UCB SA | 105,539 | 5,099 |
| | Solvay SA Class A | 32,690 | 4,713 |
| | Colruyt SA | 51,665 | 2,980 |
2
| | | |
| Vanguard® FTSE All-World ex-US Index Fund | | |
| Schedule of Investments | | |
| April 30, 2011 | | |
| | | | Market |
| | | | Value |
| | | Shares | ($000) |
| *,^ | Dexia SA | 452,083 | 1,801 |
| * | Cie Nationale a Portefeuille | 24,351 | 1,760 |
| | Mobistar SA | 13,636 | 1,012 |
| | | | 92,513 |
| Brazil (3.9%) | | |
| | Petroleo Brasileiro SA ADR Type A | 1,386,488 | 46,267 |
| | Itau Unibanco Holding SA ADR | 1,657,257 | 39,360 |
| | Petroleo Brasileiro SA ADR | 1,044,265 | 38,982 |
| | Banco Bradesco SA ADR | 1,473,634 | 29,812 |
| | Vale SA Class B Pfd. ADR | 973,626 | 29,111 |
| | Petroleo Brasileiro SA Prior Pfd. | 1,602,611 | 26,038 |
| | Vale SA Class B ADR | 711,836 | 23,775 |
| | Cia de Bebidas das Americas ADR | 701,275 | 22,848 |
| | Vale SA Prior Pfd. | 674,375 | 19,766 |
| | Vale SA | 558,229 | 18,313 |
| | Banco do Brasil SA | 892,286 | 16,391 |
| | Itausa - Investimentos Itau SA Prior Pfd. | 2,087,580 | 16,003 |
| | Petroleo Brasileiro SA | 811,871 | 14,847 |
| | BRF - Brasil Foods SA | 632,652 | 12,828 |
| | BM&FBovespa SA | 1,591,036 | 11,944 |
| | Cia Siderurgica Nacional SA ADR | 699,338 | 11,140 |
| | Natura Cosmeticos SA | 333,673 | 9,364 |
| | CCR SA | 258,576 | 8,029 |
| | Banco Santander Brasil SA | 593,706 | 6,868 |
| | Redecard SA | 386,937 | 5,623 |
| | Cia Energetica de Minas Gerais ADR | 261,839 | 5,465 |
| * | OGX Petroleo e Gas Participacoes SA | 495,592 | 5,236 |
| | Gerdau SA ADR | 424,928 | 5,133 |
| | PDG Realty SA Empreendimentos e Participacoes | 845,900 | 4,979 |
| | Embraer SA ADR | 146,004 | 4,742 |
| | Ultrapar Participacoes SA Prior Pfd. | 265,524 | 4,641 |
| | Bradespar SA Prior Pfd. | 173,740 | 4,500 |
| | All America Latina Logistica SA | 529,316 | 4,361 |
| | Centrais Eletricas Brasileiras SA Prior Pfd. | 220,976 | 4,047 |
| | Souza Cruz SA | 351,500 | 3,999 |
| | Usinas Siderurgicas de Minas Gerais SA Prior Pfd. | 386,054 | 3,951 |
| | Cia de Bebidas das Americas | 146,550 | 3,940 |
| | Cielo SA | 420,295 | 3,930 |
| | Centrais Eletricas Brasileiras SA | 250,034 | 3,649 |
| | Cia Brasileira de Distribuicao Grupo Pao de Acucar ADR | 79,612 | 3,619 |
| * | Braskem SA ADR | 120,356 | 3,590 |
| | Tractebel Energia SA | 196,570 | 3,480 |
| | Lojas Renner SA | 93,500 | 3,465 |
| | Cia de Bebidas das Americas Prior Pfd. | 108,495 | 3,457 |
| | Tele Norte Leste Participacoes SA ADR | 197,733 | 3,371 |
| | Hypermarcas SA | 238,726 | 3,200 |
| | Metalurgica Gerdau SA Prior Pfd. Class A | 210,918 | 3,037 |
| | Cia Paranaense de Energia ADR | 108,900 | 3,002 |
| | Cia Siderurgica Nacional SA | 190,600 | 2,976 |
| | Weg SA | 236,756 | 2,942 |
| | Gerdau SA Prior Pfd. | 246,386 | 2,937 |
| | Itau Unibanco Holding SA Prior Pfd. | 123,255 | 2,879 |
| | Cyrela Brazil Realty SA Empreendimentos e Participacoes | 244,071 | 2,586 |
| | Usinas Siderurgicas de Minas Gerais SA | 152,820 | 2,482 |
| | Lojas Americanas SA Prior Pfd. | 269,100 | 2,395 |
| | Tim Participacoes SA ADR | 48,981 | 2,311 |
| | Cia Energetica de Sao Paulo Prior Pfd. | 116,834 | 2,252 |
| | Cia Brasileira de Distribuicao Grupo Pao de Acucar Prior Pfd. | 49,157 | 2,181 |
| | Fibria Celulose SA | 138,300 | 2,167 |
| | Suzano Papel e Celulose SA Prior Pfd. | 205,674 | 2,024 |
| | Vivo Participacoes SA ADR | 46,965 | 1,964 |
| | Eletropaulo Metropolitana Eletricidade de Sao Paulo SA Prior Pfd. | 77,204 | 1,884 |
| | Duratex SA | 176,900 | 1,861 |
| | Banco do Estado do Rio Grande do Sul Prior Pfd. | 147,500 | 1,753 |
3
| | | |
| Vanguard® FTSE All-World ex-US Index Fund | | |
| Schedule of Investments | | |
| April 30, 2011 | | |
| | | | Market |
| | | | Value |
| | | Shares | ($000) |
| | AES Tiete SA Prior Pfd. | 106,116 | 1,750 |
| | Klabin SA Prior Pfd. | 450,000 | 1,742 |
| | Brasil Telecom SA ADR | 59,176 | 1,669 |
| | Porto Seguro SA | 97,012 | 1,612 |
| | Tele Norte Leste Participacoes SA | 72,994 | 1,563 |
| * | NET Servicos de Comunicacao SA Prior Pfd. | 167,000 | 1,546 |
| | TAM SA Prior Pfd. | 75,381 | 1,534 |
| | MRV Engenharia e Participacoes SA | 174,900 | 1,526 |
| | Vivo Participacoes SA Prior Pfd. | 36,000 | 1,461 |
| | Cia de Saneamento Basico do Estado de Sao Paulo | 49,692 | 1,447 |
| | Telemar Norte Leste SA Prior Pfd. | 41,500 | 1,441 |
| * | MMX Mineracao e Metalicos SA | 224,100 | 1,425 |
| | Marfrig Alimentos SA | 133,700 | 1,370 |
| | Amil Participacoes SA | 111,100 | 1,349 |
| | Gerdau SA | 134,384 | 1,310 |
| | Light SA | 75,564 | 1,274 |
| | JBS SA | 376,374 | 1,273 |
| | Cia Energetica de Minas Gerais Prior Pfd. | 56,400 | 1,148 |
| | EDP - Energias do Brasil SA | 45,000 | 1,119 |
| | CPFL Energia SA | 38,100 | 1,104 |
| | Vale Fertilizantes SA Prior Pfd. | 102,092 | 1,060 |
| | Tim Participacoes SA | 188,068 | 1,017 |
| | BRF - Brasil Foods SA ADR | 48,832 | 1,011 |
| * | PortX Operacoes Portuarias SA | 421,300 | 924 |
| | Cosan SA Industria e Comercio | 58,334 | 892 |
| | B2W Cia Global Do Varejo | 62,314 | 870 |
| | M Dias Branco SA | 33,300 | 859 |
| | Cia de Transmissao de Energia Electrica Paulista Prior Pfd. | 25,700 | 829 |
| | Brasil Telecom SA Prior Pfd. | 82,790 | 765 |
| | Multiplan Empreendimentos Imobiliarios SA | 36,600 | 765 |
| | Telecomunicacoes de Sao Paulo SA Prior Pfd. | 28,000 | 746 |
| | LLX Logistica SA | 257,800 | 744 |
| | Cia Energetica de Minas Gerais | 43,562 | 706 |
| | AES Tiete SA | 42,600 | 636 |
| | Banco Bradesco SA Prior Pfd. | 31,366 | 622 |
| | Cia de Gas de Sao Paulo Prior Pfd. | 20,500 | 580 |
| | Tele Norte Leste Participacoes SA Prior Pfd. | 28,500 | 476 |
| | Embraer SA | 45,500 | 360 |
| | Tim Participacoes SA Prior Pfd. | 62,158 | 282 |
| * | Braskem SA Prior Pfd. | 9,400 | 136 |
| | Cia de Transmissao de Energia Electrica Paulista Prior Pfd. Rights Exp. 05/26/11 | 255 | — |
| * | Tim Participacoes SA Rights | 162 | — |
| * | Tim Participacoes SA Rights Exp. 05/12/2011 | 51 | — |
| | | | 580,640 |
| Canada (7.0%) | | |
| | Royal Bank of Canada | 1,111,307 | 70,004 |
| ^ | Toronto-Dominion Bank | 689,875 | 59,731 |
| | Suncor Energy Inc. | 1,217,215 | 56,104 |
| | Bank of Nova Scotia | 838,366 | 51,118 |
| | Canadian Natural Resources Ltd. | 846,766 | 39,835 |
| | Barrick Gold Corp. | 779,929 | 39,831 |
| | Potash Corp. of Saskatchewan Inc. | 665,526 | 37,597 |
| | Goldcorp Inc. | 622,083 | 34,775 |
| ^ | Bank of Montreal | 438,800 | 28,819 |
| | Canadian National Railway Co. | 359,614 | 27,894 |
| ^ | Canadian Imperial Bank of Commerce | 305,943 | 26,486 |
| | Manulife Financial Corp. | 1,386,859 | 24,904 |
| | Teck Resources Ltd. Class B | 452,494 | 24,596 |
| | TransCanada Corp. | 543,559 | 23,388 |
| | Cenovus Energy Inc. | 587,313 | 22,583 |
| * | Research In Motion Ltd. | 409,437 | 19,945 |
| | Encana Corp. | 578,380 | 19,433 |
| | Enbridge Inc. | 298,468 | 19,401 |
| | Talisman Energy Inc. | 795,211 | 19,205 |
4
| | | |
| Vanguard® FTSE All-World ex-US Index Fund | | |
| Schedule of Investments | | |
| April 30, 2011 | | |
| | | | Market |
| | | | Value |
| | | Shares | ($000) |
| | Brookfield Asset Management Inc. Class A | 488,446 | 16,448 |
| | Sun Life Financial Inc. | 447,932 | 14,662 |
| | Imperial Oil Ltd. | 265,235 | 14,017 |
| | Kinross Gold Corp. | 881,713 | 13,978 |
| ^ | Rogers Communications Inc. Class B | 345,657 | 13,082 |
| | Thomson Reuters Corp. | 322,601 | 13,079 |
| | Valeant Pharmaceuticals International Inc. | 230,400 | 12,151 |
| | Silver Wheaton Corp. | 275,531 | 11,212 |
| | Agrium Inc. | 123,314 | 11,177 |
| | Nexen Inc. | 411,626 | 10,889 |
| | National Bank of Canada | 127,025 | 10,518 |
| * | Ivanhoe Mines Ltd. | 382,395 | 10,027 |
| | Magna International Inc. | 189,688 | 9,748 |
| | Power Corp. of Canada | 319,644 | 9,618 |
| | First Quantum Minerals Ltd. | 67,241 | 9,582 |
| | Crescent Point Energy Corp. | 210,400 | 9,553 |
| | Agnico-Eagle Mines Ltd. | 130,362 | 9,083 |
| | Cameco Corp. | 306,210 | 9,039 |
| | Canadian Pacific Railway Ltd. | 130,542 | 8,658 |
| | Bombardier Inc. Class B | 1,115,215 | 8,310 |
| | Eldorado Gold Corp. | 429,900 | 8,001 |
| * | MEG Energy Corp. | 148,500 | 7,841 |
| | BCE Inc. | 198,705 | 7,447 |
| | Power Financial Corp. | 221,700 | 7,374 |
| | Yamana Gold Inc. | 574,959 | 7,329 |
| | Shoppers Drug Mart Corp. | 167,050 | 7,274 |
| | SNC-Lavalin Group Inc. | 118,400 | 7,163 |
| | Shaw Communications Inc. Class B | 321,600 | 6,791 |
| | Husky Energy Inc. | 209,849 | 6,565 |
| | Great-West Lifeco Inc. | 222,707 | 6,414 |
| | Tim Hortons Inc. | 131,400 | 6,393 |
| | Pacific Rubiales Energy Corp. | 207,200 | 6,296 |
| | Fairfax Financial Holdings Ltd. | 15,534 | 6,273 |
| | IAMGOLD Corp. | 289,400 | 6,016 |
| | Brookfield Properties Corp. | 293,206 | 5,801 |
| | Saputo Inc. | 120,890 | 5,755 |
| ^ | RioCan Real Estate Investment Trust | 202,000 | 5,412 |
| | IGM Financial Inc. | 100,566 | 5,173 |
| | Fortis Inc. | 136,500 | 4,687 |
| | Intact Financial Corp. | 89,100 | 4,520 |
| | CI Financial Corp. | 170,000 | 4,161 |
| * | CGI Group Inc. Class A | 182,178 | 3,986 |
| | Finning International Inc. | 133,860 | 3,926 |
| | Canadian Utilities Ltd. Class A | 68,421 | 3,878 |
| | Canadian Tire Corp. Ltd. Class A | 60,602 | 3,862 |
| | TransAlta Corp. | 171,743 | 3,826 |
| ^ | Loblaw Cos. Ltd. | 86,417 | 3,642 |
| | Niko Resources Ltd. | 39,900 | 3,372 |
| * | Osisko Mining Corp. | 225,300 | 3,298 |
| | George Weston Ltd. | 40,121 | 2,875 |
| | TELUS Corp. | 45,237 | 2,384 |
| | TELUS Corp. Class A | 38,883 | 1,957 |
| | Bombardier Inc. Class A | 47,233 | 352 |
| | | | 1,040,524 |
| Chile (0.4%) | | |
| | SACI Falabella | 735,121 | 8,022 |
| | Empresas COPEC SA | 392,684 | 7,616 |
| | Sociedad Quimica y Minera de Chile SA ADR | 105,388 | 6,432 |
| | Empresa Nacional de Electricidad SA ADR | 88,356 | 4,982 |
| | CAP SA | 85,138 | 4,576 |
| | Empresas CMPC SA | 81,539 | 4,525 |
| | Cencosud SA | 503,445 | 3,976 |
| | Banco Santander Chile ADR | 40,785 | 3,735 |
| | Enersis SA ADR | 174,663 | 3,731 |
5
| | | |
| Vanguard® FTSE All-World ex-US Index Fund | | |
| Schedule of Investments | | |
| April 30, 2011 | | |
| |
| | | | Market |
| | | | Value |
| | | Shares | ($000) |
| | Banco de Chile | 19,531,972 | 2,927 |
| | Lan Airlines SA | 71,857 | 2,023 |
| | Colbun SA | 4,928,522 | 1,485 |
| | Banco de Credito e Inversiones | 21,467 | 1,455 |
| | ENTEL Chile SA | 69,162 | 1,397 |
| | Empresa Nacional de Electricidad SA | 645,415 | 1,222 |
| | Cia Cervecerias Unidas SA | 96,304 | 1,162 |
| | Corpbanca | 64,887,520 | 1,031 |
| | AES Gener SA | 1,645,598 | 1,008 |
| | Enersis SA | 1,511,109 | 646 |
| | Embotelladora Andina SA Prior Pfd. | 95,416 | 469 |
| | Sociedad Quimica y Minera de Chile SA Prior Pfd. Class B | 2,337 | 141 |
| | | | 62,561 |
| China (4.2%) | | |
| | China Construction Bank Corp. | 56,335,463 | 53,345 |
| | China Mobile Ltd. | 4,692,457 | 43,163 |
| | Industrial & Commercial Bank of China | 50,863,976 | 43,143 |
| | CNOOC Ltd. | 13,940,000 | 34,649 |
| | Bank of China Ltd. | 49,036,000 | 27,141 |
| | PetroChina Co. Ltd. | 16,464,000 | 23,899 |
| | China Life Insurance Co. Ltd. | 5,811,000 | 20,771 |
| | Tencent Holdings Ltd. | 715,958 | 20,444 |
| ^ | Ping An Insurance Group Co. | 1,675,248 | 18,265 |
| | China Petroleum & Chemical Corp. | 13,106,000 | 13,210 |
| | China Shenhua Energy Co. Ltd. | 2,652,500 | 12,389 |
| | China Unicom Hong Kong Ltd. | 5,530,182 | 11,311 |
| | Belle International Holdings Ltd. | 4,955,328 | 9,699 |
| | China Merchants Bank Co. Ltd. | 3,089,446 | 7,981 |
| | China Telecom Corp. Ltd. | 12,672,000 | 7,373 |
| | Agricultural Bank of China Ltd. | 12,004,000 | 7,108 |
| | Bank of Communications Co. Ltd. | 6,202,200 | 6,585 |
| | Yanzhou Coal Mining Co. Ltd. | 1,610,000 | 6,333 |
| | China Overseas Land & Investment Ltd. | 3,239,760 | 6,251 |
| | China Pacific Insurance Group Co. Ltd. | 1,352,600 | 5,855 |
| | Hengan International Group Co. Ltd. | 718,946 | 5,619 |
| | China Citic Bank Corp. Ltd. | 7,177,700 | 5,151 |
| | Tingyi Cayman Islands Holding Corp. | 1,816,192 | 4,820 |
| | Anhui Conch Cement Co. Ltd. | 1,014,000 | 4,808 |
| | Want Want China Holdings Ltd. | 5,192,552 | 4,667 |
| | China Coal Energy Co. Ltd. | 3,310,000 | 4,636 |
| | China National Building Material Co. Ltd. | 2,104,400 | 4,453 |
| | China Merchants Holdings International Co. Ltd. | 959,560 | 4,424 |
| * | GCL-Poly Energy Holdings Ltd. | 5,989,000 | 4,291 |
| | China Yurun Food Group Ltd. | 1,128,000 | 4,144 |
| | Inner Mongolia Yitai Coal Co. Class B | 573,120 | 4,006 |
| | China Resources Enterprise Ltd. | 968,000 | 3,909 |
| | Jiangxi Copper Co. Ltd. | 1,090,000 | 3,714 |
| * | GOME Electrical Appliances Holding Ltd. | 9,669,940 | 3,477 |
| | Lenovo Group Ltd. | 5,838,000 | 3,407 |
| * | PICC Property & Casualty Co. Ltd. | 2,629,976 | 3,383 |
| | China Communications Construction Co. Ltd. | 3,645,000 | 3,376 |
| ^ | Evergrande Real Estate Group Ltd. | 4,715,000 | 3,372 |
| | Kunlun Energy Co. Ltd. | 1,892,000 | 3,358 |
| | China Mengniu Dairy Co. Ltd. | 1,031,000 | 3,171 |
| | Dongfeng Motor Group Co. Ltd. | 1,978,000 | 3,096 |
| ^ | China Minsheng Banking Corp. Ltd. | 3,195,300 | 3,069 |
| | Aluminum Corp. of China Ltd. | 3,170,000 | 2,983 |
| | China Resources Land Ltd. | 1,679,552 | 2,903 |
| | Citic Pacific Ltd. | 913,000 | 2,735 |
| | Kingboard Chemical Holdings Ltd. | 497,500 | 2,730 |
| | China Resources Power Holdings Co. Ltd. | 1,446,400 | 2,667 |
| | Air China Ltd. | 2,624,000 | 2,666 |
| | Beijing Enterprises Holdings Ltd. | 472,500 | 2,516 |
| | Zijin Mining Group Co. Ltd. | 3,148,000 | 2,482 |
6
| | | |
| Vanguard® FTSE All-World ex-US Index Fund | | |
| Schedule of Investments | | |
| April 30, 2011 | | |
| | | | Market |
| | | | Value |
| | | Shares | ($000) |
| | China International Marine Containers Group Co. Ltd. Class B | 1,110,737 | 2,378 |
| | China Oilfield Services Ltd. | 1,192,000 | 2,365 |
| * | Changsha Zoomlion Heavy Industry Science and Technology Development Co. Ltd. | 841,800 | 2,233 |
| | COSCO Pacific Ltd. | 1,039,924 | 2,159 |
| ^ | Alibaba.com Ltd. | 1,186,000 | 2,108 |
| | Guangzhou Automobile Group Co. Ltd. | 1,861,558 | 2,106 |
| | Weichai Power Co. Ltd. | 306,000 | 2,097 |
| | Tsingtao Brewery Co. Ltd. | 388,000 | 2,066 |
| | ENN Energy Holdings Ltd. | 600,000 | 2,065 |
| ^ | Byd Co. Ltd. | 553,600 | 2,010 |
| | BBMG Corp. | 1,190,500 | 1,965 |
| *,^ | China COSCO Holdings Co. Ltd. | 2,031,800 | 1,957 |
| | China Railway Group Ltd. | 3,485,000 | 1,872 |
| | Sino-Ocean Land Holdings Ltd. | 3,288,980 | 1,871 |
| * | China Taiping Insurance Holdings Co. Ltd. | 675,200 | 1,858 |
| *,^ | Brilliance China Automotive Holdings Ltd. | 1,900,000 | 1,856 |
| | Sinopharm Group Co. | 525,600 | 1,824 |
| | Shandong Weigao Group Medical Polymer Co. Ltd. | 656,000 | 1,801 |
| ^ | Agile Property Holdings Ltd. | 1,090,000 | 1,778 |
| | CSR Corp. Ltd. | 1,596,000 | 1,764 |
| | ZTE Corp. | 477,626 | 1,724 |
| | Parkson Retail Group Ltd. | 1,088,500 | 1,675 |
| ^ | Zhuzhou CSR Times Electric Co. Ltd. | 413,000 | 1,638 |
| | Chaoda Modern Agriculture Holdings Ltd. | 2,603,884 | 1,626 |
| | Shanghai Industrial Holdings Ltd. | 411,000 | 1,625 |
| ^ | Zhaojin Mining Industry Co. Ltd. | 347,000 | 1,610 |
| | Huaneng Power International Inc. | 2,816,000 | 1,555 |
| | Yantai Changyu Pioneer Wine Co. Ltd. Class B | 140,303 | 1,554 |
| | Great Wall Motor Co. Ltd. | 853,750 | 1,534 |
| | China Resources Cement Holdings Ltd. | 1,492,000 | 1,522 |
| * | Chongqing Rural Commercial Bank | 2,150,000 | 1,492 |
| | China Everbright Ltd. | 674,000 | 1,492 |
| | Huabao International Holdings Ltd. | 999,000 | 1,484 |
| | Fushan International Energy Group Ltd. | 2,106,000 | 1,478 |
| | China Vanke Co. Ltd. Class B | 1,035,339 | 1,466 |
| | Shimao Property Holdings Ltd. | 1,070,594 | 1,459 |
| | China Agri-Industries Holdings Ltd. | 1,215,000 | 1,390 |
| | China Railway Construction Corp. Ltd. | 1,563,074 | 1,386 |
| * | Semiconductor Manufacturing International Corp. | 15,445,000 | 1,385 |
| | China High Speed Transmission Equipment Group Co. Ltd. | 1,039,000 | 1,379 |
| ^ | China Rongsheng Heavy Industry Group Co. Ltd. | 1,624,500 | 1,374 |
| | Soho China Ltd. | 1,551,000 | 1,343 |
| | Shanghai Electric Group Co. Ltd. | 2,558,000 | 1,271 |
| | Longfor Properties Co. Ltd. | 785,500 | 1,253 |
| ^ | Anta Sports Products Ltd. | 756,000 | 1,226 |
| | China Longyuan Power Group Corp. | 1,178,000 | 1,214 |
| | Nine Dragons Paper Holdings Ltd. | 1,056,331 | 1,210 |
| | China National Materials Co. Ltd. | 1,223,000 | 1,207 |
| | Golden Eagle Retail Group Ltd. | 458,000 | 1,204 |
| | China BlueChemical Ltd. | 1,410,000 | 1,149 |
| | Fosun International Ltd. | 1,451,500 | 1,148 |
| * | Yuexiu Property Co. Ltd. | 5,430,000 | 1,143 |
| ^ | Datang International Power Generation Co. Ltd. | 3,024,000 | 1,143 |
| | Zhejiang Expressway Co. Ltd. | 1,356,000 | 1,121 |
| ^ | Geely Automobile Holdings Ltd. | 2,785,000 | 1,120 |
| ^ | Renhe Commercial Holdings Co. Ltd. | 6,520,000 | 1,119 |
| * | China Shipping Container Lines Co. Ltd. | 2,783,700 | 1,114 |
| ^ | Poly Hong Kong Investments Ltd. | 1,358,000 | 1,088 |
| | China Shipping Development Co. Ltd. | 1,028,000 | 1,086 |
| | Lee & Man Paper Manufacturing Ltd. | 1,435,200 | 1,033 |
| | Country Garden Holdings Co. | 2,542,960 | 1,033 |
| | Angang Steel Co. Ltd. | 796,000 | 1,025 |
| ^ | Guangzhou R&F Properties Co. Ltd. | 738,000 | 1,009 |
| ^ | Li Ning Co. Ltd. | 579,500 | 995 |
7
| | | |
| Vanguard® FTSE All-World ex-US Index Fund | | |
| Schedule of Investments | | |
| April 30, 2011 | | |
| | | | Market |
| | | | Value |
| | | Shares | ($000) |
| | Jiangsu Expressway Co. Ltd. | 896,000 | 950 |
| *,^ | Metallurgical Corp. of China Ltd. | 2,208,000 | 938 |
| ^ | Shui On Land Ltd. | 2,047,900 | 908 |
| *,^ | China Southern Airlines Co. Ltd. | 1,689,000 | 886 |
| | Franshion Properties China Ltd. | 2,828,000 | 882 |
| ^ | Shenzhen International Holdings Ltd. | 9,397,500 | 873 |
| | Sinopec Shanghai Petrochemical Co. Ltd. | 1,764,000 | 856 |
| | Hidili Industry International Development Ltd. | 838,000 | 849 |
| ^ | Sany Heavy Equipment International Holdings Co. Ltd. | 474,000 | 843 |
| | China Communications Services Corp. Ltd. | 1,344,000 | 822 |
| | TPV Technology Ltd. | 1,398,000 | 804 |
| | Dongfang Electric Corp. Ltd. | 244,800 | 804 |
| | Lianhua Supermarket Holdings Co. Ltd. | 189,000 | 770 |
| | China Dongxiang Group Co. | 2,186,000 | 765 |
| | CSG Holding Co. Ltd. Class B | 563,712 | 728 |
| | Guangdong Investment Ltd. | 1,364,000 | 708 |
| * | Sinofert Holdings Ltd. | 1,623,153 | 680 |
| | China Molybdenum Co. Ltd. | 740,000 | 664 |
| | Maanshan Iron & Steel | 1,244,000 | 658 |
| | Beijing Capital International Airport Co. Ltd. | 1,304,000 | 644 |
| ^ | China Zhongwang Holdings Ltd. | 1,220,800 | 628 |
| | KWG Property Holding Ltd. | 866,500 | 627 |
| | Shenzhen Investment Ltd. | 1,990,808 | 624 |
| * | Shanghai Zhenhua Heavy Industries Co. Ltd. Class B | 996,370 | 609 |
| | Kingboard Laminates Holdings Ltd. | 686,500 | 609 |
| | Travelsky Technology Ltd. | 596,000 | 604 |
| ^ | Bosideng International Holdings Ltd. | 1,778,000 | 564 |
| ^ | China Foods Ltd. | 792,000 | 555 |
| *,^ | Zhongsheng Group Holdings Ltd. | 291,000 | 546 |
| | Shanghai Lujiazui Finance & Trade Zone Development Co. Ltd. Class B | 382,790 | 545 |
| *,^ | China Eastern Airlines Corp. Ltd. | 1,216,000 | 534 |
| ^ | Sinotruk Hong Kong Ltd. | 631,500 | 525 |
| | Inner Mongolia Eerduosi Cashmere Products Co. Ltd. Class B | 335,200 | 524 |
| *,^ | Hopson Development Holdings Ltd. | 524,000 | 518 |
| | Greentown China Holdings Ltd. | 486,500 | 488 |
| | New World China Land Ltd. | 1,319,600 | 475 |
| *,^ | Sinopec Yizheng Chemical Fibre Co. Ltd. | 1,056,000 | 453 |
| ^ | Hopewell Highway Infrastructure Ltd. | 649,100 | 421 |
| | Harbin Power Equipment Co. Ltd. | 432,000 | 417 |
| *,^ | Xinjiang Goldwind Science & Technology Co. Ltd. | 296,400 | 411 |
| | Sichuan Expressway Co. Ltd. | 674,000 | 409 |
| | Weiqiao Textile Co. | 450,000 | 406 |
| | Guangshen Railway Co. Ltd. | 1,022,000 | 406 |
| | Shandong Chenming Paper Holdings Ltd. Class B | 476,500 | 402 |
| * | China Travel International Inv HK | 1,934,000 | 397 |
| | Zhejiang Southeast Electric Power Co. Class B | 632,700 | 384 |
| | Shenzhen Expressway Co. Ltd. | 552,000 | 369 |
| | Weifu High-Technology Group Co. Ltd. Class B | 98,200 | 362 |
| * | Citic Resources Holdings Ltd. | 1,451,300 | 360 |
| | People's Food Holdings Ltd. | 563,000 | 350 |
| | C C Land Holdings Ltd. | 891,000 | 344 |
| | China Merchants Property Development Co. Ltd. Class B | 187,950 | 337 |
| | Chongqing Changan Automobile Co. Ltd. Class B | 389,656 | 322 |
| | Anhui Expressway Co. | 376,000 | 315 |
| | Sinotrans Ltd. | 1,258,000 | 308 |
| | Shanghai Friendship Group Inc. Ltd. Class B | 139,590 | 285 |
| | Guangzhou Shipyard International Co. Ltd. | 136,000 | 253 |
| ^ | China Huiyuan Juice Group Ltd. | 383,000 | 252 |
| | Shanghai Mechanical and Electrical Industry Co. Ltd. Class B | 200,391 | 241 |
| | Shenzhen Chiwan Wharf Holdings Ltd. Class B | 143,700 | 236 |
| | Guangdong Electric Power Development Co. Ltd. Class B | 458,560 | 233 |
| | Shanghai Jinjiang International Hotels Development Co. Ltd. Class B | 137,100 | 230 |
| | Dazhong Transportation Group Co. Ltd. Class B | 345,500 | 229 |
| | Bengang Steel Plates Co. Class B | 372,700 | 219 |
8
| | | |
| Vanguard® FTSE All-World ex-US Index Fund | | |
| Schedule of Investments | | |
| April 30, 2011 | | |
| |
| | | | Market |
| | | | Value |
| | | Shares | ($000) |
| | Jiangling Motors Corp. Ltd. Class B | 69,000 | 210 |
| | Shanghai Jinqiao Export Processing Zone Development Co. Ltd. Class B | 242,110 | 203 |
| | Foshan Electrical and Lighting Co. Ltd. Class B | 198,820 | 200 |
| ^ | Huadian Power International Co. | 924,000 | 199 |
| * | Shanghai Haixin Group Co. Class B | 286,800 | 176 |
| * | BOE Technology Group Co. Ltd. Class B | 715,600 | 171 |
| ^ | Guangzhou Pharmaceutical Co. Ltd. | 148,000 | 167 |
| | Beijing North Star Co. Ltd. | 620,000 | 152 |
| * | Shanghai Chlor-Alkali Chemical Co. Ltd. Class B | 243,435 | 148 |
| * | Jinzhou Port Co. Ltd. Class B | 211,860 | 116 |
| * | Huadian Energy Co. Ltd. Class B | 299,100 | 113 |
| * | Shanghai Waigaoqiao Free Trade Zone Development Co. Ltd. Class B | 124,100 | 112 |
| | Shanghai Jinjiang International Industrial Investment Co. Ltd. Class B | 108,700 | 109 |
| * | Double Coin Holdings Ltd. Class B | 132,000 | 105 |
| | Guangdong Provincial Expressway Development Co. Ltd. Class B | 212,800 | 104 |
| | Tianjin Capital Environmental Protection Group Co. Ltd. | 286,000 | 95 |
| * | Hainan Airlines Co. Ltd. Class B | 35,200 | 38 |
| * | Kingboard Chemical Holdings Ltd. Warrants Exp. 10/31/2012 | 39,600 | 33 |
| | | | 623,992 |
| Colombia (0.2%) | | |
| | Ecopetrol SA | 3,350,033 | 7,198 |
| | BanColombia SA ADR | 76,073 | 5,040 |
| | Grupo de Inversiones Suramericana SA | 174,915 | 3,633 |
| | Inversiones Argos SA | 235,272 | 2,456 |
| | BanColombia SA | 150,350 | 2,448 |
| | Almacenes Exito SA | 119,465 | 1,837 |
| | Interconexion Electrica SA ESP | 234,038 | 1,659 |
| | Cementos Argos SA | 251,150 | 1,519 |
| | Corp Financiera Colombiana SA | 63,883 | 1,232 |
| | Isagen SA ESP | 613,428 | 815 |
| | | | 27,837 |
| Czech Republic (0.1%) | | |
| | CEZ AS | 162,155 | 9,302 |
| | Komercni Banka AS | 12,385 | 3,265 |
| | Telefonica O2 Czech Republic AS | 101,304 | 2,601 |
| * | Unipetrol AS | 64,935 | 772 |
| | | | 15,940 |
| Denmark (0.8%) | | |
| | Novo Nordisk A/S Class B | 384,543 | 48,681 |
| * | Danske Bank A/S | 725,299 | 17,418 |
| | AP Moller - Maersk A/S Class B | 1,289 | 13,064 |
| | Carlsberg A/S Class B | 92,277 | 10,949 |
| | Novozymes A/S | 42,389 | 7,330 |
| * | Vestas Wind Systems A/S | 160,592 | 5,691 |
| | AP Moller - Maersk A/S | 560 | 5,507 |
| | Danisco A/S | 35,694 | 4,732 |
| * | FLSmidth & Co. A/S | 41,553 | 3,748 |
| | Coloplast A/S Class B | 23,907 | 3,517 |
| * | William Demant Holding A/S | 18,229 | 1,699 |
| | Tryg A/S | 18,484 | 1,181 |
| | H Lundbeck A/S | 45,810 | 1,101 |
| | Rockwool International A/S Class B | 3,530 | 466 |
| | | | 125,084 |
| Egypt (0.1%) | | |
| | Orascom Construction Industries GDR | 90,612 | 3,717 |
| | Commercial International Bank Egypt SAE | 452,673 | 2,087 |
| * | Orascom Telecom Holding SAE GDR | 402,944 | 1,394 |
| | Egyptian Financial Group-Hermes Holding | 314,998 | 926 |
| | Egyptian Kuwaiti Holding Co. | 629,354 | 800 |
| | Egyptian Co. for Mobile Services | 30,416 | 732 |
| | Telecom Egypt | 261,840 | 720 |
| * | Talaat Moustafa Group | 1,103,040 | 670 |
| | National Societe Generale Bank SAE | 86,411 | 538 |
9
| | | |
| Vanguard® FTSE All-World ex-US Index Fund | | |
| Schedule of Investments | | |
| April 30, 2011 | | |
| | | | Market |
| | | | Value |
| | | Shares | ($000) |
| * | Ezz Steel | 305,708 | 412 |
| * | ElSwedy Electric Co. | 46,186 | 327 |
| | Sidi Kerir Petrochemcials Co. | 114,979 | 257 |
| | South Valley Cement | 331,529 | 245 |
| * | Oriental Weavers | 34,103 | 181 |
| | Delta Sugar Co. | 50,749 | 177 |
| * | Egyptian Iron & Steel Co. | 147,028 | 173 |
| * | Medinet Nasr Housing | 27,400 | 105 |
| | Credit Agricole Egypt SAE | 54,033 | 98 |
| | Heliopolis Housing | 15,000 | 49 |
| * | Asek Co. for Mining | 2,000 | 4 |
| | | | 13,612 |
| Finland (0.7%) | | |
| ^ | Nokia Oyj | 2,919,085 | 26,892 |
| | Sampo Oyj | 438,062 | 14,748 |
| | Fortum Oyj | 346,936 | 11,945 |
| | UPM-Kymmene Oyj | 405,361 | 8,315 |
| | Kone Oyj Class B | 132,457 | 8,296 |
| | Metso Oyj | 115,429 | 7,089 |
| | Wartsila Oyj | 152,653 | 6,001 |
| ^ | Stora Enso Oyj | 472,158 | 5,692 |
| | Nokian Renkaat Oyj | 97,682 | 5,062 |
| | Kesko Oyj Class B | 50,568 | 2,624 |
| | Neste Oil Oyj | 114,388 | 2,165 |
| | Rautaruukki Oyj | 81,312 | 2,110 |
| | Outokumpu Oyj | 107,343 | 1,788 |
| | Sanoma Oyj | 38,003 | 790 |
| | | | 103,517 |
| France (7.7%) | | |
| | Total SA | 1,744,417 | 111,715 |
| | Sanofi-Aventis SA | 1,016,630 | 80,433 |
| | BNP Paribas | 814,210 | 64,367 |
| ^ | GDF Suez | 1,318,034 | 53,894 |
| | LVMH Moet Hennessy Louis Vuitton SA | 286,958 | 51,520 |
| ^ | AXA SA | 1,812,953 | 40,643 |
| | Societe Generale | 577,845 | 38,616 |
| ^ | Schneider Electric SA | 211,049 | 37,287 |
| | Danone | 506,129 | 37,057 |
| | France Telecom SA | 1,551,760 | 36,365 |
| | ArcelorMittal | 899,079 | 33,226 |
| | Air Liquide SA | 221,004 | 32,654 |
| ^ | Vivendi SA | 965,791 | 30,282 |
| ^ | L'Oreal SA | 234,837 | 29,769 |
| | Cie de St-Gobain | 415,011 | 28,636 |
| | Vinci SA | 423,041 | 28,239 |
| | Carrefour SA | 531,250 | 25,172 |
| | Pernod-Ricard SA | 204,361 | 20,527 |
| ^ | Unibail-Rodamco SE | 71,384 | 16,701 |
| | Alstom SA | 229,547 | 15,262 |
| | Cie Generale d'Optique Essilor International SA | 166,157 | 13,913 |
| | PPR | 74,184 | 13,263 |
| | Veolia Environnement SA | 389,142 | 12,997 |
| | Credit Agricole SA | 747,760 | 12,438 |
| | Lafarge SA | 166,345 | 11,778 |
| * | Alcatel-Lucent | 1,809,185 | 11,723 |
| | Vallourec SA | 92,320 | 11,518 |
| ^ | Bouygues SA | 214,462 | 10,673 |
| * | Renault SA | 172,387 | 10,497 |
| | Cie Generale des Etablissements Michelin Class B | 102,833 | 10,307 |
| | Technip SA | 85,593 | 9,657 |
| | Christian Dior SA | 56,726 | 9,100 |
| | EDF SA | 201,253 | 8,465 |
| | Accor SA | 178,467 | 7,931 |
| * | European Aeronautic Defence and Space Co. NV | 256,165 | 7,926 |
10
| | | |
| Vanguard® FTSE All-World ex-US Index Fund | | |
| Schedule of Investments | | |
| April 30, 2011 | | |
| | | | Market |
| | | | Value |
| | | Shares | ($000) |
| | Hermes International | 33,006 | 7,730 |
| | Cap Gemini SA | 120,983 | 7,328 |
| | Sodexo | 91,524 | 7,130 |
| | Legrand SA | 152,452 | 6,961 |
| | SES SA | 260,198 | 6,833 |
| | Suez Environnement Co. | 287,548 | 6,625 |
| ^ | Safran SA | 163,249 | 6,333 |
| | Publicis Groupe SA | 111,678 | 6,327 |
| | STMicroelectronics NV | 530,918 | 6,283 |
| * | Peugeot SA | 136,572 | 6,198 |
| | Edenred | 175,677 | 5,447 |
| | Lagardere SCA | 103,429 | 4,541 |
| | SCOR SE | 147,492 | 4,502 |
| * | Cie Generale de Geophysique - Veritas | 119,014 | 4,193 |
| * | Natixis | 689,571 | 3,964 |
| | Dassault Systemes SA | 46,767 | 3,803 |
| | Bureau Veritas SA | 42,890 | 3,699 |
| ^ | Casino Guichard Perrachon SA | 34,979 | 3,680 |
| ^ | Eiffage SA | 53,117 | 3,672 |
| * | Atos Origin SA | 54,978 | 3,387 |
| ^ | Eramet | 8,203 | 3,229 |
| | CNP Assurances | 136,541 | 3,133 |
| | Klepierre | 73,223 | 3,009 |
| | Eutelsat Communications SA | 69,453 | 2,997 |
| | Thales SA | 63,219 | 2,792 |
| | Societe BIC SA | 28,593 | 2,780 |
| | Wendel SA | 19,723 | 2,469 |
| | Fonciere Des Regions | 20,983 | 2,381 |
| | Societe Television Francaise 1 | 124,169 | 2,331 |
| | Imerys SA | 30,021 | 2,325 |
| | Aeroports de Paris | 22,961 | 2,201 |
| | Iliad SA | 16,524 | 2,124 |
| * | Air France-KLM | 116,855 | 2,062 |
| | Gecina SA | 14,061 | 2,027 |
| ^ | ICADE | 15,561 | 1,995 |
| | APERAM | 46,025 | 1,938 |
| | Eurazeo | 22,454 | 1,868 |
| * | JCDecaux SA | 51,077 | 1,784 |
| | BioMerieux | 15,826 | 1,721 |
| *,^ | Rexel SA | 58,951 | 1,614 |
| * | Euler Hermes SA | 10,905 | 1,162 |
| ^ | PagesJaunes Groupe | 108,203 | 1,128 |
| | EDF Energies Nouvelles SA | 18,471 | 1,095 |
| | Bollore | 3,894 | 979 |
| ^ | Ciments Francais SA | 8,208 | 867 |
| | Ipsen SA | 14,092 | 552 |
| | | | 1,135,750 |
| Germany (6.0%) | | |
| | Siemens AG | 714,063 | 103,867 |
| *,^ | BASF SE | 721,034 | 74,039 |
| | Daimler AG | 829,016 | 64,072 |
| ^ | Bayer AG | 646,270 | 56,739 |
| ^ | Allianz SE | 351,601 | 55,240 |
| ^ | E.ON AG | 1,488,875 | 50,889 |
| | Deutsche Bank AG | 727,162 | 47,360 |
| | SAP AG | 718,061 | 46,258 |
| | Deutsche Telekom AG | 2,554,808 | 42,221 |
| *,^ | Volkswagen AG Prior Pfd. | 132,710 | 26,120 |
| | Muenchener Rueckversicherungs AG | 147,391 | 24,313 |
| | Bayerische Motoren Werke AG | 234,693 | 22,096 |
| ^ | RWE AG | 307,126 | 20,036 |
| | Linde AG | 98,414 | 17,711 |
| * | MAN SE | 110,009 | 15,326 |
| * | Deutsche Post AG | 703,761 | 13,909 |
11
| | | |
| Vanguard® FTSE All-World ex-US Index Fund | | |
| Schedule of Investments | | |
| April 30, 2011 | | |
| |
| | | | Market |
| | | | Value |
| | | Shares | ($000) |
| | ThyssenKrupp AG | 301,009 | 13,839 |
| | Fresenius Medical Care AG & Co. KGaA | 172,469 | 13,564 |
| | Deutsche Boerse AG | 152,760 | 12,682 |
| | Adidas AG | 163,833 | 12,209 |
| ^ | K&S AG | 149,922 | 12,109 |
| | HeidelbergCement AG | 145,651 | 11,138 |
| | Fresenius SE & Co. KGaA | 100,346 | 10,539 |
| | Infineon Technologies AG | 836,476 | 9,484 |
| ^ | Henkel AG & Co. KGaA Prior Pfd. | 138,680 | 9,454 |
| | Metro AG | 125,992 | 9,247 |
| | Porsche Automobil Holding SE Prior Pfd. | 119,755 | 8,656 |
| * | Continental AG | 62,682 | 6,285 |
| | Lanxess AG | 64,867 | 5,935 |
| | Henkel AG & Co. KGaA | 100,237 | 5,693 |
| | Merck KGaA | 50,049 | 5,300 |
| | GEA Group AG | 142,824 | 5,216 |
| ^ | Beiersdorf AG | 71,501 | 4,657 |
| * | Commerzbank AG | 693,345 | 4,412 |
| | Hochtief AG | 45,184 | 4,281 |
| * | Commerzbank AG | 672,965 | 4,196 |
| *,^ | Volkswagen AG | 23,221 | 4,135 |
| *,^ | Deutsche Lufthansa AG | 178,394 | 4,047 |
| * | QIAGEN NV | 182,499 | 3,902 |
| | Wacker Chemie AG | 12,326 | 3,052 |
| | Hannover Rueckversicherung AG | 47,759 | 2,885 |
| | Salzgitter AG | 35,795 | 2,807 |
| * | TUI AG | 197,395 | 2,520 |
| | Fraport AG Frankfurt Airport Services Worldwide | 28,665 | 2,289 |
| | Celesio AG | 65,053 | 1,580 |
| | Puma AG Rudolf Dassler Sport | 4,518 | 1,506 |
| | Suedzucker AG | 44,913 | 1,385 |
| ^ | SMA Solar Technology AG | 8,422 | 1,004 |
| | Hamburger Hafen und Logistik AG | 20,648 | 1,002 |
| ^ | Generali Deutschland Holding AG | 6,554 | 850 |
| | | | 882,056 |
| Greece (0.2%) | | |
| | OPAP SA | 180,703 | 3,826 |
| | Hellenic Telecommunications Organization SA ADR | 647,453 | 3,788 |
| | National Bank of Greece SA ADR | 2,070,056 | 3,291 |
| | Coca Cola Hellenic Bottling Co. SA | 110,293 | 3,050 |
| | National Bank of Greece SA | 329,856 | 2,551 |
| * | Alpha Bank AE | 406,598 | 2,370 |
| * | EFG Eurobank Ergasias SA | 308,619 | 1,737 |
| | Public Power Corp. SA | 89,608 | 1,483 |
| | Hellenic Petroleum SA | 92,718 | 988 |
| | | | 23,084 |
| Hong Kong (2.3%) | | |
| | Hutchison Whampoa Ltd. | 2,494,000 | 28,523 |
| * | AIA Group Ltd. | 7,040,592 | 23,744 |
| | Sun Hung Kai Properties Ltd. | 1,500,409 | 23,500 |
| | Cheung Kong Holdings Ltd. | 1,354,000 | 21,369 |
| | Hong Kong Exchanges and Clearing Ltd. | 833,600 | 19,063 |
| | Li & Fung Ltd. | 2,372,000 | 12,140 |
| | CLP Holdings Ltd. | 1,412,500 | 11,618 |
| | Swire Pacific Ltd. Class A | 704,000 | 10,775 |
| | Hong Kong & China Gas Co. Ltd. | 4,190,335 | 10,407 |
| | BOC Hong Kong Holdings Ltd. | 3,297,237 | 10,365 |
| | Hongkong Land Holdings Ltd. | 1,352,335 | 10,142 |
| | Jardine Matheson Holdings Ltd. | 200,800 | 9,659 |
| | Hang Seng Bank Ltd. | 592,600 | 9,262 |
| | Power Assets Holdings Ltd. | 1,254,000 | 8,781 |
| | Wharf Holdings Ltd. | 1,195,275 | 8,771 |
| | Hang Lung Properties Ltd. | 1,760,000 | 7,848 |
| | Bank of East Asia Ltd. | 1,582,400 | 6,552 |
12
| | | |
| Vanguard® FTSE All-World ex-US Index Fund | | |
| Schedule of Investments | | |
| April 30, 2011 | | |
| | | | Market |
| | | | Value |
| | | Shares | ($000) |
| | Henderson Land Development Co. Ltd. | 896,466 | 6,153 |
| | Hang Lung Group Ltd. | 820,000 | 5,526 |
| | Link REIT | 1,731,843 | 5,458 |
| * | Sands China Ltd. | 1,860,400 | 5,228 |
| | MTR Corp. | 1,345,000 | 4,911 |
| | Jardine Strategic Holdings Ltd. | 170,000 | 4,828 |
| | Wynn Macau Ltd. | 1,215,600 | 4,338 |
| | Esprit Holdings Ltd. | 982,696 | 4,101 |
| | New World Development Ltd. | 2,278,000 | 4,009 |
| | Shangri-La Asia Ltd. | 1,370,390 | 3,826 |
| | SJM Holdings Ltd. | 1,670,000 | 3,608 |
| | Sino Land Co. Ltd. | 2,006,000 | 3,538 |
| | Cathay Pacific Airways Ltd. | 1,204,015 | 3,009 |
| | Kerry Properties Ltd. | 550,000 | 2,941 |
| | Hysan Development Co. Ltd. | 606,000 | 2,833 |
| | Wheelock & Co. Ltd. | 625,000 | 2,581 |
| | Xinyi Glass Holdings Ltd. | 2,028,000 | 2,449 |
| | Yue Yuen Industrial Holdings Ltd. | 641,330 | 2,216 |
| | Wing Hang Bank Ltd. | 192,000 | 2,140 |
| | First Pacific Co. Ltd. | 2,215,200 | 2,087 |
| | ASM Pacific Technology Ltd. | 154,100 | 2,076 |
| | AAC Acoustic Technologies Holdings Inc. | 702,000 | 1,839 |
| | PCCW Ltd. | 4,271,000 | 1,696 |
| *,^ | Galaxy Entertainment Group Ltd. | 931,000 | 1,679 |
| | Cheung Kong Infrastructure Holdings Ltd. | 334,000 | 1,629 |
| ^ | VTech Holdings Ltd. | 141,200 | 1,613 |
| | Hopewell Holdings Ltd. | 493,000 | 1,491 |
| | Television Broadcasts Ltd. | 252,000 | 1,481 |
| | Orient Overseas International Ltd. | 193,000 | 1,481 |
| | Lifestyle International Holdings Ltd. | 498,000 | 1,427 |
| | Techtronic Industries Co. | 1,029,500 | 1,408 |
| | Guoco Group Ltd. | 96,000 | 1,209 |
| ^ | Champion REIT | 1,880,000 | 1,090 |
| | NWS Holdings Ltd. | 718,500 | 1,060 |
| | Hongkong & Shanghai Hotels | 563,000 | 993 |
| *,^ | Foxconn International Holdings Ltd. | 1,654,000 | 978 |
| * | Mongolia Energy Corp. Ltd. | 3,891,000 | 917 |
| | Hong Kong Aircraft Engineering Co. Ltd. | 61,200 | 906 |
| | Johnson Electric Holdings Ltd. | 1,328,500 | 816 |
| ^ | Shun Tak Holdings Ltd. | 1,303,000 | 814 |
| | Great Eagle Holdings Ltd. | 223,000 | 794 |
| | Cafe de Coral Holdings Ltd. | 308,000 | 717 |
| | Dah Sing Financial Holdings Ltd. | 108,900 | 683 |
| | Brightoil Petroleum Holdings Ltd. | 1,547,000 | 682 |
| ^ | Melco International Development Ltd. | 770,000 | 655 |
| | Texwinca Holdings Ltd. | 548,000 | 618 |
| | Chinese Estates Holdings Ltd. | 281,500 | 534 |
| | Dah Sing Banking Group Ltd. | 260,920 | 422 |
| | Kowloon Development Co. Ltd. | 311,000 | 409 |
| | Hutchison Harbour Ring Ltd. | 2,988,000 | 343 |
| | Hutchison Telecommunications Hong Kong Holdings Ltd. | 1,035,000 | 327 |
| | Public Financial Holdings Ltd. | 326,000 | 204 |
| * | Henderson Land Development Co. Ltd. Warrants Exp. 06/01/2011 | 134,693 | 4 |
| | | | 341,294 |
| Hungary (0.1%) | | |
| * | MOL Hungarian Oil and Gas plc | 60,359 | 8,436 |
| * | OTP Bank plc | 219,465 | 7,791 |
| | Richter Gedeon Nyrt | 12,105 | 2,533 |
| | Magyar Telekom Telecommunications plc | 306,186 | 1,045 |
| | | | 19,805 |
| India (2.2%) | | |
| | Infosys Technologies Ltd. ADR | 365,242 | 23,806 |
| | ITC Ltd. | 4,465,304 | 19,463 |
| 1 | Reliance Industries Ltd. GDR | 383,293 | 16,903 |
13
| | | |
| Vanguard® FTSE All-World ex-US Index Fund | | |
| Schedule of Investments | | |
| April 30, 2011 | | |
| | | | Market |
| | | | Value |
| | | Shares | ($000) |
| | Housing Development Finance Corp. | 833,939 | 13,341 |
| | Larsen & Toubro Ltd. | 349,641 | 12,634 |
| | ICICI Bank Ltd. ADR | 220,875 | 11,132 |
| | Reliance Industries Ltd. | 489,407 | 10,883 |
| | Bharti Airtel Ltd. | 1,160,592 | 9,986 |
| | HDFC Bank Ltd. ADR | 50,908 | 8,761 |
| | Wipro Ltd. ADR | 551,940 | 7,600 |
| | State Bank of India GDR | 52,722 | 7,235 |
| | Axis Bank Ltd. | 234,469 | 6,828 |
| | Oil & Natural Gas Corp. Ltd. | 916,743 | 6,391 |
| | Tata Consultancy Services Ltd. | 224,698 | 5,925 |
| | Bajaj Auto Ltd. | 166,104 | 5,548 |
| | Hindalco Industries Ltd. | 1,098,354 | 5,377 |
| | Infosys Technologies Ltd. | 81,387 | 5,351 |
| | NTPC Ltd. | 1,262,159 | 5,206 |
| | Bharat Heavy Electricals Ltd. | 112,399 | 5,091 |
| | Hindustan Unilever Ltd. | 672,204 | 4,339 |
| | Jindal Steel & Power Ltd. | 285,923 | 4,242 |
| | Coal India Ltd. | 483,433 | 4,167 |
| | Sterlite Industries India Ltd. | 873,574 | 3,600 |
| | Tata Motors Ltd. | 119,702 | 3,351 |
| | Dr Reddy's Laboratories Ltd. ADR | 83,494 | 3,276 |
| | Cipla Ltd. | 460,896 | 3,231 |
| | GAIL India Ltd. | 291,255 | 3,135 |
| | Mahindra & Mahindra Ltd. | 165,062 | 2,827 |
| | Siemens India Ltd. | 131,674 | 2,582 |
| | Lupin Ltd. | 257,300 | 2,569 |
| | Jaiprakash Associates Ltd. | 1,222,687 | 2,567 |
| | Power Grid Corp. of India Ltd. | 1,063,030 | 2,515 |
| | Grasim Industries Ltd. | 45,120 | 2,502 |
| | Punjab National Bank | 92,381 | 2,480 |
| | Infrastructure Development Finance Co. Ltd. | 743,941 | 2,450 |
| | Tata Steel Ltd. | 169,478 | 2,368 |
| | Sesa Goa Ltd. | 331,347 | 2,358 |
| | Sun Pharmaceutical Industries Ltd. | 222,372 | 2,345 |
| | Titan Industries Ltd. | 25,398 | 2,316 |
| | JSW Steel Ltd. | 107,370 | 2,306 |
| | Hero Honda Motors Ltd. | 59,587 | 2,305 |
| * | Cairn India Ltd. | 282,649 | 2,233 |
| | Kotak Mahindra Bank Ltd. | 226,155 | 2,202 |
| | Ultratech Cement Ltd. | 81,578 | 2,012 |
| | DLF Ltd. | 394,136 | 1,988 |
| | Maruti Suzuki India Ltd. | 66,337 | 1,980 |
| | Nestle India Ltd. | 21,457 | 1,939 |
| | HCL Technologies Ltd. | 156,840 | 1,852 |
| | NMDC Ltd. | 289,832 | 1,793 |
| | Tata Power Co. Ltd. | 60,717 | 1,793 |
| | Steel Authority of India Ltd. | 474,190 | 1,713 |
| | Adani Enterprises Ltd. | 106,284 | 1,505 |
| | Crompton Greaves Ltd. | 245,489 | 1,402 |
| | Reliance Infrastructure Ltd. | 92,465 | 1,382 |
| | Asian Paints Ltd. | 21,952 | 1,379 |
| | Canara Bank | 88,169 | 1,262 |
| | Bank of India | 120,789 | 1,251 |
| | Piramal Healthcare Ltd. | 120,184 | 1,249 |
| | Indian Oil Corp. Ltd. | 159,741 | 1,229 |
| | Cummins India Ltd. | 75,524 | 1,210 |
| * | Reliance Power Ltd. | 403,178 | 1,192 |
| | Tata Chemicals Ltd. | 139,676 | 1,191 |
| | Reliance Capital Ltd. | 92,778 | 1,184 |
| | Ambuja Cements Ltd. | 328,120 | 1,176 |
| * | Tata Communications Ltd. ADR | 108,099 | 1,173 |
| | Rural Electrification Corp. Ltd. | 215,978 | 1,167 |
| | United Spirits Ltd. | 49,346 | 1,158 |
14
| | | |
| Vanguard® FTSE All-World ex-US Index Fund | | |
| Schedule of Investments | | |
| April 30, 2011 | | |
| | | | Market |
| | | | Value |
| | | Shares | ($000) |
| | Unitech Ltd. | 1,380,470 | 1,156 |
| | Exide Industries Ltd. | 324,221 | 1,119 |
| | Bank of Baroda | 52,285 | 1,080 |
| | Reliance Communications Ltd. | 472,822 | 1,071 |
| | Bharat Petroleum Corp. Ltd. | 74,910 | 1,068 |
| | Bajaj Holdings and Investment Ltd. | 58,140 | 1,033 |
| | Union Bank of India | 141,143 | 1,022 |
| | Colgate-Palmolive India Ltd. | 49,834 | 1,020 |
| | Zee Entertainment Enterprises Ltd. | 330,872 | 1,010 |
| | Aditya Birla Nuvo Ltd. | 50,264 | 987 |
| | Bharat Forge Ltd. | 124,839 | 983 |
| | Hindustan Petroleum Corp. Ltd. | 116,253 | 983 |
| | Mundra Port and Special Economic Zone Ltd. | 288,065 | 942 |
| | Ranbaxy Laboratories Ltd. | 89,943 | 932 |
| * | Mahanagar Telephone Nigam ADR | 400,995 | 914 |
| * | Idea Cellular Ltd. | 577,110 | 901 |
| | ICICI Bank Ltd. | 33,085 | 836 |
| | National Aluminium Co. Ltd. | 394,813 | 829 |
| | Dabur India Ltd. | 359,960 | 825 |
| | ACC Ltd. | 31,834 | 802 |
| * | GlaxoSmithKline Pharmaceuticals Ltd. | 15,508 | 793 |
| | HDFC Bank Ltd. | 15,073 | 783 |
| | Divi's Laboratories Ltd. | 48,675 | 779 |
| | Container Corp. Of India | 29,845 | 773 |
| | Mphasis Ltd. | 71,416 | 758 |
| | Cadila Healthcare Ltd. | 37,487 | 734 |
| | NHPC Ltd. | 1,247,760 | 732 |
| | Shriram Transport Finance Co. Ltd. | 41,408 | 727 |
| * | Suzlon Energy Ltd. | 600,007 | 722 |
| | Oriental Bank of Commerce | 90,845 | 711 |
| | Oil India Ltd. | 21,932 | 693 |
| | Bharat Electronics Ltd. | 16,614 | 689 |
| | Indiabulls Financial Services Ltd. | 162,410 | 656 |
| * | GMR Infrastructure Ltd. | 745,467 | 639 |
| * | Housing Development & Infrastructure Ltd. | 173,661 | 633 |
| * | Satyam Computer Services Ltd. | 366,833 | 626 |
| * | Essar Oil Ltd. | 207,237 | 620 |
| | Glenmark Pharmaceuticals Ltd. | 91,245 | 619 |
| | Hindustan Zinc Ltd. | 189,510 | 611 |
| * | Adani Power Ltd. | 210,914 | 538 |
| | IDBI Bank Ltd. | 164,815 | 535 |
| * | Oracle Financial Sevices Software Ltd. | 11,252 | 516 |
| | Great Eastern Shipping Co. Ltd. | 77,788 | 502 |
| | Power Finance Corp. Ltd. | 91,059 | 478 |
| | Godrej Industries Ltd. | 102,084 | 439 |
| | Torrent Power Ltd. | 78,358 | 438 |
| | Ashok Leyland Ltd. | 361,254 | 434 |
| | JSW Energy Ltd. | 250,611 | 423 |
| | Financial Technologies India Ltd. | 19,257 | 376 |
| | Aban Offshore Ltd. | 24,789 | 355 |
| | Castrol India Ltd. | 32,482 | 344 |
| * | Lanco Infratech Ltd. | 381,279 | 343 |
| | Punj Lloyd Ltd. | 211,766 | 320 |
| * | Satyam Computer Services Ltd. ADR | 86,551 | 300 |
| | Corp Bank | 22,522 | 296 |
| | Mangalore Refinery & Petrochemicals Ltd. | 149,186 | 249 |
| | Sun TV Network Ltd. | 24,986 | 241 |
| | ABB Ltd. | 11,814 | 228 |
| | Shipping Corp. of India Ltd. | 67,304 | 170 |
| * | Tata Teleservices Maharashtra Ltd. | 391,536 | 164 |
| | Dr Reddy's Laboratories Ltd. | 3,491 | 132 |
| | Wipro Ltd. | 11,269 | 115 |
| * | Jet Airways India Ltd. | 9,411 | 102 |
| | | | 331,756 |
15
| | | |
| Vanguard® FTSE All-World ex-US Index Fund | | |
| Schedule of Investments | | |
| April 30, 2011 | | |
| | | | Market |
| | | | Value |
| | | Shares | ($000) |
| Indonesia (0.6%) | | |
| | Astra International Tbk PT | 2,353,000 | 15,465 |
| | Bank Central Asia Tbk PT | 9,592,000 | 8,308 |
| | Bank Rakyat Indonesia Persero Tbk PT | 9,583,000 | 7,235 |
| | Telekomunikasi Indonesia Tbk PT | 7,866,000 | 7,090 |
| | Bumi Resources Tbk PT | 16,229,000 | 6,521 |
| | Bank Mandiri Tbk PT | 7,146,478 | 5,977 |
| | United Tractors Tbk PT | 2,040,000 | 5,549 |
| | Perusahaan Gas Negara PT | 7,513,000 | 3,519 |
| | Semen Gresik Persero Tbk PT | 2,293,500 | 2,548 |
| | Adaro Energy Tbk PT | 9,792,276 | 2,528 |
| | Kalbe Farma Tbk PT | 5,810,500 | 2,431 |
| | Unilever Indonesia Tbk PT | 1,220,500 | 2,184 |
| | Gudang Garam Tbk PT | 437,500 | 2,078 |
| | Bank Negara Indonesia Persero Tbk PT | 4,236,644 | 2,007 |
| | Tambang Batubara Bukit Asam Tbk PT | 704,000 | 1,837 |
| | Indofood Sukses Makmur Tbk PT | 2,753,500 | 1,787 |
| | Indocement Tunggal Prakarsa Tbk PT | 856,500 | 1,704 |
| | Indo Tambangraya Megah PT | 259,000 | 1,419 |
| | Charoen Pokphand Indonesia Tbk PT | 6,264,000 | 1,414 |
| | Indosat Tbk PT | 1,700,500 | 1,066 |
| | Bank Danamon Indonesia Tbk PT | 1,341,735 | 974 |
| | Astra Agro Lestari Tbk PT | 357,500 | 970 |
| | International Nickel Indonesia Tbk PT | 1,600,000 | 933 |
| | Aneka Tambang Tbk PT | 3,116,500 | 831 |
| | | | 86,375 |
| Ireland (0.2%) | | |
| | CRH plc | 551,510 | 13,690 |
| | Kerry Group plc Class A | 106,841 | 4,425 |
| * | Elan Corp. plc | 447,671 | 3,599 |
| | Ryanair Holdings plc ADR | 98,308 | 2,997 |
| * | Governor & Co. of the Bank of Ireland | 2,879,174 | 1,172 |
| | Ryanair Holdings plc | 58,749 | 302 |
| * | Anglo Irish Bank Corp. Ltd. | 236,607 | — |
| | | | 26,185 |
| Israel (0.5%) | | |
| | Teva Pharmaceutical Industries Ltd. | 693,979 | 31,886 |
| | Israel Chemicals Ltd. | 414,382 | 7,355 |
| | Bezeq The Israeli Telecommunication Corp. Ltd. | 1,558,159 | 4,629 |
| * | Bank Hapoalim BM | 772,048 | 4,060 |
| | Bank Leumi Le-Israel BM | 447,620 | 2,329 |
| | Israel Corp. Ltd. | 1,805 | 2,250 |
| * | NICE Systems Ltd. | 54,994 | 2,098 |
| | Cellcom Israel Ltd. (Registered) | 37,303 | 1,199 |
| * | Israel Discount Bank Ltd. Class A | 565,200 | 1,196 |
| * | Makhteshim-Agan Industries Ltd. | 216,621 | 1,169 |
| | Partner Communications Co. Ltd. | 58,240 | 1,104 |
| | Elbit Systems Ltd. | 16,328 | 927 |
| | Mizrahi Tefahot Bank Ltd. | 82,131 | 912 |
| | Gazit-Globe Ltd. | 55,853 | 763 |
| * | Delek Drilling - LP | 164,897 | 668 |
| | Osem Investments Ltd. | 33,048 | 578 |
| | Delek Group Ltd. | 1,755 | 467 |
| * | Oil Refineries Ltd. | 536,391 | 402 |
| | Discount Investment Corp. | 19,579 | 400 |
| | Paz Oil Co. Ltd. | 1,964 | 364 |
| | Strauss Group Ltd. | 21,363 | 357 |
| | IDB Holding Corp. Ltd. | 11,488 | 354 |
| | Migdal Insurance & Financial Holding Ltd. | 171,429 | 324 |
| | Clal Industries and Investments Ltd. | 38,102 | 306 |
| * | Koor Industries Ltd. | 12,202 | 297 |
| | Clal Insurance Enterprises Holdings Ltd. | 9,587 | 271 |
| | Harel Insurance Investments & Financial Services Ltd. | 4,300 | 257 |
| | Shufersal Ltd. | 38,964 | 244 |
16
| | | |
| Vanguard® FTSE All-World ex-US Index Fund | | |
| Schedule of Investments | | |
| April 30, 2011 | | |
| |
| | | | Market |
| | | | Value |
| | | Shares | ($000) |
| * | Hot Telecommunication System Ltd. | 12,978 | 234 |
| * | Menorah Mivtachim Holdings Ltd. | 16,132 | 216 |
| | Delek Automotive Systems Ltd. | 16,396 | 212 |
| * | Africa Israel Investments Ltd. | 22,211 | 190 |
| | Ormat Industries | 19,269 | 139 |
| | Property & Building Corp. | 1,142 | 104 |
| | First International Bank Of Israel Ltd. | 5,951 | 92 |
| * | Elbit Imaging Ltd. | 6,450 | 77 |
| * | Given Imaging Ltd. | | — |
| | | | 68,430 |
| Italy (2.2%) | | |
| | ENI SPA | 2,170,156 | 58,103 |
| | Enel SPA | 5,479,164 | 39,074 |
| | UniCredit SPA | 15,088,029 | 38,856 |
| | Assicurazioni Generali SPA | 1,211,848 | 29,041 |
| | Intesa Sanpaolo SPA (Registered) | 6,948,177 | 23,078 |
| | Telecom Italia SPA (Registered) | 10,405,766 | 15,646 |
| | Saipem SPA | 253,926 | 14,423 |
| * | Fiat Industrial SPA | 635,023 | 9,434 |
| | Atlantia SPA | 344,569 | 8,481 |
| | Snam Rete Gas SPA | 1,318,198 | 8,199 |
| | Tenaris SA ADR | 137,850 | 7,001 |
| ^ | Fiat SPA | 611,302 | 6,528 |
| | Telecom Italia SPA (Bearer) | 4,715,827 | 6,081 |
| | Terna Rete Elettrica Nazionale SPA | 1,167,699 | 5,846 |
| | Mediobanca SPA | 496,939 | 5,660 |
| * | Parmalat SPA | 1,340,366 | 5,075 |
| | Finmeccanica SPA | 339,410 | 4,586 |
| | Unione di Banche Italiane SCPA | 497,108 | 4,456 |
| | Mediaset SPA | 668,160 | 4,452 |
| | Banco Popolare SC | 1,360,232 | 4,035 |
| | Luxottica Group SPA | 109,966 | 3,635 |
| | Pirelli & C SPA | 277,110 | 2,885 |
| *,^ | Banca Monte dei Paschi di Siena SPA | 2,105,031 | 2,852 |
| | Tenaris SA | 92,452 | 2,335 |
| | A2A SPA | 1,221,888 | 2,207 |
| ^ | Bulgari SPA | 117,179 | 2,134 |
| | Exor SPA | 58,465 | 2,110 |
| * | Autogrill SPA | 105,856 | 1,518 |
| ^ | Banca Carige SPA | 621,003 | 1,505 |
| | Exor SPA Prior Pfd. | 38,234 | 1,185 |
| ^ | Banca Popolare di Milano Scarl | 336,967 | 1,153 |
| | Buzzi Unicem SPA | 64,063 | 991 |
| | Mediolanum SPA | 164,544 | 967 |
| ^ | Lottomatica SPA | 42,140 | 941 |
| ^ | Italcementi SPA | 72,677 | 797 |
| * | Saras SPA | 304,882 | 766 |
| | Unipol Gruppo Finanziario SPA | 827,082 | 669 |
| | Unipol Gruppo Finanziario SPA Prior Pfd. | 1,052,115 | 652 |
| *,^ | Edison SPA | 424,615 | 526 |
| | Italcementi SPA RSP | 87,604 | 496 |
| | | | 328,379 |
| Japan (12.3%) | | |
| | Toyota Motor Corp. | 1,837,076 | 73,283 |
| | Mitsubishi UFJ Financial Group Inc. | 11,051,037 | 53,040 |
| | Canon Inc. | 1,039,779 | 48,966 |
| | Honda Motor Co. Ltd. | 1,061,113 | 40,794 |
| | Sumitomo Mitsui Financial Group Inc. | 1,102,714 | 34,252 |
| | Komatsu Ltd. | 787,800 | 27,777 |
| | Mitsubishi Corp. | 991,800 | 26,905 |
| | Panasonic Corp. | 2,181,270 | 26,822 |
| | Mizuho Financial Group Inc. | 16,849,099 | 26,695 |
| | Softbank Corp. | 632,400 | 26,685 |
| | NTT DoCoMo Inc. | 13,735 | 25,484 |
17
| | |
| Vanguard® FTSE All-World ex-US Index Fund | | |
| Schedule of Investments | | |
| April 30, 2011 | | |
| |
| | | Market |
| | | Value |
| | Shares | ($000) |
| FANUC Corp. | 140,456 | 23,512 |
| Takeda Pharmaceutical Co. Ltd. | 462,500 | 22,414 |
| Sony Corp. | 778,900 | 21,993 |
| Nintendo Co. Ltd. | 82,800 | 19,592 |
| Mitsui & Co. Ltd. | 1,064,900 | 18,950 |
| Nippon Telegraph & Telephone Corp. | 377,845 | 17,607 |
| KDDI Corp. | 2,627 | 17,538 |
| Nissan Motor Co. Ltd. | 1,761,000 | 16,943 |
| Inpex Corp. | 2,138 | 16,436 |
| Kyocera Corp. | 148,500 | 16,385 |
| Japan Tobacco Inc. | 3,891 | 15,122 |
| Nomura Holdings Inc. | 2,877,600 | 14,700 |
| Hitachi Ltd. | 2,652,288 | 14,396 |
| Mitsubishi Estate Co. Ltd. | 815,000 | 14,262 |
| Mitsubishi Electric Corp. | 1,254,800 | 13,970 |
| Toshiba Corp. | 2,487,000 | 13,243 |
| Tokio Marine Holdings Inc. | 469,600 | 13,137 |
| Shin-Etsu Chemical Co. Ltd. | 251,900 | 13,105 |
| Seven & I Holdings Co. Ltd. | 519,236 | 13,067 |
| East Japan Railway Co. | 233,400 | 12,973 |
| Dai-ichi Life Insurance Co. Ltd. | 7,791 | 12,869 |
| Murata Manufacturing Co. Ltd. | 175,800 | 12,697 |
| Mitsubishi Heavy Industries Ltd. | 2,634,000 | 12,586 |
| Nippon Steel Corp. | 3,970,000 | 12,418 |
| Mitsui Fudosan Co. Ltd. | 686,000 | 11,906 |
| Kansai Electric Power Co. Inc. | 552,400 | 11,635 |
| MS&AD Insurance Group Holdings | 496,815 | 11,634 |
| Denso Corp. | 344,100 | 11,516 |
| Kao Corp. | 419,700 | 10,506 |
| Bridgestone Corp. | 475,200 | 10,495 |
| Astellas Pharma Inc. | 273,400 | 10,442 |
| JX Holdings Inc. | 1,465,200 | 10,319 |
| Sumitomo Corp. | 730,400 | 10,076 |
| JFE Holdings Inc. | 360,000 | 9,854 |
| Chubu Electric Power Co. Inc. | 448,200 | 9,821 |
| ITOCHU Corp. | 923,200 | 9,617 |
| Central Japan Railway Co. | 1,263 | 9,549 |
| FUJIFILM Holdings Corp. | 302,300 | 9,398 |
| Otsuka Holdings Co. Ltd. | 327,500 | 8,769 |
| Asahi Glass Co. Ltd. | 684,600 | 8,692 |
| Keyence Corp. | 32,510 | 8,591 |
| ORIX Corp. | 86,310 | 8,480 |
| NKSJ Holdings Inc. | 1,301,400 | 8,388 |
| Sumitomo Mitsui Trust Holdings Inc. | 2,428,180 | 8,360 |
| Daiichi Sankyo Co. Ltd. | 413,900 | 8,133 |
| Sumitomo Metal Mining Co. Ltd. | 454,000 | 8,106 |
| Kirin Holdings Co. Ltd. | 564,000 | 7,936 |
| Suzuki Motor Corp. | 327,000 | 7,785 |
| Sumitomo Realty & Development Co. Ltd. | 375,000 | 7,762 |
| SMC Corp. | 41,700 | 7,618 |
| Marubeni Corp. | 1,015,000 | 7,415 |
| Nidec Corp. | 84,600 | 7,395 |
| Hoya Corp. | 339,800 | 7,318 |
| Toray Industries Inc. | 960,000 | 7,121 |
| Tokyo Gas Co. Ltd. | 1,588,000 | 7,085 |
| Fujitsu Ltd. | 1,219,000 | 6,984 |
| Terumo Corp. | 124,000 | 6,916 |
| Resona Holdings Inc. | 1,432,773 | 6,793 |
| Secom Co. Ltd. | 136,100 | 6,751 |
| Fast Retailing Co. Ltd. | 41,300 | 6,512 |
| Sumitomo Electric Industries Ltd. | 458,100 | 6,378 |
| Eisai Co. Ltd. | 175,100 | 6,367 |
| Tokyo Electron Ltd. | 107,400 | 6,218 |
| Sharp Corp. | 651,000 | 5,990 |
18
| | | |
| Vanguard® FTSE All-World ex-US Index Fund | | |
| Schedule of Investments | | |
| April 30, 2011 | | |
| | | | Market |
| | | | Value |
| | | Shares | ($000) |
| | Mitsubishi Chemical Holdings Corp. | 878,500 | 5,949 |
| | Sumitomo Metal Industries Ltd. | 2,790,000 | 5,902 |
| | Daiwa Securities Group Inc. | 1,363,000 | 5,883 |
| | Asahi Kasei Corp. | 826,000 | 5,710 |
| | Aeon Co. Ltd. | 461,300 | 5,558 |
| | Nitto Denko Corp. | 103,700 | 5,554 |
| | Daikin Industries Ltd. | 173,400 | 5,523 |
| | Daito Trust Construction Co. Ltd. | 68,200 | 5,456 |
| | Yamada Denki Co. Ltd. | 77,210 | 5,424 |
| | Rohm Co. Ltd. | 89,300 | 5,378 |
| | Asahi Breweries Ltd. | 283,200 | 5,320 |
| | Sumitomo Chemical Co. Ltd. | 997,000 | 5,302 |
| | Omron Corp. | 187,400 | 5,154 |
| | Kyushu Electric Power Co. Inc. | 276,800 | 5,118 |
| | Yahoo Japan Corp. | 13,725 | 5,049 |
| | Tokyo Electric Power Co. Inc. | 929,463 | 4,985 |
| | Dai Nippon Printing Co. Ltd. | 410,000 | 4,918 |
| | Nikon Corp. | 234,500 | 4,915 |
| | T&D Holdings Inc. | 197,300 | 4,872 |
| | Kubota Corp. | 503,000 | 4,823 |
| | Ricoh Co. Ltd. | 436,000 | 4,812 |
| | Osaka Gas Co. Ltd. | 1,271,000 | 4,690 |
| | Ajinomoto Co. Inc. | 415,000 | 4,615 |
| | Kobe Steel Ltd. | 1,834,000 | 4,551 |
| | JS Group Corp. | 188,500 | 4,543 |
| | Olympus Corp. | 159,200 | 4,506 |
| | Hankyu Hanshin Holdings Inc. | 1,015,000 | 4,496 |
| | Nippon Electric Glass Co. Ltd. | 292,500 | 4,429 |
| | Kuraray Co. Ltd. | 303,500 | 4,421 |
| | Isuzu Motors Ltd. | 1,020,000 | 4,375 |
| | Yamato Holdings Co. Ltd. | 270,700 | 4,322 |
| | West Japan Railway Co. | 1,178 | 4,296 |
| | Tohoku Electric Power Co. Inc. | 292,500 | 4,296 |
| | NEC Corp. | 2,006,000 | 4,231 |
| | Daiwa House Industry Co. Ltd. | 346,000 | 4,192 |
| | Aisin Seiki Co. Ltd. | 116,400 | 4,106 |
| | Taisho Pharmaceutical Co. Ltd. | 174,000 | 4,103 |
| | Kawasaki Heavy Industries Ltd. | 980,600 | 4,053 |
| | Bank of Yokohama Ltd. | 807,000 | 3,998 |
| * | Yamaha Motor Co. Ltd. | 207,300 | 3,985 |
| | Yakult Honsha Co. Ltd. | 142,600 | 3,961 |
| * | Mitsubishi Motors Corp. | 3,221,000 | 3,952 |
| | Chugoku Electric Power Co. Inc. | 221,800 | 3,939 |
| | Shiseido Co. Ltd. | 235,500 | 3,917 |
| | TDK Corp. | 75,300 | 3,885 |
| | Mitsui OSK Lines Ltd. | 695,000 | 3,876 |
| | Sekisui House Ltd. | 393,000 | 3,810 |
| | Shizuoka Bank Ltd. | 418,000 | 3,809 |
| | Makita Corp. | 82,300 | 3,784 |
| | Nippon Yusen KK | 1,017,000 | 3,760 |
| | JGC Corp. | 149,000 | 3,730 |
| | Ono Pharmaceutical Co. Ltd. | 71,400 | 3,625 |
| | Fuji Heavy Industries Ltd. | 475,000 | 3,536 |
| | JTEKT Corp. | 272,100 | 3,535 |
| | Odakyu Electric Railway Co. Ltd. | 435,000 | 3,515 |
| | Shikoku Electric Power Co. Inc. | 135,600 | 3,442 |
| | Electric Power Development Co. Ltd. | 130,800 | 3,432 |
| | NGK Insulators Ltd. | 194,000 | 3,366 |
| | Brother Industries Ltd. | 216,100 | 3,309 |
| | Shionogi & Co. Ltd. | 203,400 | 3,297 |
| | Dena Co. Ltd. | 86,600 | 3,251 |
| | JSR Corp. | 153,300 | 3,225 |
| | Toppan Printing Co. Ltd. | 406,000 | 3,191 |
| | Tobu Railway Co. Ltd. | 814,570 | 3,181 |
19
| | | |
| Vanguard® FTSE All-World ex-US Index Fund | | |
| Schedule of Investments | | |
| April 30, 2011 | | |
| |
| | | | Market |
| | | | Value |
| | | Shares | ($000) |
| | Tokyu Corp. | 766,000 | 3,169 |
| | Unicharm Corp. | 79,800 | 3,161 |
| | Toyota Industries Corp. | 103,300 | 3,131 |
| | Ibiden Co. Ltd. | 91,400 | 3,086 |
| | Chiba Bank Ltd. | 514,000 | 3,043 |
| | NTT Data Corp. | 908 | 3,009 |
| ^ | Kintetsu Corp. | 1,003,000 | 3,003 |
| | Chugai Pharmaceutical Co. Ltd. | 179,100 | 2,970 |
| | Oriental Land Co. Ltd. | 34,800 | 2,955 |
| | Shimano Inc. | 54,800 | 2,941 |
| | NSK Ltd. | 322,000 | 2,857 |
| | Dentsu Inc. | 107,400 | 2,856 |
| | Mitsubishi Materials Corp. | 811,000 | 2,815 |
| | Fukuoka Financial Group Inc. | 675,000 | 2,805 |
| | Lawson Inc. | 57,100 | 2,802 |
| | OJI Paper Co. Ltd. | 619,000 | 2,779 |
| | Nomura Research Institute Ltd. | 129,100 | 2,775 |
| | TonenGeneral Sekiyu KK | 223,000 | 2,767 |
| | Konica Minolta Holdings Inc. | 311,000 | 2,739 |
| | THK Co. Ltd. | 106,100 | 2,727 |
| | Teijin Ltd. | 568,000 | 2,722 |
| | Hokuriku Electric Power Co. | 134,200 | 2,722 |
| | Benesse Holdings Inc. | 63,000 | 2,620 |
| | Nippon Express Co. Ltd. | 656,000 | 2,614 |
| | Sekisui Chemical Co. Ltd. | 311,000 | 2,609 |
| | Nissin Foods Holdings Co. Ltd. | 71,800 | 2,545 |
| | Sony Financial Holdings Inc. | 133,000 | 2,472 |
| | Credit Saison Co. Ltd. | 146,164 | 2,451 |
| | Hirose Electric Co. Ltd. | 23,300 | 2,428 |
| | Mazda Motor Corp. | 1,056,000 | 2,425 |
| | Hokkaido Electric Power Co. Inc. | 132,300 | 2,399 |
| | Advantest Corp. | 119,000 | 2,365 |
| | Sumitomo Heavy Industries Ltd. | 357,000 | 2,354 |
| | Trend Micro Inc. | 82,000 | 2,341 |
| | Kurita Water Industries Ltd. | 77,300 | 2,264 |
| | Keikyu Corp. | 324,000 | 2,262 |
| | Isetan Mitsukoshi Holdings Ltd. | 232,140 | 2,241 |
| | Toyo Seikan Kaisha Ltd. | 130,600 | 2,220 |
| | IHI Corp. | 872,000 | 2,219 |
| | Mitsubishi Gas Chemical Co. Inc. | 283,000 | 2,217 |
| | Mitsui Chemicals Inc. | 604,000 | 2,213 |
| | Daihatsu Motor Co. Ltd. | 135,000 | 2,181 |
| | Mitsubishi Tanabe Pharma Corp. | 130,000 | 2,157 |
| | Keio Corp. | 376,000 | 2,112 |
| | Bank of Kyoto Ltd. | 224,000 | 2,076 |
| | Rinnai Corp. | 31,100 | 2,064 |
| | Denki Kagaku Kogyo KK | 401,000 | 2,060 |
| | Nippon Sheet Glass Co. Ltd. | 699,344 | 2,059 |
| | Sankyo Co. Ltd. | 39,100 | 2,033 |
| | FamilyMart Co. Ltd. | 56,000 | 2,033 |
| | Seiko Epson Corp. | 115,500 | 2,010 |
| | Joyo Bank Ltd. | 492,000 | 1,986 |
| | All Nippon Airways Co. Ltd. | 662,000 | 1,946 |
| | Nitori Holdings Co. Ltd. | 22,450 | 1,941 |
| | Shinsei Bank Ltd. | 1,609,000 | 1,935 |
| | Toyota Tsusho Corp. | 115,700 | 1,929 |
| | Stanley Electric Co. Ltd. | 114,500 | 1,924 |
| | Sega Sammy Holdings Inc. | 109,800 | 1,923 |
| | MEIJI Holdings Co. Ltd. | 44,845 | 1,915 |
| | Taiyo Nippon Sanso Corp. | 237,000 | 1,914 |
| | Ube Industries Ltd. | 598,000 | 1,913 |
| | Santen Pharmaceutical Co. Ltd. | 49,200 | 1,903 |
| | Shimizu Corp. | 446,000 | 1,884 |
| | Hamamatsu Photonics KK | 47,800 | 1,881 |
20
| | | |
| Vanguard® FTSE All-World ex-US Index Fund | | |
| Schedule of Investments | | |
| April 30, 2011 | | |
| | | | Market |
| | | | Value |
| | | Shares | ($000) |
| | Hachijuni Bank Ltd. | 315,000 | 1,880 |
| | Sojitz Corp. | 966,300 | 1,865 |
| | Keihan Electric Railway Co. Ltd. | 449,000 | 1,861 |
| | Amada Co. Ltd. | 227,000 | 1,823 |
| | Idemitsu Kosan Co. Ltd. | 15,400 | 1,821 |
| | Obayashi Corp. | 431,000 | 1,818 |
| | Nippon Meat Packers Inc. | 131,000 | 1,815 |
| * | Elpida Memory Inc. | 120,000 | 1,798 |
| | Toho Co. Ltd. | 118,700 | 1,797 |
| | Kyowa Hakko Kirin Co. Ltd. | 180,000 | 1,796 |
| | Nisshin Seifun Group Inc. | 143,000 | 1,790 |
| | Showa Denko KK | 892,000 | 1,780 |
| | SBI Holdings Inc. | 16,140 | 1,740 |
| | Asics Corp. | 119,000 | 1,721 |
| | Yaskawa Electric Corp. | 147,000 | 1,721 |
| | Kajima Corp. | 598,000 | 1,715 |
| | TOTO Ltd. | 218,000 | 1,712 |
| | Japan Steel Works Ltd. | 211,000 | 1,704 |
| | Hokuhoku Financial Group Inc. | 889,000 | 1,697 |
| | Namco Bandai Holdings Inc. | 153,300 | 1,693 |
| ^ | GS Yuasa Corp. | 246,000 | 1,683 |
| | Konami Corp. | 83,800 | 1,670 |
| | Furukawa Electric Co. Ltd. | 419,000 | 1,665 |
| | NOK Corp. | 97,400 | 1,665 |
| | Aeon Mall Co. Ltd. | 69,000 | 1,659 |
| * | Sumco Corp. | 85,800 | 1,655 |
| | Cosmo Oil Co. Ltd. | 501,000 | 1,654 |
| | Ushio Inc. | 81,200 | 1,653 |
| | Don Quijote Co. Ltd. | 44,100 | 1,652 |
| | Taisei Corp. | 699,000 | 1,637 |
| | Hiroshima Bank Ltd. | 374,000 | 1,635 |
| | Minebea Co. Ltd. | 302,000 | 1,634 |
| | Hitachi Chemical Co. Ltd. | 79,000 | 1,628 |
| | Iyo Bank Ltd. | 194,000 | 1,622 |
| | Nippon Shokubai Co. Ltd. | 123,000 | 1,614 |
| | Hitachi Construction Machinery Co. Ltd. | 65,500 | 1,597 |
| | Mitsui Mining & Smelting Co. Ltd. | 446,000 | 1,597 |
| | Gunma Bank Ltd. | 288,000 | 1,559 |
| | Dowa Holdings Co. Ltd. | 237,000 | 1,554 |
| | Hisamitsu Pharmaceutical Co. Inc. | 36,900 | 1,540 |
| | Chugoku Bank Ltd. | 131,000 | 1,527 |
| | Shimadzu Corp. | 175,000 | 1,520 |
| | NTN Corp. | 316,000 | 1,517 |
| | Hitachi Metals Ltd. | 115,000 | 1,515 |
| | Chiyoda Corp. | 152,000 | 1,513 |
| | Kawasaki Kisen Kaisha Ltd. | 449,000 | 1,506 |
| | Toyo Suisan Kaisha Ltd. | 65,000 | 1,497 |
| | Toho Gas Co. Ltd. | 318,000 | 1,489 |
| | Yamaha Corp. | 118,700 | 1,485 |
| | Daido Steel Co. Ltd. | 258,000 | 1,475 |
| | Fujikura Ltd. | 282,000 | 1,461 |
| * | Gree Inc. | 70,100 | 1,444 |
| | Mitsubishi UFJ Lease & Finance Co. Ltd. | 35,860 | 1,434 |
| | Daicel Chemical Industries Ltd. | 218,000 | 1,406 |
| | Nippon Paper Group Inc. | 69,700 | 1,400 |
| | Fuji Electric Co. Ltd. | 444,000 | 1,399 |
| | Kansai Paint Co. Ltd. | 155,000 | 1,398 |
| | Yamaguchi Financial Group Inc. | 154,000 | 1,391 |
| | Nissan Chemical Industries Ltd. | 133,000 | 1,380 |
| | Shimamura Co. Ltd. | 14,600 | 1,375 |
| ^ | Aozora Bank Ltd. | 633,000 | 1,371 |
| | Nagoya Railroad Co. Ltd. | 521,000 | 1,369 |
| | Air Water Inc. | 113,000 | 1,366 |
| | Kamigumi Co. Ltd. | 158,000 | 1,353 |
21
| | | |
| Vanguard® FTSE All-World ex-US Index Fund | | |
| Schedule of Investments | | |
| April 30, 2011 | | |
| | | | Market |
| | | | Value |
| | | Shares | ($000) |
| | Taiyo Yuden Co. Ltd. | 96,000 | 1,352 |
| | Ebara Corp. | 239,000 | 1,348 |
| | USS Co. Ltd. | 17,530 | 1,347 |
| | Tosoh Corp. | 348,000 | 1,346 |
| | Kinden Corp. | 157,000 | 1,338 |
| ^ | Kagome Co. Ltd. | 76,500 | 1,332 |
| | Dainippon Screen Manufacturing Co. Ltd. | 143,000 | 1,328 |
| | J Front Retailing Co. Ltd. | 305,400 | 1,327 |
| | Maruichi Steel Tube Ltd. | 53,200 | 1,324 |
| | Miraca Holdings Inc. | 34,700 | 1,321 |
| | Marui Group Co. Ltd. | 190,700 | 1,317 |
| | Nishi-Nippon City Bank Ltd. | 465,000 | 1,317 |
| | Yokogawa Electric Corp. | 162,500 | 1,317 |
| | Yamato Kogyo Co. Ltd. | 39,800 | 1,314 |
| | Zeon Corp. | 145,000 | 1,310 |
| | Casio Computer Co. Ltd. | 164,200 | 1,306 |
| | NHK Spring Co. Ltd. | 136,000 | 1,293 |
| | Tokyu Land Corp. | 298,000 | 1,287 |
| | Suruga Bank Ltd. | 154,000 | 1,285 |
| | NGK Spark Plug Co. Ltd. | 92,000 | 1,281 |
| | Takashimaya Co. Ltd. | 186,000 | 1,272 |
| | Citizen Holdings Co. Ltd. | 205,800 | 1,246 |
| | DIC Corp. | 519,000 | 1,244 |
| | Kikkoman Corp. | 125,000 | 1,241 |
| | Nisshin Steel Co. Ltd. | 620,000 | 1,238 |
| | MediPal Holdings Corp. | 147,900 | 1,230 |
| | Tsumura & Co. | 39,500 | 1,229 |
| | Keisei Electric Railway Co. Ltd. | 205,000 | 1,189 |
| | Mabuchi Motor Co. Ltd. | 23,900 | 1,186 |
| | Mitsui Engineering & Shipbuilding Co. Ltd. | 469,000 | 1,164 |
| | Mitsubishi Logistics Corp. | 105,000 | 1,161 |
| | Dainippon Sumitomo Pharma Co. Ltd. | 119,400 | 1,148 |
| | Hakuhodo DY Holdings Inc. | 21,720 | 1,137 |
| | Sumitomo Rubber Industries Ltd. | 100,100 | 1,134 |
| | Yamazaki Baking Co. Ltd. | 87,000 | 1,122 |
| | Mizuho Trust & Banking Co. Ltd. | 1,323,000 | 1,119 |
| | Nanto Bank Ltd. | 225,000 | 1,101 |
| | Japan Petroleum Exploration Co. | 22,100 | 1,084 |
| | Alfresa Holdings Corp. | 30,600 | 1,081 |
| | Toyobo Co. Ltd. | 681,000 | 1,076 |
| | Yamatake Corp. | 41,800 | 1,071 |
| | Nippon Paint Co. Ltd. | 149,000 | 1,045 |
| | Wacoal Holdings Corp. | 80,000 | 1,041 |
| | Tokuyama Corp. | 199,000 | 1,035 |
| | Senshu Ikeda Holdings Inc. | 688,400 | 1,028 |
| | Kewpie Corp. | 85,700 | 1,027 |
| | Nabtesco Corp. | 40,000 | 1,024 |
| | Nisshinbo Holdings Inc. | 103,000 | 1,020 |
| | Takata Corp. | 33,500 | 1,018 |
| | Ryohin Keikaku Co. Ltd. | 21,900 | 1,017 |
| | Kaneka Corp. | 139,000 | 1,015 |
| | Sapporo Hokuyo Holdings Inc. | 227,900 | 1,011 |
| | Alps Electric Co. Ltd. | 100,900 | 1,009 |
| | Nippon Kayaku Co. Ltd. | 104,000 | 1,005 |
| | Yokohama Rubber Co. Ltd. | 196,000 | 1,002 |
| | 77 Bank Ltd. | 217,000 | 1,002 |
| | Nishi-Nippon Railroad Co. Ltd. | 229,000 | 990 |
| | UNY Co. Ltd. | 112,900 | 989 |
| ^ | Taiheiyo Cement Corp. | 573,000 | 982 |
| | NTT Urban Development Corp. | 1,181 | 980 |
| | Koito Manufacturing Co. Ltd. | 62,000 | 975 |
| | Ezaki Glico Co. Ltd. | 81,000 | 969 |
| | Ito En Ltd. | 54,500 | 967 |
| | Shimachu Co. Ltd. | 41,400 | 966 |
22
| | | |
| Vanguard® FTSE All-World ex-US Index Fund | | |
| Schedule of Investments | | |
| April 30, 2011 | | |
| | | | Market |
| | | | Value |
| | | Shares | ($000) |
| | Rengo Co. Ltd. | 161,000 | 964 |
| | Tokyo Steel Manufacturing Co. Ltd. | 88,700 | 961 |
| | Tokyo Tatemono Co. Ltd. | 262,000 | 947 |
| | Sumitomo Bakelite Co. Ltd. | 146,000 | 936 |
| | Showa Shell Sekiyu KK | 85,700 | 935 |
| | COMSYS Holdings Corp. | 88,900 | 930 |
| | Lion Corp. | 176,000 | 923 |
| | Toyoda Gosei Co. Ltd. | 42,000 | 918 |
| | OKUMA Corp. | 97,000 | 914 |
| | Glory Ltd. | 41,600 | 914 |
| | Park24 Co. Ltd. | 86,900 | 908 |
| | Mizuho Securities Co. Ltd. | 356,000 | 906 |
| | MISUMI Group Inc. | 35,800 | 903 |
| | Toyota Boshoku Corp. | 57,900 | 902 |
| | Sumitomo Osaka Cement Co. Ltd. | 328,000 | 892 |
| | Sapporo Holdings Ltd. | 220,000 | 884 |
| | Pacific Metals Co. Ltd. | 116,450 | 882 |
| | Kagoshima Bank Ltd. | 129,000 | 867 |
| | Seino Holdings Corp. | 115,000 | 864 |
| | Oracle Corp. Japan | 19,900 | 862 |
| | Aeon Credit Service Co. Ltd. | 63,500 | 861 |
| | Mitsumi Electric Co. Ltd. | 67,100 | 860 |
| | Disco Corp. | 12,500 | 858 |
| | Coca-Cola West Co. Ltd. | 41,400 | 857 |
| | Lintec Corp. | 28,900 | 855 |
| | OSAKA Titanium Technologies Co. | 11,000 | 854 |
| | Nomura Real Estate Holdings Inc. | 55,300 | 854 |
| | Komeri Co. Ltd. | 31,300 | 852 |
| | Suzuken Co. Ltd. | 33,700 | 843 |
| | Sumitomo Forestry Co. Ltd. | 95,500 | 837 |
| | Sawai Pharmaceutical Co. Ltd. | 9,300 | 834 |
| | Shiga Bank Ltd. | 155,000 | 832 |
| | Mori Seiki Co. Ltd. | 64,400 | 829 |
| | Hino Motors Ltd. | 174,000 | 825 |
| | Mochida Pharmaceutical Co. Ltd. | 74,000 | 823 |
| | Sotetsu Holdings Inc. | 299,000 | 820 |
| | Awa Bank Ltd. | 131,000 | 819 |
| | Nichirei Corp. | 184,000 | 808 |
| | Kobayashi Pharmaceutical Co. Ltd. | 16,800 | 790 |
| | Autobacs Seven Co. Ltd. | 21,400 | 787 |
| * | Haseko Corp. | 1,167,000 | 782 |
| | Sysmex Corp. | 22,000 | 771 |
| | Higo Bank Ltd. | 132,000 | 761 |
| | Capcom Co. Ltd. | 40,300 | 749 |
| | Onward Holdings Co. Ltd. | 100,000 | 745 |
| ^ | Promise Co. Ltd. | 86,850 | 742 |
| | Obic Co. Ltd. | 3,930 | 729 |
| | Tokai Carbon Co. Ltd. | 138,000 | 728 |
| | Toda Corp. | 195,000 | 724 |
| | Rohto Pharmaceutical Co. Ltd. | 70,000 | 712 |
| | Matsumotokiyoshi Holdings Co. Ltd. | 33,100 | 703 |
| | Jafco Co. Ltd. | 27,300 | 699 |
| | San-In Godo Bank Ltd. | 94,000 | 697 |
| | ABC-Mart Inc. | 18,600 | 697 |
| | Asatsu-DK Inc. | 26,200 | 687 |
| | Hitachi High-Technologies Corp. | 32,600 | 686 |
| | Hyakugo Bank Ltd. | 157,000 | 684 |
| | Daishi Bank Ltd. | 216,000 | 682 |
| | Itochu Techno-Solutions Corp. | 19,000 | 674 |
| | Hokkoku Bank Ltd. | 197,000 | 666 |
| | Juroku Bank Ltd. | 214,000 | 664 |
| | Nagase & Co. Ltd. | 52,000 | 659 |
| | Acom Co. Ltd. | 44,070 | 646 |
| | Kissei Pharmaceutical Co. Ltd. | 34,000 | 642 |
23
| | | |
| Vanguard® FTSE All-World ex-US Index Fund | | |
| Schedule of Investments | | |
| April 30, 2011 | | |
| | | | Market |
| | | | Value |
| | | Shares | ($000) |
| | Ogaki Kyoritsu Bank Ltd. | 200,000 | 642 |
| | Ulvac Inc. | 28,600 | 640 |
| | House Foods Corp. | 38,700 | 634 |
| | Musashino Bank Ltd. | 19,500 | 618 |
| | Hyakujushi Bank Ltd. | 165,000 | 616 |
| | Takara Holdings Inc. | 125,000 | 608 |
| | Toho Titanium Co. Ltd. | 21,500 | 606 |
| | Izumi Co. Ltd. | 42,200 | 604 |
| | Canon Marketing Japan Inc. | 54,500 | 604 |
| | Aoyama Trading Co. Ltd. | 36,200 | 596 |
| | Otsuka Corp. | 9,400 | 590 |
| | Shima Seiki Manufacturing Ltd. | 22,200 | 589 |
| | Nippon Television Network Corp. | 3,950 | 562 |
| | Circle K Sunkus Co. Ltd. | 36,000 | 556 |
| | Keiyo Bank Ltd. | 112,000 | 551 |
| | Square Enix Holdings Co. Ltd. | 32,600 | 543 |
| | Kansai Urban Banking Corp. | 299,000 | 535 |
| | H2O Retailing Corp. | 73,000 | 531 |
| | Shinko Electric Industries Co. Ltd. | 51,400 | 528 |
| | Kokuyo Co. Ltd. | 69,700 | 515 |
| | Tokai Rika Co. Ltd. | 29,400 | 515 |
| | Nipro Corp. | 24,600 | 502 |
| | Fuji Media Holdings Inc. | 366 | 489 |
| | Kose Corp. | 18,600 | 485 |
| ^ | Nissha Printing Co. Ltd. | 23,600 | 482 |
| | Sundrug Co. Ltd. | 16,900 | 478 |
| | Heiwa Corp. | 29,900 | 462 |
| | IT Holdings Corp. | 45,000 | 443 |
| | Toshiba TEC Corp. | 95,000 | 439 |
| | Tokyo Style Co. Ltd. | 61,000 | 412 |
| | Sohgo Security Services Co. Ltd. | 35,400 | 406 |
| | Hitachi Capital Corp. | 28,000 | 399 |
| | Matsui Securities Co. Ltd. | 78,500 | 387 |
| | Fukuyama Transporting Co. Ltd. | 80,000 | 387 |
| | PanaHome Corp. | 55,000 | 368 |
| | Tokyo Broadcasting System Holdings Inc. | 30,400 | 356 |
| | Toyota Auto Body Co. Ltd. | 19,300 | 342 |
| | Kandenko Co. Ltd. | 62,000 | 321 |
| | Hitachi Transport System Ltd. | 23,100 | 321 |
| | Nidec Sankyo Corp. | 47,000 | 314 |
| | Hitachi Cable Ltd. | 126,000 | 302 |
| | Okasan Securities Group Inc. | 83,000 | 298 |
| | Hitachi Koki Co. Ltd. | 32,300 | 296 |
| | Funai Electric Co. Ltd. | 9,100 | 276 |
| | Tokai Rubber Industries Ltd. | 20,900 | 254 |
| | Sumitomo Real Estate Sales Co. Ltd. | 5,710 | 232 |
| | NS Solutions Corp. | 12,100 | 231 |
| | Point Inc. | 5,050 | 231 |
| | Hikari Tsushin Inc. | 11,600 | 228 |
| | TV Asahi Corp. | 148 | 227 |
| | Monex Group Inc. | 1,126 | 224 |
| | Mizuho Investors Securities Co. Ltd. | 230,000 | 220 |
| | SKY Perfect JSAT Holdings Inc. | 483 | 193 |
| | Toppan Forms Co. Ltd. | 20,700 | 166 |
| | kabu.com Securities Co. Ltd. | 48,800 | 155 |
| * | SFCG Co. Ltd. | 140 | — |
| | | | 1,818,301 |
| Luxembourg (0.0%) | | |
| | RTL Group SA | 11,804 | 1,223 |
| * | L'Occitane International SA | 338,000 | 810 |
| | | | 2,033 |
| Malaysia (0.9%) | | |
| | Malayan Banking Bhd. | 4,281,496 | 12,661 |
| | Public Bank Bhd. (Foreign) | 2,725,408 | 12,060 |
24
| | | |
| Vanguard® FTSE All-World ex-US Index Fund | | |
| Schedule of Investments | | |
| April 30, 2011 | | |
| | | | Market |
| | | | Value |
| | | Shares | ($000) |
| | CIMB Group Holdings Bhd. | 4,346,100 | 12,032 |
| | Sime Darby Bhd. | 3,507,194 | 10,685 |
| | Genting Bhd. | 2,170,600 | 8,512 |
| * | Axiata Group Bhd. | 4,965,937 | 8,226 |
| | IOI Corp. Bhd. | 3,926,365 | 7,020 |
| * | Petronas Chemicals Group Bhd. | 1,891,700 | 4,617 |
| | DiGi.Com Bhd. | 457,434 | 4,498 |
| | AMMB Holdings Bhd. | 1,775,300 | 3,828 |
| | MISC Bhd. | 1,383,640 | 3,648 |
| | Maxis Bhd. | 1,751,900 | 3,179 |
| | Kuala Lumpur Kepong Bhd. | 415,400 | 2,965 |
| | Genting Malaysia Bhd. | 2,274,900 | 2,831 |
| | PPB Group Bhd. | 461,700 | 2,649 |
| | PLUS Expressways Bhd. | 1,578,200 | 2,396 |
| | Petronas Gas Bhd. | 622,700 | 2,368 |
| | IJM Corp. Bhd. | 1,057,620 | 2,215 |
| | Tenaga Nasional Bhd. | 1,032,100 | 2,096 |
| | Gamuda Bhd. | 1,587,900 | 2,006 |
| | SP Setia Bhd. | 1,373,175 | 1,937 |
| | British American Tobacco Malaysia Bhd. | 109,800 | 1,781 |
| | YTL Power International Bhd. | 2,260,302 | 1,725 |
| | UMW Holdings Bhd. | 693,900 | 1,646 |
| | Hong Leong Bank Bhd. | 363,800 | 1,277 |
| | Petronas Dagangan Bhd. | 231,900 | 1,213 |
| | Berjaya Sports Toto Bhd. | 827,257 | 1,180 |
| | Telekom Malaysia Bhd. | 831,800 | 1,121 |
| | RHB Capital Bhd. | 321,700 | 964 |
| | Alliance Financial Group Bhd. | 904,100 | 950 |
| | Parkson Holdings Bhd. | 444,556 | 860 |
| * | UEM Land Holdings Bhd. | 918,500 | 835 |
| | MMC Corp. Bhd. | 901,700 | 817 |
| | Lafarge Malayan Cement Bhd. | 313,210 | 766 |
| | Proton Holdings Bhd. | 220,900 | 258 |
| | Public Bank Bhd. (Local) | 28,231 | 125 |
| | | | 127,947 |
| Mexico (1.1%) | | |
| | America Movil SAB de CV | 17,005,253 | 48,733 |
| | Grupo Mexico SAB de CV Class B | 6,361,446 | 22,027 |
| | Wal-Mart de Mexico SAB de CV | 5,587,300 | 17,502 |
| | Fomento Economico Mexicano SAB de CV | 1,710,100 | 10,763 |
| * | Grupo Televisa SA | 2,199,300 | 10,414 |
| | Grupo Financiero Banorte SAB de CV | 1,813,700 | 9,133 |
| | Telefonos de Mexico SAB de CV | 7,518,380 | 7,060 |
| | Industrias Penoles SAB de CV | 124,359 | 4,842 |
| * | Cemex SAB de CV ADR | 538,480 | 4,674 |
| | Grupo Financiero Inbursa SA | 788,100 | 4,203 |
| | Grupo Modelo SAB de CV | 531,200 | 3,321 |
| | Alfa SAB de CV Class A | 211,370 | 3,166 |
| | Grupo Elektra SA de CV | 55,800 | 2,541 |
| * | Cemex SAB de CV | 2,746,107 | 2,381 |
| | Grupo Bimbo SAB de CV Class A | 1,070,428 | 2,362 |
| * | Minera Frisco SAB de CV | 526,243 | 2,269 |
| | Grupo Carso SAB de CV | 533,800 | 2,076 |
| | Mexichem SAB de CV | 541,629 | 2,058 |
| | Kimberly-Clark de Mexico SAB de CV Class A | 326,780 | 2,022 |
| | Grupo Aeroportuario del Pacifico SAB de CV Class B | 354,295 | 1,474 |
| * | Impulsora del Desarrollo y El Empleo en America Latina SAB de CV | 672,700 | 1,228 |
| | Organizacion Soriana SAB de CV Class B | 289,100 | 997 |
| * | Urbi Desarrollos Urbanos SAB de CV | 396,000 | 949 |
| * | Inmuebles Carso SAB de CV | 502,700 | 568 |
| * | Carso Infraestructura y Construccion SAB de CV | 621,400 | 421 |
| | Grupo Aeroportuario del Pacifico SAB de CV ADR | 64 | 3 |
| | | | 167,187 |
25
| | | |
| Vanguard® FTSE All-World ex-US Index Fund | | |
| Schedule of Investments | | |
| April 30, 2011 | | |
| | | | Market |
| | | | Value |
| | | Shares | ($000) |
| Morocco (0.0%) | | |
| | Maroc Telecom | 136,957 | 2,710 |
| | Douja Promotion Groupe Addoha SA | 103,011 | 1,267 |
| | | | 3,977 |
| Netherlands (1.7%) | | |
| | Unilever NV | 1,211,021 | 39,868 |
| * | ING Groep NV | 3,017,672 | 39,756 |
| | Koninklijke Philips Electronics NV | 768,640 | 22,766 |
| | Koninklijke KPN NV | 1,228,110 | 19,486 |
| | ASML Holding NV | 336,457 | 14,024 |
| | Akzo Nobel NV | 180,492 | 13,995 |
| | Heineken NV | 224,118 | 13,410 |
| | Koninklijke Ahold NV | 932,677 | 13,098 |
| * | Aegon NV | 1,490,691 | 11,849 |
| | Koninklijke DSM NV | 141,825 | 9,776 |
| | Reed Elsevier NV | 569,028 | 7,424 |
| | TNT NV | 294,323 | 7,243 |
| | Fugro NV | 62,464 | 5,726 |
| | Randstad Holding NV | 99,659 | 5,607 |
| | Wolters Kluwer NV | 232,168 | 5,409 |
| | Corio NV | 71,084 | 5,033 |
| | Heineken Holding NV | 90,024 | 4,750 |
| * | SBM Offshore NV | 132,399 | 3,872 |
| | Koninklijke Boskalis Westminster NV | 58,717 | 3,120 |
| | Koninklijke Vopak NV | 40,710 | 1,950 |
| | | | 248,162 |
| New Zealand (0.1%) | | |
| | Fletcher Building Ltd. | 545,437 | 4,066 |
| | Telecom Corp. of New Zealand Ltd. | 1,500,616 | 2,632 |
| | Auckland International Airport Ltd. | 746,992 | 1,344 |
| | Sky City Entertainment Group Ltd. | 454,524 | 1,311 |
| | Contact Energy Ltd. | 245,402 | 1,184 |
| | Fisher & Paykel Healthcare Corp. Ltd. | 414,347 | 1,038 |
| | Sky Network Television Ltd. | 146,427 | 691 |
| | Kiwi Income Property Trust | 817,166 | 682 |
| | Vector Ltd. | 226,009 | 469 |
| | Warehouse Group Ltd. | 112,293 | 333 |
| | Air New Zealand Ltd. | 205,295 | 185 |
| | | | 13,935 |
| Norway (0.7%) | | |
| | Statoil ASA | 995,293 | 29,156 |
| ^ | DnB NOR ASA | 950,232 | 15,451 |
| | Telenor ASA | 644,583 | 11,136 |
| | Yara International ASA | 170,723 | 9,995 |
| | Seadrill Ltd. | 260,780 | 9,252 |
| ^ | Orkla ASA | 802,578 | 8,122 |
| ^ | Norsk Hydro ASA | 798,446 | 7,082 |
| *,^ | Aker Solutions ASA | 162,673 | 3,921 |
| ^ | Storebrand ASA | 351,453 | 3,650 |
| *,^ | Renewable Energy Corp. ASA | 380,122 | 1,343 |
| | | | 99,108 |
| Peru (0.1%) | | |
| | Cia de Minas Buenaventura SA ADR | 143,594 | 5,984 |
| | Credicorp Ltd. | 45,881 | 4,434 |
| | Volcan Cia Minera SAA Class B | 969,379 | 1,063 |
| | Cia de Minas Buenaventura SA | 21,537 | 884 |
| | | | 12,365 |
| Philippines (0.1%) | | |
| | Ayala Land Inc. | 5,116,064 | 1,968 |
| | Bank of the Philippine Islands | 1,377,664 | 1,895 |
| | Manila Electric Co. | 324,850 | 1,861 |
| | SM Investments Corp. | 135,690 | 1,837 |
| | Philippine Long Distance Telephone Co. | 28,050 | 1,631 |
26
| | | |
| Vanguard® FTSE All-World ex-US Index Fund | | |
| Schedule of Investments | | |
| April 30, 2011 | | |
| | | | Market |
| | | | Value |
| | | Shares | ($000) |
| | Aboitiz Equity Ventures Inc. | 1,737,660 | 1,611 |
| | Aboitiz Power Corp. | 1,684,080 | 1,244 |
| | SM Prime Holdings Inc. | 3,437,302 | 965 |
| | Ayala Corp. | 103,240 | 944 |
| | Banco de Oro Unibank Inc. | 726,800 | 923 |
| * | Metropolitan Bank & Trust | 478,131 | 767 |
| | Jollibee Foods Corp. | 285,600 | 631 |
| | Globe Telecom Inc. | 26,850 | 565 |
| | Petron Corp. | 1,307,000 | 423 |
| | | | 17,265 |
| Poland (0.3%) | | |
| | KGHM Polska Miedz SA | 117,591 | 8,650 |
| | Powszechna Kasa Oszczednosci Bank Polski SA | 492,632 | 8,477 |
| * | Polski Koncern Naftowy Orlen SA | 277,222 | 5,778 |
| | Bank Pekao SA | 81,319 | 5,330 |
| | Powszechny Zaklad Ubezpieczen SA | 33,011 | 4,639 |
| | PGE SA | 431,749 | 3,897 |
| ^ | Telekomunikacja Polska SA | 514,373 | 3,400 |
| * | Getin Holding SA | 265,298 | 1,491 |
| | Polskie Gornictwo Naftowe i Gazownictwo SA | 854,140 | 1,251 |
| * | BRE Bank SA | 9,334 | 1,216 |
| | Bank Handlowy w Warszawie SA | 29,067 | 1,095 |
| * | ING Bank Slaski SA | 2,867 | 946 |
| | TVN SA | 132,739 | 880 |
| * | Globe Trade Centre SA | 78,081 | 609 |
| | | | 47,659 |
| Portugal (0.2%) | | |
| | EDP - Energias de Portugal SA | 2,155,297 | 8,805 |
| | Portugal Telecom SGPS SA | 700,249 | 8,569 |
| | Galp Energia SGPS SA Class B | 194,237 | 4,344 |
| | Jeronimo Martins SGPS SA | 193,018 | 3,166 |
| * | Brisa Auto-Estradas de Portugal SA | 357,842 | 2,394 |
| *,^ | Banco Comercial Portugues SA | 2,913,865 | 2,325 |
| * | EDP Renovaveis SA | 197,061 | 1,518 |
| | Cimpor Cimentos de Portugal SGPS SA | 139,383 | 963 |
| ^ | Banco Espirito Santo SA | 215,600 | 908 |
| | Banco BPI SA | 392,577 | 706 |
| | | | 33,698 |
| Russia (1.7%) | | |
| | Gazprom OAO ADR | 3,696,262 | 62,628 |
| | Lukoil OAO ADR | 496,776 | 34,527 |
| | Sberbank of Russia | 6,713,444 | 24,543 |
| | NovaTek OAO | 1,778,690 | 23,239 |
| | MMC Norilsk Nickel OJSC ADR | 599,501 | 16,595 |
| | Rosneft Oil Co. GDR | 1,517,776 | 13,593 |
| | Tatneft ADR | 237,642 | 10,735 |
| | Surgutneftegas OJSC ADR | 573,967 | 6,138 |
| | VTB Bank OJSC GDR | 872,838 | 5,666 |
| | Uralkali | 651,473 | 5,435 |
| | Gazprom Neft JSC | 1,081,166 | 5,426 |
| | Novolipetsk Steel OJSC | 1,378,443 | 5,372 |
| | Mobile Telesystems OJSC | 572,558 | 5,345 |
| * | Federal Hydrogenerating Co. JSC | 88,188,158 | 4,474 |
| | Polyus Gold OJSC ADR | 122,142 | 4,404 |
| * | Polymetal JSC | 177,637 | 3,494 |
| | Sistema JSFC GDR | 111,548 | 3,159 |
| | Severstal OAO GDR | 155,472 | 2,812 |
| * | Federal Grid Co. Unified Energy System JSC | 204,406,667 | 2,700 |
| | Rostelecom OJSC ADR | 58,512 | 2,102 |
| | Mobile Telesystems OJSC ADR | 92,735 | 1,961 |
| * | IDGC Holding JSC | 12,008,894 | 1,826 |
| | Wimm-Bill-Dann Foods OJSC ADR | 50,879 | 1,796 |
| * | Inter Rao Ues OAO | 1,094,890,600 | 1,412 |
27
| | | |
| Vanguard® FTSE All-World ex-US Index Fund | | |
| Schedule of Investments | | |
| April 30, 2011 | | |
| | | | Market |
| | | | Value |
| | | Shares | ($000) |
| * | OGK-4 OJSC | 14,199,000 | 1,264 |
| * | Raspadskaya | 168,900 | 1,124 |
| | Magnitogorsk Iron & Steel Works | 1,095,748 | 1,083 |
| * | TMK OAO | 190,718 | 968 |
| | VTB Bank OJSC | 276,599,217 | 893 |
| | Mosenergo OAO | 8,661,629 | 861 |
| * | WGC-3 OJSC | 14,128,700 | 682 |
| | Aeroflot - Russian Airlines OJSC | 231,082 | 582 |
| * | TGK-1 OAO | 778,059,000 | 475 |
| * | PIK Group | 47,161 | 204 |
| * | RusHydro JSC | 467,678 | 24 |
| * | IDGC Holding JSC New Shares | 68,233 | 10 |
| *,1 | Yenisei Territorial Generating Co. GDR | 5,021 | 9 |
| | | | 257,561 |
| Singapore (1.2%) | | |
| | DBS Group Holdings Ltd. | 1,357,200 | 16,628 |
| | Singapore Telecommunications Ltd. | 6,191,000 | 15,803 |
| | Oversea-Chinese Banking Corp. Ltd. | 1,957,600 | 15,287 |
| | United Overseas Bank Ltd. | 912,460 | 14,640 |
| | Keppel Corp. Ltd. | 1,019,700 | 9,930 |
| | Wilmar International Ltd. | 1,975,284 | 8,513 |
| * | Genting Singapore plc | 4,742,032 | 8,422 |
| | CapitaLand Ltd. | 2,527,998 | 7,031 |
| | Noble Group Ltd. | 3,519,072 | 6,430 |
| | Fraser and Neave Ltd. | 1,148,000 | 5,885 |
| | Singapore Exchange Ltd. | 868,000 | 5,538 |
| | Singapore Airlines Ltd. | 476,670 | 5,491 |
| | City Developments Ltd. | 535,498 | 5,187 |
| | Singapore Press Holdings Ltd. | 1,345,000 | 4,377 |
| | Golden Agri-Resources Ltd. | 6,979,251 | 3,801 |
| | Jardine Cycle & Carriage Ltd. | 111,000 | 3,350 |
| | SembCorp Industries Ltd. | 691,000 | 3,053 |
| | SembCorp Marine Ltd. | 640,600 | 2,973 |
| | Singapore Technologies Engineering Ltd. | 1,141,151 | 2,941 |
| | Olam International Ltd. | 1,226,000 | 2,880 |
| | CapitaMall Trust | 1,822,800 | 2,820 |
| | Ascendas Real Estate Investment Trust | 1,622,000 | 2,694 |
| | ComfortDelGro Corp. Ltd. | 1,879,424 | 2,354 |
| | Yangzijiang Shipbuilding Holdings Ltd. | 1,471,964 | 2,180 |
| | Keppel Land Ltd. | 560,724 | 1,914 |
| | CapitaCommercial Trust | 1,614,235 | 1,902 |
| | UOL Group Ltd. | 436,000 | 1,726 |
| | CapitaMalls Asia Ltd. | 1,185,000 | 1,717 |
| | Venture Corp. Ltd. | 206,000 | 1,625 |
| ^ | Cosco Corp. Singapore Ltd. | 692,000 | 1,260 |
| | Neptune Orient Lines Ltd. | 753,750 | 1,161 |
| | StarHub Ltd. | 492,840 | 1,157 |
| | Singapore Post Ltd. | 1,031,000 | 978 |
| | SMRT Corp. Ltd. | 551,000 | 856 |
| * | Indofood Agri Resources Ltd. | 331,000 | 564 |
| | Wing Tai Holdings Ltd. | 426,000 | 550 |
| | SIA Engineering Co. Ltd. | 155,000 | 528 |
| | Allgreen Properties Ltd. | 536,000 | 517 |
| | M1 Ltd. | 248,900 | 486 |
| | Yanlord Land Group Ltd. | 409,000 | 485 |
| | GuocoLand Ltd. | 203,999 | 416 |
| | Wheelock Properties Singapore Ltd. | 271,000 | 412 |
| | Hotel Properties Ltd. | 136,000 | 267 |
| | STATS ChipPAC Ltd. | 313,000 | 187 |
| * | Golden Agri-Resources Ltd. Warrants Exp. 07/23/2012 | 190,356 | 25 |
| | | | 176,941 |
| South Africa (2.0%) | | |
| | MTN Group Ltd. | 1,466,118 | 32,610 |
| | Sasol Ltd. | 496,974 | 28,718 |
28
| | | |
| Vanguard® FTSE All-World ex-US Index Fund | | |
| Schedule of Investments | | |
| April 30, 2011 | | |
| | | | Market |
| | | | Value |
| | | Shares | ($000) |
| | Standard Bank Group Ltd. | 1,234,206 | 19,384 |
| | Naspers Ltd. | 315,831 | 19,020 |
| | Impala Platinum Holdings Ltd. | 492,477 | 15,401 |
| | AngloGold Ashanti Ltd. | 296,656 | 15,107 |
| | FirstRand Ltd. | 3,254,160 | 10,248 |
| | Gold Fields Ltd. | 569,388 | 10,184 |
| | Sanlam Ltd. | 1,640,161 | 7,035 |
| | Shoprite Holdings Ltd. | 418,011 | 6,598 |
| | Remgro Ltd. | 373,669 | 6,480 |
| | Anglo Platinum Ltd. | 63,373 | 6,449 |
| | Bidvest Group Ltd. | 276,966 | 6,386 |
| | ABSA Group Ltd. | 276,731 | 5,736 |
| | Kumba Iron Ore Ltd. | 75,081 | 5,494 |
| | Harmony Gold Mining Co. Ltd. | 351,475 | 5,396 |
| | Steinhoff International Holdings Ltd. | 1,277,360 | 4,926 |
| | Nedbank Group Ltd. | 203,442 | 4,533 |
| | Vodacom Group Ltd. | 344,093 | 4,214 |
| | Truworths International Ltd. | 358,282 | 4,144 |
| | African Bank Investments Ltd. | 619,718 | 3,618 |
| | Massmart Holdings Ltd. | 161,359 | 3,533 |
| | Growthpoint Properties Ltd. | 1,239,861 | 3,442 |
| | Aspen Pharmacare Holdings Ltd. | 275,362 | 3,399 |
| | RMB Holdings Ltd. | 782,590 | 3,381 |
| | Tiger Brands Ltd. | 111,075 | 3,261 |
| | MMI Holdings Ltd. | 1,174,374 | 3,046 |
| | Woolworths Holdings Ltd. | 652,754 | 2,979 |
| | Imperial Holdings Ltd. | 165,426 | 2,976 |
| | Foschini Group Ltd. | 187,499 | 2,588 |
| | ArcelorMittal South Africa Ltd. | 174,083 | 2,384 |
| * | Sappi Ltd. | 429,728 | 2,344 |
| | Netcare Ltd. | 1,080,154 | 2,332 |
| | Exxaro Resources Ltd. | 81,207 | 2,198 |
| | African Rainbow Minerals Ltd. | 63,656 | 2,073 |
| | Barloworld Ltd. | 175,831 | 1,993 |
| | Spar Group Ltd. | 131,410 | 1,950 |
| | Mr Price Group Ltd. | 189,537 | 1,942 |
| | Nampak Ltd. | 534,031 | 1,825 |
| | Reunert Ltd. | 187,780 | 1,782 |
| | Telkom SA Ltd. | 304,512 | 1,775 |
| | Investec Ltd. | 208,523 | 1,688 |
| | Pretoria Portland Cement Co. Ltd. | 432,334 | 1,648 |
| | Aveng Ltd. | 308,065 | 1,637 |
| | Northam Platinum Ltd. | 238,720 | 1,577 |
| | Clicks Group Ltd. | 211,670 | 1,416 |
| | Discovery Holdings Ltd. | 217,483 | 1,255 |
| | RMI Holdings | 681,778 | 1,232 |
| | Liberty Holdings Ltd. | 111,689 | 1,225 |
| | AVI Ltd. | 259,949 | 1,219 |
| | Adcock Ingram Holdings Ltd. | 128,577 | 1,194 |
| | Tongaat Hulett Ltd. | 78,758 | 1,151 |
| | Aeci Ltd. | 87,794 | 1,149 |
| | Pick n Pay Stores Ltd. | 176,274 | 1,141 |
| | Sun International Ltd. | 81,548 | 1,139 |
| | Mondi Ltd. | 114,766 | 1,104 |
| | Medi-Clinic Corp. Ltd. | 231,675 | 1,022 |
| | JD Group Ltd. | 129,048 | 943 |
| | Murray & Roberts Holdings Ltd. | 239,031 | 917 |
| | Lewis Group Ltd. | 72,272 | 869 |
| | Fountainhead Property Trust | 847,492 | 853 |
| | Illovo Sugar Ltd. | 172,233 | 747 |
| | Santam Ltd. | 36,953 | 732 |
| | JSE Ltd. | 61,328 | 613 |
| | Wilson Bayly Holmes-Ovcon Ltd. | 34,642 | 602 |
| | Grindrod Ltd. | 248,189 | 553 |
29
| | | |
| Vanguard® FTSE All-World ex-US Index Fund | | |
| Schedule of Investments | | |
| April 30, 2011 | | |
| |
| | | | Market |
| | | | Value |
| | | Shares | ($000) |
| | Pick'n Pay Holdings Ltd. | 154,332 | 424 |
| | Allied Technologies Ltd. | 41,309 | 403 |
| * | Evraz Highveld Steel and Vanadium Ltd. | 39,410 | 336 |
| | African Oxygen Ltd. | 108,981 | 307 |
| | Group Five Ltd. | 64,809 | 286 |
| | Mvelaphanda Resources Ltd. | 157,646 | 99 |
| | | | 302,365 |
| South Korea (3.9%) | | |
| 1 | Samsung Electronics Co. Ltd. GDR | 153,461 | 64,064 |
| | Samsung Electronics Co. Ltd. | 38,028 | 31,764 |
| | POSCO ADR | 280,406 | 30,929 |
| | Hyundai Motor Co. | 128,106 | 29,548 |
| | Hyundai Heavy Industries Co. Ltd. | 44,439 | 22,226 |
| | LG Chem Ltd. | 38,822 | 19,287 |
| | Hyundai Mobis | 56,398 | 18,916 |
| | Shinhan Financial Group Co. Ltd. ADR | 177,032 | 17,176 |
| | Kia Motors Corp. | 233,208 | 16,777 |
| | KB Financial Group Inc. ADR | 293,356 | 15,633 |
| | SK Innovation Co. Ltd. | 54,167 | 11,783 |
| | Hynix Semiconductor Inc. | 345,400 | 10,922 |
| | OCI Co. Ltd. | 18,059 | 10,803 |
| | S-Oil Corp. | 64,625 | 9,662 |
| | Samsung C&T Corp. | 118,965 | 8,618 |
| | Samsung Heavy Industries Co. Ltd. | 176,700 | 8,011 |
| | LG Electronics Inc. | 83,031 | 7,993 |
| | Hana Financial Group Inc. | 185,990 | 7,891 |
| | Samsung Fire & Marine Insurance Co. Ltd. | 36,259 | 7,789 |
| | LG Display Co. Ltd. | 205,400 | 7,368 |
| * | NHN Corp. | 36,622 | 7,265 |
| | Samsung Engineering Co. Ltd. | 30,615 | 6,809 |
| | Korea Electric Power Corp. ADR | 549,517 | 6,649 |
| | SK Holdings Co. Ltd. | 35,915 | 6,454 |
| | SK Telecom Co. Ltd. ADR | 321,611 | 6,104 |
| | LG Corp. | 66,146 | 6,090 |
| | KT Corp. ADR | 273,378 | 5,550 |
| | Shinsegae Co. Ltd. | 21,653 | 5,455 |
| | Hyundai Engineering & Construction Co. Ltd. | 63,495 | 5,334 |
| | Samsung SDI Co. Ltd. | 26,196 | 4,694 |
| | Honam Petrochemical Corp. | 12,213 | 4,324 |
| | Samsung Securities Co. Ltd. | 51,240 | 4,284 |
| | Korea Zinc Co. Ltd. | 10,832 | 4,278 |
| | Cheil Industries Inc. | 38,333 | 4,226 |
| | Woori Finance Holdings Co. Ltd. | 308,450 | 4,215 |
| | Samsung Life Insurance Co. Ltd. | 45,922 | 4,169 |
| | Samsung Electro-Mechanics Co. Ltd. | 42,876 | 4,150 |
| | Hyundai Steel Co. | 32,489 | 4,139 |
| | LG Household & Health Care Ltd. | 8,965 | 3,606 |
| | GS Engineering & Construction Corp. | 29,476 | 3,553 |
| | Hankook Tire Co. Ltd. | 87,960 | 3,533 |
| | Amorepacific Corp. | 3,356 | 3,383 |
| | NCSoft Corp. | 12,540 | 3,326 |
| | Samsung Techwin Co. Ltd. | 39,708 | 3,273 |
| | KT&G Corp. | 52,539 | 3,110 |
| | Lotte Shopping Co. Ltd. | 6,495 | 2,962 |
| | Daelim Industrial Co. Ltd. | 25,846 | 2,923 |
| | GS Holdings | 34,660 | 2,906 |
| | Kangwon Land Inc. | 122,810 | 2,792 |
| | LS Corp. | 24,686 | 2,736 |
| | Dongbu Insurance Co. Ltd. | 54,580 | 2,603 |
| | Hanwha Corp. | 55,500 | 2,555 |
| | Hyundai Department Store Co. Ltd. | 17,346 | 2,545 |
| | Daewoo Shipbuilding & Marine Engineering Co. Ltd. | 59,300 | 2,541 |
| | Hanwha Chem Corp. | 53,680 | 2,396 |
| | Doosan Corp. | 19,147 | 2,353 |
30
| | | |
| Vanguard® FTSE All-World ex-US Index Fund | | |
| Schedule of Investments | | |
| April 30, 2011 | | |
| | | | Market |
| | | | Value |
| | | Shares | ($000) |
| | Industrial Bank of Korea | 120,470 | 2,315 |
| | Celltrion Inc. | 66,363 | 2,277 |
| | Daewoo Securities Co. Ltd. | 106,720 | 2,252 |
| | Hyosung Corp. | 26,624 | 2,185 |
| * | BS Financial Group Inc. | 143,740 | 2,092 |
| | Woongjin Coway Co. Ltd. | 59,430 | 1,986 |
| | Hyundai Mipo Dockyard | 11,069 | 1,966 |
| | Doosan Heavy Industries and Construction Co. Ltd. | 32,595 | 1,820 |
| * | Doosan Infracore Co. Ltd. | 64,730 | 1,795 |
| | CJ CheilJedang Corp. | 7,333 | 1,702 |
| | Daegu Bank Ltd. | 101,120 | 1,691 |
| | Hyundai Securities Co. | 130,330 | 1,653 |
| | Hyundai Merchant Marine Co. Ltd. | 53,763 | 1,642 |
| | Korea Exchange Bank | 191,740 | 1,634 |
| | Korean Air Lines Co. Ltd. | 26,563 | 1,624 |
| | Korea Investment Holdings Co. Ltd. | 40,740 | 1,600 |
| | SK C&C Co. Ltd. | 15,257 | 1,569 |
| | Hyundai Development Co. | 56,440 | 1,546 |
| | Woori Investment & Securities Co. Ltd. | 71,610 | 1,438 |
| | Samsung Card Co. | 28,427 | 1,412 |
| ^ | Dongkuk Steel Mill Co. Ltd. | 34,580 | 1,379 |
| | Korea Life Insurance Co. Ltd. | 198,770 | 1,373 |
| | Shinhan Financial Group Co. Ltd. | 27,661 | 1,357 |
| | STX Offshore & Shipbuilding Co. Ltd. | 44,810 | 1,323 |
| | KCC Corp. | 3,796 | 1,287 |
| | Hanjin Shipping Co. Ltd. | 47,449 | 1,235 |
| | Lotte Confectionery Co. Ltd. | 781 | 1,156 |
| | AMOREPACIFIC Group | 5,833 | 1,149 |
| ^ | Daewoo International Corp. | 28,843 | 1,122 |
| | LG Uplus Corp. | 182,230 | 1,107 |
| | Samsung Fine Chemicals Co. Ltd. | 14,600 | 1,082 |
| | Yuhan Corp. | 8,045 | 1,077 |
| | S1 Corp. | 20,830 | 1,017 |
| * | Daewoo Engineering & Construction Co. Ltd. | 95,429 | 1,017 |
| | Daum Communications Corp. | 9,864 | 1,011 |
| * | Hanjin Heavy Industries & Construction Co. Ltd. | 25,792 | 940 |
| | STX Corp. Co. Ltd. | 37,045 | 924 |
| | Hyundai Hysco | 20,850 | 851 |
| * | Korea Express Co. Ltd. | 8,632 | 850 |
| | KB Financial Group Inc. | 15,684 | 841 |
| | NongShim Co. Ltd. | 3,516 | 818 |
| | Cheil Worldwide Inc. | 61,790 | 797 |
| | Lotte Chilsung Beverage Co. Ltd. | 715 | 765 |
| | CJ Corp. | 10,097 | 763 |
| | Hyundai Glovis Co. Ltd. | 5,314 | 759 |
| | Halla Climate Control Corp. | 32,630 | 669 |
| | SKC Co. Ltd. | 11,170 | 642 |
| | STX Pan Ocean Co. Ltd. | 76,430 | 620 |
| | SK Networks Co. Ltd. | 55,870 | 619 |
| | Korea Gas Corp. | 17,760 | 567 |
| | Hite Brewery Co. Ltd. | 4,964 | 545 |
| | Daishin Securities Co. Ltd. | 38,520 | 521 |
| | Mirae Asset Securities Co. Ltd. | 11,372 | 461 |
| | KT Corp. | 10,731 | 385 |
| | KEPCO Engineering & Construction Co. Inc. | 5,831 | 381 |
| | LG Hausys Ltd. | 4,342 | 323 |
| | POSCO | 699 | 307 |
| * | Korea Electric Power Corp. | 12,280 | 294 |
| | Hanjin Shipping Holdings Co. Ltd. | 20,539 | 267 |
| | Daishin Securities Co. Ltd. Prior Pfd. | 21,130 | 177 |
| | Lotte Midopa Co. Ltd. | 10,880 | 159 |
| | SK Telecom Co. Ltd. | 745 | 113 |
| | | | 573,694 |
31
| | | |
| Vanguard® FTSE All-World ex-US Index Fund | | |
| Schedule of Investments | | |
| April 30, 2011 | | |
| |
| | | | Market |
| | | | Value |
| | | Shares | ($000) |
| Spain (2.7%) | | |
| | Telefonica SA | 3,586,546 | 96,353 |
| | Banco Santander SA | 6,496,632 | 82,965 |
| | Banco Bilbao Vizcaya Argentaria SA | 3,480,459 | 44,583 |
| | Iberdrola SA | 4,267,672 | 39,576 |
| | Repsol YPF SA | 953,311 | 34,033 |
| | Inditex SA | 195,019 | 17,489 |
| | ACS Actividades de Construccion y Servicios SA | 184,631 | 9,290 |
| | Abertis Infraestructuras SA | 288,989 | 6,846 |
| | Gas Natural SDG SA | 288,730 | 5,937 |
| | Ferrovial SA | 428,899 | 5,914 |
| | Criteria Caixacorp SA | 789,078 | 5,821 |
| | Banco Popular Espanol SA | 805,090 | 4,823 |
| | Banco de Sabadell SA | 1,083,918 | 4,800 |
| | Acerinox SA | 195,492 | 3,927 |
| | Enagas SA | 141,283 | 3,493 |
| | Grifols SA | 165,864 | 3,283 |
| | Iberdrola Renovables SA | 661,259 | 3,026 |
| | Mapfre SA | 694,231 | 2,898 |
| ^ | Indra Sistemas SA | 127,278 | 2,887 |
| * | International Consolidated Airlines Group SA | 717,456 | 2,855 |
| | Red Electrica Corp. SA | 44,618 | 2,843 |
| | Acciona SA | 20,407 | 2,374 |
| | Endesa SA | 64,715 | 2,256 |
| | Bankinter SA | 276,024 | 2,059 |
| * | Gamesa Corp. Tecnologica SA | 199,565 | 1,875 |
| | Zardoya Otis SA | 105,888 | 1,803 |
| | Corp Financiera Alba | 22,995 | 1,417 |
| ^ | Fomento de Construcciones y Contratas SA | 40,290 | 1,369 |
| * | Gestevision Telecinco SA | 100,527 | 1,130 |
| *,^ | Banco de Valencia SA | 178,143 | 720 |
| ^ | Banco Espanol de Credito SA | 62,761 | 586 |
| *,^ | Banco de Valencia SA Rights Exp. 05/09/2011 | 178,168 | 14 |
| | | | 399,245 |
| Sweden (2.2%) | | |
| ^ | Telefonaktiebolaget LM Ericsson Class B | 2,352,286 | 35,693 |
| | Nordea Bank AB | 2,352,080 | 26,817 |
| | Volvo AB Class B | 1,137,593 | 22,356 |
| ^ | Sandvik AB | 926,737 | 19,647 |
| | Svenska Handelsbanken AB Class A | 480,115 | 16,650 |
| | Skandinaviska Enskilda Banken AB Class A | 1,705,047 | 16,391 |
| ^ | Hennes & Mauritz AB Class B | 454,594 | 16,066 |
| ^ | Atlas Copco AB Class A | 495,846 | 14,563 |
| | Swedbank AB Class A | 741,654 | 14,066 |
| | TeliaSonera AB | 1,695,437 | 13,836 |
| | Volvo AB Class A | 531,046 | 10,404 |
| ^ | SKF AB | 324,871 | 10,257 |
| | Investor AB Class B | 355,904 | 8,865 |
| ^ | Atlas Copco AB Class B | 314,661 | 8,340 |
| | Tele2 AB | 323,208 | 8,117 |
| | Scania AB Class B | 310,818 | 8,075 |
| *,^ | Assa Abloy AB Class B | 268,777 | 8,074 |
| ^ | Svenska Cellulosa AB Class B | 470,956 | 7,220 |
| | Skanska AB Class B | 309,307 | 6,650 |
| | Electrolux AB Class B | 238,203 | 6,062 |
| ^ | Swedish Match AB | 163,864 | 5,816 |
| ^ | Alfa Laval AB | 242,670 | 5,432 |
| ^ | Boliden AB | 210,102 | 4,739 |
| ^ | Industrivarden AB Class A | 206,973 | 4,639 |
| ^ | Getinge AB | 171,374 | 4,559 |
| | Kinnevik Investment AB Class B | 174,311 | 4,501 |
| | Ratos AB | 92,109 | 3,807 |
| | Modern Times Group AB Class B | 45,667 | 3,503 |
| | SSAB AB Class A | 194,739 | 3,480 |
32
| | | |
| Vanguard® FTSE All-World ex-US Index Fund | | |
| Schedule of Investments | | |
| April 30, 2011 | | |
| | | | Market |
| | | | Value |
| | | Shares | ($000) |
| ^ | Securitas AB Class B | 276,964 | 3,471 |
| ^ | Husqvarna AB | 340,300 | 2,677 |
| | Holmen AB | 47,493 | 1,753 |
| | Industrivarden AB | 85,847 | 1,713 |
| | SSAB AB Class B | 61,682 | 965 |
| * | CDON Group AB | 85,612 | 550 |
| *,^ | Scania AB Class A | 16,725 | 430 |
| | | | 330,184 |
| Switzerland (5.3%) | | |
| | Nestle SA | 2,706,429 | 167,984 |
| | Novartis AG | 1,919,685 | 113,838 |
| | Roche Holding AG | 548,784 | 89,078 |
| * | UBS AG | 2,963,326 | 59,304 |
| | ABB Ltd. | 1,814,462 | 50,107 |
| | Credit Suisse Group AG | 926,493 | 42,171 |
| | Zurich Financial Services AG | 115,093 | 32,362 |
| | Cie Financiere Richemont SA | 407,903 | 26,383 |
| | Syngenta AG | 73,761 | 26,086 |
| * | Transocean Ltd. | 248,538 | 18,377 |
| | Swiss Reinsurance Co. Ltd. | 288,864 | 17,235 |
| | Holcim Ltd. | 189,904 | 16,547 |
| | Swatch Group AG (Bearer) | 23,964 | 11,801 |
| | SGS SA | 4,596 | 9,132 |
| | Givaudan SA | 7,232 | 8,047 |
| | Adecco SA | 111,376 | 7,959 |
| | Julius Baer Group Ltd. | 160,194 | 7,497 |
| | Swisscom AG | 16,323 | 7,492 |
| | Kuehne & Nagel International AG | 46,778 | 7,480 |
| | Geberit AG | 31,754 | 7,430 |
| 1 | Synthes Inc. | 37,009 | 6,378 |
| | Swiss Life Holding AG | 25,372 | 4,632 |
| * | Actelion Ltd. | 76,235 | 4,492 |
| * | Baloise Holding AG | 39,200 | 4,338 |
| * | Lindt & Spruengli AG | 108 | 4,022 |
| | Sonova Holding AG | 38,293 | 3,869 |
| | Lonza Group AG | 41,986 | 3,611 |
| | Swatch Group AG (Registered) | 37,184 | 3,303 |
| | GAM Holding AG | 162,153 | 3,196 |
| | Pargesa Holding SA | 29,559 | 3,040 |
| | Schindler Holding AG (Registered) | 22,799 | 2,936 |
| * | Lindt & Spruengli AG | 700 | 2,320 |
| | Nobel Biocare Holding AG | 101,072 | 2,245 |
| | Sika AG | 840 | 2,146 |
| | Schindler Holding AG (Bearer) | 14,876 | 1,925 |
| | Straumann Holding AG | 6,039 | 1,580 |
| * | BKW FMB Energie AG | 11,504 | 765 |
| | EFG International AG | 34,867 | 521 |
| | | | 781,629 |
| Taiwan (2.7%) | | |
| | Taiwan Semiconductor Manufacturing Co. Ltd. ADR | 3,371,028 | 45,509 |
| | HTC Corp. | 633,496 | 28,835 |
| | Hon Hai Precision Industry Co. Ltd. | 7,407,841 | 28,131 |
| | Formosa Plastics Corp. | 4,781,220 | 19,580 |
| | Nan Ya Plastics Corp. | 6,133,370 | 18,839 |
| | Formosa Chemicals & Fibre Corp. | 3,292,210 | 13,313 |
| | Chunghwa Telecom Co. Ltd. ADR | 321,368 | 10,139 |
| | Cathay Financial Holding Co. Ltd. | 5,960,552 | 9,966 |
| | China Steel Corp. | 7,926,051 | 9,815 |
| | MediaTek Inc. | 836,227 | 9,259 |
| | Taiwan Semiconductor Manufacturing Co. Ltd. | 3,435,107 | 8,885 |
| | Fubon Financial Holding Co. Ltd. | 4,897,435 | 7,194 |
| | Chinatrust Financial Holding Co. Ltd. | 7,642,128 | 7,021 |
| * | AU Optronics Corp. ADR | 823,969 | 6,674 |
| | Delta Electronics Inc. | 1,367,818 | 6,123 |
33
| | | |
| Vanguard® FTSE All-World ex-US Index Fund | | |
| Schedule of Investments | | |
| April 30, 2011 | | |
| | | | Market |
| | | | Value |
| | | Shares | ($000) |
| | Mega Financial Holding Co. Ltd. | 6,412,000 | 5,602 |
| * | Chimei Innolux Corp. | 5,174,575 | 5,327 |
| | Formosa Petrochemical Corp. | 1,451,580 | 5,106 |
| | United Microelectronics Corp. ADR | 1,710,611 | 4,858 |
| | Uni-President Enterprises Corp. | 3,281,700 | 4,730 |
| | Advanced Semiconductor Engineering Inc. ADR | 778,581 | 4,594 |
| | Quanta Computer Inc. | 2,200,480 | 4,343 |
| | Asustek Computer Inc. | 479,642 | 4,330 |
| | Yuanta Financial Holding Co. Ltd. | 6,200,845 | 4,316 |
| | Far Eastern New Century Corp. | 2,729,414 | 4,297 |
| | Taiwan Cement Corp. | 2,825,768 | 4,152 |
| | Foxconn Technology Co. Ltd. | 843,254 | 4,043 |
| | Compal Electronics Inc. | 3,383,510 | 3,843 |
| | Acer Inc. | 2,044,822 | 3,836 |
| | Siliconware Precision Industries Co. ADR | 558,248 | 3,785 |
| | Taiwan Mobile Co. Ltd. | 1,425,609 | 3,682 |
| | China Development Financial Holding Corp. | 8,718,353 | 3,658 |
| | First Financial Holding Co. Ltd. | 3,719,780 | 3,451 |
| | President Chain Store Corp. | 596,904 | 3,277 |
| * | MStar Semiconductor Inc. | 370,000 | 3,068 |
| | Hua Nan Financial Holdings Co. Ltd. | 3,798,143 | 3,041 |
| | Synnex Technology International Corp. | 1,150,990 | 2,942 |
| | Taiwan Cooperative Bank | 3,463,740 | 2,909 |
| | Wistron Corp. | 1,495,489 | 2,695 |
| | SinoPac Financial Holdings Co. Ltd. | 5,348,000 | 2,541 |
| | Largan Precision Co. Ltd. | 77,068 | 2,450 |
| | Catcher Technology Co. Ltd. | 389,153 | 2,449 |
| | Chang Hwa Commercial Bank | 2,761,000 | 2,413 |
| | Asia Cement Corp. | 1,764,526 | 2,366 |
| * | Taishin Financial Holding Co. Ltd. | 3,868,338 | 2,280 |
| | Lite-On Technology Corp. | 1,731,723 | 2,196 |
| | Epistar Corp. | 649,000 | 2,158 |
| | Pou Chen Corp. | 2,223,725 | 2,101 |
| | Cheng Shin Rubber Industry Co. Ltd. | 788,667 | 1,994 |
| | Unimicron Technology Corp. | 1,190,975 | 1,965 |
| | Taiwan Glass Industrial Corp. | 1,187,231 | 1,941 |
| * | Shin Kong Financial Holding Co. Ltd. | 4,389,005 | 1,927 |
| | Taiwan Fertilizer Co. Ltd. | 568,000 | 1,916 |
| | Far EasTone Telecommunications Co. Ltd. | 1,235,643 | 1,875 |
| | Yulon Motor Co. Ltd. | 895,898 | 1,867 |
| | Macronix International | 2,584,937 | 1,700 |
| * | Walsin Lihwa Corp. | 2,789,000 | 1,619 |
| | E.Sun Financial Holding Co. Ltd. | 2,203,842 | 1,564 |
| * | Pegatron Corp. | 1,295,038 | 1,370 |
| | United Microelectronics Corp. | 2,534,000 | 1,323 |
| | KGI Securities Co. Ltd. | 2,393,000 | 1,257 |
| | Inventec Co. Ltd. | 2,298,400 | 1,238 |
| | Polaris Securities Co. Ltd. | 1,551,359 | 1,118 |
| * | Evergreen Marine Corp. Taiwan Ltd. | 1,200,000 | 1,112 |
| | Novatek Microelectronics Corp. | 343,916 | 1,054 |
| | Formosa Taffeta Co. Ltd. | 935,000 | 1,014 |
| | Teco Electric and Machinery Co. Ltd. | 1,427,000 | 1,011 |
| | Advantech Co. Ltd. | 284,641 | 944 |
| | Yageo Corp. | 1,713,000 | 930 |
| * | Powerchip Technology Corp. | 4,183,958 | 905 |
| * | Taiwan Business Bank | 2,215,200 | 902 |
| * | Tatung Co. Ltd. | 1,750,794 | 879 |
| | Chicony Electronics Co. Ltd. | 444,931 | 878 |
| | Capital Securities Corp. | 1,799,243 | 878 |
| | Giant Manufacturing Co. Ltd. | 215,625 | 863 |
| * | Inotera Memories Inc. | 1,711,025 | 860 |
| | Coretronic Corp. | 555,386 | 852 |
| * | Nanya Technology Corp. | 1,662,753 | 845 |
| * | China Airlines Ltd. | 1,306,244 | 836 |
34
| | | |
| Vanguard® FTSE All-World ex-US Index Fund | | |
| Schedule of Investments | | |
| April 30, 2011 | | |
| | | | Market |
| | | | Value |
| | | Shares | ($000) |
| * | Yang Ming Marine Transport Corp. | 929,369 | 788 |
| | Feng Hsin Iron & Steel Co. | 421,790 | 771 |
| | Realtek Semiconductor Corp. | 355,939 | 709 |
| | U-Ming Marine Transport Corp. | 322,000 | 698 |
| * | HannStar Display Corp. | 3,902,463 | 688 |
| | Chunghwa Telecom Co. Ltd. | 215,854 | 687 |
| * | Eva Airways Corp. | 732,201 | 675 |
| | Oriental Union Chemical Corp. | 451,083 | 663 |
| | Waterland Financial Holdings Co. Ltd. | 1,340,329 | 639 |
| * | Winbond Electronics Corp. | 1,979,000 | 626 |
| | Eternal Chemical Co. Ltd. | 508,625 | 612 |
| | Nan Ya Printed Circuit Board Corp. | 185,821 | 608 |
| * | Wan Hai Lines Ltd. | 793,050 | 608 |
| * | Ritek Corp. | 2,069,397 | 590 |
| * | Qisda Corp. | 990,640 | 565 |
| * | CMC Magnetics Corp. | 2,276,000 | 554 |
| | Cheng Uei Precision Industry Co. Ltd. | 275,078 | 553 |
| | Far Eastern International Bank | 1,132,483 | 545 |
| | China Motor Corp. | 570,105 | 541 |
| | Yuen Foong Yu Paper Manufacturing Co. Ltd. | 1,150,918 | 535 |
| | D-Link Corp. | 525,870 | 502 |
| | Transcend Information Inc. | 161,455 | 475 |
| | Cathay Real Estate Development Co. Ltd. | 897,000 | 465 |
| | Ton Yi Industrial Corp. | 763,000 | 462 |
| | President Securities Corp. | 687,260 | 457 |
| | Taiwan Secom Co. Ltd. | 219,000 | 421 |
| | Mitac International Corp. | 873,736 | 370 |
| | Micro-Star International Co. Ltd. | 658,929 | 343 |
| * | Chunghwa Picture Tubes | 2,447,130 | 329 |
| * | AU Optronics Corp. | 313,000 | 252 |
| | Faraday Technology Corp. | 167,897 | 250 |
| | Vanguard International Semiconductor Corp. | 476,466 | 245 |
| | Compal Communications Inc. | 222,520 | 190 |
| | Advanced Semiconductor Engineering Inc. | 125,000 | 146 |
| | Siliconware Precision Industries Co. | 98,000 | 131 |
| | LITE-ON IT Corp. | 120,654 | 131 |
| * | Tatung Co. Ltd. GDR | 11,142 | 121 |
| | | | 403,504 |
| Thailand (0.4%) | | |
| | PTT PCL (Foreign) | 564,700 | 7,107 |
| | PTT Exploration & Production PCL (Foreign) | 1,114,972 | 6,920 |
| | Kasikornbank PCL (Foreign) | 958,400 | 4,182 |
| | Siam Commercial Bank PCL (Foreign) | 1,042,186 | 4,056 |
| | Siam Cement PCL (Foreign) | 287,512 | 3,990 |
| | Advanced Info Service PCL (Foreign) | 1,061,250 | 3,296 |
| | Bangkok Bank PCL (Foreign) | 419,597 | 2,395 |
| | CP ALL PCL (Foreign) | 1,502,100 | 2,179 |
| | Charoen Pokphand Foods PCL (Foreign) | 1,947,300 | 1,927 |
| | Bank of Ayudhya PCL(Local) | 1,981,253 | 1,882 |
| | Indorama Ventures PCL | 996,000 | 1,781 |
| | Thai Oil PCL (Foreign) | 612,800 | 1,739 |
| | IRPC PCL (Foreign) | 5,950,900 | 1,238 |
| | TMB Bank PCL | 15,378,000 | 1,195 |
| | PTT Chemical PCL (Foreign) | 218,600 | 1,176 |
| | Krung Thai Bank PCL (Foreign) | 1,740,000 | 1,145 |
| | PTT PCL | 84,500 | 1,064 |
| | PTT Aromatics & Refining PCL (Foreign) | 756,596 | 1,048 |
| | Banpu PCL | 41,500 | 1,039 |
| | Banpu PCL (Local) | 39,600 | 992 |
| | BEC World PCL (Foreign) | 573,400 | 664 |
| | Siam Commercial Bank PCL (Local) | 135,200 | 526 |
| | Land and Houses PCL (Foreign) | 2,192,600 | 489 |
| | Thai Airways International PCL (Foreign) | 364,302 | 468 |
| | Central Pattana PCL | 451,600 | 447 |
35
| | | |
| Vanguard® FTSE All-World ex-US Index Fund | | |
| Schedule of Investments | | |
| April 30, 2011 | | |
| | | | Market |
| | | | Value |
| | | Shares | ($000) |
| | Thai Union Frozen Products PCL (Foreign) | 278,880 | 433 |
| | Electricity Generating PCL (Foreign) | 130,500 | 427 |
| | Total Access Communication PCL (Foreign) | 246,500 | 418 |
| | Siam Makro PCL (Foreign) | 74,500 | 413 |
| | Total Access Communication PCL (Local) | 238,100 | 403 |
| | Airports of Thailand PCL (Foreign) | 324,200 | 402 |
| | Delta Electronics Thai PCL (Foreign) | 339,900 | 299 |
| | PTT Chemical PCL | 52,600 | 283 |
| | Ratchaburi Electricity Generating Holding PCL (Foreign) | 187,700 | 252 |
| | Charoen Pokphand Foods PCL | 253,900 | 251 |
| | CP ALL PCL (Local) | 165,500 | 240 |
| | Siam City Cement PCL (Foreign) | 29,100 | 212 |
| | IRPC PCL | 920,400 | 191 |
| | Krung Thai Bank PCL | 209,800 | 138 |
| | PTT Exploration and Production PCL (Local) | 21,000 | 130 |
| | BEC World PCL | 109,200 | 126 |
| | Bank of Ayudhya PCL (Local) | 128,200 | 124 |
| | Siam City Cement PCL (Local) | 15,500 | 113 |
| | Ratchaburi Electricity Generating Holding PCL (Local) | 81,900 | 110 |
| | Electricity Generating PCL | 33,800 | 107 |
| | Thai Airways International PCL | 61,500 | 79 |
| | | | 58,096 |
| Turkey (0.3%) | | |
| | Turkiye Garanti Bankasi AS | 969,258 | 5,020 |
| | Akbank TAS | 920,645 | 4,786 |
| | KOC Holding AS | 830,049 | 4,462 |
| | Turkiye Is Bankasi | 1,055,659 | 3,733 |
| | Anadolu Efes Biracilik Ve Malt Sanayii AS | 209,685 | 3,220 |
| * | Eregli Demir ve Celik Fabrikalari TAS | 1,045,404 | 3,183 |
| | Turkiye Halk Bankasi AS | 286,192 | 2,481 |
| | Tupras Turkiye Petrol Rafinerileri AS | 72,325 | 2,353 |
| | Turk Telekomunikasyon AS | 407,841 | 2,124 |
| * | Yapi ve Kredi Bankasi AS | 656,089 | 2,063 |
| | BIM Birlesik Magazalar AS | 55,327 | 1,927 |
| * | Turk Hava Yollari | 607,814 | 1,792 |
| | Haci Omer Sabanci Holding AS (Bearer) | 302,607 | 1,620 |
| | Turkiye Vakiflar Bankasi Tao | 550,606 | 1,462 |
| | Enka Insaat ve Sanayi AS | 309,478 | 1,354 |
| | Turkcell Iletisim Hizmetleri AS | 222,566 | 1,316 |
| | Asya Katilim Bankasi AS | 656,750 | 1,301 |
| | Arcelik AS | 150,520 | 853 |
| | Coca-Cola Icecek AS | 51,265 | 771 |
| * | Dogan Sirketler Grubu Holdings | 692,262 | 550 |
| | Ford Otomotiv Sanayi AS | 49,167 | 500 |
| | | | 46,871 |
| United Kingdom (14.0%) | | |
| | HSBC Holdings plc | 13,753,436 | 150,023 |
| | Vodafone Group plc | 40,542,409 | 117,201 |
| | BP plc | 14,717,564 | 113,139 |
| | Royal Dutch Shell plc Class A | 2,770,779 | 107,928 |
| | GlaxoSmithKline plc | 4,051,568 | 88,508 |
| | Rio Tinto plc | 1,192,918 | 87,043 |
| | Royal Dutch Shell plc Class B | 2,122,062 | 82,559 |
| | BHP Billiton plc | 1,706,106 | 72,135 |
| | British American Tobacco plc | 1,559,449 | 68,144 |
| | BG Group plc | 2,631,619 | 67,769 |
| | Anglo American plc | 1,035,883 | 54,301 |
| | AstraZeneca plc | 1,087,078 | 53,939 |
| | Standard Chartered plc | 1,821,741 | 50,630 |
| | Barclays plc | 9,513,753 | 45,229 |
| | Xstrata plc | 1,736,738 | 44,546 |
| | Tesco plc | 6,211,219 | 41,876 |
| | Diageo plc | 1,967,309 | 40,022 |
| | SABMiller plc | 929,376 | 34,720 |
36
| | | |
| Vanguard® FTSE All-World ex-US Index Fund | | |
| Schedule of Investments | | |
| April 30, 2011 | | |
| | | | Market |
| | | | Value |
| | | Shares | ($000) |
| | Unilever plc | 1,022,718 | 33,225 |
| | Reckitt Benckiser Group plc | 566,495 | 31,524 |
| * | Lloyds Banking Group plc | 31,321,163 | 31,098 |
| | National Grid plc | 2,744,153 | 28,156 |
| | Imperial Tobacco Group plc | 794,771 | 28,034 |
| | Prudential plc | 1,974,062 | 25,540 |
| | Centrica plc | 4,018,116 | 21,579 |
| | BT Group plc | 6,048,287 | 19,857 |
| | Tullow Oil plc | 690,909 | 16,577 |
| | Scottish & Southern Energy plc | 729,727 | 16,555 |
| | Aviva plc | 2,193,835 | 16,419 |
| | Rolls-Royce Group plc | 1,464,595 | 15,752 |
| | BAE Systems plc | 2,653,284 | 14,565 |
| | British Sky Broadcasting Group plc | 1,023,106 | 14,408 |
| | Compass Group plc | 1,464,713 | 14,333 |
| | Shire plc | 436,011 | 13,531 |
| | WPP plc | 981,772 | 12,860 |
| | Pearson plc | 634,572 | 12,162 |
| | ARM Holdings plc | 1,050,819 | 10,891 |
| | Experian plc | 781,200 | 10,542 |
| | WM Morrison Supermarkets plc | 2,064,459 | 10,185 |
| | Old Mutual plc | 4,219,958 | 9,837 |
| * | Royal Bank of Scotland Group plc | 13,614,498 | 9,489 |
| | Legal & General Group plc | 4,561,090 | 9,381 |
| | Reed Elsevier plc | 978,117 | 8,665 |
| | J Sainsbury plc | 1,454,156 | 8,470 |
| | Kingfisher plc | 1,822,333 | 8,373 |
| * | Cairn Energy plc | 1,086,025 | 8,217 |
| | Marks & Spencer Group plc | 1,237,559 | 8,041 |
| | Wolseley plc | 220,169 | 7,998 |
| | Land Securities Group plc | 595,794 | 7,832 |
| | Smith & Nephew plc | 691,576 | 7,595 |
| | Burberry Group plc | 338,505 | 7,345 |
| | Antofagasta plc | 307,861 | 7,080 |
| | British Land Co. plc | 693,903 | 6,987 |
| | Smiths Group plc | 303,933 | 6,777 |
| | Standard Life plc | 1,784,051 | 6,761 |
| | Carnival plc | 165,545 | 6,665 |
| | International Power plc | 1,181,002 | 6,537 |
| | Aggreko plc | 214,004 | 6,403 |
| | RSA Insurance Group plc | 2,726,662 | 6,284 |
| * | Randgold Resources Ltd. | 71,152 | 6,187 |
| | Man Group plc | 1,473,269 | 6,165 |
| | Capita Group plc | 481,355 | 5,925 |
| | Resolution Ltd. | 1,138,626 | 5,766 |
| | Johnson Matthey plc | 168,693 | 5,651 |
| | United Utilities Group plc | 529,691 | 5,597 |
| | Next plc | 139,431 | 5,224 |
| | AMEC plc | 257,609 | 5,172 |
| | Associated British Foods plc | 306,260 | 5,158 |
| | Petrofac Ltd. | 203,144 | 5,136 |
| | G4S plc | 1,099,950 | 5,080 |
| * | Autonomy Corp. plc | 187,879 | 5,071 |
| | Intercontinental Hotels Group plc | 228,156 | 5,009 |
| | Sage Group plc | 1,023,746 | 4,885 |
| | Severn Trent plc | 185,757 | 4,670 |
| | Fresnillo plc | 167,427 | 4,614 |
| | Eurasian Natural Resources Corp. plc | 299,386 | 4,588 |
| | Rexam plc | 687,836 | 4,495 |
| | ICAP plc | 515,156 | 4,470 |
| | Admiral Group plc | 156,182 | 4,419 |
| | Lonmin plc | 159,662 | 4,374 |
| | Hammerson plc | 550,151 | 4,325 |
| | Schroders plc | 132,700 | 4,216 |
37
| | | | | |
| Vanguard® FTSE All-World ex-US Index Fund | | | | |
| Schedule of Investments | | | | |
| April 30, 2011 | | | | |
| | | | | | Market |
| | | | | | Value |
| | | | | Shares | ($000) |
| | Vedanta Resources plc | | | 102,948 | 4,020 |
| | Whitbread plc | | | 137,995 | 3,880 |
| * | ITV plc | | | 3,029,145 | 3,858 |
| | Kazakhmys plc | | | 165,537 | 3,845 |
| | Serco Group plc | | | 386,070 | 3,652 |
| | Tate & Lyle plc | | | 365,253 | 3,630 |
| | Inmarsat plc | | | 355,298 | 3,619 |
| | Invensys plc | | | 634,155 | 3,611 |
| | 3i Group plc | | | 760,295 | 3,566 |
| | Cobham plc | | | 896,365 | 3,424 |
| | Capital Shopping Centres Group plc | | | 498,682 | 3,389 |
| | Bunzl plc | | | 256,458 | 3,193 |
| | Segro plc | | | 568,126 | 3,092 |
| | Logica plc | | | 1,265,743 | 2,859 |
| | Aegis Group plc | | | 997,250 | 2,337 |
| | Home Retail Group plc | | | 632,611 | 2,335 |
| * | Rentokil Initial plc | | | 1,449,510 | 2,290 |
| | Hays plc | | | 1,103,476 | 2,198 |
| | Drax Group plc | | | 289,069 | 2,129 |
| | William Hill plc | | | 550,898 | 2,060 |
| | United Business Media Ltd. | | | 191,055 | 1,932 |
| | Thomas Cook Group plc | | | 664,796 | 1,907 |
| | Ladbrokes plc | | | 708,809 | 1,807 |
| | Provident Financial plc | | | 106,934 | 1,802 |
| | Daily Mail & General Trust plc | | | 212,589 | 1,774 |
| | TUI Travel plc | | | 435,416 | 1,746 |
| | Cable & Wireless Worldwide plc | | | 2,129,577 | 1,714 |
| | Cable & Wireless Communications plc | | | 2,053,505 | 1,595 |
| | Schroders plc | | | 48,943 | 1,271 |
| | TalkTalk Telecom Group plc | | | 519,370 | 1,207 |
| | African Barrick Gold Ltd. | | | 95,470 | 842 |
| |
| | | | | | 2,069,023 |
| |
| Total Common Stocks (Cost $12,343,592) | | | | 14,824,409 |
| |
| |
| | | Coupon | | | |
| Temporary Cash Investments (5.6%) | | | | |
| Money Market Fund (5.6%) | | | | |
| 2,3 | Vanguard Market Liquidity Fund | 0.179% | | 830,251,873 | 830,252 |
| |
| |
| | | | | Face | |
| | | | Maturity | Amount | |
| | | | Date | ($000) | |
| U.S. Government and Agency Obligations (0.0%) | | | | |
| 4 | Federal Home Loan Bank Discount Notes | 0.210% | 6/3/11 | 300 | 300 |
| |
| Total Temporary Cash Investments (Cost $830,552) | | | | 830,552 |
| |
| Total Investments (105.6%) (Cost $13,174,144) | | | | 15,654,961 |
| Other Assets and Liabilities—Net (-5.6%)3 | | | | (824,190) |
| Net Assets (100%) | | | | 14,830,771 |
* Non-income-producing security.
^ Part of security position is on loan to broker-dealers. The total value of securities on loan is $788,530,000.
1 Security exempt from registration under Rule 144A of the Securities Act of 1933. Such securities may be sold in transactions exempt from registration, normally to qualified institutional buyers. At April 30, 2011, the aggregate value of these securities was $87,354,000, representing 0.6% of net assets.
2 Affiliated money market fund available only to Vanguard funds and certain trusts and accounts managed by Vanguard. Rate shown is the 7-day yield.
3 Includes $830,252,000 of collateral received for securities on loan.
38
Vanguard® FTSE All-World ex-US Index Fund
Schedule of Investments
April 30, 2011
4 The issuer operates under a congressional charter; its securities are not backed by the full faith and credit of the U.S. government.
ADR—American Depositary Receipt.
GDR—Global Depositary Receipt.
REIT—Real Estate Investment Trust.
39
| | | |
| Vanguard® FTSE All-World ex-US Small-Cap Index Fund | | |
| Schedule of Investments | | |
| April 30, 2011 | | |
| | | | Market |
| | | | Value |
| | | Shares | ($000) |
| Common Stocks (99.3%) | | |
| Australia (5.0%) | | |
| | UGL Ltd. | 112,207 | 1,861 |
| | David Jones Ltd. | 340,187 | 1,742 |
| | Campbell Brothers Ltd. | 34,945 | 1,737 |
| | APA Group | 367,845 | 1,717 |
| * | Atlas Iron Ltd. | 422,254 | 1,631 |
| * | PanAust Ltd. | 1,625,221 | 1,383 |
| | Seek Ltd. | 172,361 | 1,319 |
| * | Mount Gibson Iron Ltd. | 612,647 | 1,271 |
| | Boart Longyear Ltd. | 251,929 | 1,269 |
| | Transfield Services Ltd. | 313,180 | 1,224 |
| ^ | JB Hi-Fi Ltd. | 57,186 | 1,189 |
| | Monadelphous Group Ltd. | 54,696 | 1,155 |
| | Investa Office Fund | 1,505,436 | 1,042 |
| | Mineral Resources Ltd. | 80,836 | 1,036 |
| | Primary Health Care Ltd. | 268,866 | 1,026 |
| | Myer Holdings Ltd. | 282,723 | 982 |
| | GrainCorp Ltd. | 108,595 | 933 |
| | ConnectEast Group | 1,722,747 | 889 |
| | Iress Market Technology Ltd. | 88,401 | 888 |
| | Kingsgate Consolidated Ltd. | 92,880 | 792 |
| 1 | Spark Infrastructure Group | 550,000 | 716 |
| | Independence Group NL | 96,751 | 714 |
| | Medusa Mining Ltd. | 80,044 | 708 |
| * | Perseus Mining Ltd. | 212,089 | 684 |
| | Abacus Property Group | 276,322 | 682 |
| | FKP Property Group | 795,347 | 681 |
| | Invocare Ltd. | 89,648 | 676 |
| | Beach Energy Ltd. | 630,621 | 665 |
| * | Karoon Gas Australia Ltd. | 90,490 | 658 |
| * | Sundance Resources Ltd. | 1,470,851 | 646 |
| | Seven Group Holdings Ltd. | 63,998 | 642 |
| ^ | Western Areas NL | 85,869 | 635 |
| | Bradken Ltd. | 72,299 | 633 |
| | Linc Energy Ltd. | 207,824 | 623 |
| | Navitas Ltd. | 135,891 | 608 |
| * | Mesoblast Ltd. | 63,496 | 568 |
| * | Regis Resources Ltd. | 213,289 | 562 |
| | SAI Global Ltd. | 101,921 | 560 |
| * | Aurora Oil and Gas Ltd. | 191,364 | 559 |
| * | Mirabela Nickel Ltd. | 252,250 | 549 |
| * | CGA Mining Ltd. | 168,871 | 539 |
| | Charter Hall Retail REIT | 143,989 | 507 |
| | Wotif.com Holdings Ltd. | 77,314 | 485 |
| * | AWE Ltd. | 282,857 | 484 |
| * | Centro Retail Group | 1,181,101 | 475 |
| | Emeco Holdings Ltd. | 387,571 | 467 |
| * | Intrepid Mines Ltd. | 231,151 | 465 |
| | BWP Trust | 234,349 | 457 |
| * | Silex Systems Ltd. | 102,076 | 454 |
| *,^ | Virgin Blue Holdings Ltd. | 1,418,331 | 444 |
| * | Pharmaxis Ltd. | 135,282 | 444 |
| * | Bathurst Resources Ltd. | 339,416 | 437 |
| * | Austar United Communications Ltd. | 319,569 | 436 |
| | Cabcharge Australia Ltd. | 70,821 | 426 |
| | NRW Holdings Ltd. | 143,126 | 426 |
| | Minara Resources Ltd. | 494,624 | 420 |
| | Pacific Brands Ltd. | 513,318 | 412 |
| * | St. Barbara Ltd. | 162,666 | 398 |
| * | Transpacific Industries Group Ltd. | 316,472 | 387 |
| * | Coal of Africa Ltd. | 284,162 | 382 |
| *,^ | Gindalbie Metals Ltd. | 341,880 | 378 |
40
| | | |
| Vanguard® FTSE All-World ex-US Small-Cap Index Fund | | |
| Schedule of Investments | | |
| April 30, 2011 | | |
| |
| | | | Market |
| | | | Value |
| | | Shares | ($000) |
| | Oakton Ltd. | 148,607 | 375 |
| | Macmahon Holdings Ltd. | 647,758 | 374 |
| *,^ | Mantra Resources Ltd. | 49,865 | 370 |
| * | Extract Resources Ltd. | 49,148 | 359 |
| * | Coalspur Mines Ltd. | 185,340 | 357 |
| * | Sandfire Resources NL | 44,744 | 352 |
| | Fleetwood Corp. Ltd. | 28,745 | 351 |
| | Charter Hall Group | 128,482 | 350 |
| | GUD Holdings Ltd. | 33,919 | 350 |
| *,^ | White Energy Co. Ltd. | 116,981 | 345 |
| | OM Holdings Ltd. | 249,695 | 325 |
| | Infigen Energy | 646,825 | 317 |
| * | Brockman Resources Ltd. | 55,808 | 313 |
| | Premier Investments Ltd. | 47,479 | 313 |
| | REA Group Ltd. | 20,653 | 312 |
| | Australian Pharmaceutical Industries Ltd. | 883,398 | 305 |
| *,^ | Discovery Metals Ltd. | 216,516 | 302 |
| | Ausdrill Ltd. | 80,142 | 296 |
| | Industrea Ltd. | 180,323 | 296 |
| | Acrux Ltd. | 75,646 | 290 |
| *,^ | Murchison Metals Ltd. | 244,285 | 283 |
| * | Cudeco Ltd. | 73,935 | 279 |
| | Cardno Ltd. | 43,053 | 273 |
| * | Aston Resources Ltd. | 26,002 | 271 |
| *,^ | Arafura Resources Ltd. | 206,149 | 266 |
| * | Carnarvon Petroleum Ltd. | 953,779 | 262 |
| * | Gryphon Minerals Ltd. | 149,823 | 260 |
| | Ardent Leisure Group | 167,435 | 255 |
| * | Mineral Deposits Ltd. | 34,450 | 253 |
| * | Eastern Star Gas Ltd. | 301,181 | 252 |
| | Panoramic Resources Ltd. | 104,845 | 238 |
| * | Tiger Resources Ltd. | 347,814 | 237 |
| * | International Ferro Metals Ltd. | 585,578 | 236 |
| | McMillan Shakespeare Ltd. | 22,075 | 230 |
| | Ramelius Resources Ltd. | 154,659 | 228 |
| * | Beadell Resources Ltd. | 248,074 | 226 |
| | Sigma Pharmaceuticals Ltd. | 552,611 | 225 |
| * | Ampella Mining Ltd. | 91,999 | 218 |
| | Mermaid Marine Australia Ltd. | 63,896 | 218 |
| * | Horizon Oil Ltd. | 479,101 | 208 |
| | Imdex Ltd. | 90,593 | 208 |
| | Automotive Holdings Group | 69,277 | 206 |
| | Austal Ltd. | 60,348 | 205 |
| * | Nexus Energy Ltd. | 432,962 | 205 |
| * | Northern Iron Ltd. | 102,920 | 199 |
| * | Integra Mining Ltd. | 379,907 | 199 |
| | Super Retail Group Ltd. | 25,186 | 199 |
| | Spotless Group Ltd. | 91,549 | 198 |
| | STW Communications Group Ltd. | 155,041 | 197 |
| * | Silver Lake Resources Ltd. | 85,416 | 196 |
| * | Resolute Mining Ltd. | 151,289 | 195 |
| * | PaperlinX Ltd. | 608,852 | 195 |
| * | Kagara Ltd. | 296,246 | 193 |
| * | Energy World Corp. Ltd. | 349,186 | 190 |
| | FlexiGroup Ltd. | 76,771 | 187 |
| * | Rex Minerals Ltd. | 62,042 | 182 |
| | TPG Telecom Ltd. | 97,895 | 181 |
| * | Dart Energy Ltd. | 213,129 | 177 |
| | Clough Ltd. | 203,161 | 176 |
| | Hills Holdings Ltd. | 96,865 | 167 |
| ^ | carsales.com.au Ltd. | 29,331 | 165 |
| | Challenger Diversified Property Group | 275,533 | 165 |
| * | Elders Ltd. | 277,515 | 156 |
| | Reject Shop Ltd. | 12,663 | 154 |
41
| | | |
| Vanguard® FTSE All-World ex-US Small-Cap Index Fund | | |
| Schedule of Investments | | |
| April 30, 2011 | | |
| | | | Market |
| | | | Value |
| | | Shares | ($000) |
| | Alesco Corp. Ltd. | 40,389 | 145 |
| * | Roc Oil Co. Ltd. | 290,223 | 137 |
| * | Skilled Group Ltd. | 59,084 | 136 |
| * | Flinders Mines Ltd. | 762,431 | 134 |
| * | Australian Agricultural Co. Ltd. | 76,591 | 133 |
| * | Conquest Mining Ltd. | 210,497 | 129 |
| * | Deep Yellow Ltd. | 621,391 | 128 |
| * | Saracen Mineral Holdings Ltd. | 164,535 | 127 |
| * | Troy Resources NL | 31,485 | 124 |
| *,^ | Galaxy Resources Ltd. | 104,321 | 124 |
| * | Ausenco Ltd. | 38,665 | 123 |
| * | Adamus Resources Ltd. | 155,860 | 117 |
| * | Indophil Resources NL | 149,535 | 115 |
| | Aspen Group | 212,116 | 110 |
| * | Tap Oil Ltd. | 100,081 | 106 |
| | Mincor Resources NL | 79,370 | 105 |
| * | Biota Holdings Ltd. | 78,962 | 104 |
| | Programmed Maintenance Services Ltd. | 49,299 | 103 |
| * | Straits Resources Ltd. | 103,702 | 101 |
| | WHK Group Ltd. | 97,897 | 98 |
| * | Platinum Australia Ltd. | 160,890 | 90 |
| | Customers Ltd. | 50,751 | 76 |
| | Astro Japan Property Group | 21,370 | 73 |
| * | Equinox Minerals Ltd. | 4,632 | 39 |
| | Hastie Group Ltd. | 98,147 | 20 |
| | | | 65,940 |
| Austria (0.9%) | | |
| | Andritz AG | 22,287 | 2,302 |
| * | Wienerberger AG | 65,157 | 1,393 |
| *,^ | CA Immobilien Anlagen AG | 55,802 | 1,099 |
| | Atrium European Real Estate Ltd. | 152,492 | 1,043 |
| *,^ | Conwert Immobilien Invest SE | 55,230 | 971 |
| | Schoeller-Bleckmann Oilfield Equipment AG | 8,489 | 859 |
| ^ | Semperit AG Holding | 11,898 | 696 |
| ^ | Oesterreichische Post AG | 17,241 | 624 |
| * | RHI AG | 16,929 | 604 |
| ^ | Mayr Melnhof Karton AG | 4,224 | 513 |
| ^ | Flughafen Wien AG | 6,965 | 439 |
| | Kapsch TrafficCom AG | 2,596 | 246 |
| * | Sparkassen Immobilien AG | 28,130 | 214 |
| * | Intercell AG | 18,804 | 170 |
| ^ | Palfinger AG | 4,088 | 169 |
| | BWT AG | 3,018 | 91 |
| | Zumtobel AG | 2,475 | 90 |
| | | | 11,523 |
| Belgium (1.5%) | | |
| | Bekaert SA | 24,532 | 3,069 |
| | Telenet Group Holding NV | 46,134 | 2,293 |
| | Nyrstar | 112,483 | 1,553 |
| | Ackermans & van Haaren NV | 13,704 | 1,434 |
| | D'ieteren SA/NV | 16,503 | 1,199 |
| | Sofina SA | 9,249 | 961 |
| | Cofinimmo | 6,124 | 943 |
| | Befimmo SCA Sicafi | 8,754 | 812 |
| | Sipef SA | 5,826 | 613 |
| | Warehouses De Pauw SCA | 9,424 | 575 |
| | Banque Nationale de Belgique | 104 | 539 |
| | Omega Pharma | 10,079 | 517 |
| * | AGFA-Gevaert NV | 107,640 | 480 |
| | Tessenderlo Chemie NV | 11,364 | 452 |
| | Cie d'Entreprises CFE | 4,942 | 428 |
| * | Barco NV | 4,858 | 424 |
| * | RHJ International | 48,431 | 403 |
| | Cie Maritime Belge SA | 12,807 | 401 |
42
| | | |
| Vanguard® FTSE All-World ex-US Small-Cap Index Fund | | |
| Schedule of Investments | | |
| April 30, 2011 | | |
| |
| | | | Market |
| | | | Value |
| | | Shares | ($000) |
| * | ThromboGenics NV | 11,540 | 359 |
| | EVS Broadcast Equipment SA | 4,867 | 333 |
| | Euronav NV | 16,518 | 277 |
| | Melexis NV | 13,061 | 250 |
| | Van de Velde NV | 3,710 | 224 |
| | Gimv NV | 3,059 | 203 |
| * | KBC Ancora | 6,324 | 123 |
| * | Ion Beam Applications | 8,202 | 97 |
| | Intervest Offices | 2,702 | 92 |
| | Wereldhave Belgium NV | 673 | 70 |
| * | AGFA-Gevaert NV | 15,368 | — |
| | | | 19,124 |
| Brazil (1.8%) | | |
| | Diagnosticos da America SA | 170,589 | 2,290 |
| | CETIP SA - Balcao Organizado de Ativos e Derivativos | 136,159 | 2,238 |
| | Cia Hering | 86,143 | 1,864 |
| | BR Malls Participacoes SA | 165,670 | 1,750 |
| | Anhanguera Educacional Participacoes SA | 77,304 | 1,726 |
| | Gafisa SA | 219,963 | 1,337 |
| | Totvs SA | 62,075 | 1,188 |
| | Rossi Residencial SA | 108,362 | 1,008 |
| | Sul America SA | 76,783 | 999 |
| | Localiza Rent a Car SA | 54,415 | 936 |
| | Odontoprev SA | 45,650 | 729 |
| * | Gol Linhas Aereas Inteligentes SA Prior Pfd. | 51,782 | 719 |
| | Brookfield Incorporacoes SA | 116,756 | 658 |
| | Marcopolo SA Prior Pfd. | 143,808 | 638 |
| | Randon Participacoes SA Prior Pfd. | 84,876 | 636 |
| * | Magnesita Refratarios SA | 108,140 | 574 |
| | Santos Brasil Participacoes SA | 28,860 | 550 |
| | LPS Brasil Consultoria de Imoveis SA | 19,603 | 534 |
| * | MPX Energia SA | 22,400 | 530 |
| | Cia de Saneamento de Minas Gerais-COPASA | 29,598 | 526 |
| | Guararapes Confeccoes SA | 6,748 | 369 |
| | Confab Industrial SA Prior Pfd. | 122,411 | 339 |
| | Contax Participacoes SA Prior Pfd. | 21,153 | 313 |
| | Grendene SA | 48,300 | 285 |
| * | Lupatech SA | 16,300 | 122 |
| * | Cia Energetica do Ceara Prior Pfd. | 5,200 | 113 |
| * | Unipar Participacoes SA Prior Pfd. | 307,000 | 88 |
| | Cia de Tecidos do Norte de Minas - Coteminas Prior Pfd. | 23,200 | 69 |
| | | | 23,128 |
| Canada (13.9%) | | |
| * | Equinox Minerals Ltd. | 483,908 | 4,143 |
| * | Athabasca Oil Sands Corp. | 215,359 | 3,508 |
| * | Sino-Forest Corp. | 140,606 | 3,494 |
| | Metro Inc. Class A | 58,894 | 2,882 |
| | Gildan Activewear Inc. | 71,725 | 2,671 |
| | Onex Corp. | 68,907 | 2,585 |
| | Franco-Nevada Corp. | 64,831 | 2,571 |
| | Vermilion Energy Inc. | 47,819 | 2,567 |
| * | New Gold Inc. | 217,986 | 2,449 |
| * | Consolidated Thompson Iron Mines Ltd. | 130,531 | 2,362 |
| * | Lundin Mining Corp. | 239,632 | 2,345 |
| | Pan American Silver Corp. | 63,176 | 2,279 |
| * | Precision Drilling Corp. | 149,737 | 2,268 |
| | Inmet Mining Corp. | 32,030 | 2,248 |
| | Viterra Inc. | 184,292 | 2,215 |
| | Pembina Pipeline Corp. | 88,943 | 2,167 |
| | Industrial Alliance Insurance & Financial Services Inc. | 50,029 | 2,150 |
| | Emera Inc. | 63,667 | 2,120 |
| | Petrominerales Ltd. | 54,300 | 2,078 |
| | CAE Inc. | 148,771 | 2,005 |
| | H&R Real Estate Investment Trust | 86,445 | 2,001 |
43
| | | |
| Vanguard® FTSE All-World ex-US Small-Cap Index Fund | | |
| Schedule of Investments | | |
| April 30, 2011 | | |
| | | | Market |
| | | | Value |
| | | Shares | ($000) |
| | Trican Well Service Ltd. | 80,046 | 1,973 |
| * | Open Text Corp. | 31,752 | 1,945 |
| ^ | Ritchie Bros Auctioneers Inc. | 61,884 | 1,940 |
| | Alimentation Couche Tard Inc. Class B | 73,193 | 1,922 |
| | TMX Group Inc. | 44,793 | 1,920 |
| * | SXC Health Solutions Corp. | 34,300 | 1,896 |
| | Centerra Gold Inc. | 99,696 | 1,855 |
| | Atco Ltd. | 29,525 | 1,818 |
| * | Quadra FNX Mining Ltd. | 106,019 | 1,740 |
| | Methanex Corp. | 53,677 | 1,735 |
| | Progress Energy Resources Corp. | 120,601 | 1,649 |
| | Ensign Energy Services Inc. | 84,972 | 1,641 |
| | IESI-BFC Ltd. | 64,560 | 1,638 |
| * | Detour Gold Corp. | 46,362 | 1,567 |
| * | Alacer Gold Corp. | 146,907 | 1,532 |
| | Toromont Industries Ltd. | 42,744 | 1,489 |
| * | BlackPearl Resources Inc. | 176,228 | 1,484 |
| * | Silver Standard Resources Inc. | 42,616 | 1,482 |
| ^ | Calloway Real Estate Investment Trust | 55,908 | 1,479 |
| | Groupe Aeroplan Inc. | 107,386 | 1,472 |
| | HudBay Minerals Inc. | 90,683 | 1,447 |
| * | European Goldfields Ltd. | 102,884 | 1,431 |
| * | SEMAFO Inc. | 163,789 | 1,392 |
| * | Dundee Corp. Class A | 51,775 | 1,341 |
| | Canadian Real Estate Investment Trust | 37,703 | 1,335 |
| | MacDonald Dettwiler & Associates Ltd. | 22,100 | 1,332 |
| | Boardwalk Real Estate Investment Trust | 26,128 | 1,331 |
| | Sherritt International Corp. | 156,120 | 1,320 |
| | Petrobank Energy & Resources Ltd. | 61,362 | 1,298 |
| * | Celestica Inc. | 113,431 | 1,255 |
| | Silvercorp Metals Inc. | 91,793 | 1,250 |
| | Canadian Western Bank | 38,495 | 1,233 |
| | Astral Media Inc. Class A | 31,601 | 1,229 |
| *,^ | Novagold Resources Inc. | 95,237 | 1,226 |
| | Uranium One Inc. | 293,206 | 1,221 |
| * | Bankers Petroleum Ltd. | 138,290 | 1,213 |
| * | Dollarama Inc. | 37,831 | 1,186 |
| | Daylight Energy Ltd. | 103,019 | 1,182 |
| * | Imax Corp. | 33,512 | 1,178 |
| | Home Capital Group Inc. Class B | 19,279 | 1,161 |
| | AltaGas Ltd. | 43,102 | 1,156 |
| | ShawCor Ltd. Class A | 31,897 | 1,141 |
| * | Thompson Creek Metals Co. Inc. | 92,419 | 1,136 |
| | Mullen Group Ltd. | 50,439 | 1,131 |
| * | Advantage Oil & Gas Ltd. | 129,545 | 1,101 |
| | Alamos Gold Inc. | 63,487 | 1,066 |
| * | Lake Shore Gold Corp. | 245,511 | 1,053 |
| | Russel Metals Inc. | 38,271 | 1,052 |
| | Empire Co. Ltd. Class A | 18,210 | 1,034 |
| * | Celtic Exploration Ltd. | 50,035 | 1,026 |
| | RONA Inc. | 70,034 | 1,024 |
| | Canadian Apartment Properties REIT | 50,074 | 1,008 |
| | West Fraser Timber Co. Ltd. | 17,435 | 991 |
| | AGF Management Ltd. Class B | 46,520 | 974 |
| * | Legacy Oil & Gas Inc. | 66,765 | 951 |
| * | Birchcliff Energy Ltd. | 66,384 | 918 |
| | Major Drilling Group International | 53,920 | 898 |
| ^ | PetroBakken Energy Ltd. Class A | 46,777 | 888 |
| | Maple Leaf Foods Inc. | 70,945 | 883 |
| ^ | Dundee Real Estate Investment Trust | 24,798 | 866 |
| | TransForce Inc. | 56,876 | 847 |
| | Genworth MI Canada Inc. | 30,729 | 842 |
| | Cogeco Cable Inc. | 17,423 | 836 |
| | Quebecor Inc. Class B | 23,408 | 832 |
44
| | | |
| Vanguard® FTSE All-World ex-US Small-Cap Index Fund | | |
| Schedule of Investments | | |
| April 30, 2011 | | |
| | | | Market |
| | | | Value |
| | | Shares | ($000) |
| * | Minefinders Corp. | 48,498 | 816 |
| ^ | Primaris Retail Real Estate Investment Trust | 36,082 | 793 |
| * | Gammon Gold Inc. | 72,355 | 791 |
| ^ | Chartwell Seniors Housing Real Estate Investment Trust | 83,379 | 783 |
| ^ | Cominar Real Estate Investment Trust | 32,497 | 781 |
| * | Canfor Corp. | 59,288 | 781 |
| | Linamar Corp. | 34,785 | 781 |
| * | Stantec Inc. | 24,470 | 771 |
| *,^ | China Gold International Resources Corp. Ltd. | 152,979 | 765 |
| | Trilogy Energy Corp. | 31,729 | 764 |
| * | Rubicon Minerals Corp. | 147,112 | 763 |
| | Trinidad Drilling Ltd. | 65,726 | 753 |
| | Jean Coutu Group PJC Inc. Class A | 67,233 | 746 |
| * | Crew Energy Inc. | 42,898 | 741 |
| * | Kirkland Lake Gold Inc. | 49,372 | 735 |
| | GMP Capital Inc. | 44,509 | 711 |
| * | Seabridge Gold Inc. | 20,605 | 699 |
| | Superior Plus Corp. | 59,880 | 697 |
| * | Gabriel Resources Ltd. | 89,310 | 682 |
| | First Capital Realty Inc. | 38,563 | 671 |
| | Allied Properties Real Estate Investment Trust | 27,188 | 665 |
| | Canaccord Financial Inc. | 43,882 | 663 |
| | Pason Systems Inc. | 40,021 | 656 |
| | Laurentian Bank of Canada | 12,244 | 651 |
| | CCL Industries Inc. Class B | 19,026 | 636 |
| * | Nevsun Resources Ltd. | 96,931 | 631 |
| * | Northern Dynasty Minerals Ltd. | 46,392 | 630 |
| | Manitoba Telecom Services Inc. | 19,716 | 628 |
| * | Dundee Precious Metals Inc. | 61,576 | 596 |
| | Calfrac Well Services Ltd. | 16,558 | 586 |
| * | Westport Innovations Inc. | 23,028 | 582 |
| | Nordion Inc. | 49,180 | 577 |
| * | Eastern Platinum Ltd. | 472,902 | 575 |
| *,^ | Great Basin Gold Ltd. | 211,859 | 562 |
| * | Aurizon Mines Ltd. | 82,083 | 560 |
| | Bonterra Energy Corp. | 9,370 | 560 |
| | Artis Real Estate Investment Trust | 38,586 | 559 |
| * | Paramount Resources Ltd. Class A | 17,793 | 553 |
| * | Harry Winston Diamond Corp. | 32,433 | 552 |
| | Torstar Corp. Class B | 37,005 | 547 |
| | Transcontinental Inc. Class A | 35,062 | 540 |
| | CML HealthCare Inc. | 50,005 | 540 |
| | NuVista Energy Ltd. | 53,361 | 539 |
| | Reitmans Canada Ltd. Class A | 29,168 | 538 |
| * | QLT Inc. | 65,330 | 534 |
| | Dorel Industries Inc. Class B | 16,007 | 532 |
| * | Capstone Mining Corp. | 132,677 | 530 |
| ^ | Extendicare Real Estate Investment Trust | 41,359 | 520 |
| | Morguard Real Estate Investment Trust | 30,832 | 492 |
| * | Taseko Mines Ltd. | 91,470 | 483 |
| | Atlantic Power Corp. | 31,789 | 482 |
| | Forzani Group Ltd. Class A | 24,185 | 477 |
| * | Jaguar Mining Inc. | 84,776 | 473 |
| * | FirstService Corp. | 12,147 | 466 |
| * | Northgate Minerals Corp. | 151,858 | 454 |
| * | Alacer Gold Corp. | 41,852 | 452 |
| * | Savanna Energy Services Corp. | 41,336 | 450 |
| * | Golden Star Resources Ltd. | 138,458 | 448 |
| * | Cott Corp. | 46,344 | 413 |
| * | Imperial Metals Corp. | 17,751 | 412 |
| * | Denison Mines Corp. | 175,167 | 407 |
| | Corus Entertainment Inc. Class B | 19,214 | 404 |
| * | Guyana Goldfields Inc. | 40,151 | 397 |
| * | Martinrea International Inc. | 43,176 | 389 |
45
| | | |
| Vanguard® FTSE All-World ex-US Small-Cap Index Fund | | |
| Schedule of Investments | | |
| April 30, 2011 | | |
| | | | Market |
| | | | Value |
| | | Shares | ($000) |
| *,^ | Mercator Minerals Ltd. | 99,021 | 367 |
| * | ATS Automation Tooling Systems Inc. | 49,284 | 357 |
| * | Fairborne Energy Ltd. | 70,100 | 355 |
| * | OceanaGold Corp. | 110,909 | 325 |
| * | Sierra Wireless Inc. | 26,650 | 316 |
| * | Transat AT Inc. Class A | 25,349 | 314 |
| | Aecon Group Inc. | 31,300 | 310 |
| * | Great Canadian Gaming Corp. | 35,330 | 292 |
| | InnVest Real Estate Investment Trust | 37,343 | 283 |
| * | Hanfeng Evergreen Inc. | 50,331 | 274 |
| * | Flint Energy Services Ltd. | 17,584 | 267 |
| * | Connacher Oil and Gas Ltd. | 188,042 | 266 |
| ^ | Viterra Inc. | 22,132 | 261 |
| * | Atrium Innovations Inc. | 14,310 | 244 |
| | Sprott Inc. | 24,400 | 238 |
| | Cascades Inc. | 30,100 | 220 |
| * | Cardiome Pharma Corp. | 40,160 | 219 |
| * | Aura Minerals Inc. | 65,405 | 210 |
| *,^ | Corridor Resources Inc. | 36,333 | 179 |
| * | Chinook Energy Inc. | 77,794 | 166 |
| * | Norbord Inc. | 10,260 | 144 |
| * | Galleon Energy Inc. Class A | 36,800 | 136 |
| | Melcor Developments Ltd. | 6,600 | 114 |
| * | OPTI Canada Inc. | 287,700 | 73 |
| * | Kinross Gold Corp. Warrants Exp. 09/18/2014 | 9,734 | 27 |
| | | | 180,822 |
| Chile (0.2%) | | |
| | Empresas La Polar SA | 135,172 | 758 |
| | Cia Sud Americana de Vapores SA | 756,278 | 603 |
| | Inversiones Aguas Metropolitanas SA | 292,226 | 479 |
| | Madeco SA | 3,438,455 | 201 |
| * | Masisa SA | 1,135,187 | 186 |
| | | | 2,227 |
| China (3.9%) | | |
| | China Shanshui Cement Group Ltd. | 1,092,363 | 1,225 |
| *,^ | Hunan Non-Ferrous Metal Corp. Ltd. | 2,511,223 | 1,095 |
| ^ | China State Construction International Holdings Ltd. | 1,066,560 | 1,044 |
| | Digital China Holdings Ltd. | 495,671 | 966 |
| *,^ | AviChina Industry & Technology Co. Ltd. | 1,435,841 | 898 |
| | Minth Group Ltd. | 572,219 | 881 |
| | Intime Department Store Group Co. Ltd. | 507,467 | 793 |
| | Ajisen China Holdings Ltd. | 357,408 | 714 |
| | West China Cement Ltd. | 1,722,000 | 712 |
| * | Beijing Enterprises Water Group Ltd. | 2,169,448 | 684 |
| | China Gas Holdings Ltd. | 1,746,600 | 677 |
| | Ports Design Ltd. | 237,855 | 656 |
| | Dalian Port PDA Co. Ltd. | 1,668,278 | 655 |
| | CP Pokphand Co. | 4,854,000 | 651 |
| ^ | Skyworth Digital Holdings Ltd. | 998,497 | 639 |
| | Kingdee International Software Group Co. Ltd. | 991,200 | 636 |
| | Dongyue Group | 587,000 | 621 |
| | Lingbao Gold Co. Ltd. | 690,558 | 565 |
| ^ | China Lumena New Materials Corp. | 1,072,000 | 558 |
| | Tianjin Port Development Holdings Ltd. | 2,391,976 | 555 |
| ^ | Sino Biopharmaceutical | 1,505,796 | 550 |
| ^ | VODone Ltd. | 1,803,060 | 543 |
| | Lonking Holdings Ltd. | 720,313 | 532 |
| ^ | Fufeng Group Ltd. | 670,505 | 495 |
| | China Wireless Technologies Ltd. | 1,254,378 | 487 |
| ^ | New World Department Store China Ltd. | 552,000 | 483 |
| | Haitian International Holdings Ltd. | 312,221 | 463 |
| | China Everbright International Ltd. | 1,028,810 | 462 |
| ^ | China Power International Development Ltd. | 2,000,100 | 462 |
| * | Phoenix Satellite Television Holdings Ltd. | 847,783 | 458 |
46
| | | |
| Vanguard® FTSE All-World ex-US Small-Cap Index Fund | | |
| Schedule of Investments | | |
| April 30, 2011 | | |
| | | | Market |
| | | | Value |
| | | Shares | ($000) |
| * | Yingde Gases | 493,500 | 451 |
| * | Haier Electronics Group Co. Ltd. | 359,221 | 446 |
| | Hengdeli Holdings Ltd. | 737,969 | 443 |
| ^ | China Liansu Group Holdings Ltd. | 471,000 | 439 |
| | Huaxin Cement Co. Ltd. Class B | 89,900 | 437 |
| | AMVIG Holdings Ltd. | 602,000 | 436 |
| | Daphne International Holdings Ltd. | 531,996 | 427 |
| | Vinda International Holdings Ltd. | 398,000 | 422 |
| | PCD Stores Group Ltd. | 1,562,000 | 420 |
| * | Shougang Concord International Enterprises Co. Ltd. | 3,079,116 | 410 |
| ^ | China Green Holdings Ltd. | 474,928 | 406 |
| | REXLot Holdings Ltd. | 3,979,448 | 405 |
| | BYD Electronic International Co. Ltd. | 749,500 | 402 |
| ^ | SRE Group Ltd. | 4,418,000 | 399 |
| | Sinotrans Shipping Ltd. | 1,271,986 | 397 |
| ^ | Uni-President China Holdings Ltd. | 685,836 | 394 |
| * | China Grand Forestry Green Resources Group Ltd. | 12,464,000 | 381 |
| | China Pharmaceutical Group Ltd. | 620,000 | 371 |
| | Xingda International Holdings Ltd. | 320,000 | 370 |
| | Shanghai Jin Jiang International Hotels Group Co. Ltd. | 1,652,000 | 347 |
| ^ | Real Gold Mining Ltd. | 239,476 | 341 |
| ^ | NVC Lighting Holdings Ltd. | 638,000 | 340 |
| | First Tractor Co. Ltd. | 244,832 | 338 |
| * | Global Bio-Chem Technology Group Co. Ltd. | 1,384,000 | 338 |
| *,^ | Hi Sun Technology China Ltd. | 1,056,724 | 333 |
| | Silver Grant International | 889,998 | 328 |
| | China High Precision Automation Group Ltd. | 401,000 | 326 |
| ^ | China Automation Group Ltd. | 369,670 | 324 |
| ^ | Peak Sport Products Co. Ltd. | 423,756 | 324 |
| | China Metal Recycling Holdings Ltd. | 232,200 | 323 |
| | Shanghai Forte Land Co. | 712,000 | 320 |
| * | Sino Union Energy Investment Group Ltd. | 3,720,000 | 317 |
| | Shenguan Holdings Group Ltd. | 238,000 | 317 |
| ^ | Comba Telecom Systems Holdings Ltd. | 251,978 | 316 |
| | China Shineway Pharmaceutical Group Ltd. | 130,000 | 315 |
| | TCC International Holdings Ltd. | 505,000 | 306 |
| | Sinolink Worldwide Holdings Ltd. | 2,884,000 | 305 |
| ^ | XTEP International Holdings | 437,379 | 302 |
| | Chiho-Tiande Group Ltd. | 392,000 | 301 |
| ^ | China Resources Gas Group Ltd. | 199,306 | 291 |
| * | United Energy Group Ltd. | 1,895,259 | 288 |
| | Jiangsu Future Land Co. Ltd. Class B | 308,300 | 287 |
| * | China Rare Earth Holdings Ltd. | 656,000 | 284 |
| *,^ | Minmetals Resources Ltd. | 406,127 | 267 |
| | International Mining Machinery Holdings Ltd. | 256,000 | 264 |
| | Powerlong Real Estate Holdings Ltd. | 839,000 | 262 |
| * | China Precious Metal Resources Holdings Co. Ltd. | 1,220,000 | 259 |
| | Cosco International Holdings Ltd. | 400,000 | 258 |
| | China Lilang Ltd. | 179,000 | 255 |
| | Anhui Gujing Distillery Co. Ltd. Class B | 35,300 | 254 |
| * | Wuxi Little Swan Co. Ltd. Class B | 123,700 | 254 |
| ^ | China Vanadium Titano - Magnetite Mining Co. Ltd. | 536,000 | 253 |
| ^ | Maoye International Holdings Ltd. | 490,459 | 248 |
| * | Interchina Holdings Co. | 1,290,000 | 246 |
| | Luthai Textile Co. Ltd. Class B | 249,700 | 240 |
| * | TCL Communication Technology Holdings Ltd. | 236,000 | 229 |
| | Heng Tai Consumables Group Ltd. | 1,790,000 | 224 |
| ^ | 361 Degrees International Ltd. | 331,000 | 220 |
| | China Aerospace International Holdings Ltd. | 1,724,000 | 207 |
| | China SCE Property Holdings Ltd. | 753,000 | 202 |
| * | Sino Prosper State Gold Resources Holdings Ltd. | 3,620,000 | 201 |
| | Xinjiang Xinxin Mining Industry Co. Ltd. | 332,000 | 201 |
| * | Anxin-China Holdings Ltd. | 792,000 | 200 |
| * | Shanghai Industrial Urban Development Group Ltd. | 550,000 | 194 |
47
| | | |
| Vanguard® FTSE All-World ex-US Small-Cap Index Fund | | |
| Schedule of Investments | | |
| April 30, 2011 | | |
| | | | Market |
| | | | Value |
| | | Shares | ($000) |
| * | China Fangda Group Co. Ltd. Class B | 436,800 | 193 |
| * | Citic 21CN Co. Ltd. | 1,450,000 | 191 |
| | Chongqing Machinery & Electric Co. Ltd. | 520,000 | 187 |
| | Lao Feng Xiang Co. Ltd. Class B | 62,000 | 187 |
| * | Vitar International Holdings Ltd. | 880,000 | 186 |
| | Hangzhou Steam Turbine Co. Class B | 87,490 | 185 |
| ^ | Kingsoft Corp. Ltd. | 280,000 | 183 |
| | Fantasia Holdings Group Co. Ltd. | 1,087,500 | 182 |
| | Beijing Capital Land Ltd. | 524,000 | 180 |
| | Sparkle Roll Group Ltd. | 952,000 | 179 |
| *,^ | O-Net Communications Group Ltd. | 311,000 | 176 |
| * | Shanghai Dajiang Group Class B | 396,800 | 171 |
| * | China Power New Energy Development Co. Ltd. | 2,160,000 | 170 |
| | Great Wall Technology Co. Ltd. | 340,000 | 169 |
| | China Tontine Wines Group Ltd. | 802,000 | 168 |
| * | Golden Meditech Holdings Ltd. | 952,000 | 167 |
| ^ | Tianneng Power International Ltd. | 314,000 | 166 |
| | GZI Real Estate Investment Trust | 312,000 | 166 |
| | Shenzhou International Group Holdings Ltd. | 142,000 | 165 |
| | Wasion Group Holdings Ltd. | 312,000 | 163 |
| * | North Mining Shares Co. Ltd. | 4,340,000 | 159 |
| * | Shenzhen SEG Co. Ltd. Class B | 407,600 | 159 |
| | Minmetals Land Ltd. | 874,000 | 158 |
| * | China Oil and Gas Group Ltd. | 1,440,000 | 156 |
| | China Water Affairs Group Ltd. | 408,000 | 155 |
| | Livzon Pharmaceutical Inc. Class B | 51,500 | 153 |
| *,^ | China ITS Holdings Co. Ltd. | 309,000 | 152 |
| | Shanghai Prime Machinery Co. Ltd. | 694,000 | 151 |
| * | Shandong Airlines Co. Ltd. | 90,400 | 150 |
| * | Sino Oil And Gas Holdings Ltd. | 2,835,000 | 150 |
| | Road King Infrastructure Ltd. | 167,000 | 150 |
| | China Singyes Solar Technologies Holdings Ltd. | 156,000 | 149 |
| | Shenzhen Accord Pharmaceutical Co. Ltd. Class B | 52,900 | 147 |
| * | Jingwei Textile Machinery | 146,000 | 146 |
| | Shanghai Baosight Software Co. Ltd. Class B | 69,900 | 143 |
| | Chigo Holding Ltd. | 1,440,000 | 139 |
| | Ruinian International Ltd. | 199,000 | 136 |
| * | Kama Co. Ltd. Class B | 219,400 | 133 |
| * | Kingway Brewery Holdings Ltd. | 470,000 | 132 |
| | Truly International Holdings | 661,000 | 131 |
| * | Pou Sheng International Holdings Ltd. | 822,000 | 127 |
| * | Jinshan Development & Construction Co. Ltd. Class B | 211,300 | 125 |
| | Shandong Chenming Paper Holdings Ltd. | 146,000 | 124 |
| * | Foshan Huaxin Packaging Co. Ltd. Class B | 207,500 | 121 |
| | Shanghai Diesel Engine Co. Ltd. Class B | 127,500 | 120 |
| | Yip's Chemical Holdings Ltd. | 100,000 | 120 |
| | China Nickel Resources Holding Co. Ltd. | 730,000 | 116 |
| | Ju Teng International Holdings Ltd. | 344,000 | 114 |
| * | Huangshan Tourism Development Co. Ltd. Class B | 77,300 | 114 |
| ^ | Lijun International Pharmaceutical Holding Ltd. | 455,000 | 113 |
| *,^ | HKC Holdings Ltd. | 2,208,360 | 113 |
| | Tomson Group Ltd. | 292,000 | 111 |
| * | Hisense Kelon Electrical Holdings Co. Ltd. Class A | 190,000 | 110 |
| | Qingling Motors Co. Ltd. | 308,000 | 109 |
| | China South City Holdings Ltd. | 670,000 | 109 |
| ^ | Mingyuan Medicare Development Co. Ltd. | 1,220,000 | 109 |
| * | Kai Yuan Holdings Ltd. | 2,680,000 | 107 |
| * | Tianjin Development Hldgs Ltd. | 136,000 | 102 |
| ^ | BaWang International Group Holding Ltd. | 360,000 | 101 |
| * | SGSB Group Co. Ltd. Class B | 153,400 | 100 |
| *,^ | PetroAsian Energy Holdings Ltd. | 1,848,000 | 96 |
| * | Shanghai Highly Group Co. Ltd. Class B | 147,000 | 92 |
| * | SVA Electron Co. Ltd. Class B | 159,733 | 84 |
| * | Hubei Sanonda Co. Ltd. Class B | 178,600 | 84 |
48
| | | |
| Vanguard® FTSE All-World ex-US Small-Cap Index Fund | | |
| Schedule of Investments | | |
| April 30, 2011 | | |
| | | | Market |
| | | | Value |
| | | Shares | ($000) |
| | Xiamen International Port Co. Ltd. | 380,000 | 81 |
| | China Hongxing Sports Ltd. | 831,000 | 78 |
| * | Tsann Kuen China Enterprise Co. Ltd. Class B | 334,700 | 77 |
| * | Konka Group Co. Ltd. Class B | 206,600 | 74 |
| | Sinopec Kantons Holdings Ltd. | 134,000 | 71 |
| | Welling Holding Ltd. | 1,408,000 | 70 |
| * | Shanghai Yaohua Pilkington Glass Co. Ltd. Class B | 80,500 | 66 |
| * | Chengde Dalu Co. Ltd. Class B | 271,700 | 66 |
| * | Hefei Meiling Co. Ltd. Class B | 61,500 | 51 |
| * | China Milk Products Group Ltd. | 140,000 | 28 |
| * | HKC Holdings Ltd. Warrants Exp. 06/09/2011 | 200,760 | — |
| * | HKC Holdings Ltd. Warrants Exp. 05/26/2011 | 9,100 | — |
| | | | 50,331 |
| Czech Republic (0.0%) | | |
| | Philip Morris CR AS | 500 | 284 |
| |
| Denmark (1.0%) | | |
| | DSV A/S | 116,399 | 3,044 |
| * | Jyske Bank A/S | 36,504 | 1,814 |
| * | Topdanmark A/S | 9,286 | 1,706 |
| | GN Store Nord A/S | 130,344 | 1,293 |
| | Sydbank A/S | 40,175 | 1,164 |
| ^ | NKT Holding A/S | 12,457 | 767 |
| | SimCorp A/S | 3,215 | 584 |
| | East Asiatic Co. Ltd. A/S | 10,345 | 344 |
| | ALK-Abello A/S | 5,627 | 342 |
| | Solar A/S Class B | 3,471 | 304 |
| * | Genmab A/S | 28,010 | 302 |
| | IC Companys A/S | 6,408 | 289 |
| *,^ | Torm A/S | 31,117 | 202 |
| * | Bang & Olufsen A/S | 11,572 | 181 |
| | D/S Norden | 4,595 | 165 |
| * | Alm Brand A/S | 72,615 | 163 |
| | Schouw & Co. | 5,110 | 152 |
| *,^ | Bavarian Nordic A/S | 5,129 | 118 |
| | | | 12,934 |
| Egypt (0.1%) | | |
| | Six of October Development & Investment | 17,776 | 185 |
| * | Olympic Group Financial Investments | 23,564 | 141 |
| * | Palm Hills Developments SAE | 381,740 | 126 |
| | Ghabbour Auto | 23,974 | 114 |
| | Arab Cotton Ginning | 184,483 | 106 |
| * | Egyptian Media Production City | 148,362 | 102 |
| * | Egyptian Financial & Industrial Co. | 45,940 | 96 |
| * | Housing & Development Bank | 29,623 | 93 |
| * | Nile Cotton Ginning | 48,692 | 87 |
| | Canal Shipping Agencies Co. | 91,337 | 85 |
| * | Egyptian Resorts Co. | 516,732 | 80 |
| | | | 1,215 |
| Finland (1.8%) | | |
| ^ | Elisa Oyj | 95,827 | 2,307 |
| | YIT Oyj | 72,543 | 2,176 |
| | Konecranes Oyj | 34,884 | 1,678 |
| | Outotec Oyj | 26,051 | 1,652 |
| | Pohjola Bank plc | 104,837 | 1,556 |
| | Cargotec Oyj Class B | 24,714 | 1,388 |
| | Orion Oyj Class B | 49,097 | 1,221 |
| | Amer Sports Oyj Class A | 70,507 | 1,156 |
| | Sponda Oyj | 142,746 | 842 |
| ^ | Uponor Oyj | 42,645 | 831 |
| ^ | Huhtamaki Oyj | 57,382 | 802 |
| | Kemira Oyj | 43,640 | 798 |
| ^ | Tieto Oyj | 40,701 | 751 |
| | Ramirent Oyj | 42,929 | 732 |
49
| | | |
| Vanguard® FTSE All-World ex-US Small-Cap Index Fund | | |
| Schedule of Investments | | |
| April 30, 2011 | | |
| | | | Market |
| | | | Value |
| | | Shares | ($000) |
| | Vacon plc | 8,180 | 566 |
| * | M-real Oyj Class B | 111,615 | 528 |
| | Stockmann OYJ Abp Class B | 17,012 | 521 |
| | Alma Media Oyj | 40,796 | 476 |
| | Citycon Oyj | 95,622 | 453 |
| ^ | Poyry Oyj | 25,102 | 427 |
| ^ | Cramo Oyj | 15,542 | 412 |
| | Ruukki Group Oyj | 143,037 | 360 |
| | Oriola-KD Oyj | 69,325 | 302 |
| | Lassila & Tikanoja Oyj | 15,495 | 296 |
| | Tikkurila Oyj | 9,449 | 225 |
| * | Finnair Oyj | 41,300 | 223 |
| | Raisio plc | 55,409 | 212 |
| ^ | HKScan Oyj | 13,418 | 134 |
| | Lemminkainen Oyj | 3,014 | 119 |
| | F-Secure Oyj | 22,782 | 87 |
| | | | 23,231 |
| France (4.4%) | | |
| | Arkema SA | 34,579 | 3,601 |
| | Groupe Eurotunnel SA | 288,935 | 3,141 |
| * | Valeo SA | 42,910 | 2,733 |
| | Rhodia SA | 56,370 | 2,624 |
| | Gemalto NV | 48,594 | 2,489 |
| | Zodiac Aerospace | 23,014 | 1,806 |
| | SEB SA | 15,145 | 1,665 |
| | Nexans SA | 15,650 | 1,659 |
| ^ | Bourbon SA | 33,772 | 1,601 |
| | Neopost SA | 16,488 | 1,574 |
| | Metropole Television SA | 54,190 | 1,438 |
| | Etablissements Maurel et Prom | 65,244 | 1,390 |
| | Havas SA | 236,196 | 1,346 |
| * | Faurecia | 30,360 | 1,252 |
| | Teleperformance | 31,854 | 1,215 |
| | CFAO SA | 28,476 | 1,145 |
| ^ | Mercialys SA | 25,662 | 1,109 |
| | Societe Immobiliere de Location pour l'Industrie et le Commerce | 6,840 | 1,025 |
| | Remy Cointreau SA | 10,504 | 865 |
| * | Derichebourg SA | 89,405 | 847 |
| | Rubis | 6,662 | 818 |
| | IPSOS | 14,916 | 775 |
| *,^ | SOITEC | 46,803 | 760 |
| | Nexity SA | 13,843 | 753 |
| ^ | Ingenico | 14,046 | 697 |
| | Alten Ltd. | 16,609 | 681 |
| * | Technicolor | 87,849 | 671 |
| * | IMS-Intl Metal Service | 24,670 | 644 |
| | Saft Groupe SA | 13,781 | 633 |
| | Virbac SA | 3,414 | 630 |
| | SA des Ciments Vicat | 6,808 | 622 |
| | Mersen | 9,340 | 568 |
| | Delachaux SA | 4,967 | 562 |
| | Rallye SA | 9,903 | 521 |
| * | UBISOFT Entertainment | 50,057 | 503 |
| * | Medica SA | 23,742 | 490 |
| | Societe Fonciere Financiere et de Participations FFP | 5,895 | 488 |
| | Sechilienne-Sidec | 16,636 | 487 |
| | Sopra Group SA | 3,992 | 470 |
| * | Altran Technologies SA | 59,299 | 468 |
| ^ | Stallergenes SA | 5,193�� | 447 |
| | Boiron SA | 9,999 | 445 |
| ^ | Plastic Omnium SA | 4,624 | 443 |
| | Esso SA Francaise | 3,107 | 437 |
| | Beneteau SA | 20,036 | 430 |
| | Canal & | 50,077 | 409 |
50
| | | |
| Vanguard® FTSE All-World ex-US Small-Cap Index Fund | | |
| Schedule of Investments | | |
| April 30, 2011 | | |
| | | | Market |
| | | | Value |
| | | Shares | ($000) |
| * | GameLoft SA | 55,062 | 401 |
| ^ | April Group | 12,067 | 388 |
| | Orpea | 7,520 | 376 |
| | Groupe Steria SCA | 11,323 | 376 |
| | Seche Environnement SA | 3,904 | 373 |
| | Eurofins Scientific | 3,368 | 363 |
| | Pierre & Vacances | 3,887 | 347 |
| | Fimalac | 7,406 | 334 |
| * | Bull | 46,952 | 312 |
| | Vilmorin & Cie | 2,451 | 310 |
| ^ | LISI | 2,919 | 283 |
| | Faiveley Transport | 2,709 | 276 |
| * | Manitou BF SA | 7,849 | 266 |
| *,^ | NicOx SA | 91,323 | 241 |
| | Societe de la Tour Eiffel | 2,295 | 230 |
| * | Euro Disney SCA | 17,210 | 218 |
| | Bonduelle S.C.A. | 2,091 | 212 |
| * | Club Mediterranee | 8,976 | 209 |
| * | Parrot SA | 5,384 | 203 |
| | Meetic | 8,293 | 187 |
| | Sequana | 10,146 | 174 |
| | Laurent-Perrier | 1,215 | 155 |
| ^ | Union Financiere de France BQE SA | 3,200 | 152 |
| | Assystem | 5,746 | 151 |
| | Trigano SA | 4,091 | 146 |
| * | Etam Developpement SA | 2,835 | 136 |
| | GL Events | 3,251 | 125 |
| * | GFI Informatique | 20,155 | 115 |
| * | Boursorama | 8,356 | 110 |
| * | Haulotte Group SA | 4,806 | 107 |
| | NRJ Group | 8,245 | 98 |
| * | Maisons France Confort | 1,475 | 78 |
| *,^ | Theolia SA | 36,283 | 74 |
| * | Recylex SA | 7,038 | 73 |
| * | Etablissements Maurel et Prom Warrants Exp. 06/30/2014 | 38,916 | 21 |
| | | | 56,997 |
| Germany (4.7%) | | |
| ^ | Aixtron SE NA | 57,190 | 2,429 |
| * | Kabel Deutschland Holding AG | 36,728 | 2,294 |
| ^ | Software AG | 11,815 | 2,236 |
| | Symrise AG | 66,458 | 2,187 |
| | Tognum AG | 56,273 | 2,157 |
| * | Bilfinger Berger SE | 20,986 | 2,020 |
| *,^ | MTU Aero Engines Holding AG | 22,140 | 1,695 |
| *,^ | SGL Carbon SE | 31,002 | 1,650 |
| | Wincor Nixdorf AG | 19,578 | 1,618 |
| | Axel Springer AG | 8,908 | 1,460 |
| | Stada Arzneimittel AG | 32,672 | 1,445 |
| * | Sky Deutschland AG | 310,713 | 1,365 |
| | ProSiebenSat.1 Media AG Prior Pfd. | 46,298 | 1,327 |
| | Aurubis AG | 22,054 | 1,303 |
| | Douglas Holding AG | 22,156 | 1,298 |
| | United Internet AG | 65,717 | 1,286 |
| | Fuchs Petrolub AG | 8,380 | 1,213 |
| | Hugo Boss AG Prior Pfd. | 11,248 | 1,115 |
| | Deutsche Euroshop AG | 27,122 | 1,096 |
| | Brenntag AG | 8,425 | 1,035 |
| | Fuchs Petrolub AG Prior Pfd. | 5,952 | 975 |
| | Rhoen Klinikum AG | 42,471 | 971 |
| ^ | Gildemeister AG | 37,645 | 954 |
| | Wirecard AG | 49,453 | 944 |
| | ElringKlinger AG | 25,880 | 907 |
| * | Dialog Semiconductor plc | 42,493 | 885 |
| | Gerry Weber International AG | 13,359 | 870 |
51
| | | |
| Vanguard® FTSE All-World ex-US Small-Cap Index Fund | | |
| Schedule of Investments | | |
| April 30, 2011 | | |
| | | | Market |
| | | | Value |
| | | Shares | ($000) |
| * | Leoni AG | 15,626 | 860 |
| | Freenet AG | 67,466 | 858 |
| * | Rational AG | 3,015 | 833 |
| | Vossloh AG | 5,252 | 755 |
| * | Deutsche Wohnen AG | 47,620 | 749 |
| * | Aareal Bank AG | 22,974 | 696 |
| | Fielmann AG | 6,507 | 692 |
| ^ | Solarworld AG | 43,031 | 689 |
| * | Krones AG | 8,258 | 668 |
| | Pfeiffer Vacuum Technology AG | 4,711 | 654 |
| | Demag Cranes AG | 12,048 | 647 |
| * | Heidelberger Druckmaschinen AG | 138,744 | 619 |
| ^ | Rheinmetall AG | 6,800 | 610 |
| * | Deutz AG | 63,022 | 576 |
| * | KUKA AG | 19,822 | 540 |
| | Bechtle AG | 11,148 | 530 |
| * | IVG Immobilien AG | 62,734 | 529 |
| | GFK SE | 9,097 | 517 |
| * | Kloeckner & Co. SE | 13,823 | 496 |
| | MLP AG | 46,013 | 456 |
| | Bauer AG | 8,424 | 453 |
| | Kontron AG | 36,112 | 445 |
| | GAGFAH SA | 45,539 | 414 |
| | CTS Eventim AG | 5,518 | 414 |
| | BayWa AG | 8,453 | 399 |
| | KWS Saat AG | 1,711 | 391 |
| | Jungheinrich AG Prior Pfd. | 8,168 | 375 |
| | H&R WASAG AG | 11,674 | 366 |
| | Praktiker Bau- und Heimwerkermaerkte Holding AG | 29,631 | 351 |
| * | Morphosys AG | 11,856 | 349 |
| | Draegerwerk AG & Co. KGaA Prior Pfd. | 3,270 | 343 |
| ^ | Delticom AG | 2,961 | 322 |
| *,^ | Asian Bamboo AG | 5,731 | 289 |
| *,^ | Q-Cells SE | 59,019 | 251 |
| * | Roth & Rau AG | 6,904 | 237 |
| | Alstria Office REIT-AG | 12,669 | 201 |
| ^ | Phoenix Solar AG | 6,064 | 196 |
| *,^ | Nordex SE | 18,811 | 189 |
| * | Jenoptik AG | 21,581 | 177 |
| | Sixt AG | 3,469 | 175 |
| *,^ | Solar Millennium AG | 5,506 | 169 |
| * | QSC AG | 43,900 | 167 |
| | DIC Asset AG | 12,211 | 164 |
| * | Patrizia Immobilien AG | 21,202 | 158 |
| | Deutsche Beteiligungs AG | 5,238 | 154 |
| * | Centrotherm Photovoltaics AG | 2,480 | 150 |
| * | Sixt AG Prior Pfd. | 3,677 | 149 |
| * | Biotest AG Prior Pfd. | 2,209 | 148 |
| ^ | Grenkeleasing AG | 2,429 | 145 |
| | Medion AG | 8,993 | 130 |
| * | Air Berlin plc | 28,265 | 126 |
| | Carl Zeiss Meditec AG | 5,721 | 125 |
| ^ | Takkt AG | 7,014 | 121 |
| * | Duerr AG | 2,879 | 112 |
| * | Singulus Technologies AG | 14,871 | 105 |
| | CAT Oil AG | 8,289 | 102 |
| * | Manz Automation AG | 1,341 | 94 |
| * | Comdirect Bank AG | 7,308 | 91 |
| * | Indus Holding AG | 2,596 | 86 |
| | CropEnergies AG | 10,226 | 83 |
| *,^ | Conergy AG | 131,925 | 76 |
| * | Constantin Medien AG | 23,248 | 71 |
| | | | 60,772 |
52
| | | |
| Vanguard® FTSE All-World ex-US Small-Cap Index Fund | | |
| Schedule of Investments | | |
| April 30, 2011 | | |
| | | | Market |
| | | | Value |
| | | Shares | ($000) |
| Greece (0.5%) | | |
| * | Piraeus Bank SA | 606,967 | 988 |
| | Titan Cement Co. SA | 31,720 | 846 |
| * | Folli Follie Group | 24,167 | 456 |
| | JUMBO SA | 56,316 | 454 |
| * | Mytilineos Holdings SA | 43,604 | 347 |
| * | Viohalco | 56,724 | 336 |
| | Marfin Investment Group SA | 309,096 | 325 |
| | Ellaktor SA | 68,555 | 311 |
| | Motor Oil Hellas Corinth Refineries SA | 23,337 | 310 |
| | Hellenic Exchanges SA | 34,557 | 276 |
| * | TT Hellenic Postbank SA | 54,511 | 234 |
| | Intralot SA-Integrated Lottery Systems & Services | 59,966 | 214 |
| | Frigoglass SA | 12,055 | 205 |
| | Athens Water Supply & Sewage Co. SA | 24,447 | 191 |
| | Fourlis Holdings SA | 23,049 | 190 |
| | Metka SA | 12,592 | 169 |
| | GEK Terna Holding Real Estate Construction SA | 38,413 | 139 |
| | Eurobank Properties Real Estate Investment Co. | 11,421 | 101 |
| * | Sidenor Steel Products Manufacturing Co. SA | 24,324 | 98 |
| * | Piraeus Port Authority | 4,046 | 88 |
| * | Agricultural Bank of Greece | 105,791 | 72 |
| | | | 6,350 |
| Hong Kong (1.1%) | | |
| | Luk Fook Holdings International Ltd. | 223,000 | 827 |
| | Pacific Basin Shipping Ltd. | 1,119,766 | 696 |
| | Trinity Ltd. | 622,000 | 673 |
| | Chow Sang Sang Holdings International Ltd. | 228,519 | 627 |
| | Giordano International Ltd. | 819,841 | 592 |
| * | G-Resources Group Ltd. | 7,637,279 | 591 |
| | Dah Chong Hong Holdings Ltd. | 453,032 | 519 |
| | Stella International Holdings Ltd. | 219,091 | 498 |
| * | Singamas Container Holdings Ltd. | 1,027,960 | 471 |
| | Glorious Property Holdings Ltd. | 1,630,000 | 467 |
| *,^ | Kaisa Group Holdings Ltd. | 1,069,000 | 435 |
| | Value Partners Group Ltd. | 474,000 | 427 |
| | SmarTone Telecommunications Holding Ltd. | 274,000 | 425 |
| | Midland Holdings Ltd. | 546,000 | 423 |
| * | China WindPower Group Ltd. | 3,770,000 | 394 |
| * | United Laboratories International Holdings Ltd. | 204,000 | 344 |
| *,^ | Fook Woo Group Holdings Ltd. | 998,000 | 310 |
| | Vitasoy International Holdings Ltd. | 342,698 | 295 |
| | SA SA International Holdings Ltd. | 437,747 | 263 |
| * | King Stone Energy Group Ltd. | 10,800,000 | 260 |
| * | CST Mining Group Ltd. | 9,768,000 | 259 |
| | EVA Precision Industrial Holdings Ltd. | 282,000 | 242 |
| | IT Ltd. | 278,000 | 224 |
| | TAI Cheung Holdings | 289,000 | 218 |
| * | Lai Sun Development | 6,052,000 | 207 |
| | K Wah International Holdings Ltd. | 507,000 | 202 |
| * | eSun Holdings Ltd. | 546,000 | 196 |
| * | China Daye Non-Ferrous Metals Mining Ltd. | 2,446,000 | 193 |
| | China Medical System Holdings Ltd. | 179,200 | 191 |
| *,^ | Boshiwa International Holding Ltd. | 282,000 | 183 |
| | HKR International Ltd. | 295,200 | 172 |
| | Silver base Group Holdings Ltd. | 201,000 | 166 |
| | Sunlight Real Estate Investment Trust | 504,000 | 164 |
| | Emperor Watch & Jewellery Ltd. | 1,060,000 | 153 |
| * | Varitronix International Ltd. | 223,000 | 152 |
| *,^ | China Timber Resources Group Ltd. | 3,600,000 | 148 |
| | Shenglong PV-Tech Investment Co. Ltd. | 27,128 | 145 |
| * | Apollo Solar Energy Technology Holdings Ltd. | 2,036,000 | 145 |
| | Man Wah Holdings Ltd. | 116,000 | 144 |
| | Shui On Construction and Materials Ltd. | 106,000 | 143 |
53
| | | |
| Vanguard® FTSE All-World ex-US Small-Cap Index Fund | | |
| Schedule of Investments | | |
| April 30, 2011 | | |
| | | | Market |
| | | | Value |
| | | Shares | ($000) |
| * | Titan Petrochemicals Group Ltd. | 1,560,000 | 129 |
| | Prosperity REIT | 531,000 | 128 |
| | Regal Hotels International Holdings Ltd. | 276,000 | 124 |
| * | Apac Resources Ltd. | 2,040,000 | 118 |
| | Microport Scientific Corp. | 155,000 | 114 |
| ^ | Citic Telecom International Holdings Ltd. | 395,000 | 113 |
| * | Tom Group Ltd. | 920,000 | 109 |
| ^ | Besunyen Holdings Co. | 319,000 | 109 |
| | City Telecom HK Ltd. | 143,000 | 108 |
| | Pacific Textile Holdings Ltd. | 147,000 | 95 |
| | Dickson Concepts International Ltd. | 107,000 | 85 |
| | Far East Consortium | 284,000 | 70 |
| * | Polytec Asset Holdings Ltd. | 460,000 | 69 |
| * | Dejin Resources Group Co. Ltd. | 2,404,000 | 67 |
| * | Hong Kong Energy Holdings Ltd. Warrants Exp. 06/09/2011 | 12,166 | — |
| | | | 14,622 |
| Hungary (0.0%) | | |
| * | Egis Gyogyszergyar Nyrt | 1,466 | 161 |
| * | FHB Mortgage Bank plc | 12,740 | 74 |
| | | | 235 |
| India (2.4%) | | |
| | LIC Housing Finance Ltd. | 199,749 | 993 |
| | Yes Bank Ltd. | 142,580 | 987 |
| | IndusInd Bank Ltd. | 167,419 | 985 |
| | Federal Bank Ltd. | 89,349 | 850 |
| | Petronet LNG Ltd. | 213,071 | 637 |
| | United Phosphorus Ltd. | 185,213 | 634 |
| | Indian Hotels Co. Ltd. | 302,716 | 566 |
| | Tata Global Beverages Ltd. | 245,651 | 560 |
| | Apollo Hospitals Enterprise Ltd. | 51,393 | 552 |
| | Patni Computer Systems Ltd. | 56,986 | 552 |
| | CESC Ltd. | 75,189 | 525 |
| | Aurobindo Pharma Ltd. | 119,105 | 525 |
| | Allahabad Bank | 110,153 | 512 |
| | Andhra Bank | 161,994 | 510 |
| | Jindal Saw Ltd. | 109,065 | 496 |
| | GTL Ltd. | 51,218 | 484 |
| * | Indiabulls Real Estate Ltd. | 162,668 | 460 |
| | Godrej Consumer Products Ltd. | 53,110 | 453 |
| | IFCI Ltd. | 383,331 | 451 |
| | Shree Renuka Sugars Ltd. | 266,476 | 425 |
| | Jain Irrigation Systems Ltd. | 101,889 | 422 |
| | Biocon Ltd. | 48,449 | 405 |
| | Thermax Ltd. | 24,065 | 353 |
| | Gujarat State Petronet Ltd. | 140,320 | 313 |
| | Amtek Auto Ltd. | 83,893 | 310 |
| | India Cements Ltd. | 134,441 | 303 |
| | Bhushan Steel Ltd. | 26,256 | 297 |
| | South Indian Bank Ltd. | 555,263 | 286 |
| * | GVK Power & Infrastructure Ltd. | 516,010 | 283 |
| | Century Textile & Industries Ltd. | 34,675 | 282 |
| * | Videocon Industries Ltd. | 62,775 | 281 |
| | Opto Circuits India Ltd. | 41,130 | 281 |
| | Indraprastha Gas Ltd. | 38,105 | 277 |
| | Sterling Biotech Ltd. | 131,759 | 276 |
| | Mahindra & Mahindra Financial Services Ltd. | 16,632 | 276 |
| | Indian Overseas Bank | 79,784 | 275 |
| | IVRCL Ltd. | 150,193 | 270 |
| | Hindustan Oil Exploration Co. Ltd. | 56,300 | 268 |
| | Sintex Industries Ltd. | 68,109 | 268 |
| | Monnet Ispat & Energy Ltd. | 22,411 | 266 |
| | Gujarat State Fertilisers & Chemicals Ltd. | 31,276 | 264 |
| * | Indiabulls Power Ltd. | 508,588 | 256 |
| | Torrent Pharmaceuticals Ltd. | 18,709 | 254 |
54
| | | |
| Vanguard® FTSE All-World ex-US Small-Cap Index Fund | | |
| Schedule of Investments | | |
| April 30, 2011 | | |
| | | | Market |
| | | | Value |
| | | Shares | ($000) |
| * | Coromandel International Ltd. | 34,013 | 253 |
| | Marico Ltd. | 79,487 | 253 |
| | Ruchi Soya Industries Ltd. | 107,829 | 252 |
| | Alstom Projects India Ltd. | 17,933 | 250 |
| | Era Infra Engineering Ltd. | 59,024 | 250 |
| | Motherson Sumi Systems Ltd. | 47,674 | 249 |
| | NCC Ltd. | 106,537 | 247 |
| | Jammu & Kashmir Bank Ltd. | 13,467 | 246 |
| | HCL Infosystems Ltd. | 94,428 | 237 |
| | Engineers India Ltd. | 36,086 | 237 |
| | Rolta India Ltd. | 74,345 | 232 |
| | Areva T&D India Ltd. | 36,654 | 232 |
| * | Dish TV India Ltd. | 150,340 | 232 |
| | Chambal Fertilizers & Chemicals Ltd. | 118,848 | 230 |
| | Bajaj Finserv Ltd. | 19,145 | 229 |
| * | Balrampur Chini Mills Ltd. | 135,840 | 229 |
| | Gujarat NRE Coke Ltd. | 199,622 | 228 |
| | Bombay Dyeing & Manufacturing Co. Ltd. | 24,951 | 222 |
| | Voltas Ltd. | 58,912 | 220 |
| | Ballarpur Industries Ltd. | 275,816 | 216 |
| | McLeod Russel India Ltd. | 35,988 | 215 |
| | Chennai Petroleum Corp. Ltd. | 41,815 | 212 |
| * | Praj Industries Ltd. | 115,383 | 211 |
| | SRF Ltd. | 27,443 | 208 |
| | Educomp Solutions Ltd. | 19,183 | 207 |
| | Religare Enterprises Ltd. | 19,656 | 207 |
| * | JSL Stainless Ltd. | 97,190 | 196 |
| | Central Bank Of India | 63,788 | 194 |
| | Nava Bharat Ventures Ltd. | 34,887 | 194 |
| | Apollo Tyres Ltd. | 120,020 | 189 |
| | IRB Infrastructure Developers Ltd. | 46,826 | 187 |
| * | Ispat Industries Ltd. | 360,488 | 185 |
| | UCO Bank | 78,235 | 185 |
| | Indian Bank | 33,487 | 183 |
| | Gujarat Mineral Development Corp. Ltd. | 56,059 | 178 |
| | Welspun Corp. Ltd. | 40,857 | 177 |
| | Bajaj Hindusthan Ltd. | 100,513 | 171 |
| | Syndicate Bank | 63,389 | 168 |
| | CMC Ltd. | 3,596 | 166 |
| | SREI Infrastructure Finance Ltd. | 140,943 | 165 |
| * | Raymond Ltd. | 20,579 | 164 |
| | BEML Ltd. | 10,226 | 161 |
| * | Wockhardt Ltd. | 20,670 | 160 |
| | Triveni Engineering & Industries Ltd. | 67,622 | 159 |
| * | 3i Infotech Ltd. | 140,184 | 157 |
| | TVS Motor Co. Ltd. | 121,091 | 155 |
| | Nagarjuna Fertilizers & Chemicals | 212,223 | 153 |
| | India Infoline Ltd. | 90,783 | 148 |
| | Usha Martin Ltd. | 98,474 | 145 |
| * | Arvind Ltd. | 86,337 | 144 |
| | Shiv-Vani Oil & Gas Exploration Services Ltd. | 20,699 | 142 |
| | Emami Ltd. | 15,075 | 141 |
| * | Essar Shipping Ports & Logistics Ltd. | 62,554 | 140 |
| | PTC India Ltd. | 67,119 | 136 |
| | Kesoram Industries Ltd. | 29,420 | 130 |
| | Finolex Industries Ltd. | 55,785 | 130 |
| | Mercator Lines Ltd. | 137,503 | 127 |
| | Hindustan Construction Co. | 159,091 | 127 |
| | Peninsula Land Ltd. | 96,537 | 126 |
| * | Firstsource Solutions Ltd. | 285,028 | 125 |
| | Hotel Leela Venture Ltd. | 127,786 | 120 |
| | Sterlite Technologies Ltd. | 85,739 | 119 |
| | Karnataka Bank Ltd. | 44,462 | 114 |
| * | Manappuram General Finance & Leasing Ltd. | 37,816 | 114 |
55
| | | |
| Vanguard® FTSE All-World ex-US Small-Cap Index Fund | | |
| Schedule of Investments | | |
| April 30, 2011 | | |
| | | | Market |
| | | | Value |
| | | Shares | ($000) |
| | Everest Kanto Cylinder Ltd. | 59,062 | 112 |
| * | Pipavav Shipyard Ltd. | 56,896 | 112 |
| | Gateway Distriparks Ltd. | 40,141 | 111 |
| | Gujarat Gas Co. Ltd. | 12,465 | 104 |
| | Indiabulls Securities Ltd. | 268,678 | 99 |
| | Radico Khaitan Ltd. | 30,378 | 99 |
| | Vijaya Bank | 47,346 | 89 |
| | Gujarat Narmada Valley Fertilizers Co. Ltd. | 36,338 | 89 |
| | Gujarat Alkalies & Chemicals | 28,063 | 88 |
| | Electrosteel Castings Ltd. | 116,049 | 82 |
| | Maharashtra Seamless Ltd. | 9,680 | 79 |
| * | Deccan Chronicle Holdings Ltd. | 42,653 | 77 |
| | | | 31,943 |
| Indonesia (0.8%) | | |
| | Lippo Karawaci Tbk PT | 9,132,676 | 832 |
| | Bakrieland Development Tbk PT | 33,976,164 | 573 |
| * | Bakrie Telecom Tbk PT | 11,699,073 | 527 |
| | Bakrie Sumatera Plantations Tbk PT | 10,858,500 | 497 |
| * | Energi Mega Persada Tbk PT | 25,399,000 | 468 |
| * | Pakuwon Jati Tbk PT | 4,438,000 | 451 |
| | Medco Energi Internasional Tbk PT | 1,336,171 | 431 |
| | Summarecon Agung Tbk PT | 2,902,584 | 428 |
| * | Barito Pacific Tbk PT | 3,355,041 | 416 |
| | Bumi Serpong Damai PT | 3,853,000 | 415 |
| * | Delta Dunia Makmur Tbk PT | 2,487,500 | 379 |
| | Indika Energy Tbk PT | 770,939 | 366 |
| | Jasa Marga PT | 921,080 | 356 |
| * | Bakrie and Brothers Tbk PT | 45,320,988 | 356 |
| | Timah Tbk PT | 1,014,407 | 342 |
| * | Ciputra Development Tbk PT | 7,038,500 | 321 |
| | Perusahaan Perkebunan London Sumatra Indonesia Tbk PT | 1,042,025 | 299 |
| * | Holcim Indonesia Tbk PT | 1,089,977 | 287 |
| * | Indah Kiat Pulp & Paper Corp. Tbk PT | 1,439,852 | 271 |
| | Bank Tabungan Negara Tbk PT | 1,326,500 | 265 |
| | Alam Sutera Realty Tbk PT | 7,380,500 | 255 |
| * | Bhakti Investama Tbk PT | 11,813,500 | 232 |
| | Gajah Tunggal Tbk PT | 837,500 | 228 |
| * | Bisi International PT | 1,163,500 | 227 |
| | Media Nusantara Citra Tbk PT | 1,984,000 | 205 |
| | AKR Corporindo Tbk PT | 914,500 | 183 |
| * | Intiland Development Tbk PT | 4,188,500 | 179 |
| | Global Mediacom Tbk PT | 1,997,500 | 175 |
| | Bank Pembangunan Daerah Jawa Barat Dan Banten Tbk PT | 1,003,000 | 149 |
| | Ramayana Lestari Sentosa Tbk PT | 1,562,000 | 133 |
| * | Berlian Laju Tanker Tbk PT | 2,727,500 | 124 |
| * | Bakrie Sumatera Plantations Tbk PT Warrants Exp. 02/18/2013 | 94,500 | 1 |
| | | | 10,371 |
| Ireland (0.6%) | | |
| | DCC plc | 49,954 | 1,665 |
| * | Smurfit Kappa Group plc | 76,285 | 1,039 |
| | C&C Group plc | 192,011 | 984 |
| | Paddy Power plc | 19,423 | 949 |
| | Kingspan Group plc | 93,888 | 916 |
| | Grafton Group plc | 141,974 | 746 |
| | Glanbia plc | 85,168 | 549 |
| | United Drug plc | 135,022 | 466 |
| | FBD Holdings plc | 26,379 | 283 |
| | Greencore Group plc | 167,008 | 272 |
| * | Independent News & Media plc | 187,458 | 162 |
| * | Aer Lingus | 89,102 | 109 |
| | Fyffes plc | 147,806 | 90 |
| | Total Produce plc | 143,022 | 89 |
| * | Smurfit Kappa Group plc | 6,094 | 84 |
| | C&C Group plc | 11,196 | 57 |
56
| | | |
| Vanguard® FTSE All-World ex-US Small-Cap Index Fund | | |
| Schedule of Investments | | |
| April 30, 2011 | | |
| | | | Market |
| | | | Value |
| | | Shares | ($000) |
| * | Irish Life & Permanent Group Holdings plc | 148,118 | 33 |
| | | | 8,493 |
| Israel (0.3%) | | |
| * | B Communications Ltd. | 25,103 | 828 |
| * | Mellanox Technologies Ltd. | 16,770 | 469 |
| | FMS Enterprises Migun Ltd. | 11,359 | 338 |
| | Frutarom Industries Ltd. | 30,752 | 338 |
| * | Internet Gold-Golden Lines Ltd. | 10,804 | 307 |
| * | Ceragon Networks Ltd. | 16,777 | 213 |
| | Jerusalem Economy Ltd. | 16,457 | 209 |
| * | Delek Real Estate Ltd. | 983,390 | 184 |
| | Alony Hetz Properties & Investments Ltd. | 24,685 | 142 |
| | Ituran Location and Control Ltd. | 8,568 | 138 |
| * | Hadera Paper Ltd. | 1,541 | 125 |
| | Shikun & Binui Ltd. | 40,313 | 118 |
| * | Given Imaging Ltd. | 5,308 | 113 |
| * | Retalix Ltd. | 7,204 | 104 |
| | Electra Ltd. | 630 | 77 |
| | Elco Holdings Ltd. | 5,355 | 76 |
| * | Gilat Satellite Networks Ltd. | 14,900 | 72 |
| | | | 3,851 |
| Italy (2.2%) | | |
| | Prysmian SPA | 120,486 | 2,844 |
| | Banca Popolare dell'Emilia Romagna Scrl | 136,799 | 1,673 |
| ^ | Banca Popolare di Sondrio SCARL | 155,099 | 1,345 |
| | Davide Campari-Milano SPA | 149,321 | 1,075 |
| | Societa Cattolica di Assicurazioni SCRL | 35,210 | 991 |
| | Tod's SPA | 6,579 | 893 |
| | Societa Iniziative Autostradali e Servizi SPA | 61,641 | 794 |
| | Azimut Holding SPA | 61,927 | 792 |
| | DiaSorin SPA | 15,474 | 747 |
| | Hera SPA | 292,071 | 739 |
| | Ansaldo STS SPA | 47,287 | 731 |
| * | Impregilo SPA | 205,756 | 706 |
| | Iren SPA | 323,083 | 667 |
| | Danieli & C Officine Meccaniche SPA | 33,444 | 599 |
| | Recordati SPA | 54,574 | 578 |
| * | Beni Stabili SPA | 502,491 | 569 |
| * | Cofide SPA | 475,563 | 553 |
| * | ACEA SPA | 42,656 | 551 |
| * | CIR-Compagnie Industriali Riunite SPA | 200,297 | 525 |
| | Piccolo Credito Valtellinese Scarl | 107,702 | 513 |
| * | Sorin SPA | 170,063 | 489 |
| | ERG SPA | 30,267 | 447 |
| | Piaggio & C SPA | 107,134 | 419 |
| | Italmobiliare SPA | 15,099 | 414 |
| | Credito Emiliano SPA | 59,988 | 413 |
| * | Safilo Group SPA | 21,572 | 412 |
| * | Arnoldo Mondadori Editore SPA | 91,454 | 388 |
| | MARR SPA | 29,203 | 383 |
| | Autostrada Torino-Milano SPA | 22,526 | 379 |
| ^ | Fondiaria-Sai SPA | 39,833 | 370 |
| | Maire Tecnimont SPA | 85,350 | 358 |
| * | Interpump Group SPA | 39,229 | 354 |
| * | Banca Popolare dell'Etruria e del Lazio | 80,819 | 341 |
| | De'Longhi SPA | 23,853 | 305 |
| | Credito Artigiano SPA | 130,435 | 261 |
| | Banca Generali SPA | 15,300 | 257 |
| | Banco di Desio e della Brianza SPA | 43,406 | 245 |
| * | Gemina SPA | 230,344 | 239 |
| *,^ | Tiscali SPA | 2,015,064 | 236 |
| | Geox SPA | 31,697 | 224 |
| | Trevi Finanziaria SPA | 13,424 | 218 |
| | Amplifon SPA | 34,009 | 209 |
57
| | | |
| Vanguard® FTSE All-World ex-US Small-Cap Index Fund | | |
| Schedule of Investments | | |
| April 30, 2011 | | |
| | | | Market |
| | | | Value |
| | | Shares | ($000) |
| | Indesit Co. SPA | 15,820 | 209 |
| *,^ | Milano Assicurazioni SPA | 141,245 | 208 |
| | Benetton Group SPA | 25,422 | 206 |
| | SAES Getters SPA | 26,385 | 203 |
| * | Prelios SPA | 253,144 | 199 |
| | Danieli & C Officine Meccaniche SPA | 6,220 | 198 |
| * | Gruppo Editoriale L'Espresso SPA | 63,749 | 198 |
| | Italmobiliare SPA | 3,975 | 174 |
| | Brembo SPA | 12,475 | 170 |
| * | Gruppo Coin SPA | 16,608 | 169 |
| *,^ | Premafin Finanziaria SPA | 186,237 | 168 |
| | Astaldi SPA | 18,879 | 165 |
| * | Cam Finanziaria SPA | 222,465 | 133 |
| * | RCS MediaGroup SPA | 65,312 | 128 |
| * | DeA Capital SPA | 54,287 | 125 |
| | Fondiaria-Sai SPA RSP | 20,355 | 115 |
| | Cementir Holding SPA | 31,451 | 101 |
| * | Digital Multimedia Technologies SPA | 2,995 | 95 |
| | Esprinet SPA | 10,427 | 90 |
| | Immobiliare Grande Distribuzione | 36,604 | 88 |
| | Landi Renzo SPA | 23,836 | 87 |
| | Sogefi SPA | 18,986 | 80 |
| * | IMMSI SPA | 60,268 | 78 |
| | Industria Macchine Automatiche SPA | 3,530 | 76 |
| * | Snai SPA | 19,897 | 72 |
| * | KME Group SPA | 127,058 | 68 |
| * | Interpump Group SPA Warrants Exp. 10/31/2012 | 2,440 | 3 |
| * | Tiscali SPA Warrants Exp. 12/15/2014 | 221,192 | 1 |
| | | | 28,853 |
| Japan (10.2%) | | |
| | Kayaba Industry Co. Ltd. | 117,959 | 981 |
| | Nachi-Fujikoshi Corp. | 150,742 | 842 |
| | K's Holdings Corp. | 26,905 | 839 |
| | Sanrio Co. Ltd. | 24,956 | 830 |
| | Duskin Co. Ltd. | 40,378 | 815 |
| | Sankyu Inc. | 170,014 | 781 |
| | OSG Corp. | 54,994 | 737 |
| | Kyowa Exeo Corp. | 69,323 | 729 |
| | Makino Milling Machine Co. Ltd. | 74,901 | 704 |
| ^ | eAccess Ltd. | 1,456 | 687 |
| | Maeda Road Construction Co. Ltd. | 71,139 | 675 |
| ^ | Anritsu Corp. | 83,829 | 669 |
| | Iwatani Corp. | 188,696 | 623 |
| | Shochiku Co. Ltd. | 85,723 | 619 |
| | Sanyo Chemical Industries Ltd. | 75,274 | 615 |
| | Miura Co. Ltd. | 21,218 | 603 |
| | Yamagata Bank Ltd. | 123,426 | 602 |
| | Hoshizaki Electric Co. Ltd. | 30,641 | 596 |
| ^ | Hitachi Kokusai Electric Inc. | 71,038 | 592 |
| | Okumura Corp. | 151,213 | 591 |
| | Exedy Corp. | 18,304 | 585 |
| | Joshin Denki Co. Ltd. | 60,000 | 581 |
| | Hitachi Zosen Corp. | 397,790 | 581 |
| | FP Corp. | 9,995 | 577 |
| | Horiba Ltd. | 19,014 | 572 |
| | M3 Inc. | 88 | 572 |
| * | Pioneer Corp. | 134,113 | 567 |
| | Toagosei Co. Ltd. | 104,584 | 566 |
| | Nichicon Corp. | 36,787 | 565 |
| | Kiyo Holdings Inc. | 387,965 | 552 |
| | Kakaku.com Inc. | 95 | 547 |
| | Hulic Co. Ltd. | 64,829 | 542 |
| | Fuji Oil Co. Ltd. | 38,898 | 540 |
| | Aichi Steel Corp. | 89,029 | 540 |
58
| | | |
| Vanguard® FTSE All-World ex-US Small-Cap Index Fund | | |
| Schedule of Investments | | |
| April 30, 2011 | | |
| | | | Market |
| | | | Value |
| | | Shares | ($000) |
| | Kyudenko Corp. | 90,000 | 535 |
| | Fuyo General Lease Co. Ltd. | 16,923 | 530 |
| | Asahi Diamond Industrial Co. Ltd. | 25,422 | 529 |
| ^ | Toyo Tanso Co. Ltd. | 9,510 | 528 |
| | KYORIN Holdings Inc. | 29,320 | 523 |
| | Kadokawa Group Holdings Inc. | 19,850 | 518 |
| | Nikkiso Co. Ltd. | 62,264 | 517 |
| | Nifco Inc. | 20,408 | 516 |
| | Tsubakimoto Chain Co. | 96,250 | 512 |
| | Japan Airport Terminal Co. Ltd. | 39,227 | 507 |
| | Aica Kogyo Co. Ltd. | 37,960 | 502 |
| | Inaba Denki Sangyo Co. Ltd. | 18,915 | 499 |
| | Takasago Thermal Engineering Co. Ltd. | 58,316 | 498 |
| | Sanyo Special Steel Co. Ltd. | 88,472 | 494 |
| | Hanwa Co. Ltd. | 115,415 | 493 |
| | Meitec Corp. | 25,367 | 491 |
| | Tadano Ltd. | 91,807 | 491 |
| | Mitsui Sugar Co. Ltd. | 97,000 | 485 |
| | Toyo Ink SC Holdings Co. Ltd. | 95,151 | 482 |
| | Daio Paper Corp. | 66,454 | 481 |
| | Tokyo Seimitsu Co. Ltd. | 24,423 | 478 |
| | Kureha Corp. | 95,338 | 478 |
| | Hosiden Corp. | 47,612 | 477 |
| | Oiles Corp. | 24,690 | 476 |
| | Tamron Co. Ltd. | 21,600 | 476 |
| | Toho Zinc Co. Ltd. | 86,758 | 473 |
| | Nippon Denko Co. Ltd. | 71,990 | 471 |
| | IBJ Leasing Co. Ltd. | 19,063 | 470 |
| | Nippon Flour Mills Co. Ltd. | 94,404 | 468 |
| | Nissin Kogyo Co. Ltd. | 27,501 | 463 |
| | Mirait Holdings Corp. | 61,100 | 462 |
| | Daiseki Co. Ltd. | 21,387 | 454 |
| | Nippon Light Metal Co. Ltd. | 219,023 | 448 |
| | Ryosan Co. Ltd. | 19,079 | 443 |
| | Nisshin Oillio Group Ltd. | 94,416 | 442 |
| | Kaken Pharmaceutical Co. Ltd. | 34,067 | 442 |
| | Sangetsu Co. Ltd. | 19,132 | 440 |
| | Sumitomo Warehouse Co. Ltd. | 95,208 | 438 |
| | Sanken Electric Co. Ltd. | 81,469 | 437 |
| | Bank of the Ryukyus Ltd. | 36,719 | 434 |
| | Toei Co. Ltd. | 94,648 | 432 |
| | FCC Co. Ltd. | 18,243 | 430 |
| | Seikagaku Corp. | 36,964 | 429 |
| ^ | Meidensha Corp. | 99,919 | 428 |
| | Musashi Seimitsu Industry Co. Ltd. | 17,715 | 428 |
| | Tsuruha Holdings Inc. | 9,000 | 426 |
| | Hokuto Corp. | 18,895 | 423 |
| | Megmilk Snow Brand Co. Ltd. | 27,152 | 422 |
| | NOF Corp. | 95,202 | 418 |
| ^ | Geo Corp. | 358 | 415 |
| | Sugi Holdings Co. Ltd. | 17,291 | 414 |
| | Sakai Chemical Industry Co. Ltd. | 79,000 | 413 |
| | Okinawa Electric Power Co. Inc. | 9,440 | 412 |
| | Mizuno Corp. | 94,782 | 409 |
| | Ricoh Leasing Co. Ltd. | 18,200 | 408 |
| | Nihon Kohden Corp. | 19,081 | 405 |
| | Fancl Corp. | 29,404 | 404 |
| | Tokyo Ohka Kogyo Co. Ltd. | 19,073 | 403 |
| | Hogy Medical Co. Ltd. | 9,751 | 403 |
| | Kitz Corp. | 77,200 | 402 |
| | Nippon Soda Co. Ltd. | 91,587 | 402 |
| | Mitsuboshi Belting Co. Ltd. | 85,000 | 401 |
| | Zensho Co. Ltd. | 37,961 | 400 |
| | Sanki Engineering Co. Ltd. | 67,000 | 400 |
59
| | | |
| Vanguard® FTSE All-World ex-US Small-Cap Index Fund | | |
| Schedule of Investments | | |
| April 30, 2011 | | |
| | | | Market |
| | | | Value |
| | | Shares | ($000) |
| | Topy Industries Ltd. | 150,795 | 398 |
| | NSD Co. Ltd. | 42,900 | 397 |
| | Morinaga Milk Industry Co. Ltd. | 97,678 | 394 |
| | Nakamuraya Co. Ltd. | 83,000 | 389 |
| | Toyo Engineering Corp. | 96,000 | 388 |
| | Yamanashi Chuo Bank Ltd. | 86,311 | 385 |
| | Fujitec Co. Ltd. | 75,000 | 384 |
| | Bank of Okinawa Ltd. | 9,504 | 381 |
| | Shimizu Bank Ltd. | 9,500 | 381 |
| | MOS Food Services Inc. | 20,710 | 381 |
| ^ | Nichi-iko Pharmaceutical Co. Ltd. | 14,700 | 380 |
| | Fuji Soft Inc. | 24,864 | 380 |
| | Izumiya Co. Ltd. | 87,000 | 379 |
| | ADEKA Corp. | 38,255 | 379 |
| | Itoham Foods Inc. | 95,000 | 377 |
| | Central Glass Co. Ltd. | 95,015 | 376 |
| | Oyo Corp. | 36,300 | 374 |
| | So-net Entertainment Corp. | 99 | 373 |
| | Seiren Co. Ltd. | 55,300 | 372 |
| | Keihin Corp. | 19,349 | 370 |
| | NET One Systems Co. Ltd. | 204 | 369 |
| | Okamoto Industries Inc. | 96,000 | 368 |
| | Tokyo Rope Manufacturing Co. Ltd. | 93,000 | 367 |
| | Taikisha Ltd. | 19,063 | 366 |
| | Denki Kogyo Co. Ltd. | 76,400 | 365 |
| | Accordia Golf Co. Ltd. | 563 | 363 |
| | Komori Corp. | 37,975 | 361 |
| | Mitsui-Soko Co. Ltd. | 96,000 | 356 |
| | Futaba Corp. | 19,080 | 356 |
| | San-A Co. Ltd. | 9,100 | 353 |
| | Bank of Iwate Ltd. | 9,324 | 353 |
| ^ | Kappa Create Co. Ltd. | 19,150 | 352 |
| | Alpine Electronics Inc. | 27,774 | 349 |
| | Resorttrust Inc. | 28,528 | 348 |
| | Nitta Corp. | 19,300 | 346 |
| | Toa Corp. | 192,000 | 346 |
| | EDION Corp. | 39,933 | 345 |
| | Japan Vilene Co. Ltd. | 73,000 | 344 |
| | TS Tech Co. Ltd. | 19,485 | 343 |
| ^ | Megachips Corp. | 19,900 | 340 |
| | Tokai Tokyo Financial Holdings Inc. | 113,432 | 340 |
| | Saizeriya Co. Ltd. | 19,921 | 340 |
| *,^ | Tobishima Corp. | 938,500 | 339 |
| | Yodogawa Steel Works Ltd. | 80,113 | 338 |
| | Noritake Co. Ltd. | 84,000 | 336 |
| | Japan Securities Finance Co. Ltd. | 53,641 | 336 |
| | Colowide Co. Ltd. | 60,500 | 336 |
| | Noritz Corp. | 19,135 | 334 |
| | Tomy Co. Ltd. | 38,617 | 333 |
| * | Furukawa Co. Ltd. | 297,000 | 332 |
| | Pigeon Corp. | 9,600 | 331 |
| | Minato Bank Ltd. | 176,000 | 328 |
| | Ariake Japan Co. Ltd. | 19,300 | 326 |
| | Daifuku Co. Ltd. | 47,961 | 325 |
| | Hokuetsu Kishu Paper Co. Ltd. | 57,721 | 323 |
| ^ | Penta-Ocean Construction Co. Ltd. | 146,000 | 322 |
| | Wacom Co. Ltd. | 249 | 318 |
| | Mandom Corp. | 12,079 | 318 |
| | Earth Chemical Co. Ltd. | 9,515 | 317 |
| * | Sumitomo Light Metal Industries Ltd. | 276,000 | 316 |
| | Daihen Corp. | 78,759 | 316 |
| | CKD Corp. | 34,500 | 313 |
| | Sanwa Holdings Corp. | 95,637 | 311 |
| | Maeda Corp. | 101,306 | 308 |
60
| | | |
| Vanguard® FTSE All-World ex-US Small-Cap Index Fund | | |
| Schedule of Investments | | |
| April 30, 2011 | | |
| | | | Market |
| | | | Value |
| | | Shares | ($000) |
| | Paris Miki Holdings Inc. | 31,500 | 308 |
| | Toho Holdings Co. Ltd. | 29,618 | 305 |
| | Marudai Food Co. Ltd. | 96,000 | 305 |
| | Century Tokyo Leasing Corp. | 17,579 | 302 |
| | Nippon Signal Co. Ltd. | 38,600 | 302 |
| | Daibiru Corp. | 37,887 | 301 |
| | Nihon Parkerizing Co. Ltd. | 21,596 | 300 |
| | AOKI Holdings Inc. | 19,400 | 299 |
| | SHO-BOND Holdings Co. Ltd. | 11,400 | 298 |
| *,^ | Fudo Tetra Corp. | 143,400 | 298 |
| | Nippon Gas Co. Ltd. | 21,400 | 298 |
| | Shinko Plantech Co. Ltd. | 26,600 | 298 |
| | Arcs Co. Ltd. | 19,200 | 297 |
| * | Unitika Ltd. | 388,000 | 297 |
| | Yachiyo Bank Ltd. | 9,700 | 296 |
| | Sintokogio Ltd. | 29,500 | 295 |
| | Aomori Bank Ltd. | 96,000 | 293 |
| | Ain Pharmaciez Inc. | 7,500 | 292 |
| | TOMONY Holdings Inc. | 82,700 | 292 |
| | Nippon Chemi-Con Corp. | 55,696 | 291 |
| | Kyoei Steel Ltd. | 16,400 | 288 |
| * | JVC Kenwood Holdings Inc. | 55,640 | 287 |
| | Toyo Tire & Rubber Co. Ltd. | 117,000 | 286 |
| | Shikoku Bank Ltd. | 95,003 | 285 |
| | Nichiden Corp. | 9,600 | 285 |
| | Maruha Nichiro Holdings Inc. | 190,348 | 284 |
| | Akita Bank Ltd. | 96,000 | 283 |
| | Amano Corp. | 30,456 | 283 |
| | Nagaileben Co. Ltd. | 10,400 | 278 |
| | Akebono Brake Industry Co. Ltd. | 52,857 | 278 |
| | Shibusawa Warehouse Co. Ltd. | 86,000 | 277 |
| | GMO internet Inc. | 63,000 | 275 |
| | Ehime Bank Ltd. | 97,000 | 274 |
| | Sakata Seed Corp. | 19,056 | 270 |
| | Sanden Corp. | 57,000 | 270 |
| | Xebio Co. Ltd. | 14,508 | 269 |
| * | Unihair Co. Ltd. | 27,809 | 268 |
| | Yamazen Corp. | 46,900 | 268 |
| | Japan Wool Textile Co. Ltd. | 30,189 | 268 |
| | Asahi Organic Chemicals Industry Co. Ltd. | 96,000 | 267 |
| | Fujimi Inc. | 19,300 | 263 |
| | Toyo Corp. | 25,800 | 262 |
| | Nippon Suisan Kaisha Ltd. | 93,562 | 262 |
| ^ | Kohnan Shoji Co. Ltd. | 15,800 | 261 |
| | Eighteenth Bank Ltd. | 96,000 | 261 |
| | Daiwabo Holdings Co. Ltd. | 125,761 | 258 |
| | Tokyo Tomin Bank Ltd. | 19,300 | 258 |
| | Mikuni Coca-Cola Bottling Co. Ltd. | 28,600 | 258 |
| * | Orient Corp. | 209,500 | 258 |
| | Prima Meat Packers Ltd. | 191,000 | 256 |
| | Pilot Corp. | 138 | 255 |
| | Atsugi Co. Ltd. | 215,000 | 253 |
| | Ryoyo Electro Corp. | 24,600 | 253 |
| ^ | Toyo Construction Co. Ltd. | 226,000 | 253 |
| | Toyo Kanetsu KK | 105,000 | 251 |
| | Gunze Ltd. | 69,079 | 250 |
| ^ | Dr Ci:Labo Co. Ltd. | 59 | 250 |
| | Parco Co. Ltd. | 29,200 | 249 |
| | Mie Bank Ltd. | 95,000 | 248 |
| | Kato Works Co. Ltd. | 88,000 | 248 |
| | Doutor Nichires Holdings Co. Ltd. | 20,737 | 247 |
| | Star Micronics Co. Ltd. | 21,700 | 245 |
| | Bank of Saga Ltd. | 96,000 | 245 |
| ^ | Temp Holdings Co. Ltd. | 26,400 | 244 |
61
| | | |
| Vanguard® FTSE All-World ex-US Small-Cap Index Fund | | |
| Schedule of Investments | | |
| April 30, 2011 | | |
| | | | Market |
| | | | Value |
| | | Shares | ($000) |
| | Heiwado Co. Ltd. | 19,200 | 243 |
| | Sanyo Shokai Ltd. | 81,000 | 243 |
| | Nichias Corp. | 39,855 | 242 |
| | Cocokara fine Inc. | 11,289 | 242 |
| | Nitto Kohki Co. Ltd. | 9,900 | 242 |
| | Jaccs Co. Ltd. | 87,000 | 241 |
| | TKC | 11,300 | 241 |
| | Saibu Gas Co. Ltd. | 99,734 | 241 |
| | Wood One Co. Ltd. | 51,000 | 240 |
| | Avex Group Holdings Inc. | 19,300 | 240 |
| | Chofu Seisakusho Co. Ltd. | 9,800 | 239 |
| | Nihon Unisys Ltd. | 38,600 | 239 |
| | Foster Electric Co. Ltd. | 10,185 | 238 |
| | AOC Holdings Inc. | 35,600 | 238 |
| | Morinaga & Co. Ltd. | 105,518 | 238 |
| | Seiko Holdings Corp. | 72,291 | 237 |
| | Chudenko Corp. | 19,100 | 235 |
| | Canon Electronics Inc. | 9,794 | 235 |
| | Yoshinoya Holdings Co. Ltd. | 193 | 234 |
| | Toho Bank Ltd. | 94,664 | 233 |
| | Kitagawa Iron Works Co. Ltd. | 128,000 | 233 |
| | Okamura Corp. | 41,000 | 233 |
| | Nitto Boseki Co. Ltd. | 95,738 | 233 |
| | HIS Co. Ltd. | 9,700 | 232 |
| | Showa Sangyo Co. Ltd. | 85,000 | 231 |
| | Godo Steel Ltd. | 89,000 | 230 |
| | Iino Kaiun Kaisha Ltd. | 48,000 | 228 |
| | Fuji Co. Ltd. | 11,000 | 228 |
| | Kurabo Industries Ltd. | 124,000 | 224 |
| | Daisan Bank Ltd. | 91,000 | 223 |
| | F&A Aqua Holdings Inc. | 25,000 | 221 |
| | Heiwa Real Estate Co. Ltd. | 98,000 | 220 |
| *,^ | Iseki & Co. Ltd. | 97,000 | 220 |
| | Nihon Dempa Kogyo Co. Ltd. | 14,400 | 220 |
| | Nippon Beet Sugar Manufacturing Co. Ltd. | 97,000 | 218 |
| | Miyazaki Bank Ltd. | 96,000 | 218 |
| | Nippon Carbon Co. Ltd. | 93,000 | 217 |
| * | Kenedix Inc. | 1,176 | 215 |
| | Ryobi Ltd. | 55,435 | 215 |
| | Roland Corp. | 18,600 | 214 |
| | Ryoshoku Ltd. | 10,000 | 213 |
| ^ | Yorozu Corp. | 10,500 | 213 |
| * | Ishihara Sangyo Kaisha Ltd. | 177,000 | 213 |
| | Chugoku Marine Paints Ltd. | 25,000 | 211 |
| | TOC Co. Ltd. | 51,500 | 211 |
| | Max Co. Ltd. | 17,000 | 210 |
| * | Tokyo Dome Corp. | 97,000 | 210 |
| | Hokuetsu Bank Ltd. | 97,000 | 209 |
| | Itochu Enex Co. Ltd. | 38,400 | 208 |
| | Nippon Densetsu Kogyo Co. Ltd. | 21,403 | 206 |
| | Fuji Seal International Inc. | 9,700 | 205 |
| | Nagano Bank Ltd. | 97,000 | 205 |
| | Nippon Shinyaku Co. Ltd. | 15,571 | 203 |
| | Valor Co. Ltd. | 18,700 | 199 |
| * | Kanematsu Corp. | 198,000 | 197 |
| | Nishimatsu Construction Co. Ltd. | 129,000 | 197 |
| | Mitsubishi Paper Mills Ltd. | 193,000 | 196 |
| * | Oki Electric Industry Co. Ltd. | 238,311 | 195 |
| | Tachi-S Co. Ltd. | 11,600 | 195 |
| | Unipres Corp. | 9,100 | 195 |
| | Higashi-Nippon Bank Ltd. | 96,000 | 195 |
| ^ | Takaoka Electric Manufacturing Co. Ltd. | 50,000 | 195 |
| | Toli Corp. | 84,000 | 194 |
| | Shin-Etsu Polymer Co. Ltd. | 36,000 | 194 |
62
| | | |
| Vanguard® FTSE All-World ex-US Small-Cap Index Fund | | |
| Schedule of Investments | | |
| April 30, 2011 | | |
| | | | Market |
| | | | Value |
| | | Shares | ($000) |
| | FIDEA Holdings Co. Ltd. | 75,300 | 194 |
| | Nippon Konpo Unyu Soko Co. Ltd. | 18,000 | 193 |
| ^ | Krosaki Harima Corp. | 47,000 | 193 |
| | Kisoji Co. Ltd. | 9,700 | 193 |
| | DCM Holdings Co. Ltd. | 30,300 | 193 |
| | Kato Sangyo Co. Ltd. | 11,400 | 192 |
| * | Misawa Homes Co. Ltd. | 33,800 | 192 |
| | Takara Standard Co. Ltd. | 25,098 | 190 |
| | Sanyo Denki Co. Ltd. | 22,000 | 189 |
| | Riken Corp. | 48,000 | 189 |
| | Toshiba Plant Systems & Services Corp. | 16,524 | 189 |
| | Okabe Co. Ltd. | 33,900 | 188 |
| | Tokushu Tokai Paper Co. Ltd. | 96,000 | 188 |
| | Sumitomo Mitsui Financial Group Inc. | 6,042�� | 188 |
| *,^ | Daiei Inc. | 53,500 | 187 |
| | Fukui Bank Ltd. | 61,769 | 187 |
| | Japan Drilling Co. Ltd. | 4,600 | 186 |
| | Sasebo Heavy Industries Co. Ltd. | 97,000 | 186 |
| ^ | WATAMI Co. Ltd. | 10,600 | 185 |
| | Aeon Delight Co. Ltd. | 9,600 | 184 |
| | Senshukai Co. Ltd. | 29,700 | 182 |
| * | SWCC Showa Holdings Co. Ltd. | 143,000 | 181 |
| | Calsonic Kansei Corp. | 44,000 | 179 |
| | Melco Holdings Inc. | 5,600 | 179 |
| | Moshi Moshi Hotline Inc. | 9,750 | 179 |
| | Nippon Thompson Co. Ltd. | 24,000 | 179 |
| | Nippo Corp. | 22,000 | 177 |
| ^ | Topcon Corp. | 30,800 | 176 |
| | Mitsubishi Steel Manufacturing Co. Ltd. | 52,000 | 175 |
| | Ship Healthcare Holdings Inc. | 13,400 | 174 |
| | T-Gaia Corp. | 100 | 174 |
| | Osaka Steel Co. Ltd. | 9,600 | 173 |
| ^ | Sumisho Computer Systems Corp. | 12,100 | 172 |
| | Michinoku Bank Ltd. | 96,000 | 171 |
| | Milbon Co. Ltd. | 6,050 | 170 |
| | Taiyo Holdings Co. Ltd. | 5,500 | 170 |
| | Bank of Nagoya Ltd. | 53,121 | 169 |
| * | Showa Corp. | 25,800 | 168 |
| | Asahi Holdings Inc. | 8,100 | 168 |
| *,^ | CSK Corp. | 51,600 | 165 |
| | Press Kogyo Co. Ltd. | 36,000 | 165 |
| | Morita Holdings Corp. | 26,154 | 165 |
| | Aiphone Co. Ltd. | 10,000 | 164 |
| * | Janome Sewing Machine Co. Ltd. | 179,000 | 163 |
| * | Sankyo-Tateyama Holdings Inc. | 112,000 | 162 |
| | Towa Pharmaceutical Co. Ltd. | 3,100 | 162 |
| | Eizo Nanao Corp. | 7,200 | 161 |
| | Riso Kagaku Corp. | 8,500 | 160 |
| * | Cosmos Pharmaceutical Corp. | 3,600 | 159 |
| | Alpen Co. Ltd. | 9,700 | 159 |
| | ZERIA Pharmaceutical Co. Ltd. | 13,000 | 157 |
| * | Daikyo Inc. | 97,000 | 156 |
| * | Chiba Kogyo Bank Ltd. | 28,700 | 155 |
| | Coca-Cola Central Japan Co. Ltd. | 11,400 | 155 |
| | Toshiba Machine Co. Ltd. | 29,000 | 155 |
| | Nippon Steel Trading Co. Ltd. | 54,000 | 155 |
| ^ | Towa Bank Ltd. | 128,000 | 155 |
| | Sanei-International Co. Ltd. | 13,900 | 155 |
| | Paramount Bed Co. Ltd. | 5,700 | 155 |
| | Round One Corp. | 25,400 | 154 |
| | Marusan Securities Co. Ltd. | 36,700 | 154 |
| | Sodick Co. Ltd. | 23,000 | 151 |
| | Nippon Seiki Co. Ltd. | 13,000 | 151 |
| ^ | Toda Kogyo Corp. | 16,000 | 150 |
63
| | | |
| Vanguard® FTSE All-World ex-US Small-Cap Index Fund | | |
| Schedule of Investments | | |
| April 30, 2011 | | |
| | | | Market |
| | | | Value |
| | | Shares | ($000) |
| ^ | Tsugami Corp. | 22,000 | 149 |
| | Tsukishima Kikai Co. Ltd. | 16,000 | 147 |
| | Ministop Co. Ltd. | 9,000 | 146 |
| | Kanto Auto Works Ltd. | 22,000 | 143 |
| ^ | Gourmet Navigator Inc. | 12,200 | 143 |
| | Nippon Synthetic Chemical Industry Co. Ltd. | 22,000 | 140 |
| *,^ | Clarion Co. Ltd. | 81,000 | 139 |
| | Japan Aviation Electronics Industry Ltd. | 19,000 | 139 |
| | Aida Engineering Ltd. | 31,600 | 139 |
| | Stella Chemifa Corp. | 3,800 | 138 |
| | Oita Bank Ltd. | 43,435 | 138 |
| | ASKUL Corp. | 10,000 | 138 |
| ^ | Dwango Co. Ltd. | 51 | 138 |
| | Transcosmos Inc. | 14,700 | 138 |
| | Mitsui Matsushima Co. Ltd. | 60,000 | 137 |
| | Sinfonia Technology Co. Ltd. | 44,000 | 137 |
| | Vital KSK Holdings Inc. | 16,200 | 136 |
| | Kuroda Electric Co. Ltd. | 12,200 | 136 |
| | Aichi Machine Industry Co. Ltd. | 38,000 | 136 |
| | Daido Metal Co. Ltd. | 15,000 | 135 |
| | Nichii Gakkan Co. | 17,200 | 135 |
| | Futaba Industrial Co. Ltd. | 23,600 | 135 |
| | Nissan Shatai Co. Ltd. | 18,000 | 135 |
| | Nissen Holdings Co. Ltd. | 20,700 | 135 |
| ^ | Token Corp. | 3,150 | 134 |
| | Hibiya Engineering Ltd. | 14,300 | 134 |
| | Tv Tokyo Holdings Corp. | 10,400 | 134 |
| | ASKA Pharmaceutical Co. Ltd. | 16,000 | 133 |
| | Chugai Ro Co. Ltd. | 31,000 | 132 |
| | Japan Radio Co. Ltd. | 53,000 | 132 |
| | Sato Corp. | 10,000 | 131 |
| | Macromill Inc. | 11,500 | 131 |
| | Koa Corp. | 11,700 | 131 |
| | Chiyoda Co. Ltd. | 9,800 | 130 |
| | Kanto Denka Kogyo Co. Ltd. | 17,000 | 130 |
| | Sankyo Seiko Co. Ltd. | 40,597 | 128 |
| | Cosel Co. Ltd. | 8,100 | 128 |
| | United Arrows Ltd. | 7,600 | 126 |
| * | Daikokutenbussan Co. Ltd. | 3,900 | 126 |
| | Nippon Coke & Engineering Co. Ltd. | 65,500 | 125 |
| | Sekisui Jushi Corp. | 12,000 | 125 |
| | Hisaka Works Ltd. | 11,000 | 124 |
| | Seika Corp. | 45,000 | 124 |
| | Aisan Industry Co. Ltd. | 13,200 | 124 |
| | Bic Camera Inc. | 265 | 121 |
| | Takasago International Corp. | 23,000 | 120 |
| | Shinmaywa Industries Ltd. | 28,000 | 119 |
| ^ | Nihon M&A Center Inc. | 22 | 117 |
| | Torii Pharmaceutical Co. Ltd. | 5,700 | 117 |
| *,^ | Aiful Corp. | 100,000 | 116 |
| | Nissin Electric Co. Ltd. | 14,000 | 115 |
| | Taiko Pharmaceutical Co. Ltd. | 9,800 | 115 |
| | Furukawa-Sky Aluminum Corp. | 40,000 | 115 |
| | Fuji Kyuko Co. Ltd. | 22,000 | 114 |
| | Aichi Bank Ltd. | 1,900 | 114 |
| | Ichiyoshi Securities Co. Ltd. | 18,100 | 113 |
| | Paltac Corp. | 6,600 | 111 |
| | Descente Ltd. | 26,000 | 110 |
| | T RAD Co. Ltd. | 26,000 | 109 |
| | Mitsubishi Pencil Co. Ltd. | 6,100 | 109 |
| | Taihei Dengyo Kaisha Ltd. | 12,000 | 109 |
| | DTS Corp. | 11,400 | 108 |
| | Kintetsu World Express Inc. | 3,200 | 108 |
| | Mitsuba Corp. | 14,000 | 108 |
64
| | | |
| Vanguard® FTSE All-World ex-US Small-Cap Index Fund | | |
| Schedule of Investments | | |
| April 30, 2011 | | |
| | | | Market |
| | | | Value |
| | | Shares | ($000) |
| | Elematec Corp. | 8,300 | 108 |
| | Nihon Nohyaku Co. Ltd. | 24,000 | 108 |
| | Panasonic Electric Works SUNX Co. Ltd. | 19,100 | 107 |
| | Kumiai Chemical Industry Co. Ltd. | 39,000 | 107 |
| ^ | Kinugawa Rubber Industrial Co. Ltd. | 22,000 | 107 |
| | Yokohama Reito Co. Ltd. | 15,800 | 107 |
| | Shoei Co. Ltd. | 11,600 | 107 |
| | Inabata & Co. Ltd. | 18,500 | 106 |
| | BML Inc. | 3,700 | 105 |
| | Zappallas Inc. | 77 | 105 |
| | Shibuya Kogyo Co. Ltd. | 9,500 | 105 |
| | Teikoku Piston Ring Co. Ltd. | 11,500 | 104 |
| * | Tsukuba Bank Ltd. | 35,700 | 104 |
| | Tokyu Livable Inc. | 12,200 | 104 |
| | St. Marc Holdings Co. Ltd. | 2,800 | 103 |
| | Goldcrest Co. Ltd. | 6,180 | 103 |
| | Fujitsu General Ltd. | 19,000 | 102 |
| | Hamakyorex Co. Ltd. | 3,500 | 102 |
| | Modec Inc. | 5,500 | 102 |
| | Nidec-Tosok Corp. | 11,500 | 102 |
| | Bando Chemical Industries Ltd. | 24,000 | 101 |
| | Toyo Denki Seizo - Toyo Electric Manufacturing Co. Ltd. | 21,000 | 100 |
| | Yusen Logistics Co. Ltd. | 5,700 | 100 |
| | Osaki Electric Co. Ltd. | 11,000 | 99 |
| | Nidec Copal Corp. | 8,500 | 99 |
| * | Uniden Corp. | 27,000 | 99 |
| | JFE Shoji Holdings Inc. | 22,000 | 97 |
| | SMK Corp. | 22,000 | 96 |
| | Gulliver International Co. Ltd. | 2,390 | 96 |
| | Juki Corp. | 38,000 | 96 |
| | Mito Securities Co. Ltd. | 65,000 | 95 |
| | Nittetsu Mining Co. Ltd. | 20,000 | 95 |
| | Nippon Ceramic Co. Ltd. | 4,500 | 95 |
| | Asahi Co. Ltd. | 4,600 | 95 |
| | Idec Corp. | 9,200 | 94 |
| | TECMO KOEI HOLDINGS CO Ltd. | 12,600 | 94 |
| | Kaga Electronics Co. Ltd. | 8,200 | 94 |
| | Enplas Corp. | 6,700 | 93 |
| | Ryoden Trading Co. Ltd. | 15,000 | 92 |
| ^ | Shin-Kobe Electric Machinery Co. Ltd. | 6,000 | 92 |
| * | Takuma Co. Ltd. | 25,000 | 92 |
| | Kyosan Electric Manufacturing Co. Ltd. | 16,000 | 91 |
| | Royal Holdings Co. Ltd. | 8,800 | 91 |
| | Nippon Valqua Industries Ltd. | 31,000 | 90 |
| | NEC Networks & System Integration Corp. | 6,900 | 90 |
| ^ | Axell Corp. | 4,700 | 90 |
| | Trusco Nakayama Corp. | 5,300 | 90 |
| | Yokogawa Bridge Holdings Corp. | 13,000 | 89 |
| | Daiichi Jitsugyo Co. Ltd. | 22,000 | 89 |
| | Tsutsumi Jewelry Co. Ltd. | 3,500 | 87 |
| | Sanshin Electronics Co. Ltd. | 10,400 | 87 |
| | Nitto Kogyo Corp. | 8,400 | 87 |
| | Japan Pulp & Paper Co. Ltd. | 24,000 | 87 |
| | Japan Digital Laboratory Co. Ltd. | 7,500 | 87 |
| | Megane TOP Co. Ltd. | 8,500 | 84 |
| | Shindengen Electric Manufacturing Co. Ltd. | 19,000 | 82 |
| | Internet Initiative Japan Inc. | 24 | 82 |
| | NS United Kaiun Kaisha Ltd. | 41,000 | 82 |
| | NEC Fielding Ltd. | 7,300 | 82 |
| * | Nippon Yakin Kogyo Co. Ltd. | 34,000 | 81 |
| *,^ | Leopalace21 Corp. | 56,500 | 80 |
| | Torishima Pump Manufacturing Co. Ltd. | 5,000 | 80 |
| | Maezawa Kyuso Industries Co. Ltd. | 5,900 | 78 |
| | Totetsu Kogyo Co. Ltd. | 9,000 | 78 |
65
| | | |
| Vanguard® FTSE All-World ex-US Small-Cap Index Fund | | |
| Schedule of Investments | | |
| April 30, 2011 | | |
| | | | Market |
| | | | Value |
| | | Shares | ($000) |
| | Ines Corp. | 11,800 | 78 |
| | Topre Corp. | 9,400 | 77 |
| | ST Corp. | 7,500 | 77 |
| | Senko Co. Ltd. | 26,000 | 77 |
| | Doshisha Co. Ltd. | 3,500 | 77 |
| | Tokyo Rakutenchi Co. Ltd. | 23,000 | 76 |
| | Kentucky Fried Chicken Japan Ltd. | 3,000 | 75 |
| | Shinko Shoji Co. Ltd. | 8,800 | 75 |
| | Nihon Yamamura Glass Co. Ltd. | 27,000 | 75 |
| * | Daiichi Chuo KK | 38,000 | 74 |
| | Eagle Industry Co. Ltd. | 7,000 | 73 |
| | Nice Holdings Inc. | 30,000 | 72 |
| | Tocalo Co. Ltd. | 3,800 | 72 |
| | Pacific Industrial Co. Ltd. | 15,000 | 71 |
| | Macnica Inc. | 3,000 | 71 |
| | JSP Corp. | 4,000 | 71 |
| | EPS Co. Ltd. | 31 | 71 |
| | Fujimori Kogyo Co. Ltd. | 5,100 | 70 |
| | Nippon Sharyo Ltd. | 16,000 | 70 |
| | Arisawa Manufacturing Co. Ltd. | 13,900 | 69 |
| | Shinkawa Ltd. | 7,200 | 69 |
| *,^ | Fujiya Co. Ltd. | 41,000 | 68 |
| | Dydo Drinco Inc. | 1,700 | 66 |
| | Shimojima Co. Ltd. | 5,600 | 65 |
| | Toyo Securities Co. Ltd. | 43,000 | 65 |
| | Nomura Co. Ltd. | 21,000 | 63 |
| | Origin Electric Co. Ltd. | 12,000 | 62 |
| | Zuken Inc. | 7,600 | 57 |
| | | | 132,819 |
| Malaysia (1.0%) | | |
| * | AirAsia Bhd. | 1,124,262 | 1,092 |
| | Dialog Group Bhd. | 791,453 | 666 |
| | Malaysian Resources Corp. Bhd. | 781,447 | 563 |
| | Bursa Malaysia Bhd. | 202,736 | 550 |
| | Genting Plantations Bhd. | 189,573 | 512 |
| | Media Prima Bhd. | 555,940 | 493 |
| | SapuraCrest Petroleum Bhd. | 391,815 | 493 |
| | IGB Corp. Bhd. | 655,673 | 472 |
| | Top Glove Corp. Bhd. | 264,779 | 464 |
| | Multi-Purpose Holdings Bhd. | 425,344 | 451 |
| | Kulim Malaysia Bhd. | 396,236 | 428 |
| | DRB-Hicom Bhd. | 572,727 | 428 |
| | Boustead Holdings Bhd. | 211,675 | 414 |
| | Kencana Petroleum Bhd. | 456,300 | 406 |
| | Berjaya Corp. Bhd. | 1,051,471 | 405 |
| | Affin Holdings Bhd. | 342,600 | 405 |
| | WCT Bhd. | 366,343 | 377 |
| | KNM Group Bhd. | 409,146 | 364 |
| * | Malaysian Airline System Bhd. | 569,300 | 351 |
| | Samling Global Ltd. | 2,418,000 | 335 |
| | Malaysia Airports Holdings Bhd. | 156,177 | 326 |
| | KLCC Property Holdings Bhd. | 272,799 | 303 |
| | Carlsberg Brewery-Malay Bhd. | 100,400 | 268 |
| | TAN Chong Motor Holdings Bhd. | 159,498 | 252 |
| | Eastern & Oriental Bhd. | 515,300 | 248 |
| | Wah Seong Corp. Bhd. | 325,136 | 245 |
| | Supermax Corp. Bhd. | 173,575 | 242 |
| | OSK Holdings Bhd. | 371,297 | 218 |
| | IJM Land Bhd. | 197,100 | 187 |
| * | Mulpha International Bhd. | 968,500 | 174 |
| | Unisem M Bhd. | 266,980 | 168 |
| | Mudajaya Group Bhd. | 106,300 | 166 |
| | TA Enterprise Bhd. | 649,200 | 166 |
| | Malaysian Bulk Carriers Bhd. | 182,500 | 160 |
66
| | | |
| Vanguard® FTSE All-World ex-US Small-Cap Index Fund | | |
| Schedule of Investments | | |
| April 30, 2011 | | |
| | | | Market |
| | | | Value |
| | | Shares | ($000) |
| | Lion Industries Corp. Bhd. | 257,300 | 147 |
| | Hartalega Holdings Bhd. | 73,200 | 141 |
| | Muhibbah Engineering M Bhd. | 235,900 | 128 |
| | Uchi Technologies Bhd. | 206,000 | 97 |
| | Puncak Niaga Holding Bhd. | 107,200 | 76 |
| * | WCT Bhd. Warrants Expire 02/24/2016 | 73,268 | 19 |
| * | Kulim Malaysia Bhd. Warrants | 46,729 | 13 |
| * | Petra Perdana Bhd. Warrants Exp. 10/26/2015 | 25,612 | 6 |
| * | Media Prima Bhd. Warrants Exp. 12/31/2014 | 9,277 | 3 |
| | | | 13,422 |
| Mexico (0.7%) | | |
| | Coca-Cola Femsa SAB de CV | 161,498 | 1,287 |
| | Banco Compartamos SA de CV | 158,385 | 1,101 |
| * | Empresas ICA SAB de CV | 373,896 | 923 |
| | Grupo Aeroportuario del Sureste SAB de CV Class B | 149,519 | 884 |
| * | Genomma Lab Internacional SAB de CV Class B | 348,282 | 870 |
| * | Desarrolladora Homex SAB de CV | 137,128 | 646 |
| * | Corp GEO SAB de CV | 215,720 | 637 |
| | TV Azteca SAB de CV | 797,854 | 570 |
| * | Axtel SAB de CV | 748,225 | 443 |
| * | Industrias CH SAB de CV Class B | 100,572 | 400 |
| * | Controladora Comercial Mexicana SAB de CV | 226,800 | 395 |
| | Consorcio ARA SAB de CV | 597,177 | 355 |
| | Grupo Aeroportuario del Centro Norte Sab de CV | 125,884 | 264 |
| * | Gruma SAB de CV Class B | 93,400 | 187 |
| * | Grupo Famsa SAB de CV Class A | 86,757 | 175 |
| * | Grupo Simec SAB de CV Class B | 56,315 | 161 |
| | Compartamos SAB de CV | 74,100 | 138 |
| | | | 9,436 |
| Netherlands (1.8%) | | |
| | Imtech NV | 49,934 | 1,896 |
| * | ASM International NV | 35,173 | 1,526 |
| | Nutreco NV | 19,417 | 1,511 |
| | Aalberts Industries NV | 56,721 | 1,435 |
| | CSM | 36,224 | 1,388 |
| | Wereldhave NV | 12,939 | 1,352 |
| | Eurocommercial Properties NV | 26,110 | 1,342 |
| ^ | Delta Lloyd NV | 37,459 | 986 |
| * | USG People NV | 43,485 | 861 |
| | Koninklijke Ten Cate NV | 17,445 | 807 |
| | Vastned Retail NV | 10,081 | 773 |
| | Koninklijke BAM Groep NV | 96,742 | 772 |
| | Arcadis NV | 28,795 | 743 |
| | BinckBank NV | 40,064 | 724 |
| | TKH Group NV | 21,905 | 685 |
| | Mediq NV | 31,613 | 681 |
| | Nieuwe Steen Investments NV | 29,769 | 659 |
| | Unit 4 NV | 15,039 | 564 |
| * | ProLogis European Properties | 60,414 | 550 |
| | Sligro Food Group NV | 14,536 | 540 |
| * | SNS REAAL NV | 73,622 | 452 |
| * | Wavin NV | 24,485 | 438 |
| | Grontmij NV | 17,441 | 392 |
| *,^ | TomTom NV | 35,074 | 317 |
| ^ | Koninklijke Wessanen NV | 53,447 | 238 |
| | Heijmans NV | 6,930 | 235 |
| | Beter Bed Holding NV | 7,072 | 224 |
| * | Accell Group | 3,313 | 197 |
| | Brunel International NV | 3,836 | 195 |
| *,^ | AMG Advanced Metallurgical Group NV | 8,253 | 185 |
| | Vastned Offices/Industrial NV | 8,156 | 163 |
| * | Ordina NV | 21,103 | 125 |
| * | Kardan NV | 17,537 | 104 |
67
| | | |
| Vanguard® FTSE All-World ex-US Small-Cap Index Fund | | |
| Schedule of Investments | | |
| April 30, 2011 | | |
| | | | Market |
| | | | Value |
| | | Shares | ($000) |
| | KAS Bank NV | 3,871 | 68 |
| | | | 23,128 |
| New Zealand (0.2%) | | |
| | Infratil Ltd. | 279,948 | 431 |
| | New Zealand Oil & Gas Ltd. | 491,311 | 387 |
| | Goodman Property Trust | 411,230 | 303 |
| | Freightways Ltd. | 103,196 | 288 |
| | AMP NZ Office Ltd. | 386,275 | 257 |
| | Nuplex Industries Ltd. | 75,791 | 201 |
| * | Fisher & Paykel Appliances Holdings Ltd. | 298,411 | 145 |
| | Mainfreight Ltd. | 15,887 | 119 |
| | Tower Ltd. | 50,936 | 77 |
| | | | 2,208 |
| Norway (2.1%) | | |
| | Subsea 7 SA | 194,555 | 5,124 |
| | Marine Harvest ASA | 1,613,946 | 2,132 |
| * | Petroleum Geo-Services ASA | 119,264 | 1,887 |
| | TGS Nopec Geophysical Co. ASA | 58,516 | 1,541 |
| | Schibsted ASA | 46,954 | 1,413 |
| | ProSafe SE | 123,280 | 1,001 |
| ^ | Tomra Systems ASA | 113,733 | 976 |
| * | DNO International ASA | 647,559 | 972 |
| | Cermaq ASA | 41,825 | 861 |
| | SpareBank 1 SR Bank | 80,183 | 859 |
| | Fred Olsen Energy ASA | 17,162 | 790 |
| * | BW Offshore Ltd. | 302,263 | 784 |
| ^ | Frontline Ltd. | 31,684 | 700 |
| | SpareBank 1 SMN | 67,828 | 681 |
| ^ | Veidekke ASA | 59,687 | 603 |
| * | Algeta ASA | 19,820 | 574 |
| * | Seawell Ltd. | 81,914 | 546 |
| ^ | Atea ASA | 49,159 | 544 |
| | Golar LNG Ltd. | 17,012 | 537 |
| * | Songa Offshore SE | 83,019 | 507 |
| * | Norwegian Property ASA | 247,343 | 500 |
| ^ | Aker ASA | 15,877 | 484 |
| * | Norske Skogindustrier ASA | 147,044 | 418 |
| * | Norwegian Energy Co. AS | 121,577 | 333 |
| ^ | Nordic Semiconductor ASA | 84,681 | 317 |
| ^ | Opera Software ASA | 50,162 | 281 |
| * | Dockwise Ltd. | 9,192 | 266 |
| * | EDB ErgoGroup ASA | 95,416 | 264 |
| *,^ | Norwegian Air Shuttle AS | 13,301 | 261 |
| | Austevoll Seafood ASA | 32,297 | 248 |
| | Stolt-Nielsen Ltd. | 10,167 | 246 |
| | Leroey Seafood Group ASA | 6,430 | 209 |
| *,^ | Sevan Marine ASA | 271,606 | 192 |
| * | Siem Offshore Inc. | 80,466 | 187 |
| | Golden Ocean Group Ltd. | 138,611 | 170 |
| * | Pronova BioPharma AS | 62,418 | 102 |
| | Rem Offshore ASA | 3,800 | 38 |
| | | | 27,548 |
| Philippines (0.5%) | | |
| | Energy Development Corp. | 7,420,490 | 1,172 |
| | Alliance Global Group Inc. | 2,080,803 | 577 |
| * | First Gen Corp. | 1,668,468 | 570 |
| | International Container Terminal Services Inc. | 491,861 | 565 |
| * | Philippine National Bank | 355,810 | 532 |
| | DMCI Holdings Inc. | 493,700 | 510 |
| | Philex Mining Corp. | 1,079,881 | 450 |
| | Semirara Mining Corp. Class A | 87,560 | 447 |
| | Metro Pacific Investments Corp. | 4,945,000 | 425 |
| * | Universal Robina Corp. | 430,499 | 375 |
68
| | | |
| Vanguard® FTSE All-World ex-US Small-Cap Index Fund | | |
| Schedule of Investments | | |
| April 30, 2011 | | |
| | | | Market |
| | | | Value |
| | | Shares | ($000) |
| | Robinsons Land Corp. | 1,195,150 | 372 |
| | Megaworld Corp. | 4,790,906 | 262 |
| | Manila Water Co. Inc. | 537,616 | 226 |
| | First Philippine Holdings Corp. | 126,580 | 196 |
| | Filinvest Land Inc. | 6,134,000 | 182 |
| | Vista Land & Lifescapes Inc. | 1,389,000 | 103 |
| | | | 6,964 |
| Poland (0.5%) | | |
| * | Synthos SA | 734,051 | 1,246 |
| * | Grupa Lotos SA | 45,445 | 813 |
| | Asseco Poland SA | 37,352 | 747 |
| ^ | Eurocash SA | 44,582 | 546 |
| * | Bank Millennium SA | 211,567 | 434 |
| | PBG SA | 6,706 | 415 |
| ^ | Polimex-Mostostal SA | 310,388 | 408 |
| *,^ | AmRest Holdings SE | 13,038 | 400 |
| *,^ | Cersanit SA | 79,162 | 366 |
| * | Netia SA | 181,344 | 361 |
| *,^ | Echo Investment SA | 168,342 | 321 |
| | Budimex SA | 4,749 | 193 |
| | Agora SA | 12,709 | 122 |
| *,^ | Bioton SA | 1,495,999 | 95 |
| | | | 6,467 |
| Portugal (0.2%) | | |
| | Zon Multimedia Servicos de Telecomunicacoes e Multimedia SGPS SA | 168,084 | 952 |
| | Sonae | 394,497 | 473 |
| | Semapa-Sociedade de Investimento e Gestao | 33,149 | 417 |
| | Portucel Empresa Produtora de Pasta e Papel SA | 96,917 | 363 |
| * | Mota-Engil SGPS SA | 118,723 | 315 |
| * | Sonaecom - SGPS SA | 82,780 | 191 |
| * | BANIF SGPS SA | 169,587 | 176 |
| * | REN - Redes Energeticas Nacionais SA | 43,529 | 166 |
| * | Altri SGPS SA | 56,620 | 137 |
| | Teixeira Duarte SA | 90,220 | 73 |
| | | | 3,263 |
| Russia (0.5%) | | |
| | AK Transneft OAO Prior Pfd. | 815 | 1,203 |
| * | DIXY Group OJSC | 44,594 | 585 |
| * | OGK-2 OAO | 9,419,100 | 531 |
| | Uralsvyazinform | 8,018,513 | 483 |
| | Nizhnekamskneftekhim Prior Pfd. | 848,100 | 401 |
| | VolgaTelecom | 66,649 | 397 |
| | Vsmpo-Avisma Corp. | 3,068 | 389 |
| | Akron JSC | 8,234 | 388 |
| * | AvtoVAZ | 376,702 | 375 |
| * | Baltika Brewery | 7,537 | 373 |
| | Sibirtelecom OJSC | 3,000,200 | 344 |
| * | OGK-6 OAO | 6,166,300 | 281 |
| * | TGK-5 | 434,814,400 | 217 |
| * | OGK-1 OAO | 4,852,700 | 168 |
| * | TGK-9 OAO | 1,237,900,000 | 149 |
| * | Inter-Regional Distribution Network Co. North-West OJSC | 25,604,400 | 144 |
| | | | 6,428 |
| Singapore (1.1%) | | |
| | Suntec Real Estate Investment Trust | 1,143,510 | 1,422 |
| | Mapletree Logistics Trust | 1,525,280 | 1,128 |
| | SATS Ltd. | 463,878 | 979 |
| | Straits Asia Resources Ltd. | 397,116 | 961 |
| ^ | Hyflux Ltd. | 478,169 | 841 |
| * | Biosensors International Group Ltd. | 735,004 | 811 |
| | CDL Hospitality Trusts | 437,595 | 723 |
| | Ascendas India Trust | 905,000 | 702 |
| | OSIM International Ltd. | 276,000 | 384 |
69
| | | |
| Vanguard® FTSE All-World ex-US Small-Cap Index Fund | | |
| Schedule of Investments | | |
| April 30, 2011 | | |
| | | | Market |
| | | | Value |
| | | Shares | ($000) |
| ^ | Ezra Holdings Ltd. | 280,902 | 380 |
| | Goodpack Ltd. | 207,495 | 336 |
| * | Ho Bee Investment Ltd. | 277,000 | 336 |
| | Ascott Residence Trust | 339,882 | 331 |
| | GMG Global Ltd. | 1,380,000 | 316 |
| | Midas Holdings Ltd. | 434,847 | 260 |
| ^ | First Resources Ltd. | 227,629 | 257 |
| | Parkway Life Real Estate Investment Trust | 181,485 | 257 |
| | CSE Global Ltd. | 262,759 | 249 |
| * | Super Group Ltd. | 220,000 | 249 |
| *,1 | ARA Asset Management Ltd. | 171,000 | 246 |
| ^ | Fortune Real Estate Investment Trust | 470,836 | 235 |
| *,^ | Oceanus Group Ltd. | 1,015,000 | 228 |
| | China Fishery Group Ltd. | 144,330 | 217 |
| *,^ | Raffles Education Corp. Ltd. | 361,366 | 196 |
| *,^ | Gallant Venture Ltd. | 537,000 | 191 |
| * | Think Environmental Co. Ltd. | 272,000 | 186 |
| | Cambridge Industrial Trust | 453,510 | 185 |
| | Frasers Centrepoint Trust | 147,000 | 178 |
| | Frasers Commercial Trust | 253,200 | 166 |
| * | Ying Li International Real Estate Ltd. | 502,000 | 162 |
| | Sound Global Ltd. | 261,000 | 160 |
| | K-REIT Asia | 148,000 | 158 |
| * | Hi-P International Ltd. | 156,000 | 156 |
| * | KS Energy Services Ltd. | 180,000 | 146 |
| * | Raffles Medical Group Ltd. | 76,000 | 141 |
| | Lippo-Mapletree Indonesia Retail Trust | 302,000 | 138 |
| | CapitaRetail China Trust | 103,000 | 106 |
| * | Swiber Holdings Ltd. | 151,000 | 98 |
| | Cityspring Infrastructure Trust | 200,000 | 89 |
| | Hong Leong Asia Ltd. | 40,000 | 88 |
| | CH Offshore Ltd. | 186,000 | 68 |
| | | | 14,460 |
| South Africa (0.5%) | | |
| ^ | Aquarius Platinum Ltd. | 256,820 | 1,480 |
| * | Metorex Ltd. | 724,585 | 810 |
| | Astral Foods Ltd. | 26,380 | 540 |
| | Capital Property Fund | 421,920 | 526 |
| | SA Corporate Real Estate Fund Nominees Pty Ltd. | 870,571 | 437 |
| | Blue Label Telecoms Ltd. | 455,144 | 426 |
| | DataTec Ltd. | 73,702 | 411 |
| | Emira Property Fund | 203,240 | 409 |
| * | Omnia Holdings Ltd. | 31,985 | 364 |
| | City Lodge Hotels Ltd. | 21,925 | 231 |
| | DRDGOLD Ltd. | 367,200 | 223 |
| * | Simmer & Jack Mines Ltd. | 1,514,223 | 185 |
| * | Eqstra Holdings Ltd. | 116,881 | 119 |
| | Palabora Mining Co. Ltd. | 5,085 | 114 |
| | Merafe Resources Ltd. | 345,440 | 78 |
| | | | 6,353 |
| South Korea (3.2%) | | |
| | Korea Kumho Petrochemical | 10,480 | 1,997 |
| | Seah Besteel Corp. | 19,892 | 1,022 |
| | Hyundai Marine & Fire Insurance Co. Ltd. | 35,672 | 939 |
| | Orion Corp. | 2,392 | 928 |
| | Taekwang Industrial Co. Ltd. | 610 | 865 |
| | Mando Corp. | 4,907 | 863 |
| | LG International Corp. | 21,627 | 857 |
| | SK Chemicals Co. Ltd. | 11,187 | 790 |
| | Kolon Industries Inc. | 9,576 | 777 |
| | Korean Reinsurance Co. | 64,090 | 736 |
| | Macquarie Korea Infrastructure Fund | 152,465 | 720 |
| | Seoul Semiconductor Co. Ltd. | 23,640 | 710 |
| | Poongsan Corp. | 16,098 | 613 |
70
| | | |
| Vanguard® FTSE All-World ex-US Small-Cap Index Fund | | |
| Schedule of Investments | | |
| April 30, 2011 | | |
| | | | Market |
| | | | Value |
| | | Shares | ($000) |
| | LIG Insurance Co. Ltd. | 24,820 | 613 |
| | LG Innotek Co. Ltd. | 5,994 | 605 |
| | Dong-A Pharmaceutical Co. Ltd. | 6,152 | 603 |
| | SFA Engineering Corp. | 10,140 | 581 |
| | OCI Materials Co. Ltd. | 4,218 | 525 |
| | Tong Yang Securities Inc. | 71,039 | 523 |
| | Hotel Shilla Co. Ltd. | 20,801 | 511 |
| | LG Fashion Corp. | 15,874 | 492 |
| * | Asiana Airlines | 53,372 | 474 |
| ^ | Hyundai Elevator Co. Ltd. | 4,897 | 474 |
| | Capro Corp. | 15,650 | 474 |
| | Samyang Corp. | 6,101 | 473 |
| | Hyundai Greenfood Co. Ltd. | 38,765 | 456 |
| | Young Poong Corp. | 492 | 427 |
| | Meritz Fire & Marine Insurance Co. Ltd. | 36,060 | 414 |
| * | CJ E&M Corp. | 9,532 | 398 |
| | MegaStudy Co. Ltd. | 2,797 | 397 |
| | SK Gas Co. Ltd. | 8,284 | 393 |
| | Jinro Ltd. | 11,560 | 392 |
| *,^ | Taihan Electric Wire Co. Ltd. | 80,171 | 388 |
| * | Neowiz Games Corp. | 8,190 | 383 |
| *,^ | LG Life Sciences Ltd. | 8,932 | 382 |
| | CJ O Shopping Co. Ltd. | 1,744 | 374 |
| ^ | KP Chemical Corp. | 15,050 | 371 |
| | KIWOOM Securities Co. Ltd. | 6,116 | 366 |
| | LS Industrial Systems Co. Ltd. | 4,835 | 359 |
| | Sungwoo Hitech Co. Ltd. | 16,476 | 334 |
| | Fila Korea Ltd. | 4,989 | 332 |
| | Daeduck Electronics Co. | 31,010 | 332 |
| | SK Securities Co. Ltd. | 160,091 | 318 |
| ^ | Nexen Tire Corp. | 18,800 | 313 |
| * | SK Broadband Co. Ltd. | 77,356 | 311 |
| ^ | STX Engine Co. Ltd. | 11,347 | 307 |
| | CJ CGV Co. Ltd. | 11,093 | 289 |
| | Hanwha Securities Co. | 42,505 | 288 |
| | Handsome Co. Ltd. | 13,660 | 287 |
| | Melfas Inc. | 6,918 | 285 |
| | Tong Yang Life Insurance | 23,280 | 278 |
| | Lock & Lock Co. Ltd. | 7,440 | 272 |
| * | Woongjin Chemical Co. Ltd. | 206,270 | 263 |
| | Huchems Fine Chemical Corp. | 11,358 | 263 |
| | POSCO Chemtech Co. Ltd. | 1,762 | 263 |
| ^ | Dongbu Steel Co. Ltd. | 29,368 | 259 |
| | Samchully Co. Ltd. | 2,706 | 258 |
| | Dongsuh Co. Inc. | 7,489 | 257 |
| | Hanjin Heavy Industries & Construction Holdings Co. Ltd. | 21,077 | 256 |
| | GS Home Shopping Inc. | 1,779 | 256 |
| | S&T Dynamics Co. Ltd. | 16,203 | 251 |
| * | TK Corp. | 11,010 | 248 |
| * | Jusung Engineering Co. Ltd. | 15,308 | 246 |
| * | Chabio & Diostech Co. Ltd. | 26,954 | 245 |
| | E1 Corp. | 5,167 | 244 |
| | Green Cross Corp. | 1,870 | 243 |
| *,^ | Dongbu HiTek Co. Ltd. | 17,030 | 243 |
| | Binggrae Co. Ltd. | 4,040 | 242 |
| | Hyundai Home Shopping Network Corp. | 2,042 | 241 |
| | Hanil Cement Co. Ltd. | 4,950 | 239 |
| | NH Investment & Securities Co. Ltd. | 29,641 | 238 |
| * | Komipharm International Co. Ltd. | 4,743 | 235 |
| | Hana Tour Service Inc. | 5,827 | 235 |
| | Namyang Dairy Products Co. Ltd. | 308 | 232 |
| | Silicon Works Co. Ltd. | 6,779 | 226 |
| * | Hanmi Holdings Co. Ltd. | 7,130 | 224 |
| * | CNK International Co. Ltd. | 28,865 | 215 |
71
| | | |
| Vanguard® FTSE All-World ex-US Small-Cap Index Fund | | |
| Schedule of Investments | | |
| April 30, 2011 | | |
| | | | Market |
| | | | Value |
| | | Shares | ($000) |
| | Hanjin Transportation Co. Ltd. | 8,724 | 214 |
| | Chong Kun Dang Pharm Corp. | 7,950 | 212 |
| | Youngone Holdings Co. Ltd. | 6,140 | 210 |
| * | Hanmi Pharm Co. Ltd. | 2,928 | 209 |
| | S&T Daewoo Co. Ltd. | 7,080 | 206 |
| | Daewoong Pharmaceutical Co. Ltd. | 5,411 | 205 |
| | Jeonbuk Bank | 37,309 | 205 |
| | Hansol Paper Co. | 26,540 | 204 |
| | Partron Co. Ltd. | 11,916 | 203 |
| | Meritz Securities Co. Ltd. | 230,630 | 203 |
| | Daesang Corp. | 24,200 | 201 |
| | Hansol Technics Co. Ltd. | 4,510 | 197 |
| | KISCO Corp. | 6,276 | 194 |
| ^ | China Ocean Resources Co. Ltd. | 21,020 | 193 |
| ^ | Namhae Chemical Corp. | 14,600 | 193 |
| | Ottogi Corp. | 1,507 | 186 |
| | Taeyoung Engineering & Construction | 35,470 | 186 |
| | Youngone Corp. | 17,534 | 184 |
| ^ | Kumho Electric Co. Ltd. | 6,201 | 181 |
| * | Ace Digitech Co. Ltd. | 11,978 | 178 |
| * | Ssangyong Cement Industrial Co. Ltd. | 27,910 | 178 |
| | Sam Young Electronics Co. Ltd. | 15,440 | 173 |
| ^ | Sung Kwang Bend Co. Ltd. | 10,374 | 171 |
| ^ | Shinsung Solar Energy Co. Ltd. | 18,350 | 165 |
| *,^ | Posco ICT Co. Ltd. | 21,877 | 159 |
| * | KTB Investement & Securities Co. Ltd. | 41,500 | 159 |
| ^ | Daeduck GDS Co. Ltd. | 18,520 | 157 |
| | Daekyo Co. Ltd. | 29,480 | 157 |
| | KEPCO Plant Service & Engineering Co. Ltd. | 5,115 | 157 |
| * | Eugene Investment & Securities Co. Ltd. | 257,840 | 153 |
| | Ilyang Pharmaceutical Co. Ltd. | 9,188 | 150 |
| | Doosan Engineering & Construction Co. Ltd. | 31,170 | 149 |
| * | DuzonBIzon Co. Ltd. | 15,040 | 149 |
| * | Ssangyong Motor Co. | 16,020 | 148 |
| * | Hanwha General Insurance Co. Ltd. | 17,610 | 147 |
| | Dongbu Securities Co. Ltd. | 24,040 | 144 |
| | Woongjin Thinkbig Co. Ltd. | 8,770 | 141 |
| * | Taewoong Co. Ltd. | 3,157 | 140 |
| *,^ | Interpark Corp. | 32,025 | 133 |
| ^ | Bukwang Pharmaceutical Co. Ltd. | 11,370 | 133 |
| *,^ | Woongjin Holdings Co. Ltd. | 15,740 | 133 |
| | Kyobo Securities Co. | 18,690 | 131 |
| * | Woongjin Energy Co. Ltd. | 8,220 | 126 |
| | Grand Korea Leisure Co. Ltd. | 9,110 | 125 |
| * | SK Communications Co. Ltd. | 11,449 | 123 |
| | Paradise Co. Ltd. | 20,841 | 122 |
| * | Hyunjin Materials Co. Ltd. | 7,343 | 119 |
| | Youlchon Chemical Co. Ltd. | 12,100 | 100 |
| | Korea Electric Terminal Co. Ltd. | 4,600 | 98 |
| | Kwang Dong Pharmaceutical Co. Ltd. | 30,680 | 90 |
| | Hanssem Co. Ltd. | 6,960 | 90 |
| | Dae Han Flour Mills Co. Ltd. | 577 | 87 |
| | Humax Holdings Co. Ltd. | 11,685 | 77 |
| * | Meritz Finance Holdings Co. Ltd. | 15,094 | 59 |
| * | Insun ENT Co. Ltd. | 18,780 | 59 |
| | | | 42,299 |
| Spain (1.5%) | | |
| | Obrascon Huarte Lain SA | 40,229 | 1,648 |
| | Ebro Foods SA | 65,959 | 1,627 |
| ^ | Bolsas y Mercados Espanoles SA | 43,925 | 1,487 |
| | Construcciones y Auxiliar de Ferrocarriles SA | 2,017 | 1,229 |
| *,^ | NH Hoteles SA | 138,507 | 1,169 |
| *,^ | Sacyr Vallehermoso SA | 88,017 | 1,112 |
| | Viscofan SA | 24,642 | 1,086 |
72
| | | |
| Vanguard® FTSE All-World ex-US Small-Cap Index Fund | | |
| Schedule of Investments | | |
| April 30, 2011 | | |
| | | | Market |
| | | | Value |
| | | Shares | ($000) |
| | Prosegur Cia de Seguridad SA | 17,729 | 1,083 |
| | Grupo Catalana Occidente SA | 34,449 | 903 |
| ^ | Abengoa SA | 23,990 | 800 |
| | Tecnicas Reunidas SA | 12,691 | 797 |
| *,^ | Zeltia SA | 133,264 | 555 |
| | Sol Melia SA | 40,909 | 533 |
| * | Grupo Empresarial Ence SA | 123,371 | 516 |
| *,^ | Promotora de Informaciones SA | 169,240 | 479 |
| | Antena 3 de Television SA | 49,397 | 458 |
| | Faes Farma SA | 110,355 | 444 |
| * | Tubacex SA | 94,560 | 405 |
| * | SOS Corp. Alimentaria SA | 414,287 | 393 |
| | Duro Felguera SA | 43,179 | 367 |
| | Banco Pastor SA | 72,739 | 351 |
| | Campofrio Food Group SA | 23,092 | 315 |
| * | Tubos Reunidos SA | 91,467 | 302 |
| | Almirall SA | 25,025 | 285 |
| * | Realia Business SA | 94,714 | 248 |
| | Pescanova SA | 5,047 | 210 |
| | Caja de Ahorros del Mediterraneo | 19,224 | 138 |
| | Fersa Energias Renovables SA | 70,720 | 136 |
| | Miquel y Costas & Miquel SA | 4,028 | 134 |
| | Cementos Portland Valderrivas SA | 4,509 | 103 |
| | Papeles y Cartones de Europa SA | 15,999 | 98 |
| * | Codere SA | 5,989 | 97 |
| * | Laboratorios Farmaceuticos Rovi SA | 10,594 | 82 |
| * | Banco Pastor SA Rights Exp. 05/12/2011 | 72,739 | 8 |
| | | | 19,598 |
| Sweden (2.6%) | | |
| ^ | Hexagon AB Class B | 140,183 | 3,642 |
| | Lundin Petroleum AB | 129,883 | 1,971 |
| | Elekta AB Class B | 36,942 | 1,686 |
| | Trelleborg AB Class B | 134,379 | 1,626 |
| | Castellum AB | 102,290 | 1,586 |
| | Meda AB Class A | 124,583 | 1,320 |
| | NCC AB Class B | 41,691 | 1,115 |
| | Hufvudstaden AB Class A | 84,020 | 1,078 |
| | JM AB | 36,324 | 1,037 |
| | Peab AB | 109,714 | 1,015 |
| | Fabege AB | 86,829 | 997 |
| | Hoganas AB Class B | 22,110 | 918 |
| | Kungsleden AB | 84,906 | 896 |
| | Axis Communications AB | 31,651 | 807 |
| ^ | Wihlborgs Fastigheter AB | 26,478 | 797 |
| | Lundbergforetagen AB Class B | 9,971 | 789 |
| ^ | Wallenstam AB | 23,037 | 751 |
| * | Lindab International AB | 51,846 | 692 |
| ^ | Billerud AB | 52,534 | 639 |
| ^ | Husqvarna AB | 81,383 | 639 |
| | Loomis AB Class B | 37,538 | 596 |
| ^ | Hakon Invest AB | 33,457 | 590 |
| | Avanza Bank Holding AB | 14,662 | 537 |
| | Saab AB Class B | 23,648 | 534 |
| | AarhusKarlshamn AB | 15,670 | 514 |
| | Axfood AB | 13,317 | 489 |
| | Klovern AB | 88,562 | 481 |
| | Oresund Investment AB | 23,667 | 433 |
| | Niscayah Group AB | 208,880 | 429 |
| * | Nobia AB | 52,138 | 416 |
| *,^ | Active Biotech AB | 25,356 | 416 |
| * | Rezidor Hotel Group AB | 56,816 | 410 |
| | Betsson AB | 18,162 | 409 |
| | Intrum Justitia AB | 22,290 | 338 |
| | Bure Equity AB | 58,240 | 331 |
73
| | | |
| Vanguard® FTSE All-World ex-US Small-Cap Index Fund | | |
| Schedule of Investments | | |
| April 30, 2011 | | |
| | | | Market |
| | | | Value |
| | | Shares | ($000) |
| * | Haldex AB | 17,587 | 310 |
| | Mekonomen AB | 7,915 | 305 |
| * | AF AB | 13,629 | 303 |
| *,^ | SAS AB | 85,417 | 284 |
| | SkiStar AB | 14,250 | 245 |
| | Clas Ohlson AB | 13,964 | 225 |
| *,^ | PA Resources AB | 297,811 | 219 |
| *,^ | Eniro AB | 50,840 | 192 |
| * | Diamyd Medical AB Class B | 8,816 | 182 |
| * | BE Group AB | 23,272 | 174 |
| | Gunnebo AB | 24,161 | 171 |
| * | Nibe Industrier AB Class B | 9,684 | 165 |
| * | TradeDoubler AB | 18,190 | 146 |
| ^ | Nordnet AB | 35,085 | 135 |
| | | | 33,980 |
| Switzerland (4.5%) | | |
| | Sulzer AG | 18,711 | 3,380 |
| * | Clariant AG | 146,158 | 3,034 |
| | Aryzta AG | 45,993 | 2,565 |
| | PSP Swiss Property AG | 27,369 | 2,492 |
| | Swiss Prime Site AG | 27,451 | 2,290 |
| | EMS-Chemie Holding AG | 9,614 | 1,985 |
| | Galenica AG | 2,774 | 1,832 |
| * | Georg Fischer AG | 2,598 | 1,699 |
| * | Helvetia Holding AG | 3,617 | 1,698 |
| * | Dufry Group | 12,521 | 1,638 |
| *,^ | Logitech International SA | 107,804 | 1,495 |
| * | Panalpina Welttransport Holding AG | 10,867 | 1,472 |
| | Bucher Industries AG | 5,600 | 1,366 |
| ^ | Valiant Holding | 9,477 | 1,348 |
| | Partners Group Holding AG | 6,008 | 1,276 |
| * | OC Oerlikon Corp. AG | 144,861 | 1,273 |
| *,^ | Meyer Burger Technology AG | 25,335 | 1,267 |
| * | Forbo Holding AG | 1,437 | 1,176 |
| * | Rieter Holding AG | 2,538 | 1,094 |
| | Barry Callebaut AG | 1,112 | 1,064 |
| | Banque Cantonale Vaudoise | 1,716 | 1,055 |
| | Kaba Holding AG Class B | 2,194 | 980 |
| * | Temenos Group AG | 27,908 | 928 |
| | Bank Sarasin & Cie AG Class B | 20,931 | 920 |
| | Belimo Holding AG | 381 | 881 |
| | Petroplus Holdings AG | 56,778 | 851 |
| | Valora Holding AG | 2,201 | 752 |
| | Basler Kantonalbank | 4,230 | 694 |
| | Flughafen Zuerich AG | 1,530 | 674 |
| | Vontobel Holding AG | 15,973 | 651 |
| | Burckhardt Compression Holding AG | 2,018 | 649 |
| | St. Galler Kantonalbank AG | 1,137 | 637 |
| | Allreal Holding AG | 3,759 | 617 |
| | Ascom Holding AG | 37,904 | 616 |
| | BB Biotech AG | 7,989 | 604 |
| | Mobimo Holding AG | 2,447 | 592 |
| | Huber & Suhner AG | 7,922 | 589 |
| | Schroder ImmoPLUS | 458 | 574 |
| * | Schmolz & Bickenbach AG | 47,592 | 566 |
| | Liechtensteinische Landesbank AG | 6,211 | 546 |
| | Vetropack Holding AG | 247 | 541 |
| | Schweiter Technologies AG | 676 | 532 |
| | Swissquote Group Holding SA | 8,156 | 523 |
| | Kuoni Reisen Holding AG | 1,095 | 504 |
| | Tecan Group AG | 5,916 | 493 |
| | Swisscanto CH Real Estate Fund Ifca | 3,500 | 461 |
| | Kudelski SA | 24,641 | 452 |
| | Schulthess Group | 6,692 | 443 |
74
| | | |
| Vanguard® FTSE All-World ex-US Small-Cap Index Fund | | |
| Schedule of Investments | | |
| April 30, 2011 | | |
| | | | Market |
| | | | Value |
| | | Shares | ($000) |
| | Zehnder Group AG | 124 | 391 |
| * | AFG Arbonia-Forster Hldg | 9,223 | 381 |
| * | Charles Voegele Holding AG | 4,755 | 380 |
| * | Bobst Group AG | 6,939 | 336 |
| | Intershop Holdings | 892 | 317 |
| | Phoenix Mecano AG | 372 | 308 |
| * | Basilea Pharmaceutica | 3,467 | 278 |
| | Ypsomed Holding AG | 3,808 | 251 |
| | Orascom Development Holding AG | 5,811 | 247 |
| | Daetwyler Holding AG | 2,341 | 230 |
| ^ | Von Roll Holding AG | 41,654 | 217 |
| | Verwaltungs- und Privat-Bank AG | 1,612 | 213 |
| | Emmi AG | 786 | 196 |
| * | Siegfried Holding AG | 1,250 | 152 |
| * | Gurit Holding AG | 166 | 130 |
| | Acino Holding AG | 1,265 | 122 |
| | Coltene Holding AG | 1,633 | 100 |
| * | Zueblin Immobilien Holding AG | 20,963 | 95 |
| | Cie Financiere Tradition SA | 587 | 82 |
| * | Gottex Fund Management Holdings Ltd. | 10,003 | 75 |
| | Bachem Holding AG | 1,133 | 67 |
| | Bellevue Group AG | 1,973 | 62 |
| | | | 58,399 |
| Taiwan (6.1%) | | |
| | WPG Holdings Ltd. | 788,137 | 1,460 |
| | Powertech Technology Inc. | 387,420 | 1,409 |
| * | Hiwin Technologies Corp. | 125,000 | 1,248 |
| * | China Petrochemical Development Corp. | 979,151 | 1,222 |
| | Tripod Technology Corp. | 254,466 | 1,206 |
| * | Wintek Corp. | 807,587 | 1,182 |
| | Far Eastern Department Stores Co. Ltd. | 666,765 | 1,180 |
| | TSRC Corp. | 365,076 | 1,092 |
| | China Life Insurance Co. Ltd. | 929,559 | 1,089 |
| | Simplo Technology Co. Ltd. | 145,251 | 986 |
| | LCY Chemical Corp. | 318,561 | 944 |
| * | E Ink Holdings Inc. | 441,708 | 902 |
| | Highwealth Construction Corp. | 398,021 | 885 |
| | Clevo Co. | 370,983 | 850 |
| | Ruentex Industries Ltd. | 295,487 | 835 |
| | Sino-American Silicon Products Inc. | 203,413 | 755 |
| | Radiant Opto-Electronics Corp. | 243,119 | 737 |
| * | Jih Sun Financial Holdings Co. Ltd. | 1,335,665 | 682 |
| | Everlight Electronics Co. Ltd. | 235,725 | 675 |
| | Motech Industries Inc. | 157,662 | 596 |
| | China Steel Chemical Corp. | 95,853 | 591 |
| * | Nan Kang Rubber Tire Co. Ltd. | 361,744 | 575 |
| | Standard Foods Corp. | 162,185 | 525 |
| | Chroma ATE Inc. | 158,693 | 524 |
| | Richtek Technology Corp. | 78,155 | 523 |
| | Ruentex Development Co. Ltd. | 309,056 | 516 |
| | Phison Electronics Corp. | 94,962 | 513 |
| | USI Corp. | 369,565 | 496 |
| | Tung Ho Steel Enterprise Corp. | 387,150 | 458 |
| | Huaku Development Co. Ltd. | 155,177 | 456 |
| * | HannStar Touch Solution Inc. | 500,482 | 456 |
| | Gintech Energy Corp. | 155,248 | 442 |
| * | Chipbond Technology Corp. | 291,852 | 441 |
| | AmTRAN Technology Co. Ltd. | 491,040 | 437 |
| | Shinkong Synthetic Fibers Corp. | 941,142 | 436 |
| | Solar Applied Materials Technology Co. | 179,791 | 435 |
| | Tainan Spinning Co. Ltd. | 647,343 | 435 |
| | Yungtay Engineering Co. Ltd. | 231,993 | 434 |
| | Gigabyte Technology Co. Ltd. | 416,271 | 433 |
| | St. Shine Optical Co. Ltd. | 29,419 | 432 |
75
| | | |
| Vanguard® FTSE All-World ex-US Small-Cap Index Fund | | |
| Schedule of Investments | | |
| April 30, 2011 | | |
| | | | Market |
| | | | Value |
| | | Shares | ($000) |
| | First Steamship Co. Ltd. | 174,137 | 423 |
| | Career Technology MFG. Co. Ltd. | 194,126 | 411 |
| * | Compeq Manufacturing Co. | 696,471 | 404 |
| * | Green Energy Technology Inc. | 97,946 | 401 |
| | Farglory Land Development Co. Ltd. | 174,067 | 398 |
| | Kinsus Interconnect Technology Corp. | 113,282 | 396 |
| * | Taichung Commercial Bank | 942,074 | 395 |
| | Wistron NeWeb Corp. | 102,488 | 395 |
| | Huang Hsiang Construction Co. | 143,051 | 392 |
| | Goldsun Development & Construction Co. Ltd. | 769,893 | 391 |
| | Masterlink Securities Corp. | 862,176 | 386 |
| | CTCI Corp. | 300,667 | 381 |
| | Tong Yang Industry Co. Ltd. | 263,660 | 380 |
| | Kenda Rubber Industrial Co. Ltd. | 315,604 | 380 |
| | Young Fast Optoelectronics Co. Ltd. | 55,280 | 379 |
| * | King Yuan Electronics Co. Ltd. | 669,195 | 377 |
| | Radium Life Tech Co. Ltd. | 296,078 | 376 |
| | Great Wall Enterprise Co. Ltd. | 301,276 | 375 |
| | Formosa International Hotels Corp. | 20,043 | 374 |
| * | China Manmade Fibers Corp. | 788,778 | 369 |
| * | Via Technologies Inc. | 371,962 | 362 |
| * | Chung Hung Steel Corp. | 592,353 | 353 |
| | Taiwan Hon Chuan Enterprise Co. Ltd. | 120,112 | 352 |
| | China Synthetic Rubber Corp. | 327,562 | 351 |
| | TXC Corp. | 177,331 | 349 |
| | Feng TAY Enterprise Co. Ltd. | 313,225 | 345 |
| * | Ta Chong Bank Co. Ltd. | 850,933 | 343 |
| | Taiwan Navigation Co. Ltd. | 298,000 | 341 |
| | Senao International Co. Ltd. | 103,000 | 338 |
| * | Neo Solar Power Corp. | 150,065 | 336 |
| * | Lung Yen Co. Ltd. | 107,000 | 335 |
| * | King's Town Bank | 510,193 | 330 |
| | Ability Enterprise Co. Ltd. | 217,257 | 327 |
| * | Genius Electronic Optical Co. Ltd. | 33,000 | 326 |
| | Ambassador Hotel | 193,519 | 321 |
| | Grand Pacific Petrochemical | 460,928 | 316 |
| | T JOIN Transportation Co. | 261,092 | 313 |
| | Yung Chi Paint & Varnish Manufacturing Co. Ltd. | 191,000 | 311 |
| * | CSBC Corp. Taiwan | 313,406 | 308 |
| | Universal Cement Corp. | 463,000 | 306 |
| | Lien Hwa Industrial Corp. | 398,175 | 306 |
| * | TTY Biopharm Co. Ltd. | 54,329 | 305 |
| | Altek Corp. | 213,628 | 297 |
| | Pan-International Industrial | 232,211 | 295 |
| | UPC Technology Corp. | 347,068 | 295 |
| | Ralink Technology Corp. | 92,091 | 294 |
| | National Petroleum Co. Ltd. | 211,000 | 294 |
| * | Shihlin Paper Corp. | 134,428 | 293 |
| * | Taiwan Surface Mounting Technology Co. Ltd. | 114,334 | 293 |
| | Elan Microelectronics Corp. | 226,350 | 293 |
| * | Hey Song Corp. | 319,000 | 292 |
| | Greatek Electronics Inc. | 317,299 | 292 |
| * | Asia Optical Co. Inc. | 149,000 | 287 |
| * | Shining Building Business Co. Ltd. | 215,738 | 286 |
| | Pixart Imaging Inc. | 72,406 | 284 |
| | BES Engineering Corp. | 819,468 | 281 |
| | Shihlin Electric & Engineering Corp. | 222,239 | 280 |
| | Formosan Rubber Group Inc. | 272,888 | 278 |
| | Wei Chuan Food Corp. | 235,835 | 277 |
| | Phihong Technology Co. Ltd. | 142,618 | 276 |
| * | Genesis Photonics Inc. | 83,000 | 276 |
| | Wah Lee Industrial Corp. | 136,883 | 275 |
| | Prince Housing & Development Corp. | 369,752 | 273 |
| | ITEQ Corp. | 162,000 | 267 |
76
| | | |
| Vanguard® FTSE All-World ex-US Small-Cap Index Fund | | |
| Schedule of Investments | | |
| April 30, 2011 | | |
| | | | Market |
| | | | Value |
| | | Shares | ($000) |
| | Young Optics Inc. | 49,428 | 266 |
| * | Kinpo Electronics | 812,196 | 266 |
| | Depo Auto Parts Ind Co. Ltd. | 105,313 | 265 |
| | Infortrend Technology Inc. | 204,885 | 265 |
| | Solartech Energy Corp. | 105,000 | 264 |
| * | Sanyang Industry Co. Ltd. | 455,696 | 263 |
| | Dynapack International Technology Corp. | 79,299 | 262 |
| * | YungShin Global Holding Corp. | 148,617 | 259 |
| | Cheng Loong Corp. | 523,270 | 259 |
| | Holy Stone Enterprise Co. Ltd. | 206,672 | 257 |
| | Chin-Poon Industrial Co. | 306,072 | 254 |
| * | Pan Jit International Inc. | 196,000 | 252 |
| | Test-Rite International Co. | 314,067 | 251 |
| | Yieh Phui Enterprise Co. Ltd. | 637,168 | 250 |
| | Visual Photonics Epitaxy Co. Ltd. | 95,958 | 249 |
| * | Chinese Maritime Transport Ltd. | 118,000 | 247 |
| | Shih Wei Navigation Co. Ltd. | 181,335 | 247 |
| | ICP Electronics Inc. | 121,214 | 242 |
| | Unity Opto Technology Co. Ltd. | 144,231 | 241 |
| | Shinkong Textile Co. Ltd. | 170,338 | 237 |
| | Taiwan TEA Corp. | 377,293 | 237 |
| | Lealea Enterprise Co. Ltd. | 406,038 | 237 |
| | MIN AIK Technology Co. Ltd. | 82,987 | 235 |
| | China Bills Finance Corp. | 613,800 | 235 |
| | Tong Hsing Electronic Industries Ltd. | 54,877 | 235 |
| * | Gigastorage Corp. | 144,000 | 234 |
| | Silicon Integrated Systems Corp. | 411,592 | 233 |
| * | Ho Tung Chemical Corp. | 330,040 | 232 |
| * | Walsin Technology Corp. | 375,857 | 231 |
| | Hung Sheng Construction Co. Ltd. | 387,100 | 229 |
| | King's Town Construction Co. Ltd. | 217,560 | 226 |
| | Chung Hsin Electric & Machinery Manufacturing Corp. | 358,000 | 225 |
| | Asia Polymer Corp. | 125,000 | 225 |
| | Chong Hong Construction Co. | 92,725 | 225 |
| | Sincere Navigation | 194,000 | 223 |
| * | Kuoyang Construction Co. Ltd. | 281,000 | 223 |
| | TA Chen Stainless Pipe | 311,348 | 223 |
| | O-TA Precision Industry Co. Ltd. | 205,000 | 220 |
| * | WT Microelectronics Co. Ltd. | 124,000 | 218 |
| * | Wafer Works Corp. | 134,372 | 217 |
| | ALI Corp. | 155,358 | 217 |
| | Sinyi Realty Co. | 103,988 | 216 |
| | Aten International Co. Ltd. | 110,260 | 214 |
| | Makalot Industrial Co. Ltd. | 87,000 | 214 |
| | Entire Technology Co. Ltd. | 57,725 | 213 |
| | Ardentec Corp. | 222,978 | 213 |
| | United Integrated Services Co. Ltd. | 139,000 | 212 |
| | Evergreen International Storage & Transport Corp. | 239,502 | 212 |
| * | Gloria Material Technology Corp. | 182,000 | 211 |
| * | Darfon Electronics Corp. | 165,000 | 211 |
| * | Pihsiang Machinery Manufacturing Co. Ltd. | 118,000 | 206 |
| | King Slide Works Co. Ltd. | 39,675 | 205 |
| | Avermedia Technologies | 157,290 | 205 |
| | Taiwan Cogeneration Corp. | 294,520 | 205 |
| | Elite Semiconductor Memory Technology Inc. | 133,000 | 205 |
| | Merida Industry Co. Ltd. | 107,150 | 205 |
| * | Taiflex Scientific Co. Ltd. | 93,000 | 204 |
| | Gemtek Technology Corp. | 158,491 | 204 |
| | Opto Technology Corp. | 296,000 | 204 |
| | Tsann Kuen Enterprise Co. Ltd. | 91,295 | 202 |
| | Asia Vital Components Co. Ltd. | 179,557 | 200 |
| | Zinwell Corp. | 114,099 | 200 |
| | Taiwan Paiho Ltd. | 159,050 | 198 |
| * | Great China Metal Industry | 156,000 | 196 |
77
| | | |
| Vanguard® FTSE All-World ex-US Small-Cap Index Fund | | |
| Schedule of Investments | | |
| April 30, 2011 | | |
| | | | Market |
| | | | Value |
| | | Shares | ($000) |
| | AV Tech Corp. | 57,053 | 196 |
| * | FSP Technology Inc. | 177,000 | 195 |
| | L&K Engineering Co. Ltd. | 159,000 | 195 |
| | Kinik Co. | 79,000 | 195 |
| | Systex Corp. | 132,000 | 195 |
| * | Unizyx Holding Corp. | 217,000 | 194 |
| | Nien Hsing Textile Co. Ltd. | 228,852 | 192 |
| | Jess-Link Products Co. Ltd. | 92,900 | 192 |
| | CyberTAN Technology Inc. | 188,571 | 191 |
| | Soft-World International Corp. | 47,284 | 189 |
| | Advanced International Multitech Co. Ltd. | 86,000 | 186 |
| | Sonix Technology Co. Ltd. | 92,000 | 185 |
| * | Unitech Printed Circuit Board Corp. | 274,000 | 185 |
| | Firich Enterprises Co. Ltd. | 116,701 | 184 |
| | Kindom Construction Co. | 231,000 | 183 |
| * | Namchow Chemical Industrial Ltd. | 130,000 | 182 |
| * | Forhouse Corp. | 194,000 | 182 |
| | A-DATA Technology Co. Ltd. | 124,000 | 182 |
| * | LES Enphants Co. Ltd. | 112,000 | 179 |
| | Hsin Kuang Steel Co. Ltd. | 157,249 | 178 |
| | Global Mixed Mode Technology Inc. | 43,199 | 178 |
| * | Newmax Technology Co. Ltd. | 39,000 | 177 |
| | Formosa Epitaxy Inc. | 154,615 | 177 |
| | Accton Technology Corp. | 265,000 | 175 |
| | Merry Electronics Co. Ltd. | 109,000 | 175 |
| * | Microbio Co. Ltd. | 101,000 | 175 |
| * | Li Peng Enterprise Co. Ltd. | 335,000 | 174 |
| * | Lotes Co. Ltd. | 40,000 | 174 |
| | Global Unichip Corp. | 54,649 | 173 |
| | Getac Technology Corp. | 340,000 | 173 |
| | Long Bon International Co. Ltd. | 438,000 | 172 |
| | AcBel Polytech Inc. | 225,000 | 172 |
| * | J Touch Corp. | 50,000 | 171 |
| * | Tong-Tai Machine & Tool Co. Ltd. | 100,000 | 170 |
| | Long Chen Paper Co. Ltd. | 414,245 | 170 |
| * | Continental Holdings Corp. | 368,000 | 169 |
| * | Powercom Co. Ltd. | 87,000 | 169 |
| | Syncmold Enterprise Corp. | 93,000 | 165 |
| | KYE Systems Corp. | 194,862 | 161 |
| | Everlight Chemical Industrial Corp. | 161,000 | 161 |
| * | E-Ton Solar Tech Co. Ltd. | 125,000 | 158 |
| * | Champion Building Materials Co. Ltd. | 179,000 | 154 |
| | Mercuries & Associates Ltd. | 187,950 | 153 |
| | Globe Union Industrial Corp. | 137,000 | 153 |
| | Central Reinsurance Co. Ltd. | 240,000 | 149 |
| | Taiwan Life Insurance Co. Ltd. | 147,332 | 148 |
| | Etron Technology Inc. | 237,165 | 148 |
| | Alpha Networks Inc. | 182,919 | 146 |
| | Holtek Semiconductor Inc. | 99,000 | 145 |
| | Cyberlink Corp. | 50,411 | 144 |
| * | Eastern Media International Corp. | 591,000 | 143 |
| | Federal Corp. | 210,400 | 143 |
| * | KEE TAI Properties Co. Ltd. | 237,000 | 143 |
| | Shin Zu Shing Co. Ltd. | 58,000 | 141 |
| * | Jentech Precision Industrial Co. Ltd. | 32,000 | 139 |
| * | Mosel Vitelic Inc. | 291,988 | 136 |
| | Taiwan Fire & Marine Insurance Co. | 144,840 | 135 |
| * | Sunplus Technology Co. Ltd. | 205,000 | 134 |
| * | Sampo Corp. | 318,311 | 134 |
| * | ENG Electric Co. Ltd. | 35,000 | 130 |
| | Sunrex Technology Corp. | 130,000 | 128 |
| | Southeast Cement Co. Ltd. | 283,000 | 126 |
| * | China Chemical & Pharmaceutical Co. Ltd. | 131,000 | 123 |
| | International Games System Co. Ltd. | 25,213 | 122 |
78
| | | |
| Vanguard® FTSE All-World ex-US Small-Cap Index Fund | | |
| Schedule of Investments | | |
| April 30, 2011 | | |
| | | | Market |
| | | | Value |
| | | Shares | ($000) |
| | San Shing Fastech Corp. | 92,000 | 122 |
| * | WUS Printed Circuit Co. Ltd. | 193,000 | 121 |
| * | Concord Securities Corp. | 357,929 | 121 |
| | Taiwan Styrene Monomer | 241,000 | 120 |
| | Chinese Gamer International Corp. | 20,000 | 116 |
| | Quanta Storage Inc. | 108,160 | 113 |
| * | China Electric Manufacturing Corp. | 128,000 | 113 |
| | Yeun Chyang Industrial Co. Ltd. | 136,159 | 113 |
| | GeoVision Inc. | 25,000 | 112 |
| | Chun Yuan Steel | 201,280 | 110 |
| | Springsoft Inc. | 92,000 | 109 |
| | China Metal Products | 101,173 | 107 |
| * | Chung Hwa Pulp Corp. | 183,000 | 106 |
| * | Lite-On Semiconductor Corp. | 172,000 | 106 |
| | Elitegroup Computer Systems Co. Ltd. | 303,000 | 105 |
| | Silitech Technology Corp. | 40,380 | 102 |
| * | Gold Circuit Electronics Ltd. | 230,280 | 102 |
| * | Tyntek Corp. | 138,000 | 102 |
| | Basso Industry Corp. | 113,000 | 99 |
| | Sitronix Technology Corp. | 54,282 | 99 |
| | HUA ENG Wire & Cable | 248,000 | 98 |
| * | ACES Electronic Co. Ltd. | 49,000 | 97 |
| * | Giantplus Technology Co. Ltd. | 143,000 | 97 |
| * | ITE Technology Inc. | 62,000 | 92 |
| | Taiwan Semiconductor Co. Ltd. | 105,000 | 91 |
| | Topco Scientific Co. Ltd. | 60,792 | 91 |
| | Taiwan Mask Corp. | 209,650 | 89 |
| | Weltrend Semiconductor | 114,000 | 84 |
| * | Jenn Feng New Energy Co. Ltd. | 52,000 | 84 |
| | Chia Hsin Cement Corp. | 131,580 | 83 |
| | Bright Led Electronics Corp. | 74,600 | 82 |
| | Sheng Yu Steel Co. Ltd. | 111,000 | 82 |
| | Hsing TA Cement Co. | 220,000 | 82 |
| * | Bank of Kaohsiung | 163,000 | 80 |
| * | Great Taipei Gas Co. Ltd. | 121,000 | 78 |
| * | Taiwan Acceptance Corp. | 35,000 | 77 |
| | Hung Poo Real Estate Development Corp. | 62,000 | 74 |
| * | Ta Ya Electric Wire & Cable | 236,000 | 74 |
| * | Taiyen Biotech Co. Ltd. | 80,000 | 71 |
| * | Sanyo Electric Taiwan Co. Ltd. | 60,000 | 69 |
| * | Harvatek Corp. | 60,000 | 67 |
| * | China Life Insurance Rights EXP 05/12/11 | 122,409 | 36 |
| * | Unitech Printed Circuit Board Corp. Rights Exp. 06/13/11 | 48,738 | 7 |
| | | | 80,008 |
| Thailand (0.6%) | | |
| * | True Corp. PCL | 3,067,462 | 520 |
| | Big C Supercenter PCL | 175,000 | 507 |
| | Glow Energy PCL (Foreign) | 277,700 | 426 |
| | Tisco Financial Group PCL | 321,846 | 408 |
| | Hana Microelectronics PCL | 488,210 | 405 |
| * | Glow Energy PCL | 241,763 | 371 |
| | Minor International PCL | 808,185 | 342 |
| * | Sahaviriya Steel Industries PCL | 7,240,800 | 328 |
| | Minor International PCL (Foreign) | 718,800 | 304 |
| | Thanachart Capital PCL | 292,300 | 299 |
| | Sri Trang Agro-Industry PCL | 260,700 | 273 |
| | Hana Microelectronics PCL (Foreign) | 326,300 | 270 |
| | LPN Development PCL | 663,200 | 238 |
| * | G J Steel PCL | 29,338,500 | 237 |
| | Bumrungrad Hospital PCL (Foreign) | 177,513 | 230 |
| | Robinson Department Store PCL | 235,500 | 225 |
| | Thai Plastic & Chemical PCL (Foreign) | 231,400 | 215 |
| | CPN Retail Growth Leasehold Property Fund | 501,835 | 212 |
| | Pruksa Real Estate PCL (Foreign) | 295,700 | 202 |
79
| | | |
| Vanguard® FTSE All-World ex-US Small-Cap Index Fund | | |
| Schedule of Investments | | |
| April 30, 2011 | | |
| | | | Market |
| | | | Value |
| | | Shares | ($000) |
| | Bangkok Dusit Medical Services PCL | 113,000 | 198 |
| | Thai Vegetable Oil PCL | 208,900 | 196 |
| | Tisco Financial Group PCL (Foreign) | 139,500 | 177 |
| | Samart Corp. PCL | 538,400 | 172 |
| | Hemaraj Land and Development PCL | 2,175,000 | 169 |
| | Precious Shipping PCL | 269,200 | 168 |
| | Bangkok Expressway PCL (Foreign) | 278,700 | 167 |
| | Sino Thai Engineering & Construction PCL | 352,800 | 162 |
| | Bangkok Life Assurance PCL | 122,200 | 147 |
| * | True Corp. PCL Rights Expire 06/3/11 | 1,362,861 | 142 |
| | Khon Kaen Sugar Industry PCL (Foreign) | 291,200 | 133 |
| | Kiatnakin Bank PCL | 104,000 | 115 |
| | TPI Polene PCL | 245,000 | 104 |
| | CalComp Electronics Thailand PCL (Foreign) | 863,700 | 97 |
| | Kim Eng Securities Thailand PCL | 129,300 | 65 |
| | Asian Property Development PCL (Foreign) | 259,800 | 55 |
| | LPN Development PCL | 92,900 | 33 |
| | Pruksa Real Estate PCL | 39,700 | 27 |
| | Khon Kaen Sugar Industry PCL | 25,000 | 11 |
| * | Minor International PCL Warrants Exp. 05/18/2013 | 71,880 | 7 |
| * | Bangkokland PCL Warrants Exp. 12/30/2015 | 97,606 | 1 |
| | | | 8,358 |
| Turkey (0.6%) | | |
| | Ulker Biskuvi Sanayi AS | 187,645 | 750 |
| * | TAV Havalimanlari Holding AS | 141,444 | 713 |
| * | Petkim Petrokimya Holding AS | 367,132 | 638 |
| | Turk Ekonomi Bankasi AS | 434,935 | 623 |
| | Turkiye Sinai Kalkinma Bankasi AS | 261,132 | 501 |
| * | Kardemir Karabuk Demir Celik Sanayi ve Ticaret AS | 803,637 | 485 |
| | Tofas Turk Otomobil Fabrikasi AS | 73,352 | 422 |
| * | Turkiye Sise ve Cam Fabrikalari AS | 169,378 | 416 |
| * | Zorlu Enerji Elektrik Uretim AS | 182,525 | 325 |
| * | Tekfen Holding AS | 71,663 | 307 |
| * | Aksigorta AS | 220,173 | 289 |
| * | Dogan Yayin Holding AS | 201,271 | 239 |
| | Aygaz AS | 31,275 | 232 |
| * | Trakya Cam Sanayi AS | 85,143 | 208 |
| | Sekerbank TAS | 122,898 | 142 |
| | Yazicilar Holding AS Class A | 15,985 | 142 |
| * | Dogus Otomotiv Servis ve Ticaret AS | 34,748 | 137 |
| | Albaraka Turk Katilim Bankasi AS | 77,513 | 130 |
| * | Akenerji Elektrik Uretim AS | 49,987 | 126 |
| | Cimsa Cimento Sanayi VE Tica | 18,545 | 125 |
| | Hurriyet Gazetecilik AS | 91,921 | 120 |
| | Akcansa Cimento AS | 20,129 | 104 |
| | Aselsan Elektronik Sanayi Ve Ticaret AS | 17,202 | 102 |
| | EIS Eczacibasi Ilac ve Sinai ve Finansal Yatirimlar Sanayi ve Ticaret AS | 57,261 | 98 |
| * | Vestel Elektronik Sanayi ve Ticaret A.S. | 52,092 | 93 |
| * | Anadolu Cam Sanayii AS | 30,950 | 75 |
| | | | 7,542 |
| United Kingdom (13.8%) | | |
| | Weir Group plc | 114,365 | 3,684 |
| | IMI plc | 178,736 | 3,271 |
| | GKN plc | 859,013 | 3,205 |
| | Intertek Group plc | 89,370 | 3,175 |
| | Travis Perkins plc | 143,033 | 2,576 |
| | John Wood Group plc | 220,658 | 2,560 |
| | Meggitt plc | 423,290 | 2,547 |
| | Aberdeen Asset Management plc | 646,089 | 2,481 |
| | Investec plc | 306,921 | 2,472 |
| | Croda International plc | 75,286 | 2,366 |
| | Informa plc | 338,098 | 2,359 |
| | Babcock International Group plc | 210,671 | 2,257 |
| * | Premier Oil plc | 65,013 | 2,185 |
80
| | | |
| Vanguard® FTSE All-World ex-US Small-Cap Index Fund | | |
| Schedule of Investments | | |
| April 30, 2011 | | |
| | | | Market |
| | | | Value |
| | | Shares | ($000) |
| | Pennon Group plc | 195,305 | 2,157 |
| | Balfour Beatty plc | 377,568 | 2,072 |
| | Mondi plc | 203,546 | 2,023 |
| | Amlin plc | 281,744 | 1,971 |
| * | Cookson Group plc | 160,886 | 1,930 |
| | Stagecoach Group plc | 404,922 | 1,672 |
| | Derwent London plc | 55,324 | 1,660 |
| | Melrose plc | 279,825 | 1,658 |
| ^ | London Stock Exchange Group plc | 111,058 | 1,621 |
| | Inchcape plc | 258,244 | 1,576 |
| | Spectris plc | 63,369 | 1,570 |
| | Michael Page International plc | 168,063 | 1,556 |
| | Petropavlovsk plc | 103,048 | 1,544 |
| | IG Group Holdings plc | 195,252 | 1,528 |
| | Carillion plc | 228,567 | 1,500 |
| ^ | Henderson Group plc | 550,830 | 1,497 |
| | Homeserve plc | 181,332 | 1,482 |
| * | Afren plc | 538,174 | 1,442 |
| | Rotork plc | 50,133 | 1,441 |
| | Misys plc | 269,978 | 1,424 |
| | Firstgroup plc | 259,800 | 1,412 |
| | Spirax-Sarco Engineering plc | 41,278 | 1,388 |
| | Hiscox Ltd. | 200,967 | 1,387 |
| | Persimmon plc | 165,186 | 1,336 |
| | Halma plc | 208,471 | 1,302 |
| * | Mitchells & Butlers plc | 230,457 | 1,270 |
| | Catlin Group Ltd. | 190,740 | 1,261 |
| * | Berkeley Group Holdings plc | 70,190 | 1,245 |
| * | Soco International plc | 191,276 | 1,243 |
| | Charter International plc | 89,943 | 1,236 |
| * | Centamin Egypt Ltd. | 563,392 | 1,230 |
| | Hargreaves Lansdown plc | 114,173 | 1,230 |
| | Northumbrian Water Group plc | 209,171 | 1,227 |
| | National Express Group plc | 274,016 | 1,206 |
| | Great Portland Estates plc | 168,747 | 1,189 |
| | Intermediate Capital Group plc | 213,714 | 1,182 |
| * | Taylor Wimpey plc | 1,785,150 | 1,167 |
| * | Imagination Technologies Group plc | 138,802 | 1,162 |
| | Electrocomponents plc | 243,275 | 1,132 |
| | Victrex plc | 45,271 | 1,113 |
| * | SVG Capital plc | 234,375 | 1,073 |
| | Rightmove plc | 60,438 | 1,072 |
| | Capital & Counties Properties plc | 379,511 | 1,068 |
| | Chemring Group plc | 94,100 | 1,056 |
| | Shaftesbury plc | 121,891 | 1,048 |
| | Ultra Electronics Holdings plc | 36,035 | 1,040 |
| * | Barratt Developments plc | 554,856 | 1,038 |
| | Hikma Pharmaceuticals plc | 78,067 | 1,026 |
| * | easyJet plc | 174,890 | 1,021 |
| | Premier Farnell plc | 211,992 | 1,012 |
| *,^ | PartyGaming plc | 393,572 | 1,009 |
| | Ashmore Group plc | 160,551 | 1,003 |
| | Lancashire Holdings Ltd. | 92,702 | 1,002 |
| | Jardine Lloyd Thompson Group plc | 84,625 | 998 |
| | Britvic plc | 144,644 | 991 |
| | Hochschild Mining plc | 94,423 | 969 |
| | Ashtead Group plc | 286,160 | 969 |
| | Hunting plc | 71,361 | 966 |
| | Aveva Group plc | 35,938 | 962 |
| | Close Brothers Group plc | 69,965 | 949 |
| | Greene King plc | 113,656 | 931 |
| * | Telecity Group plc | 104,774 | 922 |
| | Spirent Communications plc | 376,643 | 919 |
| * | Talvivaara Mining Co. plc | 100,754 | 897 |
81
| | | |
| Vanguard® FTSE All-World ex-US Small-Cap Index Fund | | |
| Schedule of Investments | | |
| April 30, 2011 | | |
| | | | Market |
| | | | Value |
| | | Shares | ($000) |
| | Booker Group plc | 872,484 | 877 |
| | BBA Aviation plc | 233,649 | 849 |
| | International Personal Finance plc | 136,694 | 842 |
| | Bellway plc | 70,789 | 838 |
| | F&C Commercial Property Trust Ltd. | 470,004 | 830 |
| | Tullett Prebon plc | 117,821 | 830 |
| | Ferrexpo plc | 97,660 | 818 |
| | DS Smith plc | 219,339 | 795 |
| * | QinetiQ Group plc | 386,572 | 783 |
| * | Debenhams plc | 683,214 | 780 |
| | Davis Service Group plc | 89,500 | 778 |
| * | EnQuest plc | 330,621 | 772 |
| * | SIG plc | 326,527 | 767 |
| | Regus plc | 408,519 | 766 |
| | Atkins WS plc | 58,667 | 765 |
| * | Premier Foods plc | 1,404,776 | 755 |
| | Millennium & Copthorne Hotels plc | 85,193 | 753 |
| | Halfords Group plc | 112,608 | 744 |
| | Forth Ports plc | 27,096 | 735 |
| * | BTG plc | 176,544 | 734 |
| | Morgan Crucible Co. plc | 140,600 | 731 |
| | Restaurant Group plc | 125,943 | 707 |
| | De La Rue plc | 53,034 | 705 |
| | Micro Focus International plc | 109,754 | 683 |
| | Mitie Group plc | 191,231 | 677 |
| | Fidessa Group plc | 22,958 | 676 |
| | Elementis plc | 241,774 | 667 |
| | Bodycote plc | 99,691 | 650 |
| | Beazley plc | 293,277 | 643 |
| | Rank Group plc | 254,680 | 642 |
| | PZ Cussons plc | 115,464 | 633 |
| | Filtrona plc | 109,684 | 631 |
| | Domino Printing Sciences plc | 55,713 | 627 |
| | Fenner plc | 96,096 | 625 |
| * | CSR plc | 99,887 | 625 |
| | WH Smith plc | 77,929 | 614 |
| * | SDL plc | 56,669 | 613 |
| | Bovis Homes Group plc | 82,096 | 605 |
| | Kesa Electricals plc | 275,461 | 595 |
| * | Howden Joinery Group plc | 319,914 | 592 |
| | Renishaw plc | 19,782 | 585 |
| | N Brown Group plc | 114,114 | 579 |
| | JD Wetherspoon plc | 75,919 | 577 |
| * | SuperGroup plc | 21,736 | 577 |
| | St. James's Place plc | 94,219 | 559 |
| | Marston's plc | 307,297 | 557 |
| | Interserve plc | 117,077 | 550 |
| | ITE Group plc | 126,279 | 545 |
| | Go-Ahead Group plc | 22,847 | 541 |
| * | Cineworld Group plc | 145,535 | 532 |
| | Genus plc | 31,603 | 528 |
| | Savills plc | 77,300 | 518 |
| | Kier Group plc | 23,251 | 518 |
| | Senior plc | 201,680 | 515 |
| * | Sports Direct International plc | 151,448 | 510 |
| | Heritage Oil plc | 121,743 | 509 |
| | Laird plc | 214,149 | 505 |
| | Grainger plc | 256,854 | 495 |
| | Lamprell plc | 79,502 | 494 |
| | Yule Catto & Co. plc | 135,150 | 492 |
| * | Colt Group SA | 194,655 | 490 |
| | Greggs plc | 54,000 | 465 |
| *,^ | Dixons Retail plc | 1,922,335 | 464 |
| | Dairy Crest Group plc | 68,912 | 463 |
82
| | | |
| Vanguard® FTSE All-World ex-US Small-Cap Index Fund | | |
| Schedule of Investments | | |
| April 30, 2011 | | |
| | | | Market |
| | | | Value |
| | | Shares | ($000) |
| * | Punch Taverns plc | 348,059 | 458 |
| | Pace plc | 168,534 | 453 |
| | Domino's Pizza UK & IRL plc | 58,456 | 452 |
| | Computacenter plc | 58,212 | 448 |
| | Keller Group plc | 40,396 | 445 |
| | Paragon Group of Cos. plc | 151,189 | 437 |
| | RPS Group plc | 113,597 | 434 |
| * | Enterprise Inns plc | 270,739 | 432 |
| | PayPoint plc | 54,711 | 429 |
| | Brewin Dolphin Holdings plc | 146,952 | 424 |
| | Galliford Try plc | 61,159 | 424 |
| | Shanks Group plc | 209,945 | 423 |
| * | Gem Diamonds Ltd. | 87,106 | 419 |
| | JKX Oil & Gas plc | 80,620 | 414 |
| * | Redrow plc | 188,493 | 413 |
| * | Salamander Energy plc | 77,889 | 393 |
| | Dignity plc | 30,569 | 391 |
| | Big Yellow Group plc | 70,253 | 390 |
| | Devro plc | 81,526 | 390 |
| | Rathbone Brothers plc | 19,879 | 387 |
| | Cranswick plc | 30,668 | 387 |
| | Synergy Health plc | 26,969 | 381 |
| | Carpetright plc | 32,886 | 379 |
| | Chaucer Holdings plc | 405,991 | 375 |
| | Invista Foundation Property Trust Ltd. | 568,588�� | 369 |
| | Sthree plc | 50,186 | 368 |
| | Dechra Pharmaceuticals plc | 44,244 | 355 |
| | Mucklow A & J Group plc | 68,612 | 354 |
| | F&C Asset Management plc | 261,143 | 348 |
| | Mothercare plc | 48,314 | 339 |
| | Robert Walters plc | 64,455 | 330 |
| | Dunelm Group plc | 43,218 | 330 |
| | ST Modwen Properties plc | 115,970 | 330 |
| | Stobart Group Ltd. | 136,409 | 329 |
| * | Hansen Transmissions International NV | 395,797 | 329 |
| | Speedy Hire plc | 623,099 | 326 |
| * | CLS Holdings plc | 28,473 | 323 |
| | Workspace Group plc | 658,978 | 319 |
| | Novae Group plc | 49,828 | 316 |
| | Helical Bar plc | 70,583 | 308 |
| | Morgan Sindall Group plc | 23,903 | 277 |
| | Kcom Group plc | 262,873 | 271 |
| | Arena Leisure plc | 524,597 | 270 |
| | PV Crystalox Solar plc | 299,236 | 270 |
| | Headlam Group plc | 52,688 | 268 |
| | Anglo Pacific Group plc | 45,566 | 241 |
| * | Wolfson Microelectronics plc | 59,760 | 238 |
| | Evolution Group plc | 194,255 | 232 |
| * | Unite Group plc | 64,184 | 231 |
| | Promethean World plc | 197,115 | 224 |
| | Mcbride plc | 94,701 | 212 |
| | UK Commercial Property Trust Ltd. | 152,324 | 211 |
| | Severfield-Rowen plc | 50,786 | 209 |
| | Chesnara plc | 47,790 | 203 |
| | Collins Stewart plc | 139,609 | 197 |
| | Development Securities plc | 51,146 | 186 |
| | Robert Wiseman Dairies plc | 33,926 | 179 |
| | Euromoney Institutional Investor plc | 14,871 | 177 |
| * | Xchanging plc | 132,013 | 177 |
| | Sportingbet plc | 213,945 | 171 |
| | Moneysupermarket.com Group plc | 107,457 | 171 |
| | Marshalls plc | 83,306 | 169 |
| | WSP Group plc | 27,862 | 167 |
| | Game Group plc | 187,229 | 166 |
83
| | | | |
| Vanguard® FTSE All-World ex-US Small-Cap Index Fund | | | |
| Schedule of Investments | | | |
| April 30, 2011 | | | |
| | | | | Market |
| | | | | Value |
| | | | Shares | ($000) |
| *,^ | Yell Group plc | | 1,272,755 | 152 |
| * | Avis Europe plc | | 43,034 | 140 |
| | Smiths News plc | | 80,777 | 136 |
| | Holidaybreak plc | | 30,257 | 136 |
| * | Trinity Mirror plc | | 151,016 | 122 |
| | Wincanton plc | | 63,960 | 113 |
| | Melrose Resources plc | | 23,595 | 109 |
| | Daejan Holdings plc | | 2,070 | 94 |
| * | UK Coal plc | | 129,514 | 88 |
| | Mouchel Group plc | | 65,607 | 85 |
| | Hampson Industries plc | | 120,932 | 53 |
| | ING UK Real Estate Income Trust Ltd. | | 28,714 | 25 |
| | Connaught plc | | 50,771 | 14 |
| | HMV Group plc | | 8,104 | 1 |
| * | Stobart Group Ltd. Rights Exp 05/16/11 | | 39,785 | — |
| |
| | | | | 180,377 |
| |
| Total Common Stocks (Cost $1,038,602) | | | 1,296,303 |
| |
| | | | | Market |
| | | | | Value |
| | | Coupon | Shares | ($000) |
| |
| Temporary Cash Investment (6.4%) | | | |
| Money Market Fund (6.4%) | | | |
| 2,3 | Vanguard Market Liquidity Fund (Cost $82,933) | 0.179% | 82,933,010 | 82,933 |
| |
| |
| Total Investments (105.7%) (Cost $1,122,933) | | | 1,379,236 |
| Other Assets and Liabilities—Net (-5.7%)2 | | | (74,041) |
| Net Assets (100%) | | | 1,305,195 |
* Non-income-producing security.
^ Part of security position is on loan to broker-dealers. The total value of securities on loan is $75,756,000.
1 Security exempt from registration under Rule 144A of the Securities Act of 1933. Such securities may be sold in transactions exempt from registration, normally to qualified institutional buyers. At April 30, 2011, the aggregate value of these securities was $962,000, representing 0.1% of net assets.
2 Includes $80,280,000 of collateral received for securities on loan.
3 Affiliated money market fund available only to Vanguard funds and certain trusts and accounts managed by Vanguard. Rate shown is the 7-day yield.
CP—Commercial Paper.
REIT—Real Estate Investment Trust.
TAN—Tax Anticipation Note.
84
© 2011 The Vanguard Group. Inc.
All rights reserved.
Vanguard Marketing Corporation, Distributor.
SNA 7702 062011
 |
|
| Vanguard Global ex-U.S. Real Estate |
| Index Fund Semiannual Report |
|
| April 30, 2011 |
 |
> In its first six months of operation, Vanguard Global ex-U.S. Real Estate Index Fund returned 5.98% for Investor Shares.
> The fund tracked its benchmark index but trailed the average return of peer real estate funds.
> Holdings in Australia and the United Kingdom provided the largest gains, while those in Hong Kong and India were the biggest hindrances.
| |
| Contents | |
| Your Fund’s Total Returns. | 1 |
| Chairman’s Letter. | 2 |
| Fund Profile. | 7 |
| Performance Summary. | 9 |
| Financial Statements. | 10 |
| Trustees Approve Advisory Arrangement. | 27 |
| Glossary. | 28 |
Please note: The opinions expressed in this report are just that—informed opinions. They should not be considered promises or advice.
Also, please keep in mind that the information and opinions cover the period through the date on the front of this report. Of course, the risks of investing in your fund are spelled out in the prospectus.
See the Glossary for definitions of investment terms used in this report.
Cover photograph: Jean Maher.
Your Fund’s Total Returns
| |
| Period Ended April 30, 2011 | |
| | Returns |
| | Since Inception |
| Vanguard Global ex-U.S. Real Estate Index Fund | |
| Investor Shares (Inception: 11/1/2010) | 5.98% |
| Signal® Shares (Inception: 2/10/2011) | 6.46 |
| Institutional Shares (Inception: 4/19/2011) | 3.94 |
| ETF Shares (Inception: 11/1/2010) | |
| Market Price | 6.15 |
| Net Asset Value | 6.04 |
| S&P Global ex-U.S. Property Index | 5.61 |
| International Real Estate Funds Average | 6.82 |
| International Real Estate Funds Average: Derived from data provided by Lipper Inc. |
Signal Shares and Institutional Shares are available to certain institutional investors who meet specific administrative, service, and account-size criteria. The Vanguard ETF® Shares shown are traded on the Nasdaq exchange and are available only through brokers. The table provides ETF returns based on both the Nasdaq market price and the net asset value for a share. U.S. Pat. No. 6,879,964 B2; 7,337,138.
For the ETF Shares, the market price is determined by the midpoint of the bid-offer spread as of the closing time of the New York Stock Exchange (generally 4 p.m., Eastern time). The net asset value is also determined as of the NYSE closing time. For more information about how the ETF Shares' market prices have compared with their net asset value, visit vanguard.com, select your ETF, and then select the Price and Performance tab. The ETF premium/discount analysis there shows the percentages of days on which the ETF Shares' market price was above or below the NAV.
Benchmark returns are calculated from the start of the reporting period or from the earliest share-class inception date.
Your Fund’s Performance at a Glance
Inception Through April 30, 2011
| | | | |
| | | | Distributions Per Share |
| | Starting | Ending | Income | Capital |
| | Share Price | Share Price | Dividends | Gains |
| Vanguard Global ex-U.S. Real Estate Index Fund | | | | |
| Investor Shares (Inception: 11/1/2010) | $20.00 | $21.01 | $0.174 | $0.000 |
| Signal Shares (Inception: 2/10/2011) | 29.89 | 31.82 | 0.000 | 0.000 |
| Institutional Shares (Inception: 4/19/2011) | 102.01 | 106.03 | 0.000 | 0.000 |
| ETF Shares (Inception: 11/1/2010) | 49.97 | 52.51 | 0.447 | 0.000 |
1

Chairman’s Letter
Dear Shareholder,
For the six months since its inception on November 1, 2010, Vanguard Global ex-U.S. Real Estate Fund returned 5.98% for Investor Shares and 6.04% for ETF Shares in terms of net asset value. Two share classes for institutional investors were launched in 2011 and thus provided returns for shorter periods, as shown in the table on page 1.
This new fund seeks to track the performance of the Standard & Poor’s Global ex-U.S. Property Index by holding nearly all of the 400-plus stocks in the benchmark. The index measures the performance of real estate stocks in both developed and emerging markets outside the United States.
The fund is designed for investors who want to supplement a domestic real estate portfolio with a diversified mix of real estate investment trusts (REITs) and real estate operating companies (REOCs) around the world. Both REITs and REOCs own and manage real estate. REITs generally distribute earnings to their shareholders, while REOCs tend to reinvest earnings into their businesses. REOCs also enjoy more flexibility in the types of real estate investments they can make.
2
The fund’s performance in its first six months tracked that of its benchmark and was respectable enough in absolute terms. However, it trailed the 6.82% average performance of international real estate funds.
Stock returns were strong around the globe
During the six months ended April 30, the headlines were dominated by political upheaval, natural and nuclear disaster, and economic distress, but global stock markets produced outstanding returns nonetheless. The broad U.S. stock market returned more than 17%. Although rising food and gasoline prices put pressure on consumer budgets, corporate earnings growth remained strong and the pace of new job creation bounced back from extremely depressed levels.
For U.S.-based investors, international stock markets produced a smaller but still robust six-month return of 12.44% in U.S. dollars. Almost half of this return reflected exchange-rate gains produced largely by strength in the euro and currencies in emerging economies.
As the economy found its footing, U.S. interest rates edged higher
Rising longer-term interest rates put pressure on bond prices, restraining fixed income returns for the six-month period. The broad taxable U.S. bond market had
| | | |
| Market Barometer | | | |
| |
| | | | Total Returns |
| | | Periods Ended April 30, 2011 |
| | Six | One | Five Years |
| | Months | Year | (Annualized) |
| Stocks | | | |
| Russell 1000 Index (Large-caps) | 17.12% | 18.02% | 3.30% |
| Russell 2000 Index (Small-caps) | 23.73 | 22.20 | 3.89 |
| Dow Jones U.S. Total Stock Market Index | 17.28 | 18.40 | 3.65 |
| MSCI All Country World Index ex USA (International) | 12.44 | 19.73 | 3.55 |
| |
| Bonds | | | |
| Barclays Capital U.S. Aggregate Bond Index (Broad | | | |
| taxable market) | 0.02% | 5.36% | 6.33% |
| Barclays Capital Municipal Bond Index (Broad | | | |
| tax-exempt market) | -1.68 | 2.20 | 4.52 |
| Citigroup Three-Month U.S. Treasury Bill Index | 0.06 | 0.15 | 2.02 |
| |
| CPI | | | |
| Consumer Price Index | 2.83% | 3.16% | 2.22% |
3
a flat return, while the broad municipal market returned –1.68%. The rise in rates reflected both confidence that the economic recovery would prove self-sustaining and anxiety that higher rates would be necessary to help curb inflation. Even so, inflation expectations remained subdued, as measured by the difference between the yields of nominal and inflation-protected U.S. Treasury bonds.
| Investment insight |
|
| A note on foreign currency translation effects |
| When you buy stocks of companies based outside of your home country, you gain |
| exposure to a wider array of economic and market forces, including the dynamics |
| of the foreign exchange markets. |
| |
| The exchange rate of the U.S. dollar versus another currency is the price at which |
| the dollar can be converted into that currency. For example, if the exchange rate of |
| the U.S. dollar versus Britain’s pound sterling is $1.50, it takes 1.5 dollars to purchase |
| 1 pound. If the U.S. dollar weakens—say, to a rate of $2.00—then you’ll need 2 dollars |
| to buy 1 pound. Conversely, if the dollar strengthens to $1.25, it will take fewer dollars |
| to buy a pound. |
| |
| The price of one currency relative to another is determined by supply and demand |
| factors—including interest rates, the strength of the two economies, and geopolitical |
| risks. In the long run, the portfolio effects of exchange-rate movements tend to |
| balance out. But a rise or fall in the dollar’s value versus other currencies can influence |
| short-term returns. Exchange-rate changes also affect the purchasing power of each |
| new dollar you invest in foreign stocks, just as they affect the prices of foreign goods. |
| And they can have a less immediately visible impact on a company’s profits, |
| ultimately driving its stock price. |
| |
| Performance during the period |
| From October 31, 2010, through April 30, 2011, most major currencies rose in value |
| against the U.S. dollar. In part, this reflected the Federal Reserve’s policy of holding |
| short-term interest rates near zero while some foreign central banks raised rates. |
| For U.S.-based investors, the shrinking dollar boosted returns earned in local markets. |
| Two widely used international benchmarks show the effect: the MSCI Europe Index |
| returned more than 15% when translated into U.S. dollars, and the MSCI Emerging |
| Markets Index returned nearly 10% in dollars—both nearly double the indexes’ |
| local-currency returns. |
|
4
The return from short-term money market instruments such as the 3-month U.S. Treasury bill remained near 0%, consistent with the Federal Reserve Board’s target for short-term rates.
Australian real estate led the way, while Hong Kong firms lagged
In tracking the performance of its target index, the Global ex-U.S. Real Estate Index Fund holds stocks from different countries in the same market-weighted proportions as those in the benchmark. Consequently, more than half of the fund’s holdings are in Asia, where the REOC structure predominates. In fact, REOCs represent more than half of the market value of real estate equity securities outside the United States as measured by the S&P Global ex-U.S. Property Index.
For the first half of the fund’s inaugural fiscal year, the Australian real estate market (+14%)—the third-largest in the portfolio—was the leading contributor to returns. The Australian economy has been growing at a healthy pace as the nation’s wealth of natural resources has helped it benefit from the recent commodity boom. Two European real estate markets—the United Kingdom (+20%) and France (+13%)—also rose smartly, sharing the rebound of European markets in general from concerns about Eurozone debt.
On the other side of the ledger, Hong Kong (–3%), the fund’s largest holding by market value, created the biggest drag on performance as fears surfaced that the Chinese government would act aggressively to cool off its rapidly growing economy. Similar fears hit the Indian real estate market hard, leading to a –44% return. Unsurprisingly, the real estate markets in Egypt (–50%), roiled by political turmoil, and Greece (–18%), struggling with heavy sovereign debt, also weighed on the fund’s results.
Looking at the performance of different segments within the broad real estate market, the fund’s REIT holdings (+13%) performed much better than its REOCs. The two largest REIT subsectors, retail REITs (+10%) and diversified REITs (+17%), benefited from rising consumer spending and contributed the most to the fund’s advance. Among REOCs, those involved in diversified real estate activities (–2%) and real estate development (–3%) were the biggest drag on returns.
For U.S.-based investors, the dollar’s six-month decline against most major currencies enhanced returns from the Global ex-U.S. Real Estate Index Fund. (For more information on the effects of currency markets, see the box on page 4.)
5
International real estate offers a way to diversify further
Vanguard Global ex-U.S. Real Estate Index Fund, which provides exposure to a narrow but meaningful slice of the international stock market, is suited for investors who are looking to diversify a U.S.-based real estate portfolio. REITs and REOCs frequently behave independently from the rest of the stock market, and investing in a broad mix of such companies located across more than 35 nations can add additional ballast to an investor’s portfolio.
The fund’s advisor, Vanguard Quantitative Equity Group, has 35 years of experience in developing and implementing sophisticated indexing techniques and trading methodologies. In seeking to track the index closely, the advisor is supported by Vanguard’s at-cost corporate structure, which helps keep fund expenses down. Lower costs also mean that more of the fund’s returns are retained by you, our shareholders.
Vanguard counsels investors to maintain a long-term approach and to hold a diversified mix of stocks, bonds, and cash that is consistent with personal goals, time horizon, and risk tolerance. The Global ex-U.S. Real Estate Index Fund, with its low costs and broad exposure to the international real estate market, offers a new way to diversify an already well-rounded portfolio.
As always, thank you for entrusting your assets to Vanguard.
Sincerely,

F. William McNabb III
Chairman and Chief Executive Officer
May 17, 2011
6
Global ex-U.S. Real Estate Index Fund
Fund Profile
As of April 30, 2011
| | | | |
| Share-Class Characteristics | | | | |
| | Investor | Signal | Institutional | ETF |
| | Shares | Shares | Shares | Shares |
| Ticker Symbol | VGXRX | VGRLX | VGRNX | VNQI |
| Expense Ratio1 | 0.50% | 0.35% | 0.30% | 0.35% |
| | |
| Portfolio Characteristics | | |
| | | S&P |
| | | Global |
| | | ex-U.S. |
| | | Property |
| | Fund | Index |
| Number of Stocks | 421 | 418 |
| Median Market Cap | $5.6B | $5.6B |
| Price/Earnings Ratio | 10.4x | 10.4x |
| Price/Book Ratio | 1.2x | 1.2x |
| Return on Equity | 11.0% | 11.0% |
| Earnings Growth Rate | 7.6% | 7.6% |
| Dividend Yield | 3.4% | 3.4% |
| Turnover Rate | | |
| (Annualized) | 3% | — |
| Short-Term Reserves | 0.5% | — |
| | |
| Ten Largest Holdings (% of total net assets) |
| Sun Hung Kai Properties | Diversified Real | |
| Ltd. | Estate Activities | 3.7% |
| Mitsubishi Estate Co. | Diversified Real | |
| Ltd. | Estate Activities | 3.4 |
| Cheung Kong Holdings | Real Estate | |
| Ltd. | Development | 3.4 |
| Unibail-Rodamco SE | Retail REITs | 3.4 |
| Westfield Group | Retail REITs | 3.3 |
| Mitsui Fudosan Co. Ltd. | Diversified Real | |
| | Estate Activities | 2.3 |
| Land Securities Group | | |
| plc | Diversified REITs | 1.6 |
| Stockland | Diversified REITs | 1.6 |
| Hang Lung Properties | Diversified Real | |
| Ltd. | Estate Activities | 1.5 |
| CapitaLand Ltd. | Diversified Real | |
| | Estate Activities | 1.5 |
| Top Ten | | 25.7% |
| The holdings listed exclude any temporary cash investments and equity index products. |
Allocation by Region (% of portfolio)
1 The expense ratios shown are from the prospectus dated October 13, 2010, and represent estimated costs for the current fiscal year. For the periods from inception through April 30, 2011, the annualized expense ratios were 0.50% for Investor Shares, 0.35% for Signal Shares, 0.30% for Institutional Shares, and 0.35% for ETF Shares.
7
Global ex-U.S. Real Estate Index Fund
| | |
| Market Diversification (% of equity exposure) |
| | | S&P |
| | | Global |
| | | ex-U.S. |
| | | Property |
| | Fund | Index |
| Europe | | |
| United Kingdom | 7.8% | 7.8% |
| France | 6.2 | 6.3 |
| Netherlands | 2.1 | 2.1 |
| Sweden | 1.7 | 1.7 |
| Switzerland | 1.6 | 1.6 |
| Austria | 1.5 | 1.5 |
| Germany | 1.0 | 0.9 |
| Other | 1.9 | 2.1 |
| Subtotal | 23.8% | 24.0% |
| Pacific | | |
| Hong Kong | 17.1% | 17.3% |
| Japan | 16.6 | 16.6 |
| Australia | 13.1 | 13.2 |
| Singapore | 7.9 | 7.7 |
| Other | 0.4 | 0.4 |
| Subtotal | 55.1% | 55.2% |
| Emerging Markets | | |
| China | 7.1% | 6.8% |
| South Africa | 2.3 | 2.3 |
| Brazil | 1.6 | 1.6 |
| Taiwan | 1.2 | 1.2 |
| Other | 4.6 | 4.6 |
| Subtotal | 16.8% | 16.5% |
| Middle East | 0.7% | 0.7% |
| North America | | |
| Canada | 3.6% | 3.6% |
8
Global ex-U.S. Real Estate Index Fund
Performance Summary
All of the returns in this report represent past performance, which is not a guarantee of future results that may be achieved by the fund. (Current performance may be lower or higher than the performance data cited. For performance data current to the most recent month-end, visit our website at vanguard.com/performance.) Note, too, that both investment returns and principal value can fluctuate widely, so an investor’s shares, when sold, could be worth more or less than their original cost. The returns shown do not reflect taxes that a shareholder would pay on fund distributions or on the sale of fund shares.
Fiscal-Period Total Returns (%): November 1, 2010, Through April 30, 2011
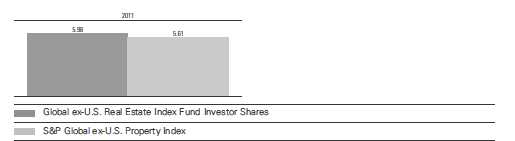
Note: For 2011, performance data reflect the period ended April 30, 2011.
Total Returns: Period Ended March 31, 2011
This table presents returns through the latest calendar quarter—rather than through the end of the fiscal period.
Securities and Exchange Commission rules require that we provide this information.
| | |
| | Inception | Since |
| | Date | Inception |
| Investor Shares | 11/1/2010 | 1.29% |
| Fee-Adjusted Returns | | 0.79 |
| Signal Shares | 2/10/2011 | 1.77 |
| Fee-Adjusted Returns | | 1.26 |
| Institutional Shares | 4/19/2011 | — |
| ETF Shares | 11/1/2010 | |
| Market Price | | 1.66 |
| Net Asset Value | | 1.37 |
The Fiscal-Period Total Returns chart is not adjusted for fees. Fee-adjusted returns reflect the 0.25% transaction fee on purchases and redemptions. The fees do not apply to the ETF Shares.
See Financial Highlights for dividend and capital gains information.
9
Global ex-U.S. Real Estate Index Fund
Financial Statements (unaudited)
Statement of Net Assets
As of April 30, 2011
The fund reports a complete list of its holdings in regulatory filings four times in each fiscal year, at the quarter-ends. For the second and fourth fiscal quarters, the lists appear in the fund’s semiannual and annual reports to shareholders. For the first and third fiscal quarters, the fund files the lists with the Securities and Exchange Commission on Form N-Q. Shareholders can look up the fund’s Forms N-Q on the SEC’s website at sec.gov. Forms N-Q may also be reviewed and copied at the SEC’s Public Reference Room (see the back cover of this report for further information).
| | | |
| | | | Market |
| | | | Value |
| | | Shares | ($000) |
| Common Stocks (99.8%) | | |
| Australia (13.2%) | | |
| | Westfield Group | 688,173 | 6,820 |
| | Stockland | 774,498 | 3,215 |
| | Westfield Retail Trust | 913,110 | 2,652 |
| | GPT Group | 556,134 | 1,932 |
| | Goodman Group | 2,240,330 | 1,748 |
| | Lend Lease Group | 169,031 | 1,616 |
| | Mirvac Group | 1,109,994 | 1,549 |
| | Dexus Property Group | 1,572,706 | 1,521 |
| | CFS Retail Property Trust | 763,143 | 1,498 |
| | Commonwealth Property | | |
| | Office Fund | 796,132 | 801 |
| | Investa Office Fund | 918,712 | 636 |
| | Charter Hall Office REIT | 133,600 | 516 |
| | Charter Hall Retail REIT | 85,641 | 301 |
| | Australand Property Group | 76,346 | 254 |
| | BWP Trust | 128,481 | 250 |
| | Charter Hall Group | 78,645 | 214 |
| | Abacus Property Group | 80,004 | 198 |
| | FKP Property Group | 227,199 | 195 |
| | Cromwell Property Group | 234,591 | 185 |
| * | Centro Retail Group | 400,560 | 161 |
| | Ardent Leisure Group | 99,937 | 152 |
| | Peet Ltd. | 57,610 | 109 |
| | Aspen Group | 187,859 | 97 |
| | ALE Property Group | 43,801 | 96 |
| | Challenger Diversified | | |
| | Property Group | 153,651 | 92 |
| * | Valad Property Group | 36,724 | 71 |
| * | EDT Retail Trust | 780,650 | 69 |
| | Astro Japan Property Group | 19,434 | 66 |
| * | Sunland Group Ltd. | 57,627 | 44 |
| | | | 27,058 |
| Austria (1.5%) | | |
| *,^ | IMMOFINANZ AG | 339,375 | 1,613 |
| * | CA Immobilien Anlagen | | |
| | AG | 25,685 | 506 |
| | | |
| | | | Market |
| | | | Value |
| | | Shares | ($000) |
| | Atrium European Real | | |
| | Estate Ltd. | 61,413 | 420 |
| *,^ | Conwert Immobilien | | |
| | Invest SE | 22,844 | 401 |
| * | Sparkassen Immobilien AG | 15,622 | 119 |
| | | | 3,059 |
| Belgium (0.6%) | | |
| | Cofinimmo | 4,393 | 676 |
| | Befimmo SCA Sicafi | 4,398 | 408 |
| | Warehouses De Pauw SCA | 2,839 | 173 |
| | Intervest Offices | 2,103 | 72 |
| | | | 1,329 |
| Brazil (1.6%) | | |
| | BR Malls Participacoes SA | 96,200 | 1,016 |
| | BR Properties SA | 45,366 | 536 |
| | Multiplan Empreendimentos | | |
| | Imobiliarios SA | 20,100 | 420 |
| | Brasil Brokers Participacoes | | |
| | SA | 62,996 | 341 |
| | Iguatemi Empresa de | | |
| | Shopping Centers SA | 9,393 | 244 |
| | Aliansce Shopping Centers | | |
| | SA | 25,887 | 230 |
| | Sao Carlos | | |
| | Empreendimentos e | | |
| | Participacoes SA | 9,600 | 134 |
| | Jereissati Participacoes | | |
| | SA Prior Pfd. | 124,676 | 126 |
| | Cyrela Commercial | | |
| | Properties SA | | |
| | Empreendimentos e | | |
| | Participacoes | 11,900 | 106 |
| * | BHG SA - Brazil Hospitality | | |
| | Group | 5,770 | 83 |
| | JHSF Participacoes SA | 26,127 | 71 |
| * | General Shopping Brasil SA | 6,702 | 53 |
| | | | 3,360 |
10
Global ex-U.S. Real Estate Index Fund
| | | |
| | | | Market |
| | | | Value |
| | | Shares | ($000) |
| Canada (3.6%) | | |
| | Brookfield Properties Corp. | 76,840 | 1,520 |
| ^ | RioCan REIT | 42,300 | 1,133 |
| | H&R REIT | 23,300 | 539 |
| | Boardwalk REIT | 8,300 | 423 |
| ^ | Calloway REIT | 15,500 | 410 |
| | Canadian REIT | 10,588 | 375 |
| | First Capital Realty Inc. | 18,600 | 324 |
| | Dundee REIT | 8,040 | 281 |
| | Canadian Apartment | | |
| | Properties REIT | 12,200 | 246 |
| ^ | Primaris Retail REIT | 11,000 | 242 |
| | Cominar REIT | 9,940 | 239 |
| ^ | Chartwell Seniors Housing | | |
| | REIT | 22,900 | 215 |
| | Allied Properties REIT | 7,400 | 181 |
| | Artis REIT | 12,100 | 175 |
| | Killam Properties Inc. | 14,426 | 166 |
| ^ | Extendicare REIT | 12,800 | 161 |
| | Morguard REIT | 9,100 | 145 |
| | Northern Property REIT | 4,300 | 135 |
| | InnVest REIT | 14,400 | 109 |
| | Crombie REIT | 5,718 | 79 |
| | NorthWest Healthcare | | |
| | Properties REIT | 5,561 | 71 |
| | Melcor Developments Ltd. | 4,000 | 69 |
| | Whiterock REIT | 4,200 | 61 |
| | | | 7,299 |
| Chile (0.2%) | | |
| | Parque Arauco SA | 152,734 | 352 |
| |
| China (7.1%) | | |
| | China Overseas Land | | |
| | & Investment Ltd. | 1,246,000 | 2,404 |
| | China Resources Land Ltd. | 648,000 | 1,120 |
| | Evergrande Real Estate | | |
| | Group Ltd. | 1,533,190 | 1,096 |
| | Country Garden | | |
| | Holdings Co. | 1,892,000 | 768 |
| | Sino-Ocean Land | | |
| | Holdings Ltd. | 1,334,500 | 759 |
| ^ | Agile Property | | |
| | Holdings Ltd. | 436,000 | 711 |
| | Longfor Properties Co. Ltd. | 403,996 | 644 |
| | Shimao Property | | |
| | Holdings Ltd. | 472,500 | 644 |
| | China Vanke Co. Ltd. | | |
| | Class B | 427,405 | 605 |
| | Soho China Ltd. | 604,500 | 523 |
| ^ | Renhe Commercial | | |
| | Holdings Co. Ltd. | 2,634,000 | 452 |
| ^ | Guangzhou R&F | | |
| | Properties Co. Ltd. | 330,400 | 452 |
| | | |
| | | | Market |
| | | | Value |
| | | Shares | ($000) |
| | Shui On Land Ltd. | 850,000 | 377 |
| | Franshion Properties | | |
| | China Ltd. | 1,098,000 | 343 |
| * | Yuexiu Property Co. Ltd. | 1,604,000 | 338 |
| | KWG Property Holding Ltd. | 383,000 | 277 |
| | Shanghai Lujiazui Finance | | |
| | & Trade Zone | | |
| | Development Co. Ltd. | | |
| | Class B | 164,200 | 234 |
| *,^ | Hopson Development | | |
| | Holdings Ltd. | 210,000 | 207 |
| | Shenzhen Investment Ltd. | 654,000 | 205 |
| | Tian An China Investment | 306,000 | 205 |
| | New World China | | |
| | Land Ltd. | 550,000 | 198 |
| | Greentown China | | |
| | Holdings Ltd. | 194,000 | 195 |
| * | United Energy Group Ltd. | 1,236,000 | 188 |
| * | Sunac China Holdings Ltd. | 469,774 | 167 |
| | Silver Grant International | 416,000 | 153 |
| | Powerlong Real Estate | | |
| | Holdings Ltd. | 454,647 | 142 |
| | Jiangsu Future Land | | |
| | Co. Ltd. Class B | 138,100 | 128 |
| | GZI REIT | 220,000 | 117 |
| | Beijing Capital Land Ltd. | 336,000 | 115 |
| | China SCE Property | | |
| | Holdings Ltd. | 393,560 | 106 |
| | China South City | | |
| | Holdings Ltd. | 637,808 | 104 |
| * | Shanghai Industrial | | |
| | Urban Development | | |
| | Group Ltd. | 278,000 | 98 |
| ^ | Fantasia Holdings | | |
| | Group Co. Ltd. | 563,833 | 94 |
| | Tomson Group Ltd. | 218,000 | 83 |
| | Shanghai Jinqiao Export | | |
| | Processing Zone | | |
| | Development Co. Ltd. | | |
| | Class B | 87,700 | 74 |
| | Sinolink Worldwide | | |
| | Holdings Ltd. | 652,000 | 69 |
| | SRE Group Ltd. | 756,000 | 68 |
| | Lai Fung Holdings Ltd. | 1,503,000 | 66 |
| * | Yuzhou Properties Co. | 189,355 | 63 |
| | China Aoyuan Property | | |
| | Group Ltd. | 364,205 | 62 |
| | Beijing North Star Co. Ltd. | 226,000 | 55 |
| | China Merchants Property | | |
| | Development Co. Ltd. | | |
| | Class B | 30,600 | 55 |
| | Shanghai Forte Land Co. | 1 | — |
| | | | 14,764 |
11
Global ex-U.S. Real Estate Index Fund
| | | |
| | | | Market |
| | | | Value |
| | | Shares | ($000) |
| Denmark (0.1%) | | |
| * | TK Development | 12,492 | 58 |
| | Jeudan A/S | 666 | 56 |
| | | | 114 |
| Egypt (0.2%) | | |
| * | Talaat Moustafa Group | 325,327 | 198 |
| | Six of October | | |
| | Development | | |
| | & Investment | 7,241 | 75 |
| * | Palm Hills Developments | | |
| | SAE | 161,930 | 53 |
| * | Medinet Nasr Housing | 12,976 | 50 |
| | El Kahera Housing | 27,258 | 23 |
| | | | 399 |
| Finland (0.3%) | | |
| | Sponda Oyj | 59,837 | 353 |
| | Citycon Oyj | 41,684 | 197 |
| | Technopolis plc | 20,396 | 109 |
| | | | 659 |
| France (6.2%) | | |
| ^ | Unibail-Rodamco SE | 29,675 | 6,942 |
| | Klepierre | 30,510 | 1,254 |
| | Gecina SA | 8,490 | 1,224 |
| | Fonciere Des Regions | 10,732 | 1,218 |
| ^ | ICADE | 7,364 | 944 |
| ^ | Mercialys SA | 14,622 | 632 |
| | Societe Immobiliere de | | |
| | Location pour l’Industrie | | |
| | et le Commerce | 2,720 | 408 |
| | Societe de la Tour Eiffel | 1,829 | 183 |
| | | | 12,805 |
| Germany (1.0%) | | |
| | Deutsche Euroshop AG | 13,877 | 561 |
| * | Deutsche Wohnen AG | 20,443 | 322 |
| | Alstria Office REIT-AG | 18,196 | 289 |
| | GAGFAH SA | 29,207 | 265 |
| * | IVG Immobilien AG | 29,015 | 245 |
| * | TAG Immobilien AG | 17,759 | 189 |
| | DIC Asset AG | 9,103 | 122 |
| * | Patrizia Immobilien AG | 8,234 | 62 |
| * | Colonia Real Estate AG | 5,092 | 39 |
| | | | 2,094 |
| Greece (0.0%) | | |
| | Eurobank Properties | | |
| | Real Estate | | |
| | Investment Co. | 5,154 | 46 |
| * | Babis Vovos International | | |
| | Construction SA | 7,738 | 6 |
| | | | 52 |
| Hong Kong (17.1%) | | |
| | Sun Hung Kai | | |
| | Properties Ltd. | 485,000 | 7,596 |
| | Cheung Kong Holdings Ltd. | 440,000 | 6,944 |
| | | |
| | | | Market |
| | | | Value |
| | | Shares | ($000) |
| | Hang Lung Properties Ltd. | 679,000 | 3,028 |
| | Hongkong Land | | |
| | Holdings Ltd. | 372,500 | 2,793 |
| | Link REIT | 725,500 | 2,287 |
| | Henderson Land | | |
| | Development Co. Ltd. | 320,000 | 2,196 |
| | Hang Lung Group Ltd. | 275,000 | 1,853 |
| | Sino Land Co. Ltd. | 848,000 | 1,496 |
| | Kerry Properties Ltd. | 215,000 | 1,150 |
| | Wheelock & Co. Ltd. | 269,000 | 1,111 |
| | Hysan Development | | |
| | Co. Ltd. | 201,000 | 940 |
| | Hopewell Holdings Ltd. | 206,500 | 624 |
| ^ | Champion REIT | 759,000 | 440 |
| | Great Eagle Holdings Ltd. | 103,000 | 367 |
| | Chinese Estates | | |
| | Holdings Ltd. | 164,000 | 311 |
| * | Kaisa Group Holdings Ltd. | 661,642 | 269 |
| | Glorious Property | | |
| | Holdings Ltd. | 895,829 | 257 |
| | Kowloon Development | | |
| | Co. Ltd. | 110,000 | 145 |
| | K Wah International | | |
| | Holdings Ltd. | 342,000 | 136 |
| | HKR International Ltd. | 214,400 | 125 |
| | Sunlight REIT | 348,000 | 113 |
| ^ | Mingfa Group | | |
| | International Co. Ltd. | 285,099 | 95 |
| * | Regal REIT | 267,000 | 91 |
| | Far East Consortium | 356,000 | 88 |
| | TAI Cheung Holdings | 114,000 | 86 |
| | Prosperity REIT | 353,000 | 85 |
| * | Lai Sun Development | 2,447,000 | 84 |
| * | Zhuguang Holdings | | |
| | Group Co. Ltd. | 329,630 | 74 |
| | Liu Chong Hing | | |
| | Investment | 52,000 | 73 |
| | Emperor International | | |
| | Holdings | 333,666 | 73 |
| | Pacific Century Premium | | |
| | Developments Ltd. | 315,000 | 60 |
| * | China Properties | | |
| | Group Ltd. | 150,073 | 47 |
| | | | 35,037 |
| India (0.8%) | | |
| | DLF Ltd. | 132,197 | 667 |
| | Unitech Ltd. | 455,737 | 382 |
| * | Indiabulls Real Estate Ltd. | 102,503�� | 290 |
| | Godrej Properties Ltd. | 5,402 | 84 |
| | Sobha Developers Ltd. | 9,258 | 60 |
| | Peninsula Land Ltd. | 36,395 | 47 |
| * | DB Realty Ltd. | 19,003 | 42 |
| | Sunteck Realty Ltd. | 4,869 | 37 |
| * | Parsvnath Developers Ltd. | 34,381 | 34 |
12
Global ex-U.S. Real Estate Index Fund
| | | |
| | | | Market |
| | | | Value |
| | | Shares | ($000) |
| | Mahindra Lifespace | | |
| | Developers Ltd. | 3,695 | 31 |
| | Ackruti City Ltd. | 5,562 | 27 |
| | Ansal Properties | | |
| | & Infrastructure Ltd. | 25,916 | 26 |
| | Orbit Corp. Ltd. | 19,278 | 21 |
| | | | 1,748 |
| Indonesia (0.8%) | | |
| | Lippo Karawaci Tbk PT | 5,338,000 | 487 |
| | Bumi Serpong Damai PT | 2,389,527 | 257 |
| | Summarecon Agung Tbk | | |
| | PT | 1,479,500 | 218 |
| | Bakrieland Development | | |
| | Tbk PT | 11,487,000 | 194 |
| * | Ciputra Development | | |
| | Tbk PT | 2,959,500 | 135 |
| | Alam Sutera Realty | | |
| | Tbk PT | 3,102,797 | 107 |
| * | Kawasan Industri | | |
| | Jababeka Tbk PT | 4,605,180 | 70 |
| * | Intiland Development | | |
| | Tbk PT | 1,161,051 | 50 |
| | Ciputra Property Tbk PT | 994,096 | 48 |
| * | Sentul City Tbk PT | 3,466,000 | 43 |
| | | | 1,609 |
| Israel (0.7%) | | |
| | Azrieli Group | 9,822 | 289 |
| | Gazit-Globe Ltd. | 18,212 | 249 |
| | Alony Hetz Properties | | |
| | & Investments Ltd. | 20,150 | 116 |
| | Amot Investments Ltd. | 30,090 | 93 |
| * | Nitsba Holdings 1995 Ltd. | 8,010 | 86 |
| | Jerusalem Economy Ltd. | 6,282 | 80 |
| | Industrial Buildings Corp. | 30,092 | 65 |
| | British Israel Investments | | |
| | Ltd. | 15,419 | 61 |
| * | Africa Israel Properties Ltd. | 3,977 | 55 |
| * | Elbit Imaging Ltd. | 4,353 | 52 |
| | Melisron Ltd. | 2,014 | 51 |
| * | AL-ROV Israel Ltd. | 1,304 | 51 |
| | Reit 1 Ltd. | 21,526 | 45 |
| * | Airport City Ltd. | 8,416 | 44 |
| | | | 1,337 |
| Italy (0.3%) | | |
| * | Beni Stabili SPA | 266,413 | 302 |
| * | Prelios SPA | 189,835 | 149 |
| | Immobiliare Grande | | |
| | Distribuzione | 46,483 | 112 |
| | | | 563 |
| | |
| | | Market |
| | | Value |
| | Shares | ($000) |
| Japan (16.6%) | | |
| Mitsubishi Estate Co. Ltd. | 398,300 | 6,970 |
| Mitsui Fudosan Co. Ltd. | 268,000 | 4,651 |
| Sumitomo Realty & | | |
| Development Co. Ltd. | 139,000 | 2,877 |
| Daito Trust Construction | | |
| Co. Ltd. | 26,000 | 2,080 |
| Daiwa House Industry | | |
| Co. Ltd. | 168,400 | 2,040 |
| Nippon Building Fund Inc. | 174 | 1,751 |
| Japan Real Estate | | |
| Investment Corp. | 158 | 1,564 |
| Japan Retail Fund | | |
| Investment Corp. Class A | 494 | 799 |
| Advance Residence | | |
| Investment Corp. Class A | 318 | 666 |
| Nomura Real Estate Office | | |
| Fund Inc. Class A | 90 | 652 |
| Aeon Mall Co. Ltd. | 24,700 | 594 |
| Japan Prime Realty | | |
| Investment Corp. | 207 | 589 |
| Tokyu Land Corp. | 126,000 | 544 |
| Mori Trust Sogo Reit Inc. | 52 | 528 |
| United Urban Investment | | |
| Corp. Class A | 404 | 513 |
| Frontier Real Estate | | |
| Investment Corp. | 53 | 491 |
| Nomura Real Estate | | |
| Holdings Inc. | 30,300 | 468 |
| Tokyo Tatemono Co. Ltd. | 129,000 | 466 |
| Orix JREIT Inc. Class A | 81 | 442 |
| Nippon Accommodations | | |
| Fund Inc. Class A | 53 | 389 |
| Japan Logistics Fund Inc. | 43 | 369 |
| Tokyu REIT Inc. | 47 | 327 |
| Kenedix Realty Investment | | |
| Corp. Class A | 76 | 323 |
| NTT Urban Development | | |
| Corp. | 349 | 290 |
| Daiwa Office Investment | | |
| Corp. Class A | 80 | 287 |
| Japan Excellent Inc. | 50 | 276 |
| Top REIT Inc. | 44 | 267 |
| Global One Real Estate | | |
| Investment Corp. | 29 | 258 |
| BLife Investment Corp. | 33 | 243 |
| Fukuoka REIT Co. Class A | 32 | 238 |
| Nomura Real Estate | | |
| Residential Fund Inc. | 36 | 221 |
| Premier Investment Corp. | | |
| Class A | 41 | 191 |
13
Global ex-U.S. Real Estate Index Fund
| | | |
| | | | Market |
| | | | Value |
| | | Shares | ($000) |
| | Mori Hills REIT Investment | | |
| | Corp. | 52 | 180 |
| | Hulic Co. Ltd. | 19,900 | 166 |
| | MID REIT Inc. | 49 | 153 |
| | Sekisui House SI Investment | | |
| | Co. Class A | 32 | 146 |
| | Hankyu REIT Inc. Class A | 22 | 124 |
| | Daibiru Corp. | 15,600 | 124 |
| | Heiwa Real Estate Co. Ltd. | 53,000 | 119 |
| | Industrial & Infrastructure | | |
| | Fund Investment Corp. | 22 | 115 |
| | Shoei Co. Ltd. | 11,400 | 105 |
| | TOC Co. Ltd. | 21,200 | 87 |
| | Heiwa Real Estate REIT Inc. | | |
| | Class A | 122 | 81 |
| | Japan Rental Housing | | |
| | Investments Inc. Class A | 143 | 65 |
| | Japan Hotel and Resort Inc. | 27 | 62 |
| | Sankei Building Co. Ltd. | 10,700 | 61 |
| * | Leopalace21 Corp. | 42,700 | 61 |
| ^ | Nippon Hotel Fund | | |
| | Investment Corp. | 15 | 54 |
| | Iida Home Max | 5,200 | 45 |
| | Tokyo Theatres Co. Inc. | 22,500 | 30 |
| | | | 34,142 |
| Luxembourg (0.2%) | | |
| * | ProLogis European | | |
| | Properties | 43,445 | 396 |
| |
| Malaysia (0.7%) | | |
| | SP Setia Bhd. | 230,500 | 325 |
| * | UEM Land Holdings Bhd. | 340,365 | 310 |
| | IGB Corp. Bhd. | 302,987 | 218 |
| | Sunway REIT | 568,434 | 211 |
| | KLCC Property Holdings | | |
| | Bhd. | 105,100 | 117 |
| | Sunway City Bhd. | 71,114 | 116 |
| | Mah Sing Group Bhd. | 117,943 | 103 |
| | IJM Land Bhd. | 76,041 | 72 |
| | TA Global Bhd. | 360,335 | 48 |
| | | | 1,520 |
| Netherlands (2.1%) | | |
| ^ | Corio NV | 29,576 | 2,094 |
| | Wereldhave NV | 6,971 | 729 |
| | Eurocommercial | | |
| | Properties NV | 11,747 | 604 |
| | Vastned Retail NV | 6,016 | 461 |
| | Nieuwe Steen | | |
| | Investments NV | 11,398 | 252 |
| | Vastned Offices/Industrial | | |
| | NV | 6,152 | 123 |
| * | Plaza Centers NV | 30,530 | 58 |
| | | | 4,321 |
| | | |
| | | | Market |
| | | | Value |
| | | Shares | ($000) |
| New Zealand (0.4%) | | |
| | Kiwi Income Property | | |
| | Trust | 315,881 | 264 |
| | Goodman Property Trust | 240,086 | 177 |
| | AMP NZ Office Ltd. | 261,885 | 174 |
| | Argosy Property Trust | 175,107 | 113 |
| | | | 728 |
| Norway (0.2%) | | |
| * | Norwegian Property ASA | 163,774 | 331 |
| |
| Philippines (0.8%) | | |
| | Ayala Land Inc. | 1,685,200 | 648 |
| | SM Prime Holdings Inc. | 1,576,100 | 442 |
| | Megaworld Corp. | 3,352,000 | 183 |
| | Robinsons Land Corp. | 528,450 | 165 |
| | Filinvest Land Inc. | 3,146,000 | 94 |
| | SM Development Corp. | 425,916 | 90 |
| | Vista Land & Lifescapes | | |
| | Inc. | 892,000 | 66 |
| | | | 1,688 |
| Poland (0.3%) | | |
| * | Globe Trade Centre SA | 40,366 | 315 |
| * | Echo Investment SA | 82,270 | 157 |
| * | LC Corp. SA | 73,622 | 44 |
| * | JW Construction Holding | | |
| | SA | 6,829 | 40 |
| * | Gant Development SA | 4,838 | 25 |
| | | | 581 |
| Singapore (7.8%) | | |
| | CapitaLand Ltd. | 1,075,000 | 2,990 |
| | City Developments Ltd. | 202,000 | 1,957 |
| | CapitaMall Trust | 759,000 | 1,174 |
| * | Global Logistic Properties | | |
| | Ltd. | 723,000 | 1,141 |
| | Suntec REIT | 718,000 | 893 |
| | Ascendas REIT | 492,000 | 817 |
| | Keppel Land Ltd. | 226,000 | 771 |
| | CapitaCommercial Trust | 615,000 | 724 |
| | UOL Group Ltd. | 179,000 | 709 |
| | CapitaMalls Asia Ltd. | 272,000 | 394 |
| | CDL Hospitality Trusts | 194,000 | 320 |
| | Mapletree Logistics Trust | 392,000 | 290 |
| | United Industrial Corp. Ltd. | 123,000 | 285 |
| ^ | Mapletree Industrial Trust | 301,331 | 266 |
| | Yanlord Land Group Ltd. | 219,000 | 260 |
| | Allgreen Properties Ltd. | 266,000 | 257 |
| | Starhill Global REIT | 457,000 | 237 |
| | Wing Tai Holdings Ltd. | 158,000 | 204 |
| | GuocoLand Ltd. | 96,666 | 197 |
| | Singapore Land Ltd. | 33,000 | 193 |
| | Ascott Residence Trust | 191,000 | 186 |
| | Frasers Centrepoint Trust | 142,000 | 172 |
14
Global ex-U.S. Real Estate Index Fund
| | | |
| | | | Market |
| | | | Value |
| | | Shares | ($000) |
| * | Bukit Sembawang | | |
| | Estates Ltd. | 48,000 | 171 |
| | Parkway Life REIT | 116,000 | 164 |
| | Cambridge Industrial Trust | 391,000 | 160 |
| ^ | Fortune REIT | 298,000 | 148 |
| | Wheelock Properties | | |
| | Singapore Ltd. | 94,000 | 143 |
| | CapitaRetail China Trust | 122,000 | 126 |
| | Ascendas India Trust | 155,000 | 120 |
| | K-REIT Asia | 105,000 | 112 |
| * | Ho Bee Investment Ltd. | 90,000 | 109 |
| | AIMS AMP Capital | | |
| | Industrial REIT | 631,950 | 106 |
| | Frasers Commercial Trust | 157,200 | 103 |
| | Lippo-Mapletree | | |
| | Indonesia Retail Trust | 173,000 | 79 |
| * | Hong Fok Corp. Ltd. | 119,000 | 58 |
| | Saizen REIT | 373,000 | 46 |
| * | Debao Property | | |
| | Development Ltd. | 191,000 | 24 |
| | | | 16,106 |
| South Africa (2.3%) | | |
| | Redefine Properties Ltd. | 874,394 | 1,043 |
| | Growthpoint Properties | | |
| | Ltd. | 370,372 | 1,028 |
| | Capital Property Fund | 542,491 | 677 |
| | Resilient Property | | |
| | Income Fund Ltd. | 83,210 | 395 |
| | Fountainhead Property | | |
| | Trust | 375,112 | 378 |
| | SA Corporate Real Estate | | |
| | Fund Nominees Pty Ltd. | 673,102 | 338 |
| | Acucap Properties Ltd. | 46,849 | 260 |
| | Vukile Property Fund Ltd. | 114,097 | 247 |
| | Hyprop Investments Ltd. | 29,347 | 237 |
| | Emira Property Fund | 98,044 | 197 |
| | | | 4,800 |
| Spain (0.2%) | | |
| * | Inmobiliaria Colonial SA | 2,520,441 | 287 |
| * | Realia Business SA | 21,733 | 57 |
| | | | 344 |
| Sweden (1.7%) | | |
| | Castellum AB | 55,682 | 863 |
| | Fabege AB | 42,784 | 491 |
| | Hufvudstaden AB Class A | 36,876 | 473 |
| ^ | Kungsleden AB | 44,456 | 469 |
| ^ | Wallenstam AB | 12,524 | 408 |
| ^ | Wihlborgs Fastigheter AB | 11,156 | 336 |
| | Klovern AB | 31,743 | 172 |
| | Sagax AB | 3,211 | 112 |
| | Heba Fastighets AB Class B | 8,403 | 96 |
| * | Fastighets AB Balder | | |
| | Class B | 11,781 | 94 |
| | | | 3,514 |
| | | |
| | | | Market |
| | | | Value |
| | | Shares | ($000) |
| Switzerland (1.6%) | | |
| | Swiss Prime Site AG | 15,359 | 1,281 |
| | PSP Swiss Property AG | 11,299 | 1,028 |
| | Mobimo Holding AG | 1,639 | 397 |
| | Allreal Holding AG | 2,215 | 364 |
| | Intershop Holdings | 364 | 129 |
| * | Zueblin Immobilien Holding | | |
| | AG | 11,897 | 54 |
| | | | 3,253 |
| Taiwan (1.2%) | | |
| | Highwealth Construction | | |
| | Corp. | 180,000 | 400 |
| | Ruentex Development Co. | | |
| | Ltd. | 179,000 | 299 |
| | Cathay Real Estate | | |
| | Development Co. Ltd. | 399,000 | 207 |
| | Huaku Development Co. | | |
| | Ltd. | 70,000 | 206 |
| | Radium Life Tech Co. Ltd. | 151,000 | 192 |
| | Cathay No 1 REIT | 449,310 | 191 |
| | Prince Housing & | | |
| | Development Corp. | 229,000 | 169 |
| | Farglory Land | | |
| | Development Co. Ltd. | 56,000 | 128 |
| * | Kuoyang Construction | | |
| | Co. Ltd. | 143,000 | 113 |
| * | Shining Building Business | | |
| | Co. Ltd. | 85,000 | 113 |
| | Hung Sheng Construction | | |
| | Co. Ltd. | 158,000 | 93 |
| | Hung Poo Real Estate | | |
| | Development Corp. | 63,000 | 76 |
| * | Taiwan Land Development | | |
| | Corp. | 136,041 | 72 |
| * | KEE TAI Properties Co. Ltd. | 116,205 | 70 |
| | King’s Town Construction | | |
| | Co. Ltd. | 41,000 | 42 |
| | | | 2,371 |
| Thailand (0.5%) | | |
| * | Land and Houses PCL | 978,600 | 217 |
| * | Central Pattana PCL | 213,200 | 211 |
| | Hemaraj Land and | | |
| | Development PCL | 1,521,778 | 118 |
| | Amata Corp. PCL | 172,700 | 92 |
| | Supalai PCL | 191,305 | 77 |
| * | Bangkokland PCL | 2,774,900 | 71 |
| | Ticon Industrial | | |
| | Connection PCL | 113,388 | 53 |
| | Rojana Industrial Park PCL | 130,270 | 52 |
| | Sansiri PCL | 193,100 | 39 |
| | | | 930 |
15
Global ex-U.S. Real Estate Index Fund
| | | |
| | | | Market |
| | | | Value |
| | | Shares | ($000) |
| Turkey (0.2%) | | |
| | Akmerkez Gayrimenkul | | |
| | Yatirim Ortakligi AS | 2,827 | 151 |
| * | Sinpas Gayrimenkul | | |
| | Yatirim Ortakligi AS | 84,986 | 122 |
| | Is Gayrimenkul Yatirim | | |
| | Ortakligi AS | 84,103 | 102 |
| | | | 375 |
| United Kingdom (7.7%) | | |
| | Land Securities Group plc | 247,999 | 3,260 |
| | British Land Co. plc | 286,121 | 2,881 |
| | Hammerson plc | 228,750 | 1,798 |
| | Capital Shopping Centres | | |
| | Group plc | 193,102 | 1,312 |
| | Segro plc | 239,804 | 1,305 |
| | Derwent London plc | 26,382 | 792 |
| | Great Portland Estates plc | 101,360 | 714 |
| | Shaftesbury plc | 80,781 | 694 |
| | Capital & Counties | | |
| | Properties plc | 148,363 | 417 |
| | London & Stamford | | |
| | Property plc | 176,107 | 391 |
| | Grainger plc | 135,322 | 261 |
| | Hansteen Holdings plc | 182,811 | 253 |
| | Big Yellow Group plc | 37,771 | 210 |
| * | Raven Russia Ltd. | 172,986 | 203 |
| * | Unite Group plc | 52,465 | 189 |
| | Helical Bar plc | 32,803 | 143 |
| | Development | | |
| | Securities plc | 38,944 | 141 |
| | ST Modwen Properties plc | 49,130 | 140 |
| | | |
| | | | Market |
| | | | Value |
| | | Shares | ($000) |
| | Workspace Group plc | 271,416 | 131 |
| | Safestore Holdings plc | 50,046 | 129 |
| | Primary Health | | |
| | Properties plc | 20,082 | 109 |
| * | Metric Property | | |
| | Investments plc | 60,897 | 108 |
| | Daejan Holdings plc | 2,031 | 92 |
| | Invista Foundation | | |
| | Property Trust Ltd. | 117,245 | 76 |
| * | Minerva plc | 38,850 | 60 |
| * | CLS Holdings plc | 5,118 | 58 |
| * | Capital & Regional plc | 81,755 | 53 |
| | | | 15,920 |
| Total Common Stocks | | |
| (Cost $197,555) | | 204,958 |
| Temporary Cash Investment (4.8%) | |
| Money Market Fund (4.8%) | | |
| 1,2 | Vanguard Market | | |
| | Liquidity Fund, | | |
| | 0.179% | | |
| | (Cost $9,896) | 9,896,093 | 9,896 |
| Total Investments (104.6%) | | |
| (Cost $207,451) | | 214,854 |
| Other Assets and Liabilities (-4.6%) | |
| Other Assets | | 5,536 |
| Liabilities2 | | (14,972) |
| | | | (9,436) |
| Net Assets (100%) | | 205,418 |
16
Global ex-U.S. Real Estate Index Fund
| |
| At April 30, 2011, net assets consisted of: | |
| | Amount |
| | ($000) |
| Paid-in Capital | 196,656 |
| Undistributed Net Investment Income | 1,344 |
| Accumulated Net Realized Losses | (27) |
| Unrealized Appreciation (Depreciation) | |
| Investment Securities | 7,403 |
| Foreign Currencies | 42 |
| Net Assets | 205,418 |
| |
| |
| Investor Shares—Net Assets | |
| Applicable to 1,881,512 outstanding | |
| $.001 par value shares of beneficial | |
| interest (unlimited authorization) | 39,523 |
| Net Asset Value Per Share— | |
| Investor Shares | $21.01 |
| |
| |
| Signal Shares—Net Assets | |
| Applicable to 176,466 outstanding | |
| $.001 par value shares of beneficial | |
| interest (unlimited authorization) | 5,616 |
| Net Asset Value Per Share— | |
| Signal Shares | $31.82 |
| |
| |
| Institutional Shares—Net Assets | |
| Applicable to 73,339 outstanding | |
| $.001 par value shares of beneficial | |
| interest (unlimited authorization) | 7,776 |
| Net Asset Value Per Share— | |
| Institutional Shares | $106.03 |
| |
| |
| ETF Shares—Net Assets | |
| Applicable to 2,904,181 outstanding | |
| $.001 par value shares of beneficial | |
| interest (unlimited authorization) | 152,503 |
| Net Asset Value Per Share— | |
| ETF Shares | $52.51 |
See Note A in Notes to Financial Statements.
* Non-income-producing security.
^ Part of security position is on loan to broker-dealers. The total value of securities on loan is $8,356,000.
1 Affiliated money market fund available only to Vanguard funds and certain trusts and accounts managed by Vanguard. Rate shown is the 7-day yield.
2 Includes $8,857,000 of collateral received for securities on loan.
REIT—Real Estate Investment Trust.
See accompanying Notes, which are an integral part of the Financial Statements.
17
Global ex-U.S. Real Estate Index Fund
Statement of Operations
| |
| | November 1, 20101 to |
| | April 30, 2011 |
| | ($000) |
| Investment Income | |
| Income | |
| Dividends2 | 2,331 |
| Interest3 | 1 |
| Security Lending | 12 |
| Total Income | 2,344 |
| Expenses | |
| The Vanguard Group—Note B | |
| Management and Administrative—Investor Shares | 41 |
| Management and Administrative—Signal Shares | 1 |
| Management and Administrative—Institutional Shares | 1 |
| Management and Administrative—ETF Shares | 83 |
| Marketing and Distribution—Investor Shares | 1 |
| Marketing and Distribution—Signal Shares | — |
| Marketing and Distribution—Institutional Shares | — |
| Marketing and Distribution—ETF Shares | 4 |
| Custodian Fees | 69 |
| Shareholders’ Reports—Investor Shares | 1 |
| Shareholders’ Reports—Signal Shares | — |
| Shareholders’ Reports—Institutional Shares | — |
| Shareholders’ Reports—ETF Shares | — |
| Total Expenses | 201 |
| Net Investment Income | 2,143 |
| Realized Net Gain (Loss) | |
| Investment Securities Sold | (27) |
| Foreign Currencies | (74) |
| Realized Net Gain (Loss) | (101) |
| Change in Unrealized Appreciation (Depreciation) | |
| Investment Securities | 7,403 |
| Foreign Currencies | 42 |
| Change in Unrealized Appreciation (Depreciation) | 7,445 |
| Net Increase (Decrease) in Net Assets Resulting from Operations | 9,487 |
1 Inception.
2 Dividends are net of foreign withholding taxes of $141,000.
3 Interest income from an affiliated company of the fund was $1,000.
See accompanying Notes, which are an integral part of the Financial Statements.
18
Global ex-U.S. Real Estate Index Fund
Statement of Changes in Net Assets
| |
| | November 1, 20101 to |
| | April 30, 2011 |
| | ($000) |
| Increase (Decrease) in Net Assets | |
| Operations | |
| Net Investment Income | 2,143 |
| Realized Net Gain (Loss) | (101) |
| Change in Unrealized Appreciation (Depreciation) | 7,445 |
| Net Increase (Decrease) in Net Assets Resulting from Operations | 9,487 |
| Distributions | |
| Net Investment Income | |
| Investor Shares | (143) |
| Signal Shares | — |
| Institutional Shares | — |
| ETF Shares | (582) |
| Realized Capital Gain | |
| Investor Shares | — |
| Signal Shares | — |
| Institutional Shares | — |
| ETF Shares | — |
| Total Distributions | (725) |
| Capital Share Transactions | |
| Investor Shares | 37,893 |
| Signal Shares | 5,487 |
| Institutional Shares | 7,483 |
| ETF Shares | 145,793 |
| Net Increase (Decrease) from Capital Share Transactions | 196,656 |
| Total Increase (Decrease) | 205,418 |
| Net Assets | |
| Beginning of Period | — |
| End of Period2 | 205,418 |
1 Inception.
2 Net Assets—End of Period includes undistributed net investment income of $1,344,000.
See accompanying Notes, which are an integral part of the Financial Statements.
19
Global ex-U.S. Real Estate Index Fund
Financial Highlights
| |
| Investor Shares | |
| | November 1, 20101 to |
| For a Share Outstanding Throughout the Period | April 30, 2011 |
| Net Asset Value, Beginning of Period | $20.00 |
| Investment Operations | |
| Net Investment Income | .4232 |
| Net Realized and Unrealized Gain (Loss) on Investments3 | .761 |
| Total from Investment Operations | 1.184 |
| Distributions | |
| Dividends from Net Investment Income | (.174) |
| Distributions from Realized Capital Gains | — |
| Total Distributions | (.174) |
| Net Asset Value, End of Period | $21.01 |
| |
| Total Return4 | 5.98% |
| |
| Ratios/Supplemental Data | |
| Net Assets, End of Period (Millions) | $40 |
| Ratio of Total Expenses to Average Net Assets | 0.50% |
| Ratio of Net Investment Income to Average Net Assets | 3.99% |
| Portfolio Turnover Rate | 3% |
| The expense ratio, net income ratio, and turnover rate for the current period have been annualized. |
1 Inception.
2 Calculated based on average shares outstanding.
3 Includes increases from purchase and redemption fees of $.02.
4 Total return does not include transaction or account service fees that may have applied in the period shown. Fund prospectuses provide information about any applicable transaction and account service fees.
See accompanying Notes, which are an integral part of the Financial Statements.
20
Global ex-U.S. Real Estate Index Fund
Financial Highlights
| |
| Signal Shares | |
| | February 10, 20111 to |
| For a Share Outstanding Throughout the Period | April 30, 2011 |
| Net Asset Value, Beginning of Period | $29.89 |
| Investment Operations | |
| Net Investment Income | .2502 |
| Net Realized and Unrealized Gain (Loss) on Investments | 1.680 |
| Total from Investment Operations | 1.930 |
| Distributions | |
| Dividends from Net Investment Income | — |
| Distributions from Realized Capital Gains | — |
| Total Distributions | — |
| Net Asset Value, End of Period | $31.82 |
| |
| Total Return3 | 6.46% |
| |
| Ratios/Supplemental Data | |
| Net Assets, End of Period (Millions) | $6 |
| Ratio of Total Expenses to Average Net Assets | 0.35% |
| Ratio of Net Investment Income to Average Net Assets | 4.14% |
| Portfolio Turnover Rate | 3% |
| The expense ratio, net income ratio, and turnover rate for the current period have been annualized. |
1 Inception.
2 Calculated based on average shares outstanding.
3 Total return does not include transaction fees that may have applied in the period shown. Fund prospectuses provide information about any applicable transaction fees.
See accompanying Notes, which are an integral part of the Financial Statements.
21
Global ex-U.S. Real Estate Index Fund
Financial Highlights
| |
| Institutional Shares | |
| | April 19, 20111 to |
| For a Share Outstanding Throughout the Period | April 30, 2011 |
| Net Asset Value, Beginning of Period | $102.01 |
| Investment Operations | |
| Net Investment Income | .3012 |
| Net Realized and Unrealized Gain (Loss) on Investments | 3.719 |
| Total from Investment Operations | 4.020 |
| Distributions | |
| Dividends from Net Investment Income | — |
| Distributions from Realized Capital Gains | — |
| Total Distributions | — |
| Net Asset Value, End of Period | $106.03 |
| |
| Total Return3 | 3.94% |
| |
| Ratios/Supplemental Data | |
| Net Assets, End of Period (Millions) | $8 |
| Ratio of Total Expenses to Average Net Assets | 0.30% |
| Ratio of Net Investment Income to Average Net Assets | 4.19% |
| Portfolio Turnover Rate | 3% |
| The expense ratio, net income ratio, and turnover rate for the current period have been annualized. |
1 Inception.
2 Calculated based on average shares outstanding.
3 Total return does not include transaction fees that may have applied in the period shown. Fund prospectuses provide information about any applicable transaction fees.
See accompanying Notes, which are an integral part of the Financial Statements.
22
Global ex-U.S. Real Estate Index Fund
Financial Highlights
| |
| ETF Shares | |
| | November 1, 20101 to |
| For a Share Outstanding Throughout the Period | April 30, 2011 |
| Net Asset Value, Beginning of Period | $49.97 |
| Investment Operations | |
| Net Investment Income | 1.0062 |
| Net Realized and Unrealized Gain (Loss) on Investments3 | 1.981 |
| Total from Investment Operations | 2.987 |
| Distributions | |
| Dividends from Net Investment Income | (.447) |
| Distributions from Realized Capital Gains | — |
| Total Distributions | (.447) |
| Net Asset Value, End of Period | $52.51 |
| |
| Total Return | 6.04% |
| |
| Ratios/Supplemental Data | |
| Net Assets, End of Period (Millions) | $153 |
| Ratio of Total Expenses to Average Net Assets | 0.35% |
| Ratio of Net Investment Income to Average Net Assets | 4.14% |
| Portfolio Turnover Rate | 3% |
| The expense ratio, net income ratio, and turnover rate for the current period have been annualized. |
1 Inception.
2 Calculated based on average shares outstanding.
3 Includes increases from purchase and redemption fees of $.04.
See accompanying Notes, which are an integral part of the Financial Statements.
23
Global ex-U.S. Real Estate Index Fund
Notes to Financial Statements
Vanguard Global ex-U.S. Real Estate Index Fund is registered under the Investment Company Act of 1940 as an open-end investment company, or mutual fund. The fund invests in securities of foreign issuers, which may subject it to investment risks not normally associated with investing in securities of U.S. corporations. The fund offers four classes of shares: Investor Shares, Signal Shares, Institutional Shares, and ETF Shares. Investor Shares are available to any investor who meets the fund’s minimum purchase requirements. Signal Shares and Institutional Shares are designed for investors who meet certain administrative, service, and account-size criteria. Investor Shares were first issued on November 1, 2010. Signal Shares were first issued on February 10, 2011. Institutional Shares were first issued on April 19, 2011. ETF Shares were first issued on November 1, 2010. ETF Shares are listed for trading on Nasdaq; they can be purchased and sold through a broker.
A. The following significant accounting policies conform to generally accepted accounting principles for U.S. mutual funds. The fund consistently follows such policies in preparing its financial statements.
1. Security Valuation: Securities are valued as of the close of trading on the New York Stock Exchange (generally 4 p.m., Eastern time) on the valuation date. Equity securities are valued at the latest quoted sales prices or official closing prices taken from the primary market in which each security trades; such securities not traded on the valuation date are valued at the mean of the latest quoted bid and asked prices. Securities for which market quotations are not readily available, or whose values have been affected by events occurring before the fund’s pricing time but after the close of the securities’ primary markets, are valued at their fair values calculated according to procedures adopted by the board of trustees. These procedures include obtaining quotations from an independent pricing service, monitoring news to identify significant market- or security-specific events, and evaluating changes in the values of foreign market proxies (for example, ADRs, futures contracts, or exchange-traded funds), between the time the foreign markets close and the fund’s pricing time. When fair-value pricing is employed, the prices of securities used by a fund to calculate its net asset value may differ from quoted or published prices for the same securities. Investments in Vanguard Market Liquidity Fund are valued at that fund’s net asset value.
2. Foreign Currency: Securities and other assets and liabilities denominated in foreign currencies are translated into U.S. dollars using exchange rates obtained from an independent third party as of the fund’s pricing time on the valuation date. Realized gains (losses) and unrealized appreciation (depreciation) on investment securities include the effects of changes in exchange rates since the securities were purchased, combined with the effects of changes in security prices. Fluctuations in the value of other assets and liabilities resulting from changes in exchange rates are recorded as unrealized foreign currency gains (losses) until the assets or liabilities are settled in cash, at which time they are recorded as realized foreign currency gains (losses).
3. Federal Income Taxes: The fund intends to qualify as a regulated investment company and distribute all of its taxable income. Management has analyzed the fund’s tax positions taken for its open federal income tax period ended April 30, 2011, and has concluded that no provision for federal income tax is required in the fund’s financial statements.
4. Distributions: Distributions to shareholders are recorded on the ex-dividend date.
5. Security Lending: The fund may lend its securities to qualified institutional borrowers to earn additional income. Security loans are required to be secured at all times by collateral at least equal to the market value of securities loaned. The fund invests cash collateral received in Vanguard Market Liquidity Fund, and records a liability for the return of the collateral, during the period the securities are on loan. Security lending income represents fees charged to borrowers plus income earned on investing cash collateral, less expenses associated with the loan.
24
Global ex-U.S. Real Estate Index Fund
6. Other: Dividend income is recorded on the ex-dividend date. Interest income includes income distributions received from Vanguard Market Liquidity Fund and is accrued daily. Security transactions are accounted for on the date securities are bought or sold. Costs used to determine realized gains (losses) on the sale of investment securities are those of the specific securities sold. Fees assessed on capital share transactions are credited to paid-in capital.
Each class of shares has equal rights as to assets and earnings, except that each class separately bears certain class-specific expenses related to maintenance of shareholder accounts (included in Management and Administrative expenses) and shareholder reporting. Marketing and distribution expenses are allocated to each class of shares based on a method approved by the board of trustees. Income, other non-class-specific expenses, and gains and losses on investments are allocated to each class of shares based on its relative net assets.
B. The Vanguard Group furnishes at cost investment advisory, corporate management, administrative, marketing, and distribution services. The costs of such services are allocated to the fund under methods approved by the board of trustees. The fund has committed to provide up to 0.40% of its net assets in capital contributions to Vanguard. At April 30, 2011, the fund had contributed capital of $27,000 to Vanguard (included in Other Assets), representing 0.01% of the fund’s net assets and 0.01% of Vanguard’s capitalization. The fund’s trustees and officers are also directors and officers of Vanguard.
C. Various inputs may be used to determine the value of the fund’s investments. These inputs are summarized in three broad levels for financial statement purposes. The inputs or methodologies used to value securities are not necessarily an indication of the risk associated with investing in those securities.
Level 1—Quoted prices in active markets for identical securities.
Level 2—Other significant observable inputs (including quoted prices for similar securities, interest rates, prepayment speeds, credit risk, etc.).
Level 3—Significant unobservable inputs (including the fund’s own assumptions used to determine the fair value of investments).
The following table summarizes the fund’s investments as of April 30, 2011, based on the inputs used to value them:
| | | |
| | Level 1 | Level 2 | Level 3 |
| Investments | ($000) | ($000) | ($000) |
| Common Stocks | 11,010 | 193,948 | — |
| Temporary Cash Investments | 9,896 | — | — |
| Total | 20,906 | 193,948 | — |
D. Distributions are determined on a tax basis and may differ from net investment income and realized capital gains for financial reporting purposes. Differences may be permanent or temporary. Permanent differences are reclassified among capital accounts in the financial statements to reflect their tax character. Temporary differences arise when certain items of income, expense, gain, or loss are recognized in different periods for financial statement and tax purposes; these differences will reverse at some time in the future. Differences in classification may also result from the treatment of short-term gains as ordinary income for tax purposes. The fund’s tax-basis capital gains and losses are determined only at the end of each fiscal year.
25
Global ex-U.S. Real Estate Index Fund
During the six months ended April 30, 2011, the fund realized net foreign currency losses of $74,000, which decreased distributable net income for tax purposes; accordingly, such losses have been reclassified from accumulated net realized losses to undistributed net investment income.
At April 30, 2011, the cost of investment securities for tax purposes was $207,451,000. Net unrealized appreciation of investment securities for tax purposes was $7,403,000, consisting of unrealized gains of $11,757,000 on securities that had risen in value since their purchase and $4,354,000 in unrealized losses on securities that had fallen in value since their purchase.
E. During the six months ended April 30, 2011, the fund purchased $198,783,000 of investment securities and sold $1,681,000 of investment securities, other than temporary cash investments.
F. Capital share transactions for each class of shares were:
| | |
| | | Inception1 to |
| | | April 30, 2011 |
| | Amount | Shares |
| | ($000) | (000) |
| Investor Shares | | |
| Issued2 | 41,132 | 2,044 |
| Issued in Lieu of Cash Distributions | 129 | 7 |
| Redeemed3 | (3,368) | (169) |
| Net Increase (Decrease)—Investor Shares | 37,893 | 1,882 |
| Signal Shares | | |
| Issued2 | 5,487 | 176 |
| Issued in Lieu of Cash Distributions | — | — |
| Redeemed3 | — | — |
| Net Increase (Decrease)—Signal Shares | 5,487 | 176 |
| Institutional Shares | | |
| Issued2 | 7,483 | 73 |
| Issued in Lieu of Cash Distributions | — | — |
| Redeemed3 | — | — |
| Net Increase (Decrease)—Institutional Shares | 7,483 | 73 |
| ETF Shares | | |
| Issued2 | 145,793 | 2,904 |
| Issued in Lieu of Cash Distributions | — | — |
| Redeemed3 | — | — |
| Net Increase (Decrease)—ETF Shares | 145,793 | 2,904 |
1 Inception was November 1, 2010, for the Investor Shares, November 1, 2010, for the ETF Shares, February 10, 2011, for the Signal Shares, and April 19, 2011, for the Institutional Shares.
2 Includes purchase fees for fiscal 2011 of $135,000 (fund totals).
3 Net of redemption fees for fiscal 2011 of $8,000 (fund totals).
G. In preparing the financial statements as of April 30, 2011, management considered the impact of subsequent events for potential recognition or disclosure in these financial statements.
26
Trustees Approve Advisory Arrangement
The board of trustees approved the launch of Vanguard Global ex-U.S. Real Estate Index Fund utilizing an internalized management structure whereby The Vanguard Group, Inc.—through its Quantitative Equity Group—would provide investment advisory services to the fund at cost. The board determined that the investment advisory arrangement with Vanguard was in the best interests of the fund and its prospective shareholders.
The board based its decision upon an evaluation of the advisor’s investment staff, portfolio management process, and performance. The trustees considered the factors discussed below, among others. However, no single factor determined whether the board approved the arrangement. Rather, it was the totality of the circumstances that drove the board’s decision.
Nature, extent, and quality of services
The board considered the quality of the investment management services to be provided to the fund and took into account the organizational depth and stability of the advisor. The board noted that Vanguard has been managing investments for more than three decades. The Quantitative Equity Group adheres to a sound, disciplined investment management process; the team has considerable experience, stability, and depth.
The board concluded that Vanguard’s experience, stability, depth, and performance, among other factors, warranted approval of the advisory arrangement.
Investment performance
The board determined that, in its management of other Vanguard index funds, the Quantitative Equity Group has a track record of consistent performance and disciplined investment processes. Information about the fund’s performance since inception can be found in the Performance Summary section of this report.
Cost
The board considered the cost of services to be provided and concluded that the fund’s expense ratio will be below the average expense ratio charged by funds in its peer group. Information about the fund’s expense ratio appears in the Financial Statements section of this report.
The board does not conduct a profitability analysis of Vanguard, because of Vanguard’s unique “at-cost” structure. Unlike most other mutual fund management companies, Vanguard is owned by the funds it oversees, and produces “profits” only in the form of reduced expenses for fund shareholders.
The benefit of economies of scale
The board concluded that the fund’s low-cost arrangement with Vanguard ensures that the fund will realize economies of scale as it grows, with the cost to shareholders declining as fund assets increase.
The board will consider whether to renew the advisory arrangement after a one-year period.
27
Glossary
Dividend Yield. Dividend income earned by stocks, expressed as a percentage of the aggregate market value (or of net asset value, for a fund). The yield is determined by dividing the amount of the annual dividends by the aggregate value (or net asset value) at the end of the period. For a fund, the dividend yield is based solely on stock holdings and does not include any income produced by other investments. This yield may include some payments that represent a return of capital, capital gains distributions, or both by the underlying stocks.
Earnings Growth Rate. The average annual rate of growth in earnings over the past five years for the stocks now in a fund.
Equity Exposure. A measure that reflects a fund’s investments in stocks and stock futures. Any holdings in short-term reserves are excluded.
Expense Ratio. The percentage of a fund’s average net assets used to pay its annual administrative and advisory expenses. These expenses directly reduce returns to investors.
Inception Date. The date on which the assets of a fund (or one of its share classes) are first invested in accordance with the fund’s investment objective. For funds with a subscription period, the inception date is the day after that period ends. Investment performance is measured from the inception date.
Median Market Cap. An indicator of the size of companies in which a fund invests; the midpoint of market capitalization (market price x shares outstanding) of a fund’s stocks, weighted by the proportion of the fund’s assets invested in each stock. Stocks representing half of the fund’s assets have market capitalizations above the median, and the rest are below it.
Price/Book Ratio. The share price of a stock divided by its net worth, or book value, per share. For a fund, the weighted average price/book ratio of the stocks it holds.
Price/Earnings Ratio. The ratio of a stock’s current price to its per-share earnings over the past year. For a fund, the weighted average P/E of the stocks it holds. P/E is an indicator of market expectations about corporate prospects; the higher the P/E, the greater the expectations for a company’s future growth.
Return on Equity. The annual average rate of return generated by a company during the past five years for each dollar of shareholder’s equity (net income divided by shareholder’s equity). For a fund, the weighted average return on equity for the companies whose stocks it holds.
Short-Term Reserves. The percentage of a fund invested in highly liquid, short-term securities that can be readily converted to cash.
Turnover Rate. An indication of the fund’s trading activity. Funds with high turnover rates incur higher transaction costs and may be more likely to distribute capital gains (which may be taxable to investors). The turnover rate excludes in-kind transactions, which have minimal impact on costs.
28
This page intentionally left blank.
This page intentionally left blank.
This page intentionally left blank.
The People Who Govern Your Fund
The trustees of your mutual fund are there to see that the fund is operated and managed in your best interests since, as a shareholder, you are a part owner of the fund. Your fund’s trustees also serve on the board of directors of The Vanguard Group, Inc., which is owned by the Vanguard funds and provides services to them on an at-cost basis.
A majority of Vanguard’s board members are independent, meaning that they have no affiliation with Vanguard or the funds they oversee, apart from the sizable personal investments they have made as private individuals. The independent board members have distinguished backgrounds in business, academia, and public service. Each of the trustees and executive officers oversees 179 Vanguard funds.
The following table provides information for each trustee and executive officer of the fund. More information about the trustees is in the Statement of Additional Information, which can be obtained, without charge, by contacting Vanguard at 800-662-7447, or online at vanguard.com.
| |
| Interested Trustee1 | and President (2006–2008) of Rohm and Haas Co. |
| | (chemicals); Director of Tyco International, Ltd. |
| F. William McNabb III | (diversified manufacturing and services) and Hewlett- |
| Born 1957. Trustee Since July 2009. Chairman of the | Packard Co. (electronic computer manufacturing); |
| Board. Principal Occupation(s) During the Past Five | Senior Advisor at New Mountain Capital; Trustee |
| Years: Chairman of the Board of The Vanguard Group, | of The Conference Board; Member of the Board of |
| Inc., and of each of the investment companies served | Managers of Delphi Automotive LLP (automotive |
| by The Vanguard Group, since January 2010; Director | components). |
| of The Vanguard Group since 2008; Chief Executive | |
| Officer and President of The Vanguard Group and of | Amy Gutmann |
| each of the investment companies served by The | Born 1949. Trustee Since June 2006. Principal |
| Vanguard Group since 2008; Director of Vanguard | Occupation(s) During the Past Five Years: President |
| Marketing Corporation; Managing Director of The | of the University of Pennsylvania; Christopher H. |
| Vanguard Group (1995–2008). | Browne Distinguished Professor of Political Science |
| | in the School of Arts and Sciences with secondary |
| | appointments at the Annenberg School for Commu- |
| Independent Trustees | nication and the Graduate School of Education |
| | of the University of Pennsylvania; Director of |
| Emerson U. Fullwood | Carnegie Corporation of New York, Schuylkill River |
| Born 1948. Trustee Since January 2008. Principal | Development Corporation, and Greater Philadelphia |
| Occupation(s) During the Past Five Years: Executive | Chamber of Commerce; Trustee of the National |
| Chief Staff and Marketing Officer for North America | Constitution Center; Chair of the Presidential |
| and Corporate Vice President (retired 2008) of Xerox | Commission for the Study of Bioethical Issues. |
| Corporation (document management products and | |
| services); Executive in Residence and 2010 | JoAnn Heffernan Heisen |
| Distinguished Minett Professor at the Rochester | Born 1950. Trustee Since July 1998. Principal |
| Institute of Technology; Director of SPX Corporation | Occupation(s) During the Past Five Years: Corporate |
| (multi-industry manufacturing), the United Way of | Vice President and Chief Global Diversity Officer |
| Rochester, Amerigroup Corporation (managed health | (retired 2008) and Member of the Executive |
| care), the University of Rochester Medical Center, | Committee (1997–2008) of Johnson & Johnson |
| Monroe Community College Foundation, and North | (pharmaceuticals/consumer products); Director of |
| Carolina A&T University. | Skytop Lodge Corporation (hotels), the University |
| | Medical Center at Princeton, the Robert Wood |
| Rajiv L. Gupta | Johnson Foundation, and the Center for Work Life |
| Born 1945. Trustee Since December 2001.2 | Policy; Member of the Advisory Board of the |
| Principal Occupation(s) During the Past Five Years: | Maxwell School of Citizenship and Public Affairs |
| Chairman and Chief Executive Officer (retired 2009) | at Syracuse University. |
| | |
| F. Joseph Loughrey | Thomas J. Higgins | |
| Born 1949. Trustee Since October 2009. Principal | Born 1957. Chief Financial Officer Since September |
| Occupation(s) During the Past Five Years: President | 2008. Principal Occupation(s) During the Past Five |
| and Chief Operating Officer (retired 2009) and Vice | Years: Principal of The Vanguard Group, Inc.; Chief |
| Chairman of the Board (2008–2009) of Cummins Inc. | Financial Officer of each of the investment companies |
| (industrial machinery); Director of SKF AB (industrial | served by The Vanguard Group since 2008; Treasurer |
| machinery), Hillenbrand, Inc. (specialized consumer | of each of the investment companies served by The |
| services), the Lumina Foundation for Education, and | Vanguard Group (1998–2008). |
| Oxfam America; Chairman of the Advisory Council | | |
| for the College of Arts and Letters and Member | Kathryn J. Hyatt | |
| of the Advisory Board to the Kellogg Institute for | Born 1955. Treasurer Since November 2008. Principal |
| International Studies at the University of Notre Dame. | Occupation(s) During the Past Five Years: Principal |
| | of The Vanguard Group, Inc.; Treasurer of each of |
| André F. Perold | the investment companies served by The Vanguard |
| Born 1952. Trustee Since December 2004. Principal | Group since 2008; Assistant Treasurer of each of the |
| Occupation(s) During the Past Five Years: George | investment companies served by The Vanguard Group |
| Gund Professor of Finance and Banking at the Harvard | (1988–2008). | |
| Business School; Chair of the Investment Committee | | |
| of HighVista Strategies LLC (private investment firm). | Heidi Stam | |
| | Born 1956. Secretary Since July 2005. Principal |
| Alfred M. Rankin, Jr. | Occupation(s) During the Past Five Years: Managing |
| Born 1941. Trustee Since January 1993. Principal | Director of The Vanguard Group, Inc., since 2006; |
| Occupation(s) During the Past Five Years: Chairman, | General Counsel of The Vanguard Group since 2005; |
| President, and Chief Executive Officer of NACCO | Secretary of The Vanguard Group and of each of the |
| Industries, Inc. (forklift trucks/housewares/lignite); | investment companies served by The Vanguard Group |
| Director of Goodrich Corporation (industrial products/ | since 2005; Director and Senior Vice President of |
| aircraft systems and services) and the National | Vanguard Marketing Corporation since 2005; |
| Association of Manufacturers; Chairman of the | Principal of The Vanguard Group (1997–2006). |
| Federal Reserve Bank of Cleveland; Vice Chairman | | |
| of University Hospitals of Cleveland; President of | | |
| the Board of The Cleveland Museum of Art. | Vanguard Senior Management Team |
| |
| Peter F. Volanakis | R. Gregory Barton | Michael S. Miller |
| Born 1955. Trustee Since July 2009. Principal | Mortimer J. Buckley | James M. Norris |
| Occupation(s) During the Past Five Years: President | Kathleen C. Gubanich | Glenn W. Reed |
| and Chief Operating Officer (retired 2010) of Corning | Paul A. Heller | George U. Sauter |
| Incorporated (communications equipment); Director of | Martha G. King | |
| Corning Incorporated (2000–2010) and Dow Corning | | |
| (2001–2010); Overseer of the Amos Tuck School of | | |
| Business Administration at Dartmouth College. | Chairman Emeritus and Senior Advisor |
| |
| | John J. Brennan | |
| Executive Officers | Chairman, 1996–2009 | |
| | Chief Executive Officer and President, 1996–2008 |
| Glenn Booraem | | |
| Born 1967. Controller Since July 2010. Principal | | |
| Occupation(s) During the Past Five Years: Principal | Founder | |
| of The Vanguard Group, Inc.; Controller of each of | | |
| the investment companies served by The Vanguard | John C. Bogle | |
| Group since 2010; Assistant Controller of each of | Chairman and Chief Executive Officer, 1974–1996 |
| the investment companies served by The Vanguard | | |
| Group (2001–2010). | | |
1 Mr. McNabb is considered an “interested person,” as defined in the Investment Company Act of 1940, because he is an officer of the Vanguard funds.
2 December 2002 for Vanguard Equity Income Fund, Vanguard Growth Equity Fund, the Vanguard Municipal Bond Funds, and the Vanguard State Tax-Exempt Funds.
|  |
| P.O. Box 2600 |
| Valley Forge, PA 19482-2600 |
Connect with Vanguard® > vanguard.com
| |
| Fund Information > 800-662-7447 | Standard & Poor’s® and S&P® are registered |
| Direct Investor Account Services > 800-662-2739 | trademarks of Standard & Poor’s Financial Services LLC |
| Institutional Investor Services > 800-523-1036 | (”S&P”) and have been licensed for use by The |
| Text Telephone for People | Vanguard Group, Inc. The Vanguard mutual funds and |
| With Hearing Impairment > 800-749-7273 | ETFs are not sponsored, endorsed, sold, or promoted by |
| S&P or its Affiliates, and S&P and its Affiliates make |
| This material may be used in conjunction | no representation, warranty, or condition regarding the |
| with the offering of shares of any Vanguard | advisability of buying, selling, or holding units/shares in |
| fund only if preceded or accompanied by | the funds. |
| the fund’s current prospectus. | |
| |
| All comparative mutual fund data are from Lipper Inc. or | �� |
| Morningstar, Inc., unless otherwise noted. | |
| |
| You can obtain a free copy of Vanguard’s proxy voting | |
| guidelines by visiting vanguard.com/proxyreporting or by | |
| calling Vanguard at 800-662-2739. The guidelines are | |
| also available from the SEC’s website, sec.gov. In | |
| addition, you may obtain a free report on how your fund | |
| voted the proxies for securities it owned during the 12 | |
| months ended June 30. To get the report, visit either | |
| vanguard.com/proxyreporting or sec.gov. | |
| |
| You can review and copy information about your fund at | |
| the SEC’s Public Reference Room in Washington, D.C. To | |
| find out more about this public service, call the SEC at | |
| 202-551-8090. Information about your fund is also | |
| available on the SEC’s website, and you can receive | |
| copies of this information, for a fee, by sending a | |
| request in either of two ways: via e-mail addressed to | |
| publicinfo@sec.gov or via regular mail addressed to the | |
| Public Reference Section, Securities and Exchange | |
| Commission, Washington, DC 20549-1520. | |
| |
| |
| | © 2011 The Vanguard Group, Inc. |
| | All rights reserved. |
| | Vanguard Marketing Corporation, Distributor. |
| |
| | Q7382 062011 |
Item 2: Code of Ethics.
Not Applicable.
Item 3: Audit Committee Financial Expert.
Not Applicable.
Item 4: Principal Accountant Fees and Services.
Not Applicable.
Item 5: Audit Committee of Listed Registrants.
Not Applicable.
Item 6: Investments.
Not Applicable.
Item 7: Disclosure of Proxy Voting Policies and Procedures for Closed-End Management Investment Companies.
Not Applicable.
Item 8: Portfolio Managers of Closed-End Management Investment Companies.
Not Applicable.
Item 9: Purchase of Equity Securities by Closed-End Management Investment Company and Affiliated Purchasers.
Not Applicable.
Item 10: Submission of Matters to a Vote of Security Holders.
Not Applicable.
Item 11: Controls and Procedures.
(a) Disclosure Controls and Procedures. The Principal Executive and Financial Officers concluded that the Registrant's Disclosure Controls and Procedures are effective based on their evaluation of the Disclosure Controls and Procedures as of a date within 90 days of the filing date of this report.
(b) Internal Control Over Financial Reporting. There were no significant changes in Registrant’s Internal Control Over Financial Reporting or in other factors that could significantly affect this control subsequent to the date of the evaluation, including any corrective actions with regard to significant deficiencies and material weaknesses.
Item 12: Exhibits.
(a) Certifications.
(b) Pursuant to the requirements of the Securities Exchange Act of 1934 and the Investment Company Act of 1940, the registrant has duly caused this report to be signed on its behalf by the undersigned, thereunto duly authorized.
| |
| | VANGUARD INTERNATIONAL EQUITY INDEX FUNDS |
| |
| By: | /s/ F. WILLIAM MCNABB III* |
| | F. WILLIAM MCNABB III |
| | CHIEF EXECUTIVE OFFICER |
| |
| Date: June 16, 2011 |
Pursuant to the requirements of the Securities Exchange Act of 1934 and the Investment Company Act of 1940, this report has been signed below by the following persons on behalf of the registrant and in the capacities and on the dates indicated.
| |
| | VANGUARD INTERNATIONAL EQUITY INDEX FUNDS |
| |
| By: | /s/ F. WILLIAM MCNABB III* |
| | F. WILLIAM MCNABB III |
| | CHIEF EXECUTIVE OFFICER |
| |
| Date: June 16, 2011 |
| |
| | VANGUARD INTERNATIONAL EQUITY INDEX FUNDS |
| |
| By: | /s/ THOMAS J. HIGGINS* |
| | THOMAS J. HIGGINS |
| | CHIEF FINANCIAL OFFICER |
| |
| Date: June 16, 2011 |
* By: /s/ Heidi Stam
Heidi Stam, pursuant to a Power of Attorney filed on April 26, 2010, see file Number 33-53683, Incorporated by Reference.