UNITED STATES
SECURITIES AND EXCHANGE COMMISSION
Washington, D.C. 20549
FORM N-CSR
CERTIFIED SHAREHOLDER REPORT
OF
REGISTERED MANAGEMENT INVESTMENT COMPANIES
| | |
| Investment Company Act file number: | 811-05972 |
Name of Registrant: | Vanguard International Equity Index Funds |
Address of Registrant: | P.O. Box 2600 |
| | Valley Forge, PA 19482 |
Name and address of agent for service: | Anne E. Robinson, Esquire |
| | P.O. Box 876 |
| | Valley Forge, PA 19482 |
Registrant’s telephone number, including area code: (610) 669-1000 |
Date of fiscal year end: October 31 |
Date of reporting period: November 1, 2015 – October 31, 2016 |
Item 1: Reports to Shareholders |

Annual Report | October 31, 2016
Vanguard International Stock Index Funds
Vanguard European Stock Index Fund
Vanguard Pacific Stock Index Fund
A new format, unwavering commitment
As you begin reading this report, you’ll notice that we’ve made some improvements to the opening sections—based on feedback from you, our clients.
Page 1 starts with a new ”Your Fund’s Performance at a Glance,” a concise, handy summary of how your fund performed during the period.
In the renamed ”Chairman’s Perspective,” Bill McNabb will focus on enduring principles and investment insights.
We’ve modified some tables, and eliminated some redundancy, but we haven’t removed any information.
At Vanguard, we’re always looking for better ways to communicate and to help you make sound investment decisions. Thank you for entrusting your assets to us.
| |
| Contents | |
| Your Fund’s Performance at a Glance. | 1 |
| Chairman’s Perspective. | 4 |
| European Stock Index Fund. | 8 |
| Pacific Stock Index Fund. | 33 |
| Your Fund’s After-Tax Returns. | 57 |
| About Your Fund’s Expenses. | 58 |
| Glossary. | 60 |
Please note: The opinions expressed in this report are just that—informed opinions. They should not be considered promises or advice.
Also, please keep in mind that the information and opinions cover the period through the date on the front of this report. Of course, the
risks of investing in your fund are spelled out in the prospectus.
See the Glossary for definitions of investment terms used in this report.
About the cover: No matter what language you speak, Vanguard has one consistent message and set of principles. Our primary
focus is on you, our clients. We conduct our business with integrity as a faithful steward of your assets. This message is shown
translated into seven languages, reflecting our expanding global presence.
Your Fund’s Performance at a Glance
• For the 12 months ended October 31, 2016, returns for European stocks significantly trailed those of stocks in the Pacific region.
• Vanguard European Stock Index Fund returned –6.63% for the fiscal year, while Vanguard Pacific Stock Index Fund returned 6.40%. (All returns are for Investor Shares.)
• Returns for both funds diverged from those of their benchmark indexes, in part because of temporary pricing discrepancies arising from fair-value adjustments. (Please see the Glossary entry on fair-value pricing.)
• The European Stock Index Fund’s results lagged the average return of its peers; the Pacific Stock Index Fund’s return surpassed its peer group average.
• In Europe, the relative strength of the U.S. dollar against local currencies hurt returns, as did fallout from Britain’s Brexit vote.
• Returns in the Pacific region were aided by Japan and Australia, as both countries’ currencies strengthened against the U.S. dollar.
| |
| Total Returns: Fiscal Year Ended October 31, 2016 | |
| | Total |
| | Returns |
| Vanguard European Stock Index Fund | |
| Investor Shares | -6.63% |
| FTSE Europe ETF Shares | |
| Market Price | -6.49 |
| Net Asset Value | -6.43 |
| Admiral™ Shares | -6.48 |
| Institutional Shares | -6.46 |
| Institutional Plus Shares | -6.45 |
| FTSE Developed Europe All Cap Index | -7.02 |
| European Region Funds Average | -5.75 |
| For a benchmark description, see the Glossary. |
| European Region Funds Average: Derived from data provided by Lipper, a Thomson Reuters Company. |
1
| |
| | Total |
| | Returns |
| Vanguard Pacific Stock Index Fund | |
| Investor Shares | 6.40% |
| FTSE Pacific ETF Shares | |
| Market Price | 6.58 |
| Net Asset Value | 6.59 |
| Admiral Shares | 6.57 |
| Institutional Shares | 6.61 |
| FTSE Developed Asia Pacific All Cap Index | 5.70 |
| Japan/Pacific Region Funds Average | 5.41 |
| For a benchmark description, see the Glossary. | |
Japan/Pacific Region Funds Average: Derived from data provided by Lipper, a Thomson Reuters Company.
Admiral Shares carry lower expenses and are available to investors who meet certain account-balance requirements. Institutional Shares and
Institutional Plus Shares are available to certain institutional investors who meet specific administrative, service, and account-size criteria.
The Vanguard ETF® Shares shown are traded on the NYSE Arca exchange and are available only through brokers. The table provides ETF
returns based on both the NYSE Arca market price and the net asset value for a share. U.S. Pat. Nos. 6,879,964; 7,337,138; 7,720,749;
7,925,573; 8,090,646; and 8,417,623.
For the ETF Shares, the market price is determined by the midpoint of the bid-offer spread as of the closing time of the New York Stock
Exchange (generally 4 p.m., Eastern time). The net asset value is also determined as of the NYSE closing time. For more information about
how the ETF Shares' market prices have compared with their net asset value, visit vanguard.com, select your ETF, and then select the Price
and Performance tab. The ETF premium/discount analysis there shows the percentages of days on which the ETF Shares' market price was
above or below the NAV.
| |
| Total Returns: Ten Years Ended October 31, 2016 | |
| | Average |
| | Annual Return |
| European Stock Index Fund Investor Shares | 0.92% |
| Spliced European Stock Index | 0.88 |
| European Region Funds Average | 1.17 |
| For a benchmark description, see the Glossary. |
| European Region Funds Average: Derived from data provided by Lipper, a Thomson Reuters Company. |
| |
| Pacific Stock Index Fund Investor Shares | 2.08% |
| Spliced Pacific Stock Index | 2.19 |
| Japan/Pacific Region Funds Average | 0.99 |
| For a benchmark description, see the Glossary. |
| Japan/Pacific Region Funds Average: Derived from data provided by Lipper, a Thomson Reuters Company. |
The figures shown represent past performance, which is not a guarantee of future results. (Current performance may be
lower or higher than the performance data cited. For performance data current to the most recent month-end, visit our
website at vanguard.com/performance.) Note, too, that both investment returns and principal value can fluctuate widely, so
an investor’s shares, when sold, could be worth more or less than their original cost.
2
| | | | | | |
| Expense Ratios | | | | | | |
| Your Fund Compared With Its Peer Group | | | | | |
| | Investor | ETF | Admiral | Institutional | Institutional | Peer Group |
| | Shares | Shares | Shares | Shares | Plus Shares | Average |
| European Stock Index Fund | 0.26% | 0.12% | 0.12% | 0.09% | 0.08% | 1.49% |
| Pacific Stock Index Fund | 0.26 | 0.12 | 0.12 | 0.09 | — | 1.26 |
The fund expense ratios shown are from the prospectus dated February 26, 2016, and represent estimated costs for the current fiscal year. For
the fiscal year ended October 31, 2016, the funds’ expense ratios were: for the European Stock Index Fund, 0.26% for Investor Shares, 0.10%
for FTSE Europe ETF Shares, 0.10% for Admiral Shares, 0.08% for Institutional Shares, and 0.07% for Institutional Plus Shares; and for the
Pacific Stock Index Fund, 0.26% for Investor Shares, 0.10% for FTSE Pacific ETF Shares, 0.10% for Admiral Shares, and 0.08% for Institutional
Shares. The peer group expense ratio is derived from data provided by Lipper, a Thomson Reuters Company, and captures information through
year-end 2015.
Peer groups: For the European Stock Index Fund, European Region Funds; and for the Pacific Stock Index Fund, Japan/Pacific Region Funds.
3
Chairman’s Perspective

Bill McNabb
Chairman and Chief Executive Officer
Dear Shareholder,
Over the three years ended August 31, 2016, investors poured more than $1 trillion into index funds. Indexing now accounts for nearly a third of all mutual fund assets—more than double what it did a decade ago and eight times its share two decades ago.1
By contrast, active management’s commercial struggles have reflected its disappointing investment performance. Over the decade ended December 31, 2015, 82% of actively managed stock funds and 81% of active bond funds have either underperformed their benchmarks or shut down.
This subpar performance has fueled the explosion of asset growth in indexing among individual, retirement, and nonprofit investors. So what might the trend mean for the future of actively managed funds?
Our research and experience indicate that active management can survive—and even succeed—but only if it’s offered at much lower expense.
High costs, which limit a manager’s ability to deliver benchmark-beating returns to clients, are the biggest reason why active has lagged. Industrywide as of December 31, 2015, the average expense ratio for all active stock funds is 1.14%, compared with 0.76% for stock index
1 Sources: Wall Street Journal; Morningstar, Inc.; and Investment Company Institute, 2016.
4
funds. And the expense advantage is even wider for bonds; the average expense ratio for an active bond fund is 0.93%, compared with 0.43% for bond index funds.
But even these big differences understate the real gap. These days, it’s not hard to find an index fund that charges maybe 0.05% or 0.10%. So even if you have identified active managers who are skilled at selecting stocks and bonds, to match the return of a comparable (much cheaper) index fund would require significant outperformance. Think about it. Any fund that charges 1.00% in expenses—not even the high end of the range—will find it extraordinarily difficult to overcome the index fund’s head start.
Active management also has taken a hit from a regulatory environment that has been favorable to low-cost strategies. The U.S. Department of Labor several years ago mandated greater disclosure of retirement plan fees. And its new fiduciary rule, which is set to take effect in April, requires financial advisors to demonstrate that their recommendations are aligned with their clients’ best interest. Both changes encourage the use of lower-cost investments, including index funds.
The future of active management
In light of all this, people have been asking me whether active management is “dead.” My response is both yes and no. High-cost active management is dead, and rightly so. It has never been a winning proposition
| | | |
| Market Barometer | | | |
| | Average Annual Total Returns |
| | Periods Ended October 31, 2016 |
| | One | Three | Five |
| | Year | Years | Years |
| Stocks | | | |
| Russell 1000 Index (Large-caps) | 4.26% | 8.48% | 13.51% |
| Russell 2000 Index (Small-caps) | 4.11 | 4.12 | 11.51 |
| Russell 3000 Index (Broad U.S. market) | 4.24 | 8.13 | 13.35 |
| FTSE All-World ex US Index (International) | 0.64 | -0.94 | 4.09 |
| |
| Bonds | | | |
| Bloomberg Barclays U.S. Aggregate Bond Index | | | |
| (Broad taxable market) | 4.37% | 3.48% | 2.90% |
| Bloomberg Barclays Municipal Bond Index | | | |
| (Broad tax-exempt market) | 4.06 | 4.89 | 4.34 |
| Citigroup Three-Month U.S. Treasury Bill Index | 0.22 | 0.07 | 0.07 |
| |
| CPI | | | |
| Consumer Price Index | 1.64% | 1.15% | 1.32% |
5
for investors. Low-cost active funds, though, can potentially play an important role for investors who seek to outperform the market.
Paying less for your funds is the only sure-fire way to improve your odds of achieving success in active management. But even if you have found an active manager with low costs, the odds of outperforming the market are still long. You have to be able to identify talented stock and bond portfolio managers with long time horizons and clear investment strategies. Look for managers with consistent track records and the discipline to stick closely to their investment strategy.
Know what you own and why
Despite the well-deserved reputation of indexing and the challenges for active managers, there’s still a place for traditional active strategies that are low-cost, diversified, and highly disciplined, and are run by talented managers who focus on the long term.
Vanguard has always applied these principles to our active strategies, and investors have benefited as a majority of our active funds outperformed their benchmarks and bested their peers’ average annual return over the ten years ended September 30, 2016.
|
| Worried about the election’s impact on your portfolio? |
|
| The 2016 presidential election season was |
| one of the most intense and unpredictable |
| in U.S. history. In its aftermath, investors |
| may be left with lingering questions about |
| what the outcome will mean for their |
| portfolios. The answer, based on Vanguard |
| research into decades of historical data, is |
| that presidential elections typically have no |
| long-term effect on market performance. |
| |
| These findings hold true regardless of the |
| market’s initial reaction. Whether there’s |
| a swoon or bounce immediately after an |
| election, investors shouldn’t extrapolate |
| that performance to the long term. |
| |
| As you can see in the accompanying chart, |
| data going back to 1853 show that stock |
| market returns are virtually identical no matter |
| which party controls the White House. |
| Although headlines out of Washington at any |
| given time may still cause concern, investors |
| shouldn’t overreact to short-term events. |
| Instead, it’s best to maintain a balanced and |
| diversified portfolio and stay focused on your |
| long-term goals. |
| |
| Average annual stock market returns based |
| on party control of the White House |
| (1853–2015) |
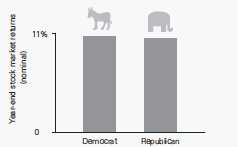
| Sources: Global Financial Data, 1853–1926; Morningstar, Inc., |
| and Ibbotson Associates thereafter through 2015. |
6
But it’s crucial for investors to be patient. Even active managers with the best track records frequently underperform their benchmarks when their investment styles are out of favor. Such periods, though temporary, can persist. So it’s important when entrusting your assets to an active strategy to be in it for the long haul.
Make sure you know what you’re buying and what the risks are. Active strategies are becoming more complex, so it’s important to clearly understand what the investments in your portfolio are designed to accomplish and why you want to hold them. Otherwise, you run the risk of selecting strategies that don’t fit your needs or objectives.
Keeping these considerations in mind can potentially boost your chances of success in identifying active strategies that may be able to help you reach your goals.
As always, thank you for investing with Vanguard.
Sincerely,
F. William McNabb III
Chairman and Chief Executive Officer
November 9, 2016
7
European Stock Index Fund
Fund Profile
As of October 31, 2016
| | | | | |
| Share-Class Characteristics | | | | | |
| | Investor | FTSE Europe | Admiral | Institutional | Institutional |
| | Shares | ETF Shares | Shares | Shares | Plus Shares |
| Ticker Symbol | VEURX | VGK | VEUSX | VESIX | VEUPX |
| Expense Ratio1 | 0.26% | 0.12% | 0.12% | 0.09% | 0.08% |
| | | |
| Portfolio Characteristics | | |
| | | FTSE | FTSE |
| | | Developed | Global |
| | | Europe All | All Cap |
| | | Cap | ex US |
| | Fund | Index | Index |
| Number of Stocks | 1,259 | 1,223 | 5,783 |
| Median Market Cap | $36.3B | $36.7B | $21.0B |
| Price/Earnings Ratio | 24.9x | 24.4x | 20.8x |
| Price/Book Ratio | 1.8x | 1.8x | 1.6x |
| Return on Equity | 16.0% | 16.0% | 14.3% |
| Earnings Growth | | | |
| Rate | 3.2% | 3.0% | 7.4% |
| Dividend Yield | 3.4% | 3.4% | 3.0% |
| Turnover Rate | 6% | — | — |
| Short-Term Reserves | 0.0% | — | — |
| | | |
| Sector Diversification (% of equity exposure) |
| | | FTSE | FTSE |
| | | Developed | Global |
| | | Europe All | All Cap |
| | | Cap | ex US |
| | Fund | Index | Index |
| Basic Materials | 7.8% | 7.8% | 7.8% |
| Consumer Goods | 18.2 | 18.3 | 16.2 |
| Consumer Services | 7.6 | 7.6 | 8.6 |
| Financials | 21.5 | 21.4 | 25.2 |
| Health Care | 11.7 | 11.7 | 7.7 |
| Industrials | 14.7 | 14.7 | 14.7 |
| Oil & Gas | 6.9 | 6.9 | 6.5 |
| Technology | 3.6 | 3.6 | 5.6 |
| Telecommunications | 4.1 | 4.1 | 4.2 |
| Utilities | 3.9 | 3.9 | 3.5 |
| | |
| Volatility Measures | | |
| | Spliced | |
| | European | FTSE Global |
| | Stock | All Cap ex US |
| | Index | Index |
| R-Squared | 0.99 | 0.86 |
| Beta | 0.96 | 0.96 |
| These measures show the degree and timing of the fund’s fluctuations compared with the indexes over 36 months. |
| | |
| Ten Largest Holdings (% of total net assets) |
| Nestle SA | Food Products | 2.7% |
| Royal Dutch Shell plc | Integrated Oil & Gas | 2.4 |
| Roche Holding AG | Pharmaceuticals | 2.0 |
| Novartis AG | Pharmaceuticals | 2.0 |
| HSBC Holdings plc | Banks | 1.8 |
| Unilever | Personal Products | 1.4 |
| BP plc | Integrated Oil & Gas | 1.3 |
| British American | | |
| Tobacco plc | Tobacco | 1.3 |
| TOTAL SA | Integrated Oil & Gas | 1.2 |
| GlaxoSmithKline plc | Pharmaceuticals | 1.1 |
| Top Ten | | 17.2% |
| The holdings listed exclude any temporary cash investments and equity index products. |
1 The expense ratios shown are from the prospectus dated February 26, 2016, and represent estimated costs for the current fiscal year. For the fiscal
year ended October 31, 2016, the expense ratios were 0.26% for Investor Shares, 0.10% for FTSE Europe ETF Shares, 0.10% for Admiral Shares,
0.08% for Institutional Shares, and 0.07% for Institutional Plus Shares.
8
European Stock Index Fund
| | | |
| Market Diversification (% of equity exposure) |
| | | FTSE | FTSE |
| | | Developed Global |
| | | Europe All | All Cap |
| | | Cap | ex US |
| | Fund | Index | Index |
| Europe | | | |
| United Kingdom | 29.8% | 29.9% | 12.6% |
| France | 14.4 | 14.4 | 6.1 |
| Germany | 14.4 | 14.3 | 6.0 |
| Switzerland | 13.5 | 13.6 | 5.7 |
| Spain | 5.1 | 5.1 | 2.1 |
| Netherlands | 5.0 | 5.0 | 2.1 |
| Sweden | 4.9 | 4.9 | 2.1 |
| Italy | 3.6 | 3.6 | 1.5 |
| Denmark | 2.8 | 2.8 | 1.2 |
| Belgium | 2.2 | 2.2 | 0.9 |
| Finland | 1.8 | 1.8 | 0.8 |
| Norway | 1.2 | 1.2 | 0.5 |
| Other | 1.3 | 1.2 | 0.6 |
| Subtotal | 100.0% | 100.0% | 42.2% |
| Pacific | 0.0% | 0.0% | 30.7% |
| Emerging Markets | 0.0% | 0.0% | 19.7% |
| North America | 0.0% | 0.0% | 6.9% |
| Middle East | 0.0% | 0.0% | 0.5% |
9
European Stock Index Fund
Performance Summary
All of the returns in this report represent past performance, which is not a guarantee of future results that may be achieved by the fund. (Current performance may be lower or higher than the performance data cited. For performance data current to the most recent month-end, visit our website at vanguard.com/performance.) Note, too, that both investment returns and principal value can fluctuate widely, so an investor’s shares, when sold, could be worth more or less than their original cost. The returns shown do not reflect taxes that a shareholder would pay on fund distributions or on the sale of fund shares.
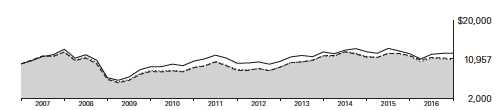
Cumulative Performance: October 31, 2006, Through October 31, 2016
Initial Investment of $10,000
| | | | | |
| | | Average Annual Total Returns | |
| | | Periods Ended October 31, 2016 | |
| | | | | | Final Value |
| | | One | Five | Ten | of a $10,000 |
| | | Year | Years | Years | Investment |
| | European Stock Index Fund*Investor | | | | |
| | Shares | -6.63% | 4.79% | 0.92% | $10,957 |
| • • • • • • • • | Spliced European Stock Index | -7.02 | 4.64 | 0.88 | 10,918 |
| |
| – – – – | European Region Funds Average | -5.75 | 5.82 | 1.17 | 11,230 |
| | FTSE Global All Cap ex US Index | 0.92 | 4.20 | 2.24 | 12,478 |
| For a benchmark description, see the Glossary. |
| European Region Funds Average: Derived from data provided by Lipper, a Thomson Reuters Company. |
| | | | |
| | | | | Final Value |
| | One | Five | Ten | of a $10,000 |
| | Year | Years | Years | Investment |
| FTSE Europe ETF Shares | | | | |
| Net Asset Value | -6.43% | 4.96% | 1.05% | $11,105 |
| Spliced European Stock Index | -7.02 | 4.64 | 0.88 | 10,918 |
| FTSE Global All Cap ex US Index | 0.92 | 4.20 | 2.24 | 12,478 |
See Financial Highlights for dividend and capital gains information.
10
European Stock Index Fund
| | | | |
| | | Average Annual Total Returns | |
| | Periods Ended October 31, 2016 | |
| | | | | Final Value |
| | One | Five | Ten | of a $10,000 |
| | Year | Years | Years | Investment |
| European Stock Index Fund Admiral Shares | -6.48% | 4.94% | 1.04% | $11,095 |
| Spliced European Stock Index | -7.02 | 4.64 | 0.88 | 10,918 |
| FTSE Global All Cap ex US Index | 0.92 | 4.20 | 2.24 | 12,478 |
| | | | |
| | | | | Final Value |
| | One | Five | Ten | of a $5,000,000 |
| | Year | Years | Years | Investment |
| European Stock Index Fund Institutional | | | | |
| Shares | -6.46% | 4.97% | 1.08% | $5,567,434 |
| Spliced European Stock Index | -7.02 | 4.64 | 0.88 | 5,459,154 |
| |
| FTSE Global All Cap ex US Index | 0.92 | 4.20 | 2.24 | 6,238,904 |
| | | |
| | | Since | Final Value |
| | One | Inception | of a $100,000,000 |
| | Year | (12/5/2014) | Investment |
| European Stock Index Fund Institutional Plus | | | |
| Shares | -6.45% | -4.76% | $91,123,783 |
| Spliced European Stock Index | -7.02 | -4.83 | 90,997,289 |
| FTSE Global All Cap ex US Index | 0.92 | -1.33 | 97,477,765 |
| "Since Inception" performance is calculated from the Institutional Plus Shares’ inception date for both the fund and its comparative standards. |
| | | |
| Cumulative Returns of ETF Shares: October 31, 2006, Through October 31, 2016 | | |
| | One | Five | Ten |
| | Year | Years | Years |
| FTSE Europe ETF Shares Market Price | -6.49% | 27.07% | 10.41% |
| FTSE Europe ETF Shares Net Asset Value | -6.43 | 27.38 | 11.05 |
| Spliced European Stock Index | -7.02 | 25.44 | 9.18 |
11
European Stock Index Fund
Fiscal-Year Total Returns (%): October 31, 2006, Through October 31, 2016
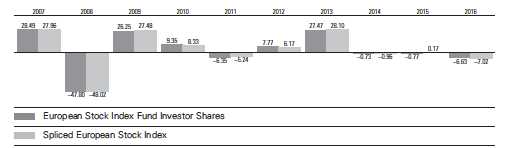
For a benchmark description, see the Glossary.
Average Annual Total Returns: Periods Ended September 30, 2016
This table presents returns through the latest calendar quarter—rather than through the end of the fiscal period.
Securities and Exchange Commission rules require that we provide this information.
| | | | |
| | Inception | One | Five | Ten |
| | Date | Year | Years | Years |
| Investor Shares | 6/18/1990 | 2.52% | 7.91% | 1.70% |
| FTSE Europe ETF Shares | 3/4/2005 | | | |
| Market Price | | 2.65 | 8.17 | 1.73 |
| Net Asset Value | | 2.73 | 8.09 | 1.83 |
| Admiral Shares | 8/13/2001 | 2.67 | 8.07 | 1.82 |
| Institutional Shares | 5/15/2000 | 2.69 | 8.10 | 1.86 |
| Institutional Plus Shares | 12/5/2014 | 2.70 | — | -3.181 |
| 1 Return since inception. |
12
European Stock Index Fund
Financial Statements
Statement of Net Assets—Investments Summary
As of October 31, 2016
This Statement summarizes the fund’s holdings by asset type. Details are reported for each of the fund’s 50 largest individual holdings and for investments that, in total for any issuer, represent more than 1% of the fund’s net assets. The total value of smaller holdings is reported as a single amount within each category.
The fund reports a complete list of its holdings in regulatory filings four times in each fiscal year, at the quarter-ends. For the second and fourth fiscal quarters, the complete listing of the fund’s holdings is available electronically on vanguard.com and on the Securities and Exchange Commission’s website (sec.gov), or you can have it mailed to you without charge by calling 800-662-7447. For the first and third fiscal quarters, the fund files the lists with the SEC on Form N-Q. Shareholders can look up the fund’s Forms N-Q on the SEC’s website. Forms N-Q may also be reviewed and copied at the SEC’s Public Reference Room (see the back cover of this report for further information).
| | | |
| | | Market | Percentage |
| | | Value• | of Net |
| | Shares | ($000) | Assets |
| Common Stocks | | | |
| Austria † | | 79,573 | 0.5% |
| |
| Belgium | | | |
| * Anheuser-Busch InBev SA/NV | 1,467,974 | 168,480 | 1.1% |
| Belgium—Other † | | 174,413 | 1.1% |
| | | 342,893 | 2.2% |
| Denmark | | | |
| Novo Nordisk A/S Class B | 3,395,967 | 120,983 | 0.8% |
| 1 Denmark—Other † | | 307,346 | 2.0% |
| | | 428,329 | 2.8% |
| |
| Finland † | | 278,338 | 1.8% |
| |
| France | | | |
| TOTAL SA | 3,958,249 | 189,620 | 1.2% |
| Sanofi | 2,053,898 | 159,833 | 1.1% |
| BNP Paribas SA | 1,798,456 | 104,281 | 0.7% |
| LVMH Moet Hennessy Louis Vuitton SE | 460,992 | 83,929 | 0.6% |
| AXA SA | 3,544,985 | 79,983 | 0.5% |
| Danone SA | 1,045,391 | 72,507 | 0.5% |
| Schneider Electric SE | 998,287 | 67,135 | 0.4% |
| 1 France—Other † | | 1,453,996 | 9.4% |
| | | 2,211,284 | 14.4% |
| Germany | | | |
| Siemens AG | 1,398,861 | 158,936 | 1.0% |
| Bayer AG | 1,522,417 | 151,161 | 1.0% |
| BASF SE | 1,698,847 | 149,971 | 1.0% |
| SAP SE | 1,644,643 | 144,893 | 0.9% |
| Allianz SE | 837,961 | 130,810 | 0.9% |
13
| | | | |
| European Stock Index Fund | | | |
| |
| |
| |
| | | | Market | Percentage |
| | | | Value• | of Net |
| | | Shares | ($000) | Assets |
| | Daimler AG | 1,757,817 | 125,407 | 0.8% |
| | Deutsche Telekom AG | 5,913,660 | 96,483 | 0.6% |
| *,1 | Covestro AG | 116,035 | 6,871 | 0.0% |
| 1 | Germany—Other † | | 1,246,297 | 8.1% |
| | | | 2,210,829 | 14.3% |
| |
| Ireland † | | 70,142 | 0.5% |
| |
| Isle of Man † | | 4,735 | 0.0% |
| |
| Italy | | | |
| | Eni SPA | 4,536,993 | 65,842 | 0.5% |
| 1 | Italy—Other † | | 495,265 | 3.2% |
| | | | 561,107 | 3.7% |
| Netherlands | | | |
| | Unilever NV | 2,865,071 | 119,835 | 0.8% |
| | ING Groep NV | 7,109,259 | 93,324 | 0.6% |
| 1 | Netherlands—Other † | | 555,241 | 3.6% |
| | | | 768,400 | 5.0% |
| |
| 1Norway † | | 190,810 | 1.2% |
| |
| Other † | | 579 | 0.0% |
| |
| Portugal † | | 47,438 | 0.3% |
| |
| Spain | | | |
| | Banco Santander SA | 26,515,106 | 129,925 | 0.8% |
| | Banco Bilbao Vizcaya Argentaria SA | 11,849,532 | 85,301 | 0.6% |
| | Telefonica SA | 7,880,006 | 80,066 | 0.5% |
| | Iberdrola SA | 10,393,273 | 70,731 | 0.5% |
| | Industria de Diseno Textil SA | 1,950,921 | 68,073 | 0.4% |
| 1 | Spain—Other † | | 347,291 | 2.3% |
| | | | 781,387 | 5.1% |
| |
| 1Sweden † | | 759,782 | 4.9% |
| |
| Switzerland | | | |
| | Nestle SA | 5,676,575 | 411,631 | 2.7% |
| | Novartis AG | 4,350,342 | 308,733 | 2.0% |
| | Roche Holding AG | 1,322,779 | 303,818 | 2.0% |
| | UBS Group AG | 6,407,232 | 90,583 | 0.6% |
| | ABB Ltd. | 3,522,923 | 72,679 | 0.5% |
| | Zurich Insurance Group AG | 274,205 | 71,775 | 0.4% |
| | Syngenta AG | 168,855 | 67,570 | 0.4% |
| | Roche Holding AG (Bearer) | 23,663 | 5,500 | 0.0% |
| 1 | Switzerland—Other † | | 752,441 | 4.9% |
| | | | 2,084,730 | 13.5% |
| United Kingdom | | | |
| | HSBC Holdings plc | 36,461,098 | 274,595 | 1.8% |
| | BP plc | 34,572,312 | 204,382 | 1.3% |
| | British American Tobacco plc | 3,429,525 | 196,557 | 1.3% |
| | Royal Dutch Shell plc Class B | 6,892,488 | 177,775 | 1.1% |
14
| | | | |
| European Stock Index Fund | | | | |
| |
| |
| |
| | | | Market | Percentage |
| | | | Value• | of Net |
| | | Shares | ($000) | Assets |
| GlaxoSmithKline plc | | 8,945,514 | 176,713 | 1.1% |
| Royal Dutch Shell plc Class A (London Shares) | | 6,731,459 | 167,661 | 1.1% |
| Vodafone Group plc | | 48,886,159 | 134,258 | 0.9% |
| AstraZeneca plc | | 2,322,103 | 130,027 | 0.8% |
| Diageo plc | | 4,633,626 | 123,332 | 0.8% |
| Reckitt Benckiser Group plc | | 1,156,583 | 103,469 | 0.7% |
| Shire plc | | 1,656,510 | 93,531 | 0.6% |
| Unilever plc | | 2,219,261 | 92,653 | 0.6% |
| National Grid plc | | 6,943,087 | 90,315 | 0.6% |
| Imperial Brands plc | | 1,772,045 | 85,717 | 0.6% |
| Lloyds Banking Group plc | | 117,829,254 | 82,283 | 0.5% |
| Prudential plc | | 4,746,147 | 77,452 | 0.5% |
| Rio Tinto plc | | 2,226,178 | 77,416 | 0.5% |
| Barclays plc | | 31,126,113 | 72,114 | 0.5% |
| BT Group plc | | 15,400,292 | 70,688 | 0.5% |
| Royal Dutch Shell plc Class A | | 1,230,297 | 30,656 | 0.2% |
| 1 United Kingdom—Other † | | | 2,117,443 | 13.7% |
| | | | 4,579,037 | 29.7% |
| |
| United States † | | | 16 | 0.0% |
| Total Common Stocks (Cost $21,109,126) | | | 15,399,409 | 99.9%2 |
| |
| | Coupon | | | |
| Temporary Cash Investments | | | | |
| Money Market Fund | | | | |
| 3,4 Vanguard Market Liquidity Fund | 0.718% | 2,302,737 | 230,297 | 1.5% |
| |
| 5,6U.S. Government and Agency Obligations † | | | 23,391 | 0.1% |
| Total Temporary Cash Investments (Cost $253,686) | | | 253,688 | 1.6%2 |
| 7Total Investments (Cost $21,362,812) | | | 15,653,097 | 101.5% |
| |
| | | | Amount | |
| | | | ($000) | |
| Other Assets and Liabilities | | | | |
| Other Assets | | | | |
| Investment in Vanguard | | | 1,244 | |
| Receivables for Investment Securities Sold | | | 151 | |
| Receivables for Accrued Income | | | 69,634 | |
| Receivables for Capital Shares Issued | | | 2,399 | |
| Other Assets | | | 9,490 | |
| Total Other Assets | | | 82,918 | 0.5% |
| Liabilities | | | | |
| Payables for Investment Securities Purchased | | | (92) | |
| Collateral for Securities on Loan | | | (229,152) | |
| Payables for Capital Shares Redeemed | | | (7,272) | |
| Payables to Vanguard | | | (14,354) | |
| Other Liabilities | | | (62,052) | |
| Total Liabilities | | | (312,922) | (2.0%) |
| Net Assets | | | 15,423,093 | 100.0% |
15
| |
| European Stock Index Fund | |
| |
| |
| |
| At October 31, 2016, net assets consisted of: | |
| | Amount |
| | ($000) |
| Paid-in Capital | 23,183,731 |
| Undistributed Net Investment Income | 19,219 |
| Accumulated Net Realized Losses | (2,061,444) |
| Unrealized Appreciation (Depreciation) | |
| Investment Securities | (5,709,715) |
| Futures Contracts | (67) |
| Forward Currency Contracts | (4,777) |
| Foreign Currencies | (3,854) |
| Net Assets | 15,423,093 |
| |
| |
| Investor Shares—Net Assets | |
| Applicable to 24,052,159 outstanding $.001 par value shares of | |
| beneficial interest (unlimited authorization) | 607,841 |
| Net Asset Value Per Share—Investor Shares | $25.27 |
| |
| |
| ETF Shares—Net Assets | |
| Applicable to 223,863,297 outstanding $.001 par value shares of | |
| beneficial interest (unlimited authorization) | 10,533,175 |
| Net Asset Value Per Share—ETF Shares | $47.05 |
| |
| |
| Admiral Shares—Net Assets | |
| Applicable to 61,329,916 outstanding $.001 par value shares of | |
| beneficial interest (unlimited authorization) | 3,609,415 |
| Net Asset Value Per Share—Admiral Shares | $58.85 |
16
| |
| European Stock Index Fund | |
| |
| |
| |
| | Amount |
| | ($000) |
| Institutional Shares—Net Assets | |
| Applicable to 22,863,541 outstanding $.001 par value shares of | |
| beneficial interest (unlimited authorization) | 573,833 |
| Net Asset Value Per Share—Institutional Shares | $25.10 |
| |
| Institutional Plus Shares—Net Assets | |
| Applicable to 881,675 outstanding $.001 par value shares of | |
| beneficial interest (unlimited authorization) | 98,829 |
| Net Asset Value Per Share—Institutional Plus Shares | $112.09 |
• See Note A in Notes to Financial Statements.
* Non-income-producing security.
† Represents the aggregate value, by category, of securities that are not among the 50 largest holdings and, in total for any issuer, represent
1% or less of net assets.
1 Certain of the fund’s securities are exempt from registration under Rule 144A of the Securities Act of 1933. Such securities may be sold in
transactions exempt from registration, normally to qualified institutional buyers. At October 31, 2016, the aggregate value of these
securities was $165,071,000, representing 1.1% of net assets.
2 The fund invests a portion of its cash reserves in equity markets through the use of index futures contracts. After giving effect to futures
investments, the fund’s effective common stock and temporary cash investment positions represent 100.0% and 1.5%, respectively,
of net assets.
3 Affiliated money market fund available only to Vanguard funds and certain trusts and accounts managed by Vanguard. Rate shown is the
7-day yield.
4 Includes $229,152,000 of collateral received for securities on loan.
5 Securities with a value of $1,999,000 have been segregated as initial margin for open futures contracts.
6 Securities with a value of $8,710,000 and cash of $1,280,000 have been segregated as collateral for open forward currency contracts.
7 The total value of securities on loan is $214,827,000.
See accompanying Notes, which are an integral part of the Financial Statements.
17
| |
| European Stock Index Fund | |
| |
| |
| Statement of Operations | |
| |
| |
| | Year Ended |
| | October 31, 2016 |
| | ($000) |
| Investment Income | |
| Income | |
| Dividends1 | 644,605 |
| Interest2 | 314 |
| Securities Lending—Net | 22,159 |
| Total Income | 667,078 |
| Expenses | |
| The Vanguard Group—Note B | |
| Investment Advisory Services | 2,127 |
| Management and Administrative—Investor Shares | 1,328 |
| Management and Administrative—ETF Shares | 8,449 |
| Management and Administrative—Admiral Shares | 2,437 |
| Management and Administrative—Institutional Shares | 361 |
| Management and Administrative—Institutional Plus Shares | 59 |
| Marketing and Distribution—Investor Shares | 150 |
| Marketing and Distribution—ETF Shares | 980 |
| Marketing and Distribution—Admiral Shares | 328 |
| Marketing and Distribution—Institutional Shares | 22 |
| Marketing and Distribution—Institutional Plus Shares | 2 |
| Custodian Fees | 2,334 |
| Auditing Fees | 48 |
| Shareholders’ Reports—Investor Shares | 49 |
| Shareholders’ Reports—ETF Shares | 290 |
| Shareholders’ Reports—Admiral Shares | 31 |
| Shareholders’ Reports—Institutional Shares | 1 |
| Shareholders’ Reports—Institutional Plus Shares | — |
| Trustees’ Fees and Expenses | 10 |
| Total Expenses | 19,006 |
| Net Investment Income | 648,072 |
| Realized Net Gain (Loss) | |
| Investment Securities Sold2 | (242,793) |
| Futures Contracts | 15,404 |
| Foreign Currencies and Forward Currency Contracts | (22,528) |
| Realized Net Gain (Loss) | (249,917) |
| Change in Unrealized Appreciation (Depreciation) | |
| Investment Securities | (1,791,913) |
| Futures Contracts | (9,675) |
| Foreign Currencies and Forward Currency Contracts | (6,003) |
| Change in Unrealized Appreciation (Depreciation) | (1,807,591) |
| Net Increase (Decrease) in Net Assets Resulting from Operations | (1,409,436) |
1 Dividends are net of foreign withholding taxes of $38,969,000.
2 Interest income and realized net gain (loss) from an affiliated company of the fund were $222,000 and $0, respectively.
See accompanying Notes, which are an integral part of the Financial Statements.
18
| | |
| European Stock Index Fund | | |
| |
| |
| Statement of Changes in Net Assets | | |
| |
| | Year Ended October 31, |
| | 2016 | 2015 |
| | ($000) | ($000) |
| Increase (Decrease) in Net Assets | | |
| Operations | | |
| Net Investment Income | 648,072 | 620,752 |
| Realized Net Gain (Loss) | (249,917) | 211,428 |
| Change in Unrealized Appreciation (Depreciation) | (1,807,591) | (1,172,701) |
| Net Increase (Decrease) in Net Assets Resulting from Operations | (1,409,436) | (340,521) |
| Distributions | | |
| Net Investment Income | | |
| Investor Shares | (21,135) | (23,457) |
| ETF Shares | (453,005) | (433,791) |
| Admiral Shares | (129,984) | (131,297) |
| Institutional Shares | (24,805) | (28,805) |
| Institutional Plus Shares | (3,926) | (6,528) |
| Realized Capital Gain | | |
| Investor Shares | — | — |
| ETF Shares | — | — |
| Admiral Shares | — | — |
| Institutional Shares | — | — |
| Institutional Plus Shares | — | — |
| Total Distributions | (632,855) | (623,878) |
| Capital Share Transactions | | |
| Investor Shares | (53,855) | (21,781) |
| ETF Shares | (3,566,616) | 4,618,360 |
| Admiral Shares | (133,939) | 363,663 |
| Institutional Shares | (213,685) | (118,126) |
| Institutional Plus Shares | (121,144) | 264,731 |
| Net Increase (Decrease) from Capital Share Transactions | (4,089,239) | 5,106,847 |
| Total Increase (Decrease) | (6,131,530) | 4,142,448 |
| Net Assets | | |
| Beginning of Period | 21,554,623 | 17,412,175 |
| End of Period1 | 15,423,093 | 21,554,623 |
1 Net Assets—End of Period includes undistributed (overdistributed) net investment income of $19,219,000 and $12,532,000.
See accompanying Notes, which are an integral part of the Financial Statements.
19
| | | | | |
| European Stock Index Fund | | | | | |
| |
| |
| Financial Highlights | | | | | |
| |
| |
| Investor Shares | | | | | |
| |
| For a Share Outstanding | Year Ended October 31, |
| Throughout Each Period | 2016 | 2015 | 2014 | 2013 | 2012 |
| Net Asset Value, Beginning of Period | $27.98 | $29.05 | $30.42 | $24.69 | $24.48 |
| Investment Operations | | | | | |
| Net Investment Income | . 881 | . 866 | 1.2351 | .830 | .836 |
| Net Realized and Unrealized Gain (Loss) | | | | | |
| on Investments | (2.738) | (1.058) | (1.380) | 5.800 | .925 |
| Total from Investment Operations | (1.857) | (.192) | (.145) | 6.630 | 1.761 |
| Distributions | | | | | |
| Dividends from Net Investment Income | (.853) | (.878) | (1.225) | (.900) | (1.551) |
| Distributions from Realized Capital Gains | — | — | — | — | — |
| Total Distributions | (.853) | (.878) | (1.225) | (.900) | (1.551) |
| Net Asset Value, End of Period | $25.27 | $27.98 | $29.05 | $30.42 | $24.69 |
| |
| Total Return2 | -6.63% | -0.77% | -0.73% | 27.47% | 7.77% |
| |
| Ratios/Supplemental Data | | | | | |
| Net Assets, End of Period (Millions) | $608 | $730 | $782 | $868 | $760 |
| Ratio of Total Expenses to Average Net Assets | 0.26% | 0.26% | 0.26% | 0.26% | 0.26% |
| Ratio of Net Investment Income to | | | | | |
| Average Net Assets | 3.35% | 3.05% | 4.12%1 | 3.02% | 3.75% |
| Portfolio Turnover Rate 3 | 6% | 13% | 7% | 10% | 7% |
1 Net investment income per share and the ratio of net investment income to average net assets include $.299 and 0.97%, respectively,
resulting from income received from Vodafone Group plc in the form of cash and shares in Verizon Communications Inc. in February 2014.
2 Total returns do not include transaction or account service fees that may have applied in the periods shown. Fund prospectuses provide
information about any applicable transaction and account service fees.
3 Excludes the value of portfolio securities received or delivered as a result of in-kind purchases or redemptions of the fund’s capital shares,
including ETF Creation Units.
See accompanying Notes, which are an integral part of the Financial Statements.
20
| | | | | |
| European Stock Index Fund | | | | | |
| |
| |
| Financial Highlights | | | | | |
| |
| |
| FTSE Europe ETF Shares | | | | | |
| |
| For a Share Outstanding | Year Ended October 31, |
| Throughout Each Period | 2016 | 2015 | 2014 | 2013 | 2012 |
| Net Asset Value, Beginning of Period | $52.09 | $54.08 | $56.64 | $46.01 | $45.66 |
| Investment Operations | | | | | |
| Net Investment Income | 1.717 | 1.691 | 2.3841 | 1.626 | 1.630 |
| Net Realized and Unrealized Gain (Loss) | | | | | |
| on Investments | (5.094) | (1.970) | (2.577) | 10.787 | 1.706 |
| Total from Investment Operations | (3.377) | (.279) | (.193) | 12.413 | 3.336 |
| Distributions | | | | | |
| Dividends from Net Investment Income | (1.663) | (1.711) | (2.367) | (1.783) | (2.986) |
| Distributions from Realized Capital Gains | — | — | — | — | — |
| Total Distributions | (1.663) | (1.711) | (2.367) | (1.783) | (2.986) |
| Net Asset Value, End of Period | $47.05 | $52.09 | $54.08 | $56.64 | $46.01 |
| |
| Total Return | -6.43% | -0.62% | -0.60% | 27.67% | 7.95% |
| |
| Ratios/Supplemental Data | | | | | |
| Net Assets, End of Period (Millions) | $10,533 | $15,578 | $11,676 | $12,061 | $3,928 |
| Ratio of Total Expenses to Average Net Assets | 0.10% | 0.12% | 0.12% | 0.12% | 0.12% |
| Ratio of Net Investment Income to | | | | | |
| Average Net Assets | 3.51% | 3.19% | 4.26%1 | 3.16% | 3.89% |
| Portfolio Turnover Rate2 | 6% | 13% | 7% | 10% | 7% |
1 Net investment income per share and the ratio of net investment income to average net assets include $.556 and 0.97%, respectively,
resulting from income received from Vodafone Group plc in the form of cash and shares in Verizon Communications Inc. in February 2014
2 Excludes the value of portfolio securities received or delivered as a result of in-kind purchases or redemptions of the fund’s capital shares,
including ETF Creation Units.
See accompanying Notes, which are an integral part of the Financial Statements.
21
| | | | | |
| European Stock Index Fund | | | | | |
| |
| |
| Financial Highlights | | | | | |
| |
| |
| Admiral Shares | | | | | |
| |
| For a Share Outstanding | Year Ended October 31, |
| Throughout Each Period | 2016 | 2015 | 2014 | 2013 | 2012 |
| Net Asset Value, Beginning of Period | $65.16 | $67.64 | $70.85 | $57.54 | $57.09 |
| Investment Operations | | | | | |
| Net Investment Income | 2.151 | 2.113 | 2.9831 | 2.026 | 2.032 |
| Net Realized and Unrealized Gain (Loss) | | | | | |
| on Investments | (6.379) | (2.454) | (3.233) | 13.503 | 2.152 |
| Total from Investment Operations | (4.228) | (.341) | (.250) | 15.529 | 4.184 |
| Distributions | | | | | |
| Dividends from Net Investment Income | (2.082) | (2.139) | (2.960) | (2.219) | (3.734) |
| Distributions from Realized Capital Gains | — | — | — | — | — |
| Total Distributions | (2.082) | (2.139) | (2.960) | (2.219) | (3.734) |
| Net Asset Value, End of Period | $58.85 | $65.16 | $67.64 | $70.85 | $57.54 |
| |
| Total Return2 | -6.48% | -0.61% | -0.61% | 27.64% | 7.93% |
| |
| Ratios/Supplemental Data | | | | | |
| Net Assets, End of Period (Millions) | $3,609 | $4,137 | $3,949 | $3,340 | $2,508 |
| Ratio of Total Expenses to Average Net Assets | 0.10% | 0.12% | 0.12% | 0.12% | 0.12% |
| Ratio of Net Investment Income to | | | | | |
| Average Net Assets | 3.51% | 3.19% | 4.26%1 | 3.16% | 3.89% |
| Portfolio Turnover Rate 3 | 6% | 13% | 7% | 10% | 7% |
1 Net investment income per share and the ratio of net investment income to average net assets include $.695 and 0.97%, respectively,
resulting from income received from Vodafone Group plc in the form of cash and shares in Verizon Communications Inc. in February 2014.
2 Total returns do not include transaction or account service fees that may have applied in the periods shown. Fund prospectuses provide
information about any applicable transaction and account service fees.
3 Excludes the value of portfolio securities received or delivered as a result of in-kind purchases or redemptions of the fund’s capital shares,
including ETF Creation Units.
See accompanying Notes, which are an integral part of the Financial Statements.
22
| | | | | |
| European Stock Index Fund | | | | | |
| |
| |
| Financial Highlights | | | | | |
| |
| |
| Institutional Shares | | | | | |
| |
| For a Share Outstanding | | | Year Ended October 31, |
| Throughout Each Period | 2016 | 2015 | 2014 | 2013 | 2012 |
| Net Asset Value, Beginning of Period | $27.79 | $28.85 | $30.21 | $24.54 | $24.36 |
| Investment Operations | | | | | |
| Net Investment Income | .. 921 | .. 910 | 1.2821 | ..871 | ..875 |
| Net Realized and Unrealized Gain (Loss) | | | | | |
| on Investments | (2.719) | (1.048) | (1.371) | 5.755 | ..912 |
| Total from Investment Operations | (1.798) | (.138) | (.089) | 6.626 | 1.787 |
| Distributions | | | | | |
| Dividends from Net Investment Income | (.892) | (.922) | (1.271) | (.956) | (1.607) |
| Distributions from Realized Capital Gains | — | — | — | — | — |
| Total Distributions | (.892) | (.922) | (1.271) | (.956) | (1.607) |
| Net Asset Value, End of Period | $25.10 | $27.79 | $28.85 | $30.21 | $24.54 |
| |
| Total Return2 | -6.46% | -0.58% | -0.55% | 27.66% | 7.95% |
| |
| Ratios/Supplemental Data | | | | | |
| Net Assets, End of Period (Millions) | $574 | $867 | $1,006 | $901 | $762 |
| Ratio of Total Expenses to Average Net Assets | 0.08% | 0.09% | 0.09% | 0.09% | 0.09% |
| Ratio of Net Investment Income to | | | | | |
| Average Net Assets | 3.53% | 3.22% | 4.29%1 | 3.19% | 3.92% |
| Portfolio Turnover Rate 3 | 6% | 13% | 7% | 10% | 7% |
1 Net investment income per share and the ratio of net investment income to average net assets include $.297 and 0.97%, respectively,
resulting from income received from Vodafone Group plc in the form of cash and shares in Verizon Communications Inc. in February 2014.
2 Total returns do not include transaction fees that may have applied in the periods shown. Fund prospectuses provide information about any
applicable transaction fees.
3 Excludes the value of portfolio securities received or delivered as a result of in-kind purchases or redemptions of the fund’s capital shares,
including ETF Creation Units.
See accompanying Notes, which are an integral part of the Financial Statements.
23
| | | | |
| European Stock Index Fund | | | | |
| |
| |
| Financial Highlights | | | | |
| |
| |
| Institutional Plus Shares | | | | |
| | Year | Dec. 5, | Nov. 1, | May 17, |
| | Ended | 20143 to | 2013 to | 20131 to |
| | Oct. 31, | Oct. 31, | March 17, | Oct 31, |
| For a Share Outstanding Throughout Each Period | 2016 | 2015 | 20142 | 2013 |
| Net Asset Value, Beginning of Period | $124.09 | $131.51 | $126.52 | $116.90 |
| Investment Operations | | | | |
| Net Investment Income | 4.121 | 3.878 | 2.2534 | 2.257 |
| Net Realized and Unrealized Gain (Loss) on Investments | (12.133) | (7.151) | 2.866 | 9.966 |
| Total from Investment Operations | (8.012) | (3.273) | 5.119 | 12.223 |
| Distributions | | | | |
| Dividends from Net Investment Income | (3.988) | (4.147) | (.539) | (2.603) |
| Distributions from Realized Capital Gains | — | — | — | — |
| Total Distributions | (3.988) | (4.147) | (.539) | (2.603) |
| Net Asset Value, End of Period | $112.09 | $124.09 | $131.102 | $126.52 |
| |
| Total Return | -6.45% | -2.59% | 4.06% | 10.81% |
| |
| Ratios/Supplemental Data | | | | |
| Net Assets, End of Period (Millions) | $99 | $242 | — | $110 |
| Ratio of Total Expenses to Average Net Assets | 0.07% | 0.08%5 | 0.08%5 | 0.08%5 |
| Ratio of Net Investment Income to Average Net Assets | 3.54% | 3.11%5 | 4.80%4,5 | 3.20%5 |
| Portfolio Turnover Rate 6 | 6% | 13% | 7% | 10% |
1 Inception.
2 Net asset value as of March 17, 2014, on which date all shares were redeemed.
3 Recommencement of operations.
4 Net investment income per share and the ratio of net investment income to average net assets include $1.242 and 0.97%, respectively,
resulting from income received from Vodafone Group plc in the form of cash and shares in Verizon Communications Inc. in February 2014.
5 Annualized.
6 Excludes the value of portfolio securities received or delivered as a result of in-kind purchases or redemptions of the fund’s capital shares,
including ETF Creation Units.
See accompanying Notes, which are an integral part of the Financial Statements.
24
European Stock Index Fund
Notes to Financial Statements
Vanguard European Stock Index Fund is registered under the Investment Company Act of 1940 as an open-end investment company, or mutual fund. The fund invests in securities of foreign issuers, which may subject it to investment risks not normally associated with investing in securities of U.S. corporations. The fund offers five classes of shares: Investor Shares, ETF Shares, Admiral Shares, Institutional Shares, and Institutional Plus Shares. Investor Shares are available to any investor who meets the fund’s minimum purchase requirements. ETF Shares, known as Vanguard FTSE Europe ETF Shares, are listed for trading on NYSE Arca; they can be purchased and sold through a broker. Admiral Shares, Institutional Shares, and Institutional Plus Shares are designed for investors who meet certain administrative, service, and account-size criteria. Institutional Plus Shares were first issued May 17, 2013, and on March 17, 2014, all outstanding shares were redeemed. Institutional Plus Shares recommenced operations on December 5, 2014.
A. The following significant accounting policies conform to generally accepted accounting principles for U.S. investment companies. The fund consistently follows such policies in preparing its financial statements.
1. Security Valuation: Securities are valued as of the close of trading on the New York Stock Exchange (generally 4 p.m., Eastern time) on the valuation date. Equity securities are valued at the latest quoted sales prices or official closing prices taken from the primary market in which each security trades; such securities not traded on the valuation date are valued at the mean of the latest quoted bid and asked prices. Securities for which market quotations are not readily available, or whose values have been affected by events occurring before the fund’s pricing time but after the close of the securities’ primary markets, are valued at their fair values calculated according to procedures adopted by the board of trustees. These procedures include obtaining quotations from an independent pricing service, monitoring news to identify significant market- or security-specific events, and evaluating changes in the values of foreign market proxies (for example, ADRs, futures contracts, or exchange-traded funds), between the time the foreign markets close and the fund’s pricing time. When fair-value pricing is employed, the prices of securities used by a fund to calculate its net asset value may differ from quoted or published prices for the same securities. Investments in Vanguard Market Liquidity Fund are valued at that fund’s net asset value. Temporary cash investments acquired over 60 days to maturity are valued using the latest bid prices or using valuations based on a matrix system (which considers such factors as security prices, yields, maturities, and ratings), both as furnished by independent pricing services. Other temporary cash investments are valued at amortized cost, which approximates market value.
2. Foreign Currency: Securities and other assets and liabilities denominated in foreign currencies are translated into U.S. dollars using exchange rates obtained from an independent third party as of the fund’s pricing time on the valuation date. Realized gains (losses) and unrealized appreciation (depreciation) on investment securities include the effects of changes in exchange rates since the securities were purchased, combined with the effects of changes in security prices. Fluctuations in the value of other assets and liabilities resulting from changes in exchange rates are recorded as unrealized foreign currency gains (losses) until the assets or liabilities are settled in cash, at which time they are recorded as realized foreign currency gains (losses).
3. Futures and Forward Currency Contracts: The fund uses index futures contracts to a limited extent, with the objectives of maintaining full exposure to the stock market, enhancing returns, maintaining liquidity, and minimizing transaction costs. The fund may purchase futures contracts to immediately invest incoming cash in the market, or sell futures in response to cash outflows, thereby simulating a fully invested position in the underlying index while maintaining a cash balance for liquidity. The fund may seek to enhance returns by using futures contracts instead of the underlying securities when
25
European Stock Index Fund
futures are believed to be priced more attractively than the underlying securities. The primary risks associated with the use of futures contracts are imperfect correlation between changes in market values of stocks held by the fund and the prices of futures contracts, and the possibility of an illiquid market. Counterparty risk involving futures is mitigated because a regulated clearinghouse is the counterparty instead of the clearing broker. To further mitigate counterparty risk, the fund trades futures contracts on an exchange, monitors the financial strength of its clearing brokers and clearinghouse, and has entered into clearing agreements with its clearing brokers. The clearinghouse imposes initial margin requirements to secure the fund’s performance and requires daily settlement of variation margin representing changes in the market value of each contract.
The fund also enters into forward currency contracts to provide the appropriate currency exposure related to any open futures contracts. The fund’s risks in using these contracts include movement in the values of the foreign currencies relative to the U.S. dollar and the ability of the counterparties to fulfill their obligations under the contracts. The fund mitigates its counterparty risk by entering into forward currency contracts only with a diverse group of prequalified counterparties, monitoring their financial strength, entering into master netting arrangements with its counterparties, and requiring its counterparties to transfer collateral as security for their performance. In the absence of a default, the collateral pledged or received by the fund cannot be repledged, resold or rehypothecated. The master netting arrangements provide that, in the event of a counterparty’s default (including bankruptcy), the fund may terminate the forward currency contracts, determine the net amount owed by either party in accordance with its master netting arrangements, and sell or retain any collateral held up to the net amount owed to the fund under the master netting arrangements. The forward currency contracts contain provisions whereby a counterparty may terminate open contracts if the fund’s net assets decline below a certain level, triggering a payment by the fund if the fund is in a net liability position at the time of the termination. The payment amount would be reduced by any collateral the fund has pledged. Any assets pledged as collateral for open contracts are noted in the Statement of Net Assets. The value of collateral received or pledged is compared daily to the value of the forward currency contracts exposure with each counterparty, and any difference, if in excess of a specified minimum transfer amount, is adjusted and settled within two business days.
Futures contracts are valued at their quoted daily settlement prices. Forward currency contracts are valued at their quoted daily prices obtained from an independent third party, adjusted for currency risk based on the expiration date of each contract. The aggregate settlement values and notional amounts of the contracts are not recorded in the Statement of Net Assets. Fluctuations in the value of the contracts are recorded in the Statement of Net Assets as an asset (liability) and in the Statement of Operations as unrealized appreciation (depreciation) until the contracts are closed, when they are recorded as realized gains (losses) on futures or forward currency contracts.
During the year ended October 31, 2016, the fund’s average investments in long and short futures contracts represented less than 1% and 0% of net assets, respectively, based on the average of aggregate settlement values at each quarter-end during the period. The fund’s average investment in forward currency contracts represented 4% of net assets, based on the average of notional amounts at each quarter-end during the period.
26
European Stock Index Fund
4. Federal Income Taxes: The fund intends to continue to qualify as a regulated investment company and distribute all of its taxable income. Management has analyzed the fund’s tax positions taken for all open federal income tax years (October 31, 2013–2016), and has concluded that no provision for federal income tax is required in the fund’s financial statements.
5. Distributions: Distributions to shareholders are recorded on the ex-dividend date.
6. Securities Lending: To earn additional income, the fund lends its securities to qualified institutional borrowers. Security loans are subject to termination by the fund at any time, and are required to be secured at all times by collateral in an amount at least equal to the market value of securities loaned. Daily market fluctuations could cause the value of loaned securities to be more or less than the value of the collateral received. When this occurs, the collateral is adjusted and settled on the next business day. The fund further mitigates its counterparty risk by entering into securities lending transactions only with a diverse group of prequalified counterparties, monitoring their financial strength, and entering into master securities lending agreements with its counterparties. The master securities lending agreements provide that, in the event of a counterparty’s default (including bankruptcy), the fund may terminate any loans with that borrower, determine the net amount owed, and sell or retain the collateral up to the net amount owed to the fund; however, such actions may be subject to legal proceedings. While collateral mitigates counterparty risk, in the absence of a default the fund may experience delays and costs in recovering the securities loaned. The fund invests cash collateral received in Vanguard Market Liquidity Fund, and records a liability in the Statement of Net Assets for the return of the collateral, during the period the securities are on loan. Securities lending income represents fees charged to borrowers plus income earned on invested cash collateral, less expenses associated with the loan. During the term of the loan, the fund is entitled to all distributions made on or in respect of the loaned securities.
7. Credit Facility: The fund and certain other funds managed by The Vanguard Group (“Vanguard”) participate in a $3.1 billion committed credit facility provided by a syndicate of lenders pursuant to a credit agreement that may be renewed annually; each fund is individually liable for its borrowings, if any, under the credit facility. Borrowings may be utilized for temporary and emergency purposes, and are subject to the fund’s regulatory and contractual borrowing restrictions. The participating funds are charged administrative fees and an annual commitment fee of 0.10% of the undrawn amount of the facility; these fees are allocated to the funds based on a method approved by the fund’s board of trustees and included in Management and Administrative expenses on the fund’s Statement of Operations. Any borrowings under this facility bear interest at a rate based upon the higher of the one-month London Interbank Offered Rate, federal funds effective rate, or overnight bank funding rate plus an agreed-upon spread.
The fund had no borrowings outstanding at October 31, 2016, or at any time during the period then ended.
8. Other: Dividend income is recorded on the ex-dividend date. Interest income includes income distributions received from Vanguard Market Liquidity Fund and is accrued daily. Premiums and discounts on debt securities purchased are amortized and accreted, respectively, to interest income over the lives of the respective securities. Security transactions are accounted for on the date securities are bought or sold. Costs used to determine realized gains (losses) on the sale of investment securities are those of the specific securities sold.
27
European Stock Index Fund
Withholding taxes on foreign dividends and capital gains have been provided for in accordance with the fund’s understanding of the applicable countries’ tax rules and rates. The fund has filed tax reclaims for previously withheld taxes on dividends earned in certain European Union countries. These filings are subject to various administrative and judicial proceedings within these countries. Such tax reclaims received during the year, if any, are included in dividend income. No other amounts for additional tax reclaims are reflected in the financial statements due to the uncertainty as to the ultimate resolution of proceedings, the likelihood of receipt of these reclaims, and the potential timing of payment.
Each class of shares has equal rights as to assets and earnings, except that each class separately bears certain class-specific expenses related to maintenance of shareholder accounts (included in Management and Administrative expenses) and shareholder reporting. Marketing and distribution expenses are allocated to each class of shares based on a method approved by the board of trustees. Income, other non-class-specific expenses, and gains and losses on investments are allocated to each class of shares based on its relative net assets.
B. In accordance with the terms of a Funds’ Service Agreement (the “FSA”) between Vanguard and the fund, Vanguard furnishes to the fund investment advisory, corporate management, administrative, marketing, and distribution services at Vanguard’s cost of operations (as defined by the FSA). These costs of operations are allocated to the fund based on methods and guidelines approved by the board of trustees. Vanguard does not require reimbursement in the current period for certain costs of operations (such as deferred compensation/benefits and risk/insurance costs); the fund’s liability for these costs of operations is included in Payables to Vanguard on the Statement of Net Assets.
Upon the request of Vanguard, the fund may invest up to 0.40% of its net assets as capital in Vanguard. At October 31, 2016, the fund had contributed to Vanguard capital in the amount of $1,244,000, representing 0.01% of the fund’s net assets and 0.50% of Vanguard’s capitalization. The fund’s trustees and officers are also directors and employees, respectively, of Vanguard.
C. Various inputs may be used to determine the value of the fund’s investments. These inputs are summarized in three broad levels for financial statement purposes. The inputs or methodologies used to value securities are not necessarily an indication of the risk associated with investing in those securities.
Level 1—Quoted prices in active markets for identical securities.
Level 2—Other significant observable inputs (including quoted prices for similar securities, interest
rates, prepayment speeds, credit risk, etc.).
Level 3—Significant unobservable inputs (including the fund’s own assumptions used to determine
the fair value of investments).
28
European Stock Index Fund
The following table summarizes the market value of the fund’s investments as of October 31, 2016, based on the inputs used to value them:
| | | |
| | Level 1 | Level 2 | Level 3 |
| Investments | ($000) | ($000) | ($000) |
| Common Stocks | 8,336 | 15,391,073 | — |
| Temporary Cash Investments | 230,297 | 23,391 | — |
| Futures Contracts—Liabilities1 | (150) | — | — |
| Forward Currency Contracts—Assets | — | 1,492 | — |
| Forward Currency Contracts—Liabilities | — | (6,269) | — |
| Total | 238,483 | 15,409,687 | — |
| 1 Represents variation margin on the last day of the reporting period. | | | |
D. At October 31, 2016, the fair values of derivatives were reflected in the Statement of Net Assets as follows:
| | | |
| | | Foreign | |
| | Equity | Exchange | |
| | Contracts | Contracts | Total |
| Statement of Net Assets Caption | ($000) | ($000) | ($000) |
| Other Assets | — | 1,492 | 1,492 |
| Other Liabilities | (150) | (6,269) | (6,419) |
Realized net gain (loss) and the change in unrealized appreciation (depreciation) on derivatives for the year ended October 31, 2016, were:
| | | |
| | | Foreign | |
| | Equity | Exchange | |
| | Contracts | Contracts | Total |
| Realized Net Gain (Loss) on Derivatives | ($000) | ($000) | ($000) |
| Futures Contracts | 15,404 | — | 15,404 |
| Forward Currency Contracts | — | (9,678) | (9,678) |
| Realized Net Gain (Loss) on Derivatives | 15,404 | (9,678) | 5,726 |
| |
| Change in Unrealized Appreciation (Depreciation) on Derivatives | | | |
| Futures Contracts | (9,675) | — | (9,675) |
| Forward Currency Contracts | — | (5,413) | (5,413) |
| Change in Unrealized Appreciation (Depreciation) on Derivatives | (9,675) | (5,413) | (15,088) |
29
European Stock Index Fund
At October 31, 2016, the aggregate settlement value of open futures contracts and the related unrealized appreciation (depreciation) were:
| | | | |
| | | | | ($000) |
| | | | Aggregate | |
| | | Number of | Settlement | Unrealized |
| | | Long (Short) | Value | Appreciation |
| Futures Contracts | Expiration | Contracts | Long (Short) | (Depreciation) |
| Dow Jones EURO STOXX 50 Index | December 2016 | 570 | 19,076 | 266 |
| FTSE 100 Index | December 2016 | 92 | 7,783 | (333) |
| | | | | (67) |
Unrealized appreciation (depreciation) on open futures contracts is required to be treated as realized gain (loss) for tax purposes.
At October 31, 2016, the fund had open forward currency contracts to receive and deliver currencies as follows. Unrealized appreciation (depreciation) on open forward currency contracts is treated as realized gain (loss) for tax purposes.
| | | | | | |
| | | | | | | Unrealized |
| | Contract | | | | | Appreciation |
| | | | | Contract Amount (000) | |
| | Settlement | | | | | (Depreciation) |
| Counterparty | Date | | Receive | | Deliver | ($000) |
| BNP Paribas | 12/21/16 | EUR | 55,963 | USD | 62,736 | (1,152) |
| Toronto-Dominion Securities | 12/21/16 | EUR | 51,870 | USD | 58,544 | (1,466) |
| Bank of America, N.A. | 12/21/16 | GBP | 19,616 | USD | 26,252 | (2,210) |
| BNP Paribas | 12/21/16 | GBP | 12,792 | USD | 16,330 | (653) |
| JPMorgan Chase Bank, N.A. | 12/21/16 | GBP | 5,880 | USD | 7,855 | (649) |
| Citibank, N.A. | 12/21/16 | USD | 32,525 | EUR | 29,676 | (131) |
| Barclays Bank PLC | 12/21/16 | USD | 32,317 | EUR | 28,878 | 539 |
| Citibank, N.A. | 12/21/16 | USD | 21,759 | EUR | 19,636 | 152 |
| JPMorgan Chase Bank, N.A. | 12/21/16 | USD | 15,012 | EUR | 13,549 | 102 |
| Goldman Sachs International | 12/21/16 | USD | 13,833 | GBP | 10,745 | 664 |
| JPMorgan Chase Bank, N.A. | 12/21/16 | USD | 9,128 | GBP | 7,448 | — |
| Goldman Sachs International | 12/21/16 | USD | 7,156 | GBP | 5,846 | (8) |
| Barclays Bank PLC | 12/21/16 | USD | 5,605 | GBP | 4,561 | 16 |
| JPMorgan Chase Bank, N.A. | 12/21/16 | USD | 5,602 | GBP | 4,556 | 19 |
| | | | | | | (4,777) |
| EUR—Euro. | | | | | | |
| GBP—British pound. | | | | | | |
| USD—U.S. dollar. | | | | | | |
At October 31, 2016, the counterparties had deposited in segregated accounts securities and cash with a value of $2,090,000 in connection with open forward currency contracts.
30
European Stock Index Fund
E. Distributions are determined on a tax basis and may differ from net investment income and realized capital gains for financial reporting purposes. Differences may be permanent or temporary. Permanent differences are reclassified among capital accounts in the financial statements to reflect their tax character. Temporary differences arise when certain items of income, expense, gain, or loss are recognized in different periods for financial statement and tax purposes. These differences will reverse at some time in the future. Differences in classification may also result from the treatment of short-term gains as ordinary income for tax purposes.
During the year ended October 31, 2016, the fund realized net foreign currency losses of $12,851,000, which decreased distributable net income for tax purposes; accordingly, such losses have been reclassified from accumulated net realized losses to undistributed net investment income.
During the year ended October 31, 2016, the fund realized $141,245,000 of net capital losses resulting from in-kind redemptions—in which shareholders exchanged fund shares for securities held by the fund rather than for cash. Because such gains are not taxable to the fund, and are not distributed to shareholders, they have been reclassified from accumulated net realized losses to paid-in capital.
For tax purposes, at October 31, 2016, the fund had $37,132,000 of ordinary income available for distribution. The fund used capital loss carryforwards of $115,230,000 to offset taxable capital gains realized during the year ended October 31, 2016. At October 31, 2016, the fund had available capital losses totaling $2,065,201,000 to offset future net capital gains of $1,500,333,000 through October 31, 2017, $282,885,000 through October 31, 2018, and $166,753,000 through October 31, 2019.
At October 31, 2016, the cost of investment securities for tax purposes was $21,368,194,000. Net unrealized depreciation of investment securities for tax purposes was $5,715,097,000, consisting of unrealized gains of $513,906,000 on securities that had risen in value since their purchase and $6,229,003,000 in unrealized losses on securities that had fallen in value since their purchase.
F. During the year ended October 31, 2016, the fund purchased $1,246,858,000 of investment securities and sold $5,163,653,000 of investment securities, other than temporary cash investments. Purchases and sales include $213,143,000 and $3,903,894,000, respectively, in connection with in-kind purchases and redemptions of the fund’s capital shares.
31
European Stock Index Fund
G. Capital share transactions for each class of shares were:
| | | | |
| | | | Year Ended October 31, |
| | | 2016 | | 2015 |
| | Amount | Shares | Amount | Shares |
| | ($000) | (000) | ($000) | (000) |
| Investor Shares | | | | |
| Issued | 100,437 | 3,906 | 173,988 | 5,929 |
| Issued in Lieu of Cash Distributions | 17,789 | 697 | 20,022 | 684 |
| Redeemed | (172,081) | (6,639) | (215,791) | (7,454) |
| Net Increase (Decrease)—Investor Shares | (53,855) | (2,036) | (21,781) | (841) |
| ETF Shares | | | | |
| Issued | 340,229 | 7,004 | 5,207,514 | 94,654 |
| Issued in Lieu of Cash Distributions | — | — | — | — |
| Redeemed | (3,906,845) | (82,200) | (589,154) | (11,500) |
| Net Increase (Decrease)—ETF Shares | (3,566,616) | (75,196) | 4,618,360 | 83,154 |
| Admiral Shares | | | | |
| Issued | 454,762 | 7,584 | 936,063 | 13,685 |
| Issued in Lieu of Cash Distributions | 108,578 | 1,827 | 111,233 | 1,634 |
| Redeemed | (697,279) | (11,579) | (683,633) | (10,195) |
| Net Increase (Decrease)—Admiral Shares | (133,939) | (2,168) | 363,663 | 5,124 |
| Institutional Shares | | | | |
| Issued | 129,495 | 5,017 | 293,093 | 10,179 |
| Issued in Lieu of Cash Distributions | 19,570 | 772 | 21,252 | 732 |
| Redeemed | (362,750) | (14,133) | (432,471) | (14,564) |
| Net Increase (Decrease)—Institutional Shares | (213,685) | (8,344) | (118,126) | (3,653) |
| Institutional Plus Shares | | | | |
| Issued | 35,730 | 311 | 276,203 | 2,054 |
| Issued in Lieu of Cash Distributions | 3,926 | 34 | 6,528 | 50 |
| Redeemed | (160,800) | (1,413) | (18,000) | (154) |
| Net Increase (Decrease)—Institutional Plus Shares | (121,144) | (1,068) | 264,731 | 1,950 |
H. Management has determined that no material events or transactions occurred subsequent to October 31, 2016, that would require recognition or disclosure in these financial statements.
32
Pacific Stock Index Fund
Fund Profile
As of October 31, 2016
| | | | |
| Share-Class Characteristics | | | | |
| | Investor | FTSE Pacific ETF | Admiral | Institutional |
| | Shares | Shares | Shares | Shares |
| Ticker Symbol | VPACX | VPL | VPADX | VPKIX |
| Expense Ratio1 | 0.26% | 0.12% | 0.12% | 0.09% |
| | | |
| Portfolio Characteristics | | |
| | | FTSE | FTSE |
| | | Developed | Global |
| | | APAC All | All Cap |
| | | Cap | ex US |
| | Fund | Index | Index |
| Number of Stocks | 2,273 | 2,237 | 5,783 |
| Median Market Cap | $15.7B | $15.7B | $21.0B |
| Price/Earnings Ratio | 17.0x | 17.0x | 20.8x |
| Price/Book Ratio | 1.3x | 1.3x | 1.6x |
| Return on Equity | 10.8% | 10.8% | 14.3% |
| Earnings Growth | | | |
| Rate | 12.5% | 12.5% | 7.4% |
| Dividend Yield | 2.5% | 2.5% | 3.0% |
| Turnover Rate | 4% | — | — |
| Short-Term Reserves | -0.4% | — | — |
| | | |
| Sector Diversification (% of equity exposure) |
| | | FTSE | FTSE |
| | | Developed | Global |
| | | APAC All | All Cap |
| | | Cap | ex US |
| | Fund | Index | Index |
| Basic Materials | 7.2% | 7.1% | 7.8% |
| Consumer Goods | 20.8 | 20.9 | 16.2 |
| Consumer Services | 10.4 | 10.4 | 8.6 |
| Financials | 25.0 | 25.0 | 25.2 |
| Health Care | 6.1 | 6.1 | 7.7 |
| Industrials | 18.2 | 18.1 | 14.7 |
| Oil & Gas | 1.6 | 1.7 | 6.5 |
| Technology | 4.3 | 4.3 | 5.6 |
| Telecommunications | 3.6 | 3.6 | 4.2 |
| Utilities | 2.8 | 2.8 | 3.5 |
| | |
| Volatility Measures | | |
| | Spliced | |
| | Pacific | FTSE Global |
| | Stock | All Cap ex US |
| | Index | Index |
| R-Squared | 0.92 | 0.84 |
| Beta | 0.92 | 0.91 |
| These measures show the degree and timing of the fund’s |
| fluctuations compared with the indexes over 36 months. |
| | |
| Ten Largest Holdings (% of total net assets) |
| Samsung Electronics Co. Consumer | |
| Ltd. | Electronics | 2.7% |
| Toyota Motor Corp. | Automobiles | 2.6 |
| Commonwealth Bank of | | |
| Australia | Banks | 1.6 |
| Westpac Banking Corp. | Banks | 1.3 |
| AIA Group Ltd. | Life Insurance | 1.3 |
| Mitsubishi UFJ Financial | | |
| Group Inc. | Banks | 1.2 |
| Australia & New Zealand | | |
| Banking Group Ltd. | Banks | 1.0 |
| KDDI Corp. | Mobile | |
| | Telecommunications | 0.9 |
| National Australia Bank | | |
| Ltd. | Banks | 0.9 |
| BHP Billiton | General Mining | 0.9 |
| Top Ten | | 14.4% |
| The holdings listed exclude any temporary cash investments and |
| equity index products. | | |
1 The expense ratios shown are from the prospectus dated February 26, 2016, and represent estimated costs for the current fiscal year. For the fiscal
year ended October 31, 2016, the expense ratios were 0.26% for Investor Shares, 0.10% for FTSE Pacific ETF Shares, 0.10% for Admiral Shares, and
0.08% for Institutional Shares.
33
Pacific Stock Index Fund
| | | |
| Market Diversification (% of equity exposure) |
| | | FTSE | FTSE |
| | | Developed Global |
| | | APAC All | All Cap |
| | | Cap | ex US |
| | Fund | Index | Index |
| Europe | 0.0% | 0.0% | 42.2% |
| Pacific | | | |
| Japan | 59.4% | 59.3% | 18.1% |
| Australia | 16.9 | 16.8 | 5.2 |
| South Korea | 11.0 | 11.2 | 3.4 |
| Hong Kong | 8.8 | 8.8 | 2.7 |
| Singapore | 3.1 | 3.1 | 1.0 |
| Other | 0.8 | 0.8 | 0.3 |
| Subtotal | 100.0% | 100.0% | 30.7% |
| Emerging Markets | 0.0% | 0.0% | 19.7% |
| North America | 0.0% | 0.0% | 6.9% |
| Middle East | 0.0% | 0.0% | 0.5% |
34
Pacific Stock Index Fund
Performance Summary
All of the returns in this report represent past performance, which is not a guarantee of future results that may be achieved by the fund. (Current performance may be lower or higher than the performance data cited. For performance data current to the most recent month-end, visit our website at vanguard.com/performance.) Note, too, that both investment returns and principal value can fluctuate widely, so an investor’s shares, when sold, could be worth more or less than their original cost. The returns shown do not reflect taxes that a shareholder would pay on fund distributions or on the sale of fund shares.
Cumulative Performance: October 31, 2006, Through October 31, 2016
Initial Investment of $10,000
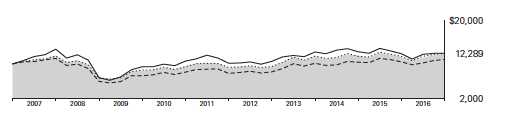
| | | | | |
| | | Average Annual Total Returns | |
| | | Periods Ended October 31, 2016 | |
| | | | | | Final Value |
| | | One | Five | Ten | of a $10,000 |
| | | Year | Years | Years | Investment |
| | Pacific Stock Index Fund*Investor | | | | |
| | Shares | 6.40% | 6.31% | 2.08% | $12,289 |
| • • • • • • • • | Spliced Pacific Stock Index | 5.70 | 6.19 | 2.19 | 12,415 |
| |
| – – – – | Japan/Pacific Region Funds Average | 5.41 | 7.20 | 0.99 | 11,035 |
| | FTSE Global All Cap ex US Index | 0.92 | 4.20 | 2.24 | 12,478 |
| For a benchmark description, see the Glossary. | | | | |
| Japan/Pacific Region Funds Average: Derived from data provided by Lipper, a Thomson Reuters Company. | | |
| | | | |
| | | | | Final Value |
| | One | Five | Ten | of a $10,000 |
| | Year | Years | Years | Investment |
| FTSE Pacific ETF Shares | | | | |
| Net Asset Value | 6.59% | 6.46% | 2.21% | $12,447 |
| Spliced Pacific Stock Index | 5.70 | 6.19 | 2.19 | 12,415 |
| FTSE Global All Cap ex US Index | 0.92 | 4.20 | 2.24 | 12,478 |
See Financial Highlights for dividend and capital gains information.
35
Pacific Stock Index Fund
| | | | |
| | | Average Annual Total Returns | |
| | Periods Ended October 31, 2016 | |
| | | | | Final Value |
| | One | Five | Ten | of a $10,000 |
| | Year | Years | Years | Investment |
| Pacific Stock Index Fund Admiral Shares | 6.57% | 6.47% | 2.21% | $12,448 |
| Spliced Pacific Stock Index | 5.70 | 6.19 | 2.19 | 12,415 |
| FTSE Global All Cap ex US Index | 0.92 | 4.20 | 2.24 | 12,478 |
| | | | |
| | | | | Final Value |
| | One | Five | Ten | of a $5,000,000 |
| | Year | Years | Years | Investment |
| Pacific Stock Index Fund Institutional Shares | 6.61% | 6.49% | 2.25% | $6,246,771 |
| Spliced Pacific Stock Index | 5.70 | 6.19 | 2.19 | 6,207,327 |
| |
| FTSE Global All Cap ex US Index | 0.92 | 4.20 | 2.24 | 6,238,904 |
| | | |
| Cumulative Returns of ETF Shares: October 31, 2006, Through October 31, 2016 | | |
| | One | Five | Ten |
| | Year | Years | Years |
| FTSE Pacific ETF Shares Market Price | 6.58% | 37.31% | 24.16% |
| FTSE Pacific ETF Shares Net Asset Value | 6.59 | 36.76 | 24.47 |
| Spliced Pacific Stock Index | 5.70 | 35.00 | 24.15 |
Fiscal-Year Total Returns (%): October 31, 2006, Through October 31, 2016
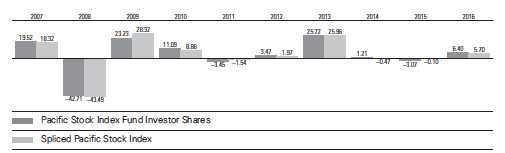
For a benchmark description, see the Glossary.
36
Pacific Stock Index Fund
Average Annual Total Returns: Periods Ended September 30, 2016
This table presents returns through the latest calendar quarter—rather than through the end of the fiscal period.
Securities and Exchange Commission rules require that we provide this information.
| | | | |
| | Inception | One | Five | Ten |
| | Date | Year | Years | Years |
| Investor Shares | 6/18/1990 | 15.62% | 7.57% | 2.49% |
| FTSE Pacific ETF Shares | 3/4/2005 | | | |
| Market Price | | 15.74 | 7.86 | 2.58 |
| Net Asset Value | | 15.77 | 7.70 | 2.61 |
| Admiral Shares | 8/13/2001 | 15.75 | 7.71 | 2.62 |
| Institutional Shares | 5/15/2000 | 15.70 | 7.74 | 2.65 |
37
Pacific Stock Index Fund
Financial Statements
Statement of Net Assets—Investments Summary
As of October 31, 2016
This Statement summarizes the fund’s holdings by asset type. Details are reported for each of the fund’s 50 largest individual holdings and for investments that, in total for any issuer, represent more than 1% of the fund’s net assets. The total value of smaller holdings is reported as a single amount within each category.
The fund reports a complete list of its holdings in regulatory filings four times in each fiscal year, at the quarter-ends. For the second and fourth fiscal quarters, the complete listing of the fund’s holdings is available electronically on vanguard.com and on the Securities and Exchange Commission’s website (sec.gov), or you can have it mailed to you without charge by calling 800-662-7447. For the first and third fiscal quarters, the fund files the lists with the SEC on Form N-Q. Shareholders can look up the fund’s Forms N-Q on the SEC’s website. Forms N-Q may also be reviewed and copied at the SEC’s Public Reference Room (see the back cover of this report for further information).
| | | |
| | | Market | Percentage |
| | | Value• | of Net |
| | Shares | ($000) | Assets |
| Common Stocks | | | |
| Australia | | | |
| Commonwealth Bank of Australia | 1,615,225 | 89,922 | 1.6% |
| Westpac Banking Corp. | 3,170,785 | 73,325 | 1.3% |
| Australia & New Zealand Banking Group Ltd. | 2,773,182 | 58,557 | 1.0% |
| National Australia Bank Ltd. | 2,524,978 | 53,599 | 0.9% |
| BHP Billiton Ltd. | 3,064,581 | 53,541 | 0.9% |
| Wesfarmers Ltd. | 1,068,281 | 33,265 | 0.6% |
| CSL Ltd. | 435,916 | 33,263 | 0.6% |
| Woolworths Ltd. | 1,207,043 | 21,662 | 0.4% |
| 1 Australia—Other † | | 550,904 | 9.5% |
| | | 968,038 | 16.8% |
| Hong Kong | | | |
| AIA Group Ltd. | 11,502,645 | 72,363 | 1.3% |
| CK Hutchison Holdings Ltd. | 2,695,591 | 33,285 | 0.6% |
| Hong Kong Exchanges & Clearing Ltd. | 1,162,397 | 30,730 | 0.5% |
| Cheung Kong Property Holdings Ltd. | 2,698,091 | 19,946 | 0.4% |
| Sun Hung Kai Properties Ltd. | 1,335,118 | 19,881 | 0.3% |
| 1 Hong Kong—Other † | | 329,631 | 5.7% |
| | | 505,836 | 8.8% |
| Japan | | | |
| Toyota Motor Corp. | 2,598,707 | 150,743 | 2.6% |
| Mitsubishi UFJ Financial Group Inc. | 12,934,024 | 66,737 | 1.2% |
| KDDI Corp. | 1,764,400 | 53,626 | 0.9% |
| SoftBank Group Corp. | 818,070 | 51,523 | 0.9% |
| Honda Motor Co. Ltd. | 1,705,527 | 51,032 | 0.9% |
| Japan Tobacco Inc. | 1,141,059 | 43,383 | 0.8% |
| Sumitomo Mitsui Financial Group Inc. | 1,235,334 | 42,831 | 0.7% |
| Mizuho Financial Group Inc. | 23,793,341 | 40,062 | 0.7% |
| Sony Corp. | 1,194,744 | 37,656 | 0.7% |
| FANUC Corp. | 186,176 | 34,087 | 0.6% |
| Takeda Pharmaceutical Co. Ltd. | 735,991 | 32,917 | 0.6% |
38
| | | | |
| Pacific Stock Index Fund | | | | |
| |
| |
| |
| | | | Market | Percentage |
| | | | Value• | of Net |
| | | Shares | ($000) | Assets |
| Keyence Corp. | | 43,477 | 31,873 | 0.6% |
| NTT DOCOMO Inc. | | 1,248,800 | 31,362 | 0.5% |
| East Japan Railway Co. | | 355,285 | 31,275 | 0.5% |
| Seven & i Holdings Co. Ltd. | | 741,954 | 30,969 | 0.5% |
| Astellas Pharma Inc. | | 2,022,870 | 30,023 | 0.5% |
| Shin-Etsu Chemical Co. Ltd. | | 392,755 | 29,779 | 0.5% |
| Central Japan Railway Co. | | 172,300 | 29,299 | 0.5% |
| Canon Inc. | | 998,817 | 28,694 | 0.5% |
| Mitsubishi Corp. | | 1,310,134 | 28,515 | 0.5% |
| Tokio Marine Holdings Inc. | | 669,390 | 26,403 | 0.5% |
| Mitsubishi Electric Corp. | | 1,878,654 | 25,417 | 0.4% |
| Murata Manufacturing Co. Ltd. | | 180,179 | 25,160 | 0.4% |
| Nintendo Co. Ltd. | | 102,898 | 24,805 | 0.4% |
| Kao Corp. | | 476,877 | 24,538 | 0.4% |
| Daikin Industries Ltd. | | 253,212 | 24,265 | 0.4% |
| Hitachi Ltd. | | 4,411,258 | 23,516 | 0.4% |
| Bridgestone Corp. | | 610,950 | 22,803 | 0.4% |
| Fuji Heavy Industries Ltd. | | 583,412 | 22,798 | 0.4% |
| Mitsui & Co. Ltd. | | 1,622,700 | 22,483 | 0.4% |
| Mitsubishi Estate Co. Ltd. | | 1,123,982 | 22,339 | 0.4% |
| Nidec Corp. | | 230,728 | 22,325 | 0.4% |
| Panasonic Corp. | | 2,025,590 | 20,896 | 0.4% |
| Denso Corp. | | 478,686 | 20,830 | 0.4% |
| Mitsui Fudosan Co. Ltd. | | 904,580 | 20,601 | 0.4% |
| Komatsu Ltd. | | 899,109 | 20,013 | 0.3% |
| Hino Motors Ltd. | | 262,809 | 2,865 | 0.0% |
| kabu.com Securities Co. Ltd. | | 130,100 | 410 | 0.0% |
| Japan—Other † | | | 2,162,091 | 37.5% |
| | | | 3,410,944 | 59.1% |
| |
| New Zealand † | | | 46,241 | 0.8% |
| |
| 1Singapore † | | | 178,715 | 3.1% |
| |
| South Korea | | | | |
| Samsung Electronics Co. Ltd. | | 96,318 | 137,766 | 2.4% |
| Samsung Electronics Co. Ltd. Preference Shares | | 16,427 | 18,887 | 0.3% |
| South Korea—Other † | | | 481,098 | 8.3% |
| | | | 637,751 | 11.0% |
| Total Common Stocks (Cost $6,702,027) | | | 5,747,525 | 99.6%2 |
| |
| | Coupon | | | |
| Temporary Cash Investments | | | | |
| Money Market Fund | | | | |
| 3,4 Vanguard Market Liquidity Fund | 0.718% | 1,248,857 | 124,898 | 2.1% |
| |
| 5U.S. Government and Agency Obligations † | | | 3,300 | 0.1% |
| Total Temporary Cash Investments (Cost $128,194) | | | 128,198 | 2.2%2 |
| 6Total Investments (Cost $6,830,221) | | | 5,875,723 | 101.8% |
39
| | |
| Pacific Stock Index Fund | | |
| |
| |
| |
| | | Percentage |
| | Amount | of Net |
| | ($000) | Assets |
| Other Assets and Liabilities | | |
| Other Assets | | |
| Investment in Vanguard | 436 | |
| Receivables for Investment Securities Sold | 129 | |
| Receivables for Accrued Income | 25,552 | |
| Receivables for Capital Shares Issued | 2,241 | |
| Other Assets | 12,342 | |
| Total Other Assets | 40,700 | 0.7% |
| Liabilities | | |
| Payables for Investment Securities Purchased | (4,873) | |
| Collateral for Securities on Loan | (124,959) | |
| Payables for Capital Shares Redeemed | (2,989) | |
| Payables to Vanguard | (6,388) | |
| Other Liabilities | (5,566) | |
| Total Liabilities | (144,775) | (2.5%) |
| Net Assets | 5,771,648 | 100.0% |
| |
| |
| At October 31, 2016, net assets consisted of: | | |
| | | Amount |
| | | ($000) |
| Paid-in Capital | | 7,387,653 |
| Undistributed Net Investment Income | | 29,225 |
| Accumulated Net Realized Losses | | (692,318) |
| Unrealized Appreciation (Depreciation) | | |
| Investment Securities | | (954,498) |
| Futures Contracts | | 1,792 |
| Forward Currency Contracts | | 848 |
| Foreign Currencies | | (1,054) |
| Net Assets | | 5,771,648 |
40
| |
| Pacific Stock Index Fund | |
| |
| |
| |
| | Amount |
| | ($000) |
| Investor Shares—Net Assets | |
| Applicable to 24,610,820 outstanding $.001 par value shares of | |
| beneficial interest (unlimited authorization) | 281,014 |
| Net Asset Value Per Share—Investor Shares | $11.42 |
| |
| ETF Shares—Net Assets | |
| Applicable to 53,683,061 outstanding $.001 par value shares of | |
| beneficial interest (unlimited authorization) | 3,216,633 |
| Net Asset Value Per Share—ETF Shares | $59.92 |
| |
| Admiral Shares—Net Assets | |
| Applicable to 26,759,286 outstanding $.001 par value shares of | |
| beneficial interest (unlimited authorization) | 1,982,935 |
| Net Asset Value Per Share—Admiral Shares | $74.10 |
| |
| Institutional Shares—Net Assets | |
| Applicable to 25,670,072 outstanding $.001 par value shares of | |
| beneficial interest (unlimited authorization) | 291,066 |
| Net Asset Value Per Share—Institutional Shares | $11.34 |
• See Note A in Notes to Financial Statements.
† Represents the aggregate value, by category, of securities that are not among the 50 largest holdings and, in total for any issuer, represent
1% or less of net assets.
1 Certain of the fund’s securities are exempt from registration under Rule 144A of the Securities Act of 1933. Such securities may be sold in
transactions exempt from registration, normally to qualified institutional buyers. At October 31, 2016, the aggregate value of these
securities was $7,950,000, representing 0.1% of net assets.
2 The fund invests a portion of its cash reserves in equity markets through the use of index futures contracts. After giving effect to futures
investments, the fund’s effective common stock and temporary cash investment positions represent 100.1% and 1.7%, respectively,
of net assets.
3 Affiliated money market fund available only to Vanguard funds and certain trusts and accounts managed by Vanguard. Rate shown is the
7-day yield.
4 Includes $124,959,000 of collateral received for securities on loan.
5 Securities with a value of $1,700,000 have been segregated as initial margin for open futures contracts.
6 The total value of securities on loan is $115,977,000.
See accompanying Notes, which are an integral part of the Financial Statements.
41
| |
| Pacific Stock Index Fund | |
| |
| |
| Statement of Operations | |
| |
| | Year Ended |
| | October 31, 2016 |
| | ($000) |
| Investment Income | |
| Income | |
| Dividends1 | 137,625 |
| Interest2 | 76 |
| Securities Lending—Net | 5,840 |
| Total Income | 143,541 |
| Expenses | |
| The Vanguard Group—Note B | |
| Investment Advisory Services | 759 |
| Management and Administrative—Investor Shares | 562 |
| Management and Administrative—ETF Shares | 1,622 |
| Management and Administrative—Admiral Shares | 1,081 |
| Management and Administrative—Institutional Shares | 123 |
| Marketing and Distribution—Investor Shares | 62 |
| Marketing and Distribution—ETF Shares | 209 |
| Marketing and Distribution—Admiral Shares | 130 |
| Marketing and Distribution—Institutional Shares | 8 |
| Custodian Fees | 1,099 |
| Auditing Fees | 48 |
| Shareholders’ Reports—Investor Shares | 8 |
| Shareholders’ Reports—ETF Shares | 42 |
| Shareholders’ Reports—Admiral Shares | 7 |
| Shareholders’ Reports—Institutional Shares | 10 |
| Trustees’ Fees and Expenses | 3 |
| Total Expenses | 5,773 |
| Net Investment Income | 137,768 |
| Realized Net Gain (Loss) | |
| Investment Securities Sold2 | 28,978 |
| Futures Contracts | (1,903) |
| Foreign Currencies and Forward Currency Contracts | 7,178 |
| Realized Net Gain (Loss) | 34,253 |
| Change in Unrealized Appreciation (Depreciation) | |
| Investment Securities | 159,057 |
| Futures Contracts | (252) |
| Foreign Currencies and Forward Currency Contracts | (688) |
| Change in Unrealized Appreciation (Depreciation) | 158,117 |
| Net Increase (Decrease) in Net Assets Resulting from Operations | 330,138 |
1 Dividends are net of foreign withholding taxes of $9,440,000.
2 Interest income and realized net gain (loss) from an affiliated company of the fund were $55,000 and $15,000, respectively.
See accompanying Notes, which are an integral part of the Financial Statements.
42
| | |
| Pacific Stock Index Fund | | |
| |
| |
| Statement of Changes in Net Assets | | |
| |
| | Year Ended October 31, |
| | 2016 | 2015 |
| | ($000) | ($000) |
| Increase (Decrease) in Net Assets | | |
| Operations | | |
| Net Investment Income | 137,768 | 136,527 |
| Realized Net Gain (Loss) | 34,253 | 116,379 |
| Change in Unrealized Appreciation (Depreciation) | 158,117 | (430,032) |
| Net Increase (Decrease) in Net Assets Resulting from Operations | 330,138 | (177,126) |
| Distributions | | |
| Net Investment Income | | |
| Investor Shares | (6,699) | (7,391) |
| ETF Shares | (72,522) | (67,700) |
| Admiral Shares | (47,540) | (46,916) |
| Institutional Shares | (8,137) | (7,766) |
| Realized Capital Gain | | |
| Investor Shares | — | — |
| ETF Shares | — | — |
| Admiral Shares | — | — |
| Institutional Shares | — | — |
| Total Distributions | (134,898) | (129,773) |
| Capital Share Transactions | | |
| Investor Shares | (37,259) | (32,520) |
| ETF Shares | 184,797 | 328,336 |
| Admiral Shares | (71,298) | 63,582 |
| Institutional Shares | (50,031) | 9,869 |
| Net Increase (Decrease) from Capital Share Transactions | 26,209 | 369,267 |
| Total Increase (Decrease) | 221,449 | 62,368 |
| Net Assets | | |
| Beginning of Period | 5,550,199 | 5,487,831 |
| End of Period1 | 5,771,648 | 5,550,199 |
1 Net Assets—End of Period includes undistributed (overdistributed) net investment income of $29,225,000 and $20,721,000.
See accompanying Notes, which are an integral part of the Financial Statements.
43
| | | | | |
| Pacific Stock Index Fund | | | | | |
| |
| |
| Financial Highlights | | | | | |
| |
| |
| Investor Shares | | | | | |
| |
| For a Share Outstanding | Year Ended October 31, |
| Throughout Each Period | 2016 | 2015 | 2014 | 2013 | 2012 |
| Net Asset Value, Beginning of Period | $10.99 | $11.59 | $11.76 | $9.63 | $9.74 |
| Investment Operations | | | | | |
| Net Investment Income | .257 | .258 | .282 | .246 | .278 |
| Net Realized and Unrealized Gain (Loss) | | | | | |
| on Investments | .426 | (.612) | (.147) | 2.187 | .037 |
| Total from Investment Operations | .683 | (.354) | .135 | 2.433 | .315 |
| Distributions | | | | | |
| Dividends from Net Investment Income | (. 253) | (. 246) | (. 305) | (. 303) | (. 425) |
| Distributions from Realized Capital Gains | — | — | — | — | — |
| Total Distributions | (. 253) | (. 246) | (. 305) | (. 303) | (. 425) |
| Net Asset Value, End of Period | $11.42 | $10.99 | $11.59 | $11.76 | $9.63 |
| |
| Total Return1 | 6.40% | -3.07% | 1.21% | 25.72% | 3.47% |
| |
| Ratios/Supplemental Data | | | | | |
| Net Assets, End of Period (Millions) | $281 | $309 | $360 | $398 | $360 |
| Ratio of Total Expenses to Average Net Assets | 0.26% | 0.26% | 0.26% | 0.26% | 0.26% |
| Ratio of Net Investment Income to | | | | | |
| Average Net Assets | 2.39% | 2.26% | 2.45% | 2.27% | 2.93% |
| Portfolio Turnover Rate2 | 4% | 14% | 5% | 22% | 4% |
1 Total returns do not include transaction or account service fees that may have applied in the periods shown. Fund prospectuses provide
information about any applicable transaction and account service fees.
2 Excludes the value of portfolio securities received or delivered as a result of in-kind purchases or redemptions of the fund’s capital shares,
including ETF Creation Units.
See accompanying Notes, which are an integral part of the Financial Statements.
44
| | | | | |
| Pacific Stock Index Fund | | | | | |
| |
| |
| Financial Highlights | | | | | |
| |
| |
| FTSE Pacific ETF Shares | | | | | |
| |
| For a Share Outstanding | Year Ended October 31, |
| Throughout Each Period | 2016 | 2015 | 2014 | 2013 | 2012 |
| Net Asset Value, Beginning of Period | $57.65 | $60.80 | $61.71 | $50.57 | $51.18 |
| Investment Operations | | | | | |
| Net Investment Income | 1.440 | 1.443 | 1.568 | 1.372 | 1.544 |
| Net Realized and Unrealized Gain (Loss) | | | | | |
| on Investments | 2.240 | (3.210) | (.791) | 11.475 | .190 |
| Total from Investment Operations | 3.680 | (1.767) | .777 | 12.847 | 1.734 |
| Distributions | | | | | |
| Dividends from Net Investment Income | (1.410) | (1.383) | (1.687) | (1.707) | (2.344) |
| Distributions from Realized Capital Gains | — | — | — | — | — |
| Total Distributions | (1.410) | (1.383) | (1.687) | (1.707) | (2.344) |
| Net Asset Value, End of Period | $59.92 | $57.65 | $60.80 | $61.71 | $50.57 |
| |
| Total Return | 6.59% | -2.93% | 1.31% | 25.88% | 3.65% |
| |
| Ratios/Supplemental Data | | | | | |
| Net Assets, End of Period (Millions) | $3,217 | $2,931 | $2,760 | $2,645 | $1,563 |
| Ratio of Total Expenses to Average Net Assets | 0.10% | 0.12% | 0.12% | 0.12% | 0.12% |
| Ratio of Net Investment Income to | | | | | |
| Average Net Assets | 2.55% | 2.40% | 2.59% | 2.41% | 3.07% |
| Portfolio Turnover Rate1 | 4% | 14% | 5% | 22% | 4% |
1 Excludes the value of portfolio securities received or delivered as a result of in-kind purchases or redemptions of the fund’s capital shares,
including ETF Creation Units.
See accompanying Notes, which are an integral part of the Financial Statements.
45
| | | | | |
| Pacific Stock Index Fund | | | | | |
| |
| |
| Financial Highlights | | | | | |
| |
| |
| Admiral Shares | | | | | |
| |
| For a Share Outstanding | Year Ended October 31, |
| Throughout Each Period | 2016 | 2015 | 2014 | 2013 | 2012 |
| Net Asset Value, Beginning of Period | $71.30 | $75.19 | $76.32 | $62.54 | $63.28 |
| Investment Operations | | | | | |
| Net Investment Income | 1.781 | 1.783 | 1.937 | 1.695 | 1.905 |
| Net Realized and Unrealized Gain (Loss) | | | | | |
| on Investments | 2.763 | (3.963) | (.982) | 14.194 | .249 |
| Total from Investment Operations | 4.544 | (2.180) | .955 | 15.889 | 2.154 |
| Distributions | | | | | |
| Dividends from Net Investment Income | (1.744) | (1.710) | (2.085) | (2.109) | (2.894) |
| Distributions from Realized Capital Gains | — | — | — | — | — |
| Total Distributions | (1.744) | (1.710) | (2.085) | (2.109) | (2.894) |
| Net Asset Value, End of Period | $74.10 | $71.30 | $75.19 | $76.32 | $62.54 |
| |
| Total Return1 | 6.57% | -2.92% | 1.32% | 25.89% | 3.65% |
| |
| Ratios/Supplemental Data | | | | | |
| Net Assets, End of Period (Millions) | $1,983 | $1,981 | $2,032 | $1,832 | $1,415 |
| Ratio of Total Expenses to Average Net Assets | 0.10% | 0.12% | 0.12% | 0.12% | 0.12% |
| Ratio of Net Investment Income to | | | | | |
| Average Net Assets | 2.55% | 2.40% | 2.59% | 2.41% | 3.07% |
| Portfolio Turnover Rate2 | 4% | 14% | 5% | 22% | 4% |
1 Total returns do not include transaction or account service fees that may have applied in the periods shown. Fund prospectuses provide
information about any applicable transaction and account service fees.
2 Excludes the value of portfolio securities received or delivered as a result of in-kind purchases or redemptions of the fund’s capital shares,
including ETF Creation Units.
See accompanying Notes, which are an integral part of the Financial Statements.
46
| | | | | |
| Pacific Stock Index Fund | | | | | |
| |
| |
| Financial Highlights | | | | | |
| |
| |
| Institutional Shares | | | | | |
| |
| For a Share Outstanding | Year Ended October 31, |
| Throughout Each Period | 2016 | 2015 | 2014 | 2013 | 2012 |
| Net Asset Value, Beginning of Period | $10.91 | $11.50 | $11.68 | $9.57 | $9.69 |
| Investment Operations | | | | | |
| Net Investment Income | .275 | .276 | .300 | .263 | .295 |
| Net Realized and Unrealized Gain (Loss) | | | | | |
| on Investments | .424 | (.601) | (.158) | 2.174 | .034 |
| Total from Investment Operations | .699 | (.325) | .142 | 2.437 | .329 |
| Distributions | | | | | |
| Dividends from Net Investment Income | (. 269) | (. 265) | (. 322) | (. 327) | (. 449) |
| Distributions from Realized Capital Gains | — | — | — | — | — |
| Total Distributions | (. 269) | (. 265) | (. 322) | (. 327) | (. 449) |
| Net Asset Value, End of Period | $11.34 | $10.91 | $11.50 | $11.68 | $9.57 |
| |
| Total Return1 | 6.61% | -2.84% | 1.28% | 25.96% | 3.65% |
| |
| Ratios/Supplemental Data | | | | | |
| Net Assets, End of Period (Millions) | $291 | $329 | $336 | $437 | $406 |
| Ratio of Total Expenses to Average Net Assets | 0.08% | 0.09% | 0.09% | 0.09% | 0.09% |
| Ratio of Net Investment Income to | | | | | |
| Average Net Assets | 2.57% | 2.43% | 2.62% | 2.44% | 3.10% |
| Portfolio Turnover Rate2 | 4% | 14% | 5% | 22% | 4% |
1 Total returns do not include transaction fees that may have applied in the periods shown. Fund prospectuses provide information about any
applicable transaction fees.
2 Excludes the value of portfolio securities received or delivered as a result of in-kind purchases or redemptions of the fund’s capital shares,
including ETF Creation Units.
See accompanying Notes, which are an integral part of the Financial Statements.
47
Pacific Stock Index Fund
Notes to Financial Statements
Vanguard Pacific Stock Index Fund is registered under the Investment Company Act of 1940 as an open-end investment company, or mutual fund. The fund invests in securities of foreign issuers, which may subject it to investment risks not normally associated with investing in securities of U.S. corporations. The fund offers five classes of shares: Investor Shares, ETF Shares, Admiral Shares, Institutional Shares and Institutional Plus Shares. Investor Shares are available to any investor who meets the fund’s minimum purchase requirements. ETF Shares, known as Vanguard FTSE Pacific ETF Shares, are listed for trading on NYSE Arca; they can be purchased and sold through a broker. Admiral Shares, Institutional Shares, and Institutional Plus Shares are designed for investors who meet certain administrative, service, and account-size criteria. The fund has not issued any Institutional Plus Shares through October 31, 2016.
A. The following significant accounting policies conform to generally accepted accounting principles for U.S. investment companies. The fund consistently follows such policies in preparing its financial statements.
1. Security Valuation: Securities are valued as of the close of trading on the New York Stock Exchange (generally 4 p.m., Eastern time) on the valuation date. Equity securities are valued at the latest quoted sales prices or official closing prices taken from the primary market in which each security trades; such securities not traded on the valuation date are valued at the mean of the latest quoted bid and asked prices. Securities for which market quotations are not readily available, or whose values have been affected by events occurring before the fund’s pricing time but after the close of the securities’ primary markets, are valued at their fair values calculated according to procedures adopted by the board of trustees. These procedures include obtaining quotations from an independent pricing service, monitoring news to identify significant market- or security-specific events, and evaluating changes in the values of foreign market proxies (for example, ADRs, futures contracts, or exchange-traded funds), between the time the foreign markets close and the fund’s pricing time. When fair-value pricing is employed, the prices of securities used by a fund to calculate its net asset value may differ from quoted or published prices for the same securities. Investments in Vanguard Market Liquidity Fund are valued at that fund’s net asset value. Temporary cash investments acquired over 60 days to maturity are valued using the latest bid prices or using valuations based on a matrix system (which considers such factors as security prices, yields, maturities, and ratings), both as furnished by independent pricing services. Other temporary cash investments are valued at amortized cost, which approximates market value.
2. Foreign Currency: Securities and other assets and liabilities denominated in foreign currencies are translated into U.S. dollars using exchange rates obtained from an independent third party as of the fund’s pricing time on the valuation date. Realized gains (losses) and unrealized appreciation (depreciation) on investment securities include the effects of changes in exchange rates since the securities were purchased, combined with the effects of changes in security prices. Fluctuations in the value of other assets and liabilities resulting from changes in exchange rates are recorded as unrealized foreign currency gains (losses) until the assets or liabilities are settled in cash, at which time they are recorded as realized foreign currency gains (losses).
3. Futures and Forward Currency Contracts: The fund uses index futures contracts to a limited extent, with the objectives of maintaining full exposure to the stock market, enhancing returns, maintaining liquidity, and minimizing transaction costs. The fund may purchase futures contracts to immediately invest incoming cash in the market, or sell futures in response to cash outflows, thereby simulating a fully invested position in the underlying index while maintaining a cash balance for liquidity. The fund may seek to enhance returns by using futures contracts instead of the underlying securities when futures are believed to be priced more attractively than the underlying securities. The primary risks
48
Pacific Stock Index Fund
associated with the use of futures contracts are imperfect correlation between changes in market values of stocks held by the fund and the prices of futures contracts, and the possibility of an illiquid market. Counterparty risk involving futures is mitigated because a regulated clearinghouse is the counterparty instead of the clearing broker. To further mitigate counterparty risk, the fund trades futures contracts on an exchange, monitors the financial strength of its clearing brokers and clearinghouse, and has entered into clearing agreements with its clearing brokers. The clearinghouse imposes initial margin requirements to secure the fund’s performance and requires daily settlement of variation margin representing changes in the market value of each contract.
The fund also enters into forward currency contracts to provide the appropriate currency exposure related to any open futures contracts. The fund’s risks in using these contracts include movement in the values of the foreign currencies relative to the U.S. dollar and the ability of the counterparties to fulfill their obligations under the contracts. The fund mitigates its counterparty risk by entering into forward currency contracts only with a diverse group of prequalified counterparties, monitoring their financial strength, entering into master netting arrangements with its counterparties, and requiring its counterparties to transfer collateral as security for their performance. In the absence of a default, the collateral pledged or received by the fund cannot be repledged, resold or rehypothecated. The master netting arrangements provide that, in the event of a counterparty’s default (including bankruptcy), the fund may terminate the forward currency contracts, determine the net amount owed by either party in accordance with its master netting arrangements, and sell or retain any collateral held up to the net amount owed to the fund under the master netting arrangements. The forward currency contracts contain provisions whereby a counterparty may terminate open contracts if the fund’s net assets decline below a certain level, triggering a payment by the fund if the fund is in a net liability position at the time of the termination. The payment amount would be reduced by any collateral the fund has pledged. Any assets pledged as collateral for open contracts are noted in the Statement of Net Assets. The value of collateral received or pledged is compared daily to the value of the forward currency contracts exposure with each counterparty, and any difference, if in excess of a specified minimum transfer amount, is adjusted and settled within two business days.
Futures contracts are valued at their quoted daily settlement prices. Forward currency contracts are valued at their quoted daily prices obtained from an independent third party, adjusted for currency risk based on the expiration date of each contract. The aggregate settlement values and notional amounts of the contracts are not recorded in the Statement of Net Assets. Fluctuations in the value of the contracts are recorded in the Statement of Net Assets as an asset (liability) and in the Statement of Operations as unrealized appreciation (depreciation) until the contracts are closed, when they are recorded as realized gains (losses) on futures or forward currency contracts.
During the year ended October 31, 2016, the fund’s average investments in long and short futures contracts represented less than 1% and 0% of net assets, respectively, based on the average of aggregate settlement values at each quarter-end during the period. The fund’s average investment in forward currency contracts represented 2% of net assets, based on the average of notional amounts at each quarter-end during the period.
49
Pacific Stock Index Fund
4. Federal Income Taxes: The fund intends to continue to qualify as a regulated investment company and distribute all of its taxable income. Management has analyzed the fund’s tax positions taken for all open federal income tax years (October 31, 2013–2016), and has concluded that no provision for federal income tax is required in the fund’s financial statements.
5. Distributions: Distributions to shareholders are recorded on the ex-dividend date.
6. Securities Lending: To earn additional income, the fund lends its securities to qualified institutional borrowers. Security loans are subject to termination by the fund at any time, and are required to be secured at all times by collateral in an amount at least equal to the market value of securities loaned. Daily market fluctuations could cause the value of loaned securities to be more or less than the value of the collateral received. When this occurs, the collateral is adjusted and settled on the next business day. The fund further mitigates its counterparty risk by entering into securities lending transactions only with a diverse group of prequalified counterparties, monitoring their financial strength, and entering into master securities lending agreements with its counterparties. The master securities lending agreements provide that, in the event of a counterparty’s default (including bankruptcy), the fund may terminate any loans with that borrower, determine the net amount owed, and sell or retain the collateral up to the net amount owed to the fund; however, such actions may be subject to legal proceedings. While collateral mitigates counterparty risk, in the absence of a default the fund may experience delays and costs in recovering the securities loaned. The fund invests cash collateral received in Vanguard Market Liquidity Fund, and records a liability in the Statement of Net Assets for the return of the collateral, during the period the securities are on loan. Securities lending income represents fees charged to borrowers plus income earned on invested cash collateral, less expenses associated with the loan. During the term of the loan, the fund is entitled to all distributions made on or in respect of the loaned securities.
7. Credit Facility: The fund and certain other funds managed by The Vanguard Group (“Vanguard”) participate in a $3.1 billion committed credit facility provided by a syndicate of lenders pursuant to a credit agreement that may be renewed annually; each fund is individually liable for its borrowings, if any, under the credit facility. Borrowings may be utilized for temporary and emergency purposes, and are subject to the fund’s regulatory and contractual borrowing restrictions. The participating funds are charged administrative fees and an annual commitment fee of 0.10% of the undrawn amount of the facility; these fees are allocated to the funds based on a method approved by the fund’s board of trustees and included in Management and Administrative expenses on the fund’s Statement of Operations. Any borrowings under this facility bear interest at a rate based upon the higher of the one-month London Interbank Offered Rate, federal funds effective rate, or overnight bank funding rate plus an agreed-upon spread.
The fund had no borrowings outstanding at October 31, 2016, or at any time during the period then ended.
8. Other: Dividend income is recorded on the ex-dividend date. Interest income includes income distributions received from Vanguard Market Liquidity Fund and is accrued daily. Premiums and discounts on debt securities purchased are amortized and accreted, respectively, to interest income over the lives of the respective securities. Security transactions are accounted for on the date securities are bought or sold. Costs used to determine realized gains (losses) on the sale of investment securities are those of the specific securities sold.
50
Pacific Stock Index Fund
Each class of shares has equal rights as to assets and earnings, except that each class separately bears certain class-specific expenses related to maintenance of shareholder accounts (included in Management and Administrative expenses) and shareholder reporting. Marketing and distribution expenses are allocated to each class of shares based on a method approved by the board of trustees. Income, other non-class-specific expenses, and gains and losses on investments are allocated to each class of shares based on its relative net assets.
B. In accordance with the terms of a Funds’ Service Agreement (the “FSA”) between Vanguard and the fund, Vanguard furnishes to the fund investment advisory, corporate management, administrative, marketing, and distribution services at Vanguard’s cost of operations (as defined by the FSA). These costs of operations are allocated to the fund based on methods and guidelines approved by the board of trustees. Vanguard does not require reimbursement in the current period for certain costs of operations (such as deferred compensation/benefits and risk/insurance costs); the fund’s liability for these costs of operations is included in Payables to Vanguard on the Statement of Net Assets.
Upon the request of Vanguard, the fund may invest up to 0.40% of its net assets as capital in Vanguard. At October 31, 2016, the fund had contributed to Vanguard capital in the amount of $436,000, representing 0.01% of the fund’s net assets and 0.17% of Vanguard’s capitalization. The fund’s trustees and officers are also directors and employees, respectively, of Vanguard.
C. Various inputs may be used to determine the value of the fund’s investments. These inputs are summarized in three broad levels for financial statement purposes. The inputs or methodologies used to value securities are not necessarily an indication of the risk associated with investing in those securities.
Level 1—Quoted prices in active markets for identical securities.
Level 2—Other significant observable inputs (including quoted prices for similar securities, interest rates, prepayment speeds, credit risk, etc.).
Level 3—Significant unobservable inputs (including the fund’s own assumptions used to determine the fair value of investments).
The following table summarizes the market value of the fund’s investments as of October 31, 2016, based on the inputs used to value them:
| | | |
| | Level 1 | Level 2 | Level 3 |
| Investments | ($000) | ($000) | ($000) |
| Common Stocks | 638 | 5,746,233 | 654 |
| Temporary Cash Investments | 124,898 | 3,300 | — |
| Futures Contracts—Assets1 | 100 | — | — |
| Futures Contracts—Liabilities1 | (7) | — | — |
| Forward Currency Contracts—Assets | — | 1,838 | — |
| Forward Currency Contracts—Liabilities | — | (990) | — |
| Total | 125,629 | 5,750,381 | 654 |
| 1 Represents variation margin on the last day of the reporting period. |
51
Pacific Stock Index Fund
D. At October 31, 2016, the fair values of derivatives were reflected in the Statement of Net Assets as follows:
| | | |
| | | Foreign | |
| | Equity | Exchange | |
| | Contracts | Contracts | Total |
| Statement of Net Assets Caption | ($000) | ($000) | ($000) |
| Other Assets | 100 | 1,838 | 1,938 |
| Other Liabilities | (7) | (990) | (997) |
Realized net gain (loss) and the change in unrealized appreciation (depreciation) on derivatives for the year ended October 31, 2016, were:
| | | |
| | | Foreign | |
| | Equity | Exchange | |
| | Contracts | Contracts | Total |
| Realized Net Gain (Loss) on Derivatives | ($000) | ($000) | ($000) |
| Futures Contracts | (1,903) | — | (1,903) |
| Forward Currency Contracts | — | 4,061 | 4,061 |
| Realized Net Gain (Loss) on Derivatives | (1,903) | 4,061 | 2,158 |
| |
| Change in Unrealized Appreciation (Depreciation) on Derivatives | | | |
| Futures Contracts | (252) | — | (252) |
| Forward Currency Contracts | — | 194 | 194 |
| Change in Unrealized Appreciation (Depreciation) on Derivatives | (252) | 194 | (58) |
At October 31, 2016, the aggregate settlement value of open futures contracts and the related unrealized appreciation (depreciation) were:
| | | | |
| | | | ($000) |
| | | | Aggregate | |
| | | Number of | Settlement | Unrealized |
| | | Long (Short) | Value | Appreciation |
| Futures Contracts | Expiration | Contracts | Long (Short) | (Depreciation) |
| Topix Index | December 2016 | 153 | 19,753 | 1,625 |
| S&P ASX 200 Index | December 2016 | 83 | 8,353 | 167 |
| | | | | 1,792 |
52
Pacific Stock Index Fund
At October 31, 2016, the fund had open forward currency contracts to receive and deliver currencies as follows. Unrealized appreciation (depreciation) on open forward currency contracts is treated as realized gain (loss) for tax purposes.
| | | | | | |
| | | | | | | Unrealized |
| | Contract | | | | | Appreciation |
| | Settlement | Contract Amount (000) | (Depreciation) |
| Counterparty | Date | | Receive | | Deliver | ($000) |
| BNP Paribas | 12/13/16 | JPY | 3,303,015 | USD | 32,395 | (843) |
| Goldman Sachs Bank USA | 12/20/16 | AUD | 20,999 | USD | 15,613 | 341 |
| Citibank, N.A. | 12/13/16 | KRW | 3,529,575 | USD | 3,219 | (135) |
| BNP Paribas | 12/13/16 | USD | 13,799 | JPY | 1,383,500 | 584 |
| Bank of America, N.A. | 12/13/16 | USD | 13,790 | JPY | 1,383,500 | 574 |
| Goldman Sachs Bank USA | 12/13/16 | USD | 8,008 | JPY | 807,600 | 294 |
| JPMorgan Chase Bank, N.A. | 12/20/16 | USD | 5,199 | AUD | 6,841 | 1 |
| JPMorgan Chase Bank, N.A. | 12/13/16 | USD | 5,042 | JPY | 529,150 | (12) |
| BNP Paribas | 12/20/16 | USD | 2,997 | AUD | 3,939 | 4 |
| Citibank, N.A. | 12/13/16 | USD | 2,996 | JPY | 309,465 | 40 |
| | | | | | | 848 |
| AUD—Australian dollar. |
| JPY—Japanese yen. |
| KRW—Korean won. |
| USD—U.S. dollar. |
At October 31, 2016, the counterparties had deposited in segregated accounts securities with a value of $1,045,000 in connection with open forward currency contracts.
E. Distributions are determined on a tax basis and may differ from net investment income and realized capital gains for financial reporting purposes. Differences may be permanent or temporary. Permanent differences are reclassified among capital accounts in the financial statements to reflect their tax character. Temporary differences arise when certain items of income, expense, gain, or loss are recognized in different periods for financial statement and tax purposes. These differences will reverse at some time in the future. Differences in classification may also result from the treatment of short-term gains as ordinary income for tax purposes.
During the year ended October 31, 2016, the fund realized net foreign currency gains of $3,117,000, which increased distributable net income for tax purposes; accordingly, such gains have been reclassified from accumulated net realized losses to undistributed net investment income.
During the year ended October 31, 2016, the fund realized $23,054,000 of net capital gains resulting from in-kind redemptions—in which shareholders exchanged fund shares for securities held by the fund rather than for cash. Because such gains are not taxable to the fund, and are not distributed to shareholders, they have been reclassified from accumulated net realized losses to paid-in capital.
For tax purposes, at October 31, 2016, the fund had $50,704,000 of ordinary income available for distribution. The fund used capital loss carryforwards of $5,759,000 to offset taxable capital gains realized during the year ended October 31, 2016. At October 31, 2016, the fund had available capital
53
Pacific Stock Index Fund
losses totaling $691,470,000 to offset future net capital gains of $607,343,000 through October 31, 2017, $29,743,000 through October 31, 2018, and $54,384,000 through October 31, 2019. Capital loss carryforwards of $412,587,000 expired on October 31, 2016; accordingly, such losses have been reclassified from accumulated net realized losses to paid-in capital.
At October 31, 2016, the cost of investment securities for tax purposes was $6,845,592,000. Net unrealized depreciation of investment securities for tax purposes was $969,869,000, consisting of unrealized gains of $628,112,000 on securities that had risen in value since their purchase and $1,597,981,000 in unrealized losses on securities that had fallen in value since their purchase.
F. During the year ended October 31, 2016, the fund purchased $694,062,000 of investment securities and sold $668,868,000 of investment securities, other than temporary cash investments. Purchases and sales include $452,383,000 and $377,206,000, respectively, in connection with in-kind purchases and redemptions of the fund’s capital shares.
G. Capital share transactions for each class of shares were:
| | | | |
| | Year Ended October 31, |
| | 2016 | 2015 |
| | Amount | Shares | Amount | Shares |
| | ($000) | (000) | ($000) | (000) |
| Investor Shares | | | | |
| Issued | 31,068 | 2,889 | 64,269 | 5,573 |
| Issued in Lieu of Cash Distributions | 6,289 | 591 | 6,971 | 624 |
| Redeemed | (74,616) | (6,949) | (103,760) | (9,176) |
| Net Increase (Decrease)—Investor Shares | (37,259) | (3,469) | (32,520) | (2,979) |
| ETF Shares | | | | |
| Issued | 611,197 | 10,738 | 830,517 | 14,049 |
| Issued in Lieu of Cash Distributions | — | — | — | — |
| Redeemed | (426,400) | (7,900) | (502,181) | (8,600) |
| Net Increase (Decrease)—ETF Shares | 184,797 | 2,838 | 328,336 | 5,449 |
| Admiral Shares | | | | |
| Issued | 178,591 | 2,564 | 320,195 | 4,274 |
| Issued in Lieu of Cash Distributions | 39,890 | 578 | 39,790 | 549 |
| Redeemed | (289,779) | (4,172) | (296,403) | (4,062) |
| Net Increase (Decrease)—Admiral Shares | (71,298) | (1,030) | 63,582 | 761 |
| Institutional Shares | | | | |
| Issued | 67,558 | 6,430 | 53,168 | 4,727 |
| Issued in Lieu of Cash Distributions | 5,752 | 545 | 4,987 | 450 |
| Redeemed | (123,341) | (11,466) | (48,286) | (4,222) |
| Net Increase (Decrease)—Institutional Shares | (50,031) | (4,491) | 9,869 | 955 |
H. Management has determined that no material events or transactions occurred subsequent to October 31, 2016, that would require recognition or disclosure in these financial statements.
54
Report of Independent Registered
Public Accounting Firm
To the Board of Trustees of Vanguard International Equity Index Funds and the Shareholders of Vanguard European Stock Index Fund and Vanguard Pacific Stock Index Fund:
In our opinion, the accompanying statements of net assets—investments summary and the related statements of operations and of changes in net assets and the financial highlights present fairly, in all material respects, the financial position of Vanguard European Stock Index Fund and Vanguard Pacific Stock Index Fund (constituting separate portfolios of Vanguard International Equity Index Funds, hereafter referred to as the “Funds”) at October 31, 2016, the results of each of their operations for the year then ended, the changes in each of their net assets for each of the two years in the period then ended, and the financial highlights for each of the periods indicated, in conformity with accounting principles generally accepted in the United States of America. These financial statements and financial highlights (hereafter referred to as “financial statements”) are the responsibility of the Funds’ management. Our responsibility is to express an opinion on these financial statements based on our audits. We conducted our audits of these financial statements in accordance with the standards of the Public Company Accounting Oversight Board (United States). Those standards require that we plan and perform the audit to obtain reasonable assurance about whether the financial statements are free of material misstatement. An audit includes examining, on a test basis, evidence supporting the amounts and disclosures in the financial statements, assessing the accounting principles used and significant estimates made by management, and evaluating the overall financial statement presentation. We believe that our audits, which included confirmation of securities at October 31, 2016 by correspondence with the custodian and brokers and by agreement to the underlying ownership records of the transfer agent, provide a reasonable basis for our opinion.
/s/PricewaterhouseCoopers LLP
Philadelphia, Pennsylvania
December 15, 2016
55

Special 2016 tax information (unaudited) for Vanguard European Stock Index Fund
This information for the fiscal year ended October 31, 2016, is included pursuant to provisions of the
Internal Revenue Code.
The fund distributed $527,641,000 of qualified dividend income to shareholders during the fiscal year.
The fund designates to shareholders foreign source income of $567,612,000 and foreign taxes paid
of $39,066,000. Shareholders will receive more detailed information with their Form 1099-DIV in
January 2017 to determine the calendar year amounts to be included on their 2016 tax returns.

Special 2016 tax information (unaudited) for Vanguard Pacific Stock Index Fund
This information for the fiscal year ended October 31, 2016, is included pursuant to provisions of the
Internal Revenue Code.
The fund distributed $106,669,000 of qualified dividend income to shareholders during the fiscal year.
The fund designates to shareholders foreign source income $140,279,000 and foreign taxes paid
of $9,085,000. Shareholders will receive more detailed information with their Form 1099-DIV in
January 2017 to determine the calendar year amounts to be included on their 2016 tax returns.
56
Your Fund’s After-Tax Returns
This table presents returns for your fund both before and after taxes. The after-tax returns are shown in two ways: (1) assuming that an investor owned the fund during the entire period and paid taxes on the fund’s distributions, and (2) assuming that an investor paid taxes on the fund’s distributions and sold all shares at the end of each period.
Calculations are based on the highest individual federal income tax and capital gains tax rates in effect at the times of the distributions and the hypothetical sales. State and local taxes were not considered. After-tax returns reflect any qualified dividend income, using actual prior-year figures and estimates for 2016. (In the example, returns after the sale of fund shares may be higher than those assuming no sale. This occurs when the sale would have produced a capital loss. The calculation assumes that the investor received a tax deduction for the loss.)
The table shows returns for Investor Shares only; returns for other share classes will differ. Please note that your actual after-tax returns will depend on your tax situation and may differ from those shown. Also note that if you own the fund in a tax-deferred account, such as an individual retirement account or a 401(k) plan, this information does not apply to you. Such accounts are not subject to current taxes.
Finally, keep in mind that a fund’s performance—whether before or after taxes—does not guarantee future results.
| | | |
| Average Annual Total Returns: International Stock Index Funds | | | |
| Periods Ended October 31, 2016 | | | |
| |
| | One | Five | Ten |
| | Year | Years | Years |
| European Stock Index Fund Investor Shares | | | |
| Returns Before Taxes | -6.63% | 4.79% | 0.92% |
| Returns After Taxes on Distributions | -7.46 | 3.90 | 0.19 |
| Returns After Taxes on Distributions and Sale of Fund Shares | -3.24 | 3.80 | 0.84 |
| | | |
| | One | Five | Ten |
| | Year | Years | Years |
| Pacific Stock Index Fund Investor Shares | | | |
| Returns Before Taxes | 6.40% | 6.31% | 2.08% |
| Returns After Taxes on Distributions | 5.74 | 5.59 | 1.53 |
| Returns After Taxes on Distributions and Sale of Fund Shares | 3.99 | 4.87 | 1.62 |
57
About Your Fund’s Expenses
As a shareholder of the fund, you incur ongoing costs, which include costs for portfolio management, administrative services, and shareholder reports (like this one), among others. Operating expenses, which are deducted from a fund’s gross income, directly reduce the investment return of the fund.
A fund’s expenses are expressed as a percentage of its average net assets. This figure is known as the expense ratio. The following examples are intended to help you understand the ongoing costs (in dollars) of investing in your fund and to compare these costs with those of other mutual funds. The examples are based on an investment of $1,000 made at the beginning of the period shown and held for the entire period.
The accompanying table illustrates your fund’s costs in two ways:
• Based on actual fund return. This section helps you to estimate the actual expenses that you paid over the period. The ”Ending Account Value“ shown is derived from the fund‘s actual return, and the third column shows the dollar amount that would have been paid by an investor who started with $1,000 in the fund. You may use the information here, together with the amount you invested, to estimate the expenses that you paid over the period.
To do so, simply divide your account value by $1,000 (for example, an $8,600 account value divided by $1,000 = 8.6), then multiply the result by the number given for your fund under the heading ”Expenses Paid During Period.“
• Based on hypothetical 5% yearly return. This section is intended to help you compare your fund‘s costs with those of other mutual funds. It assumes that the fund had a yearly return of 5% before expenses, but that the expense ratio is unchanged. In this case—because the return used is not the fund’s actual return—the results do not apply to your investment. The example is useful in making comparisons because the Securities and Exchange Commission requires all mutual funds to calculate expenses based on a 5% return. You can assess your fund’s costs by comparing this hypothetical example with the hypothetical examples that appear in shareholder reports of other funds.
Note that the expenses shown in the table are meant to highlight and help you compare ongoing costs only and do not reflect transaction costs incurred by the fund for buying and selling securities. Further, the expenses do not include any purchase, redemption, or account service fees described in the fund prospectus. If such fees were applied to your account, your costs would be higher. Your fund does not carry a “sales load.”
The calculations assume no shares were bought or sold during the period. Your actual costs may have been higher or lower, depending on the amount of your investment and the timing of any purchases or redemptions.
You can find more information about the fund’s expenses, including annual expense ratios, in the Financial Statements section of this report. For additional information on operating expenses and other shareholder costs, please refer to your fund’s current prospectus.
58
| | | |
| Six Months Ended October 31, 2016 | | | |
| | Beginning | Ending | Expenses |
| | Account Value | Account Value | Paid During |
| | 4/30/2016 | 10/31/2016 | Period |
| Based on Actual Fund Return | | | |
| European Stock Index Fund | | | |
| Investor Shares | $1,000.00 | $965.93 | $1.28 |
| FTSE Europe ETF Shares | 1,000.00 | 967.31 | 0.64 |
| Admiral Shares | 1,000.00 | 966.77 | 0.44 |
| Institutional Shares | 1,000.00 | 966.95 | 0.35 |
| Institutional Plus Shares | 1,000.00 | 966.84 | 0.30 |
| Pacific Stock Index Fund | | | |
| Investor Shares | $1,000.00 | $1,083.12 | $1.36 |
| FTSE Pacific ETF Shares | 1,000.00 | 1,083.50 | 0.52 |
| Admiral Shares | 1,000.00 | 1,083.30 | 0.52 |
| Institutional Shares | 1,000.00 | 1,083.72 | 0.42 |
| Based on Hypothetical 5% Yearly Return | | | |
| European Stock Index Fund | | | |
| Investor Shares | $1,000.00 | $1,023.83 | $1.32 |
| FTSE Europe ETF Shares | 1,000.00 | 1,024.48 | 0.66 |
| Admiral Shares | 1,000.00 | 1,024.68 | 0.46 |
| Institutional Shares | 1,000.00 | 1,024.78 | 0.36 |
| Institutional Plus Shares | 1,000.00 | 1,024.83 | 0.31 |
| Pacific Stock Index Fund | | | |
| Investor Shares | $1,000.00 | $1,023.83 | $1.32 |
| FTSE Pacific ETF Shares | 1,000.00 | 1,024.63 | 0.51 |
| Admiral Shares | 1,000.00 | 1,024.63 | 0.51 |
| Institutional Shares | 1,000.00 | 1,024.73 | 0.41 |
The calculations are based on expenses incurred in the most recent six-month period. The funds’ annualized six-month expense ratios for that
period are: for the European Stock Index Fund, 0.26% for Investor Shares, 0.13% for FTSE Europe ETF Shares, 0.09% for Admiral
Shares, 0.07% for Institutional Shares, and 0.06% for Institutional Plus Shares; and for the Pacific Stock Index Fund, 0.26% for Investor
Shares, 0.10% for FTSE Pacific ETF Shares, 0.10% for Admiral Shares, and 0.08% for Institutional Shares. The dollar amounts shown as
“Expenses Paid” are equal to the annualized expense ratio multiplied by the average account value over the period, multiplied by the number
of days in the most recent six-month period, then divided by the number of days in the most recent 12-month period (184/366).
59
Glossary
Beta. A measure of the magnitude of a fund’s past share-price fluctuations in relation to the ups and downs of a given market index. The index is assigned a beta of 1.00. Compared with a given index, a fund with a beta of 1.20 typically would have seen its share price rise or fall by 12% when the index rose or fell by 10%. For this report, beta is based on returns over the past 36 months for both the fund and the index. Note that a fund’s beta should be reviewed in conjunction with its R-squared (see definition). The lower the R-squared, the less correlation there is between the fund and the index, and the less reliable beta is as an indicator of volatility.
Dividend Yield. Dividend income earned by stocks, expressed as a percentage of the aggregate market value (or of net asset value, for a fund). The yield is determined by dividing the amount of the annual dividends by the aggregate value (or net asset value) at the end of the period. For a fund, the dividend yield is based solely on stock holdings and does not include any income produced by other investments.
Equity Exposure. A measure that reflects a fund’s investments in stocks and stock futures. Any holdings in short-term reserves are excluded.
Expense Ratio. A fund’s total annual operating expenses expressed as a percentage of the fund’s average net assets. The expense ratio includes management and administrative expenses, but does not include the transaction costs of buying and selling portfolio securities.
Fair-Value Pricing. Fair-value adjustments, which are required by the Securities and Exchange Commission, address pricing discrepancies that may arise because of time-zone differences among global stock markets. Foreign stocks may trade on exchanges that close many hours before a fund’s closing share price is calculated in the United States, generally at 4 p.m., Eastern time. In the hours between the foreign close and the U.S. close, the value of these foreign securities may change—because of company-specific announcements or market-wide developments, for example. Such price changes are not immediately reflected in international index values. Fair-value pricing takes such changes into account in calculating the fund’s daily net asset value, thus ensuring that the NAV doesn’t include “stale” prices. The result can be a temporary divergence between the return of the fund and that of its benchmark index—a difference that usually corrects itself when the foreign markets reopen.
Inception Date. The date on which the assets of a fund (or one of its share classes) are first invested in accordance with the fund’s investment objective. For funds with a subscription period, the inception date is the day after that period ends. Investment performance is measured from the inception date.
Median Market Cap. An indicator of the size of companies in which a fund invests; the midpoint of market capitalization (market price x shares outstanding) of a fund’s stocks, weighted by the proportion of the fund’s assets invested in each stock. Stocks representing half of the fund’s assets have market capitalizations above the median, and the rest are below it.
Price/Book Ratio. The share price of a stock divided by its net worth, or book value, per share. For a fund, the weighted average price/book ratio of the stocks it holds.
60
Price/Earnings Ratio. The ratio of a stock’s current price to its per-share earnings over the past year. For a fund, the weighted average P/E of the stocks it holds. P/E is an indicator of market expectations about corporate prospects; the higher the P/E, the greater the expectations for a company’s future growth.
R-Squared. A measure of how much of a fund’s past returns can be explained by the returns from the market in general, as measured by a given index. If a fund’s total returns were precisely synchronized with an index’s returns, its R-squared would be 1.00. If the fund’s returns bore no relationship to the index’s returns, its R-squared would be 0. For this report, R-squared is based on returns over the past 36 months for both the fund and the index.
Return on Equity. The annual average rate of return generated by a company during the past five years for each dollar of shareholder’s equity (net income divided by shareholder’s equity). For a fund, the weighted average return on equity for the companies whose stocks it holds.
Short-Term Reserves. The percentage of a fund invested in highly liquid, short-term securities that can be readily converted to cash.
Turnover Rate. An indication of the fund’s trading activity. Funds with high turnover rates incur higher transaction costs and may be more likely to distribute capital gains (which may be taxable to investors). The turnover rate excludes in-kind transactions, which have minimal impact on costs.
Benchmark Information
Spliced European Stock Index: MSCI Europe Index through March 26, 2013; FTSE Developed
Europe Index through September 30, 2015; FTSE Developed Europe All Cap Index thereafter.
Benchmark returns are adjusted for withholding taxes.
Spliced Pacific Stock Index: MSCI Pacific Index through March 26, 2013; FTSE Developed Asia
Pacific Index through September 30, 2015; FTSE Developed Asia Pacific All Cap Index thereafter.
Benchmark returns are adjusted for withholding taxes.
61
This page intentionally left blank.
This page intentionally left blank.
The People Who Govern Your Fund
The trustees of your mutual fund are there to see that the fund is operated and managed in your best interests since, as a shareholder, you are a part owner of the fund. Your fund’s trustees also serve on the board of directors of The Vanguard Group, Inc., which is owned by the Vanguard funds and provides services to them on an at-cost basis.
A majority of Vanguard’s board members are independent, meaning that they have no affiliation with Vanguard or the funds they oversee, apart from the sizable personal investments they have made as private individuals. The independent board members have distinguished backgrounds in business, academia, and public service. Each of the trustees and executive officers oversees 198 Vanguard funds.
The following table provides information for each trustee and executive officer of the fund. The mailing address of the trustees and officers is P.O. Box 876, Valley Forge, PA 19482. More information about the trustees is in the Statement of Additional Information, which can be obtained, without charge, by contacting Vanguard at 800-662-7447, or online at vanguard.com.
|
| InterestedTrustee1 |
F. William McNabb III |
| Born 1957. Trustee Since July 2009. Chairman of |
| the Board. Principal Occupation(s) During the Past |
| Five Years and Other Experience: Chairman of the |
| Board of The Vanguard Group, Inc., and of each of |
| the investment companies served by The Vanguard |
| Group, since January 2010; Director of The Vanguard |
| Group since 2008; Chief Executive Officer and |
| President of The Vanguard Group, and of each of |
| the investment companies served by The Vanguard |
| Group, since 2008; Director of Vanguard Marketing |
| Corporation; Managing Director of The Vanguard |
| Group (1995–2008). |
| |
| IndependentTrustees |
Emerson U. Fullwood |
| Born 1948. Trustee Since January 2008. Principal |
| Occupation(s) During the Past Five Years and Other |
| Experience: Executive Chief Staff and Marketing |
| Officer for North America and Corporate Vice President |
| (retired 2008) of Xerox Corporation (document manage- |
| ment products and services); Executive in Residence |
| and 2009–2010 Distinguished Minett Professor at |
| the Rochester Institute of Technology; Lead Director |
| of SPX FLOW, Inc. (multi-industry manufacturing); |
| Director of the United Way of Rochester, the University |
| of Rochester Medical Center, Monroe Community |
| College Foundation, North Carolina A&T University, |
| and Roberts Wesleyan College. |
|
| Rajiv L. Gupta |
| Born 1945. Trustee Since December 2001.2 Principal |
| Occupation(s) During the Past Five Years and Other |
| Experience: Chairman and Chief Executive Officer |
| (retired 2009) and President (2006–2008) of |
| Rohm and Haas Co. (chemicals); Director of Tyco |
| International plc (diversified manufacturing and |
| services), HP Inc. (printer and personal computer |
| manufacturing), and Delphi Automotive plc |
| (automotive components); Senior Advisor at |
| New Mountain Capital. |
Amy Gutmann |
| Born 1949. Trustee Since June 2006. Principal |
| Occupation(s) During the Past Five Years and |
| Other Experience: President of the University of |
| Pennsylvania; Christopher H. Browne Distinguished |
| Professor of Political Science, School of Arts and |
| Sciences, and Professor of Communication, Annenberg |
| School for Communication, with secondary faculty |
| appointments in the Department of Philosophy, School |
| of Arts and Sciences, and at the Graduate School of |
| Education, University of Pennsylvania; Trustee of the |
| National Constitution Center; Chair of the Presidential |
| Commission for the Study of Bioethical Issues. |
JoAnn Heffernan Heisen |
| Born 1950. Trustee Since July 1998. Principal |
| Occupation(s) During the Past Five Years and |
| Other Experience: Corporate Vice President and |
| Chief Global Diversity Officer (retired 2008) and |
| Member of the Executive Committee (1997–2008) |
| of Johnson & Johnson (pharmaceuticals/medical |
| devices/consumer products); Director of Skytop |
| Lodge Corporation (hotels) and the Robert Wood |
| Johnson Foundation; Member of the Advisory |
| Board of the Institute for Women’s Leadership |
| at Rutgers University. |
F. Joseph Loughrey
Born 1949. Trustee Since October 2009. Principal
Occupation(s) During the Past Five Years and Other
Experience: President and Chief Operating Officer
(retired 2009) of Cummins Inc. (industrial machinery);
Chairman of the Board of Hillenbrand, Inc. (specialized
consumer services), and of Oxfam America; Director
of SKF AB (industrial machinery), Hyster-Yale Materials
Handling, Inc. (forklift trucks), the Lumina Foundation
for Education, and the V Foundation for Cancer
Research; Member of the Advisory Council for the
College of Arts and Letters and of the Advisory Board
to the Kellogg Institute for International Studies, both
at the University of Notre Dame.
Mark Loughridge
Born 1953. Trustee Since March 2012. Principal
Occupation(s) During the Past Five Years and Other
Experience: Senior Vice President and Chief Financial
Officer (retired 2013) at IBM (information technology
services); Fiduciary Member of IBM’s Retirement Plan
Committee (2004–2013); Director of the Dow Chemical
Company; Member of the Council on Chicago Booth.
Scott C. Malpass
Born 1962. Trustee Since March 2012. Principal
Occupation(s) During the Past Five Years and Other
Experience: Chief Investment Officer and Vice
President at the University of Notre Dame; Assistant
Professor of Finance at the Mendoza College of
Business at Notre Dame; Member of the Notre Dame
403(b) Investment Committee, the Board of Advisors
for Spruceview Capital Partners, and the Investment
Advisory Committee of Major League Baseball; Board
Member of TIFF Advisory Services, Inc., and Catholic
Investment Services, Inc. (investment advisors).
André F. Perold
Born 1952. Trustee Since December 2004. Principal
Occupation(s) During the Past Five Years and Other
Experience: George Gund Professor of Finance and
Banking, Emeritus at the Harvard Business School
(retired 2011); Chief Investment Officer and Managing
Partner of HighVista Strategies LLC (private investment
firm); Director of Rand Merchant Bank; Overseer of
the Museum of Fine Arts Boston.
Peter F. Volanakis
Born 1955. Trustee Since July 2009. Principal
Occupation(s) During the Past Five Years and
Other Experience: President and Chief Operating
Officer (retired 2010) of Corning Incorporated
(communications equipment); Chairman of the
Board of Trustees of Colby-Sawyer College;
Member of the Advisory Board of the Norris
Cotton Cancer Center.
Executive Officers
Glenn Booraem
Born 1967. Treasurer Since May 2015. Principal
Occupation(s) During the Past Five Years and
Other Experience: Principal of The Vanguard Group,
Inc.; Treasurer of each of the investment companies
served by The Vanguard Group; Controller of each of
the investment companies served by The Vanguard
Group (2010–2015); Assistant Controller of each of
the investment companies served by The Vanguard
Group (2001–2010).
Thomas J. Higgins
Born 1957. Chief Financial Officer Since September
2008. Principal Occupation(s) During the Past Five
Years and Other Experience: Principal of The Vanguard
Group, Inc.; Chief Financial Officer of each of the
investment companies served by The Vanguard Group;
Treasurer of each of the investment companies served
by The Vanguard Group (1998–2008).
Peter Mahoney
Born 1974. Controller Since May 2015. Principal
Occupation(s) During the Past Five Years and Other
Experience: Head of Global Fund Accounting at The
Vanguard Group, Inc.; Controller of each of the invest-
ment companies served by The Vanguard Group;
Head of International Fund Services at The Vanguard
Group (2008–2014).
Anne E. Robinson
Born 1970. Secretary Since September 2016. Principal
Occupation(s) During the Past Five Years and Other
Experience: Managing Director of The Vanguard Group,
Inc.; General Counsel of The Vanguard Group; Secretary
of The Vanguard Group and of each of the investment
companies served by The Vanguard Group; Director
and Senior Vice President of Vanguard Marketing
Corporation; Managing Director and General Counsel
of Global Cards and Consumer Services at Citigroup
(2014–2016); Counsel at American Express (2003–2014).
| |
| Vanguard Senior Management Team |
| Mortimer J. Buckley | James M. Norris |
| Kathleen C. Gubanich | Thomas M. Rampulla |
| Martha G. King | Glenn W. Reed |
| John T. Marcante | Karin A. Risi |
| Chris D. McIsaac | Michael Rollings |
| |
| Chairman Emeritus and Senior Advisor |
| John J. Brennan | |
| Chairman, 1996–2009 | |
| Chief Executive Officer and President, 1996–2008 |
| |
| Founder | |
| John C. Bogle | |
| Chairman and Chief Executive Officer, 1974–1996 |
1 Mr. McNabb is considered an “interested person,” as defined in the Investment Company Act of 1940, because he is an officer of the Vanguard funds.
2 December 2002 for Vanguard Equity Income Fund, the Vanguard Municipal Bond Funds, and the Vanguard State Tax-Exempt Funds.
|  |
| | P.O. Box 2600 |
| | Valley Forge, PA 19482-2600 |
| |
| |
| |
| Connect with Vanguard® > vanguard.com |
| |
| |
| |
| Fund Information > 800-662-7447 | |
| |
| Direct Investor Account Services > 800-662-2739 | London Stock Exchange Group companies include FTSE |
| Institutional Investor Services > 800-523-1036 | International Limited (”FTSE”), Frank Russell Company |
| | (”Russell”), MTS Next Limited (”MTS”), and FTSE TMX |
| Text Telephone for People | Global Debt Capital Markets Inc. (”FTSE TMX”). All |
| Who Are Deaf or Hard of Hearing > 800-749-7273 | rights reserved. ”FTSE®”, ”Russell®”, ”MTS®”, ”FTSE |
| This material may be used in conjunction | TMX®” and ”FTSE Russell” and other service marks |
| | and trademarks related to the FTSE or Russell indexes |
| with the offering of shares of any Vanguard | are trademarks of the London Stock Exchange Group |
| fund only if preceded or accompanied by | companies and are used by FTSE, MTS, FTSE TMX and |
| the fund’s current prospectus. | Russell under licence. All information is provided for |
| | information purposes only. No responsibility or liability |
| All comparative mutual fund data are from Lipper, a | can be accepted by the London Stock Exchange Group |
| Thomson Reuters Company, or Morningstar, Inc., unless | companies nor its licensors for any errors or for any |
| otherwise noted. | loss from use of this publication. Neither the London |
| You can obtain a free copy of Vanguard’s proxy voting | Stock Exchange Group companies nor any of its |
| guidelines by visiting vanguard.com/proxyreporting or by | licensors make any claim, prediction, warranty or |
| calling Vanguard at 800-662-2739. The guidelines are | representation whatsoever, expressly or impliedly, |
| also available from the SEC’s website, sec.gov. In | either as to the results to be obtained from the use of |
| addition, you may obtain a free report on how your fund | the FTSE Indexes or the fitness or suitability of the |
| voted the proxies for securities it owned during the 12 | Indexes for any particular purpose to which they might |
| months ended June 30. To get the report, visit either | be put. |
| vanguard.com/proxyreporting or sec.gov. | The Industry Classification Benchmark (”ICB”) is owned |
| You can review and copy information about your fund at | by FTSE. FTSE does not accept any liability to any |
| the SEC’s Public Reference Room in Washington, D.C. To | person for any loss or damage arising out of any error |
| find out more about this public service, call the SEC at | or omission in the ICB. |
| 202-551-8090. Information about your fund is also | |
| available on the SEC’s website, and you can receive | |
| copies of this information, for a fee, by sending a | |
| request in either of two ways: via email addressed to | |
| publicinfo@sec.gov or via regular mail addressed to the | |
| Public Reference Section, Securities and Exchange | |
| Commission, Washington, DC 20549-1520. | |
| |
| | © 2016 The Vanguard Group, Inc. |
| | All rights reserved. |
| | Vanguard Marketing Corporation, Distributor. |
| |
| | Q720 122016 |
Annual Report | October 31, 2016
Vanguard Total World Stock Index Fund
A new format, unwavering commitment
As you begin reading this report, you’ll notice that we’ve made some improvements to the opening sections—based on feedback from you, our clients.
Page 1 starts with a new ”Your Fund’s Performance at a Glance,” a concise, handy summary of how your fund performed during the period.
In the renamed ”Chairman’s Perspective,” Bill McNabb will focus on enduring principles and investment insights.
We’ve modified some tables, and eliminated some redundancy, but we haven’t removed any information.
At Vanguard, we’re always looking for better ways to communicate and to help you make sound investment decisions. Thank you for entrusting your assets to us.
| |
| Contents | |
| Your Fund’s Performance at a Glance. | 1 |
| Chairman’s Perspective. | 3 |
| Fund Profile. | 7 |
| Performance Summary. | 9 |
| Financial Statements. | 12 |
| Your Fund’s After-Tax Returns. | 33 |
| About Your Fund’s Expenses. | 34 |
| Glossary. | 36 |
Please note: The opinions expressed in this report are just that—informed opinions. They should not be considered promises or advice.
Also, please keep in mind that the information and opinions cover the period through the date on the front of this report. Of course, the
risks of investing in your fund are spelled out in the prospectus.
See the Glossary for definitions of investment terms used in this report.
About the cover: No matter what language you speak, Vanguard has one consistent message and set of principles. Our primary
focus is on you, our clients. We conduct our business with integrity as a faithful steward of your assets. This message is shown
translated into seven languages, reflecting our expanding global presence.
Your Fund’s Performance at a Glance
• Vanguard Total World Stock Index Fund returned about 3% for the 12 months ended October 31, 2016. Its result is in line with that of its benchmark index and ahead of the average return of its peers.
• U.S. stocks, which represented more than half of the fund’s assets, returned about 4%.
They contributed most to the fund’s performance.
• European stocks, which represented about a fifth of the fund’s assets, returned about –7%. Fallout from Brexit, along with the relative strength of the U.S. dollar against local currencies, weighed on the region’s result.
• Stocks in emerging markets and developed markets in the Pacific region delivered solid gains, returning, respectively, more than 8% and more than 6%.
• Technology, industrials, and basic materials stocks boosted returns; health care, financials, and consumer services stocks detracted from them.
| |
| Total Returns: Fiscal Year Ended October 31, 2016 | |
| | Total |
| | Returns |
| Vanguard Total World Stock Index Fund | |
| Investor Shares | 2.80% |
| ETF Shares | |
| Market Price | 2.90 |
| Net Asset Value | 2.89 |
| Institutional Shares | 2.88 |
| FTSE Global All Cap Index | 2.74 |
| Global Funds Average | 0.98 |
Global Funds Average: Derived from data provided by Lipper, a Thomson Reuters Company.
Institutional Shares are available to certain institutional investors who meet specific administrative, service, and account-size criteria. The
Vanguard ETF® Shares shown are traded on the NYSE Arca exchange and are available only through brokers. The table provides ETF returns
based on both the NYSE Arca market price and the net asset value for a share. U.S. Pat. Nos. 6,879,964; 7,337,138; 7,720,749; 7,925,573;
8,090,646; and 8,417,623.
For the ETF Shares, the market price is determined by the midpoint of the bid-offer spread as of the closing time of the New York Stock
Exchange (generally 4 p.m., Eastern time). The net asset value is also determined as of the NYSE closing time. For more information about
how the ETF Shares' market prices have compared with their net asset value, visit vanguard.com, select your ETF, and then select the Price
and Performance tab. The ETF premium/discount analysis there shows the percentages of days on which the ETF Shares' market price was
above or below the NAV.
1
| |
| Total Returns: Inception Through October 31, 2016 | |
| | Average |
| | Annual Return |
| Total World Stock Index Fund Investor Shares (Returns since inception: 6/26/2008) | 4.40% |
| Spliced Total World Stock Index | 4.40 |
| Global Funds Average | 3.72 |
| For a benchmark description, see the Glossary. |
| Global Funds Average: Derived from data provided by Lipper, a Thomson Reuters Company. |
The figures shown represent past performance, which is not a guarantee of future results. (Current performance may be lower or higher than the performance data cited. For performance data current to the most recent month-end, visit our website at vanguard.com/performance.) Note, too, that both investment returns and principal value can fluctuate widely, so an investor’s shares, when sold, could be worth more or less than their original cost.
| | | | |
| Expense Ratios | | | | |
| Your Fund Compared With Its Peer Group | | | | |
| | Investor | ETF | Institutional | Peer Group |
| | Shares | Shares | Shares | Average |
| Total World Stock Index Fund | 0.25% | 0.14% | 0.13% | 1.27% |
The fund expense ratios shown are from the prospectus dated February 26, 2016, and represent estimated costs for the current fiscal year.
For the fiscal year ended October 31, 2016, the fund’s expense ratios were 0.21% for Investor Shares, 0.11% for ETF Shares, and 0.10% for
Institutional Shares. The peer-group expense ratio is derived from data provided by Lipper, a Thomson Reuters Company, and captures
information through year-end 2015.
Peer group: Global Funds.
2
Chairman’s Perspective

Bill McNabb
Chairman and Chief Executive Officer
Dear Shareholder,
Over the three years ended August 31, 2016, investors poured more than $1 trillion into index funds. Indexing now accounts for nearly a third of all mutual fund assets—more than double what it did a decade ago and eight times its share two decades ago.1
By contrast, active management’s commercial struggles have reflected its disappointing investment performance. Over the decade ended December 31, 2015, 82% of actively managed stock funds and 81% of active bond funds have either underperformed their benchmarks or shut down.
This subpar performance has fueled the explosion of asset growth in indexing among individual, retirement, and nonprofit investors. So what might the trend mean for the future of actively managed funds?
Our research and experience indicate that active management can survive—and even succeed—but only if it’s offered at much lower expense.
High costs, which limit a manager’s ability to deliver benchmark-beating returns to clients, are the biggest reason why active has lagged. Industrywide as of December 31, 2015, the average expense ratio for all active stock funds is 1.14%, compared with 0.76% for stock index
1 Sources: Wall Street Journal; Morningstar, Inc.; and Investment Company Institute, 2016.
3
funds. And the expense advantage is even wider for bonds; the average expense ratio for an active bond fund is 0.93%, compared with 0.43% for bond index funds.
But even these big differences understate the real gap. These days, it’s not hard to find an index fund that charges maybe 0.05% or 0.10%. So even if you have identified active managers who are skilled at selecting stocks and bonds, to match the return of a comparable (much cheaper) index fund would require significant outperformance. Think about it. Any fund that charges 1.00% in expenses—not even the high end of the range—will find it extraordinarily difficult to overcome the index fund’s head start.
Active management also has taken a hit from a regulatory environment that has been favorable to low-cost strategies. The U.S. Department of Labor several years ago mandated greater disclosure of retirement plan fees. And its new fiduciary rule, which is set to take effect in April, requires financial advisors to demonstrate that their recommendations are aligned with their clients’ best interest. Both changes encourage the use of lower-cost investments, including index funds.
The future of active management
In light of all this, people have been asking me whether active management is “dead.” My response is both yes and no. High-cost active management is dead, and rightly so. It has never been a winning proposition
| | | |
| Market Barometer | | | |
| | Average Annual Total Returns |
| | Periods Ended October 31, 2016 |
| | One | Three | Five |
| | Year | Years | Years |
| Stocks | | | |
| Russell 1000 Index (Large-caps) | 4.26% | 8.48% | 13.51% |
| Russell 2000 Index (Small-caps) | 4.11 | 4.12 | 11.51 |
| Russell 3000 Index (Broad U.S. market) | 4.24 | 8.13 | 13.35 |
| FTSE All-World ex US Index (International) | 0.64 | -0.94 | 4.09 |
| |
| Bonds | | | |
| Bloomberg Barclays U.S. Aggregate Bond Index | | | |
| (Broad taxable market) | 4.37% | 3.48% | 2.90% |
| Bloomberg Barclays Municipal Bond Index | | | |
| (Broad tax-exempt market) | 4.06 | 4.89 | 4.34 |
| Citigroup Three-Month U.S. Treasury Bill Index | 0.22 | 0.07 | 0.07 |
| |
| CPI | | | |
| Consumer Price Index | 1.64% | 1.15% | 1.32% |
4
for investors. Low-cost active funds, though, can potentially play an important role for investors who seek to outperform the market.
Paying less for your funds is the only sure-fire way to improve your odds of achieving success in active management. But even if you have found an active manager with low costs, the odds of outperforming the market are still long. You have to be able to identify talented stock and bond portfolio managers with long time horizons and clear investment strategies. Look for managers with consistent track records and the discipline to stick closely to their investment strategy.
Know what you own and why
Despite the well-deserved reputation of indexing and the challenges for active managers, there’s still a place for traditional active strategies that are low cost, diversified, and highly disciplined, and are run by talented managers who focus on the long term.
Vanguard has always applied these principles to our active strategies, and investors have benefited as a majority of our active funds outperformed their benchmarks and bested their peers’ average annual return over the ten years ended September 30, 2016.
|
| Worried about the election’s impact on your portfolio? |
|
| The 2016 presidential election season was |
| one of the most intense and unpredictable |
| in U.S. history. In its aftermath, investors |
| may be left with lingering questions about |
| what the outcome will mean for their |
| portfolios. The answer, based on Vanguard |
| research into decades of historical data, is |
| that presidential elections typically have no |
| long-term effect on market performance. |
| |
| These findings hold true regardless of the |
| market’s initial reaction. Whether there’s |
| a swoon or bounce immediately after an |
| election, investors shouldn’t extrapolate |
| that performance to the long term. |
| |
| As you can see in the accompanying chart, |
| data going back to 1853 show that stock |
| market returns are virtually identical no matter |
| which party controls the White House. |
| Although headlines out of Washington at any |
| given time may still cause concern, investors |
|
| shouldn’t overreact to short-term events. |
| Instead, it’s best to maintain a balanced and |
| diversified portfolio and stay focused on your |
| long-term goals. |
| |
| Average annual stock market returns based |
| on party control of the White House |
| (1853–2015) |
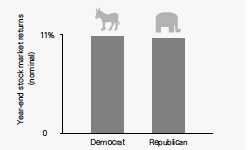
| Sources: Global Financial Data, 1853–1926; Morningstar, Inc., |
| and Ibbotson Associates thereafter through 2015. |
5
But it’s crucial for investors to be patient. Even active managers with the best track records frequently underperform their benchmarks when their investment styles are out of favor. Such periods, though temporary, can persist. So it’s important when entrusting your assets to an active strategy to be in it for the long haul.
Make sure you know what you’re buying and what the risks are. Active strategies are becoming more complex, so it’s important to clearly understand what the investments in your portfolio are designed to accomplish and why you want to hold them. Otherwise, you run the risk of selecting strategies that don’t fit your needs or objectives.
Keeping these considerations in mind can potentially boost your chances of success in identifying active strategies that may be able to help you reach your goals.
As always, thank you for investing with Vanguard.
Sincerely,
F. William McNabb III
Chairman and Chief Executive Officer
November 9, 2016
6
Total World Stock Index Fund
Fund Profile
As of October 31, 2016
| | | |
| Share-Class Characteristics | | |
| |
| | Investor | ETF | Institutional |
| | Shares | Shares | Shares |
| Ticker Symbol | VTWSX | VT | VTWIX |
| Expense Ratio1 | 0.25% | 0.14% | 0.13% |
| | |
| Portfolio Characteristics | | |
| | | FTSE |
| | | Global |
| | | All Cap |
| | Fund | Index |
| Number of Stocks | 7,627 | 7,707 |
| Median Market Cap | $33.0B | $33.4B |
| Price/Earnings Ratio | 21.9x | 21.9x |
| Price/Book Ratio | 2.0x | 2.0x |
| Return on Equity | 15.6% | 15.5% |
| Earnings Growth | | |
| Rate | 7.7% | 7.8% |
| Dividend Yield | 2.5% | 2.5% |
| Turnover Rate | 15% | — |
| Short-Term Reserves | -0.2% | — |
| | |
| Sector Diversification (% of equity exposure) |
| | | FTSE |
| | | Global |
| | | All Cap |
| | Fund | Index |
| Basic Materials | 5.0% | 5.0% |
| Consumer Goods | 13.1 | 13.1 |
| Consumer Services | 10.9 | 10.9 |
| Financials | 22.0 | 22.0 |
| Health Care | 10.2 | 10.2 |
| Industrials | 13.7 | 13.7 |
| Oil & Gas | 6.6 | 6.6 |
| Technology | 11.9 | 11.9 |
| Telecommunications | 3.2 | 3.2 |
| Utilities | 3.4 | 3.4 |
| |
| Volatility Measures | |
| | FTSE |
| | Global |
| | All Cap |
| | Index |
| R-Squared | 0.99 |
| Beta | 0.98 |
These measures show the degree and timing of the fund’s fluctuations compared with the index over 36 months.
| | |
| Ten Largest Holdings (% of total net assets) |
| Apple Inc. | Computer Hardware | 1.5% |
| Alphabet Inc. | Internet | 1.1 |
| Microsoft Corp. | Software | 1.1 |
| Exxon Mobil Corp. | Integrated Oil & Gas | 0.8 |
| Johnson & Johnson | Pharmaceuticals | 0.8 |
| Amazon.com Inc. | Broadline Retailers | 0.7 |
| Facebook Inc. | Internet | 0.7 |
| Berkshire Hathaway Inc. Reinsurance | 0.6 |
| General Electric Co. | Diversified Industrials | 0.6 |
| JPMorgan Chase & Co. | Banks | 0.6 |
| Top Ten | | 8.5% |
The holdings listed exclude any temporary cash investments and equity index products.
Allocation by Region (% of equity exposure)
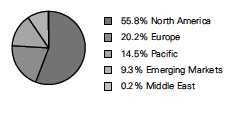
1 The expense ratios shown are from the prospectus dated February 26, 2016, and represent estimated costs for the current fiscal year. For the fiscal
year ended October 31, 2016, the expense ratios were 0.21% for Investor Shares, 0.11% for ETF Shares, and 0.10% for Institutional Shares.
7
Total World Stock Index Fund
| | |
| Market Diversification (% of equity exposure) |
| | | FTSE |
| | | Global |
| | | All Cap |
| | Fund | Index |
| Europe | | |
| United Kingdom | 6.0% | 6.0% |
| France | 2.9 | 2.9 |
| Germany | 2.9 | 2.9 |
| Switzerland | 2.7 | 2.7 |
| Spain | 1.0 | 1.0 |
| Netherlands | 1.0 | 1.0 |
| Sweden | 1.0 | 1.0 |
| Other | 2.7 | 2.6 |
| Subtotal | 20.2% | 20.1% |
| Pacific | | |
| Japan | 8.6% | 8.6% |
| Australia | 2.4 | 2.4 |
| South Korea | 1.6 | 1.6 |
| Hong Kong | 1.3 | 1.3 |
| Other | 0.6 | 0.5 |
| Subtotal | 14.5% | 14.4% |
| Emerging Markets | | |
| China | 2.2% | 2.2% |
| Taiwan | 1.5 | 1.5 |
| India | 1.2 | 1.2 |
| Other | 4.4 | 4.4 |
| Subtotal | 9.3% | 9.3% |
| North America | | |
| United States | 52.6% | 52.7% |
| Canada | 3.2 | 3.3 |
| Subtotal | 55.8% | 56.0% |
| Middle East | 0.2% | 0.2% |
8
Total World Stock Index Fund
Performance Summary
All of the returns in this report represent past performance, which is not a guarantee of future results that may be achieved by the fund. (Current performance may be lower or higher than the performance data cited. For performance data current to the most recent month-end, visit our website at vanguard.com/performance.) Note, too, that both investment returns and principal value can fluctuate widely, so an investor’s shares, when sold, could be worth more or less than their original cost. The returns shown do not reflect taxes that a shareholder would pay on fund distributions or on the sale of fund shares.
Cumulative Performance: June 26, 2008, Through October 31, 2016
Initial Investment of $10,000
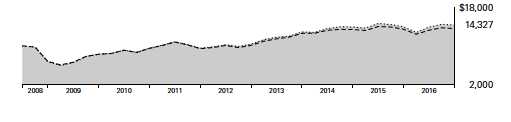
| | | | | |
| | | Average Annual Total Returns | |
| | | Periods Ended October 31, 2016 | |
| |
| | | | | Since | Final Value |
| | | One | Five | Inception | of a $10,000 |
| | | Year | Years | (6/26/2008) | Investment |
| |
| | Total World Stock Index | | | | |
| | Fund*Investor Shares | 2.80% | 8.44% | 4.40% | $14,327 |
| |
| • • • • • • •• | Spliced Total World Stock Index | 2.74 | 8.51 | 4.40 | 14,326 |
| |
| – – – – | Global Funds Average | 0.98 | 7.59 | 3.72 | 13,566 |
For a benchmark description, see the Glossary.
Global Funds Average: Derived from data provided by Lipper, a Thomson Reuters Company.
"Since Inception" performance is calculated from the Investor Shares’ inception date for both the fund and its comparative standards.
| | | | |
| | | | Since | Final Value |
| | One | Five | Inception | of a $10,000 |
| | Year | Years | (6/24/2008) | Investment |
| Total World Stock Index Fund | | | | |
| ETF Shares Net Asset Value | 2.89% | 8.57% | 4.36% | $14,286 |
| Spliced Total World Stock Index | 2.74 | 8.51 | 4.40 | 14,326 |
| "Since Inception" performance is calculated from the ETF Shares’ inception date for both the fund and its comparative standard. |
See Financial Highlights for dividend and capital gains information.
9
Total World Stock Index Fund
| | | | |
| | | Average Annual Total Returns | |
| | Periods Ended October 31, 2016 | |
| |
| | | | Since | Final Value |
| | One | Five | Inception | of a $5,000,000 |
| | Year | Years | (10/9/2008) | Investment |
| Total World Stock Index Fund Institutional | | | | |
| Shares | 2.88% | 8.58% | 10.13% | $10,878,915 |
| |
| Spliced Total World Stock Index | 2.74 | 8.51 | 9.76 | 10,590,661 |
| "Since Inception" performance is calculated from the Institutional Shares’ inception date for both the fund and its comparative standard. |
| | | |
| Cumulative Returns of ETF Shares: June 24, 2008, Through October 31, 2016 | | |
| | | | Since |
| | One | Five | Inception |
| | Year | Years | (6/24/2008) |
| Total World Stock Index Fund ETF Shares Market | | | |
| Price | 2.90% | 50.81% | 42.78% |
| Total World Stock Index Fund ETF Shares Net Asset | | | |
| Value | 2.89 | 50.86 | 42.86 |
| Spliced Total World Stock Index | 2.74 | 50.41 | 43.26 |
| "Since Inception" performance is calculated from the ETF Shares’ inception date for both the fund and its comparative standard. | |
10
Total World Stock Index Fund
Fiscal-Year Total Returns (%): June 26, 2008, Through October 31, 2016
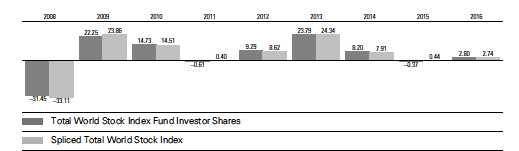
For a benchmark description, see the Glossary.
Index returns are adjusted for withholding taxes applicable to U.S.-based mutual funds organized as Delaware statutory trusts.
Average Annual Total Returns: Periods Ended September 30, 2016
This table presents returns through the latest calendar quarter—rather than through the end of the fiscal period.
Securities and Exchange Commission rules require that we provide this information.
| | | | |
| | Inception | One | Five | Since |
| | Date | Year | Years | Inception |
| Investor Shares | 6/26/2008 | 12.30% | 11.09% | 4.70% |
| ETF Shares | 6/24/2008 | | | |
| Market Price | | 12.56 | 11.33 | 4.65 |
| Net Asset Value | | 12.42 | 11.24 | 4.66 |
| Institutional Shares | 10/9/2008 | 12.42 | 11.25 | 10.51 |
11
Total World Stock Index Fund
Financial Statements
Statement of Net Assets—Investments Summary
As of October 31, 2016
This Statement summarizes the fund’s holdings by asset type. Details are reported for each of the fund’s 50 largest individual holdings and for investments that, in total for any issuer, represent more than 1% of the fund’s net assets. The total value of smaller holdings is reported as a single amount within each category.
The fund reports a complete list of its holdings in regulatory filings four times in each fiscal year, at the quarter-ends. For the second and fourth fiscal quarters, the complete listing of the fund’s holdings is available electronically on vanguard.com and on the Securities and Exchange Commission’s website (sec.gov), or you can have it mailed to you without charge by calling 800-662-7447. For the first and third fiscal quarters, the fund files the lists with the SEC on Form N-Q. Shareholders can look up the fund’s Forms N-Q on the SEC’s website. Forms N-Q may also be reviewed and copied at the SEC’s Public Reference Room (see the back cover of this report for further information).
| | | |
| | | Market | Percentage |
| | | Value• | of Net |
| | Shares | ($000) | Assets |
| Common Stocks | | | |
| Argentina † | | 1,017 | 0.0% |
| |
| 1Australia † | | 211,577 | 2.4% |
| |
| Austria † | | 9,051 | 0.1% |
| |
| Belgium † | | 38,811 | 0.4% |
| |
| 1Brazil † | | 78,251 | 0.9% |
| |
| 1Canada † | | 283,430 | 3.2% |
| |
| Chile † | | 11,329 | 0.1% |
| |
| China | | | |
| Tencent Holdings Ltd. | 1,108,056 | 29,366 | 0.4% |
| China Construction Bank Corp. | 18,939,206 | 13,830 | 0.2% |
| China Mobile Ltd. | 1,103,861 | 12,646 | 0.2% |
| Industrial & Commercial Bank of China Ltd. | 14,935,245 | 8,965 | 0.1% |
| Bank of China Ltd. | 15,637,800 | 7,008 | 0.1% |
| CNOOC Ltd. | 3,334,280 | 4,195 | 0.1% |
| China Petroleum & Chemical Corp. | 5,309,505 | 3,840 | 0.1% |
| China Life Insurance Co. Ltd. Class H | 1,540,000 | 3,813 | 0.1% |
| PetroChina Co. Ltd. | 4,076,000 | 2,789 | 0.1% |
| China Overseas Land & Investment Ltd. | 794,480 | 2,439 | 0.0% |
| Agricultural Bank of China Ltd. | 5,348,500 | 2,250 | 0.0% |
| China Telecom Corp. Ltd. | 3,346,034 | 1,725 | 0.0% |
| PICC Property & Casualty Co. Ltd. | 978,887 | 1,580 | 0.0% |
| China Shenhua Energy Co. Ltd. | 732,500 | 1,519 | 0.0% |
| CITIC Ltd. | 1,031,000 | 1,479 | 0.0% |
| China Unicom Hong Kong Ltd. | 1,213,574 | 1,425 | 0.0% |
| China Resources Land Ltd. | 571,909 | 1,420 | 0.0% |
| Sinopharm Group Co. Ltd. | 221,200 | 1,074 | 0.0% |
12
| | | | |
| Total World Stock Index Fund | | | |
| |
| |
| |
| | | | Market | Percentage |
| | | | Value• | of Net |
| | | Shares | ($000) | Assets |
| | China CITIC Bank Corp. Ltd. | 1,536,010 | 991 | 0.0% |
| | China Communications Construction Co. Ltd. | 894,875 | 983 | 0.0% |
| | CRRC Corp. Ltd. | 879,800 | 797 | 0.0% |
| | China Cinda Asset Management Co. Ltd. | 2,152,000 | 773 | 0.0% |
| * | China Resources Beer Holdings Co. Ltd. | 338,681 | 720 | 0.0% |
| 1 | China Galaxy Securities Co. Ltd. | 751,500 | 713 | 0.0% |
| | China Resources Power Holdings Co. Ltd. | 411,400 | 697 | 0.0% |
| | China Merchants Port Holdings Co. Ltd. | 256,000 | 662 | 0.0% |
| | China Railway Group Ltd. | 829,000 | 639 | 0.0% |
| | Dongfeng Motor Group Co. Ltd. | 594,000 | 619 | 0.0% |
| 1 | CGN Power Co. Ltd. | 1,974,832 | 577 | 0.0% |
| * | China Taiping Insurance Holdings Co. Ltd. | 293,059 | 564 | 0.0% |
| 1 | People’s Insurance Co. Group of China Ltd. | 1,384,000 | 550 | 0.0% |
| | China Longyuan Power Group Corp. Ltd. | 719,000 | 548 | 0.0% |
| | China State Construction International Holdings Ltd. | 372,000 | 543 | 0.0% |
| | China Resources Gas Group Ltd. | 168,000 | 527 | 0.0% |
| *,1 | China Huarong Asset Management Co. Ltd. | 1,349,000 | 516 | 0.0% |
| | Zhuzhou CRRC Times Electric Co. Ltd. | 104,709 | 506 | 0.0% |
| | China Railway Construction Corp. Ltd. | 394,126 | 493 | 0.0% |
| | Kunlun Energy Co. Ltd. | 584,000 | 440 | 0.0% |
| | China Oilfield Services Ltd. | 406,000 | 390 | 0.0% |
| | Sinopec Shanghai Petrochemical Co. Ltd. | 740,000 | 377 | 0.0% |
| | Beijing Capital International Airport Co. Ltd. | 354,000 | 370 | 0.0% |
| | AviChina Industry & Technology Co. Ltd. | 508,000 | 345 | 0.0% |
| | China Reinsurance Group Corp. | 1,403,000 | 334 | 0.0% |
| * | China Coal Energy Co. Ltd. | 581,000 | 329 | 0.0% |
| | China Jinmao Holdings Group Ltd. | 1,140,000 | 314 | 0.0% |
| | Huaneng Renewables Corp. Ltd. | 858,000 | 287 | 0.0% |
| | Chongqing Changan Automobile Co. Ltd. Class B | 187,062 | 285 | 0.0% |
| | Air China Ltd. | 422,000 | 277 | 0.0% |
| | China Power International Development Ltd. | 761,000 | 277 | 0.0% |
| 1 | China Railway Signal & Communication Corp. Ltd. | 301,500 | 244 | 0.0% |
| 1 | Sinopec Engineering Group Co. Ltd. | 265,135 | 234 | 0.0% |
| | Sinotrans Ltd. | 382,000 | 180 | 0.0% |
| * | Sinotrans Shipping Ltd. | 1,084,000 | 176 | 0.0% |
| * | China Agri-Industries Holdings Ltd. | 431,800 | 169 | 0.0% |
| | China Resources Cement Holdings Ltd. | 412,000 | 166 | 0.0% |
| | China Southern Airlines Co. Ltd. | 296,000 | 166 | 0.0% |
| | Metallurgical Corp. of China Ltd. | 489,000 | 159 | 0.0% |
| *,^ | China COSCO Holdings Co. Ltd. | 420,500 | 145 | 0.0% |
| | COSCO International Holdings Ltd. | 308,000 | 143 | 0.0% |
| | China National Accord Medicines Corp. Ltd. Class B | 20,760 | 130 | 0.0% |
| | Huadian Fuxin Energy Corp. Ltd. | 538,000 | 125 | 0.0% |
| | China Eastern Airlines Corp. Ltd. | 264,000 | 119 | 0.0% |
| * | Angang Steel Co. Ltd. | 216,000 | 111 | 0.0% |
| | China National Materials Co. Ltd. | 446,000 | 100 | 0.0% |
| | Sinopec Kantons Holdings Ltd. | 202,000 | 95 | 0.0% |
| | CSSC Offshore and Marine Engineering Group Co. Ltd. | 54,000 | 81 | 0.0% |
| | China Electronics Corp. Holdings Co. Ltd. | 322,000 | 77 | 0.0% |
| | Poly Culture Group Corp. Ltd. | 27,200 | 73 | 0.0% |
| | Dah Chong Hong Holdings Ltd. | 166,000 | 69 | 0.0% |
| | Shanghai Baosight Software Co. Ltd. Class B | 40,000 | 69 | 0.0% |
| | Foshan Huaxin Packaging Co. Ltd. Class B | 56,900 | 69 | 0.0% |
| | China Foods Ltd. | 156,000 | 69 | 0.0% |
| | China BlueChemical Ltd. | 318,000 | 61 | 0.0% |
| | China Overseas Property Holdings Ltd. | 267,493 | 54 | 0.0% |
13
| | | | |
| Total World Stock Index Fund | | | |
| |
| |
| | | | Market | Percentage |
| | | | Value• | of Net |
| | | Shares | ($000) | Assets |
| * | CITIC Resources Holdings Ltd. | 278,000 | 35 | 0.0% |
| * | China Datang Corp. Renewable Power Co. Ltd. | 330,000 | 30 | 0.0% |
| | China Merchants Land Ltd. | 168,000 | 24 | 0.0% |
| ^ | Sinofert Holdings Ltd. | 174,000 | 23 | 0.0% |
| 1 | China—Other † | | 71,757 | 0.8% |
| | | | 192,759 | 2.2% |
| |
| Colombia † | | 4,316 | 0.1% |
| |
| 1Czech Republic † | | 1,727 | 0.0% |
| |
| 1Denmark † | | 48,494 | 0.6% |
| Egypt † | | 2,723 | 0.0% |
| Finland † | | 31,689 | 0.4% |
| France | | | |
| | TOTAL SA | 441,892 | 21,169 | 0.3% |
| 1 | France—Other † | | 230,299 | 2.6% |
| | | | 251,468 | 2.9% |
| |
| 1Germany † | | 250,710 | 2.8% |
| Greece † | | 3,389 | 0.0% |
| Hong Kong | | | |
| | BOC Hong Kong Holdings Ltd. | 749,000 | 2,670 | 0.0% |
| | Nexteer Automotive Group Ltd. | 148,000 | 195 | 0.0% |
| | China Travel International Investment Hong Kong Ltd. | 516,000 | 149 | 0.0% |
| | CITIC Telecom International Holdings Ltd. | 302,500 | 104 | 0.0% |
| *,^ | MMG Ltd. | 196,000 | 52 | 0.0% |
| | Shenwan Hongyuan HK Ltd. | 75,000 | 41 | 0.0% |
| 1 | CGN New Energy Holdings Co. Ltd. | 250,000 | 36 | 0.0% |
| | APT Satellite Holdings Ltd. | 49,500 | 33 | 0.0% |
| 1 | Hong Kong—Other † | | 108,698 | 1.3% |
| | | | 111,978 | 1.3% |
| |
| Hungary † | | 2,556 | 0.0% |
| |
| 1India † | | 101,051 | 1.2% |
| Indonesia † | | 23,612 | 0.3% |
| Ireland † | | 9,291 | 0.1% |
| Israel † | | 17,919 | 0.2% |
| |
| 1Italy † | | 63,681 | 0.7% |
| Japan | | | |
| | Toyota Motor Corp. | 573,994 | 33,296 | 0.4% |
| | Japan—Other † | | 718,462 | 8.1% |
| | | | 751,758 | 8.5% |
14
| | | |
| Total World Stock Index Fund | | | |
| |
| | | Market | Percentage |
| | | Value• | of Net |
| | Shares | ($000) | Assets |
| 1Malaysia † | | 31,416 | 0.4% |
| Malta † | | — | 0.0% |
| 1Mexico † | | 39,510 | 0.5% |
| 1Netherlands † | | 87,590 | 1.0% |
| New Zealand † | | 10,214 | 0.1% |
| 1Norway † | | 22,329 | 0.3% |
| Other2 | | | |
| 3 Vanguard FTSE Emerging Markets ETF | 216,133 | 8,159 | 0.1% |
| Pakistan † | | 1,560 | 0.0% |
| Peru † | | 2,209 | 0.0% |
| Philippines † | | 13,798 | 0.2% |
| Poland † | | 10,809 | 0.1% |
| Portugal † | | 5,437 | 0.1% |
| Qatar † | | 3,901 | 0.0% |
| Russia † | | 35,522 | 0.4% |
| Singapore | | | |
| *,^ COSCO Corp. Singapore Ltd. | 92,000 | 17 | 0.0% |
| 1 Singapore—Other † | | 39,173 | 0.4% |
| | | 39,190 | 0.4% |
| South Africa † | | 67,472 | 0.8% |
| South Korea | | | |
| Samsung Electronics Co. Ltd. GDR | 42,096 | 29,615 | 0.3% |
| South Korea—Other † | | 110,653 | 1.3% |
| | | 140,268 | 1.6% |
| 1Spain † | | 89,085 | 1.0% |
| 1Sweden † | | 86,538 | 1.0% |
| Switzerland | | | |
| Nestle SA | 647,708 | 46,968 | 0.5% |
| Novartis AG | 492,855 | 34,977 | 0.4% |
| Roche Holding AG | 147,532 | 33,885 | 0.4% |
| 1 Switzerland—Other † | | 122,141 | 1.4% |
| | | 237,971 | 2.7% |
| Taiwan † | | 133,164 | 1.5% |
15
| | | |
| Total World Stock Index Fund | | | |
| |
| |
| |
| | | Market | Percentage |
| | | Value• | of Net |
| | Shares | ($000) | Assets |
| 1Thailand † | | 34,000 | 0.4% |
| |
| Turkey † | | 11,236 | 0.1% |
| |
| United Arab Emirates † | | 8,435 | 0.1% |
| |
| United Kingdom | | | |
| HSBC Holdings plc | 4,129,228 | 31,098 | 0.3% |
| BP plc | 3,909,466 | 23,112 | 0.3% |
| British American Tobacco plc | 391,977 | 22,465 | 0.3% |
| Royal Dutch Shell plc Class A | 898,651 | 22,383 | 0.2% |
| 1 United Kingdom—Other † | | 423,071 | 4.8% |
| | | 522,129 | 5.9% |
| United States | | | |
| Basic Materials † | | 115,429 | 1.3% |
| |
| Consumer Goods | | | |
| Procter & Gamble Co. | 535,583 | 46,489 | 0.5% |
| Coca-Cola Co. | 862,528 | 36,571 | 0.4% |
| PepsiCo Inc. | 300,707 | 32,236 | 0.4% |
| Philip Morris International Inc. | 326,429 | 31,481 | 0.4% |
| Altria Group Inc. | 409,284 | 27,062 | 0.3% |
| Consumer Goods—Other † | | 297,126 | 3.4% |
| | | 470,965 | 5.4% |
| Consumer Services | | | |
| * Amazon.com Inc. | 80,219 | 63,359 | 0.7% |
| Home Depot Inc. | 259,260 | 31,632 | 0.4% |
| Walt Disney Co. | 336,447 | 31,185 | 0.4% |
| Comcast Corp. Class A | 501,715 | 31,016 | 0.3% |
| Wal-Mart Stores Inc. | 326,172 | 22,839 | 0.3% |
| Consumer Services—Other † | | 413,360 | 4.7% |
| | | 593,391 | 6.8% |
| Financials | | | |
| JPMorgan Chase & Co. | 755,941 | 52,356 | 0.6% |
| Wells Fargo & Co. | 1,058,311 | 48,693 | 0.6% |
| * Berkshire Hathaway Inc. Class B | 247,977 | 35,783 | 0.4% |
| Bank of America Corp. | 2,152,467 | 35,516 | 0.4% |
| Visa Inc. Class A | 394,782 | 32,573 | 0.4% |
| Citigroup Inc. | 607,047 | 29,836 | 0.3% |
| Mastercard Inc. Class A | 203,250 | 21,752 | 0.2% |
| Financials—Other † | | 626,044 | 7.1% |
| | | 882,553 | 10.0% |
| Health Care | | | |
| Johnson & Johnson | 574,601 | 66,648 | 0.7% |
| Pfizer Inc. | 1,270,446 | 40,286 | 0.5% |
| Merck & Co. Inc. | 581,600 | 34,152 | 0.4% |
| UnitedHealth Group Inc. | 200,119 | 28,283 | 0.3% |
| Medtronic plc | 290,873 | 23,857 | 0.3% |
| Amgen Inc. | 157,502 | 22,233 | 0.2% |
| Health Care—Other † | | 360,172 | 4.1% |
| | | 575,631 | 6.5% |
16
| | | | | |
| Total World Stock Index Fund | | | | |
| |
| |
| |
| | | | | Market | Percentage |
| | | | | Value• | of Net |
| | | | Shares | ($000) | Assets |
| Industrials | | | | |
| | General Electric Co. | | 1,868,563 | 54,375 | 0.6% |
| | Industrials—Other † | | | 525,844 | 6.0% |
| | | | | 580,219 | 6.6% |
| Oil & Gas | | | | |
| | Exxon Mobil Corp. | | 869,839 | 72,475 | 0.8% |
| | Chevron Corp. | | 397,052 | 41,591 | 0.5% |
| | Schlumberger Ltd. | | 290,931 | 22,760 | 0.3% |
| | Oil & Gas—Other † | | | 171,600 | 1.9% |
| | | | | 308,426 | 3.5% |
| |
| 2Other † | | | 45 | 0.0% |
| |
| Technology | | | | |
| | Apple Inc. | | 1,128,548 | 128,135 | 1.4% |
| | Microsoft Corp. | | 1,579,912 | 94,668 | 1.1% |
| * | Facebook Inc. Class A | | 458,824 | 60,101 | 0.7% |
| * | Alphabet Inc. Class A | | 60,981 | 49,388 | 0.6% |
| * | Alphabet Inc. Class C | | 61,314 | 48,103 | 0.5% |
| | Intel Corp. | | 988,497 | 34,469 | 0.4% |
| | Cisco Systems Inc. | | 1,046,637 | 32,111 | 0.4% |
| | International Business Machines Corp. | | 200,082 | 30,751 | 0.3% |
| | Oracle Corp. | | 666,992 | 25,626 | 0.3% |
| | QUALCOMM Inc. | | 306,992 | 21,096 | 0.2% |
| | Technology—Other † | | | 278,143 | 3.2% |
| | | | | 802,591 | 9.1% |
| Telecommunications | | | | |
| | AT&T Inc. | | 1,292,788 | 47,562 | 0.5% |
| | Verizon Communications Inc. | | 853,052 | 41,032 | 0.5% |
| | Telecommunications—Other † | | | 17,356 | 0.2% |
| | | | | 105,950 | 1.2% |
| |
| Utilities † | | | 152,847 | 1.7% |
| | | | | 4,588,047 | 52.1% |
| Total Common Stocks (Cost $7,907,078) | | | 8,732,576 | 99.2%4 |
| |
| | | Coupon | | | |
| Temporary Cash Investments | | | | |
| Money Market Fund | | | | |
| 5,6 | Vanguard Market Liquidity Fund | 0.718% | 1,262,576 | 126,270 | 1.4% |
| |
| 7U.S. Government and Agency Obligations † | | | 7,196 | 0.1% |
| Total Temporary Cash Investments (Cost $133,458) | | | 133,466 | 1.5%4 |
| Total Investments (Cost $8,040,536) | | | 8,866,042 | 100.7% |
17
| | |
| Total World Stock Index Fund | | |
| |
| |
| |
| | | Percentage |
| | Amount | of Net |
| | ($000) | Assets |
| Other Assets and Liabilities | | |
| Other Assets | | |
| Investment in Vanguard | 683 | |
| Receivables for Investment Securities Sold | 220 | |
| Receivables for Accrued Income | 16,691 | |
| Receivables for Capital Shares Issued | 994 | |
| Other Assets | 5,750 | |
| Total Other Assets | 24,338 | 0.3% |
| Liabilities | | |
| Payables for Investment Securities Purchased | (1,191) | |
| Collateral for Securities on Loan | (76,749) | |
| Payables for Capital Shares Redeemed | (534) | |
| Payables to Vanguard | (2,953) | |
| Other Liabilities | (1,016) | |
| Total Liabilities | (82,443) | (1.0%) |
| Net Assets | 8,807,937 | 100.0% |
| |
| |
| At October 31, 2016, net assets consisted of: | | |
| | | Amount |
| | | ($000) |
| Paid-in Capital | | 8,122,969 |
| Undistributed Net Investment Income | | 25,728 |
| Accumulated Net Realized Losses | | (165,563) |
| Unrealized Appreciation (Depreciation) | | |
| Investment Securities | | 825,506 |
| Futures Contracts | | 587 |
| Forward Currency Contracts | | (803) |
| Foreign Currencies | | (487) |
| Net Assets | | 8,807,937 |
| |
| |
| Investor Shares—Net Assets | | |
| Applicable to 44,383,666 outstanding $.001 par value shares of | | |
| beneficial interest (unlimited authorization) | | 1,078,383 |
| Net Asset Value Per Share—Investor Shares | | $24.30 |
18
| |
| Total World Stock Index Fund | |
| |
| |
| |
| | Amount |
| | ($000) |
| ETF Shares—Net Assets | |
| Applicable to 102,521,649 outstanding $.001 par value shares of | |
| beneficial interest (unlimited authorization) | 6,112,245 |
| Net Asset Value Per Share—ETF Shares | $59.62 |
| |
| Institutional Shares—Net Assets | |
| Applicable to 13,283,342 outstanding $.001 par value shares of | |
| beneficial interest (unlimited authorization) | 1,617,309 |
| Net Asset Value Per Share—Institutional Shares | $121.75 |
• See Note A in Notes to Financial Statements.
* Non-income-producing security.
^ Includes partial security positions on loan to broker-dealers. The total value of securities on loan is $70,070,000.
† Represents the aggregate value, by category, of securities that are not among the 50 largest holdings and, in total for any issuer, represent
1% or less of net assets.
1 Certain of the fund’s securities are exempt from registration under Rule 144A of the Securities Act of 1933. Such securities may be sold
in transactions exempt from registration, normally to qualified institutional buyers. At October 31, 2016, the aggregate value of these
securities was $32,844,000, representing 0.4% of net assets.
2 “Other” represents securities that are not classified by the fund’s benchmark index.
3 Considered an affiliated company of the fund as the issuer is another member of The Vanguard Group.
4 The fund invests a portion of its cash reserves in equity markets through the use of index futures contracts. After giving effect to futures
investments, the fund’s effective common stock and temporary cash investment positions represent 100.0% and 0.7%, respectively, of
net assets.
5 Affiliated money market fund available only to Vanguard funds and certain trusts and accounts managed by Vanguard. Rate shown is the
7-day yield.
6 Includes $76,749,000 of collateral received for securities on loan.
7 Securities with a value of $3,598,000 have been segregated as initial margin for open futures contracts.
GDR—Global Depositary Receipt.
See accompanying Notes, which are an integral part of the Financial Statements.
19
Total World Stock Index Fund
Statement of Operations
| |
| | Year Ended |
| | October 31, 2016 |
| | ($000) |
| Investment Income | |
| Income | |
| Dividends1,2 | 213,412 |
| Interest2 | 208 |
| Securities Lending—Net | 4,632 |
| Total Income | 218,252 |
| Expenses | |
| The Vanguard Group—Note B | |
| Investment Advisory Services | 1,181 |
| Management and Administrative—Investor Shares | 1,548 |
| Management and Administrative—ETF Shares | 4,070 |
| Management and Administrative—Institutional Shares | 1,190 |
| Marketing and Distribution—Investor Shares | 245 |
| Marketing and Distribution—ETF Shares | 392 |
| Marketing and Distribution—Institutional Shares | 55 |
| Custodian Fees | 1,159 |
| Auditing Fees | 44 |
| Shareholders’ Reports—Investor Shares | 11 |
| Shareholders’ Reports—ETF Shares | 89 |
| Shareholders’ Reports—Institutional Shares | 7 |
| Trustees’ Fees and Expenses | 4 |
| Total Expenses | 9,995 |
| Net Investment Income | 208,257 |
| Realized Net Gain (Loss) | |
| Investment Securities Sold2 | 5,841 |
| Futures Contracts | 2,122 |
| Foreign Currencies and Forward Currency Contracts | (1,191) |
| Realized Net Gain (Loss) | 6,772 |
| Change in Unrealized Appreciation (Depreciation) | |
| Investment Securities | 33,527 |
| Futures Contracts | (1,318) |
| Foreign Currencies and Forward Currency Contracts | (968) |
| Change in Unrealized Appreciation (Depreciation) | 31,241 |
| Net Increase (Decrease) in Net Assets Resulting from Operations | 246,270 |
| 1 Dividends are net of foreign withholding taxes of $8,364,000. |
| 2 Dividend income, interest income, and realized net gain (loss) from affiliated companies of the fund were $125,000, $189,000, and ($237,000), respectively. |
See accompanying Notes, which are an integral part of the Financial Statements.
20
Total World Stock Index Fund
Statement of Changes in Net Assets
| | |
| | Year Ended October 31, |
| | 2016 | 2015 |
| | ($000) | ($000) |
| Increase (Decrease) in Net Assets | | |
| Operations | | |
| Net Investment Income | 208,257 | 164,789 |
| Realized Net Gain (Loss) | 6,772 | 20,235 |
| Change in Unrealized Appreciation (Depreciation) | 31,241 | (237,529) |
| Net Increase (Decrease) in Net Assets Resulting from Operations | 246,270 | (52,505) |
| Distributions | | |
| Net Investment Income | | |
| Investor Shares | (22,429) | (20,691) |
| ETF Shares | (131,316) | (100,240) |
| Institutional Shares | (41,678) | (38,992) |
| Realized Capital Gain | | |
| Investor Shares | — | — |
| ETF Shares | — | — |
| Institutional Shares | — | — |
| Total Distributions | (195,423) | (159,923) |
| Capital Share Transactions | | |
| Investor Shares | 108,566 | 143,962 |
| ETF Shares | 1,073,261 | 1,411,644 |
| Institutional Shares | (221,774) | 613,403 |
| Net Increase (Decrease) from Capital Share Transactions | 960,053 | 2,169,009 |
| Total Increase (Decrease) | 1,010,900 | 1,956,581 |
| Net Assets | | |
| Beginning of Period | 7,797,037 | 5,840,456 |
| End of Period1 | 8,807,937 | 7,797,037 |
| 1 Net Assets—End of Period includes undistributed (overdistributed) net investment income of $25,728,000 and $13,073,000. |
See accompanying Notes, which are an integral part of the Financial Statements.
21
Total World Stock Index Fund
Financial Highlights
| | | | | |
| Investor Shares | | | | | |
| |
| For a Share Outstanding | Year Ended October 31, |
| Throughout Each Period | 2016 | 2015 | 2014 | 2013 | 2012 |
| Net Asset Value, Beginning of Period | $24.18 | $24.82 | $23.48 | $19.46 | $18.40 |
| Investment Operations | | | | | |
| Net Investment Income | .565 | .557 | .571 | .473 | . 399 |
| Net Realized and Unrealized Gain (Loss) | | | | | |
| on Investments | .089 | (.643) | 1.340 | 4.084 | 1.263 |
| Total from Investment Operations | .654 | (.086) | 1.911 | 4.557 | 1.662 |
| Distributions | | | | | |
| Dividends from Net Investment Income | (. 534) | (. 554) | (. 571) | (. 537) | (. 602) |
| Distributions from Realized Capital Gains | — | — | — | — | — |
| Total Distributions | (. 534) | (. 554) | (. 571) | (. 537) | (. 602) |
| Net Asset Value, End of Period | $24.30 | $24.18 | $24.82 | $23.48 | $19.46 |
| |
| Total Return1 | 2.80% | -0.37% | 8.20% | 23.79% | 9.29% |
| |
| Ratios/Supplemental Data | | | | | |
| Net Assets, End of Period (Millions) | $1,078 | $961 | $844 | $615 | $364 |
| Ratio of Total Expenses to Average Net Assets | 0.21% | 0.25% | 0.27% | 0.30% | 0.35% |
| Ratio of Net Investment Income to | | | | | |
| Average Net Assets | 2.40% | 2.31% | 2.38% | 2.28% | 2.44% |
| Portfolio Turnover Rate2 | 15% | 7% | 7% | 12% | 16% |
1 Total returns do not include transaction or account service fees that may have applied in the periods shown. Fund prospectuses provide
information about any applicable transaction and account service fees.
2 Excludes the value of portfolio securities received or delivered as a result of in-kind purchases or redemptions of the fund’s capital shares,
including ETF Creation Units.
See accompanying Notes, which are an integral part of the Financial Statements.
22
Total World Stock Index Fund
Financial Highlights
| | | | | |
| ETF Shares | | | | | |
| |
| For a Share Outstanding | Year Ended October 31, |
| Throughout Each Period | 2016 | 2015 | 2014 | 2013 | 2012 |
| Net Asset Value, Beginning of Period | $59.34 | $60.89 | $57.60 | $47.76 | $45.21 |
| Investment Operations | | | | | |
| Net Investment Income | 1.443 | 1.436 | 1.459 | 1.218 | 1.056 |
| Net Realized and Unrealized Gain (Loss) | | | | | |
| on Investments | .204 | (1.562) | 3.291 | 10.025 | 3.096 |
| Total from Investment Operations | 1.647 | (.126) | 4.750 | 11.243 | 4.152 |
| Distributions | | | | | |
| Dividends from Net Investment Income | (1.367) | (1.424) | (1.460) | (1.403) | (1.602) |
| Distributions from Realized Capital Gains | — | — | — | — | — |
| Total Distributions | (1.367) | (1.424) | (1.460) | (1.403) | (1.602) |
| Net Asset Value, End of Period | $59.62 | $59.34 | $60.89 | $57.60 | $47.76 |
| |
| Total Return | 2.89% | -0.23% | 8.31% | 23.95% | 9.47% |
| |
| Ratios/Supplemental Data | | | | | |
| Net Assets, End of Period (Millions) | $6,112 | $5,008 | $3,720 | $2,837 | $1,463 |
| Ratio of Total Expenses to Average Net Assets | 0.11% | 0.14% | 0.17% | 0.18% | 0.19% |
| Ratio of Net Investment Income to | | | | | |
| Average Net Assets | 2.50% | 2.42% | 2.48% | 2.40% | 2.60% |
| Portfolio Turnover Rate1 | 15% | 7% | 7% | 12% | 16% |
| 1 Excludes the value of portfolio securities received or delivered as a result of in-kind purchases or redemptions of the fund’s capital shares, |
| including ETF Creation Units. |
See accompanying Notes, which are an integral part of the Financial Statements.
23
Total World Stock Index Fund
Financial Highlights
| | | | | |
| Institutional Shares | | | | | |
| |
| For a Share Outstanding | Year Ended October 31, |
| Throughout Each Period | 2016 | 2015 | 2014 | 2013 | 2012 |
| Net Asset Value, Beginning of Period | $121.18 | $124.35 | $117.63 | $97.56 | $92.36 |
| Investment Operations | | | | | |
| Net Investment Income | 2.956 | 2.945 | 3.007 | 2.506 | 2.167 |
| Net Realized and Unrealized Gain (Loss) | | | | | |
| on Investments | .414 | (3.189) | 6.717 | 20.461 | 6.336 |
| Total from Investment Operations | 3.370 | (.244) | 9.724 | 22.967 | 8.503 |
| Distributions | | | | | |
| Dividends from Net Investment Income | (2.800) | (2.926) | (3.004) | (2.897) | (3.303) |
| Distributions from Realized Capital Gains | — | — | — | — | — |
| Total Distributions | (2.800) | (2.926) | (3.004) | (2.897) | (3.303) |
| Net Asset Value, End of Period | $121.75 | $121.18 | $124.35 | $117.63 | $97.56 |
| |
| Total Return1 | 2.88% | -0.22% | 8.34% | 23.95% | 9.50% |
| |
| Ratios/Supplemental Data | | | | | |
| Net Assets, End of Period (Millions) | $1,617 | $1,828 | $1,277 | $724 | $325 |
| Ratio of Total Expenses to Average Net Assets | 0.10% | 0.13% | 0.15% | 0.16% | 0.17% |
| Ratio of Net Investment Income to | | | | | |
| Average Net Assets | 2.51% | 2.43% | 2.50% | 2.42% | 2.62% |
| Portfolio Turnover Rate2 | 15% | 7% | 7% | 12% | 16% |
1 Total returns do not include transaction fees that may have applied in the periods shown. Fund prospectuses provide information about any
applicable transaction fees.
2 Excludes the value of portfolio securities received or delivered as a result of in-kind purchases or redemptions of the fund’s capital shares,
including ETF Creation Units.
See accompanying Notes, which are an integral part of the Financial Statements.
24
Total World Stock Index Fund
Notes to Financial Statements
Vanguard Total World Stock Index Fund is registered under the Investment Company Act of 1940 as an open-end investment company, or mutual fund. The fund invests in securities of foreign issuers, which may subject it to investment risks not normally associated with investing in securities of U.S. corporations. The fund offers three classes of shares: Investor Shares, ETF Shares, and Institutional Shares. Investor Shares are available to any investor who meets the fund’s minimum purchase requirements. ETF Shares are listed for trading on NYSE Arca; they can be purchased and sold through a broker. Institutional Shares are designed for investors who meet certain administrative, service, and account-size criteria.
A. The following significant accounting policies conform to generally accepted accounting principles for U.S. investment companies. The fund consistently follows such policies in preparing its financial statements.
1. Security Valuation: Securities are valued as of the close of trading on the New York Stock Exchange (generally 4 p.m., Eastern time) on the valuation date. Equity securities are valued at the latest quoted sales prices or official closing prices taken from the primary market in which each security trades; such securities not traded on the valuation date are valued at the mean of the latest quoted bid and asked prices. Securities for which market quotations are not readily available, or whose values have been affected by events occurring before the fund’s pricing time but after the close of the securities’ primary markets, are valued at their fair values calculated according to procedures adopted by the board of trustees. These procedures include obtaining quotations from an independent pricing service, monitoring news to identify significant market- or security-specific events, and evaluating changes in the values of foreign market proxies (for example, ADRs, futures contracts, or exchange-traded funds), between the time the foreign markets close and the fund’s pricing time. When fair-value pricing is employed, the prices of securities used by a fund to calculate its net asset value may differ from quoted or published prices for the same securities. Investments in Vanguard Market Liquidity Fund are valued at that fund’s net asset value. Temporary cash investments acquired over 60 days to maturity are valued using the latest bid prices or using valuations based on a matrix system (which considers such factors as security prices, yields, maturities, and ratings), both as furnished by independent pricing services. Other temporary cash investments are valued at amortized cost, which approximates market value.
2. Foreign Currency: Securities and other assets and liabilities denominated in foreign currencies are translated into U.S. dollars using exchange rates obtained from an independent third party as of the fund’s pricing time on the valuation date. Realized gains (losses) and unrealized appreciation (depreciation) on investment securities include the effects of changes in exchange rates since the securities were purchased, combined with the effects of changes in security prices. Fluctuations in the value of other assets and liabilities resulting from changes in exchange rates are recorded as unrealized foreign currency gains (losses) until the assets or liabilities are settled in cash, at which time they are recorded as realized foreign currency gains (losses).
3. Futures and Forward Currency Contracts: The fund uses index futures contracts to a limited extent, with the objectives of maintaining full exposure to the stock market, enhancing returns, maintaining liquidity, and minimizing transaction costs. The fund may purchase futures contracts to immediately invest incoming cash in the market, or sell futures in response to cash outflows, thereby simulating a fully invested position in the underlying index while maintaining a cash balance for liquidity. The fund may seek to enhance returns by using futures contracts instead of the underlying securities when futures are believed to be priced more attractively than the underlying securities. The primary risks
25
Total World Stock Index Fund
associated with the use of futures contracts are imperfect correlation between changes in market values of stocks held by the fund and the prices of futures contracts, and the possibility of an illiquid market. Counterparty risk involving futures is mitigated because a regulated clearinghouse is the counterparty instead of the clearing broker. To further mitigate counterparty risk, the fund trades futures contracts on an exchange, monitors the financial strength of its clearing brokers and clearinghouse, and has entered into clearing agreements with its clearing brokers. The clearinghouse imposes initial margin requirements to secure the fund’s performance and requires daily settlement of variation margin representing changes in the market value of each contract.
The fund also enters into forward currency contracts to provide the appropriate currency exposure related to any open futures contracts. The fund’s risks in using these contracts include movement in the values of the foreign currencies relative to the U.S. dollar and the ability of the counterparties to fulfill their obligations under the contracts. The fund mitigates its counterparty risk by entering into forward currency contracts only with a diverse group of prequalified counterparties, monitoring their financial strength, entering into master netting arrangements with its counterparties, and requiring its counterparties to transfer collateral as security for their performance. In the absence of a default, the collateral pledged or received by the fund cannot be repledged, resold or rehypothecated. The master netting arrangements provide that, in the event of a counterparty’s default (including bankruptcy), the fund may terminate the forward currency contracts, determine the net amount owed by either party in accordance with its master netting arrangements, and sell or retain any collateral held up to the net amount owed to the fund under the master netting arrangements. The forward currency contracts contain provisions whereby a counterparty may terminate open contracts if the fund’s net assets decline below a certain level, triggering a payment by the fund if the fund is in a net liability position at the time of the termination. The payment amount would be reduced by any collateral the fund has pledged. Any assets pledged as collateral for open contracts are noted in the Statement of Net Assets. The value of collateral received or pledged is compared daily to the value of the forward currency contracts exposure with each counterparty, and any difference, if in excess of a specified minimum transfer amount, is adjusted and settled within two business days.
Futures contracts are valued at their quoted daily settlement prices. Forward currency contracts are valued at their quoted daily prices obtained from an independent third party, adjusted for currency risk based on the expiration date of each contract. The aggregate settlement values and notional amounts of the contracts are not recorded in the Statement of Net Assets. Fluctuations in the value of the contracts are recorded in the Statement of Net Assets as an asset (liability) and in the Statement of Operations as unrealized appreciation (depreciation) until the contracts are closed, when they are recorded as realized gains (losses) on futures or forward currency contracts.
During the year ended October 31, 2016, the fund’s average investments in long and short futures contracts represented less than 1% and 0% of net assets, respectively, based on the average of aggregate settlement values at each quarter-end during the period. The fund’s average investment in forward currency contracts represented less than 1% of net assets, based on the average of notional amounts at each quarter-end during the period.
4. Federal Income Taxes: The fund intends to continue to qualify as a regulated investment company and distribute all of its taxable income. Management has analyzed the fund’s tax positions taken for all open federal income tax years (October 31, 2013–2016), and has concluded that no provision for federal income tax is required in the fund’s financial statements.
5. Distributions: Distributions to shareholders are recorded on the ex-dividend date.
26
Total World Stock Index Fund
6. Securities Lending: To earn additional income, the fund lends its securities to qualified institutional borrowers. Security loans are subject to termination by the fund at any time, and are required to be secured at all times by collateral in an amount at least equal to the market value of securities loaned. Daily market fluctuations could cause the value of loaned securities to be more or less than the value of the collateral received. When this occurs, the collateral is adjusted and settled on the next business day. The fund further mitigates its counterparty risk by entering into securities lending transactions only with a diverse group of prequalified counterparties, monitoring their financial strength, and entering into master securities lending agreements with its counterparties. The master securities lending agreements provide that, in the event of a counterparty’s default (including bankruptcy), the fund may terminate any loans with that borrower, determine the net amount owed, and sell or retain the collateral up to the net amount owed to the fund; however, such actions may be subject to legal proceedings. While collateral mitigates counterparty risk, in the absence of a default the fund may experience delays and costs in recovering the securities loaned. The fund invests cash collateral received in Vanguard Market Liquidity Fund, and records a liability in the Statement of Net Assets for the return of the collateral, during the period the securities are on loan. Securities lending income represents fees charged to borrowers plus income earned on invested cash collateral, less expenses associated with the loan. During the term of the loan, the fund is entitled to all distributions made on or in respect of the loaned securities.
7. Credit Facility: The fund and certain other funds managed by The Vanguard Group (“Vanguard”) participate in a $3.1 billion committed credit facility provided by a syndicate of lenders pursuant to a credit agreement that may be renewed annually; each fund is individually liable for its borrowings, if any, under the credit facility. Borrowings may be utilized for temporary and emergency purposes, and are subject to the fund’s regulatory and contractual borrowing restrictions. The participating funds are charged administrative fees and an annual commitment fee of 0.10% of the undrawn amount of the facility; these fees are allocated to the funds based on a method approved by the fund’s board of trustees and included in Management and Administrative expenses on the fund’s Statement of Operations. Any borrowings under this facility bear interest at a rate based upon the higher of the one-month London Interbank Offered Rate, federal funds effective rate, or overnight bank funding rate plus an agreed-upon spread.
The fund had no borrowings outstanding at October 31, 2016, or at any time during the period then ended.
8. Other: Dividend income is recorded on the ex-dividend date. Interest income includes income distributions received from Vanguard Market Liquidity Fund and is accrued daily. Premiums and discounts on debt securities purchased are amortized and accreted, respectively, to interest income over the lives of the respective securities. Security transactions are accounted for on the date securities are bought or sold. Costs used to determine realized gains (losses) on the sale of investment securities are those of the specific securities sold.
Withholding taxes on foreign dividends and capital gains have been provided for in accordance with the fund’s understanding of the applicable countries’ tax rules and rates. The fund has filed tax reclaims for previously withheld taxes on dividends earned in certain European Union countries. These filings are subject to various administrative and judicial proceedings within these countries. Such tax reclaims received during the year, if any, are included in dividend income. No other amounts for additional tax reclaims are reflected in the financial statements due to the uncertainty as to the ultimate resolution of proceedings, the likelihood of receipt of these reclaims, and the potential timing of payment.
27
Total World Stock Index Fund
Each class of shares has equal rights as to assets and earnings, except that each class separately bears certain class-specific expenses related to maintenance of shareholder accounts (included in Management and Administrative expenses) and shareholder reporting. Marketing and distribution expenses are allocated to each class of shares based on a method approved by the board of trustees. Income, other non-class-specific expenses, and gains and losses on investments are allocated to each class of shares based on its relative net assets.
B. In accordance with the terms of a Funds’ Service Agreement (the “FSA”) between Vanguard and the fund, Vanguard furnishes to the fund investment advisory, corporate management, administrative, marketing, and distribution services at Vanguard’s cost of operations (as defined by the FSA). These costs of operations are allocated to the fund based on methods and guidelines approved by the board of trustees. Vanguard does not require reimbursement in the current period for certain costs of operations (such as deferred compensation/benefits and risk/insurance costs); the fund’s liability for these costs of operations is included in Payables to Vanguard on the Statement of Net Assets.
Upon the request of Vanguard, the fund may invest up to 0.40% of its net assets as capital in Vanguard. At October 31, 2016, the fund had contributed to Vanguard capital in the amount of $683,000, representing 0.01% of the fund’s net assets and 0.27% of Vanguard’s capitalization. The fund’s trustees and officers are also directors and employees, respectively, of Vanguard.
C. Various inputs may be used to determine the value of the fund’s investments. These inputs are summarized in three broad levels for financial statement purposes. The inputs or methodologies used to value securities are not necessarily an indication of the risk associated with investing in those securities.
Level 1—Quoted prices in active markets for identical securities.
Level 2—Other significant observable inputs (including quoted prices for similar securities, interest rates, prepayment speeds, credit risk, etc.).
Level 3—Significant unobservable inputs (including the fund’s own assumptions used to determine the fair value of investments).
The following table summarizes the market value of the fund’s investments as of October 31, 2016, based on the inputs used to value them:
| | | |
| | Level 1 | Level 2 | Level 3 |
| Investments | ($000) | ($000) | ($000) |
| Common Stocks—International | 467,016 | 3,676,206 | 1,307 |
| Common Stocks—United States | 4,587,877 | 125 | 45 |
| Temporary Cash Investments | 126,270 | 7,196 | — |
| Futures Contracts—Assets1 | 96 | — | — |
| Futures Contracts—Liabilities1 | (150) | — | — |
| Forward Currency Contracts—Assets | — | 56 | — |
| Forward Currency Contracts—Liabilities | — | (859) | — |
| Total | 5,181,109 | 3,682,724 | 1,352 |
| 1 Represents variation margin on the last day of the reporting period. |
28
Total World Stock Index Fund
D. At October 31, 2016, the fair values of derivatives were reflected in the Statement of Net Assets as follows:
| | | |
| | | Foreign | |
| | Equity | Exchange | |
| | Contracts | Contracts | Total |
| Statement of Net Assets Caption | ($000) | ($000) | ($000) |
| Other Assets | 96 | 56 | 152 |
| Other Liabilities | (150) | (859) | (1,009) |
Realized net gain (loss) and the change in unrealized appreciation (depreciation) on derivatives for the year ended October 31, 2016, were:
| | | |
| | | Foreign | |
| | Equity | Exchange | |
| | Contracts | Contracts | Total |
| Realized Net Gain (Loss) on Derivatives | ($000) | ($000) | ($000) |
| Futures Contracts | 2,122 | — | 2,122 |
| Forward Currency Contracts | — | 234 | 234 |
| Realized Net Gain (Loss) on Derivatives | 2,122 | 234 | 2,356 |
| |
| Change in Unrealized Appreciation (Depreciation) on Derivatives | | | |
| Futures Contracts | (1,318) | — | (1,318) |
| Forward Currency Contracts | — | (704) | (704) |
| Change in Unrealized Appreciation (Depreciation) on Derivatives | (1,318) | (704) | (2,022) |
At October 31, 2016, the aggregate settlement value of open futures contracts and the related unrealized appreciation (depreciation) were:
| | | | |
| | | | | ($000) |
| | | | Aggregate | |
| | | Number of | Settlement | Unrealized |
| | | Long (Short) | Value | Appreciation |
| Futures Contracts | Expiration | Contracts | Long (Short) | (Depreciation) |
| E-mini S&P 500 Index | December 2016 | 329 | 34,876 | (232) |
| Dow Jones EURO STOXX 50 Index | December 2016 | 336 | 11,245 | 302 |
| E-mini S&P Mid-Cap 400 Index | December 2016 | 59 | 8,890 | (83) |
| Topix Index | December 2016 | 59 | 7,832 | 407 |
| FTSE 100 Index | December 2016 | 60 | 5,076 | 166 |
| S&P ASX 200 Index | December 2016 | 25 | 2,516 | 27 |
| | | | | 587 |
Unrealized appreciation (depreciation) on open E-mini S&P 500 Index, Dow Jones EURO STOXX 50 Index, E-mini S&P Mid-Cap 400 Index, and FTSE 100 Index futures contracts is required to be treated as realized gain (loss) for tax purposes.
29
Total World Stock Index Fund
At October 31, 2016, the fund had open forward currency contracts to receive and deliver currencies as follows. Unrealized appreciation (depreciation) on open forward currency contracts is treated as realized gain (loss) for tax purposes.
| | | | | | |
| | | | | | | Unrealized |
| | Contract | | | | | Appreciation |
| | Settlement | Contract Amount (000) | (Depreciation) |
| Counterparty | Date | | Receive | | Deliver | ($000) |
| The Toronto-Dominion Bank | 12/21/16 | EUR | 4,327 | USD | 4,884 | (122) |
| Barclays Bank plc | 12/21/16 | EUR | 3,920 | USD | 4,425 | (112) |
| BNP Paribas | 12/13/16 | JPY | 334,313 | USD | 3,279 | (85) |
| Barclays Bank plc | 12/13/16 | JPY | 286,660 | USD | 2,809 | (71) |
| Bank of America, N.A. | 12/21/16 | GBP | 1,832 | USD | 2,451 | (207) |
| Goldman Sachs International | 12/21/16 | GBP | 1,790 | USD | 2,379 | (185) |
| JPMorgan Chase Bank, N.A. | 12/21/16 | EUR | 1,540 | USD | 1,730 | (36) |
| Goldman Sachs International | 12/20/16 | AUD | 1,928 | USD | 1,433 | 31 |
| JPMorgan Chase Bank, N.A. | 12/20/16 | AUD | 1,696 | USD | 1,265 | 23 |
| JPMorgan Chase Bank, N.A. | 12/21/16 | GBP | 364 | USD | 481 | (35) |
| BNP Paribas | 12/21/16 | EUR | 209 | USD | 236 | (6) |
| BNP Paribas | 12/20/16 | AUD | 17 | USD | 12 | — |
| JPMorgan Chase Bank, N.A. | 12/20/16 | USD | 310 | AUD | 406 | 2 |
| | | | | | | (803) |
| AUD—Australian dollar. |
| EUR—Euro. |
| GBP—British pound. |
| JPY—Japanese yen. |
| USD—U.S. dollar. |
E. Distributions are determined on a tax basis and may differ from net investment income and realized capital gains for financial reporting purposes. Differences may be permanent or temporary. Permanent differences are reclassified among capital accounts in the financial statements to reflect their tax character. Temporary differences arise when certain items of income, expense, gain, or loss are recognized in different periods for financial statement and tax purposes. These differences will reverse at some time in the future. Differences in classification may also result from the treatment of short-term gains as ordinary income for tax purposes.
During the year ended October 31, 2016, the fund realized net foreign currency losses of $1,425,000, which decreased distributable net income for tax purposes; accordingly, such losses have been reclassified from accumulated net realized losses to undistributed net investment income.
During the year ended October 31, 2016, the fund realized $133,515,000 of net capital gains resulting from in-kind redemptions—in which shareholders exchanged fund shares for securities held by the fund rather than for cash. Because such gains are not taxable to the fund, and are not distributed to shareholders, they have been reclassified from accumulated net realized losses to paid-in capital.
30
Total World Stock Index Fund
For tax purposes, at October 31, 2016, the fund had $38,322,000 of ordinary income available for distribution. At October 31, 2016, the fund had available capital losses totaling $166,213,000 to offset future net capital gains. Of this amount, $23,574,000 is subject to expiration dates; $7,777,000 may be used to offset future net capital gains through October 31, 2017, $1,086,000 through October 31, 2018, and $14,711,000 through October 31, 2019. Capital losses of $142,639,000 realized beginning in fiscal 2012 may be carried forward indefinitely under the Regulated Investment Company Modernization Act of 2010, but must be used before any expiring loss carryforwards. Capital loss carryforwards of $572,000 expired on October 31, 2016; accordingly, such losses have been reclassified from accumulated net realized losses to paid-in capital.
At October 31, 2016, the cost of investment securities for tax purposes was $8,050,657,000. Net unrealized appreciation of investment securities for tax purposes was $815,385,000, consisting of unrealized gains of $1,410,859,000 on securities that had risen in value since their purchase and $595,474,000 in unrealized losses on securities that had fallen in value since their purchase.
F. During the year ended October 31, 2016, the fund purchased $2,534,205,000 of investment securities and sold $1,593,904,000 of investment securities, other than temporary cash investments. Purchases and sales include $1,252,227,000 and $363,152,000, respectively, in connection with in-kind purchases and redemptions of the fund’s capital shares.
G. Capital share transactions for each class of shares were:
| | | | |
| | Year Ended October 31, |
| | | 2016 | | 2015 |
| | Amount | Shares | Amount | Shares |
| | ($000) | (000) | ($000) | (000) |
| Investor Shares | | | | |
| Issued | 274,726 | 11,758 | 364,888 | 14,684 |
| Issued in Lieu of Cash Distributions | 21,069 | 895 | 19,363 | 786 |
| Redeemed | (187,229) | (8,007) | (240,289) | (9,736) |
| Net Increase (Decrease)—Investor Shares | 108,566 | 4,646 | 143,962 | 5,734 |
| ETF Shares | | | | |
| Issued | 1,441,692 | 24,918 | 1,447,939 | 23,916 |
| Issued in Lieu of Cash Distributions | — | — | — | — |
| Redeemed | (368,431) | (6,800) | (36,295) | (600) |
| Net Increase (Decrease)—ETF Shares | 1,073,261 | 18,118 | 1,411,644 | 23,316 |
| Institutional Shares | | | | |
| Issued | 508,890 | 4,321 | 842,698 | 6,658 |
| Issued in Lieu of Cash Distributions | 37,475 | 318 | 35,154 | 285 |
| Redeemed | (768,139) | (6,438) | (264,449) | (2,130) |
| Net Increase (Decrease)—Institutional Shares | (221,774) | (1,799) | 613,403 | 4,813 |
H. Management has determined that no material events or transactions occurred subsequent to October 31, 2016, that would require recognition or disclosure in these financial statements.
31
Report of Independent Registered
Public Accounting Firm
To the Board of Trustees of Vanguard International Equity Index Funds and the Shareholders of Vanguard Total World Stock Index Fund:
In our opinion, the accompanying statement of net assets—investments summary and the related statements of operations and of changes in net assets and the financial highlights present fairly, in all material respects, the financial position of Vanguard Total World Stock Index Fund (constituting a separate portfolio of Vanguard International Equity Index Funds, hereafter referred to as the “Fund”) at October 31, 2016, the results of its operations for the year then ended, the changes in its net assets for each of the two years in the period then ended, and the financial highlights for each of the five years in the period then ended, in conformity with accounting principles generally accepted in the United States of America. These financial statements and financial highlights (hereafter referred to as “financial statements”) are the responsibility of the Fund’s management. Our responsibility is to express an opinion on these financial statements based on our audits. We conducted our audits of these financial statements in accordance with the standards of the Public Company Accounting Oversight Board (United States). Those standards require that we plan and perform the audit to obtain reasonable assurance about whether the financial statements are free of material misstatement. An audit includes examining, on a test basis, evidence supporting the amounts and disclosures in the financial statements, assessing the accounting principles used and significant estimates made by management, and evaluating the overall financial statement presentation. We believe that our audits, which included confirmation of securities at October 31, 2016 by correspondence with the custodian and brokers and by agreement to the underlying ownership records of the transfer agent, provide a reasonable basis for our opinion.
/s/PricewaterhouseCoopers LLP
Philadelphia, Pennsylvania
December 15, 2016

Special 2016 tax information (unaudited) for Vanguard Total World Stock Index Fund
This information for the fiscal year ended October 31, 2016, is included pursuant to provisions of the Internal Revenue Code.
The fund distributed $160,303,000 of qualified dividend income to shareholders during the fiscal year.
For corporate shareholders, 36.9% of investment income (dividend income plus short-term gains, if any) qualifies for the dividends-received deduction.
The fund designates to shareholders foreign source income of $108,290,000 and foreign taxes paid of $8,103,000. Shareholders will receive more detailed information with their Form 1099-DIV in January 2017 to determine the calendar-year amounts to be included on their 2016 tax returns.
32
Your Fund’s After-Tax Returns
This table presents returns for your fund both before and after taxes. The after-tax returns are shown in two ways: (1) assuming that an investor owned the fund during the entire period and paid taxes on the fund’s distributions, and (2) assuming that an investor paid taxes on the fund’s distributions and sold all shares at the end of each period.
Calculations are based on the highest individual federal income tax and capital gains tax rates in effect at the times of the distributions and the hypothetical sales. State and local taxes were not considered. After-tax returns reflect any qualified dividend income, using actual prior-year figures and estimates for 2016. (In the example, returns after the sale of fund shares may be higher than those assuming no sale. This occurs when the sale would have produced a capital loss. The calculation assumes that the investor received a tax deduction for the loss.)
The table shows returns for Investor Shares only; returns for other share classes will differ. Please note that your actual after-tax returns will depend on your tax situation and may differ from those shown. Also note that if you own the fund in a tax-deferred account, such as an individual retirement account or a 401(k) plan, this information does not apply to you. Such accounts are not subject to current taxes.
Finally, keep in mind that a fund’s performance—whether before or after taxes—does not guarantee future results.
| | | |
| Average Annual Total Returns: Total World Stock Index Fund Investor Shares | | |
| Periods Ended October 31, 2016 | | | |
| |
| | | | Since |
| | One | Five | Inception |
| | Year | Years | (6/26/2008) |
| Returns Before Taxes | 2.80% | 8.44% | 4.40% |
| Returns After Taxes on Distributions | 2.18 | 7.83 | 3.98 |
| Returns After Taxes on Distributions and Sale of Fund Shares | 1.94 | 6.62 | 3.46 |
33
About Your Fund’s Expenses
As a shareholder of the fund, you incur ongoing costs, which include costs for portfolio management, administrative services, and shareholder reports (like this one), among others. Operating expenses, which are deducted from a fund’s gross income, directly reduce the investment return of the fund.
A fund’s expenses are expressed as a percentage of its average net assets. This figure is known as the expense ratio. The following examples are intended to help you understand the ongoing costs (in dollars) of investing in your fund and to compare these costs with those of other mutual funds. The examples are based on an investment of $1,000 made at the beginning of the period shown and held for the entire period.
The accompanying table illustrates your fund’s costs in two ways:
• Based on actual fund return. This section helps you to estimate the actual expenses that you paid over the period. The ”Ending Account Value“ shown is derived from the fund‘s actual return, and the third column shows the dollar amount that would have been paid by an investor who started with $1,000 in the fund. You may use the information here, together with the amount you invested, to estimate the expenses that you paid over the period.
To do so, simply divide your account value by $1,000 (for example, an $8,600 account value divided by $1,000 = 8.6), then multiply the result by the number given for your fund under the heading ”Expenses Paid During Period.“
• Based on hypothetical 5% yearly return. This section is intended to help you compare your fund‘s costs with those of other mutual funds. It assumes that the fund had a yearly return of 5% before expenses, but that the expense ratio is unchanged. In this case—because the return used is not the fund’s actual return—the results do not apply to your investment. The example is useful in making comparisons because the Securities and Exchange Commission requires all mutual funds to calculate expenses based on a 5% return. You can assess your fund’s costs by comparing this hypothetical example with the hypothetical examples that appear in shareholder reports of other funds.
Note that the expenses shown in the table are meant to highlight and help you compare ongoing costs only and do not reflect transaction costs incurred by the fund for buying and selling securities. Further, the expenses do not include any purchase, redemption, or account service fees described in the fund prospectus. If such fees were applied to your account, your costs would be higher. Your fund does not carry a “sales load.”
The calculations assume no shares were bought or sold during the period. Your actual costs may have been higher or lower, depending on the amount of your investment and the timing of any purchases or redemptions.
You can find more information about the fund’s expenses, including annual expense ratios, in the Financial Statements section of this report. For additional information on operating expenses and other shareholder costs, please refer to your fund’s current prospectus.
34
| | | |
| Six Months Ended October 31, 2016 | | | |
| | Beginning | Ending | Expenses |
| | Account Value | Account Value | Paid During |
| Total World Stock Index Fund | 4/30/2016 | 10/31/2016 | Period |
| Based on Actual Fund Return | | | |
| Investor Shares | $1,000.00 | $1,034.52 | $0.97 |
| ETF Shares | 1,000.00 | 1,034.98 | 0.56 |
| Institutional Shares | 1,000.00 | 1,034.90 | 0.51 |
| Based on Hypothetical 5% Yearly Return | | | |
| Investor Shares | $1,000.00 | $1,024.18 | $0.97 |
| ETF Shares | 1,000.00 | 1,024.58 | 0.56 |
| Institutional Shares | 1,000.00 | 1,024.63 | 0.51 |
The calculations are based on expenses incurred in the most recent six-month period. The fund’s annualized six-month expense ratios for that
period are 0.19% for Investor Shares, 0.11% for ETF Shares, and 0.10% for Institutional Shares. The dollar amounts shown as “Expenses
Paid” are equal to the annualized expense ratio multiplied by the average account value over the period, multiplied by the number of days in
the most recent six-month period, then divided by the number of days in the most recent 12-month period (184/366).
35
Glossary
Beta. A measure of the magnitude of a fund’s past share-price fluctuations in relation to the ups and downs of a given market index. The index is assigned a beta of 1.00. Compared with a given index, a fund with a beta of 1.20 typically would have seen its share price rise or fall by 12% when the index rose or fell by 10%. For this report, beta is based on returns over the past 36 months for both the fund and the index. Note that a fund’s beta should be reviewed in conjunction with its R-squared (see definition). The lower the R-squared, the less correlation there is between the fund and the index, and the less reliable beta is as an indicator of volatility.
Dividend Yield. Dividend income earned by stocks, expressed as a percentage of the aggregate market value (or of net asset value, for a fund). The yield is determined by dividing the amount of the annual dividends by the aggregate value (or net asset value) at the end of the period. For a fund, the dividend yield is based solely on stock holdings and does not include any income produced by other investments.
Earnings Growth Rate. The average annual rate of growth in earnings over the past five years for the stocks now in a fund.
Equity Exposure. A measure that reflects a fund’s investments in stocks and stock futures. Any holdings in short-term reserves are excluded.
Expense Ratio. A fund’s total annual operating expenses expressed as a percentage of the fund’s average net assets. The expense ratio includes management and administrative expenses, but does not include the transaction costs of buying and selling portfolio securities.
Fair-Value Pricing. Fair-value adjustments, which are required by the Securities and Exchange Commission, address pricing discrepancies that may arise because of time-zone differences among global stock markets. Foreign stocks may trade on exchanges that close many hours before a fund’s closing share price is calculated in the United States, generally at 4 p.m., Eastern time. In the hours between the foreign close and the U.S. close, the value of these foreign securities may change—because of company-specific announcements or market-wide developments, for example. Such price changes are not immediately reflected in international index values. Fair-value pricing takes such changes into account in calculating the fund’s daily net asset value, thus ensuring that the NAV doesn’t include “stale” prices. The result can be a temporary divergence between the return of the fund and that of its benchmark index—a difference that usually corrects itself when the foreign markets reopen.
Inception Date. The date on which the assets of a fund (or one of its share classes) are first invested in accordance with the fund’s investment objective. For funds with a subscription period, the inception date is the day after that period ends. Investment performance is measured from the inception date.
Median Market Cap. An indicator of the size of companies in which a fund invests; the midpoint of market capitalization (market price x shares outstanding) of a fund’s stocks, weighted by the proportion of the fund’s assets invested in each stock. Stocks representing half of the fund’s assets have market capitalizations above the median, and the rest are below it.
Price/Book Ratio. The share price of a stock divided by its net worth, or book value, per share. For a fund, the weighted average price/book ratio of the stocks it holds.
36
Price/Earnings Ratio. The ratio of a stock’s current price to its per-share earnings over the past year. For a fund, the weighted average P/E of the stocks it holds. P/E is an indicator of market expectations about corporate prospects; the higher the P/E, the greater the expectations for a company’s future growth.
R-Squared. A measure of how much of a fund’s past returns can be explained by the returns from the market in general, as measured by a given index. If a fund’s total returns were precisely synchronized with an index’s returns, its R-squared would be 1.00. If the fund’s returns bore no relationship to the index’s returns, its R-squared would be 0. For this report, R-squared is based on returns over the past 36 months for both the fund and the index.
Return on Equity. The annual average rate of return generated by a company during the past five years for each dollar of shareholder’s equity (net income divided by shareholder’s equity). For a fund, the weighted average return on equity for the companies whose stocks it holds.
Short-Term Reserves. The percentage of a fund invested in highly liquid, short-term securities that can be readily converted to cash.
Turnover Rate. An indication of the fund’s trading activity. Funds with high turnover rates incur higher transaction costs and may be more likely to distribute capital gains (which may be taxable to investors). The turnover rate excludes in-kind transactions, which have minimal impact on costs.
Benchmark Information
Spliced Total World Stock Index: FTSE All-World Index through December 18, 2011, and FTSE
Global All Cap Index thereafter. Benchmark returns are adjusted for withholding taxes.
37
This page intentionally left blank.
This page intentionally left blank.
The People Who Govern Your Fund
The trustees of your mutual fund are there to see that the fund is operated and managed in your best interests since, as a shareholder, you are a part owner of the fund. Your fund’s trustees also serve on the board of directors of The Vanguard Group, Inc., which is owned by the Vanguard funds and provides services to them on an at-cost basis.
A majority of Vanguard’s board members are independent, meaning that they have no affiliation with Vanguard or the funds they oversee, apart from the sizable personal investments they have made as private individuals. The independent board members have distinguished backgrounds in business, academia, and public service. Each of the trustees and executive officers oversees 198 Vanguard funds.
The following table provides information for each trustee and executive officer of the fund. The mailing address of the trustees and officers is P.O. Box 876, Valley Forge, PA 19482. More information about the trustees is in the Statement of Additional Information, which can be obtained, without charge, by contacting Vanguard at 800-662-7447, or online at vanguard.com.
InterestedTrustee1
F. William McNabb III
Born 1957. Trustee Since July 2009. Chairman of
the Board. Principal Occupation(s) During the Past
Five Years and Other Experience: Chairman of the
Board of The Vanguard Group, Inc., and of each of
the investment companies served by The Vanguard
Group, since January 2010; Director of The Vanguard
Group since 2008; Chief Executive Officer and
President of The Vanguard Group, and of each of
the investment companies served by The Vanguard
Group, since 2008; Director of Vanguard Marketing
Corporation; Managing Director of The Vanguard
Group (1995–2008).
IndependentTrustees
Emerson U. Fullwood
Born 1948. Trustee Since January 2008. Principal
Occupation(s) During the Past Five Years and Other
Experience: Executive Chief Staff and Marketing
Officer for North America and Corporate Vice President
(retired 2008) of Xerox Corporation (document manage-
ment products and services); Executive in Residence
and 2009–2010 Distinguished Minett Professor at
the Rochester Institute of Technology; Lead Director
of SPX FLOW, Inc. (multi-industry manufacturing);
Director of the United Way of Rochester, the University
of Rochester Medical Center, Monroe Community
College Foundation, North Carolina A&T University,
and Roberts Wesleyan College.
Rajiv L. Gupta
Born 1945. Trustee Since December 2001.2 Principal
Occupation(s) During the Past Five Years and Other
Experience: Chairman and Chief Executive Officer
(retired 2009) and President (2006–2008) of
Rohm and Haas Co. (chemicals); Director of Tyco
International plc (diversified manufacturing and
services), HP Inc. (printer and personal computer
manufacturing), and Delphi Automotive plc
(automotive components); Senior Advisor at
New Mountain Capital.
Amy Gutmann
Born 1949. Trustee Since June 2006. Principal
Occupation(s) During the Past Five Years and
Other Experience: President of the University of
Pennsylvania; Christopher H. Browne Distinguished
Professor of Political Science, School of Arts and
Sciences, and Professor of Communication, Annenberg
School for Communication, with secondary faculty
appointments in the Department of Philosophy, School
of Arts and Sciences, and at the Graduate School of
Education, University of Pennsylvania; Trustee of the
National Constitution Center; Chair of the Presidential
Commission for the Study of Bioethical Issues.
JoAnn Heffernan Heisen
Born 1950. Trustee Since July 1998. Principal
Occupation(s) During the Past Five Years and
Other Experience: Corporate Vice President and
Chief Global Diversity Officer (retired 2008) and
Member of the Executive Committee (1997–2008)
of Johnson & Johnson (pharmaceuticals/medical
devices/consumer products); Director of Skytop
Lodge Corporation (hotels) and the Robert Wood
Johnson Foundation; Member of the Advisory
Board of the Institute for Women’s Leadership
at Rutgers University.
F. Joseph Loughrey
Born 1949. Trustee Since October 2009. Principal
Occupation(s) During the Past Five Years and Other
Experience: President and Chief Operating Officer
(retired 2009) of Cummins Inc. (industrial machinery);
Chairman of the Board of Hillenbrand, Inc. (specialized
consumer services), and of Oxfam America; Director
of SKF AB (industrial machinery), Hyster-Yale Materials
Handling, Inc. (forklift trucks), the Lumina Foundation
for Education, and the V Foundation for Cancer
Research; Member of the Advisory Council for the
College of Arts and Letters and of the Advisory Board
to the Kellogg Institute for International Studies, both
at the University of Notre Dame.
Mark Loughridge
Born 1953. Trustee Since March 2012. Principal
Occupation(s) During the Past Five Years and Other
Experience: Senior Vice President and Chief Financial
Officer (retired 2013) at IBM (information technology
services); Fiduciary Member of IBM’s Retirement Plan
Committee (2004–2013); Director of the Dow Chemical
Company; Member of the Council on Chicago Booth.
Scott C. Malpass
Born 1962. Trustee Since March 2012. Principal
Occupation(s) During the Past Five Years and Other
Experience: Chief Investment Officer and Vice
President at the University of Notre Dame; Assistant
Professor of Finance at the Mendoza College of
Business at Notre Dame; Member of the Notre Dame
403(b) Investment Committee, the Board of Advisors
for Spruceview Capital Partners, and the Investment
Advisory Committee of Major League Baseball; Board
Member of TIFF Advisory Services, Inc., and Catholic
Investment Services, Inc. (investment advisors).
André F. Perold
Born 1952. Trustee Since December 2004. Principal
Occupation(s) During the Past Five Years and Other
Experience: George Gund Professor of Finance and
Banking, Emeritus at the Harvard Business School
(retired 2011); Chief Investment Officer and Managing
Partner of HighVista Strategies LLC (private investment
firm); Director of Rand Merchant Bank; Overseer of
the Museum of Fine Arts Boston.
Peter F. Volanakis
Born 1955. Trustee Since July 2009. Principal
Occupation(s) During the Past Five Years and
Other Experience: President and Chief Operating
Officer (retired 2010) of Corning Incorporated
(communications equipment); Chairman of the
Board of Trustees of Colby-Sawyer College;
Member of the Advisory Board of the Norris
Cotton Cancer Center.
Executive Officers
Glenn Booraem
Born 1967. Treasurer Since May 2015. Principal
Occupation(s) During the Past Five Years and
Other Experience: Principal of The Vanguard Group,
Inc.; Treasurer of each of the investment companies
served by The Vanguard Group; Controller of each of
the investment companies served by The Vanguard
Group (2010–2015); Assistant Controller of each of
the investment companies served by The Vanguard
Group (2001–2010).
Thomas J. Higgins
Born 1957. Chief Financial Officer Since September
2008. Principal Occupation(s) During the Past Five
Years and Other Experience: Principal of The Vanguard
Group, Inc.; Chief Financial Officer of each of the
investment companies served by The Vanguard Group;
Treasurer of each of the investment companies served
by The Vanguard Group (1998–2008).
Peter Mahoney
Born 1974. Controller Since May 2015. Principal
Occupation(s) During the Past Five Years and Other
Experience: Head of Global Fund Accounting at The
Vanguard Group, Inc.; Controller of each of the invest-
ment companies served by The Vanguard Group;
Head of International Fund Services at The Vanguard
Group (2008–2014).
Anne E. Robinson
Born 1970. Secretary Since September 2016. Principal
Occupation(s) During the Past Five Years and Other
Experience: Managing Director of The Vanguard Group,
Inc.; General Counsel of The Vanguard Group; Secretary
of The Vanguard Group and of each of the investment
companies served by The Vanguard Group; Director
and Senior Vice President of Vanguard Marketing
Corporation; Managing Director and General Counsel
of Global Cards and Consumer Services at Citigroup
(2014–2016); Counsel at American Express (2003–2014).
| |
| Vanguard Senior Management Team |
| Mortimer J. Buckley | James M. Norris |
| Kathleen C. Gubanich | Thomas M. Rampulla |
| Martha G. King | Glenn W. Reed |
| John T. Marcante | Karin A. Risi |
| Chris D. McIsaac | Michael Rollings |
Chairman Emeritus and Senior Advisor
John J. Brennan
Chairman, 1996–2009
Chief Executive Officer and President, 1996–2008
Founder
John C. Bogle
Chairman and Chief Executive Officer, 1974–1996
1 Mr. McNabb is considered an “interested person,” as defined in the Investment Company Act of 1940, because he is an officer of the Vanguard funds.
2 December 2002 for Vanguard Equity Income Fund, the Vanguard Municipal Bond Funds, and the Vanguard State Tax-Exempt Funds.
|  |
| | P.O. Box 2600 |
| | Valley Forge, PA 19482-2600 |
| |
| |
| |
| Connect with Vanguard® > vanguard.com |
| |
| |
| |
| Fund Information > 800-662-7447 | |
| |
| Direct Investor Account Services > 800-662-2739 | London Stock Exchange Group companies include FTSE |
| Institutional Investor Services > 800-523-1036 | International Limited (”FTSE”), Frank Russell Company |
| | (”Russell”), MTS Next Limited (”MTS”), and FTSE TMX |
| Text Telephone for People | Global Debt Capital Markets Inc. (”FTSE TMX”). All |
| Who Are Deaf or Hard of Hearing > 800-749-7273 | rights reserved. ”FTSE®”, ”Russell®”, ”MTS®”, ”FTSE |
| This material may be used in conjunction | TMX®” and ”FTSE Russell” and other service marks |
| | and trademarks related to the FTSE or Russell indexes |
| with the offering of shares of any Vanguard | are trademarks of the London Stock Exchange Group |
| fund only if preceded or accompanied by | companies and are used by FTSE, MTS, FTSE TMX and |
| the fund’s current prospectus. | Russell under licence. All information is provided for |
| | information purposes only. No responsibility or liability |
| All comparative mutual fund data are from Lipper, a | can be accepted by the London Stock Exchange Group |
| Thomson Reuters Company, or Morningstar, Inc., unless | companies nor its licensors for any errors or for any |
| otherwise noted. | loss from use of this publication. Neither the London |
| You can obtain a free copy of Vanguard’s proxy voting | Stock Exchange Group companies nor any of its |
| guidelines by visiting vanguard.com/proxyreporting or by | licensors make any claim, prediction, warranty or |
| calling Vanguard at 800-662-2739. The guidelines are | representation whatsoever, expressly or impliedly, |
| also available from the SEC’s website, sec.gov. In | either as to the results to be obtained from the use of |
| addition, you may obtain a free report on how your fund | the FTSE Indexes or the fitness or suitability of the |
| voted the proxies for securities it owned during the 12 | Indexes for any particular purpose to which they might |
| months ended June 30. To get the report, visit either | be put. |
| vanguard.com/proxyreporting or sec.gov. | The Industry Classification Benchmark (”ICB”) is owned |
| You can review and copy information about your fund at | by FTSE. FTSE does not accept any liability to any |
| the SEC’s Public Reference Room in Washington, D.C. To | person for any loss or damage arising out of any error |
| find out more about this public service, call the SEC at | or omission in the ICB. |
| 202-551-8090. Information about your fund is also | |
| available on the SEC’s website, and you can receive | |
| copies of this information, for a fee, by sending a | |
| request in either of two ways: via email addressed to | |
| publicinfo@sec.gov or via regular mail addressed to the | |
| Public Reference Section, Securities and Exchange | |
| Commission, Washington, DC 20549-1520. | |
| |
| | © 2016 The Vanguard Group, Inc. |
| | All rights reserved. |
| | Vanguard Marketing Corporation, Distributor. |
| |
| | Q6280 122016 |
Annual Report | October 31, 2016
Vanguard FTSE International Index Funds
Vanguard FTSE All-World ex-US Index Fund
Vanguard FTSE All-World ex-US Small-Cap Index Fund
A new format, unwavering commitment
As you begin reading this report, you’ll notice that we’ve made some improvements to the opening sections—based on feedback from you, our clients.
Page 1 starts with a new ”Your Fund’s Performance at a Glance,” a concise, handy summary of how your fund performed during the period.
In the renamed ”Chairman’s Perspective,” Bill McNabb will focus on enduring principles and investment insights.
We’ve modified some tables, and eliminated some redundancy, but we haven’t removed any information.
At Vanguard, we’re always looking for better ways to communicate and to help you make sound investment decisions. Thank you for entrusting your assets to us.
| |
| Contents | |
| Your Fund’s Performance at a Glance. | 1 |
| Chairman’s Perspective. | 4 |
| FTSE All-World ex-US Index Fund. | 8 |
| FTSE All-World ex-US Small-Cap Index Fund. | 35 |
| Your Fund’s After-Tax Returns. | 60 |
| About Your Fund’s Expenses. | 61 |
| Glossary. | 63 |
Please note: The opinions expressed in this report are just that—informed opinions. They should not be considered promises or advice.
Also, please keep in mind that the information and opinions cover the period through the date on the front of this report. Of course, the
risks of investing in your fund are spelled out in the prospectus.
See the Glossary for definitions of investment terms used in this report.
About the cover: No matter what language you speak, Vanguard has one consistent message and set of principles. Our primary
focus is on you, our clients. We conduct our business with integrity as a faithful steward of your assets. This message is shown
translated into seven languages, reflecting our expanding global presence.
Your Fund’s Performance at a Glance
• For the 12 months ended October 31, 2016, Vanguard FTSE All-World ex-US Index
Fund returned about 1% and Vanguard FTSE All-World ex-US Small-Cap Index Fund
returned about 4%.
• Returns for both funds diverged from that of their benchmark indexes in part because
of temporary pricing discrepancies arising from fair-value adjustments. Please see the
Glossary entry for Fair-Value Pricing.
• Both funds’ returns exceeded the average returns of their peer groups.
• Returns from the Pacific region—the top contributor in both funds—were aided
by Japan and Australia, whose currencies strengthened against the U.S. dollar.
North America and emerging markets also added to performance.
• European stocks lost ground for the period. The relative strength of the U.S. dollar
against local currencies, along with fallout related to the Brexit vote, weighed on
Europe’s performance.
| |
| Total Returns: Fiscal Year Ended October 31, 2016 | |
| | Total |
| | Returns |
| Vanguard FTSE All-World ex-US Index Fund | |
| Investor Shares | 0.98% |
| ETF Shares | |
| Market Price | 1.13 |
| Net Asset Value | 1.17 |
| Admiral™ Shares | 1.13 |
| Institutional Shares | 1.15 |
| Institutional Plus Shares | 1.18 |
| FTSE All-World ex US Index | 0.64 |
| International Funds Average | -1.61 |
| International Funds Average: Derived from data provided by Lipper, a Thomson Reuters Company. |
1
| |
| | Total |
| | Returns |
| Vanguard FTSE All-World ex-US Small-Cap Index Fund | |
| Investor Shares | 3.95% |
| ETF Shares | |
| Market Price | 4.40 |
| Net Asset Value | 4.11 |
| Institutional Shares | 4.11 |
| FTSE Global Small Cap ex US Index | 3.40 |
| International Small-Cap Funds Average | 1.39 |
International Small-Cap Funds Average: Derived from data provided by Lipper, a Thomson Reuters Company.
Admiral Shares carry lower expenses and are available to investors who meet certain account-balance requirements. Institutional Shares and
Institutional Plus Shares are available to certain institutional investors who meet specific administrative, service, and account-size criteria.
The Vanguard ETF® Shares shown are traded on the NYSE Arca exchange and are available only through brokers. The table provides ETF
returns based on both the NYSE Arca market price and the net asset value for a share. U.S. Pat. Nos. 6,879,964; 7,337,138; 7,720,749;
7,925,573; 8,090,646; and 8,417,623.
For the ETF Shares, the market price is determined by the midpoint of the bid-offer spread as of the closing time of the New York Stock
Exchange (generally 4 p.m., Eastern time). The net asset value is also determined as of the NYSE closing time. For more information about
how the ETF Shares' market prices have compared with their net asset value, visit vanguard.com, select your ETF, and then select the Price
and Performance tab. The ETF premium/discount analysis there shows the percentages of days on which the ETF Shares' market price was
above or below the NAV.
| |
| Total Returns: Inception Through October 31, 2016 | |
| | Average |
| | Annual Return |
| FTSE All-World ex-US Index Fund Investor Shares (Returns since inception: 3/8/2007) | 1.11% |
| FTSE All-World ex US Index | 1.52 |
| International Funds Average | 0.57 |
| International Funds Average: Derived from data provided by Lipper, a Thomson Reuters Company. | |
| |
| FTSE All-World ex-US Small-Cap Index Fund Investor Shares (Returns since inception: 4/2/2009) | 11.11% |
| FTSE Global Small Cap ex US Index | 11.68 |
| International Small-Cap Funds Average | 13.17 |
International Small-Cap Funds Average: Derived from data provided by Lipper, a Thomson Reuters Company.
The figures shown represent past performance, which is not a guarantee of future results. (Current performance may be
lower or higher than the performance data cited. For performance data current to the most recent month-end, visit our
website at vanguard.com/performance.) Note, too, that both investment returns and principal value can fluctuate widely, so
an investor’s shares, when sold, could be worth more or less than their original cost.
2
| | | | | | |
| Expense Ratios | | | | | | |
| Your Fund Compared With Its Peer Group | | | | | |
| | Investor | ETF | Admiral | Institutional | Institutional | Peer Group |
| | Shares | Shares | Shares | Shares | Plus Shares | Average |
| FTSE All-World ex-US Index Fund | 0.26% | 0.13% | 0.13% | 0.11% | 0.09% | 1.37% |
| FTSE All-World ex-US Small-Cap | | | | | | |
| Index Fund | 0.31 | 0.17 | — | 0.15 | — | 1.59 |
The fund expense ratios shown are from the prospectus dated February 26, 2016, and represent estimated costs for the current fiscal year. For
the fiscal year ended October 31, 2016, the funds’ expense ratios were: for the FTSE All-World ex-US Index Fund, 0.23% for Investor Shares,
0.11% for ETF Shares, 0.11% for Admiral Shares, 0.10% for Institutional Shares, and 0.07% for Institutional Plus Shares; and for the FTSE
All-World ex-US Small-Cap Index Fund, 0.27% for Investor Shares, 0.13% for ETF Shares, and 0.12% for Institutional Shares. The peer-group
expense ratios are derived from data provided by Lipper, a Thomson Reuters Company, and capture information through year-end 2015.
Peer groups: For the FTSE All-World ex-US Index Fund, International Funds; and for the FTSE All-World ex-US Small-Cap Index Fund,
International Small-Cap Funds.
3
Chairman’s Perspective

Bill McNabb
Chairman and Chief Executive Officer
Dear Shareholder,
Over the three years ended August 31, 2016, investors poured more than $1 trillion into index funds. Indexing now accounts for nearly a third of all mutual fund assets—more than double what it did a decade ago and eight times its share two decades ago.1
By contrast, active management’s commercial struggles have reflected its disappointing investment performance. Over the decade ended December 31, 2015, 82% of actively managed stock funds and 81% of active bond funds have either underperformed their benchmarks or shut down.
This subpar performance has fueled the explosion of asset growth in indexing among individual, retirement, and nonprofit investors. So what might the trend mean for the future of actively managed funds?
Our research and experience indicate that active management can survive—and even succeed—but only if it’s offered at much lower expense.
High costs, which limit a manager’s ability to deliver benchmark-beating returns to clients, are the biggest reason why active has lagged. Industrywide as of December 31, 2015, the average expense ratio for all active stock funds is 1.14%, compared with 0.76% for stock index
1 Sources: Wall Street Journal; Morningstar, Inc.; and Investment Company Institute, 2016.
4
funds. And the expense advantage is even wider for bonds; the average expense ratio for an active bond fund is 0.93%, compared with 0.43% for bond index funds.
But even these big differences understate the real gap. These days, it’s not hard to find an index fund that charges maybe 0.05% or 0.10%. So even if you have identified active managers who are skilled at selecting stocks and bonds, to match the return of a comparable (much cheaper) index fund would require significant outperformance. Think about it. Any fund that charges 1.00% in expenses—not even the high end of the range—will find it extraordinarily difficult to overcome the index fund’s head start.
Active management also has taken a hit from a regulatory environment that has been favorable to low-cost strategies. The U.S. Department of Labor several years ago mandated greater disclosure of retirement plan fees. And its new fiduciary rule, which is set to take effect in April, requires financial advisors to demonstrate that their recommendations are aligned with their clients’ best interest. Both changes encourage the use of lower-cost investments, including index funds.
The future of active management
In light of all this, people have been asking me whether active management is “dead.” My response is both yes and no. High-cost active management is dead, and rightly so. It has never been a winning proposition
| | | |
| Market Barometer | | | |
| | Average Annual Total Returns |
| | Periods Ended October 31, 2016 |
| | One | Three | Five |
| | Year | Years | Years |
| Stocks | | | |
| Russell 1000 Index (Large-caps) | 4.26% | 8.48% | 13.51% |
| Russell 2000 Index (Small-caps) | 4.11 | 4.12 | 11.51 |
| Russell 3000 Index (Broad U.S. market) | 4.24 | 8.13 | 13.35 |
| FTSE All-World ex US Index (International) | 0.64 | -0.94 | 4.09 |
| |
| Bonds | | | |
| Bloomberg Barclays U.S. Aggregate Bond Index | | | |
| (Broad taxable market) | 4.37% | 3.48% | 2.90% |
| Bloomberg Barclays Municipal Bond Index | | | |
| (Broad tax-exempt market) | 4.06 | 4.89 | 4.34 |
| Citigroup Three-Month U.S. Treasury Bill Index | 0.22 | 0.07 | 0.07 |
| |
| CPI | | | |
| Consumer Price Index | 1.64% | 1.15% | 1.32% |
5
for investors. Low-cost active funds, though, can potentially play an important role for investors who seek to outperform the market.
Paying less for your funds is the only sure-fire way to improve your odds of achieving success in active management. But even if you have found an active manager with low costs, the odds of outperforming the market are still long. You have to be able to identify talented stock and bond portfolio managers with long time horizons and clear investment strategies. Look for managers with consistent track records and the discipline to stick closely to their investment strategy.
Know what you own and why
Despite the well-deserved reputation of indexing and the challenges for active managers, there’s still a place for traditional active strategies that are low-cost, diversified, and highly disciplined, and are run by talented managers who focus on the long term.
Vanguard has always applied these principles to our active strategies, and investors have benefited as a majority of our active funds outperformed their benchmarks and bested their peers’ average annual return over the ten years ended September 30, 2016.
|
| Worried about the election’s impact on your portfolio? |
|
| The 2016 presidential election season was |
| one of the most intense and unpredictable |
| in U.S. history. In its aftermath, investors |
| may be left with lingering questions about |
| what the outcome will mean for their |
| portfolios. The answer, based on Vanguard |
| research into decades of historical data, is |
| that presidential elections typically have no |
| long-term effect on market performance. |
| |
| These findings hold true regardless of the |
| market’s initial reaction. Whether there’s |
| a swoon or bounce immediately after an |
| election, investors shouldn’t extrapolate |
| that performance to the long term. |
| |
| As you can see in the accompanying chart, |
| data going back to 1853 show that stock |
| market returns are virtually identical no matter |
| which party controls the White House. |
| Although headlines out of Washington at any |
| given time may still cause concern, investors |
| shouldn’t overreact to short-term events. |
| Instead, it’s best to maintain a balanced and |
| diversified portfolio and stay focused on your |
| long-term goals. |
| |
| Average annual stock market returns based |
| on party control of the White House |
| (1853–2015) |
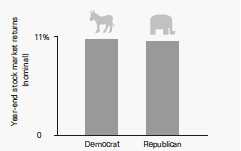
| Sources: Global Financial Data, 1853–1926; Morningstar, Inc., |
| and Ibbotson Associates thereafter through 2015. |
6
But it’s crucial for investors to be patient. Even active managers with the best track records frequently underperform their benchmarks when their investment styles are out of favor. Such periods, though temporary, can persist. So it’s important when entrusting your assets to an active strategy to be in it for the long haul.
Make sure you know what you’re buying and what the risks are. Active strategies are becoming more complex, so it’s important to clearly understand what the investments in your portfolio are designed to accomplish and why you want to hold them. Otherwise, you run the risk of selecting strategies that don’t fit your needs or objectives.
Keeping these considerations in mind can potentially boost your chances of success in identifying active strategies that may be able to help you reach your goals.
As always, thank you for investing with Vanguard.
Sincerely,
F. William McNabb III
Chairman and Chief Executive Officer
November 9, 2016
7
FTSE All-World ex-US Index Fund
Fund Profile
As of October 31, 2016
| | | | | |
| Share-Class Characteristics | | | | | |
| | Investor | | Admiral | Institutional | Institutional |
| | Shares | ETF Shares | Shares | Shares | Plus Shares |
| Ticker Symbol | VFWIX | VEU | VFWAX | VFWSX | VFWPX |
| Expense Ratio1 | 0.26% | 0.13% | 0.13% | 0.11% | 0.09% |
| | |
| Portfolio Characteristics | | |
| | | FTSE |
| | | All-World |
| | Fund | ex US Index |
| Number of Stocks | 2,586 | 2,426 |
| Median Market Cap | $27.5B | $27.5B |
| Price/Earnings Ratio | 20.3x | 20.6x |
| Price/Book Ratio | 1.6x | 1.6x |
| Return on Equity | 14.6% | 14.7% |
| Earnings Growth | | |
| Rate | 7.0% | 7.2% |
| Dividend Yield | 3.0% | 3.0% |
| Turnover Rate | 5% | — |
| Short-Term Reserves | -0.3% | — |
| | |
| Sector Diversification (% of equity exposure) |
| | | FTSE |
| | | All-World |
| | Fund | ex US Index |
| Basic Materials | 7.5% | 7.6% |
| Consumer Goods | 16.8 | 16.8 |
| Consumer Services | 8.2 | 8.2 |
| Financials | 25.9 | 25.7 |
| Health Care | 7.8 | 7.8 |
| Industrials | 13.6 | 13.7 |
| Oil & Gas | 6.6 | 6.6 |
| Technology | 5.4 | 5.4 |
| Telecommunications | 4.6 | 4.6 |
| Utilities | 3.6 | 3.6 |
| |
| Volatility Measures | |
| | FTSE |
| | All-World |
| | ex US Index |
| R-Squared | 0.98 |
| Beta | 0.96 |
These measures show the degree and timing of the fund’s
fluctuations compared with the index over 36 months.
| | |
| Ten Largest Holdings (% of total net assets) |
| Nestle SA | Food Products | 1.3% |
| Royal Dutch Shell plc | Integrated Oil & Gas | 1.1 |
| Novartis AG | Pharmaceuticals | 0.9 |
| Roche Holding AG | Pharmaceuticals | 0.9 |
| Samsung Electronics Co. Consumer | |
| Ltd. | Electronics | 0.9 |
| Toyota Motor Corp. | Automobiles | 0.9 |
| HSBC Holdings plc | Banks | 0.8 |
| Taiwan Semiconductor | | |
| Manufacturing Co. Ltd. | Semiconductors | 0.8 |
| Tencent Holdings Ltd. | Internet | 0.8 |
| Unilever | Personal Products | 0.6 |
| Top Ten | | 9.0% |
The holdings listed exclude any temporary cash investments and
equity index products.
Allocation by Region (% of equity exposure)
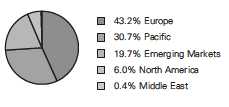
1 The expense ratios shown are from the prospectus dated February 26, 2016, and represent estimated costs for the current fiscal year. For the fiscal
year ended October 31, 2016, the expense ratios were 0.23% for Investor Shares, 0.11% for ETF Shares, 0.11% for Admiral Shares, 0.10% for
Institutional Shares, and 0.07% for Institutional Plus Shares.
8
FTSE All-World ex-US Index Fund
| | |
| Market Diversification (% of equity exposure) |
| | | FTSE |
| | | All-World |
| | | ex US |
| | Fund | Index |
| Europe | | |
| United Kingdom | 12.8% | 12.8% |
| France | 6.6 | 6.5 |
| Germany | 6.4 | 6.3 |
| Switzerland | 6.0 | 6.1 |
| Spain | 2.2 | 2.2 |
| Netherlands | 2.2 | 2.2 |
| Sweden | 1.9 | 1.9 |
| Italy | 1.4 | 1.4 |
| Denmark | 1.2 | 1.2 |
| Other | 2.5 | 2.4 |
| Subtotal | 43.2% | 43.0% |
| Pacific | | |
| Japan | 18.4% | 18.5% |
| Australia | 5.2 | 5.2 |
| South Korea | 3.3 | 3.3 |
| Hong Kong | 2.7 | 2.8 |
| Other | 1.1 | 1.1 |
| Subtotal | 30.7% | 30.9% |
| Emerging Markets | | |
| China | 4.9% | 4.9% |
| Taiwan | 2.9 | 2.9 |
| India | 2.4 | 2.4 |
| Brazil | 2.0 | 2.0 |
| South Africa | 1.8 | 1.8 |
| Mexico | 1.0 | 1.0 |
| Other | 4.7 | 4.7 |
| Subtotal | 19.7% | 19.7% |
| North America | | |
| Canada | 6.0% | 6.0% |
| Middle East | 0.4% | 0.4% |
9
FTSE All-World ex-US Index Fund
Performance Summary
All of the returns in this report represent past performance, which is not a guarantee of future results that may be achieved by the fund. (Current performance may be lower or higher than the performance data cited. For performance data current to the most recent month-end, visit our website at vanguard.com/performance.) Note, too, that both investment returns and principal value can fluctuate widely, so an investor’s shares, when sold, could be worth more or less than their original cost. The returns shown do not reflect taxes that a shareholder would pay on fund distributions or on the sale of fund shares.
Cumulative Performance: March 8, 2007, Through October 31, 2016
Initial Investment of $10,000
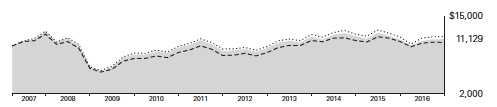
| | | | | |
| | | Average Annual Total Returns | |
| | | Periods Ended October 31, 2016 | |
| | | | | Since | Final Value |
| | | One | Five | Inception | of a $10,000 |
| | | Year | Years | (3/8/2007) | Investment |
| | FTSE All-World ex-US Index | | | | |
| | Fund*Investor Shares | 0.98% | 4.10% | 1.11% | $11,129 |
| • • • • • • •• | FTSE All-World ex US Index | 0.64 | 4.09 | 1.52 | 11,568 |
| – – – – | International Funds Average | -1.61 | 4.75 | 0.57 | 10,564 |
| International Funds Average: Derived from data provided by Lipper, a Thomson Reuters Company. | | |
| "Since Inception" performance is calculated from the Investor Shares’ inception date for both the fund and its comparative standards. |
| | | | |
| | | | Since | Final Value |
| | One | Five | Inception | of a $10,000 |
| | Year | Years | (3/2/2007) | Investment |
| FTSE All-World ex-US Index Fund | | | | |
| ETF Shares Net Asset Value | 1.17% | 4.26% | 1.47% | $11,517 |
| FTSE All-World ex US Index | 0.64 | 4.09 | 1.61 | 11,670 |
| "Since Inception" performance is calculated from the ETF Shares’ inception date for both the fund and its comparative standard. |
See Financial Highlights for dividend and capital gains information.
10
FTSE All-World ex-US Index Fund
| | | | |
| | Average Annual Total Returns | |
| | Periods Ended October 31, 2016 | |
| |
| | | | Since | Final Value |
| | One | Five | Inception | of a $10,000 |
| | Year | Years | (9/27/2011) | Investment |
| FTSE All-World ex-US Index Fund Admiral | | | | |
| Shares | 1.13% | 4.25% | 5.65% | $13,230 |
| FTSE All-World ex US Index | 0.64 | 4.09 | 5.65 | 13,233 |
| "Since Inception" performance is calculated from the Admiral Shares’ inception date for both the fund and its comparative standard. |
| | | | |
| | | | Since | Final Value |
| | One | Five | Inception | of a $5,000,000 |
| | Year | Years | (4/30/2007) | Investment |
| FTSE All-World ex-US Index Fund | | | | |
| Institutional Shares | 1.15% | 4.28% | 0.58% | $5,284,965 |
| |
| FTSE All-World ex US Index | 0.64 | 4.09 | 0.69 | 5,337,441 |
| "Since Inception" performance is calculated from the Institutional Shares’ inception date for both the fund and its comparative standard. |
| | | | |
| | | | Since | Final Value |
| | One | Five | Inception | of a $100,000,000 |
| | Year | Years | (12/16/2010) | Investment |
| FTSE All-World ex-US Index Fund Institutional | | | | |
| Plus Shares | 1.18% | 4.30% | 2.31% | $114,346,650 |
| FTSE All-World ex US Index | 0.64 | 4.09 | 2.43 | 115,158,977 |
| "Since Inception" performance is calculated from the Institutional Plus Shares’ inception date for both the fund and its comparative standard. |
| | | |
| Cumulative Returns of ETF Shares: March 2, 2007, Through October 31, 2016 | | |
| | | | Since |
| | One | Five | Inception |
| | Year | Years | (3/2/2007) |
| FTSE All-World ex-US Index Fund ETF Shares | | | |
| Market Price | 1.13% | 23.36% | 15.16% |
| FTSE All-World ex-US Index Fund ETF Shares Net | | | |
| Asset Value | 1.17 | 23.22 | 15.17 |
| FTSE All-World ex US Index | 0.64 | 22.16 | 16.70 |
| "Since Inception" performance is calculated from the ETF Shares’ inception date for both the fund and its comparative standard. |
11
FTSE All-World ex-US Index Fund
Fiscal-Year Total Returns (%): March 8, 2007, Through October 31, 2016

Index returns are adjusted for withholding taxes applicable to U.S.-based mutual funds organized as Delaware statutory trusts.
Average Annual Total Returns: Periods Ended September 30, 2016
This table presents returns through the latest calendar quarter—rather than through the end of the fiscal period.
Securities and Exchange Commission rules require that we provide this information.
| | | | |
| | Inception | One | Five | Since |
| | Date | Year | Years | Inception |
| Investor Shares | 3/8/2007 | 9.23% | 6.55% | 1.30% |
| ETF Shares | 3/2/2007 | | | |
| Market Price | | 9.73 | 6.94 | 1.67 |
| Net Asset Value | | 9.43 | 6.71 | 1.66 |
| Admiral Shares | 9/27/2011 | 9.43 | 6.71 | 6.10 |
| Institutional Shares | 4/30/2007 | 9.41 | 6.73 | 0.76 |
| Institutional Plus Shares | 12/16/2010 | 9.45 | 6.76 | 2.63 |
12
FTSE All-World ex-US Index Fund
Financial Statements
Statement of Net Assets—Investments Summary
As of October 31, 2016
This Statement summarizes the fund’s holdings by asset type. Details are reported for each of the fund’s 50 largest individual holdings and for investments that, in total for any issuer, represent more than 1% of the fund’s net assets. The total value of smaller holdings is reported as a single amount within each category.
The fund reports a complete list of its holdings in regulatory filings four times in each fiscal year, at the quarter-ends. For the second and fourth fiscal quarters, the complete listing of the fund’s holdings is available electronically on vanguard.com and on the Securities and Exchange Commission’s website (sec.gov), or you can have it mailed to you without charge by calling 800-662-7447. For the first and third fiscal quarters, the fund files the lists with the SEC on Form N-Q. Shareholders can look up the fund’s Forms N-Q on the SEC’s website. Forms N-Q may also be reviewed and copied at the SEC’s Public Reference Room (see the back cover of this report for further information).
| | | |
| | | Market | Percentage |
| | | Value• | of Net |
| | Shares | ($000) | Assets |
| Common Stocks | | | |
| Australia | | | |
| Commonwealth Bank of Australia | 2,360,406 | 131,407 | 0.5% |
| Westpac Banking Corp. | 4,617,441 | 106,779 | 0.5% |
| Australia & New Zealand Banking Group Ltd. | 4,039,059 | 85,287 | 0.4% |
| National Australia Bank Ltd. | 3,676,363 | 78,040 | 0.3% |
| BHP Billiton Ltd. | 4,460,174 | 77,923 | 0.3% |
| Australia—Other † | | 800,402 | 3.2% |
| | | 1,279,838 | 5.2% |
| |
| Austria † | | 34,418 | 0.1% |
| |
| Belgium | | | |
| * Anheuser-Busch InBev SA/NV | 1,108,561 | 127,230 | 0.5% |
| Belgium—Other † | | 98,689 | 0.4% |
| | | 225,919 | 0.9% |
| |
| Brazil † | | 489,154 | 2.0% |
| |
| Canada | | | |
| Royal Bank of Canada | 2,056,744 | 128,499 | 0.5% |
| Toronto-Dominion Bank | 2,563,836 | 116,331 | 0.5% |
| Bank of Nova Scotia | 1,681,324 | 90,352 | 0.3% |
| Suncor Energy Inc. | 2,313,081 | 69,411 | 0.3% |
| 1 Canada—Other † | | 1,069,780 | 4.3% |
| | | 1,474,373 | 5.9% |
| |
| Chile † | | 67,695 | 0.3% |
| |
| China | | | |
| Tencent Holdings Ltd. | 7,425,447 | 196,792 | 0.8% |
| China Construction Bank Corp. | 126,971,544 | 92,721 | 0.4% |
| China Mobile Ltd. | 7,398,567 | 84,761 | 0.4% |
13
| | | | |
| FTSE All-World ex-US Index Fund | | | |
| |
| |
| |
| | | | Market | Percentage |
| | | | Value• | of Net |
| | | Shares | ($000) | Assets |
| | Industrial & Commercial Bank of China Ltd. | 100,120,640 | 60,096 | 0.3% |
| | Bank of China Ltd. | 104,597,788 | 46,872 | 0.2% |
| | CNOOC Ltd. | 22,367,400 | 28,144 | 0.1% |
| | China Petroleum & Chemical Corp. | 35,497,284 | 25,672 | 0.1% |
| | China Life Insurance Co. Ltd. | 10,351,341 | 25,627 | 0.1% |
| | PetroChina Co. Ltd. | 29,249,234 | 20,013 | 0.1% |
| | China Overseas Land & Investment Ltd. | 5,315,820 | 16,319 | 0.1% |
| | Agricultural Bank of China Ltd. | 35,794,233 | 15,058 | 0.1% |
| | China Telecom Corp. Ltd. | 22,411,541 | 11,555 | 0.1% |
| | PICC Property & Casualty Co. Ltd. | 6,372,396 | 10,286 | 0.1% |
| | CITIC Ltd. | 6,851,275 | 9,831 | 0.1% |
| | China Shenhua Energy Co. Ltd. | 4,716,388 | 9,778 | 0.1% |
| | China Unicom Hong Kong Ltd. | 7,971,713 | 9,359 | 0.1% |
| | China Resources Land Ltd. | 3,742,214 | 9,294 | 0.0% |
| | Sinopharm Group Co. Ltd. | 1,455,703 | 7,069 | 0.0% |
| | China Communications Construction Co. Ltd. | 6,189,026 | 6,796 | 0.0% |
| | China CITIC Bank Corp. Ltd. | 10,531,189 | 6,792 | 0.0% |
| | CRRC Corp. Ltd. | 5,652,053 | 5,118 | 0.0% |
| 1 | China Galaxy Securities Co. Ltd. | 5,184,777 | 4,922 | 0.0% |
| * | China Resources Beer Holdings Co. Ltd. | 2,227,861 | 4,734 | 0.0% |
| | China Cinda Asset Management Co. Ltd. | 12,660,693 | 4,548 | 0.0% |
| | China Resources Power Holdings Co. Ltd. | 2,674,409 | 4,531 | 0.0% |
| | China Merchants Port Holdings Co. Ltd. | 1,668,031 | 4,313 | 0.0% |
| | Dongfeng Motor Group Co. Ltd. | 4,078,627 | 4,251 | 0.0% |
| | China Railway Group Ltd. | 5,379,352 | 4,147 | 0.0% |
| 1 | CGN Power Co. Ltd. | 13,727,267 | 4,008 | 0.0% |
| * | China Taiping Insurance Holdings Co. Ltd. | 2,060,364 | 3,966 | 0.0% |
| | China State Construction International Holdings Ltd. | 2,492,727 | 3,637 | 0.0% |
| | China Longyuan Power Group Corp. Ltd. | 4,694,785 | 3,580 | 0.0% |
| 1 | People’s Insurance Co. Group of China Ltd. | 8,775,161 | 3,487 | 0.0% |
| | China Resources Gas Group Ltd. | 1,098,547 | 3,445 | 0.0% |
| | Zhuzhou CRRC Times Electric Co. Ltd. | 707,009 | 3,419 | 0.0% |
| *,1 | China Huarong Asset Management Co. Ltd. | 8,652,874 | 3,308 | 0.0% |
| | China Railway Construction Corp. Ltd. | 2,596,745 | 3,246 | 0.0% |
| | Kunlun Energy Co. Ltd. | 3,911,523 | 2,947 | 0.0% |
| | Sinopec Shanghai Petrochemical Co. Ltd. | 4,858,331 | 2,477 | 0.0% |
| | China Oilfield Services Ltd. | 2,504,300 | 2,404 | 0.0% |
| | AviChina Industry & Technology Co. Ltd. | 3,357,954 | 2,279 | 0.0% |
| ^ | China Reinsurance Group Corp. | 9,508,576 | 2,263 | 0.0% |
| | Beijing Capital International Airport Co. Ltd. | 2,104,557 | 2,203 | 0.0% |
| | China Jinmao Holdings Group Ltd. | 7,056,005 | 1,946 | 0.0% |
| | Huaneng Renewables Corp. Ltd. | 5,663,075 | 1,898 | 0.0% |
| 1 | China Railway Signal & Communication Corp. Ltd. | 2,246,068 | 1,821 | 0.0% |
| | Chongqing Changan Automobile Co. Ltd. Class B | 1,163,079 | 1,773 | 0.0% |
| 1 | Sinopec Engineering Group Co. Ltd. | 2,006,381 | 1,771 | 0.0% |
| * | China Coal Energy Co. Ltd. | 2,991,638 | 1,694 | 0.0% |
| | Air China Ltd. | 2,540,115 | 1,669 | 0.0% |
| | China Power International Development Ltd. | 4,575,787 | 1,664 | 0.0% |
| | China Southern Airlines Co. Ltd. | 2,445,017 | 1,372 | 0.0% |
| ^ | Metallurgical Corp. of China Ltd. | 4,095,562 | 1,332 | 0.0% |
| | Sinotrans Ltd. | 2,648,860 | 1,247 | 0.0% |
| *,^ | China COSCO Holdings Co. Ltd. | 3,555,160 | 1,225 | 0.0% |
| * | China Agri-Industries Holdings Ltd. | 3,033,447 | 1,185 | 0.0% |
| | China Resources Cement Holdings Ltd. | 2,821,334 | 1,139 | 0.0% |
| ^ | China Eastern Airlines Corp. Ltd. | 2,101,145 | 943 | 0.0% |
| | Huadian Fuxin Energy Corp. Ltd. | 3,576,005 | 828 | 0.0% |
14
| | | | |
| FTSE All-World ex-US Index Fund | | | |
| |
| |
| |
| | | | Market | Percentage |
| | | | Value• | of Net |
| | | Shares | ($000) | Assets |
| *,^ | Angang Steel Co. Ltd. | 1,575,537 | 807 | 0.0% |
| | China Machinery Engineering Corp. | 1,275,516 | 761 | 0.0% |
| | Shanghai Baosight Software Co. Ltd. Class B | 308,442 | 534 | 0.0% |
| | China BlueChemical Ltd. | 2,631,895 | 509 | 0.0% |
| ^ | CSSC Offshore and Marine Engineering Group Co. Ltd. | 332,873 | 502 | 0.0% |
| | China National Accord Medicines Corp. Ltd. Class B | 73,286 | 458 | 0.0% |
| ^ | China Foods Ltd. | 918,843 | 406 | 0.0% |
| *,^ | CITIC Resources Holdings Ltd. | 3,012,222 | 376 | 0.0% |
| | China National Materials Co. Ltd. | 1,580,369 | 356 | 0.0% |
| ^ | Sinofert Holdings Ltd. | 2,319,208 | 304 | 0.0% |
| 1 | China—Other † | | 398,604 | 1.6% |
| | | | 1,203,192 | 4.8% |
| |
| Colombia † | | 27,114 | 0.1% |
| |
| 1Czech Republic † | | 10,578 | 0.0% |
| |
| Denmark | | | |
| | Novo Nordisk A/S Class B | 2,564,623 | 91,366 | 0.4% |
| 1 | Denmark—Other † | | 198,666 | 0.8% |
| | | | 290,032 | 1.2% |
| |
| Egypt † | | 14,185 | 0.1% |
| |
| Finland † | | 176,863 | 0.7% |
| |
| France | | | |
| | TOTAL SA | 2,988,449 | 143,162 | 0.6% |
| | Sanofi | 1,551,184 | 120,712 | 0.5% |
| | BNP Paribas SA | 1,357,302 | 78,701 | 0.3% |
| 1 | France—Other † | | 1,258,899 | 5.1% |
| | | | 1,601,474 | 6.5% |
| Germany | | | |
| | Siemens AG | 1,056,408 | 120,027 | 0.5% |
| | Bayer AG | 1,149,306 | 114,115 | 0.5% |
| | BASF SE | 1,282,979 | 113,259 | 0.4% |
| | SAP SE | 1,242,220 | 109,439 | 0.4% |
| | Allianz SE | 631,900 | 98,643 | 0.4% |
| | Daimler AG | 1,324,208 | 94,472 | 0.4% |
| | Deutsche Telekom AG | 4,455,828 | 72,698 | 0.3% |
| 1 | Germany—Other † | | 834,341 | 3.4% |
| | | | 1,556,994 | 6.3% |
| |
| Greece † | | 19,051 | 0.1% |
| |
| Hong Kong | | | |
| | AIA Group Ltd. | 16,738,852 | 105,304 | 0.4% |
| | BOC Hong Kong Holdings Ltd. | 4,992,196 | 17,794 | 0.1% |
| ^ | China Travel International Investment Hong Kong Ltd. | 3,505,542 | 1,010 | 0.0% |
| 1 | Hong Kong—Other † | | 555,871 | 2.2% |
| | | | 679,979 | 2.7% |
| |
| Hungary † | | 16,758 | 0.1% |
15
| | | |
| FTSE All-World ex-US Index Fund | | | |
| |
| | | Market | Percentage |
| | | Value• | of Net |
| | Shares | ($000) | Assets |
| India | | | |
| Nestle India Ltd. | 32,014 | 3,350 | 0.0% |
| 1 India—Other † | | 591,178 | 2.4% |
| | | 594,528 | 2.4% |
| Indonesia † | | 137,660 | 0.6% |
| Ireland † | | 39,854 | 0.2% |
| Israel † | | 106,469 | 0.4% |
| 1Italy † | | 348,951 | 1.4% |
| Japan | | | |
| Toyota Motor Corp. | 3,797,791 | 220,298 | 0.9% |
| Mitsubishi UFJ Financial Group Inc. | 18,902,259 | 97,532 | 0.4% |
| KDDI Corp. | 2,578,464 | 78,368 | 0.3% |
| SoftBank Group Corp. | 1,195,468 | 75,292 | 0.3% |
| Honda Motor Co. Ltd. | 2,492,379 | 74,576 | 0.3% |
| Japan—Other † | | 3,960,789 | 16.0% |
| | | 4,506,855 | 18.2% |
| 1Malaysia † | | 181,441 | 0.7% |
| Malta † | | — | 0.0% |
| 1Mexico † | | 233,634 | 0.9% |
| Netherlands | | | |
| Unilever NV | 2,163,079 | 90,473 | 0.3% |
| ING Groep NV | 5,367,265 | 70,456 | 0.3% |
| 1 Netherlands—Other † | | 369,494 | 1.5% |
| | | 530,423 | 2.1% |
| New Zealand † | | 46,672 | 0.2% |
| Norway † | | 102,699 | 0.4% |
| Other2 | | | |
| 3 Vanguard FTSE Emerging Markets ETF | 1,921,981 | 72,555 | 0.3% |
| Pakistan † | | 2,801 | 0.0% |
| Peru † | | 14,602 | 0.1% |
| Philippines † | | 77,137 | 0.3% |
| Poland † | | 64,129 | 0.3% |
| Portugal † | | 26,570 | 0.1% |
| Qatar † | | 26,379 | 0.1% |
| Russia † | | 219,281 | 0.9% |
16
| | | |
| FTSE All-World ex-US Index Fund | | | |
| |
| |
| |
| | | Market | Percentage |
| | | Value• | of Net |
| | Shares | ($000) | Assets |
| Singapore † | | 220,443 | 0.9% |
| |
| South Africa | | | |
| Naspers Ltd. | 596,325 | 99,873 | 0.4% |
| South Africa—Other † | | 331,949 | 1.3% |
| | | 431,822 | 1.7% |
| South Korea | | | |
| Samsung Electronics Co. Ltd. GDR | 207,312 | 145,846 | 0.6% |
| South Korea—Other † | | 671,996 | 2.7% |
| | | 817,842 | 3.3% |
| Spain | | | |
| Banco Santander SA | 19,213,676 | 94,148 | 0.4% |
| 1 Spain—Other † | | 446,008 | 1.8% |
| | | 540,156 | 2.2% |
| |
| Sweden † | | 471,565 | 1.9% |
| |
| Switzerland | | | |
| Nestle SA | 4,286,842 | 310,856 | 1.3% |
| Novartis AG | 3,284,554 | 233,097 | 0.9% |
| Roche Holding AG | 986,046 | 226,477 | 0.9% |
| Switzerland—Other † | | 715,967 | 2.9% |
| | | 1,486,397 | 6.0% |
| Taiwan | | | |
| Taiwan Semiconductor Manufacturing Co. Ltd. ADR | 5,137,610 | 159,780 | 0.6% |
| Taiwan—Other † | | 545,544 | 2.2% |
| | | 705,324 | 2.8% |
| |
| Thailand † | | 177,816 | 0.7% |
| |
| Turkey † | | 67,231 | 0.3% |
| |
| United Arab Emirates † | | 53,405 | 0.2% |
| |
| United Kingdom | | | |
| HSBC Holdings plc | 27,535,770 | 207,376 | 0.8% |
| BP plc | 26,106,062 | 154,332 | 0.6% |
| Royal Dutch Shell plc Class A | 6,012,207 | 149,747 | 0.6% |
| British American Tobacco plc | 2,590,633 | 148,477 | 0.6% |
| Royal Dutch Shell plc Class B | 5,205,540 | 134,265 | 0.6% |
| GlaxoSmithKline plc | 6,756,928 | 133,479 | 0.5% |
| Vodafone Group plc | 36,922,380 | 101,401 | 0.4% |
| AstraZeneca plc | 1,753,877 | 98,209 | 0.4% |
| Diageo plc | 3,500,553 | 93,173 | 0.4% |
| Reckitt Benckiser Group plc | 873,885 | 78,179 | 0.3% |
| Unilever plc | 1,676,747 | 70,003 | 0.3% |
| 1 United Kingdom—Other † | | 1,765,131 | 7.1% |
| | | 3,133,772 | 12.6% |
| Total Common Stocks (Cost $24,530,754) | | 24,606,030 | 99.2%4 |
17
| | | | |
| FTSE All-World ex-US Index Fund | | | | |
| |
| |
| |
| | | | Market | Percentage |
| | | | Value• | of Net |
| | Coupon | Shares | ($000) | Assets |
| Temporary Cash Investments | | | | |
| Money Market Fund | | | | |
| 5,6 Vanguard Market Liquidity Fund | 0.718% | 3,664,523 | 366,489 | 1.5% |
| |
| 7,8U.S. Government and Agency Obligations † | | | 29,189 | 0.1% |
| Total Temporary Cash Investments (Cost $395,649) | | | 395,678 | 1.6%4 |
| Total Investments (Cost $24,926,403) | | | 25,001,708 | 100.8% |
| |
| | | | Amount | |
| | | | ($000) | |
| Other Assets and Liabilities | | | | |
| Other Assets | | | | |
| Investment in Vanguard | | | 1,916 | |
| Receivables for Investment Securities Sold | | | 287 | |
| Receivables for Accrued Income | | | 82,661 | |
| Receivables for Capital Shares Issued | | | 7,561 | |
| Other Assets | | | 20,566 | |
| Total Other Assets | | | 112,991 | 0.5% |
| Liabilities | | | | |
| Payables for Investment Securities Purchased | | | (6,554) | |
| Collateral for Securities on Loan | | | (273,828) | |
| Payables for Capital Shares Redeemed | | | (16,084) | |
| Payables to Vanguard | | | (12,577) | |
| Other Liabilities | | | (11,208) | |
| Total Liabilities | | | (320,251) | (1.3%) |
| Net Assets | | | 24,794,448 | 100.0% |
| |
| |
| At October 31, 2016, net assets consisted of: | | | | |
| | | | | Amount |
| | | | | ($000) |
| Paid-in Capital | | | | 25,932,684 |
| Undistributed Net Investment Income | | | | 71,432 |
| Accumulated Net Realized Losses | | | | (1,280,410) |
| Unrealized Appreciation (Depreciation) | | | | |
| Investment Securities | | | | 75,305 |
| Futures Contracts | | | | 6,152 |
| Forward Currency Contracts | | | | (7,277) |
| Foreign Currencies | | | | (3,438) |
| Net Assets | | | | 24,794,448 |
| |
| |
| Investor Shares—Net Assets | | | | |
| Applicable to 30,116,872 outstanding $.001 par value shares of | | | |
| beneficial interest (unlimited authorization) | | | | 529,825 |
| Net Asset Value Per Share—Investor Shares | | | | $17.59 |
18
| |
| FTSE All-World ex-US Index Fund | |
| |
| |
| |
| | Amount |
| | ($000) |
| ETF Shares—Net Assets | |
| Applicable to 313,529,835 outstanding $.001 par value shares of | |
| beneficial interest (unlimited authorization) | 13,982,600 |
| Net Asset Value Per Share—ETF Shares | $44.60 |
| |
| Admiral Shares—Net Assets | |
| Applicable to 131,144,325 outstanding $.001 par value shares of | |
| beneficial interest (unlimited authorization) | 3,635,494 |
| Net Asset Value Per Share—Admiral Shares | $27.72 |
| |
| Institutional Shares—Net Assets | |
| Applicable to 50,347,123 outstanding $.001 par value shares of | |
| beneficial interest (unlimited authorization) | 4,424,285 |
| Net Asset Value Per Share—Institutional Shares | $87.88 |
| |
| Institutional Plus Shares—Net Assets | |
| Applicable to 23,879,953 outstanding $.001 par value shares of | |
| beneficial interest (unlimited authorization) | 2,222,244 |
| Net Asset Value Per Share—Institutional Plus Shares | $93.06 |
• See Note A in Notes to Financial Statements.
* Non-income-producing security.
^ Includes partial security positions on loan to broker-dealers. The total value of securities on loan is $255,125,000.
† Represents the aggregate value, by category, of securities that are not among the 50 largest holdings and, in total for any issuer, represent
1% or less of net assets.
1 Security exempt from registration under Rule 144A of the Securities Act of 1933. Such securities may be sold in transactions exempt from
registration, normally to qualified institutional buyers. At October 31, 2016, the aggregate value of these securities was $149,411,000,
representing 0.6% of net assets.
2 “Other” represents securities that are not classified by the fund’s benchmark index.
3 Considered an affiliated company of the fund as the issuer is another member of The Vanguard Group.
4 The fund invests a portion of its cash reserves in equity markets through the use of index futures contracts. After giving effect to futures
investments, the fund’s effective common stock and temporary cash investment positions represent 100.0% and 0.8%, respectively,
of net assets.
5 Affiliated money market fund available only to Vanguard funds and certain trusts and accounts managed by Vanguard. Rate shown is the
7-day yield.
6 Includes $273,828,000 of collateral received for securities on loan.
7 Securities with a value of $11,895,000 have been segregated as initial margin for open futures contracts.
8 Securities with a value of $8,163,000 have been segregated as collateral for open forward currency contracts.
ADR—American Depositary Receipt.
GDR—Global Depositary Receipt.
See accompanying Notes, which are an integral part of the Financial Statements.
19
| |
| FTSE All-World ex-US Index Fund | |
| |
| |
| Statement of Operations | |
| |
| |
| | Year Ended |
| | October 31, 2016 |
| | ($000) |
| Investment Income | |
| Income | |
| Dividends1,2 | 718,551 |
| Interest2 | 732 |
| Securities Lending—Net | 20,548 |
| Total Income | 739,831 |
| Expenses | |
| The Vanguard Group—Note B | |
| Investment Advisory Services | 2,563 |
| Management and Administrative—Investor Shares | 896 |
| Management and Administrative—ETF Shares | 9,603 |
| Management and Administrative—Admiral Shares | 2,278 |
| Management and Administrative—Institutional Shares | 2,946 |
| Management and Administrative—Institutional Plus Shares | 950 |
| Marketing and Distribution—Investor Shares | 147 |
| Marketing and Distribution—ETF Shares | 778 |
| Marketing and Distribution—Admiral Shares | 368 |
| Marketing and Distribution—Institutional Shares | 106 |
| Marketing and Distribution—Institutional Plus Shares | 43 |
| Custodian Fees | 4,071 |
| Auditing Fees | 41 |
| Shareholders’ Reports—Investor Shares | 12 |
| Shareholders’ Reports—ETF Shares | 269 |
| Shareholders’ Reports—Admiral Shares | 21 |
| Shareholders’ Reports—Institutional Shares | 13 |
| Shareholders’ Reports—Institutional Plus Shares | 9 |
| Trustees’ Fees and Expenses | 12 |
| Total Expenses | 25,126 |
| Net Investment Income | 714,705 |
| Realized Net Gain (Loss) | |
| Investment Securities Sold2 | 42,503 |
| Futures Contracts | (4,416) |
| Foreign Currencies and Forward Currency Contracts | (797) |
| Realized Net Gain (Loss) | 37,290 |
| Change in Unrealized Appreciation (Depreciation) | |
| Investment Securities | (522,789) |
| Futures Contracts | 1,955 |
| Foreign Currencies and Forward Currency Contracts | (6,178) |
| Change in Unrealized Appreciation (Depreciation) | (527,012) |
| Net Increase (Decrease) in Net Assets Resulting from Operations | 224,983 |
1 Dividends are net of foreign withholding taxes of $49,957,000.
2 Dividend income, interest income, and realized net gain (loss) from affiliated companies of the fund were $2,052,000, $647,000, and
($2,198,000), respectively.
See accompanying Notes, which are an integral part of the Financial Statements.
20
| | |
| FTSE All-World ex-US Index Fund | | |
| |
| |
| Statement of Changes in Net Assets | | |
| |
| | Year Ended October 31, |
| | 2016 | 2015 |
| | ($000) | ($000) |
| Increase (Decrease) in Net Assets | | |
| Operations | | |
| Net Investment Income | 714,705 | 680,179 |
| Realized Net Gain (Loss) | 37,290 | (31,448) |
| Change in Unrealized Appreciation (Depreciation) | (527,012) | (2,004,442) |
| Net Increase (Decrease) in Net Assets Resulting from Operations | 224,983 | (1,355,711) |
| Distributions | | |
| Net Investment Income | | |
| Investor Shares | (15,116) | (14,940) |
| ETF Shares | (386,248) | (373,817) |
| Admiral Shares | (95,215) | (81,360) |
| Institutional Shares | (126,359) | (129,879) |
| Institutional Plus Shares | (70,228) | (67,629) |
| Realized Capital Gain | | |
| Investor Shares | — | — |
| ETF Shares | — | — |
| Admiral Shares | — | — |
| Institutional Shares | — | — |
| Institutional Plus Shares | — | — |
| Total Distributions | (693,166) | (667,625) |
| Capital Share Transactions | | |
| Investor Shares | (24,599) | 59,412 |
| ETF Shares | 768,493 | 2,248,885 |
| Admiral Shares | 512,292 | 846,073 |
| Institutional Shares | 7,308 | 148,032 |
| Institutional Plus Shares | (383,469) | 711,587 |
| Net Increase (Decrease) from Capital Share Transactions | 880,025 | 4,013,989 |
| Total Increase (Decrease) | 411,842 | 1,990,653 |
| Net Assets | | |
| Beginning of Period | 24,382,606 | 22,391,953 |
| End of Period1 | 24,794,448 | 24,382,606 |
1 Net Assets—End of Period includes undistributed (overdistributed) net investment income of $71,432,000 and $45,885,000.
See accompanying Notes, which are an integral part of the Financial Statements.
21
| | | | | |
| FTSE All-World ex-US Index Fund | | | | | |
| |
| |
| Financial Highlights | | | | | |
| |
| |
| Investor Shares | | | | | |
| |
| For a Share Outstanding | Year Ended October 31, |
| Throughout Each Period | 2016 | 2015 | 2014 | 2013 | 2012 |
| Net Asset Value, Beginning of Period | $17.92 | $19.40 | $19.81 | $17.03 | $16.95 |
| Investment Operations | | | | | |
| Net Investment Income | . 494 | . 502 | . 6271 | .482 | .448 |
| Net Realized and Unrealized Gain (Loss) | | | | | |
| on Investments | (.341) | (1.484) | (.413) | 2.850 | .397 |
| Total from Investment Operations | .153 | (.982) | .214 | 3.332 | .845 |
| Distributions | | | | | |
| Dividends from Net Investment Income | (. 483) | (. 498) | (. 624) | (. 552) | (.765) |
| Distributions from Realized Capital Gains | — | — | — | — | — |
| Total Distributions | (. 483) | (. 498) | (. 624) | (. 552) | (.765) |
| Net Asset Value, End of Period | $17.59 | $17.92 | $19.40 | $19.81 | $17.03 |
| |
| Total Return2 | 0.98% | -5.16% | 1.05% | 19.97% | 5.30% |
| |
| Ratios/Supplemental Data | | | | | |
| Net Assets, End of Period (Millions) | $530 | $565 | $552 | $637 | $543 |
| Ratio of Total Expenses to | | | | | |
| Average Net Assets | 0.23% | 0.26% | 0.29% | 0.30% | 0.30% |
| Ratio of Net Investment Income to | | | | | |
| Average Net Assets | 2.89% | 2.70% | 3.18%1 | 2.69% | 3.13% |
| Portfolio Turnover Rate 3 | 5% | 3% | 4% | 8% | 6% |
1 Net investment income per share and the ratio of net investment income to average net assets include $.088 and 0.44%, respectively,
resulting from income received from Vodafone Group plc in the form of cash and shares in Verizon Communications Inc. in February 2014.
2 Total returns do not include transaction or account service fees that may have applied in the periods shown. Fund prospectuses provide
information about any applicable transaction and account service fees.
3 Excludes the value of portfolio securities received or delivered as a result of in-kind purchases or redemptions of the fund’s capital shares,
including ETF Creation Units.
See accompanying Notes, which are an integral part of the Financial Statements.
22
| | | | | |
| FTSE All-World ex-US Index Fund | | | | | |
| |
| |
| Financial Highlights | | | | | |
| |
| |
| ETF Shares | | | | | |
| |
| For a Share Outstanding | Year Ended October 31, |
| Throughout Each Period | 2016 | 2015 | 2014 | 2013 | 2012 |
| Net Asset Value, Beginning of Period | $45.41 | $49.17 | $50.20 | $43.21 | $43.17 |
| Investment Operations | | | | | |
| Net Investment Income | 1.304 | 1.335 | 1.6651 | 1.295 | 1.324 |
| Net Realized and Unrealized Gain (Loss) | | | | | |
| on Investments | (.846) | (3.769) | (1.036) | 7.204 | .884 |
| Total from Investment Operations | .458 | (2.434) | .629 | 8.499 | 2.208 |
| Distributions | | | | | |
| Dividends from Net Investment Income | (1.268) | (1.326) | (1.659) | (1.509) | (2.168) |
| Distributions from Realized Capital Gains | — | — | — | — | — |
| Total Distributions | (1.268) | (1.326) | (1.659) | (1.509) | (2.168) |
| Net Asset Value, End of Period | $44.60 | $45.41 | $49.17 | $50.20 | $43.21 |
| |
| Total Return | 1.17% | -5.05% | 1.21% | 20.12% | 5.51% |
| |
| Ratios/Supplemental Data | | | | | |
| Net Assets, End of Period (Millions) | $13,983 | $13,525 | $12,453 | $11,102 | $7,400 |
| Ratio of Total Expenses to | | | | | |
| Average Net Assets | 0.11% | 0.13% | 0.14% | 0.15% | 0.15% |
| Ratio of Net Investment Income to | | | | | |
| Average Net Assets | 3.01% | 2.83% | 3.33%1 | 2.84% | 3.28% |
| Portfolio Turnover Rate2 | 5% | 3% | 4% | 8% | 6% |
1 Net investment income per share and the ratio of net investment income to average net assets include $.224 and 0.44%, respectively,
resulting from income received from Vodafone Group plc in the form of cash and shares in Verizon Communications Inc. in February 2014.
2 Excludes the value of portfolio securities received or delivered as a result of in-kind purchases or redemptions of the fund’s capital shares,
including ETF Creation Units.
See accompanying Notes, which are an integral part of the Financial Statements.
23
| | | | | |
| FTSE All-World ex-US Index Fund | | | | | |
| |
| |
| Financial Highlights | | | | | |
| |
| |
| Admiral Shares | | | | | |
| |
| For a Share Outstanding | Year Ended October 31, |
| Throughout Each Period | 2016 | 2015 | 2014 | 2013 | 2012 |
| Net Asset Value, Beginning of Period | $28.23 | $30.57 | $31.21 | $26.86 | $26.86 |
| Investment Operations | | | | | |
| Net Investment Income | . 811 | . 832 | 1.0371 | .805 | .818 |
| Net Realized and Unrealized Gain (Loss) | | | | | |
| on Investments | (.532) | (2.346) | (.644) | 4.487 | .543 |
| Total from Investment Operations | .279 | (1.514) | .393 | 5.292 | 1.361 |
| Distributions | | | | | |
| Dividends from Net Investment Income | (.789) | (.826) | (1.033) | (.942) | (1.361) |
| Distributions from Realized Capital Gains | — | — | — | — | — |
| Total Distributions | (.789) | (.826) | (1.033) | (.942) | (1.361) |
| Net Asset Value, End of Period | $27.72 | $28.23 | $30.57 | $31.21 | $26.86 |
| |
| Total Return2 | 1.13% | -5.05% | 1.23% | 20.14% | 5.46% |
| |
| Ratios/Supplemental Data | | | | | |
| Net Assets, End of Period (Millions) | $3,635 | $3,163 | $2,551 | $1,909 | $1,235 |
| Ratio of Total Expenses to | | | | | |
| Average Net Assets | 0.11% | 0.13% | 0.14% | 0.15% | 0.15% |
| Ratio of Net Investment Income to | | | | | |
| Average Net Assets | 3.01% | 2.83% | 3.33%1 | 2.84% | 3.28% |
| Portfolio Turnover Rate 3 | 5% | 3% | 4% | 8% | 6% |
1 Net investment income per share and the ratio of net investment income to average net assets include $.139 and 0.44%, respectively,
resulting from income received from Vodafone Group plc in the form of cash and shares in Verizon Communications Inc. in February 2014.
2 Total returns do not include transaction or account service fees that may have applied in the periods shown. Fund prospectuses provide
information about any applicable transaction and account service fees.
3 Excludes the value of portfolio securities received or delivered as a result of in-kind purchases or redemptions of the fund’s capital shares,
including ETF Creation Units.
See accompanying Notes, which are an integral part of the Financial Statements.
24
| | | | | |
| FTSE All-World ex-US Index Fund | | | | | |
| |
| |
| Financial Highlights | | | | | |
| |
| |
| Institutional Shares | | | | | |
| |
| For a Share Outstanding | Year Ended October 31, |
| Throughout Each Period | 2016 | 2015 | 2014 | 2013 | 2012 |
| Net Asset Value, Beginning of Period | $89.48 | $96.89 | $98.93 | $85.14 | $85.10 |
| Investment Operations | | | | | |
| Net Investment Income | 2.577 | 2.651 | 3.2991 | 2.577 | 2.628 |
| Net Realized and Unrealized Gain (Loss) | | | | | |
| on Investments | (1.669) | (7.429) | (2.049) | 14.215 | 1.735 |
| Total from Investment Operations | .908 | (4.778) | 1.250 | 16.792 | 4.363 |
| Distributions | | | | | |
| Dividends from Net Investment Income | (2.508) | (2.632) | (3.290) | (3.002) | (4.323) |
| Distributions from Realized Capital Gains | — | — | — | — | — |
| Total Distributions | (2.508) | (2.632) | (3.290) | (3.002) | (4.323) |
| Net Asset Value, End of Period | $87.88 | $89.48 | $96.89 | $98.93 | $85.14 |
| |
| Total Return2 | 1.15% | -5.03% | 1.23% | 20.16% | 5.51% |
| |
| Ratios/Supplemental Data | | | | | |
| Net Assets, End of Period (Millions) | $4,424 | $4,501 | $4,713 | $4,687 | $3,684 |
| Ratio of Total Expenses to | | | | | |
| Average Net Assets | 0.10% | 0.11% | 0.12% | 0.12% | 0.12% |
| Ratio of Net Investment Income to | | | | | |
| Average Net Assets | 3.02% | 2.85% | 3.35%1 | 2.87% | 3.31% |
| Portfolio Turnover Rate 3 | 5% | 3% | 4% | 8% | 6% |
1 Net investment income per share and the ratio of net investment income to average net assets include $.441 and 0.44%, respectively,
resulting from income received from Vodafone Group plc in the form of cash and shares in Verizon Communications Inc. in February 2014.
2 Total returns do not include transaction fees that may have applied in the periods shown. Fund prospectuses provide information about any
applicable transaction fees.
3 Excludes the value of portfolio securities received or delivered as a result of in-kind purchases or redemptions of the fund’s capital shares,
including ETF Creation Units.
See accompanying Notes, which are an integral part of the Financial Statements.
25
| | | | | |
| FTSE All-World ex-US Index Fund | | | | | |
| |
| |
| Financial Highlights | | | | | |
| |
| |
| Institutional Plus Shares | | | | | |
| |
| For a Share Outstanding | Year Ended October 31, |
| Throughout Each Period | 2016 | 2015 | 2014 | 2013 | 2012 |
| Net Asset Value, Beginning of Period | $94.75 | $102.60 | $104.76 | $90.17 | $90.15 |
| Investment Operations | | | | | |
| Net Investment Income | 2.754 | 2.829 | 3.5171 | 2.749 | 2.809 |
| Net Realized and Unrealized Gain (Loss) | | | | | |
| on Investments | (1.767) | (7.869) | (2.169) | 15.050 | 1.829 |
| Total from Investment Operations | .987 | (5.040) | 1.348 | 17.799 | 4.638 |
| Distributions | | | | | |
| Dividends from Net Investment Income | (2.677) | (2.810) | (3.508) | (3.209) | (4.618) |
| Distributions from Realized Capital Gains | — | — | — | — | — |
| Total Distributions | (2.677) | (2.810) | (3.508) | (3.209) | (4.618) |
| Net Asset Value, End of Period | $93.06 | $94.75 | $102.60 | $104.76 | $90.17 |
| |
| Total Return2 | 1.18% | -5.01% | 1.25% | 20.18% | 5.54% |
| |
| Ratios/Supplemental Data | | | | | |
| Net Assets, End of Period (Millions) | $2,222 | $2,628 | $2,122 | $1,671 | $1,274 |
| Ratio of Total Expenses to | | | | | |
| Average Net Assets | 0.07% | 0.09% | 0.10% | 0.10% | 0.10% |
| Ratio of Net Investment Income to | | | | | |
| Average Net Assets | 3.05% | 2.87% | 3.37%1 | 2.89% | 3.33% |
| Portfolio Turnover Rate 3 | 5% | 3% | 4% | 8% | 6% |
1 Net investment income per share and the ratio of net investment income to average net assets include $.467 and 0.44%, respectively,
resulting from income received from Vodafone Group plc in the form of cash and shares in Verizon Communications Inc. in February 2014.
2 Total returns do not include transaction fees that may have applied in the periods shown. Fund prospectuses provide information about any
applicable transaction fees.
3 Excludes the value of portfolio securities received or delivered as a result of in-kind purchases or redemptions of the fund’s capital shares,
including ETF Creation Units.
See accompanying Notes, which are an integral part of the Financial Statements.
26
FTSE All-World ex-US Index Fund
Notes to Financial Statements
Vanguard FTSE All-World ex-US Index Fund is registered under the Investment Company Act of 1940 as an open-end investment company, or mutual fund. The fund invests in securities of foreign issuers, which may subject it to investment risks not normally associated with investing in securities of U.S. corporations. The fund offers five classes of shares: Investor Shares, ETF Shares, Admiral Shares, Institutional Shares, and Institutional Plus Shares. Investor Shares are available to any investor who meets the fund’s minimum purchase requirements. ETF Shares are listed for trading on NYSE Arca; they can be purchased and sold through a broker. Admiral Shares, Institutional Shares, and Institutional Plus Shares are designed for investors who meet certain administrative, service, and account-size criteria.
A. The following significant accounting policies conform to generally accepted accounting principles for U.S. investment companies. The fund consistently follows such policies in preparing its financial statements.
1. Security Valuation: Securities are valued as of the close of trading on the New York Stock Exchange (generally 4 p.m., Eastern time) on the valuation date. Equity securities are valued at the latest quoted sales prices or official closing prices taken from the primary market in which each security trades; such securities not traded on the valuation date are valued at the mean of the latest quoted bid and asked prices. Securities for which market quotations are not readily available, or whose values have been affected by events occurring before the fund’s pricing time but after the close of the securities’ primary markets, are valued at their fair values calculated according to procedures adopted by the board of trustees. These procedures include obtaining quotations from an independent pricing service, monitoring news to identify significant market- or security-specific events, and evaluating changes in the values of foreign market proxies (for example, ADRs, futures contracts, or exchange-traded funds), between the time the foreign markets close and the fund’s pricing time. When fair-value pricing is employed, the prices of securities used by a fund to calculate its net asset value may differ from quoted or published prices for the same securities. Investments in Vanguard Market Liquidity Fund are valued at that fund’s net asset value. Temporary cash investments acquired over 60 days to maturity are valued using the latest bid prices or using valuations based on a matrix system (which considers such factors as security prices, yields, maturities, and ratings), both as furnished by independent pricing services. Other temporary cash investments are valued at amortized cost, which approximates market value.
2. Foreign Currency: Securities and other assets and liabilities denominated in foreign currencies are translated into U.S. dollars using exchange rates obtained from an independent third party as of the fund’s pricing time on the valuation date. Realized gains (losses) and unrealized appreciation (depreciation) on investment securities include the effects of changes in exchange rates since the securities were purchased, combined with the effects of changes in security prices. Fluctuations in the value of other assets and liabilities resulting from changes in exchange rates are recorded as unrealized foreign currency gains (losses) until the assets or liabilities are settled in cash, at which time they are recorded as realized foreign currency gains (losses).
3. Futures and Forward Currency Contracts: The fund uses index futures contracts to a limited extent, with the objectives of maintaining full exposure to the stock market, enhancing returns, maintaining liquidity, and minimizing transaction costs. The fund may purchase futures contracts to immediately invest incoming cash in the market, or sell futures in response to cash outflows, thereby simulating a fully invested position in the underlying index while maintaining a cash balance for liquidity. The fund may seek to enhance returns by using futures contracts instead of the underlying securities when
27
FTSE All-World ex-US Index Fund
futures are believed to be priced more attractively than the underlying securities. The primary risks associated with the use of futures contracts are imperfect correlation between changes in market values of stocks held by the fund and the prices of futures contracts, and the possibility of an illiquid market. Counterparty risk involving futures is mitigated because a regulated clearinghouse is the counterparty instead of the clearing broker. To further mitigate counterparty risk, the fund trades futures contracts on an exchange, monitors the financial strength of its clearing brokers and clearing-house, and has entered into clearing agreements with its clearing brokers. The clearinghouse imposes initial margin requirements to secure the fund’s performance and requires daily settlement of variation margin representing changes in the market value of each contract.
The fund also enters into forward currency contracts to provide the appropriate currency exposure related to any open futures contracts. The fund’s risks in using these contracts include movement in the values of the foreign currencies relative to the U.S. dollar and the ability of the counterparties to fulfill their obligations under the contracts. The fund mitigates its counterparty risk by entering into forward currency contracts only with a diverse group of prequalified counterparties, monitoring their financial strength, entering into master netting arrangements with its counterparties, and requiring its counterparties to transfer collateral as security for their performance. In the absence of a default, the collateral pledged or received by the fund cannot be repledged, resold or rehypothecated. The master netting arrangements provide that, in the event of a counterparty’s default (including bankruptcy), the fund may terminate the forward currency contracts, determine the net amount owed by either party in accordance with its master netting arrangements, and sell or retain any collateral held up to the net amount owed to the fund under the master netting arrangements. The forward currency contracts contain provisions whereby a counterparty may terminate open contracts if the fund’s net assets decline below a certain level, triggering a payment by the fund if the fund is in a net liability position at the time of the termination. The payment amount would be reduced by any collateral the fund has pledged. Any assets pledged as collateral for open contracts are noted in the Statement of Net Assets. The value of collateral received or pledged is compared daily to the value of the forward currency contracts exposure with each counterparty, and any difference, if in excess of a specified minimum transfer amount, is adjusted and settled within two business days.
Futures contracts are valued at their quoted daily settlement prices. Forward currency contracts are valued at their quoted daily prices obtained from an independent third party, adjusted for currency risk based on the expiration date of each contract. The aggregate settlement values and notional amounts of the contracts are not recorded in the Statement of Net Assets. Fluctuations in the value of the contracts are recorded in the Statement of Net Assets as an asset (liability) and in the Statement of Operations as unrealized appreciation (depreciation) until the contracts are closed, when they are recorded as realized gains (losses) on futures or forward currency contracts.
During the year ended October 31, 2016, the fund’s average investments in long and short futures contracts represented less than 1% and 0% of net assets, respectively, based on the average of aggregate settlement values at each quarter-end during the period. The fund’s average investment in forward currency contracts represented 2% of net assets, based on the average of notional amounts at each quarter-end during the period.
4. Federal Income Taxes: The fund intends to continue to qualify as a regulated investment company and distribute all of its taxable income. Management has analyzed the fund’s tax positions taken for all open federal income tax years (October 31, 2013–2016), and has concluded that no provision for federal income tax is required in the fund’s financial statements.
28
FTSE All-World ex-US Index Fund
5. Distributions: Distributions to shareholders are recorded on the ex-dividend date.
6. Securities Lending: To earn additional income, the fund lends its securities to qualified institutional borrowers. Security loans are subject to termination by the fund at any time, and are required to be secured at all times by collateral in an amount at least equal to the market value of securities loaned. Daily market fluctuations could cause the value of loaned securities to be more or less than the value of the collateral received. When this occurs, the collateral is adjusted and settled on the next business day. The fund further mitigates its counterparty risk by entering into securities lending transactions only with a diverse group of prequalified counterparties, monitoring their financial strength, and entering into master securities lending agreements with its counterparties. The master securities lending agreements provide that, in the event of a counterparty’s default (including bankruptcy), the fund may terminate any loans with that borrower, determine the net amount owed, and sell or retain the collateral up to the net amount owed to the fund; however, such actions may be subject to legal proceedings. While collateral mitigates counterparty risk, in the absence of a default the fund may experience delays and costs in recovering the securities loaned. The fund invests cash collateral received in Vanguard Market Liquidity Fund, and records a liability in the Statement of Net Assets for the return of the collateral, during the period the securities are on loan. Securities lending income represents fees charged to borrowers plus income earned on invested cash collateral, less expenses associated with the loan. During the term of the loan, the fund is entitled to all distributions made on or in respect of the loaned securities.
7. Credit Facility: The fund and certain other funds managed by The Vanguard Group (“Vanguard”) participate in a $3.1 billion committed credit facility provided by a syndicate of lenders pursuant to a credit agreement that may be renewed annually; each fund is individually liable for its borrowings, if any, under the credit facility. Borrowings may be utilized for temporary and emergency purposes, and are subject to the fund’s regulatory and contractual borrowing restrictions. The participating funds are charged administrative fees and an annual commitment fee of 0.10% of the undrawn amount of the facility; these fees are allocated to the funds based on a method approved by the fund’s board of trustees and included in Management and Administrative expenses on the fund’s Statement of Operations. Any borrowings under this facility bear interest at a rate based upon the higher of the one-month London Interbank Offered Rate, federal funds effective rate, or overnight bank funding rate plus an agreed-upon spread.
The fund had no borrowings outstanding at October 31, 2016, or at any time during the period then ended.
8. Other: Dividend income is recorded on the ex-dividend date. Interest income includes income distributions received from Vanguard Market Liquidity Fund and is accrued daily. Premiums and discounts on debt securities purchased are amortized and accreted, respectively, to interest income over the lives of the respective securities. Security transactions are accounted for on the date securities are bought or sold. Costs used to determine realized gains (losses) on the sale of investment securities are those of the specific securities sold.
Withholding taxes on foreign dividends and capital gains have been provided for in accordance with the fund’s understanding of the applicable countries’ tax rules and rates. The fund has filed tax reclaims for previously withheld taxes on dividends earned in certain European Union countries. These filings are subject to various administrative and judicial proceedings within these countries. Such tax reclaims received during the year, if any, are included in dividend income. No other amounts
29
FTSE All-World ex-US Index Fund
for additional tax reclaims are reflected in the financial statements due to the uncertainty as to the ultimate resolution of proceedings, the likelihood of receipt of these reclaims, and the potential timing of payment.
Each class of shares has equal rights as to assets and earnings, except that each class separately bears certain class-specific expenses related to maintenance of shareholder accounts (included in Management and Administrative expenses) and shareholder reporting. Marketing and distribution expenses are allocated to each class of shares based on a method approved by the board of trustees. Income, other non-class-specific expenses, and gains and losses on investments are allocated to each class of shares based on its relative net assets.
B. In accordance with the terms of a Funds’ Service Agreement (the “FSA”) between Vanguard and the fund, Vanguard furnishes to the fund investment advisory, corporate management, administrative, marketing, and distribution services at Vanguard’s cost of operations (as defined by the FSA). These costs of operations are allocated to the fund based on methods and guidelines approved by the board of trustees. Vanguard does not require reimbursement in the current period for certain costs of operations (such as deferred compensation/benefits and risk/insurance costs); the fund’s liability for these costs of operations is included in Payables to Vanguard on the Statement of Net Assets.
Upon the request of Vanguard, the fund may invest up to 0.40% of its net assets as capital in Vanguard. At October 31, 2016, the fund had contributed to Vanguard capital in the amount of $1,916,000, representing 0.01% of the fund’s net assets and 0.77% of Vanguard’s capitalization. The fund’s trustees and officers are also directors and employees, respectively, of Vanguard.
C. Various inputs may be used to determine the value of the fund’s investments. These inputs are summarized in three broad levels for financial statement purposes. The inputs or methodologies used to value securities are not necessarily an indication of the risk associated with investing in those securities.
Level 1—Quoted prices in active markets for identical securities.
Level 2—Other significant observable inputs (including quoted prices for similar securities, interest rates, prepayment speeds, credit risk, etc.).
Level 3—Significant unobservable inputs (including the fund’s own assumptions used to determine the fair value of investments).
The following table summarizes the market value of the fund’s investments as of October 31, 2016, based on the inputs used to value them:
| | | |
| | Level 1 | Level 2 | Level 3 |
| Investments | ($000) | ($000) | ($000) |
| Common Stocks—North and South America | 2,255,548 | 51,024 | — |
| Common Stocks—Other | 440,768 | 21,855,523 | 3,167 |
| Temporary Cash Investments | 366,489 | 29,189 | — |
| Futures Contracts—Assets1 | 236 | — | — |
| Futures Contracts—Liabilities1 | (649) | — | — |
| Forward Currency Contracts—Assets | — | 3,203 | — |
| Forward Currency Contracts—Liabilities | — | (10,480) | — |
| Total | 3,062,392 | 21,928,459 | 3,167 |
| 1 Represents variation margin on the last day of the reporting period. |
30
FTSE All-World ex-US Index Fund
D. At October 31, 2016, the fair values of derivatives were reflected in the Statement of Net Assets as follows:
| | | |
| | | Foreign | |
| | Equity | Exchange | |
| | Contracts | Contracts | Total |
| Statement of Net Assets Caption | ($000) | ($000) | ($000) |
| Other Assets | 236 | 3,203 | 3,439 |
| Other Liabilities | (649) | (10,480) | (11,129) |
Realized net gain (loss) and the change in unrealized appreciation (depreciation) on derivatives for the year ended October 31, 2016, were:
| | | |
| | | Foreign | |
| | Equity | Exchange | |
| | Contracts | Contracts | Total |
| Realized Net Gain (Loss) on Derivatives | ($000) | ($000) | ($000) |
| Futures Contracts | (4,416) | — | (4,416) |
| Forward Currency Contracts | — | (221) | (221) |
| Realized Net Gain (Loss) on Derivatives | (4,416) | (221) | (4,637) |
| |
| Change in Unrealized Appreciation (Depreciation) on Derivatives | | | |
| Futures Contracts | 1,955 | — | 1,955 |
| Forward Currency Contracts | — | (4,713) | (4,713) |
| Change in Unrealized Appreciation | | | |
| (Depreciation) on Derivatives | 1,955 | (4,713) | (2,758) |
At October 31, 2016, the aggregate settlement value of open futures contracts and the related unrealized appreciation (depreciation) were:
| | | | |
| | | | ($000) |
| | | | Aggregate | |
| | | Number of | Settlement | Unrealized |
| | | Long (Short) | Value | Appreciation |
| Futures Contracts | Expiration | Contracts | Long (Short) | (Depreciation) |
| Dow Jones EURO STOXX 50 | December 2016 | 2,478 | 82,932 | 2,081 |
| Topix Index | December 2016 | 407 | 54,029 | 2,324 |
| FTSE 100 Index | December 2016 | 425 | 35,954 | 1,409 |
| S&P ASX 200 Index | December 2016 | 186 | 18,718 | 338 |
| | | | | 6,152 |
Unrealized appreciation (depreciation) on open Dow Jones EURO STOXX 50 Index and FTSE 100 Index futures contracts is required to be treated as realized gain (loss) for tax purposes.
31
FTSE All-World ex-US Index Fund
At October 31, 2016, the fund had open forward currency contracts to receive and deliver currencies as follows. Unrealized appreciation (depreciation) on open forward currency contracts is treated as realized gain (loss) for tax purposes.
| | | | | | |
| | | | | | | Unrealized |
| | Contract | | | | | Appreciation |
| | Settlement | Contract Amount (000) | (Depreciation) |
| Counterparty | Date | | Receive | | Deliver | ($000) |
| The Toronto-Dominion Bank | 12/21/16 | EUR | 101,426 | USD | 114,476 | (2,866) |
| BNP Paribas | 12/13/16 | JPY | 7,769,440 | USD | 76,200 | (1,984) |
| Bank of America, N.A. | 12/21/16 | GBP | 39,256 | USD | 52,535 | (4,423) |
| Goldman Sachs International | 12/20/16 | AUD | 36,733 | USD | 27,310 | 597 |
| BNP Paribas | 12/21/16 | EUR | 12,219 | USD | 13,762 | (316) |
| Citibank, N.A. | 12/13/16 | JPY | 622,515 | USD | 6,223 | (277) |
| JPMorgan Chase Bank, N.A. | 12/21/16 | GBP | 4,167 | USD | 5,567 | (460) |
| BNP Paribas | 12/20/16 | AUD | 210 | USD | 156 | 3 |
| JPMorgan Chase Bank, N.A. | 12/20/16 | AUD | 135 | USD | 103 | (1) |
| Bank of America, N.A. | 12/13/16 | USD | 32,500 | JPY | 3,301,140 | 966 |
| JPMorgan Chase Bank, N.A. | 12/21/16 | USD | 19,651 | EUR | 17,737 | 134 |
| BNP Paribas | 12/13/16 | USD | 18,886 | JPY | 1,893,500 | 799 |
| Barclays Bank plc | 12/21/16 | USD | 14,904 | EUR | 13,331 | 235 |
| Citibank, N.A. | 12/21/16 | USD | 9,796 | EUR | 8,986 | (92) |
| Goldman Sachs International | 12/13/16 | USD | 8,597 | JPY | 891,990 | 76 |
| Barclays Bank plc | 12/21/16 | USD | 7,675 | GBP | 6,245 | 22 |
| JPMorgan Chase Bank, N.A. | 12/13/16 | USD | 6,757 | JPY | 702,780 | 44 |
| Goldman Sachs International | 12/21/16 | USD | 6,170 | GBP | 4,885 | 183 |
| UBS AG | 12/20/16 | USD | 4,642 | AUD | 6,148 | (29) |
| JPMorgan Chase Bank, N.A. | 12/21/16 | USD | 3,831 | GBP | 3,143 | (21) |
| Barclays Bank plc | 12/20/16 | USD | 3,415 | AUD | 4,510 | (11) |
| JPMorgan Chase Bank, N.A. | 12/21/16 | USD | 2,324 | GBP | 1,787 | 134 |
| Citibank, N.A. | 12/20/16 | USD | 2,276 | AUD | 2,983 | 10 |
| | | | | | | (7,277) |
| AUD—Australian dollar. |
| EUR—Euro. |
| GBP—British pound. |
| JPY—Japanese yen. |
| USD—U.S. dollar. |
At October 31, 2016, the counterparty had deposited in segregated accounts securities with a value of $737,000 in connection with open forward currency contracts.
32
FTSE All-World ex-US Index Fund
E. Distributions are determined on a tax basis and may differ from net investment income and realized capital gains for financial reporting purposes. Differences may be permanent or temporary. Permanent differences are reclassified among capital accounts in the financial statements to reflect their tax character. Temporary differences arise when certain items of income, expense, gain, or loss are recognized in different periods for financial statement and tax purposes. These differences will reverse at some time in the future. Differences in classification may also result from the treatment of short-term gains as ordinary income for tax purposes.
During the year ended October 31, 2016, the fund realized net foreign currency losses of $1,018,000, which decreased distributable net income for tax purposes; accordingly, such losses have been reclassified from accumulated net realized losses to undistributed net investment income.
During the year ended October 31, 2016, the fund realized $259,929,000 of net capital gains resulting from in-kind redemptions—in which shareholders exchanged fund shares for securities held by the fund rather than for cash. Because such gains are not taxable to the fund, and are not distributed to shareholders, they have been reclassified from accumulated net realized losses to paid-in capital.
For tax purposes, at October 31, 2016, the fund had $146,451,000 of ordinary income available for distribution. At October 31, 2016, the fund had available capital losses totaling $1,284,197,000 to offset future net capital gains. Of this amount, $249,855,000 is subject to expiration dates; $138,065,000 may be used to offset future net capital gains through October 31, 2017, $32,560,000 through October 31, 2018, and $79,230,000 through October 31, 2019. Capital losses of $1,034,342,000 realized beginning in fiscal 2012 may be carried forward indefinitely under the Regulated Investment Company Modernization Act of 2010, but must be used before any expiring loss carryforwards. Capital loss carryforwards of $29,919,000 expired on October 31, 2016; accordingly, such losses have been reclassified from accumulated net realized losses to paid-in capital.
At October 31, 2016, the cost of investment securities for tax purposes was $24,990,136,000. Net unrealized appreciation of investment securities for tax purposes was $11,572,000, consisting of unrealized gains of $3,600,716,000 on securities that had risen in value since their purchase and $3,589,144,000 in unrealized losses on securities that had fallen in value since their purchase.
F. During the year ended October 31, 2016, the fund purchased $2,723,278,000 of investment securities and sold $1,904,958,000 of investment securities, other than temporary cash investments. Purchases and sales include $230,305,000 and $772,210,000, respectively, in connection with in-kind purchases and redemptions of the fund’s capital shares.
33
FTSE All-World ex-US Index Fund
G. Capital share transactions for each class of shares were:
| | | | |
| | Year Ended October 31, |
| | 2016 | 2015 |
| | Amount | Shares | Amount | Shares |
| | ($000) | (000) | ($000) | (000) |
| Investor Shares | | | | |
| Issued | 150,674 | 8,858 | 202,214 | 10,640 |
| Issued in Lieu of Cash Distributions | 14,669 | 866 | 14,509 | 772 |
| Redeemed | (189,942) | (11,169) | (157,311) | (8,322) |
| Net Increase (Decrease)—Investor Shares | (24,599) | (1,445) | 59,412 | 3,090 |
| ETF Shares | | | | |
| Issued | 1,251,872 | 27,991 | 2,660,025 | 53,578 |
| Issued in Lieu of Cash Distributions | — | — | — | — |
| Redeemed | (483,379) | (12,300) | (411,140) | (9,000) |
| Net Increase (Decrease)—ETF Shares | 768,493 | 15,691 | 2,248,885 | 44,578 |
| Admiral Shares | | | | |
| Issued | 1,345,709 | 50,503 | 1,381,231 | 47,037 |
| Issued in Lieu of Cash Distributions | 79,969 | 2,993 | 67,575 | 2,285 |
| Redeemed | (913,386) | (34,390) | (602,733) | (20,743) |
| Net Increase (Decrease)—Admiral Shares | 512,292 | 19,106 | 846,073 | 28,579 |
| Institutional Shares | | | | |
| Issued | 920,593 | 10,694 | 1,019,443 | 10,800 |
| Issued in Lieu of Cash Distributions | 114,255 | 1,350 | 118,859 | 1,266 |
| Redeemed | (1,027,540) | (11,995) | (990,270) | (10,410) |
| Net Increase (Decrease)—Institutional Shares | 7,308 | 49 | 148,032 | 1,656 |
| Institutional Plus Shares | | | | |
| Issued | 586,317 | 6,493 | 865,085 | 8,576 |
| Issued in Lieu of Cash Distributions | 64,624 | 721 | 64,893 | 655 |
| Redeemed | (1,034,410) | (11,072) | (218,391) | (2,179) |
| Net Increase (Decrease)—Institutional Plus Shares | (383,469) | (3,858) | 711,587 | 7,052 |
H. Management has determined that no material events or transactions occurred subsequent to October 31, 2016, that would require recognition or disclosure in these financial statements.
34
FTSE All-World ex-US Small-Cap Index Fund
Fund Profile
As of October 31, 2016
| | | |
| Share-Class Characteristics | | | |
| | Investor | | Institutional |
| | Shares | ETF Shares | Shares |
| Ticker Symbol | VFSVX | VSS | VFSNX |
| Expense Ratio1 | 0.31% | 0.17% | 0.15% |
| | |
| Portfolio Characteristics | | |
| | | FTSE Global |
| | | Small Cap |
| | Fund | ex US Index |
| Number of Stocks | 3,515 | 3,337 |
| Median Market Cap | $1.4B | $1.4B |
| Price/Earnings Ratio | 22.6x | 22.8x |
| Price/Book Ratio | 1.4x | 1.4x |
| Return on Equity | 10.5% | 10.5% |
| Earnings Growth | | |
| Rate | 9.8% | 9.9% |
| Dividend Yield | 2.4% | 2.4% |
| Turnover Rate | 14% | — |
| Short-Term Reserves | -0.3% | — |
| | |
| Sector Diversification (% of equity exposure) |
| | | FTSE Global |
| | | Small Cap |
| | Fund | ex US Index |
| Basic Materials | 9.8% | 9.7% |
| Consumer Goods | 11.4 | 11.5 |
| Consumer Services | 11.8 | 11.8 |
| Financials | 20.7 | 20.7 |
| Health Care | 6.3 | 6.3 |
| Industrials | 23.6 | 23.6 |
| Oil & Gas | 5.2 | 5.2 |
| Technology | 7.4 | 7.4 |
| Telecommunications | 1.1 | 1.1 |
| Utilities | 2.7 | 2.7 |
| |
| Volatility Measures | |
| | FTSE Global |
| | Small Cap |
| | ex US Index |
| R-Squared | 0.99 |
| Beta | 0.97 |
| These measures show the degree and timing of the fund’s |
| fluctuations compared with the index over 36 months. |
| | |
| Ten Largest Holdings (% of total net assets) |
| Teck Resources Ltd. | Nonferrous Metals | 0.5% |
| Dollarama Inc. | Specialty Retailers | 0.4 |
| Open Text Corp. | Software | 0.4 |
| First Quantum Minerals | | |
| Ltd. | Nonferrous Metals | 0.3 |
| Gildan Activewear Inc. | Clothing & | |
| | Accessories | 0.3 |
| CCL Industries Inc. | Containers & | |
| | Packaging | 0.3 |
| Seven Generations | Exploration & | |
| Energy Ltd. | Production | 0.3 |
| Keyera Corp. | Exploration & | |
| | Production | 0.3 |
| Onex Corp. | Diversified Industrials | 0.2 |
| Kinross Gold Corp. | Gold Mining | 0.2 |
| Top Ten | | 3.2% |
| The holdings listed exclude any temporary cash investments and equity index products. |
1 The expense ratios shown are from the prospectus dated February 26, 2016, and represent estimated costs for the current fiscal year. For the fiscal
year ended October 31, 2016, the expense ratios were 0.27% for Investor Shares, 0.13% for ETF Shares, and 0.12% for Institutional Shares.
35
FTSE All-World ex-US Small-Cap Index Fund
Allocation by Region (% of equity exposure)
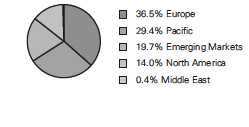
| | |
| Market Diversification (% of equity exposure) |
| | | FTSE |
| | | Global |
| | | Small Cap |
| | | ex US |
| | Fund | Index |
| Europe | | |
| United Kingdom | 11.2% | 11.3% |
| Germany | 3.8 | 3.6 |
| Sweden | 3.5 | 3.5 |
| Switzerland | 3.1 | 3.0 |
| Italy | 2.6 | 2.6 |
| France | 2.5 | 2.5 |
| Netherlands | 1.7 | 1.7 |
| Spain | 1.7 | 1.7 |
| Norway | 1.4 | 1.4 |
| Denmark | 1.1 | 1.1 |
| Finland | 1.1 | 1.2 |
| Belgium | 1.1 | 1.1 |
| Other | 1.7 | 1.8 |
| Subtotal | 36.5% | 36.5% |
| Pacific | | |
| Japan | 16.5% | 16.4% |
| Australia | 4.4 | 4.5 |
| South Korea | 4.2 | 4.2 |
| Hong Kong | 2.2 | 2.1 |
| Singapore | 1.4 | 1.4 |
| Other | 0.7 | 0.7 |
| Subtotal | 29.4% | 29.3% |
| Emerging Markets | | |
| Taiwan | 6.3% | 6.3% |
| China | 3.0 | 3.0 |
| India | 2.8 | 2.8 |
| Thailand | 1.6 | 1.6 |
| Brazil | 1.2 | 1.2 |
| Other | 4.8 | 4.8 |
| Subtotal | 19.7% | 19.7% |
| North America | | |
| Canada | 14.0% | 14.1% |
| Middle East | 0.4% | 0.4% |
36
FTSE All-World ex-US Small-Cap Index Fund
Performance Summary
All of the returns in this report represent past performance, which is not a guarantee of future results that may be achieved by the fund. (Current performance may be lower or higher than the performance data cited. For performance data current to the most recent month-end, visit our website at vanguard.com/performance.) Note, too, that both investment returns and principal value can fluctuate widely, so an investor’s shares, when sold, could be worth more or less than their original cost. The returns shown do not reflect taxes that a shareholder would pay on fund distributions or on the sale of fund shares.
Cumulative Performance: April 2, 2009, Through October 31, 2016
Initial Investment of $10,000
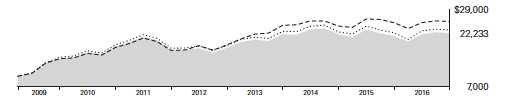
| | | | | |
| | | Average Annual Total Returns | |
| | | Periods Ended October 31, 2016 | |
| |
| | | | | Since | Final Value |
| | | One | Five | Inception | of a $10,000 |
| | | Year | Years | (4/2/2009) | Investment |
| |
| | FTSE All-World ex-US Small-Cap | | | | |
| | Index Fund*Investor Shares | 3.95% | 5.25% | 11.11% | $22,233 |
| |
| • • • • • • •• | FTSE Global Small Cap ex US Index | 3.40 | 5.18 | 11.68 | 23,112 |
| |
| – – –– | International Small-Cap Funds | | | | |
| | Average | 1.39 | 8.07 | 13.17 | 25,553 |
International Small-Cap Funds Average: Derived from data provided by Lipper, a Thomson Reuters Company.
"Since Inception" performance is calculated from the Investor Shares’ inception date for both the fund and its comparative standards.
| | | | |
| | | | Since | Final Value |
| | One | Five | Inception | of a $10,000 |
| | Year | Years | (4/2/2009) | Investment |
| FTSE All-World ex-US Small-Cap Index Fund | | | | |
| ETF Shares Net Asset Value | 4.11% | 5.44% | 11.33% | $22,562 |
| FTSE Global Small Cap ex US Index | 3.40 | 5.18 | 11.68 | 23,112 |
| "Since Inception" performance is calculated from the ETF Shares’ inception date for both the fund and its comparative standard. |
See Financial Highlights for dividend and capital gains information.
37
FTSE All-World ex-US Small-Cap Index Fund
| | | | |
| | | Average Annual Total Returns | |
| | Periods Ended October 31, 2016 | |
| |
| | | | Since | Final Value |
| | One | Five | Inception | of a $5,000,000 |
| | Year | Years | (4/2/2009) | Investment |
| FTSE All-World ex-US Small-Cap Index Fund | | | | |
| Institutional Shares | 4.11% | 5.45% | 11.35% | $11,296,350 |
| |
| FTSE Global Small Cap ex US Index | 3.40 | 5.18 | 11.68 | 11,555,755 |
| "Since Inception" performance is calculated from the Institutional Shares’ inception date for both the fund and its comparative standard. |
| | | |
| Cumulative Returns of ETF Shares: April 2, 2009, Through October 31, 2016 | | |
| | | | Since |
| | One | Five | Inception |
| | Year | Years | (4/2/2009) |
| FTSE All-World ex-US Small-Cap Index Fund ETF | | | |
| Shares Market Price | 4.40% | 31.54% | 126.08% |
| FTSE All-World ex-US Small-Cap Index Fund ETF | | | |
| Shares Net Asset Value | 4.11 | 30.34 | 125.62 |
| FTSE Global Small Cap ex US Index | 3.40 | 28.74 | 131.12 |
| "Since Inception" performance is calculated from the ETF Shares’ inception date for both the fund and its comparative standard. | |
38
FTSE All-World ex-US Small-Cap Index Fund
Fiscal-Year Total Returns (%): April 2, 2009, Through October 31, 2016
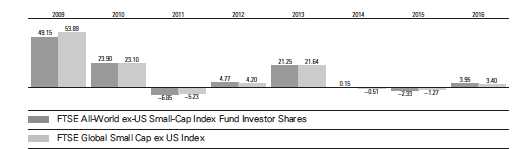
Index returns are adjusted for withholding taxes applicable to U.S.-based mutual funds organized as Delaware statutory trusts.
Average Annual Total Returns: Periods Ended September 30, 2016
This table presents returns through the latest calendar quarter—rather than through the end of the fiscal period.
Securities and Exchange Commission rules require that we provide this information.
| | | | |
| | Inception | One | Five | Since |
| | Date | Year | Years | Inception |
| Investor Shares | 4/2/2009 | 12.29% | 7.79% | 11.69% |
| ETF Shares | 4/2/2009 | | | |
| Market Price | | 12.73 | 8.20 | 11.94 |
| Net Asset Value | | 12.47 | 7.98 | 11.91 |
| Institutional Shares | 4/2/2009 | 12.47 | 8.00 | 11.93 |
39
FTSE All-World ex-US Small-Cap Index Fund
Financial Statements
Statement of Net Assets—Investments Summary
As of October 31, 2016
This Statement summarizes the fund’s holdings by asset type. Details are reported for each of the fund’s 50 largest individual holdings and for investments that, in total for any issuer, represent more than 1% of the fund’s net assets. The total value of smaller holdings is reported as a single amount within each category.
The fund reports a complete list of its holdings in regulatory filings four times in each fiscal year, at the quarter-ends. For the second and fourth fiscal quarters, the complete listing of the fund’s holdings is available electronically on vanguard.com and on the Securities and Exchange Commission’s website (sec.gov), or you can have it mailed to you without charge by calling 800-662-7447. For the first and third fiscal quarters, the fund files the lists with the SEC on Form N-Q. Shareholders can look up the fund’s Forms N-Q on the SEC’s website. Forms N-Q may also be reviewed and copied at the SEC’s Public Reference Room (see the back cover of this report for further information).
| | | |
| | | Market | Percentage |
| | | Value• | of Net |
| | Shares | ($000) | Assets |
| Common Stocks | | | |
| 1Australia † | | 147,728 | 4.4% |
| |
| Austria † | | 29,235 | 0.9% |
| |
| Belgium † | | 37,231 | 1.1% |
| |
| 1Brazil † | | 39,250 | 1.2% |
| |
| Canada | | | |
| Teck Resources Ltd. Class B | 743,955 | 16,063 | 0.5% |
| Dollarama Inc. | 161,502 | 12,068 | 0.4% |
| Open Text Corp. | 192,041 | 11,924 | 0.3% |
| First Quantum Minerals Ltd. | 1,089,547 | 10,349 | 0.3% |
| Gildan Activewear Inc. | 369,631 | 9,494 | 0.3% |
| CCL Industries Inc. Class B | 51,570 | 9,171 | 0.3% |
| * Seven Generations Energy Ltd. Class A | 417,714 | 8,907 | 0.3% |
| Keyera Corp. | 288,908 | 8,672 | 0.3% |
| Onex Corp. | 128,992 | 8,344 | 0.2% |
| * Kinross Gold Corp. | 1,968,013 | 7,644 | 0.2% |
| ^ H&R REIT | 444,035 | 7,551 | 0.2% |
| ^ PrairieSky Royalty Ltd. | 324,632 | 7,060 | 0.2% |
| ^ Vermilion Energy Inc. | 163,646 | 6,418 | 0.2% |
| ^ AltaGas Ltd. | 256,513 | 6,347 | 0.2% |
| Industrial Alliance Insurance & Financial Services Inc. | 162,417 | 6,289 | 0.2% |
| CAE Inc. | 426,452 | 5,990 | 0.2% |
| Element Fleet Management Corp. | 607,852 | 5,923 | 0.2% |
| ^ Tahoe Resources Inc. | 481,976 | 5,778 | 0.2% |
| Peyto Exploration & Development Corp. | 223,326 | 5,738 | 0.2% |
| Yamana Gold Inc. | 1,497,511 | 5,348 | 0.2% |
| Methanex Corp. | 145,320 | 5,282 | 0.2% |
40
| | | |
| FTSE All-World ex-US Small-Cap Index Fund | | | |
| |
| |
| | | Market | Percentage |
| | | Value• | of Net |
| | Shares | ($000) | Assets |
| * Detour Gold Corp. | 274,307 | 5,229 | 0.1% |
| WSP Global Inc. | 159,144 | 5,155 | 0.1% |
| Finning International Inc. | 268,161 | 4,990 | 0.1% |
| Ritchie Bros Auctioneers Inc. | 141,905 | 4,907 | 0.1% |
| Canada—Other † | | 276,051 | 8.2% |
| | | 466,692 | 13.9% |
| |
| Chile † | | 9,723 | 0.3% |
| |
| 1China † | | 98,137 | 2.9% |
| |
| Colombia † | | 2,163 | 0.1% |
| |
| Czech Republic † | | 829 | 0.0% |
| |
| 1Denmark † | | 37,900 | 1.1% |
| |
| Egypt † | | 4,250 | 0.1% |
| |
| Finland | | | |
| Amer Sports Oyj | 185,785 | 5,055 | 0.1% |
| Finland—Other † | | 32,766 | 1.0% |
| | | 37,821 | 1.1% |
| France | | | |
| Rubis SCA | 58,904 | 5,372 | 0.2% |
| 1 France—Other † | | 77,406 | 2.3% |
| | | 82,778 | 2.5% |
| Germany | | | |
| STADA Arzneimittel AG | 98,907 | 4,960 | 0.2% |
| * KUKA AG | 43,514 | 4,938 | 0.2% |
| Freenet AG | 171,575 | 4,919 | 0.1% |
| 1 Germany—Other † | | 108,306 | 3.2% |
| | | 123,123 | 3.7% |
| |
| Greece † | | 3,923 | 0.1% |
| |
| 1Hong Kong † | | 73,319 | 2.2% |
| |
| 1India † | | 94,143 | 2.8% |
| |
| Indonesia † | | 23,391 | 0.7% |
| |
| Ireland | | | |
| Kingspan Group plc | 278,294 | 6,815 | 0.2% |
| Ireland—Other † | | 7,868 | 0.2% |
| | | 14,683 | 0.4% |
| |
| Israel † | | 12,299 | 0.4% |
| |
| 1Italy † | | 84,116 | 2.5% |
41
| | | |
| FTSE All-World ex-US Small-Cap Index Fund | | | |
| |
| |
| | | Market | Percentage |
| | | Value• | of Net |
| | Shares | ($000) | Assets |
| Japan | | | |
| Mebuki Financial Group Inc. | 1,504,100 | 5,353 | 0.2% |
| Japan—Other † | | 537,441 | 16.0% |
| | | 542,794 | 16.2% |
| |
| Malaysia † | | 31,557 | 0.9% |
| |
| 1Mexico † | | 15,951 | 0.5% |
| |
| Netherlands | | | |
| Aalberts Industries NV | 153,196 | 4,838 | 0.1% |
| 1 Netherlands—Other † | | 52,222 | 1.6% |
| | | 57,060 | 1.7% |
| |
| New Zealand † | | 23,434 | 0.7% |
| |
| Norway | | | |
| *,^ Subsea 7 SA | 438,043 | 4,904 | 0.1% |
| 1 Norway—Other † | | 42,133 | 1.3% |
| | | 47,037 | 1.4% |
| |
| 2Other † | | 392 | 0.0% |
| |
| Pakistan † | | 8,530 | 0.3% |
| |
| Philippines † | | 16,587 | 0.5% |
| Poland † | | 7,746 | 0.2% |
| |
| Portugal † | | 10,663 | 0.3% |
| Qatar † | | 494 | 0.0% |
| |
| Russia † | | 2,448 | 0.1% |
| |
| 1Singapore † | | 46,684 | 1.4% |
| |
| South Africa † | | 22,157 | 0.7% |
| South Korea † | | 139,036 | 4.2% |
| |
| Spain | | | |
| Merlin Properties Socimi SA | 512,346 | 5,748 | 0.2% |
| 1 Spain—Other † | | 50,383 | 1.5% |
| | | 56,131 | 1.7% |
| Sweden | | | |
| Castellum AB | 416,719 | 5,647 | 0.2% |
| Elekta AB Class B | 563,357 | 4,884 | 0.1% |
| 1 Sweden—Other † | | 105,606 | 3.2% |
| | | 116,137 | 3.5% |
42
| | | | | |
| FTSE All-World ex-US Small-Cap Index Fund | | | | |
| |
| |
| |
| | | | | Market | Percentage |
| | | | | Value• | of Net |
| | | | Shares | ($000) | Assets |
| Switzerland | | | | |
| | Temenos Group AG | | 92,912 | 6,000 | 0.2% |
| | Georg Fischer AG | | 6,520 | 5,781 | 0.2% |
| | Logitech International SA | | 227,854 | 5,511 | 0.2% |
| 1 | Switzerland—Other † | | | 85,126 | 2.5% |
| | | | | 102,418 | 3.1% |
| Taiwan | | | | |
| | China Life Insurance Co. Ltd. | | 5,513,597 | 5,082 | 0.1% |
| | Taiwan—Other † | | | 203,491 | 6.1% |
| | | | | 208,573 | 6.2% |
| |
| 1Thailand † | | | 51,846 | 1.5% |
| |
| Turkey † | | | 9,712 | 0.3% |
| |
| United Arab Emirates † | | | 2,242 | 0.1% |
| |
| United Kingdom | | | | |
| | Spirax-Sarco Engineering plc | | 115,195 | 6,211 | 0.2% |
| | Melrose Industries plc | | 2,982,945 | 6,156 | 0.2% |
| | RPC Group plc | | 523,910 | 6,076 | 0.2% |
| | IG Group Holdings plc | | 573,775 | 5,794 | 0.2% |
| | Hiscox Ltd. | | 448,866 | 5,605 | 0.2% |
| | UBM plc | | 617,892 | 5,425 | 0.2% |
| | BBA Aviation plc | | 1,650,388 | 5,219 | 0.1% |
| | Shaftesbury plc | | 441,128 | 4,949 | 0.1% |
| * | BTG plc | | 607,650 | 4,890 | 0.1% |
| 1 | United Kingdom—Other † | | | 324,008 | 9.7% |
| | | | | 374,333 | 11.2% |
| Total Common Stocks (Cost $3,428,705) | | | 3,316,696 | 99.1%3 |
| |
| | | Coupon | | | |
| Temporary Cash Investments | | | | |
| Money Market Fund | | | | |
| 4,5 | Vanguard Market Liquidity Fund | 0.718% | 2,716,461 | 271,673 | 8.1% |
| |
| 6U.S. Government and Agency Obligations † | | | 6,898 | 0.2% |
| Total Temporary Cash Investments (Cost $278,546) | | | 278,571 | 8.3%3 |
| Total Investments (Cost $3,707,251) | | | 3,595,267 | 107.4% |
| Other Assets and Liabilities | | | | |
| Other Assets4 | | | 16,015 | 0.5% |
| Liabilities4 | | | (264,613) | (7.9%) |
| | | | | (248,598) | (7.4%) |
| Net Assets | | | 3,346,669 | 100.0% |
43
FTSE All-World ex-US Small-Cap Index Fund
| |
| | Amount |
| | ($000) |
| Statement of Assets and Liabilities | |
| Assets | |
| Investments in Securities, at Value | |
| Unaffiliated Issuers | 3,323,594 |
| Affiliated Vanguard Funds | 271,673 |
| Total Investments in Securities | 3,595,267 |
| Investment in Vanguard | 261 |
| Receivables for Investment Securities Sold | 349 |
| Receivables for Accrued Income | 7,273 |
| Receivables for Capital Shares Issued | 509 |
| Other Assets4 | 7,623 |
| Total Assets | 3,611,282 |
| Liabilities | |
| Payables for Investment Securities Purchased | 830 |
| Collateral for Securities on Loan | 261,189 |
| Payables for Capital Shares Redeemed | 395 |
| Payables to Vanguard | 1,594 |
| Other Liabilities | 605 |
| Total Liabilities | 264,613 |
| Net Assets | 3,346,669 |
| |
| At October 31, 2016, net assets consisted of: | |
| | Amount |
| | ($000) |
| Paid-in Capital | 3,601,325 |
| Undistributed Net Investment Income | 16,204 |
| Accumulated Net Realized Losses | (158,507) |
| Unrealized Appreciation (Depreciation) | |
| Investment Securities | (111,984) |
| Futures Contracts | 202 |
| Forward Currency Contracts | (256) |
| Foreign Currencies | (315) |
| Net Assets | 3,346,669 |
| |
| |
| Investor Shares—Net Assets | |
| Applicable to 14,138,956 outstanding $.001 par value shares of | |
| beneficial interest (unlimited authorization) | 519,531 |
| Net Asset Value Per Share—Investor Shares | $36.74 |
| |
| |
| ETF Shares—Net Assets | |
| Applicable to 27,529,681 outstanding $.001 par value shares of | |
| beneficial interest (unlimited authorization) | 2,652,168 |
| Net Asset Value Per Share—ETF Shares | $96.34 |
44
| |
| FTSE All-World ex-US Small-Cap Index Fund | |
| |
| |
| |
| | Amount |
| | ($000) |
| Institutional Shares—Net Assets | |
| Applicable to 950,557 outstanding $.001 par value shares of | |
| beneficial interest (unlimited authorization) | 174,970 |
| Net Asset Value Per Share—Institutional Shares | $184.07 |
• See Note A in Notes to Financial Statements.
* Non-income-producing security.
^ Includes partial security positions on loan to broker-dealers. The total value of securities on loan is $243,504,000.
† Represents the aggregate value, by category, of securities that are not among the 50 largest holdings and, in total for any issuer, represent
1% or less of net assets.
1 Certain of the fund’s securities are exempt from registration under Rule 144A of the Securities Act of 1933. Such securities may be sold
in transactions exempt from registration, normally to qualified institutional buyers. At October 31, 2016, the aggregate value of these
securities was $72,621,000, representing 2.2% of net assets.
2 “Other” represents securities that are not classified by the fund’s benchmark index.
3 The fund invests a portion of its cash reserves in equity markets through the use of index futures contracts. After giving effect to futures
investments, the fund’s effective common stock and temporary cash investment positions represent 100.0% and 7.4%, respectively,
of net assets.
4 Includes a portion of $261,189,000 of collateral received for securities on loan.
5 Affiliated money market fund available only to Vanguard funds and certain trusts and accounts managed by Vanguard. Rate shown is the
7-day yield.
6 Securities with a value of $2,299,000 have been segregated as initial margin for open futures contracts.
REIT—Real Estate Investment Trust.
See accompanying Notes, which are an integral part of the Financial Statements.
45
| |
| FTSE All-World ex-US Small-Cap Index Fund | |
| |
| |
| Statement of Operations | |
| |
| | Year Ended |
| | October 31, 2016 |
| | ($000) |
| Investment Income | |
| Income | |
| Dividends1 | 79,077 |
| Interest2 | 122 |
| Securities Lending—Net | 11,288 |
| Total Income | 90,487 |
| Expenses | |
| The Vanguard Group—Note B | |
| Investment Advisory Services | 442 |
| Management and Administrative—Investor Shares | 929 |
| Management and Administrative—ETF Shares | 1,674 |
| Management and Administrative—Institutional Shares | 106 |
| Marketing and Distribution—Investor Shares | 99 |
| Marketing and Distribution—ETF Shares | 172 |
| Marketing and Distribution—Institutional Shares | 5 |
| Custodian Fees | 1,074 |
| Auditing Fees | 44 |
| Shareholders’ Reports—Investor Shares | 7 |
| Shareholders’ Reports—ETF Shares | 145 |
| Shareholders’ Reports—Institutional Shares | — |
| Trustees’ Fees and Expenses | 2 |
| Total Expenses | 4,699 |
| Net Investment Income | 85,788 |
| Realized Net Gain (Loss) | |
| Investment Securities Sold2 | 3,239 |
| Futures Contracts | (2,282) |
| Foreign Currencies and Forward Currency Contracts | 2,853 |
| Realized Net Gain (Loss) | 3,810 |
| Change in Unrealized Appreciation (Depreciation) | |
| Investment Securities | 38,147 |
| Futures Contracts | (481) |
| Foreign Currencies and Forward Currency Contracts | (311) |
| Change in Unrealized Appreciation (Depreciation) | 37,355 |
| Net Increase (Decrease) in Net Assets Resulting from Operations | 126,953 |
1 Dividends are net of foreign withholding taxes of $6,335,000.
2 Interest income and realized net gain (loss) from an affiliated company of the fund were $103,000 and $3,000, respectively.
See accompanying Notes, which are an integral part of the Financial Statements.
46
| | |
| FTSE All-World ex-US Small-Cap Index Fund | | |
| |
| |
| Statement of Changes in Net Assets | | |
| |
| | Year Ended October 31, |
| | 2016 | 2015 |
| | ($000) | ($000) |
| Increase (Decrease) in Net Assets | | |
| Operations | | |
| Net Investment Income | 85,788 | 72,412 |
| Realized Net Gain (Loss) | 3,810 | 51,320 |
| Change in Unrealized Appreciation (Depreciation) | 37,355 | (227,964) |
| Net Increase (Decrease) in Net Assets Resulting from Operations | 126,953 | (104,232) |
| Distributions | | |
| Net Investment Income | | |
| Investor Shares | (12,013) | (10,561) |
| ETF Shares | (67,444) | (61,064) |
| Institutional Shares | (4,391) | (2,759) |
| Realized Capital Gain | | |
| Investor Shares | — | — |
| ETF Shares | — | — |
| Institutional Shares | — | — |
| Total Distributions | (83,848) | (74,384) |
| Capital Share Transactions | | |
| Investor Shares | 66,018 | 86,821 |
| ETF Shares | 211,232 | 604,382 |
| Institutional Shares | 9,188 | 118,310 |
| Net Increase (Decrease) from Capital Share Transactions | 286,438 | 809,513 |
| Total Increase (Decrease) | 329,543 | 630,897 |
| Net Assets | | |
| Beginning of Period | 3,017,126 | 2,386,229 |
| End of Period1 | 3,346,669 | 3,017,126 |
1 Net Assets—End of Period includes undistributed (overdistributed) net investment income of $16,204,000 and $8,731,000.
See accompanying Notes, which are an integral part of the Financial Statements.
47
| | | | | |
| FTSE All-World ex-US Small-Cap Index Fund | | | | | |
| |
| |
| Financial Highlights | | | | | |
| |
| |
| Investor Shares | | | | | |
| |
| For a Share Outstanding | Year Ended October 31, |
| Throughout Each Period | 2016 | 2015 | 2014 | 2013 | 2012 |
| Net Asset Value, Beginning of Period | $36.27 | $38.10 | $38.99 | $33.21 | $32.89 |
| Investment Operations | | | | | |
| Net Investment Income | .933 | .887 | .909 | .946 | .798 |
| Net Realized and Unrealized Gain (Loss) | | | | | |
| on Investments1 | .461 | (1.769) | (.834) | 5.947 | .649 |
| Total from Investment Operations | 1.394 | (.882) | .075 | 6.893 | 1.447 |
| Distributions | | | | | |
| Dividends from Net Investment Income | (.924) | (.948) | (.965) | (1.113) | (1.127) |
| Distributions from Realized Capital Gains | — | — | — | — | — |
| Total Distributions | (.924) | (.948) | (.965) | (1.113) | (1.127) |
| Net Asset Value, End of Period | $36.74 | $36.27 | $38.10 | $38.99 | $33.21 |
| |
| Total Return2 | 3.95% | -2.33% | 0.15% | 21.25% | 4.77% |
| |
| Ratios/Supplemental Data | | | | | |
| Net Assets, End of Period (Millions) | $520 | $446 | $382 | $318 | $232 |
| Ratio of Total Expenses to | | | | | |
| Average Net Assets | 0.27% | 0.31% | 0.37% | 0.40% | 0.45% |
| Ratio of Net Investment Income to | | | | | |
| Average Net Assets | 2.63% | 2.41% | 2.25% | 2.58% | 2.54% |
| Portfolio Turnover Rate 3 | 14% | 9% | 13% | 19% | 18% |
1 Includes increases from purchase and redemption fees of $.00, $.00, $.01, $.01, and $.03. Effective July 25, 2014, fees were eliminated.
2 Total returns do not include transaction or account service fees that may have applied in the periods shown. Fund prospectuses provide
information about any applicable transaction and account service fees.
3 Excludes the value of portfolio securities received or delivered as a result of in-kind purchases or redemptions of the fund’s capital shares,
including ETF Creation Units.
See accompanying Notes, which are an integral part of the Financial Statements.
48
| | | | | |
| FTSE All-World ex-US Small-Cap Index Fund | | | | | |
| |
| |
| Financial Highlights | | | | | |
| |
| |
| ETF Shares | | | | | |
| |
| For a Share Outstanding | Year Ended October 31, |
| Throughout Each Period | 2016 | 2015 | 2014 | 2013 | 2012 |
| Net Asset Value, Beginning of Period | $95.09 | $99.89 | $102.21 | $87.11 | $86.38 |
| Investment Operations | | | | | |
| Net Investment Income | 2.574 | 2.461 | 2.570 | 2.664 | 2.252 |
| Net Realized and Unrealized Gain (Loss) | | | | | |
| on Investments1 | 1.216 | (4.634) | (2.169) | 15.595 | 1.707 |
| Total from Investment Operations | 3.790 | (2.173) | .401 | 18.259 | 3.959 |
| Distributions | | | | | |
| Dividends from Net Investment Income | (2.540) | (2.627) | (2.721) | (3.159) | (3.229) |
| Distributions from Realized Capital Gains | — | — | — | — | — |
| Total Distributions | (2.540) | (2.627) | (2.721) | (3.159) | (3.229) |
| Net Asset Value, End of Period | $96.34 | $95.09 | $99.89 | $102.21 | $87.11 |
| |
| Total Return | 4.11% | -2.19% | 0.34% | 21.50% | 4.99% |
| |
| Ratios/Supplemental Data | | | | | |
| Net Assets, End of Period (Millions) | $2,652 | $2,407 | $1,947 | $1,723 | $1,040 |
| Ratio of Total Expenses to | | | | | |
| Average Net Assets | 0.13% | 0.17% | 0.19% | 0.20% | 0.25% |
| Ratio of Net Investment Income to | | | | | |
| Average Net Assets | 2.77% | 2.55% | 2.43% | 2.78% | 2.74% |
| Portfolio Turnover Rate 2 | 14% | 9% | 13% | 19% | 18% |
1 Includes increases from purchase and redemption fees of $.00, $.00, $.04, $.03, and $.07. Effective July 25, 2014, fees were eliminated.
2 Excludes the value of portfolio securities received or delivered as a result of in-kind purchases or redemptions of the fund’s capital shares,
including ETF Creation Units.
See accompanying Notes, which are an integral part of the Financial Statements.
49
| | | | | |
| FTSE All-World ex-US Small-Cap Index Fund | | | | | |
| |
| |
| Financial Highlights | | | | | |
| |
| |
| Institutional Shares | | | | | |
| |
| For a Share Outstanding | Year Ended October 31, |
| Throughout Each Period | 2016 | 2015 | 2014 | 2013 | 2012 |
| Net Asset Value, Beginning of Period | $181.69 | $190.87 | $195.32 | $166.39 | $165.23 |
| Investment Operations | | | | | |
| Net Investment Income | 4.937 | 4.756 | 4.933 | 5.100 | 4.244 |
| Net Realized and Unrealized Gain (Loss) | | | | | |
| on Investments1 | 2.326 | (8.864) | (4.161) | 29.812 | 3.315 |
| Total from Investment Operations | 7.263 | (4.108) | .772 | 34.912 | 7.559 |
| Distributions | | | | | |
| Dividends from Net Investment Income | (4.883) | (5.072) | (5.222) | (5.982) | (6.399) |
| Distributions from Realized Capital Gains | — | — | — | — | — |
| Total Distributions | (4.883) | (5.072) | (5.222) | (5.982) | (6.399) |
| Net Asset Value, End of Period | $184.07 | $181.69 | $190.87 | $195.32 | $166.39 |
| |
| Total Return2 | 4.11% | -2.17% | 0.34% | 21.51% | 5.00% |
| |
| Ratios/Supplemental Data | | | | | |
| Net Assets, End of Period (Millions) | $175 | $164 | $57 | $18 | $15 |
| Ratio of Total Expenses to | | | | | |
| Average Net Assets | 0.12% | 0.15% | 0.18% | 0.19% | 0.24% |
| Ratio of Net Investment Income to | | | | | |
| Average Net Assets | 2.78% | 2.57% | 2.44% | 2.79% | 2.75% |
| Portfolio Turnover Rate 3 | 14% | 9% | 13% | 19% | 18% |
1 Includes increases from purchase and redemption fees of $.00, $.00, $.06, $.07, and $.20. Effective July 25, 2014, fees were eliminated.
2 Total returns do not include transaction fees that may have applied in the periods shown. Fund prospectuses provide information about any
applicable transaction fees.
3 Excludes the value of portfolio securities received or delivered as a result of in-kind purchases or redemptions of the fund’s capital shares,
including ETF Creation Units.
See accompanying Notes, which are an integral part of the Financial Statements.
50
FTSE All-World ex-US Small-Cap Index Fund
Notes to Financial Statements
Vanguard FTSE All-World ex-US Small-Cap Index Fund is registered under the Investment Company Act of 1940 as an open-end investment company, or mutual fund. The fund invests in securities of foreign issuers, which may subject it to investment risks not normally associated with investing in securities of U.S. corporations. The fund offers three classes of shares: Investor Shares, ETF Shares, and Institutional Shares. Investor Shares are available to any investor who meets the fund’s minimum purchase requirements. ETF Shares are listed for trading on NYSE Arca; they can be purchased and sold through a broker. Institutional Shares are designed for investors who meet certain administrative, service, and account-size criteria.
A. The following significant accounting policies conform to generally accepted accounting principles for U.S. investment companies. The fund consistently follows such policies in preparing its financial statements.
1. Security Valuation: Securities are valued as of the close of trading on the New York Stock Exchange (generally 4 p.m., Eastern time) on the valuation date. Equity securities are valued at the latest quoted sales prices or official closing prices taken from the primary market in which each security trades; such securities not traded on the valuation date are valued at the mean of the latest quoted bid and asked prices. Securities for which market quotations are not readily available, or whose values have been affected by events occurring before the fund’s pricing time but after the close of the securities’ primary markets, are valued at their fair values calculated according to procedures adopted by the board of trustees. These procedures include obtaining quotations from an independent pricing service, monitoring news to identify significant market- or security-specific events, and evaluating changes in the values of foreign market proxies (for example, ADRs, futures contracts, or exchange-traded funds), between the time the foreign markets close and the fund’s pricing time. When fair-value pricing is employed, the prices of securities used by a fund to calculate its net asset value may differ from quoted or published prices for the same securities. Investments in Vanguard Market Liquidity Fund are valued at that fund’s net asset value. Temporary cash investments acquired over 60 days to maturity are valued using the latest bid prices or using valuations based on a matrix system (which considers such factors as security prices, yields, maturities, and ratings), both as furnished by independent pricing services. Other temporary cash investments are valued at amortized cost, which approximates market value.
2. Foreign Currency: Securities and other assets and liabilities denominated in foreign currencies are translated into U.S. dollars using exchange rates obtained from an independent third party as of the fund’s pricing time on the valuation date. Realized gains (losses) and unrealized appreciation (depreciation) on investment securities include the effects of changes in exchange rates since the securities were purchased, combined with the effects of changes in security prices. Fluctuations in the value of other assets and liabilities resulting from changes in exchange rates are recorded as unrealized foreign currency gains (losses) until the assets or liabilities are settled in cash, at which time they are recorded as realized foreign currency gains (losses).
3. Futures and Forward Currency Contracts: The fund uses index futures contracts to a limited extent, with the objectives of maintaining full exposure to the stock market, enhancing returns, maintaining liquidity, and minimizing transaction costs. The fund may purchase futures contracts to immediately invest incoming cash in the market, or sell futures in response to cash outflows, thereby simulating a fully invested position in the underlying index while maintaining a cash balance for liquidity. The fund may seek to enhance returns by using futures contracts instead of the underlying securities when futures are believed to be priced more attractively than the underlying securities. The primary risks
51
FTSE All-World ex-US Small-Cap Index Fund
associated with the use of futures contracts are imperfect correlation between changes in market values of stocks held by the fund and the prices of futures contracts, and the possibility of an illiquid market. Counterparty risk involving futures is mitigated because a regulated clearinghouse is the counterparty instead of the clearing broker. To further mitigate counterparty risk, the fund trades futures contracts on an exchange, monitors the financial strength of its clearing brokers and clearing-house, and has entered into clearing agreements with its clearing brokers. The clearinghouse imposes initial margin requirements to secure the fund’s performance and requires daily settlement of variation margin representing changes in the market value of each contract.
The fund also enters into forward currency contracts to provide the appropriate currency exposure related to any open futures contracts. The fund’s risks in using these contracts include movement in the values of the foreign currencies relative to the U.S. dollar and the ability of the counterparties to fulfill their obligations under the contracts. The fund mitigates its counterparty risk by entering into forward currency contracts only with a diverse group of prequalified counterparties, monitoring their financial strength, entering into master netting arrangements with its counterparties, and requiring its counterparties to transfer collateral as security for their performance. In the absence of a default, the collateral pledged or received by the fund cannot be repledged, resold or rehypothecated. The master netting arrangements provide that, in the event of a counterparty’s default (including bankruptcy), the fund may terminate the forward currency contracts, determine the net amount owed by either party in accordance with its master netting arrangements, and sell or retain any collateral held up to the net amount owed to the fund under the master netting arrangements. The forward currency contracts contain provisions whereby a counterparty may terminate open contracts if the fund’s net assets decline below a certain level, triggering a payment by the fund if the fund is in a net liability position at the time of the termination. The payment amount would be reduced by any collateral the fund has pledged. Any assets pledged as collateral for open contracts are noted in the Statement of Net Assets. The value of collateral received or pledged is compared daily to the value of the forward currency contracts exposure with each counterparty, and any difference, if in excess of a specified minimum transfer amount, is adjusted and settled within two business days.
Futures contracts are valued at their quoted daily settlement prices. Forward currency contracts are valued at their quoted daily prices obtained from an independent third party, adjusted for currency risk based on the expiration date of each contract. The aggregate settlement values and notional amounts of the contracts are not recorded in the Statement of Assets and Liabilities. Fluctuations in the value of the contracts are recorded in the Statement of Assets and Liabilities as an asset (liability) and in the Statement of Operations as unrealized appreciation (depreciation) until the contracts are closed, when they are recorded as realized gains (losses) on futures or forward currency contracts.
During the year ended October 31, 2016, the fund’s average investments in long and short futures contracts represented less than 1% and 0% of net assets, respectively, based on the average of aggregate settlement values at each quarter-end during the period. The fund’s average investment in forward currency contracts represented less than 1% of net assets, based on the average of notional amounts at each quarter-end during the period.
4. Federal Income Taxes: The fund intends to continue to qualify as a regulated investment company and distribute all of its taxable income. Management has analyzed the fund’s tax positions taken for all open federal income tax years (October 31, 2013–2016), and has concluded that no provision for federal income tax is required in the fund’s financial statements.
5. Distributions: Distributions to shareholders are recorded on the ex-dividend date.
52
FTSE All-World ex-US Small-Cap Index Fund
6. Securities Lending: To earn additional income, the fund lends its securities to qualified institutional borrowers. Security loans are subject to termination by the fund at any time, and are required to be secured at all times by collateral in an amount at least equal to the market value of securities loaned. Daily market fluctuations could cause the value of loaned securities to be more or less than the value of the collateral received. When this occurs, the collateral is adjusted and settled on the next business day. The fund further mitigates its counterparty risk by entering into securities lending transactions only with a diverse group of prequalified counterparties, monitoring their financial strength, and entering into master securities lending agreements with its counterparties. The master securities lending agreements provide that, in the event of a counterparty’s default (including bankruptcy), the fund may terminate any loans with that borrower, determine the net amount owed, and sell or retain the collateral up to the net amount owed to the fund; however, such actions may be subject to legal proceedings. While collateral mitigates counterparty risk, in the absence of a default the fund may experience delays and costs in recovering the securities loaned. The fund invests cash collateral received in Vanguard Market Liquidity Fund, and records a liability in the Statement of Assets and Liabilities for the return of the collateral, during the period the securities are on loan. Securities lending income represents fees charged to borrowers plus income earned on invested cash collateral, less expenses associated with the loan. During the term of the loan, the fund is entitled to all distributions made on or in respect of the loaned securities.
7. Credit Facility: The fund and certain other funds managed by The Vanguard Group (“Vanguard”) participate in a $3.1 billion committed credit facility provided by a syndicate of lenders pursuant to a credit agreement that may be renewed annually; each fund is individually liable for its borrowings, if any, under the credit facility. Borrowings may be utilized for temporary and emergency purposes, and are subject to the fund’s regulatory and contractual borrowing restrictions. The participating funds are charged administrative fees and an annual commitment fee of 0.10% of the undrawn amount of the facility; these fees are allocated to the funds based on a method approved by the fund’s board of trustees and included in Management and Administrative expenses on the fund’s Statement of Operations. Any borrowings under this facility bear interest at a rate based upon the higher of the one-month London Interbank Offered Rate, federal funds effective rate, or overnight bank funding rate plus an agreed-upon spread.
The fund had no borrowings outstanding at October 31, 2016, or at any time during the period then ended.
8. Other: Dividend income is recorded on the ex-dividend date. Interest income includes income distributions received from Vanguard Market Liquidity Fund and is accrued daily. Premiums and discounts on debt securities purchased are amortized and accreted, respectively, to interest income over the lives of the respective securities. Security transactions are accounted for on the date securities are bought or sold. Costs used to determine realized gains (losses) on the sale of investment securities are those of the specific securities sold.
Withholding taxes on foreign dividends and capital gains have been provided for in accordance with the fund’s understanding of the applicable countries’ tax rules and rates. The fund has filed tax reclaims for previously withheld taxes on dividends earned in certain European Union countries. These filings are subject to various administrative and judicial proceedings within these countries. Such tax reclaims received during the year, if any, are included in dividend income. No other amounts for additional tax reclaims are reflected in the financial statements due to the uncertainty as to the ultimate resolution of proceedings, the likelihood of receipt of these reclaims, and the potential timing of payment.
53
FTSE All-World ex-US Small-Cap Index Fund
Each class of shares has equal rights as to assets and earnings, except that each class separately bears certain class-specific expenses related to maintenance of shareholder accounts (included in Management and Administrative expenses) and shareholder reporting. Marketing and distribution expenses are allocated to each class of shares based on a method approved by the board of trustees. Income, other non-class-specific expenses, and gains and losses on investments are allocated to each class of shares based on its relative net assets.
B. In accordance with the terms of a Funds’ Service Agreement (the “FSA”) between Vanguard and the fund, Vanguard furnishes to the fund investment advisory, corporate management, administrative, marketing, and distribution services at Vanguard’s cost of operations (as defined by the FSA). These costs of operations are allocated to the fund based on methods and guidelines approved by the board of trustees. Vanguard does not require reimbursement in the current period for certain costs of operations (such as deferred compensation/benefits and risk/insurance costs); the fund’s liability for these costs of operations is included in Payables to Vanguard on the Statement of Assets and Liabilities.
Upon the request of Vanguard, the fund may invest up to 0.40% of its net assets as capital in Vanguard. At October 31, 2016, the fund had contributed to Vanguard capital in the amount of $261,000, representing 0.01% of the fund’s net assets and 0.10% of Vanguard’s capitalization. The fund’s trustees and officers are also directors and employees, respectively, of Vanguard.
C. Various inputs may be used to determine the value of the fund’s investments. These inputs are summarized in three broad levels for financial statement purposes. The inputs or methodologies used to value securities are not necessarily an indication of the risk associated with investing in those securities.
Level 1—Quoted prices in active markets for identical securities.
Level 2—Other significant observable inputs (including quoted prices for similar securities, interest rates, prepayment speeds, credit risk, etc.).
Level 3—Significant unobservable inputs (including the fund’s own assumptions used to determine the fair value of investments).
The following table summarizes the market value of the fund’s investments as of October 31, 2016, based on the inputs used to value them:
| | | |
| | Level 1 | Level 2 | Level 3 |
| Investments | ($000) | ($000) | ($000) |
| Common Stocks—North and South America | 524,226 | 9,723 | 221 |
| Common Stocks—Other | 203 | 2,776,077 | 6,246 |
| Temporary Cash Investments | 271,673 | 6,898 | — |
| Futures Contracts—Assets1 | 85 | — | — |
| Futures Contracts—Liabilities1 | (56) | — | — |
| Forward Currency Contracts—Assets | — | 172 | — |
| Forward Currency Contracts—Liabilities | — | (428) | — |
| Total | 796,131 | 2,792,442 | 6,467 |
| 1 Represents variation margin on the last day of the reporting period. |
54
FTSE All-World ex-US Small-Cap Index Fund
D. At October 31, 2016, the fair values of derivatives were reflected in the Statement of Assets and Liabilities as follows:
| | | |
| | | Foreign | |
| | Equity | Exchange | |
| | Contracts | Contracts | Total |
| Statement of Assets and Liabilities Caption | ($000) | ($000) | ($000) |
| Other Assets | 85 | 172 | 257 |
| Other Liabilities | (56) | (428) | (484) |
Realized net gain (loss) and the change in unrealized appreciation (depreciation) on derivatives for the year ended October 31, 2016, were:
| | | |
| | | Foreign | |
| | Equity | Exchange | |
| | Contracts | Contracts | Total |
| Realized Net Gain (Loss) on Derivatives | ($000) | ($000) | ($000) |
| Futures Contracts | (2,282) | — | (2,282) |
| Forward Currency Contracts | — | 1,240 | 1,240 |
| Realized Net Gain (Loss) on Derivatives | (2,282) | 1,240 | (1,042) |
| |
| Change in Unrealized Appreciation (Depreciation) on Derivatives | | | |
| Futures Contracts | (481) | — | (481) |
| Forward Currency Contracts | — | (120) | (120) |
| Change in Unrealized Appreciation (Depreciation) on Derivatives | (481) | (120) | (601) |
At October 31, 2016, the aggregate settlement value of open futures contracts and the related unrealized appreciation (depreciation) were:
| | | | |
| | | | ($000) |
| | | | Aggregate | |
| | | Number of | Settlement | Unrealized |
| | | Long (Short) | Value | Appreciation |
| Futures Contracts | Expiration | Contracts | Long (Short) | (Depreciation) |
| MSCI Emerging Markets Index | December 2016 | 181 | 8,177 | (117) |
| Dow Jones EURO STOXX 50 | December 2016 | 236 | 7,898 | 230 |
| E-mini Russell 2000 Index | December 2016 | 63 | 7,493 | (138) |
| Topix Index | December 2016 | 36 | 4,779 | 229 |
| E-mini S&P 500 Index | December 2016 | 3 | 318 | (2) |
| | | | | 202 |
Unrealized appreciation (depreciation) on open MSCI Emerging Markets Index, Dow Jones EURO STOXX 50, E-mini Russell 2000 Index, and E-mini S&P 500 Index futures contracts is required to be treated as realized gain (loss) for tax purposes.
55
FTSE All-World ex-US Small-Cap Index Fund
At October 31, 2016, the fund had open forward currency contracts to receive and deliver currencies as follows. Unrealized appreciation (depreciation) on open forward currency contracts is treated as realized gain (loss) for tax purposes.
| | | | | | |
| | | | | | | Unrealized |
| | Contract | | | | | Appreciation |
| | Settlement | Contract Amount (000) | (Depreciation) |
| Counterparty | Date | | Receive | | Deliver | ($000) |
| The Toronto-Dominion Bank | 12/21/16 | EUR | 10,072 | USD | 11,368 | (285) |
| BNP Paribas | 12/13/16 | JPY | 508,156 | USD | 4,984 | (130) |
| BNP Paribas | 12/21/16 | EUR | 463 | USD | 523 | (13) |
| Deutsche Bank AG | 12/21/16 | USD | 3,366 | EUR | 2,987 | 79 |
| Morgan Stanley Capital Services LLC | 12/21/16 | USD | 2,725 | EUR | 2,417 | 66 |
| JPMorgan Chase Bank, N.A. | 12/13/16 | USD | 1,162 | JPY | 118,890 | 27 |
| | | | | | | (256) |
| EUR—Euro. |
| JPY—Japanese yen. |
| USD—U.S. dollar. |
E. Distributions are determined on a tax basis and may differ from net investment income and realized capital gains for financial reporting purposes. Differences may be permanent or temporary. Permanent differences are reclassified among capital accounts in the financial statements to reflect their tax character. Temporary differences arise when certain items of income, expense, gain, or loss are recognized in different periods for financial statement and tax purposes; such differences are primarily attributed to the tax treatment of unrealized appreciation on passive foreign investment companies. These differences will reverse at some time in the future. Differences in classification may also result from the treatment of short-term gains as ordinary income for tax purposes.
During the year ended October 31, 2016, the fund realized net foreign currency gains of $1,613,000, which increased distributable net income for tax purposes; accordingly, such gains have been reclassified from accumulated net realized losses to undistributed net investment income. Certain of the fund’s investments are in securities considered to be passive foreign investment companies, for which any unrealized appreciation and/or realized gains are required to be included in distributable net income for tax purposes. During the year ended October 31, 2016, the fund realized gains on the sale of passive foreign investment companies of $4,007,000, which have been included in current and prior periods’ taxable income; accordingly, such gains have been reclassified from accumulated net realized losses to undistributed net investment income. Passive foreign investment companies held at October 31, 2016, had unrealized appreciation of $24,926,000.
During the year ended October 31, 2016, the fund realized $87,460,000 of net capital gains resulting from in-kind redemptions—in which shareholders exchanged fund shares for securities held by the fund rather than for cash. Because such gains are not taxable to the fund, and are not distributed to shareholders, they have been reclassified from accumulated net realized losses to paid-in capital.
56
FTSE All-World ex-US Small-Cap Index Fund
For tax purposes, at October 31, 2016, the fund had $42,414,000 of ordinary income available for distribution. At October 31, 2016, the fund had available capital losses totaling $158,672,000 to offset future net capital gains. Of this amount, $8,716,000 is subject to expiration on October 31, 2019. Capital losses of $149,956,000 realized beginning in fiscal 2012 may be carried forward indefinitely under the Regulated Investment Company Modernization Act of 2010, but must be used before any expiring loss carryforwards.
At October 31, 2016, the cost of investment securities for tax purposes was $3,732,177,000. Net unrealized depreciation of investment securities for tax purposes was $136,910,000, consisting of unrealized gains of $400,873,000 on securities that had risen in value since their purchase and $537,783,000 in unrealized losses on securities that had fallen in value since their purchase.
F. During the year ended October 31, 2016, the fund purchased $992,755,000 of investment securities and sold $714,166,000 of investment securities, other than temporary cash investments. Purchases and sales include $221,081,000 and $266,203,000, respectively, in connection with in-kind purchases and redemptions of the fund’s capital shares.
G. Capital share transactions for each class of shares were:
| | | | |
| | Year Ended October 31, |
| | 2016 | 2015 |
| | Amount | Shares | Amount | Shares |
| | ($000) | (000) | ($000) | (000) |
| Investor Shares | | | | |
| Issued | 147,789 | 4,161 | 165,488 | 4,391 |
| Issued in Lieu of Cash Distributions | 10,280 | 289 | 9,158 | 249 |
| Redeemed | (92,051) | (2,604) | (87,825) | (2,368) |
| Net Increase (Decrease)—Investor Shares | 66,018 | 1,846 | 86,821 | 2,272 |
| ETF Shares | | | | |
| Issued | 507,205 | 5,416 | 880,544 | 8,719 |
| Issued in Lieu of Cash Distributions | — | — | — | — |
| Redeemed | (295,973) | (3,200) | (276,162) | (2,900) |
| Net Increase (Decrease)—ETF Shares | 211,232 | 2,216 | 604,382 | 5,819 |
| Institutional Shares | | | | |
| Issued | 28,799 | 155 | 129,128 | 663 |
| Issued in Lieu of Cash Distributions | 3,148 | 18 | 2,545 | 14 |
| Redeemed | (22,759) | (126) | (13,363) | (73) |
| Net Increase (Decrease)—Institutional Shares | 9,188 | 47 | 118,310 | 604 |
H. Management has determined that no material events or transactions occurred subsequent to October 31, 2016, that would require recognition or disclosure in these financial statements.
57
Report of Independent Registered
Public Accounting Firm
To the Board of Trustees of Vanguard International Equity Index Funds and the Shareholders of Vanguard FTSE All-World ex-US Index Fund and Vanguard FTSE All-World ex-US Small-Cap Index Fund:
In our opinion, the accompanying statements of net assets—investments summary, statement of assets and liabilities and the related statements of operations and of changes in net assets and the financial highlights present fairly, in all material respects, the financial position of Vanguard FTSE All-World ex-US Index Fund and Vanguard FTSE All-World ex-US Small-Cap Index Fund (constituting separate portfolios of Vanguard International Equity Index Funds, hereafter referred to as the “Funds”) at October 31, 2016, the results of each of their operations for the year then ended, the changes in each of their net assets for each of the two years in the period then ended, and the financial highlights for each of the five years in the period then ended, in conformity with accounting principles generally accepted in the United States of America. These financial statements and financial highlights (hereafter referred to as “financial statements”) are the responsibility of the Funds’ management. Our responsibility is to express an opinion on these financial statements based on our audits. We conducted our audits of these financial statements in accordance with the standards of the Public Company Accounting Oversight Board (United States). Those standards require that we plan and perform the audit to obtain reasonable assurance about whether the financial statements are free of material misstatement. An audit includes examining, on a test basis, evidence supporting the amounts and disclosures in the financial statements, assessing the accounting principles used and significant estimates made by management, and evaluating the overall financial statement presentation. We believe that our audits, which included confirmation of securities at October 31, 2016 by correspondence with the custodian and brokers and by agreement to the underlying ownership records of the transfer agent, provide a reasonable basis for our opinion.
/s/PricewaterhouseCoopers LLP
Philadelphia, Pennsylvania
December 15, 2016
58

Special 2016 tax information (unaudited) for Vanguard FTSE All-World ex-US Index Fund
This information for the fiscal year ended October 31, 2016, is included pursuant to provisions of the
Internal Revenue Code.
The fund distributed $505,361,000 of qualified dividend income to shareholders during the fiscal year.
The fund designates to shareholders foreign source income of $653,487,000 and foreign taxes paid
of $48,831,000. Shareholders will receive more detailed information with their Form 1099-DIV in
January 2017 to determine the calendar-year amounts to be included on their 2016 tax returns.

Special 2016 tax information (unaudited) for Vanguard FTSE All-World ex-US Small-Cap Index Fund
This information for the fiscal year ended October 31, 2016, is included pursuant to provisions of the Internal Revenue Code.
The fund distributed $44,871,000 of qualified dividend income to shareholders during the fiscal year.
The fund designates to shareholders foreign source income of $73,970,000 and foreign taxes paid of $6,289,000. Shareholders will receive more detailed information with their Form 1099-DIV in January 2017 to determine the calendar-year amounts to be included on their 2016 tax returns.
59
Your Fund’s After-Tax Returns
This table presents returns for your fund both before and after taxes. The after-tax returns are shown in two ways: (1) assuming that an investor owned the fund during the entire period and paid taxes on the fund’s distributions, and (2) assuming that an investor paid taxes on the fund’s distributions and sold all shares at the end of each period.
Calculations are based on the highest individual federal income tax and capital gains tax rates in effect at the times of the distributions and the hypothetical sales. State and local taxes were not considered. After-tax returns reflect any qualified dividend income, using actual prior-year figures and estimates for 2016. (In the example, returns after the sale of fund shares may be higher than those assuming no sale. This occurs when the sale would have produced a capital loss. The calculation assumes that the investor received a tax deduction for the loss.)
The table shows returns for Investor Shares only; returns for other share classes will differ. Please note that your actual after-tax returns will depend on your tax situation and may differ from those shown. Also note that if you own the fund in a tax-deferred account, such as an individual retirement account or a 401(k) plan, this information does not apply to you. Such accounts are not subject to current taxes.
Finally, keep in mind that a fund’s performance—whether before or after taxes—does not guarantee future results.
| | | |
| Average Annual Total Returns: FTSE International Index Funds | | | |
| Periods Ended October 31, 2016 | | | |
| |
| | | | Since |
| | One | Five | Inception |
| | Year | Years | (3/8/2007) |
| FTSE All-World ex-US Index Fund Investor Shares | | | |
| Returns Before Taxes | 0.98% | 4.10% | 1.11% |
| Returns After Taxes on Distributions | 0.18 | 3.33 | 0.61 |
| Returns After Taxes on Distributions and Sale of Fund Shares | 0.95 | 3.17 | 0.88 |
| | | |
| | | | Since |
| | One | Five | Inception |
| | Year | Years | (4/2/2009) |
| FTSE All-World ex-US Small-Cap Index Fund Investor Shares | | | |
| Returns Before Taxes | 3.95% | 5.25% | 11.11% |
| Returns After Taxes on Distributions | 3.12 | 4.48 | 10.42 |
| Returns After Taxes on Distributions and Sale of Fund Shares | 2.54 | 3.97 | 8.96 |
60
About Your Fund’s Expenses
As a shareholder of the fund, you incur ongoing costs, which include costs for portfolio management, administrative services, and shareholder reports (like this one), among others. Operating expenses, which are deducted from a fund’s gross income, directly reduce the investment return of the fund.
A fund’s expenses are expressed as a percentage of its average net assets. This figure is known as the expense ratio. The following examples are intended to help you understand the ongoing costs (in dollars) of investing in your fund and to compare these costs with those of other mutual funds. The examples are based on an investment of $1,000 made at the beginning of the period shown and held for the entire period.
The accompanying table illustrates your fund’s costs in two ways:
• Based on actual fund return. This section helps you to estimate the actual expenses that you paid over the period. The ”Ending Account Value“ shown is derived from the fund‘s actual return, and the third column shows the dollar amount that would have been paid by an investor who started with $1,000 in the fund. You may use the information here, together with the amount you invested, to estimate the expenses that you paid over the period.
To do so, simply divide your account value by $1,000 (for example, an $8,600 account value divided by $1,000 = 8.6), then multiply the result by the number given for your fund under the heading ”Expenses Paid During Period.“
• Based on hypothetical 5% yearly return. This section is intended to help you compare your fund‘s costs with those of other mutual funds. It assumes that the fund had a yearly return of 5% before expenses, but that the expense ratio is unchanged. In this case—because the return used is not the fund’s actual return—the results do not apply to your investment. The example is useful in making comparisons because the Securities and Exchange Commission requires all mutual funds to calculate expenses based on a 5% return. You can assess your fund’s costs by comparing this hypothetical example with the hypothetical examples that appear in shareholder reports of other funds.
Note that the expenses shown in the table are meant to highlight and help you compare ongoing costs only and do not reflect transaction costs incurred by the fund for buying and selling securities. Further, the expenses do not include any purchase, redemption, or account service fees described in the fund prospectus. If such fees were applied to your account, your costs would be higher. Your fund does not carry a “sales load.”
The calculations assume no shares were bought or sold during the period. Your actual costs may have been higher or lower, depending on the amount of your investment and the timing of any purchases or redemptions.
You can find more information about the fund’s expenses, including annual expense ratios, in the Financial Statements section of this report. For additional information on operating expenses and other shareholder costs, please refer to your fund’s current prospectus.
61
| | | |
| Six Months Ended October 31, 2016 | | | |
| | Beginning | Ending | Expenses |
| | Account Value | Account Value | Paid During |
| | 4/30/2016 | 10/31/2016 | Period |
| Based on Actual Fund Return | | | |
| FTSE All-World ex-US Index Fund | | | |
| Investor Shares | $1,000.00 | $1,028.90 | $1.07 |
| ETF Shares | 1,000.00 | 1,029.91 | 0.56 |
| Admiral Shares | 1,000.00 | 1,029.45 | 0.56 |
| Institutional Shares | 1,000.00 | 1,029.58 | 0.56 |
| Institutional Plus Shares | 1,000.00 | 1,029.81 | 0.36 |
| FTSE All-World ex-US Small-Cap Index Fund | | | |
| Investor Shares | $1,000.00 | $1,014.78 | $1.27 |
| ETF Shares | 1,000.00 | 1,015.72 | 0.56 |
| Institutional Shares | 1,000.00 | 1,015.55 | 0.51 |
| Based on Hypothetical 5% Yearly Return | | | |
| FTSE All-World ex-US Index Fund | | | |
| Investor Shares | $1,000.00 | $1,024.08 | $1.07 |
| ETF Shares | 1,000.00 | 1,024.58 | 0.56 |
| Admiral Shares | 1,000.00 | 1,024.58 | 0.56 |
| Institutional Shares | 1,000.00 | 1,024.58 | 0.56 |
| Institutional Plus Shares | 1,000.00 | 1,024.78 | 0.36 |
| FTSE All-World ex-US Small-Cap Index Fund | | | |
| Investor Shares | $1,000.00 | $1,023.88 | $1.27 |
| ETF Shares | 1,000.00 | 1,024.58 | 0.56 |
| Institutional Shares | 1,000.00 | 1,024.63 | 0.51 |
The calculations are based on expenses incurred in the most recent six-month period. The funds’ annualized six-month expense ratios for that
period are: for the FTSE All-World ex-US Index Fund, 0.21% for Investor Shares, 0.11% for ETF Shares, 0.11% for Admiral Shares, 0.11% for
Institutional Shares, and 0.07% for Institutional Plus Shares; and for the FTSE All-World ex-US Small-Cap Index Fund, 0.25% for Investor
Shares, 0.11% for ETF Shares, and 0.10% for Institutional Shares. The dollar amounts shown as “Expenses Paid” are equal to the annualized
expense ratio multiplied by the average account value over the period, multiplied by the number of days in the most recent six-month period,
then divided by the number of days in the most recent 12-month period (184/366).
62
Glossary
Beta. A measure of the magnitude of a fund’s past share-price fluctuations in relation to the ups and downs of a given market index. The index is assigned a beta of 1.00. Compared with a given index, a fund with a beta of 1.20 typically would have seen its share price rise or fall by 12% when the index rose or fell by 10%. For this report, beta is based on returns over the past 36 months for both the fund and the index. Note that a fund’s beta should be reviewed in conjunction with its R-squared (see definition). The lower the R-squared, the less correlation there is between the fund and the index, and the less reliable beta is as an indicator of volatility.
Dividend Yield. Dividend income earned by stocks, expressed as a percentage of the aggregate market value (or of net asset value, for a fund). The yield is determined by dividing the amount of the annual dividends by the aggregate value (or net asset value) at the end of the period. For a fund, the dividend yield is based solely on stock holdings and does not include any income produced by other investments.
Earnings Growth Rate. The average annual rate of growth in earnings over the past five years for the stocks now in a fund.
Equity Exposure. A measure that reflects a fund’s investments in stocks and stock futures. Any holdings in short-term reserves are excluded.
Expense Ratio. A fund’s total annual operating expenses expressed as a percentage of the fund’s average net assets. The expense ratio includes management and administrative expenses, but does not include the transaction costs of buying and selling portfolio securities.
Fair-Value Pricing. Fair-value adjustments, which are required by the Securities and Exchange Commission, address pricing discrepancies that may arise because of time-zone differences among global stock markets. Foreign stocks may trade on exchanges that close many hours before a fund’s closing share price is calculated in the United States, generally at 4 p.m., Eastern time. In the hours between the foreign close and the U.S. close, the value of these foreign securities may change—because of company-specific announcements or market-wide developments, for example. Such price changes are not immediately reflected in international index values. Fair-value pricing takes such changes into account in calculating the fund’s daily net asset value, thus ensuring that the NAV doesn’t include “stale” prices. The result can be a temporary divergence between the return of the fund and that of its benchmark index—a difference that usually corrects itself when the foreign markets reopen.
Inception Date. The date on which the assets of a fund (or one of its share classes) are first invested in accordance with the fund’s investment objective. For funds with a subscription period, the inception date is the day after that period ends. Investment performance is measured from the inception date.
Median Market Cap. An indicator of the size of companies in which a fund invests; the midpoint of market capitalization (market price x shares outstanding) of a fund’s stocks, weighted by the proportion of the fund’s assets invested in each stock. Stocks representing half of the fund’s assets have market capitalizations above the median, and the rest are below it.
Price/Book Ratio. The share price of a stock divided by its net worth, or book value, per share. For a fund, the weighted average price/book ratio of the stocks it holds.
63
Price/Earnings Ratio. The ratio of a stock’s current price to its per-share earnings over the past year. For a fund, the weighted average P/E of the stocks it holds. P/E is an indicator of market expectations about corporate prospects; the higher the P/E, the greater the expectations for a company’s future growth.
R-Squared. A measure of how much of a fund’s past returns can be explained by the returns from the market in general, as measured by a given index. If a fund’s total returns were precisely synchronized with an index’s returns, its R-squared would be 1.00. If the fund’s returns bore no relationship to the index’s returns, its R-squared would be 0. For this report, R-squared is based on returns over the past 36 months for both the fund and the index.
Return on Equity. The annual average rate of return generated by a company during the past five years for each dollar of shareholder’s equity (net income divided by shareholder’s equity). For a fund, the weighted average return on equity for the companies whose stocks it holds.
Short-Term Reserves. The percentage of a fund invested in highly liquid, short-term securities that can be readily converted to cash.
Turnover Rate. An indication of the fund’s trading activity. Funds with high turnover rates incur higher transaction costs and may be more likely to distribute capital gains (which may be taxable to investors). The turnover rate excludes in-kind transactions, which have minimal impact on costs.
64
This page intentionally left blank.
This page intentionally left blank.
This page intentionally left blank.
The People Who Govern Your Fund
The trustees of your mutual fund are there to see that the fund is operated and managed in your best interests since, as a shareholder, you are a part owner of the fund. Your fund’s trustees also serve on the board of directors of The Vanguard Group, Inc., which is owned by the Vanguard funds and provides services to them on an at-cost basis.
A majority of Vanguard’s board members are independent, meaning that they have no affiliation with Vanguard or the funds they oversee, apart from the sizable personal investments they have made as private individuals. The independent board members have distinguished backgrounds in business, academia, and public service. Each of the trustees and executive officers oversees 198 Vanguard funds.
The following table provides information for each trustee and executive officer of the fund. The mailing address of the trustees and officers is P.O. Box 876, Valley Forge, PA 19482. More information about the trustees is in the Statement of Additional Information, which can be obtained, without charge, by contacting Vanguard at 800-662-7447, or online at vanguard.com.
InterestedTrustee1
F. William McNabb III
Born 1957. Trustee Since July 2009. Chairman of
the Board. Principal Occupation(s) During the Past
Five Years and Other Experience: Chairman of the
Board of The Vanguard Group, Inc., and of each of
the investment companies served by The Vanguard
Group, since January 2010; Director of The Vanguard
Group since 2008; Chief Executive Officer and
President of The Vanguard Group, and of each of
the investment companies served by The Vanguard
Group, since 2008; Director of Vanguard Marketing
Corporation; Managing Director of The Vanguard
Group (1995–2008).
IndependentTrustees
Emerson U. Fullwood
Born 1948. Trustee Since January 2008. Principal
Occupation(s) During the Past Five Years and Other
Experience: Executive Chief Staff and Marketing
Officer for North America and Corporate Vice President
(retired 2008) of Xerox Corporation (document manage-
ment products and services); Executive in Residence
and 2009–2010 Distinguished Minett Professor at
the Rochester Institute of Technology; Lead Director
of SPX FLOW, Inc. (multi-industry manufacturing);
Director of the United Way of Rochester, the University
of Rochester Medical Center, Monroe Community
College Foundation, North Carolina A&T University,
and Roberts Wesleyan College.
Rajiv L. Gupta
Born 1945. Trustee Since December 2001.2 Principal
Occupation(s) During the Past Five Years and Other
Experience: Chairman and Chief Executive Officer
(retired 2009) and President (2006–2008) of
Rohm and Haas Co. (chemicals); Director of Tyco
International plc (diversified manufacturing and
services), HP Inc. (printer and personal computer
manufacturing), and Delphi Automotive plc
(automotive components); Senior Advisor at
New Mountain Capital.
Amy Gutmann
Born 1949. Trustee Since June 2006. Principal
Occupation(s) During the Past Five Years and
Other Experience: President of the University of
Pennsylvania; Christopher H. Browne Distinguished
Professor of Political Science, School of Arts and
Sciences, and Professor of Communication, Annenberg
School for Communication, with secondary faculty
appointments in the Department of Philosophy, School
of Arts and Sciences, and at the Graduate School of
Education, University of Pennsylvania; Trustee of the
National Constitution Center; Chair of the Presidential
Commission for the Study of Bioethical Issues.
JoAnn Heffernan Heisen
Born 1950. Trustee Since July 1998. Principal
Occupation(s) During the Past Five Years and
Other Experience: Corporate Vice President and
Chief Global Diversity Officer (retired 2008) and
Member of the Executive Committee (1997–2008)
of Johnson & Johnson (pharmaceuticals/medical
devices/consumer products); Director of Skytop
Lodge Corporation (hotels) and the Robert Wood
Johnson Foundation; Member of the Advisory
Board of the Institute for Women’s Leadership
at Rutgers University.
F. Joseph Loughrey
Born 1949. Trustee Since October 2009. Principal
Occupation(s) During the Past Five Years and Other
Experience: President and Chief Operating Officer
(retired 2009) of Cummins Inc. (industrial machinery);
Chairman of the Board of Hillenbrand, Inc. (specialized
consumer services), and of Oxfam America; Director
of SKF AB (industrial machinery), Hyster-Yale Materials
Handling, Inc. (forklift trucks), the Lumina Foundation
for Education, and the V Foundation for Cancer
Research; Member of the Advisory Council for the
College of Arts and Letters and of the Advisory Board
to the Kellogg Institute for International Studies, both
at the University of Notre Dame.
Mark Loughridge
Born 1953. Trustee Since March 2012. Principal
Occupation(s) During the Past Five Years and Other
Experience: Senior Vice President and Chief Financial
Officer (retired 2013) at IBM (information technology
services); Fiduciary Member of IBM’s Retirement Plan
Committee (2004–2013); Director of the Dow Chemical
Company; Member of the Council on Chicago Booth.
Scott C. Malpass
Born 1962. Trustee Since March 2012. Principal
Occupation(s) During the Past Five Years and Other
Experience: Chief Investment Officer and Vice
President at the University of Notre Dame; Assistant
Professor of Finance at the Mendoza College of
Business at Notre Dame; Member of the Notre Dame
403(b) Investment Committee, the Board of Advisors
for Spruceview Capital Partners, and the Investment
Advisory Committee of Major League Baseball; Board
Member of TIFF Advisory Services, Inc., and Catholic
Investment Services, Inc. (investment advisors).
André F. Perold
Born 1952. Trustee Since December 2004. Principal
Occupation(s) During the Past Five Years and Other
Experience: George Gund Professor of Finance and
Banking, Emeritus at the Harvard Business School
(retired 2011); Chief Investment Officer and Managing
Partner of HighVista Strategies LLC (private investment
firm); Director of Rand Merchant Bank; Overseer of
the Museum of Fine Arts Boston.
Peter F. Volanakis
Born 1955. Trustee Since July 2009. Principal
Occupation(s) During the Past Five Years and
Other Experience: President and Chief Operating
Officer (retired 2010) of Corning Incorporated
(communications equipment); Chairman of the
Board of Trustees of Colby-Sawyer College;
Member of the Advisory Board of the Norris
Cotton Cancer Center.
Executive Officers
Glenn Booraem
Born 1967. Treasurer Since May 2015. Principal
Occupation(s) During the Past Five Years and
Other Experience: Principal of The Vanguard Group,
Inc.; Treasurer of each of the investment companies
served by The Vanguard Group; Controller of each of
the investment companies served by The Vanguard
Group (2010–2015); Assistant Controller of each of
the investment companies served by The Vanguard
Group (2001–2010).
Thomas J. Higgins
Born 1957. Chief Financial Officer Since September
2008. Principal Occupation(s) During the Past Five
Years and Other Experience: Principal of The Vanguard
Group, Inc.; Chief Financial Officer of each of the
investment companies served by The Vanguard Group;
Treasurer of each of the investment companies served
by The Vanguard Group (1998–2008).
Peter Mahoney
Born 1974. Controller Since May 2015. Principal
Occupation(s) During the Past Five Years and Other
Experience: Head of Global Fund Accounting at The
Vanguard Group, Inc.; Controller of each of the invest-
ment companies served by The Vanguard Group;
Head of International Fund Services at The Vanguard
Group (2008–2014).
Anne E. Robinson
Born 1970. Secretary Since September 2016. Principal
Occupation(s) During the Past Five Years and Other
Experience: Managing Director of The Vanguard Group,
Inc.; General Counsel of The Vanguard Group; Secretary
of The Vanguard Group and of each of the investment
companies served by The Vanguard Group; Director
and Senior Vice President of Vanguard Marketing
Corporation; Managing Director and General Counsel
of Global Cards and Consumer Services at Citigroup
(2014–2016); Counsel at American Express (2003–2014).
| |
| Vanguard Senior Management Team |
| Mortimer J. Buckley | James M. Norris |
| Kathleen C. Gubanich | Thomas M. Rampulla |
| Martha G. King | Glenn W. Reed |
| John T. Marcante | Karin A. Risi |
| Chris D. McIsaac | Michael Rollings |
| |
| Chairman Emeritus and Senior Advisor |
| John J. Brennan | |
| Chairman, 1996–2009 | |
| Chief Executive Officer and President, 1996–2008 |
| |
| Founder | |
| John C. Bogle | |
| Chairman and Chief Executive Officer, 1974–1996 |
1 Mr. McNabb is considered an “interested person,” as defined in the Investment Company Act of 1940, because he is an officer of the Vanguard funds.
2 December 2002 for Vanguard Equity Income Fund, the Vanguard Municipal Bond Funds, and the Vanguard State Tax-Exempt Funds.
|  |
| | P.O. Box 2600 |
| | Valley Forge, PA 19482-2600 |
| |
| |
| |
| Connect with Vanguard® > vanguard.com |
| |
| |
| |
| Fund Information > 800-662-7447 | |
| |
| Direct Investor Account Services > 800-662-2739 | London Stock Exchange Group companies include FTSE |
| Institutional Investor Services > 800-523-1036 | International Limited (”FTSE”), Frank Russell Company |
| | (”Russell”), MTS Next Limited (”MTS”), and FTSE TMX |
| Text Telephone for People | Global Debt Capital Markets Inc. (”FTSE TMX”). All |
| Who Are Deaf or Hard of Hearing > 800-749-7273 | rights reserved. ”FTSE®”, ”Russell®”, ”MTS®”, ”FTSE |
| This material may be used in conjunction | TMX®” and ”FTSE Russell” and other service marks |
| | and trademarks related to the FTSE or Russell indexes |
| with the offering of shares of any Vanguard | are trademarks of the London Stock Exchange Group |
| fund only if preceded or accompanied by | companies and are used by FTSE, MTS, FTSE TMX and |
| the fund’s current prospectus. | Russell under licence. All information is provided for |
| | information purposes only. No responsibility or liability |
| All comparative mutual fund data are from Lipper, a | can be accepted by the London Stock Exchange Group |
| Thomson Reuters Company, or Morningstar, Inc., unless | companies nor its licensors for any errors or for any |
| otherwise noted. | loss from use of this publication. Neither the London |
| You can obtain a free copy of Vanguard’s proxy voting | Stock Exchange Group companies nor any of its |
| guidelines by visiting vanguard.com/proxyreporting or by | licensors make any claim, prediction, warranty or |
| calling Vanguard at 800-662-2739. The guidelines are | representation whatsoever, expressly or impliedly, |
| also available from the SEC’s website, sec.gov. In | either as to the results to be obtained from the use of |
| addition, you may obtain a free report on how your fund | the FTSE Indexes or the fitness or suitability of the |
| voted the proxies for securities it owned during the 12 | Indexes for any particular purpose to which they might |
| months ended June 30. To get the report, visit either | be put. |
| vanguard.com/proxyreporting or sec.gov. | The Industry Classification Benchmark (”ICB”) is owned |
| You can review and copy information about your fund at | by FTSE. FTSE does not accept any liability to any |
| the SEC’s Public Reference Room in Washington, D.C. To | person for any loss or damage arising out of any error |
| find out more about this public service, call the SEC at | or omission in the ICB. |
| 202-551-8090. Information about your fund is also | |
| available on the SEC’s website, and you can receive | |
| copies of this information, for a fee, by sending a | |
| request in either of two ways: via email addressed to | |
| publicinfo@sec.gov or via regular mail addressed to the | |
| Public Reference Section, Securities and Exchange | |
| Commission, Washington, DC 20549-1520. | |
| |
| | © 2016 The Vanguard Group, Inc. |
| | All rights reserved. |
| | Vanguard Marketing Corporation, Distributor. |
| |
| | Q7700 122016 |
Annual Report | October 31, 2016
Vanguard Global ex-U.S. Real Estate
Index Fund
A new format, unwavering commitment
As you begin reading this report, you’ll notice that we’ve made some improvements to the opening sections—based on feedback from you, our clients.
Page 1 starts with a new ”Your Fund’s Performance at a Glance,” a concise, handy summary of how your fund performed during the period.
In the renamed ”Chairman’s Perspective,” Bill McNabb will focus on enduring principles and investment insights.
We’ve modified some tables, and eliminated some redundancy, but we haven’t removed any information.
At Vanguard, we’re always looking for better ways to communicate and to help you make sound investment decisions. Thank you for entrusting your assets to us.
| |
| Contents | |
| Your Fund’s Performance at a Glance. | 1 |
| Chairman’s Perspective. | 3 |
| Fund Profile. | 7 |
| Performance Summary. | 9 |
| Financial Statements. | 12 |
| Your Fund’s After-Tax Returns. | 37 |
| About Your Fund’s Expenses. | 38 |
| Glossary. | 40 |
Please note: The opinions expressed in this report are just that—informed opinions. They should not be considered promises or advice.
Also, please keep in mind that the information and opinions cover the period through the date on the front of this report. Of course, the
risks of investing in your fund are spelled out in the prospectus.
See the Glossary for definitions of investment terms used in this report.
About the cover: No matter what language you speak, Vanguard has one consistent message and set of principles. Our primary
focus is on you, our clients. We conduct our business with integrity as a faithful steward of your assets. This message is shown
translated into seven languages, reflecting our expanding global presence.
Your Fund’s Performance at a Glance
• Vanguard Global ex-U.S. Real Estate Index Fund returned nearly 3% for the 12 months ended October 31, 2016, ahead of its benchmark and the average return of its peers. The fund’s return diverged from that of its benchmark index in part because of temporary pricing discrepancies arising from fair-value adjustments. Please see the Glossary entry for Fair-Value Pricing.
• Stocks in emerging markets and in developed markets of the Pacific region contributed most to fund performance. European stocks were the biggest laggards.
• Returns in the Pacific region were aided by Japan and Australia, whose currencies strengthened against the U.S. dollar. A stronger local currency compared with the U.S. dollar helps returns for U.S. investors. In Europe, U.S. investors were hurt by U.K. stocks, which fell in part because the British pound weakened in the aftermath of this summer’s Brexit vote.
| |
| Total Returns: Fiscal Year Ended October 31, 2016 | |
| | Total |
| | Returns |
| Vanguard Global ex-U.S. Real Estate Index Fund | |
| Investor Shares | 2.72% |
| ETF Shares | |
| Market Price | 3.07 |
| Net Asset Value | 2.92 |
| Admiral™ Shares | 2.91 |
| Institutional Shares | 2.93 |
| S&P Global ex-U.S. Property Index | 2.08 |
| International Real Estate Funds Average | -2.20 |
International Real Estate Funds Average: Derived from data provided by Lipper, a Thomson Reuters Company.
Institutional Shares are available to certain institutional investors who meet specific administrative, service, and account-size criteria. The
Vanguard ETF® Shares shown are traded on the Nasdaq exchange and are available only through brokers. The table provides ETF returns
based on both the Nasdaq market price and the net asset value for a share. U.S. Pat. Nos. 6,879,964; 7,337,138; 7,720,749; 7,925,573;
8,090,646; and 8,417,623.
For the ETF Shares, the market price is determined by the midpoint of the bid-offer spread as of the closing time of the New York Stock
Exchange (generally 4 p.m., Eastern time). The net asset value is also determined as of the NYSE closing time. For more information about
how the ETF Shares' market prices have compared with their net asset value, visit vanguard.com, select your ETF, and then select the Price
and Performance tab. The ETF premium/discount analysis there shows the percentages of days on which the ETF Shares' market price was
above or below the NAV.
1
| |
| Total Returns: Inception Through October 31, 2016 | |
| | Average |
| | Annual Return |
| Global ex-U.S. Real Estate Index Fund Investor Shares (Returns since inception: 11/1/2010) | 4.67% |
| S&P Global ex-U.S. Property Index | 4.48 |
| International Real Estate Funds Average | 3.70 |
| International Real Estate Funds Average: Derived from data provided by Lipper, a Thomson Reuters Company. |
The figures shown represent past performance, which is not a guarantee of future results. (Current performance may be lower or higher than the performance data cited. For performance data current to the most recent month-end, visit our website at vanguard.com/performance.) Note, too, that both investment returns and principal value can fluctuate widely, so an investor’s shares, when sold, could be worth more or less than their original cost.
| | | | | |
| Expense Ratios | | | | | |
| Your Fund Compared With Its Peer Group | | | | | |
| | Investor | ETF | Admiral | Institutional | Peer Group |
| | Shares | Shares | Shares | Shares | Average |
| Global ex-U.S. Real Estate Index Fund | 0.36% | 0.18% | 0.18% | 0.16% | 1.38% |
The fund expense ratios shown are from the prospectus dated February 26, 2016, and represent estimated costs for the current fiscal year.
For the fiscal year ended October 31, 2016, the fund’s expense ratios were 0.35% for Investor Shares, 0.15% for ETF Shares, 0.15%
for Admiral Shares, and 0.13% for Institutional Shares. The peer-group expense ratio is derived from data provided by Lipper, a Thomson
Reuters Company, and captures information through year-end 2015.
Peer group: International Real Estate Funds.
Chairman’s Perspective

Bill McNabb
Chairman and Chief Executive Officer
Dear Shareholder,
Over the three years ended August 31, 2016, investors poured more than $1 trillion into index funds. Indexing now accounts for nearly a third of all mutual fund assets—more than double what it did a decade ago and eight times its share two decades ago.1
By contrast, active management’s commercial struggles have reflected its disappointing investment performance. Over the decade ended December 31, 2015, 82% of actively managed stock funds and 81% of active bond funds have either underperformed their benchmarks or shut down.
This subpar performance has fueled the explosion of asset growth in indexing among individual, retirement, and nonprofit investors. So what might the trend mean for the future of actively managed funds?
Our research and experience indicate that active management can survive—and even succeed—but only if it’s offered at much lower expense.
High costs, which limit a manager’s ability to deliver benchmark-beating returns to clients, are the biggest reason why active has lagged. Industrywide as of December 31, 2015, the average expense ratio for all active stock funds is 1.14%, compared with 0.76% for stock index
1 Sources: Wall Street Journal; Morningstar, Inc.; and Investment Company Institute, 2016.
3
funds. And the expense advantage is even wider for bonds; the average expense ratio for an active bond fund is 0.93%, compared with 0.43% for bond index funds.
But even these big differences understate the real gap. These days, it’s not hard to find an index fund that charges maybe 0.05% or 0.10%. So even if you have identified active managers who are skilled at selecting stocks and bonds, to match the return of a comparable (much cheaper) index fund would require significant outperformance. Think about it. Any fund that charges 1.00% in expenses—not even the high end of the range—will find it extraordinarily difficult to overcome the index fund’s head start.
Active management also has taken a hit from a regulatory environment that has been favorable to low-cost strategies. The U.S. Department of Labor several years ago mandated greater disclosure of retirement plan fees. And its new fiduciary rule, which is set to take effect in April, requires financial advisors to demonstrate that their recommendations are aligned with their clients’ best interest. Both changes encourage the use of lower-cost investments, including index funds.
The future of active management
In light of all this, people have been asking me whether active management is “dead.” My response is both yes and no. High-cost active management is dead, and rightly so. It has never been a winning proposition
| | | |
| Market Barometer | | | |
| | Average Annual Total Returns |
| | Periods Ended October 31, 2016 |
| | One | Three | Five |
| | Year | Years | Years |
| Stocks | | | |
| Russell 1000 Index (Large-caps) | 4.26% | 8.48% | 13.51% |
| Russell 2000 Index (Small-caps) | 4.11 | 4.12 | 11.51 |
| Russell 3000 Index (Broad U.S. market) | 4.24 | 8.13 | 13.35 |
| FTSE All-World ex US Index (International) | 0.64 | -0.94 | 4.09 |
| |
| Bonds | | | |
| Bloomberg Barclays U.S. Aggregate Bond Index | | | |
| (Broad taxable market) | 4.37% | 3.48% | 2.90% |
| Bloomberg Barclays Municipal Bond Index | | | |
| (Broad tax-exempt market) | 4.06 | 4.89 | 4.34 |
| Citigroup Three-Month U.S. Treasury Bill Index | 0.22 | 0.07 | 0.07 |
| |
| CPI | | | |
| Consumer Price Index | 1.64% | 1.15% | 1.32% |
4
for investors. Low-cost active funds, though, can potentially play an important role for investors who seek to outperform the market.
Paying less for your funds is the only sure-fire way to improve your odds of achieving success in active management. But even if you have found an active manager with low costs, the odds of outperforming the market are still long. You have to be able to identify talented stock and bond portfolio managers with long time horizons and clear investment strategies. Look for managers with consistent track records and the discipline to stick closely to their investment strategy.
Know what you own and why
Despite the well-deserved reputation of indexing and the challenges for active managers, there’s still a place for traditional active strategies that are low-cost, diversified, and highly disciplined, and are run by talented managers who focus on the long term.
Vanguard has always applied these principles to our active strategies, and investors have benefited as a majority of our active funds outperformed their benchmarks and bested their peers’ average annual return over the ten years ended September 30, 2016.
|
| Worried about the election’s impact on your portfolio? |
|
| The 2016 presidential election season was |
| one of the most intense and unpredictable |
| in U.S. history. In its aftermath, investors |
| may be left with lingering questions about |
| what the outcome will mean for their |
| portfolios. The answer, based on Vanguard |
| research into decades of historical data, is |
| that presidential elections typically have no |
| long-term effect on market performance. |
| |
| These findings hold true regardless of the |
| market’s initial reaction. Whether there’s |
| a swoon or bounce immediately after an |
| election, investors shouldn’t extrapolate |
| that performance to the long term. |
| |
| As you can see in the accompanying chart, |
| data going back to 1853 show that stock |
| market returns are virtually identical no matter |
| which party controls the White House. |
| Although headlines out of Washington at any |
| given time may still cause concern, investors |
| shouldn’t overreact to short-term events. |
| Instead, it’s best to maintain a balanced and |
| diversified portfolio and stay focused on your |
| long-term goals. |
| |
| Average annual stock market returns based |
| on party control of the White House |
| (1853–2015) |
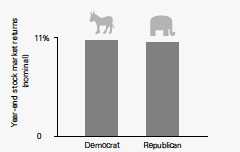
| Sources: Global Financial Data, 1853–1926; Morningstar, Inc., |
| and Ibbotson Associates thereafter through 2015. |
5
But it’s crucial for investors to be patient. Even active managers with the best track records frequently underperform their benchmarks when their investment styles are out of favor. Such periods, though temporary, can persist. So it’s important when entrusting your assets to an active strategy to be in it for the long haul.
Make sure you know what you’re buying and what the risks are. Active strategies are becoming more complex, so it’s important to clearly understand what the investments in your portfolio are designed to accomplish and why you want to hold them. Otherwise, you run the risk of selecting strategies that don’t fit your needs or objectives.
Keeping these considerations in mind can potentially boost your chances of success in identifying active strategies that may be able to help you reach your goals.
As always, thank you for investing with Vanguard.
Sincerely,
F. William McNabb III
Chairman and Chief Executive Officer
November 9, 2016
6
Global ex-U.S. Real Estate Index Fund
Fund Profile
As of October 31, 2016
| | | | |
| Share-Class Characteristics | | | | |
| | Investor | | Admiral | Institutional |
| | Shares | ETF Shares | Shares | Shares |
| Ticker Symbol | VGXRX | VNQI | VGRLX | VGRNX |
| Expense Ratio1 | 0.36% | 0.18% | 0.18% | 0.16% |
| | |
| Portfolio Characteristics | | |
| | | S&P |
| | | Global |
| | | ex-U.S |
| | | Property |
| | Fund | Index |
| Number of Stocks | 691 | 636 |
| Median Market Cap | $5.8B | $5.8B |
| Price/Earnings Ratio | 11.6x | 11. |
| Price/Book Ratio | 1.1x | 1.1x |
| Return on Equity | 10.5% | 10.5% |
| Earnings Growth | | |
| Rate | 9.2% | 9.2% |
| Dividend Yield | 3.4% | 3.4% |
| Turnover Rate | 7% | |
| Short-Term Reserves | -0.2% | |
Allocation by Region (% of equity exposure)
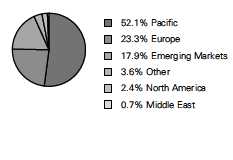
| | |
| Volatility Measures | | |
| | S&P | |
| | Global | MSCI AC |
| | ex-U.S. | World |
| | Property | Index |
| | Index | ex USA |
| R-Squared | 0.98 | 0.75 |
| Beta | 0.96 | 0.84 |
| These measures show the degree and timing of the fund’s fluctuations compared with the indexes over 36 months. |
| |
| | |
| Ten Largest Holdings (% of total net assets) |
| Mitsubishi Estate Co. | Diversified Real | |
| Ltd. | Estate Activities | 2.9% |
| Sun Hung Kai Properties Diversified Real | |
| Ltd. | Estate Activities | 2.5 |
| Unibail-Rodamco SE | Retail REITs | 2.5 |
| Mitsui Fudosan Co. Ltd. | Diversified Real | |
| | Estate Activities | 2.4 |
| Cheung Kong Property | Real Estate | |
| Holdings Ltd. | Development | 2.2 |
| Daiwa House Industry | Diversified Real | |
| Co. Ltd. | Estate Activities | 1.9 |
| Scentre Group | Retail REITs | 1.8 |
| Vonovia SE | Real Estate | |
| | Operating | |
| | Companies | 1.7 |
| Link REIT | Retail REITs | 1.7 |
| China Overseas Land & | Real Estate | |
| Investment Ltd. | Development | 1.4 |
| Top Ten | | 21.0% |
| The holdings listed exclude any temporary cash investments and equity index products. |
1 The expense ratios shown are from the prospectus dated February 26, 2016, and represent estimated costs for the current fiscal year. For the fiscal
year ended October 31, 2016, the expense ratios were 0.35% for Investor Shares, 0.15% for ETF Shares, 0.15% for Admiral Shares, and 0.13% for
Institutional Shares.
7
Global ex-U.S. Real Estate Index Fund
| | |
| Market Diversification (% of equity exposure) |
| | | S&P |
| | | Global |
| | | ex-U.S. |
| | | Property |
| | Fund | Index |
| Europe | | |
| United Kingdom | 6.2% | 6.2% |
| France | 5.3 | 5.3 |
| Germany | 4.8 | 4.8 |
| Sweden | 1.8 | 1.9 |
| Switzerland | 1.5 | 1.5 |
| Other | 3.7 | 3.8 |
| Subtotal | 23.3% | 23.5% |
| Pacific | | |
| Japan | 23.2% | 23.4% |
| Hong Kong | 13.1 | 13.2 |
| Australia | 9.6 | 9.9 |
| Singapore | 5.7 | 5.5 |
| Other | 0.5 | 0.6 |
| Subtotal | 52.1% | 52.6% |
| Emerging Markets | | |
| China | 7.3% | 7.3% |
| South Africa | 1.8 | 1.7 |
| Philippines | 1.5 | 1.5 |
| United Arab Emirates | 1.2 | 1.2 |
| Mexico | 1.0 | 1.2 |
| Indonesia | 1.0 | 1.0 |
| Other | 4.1 | 4.1 |
| Subtotal | 17.9% | 18.0% |
| North America | | |
| Canada | 2.4% | 2.5% |
| Middle East | 0.7% | 0.9% |
| Other | 3.6% | 2.5% |
| "Other" represents securities that are not classified by the fund's benchmark index. |
8
Global ex-U.S. Real Estate Index Fund
Performance Summary
All of the returns in this report represent past performance, which is not a guarantee of future results that may be achieved by the fund. (Current performance may be lower or higher than the performance data cited. For performance data current to the most recent month-end, visit our website at vanguard.com/performance.) Note, too, that both investment returns and principal value can fluctuate widely, so an investor’s shares, when sold, could be worth more or less than their original cost. The returns shown do not reflect taxes that a shareholder would pay on fund distributions or on the sale of fund shares.
Cumulative Performance: November 1, 2010, Through October 31, 2016
Initial Investment of $10,000
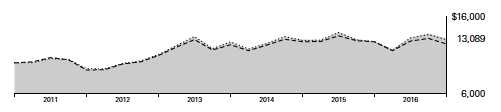
| | | | | |
| | | Average Annual Total Returns | |
| | | Periods Ended October 31, 2016 | |
| |
| | | | | Since | Final Value |
| | | One | Five | Inception | of a $10,000 |
| | | Year | Years | (11/1/2010) | Investment |
| | Global ex-U.S. Real Estate Index Fund | | | | |
| | Investor Shares | 2.22% | 7.42% | 4.59% | $13,089 |
| |
| • • • • • • • • | S&P Global ex-U.S. Property Index | 2.08 | 7.05 | 4.48 | 13,005 |
| |
| – – – – | International Real Estate Funds Average | -2.20 | 6.50 | 3.70 | 12,435 |
International Real Estate Funds Average: Derived from data provided by Lipper, a Thomson Reuters Company.
"Since Inception" performance is calculated from the Investor Shares’ inception date for both the fund and its comparative standards.
| | | | |
| | | | Since | Final Value |
| | One | Five | Inception | of a $10,000 |
| | Year | Years | (11/1/2010) | Investment |
| Global ex-U.S. Real Estate Index Fund | | | | |
| ETF Shares Net Asset Value | 2.92% | 7.66% | 4.81% | $13,255 |
| S&P Global ex-U.S. Property Index | 2.08 | 7.05 | 4.48 | 13,005 |
| "Since Inception" performance is calculated from the ETF Shares’ inception date for both the fund and its comparative standards. |
Vanguard fund returns are adjusted to reflect the 0.25% fee on purchases and redemptions. The fees do not apply to the ETF Shares. The
Fiscal-Year Total Returns chart is not adjusted for fees.
See Financial Highlights for dividend and capital gains information.
9
Global ex-U.S. Real Estate Index Fund
| | | | |
| | Average Annual Total Returns | |
| | Periods Ended October 31, 2016 | |
| |
| | | | Since | Final Value |
| | One | Five | Inception | of a $10,000 |
| | Year | Years | (2/10/2011) | Investment |
| Global ex-U.S. Real Estate Index Fund Admiral | | | | |
| Shares | 2.41% | 7.57% | 5.05% | $13,259 |
| S&P Global ex-U.S. Property Index | 2.08 | 7.05 | 4.82 | 13,094 |
| "Since Inception" performance is calculated from the Admiral Shares’ inception date for both the fund and its comparative standards. |
| | | | |
| | | | Since | Final Value |
| | One | Five | Inception | of a $5,000,000 |
| | Year | Years | (4/19/2011) | Investment |
| Global ex-U.S. Real Estate Index Fund | | | | |
| Institutional Shares | 2.42% | 7.60% | 4.80% | $6,482,647 |
| S&P Global ex-U.S. Property Index | 2.08 | 7.05 | 4.60 | 6,412,480 |
| "Since Inception" performance is calculated from the Institutional Shares’ inception date for both the fund and its comparative standards. |
| | | |
| Cumulative Returns of ETF Shares: November 1, 2010, Through October 31, 2016 | | |
| | | | Since |
| | One | Five | Inception |
| | Year | Years | (11/1/2010) |
| Global ex-U.S. Real Estate Index Fund ETF Shares | | | |
| Market Price | 3.07% | 45.19% | 32.07% |
| Global ex-U.S. Real Estate Index Fund ETF Shares | | | |
| Net Asset Value | 2.92 | 44.62 | 32.55 |
| S&P Global ex-U.S. Property Index | 2.08 | 40.56 | 30.05 |
| "Since Inception" performance is calculated from the ETF Shares’ inception date for both the fund and its comparative standards. |
Fiscal-Year Total Returns (%): November 1, 2010, Through October 31, 2016
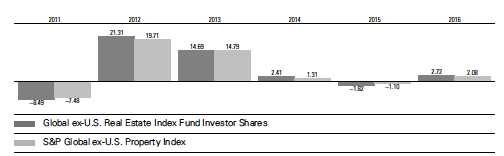
Vanguard fund returns are adjusted to reflect the 0.25% fee on purchases and redemptions. The fees do not apply to the ETF Shares. The
Fiscal-Year Total Returns chart is not adjusted for fees.
10
Global ex-U.S. Real Estate Index Fund
Average Annual Total Returns: Periods Ended September 30, 2016
This table presents returns through the latest calendar quarter—rather than through the end of the fiscal period.
Securities and Exchange Commission rules require that we provide this information.
| | | | |
| | Inception | One | Five | Since |
| | Date | Year | Years | Inception |
| Investor Shares | 11/1/2010 | 13.22% | 10.67% | 5.58% |
| Fee-Adjusted Returns | | 12.67 | 10.57 | 5.50 |
| ETF Shares | 11/1/2010 | | | |
| Market Price | | 13.91 | 11.02 | 5.70 |
| Net Asset Value | | 13.49 | 10.82 | 5.72 |
| Admiral Shares | 2/10/2011 | 13.47 | 10.83 | 6.10 |
| Fee-Adjusted Returns | | 12.91 | 10.73 | 6.01 |
| Institutional Shares | 4/19/2011 | 13.49 | 10.86 | 5.88 |
| Fee-Adjusted Returns | | 12.93 | 10.76 | 5.79 |
Vanguard fund returns are adjusted to reflect the 0.25% fee on purchases and redemptions. The fees do not apply to the ETF Shares. The
Fiscal-Year Total Returns chart is not adjusted for fees.
11
Global ex-U.S. Real Estate Index Fund
Financial Statements
Statement of Net Assets
As of October 31, 2016
The fund reports a complete list of its holdings in regulatory filings four times in each fiscal year, at the quarter-ends. For the second and fourth fiscal quarters, the lists appear in the fund’s semiannual and annual reports to shareholders. For the first and third fiscal quarters, the fund files the lists with the Securities and Exchange Commission on Form N-Q. Shareholders can look up the fund’s Forms N-Q on the SEC’s website at sec.gov. Forms N-Q may also be reviewed and copied at the SEC’s Public Reference Room (see the back cover of this report for further information).
| | | |
| | | | Market |
| | | | Value• |
| | | Shares | ($000) |
| Common Stocks (99.4%)1 | | |
| Australia (9.8%) | | |
| | Scentre Group | 23,653,150 | 75,703 |
| | Westfield Corp. | 8,492,515 | 57,392 |
| | Goodman Group | 7,003,466 | 36,100 |
| | Stockland | 10,567,053 | 35,489 |
| | Vicinity Centres | 14,521,986 | 31,669 |
| | Dexus Property Group | 4,267,645 | 28,991 |
| | GPT Group | 7,977,551 | 28,204 |
| | Mirvac Group | 16,469,190 | 26,126 |
| | LendLease Group | 2,357,747 | 24,153 |
| | Investa Office Fund | 2,731,937 | 8,799 |
| | Charter Hall Group | 1,833,376 | 6,542 |
| | Shopping Centres | | |
| | Australasia Property | | |
| | Group | 3,209,890 | 5,332 |
| | Aveo Group | 2,004,071 | 4,891 |
| | BWP Trust | 2,152,705 | 4,855 |
| | Charter Hall Retail REIT | 1,521,252 | 4,790 |
| | Cromwell Property Group | 5,800,465 | 4,011 |
| | Abacus Property Group | 1,248,349 | 2,652 |
| | ALE Property Group | 797,764 | 2,613 |
| | National Storage REIT | 2,136,738 | 2,352 |
| | Gateway Lifestyle | 1,236,176 | 2,175 |
| ^ | Growthpoint Properties | | |
| | Australia Ltd. | 894,295 | 2,110 |
| | Folkestone Education | | |
| | Trust | 939,813 | 1,772 |
| | GDI Property Group | 2,179,828 | 1,609 |
| ^ | Arena REIT | 977,738 | 1,441 |
| | Ingenia Communities | | |
| | Group | 694,431 | 1,437 |
| ^ | Hotel Property | | |
| | Investments | 609,565 | 1,307 |
| * | Servcorp Ltd. | 213,819 | 1,290 |
| | Astro Japan Property | | |
| | Group | 237,527 | 1,221 |
| | Peet Ltd. | 1,642,282 | 1,186 |
| ^,* | Generation Healthcare | | |
| | REIT | 642,896 | 922 |
| | | |
| | Villa World Ltd. | 522,212 | 905 |
| | Industria REIT | 551,046 | 894 |
| | Cedar Woods | | |
| | Properties Ltd. | 239,025 | 816 |
| | Sunland Group Ltd. | 578,453 | 667 |
| ^ | 360 Capital Group Ltd. | 809,216 | 582 |
| | 360 Capital Office Fund | 273,972 | 454 |
| | Aspen Group | 450,583 | 383 |
| | | | 411,835 |
| Austria (0.8%) | | |
| | IMMOFINANZ AG | 3,903,901 | 8,402 |
| | BUWOG AG | 314,191 | 7,594 |
| | Conwert Immobilien | | |
| | Invest SE | 353,060 | 6,263 |
| | CA Immobilien | | |
| | Anlagen AG | 324,905 | 5,895 |
| | Atrium European | | |
| | Real Estate Ltd. | 750,587 | 3,211 |
| | S IMMO AG | 242,760 | 2,605 |
| * | UBM Development AG | 16,427 | 557 |
| | | | 34,527 |
| Belgium (0.8%) | | |
| | Cofinimmo SA | 89,970 | 10,534 |
| | Befimmo SA | 101,607 | 5,922 |
| | Warehouses De Pauw CVA | 62,844 | 5,790 |
| * | Aedifica SA | 63,578 | 5,274 |
| | Retail Estates NV | 25,987 | 2,171 |
| | Intervest Offices | | |
| | & Warehouses NV | 54,250 | 1,439 |
| * | Montea SCA | 26,838 | 1,329 |
| | Wereldhave Belgium NV | 8,750 | 1,095 |
| | Xior Student Housing NV | 15,258 | 601 |
| | | | 34,155 |
| Brazil (0.6%) | | |
| | Multiplan Empreendimentos | |
| | Imobiliarios SA | 542,750 | 10,908 |
| * | BR Malls Participacoes | | |
| | SA | 2,317,414 | 9,278 |
| | Iguatemi Empresa de | | |
| | Shopping Centers SA | 372,186 | 3,516 |
12
Global ex-U.S. Real Estate Index Fund
| | | |
| | | | Market |
| | | | Value• |
| | | Shares | ($000) |
| | Aliansce Shopping | | |
| | Centers SA | 250,405 | 1,316 |
| | BR Properties SA | 393,353 | 1,059 |
| | Sonae Sierra Brasil SA | 95,683 | 575 |
| * | Aliansce Shopping | | |
| | Centers SA Receipts | 74,632 | 396 |
| * | JHSF Participacoes SA | 131,500 | 72 |
| | | | 27,120 |
| Canada (2.5%) | | |
| | RioCan REIT | 707,428 | 13,755 |
| | H&R REIT | 616,126 | 10,478 |
| | First Capital Realty Inc. | 614,869 | 9,805 |
| ^ | Smart REIT | 282,090 | 7,035 |
| ^ | Canadian Apartment | | |
| | Properties REIT | 293,467 | 6,415 |
| | Canadian REIT | 159,329 | 5,486 |
| | Allied Properties REIT | 187,216 | 5,033 |
| | Cominar REIT | 393,950 | 4,365 |
| ^ | Boardwalk REIT | 102,147 | 3,748 |
| | Granite REIT | 104,705 | 3,294 |
| | Tricon Capital Group Inc. | 469,709 | 3,061 |
| ^ | Dream Office REIT | 238,998 | 2,978 |
| | Morguard Corp. | 23,085 | 2,900 |
| ^ | Artis REIT | 329,995 | 2,883 |
| ^ | Milestone Apartments | | |
| | REIT | 166,425 | 2,238 |
| ^ | Pure Industrial | | |
| | Real Estate Trust | 530,830 | 2,129 |
| ^ | Crombie REIT | 193,698 | 1,954 |
| ^ | Choice Properties REIT | 196,907 | 1,935 |
| ^ | Dream Global REIT | 277,031 | 1,884 |
| ^ | CT REIT | 143,421 | 1,572 |
| ^ | Northview Apartment REIT | 98,359 | 1,462 |
| | Morguard REIT | 119,153 | 1,350 |
| ^ | Killam Apartment REIT | 142,983 | 1,264 |
| ^,* | DREAM Unlimited Corp. | | |
| | Class A | 233,206 | 1,201 |
| ^ | NorthWest Healthcare | | |
| | Properties REIT | 149,579 | 1,171 |
| ^ | Brookfield Canada | | |
| | Office Properties | 58,881 | 1,165 |
| ^ | InterRent REIT | 150,116 | 826 |
| | Plaza Retail REIT | 200,896 | 759 |
| | Slate Retail REIT | 66,202 | 684 |
| | Dream Industrial REIT | 118,038 | 668 |
| | Morguard North American | | |
| | Residential REIT | 60,242 | 557 |
| | Slate Office REIT | 87,715 | 544 |
| | Agellan Commercial REIT | 60,146 | 479 |
| | Melcor Developments Ltd. | 51,374 | 475 |
| * | Mainstreet Equity Corp. | 18,005 | 436 |
| | OneREIT | 164,483 | 433 |
| | | | 106,422 |
| Chile (0.2%) | | |
| | Parque Arauco SA | 2,761,445 | 6,848 |
| | | |
| China (7.5%) | | |
| | China Overseas Land | | |
| | & Investment Ltd. | 18,960,710 | 58,207 |
| | China Resources | | |
| | Land Ltd. | 12,012,446 | 29,833 |
| | Country Garden | | |
| | Holdings Co. Ltd. | 35,525,163 | 18,436 |
| | China Vanke Co. Ltd. | 5,841,754 | 15,247 |
| | Fullshare Holdings Ltd. | 24,520,500 | 13,675 |
| * | China Evergrande | | |
| | Group | 15,807,921 | 10,405 |
| | Longfor Properties | | |
| | Co. Ltd. | 5,449,208 | 7,233 |
| | Shimao Property | | |
| | Holdings Ltd. | 5,219,164 | 6,962 |
| | Guangzhou R&F | | |
| | Properties Co. Ltd. | 4,512,209 | 6,359 |
| | Shanghai Lujiazui | | |
| | Finance & Trade Zone | | |
| | Development Co. Ltd. | | |
| | Class B | 4,033,277 | 6,279 |
| | Shenzhen | | |
| | Investment Ltd. | 13,346,201 | 5,817 |
| | Sino-Ocean Group | | |
| | Holding Ltd. | 13,355,329 | 5,547 |
| | Sunac China | | |
| | Holdings Ltd. | 8,017,378 | 5,472 |
| ^,* | Zall Group Ltd. | 7,535,574 | 5,136 |
| ^,2 | Red Star Macalline | | |
| | Group Corp. Ltd. | 4,722,800 | 5,083 |
| | China Jinmao Holdings | | |
| | Group Ltd. | 18,221,054 | 5,024 |
| | Future Land Holdings | | |
| | Co. Ltd. Class A | 2,878,159 | 4,742 |
| | SOHO China Ltd. | 8,322,545 | 4,291 |
| | Yuexiu Property Co. Ltd. | 27,551,094 | 4,036 |
| ^ | Shui On Land Ltd. | 15,344,038 | 3,795 |
| ^,* | Goldin Properties | | |
| | Holdings Ltd. | 5,727,010 | 3,679 |
| | Agile Group | | |
| | Holdings Ltd. | 6,619,409 | 3,669 |
| | KWG Property | | |
| | Holding Ltd. | 6,067,158 | 3,511 |
| | CIFI Holdings Group | | |
| | Co. Ltd. | 11,928,000 | 3,509 |
| * | China Logistics Property | | |
| | Holdings Co. Ltd. | 6,776,000 | 3,244 |
| ^ | China South City | | |
| | Holdings Ltd. | 14,242,111 | 3,151 |
| ^,* | Carnival Group | | |
| | International | | |
| | Holdings Ltd. | 24,693,514 | 2,930 |
| | Yuexiu REIT | 4,827,516 | 2,769 |
| ^,* | Poly Property Group | | |
| | Co. Ltd. | 8,622,848 | 2,726 |
13
Global ex-U.S. Real Estate Index Fund
| | | |
| | | | Market |
| | | | Value• |
| | | Shares | ($000) |
| | Hopson Development | | |
| | Holdings Ltd. | 2,984,710 | 2,691 |
| | K Wah International | | |
| | Holdings Ltd. | 4,947,338 | 2,675 |
| | Logan Property | | |
| | Holdings Co. Ltd. | 5,697,984 | 2,285 |
| * | Greentown China | | |
| | Holdings Ltd. | 2,694,314 | 2,197 |
| ^,* | China Oceanwide | | |
| | Holdings Ltd. | 20,584,000 | 2,094 |
| | Powerlong Real Estate | | |
| | Holdings Ltd. | 6,037,139 | 2,049 |
| | Yuzhou Properties | | |
| | Co. Ltd. | 5,433,000 | 2,016 |
| | China SCE Property | | |
| | Holdings Ltd. | 6,473,766 | 1,977 |
| * | Renhe Commercial | | |
| | Holdings Co. Ltd. | 72,271,484 | 1,871 |
| | Shanghai Jinqiao Export | | |
| | Processing Zone | | |
| | Development Co. | | |
| | Ltd. Class B | 1,195,134 | 1,814 |
| | Shanghai Industrial | | |
| | Urban Development | | |
| | Group Ltd. | 6,342,799 | 1,607 |
| 2 | Sunshine 100 China | | |
| | Holdings Ltd. | 3,745,000 | 1,589 |
| ^ | Spring REIT | 3,685,000 | 1,553 |
| ^ | LVGEM China Real | | |
| | Estate Investment | | |
| | Co. Ltd. | 4,824,000 | 1,511 |
| * | China Overseas Grand | | |
| | Oceans Group Ltd. | 4,049,386 | 1,487 |
| * | Glorious Property | | |
| | Holdings Ltd. | 12,335,036 | 1,478 |
| | Beijing Capital Land Ltd. | 3,835,034 | 1,471 |
| | C C Land Holdings Ltd. | 5,531,000 | 1,469 |
| ^ | China Aoyuan Property | | |
| | Group Ltd. | 6,165,000 | 1,450 |
| *,2 | Redco Properties | | |
| | Group Ltd. | 3,624,000 | 1,308 |
| ^ | Future Land | | |
| | Development | | |
| | Holdings Ltd. | 7,126,000 | 1,289 |
| | Tian An China | | |
| | Investment Co. Ltd. | 2,384,761 | 1,272 |
| | Gemdale Properties | | |
| | & Investment Corp. | | |
| | Ltd. | 18,676,000 | 1,229 |
| * | Beijing Enterprises | | |
| | Medical & Health | | |
| | Group Ltd. | 20,268,000 | 1,173 |
| * | Sinolink Worldwide | | |
| | Holdings Ltd. | 9,776,643 | 1,143 |
| | Optics Valley Union | | |
| | Holding Co. Ltd. | 10,552,000 | 1,126 |
| | | |
| | Times Property | | |
| | Holdings Ltd. | 2,428,000 | 1,126 |
| | Shanghai Shibei Hi-Tech | | |
| | Co. Ltd. Class B | 1,015,000 | 1,112 |
| * | Ronshine China | | |
| | Holdings Ltd. | 1,389,000 | 1,105 |
| | Guorui Properties Ltd. | 3,240,000 | 1,082 |
| * | Mingfa Group | | |
| | International Co. Ltd. | 4,231,908 | 1,031 |
| | Beijing North Star | | |
| | Co. Ltd. | 2,994,000 | 1,007 |
| | Road King | | |
| | Infrastructure Ltd. | 1,074,000 | 911 |
| | Xinyuan Real Estate | | |
| | Co. Ltd. ADR | 166,153 | 896 |
| | Nam Tai Property Inc. | 108,961 | 883 |
| ^,* | Greenland Hong Kong | | |
| | Holdings Ltd. | 3,439,000 | 881 |
| * | Crown International | | |
| | Corp. Ltd. | 3,270,000 | 831 |
| | Fantasia Holdings | | |
| | Group Co. Ltd. | 6,352,443 | 825 |
| 2 | China Vast Industrial | | |
| | Urban Development | | |
| | Co. Ltd. | 2,017,000 | 819 |
| | China Merchants | | |
| | Land Ltd. | 5,230,000 | 740 |
| ^ | Hydoo International | | |
| | Holding Ltd. | 7,242,000 | 724 |
| ^,* | China New Town | | |
| | Development Co. Ltd. | 13,763,700 | 691 |
| ^,* | Ping An Securities | | |
| | Group Holdings Ltd. | 53,420,000 | 656 |
| * | China Minsheng Drawin | | |
| | Technology Group Ltd. | 15,400,000 | 644 |
| * | SRE Group Ltd. | 21,628,000 | 634 |
| * | Wuzhou International | | |
| | Holdings Ltd. | 6,056,000 | 625 |
| * | Shanghai Huili Building | | |
| | Materials Co. Ltd. | | |
| | Class B | 363,700 | 617 |
| ^ | Central China Real | | |
| | Estate Ltd. | 2,792,000 | 610 |
| * | China New City | | |
| | Commercial | | |
| | Development Ltd. | 2,064,000 | 579 |
| * | EverChina International | | |
| | Holdings Co. Ltd. | 11,089,331 | 577 |
| * | Greattown Holdings | | |
| | Ltd. Class B | 643,800 | 522 |
| ^,* | Zhuguang Holdings | | |
| | Group Co. Ltd. | 3,088,000 | 466 |
| ^,* | Shanghai Zendai | | |
| | Property Ltd. | 21,210,000 | 418 |
| * | Guangdong Land | | |
| | Holdings Ltd. | 1,780,000 | 374 |
14
Global ex-U.S. Real Estate Index Fund
| | | |
| | | | Market |
| | | | Value• |
| | | Shares | ($000) |
| * | Beijing Properties | | |
| | Holdings Ltd. | 7,442,000 | 364 |
| * | Shenzhen Wongtee | | |
| | International Enterprise | | |
| | Co. Ltd. Class B | 519,100 | 362 |
| * | Wanda Hotel | | |
| | Development Co. Ltd. | 2,812,741 | 278 |
| | Lai Fung Holdings Ltd. | 12,141,000 | 262 |
| | Top Spring International | | |
| | Holdings Ltd. | 733,500 | 220 |
| | Tian Shan Development | | |
| | Holding Ltd. | 374,000 | 137 |
| | | | 317,600 |
| Denmark (0.0%) | | |
| ^,* | TK Development A/S | 312,715 | 414 |
| |
| Egypt (0.2%) | | |
| | Talaat Moustafa Group | 4,641,392 | 2,960 |
| * | Medinet Nasr Housing | 1,033,284 | 1,622 |
| * | Six of October | | |
| | Development | | |
| | & Investment | 990,968 | 1,462 |
| | Palm Hills Developments | | |
| | SAE | 5,275,893 | 1,359 |
| | Heliopolis Housing | 134,738 | 886 |
| * | Emaar Misr for | | |
| | Development SAE | 2,954,599 | 714 |
| * | United Housing | | |
| | & Development | 89,000 | 69 |
| | | | 9,072 |
| Finland (0.2%) | | |
| | Sponda Oyj | 941,497 | 4,457 |
| | Citycon Oyj | 1,662,033 | 3,895 |
| | Technopolis Oyj | 543,194 | 1,878 |
| | | | 10,230 |
| France (5.3%) | | |
| | Unibail-Rodamco SE | 441,269 | 104,742 |
| | Klepierre | 921,522 | 37,661 |
| | Gecina SA | 179,048 | 26,106 |
| | Fonciere Des Regions | 218,410 | 19,088 |
| | ICADE | 200,310 | 14,385 |
| | Nexity SA | 167,756 | 8,423 |
| * | Fonciere de Paris SIIC | 42,210 | 6,134 |
| | Mercialys SA | 245,140 | 5,078 |
| | Altarea SCA | 11,573 | 2,211 |
| | Fonciere des Murs SCA | 16,765 | 487 |
| | ANF Immobilier | 12,873 | 289 |
| | Affine SA | 448 | 7 |
| | | | 224,611 |
| Germany (4.8%) | | |
| | Vonovia SE | 2,070,185 | 72,985 |
| | Deutsche Wohnen AG | 1,493,823 | 48,806 |
| | LEG Immobilien AG | 278,974 | 23,532 |
| | TAG Immobilien AG | 649,055 | 8,655 |
| | | |
| | Deutsche EuroShop AG | 199,195 | 8,609 |
| | Grand City Properties SA | 464,740 | 8,175 |
| | alstria office REIT-AG | 459,635 | 5,929 |
| | TLG Immobilien AG | 263,715 | 5,529 |
| 2 | ADO Properties SA | 133,185 | 4,868 |
| * | PATRIZIA Immobilien AG | 180,511 | 3,737 |
| | Hamborner REIT AG | 358,511 | 3,538 |
| | VIB Vermoegen AG | 119,323 | 2,617 |
| | DIC Asset AG | 216,408 | 2,077 |
| ^,* | WCM Beteiligungs | | |
| | & Grundbesitz-AG | 516,418 | 1,526 |
| ^,* | ADLER Real Estate AG | 99,289 | 1,457 |
| | | | 202,040 |
| Greece (0.1%) | | |
| | Grivalia Properties | | |
| | REIC AE | 174,606 | 1,345 |
| * | LAMDA Development SA | 186,890 | 1,012 |
| | | | 2,357 |
| Hong Kong (13.3%) | | |
| | Sun Hung Kai | | |
| | Properties Ltd. | 7,073,441 | 105,332 |
| | Cheung Kong Property | | |
| | Holdings Ltd. | 12,301,875 | 90,944 |
| | Link REIT | 9,982,089 | 71,012 |
| | Wharf Holdings Ltd. | 5,331,000 | 39,970 |
| | Hongkong Land | | |
| | Holdings Ltd. | 5,228,612 | 35,012 |
| | Henderson Land | | |
| | Development Co. Ltd. | 5,493,320 | 32,494 |
| | New World | | |
| | Development Co. Ltd. | 23,535,000 | 29,260 |
| | Sino Land Co. Ltd. | 13,506,605 | 22,933 |
| | Wheelock & Co. Ltd. | 3,524,652 | 21,691 |
| | Hang Lung | | |
| | Properties Ltd. | 9,199,932 | 20,232 |
| | Hang Lung Group Ltd. | 3,812,103 | 14,582 |
| | Swire Properties Ltd. | 4,679,600 | 13,438 |
| | Hysan | | |
| | Development Co. Ltd. | 2,745,655 | 12,672 |
| | Kerry Properties Ltd. | 2,697,332 | 8,541 |
| | Champion REIT | 9,524,512 | 5,410 |
| | Great Eagle | | |
| | Holdings Ltd. | 1,086,697 | 4,821 |
| | Chinese Estates | | |
| | Holdings Ltd. | 2,164,452 | 3,917 |
| | Sunlight REIT | 4,515,400 | 2,793 |
| | Prosperity REIT | 5,299,649 | 2,289 |
| | Joy City Property Ltd. | 15,846,030 | 2,235 |
| * | Wang On Properties Ltd. | 1,668,000 | 2,073 |
| ^ | Yida China Holdings Ltd. | 4,570,000 | 1,872 |
| | Far East Consortium | | |
| | International Ltd. | 4,119,000 | 1,686 |
| * | HKR International Ltd. | 3,077,282 | 1,479 |
| | Kowloon Development | | |
| | Co. Ltd. | 1,472,414 | 1,474 |
15
Global ex-U.S. Real Estate Index Fund
| | | |
| | | | Market |
| | | | Value• |
| | | Shares | ($000) |
| ^ | Langham Hospitality | | |
| | Investments and | | |
| | Langham Hospitality | | |
| | Investments Ltd. | 3,557,000 | 1,422 |
| | Liu Chong Hing | | |
| | Investment Ltd. | 930,000 | 1,310 |
| | Lai Sun Development | | |
| | Co. Ltd. | 51,532,953 | 1,054 |
| ^ | Emperor International | | |
| | Holdings Ltd. | 4,249,832 | 995 |
| | Regal REIT | 3,748,815 | 990 |
| | SEA Holdings Ltd. | 376,000 | 957 |
| * | Jiayuan International | | |
| | Group Ltd. | 2,048,000 | 822 |
| | CSI Properties Ltd. | 21,998,348 | 791 |
| * | Chuang’s Consortium | | |
| | International Ltd. | 3,488,000 | 762 |
| | Soundwill Holdings Ltd. | 397,500 | 721 |
| | China Properties | | |
| | Investment | | |
| | Holdings Ltd. | 19,533,600 | 424 |
| * | Man Sang | | |
| | International Ltd. | 4,688,000 | 392 |
| | Wang On Group Ltd. | 32,000,000 | 284 |
| * | ZH International | | |
| | Holdings Ltd. | 2,370,000 | 63 |
| * | Kingwell Group Ltd. | 1,228,000 | 29 |
| | | | 559,178 |
| India (0.4%) | | |
| | DLF Ltd. | 1,882,495 | 4,252 |
| | Oberoi Realty Ltd. | 344,578 | 1,819 |
| * | Indiabulls Real Estate Ltd. | 1,215,071 | 1,598 |
| * | Housing Development | | |
| | & Infrastructure Ltd. | 1,230,719 | 1,535 |
| | Prestige Estates | | |
| | Projects Ltd. | 484,053 | 1,407 |
| | Phoenix Mills Ltd. | 242,272 | 1,369 |
| * | Godrej Properties Ltd. | 221,265 | 1,188 |
| * | Unitech Ltd. | 8,622,320 | 779 |
| | Sobha Ltd. | 165,145 | 691 |
| | Mahindra Lifespace | | |
| | Developers Ltd. | 84,255 | 537 |
| | Omaxe Ltd. | 193,009 | 489 |
| | | | 15,664 |
| Indonesia (1.0%) | | |
| | Bumi Serpong Damai | | |
| | Tbk PT | 41,064,027 | 6,813 |
| | Ciputra Development | | |
| | Tbk PT | 47,281,799 | 5,722 |
| | Pakuwon Jati Tbk PT | 102,813,028 | 5,673 |
| | Lippo Karawaci Tbk PT | 81,024,100 | 5,605 |
| | Summarecon Agung | | |
| | Tbk PT | 39,813,800 | 5,029 |
| | Hanson International | | |
| | Tbk PT | 256,132,200 | 2,745 |
| | | | |
| * | PP Properti Tbk PT | 21,613,400 | 2,240 |
| * | Alam Sutera Realty | | | |
| | Tbk PT | 51,144,597 | 1,756 |
| * | Kawasan Industri | | | |
| | Jababeka Tbk PT | 73,722,083 | 1,695 |
| | Intiland Development | | | |
| | Tbk PT | 28,506,851 | 1,257 |
| * | Modernland Realty | | | |
| | Tbk PT | 37,306,000 | 1,047 |
| | Ciputra Surya Tbk PT | | 3,187,120 | 744 |
| * | Lippo Cikarang Tbk PT | | 1,583,900 | 734 |
| | Ciputra Property Tbk PT | 12,217,683 | 712 |
| * | Sentul City Tbk PT | 91,662,600 | 640 |
| | Puradelta Lestari | | | |
| | Tbk PT | 30,354,200 | 591 |
| * | Agung Podomoro | | | |
| | Land Tbk PT | 22,535,400 | 497 |
| | Bekasi Fajar Industrial | | | |
| | Estate Tbk PT | 19,500,682 | 465 |
| * | Bakrieland Development | | | |
| | Tbk PT | 48,597,400 | 186 |
| | | | | 44,151 |
| Ireland (0.3%) | | | |
| | Green REIT plc | | 3,030,989 | 4,526 |
| | Hibernia REIT plc | | 3,052,645 | 4,299 |
| | Irish Residential | | | |
| | Properties REIT plc | | 1,557,961 | 2,009 |
| | | | | 10,834 |
| Israel (0.8%) | | | |
| | Azrieli Group Ltd. | | 161,642 | 6,881 |
| | Gazit-Globe Ltd. | | 425,928 | 3,847 |
| | Alony Hetz Properties | | | |
| | & Investments Ltd. | | 433,773 | 3,729 |
| | Melisron Ltd. | | 78,750 | 3,346 |
| * | Airport City Ltd. | | 265,234 | 2,883 |
| | Reit 1 Ltd. | | 736,805 | 2,220 |
| | Amot Investments Ltd. | | 496,870 | 2,073 |
| | Norstar Holdings Inc. | | 74,256 | 1,259 |
| * | Summit Real Estate | | | |
| | Holdings Ltd. | | 200,231 | 1,162 |
| * | Jerusalem Economy Ltd. | | 488,181 | 1,103 |
| | Sella Capital Real | | | |
| | Estate Ltd. | | 619,059 | 1,081 |
| | Big Shopping Centers Ltd. | 15,989 | 1,074 |
| | Africa Israel Properties Ltd. | 56,107 | 965 |
| | Blue Square Real | | | |
| | Estate Ltd. | | 22,519 | 914 |
| | Alrov Properties and | | | |
| | Lodgings Ltd. | | 36,472 | 780 |
| | Property & Building | | | |
| | Corp. Ltd. | | 9,286 | 766 |
| * | ADO Group Ltd. | | 44,165 | 569 |
| * | Africa Israel | | | |
| | Investments Ltd. | | 259,759 | 75 |
| | | | | 34,727 |
16
Global ex-U.S. Real Estate Index Fund
| | | |
| | | | Market |
| | | | Value• |
| | | Shares | ($000) |
| Italy (0.1%) | | |
| | Beni Stabili SpA SIIQ | 4,538,517 | 2,646 |
| | Immobiliare Grande | | |
| | Distribuzione SIIQ SPA | 1,521,045 | 1,172 |
| * | Prelios SPA | 1,827,926 | 167 |
| | | | 3,985 |
| Japan (23.4%) | | |
| | Mitsubishi Estate | | |
| | Co. Ltd. | 6,178,845 | 122,803 |
| | Mitsui Fudosan Co. Ltd. | 4,407,057 | 100,366 |
| | Daiwa House Industry | | |
| | Co. Ltd. | 2,959,774 | 81,236 |
| | Daito Trust Construction | | |
| | Co. Ltd. | 346,600 | 58,083 |
| | Sumitomo Realty | | |
| | & Development | | |
| | Co. Ltd. | 2,117,367 | 55,657 |
| | Nippon Building Fund Inc. | 6,281 | 37,323 |
| | Japan Real Estate | | |
| | Investment Corp. | 5,535 | 32,052 |
| | Nomura Real Estate | | |
| | Master Fund Inc. | 18,529 | 30,076 |
| | Japan Retail Fund | | |
| | Investment Corp. | 11,342 | 25,803 |
| | United Urban | | |
| | Investment Corp. | 13,121 | 22,188 |
| | Hulic Co. Ltd. | 2,148,512 | 20,457 |
| | Nippon Prologis REIT Inc. | 8,188 | 18,531 |
| | Orix JREIT Inc. | 10,766 | 18,442 |
| | Japan Prime Realty | | |
| | Investment Corp. | 3,880 | 16,756 |
| | Daiwa House REIT | | |
| | Investment Corp. | 6,018 | 16,316 |
| | Advance Residence | | |
| | Investment Corp. | 5,781 | 16,181 |
| | GLP J-Reit | 12,621 | 15,816 |
| | Activia Properties Inc. | 2,670 | 12,956 |
| | Tokyu Fudosan | | |
| | Holdings Corp. | 2,278,156 | 12,841 |
| | Tokyo Tatemono Co. Ltd. | 964,383 | 12,250 |
| | Japan Hotel REIT | | |
| | Investment Corp. | 16,666 | 11,244 |
| | Kenedix Office | | |
| | Investment Corp. | 1,806 | 10,183 |
| | Nippon Accommodations | | |
| | Fund Inc. | 2,158 | 9,820 |
| | Frontier Real Estate | | |
| | Investment Corp. | 2,058 | 9,680 |
| | Nomura Real Estate | | |
| | Holdings Inc. | 562,729 | 9,503 |
| ^ | Mori Hills REIT | | |
| | Investment Corp. | 6,225 | 8,777 |
| | Japan Logistics Fund Inc. | 3,926 | 8,539 |
| ^ | Daiwa Office | | |
| | Investment Corp. | 1,459 | 8,241 |
| | | |
| ^ | Industrial & Infrastructure | | |
| | Fund Investment Corp. | 1,561 | 8,219 |
| | Japan Excellent Inc. | 5,787 | 8,096 |
| | Leopalace21 Corp. | 1,188,750 | 7,729 |
| | Aeon Mall Co. Ltd. | 506,683 | 7,525 |
| | Hulic Reit Inc. | 4,206 | 7,361 |
| | Invincible Investment Corp. | 14,377 | 6,970 |
| | Mori Trust Sogo Reit Inc. | 4,288 | 6,899 |
| | Premier Investment Corp. | 4,985 | 6,426 |
| | AEON REIT | | |
| | Investment Corp. | 4,775 | 5,791 |
| | Tokyu REIT Inc. | 4,348 | 5,734 |
| | Fukuoka REIT Corp. | 3,285 | 5,701 |
| ^ | Sekisui House SI | | |
| | Residential Investment | | |
| | Corp. | 4,913 | 5,695 |
| | Japan Rental Housing | | |
| | Investments Inc. | 7,353 | 5,690 |
| | LaSalle Logiport REIT | 4,838 | 5,133 |
| | Sekisui House Reit Inc. | 3,639 | 4,920 |
| | Comforia Residential | | |
| | REIT Inc. | 2,140 | 4,806 |
| | Ichigo Office REIT | | |
| | Investment | 6,809 | 4,589 |
| | Kenedix Residential | | |
| | Investment Corp. | 1,568 | 4,454 |
| | NIPPON REIT | | |
| | Investment Corp. | 1,763 | 4,445 |
| | NTT Urban | | |
| | Development Corp. | 483,200 | 4,442 |
| | Kenedix Retail REIT Corp. | 1,764 | 4,258 |
| ^ | Hoshino Resorts REIT Inc. | 722 | 4,233 |
| | Hankyu Reit Inc. | 2,670 | 3,802 |
| | MCUBS MidCity | | |
| | Investment Corp. | 1,116 | 3,629 |
| | TOC Co. Ltd. | 400,829 | 3,622 |
| | Heiwa Real Estate | | |
| | REIT Inc. | 4,463 | 3,378 |
| | Global One Real Estate | | |
| | Investment Corp. | | |
| | Class A | 871 | 3,288 |
| ^ | Invesco Office J-Reit Inc. | 3,653 | 2,954 |
| | Daikyo Inc. | 1,351,050 | 2,899 |
| * | Mitsui Fudosan | | |
| | Logistics Park Inc. | 817 | 2,602 |
| | Takara Leben Co. Ltd. | 375,952 | 2,550 |
| | Unizo Holdings Co. Ltd. | 81,300 | 2,266 |
| | Daibiru Corp. | 256,457 | 2,228 |
| | Heiwa Real Estate Co. Ltd. | 148,632 | 2,115 |
| ^ | SIA Reit Inc. | 418 | 1,479 |
| | Goldcrest Co. Ltd. | 77,140 | 1,402 |
| ^ | Ichigo Hotel REIT | | |
| | Investment Corp. | 1,055 | 1,201 |
| | Keihanshin Building | | |
| | Co. Ltd. | 202,300 | 1,056 |
17
Global ex-U.S. Real Estate Index Fund
| | | |
| | | | Market |
| | | | Value• |
| | | Shares | ($000) |
| ^ | Starts Proceed | | |
| | Investment Corp. | 681 | 1,026 |
| ^ | Samty Residential | | |
| | Investment Corp. | 1,249 | 975 |
| | Tosei Corp. | 129,500 | 969 |
| ^ | Star Asia Investment Corp. | 1,091 | 918 |
| ^ | Shinoken Group Co. Ltd. | 50,000 | 905 |
| | Sun Frontier Fudousan | | |
| | Co. Ltd. | 94,000 | 896 |
| ^ | Japan Property | | |
| | Management | | |
| | Center Co. Ltd. | 52,300 | 698 |
| ^ | Nippon Commercial | | |
| | Development Co. Ltd. | 38,800 | 679 |
| ^ | Tosei Reit Investment | | |
| | Corp. | 664 | 662 |
| | Tokyo Rakutenchi Co. Ltd. | 135,000 | 647 |
| ^ | SAMTY Co. Ltd. | 61,400 | 639 |
| * | Ardepro Co. Ltd. | 604,600 | 627 |
| | Airport Facilities Co. Ltd. | 110,700 | 604 |
| ^ | Nippon Healthcare | | |
| | Investment Corp. | 330 | 558 |
| * | Health Care & Medical | | |
| | Investment Corp. | 532 | 553 |
| ^ | Japan Senior Living | | |
| | Investment Corp. | 360 | 494 |
| * | Arealink Co. Ltd. | 41,500 | 473 |
| | Tokyo Theatres Co. Inc. | 354,017 | 408 |
| | | | 984,438 |
| Malaysia (0.7%) | | |
| | IOI Properties | | |
| | Group Bhd. | 6,807,716 | 3,967 |
| | KLCCP Stapled Group | 1,443,370 | 2,746 |
| | Sunway Bhd. | 3,395,385 | 2,525 |
| | IGB REIT | 5,880,000 | 2,270 |
| | Sunway REIT | 5,113,434 | 2,244 |
| | SP Setia Bhd Group | 2,353,860 | 1,967 |
| | Mah Sing Group Bhd. | 5,366,225 | 1,955 |
| | Capitaland Malaysia | | |
| | Mall Trust | 4,087,800 | 1,561 |
| | UEM Sunrise Bhd. | 5,386,765 | 1,436 |
| * | Eco World Development | | |
| | Group Bhd. | 3,664,900 | 1,187 |
| | Eastern & Oriental Bhd. | 3,169,156 | 1,186 |
| | Pavilion REIT | 2,658,000 | 1,113 |
| | UOA Development Bhd. | 1,722,700 | 1,057 |
| | Matrix Concepts | | |
| | Holdings Bhd. | 1,695,483 | 1,047 |
| | Axis REIT | 2,406,100 | 987 |
| * | YNH Property Bhd. | 1,724,359 | 642 |
| | LBS Bina Group Bhd. | 1,158,900 | 481 |
| * | KSL Holdings Bhd. | 1,802,900 | 477 |
| | Tropicana Corp. Bhd. | 1,710,146 | 414 |
| | IGB Corp. Bhd. | 126,100 | 75 |
| | | |
| * | Eco World Development | | |
| | Group Bhd Warrants 2 | | |
| | Exp. 03/26/2022 | 450,320 | 43 |
| * | Eastern & Oriental Bhd | | |
| | Warrants Exp. | | |
| | 07/21/2019 | 438,840 | 18 |
| * | Matrix Concepts Holdings | | |
| | Bhd. Warrants Exp. | | |
| | 07/20/2020 | 133,683 | 14 |
| * | Mah Sing Group Warrants | | |
| | Exp. 01/15/2026 | 264,345 | 8 |
| * | Mah Sing Group Bhd. | | |
| | Warrants Exp. | | |
| | 03/18/2018 | 156,256 | 7 |
| | | | 29,427 |
| Mexico (1.2%) | | |
| | Fibra Uno Administracion | | |
| | SA de CV | 11,737,012 | 22,398 |
| | Concentradora Fibra | | |
| | Danhos SA de CV | 4,214,015 | 7,716 |
| | Macquarie Mexico Real | | |
| | Estate Management | | |
| | SA de CV | 3,652,182 | 4,601 |
| | PLA Administradora | | |
| | Industrial S de RL | | |
| | de CV | 2,701,594 | 4,477 |
| | Corp Inmobiliaria Vesta | | |
| | SAB de CV | 2,324,770 | 3,518 |
| | Prologis Property Mexico | | |
| | SA de CV | 1,524,100 | 2,562 |
| * | Grupo GICSA SA de CV | 2,209,703 | 1,494 |
| | Fibra Shop Portafolios | | |
| | Inmobiliarios SAPI | | |
| | de CV | 1,646,718 | 1,382 |
| | Concentradora Fibra | | |
| | Hotelera Mexicana | | |
| | SA de CV | 1,435,238 | 1,128 |
| | Asesor de Activos | | |
| | Prisma SAPI de CV | 1,520,700 | 1,021 |
| | | | 50,297 |
| Netherlands (0.6%) | | |
| | Eurocommercial | | |
| | Properties NV | 214,461 | 9,124 |
| | Wereldhave NV | 178,951 | 8,010 |
| | Vastned Retail NV | 86,056 | 3,311 |
| | NSI NV | 622,090 | 2,441 |
| | Brack Capital | | |
| | Properties NV | 14,120 | 1,210 |
| | | | 24,096 |
| New Zealand (0.6%) | | |
| | Kiwi Property Group Ltd. | 5,795,709 | 6,077 |
| | Goodman Property Trust | 4,483,165 | 3,990 |
| | Precinct Properties | | |
| | New Zealand Ltd. | 4,472,750 | 3,984 |
18
Global ex-U.S. Real Estate Index Fund
| | | |
| | | | Market |
| | | | Value• |
| | | Shares | ($000) |
| | Argosy Property Ltd. | 3,697,741 | 2,776 |
| | Property for | | |
| | Industry Ltd. | 2,026,065 | 2,320 |
| | Vital Healthcare | | |
| | Property Trust | 1,476,466 | 2,154 |
| ^ | Stride Property Group | 1,615,091 | 2,149 |
| ^,* | Investore Property Ltd. | 924,437 | 1,007 |
| | | | 24,457 |
| Norway (0.2%) | | |
| 2 | Entra ASA | 345,217 | 3,701 |
| | Olav Thon | | |
| | Eiendomsselskap ASA | 136,270 | 2,679 |
| | Norwegian Property ASA | 975,139 | 1,271 |
| | Selvaag Bolig ASA | 181,004 | 884 |
| | | | 8,535 |
| Philippines (1.5%) | | |
| | SM Prime Holdings Inc. | 51,318,299 | 28,496 |
| | Ayala Land Inc. | 26,145,200 | 19,556 |
| | Megaworld Corp. | 55,861,000 | 4,630 |
| | Robinsons Land Corp. | 7,100,150 | 4,539 |
| * | DoubleDragon | | |
| | Properties Corp. | 2,645,990 | 3,045 |
| | Vista Land | | |
| | & Lifescapes Inc. | 18,961,278 | 2,047 |
| | Filinvest Land Inc. | 44,943,000 | 1,637 |
| | Belle Corp. | 17,410,800 | 1,049 |
| | | | 64,999 |
| Poland (0.0%) | | |
| ^,* | Globe Trade Centre SA | 850,784 | 1,740 |
| | Echo Investment SA | 160,767 | 215 |
| | | | 1,955 |
| Qatar (0.2%) | | |
| | United Development | | |
| | Co. QSC | 762,880 | 4,180 |
| | Barwa Real Estate Co. | 437,612 | 3,833 |
| * | Mazaya Qatar Real | | |
| | Estate Development | | |
| | QSC | 237,537 | 821 |
| | | | 8,834 |
| Russia (0.1%) | | |
| | LSR Group PJSC GDR | 893,843 | 2,527 |
| | Etalon Group Ltd. GDR | 369,499 | 1,055 |
| | | | 3,582 |
| Singapore (5.8%) | | |
| | CapitaLand Ltd. | 11,482,838 | 25,468 |
| | CapitaLand Mall Trust | 11,962,534 | 17,826 |
| | Ascendas REIT | 10,384,561 | 17,697 |
| | Global Logistic | | |
| | Properties Ltd. | 13,125,831 | 16,702 |
| | City Developments Ltd. | 2,741,990 | 16,695 |
| | Suntec REIT | 11,259,027 | 13,599 |
| | CapitaLand Commercial | | |
| | Trust | 9,459,282 | 10,704 |
| | UOL Group Ltd. | 2,617,378 | 10,645 |
| | | |
| | Mapletree Commercial | | |
| | Trust | 7,832,633 | 8,609 |
| ^ | Fortune REIT | 6,074,861 | 7,360 |
| | Mapletree Industrial | | |
| | Trust | 5,287,234 | 6,539 |
| | Keppel REIT | 7,969,015 | 6,250 |
| | Mapletree Greater China | | |
| | Commercial Trust | 8,043,142 | 6,016 |
| | Mapletree Logistics | | |
| | Trust | 6,790,029 | 5,051 |
| | Frasers Centrepoint | | |
| | Trust | 2,533,541 | 3,790 |
| | Starhill Global REIT | 6,010,968 | 3,521 |
| | Ascott Residence Trust | 4,107,655 | 3,354 |
| | CapitaLand Retail | | |
| | China Trust | 3,079,486 | 3,314 |
| | Parkway Life REIT | 1,764,055 | 3,246 |
| * | Frasers Logistics | | |
| | & Industrial Trust | 4,574,400 | 3,172 |
| | CDL Hospitality Trusts | 3,059,202 | 2,950 |
| | Yanlord Land Group Ltd. | 2,938,904 | 2,925 |
| | Frasers Commercial | | |
| | Trust | 2,609,367 | 2,559 |
| | AIMS AMP Capital | | |
| | Industrial REIT | 2,522,776 | 2,504 |
| ^ | Keppel DC REIT | 2,718,300 | 2,434 |
| ^ | SPH REIT | 3,400,900 | 2,386 |
| | Lippo Malls Indonesia | | |
| | Retail Trust | 8,504,206 | 2,382 |
| | Ascendas India Trust | 3,057,166 | 2,350 |
| | Cache Logistics Trust | 3,805,805 | 2,272 |
| | Wing Tai Holdings Ltd. | 1,832,610 | 2,233 |
| | First REIT | 2,293,454 | 2,201 |
| * | Manulife US REIT | 2,530,400 | 2,124 |
| | Croesus Retail Trust | 3,349,700 | 2,071 |
| ^ | Yoma Strategic | | |
| | Holdings Ltd. | 4,862,618 | 2,059 |
| | OUE Hospitality Trust | 4,172,600 | 2,041 |
| | Ascendas Hospitality | | |
| | Trust | 3,751,700 | 1,997 |
| ^ | Sinarmas Land Ltd. | 5,682,700 | 1,961 |
| | Cambridge Industrial | | |
| | Trust | 4,677,509 | 1,898 |
| ^ | United Industrial | | |
| | Corp. Ltd. | 877,388 | 1,716 |
| | Frasers Centrepoint Ltd. | 1,549,300 | 1,654 |
| ^ | GuocoLand Ltd. | 1,183,077 | 1,631 |
| | Far East Hospitality | | |
| | Trust | 3,776,496 | 1,612 |
| | Soilbuild Business | | |
| | Space REIT | 3,221,460 | 1,565 |
| ^ | Wheelock Properties | | |
| | Singapore Ltd. | 1,297,869 | 1,391 |
| | Ho Bee Land Ltd. | 818,103 | 1,253 |
| | Perennial Real Estate | | |
| | Holdings Ltd. | 1,903,577 | 1,149 |
19
Global ex-U.S. Real Estate Index Fund
| | | |
| | | | Market |
| | | | Value• |
| | | Shares | ($000) |
| | Sabana Shari’ah Compliant | |
| | Industrial REIT | 2,936,060 | 1,098 |
| | OUE Commercial REIT | 2,163,900 | 1,081 |
| ^,* | Ying Li International | | |
| | Real Estate Ltd. | 4,365,000 | 508 |
| * | Keppel DC REIT Rights | | |
| | Exp. 01/07/2016 | 744,814 | 48 |
| | | | 245,611 |
| South Africa (1.8%) | | |
| | Growthpoint | | |
| | Properties Ltd. | 10,151,110 | 18,929 |
| | Redefine | | |
| | Properties Ltd. | 20,247,803 | 17,326 |
| | Resilient REIT Ltd. | 1,455,075 | 12,037 |
| | Hyprop | | |
| | Investments Ltd. | 958,163 | 8,502 |
| * | Attacq Ltd. | 3,066,484 | 3,900 |
| | Vukile Property Fund Ltd. | 2,600,038 | 3,546 |
| | SA Corporate Real Estate | | |
| | Fund Nominees | | |
| | Pty Ltd. | 7,803,114 | 3,191 |
| * | Arrowhead | | |
| | Properties Ltd. | 4,007,983 | 2,589 |
| | Emira Property | | |
| | Fund Ltd. | 2,023,437 | 2,093 |
| | Rebosis Property | | |
| | Fund Ltd. | 1,693,627 | 1,437 |
| | Octodec | | |
| | Investments Ltd. | 808,714 | 1,298 |
| | Delta Property Fund Ltd. | 2,165,978 | 1,232 |
| | MAS Real Estate Inc. | 629,632 | 967 |
| | Balwin Properties Ltd. | 1,441,955 | 739 |
| * | Hospitality Property | | |
| | Fund Ltd. Class B | 24,739 | 24 |
| | | | 77,810 |
| South Korea (0.0%) | | |
| ^ | SK D&D Co. Ltd. | 21,312 | 861 |
| ^ | Dongwon Development | | |
| | Co. Ltd. | 189,529 | 756 |
| | | | 1,617 |
| Spain (0.9%) | | |
| | Merlin Properties | | |
| | Socimi SA | 1,434,564 | 16,096 |
| | Inmobiliaria Colonial SA | 1,179,079 | 8,314 |
| | Hispania Activos | | |
| | Inmobiliarios | | |
| | SOCIMI SA | 482,795 | 5,929 |
| | Axiare Patrimonio | | |
| | SOCIMI SA | 258,987 | 3,680 |
| | Lar Espana Real Estate | | |
| | Socimi SA | 411,167 | 2,951 |
| ^,* | Realia Business SA | 705,481 | 682 |
| | | | 37,652 |
| | | |
| Sweden (2.1%) | | |
| | Castellum AB | 1,213,732 | 16,446 |
| | Fabege AB | 624,890 | 10,554 |
| * | Fastighets AB Balder | | |
| | Class B | 400,563 | 9,098 |
| | Hufvudstaden AB Class A | 523,177 | 8,097 |
| | Wallenstam AB | 977,811 | 7,532 |
| | Hemfosa Fastigheter AB | 702,846 | 6,608 |
| | Wihlborgs Fastigheter AB | 307,386 | 5,958 |
| | Kungsleden AB | 696,049 | 4,389 |
| | Atrium Ljungberg AB | 217,438 | 3,378 |
| | Sagax AB Class B | 324,170 | 2,861 |
| | Klovern AB B Shares | 2,052,081 | 2,165 |
| * | D Carnegie & Co. | | |
| | AB Class B | 161,321 | 1,813 |
| | Dios Fastigheter AB | 220,400 | 1,468 |
| | Victoria Park AB | 560,737 | 1,385 |
| | Catena AB | 69,998 | 1,021 |
| | Platzer Fastigheter | | |
| | Holding AB Class B | 171,531 | 992 |
| | NP3 Fastigheter AB | 188,303 | 964 |
| * | Magnolia Bostad AB | 69,451 | 802 |
| * | Tribona AB | 129,122 | 606 |
| | FastPartner AB | 28,279 | 452 |
| | | | 86,589 |
| Switzerland (1.6%) | | |
| | Swiss Prime Site AG | 317,412 | 26,326 |
| | PSP Swiss Property AG | 179,432 | 16,055 |
| | Allreal Holding AG | 63,796 | 9,389 |
| | Mobimo Holding AG | 27,442 | 6,603 |
| | Intershop Holding AG | 6,149 | 3,140 |
| | Zug Estates Holding AG | | |
| | Class B | 1,134 | 1,895 |
| | Hiag Immobilien | | |
| | Holding AG | 12,238 | 1,276 |
| * | Investis Holding SA | 12,083 | 698 |
| | | | 65,382 |
| Taiwan (0.7%) | | |
| | Highwealth Construction | | |
| | Corp. | 3,950,149 | 5,850 |
| * | Ruentex Development | | |
| | Co. Ltd. | 4,043,579 | 4,667 |
| | Huaku Development | | |
| | Co. Ltd. | 1,063,554 | 1,872 |
| | Prince Housing | | |
| | & Development Corp. | 4,792,478 | 1,518 |
| | Chong Hong | | |
| | Construction Co. Ltd. | 869,497 | 1,428 |
| | Farglory Land | | |
| | Development Co. Ltd. | 1,175,631 | 1,351 |
| | Cathay No 1 REIT | 2,257,310 | 1,191 |
| | Cathay Real Estate | | |
| | Development Co. Ltd. | 2,151,100 | 1,103 |
| | Shin Kong No.1 REIT | 2,144,000 | 952 |
20
Global ex-U.S. Real Estate Index Fund
| | | | |
| | | | | Market |
| | | | | Value• |
| | | | Shares | ($000) |
| | Hung Sheng | | | |
| | Construction Ltd. | 1,711,000 | 923 |
| | Taiwan Land | | | |
| | Development Corp. | 2,881,450 | 900 |
| * | Radium Life Tech | | | |
| | Co. Ltd. | | 2,950,947 | 837 |
| | Hung Poo Real Estate | | |
| | Development Corp. | 939,194 | 772 |
| | Kindom Construction | | |
| | Corp. | | 1,564,000 | 770 |
| | Huang Hsiang | | | |
| | Construction Corp. | 579,000 | 708 |
| | Kuoyang Construction | | |
| | Co. Ltd. | | 1,647,665 | 648 |
| | KEE TAI Properties | | |
| | Co. Ltd. | | 1,886,869 | 603 |
| * | Shining Building | | | |
| | Business Co. Ltd. | 1,642,971 | 519 |
| | Cathay No 2 REIT | | 1,033,000 | 514 |
| | Pacific Construction Co. | 784,000 | 279 |
| | Advancetek | | | |
| | Enterprise Co. Ltd. | 53,000 | 30 |
| | | | | 27,435 |
| Thailand (1.2%) | | | |
| * | Central Pattana PCL | 5,985,700 | 9,512 |
| | CPN Retail Growth | | |
| | Leasehold Property | | |
| | Fund | | 7,258,610 | 4,254 |
| | Tesco Lotus Retail | | |
| | Growth Freehold | | |
| | & Leasehold | | | |
| | Property Fund | | 7,986,086 | 4,172 |
| * | Land & Houses PCL | 15,502,400 | 4,063 |
| | Samui Airport Property | | |
| | Fund Leasehold | | 2,967,975 | 2,245 |
| * | Pruksa Real Estate PCL | 3,187,700 | 2,101 |
| * | WHA Corp. PCL | | | |
| | (Foreign) | | 22,319,630 | 2,101 |
| * | Supalai PCL | | 2,709,705 | 1,888 |
| * | Bangkok Land PCL | 39,225,400 | 1,770 |
| * | IMPACT Growth REIT | 3,127,700 | 1,393 |
| * | Quality Houses PCL | 19,279,200 | 1,376 |
| * | Golden Ventures | | | |
| | Leasehold REIT | | 2,646,900 | 1,120 |
| * | U City PCL | 1,209,459,100 | 1,037 |
| * | Ananda Development | | |
| | PCL | | 6,594,800 | 928 |
| * | LPN Development PCL | 2,447,500 | 798 |
| | TICON Property Fund | 2,678,900 | 774 |
| * | Singha Estate PCL | 5,474,800 | 734 |
| * | Amata Corp. PCL | | 2,149,500 | 711 |
| | Sansiri PCL | | 14,694,200 | 696 |
| ^ | TICON Industrial | | | |
| | Connection PCL NVDR | 1,609,280 | 683 |
| | | |
| * | CP Tower Growth | | |
| | Leasehold Property | | |
| | Fund | 1,497,400 | 663 |
| * | Siam Future | | |
| | Development PCL | 3,772,367 | 652 |
| * | Platinum Group PCL | 3,319,400 | 625 |
| * | AP Thailand PCL | 2,878,050 | 583 |
| * | Country Group | | |
| | Development PCL | 15,806,100 | 460 |
| ^,* | WHA Corp. PCL | 4,759,678 | 448 |
| * | Property Perfect PCL | 12,008,800 | 343 |
| * | MBK PCL | 743,220 | 312 |
| | Asian Property | | |
| | Development PCL | | |
| | (Foreign) | 1,513,270 | 307 |
| * | SC Asset Corp. PCL | 3,071,925 | 303 |
| | Univentures PCL | | |
| | (Foreign) | 1,577,100 | 261 |
| * | Sansiri PCL (Local) | 5,418,200 | 257 |
| | SC Asset Corp. PCL | | |
| | (Foreign) | 2,526,712 | 250 |
| | TICON Industrial | | |
| | Connection PCL | | |
| | (Foreign) | 578,993 | 246 |
| * | Rojana Industrial | | |
| | Park PCL | 1,700,812 | 226 |
| ^ | Rojana Industrial | | |
| | Park PCL NVDR | 1,541,382 | 205 |
| | Bangkok Land PCL | | |
| | (Foreign) | 4,269,495 | 193 |
| | Sansiri PCL (Foreign) | 4,060,798 | 192 |
| * | Univentures PCL | 1,067,500 | 177 |
| ^ | Land & Houses PCL | | |
| | (Foreign) | 481,300 | 126 |
| ^ | Singha Estate PCL | | |
| | (Foreign) | 933,364 | 125 |
| ^ | SC Asset Corp. PCL | | |
| | NVDR | 831,300 | 82 |
| | Property Perfect PCL | | |
| | (Foreign) | 2,742,000 | 78 |
| | Rojana Industrial Park | | |
| | PCL (Foreign) | 481,328 | 64 |
| * | TICON Industrial | | |
| | Connection PCL | 98,400 | 42 |
| * | WHA Corp. PCL Warrants | | |
| | Exp. 12/31/2019 | 108,341 | 25 |
| * | Sansiri PCL (Foreign) | | |
| | Warrants Exp. | | |
| | 11/24/2017 | 3,159,666 | 11 |
| | Sansiri PCL NVDR | | |
| | Warrants Exp. | | |
| | 11/24/2017 | 2,936,700 | 10 |
| * | Raimon Land PCL | | |
| | Warrants Exp. | | |
| | 06/14/2018 | 1,271,475 | — |
| | | | 49,622 |
21
Global ex-U.S. Real Estate Index Fund
| | | |
| | | | Market |
| | | | Value• |
| | | Shares | ($000) |
| Turkey (0.3%) | | |
| | Emlak Konut Gayrimenkul | | |
| | Yatirim Ortakligi AS | 8,625,296 | 8,813 |
| | Is Gayrimenkul Yatirim | | |
| | Ortakligi AS | 2,049,595 | 1,042 |
| | Torunlar Gayrimenkul | | |
| | Yatirim Ortakligi AS | 336,025 | 533 |
| | Saf Gayrimenkul Yatirim | | |
| | Ortakligi AS | 1,154,444 | 317 |
| | | | 10,705 |
| United Arab Emirates (1.3%) | |
| | Emaar Properties PJSC | 15,425,709 | 29,210 |
| | Aldar Properties PJSC | 13,828,648 | 9,899 |
| | Emaar Malls PJSC | 8,583,491 | 5,996 |
| | DAMAC Properties | | |
| | Dubai Co. PJSC | 7,448,440 | 4,448 |
| * | Eshraq Properties Co. | | |
| | PJSC | 4,734,595 | 1,016 |
| * | Deyaar Development | | |
| | PJSC | 6,299,477 | 913 |
| * | Union Properties PJSC | 4,365,950 | 840 |
| | RAK Properties PJSC | 4,611,175 | 775 |
| | | | 53,097 |
| United Kingdom (6.5%) | | |
| | Land Securities | | |
| | Group plc | 3,558,832 | 43,456 |
| | British Land Co. plc | 4,545,998 | 32,547 |
| | Hammerson plc | 3,484,382 | 23,441 |
| | Segro plc | 3,678,704 | 19,703 |
| | Derwent London plc | 492,342 | 14,560 |
| | Shaftesbury plc | 1,234,445 | 13,849 |
| | Intu Properties plc | 4,002,493 | 13,489 |
| | Capital & Counties | | |
| | Properties plc | 3,342,978 | 11,789 |
| | Great Portland | | |
| | Estates plc | 1,527,982 | 11,087 |
| | Tritax Big Box REIT plc | 4,907,849 | 8,165 |
| | UNITE Group plc | 985,501 | 6,676 |
| | Big Yellow Group plc | 659,260 | 5,578 |
| | F&C Commercial | | |
| | Property Trust Ltd. | 3,606,594 | 5,540 |
| | Assura plc | 7,253,622 | 5,225 |
| | LondonMetric | | |
| | Property plc | 2,790,423 | 5,091 |
| | Grainger plc | 1,849,906 | 5,008 |
| | Hansteen Holdings plc | 3,306,923 | 4,359 |
| | Safestore Holdings plc | 919,375 | 4,035 |
| | Workspace Group plc | 522,245 | 4,017 |
| | NewRiver REIT plc | 1,033,138 | 3,928 |
| | | |
| | Primary Health | | |
| | Properties plc | 2,686,041 | 3,670 |
| | Empiric Student | | |
| | Property plc | 2,096,368 | 2,843 |
| | St. Modwen | | |
| | Properties plc | 845,471 | 2,830 |
| | Redefine International plc | 5,560,077 | 2,821 |
| | UK Commercial Property | | |
| | Trust Ltd. | 2,944,041 | 2,811 |
| | Daejan Holdings plc | 40,167 | 2,675 |
| | Picton Property | | |
| | Income Ltd. | 2,452,197 | 2,126 |
| | Schroder REIT Ltd. | 2,335,556 | 1,614 |
| | Helical plc | 487,898 | 1,579 |
| | Capital & Regional plc | 2,095,201 | 1,451 |
| | Mucklow A & J Group plc | 262,432 | 1,425 |
| * | CLS Holdings plc | 74,411 | 1,415 |
| ^,* | Raven Russia Ltd. | 2,846,645 | 1,356 |
| | Urban & Civic plc | 473,312 | 1,143 |
| | U & I Group plc | 556,211 | 1,072 |
| 2 | Regional REIT Ltd. | 812,955 | 1,053 |
| | McKay Securities plc | 438,847 | 1,030 |
| | | | 274,457 |
| Total Common Stocks | | |
| (Cost $4,376,453) | | 4,186,367 |
| |
| Temporary Cash Investments (2.3%)1 | |
| Money Market Fund (2.3%) | | |
| 3,4 | Vanguard Market | | |
| | Liquidity Fund, | | |
| | 0.718% | 951,203 | 95,130 |
| |
| | | Face | |
| | | Amount | |
| | | ($000) | |
| U.S. Government and Agency Obligations (0.0%) |
| 5 | United States Treasury Bill, | | |
| | 0.320%–0.340%, 12/8/16 | 1,100 | 1,100 |
| |
| 5 | United States Treasury Bill, | | |
| | 0.360%, 1/12/17 | 400 | 399 |
| | | | 1,499 |
| Total Temporary Cash Investments | |
| (Cost $96,624) | | 96,629 |
| Total Investments (101.7%) | | |
| (Cost $4,473,077) | | 4,282,996 |
22
Global ex-U.S. Real Estate Index Fund
| | |
| | | Amount |
| | | ($000) |
| Other Assets and Liabilities (-1.7%) | | |
| Other Assets | | |
| Investment in Vanguard | | 336 |
| Receivables for Investment Securities Sold | 597 |
| Receivables for Accrued Income | | 12,003 |
| Receivables for Capital Shares Issued | | 1,477 |
| Other Assets | | 1,552 |
| Total Other Assets | | 15,965 |
| Liabilities | | |
| Payables for Investment Securities | | |
| Purchased | | (4,624) |
| Collateral for Securities on Loan | | (80,113) |
| Payables for Capital Shares Redeemed | | (191) |
| Payables to Vanguard | | (1,211) |
| Other Liabilities | | (119) |
| Total Liabilities | | (86,258) |
| Net Assets (100%) | 4,212,703 |
| |
| |
| At October 31, 2016, net assets consisted of: |
| | | Amount |
| | | ($000) |
| Paid-in Capital | 4,470,877 |
| Undistributed Net Investment Income | | 20,409 |
| Accumulated Net Realized Losses | | (87,958) |
| Unrealized Appreciation (Depreciation) | | |
| Investment Securities | | (190,081) |
| Futures Contracts | | (109) |
| Foreign Currencies | | (435) |
| Net Assets | 4,212,703 |
| |
| | Amount |
| | ($000) |
| Investor Shares—Net Assets | |
| Applicable to 2,765,697 outstanding | |
| $.001 par value shares of beneficial | |
| interest (unlimited authorization) | 59,042 |
| Net Asset Value Per Share— | |
| Investor Shares | $21.35 |
| |
| |
| ETF Shares—Net Assets | |
| Applicable to 67,775,790 outstanding | |
| $.001 par value shares of beneficial | |
| interest (unlimited authorization) | 3,615,983 |
| Net Asset Value Per Share— | |
| ETF Shares | $53.35 |
| |
| |
| Admiral Shares—Net Assets | |
| Applicable to 11,533,433 outstanding | |
| $.001 par value shares of beneficial | |
| interest (unlimited authorization) | 372,914 |
| Net Asset Value Per Share— | |
| Admiral Shares | $32.33 |
| |
| |
| Institutional Shares—Net Assets | |
| Applicable to 1,529,648 outstanding | |
| $.001 par value shares of beneficial | |
| interest (unlimited authorization) | 164,764 |
| Net Asset Value Per Share— | |
| Institutional Shares | $107.71 |
• See Note A in Notes to Financial Statements.
^ Includes partial security positions on loan to broker-dealers. The total value of securities on loan is $71,766,000.
* Non-income-producing security.
1 The fund invests a portion of its cash reserves in equity markets through the use of index futures contracts. After giving effect to futures
investments, the fund’s effective common stock and temporary cash investment positions represent 100.0% and 1.7%, respectively,
of net assets.
2 Security exempt from registration under Rule 144A of the Securities Act of 1933. Such securities may be sold in transactions exempt
from registration, normally to qualified institutional buyers. At October 31, 2016, the aggregate value of these securities was $18,421,000,
representing 0.4% of net assets.
3 Affiliated money market fund available only to Vanguard funds and certain trusts and accounts managed by Vanguard. Rate shown is the
7-day yield.
4 Includes $80,113,000 of collateral received for securities on loan.
5 Securities with a value of $1,200,000 have been segregated as initial margin for open futures contracts.
ADR—American Depositary Receipt.
GDR—Global Depositary Receipt.
NVDR—Non-Voting Depository Receipt.
REIT—Real Estate Investment Trust.
See accompanying Notes, which are an integral part of the Financial Statements.
23
Global ex-U.S. Real Estate Index Fund
Statement of Operations
| |
| | Year Ended |
| | October 31, 2016 |
| | ($000) |
| Investment Income | |
| Income | |
| Dividends1,2 | 132,204 |
| Interest2 | 52 |
| Securities Lending—Net | 2,846 |
| Total Income | 135,102 |
| Expenses | |
| The Vanguard Group—Note B | |
| Investment Advisory Services | 552 |
| Management and Administrative—Investor Shares | 162 |
| Management and Administrative—ETF Shares | 3,331 |
| Management and Administrative—Admiral Shares | 358 |
| Management and Administrative—Institutional Shares | 151 |
| Marketing and Distribution—Investor Shares | 16 |
| Marketing and Distribution—ETF Shares | 272 |
| Marketing and Distribution—Admiral Shares | 38 |
| Marketing and Distribution—Institutional Shares | 5 |
| Custodian Fees | 846 |
| Auditing Fees | 41 |
| Shareholders’ Reports—Investor Shares | 2 |
| Shareholders’ Reports—ETF Shares | 197 |
| Shareholders’ Reports—Admiral Shares | 2 |
| Shareholders’ Reports—Institutional Shares | — |
| Trustees’ Fees and Expenses | 2 |
| Total Expenses | 5,975 |
| Net Investment Income | 129,127 |
| Realized Net Gain (Loss) | |
| Investment Securities Sold2 | (31,174) |
| Futures Contracts | (963) |
| Foreign Currencies | 414 |
| Realized Net Gain (Loss) | (31,723) |
| Change in Unrealized Appreciation (Depreciation) | |
| Investment Securities | 3,730 |
| Futures Contracts | (109) |
| Foreign Currencies | (348) |
| Change in Unrealized Appreciation (Depreciation) | 3,273 |
| Net Increase (Decrease) in Net Assets Resulting from Operations | 100,677 |
| 1 Dividends are net of foreign withholding taxes of $9,691,000. |
| 2 Dividend income, interest income, and realized net gain (loss) from affiliated companies of the fund were $0, $43,000, and ($36,000), respectively. |
| See accompanying Notes, which are an integral part of the Financial Statements. |
24
Global ex-U.S. Real Estate Index Fund
Statement of Changes in Net Assets
| | |
| | Year Ended October 31, |
| | 2016 | 2015 |
| | ($000) | ($000) |
| Increase (Decrease) in Net Assets | | |
| Operations | | |
| Net Investment Income | 129,127 | 105,492 |
| Realized Net Gain (Loss) | (31,723) | 15,715 |
| Change in Unrealized Appreciation (Depreciation) | 3,273 | (229,808) |
| Net Increase (Decrease) in Net Assets Resulting from Operations | 100,677 | (108,601) |
| Distributions | | |
| Net Investment Income | | |
| Investor Shares | (1,787) | (1,956) |
| ETF Shares | (110,683) | (91,740) |
| Admiral Shares | (11,538) | (11,597) |
| Institutional Shares | (5,506) | (7,070) |
| Realized Capital Gain | | |
| Investor Shares | — | — |
| ETF Shares | — | — |
| Admiral Shares | — | — |
| Institutional Shares | — | — |
| Total Distributions | (129,514) | (112,363) |
| Capital Share Transactions | | |
| Investor Shares | 1,259 | 10,627 |
| ETF Shares | 531,472 | 1,089,398 |
| Admiral Shares | 25,946 | 72,528 |
| Institutional Shares | (2,165) | 6,988 |
| Net Increase (Decrease) from Capital Share Transactions | 556,512 | 1,179,541 |
| Total Increase (Decrease) | 527,675 | 958,577 |
| Net Assets | | |
| Beginning of Period | 3,685,028 | 2,726,451 |
| End of Period1 | 4,212,703 | 3,685,028 |
| 1 Net Assets—End of Period includes undistributed (overdistributed) net investment income of $20,409,000 and $14,970,000. |
See accompanying Notes, which are an integral part of the Financial Statements.
25
Global ex-U.S. Real Estate Index Fund
Financial Highlights
| | | | | |
| Investor Shares | | | | | |
| |
| For a Share Outstanding | Year Ended October 31, |
| Throughout Each Period | 2016 | 2015 | 2014 | 2013 | 2012 |
| Net Asset Value, Beginning of Period | $21.44 | $22.63 | $23.06 | $21.04 | $18.14 |
| Investment Operations | | | | | |
| Net Investment Income | . 6551 | .683 | . 944 | .6851 | .7001 |
| Net Realized and Unrealized Gain (Loss) | | | | | |
| on Investments 2 | (.088) | (1.103) | (.443) | 2.321 | 2.995 |
| Total from Investment Operations | .567 | (.420) | .501 | 3.006 | 3.695 |
| Distributions | | | | | |
| Dividends from Net Investment Income | (. 657) | (.770) | (. 931) | (. 986) | (.795) |
| Distributions from Realized Capital Gains | — | — | — | — | — |
| Total Distributions | (. 657) | (.770) | (. 931) | (. 986) | (.795) |
| Net Asset Value, End of Period | $21.35 | $21.44 | $22.63 | $23.06 | $21.04 |
| |
| Total Return3 | 2.72% | -1.82% | 2.41% | 14.69% | 21.31% |
| |
| Ratios/Supplemental Data | | | | | |
| Net Assets, End of Period (Millions) | $59 | $58 | $51 | $156 | $84 |
| Ratio of Total Expenses to | | | | | |
| Average Net Assets | 0.35% | 0.36% | 0.37% | 0.40% | 0.45% |
| Ratio of Net Investment Income to | | | | | |
| Average Net Assets | 3.10% | 2.97% | 4.10% | 2.95% | 3.74% |
| Portfolio Turnover Rate 4 | 7% | 12% | 8% | 8% | 10% |
1 Calculated based on average shares outstanding.
2 Includes increases from purchase and redemption fees of $.00, $.00, $.00, $.02, and $.01.
3 Total returns do not include transaction or account service fees that may have applied in the periods shown. Fund prospectuses provide
information about any applicable transaction and account service fees.
4 Excludes the value of portfolio securities received or delivered as a result of in-kind purchases or redemptions of the fund’s capital shares,
including ETF Creation Units.
See accompanying Notes, which are an integral part of the Financial Statements.
26
Global ex-U.S. Real Estate Index Fund
Financial Highlights
| | | | | |
| ETF Shares | | | | | |
| |
| For a Share Outstanding | Year Ended October 31, |
| Throughout Each Period | 2016 | 2015 | 2014 | 2013 | 2012 |
| Net Asset Value, Beginning of Period | $53.58 | $56.54 | $57.64 | $52.60 | $45.39 |
| Investment Operations | | | | | |
| Net Investment Income | 1.7521 | 1.802 | 2.437 | 1.7131 | 1.8201 |
| Net Realized and Unrealized Gain (Loss) | | | | | |
| on Investments 2 | (.241) | (2.747) | (1.120) | 5.869 | 7.460 |
| Total from Investment Operations | 1.511 | (.945) | 1.317 | 7.582 | 9.280 |
| Distributions | | | | | |
| Dividends from Net Investment Income | (1.741) | (2.015) | (2.417) | (2.542) | (2.070) |
| Distributions from Realized Capital Gains | — | — | — | — | — |
| Total Distributions | (1.741) | (2.015) | (2.417) | (2.542) | (2.070) |
| Net Asset Value, End of Period | $53.35 | $53.58 | $56.54 | $57.64 | $52.60 |
| |
| Total Return | 2.92% | -1.66% | 2.51% | 14.77% | 21.44% |
| |
| Ratios/Supplemental Data | | | | | |
| Net Assets, End of Period (Millions) | $3,616 | $3,111 | $2,203 | $1,306 | $381 |
| Ratio of Total Expenses to | | | | | |
| Average Net Assets | 0.15% | 0.18% | 0.24% | 0.27% | 0.32% |
| Ratio of Net Investment Income to | | | | | |
| Average Net Assets | 3.30% | 3.15% | 4.23% | 3.08% | 3.87% |
| Portfolio Turnover Rate 3 | 7% | 12% | 8% | 8% | 10% |
1 Calculated based on average shares outstanding.
2 Includes increases from purchase and redemption fees of $.00, $.00, $.00, $.02, and $.03.
3 Excludes the value of portfolio securities received or delivered as a result of in-kind purchases or redemptions of the fund’s capital shares,
including ETF Creation Units.
See accompanying Notes, which are an integral part of the Financial Statements.
27
Global ex-U.S. Real Estate Index Fund
Financial Highlights
| | | | | |
| Admiral Shares | | | | | |
| |
| For a Share Outstanding | Year Ended October 31, |
| Throughout Each Period | 2016 | 2015 | 2014 | 2013 | 2012 |
| Net Asset Value, Beginning of Period | $32.47 | $34.27 | $34.92 | $31.87 | $27.51 |
| Investment Operations | | | | | |
| Net Investment Income | 1.0581 | 1.090 | 1.466 | 1.0121 | 1.0931 |
| Net Realized and Unrealized Gain (Loss) | | | | | |
| on Investments 2 | (.139) | (1.673) | (.661) | 3.580 | 4.528 |
| Total from Investment Operations | .919 | (.583) | .805 | 4.592 | 5.621 |
| Distributions | | | | | |
| Dividends from Net Investment Income | (1.059) | (1.217) | (1.455) | (1.542) | (1.261) |
| Distributions from Realized Capital Gains | — | — | — | — | — |
| Total Distributions | (1.059) | (1.217) | (1.455) | (1.542) | (1.261) |
| Net Asset Value, End of Period | $32.33 | $32.47 | $34.27 | $34.92 | $31.87 |
| |
| Total Return3 | 2.91% | -1.66% | 2.55% | 14.83% | 21.43% |
| |
| Ratios/Supplemental Data | | | | | |
| Net Assets, End of Period (Millions) | $373 | $349 | $296 | $117 | $43 |
| Ratio of Total Expenses to | | | | | |
| Average Net Assets | 0.15% | 0.18% | 0.24% | 0.27% | 0.32% |
| Ratio of Net Investment Income to | | | | | |
| Average Net Assets | 3.30% | 3.15% | 4.23% | 3.08% | 3.87% |
| Portfolio Turnover Rate 4 | 7% | 12% | 8% | 8% | 10% |
Signal Shares were renamed Admiral Shares in October 2013. Prior periods’ Financial Highlights are for the Signal class.
1 Calculated based on average shares outstanding.
2 Includes increases from purchase and redemption fees of $.00, $.00, $.00, $.01, and $.01.
3 Total returns do not include transaction or account service fees that may have applied in the periods shown. Fund prospectuses provide
information about any applicable transaction and account service fees.
4 Excludes the value of portfolio securities received or delivered as a result of in-kind purchases or redemptions of the fund’s capital shares,
including ETF Creation Units.
See accompanying Notes, which are an integral part of the Financial Statements.
28
Global ex-U.S. Real Estate Index Fund
Financial Highlights
| | | | | |
| Institutional Shares | | | | | |
| |
| For a Share Outstanding | Year Ended October 31, |
| Throughout Each Period | 2016 | 2015 | 2014 | 2013 | 2012 |
| Net Asset Value, Beginning of Period | $108.17 | $114.14 | $116.37 | $106.19 | $91.68 |
| Investment Operations | | | | | |
| Net Investment Income | 3.5591 | 3.657 | 4.954 | 3.4071 | 3.6581 |
| Net Realized and Unrealized Gain (Loss) | | | | | |
| on Investments 2 | (. 483) | (5.541) | (2.273) | 11.930 | 15.107 |
| Total from Investment Operations | 3.076 | (1.884) | 2.681 | 15.337 | 18.765 |
| Distributions | | | | | |
| Dividends from Net Investment Income | (3.536) | (4.086) | (4.911) | (5.157) | (4.255) |
| Distributions from Realized Capital Gains | — | — | — | — | — |
| Total Distributions | (3.536) | (4.086) | (4.911) | (5.157) | (4.255) |
| Net Asset Value, End of Period | $107.71 | $108.17 | $114.14 | $116.37 | $106.19 |
| |
| Total Return3 | 2.93% | -1.61% | 2.55% | 14.87% | 21.48% |
| |
| Ratios/Supplemental Data | | | | | |
| Net Assets, End of Period (Millions) | $165 | $167 | $176 | $92 | $61 |
| Ratio of Total Expenses to | | | | | |
| Average Net Assets | 0.13% | 0.16% | 0.22% | 0.24% | 0.29% |
| Ratio of Net Investment Income to | | | | | |
| Average Net Assets | 3.32% | 3.17% | 4.25% | 3.11% | 3.90% |
| Portfolio Turnover Rate 4 | 7% | 12% | 8% | 8% | 10% |
1 Calculated based on average shares outstanding.
2 Includes increases from purchase and redemption fees of $.01, $.00, $.00, $.07, and $.06.
3 Total returns do not include transaction fees that may have applied in the periods shown. Fund prospectuses provide information about any
applicable transaction fees.
4 Excludes the value of portfolio securities received or delivered as a result of in-kind purchases or redemptions of the fund’s capital shares,
including ETF Creation Units.
See accompanying Notes, which are an integral part of the Financial Statements.
29
Global ex-U.S. Real Estate Index Fund
Notes to Financial Statements
Vanguard Global ex-U.S. Real Estate Index Fund is registered under the Investment Company Act of 1940 as an open-end investment company, or mutual fund. The fund invests in securities of foreign issuers, which may subject it to investment risks not normally associated with investing in securities of U.S. corporations. The fund offers four classes of shares: Investor Shares, ETF Shares, Admiral Shares, and Institutional Shares. Investor Shares are available to any investor who meets the fund’s minimum purchase requirements. ETF Shares are listed for trading on Nasdaq; they can be purchased and sold through a broker. Admiral Shares and Institutional Shares are designed for investors who meet certain administrative, service, and account-size criteria.
A. The following significant accounting policies conform to generally accepted accounting principles for U.S. investment companies. The fund consistently follows such policies in preparing its financial statements.
1. Security Valuation: Securities are valued as of the close of trading on the New York Stock Exchange (generally 4 p.m., Eastern time) on the valuation date. Equity securities are valued at the latest quoted sales prices or official closing prices taken from the primary market in which each security trades; such securities not traded on the valuation date are valued at the mean of the latest quoted bid and asked prices. Securities for which market quotations are not readily available, or whose values have been affected by events occurring before the fund’s pricing time but after the close of the securities’ primary markets, are valued at their fair values calculated according to procedures adopted by the board of trustees. These procedures include obtaining quotations from an independent pricing service, monitoring news to identify significant market- or security-specific events, and evaluating changes in the values of foreign market proxies (for example, ADRs, futures contracts, or exchange-traded funds), between the time the foreign markets close and the fund’s pricing time. When fair-value pricing is employed, the prices of securities used by a fund to calculate its net asset value may differ from quoted or published prices for the same securities. Investments in Vanguard Market Liquidity Fund are valued at that fund’s net asset value. Temporary cash investments acquired over 60 days to maturity are valued using the latest bid prices or using valuations based on a matrix system (which considers such factors as security prices, yields, maturities, and ratings), both as furnished by independent pricing services. Other temporary cash investments are valued at amortized cost, which approximates market value.
2. Foreign Currency: Securities and other assets and liabilities denominated in foreign currencies are translated into U.S. dollars using exchange rates obtained from an independent third party as of the fund’s pricing time on the valuation date. Realized gains (losses) and unrealized appreciation (depreciation) on investment securities include the effects of changes in exchange rates since the securities were purchased, combined with the effects of changes in security prices. Fluctuations in the value of other assets and liabilities resulting from changes in exchange rates are recorded as unrealized foreign currency gains (losses) until the assets or liabilities are settled in cash, at which time they are recorded as realized foreign currency gains (losses).
3. Futures Contracts: The fund uses index futures contracts to a limited extent, with the objectives of maintaining full exposure to the stock market, enhancing returns, maintaining liquidity, and minimizing transaction costs. The fund may purchase futures contracts to immediately invest incoming cash in the market, or sell futures in response to cash outflows, thereby simulating a fully invested position
30
Global ex-U.S. Real Estate Index Fund
in the underlying index while maintaining a cash balance for liquidity. The fund may seek to enhance returns by using futures contracts instead of the underlying securities when futures are believed to be priced more attractively than the underlying securities. The primary risks associated with the use of futures contracts are imperfect correlation between changes in market values of stocks held by the fund and the prices of futures contracts, and the possibility of an illiquid market. Counterparty risk involving futures is mitigated because a regulated clearinghouse is the counterparty instead of the clearing broker. To further mitigate counterparty risk, the fund trades futures contracts on an exchange, monitors the financial strength of its clearing brokers and clearinghouse, and has entered into clearing agreements with its clearing brokers. The clearinghouse imposes initial margin requirements to secure the fund’s performance and requires daily settlement of variation margin representing changes in the market value of each contract.
Futures contracts are valued at their quoted daily settlement prices. The aggregate settlement values of the contracts are not recorded in the Statement of Net Assets. Fluctuations in the value of the contracts are recorded in the Statement of Net Assets as an asset (liability) and in the Statement of Operations as unrealized appreciation (depreciation) until the contracts are closed, when they are recorded as realized futures gains (losses).
During the year ended October 31, 2016, the fund’s average investments in long and short futures contracts represented less than 1% and 0% of net assets, respectively, based on the average of aggregate settlement values at each quarter-end during the period.
4. Federal Income Taxes: The fund intends to continue to qualify as a regulated investment company and distribute all of its taxable income. Management has analyzed the fund’s tax positions taken for all open federal income tax years (October 31, 2013–2016), and has concluded that no provision for federal income tax is required in the fund’s financial statements.
5. Distributions: Distributions to shareholders are recorded on the ex-dividend date.
6. Securities Lending: To earn additional income, the fund lends its securities to qualified institutional borrowers. Security loans are subject to termination by the fund at any time, and are required to be secured at all times by collateral in an amount at least equal to the market value of securities loaned. Daily market fluctuations could cause the value of loaned securities to be more or less than the value of the collateral received. When this occurs, the collateral is adjusted and settled on the next business day. The fund further mitigates its counterparty risk by entering into securities lending transactions only with a diverse group of prequalified counterparties, monitoring their financial strength, and entering into master securities lending agreements with its counterparties. The master securities lending agreements provide that, in the event of a counterparty’s default (including bankruptcy), the fund may terminate any loans with that borrower, determine the net amount owed, and sell or retain the collateral up to the net amount owed to the fund; however, such actions may be subject to legal proceedings. While collateral mitigates counterparty risk, in the absence of a default the fund may experience delays and costs in recovering the securities loaned. The fund invests cash collateral received in Vanguard Market Liquidity Fund, and records a liability in the Statement of Net Assets for the return of the collateral, during the period the securities are on loan. Securities lending income
31
Global ex-U.S. Real Estate Index Fund
represents fees charged to borrowers plus income earned on invested cash collateral, less expenses associated with the loan. During the term of the loan, the fund is entitled to all distributions made on or in respect of the loaned securities.
7. Credit Facility: The fund and certain other funds managed by The Vanguard Group (“Vanguard”) participate in a $3.1 billion committed credit facility provided by a syndicate of lenders pursuant to a credit agreement that may be renewed annually; each fund is individually liable for its borrowings, if any, under the credit facility. Borrowings may be utilized for temporary and emergency purposes, and are subject to the fund’s regulatory and contractual borrowing restrictions. The participating funds are charged administrative fees and an annual commitment fee of 0.10% of the undrawn amount of the facility; these fees are allocated to the funds based on a method approved by the fund’s board of trustees and included in Management and Administrative expenses on the fund’s Statement of Operations. Any borrowings under this facility bear interest at a rate based upon the higher of the one-month London Interbank Offered Rate, federal funds effective rate, or overnight bank funding rate plus an agreed-upon spread.
The fund had no borrowings outstanding at October 31, 2016, or at any time during the period then ended.
8. Other: Dividend income is recorded on the ex-dividend date. Interest income includes income distributions received from Vanguard Market Liquidity Fund and is accrued daily. Premiums and discounts on debt securities purchased are amortized and accreted, respectively, to interest income over the lives of the respective securities. Security transactions are accounted for on the date securities are bought or sold. Costs used to determine realized gains (losses) on the sale of investment securities are those of the specific securities sold. Fees assessed on capital share transactions are credited to paid-in capital.
Each class of shares has equal rights as to assets and earnings, except that each class separately bears certain class-specific expenses related to maintenance of shareholder accounts (included in Management and Administrative expenses) and shareholder reporting. Marketing and distribution expenses are allocated to each class of shares based on a method approved by the board of trustees. Income, other non-class-specific expenses, and gains and losses on investments are allocated to each class of shares based on its relative net assets.
B. In accordance with the terms of a Funds’ Service Agreement (the “FSA”) between Vanguard and the fund, Vanguard furnishes to the fund investment advisory, corporate management, administrative, marketing, and distribution services at Vanguard’s cost of operations (as defined by the FSA). These costs of operations are allocated to the fund based on methods and guidelines approved by the board of trustees. Vanguard does not require reimbursement in the current period for certain costs of operations (such as deferred compensation/benefits and risk/insurance costs); the fund’s liability for these costs of operations is included in Payables to Vanguard on the Statement of Net Assets.
Upon the request of Vanguard, the fund may invest up to 0.40% of its net assets as capital in Vanguard. At October 31, 2016, the fund had contributed to Vanguard capital in the amount of $336,000, representing 0.01% of the fund’s net assets and 0.13% of Vanguard’s capitalization. The fund’s trustees and officers are also directors and employees, respectively, of Vanguard.
32
Global ex-U.S. Real Estate Index Fund
C. Various inputs may be used to determine the value of the fund’s investments. These inputs are summarized in three broad levels for financial statement purposes. The inputs or methodologies used to value securities are not necessarily an indication of the risk associated with investing in those securities.
Level 1—Quoted prices in active markets for identical securities.
Level 2—Other significant observable inputs (including quoted prices for similar securities, interest rates, prepayment speeds, credit risk, etc.).
Level 3—Significant unobservable inputs (including the fund’s own assumptions used to determine the fair value of investments).
The following table summarizes the market value of the fund’s investments as of October 31, 2016, based on the inputs used to value them:
| | | |
| | Level 1 | Level 2 | Level 3 |
| Investments | ($000) | ($000) | ($000) |
| Common Stocks | 185,618 | 3,992,833 | 7,916 |
| Temporary Cash Investments | 95,130 | 1,499 | — |
| Futures Contracts—Liabilities1 | (45) | — | — |
| Total | 280,703 | 3,994,332 | 7,916 |
| 1 Represents variation margin on the last day of the reporting period. |
D. At October 31, 2016, the aggregate settlement value of open futures contracts and the related unrealized appreciation (depreciation) were:
| | | | |
| | | | ($000) |
| | | | Aggregate | |
| | | Number of | Settlement | Unrealized |
| | | Long (Short) | Value | Appreciation |
| Futures Contracts | Expiration | Contracts | Long (Short) | (Depreciation) |
| E-mini S&P 500 Index | December 2016 | 242 | 25,653 | (109) |
Unrealized appreciation (depreciation) on open futures contracts is required to be treated as realized gain (loss) for tax purposes.
E. Distributions are determined on a tax basis and may differ from net investment income and realized capital gains for financial reporting purposes. Differences may be permanent or temporary. Permanent differences are reclassified among capital accounts in the financial statements to reflect their tax character. Temporary differences arise when certain items of income, expense, gain, or loss are recognized in different periods for financial statement and tax purposes; such differences are primarily attributed to the tax treatment of unrealized appreciation on passive foreign investment companies. These differences will reverse at some time in the future. Differences in classification may also result from the treatment of short-term gains as ordinary income for tax purposes.
33
Global ex-U.S. Real Estate Index Fund
During the year ended October 31, 2016, the fund realized net foreign currency gains of $414,000, which increased distributable net income for tax purposes; accordingly, such gains have been reclassified from accumulated net realized losses to undistributed net investment income. Certain of the fund’s investments are in securities considered to be passive foreign investment companies, for which any unrealized appreciation and/or realized gains are required to be included in distributable net income for tax purposes. During the year ended October 31, 2016, the fund realized gains on the sale of passive foreign investment companies of $5,412,000, which have been included in current and prior periods’ taxable income; accordingly, such gains have been reclassified from accumulated net realized losses to undistributed net investment income. Passive foreign investment companies held at October 31, 2016, had unrealized appreciation of $85,137,000.
During the year ended October 31, 2016, the fund realized $7,366,000 of net capital gains resulting from in-kind redemptions—in which shareholders exchanged fund shares for securities held by the fund rather than for cash. Because such gains are not taxable to the fund, and are not distributed to shareholders, they have been reclassified from accumulated net realized losses to paid-in capital.
For tax purposes, at October 31, 2016, the fund had $106,465,000 of ordinary income available for distribution. At October 31, 2016, the fund had available capital losses totaling $88,065,000 to offset future net capital gains. Of this amount, $1,948,000 is subject to expiration on October 31, 2019. Capital losses of $86,117,000 realized beginning in fiscal 2012 may be carried forward indefinitely under the Regulated Investment Company Modernization Act of 2010, but must be used before any expiring loss carryforwards.
At October 31, 2016, the cost of investment securities for tax purposes was $4,558,214,000.
Net unrealized depreciation of investment securities for tax purposes was $275,218,000, consisting of unrealized gains of $187,425,000 on securities that had risen in value since their purchase and $462,643,000 in unrealized losses on securities that had fallen in value since their purchase.
F. During the year ended October 31, 2016, the fund purchased $891,251,000 of investment securities and sold $363,507,000 of investment securities, other than temporary cash investments. Purchases and sales include $461,932,000 and $87,712,000, respectively, in connection with in-kind purchases and redemptions of the fund’s capital shares.
34
Global ex-U.S. Real Estate Index Fund
| | | | |
| G. Capital share transactions for each class of shares were: | | | |
| | Year Ended October 31, |
| | 2016 | 2015 |
| | Amount | Shares | Amount | Shares |
| | ($000) | (000) | ($000) | (000) |
| Investor Shares | | | | |
| Issued1 | 9,439 | 444 | 24,542 | 1,092 |
| Issued in Lieu of Cash Distributions | 1,605 | 76 | 1,827 | 85 |
| Redeemed 2 | (9,785) | (462) | (15,742) | (716) |
| Net Increase (Decrease)—Investor Shares | 1,259 | 58 | 10,627 | 461 |
| ETF Shares | | | | |
| Issued1 | 623,142 | 11,610 | 1,249,356 | 22,106 |
| Issued in Lieu of Cash Distributions | — | — | — | — |
| Redeemed 2 | (91,670) | (1,900) | (159,958) | (3,000) |
| Net Increase (Decrease)—ETF Shares | 531,472 | 9,710 | 1,089,398 | 19,106 |
| Admiral Shares | | | | |
| Issued1 | 69,738 | 2,160 | 119,047 | 3,503 |
| Issued in Lieu of Cash Distributions | 9,885 | 310 | 9,915 | 306 |
| Redeemed 2 | (53,677) | (1,680) | (56,434) | (1,716) |
| Net Increase (Decrease)—Admiral Shares | 25,946 | 790 | 72,528 | 2,093 |
| Institutional Shares | | | | |
| Issued1 | 8,742 | 83 | 64,020 | 552 |
| Issued in Lieu of Cash Distributions | 3,610 | 34 | 4,296 | 40 |
| Redeemed 2 | (14,517) | (132) | (61,328) | (592) |
| Net Increase (Decrease)—Institutional Shares | (2,165) | (15) | 6,988 | — |
| 1 Includes purchase fees for fiscal 2016 and 2015 of $266,000 and $611,000, respectively (fund totals). |
| 2 Net of redemption fees for fiscal 2016 and 2015 of $170,000 and $296,000, respectively (fund totals). |
H. Management has determined that no material events or transactions occurred subsequent to October 31, 2016, that would require recognition or disclosure in these financial statements.
35
Report of Independent Registered
Public Accounting Firm
To the Board of Trustees of Vanguard International Equity Index Funds and the Shareholders of Vanguard Global ex-U.S. Real Estate Index Fund:
In our opinion, the accompanying statement of net assets and the related statements of operations and of changes in net assets and the financial highlights present fairly, in all material respects, the financial position of Vanguard Global ex-U.S. Real Estate Index Fund (constituting a separate portfolio of Vanguard International Equity Index Funds, hereafter referred to as the “Fund”) at October 31, 2016, the results of its operations for the year then ended, the changes in its net assets for each of the two years in the period then ended, and the financial highlights for each of the five years in the period then ended, in conformity with accounting principles generally accepted in the United States of America. These financial statements and financial highlights (hereafter referred to as “financial statements”) are the responsibility of the Fund’s management. Our responsibility is to express an opinion on these financial statements based on our audits. We conducted our audits of these financial statements in accordance with the standards of the Public Company Accounting Oversight Board (United States). Those standards require that we plan and perform the audit to obtain reasonable assurance about whether the financial statements are free of material misstatement. An audit includes examining, on a test basis, evidence supporting the amounts and disclosures in the financial statements, assessing the accounting principles used and significant estimates made by management, and evaluating the overall financial statement presentation. We believe that our audits, which included confirmation of securities at October 31, 2016 by correspondence with the custodian and brokers and by agreement to the underlying ownership records of the transfer agent, provide a reasonable basis for our opinion.
/s/PricewaterhouseCoopers LLP
Philadelphia, Pennsylvania
December 15, 2016

Special 2016 tax information (unaudited) for Vanguard Global ex-U.S. Real Estate Index Fund
This information for the fiscal year ended October 31, 2016, is included pursuant to provisions of the
Internal Revenue Code.
The fund distributed $32,065,000 of qualified dividend income to shareholders during the fiscal year.
The fund designates to shareholders foreign source income of $128,192,000 and foreign taxes paid
of $9,403,000. Shareholders will receive more detailed information with their Form 1099-DIV in
January 2017 to determine the calendar-year amounts to be included on their 2016 tax returns.
36
Your Fund’s After-Tax Returns
This table presents returns for your fund both before and after taxes. The after-tax returns are shown in two ways: (1) assuming that an investor owned the fund during the entire period and paid taxes on the fund’s distributions, and (2) assuming that an investor paid taxes on the fund’s distributions and sold all shares at the end of each period.
Calculations are based on the highest individual federal income tax and capital gains tax rates in effect at the times of the distributions and the hypothetical sales. State and local taxes were not considered. After-tax returns reflect any qualified dividend income, using actual prior-year figures and estimates for 2016. (In the example, returns after the sale of fund shares may be higher than those assuming no sale. This occurs when the sale would have produced a capital loss. The calculation assumes that the investor received a tax deduction for the loss.)
The table shows returns for Investor Shares only; returns for other share classes will differ. Please note that your actual after-tax returns will depend on your tax situation and may differ from those shown. Also note that if you own the fund in a tax-deferred account, such as an individual retirement account or a 401(k) plan, this information does not apply to you. Such accounts are not subject to current taxes.
Finally, keep in mind that a fund’s performance—whether before or after taxes—does not guarantee future results.
| | | |
| Average Annual Total Returns: Global ex-U.S. Real Estate Index Fund Investor Shares | |
| Periods Ended October 31, 2016 | | | |
| |
| | | | Since |
| | One | Five | Inception |
| | Year | Years | (11/1/2010) |
| Returns Before Taxes | 2.22% | 7.42% | 4.59% |
| Returns After Taxes on Distributions | 1.07 | 5.99 | 3.37 |
| Returns After Taxes on Distributions and Sale of Fund Shares | 1.45 | 5.31 | 3.14 |
Vanguard fund returns are adjusted to reflect the 0.25% fee on purchases and redemptions.
37
About Your Fund’s Expenses
As a shareholder of the fund, you incur ongoing costs, which include costs for portfolio management, administrative services, and shareholder reports (like this one), among others. Operating expenses, which are deducted from a fund’s gross income, directly reduce the investment return of the fund.
A fund’s expenses are expressed as a percentage of its average net assets. This figure is known as the expense ratio. The following examples are intended to help you understand the ongoing costs (in dollars) of investing in your fund and to compare these costs with those of other mutual funds. The examples are based on an investment of $1,000 made at the beginning of the period shown and held for the entire period.
The accompanying table illustrates your fund’s costs in two ways:
• Based on actual fund return. This section helps you to estimate the actual expenses that you paid over the period. The ”Ending Account Value“ shown is derived from the fund‘s actual return, and the third column shows the dollar amount that would have been paid by an investor who started with $1,000 in the fund. You may use the information here, together with the amount you invested, to estimate the expenses that you paid over the period.
To do so, simply divide your account value by $1,000 (for example, an $8,600 account value divided by $1,000 = 8.6), then multiply the result by the number given for your fund under the heading ”Expenses Paid During Period.“
• Based on hypothetical 5% yearly return. This section is intended to help you compare your fund‘s costs with those of other mutual funds. It assumes that the fund had a yearly return of 5% before expenses, but that the expense ratio is unchanged. In this case—because the return used is not the fund’s actual return—the results do not apply to your investment. The example is useful in making comparisons because the Securities and Exchange Commission requires all mutual funds to calculate expenses based on a 5% return. You can assess your fund’s costs by comparing this hypothetical example with the hypothetical examples that appear in shareholder reports of other funds.
Note that the expenses shown in the table are meant to highlight and help you compare ongoing costs only and do not reflect transaction costs incurred by the fund for buying and selling securities. Further, the expenses do not include any purchase, redemption, or account service fees described in the fund prospectus. If such fees were applied to your account, your costs would be higher. Your fund does not carry a “sales load.”
The calculations assume no shares were bought or sold during the period. Your actual costs may have been higher or lower, depending on the amount of your investment and the timing of any purchases or redemptions.
You can find more information about the fund’s expenses, including annual expense ratios, in the Financial Statements section of this report. For additional information on operating expenses and other shareholder costs, please refer to your fund’s current prospectus.
38
| | | |
| Six Months Ended October 31, 2016 | | | |
| | Beginning | Ending | Expenses |
| | Account Value | Account Value | Paid During |
| Global ex-U.S. Real Estate Index Fund | 4/30/2016 | 10/31/2016 | Period |
| Based on Actual Fund Return | | | |
| Investor Shares | $1,000.00 | $991.52 | $1.70 |
| ETF Shares | 1,000.00 | 992.69 | 0.75 |
| Admiral Shares | 1,000.00 | 992.56 | 0.75 |
| Institutional Shares | 1,000.00 | 992.59 | 0.65 |
| Based on Hypothetical 5% Yearly Return | | | |
| Investor Shares | $1,000.00 | $1,023.43 | $1.73 |
| ETF Shares | 1,000.00 | 1,024.38 | 0.76 |
| Admiral Shares | 1,000.00 | 1,024.38 | 0.76 |
| Institutional Shares | 1,000.00 | 1,024.48 | 0.66 |
The calculations are based on expenses incurred in the most recent six-month period. The fund’s annualized six-month expense ratios for that
period are 0.34% for Investor Shares, 0.15% for ETF Shares, 0.15% for Admiral Shares, and 0.13% for Institutional Shares. The dollar
amounts shown as “Expenses Paid” are equal to the annualized expense ratio multiplied by the average account value over the period,
multiplied by the number of days in the most recent six-month period, then divided by the number of days in the most recent 12-month period
(184/366).
39
Glossary
Beta. A measure of the magnitude of a fund’s past share-price fluctuations in relation to the ups and downs of a given market index. The index is assigned a beta of 1.00. Compared with a given index, a fund with a beta of 1.20 typically would have seen its share price rise or fall by 12% when the index rose or fell by 10%. For this report, beta is based on returns over the past 36 months for both the fund and the index. Note that a fund’s beta should be reviewed in conjunction with its R-squared (see definition). The lower the R-squared, the less correlation there is between the fund and the index, and the less reliable beta is as an indicator of volatility.
Dividend Yield. Dividend income earned by stocks, expressed as a percentage of the aggregate market value (or of net asset value, for a fund). The yield is determined by dividing the amount of the annual dividends by the aggregate value (or net asset value) at the end of the period. For a fund, the dividend yield is based solely on stock holdings and does not include any income produced by other investments. This yield may include some payments that represent a return of capital, capital gains distributions, or both by the underlying stocks.
Earnings Growth Rate. The average annual rate of growth in earnings over the past five years for the stocks now in a fund.
Equity Exposure. A measure that reflects a fund’s investments in stocks and stock futures. Any holdings in short-term reserves are excluded.
Expense Ratio. A fund’s total annual operating expenses expressed as a percentage of the fund’s average net assets. The expense ratio includes management and administrative expenses, but does not include the transaction costs of buying and selling portfolio securities.
Fair-Value Pricing. Fair-value adjustments, which are required by the Securities and Exchange Commission, address pricing discrepancies that may arise because of time-zone differences among global stock markets. Foreign stocks may trade on exchanges that close many hours before a fund’s closing share price is calculated in the United States, generally at 4 p.m., Eastern time. In the hours between the foreign close and the U.S. close, the value of these foreign securities may change—because of company-specific announcements or market-wide developments, for example. Such price changes are not immediately reflected in international index values. Fair-value pricing takes such changes into account in calculating the fund’s daily net asset value, thus ensuring that the NAV doesn’t include “stale” prices. The result can be a temporary divergence between the return of the fund and that of its benchmark index—a difference that usually corrects itself when the foreign markets reopen.
Inception Date. The date on which the assets of a fund (or one of its share classes) are first invested in accordance with the fund’s investment objective. For funds with a subscription period, the inception date is the day after that period ends. Investment performance is measured from the inception date.
Median Market Cap. An indicator of the size of companies in which a fund invests; the midpoint of market capitalization (market price x shares outstanding) of a fund’s stocks, weighted by the proportion of the fund’s assets invested in each stock. Stocks representing half of the fund’s assets have market capitalizations above the median, and the rest are below it.
Price/Book Ratio. The share price of a stock divided by its net worth, or book value, per share. For a fund, the weighted average price/book ratio of the stocks it holds.
40
Price/Earnings Ratio. The ratio of a stock’s current price to its per-share earnings over the past year. For a fund, the weighted average P/E of the stocks it holds. P/E is an indicator of market expectations about corporate prospects; the higher the P/E, the greater the expectations for a company’s future growth.
R-Squared. A measure of how much of a fund’s past returns can be explained by the returns from the market in general, as measured by a given index. If a fund’s total returns were precisely synchronized with an index’s returns, its R-squared would be 1.00. If the fund’s returns bore no relationship to the index’s returns, its R-squared would be 0. For this report, R-squared is based on returns over the past 36 months for both the fund and the index.
Return on Equity. The annual average rate of return generated by a company during the past five years for each dollar of shareholder’s equity (net income divided by shareholder’s equity). For a fund, the weighted average return on equity for the companies whose stocks it holds.
Short-Term Reserves. The percentage of a fund invested in highly liquid, short-term securities that can be readily converted to cash.
Turnover Rate. An indication of the fund’s trading activity. Funds with high turnover rates incur higher transaction costs and may be more likely to distribute capital gains (which may be taxable to investors). The turnover rate excludes in-kind transactions, which have minimal impact on costs.
41
This page intentionally left blank.
This page intentionally left blank.
The People Who Govern Your Fund
The trustees of your mutual fund are there to see that the fund is operated and managed in your best interests since, as a shareholder, you are a part owner of the fund. Your fund’s trustees also serve on the board of directors of The Vanguard Group, Inc., which is owned by the Vanguard funds and provides services to them on an at-cost basis.
A majority of Vanguard’s board members are independent, meaning that they have no affiliation with Vanguard or the funds they oversee, apart from the sizable personal investments they have made as private individuals. The independent board members have distinguished backgrounds in business, academia, and public service. Each of the trustees and executive officers oversees 198 Vanguard funds.
The following table provides information for each trustee and executive officer of the fund. The mailing address of the trustees and officers is P.O. Box 876, Valley Forge, PA 19482. More information about the trustees is in the Statement of Additional Information, which can be obtained, without charge, by contacting Vanguard at 800-662-7447, or online at vanguard.com.
InterestedTrustee1
F. William McNabb III
Born 1957. Trustee Since July 2009. Chairman of
the Board. Principal Occupation(s) During the Past
Five Years and Other Experience: Chairman of the
Board of The Vanguard Group, Inc., and of each of
the investment companies served by The Vanguard
Group, since January 2010; Director of The Vanguard
Group since 2008; Chief Executive Officer and
President of The Vanguard Group, and of each of
the investment companies served by The Vanguard
Group, since 2008; Director of Vanguard Marketing
Corporation; Managing Director of The Vanguard
Group (1995–2008).
IndependentTrustees
Emerson U. Fullwood
Born 1948. Trustee Since January 2008. Principal
Occupation(s) During the Past Five Years and Other
Experience: Executive Chief Staff and Marketing
Officer for North America and Corporate Vice President
(retired 2008) of Xerox Corporation (document manage-
ment products and services); Executive in Residence
and 2009–2010 Distinguished Minett Professor at
the Rochester Institute of Technology; Lead Director
of SPX FLOW, Inc. (multi-industry manufacturing);
Director of the United Way of Rochester, the University
of Rochester Medical Center, Monroe Community
College Foundation, North Carolina A&T University,
and Roberts Wesleyan College.
Rajiv L. Gupta
Born 1945. Trustee Since December 2001.2 Principal
Occupation(s) During the Past Five Years and Other
Experience: Chairman and Chief Executive Officer
(retired 2009) and President (2006–2008) of
Rohm and Haas Co. (chemicals); Director of Tyco
International plc (diversified manufacturing and
services), HP Inc. (printer and personal computer
manufacturing), and Delphi Automotive plc
(automotive components); Senior Advisor at
New Mountain Capital.
Amy Gutmann
Born 1949. Trustee Since June 2006. Principal
Occupation(s) During the Past Five Years and
Other Experience: President of the University of
Pennsylvania; Christopher H. Browne Distinguished
Professor of Political Science, School of Arts and
Sciences, and Professor of Communication, Annenberg
School for Communication, with secondary faculty
appointments in the Department of Philosophy, School
of Arts and Sciences, and at the Graduate School of
Education, University of Pennsylvania; Trustee of the
National Constitution Center; Chair of the Presidential
Commission for the Study of Bioethical Issues.
JoAnn Heffernan Heisen
Born 1950. Trustee Since July 1998. Principal
Occupation(s) During the Past Five Years and
Other Experience: Corporate Vice President and
Chief Global Diversity Officer (retired 2008) and
Member of the Executive Committee (1997–2008)
of Johnson & Johnson (pharmaceuticals/medical
devices/consumer products); Director of Skytop
Lodge Corporation (hotels) and the Robert Wood
Johnson Foundation; Member of the Advisory
Board of the Institute for Women’s Leadership
at Rutgers University.
F. Joseph Loughrey
Born 1949. Trustee Since October 2009. Principal
Occupation(s) During the Past Five Years and Other
Experience: President and Chief Operating Officer
(retired 2009) of Cummins Inc. (industrial machinery);
Chairman of the Board of Hillenbrand, Inc. (specialized
consumer services), and of Oxfam America; Director
of SKF AB (industrial machinery), Hyster-Yale Materials
Handling, Inc. (forklift trucks), the Lumina Foundation
for Education, and the V Foundation for Cancer
Research; Member of the Advisory Council for the
College of Arts and Letters and of the Advisory Board
to the Kellogg Institute for International Studies, both
at the University of Notre Dame.
Mark Loughridge
Born 1953. Trustee Since March 2012. Principal
Occupation(s) During the Past Five Years and Other
Experience: Senior Vice President and Chief Financial
Officer (retired 2013) at IBM (information technology
services); Fiduciary Member of IBM’s Retirement Plan
Committee (2004–2013); Director of the Dow Chemical
Company; Member of the Council on Chicago Booth.
Scott C. Malpass
Born 1962. Trustee Since March 2012. Principal
Occupation(s) During the Past Five Years and Other
Experience: Chief Investment Officer and Vice
President at the University of Notre Dame; Assistant
Professor of Finance at the Mendoza College of
Business at Notre Dame; Member of the Notre Dame
403(b) Investment Committee, the Board of Advisors
for Spruceview Capital Partners, and the Investment
Advisory Committee of Major League Baseball; Board
Member of TIFF Advisory Services, Inc., and Catholic
Investment Services, Inc. (investment advisors).
André F. Perold
Born 1952. Trustee Since December 2004. Principal
Occupation(s) During the Past Five Years and Other
Experience: George Gund Professor of Finance and
Banking, Emeritus at the Harvard Business School
(retired 2011); Chief Investment Officer and Managing
Partner of HighVista Strategies LLC (private investment
firm); Director of Rand Merchant Bank; Overseer of
the Museum of Fine Arts Boston.
Peter F. Volanakis
Born 1955. Trustee Since July 2009. Principal
Occupation(s) During the Past Five Years and
Other Experience: President and Chief Operating
Officer (retired 2010) of Corning Incorporated
(communications equipment); Chairman of the
Board of Trustees of Colby-Sawyer College;
Member of the Advisory Board of the Norris
Cotton Cancer Center.
Executive Officers
Glenn Booraem
Born 1967. Treasurer Since May 2015. Principal
Occupation(s) During the Past Five Years and
Other Experience: Principal of The Vanguard Group,
Inc.; Treasurer of each of the investment companies
served by The Vanguard Group; Controller of each of
the investment companies served by The Vanguard
Group (2010–2015); Assistant Controller of each of
the investment companies served by The Vanguard
Group (2001–2010).
Thomas J. Higgins
Born 1957. Chief Financial Officer Since September
2008. Principal Occupation(s) During the Past Five
Years and Other Experience: Principal of The Vanguard
Group, Inc.; Chief Financial Officer of each of the
investment companies served by The Vanguard Group;
Treasurer of each of the investment companies served
by The Vanguard Group (1998–2008).
Peter Mahoney
Born 1974. Controller Since May 2015. Principal
Occupation(s) During the Past Five Years and Other
Experience: Head of Global Fund Accounting at The
Vanguard Group, Inc.; Controller of each of the invest-
ment companies served by The Vanguard Group;
Head of International Fund Services at The Vanguard
Group (2008–2014).
Anne E. Robinson
Born 1970. Secretary Since September 2016. Principal
Occupation(s) During the Past Five Years and Other
Experience: Managing Director of The Vanguard Group,
Inc.; General Counsel of The Vanguard Group; Secretary
of The Vanguard Group and of each of the investment
companies served by The Vanguard Group; Director
and Senior Vice President of Vanguard Marketing
Corporation; Managing Director and General Counsel
of Global Cards and Consumer Services at Citigroup
(2014–2016); Counsel at American Express (2003–2014).
| |
| Vanguard Senior Management Team |
| Mortimer J. Buckley | James M. Norris |
| Kathleen C. Gubanich | Thomas M. Rampulla |
| Martha G. King | Glenn W. Reed |
| John T. Marcante | Karin A. Risi |
| Chris D. McIsaac | Michael Rollings |
| |
| Chairman Emeritus and Senior Advisor |
| John J. Brennan | |
| Chairman, 1996–2009 | |
| Chief Executive Officer and President, 1996–2008 |
| |
| Founder | |
| John C. Bogle | |
| Chairman and Chief Executive Officer, 1974–1996 |
1 Mr. McNabb is considered an “interested person,” as defined in the Investment Company Act of 1940, because he is an officer of the Vanguard funds.
2 December 2002 for Vanguard Equity Income Fund, the Vanguard Municipal Bond Funds, and the Vanguard State Tax-Exempt Funds.
|  |
| | P.O. Box 2600 |
| | Valley Forge, PA 19482-2600 |
| |
| |
| |
| Connect with Vanguard® > vanguard.com |
| |
| |
| |
| Fund Information > 800-662-7447 | The index is a product of S&P Dow Jones Indices LLC |
| Direct Investor Account Services > 800-662-2739 | (“SPDJI”), and has been licensed for use by Vanguard. |
| | Standard & Poor’s® and S&P® are registered |
| Institutional Investor Services > 800-523-1036 | trademarks of Standard & Poor’s Financial Services LLC |
| Text Telephone for People | (“S&P”); Dow Jones® is a registered trademark of Dow |
| Who Are Deaf or Hard of Hearing > 800-749-7273 | Jones Trademark Holdings LLC (“Dow Jones”); S&P® |
| | and S&P 500® are trademarks of S&P; and these |
| This material may be used in conjunction | trademarks have been licensed for use by SPDJI and |
| with the offering of shares of any Vanguard | sublicensed for certain purposes by Vanguard. |
| fund only if preceded or accompanied by | Vanguard product(s) are not sponsored, endorsed, sold |
| | or promoted by SPDJI, Dow Jones, S&P, or their |
| the fund’s current prospectus. | respective affiliates and none of such parties make any |
| All comparative mutual fund data are from Lipper, a | representation regarding the advisability of investing in |
| Thomson Reuters Company, or Morningstar, Inc., unless | such product(s) nor do they have any liability for any |
| otherwise noted. | errors, omissions, or interruptions of the index. |
| |
| You can obtain a free copy of Vanguard’s proxy voting | |
| guidelines by visiting vanguard.com/proxyreporting or by | |
| calling Vanguard at 800-662-2739. The guidelines are | |
| also available from the SEC’s website, sec.gov. In | |
| addition, you may obtain a free report on how your fund | |
| voted the proxies for securities it owned during the 12 | |
| months ended June 30. To get the report, visit either | |
| vanguard.com/proxyreporting or sec.gov. | |
| |
| You can review and copy information about your fund at | |
| the SEC’s Public Reference Room in Washington, D.C. To | |
| find out more about this public service, call the SEC at | |
| 202-551-8090. Information about your fund is also | |
| available on the SEC’s website, and you can receive | |
| copies of this information, for a fee, by sending a | |
| request in either of two ways: via email addressed to | |
| publicinfo@sec.gov or via regular mail addressed to the | |
| Public Reference Section, Securities and Exchange | |
| Commission, Washington, DC 20549-1520. | |
| |
| | © 2016 The Vanguard Group, Inc. |
| | All rights reserved. |
| | Vanguard Marketing Corporation, Distributor. |
| |
| | Q7380 122016 |
Annual Report | October 31, 2016
Vanguard Emerging Markets Stock
Index Fund
A new format, unwavering commitment
As you begin reading this report, you’ll notice that we’ve made some improvements to the opening sections—based on feedback from you, our clients.
Page 1 starts with a new ”Your Fund’s Performance at a Glance,” a concise, handy summary of how your fund performed during the period.
In the renamed ”Chairman’s Perspective,” Bill McNabb will focus on enduring principles and investment insights.
We’ve modified some tables, and eliminated some redundancy, but we haven’t removed any information.
At Vanguard, we’re always looking for better ways to communicate and to help you make sound investment decisions. Thank you for entrusting your assets to us.
| |
| Contents | |
| Your Fund’s Performance at a Glance. | 1 |
| Chairman’s Perspective. | 3 |
| Fund Profile. | 7 |
| Performance Summary. | 9 |
| Financial Statements. | 12 |
| Your Fund’s After-Tax Returns. | 37 |
| About Your Fund’s Expenses. | 38 |
| Glossary. | 40 |
Please note: The opinions expressed in this report are just that—informed opinions. They should not be considered promises or advice.
Also, please keep in mind that the information and opinions cover the period through the date on the front of this report. Of course, the
risks of investing in your fund are spelled out in the prospectus.
See the Glossary for definitions of investment terms used in this report.
About the cover: No matter what language you speak, Vanguard has one consistent message and set of principles. Our primary
focus is on you, our clients. We conduct our business with integrity as a faithful steward of your assets. This message is shown
translated into seven languages, reflecting our expanding global presence.
Your Fund’s Performance at a Glance
• For the 12 months ended October 31, 2016, Vanguard Emerging Markets Stock Index
Fund closely tracked its target index, returning 10.21% for Investor Shares. The fund’s
result exceeded the 7.71% average annual return of its emerging markets peers.
• Among countries represented in the fund, Brazil had extremely strong returns amid a
sharp rebound in shares of the state-controlled oil company. By contrast, Chinese stocks
were generally weak, as concerns about that country’s economic slowdown persisted.
• In September, your fund completed a previously announced, phased benchmark
transition to the FTSE Emerging Markets All Cap China A Inclusion Index from the FTSE
Emerging Index. The change gives your fund exposure to small-cap companies and China
A-share firms.
• For the ten years ended October 31, 2016, the fund had an annualized return of 3.34%,
in line with its benchmark index and more than a percentage point better than the average
return of peers.
| |
| Total Returns: Fiscal Year Ended October 31, 2016 | |
| | Total |
| | Returns |
| Vanguard Emerging Markets Stock Index Fund | |
| Investor Shares | 10.21% |
| FTSE Emerging Markets ETF Shares | |
| Market Price | 11.00 |
| Net Asset Value | 10.47 |
| Admiral™ Shares | 10.41 |
| Institutional Shares | 10.42 |
| Institutional Plus Shares | 10.48 |
| Spliced Emerging Markets Index | 10.10 |
| Emerging Markets Funds Average | 7.71 |
For a benchmark description, see the Glossary.
Emerging Markets Funds Average: Derived from data provided by Lipper, a Thomson Reuters Company.
Admiral Shares carry lower expenses and are available to investors who meet certain account-balance requirements. Institutional Shares and
Institutional Plus Shares are available to certain institutional investors who meet specific administrative, service, and account-size criteria.
The Vanguard ETF® Shares shown are traded on the NYSE Arca exchange and are available only through brokers. The table provides ETF
returns based on both the NYSE Arca market price and the net asset value for a share. U.S. Pat. Nos. 6,879,964; 7,337,138; 7,720,749;
7,925,573; 8,090,646; and 8,417,623.
For the ETF Shares, the market price is determined by the midpoint of the bid-offer spread as of the closing time of the New York Stock
Exchange (generally 4 p.m., Eastern time). The net asset value is also determined as of the NYSE closing time. For more information about
how the ETF Shares' market prices have compared with their net asset value, visit vanguard.com, select your ETF, and then select the Price
and Performance tab. The ETF premium/discount analysis there shows the percentages of days on which the ETF Shares' market price was
above or below the NAV.
1
| |
| Total Returns: Ten Years Ended October 31, 2016 | |
| | Average |
| | Annual Return |
| Emerging Markets Stock Index Fund Investor Shares | 3.34% |
| Spliced Emerging Markets Index | 3.64 |
| Emerging Markets Funds Average | 2.29 |
| For a benchmark description, see the Glossary. |
| Emerging Markets Funds Average: Derived from data provided by Lipper, a Thomson Reuters Company. |
The figures shown represent past performance, which is not a guarantee of future results. (Current performance may be lower or higher than the performance data cited. For performance data current to the most recent month-end, visit our website at vanguard.com/performance.) Note, too, that both investment returns and principal value can fluctuate widely, so an investor’s shares, when sold, could be worth more or less than their original cost.
| | | | | | |
| Expense Ratios | | | | | | |
| Your Fund Compared With Its Peer Group | | | | | |
| | Investor | ETF | Admiral | Institutional | Institutional | Peer Group |
| | Shares | Shares | Shares | Shares | Plus Shares | Average |
| Emerging Markets Stock Index | | | | | | |
| Fund | 0.33% | 0.15% | 0.15% | 0.12% | 0.10% | 1.54% |
The fund expense ratios shown are from the prospectus dated February 26, 2016, and represent estimated costs for the current fiscal year.
For the fiscal year ended October 31, 2016, the fund’s expense ratios were 0.32% for Investor Shares, 0.14% for FTSE Emerging Markets ETF
Shares, 0.14% for Admiral Shares, 0.11% for Institutional Shares, and 0.09% for Institutional Plus Shares. The peer-group expense ratio is
derived from data provided by Lipper, a Thomson Reuters Company, and captures information through year-end 2015.
Peer group: Emerging Markets Funds.
2
Chairman’s Perspective

Bill McNabb
Chairman and Chief Executive Officer
Dear Shareholder,
Over the three years ended August 31, 2016, investors poured more than $1 trillion into index funds. Indexing now accounts for nearly a third of all mutual fund assets—more than double what it did a decade ago and eight times its share two decades ago.1
By contrast, active management’s commercial struggles have reflected its disappointing investment performance. Over the decade ended December 31, 2015, 82% of actively managed stock funds and 81% of active bond funds have either underperformed their benchmarks or shut down.
This subpar performance has fueled the explosion of asset growth in indexing among individual, retirement, and nonprofit investors. So what might the trend mean for the future of actively managed funds?
Our research and experience indicate that active management can survive—and even succeed—but only if it’s offered at much lower expense.
High costs, which limit a manager’s ability to deliver benchmark-beating returns to clients, are the biggest reason why active has lagged. Industrywide as of December 31, 2015, the average expense ratio for all active stock funds is 1.14%, compared with 0.76% for stock index
1 Sources: Wall Street Journal; Morningstar, Inc.; and Investment Company Institute, 2016.
3
funds. And the expense advantage is even wider for bonds; the average expense ratio for an active bond fund is 0.93%, compared with 0.43% for bond index funds.
But even these big differences understate the real gap. These days, it’s not hard to find an index fund that charges maybe 0.05% or 0.10%. So even if you have identified active managers who are skilled at selecting stocks and bonds, to match the return of a comparable (much cheaper) index fund would require significant outperformance. Think about it. Any fund that charges 1.00% in expenses—not even the high end of the range—will find it extraordinarily difficult to overcome the index fund’s head start.
Active management also has taken a hit from a regulatory environment that has been favorable to low-cost strategies. The U.S. Department of Labor several years ago mandated greater disclosure of retirement plan fees. And its new fiduciary rule, which is set to take effect in April, requires financial advisors to demonstrate that their recommendations are aligned with their clients’ best interest. Both changes encourage the use of lower-cost investments, including index funds.
The future of active management
In light of all this, people have been asking me whether active management is “dead.” My response is both yes and no. High-cost active management is dead, and rightly so. It has never been a winning proposition
| | | |
| Market Barometer | | | |
| | Average Annual Total Returns |
| | Periods Ended October 31, 2016 |
| | One | Three | Five |
| | Year | Years | Years |
| Stocks | | | |
| Russell 1000 Index (Large-caps) | 4.26% | 8.48% | 13.51% |
| Russell 2000 Index (Small-caps) | 4.11 | 4.12 | 11.51 |
| Russell 3000 Index (Broad U.S. market) | 4.24 | 8.13 | 13.35 |
| FTSE All-World ex US Index (International) | 0.64 | -0.94 | 4.09 |
| |
| Bonds | | | |
| Bloomberg Barclays U.S. Aggregate Bond Index | | | |
| (Broad taxable market) | 4.37% | 3.48% | 2.90% |
| Bloomberg Barclays Municipal Bond Index | | | |
| (Broad tax-exempt market) | 4.06 | 4.89 | 4.34 |
| Citigroup Three-Month U.S. Treasury Bill Index | 0.22 | 0.07 | 0.07 |
| |
| CPI | | | |
| Consumer Price Index | 1.64% | 1.15% | 1.32% |
4
for investors. Low-cost active funds, though, can potentially play an important role for investors who seek to outperform the market.
Paying less for your funds is the only sure-fire way to improve your odds of achieving success in active management. But even if you have found an active manager with low costs, the odds of outperforming the market are still long. You have to be able to identify talented stock and bond portfolio managers with long time horizons and clear investment strategies. Look for managers with consistent track records and the discipline to stick closely to their investment strategy.
Know what you own and why
Despite the well-deserved reputation of indexing and the challenges for active managers, there’s still a place for traditional active strategies that are low-cost, diversified, and highly disciplined, and are run by talented managers who focus on the long term.
Vanguard has always applied these principles to our active strategies, and investors have benefited as a majority of our active funds outperformed their benchmarks and bested their peers’ average annual return over the ten years ended September 30, 2016.
|
| Worried about the election’s impact on your portfolio? |
|
| The 2016 presidential election season was |
| one of the most intense and unpredictable |
| in U.S. history. In its aftermath, investors |
| may be left with lingering questions about |
| what the outcome will mean for their |
| portfolios. The answer, based on Vanguard |
| research into decades of historical data, is |
| that presidential elections typically have no |
| long-term effect on market performance. |
| |
| These findings hold true regardless of the |
| market’s initial reaction. Whether there’s |
| a swoon or bounce immediately after an |
| election, investors shouldn’t extrapolate |
| that performance to the long term. |
| |
| As you can see in the accompanying chart, |
| data going back to 1853 show that stock |
| market returns are virtually identical no matter |
| which party controls the White House. |
| Although headlines out of Washington at any |
| given time may still cause concern, investors |
| shouldn’t overreact to short-term events. |
| Instead, it’s best to maintain a balanced and |
| diversified portfolio and stay focused on your |
| long-term goals. |
| |
| Average annual stock market returns based |
| on party control of the White House |
| (1853–2015) |
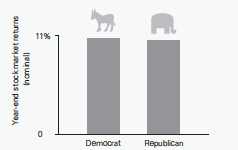
| Sources: Global Financial Data, 1853–1926; Morningstar, Inc., |
| and Ibbotson Associates thereafter through 2015. |
5
But it’s crucial for investors to be patient. Even active managers with the best track records frequently underperform their benchmarks when their investment styles are out of favor. Such periods, though temporary, can persist. So it’s important when entrusting your assets to an active strategy to be in it for the long haul.
Make sure you know what you’re buying and what the risks are. Active strategies are becoming more complex, so it’s important to clearly understand what the investments in your portfolio are designed to accomplish and why you want to hold them. Otherwise, you run the risk of selecting strategies that don’t fit your needs or objectives.
Keeping these considerations in mind can potentially boost your chances of success in identifying active strategies that may be able to help you reach your goals.
As always, thank you for investing with Vanguard.
Sincerely,
F. William McNabb III
Chairman and Chief Executive Officer
November 9, 2016
6
Emerging Markets Stock Index Fund
Fund Profile
As of October 31, 2016
| | | | | |
| Share-Class Characteristics | | | | | |
| | | FTSE | | | |
| | | Emerging | | | |
| | Investor | Markets ETF | Admiral | Institutional | Institutional |
| | Shares | Shares | Shares | Shares | Plus Shares |
| Ticker Symbol | VEIEX | VWO | VEMAX | VEMIX | VEMRX |
| Expense Ratio1 | 0.33% | 0.15% | 0.15% | 0.12% | 0.10% |
| | | |
| Portfolio Characteristics | | |
| | | FTSE | |
| | | Emerging | |
| | | Markets | FTSE |
| | | All Cap | Global |
| | | China A | All Cap |
| | | Inclusion | ex US |
| | Fund | Index | Index |
| Number of Stocks | 4,293 | 3,658 | 5,783 |
| Median Market Cap | $12.2B | $12.2B | $21.0B |
| Price/Earnings Ratio | 19.1x | 19.9x | 20.8x |
| Price/Book Ratio | 1.7x | 1.7x | 1.6x |
| Return on Equity | 16.7% | 16.7% | 14.3% |
| Earnings Growth | | | |
| Rate | 9.4% | 9.6% | 7.4% |
| Dividend Yield | 2.6% | 2.7% | 3.0% |
| Turnover Rate | 13% | — | — |
| Short-Term Reserves | 0.0% | — | — |
| | | |
| Sector Diversification (% of equity exposure) |
| | | FTSE | |
| | | Emerging | |
| | | Markets | FTSE |
| | | All Cap | Global |
| | | China A | All Cap |
| | | Inclusion | ex US |
| | Fund | Index | Index |
| Basic Materials | 7.4% | 7.4% | 7.8% |
| Consumer Goods | 10.5 | 10.5 | 16.2 |
| Consumer Services | 7.9 | 7.9 | 8.6 |
| Financials | 29.1 | 29.1 | 25.2 |
| Health Care | 3.3 | 3.3 | 7.7 |
| Industrials | 11.8 | 11.9 | 14.7 |
| Oil & Gas | 7.9 | 7.9 | 6.5 |
| Technology | 12.5 | 12.4 | 5.6 |
| Telecommunications | 5.7 | 5.8 | 4.2 |
| Utilities | 3.9 | 3.8 | 3.5 |
| | |
| Volatility Measures | | |
| | Spliced | FTSE Global |
| | Emerging | All Cap ex US |
| | Mkts Index | Index |
| R-Squared | 0.99 | 0.71 |
| Beta | 0.99 | 1.10 |
| These measures show the degree and timing of the fund’s fluctuations compared with the indexes over 36 months. |
| | |
| Ten Largest Holdings (% of total net assets) |
| Taiwan Semiconductor | | |
| Manufacturing Co. Ltd. | Semiconductors | 3.5% |
| Tencent Holdings Ltd. | Internet | 3.4 |
| Naspers Ltd. | Broadcasting & | |
| | Entertainment | 1.7 |
| China Construction Bank | | |
| Corp. | Banks | 1.6 |
| China Mobile Ltd. | Mobile | |
| | Telecommunications | 1.5 |
| Petroleo Brasileiro SA | Integrated Oil & Gas | 1.1 |
| Industrial & Commercial | | |
| Bank of China Ltd. | Banks | 1.1 |
| Hon Hai Precision | Electrical | |
| Industry Co. Ltd. | Components & | |
| | Equipment | 1.0 |
| Itau Unibanco Holding | | |
| SA | Banks | 1.0 |
| Banco Bradesco SA | Banks | 0.9 |
| Top Ten | | 16.8% |
| The holdings listed exclude any temporary cash investments and equity index products. |
1 The expense ratios shown are from the prospectus dated February 26, 2016, and represent estimated costs for the current fiscal year. For the fiscal
year ended October 31, 2016, the expense ratios were 0.32% for Investor Shares, 0.14% for FTSE Emerging Markets ETF Shares, 0.14% for Admiral
Shares, 0.11% for Institutional Shares, and 0.09% for Institutional Plus Shares.
7
Emerging Markets Stock Index Fund
| | | |
| Market Diversification (% of equity exposure) |
| | | FTSE | |
| | | Emerging | |
| | | Markets | FTSE |
| | | All Cap | Global |
| | | China A | All Cap |
| | | Inclusion | ex US |
| | Fund | Index | Index |
| Europe | | | |
| Other | 0.5% | 0.4% | 42.2% |
| Pacific | | | |
| Other | 0.1% | 0.0% | 30.7% |
| Emerging Markets | | | |
| China | 27.9% | 27.9% | 4.7% |
| Taiwan | 15.5 | 15.5 | 3.2 |
| India | 11.8 | 11.8 | 2.5 |
| Brazil | 9.2 | 9.3 | 1.9 |
| South Africa | 7.8 | 7.9 | 1.7 |
| Mexico | 4.3 | 4.3 | 0.9 |
| Thailand | 3.9 | 3.9 | 0.8 |
| Russia | 3.9 | 3.9 | 0.8 |
| Malaysia | 3.6 | 3.7 | 0.8 |
| Indonesia | 2.8 | 2.8 | 0.6 |
| Philippines | 1.6 | 1.6 | 0.3 |
| Chile | 1.3 | 1.3 | 0.3 |
| Turkey | 1.3 | 1.3 | 0.3 |
| Poland | 1.3 | 1.2 | 0.3 |
| United Arab | | | |
| Emirates | 1.0 | 1.0 | 0.2 |
| Other | 1.7 | 1.7 | 0.4 |
| Subtotal | 98.9% | 99.1% | 19.7% |
| North America | 0.0% | 0.0% | 6.9% |
| Middle East | | | |
| Other | 0.5% | 0.5% | 0.5% |
8
Emerging Markets Stock Index Fund
Performance Summary
All of the returns in this report represent past performance, which is not a guarantee of future results that may be achieved by the fund. (Current performance may be lower or higher than the performance data cited. For performance data current to the most recent month-end, visit our website at vanguard.com/performance.) Note, too, that both investment returns and principal value can fluctuate widely, so an investor’s shares, when sold, could be worth more or less than their original cost. The returns shown do not reflect taxes that a shareholder would pay on fund distributions or on the sale of fund shares.
Cumulative Performance: October 31, 2006, Through October 31, 2016
Initial Investment of $10,000
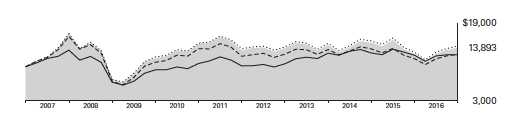
| | | | | |
| | | Average Annual Total Returns | |
| | | Periods Ended October 31, 2016 | |
| | | | | | Final Value |
| | | One | Five | Ten | of a $10,000 |
| | | Year | Years | Years | Investment |
| | Emerging Markets Stock Index | | | | |
| | Fund*Investor Shares | 10.21% | 0.81% | 3.34% | $13,893 |
| • • • • • • • • | Spliced Emerging Markets Index | 10.10 | 0.84 | 3.64 | 14,298 |
| |
| – – – – | Emerging Markets Funds Average | 7.71 | 0.64 | 2.29 | 12,547 |
| | FTSE Global All Cap ex US Index | 0.92 | 4.20 | 2.24 | 12,478 |
| For a benchmark description, see the Glossary. |
| Emerging Markets Funds Average: Derived from data provided by Lipper, a Thomson Reuters Company. |
| | | | |
| | | | | Final Value |
| | One | Five | Ten | of a $10,000 |
| | Year | Years | Years | Investment |
| FTSE Emerging Markets | | | | |
| ETF Shares Net Asset Value | 10.47% | 1.00% | 3.50% | $14,105 |
| Spliced Emerging Markets Index | 10.10 | 0.84 | 3.64 | 14,298 |
| FTSE Global All Cap ex US Index | 0.92 | 4.20 | 2.24 | 12,478 |
See Financial Highlights for dividend and capital gains information.
9
Emerging Markets Stock Index Fund
| | | | |
| | Average Annual Total Returns | |
| | Periods Ended October 31, 2016 | |
| |
| | | | | Final Value |
| | One | Five | Ten | of a $10,000 |
| | Year | Years | Years | Investment |
| Emerging Markets Stock Index Fund Admiral | | | | |
| Shares | 10.41% | 0.99% | 3.50% | $14,101 |
| Spliced Emerging Markets Index | 10.10 | 0.84 | 3.64 | 14,298 |
| FTSE Global All Cap ex US Index | 0.92 | 4.20 | 2.24 | 12,478 |
| | | | |
| | | | | Final Value |
| | One | Five | Ten | of a $5,000,000 |
| | Year | Years | Years | Investment |
| Emerging Markets Stock Index Fund | | | | |
| Institutional Shares | 10.42% | 1.02% | 3.54% | $7,083,305 |
| |
| Spliced Emerging Markets Index | 10.10 | 0.84 | 3.64 | 7,148,756 |
| |
| FTSE Global All Cap ex US Index | 0.92 | 4.20 | 2.24 | 6,238,904 |
| | | | |
| | | | Since | Final Value |
| | One | Five | Inception | of a $100,000,000 |
| | Year | Years | (12/15/2010) | Investment |
| Emerging Markets Stock Index Fund | | | | |
| Institutional Plus Shares | 10.48% | 1.05% | -0.89% | $94,857,950 |
| Spliced Emerging Markets Index | 10.10 | 0.84 | -0.89 | 91,300,862 |
| FTSE Global All Cap ex US Index | 0.92 | 4.20 | 2.38 | 114,801,984 |
| "Since Inception" performance is calculated from the Institutional Plus Shares’ inception date for both the fund and its comparative standards. |
| | | |
| Cumulative Returns of ETF Shares: October 31, 2006, Through October 31, 2016 | | |
| | One | Five | Ten |
| | Year | Years | Years |
| FTSE Emerging Markets ETF Shares Market Price | 11.00% | 5.80% | 39.76% |
| FTSE Emerging Markets ETF Shares Net Asset | | | |
| Value | 10.47 | 5.09 | 41.05 |
| Spliced Emerging Markets Index | 10.10 | 4.29 | 42.98 |
10
Emerging Markets Stock Index Fund
Fiscal-Year Total Returns (%): October 31, 2006, Through October 31, 2016

For a benchmark description, see the Glossary.
Average Annual Total Returns: Periods Ended September 30, 2016
This table presents returns through the latest calendar quarter—rather than through the end of the fiscal period.
Securities and Exchange Commission rules require that we provide this information.
| | | | |
| | Inception | One | Five | Ten |
| | Date | Year | Years | Years |
| Investor Shares | 5/4/1994 | 15.62% | 3.27% | 3.76% |
| FTSE Emerging Markets ETF | | | | |
| Shares | 3/4/2005 | | | |
| Market Price | | 16.66 | 4.08 | 3.91 |
| Net Asset Value | | 15.83 | 3.44 | 3.91 |
| Admiral Shares | 6/23/2006 | 15.84 | 3.44 | 3.91 |
| Institutional Shares | 6/22/2000 | 15.86 | 3.48 | 3.95 |
| Institutional Plus Shares | 12/15/2010 | 15.88 | 3.50 | -1.021 |
| 1 Return since inception. |
11
Emerging Markets Stock Index Fund
Financial Statements
Statement of Net Assets—Investments Summary
As of October 31, 2016
This Statement summarizes the fund’s holdings by asset type. Details are reported for each of the fund’s 50 largest individual holdings and for investments that, in total for any issuer, represent more than 1% of the fund’s net assets. The total value of smaller holdings is reported as a single amount within each category.
The fund reports a complete list of its holdings in regulatory filings four times in each fiscal year, at the quarter-ends. For the second and fourth fiscal quarters, the complete listing of the fund’s holdings is available electronically on vanguard.com and on the Securities and Exchange Commission’s website (sec.gov), or you can have it mailed to you without charge by calling 800-662-7447. For the first and third fiscal quarters, the fund files the lists with the SEC on Form N-Q. Shareholders can look up the fund’s Forms N-Q on the SEC’s website. Forms N-Q may also be reviewed and copied at the SEC’s Public Reference Room (see the back cover of this report for further information).
| | | |
| | | Market | Percentage |
| | | Value• | of Net |
| | Shares | ($000) | Assets |
| Common Stocks | | | |
| Brazil | | | |
| Itau Unibanco Holding SA Preference Shares | 27,781,186 | 334,210 | 0.5% |
| Ambev SA | 52,785,855 | 311,390 | 0.5% |
| * Petroleo Brasileiro SA | 48,210,897 | 281,532 | 0.5% |
| Banco Bradesco SA Preference Shares | 26,049,295 | 272,897 | 0.4% |
| * Petroleo Brasileiro SA Preference Shares | 47,865,186 | 265,268 | 0.4% |
| Itau Unibanco Holding SA ADR | 19,605,348 | 233,892 | 0.4% |
| Itausa - Investimentos Itau SA Preference Shares | 58,123,729 | 171,895 | 0.3% |
| * Petroleo Brasileiro SA ADR (XNYS) Preference Shares | 8,139,235 | 90,020 | 0.1% |
| * Petroleo Brasileiro SA ADR (XNYS) | 4,172,883 | 48,698 | 0.1% |
| Itau Unibanco Holding SA | 2,879,395 | 30,075 | 0.0% |
| Itausa - Investimentos Itau SA | 51,353 | 143 | 0.0% |
| 1 Brazil—Other † | | 3,664,488 | 5.9% |
| | | 5,704,508 | 9.1% |
| |
| Chile † | | 853,931 | 1.4% |
| |
| China | | | |
| Tencent Holdings Ltd. | 80,402,164 | 2,130,845 | 3.4% |
| China Construction Bank Corp. | 1,361,995,111 | 994,593 | 1.6% |
| China Mobile Ltd. | 79,235,456 | 907,753 | 1.5% |
| Industrial & Commercial Bank of China Ltd. | 1,113,554,240 | 668,399 | 1.1% |
| Bank of China Ltd. | 1,161,352,650 | 520,425 | 0.8% |
| Ping An Insurance Group Co. of China Ltd. | 80,050,946 | 421,350 | 0.7% |
| CNOOC Ltd. | 238,545,705 | 300,156 | 0.5% |
| China Petroleum & Chemical Corp. | 393,698,659 | 284,723 | 0.5% |
| China Life Insurance Co. Ltd. (XHKG) | 112,979,287 | 279,707 | 0.5% |
| PetroChina Co. Ltd. | 312,836,155 | 214,054 | 0.4% |
| Agricultural Bank of China Ltd. | 434,111,065 | 182,618 | 0.3% |
| China Overseas Land & Investment Ltd. | 57,620,178 | 176,888 | 0.3% |
| China Telecom Corp. Ltd. | 242,161,271 | 124,849 | 0.2% |
12
| | | | |
| Emerging Markets Stock Index Fund | | | |
| |
| |
| |
| | | | Market | Percentage |
| | | | Value• | of Net |
| | | Shares | ($000) | Assets |
| | China Shenhua Energy Co. Ltd. | 54,170,270 | 112,307 | 0.2% |
| | PICC Property & Casualty Co. Ltd. | 67,580,295 | 109,082 | 0.2% |
| | CITIC Ltd. | 74,223,897 | 106,509 | 0.2% |
| | China Resources Land Ltd. | 41,274,696 | 102,507 | 0.2% |
| | China Unicom Hong Kong Ltd. | 86,542,017 | 101,602 | 0.2% |
| | Sinopharm Group Co. Ltd. | 16,284,700 | 79,079 | 0.1% |
| | China Communications Construction Co. Ltd. | 71,048,276 | 78,015 | 0.1% |
| | China CITIC Bank Corp. Ltd. | 120,554,719 | 77,750 | 0.1% |
| | CRRC Corp. Ltd. | 69,624,277 | 63,040 | 0.1% |
| 1 | China Galaxy Securities Co. Ltd. | 58,479,870 | 55,520 | 0.1% |
| | China Cinda Asset Management Co. Ltd. | 152,160,000 | 54,664 | 0.1% |
| * | China Resources Beer Holdings Co. Ltd. | 25,215,499 | 53,585 | 0.1% |
| | China Resources Power Holdings Co. Ltd. | 29,989,048 | 50,812 | 0.1% |
| | China Railway Group Ltd. | 64,864,408 | 50,000 | 0.1% |
| | China Merchants Port Holdings Co. Ltd. | 18,595,610 | 48,078 | 0.1% |
| | Dongfeng Motor Group Co. Ltd. | 45,270,744 | 47,185 | 0.1% |
| 1 | CGN Power Co. Ltd. | 160,659,878 | 46,905 | 0.1% |
| * | China Taiping Insurance Holdings Co. Ltd. | 23,268,820 | 44,785 | 0.1% |
| 1 | People’s Insurance Co. Group of China Ltd. | 105,149,000 | 41,779 | 0.1% |
| | China Railway Construction Corp. Ltd. | 32,296,265 | 40,371 | 0.1% |
| | China State Construction International Holdings Ltd. | 27,442,872 | 40,035 | 0.1% |
| | China Longyuan Power Group Corp. Ltd. | 51,834,660 | 39,521 | 0.1% |
| | Zhuzhou CRRC Times Electric Co. Ltd. | 7,782,500 | 37,631 | 0.1% |
| | China Resources Gas Group Ltd. | 11,428,100 | 35,834 | 0.1% |
| | Kunlun Energy Co. Ltd. | 46,321,230 | 34,901 | 0.1% |
| | China Oilfield Services Ltd. | 31,941,800 | 30,657 | 0.1% |
| | Sinopec Shanghai Petrochemical Co. Ltd. | 57,364,788 | 29,242 | 0.1% |
| *,^,1 China Huarong Asset Management Co. Ltd. | 73,402,000 | 28,061 | 0.1% |
| | Beijing Capital International Airport Co. Ltd. | 24,969,081 | 26,132 | 0.1% |
| | AviChina Industry & Technology Co. Ltd. | 37,443,000 | 25,410 | 0.1% |
| | Huaneng Renewables Corp. Ltd. | 64,942,000 | 21,761 | 0.0% |
| | Chongqing Changan Automobile Co. Ltd. Class B | 14,142,062 | 21,563 | 0.0% |
| *,^ | China Coal Energy Co. Ltd. | 37,583,800 | 21,277 | 0.0% |
| | China Jinmao Holdings Group Ltd. | 71,106,094 | 19,607 | 0.0% |
| | Air China Ltd. | 29,018,748 | 19,066 | 0.0% |
| 1 | Sinopec Engineering Group Co. Ltd. | 20,204,772 | 17,838 | 0.0% |
| | China Southern Airlines Co. Ltd. | 31,218,000 | 17,519 | 0.0% |
| | China Power International Development Ltd. | 46,674,469 | 16,973 | 0.0% |
| ^,1 | China Railway Signal & Communication Corp. Ltd. | 20,740,400 | 16,817 | 0.0% |
| | Metallurgical Corp. of China Ltd. | 47,542,937 | 15,459 | 0.0% |
| *,^ | China COSCO Holdings Co. Ltd. | 43,008,000 | 14,819 | 0.0% |
| | Sinotrans Ltd. | 30,905,000 | 14,553 | 0.0% |
| * | China Agri-Industries Holdings Ltd. | 35,587,961 | 13,908 | 0.0% |
| | China Resources Cement Holdings Ltd. | 33,444,686 | 13,505 | 0.0% |
| * | China Construction Bank Corp. Class A | 16,697,218 | 12,956 | 0.0% |
| | China Merchants Shekou Industrial Zone Holdings Co. Ltd. Class A | 5,050,130 | 12,628 | 0.0% |
| ^ | China Reinsurance Group Corp. | 49,853,000 | 11,866 | 0.0% |
| | Shenwan Hongyuan Group Co. Ltd. Class A | 12,122,481 | 11,530 | 0.0% |
| ^ | China Eastern Airlines Corp. Ltd. | 25,606,000 | 11,497 | 0.0% |
| | China State Construction Engineering Corp. Ltd. Class A (XSSC) | 10,651,095 | 11,275 | 0.0% |
| | Huadian Fuxin Energy Corp. Ltd. | 43,759,852 | 10,133 | 0.0% |
| | Agricultural Bank of China Ltd. Class A (XSHG) | 20,559,300 | 9,587 | 0.0% |
| *,^ | Angang Steel Co. Ltd. | 18,440,374 | 9,443 | 0.0% |
| | China National Accord Medicines Corp. Ltd. Class B | 1,404,917 | 8,780 | 0.0% |
| * | Industrial & Commercial Bank of China Ltd. Class A | 12,670,959 | 8,285 | 0.0% |
| * | PetroChina Co. Ltd. Class A | 7,591,886 | 8,215 | 0.0% |
13
| | | | |
| Emerging Markets Stock Index Fund | | | |
| |
| |
| |
| | | | Market | Percentage |
| | | | Value• | of Net |
| | | Shares | ($000) | Assets |
| * | Bank of China Ltd. Class A | 15,736,100 | 7,871 | 0.0% |
| | Shanghai Baosight Software Co. Ltd. Class B | 4,312,026 | 7,472 | 0.0% |
| | China BlueChemical Ltd. | 34,769,405 | 6,721 | 0.0% |
| | China State Construction Engineering Corp. Ltd. Class A (XSHG) | 6,181,400 | 6,543 | 0.0% |
| | China Merchants Securities Co. Ltd. Class A (XSSC) | 2,453,174 | 6,492 | 0.0% |
| ^ | CSSC Offshore and Marine Engineering Group Co. Ltd. | 4,292,000 | 6,470 | 0.0% |
| ^ | Sinopec Kantons Holdings Ltd. | 13,467,000 | 6,314 | 0.0% |
| * | China Petroleum & Chemical Corp. Class A | 8,034,099 | 5,931 | 0.0% |
| | China Foods Ltd. | 12,991,506 | 5,742 | 0.0% |
| *,^ | CITIC Resources Holdings Ltd. | 45,704,000 | 5,703 | 0.0% |
| | China Machinery Engineering Corp. | 9,487,639 | 5,661 | 0.0% |
| | Shenzhen Overseas Chinese Town Co. Ltd. Class A | 5,511,821 | 5,633 | 0.0% |
| | CRRC Corp. Ltd. Class A (XSHG) | 3,879,500 | 5,335 | 0.0% |
| | China National Nuclear Power Co. Ltd. Class A | 5,319,107 | 5,302 | 0.0% |
| | Cinda Real Estate Co. Ltd. Class A (XSSC) | 4,878,719 | 5,214 | 0.0% |
| | AVIC Aircraft Co. Ltd. Class A | 1,540,402 | 5,072 | 0.0% |
| | CRRC Corp. Ltd. Class A (XSSC) | 3,574,774 | 4,916 | 0.0% |
| | China Railway Group Ltd. Class A (XSSC) | 3,857,814 | 4,783 | 0.0% |
| * | China Shipbuilding Industry Co. Ltd. Class A (XSSC) | 4,957,752 | 4,767 | 0.0% |
| | China National Materials Co. Ltd. | 20,269,000 | 4,562 | 0.0% |
| ^ | China Overseas Property Holdings Ltd. | 22,090,092 | 4,479 | 0.0% |
| | Agricultural Bank of China Ltd. Class A (XSSC) | 9,440,500 | 4,402 | 0.0% |
| | China International Travel Service Corp. Ltd. Class A | 658,141 | 4,378 | 0.0% |
| ^ | Sinofert Holdings Ltd. | 32,824,000 | 4,307 | 0.0% |
| | China United Network Communications Ltd. Class A (XSSC) | 5,497,924 | 4,160 | 0.0% |
| | China Railway Group Ltd. Class A (XSHG) | 3,248,829 | 4,028 | 0.0% |
| | Dah Chong Hong Holdings Ltd. | 9,481,000 | 3,965 | 0.0% |
| | Chongqing Changan Automobile Co. Ltd. Class A | 1,695,900 | 3,918 | 0.0% |
| | China Resources Sanjiu Medical & Pharmaceutical Co. Ltd. Class A | 974,679 | 3,866 | 0.0% |
| | Baoshan Iron & Steel Co. Ltd. Class A (XSSC) | 4,663,265 | 3,855 | 0.0% |
| * | China Shipbuilding Industry Co. Ltd. Class A (XSHG) | 3,837,900 | 3,690 | 0.0% |
| | Daqin Railway Co. Ltd. Class A (XSHG) | 3,643,120 | 3,643 | 0.0% |
| | COSCO International Holdings Ltd. | 7,598,000 | 3,524 | 0.0% |
| | Poly Culture Group Corp. Ltd. | 1,250,300 | 3,374 | 0.0% |
| | Offshore Oil Engineering Co. Ltd. Class A (XSSC) | 3,187,570 | 3,340 | 0.0% |
| | China United Network Communications Ltd. Class A (XSHG) | 4,397,800 | 3,328 | 0.0% |
| | Daqin Railway Co. Ltd. Class A (XSSC) | 3,323,570 | 3,324 | 0.0% |
| * | China Life Insurance Co. Ltd. Class A | 963,800 | 3,102 | 0.0% |
| | China XD Electric Co. Ltd. Class A (XSSC) | 3,641,107 | 2,944 | 0.0% |
| | Avic Aviation Engine Corp. plc Class A (XSSC) | 544,366 | 2,814 | 0.0% |
| | Inner Mongolia MengDian HuaNeng Thermal Power Corp. | | | |
| | Ltd. Class A (XSSC) | 5,879,228 | 2,738 | 0.0% |
| | China Railway Construction Corp. Ltd. Class A (XSSC) | 1,769,795 | 2,688 | 0.0% |
| | Dongxing Securities Co. Ltd. Class A (XSHG) | 771,200 | 2,635 | 0.0% |
| | Power Construction Corp. of China Ltd. Class A (XSSC) | 2,613,156 | 2,616 | 0.0% |
| *,^ | Sinotrans Shipping Ltd. | 16,009,500 | 2,595 | 0.0% |
| | Power Construction Corp. of China Ltd. Class A (XSHG) | 2,430,302 | 2,433 | 0.0% |
| | Baoshan Iron & Steel Co. Ltd. Class A (XSHG) | 2,918,600 | 2,413 | 0.0% |
| | Bluestar Adisseo Co. Class A | 1,157,745 | 2,398 | 0.0% |
| | AVIC Electromechanical Systems Co. Ltd. Class A | 914,232 | 2,348 | 0.0% |
| * | Zhongjin Gold Corp. Ltd. Class A (XSSC) | 1,174,812 | 2,196 | 0.0% |
| | China National Chemical Engineering Co. Ltd. Class A (XSHG) | 2,490,177 | 2,193 | 0.0% |
| | China National Chemical Engineering Co. Ltd. Class A (XSSC) | 2,391,725 | 2,106 | 0.0% |
| * | China Datang Corp. Renewable Power Co. Ltd. | 23,042,000 | 2,105 | 0.0% |
| | China Merchants Securities Co. Ltd. Class A (XSHG) | 784,200 | 2,075 | 0.0% |
| | Huadian Heavy Industries Co. Ltd. Class A (XSSC) | 1,526,509 | 1,997 | 0.0% |
14
| | | |
| Emerging Markets Stock Index Fund | | | |
| |
| |
| |
| | | Market | Percentage |
| | | Value• | of Net |
| | Shares | ($000) | Assets |
| ^ China Electronics Corp. Holdings Co. Ltd. | 8,296,000 | 1,996 | 0.0% |
| Shanghai Baosteel Packaging Co. Ltd. Class A | 1,258,200 | 1,912 | 0.0% |
| China CAMC Engineering Co. Ltd. Class A | 553,597 | 1,906 | 0.0% |
| * Shanghai Datun Energy Resources Co. Ltd. Class A | 1,156,850 | 1,877 | 0.0% |
| Avic Aviation Engine Corp. plc Class A (XSHG) | 357,386 | 1,847 | 0.0% |
| Norinco International Cooperation Ltd. Class A | 483,900 | 1,812 | 0.0% |
| * China Eastern Airlines Corp. Ltd. Class A (XSHG) | 1,928,700 | 1,802 | 0.0% |
| * Baoding Tianwei Baobian Electric Co. Ltd. Class A | 1,886,301 | 1,779 | 0.0% |
| Air China Ltd. Class A (XSHG) | 1,626,099 | 1,778 | 0.0% |
| * Sinopec Oilfield Equipment Corp. Class A | 1,040,893 | 1,721 | 0.0% |
| China Spacesat Co. Ltd. Class A (XSSC) | 358,897 | 1,676 | 0.0% |
| ^ China Energy Engineering Corp. Ltd. | 12,130,000 | 1,671 | 0.0% |
| North Electro-Optic Co. Ltd. Class A | 494,561 | 1,593 | 0.0% |
| * Sinosteel Engineering & Technology Co. Ltd. Class A | 668,330 | 1,579 | 0.0% |
| * Dongxing Securities Co. Ltd. Class A (XSSC) | 459,313 | 1,571 | 0.0% |
| * Inner Mongolia Lantai Industrial Co. Ltd. Class A | 802,400 | 1,556 | 0.0% |
| China Oilfield Services Ltd. Class A | 862,777 | 1,554 | 0.0% |
| * Angang Steel Co. Ltd. Class A | 2,266,055 | 1,510 | 0.0% |
| SDIC Power Holdings Co. Ltd. Class A (XSHG) | 1,529,000 | 1,479 | 0.0% |
| Shanghai Electric Power Co. Ltd. Class A (XSSC) | 844,723 | 1,463 | 0.0% |
| * Zhongjin Gold Corp. Ltd. Class A (XSHG) | 781,160 | 1,460 | 0.0% |
| Shenzhen Topway Video Communication Co. Ltd. Class A | 625,920 | 1,398 | 0.0% |
| Sinoma Science & Technology Co. Ltd. Class A | 515,740 | 1,345 | 0.0% |
| East China Engineering Science and Technology Co. Ltd. Class A | 589,564 | 1,306 | 0.0% |
| * China Eastern Airlines Corp. Ltd. Class A (XSSC) | 1,386,700 | 1,295 | 0.0% |
| North Navigation Control Technology Co. Ltd. Class A (XSSC) | 597,204 | 1,295 | 0.0% |
| Jihua Group Corp. Ltd. Class A (XSSC) | 1,027,040 | 1,288 | 0.0% |
| China XD Electric Co. Ltd. Class A (XSHG) | 1,531,400 | 1,238 | 0.0% |
| * China Greatwall Computer Shenzhen Co. Ltd. Class A | 716,877 | 1,224 | 0.0% |
| Offshore Oil Engineering Co. Ltd. Class A (XSHG) | 1,162,500 | 1,218 | 0.0% |
| Lanpec Technologies Ltd. Class A | 638,300 | 1,209 | 0.0% |
| Inner Mongolia MengDian HuaNeng Thermal Power Corp. Ltd. | | | |
| Class A (XSHG) | 2,555,201 | 1,190 | 0.0% |
| Sinochem International Corp. Class A (XSSC) | 794,851 | 1,173 | 0.0% |
| China Avionics Systems Co. Ltd. Class A (XSSC) | 411,820 | 1,169 | 0.0% |
| * Wuhan Iron & Steel Co. Ltd. Class A (XSHG) | 2,526,701 | 1,168 | 0.0% |
| Guangxi Guiguan Electric Power Co. Ltd. Class A (XSSC) | 1,175,359 | 1,153 | 0.0% |
| Sichuan Chengfei Integration Technology Corp. Class A | 216,379 | 1,147 | 0.0% |
| China Shenhua Energy Co. Ltd. Class A (XSHG) | 427,130 | 1,064 | 0.0% |
| Metallurgical Corp. of China Ltd. Class A (XSHG) | 1,714,400 | 1,062 | 0.0% |
| China Spacesat Co. Ltd. Class A (XSHG) | 226,387 | 1,057 | 0.0% |
| Guodian Nanjing Automation Co. Ltd. Class A | 851,900 | 1,053 | 0.0% |
| Metallurgical Corp. of China Ltd. Class A (XSSC) | 1,696,933 | 1,051 | 0.0% |
| China Southern Airlines Co. Ltd. Class A (XSSC) | 983,183 | 1,043 | 0.0% |
| * SDIC Essence Holdings Co. Ltd. Class A (XSHG) | 439,500 | 1,043 | 0.0% |
| Sinomach Automobile Co. Ltd. Class A (XSSC) | 531,194 | 1,033 | 0.0% |
| Daye Special Steel Co. Ltd. Class A | 556,300 | 1,005 | 0.0% |
| * China First Heavy Industries Class A (XSHG) | 1,200,650 | 995 | 0.0% |
| FAW CAR Co. Ltd. Class A | 589,943 | 989 | 0.0% |
| China National Software & Service Co. Ltd. Class A (XSSC) | 242,434 | 977 | 0.0% |
| Jihua Group Corp. Ltd. Class A (XSHG) | 768,000 | 963 | 0.0% |
| China Railway Construction Corp. Ltd. Class A (XSHG) | 631,100 | 959 | 0.0% |
| China Railway Erju Co. Ltd. Class A (XSHG) | 498,900 | 950 | 0.0% |
| China Animal Husbandry Industry Co. Ltd. Class A (XSHG) | 291,800 | 929 | 0.0% |
| Tian Di Science & Technology Co. Ltd. Class A (XSSC) | 1,340,984 | 928 | 0.0% |
| * China First Heavy Industries Class A (XSSC) | 1,118,300 | 927 | 0.0% |
15
| | | |
| Emerging Markets Stock Index Fund | | | |
| |
| |
| |
| | | Market | Percentage |
| | | Value• | of Net |
| | Shares | ($000) | Assets |
| Shanghai Electric Power Co. Ltd. Class A (XSHG) | 521,400 | 903 | 0.0% |
| * North Huajin Chemical Industries Co. Ltd. Class A | 687,903 | 896 | 0.0% |
| Cinda Real Estate Co. Ltd. Class A (XSHG) | 837,122 | 895 | 0.0% |
| * Beijing Tiantan Biological Products Corp. Ltd. Class A (XSSC) | 146,821 | 882 | 0.0% |
| Guangxi Guiguan Electric Power Co. Ltd. Class A (XSHG) | 868,300 | 852 | 0.0% |
| China CSSC Holdings Ltd. Class A (XSHG) | 249,270 | 828 | 0.0% |
| Xinjiang Guannong Fruit & Antler Group Co. Ltd. Class A (XSSC) | 687,142 | 828 | 0.0% |
| Minmetals Land Ltd. | 6,472,000 | 816 | 0.0% |
| China CSSC Holdings Ltd. Class A (XSSC) | 244,280 | 812 | 0.0% |
| Heilongjiang Agriculture Co. Ltd. Class A | 517,150 | 809 | 0.0% |
| Xinjiang Yilite Industry Co. Ltd. Class A (XSHG) | 342,900 | 778 | 0.0% |
| * Beijing Tiantan Biological Products Corp. Ltd. Class A (XSHG) | 127,100 | 763 | 0.0% |
| * Grinm Advanced Materials Co. Ltd. Class A (XSSC) | 474,000 | 760 | 0.0% |
| China Avionics Systems Co. Ltd. Class A (XSHG) | 262,584 | 746 | 0.0% |
| China CITIC Bank Corp. Ltd. Class A (XSHG) | 824,050 | 738 | 0.0% |
| * Inner Mongolia Pingzhuang Energy Co. Ltd. Class A | 711,300 | 733 | 0.0% |
| COFCO Tunhe Co. Ltd. Class A | 421,800 | 723 | 0.0% |
| CSSC Offshore and Marine Engineering Group Co. Ltd. Class A | | | |
| (XSSC) | 177,401 | 722 | 0.0% |
| * SDIC Essence Holdings Co. Ltd. Class A (XSSC) | 298,900 | 709 | 0.0% |
| China Southern Airlines Co. Ltd. Class A (XSHG) | 663,500 | 704 | 0.0% |
| China Merchants Land Ltd. | 4,948,000 | 700 | 0.0% |
| * Minmetals Development Co. Ltd. Class A (XSHG) | 283,000 | 700 | 0.0% |
| Air China Ltd. Class A (XSSC) | 630,438 | 689 | 0.0% |
| Besttone Holdings Co. Ltd. Class A (XSSC) | 218,900 | 685 | 0.0% |
| CITIC Heavy Industries Co. Ltd. Class A (XSSC) | 831,227 | 647 | 0.0% |
| China Shenhua Energy Co. Ltd. Class A (XSSC) | 251,550 | 626 | 0.0% |
| * China Tungsten And Hightech Materials Co. Ltd. Class A | 259,900 | 624 | 0.0% |
| Sinochem International Corp. Class A (XSHG) | 414,700 | 612 | 0.0% |
| SDIC Power Holdings Co. Ltd. Class A (XSSC) | 631,993 | 611 | 0.0% |
| North Navigation Control Technology Co. Ltd. Class A (XSHG) | 256,600 | 556 | 0.0% |
| Huadian Heavy Industries Co. Ltd. Class A (XSHG) | 414,676 | 543 | 0.0% |
| * Wuhan Iron & Steel Co. Ltd. Class A (XSSC) | 1,161,460 | 537 | 0.0% |
| CITIC Heavy Industries Co. Ltd. Class A (XSHG) | 624,200 | 486 | 0.0% |
| COSCO Shipping Co. Ltd. Class A (XSHG) | 557,401 | 480 | 0.0% |
| Sinotrans Air Transportation Development Co. Ltd. Class A (XSSC) | 161,950 | 456 | 0.0% |
| China Television Media Ltd. Class A (XSSC) | 129,531 | 440 | 0.0% |
| CSSC Offshore and Marine Engineering Group Co. Ltd. Class A | | | |
| (XSHG) | 107,500 | 437 | 0.0% |
| China National Software & Service Co. Ltd. Class A (XSHG) | 97,500 | 393 | 0.0% |
| * Grinm Advanced Materials Co. Ltd. Class A (XSHG) | 241,500 | 387 | 0.0% |
| Besttone Holdings Co. Ltd. Class A (XSHG) | 119,700 | 374 | 0.0% |
| * China Coal Energy Co. Ltd. Class A (XSHG) | 361,900 | 355 | 0.0% |
| Huolinhe Opencut Coal Industry Corp. Ltd. of Inner Mongolia Class A | 251,700 | 345 | 0.0% |
| Sinomach Automobile Co. Ltd. Class A (XSHG) | 177,150 | 344 | 0.0% |
| Xinjiang Yilite Industry Co. Ltd. Class A (XSSC) | 148,688 | 338 | 0.0% |
| Sinopec Shanghai Petrochemical Co. Ltd. Class A | 388,400 | 337 | 0.0% |
| Tian Di Science & Technology Co. Ltd. Class A (XSHG) | 456,100 | 316 | 0.0% |
| * SGIS Songshan Co. Ltd. Class A | 459,790 | 277 | 0.0% |
| Sinotrans Air Transportation Development Co. Ltd. Class A (XSHG) | 96,100 | 271 | 0.0% |
| China CITIC Bank Corp. Ltd. Class A (XSSC) | 301,100 | 270 | 0.0% |
| * Minmetals Development Co. Ltd. Class A (XSSC) | 104,800 | 259 | 0.0% |
| Xinjiang Guannong Fruit & Antler Group Co. Ltd. Class A (XSHG) | 203,200 | 245 | 0.0% |
| China Television Media Ltd. Class A (XSHG) | 59,700 | 203 | 0.0% |
| * China COSCO Holdings Co. Ltd. Class A | 221,002 | 171 | 0.0% |
| * China Animal Husbandry Industry Co. Ltd. Class A (XSSC) | 44,200 | 141 | 0.0% |
16
| | | |
| Emerging Markets Stock Index Fund | | | |
| |
| |
| |
| | | Market | Percentage |
| | | Value• | of Net |
| | Shares | ($000) | Assets |
| * China Coal Energy Co. Ltd. Class A (XSSC) | 125,594 | 123 | 0.0% |
| * Xinjiang Ba Yi Iron & Steel Co. Ltd. Class A | 149,000 | 116 | 0.0% |
| China Railway Erju Co. Ltd. Class A (XSSC) | 35,100 | 67 | 0.0% |
| COSCO Shipping Co. Ltd. Class A (XSSC) | 67,400 | 58 | 0.0% |
| 1 China—Other † | | 7,730,578 | 12.4% |
| | | 17,329,780 | 27.7% |
| |
| Colombia † | | 316,151 | 0.5% |
| |
| 1Czech Republic † | | 123,047 | 0.2% |
| |
| Egypt † | | 197,766 | 0.3% |
| |
| Greece † | | 217,958 | 0.3% |
| |
| Hong Kong † | | 55,315 | 0.1% |
| |
| Hungary † | | 199,565 | 0.3% |
| |
| India | | | |
| Housing Development Finance Corp. Ltd. | 23,773,814 | 496,037 | 0.8% |
| Infosys Ltd. | 28,474,195 | 424,940 | 0.7% |
| Reliance Industries Ltd. | 23,839,604 | 376,526 | 0.6% |
| Tata Consultancy Services Ltd. | 7,092,451 | 254,795 | 0.4% |
| Sun Pharmaceutical Industries Ltd. | 16,777,713 | 186,915 | 0.3% |
| Oil & Natural Gas Corp. Ltd. | 31,588,075 | 135,468 | 0.2% |
| Coal India Ltd. | 20,478,617 | 99,705 | 0.2% |
| Bharat Petroleum Corp. Ltd. | 9,639,505 | 96,752 | 0.2% |
| State Bank of India | 22,903,690 | 88,613 | 0.2% |
| Indian Oil Corp. Ltd. | 17,539,844 | 85,083 | 0.1% |
| NTPC Ltd. | 31,905,779 | 72,764 | 0.1% |
| Power Grid Corp. of India Ltd. | 18,063,876 | 47,604 | 0.1% |
| Hindustan Petroleum Corp. Ltd. | 5,690,848 | 39,817 | 0.1% |
| GAIL India Ltd. | 5,021,506 | 32,587 | 0.1% |
| NMDC Ltd. | 13,353,067 | 26,275 | 0.1% |
| Rural Electrification Corp. Ltd. | 11,913,992 | 24,078 | 0.1% |
| Power Finance Corp. Ltd. | 10,930,581 | 20,345 | 0.0% |
| Bharat Heavy Electricals Ltd. | 9,719,991 | 20,240 | 0.0% |
| Bharat Electronics Ltd. | 1,014,910 | 19,788 | 0.0% |
| * Bank of Baroda | 7,464,745 | 17,498 | 0.0% |
| NHPC Ltd. | 39,309,568 | 15,779 | 0.0% |
| * Steel Authority of India Ltd. | 17,399,502 | 13,586 | 0.0% |
| Oil India Ltd. | 2,089,320 | 12,995 | 0.0% |
| * Punjab National Bank | 4,964,487 | 10,724 | 0.0% |
| * Canara Bank | 1,829,788 | 8,614 | 0.0% |
| * IDBI Bank Ltd. | 5,680,208 | 6,266 | 0.0% |
| * Mangalore Refinery & Petrochemicals Ltd. | 3,978,304 | 5,380 | 0.0% |
| Union Bank of India | 2,209,377 | 4,900 | 0.0% |
| * Bank of India | 2,581,349 | 4,446 | 0.0% |
| Indian Bank | 1,188,005 | 4,142 | 0.0% |
| National Aluminium Co. Ltd. | 5,087,835 | 4,067 | 0.0% |
| IFCI Ltd. | 7,003,134 | 2,729 | 0.0% |
| Engineers India Ltd. | 644,768 | 2,602 | 0.0% |
| Oriental Bank of Commerce | 1,126,646 | 2,169 | 0.0% |
| * Central Bank of India | 1,473,550 | 2,017 | 0.0% |
| * Corp Bank | 3,188,493 | 1,991 | 0.0% |
17
| | | |
| Emerging Markets Stock Index Fund | | | |
| |
| |
| |
| | | Market | Percentage |
| | | Value• | of Net |
| | Shares | ($000) | Assets |
| * Vijaya Bank | 2,143,889 | 1,421 | 0.0% |
| * Shipping Corp. of India Ltd. | 1,047,395 | 1,065 | 0.0% |
| Gujarat Mineral Development Corp. Ltd. | 576,191 | 957 | 0.0% |
| * Indian Overseas Bank | 2,108,758 | 842 | 0.0% |
| * Syndicate Bank | 657,322 | 727 | 0.0% |
| * UCO Bank | 800,000 | 418 | 0.0% |
| * Allahabad Bank | 287,312 | 325 | 0.0% |
| Andhra Bank | 286,108 | 242 | 0.0% |
| 1 India—Other † | | 4,647,859 | 7.4% |
| | | 7,322,093 | 11.7% |
| Indonesia | | | |
| Telekomunikasi Indonesia Persero Tbk PT | 760,083,605 | 245,411 | 0.4% |
| Bank Central Asia Tbk PT | 187,880,124 | 223,379 | 0.3% |
| Astra International Tbk PT | 302,692,000 | 190,971 | 0.3% |
| Bank Rakyat Indonesia Persero Tbk PT | 164,527,800 | 153,631 | 0.2% |
| Bank Mandiri Persero Tbk PT | 142,274,080 | 125,322 | 0.2% |
| Bank Negara Indonesia Persero Tbk PT | 123,025,361 | 52,521 | 0.1% |
| Semen Indonesia Persero Tbk PT | 47,967,204 | 36,156 | 0.1% |
| Perusahaan Gas Negara Persero Tbk | 165,598,604 | 32,437 | 0.1% |
| Tambang Batubara Bukit Asam Persero Tbk PT | 14,277,925 | 13,028 | 0.0% |
| Jasa Marga Persero Tbk PT | 34,702,700 | 12,038 | 0.0% |
| * Aneka Tambang Persero Tbk PT | 162,408,891 | 11,146 | 0.0% |
| Waskita Karya Persero Tbk PT | 48,058,000 | 9,646 | 0.0% |
| Bank Tabungan Negara Persero Tbk PT | 35,960,000 | 5,260 | 0.0% |
| Wijaya Karya Persero Tbk PT | 21,869,500 | 4,308 | 0.0% |
| Wijaya Karya Beton Tbk PT | 34,608,000 | 2,357 | 0.0% |
| * Krakatau Steel Persero Tbk PT | 40,419,400 | 2,045 | 0.0% |
| Timah Persero Tbk PT | 16,286,100 | 1,161 | 0.0% |
| Adhi Karya Persero Tbk PT | 5,388,200 | 936 | 0.0% |
| Indonesia—Other † | | 600,044 | 1.0% |
| | | 1,721,797 | 2.7% |
| Malaysia | | | |
| Public Bank Bhd. (Local) | 46,755,000 | 221,304 | 0.3% |
| Tenaga Nasional Bhd. | 52,309,907 | 178,736 | 0.3% |
| 1 Malaysia—Other † | | 1,859,568 | 3.0% |
| | | 2,259,608 | 3.6% |
| Mexico | | | |
| Fomento Economico Mexicano SAB de CV | 32,549,470 | 312,217 | 0.5% |
| America Movil SAB de CV | 434,326,703 | 287,697 | 0.5% |
| Grupo Financiero Banorte SAB de CV | 34,803,555 | 204,962 | 0.3% |
| Grupo Televisa SAB | 37,976,940 | 186,861 | 0.3% |
| * Cemex SAB de CV | 209,551,603 | 181,380 | 0.3% |
| Wal-Mart de Mexico SAB de CV | 83,359,054 | 176,368 | 0.3% |
| 1 Mexico—Other † | | 1,334,222 | 2.1% |
| | | 2,683,707 | 4.3% |
| |
| Pakistan † | | 75,000 | 0.1% |
| |
| Peru † | | 161,261 | 0.3% |
| |
| Philippines † | | 1,009,334 | 1.6% |
| |
| Poland † | | 774,351 | 1.2% |
18
| | | |
| Emerging Markets Stock Index Fund | | | |
| |
| |
| |
| | | Market | Percentage |
| | | Value• | of Net |
| | Shares | ($000) | Assets |
| Qatar † | | 223,415 | 0.4% |
| |
| Russia | | | |
| Sberbank of Russia PJSC | 161,438,168 | 375,771 | 0.6% |
| Gazprom PJSC | 88,022,453 | 192,884 | 0.3% |
| Lukoil PJSC ADR | 3,636,459 | 176,886 | 0.3% |
| Gazprom PJSC ADR | 38,808,778 | 167,339 | 0.3% |
| VTB Bank PJSC | 58,129,231,072 | 62,180 | 0.1% |
| AK Transneft OAO Preference Shares | 23,793 | 56,979 | 0.1% |
| Rosneft PJSC GDR | 10,469,019 | 56,932 | 0.1% |
| Rosneft PJSC | 6,996,815 | 38,383 | 0.1% |
| RusHydro PJSC | 1,579,839,418 | 19,830 | 0.0% |
| VTB Bank PJSC GDR | 9,086,137 | 18,991 | 0.0% |
| Bashneft PJSC | 340,785 | 17,868 | 0.0% |
| Inter RAO UES PJSC | 266,733,670 | 14,310 | 0.0% |
| * Aeroflot PJSC | 6,789,524 | 13,910 | 0.0% |
| Federal Grid Co. Unified Energy System JSC | 4,093,494,717 | 11,048 | 0.0% |
| Bashneft PAO Preference Shares | 300,228 | 7,009 | 0.0% |
| Rosseti PJSC | 450,217,605 | 6,934 | 0.0% |
| Mosenergo OAO | 28,759,534 | 777 | 0.0% |
| OGK-2 PJSC | 97,144,880 | 561 | 0.0% |
| Russia—Other † | | 1,159,924 | 1.9% |
| | | 2,398,516 | 3.8% |
| |
| Singapore † | | 4,882 | 0.0% |
| |
| South Africa | | | |
| Naspers Ltd. | 6,441,259 | 1,078,784 | 1.7% |
| Sasol Ltd. | 8,256,486 | 228,003 | 0.4% |
| MTN Group Ltd. | 26,228,732 | 226,546 | 0.4% |
| * Steinhoff International Holdings NV | 37,181,472 | 200,582 | 0.3% |
| Standard Bank Group Ltd. | 18,067,927 | 191,796 | 0.3% |
| South Africa—Other † | | 2,945,264 | 4.7% |
| | | 4,870,975 | 7.8% |
| Taiwan | | | |
| Taiwan Semiconductor Manufacturing Co. Ltd. | 237,443,845 | 1,424,985 | 2.3% |
| Taiwan Semiconductor Manufacturing Co. Ltd. ADR | 24,605,789 | 765,240 | 1.2% |
| Hon Hai Precision Industry Co. Ltd. | 225,418,779 | 608,893 | 1.0% |
| Formosa Plastics Corp. | 77,331,616 | 208,977 | 0.3% |
| Formosa Chemicals & Fibre Corp. | 68,355,830 | 202,949 | 0.3% |
| Nan Ya Plastics Corp. | 90,671,253 | 188,299 | 0.3% |
| Delta Electronics Inc. | 33,733,767 | 177,594 | 0.3% |
| Largan Precision Co. Ltd. | 1,499,135 | 176,861 | 0.3% |
| Taiwan—Other † | | 5,860,200 | 9.4% |
| | | 9,613,998 | 15.4% |
| |
| 1Thailand † | | 2,414,087 | 3.9% |
| |
| Turkey † | | 812,775 | 1.3% |
| |
| United Arab Emirates † | | 634,146 | 1.0% |
| Total Common Stocks (Cost $61,426,171) | | 61,977,966 | 99.0%2 |
19
| | | | |
| Emerging Markets Stock Index Fund | | | | |
| |
| |
| |
| | | | Market | Percentage |
| | | | Value• | of Net |
| | Coupon | Shares | ($000) | Assets |
| Temporary Cash Investments | | | | |
| Money Market Fund | | | | |
| 3,4 Vanguard Market Liquidity Fund | 0.718% | 12,180,663 | 1,218,188 | 2.0% |
| |
| 5U.S. Government and Agency Obligations † | | | 66,884 | 0.1% |
| Total Temporary Cash Investments (Cost $1,284,948) | | | 1,285,072 | 2.1%2 |
| Total Investments (Cost $62,711,119) | | | 63,263,038 | 101.1% |
| |
| | | | Amount | |
| | | | ($000) | |
| Other Assets and Liabilities | | | | |
| Other Assets | | | | |
| Investment in Vanguard | | | 4,643 | |
| Receivables for Investment Securities Sold | | | 3,836 | |
| Receivables for Accrued Income | | | 41,644 | |
| Receivables for Capital Shares Issued | | | 10,688 | |
| Currency at Value and Receivable | | | 63,194 | |
| Other Assets | | | 9,525 | |
| Total Other Assets | | | 133,530 | 0.2% |
| Liabilities | | | | |
| Payables for Investment Securities Purchased | | | (38,396) | |
| Collateral for Securities on Loan | | | (698,123) | |
| Payables for Capital Shares Redeemed | | | (21,071) | |
| Payables to Vanguard | | | (50,365) | |
| Other Liabilities | | | (289) | |
| Total Liabilities | | | (808,244) | (1.3%) |
| Net Assets | | | 62,588,324 | 100.0% |
| |
| |
| At October 31, 2016, net assets consisted of: | | | | |
| | | | | Amount |
| | | | | ($000) |
| Paid-in Capital | | | | 71,249,357 |
| Undistributed Net Investment Income | | | | 66,975 |
| Accumulated Net Realized Losses | | | | (9,267,814) |
| Unrealized Appreciation (Depreciation) | | | | |
| Investment Securities | | | | 551,919 |
| Futures Contracts | | | | (12,451) |
| Swap Contracts | | | | (139) |
| Foreign Currencies | | | | 477 |
| Net Assets | | | | 62,588,324 |
20
| |
| Emerging Markets Stock Index Fund | |
| |
| |
| |
| | Amount |
| | ($000) |
| Investor Shares—Net Assets | |
| Applicable to 65,821,560 outstanding $.001 par value shares of | |
| beneficial interest (unlimited authorization) | 1,570,049 |
| Net Asset Value Per Share—Investor Shares | $23.85 |
| |
| ETF Shares—Net Assets | |
| Applicable to 1,184,963,795 outstanding $.001 par value shares of | |
| beneficial interest (unlimited authorization) | 44,636,253 |
| Net Asset Value Per Share—ETF Shares | $37.67 |
| |
| Admiral Shares—Net Assets | |
| Applicable to 292,538,247 outstanding $.001 par value shares of | |
| beneficial interest (unlimited authorization) | 9,165,539 |
| Net Asset Value Per Share—Admiral Shares | $31.33 |
| |
| Institutional Shares—Net Assets | |
| Applicable to 175,906,635 outstanding $.001 par value shares of | |
| beneficial interest (unlimited authorization) | 4,190,902 |
| Net Asset Value Per Share—Institutional Shares | $23.82 |
| |
| Institutional Plus Shares—Net Assets | |
| Applicable to 38,173,213 outstanding $.001 par value shares of | |
| beneficial interest (unlimited authorization) | 3,025,581 |
| Net Asset Value Per Share—Institutional Plus Shares | $79.26 |
• See Note A in Notes to Financial Statements.
* Non-income-producing security.
^ Includes partial security positions on loan to broker-dealers. The total value of securities on loan is $619,217,000.
† Represents the aggregate value, by category, of securities that are not among the 50 largest holdings and, in total for any issuer, represent
1% or less of net assets.
1 Certain of the fund’s securities are exempt from registration under Rule 144A of the Securities Act of 1933. Such securities may be sold in
transactions exempt from registration, normally to qualified institutional buyers. At October 31, 2016, the aggregate value of these
securities was $486,064,000, representing 0.8% of net assets.
2 The fund invests a portion of its cash reserves in equity markets through the use of index futures contracts and swap contracts. After giving
effect to futures and swap investments, the fund’s effective common stock and temporary cash investment positions represent 100.0% and
1.1%, respectively, of net assets.
3 Includes $698,123,000 of collateral received for securities on loan.
4 Affiliated money market fund available only to Vanguard funds and certain trusts and accounts managed by Vanguard. Rate shown is the
7-day yield.
5 Securities with a value of $27,394,000 have been segregated as initial margin for open futures contracts.
ADR—American Depositary Receipt.
GDR—Global Depositary Receipt.
See accompanying Notes, which are an integral part of the Financial Statements.
21
Emerging Markets Stock Index Fund
Statement of Operations
| |
| | Year Ended |
| | October 31, 2016 |
| | ($000) |
| Investment Income | |
| Income | |
| Dividends1 | 1,457,321 |
| Interest2 | 2,551 |
| Securities Lending—Net | 33,951 |
| Total Income | 1,493,823 |
| Expenses | |
| The Vanguard Group—Note B | |
| Investment Advisory Services | 4,133 |
| Management and Administrative—Investor Shares | 3,242 |
| Management and Administrative—ETF Shares | 22,714 |
| Management and Administrative—Admiral Shares | 4,578 |
| Management and Administrative—Institutional Shares | 1,288 |
| Management and Administrative—Institutional Plus Shares | 446 |
| Marketing and Distribution—Investor Shares | 343 |
| Marketing and Distribution—ETF Shares | 1,917 |
| Marketing and Distribution—Admiral Shares | 896 |
| Marketing and Distribution—Institutional Shares | 114 |
| Marketing and Distribution—Institutional Plus Shares | 50 |
| Custodian Fees | 33,073 |
| Auditing Fees | 52 |
| Shareholders’ Reports—Investor Shares | 37 |
| Shareholders’ Reports—ETF Shares | 922 |
| Shareholders’ Reports—Admiral Shares | 71 |
| Shareholders’ Reports—Institutional Shares | 19 |
| Shareholders’ Reports—Institutional Plus Shares | — |
| Trustees’ Fees and Expenses | 28 |
| Total Expenses | 73,923 |
| Net Investment Income | 1,419,900 |
| Realized Net Gain (Loss) | |
| Investment Securities Sold2 | (3,365,309) |
| Futures Contracts | 103,571 |
| Swap Contracts | (21) |
| Foreign Currencies | (697) |
| Realized Net Gain (Loss) | (3,262,456) |
| Change in Unrealized Appreciation (Depreciation) | |
| Investment Securities | 7,275,501 |
| Futures Contracts | (26,611) |
| Swap Contracts | (139) |
| Foreign Currencies | 1,846 |
| Change in Unrealized Appreciation (Depreciation) | 7,250,597 |
| Net Increase (Decrease) in Net Assets Resulting from Operations | 5,408,041 |
1 Dividends are net of foreign withholding taxes of $168,824,000.
2 Interest income and realized net gain (loss) from an affiliated company of the fund were $2,422,000 and $31,000, respectively.
See accompanying Notes, which are an integral part of the Financial Statements.
22
Emerging Markets Stock Index Fund
Statement of Changes in Net Assets
| | |
| | Year Ended October 31, |
| | 2016 | 2015 |
| | ($000) | ($000) |
| Increase (Decrease) in Net Assets | | |
| Operations | | |
| Net Investment Income | 1,419,900 | 1,679,389 |
| Realized Net Gain (Loss) | (3,262,456) | (1,993,789) |
| Change in Unrealized Appreciation (Depreciation) | 7,250,597 | (10,361,915) |
| Net Increase (Decrease) in Net Assets Resulting from Operations | 5,408,041 | (10,676,315) |
| Distributions | | |
| Net Investment Income | | |
| Investor Shares | (35,658) | (45,750) |
| ETF Shares | (979,859) | (1,206,542) |
| Admiral Shares | (210,225) | (237,570) |
| Institutional Shares | (98,859) | (105,620) |
| Institutional Plus Shares | (74,323) | (77,229) |
| Realized Capital Gain | | |
| Investor Shares | — | — |
| ETF Shares | — | — |
| Admiral Shares | — | — |
| Institutional Shares | — | — |
| Institutional Plus Shares | — | — |
| Total Distributions | (1,398,924) | (1,672,711) |
| Capital Share Transactions | | |
| Investor Shares | (111,055) | (137,894) |
| ETF Shares | 4,839,640 | (1,905,825) |
| Admiral Shares | 470,804 | 874,453 |
| Institutional Shares | 231,732 | 380,858 |
| Institutional Plus Shares | 233,053 | 363,624 |
| Net Increase (Decrease) from Capital Share Transactions | 5,664,174 | (424,784) |
| Total Increase (Decrease) | 9,673,291 | (12,773,810) |
| Net Assets | | |
| Beginning of Period | 52,915,033 | 65,688,843 |
| End of Period1 | 62,588,324 | 52,915,033 |
| 1 Net Assets—End of Period includes undistributed (overdistributed) net investment income of $66,975,000 and $41,604,000. |
See accompanying Notes, which are an integral part of the Financial Statements.
23
Emerging Markets Stock Index Fund
Financial Highlights
| | | | | |
| Investor Shares | | | | | |
| |
| For a Share Outstanding | Year Ended October 31, |
| Throughout Each Period | 2016 | 2015 | 2014 | 2013 | 2012 |
| Net Asset Value, Beginning of Period | $22.16 | $27.02 | $26.78 | $26.36 | $26.39 |
| Investment Operations | | | | | |
| Net Investment Income | . 530 | .642 | .672 | .667 | . 576 |
| Net Realized and Unrealized Gain (Loss) | | | | | |
| on Investments | 1.691 | (4.865) | .271 | .548 | .237 |
| Total from Investment Operations | 2.221 | (4.223) | .943 | 1.215 | .813 |
| Distributions | | | | | |
| Dividends from Net Investment Income | (. 531) | (. 637) | (.703) | (.795) | (. 843) |
| Distributions from Realized Capital Gains | — | — | — | — | — |
| Total Distributions | (. 531) | (. 637) | (.703) | (.795) | (. 843) |
| Net Asset Value, End of Period | $23.85 | $22.16 | $27.02 | $26.78 | $26.36 |
| |
| Total Return1 | 10.21% | -15.74% | 3.59% | 4.78% | 3.30% |
| |
| Ratios/Supplemental Data | | | | | |
| Net Assets, End of Period (Millions) | $1,570 | $1,573 | $2,063 | $2,181 | $2,333 |
| Ratio of Total Expenses to Average Net Assets | 0.32% | 0.33% | 0.33% | 0.33% | 0.33% |
| Ratio of Net Investment Income to | | | | | |
| Average Net Assets | 2.50% | 2.53% | 2.56% | 2.45% | 2.38% |
| Portfolio Turnover Rate2 | 13% | 7% | 9% | 26% | 8% |
1 Total returns do not include transaction or account service fees that may have applied in the periods shown. Fund prospectuses provide
information about any applicable transaction and account service fees.
2 Excludes the value of portfolio securities received or delivered as a result of in-kind purchases or redemptions of the fund’s capital shares,
including ETF Creation Units.
See accompanying Notes, which are an integral part of the Financial Statements.
24
Emerging Markets Stock Index Fund
Financial Highlights
| | | | | |
| FTSE Emerging Markets ETF Shares | | | | | |
| |
| For a Share Outstanding | Year Ended October 31, |
| Throughout Each Period | 2016 | 2015 | 2014 | 2013 | 2012 |
| Net Asset Value, Beginning of Period | $34.98 | $42.66 | $42.28 | $41.65 | $41.73 |
| Investment Operations | | | | | |
| Net Investment Income | .900 | 1.086 | 1.137 | 1.129 | .984 |
| Net Realized and Unrealized Gain (Loss) | | | | | |
| on Investments1 | 2.679 | (7.685) | .428 | .860 | .367 |
| Total from Investment Operations | 3.579 | (6.599) | 1.565 | 1.989 | 1.351 |
| Distributions | | | | | |
| Dividends from Net Investment Income | (.889) | (1.081) | (1.185) | (1.359) | (1.431) |
| Distributions from Realized Capital Gains | — | — | — | — | — |
| Total Distributions | (.889) | (1.081) | (1.185) | (1.359) | (1.431) |
| Net Asset Value, End of Period | $37.67 | $34.98 | $42.66 | $42.28 | $41.65 |
| |
| Total Return | 10.47% | -15.59% | 3.77% | 4.97% | 3.47% |
| |
| Ratios/Supplemental Data | | | | | |
| Net Assets, End of Period (Millions) | $44,636 | $37,071 | $48,000 | $51,083 | $57,125 |
| Ratio of Total Expenses to Average Net Assets | 0.14% | 0.15% | 0.15% | 0.15% | 0.18% |
| Ratio of Net Investment Income to | | | | | |
| Average Net Assets | 2.68% | 2.71% | 2.74% | 2.63% | 2.53% |
| Portfolio Turnover Rate2 | 13% | 7% | 9% | 26% | 8% |
1 Includes increases from purchase and redemption fees of $.00, $.00, $.00, $.00, and $.01. Purchase and redemption fees were eliminated
effective February 29, 2012, and May 23, 2012, respectively.
2 Excludes the value of portfolio securities received or delivered as a result of in-kind purchases or redemptions of the fund’s capital shares,
including ETF Creation Units.
See accompanying Notes, which are an integral part of the Financial Statements.
25
Emerging Markets Stock Index Fund
Financial Highlights
| | | | | |
| Admiral Shares | | | | | |
| |
| For a Share Outstanding | Year Ended October 31, |
| Throughout Each Period | 2016 | 2015 | 2014 | 2013 | 2012 |
| Net Asset Value, Beginning of Period | $29.10 | $35.49 | $35.17 | $34.65 | $34.71 |
| Investment Operations | | | | | |
| Net Investment Income | .747 | .903 | .946 | .940 | .816 |
| Net Realized and Unrealized Gain (Loss) | | | | | |
| on Investments1 | 2.222 | (6.394) | .361 | .709 | .311 |
| Total from Investment Operations | 2.969 | (5.491) | 1.307 | 1.649 | 1.127 |
| Distributions | | | | | |
| Dividends from Net Investment Income | (.739) | (.899) | (.987) | (1.129) | (1.187) |
| Distributions from Realized Capital Gains | — | — | — | — | — |
| Total Distributions | (.739) | (.899) | (.987) | (1.129) | (1.187) |
| Net Asset Value, End of Period | $31.33 | $29.10 | $35.49 | $35.17 | $34.65 |
| |
| Total Return2 | 10.41% | -15.60% | 3.79% | 4.94% | 3.49% |
| |
| Ratios/Supplemental Data | | | | | |
| Net Assets, End of Period (Millions) | $9,166 | $8,060 | $8,870 | $6,959 | $6,801 |
| Ratio of Total Expenses to Average Net Assets | 0.14% | 0.15% | 0.15% | 0.15% | 0.18% |
| Ratio of Net Investment Income to | | | | | |
| Average Net Assets | 2.68% | 2.71% | 2.74% | 2.63% | 2.53% |
| Portfolio Turnover Rate 3 | 13% | 7% | 9% | 26% | 8% |
1 Includes increases from purchase and redemption fees of $.00, $.00, $.00, $.00, and $.01. Purchase and redemption fees were eliminated
effective February 29, 2012, and May 23, 2012, respectively.
2 Total returns do not include transaction or account service fees that may have applied in the periods shown. Fund prospectuses provide
information about any applicable transaction and account service fees.
3 Excludes the value of portfolio securities received or delivered as a result of in-kind purchases or redemptions of the fund’s capital shares,
including ETF Creation Units.
See accompanying Notes, which are an integral part of the Financial Statements.
26
Emerging Markets Stock Index Fund
Financial Highlights
| | | | | |
| Institutional Shares | | | | | |
| |
| For a Share Outstanding | Year Ended October 31, |
| Throughout Each Period | 2016 | 2015 | 2014 | 2013 | 2012 |
| Net Asset Value, Beginning of Period | $22.13 | $26.99 | $26.74 | $26.36 | $26.42 |
| Investment Operations | | | | | |
| Net Investment Income | . 577 | . 696 | .726 | .725 | . 643 |
| Net Realized and Unrealized Gain (Loss) | | | | | |
| on Investments | 1.683 | (4.865) | .283 | .532 | .225 |
| Total from Investment Operations | 2.260 | (4.169) | 1.009 | 1.257 | .868 |
| Distributions | | | | | |
| Dividends from Net Investment Income | (. 570) | (. 691) | (.759) | (. 877) | (. 928) |
| Distributions from Realized Capital Gains | — | — | — | — | — |
| Total Distributions | (. 570) | (. 691) | (.759) | (. 877) | (. 928) |
| Net Asset Value, End of Period | $23.82 | $22.13 | $26.99 | $26.74 | $26.36 |
| |
| Total Return1 | 10.42% | -15.57% | 3.85% | 4.95% | 3.54% |
| |
| Ratios/Supplemental Data | | | | | |
| Net Assets, End of Period (Millions) | $4,191 | $3,645 | $4,002 | $3,558 | $2,495 |
| Ratio of Total Expenses to Average Net Assets | 0.11% | 0.12% | 0.12% | 0.12% | 0.12% |
| Ratio of Net Investment Income to | | | | | |
| Average Net Assets | 2.71% | 2.74% | 2.77% | 2.66% | 2.59% |
| Portfolio Turnover Rate2 | 13% | 7% | 9% | 26% | 8% |
1 Total returns do not include transaction fees that may have applied in the periods shown. Fund prospectuses provide information about any
applicable transaction fees.
2 Excludes the value of portfolio securities received or delivered as a result of in-kind purchases or redemptions of the fund’s capital shares,
including ETF Creation Units.
See accompanying Notes, which are an integral part of the Financial Statements.
27
Emerging Markets Stock Index Fund
Financial Highlights
| | | | | |
| Institutional Plus Shares | | | | | |
| |
| For a Share Outstanding | Year Ended October 31, |
| Throughout Each Period | 2016 | 2015 | 2014 | 2013 | 2012 |
| Net Asset Value, Beginning of Period | $73.61 | $89.77 | $88.97 | $87.68 | $87.90 |
| Investment Operations | | | | | |
| Net Investment Income | 1.928 | 2.326 | 2.436 | 2.426 | 2.131 |
| Net Realized and Unrealized Gain (Loss) | | | | | |
| on Investments1 | 5.630 | (16.171) | .904 | 1.792 | .776 |
| Total from Investment Operations | 7.558 | (13.845) | 3.340 | 4.218 | 2.907 |
| Distributions | | | | | |
| Dividends from Net Investment Income | (1.908) | (2.315) | (2.540) | (2.928) | (3.127) |
| Distributions from Realized Capital Gains | — | — | — | — | — |
| Total Distributions | (1.908) | (2.315) | (2.540) | (2.928) | (3.127) |
| Net Asset Value, End of Period | $79.26 | $73.61 | $89.77 | $88.97 | $87.68 |
| |
| Total Return2 | 10.48% | -15.55% | 3.83% | 4.99% | 3.56% |
| |
| Ratios/Supplemental Data | | | | | |
| Net Assets, End of Period (Millions) | $3,026 | $2,566 | $2,754 | $2,320 | $1,607 |
| Ratio of Total Expenses to Average Net Assets | 0.09% | 0.10% | 0.10% | 0.10% | 0.10% |
| Ratio of Net Investment Income to | | | | | |
| Average Net Assets | 2.73% | 2.76% | 2.79% | 2.68% | 2.61% |
| Portfolio Turnover Rate 3 | 13% | 7% | 9% | 26% | 8% |
1 Includes increases from purchase and redemption fees of $.00, $.00, $.00, $.00, and $.01. Purchase and redemption fees were eliminated
effective February 29, 2012, and May 23, 2012, respectively.
2 Total returns do not include transaction fees that may have applied in the periods shown. Fund prospectuses provide information about any
applicable transaction fees.
3 Excludes the value of portfolio securities received or delivered as a result of in-kind purchases or redemptions of the fund’s capital shares,
including ETF Creation Units.
See accompanying Notes, which are an integral part of the Financial Statements.
28
Emerging Markets Stock Index Fund
Notes to Financial Statements
Vanguard Emerging Markets Stock Index Fund is registered under the Investment Company Act of 1940 as an open-end investment company, or mutual fund. The fund invests in securities of foreign issuers, which may subject it to investment risks not normally associated with investing in securities of U.S. corporations. The fund offers five classes of shares: Investor Shares, ETF Shares, Admiral Shares, Institutional Shares, and Institutional Plus Shares. Investor Shares are available to any investor who meets the fund’s minimum purchase requirements. ETF Shares, known as Vanguard FTSE Emerging Markets ETF Shares, are listed for trading on NYSE Arca; they can be purchased and sold through a broker. Admiral Shares, Institutional Shares, and Institutional Plus Shares are designed for investors who meet certain administrative, service, and account-size criteria.
A. The following significant accounting policies conform to generally accepted accounting principles for U.S. investment companies. The fund consistently follows such policies in preparing its financial statements.
1. Security Valuation: Securities are valued as of the close of trading on the New York Stock Exchange (generally 4 p.m., Eastern time) on the valuation date. Equity securities are valued at the latest quoted sales prices or official closing prices taken from the primary market in which each security trades; such securities not traded on the valuation date are valued at the mean of the latest quoted bid and asked prices. Securities for which market quotations are not readily available, or whose values have been affected by events occurring before the fund’s pricing time but after the close of the securities’ primary markets, are valued at their fair values calculated according to procedures adopted by the board of trustees. These procedures include obtaining quotations from an independent pricing service, monitoring news to identify significant market- or security-specific events, and evaluating changes in the values of foreign market proxies (for example, ADRs, futures contracts, or exchange-traded funds), between the time the foreign markets close and the fund’s pricing time. When fair-value pricing is employed, the prices of securities used by a fund to calculate its net asset value may differ from quoted or published prices for the same securities. Investments in Vanguard Market Liquidity Fund are valued at that fund’s net asset value. Temporary cash investments acquired over 60 days to maturity are valued using the latest bid prices or using valuations based on a matrix system (which considers such factors as security prices, yields, maturities, and ratings), both as furnished by independent pricing services. Other temporary cash investments are valued at amortized cost, which approximates market value.
2. Foreign Currency: Securities and other assets and liabilities denominated in foreign currencies are translated into U.S. dollars using exchange rates obtained from an independent third party as of the fund’s pricing time on the valuation date. Realized gains (losses) and unrealized appreciation (depreciation) on investment securities include the effects of changes in exchange rates since the securities were purchased, combined with the effects of changes in security prices. Fluctuations in the value of other assets and liabilities resulting from changes in exchange rates are recorded as unrealized foreign currency gains (losses) until the assets or liabilities are settled in cash, at which time they are recorded as realized foreign currency gains (losses).
3. Futures Contracts: The fund uses index futures contracts to a limited extent, with the objectives of maintaining full exposure to the stock market, enhancing returns, maintaining liquidity, and minimizing transaction costs. The fund may purchase futures contracts to immediately invest incoming cash in the market, or sell futures in response to cash outflows, thereby simulating a fully invested position in the underlying index while maintaining a cash balance for liquidity. The fund may seek to enhance
29
Emerging Markets Stock Index Fund
returns by using futures contracts instead of the underlying securities when futures are believed to be priced more attractively than the underlying securities. The primary risks associated with the use of futures contracts are imperfect correlation between changes in market values of stocks held by the fund and the prices of futures contracts, and the possibility of an illiquid market. Counterparty risk involving futures is mitigated because a regulated clearinghouse is the counterparty instead of the clearing broker. To further mitigate counterparty risk, the fund trades futures contracts on an exchange, monitors the financial strength of its clearing brokers and clearinghouse, and has entered into clearing agreements with its clearing brokers. The clearinghouse imposes initial margin requirements to secure the fund’s performance and requires daily settlement of variation margin representing changes in the market value of each contract.
Futures contracts are valued at their quoted daily settlement prices. The aggregate settlement values of the contracts are not recorded in the Statement of Net Assets. Fluctuations in the value of the contracts are recorded in the Statement of Net Assets as an asset (liability) and in the Statement of Operations as unrealized appreciation (depreciation) until the contracts are closed, when they are recorded as realized futures gains (losses).
During the year ended October 31, 2016, the fund’s average investments in long and short futures contracts represented less than 1% and 0% of net assets, respectively, based on the average of aggregate settlement values at each quarter-end during the period.
4. Swap Contracts: The fund has entered into equity swap contracts to earn the total return on selected reference stocks in the fund’s target index. Under the terms of the swaps, the fund receives the total return on the referenced stock (i.e., receiving the increase or paying the decrease in value of the selected reference stock and receiving the equivalent of any dividends in respect of the selected referenced stock) over a specified period of time, applied to a notional amount that represents the value of a designated number of shares of the selected reference stock at the beginning of the equity swap contract. The fund also receives a fixed rate spread related to the reference stock and pays a floating rate based on short-term interest rates, applied to the notional amount. To mitigate interest rate risk on the floating rate payable, the fund invests an amount approximating the notional amount of the swap in high-quality temporary cash investments.
The notional amounts of swap contracts are not recorded in the Statement of Net Assets. Swaps are valued daily based on market quotations received from independent pricing services or recognized dealers and the change in value is recorded in the Statement of Net Assets as an asset (liability) and in the Statement of Operations as unrealized appreciation (depreciation) until termination of the swap, at which time realized gain (loss) is recorded. A risk associated with all types of swaps is the possibility that a counterparty may default on its obligation to pay net amounts due to the fund. The fund’s maximum amount subject to counterparty risk is the unrealized appreciation on the swap contract. The fund mitigates its counterparty risk by entering into swaps only with a diverse group of prequalified counterparties, monitoring their financial strength, entering into master netting arrangements with its counterparties, and requiring its counterparties to transfer collateral as security for their performance. In the absence of a default, the collateral pledged or received by the fund cannot be repledged, resold or rehypothecated. In the event of a counterparty’s default (including bankruptcy), the fund may terminate any swap contracts with that counterparty, determine the net amount owed by either party in accordance with its master netting arrangements, and sell or retain any collateral held up to the net amount owed to the fund under the master netting arrangements. The swap contracts contain provisions whereby a counterparty may terminate open contracts if the
30
Emerging Markets Stock Index Fund
fund net assets decline below a certain level, triggering a payment by the fund if the fund is in a net liability position at the time of the termination. The payment amount would be reduced by any collateral the fund has pledged. Any securities pledged as collateral for open contracts are noted in the Statement of Net Assets. The value of collateral received or pledged is compared daily to the value of the swap contracts exposure with each counterparty, and any difference, if in excess of a specified minimum transfer amount, is adjusted and settled within two business days.
During the year ended October 31, 2016, the fund’s average amounts of investments in total return swaps represented less than 1% of net assets, based on the average of notional amounts at each quarter-end during the period.
5. Federal Income Taxes: The fund intends to continue to qualify as a regulated investment company and distribute all of its taxable income. Management has analyzed the fund’s tax positions taken for all open federal income tax years (October 31, 2013–2016), and has concluded that no provision for federal income tax is required in the fund’s financial statements.
6. Distributions: Distributions to shareholders are recorded on the ex-dividend date.
7. Securities Lending: To earn additional income, the fund lends its securities to qualified institutional borrowers. Security loans are subject to termination by the fund at any time, and are required to be secured at all times by collateral in an amount at least equal to the market value of securities loaned. Daily market fluctuations could cause the value of loaned securities to be more or less than the value of the collateral received. When this occurs, the collateral is adjusted and settled on the next business day. The fund further mitigates its counterparty risk by entering into securities lending transactions only with a diverse group of prequalified counterparties, monitoring their financial strength, and entering into master securities lending agreements with its counterparties. The master securities lending agreements provide that, in the event of a counterparty’s default (including bankruptcy), the fund may terminate any loans with that borrower, determine the net amount owed, and sell or retain the collateral up to the net amount owed to the fund; however, such actions may be subject to legal proceedings. While collateral mitigates counterparty risk, in the absence of a default the fund may experience delays and costs in recovering the securities loaned. The fund invests cash collateral received in Vanguard Market Liquidity Fund, and records a liability in the Statement of Net Assets for the return of the collateral, during the period the securities are on loan. Securities lending income represents fees charged to borrowers plus income earned on invested cash collateral, less expenses associated with the loan. During the term of the loan, the fund is entitled to all distributions made on or in respect of the loaned securities.
8. Credit Facility: The fund and certain other funds managed by The Vanguard Group (“Vanguard”) participate in a $3.1 billion committed credit facility provided by a syndicate of lenders pursuant to a credit agreement that may be renewed annually; each fund is individually liable for its borrowings, if any, under the credit facility. Borrowings may be utilized for temporary and emergency purposes, and are subject to the fund’s regulatory and contractual borrowing restrictions. The participating funds are charged administrative fees and an annual commitment fee of 0.10% of the undrawn amount of the facility; these fees are allocated to the funds based on a method approved by the fund’s board of trustees and included in Management and Administrative expenses on the fund’s Statement of
31
Emerging Markets Stock Index Fund
Operations. Any borrowings under this facility bear interest at a rate based upon the higher of the one-month London Interbank Offered Rate, federal funds effective rate, or overnight bank funding rate plus an agreed-upon spread.
The fund had no borrowings outstanding at October 31, 2016, or at any time during the period then ended.
9. Other: Dividend income is recorded on the ex-dividend date. Interest income includes income distributions received from Vanguard Market Liquidity Fund and is accrued daily. Premiums and discounts on debt securities purchased are amortized and accreted, respectively, to interest income over the lives of the respective securities. Security transactions are accounted for on the date securities are bought or sold. Costs used to determine realized gains (losses) on the sale of investment securities are those of the specific securities sold.
Withholding taxes on foreign dividends and capital gains have been provided for in accordance with the fund’s understanding of the applicable countries’ tax rules and rates. The fund has filed tax reclaims for previously withheld taxes on dividends earned in certain European Union countries. These filings are subject to various administrative and judicial proceedings within these countries. Such tax reclaims received during the year, if any, are included in dividend income. No other amounts for additional tax reclaims are reflected in the financial statements due to the uncertainty as to the ultimate resolution of proceedings, the likelihood of receipt of these reclaims, and the potential timing of payment.
Each class of shares has equal rights as to assets and earnings, except that each class separately bears certain class-specific expenses related to maintenance of shareholder accounts (included in Management and Administrative expenses) and shareholder reporting. Marketing and distribution expenses are allocated to each class of shares based on a method approved by the board of trustees. Income, other non-class-specific expenses, and gains and losses on investments are allocated to each class of shares based on its relative net assets.
B. In accordance with the terms of a Funds’ Service Agreement (the “FSA”) between Vanguard and the fund, Vanguard furnishes to the fund investment advisory, corporate management, administrative, marketing, and distribution services at Vanguard’s cost of operations (as defined by the FSA). These costs of operations are allocated to the fund based on methods and guidelines approved by the board of trustees. Vanguard does not require reimbursement in the current period for certain costs of operations (such as deferred compensation/benefits and risk/insurance costs); the fund’s liability for these costs of operations is included in Payables to Vanguard on the Statement of Net Assets.
Upon the request of Vanguard, the fund may invest up to 0.40% of its net assets as capital in Vanguard. At October 31, 2016, the fund had contributed to Vanguard capital in the amount of $4,643,000, representing 0.01% of the fund’s net assets and 1.86% of Vanguard’s capitalization. The fund’s trustees and officers are also directors and employees, respectively, of Vanguard.
32
Emerging Markets Stock Index Fund
C. Various inputs may be used to determine the value of the fund’s investments. These inputs are summarized in three broad levels for financial statement purposes. The inputs or methodologies used to value securities are not necessarily an indication of the risk associated with investing in those securities.
Level 1—Quoted prices in active markets for identical securities.
Level 2—Other significant observable inputs (including quoted prices for similar securities, interest rates, prepayment speeds, credit risk, etc.).
Level 3—Significant unobservable inputs (including the fund’s own assumptions used to determine the fair value of investments).
The following table summarizes the market value of the fund’s investments as of October 31, 2016, based on the inputs used to value them:
| | | |
| | Level 1 | Level 2 | Level 3 |
| Investments | ($000) | ($000) | ($000) |
| Common Stocks—North and South America | 8,979,738 | 733,775 | 6,045 |
| Common Stocks—Other | 1,106,172 | 50,996,919 | 155,317 |
| Temporary Cash Investments | 1,218,188 | 66,884 | — |
| Futures Contracts—Assets1 | 3,105 | — | — |
| Swap Contracts—Liabilities | — | (139) | — |
| Total | 11,307,203 | 51,797,439 | 161,362 |
| 1 Represents variation margin on the last day of the reporting period. |
Securities in certain countries may transfer between Level 1 and Level 2 because of differences in stock market closure times that may result from transitions between standard and daylight saving time in those countries and the United States. Based on values on the date of transfer, securities valued at $2,409,146,000 based on Level 1 inputs were transferred from Level 2 during the fiscal year. Additionally, based on values on the date of transfer, securities valued at $704,360,000 based on Level 2 inputs were transferred from Level 1 during the fiscal year.
The fund invests in securities of foreign issuers, which may subject it to investment risks not normally associated with investing in securities of U.S. corporations. Further, at October 31, 2016, the fund had a concentration of its investments in securities issued in China, and the performance of such investments may be impacted by the country’s social, political, and economic conditions.
D. At October 31, 2016, the aggregate settlement value of open futures contracts and the related unrealized appreciation (depreciation) were:
| | | | |
| | | | ($000) |
| | | | Aggregate | |
| | | Number of | Settlement | Unrealized |
| | | Long (Short) | Value | Appreciation |
| Futures Contracts | Expiration | Contracts | Long (Short) | (Depreciation) |
| MSCI Emerging Markets Index | December 2016 | 13,500 | 609,863 | (12,451) |
Unrealized appreciation (depreciation) on open futures contracts is required to be treated as realized gain (loss) for tax purposes.
33
Emerging Markets Stock Index Fund
E. At October 31, 2016, the fund had the following open total return swap contracts:
| | | | | |
| | | | | Fixed/Floating | Unrealized |
| | | | Notional | Net Rate | Appreciation |
| | Termination | | Amount | Received | (Depreciation) |
| Reference Entity | Date | Counterparty | ($000) | (Paid) | ($000) |
| Odontoprev SA | 1/19/17 | MSCS | 6,166 | 9.118% | (139) |
| MSCS—Morgan Stanley Capital Services Inc. |
F. Distributions are determined on a tax basis and may differ from net investment income and realized capital gains for financial reporting purposes. Differences may be permanent or temporary. Permanent differences are reclassified among capital accounts in the financial statements to reflect their tax character. Temporary differences arise when certain items of income, expense, gain, or loss are recognized in different periods for financial statement and tax purposes. These differences will reverse at some time in the future. Differences in classification may also result from the treatment of short-term gains as ordinary income for tax purposes.
During the year ended October 31, 2016, the fund realized net foreign currency losses of $697,000, which decreased distributable net income for tax purposes; accordingly, such losses have been reclassified from accumulated net realized losses to undistributed net investment income.
During the year ended October 31, 2016, the fund realized $215,435,000 of net capital losses resulting from in-kind redemptions—in which shareholders exchanged fund shares for securities held by the fund rather than for cash. Because such losses are not taxable to the fund, and are not distributed to shareholders, they have been reclassified from accumulated net realized losses to paid-in capital.
Realized and unrealized gains (losses) on certain of the fund’s swap contracts are treated as ordinary income (loss) for tax purposes. Realized losses of $21,000 on swap contracts have been reclassified from accumulated net realized losses to undistributed net investment income.
For tax purposes, at October 31, 2016, the fund had $198,648,000 of ordinary income available for distribution. At October 31, 2016, the fund had available capital losses totaling $9,280,265,000 to offset future net capital gains. Of this amount, $2,105,602,000 is subject to expiration dates; $1,591,794,000 may be used to offset future net capital gains through October 31, 2017, $212,374,000 through October 31, 2018, and $301,434,000 through October 31, 2019. Capital losses of $7,174,663,000 realized beginning in fiscal 2012 may be carried forward indefinitely under the Regulated Investment Company Modernization Act of 2010, but must be used before any expiring loss carryforwards. Capital loss carryforwards of $59,681,000 expired on October 31, 2016; accordingly, such losses have been reclassified from accumulated net realized losses to paid-in capital.
At October 31, 2016, the cost of investment securities for tax purposes was $62,796,859,000. Net unrealized appreciation of investment securities for tax purposes was $466,179,000, consisting of unrealized gains of $11,500,043,000 on securities that had risen in value since their purchase and $11,033,864,000 in unrealized losses on securities that had fallen in value since their purchase.
G. During the year ended October 31, 2016, the fund purchased $13,450,074,000 of investment securities and sold $7,883,014,000 of investment securities, other than temporary cash investments. Purchases and sales include $2,990,301,000 and $1,021,634,000, respectively, in connection with in-kind purchases and redemptions of the fund’s capital shares.
34
Emerging Markets Stock Index Fund
H. Capital share transactions for each class of shares were:
| | | | |
| | Year Ended October 31, |
| | 2016 | 2015 |
| | Amount | Shares | Amount | Shares |
| | ($000) | (000) | ($000) | (000) |
| Investor Shares | | | | |
| Issued | 246,846 | 11,404 | 364,606 | 14,768 |
| Issued in Lieu of Cash Distributions | 33,853 | 1,520 | 43,224 | 1,839 |
| Redeemed | (391,754) | (18,106) | (545,724) | (21,958) |
| Net Increase (Decrease)—Investor Shares | (111,055) | (5,182) | (137,894) | (5,351) |
| ETF Shares | | | | |
| Issued | 6,502,086 | 179,818 | 2,723,101 | 66,677 |
| Issued in Lieu of Cash Distributions | — | — | — | — |
| Redeemed | (1,662,446) | (54,600) | (4,628,926) | (132,000) |
| Net Increase (Decrease)—ETF Shares | 4,839,640 | 125,218 | (1,905,825) | (65,323) |
| Admiral Shares | | | | |
| Issued | 2,310,990 | 81,410 | 2,379,828 | 73,134 |
| Issued in Lieu of Cash Distributions | 183,978 | 6,293 | 207,486 | 6,725 |
| Redeemed | (2,024,164) | (72,200) | (1,712,861) | (52,780) |
| Net Increase (Decrease)—Admiral Shares | 470,804 | 15,503 | 874,453 | 27,079 |
| Institutional Shares | | | | |
| Issued | 1,295,401 | 60,195 | 1,464,969 | 59,422 |
| Issued in Lieu of Cash Distributions | 90,635 | 4,081 | 97,029 | 4,142 |
| Redeemed | (1,154,304) | (53,098) | (1,181,140) | (47,125) |
| Net Increase (Decrease)—Institutional Shares | 231,732 | 11,178 | 380,858 | 16,439 |
| Institutional Plus Shares | | | | |
| Issued | 596,491 | 8,606 | 622,489 | 7,130 |
| Issued in Lieu of Cash Distributions | 69,387 | 940 | 69,085 | 885 |
| Redeemed | (432,825) | (6,232) | (327,950) | (3,832) |
| Net Increase (Decrease)—Institutional Plus Shares | 233,053 | 3,314 | 363,624 | 4,183 |
I. Management has determined that no material events or transactions occurred subsequent to October 31, 2016, that would require recognition or disclosure in these financial statements.
35
Report of Independent Registered
Public Accounting Firm
To the Board of Trustees of Vanguard International Equity Index Funds and the Shareholders of Vanguard Emerging Markets Stock Index Fund: In our opinion, the accompanying statement of net assets—investments summary and the related statements of operations and of changes in net assets and the financial highlights present fairly, in all material respects, the financial position of Vanguard Emerging Markets Stock Index Fund (constituting a separate portfolio of Vanguard International Equity Index Funds, hereafter referred to as the “Fund”) at October 31, 2016, the results of its operations for the year then ended, the changes in its net assets for each of the two years in the period then ended, and the financial highlights for each of the five years in the period then ended, in conformity with accounting principles generally accepted in the United States of America. These financial statements and financial highlights (hereafter referred to as “financial statements”) are the responsibility of the Fund’s management. Our responsibility is to express an opinion on these financial statements based on our audits. We conducted our audits of these financial statements in accordance with the standards of the Public Company Accounting Oversight Board (United States). Those standards require that we plan and perform the audit to obtain reasonable assurance about whether the financial statements are free of material misstatement. An audit includes examining, on a test basis, evidence supporting the amounts and disclosures in the financial statements, assessing the accounting principles used and significant estimates made by management, and evaluating the overall financial statement presentation. We believe that our audits, which included confirmation of securities at October 31, 2016 by correspondence with the custodian and brokers and by agreement to the underlying ownership records of the transfer agent, provide a reasonable basis for our opinion.
/s/PricewaterhouseCoopers LLP
Philadelphia, Pennsylvania
December 15, 2016

Special 2016 tax information (unaudited) for Vanguard Emerging Markets Stock Index Fund
This information for the fiscal year ended October 31, 2016, is included pursuant to provisions of the
Internal Revenue Code.
The fund distributed $551,616,000 of qualified dividend income to shareholders during the fiscal year.
The fund designates to shareholders foreign source income of $1,549,342,000 and foreign taxes paid
of $166,497,000. Shareholders will receive more detailed information with their Form 1099-DIV in
January 2017 to determine the calendar-year amounts to be included on their 2016 tax returns.
36
Your Fund’s After-Tax Returns
This table presents returns for your fund both before and after taxes. The after-tax returns are shown in two ways: (1) assuming that an investor owned the fund during the entire period and paid taxes on the fund’s distributions, and (2) assuming that an investor paid taxes on the fund’s distributions and sold all shares at the end of each period.
Calculations are based on the highest individual federal income tax and capital gains tax rates in effect at the times of the distributions and the hypothetical sales. State and local taxes were not considered. After-tax returns reflect any qualified dividend income, using actual prior-year figures and estimates for 2016. (In the example, returns after the sale of fund shares may be higher than those assuming no sale. This occurs when the sale would have produced a capital loss. The calculation assumes that the investor received a tax deduction for the loss.)
The table shows returns for Investor Shares only; returns for other share classes will differ. Please note that your actual after-tax returns will depend on your tax situation and may differ from those shown. Also note that if you own the fund in a tax-deferred account, such as an individual retirement account or a 401(k) plan, this information does not apply to you. Such accounts are not subject to current taxes.
Finally, keep in mind that a fund’s performance—whether before or after taxes—does not guarantee future results.
| | | |
| Average Annual Total Returns: Emerging Markets Stock Index Fund Investor Shares | |
| Periods Ended October 31, 2016 | | | |
| |
| | One | Five | Ten |
| | Year | Years | Years |
| Returns Before Taxes | 10.21% | 0.81% | 3.34% |
| Returns After Taxes on Distributions | 9.31 | 0.08 | 2.80 |
| Returns After Taxes on Distributions and Sale of Fund Shares | 5.96 | 0.55 | 2.64 |
37
About Your Fund’s Expenses
As a shareholder of the fund, you incur ongoing costs, which include costs for portfolio management, administrative services, and shareholder reports (like this one), among others. Operating expenses, which are deducted from a fund’s gross income, directly reduce the investment return of the fund.
A fund’s expenses are expressed as a percentage of its average net assets. This figure is known as the expense ratio. The following examples are intended to help you understand the ongoing costs (in dollars) of investing in your fund and to compare these costs with those of other mutual funds. The examples are based on an investment of $1,000 made at the beginning of the period shown and held for the entire period.
The accompanying table illustrates your fund’s costs in two ways:
• Based on actual fund return. This section helps you to estimate the actual expenses that you paid over the period. The ”Ending Account Value“ shown is derived from the fund‘s actual return, and the third column shows the dollar amount that would have been paid by an investor who started with $1,000 in the fund. You may use the information here, together with the amount you invested, to estimate the expenses that you paid over the period.
To do so, simply divide your account value by $1,000 (for example, an $8,600 account value divided by $1,000 = 8.6), then multiply the result by the number given for your fund under the heading ”Expenses Paid During Period.“
• Based on hypothetical 5% yearly return. This section is intended to help you compare your fund‘s costs with those of other mutual funds. It assumes that the fund had a yearly return of 5% before expenses, but that the expense ratio is unchanged. In this case—because the return used is not the fund’s actual return—the results do not apply to your investment. The example is useful in making comparisons because the Securities and Exchange Commission requires all mutual funds to calculate expenses based on a 5% return. You can assess your fund’s costs by comparing this hypothetical example with the hypothetical examples that appear in shareholder reports of other funds.
Note that the expenses shown in the table are meant to highlight and help you compare ongoing costs only and do not reflect transaction costs incurred by the fund for buying and selling securities. Further, the expenses do not include any purchase, redemption, or account service fees described in the fund prospectus. If such fees were applied to your account, your costs would be higher. Your fund does not carry a “sales load.”
The calculations assume no shares were bought or sold during the period. Your actual costs may have been higher or lower, depending on the amount of your investment and the timing of any purchases or redemptions.
You can find more information about the fund’s expenses, including annual expense ratios, in the Financial Statements section of this report. For additional information on operating expenses and other shareholder costs, please refer to your fund’s current prospectus.
38
| | | |
| Six Months Ended October 31, 2016 | | | |
| | Beginning | Ending | Expenses |
| | Account Value | Account Value | Paid During |
| Emerging Markets Stock Index Fund | 4/30/2016 | 10/31/2016 | Period |
| Based on Actual Fund Return | | | |
| Investor Shares | $1,000.00 | $1,100.59 | $1.58 |
| FTSE Emerging Markets ETF Shares | 1,000.00 | 1,102.16 | 0.69 |
| Admiral Shares | 1,000.00 | 1,101.79 | 0.74 |
| Institutional Shares | 1,000.00 | 1,101.78 | 0.58 |
| Institutional Plus Shares | 1,000.00 | 1,102.11 | 0.48 |
| Based on Hypothetical 5% Yearly Return | | | |
| Investor Shares | $1,000.00 | $1,023.63 | $1.53 |
| FTSE Emerging Markets ETF Shares | 1,000.00 | 1,024.48 | 0.66 |
| Admiral Shares | 1,000.00 | 1,024.43 | 0.71 |
| Institutional Shares | 1,000.00 | 1,024.58 | 0.56 |
| Institutional Plus Shares | 1,000.00 | 1,024.68 | 0.46 |
The calculations are based on expenses incurred in the most recent six-month period. The funds’ annualized six-month expense ratios for that
period are 0.30% for Investor Shares, 0.13% for FTSE Emerging Markets ETF Shares, 0.14% for Admiral Shares, 0.11% for Institutional
Shares, and 0.09% for Institutional Plus Shares. The dollar amounts shown as “Expenses Paid” are equal to the annualized expense ratio
multiplied by the average account value over the period, multiplied by the number of days in the most recent six-month period, then divided
by the number of days in the most recent 12-month period (184/366).
39
Glossary
Beta. A measure of the magnitude of a fund’s past share-price fluctuations in relation to the ups and downs of a given market index. The index is assigned a beta of 1.00. Compared with a given index, a fund with a beta of 1.20 typically would have seen its share price rise or fall by 12% when the index rose or fell by 10%. For this report, beta is based on returns over the past 36 months for both the fund and the index. Note that a fund’s beta should be reviewed in conjunction with its R-squared (see definition). The lower the R-squared, the less correlation there is between the fund and the index, and the less reliable beta is as an indicator of volatility.
Dividend Yield. Dividend income earned by stocks, expressed as a percentage of the aggregate market value (or of net asset value, for a fund). The yield is determined by dividing the amount of the annual dividends by the aggregate value (or net asset value) at the end of the period. For a fund, the dividend yield is based solely on stock holdings and does not include any income produced by other investments.
Equity Exposure. A measure that reflects a fund’s investments in stocks and stock futures. Any holdings in short-term reserves are excluded.
Expense Ratio. A fund’s total annual operating expenses expressed as a percentage of the fund’s average net assets. The expense ratio includes management and administrative expenses, but does not include the transaction costs of buying and selling portfolio securities.
Fair-Value Pricing. Fair-value adjustments, which are required by the Securities and Exchange Commission, address pricing discrepancies that may arise because of time-zone differences among global stock markets. Foreign stocks may trade on exchanges that close many hours before a fund’s closing share price is calculated in the United States, generally at 4 p.m., Eastern time. In the hours between the foreign close and the U.S. close, the value of these foreign securities may change—because of company-specific announcements or market-wide developments, for example. Such price changes are not immediately reflected in international index values. Fair-value pricing takes such changes into account in calculating the fund’s daily net asset value, thus ensuring that the NAV doesn’t include “stale” prices. The result can be a temporary divergence between the return of the fund and that of its benchmark index—a difference that usually corrects itself when the foreign markets reopen.
Inception Date. The date on which the assets of a fund (or one of its share classes) are first invested in accordance with the fund’s investment objective. For funds with a subscription period, the inception date is the day after that period ends. Investment performance is measured from the inception date.
Median Market Cap. An indicator of the size of companies in which a fund invests; the midpoint of market capitalization (market price x shares outstanding) of a fund’s stocks, weighted by the proportion of the fund’s assets invested in each stock. Stocks representing half of the fund’s assets have market capitalizations above the median, and the rest are below it.
Price/Book Ratio. The share price of a stock divided by its net worth, or book value, per share. For a fund, the weighted average price/book ratio of the stocks it holds.
40
Price/Earnings Ratio. The ratio of a stock’s current price to its per-share earnings over the past year. For a fund, the weighted average P/E of the stocks it holds. P/E is an indicator of market expectations about corporate prospects; the higher the P/E, the greater the expectations for a company’s future growth.
R-Squared. A measure of how much of a fund’s past returns can be explained by the returns from the market in general, as measured by a given index. If a fund’s total returns were precisely synchronized with an index’s returns, its R-squared would be 1.00. If the fund’s returns bore no relationship to the index’s returns, its R-squared would be 0. For this report, R-squared is based on returns over the past 36 months for both the fund and the index.
Return on Equity. The annual average rate of return generated by a company during the past five years for each dollar of shareholder’s equity (net income divided by shareholder’s equity). For a fund, the weighted average return on equity for the companies whose stocks it holds.
Short-Term Reserves. The percentage of a fund invested in highly liquid, short-term securities that can be readily converted to cash.
Turnover Rate. An indication of the fund’s trading activity. Funds with high turnover rates incur higher transaction costs and may be more likely to distribute capital gains (which may be taxable to investors). The turnover rate excludes in-kind transactions, which have minimal impact on costs.
Benchmark Information
Spliced Emerging Markets Index: Select Emerging Markets Index through August 23, 2006; MSCI Emerging Markets Index through January 9, 2013; FTSE Emerging Transition Index through June 27, 2013; FTSE Emerging Index through November 1, 2015; FTSE Emerging Markets All Cap China A Transition Index through September 18, 2016; and FTSE Emerging Markets All Cap China A Inclusion Index thereafter. Benchmark returns are adjusted for withholding taxes.
41
This page intentionally left blank.
This page intentionally left blank.
The People Who Govern Your Fund
The trustees of your mutual fund are there to see that the fund is operated and managed in your best interests since, as a shareholder, you are a part owner of the fund. Your fund’s trustees also serve on the board of directors of The Vanguard Group, Inc., which is owned by the Vanguard funds and provides services to them on an at-cost basis.
A majority of Vanguard’s board members are independent, meaning that they have no affiliation with Vanguard or the funds they oversee, apart from the sizable personal investments they have made as private individuals. The independent board members have distinguished backgrounds in business, academia, and public service. Each of the trustees and executive officers oversees 198 Vanguard funds.
The following table provides information for each trustee and executive officer of the fund. The mailing address of the trustees and officers is P.O. Box 876, Valley Forge, PA 19482. More information about the trustees is in the Statement of Additional Information, which can be obtained, without charge, by contacting Vanguard at 800-662-7447, or online at vanguard.com.
InterestedTrustee1
F. William McNabb III
Born 1957. Trustee Since July 2009. Chairman of
the Board. Principal Occupation(s) During the Past
Five Years and Other Experience: Chairman of the
Board of The Vanguard Group, Inc., and of each of
the investment companies served by The Vanguard
Group, since January 2010; Director of The Vanguard
Group since 2008; Chief Executive Officer and
President of The Vanguard Group, and of each of
the investment companies served by The Vanguard
Group, since 2008; Director of Vanguard Marketing
Corporation; Managing Director of The Vanguard
Group (1995–2008).
IndependentTrustees
Emerson U. Fullwood
Born 1948. Trustee Since January 2008. Principal
Occupation(s) During the Past Five Years and Other
Experience: Executive Chief Staff and Marketing
Officer for North America and Corporate Vice President
(retired 2008) of Xerox Corporation (document manage-
ment products and services); Executive in Residence
and 2009–2010 Distinguished Minett Professor at
the Rochester Institute of Technology; Lead Director
of SPX FLOW, Inc. (multi-industry manufacturing);
Director of the United Way of Rochester, the University
of Rochester Medical Center, Monroe Community
College Foundation, North Carolina A&T University,
and Roberts Wesleyan College.
Rajiv L. Gupta
Born 1945. Trustee Since December 2001.2 Principal
Occupation(s) During the Past Five Years and Other
Experience: Chairman and Chief Executive Officer
(retired 2009) and President (2006–2008) of
Rohm and Haas Co. (chemicals); Director of Tyco
International plc (diversified manufacturing and
services), HP Inc. (printer and personal computer
manufacturing), and Delphi Automotive plc
(automotive components); Senior Advisor at
New Mountain Capital.
Amy Gutmann
Born 1949. Trustee Since June 2006. Principal
Occupation(s) During the Past Five Years and
Other Experience: President of the University of
Pennsylvania; Christopher H. Browne Distinguished
Professor of Political Science, School of Arts and
Sciences, and Professor of Communication, Annenberg
School for Communication, with secondary faculty
appointments in the Department of Philosophy, School
of Arts and Sciences, and at the Graduate School of
Education, University of Pennsylvania; Trustee of the
National Constitution Center; Chair of the Presidential
Commission for the Study of Bioethical Issues.
JoAnn Heffernan Heisen
Born 1950. Trustee Since July 1998. Principal
Occupation(s) During the Past Five Years and
Other Experience: Corporate Vice President and
Chief Global Diversity Officer (retired 2008) and
Member of the Executive Committee (1997–2008)
of Johnson & Johnson (pharmaceuticals/medical
devices/consumer products); Director of Skytop
Lodge Corporation (hotels) and the Robert Wood
Johnson Foundation; Member of the Advisory
Board of the Institute for Women’s Leadership
at Rutgers University.
F. Joseph Loughrey
Born 1949. Trustee Since October 2009. Principal
Occupation(s) During the Past Five Years and Other
Experience: President and Chief Operating Officer
(retired 2009) of Cummins Inc. (industrial machinery);
Chairman of the Board of Hillenbrand, Inc. (specialized
consumer services), and of Oxfam America; Director
of SKF AB (industrial machinery), Hyster-Yale Materials
Handling, Inc. (forklift trucks), the Lumina Foundation
for Education, and the V Foundation for Cancer
Research; Member of the Advisory Council for the
College of Arts and Letters and of the Advisory Board
to the Kellogg Institute for International Studies, both
at the University of Notre Dame.
Mark Loughridge
Born 1953. Trustee Since March 2012. Principal
Occupation(s) During the Past Five Years and Other
Experience: Senior Vice President and Chief Financial
Officer (retired 2013) at IBM (information technology
services); Fiduciary Member of IBM’s Retirement Plan
Committee (2004–2013); Director of the Dow Chemical
Company; Member of the Council on Chicago Booth.
Scott C. Malpass
Born 1962. Trustee Since March 2012. Principal
Occupation(s) During the Past Five Years and Other
Experience: Chief Investment Officer and Vice
President at the University of Notre Dame; Assistant
Professor of Finance at the Mendoza College of
Business at Notre Dame; Member of the Notre Dame
403(b) Investment Committee, the Board of Advisors
for Spruceview Capital Partners, and the Investment
Advisory Committee of Major League Baseball; Board
Member of TIFF Advisory Services, Inc., and Catholic
Investment Services, Inc. (investment advisors).
André F. Perold
Born 1952. Trustee Since December 2004. Principal
Occupation(s) During the Past Five Years and Other
Experience: George Gund Professor of Finance and
Banking, Emeritus at the Harvard Business School
(retired 2011); Chief Investment Officer and Managing
Partner of HighVista Strategies LLC (private investment
firm); Director of Rand Merchant Bank; Overseer of
the Museum of Fine Arts Boston.
Peter F. Volanakis
Born 1955. Trustee Since July 2009. Principal
Occupation(s) During the Past Five Years and
Other Experience: President and Chief Operating
Officer (retired 2010) of Corning Incorporated
(communications equipment); Chairman of the
Board of Trustees of Colby-Sawyer College;
Member of the Advisory Board of the Norris
Cotton Cancer Center.
Executive Officers
Glenn Booraem
Born 1967. Treasurer Since May 2015. Principal
Occupation(s) During the Past Five Years and
Other Experience: Principal of The Vanguard Group,
Inc.; Treasurer of each of the investment companies
served by The Vanguard Group; Controller of each of
the investment companies served by The Vanguard
Group (2010–2015); Assistant Controller of each of
the investment companies served by The Vanguard
Group (2001–2010).
Thomas J. Higgins
Born 1957. Chief Financial Officer Since September
2008. Principal Occupation(s) During the Past Five
Years and Other Experience: Principal of The Vanguard
Group, Inc.; Chief Financial Officer of each of the
investment companies served by The Vanguard Group;
Treasurer of each of the investment companies served
by The Vanguard Group (1998–2008).
Peter Mahoney
Born 1974. Controller Since May 2015. Principal
Occupation(s) During the Past Five Years and Other
Experience: Head of Global Fund Accounting at The
Vanguard Group, Inc.; Controller of each of the invest-
ment companies served by The Vanguard Group;
Head of International Fund Services at The Vanguard
Group (2008–2014).
Anne E. Robinson
Born 1970. Secretary Since September 2016. Principal
Occupation(s) During the Past Five Years and Other
Experience: Managing Director of The Vanguard Group,
Inc.; General Counsel of The Vanguard Group; Secretary
of The Vanguard Group and of each of the investment
companies served by The Vanguard Group; Director
and Senior Vice President of Vanguard Marketing
Corporation; Managing Director and General Counsel
of Global Cards and Consumer Services at Citigroup
(2014–2016); Counsel at American Express (2003–2014).
| |
| Vanguard Senior Management Team |
| Mortimer J. Buckley | James M. Norris |
| Kathleen C. Gubanich | Thomas M. Rampulla |
| Martha G. King | Glenn W. Reed |
| John T. Marcante | Karin A. Risi |
| Chris D. McIsaac | Michael Rollings |
| |
| Chairman Emeritus and Senior Advisor |
| John J. Brennan | |
| Chairman, 1996–2009 | |
| Chief Executive Officer and President, 1996–2008 |
| |
| Founder | |
| John C. Bogle | |
| Chairman and Chief Executive Officer, 1974–1996 |
1 Mr. McNabb is considered an “interested person,” as defined in the Investment Company Act of 1940, because he is an officer of the Vanguard funds.
2 December 2002 for Vanguard Equity Income Fund, the Vanguard Municipal Bond Funds, and the Vanguard State Tax-Exempt Funds.
|  |
| | P.O. Box 2600 |
| | Valley Forge, PA 19482-2600 |
| |
| |
| |
| Connect with Vanguard® > vanguard.com |
| |
| |
| |
| Fund Information > 800-662-7447 | |
| |
| Direct Investor Account Services > 800-662-2739 | London Stock Exchange Group companies include FTSE |
| Institutional Investor Services > 800-523-1036 | International Limited (”FTSE”), Frank Russell Company |
| | (”Russell”), MTS Next Limited (”MTS”), and FTSE TMX |
| Text Telephone for People | Global Debt Capital Markets Inc. (”FTSE TMX”). All |
| Who Are Deaf or Hard of Hearing > 800-749-7273 | rights reserved. ”FTSE®”, ”Russell®”, ”MTS®”, ”FTSE |
| This material may be used in conjunction | TMX®” and ”FTSE Russell” and other service marks |
| | and trademarks related to the FTSE or Russell indexes |
| with the offering of shares of any Vanguard | are trademarks of the London Stock Exchange Group |
| fund only if preceded or accompanied by | companies and are used by FTSE, MTS, FTSE TMX and |
| the fund’s current prospectus. | Russell under licence. All information is provided for |
| | information purposes only. No responsibility or liability |
| All comparative mutual fund data are from Lipper, a | can be accepted by the London Stock Exchange Group |
| Thomson Reuters Company, or Morningstar, Inc., unless | companies nor its licensors for any errors or for any |
| otherwise noted. | loss from use of this publication. Neither the London |
| You can obtain a free copy of Vanguard’s proxy voting | Stock Exchange Group companies nor any of its |
| guidelines by visiting vanguard.com/proxyreporting or by | licensors make any claim, prediction, warranty or |
| calling Vanguard at 800-662-2739. The guidelines are | representation whatsoever, expressly or impliedly, |
| also available from the SEC’s website, sec.gov. In | either as to the results to be obtained from the use of |
| addition, you may obtain a free report on how your fund | the FTSE Indexes or the fitness or suitability of the |
| voted the proxies for securities it owned during the 12 | Indexes for any particular purpose to which they might |
| months ended June 30. To get the report, visit either | be put. |
| vanguard.com/proxyreporting or sec.gov. | The Industry Classification Benchmark (”ICB”) is owned |
| You can review and copy information about your fund at | by FTSE. FTSE does not accept any liability to any |
| the SEC’s Public Reference Room in Washington, D.C. To | person for any loss or damage arising out of any error |
| find out more about this public service, call the SEC at | or omission in the ICB. |
| 202-551-8090. Information about your fund is also | |
| available on the SEC’s website, and you can receive | |
| copies of this information, for a fee, by sending a | |
| request in either of two ways: via email addressed to | |
| publicinfo@sec.gov or via regular mail addressed to the | |
| Public Reference Section, Securities and Exchange | |
| Commission, Washington, DC 20549-1520. | |
| |
| | © 2016 The Vanguard Group, Inc. |
| | All rights reserved. |
| | Vanguard Marketing Corporation, Distributor. |
| |
| | Q5330 122016 |
Item 2: Code of Ethics. The Registrant has adopted a code of ethics that applies to the Registrant’s principal executive officer, principal financial officer, principal accounting officer or controller or persons performing similar functions. The Code of Ethics was amended during the reporting period covered by this report to make certain technical, non-material changes.
Item 3: Audit Committee Financial Expert. All members of the Audit Committee have been determined by the Registrant’s Board of Trustees to be Audit Committee Financial Experts and to be independent: Rajiv L. Gupta, JoAnn Heffernan Heisen, F. Joseph Loughrey, Mark Loughridge, and Peter F. Volanakis.
Item 4: Principal Accountant Fees and Services.
(a) Audit Fees.
Audit Fees of the Registrant
Fiscal Year Ended October 31, 2016: $318,000
Fiscal Year Ended October 31, 2015: $307,000
Aggregate Audit Fees of Registered Investment Companies in the Vanguard Group.
Fiscal Year Ended October 31, 2016: $9,629,849
Fiscal Year Ended October 31, 2015: $7,000,200
Includes fees billed in connection with audits of the Registrant, other registered investment companies in the Vanguard complex, The Vanguard Group, Inc. and Vanguard Marketing Corporation.
(b) Audit-Related Fees.
Fiscal Year Ended October 31, 2016: $2,717,627
Fiscal Year Ended October 31, 2015: $2,899,096
Includes fees billed in connection with assurance and related services provided to the Registrant, other registered investment companies in the Vanguard complex, The Vanguard Group, Inc., and Vanguard Marketing Corporation.
(c) Tax Fees.
Fiscal Year Ended October 31, 2016: $254,050
Fiscal Year Ended October 31, 2015: $353,389
Includes fees billed in connection with tax compliance, planning, and advice services provided to the Registrant, other registered investment companies in the Vanguard complex, The Vanguard Group, Inc., and Vanguard Marketing Corporation.
(d) All Other Fees.
Fiscal Year Ended October 31, 2016: $214,225
Fiscal Year Ended October 31, 2015: $202,313
Includes fees billed for services related to tax reported information provided to the Registrant, other registered investment companies in the Vanguard complex, The Vanguard Group, Inc., and Vanguard Marketing Corporation.
(e) (1) Pre-Approval Policies. The policy of the Registrant’s Audit Committee is to consider and, if appropriate, approve before the principal accountant is engaged for such services, all specific audit and non-audit services provided to: the Registrant, other registered investment companies in the Vanguard complex, The Vanguard Group, Inc., and entities controlled by The Vanguard Group, Inc. that provide ongoing services to the Registrant. In making a determination, the Audit Committee considers whether the services are consistent with maintaining the principal accountant’s independence.
In the event of a contingency situation in which the principal accountant is needed to provide services in between scheduled Audit Committee meetings, the Chairman of the Audit Committee would be called on to consider and, if appropriate, pre-approve audit or permitted non-audit services in an amount sufficient to complete services through the next Audit Committee meeting, and to determine if such services would be consistent with maintaining the accountant’s independence. At the next scheduled Audit Committee meeting, services and fees would be presented to the Audit Committee for formal consideration, and, if appropriate, approval by the entire Audit Committee. The Audit Committee would again consider whether such services and fees are consistent with maintaining the principal accountant’s independence.
The Registrant’s Audit Committee is informed at least annually of all audit and non-audit services provided by the principal accountant to the Vanguard complex, whether such services are provided to: the Registrant, other registered investment companies in the Vanguard complex, The Vanguard Group, Inc., or other entities controlled by The Vanguard Group, Inc. that provide ongoing services to the Registrant.
(2) No percentage of the principal accountant’s fees or services were approved pursuant to the waiver provision of paragraph (c)(7)(i)(C) of Rule 2-01 of Regulation S-X.
(f) For the most recent fiscal year, over 50% of the hours worked under the principal accountant’s engagement were not performed by persons other than full-time, permanent employees of the principal accountant.
(g) Aggregate Non-Audit Fees.
Fiscal Year Ended October 31, 2016: $468,275
Fiscal Year Ended October 31, 2015: $555,702
Includes fees billed for non-audit services provided to the Registrant, other registered investment companies in the Vanguard complex, The Vanguard Group, Inc., and Vanguard Marketing Corporation.
(h) For the most recent fiscal year, the Audit Committee has determined that the provision of all non-audit services was consistent with maintaining the principal accountant’s independence.
Item 5: Audit Committee of Listed Registrants.
The Registrant is a listed issuer as defined in rule 10A-3 under the Securities Exchange Act of 1934 (“Exchange Act”). The Registrant has a separately-designated standing audit committee established in accordance with Section 3(a)(58)(A) of the Exchange Act. The Registrant’s audit committee members are: Emerson U. Fullwood, Rajiv L. Gupta, Amy Gutmann, JoAnn Heffernan Heisen, F. Joseph Loughrey, Mark Loughridge, Scott C. Malpass, André F. Perold, and Peter F. Volanakis.
Item 6: Investments.
| | | |
| Vanguard® European Stock Index Fund | | |
| Schedule of Investments | | |
| October 31, 2016 | | |
| |
| | | | Market |
| | | | Value |
| | | Shares | ($000) |
| |
| Common Stocks (99.9%)1 | | |
| Austria (0.5%) | | |
| | Erste Group Bank AG | 528,601 | 16,576 |
| | OMV AG | 266,276 | 8,310 |
| | voestalpine AG | 210,643 | 7,462 |
| | ANDRITZ AG | 132,154 | 6,910 |
| | BUWOG AG | 167,955 | 4,060 |
| | IMMOFINANZ AG | 1,671,121 | 3,597 |
| * | Raiffeisen Bank International AG | 217,730 | 3,566 |
| | Wienerberger AG | 215,433 | 3,443 |
| | CA Immobilien Anlagen AG | 130,235 | 2,363 |
| | Conwert Immobilien Invest SE | 129,439 | 2,296 |
| | Oesterreichische Post AG | 63,070 | 2,176 |
| | Lenzing AG | 16,454 | 2,144 |
| | Verbund AG | 120,727 | 2,013 |
| | Mayr Melnhof Karton AG | 13,910 | 1,541 |
| | Telekom Austria AG Class A | 260,973 | 1,499 |
| | Schoeller-Bleckmann Oilfield Equipment AG | 19,862 | 1,407 |
| | Vienna Insurance Group AG Wiener Versicherung Gruppe | 68,960 | 1,359 |
| | UNIQA Insurance Group AG | 192,102 | 1,237 |
| | RHI AG | 47,268 | 1,190 |
| | S IMMO AG | 95,903 | 1,029 |
| | Strabag SE | 28,809 | 967 |
| | DO & CO AG | 11,749 | 910 |
| | Zumtobel Group AG | 47,769 | 838 |
| | EVN AG | 57,286 | 670 |
| | Palfinger AG | 21,181 | 641 |
| | Semperit AG Holding | 17,913 | 486 |
| *,^ | Flughafen Wien AG | 18,215 | 442 |
| | Kapsch TrafficCom AG | 9,843 | 441 |
| | | | 79,573 |
| Belgium (2.2%) | | |
| * | Anheuser-Busch InBev SA/NV | 1,467,974 | 168,480 |
| * | KBC Group NV | 506,910 | 30,902 |
| | UCB SA | 221,988 | 15,022 |
| | Solvay SA Class A | 130,043 | 14,918 |
| | Ageas | 368,713 | 13,470 |
| | Groupe Bruxelles Lambert SA | 142,839 | 12,279 |
| | Umicore SA | 168,913 | 10,267 |
| | Proximus SADP | 257,804 | 7,379 |
| | Colruyt SA | 121,987 | 6,557 |
| | Ackermans & van Haaren NV | 45,759 | 6,351 |
| | bpost SA | 185,341 | 4,931 |
| * | Telenet Group Holding NV | 90,230 | 4,831 |
| | Cofinimmo SA | 37,403 | 4,379 |
| | Ontex Group NV | 135,061 | 4,085 |
| | Sofina SA | 28,715 | 4,011 |
| | Bekaert SA | 63,883 | 2,840 |
| | Melexis NV | 39,448 | 2,583 |
| | Elia System Operator SA/NV | 47,402 | 2,453 |
| | Warehouses De Pauw CVA | 26,092 | 2,404 |
| | D'ieteren SA/NV | 49,684 | 2,190 |
| | Befimmo SA | 34,738 | 2,025 |
| * | Aedifica SA | 23,661 | 1,963 |
| | Gimv NV | 36,262 | 1,952 |
| | Euronav NV | 241,310 | 1,888 |
| | Ion Beam Applications | 35,106 | 1,667 |
| * | Tessenderlo Chemie NV (Voting Shares) | 43,947 | 1,467 |
| | Econocom Group SA/NV | 96,756 | 1,439 |
| | Cie d'Entreprises CFE | 12,571 | 1,386 |
| * | AGFA-Gevaert NV | 325,534 | 1,353 |
| * | Orange Belgium SA | 54,525 | 1,228 |
| | Barco NV | 14,649 | 1,152 |
1
| | | |
| Vanguard® European Stock Index Fund | | |
| Schedule of Investments | | |
| October 31, 2016 | | |
| |
| | | | Market |
| | | | Value |
| | | Shares | ($000) |
| * | KBC Ancora | 29,836 | 1,132 |
| | Kinepolis Group NV | 22,442 | 1,010 |
| | Van de Velde NV | 13,291 | 936 |
| *,^ | Nyrstar (Voting Shares) | 167,522 | 860 |
| | EVS Broadcast Equipment SA | 17,867 | 625 |
| | Wereldhave Belgium NV | 3,820 | 478 |
| | | | 342,893 |
| Denmark (2.8%) | | |
| | Novo Nordisk A/S Class B | 3,395,967 | 120,983 |
| | Danske Bank A/S | 1,373,356 | 42,367 |
| | Vestas Wind Systems A/S | 403,228 | 32,305 |
| | Pandora A/S | 203,944 | 26,524 |
| | AP Moller - Maersk A/S Class B | 11,564 | 17,738 |
| | Carlsberg A/S Class B | 195,232 | 17,589 |
| | DSV A/S | 340,786 | 16,501 |
| * | Genmab A/S | 100,043 | 16,475 |
| | Novozymes A/S | 411,571 | 15,268 |
| | ISS A/S | 340,218 | 13,356 |
| | Coloplast A/S Class B | 185,000 | 12,888 |
| | AP Moller - Maersk A/S Class A | 7,718 | 11,281 |
| | Chr Hansen Holding A/S | 161,781 | 9,689 |
| * | TDC A/S | 1,478,394 | 8,151 |
| | Jyske Bank A/S | 130,087 | 5,898 |
| *,2 | DONG Energy A/S | 145,360 | 5,760 |
| | GN Store Nord A/S | 272,376 | 5,521 |
| | Tryg A/S | 208,110 | 4,058 |
| | Sydbank A/S | 128,793 | 4,022 |
| | William Demant Holding A/S | 207,257 | 3,856 |
| * | H Lundbeck A/S | 110,373 | 3,557 |
| | SimCorp A/S | 62,348 | 3,443 |
| | Royal Unibrew A/S | 71,440 | 3,342 |
| ^ | FLSmidth & Co. A/S | 90,522 | 3,284 |
| * | Topdanmark A/S | 118,907 | 3,200 |
| | NKT Holding A/S | 44,734 | 3,012 |
| | Dfds A/S | 55,570 | 2,685 |
| ^ | Ambu A/S Class B | 43,751 | 2,267 |
| | Rockwool International A/S Class B | 11,794 | 1,973 |
| *,^ | Bavarian Nordic A/S | 54,464 | 1,845 |
| 2 | Scandinavian Tobacco Group A/S | 89,728 | 1,552 |
| | Spar Nord Bank A/S | 151,169 | 1,516 |
| | ALK-Abello A/S | 10,274 | 1,390 |
| | Schouw & Co. AB | 21,702 | 1,377 |
| | Matas A/S | 61,827 | 1,200 |
| | Alm Brand A/S | 120,582 | 907 |
| *,^ | Bang & Olufsen A/S | 61,177 | 676 |
| | Solar A/S Class B | 10,978 | 603 |
| *,^ | D/S Norden A/S | 18,961 | 270 |
| | | | 428,329 |
| Finland (1.8%) | | |
| | Nokia Oyj | 10,513,658 | 46,939 |
| | Sampo Oyj Class A | 864,682 | 39,615 |
| | Kone Oyj Class B | 700,536 | 32,233 |
| | UPM-Kymmene Oyj | 982,164 | 22,847 |
| | Fortum Oyj | 820,724 | 13,681 |
| | Wartsila OYJ Abp | 287,846 | 12,439 |
| | Neste Oyj | 235,034 | 10,140 |
| | Stora Enso Oyj | 1,066,252 | 10,076 |
| | Elisa Oyj | 294,691 | 9,929 |
| | Nokian Renkaat Oyj | 249,225 | 8,359 |
| | Orion Oyj Class B | 186,837 | 7,953 |
| | Huhtamaki Oyj | 188,352 | 7,601 |
| | Metso Oyj | 247,072 | 6,478 |
| | Kesko Oyj Class B | 124,310 | 6,177 |
| | Amer Sports Oyj | 214,142 | 5,827 |
2
| | | |
| Vanguard® European Stock Index Fund | | |
| Schedule of Investments | | |
| October 31, 2016 | | |
| |
| | | | Market |
| | | | Value |
| | | Shares | ($000) |
| | Tieto Oyj | 135,372 | 3,714 |
| | Valmet Oyj | 247,243 | 3,671 |
| | Konecranes Oyj | 106,366 | 3,623 |
| | Cargotec Oyj Class B | 76,379 | 3,132 |
| * | Outokumpu Oyj | 375,270 | 2,616 |
| ^ | Metsa Board Oyj | 413,767 | 2,377 |
| | Sponda Oyj | 453,631 | 2,148 |
| | YIT Oyj | 233,359 | 1,946 |
| | Citycon Oyj | 753,031 | 1,765 |
| | Kemira Oyj | 137,901 | 1,643 |
| | Uponor Oyj | 95,536 | 1,625 |
| ^ | Caverion Corp. | 220,729 | 1,588 |
| *,^ | Outotec Oyj | 334,566 | 1,457 |
| | Sanoma Oyj | 152,449 | 1,426 |
| | Cramo Oyj | 45,631 | 1,196 |
| | Oriola-KD Oyj | 224,026 | 1,050 |
| | Ramirent Oyj | 119,552 | 881 |
| | Raisio Oyj | 202,935 | 848 |
| * | Finnair Oyj | 120,744 | 535 |
| ^ | F-Secure Oyj | 117,927 | 417 |
| *,^ | Stockmann OYJ Abp Class B | 51,685 | 386 |
| | | | 278,338 |
| France (14.4%) | | |
| | TOTAL SA | 3,958,249 | 189,620 |
| | Sanofi | 2,053,898 | 159,833 |
| | BNP Paribas SA | 1,798,456 | 104,281 |
| | LVMH Moet Hennessy Louis Vuitton SE | 460,992 | 83,929 |
| | AXA SA | 3,544,985 | 79,983 |
| | Danone SA | 1,045,391 | 72,507 |
| | Schneider Electric SE | 998,287 | 67,135 |
| | Vinci SA | 857,828 | 62,124 |
| | Airbus Group SE | 1,005,962 | 59,734 |
| | Orange SA | 3,507,427 | 55,185 |
| | Societe Generale SA | 1,347,610 | 52,567 |
| | Pernod Ricard SA | 390,653 | 46,458 |
| | Essilor International SA | 372,442 | 41,853 |
| | L'Oreal SA Loyalty Line | 232,325 | 41,623 |
| | Vivendi SA | 2,024,839 | 40,984 |
| | Cie de Saint-Gobain | 877,069 | 38,945 |
| ^ | Engie SA | 2,644,386 | 38,137 |
| | Safran SA | 544,319 | 37,455 |
| | Air Liquide SA | 368,372 | 37,431 |
| | L'Oreal SA | 201,798 | 36,154 |
| | Cie Generale des Etablissements Michelin | 331,926 | 35,950 |
| | Air Liquide SA (Prime de fidelite) | 337,631 | 34,308 |
| | Kering | 137,164 | 30,433 |
| | Legrand SA | 489,327 | 27,646 |
| | Renault SA | 317,214 | 27,586 |
| | Carrefour SA | 1,043,692 | 27,354 |
| | Publicis Groupe SA | 377,582 | 25,902 |
| * | Valeo SA | 435,192 | 25,113 |
| | Capgemini SA | 293,267 | 24,288 |
| | Veolia Environnement SA | 897,897 | 19,617 |
| | Sodexo SA | 163,120 | 18,942 |
| | Dassault Systemes | 232,658 | 18,416 |
| | Christian Dior SE | 95,027 | 18,328 |
| | Thales SA | 192,745 | 18,134 |
| | Hermes International | 43,923 | 17,794 |
| | Atos SE | 167,005 | 17,331 |
| | Credit Agricole SA | 1,530,944 | 16,517 |
| | Klepierre | 377,664 | 15,434 |
| | SES SA Class A | 657,266 | 15,121 |
| | Technip SA | 215,989 | 14,335 |
| | Arkema SA | 131,213 | 12,442 |
3
| | | |
| Vanguard® European Stock Index Fund | | |
| Schedule of Investments | | |
| October 31, 2016 | | |
| |
| | | | Market |
| | | | Value |
| | | Shares | ($000) |
| | Accor SA | 318,624 | 12,091 |
| | Bouygues SA | 357,102 | 11,641 |
| | Teleperformance | 104,942 | 11,088 |
| | Gecina SA | 73,687 | 10,744 |
| | STMicroelectronics NV | 1,131,607 | 10,740 |
| * | Peugeot SA | 715,791 | 10,719 |
| | Eiffage SA | 132,344 | 9,798 |
| | Suez | 593,586 | 9,402 |
| | SCOR SE | 288,931 | 9,357 |
| | Iliad SA | 43,075 | 9,030 |
| | Bureau Veritas SA | 474,927 | 8,970 |
| | Edenred | 379,516 | 8,783 |
| | Zodiac Aerospace | 357,111 | 8,679 |
| | Natixis SA | 1,712,374 | 8,664 |
| | Ingenico Group SA | 99,864 | 7,899 |
| | Groupe Eurotunnel SE | 841,300 | 7,874 |
| | Rexel SA | 555,756 | 7,708 |
| * | Alstom SA | 283,627 | 7,622 |
| | Eurofins Scientific SE | 16,524 | 7,509 |
| | SEB SA | 49,506 | 7,286 |
| | Societe BIC SA | 49,353 | 6,841 |
| | Eutelsat Communications SA | 320,666 | 6,720 |
| | Orpea | 77,124 | 6,419 |
| | Wendel SA | 55,072 | 6,336 |
| | Rubis SCA | 68,384 | 6,236 |
| | Bollore SA | 1,787,809 | 5,886 |
| | Fonciere Des Regions | 65,769 | 5,748 |
| 2 | Elior Group | 241,211 | 5,419 |
| | Lagardere SCA | 211,980 | 5,398 |
| | Aeroports de Paris | 53,147 | 5,368 |
| | Credit Agricole SA Loyalty Line | 497,173 | 5,364 |
| 2 | Euronext NV | 129,084 | 5,169 |
| | Casino Guichard Perrachon SA | 103,821 | 5,168 |
| | CNP Assurances | 297,421 | 5,151 |
| | Faurecia | 136,093 | 5,017 |
| | Imerys SA | 69,337 | 4,828 |
| * | Ubisoft Entertainment SA | 139,400 | 4,743 |
| | ICADE | 65,415 | 4,698 |
| | SFR Group SA | 168,728 | 4,547 |
| | Eurazeo SA | 76,412 | 4,400 |
| | Ipsen SA | 62,677 | 4,333 |
| | Electricite de France SA | 385,788 | 4,325 |
| | JCDecaux SA | 136,600 | 4,178 |
| | Nexity SA | 78,122 | 3,922 |
| | Technicolor SA | 670,709 | 3,918 |
| 2 | Amundi SA | 78,120 | 3,831 |
| | BioMerieux | 26,195 | 3,816 |
| | Remy Cointreau SA | 43,869 | 3,557 |
| | Plastic Omnium SA | 105,995 | 3,456 |
| * | Nexans SA | 60,683 | 3,449 |
| | Altran Technologies SA | 212,578 | 3,033 |
| * | Sartorius Stedim Biotech | 44,017 | 2,970 |
| | Alten SA | 41,465 | 2,963 |
| * | Vallourec SA | 536,553 | 2,637 |
| | Elis SA | 157,762 | 2,621 |
| * | DBV Technologies SA | 37,873 | 2,611 |
| | Euler Hermes Group | 28,828 | 2,501 |
| | Havas SA | 302,136 | 2,459 |
| | Sopra Steria Group | 23,325 | 2,373 |
| | Korian SA | 70,736 | 2,167 |
| | Metropole Television SA | 121,466 | 2,116 |
| | SPIE SA | 109,743 | 2,074 |
| *,2 | Worldline SA/France | 74,359 | 2,042 |
| | IPSOS | 62,107 | 2,028 |
4
| | | |
| Vanguard® European Stock Index Fund | | |
| Schedule of Investments | | |
| October 31, 2016 | | |
| |
| | | | Market |
| | | | Value |
| | | Shares | ($000) |
| | Neopost SA | 62,759 | 1,901 |
| | Vicat SA | 28,789 | 1,810 |
| * | Groupe Fnac SA | 25,390 | 1,733 |
| ^ | Television Francaise 1 | 186,807 | 1,721 |
| | Tarkett SA | 46,524 | 1,657 |
| *,^ | Air France-KLM | 271,367 | 1,654 |
| | Mercialys SA | 78,218 | 1,620 |
| | Electricite de France SA Loyalty Line | 122,442 | 1,373 |
| | Trigano SA | 18,323 | 1,296 |
| | Faiveley Transport SA | 11,671 | 1,272 |
| * | Virbac SA | 7,880 | 1,254 |
| *,2 | Europcar Groupe SA | 131,159 | 1,219 |
| | Gaztransport Et Technigaz SA | 34,438 | 1,164 |
| | Coface SA | 154,361 | 1,000 |
| ^ | CGG SA | 37,505 | 991 |
| *,^ | Etablissements Maurel et Prom | 221,852 | 977 |
| *,^ | Genfit | 51,982 | 973 |
| | Boiron SA | 9,687 | 819 |
| * | Eramet | 16,877 | 792 |
| | FFP | 10,444 | 769 |
| ^ | Rallye SA | 41,032 | 743 |
| | Vilmorin & Cie SA | 12,093 | 727 |
| | Beneteau SA | 59,221 | 685 |
| * | Fonciere de Paris SIIC | 4,667 | 678 |
| | Assystem | 20,994 | 629 |
| | Bonduelle SCA | 25,794 | 611 |
| ^ | Bourbon Corp. | 45,936 | 599 |
| | Guerbet | 9,331 | 555 |
| | Albioma SA | 33,290 | 550 |
| | Interparfums SA | 17,165 | 493 |
| | Derichebourg SA | 147,311 | 461 |
| | Mersen | 20,538 | 411 |
| | Direct Energie | 10,921 | 407 |
| | Jacquet Metal Service | 24,187 | 406 |
| | GL Events | 21,932 | 391 |
| *,^ | Parrot SA | 36,713 | 326 |
| | Manitou BF SA | 16,467 | 297 |
| * | Esso SA Francaise | 5,970 | 240 |
| | Haulotte Group SA | 17,128 | 237 |
| | Union Financiere de France BQE SA | 6,570 | 175 |
| * | Stallergenes Greer plc | 5,371 | 172 |
| * | Euro Disney SCA | 100,136 | 127 |
| | | | 2,211,284 |
| Germany (14.3%) | | |
| | Siemens AG | 1,398,861 | 158,936 |
| | Bayer AG | 1,522,417 | 151,161 |
| | BASF SE | 1,698,847 | 149,971 |
| | SAP SE | 1,644,643 | 144,893 |
| | Allianz SE | 837,961 | 130,810 |
| | Daimler AG | 1,757,817 | 125,407 |
| | Deutsche Telekom AG | 5,913,660 | 96,483 |
| | adidas AG | 368,074 | 60,473 |
| | Linde AG | 340,364 | 56,217 |
| | Deutsche Post AG | 1,747,188 | 54,182 |
| | Bayerische Motoren Werke AG | 597,460 | 52,126 |
| | Muenchener Rueckversicherungs-Gesellschaft AG in Muenchen | 262,596 | 50,986 |
| | Fresenius SE & Co. KGaA | 672,375 | 49,680 |
| | Volkswagen AG Preference Shares | 337,451 | 46,526 |
| | Henkel AG & Co. KGaA Preference Shares | 319,185 | 41,025 |
| | Continental AG | 198,503 | 38,131 |
| | Infineon Technologies AG | 2,064,508 | 37,131 |
| * | Deutsche Bank AG | 2,540,393 | 36,738 |
| | Fresenius Medical Care AG & Co. KGaA | 398,482 | 32,458 |
| | Vonovia SE | 858,879 | 30,280 |
5
| | | |
| Vanguard® European Stock Index Fund | | |
| Schedule of Investments | | |
| October 31, 2016 | | |
| |
| | | | Market |
| | | | Value |
| | | Shares | ($000) |
| * | Deutsche Boerse AG | 352,116 | 27,496 |
| | HeidelbergCement AG | 268,178 | 25,369 |
| | E.ON SE | 3,453,978 | 25,314 |
| | Merck KGaA | 237,492 | 24,445 |
| | Henkel AG & Co. KGaA | 214,760 | 23,663 |
| | Deutsche Wohnen AG | 619,696 | 20,247 |
| | thyssenkrupp AG | 782,210 | 18,150 |
| | ProSiebenSat.1 Media SE | 392,895 | 16,933 |
| | Beiersdorf AG | 183,736 | 16,198 |
| | Symrise AG | 224,084 | 15,389 |
| | Porsche Automobil Holding SE Preference Shares | 282,429 | 15,262 |
| | Brenntag AG | 284,515 | 15,210 |
| * | RWE AG | 886,097 | 14,097 |
| | Commerzbank AG | 1,918,079 | 13,063 |
| | GEA Group AG | 327,369 | 12,680 |
| | Hannover Rueck SE | 111,328 | 12,420 |
| | LANXESS AG | 168,671 | 10,816 |
| * | QIAGEN NV | 413,341 | 10,109 |
| | Wirecard AG | 211,612 | 10,045 |
| | MTU Aero Engines AG | 94,220 | 9,839 |
| | LEG Immobilien AG | 116,141 | 9,797 |
| *,2 | Innogy SE | 238,215 | 9,460 |
| | METRO AG | 301,391 | 9,028 |
| | Evonik Industries AG | 283,802 | 8,888 |
| | United Internet AG | 215,710 | 8,869 |
| | OSRAM Licht AG | 153,746 | 8,732 |
| *,2 | Zalando SE | 192,551 | 8,467 |
| | Volkswagen AG | 54,386 | 8,130 |
| | Bayerische Motoren Werke AG Preference Shares | 99,970 | 7,590 |
| | HUGO BOSS AG | 117,479 | 7,387 |
| | KION Group AG | 119,774 | 7,237 |
| ^ | K&S AG | 355,103 | 7,191 |
| *,2 | Covestro AG | 116,035 | 6,871 |
| | MAN SE | 63,908 | 6,541 |
| * | KUKA AG | 54,574 | 6,193 |
| | Fuchs Petrolub SE Preference Shares | 128,312 | 5,743 |
| | STADA Arzneimittel AG | 114,197 | 5,727 |
| | Freenet AG | 197,504 | 5,662 |
| | RTL Group SA | 71,643 | 5,615 |
| | Deutsche Lufthansa AG | 430,163 | 5,506 |
| | HOCHTIEF AG | 39,827 | 5,438 |
| | Rheinmetall AG | 77,155 | 5,356 |
| * | Dialog Semiconductor plc | 129,769 | 5,103 |
| | Sartorius AG Preference Shares | 62,967 | 4,957 |
| * | Uniper SE | 370,369 | 4,930 |
| | Telefonica Deutschland Holding AG | 1,261,666 | 4,893 |
| | TUI AG-DI | 383,129 | 4,875 |
| | Aurubis AG | 82,672 | 4,310 |
| | Gerresheimer AG | 56,979 | 4,298 |
| | Axel Springer SE | 82,319 | 4,124 |
| | Fraport AG Frankfurt Airport Services Worldwide | 68,068 | 4,041 |
| | Rational AG | 7,630 | 3,965 |
| | Aareal Bank AG | 108,282 | 3,917 |
| | Suedzucker AG | 144,892 | 3,717 |
| | Deutsche EuroShop AG | 85,575 | 3,699 |
| | TAG Immobilien AG | 261,535 | 3,487 |
| ^ | Drillisch AG | 75,024 | 3,428 |
| | Software AG | 92,613 | 3,366 |
| | Fielmann AG | 46,824 | 3,250 |
| | Hella KGaA Hueck & Co. | 82,907 | 3,164 |
| * | Nordex SE | 116,564 | 3,070 |
| | alstria office REIT-AG | 234,899 | 3,030 |
| | Jungheinrich AG Preference Shares | 89,815 | 2,836 |
| | Krones AG | 27,002 | 2,754 |
6
| | | |
| Vanguard® European Stock Index Fund | | |
| Schedule of Investments | | |
| October 31, 2016 | | |
| |
| | | | Market |
| | | | Value |
| | | Shares | ($000) |
| | Norma Group SE | 57,711 | 2,655 |
| | Wacker Chemie AG | 27,478 | 2,451 |
| | FUCHS PETROLUB SE | 61,192 | 2,421 |
| | Salzgitter AG | 71,037 | 2,335 |
| | Leoni AG | 61,342 | 2,327 |
| | GRENKE AG | 13,030 | 2,268 |
| | CTS Eventim AG & Co. KGaA | 61,796 | 2,218 |
| | Bechtle AG | 20,854 | 2,193 |
| | Talanx AG | 69,486 | 2,157 |
| ^ | Stroeer SE & Co. KGaA | 47,101 | 2,155 |
| *,^ | Bilfinger SE | 61,104 | 2,152 |
| | TLG Immobilien AG | 101,360 | 2,125 |
| | Nemetschek SE | 33,578 | 2,094 |
| * | MorphoSys AG | 47,120 | 2,092 |
| * | Kloeckner & Co. SE | 166,189 | 2,075 |
| * | Schaeffler AG Preference Shares | 134,092 | 2,033 |
| | Indus Holding AG | 34,028 | 2,008 |
| 2 | ADO Properties SA | 53,584 | 1,959 |
| | Duerr AG | 25,918 | 1,933 |
| 2 | Deutsche Pfandbriefbank AG | 185,523 | 1,908 |
| | RHOEN-KLINIKUM AG | 68,316 | 1,902 |
| | CompuGroup Medical SE | 41,653 | 1,846 |
| * | PATRIZIA Immobilien AG | 79,531 | 1,646 |
| | DMG Mori AG | 34,736 | 1,590 |
| | Pfeiffer Vacuum Technology AG | 17,449 | 1,583 |
| * | zooplus AG | 11,113 | 1,582 |
| | Sixt SE | 24,616 | 1,494 |
| | Sixt SE Preference Shares | 32,206 | 1,438 |
| *,2 | Tele Columbus AG | 180,694 | 1,428 |
| *,^ | SGL Carbon SE | 111,926 | 1,397 |
| | Takkt AG | 58,275 | 1,382 |
| | KWS Saat SE | 3,889 | 1,272 |
| | Puma SE | 4,971 | 1,239 |
| * | Vossloh AG | 20,195 | 1,228 |
| | BRAAS Monier Building Group SA | 41,593 | 1,199 |
| | Jenoptik AG | 67,991 | 1,168 |
| *,^ | Heidelberger Druckmaschinen AG | 425,530 | 1,130 |
| | Carl Zeiss Meditec AG | 30,235 | 1,088 |
| | XING AG | 5,240 | 1,069 |
| * | Wincor Nixdorf AG | 12,963 | 944 |
| ^ | BayWa AG | 27,549 | 926 |
| | Draegerwerk AG & Co. KGaA Preference Shares | 12,656 | 904 |
| | Deutz AG | 176,692 | 874 |
| | ElringKlinger AG | 56,190 | 870 |
| | Bertrandt AG | 8,181 | 870 |
| * | HeidelbergCement AG (Milan Shares) | 8,655 | 817 |
| | DIC Asset AG | 81,773 | 785 |
| * | AIXTRON SE | 151,756 | 752 |
| * | Wuestenrot & Wuerttembergische AG | 37,071 | 738 |
| | Deutsche Beteiligungs AG | 19,285 | 652 |
| *,2 | Hapag-Lloyd AG | 31,597 | 629 |
| | Gerry Weber International AG | 48,792 | 609 |
| | RWE AG Preference Shares | 52,183 | 604 |
| | comdirect bank AG | 57,063 | 579 |
| | Hamburger Hafen und Logistik AG | 36,413 | 579 |
| | Wacker Neuson SE | 40,721 | 563 |
| * | H&R GmbH & Co. KGaA | 28,131 | 521 |
| ^ | SMA Solar Technology AG | 19,545 | 502 |
| | Hornbach Baumarkt AG | 15,377 | 485 |
| | Biotest AG Preference Shares | 33,095 | 461 |
| | Draegerwerk AG & Co. KGaA | 6,552 | 418 |
| | CropEnergies AG | 46,603 | 264 |
| | Biotest AG | 13,549 | 242 |
| | | | 2,210,829 |
7
| | | |
| Vanguard® European Stock Index Fund | | |
| Schedule of Investments | | |
| October 31, 2016 | | |
| |
| | | | Market |
| | | | Value |
| | | Shares | ($000) |
| Ireland (0.5%) | | |
| | Kerry Group plc Class A | 268,064 | 19,455 |
| * | Bank of Ireland | 50,715,735 | 10,856 |
| | Smurfit Kappa Group plc | 433,742 | 9,523 |
| | Kingspan Group plc | 325,165 | 7,963 |
| * | Ryanair Holdings plc ADR | 103,091 | 7,741 |
| | Glanbia plc | 324,246 | 5,282 |
| | C&C Group plc | 602,119 | 2,310 |
| | Green REIT plc | 1,236,761 | 1,847 |
| | Hibernia REIT plc | 1,245,641 | 1,754 |
| | Origin Enterprises plc | 227,588 | 1,411 |
| | Irish Continental Group plc | 292,972 | 1,367 |
| * | Permanent TSB Group Holdings plc | 232,610 | 633 |
| *,^ | Irish Bank Resolution Corp. Ltd. | 2,503,596 | — |
| | | | 70,142 |
| Isle of Man (0.0%) | | |
| * | Paysafe Group plc | 895,840 | 4,735 |
| |
| Italy (3.7%) | | |
| | Eni SPA | 4,536,993 | 65,842 |
| | Enel SPA | 14,010,558 | 60,236 |
| | Intesa Sanpaolo SPA (Registered) | 22,121,265 | 51,292 |
| | Assicurazioni Generali SPA | 2,314,510 | 29,897 |
| | UniCredit SPA | 9,798,308 | 24,316 |
| | Snam SPA | 4,514,500 | 23,786 |
| | Atlantia SPA | 879,627 | 21,537 |
| | Luxottica Group SPA | 328,457 | 16,355 |
| *,^ | Telecom Italia SPA (Registered) | 18,328,242 | 15,933 |
| | CNH Industrial NV | 1,692,207 | 13,138 |
| | Terna Rete Elettrica Nazionale SPA | 2,621,661 | 12,833 |
| | Ferrari NV | 243,513 | 12,821 |
| | Tenaris SA | 867,592 | 12,271 |
| | Fiat Chrysler Automobiles NV | 1,612,742 | 11,823 |
| | Prysmian SPA | 380,215 | 9,455 |
| | EXOR SPA | 207,056 | 8,803 |
| * | Leonardo-Finmeccanica SPA | 705,713 | 8,593 |
| | Telecom Italia SPA (Bearer) | 11,019,539 | 7,822 |
| | Mediobanca SPA | 1,029,119 | 7,539 |
| 2 | Poste Italiane SPA | 843,911 | 5,618 |
| | Davide Campari-Milano SPA | 524,959 | 5,287 |
| | Recordati SPA | 186,113 | 5,263 |
| | Moncler SPA | 271,639 | 4,522 |
| ^ | Banco Popolare SC | 1,519,457 | 4,386 |
| * | Saipem SPA | 10,600,424 | 4,359 |
| ^ | Unione di Banche Italiane SPA | 1,564,595 | 4,317 |
| | FinecoBank Banca Fineco SPA | 728,610 | 4,258 |
| | Banca Popolare dell'Emilia Romagna SC | 890,625 | 4,185 |
| | Mediaset SPA | 1,354,078 | 3,872 |
| | A2A SPA | 2,835,702 | 3,862 |
| | UnipolSai SPA | 1,940,204 | 3,708 |
| | Intesa Sanpaolo SPA | 1,711,525 | 3,706 |
| ^ | Banca Popolare di Milano Scarl | 7,951,652 | 3,644 |
| | Brembo SPA | 53,844 | 3,334 |
| * | Yoox Net-A-Porter Group SPA | 114,594 | 3,296 |
| | Banca Mediolanum SPA | 461,851 | 3,193 |
| | Hera SPA | 1,222,410 | 3,125 |
| ^ | Salvatore Ferragamo SPA | 115,531 | 2,824 |
| | Azimut Holding SPA | 175,223 | 2,813 |
| | Banca Popolare di Sondrio SCPA | 833,020 | 2,781 |
| | Unipol Gruppo Finanziario SPA | 907,973 | 2,780 |
| | Cerved Information Solutions SPA | 345,113 | 2,778 |
| | DiaSorin SPA | 44,178 | 2,715 |
| | Buzzi Unicem SPA | 132,117 | 2,569 |
| | De' Longhi SPA | 105,478 | 2,468 |
8
| | | |
| Vanguard® European Stock Index Fund | | |
| Schedule of Investments | | |
| October 31, 2016 | | |
| |
| | | | Market |
| | | | Value |
| | | Shares | ($000) |
| | Interpump Group SPA | 151,775 | 2,434 |
| | Banca Generali SPA | 103,732 | 2,307 |
| | Ansaldo STS SPA | 187,036 | 2,150 |
| 2 | Infrastrutture Wireless Italiane SPA | 430,710 | 2,036 |
| 2 | Anima Holding SPA | 414,233 | 2,018 |
| | Autogrill SPA | 231,908 | 1,933 |
| ^ | Societa Cattolica di Assicurazioni SCRL | 309,806 | 1,873 |
| | Industria Macchine Automatiche SPA | 27,824 | 1,721 |
| | Iren SPA | 913,801 | 1,640 |
| | Parmalat SPA | 596,694 | 1,577 |
| | Amplifon SPA | 143,137 | 1,512 |
| * | Ei Towers SPA | 31,209 | 1,470 |
| ^ | Tod's SPA | 25,053 | 1,464 |
| *,^ | Banca Monte dei Paschi di Siena SPA | 4,758,225 | 1,274 |
| 2 | OVS SPA | 225,717 | 1,237 |
| | Societa Iniziative Autostradali e Servizi SPA | 126,470 | 1,184 |
| | Beni Stabili SpA SIIQ | 1,966,201 | 1,146 |
| ^ | Saras SPA | 647,439 | 1,125 |
| | Banca IFIS SPA | 38,655 | 1,120 |
| | ACEA SPA | 86,029 | 1,114 |
| | MARR SPA | 58,599 | 1,079 |
| | Brunello Cucinelli SPA | 49,856 | 988 |
| | Danieli & C Officine Meccaniche SPA RSP | 72,389 | 970 |
| | ERG SPA | 86,590 | 962 |
| | Credito Valtellinese SC | 2,075,530 | 913 |
| | Reply SPA | 7,163 | 900 |
| ^ | Salini Impregilo SPA | 292,212 | 814 |
| | Datalogic SPA | 37,613 | 789 |
| | Buzzi Unicem SPA RSP | 76,287 | 779 |
| | Italmobiliare SPA | 16,326 | 775 |
| ^ | Credito Emiliano SPA | 134,130 | 756 |
| 2 | RAI Way SPA | 187,560 | 734 |
| * | Safilo Group SPA | 62,173 | 651 |
| | ASTM SPA | 57,886 | 625 |
| | CIR-Compagnie Industriali Riunite SPA | 560,182 | 624 |
| ^ | Piaggio & C SPA | 342,710 | 597 |
| | Immobiliare Grande Distribuzione SIIQ SPA | 702,597 | 541 |
| ^ | Cairo Communication SPA | 115,084 | 494 |
| *,^ | Banca Carige SPA | 1,323,517 | 452 |
| | Cementir Holding SPA | 90,352 | 441 |
| *,^ | Fincantieri SPA | 972,674 | 441 |
| | Danieli & C Officine Meccaniche SPA | 23,099 | 431 |
| | Esprinet SPA | 53,275 | 395 |
| * | Gruppo Editoriale L'Espresso SPA | 386,076 | 321 |
| | Geox SPA | 146,782 | 316 |
| | Cofide SPA | 734,900 | 312 |
| * | Juventus Football Club SPA | 936,139 | 301 |
| *,^ | Arnoldo Mondadori Editore SPA | 285,378 | 282 |
| | DeA Capital SPA | 216,354 | 256 |
| ^ | Astaldi SPA | 63,339 | 256 |
| *,^ | Rizzoli Corriere Della Sera Mediagroup SPA | 232,091 | 249 |
| | Zignago Vetro SPA | 39,469 | 239 |
| | Falck Renewables SPA | 149,610 | 134 |
| * | EXOR SPA Rights Exp. 11/09/2016 | 210,136 | — |
| | | | 561,107 |
| Netherlands (5.0%) | | |
| | Unilever NV | 2,865,071 | 119,835 |
| | ING Groep NV | 7,109,259 | 93,324 |
| | ASML Holding NV | 590,562 | 62,478 |
| * | Koninklijke Ahold Delhaize NV | 2,326,236 | 53,067 |
| | Koninklijke Philips NV | 1,678,400 | 50,574 |
| | Unibail-Rodamco SE | 180,991 | 42,961 |
| | Heineken NV | 397,683 | 32,757 |
| | Akzo Nobel NV | 456,486 | 29,494 |
9
| | | |
| Vanguard® European Stock Index Fund | | |
| Schedule of Investments | | |
| October 31, 2016 | | |
| |
| | | | Market |
| | | | Value |
| | | Shares | ($000) |
| | RELX NV (London Shares) | 1,675,265 | 28,249 |
| * | ArcelorMittal | 3,370,992 | 22,778 |
| | Wolters Kluwer NV | 537,707 | 20,793 |
| | Koninklijke DSM NV | 322,060 | 20,700 |
| | Koninklijke KPN NV | 5,736,351 | 18,705 |
| | NN Group NV | 595,338 | 17,933 |
| | Aegon NV | 3,537,628 | 15,304 |
| | Heineken Holding NV | 180,002 | 13,850 |
| * | Altice NV Class A | 689,879 | 12,724 |
| | Randstad Holding NV | 203,094 | 10,446 |
| 2 | ABN AMRO Group NV | 393,832 | 9,090 |
| | Gemalto NV | 149,505 | 8,123 |
| | Koninklijke Vopak NV | 121,261 | 6,120 |
| | Aalberts Industries NV | 176,404 | 5,571 |
| | Delta Lloyd NV | 828,928 | 5,008 |
| | Boskalis Westminster | 152,096 | 4,905 |
| | SBM Offshore NV | 334,391 | 4,800 |
| | IMCD Group NV | 98,064 | 4,241 |
| * | Galapagos NV | 68,120 | 4,145 |
| * | Altice NV Class B | 216,935 | 4,039 |
| | APERAM SA | 84,712 | 3,853 |
| * | PostNL NV | 817,785 | 3,851 |
| | ASM International NV | 88,636 | 3,781 |
| | Eurocommercial Properties NV | 81,357 | 3,461 |
| | Wereldhave NV | 74,221 | 3,322 |
| | TKH Group NV | 78,972 | 3,039 |
| | Corbion NV | 104,931 | 2,421 |
| 2 | GrandVision NV | 94,342 | 2,160 |
| *,^ | OCI NV | 153,498 | 2,131 |
| | BE Semiconductor Industries NV | 62,349 | 2,031 |
| * | Fugro NV | 109,975 | 1,967 |
| | Koninklijke BAM Groep NV | 399,564 | 1,859 |
| *,^ | TomTom NV | 222,199 | 1,797 |
| 2 | Flow Traders | 54,947 | 1,696 |
| | Arcadis NV | 123,980 | 1,632 |
| 2 | Refresco Group NV | 105,454 | 1,540 |
| | Vastned Retail NV | 34,873 | 1,342 |
| | Wessanen | 94,835 | 1,133 |
| | Accell Group | 44,443 | 1,112 |
| | NSI NV | 262,454 | 1,030 |
| | Brunel International NV | 38,161 | 623 |
| | BinckBank NV | 102,001 | 605 |
| | | | 768,400 |
| Norway (1.2%) | | |
| ^ | Statoil ASA | 1,765,910 | 28,830 |
| | DNB ASA | 1,774,060 | 25,647 |
| | Telenor ASA | 1,278,400 | 20,333 |
| | Orkla ASA | 1,438,581 | 13,584 |
| | Marine Harvest ASA | 684,377 | 12,419 |
| | Yara International ASA | 322,730 | 11,400 |
| | Norsk Hydro ASA | 2,452,942 | 10,966 |
| | Gjensidige Forsikring ASA | 316,796 | 5,676 |
| *,^ | Subsea 7 SA | 503,378 | 5,635 |
| * | Storebrand ASA | 830,213 | 4,270 |
| | TGS Nopec Geophysical Co. ASA | 184,897 | 3,740 |
| | Schibsted ASA Class B | 162,767 | 3,667 |
| | Schibsted ASA Class A | 149,769 | 3,590 |
| | Salmar ASA | 92,997 | 3,018 |
| * | Aker BP ASA | 185,841 | 2,974 |
| ^ | Tomra Systems ASA | 271,272 | 2,945 |
| | Bakkafrost P/F | 61,080 | 2,561 |
| | Leroy Seafood Group ASA | 46,586 | 2,463 |
| 2 | XXL ASA | 182,186 | 2,280 |
| | Veidekke ASA | 131,424 | 1,964 |
10
| | | |
| Vanguard® European Stock Index Fund | | |
| Schedule of Investments | | |
| October 31, 2016 | | |
| |
| | | | Market |
| | | | Value |
| | | Shares | ($000) |
| 2 | Entra ASA | 167,444 | 1,795 |
| | SpareBank 1 SMN | 231,628 | 1,704 |
| | Aker ASA | 44,347 | 1,636 |
| | Atea ASA | 175,469 | 1,571 |
| *,^ | Seadrill Ltd. | 656,264 | 1,395 |
| * | Opera Software ASA | 192,956 | 1,360 |
| | Kongsberg Gruppen ASA | 92,809 | 1,325 |
| | SpareBank 1 SR-Bank ASA | 217,769 | 1,298 |
| | Austevoll Seafood ASA | 133,128 | 1,200 |
| *,2 | Aker Solutions ASA | 261,333 | 1,199 |
| *,^ | Nordic Semiconductor ASA | 279,542 | 1,119 |
| *,^ | Petroleum Geo-Services ASA | 400,819 | 1,076 |
| *,^ | DNO ASA | 1,183,964 | 1,010 |
| | Hoegh LNG Holdings Ltd. | 76,914 | 806 |
| *,^ | Norwegian Air Shuttle ASA | 21,073 | 711 |
| ^ | Ocean Yield ASA | 75,805 | 633 |
| | Norwegian Property ASA | 467,128 | 609 |
| *,^ | REC Silicon ASA | 3,803,657 | 475 |
| *,^ | Akastor ASA | 339,876 | 468 |
| | Stolt-Nielsen Ltd. | 34,424 | 423 |
| * | Treasure ASA | 153,272 | 340 |
| | Wilh Wilhelmsen ASA | 103,093 | 326 |
| ^,2 | BW LPG Ltd. | 100,886 | 325 |
| * | Prosafe SE Class A | 1,303,496 | 44 |
| | | | 190,810 |
| Other (0.0%) 3 | | |
| | Diebold Inc. | 26,549 | 579 |
| |
| Portugal (0.3%) | | |
| | Galp Energia SGPS SA | 947,398 | 12,845 |
| | EDP - Energias de Portugal SA | 3,522,362 | 11,642 |
| | Jeronimo Martins SGPS SA | 454,920 | 7,817 |
| | NOS SGPS SA | 410,428 | 2,727 |
| | EDP Renovaveis SA | 358,345 | 2,707 |
| | CTT-Correios de Portugal SA | 265,100 | 1,754 |
| | REN - Redes Energeticas Nacionais SGPS SA | 511,483 | 1,495 |
| | Sonae SGPS SA | 1,765,448 | 1,404 |
| ^ | Banco Comercial Portugues SA | 1,007,576 | 1,342 |
| | Navigator Co. SA | 451,234 | 1,322 |
| * | Banco BPI SA | 638,456 | 793 |
| | Semapa-Sociedade de Investimento e Gestao | 44,815 | 575 |
| | Altri SGPS SA | 135,891 | 473 |
| ^ | Mota-Engil SGPS SA | 156,825 | 306 |
| | Sonaecom SGPS SA | 78,110 | 219 |
| * | Banco Espirito Santo SA | 8,371,877 | 17 |
| | | | 47,438 |
| Spain (5.1%) | | |
| | Banco Santander SA | 26,515,106 | 129,925 |
| | Banco Bilbao Vizcaya Argentaria SA | 11,849,532 | 85,301 |
| | Telefonica SA | 7,880,006 | 80,066 |
| | Iberdrola SA | 10,393,273 | 70,731 |
| | Industria de Diseno Textil SA | 1,950,921 | 68,073 |
| | Amadeus IT Group SA | 761,194 | 35,825 |
| * | Repsol SA | 2,020,045 | 28,205 |
| 2 | Aena SA | 118,812 | 17,410 |
| ^ | Abertis Infraestructuras SA | 1,157,020 | 17,150 |
| * | Ferrovial SA | 879,685 | 17,090 |
| * | Red Electrica Corp. SA | 798,422 | 16,633 |
| | CaixaBank SA | 4,777,500 | 14,416 |
| | Endesa SA | 582,402 | 12,362 |
| | Grifols SA | 612,645 | 12,089 |
| | Enagas SA | 418,860 | 12,007 |
| * | Banco de Sabadell SA | 8,822,860 | 11,781 |
| | Gas Natural SDG SA | 565,458 | 11,131 |
11
| | | |
| Vanguard® European Stock Index Fund | | |
| Schedule of Investments | | |
| October 31, 2016 | | |
| |
| | | | Market |
| | | | Value |
| | | Shares | ($000) |
| | Bankinter SA | 1,278,135 | 9,769 |
| * | ACS Actividades de Construccion y Servicios SA | 311,129 | 9,517 |
| | Gamesa Corp. Tecnologica SA | 410,495 | 9,478 |
| | Bankia SA | 8,430,010 | 7,406 |
| | Grifols SA Preference Shares | 475,697 | 6,833 |
| | Merlin Properties Socimi SA | 593,440 | 6,658 |
| * | Banco Popular Espanol SA | 5,688,793 | 6,224 |
| | Distribuidora Internacional de Alimentacion SA | 1,138,809 | 6,083 |
| | Mapfre SA | 1,882,812 | 5,585 |
| ^ | Bolsas y Mercados Espanoles SHMSF SA | 142,458 | 4,305 |
| 2 | Cellnex Telecom SA | 257,692 | 4,226 |
| | Viscofan SA | 84,540 | 3,980 |
| | Mediaset Espana Comunicacion SA | 334,209 | 3,730 |
| | Acciona SA | 47,645 | 3,621 |
| | Ebro Foods SA | 158,723 | 3,423 |
| * | Acerinox SA | 259,836 | 3,198 |
| | Inmobiliaria Colonial SA | 430,514 | 3,036 |
| | Zardoya Otis SA | 353,922 | 2,981 |
| | Prosegur Cia de Seguridad SA | 381,586 | 2,767 |
| | Grupo Catalana Occidente SA | 83,901 | 2,642 |
| | Melia Hotels International SA | 213,252 | 2,633 |
| * | Indra Sistemas SA | 212,207 | 2,624 |
| | Applus Services SA | 237,303 | 2,277 |
| | Tecnicas Reunidas SA | 58,085 | 2,173 |
| | Hispania Activos Inmobiliarios SOCIMI SA | 167,214 | 2,054 |
| *,^,2 | Euskaltel SA | 180,118 | 1,812 |
| | CIE Automotive SA | 87,053 | 1,792 |
| | Vidrala SA | 30,136 | 1,728 |
| * | NH Hotel Group SA | 389,222 | 1,717 |
| | Faes Farma SA | 448,947 | 1,648 |
| | Almirall SA | 110,148 | 1,583 |
| | Axiare Patrimonio SOCIMI SA | 106,910 | 1,519 |
| | Cia de Distribucion Integral Logista Holdings SA | 65,314 | 1,448 |
| | Corp Financiera Alba SA | 31,227 | 1,369 |
| | Construcciones y Auxiliar de Ferrocarriles SA | 3,401 | 1,281 |
| * | Sacyr SA | 505,788 | 1,153 |
| *,^ | Fomento de Construcciones y Contratas SA | 128,960 | 1,116 |
| ^ | Obrascon Huarte Lain SA | 252,756 | 1,013 |
| | Atresmedia Corp. de Medios de Comunicacion SA | 94,565 | 972 |
| *,^ | Pharma Mar SA | 302,813 | 818 |
| * | Promotora de Informaciones SA | 98,830 | 685 |
| *,^ | Codere SA | 914,906 | 551 |
| | Papeles y Cartones de Europa SA | 91,945 | 480 |
| | Ence Energia y Celulosa SA | 212,340 | 463 |
| *,^ | Liberbank SA | 422,956 | 420 |
| * | Ferrovial SA Rights Exp. 11/14/2016 | 879,685 | 377 |
| * | Papeles y Cartones de Europa SA Rights | 91,945 | 18 |
| *,^ | Deoleo SA | 29,797 | 6 |
| | | | 781,387 |
| Sweden (4.9%) | | |
| | Nordea Bank AB | 5,840,849 | 61,382 |
| | Hennes & Mauritz AB Class B | 1,746,176 | 49,107 |
| | Swedbank AB Class A | 1,938,627 | 45,362 |
| | Svenska Handelsbanken AB Class A | 2,691,555 | 36,694 |
| | Atlas Copco AB Class A | 1,141,741 | 33,447 |
| | Assa Abloy AB Class B | 1,730,698 | 31,453 |
| | Svenska Cellulosa AB SCA Class B | 1,101,050 | 31,185 |
| | Volvo AB Class B | 2,850,489 | 30,574 |
| | Investor AB Class B | 834,737 | 29,644 |
| | Skandinaviska Enskilda Banken AB Class A | 2,648,309 | 26,712 |
| | Telefonaktiebolaget LM Ericsson Class B | 5,473,399 | 26,551 |
| | Sandvik AB | 1,977,269 | 22,465 |
| | Telia Co. AB | 4,762,120 | 19,024 |
| ^ | Atlas Copco AB Class B | 721,293 | 18,841 |
12
| | | |
| Vanguard® European Stock Index Fund | | |
| Schedule of Investments | | |
| October 31, 2016 | | |
| |
| | | | Market |
| | | | Value |
| | | Shares | ($000) |
| | Hexagon AB Class B | 472,439 | 16,532 |
| | Skanska AB Class B | 663,841 | 14,416 |
| | Swedish Match AB | 346,761 | 12,067 |
| | SKF AB | 697,274 | 11,810 |
| | Boliden AB | 504,353 | 11,689 |
| | Electrolux AB Class B | 409,550 | 9,693 |
| * | Kinnevik AB | 369,462 | 9,341 |
| | Securitas AB Class B | 557,074 | 8,598 |
| | Alfa Laval AB | 576,658 | 8,273 |
| | Trelleborg AB Class B | 447,804 | 7,816 |
| | Industrivarden AB Class A | 386,156 | 7,331 |
| | Castellum AB | 487,074 | 6,600 |
| * | Lundin Petroleum AB | 328,421 | 5,903 |
| ^ | ICA Gruppen AB | 182,148 | 5,655 |
| | Elekta AB Class B | 643,935 | 5,583 |
| | Getinge AB | 339,045 | 5,552 |
| | Industrivarden AB | 301,018 | 5,369 |
| | Husqvarna AB | 696,655 | 5,238 |
| ^ | Tele2 AB | 580,651 | 4,795 |
| ^ | Fingerprint Cards AB Class B | 478,395 | 4,633 |
| | BillerudKorsnas AB | 281,656 | 4,625 |
| | Fabege AB | 245,308 | 4,143 |
| * | NCC AB Class B | 154,048 | 3,915 |
| * | Fastighets AB Balder Class B | 169,337 | 3,846 |
| | Hexpol AB | 459,392 | 3,775 |
| | Loomis AB Class B | 130,589 | 3,712 |
| *,^ | Nibe Industrier AB Class B | 487,078 | 3,623 |
| | AAK AB | 47,463 | 3,134 |
| | Hufvudstaden AB Class A | 201,227 | 3,114 |
| | Indutrade AB | 167,249 | 3,111 |
| | L E Lundbergforetagen AB Class B | 47,502 | 3,075 |
| | Axfood AB | 193,976 | 3,031 |
| *,^ | Swedish Orphan Biovitrum AB | 292,755 | 2,997 |
| | Holmen AB | 87,587 | 2,997 |
| 2 | Thule Group AB | 185,828 | 2,869 |
| *,2 | Dometic Group AB | 400,924 | 2,836 |
| | Wallenstam AB | 355,675 | 2,740 |
| | Saab AB Class B | 76,718 | 2,717 |
| | Modern Times Group MTG AB Class B | 100,670 | 2,709 |
| | NetEnt AB | 341,406 | 2,690 |
| * | SSAB AB Class B | 986,293 | 2,618 |
| | Peab AB | 296,859 | 2,518 |
| | Sweco AB Class B | 121,284 | 2,433 |
| | JM AB | 83,913 | 2,416 |
| | Wihlborgs Fastigheter AB | 123,933 | 2,402 |
| | Lifco AB Class B | 86,852 | 2,198 |
| | Com Hem Holding AB | 242,041 | 2,178 |
| * | Betsson AB | 218,557 | 2,110 |
| ^ | Investment AB Latour Class B | 55,895 | 2,063 |
| | Intrum Justitia AB | 65,545 | 2,021 |
| *,^,2 | Attendo AB | 237,182 | 2,021 |
| | Avanza Bank Holding AB | 51,992 | 1,965 |
| * | Bonava AB B Ord | 153,336 | 1,895 |
| | Bilia AB | 79,054 | 1,885 |
| | AF AB | 100,361 | 1,837 |
| | Kungsleden AB | 290,762 | 1,833 |
| * | Oriflame Holding AG | 45,095 | 1,657 |
| | Hemfosa Fastigheter AB | 170,689 | 1,605 |
| 2 | Bravida Holding AB | 256,680 | 1,578 |
| | Pandox AB | 98,423 | 1,562 |
| | Ratos AB | 364,661 | 1,499 |
| * | Cloetta AB Class B | 395,709 | 1,402 |
| | Atrium Ljungberg AB | 85,235 | 1,324 |
| *,^ | SSAB AB Class A | 408,100 | 1,294 |
13
| | | |
| Vanguard® European Stock Index Fund | | |
| Schedule of Investments | | |
| October 31, 2016 | | |
| |
| | | | Market |
| | | | Value |
| | | Shares | ($000) |
| | Vitrolife AB | 24,244 | 1,254 |
| | Bure Equity AB | 103,093 | 1,130 |
| | Nobia AB | 128,867 | 1,123 |
| | Melker Schorling AB | 19,196 | 1,110 |
| | Haldex AB | 86,082 | 1,109 |
| | Klovern AB | 914,147 | 964 |
| | Lindab International AB | 104,310 | 893 |
| | Concentric AB | 74,159 | 882 |
| | SAS AB Preference Shares | 13,832 | 847 |
| | Klovern AB Preference Shares | 24,390 | 833 |
| * | Investment AB Oresund | 51,683 | 826 |
| | Svenska Handelsbanken AB Class B | 60,446 | 812 |
| | Rezidor Hotel Group AB | 184,202 | 752 |
| *,^ | Collector AB | 50,994 | 630 |
| | SKF AB Class A | 37,098 | 630 |
| | SkiStar AB | 39,583 | 609 |
| | Clas Ohlson AB | 42,466 | 600 |
| ^ | Nordnet AB | 129,142 | 530 |
| | Mekonomen AB | 27,837 | 495 |
| *,^ | SAS AB | 268,120 | 454 |
| ^ | Fastighets AB Balder Preference Shares | 10,918 | 413 |
| ^ | Hemfosa Fastigheter AB Preference Shares | 21,058 | 374 |
| | Sagax AB Preference Shares | 98,641 | 357 |
| | Ratos AB Preference Shares | 1,612 | 334 |
| * | NCC AB Class A | 8,944 | 226 |
| * | Tele2 AB Rights | 580,651 | 174 |
| * | Bonava AB A Ord | 9,328 | 113 |
| | | | 759,782 |
| Switzerland (13.5%) | | |
| | Nestle SA | 5,676,575 | 411,631 |
| | Novartis AG | 4,350,342 | 308,733 |
| | Roche Holding AG | 1,322,779 | 303,818 |
| | UBS Group AG | 6,407,232 | 90,583 |
| | ABB Ltd. | 3,522,923 | 72,679 |
| | Zurich Insurance Group AG | 274,205 | 71,775 |
| | Syngenta AG | 168,855 | 67,570 |
| | Cie Financiere Richemont SA | 940,689 | 60,477 |
| | Swiss Re AG | 600,883 | 55,769 |
| | Credit Suisse Group AG | 3,829,469 | 53,432 |
| | Givaudan SA | 16,977 | 32,835 |
| | Geberit AG | 67,919 | 28,714 |
| | LafargeHolcim Ltd. | 475,546 | 25,366 |
| | Actelion Ltd. | 166,455 | 24,052 |
| | LafargeHolcim Ltd. (France Shares) | 415,132 | 22,172 |
| | Swisscom AG | 41,775 | 19,096 |
| | SGS SA | 9,351 | 18,927 |
| | Sika AG | 3,876 | 18,630 |
| | Lonza Group AG | 95,404 | 18,003 |
| | Adecco Group AG | 291,793 | 17,327 |
| | Partners Group Holding AG | 33,585 | 17,002 |
| ^ | Swatch Group AG (Bearer) | 55,927 | 16,820 |
| | Julius Baer Group Ltd. | 401,018 | 16,234 |
| | Swiss Life Holding AG | 58,910 | 15,590 |
| | Schindler Holding AG | 74,343 | 13,811 |
| | Kuehne & Nagel International AG | 93,070 | 12,615 |
| | Sonova Holding AG | 93,825 | 12,583 |
| | Chocoladefabriken Lindt & Spruengli AG Registered Shares | 193 | 11,972 |
| * | Dufry AG | 87,982 | 10,704 |
| | Baloise Holding AG | 85,804 | 10,556 |
| | Swiss Prime Site AG | 119,238 | 9,890 |
| | Chocoladefabriken Lindt & Spruengli AG Participation Certificates | 1,816 | 9,430 |
| | Clariant AG | 507,814 | 8,409 |
| | Galenica AG | 7,494 | 7,514 |
| | Straumann Holding AG | 19,612 | 7,358 |
14
| | |
| Vanguard® European Stock Index Fund | | |
| Schedule of Investments | | |
| October 31, 2016 | | |
| |
| | | Market |
| | | Value |
| | Shares | ($000) |
| Schindler Holding AG (Registered) | 37,953 | 7,025 |
| Temenos Group AG | 106,625 | 6,886 |
| Aryzta AG | 155,307 | 6,824 |
| EMS-Chemie Holding AG | 13,363 | 6,708 |
| Georg Fischer AG | 7,491 | 6,642 |
| PSP Swiss Property AG | 72,562 | 6,493 |
| Logitech International SA | 263,390 | 6,370 |
| Helvetia Holding AG | 11,173 | 5,813 |
| Roche Holding AG (Bearer) | 23,663 | 5,500 |
| * Flughafen Zuerich AG | 27,815 | 5,113 |
| Swatch Group AG (Registered) | 88,440 | 5,098 |
| BB Biotech AG | 100,332 | 4,747 |
| Barry Callebaut AG | 3,548 | 4,418 |
| 2 Sunrise Communications Group AG | 62,775 | 4,289 |
| Cembra Money Bank AG | 52,037 | 3,977 |
| dorma&kaba Holding AG | 5,635 | 3,916 |
| Tecan Group AG | 21,379 | 3,523 |
| * CS Real Estate Fund LivingPlus | 25,161 | 3,494 |
| Pargesa Holding SA | 51,501 | 3,457 |
| DKSH Holding AG | 49,551 | 3,434 |
| Panalpina Welttransport Holding AG | 25,631 | 3,325 |
| Banque Cantonale Vaudoise | 5,193 | 3,262 |
| ams AG | 105,729 | 2,961 |
| OC Oerlikon Corp. AG | 308,295 | 2,898 |
| Valiant Holding AG | 28,791 | 2,730 |
| GAM Holding AG | 280,316 | 2,715 |
| Belimo Holding AG | 877 | 2,678 |
| Forbo Holding AG | 2,083 | 2,655 |
| Mobimo Holding AG | 11,012 | 2,650 |
| Bucher Industries AG | 11,869 | 2,637 |
| Allreal Holding AG | 17,392 | 2,560 |
| Emmi AG | 3,998 | 2,362 |
| Sulzer AG | 23,973 | 2,361 |
| Autoneum Holding AG | 8,526 | 2,256 |
| SFS Group AG | 29,201 | 2,200 |
| * Gategroup Holding AG | 40,367 | 2,124 |
| u-blox Holding AG | 10,873 | 2,055 |
| Schweiter Technologies AG | 1,672 | 1,801 |
| Implenia AG | 26,445 | 1,771 |
| Burckhardt Compression Holding AG | 5,584 | 1,619 |
| Huber & Suhner AG | 27,567 | 1,605 |
| Rieter Holding AG | 8,315 | 1,579 |
| St. Galler Kantonalbank AG | 4,115 | 1,545 |
| VZ Holding AG | 4,839 | 1,431 |
| Valora Holding AG | 4,695 | 1,364 |
| Daetwyler Holding AG | 9,484 | 1,299 |
| COSMO Pharmaceuticals NV | 8,765 | 1,273 |
| * AFG Arbonia-Forster Holding AG | 84,445 | 1,267 |
| Vontobel Holding AG | 25,849 | 1,266 |
| Intershop Holding AG | 2,220 | 1,134 |
| Conzzeta AG | 1,637 | 1,131 |
| Ascom Holding AG | 64,075 | 1,097 |
| Ypsomed Holding AG | 5,594 | 1,068 |
| Kudelski SA | 58,909 | 1,016 |
| LEM Holding SA | 910 | 1,015 |
| * Bell AG | 2,365 | 1,012 |
| ^ Leonteq AG | 16,737 | 965 |
| ^ BKW AG | 19,771 | 920 |
| Siegfried Holding AG | 4,071 | 837 |
| APG SGA SA | 1,901 | 794 |
| EFG International AG | 138,136 | 745 |
| Vetropack Holding AG | 443 | 727 |
| * Zehnder Group AG | 15,956 | 663 |
| * Schmolz & Bickenbach AG | 912,440 | 598 |
15
| | | |
| Vanguard® European Stock Index Fund | | |
| Schedule of Investments | | |
| October 31, 2016 | | |
| |
| | | | Market |
| | | | Value |
| | | Shares | ($000) |
| *,^ | Basilea Pharmaceutica AG | 8,136 | 548 |
| *,^ | Meyer Burger Technology AG | 157,406 | 514 |
| | Swissquote Group Holding SA | 17,559 | 499 |
| | Bachem Holding AG | 5,172 | 461 |
| * | Alpiq Holding AG | 4,393 | 408 |
| | Plazza AG | 1,622 | 386 |
| * | Orascom Development Holding AG | 23,200 | 139 |
| | | | 2,084,730 |
| United Kingdom (29.7%) | | |
| | HSBC Holdings plc | 36,461,098 | 274,595 |
| | BP plc | 34,572,312 | 204,382 |
| | British American Tobacco plc | 3,429,525 | 196,557 |
| | Royal Dutch Shell plc Class B | 6,892,488 | 177,775 |
| | GlaxoSmithKline plc | 8,945,514 | 176,713 |
| | Royal Dutch Shell plc Class A (London Shares) | 6,731,459 | 167,661 |
| | Vodafone Group plc | 48,886,159 | 134,258 |
| | AstraZeneca plc | 2,322,103 | 130,027 |
| | Diageo plc | 4,633,626 | 123,332 |
| | Reckitt Benckiser Group plc | 1,156,583 | 103,469 |
| | Shire plc | 1,656,510 | 93,531 |
| | Unilever plc | 2,219,261 | 92,653 |
| | National Grid plc | 6,943,087 | 90,315 |
| | Imperial Brands plc | 1,772,045 | 85,717 |
| | Lloyds Banking Group plc | 117,829,254 | 82,283 |
| | Prudential plc | 4,746,147 | 77,452 |
| | Rio Tinto plc | 2,226,178 | 77,416 |
| | Barclays plc | 31,126,113 | 72,114 |
| | BT Group plc | 15,400,292 | 70,688 |
| * | Glencore plc | 21,436,358 | 65,619 |
| | BHP Billiton plc | 3,883,094 | 58,391 |
| | Compass Group plc | 3,032,089 | 54,864 |
| | WPP plc | 2,384,304 | 51,771 |
| * | Standard Chartered plc | 4,933,112 | 42,898 |
| | Aviva plc | 7,431,922 | 40,272 |
| | BAE Systems plc | 5,809,601 | 38,493 |
| * | Tesco plc | 14,916,779 | 38,421 |
| | CRH plc (Dublin Shares) | 1,135,535 | 36,864 |
| | RELX NV | 2,014,591 | 35,961 |
| | SSE plc | 1,848,200 | 35,935 |
| | Experian plc | 1,764,483 | 33,922 |
| * | Anglo American plc | 2,401,874 | 33,336 |
| | Royal Dutch Shell plc Class A | 1,230,297 | 30,656 |
| | Legal & General Group plc | 10,901,680 | 27,889 |
| | Rolls-Royce Holdings plc | 3,051,897 | 27,091 |
| | Centrica plc | 9,960,441 | 26,089 |
| | Wolseley plc | 464,205 | 24,078 |
| | Smith & Nephew plc | 1,648,416 | 23,830 |
| | Old Mutual plc | 8,985,774 | 22,105 |
| | London Stock Exchange Group plc | 580,551 | 19,941 |
| | Sky plc | 1,927,551 | 19,270 |
| | Associated British Foods plc | 639,532 | 19,237 |
| | Kingfisher plc | 4,155,709 | 18,358 |
| | Land Securities Group plc | 1,443,904 | 17,631 |
| | Sage Group plc | 1,987,940 | 17,540 |
| | Bunzl plc | 618,730 | 16,611 |
| | Carnival plc | 335,878 | 16,200 |
| | Paddy Power Betfair plc | 150,812 | 15,623 |
| | Next plc | 260,442 | 15,323 |
| | Randgold Resources Ltd. | 171,536 | 15,234 |
| | Standard Life plc | 3,643,502 | 15,036 |
| | Whitbread plc | 336,823 | 14,879 |
| | Johnson Matthey plc | 355,763 | 14,829 |
| | Burberry Group plc | 816,600 | 14,728 |
| | 3i Group plc | 1,783,030 | 14,616 |
16
| | |
| Vanguard® European Stock Index Fund | | |
| Schedule of Investments | | |
| October 31, 2016 | | |
| |
| | | Market |
| | | Value |
| | Shares | ($000) |
| United Utilities Group plc | 1,255,330 | 14,430 |
| Ashtead Group plc | 922,277 | 14,371 |
| ITV plc | 6,868,378 | 14,319 |
| InterContinental Hotels Group plc | 362,748 | 14,063 |
| Pearson plc | 1,514,124 | 14,008 |
| * Royal Bank of Scotland Group plc | 6,038,193 | 13,954 |
| British Land Co. plc | 1,891,209 | 13,540 |
| DCC plc | 162,864 | 13,251 |
| Mondi plc | 676,426 | 13,201 |
| RSA Insurance Group plc | 1,872,723 | 12,644 |
| CRH plc (London Shares) | 389,555 | 12,606 |
| Smiths Group plc | 724,231 | 12,550 |
| Marks & Spencer Group plc | 2,984,458 | 12,418 |
| Severn Trent plc | 433,572 | 12,342 |
| Informa plc | 1,495,777 | 12,306 |
| GKN plc | 3,155,117 | 12,304 |
| Intertek Group plc | 294,489 | 12,287 |
| Persimmon plc | 563,509 | 11,665 |
| St. James's Place plc | 958,909 | 11,074 |
| Wm Morrison Supermarkets plc | 3,974,784 | 11,003 |
| 2 Worldpay Group plc | 3,116,658 | 10,832 |
| Micro Focus International plc | 410,120 | 10,739 |
| Direct Line Insurance Group plc | 2,535,937 | 10,729 |
| Taylor Wimpey plc | 6,017,156 | 10,420 |
| International Consolidated Airlines Group SA (London Shares) | 1,952,342 | 10,353 |
| Croda International plc | 240,752 | 10,296 |
| Barratt Developments plc | 1,835,820 | 10,180 |
| Royal Mail plc | 1,681,792 | 10,090 |
| Provident Financial plc | 272,293 | 9,816 |
| Hammerson plc | 1,445,098 | 9,722 |
| J Sainsbury plc | 3,112,951 | 9,544 |
| Rentokil Initial plc | 3,344,311 | 9,328 |
| Halma plc | 694,718 | 8,894 |
| Capita plc | 1,218,464 | 8,722 |
| Admiral Group plc | 369,201 | 8,650 |
| DS Smith plc | 1,714,460 | 8,360 |
| Weir Group plc | 399,720 | 8,303 |
| Tate & Lyle plc | 862,687 | 8,227 |
| 2 Auto Trader Group plc | 1,794,712 | 8,222 |
| Segro plc | 1,528,263 | 8,186 |
| Mediclinic International plc | 713,636 | 7,913 |
| Pennon Group plc | 762,212 | 7,779 |
| Coca-Cola HBC AG | 357,191 | 7,708 |
| G4S plc | 2,852,754 | 7,663 |
| Rightmove plc | 166,548 | 7,602 |
| Meggitt plc | 1,424,294 | 7,577 |
| Travis Perkins plc | 463,266 | 7,537 |
| 2 Merlin Entertainments plc | 1,307,776 | 7,370 |
| Spirax-Sarco Engineering plc | 135,077 | 7,283 |
| Investec plc | 1,167,882 | 7,248 |
| Melrose Industries plc | 3,460,522 | 7,142 |
| RPC Group plc | 612,911 | 7,108 |
| Schroders plc | 206,166 | 7,096 |
| Inmarsat plc | 826,811 | 7,092 |
| Aberdeen Asset Management plc | 1,812,994 | 7,092 |
| * Just Eat plc | 1,025,029 | 7,041 |
| Dixons Carphone plc | 1,819,955 | 6,997 |
| Berkeley Group Holdings plc | 237,948 | 6,863 |
| IG Group Holdings plc | 668,236 | 6,748 |
| Booker Group plc | 3,029,134 | 6,644 |
| Hiscox Ltd. | 523,521 | 6,537 |
| Bellway plc | 224,542 | 6,498 |
| Hargreaves Lansdown plc | 447,277 | 6,341 |
| John Wood Group plc | 672,369 | 6,320 |
17
| | | |
| Vanguard® European Stock Index Fund | | |
| Schedule of Investments | | |
| October 31, 2016 | | |
| |
| | | | Market |
| | | | Value |
| | | Shares | ($000) |
| | UBM plc | 718,739 | 6,310 |
| | Inchcape plc | 787,035 | 6,258 |
| | Fresnillo plc | 308,217 | 6,201 |
| | IMI plc | 502,255 | 6,101 |
| | BBA Aviation plc | 1,922,347 | 6,079 |
| | TUI AG | 468,617 | 5,940 |
| | ICAP plc | 992,484 | 5,885 |
| | William Hill plc | 1,613,754 | 5,838 |
| ^ | Intu Properties plc | 1,731,798 | 5,837 |
| | Shaftesbury plc | 512,285 | 5,747 |
| * | BTG plc | 701,782 | 5,647 |
| | Polymetal International plc | 515,514 | 5,621 |
| | Babcock International Group plc | 462,478 | 5,590 |
| | Cobham plc | 3,160,132 | 5,514 |
| | Henderson Group plc | 1,936,295 | 5,479 |
| | Hikma Pharmaceuticals plc | 255,184 | 5,473 |
| | Spectris plc | 218,489 | 5,471 |
| | Derwent London plc | 183,548 | 5,428 |
| * | CYBG plc | 1,622,423 | 5,363 |
| *,^ | Tullow Oil plc | 1,650,174 | 5,328 |
| | Indivior plc | 1,341,162 | 5,151 |
| | Howden Joinery Group plc | 1,124,124 | 5,148 |
| | Greene King plc | 567,185 | 5,074 |
| * | Metro Bank plc | 139,958 | 4,734 |
| | Capital & Counties Properties plc | 1,336,064 | 4,711 |
| | Petrofac Ltd. | 476,053 | 4,688 |
| | Great Portland Estates plc | 637,294 | 4,624 |
| | easyJet plc | 403,065 | 4,622 |
| | Hays plc | 2,653,037 | 4,431 |
| * | GVC Holdings plc | 519,828 | 4,429 |
| | Close Brothers Group plc | 272,600 | 4,424 |
| | Daily Mail & General Trust plc | 480,548 | 4,411 |
| | Beazley plc | 972,261 | 4,329 |
| | Playtech plc | 379,802 | 4,308 |
| | Aggreko plc | 440,375 | 4,306 |
| | Antofagasta plc | 642,953 | 4,276 |
| | Man Group plc | 2,797,146 | 4,264 |
| | Balfour Beatty plc | 1,253,298 | 4,155 |
| | Jupiter Fund Management plc | 768,300 | 4,051 |
| | Phoenix Group Holdings | 451,365 | 4,032 |
| * | Intermediate Capital Group plc | 533,162 | 3,949 |
| | Rotork plc | 1,582,312 | 3,948 |
| | Amec Foster Wheeler plc | 716,253 | 3,908 |
| | Centamin plc | 2,009,187 | 3,892 |
| | Domino's Pizza Group plc | 923,059 | 3,838 |
| | Regus plc | 1,250,793 | 3,805 |
| | Berendsen plc | 318,152 | 3,755 |
| | Electrocomponents plc | 817,684 | 3,725 |
| | B&M European Value Retail SA | 1,287,054 | 3,695 |
| | SSP Group plc | 867,266 | 3,604 |
| | WH Smith plc | 200,064 | 3,601 |
| | UDG Healthcare plc | 444,198 | 3,550 |
| | HomeServe plc | 465,742 | 3,477 |
| | AA plc | 1,106,757 | 3,462 |
| | National Express Group plc | 761,610 | 3,421 |
| | Tritax Big Box REIT plc | 2,035,478 | 3,386 |
| | WS Atkins plc | 180,684 | 3,339 |
| * | Serco Group plc | 1,987,422 | 3,328 |
| | Victrex plc | 150,671 | 3,227 |
| | Lancashire Holdings Ltd. | 370,556 | 3,160 |
| | Moneysupermarket.com Group plc | 976,944 | 3,128 |
| | Ashmore Group plc | 723,985 | 3,109 |
| | Britvic plc | 450,237 | 3,055 |
| | QinetiQ Group plc | 1,064,951 | 2,999 |
18
| | | |
| Vanguard® European Stock Index Fund | | |
| Schedule of Investments | | |
| October 31, 2016 | | |
| |
| | | | Market |
| | | | Value |
| | | Shares | ($000) |
| | Essentra plc | 480,129 | 2,993 |
| | Greencore Group plc | 737,633 | 2,977 |
| * | Firstgroup plc | 2,201,823 | 2,949 |
| | Dignity plc | 90,841 | 2,946 |
| | Ultra Electronics Holdings plc | 128,005 | 2,909 |
| | Drax Group plc | 742,117 | 2,875 |
| | Kier Group plc | 172,892 | 2,875 |
| | Dechra Pharmaceuticals plc | 172,576 | 2,840 |
| | UNITE Group plc | 418,227 | 2,833 |
| ^ | Ladbrokes plc | 1,680,855 | 2,744 |
| | AVEVA Group plc | 119,722 | 2,696 |
| *,^ | Ocado Group plc | 802,202 | 2,695 |
| | Kennedy Wilson Europe Real Estate plc | 215,125 | 2,670 |
| * | Cairn Energy plc | 1,065,964 | 2,650 |
| | Genus plc | 111,216 | 2,554 |
| | JD Sports Fashion plc | 135,155 | 2,513 |
| | Bodycote plc | 346,480 | 2,511 |
| | Elementis plc | 856,657 | 2,498 |
| ^ | TalkTalk Telecom Group plc | 990,469 | 2,467 |
| | Carillion plc | 800,795 | 2,454 |
| | Pagegroup plc | 553,278 | 2,450 |
| | Grafton Group plc | 401,997 | 2,442 |
| * | SVG Capital plc | 278,993 | 2,398 |
| 2 | Spire Healthcare Group plc | 527,525 | 2,397 |
| | Cineworld Group plc | 359,890 | 2,377 |
| | Diploma plc | 207,292 | 2,376 |
| | Galliford Try plc | 153,543 | 2,302 |
| | PZ Cussons plc | 557,721 | 2,283 |
| * | Thomas Cook Group plc | 2,660,234 | 2,261 |
| | Vesuvius plc | 505,260 | 2,255 |
| | Bovis Homes Group plc | 241,055 | 2,232 |
| | Synthomer plc | 509,502 | 2,227 |
| | Big Yellow Group plc | 259,352 | 2,194 |
| 2 | John Laing Group plc | 662,270 | 2,191 |
| * | Evraz plc | 873,875 | 2,191 |
| | BGEO Group plc | 60,421 | 2,183 |
| | Crest Nicholson Holdings plc | 438,315 | 2,178 |
| | Assura plc | 3,000,464 | 2,161 |
| | Greggs plc | 184,589 | 2,158 |
| | Renishaw plc | 68,194 | 2,150 |
| | Fidessa Group plc | 71,437 | 2,148 |
| | Paragon Group of Cos. plc | 529,320 | 2,147 |
| | Grainger plc | 767,304 | 2,077 |
| | NMC Health plc | 115,517 | 2,063 |
| * | Vectura Group plc | 1,244,530 | 2,060 |
| | Go-Ahead Group plc | 78,428 | 1,989 |
| | Savills plc | 233,547 | 1,981 |
| | LondonMetric Property plc | 1,076,133 | 1,963 |
| | Dairy Crest Group plc | 255,616 | 1,908 |
| | Tullett Prebon plc | 436,200 | 1,895 |
| | Redrow plc | 406,324 | 1,887 |
| | Stagecoach Group plc | 779,225 | 1,885 |
| | Hansteen Holdings plc | 1,399,142 | 1,844 |
| | Virgin Money Holdings UK plc | 435,250 | 1,752 |
| | Dunelm Group plc | 188,439 | 1,745 |
| | esure Group plc | 523,812 | 1,741 |
| | Acacia Mining plc | 274,047 | 1,740 |
| | Marston's plc | 1,062,120 | 1,737 |
| | Morgan Advanced Materials plc | 519,706 | 1,731 |
| | Restaurant Group plc | 376,648 | 1,728 |
| | Mitie Group plc | 664,244 | 1,707 |
| | Entertainment One Ltd. | 600,004 | 1,706 |
| | Pets at Home Group plc | 648,200 | 1,694 |
| | Workspace Group plc | 218,714 | 1,682 |
19
| | | |
| Vanguard® European Stock Index Fund | | |
| Schedule of Investments | | |
| October 31, 2016 | | |
| |
| | | | Market |
| | | | Value |
| | | Shares | ($000) |
| * | Petra Diamonds Ltd. | 899,971 | 1,676 |
| | Senior plc | 769,945 | 1,641 |
| | J D Wetherspoon plc | 153,388 | 1,633 |
| | Brewin Dolphin Holdings plc | 512,399 | 1,630 |
| | Telecom Plus plc | 112,500 | 1,629 |
| | Safestore Holdings plc | 371,095 | 1,629 |
| *,^ | Sports Direct International plc | 476,495 | 1,611 |
| * | KAZ Minerals plc | 456,317 | 1,594 |
| | SuperGroup plc | 95,739 | 1,576 |
| | Halfords Group plc | 378,259 | 1,573 |
| 2 | Zoopla Property Group plc | 420,803 | 1,569 |
| | Ted Baker plc | 51,507 | 1,559 |
| *,2 | Wizz Air Holdings plc | 83,583 | 1,544 |
| | Debenhams plc | 2,331,536 | 1,531 |
| | Mitchells & Butlers plc | 437,711 | 1,492 |
| 2 | Hastings Group Holdings plc | 555,561 | 1,486 |
| | SIG plc | 1,059,157 | 1,433 |
| | International Personal Finance plc | 396,023 | 1,426 |
| | Hunting plc | 230,473 | 1,416 |
| | Hochschild Mining plc | 434,190 | 1,415 |
| | F&C Commercial Property Trust Ltd. | 920,041 | 1,413 |
| | Card Factory plc | 439,988 | 1,367 |
| | KCOM Group plc | 896,781 | 1,293 |
| | Northgate plc | 251,151 | 1,290 |
| | Vedanta Resources plc | 146,584 | 1,281 |
| | De La Rue plc | 180,255 | 1,262 |
| 2 | Sophos Group plc | 439,992 | 1,245 |
| * | Imagination Technologies Group plc | 449,843 | 1,244 |
| | Lonmin plc | 518,283 | 1,208 |
| | UK Commercial Property Trust Ltd. | 1,247,453 | 1,191 |
| | NCC Group plc | 490,583 | 1,139 |
| | Redefine International PLC | 2,239,563 | 1,136 |
| | Keller Group plc | 133,896 | 1,115 |
| | St. Modwen Properties plc | 332,405 | 1,113 |
| | Interserve plc | 267,293 | 1,111 |
| 2 | McCarthy & Stone plc | 536,464 | 1,102 |
| | Computacenter plc | 123,800 | 1,100 |
| * | Ophir Energy plc | 1,278,053 | 1,079 |
| | Polypipe Group plc | 345,803 | 1,066 |
| * | Enterprise Inns plc | 936,945 | 1,057 |
| | Fenner plc | 366,510 | 982 |
| * | Allied Minds plc | 231,742 | 962 |
| | Laird plc | 500,742 | 887 |
| | 888 Holdings plc | 325,679 | 867 |
| | Picton Property Income Ltd. | 989,923 | 858 |
| | Shanks Group plc | 773,660 | 850 |
| * | Chemring Group plc | 478,026 | 848 |
| | Chesnara plc | 216,191 | 842 |
| 2 | Ibstock plc | 413,116 | 842 |
| | Devro plc | 299,723 | 833 |
| | RPS Group plc | 400,556 | 825 |
| | ITE Group plc | 464,760 | 823 |
| *,2 | Countryside Properties plc | 285,847 | 815 |
| * | Premier Oil plc | 963,071 | 776 |
| | Oxford Instruments plc | 93,613 | 774 |
| | Rank Group plc | 318,512 | 752 |
| * | Nostrum Oil & Gas plc | 169,240 | 728 |
| * | Phoenix Group Holdings Rights | 267,253 | 726 |
| | Soco International plc | 427,922 | 722 |
| | Lookers plc | 568,234 | 717 |
| | Xaar plc | 135,653 | 697 |
| * | Premier Foods plc | 1,236,920 | 689 |
| * | Aldermore Group plc | 323,966 | 684 |
| | Schroder REIT Ltd. | 976,195 | 675 |
20
| | | | | |
| Vanguard® European Stock Index Fund | | | | |
| Schedule of Investments | | | | |
| October 31, 2016 | | | | |
| |
| | | | | | Market |
| | | | | | Value |
| | | | | Shares | ($000) |
| *,^ | AO World plc | | | 333,660 | 644 |
| | Foxtons Group plc | | | 488,511 | 640 |
| | Countrywide plc | | | 290,899 | 638 |
| | N Brown Group plc | | | 264,402 | 617 |
| *,2 | Shawbrook Group plc | | | 220,763 | 607 |
| | Cape plc | | | 226,767 | 577 |
| | Daejan Holdings plc | | | 8,543 | 569 |
| | OneSavings Bank plc | | | 152,472 | 540 |
| | Helical plc | | | 161,234 | 522 |
| * | Lamprell plc | | | 478,670 | 430 |
| 2 | CMC Markets plc | | | 157,110 | 365 |
| * | Mothercare plc | | | 257,194 | 337 |
| *,^ | Genel Energy plc | | | 260,124 | 259 |
| * | Shanks Group plc Rights | | | 290,122 | 112 |
| | | | | | 4,579,037 |
| United States (0.0%) | | | | |
| * | Mylan NV | | | 439 | 16 |
| |
| |
| Total Common Stocks (Cost $21,109,126) | | | | 15,399,409 |
| |
| | | | | | Market |
| | | | | | Value |
| | | Coupon | | Shares | ($000) |
| |
| Temporary Cash Investments (1.6%)1 | | | | |
| Money Market Fund (1.5%) | | | | |
| 4,5 | Vanguard Market Liquidity Fund | 0.718% | | 2,302,737 | 230,297 |
| |
| |
| | | | | Face | |
| | | | Maturity | Amount | |
| | | | Date | ($000) | |
| U.S. Government and Agency Obligations (0.1%) | | | | |
| 6 | Federal Home Loan Bank Discount Notes | 0.339% | 11/4/16 | 5,000 | 5,000 |
| 7 | Freddie Mac Discount Notes | 0.300% | 11/8/16 | 1,000 | 1,000 |
| 8 | United States Treasury Bill | 0.320%-0.341% | 12/8/16 | 4,300 | 4,299 |
| 9 | United States Treasury Bill | 0.280%-0.291% | 12/22/16 | 2,800 | 2,799 |
| 9 | United States Treasury Bill | 0.326% | 12/29/16 | 600 | 600 |
| 8 | United States Treasury Bill | 0.337%-0.360% | 1/12/17 | 3,600 | 3,598 |
| 8 | United States Treasury Bill | 0.320% | 1/26/17 | 5,000 | 4,996 |
| 8 | United States Treasury Bill | 0.406% | 2/9/17 | 1,100 | 1,099 |
| |
| | | | | | 23,391 |
| |
| Total Temporary Cash Investments (Cost $253,686) | | | | 253,688 |
| |
| Total Investments (101.5%) (Cost $21,362,812) | | | | 15,653,097 |
| Other Assets and Liabilities—Net (-1.5%)5 | | | | (230,004) |
| |
| Net Assets (100%) | | | | 15,423,093 |
* Non-income-producing security.
^ Includes partial security positions on loan to broker-dealers. The total value of securities on loan is $214,827,000.
1 The fund invests a portion of its cash reserves in equity markets through the use of index futures contracts. After giving effect to futures
investments, the fund's effective common stock and temporary cash investment positions represent 100.0% and 1.5%, respectively, of net
assets.
2 Security exempt from registration under Rule 144A of the Securities Act of 1933. Such securities may be sold in transactions exempt from
registration, normally to qualified institutional buyers. At October 31, 2016, the aggregate value of these securities was $165,071,000,
representing 1.1% of net assets.
3 “Other” represents securities that are not classified by the fund’s benchmark index.
4 Affiliated money market fund available only to Vanguard funds and certain trusts and accounts managed by Vanguard. Rate shown is the 7-day
yield.
5 Includes $229,152,000 of collateral received for securities on loan.
21
Vanguard® European Stock Index Fund
Schedule of Investments
October 31, 2016
6 The issuer operates under a congressional charter; its securities are generally neither guaranteed by the U.S. Treasury nor backed by the full
faith and credit of the U.S. government.
7 The issuer was placed under federal conservatorship in September 2008; since that time, its daily operations have been managed by the Federal
Housing Finance Agency and it receives capital from the U.S. Treasury, as needed to maintain a positive net worth, in exchange for senior
preferred stock.
8 Securities with a value of $8,710,000 and cash of $1,280,000 have been segregated as collateral for open forward currency contracts.
9 Securities with a value of $1,999,000 have been segregated as initial margin for open futures contracts.
ADR—American Depositary Receipt.
REIT—Real Estate Investment Trust.
22
| | |
| Vanguard® Pacific Stock Index Fund | | |
| Schedule of Investments | | |
| October 31, 2016 | | |
| |
| | | Market |
| | | Value |
| | Shares | ($000) |
| |
| Common Stocks (99.6%)1 | | |
| Australia (16.8%) | | |
| Commonwealth Bank of Australia | 1,615,225 | 89,922 |
| Westpac Banking Corp. | 3,170,785 | 73,325 |
| Australia & New Zealand Banking Group Ltd. | 2,773,182 | 58,557 |
| National Australia Bank Ltd. | 2,524,978 | 53,599 |
| BHP Billiton Ltd. | 3,064,581 | 53,541 |
| Wesfarmers Ltd. | 1,068,281 | 33,265 |
| CSL Ltd. | 435,916 | 33,263 |
| Woolworths Ltd. | 1,207,043 | 21,662 |
| Macquarie Group Ltd. | 293,675 | 17,753 |
| Rio Tinto Ltd. | 403,813 | 16,708 |
| Scentre Group | 4,866,177 | 15,574 |
| Telstra Corp. Ltd. | 4,096,864 | 15,494 |
| Transurban Group | 1,948,870 | 15,378 |
| Woodside Petroleum Ltd. | 696,189 | 14,903 |
| Brambles Ltd. | 1,506,181 | 13,187 |
| Westfield Corp. | 1,846,676 | 12,480 |
| Newcrest Mining Ltd. | 708,695 | 12,409 |
| Amcor Ltd. | 1,101,496 | 12,295 |
| Suncorp Group Ltd. | 1,229,085 | 11,155 |
| QBE Insurance Group Ltd. | 1,313,320 | 9,950 |
| South32 Ltd. | 5,079,710 | 9,913 |
| Insurance Australia Group Ltd. | 2,322,169 | 9,709 |
| AMP Ltd. | 2,778,425 | 9,635 |
| AGL Energy Ltd. | 646,659 | 9,420 |
| Goodman Group | 1,699,443 | 8,760 |
| Stockland | 2,288,252 | 7,685 |
| Aristocrat Leisure Ltd. | 603,329 | 7,024 |
| Aurizon Holdings Ltd. | 1,887,745 | 6,994 |
| Vicinity Centres | 3,151,534 | 6,873 |
| Ramsay Health Care Ltd. | 123,259 | 6,864 |
| Origin Energy Ltd. | 1,673,334 | 6,745 |
| ASX Ltd. | 182,956 | 6,545 |
| APA Group | 1,062,367 | 6,421 |
| Fortescue Metals Group Ltd. | 1,523,304 | 6,393 |
| James Hardie Industries plc | 425,235 | 6,329 |
| Dexus Property Group | 922,219 | 6,265 |
| Sonic Healthcare Ltd. | 393,070 | 6,113 |
| GPT Group | 1,707,663 | 6,037 |
| Caltex Australia Ltd. | 250,200 | 5,824 |
| Treasury Wine Estates Ltd. | 706,211 | 5,757 |
| Oil Search Ltd. | 1,115,899 | 5,594 |
| Mirvac Group | 3,523,886 | 5,590 |
| LendLease Group | 525,779 | 5,386 |
| Cochlear Ltd. | 54,214 | 5,268 |
| Medibank Pvt Ltd. | 2,631,003 | 5,154 |
| Sydney Airport | 1,044,104 | 4,963 |
| Challenger Ltd. | 548,542 | 4,478 |
| Orica Ltd. | 360,145 | 4,449 |
| Tatts Group Ltd. | 1,385,060 | 4,270 |
| Santos Ltd. | 1,577,724 | 4,222 |
| DUET Group | 2,326,076 | 4,211 |
| Bendigo & Adelaide Bank Ltd. | 440,967 | 3,724 |
| Computershare Ltd. | 463,232 | 3,711 |
| Coca-Cola Amatil Ltd. | 511,749 | 3,708 |
| SEEK Ltd. | 330,859 | 3,675 |
| Incitec Pivot Ltd. | 1,588,018 | 3,552 |
| Boral Ltd. | 716,774 | 3,425 |
| BlueScope Steel Ltd. | 544,139 | 3,228 |
| Star Entertainment Grp Ltd. | 782,975 | 2,963 |
| Crown Resorts Ltd. | 357,512 | 2,956 |
| Tabcorp Holdings Ltd. | 797,291 | 2,929 |
23
| | |
| Vanguard® Pacific Stock Index Fund | | |
| Schedule of Investments | | |
| October 31, 2016 | | |
| |
| | | Market |
| | | Value |
| | Shares | ($000) |
| Domino's Pizza Enterprises Ltd. | 59,208 | 2,884 |
| Alumina Ltd. | 2,388,400 | 2,871 |
| ^ Bank of Queensland Ltd. | 360,927 | 2,864 |
| Healthscope Ltd. | 1,670,540 | 2,802 |
| Orora Ltd. | 1,160,197 | 2,557 |
| Vocus Communications Ltd. | 563,680 | 2,444 |
| JB Hi-Fi Ltd. | 109,669 | 2,364 |
| Ansell Ltd. | 140,576 | 2,316 |
| Qantas Airways Ltd. | 979,502 | 2,276 |
| ALS Ltd. | 480,690 | 2,271 |
| CIMIC Group Ltd. | 91,120 | 2,045 |
| Harvey Norman Holdings Ltd. | 517,958 | 1,984 |
| AusNet Services | 1,700,789 | 1,937 |
| REA Group Ltd. | 48,912 | 1,897 |
| Downer EDI Ltd. | 421,170 | 1,862 |
| Link Administration Holdings Ltd. | 338,724 | 1,852 |
| ^ IOOF Holdings Ltd. | 296,245 | 1,844 |
| TPG Telecom Ltd. | 319,758 | 1,833 |
| Northern Star Resources Ltd. | 560,759 | 1,814 |
| DuluxGroup Ltd. | 370,548 | 1,812 |
| Iluka Resources Ltd. | 409,173 | 1,794 |
| ^ Qube Holdings Ltd. | 1,056,954 | 1,789 |
| Investa Office Fund | 554,281 | 1,785 |
| Adelaide Brighton Ltd. | 438,190 | 1,780 |
| Evolution Mining Ltd. | 973,396 | 1,717 |
| Magellan Financial Group Ltd. | 102,444 | 1,654 |
| carsales.com Ltd. | 204,145 | 1,652 |
| * Mayne Pharma Group Ltd. | 1,295,064 | 1,612 |
| Macquarie Atlas Roads Group | 438,193 | 1,570 |
| nib holdings Ltd. | 426,514 | 1,562 |
| Independence Group NL | 467,419 | 1,522 |
| Charter Hall Group | 416,537 | 1,486 |
| Perpetual Ltd. | 42,321 | 1,453 |
| OZ Minerals Ltd. | 278,772 | 1,424 |
| * Whitehaven Coal Ltd. | 607,507 | 1,397 |
| Fairfax Media Ltd. | 2,196,094 | 1,376 |
| ^ Flight Centre Travel Group Ltd. | 53,452 | 1,373 |
| CSR Ltd. | 487,846 | 1,355 |
| Primary Health Care Ltd. | 463,333 | 1,350 |
| BT Investment Management Ltd. | 191,669 | 1,343 |
| * Metcash Ltd. | 867,522 | 1,309 |
| * WorleyParsons Ltd. | 203,706 | 1,302 |
| ^ Mineral Resources Ltd. | 142,928 | 1,257 |
| Navitas Ltd. | 294,828 | 1,172 |
| Shopping Centres Australasia Property Group | 702,659 | 1,167 |
| Nufarm Ltd. | 171,248 | 1,150 |
| ^ Regis Resources Ltd. | 452,325 | 1,141 |
| GrainCorp Ltd. Class A | 178,084 | 1,136 |
| ^ Blackmores Ltd. | 12,666 | 1,077 |
| BWP Trust | 475,187 | 1,072 |
| Sigma Pharmaceuticals Ltd. | 1,052,078 | 1,062 |
| ^ InvoCare Ltd. | 106,183 | 1,054 |
| Bapcor Ltd. | 268,475 | 1,047 |
| IRESS Ltd. | 120,238 | 1,035 |
| Charter Hall Retail REIT | 328,179 | 1,033 |
| ^ Super Retail Group Ltd. | 137,442 | 1,022 |
| Aveo Group | 414,523 | 1,012 |
| Cromwell Property Group | 1,419,661 | 982 |
| * St. Barbara Ltd. | 478,731 | 977 |
| ^ Sirtex Medical Ltd. | 45,039 | 953 |
| Breville Group Ltd. | 127,126 | 894 |
| Sims Metal Management Ltd. | 115,397 | 878 |
| ^ Platinum Asset Management Ltd. | 229,545 | 869 |
| ^ G8 Education Ltd. | 360,747 | 865 |
24
| | | |
| Vanguard® Pacific Stock Index Fund | | |
| Schedule of Investments | | |
| October 31, 2016 | | |
| |
| | | | Market |
| | | | Value |
| | | Shares | ($000) |
| | Cleanaway Waste Management Ltd. | 978,116 | 861 |
| | Pact Group Holdings Ltd. | 169,073 | 843 |
| | Spotless Group Holdings Ltd. | 1,102,154 | 836 |
| ^ | ARB Corp. Ltd. | 63,985 | 829 |
| | Premier Investments Ltd. | 76,601 | 824 |
| | Beach Energy Ltd. | 1,427,886 | 777 |
| | SAI Global Ltd. | 214,629 | 763 |
| | Retail Food Group Ltd. | 148,059 | 762 |
| | Southern Cross Media Group Ltd. | 659,401 | 720 |
| ^ | Mantra Group Ltd. | 285,844 | 714 |
| | Myer Holdings Ltd. | 794,184 | 708 |
| | MYOB Group Ltd. | 252,093 | 707 |
| ^,* | Syrah Resources Ltd. | 254,698 | 696 |
| | Automotive Holdings Group Ltd. | 220,725 | 678 |
| | Steadfast Group Ltd. | 416,018 | 675 |
| ^,* | Aconex Ltd. | 158,672 | 671 |
| | Abacus Property Group | 311,442 | 662 |
| ^ | Webjet Ltd. | 78,853 | 655 |
| ^ | Altium Ltd. | 109,996 | 655 |
| | Ardent Leisure Group | 426,864 | 654 |
| * | Saracen Mineral Holdings Ltd. | 743,557 | 642 |
| ^ | Eclipx Group Ltd. | 215,594 | 631 |
| ^ | Monadelphous Group Ltd. | 88,616 | 626 |
| | Seven Group Holdings Ltd. | 89,722 | 618 |
| | GUD Holdings Ltd. | 83,961 | 606 |
| | Technology One Ltd. | 137,638 | 588 |
| | GWA Group Ltd. | 269,958 | 585 |
| | Sandfire Resources NL | 147,827 | 583 |
| | Brickworks Ltd. | 56,254 | 576 |
| | APN Outdoor Group Ltd. | 159,002 | 573 |
| ^ | Costa Group Holdings Ltd. | 258,528 | 559 |
| | Resolute Mining Ltd. | 470,324 | 556 |
| * | NEXTDC Ltd. | 196,058 | 548 |
| * | Nanosonics Ltd. | 206,023 | 542 |
| | Genworth Mortgage Insurance Australia Ltd. | 233,090 | 542 |
| * | Australian Agricultural Co. Ltd. | 405,689 | 538 |
| ^,* | Orocobre Ltd. | 180,214 | 525 |
| ^ | FlexiGroup Ltd. | 304,752 | 520 |
| | Tassal Group Ltd. | 175,679 | 514 |
| ^ | Gateway Lifestyle | 291,077 | 512 |
| | Australian Pharmaceutical Industries Ltd. | 348,960 | 503 |
| ^,* | Perseus Mining Ltd. | 1,049,581 | 493 |
| ^ | Bellamy's Australia Ltd. | 55,910 | 483 |
| ^ | Credit Corp. Group Ltd. | 35,221 | 474 |
| ^ | IPH Ltd. | 105,688 | 470 |
| | Seven West Media Ltd. | 896,040 | 462 |
| | Bega Cheese Ltd. | 122,363 | 458 |
| ^ | Greencross Ltd. | 86,185 | 457 |
| | McMillan Shakespeare Ltd. | 55,164 | 453 |
| | National Storage REIT | 408,830 | 450 |
| | Corporate Travel Management Ltd. | 31,119 | 449 |
| ^,* | Galaxy Resources Ltd. | 1,604,440 | 430 |
| ^,* | Western Areas Ltd. | 217,908 | 409 |
| | Growthpoint Properties Australia Ltd. | 169,089 | 399 |
| ^ | IDP Education Ltd. | 115,828 | 399 |
| ^ | Regis Healthcare Ltd. | 131,828 | 394 |
| | iSentia Group Ltd. | 146,079 | 390 |
| * | Infigen Energy | 508,622 | 389 |
| | Nine Entertainment Co. Holdings Ltd. | 593,316 | 387 |
| ^,* | UGL Ltd. | 157,819 | 385 |
| * | Pilbara Minerals Ltd. | 962,055 | 379 |
| | Asaleo Care Ltd. | 340,609 | 377 |
| | oOh!media Ltd. | 114,104 | 371 |
| * | Beadell Resources Ltd. | 1,033,535 | 368 |
25
| | | |
| Vanguard® Pacific Stock Index Fund | | |
| Schedule of Investments | | |
| October 31, 2016 | | |
| |
| | | | Market |
| | | | Value |
| | | Shares | ($000) |
| ^ | Cover-More Group Ltd. | 338,377 | 366 |
| | Folkestone Education Trust | 193,839 | 365 |
| | Ingenia Communities Group | 175,428 | 363 |
| | 360 Capital Industrial Fund | 185,927 | 348 |
| * | Bradken Ltd. | 140,925 | 344 |
| ^ | Japara Healthcare Ltd. | 240,857 | 344 |
| ^,* | Karoon Gas Australia Ltd. | 196,111 | 341 |
| | SmartGroup Corp. Ltd. | 74,085 | 336 |
| ^,* | Gold Road Resources Ltd. | 770,873 | 336 |
| | Sims Metal Management Ltd. ADR | 42,621 | 325 |
| ^ | Estia Health Ltd. | 158,766 | 323 |
| ^ | Select Harvests Ltd. | 69,220 | 322 |
| | Village Roadshow Ltd. | 83,042 | 321 |
| * | APN News & Media Ltd. | 155,943 | 317 |
| | Arena REIT | 213,761 | 315 |
| ^ | RCG Corp. Ltd. | 282,028 | 312 |
| | Cabcharge Australia Ltd. | 114,012 | 312 |
| | GDI Property Group | 421,136 | 311 |
| | Virtus Health Ltd. | 56,444 | 299 |
| | Newcrest Mining Ltd. ADR | 16,929 | 292 |
| | Collins Foods Ltd. | 79,843 | 292 |
| ^ | TFS Corp. Ltd. | 269,055 | 286 |
| | Programmed Maintenance Services Ltd. | 257,640 | 281 |
| ^,* | Mesoblast Ltd. | 297,448 | 277 |
| ^ | BWX Ltd. | 75,447 | 274 |
| | SG Fleet Group Ltd. | 98,686 | 269 |
| ^ | Tox Free Solutions Ltd. | 147,025 | 264 |
| ^,* | Blue Sky Alternative Investments Ltd. | 47,352 | 262 |
| | Astro Japan Property Group | 48,525 | 249 |
| | Hotel Property Investments | 112,164 | 240 |
| ^ | OFX Group Ltd. | 184,906 | 218 |
| | RCR Tomlinson Ltd. | 105,718 | 214 |
| ^,* | Ten Network Holdings Ltd. | 270,457 | 212 |
| ^,* | Highfield Resources Ltd. | 244,305 | 211 |
| ^,* | Senex Energy Ltd. | 1,091,195 | 209 |
| | CSG Ltd. | 205,452 | 200 |
| ^,* | Starpharma Holdings Ltd. | 349,356 | 194 |
| * | AWE Ltd. | 465,794 | 191 |
| ^ | Thorn Group Ltd. | 143,264 | 188 |
| | MACA Ltd. | 139,094 | 186 |
| ^ | Ainsworth Game Technology Ltd. | 137,090 | 186 |
| ^,* | Liquefied Natural Gas Ltd. | 418,482 | 176 |
| | WPP AUNZ Ltd. | 254,584 | 158 |
| ^,* | Mount Gibson Iron Ltd. | 623,360 | 155 |
| | Reject Shop Ltd. | 27,271 | 155 |
| | Cedar Woods Properties Ltd. | 44,952 | 153 |
| * | Cardno Ltd. | 208,032 | 146 |
| ^,* | Paladin Energy Ltd. | 1,369,635 | 146 |
| ^,* | Lynas Corp. Ltd. | 3,376,727 | 143 |
| | ERM Power Ltd. | 121,428 | 104 |
| ^ | Decmil Group Ltd. | 119,124 | 100 |
| ^,* | Slater & Gordon Ltd. | 323,362 | 89 |
| ^,* | Billabong International Ltd. | 86,734 | 80 |
| ^ | Cash Converters International Ltd. | 319,273 | 78 |
| * | Watpac Ltd. | 101,769 | 69 |
| ^ | SMS Management & Technology Ltd. | 56,015 | 65 |
| * | MMA Offshore Ltd. | 279,707 | 65 |
| | NZME Ltd. | 119,012 | 57 |
| ^,* | Arrium Ltd. | 2,773,644 | 46 |
| ^,* | Capitol Health Ltd. | 465,009 | 44 |
| * | Kingsgate Consolidated Ltd. | 130,071 | 20 |
| ^,* | Acrux Ltd. | 77,116 | 20 |
| * | BGP Holdings PLC | 15,642,708 | — |
26
| | | |
| Vanguard® Pacific Stock Index Fund | | |
| Schedule of Investments | | |
| October 31, 2016 | | |
| |
| | | | Market |
| | | | Value |
| | | Shares | ($000) |
| ^,* | DSHE Holdings Ltd. | 147,770 | — |
| | | | 968,038 |
| Hong Kong (8.8%) | | |
| | AIA Group Ltd. | 11,502,645 | 72,363 |
| | CK Hutchison Holdings Ltd. | 2,695,591 | 33,285 |
| | Hong Kong Exchanges & Clearing Ltd. | 1,162,397 | 30,730 |
| | Cheung Kong Property Holdings Ltd. | 2,698,091 | 19,946 |
| | Sun Hung Kai Properties Ltd. | 1,335,118 | 19,881 |
| | Link REIT | 2,148,643 | 15,285 |
| | CLP Holdings Ltd. | 1,465,541 | 14,897 |
| | Hong Kong & China Gas Co. Ltd. | 7,143,332 | 13,954 |
| | Hang Seng Bank Ltd. | 725,541 | 13,085 |
| | BOC Hong Kong Holdings Ltd. | 3,440,546 | 12,263 |
| | Jardine Matheson Holdings Ltd. | 196,020 | 11,940 |
| | Power Assets Holdings Ltd. | 1,262,816 | 11,852 |
| | Sands China Ltd. | 2,310,347 | 10,026 |
| | Wharf Holdings Ltd. | 1,153,297 | 8,647 |
| | Galaxy Entertainment Group Ltd. | 2,037,950 | 8,345 |
| | Hongkong Land Holdings Ltd. | 1,118,700 | 7,491 |
| | Jardine Strategic Holdings Ltd. | 212,700 | 7,463 |
| | MTR Corp. Ltd. | 1,337,717 | 7,403 |
| | AAC Technologies Holdings Inc. | 681,000 | 6,489 |
| | Henderson Land Development Co. Ltd. | 1,066,726 | 6,310 |
| | New World Development Co. Ltd. | 5,018,870 | 6,240 |
| 2 | WH Group Ltd. | 6,921,665 | 5,606 |
| | Swire Pacific Ltd. Class A | 485,625 | 5,048 |
| | Sino Land Co. Ltd. | 2,954,300 | 5,016 |
| | China Mengniu Dairy Co. Ltd. | 2,624,000 | 4,957 |
| | Cheung Kong Infrastructure Holdings Ltd. | 601,215 | 4,920 |
| | Wheelock & Co. Ltd. | 787,486 | 4,846 |
| | Techtronic Industries Co. Ltd. | 1,203,000 | 4,520 |
| | Bank of East Asia Ltd. | 1,118,476 | 4,496 |
| | Hang Lung Properties Ltd. | 1,916,317 | 4,214 |
| | Samsonite International SA | 1,250,973 | 3,933 |
| | Want Want China Holdings Ltd. | 5,612,000 | 3,416 |
| | Hang Lung Group Ltd. | 839,000 | 3,209 |
| | Swire Properties Ltd. | 1,108,965 | 3,185 |
| * | Semiconductor Manufacturing International Corp. | 23,907,000 | 2,895 |
| | Hysan Development Co. Ltd. | 610,603 | 2,818 |
| | Li & Fung Ltd. | 5,585,259 | 2,746 |
| | Yue Yuen Industrial Holdings Ltd. | 703,019 | 2,677 |
| | NWS Holdings Ltd. | 1,347,411 | 2,384 |
| | PCCW Ltd. | 3,931,143 | 2,340 |
| | ASM Pacific Technology Ltd. | 234,528 | 2,260 |
| | Wynn Macau Ltd. | 1,384,040 | 2,120 |
| ^ | Tingyi Cayman Islands Holding Corp. | 1,842,600 | 1,986 |
| | Hopewell Holdings Ltd. | 559,124 | 1,958 |
| | VTech Holdings Ltd. | 153,900 | 1,888 |
| | Shangri-La Asia Ltd. | 1,650,096 | 1,812 |
| | Kerry Properties Ltd. | 561,358 | 1,778 |
| | Minth Group Ltd. | 482,000 | 1,706 |
| | First Pacific Co. Ltd. | 2,228,823 | 1,688 |
| | PRADA SPA | 479,900 | 1,681 |
| | Xinyi Glass Holdings Ltd. | 1,850,000 | 1,591 |
| | Fortune REIT | 1,243,000 | 1,506 |
| | Sun Art Retail Group Ltd. | 2,135,000 | 1,504 |
| * | Esprit Holdings Ltd. | 1,758,400 | 1,450 |
| | Vitasoy International Holdings Ltd. | 694,000 | 1,449 |
| | Kingston Financial Group Ltd. | 3,408,000 | 1,415 |
| | Champion REIT | 2,363,000 | 1,342 |
| | Haitong International Securities Group Ltd. | 2,056,347 | 1,316 |
| | Cathay Pacific Airways Ltd. | 993,548 | 1,308 |
| | SJM Holdings Ltd. | 1,849,359 | 1,276 |
| | MGM China Holdings Ltd. | 735,200 | 1,213 |
27
| | | |
| Vanguard® Pacific Stock Index Fund | | |
| Schedule of Investments | | |
| October 31, 2016 | | |
| |
| | | | Market |
| | | | Value |
| | | Shares | ($000) |
| | Great Eagle Holdings Ltd. | 253,000 | 1,122 |
| | Luk Fook Holdings International Ltd. | 366,000 | 1,073 |
| | Dah Sing Financial Holdings Ltd. | 155,352 | 1,054 |
| | Melco International Development Ltd. | 799,000 | 1,042 |
| | Cafe de Coral Holdings Ltd. | 294,000 | 1,038 |
| ^ | Xinyi Solar Holdings Ltd. | 2,736,000 | 1,014 |
| | Man Wah Holdings Ltd. | 1,478,400 | 981 |
| | Television Broadcasts Ltd. | 260,500 | 943 |
| | L'Occitane International SA | 442,500 | 914 |
| | Nexteer Automotive Group Ltd. | 680,000 | 897 |
| ^ | China Goldjoy Group Ltd. | 9,020,000 | 871 |
| | Johnson Electric Holdings Ltd. | 355,625 | 860 |
| | HKBN Ltd. | 727,000 | 857 |
| | Uni-President China Holdings Ltd. | 1,265,400 | 855 |
| | Value Partners Group Ltd. | 890,000 | 849 |
| | Shui On Land Ltd. | 3,333,666 | 824 |
| * | Freeman FinTech Corp. Ltd. | 11,966,489 | 816 |
| | Guotai Junan International Holdings Ltd. | 2,123,213 | 811 |
| | NagaCorp Ltd. | 1,310,000 | 808 |
| ^ | Brightoil Petroleum Holdings Ltd. | 2,726,000 | 784 |
| ^ | Chow Tai Fook Jewellery Group Ltd. | 1,101,600 | 781 |
| | China Travel International Investment Hong Kong Ltd. | 2,576,000 | 742 |
| | Orient Overseas International Ltd. | 196,324 | 734 |
| | Kerry Logistics Network Ltd. | 546,179 | 725 |
| * | Huabao International Holdings Ltd. | 1,925,000 | 721 |
| | FIH Mobile Ltd. | 2,170,000 | 716 |
| | Shougang Fushan Resources Group Ltd. | 3,304,000 | 714 |
| * | Global Brands Group Holding Ltd. | 6,113,259 | 692 |
| | Dah Sing Banking Group Ltd. | 378,456 | 684 |
| | Pou Sheng International Holdings Ltd. | 2,084,000 | 651 |
| | IGG Inc. | 887,000 | 647 |
| | Sunlight REIT | 1,042,000 | 645 |
| | Stella International Holdings Ltd. | 370,000 | 641 |
| | CP Pokphand Co. Ltd. | 4,996,000 | 637 |
| | SITC International Holdings Co. Ltd. | 1,075,000 | 636 |
| | Yuexiu REIT | 1,091,000 | 626 |
| | Pacific Textiles Holdings Ltd. | 487,000 | 614 |
| | Lifestyle International Holdings Ltd. | 457,000 | 612 |
| ^,* | KuangChi Science Ltd. | 1,741,000 | 606 |
| | BEP International Holdings Ltd. | 9,130,000 | 599 |
| | Town Health International Medical Group Ltd. | 3,730,000 | 596 |
| | Shun Tak Holdings Ltd. | 1,764,000 | 595 |
| | Giordano International Ltd. | 1,124,000 | 593 |
| | K Wah International Holdings Ltd. | 1,071,500 | 579 |
| | Towngas China Co. Ltd. | 979,929 | 551 |
| | Hopewell Highway Infrastructure Ltd. | 1,014,656 | 543 |
| * | China Baoli Technologies Holdings Ltd. | 17,250,000 | 537 |
| | SmarTone Telecommunications Holdings Ltd. | 349,000 | 527 |
| ^,*,2 | IMAX China Holding Inc. | 110,300 | 522 |
| | Truly International Holdings Ltd. | 1,330,000 | 520 |
| | SEA Holdings Ltd. | 201,060 | 512 |
| | Prosperity REIT | 1,181,000 | 510 |
| | United Co. RUSAL plc | 1,437,000 | 510 |
| ^ | China LNG Group Ltd. | 16,820,000 | 491 |
| * | Pacific Basin Shipping Ltd. | 3,286,000 | 491 |
| * | Vision Fame International Holding Ltd. | 1,388,000 | 484 |
| | SA Sa International Holdings Ltd. | 1,035,860 | 474 |
| | CITIC Telecom International Holdings Ltd. | 1,323,000 | 453 |
| * | China Oceanwide Holdings Ltd. | 4,297,000 | 437 |
| | Yingde Gases Group Co. Ltd. | 1,045,000 | 421 |
| | Texwinca Holdings Ltd. | 588,000 | 412 |
| | Goodbaby International Holdings Ltd. | 807,000 | 390 |
| ^,* | MMG Ltd. | 1,460,000 | 384 |
| * | Nan Hai Corp. Ltd. | 11,450,000 | 376 |
28
| | | |
| Vanguard® Pacific Stock Index Fund | | |
| Schedule of Investments | | |
| October 31, 2016 | | |
| |
| | | | Market |
| | | | Value |
| | | Shares | ($000) |
| | Hutchison Telecommunications Hong Kong Holdings Ltd. | 1,138,000 | 367 |
| * | HC International Inc. | 494,000 | 364 |
| | Dynam Japan Holdings Co. Ltd. | 253,200 | 364 |
| * | GCL New Energy Holdings Ltd. | 6,032,000 | 361 |
| | Kowloon Development Co. Ltd. | 359,000 | 359 |
| | Chow Sang Sang Holdings International Ltd. | 202,000 | 357 |
| | G-Resources Group Ltd. | 20,139,000 | 354 |
| | Sun Hung Kai & Co. Ltd. | 558,000 | 351 |
| * | Convoy Global Holdings Ltd. | 10,734,000 | 331 |
| | Lai Sun Development Co. Ltd. | 15,930,000 | 326 |
| ^ | Regina Miracle International Holdings Ltd. | 317,000 | 324 |
| | Gemdale Properties & Investment Corp. Ltd. | 4,906,000 | 323 |
| * | China Strategic Holdings Ltd. | 13,490,000 | 320 |
| * | Sino Oil And Gas Holdings Ltd. | 12,815,000 | 315 |
| | China Harmony New Energy Auto Holding Ltd. | 665,000 | 309 |
| | Emperor Capital Group Ltd. | 2,904,000 | 306 |
| | NewOcean Energy Holdings Ltd. | 1,184,000 | 305 |
| | Chong Hing Bank Ltd. | 155,000 | 305 |
| | Canvest Environmental Protection Group Co. Ltd. | 667,000 | 301 |
| * | Microport Scientific Corp. | 406,000 | 300 |
| * | United Photovoltaics Group Ltd. | 3,432,000 | 300 |
| | Far East Consortium International Ltd. | 728,000 | 298 |
| ^,* | Macau Legend Development Ltd. | 1,673,000 | 293 |
| * | Beijing Enterprises Medical & Health Group Ltd. | 4,866,000 | 282 |
| ^,* | China LotSynergy Holdings Ltd. | 6,680,000 | 271 |
| | Ju Teng International Holdings Ltd. | 822,000 | 260 |
| ^,* | China Ocean Industry Group Ltd. | 8,825,000 | 259 |
| * | United Laboratories International Holdings Ltd. | 464,000 | 256 |
| | TCC International Holdings Ltd. | 978,000 | 248 |
| * | China Innovative Finance Group Ltd. | 2,142,000 | 238 |
| ^,* | Summit Ascent Holdings Ltd. | 778,000 | 237 |
| | APT Satellite Holdings Ltd. | 355,500 | 234 |
| * | China Medical & HealthCare Group Ltd. | 4,073,039 | 233 |
| * | Mei Ah Entertainment Group Ltd. | 3,040,000 | 231 |
| | China Aerospace International Holdings Ltd. | 1,792,000 | 230 |
| * | TOM Group Ltd. | 910,000 | 223 |
| * | NetMind Financial Holdings Ltd. | 24,144,000 | 217 |
| | Liu Chong Hing Investment Ltd. | 152,000 | 214 |
| * | China Jicheng Holdings Ltd. | 6,400,782 | 213 |
| | Shenwan Hongyuan HK Ltd. | 380,000 | 209 |
| ^ | Lee's Pharmaceutical Holdings Ltd. | 238,000 | 206 |
| | Spring REIT | 487,000 | 205 |
| * | China Financial International Investments Ltd. | 4,010,000 | 204 |
| * | Kong Sun Holdings Ltd. | 3,825,000 | 192 |
| | Technovator International Ltd. | 412,000 | 170 |
| * | Midland Holdings Ltd. | 472,000 | 168 |
| | Road King Infrastructure Ltd. | 189,000 | 160 |
| ^,* | Honghua Group Ltd. | 1,535,000 | 156 |
| * | 13 Holdings Ltd. | 528,500 | 156 |
| ^ | China Silver Group Ltd. | 712,000 | 141 |
| | Parkson Retail Group Ltd. | 1,420,000 | 141 |
| | CGN New Energy Holdings Co. Ltd. | 968,000 | 140 |
| * | Qianhai Health Holdings Ltd. | 6,522,500 | 138 |
| * | Peace Map Holding Ltd. | 5,520,000 | 131 |
| * | Xinchen China Power Holdings Ltd. | 748,000 | 130 |
| * | Yanchang Petroleum International Ltd. | 4,510,000 | 127 |
| * | Lifestyle China Group Ltd. | 436,000 | 122 |
| ^,* | Anton Oilfield Services Group | 912,000 | 122 |
| | AMVIG Holdings Ltd. | 352,000 | 119 |
| * | Good Resources Holdings Ltd. | 2,258,940 | 116 |
| | EVA Precision Industrial Holdings Ltd. | 1,048,000 | 115 |
| ^,* | Suncorp Technologies Ltd. | 11,530,000 | 113 |
| * | Singamas Container Holdings Ltd. | 1,048,000 | 109 |
| * | New Sports Group Ltd. | 8,060,000 | 104 |
29
| | | |
| Vanguard® Pacific Stock Index Fund | | |
| Schedule of Investments | | |
| October 31, 2016 | | |
| |
| | | | Market |
| | | | Value |
| | | Shares | ($000) |
| * | New Focus Auto Tech Holdings Ltd. | 1,460,000 | 101 |
| | TPV Technology Ltd. | 530,000 | 101 |
| | Inspur International Ltd. | 498,000 | 99 |
| | Varitronix International Ltd. | 242,000 | 98 |
| | Yip's Chemical Holdings Ltd. | 240,000 | 98 |
| * | Sunshine Oilsands Ltd. | 1,682,500 | 97 |
| ^ | China Huarong Energy Co. Ltd. | 1,437,800 | 96 |
| ^,* | Haier Healthwise Holdings Ltd. | 2,930,000 | 96 |
| * | Tou Rong Chang Fu Group Ltd. | 4,044,000 | 83 |
| * | Mason Financial Holdings Ltd. | 3,500,000 | 80 |
| * | SOCAM Development Ltd. | 186,000 | 72 |
| | New World Department Store China Ltd. | 482,000 | 71 |
| * | Hong Kong Television Network Ltd. | 385,000 | 69 |
| * | Emperor Watch & Jewellery Ltd. | 1,740,000 | 69 |
| ^,* | Trinity Ltd. | 926,000 | 68 |
| * | Sincere Watch Hong Kong Ltd. | 2,250,000 | 62 |
| | Polytec Asset Holdings Ltd. | 775,000 | 56 |
| * | Auto Italia Holdings | 3,225,000 | 54 |
| | Henderson Investment Ltd. | 524,000 | 44 |
| * | Silver Base Group Holdings Ltd. | 537,000 | 39 |
| * | China Healthcare Enterprise Group Ltd. | 2,203,826 | 38 |
| * | Winshine Science Co. Ltd. | 1,108,000 | 27 |
| * | GT Group Holdings Ltd. | 640,000 | 23 |
| * | Neo-Neon Holdings Ltd. | 66,000 | 10 |
| | | | 505,836 |
| Japan (59.1%) | | |
| | Toyota Motor Corp. | 2,598,707 | 150,743 |
| | Mitsubishi UFJ Financial Group Inc. | 12,934,024 | 66,737 |
| | KDDI Corp. | 1,764,400 | 53,626 |
| | SoftBank Group Corp. | 818,070 | 51,523 |
| | Honda Motor Co. Ltd. | 1,705,527 | 51,032 |
| | Japan Tobacco Inc. | 1,141,059 | 43,383 |
| | Sumitomo Mitsui Financial Group Inc. | 1,235,334 | 42,831 |
| | Mizuho Financial Group Inc. | 23,793,341 | 40,062 |
| | Sony Corp. | 1,194,744 | 37,656 |
| | FANUC Corp. | 186,176 | 34,087 |
| | Takeda Pharmaceutical Co. Ltd. | 735,991 | 32,917 |
| | Keyence Corp. | 43,477 | 31,873 |
| | NTT DOCOMO Inc. | 1,248,800 | 31,362 |
| | East Japan Railway Co. | 355,285 | 31,275 |
| | Seven & i Holdings Co. Ltd. | 741,954 | 30,969 |
| | Astellas Pharma Inc. | 2,022,870 | 30,023 |
| | Shin-Etsu Chemical Co. Ltd. | 392,755 | 29,779 |
| | Central Japan Railway Co. | 172,300 | 29,299 |
| | Canon Inc. | 998,817 | 28,694 |
| | Mitsubishi Corp. | 1,310,134 | 28,515 |
| | Tokio Marine Holdings Inc. | 669,390 | 26,403 |
| | Mitsubishi Electric Corp. | 1,878,654 | 25,417 |
| | Murata Manufacturing Co. Ltd. | 180,179 | 25,160 |
| | Nintendo Co. Ltd. | 102,898 | 24,805 |
| | Kao Corp. | 476,877 | 24,538 |
| | Daikin Industries Ltd. | 253,212 | 24,265 |
| | Hitachi Ltd. | 4,411,258 | 23,516 |
| | Bridgestone Corp. | 610,950 | 22,803 |
| | Fuji Heavy Industries Ltd. | 583,412 | 22,798 |
| | Mitsui & Co. Ltd. | 1,622,700 | 22,483 |
| | Mitsubishi Estate Co. Ltd. | 1,123,982 | 22,339 |
| | Nidec Corp. | 230,728 | 22,325 |
| | Panasonic Corp. | 2,025,590 | 20,896 |
| | Denso Corp. | 478,686 | 20,830 |
| | Mitsui Fudosan Co. Ltd. | 904,580 | 20,601 |
| | Komatsu Ltd. | 899,109 | 20,013 |
| | ORIX Corp. | 1,248,310 | 19,781 |
| | Nissan Motor Co. Ltd. | 1,917,052 | 19,501 |
30
| | |
| Vanguard® Pacific Stock Index Fund | | |
| Schedule of Investments | | |
| October 31, 2016 | | |
| |
| | | Market |
| | | Value |
| | Shares | ($000) |
| Otsuka Holdings Co. Ltd. | 402,279 | 17,606 |
| ITOCHU Corp. | 1,374,597 | 17,359 |
| Kubota Corp. | 1,069,428 | 17,237 |
| Daiwa House Industry Co. Ltd. | 613,905 | 16,850 |
| Nomura Holdings Inc. | 3,243,894 | 16,248 |
| Eisai Co. Ltd. | 253,668 | 16,166 |
| SMC Corp. | 55,700 | 16,146 |
| Fast Retailing Co. Ltd. | 47,320 | 15,942 |
| Dai-ichi Life Holdings Inc. | 1,079,900 | 15,832 |
| Hoya Corp. | 376,502 | 15,709 |
| Daiichi Sankyo Co. Ltd. | 630,691 | 15,155 |
| Nippon Steel & Sumitomo Metal Corp. | 747,430 | 14,809 |
| FUJIFILM Holdings Corp. | 382,895 | 14,478 |
| Kyocera Corp. | 296,450 | 14,404 |
| MS&AD Insurance Group Holdings Inc. | 485,101 | 14,401 |
| Suzuki Motor Corp. | 392,368 | 13,990 |
| Shionogi & Co. Ltd. | 282,251 | 13,900 |
| Kirin Holdings Co. Ltd. | 802,316 | 13,793 |
| Toray Industries Inc. | 1,437,857 | 13,382 |
| Secom Co. Ltd. | 185,103 | 13,353 |
| Tokyo Electron Ltd. | 147,513 | 13,306 |
| * Toshiba Corp. | 3,627,424 | 13,134 |
| Mitsubishi Heavy Industries Ltd. | 3,062,743 | 13,102 |
| MEIJI Holdings Co. Ltd. | 130,030 | 12,969 |
| Asahi Group Holdings Ltd. | 361,721 | 12,903 |
| Shimano Inc. | 74,998 | 12,823 |
| Recruit Holdings Co. Ltd. | 309,135 | 12,418 |
| Sumitomo Corp. | 1,076,538 | 12,377 |
| Sumitomo Mitsui Trust Holdings Inc. | 359,681 | 12,137 |
| Daito Trust Construction Co. Ltd. | 69,258 | 11,606 |
| Terumo Corp. | 299,900 | 11,598 |
| Sompo Holdings Inc. | 352,226 | 11,397 |
| Ono Pharmaceutical Co. Ltd. | 436,465 | 11,066 |
| Olympus Corp. | 304,994 | 10,872 |
| Sumitomo Realty & Development Co. Ltd. | 412,539 | 10,844 |
| West Japan Railway Co. | 175,037 | 10,778 |
| Oriental Land Co. Ltd. | 184,377 | 10,770 |
| Ajinomoto Co. Inc. | 481,606 | 10,710 |
| Asahi Kasei Corp. | 1,180,836 | 10,645 |
| Sumitomo Electric Industries Ltd. | 717,321 | 10,597 |
| Dentsu Inc. | 212,002 | 10,568 |
| Nitto Denko Corp. | 147,766 | 10,295 |
| Nippon Telegraph & Telephone Corp. | 231,375 | 10,258 |
| Fujitsu Ltd. | 1,706,981 | 10,124 |
| Chubu Electric Power Co. Inc. | 678,872 | 9,994 |
| Shiseido Co. Ltd. | 372,853 | 9,617 |
| Daiwa Securities Group Inc. | 1,609,984 | 9,612 |
| Sysmex Corp. | 135,284 | 9,375 |
| Rakuten Inc. | 802,500 | 9,252 |
| Resona Holdings Inc. | 2,077,543 | 9,209 |
| Aeon Co. Ltd. | 664,295 | 9,180 |
| JX Holdings Inc. | 2,316,923 | 9,155 |
| Sekisui House Ltd. | 551,335 | 9,110 |
| Tokyo Gas Co. Ltd. | 1,984,959 | 9,007 |
| Mazda Motor Corp. | 539,691 | 8,950 |
| Unicharm Corp. | 374,823 | 8,913 |
| Nitori Holdings Co. Ltd. | 70,482 | 8,419 |
| Mitsubishi Chemical Holdings Corp. | 1,259,379 | 8,269 |
| Inpex Corp. | 879,600 | 8,206 |
| Aisin Seiki Co. Ltd. | 184,589 | 8,109 |
| Makita Corp. | 116,227 | 8,036 |
| Hankyu Hanshin Holdings Inc. | 239,200 | 7,919 |
| TDK Corp. | 114,187 | 7,884 |
| Osaka Gas Co. Ltd. | 1,888,548 | 7,855 |
31
| | |
| Vanguard® Pacific Stock Index Fund | | |
| Schedule of Investments | | |
| October 31, 2016 | | |
| |
| | | Market |
| | | Value |
| | Shares | ($000) |
| Marubeni Corp. | 1,488,556 | 7,822 |
| Japan Exchange Group Inc. | 522,300 | 7,755 |
| Yamato Holdings Co. Ltd. | 338,261 | 7,707 |
| Taisei Corp. | 1,016,863 | 7,621 |
| Omron Corp. | 186,810 | 7,170 |
| Toyota Industries Corp. | 156,120 | 7,163 |
| Tokyu Corp. | 952,409 | 7,130 |
| Chugai Pharmaceutical Co. Ltd. | 208,757 | 7,114 |
| T&D Holdings Inc. | 585,661 | 7,082 |
| JFE Holdings Inc. | 492,407 | 7,057 |
| Kintetsu Group Holdings Co. Ltd. | 1,724,927 | 6,963 |
| Sumitomo Chemical Co. Ltd. | 1,455,276 | 6,883 |
| * Kansai Electric Power Co. Inc. | 700,014 | 6,692 |
| NEC Corp. | 2,478,284 | 6,627 |
| Isuzu Motors Ltd. | 517,598 | 6,402 |
| Asahi Glass Co. Ltd. | 912,115 | 6,379 |
| NTT Data Corp. | 120,200 | 6,203 |
| Obayashi Corp. | 643,775 | 6,202 |
| Odakyu Electric Railway Co. Ltd. | 291,581 | 5,949 |
| Yamaha Motor Co. Ltd. | 266,047 | 5,910 |
| Kajima Corp. | 871,362 | 5,876 |
| Sumitomo Metal Mining Co. Ltd. | 452,149 | 5,876 |
| Nippon Paint Holdings Co. Ltd. | 172,800 | 5,876 |
| Dai Nippon Printing Co. Ltd. | 574,513 | 5,763 |
| * Tokyo Electric Power Co. Holdings Inc. | 1,483,884 | 5,749 |
| Yamaha Corp. | 160,739 | 5,743 |
| LIXIL Group Corp. | 248,518 | 5,708 |
| Koito Manufacturing Co. Ltd. | 107,555 | 5,647 |
| Sekisui Chemical Co. Ltd. | 356,645 | 5,617 |
| Tohoku Electric Power Co. Inc. | 454,542 | 5,569 |
| Bandai Namco Holdings Inc. | 185,854 | 5,567 |
| Santen Pharmaceutical Co. Ltd. | 380,400 | 5,547 |
| Japan Post Holdings Co. Ltd. | 430,713 | 5,483 |
| Concordia Financial Group Ltd. | 1,166,179 | 5,407 |
| Seiko Epson Corp. | 264,400 | 5,359 |
| TOTO Ltd. | 134,039 | 5,355 |
| M3 Inc. | 174,300 | 5,304 |
| Ricoh Co. Ltd. | 649,882 | 5,297 |
| Suntory Beverage & Food Ltd. | 119,300 | 5,216 |
| Kikkoman Corp. | 163,922 | 5,215 |
| Kuraray Co. Ltd. | 335,213 | 5,082 |
| Nikon Corp. | 334,430 | 5,054 |
| Toyota Tsusho Corp. | 212,048 | 5,006 |
| FamilyMart UNY Holdings Co. Ltd. | 77,713 | 4,874 |
| Shimizu Corp. | 541,293 | 4,811 |
| NSK Ltd. | 432,336 | 4,806 |
| Yahoo Japan Corp. | 1,246,500 | 4,782 |
| Keikyu Corp. | 473,531 | 4,777 |
| ^ Lawson Inc. | 62,595 | 4,756 |
| Ryohin Keikaku Co. Ltd. | 22,200 | 4,742 |
| MISUMI Group Inc. | 258,500 | 4,715 |
| Tobu Railway Co. Ltd. | 959,206 | 4,709 |
| Japan Post Bank Co. Ltd. | 396,911 | 4,678 |
| Nagoya Railroad Co. Ltd. | 876,000 | 4,623 |
| NGK Insulators Ltd. | 249,541 | 4,580 |
| Toppan Printing Co. Ltd. | 482,872 | 4,541 |
| Nissan Chemical Industries Ltd. | 133,900 | 4,540 |
| Yakult Honsha Co. Ltd. | 97,115 | 4,528 |
| Rohm Co. Ltd. | 86,133 | 4,528 |
| Keio Corp. | 546,808 | 4,526 |
| * Kyushu Railway Co. | 152,019 | 4,479 |
| Hoshizaki Corp. | 48,700 | 4,395 |
| Mitsui Chemicals Inc. | 882,190 | 4,345 |
| Shizuoka Bank Ltd. | 512,859 | 4,328 |
32
| | |
| Vanguard® Pacific Stock Index Fund | | |
| Schedule of Investments | | |
| October 31, 2016 | | |
| |
| | | Market |
| | | Value |
| | Shares | ($000) |
| NH Foods Ltd. | 179,466 | 4,301 |
| Alps Electric Co. Ltd. | 178,200 | 4,275 |
| Don Quijote Holdings Co. Ltd. | 112,000 | 4,257 |
| Taisho Pharmaceutical Holdings Co. Ltd. | 43,423 | 4,236 |
| Brother Industries Ltd. | 224,759 | 4,124 |
| Mitsubishi Tanabe Pharma Corp. | 211,636 | 4,119 |
| Suruga Bank Ltd. | 166,696 | 4,070 |
| Nissin Foods Holdings Co. Ltd. | 69,947 | 4,048 |
| Yaskawa Electric Corp. | 253,355 | 4,042 |
| Tosoh Corp. | 618,000 | 4,036 |
| Kawasaki Heavy Industries Ltd. | 1,370,357 | 4,003 |
| Chiba Bank Ltd. | 645,129 | 3,990 |
| Kyushu Electric Power Co. Inc. | 438,944 | 3,989 |
| Electric Power Development Co. Ltd. | 170,879 | 3,979 |
| Hirose Electric Co. Ltd. | 30,118 | 3,974 |
| Kansai Paint Co. Ltd. | 183,790 | 3,950 |
| Daicel Corp. | 299,773 | 3,942 |
| Amada Holdings Co. Ltd. | 345,493 | 3,936 |
| Konica Minolta Inc. | 437,953 | 3,923 |
| Stanley Electric Co. Ltd. | 142,441 | 3,922 |
| Hamamatsu Photonics KK | 129,144 | 3,908 |
| Tsuruha Holdings Inc. | 33,500 | 3,865 |
| Toho Gas Co. Ltd. | 415,518 | 3,853 |
| Trend Micro Inc. | 109,258 | 3,847 |
| Seibu Holdings Inc. | 220,517 | 3,815 |
| NGK Spark Plug Co. Ltd. | 189,381 | 3,758 |
| Hisamitsu Pharmaceutical Co. Inc. | 70,340 | 3,752 |
| * IHI Corp. | 1,423,720 | 3,745 |
| Kyowa Hakko Kirin Co. Ltd. | 244,886 | 3,737 |
| Lion Corp. | 228,000 | 3,729 |
| Aozora Bank Ltd. | 1,117,676 | 3,693 |
| Shimadzu Corp. | 252,596 | 3,675 |
| Alfresa Holdings Corp. | 173,832 | 3,674 |
| Nisshin Seifun Group Inc. | 247,924 | 3,652 |
| Asics Corp. | 171,132 | 3,652 |
| Oji Holdings Corp. | 851,521 | 3,600 |
| Nippon Express Co. Ltd. | 727,925 | 3,596 |
| Konami Holdings Corp. | 90,549 | 3,576 |
| JGC Corp. | 202,021 | 3,571 |
| Toyo Suisan Kaisha Ltd. | 87,996 | 3,565 |
| USS Co. Ltd. | 206,760 | 3,497 |
| Isetan Mitsukoshi Holdings Ltd. | 345,080 | 3,488 |
| Yamada Denki Co. Ltd. | 670,940 | 3,468 |
| Chugoku Electric Power Co. Inc. | 292,813 | 3,426 |
| Mitsubishi Materials Corp. | 117,350 | 3,362 |
| Nabtesco Corp. | 112,465 | 3,359 |
| Rinnai Corp. | 34,907 | 3,353 |
| Taiheiyo Cement Corp. | 1,170,000 | 3,351 |
| Toho Co. Ltd. | 111,433 | 3,343 |
| Obic Co. Ltd. | 64,000 | 3,325 |
| Nomura Research Institute Ltd. | 94,732 | 3,286 |
| DeNA Co. Ltd. | 102,051 | 3,283 |
| J Front Retailing Co. Ltd. | 238,290 | 3,280 |
| Yokogawa Electric Corp. | 232,796 | 3,270 |
| Teijin Ltd. | 168,735 | 3,260 |
| Hulic Co. Ltd. | 341,400 | 3,251 |
| Mitsubishi Motors Corp. | 584,721 | 3,246 |
| Mebuki Financial Group Inc. | 910,925 | 3,242 |
| JTEKT Corp. | 218,366 | 3,232 |
| Keisei Electric Railway Co. Ltd. | 131,702 | 3,175 |
| Minebea Co. Ltd. | 310,200 | 3,165 |
| Keihan Holdings Co. Ltd. | 468,000 | 3,160 |
| Nippon Yusen KK | 1,527,083 | 3,125 |
| Fukuoka Financial Group Inc. | 712,041 | 3,081 |
33
| | | |
| Vanguard® Pacific Stock Index Fund | | |
| Schedule of Investments | | |
| October 31, 2016 | | |
| |
| | | | Market |
| | | | Value |
| | | Shares | ($000) |
| | ANA Holdings Inc. | 1,094,143 | 3,073 |
| | Disco Corp. | 25,400 | 3,070 |
| | Park24 Co. Ltd. | 99,000 | 3,059 |
| | Sojitz Corp. | 1,163,818 | 3,054 |
| | Kobayashi Pharmaceutical Co. Ltd. | 58,300 | 3,047 |
| | Kewpie Corp. | 106,100 | 3,013 |
| | Start Today Co. Ltd. | 171,600 | 3,007 |
| | Sohgo Security Services Co. Ltd. | 65,800 | 2,997 |
| ^ | Casio Computer Co. Ltd. | 214,872 | 2,993 |
| | Marui Group Co. Ltd. | 212,342 | 2,979 |
| | Iida Group Holdings Co. Ltd. | 153,000 | 2,957 |
| | Sumitomo Rubber Industries Ltd. | 173,890 | 2,917 |
| | Mabuchi Motor Co. Ltd. | 50,102 | 2,912 |
| | Pigeon Corp. | 103,400 | 2,909 |
| | Toyo Seikan Group Holdings Ltd. | 155,473 | 2,868 |
| | Hino Motors Ltd. | 262,809 | 2,865 |
| | Sega Sammy Holdings Inc. | 192,291 | 2,839 |
| | Sumitomo Heavy Industries Ltd. | 537,153 | 2,828 |
| | Tokyu Fudosan Holdings Corp. | 497,855 | 2,806 |
| | Ezaki Glico Co. Ltd. | 49,200 | 2,797 |
| | Fuji Electric Co. Ltd. | 558,783 | 2,790 |
| | Mitsubishi Gas Chemical Co. Inc. | 179,460 | 2,762 |
| | Hakuhodo DY Holdings Inc. | 228,550 | 2,747 |
| | TonenGeneral Sekiyu KK | 278,713 | 2,744 |
| | JSR Corp. | 180,143 | 2,738 |
| | CyberAgent Inc. | 93,800 | 2,725 |
| | Yamazaki Baking Co. Ltd. | 119,335 | 2,676 |
| | Miraca Holdings Inc. | 55,285 | 2,669 |
| | Air Water Inc. | 142,281 | 2,662 |
| | Shimamura Co. Ltd. | 20,653 | 2,644 |
| | MediPal Holdings Corp. | 153,484 | 2,622 |
| | Haseko Corp. | 269,000 | 2,618 |
| | Credit Saison Co. Ltd. | 151,375 | 2,617 |
| | Calbee Inc. | 72,100 | 2,616 |
| | Hitachi High-Technologies Corp. | 62,680 | 2,614 |
| | Mitsui OSK Lines Ltd. | 1,042,811 | 2,608 |
| | Sumitomo Dainippon Pharma Co. Ltd. | 150,438 | 2,606 |
| | Kurita Water Industries Ltd. | 109,878 | 2,600 |
| | Suzuken Co. Ltd. | 80,862 | 2,597 |
| | SCREEN Holdings Co. Ltd. | 37,600 | 2,572 |
| | Ebara Corp. | 85,800 | 2,547 |
| | Shinsei Bank Ltd. | 1,565,373 | 2,531 |
| | Square Enix Holdings Co. Ltd. | 76,415 | 2,528 |
| | Tokyo Tatemono Co. Ltd. | 197,500 | 2,509 |
| | NOK Corp. | 110,356 | 2,487 |
| | Nippon Shinyaku Co. Ltd. | 48,800 | 2,477 |
| | Kyushu Financial Group Inc. | 371,900 | 2,473 |
| | Kose Corp. | 27,100 | 2,472 |
| | Bank of Kyoto Ltd. | 336,363 | 2,467 |
| | Sundrug Co. Ltd. | 31,200 | 2,454 |
| | Hiroshima Bank Ltd. | 571,000 | 2,444 |
| | DIC Corp. | 80,200 | 2,429 |
| | Nankai Electric Railway Co. Ltd. | 531,000 | 2,411 |
| * | Kobe Steel Ltd. | 290,995 | 2,401 |
| | Sony Financial Holdings Inc. | 169,924 | 2,387 |
| | Advantest Corp. | 166,387 | 2,378 |
| | Otsuka Corp. | 49,726 | 2,366 |
| | Hitachi Metals Ltd. | 189,007 | 2,362 |
| | Hitachi Chemical Co. Ltd. | 100,666 | 2,353 |
| ^,* | Sharp Corp. | 1,349,829 | 2,342 |
| | THK Co. Ltd. | 110,432 | 2,332 |
| | Yamaguchi Financial Group Inc. | 210,864 | 2,325 |
| | Temp Holdings Co. Ltd. | 136,300 | 2,312 |
| | Nichirei Corp. | 104,000 | 2,274 |
34
| | | |
| Vanguard® Pacific Stock Index Fund | | |
| Schedule of Investments | | |
| October 31, 2016 | | |
| |
| | | | Market |
| | | | Value |
| | | Shares | ($000) |
| | Takashimaya Co. Ltd. | 277,494 | 2,263 |
| | Nifco Inc. | 39,100 | 2,252 |
| | Chugoku Bank Ltd. | 166,309 | 2,231 |
| | Kakaku.com Inc. | 132,400 | 2,224 |
| | Idemitsu Kosan Co. Ltd. | 96,792 | 2,224 |
| | Kaneka Corp. | 267,995 | 2,217 |
| | Nippon Electric Glass Co. Ltd. | 405,752 | 2,207 |
| | SBI Holdings Inc. | 185,506 | 2,204 |
| | Hachijuni Bank Ltd. | 395,628 | 2,157 |
| | Nexon Co. Ltd. | 126,200 | 2,148 |
| | Ube Industries Ltd. | 1,027,936 | 2,121 |
| | Hitachi Construction Machinery Co. Ltd. | 101,232 | 2,118 |
| ^ | Japan Airport Terminal Co. Ltd. | 54,500 | 2,092 |
| | Nippon Shokubai Co. Ltd. | 30,300 | 2,091 |
| | Zenkoku Hosho Co. Ltd. | 48,600 | 2,090 |
| | Hokuriku Electric Power Co. | 181,834 | 2,065 |
| | Asahi Intecc Co. Ltd. | 47,670 | 2,065 |
| | Gunma Bank Ltd. | 431,481 | 2,060 |
| | Mitsubishi UFJ Lease & Finance Co. Ltd. | 424,660 | 2,056 |
| ^ | Ito En Ltd. | 55,100 | 2,006 |
| | Azbil Corp. | 67,600 | 2,005 |
| | Kaken Pharmaceutical Co. Ltd. | 31,800 | 2,003 |
| ^ | Kawasaki Kisen Kaisha Ltd. | 801,000 | 1,982 |
| | Hikari Tsushin Inc. | 21,400 | 1,964 |
| | Sawai Pharmaceutical Co. Ltd. | 30,300 | 1,958 |
| | Daifuku Co. Ltd. | 107,400 | 1,941 |
| | Nomura Real Estate Holdings Inc. | 114,878 | 1,940 |
| | Maruichi Steel Tube Ltd. | 59,914 | 1,932 |
| | Denka Co. Ltd. | 421,927 | 1,914 |
| | Kagome Co. Ltd. | 71,900 | 1,885 |
| | Sotetsu Holdings Inc. | 385,000 | 1,879 |
| | Matsumotokiyoshi Holdings Co. Ltd. | 36,400 | 1,875 |
| | Seven Bank Ltd. | 609,440 | 1,874 |
| | Tsumura & Co. | 65,672 | 1,866 |
| | Sanwa Holdings Corp. | 187,200 | 1,864 |
| ^,* | PeptiDream Inc. | 36,000 | 1,854 |
| | COMSYS Holdings Corp. | 104,400 | 1,838 |
| | Nihon M&A Center Inc. | 56,600 | 1,837 |
| | Nippon Kayaku Co. Ltd. | 159,000 | 1,832 |
| | Sumco Corp. | 173,768 | 1,818 |
| | AEON Financial Service Co. Ltd. | 102,970 | 1,813 |
| | Sugi Holdings Co. Ltd. | 33,700 | 1,805 |
| | Calsonic Kansei Corp. | 144,000 | 1,805 |
| | TIS Inc. | 79,500 | 1,799 |
| | Nihon Kohden Corp. | 73,600 | 1,794 |
| | Benesse Holdings Inc. | 68,247 | 1,788 |
| | Hokuhoku Financial Group Inc. | 124,000 | 1,787 |
| | Morinaga & Co. Ltd. | 38,400 | 1,786 |
| | Coca-Cola West Co. Ltd. | 60,324 | 1,783 |
| | Glory Ltd. | 53,900 | 1,782 |
| | Megmilk Snow Brand Co. Ltd. | 50,900 | 1,771 |
| | Yokohama Rubber Co. Ltd. | 101,100 | 1,755 |
| | Horiba Ltd. | 36,600 | 1,750 |
| | Showa Shell Sekiyu KK | 186,822 | 1,741 |
| | Furukawa Electric Co. Ltd. | 59,160 | 1,741 |
| * | Acom Co. Ltd. | 376,400 | 1,732 |
| | Sumitomo Forestry Co. Ltd. | 123,500 | 1,720 |
| | Izumi Co. Ltd. | 37,200 | 1,719 |
| | Mitsubishi Logistics Corp. | 126,831 | 1,717 |
| | Nippon Paper Industries Co. Ltd. | 91,048 | 1,704 |
| | Cosmos Pharmaceutical Corp. | 7,800 | 1,697 |
| | Aeon Mall Co. Ltd. | 114,155 | 1,695 |
| | Toyoda Gosei Co. Ltd. | 73,903 | 1,693 |
| | Kamigumi Co. Ltd. | 198,148 | 1,692 |
35
| | | |
| Vanguard® Pacific Stock Index Fund | | |
| Schedule of Investments | | |
| October 31, 2016 | | |
| |
| | | | Market |
| | | | Value |
| | | Shares | ($000) |
| | Nishi-Nippon Railroad Co. Ltd. | 354,000 | 1,678 |
| | Oracle Corp. Japan | 30,468 | 1,658 |
| | Zensho Holdings Co. Ltd. | 88,600 | 1,655 |
| | Aoyama Trading Co. Ltd. | 46,900 | 1,652 |
| | Sankyo Co. Ltd. | 46,817 | 1,649 |
| | House Foods Group Inc. | 73,600 | 1,643 |
| | GS Yuasa Corp. | 379,999 | 1,641 |
| | Sapporo Holdings Ltd. | 57,800 | 1,633 |
| | Tokyo Century Corp. | 46,300 | 1,631 |
| | Miura Co. Ltd. | 94,500 | 1,631 |
| | Penta-Ocean Construction Co. Ltd. | 273,400 | 1,629 |
| | Rohto Pharmaceutical Co. Ltd. | 92,800 | 1,628 |
| | Takara Holdings Inc. | 171,700 | 1,626 |
| | Citizen Watch Co. Ltd. | 289,348 | 1,626 |
| | Welcia Holdings Co. Ltd. | 23,758 | 1,620 |
| | Daiichikosho Co. Ltd. | 37,000 | 1,608 |
| | Iyo Bank Ltd. | 261,398 | 1,607 |
| | Dowa Holdings Co. Ltd. | 216,000 | 1,604 |
| | Seino Holdings Co. Ltd. | 143,900 | 1,595 |
| | Showa Denko KK | 120,049 | 1,586 |
| | SCSK Corp. | 42,500 | 1,585 |
| | Coca-Cola East Japan Co. Ltd. | 71,000 | 1,565 |
| | NTN Corp. | 411,000 | 1,556 |
| | Toyota Boshoku Corp. | 61,109 | 1,541 |
| | Relo Group Inc. | 9,300 | 1,540 |
| | OSG Corp. | 72,230 | 1,538 |
| | Leopalace21 Corp. | 236,400 | 1,537 |
| | NHK Spring Co. Ltd. | 160,896 | 1,523 |
| | Morinaga Milk Industry Co. Ltd. | 189,000 | 1,522 |
| | Kinden Corp. | 126,331 | 1,521 |
| * | Itoham Yonekyu Holdings Inc. | 158,462 | 1,511 |
| | Ain Holdings Inc. | 22,300 | 1,505 |
| | Toyo Tire & Rubber Co. Ltd. | 96,500 | 1,497 |
| | Fujikura Ltd. | 254,000 | 1,492 |
| | 77 Bank Ltd. | 330,000 | 1,491 |
| | Ulvac Inc. | 47,200 | 1,490 |
| | NOF Corp. | 136,000 | 1,478 |
| | Sumitomo Osaka Cement Co. Ltd. | 352,000 | 1,458 |
| * | Nishi-Nippon Financial Holdings Inc. | 146,067 | 1,454 |
| | Aica Kogyo Co. Ltd. | 50,800 | 1,450 |
| | Taiyo Nippon Sanso Corp. | 137,701 | 1,447 |
| | Nipro Corp. | 117,000 | 1,445 |
| | ADEKA Corp. | 95,300 | 1,441 |
| | Shikoku Electric Power Co. Inc. | 152,044 | 1,430 |
| | Pilot Corp. | 31,900 | 1,426 |
| | Topcon Corp. | 94,500 | 1,411 |
| | Ibiden Co. Ltd. | 96,783 | 1,405 |
| | Pola Orbis Holdings Inc. | 16,800 | 1,398 |
| | Daido Steel Co. Ltd. | 327,087 | 1,388 |
| | Japan Post Insurance Co. Ltd. | 66,031 | 1,384 |
| | Nagase & Co. Ltd. | 107,800 | 1,379 |
| | Sankyu Inc. | 234,000 | 1,378 |
| | ABC-Mart Inc. | 22,587 | 1,374 |
| | TS Tech Co. Ltd. | 51,100 | 1,370 |
| | Toyobo Co. Ltd. | 832,000 | 1,362 |
| ^ | MonotaRO Co. Ltd. | 55,802 | 1,357 |
| | Ushio Inc. | 112,384 | 1,356 |
| | Wacoal Holdings Corp. | 117,000 | 1,350 |
| ^,* | LINE Corp. | 32,880 | 1,346 |
| | Daishi Bank Ltd. | 310,000 | 1,333 |
| | K's Holdings Corp. | 77,000 | 1,333 |
| ^,* | Tokuyama Corp. | 308,000 | 1,317 |
| | Tokyo Ohka Kogyo Co. Ltd. | 37,000 | 1,314 |
| | Bic Camera Inc. | 151,300 | 1,302 |
36
| | |
| Vanguard® Pacific Stock Index Fund | | |
| Schedule of Investments | | |
| October 31, 2016 | | |
| |
| | | Market |
| | | Value |
| | Shares | ($000) |
| Hokkaido Electric Power Co. Inc. | 171,193 | 1,302 |
| Nihon Parkerizing Co. Ltd. | 93,900 | 1,294 |
| Skylark Co. Ltd. | 91,500 | 1,287 |
| Toagosei Co. Ltd. | 114,000 | 1,269 |
| Nikkon Holdings Co. Ltd. | 59,000 | 1,267 |
| Resorttrust Inc. | 63,300 | 1,265 |
| Nippon Suisan Kaisha Ltd. | 262,800 | 1,263 |
| Kyowa Exeo Corp. | 83,300 | 1,251 |
| Chiyoda Corp. | 143,123 | 1,248 |
| Shimachu Co. Ltd. | 46,300 | 1,242 |
| Tsubakimoto Chain Co. | 156,000 | 1,236 |
| Japan Steel Works Ltd. | 57,373 | 1,232 |
| Ship Healthcare Holdings Inc. | 41,700 | 1,220 |
| Tadano Ltd. | 108,500 | 1,218 |
| Amano Corp. | 64,600 | 1,202 |
| Nisshin Steel Co. Ltd. | 90,300 | 1,201 |
| Shochiku Co. Ltd. | 107,000 | 1,199 |
| OKUMA Corp. | 143,000 | 1,197 |
| Mitsui Mining & Smelting Co. Ltd. | 535,000 | 1,192 |
| H2O Retailing Corp. | 80,000 | 1,188 |
| Sangetsu Corp. | 61,500 | 1,188 |
| Nippon Light Metal Holdings Co. Ltd. | 518,400 | 1,180 |
| Rengo Co. Ltd. | 188,000 | 1,179 |
| Zeon Corp. | 129,000 | 1,178 |
| Japan Airlines Co. Ltd. | 39,792 | 1,174 |
| Nisshinbo Holdings Inc. | 117,800 | 1,173 |
| Capcom Co. Ltd. | 45,400 | 1,173 |
| Awa Bank Ltd. | 178,000 | 1,171 |
| Shiga Bank Ltd. | 225,000 | 1,167 |
| Nippon Gas Co. Ltd. | 38,500 | 1,165 |
| Nishimatsu Construction Co. Ltd. | 245,000 | 1,144 |
| Itochu Techno-Solutions Corp. | 46,332 | 1,143 |
| Iwatani Corp. | 191,000 | 1,141 |
| Toda Corp. | 210,000 | 1,138 |
| Taiyo Yuden Co. Ltd. | 106,200 | 1,135 |
| Tokai Tokyo Financial Holdings Inc. | 223,100 | 1,132 |
| Hazama Ando Corp. | 174,600 | 1,126 |
| Fujitsu General Ltd. | 49,000 | 1,124 |
| San-In Godo Bank Ltd. | 156,200 | 1,124 |
| FP Corp. | 20,800 | 1,120 |
| Yamato Kogyo Co. Ltd. | 39,517 | 1,113 |
| Kyudenko Corp. | 34,500 | 1,111 |
| Ogaki Kyoritsu Bank Ltd. | 309,000 | 1,105 |
| Lintec Corp. | 50,700 | 1,104 |
| Senshu Ikeda Holdings Inc. | 242,500 | 1,103 |
| Colowide Co. Ltd. | 56,400 | 1,096 |
| Heiwa Corp. | 46,600 | 1,095 |
| Valor Holdings Co. Ltd. | 38,500 | 1,092 |
| TechnoPro Holdings Inc. | 31,800 | 1,089 |
| Maeda Corp. | 117,000 | 1,084 |
| Hanwa Co. Ltd. | 177,000 | 1,083 |
| ^ Sanrio Co. Ltd. | 57,650 | 1,080 |
| Kiyo Bank Ltd. | 64,700 | 1,073 |
| Kokuyo Co. Ltd. | 80,900 | 1,072 |
| Toho Holdings Co. Ltd. | 51,000 | 1,070 |
| Arcs Co. Ltd. | 42,600 | 1,069 |
| ^ Mitsubishi Pencil Co. Ltd. | 21,000 | 1,050 |
| Oki Electric Industry Co. Ltd. | 80,300 | 1,048 |
| SHO-BOND Holdings Co. Ltd. | 21,700 | 1,046 |
| Fuji Machine Manufacturing Co. Ltd. | 81,900 | 1,042 |
| KYORIN Holdings Inc. | 46,300 | 1,035 |
| Tokyo Seimitsu Co. Ltd. | 37,500 | 1,023 |
| Maeda Road Construction Co. Ltd. | 55,000 | 1,018 |
| Okumura Corp. | 175,000 | 1,008 |
37
| | | |
| Vanguard® Pacific Stock Index Fund | | |
| Schedule of Investments | | |
| October 31, 2016 | | |
| |
| | | | Market |
| | | | Value |
| | | Shares | ($000) |
| | Kenedix Inc. | 239,700 | 1,008 |
| | Jafco Co. Ltd. | 29,900 | 993 |
| | Juroku Bank Ltd. | 328,000 | 989 |
| | Mochida Pharmaceutical Co. Ltd. | 12,600 | 987 |
| | Mitsui Engineering & Shipbuilding Co. Ltd. | 710,000 | 987 |
| | DMG Mori Co. Ltd. | 92,900 | 985 |
| * | Orient Corp. | 524,400 | 977 |
| | NTT Urban Development Corp. | 105,800 | 973 |
| | Hitachi Capital Corp. | 42,900 | 957 |
| | Trusco Nakayama Corp. | 18,500 | 956 |
| | Autobacs Seven Co. Ltd. | 66,800 | 950 |
| | Ariake Japan Co. Ltd. | 17,000 | 950 |
| | North Pacific Bank Ltd. | 253,600 | 946 |
| | Nippo Corp. | 49,000 | 945 |
| | Sakata Seed Corp. | 32,800 | 944 |
| | Koei Tecmo Holdings Co. Ltd. | 48,300 | 924 |
| | Takasago Thermal Engineering Co. Ltd. | 65,500 | 924 |
| ^ | GungHo Online Entertainment Inc. | 363,800 | 920 |
| | Topre Corp. | 39,600 | 917 |
| | Kandenko Co. Ltd. | 93,000 | 917 |
| ^ | Yoshinoya Holdings Co. Ltd. | 60,800 | 916 |
| | Hitachi Kokusai Electric Inc. | 45,800 | 915 |
| | Hitachi Transport System Ltd. | 43,900 | 905 |
| | Nanto Bank Ltd. | 23,768 | 904 |
| | Fuyo General Lease Co. Ltd. | 17,800 | 903 |
| | Maruha Nichiro Corp. | 32,300 | 896 |
| | Duskin Co. Ltd. | 46,600 | 895 |
| | Nichias Corp. | 100,000 | 890 |
| | Inaba Denki Sangyo Co. Ltd. | 24,500 | 889 |
| | Fuji Oil Holdings Inc. | 45,700 | 881 |
| | Asatsu-DK Inc. | 31,740 | 881 |
| | San-A Co. Ltd. | 16,100 | 876 |
| | Keiyo Bank Ltd. | 208,000 | 875 |
| | Kumagai Gumi Co. Ltd. | 329,000 | 874 |
| | Ai Holdings Corp. | 35,500 | 872 |
| | Kissei Pharmaceutical Co. Ltd. | 33,200 | 868 |
| | Ryosan Co. Ltd. | 28,100 | 865 |
| | Toyo Ink SC Holdings Co. Ltd. | 185,000 | 860 |
| | Fujitec Co. Ltd. | 75,100 | 859 |
| | Tokai Rika Co. Ltd. | 45,600 | 855 |
| | Yaoko Co. Ltd. | 20,300 | 852 |
| | Okasan Securities Group Inc. | 160,000 | 851 |
| | Musashino Bank Ltd. | 30,700 | 848 |
| ^ | Nissha Printing Co. Ltd. | 34,900 | 845 |
| | Tomy Co. Ltd. | 78,000 | 843 |
| | Sumitomo Bakelite Co. Ltd. | 155,000 | 842 |
| | Daiseki Co. Ltd. | 41,000 | 842 |
| ^ | HIS Co. Ltd. | 30,700 | 838 |
| | Tokyo Dome Corp. | 88,000 | 836 |
| | Nippon Seiki Co. Ltd. | 43,000 | 831 |
| | Cosmo Energy Holdings Co. Ltd. | 63,604 | 831 |
| | KYB Corp. | 181,180 | 829 |
| | Takara Standard Co. Ltd. | 44,500 | 827 |
| | Ichigo Inc. | 190,300 | 825 |
| | Fuji Seal International Inc. | 20,000 | 824 |
| | Hokkoku Bank Ltd. | 246,000 | 824 |
| | Mandom Corp. | 17,500 | 816 |
| | Nihon Unisys Ltd. | 66,900 | 815 |
| ^ | Daio Paper Corp. | 67,800 | 814 |
| | Hitachi Zosen Corp. | 160,700 | 809 |
| ^,* | Aiful Corp. | 265,800 | 808 |
| | GMO Internet Inc. | 60,500 | 808 |
| | ASKUL Corp. | 19,600 | 807 |
| | PALTAC Corp. | 32,700 | 802 |
38
| | | |
| Vanguard® Pacific Stock Index Fund | | |
| Schedule of Investments | | |
| October 31, 2016 | | |
| |
| | | | Market |
| | | | Value |
| | | Shares | ($000) |
| | Tokyo TY Financial Group Inc. | 25,070 | 802 |
| | Toho Bank Ltd. | 209,000 | 793 |
| | Tokyu Construction Co. Ltd. | 78,400 | 792 |
| ^,* | euglena Co. Ltd. | 58,200 | 791 |
| | Matsui Securities Co. Ltd. | 98,600 | 789 |
| | Okamura Corp. | 80,200 | 787 |
| | Hokuetsu Kishu Paper Co. Ltd. | 125,700 | 786 |
| | Exedy Corp. | 27,500 | 786 |
| | FCC Co. Ltd. | 35,400 | 781 |
| ^ | Fukuyama Transporting Co. Ltd. | 137,000 | 780 |
| | Shima Seiki Manufacturing Ltd. | 27,600 | 778 |
| | Central Glass Co. Ltd. | 190,000 | 777 |
| | Meitec Corp. | 22,800 | 777 |
| | Nichi-iko Pharmaceutical Co. Ltd. | 43,200 | 775 |
| | Hyakujushi Bank Ltd. | 225,000 | 766 |
| ^ | Okamoto Industries Inc. | 70,000 | 758 |
| | Canon Marketing Japan Inc. | 43,800 | 756 |
| | Saibu Gas Co. Ltd. | 322,000 | 755 |
| | Taikisha Ltd. | 29,800 | 753 |
| | Kusuri No Aoki Co. Ltd. | 14,700 | 750 |
| | Joyful Honda Co. Ltd. | 27,000 | 745 |
| ^ | Fuji Kyuko Co. Ltd. | 65,000 | 745 |
| | Onward Holdings Co. Ltd. | 111,000 | 743 |
| | Unipres Corp. | 38,400 | 741 |
| | Kuroda Electric Co. Ltd. | 37,900 | 737 |
| | Yodogawa Steel Works Ltd. | 27,000 | 737 |
| ^ | Jin Co. Ltd. | 14,100 | 732 |
| | Japan Aviation Electronics Industry Ltd. | 51,000 | 730 |
| | ZERIA Pharmaceutical Co. Ltd. | 43,300 | 726 |
| | Nippon Flour Mills Co. Ltd. | 49,000 | 725 |
| | Yamanashi Chuo Bank Ltd. | 148,000 | 724 |
| | TOMONY Holdings Inc. | 139,900 | 723 |
| | DCM Holdings Co. Ltd. | 82,200 | 720 |
| | Paramount Bed Holdings Co. Ltd. | 18,900 | 720 |
| | Noritz Corp. | 34,700 | 719 |
| | MOS Food Services Inc. | 21,300 | 716 |
| | Anritsu Corp. | 134,295 | 712 |
| | GMO Payment Gateway Inc. | 15,500 | 712 |
| | Bank of Okinawa Ltd. | 20,280 | 712 |
| | TPR Co. Ltd. | 24,600 | 711 |
| | Keihin Corp. | 43,500 | 711 |
| | Hyakugo Bank Ltd. | 193,000 | 711 |
| | United Arrows Ltd. | 25,900 | 707 |
| | CKD Corp. | 56,700 | 706 |
| * | Nippon Sheet Glass Co. Ltd. | 86,900 | 706 |
| | Nissan Shatai Co. Ltd. | 68,200 | 704 |
| | Totetsu Kogyo Co. Ltd. | 24,800 | 703 |
| | Accordia Golf Co. Ltd. | 69,600 | 702 |
| | Hogy Medical Co. Ltd. | 10,600 | 698 |
| | Okinawa Electric Power Co. Inc. | 30,000 | 695 |
| | Senko Co. Ltd. | 100,400 | 694 |
| | Siix Corp. | 17,300 | 692 |
| | Tokyo Steel Manufacturing Co. Ltd. | 99,700 | 692 |
| | Takeuchi Manufacturing Co. Ltd. | 35,500 | 688 |
| | Kanematsu Corp. | 417,000 | 686 |
| | J Trust Co. Ltd. | 83,200 | 680 |
| | Kyoritsu Maintenance Co. Ltd. | 11,300 | 678 |
| | UACJ Corp. | 208,000 | 676 |
| ^ | EDION Corp. | 75,900 | 672 |
| | Japan Petroleum Exploration Co. Ltd. | 30,579 | 669 |
| | Kameda Seika Co. Ltd. | 12,600 | 660 |
| | Kadokawa Dwango Corp. | 44,652 | 659 |
| | Daikyonishikawa Corp. | 50,800 | 658 |
| ^ | Nachi-Fujikoshi Corp. | 173,000 | 656 |
39
| | |
| Vanguard® Pacific Stock Index Fund | | |
| Schedule of Investments | | |
| October 31, 2016 | | |
| |
| | | Market |
| | | Value |
| | Shares | ($000) |
| Saizeriya Co. Ltd. | 24,800 | 653 |
| Takuma Co. Ltd. | 71,000 | 653 |
| ^ Japan Display Inc. | 331,100 | 652 |
| * Pioneer Corp. | 265,200 | 650 |
| Nippon Densetsu Kogyo Co. Ltd. | 35,700 | 650 |
| Bank of Iwate Ltd. | 15,300 | 644 |
| ^ COLOPL Inc. | 44,800 | 644 |
| Descente Ltd. | 46,100 | 639 |
| cocokara fine Inc. | 16,500 | 638 |
| Komeri Co. Ltd. | 26,100 | 637 |
| SKY Perfect JSAT Holdings Inc. | 128,400 | 636 |
| Nomura Co. Ltd. | 39,200 | 636 |
| Nichiha Corp. | 25,700 | 635 |
| IBJ Leasing Co. Ltd. | 30,200 | 632 |
| Adastria Co. Ltd. | 24,100 | 631 |
| TOKAI Holdings Corp. | 97,100 | 624 |
| ^ Yamagata Bank Ltd. | 144,000 | 622 |
| Nishimatsuya Chain Co. Ltd. | 43,900 | 618 |
| Aomori Bank Ltd. | 181,000 | 612 |
| Shinmaywa Industries Ltd. | 79,000 | 612 |
| Takara Bio Inc. | 42,300 | 611 |
| Starts Corp. Inc. | 32,900 | 610 |
| Transcosmos Inc. | 24,100 | 610 |
| Taiyo Holdings Co. Ltd. | 16,200 | 607 |
| Nagaileben Co. Ltd. | 27,600 | 606 |
| Gurunavi Inc. | 22,000 | 602 |
| Sumitomo Mitsui Construction Co. Ltd. | 630,300 | 600 |
| Showa Sangyo Co. Ltd. | 112,000 | 599 |
| ^ Bank of Nagoya Ltd. | 17,000 | 598 |
| Takara Leben Co. Ltd. | 87,800 | 596 |
| Heiwado Co. Ltd. | 28,600 | 595 |
| Daikyo Inc. | 277,000 | 594 |
| Seikagaku Corp. | 37,000 | 593 |
| Meidensha Corp. | 177,000 | 592 |
| Hitachi Maxell Ltd. | 32,300 | 589 |
| Komori Corp. | 46,300 | 588 |
| ^ Ichibanya Co. Ltd. | 15,400 | 582 |
| Nippon Soda Co. Ltd. | 131,000 | 581 |
| Ci:z Holdings Co. Ltd. | 20,200 | 579 |
| ^ Zojirushi Corp. | 42,000 | 579 |
| Sumitomo Warehouse Co. Ltd. | 108,000 | 577 |
| Chudenko Corp. | 27,700 | 576 |
| Earth Chemical Co. Ltd. | 12,400 | 576 |
| Eizo Corp. | 18,200 | 575 |
| TOC Co. Ltd. | 63,500 | 574 |
| Kureha Corp. | 15,000 | 574 |
| Futaba Corp. | 35,100 | 573 |
| NSD Co. Ltd. | 35,500 | 571 |
| Nissin Kogyo Co. Ltd. | 38,500 | 570 |
| Makino Milling Machine Co. Ltd. | 88,000 | 559 |
| Chiyoda Co. Ltd. | 23,500 | 558 |
| Nissin Electric Co. Ltd. | 41,700 | 556 |
| Life Corp. | 17,100 | 555 |
| Fancl Corp. | 36,600 | 553 |
| NS Solutions Corp. | 29,000 | 553 |
| Daihen Corp. | 95,000 | 551 |
| Nippon Signal Company Ltd. | 61,700 | 548 |
| Star Micronics Co. Ltd. | 38,400 | 547 |
| Financial Products Group Co. Ltd. | 62,500 | 546 |
| Nichicon Corp. | 63,400 | 543 |
| Gunze Ltd. | 161,000 | 540 |
| Nikkiso Co. Ltd. | 61,100 | 540 |
| Inabata & Co. Ltd. | 49,600 | 539 |
| Furukawa Co. Ltd. | 336,000 | 537 |
40
| | | |
| Vanguard® Pacific Stock Index Fund | | |
| Schedule of Investments | | |
| October 31, 2016 | | |
| |
| | | | Market |
| | | | Value |
| | | Shares | ($000) |
| | Kanamoto Co. Ltd. | 22,300 | 536 |
| | Aida Engineering Ltd. | 62,200 | 535 |
| | Tokyo Broadcasting System Holdings Inc. | 34,000 | 534 |
| | Oita Bank Ltd. | 141,000 | 534 |
| | Sanyo Special Steel Co. Ltd. | 104,000 | 533 |
| | Seiren Co. Ltd. | 45,500 | 532 |
| | Toshiba Plant Systems & Services Corp. | 33,000 | 532 |
| | Fukui Bank Ltd. | 201,000 | 532 |
| | Akita Bank Ltd. | 158,000 | 529 |
| | Tokai Carbon Co. Ltd. | 174,000 | 529 |
| | Milbon Co. Ltd. | 11,800 | 529 |
| | Aichi Bank Ltd. | 9,500 | 526 |
| | Morita Holdings Corp. | 34,700 | 523 |
| | Aichi Steel Corp. | 10,800 | 520 |
| | BML Inc. | 19,600 | 520 |
| | Oiles Corp. | 28,600 | 518 |
| | Marusan Securities Co. Ltd. | 62,000 | 515 |
| | Aeon Delight Co. Ltd. | 17,400 | 514 |
| | Internet Initiative Japan Inc. | 29,100 | 514 |
| | Atom Corp. | 77,647 | 513 |
| | Asahi Holdings Inc. | 28,500 | 513 |
| | SMS Co. Ltd. | 19,700 | 513 |
| | Nitto Boseki Co. Ltd. | 157,000 | 510 |
| | Sakata INX Corp. | 38,900 | 509 |
| | Bunka Shutter Co. Ltd. | 61,100 | 507 |
| | United Super Markets Holdings Inc. | 56,100 | 507 |
| | Doutor Nichires Holdings Co. Ltd. | 25,300 | 506 |
| | Toei Co. Ltd. | 63,000 | 506 |
| | NET One Systems Co. Ltd. | 69,600 | 506 |
| | Obara Group Inc. | 11,700 | 504 |
| | Raito Kogyo Co. Ltd. | 41,700 | 502 |
| | Prima Meat Packers Ltd. | 138,000 | 501 |
| | Shizuoka Gas Co. Ltd. | 63,800 | 501 |
| | Gree Inc. | 90,279 | 501 |
| | Marudai Food Co. Ltd. | 105,000 | 500 |
| | Ryobi Ltd. | 124,000 | 500 |
| | Sanki Engineering Co. Ltd. | 55,100 | 500 |
| | Daibiru Corp. | 57,500 | 500 |
| | Token Corp. | 6,900 | 499 |
| | Kato Sangyo Co. Ltd. | 20,700 | 499 |
| | As One Corp. | 11,100 | 498 |
| | Nisshin Oillio Group Ltd. | 109,000 | 496 |
| | TSI Holdings Co. Ltd. | 88,100 | 495 |
| | Nippon Steel & Sumikin Bussan Corp. | 13,500 | 495 |
| | Tochigi Bank Ltd. | 102,000 | 492 |
| | Mitsuba Corp. | 33,600 | 491 |
| | VT Holdings Co. Ltd. | 91,100 | 489 |
| | Fuji Soft Inc. | 18,400 | 489 |
| | Mirait Holdings Corp. | 55,000 | 488 |
| | Kitz Corp. | 84,800 | 488 |
| ^,* | Mitsumi Electric Co. Ltd. | 79,800 | 485 |
| | Piolax Inc. | 7,600 | 483 |
| | Riso Kagaku Corp. | 27,700 | 480 |
| | Shinko Electric Industries Co. Ltd. | 74,400 | 479 |
| | Sekisui Jushi Corp. | 29,100 | 479 |
| | Doshisha Co. Ltd. | 23,100 | 478 |
| | PanaHome Corp. | 64,000 | 476 |
| | Pacific Industrial Co. Ltd. | 38,700 | 476 |
| * | Toshiba TEC Corp. | 106,000 | 472 |
| | Iseki & Co. Ltd. | 191,000 | 472 |
| | Yamazen Corp. | 59,200 | 472 |
| | Axial Retailing Inc. | 13,100 | 471 |
| | Sanyo Chemical Industries Ltd. | 10,400 | 470 |
| | Fuso Chemical Co. Ltd. | 22,000 | 469 |
41
| | | |
| Vanguard® Pacific Stock Index Fund | | |
| Schedule of Investments | | |
| October 31, 2016 | | |
| |
| | | | Market |
| | | | Value |
| | | Shares | ($000) |
| | Kohnan Shoji Co. Ltd. | 23,700 | 469 |
| | Unizo Holdings Co. Ltd. | 16,800 | 468 |
| | Takasago International Corp. | 17,400 | 466 |
| | Nitta Corp. | 18,000 | 466 |
| | V Technology Co. Ltd. | 3,900 | 464 |
| | Heiwa Real Estate Co. Ltd. | 32,600 | 464 |
| | Kura Corp. | 9,200 | 464 |
| | Toridoll Holdings Corp. | 20,000 | 463 |
| | Bank of the Ryukyus Ltd. | 35,200 | 463 |
| | Toyo Engineering Corp. | 135,000 | 462 |
| | Alpine Electronics Inc. | 34,600 | 462 |
| | Kintetsu World Express Inc. | 33,800 | 460 |
| * | Infomart Corp. | 38,800 | 460 |
| | Dydo Drinco Inc. | 8,300 | 459 |
| | Jaccs Co. Ltd. | 117,000 | 459 |
| | Musashi Seimitsu Industry Co. Ltd. | 18,700 | 458 |
| | Hokuetsu Bank Ltd. | 19,400 | 458 |
| | AOKI Holdings Inc. | 37,700 | 456 |
| | Dip Corp. | 17,100 | 453 |
| | Mani Inc. | 19,400 | 451 |
| | NEC Networks & System Integration Corp. | 25,400 | 451 |
| ^ | Plenus Co. Ltd. | 21,900 | 451 |
| | Sato Holdings Corp. | 20,400 | 449 |
| | Royal Holdings Co. Ltd. | 25,900 | 448 |
| | Max Co. Ltd. | 37,000 | 446 |
| | Toppan Forms Co. Ltd. | 44,800 | 445 |
| | Asahi Diamond Industrial Co. Ltd. | 58,900 | 439 |
| | Japan Wool Textile Co. Ltd. | 60,000 | 438 |
| | Yondoshi Holdings Inc. | 17,500 | 437 |
| | Toho Zinc Co. Ltd. | 125,000 | 436 |
| | Chofu Seisakusho Co. Ltd. | 16,900 | 434 |
| | Eighteenth Bank Ltd. | 140,000 | 434 |
| | Japan Securities Finance Co. Ltd. | 97,600 | 434 |
| | Fujicco Co. Ltd. | 18,900 | 432 |
| | Ringer Hut Co. Ltd. | 16,900 | 430 |
| | Nishio Rent All Co. Ltd. | 14,200 | 429 |
| | Round One Corp. | 60,500 | 427 |
| | Create SD Holdings Co. Ltd. | 20,400 | 427 |
| | Foster Electric Co. Ltd. | 23,100 | 424 |
| | Seiko Holdings Corp. | 129,000 | 422 |
| | Shikoku Bank Ltd. | 178,000 | 420 |
| ^,* | Pacific Metals Co. Ltd. | 139,000 | 418 |
| | Daiho Corp. | 76,000 | 418 |
| | Tsukishima Kikai Co. Ltd. | 37,300 | 418 |
| | Tachi-S Co. Ltd. | 25,100 | 417 |
| ^ | Next Co. Ltd. | 49,600 | 416 |
| ^ | Wacom Co. Ltd. | 137,800 | 416 |
| | Kisoji Co. Ltd. | 19,200 | 414 |
| ^ | Benefit One Inc. | 14,300 | 414 |
| | Dexerials Corp. | 51,200 | 411 |
| | Kotobuki Spirits Co. Ltd. | 17,400 | 410 |
| ^,* | W-Scope Corp. | 22,900 | 410 |
| | kabu.com Securities Co. Ltd. | 130,100 | 410 |
| | Mizuno Corp. | 76,000 | 409 |
| * | Outsourcing Inc. | 10,700 | 406 |
| | Noevir Holdings Co. Ltd. | 13,400 | 406 |
| | Fuji Co. Ltd. | 19,300 | 405 |
| | Shibuya Corp. | 19,400 | 403 |
| | Yokohama Reito Co. Ltd. | 39,700 | 402 |
| | Press Kogyo Co. Ltd. | 82,300 | 401 |
| | Ohsho Food Service Corp. | 10,400 | 400 |
| | Hiday Hidaka Corp. | 15,900 | 396 |
| | Bando Chemical Industries Ltd. | 41,000 | 395 |
| | Eiken Chemical Co. Ltd. | 14,400 | 393 |
42
| | |
| Vanguard® Pacific Stock Index Fund | | |
| Schedule of Investments | | |
| October 31, 2016 | | |
| |
| | | Market |
| | | Value |
| | Shares | ($000) |
| Chugoku Marine Paints Ltd. | 54,000 | 393 |
| Kyoei Steel Ltd. | 20,600 | 392 |
| ^ Monex Group Inc. | 171,100 | 392 |
| Miyazaki Bank Ltd. | 139,000 | 392 |
| Hitachi Koki Co. Ltd. | 46,100 | 390 |
| TKC Corp. | 13,200 | 390 |
| Sanyo Electric Railway Co. Ltd. | 79,000 | 390 |
| Sintokogio Ltd. | 44,500 | 388 |
| Showa Corp. | 59,300 | 388 |
| DTS Corp. | 17,500 | 388 |
| ^ Tekken Corp. | 119,000 | 387 |
| Kenko Mayonnaise Co. Ltd. | 10,500 | 385 |
| Mitsubishi Shokuhin Co. Ltd. | 11,700 | 384 |
| Nitto Kogyo Corp. | 25,900 | 380 |
| Daiwabo Holdings Co. Ltd. | 157,000 | 379 |
| Fukushima Industries Corp. | 11,100 | 379 |
| Relia Inc. | 39,500 | 379 |
| Elecom Co. Ltd. | 18,500 | 378 |
| Sankyo Tateyama Inc. | 23,900 | 376 |
| COOKPAD Inc. | 39,600 | 376 |
| ^ Yonex Co. Ltd. | 8,500 | 375 |
| Namura Shipbuilding Co. Ltd. | 61,200 | 373 |
| Katakura Industries Co. Ltd. | 30,700 | 373 |
| Iino Kaiun Kaisha Ltd. | 100,000 | 372 |
| Mitsuboshi Belting Ltd. | 43,000 | 371 |
| St. Marc Holdings Co. Ltd. | 13,200 | 370 |
| G-Tekt Corp. | 19,500 | 370 |
| Avex Group Holdings Inc. | 28,000 | 370 |
| Sanken Electric Co. Ltd. | 104,000 | 368 |
| Goldwin Inc. | 8,000 | 367 |
| Ricoh Leasing Co. Ltd. | 12,700 | 367 |
| San-Ai Oil Co. Ltd. | 52,000 | 367 |
| Macnica Fuji Electronics Holdings Inc. | 29,200 | 366 |
| Tokai Corp. | 10,700 | 364 |
| Topy Industries Ltd. | 15,600 | 362 |
| Tv Tokyo Holdings Corp. | 15,800 | 362 |
| Konoike Transport Co. Ltd. | 27,300 | 361 |
| Create Restaurants Holdings Inc. | 38,100 | 361 |
| Kanto Denka Kogyo Co. Ltd. | 43,000 | 361 |
| ^ Ehime Bank Ltd. | 27,200 | 359 |
| Minato Bank Ltd. | 19,600 | 359 |
| Daido Metal Co. Ltd. | 33,200 | 358 |
| Micronics Japan Co. Ltd. | 30,800 | 356 |
| Shikoku Chemicals Corp. | 37,000 | 355 |
| T Hasegawa Co. Ltd. | 20,000 | 353 |
| Itochu Enex Co. Ltd. | 45,800 | 352 |
| Open House Co. Ltd. | 16,600 | 351 |
| * Unitika Ltd. | 519,000 | 350 |
| Toa Corp. | 16,600 | 349 |
| Hokuto Corp. | 17,900 | 348 |
| Hibiya Engineering Ltd. | 22,200 | 348 |
| Kurabo Industries Ltd. | 174,000 | 348 |
| Bank of Saga Ltd. | 133,000 | 347 |
| Sanden Holdings Corp. | 112,000 | 347 |
| NichiiGakkan Co. Ltd. | 41,500 | 345 |
| ^ Nippon Synthetic Chemical Industry Co. Ltd. | 40,000 | 344 |
| Belc Co. Ltd. | 8,500 | 343 |
| ^ S Foods Inc. | 12,800 | 343 |
| Hosiden Corp. | 46,100 | 342 |
| * Miroku Jyoho Service Co. Ltd. | 17,500 | 342 |
| ASKA Pharmaceutical Co. Ltd. | 19,800 | 342 |
| JVC Kenwood Corp. | 126,300 | 341 |
| JCR Pharmaceuticals Co. Ltd. | 13,600 | 341 |
| Toshiba Machine Co. Ltd. | 94,000 | 340 |
43
| | |
| Vanguard® Pacific Stock Index Fund | | |
| Schedule of Investments | | |
| October 31, 2016 | | |
| |
| | | Market |
| | | Value |
| | Shares | ($000) |
| Takamatsu Construction Group Co. Ltd. | 14,300 | 339 |
| Osaka Soda Co. Ltd. | 79,000 | 338 |
| Trancom Co. Ltd. | 5,800 | 337 |
| EPS Holdings Inc. | 25,700 | 337 |
| Sumitomo Real Estate Sales Co. Ltd. | 14,900 | 337 |
| Pressance Corp. | 29,200 | 337 |
| Osaki Electric Co. Ltd. | 35,000 | 336 |
| Okabe Co. Ltd. | 39,100 | 334 |
| OBIC Business Consultants Co. Ltd. | 7,100 | 332 |
| Fujibo Holdings Inc. | 10,500 | 332 |
| Megachips Corp. | 16,500 | 331 |
| Yuasa Trading Co. Ltd. | 13,800 | 331 |
| Sumitomo Riko Co. Ltd. | 34,500 | 330 |
| Dainichiseika Color & Chemicals Manufacturing Co. Ltd. | 62,000 | 330 |
| Kyokuto Kaihatsu Kogyo Co. Ltd. | 27,800 | 328 |
| Towa Bank Ltd. | 310,000 | 328 |
| Optex Co. Ltd. | 12,800 | 326 |
| Japan Pulp & Paper Co. Ltd. | 97,000 | 325 |
| Denki Kogyo Co. Ltd. | 59,000 | 325 |
| Mitsui Sugar Co. Ltd. | 14,400 | 324 |
| Yokogawa Bridge Holdings Corp. | 29,400 | 323 |
| Zenrin Co. Ltd. | 18,400 | 321 |
| TV Asahi Holdings Corp. | 17,100 | 321 |
| Starzen Co. Ltd. | 6,000 | 318 |
| Menicon Co. Ltd. | 11,200 | 317 |
| Clarion Co. Ltd. | 96,000 | 315 |
| Konishi Co. Ltd. | 26,400 | 314 |
| Xebio Holdings Co. Ltd. | 20,200 | 314 |
| Futaba Industrial Co. Ltd. | 52,300 | 313 |
| Shindengen Electric Manufacturing Co. Ltd. | 72,000 | 311 |
| Tsubaki Nakashima Co. Ltd. | 19,500 | 310 |
| Eagle Industry Co. Ltd. | 21,700 | 310 |
| Geo Holdings Corp. | 24,400 | 310 |
| ^ IDOM Inc. | 59,300 | 310 |
| Nohmi Bosai Ltd. | 20,700 | 309 |
| Enplas Corp. | 10,000 | 309 |
| * Japan Material Co. Ltd. | 8,700 | 308 |
| YAMABIKO Corp. | 31,100 | 308 |
| Tsugami Corp. | 56,000 | 307 |
| ^ Matsuya Co. Ltd. | 38,400 | 307 |
| Sumitomo Seika Chemicals Co. Ltd. | 8,200 | 307 |
| Towa Pharmaceutical Co. Ltd. | 8,200 | 306 |
| J-Oil Mills Inc. | 8,600 | 306 |
| Vital KSK Holdings Inc. | 28,800 | 305 |
| Wakita & Co. Ltd. | 35,600 | 304 |
| Tosho Co. Ltd. | 7,000 | 303 |
| Nippon Koei Co. Ltd. | 64,000 | 300 |
| Sodick Co. Ltd. | 39,900 | 300 |
| Key Coffee Inc. | 15,100 | 299 |
| Modec Inc. | 17,700 | 299 |
| ^ Funai Soken Holdings Inc. | 19,300 | 298 |
| Jeol Ltd. | 71,000 | 297 |
| Warabeya Nichiyo Holdings Co. Ltd. | 12,300 | 297 |
| * Rokko Butter Co. Ltd. | 11,000 | 296 |
| Tamura Corp. | 72,000 | 296 |
| Belluna Co. Ltd. | 43,900 | 293 |
| Riken Corp. | 8,000 | 293 |
| Kyokuto Securities Co. Ltd. | 20,200 | 292 |
| Anicom Holdings Inc. | 13,000 | 291 |
| Fujimi Inc. | 18,700 | 291 |
| Joshin Denki Co. Ltd. | 34,000 | 291 |
| Pack Corp. | 10,700 | 290 |
| Justsystems Corp. | 29,600 | 290 |
| ^ METAWATER Co. Ltd. | 10,600 | 289 |
44
| | |
| Vanguard® Pacific Stock Index Fund | | |
| Schedule of Investments | | |
| October 31, 2016 | | |
| |
| | | Market |
| | | Value |
| | Shares | ($000) |
| Tsukui Corp. | 44,000 | 289 |
| Arcland Sakamoto Co. Ltd. | 24,200 | 288 |
| Maruwa Co. Ltd. | 7,600 | 287 |
| Wowow Inc. | 10,000 | 286 |
| Fujimori Kogyo Co. Ltd. | 11,500 | 286 |
| Bell System24 Holdings Inc. | 30,400 | 285 |
| Anest Iwata Corp. | 28,300 | 285 |
| Inageya Co. Ltd. | 20,876 | 283 |
| * Kintetsu Department Store Co. Ltd. | 85,000 | 283 |
| Fukuda Corp. | 24,000 | 283 |
| Yellow Hat Ltd. | 13,200 | 282 |
| Sakai Chemical Industry Co. Ltd. | 79,000 | 282 |
| Mitsui-Soko Holdings Co. Ltd. | 93,000 | 281 |
| Toyo Construction Co. Ltd. | 67,000 | 279 |
| Ines Corp. | 25,100 | 279 |
| Tokyotokeiba Co. Ltd. | 142,000 | 279 |
| ^ Alpen Co. Ltd. | 15,300 | 279 |
| Noritake Co. Ltd. | 12,200 | 278 |
| Jimoto Holdings Inc. | 165,300 | 278 |
| Tocalo Co. Ltd. | 12,400 | 278 |
| Riken Vitamin Co. Ltd. | 6,400 | 278 |
| Stella Chemifa Corp. | 7,900 | 278 |
| Daisan Bank Ltd. | 16,400 | 277 |
| Goldcrest Co. Ltd. | 15,200 | 276 |
| Systena Corp. | 15,700 | 274 |
| Sanyo Denki Co. Ltd. | 42,000 | 273 |
| Nissin Corp. | 82,000 | 272 |
| Hamakyorex Co. Ltd. | 14,600 | 272 |
| Kansai Urban Banking Corp. | 24,500 | 272 |
| JSP Corp. | 11,300 | 270 |
| Daiken Corp. | 13,000 | 270 |
| Torii Pharmaceutical Co. Ltd. | 11,700 | 270 |
| ^ Nippon Ceramic Co. Ltd. | 14,600 | 269 |
| Yorozu Corp. | 17,100 | 269 |
| Tokushu Tokai Paper Co. Ltd. | 7,900 | 269 |
| Neturen Co. Ltd. | 33,100 | 268 |
| Kasai Kogyo Co. Ltd. | 23,500 | 266 |
| Teikoku Sen-I Co. Ltd. | 17,900 | 265 |
| Cawachi Ltd. | 10,300 | 265 |
| Sagami Chain Co. Ltd. | 22,000 | 264 |
| Canon Electronics Inc. | 17,000 | 264 |
| Ihara Chemical Industry Co. Ltd. | 30,900 | 264 |
| T-Gaia Corp. | 17,100 | 263 |
| Okuwa Co. Ltd. | 25,000 | 262 |
| Nippon Chemi-Con Corp. | 150,000 | 261 |
| Taihei Dengyo Kaisha Ltd. | 25,000 | 259 |
| Nihon Chouzai Co. Ltd. | 6,200 | 259 |
| Sogo Medical Co. Ltd. | 8,500 | 258 |
| Shinko Plantech Co. Ltd. | 34,800 | 258 |
| Itoki Corp. | 41,800 | 258 |
| Tamron Co. Ltd. | 14,700 | 257 |
| FIDEA Holdings Co. Ltd. | 143,100 | 257 |
| Cosel Co. Ltd. | 21,500 | 257 |
| Melco Holdings Inc. | 9,500 | 257 |
| Kato Works Co. Ltd. | 10,200 | 256 |
| Ichiyoshi Securities Co. Ltd. | 34,100 | 256 |
| PAL GROUP Holdings Co. Ltd. | 10,200 | 253 |
| Maruzen Showa Unyu Co. Ltd. | 62,000 | 252 |
| Kappa Create Co. Ltd. | 21,600 | 250 |
| Rock Field Co. Ltd. | 18,000 | 250 |
| * Ishihara Sangyo Kaisha Ltd. | 32,900 | 250 |
| Yahagi Construction Co. Ltd. | 27,100 | 249 |
| Chukyo Bank Ltd. | 11,200 | 248 |
| * Nissei Build Kogyo Co. Ltd. | 53,000 | 248 |
45
| | | |
| Vanguard® Pacific Stock Index Fund | | |
| Schedule of Investments | | |
| October 31, 2016 | | |
| |
| | | | Market |
| | | | Value |
| | | Shares | ($000) |
| | Tsurumi Manufacturing Co. Ltd. | 17,000 | 247 |
| | Matsuya Foods Co. Ltd. | 7,600 | 247 |
| | Qol Co. Ltd. | 15,600 | 246 |
| | Aisan Industry Co. Ltd. | 30,200 | 246 |
| ^ | Michinoku Bank Ltd. | 123,000 | 245 |
| | Kyodo Printing Co. Ltd. | 72,000 | 244 |
| | Daiichi Jitsugyo Co. Ltd. | 44,000 | 244 |
| * | Vector Inc. | 20,600 | 243 |
| | Ryoyo Electro Corp. | 19,100 | 243 |
| | Union Tool Co. | 9,400 | 243 |
| ^ | Nihon Nohyaku Co. Ltd. | 44,300 | 242 |
| | Broadleaf Co. Ltd. | 21,500 | 242 |
| ^ | F@N Communications Inc. | 32,300 | 241 |
| | BRONCO BILLY Co. Ltd. | 8,100 | 240 |
| | Koa Corp. | 26,000 | 239 |
| * | Chiyoda Integre Co. Ltd. | 11,500 | 238 |
| | Nitto Kohki Co. Ltd. | 10,300 | 238 |
| | Arata Corp. | 10,400 | 238 |
| | Meisei Industrial Co. Ltd. | 46,200 | 237 |
| | Digital Arts Inc. | 8,800 | 237 |
| * | CMK Corp. | 44,300 | 234 |
| | Tenma Corp. | 13,500 | 234 |
| ^,* | OSAKA Titanium Technologies Co. Ltd. | 17,400 | 233 |
| | Fujita Kanko Inc. | 70,000 | 233 |
| | OSJB Holdings Corp. | 97,400 | 232 |
| | UKC Holdings Corp. | 13,800 | 231 |
| | Nittetsu Mining Co. Ltd. | 5,500 | 230 |
| | Kyokuyo Co. Ltd. | 8,700 | 229 |
| ^ | Yushin Precision Equipment Co. Ltd. | 9,800 | 228 |
| | Kaga Electronics Co. Ltd. | 15,600 | 228 |
| | Shin-Etsu Polymer Co. Ltd. | 34,000 | 227 |
| ^ | Riken Technos Corp. | 43,400 | 227 |
| | Tanseisha Co. Ltd. | 30,200 | 227 |
| | Sinfonia Technology Co. Ltd. | 123,000 | 226 |
| | Daiwa Industries Ltd. | 25,600 | 223 |
| ^ | Maeda Kosen Co. Ltd. | 20,100 | 223 |
| ^ | Kumiai Chemical Industry Co. Ltd. | 39,300 | 223 |
| | SMK Corp. | 58,000 | 222 |
| | Idec Corp. | 24,600 | 220 |
| | Nippon Kanzai Co. Ltd. | 15,100 | 220 |
| | Yurtec Corp. | 30,000 | 220 |
| | Torishima Pump Manufacturing Co. Ltd. | 20,300 | 219 |
| | Toyo Corp. | 22,700 | 218 |
| | Toyo Kanetsu KK | 96,000 | 217 |
| | ESPEC Corp. | 17,900 | 217 |
| * | Daito Pharmaceutical Co. Ltd. | 9,800 | 216 |
| | Achilles Corp. | 14,900 | 214 |
| | Kanematsu Electronics Ltd. | 10,600 | 214 |
| | Prestige International Inc. | 28,400 | 214 |
| | Nippon Road Co. Ltd. | 52,000 | 213 |
| | Tsukuba Bank Ltd. | 71,400 | 213 |
| ^ | Kurimoto Ltd. | 11,400 | 213 |
| | Dai Nippon Toryo Co. Ltd. | 99,000 | 212 |
| | Juki Corp. | 28,200 | 211 |
| | Japan Digital Laboratory Co. Ltd. | 13,500 | 210 |
| | Sanshin Electronics Co. Ltd. | 23,700 | 210 |
| | Nippon Thompson Co. Ltd. | 53,000 | 210 |
| | Shinko Shoji Co. Ltd. | 18,500 | 209 |
| | Shinnihon Corp. | 21,600 | 208 |
| | Osaka Steel Co. Ltd. | 11,100 | 208 |
| | Fudo Tetra Corp. | 118,300 | 208 |
| | Senshukai Co. Ltd. | 30,600 | 207 |
| | Oyo Corp. | 17,900 | 207 |
| | Kamei Corp. | 21,700 | 207 |
46
| | | |
| Vanguard® Pacific Stock Index Fund | | |
| Schedule of Investments | | |
| October 31, 2016 | | |
| |
| | | | Market |
| | | | Value |
| | | Shares | ($000) |
| | Mie Bank Ltd. | 10,100 | 206 |
| | Nagatanien Holdings Co. Ltd. | 16,000 | 204 |
| | Roland DG Corp. | 8,600 | 203 |
| ^ | Toho Titanium Co. Ltd. | 30,400 | 203 |
| ^ | Japan Cash Machine Co. Ltd. | 14,300 | 203 |
| | Chiba Kogyo Bank Ltd. | 45,300 | 201 |
| | Nichiden Corp. | 7,000 | 200 |
| | Komatsu Seiren Co. Ltd. | 32,100 | 200 |
| ^ | Istyle Inc. | 25,300 | 199 |
| | Nihon Trim Co. Ltd. | 4,400 | 199 |
| | Ministop Co. Ltd. | 11,500 | 198 |
| | Nippon Denko Co. Ltd. | 106,700 | 198 |
| | Nippon Yakin Kogyo Co. Ltd. | 134,700 | 197 |
| | Ateam Inc. | 8,700 | 197 |
| | Nippon Beet Sugar Manufacturing Co. Ltd. | 10,100 | 197 |
| | CONEXIO Corp. | 14,500 | 197 |
| | Aiphone Co. Ltd. | 11,200 | 197 |
| | Aichi Corp. | 24,300 | 197 |
| | Mitsubishi Steel Manufacturing Co. Ltd. | 109,000 | 196 |
| | Pronexus Inc. | 18,500 | 195 |
| ^ | Marvelous Inc. | 27,400 | 195 |
| | Arakawa Chemical Industries Ltd. | 13,100 | 194 |
| * | Fujiya Co. Ltd. | 100,000 | 194 |
| * | Wellnet Corp. | 15,500 | 194 |
| | Information Services International-Dentsu Ltd. | 11,100 | 193 |
| | K&O Energy Group Inc. | 13,400 | 192 |
| | Giken Ltd. | 11,000 | 192 |
| ^ | Nippon Carbon Co. Ltd. | 99,000 | 192 |
| | Tokyo Rope Manufacturing Co. Ltd. | 11,600 | 191 |
| | Nippon Parking Development Co. Ltd. | 140,100 | 190 |
| | Toyo Tanso Co. Ltd. | 13,200 | 190 |
| | Toa Corp. | 20,800 | 190 |
| | Jamco Corp. | 9,200 | 190 |
| ^ | U-Shin Ltd. | 26,700 | 189 |
| | Daikokutenbussan Co. Ltd. | 4,000 | 188 |
| | GCA Corp. | 25,200 | 188 |
| | Hosokawa Micron Corp. | 30,000 | 187 |
| | Nippon Valqua Industries Ltd. | 13,800 | 187 |
| | Arcland Service Holdings Co. Ltd. | 6,300 | 187 |
| | Kanagawa Chuo Kotsu Co. Ltd. | 26,000 | 185 |
| | Sun Frontier Fudousan Co. Ltd. | 19,400 | 185 |
| | Mitani Sekisan Co. Ltd. | 7,400 | 185 |
| | Mie Kotsu Group Holdings Inc. | 50,000 | 184 |
| | Mitsubishi Research Institute Inc. | 5,800 | 184 |
| | Sac's Bar Holdings Inc. | 17,200 | 184 |
| | Tokyo Energy & Systems Inc. | 19,000 | 183 |
| | Sakai Moving Service Co. Ltd. | 8,400 | 182 |
| | Sekisui Plastics Co. Ltd. | 24,500 | 181 |
| | Misawa Homes Co. Ltd. | 24,000 | 181 |
| | Denyo Co. Ltd. | 14,500 | 180 |
| | Takaoka Toko Co. Ltd. | 9,800 | 179 |
| | Keihanshin Building Co. Ltd. | 34,200 | 178 |
| | Studio Alice Co. Ltd. | 8,800 | 178 |
| | Mimasu Semiconductor Industry Co. Ltd. | 13,900 | 177 |
| ^ | Onoken Co. Ltd. | 14,200 | 175 |
| | Shimizu Bank Ltd. | 5,800 | 175 |
| ^,* | Mitsubishi Paper Mills Ltd. | 26,600 | 175 |
| | Tokyo Tekko Co. Ltd. | 40,000 | 174 |
| | Koatsu Gas Kogyo Co. Ltd. | 26,000 | 174 |
| | Furuno Electric Co. Ltd. | 22,400 | 173 |
| | WATAMI Co. Ltd. | 15,900 | 172 |
| | Uchida Yoko Co. Ltd. | 41,000 | 171 |
| | Fuji Pharma Co. Ltd. | 6,900 | 171 |
| | CHIMNEY Co. Ltd. | 6,000 | 171 |
47
| | | |
| Vanguard® Pacific Stock Index Fund | | |
| Schedule of Investments | | |
| October 31, 2016 | | |
| |
| | | | Market |
| | | | Value |
| | | Shares | ($000) |
| | Sanyo Shokai Ltd. | 106,000 | 171 |
| | Mars Engineering Corp. | 8,600 | 171 |
| ^,* | Laox Co. Ltd. | 21,101 | 170 |
| | Kita-Nippon Bank Ltd. | 5,700 | 170 |
| * | JAC Recruitment Co. Ltd. | 13,100 | 170 |
| | Kobe Bussan Co. Ltd. | 5,400 | 169 |
| | Cleanup Corp. | 19,800 | 169 |
| | Meiko Network Japan Co. Ltd. | 17,900 | 168 |
| ^ | Honeys Co. Ltd. | 14,300 | 168 |
| | Icom Inc. | 9,100 | 167 |
| | Tonami Holdings Co. Ltd. | 62,000 | 167 |
| | Weathernews Inc. | 5,300 | 165 |
| | MTI Ltd. | 26,500 | 165 |
| ^,* | KLab Inc. | 27,400 | 164 |
| | Shibusawa Warehouse Co. Ltd. | 56,000 | 163 |
| ^ | Aeon Fantasy Co. Ltd. | 5,200 | 161 |
| | Hioki EE Corp. | 8,300 | 161 |
| | Godo Steel Ltd. | 9,200 | 161 |
| | Takiron Co. Ltd. | 34,000 | 160 |
| | Amuse Inc. | 9,400 | 159 |
| | Yusen Logistics Co. Ltd. | 15,600 | 159 |
| | Chori Co. Ltd. | 10,000 | 159 |
| | HI-LEX Corp. | 5,800 | 159 |
| | Toenec Corp. | 33,000 | 158 |
| | Yomiuri Land Co. Ltd. | 36,000 | 155 |
| | Ryoden Corp. | 24,000 | 154 |
| ^ | Keiyo Co. Ltd. | 30,500 | 154 |
| | Atsugi Co. Ltd. | 139,000 | 152 |
| | Tosei Corp. | 20,200 | 151 |
| ^ | Hodogaya Chemical Co. Ltd. | 5,400 | 151 |
| | Mitsui High-Tec Inc. | 22,500 | 151 |
| | Hokkaido Gas Co. Ltd. | 59,000 | 151 |
| ^ | Happinet Corp. | 14,200 | 150 |
| | Asahi Co. Ltd. | 12,400 | 150 |
| | Advan Co. Ltd. | 16,200 | 150 |
| ^,* | Nippon Sharyo Ltd. | 59,000 | 149 |
| | Mitsui Matsushima Co. Ltd. | 12,600 | 149 |
| | Halows Co. Ltd. | 6,700 | 149 |
| | Seika Corp. | 50,000 | 149 |
| | Ichikoh Industries Ltd. | 48,000 | 148 |
| * | SWCC Showa Holdings Co. Ltd. | 210,000 | 148 |
| | SRA Holdings | 6,200 | 147 |
| | Noritsu Koki Co. Ltd. | 19,300 | 146 |
| | Mitsubishi Nichiyu Forklift Co. Ltd. | 24,000 | 145 |
| ^ | PC Depot Corp. | 29,520 | 144 |
| | Nihon Yamamura Glass Co. Ltd. | 79,000 | 144 |
| | Itochu-Shokuhin Co. Ltd. | 3,600 | 144 |
| | Toho Co. Ltd. | 6,100 | 144 |
| | Sanoh Industrial Co. Ltd. | 20,800 | 143 |
| | Fields Corp. | 11,800 | 143 |
| | Mito Securities Co. Ltd. | 60,100 | 140 |
| | Yushiro Chemical Industry Co. Ltd. | 10,000 | 138 |
| | Chuetsu Pulp & Paper Co. Ltd. | 63,000 | 138 |
| * | Linical Co. Ltd. | 9,700 | 136 |
| | Japan Radio Co. Ltd. | 10,600 | 136 |
| * | Hito Communications Inc. | 9,300 | 136 |
| | T RAD Co. Ltd. | 62,000 | 136 |
| | C Uyemura & Co. Ltd. | 2,900 | 135 |
| ^,* | Akebono Brake Industry Co. Ltd. | 70,500 | 135 |
| | Sumitomo Densetsu Co. Ltd. | 12,100 | 134 |
| | Toyo Kohan Co. Ltd. | 44,800 | 134 |
| ^ | Pasona Group Inc. | 15,800 | 134 |
| | Organo Corp. | 31,000 | 134 |
| | Nissei ASB Machine Co. Ltd. | 7,400 | 134 |
48
| | | |
| Vanguard® Pacific Stock Index Fund | | |
| Schedule of Investments | | |
| October 31, 2016 | | |
| |
| | | | Market |
| | | | Value |
| | | Shares | ($000) |
| | Parco Co. Ltd. | 14,400 | 133 |
| * | Fuji Oil Co. Ltd. | 41,600 | 133 |
| | Zuiko Corp. | 3,500 | 132 |
| | France Bed Holdings Co. Ltd. | 15,400 | 132 |
| ^ | JP-Holdings Inc. | 51,400 | 129 |
| | Rhythm Watch Co. Ltd. | 75,000 | 128 |
| | Taiho Kogyo Co. Ltd. | 8,900 | 128 |
| | Fuso Pharmaceutical Industries Ltd. | 4,900 | 128 |
| | Nihon Dempa Kogyo Co. Ltd. | 15,800 | 127 |
| | Tatsuta Electric Wire and Cable Co. Ltd. | 31,900 | 127 |
| | Tosho Printing Co. Ltd. | 28,000 | 127 |
| | Teikoku Electric Manufacturing Co. Ltd. | 16,600 | 126 |
| ^,* | Takata Corp. | 36,100 | 125 |
| | Elematec Corp. | 7,400 | 125 |
| | Japan Drilling Co. Ltd. | 5,500 | 123 |
| | Sinanen Holdings Co. Ltd. | 6,200 | 123 |
| | Japan Transcity Corp. | 33,000 | 123 |
| | Zuken Inc. | 11,900 | 122 |
| | CMIC Holdings Co. Ltd. | 8,200 | 122 |
| | Nippon Coke & Engineering Co. Ltd. | 137,400 | 121 |
| | Kanaden Corp. | 12,400 | 120 |
| | Artnature Inc. | 19,100 | 117 |
| | NS United Kaiun Kaisha Ltd. | 84,000 | 117 |
| | Aderans Co. Ltd. | 19,800 | 117 |
| | Krosaki Harima Corp. | 38,000 | 115 |
| | Shinwa Co. Ltd. | 7,600 | 115 |
| | NEC Capital Solutions Ltd. | 6,900 | 115 |
| | Fujitsu Frontech Ltd. | 9,600 | 115 |
| | Toyo Securities Co. Ltd. | 64,000 | 114 |
| | Funai Electric Co. Ltd. | 13,900 | 113 |
| * | KNT-CT Holdings Co. Ltd. | 102,000 | 113 |
| | Future Corp. | 16,900 | 113 |
| | Cybozu Inc. | 27,300 | 112 |
| | Hokkan Holdings Ltd. | 31,000 | 110 |
| | Hakuto Co. Ltd. | 11,700 | 109 |
| | Matsuda Sangyo Co. Ltd. | 7,700 | 108 |
| | Dunlop Sports Co. Ltd. | 11,000 | 108 |
| | Corona Corp. Class A | 9,900 | 106 |
| | Hisaka Works Ltd. | 13,300 | 104 |
| | Kyosan Electric Manufacturing Co. Ltd. | 28,000 | 104 |
| | Toli Corp. | 29,000 | 103 |
| | Daikoku Denki Co. Ltd. | 6,400 | 103 |
| | Mitsubishi Kakoki Kaisha Ltd. | 52,000 | 102 |
| | AOI Electronics Co. Ltd. | 4,200 | 102 |
| | Tomoku Co. Ltd. | 35,000 | 102 |
| ^ | Right On Co. Ltd. | 10,300 | 101 |
| | Srg Takamiya Co. Ltd. | 18,000 | 101 |
| | Toda Kogyo Corp. | 35,000 | 100 |
| ^,* | Shin Nippon Biomedical Laboratories Ltd. | 17,300 | 100 |
| | Kitagawa Iron Works Co. Ltd. | 5,700 | 97 |
| | Gakken Holdings Co. Ltd. | 29,000 | 96 |
| | CAC Holdings Corp. | 11,400 | 96 |
| ^ | Inaba Seisakusho Co. Ltd. | 7,500 | 95 |
| | NDS Co. Ltd. | 3,700 | 93 |
| | Fujikura Kasei Co. Ltd. | 15,400 | 93 |
| | Mitsui Home Co. Ltd. | 21,000 | 93 |
| | Gun-Ei Chemical Industry Co. Ltd. | 3,200 | 92 |
| ^,* | Aplus Financial Co. Ltd. | 91,000 | 92 |
| | Asunaro Aoki Construction Co. Ltd. | 13,300 | 92 |
| | Nippon Chemiphar Co. Ltd. | 2,200 | 91 |
| | Gecoss Corp. | 9,900 | 91 |
| | Kourakuen Holdings Corp. | 5,900 | 88 |
| | Maezawa Kyuso Industries Co. Ltd. | 6,300 | 84 |
| | Sumitomo Precision Products Co. Ltd. | 27,000 | 83 |
49
| | | |
| Vanguard® Pacific Stock Index Fund | | |
| Schedule of Investments | | |
| October 31, 2016 | | |
| |
| | | | Market |
| | | | Value |
| | | Shares | ($000) |
| | Tokyo Electron Device Ltd. | 5,700 | 81 |
| | Panasonic Industrial Devices SUNX Co. Ltd. | 13,400 | 81 |
| | Taisei Lamick Co. Ltd. | 2,800 | 80 |
| | Shimojima Co. Ltd. | 7,900 | 79 |
| | Tsutsumi Jewelry Co. Ltd. | 5,000 | 79 |
| ^ | Daisyo Corp. | 5,400 | 79 |
| | Sankyo Seiko Co. Ltd. | 24,100 | 79 |
| | Toyo Denki Seizo KK | 28,000 | 79 |
| ^ | Dai-ichi Seiko Co. Ltd. | 7,000 | 77 |
| | Chugai Ro Co. Ltd. | 40,000 | 77 |
| | Tabuchi Electric Co. Ltd. | 24,200 | 77 |
| | Toa Oil Co. Ltd. | 53,000 | 76 |
| | Okura Industrial Co. Ltd. | 19,000 | 76 |
| | Kobelco Eco-Solutions Co. Ltd. | 19,000 | 74 |
| | Chuo Spring Co. Ltd. | 25,000 | 73 |
| | Kinki Sharyo Co. Ltd. | 3,200 | 73 |
| | Nice Holdings Inc. | 55,000 | 73 |
| | Alpha Systems Inc. | 4,300 | 72 |
| | Best Denki Co. Ltd. | 54,800 | 72 |
| | Tokyo Rakutenchi Co. Ltd. | 15,000 | 72 |
| | ST Corp. | 5,800 | 72 |
| | Pocket Card Co. Ltd. | 14,800 | 70 |
| | Endo Lighting Corp. | 8,600 | 67 |
| | ASAHI YUKIZAI Corp. | 34,000 | 66 |
| * | Yamada SxL Home Co. Ltd. | 89,000 | 65 |
| | Maezawa Kasei Industries Co. Ltd. | 6,100 | 64 |
| | Kitano Construction Corp. | 24,000 | 64 |
| * | Nakayama Steel Works Ltd. | 9,900 | 63 |
| | Takihyo Co. Ltd. | 14,000 | 58 |
| ^ | Daidoh Ltd. | 14,600 | 57 |
| | Showa Aircraft Industry Co. Ltd. | 6,000 | 55 |
| | Paris Miki Holdings Inc. | 12,800 | 54 |
| | Airport Facilities Co. Ltd. | 9,900 | 54 |
| | Kojima Co. Ltd. | 17,000 | 39 |
| ^,* | FDK Corp. | 14,000 | 12 |
| | | | 3,410,944 |
| New Zealand (0.8%) | | |
| | Fletcher Building Ltd. | 662,601 | 4,909 |
| | Spark New Zealand Ltd. | 1,735,701 | 4,540 |
| | Auckland International Airport Ltd. | 846,913 | 3,989 |
| | Fisher & Paykel Healthcare Corp. Ltd. | 533,888 | 3,380 |
| | Ryman Healthcare Ltd. | 397,529 | 2,523 |
| | Contact Energy Ltd. | 678,995 | 2,309 |
| | Meridian Energy Ltd. | 1,190,037 | 2,187 |
| | Z Energy Ltd. | 351,814 | 1,966 |
| | SKYCITY Entertainment Group Ltd. | 615,697 | 1,716 |
| | Mercury NZ Ltd. | 661,521 | 1,444 |
| | Trade Me Group Ltd. | 380,452 | 1,322 |
| | Kiwi Property Group Ltd. | 1,178,147 | 1,235 |
| | SKY Network Television Ltd. | 371,816 | 1,228 |
| * | Xero Ltd. | 86,511 | 1,098 |
| | EBOS Group Ltd. | 84,451 | 1,029 |
| | Mainfreight Ltd. | 75,196 | 998 |
| | Chorus Ltd. | 381,063 | 995 |
| * | a2 Milk Co. Ltd. | 677,897 | 900 |
| | Goodman Property Trust | 972,432 | 865 |
| | Infratil Ltd. | 384,880 | 820 |
| | Precinct Properties New Zealand Ltd. | 845,173 | 753 |
| | Summerset Group Holdings Ltd. | 205,994 | 701 |
| | Genesis Energy Ltd. | 487,492 | 683 |
| | Air New Zealand Ltd. | 462,633 | 638 |
| | Vector Ltd. | 262,787 | 598 |
| | Freightways Ltd. | 129,875 | 593 |
| | Argosy Property Ltd. | 778,382 | 584 |
50
| | | |
| Vanguard® Pacific Stock Index Fund | | |
| Schedule of Investments | | |
| October 31, 2016 | | |
| |
| | | | Market |
| | | | Value |
| | | Shares | ($000) |
| | Vital Healthcare Property Trust | 348,233 | 508 |
| | Metlifecare Ltd. | 119,625 | 494 |
| | Heartland Bank Ltd. | 318,266 | 341 |
| | Warehouse Group Ltd. | 145,129 | 311 |
| | Kathmandu Holdings Ltd. | 153,523 | 221 |
| | New Zealand Refining Co. Ltd. | 102,092 | 164 |
| | TOWER Ltd. | 165,523 | 106 |
| | New Zealand Oil & Gas Ltd. | 245,090 | 93 |
| | | | 46,241 |
| Singapore (3.1%) | | |
| | Singapore Telecommunications Ltd. | 6,954,409 | 19,381 |
| | Oversea-Chinese Banking Corp. Ltd. | 3,155,591 | 19,224 |
| | DBS Group Holdings Ltd. | 1,698,479 | 18,307 |
| | United Overseas Bank Ltd. | 1,142,767 | 15,417 |
| | CapitaLand Ltd. | 2,388,258 | 5,297 |
| | Keppel Corp. Ltd. | 1,357,458 | 5,133 |
| | Wilmar International Ltd. | 2,022,703 | 4,802 |
| | Singapore Press Holdings Ltd. | 1,538,617 | 4,112 |
| | Singapore Exchange Ltd. | 780,860 | 3,978 |
| | CapitaLand Mall Trust | 2,532,512 | 3,774 |
| | Global Logistic Properties Ltd. | 2,875,673 | 3,659 |
| | Ascendas REIT | 2,126,613 | 3,624 |
| | ComfortDelGro Corp. Ltd. | 1,969,180 | 3,590 |
| | Singapore Airlines Ltd. | 484,151 | 3,523 |
| | City Developments Ltd. | 571,313 | 3,479 |
| | Singapore Technologies Engineering Ltd. | 1,480,055 | 3,327 |
| | Jardine Cycle & Carriage Ltd. | 104,190 | 3,155 |
| | Genting Singapore plc | 5,749,197 | 3,077 |
| | Suntec REIT | 2,293,400 | 2,770 |
| | CapitaLand Commercial Trust | 1,932,300 | 2,187 |
| | Hutchison Port Holdings Trust | 4,907,539 | 2,180 |
| | SATS Ltd. | 605,900 | 2,108 |
| | Mapletree Commercial Trust | 1,758,781 | 1,933 |
| | UOL Group Ltd. | 455,817 | 1,854 |
| | Golden Agri-Resources Ltd. | 6,275,963 | 1,733 |
| | Venture Corp. Ltd. | 243,500 | 1,663 |
| | Singapore Post Ltd. | 1,370,600 | 1,575 |
| | Sembcorp Industries Ltd. | 861,320 | 1,560 |
| | Mapletree Industrial Trust | 1,176,100 | 1,455 |
| | Keppel REIT | 1,761,600 | 1,382 |
| | Mapletree Greater China Commercial Trust | 1,782,800 | 1,334 |
| | StarHub Ltd. | 548,867 | 1,332 |
| | Yangzijiang Shipbuilding Holdings Ltd. | 2,025,910 | 1,083 |
| | Mapletree Logistics Trust | 1,405,100 | 1,045 |
| ^,* | Noble Group Ltd. | 8,481,304 | 1,008 |
| | Raffles Medical Group Ltd. | 834,600 | 902 |
| | United Engineers Ltd. | 464,800 | 865 |
| ^ | Olam International Ltd. | 521,100 | 805 |
| | Frasers Centrepoint Trust | 512,000 | 766 |
| | Starhill Global REIT | 1,299,200 | 761 |
| ^ | Sembcorp Marine Ltd. | 807,666 | 749 |
| | Keppel Infrastructure Trust | 1,908,600 | 692 |
| | Yanlord Land Group Ltd. | 676,500 | 673 |
| | Parkway Life REIT | 359,463 | 662 |
| | CDL Hospitality Trusts | 633,400 | 611 |
| | Ascott Residence Trust | 744,700 | 608 |
| ^ | First Resources Ltd. | 462,700 | 605 |
| | SIA Engineering Co. Ltd. | 216,300 | 574 |
| ^,* | Genting Hong Kong Ltd. | 1,929,100 | 550 |
| | Cambridge Industrial Trust | 1,319,900 | 536 |
| | CapitaLand Retail China Trust | 495,200 | 533 |
| | Asian Pay Television Trust | 1,421,300 | 526 |
| ^ | Cache Logistics Trust | 877,000 | 524 |
| | Wing Tai Holdings Ltd. | 399,600 | 487 |
51
| | | |
| Vanguard® Pacific Stock Index Fund | | |
| Schedule of Investments | | |
| October 31, 2016 | | |
| |
| | | | Market |
| | | | Value |
| | | Shares | ($000) |
| | First REIT | 506,600 | 486 |
| | OUE Hospitality Trust | 992,300 | 485 |
| | Ascendas India Trust | 624,600 | 480 |
| | Frasers Commercial Trust | 489,500 | 480 |
| | Lippo Malls Indonesia Retail Trust | 1,664,300 | 466 |
| ^ | M1 Ltd. | 317,300 | 466 |
| ^ | Keppel DC REIT | 501,500 | 449 |
| ^,* | SIIC Environment Holdings Ltd. | 982,500 | 449 |
| | Ascendas Hospitality Trust | 835,900 | 445 |
| ^ | Croesus Retail Trust | 710,300 | 439 |
| | ARA Asset Management Ltd. | 435,556 | 438 |
| | Yoma Strategic Holdings Ltd. | 1,027,500 | 435 |
| ^,* | Ezion Holdings Ltd. | 1,747,800 | 375 |
| | Far East Hospitality Trust | 843,100 | 360 |
| | SPH REIT | 509,100 | 357 |
| | Soilbuild Business Space REIT | 735,130 | 357 |
| | Silverlake Axis Ltd. | 769,700 | 354 |
| | Accordia Golf Trust | 722,800 | 341 |
| | RHT Health Trust | 539,800 | 334 |
| ^ | Sarine Technologies Ltd. | 285,300 | 334 |
| ^ | OUE Ltd. | 258,400 | 315 |
| ^ | Sheng Siong Group Ltd. | 417,300 | 313 |
| | Super Group Ltd. | 384,800 | 268 |
| * | GL Ltd. | 430,000 | 247 |
| | Sabana Shari'ah Compliant Industrial REIT | 620,800 | 232 |
| ^,* | COSCO Corp. Singapore Ltd. | 1,089,601 | 199 |
| ^ | China Everbright Water Ltd. | 469,100 | 192 |
| ^ | Midas Holdings Ltd. | 1,176,200 | 182 |
| ^ | Hyflux Ltd. | 519,400 | 173 |
| ^ | Bumitama Agri Ltd. | 291,300 | 156 |
| | Indofood Agri Resources Ltd. | 443,700 | 153 |
| | Boustead Singapore Ltd. | 157,900 | 102 |
| * | Ying Li International Real Estate Ltd. | 680,500 | 79 |
| ^,* | Vard Holdings Ltd. | 502,700 | 67 |
| ^,* | Ezra Holdings Ltd. | 1,786,900 | 55 |
| * | Halcyon Agri Corp. Ltd. | 153,360 | 52 |
| * | Gallant Venture Ltd. | 512,200 | 47 |
| ^,* | China Fishery Group Ltd. | 754,600 | 41 |
| * | Ezion Holdings Ltd Warrants Exp. 04/15/2020 | 276,736 | 13 |
| * | Keppel DC REIT Rights Exp. 11/07/2016 | 137,411 | 9 |
| | | | 178,715 |
| South Korea (11.0%) | | |
| | Samsung Electronics Co. Ltd. | 96,318 | 137,766 |
| | Samsung Electronics Co. Ltd. Preference Shares | 16,427 | 18,887 |
| | NAVER Corp. | 24,975 | 18,685 |
| | SK Hynix Inc. | 499,235 | 17,856 |
| | Hyundai Motor Co. | 136,395 | 16,652 |
| | Shinhan Financial Group Co. Ltd. | 428,921 | 16,408 |
| | Hyundai Mobis Co. Ltd. | 61,536 | 14,677 |
| | KB Financial Group Inc. | 389,473 | 14,417 |
| | POSCO | 64,154 | 13,349 |
| | Samsung C&T Corp. | 84,769 | 11,949 |
| | Korea Electric Power Corp. | 241,140 | 10,432 |
| | KT&G Corp. | 104,648 | 10,321 |
| | Amorepacific Corp. | 29,830 | 9,346 |
| | LG Chem Ltd. | 41,394 | 8,891 |
| | Kia Motors Corp. | 243,586 | 8,649 |
| | Hana Financial Group Inc. | 278,897 | 7,977 |
| | Samsung Fire & Marine Insurance Co. Ltd. | 30,773 | 7,829 |
| | SK Innovation Co. Ltd. | 57,685 | 7,593 |
| | Samsung Life Insurance Co. Ltd. | 69,370 | 6,694 |
| ^,* | Celltrion Inc. | 67,926 | 6,293 |
| | SK Holdings Co. Ltd. | 31,583 | 6,161 |
| | LG Household & Health Care Ltd. | 8,278 | 5,922 |
52
| | | |
| Vanguard® Pacific Stock Index Fund | | |
| Schedule of Investments | | |
| October 31, 2016 | | |
| |
| | | | Market |
| | | | Value |
| | | Shares | ($000) |
| * | Hyundai Heavy Industries Co. Ltd. | 44,150 | 5,599 |
| | LG Display Co. Ltd. | 212,754 | 5,087 |
| | LG Corp. | 84,461 | 4,517 |
| | LG Electronics Inc. | 103,021 | 4,295 |
| | Samsung SDI Co. Ltd. | 51,905 | 4,272 |
| | SK Telecom Co. Ltd. | 21,318 | 4,179 |
| | Samsung SDS Co. Ltd. | 30,948 | 4,173 |
| | Coway Co. Ltd. | 50,919 | 3,983 |
| | NCSoft Corp. | 16,301 | 3,766 |
| | Korea Zinc Co. Ltd. | 9,438 | 3,748 |
| | AMOREPACIFIC Group | 26,720 | 3,449 |
| | Hankook Tire Co. Ltd. | 70,432 | 3,382 |
| | Lotte Chemical Corp. | 13,428 | 3,374 |
| | Kangwon Land Inc. | 100,652 | 3,336 |
| | Korea Aerospace Industries Ltd. | 56,674 | 3,201 |
| | Woori Bank | 275,619 | 3,004 |
| | Hyundai Steel Co. | 69,320 | 2,987 |
| | Hyundai Motor Co. 2nd Preference Shares | 33,825 | 2,969 |
| | Industrial Bank of Korea | 249,148 | 2,868 |
| | E-MART Inc. | 19,436 | 2,756 |
| | Dongbu Insurance Co. Ltd. | 43,334 | 2,688 |
| | S-Oil Corp. | 38,672 | 2,643 |
| | Hyundai Glovis Co. Ltd. | 17,067 | 2,583 |
| | Hyosung Corp. | 21,464 | 2,507 |
| | Hyundai Engineering & Construction Co. Ltd. | 68,790 | 2,485 |
| | Hyundai Development Co-Engineering & Construction | 58,106 | 2,457 |
| | Orion Corp. | 3,773 | 2,355 |
| | GS Holdings Corp. | 48,854 | 2,173 |
| | BNK Financial Group Inc. | 264,887 | 2,147 |
| | Samsung Electro-Mechanics Co. Ltd. | 50,490 | 2,073 |
| | LG Uplus Corp. | 199,453 | 2,056 |
| | CJ CheilJedang Corp. | 6,731 | 2,053 |
| | Lotte Shopping Co. Ltd. | 9,775 | 1,950 |
| ^ | Kakao Corp. | 28,726 | 1,915 |
| ^ | Hanmi Pharm Co. Ltd. | 5,891 | 1,860 |
| | Hanwha Techwin Co. Ltd. | 33,387 | 1,855 |
| | Hanwha Chemical Corp. | 77,282 | 1,820 |
| | CJ Corp. | 11,932 | 1,817 |
| | Hyundai Motor Co. Preference Shares | 21,593 | 1,803 |
| | Daelim Industrial Co. Ltd. | 24,958 | 1,779 |
| | KCC Corp. | 5,033 | 1,777 |
| | Hyundai Marine & Fire Insurance Co. Ltd. | 56,110 | 1,732 |
| | Amorepacific Corp. Preference Shares | 9,768 | 1,705 |
| ^ | Hotel Shilla Co. Ltd. | 29,512 | 1,476 |
| | Mando Corp. | 6,311 | 1,476 |
| | Samsung Securities Co. Ltd. | 48,749 | 1,466 |
| | BGF retail Co. Ltd. | 9,556 | 1,451 |
| | Hanssem Co. Ltd. | 9,361 | 1,450 |
| | Hyundai Department Store Co. Ltd. | 13,918 | 1,428 |
| | Hanwha Corp. | 43,773 | 1,426 |
| | Hanon Systems | 151,554 | 1,417 |
| | KT Corp. | 49,920 | 1,408 |
| | S-1 Corp. | 17,340 | 1,400 |
| ^,* | Kumho Tire Co. Inc. | 152,570 | 1,368 |
| | Medy-Tox Inc. | 3,726 | 1,322 |
| | Doosan Heavy Industries & Construction Co. Ltd. | 57,939 | 1,322 |
| | Yuhan Corp. | 7,202 | 1,320 |
| ^,* | OCI Co. Ltd. | 16,399 | 1,292 |
| | Samsung Card Co. Ltd. | 29,881 | 1,258 |
| | Korea Investment Holdings Co. Ltd. | 35,075 | 1,256 |
| ^,* | Samsung Heavy Industries Co. Ltd. | 144,843 | 1,231 |
| * | CJ Korea Express Corp. | 6,924 | 1,216 |
| | Mirae Asset Securities Co. Ltd. | 61,234 | 1,208 |
| | Hanwha Life Insurance Co. Ltd. | 219,458 | 1,198 |
53
| | | |
| Vanguard® Pacific Stock Index Fund | | |
| Schedule of Investments | | |
| October 31, 2016 | | |
| |
| | | | Market |
| | | | Value |
| | | Shares | ($000) |
| ^,* | Samsung Engineering Co. Ltd. | 144,755 | 1,195 |
| | DGB Financial Group Inc. | 141,920 | 1,189 |
| | Mirae Asset Daewoo Co. Ltd. | 168,072 | 1,133 |
| | LG Chem Ltd. Preference Shares | 7,132 | 1,120 |
| | Shinsegae Inc. | 6,454 | 1,048 |
| | Kumho Petrochemical Co. Ltd. | 17,117 | 1,046 |
| | CJ E&M Corp. | 17,146 | 1,046 |
| | NH Investment & Securities Co. Ltd. | 116,179 | 1,022 |
| ^,* | GS Engineering & Construction Corp. | 43,417 | 1,013 |
| ^,* | ViroMed Co. Ltd. | 12,532 | 1,000 |
| | Hyundai Wia Corp. | 14,544 | 998 |
| * | Daewoo Engineering & Construction Co. Ltd. | 180,731 | 997 |
| | Kolon Industries Inc. | 15,316 | 995 |
| | Posco Daewoo Corp. | 45,002 | 977 |
| | Korea Gas Corp. | 24,018 | 971 |
| ^,* | Komipharm International Co. Ltd. | 28,322 | 957 |
| * | Korean Air Lines Co. Ltd. | 33,944 | 949 |
| | KEPCO Plant Service & Engineering Co. Ltd. | 19,133 | 917 |
| | Lotte Confectionery Co. Ltd. | 5,354 | 899 |
| | LG Innotek Co. Ltd. | 13,096 | 892 |
| | Korea Kolmar Co. Ltd. | 12,343 | 878 |
| | Doosan Corp. | 9,783 | 875 |
| | KB Insurance Co. Ltd. | 34,485 | 872 |
| | SK Chemicals Co. Ltd. | 16,693 | 871 |
| ^ | Meritz Securities Co. Ltd. | 288,414 | 855 |
| | Cheil Worldwide Inc. | 57,706 | 854 |
| | Korean Reinsurance Co. | 81,234 | 837 |
| | LG Household & Health Care Ltd. Preference Shares | 1,958 | 814 |
| | SK Networks Co. Ltd. | 142,616 | 811 |
| | LS Corp. | 16,482 | 788 |
| ^,* | Doosan Infracore Co. Ltd. | 129,731 | 783 |
| ^ | Youngone Corp. | 27,235 | 764 |
| | Ottogi Corp. | 1,309 | 752 |
| ^ | Hanmi Science Co. ltd | 11,213 | 744 |
| ^,* | Com2uSCorp | 8,909 | 738 |
| | Meritz Fire & Marine Insurance Co. Ltd. | 52,954 | 737 |
| ^ | Lotte Chilsung Beverage Co. Ltd. | 544 | 732 |
| ^ | Fila Korea Ltd. | 9,574 | 729 |
| | NongShim Co. Ltd. | 2,878 | 724 |
| ^ | CJ CGV Co. Ltd. | 11,971 | 708 |
| | SK Materials Co. Ltd. | 5,130 | 698 |
| ^ | Innocean Worldwide Inc. | 11,322 | 685 |
| ^ | Hyundai Greenfood Co. Ltd. | 46,244 | 677 |
| | Dongsuh Cos. Inc. | 28,324 | 671 |
| ^ | KIWOOM Securities Co. Ltd. | 11,541 | 669 |
| ^,* | LIG Nex1 Co. Ltd. | 9,977 | 644 |
| * | NHN Entertainment Corp. | 14,082 | 617 |
| ^ | Tongyang Inc. | 216,659 | 608 |
| ^,* | Yungjin Pharmaceutical Co. Ltd. | 77,224 | 589 |
| ^ | Green Cross Corp. | 4,823 | 587 |
| | GS Retail Co. Ltd. | 13,508 | 575 |
| ^ | Hansol Chemical Co. Ltd. | 7,832 | 566 |
| * | Hugel Inc. | 1,884 | 564 |
| ^ | Samyang Holdings Corp. | 5,120 | 558 |
| ^ | Kolon Life Science Inc. | 4,251 | 555 |
| * | LG Life Sciences Ltd. | 10,069 | 546 |
| * | Hyundai Mipo Dockyard Co. Ltd. | 8,878 | 543 |
| ^,* | HLB Inc. | 31,994 | 542 |
| ^ | Cosmax Inc. | 5,301 | 534 |
| ^ | IS Dongseo Co. Ltd. | 12,153 | 525 |
| | LG International Corp. | 21,588 | 525 |
| ^ | Hite Jinro Co. Ltd. | 26,920 | 517 |
| | Poongsan Corp. | 16,979 | 516 |
| ^,* | Pan Ocean Co. Ltd. | 163,210 | 514 |
54
| | | |
| Vanguard® Pacific Stock Index Fund | | |
| Schedule of Investments | | |
| October 31, 2016 | | |
| |
| | | | Market |
| | | | Value |
| | | Shares | ($000) |
| ^ | Paradise Co. Ltd. | 44,487 | 504 |
| | Hyundai Home Shopping Network Corp. | 5,034 | 499 |
| ^,* | Advanced Process Systems Corp. | 21,795 | 496 |
| | Huchems Fine Chemical Corp. | 23,812 | 492 |
| | JB Financial Group Co. Ltd. | 94,330 | 489 |
| | Green Cross Holdings Corp. | 24,522 | 475 |
| ^ | JW Pharmaceutical Corp. | 11,000 | 472 |
| | Korea Petrochemical Ind Co. Ltd. | 2,614 | 466 |
| ^,* | Wonik Holdings Co. Ltd. | 82,164 | 465 |
| | LS Industrial Systems Co. Ltd. | 13,302 | 455 |
| ^ | Chong Kun Dang Pharmaceutical Corp. | 5,573 | 450 |
| ^ | Koh Young Technology Inc. | 11,455 | 448 |
| ^,* | Osstem Implant Co. Ltd. | 9,405 | 447 |
| | LG Hausys Ltd. | 5,356 | 442 |
| | Handsome Co. Ltd. | 12,437 | 441 |
| | SFA Engineering Corp. | 8,620 | 435 |
| | GS Home Shopping Inc. | 2,831 | 435 |
| * | Dongbu HiTek Co. Ltd. | 29,245 | 435 |
| | Hankook Tire Worldwide Co. Ltd. | 22,755 | 430 |
| ^ | Hana Tour Service Inc. | 7,619 | 429 |
| | Daesang Corp. | 18,123 | 426 |
| | Halla Holdings Corp. | 7,070 | 418 |
| | Soulbrain Co. Ltd. | 7,671 | 418 |
| ^ | Bukwang Pharmaceutical Co. Ltd. | 19,101 | 416 |
| ^,* | Hyundai Elevator Co. Ltd. | 8,461 | 413 |
| ^,* | SM Entertainment Co. | 17,136 | 408 |
| ^,* | DIO Corp. | 10,192 | 406 |
| ^ | Hanjin Kal Corp. | 27,412 | 404 |
| ^ | Lotte Food Co. Ltd. | 667 | 403 |
| | SKC Co. Ltd. | 16,997 | 401 |
| | Samsung Fire & Marine Insurance Co. Ltd. Preference Shares | 2,427 | 400 |
| | Daou Technology Inc. | 22,159 | 400 |
| ^ | Eo Technics Co. Ltd. | 7,251 | 399 |
| ^,* | Chabiotech Co. Ltd. | 32,644 | 393 |
| | LOTTE Himart Co. Ltd. | 10,196 | 393 |
| ^ | Korea Real Estate Investment & Trust Co. Ltd. | 151,848 | 390 |
| ^,* | Ilyang Pharmaceutical Co. Ltd. | 11,252 | 384 |
| | LOTTE Fine Chemical Co. Ltd. | 15,160 | 384 |
| | Korea Electric Terminal Co. Ltd. | 6,075 | 379 |
| ^,* | Hanall Biopharma Co. Ltd. | 36,876 | 379 |
| ^ | Seoul Semiconductor Co. Ltd. | 31,625 | 378 |
| ^,* | Daewoo Shipbuilding & Marine Engineering Co. Ltd. | 95,520 | 374 |
| ^ | Nexen Tire Corp. | 32,546 | 373 |
| | Young Poong Corp. | 426 | 369 |
| * | Dongkuk Steel Mill Co. Ltd. | 51,535 | 368 |
| ^,* | Medipost Co. Ltd. | 7,412 | 366 |
| ^ | Jeil Pharmaceutical Co. | 6,129 | 363 |
| | Hanwha General Insurance Co. Ltd. | 54,548 | 362 |
| ^,* | Seegene Inc. | 13,696 | 362 |
| ^,* | Taihan Electric Wire Co. Ltd. | 217,722 | 359 |
| | Taekwang Industrial Co. Ltd. | 483 | 354 |
| | CJ O Shopping Co. Ltd. | 2,493 | 353 |
| ^,* | GemVax & Kael Co. Ltd. | 27,900 | 350 |
| ^ | Amicogen Inc. | 8,184 | 347 |
| ^ | DuzonBizon Co. Ltd. | 17,697 | 345 |
| ^ | Dong-A ST Co. Ltd. | 4,596 | 344 |
| ^,* | Hyundai Rotem Co. Ltd. | 20,921 | 342 |
| ^,* | Vieworks Co. Ltd. | 6,340 | 340 |
| ^,* | Loen Entertainment Inc. | 5,746 | 338 |
| | LG Electronics Inc. Preference Shares | 16,228 | 337 |
| ^ | Grand Korea Leisure Co. Ltd. | 17,707 | 336 |
| | Daishin Securities Co. Ltd. | 36,349 | 334 |
| | LEENO Industrial Inc. | 8,900 | 334 |
| ^,* | CrystalGenomics Inc. | 20,156 | 332 |
55
| | | |
| Vanguard® Pacific Stock Index Fund | | |
| Schedule of Investments | | |
| October 31, 2016 | | |
| |
| | | | Market |
| | | | Value |
| | | Shares | ($000) |
| ^ | Dongwon Industries Co. Ltd. | 1,228 | 330 |
| * | Asiana Airlines Inc. | 81,449 | 329 |
| ^,* | Genexine Co. Ltd. | 10,214 | 329 |
| ^ | Samyang Corp. | 3,651 | 328 |
| * | Foosung Co. Ltd. | 48,122 | 326 |
| | Tongyang Life Insurance Co. Ltd. | 31,110 | 326 |
| ^ | Hansae Co. Ltd. | 14,690 | 325 |
| ^,* | iNtRON Biotechnology Inc. | 11,932 | 322 |
| | Dong-A Socio Holdings Co. Ltd. | 2,527 | 320 |
| ^,* | Caregen Co. Ltd. | 3,866 | 319 |
| | LF Corp. | 16,620 | 315 |
| ^ | Ahnlab Inc. | 5,591 | 315 |
| ^ | Meritz Financial Group Inc. | 31,983 | 314 |
| ^ | Samlip General Foods Co. Ltd. | 2,049 | 305 |
| | Partron Co. Ltd. | 37,918 | 296 |
| | KEPCO Engineering & Construction Co. Inc. | 13,462 | 295 |
| ^ | Toptec Co. Ltd. | 17,172 | 288 |
| ^ | SK Gas Ltd. | 3,416 | 287 |
| ^,* | Binex Co. Ltd. | 21,825 | 287 |
| ^,* | Jenax Inc. | 12,793 | 283 |
| ^ | Hanjin Transportation Co. Ltd. | 10,922 | 281 |
| * | Ssangyong Cement Industrial Co. Ltd. | 19,667 | 276 |
| ^ | Mirae Asset Life Insurance Co. Ltd. | 67,421 | 276 |
| ^ | InBody Co. Ltd. | 9,464 | 273 |
| ^,* | G-SMATT GLOBAL Co. Ltd. | 12,258 | 271 |
| ^,* | Jusung Engineering Co. Ltd. | 32,397 | 267 |
| ^,* | NUTRIBIOTECH Co. Ltd. | 4,678 | 266 |
| ^,* | DoubleUGames Co. Ltd. | 8,541 | 265 |
| ^ | Muhak Co. Ltd. | 13,199 | 262 |
| * | Ssangyong Motor Co. | 40,269 | 259 |
| ^,* | Emerson Pacific Inc. | 7,836 | 257 |
| ^ | JW Holdings Corp. | 29,522 | 257 |
| | AK Holdings Inc. | 4,761 | 256 |
| ^,* | ATGen Co. Ltd. | 7,982 | 254 |
| | NICE Holdings Co. Ltd. | 17,208 | 253 |
| * | WONIK IPS Co. Ltd. | 12,458 | 253 |
| ^,* | Cellumed Co. Ltd. | 152,054 | 253 |
| ^,* | Posco ICT Co. Ltd. | 50,296 | 251 |
| | Namyang Dairy Products Co. Ltd. | 425 | 250 |
| ^ | Daewoong Pharmaceutical Co. Ltd. | 4,186 | 249 |
| | Youngone Holdings Co. Ltd. | 4,909 | 247 |
| | KISWIRE Ltd. | 7,200 | 245 |
| ^ | Sebang Global Battery Co. Ltd. | 7,567 | 245 |
| ^,* | Seobu T&D | 14,052 | 244 |
| ^ | YG Entertainment Inc. | 9,383 | 240 |
| ^,* | i-SENS Inc. | 8,269 | 236 |
| ^,* | Webzen Inc. | 15,711 | 236 |
| ^ | Dae Hwa Pharmaceutical Co. Ltd. | 10,363 | 235 |
| ^ | iMarketKorea Inc. | 20,930 | 234 |
| | Binggrae Co. Ltd. | 4,279 | 233 |
| | S&T Motiv Co. Ltd. | 6,492 | 232 |
| ^ | Hanil Cement Co. Ltd. | 3,546 | 230 |
| ^,* | Schnell Biopharmaceuticals Inc. | 69,551 | 228 |
| | Lutronic Corp. | 6,830 | 227 |
| | Samchully Co. Ltd. | 2,633 | 224 |
| | Songwon Industrial Co. Ltd. | 14,653 | 224 |
| * | Hanwha Corp. Preference Shares | 13,575 | 224 |
| ^ | Hankook Shell Oil Co. Ltd. | 578 | 223 |
| ^,* | It's Skin Co. Ltd. | 5,498 | 222 |
| * | SK Securities Co. Ltd. | 245,171 | 222 |
| | KT Skylife Co. Ltd. | 13,988 | 218 |
| ^ | Cell Biotech Co. Ltd. | 5,481 | 217 |
| ^,* | Naturalendo Tech Co. Ltd. | 12,905 | 217 |
| ^ | NS Shopping Co. Ltd. | 1,499 | 216 |
56
| | | |
| Vanguard® Pacific Stock Index Fund | | |
| Schedule of Investments | | |
| October 31, 2016 | | |
| |
| | | | Market |
| | | | Value |
| | | Shares | ($000) |
| | Silicon Works Co. Ltd. | 9,198 | 215 |
| ^,* | Yuanta Securities Korea Co. Ltd. | 78,425 | 214 |
| ^ | Dawonsys Co. Ltd. | 17,532 | 214 |
| * | Kumho Industrial Co. Ltd. | 25,549 | 213 |
| ^ | Hancom Inc. | 13,852 | 213 |
| | NICE Information Service Co. Ltd. | 31,728 | 212 |
| | Kwang Dong Pharmaceutical Co. Ltd. | 29,386 | 212 |
| ^,* | Hansol Technics Co. Ltd. | 16,017 | 211 |
| ^ | Hyundai Livart Furniture Co. Ltd. | 9,784 | 211 |
| | Sungwoo Hitech Co. Ltd. | 31,431 | 210 |
| ^ | Modetour Network Inc. | 9,061 | 210 |
| | Seah Besteel Corp. | 10,317 | 209 |
| | Maeil Dairy Industry Co. Ltd. | 6,926 | 205 |
| ^,* | DongKook Pharmaceutical Co. Ltd. | 4,442 | 203 |
| ^ | POSCO Chemtech Co. Ltd. | 19,572 | 203 |
| * | Samsung Heavy Industries Rights Exp. 11/08/2016 | 89,932 | 203 |
| | Daekyo Co. Ltd. | 27,547 | 201 |
| ^ | Huons Global Co. Ltd. | 5,340 | 201 |
| | Hansol Paper Co. Ltd. | 11,125 | 197 |
| ^,* | CMG Pharmaceutical Co. Ltd. | 74,002 | 197 |
| * | Taewoong Co. Ltd. | 8,132 | 196 |
| * | Hanjin Heavy Industries & Construction Co. Ltd. | 57,114 | 194 |
| | Daeduck Electronics Co. | 29,381 | 193 |
| ^ | Kolao Holdings | 25,107 | 193 |
| | CJ CheilJedang Corp. Preference Shares | 1,253 | 192 |
| ^,* | Leaders Cosmetics Co. Ltd. | 11,056 | 191 |
| | Humax Co. Ltd. | 14,878 | 190 |
| | AtlasBX Co. Ltd. | 4,004 | 189 |
| ^,* | Pharmicell Co. Ltd. | 47,087 | 189 |
| | Kwangju Bank | 21,375 | 189 |
| ^ | Dongwon F&B Co. Ltd. | 1,066 | 188 |
| | Shinyoung Securities Co. Ltd. | 4,264 | 185 |
| ^ | SL Corp. | 13,785 | 184 |
| ^ | Able C&C Co. Ltd. | 10,026 | 183 |
| | Sindoh Co. Ltd. | 3,962 | 182 |
| ^ | Chongkundang Holdings Corp. | 3,115 | 180 |
| ^ | Lock&Lock Co. Ltd. | 15,389 | 180 |
| ^,* | Gamevil Inc. | 3,698 | 179 |
| | CJ Hellovision Co. Ltd. | 25,075 | 179 |
| ^ | Cuckoo Electronics Co. Ltd. | 1,552 | 179 |
| ^ | Byucksan Corp. | 41,431 | 178 |
| ^,* | Huons Co. Ltd. | 3,370 | 173 |
| | S&T Dynamics Co. Ltd. | 21,412 | 173 |
| ^,* | Korea Line Corp. | 10,864 | 171 |
| ^,* | ICD Co. Ltd. | 12,547 | 169 |
| ^ | GOLFZON Co. Ltd. | 2,849 | 168 |
| ^,* | Peptron Inc. | 4,599 | 168 |
| ^ | Crown Confectionery Co. Ltd. | 6,080 | 166 |
| * | Woongjin Thinkbig Co. Ltd. | 19,431 | 162 |
| ^ | Seoyon E-Hwa Co. Ltd. | 12,026 | 160 |
| | E1 Corp. | 2,974 | 158 |
| * | Hansol Holdings Co. Ltd. | 28,037 | 157 |
| | Daeduck GDS Co. Ltd. | 15,142 | 157 |
| ^ | Interpark Holdings Corp. | 36,083 | 157 |
| ^,* | COSON Co. Ltd. | 13,322 | 156 |
| ^ | Humedix Co. Ltd. | 4,909 | 155 |
| | SeAH Steel Corp. | 2,547 | 155 |
| * | Taeyoung Engineering & Construction Co. Ltd. | 36,177 | 154 |
| ^,* | CUROCOM Co. Ltd. | 69,635 | 153 |
| | Kolon Corp. | 3,425 | 152 |
| ^ | Korea Kolmar Holdings Co. Ltd. | 5,897 | 151 |
| ^ | CJ Freshway Corp. | 4,321 | 148 |
| ^,* | CrucialTec Co. Ltd. | 21,108 | 147 |
| ^,* | Hanwha Investment & Securities Co. Ltd. | 75,291 | 147 |
57
| | | |
| Vanguard® Pacific Stock Index Fund | | |
| Schedule of Investments | | |
| October 31, 2016 | | |
| |
| | | | Market |
| | | | Value |
| | | Shares | ($000) |
| ^,* | Agabang&Company | 22,329 | 145 |
| ^ | Cosmax BTI Inc | 4,116 | 145 |
| ^,* | Duk San Neolux Co. Ltd. | 5,604 | 144 |
| ^ | KISCO Corp. | 4,359 | 143 |
| | Youlchon Chemical Co. Ltd. | 12,047 | 143 |
| ^ | KH Vatec Co. Ltd. | 12,932 | 142 |
| | SBS Media Holdings Co. Ltd. | 55,748 | 139 |
| * | Samsung Biologics Co. Ltd. | 1,150 | 137 |
| * | Green Cross Cell Corp. | 5,374 | 137 |
| ^,* | WeMade Entertainment Co. Ltd. | 7,992 | 136 |
| | Kyobo Securities Co. Ltd. | 16,417 | 133 |
| ^,* | Lumens Co. Ltd. | 37,737 | 132 |
| ^ | Namhae Chemical Corp. | 18,610 | 132 |
| | Daishin Securities Co. Ltd. Preference Shares | 19,354 | 132 |
| | Hyundai Corp. | 7,187 | 132 |
| ^ | Sung Kwang Bend Co. Ltd. | 15,908 | 131 |
| | Dae Han Flour Mills Co. Ltd. | 842 | 130 |
| ^ | Daewoong Co. Ltd. | 3,221 | 124 |
| ^,* | Insun ENT Co. Ltd. | 24,551 | 122 |
| ^ | Coreana Cosmetics Co. Ltd. | 22,740 | 119 |
| * | Eugene Investment & Securities Co. Ltd. | 56,837 | 119 |
| ^ | KONA I Co. Ltd. | 11,398 | 119 |
| ^,* | KTB Investment & Securities Co. Ltd. | 44,088 | 110 |
| | Sam Young Electronics Co. Ltd. | 11,192 | 109 |
| ^,* | Neowiz Games Corp. | 11,282 | 106 |
| * | Interflex Co. Ltd. | 7,133 | 102 |
| ^,* | Samsung Pharmaceutical Co. Ltd. | 28,070 | 101 |
| | INTOPS Co. Ltd. | 5,617 | 99 |
| ^,* | SFA Semicon Co. Ltd. | 49,016 | 95 |
| ^ | NEPES Corp. | 15,206 | 94 |
| | Seoyon Co. Ltd. | 9,429 | 91 |
| ^ | GOLFZONYUWONHOLDINGS Co. Ltd. | 13,382 | 91 |
| | TK Corp. | 12,269 | 91 |
| ^,* | 3S Korea Co. Ltd. | 38,610 | 90 |
| | Eusu Holdings Co. Ltd. | 15,078 | 82 |
| ^,* | Duksan Hi-Metal Co. Ltd. | 12,546 | 81 |
| * | Doosan Engine Co. Ltd. | 23,830 | 73 |
| * | Dongbu Securities Co. Ltd. | 24,758 | 72 |
| | Hyundai C&F Inc. | 5,099 | 72 |
| | MegaStudy Co. Ltd. | 2,433 | 69 |
| | Hitejinro Holdings Co. Ltd. | 6,100 | 64 |
| | MegaStudyEdu Co. Ltd. | 1,495 | 62 |
| ^ | DY Corp. | 7,582 | 41 |
| * | Hanjin Heavy Industries & Construction Holdings Co. Ltd. | 4,775 | 22 |
| | KT Corp. ADR | 1,302 | 21 |
| * | Interflex Co. Ltd. Rights Exp. 11/24/2016 | 2,046 | 7 |
| * | Lutronic Corp. Pref Rights Exp. 12/02/2016 | 1,099 | 3 |
| * | Lutronic Corp. Rights Exp. 12/02/2016 | 231 | 1 |
| |
| | | | 637,751 |
| Total Common Stocks (Cost $6,702,027) | | 5,747,525 |
58
Vanguard® Pacific Stock Index Fund
Schedule of Investments
October 31, 2016
| | | | |
| | | | | Market |
| | | | | Value |
| | Coupon | | Shares | ($000) |
| Temporary Cash Investments (2.2%)1 | | | | |
| Money Market Fund (2.1%) | | | | |
| 3,4 Vanguard Market Liquidity Fund | 0.718% | | 1,248,857 | 124,898 |
| |
| | | | Face | |
| | | Maturity | Amount | |
| | | Date | ($000) | |
| U.S. Government and Agency Obligations (0.1%) | | | | |
| 5 United States Treasury Bill | 0.311%-0.321% | 12/1/16 | 2,700 | 2,700 |
| United States Treasury Bill | 0.340% | 12/8/16 | 600 | 600 |
| | | | | 3,300 |
| Total Temporary Cash Investments (Cost $128,194) | | | | 128,198 |
| Total Investments (101.8%) (Cost $6,830,221) | | | | 5,875,723 |
| Other Assets and Liabilities—Net (-1.8%)4 | | | | (104,075) |
| Net Assets (100%) | | | | 5,771,648 |
^ Includes partial security positions on loan to broker-dealers. The total value of securities on loan is $115,977,000.
* Non-income-producing security.
1 The fund invests a portion of its cash reserves in equity markets through the use of index futures contracts. After giving effect to futures
investments, the fund's effective common stock and temporary cash investment positions represent 100.1% and 1.7%, respectively, of net
assets.
2 Security exempt from registration under Rule 144A of the Securities Act of 1933. Such securities may be sold in transactions exempt from
registration, normally to qualified institutional buyers. At October 31, 2016, the aggregate value of these securities was $7,950,000,
representing 0.1% of net assets.
3 Affiliated money market fund available only to Vanguard funds and certain trusts and accounts managed by Vanguard. Rate shown is the 7-day
yield.
4 Includes $124,959,000 of collateral received for securities on loan.
5 Securities with a value of $1,700,000 have been segregated as initial margin for open futures contracts.
ADR—American Depositary Receipt.
REIT—Real Estate Investment Trust.
59
© 2016 The Vanguard Group, Inc.
All rights reserved.
Vanguard Marketing Corporation, Distributor.
SNA720 122016
| | |
| Vanguard® Total World Stock Index Fund | | |
| Schedule of Investments | | |
| October 31, 2016 | | |
| |
| | | Market |
| | | Value |
| | Shares | ($000) |
| |
| Common Stocks (99.2%)1 | | |
| Argentina (0.0%) | | |
| * First Data Corp. Class A | 72,700 | 1,017 |
| |
| Australia (2.4%) | | |
| Commonwealth Bank of Australia | 350,257 | 19,499 |
| Westpac Banking Corp. | 682,303 | 15,778 |
| Australia & New Zealand Banking Group Ltd. | 597,486 | 12,616 |
| BHP Billiton Ltd. | 673,278 | 11,763 |
| National Australia Bank Ltd. | 541,482 | 11,494 |
| CSL Ltd. | 95,836 | 7,313 |
| Wesfarmers Ltd. | 234,020 | 7,287 |
| Woolworths Ltd. | 264,896 | 4,754 |
| Macquarie Group Ltd. | 64,191 | 3,880 |
| Rio Tinto Ltd. | 91,094 | 3,769 |
| Scentre Group | 1,065,100 | 3,409 |
| Telstra Corp. Ltd. | 895,053 | 3,385 |
| Transurban Group | 423,998 | 3,346 |
| Woodside Petroleum Ltd. | 152,963 | 3,274 |
| Brambles Ltd. | 327,213 | 2,865 |
| Newcrest Mining Ltd. | 158,788 | 2,780 |
| Amcor Ltd. | 245,345 | 2,738 |
| Westfield Corp. | 401,190 | 2,711 |
| Suncorp Group Ltd. | 267,043 | 2,424 |
| South32 Ltd. | 1,116,630 | 2,179 |
| QBE Insurance Group Ltd. | 286,360 | 2,170 |
| AMP Ltd. | 610,414 | 2,117 |
| Insurance Australia Group Ltd. | 503,114 | 2,103 |
| AGL Energy Ltd. | 142,905 | 2,082 |
| Goodman Group | 369,257 | 1,903 |
| Stockland | 503,157 | 1,690 |
| Aristocrat Leisure Ltd. | 134,863 | 1,570 |
| Ramsay Health Care Ltd. | 27,372 | 1,524 |
| Vicinity Centres | 695,482 | 1,517 |
| Aurizon Holdings Ltd. | 408,986 | 1,515 |
| Origin Energy Ltd. | 363,150 | 1,464 |
| APA Group | 240,272 | 1,452 |
| ASX Ltd. | 40,225 | 1,439 |
| Fortescue Metals Group Ltd. | 342,422 | 1,437 |
| James Hardie Industries plc | 95,433 | 1,420 |
| Dexus Property Group | 204,778 | 1,391 |
| Sonic Healthcare Ltd. | 86,018 | 1,338 |
| GPT Group | 373,698 | 1,321 |
| Treasury Wine Estates Ltd. | 156,826 | 1,279 |
| Caltex Australia Ltd. | 54,559 | 1,270 |
| Mirvac Group | 795,761 | 1,262 |
| Oil Search Ltd. | 248,801 | 1,247 |
| LendLease Group | 116,709 | 1,196 |
| Cochlear Ltd. | 12,057 | 1,171 |
| Medibank Pvt Ltd. | 584,055 | 1,144 |
| Sydney Airport | 234,563 | 1,115 |
| Orica Ltd. | 80,321 | 992 |
| Challenger Ltd. | 120,072 | 980 |
| Santos Ltd. | 358,688 | 960 |
| DUET Group | 500,235 | 906 |
| Tatts Group Ltd. | 292,288 | 901 |
| Computershare Ltd. | 103,253 | 827 |
| Bendigo & Adelaide Bank Ltd. | 97,541 | 824 |
| Coca-Cola Amatil Ltd. | 112,914 | 818 |
| SEEK Ltd. | 71,429 | 793 |
| Incitec Pivot Ltd. | 351,546 | 786 |
| Boral Ltd. | 156,423 | 747 |
| BlueScope Steel Ltd. | 120,876 | 717 |
| Tabcorp Holdings Ltd. | 187,869 | 690 |
1
| | |
| Vanguard® Total World Stock Index Fund | | |
| Schedule of Investments | | |
| October 31, 2016 | | |
| |
| | | Market |
| | | Value |
| | Shares | ($000) |
| Crown Resorts Ltd. | 80,841 | 668 |
| Star Entertainment Grp Ltd. | 171,369 | 648 |
| Bank of Queensland Ltd. | 79,978 | 635 |
| Domino's Pizza Enterprises Ltd. | 12,777 | 622 |
| Alumina Ltd. | 515,102 | 619 |
| Healthscope Ltd. | 364,183 | 611 |
| Orora Ltd. | 255,401 | 563 |
| Vocus Communications Ltd. | 125,166 | 543 |
| ALS Ltd. | 112,726 | 533 |
| Ansell Ltd. | 31,028 | 511 |
| JB Hi-Fi Ltd. | 23,575 | 508 |
| Qantas Airways Ltd. | 212,957 | 495 |
| CIMIC Group Ltd. | 19,655 | 441 |
| Harvey Norman Holdings Ltd. | 109,850 | 421 |
| AusNet Services | 365,960 | 417 |
| IOOF Holdings Ltd. | 66,792 | 416 |
| Qube Holdings Ltd. | 238,250 | 403 |
| REA Group Ltd. | 10,373 | 402 |
| Northern Star Resources Ltd. | 123,946 | 401 |
| Downer EDI Ltd. | 89,458 | 395 |
| DuluxGroup Ltd. | 79,739 | 390 |
| Link Administration Holdings Ltd. | 70,893 | 388 |
| nib holdings Ltd. | 105,782 | 387 |
| Evolution Mining Ltd. | 217,708 | 384 |
| Iluka Resources Ltd. | 86,756 | 380 |
| TPG Telecom Ltd. | 65,706 | 377 |
| Adelaide Brighton Ltd. | 90,107 | 366 |
| Investa Office Fund | 113,061 | 364 |
| Magellan Financial Group Ltd. | 22,224 | 359 |
| carsales.com Ltd. | 43,429 | 351 |
| * Mayne Pharma Group Ltd. | 279,002 | 347 |
| Independence Group NL | 106,625 | 347 |
| OZ Minerals Ltd. | 63,955 | 327 |
| Perpetual Ltd. | 9,284 | 319 |
| Macquarie Atlas Roads Group | 88,596 | 317 |
| Flight Centre Travel Group Ltd. | 12,231 | 314 |
| * Metcash Ltd. | 203,181 | 307 |
| CSR Ltd. | 109,660 | 305 |
| BT Investment Management Ltd. | 43,352 | 304 |
| Fairfax Media Ltd. | 483,838 | 303 |
| Primary Health Care Ltd. | 100,087 | 292 |
| * WorleyParsons Ltd. | 44,842 | 287 |
| GrainCorp Ltd. Class A | 44,150 | 282 |
| Sims Metal Management Ltd. | 36,004 | 274 |
| Mineral Resources Ltd. | 30,997 | 273 |
| Bapcor Ltd. | 69,451 | 271 |
| Premier Investments Ltd. | 23,993 | 258 |
| IRESS Ltd. | 29,801 | 257 |
| * Whitehaven Coal Ltd. | 109,265 | 251 |
| ARB Corp. Ltd. | 19,394 | 251 |
| Charter Hall Group | 69,676 | 249 |
| Regis Resources Ltd. | 98,394 | 248 |
| Nufarm Ltd. | 36,677 | 246 |
| Navitas Ltd. | 61,185 | 243 |
| InvoCare Ltd. | 24,361 | 242 |
| Charter Hall Retail REIT | 70,558 | 222 |
| Cleanaway Waste Management Ltd. | 251,594 | 222 |
| ^ Blackmores Ltd. | 2,602 | 221 |
| Super Retail Group Ltd. | 29,644 | 220 |
| Shopping Centres Australasia Property Group | 128,582 | 214 |
| Sigma Pharmaceuticals Ltd. | 209,696 | 212 |
| Sirtex Medical Ltd. | 9,804 | 208 |
| * St. Barbara Ltd. | 101,121 | 206 |
| Cromwell Property Group | 294,630 | 204 |
2
| | | |
| Vanguard® Total World Stock Index Fund | | |
| Schedule of Investments | | |
| October 31, 2016 | | |
| |
| | | | Market |
| | | | Value |
| | | Shares | ($000) |
| | Pact Group Holdings Ltd. | 40,730 | 203 |
| | Aveo Group | 83,081 | 203 |
| | BWP Trust | 89,415 | 202 |
| 2 | MYOB Group Ltd. | 71,583 | 201 |
| | Breville Group Ltd. | 27,898 | 196 |
| | Spotless Group Holdings Ltd. | 257,439 | 195 |
| | G8 Education Ltd. | 78,555 | 188 |
| | Automotive Holdings Group Ltd. | 60,314 | 185 |
| | Platinum Asset Management Ltd. | 46,689 | 177 |
| | Costa Group Holdings Ltd. | 80,223 | 174 |
| | Myer Holdings Ltd. | 192,568 | 172 |
| | Webjet Ltd. | 19,104 | 159 |
| | Southern Cross Media Group Ltd. | 144,229 | 157 |
| * | Aconex Ltd. | 36,255 | 153 |
| | Sandfire Resources NL | 38,621 | 152 |
| | Ardent Leisure Group | 97,717 | 150 |
| | Beach Energy Ltd. | 265,042 | 144 |
| * | Nanosonics Ltd. | 54,585 | 144 |
| | GUD Holdings Ltd. | 19,592 | 141 |
| * | Australian Agricultural Co. Ltd. | 106,617 | 141 |
| | GWA Group Ltd. | 65,018 | 141 |
| *,^ | Syrah Resources Ltd. | 51,297 | 140 |
| | Steadfast Group Ltd. | 85,557 | 139 |
| | Seven Group Holdings Ltd. | 19,431 | 134 |
| | Abacus Property Group | 62,402 | 133 |
| | Monadelphous Group Ltd. | 18,471 | 131 |
| | Resolute Mining Ltd. | 107,430 | 127 |
| | McMillan Shakespeare Ltd. | 15,440 | 127 |
| | FlexiGroup Ltd. | 73,158 | 125 |
| | APN Outdoor Group Ltd. | 34,532 | 125 |
| * | Orocobre Ltd. | 41,367 | 120 |
| | Corporate Travel Management Ltd. | 8,315 | 120 |
| | Bega Cheese Ltd. | 31,922 | 120 |
| * | Saracen Mineral Holdings Ltd. | 138,314 | 120 |
| | Eclipx Group Ltd. | 40,726 | 119 |
| | Tassal Group Ltd. | 40,658 | 119 |
| | Village Roadshow Ltd. | 30,616 | 118 |
| | Retail Food Group Ltd. | 22,951 | 118 |
| | Brickworks Ltd. | 11,518 | 118 |
| | IDP Education Ltd. | 34,158 | 118 |
| * | NEXTDC Ltd. | 41,947 | 117 |
| | Mantra Group Ltd. | 46,106 | 115 |
| | Credit Corp. Group Ltd. | 8,434 | 114 |
| ^ | Bellamy's Australia Ltd. | 12,983 | 112 |
| | Altium Ltd. | 18,786 | 112 |
| | 360 Capital Industrial Fund | 59,309 | 111 |
| | iSentia Group Ltd. | 40,814 | 109 |
| | SAI Global Ltd. | 29,194 | 104 |
| * | Infigen Energy | 134,985 | 103 |
| | Genworth Mortgage Insurance Australia Ltd. | 43,533 | 101 |
| ^ | IPH Ltd. | 22,711 | 101 |
| | Arena REIT | 68,505 | 101 |
| * | Western Areas Ltd. | 52,834 | 99 |
| * | Galaxy Resources Ltd. | 369,407 | 99 |
| | Seven West Media Ltd. | 191,420 | 99 |
| * | Perseus Mining Ltd. | 207,674 | 98 |
| | Technology One Ltd. | 22,813 | 97 |
| * | APN News & Media Ltd. | 47,055 | 96 |
| | Japara Healthcare Ltd. | 64,092 | 92 |
| * | Pilbara Minerals Ltd. | 220,998 | 87 |
| | Growthpoint Properties Australia Ltd. | 35,493 | 84 |
| | CSG Ltd. | 85,730 | 83 |
| | oOh!media Ltd. | 25,588 | 83 |
| ^ | Regis Healthcare Ltd. | 27,703 | 83 |
3
| | | |
| Vanguard® Total World Stock Index Fund | | |
| Schedule of Investments | | |
| October 31, 2016 | | |
| |
| | | | Market |
| | | | Value |
| | | Shares | ($000) |
| ^ | Cover-More Group Ltd. | 76,291 | 83 |
| * | Highfield Resources Ltd. | 94,587 | 82 |
| | Collins Foods Ltd. | 22,331 | 82 |
| | National Storage REIT | 73,989 | 81 |
| | RCG Corp. Ltd. | 73,467 | 81 |
| | Ingenia Communities Group | 38,871 | 80 |
| * | Beadell Resources Ltd. | 223,979 | 80 |
| | Gateway Lifestyle | 44,687 | 79 |
| | Folkestone Education Trust | 41,409 | 78 |
| | Nine Entertainment Co. Holdings Ltd. | 118,560 | 77 |
| * | Gold Road Resources Ltd. | 176,515 | 77 |
| | Select Harvests Ltd. | 16,297 | 76 |
| | SmartGroup Corp. Ltd. | 16,682 | 76 |
| | SG Fleet Group Ltd. | 27,592 | 75 |
| | BWX Ltd. | 20,537 | 75 |
| * | Bradken Ltd. | 29,923 | 73 |
| | MACA Ltd. | 54,308 | 73 |
| | Asaleo Care Ltd. | 64,802 | 72 |
| * | Karoon Gas Australia Ltd. | 40,339 | 70 |
| | Astro Japan Property Group | 13,425 | 69 |
| ^ | TFS Corp. Ltd. | 62,856 | 67 |
| | Australian Pharmaceutical Industries Ltd. | 45,992 | 66 |
| | Hotel Property Investments | 30,663 | 66 |
| * | Senex Energy Ltd. | 319,614 | 61 |
| *,^ | Mesoblast Ltd. | 65,159 | 61 |
| | Greencross Ltd. | 10,999 | 58 |
| * | Blue Sky Alternative Investments Ltd. | 10,502 | 58 |
| | GDI Property Group | 75,397 | 56 |
| * | UGL Ltd. | 22,674 | 55 |
| | Programmed Maintenance Services Ltd. | 48,054 | 52 |
| ^ | Estia Health Ltd. | 25,174 | 51 |
| | OFX Group Ltd. | 39,620 | 47 |
| | Reject Shop Ltd. | 6,933 | 39 |
| * | AWE Ltd. | 93,461 | 38 |
| | Virtus Health Ltd. | 7,125 | 38 |
| | Tox Free Solutions Ltd. | 20,484 | 37 |
| | RCR Tomlinson Ltd. | 18,116 | 37 |
| | WPP AUNZ Ltd. | 58,559 | 36 |
| | Cabcharge Australia Ltd. | 13,013 | 36 |
| *,^ | Liquefied Natural Gas Ltd. | 69,122 | 29 |
| * | Mount Gibson Iron Ltd. | 105,993 | 26 |
| | Cedar Woods Properties Ltd. | 7,313 | 25 |
| * | Cardno Ltd. | 35,086 | 25 |
| | Thorn Group Ltd. | 17,486 | 23 |
| | NZME Ltd. | 47,055 | 22 |
| * | Ten Network Holdings Ltd. | 27,323 | 21 |
| | Ainsworth Game Technology Ltd. | 14,747 | 20 |
| | ERM Power Ltd. | 23,151 | 20 |
| * | Lynas Corp. Ltd. | 437,604 | 19 |
| | SMS Management & Technology Ltd. | 14,483 | 17 |
| *,^ | Paladin Energy Ltd. | 153,176 | 16 |
| *,^ | Slater & Gordon Ltd. | 55,852 | 15 |
| * | Starpharma Holdings Ltd. | 23,801 | 13 |
| * | Billabong International Ltd. | 14,358 | 13 |
| * | MMA Offshore Ltd. | 40,368 | 9 |
| * | Arrium Ltd. | 450,831 | 8 |
| * | Capitol Health Ltd. | 76,464 | 7 |
| | Cash Converters International Ltd. | 29,337 | 7 |
| * | Acrux Ltd. | 27,063 | 7 |
| | Decmil Group Ltd. | 5,745 | 5 |
| * | Strandline Resources Ltd. | 22,019 | — |
| * | DSHE Holdings Ltd. | 14,824 | — |
| * | Jacana Minerals Ltd. | 5,347 | — |
| | | | 211,577 |
4
| | | |
| Vanguard® Total World Stock Index Fund | | |
| Schedule of Investments | | |
| October 31, 2016 | | |
| |
| | | | Market |
| | | | Value |
| | | Shares | ($000) |
| Austria (0.1%) | | |
| | Erste Group Bank AG | 59,713 | 1,873 |
| | OMV AG | 30,168 | 941 |
| | voestalpine AG | 24,646 | 873 |
| | ANDRITZ AG | 15,063 | 788 |
| | BUWOG AG | 18,778 | 454 |
| | IMMOFINANZ AG | 198,741 | 428 |
| * | Raiffeisen Bank International AG | 24,597 | 403 |
| | Wienerberger AG | 24,199 | 387 |
| | CA Immobilien Anlagen AG | 16,756 | 304 |
| | Oesterreichische Post AG | 7,276 | 251 |
| | Lenzing AG | 1,880 | 245 |
| | Conwert Immobilien Invest SE | 13,304 | 236 |
| | Verbund AG | 13,384 | 223 |
| | Mayr Melnhof Karton AG | 1,666 | 184 |
| | Schoeller-Bleckmann Oilfield Equipment AG | 2,289 | 162 |
| | Telekom Austria AG Class A | 27,541 | 158 |
| | Vienna Insurance Group AG Wiener Versicherung Gruppe | 7,914 | 156 |
| | RHI AG | 5,314 | 134 |
| | Zumtobel Group AG | 6,626 | 116 |
| | UNIQA Insurance Group AG | 17,732 | 114 |
| | Kapsch TrafficCom AG | 2,165 | 97 |
| | EVN AG | 7,792 | 91 |
| | Strabag SE | 2,677 | 90 |
| | DO & CO AG | 1,150 | 89 |
| | S IMMO AG | 7,798 | 84 |
| * | Flughafen Wien AG | 3,428 | 83 |
| | Semperit AG Holding | 2,008 | 54 |
| | Palfinger AG | 1,090 | 33 |
| | | | 9,051 |
| Belgium (0.4%) | | |
| * | Anheuser-Busch InBev SA/NV | 165,954 | 19,047 |
| * | KBC Group NV | 57,350 | 3,496 |
| | UCB SA | 25,901 | 1,753 |
| | Solvay SA Class A | 14,968 | 1,717 |
| | Ageas | 43,581 | 1,592 |
| | Groupe Bruxelles Lambert SA | 16,135 | 1,387 |
| | Umicore SA | 20,179 | 1,227 |
| | Proximus SADP | 29,243 | 837 |
| | Colruyt SA | 13,994 | 752 |
| | Ackermans & van Haaren NV | 5,274 | 732 |
| | bpost SA | 20,298 | 540 |
| * | Telenet Group Holding NV | 9,828 | 526 |
| | Cofinimmo SA | 4,202 | 492 |
| | Ontex Group NV | 15,357 | 465 |
| | Sofina SA | 3,211 | 448 |
| | Bekaert SA | 6,885 | 306 |
| | Melexis NV | 4,369 | 286 |
| | Elia System Operator SA/NV | 5,524 | 286 |
| | Warehouses De Pauw CVA | 3,090 | 285 |
| | Befimmo SA | 4,397 | 256 |
| | D'ieteren SA/NV | 5,632 | 248 |
| * | Aedifica SA | 2,582 | 214 |
| | Gimv NV | 3,672 | 198 |
| | Cie d'Entreprises CFE | 1,711 | 189 |
| | Ion Beam Applications | 3,801 | 180 |
| | Euronav NV | 22,833 | 179 |
| * | Tessenderlo Chemie NV (Voting Shares) | 4,912 | 164 |
| | Econocom Group SA/NV | 10,761 | 160 |
| * | AGFA-Gevaert NV | 35,336 | 147 |
| | Barco NV | 1,594 | 125 |
| *,^ | Nyrstar (Voting Shares) | 22,019 | 113 |
| * | Orange Belgium SA | 4,121 | 93 |
| | Kinepolis Group NV | 1,963 | 88 |
5
| | | |
| Vanguard® Total World Stock Index Fund | | |
| Schedule of Investments | | |
| October 31, 2016 | | |
| |
| | | | Market |
| | | | Value |
| | | Shares | ($000) |
| * | KBC Ancora | 2,239 | 85 |
| | EVS Broadcast Equipment SA | 2,319 | 81 |
| | Van de Velde NV | 888 | 63 |
| | Wereldhave Belgium NV | 434 | 54 |
| | | | 38,811 |
| Brazil (0.9%) | | |
| | Itau Unibanco Holding SA Preference Shares | 487,318 | 5,862 |
| * | Petroleo Brasileiro SA Preference Shares | 701,592 | 3,888 |
| | Banco Bradesco SA ADR | 368,860 | 3,840 |
| | Ambev SA ADR | 540,848 | 3,191 |
| * | Petroleo Brasileiro SA | 511,446 | 2,987 |
| | Banco Bradesco SA Preference Shares | 242,824 | 2,544 |
| | BRF SA | 148,024 | 2,476 |
| | Ambev SA | 418,917 | 2,471 |
| | Itausa - Investimentos Itau SA Preference Shares | 811,567 | 2,400 |
| * | Petroleo Brasileiro SA ADR | 200,078 | 2,335 |
| | Cielo SA | 216,174 | 2,194 |
| | BM&FBovespa SA - Bolsa de Valores Mercadorias e Futuros | 364,950 | 2,149 |
| | Itau Unibanco Holding SA ADR | 174,675 | 2,084 |
| | Ultrapar Participacoes SA | 81,248 | 1,841 |
| | Banco do Brasil SA | 183,793 | 1,687 |
| | Kroton Educacional SA | 321,636 | 1,602 |
| *,^ | Vale SA-SP Class B ADR | 194,064 | 1,343 |
| | BB Seguridade Participacoes SA | 123,939 | 1,248 |
| * | Vale SA Preference Shares | 187,666 | 1,213 |
| | Telefonica Brasil SA Preference Shares | 82,664 | 1,196 |
| * | Vale SA Class B Pfd. ADR | 183,839 | 1,184 |
| | Raia Drogasil SA | 52,300 | 1,161 |
| | Lojas Renner SA | 134,300 | 1,136 |
| | CCR SA | 175,900 | 956 |
| | Lojas Americanas SA Preference Shares | 144,825 | 939 |
| | Banco Bradesco SA | 90,697 | 902 |
| | Banco Santander Brasil SA | 95,900 | 790 |
| | Cia de Saneamento Basico do Estado de Sao Paulo | 74,600 | 788 |
| | Equatorial Energia SA | 40,500 | 722 |
| | Hypermarcas SA | 80,212 | 672 |
| | CETIP SA - Mercados Organizados | 46,054 | 647 |
| | Embraer SA ADR | 29,863 | 639 |
| | WEG SA | 109,022 | 601 |
| | Cia Brasileira de Distribuicao Grupo Pao de Acucar Preference Shares | 31,421 | 600 |
| | Klabin SA | 116,000 | 598 |
| * | Vale SA | 83,100 | 575 |
| | Engie Brasil Energia SA | 43,100 | 548 |
| * | BR Malls Participacoes SA | 128,830 | 516 |
| * | Rumo Logistica Operadora Multimodal SA | 204,283 | 457 |
| | CPFL Energia SA | 59,729 | 453 |
| | JBS SA | 144,798 | 441 |
| * | Centrais Eletricas Brasileiras SA | 57,200 | 425 |
| | M Dias Branco SA | 9,900 | 423 |
| * | Centrais Eletricas Brasileiras SA Preference Shares | 46,500 | 398 |
| | TIM Participacoes SA | 140,600 | 390 |
| | Gerdau SA Preference Shares | 107,200 | 370 |
| | Localiza Rent a Car SA | 29,800 | 370 |
| | BTG Pactual Group | 71,092 | 362 |
| | Fibria Celulose SA | 44,900 | 359 |
| | Natura Cosmeticos SA | 36,800 | 354 |
| | Cia Energetica de Minas Gerais Preference Shares | 111,500 | 341 |
| | Qualicorp SA | 52,300 | 337 |
| | Multiplan Empreendimentos Imobiliarios SA | 16,500 | 332 |
| | Sul America SA | 53,809 | 325 |
| | Cosan SA Industria e Comercio | 23,900 | 321 |
| | Estacio Participacoes SA | 54,600 | 317 |
| | EDP - Energias do Brasil SA | 65,567 | 315 |
| * | Cia Siderurgica Nacional SA | 86,800 | 292 |
6
| | |
| Vanguard® Total World Stock Index Fund | | |
| Schedule of Investments | | |
| October 31, 2016 | | |
| |
| | | Market |
| | | Value |
| | Shares | ($000) |
| Gerdau SA ADR | 82,126 | 282 |
| Braskem SA Preference Shares | 30,780 | 273 |
| TOTVS SA | 28,800 | 261 |
| AES Tiete Energia SA | 46,360 | 240 |
| Sao Martinho SA | 11,900 | 237 |
| Cia Hering | 38,400 | 233 |
| Smiles SA | 12,600 | 230 |
| Fleury SA | 16,400 | 217 |
| Porto Seguro SA | 22,872 | 217 |
| Cia Energetica de Sao Paulo Preference Shares | 46,585 | 216 |
| * Petroleo Brasileiro SA ADR Type A | 19,355 | 214 |
| Suzano Papel e Celulose SA Preference Shares Class A | 58,834 | 208 |
| MRV Engenharia e Participacoes SA | 52,900 | 205 |
| Iguatemi Empresa de Shopping Centers SA | 21,200 | 200 |
| Banco do Estado do Rio Grande do Sul SA Preference Shares | 46,698 | 199 |
| Cia de Transmissao de Energia Eletrica Paulista Preference Shares | 9,077 | 197 |
| Bradespar SA Preference Shares | 47,700 | 194 |
| Odontoprev SA | 51,300 | 193 |
| * Cia Siderurgica Nacional SA ADR | 55,570 | 187 |
| Cyrela Brazil Realty SA Empreendimentos e Participacoes | 55,598 | 187 |
| * Minerva SA | 57,400 | 182 |
| CVC Brasil Operadora e Agencia de Viagens SA | 21,400 | 164 |
| Duratex SA | 60,585 | 164 |
| Embraer SA | 30,300 | 163 |
| * Metalurgica Gerdau SA Preference Shares Class A | 107,700 | 160 |
| Valid Solucoes e Servicos de Seguranca em Meios de Pagamento e Identificacao SA | 16,853 | 158 |
| * B2W Cia Digital | 29,420 | 145 |
| Transmissora Alianca de Energia Eletrica SA | 21,427 | 139 |
| Cia Paranaense de Energia Preference Shares | 11,500 | 132 |
| * Usinas Siderurgicas de Minas Gerais SA Preference Shares | 92,471 | 131 |
| Cia de Saneamento de Minas Gerais-COPASA | 12,189 | 127 |
| Multiplus SA | 9,100 | 123 |
| Linx SA | 19,800 | 118 |
| * Marcopolo SA Preference Shares | 109,900 | 112 |
| Cia Energetica de Minas Gerais | 35,922 | 109 |
| Alpargatas SA Preference Shares | 28,989 | 96 |
| Grendene SA | 15,600 | 96 |
| TIM Participacoes SA ADR | 6,700 | 93 |
| * EcoRodovias Infraestrutura e Logistica SA | 29,800 | 88 |
| Aliansce Shopping Centers SA | 16,800 | 88 |
| BR Properties SA | 32,400 | 87 |
| Alupar Investimento SA | 13,346 | 78 |
| Iochpe Maxion SA | 14,900 | 76 |
| Cia Paranaense de Energia | 10,000 | 74 |
| * Marfrig Global Foods SA | 34,700 | 62 |
| * FPC Par Corretora de Seguros SA | 12,700 | 60 |
| Lojas Americanas SA | 11,864 | 58 |
| Cia Energetica de Minas Gerais ADR | 19,000 | 57 |
| Via Varejo SA | 17,900 | 51 |
| Light SA | 8,773 | 48 |
| Dimed SA Distribuidora da Medicamentos | 300 | 47 |
| Arezzo Industria e Comercio SA | 5,100 | 47 |
| Cia de Gas de Sao Paulo COMGAS Preference Shares Class A | 2,673 | 44 |
| Cia Energetica do Ceara Preference Shares | 2,819 | 42 |
| Eletropaulo Metropolitana Eletricidade de Sao Paulo SA Preference Shares | 12,108 | 39 |
| Mahle-Metal Leve SA | 5,200 | 36 |
| JSL SA | 9,200 | 34 |
| * Santos Brasil Participacoes SA | 35,000 | 33 |
| Sonae Sierra Brasil SA | 5,200 | 31 |
| Gafisa SA | 40,500 | 31 |
| SLC Agricola SA | 6,300 | 31 |
| Ez Tec Empreendimentos e Participacoes SA | 5,959 | 31 |
| Tupy SA | 7,400 | 31 |
| * Gol Linhas Aereas Inteligentes SA Preference Shares | 11,700 | 29 |
7
| | |
| Vanguard® Total World Stock Index Fund | | |
| Schedule of Investments | | |
| October 31, 2016 | | |
| |
| | | Market |
| | | Value |
| | Shares | ($000) |
| * Randon Participacoes SA Preference Shares | 17,664 | 26 |
| * Magnesita Refratarios SA | 3,660 | 26 |
| Guararapes Confeccoes SA | 1,100 | 23 |
| GAEC Educacao SA | 4,964 | 21 |
| Even Construtora e Incorporadora SA | 15,000 | 21 |
| QGEP Participacoes SA | 11,900 | 21 |
| * Eneva SA | 4,400 | 20 |
| Direcional Engenharia SA | 9,000 | 16 |
| 2 Ser Educacional SA | 2,300 | 15 |
| * Marisa Lojas SA | 4,950 | 12 |
| * Aliansce Shopping Centers SA | 1,569 | 8 |
| * Cia de Gas de Sao Paulo - COMGAS | 1 | — |
| | | 78,251 |
| Canada (3.2%) | | |
| Royal Bank of Canada | 306,426 | 19,144 |
| Toronto-Dominion Bank | 382,320 | 17,347 |
| Bank of Nova Scotia | 249,164 | 13,390 |
| Suncor Energy Inc. | 348,604 | 10,461 |
| Canadian National Railway Co. | 143,652 | 9,031 |
| Enbridge Inc. | 193,484 | 8,355 |
| Bank of Montreal (Toronto Shares) | 127,329 | 8,103 |
| TransCanada Corp. | 167,061 | 7,563 |
| Canadian Natural Resources Ltd. | 228,500 | 7,252 |
| Brookfield Asset Management Inc. Class A (Toronto Shares) | 186,657 | 6,536 |
| Canadian Imperial Bank of Commerce | 79,852 | 5,983 |
| Manulife Financial Corp. | 412,898 | 5,981 |
| Canadian Pacific Railway Ltd. | 31,464 | 4,498 |
| Sun Life Financial Inc. | 127,936 | 4,282 |
| Alimentation Couche-Tard Inc. Class B | 82,200 | 4,129 |
| Barrick Gold Corp. (Toronto Shares) | 231,792 | 4,078 |
| Magna International Inc. | 78,650 | 3,229 |
| Rogers Communications Inc. Class B | 75,600 | 3,041 |
| Potash Corp. of Saskatchewan Inc. | 175,464 | 2,853 |
| Thomson Reuters Corp. | 69,801 | 2,751 |
| BCE Inc. | 59,116 | 2,686 |
| Agrium Inc. | 28,821 | 2,646 |
| Goldcorp Inc. | 171,986 | 2,612 |
| Cenovus Energy Inc. | 177,274 | 2,557 |
| * CGI Group Inc. Class A | 53,288 | 2,531 |
| ^ Pembina Pipeline Corp. | 82,100 | 2,522 |
| National Bank of Canada | 70,104 | 2,502 |
| Franco-Nevada Corp. | 37,831 | 2,476 |
| Fairfax Financial Holdings Ltd. | 4,800 | 2,458 |
| Loblaw Cos. Ltd. | 47,435 | 2,340 |
| Silver Wheaton Corp. | 94,288 | 2,272 |
| Agnico Eagle Mines Ltd. | 44,700 | 2,270 |
| Restaurant Brands International Inc. | 47,982 | 2,133 |
| Teck Resources Ltd. Class B | 98,124 | 2,119 |
| Waste Connections Inc. | 26,268 | 1,976 |
| Fortis Inc. | 59,244 | 1,950 |
| Saputo Inc. | 54,000 | 1,941 |
| Encana Corp. | 200,426 | 1,911 |
| Intact Financial Corp. | 27,800 | 1,890 |
| Imperial Oil Ltd. | 55,390 | 1,796 |
| Shaw Communications Inc. Class B | 88,120 | 1,746 |
| Dollarama Inc. | 21,700 | 1,622 |
| Open Text Corp. | 25,700 | 1,596 |
| Great-West Lifeco Inc. | 63,500 | 1,595 |
| Constellation Software Inc. | 3,400 | 1,593 |
| Power Corp. of Canada | 73,390 | 1,574 |
| Metro Inc. | 49,350 | 1,525 |
| Inter Pipeline Ltd. | 70,500 | 1,462 |
| Canadian Tire Corp. Ltd. Class A | 14,642 | 1,423 |
| First Quantum Minerals Ltd. | 145,723 | 1,384 |
8
| | |
| Vanguard® Total World Stock Index Fund | | |
| Schedule of Investments | | |
| October 31, 2016 | | |
| |
| | | Market |
| | | Value |
| | Shares | ($000) |
| TELUS Corp. | 42,100 | 1,363 |
| SNC-Lavalin Group Inc. | 31,900 | 1,296 |
| Gildan Activewear Inc. | 49,600 | 1,274 |
| Crescent Point Energy Corp. | 106,800 | 1,272 |
| ^ RioCan REIT | 65,100 | 1,266 |
| ^ ARC Resources Ltd. | 74,300 | 1,261 |
| CCL Industries Inc. Class B | 6,900 | 1,227 |
| * Seven Generations Energy Ltd. Class A | 56,466 | 1,204 |
| * Valeant Pharmaceuticals International Inc. | 66,955 | 1,195 |
| Power Financial Corp. | 49,160 | 1,162 |
| Keyera Corp. | 38,596 | 1,158 |
| Canadian Utilities Ltd. Class A | 40,376 | 1,154 |
| * Tourmaline Oil Corp. | 43,300 | 1,135 |
| Onex Corp. | 16,900 | 1,093 |
| H&R REIT | 62,203 | 1,058 |
| * Kinross Gold Corp. | 270,849 | 1,052 |
| ^ PrairieSky Royalty Ltd. | 43,382 | 943 |
| George Weston Ltd. | 10,600 | 864 |
| * Fortis Inc. | 26,177 | 860 |
| ^ CI Financial Corp. | 46,100 | 848 |
| ^ AltaGas Ltd. | 33,773 | 836 |
| Vermilion Energy Inc. | 21,300 | 835 |
| Industrial Alliance Insurance & Financial Services Inc. | 21,500 | 833 |
| CAE Inc. | 56,600 | 795 |
| Tahoe Resources Inc. | 64,981 | 779 |
| Element Fleet Management Corp. | 79,300 | 773 |
| Peyto Exploration & Development Corp. | 30,000 | 771 |
| Waste Connections Inc. | 10,159 | 762 |
| * BlackBerry Ltd. | 107,772 | 761 |
| Yamana Gold Inc. | 203,140 | 725 |
| * Detour Gold Corp. | 36,900 | 703 |
| * Husky Energy Inc. | 63,899 | 687 |
| Methanex Corp. | 18,900 | 687 |
| Cameco Corp. | 89,036 | 686 |
| Finning International Inc. | 35,200 | 655 |
| WSP Global Inc. | 20,203 | 654 |
| 2 Hydro One Ltd. | 35,800 | 653 |
| Ritchie Bros Auctioneers Inc. | 18,500 | 640 |
| ^ Canadian Apartment Properties REIT | 28,300 | 619 |
| Atco Ltd. | 17,100 | 599 |
| Whitecap Resources Inc. | 74,459 | 595 |
| Veresen Inc. | 65,577 | 594 |
| Smart REIT | 23,100 | 576 |
| * B2Gold Corp. | 191,893 | 555 |
| TransForce Inc. | 23,130 | 525 |
| ^ Enbridge Income Fund Holdings Inc. | 20,600 | 523 |
| * Turquoise Hill Resources Ltd. | 167,109 | 518 |
| Stantec Inc. | 23,200 | 516 |
| ^ Canadian REIT | 14,800 | 510 |
| IGM Financial Inc. | 18,900 | 507 |
| * Lundin Mining Corp. | 128,884 | 504 |
| * Eldorado Gold Corp. | 154,905 | 489 |
| Pan American Silver Corp. | 29,624 | 473 |
| ^ Parkland Fuel Corp. | 20,240 | 473 |
| Cineplex Inc. | 12,300 | 468 |
| Quebecor Inc. Class B | 16,600 | 466 |
| Chartwell Retirement Residences | 41,600 | 463 |
| Algonquin Power & Utilities Corp. | 51,252 | 453 |
| Allied Properties REIT | 16,692 | 449 |
| Alamos Gold Inc. | 56,160 | 440 |
| Empire Co. Ltd. | 30,500 | 439 |
| * IMAX Corp. | 14,500 | 439 |
| MacDonald Dettwiler & Associates Ltd. | 7,500 | 429 |
| Toromont Industries Ltd. | 14,600 | 429 |
9
| | | |
| Vanguard® Total World Stock Index Fund | | |
| Schedule of Investments | | |
| October 31, 2016 | | |
| |
| | | | Market |
| | | | Value |
| | | Shares | ($000) |
| ^ | Cominar REIT | 38,640 | 428 |
| | West Fraser Timber Co. Ltd. | 12,300 | 421 |
| * | Bombardier Inc. Class B | 316,028 | 419 |
| | Linamar Corp. | 10,300 | 419 |
| * | New Gold Inc. | 104,400 | 412 |
| ^ | Canadian Western Bank | 21,600 | 410 |
| | OceanaGold Corp. | 129,808 | 397 |
| * | IAMGOLD Corp. | 97,994 | 392 |
| | Cott Corp. | 29,036 | 381 |
| | Enerplus Corp. | 54,870 | 369 |
| | Maple Leaf Foods Inc. | 16,100 | 367 |
| ^ | Northland Power Inc. | 20,352 | 364 |
| * | Raging River Exploration Inc. | 45,300 | 363 |
| | TMX Group Ltd. | 7,864 | 363 |
| * | Parex Resources Inc. | 30,643 | 353 |
| | Gibson Energy Inc. | 27,158 | 341 |
| * | Descartes Systems Group Inc. | 16,100 | 336 |
| ^ | Emera Inc. | 9,600 | 335 |
| | ShawCor Ltd. | 13,100 | 328 |
| * | Celestica Inc. | 27,401 | 324 |
| *,^ | Amaya Inc. | 23,975 | 321 |
| | First Capital Realty Inc. | 19,500 | 311 |
| ^ | Artis REIT | 35,500 | 310 |
| | FirstService Corp. | 7,621 | 309 |
| | Stella-Jones Inc. | 8,700 | 309 |
| | Granite REIT | 9,700 | 305 |
| | Capital Power Corp. | 19,717 | 304 |
| * | Torex Gold Resources Inc. | 16,258 | 302 |
| * | Pretium Resources Inc. | 30,829 | 301 |
| | Hudson's Bay Co. | 24,400 | 300 |
| ^ | Home Capital Group Inc. Class B | 15,000 | 297 |
| | Laurentian Bank of Canada | 8,015 | 296 |
| ^ | DH Corp. | 22,409 | 290 |
| ^ | Boardwalk REIT | 7,900 | 290 |
| * | Birchcliff Energy Ltd. | 45,120 | 287 |
| | New Flyer Industries Inc. | 10,200 | 285 |
| | Precision Drilling Corp. | 63,900 | 285 |
| | TransAlta Corp. | 63,460 | 280 |
| ^ | Mullen Group Ltd. | 19,931 | 276 |
| | Colliers International Group Inc. | 7,876 | 274 |
| | Dream Office REIT | 21,700 | 270 |
| * | Silver Standard Resources Inc. | 24,294 | 267 |
| *,^ | First Majestic Silver Corp. | 32,500 | 261 |
| ^ | Enercare Inc. | 17,800 | 257 |
| ^ | Manitoba Telecom Services Inc. | 9,000 | 252 |
| | Innergex Renewable Energy Inc. | 22,500 | 250 |
| | Westshore Terminals Investment Corp. | 12,900 | 249 |
| * | SEMAFO Inc. | 63,200 | 248 |
| * | Advantage Oil & Gas Ltd. | 36,600 | 247 |
| | Osisko Gold Royalties Ltd. | 23,247 | 245 |
| * | NovaGold Resources Inc. | 48,100 | 241 |
| * | ProMetic Life Sciences Inc. | 114,000 | 240 |
| | Superior Plus Corp. | 26,353 | 235 |
| | Endeavour Mining Corp. | 11,800 | 231 |
| | HudBay Minerals Inc. | 51,265 | 216 |
| | Norbord Inc. | 8,972 | 211 |
| | Bank of Montreal (New York Shares) | 3,309 | 210 |
| | Transcontinental Inc. Class A | 15,200 | 203 |
| | Russel Metals Inc. | 12,700 | 202 |
| | Canadian Energy Services & Technology Corp. | 50,700 | 200 |
| ^ | Corus Entertainment Inc. Class B | 23,929 | 198 |
| | Jean Coutu Group PJC Inc. Class A | 13,100 | 197 |
| | Enerflex Ltd. | 18,505 | 197 |
| | Pengrowth Energy Corp. | 127,200 | 196 |
10
| | | |
| Vanguard® Total World Stock Index Fund | | |
| Schedule of Investments | | |
| October 31, 2016 | | |
| |
| | | | Market |
| | | | Value |
| | | Shares | ($000) |
| | Winpak Ltd. | 5,700 | 195 |
| | TransAlta Renewables Inc. | 17,400 | 192 |
| ^ | Secure Energy Services Inc. | 30,536 | 187 |
| | TORC Oil & Gas Ltd. | 32,814 | 186 |
| | North West Co. Inc. | 9,700 | 185 |
| * | Canfor Corp. | 16,500 | 183 |
| | Just Energy Group Inc. | 34,800 | 183 |
| | Centerra Gold Inc. | 36,052 | 182 |
| * | Crew Energy Inc. | 36,800 | 181 |
| *,^ | Baytex Energy Corp. | 46,309 | 178 |
| | Nevsun Resources Ltd. | 60,900 | 177 |
| * | ECN Capital Corp. | 79,300 | 173 |
| | Barrick Gold Corp. (New York Shares) | 9,826 | 173 |
| ^ | Genworth MI Canada Inc. | 7,900 | 172 |
| | Aimia Inc. | 31,700 | 171 |
| *,^ | Penn West Petroleum Ltd. | 105,500 | 168 |
| | Pason Systems Inc. | 14,800 | 168 |
| | Aecon Group Inc. | 12,700 | 164 |
| * | NuVista Energy Ltd. | 31,673 | 161 |
| | Ensign Energy Services Inc. | 26,400 | 159 |
| | Enghouse Systems Ltd. | 4,200 | 158 |
| | Dorel Industries Inc. Class B | 6,200 | 157 |
| | Dominion Diamond Corp. | 18,500 | 157 |
| * | Great Canadian Gaming Corp. | 8,500 | 141 |
| ^ | Northview Apartment REIT | 9,263 | 138 |
| ^ | Extendicare Inc. | 19,100 | 131 |
| | Cogeco Communications Inc. | 2,800 | 131 |
| * | ATS Automation Tooling Systems Inc. | 15,000 | 129 |
| | Cascades Inc. | 13,600 | 128 |
| *,^ | China Gold International Resources Corp. Ltd. | 46,000 | 119 |
| * | Gran Tierra Energy Inc. (Toronto Shares) | 40,100 | 117 |
| * | Bombardier Inc. Class A | 74,500 | 112 |
| | Morguard REIT | 9,540 | 108 |
| * | Paramount Resources Ltd. Class A | 9,000 | 102 |
| | Bonterra Energy Corp. | 5,400 | 102 |
| *,^ | MEG Energy Corp. | 24,200 | 99 |
| * | Kelt Exploration Ltd. | 21,851 | 97 |
| | Martinrea International Inc. | 15,500 | 91 |
| ^ | First National Financial Corp. | 4,600 | 84 |
| ^ | AutoCanada Inc. | 5,078 | 83 |
| * | Alacer Gold Corp. | 36,900 | 75 |
| * | Sierra Wireless Inc. | 4,900 | 67 |
| * | Gran Tierra Energy Inc. (American Shares) | 22,700 | 66 |
| *,^ | Athabasca Oil Corp. | 48,500 | 46 |
| | Canaccord Genuity Group Inc. | 13,000 | 41 |
| * | DREAM Unlimited Corp. Class A | 7,200 | 37 |
| | Sprott Inc. | 18,900 | 31 |
| ^ | Concordia International Corp. | 8,686 | 30 |
| * | Pacific Exploration and Production Corp. | 54,765 | 26 |
| *,^ | Avigilon Corp. | 3,900 | 25 |
| * | Osisko Gold Royalties Warrants Exp. 02/26/2019 | 620 | 1 |
| | | | 283,430 |
| Chile (0.1%) | | |
| | SACI Falabella | 109,383 | 859 |
| | Empresas COPEC SA | 78,519 | 789 |
| | Cencosud SA | 236,999 | 773 |
| * | Latam Airlines Group SA (Santiago Shares) | 69,108 | 662 |
| | Banco de Chile | 4,912,587 | 585 |
| | Empresas CMPC SA | 248,694 | 539 |
| | Banco de Credito e Inversiones | 9,503 | 488 |
| | Aguas Andinas SA Class A | 693,062 | 457 |
| | Enersis Americas SA ADR | 46,383 | 402 |
| | Empresa Nacional de Electricidad SA ADR | 19,169 | 398 |
| | Cia Cervecerias Unidas SA | 32,696 | 351 |
11
| | | |
| Vanguard® Total World Stock Index Fund | | |
| Schedule of Investments | | |
| October 31, 2016 | | |
| |
| | | | Market |
| | | | Value |
| | | Shares | ($000) |
| | Endesa Americas SA | 753,488 | 351 |
| | Sociedad Quimica y Minera de Chile SA ADR | 11,862 | 347 |
| * | Itau CorpBanca | 35,582,534 | 323 |
| | Banco Santander Chile | 5,672,801 | 317 |
| | Banco Santander Chile ADR | 13,755 | 314 |
| | Parque Arauco SA | 120,781 | 299 |
| | Colbun SA | 1,345,610 | 293 |
| * | Empresa Nacional de Telecomunicaciones SA | 26,758 | 287 |
| | Enersis Americas SA | 1,505,735 | 255 |
| | Enersis Chile SA ADR | 46,383 | 231 |
| | Engie Energia Chile SA | 127,686 | 227 |
| | SONDA SA | 103,961 | 215 |
| | AES Gener SA | 580,667 | 198 |
| | Vina Concha y Toro SA | 102,740 | 179 |
| | Inversiones Aguas Metropolitanas SA | 94,249 | 172 |
| | Embotelladora Andina SA Preference Shares | 40,520 | 162 |
| | Enersis Chile SA | 1,505,735 | 151 |
| | Sociedad Quimica y Minera de Chile SA Preference Shares Class B | 5,070 | 150 |
| | Empresa Nacional de Electricidad SA | 167,940 | 116 |
| | Inversiones La Construccion SA | 9,475 | 116 |
| | CAP SA | 14,259 | 100 |
| | Ripley Corp. SA | 145,581 | 91 |
| | Forus SA | 15,785 | 57 |
| | Endesa Americas SA ADR | 3,804 | 55 |
| * | Cia Sud Americana de Vapores SA | 977,795 | 20 |
| | | | 11,329 |
| China (2.2%) | | |
| | Tencent Holdings Ltd. | 1,108,056 | 29,366 |
| | China Construction Bank Corp. | 18,939,206 | 13,830 |
| | China Mobile Ltd. | 1,103,861 | 12,646 |
| | Industrial & Commercial Bank of China Ltd. | 14,935,245 | 8,965 |
| | Bank of China Ltd. | 15,637,800 | 7,008 |
| | Ping An Insurance Group Co. of China Ltd. | 1,028,880 | 5,416 |
| | CNOOC Ltd. | 3,334,280 | 4,195 |
| | China Petroleum & Chemical Corp. | 5,309,505 | 3,840 |
| | China Life Insurance Co. Ltd. Class H | 1,540,000 | 3,813 |
| | PetroChina Co. Ltd. | 4,076,000 | 2,789 |
| | China Overseas Land & Investment Ltd. | 794,480 | 2,439 |
| | Agricultural Bank of China Ltd. | 5,348,500 | 2,250 |
| | China Pacific Insurance Group Co. Ltd. | 543,200 | 1,958 |
| | China Merchants Bank Co. Ltd. | 782,272 | 1,902 |
| | China Telecom Corp. Ltd. | 3,346,034 | 1,725 |
| | PICC Property & Casualty Co. Ltd. | 978,887 | 1,580 |
| | China Minsheng Banking Corp. Ltd. | 1,367,760 | 1,556 |
| | China Shenhua Energy Co. Ltd. | 732,500 | 1,519 |
| | CITIC Ltd. | 1,031,000 | 1,479 |
| | China Unicom Hong Kong Ltd. | 1,213,574 | 1,425 |
| | China Resources Land Ltd. | 571,909 | 1,420 |
| | Bank of Communications Co. Ltd. | 1,671,058 | 1,270 |
| | Haitong Securities Co. Ltd. | 709,939 | 1,256 |
| | Hengan International Group Co. Ltd. | 156,730 | 1,245 |
| | Sinopharm Group Co. Ltd. | 221,200 | 1,074 |
| | CITIC Securities Co. Ltd. | 473,500 | 1,047 |
| | Geely Automobile Holdings Ltd. | 995,000 | 1,024 |
| | China CITIC Bank Corp. Ltd. | 1,536,010 | 991 |
| | China Communications Construction Co. Ltd. | 894,875 | 983 |
| *,^ | BYD Co. Ltd. | 144,460 | 951 |
| | Lenovo Group Ltd. | 1,450,000 | 929 |
| | CSPC Pharmaceutical Group Ltd. | 862,000 | 893 |
| | Guangdong Investment Ltd. | 576,000 | 868 |
| | CRRC Corp. Ltd. | 879,800 | 797 |
| | Country Garden Holdings Co. Ltd. | 1,508,230 | 783 |
| | Shenzhou International Group Holdings Ltd. | 117,991 | 782 |
| | Belle International Holdings Ltd. | 1,286,000 | 777 |
12
| | | |
| Vanguard® Total World Stock Index Fund | | |
| Schedule of Investments | | |
| October 31, 2016 | | |
| |
| | | | Market |
| | | | Value |
| | | Shares | ($000) |
| | China Cinda Asset Management Co. Ltd. | 2,152,000 | 773 |
| 2 | Huatai Securities Co. Ltd. | 357,764 | 755 |
| | New China Life Insurance Co. Ltd. | 172,001 | 743 |
| | ENN Energy Holdings Ltd. | 157,518 | 741 |
| * | China Resources Beer Holdings Co. Ltd. | 338,681 | 720 |
| 2 | China Galaxy Securities Co. Ltd. | 751,500 | 713 |
| | China Vanke Co. Ltd. | 267,904 | 699 |
| | China Resources Power Holdings Co. Ltd. | 411,400 | 697 |
| | Brilliance China Automotive Holdings Ltd. | 584,000 | 695 |
| | GF Securities Co. Ltd. | 307,000 | 682 |
| | Fosun International Ltd. | 464,464 | 673 |
| | Anhui Conch Cement Co. Ltd. | 240,000 | 663 |
| | China Merchants Port Holdings Co. Ltd. | 256,000 | 662 |
| | Great Wall Motor Co. Ltd. | 671,058 | 655 |
| | China Everbright International Ltd. | 545,000 | 651 |
| | Sunny Optical Technology Group Co. Ltd. | 133,000 | 649 |
| | China Railway Group Ltd. | 829,000 | 639 |
| | China Conch Venture Holdings Ltd. | 338,498 | 632 |
| | Beijing Enterprises Water Group Ltd. | 868,000 | 628 |
| | Dongfeng Motor Group Co. Ltd. | 594,000 | 619 |
| | Future Land Holdings Co. Ltd. Class A | 365,318 | 602 |
| | Sino Biopharmaceutical Ltd. | 858,000 | 600 |
| | Fullshare Holdings Ltd. | 1,067,500 | 595 |
| | Beijing Enterprises Holdings Ltd. | 118,000 | 590 |
| 2 | CGN Power Co. Ltd. | 1,974,832 | 577 |
| * | China Taiping Insurance Holdings Co. Ltd. | 293,059 | 564 |
| 2 | People's Insurance Co. Group of China Ltd. | 1,384,000 | 550 |
| | China Longyuan Power Group Corp. Ltd. | 719,000 | 548 |
| | Guangzhou Automobile Group Co. Ltd. | 451,857 | 546 |
| | China State Construction International Holdings Ltd. | 372,000 | 543 |
| | China Resources Gas Group Ltd. | 168,000 | 527 |
| | China Gas Holdings Ltd. | 344,000 | 524 |
| *,2 | China Huarong Asset Management Co. Ltd. | 1,349,000 | 516 |
| | ANTA Sports Products Ltd. | 178,000 | 513 |
| | Zhuzhou CRRC Times Electric Co. Ltd. | 104,709 | 506 |
| * | Alibaba Pictures Group Ltd. | 2,550,000 | 502 |
| | China Railway Construction Corp. Ltd. | 394,126 | 493 |
| | Huaneng Power International Inc. | 800,000 | 492 |
| * | China Evergrande Group | 732,000 | 482 |
| | TravelSky Technology Ltd. | 225,000 | 480 |
| | China Medical System Holdings Ltd. | 286,000 | 447 |
| | Kunlun Energy Co. Ltd. | 584,000 | 440 |
| | Longfor Properties Co. Ltd. | 320,000 | 425 |
| | Kingboard Chemical Holdings Ltd. | 141,500 | 418 |
| | Far East Horizon Ltd. | 452,000 | 412 |
| | Haier Electronics Group Co. Ltd. | 252,000 | 406 |
| | Zijin Mining Group Co. Ltd. | 1,245,301 | 396 |
| | China Oilfield Services Ltd. | 406,000 | 390 |
| | Zhejiang Expressway Co. Ltd. | 370,000 | 387 |
| | GCL-Poly Energy Holdings Ltd. | 2,872,800 | 387 |
| | Sinopec Shanghai Petrochemical Co. Ltd. | 740,000 | 377 |
| | Shanghai Pharmaceuticals Holding Co. Ltd. | 145,900 | 375 |
| | COSCO SHIPPING Ports Ltd. | 378,000 | 375 |
| | Beijing Capital International Airport Co. Ltd. | 354,000 | 370 |
| | Kingsoft Corp. Ltd. | 165,000 | 370 |
| | Shenzhen International Holdings Ltd. | 236,000 | 364 |
| | Tsingtao Brewery Co. Ltd. | 88,322 | 352 |
| | AviChina Industry & Technology Co. Ltd. | 508,000 | 345 |
| | China National Building Material Co. Ltd. | 752,000 | 343 |
| | Shimao Property Holdings Ltd. | 256,500 | 342 |
| | China Everbright Ltd. | 174,000 | 340 |
| | Jiangsu Expressway Co. Ltd. | 250,000 | 340 |
| | Chongqing Rural Commercial Bank Co. Ltd. | 566,000 | 339 |
| | GOME Electrical Appliances Holding Ltd. | 2,652,720 | 334 |
13
| | | |
| Vanguard® Total World Stock Index Fund | | |
| Schedule of Investments | | |
| October 31, 2016 | | |
| |
| | | | Market |
| | | | Value |
| | | Shares | ($000) |
| | China Reinsurance Group Corp. | 1,403,000 | 334 |
| | China Everbright Bank Co. Ltd. | 729,000 | 332 |
| 2 | BAIC Motor Corp. Ltd. | 316,400 | 332 |
| | Yanzhou Coal Mining Co. Ltd. | 446,000 | 330 |
| * | China Coal Energy Co. Ltd. | 581,000 | 329 |
| * | Alibaba Health Information Technology Ltd. | 622,000 | 325 |
| | China Communications Services Corp. Ltd. | 534,000 | 317 |
| | China Jinmao Holdings Group Ltd. | 1,140,000 | 314 |
| | Shanghai Lujiazui Finance & Trade Zone Development Co. Ltd. Class B | 200,586 | 312 |
| | Luye Pharma Group Ltd. | 458,000 | 308 |
| ^ | China Huishan Dairy Holdings Co. Ltd. | 822,401 | 305 |
| *,^ | Aluminum Corp. of China Ltd. | 817,331 | 304 |
| | Weichai Power Co. Ltd. | 199,200 | 300 |
| | Jiangxi Copper Co. Ltd. | 247,000 | 292 |
| | Huaneng Renewables Corp. Ltd. | 858,000 | 287 |
| | Chongqing Changan Automobile Co. Ltd. Class B | 187,062 | 285 |
| | Guangzhou R&F Properties Co. Ltd. | 201,400 | 284 |
| | Air China Ltd. | 422,000 | 277 |
| | China Power International Development Ltd. | 761,000 | 277 |
| | Shenzhen Investment Ltd. | 627,953 | 274 |
| 2 | Fuyao Glass Industry Group Co. Ltd. | 94,000 | 273 |
| *,2 | China International Capital Corp. Ltd. | 184,800 | 271 |
| | Nine Dragons Paper Holdings Ltd. | 329,000 | 267 |
| * | Shanghai Electric Group Co. Ltd. | 574,000 | 265 |
| | Shandong Weigao Group Medical Polymer Co. Ltd. | 400,000 | 260 |
| | Skyworth Digital Holdings Ltd. | 402,000 | 259 |
| | Sunac China Holdings Ltd. | 375,000 | 256 |
| | Shanghai Industrial Holdings Ltd. | 82,000 | 251 |
| | Shanghai Fosun Pharmaceutical Group Co. Ltd. | 81,500 | 250 |
| | Haitian International Holdings Ltd. | 120,000 | 247 |
| | Sino-Ocean Group Holding Ltd. | 593,500 | 246 |
| 2 | China Railway Signal & Communication Corp. Ltd. | 301,500 | 244 |
| | Tong Ren Tang Technologies Co. Ltd. | 134,000 | 244 |
| | Lee & Man Paper Manufacturing Ltd. | 322,000 | 242 |
| | Zhaojin Mining Industry Co. Ltd. | 234,000 | 240 |
| | SOHO China Ltd. | 464,500 | 240 |
| 2 | Legend Holdings Corp. | 95,000 | 237 |
| | Intime Retail Group Co. Ltd. | 299,500 | 235 |
| 2 | Sinopec Engineering Group Co. Ltd. | 265,135 | 234 |
| *,2 | 3SBio Inc. | 228,000 | 228 |
| | China High Speed Transmission Equipment Group Co. Ltd. | 219,000 | 227 |
| | China Traditional Chinese Medicine Holding Co. Ltd. | 444,000 | 227 |
| 2 | Dali Foods Group Co. Ltd. | 425,000 | 221 |
| | Sihuan Pharmaceutical Holdings Group Ltd. | 910,000 | 218 |
| ^ | China Hongqiao Group Ltd. | 242,500 | 217 |
| *,^ | China Shanshui Cement Group Ltd. | 267,000 | 217 |
| 2 | Shengjing Bank Co. Ltd. | 216,854 | 212 |
| ^ | China Zhongwang Holdings Ltd. | 442,800 | 204 |
| * | Li Ning Co. Ltd. | 268,749 | 192 |
| | Kingboard Laminates Holdings Ltd. | 213,000 | 191 |
| | Phoenix Healthcare Group Co. Ltd. | 120,090 | 191 |
| *,2 | Cogobuy Group | 121,000 | 188 |
| * | CAR Inc. | 183,117 | 186 |
| | Sinotrans Ltd. | 382,000 | 180 |
| * | Sinotrans Shipping Ltd. | 1,084,000 | 176 |
| 2 | Universal Medical Financial & Technical Advisory Services Co. Ltd. | 202,500 | 174 |
| | BBMG Corp. | 471,000 | 172 |
| * | China Agri-Industries Holdings Ltd. | 431,800 | 169 |
| 2 | Red Star Macalline Group Corp. Ltd. | 156,796 | 169 |
| | China Resources Cement Holdings Ltd. | 412,000 | 166 |
| | China Southern Airlines Co. Ltd. | 296,000 | 166 |
| * | Maanshan Iron & Steel Co. Ltd. | 720,000 | 164 |
| | ZTE Corp. | 117,614 | 162 |
| | CIFI Holdings Group Co. Ltd. | 548,000 | 161 |
14
| | | |
| Vanguard® Total World Stock Index Fund | | |
| Schedule of Investments | | |
| October 31, 2016 | | |
| |
| | | | Market |
| | | | Value |
| | | Shares | ($000) |
| 2 | Fu Shou Yuan International Group Ltd. | 272,000 | 159 |
| | Inner Mongolia Yitai Coal Co. Ltd. Class B | 161,304 | 159 |
| | Metallurgical Corp. of China Ltd. | 489,000 | 159 |
| | Agile Group Holdings Ltd. | 285,500 | 158 |
| | Yuexiu Property Co. Ltd. | 1,063,207 | 156 |
| | China Molybdenum Co. Ltd. | 681,000 | 151 |
| | Huishang Bank Corp. Ltd. | 312,452 | 150 |
| | China International Marine Containers Group Co. Ltd. | 125,500 | 149 |
| *,^ | China COSCO Holdings Co. Ltd. | 420,500 | 145 |
| * | Carnival Group International Holdings Ltd. | 1,209,992 | 144 |
| | COSCO International Holdings Ltd. | 308,000 | 143 |
| | Lao Feng Xiang Co. Ltd. Class B | 41,600 | 142 |
| | China Shipping Development Co. Ltd. | 256,000 | 141 |
| | KWG Property Holding Ltd. | 244,000 | 141 |
| | NetDragon Websoft Holdings Ltd. | 43,500 | 140 |
| | Wuxi Little Swan Co. Ltd. Class B | 40,175 | 139 |
| | China Dongxiang Group Co. Ltd. | 701,000 | 136 |
| | Golden Eagle Retail Group Ltd. | 97,000 | 135 |
| * | Kingdee International Software Group Co. Ltd. | 332,000 | 134 |
| | Zhongsheng Group Holdings Ltd. | 134,000 | 134 |
| | Guangshen Railway Co. Ltd. | 242,000 | 134 |
| | Hopson Development Holdings Ltd. | 144,000 | 130 |
| | China National Accord Medicines Corp. Ltd. Class B | 20,760 | 130 |
| | Datang International Power Generation Co. Ltd. | 478,000 | 129 |
| * | Greentown China Holdings Ltd. | 157,879 | 129 |
| * | Xinhua Winshare Publishing and Media Co. Ltd. | 126,000 | 128 |
| | China Lesso Group Holdings Ltd. | 175,000 | 128 |
| ^ | Digital China Holdings Ltd. | 152,000 | 127 |
| | Beijing Jingneng Clean Energy Co. Ltd. | 414,000 | 126 |
| | Huadian Fuxin Energy Corp. Ltd. | 538,000 | 125 |
| *,^ | China Shipping Container Lines Co. Ltd. | 590,000 | 124 |
| | Logan Property Holdings Co. Ltd. | 306,000 | 123 |
| * | Chinasoft International Ltd. | 260,000 | 122 |
| | Powerlong Real Estate Holdings Ltd. | 356,000 | 121 |
| ^ | CT Environmental Group Ltd. | 424,000 | 119 |
| | China Eastern Airlines Corp. Ltd. | 264,000 | 119 |
| | Shenzhen Expressway Co. Ltd. | 118,000 | 118 |
| ^ | Xinjiang Goldwind Science & Technology Co. Ltd. | 85,000 | 117 |
| | Peak Sport Products Co. Ltd. | 343,000 | 114 |
| | Huadian Power International Corp. Ltd. | 266,000 | 114 |
| * | Poly Property Group Co. Ltd. | 360,000 | 114 |
| | Shandong Airlines Co. Ltd. Class B | 49,300 | 113 |
| | Tibet Water Resources Ltd. | 300,000 | 112 |
| | Greatview Aseptic Packaging Co. Ltd. | 219,000 | 111 |
| * | Angang Steel Co. Ltd. | 216,000 | 111 |
| | Shandong Chenming Paper Holdings Ltd. | 127,500 | 110 |
| ^ | Sinosoft Technology Group Ltd. | 252,000 | 110 |
| | CSG Holding Co. Ltd. Class B | 129,105 | 108 |
| | Guangdong Electric Power Development Co. Ltd. Class B | 239,742 | 107 |
| | Shanghai Jinjiang International Travel Co. Ltd. Class B | 28,772 | 106 |
| ^ | China South City Holdings Ltd. | 480,000 | 106 |
| * | Enerchina Holdings Ltd. | 1,503,000 | 104 |
| | Central China Securities Co. Ltd. | 201,988 | 104 |
| * | Hybrid Kinetic Group Ltd. | 3,574,000 | 103 |
| * | Hangzhou Steam Turbine Co. Ltd. Class B | 87,657 | 103 |
| *,2 | Qingdao Port International Co. Ltd. | 169,000 | 103 |
| *,2 | Haichang Ocean Park Holdings Ltd. | 484,000 | 103 |
| | Shanghai Mechanical and Electrical Industry Co. Ltd. Class B | 47,573 | 102 |
| | BYD Electronic International Co. Ltd. | 129,500 | 102 |
| ^ | China Maple Leaf Educational Systems Ltd. | 144,000 | 101 |
| *,^ | Leyou Technologies Holdings Ltd. | 560,000 | 101 |
| | Shanghai Fudan-Zhangjiang Bio-Pharmaceutical Co. Ltd. | 107,000 | 101 |
| | China National Materials Co. Ltd. | 446,000 | 100 |
| | China Water Affairs Group Ltd. | 138,000 | 100 |
15
| | | |
| Vanguard® Total World Stock Index Fund | | |
| Schedule of Investments | | |
| October 31, 2016 | | |
| |
| | | | Market |
| | | | Value |
| | | Shares | ($000) |
| | Bank of Chongqing Co. Ltd. | 122,000 | 98 |
| | Dazhong Transportation Group Co. Ltd. Class B | 137,250 | 96 |
| | Yantai Changyu Pioneer Wine Co. Ltd. Class B | 34,833 | 96 |
| | Tianneng Power International Ltd. | 106,000 | 96 |
| * | Coolpad Group Ltd. | 547,400 | 95 |
| | Sinopec Kantons Holdings Ltd. | 202,000 | 95 |
| * | Xinjiang Xinxin Mining Industry Co. Ltd. | 862,000 | 94 |
| | Anhui Expressway Co. Ltd. | 116,000 | 93 |
| | Anhui Gujing Distillery Co. Ltd. Class B | 23,900 | 93 |
| | Yuzhou Properties Co. Ltd. | 250,000 | 93 |
| * | China Water Industry Group Ltd. | 544,000 | 93 |
| * | North Mining Shares Co. Ltd. | 5,110,000 | 92 |
| 2 | Hua Hong Semiconductor Ltd. | 78,000 | 92 |
| * | Lifetech Scientific Corp. | 379,998 | 90 |
| | Livzon Pharmaceutical Group Inc. | 14,690 | 86 |
| | INESA Intelligent Tech Inc. Class B | 103,700 | 83 |
| | Weifu High-Technology Group Co. Ltd. Class B | 34,600 | 82 |
| | CSSC Offshore and Marine Engineering Group Co. Ltd. | 54,000 | 81 |
| | C C Land Holdings Ltd. | 302,000 | 80 |
| | Shanghai Jinqiao Export Processing Zone Development Co. Ltd. Class B | 52,600 | 80 |
| | BOE Technology Group Co. Ltd. Class B | 288,800 | 79 |
| | Yuexiu Transport Infrastructure Ltd. | 114,000 | 78 |
| | China Electronics Corp. Holdings Co. Ltd. | 322,000 | 77 |
| | Chaowei Power Holdings Ltd. | 86,000 | 77 |
| *,2 | Ozner Water International Holding Ltd. | 366,000 | 77 |
| | Vinda International Holdings Ltd. | 38,599 | 76 |
| | Xtep International Holdings Ltd. | 173,000 | 76 |
| | PAX Global Technology Ltd. | 118,000 | 74 |
| 2 | Cosmo Lady China Holdings Co. Ltd. | 179,998 | 73 |
| | Poly Culture Group Corp. Ltd. | 27,200 | 73 |
| | Sinotruk Hong Kong Ltd. | 130,500 | 72 |
| * | China Chengtong Development Group Ltd. | 816,000 | 71 |
| * | Renhe Commercial Holdings Co. Ltd. | 2,742,000 | 71 |
| * | Guangzhou Baiyunshan Pharmaceutical Holdings Co. Ltd. | 30,000 | 71 |
| * | Chiho-Tiande Group Ltd. | 92,000 | 71 |
| *,2 | Tian Ge Interactive Holdings Ltd. | 105,000 | 71 |
| * | Greenland Hong Kong Holdings Ltd. | 275,000 | 70 |
| ^ | China All Access Holdings Ltd. | 220,000 | 70 |
| | Inner Mongolia Eerduosi Resourses Co. Ltd. Class B | 67,770 | 70 |
| | Dah Chong Hong Holdings Ltd. | 166,000 | 69 |
| | Shanghai Baosight Software Co. Ltd. Class B | 40,000 | 69 |
| | Foshan Huaxin Packaging Co. Ltd. Class B | 56,900 | 69 |
| | China Foods Ltd. | 156,000 | 69 |
| | Tianjin Port Development Holdings Ltd. | 450,000 | 69 |
| | Shanghai Shibei Hi-Tech Co. Ltd. Class B | 62,788 | 69 |
| | Guorui Properties Ltd. | 205,000 | 68 |
| | China SCE Property Holdings Ltd. | 222,000 | 68 |
| *,^ | China Modern Dairy Holdings Ltd. | 310,000 | 67 |
| | Shanghai Huayi Group Corp. Ltd. Class B | 63,200 | 67 |
| | Sichuan Expressway Co. Ltd. | 166,000 | 67 |
| | Optics Valley Union Holding Co. Ltd. | 624,000 | 67 |
| * | Huadian Energy Co. Ltd. Class B | 131,400 | 66 |
| * | Sinopec Oilfield Service Corp. | 316,000 | 65 |
| * | Shanghai Zhongyida Co. Ltd. Class B | 118,300 | 65 |
| * | Shanghai Zhenhua Heavy Industries Co. Ltd. Class B | 130,500 | 65 |
| | Wasion Group Holdings Ltd. | 108,000 | 63 |
| | Shanghai Industrial Urban Development Group Ltd. | 246,000 | 62 |
| *,^ | Munsun Capital Group Ltd. | 1,926,000 | 62 |
| | China BlueChemical Ltd. | 318,000 | 61 |
| 2 | Beijing Urban Construction Design & Development Group Co. Ltd. | 88,000 | 61 |
| * | China Overseas Grand Oceans Group Ltd. | 165,000 | 61 |
| | Dawnrays Pharmaceutical Holdings Ltd. | 100,000 | 60 |
| | Weiqiao Textile Co. | 88,000 | 59 |
| | Bosideng International Holdings Ltd. | 650,000 | 59 |
16
| | | |
| Vanguard® Total World Stock Index Fund | | |
| Schedule of Investments | | |
| October 31, 2016 | | |
| |
| | | | Market |
| | | | Value |
| | | Shares | ($000) |
| | Fiyta Holdings Ltd. Class B | 57,840 | 59 |
| | Dalian Port PDA Co. Ltd. | 326,600 | 58 |
| ^ | Zoomlion Heavy Industry Science and Technology Co. Ltd. | 160,380 | 58 |
| | Beijing Capital Land Ltd. | 152,000 | 58 |
| *,2 | Tianhe Chemicals Group Ltd. | 383,088 | 58 |
| | Dongjiang Environmental Co. Ltd. | 37,500 | 57 |
| * | O-Net Technologies Group Ltd. | 104,000 | 57 |
| | SSY Group Ltd. | 164,336 | 55 |
| * | Skyway Securities Group Ltd. | 2,520,000 | 55 |
| | 361 Degrees International Ltd. | 146,000 | 55 |
| | China ZhengTong Auto Services Holdings Ltd. | 171,000 | 55 |
| | China Overseas Property Holdings Ltd. | 267,493 | 54 |
| | Texhong Textile Group Ltd. | 38,500 | 54 |
| * | West China Cement Ltd. | 530,000 | 54 |
| | Hisense Kelon Electrical Holdings Co. Ltd. Class A | 64,000 | 54 |
| | Hua Han Health Industry Holdings Ltd. | 778,708 | 53 |
| | Fufeng Group Ltd. | 125,000 | 53 |
| *,^ | Biostime International Holdings Ltd. | 21,000 | 52 |
| * | PW Medtech Group Ltd. | 159,000 | 50 |
| | Fantasia Holdings Group Co. Ltd. | 375,000 | 49 |
| * | Hanergy Thin Film Power Group Ltd. | 1,810,000 | 48 |
| * | Shanghai Chlor-Alkali Chemical Co. Ltd. Class B | 61,900 | 48 |
| * | Kama Co. Ltd. Class B | 46,500 | 47 |
| | Zhonglu Co. Ltd. Class B | 26,400 | 47 |
| | Shanghai Jin Jiang International Hotels Group Co. Ltd. | 162,000 | 47 |
| | Huangshan Tourism Development Co. Ltd. Class B | 34,350 | 47 |
| | Harbin Electric Co. Ltd. | 96,000 | 47 |
| | China Fangda Group Co. Ltd. Class B | 49,800 | 46 |
| | Lonking Holdings Ltd. | 279,000 | 46 |
| | Luthai Textile Co. Ltd. Class B | 35,800 | 45 |
| * | Sinolink Worldwide Holdings Ltd. | 386,000 | 45 |
| | Shanghai Waigaoqiao Free Trade Zone Group Co. Ltd. Class B | 26,900 | 45 |
| * | Shang Gong Group Co. Ltd. Class B | 42,600 | 44 |
| | Xiamen International Port Co. Ltd. | 204,000 | 44 |
| * | China Oil & Gas Group Ltd. | 572,000 | 43 |
| | Qingling Motors Co. Ltd. | 140,000 | 43 |
| | Tianjin Development Holdings Ltd. | 90,000 | 43 |
| | Xingda International Holdings Ltd. | 103,000 | 43 |
| * | Glorious Property Holdings Ltd. | 355,000 | 43 |
| | Shanghai Haixin Group Co. Class B | 48,700 | 42 |
| | China Lilang Ltd. | 73,000 | 41 |
| | Shanghai Jinjiang International Industrial Investment Co. Ltd. Class B | 27,700 | 41 |
| | Hubei Sanonda Co. Ltd. Class B | 38,600 | 41 |
| | Phoenix Satellite Television Holdings Ltd. | 200,000 | 40 |
| | Tianjin Capital Environmental Protection Group Co. Ltd. | 72,000 | 40 |
| | Colour Life Services Group Co. Ltd. | 55,000 | 40 |
| | Beijing North Star Co. Ltd. | 118,000 | 40 |
| * | AVIC International Holding HK Ltd. | 604,000 | 39 |
| * | Lianhua Supermarket Holdings Co. Ltd. | 94,000 | 38 |
| * | MIE Holdings Corp. | 384,000 | 38 |
| | Shanghai Highly Group Co. Ltd. Class B | 47,700 | 38 |
| | Shanghai Diesel Engine Co. Ltd. Class B | 46,100 | 38 |
| | China Power New Energy Development Co. Ltd. | 62,000 | 38 |
| * | Shanghai Phoenix Enterprise Group Co. Ltd. Class B | 40,300 | 37 |
| * | Shanghai Potevio Co. Ltd. Class B | 25,700 | 37 |
| *,^ | National Agricultural Holdings Ltd. | 246,000 | 36 |
| * | CITIC Resources Holdings Ltd. | 278,000 | 35 |
| | Dongfang Electric Corp. Ltd. | 44,800 | 35 |
| * | Shanghai Greencourt Investment Group Co. Ltd. Class B | 55,200 | 34 |
| | China Shineway Pharmaceutical Group Ltd. | 33,000 | 34 |
| | Comba Telecom Systems Holdings Ltd. | 190,039 | 34 |
| * | Hi Sun Technology China Ltd. | 213,000 | 33 |
| | Eastern Communications Co. Ltd. Class B | 45,100 | 33 |
| | Tiangong International Co. Ltd. | 258,000 | 33 |
17
| | | |
| Vanguard® Total World Stock Index Fund | | |
| Schedule of Investments | | |
| October 31, 2016 | | |
| |
| | | | Market |
| | | | Value |
| | | Shares | ($000) |
| * | Shougang Concord International Enterprises Co. Ltd. | 994,000 | 32 |
| * | China Fiber Optic Network System Group Ltd. | 348,000 | 31 |
| | Shanghai Jinjiang International Hotels Development Co. Ltd. Class B | 14,700 | 31 |
| * | China Soft Power Technology Holdings Ltd. | 1,302,000 | 31 |
| | Welling Holding Ltd. | 156,000 | 31 |
| * | China Yurun Food Group Ltd. | 195,000 | 31 |
| * | Hengdeli Holdings Ltd. | 284,000 | 31 |
| * | China Rare Earth Holdings Ltd. | 421,113 | 30 |
| * | China Datang Corp. Renewable Power Co. Ltd. | 330,000 | 30 |
| | Jinzhou Port Co. Ltd. Class B | 56,400 | 30 |
| * | TCL Multimedia Technology Holdings Ltd. | 58,000 | 29 |
| ^ | CIMC Enric Holdings Ltd. | 70,000 | 29 |
| | CPMC Holdings Ltd. | 55,000 | 29 |
| * | China Huiyuan Juice Group Ltd. | 77,500 | 29 |
| * | Baoxin Auto Group Ltd. | 86,143 | 28 |
| | China Suntien Green Energy Corp. Ltd. | 209,000 | 28 |
| | Ajisen China Holdings Ltd. | 61,000 | 27 |
| | Foshan Electrical and Lighting Co. Ltd. Class B | 33,900 | 27 |
| ^ | China Singyes Solar Technologies Holdings Ltd. | 56,400 | 27 |
| * | Landing International Development Ltd. | 1,115,000 | 27 |
| | Concord New Energy Group Ltd. | 520,000 | 26 |
| | Huaxin Cement Co. Ltd. Class B | 36,200 | 26 |
| * | EverChina International Holdings Co. Ltd. | 475,000 | 25 |
| | China Merchants Land Ltd. | 168,000 | 24 |
| * | Chengde Nanjiang Co. Ltd. Class B | 62,900 | 23 |
| * | Tech Pro Technology Development Ltd. | 833,600 | 23 |
| ^ | Sinofert Holdings Ltd. | 174,000 | 23 |
| | NVC Lighting Holding Ltd. | 156,000 | 21 |
| ^ | Hilong Holding Ltd. | 87,000 | 21 |
| *,^ | Wisdom Sports Group | 64,000 | 21 |
| | Shenzhen Chiwan Wharf Holdings Ltd. Class B | 12,900 | 21 |
| * | Shanghai Bailian Group Co. Ltd. Class B | 15,500 | 20 |
| ^ | Boer Power Holdings Ltd. | 51,000 | 20 |
| | First Tractor Co. Ltd. | 36,000 | 20 |
| | Yashili International Holdings Ltd. | 94,000 | 19 |
| * | V1 Group Ltd. | 370,000 | 18 |
| * | Universal Health International Group Holding Ltd. | 383,000 | 17 |
| | Hydoo International Holding Ltd. | 172,000 | 17 |
| * | Anxin-China Holdings Ltd. | 312,000 | 15 |
| * | China Dynamics Holdings Ltd. | 420,000 | 15 |
| | Jiangling Motors Corp. Ltd. Class B | 6,100 | 15 |
| * | Sany Heavy Equipment International Holdings Co. Ltd. | 95,000 | 15 |
| * | SRE Group Ltd. | 490,000 | 14 |
| | Shenguan Holdings Group Ltd. | 176,000 | 14 |
| 2 | Kangda International Environmental Co. Ltd. | 59,998 | 14 |
| * | Dongyue Group Ltd. | 71,000 | 13 |
| | Real Nutriceutical Group Ltd. | 143,000 | 12 |
| * | Qinqin Foodstuffs Group Cayman Co. Ltd. | 33,285 | 11 |
| * | Daphne International Holdings Ltd. | 78,000 | 10 |
| * | China Public Procurement Ltd. | 904,000 | 8 |
| * | China Lumena New Materials Corp. | 476,000 | 8 |
| * | Mingfa Group International Co. Ltd. | 30,971 | 8 |
| | | | 192,759 |
| Colombia (0.1%) | | |
| | Bancolombia SA ADR | 20,346 | 779 |
| | Grupo de Inversiones Suramericana SA | 40,212 | 519 |
| | Grupo Argos SA | 66,286 | 430 |
| | Grupo de Inversiones Suramericana SA Preference Shares | 26,676 | 337 |
| | Grupo Aval Acciones y Valores Preference Shares | 792,630 | 327 |
| | Cementos Argos SA | 74,738 | 296 |
| * | Ecopetrol SA ADR | 31,110 | 270 |
| | Interconexion Electrica SA ESP | 73,305 | 243 |
| | Banco Davivienda SA Preference Shares | 23,252 | 237 |
| | Almacenes Exito SA | 44,355 | 221 |
18
| | | |
| Vanguard® Total World Stock Index Fund | | |
| Schedule of Investments | | |
| October 31, 2016 | | |
| |
| | | | Market |
| | | | Value |
| | | Shares | ($000) |
| * | Ecopetrol SA | 423,943 | 185 |
| | Cementos Argos SA Preference Shares | 48,144 | 175 |
| | Bancolombia SA Preference Shares | 14,574 | 138 |
| * | Cemex Latam Holdings SA | 32,512 | 121 |
| | Avianca Holdings SA Preference Shares | 47,127 | 38 |
| | | | 4,316 |
| Czech Republic (0.0%) | | |
| | CEZ AS | 32,776 | 618 |
| | Komercni banka as | 16,469 | 603 |
| *,2 | Moneta Money Bank AS | 78,656 | 275 |
| | Philip Morris CR AS | 205 | 101 |
| | O2 Czech Republic AS | 10,040 | 92 |
| | Pegas Nonwovens SA | 1,190 | 38 |
| | | | 1,727 |
| Denmark (0.6%) | | |
| | Novo Nordisk A/S Class B | 382,808 | 13,638 |
| | Danske Bank A/S | 154,982 | 4,781 |
| | Vestas Wind Systems A/S | 45,428 | 3,639 |
| | Pandora A/S | 22,974 | 2,988 |
| | Carlsberg A/S Class B | 22,877 | 2,061 |
| | AP Moller - Maersk A/S Class A | 1,368 | 2,000 |
| | DSV A/S | 39,335 | 1,905 |
| * | Genmab A/S | 11,525 | 1,898 |
| | Novozymes A/S | 43,876 | 1,628 |
| | ISS A/S | 37,852 | 1,486 |
| | Coloplast A/S Class B | 20,844 | 1,452 |
| | AP Moller - Maersk A/S Class B | 863 | 1,324 |
| | Chr Hansen Holding A/S | 18,574 | 1,112 |
| * | TDC A/S | 166,630 | 919 |
| | Jyske Bank A/S | 14,756 | 669 |
| *,2 | DONG Energy A/S | 15,995 | 634 |
| | GN Store Nord A/S | 31,155 | 631 |
| | Sydbank A/S | 14,431 | 451 |
| | Tryg A/S | 23,074 | 450 |
| | William Demant Holding A/S | 23,763 | 442 |
| | Royal Unibrew A/S | 8,803 | 412 |
| * | H Lundbeck A/S | 12,426 | 400 |
| * | Topdanmark A/S | 14,455 | 389 |
| | SimCorp A/S | 6,823 | 377 |
| ^ | FLSmidth & Co. A/S | 9,869 | 358 |
| | Dfds A/S | 7,170 | 346 |
| | NKT Holding A/S | 4,924 | 331 |
| | Ambu A/S Class B | 4,929 | 255 |
| * | Bavarian Nordic A/S | 6,766 | 229 |
| | Rockwool International A/S Class B | 1,356 | 227 |
| | Spar Nord Bank A/S | 21,626 | 217 |
| 2 | Scandinavian Tobacco Group A/S | 11,655 | 202 |
| | Matas A/S | 7,874 | 153 |
| | Schouw & Co. AB | 2,252 | 143 |
| | ALK-Abello A/S | 1,004 | 136 |
| | Alm Brand A/S | 11,849 | 89 |
| | Solar A/S Class B | 1,427 | 78 |
| * | Bang & Olufsen A/S | 4,004 | 44 |
| * | OW Bunker A/S | 3,210 | — |
| | | | 48,494 |
| Egypt (0.0%) | | |
| | Commercial International Bank Egypt SAE | 217,787 | 1,267 |
| * | Global Telecom Holding SAE GDR | 125,930 | 258 |
| | ElSewedy Electric Co. | 29,618 | 209 |
| * | Egyptian Financial Group-Hermes Holding Co. | 113,387 | 200 |
| | Sidi Kerir Petrochemicals Co. | 79,618 | 124 |
| | Talaat Moustafa Group | 193,125 | 123 |
| * | Medinet Nasr Housing | 55,348 | 87 |
19
| | |
| Vanguard® Total World Stock Index Fund | | |
| Schedule of Investments | | |
| October 31, 2016 | | |
| |
| | | Market |
| | | Value |
| | Shares | ($000) |
| * Orascom Construction Ltd. | 10,791 | 57 |
| Telecom Egypt Co. | 55,015 | 54 |
| * Pioneers Holding for Financial Investments SAE | 51,300 | 49 |
| * Orascom Telecom Media And Technology Holding SAE GDR | 126,005 | 48 |
| * Orascom Construction Ltd. | 3,826 | 39 |
| * Maridive & Oil Services SAE | 165,936 | 37 |
| * Six of October Development & Investment | 24,349 | 36 |
| * South Valley Cement | 74,684 | 32 |
| Oriental Weavers | 24,535 | 25 |
| * Citadel Capital SAE | 263,431 | 21 |
| Heliopolis Housing | 3,075 | 20 |
| * Ezz Steel | 24,554 | 19 |
| Palm Hills Developments SAE | 71,385 | 18 |
| | | 2,723 |
| Finland (0.4%) | | |
| Nokia Oyj | 1,193,815 | 5,330 |
| Sampo Oyj Class A | 98,006 | 4,490 |
| Kone Oyj Class B | 78,498 | 3,612 |
| UPM-Kymmene Oyj | 111,688 | 2,598 |
| Fortum Oyj | 92,493 | 1,542 |
| Wartsila OYJ Abp | 32,964 | 1,424 |
| Neste Oyj | 27,238 | 1,175 |
| Stora Enso Oyj | 120,404 | 1,138 |
| Elisa Oyj | 32,920 | 1,109 |
| Nokian Renkaat Oyj | 27,375 | 918 |
| Orion Oyj Class B | 20,669 | 880 |
| Huhtamaki Oyj | 21,732 | 877 |
| Metso Oyj | 29,380 | 770 |
| Kesko Oyj Class B | 14,093 | 700 |
| Amer Sports Oyj | 24,749 | 673 |
| Konecranes Oyj | 12,412 | 423 |
| Tieto Oyj | 15,241 | 418 |
| Valmet Oyj | 28,128 | 418 |
| Cargotec Oyj Class B | 9,102 | 373 |
| * Outokumpu Oyj | 47,770 | 333 |
| Metsa Board Oyj | 53,803 | 309 |
| YIT Oyj | 31,462 | 262 |
| Sponda Oyj | 44,471 | 211 |
| Uponor Oyj | 11,586 | 197 |
| Caverion Corp. | 25,972 | 187 |
| Kemira Oyj | 15,511 | 185 |
| Citycon Oyj | 77,979 | 183 |
| * Outotec Oyj | 39,740 | 173 |
| Cramo Oyj | 6,013 | 158 |
| Sanoma Oyj | 15,917 | 149 |
| Oriola-KD Oyj | 29,369 | 138 |
| Raisio Oyj | 30,159 | 126 |
| Ramirent Oyj | 11,293 | 83 |
| * Finnair Oyj | 12,392 | 55 |
| F-Secure Oyj | 12,677 | 45 |
| * Stockmann OYJ Abp Class B | 3,597 | 27 |
| | | 31,689 |
| France (2.9%) | | |
| TOTAL SA | 441,892 | 21,169 |
| Sanofi | 232,532 | 18,095 |
| BNP Paribas SA | 204,558 | 11,861 |
| LVMH Moet Hennessy Louis Vuitton SE | 52,193 | 9,502 |
| AXA SA | 403,486 | 9,104 |
| Danone SA | 118,274 | 8,203 |
| Schneider Electric SE | 113,473 | 7,631 |
| Vinci SA | 97,001 | 7,025 |
| L'Oreal SA | 38,705 | 6,934 |
| Air Liquide SA | 68,035 | 6,913 |
| Airbus Group SE | 114,303 | 6,787 |
20
| | |
| Vanguard® Total World Stock Index Fund | | |
| Schedule of Investments | | |
| October 31, 2016 | | |
| |
| | | Market |
| | | Value |
| | Shares | ($000) |
| Orange SA | 399,136 | 6,280 |
| Societe Generale SA | 153,440 | 5,985 |
| Pernod Ricard SA | 44,344 | 5,274 |
| Essilor International SA | 42,380 | 4,762 |
| Vivendi SA | 231,363 | 4,683 |
| Cie de Saint-Gobain | 99,383 | 4,413 |
| Engie SA | 300,806 | 4,338 |
| Cie Generale des Etablissements Michelin | 37,680 | 4,081 |
| Safran SA | 59,061 | 4,064 |
| Kering | 15,624 | 3,467 |
| Renault SA | 36,576 | 3,181 |
| Legrand SA | 55,714 | 3,148 |
| Carrefour SA | 118,782 | 3,113 |
| Publicis Groupe SA | 43,438 | 2,980 |
| * Valeo SA | 50,152 | 2,894 |
| Capgemini SA | 33,054 | 2,737 |
| Credit Agricole SA | 211,681 | 2,284 |
| Veolia Environnement SA | 99,821 | 2,181 |
| L'Oreal SA Loyalty Line | 12,108 | 2,169 |
| Sodexo SA | 18,600 | 2,160 |
| Christian Dior SE | 11,078 | 2,137 |
| Thales SA | 22,090 | 2,078 |
| Hermes International | 4,975 | 2,015 |
| Atos SE | 19,228 | 1,995 |
| Dassault Systemes | 24,898 | 1,971 |
| Klepierre | 43,287 | 1,769 |
| SES SA Class A | 72,395 | 1,666 |
| Technip SA | 24,791 | 1,645 |
| Arkema SA | 15,604 | 1,480 |
| Accor SA | 37,404 | 1,419 |
| Air Liquide SA (Prime de fidelite) | 13,881 | 1,410 |
| Bouygues SA | 40,592 | 1,323 |
| STMicroelectronics NV | 131,689 | 1,250 |
| Teleperformance | 11,761 | 1,243 |
| * Peugeot SA | 82,346 | 1,233 |
| Gecina SA | 8,210 | 1,197 |
| Eiffage SA | 15,454 | 1,144 |
| SCOR SE | 34,558 | 1,119 |
| Suez | 68,037 | 1,078 |
| Bureau Veritas SA | 54,156 | 1,023 |
| Iliad SA | 4,876 | 1,022 |
| Edenred | 43,645 | 1,010 |
| Natixis SA | 198,177 | 1,003 |
| Zodiac Aerospace | 41,204 | 1,001 |
| Groupe Eurotunnel SE | 99,415 | 930 |
| * Alstom SA | 33,498 | 900 |
| Ingenico Group SA | 11,353 | 898 |
| Rexel SA | 63,700 | 883 |
| Eurofins Scientific SE | 1,894 | 861 |
| Societe BIC SA | 5,859 | 812 |
| Wendel SA | 6,723 | 773 |
| Orpea | 9,148 | 761 |
| Eutelsat Communications SA | 36,234 | 759 |
| SEB SA | 5,063 | 745 |
| Rubis SCA | 7,784 | 710 |
| Bollore SA | 206,723 | 681 |
| Aeroports de Paris | 6,518 | 658 |
| Fonciere Des Regions | 7,305 | 638 |
| Casino Guichard Perrachon SA | 12,220 | 608 |
| 2 Elior Group | 26,989 | 606 |
| ^ Electricite de France SA | 53,156 | 596 |
| Lagardere SCA | 23,330 | 594 |
| 2 Euronext NV | 14,797 | 593 |
| CNP Assurances | 34,175 | 592 |
21
| | | |
| Vanguard® Total World Stock Index Fund | | |
| Schedule of Investments | | |
| October 31, 2016 | | |
| |
| | | | Market |
| | | | Value |
| | | Shares | ($000) |
| | Faurecia | 15,011 | 553 |
| | Eurazeo SA | 9,561 | 551 |
| | SFR Group SA | 19,900 | 536 |
| | Imerys SA | 7,698 | 536 |
| | Ipsen SA | 7,642 | 528 |
| | ICADE | 7,250 | 521 |
| * | Ubisoft Entertainment SA | 15,177 | 516 |
| 2 | Amundi SA | 9,457 | 464 |
| | JCDecaux SA | 15,073 | 461 |
| | Technicolor SA | 78,508 | 459 |
| * | Nexans SA | 7,979 | 454 |
| | Nexity SA | 8,554 | 429 |
| | Remy Cointreau SA | 5,230 | 424 |
| | BioMerieux | 2,904 | 423 |
| | Altran Technologies SA | 26,760 | 382 |
| | Plastic Omnium SA | 11,348 | 370 |
| * | Sartorius Stedim Biotech | 5,406 | 365 |
| | Alten SA | 4,726 | 338 |
| * | Vallourec SA | 60,028 | 295 |
| * | DBV Technologies SA | 4,224 | 291 |
| | Sopra Steria Group | 2,748 | 280 |
| | Credit Agricole SA Loyalty Line | 25,664 | 277 |
| | Euler Hermes Group | 3,160 | 274 |
| | Korian SA | 8,909 | 273 |
| | Havas SA | 33,362 | 272 |
| | Elis SA | 16,345 | 272 |
| | IPSOS | 7,959 | 260 |
| | SPIE SA | 12,811 | 242 |
| | Mercialys SA | 11,167 | 231 |
| *,2 | Worldline SA | 8,201 | 225 |
| ^ | Television Francaise 1 | 23,400 | 216 |
| | Metropole Television SA | 12,110 | 211 |
| | Vicat SA | 3,033 | 191 |
| *,^ | Air France-KLM | 30,729 | 187 |
| * | Groupe Fnac SA | 2,622 | 179 |
| | Tarkett SA | 5,002 | 178 |
| | Neopost SA | 5,799 | 176 |
| | Faiveley Transport SA | 1,533 | 167 |
| * | Virbac SA | 1,008 | 160 |
| ^ | CGG SA | 5,291 | 140 |
| *,^ | Etablissements Maurel et Prom | 31,465 | 139 |
| | Trigano SA | 1,902 | 135 |
| *,2 | Europcar Groupe SA | 13,941 | 130 |
| | Coface SA | 16,874 | 109 |
| | Albioma SA | 5,973 | 99 |
| | SEB SA Loyalty Line | 643 | 95 |
| | Bonduelle SCA | 3,988 | 94 |
| | Gaztransport Et Technigaz SA | 2,718 | 92 |
| *,^ | Genfit | 4,892 | 92 |
| | Boiron SA | 1,048 | 89 |
| | Beneteau SA | 6,653 | 77 |
| | Electricite de France SA Loyalty Line | 6,661 | 75 |
| | FFP | 992 | 73 |
| | Guerbet | 1,179 | 70 |
| * | Fonciere de Paris SIIC | 470 | 68 |
| | Derichebourg SA | 18,005 | 56 |
| | Vilmorin & Cie SA | 815 | 49 |
| | Interparfums SA | 1,661 | 48 |
| | Assystem | 1,557 | 47 |
| * | Eramet | 929 | 44 |
| ^ | Rallye SA | 2,306 | 42 |
| | Haulotte Group SA | 2,872 | 40 |
| ^ | Bourbon Corp. | 2,900 | 38 |
| | GL Events | 1,837 | 33 |
22
| | | |
| Vanguard® Total World Stock Index Fund | | |
| Schedule of Investments | | |
| October 31, 2016 | | |
| |
| | | | Market |
| | | | Value |
| | | Shares | ($000) |
| | Jacquet Metal Service | 1,267 | 21 |
| *,^ | Parrot SA | 2,373 | 21 |
| * | Euro Disney SCA | 15,974 | 20 |
| | Mersen | 914 | 18 |
| | | | 251,468 |
| Germany (2.8%) | | |
| | Siemens AG | 158,722 | 18,034 |
| | Bayer AG | 171,903 | 17,068 |
| | BASF SE | 191,474 | 16,903 |
| | SAP SE | 187,119 | 16,485 |
| | Allianz SE | 94,255 | 14,714 |
| | Daimler AG | 197,927 | 14,121 |
| | Deutsche Telekom AG | 682,334 | 11,133 |
| | adidas AG | 41,663 | 6,845 |
| | Linde AG | 38,660 | 6,385 |
| | Deutsche Post AG | 198,030 | 6,141 |
| | Bayerische Motoren Werke AG | 67,105 | 5,855 |
| | Muenchener Rueckversicherungs-Gesellschaft AG in Muenchen | 29,877 | 5,801 |
| | Fresenius SE & Co. KGaA | 76,788 | 5,674 |
| | Volkswagen AG Preference Shares | 40,497 | 5,584 |
| | Continental AG | 22,580 | 4,337 |
| | Henkel AG & Co. KGaA Preference Shares | 33,642 | 4,324 |
| | Infineon Technologies AG | 232,572 | 4,183 |
| * | Deutsche Bank AG | 287,618 | 4,159 |
| | Fresenius Medical Care AG & Co. KGaA | 42,842 | 3,490 |
| | Vonovia SE | 97,011 | 3,420 |
| | Henkel AG & Co. KGaA | 28,013 | 3,087 |
| * | Deutsche Boerse AG | 38,644 | 3,018 |
| | HeidelbergCement AG | 30,864 | 2,920 |
| | E.ON SE | 389,028 | 2,851 |
| | Merck KGaA | 26,760 | 2,754 |
| | Deutsche Wohnen AG | 69,500 | 2,271 |
| | thyssenkrupp AG | 91,059 | 2,113 |
| | Beiersdorf AG | 22,852 | 2,015 |
| | ProSiebenSat.1 Media SE | 44,389 | 1,913 |
| | Porsche Automobil Holding SE Preference Shares | 33,143 | 1,791 |
| | Brenntag AG | 33,242 | 1,777 |
| | Symrise AG | 25,761 | 1,769 |
| * | RWE AG | 98,774 | 1,571 |
| | Commerzbank AG | 218,274 | 1,487 |
| | GEA Group AG | 37,487 | 1,452 |
| | Hannover Rueck SE | 12,666 | 1,413 |
| | LANXESS AG | 19,312 | 1,238 |
| | Wirecard AG | 24,882 | 1,181 |
| * | QIAGEN NV | 47,963 | 1,173 |
| | LEG Immobilien AG | 13,141 | 1,108 |
| | MTU Aero Engines AG | 10,478 | 1,094 |
| | United Internet AG | 26,070 | 1,072 |
| *,2 | Innogy SE | 26,775 | 1,063 |
| | METRO AG | 34,617 | 1,037 |
| | Evonik Industries AG | 32,344 | 1,013 |
| | OSRAM Licht AG | 17,494 | 994 |
| | MAN SE | 9,323 | 954 |
| | Bayerische Motoren Werke AG Preference Shares | 12,517 | 950 |
| *,2 | Zalando SE | 21,460 | 944 |
| | K&S AG | 41,651 | 843 |
| | KION Group AG | 13,785 | 833 |
| | HUGO BOSS AG | 12,984 | 816 |
| *,2 | Covestro AG | 13,167 | 780 |
| | Freenet AG | 23,737 | 681 |
| * | KUKA AG | 5,810 | 659 |
| | STADA Arzneimittel AG | 13,118 | 658 |
| | Rheinmetall AG | 8,983 | 624 |
| | FUCHS PETROLUB SE | 15,731 | 622 |
23
| | | |
| Vanguard® Total World Stock Index Fund | | |
| Schedule of Investments | | |
| October 31, 2016 | | |
| |
| | | | Market |
| | | | Value |
| | | Shares | ($000) |
| | RTL Group SA | 7,886 | 618 |
| | HOCHTIEF AG | 4,523 | 618 |
| | Volkswagen AG | 4,066 | 608 |
| | Deutsche Lufthansa AG | 47,003 | 602 |
| * | Dialog Semiconductor plc | 15,147 | 596 |
| * | Uniper SE | 42,249 | 562 |
| | Telefonica Deutschland Holding AG | 144,482 | 560 |
| | Fraport AG Frankfurt Airport Services Worldwide | 9,119 | 541 |
| | Sartorius AG Preference Shares | 6,872 | 541 |
| | Aurubis AG | 9,477 | 494 |
| | Gerresheimer AG | 6,360 | 480 |
| | Aareal Bank AG | 12,683 | 459 |
| | Axel Springer SE | 8,874 | 445 |
| | Rational AG | 854 | 444 |
| | Fielmann AG | 5,877 | 408 |
| | Suedzucker AG | 15,792 | 405 |
| ^ | Drillisch AG | 8,836 | 404 |
| | TAG Immobilien AG | 29,004 | 387 |
| | Software AG | 10,632 | 386 |
| | Hella KGaA Hueck & Co. | 10,050 | 384 |
| | Norma Group SE | 8,214 | 378 |
| | Deutsche EuroShop AG | 8,453 | 365 |
| * | Nordex SE | 12,822 | 338 |
| | Jungheinrich AG Preference Shares | 9,912 | 313 |
| | alstria office REIT-AG | 24,223 | 312 |
| | Salzgitter AG | 9,449 | 311 |
| | TUI AG-DI | 23,341 | 297 |
| | Krones AG | 2,900 | 296 |
| * | Schaeffler AG Preference Shares | 18,887 | 286 |
| | Bechtle AG | 2,720 | 286 |
| | GRENKE AG | 1,580 | 275 |
| | Indus Holding AG | 4,580 | 270 |
| | Wacker Chemie AG | 2,942 | 262 |
| | Leoni AG | 6,888 | 261 |
| | TLG Immobilien AG | 12,090 | 253 |
| | CompuGroup Medical SE | 5,668 | 251 |
| * | MorphoSys AG | 5,573 | 248 |
| | Nemetschek SE | 3,904 | 244 |
| * | Kloeckner & Co. SE | 19,462 | 243 |
| *,^ | Bilfinger SE | 6,899 | 243 |
| | DMG Mori AG | 5,149 | 236 |
| | Duerr AG | 3,125 | 233 |
| | Sixt SE | 3,725 | 226 |
| | CTS Eventim AG & Co. KGaA | 6,198 | 222 |
| ^ | Stroeer SE & Co. KGaA | 4,843 | 222 |
| | Talanx AG | 6,791 | 211 |
| 2 | Deutsche Pfandbriefbank AG | 20,422 | 210 |
| | RHOEN-KLINIKUM AG | 7,525 | 209 |
| 2 | ADO Properties SA | 5,463 | 200 |
| | KWS Saat SE | 581 | 190 |
| * | PATRIZIA Immobilien AG | 9,065 | 188 |
| | Pfeiffer Vacuum Technology AG | 2,059 | 187 |
| | Puma SE | 708 | 176 |
| * | zooplus AG | 1,212 | 173 |
| | Takkt AG | 7,223 | 171 |
| | BRAAS Monier Building Group SA | 5,799 | 167 |
| | Jenoptik AG | 9,224 | 159 |
| *,^ | SGL Carbon SE | 12,610 | 157 |
| *,2 | Tele Columbus AG | 19,783 | 156 |
| | XING AG | 672 | 137 |
| *,^ | Heidelberger Druckmaschinen AG | 48,886 | 130 |
| * | Vossloh AG | 2,023 | 123 |
| | Bertrandt AG | 1,140 | 121 |
| | Draegerwerk AG & Co. KGaA Preference Shares | 1,599 | 114 |
24
| | | |
| Vanguard® Total World Stock Index Fund | | |
| Schedule of Investments | | |
| October 31, 2016 | | |
| |
| | | | Market |
| | | | Value |
| | | Shares | ($000) |
| *,2 | Hapag-Lloyd AG | 5,172 | 103 |
| | ElringKlinger AG | 6,460 | 100 |
| | Deutsche Beteiligungs AG | 2,883 | 97 |
| | RWE AG Preference Shares | 8,374 | 97 |
| | Fuchs Petrolub SE Preference Shares | 1,999 | 89 |
| ^ | BayWa AG | 2,533 | 85 |
| | Carl Zeiss Meditec AG | 2,316 | 83 |
| | Sixt SE Preference Shares | 1,806 | 81 |
| * | Wincor Nixdorf AG | 1,064 | 77 |
| | comdirect bank AG | 7,126 | 72 |
| | Wacker Neuson SE | 5,133 | 71 |
| * | Wuestenrot & Wuerttembergische AG | 3,550 | 71 |
| | Hornbach Baumarkt AG | 2,055 | 65 |
| * | AIXTRON SE | 12,390 | 61 |
| | Deutz AG | 11,888 | 59 |
| * | H&R GmbH & Co. KGaA | 3,114 | 58 |
| | Biotest AG Preference Shares | 3,969 | 55 |
| | Gerry Weber International AG | 4,199 | 52 |
| | DIC Asset AG | 5,437 | 52 |
| ^ | SMA Solar Technology AG | 1,946 | 50 |
| | Hamburger Hafen und Logistik AG | 2,013 | 32 |
| | Deutsche Boerse AG | 170 | 13 |
| | | | 250,710 |
| Greece (0.0%) | | |
| | Alpha Bank AE | 289,409 | 495 |
| | OPAP SA | 44,400 | 379 |
| | JUMBO SA | 19,978 | 284 |
| | Hellenic Telecommunications Organization SA | 26,010 | 238 |
| | National Bank of Greece SA | 1,104,110 | 226 |
| | Titan Cement Co. SA | 9,212 | 214 |
| | Eurobank Ergasias SA | 350,334 | 207 |
| | Hellenic Telecommunications Organization SA ADR | 45,296 | 206 |
| | Motor Oil Hellas Corinth Refineries SA | 14,637 | 175 |
| | Piraeus Bank SA | 1,037,374 | 171 |
| * | FF Group | 6,714 | 161 |
| | Metka Industrial - Construction SA | 15,919 | 134 |
| * | Mytilineos Holdings SA | 20,599 | 117 |
| | Athens Water Supply & Sewage Co. SA | 16,211 | 96 |
| | Hellenic Exchanges SA | 17,966 | 89 |
| | Grivalia Properties REIC AE | 7,948 | 61 |
| | Aegean Airlines SA | 7,411 | 48 |
| * | Public Power Corp. SA | 13,196 | 43 |
| * | Hellenic Petroleum SA | 7,187 | 33 |
| * | Ellaktor SA | 8,992 | 12 |
| | | | 3,389 |
| Hong Kong (1.3%) | | |
| | AIA Group Ltd. | 2,451,782 | 15,424 |
| | CK Hutchison Holdings Ltd. | 590,927 | 7,297 |
| | Hong Kong Exchanges & Clearing Ltd. | 253,483 | 6,701 |
| | Sun Hung Kai Properties Ltd. | 295,463 | 4,400 |
| | Cheung Kong Property Holdings Ltd. | 590,927 | 4,369 |
| | Link REIT | 470,860 | 3,350 |
| | CLP Holdings Ltd. | 321,645 | 3,269 |
| | Hong Kong & China Gas Co. Ltd. | 1,560,878 | 3,049 |
| | Hang Seng Bank Ltd. | 160,272 | 2,890 |
| | BOC Hong Kong Holdings Ltd. | 749,000 | 2,670 |
| | Jardine Matheson Holdings Ltd. | 43,025 | 2,621 |
| | Power Assets Holdings Ltd. | 278,500 | 2,614 |
| | Sands China Ltd. | 502,800 | 2,182 |
| | Wharf Holdings Ltd. | 256,600 | 1,924 |
| | Galaxy Entertainment Group Ltd. | 452,000 | 1,851 |
| | Jardine Strategic Holdings Ltd. | 48,295 | 1,695 |
| | Hongkong Land Holdings Ltd. | 251,100 | 1,681 |
| | MTR Corp. Ltd. | 288,500 | 1,597 |
25
| | |
| Vanguard® Total World Stock Index Fund | | |
| Schedule of Investments | | |
| October 31, 2016 | | |
| |
| | | Market |
| | | Value |
| | Shares | ($000) |
| AAC Technologies Holdings Inc. | 149,000 | 1,420 |
| New World Development Co. Ltd. | 1,122,224 | 1,395 |
| Henderson Land Development Co. Ltd. | 231,809 | 1,371 |
| 2 WH Group Ltd. | 1,551,701 | 1,257 |
| Swire Pacific Ltd. Class A | 111,142 | 1,155 |
| Cheung Kong Infrastructure Holdings Ltd. | 135,000 | 1,105 |
| Sino Land Co. Ltd. | 648,280 | 1,101 |
| China Mengniu Dairy Co. Ltd. | 580,000 | 1,096 |
| Wheelock & Co. Ltd. | 167,000 | 1,028 |
| Techtronic Industries Co. Ltd. | 266,500 | 1,001 |
| ^ Bank of East Asia Ltd. | 243,072 | 977 |
| Hang Lung Properties Ltd. | 421,000 | 926 |
| Samsonite International SA | 272,396 | 856 |
| Want Want China Holdings Ltd. | 1,221,467 | 744 |
| Hang Lung Group Ltd. | 193,000 | 738 |
| Swire Properties Ltd. | 246,246 | 707 |
| * Semiconductor Manufacturing International Corp. | 5,646,000 | 684 |
| Li & Fung Ltd. | 1,256,000 | 617 |
| Hysan Development Co. Ltd. | 129,000 | 595 |
| Yue Yuen Industrial Holdings Ltd. | 150,500 | 573 |
| PCCW Ltd. | 872,000 | 519 |
| NWS Holdings Ltd. | 292,500 | 518 |
| ASM Pacific Technology Ltd. | 52,700 | 508 |
| Wynn Macau Ltd. | 321,200 | 492 |
| First Pacific Co. Ltd. | 575,200 | 436 |
| Kerry Properties Ltd. | 137,500 | 435 |
| VTech Holdings Ltd. | 34,400 | 422 |
| Hopewell Holdings Ltd. | 117,500 | 411 |
| Minth Group Ltd. | 112,000 | 396 |
| Shangri-La Asia Ltd. | 347,519 | 382 |
| ^ PRADA SPA | 104,000 | 364 |
| Tingyi Cayman Islands Holding Corp. | 336,000 | 362 |
| Xinyi Glass Holdings Ltd. | 406,000 | 349 |
| Fortune REIT | 282,923 | 343 |
| Sun Art Retail Group Ltd. | 485,079 | 342 |
| Vitasoy International Holdings Ltd. | 162,000 | 338 |
| * Esprit Holdings Ltd. | 390,146 | 322 |
| Kingston Financial Group Ltd. | 760,000 | 315 |
| Haitong International Securities Group Ltd. | 464,038 | 297 |
| Champion REIT | 482,000 | 274 |
| Great Eagle Holdings Ltd. | 61,000 | 271 |
| Cathay Pacific Airways Ltd. | 201,000 | 265 |
| SJM Holdings Ltd. | 379,000 | 262 |
| Cafe de Coral Holdings Ltd. | 74,000 | 261 |
| MGM China Holdings Ltd. | 154,000 | 254 |
| * China Minsheng Financial Holding Corp. Ltd. | 2,560,000 | 254 |
| Melco International Development Ltd. | 179,000 | 233 |
| ^ Xinyi Solar Holdings Ltd. | 622,000 | 230 |
| HKBN Ltd. | 193,689 | 228 |
| Dah Sing Financial Holdings Ltd. | 32,544 | 221 |
| * Freeman FinTech Corp. Ltd. | 3,160,000 | 216 |
| Television Broadcasts Ltd. | 59,100 | 214 |
| NagaCorp Ltd. | 342,000 | 211 |
| Man Wah Holdings Ltd. | 313,200 | 208 |
| * China Baoli Technologies Holdings Ltd. | 6,450,000 | 201 |
| Tongda Group Holdings Ltd. | 760,000 | 201 |
| Nexteer Automotive Group Ltd. | 148,000 | 195 |
| L'Occitane International SA | 93,500 | 193 |
| ^ China Goldjoy Group Ltd. | 1,988,000 | 192 |
| ^ Towngas China Co. Ltd. | 332,000 | 187 |
| Giordano International Ltd. | 354,000 | 187 |
| Uni-President China Holdings Ltd. | 272,800 | 184 |
| Value Partners Group Ltd. | 190,000 | 181 |
| * HengTen Networks Group Ltd. | 2,664,000 | 178 |
26
| | | |
| Vanguard® Total World Stock Index Fund | | |
| Schedule of Investments | | |
| October 31, 2016 | | |
| |
| | | | Market |
| | | | Value |
| | | Shares | ($000) |
| | Johnson Electric Holdings Ltd. | 73,750 | 178 |
| | Luk Fook Holdings International Ltd. | 59,000 | 173 |
| | BEP International Holdings Ltd. | 2,630,000 | 173 |
| | CP Pokphand Co. Ltd. | 1,350,000 | 172 |
| | Shui On Land Ltd. | 690,000 | 171 |
| | Kerry Logistics Network Ltd. | 128,000 | 170 |
| | IGG Inc. | 232,000 | 169 |
| | Shougang Fushan Resources Group Ltd. | 760,000 | 164 |
| | Kowloon Development Co. Ltd. | 163,000 | 163 |
| ^ | Brightoil Petroleum Holdings Ltd. | 566,000 | 163 |
| | Shun Tak Holdings Ltd. | 472,000 | 159 |
| | Guotai Junan International Holdings Ltd. | 399,000 | 152 |
| | Orient Overseas International Ltd. | 40,500 | 151 |
| * | Huabao International Holdings Ltd. | 399,000 | 149 |
| | China Travel International Investment Hong Kong Ltd. | 516,000 | 149 |
| * | China Innovative Finance Group Ltd. | 1,320,000 | 147 |
| | Pou Sheng International Holdings Ltd. | 458,000 | 143 |
| ^ | Chow Tai Fook Jewellery Group Ltd. | 201,600 | 143 |
| | SITC International Holdings Co. Ltd. | 240,000 | 142 |
| | FIH Mobile Ltd. | 427,000 | 141 |
| | Truly International Holdings Ltd. | 360,000 | 141 |
| | Sunlight REIT | 215,000 | 133 |
| | Canvest Environmental Protection Group Co. Ltd. | 291,000 | 131 |
| | K Wah International Holdings Ltd. | 240,000 | 130 |
| | Dah Sing Banking Group Ltd. | 71,137 | 128 |
| *,^,2 | IMAX China Holding Inc. | 27,100 | 128 |
| *,^ | China Ocean Industry Group Ltd. | 4,325,000 | 127 |
| | Chong Hing Bank Ltd. | 64,000 | 126 |
| * | HC International Inc. | 170,000 | 125 |
| | Pacific Textiles Holdings Ltd. | 97,000 | 122 |
| | Prosperity REIT | 279,000 | 120 |
| | Yuexiu REIT | 207,000 | 119 |
| *,^ | Superb Summit International Group Ltd. | 620,000 | 117 |
| | SEA Holdings Ltd. | 45,509 | 116 |
| ^ | SMI Holdings Group Ltd. | 1,212,000 | 116 |
| * | Global Brands Group Holding Ltd. | 990,000 | 112 |
| * | Vision Fame International Holding Ltd. | 318,000 | 111 |
| | Lifestyle International Holdings Ltd. | 81,500 | 109 |
| | China Harmony New Energy Auto Holding Ltd. | 231,000 | 107 |
| * | China Oceanwide Holdings Ltd. | 1,050,000 | 107 |
| | Spring REIT | 251,000 | 106 |
| | CITIC Telecom International Holdings Ltd. | 302,500 | 104 |
| | Texwinca Holdings Ltd. | 146,000 | 102 |
| | Stella International Holdings Ltd. | 59,000 | 102 |
| *,^ | KuangChi Science Ltd. | 289,000 | 101 |
| | Town Health International Medical Group Ltd. | 618,000 | 99 |
| ^,2 | Regina Miracle International Holdings Ltd. | 94,000 | 96 |
| | United Co. RUSAL plc | 270,000 | 96 |
| * | Convoy Global Holdings Ltd. | 3,102,000 | 96 |
| | SmarTone Telecommunications Holdings Ltd. | 63,000 | 95 |
| | Hutchison Telecommunications Hong Kong Holdings Ltd. | 290,000 | 93 |
| *,^ | Sino Oil And Gas Holdings Ltd. | 3,795,000 | 93 |
| | Far East Consortium International Ltd. | 225,000 | 92 |
| | Yingde Gases Group Co. Ltd. | 224,000 | 90 |
| * | Huayi Tencent Entertainment Co. Ltd. | 1,480,000 | 89 |
| * | FDG Electric Vehicles Ltd. | 1,620,000 | 85 |
| | Hopewell Highway Infrastructure Ltd. | 156,300 | 84 |
| *,^ | China Strategic Holdings Ltd. | 3,500,000 | 83 |
| | Chow Sang Sang Holdings International Ltd. | 46,000 | 81 |
| * | Nan Hai Corp. Ltd. | 2,450,000 | 80 |
| | G-Resources Group Ltd. | 4,329,600 | 76 |
| | Gemdale Properties & Investment Corp. Ltd. | 1,144,000 | 75 |
| * | Mei Ah Entertainment Group Ltd. | 960,000 | 73 |
| * | Beijing Enterprises Medical & Health Group Ltd. | 1,242,000 | 72 |
27
| | | |
| Vanguard® Total World Stock Index Fund | | |
| Schedule of Investments | | |
| October 31, 2016 | | |
| |
| | | | Market |
| | | | Value |
| | | Shares | ($000) |
| * | Pacific Basin Shipping Ltd. | 470,000 | 70 |
| ^ | China LNG Group Ltd. | 2,400,000 | 70 |
| | Emperor Capital Group Ltd. | 654,000 | 69 |
| * | China Medical & HealthCare Group Ltd. | 1,149,488 | 66 |
| * | United Photovoltaics Group Ltd. | 734,000 | 64 |
| * | Rentian Technology Holdings Ltd. | 950,000 | 64 |
| * | Microport Scientific Corp. | 83,852 | 62 |
| *,^ | Honghua Group Ltd. | 587,000 | 60 |
| * | Singamas Container Holdings Ltd. | 548,000 | 57 |
| * | China Beidahuang Industry Group Holdings Ltd. | 952,000 | 55 |
| | Dynam Japan Holdings Co. Ltd. | 37,400 | 54 |
| | SA Sa International Holdings Ltd. | 115,995 | 53 |
| | China Silver Group Ltd. | 264,000 | 52 |
| *,^ | MMG Ltd. | 196,000 | 52 |
| * | TOM Group Ltd. | 209,971 | 51 |
| | Goodbaby International Holdings Ltd. | 104,464 | 50 |
| | Varitronix International Ltd. | 124,000 | 50 |
| | China Aerospace International Holdings Ltd. | 382,000 | 49 |
| * | United Laboratories International Holdings Ltd. | 86,000 | 47 |
| * | Kong Sun Holdings Ltd. | 925,000 | 46 |
| * | Summit Ascent Holdings Ltd. | 145,948 | 45 |
| | Lai Sun Development Co. Ltd. | 2,169,000 | 44 |
| | TPV Technology Ltd. | 224,000 | 43 |
| | NewOcean Energy Holdings Ltd. | 162,000 | 42 |
| * | GCL New Energy Holdings Ltd. | 696,000 | 42 |
| | Shenwan Hongyuan HK Ltd. | 75,000 | 41 |
| * | China Financial International Investments Ltd. | 790,000 | 40 |
| | Ju Teng International Holdings Ltd. | 126,000 | 40 |
| *,^ | China LotSynergy Holdings Ltd. | 940,000 | 38 |
| | Lee's Pharmaceutical Holdings Ltd. | 43,500 | 38 |
| | TCC International Holdings Ltd. | 147,000 | 37 |
| * | NetMind Financial Holdings Ltd. | 4,128,000 | 37 |
| | Sun Hung Kai & Co. Ltd. | 58,000 | 36 |
| 2 | CGN New Energy Holdings Co. Ltd. | 250,000 | 36 |
| * | Midland Holdings Ltd. | 96,000 | 34 |
| | APT Satellite Holdings Ltd. | 49,500 | 33 |
| *,^ | Macau Legend Development Ltd. | 186,000 | 33 |
| * | 13 Holdings Ltd. | 107,500 | 32 |
| * | New Sports Group Ltd. | 2,440,000 | 31 |
| | EVA Precision Industrial Holdings Ltd. | 272,000 | 30 |
| * | Hong Kong Television Network Ltd. | 164,000 | 30 |
| | Liu Chong Hing Investment Ltd. | 19,982 | 28 |
| * | Mason Financial Holdings Ltd. | 1,220,000 | 28 |
| * | Good Resources Holdings Ltd. | 479,978 | 25 |
| *,^ | Anton Oilfield Services Group | 182,000 | 24 |
| * | Lifestyle China Group Ltd. | 81,500 | 23 |
| * | Xinchen China Power Holdings Ltd. | 128,000 | 22 |
| * | Silver Base Group Holdings Ltd. | 294,000 | 21 |
| * | Suncorp Technologies Ltd. | 1,910,000 | 19 |
| * | Sunshine Oilsands Ltd. | 317,500 | 18 |
| ^ | China Huarong Energy Co. Ltd. | 232,299 | 16 |
| * | Sincere Watch Hong Kong Ltd. | 560,000 | 15 |
| * | Emperor Watch & Jewellery Ltd. | 360,000 | 14 |
| | Parkson Retail Group Ltd. | 117,500 | 12 |
| * | Trinity Ltd. | 156,000 | 11 |
| * | China Healthcare Enterprise Group Ltd. | 592,842 | 10 |
| *,^ | Haier Healthwise Holdings Ltd. | 301,115 | 10 |
| * | Winshine Science Co. Ltd. | 403,904 | 10 |
| * | Qianhai Health Holdings Ltd. | 327,500 | 7 |
| | | | 111,978 |
| Hungary (0.0%) | | |
| | OTP Bank plc | 40,824 | 1,144 |
| | MOL Hungarian Oil & Gas plc | 10,782 | 692 |
| | Richter Gedeon Nyrt | 28,755 | 617 |
28
| | |
| Vanguard® Total World Stock Index Fund | | |
| Schedule of Investments | | |
| October 31, 2016 | | |
| |
| | | Market |
| | | Value |
| | Shares | ($000) |
| Magyar Telekom Telecommunications plc | 62,225 | 103 |
| | | 2,556 |
| India (1.2%) | | |
| Housing Development Finance Corp. Ltd. | 326,152 | 6,805 |
| Infosys Ltd. ADR | 244,559 | 3,732 |
| 2 Reliance Industries Ltd. GDR | 115,206 | 3,652 |
| Tata Consultancy Services Ltd. | 97,037 | 3,486 |
| Sun Pharmaceutical Industries Ltd. | 228,496 | 2,546 |
| Infosys Ltd. | 149,029 | 2,224 |
| ITC Ltd. | 604,000 | 2,200 |
| HDFC Bank Ltd. ADR | 30,043 | 2,126 |
| Tata Motors Ltd. | 235,710 | 1,898 |
| Oil & Natural Gas Corp. Ltd. | 442,306 | 1,897 |
| Hindustan Unilever Ltd. | 148,999 | 1,867 |
| Axis Bank Ltd. | 224,558 | 1,640 |
| Reliance Industries Ltd. | 98,766 | 1,560 |
| Maruti Suzuki India Ltd. | 17,516 | 1,543 |
| Bharat Petroleum Corp. Ltd. | 140,744 | 1,413 |
| Coal India Ltd. | 279,697 | 1,362 |
| ICICI Bank Ltd. | 317,485 | 1,320 |
| HCL Technologies Ltd. | 113,183 | 1,294 |
| Bharti Airtel Ltd. | 269,453 | 1,287 |
| Mahindra & Mahindra Ltd. | 61,630 | 1,211 |
| Kotak Mahindra Bank Ltd. | 96,104 | 1,180 |
| Indian Oil Corp. Ltd. | 239,078 | 1,160 |
| State Bank of India GDR | 27,461 | 1,045 |
| Larsen & Toubro Ltd. | 46,318 | 1,028 |
| Lupin Ltd. | 45,821 | 1,022 |
| Hero MotoCorp Ltd. | 19,946 | 1,001 |
| Asian Paints Ltd. | 60,519 | 970 |
| NTPC Ltd. (Common) | 410,457 | 936 |
| Eicher Motors Ltd. | 2,556 | 920 |
| Zee Entertainment Enterprises Ltd. | 112,866 | 880 |
| Dr Reddy's Laboratories Ltd. | 17,500 | 879 |
| Indiabulls Housing Finance Ltd. | 66,438 | 845 |
| IndusInd Bank Ltd. | 45,712 | 822 |
| Yes Bank Ltd. | 41,392 | 790 |
| UltraTech Cement Ltd. | 13,200 | 788 |
| Adani Ports & Special Economic Zone Ltd. | 168,835 | 777 |
| * Vedanta Ltd. | 246,912 | 752 |
| ICICI Bank Ltd. ADR | 82,619 | 685 |
| Tech Mahindra Ltd. | 104,454 | 682 |
| Aurobindo Pharma Ltd. | 55,318 | 673 |
| Godrej Consumer Products Ltd. | 27,016 | 651 |
| Cipla Ltd. | 75,216 | 648 |
| UPL Ltd. | 60,270 | 631 |
| JSW Steel Ltd. | 25,355 | 630 |
| Bajaj Auto Ltd. | 14,484 | 618 |
| Ambuja Cements Ltd. | 169,142 | 612 |
| Power Grid Corp. of India Ltd. | 231,783 | 611 |
| Shriram Transport Finance Co. Ltd. | 36,088 | 584 |
| * Bajaj Finance Ltd. | 36,351 | 584 |
| Bharti Infratel Ltd. | 109,064 | 565 |
| Nestle India Ltd. | 5,306 | 555 |
| Bosch Ltd. | 1,604 | 527 |
| Wipro Ltd. | 69,217 | 481 |
| Dabur India Ltd. | 109,968 | 480 |
| Piramal Enterprises Ltd. | 17,152 | 456 |
| LIC Housing Finance Ltd. | 50,770 | 443 |
| Bajaj Finserv Ltd. | 8,743 | 443 |
| Hindustan Petroleum Corp. Ltd. | 62,708 | 439 |
| Shree Cement Ltd. | 1,749 | 438 |
| GAIL India Ltd. | 67,442 | 438 |
| Titan Co. Ltd. | 77,768 | 435 |
29
| | |
| Vanguard® Total World Stock Index Fund | | |
| Schedule of Investments | | |
| October 31, 2016 | | |
| |
| | | Market |
| | | Value |
| | Shares | ($000) |
| * United Spirits Ltd. | 12,220 | 412 |
| Glenmark Pharmaceuticals Ltd. | 28,885 | 404 |
| Marico Ltd. | 94,073 | 397 |
| Hindalco Industries Ltd. | 174,097 | 391 |
| Idea Cellular Ltd. | 322,545 | 368 |
| IDFC Bank Ltd. | 306,933 | 362 |
| Motherson Sumi Systems Ltd. | 72,483 | 360 |
| Tata Steel Ltd. | 58,957 | 359 |
| Divi's Laboratories Ltd. | 18,333 | 351 |
| Havells India Ltd. | 55,138 | 336 |
| NMDC Ltd. | 165,231 | 325 |
| Ashok Leyland Ltd. | 239,519 | 324 |
| Cadila Healthcare Ltd. | 50,843 | 322 |
| Cairn India Ltd. | 94,173 | 317 |
| Wipro Ltd. ADR | 32,783 | 317 |
| Mahindra & Mahindra Financial Services Ltd. | 57,113 | 310 |
| Siemens Ltd. | 17,429 | 309 |
| * Bharat Financial Inclusion Ltd. | 22,543 | 298 |
| Britannia Industries Ltd. | 5,998 | 298 |
| Apollo Hospitals Enterprise Ltd. | 14,411 | 289 |
| Tata Power Co. Ltd. | 243,302 | 285 |
| Bharat Forge Ltd. | 20,732 | 275 |
| Pidilite Industries Ltd. | 25,237 | 272 |
| Page Industries Ltd. | 1,090 | 269 |
| Vakrangee Ltd. | 69,361 | 262 |
| Max Financial Services Ltd. | 30,805 | 260 |
| Info Edge India Ltd. | 19,089 | 258 |
| Bharat Heavy Electricals Ltd. | 123,321 | 257 |
| * Alkem Laboratories Ltd. | 10,482 | 256 |
| Oracle Financial Services Software Ltd. | 5,219 | 250 |
| Federal Bank Ltd. | 202,272 | 249 |
| Petronet LNG Ltd. | 42,186 | 246 |
| Reliance Infrastructure Ltd. | 30,091 | 245 |
| Power Finance Corp. Ltd. | 130,806 | 243 |
| Emami Ltd. | 12,037 | 219 |
| Rajesh Exports Ltd. | 30,331 | 217 |
| State Bank of India | 55,530 | 215 |
| * Bank of Baroda | 91,356 | 214 |
| NHPC Ltd. | 531,677 | 213 |
| ACC Ltd. | 9,093 | 207 |
| DLF Ltd. | 88,704 | 200 |
| Kansai Nerolac Paints Ltd. | 35,036 | 199 |
| Colgate-Palmolive India Ltd. | 12,983 | 189 |
| ABB India Ltd. | 11,390 | 186 |
| Rural Electrification Corp. Ltd. | 90,759 | 183 |
| GlaxoSmithKline Consumer Healthcare Ltd. | 2,010 | 183 |
| Hindustan Zinc Ltd. | 47,157 | 179 |
| Jubilant Life Sciences Ltd. | 17,164 | 177 |
| CRISIL Ltd. | 5,359 | 176 |
| Reliance Capital Ltd. | 22,512 | 175 |
| Torrent Pharmaceuticals Ltd. | 8,262 | 175 |
| Cummins India Ltd. | 13,668 | 174 |
| * Reliance Communications Ltd. | 245,174 | 172 |
| Berger Paints India Ltd. | 44,111 | 170 |
| Edelweiss Financial Services Ltd. | 92,416 | 169 |
| Mindtree Ltd. | 25,780 | 168 |
| Castrol India Ltd. | 24,456 | 168 |
| Indian Hotels Co. Ltd. | 96,294 | 166 |
| Bharat Electronics Ltd. | 8,274 | 161 |
| GlaxoSmithKline Pharmaceuticals Ltd. | 3,693 | 161 |
| Dewan Housing Finance Corp. Ltd. | 32,669 | 161 |
| Ramco Cements Ltd. | 17,456 | 161 |
| Abbott India Ltd. | 2,099 | 157 |
| Tube Investments of India Ltd. | 16,493 | 154 |
30
| | |
| Vanguard® Total World Stock Index Fund | | |
| Schedule of Investments | | |
| October 31, 2016 | | |
| |
| | | Market |
| | | Value |
| | Shares | ($000) |
| Blue Dart Express Ltd. | 2,017 | 154 |
| United Breweries Ltd. | 11,552 | 150 |
| MRF Ltd. | 207 | 149 |
| Strides Shasun Ltd. | 9,442 | 148 |
| Tata Motors Ltd. Class A | 27,758 | 145 |
| Biocon Ltd. | 10,229 | 142 |
| TVS Motor Co. Ltd. | 23,262 | 141 |
| Apollo Tyres Ltd. | 46,583 | 141 |
| * Punjab National Bank | 64,733 | 140 |
| PI Industries Ltd. | 10,777 | 139 |
| * Steel Authority of India Ltd. | 176,832 | 138 |
| Cholamandalam Investment and Finance Co. Ltd. | 7,762 | 138 |
| Bajaj Holdings & Investment Ltd. | 4,212 | 137 |
| Dalmia Bharat Ltd. | 4,462 | 137 |
| Natco Pharma Ltd. | 15,642 | 137 |
| HDFC Bank Ltd. | 7,224 | 136 |
| Aditya Birla Nuvo Ltd. | 6,500 | 134 |
| Sun TV Network Ltd. | 16,205 | 133 |
| Manappuram Finance Ltd. | 86,495 | 133 |
| Reliance Power Ltd. | 185,943 | 131 |
| Mphasis Ltd. | 16,593 | 127 |
| Oberoi Realty Ltd. | 23,982 | 127 |
| Amara Raja Batteries Ltd. | 8,322 | 126 |
| Voltas Ltd. | 21,448 | 124 |
| Arvind Ltd. | 20,018 | 124 |
| L&T Finance Holdings Ltd. | 76,127 | 122 |
| Exide Industries Ltd. | 40,848 | 120 |
| Oil India Ltd. | 18,669 | 116 |
| Pfizer Ltd. | 4,184 | 114 |
| Sanofi India Ltd. | 1,742 | 114 |
| Ceat Ltd. | 6,232 | 113 |
| AIA Engineering Ltd. | 5,820 | 113 |
| Supreme Industries Ltd. | 8,322 | 112 |
| Jubilant Foodworks Ltd. | 7,394 | 111 |
| Credit Analysis & Research Ltd. | 5,001 | 110 |
| Gujarat Pipavav Port Ltd. | 44,750 | 109 |
| * IDFC Ltd. | 103,749 | 109 |
| Sundaram Finance Ltd. | 5,136 | 106 |
| 2 InterGlobe Aviation Ltd. | 7,456 | 104 |
| Ajanta Pharma Ltd. | 3,380 | 103 |
| Tata Communications Ltd. | 10,833 | 103 |
| * Suzlon Energy Ltd. | 451,294 | 103 |
| Balrampur Chini Mills Ltd. | 58,956 | 102 |
| Century Textiles & Industries Ltd. | 7,450 | 101 |
| KRBL Ltd. | 28,058 | 100 |
| McLeod Russel India Ltd. | 39,170 | 100 |
| Symphony Ltd. | 5,172 | 99 |
| Muthoot Finance Ltd. | 18,312 | 98 |
| * Fortis Healthcare Ltd. | 36,791 | 98 |
| * Kajaria Ceramics Ltd. | 10,526 | 98 |
| Godrej Industries Ltd. | 14,509 | 95 |
| eClerx Services Ltd. | 4,065 | 92 |
| * TV18 Broadcast Ltd. | 137,341 | 92 |
| * IDBI Bank Ltd. | 82,282 | 91 |
| Jain Irrigation Systems Ltd. | 55,803 | 90 |
| NCC Ltd. | 63,849 | 90 |
| Tata Global Beverages Ltd. | 42,253 | 89 |
| Alembic Pharmaceuticals Ltd. | 8,754 | 89 |
| CESC Ltd. | 9,350 | 88 |
| * Aditya Birla Fashion and Retail Ltd. | 35,555 | 85 |
| * Videocon Industries Ltd. | 54,258 | 85 |
| * PC Jeweller Ltd. | 10,742 | 82 |
| 2 Syngene International Ltd. | 9,331 | 82 |
| * Crompton Greaves Ltd. | 71,167 | 82 |
31
| | |
| Vanguard® Total World Stock Index Fund | | |
| Schedule of Investments | | |
| October 31, 2016 | | |
| |
| | | Market |
| | | Value |
| | Shares | ($000) |
| * Sun Pharma Advanced Research Co. Ltd. | 14,830 | 78 |
| * Whirlpool of India Ltd. | 4,543 | 76 |
| Welspun India Ltd. | 88,190 | 75 |
| Bayer CropScience Ltd. | 1,170 | 75 |
| Chambal Fertilizers and Chemicals Ltd. | 78,021 | 74 |
| * Dish TV India Ltd. | 50,292 | 72 |
| * Jindal Steel & Power Ltd. | 63,005 | 71 |
| * Canara Bank | 15,022 | 71 |
| * Gillette India Ltd. | 1,099 | 70 |
| * RattanIndia Power Ltd. | 553,078 | 69 |
| GRUH Finance Ltd. | 13,350 | 67 |
| * Wockhardt Ltd. | 5,121 | 67 |
| Engineers India Ltd. | 16,342 | 66 |
| Persistent Systems Ltd. | 6,778 | 65 |
| Thermax Ltd. | 5,117 | 65 |
| KPIT Technologies Ltd. | 30,090 | 65 |
| 2 Dr Lal PathLabs Ltd. | 3,618 | 64 |
| JSW Energy Ltd. | 65,068 | 64 |
| Repco Home Finance Ltd. | 5,587 | 63 |
| * Mangalore Refinery & Petrochemicals Ltd. | 45,416 | 61 |
| Redington India Ltd. | 38,482 | 61 |
| Torrent Power Ltd. | 23,118 | 60 |
| VA Tech Wabag Ltd. | 8,071 | 60 |
| India Cements Ltd. | 24,791 | 58 |
| Hexaware Technologies Ltd. | 18,647 | 57 |
| Gujarat Gas Ltd. | 6,502 | 56 |
| * GMR Infrastructure Ltd. | 269,033 | 55 |
| WABCO India Ltd. | 640 | 54 |
| IRB Infrastructure Developers Ltd. | 15,260 | 54 |
| Sadbhav Engineering Ltd. | 12,847 | 54 |
| * Adani Power Ltd. | 129,261 | 53 |
| Indraprastha Gas Ltd. | 4,094 | 53 |
| * Mahindra CIE Automotive Ltd. | 17,526 | 52 |
| Karur Vysya Bank Ltd. | 7,135 | 51 |
| * Bank of India | 29,471 | 51 |
| National Aluminium Co. Ltd. | 63,183 | 50 |
| Sintex Industries Ltd. | 37,552 | 50 |
| Multi Commodity Exchange of India Ltd. | 2,593 | 50 |
| Union Bank of India | 21,229 | 47 |
| GE T&D India Ltd. | 8,970 | 46 |
| Cox & Kings Ltd. | 13,948 | 46 |
| Bajaj Corp. Ltd. | 7,508 | 46 |
| * Indiabulls Real Estate Ltd. | 33,322 | 44 |
| * Ipca Laboratories Ltd. | 4,757 | 43 |
| Gateway Distriparks Ltd. | 11,596 | 43 |
| Adani Enterprises Ltd. | 42,545 | 43 |
| Indian Bank | 11,871 | 41 |
| Gujarat State Petronet Ltd. | 17,246 | 41 |
| * Just Dial Ltd. | 6,337 | 40 |
| * Housing Development & Infrastructure Ltd. | 31,911 | 40 |
| Welspun Corp. Ltd. | 36,272 | 39 |
| Prestige Estates Projects Ltd. | 12,821 | 37 |
| Srei Infrastructure Finance Ltd. | 33,628 | 37 |
| Cyient Ltd. | 4,859 | 36 |
| * Bajaj Hindusthan Sugar Ltd. | 139,539 | 35 |
| Jammu & Kashmir Bank Ltd. | 32,230 | 33 |
| * Hindustan Construction Co. Ltd. | 58,499 | 32 |
| Gujarat Fluorochemicals Ltd. | 4,074 | 31 |
| * Corp Bank | 49,046 | 31 |
| IFCI Ltd. | 75,943 | 30 |
| Sobha Ltd. | 7,055 | 30 |
| * Polaris Consulting & Services Ltd. | 12,204 | 29 |
| South Indian Bank Ltd. | 79,690 | 28 |
| * Jaiprakash Associates Ltd. | 159,746 | 27 |
32
| | |
| Vanguard® Total World Stock Index Fund | | |
| Schedule of Investments | | |
| October 31, 2016 | | |
| |
| | | Market |
| | | Value |
| | Shares | ($000) |
| Great Eastern Shipping Co. Ltd. | 4,216 | 24 |
| Coromandel International Ltd. | 4,820 | 21 |
| * Vijaya Bank | 31,062 | 21 |
| * GE Power India Ltd. | 2,496 | 19 |
| Karnataka Bank Ltd. | 10,313 | 19 |
| Radico Khaitan Ltd. | 8,653 | 18 |
| * Central Bank of India | 13,166 | 18 |
| * Unitech Ltd. | 198,930 | 18 |
| PTC India Ltd. | 16,013 | 18 |
| * Rolta India Ltd. | 18,714 | 18 |
| * Allahabad Bank | 11,991 | 14 |
| * Syndicate Bank | 11,844 | 13 |
| * Amtek Auto Ltd. | 19,970 | 13 |
| * DEN Networks Ltd. | 10,752 | 13 |
| Oriental Bank of Commerce | 6,239 | 12 |
| * Indian Overseas Bank | 27,269 | 11 |
| * UCO Bank | 17,873 | 9 |
| * Karnataka Bank Ltd Rights Exp. 11/21/2016 | 5,156 | 4 |
| * Arvind Infrastructure Ltd. | 2,001 | 3 |
| | | 101,051 |
| Indonesia (0.3%) | | |
| Telekomunikasi Indonesia Persero Tbk PT | 10,431,040 | 3,368 |
| Bank Central Asia Tbk PT | 2,559,528 | 3,043 |
| Astra International Tbk PT | 4,171,530 | 2,632 |
| Bank Rakyat Indonesia Persero Tbk PT | 2,237,378 | 2,089 |
| Bank Mandiri Persero Tbk PT | 1,933,516 | 1,703 |
| Unilever Indonesia Tbk PT | 233,600 | 796 |
| Bank Negara Indonesia Persero Tbk PT | 1,482,930 | 633 |
| Indofood Sukses Makmur Tbk PT | 877,000 | 570 |
| Kalbe Farma Tbk PT | 3,834,800 | 511 |
| United Tractors Tbk PT | 304,160 | 503 |
| Gudang Garam Tbk PT | 96,600 | 503 |
| Semen Indonesia Persero Tbk PT | 592,600 | 447 |
| Perusahaan Gas Negara Persero Tbk | 2,205,100 | 432 |
| Charoen Pokphand Indonesia Tbk PT | 1,469,600 | 416 |
| Adaro Energy Tbk PT | 2,789,300 | 339 |
| Bumi Serpong Damai Tbk PT | 1,980,200 | 329 |
| Indocement Tunggal Prakarsa Tbk PT | 257,200 | 324 |
| Indofood CBP Sukses Makmur Tbk PT | 449,200 | 324 |
| Ciputra Development Tbk PT | 2,538,430 | 307 |
| Summarecon Agung Tbk PT | 2,178,900 | 275 |
| Lippo Karawaci Tbk PT | 3,841,600 | 266 |
| Pakuwon Jati Tbk PT | 4,746,600 | 262 |
| Surya Citra Media Tbk PT | 1,175,900 | 239 |
| Tower Bersama Infrastructure Tbk PT | 477,300 | 218 |
| Bank Danamon Indonesia Tbk PT | 668,700 | 198 |
| AKR Corporindo Tbk PT | 359,800 | 195 |
| * Aneka Tambang Persero Tbk PT | 2,541,300 | 174 |
| Media Nusantara Citra Tbk PT | 1,051,100 | 169 |
| Waskita Karya Persero Tbk PT | 838,374 | 168 |
| Tambang Batubara Bukit Asam Persero Tbk PT | 168,200 | 153 |
| * XL Axiata Tbk PT | 890,300 | 150 |
| Jasa Marga Persero Tbk PT | 426,500 | 148 |
| Ramayana Lestari Sentosa Tbk PT | 1,190,900 | 125 |
| Bank Tabungan Negara Persero Tbk PT | 743,100 | 109 |
| Astra Agro Lestari Tbk PT | 82,055 | 96 |
| Ace Hardware Indonesia Tbk PT | 1,449,000 | 95 |
| Link Net Tbk PT | 246,700 | 95 |
| Wijaya Karya Beton Tbk PT | 1,298,600 | 88 |
| * Vale Indonesia Tbk PT | 414,700 | 86 |
| Wijaya Karya Persero Tbk PT | 427,600 | 84 |
| * Alam Sutera Realty Tbk PT | 2,431,200 | 83 |
| Global Mediacom Tbk PT | 1,211,000 | 79 |
| * Gajah Tunggal Tbk PT | 720,000 | 69 |
33
| | |
| Vanguard® Total World Stock Index Fund | | |
| Schedule of Investments | | |
| October 31, 2016 | | |
| |
| | | Market |
| | | Value |
| | Shares | ($000) |
| Adhi Karya Persero Tbk PT | 348,200 | 60 |
| Intiland Development Tbk PT | 1,328,600 | 59 |
| BISI International Tbk PT | 370,700 | 57 |
| Bank Pembangunan Daerah Jawa Barat Dan Banten Tbk PT | 422,600 | 51 |
| Matahari Putra Prima Tbk PT | 345,600 | 48 |
| Indo Tambangraya Megah Tbk PT | 42,500 | 47 |
| * Panin Financial Tbk PT | 3,164,200 | 46 |
| * Mitra Adiperkasa Tbk PT | 82,600 | 35 |
| Perusahaan Perkebunan London Sumatra Indonesia Tbk PT | 293,100 | 34 |
| * Agung Podomoro Land Tbk PT | 1,547,500 | 34 |
| Timah Persero Tbk PT | 473,400 | 34 |
| * Krakatau Steel Persero Tbk PT | 661,000 | 33 |
| * Lippo Cikarang Tbk PT | 69,300 | 32 |
| * Siloam International Hospitals Tbk PT | 38,600 | 31 |
| Surya Semesta Internusa Tbk PT | 704,600 | 30 |
| * Eagle High Plantations Tbk PT | 2,054,500 | 30 |
| Bekasi Fajar Industrial Estate Tbk PT | 1,002,100 | 24 |
| * Medco Energi Internasional Tbk PT | 186,500 | 19 |
| * Berlian Laju Tanker Tbk PT | 968,000 | 15 |
| | | 23,612 |
| Ireland (0.1%) | | |
| Kerry Group plc Class A | 29,965 | 2,175 |
| * Bank of Ireland | 5,735,397 | 1,228 |
| Smurfit Kappa Group plc | 49,722 | 1,092 |
| Kingspan Group plc | 37,445 | 917 |
| * ICON plc | 11,200 | 899 |
| Glanbia plc | 36,367 | 592 |
| * Ryanair Holdings plc ADR | 7,668 | 576 |
| * Prothena Corp. plc | 7,800 | 373 |
| * Ryanair Holdings plc | 22,790 | 316 |
| Green REIT plc | 192,362 | 287 |
| C&C Group plc | 64,206 | 246 |
| Hibernia REIT plc | 127,366 | 179 |
| Origin Enterprises plc | 28,396 | 176 |
| Irish Continental Group plc | 34,980 | 163 |
| * Permanent TSB Group Holdings plc | 26,375 | 72 |
| * Irish Bank Resolution Corp. Ltd. | 14,385 | — |
| | | 9,291 |
| Israel (0.2%) | | |
| Teva Pharmaceutical Industries Ltd. | 182,459 | 7,621 |
| Bank Hapoalim BM | 219,501 | 1,266 |
| * Bank Leumi Le-Israel BM | 272,803 | 1,029 |
| Bezeq The Israeli Telecommunication Corp. Ltd. | 429,373 | 780 |
| Nice Ltd. | 11,645 | 773 |
| Elbit Systems Ltd. | 4,637 | 459 |
| Frutarom Industries Ltd. | 8,398 | 444 |
| * Israel Discount Bank Ltd. Class A | 215,335 | 395 |
| Teva Pharmaceutical Industries Ltd. ADR | 8,934 | 382 |
| Azrieli Group Ltd. | 8,696 | 370 |
| * Mellanox Technologies Ltd. | 8,039 | 349 |
| Mizrahi Tefahot Bank Ltd. | 26,275 | 342 |
| Israel Chemicals Ltd. | 93,855 | 334 |
| * Tower Semiconductor Ltd. | 15,489 | 239 |
| Gazit-Globe Ltd. | 23,638 | 213 |
| Delek Group Ltd. | 997 | 195 |
| Strauss Group Ltd. | 11,068 | 174 |
| Alony Hetz Properties & Investments Ltd. | 18,950 | 163 |
| Paz Oil Co. Ltd. | 968 | 151 |
| * Airport City Ltd. | 13,853 | 151 |
| First International Bank Of Israel Ltd. | 9,518 | 122 |
| Melisron Ltd. | 2,819 | 120 |
| * Partner Communications Co. Ltd. | 25,426 | 119 |
| * Gilat Satellite Networks Ltd. | 22,997 | 101 |
| Reit 1 Ltd. | 32,738 | 99 |
34
| | | |
| Vanguard® Total World Stock Index Fund | | |
| Schedule of Investments | | |
| October 31, 2016 | | |
| |
| | | | Market |
| | | | Value |
| | | Shares | ($000) |
| | Shufersal Ltd. | 23,959 | 90 |
| * | Nova Measuring Instruments Ltd. | 7,371 | 88 |
| | Amot Investments Ltd. | 18,840 | 79 |
| * | Delek Energy Systems Ltd. | 145 | 75 |
| * | Mazor Robotics Ltd. | 6,238 | 71 |
| | B Communications Ltd. | 3,139 | 69 |
| | Rami Levy Chain Stores Hashikma Marketing 2006 Ltd. | 1,678 | 67 |
| | IDI Insurance Co. Ltd. | 1,332 | 66 |
| * | Oil Refineries Ltd. | 184,043 | 65 |
| * | Naphtha Israel Petroleum Corp. Ltd. | 11,590 | 63 |
| * | Cellcom Israel Ltd. (Registered) | 8,090 | 61 |
| | Shikun & Binui Ltd. | 35,075 | 61 |
| * | Israel Corp. Ltd. | 396 | 59 |
| * | Jerusalem Oil Exploration | 1,309 | 58 |
| | Harel Insurance Investments & Financial Services Ltd. | 14,790 | 57 |
| * | Phoenix Holdings Ltd. | 16,138 | 46 |
| * | Clal Insurance Enterprises Holdings Ltd. | 3,854 | 44 |
| | Africa Israel Properties Ltd. | 2,364 | 41 |
| | Formula Systems 1985 Ltd. | 1,026 | 40 |
| * | Jerusalem Economy Ltd. | 17,201 | 39 |
| * | Compugen Ltd. | 6,072 | 34 |
| | Delta-Galil Industries Ltd. | 1,206 | 34 |
| * | Migdal Insurance & Financial Holding Ltd. | 47,854 | 32 |
| | Bayside Land Corp. | 79 | 31 |
| | Big Shopping Centers Ltd. | 452 | 30 |
| * | Kamada Ltd. | 5,171 | 30 |
| * | Allot Communications Ltd. | 4,912 | 26 |
| * | Silicom Ltd. | 610 | 23 |
| | Delek Automotive Systems Ltd. | 2,063 | 18 |
| * | Evogene Ltd. | 2,628 | 16 |
| * | Kenon Holdings Ltd. | 1,533 | 15 |
| | | | 17,919 |
| Italy (0.7%) | | |
| | Eni SPA | 514,884 | 7,472 |
| | Enel SPA | 1,590,162 | 6,837 |
| | Intesa Sanpaolo SPA (Registered) | 2,575,158 | 5,971 |
| | Assicurazioni Generali SPA | 267,169 | 3,451 |
| | UniCredit SPA | 1,084,131 | 2,690 |
| | Snam SPA | 505,971 | 2,666 |
| | Atlantia SPA | 100,659 | 2,465 |
| * | Telecom Italia SPA (Registered) | 2,402,252 | 2,088 |
| | Luxottica Group SPA | 37,873 | 1,886 |
| | CNH Industrial NV | 190,745 | 1,481 |
| | Ferrari NV | 27,394 | 1,442 |
| | Terna Rete Elettrica Nazionale SPA | 290,545 | 1,422 |
| | Fiat Chrysler Automobiles NV | 181,528 | 1,331 |
| | Prysmian SPA | 44,872 | 1,116 |
| * | Leonardo-Finmeccanica SPA | 83,757 | 1,020 |
| | EXOR SPA | 23,806 | 1,012 |
| | Tenaris SA ADR | 32,077 | 905 |
| | Mediobanca SPA | 119,523 | 876 |
| 2 | Poste Italiane SPA | 92,715 | 617 |
| | Davide Campari-Milano SPA | 59,282 | 597 |
| | Telecom Italia SPA (Bearer) | 753,887 | 535 |
| | Parmalat SPA | 188,847 | 499 |
| * | Saipem SPA | 1,204,414 | 495 |
| ^ | Unione di Banche Italiane SPA | 176,205 | 486 |
| | FinecoBank Banca Fineco SPA | 82,591 | 483 |
| | Banco Popolare SC | 166,195 | 480 |
| | Moncler SPA | 28,113 | 468 |
| | Banca Popolare dell'Emilia Romagna SC | 98,117 | 461 |
| | Recordati SPA | 15,490 | 438 |
| | Mediaset SPA | 150,520 | 430 |
| ^ | Banca Popolare di Milano Scarl | 932,540 | 427 |
35
| | | |
| Vanguard® Total World Stock Index Fund | | |
| Schedule of Investments | | |
| October 31, 2016 | | |
| |
| | | | Market |
| | | | Value |
| | | Shares | ($000) |
| | UnipolSai SPA | 223,410 | 427 |
| | Tenaris SA | 29,761 | 421 |
| | Brembo SPA | 6,766 | 419 |
| | A2A SPA | 301,842 | 411 |
| | Banca Mediolanum SPA | 56,508 | 391 |
| | Unipol Gruppo Finanziario SPA | 119,962 | 367 |
| * | Yoox Net-A-Porter Group SPA | 12,185 | 350 |
| | DiaSorin SPA | 5,622 | 345 |
| | Hera SPA | 134,364 | 343 |
| | Azimut Holding SPA | 20,959 | 336 |
| | Cerved Information Solutions SPA | 39,954 | 322 |
| | Salvatore Ferragamo SPA | 13,022 | 318 |
| | Banca Popolare di Sondrio SCPA | 93,741 | 313 |
| | Intesa Sanpaolo SPA | 133,993 | 290 |
| | Banca Generali SPA | 12,756 | 284 |
| | De' Longhi SPA | 12,121 | 284 |
| | Interpump Group SPA | 16,923 | 271 |
| | Iren SPA | 136,998 | 246 |
| 2 | Infrastrutture Wireless Italiane SPA | 49,871 | 236 |
| 2 | Anima Holding SPA | 47,145 | 230 |
| | Buzzi Unicem SPA | 11,773 | 229 |
| * | Ei Towers SPA | 4,587 | 216 |
| | Autogrill SPA | 25,265 | 211 |
| | Ansaldo STS SPA | 18,202 | 209 |
| | Societa Cattolica di Assicurazioni SCRL | 34,500 | 209 |
| | Societa Iniziative Autostradali e Servizi SPA | 21,961 | 206 |
| | Industria Macchine Automatiche SPA | 3,087 | 191 |
| | Banca IFIS SPA | 6,213 | 180 |
| | Tod's SPA | 2,727 | 159 |
| | ACEA SPA | 11,236 | 146 |
| | Beni Stabili SpA SIIQ | 229,643 | 134 |
| | MARR SPA | 6,935 | 128 |
| *,^ | Banca Monte dei Paschi di Siena SPA | 472,739 | 127 |
| | Amplifon SPA | 11,873 | 125 |
| | ERG SPA | 11,221 | 125 |
| | Buzzi Unicem SPA | 11,877 | 121 |
| 2 | OVS SPA | 21,970 | 120 |
| | Reply SPA | 863 | 108 |
| | Italmobiliare SPA | 2,286 | 108 |
| | Brunello Cucinelli SPA | 5,457 | 108 |
| * | Juventus Football Club SPA | 297,668 | 96 |
| | Datalogic SPA | 4,466 | 94 |
| ^ | Saras SPA | 53,596 | 93 |
| | Danieli & C Officine Meccaniche SPA RSP | 6,539 | 88 |
| | Credito Valtellinese SC | 190,798 | 84 |
| | Zignago Vetro SPA | 13,478 | 82 |
| | Salini Impregilo SPA | 27,931 | 78 |
| | Falck Renewables SPA | 82,072 | 73 |
| | Cairo Communication SPA | 15,486 | 66 |
| | Credito Emiliano SPA | 9,851 | 56 |
| | Cementir Holding SPA | 10,694 | 52 |
| 2 | RAI Way SPA | 13,264 | 52 |
| | Immobiliare Grande Distribuzione SIIQ SPA | 55,106 | 42 |
| *,^ | Banca Carige SPA | 121,503 | 41 |
| | ASTM SPA | 3,541 | 38 |
| | CIR-Compagnie Industriali Riunite SPA | 32,485 | 36 |
| | Danieli & C Officine Meccaniche SPA | 1,880 | 35 |
| * | Fincantieri SPA | 74,730 | 34 |
| * | Safilo Group SPA | 3,221 | 34 |
| | Esprinet SPA | 4,334 | 32 |
| * | Rizzoli Corriere Della Sera Mediagroup SPA | 29,726 | 32 |
| | Piaggio & C SPA | 14,781 | 26 |
| * | Arnoldo Mondadori Editore SPA | 24,213 | 24 |
| | Geox SPA | 10,796 | 23 |
36
| | |
| Vanguard® Total World Stock Index Fund | | |
| Schedule of Investments | | |
| October 31, 2016 | | |
| |
| | | Market |
| | | Value |
| | Shares | ($000) |
| Cofide SPA | 48,461 | 21 |
| Astaldi SPA | 4,791 | 19 |
| * Gruppo Editoriale L'Espresso SPA | 22,920 | 19 |
| * EXOR SPA Rights Exp. 11/09/2016 | 23,806 | — |
| | | 63,681 |
| Japan (8.5%) | | |
| Toyota Motor Corp. | 573,994 | 33,296 |
| Mitsubishi UFJ Financial Group Inc. | 2,859,980 | 14,757 |
| KDDI Corp. | 388,400 | 11,805 |
| SoftBank Group Corp. | 180,605 | 11,375 |
| Honda Motor Co. Ltd. | 378,841 | 11,336 |
| Japan Tobacco Inc. | 249,740 | 9,495 |
| Sumitomo Mitsui Financial Group Inc. | 272,248 | 9,439 |
| Mizuho Financial Group Inc. | 5,247,607 | 8,836 |
| Sony Corp. | 263,000 | 8,289 |
| FANUC Corp. | 41,044 | 7,515 |
| Takeda Pharmaceutical Co. Ltd. | 162,533 | 7,269 |
| Keyence Corp. | 9,483 | 6,952 |
| NTT DOCOMO Inc. | 274,648 | 6,898 |
| East Japan Railway Co. | 78,165 | 6,881 |
| Seven & i Holdings Co. Ltd. | 163,500 | 6,824 |
| Astellas Pharma Inc. | 445,300 | 6,609 |
| Shin-Etsu Chemical Co. Ltd. | 86,254 | 6,540 |
| Central Japan Railway Co. | 37,857 | 6,437 |
| Canon Inc. | 219,000 | 6,291 |
| Mitsubishi Corp. | 289,000 | 6,290 |
| Tokio Marine Holdings Inc. | 146,813 | 5,791 |
| Mitsubishi Electric Corp. | 414,055 | 5,602 |
| Murata Manufacturing Co. Ltd. | 39,628 | 5,534 |
| Nintendo Co. Ltd. | 22,604 | 5,449 |
| Kao Corp. | 105,048 | 5,405 |
| Daikin Industries Ltd. | 55,779 | 5,345 |
| Hitachi Ltd. | 972,688 | 5,185 |
| Fuji Heavy Industries Ltd. | 130,700 | 5,107 |
| Bridgestone Corp. | 134,974 | 5,038 |
| Mitsui & Co. Ltd. | 357,800 | 4,957 |
| Mitsubishi Estate Co. Ltd. | 247,191 | 4,913 |
| Nidec Corp. | 50,706 | 4,906 |
| Panasonic Corp. | 445,504 | 4,596 |
| Mitsui Fudosan Co. Ltd. | 199,000 | 4,532 |
| Denso Corp. | 102,700 | 4,469 |
| ORIX Corp. | 281,160 | 4,455 |
| Komatsu Ltd. | 197,515 | 4,397 |
| Nissan Motor Co. Ltd. | 425,601 | 4,329 |
| Otsuka Holdings Co. Ltd. | 88,200 | 3,860 |
| ITOCHU Corp. | 302,600 | 3,821 |
| Kubota Corp. | 236,300 | 3,809 |
| Nomura Holdings Inc. | 732,800 | 3,671 |
| Fast Retailing Co. Ltd. | 10,700 | 3,605 |
| Daiwa House Industry Co. Ltd. | 130,100 | 3,571 |
| SMC Corp. | 12,300 | 3,565 |
| Eisai Co. Ltd. | 55,900 | 3,562 |
| Dai-ichi Life Holdings Inc. | 236,700 | 3,470 |
| Hoya Corp. | 83,000 | 3,463 |
| Daiichi Sankyo Co. Ltd. | 139,000 | 3,340 |
| Nippon Steel & Sumitomo Metal Corp. | 167,274 | 3,314 |
| Kyocera Corp. | 66,300 | 3,221 |
| FUJIFILM Holdings Corp. | 84,500 | 3,195 |
| MS&AD Insurance Group Holdings Inc. | 106,881 | 3,173 |
| Kirin Holdings Co. Ltd. | 178,700 | 3,072 |
| Shionogi & Co. Ltd. | 62,000 | 3,053 |
| Suzuki Motor Corp. | 85,281 | 3,041 |
| Secom Co. Ltd. | 41,200 | 2,972 |
| Toray Industries Inc. | 318,000 | 2,960 |
37
| | |
| Vanguard® Total World Stock Index Fund | | |
| Schedule of Investments | | |
| October 31, 2016 | | |
| |
| | | Market |
| | | Value |
| | Shares | ($000) |
| Tokyo Electron Ltd. | 32,400 | 2,923 |
| * Toshiba Corp. | 805,000 | 2,915 |
| Mitsubishi Heavy Industries Ltd. | 674,870 | 2,887 |
| Asahi Group Holdings Ltd. | 80,700 | 2,879 |
| MEIJI Holdings Co. Ltd. | 28,434 | 2,836 |
| Shimano Inc. | 16,500 | 2,821 |
| Recruit Holdings Co. Ltd. | 68,170 | 2,738 |
| Sumitomo Mitsui Trust Holdings Inc. | 80,346 | 2,711 |
| Terumo Corp. | 67,100 | 2,595 |
| Daito Trust Construction Co. Ltd. | 15,152 | 2,539 |
| Sompo Holdings Inc. | 77,175 | 2,497 |
| Sumitomo Corp. | 215,700 | 2,480 |
| Ono Pharmaceutical Co. Ltd. | 96,300 | 2,442 |
| Olympus Corp. | 68,000 | 2,424 |
| Oriental Land Co. Ltd. | 41,100 | 2,401 |
| Sumitomo Realty & Development Co. Ltd. | 90,846 | 2,388 |
| Sumitomo Electric Industries Ltd. | 160,900 | 2,377 |
| West Japan Railway Co. | 38,500 | 2,371 |
| Ajinomoto Co. Inc. | 106,000 | 2,357 |
| Asahi Kasei Corp. | 261,000 | 2,353 |
| Dentsu Inc. | 46,549 | 2,320 |
| Nitto Denko Corp. | 32,900 | 2,292 |
| Nippon Telegraph & Telephone Corp. | 50,400 | 2,235 |
| Fujitsu Ltd. | 372,906 | 2,212 |
| Daiwa Securities Group Inc. | 359,000 | 2,143 |
| Chubu Electric Power Co. Inc. | 143,715 | 2,116 |
| Shiseido Co. Ltd. | 81,900 | 2,113 |
| Sysmex Corp. | 29,834 | 2,068 |
| Resona Holdings Inc. | 465,106 | 2,062 |
| Aeon Co. Ltd. | 148,300 | 2,049 |
| Tokyo Gas Co. Ltd. | 450,000 | 2,042 |
| Sekisui House Ltd. | 123,200 | 2,036 |
| JX Holdings Inc. | 513,907 | 2,031 |
| Mazda Motor Corp. | 118,800 | 1,970 |
| Rakuten Inc. | 169,300 | 1,952 |
| Unicharm Corp. | 81,600 | 1,940 |
| Nitori Holdings Co. Ltd. | 15,800 | 1,887 |
| Mitsubishi Chemical Holdings Corp. | 280,384 | 1,841 |
| Aisin Seiki Co. Ltd. | 41,600 | 1,827 |
| Inpex Corp. | 193,600 | 1,806 |
| Makita Corp. | 26,000 | 1,798 |
| Marubeni Corp. | 338,128 | 1,777 |
| Osaka Gas Co. Ltd. | 419,000 | 1,743 |
| Japan Exchange Group Inc. | 116,500 | 1,730 |
| Yamato Holdings Co. Ltd. | 75,600 | 1,722 |
| TDK Corp. | 24,900 | 1,719 |
| Taisei Corp. | 223,498 | 1,675 |
| Tokyu Corp. | 217,000 | 1,625 |
| Hankyu Hanshin Holdings Inc. | 48,700 | 1,612 |
| Kintetsu Group Holdings Co. Ltd. | 395,000 | 1,594 |
| Omron Corp. | 41,200 | 1,581 |
| Chugai Pharmaceutical Co. Ltd. | 46,300 | 1,578 |
| Toyota Industries Corp. | 34,300 | 1,574 |
| T&D Holdings Inc. | 128,100 | 1,549 |
| Sumitomo Chemical Co. Ltd. | 327,492 | 1,549 |
| JFE Holdings Inc. | 107,800 | 1,545 |
| * Kansai Electric Power Co. Inc. | 157,800 | 1,509 |
| NEC Corp. | 553,000 | 1,479 |
| Isuzu Motors Ltd. | 117,320 | 1,451 |
| Obayashi Corp. | 144,100 | 1,388 |
| Asahi Glass Co. Ltd. | 198,000 | 1,385 |
| NTT Data Corp. | 26,700 | 1,378 |
| Sumitomo Metal Mining Co. Ltd. | 101,000 | 1,312 |
| Kajima Corp. | 194,000 | 1,308 |
38
| | |
| Vanguard® Total World Stock Index Fund | | |
| Schedule of Investments | | |
| October 31, 2016 | | |
| |
| | | Market |
| | | Value |
| | Shares | ($000) |
| * Tokyo Electric Power Co. Holdings Inc. | 336,900 | 1,305 |
| Nippon Paint Holdings Co. Ltd. | 38,300 | 1,302 |
| Odakyu Electric Railway Co. Ltd. | 63,500 | 1,296 |
| Yamaha Motor Co. Ltd. | 57,900 | 1,286 |
| Yamaha Corp. | 35,800 | 1,279 |
| Dai Nippon Printing Co. Ltd. | 127,000 | 1,274 |
| LIXIL Group Corp. | 55,400 | 1,272 |
| Bandai Namco Holdings Inc. | 41,500 | 1,243 |
| Tohoku Electric Power Co. Inc. | 100,800 | 1,235 |
| Koito Manufacturing Co. Ltd. | 23,500 | 1,234 |
| Sekisui Chemical Co. Ltd. | 78,300 | 1,233 |
| Santen Pharmaceutical Co. Ltd. | 84,500 | 1,232 |
| Japan Post Holdings Co. Ltd. | 95,492 | 1,216 |
| TOTO Ltd. | 30,300 | 1,211 |
| Kikkoman Corp. | 37,750 | 1,201 |
| Seiko Epson Corp. | 58,900 | 1,194 |
| Ricoh Co. Ltd. | 146,300 | 1,192 |
| Concordia Financial Group Ltd. | 253,279 | 1,174 |
| M3 Inc. | 38,500 | 1,172 |
| Suntory Beverage & Food Ltd. | 26,600 | 1,163 |
| Nikon Corp. | 74,400 | 1,124 |
| Kuraray Co. Ltd. | 74,100 | 1,123 |
| Keikyu Corp. | 111,000 | 1,120 |
| Toyota Tsusho Corp. | 47,400 | 1,119 |
| Ryohin Keikaku Co. Ltd. | 5,107 | 1,091 |
| FamilyMart UNY Holdings Co. Ltd. | 17,271 | 1,083 |
| NSK Ltd. | 96,300 | 1,071 |
| Shimizu Corp. | 120,000 | 1,067 |
| Lawson Inc. | 13,900 | 1,056 |
| Yahoo Japan Corp. | 271,900 | 1,043 |
| Japan Post Bank Co. Ltd. | 87,135 | 1,027 |
| Tobu Railway Co. Ltd. | 208,000 | 1,021 |
| MISUMI Group Inc. | 55,700 | 1,016 |
| Nagoya Railroad Co. Ltd. | 192,000 | 1,013 |
| NGK Insulators Ltd. | 55,000 | 1,010 |
| Hoshizaki Corp. | 11,182 | 1,009 |
| Toppan Printing Co. Ltd. | 107,000 | 1,006 |
| Keio Corp. | 121,000 | 1,001 |
| * Kyushu Railway Co. | 33,524 | 988 |
| NH Foods Ltd. | 41,000 | 983 |
| Yakult Honsha Co. Ltd. | 21,000 | 979 |
| Nissan Chemical Industries Ltd. | 28,800 | 976 |
| Rohm Co. Ltd. | 18,400 | 967 |
| Alps Electric Co. Ltd. | 40,100 | 962 |
| Mitsui Chemicals Inc. | 194,000 | 955 |
| Shizuoka Bank Ltd. | 113,000 | 954 |
| Don Quijote Holdings Co. Ltd. | 24,700 | 939 |
| Mitsubishi Tanabe Pharma Corp. | 47,100 | 917 |
| Yaskawa Electric Corp. | 57,463 | 917 |
| Tosoh Corp. | 139,981 | 914 |
| Toho Gas Co. Ltd. | 98,000 | 909 |
| Kyushu Electric Power Co. Inc. | 99,900 | 908 |
| Taisho Pharmaceutical Holdings Co. Ltd. | 9,300 | 907 |
| Trend Micro Inc. | 25,600 | 901 |
| Suruga Bank Ltd. | 36,900 | 901 |
| Kawasaki Heavy Industries Ltd. | 306,000 | 894 |
| Brother Industries Ltd. | 48,600 | 892 |
| Daicel Corp. | 67,400 | 886 |
| Amada Holdings Co. Ltd. | 77,800 | 886 |
| Nissin Foods Holdings Co. Ltd. | 15,300 | 886 |
| Electric Power Development Co. Ltd. | 38,000 | 885 |
| Tsuruha Holdings Inc. | 7,600 | 877 |
| Seibu Holdings Inc. | 50,478 | 873 |
| Hamamatsu Photonics KK | 28,800 | 871 |
39
| | |
| Vanguard® Total World Stock Index Fund | | |
| Schedule of Investments | | |
| October 31, 2016 | | |
| |
| | | Market |
| | | Value |
| | Shares | ($000) |
| Kansai Paint Co. Ltd. | 40,000 | 860 |
| Konica Minolta Inc. | 95,200 | 853 |
| Lion Corp. | 52,000 | 850 |
| Hirose Electric Co. Ltd. | 6,430 | 848 |
| Chiba Bank Ltd. | 137,000 | 847 |
| Stanley Electric Co. Ltd. | 30,600 | 843 |
| Hisamitsu Pharmaceutical Co. Inc. | 15,600 | 832 |
| Shimadzu Corp. | 57,000 | 829 |
| NGK Spark Plug Co. Ltd. | 41,600 | 826 |
| Nisshin Seifun Group Inc. | 55,820 | 822 |
| Aozora Bank Ltd. | 246,901 | 816 |
| * IHI Corp. | 307,000 | 808 |
| Yamada Denki Co. Ltd. | 155,660 | 805 |
| Asics Corp. | 37,500 | 800 |
| JGC Corp. | 45,000 | 795 |
| Konami Holdings Corp. | 20,100 | 794 |
| Kyowa Hakko Kirin Co. Ltd. | 52,000 | 793 |
| Nippon Express Co. Ltd. | 159,000 | 785 |
| Oji Holdings Corp. | 184,000 | 778 |
| Mitsubishi Materials Corp. | 26,534 | 760 |
| Alfresa Holdings Corp. | 35,900 | 759 |
| Toyo Suisan Kaisha Ltd. | 18,600 | 754 |
| Taiheiyo Cement Corp. | 263,000 | 753 |
| Isetan Mitsukoshi Holdings Ltd. | 74,500 | 753 |
| USS Co. Ltd. | 44,400 | 751 |
| Teijin Ltd. | 38,800 | 750 |
| Rinnai Corp. | 7,800 | 749 |
| Toho Co. Ltd. (Tokyo Shares 9602) | 24,600 | 738 |
| Nomura Research Institute Ltd. | 20,930 | 726 |
| Yokogawa Electric Corp. | 51,600 | 725 |
| Sojitz Corp. | 275,448 | 723 |
| Keihan Holdings Co. Ltd. | 107,000 | 722 |
| J Front Retailing Co. Ltd. | 52,300 | 720 |
| Nabtesco Corp. | 24,000 | 717 |
| Mebuki Financial Group Inc. | 201,150 | 716 |
| Chugoku Electric Power Co. Inc. | 61,100 | 715 |
| Hulic Co. Ltd. | 74,800 | 712 |
| Keisei Electric Railway Co. Ltd. | 29,500 | 711 |
| DeNA Co. Ltd. | 22,100 | 711 |
| JTEKT Corp. | 47,900 | 709 |
| Disco Corp. | 5,800 | 701 |
| Obic Co. Ltd. | 13,400 | 696 |
| Minebea Co. Ltd. | 68,000 | 694 |
| Mitsubishi Motors Corp. | 124,900 | 693 |
| Kobayashi Pharmaceutical Co. Ltd. | 13,200 | 690 |
| ANA Holdings Inc. | 245,000 | 688 |
| Nippon Yusen KK | 334,000 | 684 |
| Park24 Co. Ltd. | 21,800 | 674 |
| Casio Computer Co. Ltd. | 47,600 | 663 |
| Start Today Co. Ltd. | 37,500 | 657 |
| Sohgo Security Services Co. Ltd. | 14,400 | 656 |
| Hakuhodo DY Holdings Inc. | 54,000 | 649 |
| Kewpie Corp. | 22,700 | 645 |
| Sumitomo Heavy Industries Ltd. | 122,000 | 642 |
| Fukuoka Financial Group Inc. | 148,000 | 640 |
| Marui Group Co. Ltd. | 45,500 | 638 |
| Shimamura Co. Ltd. | 4,900 | 627 |
| Mitsubishi Gas Chemical Co. Inc. | 40,500 | 623 |
| Mabuchi Motor Co. Ltd. | 10,700 | 622 |
| Pigeon Corp. | 21,800 | 613 |
| Mitsui OSK Lines Ltd. | 244,397 | 611 |
| Iida Group Holdings Co. Ltd. | 31,581 | 610 |
| Sumitomo Dainippon Pharma Co. Ltd. | 34,900 | 604 |
| Sega Sammy Holdings Inc. | 40,900 | 604 |
40
| | | |
| Vanguard® Total World Stock Index Fund | | |
| Schedule of Investments | | |
| October 31, 2016 | | |
| |
| | | | Market |
| | | | Value |
| | | Shares | ($000) |
| | Sumitomo Rubber Industries Ltd. | 35,800 | 601 |
| | Air Water Inc. | 32,000 | 599 |
| | Fuji Electric Co. Ltd. | 119,000 | 594 |
| | Ezaki Glico Co. Ltd. | 10,400 | 591 |
| | TonenGeneral Sekiyu KK | 60,000 | 591 |
| | Tokyu Fudosan Holdings Corp. | 104,686 | 590 |
| | Hino Motors Ltd. | 54,000 | 589 |
| | SCREEN Holdings Co. Ltd. | 8,600 | 588 |
| | Yamazaki Baking Co. Ltd. | 26,000 | 583 |
| | Toyo Seikan Group Holdings Ltd. | 31,600 | 583 |
| | Shinsei Bank Ltd. | 359,000 | 580 |
| | Miraca Holdings Inc. | 12,000 | 579 |
| | Calbee Inc. | 15,900 | 577 |
| | CyberAgent Inc. | 19,800 | 575 |
| | Haseko Corp. | 59,100 | 575 |
| | JSR Corp. | 37,800 | 574 |
| | Tokyo Tatemono Co. Ltd. | 45,000 | 572 |
| | Kose Corp. | 6,200 | 566 |
| | Nippon Shinyaku Co. Ltd. | 11,000 | 558 |
| | Ebara Corp. | 18,800 | 558 |
| | Bank of Kyoto Ltd. | 76,000 | 557 |
| | Hitachi High-Technologies Corp. | 13,300 | 555 |
| | Kurita Water Industries Ltd. | 23,300 | 551 |
| | Square Enix Holdings Co. Ltd. | 16,600 | 549 |
| | MediPal Holdings Corp. | 32,100 | 548 |
| | Suzuken Co. Ltd. | 17,060 | 548 |
| | Kaneka Corp. | 66,000 | 546 |
| | Kyushu Financial Group Inc. | 81,970 | 545 |
| | Credit Saison Co. Ltd. | 31,500 | 545 |
| | DIC Corp. | 17,700 | 536 |
| | Sundrug Co. Ltd. | 6,800 | 535 |
| | NOK Corp. | 23,500 | 530 |
| | Advantest Corp. | 36,900 | 527 |
| | Nankai Electric Railway Co. Ltd. | 116,000 | 527 |
| *,^ | Sharp Corp. | 303,302 | 526 |
| | Nichirei Corp. | 24,000 | 525 |
| | Hitachi Metals Ltd. | 41,700 | 521 |
| | Yamaguchi Financial Group Inc. | 47,000 | 518 |
| * | Kobe Steel Ltd. | 62,100 | 512 |
| | Temp Holdings Co. Ltd. | 30,200 | 512 |
| | Takashimaya Co. Ltd. | 62,000 | 506 |
| | Hiroshima Bank Ltd. | 117,000 | 501 |
| | Chugoku Bank Ltd. | 37,300 | 500 |
| | Azbil Corp. | 16,800 | 498 |
| | Hitachi Chemical Co. Ltd. | 21,300 | 498 |
| | Hikari Tsushin Inc. | 5,400 | 496 |
| | THK Co. Ltd. | 23,400 | 494 |
| | Otsuka Corp. | 10,200 | 485 |
| | SBI Holdings Inc. | 40,840 | 485 |
| | Nifco Inc. | 8,401 | 484 |
| | Nippon Shokubai Co. Ltd. | 7,000 | 483 |
| | Sony Financial Holdings Inc. | 34,200 | 480 |
| | Nippon Electric Glass Co. Ltd. | 88,000 | 479 |
| | Kakaku.com Inc. | 28,168 | 473 |
| | Idemitsu Kosan Co. Ltd. | 20,500 | 471 |
| | Hachijuni Bank Ltd. | 86,000 | 469 |
| | Kaken Pharmaceutical Co. Ltd. | 7,300 | 460 |
| ^ | Kawasaki Kisen Kaisha Ltd. | 184,000 | 455 |
| | Ube Industries Ltd. | 220,000 | 454 |
| | Nexon Co. Ltd. | 26,600 | 453 |
| | Hokuriku Electric Power Co. | 39,500 | 449 |
| | Sumitomo Forestry Co. Ltd. | 32,200 | 449 |
| | Hitachi Construction Machinery Co. Ltd. | 21,400 | 448 |
| | Mitsubishi UFJ Lease & Finance Co. Ltd. | 92,400 | 447 |
41
| | | |
| Vanguard® Total World Stock Index Fund | | |
| Schedule of Investments | | |
| October 31, 2016 | | |
| |
| | | | Market |
| | | | Value |
| | | Shares | ($000) |
| | Gunma Bank Ltd. | 93,000 | 444 |
| ^ | Japan Airport Terminal Co. Ltd. | 11,500 | 441 |
| | Ito En Ltd. | 12,100 | 441 |
| | Zenkoku Hosho Co. Ltd. | 10,100 | 434 |
| | Asahi Intecc Co. Ltd. | 10,000 | 433 |
| | Sawai Pharmaceutical Co. Ltd. | 6,700 | 433 |
| | Showa Shell Sekiyu KK | 46,000 | 429 |
| | Kagome Co. Ltd. | 16,300 | 427 |
| *,^ | PeptiDream Inc. | 8,300 | 427 |
| | Seven Bank Ltd. | 138,400 | 425 |
| | Sotetsu Holdings Inc. | 87,000 | 425 |
| | Matsumotokiyoshi Holdings Co. Ltd. | 8,200 | 422 |
| | Maruichi Steel Tube Ltd. | 13,100 | 422 |
| | Denka Co. Ltd. | 93,000 | 422 |
| | Nihon M&A Center Inc. | 13,000 | 422 |
| | Sanwa Holdings Corp. | 42,100 | 419 |
| | Sapporo Holdings Ltd. | 14,800 | 418 |
| | Daifuku Co. Ltd. | 23,100 | 417 |
| | Nishi-Nippon Railroad Co. Ltd. | 88,000 | 417 |
| | COMSYS Holdings Corp. | 23,600 | 415 |
| | Nippon Kayaku Co. Ltd. | 36,000 | 415 |
| | Nomura Real Estate Holdings Inc. | 24,300 | 410 |
| | Sumco Corp. | 39,126 | 409 |
| | Sugi Holdings Co. Ltd. | 7,600 | 407 |
| | Tsumura & Co. | 14,300 | 406 |
| | Calsonic Kansei Corp. | 32,000 | 401 |
| | Hokuhoku Financial Group Inc. | 27,800 | 401 |
| | Morinaga & Co. Ltd. | 8,600 | 400 |
| | AEON Financial Service Co. Ltd. | 22,700 | 400 |
| | Aeon Mall Co. Ltd. | 26,772 | 398 |
| | Nihon Kohden Corp. | 16,200 | 395 |
| | Glory Ltd. | 11,900 | 393 |
| | Mitsubishi Logistics Corp. | 29,000 | 393 |
| | Coca-Cola West Co. Ltd. | 13,200 | 390 |
| | Takara Holdings Inc. | 41,100 | 389 |
| | Horiba Ltd. | 8,100 | 387 |
| | Megmilk Snow Brand Co. Ltd. | 11,100 | 386 |
| | TIS Inc. | 17,000 | 385 |
| | Daiichikosho Co. Ltd. | 8,800 | 383 |
| | Yokohama Rubber Co. Ltd. | 22,000 | 382 |
| * | Acom Co. Ltd. | 82,800 | 381 |
| | Oracle Corp. Japan | 7,000 | 381 |
| | Izumi Co. Ltd. | 8,200 | 379 |
| | Tokyo Century Corp. | 10,700 | 377 |
| | Kamigumi Co. Ltd. | 44,000 | 376 |
| | Toyo Tire & Rubber Co. Ltd. | 24,100 | 374 |
| | Furukawa Electric Co. Ltd. | 12,600 | 371 |
| | Nippon Paper Industries Co. Ltd. | 19,800 | 371 |
| | Cosmos Pharmaceutical Corp. | 1,700 | 370 |
| | Iyo Bank Ltd. | 59,400 | 365 |
| | Sankyo Co. Ltd. | 10,300 | 363 |
| | Benesse Holdings Inc. | 13,800 | 362 |
| | Welcia Holdings Co. Ltd. | 5,300 | 361 |
| | Zensho Holdings Co. Ltd. | 19,300 | 360 |
| | Ain Holdings Inc. | 5,300 | 358 |
| | Toyoda Gosei Co. Ltd. | 15,500 | 355 |
| | 77 Bank Ltd. | 78,000 | 352 |
| | GS Yuasa Corp. | 81,000 | 350 |
| | Citizen Watch Co. Ltd. | 62,100 | 349 |
| | OSG Corp. | 16,100 | 343 |
| *,^ | Tokuyama Corp. | 80,000 | 342 |
| | Seino Holdings Co. Ltd. | 30,800 | 341 |
| | Miura Co. Ltd. | 19,700 | 340 |
| | Pilot Corp. | 7,600 | 340 |
42
| | | |
| Vanguard® Total World Stock Index Fund | | |
| Schedule of Investments | | |
| October 31, 2016 | | |
| |
| | | | Market |
| | | | Value |
| | | Shares | ($000) |
| | Morinaga Milk Industry Co. Ltd. | 42,000 | 338 |
| | Coca-Cola East Japan Co. Ltd. | 15,300 | 337 |
| | NOF Corp. | 31,000 | 337 |
| | Leopalace21 Corp. | 51,600 | 335 |
| | Ulvac Inc. | 10,600 | 335 |
| | Dowa Holdings Co. Ltd. | 45,000 | 334 |
| | ADEKA Corp. | 22,100 | 334 |
| | Pola Orbis Holdings Inc. | 4,000 | 333 |
| * | Itoham Yonekyu Holdings Inc. | 34,872 | 333 |
| | Kinden Corp. | 27,500 | 331 |
| | Sumitomo Osaka Cement Co. Ltd. | 79,000 | 327 |
| | Taiyo Nippon Sanso Corp. | 31,100 | 327 |
| | Toyota Boshoku Corp. | 12,900 | 325 |
| | Nisshin Steel Co. Ltd. | 24,300 | 323 |
| | NHK Spring Co. Ltd. | 34,000 | 322 |
| | Penta-Ocean Construction Co. Ltd. | 54,000 | 322 |
| | Showa Denko KK | 24,300 | 321 |
| | House Foods Group Inc. | 14,300 | 319 |
| | Relo Group Inc. | 1,900 | 315 |
| | Rohto Pharmaceutical Co. Ltd. | 17,900 | 314 |
| | Tokyo Ohka Kogyo Co. Ltd. | 8,800 | 312 |
| | Fujikura Ltd. | 53,000 | 311 |
| | Ibiden Co. Ltd. | 21,400 | 311 |
| | Zeon Corp. | 34,000 | 311 |
| | Aoyama Trading Co. Ltd. | 8,800 | 310 |
| | Nipro Corp. | 25,100 | 310 |
| | Daido Steel Co. Ltd. | 73,000 | 310 |
| | Awa Bank Ltd. | 47,000 | 309 |
| | Heiwa Corp. | 13,100 | 308 |
| | Toyobo Co. Ltd. | 188,000 | 308 |
| *,^ | LINE Corp. | 7,494 | 307 |
| | Shikoku Electric Power Co. Inc. | 32,600 | 307 |
| | SCSK Corp. | 8,200 | 306 |
| * | Nishi-Nippon Financial Holdings Inc. | 30,600 | 305 |
| | NTN Corp. | 80,000 | 303 |
| | Shochiku Co. Ltd. | 27,000 | 302 |
| | Sankyu Inc. | 51,000 | 300 |
| | Kyowa Exeo Corp. | 20,000 | 300 |
| | Ushio Inc. | 24,800 | 299 |
| | MonotaRO Co. Ltd. | 12,300 | 299 |
| | Hokkaido Electric Power Co. Inc. | 39,000 | 297 |
| | Tadano Ltd. | 26,000 | 292 |
| | Capcom Co. Ltd. | 11,300 | 292 |
| | Wacoal Holdings Corp. | 25,000 | 288 |
| | Toagosei Co. Ltd. | 25,900 | 288 |
| | Daishi Bank Ltd. | 67,000 | 288 |
| | Mochida Pharmaceutical Co. Ltd. | 3,671 | 288 |
| | Hanwa Co. Ltd. | 47,000 | 288 |
| | Topcon Corp. | 19,200 | 287 |
| | Amano Corp. | 15,400 | 287 |
| | ABC-Mart Inc. | 4,700 | 286 |
| | TS Tech Co. Ltd. | 10,600 | 284 |
| | Japan Airlines Co. Ltd. | 9,600 | 283 |
| | Nihon Parkerizing Co. Ltd. | 20,500 | 282 |
| | Bic Camera Inc. | 32,800 | 282 |
| | K's Holdings Corp. | 16,284 | 282 |
| | Iwatani Corp. | 47,000 | 281 |
| | Sangetsu Corp. | 14,500 | 280 |
| | Japan Steel Works Ltd. | 13,000 | 279 |
| | Chiyoda Corp. | 32,000 | 279 |
| | Toda Corp. | 51,000 | 276 |
| | Nagase & Co. Ltd. | 21,600 | 276 |
| | Fujitsu General Ltd. | 12,000 | 275 |
| | TechnoPro Holdings Inc. | 8,000 | 274 |
43
| | |
| Vanguard® Total World Stock Index Fund | | |
| Schedule of Investments | | |
| October 31, 2016 | | |
| |
| | | Market |
| | | Value |
| | Shares | ($000) |
| Nippon Light Metal Holdings Co. Ltd. | 119,800 | 273 |
| DMG Mori Co. Ltd. | 25,600 | 272 |
| Hazama Ando Corp. | 42,100 | 271 |
| Shimachu Co. Ltd. | 10,100 | 271 |
| Okumura Corp. | 47,000 | 271 |
| Resorttrust Inc. | 13,400 | 268 |
| OKUMA Corp. | 32,000 | 268 |
| H2O Retailing Corp. | 17,900 | 266 |
| Okasan Securities Group Inc. | 50,000 | 266 |
| Kiyo Bank Ltd. | 16,007 | 265 |
| SHO-BOND Holdings Co. Ltd. | 5,400 | 260 |
| Aica Kogyo Co. Ltd. | 9,100 | 260 |
| Maeda Corp. | 28,000 | 259 |
| FP Corp. | 4,800 | 259 |
| Mitsui Mining & Smelting Co. Ltd. | 116,000 | 258 |
| Nichias Corp. | 29,000 | 258 |
| Japan Post Insurance Co. Ltd. | 12,280 | 257 |
| Shiga Bank Ltd. | 49,000 | 254 |
| Nishimatsu Construction Co. Ltd. | 54,000 | 252 |
| Nippon Gas Co. Ltd. | 8,300 | 251 |
| Nippo Corp. | 13,000 | 251 |
| Valor Holdings Co. Ltd. | 8,800 | 250 |
| Nisshinbo Holdings Inc. | 25,000 | 249 |
| Skylark Co. Ltd. | 17,700 | 249 |
| Ship Healthcare Holdings Inc. | 8,500 | 249 |
| Kyudenko Corp. | 7,700 | 248 |
| Yamato Kogyo Co. Ltd. | 8,800 | 248 |
| Juroku Bank Ltd. | 82,000 | 247 |
| Senshu Ikeda Holdings Inc. | 54,200 | 247 |
| Oki Electric Industry Co. Ltd. | 18,900 | 247 |
| Fuji Machine Manufacturing Co. Ltd. | 19,300 | 246 |
| Tsubakimoto Chain Co. | 31,000 | 246 |
| Nippon Suisan Kaisha Ltd. | 50,900 | 245 |
| KYORIN Holdings Inc. | 10,900 | 244 |
| Tokai Tokyo Financial Holdings Inc. | 47,900 | 243 |
| Nikkon Holdings Co. Ltd. | 11,200 | 241 |
| Itochu Techno-Solutions Corp. | 9,700 | 239 |
| Hitachi Transport System Ltd. | 11,600 | 239 |
| Rengo Co. Ltd. | 38,000 | 238 |
| Hokkoku Bank Ltd. | 69,000 | 231 |
| San-In Godo Bank Ltd. | 32,000 | 230 |
| ^ Sanrio Co. Ltd. | 12,292 | 230 |
| Onward Holdings Co. Ltd. | 34,000 | 228 |
| Kandenko Co. Ltd. | 23,000 | 227 |
| Yoshinoya Holdings Co. Ltd. | 15,000 | 226 |
| Ogaki Kyoritsu Bank Ltd. | 63,000 | 225 |
| Autobacs Seven Co. Ltd. | 15,800 | 225 |
| Lintec Corp. | 10,300 | 224 |
| Takasago Thermal Engineering Co. Ltd. | 15,900 | 224 |
| Mitsui Engineering & Shipbuilding Co. Ltd. | 160,000 | 222 |
| * Orient Corp. | 117,800 | 219 |
| Mandom Corp. | 4,700 | 219 |
| Maruha Nichiro Corp. | 7,900 | 219 |
| Arcs Co. Ltd. | 8,700 | 218 |
| Ariake Japan Co. Ltd. | 3,900 | 218 |
| Kumagai Gumi Co. Ltd. | 82,000 | 218 |
| ^ Fukuyama Transporting Co. Ltd. | 38,000 | 216 |
| Colowide Co. Ltd. | 11,100 | 216 |
| Tokyo Seimitsu Co. Ltd. | 7,900 | 216 |
| Ai Holdings Corp. | 8,700 | 214 |
| Taiyo Yuden Co. Ltd. | 20,000 | 214 |
| UACJ Corp. | 65,000 | 211 |
| Makino Milling Machine Co. Ltd. | 33,000 | 210 |
| Duskin Co. Ltd. | 10,900 | 209 |
44
| | | |
| Vanguard® Total World Stock Index Fund | | |
| Schedule of Investments | | |
| October 31, 2016 | | |
| |
| | | | Market |
| | | | Value |
| | | Shares | ($000) |
| | Kenedix Inc. | 49,600 | 209 |
| | Topre Corp. | 9,000 | 208 |
| | MOS Food Services Inc. | 6,200 | 208 |
| | Hitachi Kokusai Electric Inc. | 10,400 | 208 |
| | San-A Co. Ltd. | 3,800 | 207 |
| | Trusco Nakayama Corp. | 4,000 | 207 |
| | Koei Tecmo Holdings Co. Ltd. | 10,800 | 207 |
| | Saibu Gas Co. Ltd. | 88,000 | 206 |
| | Keiyo Bank Ltd. | 49,000 | 206 |
| | Yaoko Co. Ltd. | 4,900 | 206 |
| | Kokuyo Co. Ltd. | 15,400 | 204 |
| | Maeda Road Construction Co. Ltd. | 11,000 | 203 |
| | NTT Urban Development Corp. | 22,100 | 203 |
| | Mitsubishi Pencil Co. Ltd. | 4,000 | 200 |
| | Hitachi Capital Corp. | 8,900 | 199 |
| | FCC Co. Ltd. | 8,900 | 196 |
| | North Pacific Bank Ltd. | 52,400 | 195 |
| | Takara Standard Co. Ltd. | 10,500 | 195 |
| | Musashino Bank Ltd. | 7,000 | 193 |
| ^ | GungHo Online Entertainment Inc. | 74,800 | 189 |
| ^ | Nissha Printing Co. Ltd. | 7,800 | 189 |
| | Gunze Ltd. | 56,000 | 188 |
| | Ryosan Co. Ltd. | 6,100 | 188 |
| | Fuyo General Lease Co. Ltd. | 3,700 | 188 |
| | Tokai Rika Co. Ltd. | 10,000 | 188 |
| | Ichigo Inc. | 42,900 | 186 |
| | Tomy Co. Ltd. | 17,200 | 186 |
| | ASKUL Corp. | 4,500 | 185 |
| | Inaba Denki Sangyo Co. Ltd. | 5,100 | 185 |
| | Toho Holdings Co. Ltd. | 8,800 | 185 |
| | Totetsu Kogyo Co. Ltd. | 6,500 | 184 |
| | Meitec Corp. | 5,400 | 184 |
| | GMO Payment Gateway Inc. | 4,000 | 184 |
| *,^ | Aiful Corp. | 60,300 | 183 |
| | Fuji Oil Holdings Inc. | 9,500 | 183 |
| | Fujitec Co. Ltd. | 16,000 | 183 |
| | KYB Corp. | 40,000 | 183 |
| | Nanto Bank Ltd. | 4,800 | 182 |
| | Bank of Okinawa Ltd. | 5,180 | 182 |
| | Matsuya Foods Co. Ltd. | 5,600 | 182 |
| | Fuji Seal International Inc. | 4,400 | 181 |
| | GMO Internet Inc. | 13,500 | 180 |
| | Jafco Co. Ltd. | 5,400 | 179 |
| | Sakata Seed Corp. | 6,200 | 178 |
| | Hokuetsu Kishu Paper Co. Ltd. | 28,500 | 178 |
| | Noritz Corp. | 8,600 | 178 |
| | Takeuchi Manufacturing Co. Ltd. | 9,200 | 178 |
| | Nippon Flour Mills Co. Ltd. | 12,000 | 177 |
| | DCM Holdings Co. Ltd. | 20,200 | 177 |
| | Kyoritsu Maintenance Co. Ltd. | 2,936 | 176 |
| | Gurunavi Inc. | 6,400 | 175 |
| | Cosmo Energy Holdings Co. Ltd. | 13,400 | 175 |
| | Asatsu-DK Inc. | 6,300 | 175 |
| | Sanyo Special Steel Co. Ltd. | 34,000 | 174 |
| | Okamoto Industries Inc. | 16,000 | 173 |
| | Nichi-iko Pharmaceutical Co. Ltd. | 9,650 | 173 |
| *,^ | euglena Co. Ltd. | 12,700 | 173 |
| | Central Glass Co. Ltd. | 42,000 | 172 |
| | Unipres Corp. | 8,900 | 172 |
| | Okamura Corp. | 17,500 | 172 |
| | Kissei Pharmaceutical Co. Ltd. | 6,548 | 171 |
| | Hitachi Zosen Corp. | 34,000 | 171 |
| | Tokyo Dome Corp. | 18,000 | 171 |
| | Toho Bank Ltd. | 45,000 | 171 |
45
| | |
| Vanguard® Total World Stock Index Fund | | |
| Schedule of Investments | | |
| October 31, 2016 | | |
| |
| | | Market |
| | | Value |
| | Shares | ($000) |
| Sumitomo Mitsui Construction Co. Ltd. | 179,100 | 171 |
| Okinawa Electric Power Co. Inc. | 7,325 | 170 |
| Transcosmos Inc. | 6,700 | 170 |
| Kuroda Electric Co. Ltd. | 8,700 | 169 |
| Tokyu Construction Co. Ltd. | 16,700 | 169 |
| Nippon Steel & Sumikin Bussan Corp. | 4,600 | 169 |
| Exedy Corp. | 5,900 | 169 |
| Sumitomo Bakelite Co. Ltd. | 31,000 | 168 |
| Nisshin Oillio Group Ltd. | 37,000 | 168 |
| Kanamoto Co. Ltd. | 7,000 | 168 |
| ^ Daio Paper Corp. | 14,000 | 168 |
| Nihon Unisys Ltd. | 13,700 | 167 |
| Hyakujushi Bank Ltd. | 49,000 | 167 |
| Shima Seiki Manufacturing Ltd. | 5,900 | 166 |
| Daikyonishikawa Corp. | 12,800 | 166 |
| Daiseki Co. Ltd. | 8,000 | 164 |
| Yodogawa Steel Works Ltd. | 6,000 | 164 |
| Matsui Securities Co. Ltd. | 20,400 | 163 |
| ^ COLOPL Inc. | 11,300 | 162 |
| PALTAC Corp. | 6,600 | 162 |
| TPR Co. Ltd. | 5,600 | 162 |
| Tokyo TY Financial Group Inc. | 5,049 | 162 |
| Gree Inc. | 29,100 | 161 |
| Japan Securities Finance Co. Ltd. | 36,300 | 161 |
| ^ Jin Co. Ltd. | 3,100 | 161 |
| Adastria Co. Ltd. | 6,140 | 161 |
| Canon Marketing Japan Inc. | 9,300 | 161 |
| ^ EDION Corp. | 18,100 | 160 |
| Senko Co. Ltd. | 23,000 | 159 |
| Aichi Steel Corp. | 3,300 | 159 |
| Fukui Bank Ltd. | 60,000 | 159 |
| Hyakugo Bank Ltd. | 43,000 | 158 |
| HIS Co. Ltd. | 5,800 | 158 |
| Hokuetsu Bank Ltd. | 6,700 | 158 |
| TOMONY Holdings Inc. | 30,600 | 158 |
| Hogy Medical Co. Ltd. | 2,400 | 158 |
| Japan Aviation Electronics Industry Ltd. | 11,000 | 158 |
| Yamanashi Chuo Bank Ltd. | 32,000 | 157 |
| Saizeriya Co. Ltd. | 5,900 | 155 |
| Bank of Nagoya Ltd. | 4,400 | 155 |
| Nissan Shatai Co. Ltd. | 15,000 | 155 |
| cocokara fine Inc. | 4,000 | 155 |
| Kato Sangyo Co. Ltd. | 6,400 | 154 |
| Toyo Ink SC Holdings Co. Ltd. | 33,000 | 153 |
| Earth Chemical Co. Ltd. | 3,300 | 153 |
| United Arrows Ltd. | 5,500 | 150 |
| PanaHome Corp. | 20,000 | 149 |
| Accordia Golf Co. Ltd. | 14,700 | 148 |
| Kohnan Shoji Co. Ltd. | 7,500 | 148 |
| Itochu-Shokuhin Co. Ltd. | 3,700 | 148 |
| Japan Pulp & Paper Co. Ltd. | 44,000 | 147 |
| NEC Capital Solutions Ltd. | 8,800 | 147 |
| Iino Kaiun Kaisha Ltd. | 39,400 | 147 |
| Komeri Co. Ltd. | 6,000 | 147 |
| Yuasa Trading Co. Ltd. | 6,100 | 146 |
| United Super Markets Holdings Inc. | 16,160 | 146 |
| ZERIA Pharmaceutical Co. Ltd. | 8,700 | 146 |
| Eighteenth Bank Ltd. | 47,000 | 146 |
| Nichiha Corp. | 5,900 | 146 |
| Nippon Signal Company Ltd. | 16,400 | 146 |
| Hiday Hidaka Corp. | 5,832 | 145 |
| Nachi-Fujikoshi Corp. | 38,000 | 144 |
| Hokuto Corp. | 7,400 | 144 |
| Kameda Seika Co. Ltd. | 2,749 | 144 |
46
| | |
| Vanguard® Total World Stock Index Fund | | |
| Schedule of Investments | | |
| October 31, 2016 | | |
| |
| | | Market |
| | | Value |
| | Shares | ($000) |
| Meidensha Corp. | 43,000 | 144 |
| G-Tekt Corp. | 7,500 | 142 |
| Tokyo Steel Manufacturing Co. Ltd. | 20,500 | 142 |
| Sekisui Jushi Corp. | 8,600 | 142 |
| Eagle Industry Co. Ltd. | 9,900 | 141 |
| Nishimatsuya Chain Co. Ltd. | 10,000 | 141 |
| CKD Corp. | 11,300 | 141 |
| Joyful Honda Co. Ltd. | 5,094 | 141 |
| Nagatanien Holdings Co. Ltd. | 11,000 | 140 |
| Siix Corp. | 3,500 | 140 |
| Ehime Bank Ltd. | 10,600 | 140 |
| Bank of Iwate Ltd. | 3,300 | 139 |
| Takuma Co. Ltd. | 15,000 | 138 |
| Zojirushi Corp. | 10,000 | 138 |
| Chiyoda Co. Ltd. | 5,800 | 138 |
| Token Corp. | 1,900 | 137 |
| Takara Bio Inc. | 9,500 | 137 |
| Futaba Corp. | 8,400 | 137 |
| Taikisha Ltd. | 5,400 | 136 |
| Tokushu Tokai Paper Co. Ltd. | 4,000 | 136 |
| Chofu Seisakusho Co. Ltd. | 5,300 | 136 |
| Morita Holdings Corp. | 9,000 | 136 |
| Nippon Seiki Co. Ltd. | 7,000 | 135 |
| Anritsu Corp. | 25,500 | 135 |
| Kanematsu Corp. | 82,000 | 135 |
| * Nippon Sheet Glass Co. Ltd. | 16,574 | 135 |
| Yamagata Bank Ltd. | 31,000 | 134 |
| Life Corp. | 4,100 | 133 |
| Relia Inc. | 13,700 | 131 |
| Taiyo Holdings Co. Ltd. | 3,500 | 131 |
| Maruzen Showa Unyu Co. Ltd. | 32,000 | 130 |
| Paramount Bed Holdings Co. Ltd. | 3,400 | 129 |
| Nippon Densetsu Kogyo Co. Ltd. | 7,100 | 129 |
| Kisoji Co. Ltd. | 6,000 | 129 |
| Sankyo Tateyama Inc. | 8,200 | 129 |
| Marudai Food Co. Ltd. | 27,000 | 129 |
| Showa Sangyo Co. Ltd. | 24,000 | 128 |
| NS United Kaiun Kaisha Ltd. | 92,000 | 128 |
| NS Solutions Corp. | 6,700 | 128 |
| Daikyo Inc. | 59,000 | 127 |
| Kureha Corp. | 3,300 | 126 |
| Fuji Kyuko Co. Ltd. | 11,000 | 126 |
| Daisan Bank Ltd. | 7,400 | 125 |
| Key Coffee Inc. | 6,300 | 125 |
| Osaki Electric Co. Ltd. | 13,000 | 125 |
| Katakura Industries Co. Ltd. | 10,200 | 124 |
| Towa Bank Ltd. | 117,000 | 124 |
| Nagaileben Co. Ltd. | 5,600 | 123 |
| TOC Co. Ltd. | 13,600 | 123 |
| Keihin Corp. | 7,500 | 123 |
| Japan Petroleum Exploration Co. Ltd. | 5,600 | 123 |
| Kusuri No Aoki Co. Ltd. | 2,400 | 122 |
| Hitachi Maxell Ltd. | 6,700 | 122 |
| Osaka Steel Co. Ltd. | 6,500 | 122 |
| Daihen Corp. | 21,000 | 122 |
| Tokai Carbon Co. Ltd. | 40,000 | 122 |
| Sato Holdings Corp. | 5,500 | 121 |
| Seiko Holdings Corp. | 37,000 | 121 |
| Toshiba Plant Systems & Services Corp. | 7,500 | 121 |
| Kasai Kogyo Co. Ltd. | 10,600 | 120 |
| Nissin Electric Co. Ltd. | 9,000 | 120 |
| Eizo Corp. | 3,800 | 120 |
| Takara Leben Co. Ltd. | 17,600 | 119 |
| Dip Corp. | 4,500 | 119 |
47
| | |
| Vanguard® Total World Stock Index Fund | | |
| Schedule of Investments | | |
| October 31, 2016 | | |
| |
| | | Market |
| | | Value |
| | Shares | ($000) |
| Dexerials Corp. | 14,800 | 119 |
| ^ Japan Display Inc. | 60,300 | 119 |
| Sanyo Electric Railway Co. Ltd. | 23,907 | 118 |
| Sumitomo Warehouse Co. Ltd. | 22,000 | 118 |
| Matsuda Sangyo Co. Ltd. | 8,300 | 116 |
| Aichi Bank Ltd. | 2,100 | 116 |
| Topy Industries Ltd. | 5,000 | 116 |
| * Toshiba TEC Corp. | 26,000 | 116 |
| Royal Holdings Co. Ltd. | 6,700 | 116 |
| Chukyo Bank Ltd. | 5,200 | 115 |
| Aeon Delight Co. Ltd. | 3,900 | 115 |
| Senshukai Co. Ltd. | 17,000 | 115 |
| * Infomart Corp. | 9,700 | 115 |
| Nichiden Corp. | 4,000 | 114 |
| Akita Bank Ltd. | 34,000 | 114 |
| Oita Bank Ltd. | 30,000 | 114 |
| Fancl Corp. | 7,500 | 113 |
| VT Holdings Co. Ltd. | 21,100 | 113 |
| NET One Systems Co. Ltd. | 15,600 | 113 |
| Raito Kogyo Co. Ltd. | 9,400 | 113 |
| Tosho Co. Ltd. | 2,600 | 113 |
| SMS Co. Ltd. | 4,300 | 112 |
| Fuji Soft Inc. | 4,200 | 112 |
| Rock Field Co. Ltd. | 8,000 | 111 |
| Nitto Boseki Co. Ltd. | 34,000 | 111 |
| Kyoei Steel Ltd. | 5,800 | 110 |
| Kita-Nippon Bank Ltd. | 3,700 | 110 |
| Doutor Nichires Holdings Co. Ltd. | 5,500 | 110 |
| Seiren Co. Ltd. | 9,400 | 110 |
| TSI Holdings Co. Ltd. | 19,400 | 109 |
| Ryobi Ltd. | 27,000 | 109 |
| Iseki & Co. Ltd. | 44,000 | 109 |
| IBJ Leasing Co. Ltd. | 5,200 | 109 |
| Unizo Holdings Co. Ltd. | 3,900 | 109 |
| Kitz Corp. | 18,900 | 109 |
| Mizuno Corp. | 20,000 | 108 |
| NichiiGakkan Co. Ltd. | 12,900 | 107 |
| V Technology Co. Ltd. | 900 | 107 |
| Nomura Co. Ltd. | 6,600 | 107 |
| Nikkiso Co. Ltd. | 12,100 | 107 |
| Hosiden Corp. | 14,400 | 107 |
| Toridoll Holdings Corp. | 4,600 | 107 |
| AOKI Holdings Inc. | 8,800 | 106 |
| Mirait Holdings Corp. | 12,000 | 106 |
| Nippon Soda Co. Ltd. | 24,000 | 106 |
| Open House Co. Ltd. | 5,000 | 106 |
| Dydo Drinco Inc. | 1,900 | 105 |
| Nichicon Corp. | 12,200 | 105 |
| Toei Co. Ltd. | 13,000 | 104 |
| Nitto Kohki Co. Ltd. | 4,500 | 104 |
| J Trust Co. Ltd. | 12,700 | 104 |
| Tokyo Rope Manufacturing Co. Ltd. | 6,300 | 104 |
| Obara Group Inc. | 2,400 | 103 |
| Ci:z Holdings Co. Ltd. | 3,600 | 103 |
| Cawachi Ltd. | 4,000 | 103 |
| Sanken Electric Co. Ltd. | 29,000 | 103 |
| Yushin Precision Equipment Co. Ltd. | 4,400 | 102 |
| * Outsourcing Inc. | 2,700 | 102 |
| Heiwa Real Estate Co. Ltd. | 7,200 | 102 |
| T Hasegawa Co. Ltd. | 5,800 | 102 |
| Fuso Chemical Co. Ltd. | 4,800 | 102 |
| Daibiru Corp. | 11,700 | 102 |
| * Pioneer Corp. | 41,100 | 101 |
| ^ Tekken Corp. | 31,000 | 101 |
48
| | | |
| Vanguard® Total World Stock Index Fund | | |
| Schedule of Investments | | |
| October 31, 2016 | | |
| |
| | | | Market |
| | | | Value |
| | | Shares | ($000) |
| | Oiles Corp. | 5,560 | 101 |
| | Kanto Denka Kogyo Co. Ltd. | 12,000 | 101 |
| | Futaba Industrial Co. Ltd. | 16,800 | 100 |
| | Starts Corp. Inc. | 5,400 | 100 |
| | Descente Ltd. | 7,200 | 100 |
| | Hokkaido Gas Co. Ltd. | 39,000 | 100 |
| | Kintetsu World Express Inc. | 7,300 | 99 |
| ^ | TOKAI Holdings Corp. | 15,400 | 99 |
| | Milbon Co. Ltd. | 2,200 | 99 |
| | Pacific Industrial Co. Ltd. | 8,000 | 98 |
| | Kadokawa Dwango Corp. | 6,636 | 98 |
| | Nippon Ceramic Co. Ltd. | 5,300 | 98 |
| | Mani Inc. | 4,200 | 98 |
| | Toho Zinc Co. Ltd. | 28,000 | 98 |
| | Pack Corp. | 3,600 | 98 |
| | Doshisha Co. Ltd. | 4,700 | 97 |
| | Axial Retailing Inc. | 2,699 | 97 |
| | Noevir Holdings Co. Ltd. | 3,200 | 97 |
| | Kura Corp. | 1,900 | 96 |
| | Eiken Chemical Co. Ltd. | 3,500 | 96 |
| | Internet Initiative Japan Inc. | 5,400 | 95 |
| *,^ | W-Scope Corp. | 5,300 | 95 |
| | SKY Perfect JSAT Holdings Inc. | 19,100 | 95 |
| | Aomori Bank Ltd. | 28,000 | 95 |
| | Tachi-S Co. Ltd. | 5,700 | 95 |
| | Prima Meat Packers Ltd. | 26,000 | 94 |
| | Sintokogio Ltd. | 10,800 | 94 |
| | Osaka Soda Co. Ltd. | 22,000 | 94 |
| | Neturen Co. Ltd. | 11,600 | 94 |
| | Round One Corp. | 13,300 | 94 |
| | Kobe Bussan Co. Ltd. | 3,000 | 94 |
| | Asahi Diamond Industrial Co. Ltd. | 12,600 | 94 |
| | Alpine Electronics Inc. | 7,000 | 93 |
| | Sankyo Seiko Co. Ltd. | 28,400 | 93 |
| ^ | Yonex Co. Ltd. | 2,100 | 93 |
| | Furukawa Co. Ltd. | 58,000 | 93 |
| | Kyokuyo Co. Ltd. | 3,500 | 92 |
| | Kotobuki Spirits Co. Ltd. | 3,900 | 92 |
| | Heiwado Co. Ltd. | 4,400 | 92 |
| | Fujicco Co. Ltd. | 4,000 | 92 |
| | Stella Chemifa Corp. | 2,600 | 91 |
| | ESPEC Corp. | 7,500 | 91 |
| | Ichibanya Co. Ltd. | 2,400 | 91 |
| ^ | Next Co. Ltd. | 10,800 | 91 |
| | NEC Networks & System Integration Corp. | 5,100 | 91 |
| | Nishio Rent All Co. Ltd. | 3,000 | 91 |
| | Monex Group Inc. | 39,500 | 91 |
| * | Pacific Metals Co. Ltd. | 30,000 | 90 |
| | Aida Engineering Ltd. | 10,500 | 90 |
| | Komori Corp. | 7,100 | 90 |
| | Inageya Co. Ltd. | 6,647 | 90 |
| | Elecom Co. Ltd. | 4,400 | 90 |
| | As One Corp. | 2,000 | 90 |
| | Bank of Saga Ltd. | 34,000 | 89 |
| | TKC Corp. | 3,000 | 89 |
| | Kenko Mayonnaise Co. Ltd. | 2,400 | 88 |
| | ASKA Pharmaceutical Co. Ltd. | 5,100 | 88 |
| | Menicon Co. Ltd. | 3,100 | 88 |
| | Takaoka Toko Co. Ltd. | 4,800 | 88 |
| | Atom Corp. | 13,249 | 88 |
| ^ | METAWATER Co. Ltd. | 3,200 | 87 |
| | Godo Steel Ltd. | 5,000 | 87 |
| | Warabeya Nichiyo Holdings Co. Ltd. | 3,600 | 87 |
| | Shinko Plantech Co. Ltd. | 11,700 | 87 |
49
| | |
| Vanguard® Total World Stock Index Fund | | |
| Schedule of Investments | | |
| October 31, 2016 | | |
| |
| | | Market |
| | | Value |
| | Shares | ($000) |
| NSD Co. Ltd. | 5,390 | 87 |
| Mitsubishi Steel Manufacturing Co. Ltd. | 48,000 | 86 |
| Press Kogyo Co. Ltd. | 17,600 | 86 |
| Qol Co. Ltd. | 5,400 | 85 |
| Ohsho Food Service Corp. | 2,200 | 85 |
| Wacom Co. Ltd. | 28,000 | 84 |
| Japan Digital Laboratory Co. Ltd. | 5,400 | 84 |
| * Fujiya Co. Ltd. | 43,000 | 84 |
| Seikagaku Corp. | 5,200 | 83 |
| Konishi Co. Ltd. | 7,000 | 83 |
| Tokyo Electron Device Ltd. | 5,800 | 83 |
| Tsugami Corp. | 15,000 | 82 |
| Ines Corp. | 7,400 | 82 |
| Funai Soken Holdings Inc. | 5,300 | 82 |
| Bando Chemical Industries Ltd. | 8,500 | 82 |
| Toyo Kanetsu KK | 36,000 | 82 |
| Nissin Kogyo Co. Ltd. | 5,500 | 81 |
| Financial Products Group Co. Ltd. | 9,300 | 81 |
| Toyo Kohan Co. Ltd. | 27,100 | 81 |
| Micronics Japan Co. Ltd. | 7,000 | 81 |
| FIDEA Holdings Co. Ltd. | 44,900 | 81 |
| Foster Electric Co. Ltd. | 4,400 | 81 |
| Zenrin Co. Ltd. | 4,600 | 80 |
| Hibiya Engineering Ltd. | 5,100 | 80 |
| Dainichiseika Color & Chemicals Manufacturing Co. Ltd. | 15,000 | 80 |
| Daiwabo Holdings Co. Ltd. | 33,000 | 80 |
| Create Restaurants Holdings Inc. | 8,400 | 80 |
| BML Inc. | 3,000 | 80 |
| Konoike Transport Co. Ltd. | 6,000 | 79 |
| Belluna Co. Ltd. | 11,900 | 79 |
| Nippon Valqua Industries Ltd. | 5,800 | 79 |
| Dunlop Sports Co. Ltd. | 8,000 | 79 |
| Tokyo Broadcasting System Holdings Inc. | 5,000 | 79 |
| Sakai Chemical Industry Co. Ltd. | 22,000 | 78 |
| Plenus Co. Ltd. | 3,800 | 78 |
| * Miroku Jyoho Service Co. Ltd. | 4,000 | 78 |
| kabu.com Securities Co. Ltd. | 24,800 | 78 |
| Ricoh Leasing Co. Ltd. | 2,700 | 78 |
| Kansai Urban Banking Corp. | 7,000 | 78 |
| * Unitika Ltd. | 115,000 | 78 |
| San-Ai Oil Co. Ltd. | 11,000 | 78 |
| Asahi Holdings Inc. | 4,300 | 77 |
| Shinmaywa Industries Ltd. | 10,000 | 77 |
| Sakata INX Corp. | 5,900 | 77 |
| Giken Ltd. | 4,400 | 77 |
| COOKPAD Inc. | 8,100 | 77 |
| Tosei Corp. | 10,200 | 76 |
| Riso Kagaku Corp. | 4,400 | 76 |
| Vital KSK Holdings Inc. | 7,200 | 76 |
| Sanshin Electronics Co. Ltd. | 8,600 | 76 |
| Honeys Co. Ltd. | 6,460 | 76 |
| Kurabo Industries Ltd. | 38,000 | 76 |
| Advan Co. Ltd. | 8,200 | 76 |
| Mitsubishi Shokuhin Co. Ltd. | 2,300 | 75 |
| Toyo Engineering Corp. | 22,000 | 75 |
| Jeol Ltd. | 18,000 | 75 |
| Benefit One Inc. | 2,600 | 75 |
| Macnica Fuji Electronics Holdings Inc. | 6,000 | 75 |
| Toyo Corp. | 7,800 | 75 |
| Daiken Corp. | 3,600 | 75 |
| Nohmi Bosai Ltd. | 5,000 | 75 |
| Jaccs Co. Ltd. | 19,000 | 75 |
| Anicom Holdings Inc. | 3,300 | 74 |
| Hioki EE Corp. | 3,800 | 74 |
50
| | |
| Vanguard® Total World Stock Index Fund | | |
| Schedule of Investments | | |
| October 31, 2016 | | |
| |
| | | Market |
| | | Value |
| | Shares | ($000) |
| Taihei Dengyo Kaisha Ltd. | 7,000 | 73 |
| Sanki Engineering Co. Ltd. | 8,000 | 73 |
| Max Co. Ltd. | 6,000 | 72 |
| Tsubaki Nakashima Co. Ltd. | 4,500 | 72 |
| Kamei Corp. | 7,500 | 71 |
| Fuji Co. Ltd. | 3,400 | 71 |
| Optex Co. Ltd. | 2,800 | 71 |
| Ringer Hut Co. Ltd. | 2,800 | 71 |
| Fukuda Corp. | 6,000 | 71 |
| Ichiyoshi Securities Co. Ltd. | 9,400 | 70 |
| Istyle Inc. | 8,900 | 70 |
| Piolax Inc. | 1,100 | 70 |
| Tamura Corp. | 17,000 | 70 |
| Trancom Co. Ltd. | 1,200 | 70 |
| Bank of the Ryukyus Ltd. | 5,300 | 70 |
| Fujibo Holdings Inc. | 2,200 | 70 |
| Tsukui Corp. | 10,600 | 70 |
| Pressance Corp. | 6,000 | 69 |
| Create SD Holdings Co. Ltd. | 3,300 | 69 |
| Tv Tokyo Holdings Corp. | 3,000 | 69 |
| Hitachi Koki Co. Ltd. | 8,100 | 69 |
| Shikoku Bank Ltd. | 29,000 | 68 |
| Fukushima Industries Corp. | 2,000 | 68 |
| Yamazen Corp. | 8,500 | 68 |
| T-Gaia Corp. | 4,400 | 68 |
| Tochigi Bank Ltd. | 14,000 | 67 |
| * Japan Material Co. Ltd. | 1,900 | 67 |
| Tocalo Co. Ltd. | 3,000 | 67 |
| Mitsuba Corp. | 4,600 | 67 |
| Shikoku Chemicals Corp. | 7,000 | 67 |
| EPS Holdings Inc. | 5,100 | 67 |
| Canon Electronics Inc. | 4,300 | 67 |
| Daidoh Ltd. | 16,900 | 67 |
| Shibuya Corp. | 3,200 | 66 |
| Namura Shipbuilding Co. Ltd. | 10,900 | 66 |
| Bunka Shutter Co. Ltd. | 8,000 | 66 |
| Toho Co. Ltd. (Tokyo Shares 8142) | 2,800 | 66 |
| Daiho Corp. | 12,000 | 66 |
| Shizuoka Gas Co. Ltd. | 8,400 | 66 |
| Japan Wool Textile Co. Ltd. | 9,000 | 66 |
| Toppan Forms Co. Ltd. | 6,600 | 66 |
| OBIC Business Consultants Co. Ltd. | 1,400 | 66 |
| Anest Iwata Corp. | 6,500 | 65 |
| Riken Vitamin Co. Ltd. | 1,500 | 65 |
| Yondoshi Holdings Inc. | 2,600 | 65 |
| Sakai Moving Service Co. Ltd. | 3,000 | 65 |
| * Rokko Butter Co. Ltd. | 2,400 | 65 |
| Aisan Industry Co. Ltd. | 7,900 | 64 |
| Goldwin Inc. | 1,400 | 64 |
| Star Micronics Co. Ltd. | 4,500 | 64 |
| JVC Kenwood Corp. | 23,600 | 64 |
| Musashi Seimitsu Industry Co. Ltd. | 2,600 | 64 |
| Sanyo Chemical Industries Ltd. | 1,400 | 63 |
| Nissin Corp. | 19,000 | 63 |
| Systena Corp. | 3,600 | 63 |
| Chudenko Corp. | 3,000 | 62 |
| Kourakuen Holdings Corp. | 4,200 | 62 |
| Inabata & Co. Ltd. | 5,700 | 62 |
| UKC Holdings Corp. | 3,700 | 62 |
| St. Marc Holdings Co. Ltd. | 2,200 | 62 |
| Toyo Construction Co. Ltd. | 14,700 | 61 |
| Shibusawa Warehouse Co. Ltd. | 21,000 | 61 |
| Nippon Koei Co. Ltd. | 13,000 | 61 |
| OSJB Holdings Corp. | 25,600 | 61 |
51
| | | |
| Vanguard® Total World Stock Index Fund | | |
| Schedule of Investments | | |
| October 31, 2016 | | |
| |
| | | | Market |
| | | | Value |
| | | Shares | ($000) |
| | Mitsuboshi Belting Ltd. | 7,000 | 60 |
| | Taisei Lamick Co. Ltd. | 2,100 | 60 |
| *,^ | Mitsumi Electric Co. Ltd. | 9,900 | 60 |
| | Sodick Co. Ltd. | 8,000 | 60 |
| | TV Asahi Holdings Corp. | 3,200 | 60 |
| | Marusan Securities Co. Ltd. | 7,200 | 60 |
| | Nitta Corp. | 2,300 | 60 |
| | Nippon Thompson Co. Ltd. | 15,000 | 59 |
| | Nippon Parking Development Co. Ltd. | 43,500 | 59 |
| | Fujimi Inc. | 3,800 | 59 |
| | Takasago International Corp. | 2,200 | 59 |
| | Koa Corp. | 6,400 | 59 |
| | Justsystems Corp. | 6,000 | 59 |
| | Yahagi Construction Co. Ltd. | 6,400 | 59 |
| | Mie Kotsu Group Holdings Inc. | 15,900 | 59 |
| | Sanyo Denki Co. Ltd. | 9,000 | 58 |
| | Chugoku Marine Paints Ltd. | 8,000 | 58 |
| | Tokai Corp. | 1,700 | 58 |
| | Tokyo Energy & Systems Inc. | 6,000 | 58 |
| | DTS Corp. | 2,600 | 58 |
| ^ | Keiyo Co. Ltd. | 11,400 | 58 |
| ^ | Right On Co. Ltd. | 5,800 | 57 |
| | J-Oil Mills Inc. | 1,600 | 57 |
| ^ | Pasona Group Inc. | 6,700 | 57 |
| | Maruwa Co. Ltd. | 1,500 | 57 |
| * | Kintetsu Department Store Co. Ltd. | 17,000 | 57 |
| | Sumitomo Riko Co. Ltd. | 5,900 | 57 |
| | Miyazaki Bank Ltd. | 20,000 | 56 |
| | Shindengen Electric Manufacturing Co. Ltd. | 13,000 | 56 |
| * | Nissei Build Kogyo Co. Ltd. | 12,000 | 56 |
| | Itochu Enex Co. Ltd. | 7,300 | 56 |
| | Tsukishima Kikai Co. Ltd. | 5,000 | 56 |
| | Clarion Co. Ltd. | 17,000 | 56 |
| | Sanden Holdings Corp. | 18,000 | 56 |
| | Mars Engineering Corp. | 2,800 | 56 |
| | Oyo Corp. | 4,800 | 56 |
| | JCR Pharmaceuticals Co. Ltd. | 2,200 | 55 |
| | Kato Works Co. Ltd. | 2,200 | 55 |
| | Fudo Tetra Corp. | 31,300 | 55 |
| | JSP Corp. | 2,300 | 55 |
| *,^ | OSAKA Titanium Technologies Co. Ltd. | 4,100 | 55 |
| | Sogo Medical Co. Ltd. | 1,800 | 55 |
| | Ryoyo Electro Corp. | 4,300 | 55 |
| | Alpen Co. Ltd. | 3,000 | 55 |
| | Shinwa Co. Ltd. | 3,600 | 55 |
| | Nihon Chouzai Co. Ltd. | 1,300 | 54 |
| * | Vector Inc. | 4,600 | 54 |
| | Chiba Kogyo Bank Ltd. | 12,200 | 54 |
| | Mitsui Sugar Co. Ltd. | 2,400 | 54 |
| ^ | Marvelous Inc. | 7,600 | 54 |
| | Daido Metal Co. Ltd. | 5,000 | 54 |
| | Cosel Co. Ltd. | 4,500 | 54 |
| | Digital Arts Inc. | 2,000 | 54 |
| * | Chiyoda Integre Co. Ltd. | 2,600 | 54 |
| | Michinoku Bank Ltd. | 27,000 | 54 |
| | Yushiro Chemical Industry Co. Ltd. | 3,858 | 53 |
| | Minato Bank Ltd. | 2,900 | 53 |
| | Belc Co. Ltd. | 1,300 | 53 |
| | Mitani Sekisan Co. Ltd. | 2,100 | 52 |
| | Elematec Corp. | 3,100 | 52 |
| | Onoken Co. Ltd. | 4,200 | 52 |
| | Union Tool Co. | 2,000 | 52 |
| ^ | Nippon Synthetic Chemical Industry Co. Ltd. | 6,000 | 52 |
| | Wowow Inc. | 1,800 | 51 |
52
| | |
| Vanguard® Total World Stock Index Fund | | |
| Schedule of Investments | | |
| October 31, 2016 | | |
| |
| | | Market |
| | | Value |
| | Shares | ($000) |
| Sinfonia Technology Co. Ltd. | 28,000 | 51 |
| YAMABIKO Corp. | 5,200 | 51 |
| Yurtec Corp. | 7,000 | 51 |
| ^ Japan Cash Machine Co. Ltd. | 3,600 | 51 |
| Hakuto Co. Ltd. | 5,492 | 51 |
| ^ Kumiai Chemical Industry Co. Ltd. | 9,000 | 51 |
| Aiphone Co. Ltd. | 2,900 | 51 |
| Amuse Inc. | 3,000 | 51 |
| * CMK Corp. | 9,600 | 51 |
| Bell System24 Holdings Inc. | 5,400 | 51 |
| Toa Corp. (Tokyo Shares 1885) | 2,400 | 51 |
| Ihara Chemical Industry Co. Ltd. | 5,900 | 50 |
| BRONCO BILLY Co. Ltd. | 1,700 | 50 |
| Megachips Corp. | 2,500 | 50 |
| Shinnihon Corp. | 5,200 | 50 |
| Nittetsu Mining Co. Ltd. | 1,200 | 50 |
| Nitto Kogyo Corp. | 3,400 | 50 |
| Fujimori Kogyo Co. Ltd. | 2,000 | 50 |
| Kaga Electronics Co. Ltd. | 3,400 | 50 |
| Tokyotokeiba Co. Ltd. | 25,000 | 49 |
| Modec Inc. | 2,900 | 49 |
| Yorozu Corp. | 3,100 | 49 |
| Melco Holdings Inc. | 1,800 | 49 |
| ^ Toho Titanium Co. Ltd. | 7,300 | 49 |
| Itoki Corp. | 7,900 | 49 |
| Tenma Corp. | 2,800 | 48 |
| Japan Transcity Corp. | 13,000 | 48 |
| Shimizu Bank Ltd. | 1,600 | 48 |
| Prestige International Inc. | 6,400 | 48 |
| Fujikura Kasei Co. Ltd. | 8,000 | 48 |
| * Mitsubishi Paper Mills Ltd. | 7,300 | 48 |
| Noritake Co. Ltd. | 2,100 | 48 |
| Kitagawa Iron Works Co. Ltd. | 2,800 | 48 |
| Maeda Kosen Co. Ltd. | 4,300 | 48 |
| Avex Group Holdings Inc. | 3,600 | 48 |
| Yokohama Reito Co. Ltd. | 4,700 | 48 |
| Shin-Etsu Polymer Co. Ltd. | 7,100 | 47 |
| Teikoku Sen-I Co. Ltd. | 3,200 | 47 |
| Tanseisha Co. Ltd. | 6,300 | 47 |
| Yomiuri Land Co. Ltd. | 11,000 | 47 |
| Goldcrest Co. Ltd. | 2,600 | 47 |
| Showa Corp. | 7,200 | 47 |
| Takiron Co. Ltd. | 10,000 | 47 |
| Dai Nippon Toryo Co. Ltd. | 22,000 | 47 |
| Koatsu Gas Kogyo Co. Ltd. | 7,000 | 47 |
| WATAMI Co. Ltd. | 4,300 | 47 |
| * Ishihara Sangyo Kaisha Ltd. | 6,100 | 46 |
| * Daito Pharmaceutical Co. Ltd. | 2,100 | 46 |
| Meisei Industrial Co. Ltd. | 9,000 | 46 |
| SMK Corp. | 12,000 | 46 |
| Torishima Pump Manufacturing Co. Ltd. | 4,200 | 45 |
| Nippon Road Co. Ltd. | 11,000 | 45 |
| Kyokuto Kaihatsu Kogyo Co. Ltd. | 3,800 | 45 |
| Sumitomo Seika Chemicals Co. Ltd. | 1,200 | 45 |
| CONEXIO Corp. | 3,300 | 45 |
| Kurimoto Ltd. | 2,400 | 45 |
| Toa Corp. (Tokyo Shares 6809) | 4,900 | 45 |
| PAL GROUP Holdings Co. Ltd. | 1,800 | 45 |
| Daiichi Jitsugyo Co. Ltd. | 8,000 | 44 |
| Kyodo Printing Co. Ltd. | 13,000 | 44 |
| Yokogawa Bridge Holdings Corp. | 4,000 | 44 |
| * Wellnet Corp. | 3,500 | 44 |
| Nippon Kanzai Co. Ltd. | 3,000 | 44 |
| HI-LEX Corp. | 1,600 | 44 |
53
| | | |
| Vanguard® Total World Stock Index Fund | | |
| Schedule of Investments | | |
| October 31, 2016 | | |
| |
| | | | Market |
| | | | Value |
| | | Shares | ($000) |
| | Tsurumi Manufacturing Co. Ltd. | 3,000 | 44 |
| | Tsukuba Bank Ltd. | 14,600 | 44 |
| | Xebio Holdings Co. Ltd. | 2,800 | 43 |
| | Arata Corp. | 1,900 | 43 |
| | Jimoto Holdings Inc. | 25,700 | 43 |
| | Enplas Corp. | 1,400 | 43 |
| | Fujita Kanko Inc. | 13,000 | 43 |
| | Tonami Holdings Co. Ltd. | 16,000 | 43 |
| | ASAHI YUKIZAI Corp. | 22,000 | 43 |
| | Shinko Electric Industries Co. Ltd. | 6,600 | 43 |
| | Starzen Co. Ltd. | 800 | 42 |
| | Komatsu Seiren Co. Ltd. | 6,800 | 42 |
| | Daikokutenbussan Co. Ltd. | 900 | 42 |
| | Sanyo Shokai Ltd. | 26,000 | 42 |
| | F@N Communications Inc. | 5,600 | 42 |
| | Okabe Co. Ltd. | 4,900 | 42 |
| | Daiwa Industries Ltd. | 4,800 | 42 |
| | Zuiko Corp. | 1,100 | 42 |
| | Arcland Service Holdings Co. Ltd. | 1,400 | 42 |
| | Mitsubishi Kakoki Kaisha Ltd. | 21,000 | 41 |
| | Towa Pharmaceutical Co. Ltd. | 1,100 | 41 |
| * | KNT-CT Holdings Co. Ltd. | 37,000 | 41 |
| | Matsuya Co. Ltd. | 5,100 | 41 |
| ^ | Nippon Carbon Co. Ltd. | 21,000 | 41 |
| | Tosho Printing Co. Ltd. | 9,000 | 41 |
| | Idec Corp. | 4,500 | 40 |
| | Riken Corp. | 1,100 | 40 |
| | Pronexus Inc. | 3,800 | 40 |
| | Mitsubishi Nichiyu Forklift Co. Ltd. | 6,600 | 40 |
| | Information Services International-Dentsu Ltd. | 2,300 | 40 |
| | Furuno Electric Co. Ltd. | 5,100 | 39 |
| | Kyokuto Securities Co. Ltd. | 2,700 | 39 |
| | Denki Kogyo Co. Ltd. | 7,000 | 39 |
| | Roland DG Corp. | 1,600 | 38 |
| | Sumitomo Densetsu Co. Ltd. | 3,400 | 38 |
| | S Foods Inc. | 1,400 | 37 |
| | Kitano Construction Corp. | 14,000 | 37 |
| | Tatsuta Electric Wire and Cable Co. Ltd. | 9,200 | 37 |
| * | SWCC Showa Holdings Co. Ltd. | 52,000 | 37 |
| | Ateam Inc. | 1,600 | 36 |
| | Mitsui-Soko Holdings Co. Ltd. | 12,000 | 36 |
| | Sumitomo Real Estate Sales Co. Ltd. | 1,600 | 36 |
| | Nihon Trim Co. Ltd. | 800 | 36 |
| | Broadleaf Co. Ltd. | 3,200 | 36 |
| | Toyo Tanso Co. Ltd. | 2,500 | 36 |
| | Juki Corp. | 4,800 | 36 |
| | Torii Pharmaceutical Co. Ltd. | 1,500 | 35 |
| | Nippon Denko Co. Ltd. | 18,500 | 34 |
| | Sun Frontier Fudousan Co. Ltd. | 3,600 | 34 |
| | Geo Holdings Corp. | 2,700 | 34 |
| | Wakita & Co. Ltd. | 4,000 | 34 |
| | Hamakyorex Co. Ltd. | 1,800 | 34 |
| | Arcland Sakamoto Co. Ltd. | 2,800 | 33 |
| | Tamron Co. Ltd. | 1,900 | 33 |
| | Nippon Chemi-Con Corp. | 19,000 | 33 |
| ^ | PC Depot Corp. | 6,720 | 33 |
| | Nihon Nohyaku Co. Ltd. | 6,000 | 33 |
| | Toshiba Machine Co. Ltd. | 9,000 | 33 |
| | Kappa Create Co. Ltd. | 2,800 | 32 |
| | Sac's Bar Holdings Inc. | 3,000 | 32 |
| | IDOM Inc. | 6,100 | 32 |
| ^ | Happinet Corp. | 3,000 | 32 |
| | AOI Electronics Co. Ltd. | 1,300 | 32 |
| *,^ | Laox Co. Ltd. | 3,900 | 31 |
54
| | | |
| Vanguard® Total World Stock Index Fund | | |
| Schedule of Investments | | |
| October 31, 2016 | | |
| |
| | | | Market |
| | | | Value |
| | | Shares | ($000) |
| | Kobelco Eco-Solutions Co. Ltd. | 8,000 | 31 |
| | Nippon Chemiphar Co. Ltd. | 752 | 31 |
| * | Nippon Sharyo Ltd. | 12,000 | 30 |
| | Gecoss Corp. | 3,200 | 29 |
| | Nippon Yakin Kogyo Co. Ltd. | 19,500 | 29 |
| | Takamatsu Construction Group Co. Ltd. | 1,200 | 28 |
| | C Uyemura & Co. Ltd. | 600 | 28 |
| | Mito Securities Co. Ltd. | 12,000 | 28 |
| | Yellow Hat Ltd. | 1,300 | 28 |
| | Showa Aircraft Industry Co. Ltd. | 3,000 | 27 |
| *,^ | KLab Inc. | 4,300 | 26 |
| | Joshin Denki Co. Ltd. | 3,000 | 26 |
| | Mitsui High-Tec Inc. | 3,500 | 23 |
| | Jamco Corp. | 1,100 | 23 |
| | Chuetsu Pulp & Paper Co. Ltd. | 10,000 | 22 |
| | Future Corp. | 3,200 | 21 |
| | Chugai Ro Co. Ltd. | 11,000 | 21 |
| | Okuwa Co. Ltd. | 2,000 | 21 |
| *,^ | Akebono Brake Industry Co. Ltd. | 10,700 | 20 |
| | Japan Drilling Co. Ltd. | 900 | 20 |
| | Nissei ASB Machine Co. Ltd. | 1,000 | 18 |
| | Zuken Inc. | 1,600 | 16 |
| | Funai Electric Co. Ltd. | 2,000 | 16 |
| | Tabuchi Electric Co. Ltd. | 4,200 | 13 |
| *,^ | Takata Corp. | 3,700 | 13 |
| | Aderans Co. Ltd. | 2,000 | 12 |
| | | | 751,758 |
| Malaysia (0.4%) | | |
| | Public Bank Bhd. (Local) | 623,466 | 2,951 |
| | Tenaga Nasional Bhd. | 741,970 | 2,535 |
| | Malayan Banking Bhd. | 1,116,776 | 2,103 |
| | CIMB Group Holdings Bhd. | 1,174,852 | 1,407 |
| | Sime Darby Bhd. | 685,375 | 1,338 |
| | Axiata Group Bhd. | 924,251 | 1,084 |
| | Petronas Chemicals Group Bhd. | 600,489 | 1,002 |
| | DiGi.Com Bhd. | 775,500 | 930 |
| | Petronas Gas Bhd. | 166,800 | 873 |
| | Genting Bhd. | 464,500 | 868 |
| | IHH Healthcare Bhd. | 565,820 | 863 |
| | IOI Corp. Bhd. | 733,940 | 787 |
| | Maxis Bhd. | 528,400 | 751 |
| | Genting Malaysia Bhd. | 635,800 | 722 |
| | Kuala Lumpur Kepong Bhd. | 104,500 | 597 |
| | MISC Bhd. | 295,956 | 531 |
| | Gamuda Bhd. | 446,400 | 523 |
| | IJM Corp. Bhd. | 664,420 | 523 |
| | PPB Group Bhd. | 119,700 | 460 |
| | AMMB Holdings Bhd. | 441,700 | 442 |
| | YTL Corp. Bhd. | 1,138,466 | 432 |
| | Hong Leong Bank Bhd. | 125,800 | 399 |
| * | SapuraKencana Petroleum Bhd. | 966,695 | 372 |
| | Petronas Dagangan Bhd. | 59,700 | 332 |
| | British American Tobacco Malaysia Bhd. | 27,500 | 325 |
| | Telekom Malaysia Bhd. | 205,300 | 320 |
| | Dialog Group Bhd. | 837,748 | 309 |
| 2 | Astro Malaysia Holdings Bhd. | 432,787 | 294 |
| | RHB Bank Bhd. | 236,950 | 273 |
| | Malaysia Airports Holdings Bhd. | 165,800 | 262 |
| | IOI Properties Group Bhd. | 447,897 | 261 |
| | HAP Seng Consolidated Bhd. | 137,400 | 255 |
| | KPJ Healthcare Bhd. | 216,100 | 216 |
| | Top Glove Corp. Bhd. | 181,800 | 214 |
| | Alliance Financial Group Bhd. | 217,900 | 207 |
| | Berjaya Sports Toto Bhd. | 272,531 | 207 |
55
| | |
| Vanguard® Total World Stock Index Fund | | |
| Schedule of Investments | | |
| October 31, 2016 | | |
| |
| | | Market |
| | | Value |
| | Shares | ($000) |
| Felda Global Ventures Holdings Bhd. | 430,800 | 206 |
| Malakoff Corp. Bhd. | 557,800 | 206 |
| Bursa Malaysia Bhd. | 99,300 | 205 |
| Sunway REIT | 466,000 | 205 |
| My EG Services Bhd. | 349,100 | 203 |
| YTL Power International Bhd. | 554,718 | 202 |
| Westports Holdings Bhd. | 188,600 | 198 |
| UMW Holdings Bhd. | 121,600 | 172 |
| Hartalega Holdings Bhd. | 147,000 | 172 |
| AirAsia Bhd. | 258,800 | 171 |
| Hong Leong Financial Group Bhd. | 45,442 | 170 |
| TIME dotCom Bhd. | 86,600 | 165 |
| Lafarge Malaysia Bhd. | 85,200 | 164 |
| Genting Plantations Bhd. | 58,800 | 154 |
| Inari Amertron Bhd. | 189,825 | 152 |
| KLCCP Stapled Group | 73,300 | 139 |
| Sunway Bhd. | 177,043 | 132 |
| Kossan Rubber Industries | 81,600 | 131 |
| Bumi Armada Bhd. | 764,850 | 128 |
| Press Metal Bhd. | 119,600 | 124 |
| Mah Sing Group Bhd. | 305,050 | 111 |
| WCT Holdings Bhd. | 264,420 | 107 |
| Cahya Mata Sarawak Bhd. | 115,100 | 105 |
| QL Resources Bhd. | 92,700 | 98 |
| Media Prima Bhd. | 339,000 | 97 |
| Yinson Holdings Bhd. | 121,600 | 91 |
| Unisem M Bhd. | 143,400 | 87 |
| Pavilion REIT | 203,500 | 85 |
| Berjaya Corp. Bhd. | 1,072,100 | 83 |
| Malaysia Building Society Bhd. | 380,100 | 83 |
| MMC Corp. Bhd. | 144,100 | 82 |
| * UMW Oil & Gas Corp. Bhd. | 374,900 | 76 |
| Pos Malaysia Bhd. | 77,300 | 74 |
| Muhibbah Engineering M Bhd. | 115,500 | 63 |
| * Eco World Development Group Bhd. | 194,600 | 63 |
| Aeon Co. M Bhd. | 93,100 | 63 |
| UEM Sunrise Bhd. | 200,900 | 54 |
| Bermaz Auto Bhd. | 97,020 | 53 |
| VS Industry Bhd. | 154,600 | 52 |
| OSK Holdings Bhd. | 139,400 | 50 |
| * Syarikat Takaful Malaysia Bhd. | 43,900 | 44 |
| DRB-Hicom Bhd. | 145,200 | 44 |
| * KNM Group Bhd. | 420,500 | 40 |
| * Dayang Enterprise Holdings Bhd. | 177,900 | 36 |
| Puncak Niaga Holdings Bhd. | 140,200 | 36 |
| Malaysian Resources Corp. Bhd. | 107,900 | 35 |
| Eastern & Oriental Bhd. | 92,004 | 34 |
| Supermax Corp. Bhd. | 58,600 | 30 |
| Datasonic Group Bhd. | 87,200 | 30 |
| * Gamuda Bhd. Warrants Exp. 03/06/2021 | 73,000 | 23 |
| * Mulpha International Bhd. | 376,800 | 19 |
| Coastal Contracts Bhd. | 47,000 | 17 |
| * Parkson Holdings Bhd. | 81,552 | 15 |
| * Mudajaya Group Bhd. | 61,100 | 14 |
| Gas Malaysia Bhd. | 22,200 | 14 |
| TA Enterprise Bhd. | 118,100 | 14 |
| * Malaysia Marine and Heavy Engineering Holdings Bhd. | 25,400 | 6 |
| * BIMB Holdings Bhd. Warrants Exp. 12/04/2023 | 63,800 | 5 |
| * Puncak Niaga Holding Bhd. Warrants Exp. 07/20/2018 | 28,250 | 3 |
| * WCT Holdings Bhd. Warrants Exp. 08/24/2020 | 52,360 | 2 |
| Sunway Construction Group Bhd. | 5,294 | 2 |
| * OSK Holdings Bhd. Warrants Exp. 07/22/2020 | 34,850 | 2 |
| * KPJ Healthcare Warrants Exp. 01/23/2019 | 12,000 | 2 |
| * RHB Captial BHD | 116,200 | 1 |
56
| | |
| Vanguard® Total World Stock Index Fund | | |
| Schedule of Investments | | |
| October 31, 2016 | | |
| |
| | | Market |
| | | Value |
| | Shares | ($000) |
| * KNM Group Bhd. Warrants Exp. 04/21/2020 | 40,650 | 1 |
| * CB Industrial Product Holding Bhd Warrants Exp. 10/31/2019 | 15,733 | 1 |
| * Mah Sing Group Bhd. Warrants Exp. 03/18/2018 | 23,257 | 1 |
| * Eastern & Oriental Bhd Warrants Exp. 07/21/2019 | 16,400 | 1 |
| * Mah Sing Group Warrants Exp. 01/15/2026 | 15,015 | — |
| | | 31,416 |
| Malta (0.0%) | | |
| * BGP Holdings PLC | 197,753 | — |
| |
| Mexico (0.5%) | | |
| Fomento Economico Mexicano SAB de CV | 450,748 | 4,324 |
| America Movil SAB de CV | 6,097,109 | 4,039 |
| Grupo Aeroportuario del Pacifico SAB de CV ADR | 31,500 | 3,044 |
| Grupo Financiero Banorte SAB de CV | 473,564 | 2,789 |
| Grupo Televisa SAB | 519,300 | 2,555 |
| * Cemex SAB de CV | 2,909,763 | 2,519 |
| Wal-Mart de Mexico SAB de CV | 1,170,600 | 2,477 |
| Grupo Mexico SAB de CV Class B | 816,147 | 2,011 |
| Grupo Bimbo SAB de CV Class A | 399,800 | 1,077 |
| Fibra Uno Administracion SA de CV | 559,640 | 1,068 |
| Alfa SAB de CV Class A | 570,600 | 865 |
| Grupo Aeroportuario del Sureste SAB de CV Class B | 45,131 | 718 |
| Coca-Cola Femsa SAB de CV | 91,000 | 684 |
| Grupo Financiero Inbursa SAB de CV | 420,700 | 683 |
| Industrias Penoles SAB de CV | 27,275 | 661 |
| Grupo Financiero Santander Mexico SAB de CV Class B | 313,465 | 567 |
| Mexichem SAB de CV | 224,384 | 537 |
| Promotora y Operadora de Infraestructura SAB de CV | 46,312 | 518 |
| Gruma SAB de CV Class B | 35,535 | 493 |
| Grupo Carso SAB de CV | 106,030 | 463 |
| Gentera SAB de CV | 231,900 | 458 |
| Alsea SAB de CV | 116,400 | 434 |
| El Puerto de Liverpool SAB de CV | 39,200 | 411 |
| Arca Continental SAB de CV | 59,600 | 371 |
| Grupo Aeroportuario del Pacifico SAB de CV Class B | 37,900 | 366 |
| Kimberly-Clark de Mexico SAB de CV Class A | 169,500 | 365 |
| Infraestructura Energetica Nova SAB de CV | 75,700 | 335 |
| Banregio Grupo Financiero SAB de CV | 46,100 | 302 |
| Grupo Aeroportuario del Centro Norte SAB de CV Class B | 46,600 | 271 |
| PLA Administradora Industrial S de RL de CV | 141,986 | 235 |
| * Controladora Vuela Cia de Aviacion SAB de CV Class A | 117,600 | 225 |
| Macquarie Mexico Real Estate Management SA de CV | 161,500 | 203 |
| Megacable Holdings SAB de CV | 52,162 | 190 |
| * Genomma Lab Internacional SAB de CV Class B | 153,563 | 184 |
| * Industrias CH SAB de CV Class B | 38,547 | 182 |
| Bolsa Mexicana de Valores SAB de CV | 112,700 | 180 |
| * Grupo Aeromexico SAB de CV | 87,849 | 173 |
| Corp Inmobiliaria Vesta SAB de CV | 107,000 | 162 |
| * Telesites SAB de CV | 278,439 | 161 |
| * OHL Mexico SAB de CV | 136,100 | 160 |
| Grupo Elektra SAB DE CV | 11,000 | 153 |
| Grupo Lala SAB de CV | 78,900 | 147 |
| Grupo Financiero Interacciones SA de CV | 26,377 | 129 |
| 2 Nemak SAB de CV | 119,300 | 124 |
| Industrias Bachoco SAB de CV Class B | 27,100 | 120 |
| Grupo Comercial Chedraui SA de CV | 53,100 | 118 |
| * Organizacion Soriana SAB de CV Class B | 37,200 | 102 |
| Grupo Herdez SAB de CV | 41,400 | 100 |
| TV Azteca SAB de CV | 507,500 | 97 |
| Alpek SAB de CV | 59,100 | 88 |
| Credito Real SAB de CV SOFOM ER | 47,600 | 87 |
| * Grupo GICSA SA de CV | 122,600 | 83 |
| Unifin Financiera SAB de CV SOFOM ENR | 27,100 | 81 |
| * La Comer SAB de CV | 83,080 | 76 |
57
| | | |
| Vanguard® Total World Stock Index Fund | | |
| Schedule of Investments | | |
| October 31, 2016 | | |
| |
| | | | Market |
| | | | Value |
| | | Shares | ($000) |
| * | Minera Frisco SAB de CV | 81,563 | 63 |
| | Rassini SAB de CV | 13,422 | 62 |
| | Prologis Property Mexico SA de CV | 34,600 | 58 |
| * | Axtel SAB de CV | 212,700 | 53 |
| * | Grupo Simec SAB de CV Class B | 13,000 | 46 |
| | Concentradora Fibra Danhos SA de CV | 24,000 | 44 |
| * | Hoteles City Express SAB de CV | 40,800 | 42 |
| *,2 | Elementia SAB de CV | 36,200 | 42 |
| | Concentradora Fibra Hotelera Mexicana SA de CV | 52,200 | 41 |
| | Grupo Rotoplas SAB de CV | 23,500 | 37 |
| | Qualitas Controladora SAB de CV | 19,419 | 36 |
| | Consorcio ARA SAB de CV | 56,800 | 21 |
| | | | 39,510 |
| Netherlands (1.0%) | | |
| ^ | Unilever NV | 325,581 | 13,618 |
| | ING Groep NV | 808,589 | 10,614 |
| | ASLM Holdings NV (Amsterdam Shares) | 64,664 | 6,841 |
| * | Koninklijke Ahold Delhaize NV | 262,899 | 5,997 |
| | Koninklijke Philips NV | 189,484 | 5,710 |
| | Unibail-Rodamco SE | 20,540 | 4,876 |
| | Heineken NV | 45,508 | 3,748 |
| | RELX NV | 188,064 | 3,171 |
| | Akzo Nobel NV | 48,431 | 3,129 |
| * | ArcelorMittal | 389,858 | 2,634 |
| | Koninklijke DSM NV | 35,987 | 2,313 |
| | Wolters Kluwer NV | 59,538 | 2,302 |
| | Koninklijke KPN NV | 655,985 | 2,139 |
| | NN Group NV | 67,027 | 2,019 |
| | Aegon NV | 412,625 | 1,785 |
| | Heineken Holding NV | 21,775 | 1,675 |
| * | Altice NV Class A | 81,450 | 1,502 |
| | Randstad Holding NV | 23,250 | 1,196 |
| 2 | ABN AMRO Group NV | 47,353 | 1,093 |
| | Gemalto NV | 17,537 | 953 |
| | Koninklijke Vopak NV | 13,974 | 705 |
| | Aalberts Industries NV | 20,090 | 635 |
| | Delta Lloyd NV | 98,499 | 595 |
| | SBM Offshore NV | 38,935 | 559 |
| | Boskalis Westminster | 17,119 | 552 |
| | IMCD Group NV | 11,601 | 502 |
| * | Galapagos NV | 7,458 | 454 |
| | APERAM SA | 9,714 | 442 |
| | ASM International NV | 10,155 | 433 |
| * | PostNL NV | 91,852 | 433 |
| * | Altice NV Class B | 22,176 | 413 |
| | TKH Group NV | 10,533 | 405 |
| | Wereldhave NV | 8,273 | 370 |
| | Eurocommercial Properties NV | 8,295 | 353 |
| | Corbion NV | 13,458 | 310 |
| | ASLM Holdings (New York Shares) | 2,375 | 251 |
| *,^ | OCI NV | 17,924 | 249 |
| * | TomTom NV | 29,775 | 241 |
| | Koninklijke BAM Groep NV | 49,191 | 229 |
| * | Fugro NV | 12,379 | 221 |
| | Vastned Retail NV | 5,721 | 220 |
| | BE Semiconductor Industries NV | 6,739 | 220 |
| 2 | GrandVision NV | 8,970 | 205 |
| | Arcadis NV | 15,229 | 200 |
| | Wessanen | 15,812 | 189 |
| | NSI NV | 48,092 | 189 |
| 2 | Refresco Group NV | 11,981 | 175 |
| 2 | Flow Traders | 5,636 | 174 |
| | Accell Group | 5,098 | 128 |
| * | Constellium NV Class A | 22,400 | 118 |
58
| | | |
| Vanguard® Total World Stock Index Fund | | |
| Schedule of Investments | | |
| October 31, 2016 | | |
| |
| | | | Market |
| | | | Value |
| | | Shares | ($000) |
| | Brunel International NV | 4,071 | 67 |
| | BinckBank NV | 6,465 | 38 |
| | | | 87,590 |
| New Zealand (0.1%) | | |
| | Fletcher Building Ltd. | 149,164 | 1,105 |
| | Spark New Zealand Ltd. | 386,039 | 1,010 |
| | Auckland International Airport Ltd. | 188,277 | 887 |
| | Fisher & Paykel Healthcare Corp. Ltd. | 116,190 | 736 |
| | Ryman Healthcare Ltd. | 88,723 | 563 |
| | Contact Energy Ltd. | 158,887 | 540 |
| | Meridian Energy Ltd. | 247,597 | 455 |
| | Z Energy Ltd. | 74,039 | 414 |
| | SKYCITY Entertainment Group Ltd. | 135,440 | 378 |
| | Mercury NZ Ltd. | 171,365 | 374 |
| | Trade Me Group Ltd. | 88,361 | 307 |
| | SKY Network Television Ltd. | 91,193 | 301 |
| | Kiwi Property Group Ltd. | 260,678 | 273 |
| | Mainfreight Ltd. | 18,429 | 245 |
| * | Xero Ltd. | 19,041 | 242 |
| | Chorus Ltd. | 87,985 | 230 |
| | EBOS Group Ltd. | 17,526 | 214 |
| | Precinct Properties New Zealand Ltd. | 225,936 | 201 |
| * | a2 Milk Co. Ltd. | 146,289 | 194 |
| | Goodman Property Trust | 210,602 | 187 |
| | Infratil Ltd. | 83,585 | 178 |
| | Genesis Energy Ltd. | 126,986 | 178 |
| | Air New Zealand Ltd. | 106,432 | 147 |
| | Summerset Group Holdings Ltd. | 41,195 | 140 |
| | Freightways Ltd. | 27,905 | 127 |
| | Argosy Property Ltd. | 158,281 | 119 |
| | Vector Ltd. | 48,710 | 111 |
| | Vital Healthcare Property Trust | 70,646 | 103 |
| | Metlifecare Ltd. | 23,606 | 97 |
| | Heartland Bank Ltd. | 52,255 | 56 |
| | Kathmandu Holdings Ltd. | 32,196 | 46 |
| | Warehouse Group Ltd. | 18,061 | 39 |
| | TOWER Ltd. | 26,604 | 17 |
| | | | 10,214 |
| Norway (0.3%) | | |
| ^ | Statoil ASA | 199,768 | 3,261 |
| | DNB ASA | 201,161 | 2,908 |
| ^ | Telenor ASA | 144,672 | 2,301 |
| | Orkla ASA | 163,623 | 1,545 |
| | Marine Harvest ASA | 78,703 | 1,428 |
| | Yara International ASA | 38,059 | 1,344 |
| | Norsk Hydro ASA | 283,557 | 1,268 |
| | Schibsted ASA Class B | 32,655 | 736 |
| * | Subsea 7 SA | 58,259 | 652 |
| | Gjensidige Forsikring ASA | 32,415 | 581 |
| * | Storebrand ASA | 97,695 | 502 |
| | Golar LNG Ltd. | 19,800 | 433 |
| | TGS Nopec Geophysical Co. ASA | 21,011 | 425 |
| | Salmar ASA | 11,404 | 370 |
| * | Aker BP ASA | 21,347 | 342 |
| | Tomra Systems ASA | 30,168 | 328 |
| 2 | XXL ASA | 24,440 | 306 |
| | Bakkafrost P/F | 6,820 | 286 |
| | Leroy Seafood Group ASA | 4,755 | 251 |
| | Aker ASA | 6,302 | 233 |
| | SpareBank 1 SMN | 27,517 | 202 |
| 2 | Entra ASA | 18,694 | 200 |
| | Veidekke ASA | 13,234 | 198 |
| | Atea ASA | 21,815 | 195 |
| *,^ | Seadrill Ltd. | 84,727 | 180 |
59
| | | |
| Vanguard® Total World Stock Index Fund | | |
| Schedule of Investments | | |
| October 31, 2016 | | |
| |
| | | | Market |
| | | | Value |
| | | Shares | ($000) |
| | Kongsberg Gruppen ASA | 11,677 | 167 |
| | SpareBank 1 SR-Bank ASA | 27,343 | 163 |
| | Austevoll Seafood ASA | 15,248 | 138 |
| *,2 | Aker Solutions ASA | 29,567 | 136 |
| * | Opera Software ASA | 19,169 | 135 |
| *,^ | Nordic Semiconductor ASA | 32,248 | 129 |
| | Norwegian Property ASA | 96,123 | 125 |
| *,^ | DNO ASA | 145,158 | 124 |
| ^ | Frontline Ltd. | 14,000 | 100 |
| | Schibsted ASA Class A | 4,135 | 99 |
| *,^ | Petroleum Geo-Services ASA | 36,131 | 97 |
| | Ocean Yield ASA | 10,516 | 88 |
| 2 | BW LPG Ltd. | 23,866 | 77 |
| | Hoegh LNG Holdings Ltd. | 6,871 | 72 |
| | Stolt-Nielsen Ltd. | 3,357 | 41 |
| * | Norwegian Air Shuttle ASA | 1,163 | 39 |
| *,^ | REC Silicon ASA | 292,534 | 37 |
| | Wilh Wilhelmsen ASA | 10,986 | 35 |
| * | Treasure ASA | 10,986 | 24 |
| * | Akastor ASA | 17,120 | 24 |
| * | Prosafe SE Class A | 105,997 | 4 |
| | | | 22,329 |
| Other (0.1%)3 | | |
| 4 | Vanguard FTSE Emerging Markets ETF | 216,133 | 8,159 |
| |
| Pakistan (0.0%) | | |
| | Lucky Cement Ltd. | 34,400 | 220 |
| | Hub Power Co. Ltd. | 164,500 | 167 |
| | Oil & Gas Development Co. Ltd. | 122,500 | 164 |
| | Engro Corp. Ltd. | 54,700 | 146 |
| | Fauji Fertilizer Co. Ltd. | 120,900 | 120 |
| | Pakistan State Oil Co. Ltd. | 30,400 | 117 |
| | United Bank Ltd. | 58,100 | 112 |
| | Pakistan Petroleum Ltd. | 74,900 | 106 |
| | DG Khan Cement Co. Ltd. | 58,200 | 95 |
| | Pakistan Oilfields Ltd. | 22,800 | 86 |
| | Kot Addu Power Co. Ltd. | 114,000 | 80 |
| * | SUI Southern Gas Co. Ltd. | 206,500 | 76 |
| | National Bank of Pakistan | 103,000 | 71 |
| | | | 1,560 |
| Peru (0.0%) | | |
| | Credicorp Ltd. (New York Shares) | 7,917 | 1,177 |
| * | Cia de Minas Buenaventura SAA ADR | 43,568 | 579 |
| | Credicorp Ltd. | 3,045 | 453 |
| | | | 2,209 |
| Philippines (0.2%) | | |
| | SM Investments Corp. | 97,278 | 1,349 |
| | SM Prime Holdings Inc. | 1,943,950 | 1,079 |
| | JG Summit Holdings Inc. | 633,230 | 992 |
| | Ayala Corp. | 47,940 | 827 |
| | Aboitiz Equity Ventures Inc. | 443,620 | 714 |
| | BDO Unibank Inc. | 301,270 | 702 |
| | Bank of the Philippine Islands | 332,185 | 693 |
| | Universal Robina Corp. | 177,690 | 668 |
| | Ayala Land Inc. | 764,000 | 571 |
| | Manila Electric Co. | 76,280 | 435 |
| | Jollibee Foods Corp. | 87,190 | 428 |
| | Metropolitan Bank & Trust Co. | 247,144 | 415 |
| * | PLDT Inc. | 11,470 | 362 |
| | Aboitiz Power Corp. | 362,120 | 343 |
| | Metro Pacific Investments Corp. | 2,286,600 | 341 |
| | Security Bank Corp. | 61,570 | 280 |
| | GT Capital Holdings Inc. | 9,568 | 259 |
| | Robinsons Land Corp. | 401,800 | 257 |
60
| | |
| Vanguard® Total World Stock Index Fund | | |
| Schedule of Investments | | |
| October 31, 2016 | | |
| |
| | | Market |
| | | Value |
| | Shares | ($000) |
| Megaworld Corp. | 2,702,900 | 224 |
| Alliance Global Group Inc. | 742,000 | 218 |
| DMCI Holdings Inc. | 819,000 | 211 |
| Puregold Price Club Inc. | 214,200 | 180 |
| Semirara Mining & Power Corp. Class A | 66,259 | 172 |
| International Container Terminal Services Inc. | 107,150 | 172 |
| LT Group Inc. | 573,500 | 171 |
| Energy Development Corp. | 1,362,900 | 166 |
| Cosco Capital Inc. | 887,400 | 156 |
| First Gen Corp. | 278,700 | 132 |
| Vista Land & Lifescapes Inc. | 1,181,800 | 128 |
| Petron Corp. | 586,300 | 125 |
| * DoubleDragon Properties Corp. | 105,300 | 121 |
| Manila Water Co. Inc. | 187,900 | 117 |
| Filinvest Land Inc. | 3,219,000 | 117 |
| Globe Telecom Inc. | 2,840 | 104 |
| D&L Industries Inc. | 422,700 | 96 |
| Robinsons Retail Holdings Inc. | 58,090 | 93 |
| Cebu Air Inc. | 36,440 | 79 |
| First Philippine Holdings Corp. | 55,160 | 79 |
| Lopez Holdings Corp. | 440,600 | 72 |
| * Bloomberry Resorts Corp. | 546,100 | 67 |
| Nickel Asia Corp. | 168,600 | 24 |
| Belle Corp. | 360,000 | 22 |
| * Melco Crown Philippines Resorts Corp. | 220,700 | 20 |
| Emperador Inc. | 110,300 | 17 |
| | | 13,798 |
| Poland (0.1%) | | |
| Polski Koncern Naftowy ORLEN SA | 68,640 | 1,360 |
| Powszechna Kasa Oszczednosci Bank Polski SA | 182,038 | 1,275 |
| Bank Pekao SA | 32,605 | 1,006 |
| Powszechny Zaklad Ubezpieczen SA | 121,006 | 840 |
| KGHM Polska Miedz SA | 32,877 | 597 |
| Polskie Gornictwo Naftowe i Gazownictwo SA | 367,912 | 471 |
| Bank Zachodni WBK SA | 5,557 | 449 |
| LPP SA | 261 | 392 |
| PGE Polska Grupa Energetyczna SA | 144,518 | 379 |
| * Cyfrowy Polsat SA | 44,317 | 274 |
| CCC SA | 5,210 | 264 |
| * mBank SA | 2,640 | 238 |
| * Bank Millennium SA | 157,377 | 232 |
| Asseco Poland SA | 16,833 | 225 |
| * Alior Bank SA | 18,503 | 223 |
| Orange Polska SA | 151,454 | 216 |
| * Grupa Lotos SA | 24,908 | 216 |
| * Tauron Polska Energia SA | 300,511 | 203 |
| * Jastrzebska Spolka Weglowa SA | 10,900 | 202 |
| KRUK SA | 3,111 | 181 |
| Grupa Azoty SA | 9,650 | 154 |
| Eurocash SA | 14,897 | 151 |
| Energa SA | 71,262 | 146 |
| * Enea SA | 55,620 | 142 |
| Kernel Holding SA | 8,244 | 132 |
| * Synthos SA | 108,677 | 132 |
| Bank Handlowy w Warszawie SA | 6,584 | 130 |
| * CD Projekt SA | 12,598 | 128 |
| Budimex SA | 2,399 | 125 |
| Ciech SA | 5,603 | 91 |
| * Lubelski Wegiel Bogdanka SA | 4,449 | 79 |
| * Globe Trade Centre SA | 28,976 | 59 |
| * PKP Cargo SA | 3,586 | 39 |
| Warsaw Stock Exchange | 1,878 | 19 |
| * Getin Noble Bank SA | 48,230 | 16 |
| * Getin Holding SA | 53,314 | 16 |
61
| | |
| Vanguard® Total World Stock Index Fund | | |
| Schedule of Investments | | |
| October 31, 2016 | | |
| |
| | | Market |
| | | Value |
| | Shares | ($000) |
| * Integer.pl SA | 775 | 7 |
| | | 10,809 |
| Portugal (0.1%) | | |
| Galp Energia SGPS SA | 110,514 | 1,498 |
| EDP - Energias de Portugal SA | 402,771 | 1,331 |
| Jeronimo Martins SGPS SA | 51,182 | 879 |
| NOS SGPS SA | 46,695 | 310 |
| EDP Renovaveis SA | 39,168 | 296 |
| Sonae SGPS SA | 292,736 | 233 |
| CTT-Correios de Portugal SA | 31,206 | 207 |
| REN - Redes Energeticas Nacionais SGPS SA | 56,401 | 165 |
| ^ Banco Comercial Portugues SA | 108,654 | 145 |
| Navigator Co. SA | 41,957 | 123 |
| * Banco BPI SA | 68,043 | 84 |
| Semapa-Sociedade de Investimento e Gestao | 3,913 | 50 |
| Altri SGPS SA | 13,342 | 47 |
| Sonaecom SGPS SA | 15,610 | 44 |
| Mota-Engil SGPS SA | 12,362 | 24 |
| * Banco Espirito Santo SA | 428,634 | 1 |
| | | 5,437 |
| Qatar (0.0%) | | |
| Qatar National Bank SAQ | 22,337 | 980 |
| Industries Qatar QSC | 16,015 | 448 |
| Masraf Al Rayan QSC | 39,068 | 371 |
| Ooredoo QSC | 11,577 | 308 |
| * Qatar Insurance Co. SAQ | 12,547 | 302 |
| Qatar Gas Transport Co. Ltd. | 28,586 | 177 |
| Qatar Islamic Bank SAQ | 6,279 | 176 |
| Qatar Electricity & Water Co. QSC | 2,891 | 167 |
| Commercial Bank QSC | 17,014 | 167 |
| * Doha Bank QSC | 13,347 | 133 |
| * Vodafone Qatar QSC | 34,870 | 100 |
| United Development Co. QSC | 18,214 | 100 |
| * Aamal Co. | 26,600 | 99 |
| Barwa Real Estate Co. | 9,990 | 88 |
| * Ezdan Holding Group QSC | 16,604 | 71 |
| * Qatar International Islamic Bank QSC | 4,036 | 70 |
| * Qatar Navigation QSC | 2,068 | 53 |
| * Qatari Investors Group QSC | 3,310 | 53 |
| * Gulf International Services QSC | 4,515 | 38 |
| | | 3,901 |
| Russia (0.4%) | | |
| Lukoil PJSC ADR | 95,389 | 4,640 |
| Gazprom PJSC ADR | 814,292 | 3,511 |
| Sberbank of Russia PJSC ADR | 364,993 | 3,457 |
| NOVATEK OAO | 238,656 | 2,488 |
| Magnit PJSC GDR | 58,383 | 2,315 |
| Sberbank of Russia PJSC | 759,171 | 1,767 |
| Tatneft PJSC ADR | 52,746 | 1,761 |
| Magnitogorsk Iron & Steel OJSC | 3,276,031 | 1,646 |
| MMC Norilsk Nickel PJSC ADR | 100,254 | 1,512 |
| Gazprom PJSC | 664,220 | 1,456 |
| Surgutneftegas OJSC ADR | 308,602 | 1,324 |
| Rosneft PJSC GDR | 237,522 | 1,292 |
| Federal Grid Co. Unified Energy System JSC | 384,733,105 | 1,038 |
| AK Transneft OAO Preference Shares | 330 | 790 |
| Mobile TeleSystems PJSC | 210,141 | 741 |
| VTB Bank PJSC GDR | 273,456 | 572 |
| Alrosa PJSC | 395,900 | 554 |
| Moscow Exchange MICEX-RTS PJSC | 282,025 | 520 |
| Severstal PAO | 35,267 | 493 |
| Bashneft PJSC | 7,592 | 398 |
| VTB Bank PJSC | 360,782,455 | 386 |
62
| | | |
| Vanguard® Total World Stock Index Fund | | |
| Schedule of Investments | | |
| October 31, 2016 | | |
| |
| | | | Market |
| | | | Value |
| | | Shares | ($000) |
| | Novolipetsk Steel PJSC | 228,169 | 369 |
| | Rostelecom PJSC | 239,573 | 299 |
| | RusHydro PJSC | 21,176,242 | 266 |
| | PhosAgro PJSC GDR | 16,808 | 208 |
| | Sistema PJSC FC GDR | 24,816 | 185 |
| | Inter RAO UES PJSC | 3,379,172 | 181 |
| * | Aeroflot PJSC | 85,900 | 176 |
| * | Uralkali PJSC | 66,306 | 174 |
| | MegaFon PJSC GDR | 15,972 | 152 |
| | LSR Group PJSC GDR | 47,842 | 135 |
| | E.ON Russia JSC | 2,787,900 | 128 |
| | Rosseti PJSC | 7,066,655 | 109 |
| * | Mechel PJSC | 38,802 | 91 |
| * | DIXY Group PJSC | 14,610 | 75 |
| | Acron JSC | 1,471 | 70 |
| | M.Video PJSC | 12,342 | 66 |
| | Mosenergo OAO | 2,043,038 | 55 |
| * | Raspadskaya OAO | 41,689 | 45 |
| | Sistema PJSC FC | 106,900 | 33 |
| | TMK PJSC GDR | 6,181 | 26 |
| | Rosneft PJSC | 3,288 | 18 |
| | | | 35,522 |
| Singapore (0.4%) | | |
| | Oversea-Chinese Banking Corp. Ltd. | 699,938 | 4,264 |
| | Singapore Telecommunications Ltd. | 1,521,500 | 4,240 |
| | DBS Group Holdings Ltd. | 378,300 | 4,078 |
| | United Overseas Bank Ltd. | 254,700 | 3,436 |
| | CapitaLand Ltd. | 534,100 | 1,185 |
| | Keppel Corp. Ltd. | 300,113 | 1,135 |
| | Wilmar International Ltd. | 442,573 | 1,051 |
| | Singapore Exchange Ltd. | 185,710 | 946 |
| | Singapore Press Holdings Ltd. | 334,300 | 893 |
| | CapitaLand Mall Trust | 552,900 | 824 |
| | Singapore Airlines Ltd. | 111,820 | 814 |
| | Ascendas REIT | 473,373 | 807 |
| | Global Logistic Properties Ltd. | 615,200 | 783 |
| | ComfortDelGro Corp. Ltd. | 412,500 | 752 |
| | Singapore Technologies Engineering Ltd. | 326,200 | 733 |
| | City Developments Ltd. | 120,300 | 732 |
| | Jardine Cycle & Carriage Ltd. | 23,488 | 711 |
| | Genting Singapore plc | 1,265,500 | 677 |
| | Suntec REIT | 505,300 | 610 |
| | CapitaLand Commercial Trust | 419,210 | 474 |
| | Hutchison Port Holdings Trust | 1,054,900 | 469 |
| | Mapletree Commercial Trust | 411,998 | 453 |
| | UOL Group Ltd. | 107,655 | 438 |
| | SATS Ltd. | 125,600 | 437 |
| | Golden Agri-Resources Ltd. | 1,325,819 | 366 |
| | Venture Corp. Ltd. | 52,200 | 357 |
| | Sembcorp Industries Ltd. | 184,531 | 334 |
| | Mapletree Industrial Trust | 262,300 | 324 |
| | Keppel REIT | 413,288 | 324 |
| ^ | Singapore Post Ltd. | 281,000 | 323 |
| | Mapletree Greater China Commercial Trust | 392,900 | 294 |
| | StarHub Ltd. | 117,600 | 285 |
| | Mapletree Logistics Trust | 322,700 | 240 |
| | Yangzijiang Shipbuilding Holdings Ltd. | 428,336 | 229 |
| *,^ | Noble Group Ltd. | 1,924,600 | 229 |
| | Keppel Infrastructure Trust | 550,300 | 200 |
| | Raffles Medical Group Ltd. | 168,000 | 182 |
| | Ascott Residence Trust | 214,892 | 175 |
| | United Engineers Ltd. | 94,200 | 175 |
| ^ | Olam International Ltd. | 109,900 | 170 |
| ^ | First Resources Ltd. | 128,000 | 167 |
63
| | | |
| Vanguard® Total World Stock Index Fund | | |
| Schedule of Investments | | |
| October 31, 2016 | | |
| |
| | | | Market |
| | | | Value |
| | | Shares | ($000) |
| ^ | Sembcorp Marine Ltd. | 172,489 | 160 |
| | Frasers Commercial Trust | 151,518 | 149 |
| | Asian Pay Television Trust | 397,600 | 147 |
| | Frasers Centrepoint Trust | 98,300 | 147 |
| | Parkway Life REIT | 72,986 | 134 |
| | Starhill Global REIT | 228,300 | 134 |
| | Yanlord Land Group Ltd. | 133,100 | 132 |
| | Cambridge Industrial Trust | 316,400 | 128 |
| | Cache Logistics Trust | 211,600 | 126 |
| | Lippo Malls Indonesia Retail Trust | 442,600 | 124 |
| | Ascendas Hospitality Trust | 225,000 | 120 |
| ^ | OUE Hospitality Trust | 232,100 | 114 |
| | CapitaLand Retail China Trust | 103,600 | 112 |
| | Ascendas India Trust | 140,000 | 108 |
| | SIA Engineering Co. Ltd. | 40,300 | 107 |
| | CDL Hospitality Trusts | 110,600 | 107 |
| ^ | Keppel DC REIT | 116,700 | 104 |
| 2 | ARA Asset Management Ltd. | 99,920 | 100 |
| | First REIT | 101,800 | 98 |
| *,^ | Ezion Holdings Ltd. | 445,506 | 95 |
| * | Genting Hong Kong Ltd. | 322,798 | 92 |
| | RHT Health Trust | 147,100 | 91 |
| | Croesus Retail Trust | 142,900 | 88 |
| | Soilbuild Business Space REIT | 172,040 | 84 |
| *,^ | SIIC Environment Holdings Ltd. | 180,320 | 82 |
| | Silverlake Axis Ltd. | 177,499 | 82 |
| | Accordia Golf Trust | 158,100 | 75 |
| * | Blue Sky Power Holdings Ltd. | 872,000 | 73 |
| | OUE Ltd. | 57,600 | 70 |
| | Sheng Siong Group Ltd. | 87,100 | 65 |
| | Wing Tai Holdings Ltd. | 53,000 | 65 |
| ^ | M1 Ltd. | 44,000 | 65 |
| | Yoma Strategic Holdings Ltd. | 147,330 | 62 |
| * | China Animal Healthcare Ltd. | 84,000 | 56 |
| ^ | Sarine Technologies Ltd. | 44,300 | 52 |
| | Far East Hospitality Trust | 118,400 | 51 |
| * | GL Ltd. | 84,000 | 48 |
| | SPH REIT | 66,700 | 47 |
| | Super Group Ltd. (Singapore Shares) | 58,000 | 40 |
| | Midas Holdings Ltd. | 223,900 | 35 |
| | Sabana Shari'ah Compliant Industrial REIT | 63,000 | 24 |
| | China Everbright Water Ltd. | 47,300 | 19 |
| ^ | Hyflux Ltd. | 54,000 | 18 |
| *,^ | COSCO Corp. Singapore Ltd. | 92,000 | 17 |
| *,^ | Ezra Holdings Ltd. | 344,056 | 11 |
| * | Vard Holdings Ltd. | 70,000 | 9 |
| * | Ezion Holdings Ltd Warrants Exp. 04/15/2020 | 102,200 | 5 |
| * | Keppel DC REIT Rights Exp. 11/07/2016 | 31,975 | 2 |
| | | | 39,190 |
| South Africa (0.8%) | | |
| | Naspers Ltd. | 88,138 | 14,761 |
| | Sasol Ltd. | 114,286 | 3,156 |
| | MTN Group Ltd. | 363,883 | 3,143 |
| * | Steinhoff International Holdings NV | 514,884 | 2,778 |
| | Standard Bank Group Ltd. | 246,515 | 2,617 |
| | FirstRand Ltd. | 640,274 | 2,296 |
| | Remgro Ltd. | 111,696 | 1,854 |
| | Sanlam Ltd. | 369,688 | 1,791 |
| | Aspen Pharmacare Holdings Ltd. | 75,292 | 1,640 |
| | Shoprite Holdings Ltd. | 92,955 | 1,372 |
| | Bid Corp. Ltd. | 71,255 | 1,251 |
| * | AngloGold Ashanti Ltd. | 87,128 | 1,186 |
| | Woolworths Holdings Ltd. | 198,987 | 1,152 |
| | Vodacom Group Ltd. | 106,000 | 1,144 |
64
| | |
| Vanguard® Total World Stock Index Fund | | |
| Schedule of Investments | | |
| October 31, 2016 | | |
| |
| | | Market |
| | | Value |
| | Shares | ($000) |
| Growthpoint Properties Ltd. | 560,944 | 1,046 |
| Barclays Africa Group Ltd. | 89,332 | 1,037 |
| Tiger Brands Ltd. | 33,618 | 957 |
| Bidvest Group Ltd. | 71,432 | 887 |
| Redefine Properties Ltd. | 955,646 | 818 |
| Netcare Ltd. | 291,481 | 749 |
| Nedbank Group Ltd. | 42,915 | 702 |
| Gold Fields Ltd. | 168,734 | 696 |
| * Sappi Ltd. | 113,037 | 629 |
| RMB Holdings Ltd. | 138,002 | 608 |
| Life Healthcare Group Holdings Ltd. | 225,130 | 601 |
| New Europe Property Investments plc | 46,427 | 572 |
| Mr Price Group Ltd. | 49,770 | 567 |
| SPAR Group Ltd. | 38,449 | 545 |
| Discovery Ltd. | 63,525 | 543 |
| Capitec Bank Holdings Ltd. | 10,477 | 532 |
| * Impala Platinum Holdings Ltd. | 128,602 | 520 |
| Mondi Ltd. | 25,592 | 500 |
| Clicks Group Ltd. | 53,321 | 497 |
| Truworths International Ltd. | 92,471 | 491 |
| Resilient REIT Ltd. | 56,681 | 469 |
| Hyprop Investments Ltd. | 51,857 | 460 |
| Brait SE | 69,201 | 459 |
| AVI Ltd. | 62,391 | 438 |
| Foschini Group Ltd. | 42,215 | 434 |
| Imperial Holdings Ltd. | 34,192 | 432 |
| Sibanye Gold Ltd. | 154,558 | 430 |
| Fortress Income Fund Ltd. Class B | 159,510 | 379 |
| Pick n Pay Stores Ltd. | 74,768 | 366 |
| Pioneer Foods Group Ltd. | 29,748 | 358 |
| Telkom SA SOC Ltd. | 74,605 | 344 |
| Investec Ltd. | 53,513 | 330 |
| MMI Holdings Ltd. | 191,224 | 320 |
| * EOH Holdings Ltd. | 26,736 | 317 |
| Coronation Fund Managers Ltd. | 56,738 | 305 |
| PSG Group Ltd. | 18,229 | 285 |
| * Anglo American Platinum Ltd. | 11,847 | 280 |
| Tsogo Sun Holdings Ltd. | 121,136 | 275 |
| Barloworld Ltd. | 42,235 | 273 |
| * Northam Platinum Ltd. | 72,320 | 264 |
| SA Corporate Real Estate Fund Nominees Pty Ltd. | 642,314 | 263 |
| Tongaat Hulett Ltd. | 28,436 | 257 |
| Fortress Income Fund Ltd. Class A | 206,285 | 250 |
| Harmony Gold Mining Co. Ltd. | 77,382 | 240 |
| JSE Ltd. | 18,876 | 220 |
| KAP Industrial Holdings Ltd. | 362,105 | 208 |
| * Super Group Ltd. (South Africa Shares) | 68,300 | 202 |
| Omnia Holdings Ltd. | 16,576 | 201 |
| Santam Ltd. | 11,134 | 200 |
| Liberty Holdings Ltd. | 22,225 | 191 |
| Massmart Holdings Ltd. | 22,001 | 190 |
| Famous Brands Ltd. | 15,624 | 183 |
| AECI Ltd. | 22,863 | 173 |
| Nampak Ltd. | 122,529 | 171 |
| * Attacq Ltd. | 133,198 | 169 |
| Exxaro Resources Ltd. | 22,079 | 163 |
| Vukile Property Fund Ltd. | 119,155 | 163 |
| Assore Ltd. | 9,574 | 129 |
| * Kumba Iron Ore Ltd. | 12,476 | 127 |
| DataTec Ltd. | 37,357 | 124 |
| Wilson Bayly Holmes-Ovcon Ltd. | 10,537 | 119 |
| African Rainbow Minerals Ltd. | 16,169 | 117 |
| Reunert Ltd. | 24,815 | 113 |
| Blue Label Telecoms Ltd. | 74,154 | 112 |
65
| | | |
| Vanguard® Total World Stock Index Fund | | |
| Schedule of Investments | | |
| October 31, 2016 | | |
| |
| | | | Market |
| | | | Value |
| | | Shares | ($000) |
| | Sun International Ltd. | 17,958 | 111 |
| | Steinhoff International Holdings NV | 19,964 | 106 |
| | Cashbuild Ltd. | 3,622 | 106 |
| | PPC Ltd. | 256,312 | 105 |
| | Advtech Ltd. | 80,517 | 104 |
| | City Lodge Hotels Ltd. | 9,147 | 99 |
| | Zeder Investments Ltd. | 192,785 | 95 |
| | Emira Property Fund Ltd. | 90,821 | 94 |
| | Mpact Ltd. | 37,715 | 92 |
| * | Curro Holdings Ltd. | 24,411 | 90 |
| | Alexander Forbes Group Holdings Ltd. | 171,753 | 78 |
| | Rebosis Property Fund Ltd. | 89,547 | 76 |
| | Distell Group Ltd. | 6,056 | 74 |
| * | ArcelorMittal South Africa Ltd. | 85,605 | 73 |
| | DRDGOLD Ltd. | 143,105 | 73 |
| | Trencor Ltd. | 32,873 | 70 |
| | Astral Foods Ltd. | 7,639 | 69 |
| | Peregrine Holdings Ltd. | 35,263 | 68 |
| | Adcock Ingram Holdings Ltd. | 18,878 | 66 |
| * | Ascendis Health Ltd. | 32,511 | 66 |
| | Invicta Holdings Ltd. | 15,867 | 65 |
| | Adcorp Holdings Ltd. | 57,923 | 58 |
| | Delta Property Fund Ltd. | 90,270 | 51 |
| | Lewis Group Ltd. | 17,093 | 51 |
| | Raubex Group Ltd. | 24,403 | 46 |
| | Grindrod Ltd. | 54,052 | 45 |
| | Hudaco Industries Ltd. | 5,387 | 44 |
| | Oceana Group Ltd. | 5,057 | 43 |
| | Clover Industries Ltd. | 30,888 | 40 |
| | Murray & Roberts Holdings Ltd. | 56,830 | 39 |
| * | Consolidated Infrastructure Group Ltd. | 22,026 | 38 |
| * | Aveng Ltd. | 60,206 | 32 |
| | Group Five Ltd. | 15,342 | 26 |
| | Metair Investments Ltd. | 12,945 | 18 |
| * | Royal Bafokeng Platinum Ltd. | 3,748 | 11 |
| * | Adbee Rf Ltd. | 3,375 | 9 |
| * | Adcock Ingram Holdings Ltd. Warrants Exp. 07/26/2019 | 1,045 | — |
| * | African Bank Investments Ltd. | 150,852 | — |
| | | | 67,472 |
| South Korea (1.6%) | | |
| | Samsung Electronics Co. Ltd. GDR | 42,096 | 29,615 |
| | NAVER Corp. | 5,515 | 4,126 |
| | SK Hynix Inc. | 110,696 | 3,959 |
| | Samsung Electronics Co. Ltd. Preference Shares | 3,421 | 3,933 |
| | Hyundai Motor Co. | 29,650 | 3,620 |
| | Hyundai Mobis Co. Ltd. | 13,633 | 3,252 |
| | KB Financial Group Inc. ADR | 75,096 | 2,777 |
| | Samsung C&T Corp. | 19,137 | 2,697 |
| | Korea Electric Power Corp. | 53,383 | 2,309 |
| | KT&G Corp. | 22,189 | 2,189 |
| | Amorepacific Corp. | 6,724 | 2,107 |
| | Shinhan Financial Group Co. Ltd. ADR | 50,599 | 1,955 |
| | LG Chem Ltd. | 8,994 | 1,932 |
| | Kia Motors Corp. | 54,085 | 1,920 |
| | Hana Financial Group Inc. | 61,554 | 1,761 |
| | SK Innovation Co. Ltd. | 13,004 | 1,712 |
| | Samsung Fire & Marine Insurance Co. Ltd. | 6,636 | 1,688 |
| | POSCO ADR | 30,917 | 1,606 |
| | Samsung Life Insurance Co. Ltd. | 15,295 | 1,476 |
| *,^ | Celltrion Inc. | 15,438 | 1,430 |
| | POSCO | 6,772 | 1,409 |
| | SK Holdings Co. Ltd. | 7,065 | 1,378 |
| | LG Household & Health Care Ltd. | 1,850 | 1,323 |
| * | Hyundai Heavy Industries Co. Ltd. | 9,952 | 1,262 |
66
| | | |
| Vanguard® Total World Stock Index Fund | | |
| Schedule of Investments | | |
| October 31, 2016 | | |
| |
| | | | Market |
| | | | Value |
| | | Shares | ($000) |
| | LG Display Co. Ltd. | 46,608 | 1,114 |
| | Shinhan Financial Group Co. Ltd. | 28,483 | 1,090 |
| | LG Electronics Inc. | 24,312 | 1,014 |
| | LG Corp. | 18,363 | 982 |
| | Samsung SDI Co. Ltd. | 11,712 | 964 |
| | Hyundai Motor Co. Preference Shares | 11,234 | 938 |
| | Samsung SDS Co. Ltd. | 6,705 | 904 |
| | Coway Co. Ltd. | 11,056 | 865 |
| | NCSoft Corp. | 3,656 | 845 |
| | Korea Zinc Co. Ltd. | 2,017 | 801 |
| | Kangwon Land Inc. | 22,699 | 752 |
| | Lotte Chemical Corp. | 2,994 | 752 |
| | AMOREPACIFIC Group | 5,752 | 743 |
| | Hankook Tire Co. Ltd. | 15,254 | 733 |
| | Korea Aerospace Industries Ltd. | 12,838 | 725 |
| | Woori Bank | 65,574 | 715 |
| | Hyundai Steel Co. | 15,769 | 679 |
| | SK Telecom Co. Ltd. ADR | 30,122 | 658 |
| | Industrial Bank of Korea | 55,217 | 636 |
| | Hyosung Corp. | 5,215 | 609 |
| | E-MART Inc. | 4,188 | 594 |
| | S-Oil Corp. | 8,677 | 593 |
| | Dongbu Insurance Co. Ltd. | 9,504 | 590 |
| | Hyundai Glovis Co. Ltd. | 3,885 | 588 |
| | Hyundai Development Co-Engineering & Construction | 13,574 | 574 |
| | Hyundai Engineering & Construction Co. Ltd. | 15,212 | 549 |
| | Orion Corp. | 818 | 511 |
| | LG Uplus Corp. | 47,587 | 490 |
| | BNK Financial Group Inc. | 60,316 | 489 |
| | KB Financial Group Inc. | 13,061 | 483 |
| | Samsung Electro-Mechanics Co. Ltd. | 11,416 | 469 |
| | GS Holdings Corp. | 10,379 | 462 |
| | Hyundai Marine & Fire Insurance Co. Ltd. | 14,746 | 455 |
| | Lotte Shopping Co. Ltd. | 2,235 | 446 |
| ^ | Hanmi Pharm Co. Ltd. | 1,351 | 427 |
| ^ | Kakao Corp. | 6,311 | 421 |
| | Daelim Industrial Co. Ltd. | 5,772 | 411 |
| | Hanwha Techwin Co. Ltd. | 7,374 | 410 |
| | CJ Corp. | 2,682 | 408 |
| | KCC Corp. | 1,149 | 406 |
| | KT Corp. | 14,359 | 405 |
| | Hanwha Chemical Corp. | 17,155 | 404 |
| | Amorepacific Corp. Preference Shares | 2,239 | 391 |
| ^ | Hanssem Co. Ltd. | 2,371 | 367 |
| | Hanwha Corp. | 11,086 | 361 |
| | CJ CheilJedang Corp. | 1,179 | 360 |
| | LG Chem Ltd. Preference Shares | 2,235 | 351 |
| ^ | Hotel Shilla Co. Ltd. | 6,933 | 347 |
| | Samsung Securities Co. Ltd. | 11,149 | 335 |
| | S-1 Corp. | 4,143 | 335 |
| | Hyundai Department Store Co. Ltd. | 3,203 | 329 |
| | BGF retail Co. Ltd. | 2,148 | 326 |
| | Mirae Asset Daewoo Co. Ltd. | 48,149 | 325 |
| | SK Telecom Co. Ltd. | 1,618 | 317 |
| | Yuhan Corp. | 1,700 | 312 |
| ^ | Mando Corp. | 1,314 | 307 |
| | Hanwha Life Insurance Co. Ltd. | 55,767 | 304 |
| | Medy-Tox Inc. | 856 | 304 |
| | Hanon Systems | 32,454 | 303 |
| *,^ | OCI Co. Ltd. | 3,844 | 303 |
| | Doosan Heavy Industries & Construction Co. Ltd. | 13,264 | 303 |
| *,^ | Kumho Tire Co. Inc. | 33,480 | 300 |
| | Samsung Card Co. Ltd. | 6,838 | 288 |
| | Korea Investment Holdings Co. Ltd. | 7,929 | 284 |
67
| | | |
| Vanguard® Total World Stock Index Fund | | |
| Schedule of Investments | | |
| October 31, 2016 | | |
| |
| | | | Market |
| | | | Value |
| | | Shares | ($000) |
| | Mirae Asset Securities Co. Ltd. | 14,323 | 282 |
| | DGB Financial Group Inc. | 31,795 | 266 |
| * | CJ Korea Express Corp. | 1,510 | 265 |
| *,^ | Samsung Engineering Co. Ltd. | 31,408 | 259 |
| | CJ E&M Corp. | 3,985 | 243 |
| *,^ | Samsung Heavy Industries Co. Ltd. | 28,241 | 240 |
| *,^ | GS Engineering & Construction Corp. | 10,113 | 236 |
| | NH Investment & Securities Co. Ltd. | 26,688 | 235 |
| | Shinsegae Inc. | 1,443 | 234 |
| *,^ | Komipharm International Co. Ltd. | 6,925 | 234 |
| | Hyundai Wia Corp. | 3,336 | 229 |
| ^ | Hyundai Greenfood Co. Ltd. | 15,539 | 227 |
| * | ViroMed Co. Ltd. | 2,842 | 227 |
| | Kumho Petrochemical Co. Ltd. | 3,686 | 225 |
| | Posco Daewoo Corp. | 10,261 | 223 |
| ^ | Kolon Industries Inc. | 3,387 | 220 |
| *,^ | Daewoo Engineering & Construction Co. Ltd. | 39,765 | 219 |
| | Korea Gas Corp. | 5,413 | 219 |
| * | Korean Air Lines Co. Ltd. | 7,650 | 214 |
| | KEPCO Plant Service & Engineering Co. Ltd. | 4,453 | 213 |
| | LG Household & Health Care Ltd. Preference Shares | 511 | 212 |
| ^ | Korea Kolmar Co. Ltd. | 2,860 | 204 |
| ^ | Korean Reinsurance Co. | 19,191 | 198 |
| | Cheil Worldwide Inc. | 13,305 | 197 |
| | NongShim Co. Ltd. | 772 | 194 |
| | Samsung Electronics Co. Ltd. | 135 | 193 |
| | Lotte Confectionery Co. Ltd. | 1,150 | 193 |
| *,^ | Com2uSCorp | 2,321 | 192 |
| | Doosan Corp. | 2,111 | 189 |
| | LG Innotek Co. Ltd. | 2,680 | 183 |
| | LS Corp. | 3,811 | 182 |
| *,^ | LIG Nex1 Co. Ltd. | 2,755 | 178 |
| ^ | Youngone Corp. | 6,334 | 178 |
| ^ | Ottogi Corp. | 307 | 176 |
| | SK Networks Co. Ltd. | 30,571 | 174 |
| | Samsung Fire & Marine Insurance Co. Ltd. Preference Shares | 1,043 | 172 |
| ^ | SK Chemicals Co. Ltd. | 3,279 | 171 |
| | Meritz Fire & Marine Insurance Co. Ltd. | 12,244 | 170 |
| *,^ | Doosan Infracore Co. Ltd. | 28,117 | 170 |
| | CJ CheilJedang Corp. Preference Shares | 1,090 | 167 |
| ^ | Lotte Chilsung Beverage Co. Ltd. | 123 | 166 |
| ^ | LG Hausys Ltd. | 1,962 | 162 |
| | GS Retail Co. Ltd. | 3,759 | 160 |
| * | Hugel Inc. | 528 | 158 |
| | Innocean Worldwide Inc. | 2,612 | 158 |
| ^ | CJ CGV Co. Ltd. | 2,668 | 158 |
| ^ | Hanmi Science Co. ltd | 2,314 | 154 |
| | Fila Korea Ltd. | 1,985 | 151 |
| ^ | Meritz Securities Co. Ltd. | 50,860 | 151 |
| | Taekwang Industrial Co. Ltd. | 199 | 146 |
| | KB Insurance Co. Ltd. | 5,630 | 142 |
| ^ | Tongyang Inc. | 50,362 | 141 |
| | Daishin Securities Co. Ltd. | 14,831 | 136 |
| ^ | Kolon Life Science Inc. | 1,039 | 136 |
| *,^ | Yungjin Pharmaceutical Co. Ltd. | 17,777 | 136 |
| ^ | Hansol Chemical Co. Ltd. | 1,859 | 134 |
| ^ | SK Materials Co. Ltd. | 976 | 133 |
| *,^ | Osstem Implant Co. Ltd. | 2,787 | 133 |
| * | LG Life Sciences Ltd. | 2,403 | 130 |
| ^ | Green Cross Corp. | 1,066 | 130 |
| *,^ | HLB Inc. | 7,620 | 129 |
| | KIWOOM Securities Co. Ltd. | 2,211 | 128 |
| ^ | Cosmax Inc. | 1,245 | 125 |
| | Hite Jinro Co. Ltd. | 6,473 | 124 |
68
| | | |
| Vanguard® Total World Stock Index Fund | | |
| Schedule of Investments | | |
| October 31, 2016 | | |
| |
| | | | Market |
| | | | Value |
| | | Shares | ($000) |
| | Daesang Corp. | 5,170 | 122 |
| | Poongsan Corp. | 3,950 | 120 |
| ^ | IS Dongseo Co. Ltd. | 2,765 | 119 |
| | Hyundai Home Shopping Network Corp. | 1,182 | 117 |
| ^ | Dongsuh Cos. Inc. | 4,930 | 117 |
| ^ | JW Pharmaceutical Corp. | 2,720 | 117 |
| | Samyang Holdings Corp. | 1,069 | 117 |
| *,^ | NHN Entertainment Corp. | 2,627 | 115 |
| ^ | Ahnlab Inc. | 2,032 | 114 |
| | Korea Electric Terminal Co. Ltd. | 1,823 | 114 |
| ^ | Hanwha General Insurance Co. Ltd. | 17,139 | 114 |
| *,^ | Advanced Process Systems Corp. | 4,955 | 113 |
| ^ | Bukwang Pharmaceutical Co. Ltd. | 5,118 | 112 |
| *,^ | Loen Entertainment Inc. | 1,895 | 111 |
| * | Hyundai Mipo Dockyard Co. Ltd. | 1,814 | 111 |
| *,^ | Caregen Co. Ltd. | 1,328 | 110 |
| *,^ | DIO Corp. | 2,745 | 109 |
| *,^ | DoubleUGames Co. Ltd. | 3,487 | 108 |
| ^ | Paradise Co. Ltd. | 9,485 | 108 |
| | Hyundai Motor Co. 2nd Preference Shares | 1,219 | 107 |
| | LS Industrial Systems Co. Ltd. | 3,095 | 106 |
| ^ | LOTTE Fine Chemical Co. Ltd. | 4,172 | 106 |
| *,^ | Ssangyong Cement Industrial Co. Ltd. | 7,471 | 105 |
| ^ | Eo Technics Co. Ltd. | 1,839 | 101 |
| * | Hyundai Elevator Co. Ltd. | 2,055 | 100 |
| ^ | Green Cross Holdings Corp. | 5,182 | 100 |
| *,^ | Pan Ocean Co. Ltd. | 31,782 | 100 |
| * | Wonik Holdings Co. Ltd. | 17,538 | 99 |
| *,^ | Foosung Co. Ltd. | 14,322 | 97 |
| | LG International Corp. | 3,990 | 97 |
| | Hankook Tire Worldwide Co. Ltd. | 5,128 | 97 |
| ^ | Hana Tour Service Inc. | 1,714 | 96 |
| *,^ | Taihan Electric Wire Co. Ltd. | 58,282 | 96 |
| | SKC Co. Ltd. | 4,069 | 96 |
| ^ | Hanjin Kal Corp. | 6,454 | 95 |
| | Korea Petrochemical Ind Co. Ltd. | 533 | 95 |
| *,^ | Emerson Pacific Inc. | 2,866 | 94 |
| ^ | NS Shopping Co. Ltd. | 640 | 92 |
| | Halla Holdings Corp. | 1,555 | 92 |
| ^ | Seoul Semiconductor Co. Ltd. | 7,662 | 91 |
| ^ | DuzonBizon Co. Ltd. | 4,685 | 91 |
| | Lutronic Corp. | 2,719 | 91 |
| | CJ Hellovision Co. Ltd. | 12,615 | 90 |
| | SFA Engineering Corp. | 1,773 | 90 |
| ^ | Amicogen Inc. | 2,114 | 90 |
| ^ | LOTTE Himart Co. Ltd. | 2,295 | 88 |
| *,^ | It's Skin Co. Ltd. | 2,175 | 88 |
| | Youlchon Chemical Co. Ltd. | 7,368 | 87 |
| *,^ | Jusung Engineering Co. Ltd. | 10,459 | 86 |
| *,^ | Chabiotech Co. Ltd. | 7,025 | 85 |
| ^ | Daeduck Electronics Co. | 12,627 | 83 |
| | Modetour Network Inc. | 3,549 | 82 |
| | Jeil Pharmaceutical Co. | 1,384 | 82 |
| | Daekyo Co. Ltd. | 11,162 | 81 |
| ^ | Chong Kun Dang Pharmaceutical Corp. | 1,005 | 81 |
| *,^ | Vieworks Co. Ltd. | 1,505 | 81 |
| *,^ | iNtRON Biotechnology Inc. | 2,985 | 81 |
| | Handsome Co. Ltd. | 2,264 | 80 |
| | Koh Young Technology Inc. | 2,048 | 80 |
| * | Dongbu HiTek Co. Ltd. | 5,383 | 80 |
| *,^ | Hanall Biopharma Co. Ltd. | 7,675 | 79 |
| | Young Poong Corp. | 91 | 79 |
| ^ | Sam Young Electronics Co. Ltd. | 8,042 | 78 |
| | LEENO Industrial Inc. | 2,065 | 77 |
69
| | | |
| Vanguard® Total World Stock Index Fund | | |
| Schedule of Investments | | |
| October 31, 2016 | | |
| |
| | | | Market |
| | | | Value |
| | | Shares | ($000) |
| *,^ | CrystalGenomics Inc. | 4,601 | 76 |
| ^ | Cell Biotech Co. Ltd. | 1,908 | 76 |
| | Hankook Shell Oil Co. Ltd. | 194 | 75 |
| *,^ | ATGen Co. Ltd. | 2,320 | 74 |
| ^ | NICE Information Service Co. Ltd. | 10,929 | 73 |
| ^ | Korea Real Estate Investment & Trust Co. Ltd. | 28,386 | 73 |
| | NICE Holdings Co. Ltd. | 4,789 | 70 |
| *,^ | GemVax & Kael Co. Ltd. | 5,608 | 70 |
| * | Ssangyong Motor Co. | 10,890 | 70 |
| ^ | Dawonsys Co. Ltd. | 5,674 | 69 |
| *,^ | Jenax Inc. | 3,125 | 69 |
| *,^ | NUTRIBIOTECH Co. Ltd. | 1,213 | 69 |
| | Seah Besteel Corp. | 3,350 | 68 |
| *,^ | Ilyang Pharmaceutical Co. Ltd. | 1,960 | 67 |
| | S&T Motiv Co. Ltd. | 1,871 | 67 |
| | JB Financial Group Co. Ltd. | 12,847 | 67 |
| | Humax Co. Ltd. | 5,217 | 66 |
| * | WONIK IPS Co. Ltd. | 3,273 | 66 |
| | Soulbrain Co. Ltd. | 1,212 | 66 |
| *,^ | Pharmicell Co. Ltd. | 16,212 | 65 |
| ^ | Toptec Co. Ltd. | 3,884 | 65 |
| ^ | Hansae Co. Ltd. | 2,942 | 65 |
| *,^ | Dongkuk Steel Mill Co. Ltd. | 9,093 | 65 |
| | Lotte Food Co. Ltd. | 105 | 63 |
| ^ | Namhae Chemical Corp. | 8,782 | 62 |
| ^ | InBody Co. Ltd. | 2,162 | 62 |
| ^ | iMarketKorea Inc. | 5,560 | 62 |
| *,^ | i-SENS Inc. | 2,173 | 62 |
| ^ | Daewoong Pharmaceutical Co. Ltd. | 1,015 | 60 |
| * | Woongjin Thinkbig Co. Ltd. | 7,243 | 60 |
| *,^ | G-SMATT GLOBAL Co. Ltd. | 2,714 | 60 |
| | Daou Technology Inc. | 3,300 | 60 |
| *,^ | Genexine Co. Ltd. | 1,845 | 59 |
| | Dong-A Socio Holdings Co. Ltd. | 464 | 59 |
| | Nexen Tire Corp. | 5,080 | 58 |
| | GS Home Shopping Inc. | 379 | 58 |
| *,^ | Binex Co. Ltd. | 4,421 | 58 |
| *,^ | Cellumed Co. Ltd. | 34,880 | 58 |
| *,^ | SM Entertainment Co. | 2,434 | 58 |
| ^ | Byucksan Corp. | 13,450 | 58 |
| * | Hanwha Corp. Preference Shares | 3,438 | 57 |
| *,^ | Daewoo Shipbuilding & Marine Engineering Co. Ltd. | 14,483 | 57 |
| *,^ | Hanwha Investment & Securities Co. Ltd. | 28,944 | 56 |
| * | Asiana Airlines Inc. | 13,664 | 55 |
| ^ | Dae Hwa Pharmaceutical Co. Ltd. | 2,420 | 55 |
| *,^ | Peptron Inc. | 1,499 | 55 |
| *,^ | COSON Co. Ltd. | 4,633 | 54 |
| ^ | Hanjin Transportation Co. Ltd. | 2,100 | 54 |
| | Maeil Dairy Industry Co. Ltd. | 1,807 | 53 |
| | LF Corp. | 2,820 | 53 |
| | Mirae Asset Life Insurance Co. Ltd. | 12,832 | 52 |
| ^ | Samlip General Foods Co. Ltd. | 352 | 52 |
| ^ | Crown Confectionery Co. Ltd. | 1,910 | 52 |
| *,^ | Schnell Biopharmaceuticals Inc. | 15,801 | 52 |
| ^ | Huchems Fine Chemical Corp. | 2,510 | 52 |
| ^ | Tongyang Life Insurance Co. Ltd. | 4,930 | 52 |
| | KT Skylife Co. Ltd. | 3,297 | 51 |
| ^ | AK Holdings Inc. | 952 | 51 |
| | KISWIRE Ltd. | 1,499 | 51 |
| | Songwon Industrial Co. Ltd. | 3,277 | 50 |
| *,^ | CrucialTec Co. Ltd. | 7,161 | 50 |
| *,^ | Leaders Cosmetics Co. Ltd. | 2,889 | 50 |
| | Kwang Dong Pharmaceutical Co. Ltd. | 6,830 | 49 |
| *,^ | SK Securities Co. Ltd. | 54,276 | 49 |
70
| | | |
| Vanguard® Total World Stock Index Fund | | |
| Schedule of Investments | | |
| October 31, 2016 | | |
| |
| | | | Market |
| | | | Value |
| | | Shares | ($000) |
| *,^ | Seegene Inc. | 1,857 | 49 |
| | Sebang Global Battery Co. Ltd. | 1,460 | 47 |
| ^ | Grand Korea Leisure Co. Ltd. | 2,480 | 47 |
| *,^ | CUROCOM Co. Ltd. | 21,142 | 46 |
| | Hansol Paper Co. Ltd. | 2,597 | 46 |
| *,^ | Seobu T&D | 2,639 | 46 |
| *,^ | Hyundai Rotem Co. Ltd. | 2,780 | 45 |
| *,^ | Medipost Co. Ltd. | 914 | 45 |
| ^ | Silicon Works Co. Ltd. | 1,927 | 45 |
| *,^ | CMG Pharmaceutical Co. Ltd. | 16,869 | 45 |
| | Dongwon Industries Co. Ltd. | 165 | 44 |
| *,^ | DongKook Pharmaceutical Co. Ltd. | 967 | 44 |
| | CJ O Shopping Co. Ltd. | 311 | 44 |
| ^ | Samyang Corp. | 480 | 43 |
| * | Taewoong Co. Ltd. | 1,783 | 43 |
| | Dong-A ST Co. Ltd. | 569 | 43 |
| ^ | Cosmax BTI Inc | 1,211 | 43 |
| ^ | POSCO Chemtech Co. Ltd. | 4,011 | 42 |
| ^ | Kolao Holdings | 5,310 | 41 |
| | KEPCO Engineering & Construction Co. Inc. | 1,816 | 40 |
| * | Samsung Heavy Industries Rights Exp. 11/08/2016 | 17,534 | 40 |
| *,^ | Naturalendo Tech Co. Ltd. | 2,354 | 40 |
| *,^ | Gamevil Inc. | 801 | 39 |
| ^ | Muhak Co. Ltd. | 1,944 | 39 |
| *,^ | Webzen Inc. | 2,559 | 38 |
| * | Huons Co. Ltd. | 744 | 38 |
| | Shinyoung Securities Co. Ltd. | 878 | 38 |
| | Samchully Co. Ltd. | 442 | 38 |
| | Youngone Holdings Co. Ltd. | 745 | 37 |
| *,^ | Korea Line Corp. | 2,370 | 37 |
| * | Eugene Investment & Securities Co. Ltd. | 17,472 | 37 |
| *,^ | Yuanta Securities Korea Co. Ltd. | 13,343 | 36 |
| | Namyang Dairy Products Co. Ltd. | 61 | 36 |
| * | Kumho Industrial Co. Ltd. | 4,287 | 36 |
| | AtlasBX Co. Ltd. | 747 | 35 |
| | Kolon Corp. | 792 | 35 |
| | Partron Co. Ltd. | 4,491 | 35 |
| *,^ | Posco ICT Co. Ltd. | 6,926 | 35 |
| | Dongwon F&B Co. Ltd. | 196 | 35 |
| ^ | Hyundai Livart Furniture Co. Ltd. | 1,592 | 34 |
| ^ | Hancom Inc. | 2,196 | 34 |
| ^ | Eusu Holdings Co. Ltd. | 6,136 | 34 |
| ^ | GOLFZON Co. Ltd. | 566 | 33 |
| | Kyobo Securities Co. Ltd. | 4,032 | 33 |
| * | Green Cross Cell Corp. | 1,282 | 33 |
| ^ | Humedix Co. Ltd. | 1,006 | 32 |
| ^ | SL Corp. | 2,368 | 32 |
| | KISCO Corp. | 937 | 31 |
| ^ | Meritz Financial Group Inc. | 3,105 | 31 |
| ^ | Hanil Cement Co. Ltd. | 449 | 29 |
| ^ | KH Vatec Co. Ltd. | 2,613 | 29 |
| * | Neowiz Games Corp. | 3,030 | 29 |
| | Sungwoo Hitech Co. Ltd. | 3,981 | 27 |
| ^ | JW Holdings Corp. | 3,064 | 27 |
| | Huons Global Co. Ltd. | 695 | 26 |
| ^ | YG Entertainment Inc. | 1,017 | 26 |
| *,^ | Hansol Technics Co. Ltd. | 1,961 | 26 |
| | Cuckoo Electronics Co. Ltd. | 223 | 26 |
| | Kwangju Bank | 2,894 | 26 |
| ^ | SK Gas Ltd. | 300 | 25 |
| | Seoyon E-Hwa Co. Ltd. | 1,885 | 25 |
| *,^ | Agabang&Company | 3,825 | 25 |
| | Binggrae Co. Ltd. | 454 | 25 |
| *,^ | WeMade Entertainment Co. Ltd. | 1,456 | 25 |
71
| | | |
| Vanguard® Total World Stock Index Fund | | |
| Schedule of Investments | | |
| October 31, 2016 | | |
| |
| | | | Market |
| | | | Value |
| | | Shares | ($000) |
| | Able C&C Co. Ltd. | 1,324 | 24 |
| ^ | Korea Kolmar Holdings Co. Ltd. | 919 | 24 |
| ^ | KONA I Co. Ltd. | 2,190 | 23 |
| ^ | Chongkundang Holdings Corp. | 389 | 23 |
| *,^ | SFA Semicon Co. Ltd. | 11,646 | 22 |
| * | Hanjin Heavy Industries & Construction Co. Ltd. | 6,504 | 22 |
| * | Hansol Holdings Co. Ltd. | 3,626 | 20 |
| ^ | Interpark Holdings Corp. | 4,596 | 20 |
| ^ | GOLFZONYUWONHOLDINGS Co. Ltd. | 2,759 | 19 |
| *,^ | Lumens Co. Ltd. | 5,290 | 19 |
| * | Shenglong PV-Tech Investment Co. Ltd. | 1,034,191 | 18 |
| ^ | Sung Kwang Bend Co. Ltd. | 2,178 | 18 |
| | Hyundai Corp. | 941 | 17 |
| | SBS Media Holdings Co. Ltd. | 6,724 | 17 |
| | MegaStudy Co. Ltd. | 425 | 12 |
| | MegaStudyEdu Co. Ltd. | 246 | 10 |
| | Hyundai C&F Inc. | 648 | 9 |
| | Seoyon Co. Ltd. | 864 | 8 |
| * | Lutronic Corp. Pref Rights Exp. 12/02/2016 | 437 | 1 |
| * | Lutronic Corp. Rights Exp. 12/02/2016 | 92 | 1 |
| * | CNK International Co. Ltd. | 78 | — |
| | | | 140,268 |
| Spain (1.0%) | | |
| | Banco Santander SA | 2,439,170 | 11,952 |
| | Banco Bilbao Vizcaya Argentaria SA | 1,349,257 | 9,713 |
| | Telefonica SA | 897,946 | 9,124 |
| | Iberdrola SA | 1,172,664 | 7,981 |
| | Industria de Diseno Textil SA | 219,701 | 7,666 |
| | Amadeus IT Group SA | 86,592 | 4,075 |
| * | Repsol SA | 229,919 | 3,210 |
| | Banco Santander SA ADR | 514,394 | 2,490 |
| | Grifols SA | 101,049 | 1,994 |
| * | Ferrovial SA | 100,807 | 1,958 |
| 2 | Aena SA | 13,344 | 1,955 |
| ^ | Abertis Infraestructuras SA | 131,399 | 1,948 |
| * | Red Electrica Corp. SA | 90,568 | 1,887 |
| | CaixaBank SA | 566,727 | 1,710 |
| | Endesa SA | 70,116 | 1,488 |
| | Enagas SA | 47,613 | 1,365 |
| * | Banco de Sabadell SA | 1,014,884 | 1,355 |
| | Gas Natural SDG SA | 65,909 | 1,297 |
| * | ACS Actividades de Construccion y Servicios SA | 36,209 | 1,108 |
| | Bankinter SA | 143,810 | 1,099 |
| | Gamesa Corp. Tecnologica SA | 46,647 | 1,077 |
| | Bankia SA | 977,630 | 859 |
| | Merlin Properties Socimi SA | 68,172 | 765 |
| * | Banco Popular Espanol SA | 656,382 | 718 |
| | Mapfre SA | 232,492 | 690 |
| | Distribuidora Internacional de Alimentacion SA | 124,025 | 662 |
| | Banco Santander SA ADR Depositary Receipt | 133,014 | 563 |
| | Viscofan SA | 10,241 | 482 |
| ^ | Bolsas y Mercados Espanoles SHMSF SA | 15,847 | 479 |
| 2 | Cellnex Telecom SA | 28,969 | 475 |
| | Mediaset Espana Comunicacion SA | 37,324 | 417 |
| | Acciona SA | 5,282 | 401 |
| | Inmobiliaria Colonial SA | 53,742 | 379 |
| * | Acerinox SA | 29,997 | 369 |
| | Ebro Foods SA | 16,223 | 350 |
| | Grupo Catalana Occidente SA | 10,331 | 325 |
| | Zardoya Otis SA | 36,206 | 305 |
| * | Indra Sistemas SA | 24,221 | 300 |
| | Prosegur Cia de Seguridad SA | 40,429 | 293 |
| | Melia Hotels International SA | 22,599 | 279 |
| | Tecnicas Reunidas SA | 7,101 | 266 |
72
| | | |
| Vanguard® Total World Stock Index Fund | | |
| Schedule of Investments | | |
| October 31, 2016 | | |
| |
| | | | Market |
| | | | Value |
| | | Shares | ($000) |
| | Applus Services SA | 26,219 | 252 |
| | Faes Farma SA | 62,163 | 228 |
| | Almirall SA | 14,904 | 214 |
| | Grifols SA Preference Shares | 14,352 | 206 |
| *,2 | Euskaltel SA | 19,980 | 201 |
| | Hispania Activos Inmobiliarios SOCIMI SA | 15,938 | 196 |
| | Vidrala SA | 3,179 | 182 |
| | Axiare Patrimonio SOCIMI SA | 11,868 | 169 |
| | Cia de Distribucion Integral Logista Holdings SA | 7,483 | 166 |
| | Construcciones y Auxiliar de Ferrocarriles SA | 439 | 165 |
| | CIE Automotive SA | 7,461 | 154 |
| * | NH Hotel Group SA | 34,084 | 150 |
| ^ | Obrascon Huarte Lain SA | 33,048 | 132 |
| * | Sacyr SA | 56,966 | 130 |
| | Corp Financiera Alba SA | 2,693 | 118 |
| * | Pharma Mar SA | 40,605 | 110 |
| * | Fomento de Construcciones y Contratas SA | 11,961 | 104 |
| | Atresmedia Corp. de Medios de Comunicacion SA | 8,613 | 88 |
| | Papeles y Cartones de Europa SA | 11,391 | 59 |
| * | Codere SA | 89,077 | 54 |
| * | Promotora de Informaciones SA | 7,163 | 50 |
| * | Ferrovial SA Rights Exp. 11/14/2016 | 100,807 | 43 |
| | Ence Energia y Celulosa SA | 19,358 | 42 |
| * | Liberbank SA | 40,147 | 40 |
| * | Papeles y Cartones de Europa SA Rights Exp. 11/14/2016 | 11,391 | 2 |
| * | Deoleo SA | 6,145 | 1 |
| * | Let's GOWEX SA | 3,921 | — |
| | | | 89,085 |
| Sweden (1.0%) | | |
| | Nordea Bank AB | 665,556 | 6,994 |
| | Hennes & Mauritz AB Class B | 198,899 | 5,594 |
| | Swedbank AB Class A | 219,694 | 5,141 |
| | Svenska Handelsbanken AB Class A | 312,812 | 4,265 |
| ^ | Atlas Copco AB Class B | 137,910 | 3,602 |
| | Assa Abloy AB Class B | 195,022 | 3,544 |
| | Svenska Cellulosa AB SCA Class B | 124,099 | 3,515 |
| | Volvo AB Class B | 322,012 | 3,454 |
| | Investor AB Class B | 93,698 | 3,327 |
| | Telefonaktiebolaget LM Ericsson Class B | 623,976 | 3,027 |
| | Skandinaviska Enskilda Banken AB Class A | 299,245 | 3,018 |
| | Sandvik AB | 228,826 | 2,600 |
| ^ | Atlas Copco AB Class A | 79,377 | 2,325 |
| | Telia Co. AB | 559,084 | 2,233 |
| | Hexagon AB Class B | 52,504 | 1,837 |
| | Skanska AB Class B | 76,297 | 1,657 |
| | SKF AB | 82,509 | 1,398 |
| | Boliden AB | 59,408 | 1,377 |
| | Swedish Match AB | 39,087 | 1,360 |
| | Electrolux AB Class B | 48,220 | 1,141 |
| * | Kinnevik AB | 44,120 | 1,115 |
| | Securitas AB Class B | 64,626 | 997 |
| | Alfa Laval AB | 66,138 | 949 |
| | Industrivarden AB Class A | 46,903 | 890 |
| | Trelleborg AB Class B | 48,796 | 852 |
| | Castellum AB | 56,694 | 768 |
| * | Lundin Petroleum AB | 39,375 | 708 |
| ^ | ICA Gruppen AB | 21,542 | 669 |
| | Elekta AB Class B | 75,082 | 651 |
| | Getinge AB | 38,383 | 629 |
| | Husqvarna AB | 79,101 | 595 |
| | Industrivarden AB | 31,144 | 555 |
| ^ | Fingerprint Cards AB Class B | 56,047 | 543 |
| | BillerudKorsnas AB | 32,326 | 531 |
| | Tele2 AB | 60,961 | 503 |
73
| | | |
| Vanguard® Total World Stock Index Fund | | |
| Schedule of Investments | | |
| October 31, 2016 | | |
| |
| | | | Market |
| | | | Value |
| | | Shares | ($000) |
| * | SSAB AB Class B | 175,656 | 466 |
| | Fabege AB | 27,387 | 463 |
| * | NCC AB Class B | 17,740 | 451 |
| * | Fastighets AB Balder Class B | 19,679 | 447 |
| | Hexpol AB | 51,278 | 421 |
| | Loomis AB Class B | 14,456 | 411 |
| * | Nibe Industrier AB Class B | 52,813 | 393 |
| | Indutrade AB | 20,778 | 387 |
| | Holmen AB | 10,633 | 364 |
| * | Swedish Orphan Biovitrum AB | 35,191 | 360 |
| | AAK AB | 5,323 | 352 |
| | L E Lundbergforetagen AB Class B | 5,211 | 337 |
| | Hufvudstaden AB Class A | 21,137 | 327 |
| *,2 | Dometic Group AB | 45,706 | 323 |
| | Axfood AB | 20,384 | 319 |
| 2 | Thule Group AB | 20,219 | 312 |
| | Wallenstam AB | 40,275 | 310 |
| | Saab AB Class B | 8,678 | 307 |
| | NetEnt AB | 37,596 | 296 |
| | Modern Times Group MTG AB Class B | 10,790 | 290 |
| | Com Hem Holding AB | 31,785 | 286 |
| | Sweco AB Class B | 13,997 | 281 |
| | Peab AB | 32,769 | 278 |
| | JM AB | 9,565 | 275 |
| | Wihlborgs Fastigheter AB | 13,705 | 266 |
| | Kungsleden AB | 40,334 | 254 |
| | Investment AB Latour Class B | 6,796 | 251 |
| | Intrum Justitia AB | 7,843 | 242 |
| * | Betsson AB | 24,491 | 236 |
| *,2 | Attendo AB | 27,393 | 233 |
| | Lifco AB Class B | 9,221 | 233 |
| | Pandox AB | 14,129 | 224 |
| | Avanza Bank Holding AB | 5,824 | 220 |
| * | Bonava AB | 17,740 | 219 |
| | Bilia AB | 8,861 | 211 |
| | AF AB | 10,241 | 187 |
| * | Oriflame Holding AG | 5,024 | 185 |
| 2 | Bravida Holding AB | 28,959 | 178 |
| | Klovern AB | 153,834 | 162 |
| | Nobia AB | 18,331 | 160 |
| * | Cloetta AB Class B | 42,825 | 152 |
| | Haldex AB | 11,512 | 148 |
| | Hemfosa Fastigheter AB | 15,054 | 142 |
| | Lindab International AB | 16,386 | 140 |
| | Vitrolife AB | 2,686 | 139 |
| | Atrium Ljungberg AB | 8,932 | 139 |
| * | Investment AB Oresund | 7,614 | 122 |
| | Melker Schorling AB | 2,096 | 121 |
| | Bure Equity AB | 10,810 | 118 |
| | Hemfosa Fastigheter AB Preference Shares | 6,636 | 118 |
| | Concentric AB | 8,391 | 100 |
| | Nordnet AB | 22,596 | 93 |
| *,^ | SAS AB | 53,966 | 91 |
| | Ratos AB | 22,034 | 91 |
| | Ratos AB Preference Shares | 405 | 84 |
| * | Collector AB | 6,764 | 84 |
| | Rezidor Hotel Group AB | 19,442 | 79 |
| | SkiStar AB | 4,733 | 73 |
| | Klovern AB Preference Shares | 2,036 | 70 |
| | Mekonomen AB | 2,334 | 42 |
| | Clas Ohlson AB | 2,654 | 38 |
| | SAS AB Preference Shares | 581 | 36 |
| | Sagax AB Preference Shares | 5,206 | 19 |
74
| | |
| Vanguard® Total World Stock Index Fund | | |
| Schedule of Investments | | |
| October 31, 2016 | | |
| |
| | | Market |
| | | Value |
| | Shares | ($000) |
| * Tele2 AB Rights Exp. 11/16/2016 | 60,961 | 18 |
| | | 86,538 |
| Switzerland (2.7%) | | |
| Nestle SA | 647,708 | 46,968 |
| Novartis AG | 492,855 | 34,977 |
| Roche Holding AG | 147,532 | 33,885 |
| UBS Group AG | 729,525 | 10,314 |
| ABB Ltd. | 400,410 | 8,261 |
| Zurich Insurance Group AG | 31,157 | 8,156 |
| Syngenta AG | 19,191 | 7,680 |
| Cie Financiere Richemont SA | 107,235 | 6,894 |
| Swiss Re AG | 68,548 | 6,362 |
| Credit Suisse Group AG | 436,766 | 6,094 |
| Givaudan SA | 1,908 | 3,690 |
| LafargeHolcim Ltd. | 67,111 | 3,580 |
| Geberit AG | 7,647 | 3,233 |
| Actelion Ltd. | 18,967 | 2,741 |
| ^ Swatch Group AG (Bearer) | 7,908 | 2,378 |
| Swisscom AG | 4,790 | 2,190 |
| SGS SA | 1,080 | 2,186 |
| Sika AG | 445 | 2,139 |
| Lonza Group AG | 10,956 | 2,067 |
| Adecco Group AG | 34,177 | 2,029 |
| Partners Group Holding AG | 3,859 | 1,954 |
| Julius Baer Group Ltd. | 45,302 | 1,834 |
| LafargeHolcim Ltd. | 34,256 | 1,830 |
| Swiss Life Holding AG | 6,739 | 1,783 |
| Kuehne & Nagel International AG | 10,542 | 1,429 |
| Sonova Holding AG | 10,640 | 1,427 |
| Baloise Holding AG | 10,389 | 1,278 |
| * Dufry AG | 10,417 | 1,267 |
| Chocoladefabriken Lindt & Sprungli AG Registered Shares | 20 | 1,241 |
| Schindler Holding AG | 6,609 | 1,228 |
| ^ Chocoladefabriken Lindt & Sprungli AG Participation Certificates | 224 | 1,163 |
| Schindler Holding AG (Registered) | 6,235 | 1,154 |
| Swiss Prime Site AG | 13,121 | 1,088 |
| Roche Holding AG (Bearer) | 4,320 | 1,004 |
| Clariant AG | 59,650 | 988 |
| Galenica AG | 880 | 882 |
| Straumann Holding AG | 2,240 | 840 |
| Temenos Group AG | 12,419 | 802 |
| PSP Swiss Property AG | 8,652 | 774 |
| EMS-Chemie Holding AG | 1,513 | 759 |
| Georg Fischer AG | 851 | 754 |
| Aryzta AG | 16,968 | 746 |
| Logitech International SA | 29,100 | 704 |
| * Transocean Ltd. (New York Shares) | 71,669 | 689 |
| Helvetia Holding AG | 1,203 | 626 |
| * Flughafen Zuerich AG | 3,061 | 563 |
| ^ BB Biotech AG | 11,440 | 541 |
| Barry Callebaut AG | 429 | 534 |
| 2 Sunrise Communications Group AG | 7,178 | 490 |
| dorma&kaba Holding AG | 646 | 449 |
| Cembra Money Bank AG | 5,794 | 443 |
| DKSH Holding AG | 6,000 | 416 |
| * CS Real Estate Fund LivingPlus | 2,821 | 392 |
| Panalpina Welttransport Holding AG | 2,973 | 386 |
| Tecan Group AG | 2,313 | 381 |
| Banque Cantonale Vaudoise | 593 | 373 |
| ams AG | 13,096 | 367 |
| Pargesa Holding SA | 5,426 | 364 |
| Valiant Holding AG | 3,655 | 346 |
| OC Oerlikon Corp. AG | 35,487 | 334 |
| Bucher Industries AG | 1,488 | 331 |
75
| | | |
| Vanguard® Total World Stock Index Fund | | |
| Schedule of Investments | | |
| October 31, 2016 | | |
| |
| | | | Market |
| | | | Value |
| | | Shares | ($000) |
| | Sulzer AG | 3,315 | 326 |
| | SFS Group AG | 4,231 | 319 |
| | GAM Holding AG | 32,408 | 314 |
| | Allreal Holding AG | 2,075 | 305 |
| | Belimo Holding AG | 99 | 302 |
| | Forbo Holding AG | 218 | 278 |
| | Emmi AG | 462 | 273 |
| | u-blox Holding AG | 1,434 | 271 |
| | Mobimo Holding AG | 1,069 | 257 |
| | Autoneum Holding AG | 940 | 249 |
| | Implenia AG | 3,487 | 234 |
| | St. Galler Kantonalbank AG | 608 | 228 |
| * | Gategroup Holding AG | 4,133 | 217 |
| | Vontobel Holding AG | 4,312 | 211 |
| | Schweiter Technologies AG | 192 | 207 |
| | Huber & Suhner AG | 3,050 | 178 |
| | VZ Holding AG | 578 | 171 |
| | Rieter Holding AG | 883 | 168 |
| | Siegfried Holding AG | 782 | 161 |
| | Valora Holding AG | 544 | 158 |
| | Burckhardt Compression Holding AG | 542 | 157 |
| | COSMO Pharmaceuticals NV | 1,041 | 151 |
| | Swatch Group AG (Registered) | 2,553 | 147 |
| | Ascom Holding AG | 8,010 | 137 |
| | APG SGA SA | 321 | 134 |
| *,^ | AFG Arbonia-Forster Holding AG | 7,828 | 117 |
| * | Bell AG | 270 | 115 |
| | Intershop Holding AG | 226 | 115 |
| *,^ | Basilea Pharmaceutica AG | 1,676 | 113 |
| | Daetwyler Holding AG | 806 | 110 |
| | LEM Holding SA | 98 | 109 |
| | Kudelski SA | 6,259 | 108 |
| | Ypsomed Holding AG | 507 | 97 |
| | Conzzeta AG | 136 | 94 |
| | Leonteq AG | 1,507 | 87 |
| | BKW AG | 1,670 | 78 |
| | EFG International AG | 12,367 | 67 |
| | Vetropack Holding AG | 40 | 66 |
| | Swissquote Group Holding SA | 2,287 | 65 |
| | Plazza AG | 223 | 53 |
| * | Schmolz & Bickenbach AG | 75,992 | 50 |
| * | Zehnder Group- RG | 1,190 | 49 |
| | Bachem Holding AG | 523 | 47 |
| *,^ | Meyer Burger Technology AG | 12,887 | 42 |
| * | Alpiq Holding AG | 434 | 40 |
| * | Transocean Ltd. (Switzerland Shares) | 1,000 | 10 |
| * | Orascom Development Holding AG | 1,294 | 8 |
| | | | 237,971 |
| Taiwan (1.5%) | | |
| | Taiwan Semiconductor Manufacturing Co. Ltd. ADR | 643,152 | 20,002 |
| | Taiwan Semiconductor Manufacturing Co. Ltd. | 1,726,000 | 10,358 |
| | Hon Hai Precision Industry Co. Ltd. | 3,106,151 | 8,390 |
| | Chunghwa Telecom Co. Ltd. ADR | 99,103 | 3,384 |
| | Formosa Plastics Corp. | 1,026,873 | 2,775 |
| | Formosa Chemicals & Fibre Corp. | 927,283 | 2,753 |
| | Nan Ya Plastics Corp. | 1,203,423 | 2,499 |
| | Largan Precision Co. Ltd. | 21,020 | 2,480 |
| | Delta Electronics Inc. | 460,471 | 2,424 |
| | MediaTek Inc. | 301,086 | 2,282 |
| | Fubon Financial Holding Co. Ltd. | 1,526,880 | 2,160 |
| | Cathay Financial Holding Co. Ltd. | 1,665,549 | 2,156 |
| | CTBC Financial Holding Co. Ltd. | 3,821,715 | 2,055 |
| | Uni-President Enterprises Corp. | 1,018,992 | 1,969 |
| | China Steel Corp. | 2,624,390 | 1,896 |
76
| | |
| Vanguard® Total World Stock Index Fund | | |
| Schedule of Investments | | |
| October 31, 2016 | | |
| |
| | | Market |
| | | Value |
| | Shares | ($000) |
| Mega Financial Holding Co. Ltd. | 2,274,769 | 1,555 |
| Advanced Semiconductor Engineering Inc. ADR | 235,724 | 1,379 |
| Asustek Computer Inc. | 146,169 | 1,280 |
| Taiwan Mobile Co. Ltd. | 351,800 | 1,231 |
| Catcher Technology Co. Ltd. | 151,310 | 1,184 |
| First Financial Holding Co. Ltd. | 2,140,019 | 1,121 |
| Pegatron Corp. | 412,954 | 1,112 |
| Quanta Computer Inc. | 546,450 | 1,105 |
| Hotai Motor Co. Ltd. | 85,000 | 987 |
| E.Sun Financial Holding Co. Ltd. | 1,725,186 | 980 |
| Formosa Petrochemical Corp. | 292,140 | 975 |
| Yuanta Financial Holding Co. Ltd. | 2,498,965 | 933 |
| President Chain Store Corp. | 118,137 | 883 |
| Hua Nan Financial Holdings Co. Ltd. | 1,584,076 | 804 |
| Taiwan Cement Corp. | 671,210 | 804 |
| Cheng Shin Rubber Industry Co. Ltd. | 393,379 | 800 |
| Taishin Financial Holding Co. Ltd. | 2,126,180 | 777 |
| Far EasTone Telecommunications Co. Ltd. | 326,000 | 770 |
| Pou Chen Corp. | 569,524 | 768 |
| Taiwan Cooperative Financial Holding Co. Ltd. | 1,692,668 | 742 |
| China Development Financial Holding Corp. | 2,961,580 | 741 |
| China Life Insurance Co. Ltd. | 803,002 | 740 |
| Chang Hwa Commercial Bank Ltd. | 1,345,963 | 688 |
| Foxconn Technology Co. Ltd. | 233,514 | 677 |
| Far Eastern New Century Corp. | 863,279 | 668 |
| Lite-On Technology Corp. | 456,988 | 655 |
| Innolux Corp. | 1,934,885 | 651 |
| SinoPac Financial Holdings Co. Ltd. | 2,129,631 | 614 |
| Compal Electronics Inc. | 1,024,323 | 609 |
| Advantech Co. Ltd. | 67,518 | 549 |
| AU Optronics Corp. ADR | 137,718 | 521 |
| United Microelectronics Corp. | 1,373,180 | 511 |
| Hermes Microvision Inc. | 11,493 | 507 |
| Inventec Corp. | 636,554 | 497 |
| Eclat Textile Co. Ltd. | 43,163 | 489 |
| * Inotera Memories Inc. | 498,000 | 466 |
| Wistron Corp. | 595,461 | 449 |
| * HTC Corp. | 151,491 | 442 |
| Micro-Star International Co. Ltd. | 151,000 | 434 |
| Asia Cement Corp. | 494,264 | 431 |
| United Microelectronics Corp. ADR | 224,078 | 426 |
| Powertech Technology Inc. | 148,000 | 422 |
| Novatek Microelectronics Corp. | 112,025 | 419 |
| Giant Manufacturing Co. Ltd. | 57,881 | 409 |
| Chailease Holding Co. Ltd. | 236,892 | 409 |
| WPG Holdings Ltd. | 340,000 | 398 |
| * Shin Kong Financial Holding Co. Ltd. | 1,808,612 | 392 |
| Vanguard International Semiconductor Corp. | 188,000 | 383 |
| Siliconware Precision Industries Co. Ltd. | 237,655 | 359 |
| Siliconware Precision Industries Co. Ltd. ADR | 45,120 | 338 |
| Teco Electric and Machinery Co. Ltd. | 374,000 | 332 |
| Nien Made Enterprise Co. Ltd. | 27,000 | 313 |
| Synnex Technology International Corp. | 285,498 | 304 |
| Realtek Semiconductor Corp. | 89,420 | 303 |
| Chicony Electronics Co. Ltd. | 116,875 | 299 |
| Highwealth Construction Corp. | 199,540 | 296 |
| Feng TAY Enterprise Co. Ltd. | 70,235 | 293 |
| Kenda Rubber Industrial Co. Ltd. | 180,413 | 276 |
| Tong Yang Industry Co. Ltd. | 115,000 | 268 |
| Standard Foods Corp. | 107,116 | 265 |
| * Ruentex Development Co. Ltd. | 229,156 | 264 |
| Taiwan Business Bank | 1,044,501 | 264 |
| CTCI Corp. | 179,000 | 263 |
| Walsin Lihwa Corp. | 733,000 | 256 |
77
| | |
| Vanguard® Total World Stock Index Fund | | |
| Schedule of Investments | | |
| October 31, 2016 | | |
| |
| | | Market |
| | | Value |
| | Shares | ($000) |
| * TaiMed Biologics Inc. | 39,000 | 245 |
| Win Semiconductors Corp. | 87,151 | 242 |
| Acer Inc. | 524,551 | 240 |
| Airtac International Group | 30,050 | 239 |
| Ruentex Industries Ltd. | 146,268 | 235 |
| Tripod Technology Corp. | 99,000 | 234 |
| LCY Chemical Corp. | 190,000 | 232 |
| St. Shine Optical Co. Ltd. | 11,000 | 231 |
| Poya International Co. Ltd. | 15,237 | 221 |
| Hiwin Technologies Corp. | 49,942 | 220 |
| King Yuan Electronics Co. Ltd. | 246,000 | 216 |
| Yulon Motor Co. Ltd. | 244,000 | 213 |
| TTY Biopharm Co. Ltd. | 56,541 | 213 |
| China Airlines Ltd. | 686,000 | 208 |
| Elite Material Co. Ltd. | 74,000 | 206 |
| Phison Electronics Corp. | 29,000 | 205 |
| Merida Industry Co. Ltd. | 44,400 | 205 |
| Eva Airways Corp. | 410,674 | 198 |
| AU Optronics Corp. | 520,000 | 197 |
| Nanya Technology Corp. | 151,324 | 196 |
| Taiwan Fertilizer Co. Ltd. | 145,000 | 194 |
| Yageo Corp. | 96,346 | 194 |
| Hota Industrial Manufacturing Co. Ltd. | 46,000 | 192 |
| Parade Technologies Ltd. | 17,000 | 191 |
| Formosa Taffeta Co. Ltd. | 208,000 | 189 |
| Eternal Materials Co. Ltd. | 178,914 | 189 |
| Zhen Ding Technology Holding Ltd. | 82,700 | 188 |
| Simplo Technology Co. Ltd. | 59,400 | 183 |
| Ennoconn Corp. | 11,556 | 183 |
| Advanced Semiconductor Engineering Inc. | 155,000 | 182 |
| Accton Technology Corp. | 112,000 | 179 |
| Chroma ATE Inc. | 70,000 | 177 |
| Grape King Bio Ltd. | 21,000 | 176 |
| Tung Thih Electronic Co. Ltd. | 12,000 | 175 |
| Winbond Electronics Corp. | 557,000 | 175 |
| Waterland Financial Holdings Co. Ltd. | 684,911 | 173 |
| Taiwan Paiho Ltd. | 50,000 | 170 |
| Clevo Co. | 182,628 | 167 |
| Gigabyte Technology Co. Ltd. | 124,000 | 163 |
| Compeq Manufacturing Co. Ltd. | 306,000 | 161 |
| TSRC Corp. | 155,925 | 161 |
| Wisdom Marine Lines Co. Ltd. | 177,377 | 161 |
| Silergy Corp. | 11,000 | 160 |
| E Ink Holdings Inc. | 185,000 | 157 |
| Getac Technology Corp. | 120,000 | 156 |
| PChome Online Inc. | 14,268 | 155 |
| Chunghwa Telecom Co. Ltd. | 45,000 | 154 |
| Wistron NeWeb Corp. | 54,651 | 152 |
| Transcend Information Inc. | 55,000 | 152 |
| * Taiwan Glass Industry Corp. | 357,842 | 149 |
| eMemory Technology Inc. | 14,000 | 148 |
| Voltronic Power Technology Corp. | 9,615 | 144 |
| Advanced Ceramic X Corp. | 18,000 | 144 |
| Kinsus Interconnect Technology Corp. | 62,000 | 143 |
| Greatek Electronics Inc. | 112,000 | 141 |
| Chipbond Technology Corp. | 102,000 | 141 |
| Depo Auto Parts Ind Co. Ltd. | 45,000 | 141 |
| Radiant Opto-Electronics Corp. | 83,314 | 140 |
| Land Mark Optoelectronics Corp. | 15,600 | 140 |
| Cub Elecparts Inc. | 14,898 | 137 |
| Makalot Industrial Co. Ltd. | 34,712 | 137 |
| Walsin Technology Corp. | 111,975 | 136 |
| * Evergreen Marine Corp. Taiwan Ltd. | 362,940 | 136 |
| United Integrated Services Co. Ltd. | 89,000 | 133 |
78
| | |
| Vanguard® Total World Stock Index Fund | | |
| Schedule of Investments | | |
| October 31, 2016 | | |
| |
| | | Market |
| | | Value |
| | Shares | ($000) |
| Nan Kang Rubber Tire Co. Ltd. | 144,493 | 133 |
| * Chunghwa Precision Test Tech Co. Ltd. | 4,000 | 133 |
| Taiwan Secom Co. Ltd. | 45,675 | 131 |
| FLEXium Interconnect Inc. | 45,703 | 130 |
| King's Town Bank Co. Ltd. | 157,000 | 128 |
| Feng Hsin Steel Co. Ltd. | 96,000 | 127 |
| * HannStar Display Corp. | 508,265 | 127 |
| General Interface Solution Holding Ltd. | 46,000 | 123 |
| King Slide Works Co. Ltd. | 10,000 | 122 |
| * Epistar Corp. | 180,044 | 122 |
| Everlight Electronics Co. Ltd. | 81,000 | 122 |
| AmTRAN Technology Co. Ltd. | 154,000 | 122 |
| Lealea Enterprise Co. Ltd. | 470,000 | 120 |
| Mitac Holdings Corp. | 122,667 | 116 |
| Sinbon Electronics Co. Ltd. | 51,499 | 116 |
| Xxentria Technology Materials Corp. | 44,000 | 115 |
| Huaku Development Co. Ltd. | 65,000 | 114 |
| Chin-Poon Industrial Co. Ltd. | 59,000 | 113 |
| Coretronic Corp. | 107,400 | 111 |
| Unimicron Technology Corp. | 269,000 | 111 |
| Gourmet Master Co. Ltd. | 12,350 | 111 |
| * Tatung Co. Ltd. | 421,000 | 111 |
| Qisda Corp. | 262,000 | 110 |
| Syncmold Enterprise Corp. | 65,000 | 109 |
| China Steel Chemical Corp. | 31,000 | 106 |
| * Asia Pacific Telecom Co. Ltd. | 331,152 | 106 |
| * Yieh Phui Enterprise Co. Ltd. | 274,000 | 106 |
| * Pharmally International Holding Co. Ltd. | 7,000 | 105 |
| Merry Electronics Co. Ltd. | 26,850 | 104 |
| Tong Hsing Electronic Industries Ltd. | 30,000 | 103 |
| Sercomm Corp. | 44,000 | 103 |
| * China Petrochemical Development Corp. | 361,350 | 103 |
| Hu Lane Associate Inc. | 23,000 | 101 |
| China Motor Corp. | 129,000 | 101 |
| Bizlink Holding Inc. | 19,933 | 101 |
| Far Eastern Department Stores Ltd. | 190,115 | 101 |
| Dynapack International Technology Corp. | 77,000 | 101 |
| Sitronix Technology Corp. | 27,000 | 100 |
| China Metal Products | 101,000 | 99 |
| Taichung Commercial Bank Co. Ltd. | 345,154 | 98 |
| PharmaEngine Inc. | 14,199 | 97 |
| Formosa International Hotels Corp. | 17,058 | 96 |
| Kinpo Electronics | 254,000 | 95 |
| Holtek Semiconductor Inc. | 60,000 | 95 |
| * Egis Technology Inc. | 13,000 | 94 |
| Elan Microelectronics Corp. | 82,000 | 93 |
| Pihsiang Machinery Manufacturing Co. Ltd. | 38,000 | 89 |
| Chaun-Choung Technology Corp. | 20,000 | 88 |
| Oriental Union Chemical Corp. | 141,000 | 88 |
| * Ta Ya Electric Wire & Cable | 528,000 | 88 |
| Far Eastern International Bank | 307,559 | 87 |
| Visual Photonics Epitaxy Co. Ltd. | 65,250 | 87 |
| * Wei Chuan Foods Corp. | 152,000 | 86 |
| Cheng Uei Precision Industry Co. Ltd. | 70,000 | 86 |
| Tainan Spinning Co. Ltd. | 220,543 | 85 |
| YFY Inc. | 287,000 | 85 |
| Ginko International Co. Ltd. | 9,000 | 84 |
| Elite Advanced Laser Corp. | 23,040 | 84 |
| Yungtay Engineering Co. Ltd. | 59,000 | 83 |
| Taiwan Shin Kong Security Co. Ltd. | 65,650 | 83 |
| Bank of Kaohsiung Co. Ltd. | 294,085 | 82 |
| Grand Pacific Petrochemical | 146,000 | 81 |
| Gigasolar Materials Corp. | 6,400 | 81 |
| Primax Electronics Ltd. | 51,000 | 81 |
79
| | |
| Vanguard® Total World Stock Index Fund | | |
| Schedule of Investments | | |
| October 31, 2016 | | |
| |
| | | Market |
| | | Value |
| | Shares | ($000) |
| * TPK Holding Co. Ltd. | 49,958 | 80 |
| Sporton International Inc. | 16,472 | 79 |
| WT Microelectronics Co. Ltd. | 55,549 | 79 |
| Senao International Co. Ltd. | 49,000 | 78 |
| TXC Corp. | 55,000 | 77 |
| * Mercuries Life Insurance Co. Ltd. | 154,105 | 74 |
| Tyntek Corp. | 194,000 | 74 |
| Pan-International Industrial Corp. | 80,000 | 73 |
| Li Cheng Enterprise Co. Ltd. | 18,600 | 72 |
| Sino-American Silicon Products Inc. | 67,000 | 72 |
| Advanced Wireless Semiconductor Co. | 46,000 | 72 |
| President Securities Corp. | 204,178 | 71 |
| Tung Ho Steel Enterprise Corp. | 110,000 | 70 |
| Wan Hai Lines Ltd. | 141,000 | 69 |
| * CMC Magnetics Corp. | 575,021 | 68 |
| China Synthetic Rubber Corp. | 86,110 | 68 |
| Great Wall Enterprise Co. Ltd. | 74,100 | 67 |
| International Games System Co. Ltd. | 12,000 | 67 |
| Asia Vital Components Co. Ltd. | 90,000 | 67 |
| Huang Hsiang Construction Corp. | 55,000 | 67 |
| Nan Ya Printed Circuit Board Corp. | 89,000 | 67 |
| Cheng Loong Corp. | 185,000 | 67 |
| * Iron Force Industrial Co. Ltd. | 11,000 | 67 |
| Pan Jit International Inc. | 142,000 | 67 |
| Cathay Real Estate Development Co. Ltd. | 130,200 | 67 |
| Long Bon International Co. Ltd. | 127,000 | 66 |
| Sigurd Microelectronics Corp. | 87,000 | 65 |
| Unitech Printed Circuit Board Corp. | 206,000 | 65 |
| Lung Yen Life Service Corp. | 38,000 | 65 |
| Test Research Inc. | 51,000 | 65 |
| * Orient Semiconductor Electronics Ltd. | 176,000 | 64 |
| Topco Scientific Co. Ltd. | 24,203 | 62 |
| Everlight Chemical Industrial Corp. | 97,240 | 62 |
| Systex Corp. | 36,000 | 61 |
| China Bills Finance Corp. | 150,000 | 60 |
| Jih Sun Financial Holdings Co. Ltd. | 286,252 | 60 |
| Kinik Co. | 36,000 | 59 |
| Long Chen Paper Co. Ltd. | 125,000 | 59 |
| D-Link Corp. | 184,212 | 59 |
| Yeong Guan Energy Technology Group Co. Ltd. | 15,000 | 59 |
| Sunplus Technology Co. Ltd. | 171,000 | 59 |
| Taiwan Hon Chuan Enterprise Co. Ltd. | 35,772 | 59 |
| Pixart Imaging Inc. | 27,000 | 58 |
| Capital Securities Corp. | 232,000 | 58 |
| Firich Enterprises Co. Ltd. | 27,983 | 58 |
| Shinkong Synthetic Fibers Corp. | 217,000 | 58 |
| Namchow Chemical Industrial Co. Ltd. | 27,000 | 57 |
| Shin Zu Shing Co. Ltd. | 19,000 | 57 |
| Lien Hwa Industrial Corp. | 84,213 | 57 |
| Globalwafers Co. Ltd. | 23,000 | 57 |
| OptoTech Corp. | 134,000 | 56 |
| Posiflex Technology Inc. | 9,547 | 56 |
| Chimei Materials Technology Corp. | 143,000 | 56 |
| Sampo Corp. | 90,000 | 56 |
| USI Corp. | 114,000 | 56 |
| China General Plastics Corp. | 69,000 | 55 |
| * ALI Corp. | 105,000 | 55 |
| TYC Brother Industrial Co. Ltd. | 53,000 | 55 |
| * Neo Solar Power Corp. | 104,573 | 53 |
| Cleanaway Co. Ltd. | 10,000 | 53 |
| * Swancor Holding Co. Ltd. | 22,000 | 52 |
| Sanyang Motor Co. Ltd. | 80,000 | 51 |
| Taiwan Styrene Monomer | 93,450 | 49 |
| Kuoyang Construction Co. Ltd. | 125,000 | 49 |
80
| | |
| Vanguard® Total World Stock Index Fund | | |
| Schedule of Investments | | |
| October 31, 2016 | | |
| |
| | | Market |
| | | Value |
| | Shares | ($000) |
| Zinwell Corp. | 43,000 | 49 |
| * Etron Technology Inc. | 127,000 | 49 |
| YC INOX Co. Ltd. | 67,000 | 49 |
| Ardentec Corp. | 64,903 | 48 |
| Evergreen International Storage & Transport Corp. | 118,000 | 48 |
| TA Chen Stainless Pipe | 90,065 | 47 |
| Jess-Link Products Co. Ltd. | 57,000 | 47 |
| * Center Laboratories Inc. | 22,894 | 47 |
| Adlink Technology Inc. | 24,168 | 47 |
| Green Seal Holding Ltd. | 8,800 | 47 |
| * Sunny Friend Environmental Technology Co. Ltd. | 13,000 | 46 |
| Taiwan Semiconductor Co. Ltd. | 41,000 | 46 |
| WUS Printed Circuit Co. Ltd. | 82,000 | 46 |
| Flytech Technology Co. Ltd. | 13,853 | 46 |
| * Microbio Co. Ltd. | 61,000 | 45 |
| Taiwan PCB Techvest Co. Ltd. | 46,000 | 45 |
| Altek Corp. | 61,600 | 44 |
| Prince Housing & Development Corp. | 139,050 | 44 |
| YungShin Global Holding Corp. | 29,400 | 44 |
| Basso Industry Corp. | 16,200 | 44 |
| Zeng Hsing Industrial Co. Ltd. | 9,000 | 43 |
| Chung Hwa Pulp Corp. | 152,421 | 43 |
| UPC Technology Corp. | 123,000 | 43 |
| Taiwan Cogeneration Corp. | 58,000 | 42 |
| A-DATA Technology Co. Ltd. | 26,190 | 41 |
| * Unizyx Holding Corp. | 91,000 | 41 |
| China Man-Made Fiber Corp. | 166,950 | 40 |
| Sonix Technology Co. Ltd. | 39,000 | 40 |
| San Shing Fastech Corp. | 22,770 | 40 |
| Gloria Material Technology Corp. | 74,000 | 40 |
| * Solar Applied Materials Technology Co. | 140,000 | 39 |
| Taiflex Scientific Co. Ltd. | 40,800 | 39 |
| Casetek Holdings Ltd. | 12,000 | 39 |
| Toung Loong Textile Manufacturing | 14,000 | 38 |
| Nan Liu Enterprise Co. Ltd. | 9,000 | 38 |
| Chong Hong Construction Co. Ltd. | 23,152 | 38 |
| Farglory Land Development Co. Ltd. | 33,000 | 38 |
| Aten International Co. Ltd. | 15,000 | 38 |
| Weltrend Semiconductor | 52,000 | 37 |
| * Taigen Biopharmaceuticals Holdings Ltd. | 38,872 | 37 |
| * Asia Optical Co. Inc. | 40,000 | 37 |
| Ton Yi Industrial Corp. | 86,000 | 37 |
| Chlitina Holding Ltd. | 8,400 | 37 |
| IEI Integration Corp. | 24,380 | 36 |
| ScinoPharm Taiwan Ltd. | 28,121 | 36 |
| ITEQ Corp. | 33,000 | 36 |
| Lotes Co. Ltd. | 14,000 | 36 |
| * Gintech Energy Corp. | 49,555 | 35 |
| * Motech Industries Inc. | 36,000 | 35 |
| * Yang Ming Marine Transport Corp. | 156,000 | 35 |
| * Ritek Corp. | 200,147 | 35 |
| Taiyen Biotech Co. Ltd. | 36,000 | 34 |
| ITE Technology Inc. | 37,000 | 34 |
| CHC Healthcare Group | 24,268 | 34 |
| U-Ming Marine Transport Corp. | 48,000 | 33 |
| Goldsun Building Materials Co. Ltd. | 144,000 | 33 |
| Mercuries & Associates Holding Ltd. | 53,550 | 33 |
| Federal Corp. | 76,612 | 33 |
| Universal Cement Corp. | 41,868 | 33 |
| Soft-World International Corp. | 16,000 | 32 |
| AcBel Polytech Inc. | 43,000 | 32 |
| Wowprime Corp. | 8,665 | 32 |
| Alpha Networks Inc. | 55,000 | 32 |
| Elitegroup Computer Systems Co. Ltd. | 73,000 | 31 |
81
| | |
| Vanguard® Total World Stock Index Fund | | |
| Schedule of Investments | | |
| October 31, 2016 | | |
| |
| | | Market |
| | | Value |
| | Shares | ($000) |
| * Medigen Biotechnology Corp. | 14,000 | 31 |
| Hung Sheng Construction Ltd. | 57,000 | 31 |
| Johnson Health Tech Co. Ltd. | 21,105 | 31 |
| Lextar Electronics Corp. | 74,000 | 31 |
| Brogent Technologies Inc. | 4,389 | 30 |
| Career Technology MFG. Co. Ltd. | 46,000 | 29 |
| FocalTech Systems Co. Ltd. | 26,923 | 29 |
| Elite Semiconductor Memory Technology Inc. | 27,000 | 29 |
| Rechi Precision Co. Ltd. | 25,000 | 28 |
| Taiwan FamilyMart Co. Ltd. | 4,000 | 28 |
| Darwin Precisions Corp. | 73,000 | 28 |
| * Ho Tung Chemical Corp. | 114,639 | 28 |
| * Shining Building Business Co. Ltd. | 88,660 | 28 |
| * E-Ton Solar Tech Co. Ltd. | 90,000 | 28 |
| Taiwan Fire & Marine Insurance Co. Ltd. | 47,000 | 28 |
| MIN AIK Technology Co. Ltd. | 23,000 | 27 |
| Lite-On Semiconductor Corp. | 38,000 | 27 |
| CyberTAN Technology Inc. | 44,000 | 26 |
| Taiwan TEA Corp. | 59,000 | 26 |
| Faraday Technology Corp. | 25,800 | 26 |
| Hung Poo Real Estate Development Corp. | 31,000 | 25 |
| Microlife Corp. | 11,000 | 25 |
| Taiwan Acceptance Corp. | 11,000 | 25 |
| Taiwan Land Development Corp. | 80,731 | 25 |
| ACES Electronic Co. Ltd. | 33,000 | 25 |
| Jentech Precision Industrial Co. Ltd. | 16,000 | 25 |
| Topkey Corp. | 8,000 | 25 |
| * Radium Life Tech Co. Ltd. | 87,393 | 25 |
| Formosan Rubber Group Inc. | 53,101 | 25 |
| * Gigastorage Corp. | 34,000 | 24 |
| Wah Lee Industrial Corp. | 17,000 | 24 |
| Masterlink Securities Corp. | 95,012 | 24 |
| * AGV Products Corp. | 97,439 | 23 |
| Test Rite International Co. Ltd. | 37,000 | 23 |
| * TWi Pharmaceuticals Inc. | 7,000 | 23 |
| Advanced International Multitech Co. Ltd. | 35,000 | 22 |
| Kindom Construction Corp. | 45,000 | 22 |
| Vivotek Inc. | 8,863 | 22 |
| Taiwan Surface Mounting Technology Corp. | 26,250 | 22 |
| * Ichia Technologies Inc. | 49,000 | 22 |
| Chung-Hsin Electric & Machinery Manufacturing Corp. | 37,000 | 21 |
| Kuo Toong International Co. Ltd. | 37,643 | 21 |
| * Taiwan Liposome Co. Ltd. | 5,000 | 20 |
| Tong-Tai Machine & Tool Co. Ltd. | 28,560 | 20 |
| * Lotus Pharmaceutical Co. Ltd. | 11,000 | 20 |
| Global Mixed Mode Technology Inc. | 9,000 | 20 |
| Sinyi Realty Inc. | 21,630 | 20 |
| Ambassador Hotel | 25,000 | 20 |
| Concord Securities Co. Ltd. | 96,000 | 19 |
| * Unity Opto Technology Co. Ltd. | 38,000 | 18 |
| Rich Development Co. Ltd. | 63,000 | 17 |
| * Li Peng Enterprise Co. Ltd. | 75,600 | 17 |
| BES Engineering Corp. | 99,000 | 17 |
| * G Tech Optoelectronics Corp. | 24,043 | 16 |
| GeoVision Inc. | 9,776 | 15 |
| * Genius Electronic Optical Co. Ltd. | 8,714 | 14 |
| * Gold Circuit Electronics Ltd. | 41,000 | 14 |
| KEE TAI Properties Co. Ltd. | 41,000 | 13 |
| Yulon Nissan Motor Co. Ltd. | 2,000 | 13 |
| XPEC Entertainment Inc. | 21,467 | 8 |
| ENG Electric Co. Ltd. | 3,307 | 2 |
| Forest Water Environment Engineering Co. Ltd. | 261 | — |
| | | 133,164 |
82
| | | |
| Vanguard® Total World Stock Index Fund | | |
| Schedule of Investments | | |
| October 31, 2016 | | |
| |
| | | | Market |
| | | | Value |
| | | Shares | ($000) |
| Thailand (0.4%) | | |
| * | PTT PCL | 202,200 | 1,991 |
| ^ | Siam Cement PCL NVDR | 120,200 | 1,716 |
| | CP ALL PCL (Foreign) | 811,900 | 1,407 |
| ^ | Kasikornbank PCL (Foreign) | 269,183 | 1,321 |
| * | Bangkok Dusit Medical Services PCL (Local) | 1,650,800 | 1,075 |
| | Advanced Info Service PCL (Foreign) | 242,100 | 1,061 |
| | PTT PCL (Foreign) | 98,600 | 971 |
| * | Airports of Thailand PCL | 86,725 | 944 |
| | Siam Commercial Bank PCL (Foreign) | 227,900 | 933 |
| | Siam Cement PCL (Foreign) | 57,900 | 833 |
| ^ | Siam Commercial Bank PCL | 187,400 | 767 |
| ^ | Kasikornbank PCL | 142,100 | 698 |
| ^ | PTT Exploration & Production PCL (Foreign) | 241,281 | 571 |
| * | CP ALL PCL (Local) | 289,400 | 502 |
| | Central Pattana PCL | 312,900 | 497 |
| * | Charoen Pokphand Foods PCL | 536,300 | 482 |
| * | Minor International PCL | 417,260 | 458 |
| | PTT Global Chemical PCL (Foreign) | 239,715 | 409 |
| | Bangkok Bank PCL (Foreign) | 89,698 | 409 |
| * | Banpu PCL (Local) | 732,000 | 383 |
| ^ | Intouch Holdings NVDR | 237,596 | 360 |
| * | Bangkok Expressway & Metro PCL | 1,682,509 | 358 |
| | Krung Thai Bank PCL (Foreign) | 687,175 | 337 |
| * | Central Pattana PCL | 208,100 | 331 |
| | Charoen Pokphand Foods PCL (Foreign) | 367,500 | 331 |
| | Minor International PCL (Foreign) | 297,823 | 327 |
| | Thai Oil PCL (Foreign) | 159,800 | 319 |
| * | Siam Commercial Bank PCL (Local) | 77,800 | 319 |
| * | PTT Global Chemical PCL (Local) | 183,600 | 314 |
| ^ | Krung Thai Bank PCL | 633,000 | 311 |
| * | Digital Telecommunications Infrastructure Fund | 688,200 | 295 |
| * | Indorama Ventures PCL (Local) | 332,500 | 277 |
| * | KCE Electronics PCL | 83,000 | 266 |
| * | True Corp. PCL | 1,370,453 | 264 |
| ^ | Thai Union Frozen Products PCL (Foreign) | 404,880 | 251 |
| * | Intouch Holdings PCL | 160,600 | 243 |
| * | OBI Pharma Inc. | 23,000 | 240 |
| * | BTS Group Holdings PCL | 954,800 | 233 |
| * | Ratchaburi Electricity Generating Holding PCL (Local) | 161,300 | 230 |
| * | BTS Rail Mass Transit Growth Infrastructure Fund | 661,200 | 230 |
| * | Bumrungrad Hospital PCL | 42,500 | 222 |
| ^ | TMB Bank PCL | 3,532,900 | 212 |
| ^ | Land & Houses PCL | 790,900 | 207 |
| ^ | Electricity Generating PCL (Foreign) | 37,200 | 207 |
| ^ | IRPC PCL (Foreign) | 1,491,200 | 204 |
| * | Berli Jucker PCL | 134,600 | 203 |
| | Berli Jucker PCL | 134,484 | 203 |
| * | Group Lease PCL | 149,700 | 196 |
| ^ | Home Product Center PCL | 677,598 | 195 |
| * | Jasmine Broadband Internet Infrastructure Fund | 559,400 | 193 |
| * | Bangchak Petroleum PCL | 217,100 | 187 |
| * | Robinson Department Store PCL | 112,700 | 186 |
| * | Central Plaza Hotel PCL | 162,200 | 176 |
| * | Superblock PCL | 3,838,700 | 174 |
| *,2 | Star Petroleum Refining PCL | 484,700 | 174 |
| * | Sino-Thai Engineering & Construction PCL | 237,700 | 173 |
| * | PTG Energy PCL | 210,400 | 173 |
| * | PTT Exploration and Production PCL (Local) | 72,800 | 172 |
| * | Home Product Center PCL | 568,200 | 164 |
| ^ | Bumrungrad Hospital PCL (Foreign) | 30,900 | 161 |
| | Jasmine International PCL | 664,200 | 158 |
| * | CH Karnchang PCL | 187,300 | 158 |
| ^ | True Corp. PCL | 775,201 | 149 |
83
| | | |
| Vanguard® Total World Stock Index Fund | | |
| Schedule of Investments | | |
| October 31, 2016 | | |
| |
| | | | Market |
| | | | Value |
| | | Shares | ($000) |
| ^ | BTS Group Holdings PCL ADR | 604,800 | 148 |
| * | Supalai PCL | 211,200 | 147 |
| | Pruksa Real Estate PCL | 210,700 | 139 |
| * | Land & Houses PCL | 508,200 | 133 |
| ^ | BEC World PCL (Foreign) | 225,100 | 132 |
| * | Siam City Cement PCL (Local) | 15,684 | 129 |
| ^ | Total Access Communication PCL (Foreign) | 145,300 | 129 |
| ^ | Delta Electronics Thailand PCL | 56,600 | 127 |
| | Kiatnakin Bank PCL | 74,800 | 125 |
| * | Bangkok Land PCL | 2,749,700 | 124 |
| | Thoresen Thai Agencies PCL (Foreign) | 476,652 | 124 |
| * | Tisco Financial Group PCL | 83,500 | 123 |
| * | TPI Polene PCL | 1,930,500 | 121 |
| * | Gunkul Engineering PCL | 846,500 | 120 |
| * | Glow Energy PCL | 54,500 | 120 |
| * | Esso Thailand PCL | 408,900 | 118 |
| * | Delta Electronics Thailand PCL | 51,800 | 116 |
| | Bangkok Dusit Medical Services PCL (Foreign) | 176,000 | 115 |
| * | Thai Union Group PCL | 183,500 | 114 |
| * | Italian-Thai Development PCL | 784,500 | 111 |
| * | Thai Oil PCL | 54,500 | 109 |
| * | VGI Global Media PCL | 652,900 | 106 |
| * | Krungthai Card PCL | 24,700 | 106 |
| * | Siam Global House PCL | 238,859 | 105 |
| | momo.com Inc. | 16,000 | 104 |
| * | Electricity Generating PCL | 18,300 | 102 |
| * | Thai Airways International PCL | 126,300 | 101 |
| | Thanachart Capital PCL | 88,900 | 100 |
| * | Major Cineplex Group PCL | 120,200 | 99 |
| * | AP Thailand PCL | 476,600 | 97 |
| * | Quality Houses PCL | 1,338,683 | 96 |
| * | Dynasty Ceramic PCL | 696,900 | 89 |
| * | Srisawad Power 1979 PCL | 77,367 | 88 |
| * | Sansiri PCL (Local) | 1,855,200 | 88 |
| * | IRPC PCL | 629,800 | 86 |
| * | Carabao Group PCL | 43,100 | 85 |
| * | Thai Vegetable Oil PCL | 88,000 | 84 |
| ^ | Bangkok Life Assurance PCL | 59,100 | 84 |
| *,^ | Thai Airways International PCL (Foreign) | 104,374 | 83 |
| | Bangkok Expressway & Metro PCL | 373,046 | 79 |
| * | Kiatnakin Bank PCL | 47,400 | 79 |
| * | Global Power Synergy Co. Ltd. | 77,600 | 79 |
| * | U City PCL | 90,412,494 | 77 |
| * | Unique Engineering & Construction PCL | 155,600 | 76 |
| | TTW PCL | 246,200 | 74 |
| * | Tipco Asphalt PCL | 140,500 | 73 |
| | Bangkok Life Assurance PCL | 50,940 | 72 |
| | Glow Energy PCL (Foreign) | 32,700 | 72 |
| * | Bangkok Airways PCL | 99,400 | 71 |
| ^ | Banpu PCL | 132,528 | 69 |
| * | Chularat Hospital PCL | 837,980 | 67 |
| * | Muangthai Leasing PCL | 124,100 | 67 |
| * | Vibhavadi Medical Center PCL | 778,900 | 66 |
| * | Thaicom PCL | 103,800 | 62 |
| * | TMB Bank PCL | 1,018,600 | 61 |
| * | Tisco Financial Group PCL | 40,100 | 59 |
| * | Hana Microelectronics PCL | 64,600 | 59 |
| * | Bangkok Chain Hospital PCL | 154,400 | 58 |
| * | Thanachart Capital PCL | 50,100 | 56 |
| * | TICON Industrial Connection PCL | 132,600 | 56 |
| * | CK Power PCL | 529,000 | 54 |
| * | Amata Corp. PCL | 158,800 | 53 |
| * | Samart Corp. PCL | 128,900 | 52 |
| * | GFPT PCL | 112,200 | 49 |
84
| | | |
| Vanguard® Total World Stock Index Fund | | |
| Schedule of Investments | | |
| October 31, 2016 | | |
| |
| | | | Market |
| | | | Value |
| | | Shares | ($000) |
| | Bangkok Bank PCL | 10,200 | 46 |
| ^ | Thanachart Capital PCL | 38,600 | 44 |
| * | Inter Far East Energy Corp. | 351,100 | 43 |
| ^ | Hana Microelectronics PCL (Foreign) | 46,600 | 43 |
| * | WHA Corp. PCL | 420,000 | 40 |
| * | SPCG PCL | 65,000 | 38 |
| * | IMPACT Growth REIT | 81,000 | 36 |
| | LPN Development PCL | 102,800 | 33 |
| * | Sri Trang Agro-Industry PCL | 78,200 | 30 |
| * | Cal-Comp Electronics Thailand PCL | 387,330 | 28 |
| * | Univentures PCL | 143,400 | 24 |
| * | Total Access Communication PCL (Local) | 25,400 | 23 |
| * | Precious Shipping PCL | 125,400 | 22 |
| *,^ | WHA Corp. PCL | 210,509 | 20 |
| ^ | CK Power PCL | 179,860 | 18 |
| *,^ | Precious Shipping PCL (Foreign) | 62,700 | 11 |
| * | Group Lease PCL Warrants Exp. 07/31/2018 | 15,877 | 7 |
| * | Thoresen Thai Agencies PCL (Local) | 13,200 | 3 |
| * | CK Power PCL Foreign Line Warrants Exp. 05/28/2020 | 179,860 | 3 |
| * | Indorama Ventures PCL Warrants Exp. 08/24/2017 | 33,250 | 2 |
| * | Thoresen Thai Agencies PCL Warrants Exp. 02/28/2019 | 53,346 | 2 |
| * | Indorama Ventures Warrants Exp. 08/24/2018 | 25,576 | 2 |
| * | WHA Corp. PCL Warrants Exp. 12/31/2019 | 5,106 | 1 |
| * | TPI Polene PCL Rights | 11,916 | 1 |
| * | VGI Global Media PCL Warrants 08/01/2018 | 71,450 | 1 |
| * | Srisawad Power 1979 PCL Warrants Exp. 05/29/2020 | 2,960 | 1 |
| | BCPG PCL | 1,225 | — |
| * | Italian-Thai Development PCL Warrants Exp. 05/13/2019 | 56,840 | — |
| * | Samart Corp. PCL Warrants Exp. 02/11/2018 | 39,440 | — |
| * | Precious Shipping PCL Warrants | 6,270 | — |
| | | | 34,000 |
| Turkey (0.1%) | | |
| | Turkiye Garanti Bankasi AS | 432,590 | 1,177 |
| | Akbank TAS | 429,236 | 1,149 |
| | BIM Birlesik Magazalar AS | 47,224 | 770 |
| | Turkiye Is Bankasi | 358,415 | 582 |
| | KOC Holding AS | 131,948 | 550 |
| * | Turkcell Iletisim Hizmetleri AS | 157,420 | 508 |
| | Tupras Turkiye Petrol Rafinerileri AS | 24,875 | 507 |
| | Haci Omer Sabanci Holding AS (Bearer) | 159,095 | 481 |
| | Turkiye Halk Bankasi AS | 138,129 | 420 |
| | Emlak Konut Gayrimenkul Yatirim Ortakligi AS | 397,961 | 407 |
| | Eregli Demir ve Celik Fabrikalari TAS | 274,084 | 373 |
| | Turkiye Vakiflar Bankasi TAO | 204,427 | 303 |
| | Anadolu Efes Biracilik Ve Malt Sanayii AS | 41,074 | 251 |
| | Arcelik AS | 35,788 | 236 |
| | Enka Insaat ve Sanayi AS | 142,649 | 218 |
| | Ulker Biskuvi Sanayi AS | 33,433 | 208 |
| | Turk Telekomunikasyon AS | 106,702 | 197 |
| * | Turk Hava Yollari AO | 112,114 | 197 |
| * | Yapi ve Kredi Bankasi AS | 163,123 | 195 |
| | Ford Otomotiv Sanayi AS | 17,563 | 179 |
| | Tofas Turk Otomobil Fabrikasi AS | 22,955 | 173 |
| | Petkim Petrokimya Holding AS | 120,882 | 164 |
| | Coca-Cola Icecek AS | 13,694 | 155 |
| | Turkiye Sise ve Cam Fabrikalari AS | 147,252 | 155 |
| | Aselsan Elektronik Sanayi Ve Ticaret AS | 49,526 | 151 |
| | Is Gayrimenkul Yatirim Ortakligi AS | 267,825 | 136 |
| | TAV Havalimanlari Holding AS | 32,203 | 132 |
| | Soda Sanayii AS | 88,901 | 124 |
| * | Aksa Enerji Uretim AS Class B | 123,798 | 113 |
| | Tekfen Holding AS | 35,895 | 91 |
| * | Aksigorta AS | 132,563 | 87 |
| * | Sekerbank TAS | 205,730 | 78 |
85
| | |
| Vanguard® Total World Stock Index Fund | | |
| Schedule of Investments | | |
| October 31, 2016 | | |
| |
| | | Market |
| | | Value |
| | Shares | ($000) |
| Bizim Toptan Satis Magazalari AS | 17,130 | 72 |
| * Zorlu Enerji Elektrik Uretim AS | 123,101 | 65 |
| Kardemir Karabuk Demir Celik Sanayi ve Ticaret AS | 125,938 | 51 |
| Turkiye Sinai Kalkinma Bankasi AS | 112,275 | 50 |
| Otokar Otomotiv Ve Savunma Sanayi A.S. | 1,491 | 49 |
| * Koza Altin Isletmeleri AS | 8,052 | 46 |
| * Koza Anadolu Metal Madencilik Isletmeleri AS | 59,315 | 44 |
| * Dogan Sirketler Grubu Holding AS | 168,390 | 43 |
| Aygaz AS | 12,065 | 43 |
| * Vestel Elektronik Sanayi ve Ticaret AS | 20,037 | 43 |
| Cimsa Cimento Sanayi VE Ticaret AS | 8,065 | 40 |
| Turk Traktor ve Ziraat Makineleri AS | 1,534 | 40 |
| * Migros Ticaret AS | 6,467 | 37 |
| Aksa Akrilik Kimya Sanayii AS | 11,842 | 33 |
| Yazicilar Holding AS Class A | 5,506 | 24 |
| Dogus Otomotiv Servis ve Ticaret AS | 7,386 | 24 |
| * Pegasus Hava Tasimaciligi AS | 4,428 | 19 |
| Trakya Cam Sanayii AS | 21,506 | 18 |
| * Vakif Gayrimenkul Yatirim Ortakligi AS | 19,855 | 15 |
| Albaraka Turk Katilim Bankasi AS | 32,421 | 13 |
| * Asya Katilim Bankasi AS | 147,465 | — |
| | | 11,236 |
| United Arab Emirates (0.1%) | | |
| Emirates Telecommunications Group Co. PJSC | 343,010 | 1,760 |
| Emaar Properties PJSC | 734,579 | 1,391 |
| First Gulf Bank PJSC | 220,715 | 690 |
| DP World Ltd. | 37,047 | 665 |
| Abu Dhabi Commercial Bank PJSC | 364,999 | 609 |
| Aldar Properties PJSC | 727,850 | 521 |
| Dubai Islamic Bank PJSC | 301,078 | 429 |
| * DXB Entertainments PJSC | 666,893 | 284 |
| Emaar Malls PJSC | 391,593 | 274 |
| DAMAC Properties Dubai Co. PJSC | 381,514 | 228 |
| Dubai Investments PJSC | 414,619 | 226 |
| Union National Bank PJSC | 210,163 | 224 |
| Air Arabia PJSC | 453,800 | 160 |
| * Arabtec Holding PJSC | 386,155 | 139 |
| Dubai Financial Market PJSC | 426,230 | 133 |
| Al Waha Capital PJSC | 234,724 | 120 |
| Aramex PJSC | 106,323 | 102 |
| Amanat Holdings PJSC | 389,761 | 93 |
| * Dana Gas PJSC | 547,053 | 79 |
| National Central Cooling Co. PJSC | 134,628 | 66 |
| * Drake & Scull International PJSC | 459,669 | 57 |
| * Deyaar Development PJSC | 361,379 | 52 |
| * Eshraq Properties Co. PJSC | 184,450 | 40 |
| * Amlak Finance PJSC | 109,697 | 37 |
| RAK Properties PJSC | 168,932 | 28 |
| * Union Properties PJSC | 142,827 | 28 |
| | | 8,435 |
| United Kingdom (5.9%) | | |
| HSBC Holdings plc | 4,129,228 | 31,098 |
| BP plc | 3,909,466 | 23,112 |
| British American Tobacco plc | 391,977 | 22,465 |
| Royal Dutch Shell plc Class A | 898,651 | 22,383 |
| Royal Dutch Shell plc Class B | 780,870 | 20,141 |
| GlaxoSmithKline plc | 1,014,043 | 20,032 |
| Vodafone Group plc | 5,516,911 | 15,151 |
| AstraZeneca plc | 262,594 | 14,704 |
| Diageo plc | 529,349 | 14,090 |
| Reckitt Benckiser Group plc | 133,359 | 11,930 |
| Unilever plc | 253,837 | 10,598 |
| Shire plc | 186,799 | 10,547 |
| National Grid plc | 796,941 | 10,366 |
86
| | |
| Vanguard® Total World Stock Index Fund | | |
| Schedule of Investments | | |
| October 31, 2016 | | |
| |
| | | Market |
| | | Value |
| | Shares | ($000) |
| Imperial Brands plc | 202,707 | 9,805 |
| Lloyds Banking Group plc | 13,395,681 | 9,355 |
| Rio Tinto plc | 253,443 | 8,814 |
| Prudential plc | 538,492 | 8,788 |
| Barclays plc | 3,546,806 | 8,217 |
| BT Group plc | 1,750,186 | 8,033 |
| * Glencore plc | 2,442,255 | 7,476 |
| BHP Billiton plc | 443,179 | 6,664 |
| Compass Group plc | 348,865 | 6,313 |
| WPP plc | 272,463 | 5,916 |
| CRH plc | 172,380 | 5,578 |
| * Standard Chartered plc | 562,569 | 4,892 |
| Aviva plc | 845,296 | 4,581 |
| * Tesco plc | 1,701,935 | 4,384 |
| BAE Systems plc | 657,457 | 4,356 |
| SSE plc | 215,508 | 4,190 |
| RELX NV | 228,165 | 4,073 |
| Experian plc | 202,680 | 3,896 |
| * Anglo American plc | 273,839 | 3,801 |
| Legal & General Group plc | 1,241,079 | 3,175 |
| Rolls-Royce Holdings plc | 345,710 | 3,069 |
| Centrica plc | 1,134,043 | 2,970 |
| Wolseley plc | 52,149 | 2,705 |
| Smith & Nephew plc | 186,233 | 2,692 |
| Old Mutual plc | 974,194 | 2,396 |
| London Stock Exchange Group plc | 67,006 | 2,302 |
| Sky plc | 222,724 | 2,227 |
| Associated British Foods plc | 72,710 | 2,187 |
| Kingfisher plc | 475,588 | 2,101 |
| Sage Group plc | 228,717 | 2,018 |
| Land Securities Group plc | 163,343 | 1,995 |
| Bunzl plc | 71,186 | 1,911 |
| Carnival plc | 38,747 | 1,869 |
| Paddy Power Betfair plc | 17,261 | 1,788 |
| Next plc | 30,302 | 1,783 |
| Standard Life plc | 420,474 | 1,735 |
| Burberry Group plc | 95,781 | 1,727 |
| Johnson Matthey plc | 41,116 | 1,714 |
| Randgold Resources Ltd. | 18,953 | 1,683 |
| 3i Group plc | 204,614 | 1,677 |
| Whitbread plc | 37,793 | 1,670 |
| Ashtead Group plc | 106,623 | 1,661 |
| United Utilities Group plc | 143,538 | 1,650 |
| Pearson plc | 172,140 | 1,593 |
| * Royal Bank of Scotland Group plc | 688,079 | 1,590 |
| InterContinental Hotels Group plc | 40,406 | 1,567 |
| ITV plc | 747,020 | 1,557 |
| Mondi plc | 77,818 | 1,519 |
| British Land Co. plc | 206,030 | 1,475 |
| DCC plc | 17,827 | 1,450 |
| Severn Trent plc | 50,835 | 1,447 |
| RSA Insurance Group plc | 214,289 | 1,447 |
| Smiths Group plc | 82,900 | 1,437 |
| Intertek Group plc | 34,115 | 1,423 |
| Marks & Spencer Group plc | 338,972 | 1,410 |
| GKN plc | 361,255 | 1,409 |
| Informa plc | 166,545 | 1,370 |
| Persimmon plc | 65,599 | 1,358 |
| Wm Morrison Supermarkets plc | 467,490 | 1,294 |
| St. James's Place plc | 110,114 | 1,272 |
| 2 Worldpay Group plc | 358,937 | 1,247 |
| Micro Focus International plc | 47,062 | 1,232 |
| Direct Line Insurance Group plc | 291,253 | 1,232 |
| Taylor Wimpey plc | 692,848 | 1,200 |
87
| | | |
| Vanguard® Total World Stock Index Fund | | |
| Schedule of Investments | | |
| October 31, 2016 | | |
| |
| | | | Market |
| | | | Value |
| | | Shares | ($000) |
| | International Consolidated Airlines Group SA (London Shares) | 225,461 | 1,196 |
| | Croda International plc | 27,514 | 1,177 |
| | Rentokil Initial plc | 413,282 | 1,153 |
| | Barratt Developments plc | 207,592 | 1,151 |
| | Royal Mail plc | 191,483 | 1,149 |
| | Provident Financial plc | 31,396 | 1,132 |
| | J Sainsbury plc | 357,289 | 1,095 |
| | Hammerson plc | 161,605 | 1,087 |
| | Halma plc | 81,680 | 1,046 |
| | Capita plc | 140,647 | 1,007 |
| | Admiral Group plc | 42,389 | 993 |
| | Tate & Lyle plc | 102,159 | 974 |
| | DS Smith plc | 198,215 | 967 |
| | TUI AG | 75,309 | 955 |
| 2 | Auto Trader Group plc | 205,940 | 944 |
| | Mediclinic International plc | 84,923 | 942 |
| | Segro plc | 175,168 | 938 |
| | Weir Group plc | 44,375 | 922 |
| | Coca-Cola HBC AG | 41,317 | 892 |
| | Rightmove plc | 19,468 | 889 |
| | Spirax-Sarco Engineering plc | 16,060 | 866 |
| | Travis Perkins plc | 53,164 | 865 |
| | Meggitt plc | 161,661 | 860 |
| | Pennon Group plc | 84,216 | 860 |
| | G4S plc | 318,776 | 856 |
| | Investec plc | 137,539 | 854 |
| 2 | Merlin Entertainments plc | 148,269 | 836 |
| | Aberdeen Asset Management plc | 213,038 | 833 |
| | Melrose Industries plc | 400,729 | 827 |
| | Inmarsat plc | 95,331 | 818 |
| | Dixons Carphone plc | 211,537 | 813 |
| * | Just Eat plc | 117,535 | 807 |
| | Schroders plc | 23,227 | 799 |
| | Berkeley Group Holdings plc | 27,368 | 789 |
| | RPC Group plc | 66,759 | 774 |
| | IG Group Holdings plc | 76,613 | 774 |
| | Bellway plc | 26,449 | 765 |
| | Booker Group plc | 345,233 | 757 |
| | Hiscox Ltd. | 59,489 | 743 |
| | Fresnillo plc | 36,429 | 733 |
| | IMI plc | 60,036 | 729 |
| | Hargreaves Lansdown plc | 51,371 | 728 |
| | John Wood Group plc | 77,417 | 728 |
| | UBM plc | 82,099 | 721 |
| | Inchcape plc | 90,390 | 719 |
| | Intu Properties plc | 203,283 | 685 |
| | BBA Aviation plc | 214,525 | 678 |
| | Polymetal International plc | 61,838 | 674 |
| | ICAP plc | 113,475 | 673 |
| | Shaftesbury plc | 58,179 | 653 |
| | Cobham plc | 370,185 | 646 |
| | William Hill plc | 178,300 | 645 |
| | Henderson Group plc | 226,364 | 640 |
| | Hikma Pharmaceuticals plc | 29,762 | 638 |
| * | BTG plc | 76,868 | 619 |
| * | CYBG plc | 187,100 | 618 |
| | Babcock International Group plc | 51,150 | 618 |
| | Spectris plc | 24,121 | 604 |
| *,^ | Tullow Oil plc | 185,423 | 599 |
| | Indivior plc | 154,057 | 592 |
| | Greene King plc | 64,531 | 577 |
| | Derwent London plc | 19,519 | 577 |
| | Howden Joinery Group plc | 123,575 | 566 |
| | Petrofac Ltd. | 54,577 | 538 |
88
| | |
| Vanguard® Total World Stock Index Fund | | |
| Schedule of Investments | | |
| October 31, 2016 | | |
| |
| | | Market |
| | | Value |
| | Shares | ($000) |
| * Paysafe Group plc | 101,680 | 537 |
| * Metro Bank plc | 15,867 | 537 |
| Great Portland Estates plc | 73,056 | 530 |
| easyJet plc | 46,052 | 528 |
| Capital & Counties Properties plc | 148,928 | 525 |
| Close Brothers Group plc | 31,457 | 510 |
| Aggreko plc | 51,025 | 499 |
| Playtech plc | 43,324 | 491 |
| Daily Mail & General Trust plc | 53,295 | 489 |
| Beazley plc | 109,815 | 489 |
| Hays plc | 291,704 | 487 |
| Jupiter Fund Management plc | 92,201 | 486 |
| Man Group plc | 313,664 | 478 |
| * GVC Holdings plc | 55,926 | 476 |
| Antofagasta plc | 71,557 | 476 |
| Phoenix Group Holdings | 51,796 | 463 |
| Centamin plc | 238,257 | 461 |
| * Intermediate Capital Group plc | 61,183 | 453 |
| Balfour Beatty plc | 136,460 | 452 |
| Electrocomponents plc | 97,528 | 444 |
| Rotork plc | 177,812 | 444 |
| Domino's Pizza Group plc | 104,924 | 436 |
| Amec Foster Wheeler plc | 79,238 | 432 |
| Berendsen plc | 35,736 | 422 |
| Regus plc | 137,072 | 417 |
| HomeServe plc | 55,447 | 414 |
| B&M European Value Retail SA | 143,561 | 412 |
| SSP Group plc | 98,334 | 409 |
| UDG Healthcare plc | 50,283 | 402 |
| WH Smith plc | 22,013 | 396 |
| AA plc | 124,516 | 389 |
| WS Atkins plc | 21,067 | 389 |
| Ultra Electronics Holdings plc | 17,092 | 388 |
| Tritax Big Box REIT plc | 231,619 | 385 |
| * Serco Group plc | 228,867 | 383 |
| Britvic plc | 55,808 | 379 |
| National Express Group plc | 83,942 | 377 |
| Moneysupermarket.com Group plc | 111,951 | 358 |
| Victrex plc | 16,375 | 351 |
| * Firstgroup plc | 259,520 | 348 |
| Greencore Group plc | 85,749 | 346 |
| Drax Group plc | 88,955 | 345 |
| Kier Group plc | 20,525 | 341 |
| QinetiQ Group plc | 120,994 | 341 |
| Lancashire Holdings Ltd. | 39,009 | 333 |
| Ashmore Group plc | 76,171 | 327 |
| Essentra plc | 51,843 | 323 |
| JD Sports Fashion plc | 17,266 | 321 |
| Dignity plc | 9,696 | 314 |
| UNITE Group plc | 45,901 | 311 |
| Dechra Pharmaceuticals plc | 18,825 | 310 |
| AVEVA Group plc | 13,228 | 298 |
| Pagegroup plc | 66,953 | 296 |
| Bodycote plc | 40,530 | 294 |
| Synthomer plc | 66,722 | 292 |
| Cineworld Group plc | 44,123 | 291 |
| * Cairn Energy plc | 116,954 | 291 |
| * Ocado Group plc | 86,295 | 290 |
| 2 John Laing Group plc | 87,456 | 289 |
| ^ Ladbrokes plc | 176,641 | 288 |
| Diploma plc | 24,800 | 284 |
| Bovis Homes Group plc | 30,538 | 283 |
| 2 Spire Healthcare Group plc | 61,577 | 280 |
| ^ TalkTalk Telecom Group plc | 112,065 | 279 |
89
| | | |
| Vanguard® Total World Stock Index Fund | | |
| Schedule of Investments | | |
| October 31, 2016 | | |
| |
| | | | Market |
| | | | Value |
| | | Shares | ($000) |
| | Kennedy Wilson Europe Real Estate plc | 22,020 | 273 |
| | Renishaw plc | 8,656 | 273 |
| | Carillion plc | 88,745 | 272 |
| | Genus plc | 11,766 | 270 |
| * | Thomas Cook Group plc | 315,209 | 268 |
| | Elementis plc | 91,803 | 268 |
| * | SVG Capital plc | 30,901 | 266 |
| | Galliford Try plc | 17,522 | 263 |
| | Grafton Group plc | 43,156 | 262 |
| | Big Yellow Group plc | 30,420 | 257 |
| | Crest Nicholson Holdings plc | 51,250 | 255 |
| | Vesuvius plc | 56,567 | 253 |
| | Greggs plc | 21,531 | 252 |
| | PZ Cussons plc | 60,862 | 249 |
| | Marston's plc | 151,725 | 248 |
| | Assura plc | 339,243 | 244 |
| | Savills plc | 28,052 | 238 |
| | Fidessa Group plc | 7,895 | 237 |
| * | Vectura Group plc | 142,776 | 236 |
| | Go-Ahead Group plc | 9,218 | 234 |
| | Grainger plc | 86,141 | 233 |
| | LondonMetric Property plc | 121,469 | 222 |
| | BGEO Group plc | 6,126 | 221 |
| | Stagecoach Group plc | 90,542 | 219 |
| | Paragon Group of Cos. plc | 53,651 | 218 |
| | Tullett Prebon plc | 49,542 | 215 |
| | Redrow plc | 46,046 | 214 |
| | Dunelm Group plc | 22,807 | 211 |
| | Morgan Advanced Materials plc | 63,382 | 211 |
| * | Evraz plc | 82,987 | 208 |
| | Hansteen Holdings plc | 152,312 | 201 |
| | NMC Health plc | 11,230 | 201 |
| | Mitie Group plc | 77,374 | 199 |
| | Dairy Crest Group plc | 26,556 | 198 |
| | Northgate plc | 38,520 | 198 |
| | esure Group plc | 59,156 | 197 |
| | Virgin Money Holdings UK plc | 48,775 | 196 |
| | Pets at Home Group plc | 74,763 | 195 |
| | Senior plc | 91,403 | 195 |
| | Telecom Plus plc | 13,313 | 193 |
| * | KAZ Minerals plc | 54,865 | 192 |
| | Workspace Group plc | 24,773 | 191 |
| | Safestore Holdings plc | 43,113 | 189 |
| | Entertainment One Ltd. | 66,383 | 189 |
| 2 | Hastings Group Holdings plc | 69,143 | 185 |
| *,^ | Sports Direct International plc | 54,487 | 184 |
| | Acacia Mining plc | 29,009 | 184 |
| * | Imagination Technologies Group plc | 64,842 | 179 |
| | SuperGroup plc | 10,668 | 176 |
| | Halfords Group plc | 42,204 | 175 |
| | KCOM Group plc | 120,418 | 174 |
| | J D Wetherspoon plc | 16,288 | 173 |
| | Debenhams plc | 263,423 | 173 |
| * | Petra Diamonds Ltd. | 92,525 | 172 |
| | Ted Baker plc | 5,585 | 169 |
| | Redefine International PLC | 333,213 | 169 |
| | International Personal Finance plc | 46,925 | 169 |
| | Card Factory plc | 54,269 | 169 |
| | Restaurant Group plc | 36,332 | 167 |
| 2 | Sophos Group plc | 57,862 | 164 |
| | Mitchells & Butlers plc | 47,962 | 163 |
| | Brewin Dolphin Holdings plc | 50,121 | 159 |
| | F&C Commercial Property Trust Ltd. | 103,724 | 159 |
| 2 | Zoopla Property Group plc | 42,590 | 159 |
90
| | | |
| Vanguard® Total World Stock Index Fund | | |
| Schedule of Investments | | |
| October 31, 2016 | | |
| |
| | | | Market |
| | | | Value |
| | | Shares | ($000) |
| | Hunting plc | 25,771 | 158 |
| | Vedanta Resources plc | 18,036 | 158 |
| | De La Rue plc | 22,159 | 155 |
| | SIG plc | 110,058 | 149 |
| | Computacenter plc | 16,743 | 149 |
| | OM Asset Management plc | 10,100 | 142 |
| *,2 | Wizz Air Holdings plc | 7,662 | 142 |
| | Lonmin plc | 60,005 | 140 |
| | Keller Group plc | 16,785 | 140 |
| 2 | McCarthy & Stone plc | 66,703 | 137 |
| * | Allied Minds plc | 32,860 | 136 |
| | Hochschild Mining plc | 41,288 | 135 |
| 2 | Ibstock plc | 64,942 | 132 |
| | NCC Group plc | 55,229 | 128 |
| | Polypipe Group plc | 41,455 | 128 |
| | Picton Property Income Ltd. | 146,811 | 127 |
| | Devro plc | 44,654 | 124 |
| | Chesnara plc | 31,183 | 122 |
| | UK Commercial Property Trust Ltd. | 118,056 | 113 |
| | Interserve plc | 26,828 | 111 |
| * | Chemring Group plc | 58,521 | 104 |
| | Laird plc | 56,735 | 101 |
| | N Brown Group plc | 41,889 | 98 |
| | St. Modwen Properties plc | 28,439 | 95 |
| | RPS Group plc | 46,163 | 95 |
| | Lookers plc | 73,386 | 93 |
| *,2 | Countryside Properties plc | 32,200 | 92 |
| * | Ophir Energy plc | 108,688 | 92 |
| | Shanks Group plc | 82,917 | 91 |
| | Fenner plc | 33,918 | 91 |
| | 888 Holdings plc | 33,538 | 89 |
| * | Enterprise Inns plc | 77,242 | 87 |
| | ITE Group plc | 49,024 | 87 |
| * | Nostrum Oil & Gas plc | 19,562 | 84 |
| * | Phoenix Group Holdings Rights Exp. 11/08/2016 | 30,214 | 82 |
| | Helical plc | 25,204 | 82 |
| | Rank Group plc | 34,276 | 81 |
| | Oxford Instruments plc | 9,640 | 80 |
| | Xaar plc | 14,941 | 77 |
| *,2 | Shawbrook Group plc | 25,907 | 71 |
| * | Aldermore Group plc | 32,589 | 69 |
| 2 | CMC Markets plc | 28,615 | 66 |
| | OneSavings Bank plc | 17,280 | 61 |
| | Schroder REIT Ltd. | 87,915 | 61 |
| | Countrywide plc | 27,491 | 60 |
| * | Premier Oil plc | 73,323 | 59 |
| | Foxtons Group plc | 44,447 | 58 |
| * | Premier Foods plc | 98,103 | 55 |
| | Daejan Holdings plc | 813 | 54 |
| | Soco International plc | 29,740 | 50 |
| * | AO World plc | 25,742 | 50 |
| * | Mothercare plc | 31,304 | 41 |
| | Cape plc | 13,478 | 34 |
| * | Lamprell plc | 34,894 | 31 |
| *,^ | Genel Energy plc | 25,864 | 26 |
| * | Shanks Group plc Rights | 31,093 | 12 |
| *,^ | Afren plc | 141,140 | 3 |
| | | | 522,129 |
| United States (52.1%) | | |
| Basic Materials (1.3%) | | |
| | EI du Pont de Nemours & Co. | 181,522 | 12,487 |
| | Dow Chemical Co. | 231,946 | 12,481 |
| | Praxair Inc. | 59,361 | 6,949 |
| | Ecolab Inc. | 54,417 | 6,213 |
91
| | |
| Vanguard® Total World Stock Index Fund | | |
| Schedule of Investments | | |
| October 31, 2016 | | |
| |
| | | Market |
| | | Value |
| | Shares | ($000) |
| Air Products & Chemicals Inc. | 44,929 | 5,994 |
| LyondellBasell Industries NV Class A | 73,072 | 5,813 |
| PPG Industries Inc. | 55,546 | 5,173 |
| Newmont Mining Corp. | 112,234 | 4,157 |
| International Paper Co. | 86,520 | 3,896 |
| Nucor Corp. | 67,485 | 3,297 |
| * Freeport-McMoRan Inc. | 282,491 | 3,158 |
| * Arconic Inc. | 92,593 | 2,659 |
| Eastman Chemical Co. | 31,047 | 2,233 |
| International Flavors & Fragrances Inc. | 16,909 | 2,211 |
| Celanese Corp. Class A | 28,741 | 2,096 |
| Albemarle Corp. | 23,935 | 2,000 |
| Mosaic Co. | 73,850 | 1,738 |
| * Ashland Global Holdings Inc. | 13,143 | 1,468 |
| Steel Dynamics Inc. | 49,200 | 1,351 |
| RPM International Inc. | 27,300 | 1,298 |
| Avery Dennison Corp. | 18,430 | 1,286 |
| * Axalta Coating Systems Ltd. | 50,403 | 1,266 |
| CF Industries Holdings Inc. | 49,995 | 1,200 |
| FMC Corp. | 25,278 | 1,185 |
| WR Grace & Co. | 14,900 | 998 |
| Reliance Steel & Aluminum Co. | 14,300 | 984 |
| Southern Copper Corp. | 32,801 | 931 |
| Royal Gold Inc. | 13,100 | 902 |
| NewMarket Corp. | 2,100 | 842 |
| CONSOL Energy Inc. | 46,977 | 796 |
| Olin Corp. | 33,710 | 739 |
| Sensient Technologies Corp. | 9,500 | 708 |
| Scotts Miracle-Gro Co. Class A | 7,891 | 695 |
| United States Steel Corp. | 35,295 | 683 |
| Cabot Corp. | 12,500 | 652 |
| US Silica Holdings Inc. | 14,000 | 647 |
| Chemours Co. | 38,964 | 640 |
| Huntsman Corp. | 34,000 | 576 |
| Worthington Industries Inc. | 11,400 | 536 |
| * Versum Materials Inc. | 22,464 | 510 |
| Trinseo SA | 9,718 | 510 |
| Hecla Mining Co. | 84,112 | 504 |
| Compass Minerals International Inc. | 7,000 | 503 |
| PolyOne Corp. | 17,200 | 503 |
| HB Fuller Co. | 11,800 | 496 |
| Balchem Corp. | 6,500 | 493 |
| Minerals Technologies Inc. | 7,200 | 484 |
| * Chemtura Corp. | 13,746 | 451 |
| Domtar Corp. | 12,300 | 442 |
| * Univar Inc. | 19,100 | 425 |
| Westlake Chemical Corp. | 7,900 | 409 |
| * GCP Applied Technologies Inc. | 15,400 | 398 |
| * Stillwater Mining Co. | 29,200 | 389 |
| * Coeur Mining Inc. | 34,700 | 388 |
| * Ingevity Corp. | 8,639 | 358 |
| * Platform Specialty Products Corp. | 45,687 | 333 |
| Commercial Metals Co. | 20,900 | 328 |
| Allegheny Technologies Inc. | 22,343 | 305 |
| KapStone Paper and Packaging Corp. | 16,800 | 305 |
| Kaiser Aluminum Corp. | 4,100 | 297 |
| * AK Steel Holding Corp. | 51,800 | 269 |
| Carpenter Technology Corp. | 8,500 | 269 |
| Innospec Inc. | 4,200 | 253 |
| * Cambrex Corp. | 5,900 | 238 |
| Stepan Co. | 3,200 | 227 |
| * Ferro Corp. | 17,500 | 227 |
| * Clearwater Paper Corp. | 4,200 | 223 |
| PH Glatfelter Co. | 9,500 | 211 |
92
| | | |
| Vanguard® Total World Stock Index Fund | | |
| Schedule of Investments | | |
| October 31, 2016 | | |
| |
| | | | Market |
| | | | Value |
| | | Shares | ($000) |
| * | Kraton Corp. | 7,700 | 197 |
| | Innophos Holdings Inc. | 4,000 | 183 |
| | Calgon Carbon Corp. | 11,300 | 178 |
| | A Schulman Inc. | 6,200 | 178 |
| | Rayonier Advanced Materials Inc. | 12,300 | 159 |
| * | Century Aluminum Co. | 18,700 | 137 |
| * | Koppers Holdings Inc. | 3,800 | 124 |
| | Deltic Timber Corp. | 1,900 | 107 |
| * | AdvanSix Inc. | 6,299 | 100 |
| | Ferroglobe plc | 10,400 | 96 |
| * | Resolute Forest Products Inc. | 19,700 | 94 |
| | Haynes International Inc. | 2,600 | 84 |
| * | Veritiv Corp. | 1,032 | 56 |
| | Tredegar Corp. | 2,700 | 50 |
| | | | 115,429 |
| Consumer Goods (5.4%) | | |
| | Procter & Gamble Co. | 535,583 | 46,489 |
| | Coca-Cola Co. | 862,528 | 36,571 |
| | PepsiCo Inc. | 300,707 | 32,236 |
| | Philip Morris International Inc. | 326,429 | 31,481 |
| | Altria Group Inc. | 409,284 | 27,062 |
| | Mondelez International Inc. Class A | 323,175 | 14,523 |
| | Colgate-Palmolive Co. | 187,079 | 13,350 |
| | NIKE Inc. Class B | 229,550 | 11,519 |
| | Kraft Heinz Co. | 123,673 | 11,001 |
| | General Motors Co. | 305,647 | 9,658 |
| | Ford Motor Co. | 821,020 | 9,639 |
| | Reynolds American Inc. | 171,897 | 9,468 |
| | Monsanto Co. | 92,062 | 9,277 |
| | Kimberly-Clark Corp. | 75,424 | 8,629 |
| | General Mills Inc. | 124,076 | 7,690 |
| | Activision Blizzard Inc. | 144,877 | 6,254 |
| | Constellation Brands Inc. Class A | 35,147 | 5,874 |
| | Archer-Daniels-Midland Co. | 123,072 | 5,362 |
| | Newell Brands Inc. | 100,607 | 4,831 |
| * | Electronic Arts Inc. | 60,286 | 4,734 |
| *,^ | Tesla Motors Inc. | 23,418 | 4,630 |
| | Tyson Foods Inc. Class A | 61,692 | 4,371 |
| | ConAgra Foods Inc. | 90,456 | 4,358 |
| * | Monster Beverage Corp. | 29,453 | 4,251 |
| | Estee Lauder Cos. Inc. Class A | 44,600 | 3,886 |
| | VF Corp. | 69,057 | 3,744 |
| | Delphi Automotive plc | 57,179 | 3,721 |
| | Kellogg Co. | 49,412 | 3,712 |
| | Stanley Black & Decker Inc. | 31,440 | 3,579 |
| | Molson Coors Brewing Co. Class B | 34,332 | 3,564 |
| | Dr Pepper Snapple Group Inc. | 39,373 | 3,457 |
| | Clorox Co. | 27,304 | 3,277 |
| | Hershey Co. | 31,864 | 3,265 |
| | JM Smucker Co. | 23,550 | 3,092 |
| | Mead Johnson Nutrition Co. | 38,592 | 2,886 |
| | Genuine Parts Co. | 31,734 | 2,875 |
| | Church & Dwight Co. Inc. | 54,168 | 2,614 |
| | Whirlpool Corp. | 16,159 | 2,421 |
| * | Mohawk Industries Inc. | 13,125 | 2,419 |
| | McCormick & Co. Inc. | 24,442 | 2,343 |
| | Coty Inc. Class A | 100,432 | 2,309 |
| | Brown-Forman Corp. Class B | 49,328 | 2,277 |
| | Mattel Inc. | 71,904 | 2,267 |
| | Harley-Davidson Inc. | 37,608 | 2,144 |
| | Hormel Foods Corp. | 55,250 | 2,127 |
| | DR Horton Inc. | 71,991 | 2,076 |
93
| | | |
| Vanguard® Total World Stock Index Fund | | |
| Schedule of Investments | | |
| October 31, 2016 | | |
| |
| | | | Market |
| | | | Value |
| | | Shares | ($000) |
| | Campbell Soup Co. | 38,163 | 2,074 |
| | Coach Inc. | 57,610 | 2,068 |
| * | WhiteWave Foods Co. Class A | 37,322 | 2,034 |
| | Hasbro Inc. | 23,929 | 1,996 |
| | Hanesbrands Inc. | 74,700 | 1,920 |
| * | LKQ Corp. | 57,788 | 1,865 |
| | Lear Corp. | 15,171 | 1,863 |
| | Coca-Cola European Partners plc | 47,940 | 1,843 |
| | Bunge Ltd. | 29,656 | 1,839 |
| | Ingredion Inc. | 13,900 | 1,823 |
| | Snap-on Inc. | 11,800 | 1,818 |
| | PVH Corp. | 16,388 | 1,753 |
| * | Michael Kors Holdings Ltd. | 34,300 | 1,742 |
| | Autoliv Inc. | 17,798 | 1,723 |
| | BorgWarner Inc. | 46,323 | 1,660 |
| | Goodyear Tire & Rubber Co. | 55,809 | 1,620 |
| | Lennar Corp. Class A | 37,443 | 1,561 |
| | Leucadia National Corp. | 68,420 | 1,277 |
| | Leggett & Platt Inc. | 27,112 | 1,244 |
| | Pinnacle Foods Inc. | 24,168 | 1,243 |
| *,^ | Under Armour Inc. Class A | 39,400 | 1,225 |
| * | lululemon athletica Inc. | 20,898 | 1,196 |
| * | Herbalife Ltd. | 19,400 | 1,177 |
| * | NVR Inc. | 771 | 1,174 |
| | Ralph Lauren Corp. Class A | 11,959 | 1,173 |
| * | WABCO Holdings Inc. | 11,900 | 1,172 |
| | Harman International Industries Inc. | 14,512 | 1,157 |
| * | Middleby Corp. | 10,300 | 1,155 |
| | PulteGroup Inc. | 59,696 | 1,110 |
| * | TreeHouse Foods Inc. | 11,931 | 1,044 |
| | Gentex Corp. | 60,678 | 1,026 |
| * | Post Holdings Inc. | 13,172 | 1,004 |
| | Polaris Industries Inc. | 12,600 | 965 |
| * | Under Armour Inc. | 37,061 | 958 |
| * | Edgewell Personal Care Co. | 12,560 | 947 |
| * | Adient plc | 19,660 | 895 |
| * | Toll Brothers Inc. | 31,372 | 861 |
| | Brunswick Corp. | 18,800 | 818 |
| * | Take-Two Interactive Software Inc. | 17,200 | 764 |
| | Spectrum Brands Holdings Inc. | 5,623 | 760 |
| | Pool Corp. | 8,200 | 759 |
| | Thor Industries Inc. | 9,400 | 746 |
| | Carter's Inc. | 8,600 | 743 |
| * | Hain Celestial Group Inc. | 20,400 | 742 |
| * | Tempur Sealy International Inc. | 12,511 | 676 |
| * | Tenneco Inc. | 11,900 | 655 |
| | Avon Products Inc. | 95,425 | 625 |
| | Nu Skin Enterprises Inc. Class A | 10,100 | 623 |
| | Energizer Holdings Inc. | 13,060 | 607 |
| | Snyder's-Lance Inc. | 17,013 | 605 |
| | B&G Foods Inc. | 14,100 | 598 |
| * | Skechers U.S.A. Inc. Class A | 28,300 | 595 |
| | Flowers Foods Inc. | 37,640 | 584 |
| | Lancaster Colony Corp. | 4,300 | 562 |
| | CalAtlantic Group Inc. | 16,888 | 546 |
| | Visteon Corp. | 7,700 | 544 |
| | Tupperware Brands Corp. | 9,000 | 536 |
| * | Vista Outdoor Inc. | 13,262 | 513 |
| * | Blue Buffalo Pet Products Inc. | 20,116 | 505 |
| * | Darling Ingredients Inc. | 35,700 | 486 |
| | Dana Inc. | 30,300 | 469 |
| | Fresh Del Monte Produce Inc. | 7,695 | 464 |
| | Drew Industries Inc. | 5,100 | 457 |
| *,^ | Fitbit Inc. Class A | 34,400 | 456 |
94
| | | |
| Vanguard® Total World Stock Index Fund | | |
| Schedule of Investments | | |
| October 31, 2016 | | |
| |
| | | | Market |
| | | | Value |
| | | Shares | ($000) |
| | Wolverine World Wide Inc. | 21,300 | 455 |
| * | Helen of Troy Ltd. | 5,300 | 432 |
| * | Zynga Inc. Class A | 152,551 | 429 |
| * | Kate Spade & Co. | 25,400 | 425 |
| | Cooper Tire & Rubber Co. | 11,400 | 419 |
| * | Steven Madden Ltd. | 12,450 | 416 |
| * | Manitowoc Foodservice Inc. | 26,300 | 397 |
| | Vector Group Ltd. | 18,868 | 395 |
| | HNI Corp. | 9,300 | 378 |
| | Sanderson Farms Inc. | 4,200 | 378 |
| * | TRI Pointe Group Inc. | 33,600 | 364 |
| | Herman Miller Inc. | 12,600 | 350 |
| * | Deckers Outdoor Corp. | 6,600 | 344 |
| | Dean Foods Co. | 17,950 | 328 |
| * | Dorman Products Inc. | 4,900 | 315 |
| | J&J Snack Foods Corp. | 2,500 | 305 |
| | Cosan Ltd. | 32,600 | 290 |
| | Pilgrim's Pride Corp. | 12,900 | 282 |
| | Columbia Sportswear Co. | 4,800 | 272 |
| | WD-40 Co. | 2,500 | 267 |
| * | Meritage Homes Corp. | 8,600 | 266 |
| * | Boston Beer Co. Inc. Class A | 1,700 | 264 |
| * | American Axle & Manufacturing Holdings Inc. | 14,400 | 258 |
| | Steelcase Inc. Class A | 19,200 | 256 |
| * | Fossil Group Inc. | 9,100 | 248 |
| | La-Z-Boy Inc. | 10,500 | 246 |
| | Universal Corp. | 4,500 | 244 |
| | Schweitzer-Mauduit International Inc. | 6,300 | 233 |
| | KB Home | 15,600 | 227 |
| | Oxford Industries Inc. | 3,500 | 220 |
| * | Cooper-Standard Holding Inc. | 2,400 | 219 |
| *,^ | GoPro Inc. Class A | 17,103 | 219 |
| | Interface Inc. Class A | 13,600 | 216 |
| ^ | Cal-Maine Foods Inc. | 5,500 | 213 |
| * | Gentherm Inc. | 7,500 | 211 |
| * | ACCO Brands Corp. | 17,742 | 197 |
| * | G-III Apparel Group Ltd. | 7,400 | 193 |
| | Andersons Inc. | 5,050 | 192 |
| * | Caesarstone Ltd. | 5,400 | 191 |
| | Knoll Inc. | 8,700 | 188 |
| | Callaway Golf Co. | 16,997 | 174 |
| | MDC Holdings Inc. | 7,300 | 173 |
| | Briggs & Stratton Corp. | 8,700 | 162 |
| * | Select Comfort Corp. | 8,400 | 161 |
| | Winnebago Industries Inc. | 5,600 | 158 |
| * | Adecoagro SA | 14,300 | 157 |
| * | Wayfair Inc. | 4,600 | 153 |
| * | National Beverage Corp. | 3,000 | 142 |
| * | USANA Health Sciences Inc. | 1,100 | 141 |
| | Coca-Cola Bottling Co. Consolidated | 1,000 | 141 |
| | Tootsie Roll Industries Inc. | 3,972 | 141 |
| | Superior Industries International Inc. | 5,500 | 135 |
| | Ethan Allen Interiors Inc. | 4,100 | 126 |
| * | Crocs Inc. | 12,400 | 95 |
| | National Presto Industries Inc. | 1,000 | 87 |
| * | Modine Manufacturing Co. | 5,400 | 59 |
| * | Federal-Mogul Holdings Corp. | 4,100 | 38 |
| * | Vera Bradley Inc. | 1,800 | 24 |
| | | | 470,965 |
| Consumer Services (6.8%) | | |
| * | Amazon.com Inc. | 80,219 | 63,359 |
| | Home Depot Inc. | 259,260 | 31,632 |
| | Walt Disney Co. | 336,447 | 31,185 |
| | Comcast Corp. Class A | 501,715 | 31,016 |
95
| | |
| Vanguard® Total World Stock Index Fund | | |
| Schedule of Investments | | |
| October 31, 2016 | | |
| |
| | | Market |
| | | Value |
| | Shares | ($000) |
| Wal-Mart Stores Inc. | 326,172 | 22,839 |
| McDonald's Corp. | 177,276 | 19,956 |
| CVS Health Corp. | 224,425 | 18,874 |
| Starbucks Corp. | 291,264 | 15,457 |
| * Priceline Group Inc. | 10,373 | 15,292 |
| Walgreens Boots Alliance Inc. | 182,522 | 15,100 |
| Time Warner Inc. | 162,663 | 14,475 |
| Costco Wholesale Corp. | 91,002 | 13,456 |
| Lowe's Cos. Inc. | 186,321 | 12,418 |
| * Charter Communications Inc. Class A | 43,560 | 10,885 |
| * Netflix Inc. | 85,149 | 10,633 |
| TJX Cos. Inc. | 138,682 | 10,228 |
| Target Corp. | 120,451 | 8,279 |
| 5 Yum! Brands Inc. | 80,408 | 6,892 |
| * eBay Inc. | 212,560 | 6,060 |
| McKesson Corp. | 47,030 | 5,981 |
| Kroger Co. | 189,292 | 5,864 |
| Twenty-First Century Fox Inc. Class A | 219,238 | 5,759 |
| * O'Reilly Automotive Inc. | 19,901 | 5,263 |
| Ross Stores Inc. | 83,520 | 5,223 |
| Sysco Corp. | 107,029 | 5,150 |
| Marriott International Inc. Class A | 71,773 | 4,931 |
| Las Vegas Sands Corp. | 83,957 | 4,859 |
| CBS Corp. Class B | 84,686 | 4,795 |
| Cardinal Health Inc. | 66,765 | 4,586 |
| * AutoZone Inc. | 6,108 | 4,533 |
| Carnival Corp. | 80,640 | 3,959 |
| Omnicom Group Inc. | 49,246 | 3,931 |
| * Liberty Global plc | 122,567 | 3,898 |
| Dollar General Corp. | 54,681 | 3,778 |
| * Dollar Tree Inc. | 46,202 | 3,491 |
| L Brands Inc. | 45,150 | 3,259 |
| Expedia Inc. | 24,874 | 3,214 |
| Nielsen Holdings plc | 71,304 | 3,210 |
| * Ulta Salon Cosmetics & Fragrance Inc. | 12,400 | 3,017 |
| Viacom Inc. Class B | 72,104 | 2,708 |
| AmerisourceBergen Corp. Class A | 38,454 | 2,704 |
| * DISH Network Corp. Class A | 44,610 | 2,612 |
| * MGM Resorts International | 95,710 | 2,505 |
| Twenty-First Century Fox Inc. | 93,613 | 2,470 |
| Royal Caribbean Cruises Ltd. | 32,107 | 2,468 |
| Hilton Worldwide Holdings Inc. | 108,069 | 2,442 |
| Macy's Inc. | 63,976 | 2,334 |
| Advance Auto Parts Inc. | 15,600 | 2,185 |
| * Chipotle Mexican Grill Inc. Class A | 5,919 | 2,135 |
| Best Buy Co. Inc. | 54,772 | 2,131 |
| * Sirius XM Holdings Inc. | 510,940 | 2,131 |
| * CarMax Inc. | 41,092 | 2,052 |
| * Liberty Global plc Class A | 60,694 | 1,979 |
| Foot Locker Inc. | 28,833 | 1,925 |
| Interpublic Group of Cos. Inc. | 85,807 | 1,921 |
| Tiffany & Co. | 24,255 | 1,781 |
| Whole Foods Market Inc. | 62,928 | 1,780 |
| Aramark | 47,788 | 1,779 |
| Darden Restaurants Inc. | 27,432 | 1,777 |
| * Liberty Interactive Corp. QVC Group Class A | 95,047 | 1,757 |
| Delta Air Lines Inc. | 40,365 | 1,686 |
| Wynn Resorts Ltd. | 17,593 | 1,663 |
| Kohl's Corp. | 36,904 | 1,615 |
| Nordstrom Inc. | 30,135 | 1,567 |
| Domino's Pizza Inc. | 9,200 | 1,557 |
| Wyndham Worldwide Corp. | 22,898 | 1,508 |
| * Discovery Communications Inc. | 59,447 | 1,493 |
| * TripAdvisor Inc. | 22,068 | 1,423 |
96
| | |
| Vanguard® Total World Stock Index Fund | | |
| Schedule of Investments | | |
| October 31, 2016 | | |
| |
| | | Market |
| | | Value |
| | Shares | ($000) |
| Signet Jewelers Ltd. | 16,700 | 1,357 |
| * Norwegian Cruise Line Holdings Ltd. | 34,487 | 1,341 |
| Southwest Airlines Co. | 33,436 | 1,339 |
| Vail Resorts Inc. | 8,389 | 1,338 |
| Tractor Supply Co. | 21,300 | 1,334 |
| Gap Inc. | 48,209 | 1,330 |
| Bed Bath & Beyond Inc. | 32,800 | 1,326 |
| * Liberty Media Corp-Liberty SiriusXM | 38,274 | 1,270 |
| FactSet Research Systems Inc. | 7,900 | 1,222 |
| KAR Auction Services Inc. | 28,304 | 1,205 |
| * Rite Aid Corp. | 167,800 | 1,126 |
| * Copart Inc. | 21,100 | 1,107 |
| American Airlines Group Inc. | 27,266 | 1,107 |
| * Burlington Stores Inc. | 14,662 | 1,099 |
| H&R Block Inc. | 47,442 | 1,090 |
| Six Flags Entertainment Corp. | 19,500 | 1,085 |
| Service Corp. International | 41,000 | 1,050 |
| Staples Inc. | 138,901 | 1,028 |
| * ServiceMaster Global Holdings Inc. | 28,598 | 1,024 |
| * Live Nation Entertainment Inc. | 36,800 | 1,018 |
| * United Continental Holdings Inc. | 17,400 | 978 |
| Scripps Networks Interactive Inc. Class A | 15,065 | 970 |
| Dun & Bradstreet Corp. | 7,730 | 965 |
| Casey's General Stores Inc. | 8,300 | 938 |
| MercadoLibre Inc. | 5,500 | 924 |
| Sabre Corp. | 35,754 | 924 |
| * Panera Bread Co. Class A | 4,800 | 916 |
| * VCA Inc. | 14,600 | 897 |
| TEGNA Inc. | 45,477 | 892 |
| Cinemark Holdings Inc. | 22,200 | 884 |
| News Corp. Class A | 69,770 | 846 |
| Dick's Sporting Goods Inc. | 15,100 | 840 |
| Dunkin' Brands Group Inc. | 15,418 | 746 |
| CST Brands Inc. | 15,423 | 741 |
| * Sally Beauty Holdings Inc. | 28,400 | 737 |
| * Sprouts Farmers Market Inc. | 31,694 | 702 |
| * Madison Square Garden Co. Class A | 4,233 | 701 |
| Rollins Inc. | 22,650 | 698 |
| Williams-Sonoma Inc. | 14,100 | 652 |
| Cracker Barrel Old Country Store Inc. | 4,700 | 649 |
| International Game Technology plc | 22,478 | 646 |
| * Liberty Media Corp-Liberty SiriusXM | 19,287 | 642 |
| Tribune Media Co. Class A | 19,200 | 626 |
| American Eagle Outfitters Inc. | 36,143 | 616 |
| * Avis Budget Group Inc. | 19,000 | 615 |
| * Hertz Global Holdings Inc. | 18,081 | 599 |
| * Urban Outfitters Inc. | 17,917 | 599 |
| AMERCO | 1,846 | 595 |
| * AMC Networks Inc. Class A | 12,134 | 594 |
| Brinker International Inc. | 12,000 | 591 |
| * AutoNation Inc. | 13,466 | 591 |
| Jack in the Box Inc. | 6,300 | 590 |
| * Bright Horizons Family Solutions Inc. | 8,754 | 586 |
| * Buffalo Wild Wings Inc. | 4,000 | 583 |
| Cable One Inc. | 992 | 572 |
| Dolby Laboratories Inc. Class A | 11,700 | 557 |
| * GrubHub Inc. | 14,600 | 556 |
| * Discovery Communications Inc. Class A | 21,241 | 555 |
| * Murphy USA Inc. | 7,830 | 539 |
| * Cabela's Inc. | 8,700 | 536 |
| * Starz | 16,987 | 534 |
| * Beacon Roofing Supply Inc. | 12,498 | 525 |
| * JC Penney Co. Inc. | 60,834 | 523 |
| * Liberty Global PLC LiLAC Class A | 18,690 | 517 |
97
| | |
| Vanguard® Total World Stock Index Fund | | |
| Schedule of Investments | | |
| October 31, 2016 | | |
| |
| | | Market |
| | | Value |
| | Shares | ($000) |
| GameStop Corp. Class A | 20,916 | 503 |
| * Michaels Cos. Inc. | 21,267 | 494 |
| Alaska Air Group Inc. | 6,700 | 484 |
| * Liberty Global PLC LiLAC | 17,419 | 481 |
| * Yelp Inc. Class A | 14,577 | 476 |
| Graham Holdings Co. Class B | 999 | 475 |
| Wendy's Co. | 42,028 | 456 |
| * Pandora Media Inc. | 40,000 | 453 |
| John Wiley & Sons Inc. Class A | 8,700 | 449 |
| Cheesecake Factory Inc. | 8,400 | 447 |
| Texas Roadhouse Inc. Class A | 10,800 | 438 |
| Big Lots Inc. | 10,000 | 434 |
| News Corp. Class B | 33,640 | 417 |
| Papa John's International Inc. | 5,500 | 415 |
| Lions Gate Entertainment Corp. | 20,185 | 411 |
| Hillenbrand Inc. | 13,500 | 410 |
| PriceSmart Inc. | 4,500 | 409 |
| Penske Automotive Group Inc. | 9,100 | 407 |
| * United Natural Foods Inc. | 9,633 | 402 |
| Chemed Corp. | 2,800 | 396 |
| Bloomin' Brands Inc. | 22,435 | 388 |
| * Grand Canyon Education Inc. | 8,700 | 380 |
| Lithia Motors Inc. Class A | 4,400 | 377 |
| Churchill Downs Inc. | 2,700 | 367 |
| * ILG Inc. | 22,338 | 366 |
| Travelport Worldwide Ltd. | 25,600 | 361 |
| Sinclair Broadcast Group Inc. Class A | 14,400 | 361 |
| * WebMD Health Corp. | 7,300 | 359 |
| Meredith Corp. | 7,900 | 358 |
| * Five Below Inc. | 9,500 | 357 |
| * Media General Inc. | 21,051 | 355 |
| Matthews International Corp. Class A | 5,919 | 355 |
| * Groupon Inc. Class A | 88,100 | 352 |
| Sotheby's | 9,700 | 348 |
| New York Times Co. Class A | 31,500 | 343 |
| * Acxiom Corp. | 14,400 | 339 |
| Regal Entertainment Group Class A | 15,700 | 338 |
| * Shutterfly Inc. | 6,800 | 333 |
| Aaron's Inc. | 13,400 | 331 |
| Office Depot Inc. | 104,867 | 330 |
| Monro Muffler Brake Inc. | 6,000 | 330 |
| Nexstar Broadcasting Group Inc. Class A | 6,600 | 322 |
| Core-Mark Holding Co. Inc. | 9,000 | 318 |
| * JetBlue Airways Corp. | 17,812 | 311 |
| * Liberty TripAdvisor Holdings Inc. Class A | 13,867 | 308 |
| * Houghton Mifflin Harcourt Co. | 24,100 | 305 |
| Group 1 Automotive Inc. | 4,900 | 295 |
| Chico's FAS Inc. | 25,100 | 293 |
| DSW Inc. Class A | 14,020 | 291 |
| HSN Inc. | 7,600 | 287 |
| * comScore Inc. | 9,866 | 284 |
| * Stamps.com Inc. | 2,900 | 283 |
| * Hyatt Hotels Corp. Class A | 5,549 | 282 |
| * Boyd Gaming Corp. | 15,700 | 280 |
| Morningstar Inc. | 3,900 | 275 |
| Time Inc. | 21,002 | 273 |
| Choice Hotels International Inc. | 5,600 | 271 |
| Dillard's Inc. Class A | 4,400 | 270 |
| DineEquity Inc. | 3,400 | 269 |
| Extended Stay America Inc. | 18,221 | 261 |
| DeVry Education Group Inc. | 11,336 | 257 |
| * Dave & Buster's Entertainment Inc. | 6,200 | 256 |
| * Belmond Ltd. Class A | 19,600 | 254 |
| Scholastic Corp. | 6,500 | 249 |
98
| | |
| Vanguard® Total World Stock Index Fund | | |
| Schedule of Investments | | |
| October 31, 2016 | | |
| |
| | | Market |
| | | Value |
| | Shares | ($000) |
| * Express Inc. | 20,600 | 248 |
| Sonic Corp. | 10,700 | 245 |
| * MSG Networks Inc. | 12,700 | 243 |
| Marriott Vacations Worldwide Corp. | 3,763 | 239 |
| * Arcos Dorados Holdings Inc. Class A | 38,800 | 239 |
| * Asbury Automotive Group Inc. | 4,600 | 234 |
| Caleres Inc. | 9,200 | 230 |
| Bob Evans Farms Inc. | 5,500 | 227 |
| * Genesco Inc. | 4,200 | 226 |
| Weis Markets Inc. | 3,900 | 217 |
| Abercrombie & Fitch Co. | 14,680 | 214 |
| SpartanNash Co. | 7,500 | 210 |
| Children's Place Inc. | 2,700 | 205 |
| SeaWorld Entertainment Inc. | 14,500 | 203 |
| * SUPERVALU Inc. | 47,097 | 202 |
| * Liberty Media Corp-Liberty Media | 7,368 | 202 |
| Finish Line Inc. Class A | 10,200 | 201 |
| Buckle Inc. | 9,500 | 198 |
| * Spirit Airlines Inc. | 4,100 | 197 |
| * Diplomat Pharmacy Inc. | 8,136 | 189 |
| * Popeyes Louisiana Kitchen Inc. | 3,500 | 187 |
| GNC Holdings Inc. Class A | 13,900 | 187 |
| Gannett Co. Inc. | 23,988 | 186 |
| Copa Holdings SA Class A | 2,000 | 184 |
| Capella Education Co. | 2,500 | 183 |
| Sonic Automotive Inc. Class A | 10,200 | 183 |
| * Ascena Retail Group Inc. | 36,762 | 180 |
| * Hibbett Sports Inc. | 4,600 | 179 |
| * Francesca's Holdings Corp. | 11,100 | 178 |
| National CineMedia Inc. | 12,700 | 176 |
| Cato Corp. Class A | 5,900 | 175 |
| Tailored Brands Inc. | 11,000 | 174 |
| * Herc Holdings Inc. | 5,760 | 173 |
| * Performance Food Group Co. | 7,200 | 173 |
| * Penn National Gaming Inc. | 13,100 | 169 |
| Guess? Inc. | 12,400 | 167 |
| * EW Scripps Co. Class A | 12,500 | 166 |
| * Restoration Hardware Holdings Inc. | 5,700 | 165 |
| * Strayer Education Inc. | 2,800 | 164 |
| * Apollo Education Group Inc. | 18,675 | 164 |
| * Liberty Media Corp-Liberty Media Class A | 5,771 | 161 |
| * Fiesta Restaurant Group Inc. | 5,900 | 156 |
| * Scientific Games Corp. Class A | 12,481 | 155 |
| * BJ's Restaurants Inc. | 4,200 | 152 |
| * Barnes & Noble Education Inc. | 15,824 | 147 |
| * Vitamin Shoppe Inc. | 5,800 | 145 |
| ClubCorp Holdings Inc. | 12,500 | 144 |
| * Virgin America Inc. | 2,600 | 141 |
| * La Quinta Holdings Inc. | 14,106 | 141 |
| International Speedway Corp. Class A | 4,200 | 138 |
| Allegiant Travel Co. Class A | 1,000 | 138 |
| Barnes & Noble Inc. | 13,300 | 137 |
| * SolarCity Corp. | 6,900 | 135 |
| * Pinnacle Entertainment Inc. | 10,200 | 121 |
| * Regis Corp. | 9,500 | 120 |
| * Rush Enterprises Inc. Class A | 4,400 | 115 |
| * Red Robin Gourmet Burgers Inc. | 2,500 | 115 |
| Rent-A-Center Inc. | 11,100 | 112 |
| * FTD Cos. Inc. | 5,200 | 105 |
| * Hawaiian Holdings Inc. | 2,300 | 104 |
| * Biglari Holdings Inc. | 225 | 99 |
| New Media Investment Group Inc. | 6,698 | 96 |
| * Liberty Media Corp-Liberty Braves | 5,418 | 90 |
| * Caesars Entertainment Corp. | 11,200 | 80 |
99
| | | |
| Vanguard® Total World Stock Index Fund | | |
| Schedule of Investments | | |
| October 31, 2016 | | |
| |
| | | | Market |
| | | | Value |
| | | Shares | ($000) |
| * | Bankrate Inc. | 8,600 | 67 |
| | Pier 1 Imports Inc. | 15,000 | 65 |
| *,^ | Sears Holdings Corp. | 5,794 | 64 |
| * | Lumber Liquidators Holdings Inc. | 4,000 | 62 |
| * | TrueCar Inc. | 6,400 | 62 |
| *,^ | Weight Watchers International Inc. | 5,700 | 59 |
| | Fred's Inc. Class A | 5,400 | 49 |
| * | RetailMeNot Inc. | 4,700 | 43 |
| * | Lands' End Inc. | 2,691 | 42 |
| * | Liberty Media Corp-Liberty Braves | 2,308 | 39 |
| | Speedway Motorsports Inc. | 1,200 | 23 |
| | | | 593,391 |
| Financials (10.0%) | | |
| | JPMorgan Chase & Co. | 755,941 | 52,356 |
| | Wells Fargo & Co. | 1,058,311 | 48,693 |
| * | Berkshire Hathaway Inc. Class B | 247,977 | 35,783 |
| | Bank of America Corp. | 2,152,467 | 35,516 |
| | Visa Inc. Class A | 394,782 | 32,573 |
| | Citigroup Inc. | 607,047 | 29,836 |
| | Mastercard Inc. Class A | 203,250 | 21,752 |
| * | Berkshire Hathaway Inc. Class A | 97 | 20,923 |
| | US Bancorp | 359,403 | 16,087 |
| | Goldman Sachs Group Inc. | 80,633 | 14,372 |
| | American International Group Inc. | 223,051 | 13,762 |
| | Chubb Ltd. | 96,178 | 12,215 |
| | Simon Property Group Inc. | 64,928 | 12,074 |
| | American Express Co. | 164,864 | 10,950 |
| | American Tower Corporation | 85,630 | 10,035 |
| | Morgan Stanley | 297,516 | 9,988 |
| | PNC Financial Services Group Inc. | 102,109 | 9,762 |
| | Bank of New York Mellon Corp. | 225,224 | 9,745 |
| | BlackRock Inc. | 25,654 | 8,754 |
| | MetLife Inc. | 184,714 | 8,674 |
| | Prudential Financial Inc. | 91,703 | 7,775 |
| | Charles Schwab Corp. | 232,986 | 7,386 |
| | Capital One Financial Corp. | 97,041 | 7,185 |
| | Marsh & McLennan Cos. Inc. | 106,025 | 6,721 |
| | S&P Global Inc. | 55,027 | 6,705 |
| | Intercontinental Exchange Inc. | 24,748 | 6,692 |
| | CME Group Inc. | 66,609 | 6,668 |
| | BB&T Corp. | 169,458 | 6,643 |
| | Travelers Cos. Inc. | 59,569 | 6,444 |
| | Public Storage | 29,983 | 6,408 |
| | Crown Castle International Corp. | 70,288 | 6,395 |
| | Aon plc | 53,557 | 5,936 |
| | State Street Corp. | 81,583 | 5,728 |
| | Prologis Inc. | 109,253 | 5,699 |
| | Aflac Inc. | 80,069 | 5,514 |
| | Equinix Inc. | 14,703 | 5,253 |
| | Allstate Corp. | 77,275 | 5,247 |
| | Welltower Inc. | 74,268 | 5,090 |
| | Synchrony Financial | 174,301 | 4,983 |
| | Ventas Inc. | 72,961 | 4,943 |
| | AvalonBay Communities Inc. | 28,565 | 4,890 |
| | Discover Financial Services | 84,657 | 4,769 |
| | SunTrust Banks Inc. | 103,826 | 4,696 |
| | Weyerhaeuser Co. | 156,457 | 4,683 |
| | Equity Residential | 75,497 | 4,662 |
| | Moody's Corp. | 40,003 | 4,021 |
| | Boston Properties Inc. | 32,001 | 3,855 |
| | M&T Bank Corp. | 31,129 | 3,820 |
| | Willis Towers Watson plc | 28,591 | 3,600 |
| | Hartford Financial Services Group Inc. | 80,984 | 3,572 |
| | Progressive Corp. | 111,517 | 3,514 |
100
| | |
| Vanguard® Total World Stock Index Fund | | |
| Schedule of Investments | | |
| October 31, 2016 | | |
| |
| | | Market |
| | | Value |
| | Shares | ($000) |
| Northern Trust Corp. | 47,421 | 3,434 |
| Fifth Third Bancorp | 155,000 | 3,373 |
| HCP Inc. | 97,127 | 3,327 |
| Principal Financial Group Inc. | 60,325 | 3,294 |
| KeyCorp | 230,110 | 3,249 |
| Realty Income Corp. | 53,475 | 3,168 |
| * IHS Markit Ltd. | 85,887 | 3,160 |
| T. Rowe Price Group Inc. | 49,308 | 3,156 |
| Digital Realty Trust Inc. | 32,811 | 3,066 |
| Equifax Inc. | 24,497 | 3,037 |
| Vornado Realty Trust | 32,649 | 3,029 |
| Ameriprise Financial Inc. | 33,688 | 2,978 |
| Essex Property Trust Inc. | 13,718 | 2,937 |
| Citizens Financial Group Inc. | 110,489 | 2,910 |
| Regions Financial Corp. | 269,366 | 2,885 |
| Franklin Resources Inc. | 79,796 | 2,686 |
| General Growth Properties Inc. | 104,343 | 2,603 |
| Huntington Bancshares Inc. | 230,151 | 2,440 |
| Host Hotels & Resorts Inc. | 155,604 | 2,409 |
| Loews Corp. | 55,787 | 2,400 |
| Invesco Ltd. | 85,448 | 2,400 |
| Lincoln National Corp. | 48,582 | 2,385 |
| Kimco Realty Corp. | 88,726 | 2,361 |
| First Republic Bank | 31,597 | 2,352 |
| * Markel Corp. | 2,645 | 2,321 |
| Annaly Capital Management Inc. | 211,085 | 2,187 |
| Federal Realty Investment Trust | 14,850 | 2,157 |
| Macerich Co. | 29,946 | 2,120 |
| SL Green Realty Corp. | 21,159 | 2,078 |
| FNF Group | 57,302 | 2,058 |
| Western Union Co. | 101,734 | 2,042 |
| XL Group Ltd. | 58,720 | 2,038 |
| Cincinnati Financial Corp. | 28,671 | 2,029 |
| UDR Inc. | 56,687 | 1,982 |
| VEREIT Inc. | 204,778 | 1,925 |
| * Arch Capital Group Ltd. | 24,210 | 1,888 |
| Duke Realty Corp. | 71,252 | 1,863 |
| Ally Financial Inc. | 102,243 | 1,848 |
| * Liberty Broadband Corp. | 27,544 | 1,836 |
| Everest Re Group Ltd. | 8,946 | 1,821 |
| Extra Space Storage Inc. | 24,500 | 1,792 |
| Arthur J Gallagher & Co. | 37,042 | 1,787 |
| Alexandria Real Estate Equities Inc. | 16,471 | 1,776 |
| Unum Group | 49,603 | 1,756 |
| Nasdaq Inc. | 27,100 | 1,734 |
| Comerica Inc. | 33,234 | 1,731 |
| Iron Mountain Inc. | 50,674 | 1,709 |
| * Alleghany Corp. | 3,247 | 1,676 |
| Brixmor Property Group Inc. | 63,957 | 1,626 |
| MSCI Inc. Class A | 20,100 | 1,612 |
| * E*TRADE Financial Corp. | 56,800 | 1,599 |
| Regency Centers Corp. | 22,086 | 1,592 |
| CIT Group Inc. | 42,733 | 1,552 |
| * CBRE Group Inc. Class A | 60,198 | 1,551 |
| * Affiliated Managers Group Inc. | 11,483 | 1,523 |
| TD Ameritrade Holding Corp. | 43,631 | 1,493 |
| Torchmark Corp. | 23,425 | 1,485 |
| Mid-America Apartment Communities Inc. | 15,944 | 1,479 |
| Camden Property Trust | 18,148 | 1,478 |
| New York Community Bancorp Inc. | 101,898 | 1,463 |
| Apartment Investment & Management Co. | 33,057 | 1,457 |
| Raymond James Financial Inc. | 23,900 | 1,437 |
| Reinsurance Group of America Inc. Class A | 13,300 | 1,435 |
| American Campus Communities Inc. | 27,500 | 1,433 |
101
| | |
| Vanguard® Total World Stock Index Fund | | |
| Schedule of Investments | | |
| October 31, 2016 | | |
| |
| | | Market |
| | | Value |
| | Shares | ($000) |
| National Retail Properties Inc. | 31,105 | 1,419 |
| AGNC Investment Corp. | 70,094 | 1,406 |
| Zions Bancorporation | 43,496 | 1,401 |
| * Signature Bank | 11,400 | 1,374 |
| Kilroy Realty Corp. | 19,118 | 1,373 |
| * SVB Financial Group | 11,060 | 1,352 |
| Voya Financial Inc. | 43,181 | 1,319 |
| Liberty Property Trust | 31,198 | 1,261 |
| Equity LifeStyle Properties Inc. | 16,400 | 1,244 |
| Endurance Specialty Holdings Ltd. | 12,938 | 1,190 |
| WR Berkley Corp. | 20,776 | 1,186 |
| East West Bancorp Inc. | 29,800 | 1,177 |
| American Financial Group Inc. | 15,700 | 1,170 |
| Omega Healthcare Investors Inc. | 36,559 | 1,164 |
| SEI Investments Co. | 25,817 | 1,144 |
| Spirit Realty Capital Inc. | 95,599 | 1,139 |
| * Liberty Ventures Class A | 28,453 | 1,135 |
| WP Carey Inc. | 18,443 | 1,120 |
| Lamar Advertising Co. Class A | 17,527 | 1,112 |
| Starwood Property Trust Inc. | 49,605 | 1,103 |
| CBOE Holdings Inc. | 17,100 | 1,081 |
| Douglas Emmett Inc. | 29,400 | 1,073 |
| Senior Housing Properties Trust | 50,303 | 1,070 |
| Forest City Realty Trust Inc. Class A | 49,546 | 1,070 |
| People's United Financial Inc. | 65,124 | 1,058 |
| MarketAxess Holdings Inc. | 6,900 | 1,040 |
| Highwoods Properties Inc. | 20,900 | 1,037 |
| Gaming and Leisure Properties Inc. | 31,559 | 1,036 |
| Assurant Inc. | 12,638 | 1,018 |
| Axis Capital Holdings Ltd. | 17,862 | 1,018 |
| RenaissanceRe Holdings Ltd. | 8,131 | 1,011 |
| PacWest Bancorp | 23,269 | 1,010 |
| DDR Corp. | 65,500 | 1,001 |
| CubeSmart | 38,300 | 998 |
| Sun Communities Inc. | 12,500 | 962 |
| EPR Properties | 13,200 | 960 |
| Commerce Bancshares Inc. | 18,942 | 944 |
| Hospitality Properties Trust | 34,268 | 938 |
| Communications Sales & Leasing Inc. | 32,668 | 929 |
| Taubman Centers Inc. | 12,713 | 921 |
| Jones Lang LaSalle Inc. | 9,400 | 910 |
| First American Financial Corp. | 23,000 | 898 |
| * Howard Hughes Corp. | 8,100 | 890 |
| Brown & Brown Inc. | 24,028 | 886 |
| Navient Corp. | 68,767 | 879 |
| Healthcare Trust of America Inc. Class A | 28,646 | 877 |
| Assured Guaranty Ltd. | 29,300 | 876 |
| Cullen/Frost Bankers Inc. | 11,500 | 874 |
| DCT Industrial Trust Inc. | 18,525 | 866 |
| Medical Properties Trust Inc. | 61,950 | 864 |
| Eaton Vance Corp. | 24,500 | 859 |
| Weingarten Realty Investors | 23,500 | 851 |
| STORE Capital Corp. | 30,781 | 840 |
| Synovus Financial Corp. | 25,185 | 833 |
| Old Republic International Corp. | 49,267 | 831 |
| White Mountains Insurance Group Ltd. | 1,000 | 830 |
| American Homes 4 Rent Class A | 39,220 | 828 |
| Gramercy Property Trust | 88,190 | 813 |
| Lazard Ltd. Class A | 22,000 | 802 |
| Life Storage Inc. | 9,907 | 799 |
| * Equity Commonwealth | 26,400 | 798 |
| Post Properties Inc. | 11,860 | 780 |
| Webster Financial Corp. | 19,300 | 780 |
| Investors Bancorp Inc. | 63,531 | 779 |
102
| | |
| Vanguard® Total World Stock Index Fund | | |
| Schedule of Investments | | |
| October 31, 2016 | | |
| |
| | | Market |
| | | Value |
| | Shares | ($000) |
| Retail Properties of America Inc. | 49,800 | 775 |
| Healthcare Realty Trust Inc. | 24,300 | 775 |
| Allied World Assurance Co. Holdings AG | 18,000 | 774 |
| Prosperity Bancshares Inc. | 13,800 | 765 |
| Bank of the Ozarks Inc. | 20,637 | 763 |
| Hudson Pacific Properties Inc. | 22,631 | 761 |
| PrivateBancorp Inc. | 16,800 | 760 |
| First Horizon National Corp. | 48,981 | 755 |
| New Residential Investment Corp. | 52,159 | 728 |
| CyrusOne Inc. | 16,287 | 727 |
| Popular Inc. | 19,998 | 726 |
| Tanger Factory Outlet Centers Inc. | 20,500 | 713 |
| Realogy Holdings Corp. | 30,990 | 709 |
| Umpqua Holdings Corp. | 46,233 | 706 |
| * Western Alliance Bancorp | 18,900 | 706 |
| Rayonier Inc. | 25,900 | 695 |
| Validus Holdings Ltd. | 13,465 | 688 |
| Hanover Insurance Group Inc. | 8,800 | 670 |
| ProAssurance Corp. | 12,516 | 667 |
| Education Realty Trust Inc. | 15,417 | 657 |
| DuPont Fabros Technology Inc. | 16,000 | 653 |
| * SLM Corp. | 92,267 | 650 |
| Acadia Realty Trust | 19,200 | 647 |
| Bank of Hawaii Corp. | 8,600 | 646 |
| First Industrial Realty Trust Inc. | 24,351 | 643 |
| Chemical Financial Corp. | 14,798 | 636 |
| Outfront Media Inc. | 28,915 | 622 |
| National Health Investors Inc. | 8,200 | 621 |
| Radian Group Inc. | 45,300 | 616 |
| Associated Banc-Corp | 30,100 | 611 |
| Two Harbors Investment Corp. | 73,200 | 610 |
| Corporate Office Properties Trust | 22,810 | 609 |
| Piedmont Office Realty Trust Inc. Class A | 29,600 | 606 |
| Apple Hospitality REIT Inc. | 33,300 | 600 |
| Aspen Insurance Holdings Ltd. | 12,400 | 598 |
| Legg Mason Inc. | 20,607 | 592 |
| Chimera Investment Corp. | 37,320 | 585 |
| United Bankshares Inc. | 15,402 | 581 |
| Hancock Holding Co. | 17,300 | 580 |
| * Enstar Group Ltd. | 3,432 | 579 |
| Wintrust Financial Corp. | 10,700 | 577 |
| BankUnited Inc. | 19,801 | 577 |
| Blackstone Mortgage Trust Inc. Class A | 18,901 | 571 |
| * Texas Capital Bancshares Inc. | 9,600 | 569 |
| Brandywine Realty Trust | 36,464 | 565 |
| Valley National Bancorp | 56,984 | 562 |
| EastGroup Properties Inc. | 8,200 | 557 |
| Home BancShares Inc. | 25,840 | 556 |
| Columbia Property Trust Inc. | 26,000 | 548 |
| * MGIC Investment Corp. | 67,000 | 547 |
| Cousins Properties Inc. | 70,322 | 546 |
| LaSalle Hotel Properties | 23,000 | 546 |
| Equity One Inc. | 19,160 | 546 |
| NorthStar Asset Management Group Inc. | 39,748 | 545 |
| IBERIABANK Corp. | 8,290 | 544 |
| Physicians Realty Trust | 27,396 | 542 |
| Sunstone Hotel Investors Inc. | 43,089 | 541 |
| Washington REIT | 18,200 | 535 |
| MFA Financial Inc. | 72,900 | 533 |
| FNB Corp. | 40,675 | 532 |
| CoreSite Realty Corp. | 7,200 | 531 |
| UMB Financial Corp. | 8,500 | 527 |
| TCF Financial Corp. | 36,788 | 526 |
| RLJ Lodging Trust | 26,600 | 525 |
103
| | |
| Vanguard® Total World Stock Index Fund | | |
| Schedule of Investments | | |
| October 31, 2016 | | |
| |
| | | Market |
| | | Value |
| | Shares | ($000) |
| Primerica Inc. | 9,500 | 520 |
| Mack-Cali Realty Corp. | 20,200 | 519 |
| NorthStar Realty Finance Corp. | 35,445 | 515 |
| Federated Investors Inc. Class B | 18,679 | 504 |
| CNO Financial Group Inc. | 33,200 | 501 |
| Lexington Realty Trust | 49,300 | 500 |
| Empire State Realty Trust Inc. | 25,511 | 499 |
| Washington Federal Inc. | 18,300 | 499 |
| * Liberty Broadband Corp. Class A | 7,646 | 497 |
| Fulton Financial Corp. | 33,300 | 496 |
| * Stifel Financial Corp. | 12,600 | 493 |
| Ryman Hospitality Properties Inc. | 9,737 | 491 |
| Sterling Bancorp | 26,900 | 484 |
| LTC Properties Inc. | 9,600 | 481 |
| Urban Edge Properties | 18,574 | 479 |
| Paramount Group Inc. | 30,700 | 477 |
| Retail Opportunity Investments Corp. | 23,400 | 471 |
| Janus Capital Group Inc. | 36,642 | 470 |
| Interactive Brokers Group Inc. | 14,100 | 468 |
| Kite Realty Group Trust | 18,600 | 464 |
| First Financial Bankshares Inc. | 12,800 | 463 |
| * FirstCash Inc. | 9,696 | 458 |
| PS Business Parks Inc. | 4,100 | 450 |
| * Genworth Financial Inc. Class A | 108,274 | 448 |
| Pinnacle Financial Partners Inc. | 8,667 | 447 |
| * Zillow Group Inc. | 13,313 | 444 |
| Care Capital Properties Inc. | 16,715 | 444 |
| Glacier Bancorp Inc. | 15,700 | 444 |
| * Hilltop Holdings Inc. | 17,832 | 440 |
| Cathay General Bancorp | 14,600 | 437 |
| QTS Realty Trust Inc. Class A | 9,500 | 437 |
| LPL Financial Holdings Inc. | 14,100 | 437 |
| MB Financial Inc. | 11,900 | 433 |
| Colony Capital Inc. Class A | 22,764 | 433 |
| Hope Bancorp Inc. | 26,754 | 432 |
| RLI Corp. | 7,600 | 424 |
| Columbia Banking System Inc. | 12,700 | 419 |
| Evercore Partners Inc. Class A | 7,800 | 419 |
| Washington Prime Group Inc. | 39,071 | 410 |
| * Zillow Group Inc. Class A | 12,363 | 408 |
| * Blackhawk Network Holdings Inc. | 11,808 | 407 |
| Selective Insurance Group Inc. | 11,000 | 406 |
| DiamondRock Hospitality Co. | 43,400 | 397 |
| Kennedy-Wilson Holdings Inc. | 19,200 | 395 |
| CBL & Associates Properties Inc. | 36,800 | 394 |
| BGC Partners Inc. Class A | 45,084 | 387 |
| Community Bank System Inc. | 8,100 | 382 |
| Invesco Mortgage Capital Inc. | 25,500 | 381 |
| BancorpSouth Inc. | 16,100 | 378 |
| Old National Bancorp | 25,646 | 377 |
| AmTrust Financial Services Inc. | 14,020 | 370 |
| Mercury General Corp. | 6,755 | 368 |
| GEO Group Inc. | 15,332 | 367 |
| Great Western Bancorp Inc. | 11,300 | 364 |
| Alexander & Baldwin Inc. | 8,700 | 364 |
| Pebblebrook Hotel Trust | 14,960 | 363 |
| Capitol Federal Financial Inc. | 24,500 | 359 |
| LegacyTexas Financial Group Inc. | 10,400 | 356 |
| Ramco-Gershenson Properties Trust | 20,500 | 355 |
| Argo Group International Holdings Ltd. | 6,355 | 353 |
| * HRG Group Inc. | 23,225 | 349 |
| First Citizens BancShares Inc. Class A | 1,200 | 349 |
| Select Income REIT | 14,089 | 349 |
| South State Corp. | 4,700 | 345 |
104
| | |
| Vanguard® Total World Stock Index Fund | | |
| Schedule of Investments | | |
| October 31, 2016 | | |
| |
| | | Market |
| | | Value |
| | Shares | ($000) |
| EverBank Financial Corp. | 17,833 | 344 |
| Trustmark Corp. | 12,400 | 343 |
| Xenia Hotels & Resorts Inc. | 21,800 | 340 |
| BOK Financial Corp. | 4,700 | 334 |
| International Bancshares Corp. | 10,800 | 333 |
| * PRA Group Inc. | 10,400 | 332 |
| * Credit Acceptance Corp. | 1,783 | 328 |
| Sabra Health Care REIT Inc. | 14,039 | 327 |
| Monogram Residential Trust Inc. | 30,800 | 325 |
| * Eagle Bancorp Inc. | 6,500 | 319 |
| CYS Investments Inc. | 37,000 | 319 |
| American Equity Investment Life Holding Co. | 17,784 | 319 |
| American Assets Trust Inc. | 8,000 | 318 |
| Northwest Bancshares Inc. | 20,100 | 316 |
| American National Insurance Co. | 2,700 | 316 |
| STAG Industrial Inc. | 13,708 | 316 |
| * OneMain Holdings Inc. Class A | 11,152 | 316 |
| Financial Engines Inc. | 11,400 | 315 |
| Government Properties Income Trust | 16,319 | 312 |
| TFS Financial Corp. | 17,500 | 312 |
| Corrections Corp. of America | 21,507 | 311 |
| Provident Financial Services Inc. | 13,600 | 309 |
| Potlatch Corp. | 8,000 | 307 |
| Banner Corp. | 6,700 | 302 |
| * Essent Group Ltd. | 11,300 | 299 |
| Colony Starwood Homes | 10,228 | 297 |
| New York REIT Inc. | 31,300 | 295 |
| Horace Mann Educators Corp. | 8,200 | 295 |
| * Santander Consumer USA Holdings Inc. | 24,100 | 294 |
| First Midwest Bancorp Inc. | 14,900 | 288 |
| Towne Bank | 11,600 | 288 |
| Westamerica Bancorporation | 5,800 | 287 |
| NBT Bancorp Inc. | 8,500 | 287 |
| * HealthEquity Inc. | 8,600 | 286 |
| CVB Financial Corp. | 16,800 | 282 |
| WesBanco Inc. | 8,513 | 280 |
| Rexford Industrial Realty Inc. | 13,300 | 280 |
| Kemper Corp. | 7,400 | 278 |
| Capstead Mortgage Corp. | 29,100 | 277 |
| Renasant Corp. | 8,089 | 273 |
| Astoria Financial Corp. | 18,500 | 271 |
| Beneficial Bancorp Inc. | 18,649 | 270 |
| Independent Bank Corp. | 4,900 | 270 |
| Chesapeake Lodging Trust | 12,400 | 269 |
| Redwood Trust Inc. | 19,080 | 268 |
| First Financial Bancorp | 12,300 | 264 |
| Brookline Bancorp Inc. | 20,247 | 259 |
| Tompkins Financial Corp. | 3,263 | 259 |
| Safety Insurance Group Inc. | 3,784 | 256 |
| Pennsylvania REIT | 13,014 | 254 |
| NRG Yield Inc. | 16,296 | 251 |
| Waddell & Reed Financial Inc. Class A | 15,900 | 250 |
| ServisFirst Bancshares Inc. | 4,600 | 249 |
| Boston Private Financial Holdings Inc. | 18,700 | 246 |
| Park National Corp. | 2,500 | 242 |
| Navigators Group Inc. | 2,600 | 242 |
| Simmons First National Corp. Class A | 4,900 | 242 |
| * FNFV Group | 19,971 | 241 |
| PennyMac Mortgage Investment Trust | 15,600 | 237 |
| * MBIA Inc. | 30,300 | 233 |
| National General Holdings Corp. | 11,300 | 232 |
| * BofI Holding Inc. | 12,100 | 225 |
| Franklin Street Properties Corp. | 19,400 | 224 |
| Employers Holdings Inc. | 7,100 | 223 |
105
| | |
| Vanguard® Total World Stock Index Fund | | |
| Schedule of Investments | | |
| October 31, 2016 | | |
| |
| | | Market |
| | | Value |
| | Shares | ($000) |
| Community Trust Bancorp Inc. | 6,030 | 220 |
| Saul Centers Inc. | 3,632 | 220 |
| Universal Health Realty Income Trust | 3,717 | 218 |
| HFF Inc. Class A | 8,100 | 216 |
| Artisan Partners Asset Management Inc. Class A | 8,100 | 211 |
| New Senior Investment Group Inc. | 20,051 | 209 |
| Infinity Property & Casualty Corp. | 2,500 | 205 |
| TrustCo Bank Corp. NY | 29,100 | 204 |
| FelCor Lodging Trust Inc. | 31,486 | 201 |
| Four Corners Property Trust Inc. | 9,914 | 199 |
| S&T Bancorp Inc. | 6,300 | 198 |
| * Green Dot Corp. Class A | 8,826 | 196 |
| * Black Knight Financial Services Inc. Class A | 4,900 | 193 |
| CNA Financial Corp. | 5,100 | 186 |
| Stock Yards Bancorp Inc. | 5,237 | 179 |
| * St. Joe Co. | 10,033 | 178 |
| Maiden Holdings Ltd. | 12,600 | 172 |
| Investors Real Estate Trust | 27,900 | 169 |
| Oritani Financial Corp. | 10,400 | 163 |
| First Commonwealth Financial Corp. | 15,900 | 162 |
| Greenhill & Co. Inc. | 6,800 | 159 |
| * iStar Inc. | 14,300 | 159 |
| * Parkway Inc. | 8,790 | 158 |
| United Fire Group Inc. | 4,000 | 158 |
| Ashford Hospitality Trust Inc. | 26,806 | 156 |
| Alexander's Inc. | 400 | 154 |
| * Third Point Reinsurance Ltd. | 13,000 | 153 |
| Cohen & Steers Inc. | 4,000 | 149 |
| * Piper Jaffray Cos. | 2,600 | 147 |
| WisdomTree Investments Inc. | 16,700 | 143 |
| Dime Community Bancshares Inc. | 8,800 | 143 |
| * First BanCorp | 27,000 | 138 |
| Hersha Hospitality Trust Class A | 7,475 | 133 |
| Urstadt Biddle Properties Inc. Class A | 6,057 | 130 |
| ARMOUR Residential REIT Inc. | 5,712 | 129 |
| * KCG Holdings Inc. Class A | 9,969 | 127 |
| FBL Financial Group Inc. Class A | 2,000 | 127 |
| 1st Source Corp. | 3,630 | 125 |
| City Holding Co. | 2,400 | 125 |
| Nelnet Inc. Class A | 3,200 | 125 |
| Cedar Realty Trust Inc. | 18,376 | 124 |
| Sandy Spring Bancorp Inc. | 3,700 | 117 |
| Getty Realty Corp. | 5,011 | 114 |
| Investment Technology Group Inc. | 7,400 | 113 |
| Altisource Residential Corp. | 10,800 | 109 |
| BancFirst Corp. | 1,500 | 108 |
| * Greenlight Capital Re Ltd. Class A | 4,900 | 97 |
| NorthStar Realty Europe Corp. | 9,815 | 97 |
| Virtus Investment Partners Inc. | 900 | 97 |
| Flushing Financial Corp. | 4,500 | 96 |
| * Forestar Group Inc. | 8,500 | 93 |
| * Nationstar Mortgage Holdings Inc. | 6,104 | 92 |
| Washington Trust Bancorp Inc. | 2,000 | 92 |
| Anworth Mortgage Asset Corp. | 18,500 | 91 |
| * Encore Capital Group Inc. | 4,200 | 83 |
| * Marcus & Millichap Inc. | 3,300 | 77 |
| State Auto Financial Corp. | 3,300 | 76 |
| NRG Yield Inc. Class A | 5,100 | 75 |
| InfraREIT Inc. | 3,500 | 58 |
| First Financial Corp. | 1,448 | 58 |
| * Tejon Ranch Co. | 2,500 | 56 |
| National Interstate Corp. | 1,706 | 55 |
| * LendingClub Corp. | 10,200 | 50 |
| RMR Group Inc. Class A | 1,463 | 50 |
106
| | |
| Vanguard® Total World Stock Index Fund | | |
| Schedule of Investments | | |
| October 31, 2016 | | |
| |
| | | Market |
| | | Value |
| | Shares | ($000) |
| * Altisource Portfolio Solutions SA | 1,500 | 39 |
| Republic Bancorp Inc. Class A | 1,200 | 38 |
| | | 882,553 |
| Health Care (6.5%) | | |
| Johnson & Johnson | 574,601 | 66,648 |
| Pfizer Inc. | 1,270,446 | 40,286 |
| Merck & Co. Inc. | 581,600 | 34,152 |
| UnitedHealth Group Inc. | 200,119 | 28,283 |
| Medtronic plc | 290,873 | 23,857 |
| Amgen Inc. | 157,502 | 22,233 |
| Gilead Sciences Inc. | 279,907 | 20,610 |
| AbbVie Inc. | 338,734 | 18,895 |
| Bristol-Myers Squibb Co. | 349,514 | 17,794 |
| * Allergan plc | 83,080 | 17,359 |
| * Celgene Corp. | 165,368 | 16,897 |
| Eli Lilly & Co. | 206,017 | 15,212 |
| * Biogen Inc. | 45,950 | 12,874 |
| Thermo Fisher Scientific Inc. | 83,185 | 12,231 |
| Abbott Laboratories | 308,487 | 12,105 |
| * Express Scripts Holding Co. | 129,975 | 8,760 |
| Aetna Inc. | 73,722 | 7,914 |
| Becton Dickinson and Co. | 44,550 | 7,480 |
| Stryker Corp. | 58,623 | 6,762 |
| Anthem Inc. | 55,305 | 6,739 |
| Cigna Corp. | 53,900 | 6,405 |
| * Boston Scientific Corp. | 283,572 | 6,239 |
| * Alexion Pharmaceuticals Inc. | 46,929 | 6,124 |
| * Regeneron Pharmaceuticals Inc. | 17,000 | 5,865 |
| Baxter International Inc. | 113,534 | 5,403 |
| * Intuitive Surgical Inc. | 8,017 | 5,388 |
| Humana Inc. | 31,094 | 5,334 |
| Zoetis Inc. | 104,408 | 4,991 |
| * HCA Holdings Inc. | 61,301 | 4,691 |
| St. Jude Medical Inc. | 59,402 | 4,624 |
| Zimmer Biomet Holdings Inc. | 41,482 | 4,372 |
| * Edwards Lifesciences Corp. | 44,300 | 4,218 |
| * Illumina Inc. | 30,641 | 4,171 |
| * Vertex Pharmaceuticals Inc. | 51,746 | 3,925 |
| * Mylan NV | 95,046 | 3,469 |
| CR Bard Inc. | 15,629 | 3,386 |
| * Incyte Corp. | 35,117 | 3,054 |
| Dentsply Sirona Inc. | 49,306 | 2,839 |
| * BioMarin Pharmaceutical Inc. | 34,889 | 2,809 |
| * Laboratory Corp. of America Holdings | 21,492 | 2,694 |
| * Henry Schein Inc. | 17,391 | 2,595 |
| * DaVita Inc. | 43,186 | 2,532 |
| Quest Diagnostics Inc. | 29,974 | 2,441 |
| Perrigo Co. plc | 27,763 | 2,310 |
| Universal Health Services Inc. Class B | 18,928 | 2,285 |
| * Waters Corp. | 16,125 | 2,244 |
| * Centene Corp. | 34,686 | 2,167 |
| * Quintiles IMS Holdings Inc. | 29,764 | 2,135 |
| * Hologic Inc. | 59,200 | 2,132 |
| * IDEXX Laboratories Inc. | 18,900 | 2,025 |
| ResMed Inc. | 29,800 | 1,781 |
| * Varian Medical Systems Inc. | 19,590 | 1,777 |
| Cooper Cos. Inc. | 9,895 | 1,742 |
| * Alkermes plc | 28,600 | 1,442 |
| * Mallinckrodt plc | 22,522 | 1,335 |
| Teleflex Inc. | 9,300 | 1,331 |
| * Jazz Pharmaceuticals plc | 11,300 | 1,237 |
| * MEDNAX Inc. | 19,800 | 1,213 |
| STERIS plc | 18,006 | 1,203 |
| West Pharmaceutical Services Inc. | 15,200 | 1,156 |
107
| | |
| Vanguard® Total World Stock Index Fund | | |
| Schedule of Investments | | |
| October 31, 2016 | | |
| |
| | | Market |
| | | Value |
| | Shares | ($000) |
| * United Therapeutics Corp. | 9,600 | 1,153 |
| * DexCom Inc. | 14,600 | 1,142 |
| * Seattle Genetics Inc. | 21,900 | 1,132 |
| * Align Technology Inc. | 12,700 | 1,091 |
| * WellCare Health Plans Inc. | 9,000 | 1,022 |
| * Endo International plc | 45,689 | 857 |
| * ABIOMED Inc. | 8,000 | 840 |
| * TESARO Inc. | 6,855 | 829 |
| * Cepheid | 15,500 | 820 |
| * Neurocrine Biosciences Inc. | 18,100 | 792 |
| * Envision Healthcare Holdings Inc. | 39,634 | 784 |
| HealthSouth Corp. | 19,520 | 784 |
| Bio-Techne Corp. | 7,500 | 780 |
| Patterson Cos. Inc. | 17,713 | 757 |
| * Charles River Laboratories International Inc. | 9,800 | 744 |
| Hill-Rom Holdings Inc. | 13,300 | 737 |
| * Alere Inc. | 15,300 | 684 |
| * Team Health Holdings Inc. | 15,600 | 668 |
| * Ionis Pharmaceuticals Inc. | 25,700 | 668 |
| * Amsurg Corp. | 11,031 | 659 |
| * PAREXEL International Corp. | 11,200 | 652 |
| * NuVasive Inc. | 10,600 | 633 |
| * OPKO Health Inc. | 65,800 | 620 |
| * Bio-Rad Laboratories Inc. Class A | 3,900 | 616 |
| * Catalent Inc. | 26,022 | 594 |
| Healthcare Services Group Inc. | 15,300 | 566 |
| * Alnylam Pharmaceuticals Inc. | 15,500 | 552 |
| * Horizon Pharma plc | 32,224 | 539 |
| * China Biologic Products Inc. | 4,500 | 531 |
| * Acadia Healthcare Co. Inc. | 14,769 | 531 |
| * Brookdale Senior Living Inc. | 36,473 | 526 |
| * Exelixis Inc. | 46,800 | 496 |
| * Masimo Corp. | 9,000 | 495 |
| * VWR Corp. | 17,961 | 494 |
| * ACADIA Pharmaceuticals Inc. | 21,100 | 492 |
| * LifePoint Health Inc. | 8,200 | 491 |
| * Integra LifeSciences Holdings Corp. | 6,157 | 490 |
| * Molina Healthcare Inc. | 8,800 | 479 |
| * INC Research Holdings Inc. Class A | 10,437 | 477 |
| * Prestige Brands Holdings Inc. | 10,500 | 475 |
| * Akorn Inc. | 19,800 | 474 |
| * LivaNova plc | 8,297 | 470 |
| * Wright Medical Group NV | 21,232 | 465 |
| * Medicines Co. | 14,000 | 461 |
| * Ultragenyx Pharmaceutical Inc. | 7,600 | 448 |
| Cantel Medical Corp. | 6,100 | 434 |
| * Insulet Corp. | 11,700 | 434 |
| Bruker Corp. | 21,100 | 432 |
| * ICU Medical Inc. | 3,000 | 418 |
| * Nevro Corp. | 4,500 | 414 |
| * Sarepta Therapeutics Inc. | 10,301 | 404 |
| * Ligand Pharmaceuticals Inc. | 4,200 | 402 |
| * Neogen Corp. | 7,600 | 400 |
| * Tenet Healthcare Corp. | 20,250 | 399 |
| * HMS Holdings Corp. | 18,900 | 398 |
| * Kite Pharma Inc. | 8,800 | 390 |
| Owens & Minor Inc. | 12,000 | 389 |
| * Bluebird Bio Inc. | 7,799 | 372 |
| * Intercept Pharmaceuticals Inc. | 3,000 | 371 |
| * Haemonetics Corp. | 11,000 | 367 |
| * Exact Sciences Corp. | 23,200 | 361 |
| * Juno Therapeutics Inc. | 14,700 | 357 |
| * ARIAD Pharmaceuticals Inc. | 40,441 | 353 |
| * Nektar Therapeutics Class A | 28,400 | 352 |
108
| | | |
| Vanguard® Total World Stock Index Fund | | |
| Schedule of Investments | | |
| October 31, 2016 | | |
| |
| | | | Market |
| | | | Value |
| | | Shares | ($000) |
| * | Ironwood Pharmaceuticals Inc. Class A | 27,300 | 349 |
| * | PRA Health Sciences Inc. | 6,400 | 341 |
| * | Halyard Health Inc. | 10,205 | 330 |
| * | Radius Health Inc. | 7,500 | 322 |
| * | Globus Medical Inc. | 14,500 | 321 |
| * | Impax Laboratories Inc. | 15,200 | 306 |
| * | Intrexon Corp. | 11,700 | 305 |
| * | NxStage Medical Inc. | 13,400 | 305 |
| *,^ | Taro Pharmaceutical Industries Ltd. | 3,000 | 305 |
| * | Sage Therapeutics Inc. | 6,817 | 297 |
| * | Amedisys Inc. | 6,600 | 286 |
| * | Magellan Health Inc. | 5,500 | 283 |
| * | Select Medical Holdings Corp. | 21,700 | 282 |
| * | Natus Medical Inc. | 6,900 | 272 |
| * | Omnicell Inc. | 8,300 | 271 |
| * | Surgical Care Affiliates Inc. | 6,000 | 257 |
| * | Depomed Inc. | 11,400 | 255 |
| | Analogic Corp. | 3,000 | 246 |
| * | FibroGen Inc. | 14,700 | 243 |
| * | Pacira Pharmaceuticals Inc. | 7,400 | 235 |
| | Abaxis Inc. | 4,900 | 234 |
| * | Theravance Biopharma Inc. | 9,257 | 233 |
| | CONMED Corp. | 5,800 | 232 |
| * | Myriad Genetics Inc. | 11,600 | 229 |
| * | Merit Medical Systems Inc. | 9,800 | 215 |
| * | Clovis Oncology Inc. | 7,353 | 214 |
| * | Halozyme Therapeutics Inc. | 24,700 | 213 |
| * | Lexicon Pharmaceuticals Inc. | 13,949 | 207 |
| * | Innoviva Inc. | 19,900 | 205 |
| * | Amicus Therapeutics Inc. | 28,700 | 198 |
| * | Emergent BioSolutions Inc. | 7,400 | 198 |
| * | Spectranetics Corp. | 9,000 | 195 |
| * | PharMerica Corp. | 8,200 | 195 |
| * | Momenta Pharmaceuticals Inc. | 17,412 | 194 |
| * | Puma Biotechnology Inc. | 5,000 | 191 |
| * | Ophthotech Corp. | 5,300 | 190 |
| | Ensign Group Inc. | 10,200 | 188 |
| * | Spark Therapeutics Inc. | 4,000 | 188 |
| | Kindred Healthcare Inc. | 18,600 | 183 |
| * | Repligen Corp. | 6,400 | 183 |
| * | Cempra Inc. | 9,800 | 178 |
| * | Acceleron Pharma Inc. | 6,300 | 177 |
| * | Alder Biopharmaceuticals Inc. | 7,188 | 174 |
| * | Genomic Health Inc. | 5,800 | 173 |
| | Meridian Bioscience Inc. | 10,300 | 169 |
| * | Portola Pharmaceuticals Inc. | 9,100 | 165 |
| * | Luminex Corp. | 7,800 | 162 |
| * | TherapeuticsMD Inc. | 28,000 | 161 |
| * | Healthways Inc. | 6,400 | 159 |
| * | Achillion Pharmaceuticals Inc. | 24,500 | 154 |
| * | AMAG Pharmaceuticals Inc. | 5,915 | 152 |
| * | Insmed Inc. | 11,500 | 149 |
| * | Air Methods Corp. | 5,600 | 148 |
| * | Acorda Therapeutics Inc. | 8,200 | 145 |
| * | Agios Pharmaceuticals Inc. | 2,900 | 139 |
| * | Orthofix International NV | 3,700 | 136 |
| * | Community Health Systems Inc. | 24,102 | 127 |
| * | Keryx Biopharmaceuticals Inc. | 25,900 | 117 |
| * | Lannett Co. Inc. | 5,200 | 114 |
| * | Merrimack Pharmaceuticals Inc. | 20,800 | 109 |
| * | Eagle Pharmaceuticals Inc. | 1,900 | 106 |
| * | ZIOPHARM Oncology Inc. | 18,200 | 103 |
| * | Quidel Corp. | 5,200 | 100 |
| | PDL BioPharma Inc. | 29,600 | 95 |
109
| | | |
| Vanguard® Total World Stock Index Fund | | |
| Schedule of Investments | | |
| October 31, 2016 | | |
| |
| | | | Market |
| | | | Value |
| | | Shares | ($000) |
| * | Novavax Inc. | 54,951 | 84 |
| * | Intra-Cellular Therapies Inc. Class A | 6,400 | 79 |
| * | Aduro Biotech Inc. | 6,200 | 67 |
| * | Accuray Inc. | 12,800 | 63 |
| *,^ | Insys Therapeutics Inc. | 5,400 | 58 |
| * | Arena Pharmaceuticals Inc. | 39,300 | 58 |
| * | CorVel Corp. | 1,600 | 55 |
| * | Celldex Therapeutics Inc. | 15,700 | 49 |
| | Invacare Corp. | 5,100 | 47 |
| * | Universal American Corp. | 5,500 | 41 |
| * | LHC Group Inc. | 1,100 | 38 |
| * | Quorum Health Corp. | 6,025 | 24 |
| * | MannKind Corp. | 46,800 | 20 |
| * | Aptevo Therapeutics Inc. | 3,700 | 8 |
| | | | 575,631 |
| Industrials (6.6%) | | |
| | General Electric Co. | 1,868,563 | 54,375 |
| | 3M Co. | 125,282 | 20,709 |
| | Honeywell International Inc. | 157,477 | 17,272 |
| | Boeing Co. | 117,907 | 16,794 |
| | United Technologies Corp. | 160,573 | 16,411 |
| | United Parcel Service Inc. Class B | 143,775 | 15,493 |
| | Union Pacific Corp. | 175,164 | 15,446 |
| | Lockheed Martin Corp. | 61,623 | 15,183 |
| | Accenture plc Class A | 129,345 | 15,035 |
| | Caterpillar Inc. | 121,976 | 10,180 |
| * | PayPal Holdings Inc. | 227,360 | 9,472 |
| | Danaher Corp. | 119,816 | 9,412 |
| | FedEx Corp. | 52,315 | 9,120 |
| | General Dynamics Corp. | 59,878 | 9,026 |
| | Raytheon Co. | 61,577 | 8,412 |
| | Northrop Grumman Corp. | 36,647 | 8,392 |
| | Automatic Data Processing Inc. | 95,386 | 8,304 |
| * | Johnson Controls International plc | 196,604 | 7,927 |
| | Illinois Tool Works Inc. | 66,647 | 7,569 |
| | Emerson Electric Co. | 134,607 | 6,822 |
| | Eaton Corp. plc | 95,835 | 6,111 |
| | Waste Management Inc. | 92,945 | 6,103 |
| | CSX Corp. | 197,351 | 6,021 |
| | Norfolk Southern Corp. | 61,289 | 5,700 |
| | Deere & Co. | 62,319 | 5,503 |
| | Fidelity National Information Services Inc. | 67,878 | 5,018 |
| | TE Connectivity Ltd. | 74,820 | 4,704 |
| * | LinkedIn Corp. Class A | 24,780 | 4,698 |
| * | Fiserv Inc. | 45,812 | 4,512 |
| | Cummins Inc. | 35,253 | 4,506 |
| | Amphenol Corp. Class A | 63,834 | 4,209 |
| | PACCAR Inc. | 73,967 | 4,062 |
| | Sherwin-Williams Co. | 15,740 | 3,854 |
| | Paychex Inc. | 68,025 | 3,755 |
| | Roper Technologies Inc. | 20,929 | 3,627 |
| | Ingersoll-Rand plc | 53,477 | 3,598 |
| | Parker-Hannifin Corp. | 28,911 | 3,549 |
| | Rockwell Automation Inc. | 27,152 | 3,251 |
| | Fortive Corp. | 62,441 | 3,188 |
| | Republic Services Inc. Class A | 59,178 | 3,115 |
| | Vulcan Materials Co. | 27,478 | 3,111 |
| | Agilent Technologies Inc. | 68,475 | 2,983 |
| * | FleetCor Technologies Inc. | 16,121 | 2,826 |
| | Ball Corp. | 36,179 | 2,788 |
| | TransDigm Group Inc. | 10,000 | 2,725 |
| * | Verisk Analytics Inc. Class A | 32,900 | 2,683 |
| | Alliance Data Systems Corp. | 12,356 | 2,526 |
| | Martin Marietta Materials Inc. | 13,500 | 2,503 |
110
| | |
| Vanguard® Total World Stock Index Fund | | |
| Schedule of Investments | | |
| October 31, 2016 | | |
| |
| | | Market |
| | | Value |
| | Shares | ($000) |
| WestRock Co. | 53,138 | 2,454 |
| Global Payments Inc. | 32,287 | 2,341 |
| Rockwell Collins Inc. | 27,458 | 2,315 |
| Textron Inc. | 57,070 | 2,287 |
| WW Grainger Inc. | 10,892 | 2,267 |
| L-3 Communications Holdings Inc. | 16,395 | 2,245 |
| Dover Corp. | 33,146 | 2,217 |
| Fastenal Co. | 56,580 | 2,205 |
| AMETEK Inc. | 49,493 | 2,183 |
| Masco Corp. | 70,587 | 2,180 |
| Pentair plc | 38,094 | 2,100 |
| CH Robinson Worldwide Inc. | 30,736 | 2,094 |
| Xerox Corp. | 213,182 | 2,083 |
| Kansas City Southern | 22,985 | 2,017 |
| Acuity Brands Inc. | 8,900 | 1,990 |
| Expeditors International of Washington Inc. | 38,395 | 1,976 |
| Cintas Corp. | 18,410 | 1,964 |
| Sealed Air Corp. | 41,135 | 1,877 |
| * Mettler-Toledo International Inc. | 4,624 | 1,868 |
| * Vantiv Inc. Class A | 31,810 | 1,856 |
| Xylem Inc. | 37,135 | 1,795 |
| Fortune Brands Home & Security Inc. | 32,250 | 1,762 |
| Valspar Corp. | 17,342 | 1,727 |
| * Flex Ltd. | 117,125 | 1,662 |
| Total System Services Inc. | 33,135 | 1,653 |
| Packaging Corp. of America | 19,503 | 1,609 |
| Broadridge Financial Solutions Inc. | 24,795 | 1,603 |
| Huntington Ingalls Industries Inc. | 9,929 | 1,602 |
| * Crown Holdings Inc. | 29,341 | 1,592 |
| Fluor Corp. | 29,505 | 1,534 |
| JB Hunt Transport Services Inc. | 18,781 | 1,533 |
| * AerCap Holdings NV | 36,516 | 1,501 |
| * Trimble Inc. | 53,100 | 1,468 |
| * Spirit AeroSystems Holdings Inc. Class A | 27,558 | 1,388 |
| IDEX Corp. | 16,000 | 1,383 |
| * Jacobs Engineering Group Inc. | 26,671 | 1,376 |
| * HD Supply Holdings Inc. | 41,300 | 1,363 |
| * Stericycle Inc. | 16,631 | 1,332 |
| Carlisle Cos. Inc. | 12,600 | 1,321 |
| * Old Dominion Freight Line Inc. | 17,650 | 1,318 |
| Macquarie Infrastructure Corp. | 16,000 | 1,309 |
| B/E Aerospace Inc. | 21,600 | 1,286 |
| Allegion plc | 20,091 | 1,283 |
| * Sensata Technologies Holding NV | 35,685 | 1,275 |
| AO Smith Corp. | 27,800 | 1,256 |
| * CoStar Group Inc. | 6,700 | 1,254 |
| * United Rentals Inc. | 16,500 | 1,248 |
| PerkinElmer Inc. | 24,075 | 1,225 |
| * Keysight Technologies Inc. | 37,049 | 1,215 |
| Flowserve Corp. | 27,766 | 1,176 |
| Wabtec Corp. | 15,200 | 1,175 |
| * Arrow Electronics Inc. | 19,182 | 1,172 |
| MDU Resources Group Inc. | 43,476 | 1,140 |
| Hubbell Inc. Class B | 10,855 | 1,135 |
| Avnet Inc. | 27,043 | 1,134 |
| ManpowerGroup Inc. | 14,454 | 1,110 |
| Lennox International Inc. | 7,600 | 1,109 |
| Owens Corning | 22,000 | 1,073 |
| Nordson Corp. | 10,600 | 1,061 |
| Toro Co. | 22,000 | 1,053 |
| Jack Henry & Associates Inc. | 12,700 | 1,029 |
| Allison Transmission Holdings Inc. | 34,923 | 1,023 |
| Robert Half International Inc. | 26,980 | 1,010 |
| * WEX Inc. | 9,104 | 993 |
111
| | |
| Vanguard® Total World Stock Index Fund | | |
| Schedule of Investments | | |
| October 31, 2016 | | |
| |
| | | Market |
| | | Value |
| | Shares | ($000) |
| Sonoco Products Co. | 19,500 | 981 |
| Donaldson Co. Inc. | 26,500 | 968 |
| Bemis Co. Inc. | 19,860 | 968 |
| Orbital ATK Inc. | 12,873 | 957 |
| FLIR Systems Inc. | 29,000 | 955 |
| * Berry Plastics Group Inc. | 21,082 | 922 |
| * Quanta Services Inc. | 32,000 | 920 |
| Hexcel Corp. | 19,600 | 892 |
| AGCO Corp. | 17,200 | 879 |
| * Euronet Worldwide Inc. | 11,000 | 875 |
| Graco Inc. | 11,600 | 869 |
| AptarGroup Inc. | 12,000 | 857 |
| BWX Technologies Inc. | 21,750 | 853 |
| Cognex Corp. | 16,100 | 831 |
| Curtiss-Wright Corp. | 9,200 | 825 |
| Graphic Packaging Holding Co. | 65,380 | 817 |
| * Teledyne Technologies Inc. | 7,560 | 814 |
| * AECOM | 29,100 | 810 |
| Jabil Circuit Inc. | 37,219 | 794 |
| * CoreLogic Inc. | 18,445 | 785 |
| * Genesee & Wyoming Inc. Class A | 11,500 | 781 |
| Booz Allen Hamilton Holding Corp. Class A | 25,274 | 770 |
| Oshkosh Corp. | 14,368 | 769 |
| Ryder System Inc. | 10,887 | 755 |
| Watsco Inc. | 5,500 | 755 |
| * XPO Logistics Inc. | 22,893 | 754 |
| Eagle Materials Inc. | 9,300 | 753 |
| * Colfax Corp. | 23,540 | 748 |
| * Zebra Technologies Corp. | 11,200 | 737 |
| Crane Co. | 10,800 | 735 |
| Woodward Inc. | 12,100 | 714 |
| * Genpact Ltd. | 31,000 | 713 |
| ^ MSC Industrial Direct Co. Inc. Class A | 9,600 | 699 |
| Lincoln Electric Holdings Inc. | 10,400 | 685 |
| EMCOR Group Inc. | 11,300 | 683 |
| Chicago Bridge & Iron Co. NV | 21,210 | 679 |
| ITT Inc. | 19,067 | 672 |
| * Owens-Illinois Inc. | 33,650 | 649 |
| * Kirby Corp. | 11,000 | 648 |
| * IPG Photonics Corp. | 6,500 | 631 |
| Air Lease Corp. Class A | 20,700 | 626 |
| Joy Global Inc. | 22,035 | 613 |
| Deluxe Corp. | 9,900 | 606 |
| Littelfuse Inc. | 4,300 | 600 |
| MAXIMUS Inc. | 11,400 | 593 |
| Landstar System Inc. | 8,300 | 591 |
| Valmont Industries Inc. | 4,600 | 589 |
| National Instruments Corp. | 20,700 | 581 |
| EnerSys | 8,800 | 573 |
| Belden Inc. | 8,800 | 570 |
| Trinity Industries Inc. | 26,100 | 557 |
| CLARCOR Inc. | 8,900 | 554 |
| * WESCO International Inc. | 10,174 | 551 |
| Terex Corp. | 22,502 | 537 |
| Convergys Corp. | 18,400 | 537 |
| * Shopify Inc. Class A | 12,800 | 531 |
| John Bean Technologies Corp. | 6,600 | 527 |
| * Cimpress NV | 6,300 | 524 |
| * Coherent Inc. | 5,000 | 521 |
| * Louisiana-Pacific Corp. | 28,200 | 517 |
| World Fuel Services Corp. | 12,600 | 507 |
| * Generac Holdings Inc. | 13,200 | 503 |
| Regal Beloit Corp. | 8,400 | 496 |
| * Clean Harbors Inc. | 10,300 | 487 |
112
| | |
| Vanguard® Total World Stock Index Fund | | |
| Schedule of Investments | | |
| October 31, 2016 | | |
| |
| | | Market |
| | | Value |
| | Shares | ($000) |
| Kennametal Inc. | 16,500 | 467 |
| Timken Co. | 14,100 | 466 |
| * Itron Inc. | 8,600 | 464 |
| * USG Corp. | 18,100 | 456 |
| * Esterline Technologies Corp. | 6,200 | 455 |
| HEICO Corp. Class A | 7,500 | 450 |
| KBR Inc. | 29,900 | 443 |
| ABM Industries Inc. | 11,300 | 442 |
| Tetra Tech Inc. | 11,400 | 438 |
| * Ambarella Inc. | 7,100 | 436 |
| Brink's Co. | 10,900 | 431 |
| * Universal Display Corp. | 8,300 | 429 |
| * Sanmina Corp. | 15,500 | 429 |
| Vishay Intertechnology Inc. | 29,900 | 422 |
| * Rexnord Corp. | 20,789 | 414 |
| Silgan Holdings Inc. | 7,884 | 402 |
| * RBC Bearings Inc. | 5,600 | 400 |
| Mueller Water Products Inc. Class A | 32,300 | 398 |
| * KLX Inc. | 11,400 | 392 |
| UniFirst Corp. | 3,200 | 392 |
| * Armstrong World Industries Inc. | 10,379 | 389 |
| * MasTec Inc. | 13,600 | 388 |
| G&K Services Inc. Class A | 4,100 | 388 |
| MSA Safety Inc. | 6,600 | 385 |
| * Anixter International Inc. | 5,800 | 381 |
| Barnes Group Inc. | 9,500 | 378 |
| * WageWorks Inc. | 6,400 | 377 |
| * Swift Transportation Co. | 16,600 | 372 |
| * DigitalGlobe Inc. | 14,754 | 370 |
| * Cardtronics plc Class A | 7,400 | 370 |
| Granite Construction Inc. | 7,500 | 369 |
| * FTI Consulting Inc. | 9,100 | 355 |
| * Moog Inc. Class A | 6,100 | 354 |
| Covanta Holding Corp. | 23,000 | 345 |
| Universal Forest Products Inc. | 4,000 | 344 |
| * II-VI Inc. | 11,800 | 328 |
| HEICO Corp. | 4,843 | 327 |
| * On Assignment Inc. | 9,500 | 327 |
| * LifeLock Inc. | 20,300 | 327 |
| * Advisory Board Co. | 8,200 | 326 |
| Exponent Inc. | 5,700 | 326 |
| Knight Transportation Inc. | 11,000 | 322 |
| CEB Inc. | 6,600 | 321 |
| * Smith & Wesson Holding Corp. | 11,800 | 312 |
| * Trex Co. Inc. | 5,700 | 307 |
| GATX Corp. | 7,000 | 306 |
| Applied Industrial Technologies Inc. | 6,000 | 305 |
| Brady Corp. Class A | 9,200 | 305 |
| * AMN Healthcare Services Inc. | 9,100 | 298 |
| * Plexus Corp. | 6,500 | 298 |
| * Masonite International Corp. | 5,200 | 296 |
| Watts Water Technologies Inc. Class A | 4,900 | 294 |
| Mueller Industries Inc. | 9,700 | 294 |
| Franklin Electric Co. Inc. | 8,000 | 292 |
| Simpson Manufacturing Co. Inc. | 6,600 | 282 |
| AZZ Inc. | 5,300 | 282 |
| * Knowles Corp. | 18,773 | 280 |
| * Huron Consulting Group Inc. | 5,000 | 280 |
| Kaman Corp. | 6,400 | 279 |
| * Fabrinet | 7,300 | 277 |
| * Hub Group Inc. Class A | 7,600 | 277 |
| * Gibraltar Industries Inc. | 7,000 | 272 |
| * TopBuild Corp. | 8,998 | 271 |
| Forward Air Corp. | 6,400 | 264 |
113
| | |
| Vanguard® Total World Stock Index Fund | | |
| Schedule of Investments | | |
| October 31, 2016 | | |
| |
| | | Market |
| | | Value |
| | Shares | ($000) |
| ESCO Technologies Inc. | 5,900 | 263 |
| * Navistar International Corp. | 11,700 | 261 |
| * OSI Systems Inc. | 3,700 | 259 |
| * RR Donnelley & Sons Co. | 14,586 | 259 |
| * Benchmark Electronics Inc. | 10,100 | 254 |
| * NeuStar Inc. Class A | 11,300 | 254 |
| Greif Inc. Class A | 5,400 | 253 |
| * Headwaters Inc. | 15,400 | 253 |
| Triumph Group Inc. | 10,500 | 249 |
| Aircastle Ltd. | 12,100 | 249 |
| * TASER International Inc. | 11,100 | 248 |
| Otter Tail Corp. | 6,900 | 248 |
| Sturm Ruger & Co. Inc. | 4,000 | 246 |
| EnPro Industries Inc. | 4,500 | 244 |
| Methode Electronics Inc. | 7,800 | 243 |
| * Rofin-Sinar Technologies Inc. | 7,400 | 241 |
| Mobile Mini Inc. | 9,500 | 241 |
| Actuant Corp. Class A | 10,700 | 239 |
| * SPX FLOW Inc. | 9,499 | 238 |
| AAON Inc. | 7,950 | 238 |
| Badger Meter Inc. | 7,400 | 238 |
| AAR Corp. | 7,300 | 235 |
| * ExlService Holdings Inc. | 5,200 | 229 |
| Tennant Co. | 3,600 | 227 |
| Comfort Systems USA Inc. | 7,800 | 225 |
| * Sykes Enterprises Inc. | 8,200 | 219 |
| * Proto Labs Inc. | 4,900 | 219 |
| * MACOM Technology Solutions Holdings Inc. | 5,900 | 217 |
| * Aerojet Rocketdyne Holdings Inc. | 12,300 | 216 |
| Werner Enterprises Inc. | 9,000 | 216 |
| Insperity Inc. | 2,800 | 211 |
| * American Woodmark Corp. | 2,800 | 209 |
| Korn/Ferry International | 10,200 | 208 |
| * Rogers Corp. | 3,800 | 207 |
| * Integer Holdings Corp. | 9,300 | 205 |
| Raven Industries Inc. | 9,500 | 204 |
| Apogee Enterprises Inc. | 5,000 | 204 |
| * PHH Corp. | 13,900 | 202 |
| Heartland Express Inc. | 10,900 | 201 |
| ManTech International Corp. Class A | 5,100 | 198 |
| * Paylocity Holding Corp. | 4,500 | 196 |
| * Imperva Inc. | 5,300 | 196 |
| Schnitzer Steel Industries Inc. | 8,000 | 193 |
| * Navigant Consulting Inc. | 8,200 | 192 |
| * Meritor Inc. | 18,600 | 191 |
| Standex International Corp. | 2,500 | 191 |
| Lindsay Corp. | 2,400 | 188 |
| * CBIZ Inc. | 17,000 | 188 |
| * Saia Inc. | 5,200 | 185 |
| US Ecology Inc. | 4,300 | 182 |
| * Team Inc. | 5,900 | 181 |
| Hollysys Automation Technologies Ltd. | 9,100 | 181 |
| Cubic Corp. | 4,200 | 179 |
| CIRCOR International Inc. | 3,300 | 177 |
| Astec Industries Inc. | 3,200 | 177 |
| Viad Corp. | 4,200 | 174 |
| Greenbrier Cos. Inc. | 5,500 | 173 |
| McGrath RentCorp | 5,600 | 169 |
| * SPX Corp. | 8,799 | 167 |
| * Babcock & Wilcox Enterprises Inc. | 10,525 | 166 |
| * Wesco Aircraft Holdings Inc. | 12,800 | 164 |
| Advanced Drainage Systems Inc. | 8,600 | 164 |
| Albany International Corp. | 4,000 | 163 |
| Federal Signal Corp. | 13,200 | 162 |
114
| | | |
| Vanguard® Total World Stock Index Fund | | |
| Schedule of Investments | | |
| October 31, 2016 | | |
| |
| | | | Market |
| | | | Value |
| | | Shares | ($000) |
| * | TTM Technologies Inc. | 12,200 | 160 |
| | EVERTEC Inc. | 10,400 | 158 |
| | MTS Systems Corp. | 3,300 | 157 |
| * | TriMas Corp. | 8,700 | 156 |
| * | Veeco Instruments Inc. | 6,900 | 150 |
| | Matson Inc. | 3,700 | 148 |
| | Encore Wire Corp. | 4,300 | 147 |
| | Materion Corp. | 4,832 | 146 |
| * | Tutor Perini Corp. | 7,600 | 145 |
| | Seaspan Corp. Class A | 11,600 | 143 |
| | Manitowoc Co. Inc. | 35,400 | 143 |
| | Scorpio Tankers Inc. | 37,300 | 143 |
| | AVX Corp. | 10,000 | 140 |
| * | TrueBlue Inc. | 8,000 | 140 |
| * | TriNet Group Inc. | 7,400 | 139 |
| | Harsco Corp. | 13,900 | 136 |
| * | LSC Communications Inc. | 5,470 | 133 |
| | Kelly Services Inc. Class A | 6,900 | 129 |
| | GasLog Ltd. | 8,400 | 129 |
| | Essendant Inc. | 8,400 | 129 |
| * | Boise Cascade Co. | 6,600 | 127 |
| | Primoris Services Corp. | 6,300 | 126 |
| | Ship Finance International Ltd. | 9,813 | 124 |
| | Quanex Building Products Corp. | 7,600 | 124 |
| | General Cable Corp. | 8,800 | 123 |
| * | TimkenSteel Corp. | 12,000 | 123 |
| | CTS Corp. | 6,700 | 122 |
| ^ | Nordic American Tankers Ltd. | 14,498 | 118 |
| * | FARO Technologies Inc. | 3,500 | 117 |
| * | Donnelley Financial Solutions Inc. | 5,470 | 117 |
| | Hyster-Yale Materials Handling Inc. | 1,900 | 111 |
| * | Engility Holdings Inc. | 3,673 | 106 |
| | Triton International Ltd. | 8,400 | 101 |
| * | Aegion Corp. Class A | 5,300 | 98 |
| | Resources Connection Inc. | 6,500 | 97 |
| | TeleTech Holdings Inc. | 3,400 | 96 |
| * | Armstrong Flooring Inc. | 5,144 | 83 |
| | H&E Equipment Services Inc. | 5,800 | 81 |
| * | Aerovironment Inc. | 3,200 | 77 |
| | Griffon Corp. | 4,200 | 70 |
| * | Atlas Air Worldwide Holdings Inc. | 1,500 | 63 |
| | Teekay Corp. | 7,500 | 49 |
| | Myers Industries Inc. | 3,500 | 42 |
| | American Railcar Industries Inc. | 1,000 | 37 |
| | Textainer Group Holdings Ltd. | 2,600 | 20 |
| | | | 580,219 |
| Oil & Gas (3.5%) | | |
| | Exxon Mobil Corp. | 869,839 | 72,475 |
| | Chevron Corp. | 397,052 | 41,591 |
| | Schlumberger Ltd. | 290,931 | 22,760 |
| | Occidental Petroleum Corp. | 160,019 | 11,667 |
| | ConocoPhillips | 257,649 | 11,195 |
| | EOG Resources Inc. | 114,974 | 10,396 |
| | Phillips 66 | 110,554 | 8,971 |
| | Halliburton Co. | 178,481 | 8,210 |
| | Kinder Morgan Inc. | 397,522 | 8,121 |
| | Anadarko Petroleum Corp. | 116,902 | 6,949 |
| | Pioneer Natural Resources Co. | 35,451 | 6,346 |
| | Spectra Energy Corp. | 146,279 | 6,116 |
| | Valero Energy Corp. | 96,661 | 5,726 |
| | Baker Hughes Inc. | 89,755 | 4,972 |
| | Marathon Petroleum Corp. | 110,970 | 4,837 |
| | Apache Corp. | 78,890 | 4,692 |
| | Williams Cos. Inc. | 156,599 | 4,573 |
115
| | |
| Vanguard® Total World Stock Index Fund | | |
| Schedule of Investments | | |
| October 31, 2016 | | |
| |
| | | Market |
| | | Value |
| | Shares | ($000) |
| Devon Energy Corp. | 109,569 | 4,152 |
| * Concho Resources Inc. | 29,253 | 3,713 |
| Noble Energy Inc. | 91,099 | 3,140 |
| Hess Corp. | 59,751 | 2,866 |
| Cimarex Energy Co. | 20,141 | 2,601 |
| National Oilwell Varco Inc. | 80,129 | 2,572 |
| EQT Corp. | 36,755 | 2,426 |
| Marathon Oil Corp. | 180,848 | 2,384 |
| Tesoro Corp. | 24,270 | 2,062 |
| Cabot Oil & Gas Corp. | 96,870 | 2,023 |
| * Cheniere Energy Inc. | 49,977 | 1,884 |
| * Newfield Exploration Co. | 42,201 | 1,713 |
| * Diamondback Energy Inc. | 16,600 | 1,515 |
| * FMC Technologies Inc. | 46,811 | 1,511 |
| Range Resources Corp. | 43,596 | 1,473 |
| Targa Resources Corp. | 32,608 | 1,431 |
| Helmerich & Payne Inc. | 21,600 | 1,363 |
| OGE Energy Corp. | 42,100 | 1,307 |
| * Antero Resources Corp. | 41,800 | 1,106 |
| * Parsley Energy Inc. Class A | 33,432 | 1,100 |
| * Southwestern Energy Co. | 104,918 | 1,090 |
| Energen Corp. | 20,509 | 1,028 |
| HollyFrontier Corp. | 37,970 | 947 |
| * Weatherford International plc | 195,603 | 943 |
| * Continental Resources Inc. | 19,112 | 935 |
| * Chesapeake Energy Corp. | 165,563 | 912 |
| Core Laboratories NV | 9,200 | 892 |
| Murphy Oil Corp. | 33,223 | 859 |
| QEP Resources Inc. | 49,864 | 801 |
| * WPX Energy Inc. | 73,232 | 795 |
| * RSP Permian Inc. | 20,989 | 758 |
| * PDC Energy Inc. | 11,781 | 723 |
| Patterson-UTI Energy Inc. | 30,859 | 694 |
| Nabors Industries Ltd. | 58,208 | 693 |
| * Rice Energy Inc. | 30,050 | 664 |
| * Gulfport Energy Corp. | 25,538 | 616 |
| * First Solar Inc. | 15,170 | 614 |
| SM Energy Co. | 16,914 | 569 |
| Western Refining Inc. | 17,674 | 510 |
| * Oasis Petroleum Inc. | 47,553 | 499 |
| Ensco plc Class A | 61,383 | 480 |
| * Whiting Petroleum Corp. | 57,655 | 475 |
| * NOW Inc. | 21,596 | 466 |
| * InterOil Corp. | 9,100 | 452 |
| SemGroup Corp. Class A | 13,853 | 447 |
| PBF Energy Inc. Class A | 20,102 | 438 |
| Oceaneering International Inc. | 18,400 | 438 |
| * Callon Petroleum Co. | 32,986 | 428 |
| * Dril-Quip Inc. | 8,800 | 418 |
| Superior Energy Services Inc. | 29,435 | 417 |
| * Carrizo Oil & Gas Inc. | 11,579 | 392 |
| * Laredo Petroleum Inc. | 32,000 | 381 |
| * Oil States International Inc. | 12,700 | 371 |
| * Matador Resources Co. | 16,500 | 360 |
| Rowan Cos. plc Class A | 24,688 | 328 |
| Pattern Energy Group Inc. Class A | 14,552 | 325 |
| * MRC Global Inc. | 21,900 | 323 |
| Noble Corp. plc | 61,511 | 304 |
| * McDermott International Inc. | 50,377 | 259 |
| Diamond Offshore Drilling Inc. | 13,618 | 225 |
| * Forum Energy Technologies Inc. | 12,000 | 216 |
| * Unit Corp. | 12,300 | 211 |
| Delek US Holdings Inc. | 12,080 | 204 |
| * Denbury Resources Inc. | 84,826 | 203 |
116
| | | |
| Vanguard® Total World Stock Index Fund | | |
| Schedule of Investments | | |
| October 31, 2016 | | |
| |
| | | | Market |
| | | | Value |
| | | Shares | ($000) |
| | Green Plains Inc. | 7,400 | 192 |
| * | Helix Energy Solutions Group Inc. | 21,700 | 189 |
| * | RPC Inc. | 10,600 | 183 |
| * | Chart Industries Inc. | 6,400 | 178 |
| * | Exterran Corp. | 11,100 | 175 |
| * | SEACOR Holdings Inc. | 3,100 | 153 |
| * | Kosmos Energy Ltd. | 29,279 | 153 |
| | Archrock Inc. | 12,800 | 148 |
| *,^ | Canadian Solar Inc. | 9,400 | 136 |
| * | TETRA Technologies Inc. | 23,000 | 125 |
| * | Newpark Resources Inc. | 16,900 | 106 |
| * | Flotek Industries Inc. | 7,600 | 90 |
| * | Matrix Service Co. | 5,000 | 88 |
| | Atwood Oceanics Inc. | 10,300 | 79 |
| * | SunPower Corp. Class A | 9,800 | 71 |
| ^ | Frank's International NV | 6,200 | 70 |
| | California Resources Corp. | 6,268 | 64 |
| * | Cobalt International Energy Inc. | 65,692 | 62 |
| | CVR Energy Inc. | 4,200 | 56 |
| | Bristow Group Inc. | 4,700 | 47 |
| * | EP Energy Corp. Class A | 5,200 | 19 |
| | | | 308,426 |
| Other (0.0%)3 | | |
| * | Dyax Corp CVR Exp. 12/31/2019 | 28,600 | 32 |
| * | Leap Wireless International Inc CVR | 5,200 | 13 |
| | | | 45 |
| Technology (9.1%) | | |
| | Apple Inc. | 1,128,548 | 128,135 |
| | Microsoft Corp. | 1,579,912 | 94,668 |
| * | Facebook Inc. Class A | 458,824 | 60,101 |
| * | Alphabet Inc. Class A | 60,981 | 49,388 |
| * | Alphabet Inc. Class C | 61,314 | 48,103 |
| | Intel Corp. | 988,497 | 34,469 |
| | Cisco Systems Inc. | 1,046,637 | 32,111 |
| | International Business Machines Corp. | 200,082 | 30,751 |
| | Oracle Corp. | 666,992 | 25,626 |
| | QUALCOMM Inc. | 306,992 | 21,096 |
| | Texas Instruments Inc. | 207,359 | 14,691 |
| | Broadcom Ltd. | 81,416 | 13,864 |
| * | Adobe Systems Inc. | 104,793 | 11,266 |
| * | salesforce.com Inc. | 128,787 | 9,680 |
| | Hewlett Packard Enterprise Co. | 350,185 | 7,869 |
| * | Yahoo! Inc. | 184,079 | 7,648 |
| | NVIDIA Corp. | 106,833 | 7,602 |
| | Applied Materials Inc. | 226,882 | 6,598 |
| * | Cognizant Technology Solutions Corp. Class A | 127,712 | 6,558 |
| * | NXP Semiconductors NV | 56,971 | 5,697 |
| | Intuit Inc. | 49,380 | 5,370 |
| | HP Inc. | 361,185 | 5,234 |
| | Corning Inc. | 216,212 | 4,910 |
| | Analog Devices Inc. | 65,621 | 4,206 |
| * | Micron Technology Inc. | 217,122 | 3,726 |
| * | Cerner Corp. | 62,006 | 3,632 |
| * | Autodesk Inc. | 46,765 | 3,380 |
| | Lam Research Corp. | 33,711 | 3,265 |
| | Western Digital Corp. | 55,505 | 3,244 |
| | Symantec Corp. | 128,205 | 3,209 |
| | Skyworks Solutions Inc. | 39,100 | 3,008 |
| | Linear Technology Corp. | 49,751 | 2,988 |
| * | ServiceNow Inc. | 32,500 | 2,857 |
| * | Palo Alto Networks Inc. | 18,200 | 2,800 |
| | Microchip Technology Inc. | 45,708 | 2,768 |
| * | Red Hat Inc. | 35,686 | 2,764 |
| | Xilinx Inc. | 54,097 | 2,752 |
117
| | | |
| Vanguard® Total World Stock Index Fund | | |
| Schedule of Investments | | |
| October 31, 2016 | | |
| |
| | | | Market |
| | | | Value |
| | | Shares | ($000) |
| * | Citrix Systems Inc. | 32,111 | 2,723 |
| | Motorola Solutions Inc. | 34,545 | 2,507 |
| | KLA-Tencor Corp. | 32,392 | 2,433 |
| * | Akamai Technologies Inc. | 35,002 | 2,432 |
| | Maxim Integrated Products Inc. | 60,336 | 2,391 |
| | Harris Corp. | 26,163 | 2,334 |
| | Juniper Networks Inc. | 83,334 | 2,195 |
| * | Workday Inc. Class A | 25,172 | 2,182 |
| * | Check Point Software Technologies Ltd. | 25,691 | 2,172 |
| * | Dell Technologies Inc - VMware Inc | 43,167 | 2,119 |
| | NetApp Inc. | 59,320 | 2,013 |
| | Seagate Technology plc | 58,583 | 2,010 |
| | CA Inc. | 65,050 | 2,000 |
| * | VeriSign Inc. | 22,666 | 1,904 |
| * | F5 Networks Inc. | 13,691 | 1,892 |
| * | Synopsys Inc. | 31,819 | 1,887 |
| | Amdocs Ltd. | 31,838 | 1,861 |
| * | Twitter Inc. | 98,200 | 1,763 |
| | CDK Global Inc. | 30,848 | 1,685 |
| * | Splunk Inc. | 27,298 | 1,643 |
| | Computer Sciences Corp. | 29,890 | 1,627 |
| * | ANSYS Inc. | 17,555 | 1,604 |
| * | Cadence Design Systems Inc. | 60,265 | 1,542 |
| * | Qorvo Inc. | 27,427 | 1,526 |
| * | Mobileye NV | 38,305 | 1,424 |
| | CDW Corp. | 31,034 | 1,394 |
| * | Gartner Inc. | 15,700 | 1,351 |
| * | Ultimate Software Group Inc. | 6,100 | 1,287 |
| ^ | Leidos Holdings Inc. | 29,091 | 1,209 |
| | SS&C Technologies Holdings Inc. | 37,736 | 1,205 |
| * | Tyler Technologies Inc. | 7,300 | 1,171 |
| | Marvell Technology Group Ltd. | 89,179 | 1,162 |
| * | Advanced Micro Devices Inc. | 160,406 | 1,160 |
| *,^ | VMware Inc. Class A | 14,676 | 1,154 |
| * | PTC Inc. | 24,300 | 1,153 |
| | Ingram Micro Inc. | 30,800 | 1,146 |
| * | CommScope Holding Co. Inc. | 36,092 | 1,103 |
| | Brocade Communications Systems Inc. | 100,559 | 1,066 |
| | Garmin Ltd. | 21,936 | 1,061 |
| * | ARRIS International plc | 37,983 | 1,055 |
| | Teradyne Inc. | 45,000 | 1,048 |
| * | Yandex NV Class A | 52,562 | 1,035 |
| * | Microsemi Corp. | 23,806 | 1,003 |
| * | ON Semiconductor Corp. | 85,167 | 994 |
| * | Fortinet Inc. | 29,300 | 939 |
| * | NCR Corp. | 26,615 | 933 |
| | IAC/InterActiveCorp | 14,319 | 923 |
| | CSRA Inc. | 34,425 | 864 |
| * | SINA Corp. | 11,921 | 860 |
| * | Aspen Technology Inc. | 16,900 | 832 |
| * | NetSuite Inc. | 8,519 | 793 |
| * | Veeva Systems Inc. Class A | 20,400 | 793 |
| * | athenahealth Inc. | 7,600 | 785 |
| * | Cavium Inc. | 13,881 | 784 |
| * | Teradata Corp. | 27,736 | 748 |
| * | Manhattan Associates Inc. | 14,700 | 744 |
| * | ViaSat Inc. | 10,300 | 728 |
| * | Ellie Mae Inc. | 6,800 | 720 |
| | j2 Global Inc. | 10,000 | 711 |
| * | Cirrus Logic Inc. | 13,100 | 707 |
| * | Rackspace Hosting Inc. | 21,900 | 699 |
| | Fair Isaac Corp. | 5,700 | 688 |
| | Pitney Bowes Inc. | 38,347 | 684 |
| | Cypress Semiconductor Corp. | 68,532 | 683 |
118
| | |
| Vanguard® Total World Stock Index Fund | | |
| Schedule of Investments | | |
| October 31, 2016 | | |
| |
| | | Market |
| | | Value |
| | Shares | ($000) |
| * Proofpoint Inc. | 8,700 | 682 |
| Mentor Graphics Corp. | 23,500 | 679 |
| * Arista Networks Inc. | 8,000 | 678 |
| * Nuance Communications Inc. | 48,200 | 676 |
| * Guidewire Software Inc. | 11,500 | 661 |
| * EPAM Systems Inc. | 10,200 | 657 |
| Blackbaud Inc. | 10,000 | 614 |
| SYNNEX Corp. | 5,900 | 605 |
| Monolithic Power Systems Inc. | 7,500 | 591 |
| * Tableau Software Inc. Class A | 12,102 | 581 |
| * Allscripts Healthcare Solutions Inc. | 47,800 | 574 |
| DST Systems Inc. | 5,891 | 566 |
| * Integrated Device Technology Inc. | 27,000 | 559 |
| * Tech Data Corp. | 7,000 | 539 |
| Science Applications International Corp. | 7,753 | 534 |
| * Finisar Corp. | 19,500 | 534 |
| * Ciena Corp. | 27,500 | 533 |
| * NetScout Systems Inc. | 19,338 | 531 |
| * Paycom Software Inc. | 10,252 | 530 |
| Lexmark International Inc. Class A | 13,000 | 516 |
| Intersil Corp. Class A | 23,100 | 510 |
| MKS Instruments Inc. | 10,100 | 510 |
| * Dycom Industries Inc. | 6,600 | 508 |
| * Fleetmatics Group plc | 8,400 | 503 |
| * CommVault Systems Inc. | 9,370 | 501 |
| * Medidata Solutions Inc. | 10,100 | 485 |
| InterDigital Inc. | 6,800 | 480 |
| * Cree Inc. | 21,515 | 480 |
| * Silicon Laboratories Inc. | 8,000 | 480 |
| * TiVo Corp. | 23,362 | 464 |
| * CACI International Inc. Class A | 4,700 | 460 |
| * Verint Systems Inc. | 12,700 | 457 |
| * ACI Worldwide Inc. | 25,200 | 457 |
| LogMeIn Inc. | 4,700 | 446 |
| Diebold Inc. | 19,435 | 424 |
| * Entegris Inc. | 26,000 | 413 |
| * Cornerstone OnDemand Inc. | 10,000 | 413 |
| * Electronics For Imaging Inc. | 9,500 | 404 |
| * Synaptics Inc. | 7,500 | 391 |
| * Lumentum Holdings Inc. | 11,440 | 384 |
| * Atlassian Corp. plc Class A | 14,300 | 384 |
| * Gigamon Inc. | 6,900 | 382 |
| Tessera Technologies Inc. | 10,100 | 375 |
| * FireEye Inc. | 32,200 | 374 |
| * GoDaddy Inc. Class A | 10,132 | 363 |
| * InterXion Holding NV | 9,700 | 361 |
| * Semtech Corp. | 14,900 | 361 |
| * Advanced Energy Industries Inc. | 7,500 | 358 |
| * VeriFone Systems Inc. | 22,700 | 351 |
| * MicroStrategy Inc. Class A | 1,800 | 351 |
| Cogent Communications Holdings Inc. | 9,300 | 343 |
| NIC Inc. | 14,900 | 342 |
| Power Integrations Inc. | 5,300 | 342 |
| Plantronics Inc. | 6,600 | 341 |
| * NETGEAR Inc. | 6,700 | 338 |
| * Infoblox Inc. | 12,500 | 331 |
| * Viavi Solutions Inc. | 44,700 | 318 |
| * EchoStar Corp. Class A | 6,800 | 318 |
| * 3D Systems Corp. | 22,900 | 318 |
| * Envestnet Inc. | 8,900 | 315 |
| * Inphi Corp. | 8,400 | 312 |
| * Zendesk Inc. | 11,400 | 300 |
| * Sohu.com Inc. | 8,000 | 299 |
| * Premier Inc. Class A | 9,175 | 292 |
119
| | |
| Vanguard® Total World Stock Index Fund | | |
| Schedule of Investments | | |
| October 31, 2016 | | |
| |
| | | Market |
| | | Value |
| | Shares | ($000) |
| Ebix Inc. | 5,200 | 291 |
| * Ubiquiti Networks Inc. | 5,400 | 283 |
| * Synchronoss Technologies Inc. | 7,600 | 279 |
| * Amkor Technology Inc. | 30,000 | 278 |
| Cabot Microelectronics Corp. | 5,000 | 276 |
| * RealPage Inc. | 10,100 | 275 |
| * BroadSoft Inc. | 6,400 | 266 |
| CSG Systems International Inc. | 6,900 | 262 |
| * 2U Inc. | 7,300 | 254 |
| * Kulicke & Soffa Industries Inc. | 19,200 | 254 |
| * Rambus Inc. | 20,800 | 254 |
| West Corp. | 12,418 | 245 |
| * Progress Software Corp. | 9,100 | 245 |
| Pegasystems Inc. | 7,900 | 244 |
| * Qualys Inc. | 6,500 | 242 |
| * RingCentral Inc. Class A | 11,600 | 240 |
| * ScanSource Inc. | 6,700 | 234 |
| * CyberArk Software Ltd. | 5,000 | 234 |
| * Interactive Intelligence Group Inc. | 3,700 | 224 |
| * Insight Enterprises Inc. | 7,500 | 216 |
| * New Relic Inc. | 5,900 | 215 |
| * Globant SA | 4,800 | 209 |
| * Infinera Corp. | 26,700 | 208 |
| Quality Systems Inc. | 15,900 | 205 |
| * Luxoft Holding Inc. Class A | 3,800 | 201 |
| * HubSpot Inc. | 3,800 | 199 |
| * Web.com Group Inc. | 12,300 | 198 |
| Brooks Automation Inc. | 15,000 | 195 |
| * Cvent Inc. | 6,100 | 190 |
| * Bottomline Technologies de Inc. | 7,900 | 179 |
| * Stratasys Ltd. | 9,300 | 178 |
| * Super Micro Computer Inc. | 7,500 | 178 |
| Monotype Imaging Holdings Inc. | 9,100 | 174 |
| * Cray Inc. | 8,000 | 166 |
| * Perficient Inc. | 8,500 | 158 |
| Forrester Research Inc. | 4,000 | 149 |
| ADTRAN Inc. | 8,200 | 149 |
| * InvenSense Inc. | 18,700 | 143 |
| * Gogo Inc. | 13,800 | 140 |
| Syntel Inc. | 6,800 | 137 |
| * Shutterstock Inc. | 2,300 | 136 |
| * Blucora Inc. | 9,100 | 121 |
| * Ixia | 10,100 | 121 |
| * Barracuda Networks Inc. | 5,000 | 117 |
| * Diodes Inc. | 5,500 | 114 |
| * Lattice Semiconductor Corp. | 18,600 | 113 |
| * Ultratech Inc. | 5,300 | 113 |
| * Loral Space & Communications Inc. | 2,900 | 113 |
| * Applied Micro Circuits Corp. | 13,900 | 103 |
| * Virtusa Corp. | 5,000 | 95 |
| * CommerceHub Inc. | 5,110 | 77 |
| * Nimble Storage Inc. | 10,000 | 76 |
| * Endurance International Group Holdings Inc. | 8,900 | 65 |
| Computer Programs & Systems Inc. | 2,500 | 65 |
| * CommerceHub Inc. Class A | 2,555 | 38 |
| | | 802,591 |
| Telecommunications (1.2%) | | |
| AT&T Inc. | 1,292,788 | 47,562 |
| Verizon Communications Inc. | 853,052 | 41,032 |
| * Level 3 Communications Inc. | 62,390 | 3,503 |
| CenturyLink Inc. | 112,878 | 3,000 |
| * SBA Communications Corp. Class A | 24,734 | 2,802 |
| * T-Mobile US Inc. | 55,188 | 2,745 |
| * Sprint Corp. | 177,621 | 1,094 |
120
| | |
| Vanguard® Total World Stock Index Fund | | |
| Schedule of Investments | | |
| October 31, 2016 | | |
| |
| | | Market |
| | | Value |
| | Shares | ($000) |
| Frontier Communications Corp. | 248,002 | 997 |
| * Zayo Group Holdings Inc. | 20,100 | 647 |
| Telephone & Data Systems Inc. | 23,173 | 599 |
| * Vonage Holdings Corp. | 40,000 | 274 |
| * 8x8 Inc. | 18,900 | 269 |
| Shenandoah Telecommunications Co. | 9,750 | 257 |
| Consolidated Communications Holdings Inc. | 10,500 | 251 |
| * United States Cellular Corp. | 6,300 | 221 |
| Windstream Holdings Inc. | 24,332 | 191 |
| Cincinnati Bell Inc. | 8,780 | 173 |
| ATN International Inc. | 2,400 | 162 |
| * General Communication Inc. Class A | 5,400 | 86 |
| EarthLink Holdings Corp. | 14,900 | 85 |
| | | 105,950 |
| Utilities (1.7%) | | |
| NextEra Energy Inc. | 94,862 | 12,142 |
| Duke Energy Corp. | 142,832 | 11,429 |
| Southern Co. | 201,804 | 10,407 |
| Dominion Resources Inc. | 128,194 | 9,640 |
| American Electric Power Co. Inc. | 102,767 | 6,663 |
| PG&E Corp. | 105,184 | 6,534 |
| Exelon Corp. | 185,778 | 6,329 |
| Sempra Energy | 52,173 | 5,588 |
| Edison International | 68,077 | 5,002 |
| PPL Corp. | 140,973 | 4,841 |
| Consolidated Edison Inc. | 63,288 | 4,781 |
| Public Service Enterprise Group Inc. | 106,019 | 4,461 |
| Xcel Energy Inc. | 105,459 | 4,382 |
| WEC Energy Group Inc. | 66,138 | 3,950 |
| DTE Energy Co. | 37,091 | 3,561 |
| Eversource Energy | 62,482 | 3,440 |
| FirstEnergy Corp. | 88,461 | 3,033 |
| Entergy Corp. | 37,761 | 2,782 |
| American Water Works Co. Inc. | 36,656 | 2,714 |
| Ameren Corp. | 50,767 | 2,536 |
| CMS Energy Corp. | 58,848 | 2,480 |
| ONEOK Inc. | 44,306 | 2,146 |
| CenterPoint Energy Inc. | 89,531 | 2,041 |
| SCANA Corp. | 26,827 | 1,968 |
| Alliant Energy Corp. | 47,754 | 1,817 |
| Pinnacle West Capital Corp. | 23,340 | 1,777 |
| Westar Energy Inc. Class A | 29,900 | 1,714 |
| UGI Corp. | 36,550 | 1,692 |
| AES Corp. | 139,931 | 1,647 |
| Atmos Energy Corp. | 21,900 | 1,629 |
| NiSource Inc. | 66,116 | 1,538 |
| Great Plains Energy Inc. | 41,290 | 1,174 |
| Aqua America Inc. | 29,625 | 910 |
| Vectren Corp. | 17,596 | 885 |
| National Fuel Gas Co. | 16,100 | 843 |
| IDACORP Inc. | 10,400 | 815 |
| Portland General Electric Co. | 17,925 | 782 |
| * Calpine Corp. | 62,584 | 745 |
| NRG Energy Inc. | 66,832 | 710 |
| Southwest Gas Corp. | 9,600 | 696 |
| ONE Gas Inc. | 11,076 | 679 |
| WGL Holdings Inc. | 10,700 | 675 |
| Hawaiian Electric Industries Inc. | 22,700 | 670 |
| Black Hills Corp. | 10,300 | 637 |
| NorthWestern Corp. | 10,800 | 622 |
| New Jersey Resources Corp. | 17,400 | 591 |
| ALLETE Inc. | 9,200 | 564 |
| Spire Inc. | 8,900 | 559 |
| Avista Corp. | 12,600 | 522 |
121
Vanguard® Total World Stock Index Fund
Schedule of Investments
October 31, 2016
| | | | | |
| | | | | | Market |
| | | | | | Value |
| | | | | Shares | ($000) |
| | PNM Resources Inc. | | | 15,700 | 516 |
| | MGE Energy Inc. | | | 8,445 | 494 |
| | Empire District Electric Co. | | | 14,100 | 483 |
| | Avangrid Inc. | | | 12,100 | 477 |
| | South Jersey Industries Inc. | | | 15,800 | 469 |
| | El Paso Electric Co. | | | 8,300 | 383 |
| | Northwest Natural Gas Co. | | | 6,200 | 365 |
| | American States Water Co. | | | 7,900 | 316 |
| | California Water Service Group | | | 9,500 | 295 |
| | Ormat Technologies Inc. (New York Shares) | | | 5,400 | 260 |
| * | Dynegy Inc. | | | 22,379 | 238 |
| | TerraForm Power Inc. Class A | | | 15,300 | 190 |
| * | Talen Energy Corp. | | | 13,236 | 184 |
| | SJW Corp. | | | 3,080 | 156 |
| | Atlantica Yield plc | | | 8,501 | 153 |
| | Ormat Technologies Inc. (Tel Aviv Shares) | | | 2,610 | 125 |
| | | | | | 152,847 |
| |
| | | | | | 4,588,047 |
| |
| Total Common Stocks (Cost $7,907,078) | | | | 8,732,576 |
| |
| |
| | | Coupon | | | |
| |
| Temporary Cash Investments (1.5%)1 | | | | |
| Money Market Fund (1.4%) | | | | |
| 6,7 | Vanguard Market Liquidity Fund | 0.718% | | 1,262,576 | 126,270 |
| |
| |
| | | | | Face | |
| | | | Maturity | Amount | |
| | | | Date | ($000) | |
| U.S. Government and Agency Obligations (0.1%) | | | | |
| 8,9 | Federal Home Loan Bank Discount Notes | 0.431% | 1/25/17 | 1,200 | 1,199 |
| 9 | United States Treasury Bill | 0.275%-0.340% | 12/8/16 | 500 | 500 |
| 9 | United States Treasury Bill | 0.270% | 12/29/16 | 400 | 400 |
| 9 | United States Treasury Bill | 0.314% | 1/5/17 | 100 | 100 |
| 9 | United States Treasury Bill | 0.322% | 1/19/17 | 5,000 | 4,997 |
| |
| | | | | | 7,196 |
| |
| Total Temporary Cash Investments (Cost $133,458) | | | | 133,466 |
| |
| Total Investments (100.7%) (Cost $8,040,536) | | | | 8,866,042 |
| Other Assets and Liabilities—Net (-0.7%)7 | | | | (58,105) |
| |
| Net Assets (100%) | | | | 8,807,937 |
* Non-income-producing security.
^ Includes partial security positions on loan to broker-dealers. The total value of securities on loan is $70,070,000.
1 The fund invests a portion of its cash reserves in equity markets through the use of index futures contracts. After giving effect to futures
investments, the fund's effective common stock and temporary cash investment positions represent 100.0% and 0.7%, respectively, of net
assets.
2 Security exempt from registration under Rule 144A of the Securities Act of 1933. Such securities may be sold in transactions exempt from
registration, normally to qualified institutional buyers. At October 31, 2016, the aggregate value of these securities was $32,844,000,
representing 0.4% of net assets.
3 “Other” represents securities that are not classified by the fund’s benchmark index.
4 Considered an affiliated company of the fund as the issuer is another member of The Vanguard Group.
5 Yum China Holdings Inc. shares were sold on October 25, 2016, on a when-issued basis and were settled after receipt of shares from the Yum!
Brands Inc. spin-off transaction on November 1, 2016. The market value of Yum! Brands Inc. is adjusted by $45,000 to account for this sale.
6 Affiliated money market fund available only to Vanguard funds and certain trusts and accounts managed by Vanguard. Rate shown is the 7-day
yield.
7 Includes $76,749,000 of collateral received for securities on loan.
122
Vanguard® Total World Stock Index Fund
Schedule of Investments
October 31, 2016
8 The issuer operates under a congressional charter; its securities are generally neither guaranteed by the U.S. Treasury
faith and credit of the U.S. government.
9 Securities with a value of $3,598,000 have been segregated as initial margin for open futures contracts.
ADR—American Depositary Receipt.
CVR—Contingent Value Rights.
GDR—Global Depositary Receipt.
NVDR—Non-Voting Depository Receipt.
REIT—Real Estate Investment Trust.
© 2016 The Vanguard Group, Inc.
All rights reserved.
Vanguard Marketing Corporation, Distributor.
SNA6280 122016
| | |
| Vanguard® FTSE All-World ex-US Index Fund | | |
| Schedule of Investments | | |
| October 31, 2016 | | |
| |
| | | Market |
| | | Value |
| | Shares | ($000) |
| |
| Common Stocks (99.2%)1 | | |
| Australia (5.2%) | | |
| Commonwealth Bank of Australia | 2,360,406 | 131,407 |
| Westpac Banking Corp. | 4,617,441 | 106,779 |
| Australia & New Zealand Banking Group Ltd. | 4,039,059 | 85,287 |
| National Australia Bank Ltd. | 3,676,363 | 78,040 |
| BHP Billiton Ltd. | 4,460,174 | 77,923 |
| CSL Ltd. | 636,142 | 48,542 |
| Wesfarmers Ltd. | 1,554,934 | 48,419 |
| Woolworths Ltd. | 1,761,330 | 31,609 |
| Macquarie Group Ltd. | 428,620 | 25,910 |
| Rio Tinto Ltd. | 590,657 | 24,438 |
| Scentre Group | 7,114,713 | 22,771 |
| Telstra Corp. Ltd. | 5,999,827 | 22,691 |
| Transurban Group | 2,844,116 | 22,442 |
| Woodside Petroleum Ltd. | 1,020,766 | 21,851 |
| Brambles Ltd. | 2,190,479 | 19,178 |
| Newcrest Mining Ltd. | 1,058,597 | 18,536 |
| Westfield Corp. | 2,681,817 | 18,124 |
| Amcor Ltd. | 1,607,322 | 17,941 |
| Suncorp Group Ltd. | 1,786,185 | 16,212 |
| South32 Ltd. | 7,413,788 | 14,468 |
| QBE Insurance Group Ltd. | 1,906,847 | 14,447 |
| Insurance Australia Group Ltd. | 3,385,325 | 14,153 |
| AMP Ltd. | 4,068,513 | 14,109 |
| AGL Energy Ltd. | 938,245 | 13,668 |
| Goodman Group | 2,478,263 | 12,774 |
| Stockland | 3,333,005 | 11,194 |
| Aristocrat Leisure Ltd. | 877,432 | 10,216 |
| Aurizon Holdings Ltd. | 2,732,702 | 10,125 |
| Vicinity Centres | 4,584,738 | 9,998 |
| Ramsay Health Care Ltd. | 179,363 | 9,988 |
| Origin Energy Ltd. | 2,429,886 | 9,794 |
| ASX Ltd. | 265,515 | 9,498 |
| APA Group | 1,554,891 | 9,397 |
| Fortescue Metals Group Ltd. | 2,228,414 | 9,352 |
| James Hardie Industries plc | 618,364 | 9,204 |
| Dexus Property Group | 1,344,085 | 9,131 |
| Sonic Healthcare Ltd. | 571,732 | 8,892 |
| GPT Group | 2,508,282 | 8,868 |
| Caltex Australia Ltd. | 361,999 | 8,426 |
| Treasury Wine Estates Ltd. | 1,022,638 | 8,337 |
| Oil Search Ltd. | 1,624,238 | 8,142 |
| Mirvac Group | 5,130,374 | 8,139 |
| LendLease Group | 762,707 | 7,813 |
| Cochlear Ltd. | 79,296 | 7,705 |
| Medibank Pvt Ltd. | 3,827,897 | 7,499 |
| Sydney Airport | 1,542,026 | 7,331 |
| Challenger Ltd. | 793,574 | 6,478 |
| Orica Ltd. | 519,697 | 6,421 |
| Tatts Group Ltd. | 2,016,853 | 6,217 |
| Santos Ltd. | 2,289,441 | 6,126 |
| DUET Group | 3,355,366 | 6,075 |
| Coca-Cola Amatil Ltd. | 751,885 | 5,447 |
| Computershare Ltd. | 677,205 | 5,425 |
| Bendigo & Adelaide Bank Ltd. | 636,860 | 5,378 |
| SEEK Ltd. | 481,210 | 5,345 |
| Incitec Pivot Ltd. | 2,327,845 | 5,206 |
| Boral Ltd. | 1,031,305 | 4,927 |
| BlueScope Steel Ltd. | 786,562 | 4,666 |
| Crown Resorts Ltd. | 527,262 | 4,359 |
| Star Entertainment Grp Ltd. | 1,143,019 | 4,325 |
| Tabcorp Holdings Ltd. | 1,157,844 | 4,254 |
1
| | |
| Vanguard® FTSE All-World ex-US Index Fund | | |
| Schedule of Investments | | |
| October 31, 2016 | | |
| |
| | | Market |
| | | Value |
| | Shares | ($000) |
| Bank of Queensland Ltd. | 529,291 | 4,200 |
| Domino's Pizza Enterprises Ltd. | 85,959 | 4,188 |
| Alumina Ltd. | 3,470,363 | 4,171 |
| Healthscope Ltd. | 2,416,184 | 4,053 |
| Orora Ltd. | 1,662,431 | 3,663 |
| Vocus Communications Ltd. | 813,910 | 3,529 |
| Ansell Ltd. | 208,122 | 3,429 |
| ALS Ltd. | 694,651 | 3,282 |
| Qantas Airways Ltd. | 1,393,429 | 3,238 |
| CIMIC Group Ltd. | 133,558 | 2,997 |
| Harvey Norman Holdings Ltd. | 745,380 | 2,854 |
| REA Group Ltd. | 73,433 | 2,848 |
| AusNet Services | 2,462,692 | 2,805 |
| Downer EDI Ltd. | 597,921 | 2,643 |
| TPG Telecom Ltd. | 456,210 | 2,616 |
| DuluxGroup Ltd. | 532,911 | 2,606 |
| IOOF Holdings Ltd. | 414,285 | 2,579 |
| Iluka Resources Ltd. | 584,774 | 2,564 |
| Adelaide Brighton Ltd. | 624,163 | 2,536 |
| Magellan Financial Group Ltd. | 148,399 | 2,397 |
| Macquarie Atlas Roads Group | 632,785 | 2,267 |
| OZ Minerals Ltd. | 411,861 | 2,104 |
| Perpetual Ltd. | 60,271 | 2,070 |
| Fairfax Media Ltd. | 3,213,723 | 2,013 |
| * Metcash Ltd. | 1,332,722 | 2,011 |
| Flight Centre Travel Group Ltd. | 76,990 | 1,978 |
| CSR Ltd. | 710,452 | 1,973 |
| * Whitehaven Coal Ltd. | 848,988 | 1,952 |
| * WorleyParsons Ltd. | 304,697 | 1,947 |
| Sims Metal Management Ltd. | 226,422 | 1,722 |
| Shopping Centres Australasia Property Group | 1,027,272 | 1,707 |
| Nufarm Ltd. | 240,231 | 1,613 |
| ^ Platinum Asset Management Ltd. | 330,406 | 1,251 |
| Seven West Media Ltd. | 1,194,380 | 615 |
| | | 1,279,838 |
| Austria (0.1%) | | |
| Erste Group Bank AG | 399,218 | 12,519 |
| OMV AG | 200,353 | 6,253 |
| voestalpine AG | 158,434 | 5,613 |
| ANDRITZ AG | 98,823 | 5,167 |
| * Raiffeisen Bank International AG | 164,298 | 2,691 |
| Telekom Austria AG Class A | 191,586 | 1,100 |
| Vienna Insurance Group AG Wiener Versicherung Gruppe | 54,529 | 1,075 |
| | | 34,418 |
| Belgium (0.9%) | | |
| * Anheuser-Busch InBev SA/NV | 1,108,561 | 127,230 |
| * KBC Group NV | 383,230 | 23,362 |
| UCB SA | 167,151 | 11,312 |
| Solvay SA Class A | 98,230 | 11,268 |
| Ageas | 277,481 | 10,137 |
| Groupe Bruxelles Lambert SA | 107,488 | 9,241 |
| Umicore SA | 127,773 | 7,766 |
| Proximus SADP | 195,280 | 5,589 |
| Colruyt SA | 92,819 | 4,989 |
| Ackermans & van Haaren NV | 34,316 | 4,763 |
| bpost SA | 139,093 | 3,701 |
| * Telenet Group Holding NV | 66,909 | 3,582 |
| Sofina SA | 21,324 | 2,979 |
| | | 225,919 |
| Brazil (2.0%) | | |
| Itau Unibanco Holding SA ADR | 3,899,054 | 46,516 |
| Banco Bradesco SA ADR | 3,854,765 | 40,128 |
| * Petroleo Brasileiro SA ADR Type A | 2,780,688 | 30,754 |
2
| | | |
| Vanguard® FTSE All-World ex-US Index Fund | | |
| Schedule of Investments | | |
| October 31, 2016 | | |
| |
| | | | Market |
| | | | Value |
| | | Shares | ($000) |
| * | Petroleo Brasileiro SA ADR | 2,154,126 | 25,139 |
| | Ambev SA ADR | 3,864,982 | 22,803 |
| | BRF SA | 969,362 | 16,217 |
| | Itausa - Investimentos Itau SA Preference Shares | 5,338,358 | 15,788 |
| | Ambev SA | 2,639,540 | 15,571 |
| | Cielo SA | 1,448,764 | 14,705 |
| | BM&FBovespa SA - Bolsa de Valores Mercadorias e Futuros | 2,398,729 | 14,128 |
| | Ultrapar Participacoes SA | 534,137 | 12,103 |
| * | Vale SA Class B ADR (XNYS) | 1,709,694 | 11,010 |
| | Banco do Brasil SA | 1,191,886 | 10,937 |
| | Kroton Educacional SA | 2,117,592 | 10,548 |
| *,^ | Vale SA Class B ADR (XFRA) | 1,397,013 | 9,667 |
| | Banco Bradesco SA | 921,851 | 9,164 |
| | BB Seguridade Participacoes SA | 834,728 | 8,405 |
| | Raia Drogasil SA | 343,070 | 7,616 |
| | Lojas Renner SA | 886,110 | 7,495 |
| | CCR SA | 1,208,353 | 6,568 |
| * | Vale SA Preference Shares | 992,936 | 6,417 |
| | Lojas Americanas SA Preference Shares | 840,998 | 5,454 |
| | Telefonica Brasil SA Preference Shares | 369,635 | 5,348 |
| | Banco Santander Brasil SA | 638,800 | 5,263 |
| | Cia de Saneamento Basico do Estado de Sao Paulo | 475,417 | 5,019 |
| * | Petroleo Brasileiro SA | 851,132 | 4,970 |
| | Equatorial Energia SA | 276,026 | 4,924 |
| | Hypermarcas SA | 524,533 | 4,397 |
| | Embraer SA ADR | 202,891 | 4,340 |
| | CETIP SA - Mercados Organizados | 305,821 | 4,299 |
| | WEG SA | 757,724 | 4,178 |
| | Itau Unibanco Holding SA Preference Shares | 330,855 | 3,980 |
| | Klabin SA | 752,284 | 3,877 |
| | Engie Brasil Energia SA | 291,508 | 3,703 |
| | CPFL Energia SA | 435,492 | 3,304 |
| * | BR Malls Participacoes SA | 788,326 | 3,156 |
| * | Rumo Logistica Operadora Multimodal SA | 1,335,300 | 2,987 |
| | JBS SA | 977,874 | 2,975 |
| * | Vale SA | 427,000 | 2,954 |
| * | Centrais Eletricas Brasileiras SA | 393,199 | 2,919 |
| | Gerdau SA ADR | 793,746 | 2,722 |
| | M Dias Branco SA | 63,662 | 2,719 |
| | Itau Unibanco Holding SA | 259,954 | 2,715 |
| * | Centrais Eletricas Brasileiras SA Preference Shares | 306,476 | 2,626 |
| | Cia Brasileira de Distribuicao ADR | 131,532 | 2,506 |
| | Localiza Rent a Car SA | 198,713 | 2,467 |
| | Fibria Celulose SA | 306,400 | 2,452 |
| | Telefonica Brasil SA ADR | 169,906 | 2,447 |
| * | Petroleo Brasileiro SA Preference Shares | 433,739 | 2,404 |
| *,^ | Cia Siderurgica Nacional SA ADR | 699,597 | 2,358 |
| | BTG Pactual Group | 452,805 | 2,307 |
| | Natura Cosmeticos SA | 236,931 | 2,276 |
| | Multiplan Empreendimentos Imobiliarios SA | 107,900 | 2,168 |
| | Cia Energetica de Minas Gerais ADR | 702,854 | 2,123 |
| | Estacio Participacoes SA | 362,600 | 2,103 |
| | Cosan SA Industria e Comercio | 154,234 | 2,074 |
| | EDP - Energias do Brasil SA | 430,645 | 2,071 |
| | Sul America SA | 323,988 | 1,956 |
| | TOTVS SA | 193,862 | 1,759 |
| | Cia Paranaense de Energia ADR | 138,174 | 1,576 |
| | Smiles SA | 78,730 | 1,437 |
| | Gerdau SA Preference Shares | 406,586 | 1,404 |
| | Suzano Papel e Celulose SA Preference Shares Class A | 394,600 | 1,392 |
| | Odontoprev SA | 367,900 | 1,383 |
| | Cia Brasileira de Distribuicao Grupo Pao de Acucar Preference Shares | 71,030 | 1,357 |
| | TIM Participacoes SA | 461,730 | 1,282 |
| | Braskem SA ADR | 71,104 | 1,262 |
3
| | |
| Vanguard® FTSE All-World ex-US Index Fund | | |
| Schedule of Investments | | |
| October 31, 2016 | | |
| |
| | | Market |
| | | Value |
| | Shares | ($000) |
| Sao Martinho SA | 62,600 | 1,247 |
| Porto Seguro SA | 129,912 | 1,232 |
| Lojas Americanas SA | 247,074 | 1,212 |
| AES Tiete Energia SA | 220,876 | 1,144 |
| TIM Participacoes SA ADR | 80,849 | 1,120 |
| Cia de Transmissao de Energia Eletrica Paulista Preference Shares | 51,324 | 1,114 |
| Cia Energetica de Minas Gerais Preference Shares | 328,837 | 1,004 |
| * Cia Siderurgica Nacional SA | 272,500 | 917 |
| Embraer SA | 166,500 | 895 |
| Transmissora Alianca de Energia Eletrica SA | 136,644 | 888 |
| Multiplus SA | 64,823 | 879 |
| Braskem SA Preference Shares | 67,500 | 598 |
| Cia de Gas de Sao Paulo COMGAS Preference Shares Class A | 32,068 | 522 |
| BRF SA ADR | 25,547 | 427 |
| Cia Energetica de Minas Gerais | 99,669 | 303 |
| * Usinas Siderurgicas de Minas Gerais SA | 82,164 | 227 |
| Cia Paranaense de Energia | 24,000 | 178 |
| Banco Bradesco SA Preference Shares | 12,140 | 127 |
| Cia Paranaense de Energia Preference Shares | 4,200 | 48 |
| Cia Energetica de Sao Paulo Preference Shares | 56 | — |
| * Cia de Gas de Sao Paulo - COMGAS | 11 | — |
| Itausa - Investimentos Itau SA | 7 | — |
| | | 489,154 |
| Canada (5.9%) | | |
| Royal Bank of Canada | 2,056,744 | 128,499 |
| Toronto-Dominion Bank | 2,563,836 | 116,331 |
| Bank of Nova Scotia | 1,681,324 | 90,352 |
| Suncor Energy Inc. | 2,313,081 | 69,411 |
| Canadian National Railway Co. | 958,161 | 60,234 |
| Bank of Montreal | 893,186 | 56,842 |
| Enbridge Inc. | 1,284,541 | 55,469 |
| TransCanada Corp. | 1,110,148 | 50,256 |
| Canadian Natural Resources Ltd. | 1,523,740 | 48,360 |
| Brookfield Asset Management Inc. Class A (Toronto Shares) | 1,207,167 | 42,273 |
| Canadian Imperial Bank of Commerce | 548,481 | 41,096 |
| Manulife Financial Corp. | 2,737,610 | 39,657 |
| Canadian Pacific Railway Ltd. | 210,184 | 30,046 |
| Sun Life Financial Inc. | 849,483 | 28,430 |
| Alimentation Couche-Tard Inc. Class B | 548,384 | 27,548 |
| Barrick Gold Corp. (Toronto Shares) | 1,516,505 | 26,683 |
| Magna International Inc. | 521,046 | 21,393 |
| Rogers Communications Inc. Class B | 502,888 | 20,231 |
| Potash Corp. of Saskatchewan Inc. | 1,164,306 | 18,932 |
| ^ Thomson Reuters Corp. | 470,877 | 18,557 |
| Waste Connections Inc. | 244,170 | 18,324 |
| ^ BCE Inc. | 400,059 | 18,176 |
| Goldcorp Inc. | 1,184,909 | 17,995 |
| Fortis Inc. | 535,324 | 17,621 |
| Agrium Inc. | 191,917 | 17,618 |
| * CGI Group Inc. Class A | 355,801 | 16,900 |
| National Bank of Canada | 468,083 | 16,709 |
| Cenovus Energy Inc. | 1,156,635 | 16,686 |
| Pembina Pipeline Corp. | 537,629 | 16,518 |
| Fairfax Financial Holdings Ltd. | 31,965 | 16,371 |
| Franco-Nevada Corp. | 246,206 | 16,115 |
| Agnico Eagle Mines Ltd. | 311,751 | 15,833 |
| Loblaw Cos. Ltd. | 316,831 | 15,632 |
| Silver Wheaton Corp. | 611,335 | 14,731 |
| Restaurant Brands International Inc. | 312,626 | 13,898 |
| Saputo Inc. | 353,849 | 12,716 |
| Encana Corp. | 1,330,232 | 12,684 |
| Intact Financial Corp. | 182,940 | 12,436 |
| Imperial Oil Ltd. | 366,924 | 11,900 |
| Shaw Communications Inc. Class B | 582,981 | 11,553 |
4
| | |
| Vanguard® FTSE All-World ex-US Index Fund | | |
| Schedule of Investments | | |
| October 31, 2016 | | |
| |
| | | Market |
| | | Value |
| | Shares | ($000) |
| Power Corp. of Canada | 490,365 | 10,518 |
| Great-West Lifeco Inc. | 416,266 | 10,455 |
| Constellation Software Inc. | 22,141 | 10,372 |
| ^ Metro Inc. | 330,534 | 10,217 |
| Inter Pipeline Ltd. | 463,231 | 9,604 |
| ^ Canadian Tire Corp. Ltd. Class A | 96,584 | 9,388 |
| TELUS Corp. | 274,485 | 8,888 |
| RioCan REIT | 440,477 | 8,565 |
| SNC-Lavalin Group Inc. | 209,287 | 8,504 |
| Crescent Point Energy Corp. | 700,998 | 8,346 |
| ^ ARC Resources Ltd. | 484,987 | 8,233 |
| * Valeant Pharmaceuticals International Inc. | 439,190 | 7,839 |
| Power Financial Corp. | 326,838 | 7,724 |
| Canadian Utilities Ltd. Class A | 269,058 | 7,689 |
| * Tourmaline Oil Corp. | 283,032 | 7,417 |
| CI Financial Corp. | 317,433 | 5,841 |
| George Weston Ltd. | 71,099 | 5,794 |
| * BlackBerry Ltd. | 692,477 | 4,889 |
| * Husky Energy Inc. | 418,547 | 4,503 |
| 2 Hydro One Ltd. | 238,552 | 4,352 |
| Cameco Corp. | 543,607 | 4,187 |
| IGM Financial Inc. | 131,336 | 3,525 |
| * Turquoise Hill Resources Ltd. | 1,122,466 | 3,481 |
| Barrick Gold Corp. (New York Shares) | 103,706 | 1,824 |
| Brookfield Asset Management Inc. Class A (New York Shares) | 32,799 | 1,149 |
| Restaurant Brands International LP | 1,203 | 53 |
| | | 1,474,373 |
| Chile (0.3%) | | |
| SACI Falabella | 679,332 | 5,334 |
| Empresas COPEC SA | 521,583 | 5,241 |
| Cencosud SA | 1,567,121 | 5,109 |
| * Latam Airlines Group SA (Santiago Shares) | 460,761 | 4,413 |
| Banco de Chile | 34,031,665 | 4,051 |
| Banco Santander Chile ADR | 168,713 | 3,855 |
| Banco de Credito e Inversiones | 69,424 | 3,568 |
| Sociedad Quimica y Minera de Chile SA ADR | 115,250 | 3,372 |
| Empresas CMPC SA | 1,529,970 | 3,314 |
| Enersis Americas SA ADR | 346,004 | 3,000 |
| Empresa Nacional de Electricidad SA ADR | 136,747 | 2,839 |
| Aguas Andinas SA Class A | 4,256,216 | 2,806 |
| Cia Cervecerias Unidas SA | 206,973 | 2,223 |
| * Itau CorpBanca | 237,270,889 | 2,157 |
| Colbun SA | 9,842,580 | 2,144 |
| * Empresa Nacional de Telecomunicaciones SA | 198,233 | 2,126 |
| Endesa Americas SA ADR | 134,415 | 1,932 |
| Enersis Americas SA | 9,960,968 | 1,687 |
| Enersis Chile SA ADR | 336,671 | 1,673 |
| SONDA SA | 628,485 | 1,299 |
| Embotelladora Andina SA Preference Shares | 321,927 | 1,291 |
| AES Gener SA | 3,535,310 | 1,205 |
| Enersis Chile SA | 9,960,968 | 997 |
| Banco Santander Chile | 17,451,061 | 976 |
| Empresa Nacional de Electricidad SA | 573,761 | 396 |
| Sociedad Quimica y Minera de Chile SA Preference Shares Class B | 12,529 | 372 |
| Endesa Americas SA | 676,553 | 315 |
| | | 67,695 |
| China (4.8%) | | |
| Tencent Holdings Ltd. | 7,425,447 | 196,792 |
| China Construction Bank Corp. | 126,971,544 | 92,721 |
| China Mobile Ltd. | 7,398,567 | 84,761 |
| Industrial & Commercial Bank of China Ltd. | 100,120,640 | 60,096 |
| Bank of China Ltd. | 104,597,788 | 46,872 |
| Ping An Insurance Group Co. of China Ltd. | 6,935,689 | 36,506 |
| CNOOC Ltd. | 22,367,400 | 28,144 |
5
| | | |
| Vanguard® FTSE All-World ex-US Index Fund | | |
| Schedule of Investments | | |
| October 31, 2016 | | |
| |
| | | | Market |
| | | | Value |
| | | Shares | ($000) |
| | China Petroleum & Chemical Corp. | 35,497,284 | 25,672 |
| | China Life Insurance Co. Ltd. | 10,351,341 | 25,627 |
| | PetroChina Co. Ltd. | 29,249,234 | 20,013 |
| | China Overseas Land & Investment Ltd. | 5,315,820 | 16,319 |
| | Agricultural Bank of China Ltd. | 35,794,233 | 15,058 |
| | China Pacific Insurance Group Co. Ltd. | 3,577,895 | 12,900 |
| | China Merchants Bank Co. Ltd. | 5,282,320 | 12,845 |
| | China Telecom Corp. Ltd. | 22,411,541 | 11,555 |
| | PICC Property & Casualty Co. Ltd. | 6,372,396 | 10,286 |
| | China Minsheng Banking Corp. Ltd. | 9,034,861 | 10,280 |
| | CITIC Ltd. | 6,851,275 | 9,831 |
| | China Shenhua Energy Co. Ltd. | 4,716,388 | 9,778 |
| | China Unicom Hong Kong Ltd. | 7,971,713 | 9,359 |
| | China Resources Land Ltd. | 3,742,214 | 9,294 |
| | Bank of Communications Co. Ltd. | 11,149,925 | 8,475 |
| | Haitong Securities Co. Ltd. | 4,725,793 | 8,361 |
| | Hengan International Group Co. Ltd. | 1,019,308 | 8,098 |
| | Sinopharm Group Co. Ltd. | 1,455,703 | 7,069 |
| | CITIC Securities Co. Ltd. | 3,173,990 | 7,020 |
| | Geely Automobile Holdings Ltd. | 6,622,610 | 6,814 |
| | China Communications Construction Co. Ltd. | 6,189,026 | 6,796 |
| | China CITIC Bank Corp. Ltd. | 10,531,189 | 6,792 |
| *,^ | BYD Co. Ltd. | 957,355 | 6,303 |
| | Lenovo Group Ltd. | 9,543,802 | 6,114 |
| | CSPC Pharmaceutical Group Ltd. | 5,845,115 | 6,052 |
| | Guangdong Investment Ltd. | 3,897,851 | 5,877 |
| | Country Garden Holdings Co. Ltd. | 9,942,756 | 5,160 |
| | Shenzhou International Group Holdings Ltd. | 776,315 | 5,142 |
| | Belle International Holdings Ltd. | 8,485,870 | 5,124 |
| | CRRC Corp. Ltd. | 5,652,053 | 5,118 |
| 2 | Huatai Securities Co. Ltd. | 2,400,175 | 5,067 |
| 2 | China Galaxy Securities Co. Ltd. | 5,184,777 | 4,922 |
| | New China Life Insurance Co. Ltd. | 1,122,638 | 4,848 |
| ^ | GF Securities Co. Ltd. | 2,172,626 | 4,827 |
| | ENN Energy Holdings Ltd. | 1,020,712 | 4,799 |
| | China Vanke Co. Ltd. | 1,824,843 | 4,763 |
| * | China Resources Beer Holdings Co. Ltd. | 2,227,861 | 4,734 |
| | Fosun International Ltd. | 3,219,135 | 4,662 |
| | Brilliance China Automotive Holdings Ltd. | 3,860,396 | 4,592 |
| | Anhui Conch Cement Co. Ltd. | 1,660,655 | 4,590 |
| | China Cinda Asset Management Co. Ltd. | 12,660,693 | 4,548 |
| | China Resources Power Holdings Co. Ltd. | 2,674,409 | 4,531 |
| | Sunny Optical Technology Group Co. Ltd. | 923,419 | 4,503 |
| | China Everbright International Ltd. | 3,683,967 | 4,404 |
| | China Merchants Port Holdings Co. Ltd. | 1,668,031 | 4,313 |
| | Dongfeng Motor Group Co. Ltd. | 4,078,627 | 4,251 |
| | Great Wall Motor Co. Ltd. | 4,288,303 | 4,185 |
| | China Conch Venture Holdings Ltd. | 2,229,869 | 4,163 |
| | China Railway Group Ltd. | 5,379,352 | 4,147 |
| | Sino Biopharmaceutical Ltd. | 5,885,268 | 4,114 |
| | Fullshare Holdings Ltd. | 7,225,267 | 4,030 |
| 2 | CGN Power Co. Ltd. | 13,727,267 | 4,008 |
| | Beijing Enterprises Water Group Ltd. | 5,512,679 | 3,988 |
| * | China Taiping Insurance Holdings Co. Ltd. | 2,060,364 | 3,966 |
| | Guangzhou Automobile Group Co. Ltd. | 3,105,605 | 3,750 |
| | China State Construction International Holdings Ltd. | 2,492,727 | 3,637 |
| | Huaneng Power International Inc. | 5,908,982 | 3,632 |
| | ANTA Sports Products Ltd. | 1,255,368 | 3,620 |
| | Beijing Enterprises Holdings Ltd. | 721,981 | 3,608 |
| | China Longyuan Power Group Corp. Ltd. | 4,694,785 | 3,580 |
| 2 | People's Insurance Co. Group of China Ltd. | 8,775,161 | 3,487 |
| | China Resources Gas Group Ltd. | 1,098,547 | 3,445 |
| | Zhuzhou CRRC Times Electric Co. Ltd. | 707,009 | 3,419 |
| *,^ | Alibaba Pictures Group Ltd. | 17,320,648 | 3,409 |
6
| | | |
| Vanguard® FTSE All-World ex-US Index Fund | | |
| Schedule of Investments | | |
| October 31, 2016 | | |
| |
| | | | Market |
| | | | Value |
| | | Shares | ($000) |
| *,2 | China Huarong Asset Management Co. Ltd. | 8,652,874 | 3,308 |
| | China Gas Holdings Ltd. | 2,170,915 | 3,304 |
| *,^ | China Evergrande Group | 4,951,377 | 3,259 |
| | China Railway Construction Corp. Ltd. | 2,596,745 | 3,246 |
| | TravelSky Technology Ltd. | 1,435,703 | 3,063 |
| | Kunlun Energy Co. Ltd. | 3,911,523 | 2,947 |
| | Kingboard Chemical Holdings Ltd. | 942,048 | 2,785 |
| | Haier Electronics Group Co. Ltd. | 1,697,646 | 2,736 |
| | Far East Horizon Ltd. | 2,976,070 | 2,711 |
| | China Medical System Holdings Ltd. | 1,727,715 | 2,698 |
| | Longfor Properties Co. Ltd. | 2,001,434 | 2,656 |
| | Zijin Mining Group Co. Ltd. | 8,131,955 | 2,584 |
| ^ | Kingsoft Corp. Ltd. | 1,121,944 | 2,515 |
| | Shanghai Pharmaceuticals Holding Co. Ltd. | 975,177 | 2,509 |
| | Sinopec Shanghai Petrochemical Co. Ltd. | 4,858,331 | 2,477 |
| | China Oilfield Services Ltd. | 2,504,300 | 2,404 |
| | Shenzhen International Holdings Ltd. | 1,546,589 | 2,388 |
| | GCL-Poly Energy Holdings Ltd. | 17,383,024 | 2,343 |
| | COSCO SHIPPING Ports Ltd. | 2,355,985 | 2,336 |
| | China Everbright Ltd. | 1,186,465 | 2,320 |
| | Shimao Property Holdings Ltd. | 1,727,628 | 2,304 |
| | Chongqing Rural Commercial Bank Co. Ltd. | 3,839,070 | 2,298 |
| | Jiangsu Expressway Co. Ltd. | 1,686,544 | 2,293 |
| | AviChina Industry & Technology Co. Ltd. | 3,357,954 | 2,279 |
| ^ | China Reinsurance Group Corp. | 9,508,576 | 2,263 |
| | Beijing Capital International Airport Co. Ltd. | 2,104,557 | 2,203 |
| * | Alibaba Health Information Technology Ltd. | 4,205,236 | 2,197 |
| | Tsingtao Brewery Co. Ltd. | 538,108 | 2,147 |
| | China Communications Services Corp. Ltd. | 3,593,612 | 2,132 |
| | Zhejiang Expressway Co. Ltd. | 2,031,267 | 2,127 |
| *,^ | Aluminum Corp. of China Ltd. | 5,559,377 | 2,065 |
| | Weichai Power Co. Ltd. | 1,364,219 | 2,058 |
| | China Everbright Bank Co. Ltd. | 4,499,872 | 2,052 |
| ^,2 | Fuyao Glass Industry Group Co. Ltd. | 705,910 | 2,047 |
| ^ | Yanzhou Coal Mining Co. Ltd. | 2,748,246 | 2,035 |
| 2 | BAIC Motor Corp. Ltd. | 1,939,692 | 2,034 |
| | Shanghai Lujiazui Finance & Trade Zone Development Co. Ltd. Class B | 1,305,615 | 2,033 |
| | Jiangxi Copper Co. Ltd. | 1,692,248 | 1,998 |
| | GOME Electrical Appliances Holding Ltd. | 15,784,203 | 1,989 |
| | Shanghai Industrial Holdings Ltd. | 641,587 | 1,961 |
| | China Jinmao Holdings Group Ltd. | 7,056,005 | 1,946 |
| | Huaneng Renewables Corp. Ltd. | 5,663,075 | 1,898 |
| | Guangzhou R&F Properties Co. Ltd. | 1,339,933 | 1,888 |
| ^ | China Huishan Dairy Holdings Co. Ltd. | 5,041,795 | 1,871 |
| ^ | China National Building Material Co. Ltd. | 4,081,959 | 1,863 |
| 2 | China Railway Signal & Communication Corp. Ltd. | 2,246,068 | 1,821 |
| * | Shanghai Electric Group Co. Ltd. | 3,917,316 | 1,809 |
| | Shenzhen Investment Ltd. | 4,130,281 | 1,800 |
| | Chongqing Changan Automobile Co. Ltd. Class B | 1,163,079 | 1,773 |
| 2 | Sinopec Engineering Group Co. Ltd. | 2,006,381 | 1,771 |
| | Nine Dragons Paper Holdings Ltd. | 2,163,292 | 1,759 |
| | Shanghai Fosun Pharmaceutical Group Co. Ltd. | 570,641 | 1,752 |
| | Sino-Ocean Group Holding Ltd. | 4,148,754 | 1,723 |
| ^ | Sunac China Holdings Ltd. | 2,518,964 | 1,719 |
| * | China Coal Energy Co. Ltd. | 2,991,638 | 1,694 |
| | Shandong Weigao Group Medical Polymer Co. Ltd. | 2,566,328 | 1,671 |
| | Haitian International Holdings Ltd. | 810,063 | 1,670 |
| | Air China Ltd. | 2,540,115 | 1,669 |
| | China Power International Development Ltd. | 4,575,787 | 1,664 |
| ^ | Luye Pharma Group Ltd. | 2,275,430 | 1,529 |
| ^ | China Traditional Chinese Medicine Holding Co. Ltd. | 2,949,794 | 1,507 |
| ^ | China Hongqiao Group Ltd. | 1,663,184 | 1,486 |
| | ZTE Corp. | 1,080,188 | 1,484 |
| | Inner Mongolia Yitai Coal Co. Ltd. Class B | 1,498,754 | 1,479 |
7
| | | |
| Vanguard® FTSE All-World ex-US Index Fund | | |
| Schedule of Investments | | |
| October 31, 2016 | | |
| |
| | | | Market |
| | | | Value |
| | | Shares | ($000) |
| ^,2 | Dali Foods Group Co. Ltd. | 2,820,197 | 1,468 |
| *,2 | China International Capital Corp. Ltd. | 961,126 | 1,410 |
| | Lee & Man Paper Manufacturing Ltd. | 1,855,743 | 1,394 |
| *,2 | 3SBio Inc. | 1,387,075 | 1,384 |
| | SOHO China Ltd. | 2,669,994 | 1,377 |
| | China Southern Airlines Co. Ltd. | 2,445,017 | 1,372 |
| *,^ | Li Ning Co. Ltd. | 1,889,617 | 1,347 |
| 2 | Legend Holdings Corp. | 540,470 | 1,346 |
| ^ | Metallurgical Corp. of China Ltd. | 4,095,562 | 1,332 |
| ^,2 | Shengjing Bank Co. Ltd. | 1,354,632 | 1,326 |
| | Yuexiu Property Co. Ltd. | 8,922,772 | 1,307 |
| | Kingboard Laminates Holdings Ltd. | 1,444,852 | 1,295 |
| ^ | Zhaojin Mining Industry Co. Ltd. | 1,240,548 | 1,274 |
| | Sinotrans Ltd. | 2,648,860 | 1,247 |
| | BBMG Corp. | 3,362,760 | 1,227 |
| *,^ | China COSCO Holdings Co. Ltd. | 3,555,160 | 1,225 |
| ^ | China Molybdenum Co. Ltd. | 5,477,571 | 1,215 |
| * | China Agri-Industries Holdings Ltd. | 3,033,447 | 1,185 |
| * | CAR Inc. | 1,126,492 | 1,143 |
| | China Resources Cement Holdings Ltd. | 2,821,334 | 1,139 |
| *,^ | China Shipping Container Lines Co. Ltd. | 5,142,407 | 1,078 |
| | Agile Group Holdings Ltd. | 1,885,637 | 1,045 |
| | Guangshen Railway Co. Ltd. | 1,890,327 | 1,043 |
| ^ | Datang International Power Generation Co. Ltd. | 3,788,668 | 1,021 |
| | Huishang Bank Corp. Ltd. | 2,124,092 | 1,020 |
| ^ | Golden Eagle Retail Group Ltd. | 724,928 | 1,007 |
| | KWG Property Holding Ltd. | 1,728,409 | 1,000 |
| | Shenzhen Expressway Co. Ltd. | 991,216 | 993 |
| | Lao Feng Xiang Co. Ltd. Class B | 277,721 | 947 |
| | China Shipping Development Co. Ltd. | 1,715,196 | 946 |
| ^ | China Eastern Airlines Corp. Ltd. | 2,101,145 | 943 |
| ^ | Huadian Power International Corp. Ltd. | 2,148,361 | 921 |
| | Zhongsheng Group Holdings Ltd. | 916,048 | 915 |
| ^ | China Zhongwang Holdings Ltd. | 1,889,876 | 873 |
| *,^ | Greentown China Holdings Ltd. | 1,070,020 | 872 |
| | China Dongxiang Group Co. Ltd. | 4,397,598 | 855 |
| | CSG Holding Co. Ltd. Class B | 1,005,352 | 838 |
| | Huadian Fuxin Energy Corp. Ltd. | 3,576,005 | 828 |
| ^ | Beijing Jingneng Clean Energy Co. Ltd. | 2,716,885 | 824 |
| *,^ | Poly Property Group Co. Ltd. | 2,571,998 | 813 |
| | Yantai Changyu Pioneer Wine Co. Ltd. Class B | 293,363 | 807 |
| *,^ | Angang Steel Co. Ltd. | 1,575,537 | 807 |
| ^ | Xinjiang Goldwind Science & Technology Co. Ltd. | 575,724 | 794 |
| | Hopson Development Holdings Ltd. | 876,475 | 790 |
| | Dazhong Transportation Group Co. Ltd. Class B | 1,122,902 | 784 |
| ^,2 | Red Star Macalline Group Corp. Ltd. | 714,985 | 769 |
| | China Machinery Engineering Corp. | 1,275,516 | 761 |
| * | Guangzhou Baiyunshan Pharmaceutical Holdings Co. Ltd. | 313,398 | 740 |
| ^ | China International Marine Containers Group Co. Ltd. | 605,289 | 720 |
| ^ | China South City Holdings Ltd. | 3,164,311 | 700 |
| | Shandong Chenming Paper Holdings Ltd. Class B | 699,948 | 626 |
| | Shanghai Mechanical and Electrical Industry Co. Ltd. Class B | 287,678 | 619 |
| ^ | Zoomlion Heavy Industry Science and Technology Co. Ltd. | 1,700,081 | 619 |
| | Shanghai Jinqiao Export Processing Zone Development Co. Ltd. Class B | 397,037 | 603 |
| | Anhui Gujing Distillery Co. Ltd. Class B | 154,206 | 599 |
| | Anhui Expressway Co. Ltd. | 737,659 | 594 |
| *,^ | Maanshan Iron & Steel Co. Ltd. | 2,567,903 | 585 |
| *,^ | Sinopec Oilfield Service Corp. | 2,790,643 | 578 |
| * | Shanghai Zhenhua Heavy Industries Co. Ltd. Class B | 1,143,920 | 566 |
| | Sinotruk Hong Kong Ltd. | 1,016,199 | 561 |
| *,^ | Biostime International Holdings Ltd. | 227,876 | 559 |
| *,^ | Renhe Commercial Holdings Co. Ltd. | 20,656,355 | 535 |
| | Shanghai Baosight Software Co. Ltd. Class B | 308,442 | 534 |
| *,2 | Tianhe Chemicals Group Ltd. | 3,538,329 | 534 |
8
| | | |
| Vanguard® FTSE All-World ex-US Index Fund | | |
| Schedule of Investments | | |
| October 31, 2016 | | |
| |
| | | | Market |
| | | | Value |
| | | Shares | ($000) |
| | Shanghai Haixin Group Co. Class B | 596,446 | 514 |
| | China BlueChemical Ltd. | 2,631,895 | 509 |
| ^ | CSSC Offshore and Marine Engineering Group Co. Ltd. | 332,873 | 502 |
| | Guangdong Electric Power Development Co. Ltd. Class B | 1,117,911 | 498 |
| | Weifu High-Technology Group Co. Ltd. Class B | 210,024 | 497 |
| ^ | Dalian Port PDA Co. Ltd. | 2,651,103 | 474 |
| | Shanghai Jinjiang International Hotels Development Co. Ltd. Class B | 220,415 | 470 |
| | Sichuan Expressway Co. Ltd. | 1,167,487 | 469 |
| | China National Accord Medicines Corp. Ltd. Class B | 73,286 | 458 |
| | BOE Technology Group Co. Ltd. Class B | 1,650,239 | 449 |
| | Shanghai Waigaoqiao Free Trade Zone Group Co. Ltd. Class B | 254,321 | 422 |
| | Shandong Chenming Paper Holdings Ltd. | 487,874 | 421 |
| ^ | China Foods Ltd. | 918,843 | 406 |
| * | Shanghai Chlor-Alkali Chemical Co. Ltd. Class B | 521,434 | 403 |
| * | Hanergy Thin Film Power Group Ltd. | 14,742,000 | 392 |
| | Bosideng International Holdings Ltd. | 4,255,541 | 383 |
| *,^ | CITIC Resources Holdings Ltd. | 3,012,222 | 376 |
| | China National Materials Co. Ltd. | 1,580,369 | 356 |
| ^ | Dongfang Electric Corp. Ltd. | 451,295 | 349 |
| | Shanghai Shibei Hi-Tech Co. Ltd. Class B | 309,130 | 339 |
| | Shanghai Huayi Group Corp. Ltd. Class B | 311,547 | 330 |
| ^ | CIMC Enric Holdings Ltd. | 772,225 | 323 |
| | Shanghai Jinjiang International Industrial Investment Co. Ltd. Class B | 213,740 | 317 |
| * | Shanghai Bailian Group Co. Ltd. Class B | 239,123 | 316 |
| | Foshan Electrical and Lighting Co. Ltd. Class B | 388,724 | 314 |
| ^ | Beijing North Star Co. Ltd. | 907,223 | 305 |
| ^ | Sinofert Holdings Ltd. | 2,319,208 | 304 |
| | Shenzhen Chiwan Wharf Holdings Ltd. Class B | 188,066 | 300 |
| * | Huadian Energy Co. Ltd. Class B | 598,300 | 299 |
| | Jiangling Motors Corp. Ltd. Class B | 109,467 | 276 |
| | Tianjin Capital Environmental Protection Group Co. Ltd. | 412,838 | 230 |
| * | Bengang Steel Plates Co. Ltd. Class B | 629,215 | 220 |
| *,^ | Sany Heavy Equipment International Holdings Co. Ltd. | 1,360,731 | 212 |
| | Jinzhou Port Co. Ltd. Class B | 370,560 | 197 |
| * | Qinqin Foodstuffs Group Cayman Co. Ltd. | 195,323 | 67 |
| | | | 1,203,192 |
| Colombia (0.1%) | | |
| | Bancolombia SA ADR | 157,148 | 6,016 |
| | Grupo de Inversiones Suramericana SA | 325,809 | 4,202 |
| | Grupo Argos SA | 453,992 | 2,944 |
| | Cementos Argos SA | 547,547 | 2,167 |
| * | Ecopetrol SA | 4,821,790 | 2,101 |
| | Grupo Aval Acciones y Valores Preference Shares | 4,431,864 | 1,828 |
| | Grupo de Inversiones Suramericana SA Preference Shares | 127,826 | 1,615 |
| | Almacenes Exito SA | 318,776 | 1,590 |
| | Interconexion Electrica SA ESP | 466,455 | 1,550 |
| | Cementos Argos SA Preference Shares | 283,835 | 1,035 |
| * | Ecopetrol SA ADR | 100,879 | 877 |
| * | Cemex Latam Holdings SA | 217,281 | 808 |
| | Grupo Aval Acciones y Valores SA ADR | 46,572 | 381 |
| | | | 27,114 |
| Czech Republic (0.0%) | | |
| | CEZ AS | 225,198 | 4,248 |
| | Komercni banka as | 106,049 | 3,880 |
| *,2 | Moneta Money Bank AS | 526,066 | 1,835 |
| | O2 Czech Republic AS | 67,064 | 615 |
| | | | 10,578 |
| Denmark (1.2%) | | |
| | Novo Nordisk A/S Class B | 2,564,623 | 91,366 |
| | Danske Bank A/S | 1,039,340 | 32,063 |
| | Vestas Wind Systems A/S | 303,457 | 24,312 |
| | Pandora A/S | 153,665 | 19,985 |
| | Carlsberg A/S Class B | 147,098 | 13,253 |
9
| | | |
| Vanguard® FTSE All-World ex-US Index Fund | | |
| Schedule of Investments | | |
| October 31, 2016 | | |
| |
| | | | Market |
| | | | Value |
| | | Shares | ($000) |
| | AP Moller - Maersk A/S Class B | 8,604 | 13,197 |
| | DSV A/S | 257,860 | 12,485 |
| * | Genmab A/S | 75,298 | 12,400 |
| | Novozymes A/S | 309,256 | 11,472 |
| | ISS A/S | 257,393 | 10,104 |
| | Coloplast A/S Class B | 139,730 | 9,734 |
| | AP Moller - Maersk A/S Class A | 6,044 | 8,834 |
| | Chr Hansen Holding A/S | 122,108 | 7,313 |
| * | TDC A/S | 1,106,022 | 6,098 |
| | Jyske Bank A/S | 97,984 | 4,443 |
| *,2 | DONG Energy A/S | 109,867 | 4,353 |
| | Tryg A/S | 153,909 | 3,001 |
| | William Demant Holding A/S | 157,838 | 2,937 |
| * | H Lundbeck A/S | 83,207 | 2,682 |
| | | | 290,032 |
| Egypt (0.1%) | | |
| | Commercial International Bank Egypt SAE | 1,445,862 | 8,412 |
| * | Global Telecom Holding SAE GDR | 741,490 | 1,520 |
| * | Egyptian Financial Group-Hermes Holding Co. | 789,061 | 1,392 |
| | Talaat Moustafa Group | 1,358,206 | 866 |
| | ElSewedy Electric Co. | 106,234 | 750 |
| * | Medinet Nasr Housing | 321,632 | 505 |
| | Telecom Egypt Co. | 488,828 | 482 |
| | Sidi Kerir Petrochemicals Co. | 165,354 | 258 |
| | | | 14,185 |
| Finland (0.7%) | | |
| | Nokia Oyj | 7,943,643 | 35,465 |
| | Sampo Oyj Class A | 654,489 | 29,985 |
| | Kone Oyj Class B | 528,406 | 24,313 |
| | UPM-Kymmene Oyj | 737,376 | 17,153 |
| | Fortum Oyj | 617,359 | 10,291 |
| | Wartsila OYJ Abp | 217,154 | 9,384 |
| | Neste Oyj | 176,925 | 7,633 |
| | Stora Enso Oyj | 798,764 | 7,548 |
| | Elisa Oyj | 222,578 | 7,499 |
| | Nokian Renkaat Oyj | 185,765 | 6,231 |
| | Orion Oyj Class B | 141,528 | 6,024 |
| | Huhtamaki Oyj | 143,999 | 5,811 |
| | Metso Oyj | 185,495 | 4,864 |
| | Kesko Oyj Class B | 93,828 | 4,662 |
| | | | 176,863 |
| France (6.5%) | | |
| | TOTAL SA | 2,988,449 | 143,162 |
| | Sanofi | 1,551,184 | 120,712 |
| | BNP Paribas SA | 1,357,302 | 78,701 |
| | LVMH Moet Hennessy Louis Vuitton SE | 348,065 | 63,369 |
| | AXA SA | 2,677,239 | 60,405 |
| | Danone SA | 790,043 | 54,796 |
| | Schneider Electric SE | 754,436 | 50,736 |
| ^ | Vinci SA | 647,940 | 46,924 |
| | Airbus Group SE | 759,696 | 45,111 |
| | Orange SA | 2,650,369 | 41,700 |
| | Societe Generale SA | 1,018,574 | 39,732 |
| | Pernod Ricard SA | 295,083 | 35,092 |
| | L'Oreal SA Loyalty Line | 190,657 | 34,158 |
| | Air Liquide SA | 325,738 | 33,099 |
| | Essilor International SA | 281,265 | 31,607 |
| | Vivendi SA | 1,532,944 | 31,028 |
| | Cie de Saint-Gobain | 661,161 | 29,358 |
| | Engie SA | 1,999,554 | 28,837 |
| | Safran SA | 411,412 | 28,310 |
| | Cie Generale des Etablissements Michelin | 251,418 | 27,231 |
| | L'Oreal SA | 146,370 | 26,224 |
10
| | |
| Vanguard® FTSE All-World ex-US Index Fund | | |
| Schedule of Investments | | |
| October 31, 2016 | | |
| |
| | | Market |
| | | Value |
| | Shares | ($000) |
| Kering | 103,298 | 22,919 |
| Air Liquide SA (Prime de fidelite) | 219,013 | 22,255 |
| Legrand SA | 368,276 | 20,807 |
| Renault SA | 238,732 | 20,761 |
| Carrefour SA | 785,723 | 20,593 |
| Publicis Groupe SA | 283,829 | 19,471 |
| * Valeo SA | 327,151 | 18,878 |
| Capgemini SA | 220,635 | 18,272 |
| Veolia Environnement SA | 676,184 | 14,773 |
| Sodexo SA | 123,274 | 14,315 |
| Dassault Systemes | 176,116 | 13,940 |
| Christian Dior SE | 72,159 | 13,917 |
| Thales SA | 145,337 | 13,674 |
| Hermes International | 33,225 | 13,460 |
| Atos SE | 125,904 | 13,066 |
| Credit Agricole SA | 1,184,203 | 12,776 |
| Klepierre | 285,680 | 11,675 |
| SES SA Class A | 498,591 | 11,471 |
| Technip SA | 162,231 | 10,767 |
| Arkema SA | 98,246 | 9,316 |
| Accor SA | 240,815 | 9,138 |
| Bouygues SA | 267,188 | 8,710 |
| Teleperformance | 79,302 | 8,379 |
| STMicroelectronics NV | 864,937 | 8,209 |
| Gecina SA | 55,572 | 8,102 |
| * Peugeot SA | 539,362 | 8,077 |
| Eiffage SA | 99,868 | 7,394 |
| Suez | 451,422 | 7,150 |
| SCOR SE | 218,644 | 7,081 |
| Iliad SA | 32,520 | 6,817 |
| Bureau Veritas SA | 359,160 | 6,784 |
| Natixis SA | 1,307,441 | 6,615 |
| Edenred | 284,478 | 6,584 |
| Zodiac Aerospace | 269,821 | 6,557 |
| Ingenico Group SA | 76,493 | 6,050 |
| Groupe Eurotunnel SE | 633,831 | 5,932 |
| Rexel SA | 414,939 | 5,755 |
| * Alstom SA | 213,450 | 5,736 |
| Eurofins Scientific SE | 12,515 | 5,687 |
| SEB SA | 37,112 | 5,462 |
| Societe BIC SA | 37,304 | 5,171 |
| ^ Eutelsat Communications SA | 243,550 | 5,104 |
| Orpea | 58,801 | 4,894 |
| Wendel SA | 41,735 | 4,801 |
| Bollore SA | 1,370,454 | 4,512 |
| Fonciere Des Regions | 50,403 | 4,405 |
| Aeroports de Paris | 40,153 | 4,056 |
| Lagardere SCA | 159,162 | 4,053 |
| Credit Agricole SA Loyalty Line | 374,217 | 4,037 |
| CNP Assurances | 230,750 | 3,996 |
| Casino Guichard Perrachon SA | 77,122 | 3,839 |
| Faurecia | 103,483 | 3,815 |
| Imerys SA | 52,394 | 3,648 |
| ICADE | 48,755 | 3,501 |
| SFR Group SA | 127,414 | 3,434 |
| Ipsen SA | 48,148 | 3,329 |
| Eurazeo SA | 57,496 | 3,311 |
| ^ Electricite de France SA | 294,930 | 3,306 |
| JCDecaux SA | 101,828 | 3,114 |
| BioMerieux | 19,684 | 2,868 |
| 2 Amundi SA | 57,379 | 2,814 |
| Remy Cointreau SA | 32,433 | 2,630 |
| Plastic Omnium SA | 79,131 | 2,580 |
| * Sartorius Stedim Biotech | 32,885 | 2,219 |
11
| | | |
| Vanguard® FTSE All-World ex-US Index Fund | | |
| Schedule of Investments | | |
| October 31, 2016 | | |
| |
| | | | Market |
| | | | Value |
| | | Shares | ($000) |
| | Euler Hermes Group | 21,210 | 1,840 |
| | SEB SA Loyalty Line | 9,727 | 1,432 |
| | Electricite de France SA Loyalty Line | 102,414 | 1,148 |
| | | | 1,601,474 |
| Germany (6.3%) | | |
| | Siemens AG | 1,056,408 | 120,027 |
| | Bayer AG | 1,149,306 | 114,115 |
| | BASF SE | 1,282,979 | 113,259 |
| | SAP SE | 1,242,220 | 109,439 |
| | Allianz SE | 631,900 | 98,643 |
| | Daimler AG | 1,324,208 | 94,472 |
| | Deutsche Telekom AG | 4,455,828 | 72,698 |
| | adidas AG | 277,525 | 45,596 |
| | Linde AG | 256,458 | 42,358 |
| | Deutsche Post AG | 1,317,931 | 40,870 |
| | Bayerische Motoren Werke AG | 450,641 | 39,317 |
| | Muenchener Rueckversicherungs-Gesellschaft AG in Muenchen | 197,961 | 38,436 |
| | Fresenius SE & Co. KGaA | 507,557 | 37,502 |
| | Volkswagen AG Preference Shares | 254,410 | 35,077 |
| | Henkel AG & Co. KGaA Preference Shares | 240,573 | 30,921 |
| | Continental AG | 149,720 | 28,760 |
| | Infineon Technologies AG | 1,554,502 | 27,958 |
| * | Deutsche Bank AG | 1,912,028 | 27,651 |
| | Fresenius Medical Care AG & Co. KGaA | 300,549 | 24,481 |
| | Vonovia SE | 646,087 | 22,778 |
| * | Deutsche Boerse AG-TEND | 259,011 | 20,226 |
| | HeidelbergCement AG | 206,500 | 19,535 |
| | E.ON SE | 2,601,968 | 19,070 |
| | Merck KGaA | 179,209 | 18,446 |
| | Henkel AG & Co. KGaA | 162,256 | 17,878 |
| | Deutsche Wohnen AG | 468,127 | 15,295 |
| | thyssenkrupp AG | 586,940 | 13,619 |
| | ProSiebenSat.1 Media SE | 294,672 | 12,700 |
| | Beiersdorf AG | 138,808 | 12,237 |
| | Symrise AG | 167,962 | 11,535 |
| | Porsche Automobil Holding SE Preference Shares | 211,316 | 11,419 |
| | Brenntag AG | 213,249 | 11,400 |
| * | RWE AG | 669,152 | 10,646 |
| | Commerzbank AG | 1,434,481 | 9,769 |
| | GEA Group AG | 244,890 | 9,485 |
| | Hannover Rueck SE | 83,311 | 9,294 |
| | LANXESS AG | 126,492 | 8,111 |
| * | QIAGEN NV | 313,746 | 7,673 |
| ^ | Wirecard AG | 159,883 | 7,589 |
| | MTU Aero Engines AG | 70,660 | 7,379 |
| | LEG Immobilien AG | 87,285 | 7,363 |
| *,2 | Innogy SE | 177,534 | 7,050 |
| | METRO AG | 228,684 | 6,850 |
| | United Internet AG | 164,726 | 6,773 |
| | Evonik Industries AG | 213,651 | 6,691 |
| | OSRAM Licht AG | 116,365 | 6,609 |
| *,2 | Zalando SE | 146,581 | 6,446 |
| | Volkswagen AG | 40,632 | 6,074 |
| | Bayerische Motoren Werke AG Preference Shares | 75,316 | 5,718 |
| | HUGO BOSS AG | 88,183 | 5,545 |
| | KION Group AG | 90,389 | 5,461 |
| ^ | K&S AG | 264,376 | 5,354 |
| *,2 | Covestro AG | 87,131 | 5,160 |
| | MAN SE | 49,268 | 5,043 |
| | Fuchs Petrolub SE Preference Shares | 96,061 | 4,300 |
| | RTL Group SA | 53,372 | 4,183 |
| | Deutsche Lufthansa AG | 324,724 | 4,156 |
| | HOCHTIEF AG | 29,631 | 4,046 |
| | Sartorius AG Preference Shares | 46,922 | 3,694 |
12
| | |
| Vanguard® FTSE All-World ex-US Index Fund | | |
| Schedule of Investments | | |
| October 31, 2016 | | |
| |
| | | Market |
| | | Value |
| | Shares | ($000) |
| Telefonica Deutschland Holding AG | 946,034 | 3,669 |
| * Uniper SE | 269,935 | 3,593 |
| Axel Springer SE | 61,717 | 3,092 |
| Fraport AG Frankfurt Airport Services Worldwide | 50,966 | 3,025 |
| TUI AG-DI | 232,404 | 2,957 |
| Rational AG | 5,632 | 2,926 |
| Suedzucker AG | 107,500 | 2,758 |
| Fielmann AG | 35,193 | 2,443 |
| Hella KGaA Hueck & Co. | 62,398 | 2,381 |
| FUCHS PETROLUB SE | 48,186 | 1,907 |
| Wacker Chemie AG | 20,608 | 1,839 |
| Talanx AG | 51,005 | 1,583 |
| RWE AG Preference Shares | 43,770 | 506 |
| Deutsche Boerse AG | 1,803 | 135 |
| | | 1,556,994 |
| Greece (0.1%) | | |
| Alpha Bank AE | 1,918,902 | 3,281 |
| Hellenic Telecommunications Organization SA | 335,442 | 3,076 |
| OPAP SA | 288,046 | 2,457 |
| JUMBO SA | 135,114 | 1,920 |
| National Bank of Greece SA | 7,440,054 | 1,522 |
| Titan Cement Co. SA | 64,018 | 1,487 |
| Eurobank Ergasias SA | 2,453,913 | 1,449 |
| Piraeus Bank SA | 7,797,984 | 1,290 |
| * FF Group | 49,006 | 1,174 |
| Motor Oil Hellas Corinth Refineries SA | 81,305 | 973 |
| * Hellenic Petroleum SA | 92,397 | 422 |
| | | 19,051 |
| Hong Kong (2.7%) | | |
| AIA Group Ltd. | 16,738,852 | 105,304 |
| CK Hutchison Holdings Ltd. | 3,915,710 | 48,351 |
| Hong Kong Exchanges & Clearing Ltd. | 1,691,971 | 44,730 |
| Sun Hung Kai Properties Ltd. | 1,959,433 | 29,178 |
| Cheung Kong Property Holdings Ltd. | 3,919,574 | 28,976 |
| Link REIT | 3,136,960 | 22,316 |
| CLP Holdings Ltd. | 2,146,167 | 21,816 |
| Hong Kong & China Gas Co. Ltd. | 10,416,327 | 20,348 |
| Hang Seng Bank Ltd. | 1,060,266 | 19,121 |
| BOC Hong Kong Holdings Ltd. | 4,992,196 | 17,794 |
| Jardine Matheson Holdings Ltd. | 286,492 | 17,451 |
| Power Assets Holdings Ltd. | 1,837,316 | 17,245 |
| Sands China Ltd. | 3,366,208 | 14,609 |
| Wharf Holdings Ltd. | 1,683,768 | 12,624 |
| Galaxy Entertainment Group Ltd. | 2,952,309 | 12,089 |
| Hongkong Land Holdings Ltd. | 1,633,191 | 10,936 |
| Jardine Strategic Holdings Ltd. | 309,847 | 10,872 |
| MTR Corp. Ltd. | 1,941,842 | 10,746 |
| AAC Technologies Holdings Inc. | 968,949 | 9,232 |
| Henderson Land Development Co. Ltd. | 1,559,128 | 9,223 |
| New World Development Co. Ltd. | 7,294,840 | 9,069 |
| 2 WH Group Ltd. | 10,172,266 | 8,239 |
| Swire Pacific Ltd. Class A | 705,729 | 7,335 |
| Sino Land Co. Ltd. | 4,308,374 | 7,315 |
| Cheung Kong Infrastructure Holdings Ltd. | 889,318 | 7,278 |
| China Mengniu Dairy Co. Ltd. | 3,746,849 | 7,078 |
| Wheelock & Co. Ltd. | 1,130,113 | 6,955 |
| ^ Bank of East Asia Ltd. | 1,641,715 | 6,600 |
| Techtronic Industries Co. Ltd. | 1,755,888 | 6,597 |
| Hang Lung Properties Ltd. | 2,791,742 | 6,139 |
| Samsonite International SA | 1,782,758 | 5,605 |
| ^ Want Want China Holdings Ltd. | 8,213,382 | 5,000 |
| Swire Properties Ltd. | 1,633,968 | 4,692 |
| Hang Lung Group Ltd. | 1,202,967 | 4,602 |
| * Semiconductor Manufacturing International Corp. | 35,944,177 | 4,353 |
13
| | | |
| Vanguard® FTSE All-World ex-US Index Fund | | |
| Schedule of Investments | | |
| October 31, 2016 | | |
| |
| | | | Market |
| | | | Value |
| | | Shares | ($000) |
| | Hysan Development Co. Ltd. | 862,530 | 3,981 |
| | Li & Fung Ltd. | 8,080,956 | 3,972 |
| | Yue Yuen Industrial Holdings Ltd. | 1,005,228 | 3,828 |
| | NWS Holdings Ltd. | 1,943,043 | 3,438 |
| | PCCW Ltd. | 5,755,207 | 3,426 |
| | ASM Pacific Technology Ltd. | 340,250 | 3,278 |
| | Wynn Macau Ltd. | 1,988,284 | 3,046 |
| ^ | Tingyi Cayman Islands Holding Corp. | 2,674,119 | 2,883 |
| | Hopewell Holdings Ltd. | 802,568 | 2,810 |
| | VTech Holdings Ltd. | 221,590 | 2,718 |
| | Minth Group Ltd. | 739,490 | 2,618 |
| | Kerry Properties Ltd. | 813,665 | 2,576 |
| ^ | PRADA SPA | 718,158 | 2,516 |
| | Shangri-La Asia Ltd. | 2,269,232 | 2,492 |
| | First Pacific Co. Ltd. | 3,174,253 | 2,405 |
| | Xinyi Glass Holdings Ltd. | 2,712,685 | 2,333 |
| ^ | Sun Art Retail Group Ltd. | 3,020,460 | 2,128 |
| * | Esprit Holdings Ltd. | 2,567,690 | 2,118 |
| ^ | Kingston Financial Group Ltd. | 5,035,258 | 2,090 |
| | Haitong International Securities Group Ltd. | 3,017,736 | 1,931 |
| | Cathay Pacific Airways Ltd. | 1,430,672 | 1,883 |
| | Champion REIT | 3,279,027 | 1,863 |
| | SJM Holdings Ltd. | 2,638,280 | 1,821 |
| | MGM China Holdings Ltd. | 1,091,164 | 1,800 |
| | Great Eagle Holdings Ltd. | 377,425 | 1,674 |
| | Cafe de Coral Holdings Ltd. | 471,108 | 1,663 |
| *,^ | China Minsheng Financial Holding Corp. Ltd. | 15,747,907 | 1,561 |
| ^ | Xinyi Solar Holdings Ltd. | 4,026,966 | 1,492 |
| | Television Broadcasts Ltd. | 409,909 | 1,484 |
| ^ | Melco International Development Ltd. | 1,136,504 | 1,482 |
| | Dah Sing Financial Holdings Ltd. | 213,384 | 1,447 |
| | Uni-President China Holdings Ltd. | 1,836,788 | 1,241 |
| | L'Occitane International SA | 596,275 | 1,231 |
| ^ | Shui On Land Ltd. | 4,890,385 | 1,210 |
| ^ | Guotai Junan International Holdings Ltd. | 3,140,228 | 1,199 |
| | Brightoil Petroleum Holdings Ltd. | 3,984,435 | 1,146 |
| | Johnson Electric Holdings Ltd. | 471,622 | 1,140 |
| | FIH Mobile Ltd. | 3,410,762 | 1,126 |
| * | HengTen Networks Group Ltd. | 16,564,941 | 1,109 |
| | Kerry Logistics Network Ltd. | 810,924 | 1,077 |
| ^ | Chow Tai Fook Jewellery Group Ltd. | 1,475,192 | 1,046 |
| ^ | Shougang Fushan Resources Group Ltd. | 4,765,352 | 1,030 |
| ^ | China Travel International Investment Hong Kong Ltd. | 3,505,542 | 1,010 |
| | Orient Overseas International Ltd. | 266,338 | 996 |
| * | Huabao International Holdings Ltd. | 2,630,129 | 984 |
| | Dah Sing Banking Group Ltd. | 518,444 | 936 |
| ^ | United Co. RUSAL plc | 2,438,920 | 865 |
| * | Global Brands Group Holding Ltd. | 7,559,150 | 856 |
| | Lifestyle International Holdings Ltd. | 616,563 | 826 |
| | Shun Tak Holdings Ltd. | 2,427,006 | 818 |
| ^ | Towngas China Co. Ltd. | 1,347,806 | 758 |
| | Hopewell Highway Infrastructure Ltd. | 1,354,415 | 724 |
| | SA Sa International Holdings Ltd. | 1,451,621 | 664 |
| *,^ | China Oceanwide Holdings Ltd. | 6,291,799 | 640 |
| | Texwinca Holdings Ltd. | 870,717 | 610 |
| | Hutchison Telecommunications Hong Kong Holdings Ltd. | 1,751,886 | 564 |
| | Kowloon Development Co. Ltd. | 487,832 | 488 |
| *,2 | China Jicheng Holdings Ltd. | 12,557,134 | 419 |
| *,^ | Macau Legend Development Ltd. | 2,022,006 | 354 |
| * | Lifestyle China Group Ltd. | 612,870 | 172 |
| *,^ | Good Resources Holdings Ltd. | 3,200,046 | 165 |
| | | | 679,979 |
| Hungary (0.1%) | | |
| | OTP Bank plc | 261,112 | 7,317 |
14
| | |
| Vanguard® FTSE All-World ex-US Index Fund | | |
| Schedule of Investments | | |
| October 31, 2016 | | |
| |
| | | Market |
| | | Value |
| | Shares | ($000) |
| MOL Hungarian Oil & Gas plc | 67,512 | 4,330 |
| Richter Gedeon Nyrt | 195,043 | 4,187 |
| Magyar Telekom Telecommunications plc | 558,550 | 924 |
| | | 16,758 |
| India (2.4%) | | |
| Housing Development Finance Corp. Ltd. | 2,190,889 | 45,713 |
| Infosys Ltd. ADR | 2,430,185 | 37,085 |
| Tata Consultancy Services Ltd. | 653,380 | 23,473 |
| 2 Reliance Industries Ltd. GDR | 719,181 | 22,795 |
| Sun Pharmaceutical Industries Ltd. | 1,535,386 | 17,105 |
| ITC Ltd. | 4,018,112 | 14,636 |
| Hindustan Unilever Ltd. | 991,373 | 12,421 |
| Oil & Natural Gas Corp. Ltd. | 2,856,522 | 12,250 |
| Reliance Industries Ltd. | 766,353 | 12,104 |
| HDFC Bank Ltd. ADR | 161,916 | 11,460 |
| Tata Motors Ltd. | 1,405,802 | 11,320 |
| Axis Bank Ltd. | 1,469,434 | 10,731 |
| Maruti Suzuki India Ltd. | 115,039 | 10,135 |
| ICICI Bank Ltd. ADR | 1,189,920 | 9,864 |
| Bharat Petroleum Corp. Ltd. | 921,352 | 9,248 |
| Coal India Ltd. | 1,845,280 | 8,984 |
| Bharti Airtel Ltd. | 1,779,522 | 8,502 |
| HCL Technologies Ltd. | 739,248 | 8,451 |
| Mahindra & Mahindra Ltd. | 419,323 | 8,241 |
| State Bank of India GDR | 214,935 | 8,182 |
| Indian Oil Corp. Ltd. | 1,552,360 | 7,530 |
| Kotak Mahindra Bank Ltd. | 611,381 | 7,506 |
| Larsen & Toubro Ltd. | 310,687 | 6,896 |
| Lupin Ltd. | 306,806 | 6,841 |
| Hero MotoCorp Ltd. | 136,120 | 6,832 |
| Asian Paints Ltd. | 400,318 | 6,414 |
| NTPC Ltd. (Common) | 2,752,974 | 6,278 |
| Eicher Motors Ltd. | 16,928 | 6,092 |
| Zee Entertainment Enterprises Ltd. | 748,232 | 5,832 |
| IndusInd Bank Ltd. | 319,577 | 5,748 |
| Indiabulls Housing Finance Ltd. | 450,368 | 5,730 |
| UltraTech Cement Ltd. | 91,992 | 5,490 |
| Adani Ports & Special Economic Zone Ltd. | 1,148,167 | 5,284 |
| Yes Bank Ltd. | 272,424 | 5,196 |
| * Vedanta Ltd. | 1,696,644 | 5,167 |
| ^ Wipro Ltd. ADR | 500,365 | 4,839 |
| Aurobindo Pharma Ltd. | 373,953 | 4,547 |
| UPL Ltd. | 423,827 | 4,435 |
| Godrej Consumer Products Ltd. | 176,225 | 4,248 |
| Tech Mahindra Ltd. | 644,026 | 4,204 |
| JSW Steel Ltd. | 164,964 | 4,102 |
| Bajaj Auto Ltd. | 95,532 | 4,078 |
| Ambuja Cements Ltd. | 1,108,963 | 4,011 |
| Hindustan Petroleum Corp. Ltd. | 564,479 | 3,949 |
| Cipla Ltd. | 450,903 | 3,887 |
| Power Grid Corp. of India Ltd. | 1,443,352 | 3,804 |
| Bharti Infratel Ltd. | 728,457 | 3,774 |
| Shriram Transport Finance Co. Ltd. | 229,829 | 3,720 |
| * Bajaj Finance Ltd. | 222,845 | 3,579 |
| Bosch Ltd. | 10,399 | 3,414 |
| HDFC Bank Ltd. | 178,194 | 3,359 |
| Nestle India Ltd. | 32,014 | 3,350 |
| ICICI Bank Ltd. | 761,509 | 3,165 |
| Dabur India Ltd. | 723,259 | 3,159 |
| Piramal Enterprises Ltd. | 117,630 | 3,128 |
| Dr Reddy's Laboratories Ltd. ADR | 62,396 | 3,076 |
| Infosys Ltd. | 202,326 | 3,019 |
| LIC Housing Finance Ltd. | 344,759 | 3,012 |
| Shree Cement Ltd. | 11,778 | 2,950 |
15
| | |
| Vanguard® FTSE All-World ex-US Index Fund | | |
| Schedule of Investments | | |
| October 31, 2016 | | |
| |
| | | Market |
| | | Value |
| | Shares | ($000) |
| Tata Motors Ltd. Class A | 535,933 | 2,802 |
| GAIL India Ltd. | 427,300 | 2,773 |
| * United Spirits Ltd. | 81,864 | 2,759 |
| Bajaj Finserv Ltd. | 53,672 | 2,720 |
| Marico Ltd. | 632,859 | 2,673 |
| Glenmark Pharmaceuticals Ltd. | 188,863 | 2,639 |
| Dr Reddy's Laboratories Ltd. | 52,453 | 2,635 |
| Hindalco Industries Ltd. | 1,156,143 | 2,598 |
| Titan Co. Ltd. | 432,267 | 2,419 |
| Idea Cellular Ltd. | 1,972,289 | 2,253 |
| Motherson Sumi Systems Ltd. | 447,396 | 2,223 |
| IDFC Bank Ltd. | 1,879,521 | 2,219 |
| NMDC Ltd. | 1,121,454 | 2,207 |
| Wipro Ltd. | 316,738 | 2,199 |
| Cadila Healthcare Ltd. | 346,151 | 2,193 |
| Divi's Laboratories Ltd. | 112,427 | 2,155 |
| Cairn India Ltd. | 638,135 | 2,151 |
| Siemens Ltd. | 119,960 | 2,127 |
| Ashok Leyland Ltd. | 1,554,269 | 2,102 |
| Mahindra & Mahindra Financial Services Ltd. | 383,170 | 2,077 |
| Havells India Ltd. | 336,987 | 2,055 |
| Britannia Industries Ltd. | 40,760 | 2,022 |
| Tata Steel Ltd. | 329,187 | 2,004 |
| Rural Electrification Corp. Ltd. | 975,378 | 1,971 |
| Pidilite Industries Ltd. | 173,837 | 1,872 |
| Bharat Forge Ltd. | 131,897 | 1,749 |
| Bharat Heavy Electricals Ltd. | 825,386 | 1,719 |
| Power Finance Corp. Ltd. | 903,052 | 1,681 |
| Bharat Electronics Ltd. | 82,447 | 1,607 |
| Tata Power Co. Ltd. | 1,350,354 | 1,584 |
| Petronet LNG Ltd. | 259,689 | 1,514 |
| * Bank of Baroda | 645,795 | 1,514 |
| Reliance Infrastructure Ltd. | 179,596 | 1,462 |
| NHPC Ltd. | 3,634,047 | 1,459 |
| ACC Ltd. | 64,209 | 1,459 |
| Rajesh Exports Ltd. | 198,982 | 1,426 |
| Oracle Financial Services Software Ltd. | 29,745 | 1,424 |
| Reliance Capital Ltd. | 177,462 | 1,382 |
| Emami Ltd. | 73,907 | 1,343 |
| DLF Ltd. | 584,010 | 1,319 |
| United Breweries Ltd. | 99,067 | 1,290 |
| Hindustan Zinc Ltd. | 339,512 | 1,289 |
| Colgate-Palmolive India Ltd. | 87,578 | 1,277 |
| GlaxoSmithKline Consumer Healthcare Ltd. | 13,913 | 1,267 |
| Bajaj Holdings & Investment Ltd. | 35,960 | 1,174 |
| Torrent Pharmaceuticals Ltd. | 55,122 | 1,169 |
| Cummins India Ltd. | 89,094 | 1,135 |
| ABB India Ltd. | 68,401 | 1,116 |
| Castrol India Ltd. | 158,779 | 1,090 |
| * Steel Authority of India Ltd. | 1,327,539 | 1,037 |
| Oil India Ltd. | 161,291 | 1,003 |
| * Reliance Communications Ltd. | 1,428,009 | 1,001 |
| Tata Communications Ltd. | 98,559 | 938 |
| Sun TV Network Ltd. | 111,329 | 912 |
| Aditya Birla Nuvo Ltd. | 42,667 | 881 |
| Mphasis Ltd. | 112,858 | 866 |
| Exide Industries Ltd. | 290,642 | 854 |
| 2 InterGlobe Aviation Ltd. | 54,224 | 755 |
| * Punjab National Bank | 348,421 | 753 |
| * Canara Bank | 150,093 | 707 |
| * Crompton Greaves Ltd. | 556,042 | 639 |
| * Jindal Steel & Power Ltd. | 538,915 | 609 |
| Godrej Industries Ltd. | 92,551 | 606 |
| * IDFC Ltd. | 575,126 | 603 |
16
| | |
| Vanguard® FTSE All-World ex-US Index Fund | | |
| Schedule of Investments | | |
| October 31, 2016 | | |
| |
| | | Market |
| | | Value |
| | Shares | ($000) |
| * GMR Infrastructure Ltd. | 2,915,787 | 599 |
| * IDBI Bank Ltd. | 537,300 | 593 |
| * Wockhardt Ltd. | 45,282 | 590 |
| Reliance Power Ltd. | 785,614 | 554 |
| JSW Energy Ltd. | 558,364 | 547 |
| GlaxoSmithKline Pharmaceuticals Ltd. | 11,594 | 505 |
| * Bank of India | 292,416 | 504 |
| * Adani Power Ltd. | 1,222,627 | 501 |
| Great Eastern Shipping Co. Ltd. | 75,528 | 422 |
| Union Bank of India | 188,519 | 418 |
| Adani Enterprises Ltd. | 404,396 | 405 |
| * Mangalore Refinery & Petrochemicals Ltd. | 276,782 | 374 |
| Torrent Power Ltd. | 143,644 | 373 |
| * Corp Bank | 315,585 | 197 |
| Oriental Bank of Commerce | 72,758 | 140 |
| | | 594,528 |
| Indonesia (0.6%) | | |
| Telekomunikasi Indonesia Persero Tbk PT | 70,179,424 | 22,659 |
| Bank Central Asia Tbk PT | 17,074,199 | 20,300 |
| Astra International Tbk PT | 28,010,488 | 17,672 |
| Bank Rakyat Indonesia Persero Tbk PT | 14,903,563 | 13,916 |
| Bank Mandiri Persero Tbk PT | 12,938,386 | 11,397 |
| Unilever Indonesia Tbk PT | 1,587,130 | 5,409 |
| Bank Negara Indonesia Persero Tbk PT | 10,377,707 | 4,430 |
| Indofood Sukses Makmur Tbk PT | 6,086,005 | 3,957 |
| Kalbe Farma Tbk PT | 27,097,337 | 3,611 |
| United Tractors Tbk PT | 2,086,012 | 3,451 |
| Gudang Garam Tbk PT | 632,786 | 3,292 |
| Semen Indonesia Persero Tbk PT | 4,110,849 | 3,099 |
| Perusahaan Gas Negara Persero Tbk | 14,786,146 | 2,896 |
| Charoen Pokphand Indonesia Tbk PT | 10,146,364 | 2,871 |
| Indocement Tunggal Prakarsa Tbk PT | 1,849,298 | 2,328 |
| Indofood CBP Sukses Makmur Tbk PT | 3,211,284 | 2,313 |
| Adaro Energy Tbk PT | 17,879,063 | 2,171 |
| Bumi Serpong Damai Tbk PT | 10,569,740 | 1,754 |
| Surya Citra Media Tbk PT | 7,783,479 | 1,581 |
| Tower Bersama Infrastructure Tbk PT | 3,160,965 | 1,447 |
| Bank Danamon Indonesia Tbk PT | 4,287,327 | 1,268 |
| Media Nusantara Citra Tbk PT | 7,163,166 | 1,152 |
| Tambang Batubara Bukit Asam Persero Tbk PT | 1,140,531 | 1,041 |
| Jasa Marga Persero Tbk PT | 2,764,383 | 959 |
| * XL Axiata Tbk PT | 4,914,950 | 829 |
| Astra Agro Lestari Tbk PT | 576,325 | 673 |
| Global Mediacom Tbk PT | 9,127,606 | 594 |
| * Vale Indonesia Tbk PT | 2,829,062 | 590 |
| | | 137,660 |
| Ireland (0.2%) | | |
| Kerry Group plc Class A | 200,629 | 14,561 |
| * Bank of Ireland | 38,232,165 | 8,184 |
| Smurfit Kappa Group plc | 323,811 | 7,109 |
| * Ryanair Holdings plc ADR | 78,542 | 5,898 |
| Glanbia plc | 240,232 | 3,913 |
| * Ryanair Holdings plc | 13,600 | 189 |
| * Irish Bank Resolution Corp. Ltd. | 236,607 | — |
| | | 39,854 |
| Israel (0.4%) | | |
| Teva Pharmaceutical Industries Ltd. | 1,232,618 | 51,481 |
| Bank Hapoalim BM | 1,383,446 | 7,979 |
| * Bank Leumi Le-Israel BM | 1,800,167 | 6,792 |
| Bezeq The Israeli Telecommunication Corp. Ltd. | 2,845,695 | 5,169 |
| Nice Ltd. | 74,800 | 4,965 |
| Elbit Systems Ltd. | 32,792 | 3,245 |
| Frutarom Industries Ltd. | 51,387 | 2,715 |
17
| | | |
| Vanguard® FTSE All-World ex-US Index Fund | | |
| Schedule of Investments | | |
| October 31, 2016 | | |
| |
| | | | Market |
| | | | Value |
| | | Shares | ($000) |
| * | Israel Discount Bank Ltd. Class A | 1,448,068 | 2,660 |
| | Azrieli Group Ltd. | 60,017 | 2,555 |
| | Israel Chemicals Ltd. | 618,564 | 2,198 |
| | Mizrahi Tefahot Bank Ltd. | 159,761 | 2,081 |
| * | Tower Semiconductor Ltd. | 113,448 | 1,753 |
| | Teva Pharmaceutical Industries Ltd. ADR | 36,177 | 1,546 |
| | Delek Group Ltd. | 6,704 | 1,314 |
| | Gazit-Globe Ltd. | 134,113 | 1,211 |
| | Alony Hetz Properties & Investments Ltd. | 131,336 | 1,129 |
| | Paz Oil Co. Ltd. | 6,864 | 1,072 |
| * | Airport City Ltd. | 87,721 | 953 |
| | Melisron Ltd. | 18,150 | 771 |
| | Strauss Group Ltd. | 48,017 | 756 |
| | First International Bank Of Israel Ltd. | 57,398 | 739 |
| | Amot Investments Ltd. | 153,345 | 640 |
| | Harel Insurance Investments & Financial Services Ltd. | 152,538 | 590 |
| * | Oil Refineries Ltd. | 1,420,720 | 501 |
| | Shikun & Binui Ltd. | 273,902 | 475 |
| * | Israel Corp. Ltd. | 3,065 | 456 |
| * | Delek Energy Systems Ltd. | 788 | 408 |
| | Delek Automotive Systems Ltd. | 36,853 | 315 |
| | Shufersal Ltd. | 1 | — |
| | | | 106,469 |
| Italy (1.4%) | | |
| �� | Eni SPA | 3,423,531 | 49,683 |
| | Enel SPA | 10,586,919 | 45,517 |
| | Intesa Sanpaolo SPA (Registered) | 16,732,345 | 38,797 |
| | Assicurazioni Generali SPA | 1,748,354 | 22,584 |
| | UniCredit SPA | 7,379,848 | 18,314 |
| | Snam SPA | 3,395,358 | 17,890 |
| | Atlantia SPA | 663,016 | 16,233 |
| | Luxottica Group SPA | 248,462 | 12,372 |
| * | Telecom Italia SPA (Registered) | 13,713,230 | 11,921 |
| | CNH Industrial NV | 1,279,645 | 9,935 |
| | Terna Rete Elettrica Nazionale SPA | 1,981,837 | 9,701 |
| | Ferrari NV | 183,030 | 9,637 |
| | Fiat Chrysler Automobiles NV | 1,216,119 | 8,915 |
| | Prysmian SPA | 287,165 | 7,141 |
| | EXOR SPA | 156,862 | 6,669 |
| * | Leonardo-Finmeccanica SPA | 533,487 | 6,496 |
| | Telecom Italia SPA (Bearer) | 8,440,477 | 5,991 |
| | Mediobanca SPA | 775,061 | 5,678 |
| | Tenaris SA | 379,268 | 5,364 |
| 2 | Poste Italiane SPA | 633,150 | 4,215 |
| | Recordati SPA | 141,296 | 3,996 |
| | Davide Campari-Milano SPA | 389,336 | 3,921 |
| | Tenaris SA ADR | 137,700 | 3,883 |
| ^ | Unione di Banche Italiane SPA | 1,215,274 | 3,353 |
| * | Saipem SPA | 7,882,983 | 3,242 |
| | FinecoBank Banca Fineco SPA | 547,645 | 3,200 |
| | Mediaset SPA | 1,051,491 | 3,007 |
| | UnipolSai SPA | 1,504,182 | 2,875 |
| | Intesa Sanpaolo SPA | 1,276,180 | 2,763 |
| | Banca Mediolanum SPA | 354,245 | 2,449 |
| ^ | Salvatore Ferragamo SPA | 85,550 | 2,091 |
| | Parmalat SPA | 423,063 | 1,118 |
| | EXOR SPA Rights Exp. 11/09/2016 | 156,862 | — |
| | | | 348,951 |
| Japan (18.2%) | | |
| | Toyota Motor Corp. | 3,797,791 | 220,298 |
| | Mitsubishi UFJ Financial Group Inc. | 18,902,259 | 97,532 |
| | KDDI Corp. | 2,578,464 | 78,368 |
| | SoftBank Group Corp. | 1,195,468 | 75,292 |
| | Honda Motor Co. Ltd. | 2,492,379 | 74,576 |
18
| | |
| Vanguard® FTSE All-World ex-US Index Fund | | |
| Schedule of Investments | | |
| October 31, 2016 | | |
| |
| | | Market |
| | | Value |
| | Shares | ($000) |
| Japan Tobacco Inc. | 1,667,467 | 63,397 |
| Sumitomo Mitsui Financial Group Inc. | 1,805,230 | 62,590 |
| Mizuho Financial Group Inc. | 34,772,658 | 58,549 |
| Sony Corp. | 1,745,890 | 55,027 |
| FANUC Corp. | 271,917 | 49,785 |
| Takeda Pharmaceutical Co. Ltd. | 1,075,548 | 48,104 |
| Keyence Corp. | 63,373 | 46,458 |
| NTT DOCOMO Inc. | 1,824,945 | 45,832 |
| East Japan Railway Co. | 519,116 | 45,697 |
| Seven & i Holdings Co. Ltd. | 1,084,119 | 45,250 |
| Astellas Pharma Inc. | 2,956,178 | 43,875 |
| Shin-Etsu Chemical Co. Ltd. | 572,701 | 43,423 |
| Central Japan Railway Co. | 251,649 | 42,792 |
| Canon Inc. | 1,456,888 | 41,854 |
| Mitsubishi Corp. | 1,914,563 | 41,670 |
| Tokio Marine Holdings Inc. | 975,541 | 38,479 |
| Mitsubishi Electric Corp. | 2,746,100 | 37,152 |
| Murata Manufacturing Co. Ltd. | 263,265 | 36,763 |
| Nintendo Co. Ltd. | 150,253 | 36,220 |
| Kao Corp. | 696,879 | 35,859 |
| Daikin Industries Ltd. | 370,871 | 35,540 |
| Hitachi Ltd. | 6,448,956 | 34,379 |
| Fuji Heavy Industries Ltd. | 853,338 | 33,345 |
| Bridgestone Corp. | 892,942 | 33,328 |
| Mitsui & Co. Ltd. | 2,368,033 | 32,809 |
| Mitsubishi Estate Co. Ltd. | 1,643,961 | 32,673 |
| Nidec Corp. | 337,055 | 32,613 |
| Panasonic Corp. | 2,958,870 | 30,523 |
| Denso Corp. | 699,299 | 30,430 |
| Mitsui Fudosan Co. Ltd. | 1,320,046 | 30,063 |
| Komatsu Ltd. | 1,310,811 | 29,177 |
| ORIX Corp. | 1,824,753 | 28,916 |
| Nissan Motor Co. Ltd. | 2,804,539 | 28,529 |
| Otsuka Holdings Co. Ltd. | 588,216 | 25,744 |
| ITOCHU Corp. | 2,001,865 | 25,281 |
| Kubota Corp. | 1,566,087 | 25,243 |
| Daiwa House Industry Co. Ltd. | 899,482 | 24,688 |
| Fast Retailing Co. Ltd. | 70,685 | 23,814 |
| Nomura Holdings Inc. | 4,735,823 | 23,721 |
| Eisai Co. Ltd. | 370,102 | 23,586 |
| SMC Corp. | 81,338 | 23,578 |
| Dai-ichi Life Holdings Inc. | 1,567,511 | 22,981 |
| Hoya Corp. | 548,326 | 22,878 |
| Daiichi Sankyo Co. Ltd. | 918,261 | 22,065 |
| Nippon Steel & Sumitomo Metal Corp. | 1,094,194 | 21,679 |
| FUJIFILM Holdings Corp. | 558,705 | 21,125 |
| MS&AD Insurance Group Holdings Inc. | 708,312 | 21,028 |
| Kyocera Corp. | 432,559 | 21,018 |
| Suzuki Motor Corp. | 569,475 | 20,305 |
| Shionogi & Co. Ltd. | 411,043 | 20,243 |
| Kirin Holdings Co. Ltd. | 1,165,106 | 20,030 |
| Toray Industries Inc. | 2,108,052 | 19,620 |
| Tokyo Electron Ltd. | 216,452 | 19,525 |
| Secom Co. Ltd. | 269,606 | 19,449 |
| * Toshiba Corp. | 5,296,216 | 19,177 |
| Mitsubishi Heavy Industries Ltd. | 4,447,277 | 19,025 |
| MEIJI Holdings Co. Ltd. | 190,044 | 18,955 |
| Asahi Group Holdings Ltd. | 527,486 | 18,816 |
| Shimano Inc. | 109,462 | 18,716 |
| Recruit Holdings Co. Ltd. | 449,687 | 18,064 |
| Sumitomo Corp. | 1,563,345 | 17,973 |
| Sumitomo Mitsui Trust Holdings Inc. | 525,654 | 17,737 |
| Terumo Corp. | 438,737 | 16,967 |
| Daito Trust Construction Co. Ltd. | 101,077 | 16,938 |
19
| | |
| Vanguard® FTSE All-World ex-US Index Fund | | |
| Schedule of Investments | | |
| October 31, 2016 | | |
| |
| | | Market |
| | | Value |
| | Shares | ($000) |
| Sompo Holdings Inc. | 513,867 | 16,627 |
| Ono Pharmaceutical Co. Ltd. | 632,924 | 16,047 |
| Olympus Corp. | 446,719 | 15,924 |
| Sumitomo Realty & Development Co. Ltd. | 602,762 | 15,844 |
| West Japan Railway Co. | 255,671 | 15,743 |
| Oriental Land Co. Ltd. | 269,476 | 15,741 |
| Asahi Kasei Corp. | 1,739,529 | 15,682 |
| Ajinomoto Co. Inc. | 704,480 | 15,666 |
| Sumitomo Electric Industries Ltd. | 1,051,896 | 15,540 |
| Dentsu Inc. | 309,395 | 15,423 |
| Nitto Denko Corp. | 214,754 | 14,962 |
| Nippon Telegraph & Telephone Corp. | 336,285 | 14,910 |
| Fujitsu Ltd. | 2,468,072 | 14,638 |
| Chubu Electric Power Co. Inc. | 988,197 | 14,548 |
| Shiseido Co. Ltd. | 545,855 | 14,080 |
| Daiwa Securities Group Inc. | 2,346,067 | 14,006 |
| Sysmex Corp. | 199,490 | 13,825 |
| Rakuten Inc. | 1,169,139 | 13,479 |
| Resona Holdings Inc. | 3,027,275 | 13,418 |
| Aeon Co. Ltd. | 966,386 | 13,355 |
| JX Holdings Inc. | 3,373,501 | 13,329 |
| Sekisui House Ltd. | 804,661 | 13,296 |
| Tokyo Gas Co. Ltd. | 2,896,831 | 13,144 |
| Mazda Motor Corp. | 787,342 | 13,057 |
| Unicharm Corp. | 543,657 | 12,928 |
| Nitori Holdings Co. Ltd. | 103,143 | 12,321 |
| Mitsubishi Chemical Holdings Corp. | 1,827,612 | 12,000 |
| Inpex Corp. | 1,281,378 | 11,954 |
| Aisin Seiki Co. Ltd. | 270,478 | 11,881 |
| Makita Corp. | 169,362 | 11,710 |
| Hankyu Hanshin Holdings Inc. | 350,388 | 11,601 |
| Osaka Gas Co. Ltd. | 2,761,772 | 11,487 |
| TDK Corp. | 165,954 | 11,458 |
| Marubeni Corp. | 2,164,503 | 11,374 |
| Japan Exchange Group Inc. | 765,485 | 11,366 |
| Yamato Holdings Co. Ltd. | 493,265 | 11,238 |
| Taisei Corp. | 1,485,289 | 11,132 |
| Omron Corp. | 272,825 | 10,471 |
| Tokyu Corp. | 1,389,444 | 10,402 |
| Toyota Industries Corp. | 226,460 | 10,391 |
| Chugai Pharmaceutical Co. Ltd. | 303,864 | 10,355 |
| T&D Holdings Inc. | 854,938 | 10,339 |
| JFE Holdings Inc. | 712,593 | 10,213 |
| Kintetsu Group Holdings Co. Ltd. | 2,503,946 | 10,107 |
| Sumitomo Chemical Co. Ltd. | 2,120,905 | 10,031 |
| * Kansai Electric Power Co. Inc. | 1,017,153 | 9,724 |
| NEC Corp. | 3,609,864 | 9,653 |
| Isuzu Motors Ltd. | 755,431 | 9,344 |
| Asahi Glass Co. Ltd. | 1,333,360 | 9,325 |
| Obayashi Corp. | 939,815 | 9,053 |
| NTT Data Corp. | 174,778 | 9,019 |
| Odakyu Electric Railway Co. Ltd. | 424,232 | 8,656 |
| Yamaha Motor Co. Ltd. | 388,186 | 8,624 |
| Kajima Corp. | 1,269,848 | 8,563 |
| Sumitomo Metal Mining Co. Ltd. | 658,971 | 8,563 |
| Nippon Paint Holdings Co. Ltd. | 250,169 | 8,506 |
| Dai Nippon Printing Co. Ltd. | 838,903 | 8,414 |
| * Tokyo Electric Power Co. Holdings Inc. | 2,165,149 | 8,389 |
| LIXIL Group Corp. | 363,658 | 8,353 |
| Koito Manufacturing Co. Ltd. | 158,428 | 8,318 |
| Yamaha Corp. | 232,035 | 8,290 |
| Tohoku Electric Power Co. Inc. | 663,931 | 8,134 |
| Bandai Namco Holdings Inc. | 271,134 | 8,122 |
| Sekisui Chemical Co. Ltd. | 515,089 | 8,112 |
20
| | |
| Vanguard® FTSE All-World ex-US Index Fund | | |
| Schedule of Investments | | |
| October 31, 2016 | | |
| |
| | | Market |
| | | Value |
| | Shares | ($000) |
| Santen Pharmaceutical Co. Ltd. | 555,502 | 8,101 |
| Japan Post Holdings Co. Ltd. | 627,964 | 7,993 |
| TOTO Ltd. | 199,026 | 7,951 |
| Seiko Epson Corp. | 387,573 | 7,855 |
| Concordia Financial Group Ltd. | 1,687,675 | 7,825 |
| Kikkoman Corp. | 244,348 | 7,774 |
| Ricoh Co. Ltd. | 949,079 | 7,735 |
| Suntory Beverage & Food Ltd. | 175,868 | 7,690 |
| M3 Inc. | 251,732 | 7,660 |
| ^ Nikon Corp. | 491,501 | 7,428 |
| Kuraray Co. Ltd. | 486,610 | 7,377 |
| Toyota Tsusho Corp. | 312,414 | 7,376 |
| Ryohin Keikaku Co. Ltd. | 33,204 | 7,092 |
| FamilyMart UNY Holdings Co. Ltd. | 112,758 | 7,072 |
| Shimizu Corp. | 792,196 | 7,041 |
| NSK Ltd. | 631,876 | 7,024 |
| Yahoo Japan Corp. | 1,822,601 | 6,991 |
| Keikyu Corp. | 692,349 | 6,985 |
| Lawson Inc. | 91,435 | 6,948 |
| Tobu Railway Co. Ltd. | 1,400,661 | 6,877 |
| MISUMI Group Inc. | 374,167 | 6,824 |
| NGK Insulators Ltd. | 371,377 | 6,817 |
| Toppan Printing Co. Ltd. | 722,213 | 6,792 |
| Japan Post Bank Co. Ltd. | 573,625 | 6,760 |
| Nagoya Railroad Co. Ltd. | 1,269,008 | 6,696 |
| Yakult Honsha Co. Ltd. | 143,313 | 6,682 |
| Nissan Chemical Industries Ltd. | 196,255 | 6,654 |
| Hoshizaki Corp. | 73,413 | 6,625 |
| Keio Corp. | 797,103 | 6,597 |
| NH Foods Ltd. | 272,935 | 6,541 |
| Rohm Co. Ltd. | 122,654 | 6,447 |
| Alps Electric Co. Ltd. | 261,992 | 6,285 |
| Shizuoka Bank Ltd. | 742,684 | 6,268 |
| Mitsui Chemicals Inc. | 1,272,067 | 6,264 |
| Don Quijote Holdings Co. Ltd. | 162,872 | 6,191 |
| Taisho Pharmaceutical Holdings Co. Ltd. | 63,054 | 6,151 |
| Mitsubishi Tanabe Pharma Corp. | 313,133 | 6,095 |
| Brother Industries Ltd. | 326,747 | 5,996 |
| Tosoh Corp. | 908,532 | 5,933 |
| Hirose Electric Co. Ltd. | 44,892 | 5,924 |
| Suruga Bank Ltd. | 242,390 | 5,917 |
| Kyushu Electric Power Co. Inc. | 646,496 | 5,874 |
| Yaskawa Electric Corp. | 366,494 | 5,847 |
| Nissin Foods Holdings Co. Ltd. | 100,995 | 5,845 |
| Kawasaki Heavy Industries Ltd. | 1,999,009 | 5,839 |
| Toho Gas Co. Ltd. | 629,561 | 5,838 |
| Electric Power Development Co. Ltd. | 249,034 | 5,799 |
| Kansai Paint Co. Ltd. | 269,626 | 5,794 |
| Tsuruha Holdings Inc. | 49,963 | 5,765 |
| Daicel Corp. | 437,185 | 5,749 |
| Chiba Bank Ltd. | 924,453 | 5,718 |
| Stanley Electric Co. Ltd. | 207,176 | 5,705 |
| Amada Holdings Co. Ltd. | 500,557 | 5,702 |
| Lion Corp. | 347,989 | 5,691 |
| Hamamatsu Photonics KK | 187,897 | 5,685 |
| Trend Micro Inc. | 159,719 | 5,624 |
| Seibu Holdings Inc. | 324,739 | 5,619 |
| Konica Minolta Inc. | 626,325 | 5,610 |
| Kyowa Hakko Kirin Co. Ltd. | 359,052 | 5,478 |
| * IHI Corp. | 2,072,877 | 5,453 |
| Nisshin Seifun Group Inc. | 369,624 | 5,445 |
| NGK Spark Plug Co. Ltd. | 273,237 | 5,422 |
| Shimadzu Corp. | 372,402 | 5,419 |
| Hisamitsu Pharmaceutical Co. Inc. | 100,988 | 5,387 |
21
| | |
| Vanguard® FTSE All-World ex-US Index Fund | | |
| Schedule of Investments | | |
| October 31, 2016 | | |
| |
| | | Market |
| | | Value |
| | Shares | ($000) |
| Aozora Bank Ltd. | 1,630,229 | 5,386 |
| Alfresa Holdings Corp. | 251,566 | 5,317 |
| JGC Corp. | 299,793 | 5,300 |
| Asics Corp. | 247,735 | 5,287 |
| Konami Holdings Corp. | 132,531 | 5,234 |
| Nippon Express Co. Ltd. | 1,054,686 | 5,210 |
| Oji Holdings Corp. | 1,222,903 | 5,171 |
| Toyo Suisan Kaisha Ltd. | 127,011 | 5,146 |
| USS Co. Ltd. | 301,996 | 5,107 |
| Yamada Denki Co. Ltd. | 984,763 | 5,090 |
| Isetan Mitsukoshi Holdings Ltd. | 500,357 | 5,057 |
| Rinnai Corp. | 52,022 | 4,998 |
| Chugoku Electric Power Co. Inc. | 426,379 | 4,989 |
| * Kyushu Railway Co. | 168,300 | 4,959 |
| Mitsubishi Materials Corp. | 171,804 | 4,922 |
| Taiheiyo Cement Corp. | 1,710,067 | 4,897 |
| Nabtesco Corp. | 162,291 | 4,847 |
| Mitsubishi Motors Corp. | 871,533 | 4,838 |
| Toho Co. Ltd. | 160,786 | 4,824 |
| Obic Co. Ltd. | 92,411 | 4,801 |
| Nomura Research Institute Ltd. | 137,000 | 4,752 |
| J Front Retailing Co. Ltd. | 345,137 | 4,751 |
| Yokogawa Electric Corp. | 337,748 | 4,744 |
| DeNA Co. Ltd. | 147,407 | 4,742 |
| Keisei Electric Railway Co. Ltd. | 196,682 | 4,742 |
| Hulic Co. Ltd. | 496,747 | 4,730 |
| Teijin Ltd. | 244,710 | 4,728 |
| Minebea Co. Ltd. | 459,927 | 4,693 |
| JTEKT Corp. | 314,902 | 4,660 |
| Keihan Holdings Co. Ltd. | 690,067 | 4,659 |
| Nippon Yusen KK | 2,257,129 | 4,619 |
| Sojitz Corp. | 1,750,660 | 4,594 |
| Disco Corp. | 37,968 | 4,589 |
| ANA Holdings Inc. | 1,625,941 | 4,567 |
| Kobayashi Pharmaceutical Co. Ltd. | 87,100 | 4,552 |
| ^ Casio Computer Co. Ltd. | 316,902 | 4,414 |
| Fukuoka Financial Group Inc. | 1,016,494 | 4,399 |
| Kewpie Corp. | 154,869 | 4,398 |
| Park24 Co. Ltd. | 141,856 | 4,383 |
| Start Today Co. Ltd. | 248,937 | 4,362 |
| Sohgo Security Services Co. Ltd. | 94,089 | 4,285 |
| Iida Group Holdings Co. Ltd. | 220,407 | 4,260 |
| Mabuchi Motor Co. Ltd. | 73,208 | 4,256 |
| Marui Group Co. Ltd. | 300,358 | 4,214 |
| Pigeon Corp. | 148,598 | 4,181 |
| Sumitomo Rubber Industries Ltd. | 249,185 | 4,180 |
| Sumitomo Heavy Industries Ltd. | 788,451 | 4,151 |
| Sega Sammy Holdings Inc. | 280,463 | 4,141 |
| Mitsubishi Gas Chemical Co. Inc. | 269,009 | 4,140 |
| Tokyu Fudosan Holdings Corp. | 728,482 | 4,106 |
| Ezaki Glico Co. Ltd. | 72,023 | 4,094 |
| Hino Motors Ltd. | 375,585 | 4,094 |
| Toyo Seikan Group Holdings Ltd. | 220,965 | 4,076 |
| TonenGeneral Sekiyu KK | 412,798 | 4,065 |
| JSR Corp. | 264,861 | 4,025 |
| Yamazaki Baking Co. Ltd. | 179,244 | 4,019 |
| Hakuhodo DY Holdings Inc. | 332,043 | 3,991 |
| Fuji Electric Co. Ltd. | 795,113 | 3,970 |
| Air Water Inc. | 211,818 | 3,963 |
| CyberAgent Inc. | 133,840 | 3,888 |
| Credit Saison Co. Ltd. | 223,453 | 3,863 |
| Shimamura Co. Ltd. | 30,175 | 3,863 |
| Mitsui OSK Lines Ltd. | 1,540,226 | 3,852 |
| Haseko Corp. | 394,092 | 3,835 |
22
| | | |
| Vanguard® FTSE All-World ex-US Index Fund | | |
| Schedule of Investments | | |
| October 31, 2016 | | |
| |
| | | | Market |
| | | | Value |
| | | Shares | ($000) |
| | Miraca Holdings Inc. | 79,216 | 3,824 |
| | SCREEN Holdings Co. Ltd. | 55,771 | 3,815 |
| | MediPal Holdings Corp. | 223,107 | 3,812 |
| | Sumitomo Dainippon Pharma Co. Ltd. | 218,889 | 3,791 |
| | Suzuken Co. Ltd. | 117,357 | 3,769 |
| | Hitachi High-Technologies Corp. | 90,256 | 3,764 |
| | Kurita Water Industries Ltd. | 158,835 | 3,759 |
| | Calbee Inc. | 102,952 | 3,735 |
| | Bank of Kyoto Ltd. | 507,432 | 3,721 |
| | Ebara Corp. | 125,126 | 3,715 |
| | Kose Corp. | 40,495 | 3,694 |
| | Square Enix Holdings Co. Ltd. | 110,853 | 3,667 |
| | Tokyo Tatemono Co. Ltd. | 288,616 | 3,666 |
| | Nippon Shinyaku Co. Ltd. | 72,034 | 3,657 |
| | Shinsei Bank Ltd. | 2,246,243 | 3,632 |
| | Sundrug Co. Ltd. | 45,698 | 3,595 |
| | NOK Corp. | 158,633 | 3,575 |
| | Kyushu Financial Group Inc. | 532,030 | 3,538 |
| | Yamaguchi Financial Group Inc. | 317,300 | 3,498 |
| | Nichirei Corp. | 159,126 | 3,480 |
| | DIC Corp. | 114,577 | 3,471 |
| | Sony Financial Holdings Inc. | 244,988 | 3,441 |
| | Hiroshima Bank Ltd. | 803,043 | 3,437 |
| | Nankai Electric Railway Co. Ltd. | 756,704 | 3,436 |
| *,^ | Sharp Corp. | 1,979,678 | 3,435 |
| | Temp Holdings Co. Ltd. | 202,080 | 3,427 |
| | Advantest Corp. | 239,266 | 3,420 |
| | Hitachi Metals Ltd. | 273,519 | 3,419 |
| | Otsuka Corp. | 71,735 | 3,413 |
| | Takashimaya Co. Ltd. | 417,825 | 3,408 |
| | Hitachi Chemical Co. Ltd. | 145,549 | 3,402 |
| * | Kobe Steel Ltd. | 411,118 | 3,393 |
| | Nifco Inc. | 58,129 | 3,348 |
| | THK Co. Ltd. | 157,424 | 3,324 |
| | Kaneka Corp. | 398,677 | 3,299 |
| | Chugoku Bank Ltd. | 245,663 | 3,296 |
| | SBI Holdings Inc. | 271,591 | 3,226 |
| | Idemitsu Kosan Co. Ltd. | 138,303 | 3,178 |
| | Nexon Co. Ltd. | 185,413 | 3,156 |
| | Kakaku.com Inc. | 187,737 | 3,154 |
| | Kaken Pharmaceutical Co. Ltd. | 49,365 | 3,109 |
| | Nippon Electric Glass Co. Ltd. | 567,929 | 3,090 |
| | Nippon Shokubai Co. Ltd. | 44,526 | 3,073 |
| | Hitachi Construction Machinery Co. Ltd. | 146,632 | 3,067 |
| | Hachijuni Bank Ltd. | 562,458 | 3,066 |
| | Ube Industries Ltd. | 1,482,988 | 3,060 |
| | Zenkoku Hosho Co. Ltd. | 70,154 | 3,016 |
| ^ | Japan Airport Terminal Co. Ltd. | 78,337 | 3,007 |
| | Hokuriku Electric Power Co. | 263,840 | 2,997 |
| | Mitsubishi UFJ Lease & Finance Co. Ltd. | 618,791 | 2,996 |
| | Hikari Tsushin Inc. | 32,423 | 2,976 |
| | Azbil Corp. | 100,024 | 2,966 |
| | Gunma Bank Ltd. | 618,851 | 2,955 |
| | Asahi Intecc Co. Ltd. | 67,421 | 2,920 |
| | Sawai Pharmaceutical Co. Ltd. | 44,728 | 2,890 |
| ^ | Ito En Ltd. | 77,620 | 2,826 |
| | Nomura Real Estate Holdings Inc. | 167,112 | 2,822 |
| | Denka Co. Ltd. | 621,797 | 2,821 |
| | Matsumotokiyoshi Holdings Co. Ltd. | 54,574 | 2,812 |
| | Nihon M&A Center Inc. | 86,486 | 2,807 |
| ^ | Kawasaki Kisen Kaisha Ltd. | 1,132,835 | 2,803 |
| | Seven Bank Ltd. | 910,239 | 2,798 |
| | Daifuku Co. Ltd. | 153,649 | 2,776 |
| *,^ | PeptiDream Inc. | 53,430 | 2,751 |
23
| | |
| Vanguard® FTSE All-World ex-US Index Fund | | |
| Schedule of Investments | | |
| October 31, 2016 | | |
| |
| | | Market |
| | | Value |
| | Shares | ($000) |
| Maruichi Steel Tube Ltd. | 85,208 | 2,747 |
| Sanwa Holdings Corp. | 275,807 | 2,747 |
| COMSYS Holdings Corp. | 154,872 | 2,726 |
| Calsonic Kansei Corp. | 216,534 | 2,714 |
| Kagome Co. Ltd. | 103,428 | 2,712 |
| Sugi Holdings Co. Ltd. | 50,516 | 2,706 |
| Nippon Kayaku Co. Ltd. | 233,477 | 2,690 |
| ^ Sumco Corp. | 254,972 | 2,668 |
| AEON Financial Service Co. Ltd. | 151,373 | 2,665 |
| Cosmos Pharmaceutical Corp. | 12,221 | 2,659 |
| Tsumura & Co. | 93,291 | 2,651 |
| ^ Coca-Cola West Co. Ltd. | 89,182 | 2,636 |
| Sumitomo Forestry Co. Ltd. | 187,057 | 2,606 |
| Sotetsu Holdings Inc. | 532,463 | 2,598 |
| Hokuhoku Financial Group Inc. | 179,630 | 2,589 |
| Nihon Kohden Corp. | 105,050 | 2,561 |
| TIS Inc. | 113,106 | 2,559 |
| Glory Ltd. | 77,418 | 2,559 |
| Oracle Corp. Japan | 46,608 | 2,537 |
| Kamigumi Co. Ltd. | 296,568 | 2,532 |
| Izumi Co. Ltd. | 54,682 | 2,527 |
| Sankyo Co. Ltd. | 71,682 | 2,525 |
| Horiba Ltd. | 52,637 | 2,517 |
| Benesse Holdings Inc. | 96,041 | 2,516 |
| Mitsubishi Logistics Corp. | 185,187 | 2,507 |
| Furukawa Electric Co. Ltd. | 85,026 | 2,502 |
| Megmilk Snow Brand Co. Ltd. | 71,769 | 2,497 |
| Daiichikosho Co. Ltd. | 57,396 | 2,495 |
| Showa Shell Sekiyu KK | 265,799 | 2,477 |
| Nishi-Nippon Railroad Co. Ltd. | 522,067 | 2,475 |
| Yokohama Rubber Co. Ltd. | 141,836 | 2,463 |
| * Acom Co. Ltd. | 534,372 | 2,459 |
| Sapporo Holdings Ltd. | 86,631 | 2,447 |
| ^ Nippon Paper Industries Co. Ltd. | 129,244 | 2,419 |
| Welcia Holdings Co. Ltd. | 35,207 | 2,400 |
| Aeon Mall Co. Ltd. | 160,643 | 2,386 |
| Zensho Holdings Co. Ltd. | 126,488 | 2,362 |
| Aoyama Trading Co. Ltd. | 66,900 | 2,357 |
| Toyoda Gosei Co. Ltd. | 102,757 | 2,355 |
| Dowa Holdings Co. Ltd. | 315,255 | 2,341 |
| Rohto Pharmaceutical Co. Ltd. | 133,392 | 2,340 |
| Iyo Bank Ltd. | 380,341 | 2,338 |
| Showa Denko KK | 176,875 | 2,337 |
| House Foods Group Inc. | 104,507 | 2,333 |
| Citizen Watch Co. Ltd. | 414,026 | 2,327 |
| Ain Holdings Inc. | 34,398 | 2,322 |
| Miura Co. Ltd. | 134,418 | 2,319 |
| GS Yuasa Corp. | 536,913 | 2,319 |
| Takara Holdings Inc. | 243,162 | 2,303 |
| Relo Group Inc. | 13,878 | 2,298 |
| Seino Holdings Co. Ltd. | 205,502 | 2,277 |
| NTN Corp. | 600,141 | 2,272 |
| Fujikura Ltd. | 386,096 | 2,269 |
| Coca-Cola East Japan Co. Ltd. | 102,374 | 2,256 |
| NHK Spring Co. Ltd. | 237,148 | 2,245 |
| Tokyo Century Corp. | 63,283 | 2,230 |
| Toyo Tire & Rubber Co. Ltd. | 143,287 | 2,222 |
| Kinden Corp. | 184,398 | 2,221 |
| Pola Orbis Holdings Inc. | 26,678 | 2,220 |
| 77 Bank Ltd. | 489,528 | 2,211 |
| SCSK Corp. | 58,991 | 2,201 |
| Leopalace21 Corp. | 336,738 | 2,189 |
| Toyota Boshoku Corp. | 86,725 | 2,186 |
| Pilot Corp. | 48,870 | 2,185 |
24
| | | |
| Vanguard® FTSE All-World ex-US Index Fund | | |
| Schedule of Investments | | |
| October 31, 2016 | | |
| |
| | | | Market |
| | | | Value |
| | | Shares | ($000) |
| * | Itoham Yonekyu Holdings Inc. | 228,590 | 2,180 |
| * | Nishi-Nippon Financial Holdings Inc. | 217,276 | 2,163 |
| ^ | OSG Corp. | 100,926 | 2,150 |
| | Taiyo Nippon Sanso Corp. | 203,174 | 2,136 |
| | Topcon Corp. | 142,846 | 2,132 |
| | Sumitomo Osaka Cement Co. Ltd. | 513,206 | 2,126 |
| | Ibiden Co. Ltd. | 145,472 | 2,112 |
| | ABC-Mart Inc. | 34,286 | 2,086 |
| | Toyobo Co. Ltd. | 1,268,247 | 2,076 |
| *,^ | LINE Corp. | 50,569 | 2,070 |
| | Nipro Corp. | 166,502 | 2,056 |
| | Daido Steel Co. Ltd. | 481,485 | 2,044 |
| | Nagase & Co. Ltd. | 158,469 | 2,027 |
| ^ | Shikoku Electric Power Co. Inc. | 211,153 | 1,986 |
| | K's Holdings Corp. | 113,511 | 1,964 |
| ^ | Japan Post Insurance Co. Ltd. | 93,462 | 1,959 |
| ^ | MonotaRO Co. Ltd. | 80,282 | 1,953 |
| | Daishi Bank Ltd. | 453,196 | 1,949 |
| | Ushio Inc. | 161,380 | 1,947 |
| | TS Tech Co. Ltd. | 72,538 | 1,945 |
| | Wacoal Holdings Corp. | 168,448 | 1,943 |
| | Chiyoda Corp. | 215,803 | 1,882 |
| | Hokkaido Electric Power Co. Inc. | 246,126 | 1,872 |
| | Resorttrust Inc. | 93,626 | 1,871 |
| | Skylark Co. Ltd. | 133,022 | 1,871 |
| | Zeon Corp. | 200,960 | 1,836 |
| | H2O Retailing Corp. | 123,502 | 1,834 |
| | Japan Steel Works Ltd. | 85,150 | 1,829 |
| | Bic Camera Inc. | 212,152 | 1,826 |
| | Shochiku Co. Ltd. | 161,340 | 1,807 |
| | Tadano Ltd. | 160,224 | 1,799 |
| | Nisshinbo Holdings Inc. | 180,466 | 1,797 |
| | Rengo Co. Ltd. | 286,488 | 1,797 |
| | Shiga Bank Ltd. | 343,951 | 1,784 |
| | Capcom Co. Ltd. | 68,523 | 1,770 |
| | FP Corp. | 32,723 | 1,763 |
| | Shimachu Co. Ltd. | 65,291 | 1,752 |
| | Fujitsu General Ltd. | 76,330 | 1,752 |
| | OKUMA Corp. | 208,863 | 1,748 |
| | Japan Airlines Co. Ltd. | 59,138 | 1,745 |
| | Awa Bank Ltd. | 264,274 | 1,738 |
| | Toda Corp. | 319,208 | 1,730 |
| | Senshu Ikeda Holdings Inc. | 377,548 | 1,718 |
| | Heiwa Corp. | 71,315 | 1,675 |
| | Nisshin Steel Co. Ltd. | 125,886 | 1,675 |
| | Yamato Kogyo Co. Ltd. | 58,199 | 1,639 |
| | Itochu Techno-Solutions Corp. | 66,042 | 1,629 |
| | Taiyo Yuden Co. Ltd. | 151,663 | 1,620 |
| | Kyudenko Corp. | 49,861 | 1,606 |
| | Tokai Tokyo Financial Holdings Inc. | 310,828 | 1,577 |
| ^ | Sanrio Co. Ltd. | 82,250 | 1,541 |
| | San-In Godo Bank Ltd. | 210,815 | 1,517 |
| | Lintec Corp. | 69,499 | 1,514 |
| | North Pacific Bank Ltd. | 404,068 | 1,507 |
| | DMG Mori Co. Ltd. | 140,434 | 1,489 |
| | Juroku Bank Ltd. | 489,713 | 1,477 |
| | Jafco Co. Ltd. | 43,963 | 1,460 |
| *,^ | Orient Corp. | 778,387 | 1,450 |
| | Maeda Road Construction Co. Ltd. | 78,197 | 1,447 |
| | Mochida Pharmaceutical Co. Ltd. | 18,022 | 1,412 |
| | KYORIN Holdings Inc. | 62,570 | 1,398 |
| | Autobacs Seven Co. Ltd. | 98,295 | 1,398 |
| | Kandenko Co. Ltd. | 140,828 | 1,388 |
| | Keiyo Bank Ltd. | 330,084 | 1,388 |
25
| | | |
| Vanguard® FTSE All-World ex-US Index Fund | | |
| Schedule of Investments | | |
| October 31, 2016 | | |
| |
| | | | Market |
| | | | Value |
| | | Shares | ($000) |
| | Mitsui Engineering & Shipbuilding Co. Ltd. | 996,373 | 1,384 |
| | NTT Urban Development Corp. | 150,037 | 1,379 |
| | Nippo Corp. | 71,459 | 1,378 |
| ^ | HIS Co. Ltd. | 50,188 | 1,370 |
| | Ariake Japan Co. Ltd. | 24,485 | 1,368 |
| ^ | GungHo Online Entertainment Inc. | 533,857 | 1,351 |
| | Hitachi Capital Corp. | 58,899 | 1,314 |
| | Hitachi Transport System Ltd. | 63,098 | 1,301 |
| | Koei Tecmo Holdings Co. Ltd. | 66,317 | 1,269 |
| | Tokai Rika Co. Ltd. | 66,679 | 1,250 |
| ^ | Fukuyama Transporting Co. Ltd. | 218,084 | 1,242 |
| ^ | ASKUL Corp. | 29,869 | 1,230 |
| | Ichigo Inc. | 282,516 | 1,225 |
| *,^ | Aiful Corp. | 392,479 | 1,194 |
| | Canon Marketing Japan Inc. | 67,456 | 1,165 |
| | Exedy Corp. | 40,616 | 1,160 |
| | Kissei Pharmaceutical Co. Ltd. | 44,328 | 1,159 |
| | Cosmo Energy Holdings Co. Ltd. | 88,443 | 1,156 |
| ^ | Matsui Securities Co. Ltd. | 143,360 | 1,147 |
| | Kusuri No Aoki Co. Ltd. | 21,412 | 1,093 |
| ^ | Japan Aviation Electronics Industry Ltd. | 75,747 | 1,085 |
| | Nissan Shatai Co. Ltd. | 101,647 | 1,049 |
| ^ | GMO Payment Gateway Inc. | 22,403 | 1,029 |
| | Adastria Co. Ltd. | 38,363 | 1,004 |
| ^ | Japan Display Inc. | 478,000 | 941 |
| | Komeri Co. Ltd. | 38,421 | 938 |
| | Japan Petroleum Exploration Co. Ltd. | 41,958 | 918 |
| ^ | COLOPL Inc. | 62,246 | 895 |
| | NS Solutions Corp. | 46,521 | 887 |
| | Daikyo Inc. | 398,940 | 856 |
| | SKY Perfect JSAT Holdings Inc. | 169,972 | 842 |
| | PanaHome Corp. | 100,456 | 747 |
| | Tokyo Broadcasting System Holdings Inc. | 46,579 | 732 |
| | Gree Inc. | 127,557 | 707 |
| | Mitsubishi Shokuhin Co. Ltd. | 21,308 | 699 |
| | TV Asahi Holdings Corp. | 31,741 | 595 |
| ^ | COOKPAD Inc. | 59,359 | 564 |
| | Toppan Forms Co. Ltd. | 53,573 | 533 |
| | OBIC Business Consultants Co. Ltd. | 9,842 | 461 |
| | Sumitomo Real Estate Sales Co. Ltd. | 19,014 | 430 |
| *,^ | Aplus Financial Co. Ltd. | 99,286 | 100 |
| | | | 4,506,855 |
| Malaysia (0.7%) | | |
| | Public Bank Bhd. (Local) | 4,323,800 | 20,466 |
| | Tenaga Nasional Bhd. | 4,904,700 | 16,759 |
| | Malayan Banking Bhd. | 7,624,274 | 14,355 |
| | CIMB Group Holdings Bhd. | 7,771,650 | 9,310 |
| | Sime Darby Bhd. | 4,576,997 | 8,938 |
| | Axiata Group Bhd. | 6,332,024 | 7,424 |
| | Petronas Chemicals Group Bhd. | 4,006,568 | 6,684 |
| | DiGi.Com Bhd. | 5,198,666 | 6,235 |
| | IHH Healthcare Bhd. | 3,904,800 | 5,955 |
| | Petronas Gas Bhd. | 1,107,450 | 5,799 |
| | Genting Bhd. | 3,083,600 | 5,762 |
| | Maxis Bhd. | 3,612,000 | 5,131 |
| | IOI Corp. Bhd. | 4,668,965 | 5,004 |
| | Genting Malaysia Bhd. | 3,974,000 | 4,510 |
| | Kuala Lumpur Kepong Bhd. | 743,400 | 4,244 |
| | MISC Bhd. | 2,068,323 | 3,707 |
| | Gamuda Bhd. | 2,946,400 | 3,451 |
| | IJM Corp. Bhd. | 4,361,540 | 3,432 |
| | PPB Group Bhd. | 818,900 | 3,146 |
| | Hong Leong Bank Bhd. | 870,800 | 2,763 |
| | YTL Corp. Bhd. | 7,113,353 | 2,697 |
26
| | |
| Vanguard® FTSE All-World ex-US Index Fund | | |
| Schedule of Investments | | |
| October 31, 2016 | | |
| |
| | | Market |
| | | Value |
| | Shares | ($000) |
| AMMB Holdings Bhd. | 2,683,600 | 2,687 |
| Telekom Malaysia Bhd. | 1,568,400 | 2,444 |
| British American Tobacco Malaysia Bhd. | 200,400 | 2,366 |
| Petronas Dagangan Bhd. | 420,300 | 2,340 |
| * SapuraKencana Petroleum Bhd. | 5,888,796 | 2,264 |
| Malaysia Airports Holdings Bhd. | 1,270,500 | 2,006 |
| 2 Astro Malaysia Holdings Bhd. | 2,853,668 | 1,939 |
| RHB Bank Bhd. (XKLS) | 1,548,758 | 1,783 |
| HAP Seng Consolidated Bhd. | 905,500 | 1,682 |
| Westports Holdings Bhd. | 1,489,596 | 1,566 |
| YTL Power International Bhd. | 4,148,747 | 1,513 |
| IOI Properties Group Bhd. | 2,504,954 | 1,460 |
| Alliance Financial Group Bhd. | 1,522,300 | 1,448 |
| UMW Holdings Bhd. | 940,200 | 1,332 |
| Felda Global Ventures Holdings Bhd. | 2,588,300 | 1,240 |
| Hong Leong Financial Group Bhd. | 322,335 | 1,208 |
| Lafarge Malaysia Bhd. | 624,310 | 1,205 |
| KLCCP Stapled Group | 603,000 | 1,147 |
| AirAsia Bhd. | 1,657,700 | 1,095 |
| Berjaya Sports Toto Bhd. | 1,103,577 | 839 |
| Bumi Armada Bhd. | 4,390,500 | 736 |
| MMC Corp. Bhd. | 1,136,100 | 648 |
| UEM Sunrise Bhd. | 2,081,400 | 555 |
| * Gamuda Bhd. Warrants Exp. 03/06/2021 | 491,066 | 152 |
| * RHB Captial BHD | 1,187,500 | 14 |
| | | 181,441 |
| Malta (0.0%) | | |
| * BGP Holdings PLC | 3,738,510 | — |
| |
| Mexico (0.9%) | | |
| Fomento Economico Mexicano SAB de CV | 3,006,312 | 28,837 |
| America Movil SAB de CV | 41,048,183 | 27,190 |
| Grupo Financiero Banorte SAB de CV | 3,152,993 | 18,568 |
| Grupo Televisa SAB | 3,447,942 | 16,965 |
| Wal-Mart de Mexico SAB de CV | 7,790,961 | 16,484 |
| Grupo Mexico SAB de CV Class B | 5,409,536 | 13,328 |
| * Cemex SAB de CV ADR | 1,159,518 | 10,065 |
| Fibra Uno Administracion SA de CV | 3,734,509 | 7,127 |
| Grupo Bimbo SAB de CV Class A | 2,623,220 | 7,066 |
| * Cemex SAB de CV | 7,819,213 | 6,768 |
| Alfa SAB de CV Class A | 3,904,335 | 5,920 |
| Grupo Aeroportuario del Sureste SAB de CV Class B | 312,267 | 4,967 |
| Grupo Financiero Inbursa SAB de CV | 2,871,647 | 4,660 |
| Grupo Aeroportuario del Pacifico SAB de CV Class B | 473,663 | 4,578 |
| Industrias Penoles SAB de CV | 176,790 | 4,287 |
| Coca-Cola Femsa SAB de CV | 569,046 | 4,275 |
| Grupo Financiero Santander Mexico SAB de CV Class B | 2,072,513 | 3,751 |
| Mexichem SAB de CV | 1,567,934 | 3,750 |
| Gruma SAB de CV Class B | 231,795 | 3,216 |
| Promotora y Operadora de Infraestructura SAB de CV | 274,514 | 3,069 |
| Gentera SAB de CV | 1,548,862 | 3,057 |
| Grupo Carso SAB de CV | 660,605 | 2,883 |
| El Puerto de Liverpool SAB de CV | 274,197 | 2,874 |
| Alsea SAB de CV | 728,110 | 2,717 |
| Kimberly-Clark de Mexico SAB de CV Class A | 1,197,551 | 2,582 |
| Arca Continental SAB de CV | 399,173 | 2,484 |
| Infraestructura Energetica Nova SAB de CV | 528,140 | 2,338 |
| Banregio Grupo Financiero SAB de CV | 305,201 | 2,000 |
| Grupo Aeroportuario del Centro Norte SAB de CV Class B | 284,276 | 1,654 |
| Megacable Holdings SAB de CV | 421,729 | 1,533 |
| * Controladora Vuela Cia de Aviacion SAB de CV Class A | 783,410 | 1,496 |
| * OHL Mexico SAB de CV | 1,023,111 | 1,205 |
| * Grupo Aeromexico SAB de CV | 604,492 | 1,194 |
| Grupo Lala SAB de CV | 634,123 | 1,181 |
27
| | | |
| Vanguard® FTSE All-World ex-US Index Fund | | |
| Schedule of Investments | | |
| October 31, 2016 | | |
| |
| | | | Market |
| | | | Value |
| | | Shares | ($000) |
| * | Telesites SAB de CV | 1,871,416 | 1,081 |
| | Industrias Bachoco SAB de CV Class B | 235,291 | 1,042 |
| * | Organizacion Soriana SAB de CV Class B | 365,787 | 1,000 |
| | Grupo Comercial Chedraui SA de CV | 427,555 | 954 |
| * | Industrias CH SAB de CV Class B | 194,845 | 922 |
| 2 | Nemak SAB de CV | 751,299 | 780 |
| | Promotora y Operadora de Infraestructura SAB de CV Class L | 73,691 | 694 |
| | Grupo Elektra SAB DE CV | 49,600 | 692 |
| | Alpek SAB de CV | 456,567 | 680 |
| | Concentradora Fibra Danhos SA de CV | 334,073 | 612 |
| * | Minera Frisco SAB de CV | 772,858 | 601 |
| | Grupo Financiero Interacciones SA de CV | 103,655 | 507 |
| | | | 233,634 |
| Netherlands (2.1%) | | |
| | Unilever NV | 2,163,079 | 90,473 |
| | ING Groep NV | 5,367,265 | 70,456 |
| | ASML Holding NV | 446,117 | 47,197 |
| * | Koninklijke Ahold Delhaize NV | 1,757,563 | 40,094 |
| | Koninklijke Philips NV | 1,269,043 | 38,239 |
| | Unibail-Rodamco SE | 136,914 | 32,499 |
| | Heineken NV | 301,247 | 24,813 |
| | Akzo Nobel NV | 344,753 | 22,275 |
| | RELX NV (XAMS) | 1,258,851 | 21,227 |
| * | ArcelorMittal | 2,545,458 | 17,200 |
| | Wolters Kluwer NV | 405,232 | 15,670 |
| | Koninklijke DSM NV | 242,804 | 15,606 |
| | Koninklijke KPN NV | 4,313,938 | 14,067 |
| | NN Group NV | 450,145 | 13,560 |
| | Aegon NV | 2,664,285 | 11,526 |
| | Heineken Holding NV | 135,448 | 10,422 |
| * | Altice NV Class A | 521,742 | 9,623 |
| | Randstad Holding NV | 153,257 | 7,882 |
| 2 | ABN AMRO Group NV | 301,477 | 6,958 |
| | Gemalto NV | 112,786 | 6,128 |
| | Koninklijke Vopak NV | 91,532 | 4,620 |
| | Boskalis Westminster | 112,509 | 3,629 |
| * | Altice NV Class B | 166,740 | 3,104 |
| 2 | GrandVision NV | 69,515 | 1,592 |
| *,^ | OCI NV | 112,572 | 1,563 |
| | | | 530,423 |
| New Zealand (0.2%) | | |
| | Fletcher Building Ltd. | 955,751 | 7,080 |
| | Spark New Zealand Ltd. | 2,535,018 | 6,630 |
| | Auckland International Airport Ltd. | 1,233,283 | 5,808 |
| | Fisher & Paykel Healthcare Corp. Ltd. | 790,208 | 5,003 |
| | Ryman Healthcare Ltd. | 570,514 | 3,621 |
| | Contact Energy Ltd. | 982,098 | 3,340 |
| | Meridian Energy Ltd. | 1,685,891 | 3,099 |
| | SKYCITY Entertainment Group Ltd. | 910,753 | 2,539 |
| | Mercury NZ Ltd. | 936,283 | 2,044 |
| | Kiwi Property Group Ltd. | 1,826,056 | 1,915 |
| | SKY Network Television Ltd. | 540,395 | 1,784 |
| * | Xero Ltd. | 125,806 | 1,596 |
| | Air New Zealand Ltd. | 712,756 | 983 |
| | Vector Ltd. | 353,076 | 804 |
| | Warehouse Group Ltd. | 198,746 | 426 |
| | | | 46,672 |
| Norway (0.4%) | | |
| ^ | Statoil ASA | 1,331,822 | 21,743 |
| | DNB ASA | 1,343,150 | 19,418 |
| ^ | Telenor ASA | 962,394 | 15,307 |
| | Orkla ASA | 1,082,318 | 10,220 |
| | Marine Harvest ASA | 517,819 | 9,397 |
28
| | | |
| Vanguard® FTSE All-World ex-US Index Fund | | |
| Schedule of Investments | | |
| October 31, 2016 | | |
| |
| | | | Market |
| | | | Value |
| | | Shares | ($000) |
| | Yara International ASA | 245,897 | 8,686 |
| | Norsk Hydro ASA | 1,857,206 | 8,303 |
| | Gjensidige Forsikring ASA | 235,664 | 4,222 |
| | Schibsted ASA Class B | 121,482 | 2,737 |
| | Schibsted ASA Class A | 111,247 | 2,666 |
| | | | 102,699 |
| Other (0.3%)3 | | |
| 4 | Vanguard FTSE Emerging Markets ETF | 1,921,981 | 72,555 |
| |
| Pakistan (0.0%) | | |
| | Oil & Gas Development Co. Ltd. | 894,300 | 1,196 |
| | Pakistan Petroleum Ltd. | 566,800 | 801 |
| | National Bank of Pakistan | 700,000 | 480 |
| | Fauji Fertilizer Co. Ltd. | 327,700 | 324 |
| | | | 2,801 |
| Peru (0.1%) | | |
| | Credicorp Ltd. | 64,722 | 9,618 |
| * | Cia de Minas Buenaventura SAA ADR | 292,341 | 3,885 |
| | Credicorp Ltd. (New York Shares) | 7,391 | 1,099 |
| | | | 14,602 |
| Philippines (0.3%) | | |
| | SM Investments Corp. | 662,089 | 9,178 |
| | SM Prime Holdings Inc. | 12,872,437 | 7,148 |
| | JG Summit Holdings Inc. | 4,266,249 | 6,684 |
| | Ayala Corp. | 338,228 | 5,831 |
| | Aboitiz Equity Ventures Inc. | 3,061,894 | 4,929 |
| | BDO Unibank Inc. | 2,007,681 | 4,676 |
| | Bank of the Philippine Islands | 2,198,492 | 4,588 |
| | Universal Robina Corp. | 1,213,719 | 4,561 |
| | Ayala Land Inc. | 5,365,157 | 4,013 |
| | Jollibee Foods Corp. | 602,715 | 2,960 |
| | Metropolitan Bank & Trust Co. | 1,743,215 | 2,928 |
| | Manila Electric Co. | 425,371 | 2,426 |
| * | PLDT Inc. | 76,547 | 2,416 |
| | Aboitiz Power Corp. | 2,265,332 | 2,146 |
| | Alliance Global Group Inc. | 5,660,999 | 1,666 |
| | GT Capital Holdings Inc. | 58,181 | 1,572 |
| | DMCI Holdings Inc. | 5,700,996 | 1,470 |
| | Megaworld Corp. | 16,244,706 | 1,346 |
| | International Container Terminal Services Inc. | 726,084 | 1,166 |
| | Energy Development Corp. | 9,468,077 | 1,153 |
| | LT Group Inc. | 3,826,241 | 1,141 |
| | Semirara Mining & Power Corp. Class A | 428,001 | 1,113 |
| | Petron Corp. | 3,408,073 | 728 |
| | Globe Telecom Inc. | 19,444 | 715 |
| * | Bloomberry Resorts Corp. | 4,333,150 | 529 |
| | Emperador Inc. | 362,077 | 54 |
| | | | 77,137 |
| Poland (0.3%) | | |
| | Polski Koncern Naftowy ORLEN SA | 444,110 | 8,799 |
| | Powszechna Kasa Oszczednosci Bank Polski SA | 1,196,332 | 8,381 |
| | Bank Pekao SA | 217,997 | 6,728 |
| | Powszechny Zaklad Ubezpieczen SA | 781,503 | 5,426 |
| | KGHM Polska Miedz SA | 193,114 | 3,505 |
| | Bank Zachodni WBK SA | 39,980 | 3,230 |
| | Polskie Gornictwo Naftowe i Gazownictwo SA | 2,433,599 | 3,116 |
| ^ | LPP SA | 1,807 | 2,714 |
| | PGE Polska Grupa Energetyczna SA | 1,007,318 | 2,639 |
| * | Cyfrowy Polsat SA | 306,949 | 1,897 |
| | CCC SA | 35,307 | 1,792 |
| * | mBank SA | 17,423 | 1,573 |
| * | Alior Bank SA | 121,029 | 1,457 |
| | Asseco Poland SA | 102,196 | 1,366 |
| | Orange Polska SA | 936,861 | 1,338 |
29
| | | |
| Vanguard® FTSE All-World ex-US Index Fund | | |
| Schedule of Investments | | |
| October 31, 2016 | | |
| |
| | | | Market |
| | | | Value |
| | | Shares | ($000) |
| *,^ | Bank Millennium SA | 872,749 | 1,284 |
| * | Grupa Lotos SA | 124,933 | 1,083 |
| | Eurocash SA | 105,159 | 1,065 |
| | Grupa Azoty SA | 63,106 | 1,005 |
| * | Tauron Polska Energia SA | 1,461,903 | 988 |
| | Bank Handlowy w Warszawie SA | 48,064 | 952 |
| | Energa SA | 432,895 | 888 |
| *,^ | Synthos SA | 682,066 | 826 |
| *,^ | Enea SA | 315,732 | 809 |
| | Budimex SA | 13,769 | 714 |
| | Ciech SA | 33,968 | 554 |
| | | | 64,129 |
| Portugal (0.1%) | | |
| | Galp Energia SGPS SA | 716,258 | 9,711 |
| | EDP - Energias de Portugal SA | 2,674,091 | 8,839 |
| | Jeronimo Martins SGPS SA | 340,359 | 5,848 |
| | EDP Renovaveis SA | 286,411 | 2,164 |
| * | Banco Espirito Santo SA | 3,873,216 | 8 |
| | | | 26,570 |
| Qatar (0.1%) | | |
| | Qatar National Bank SAQ | 145,369 | 6,381 |
| | Industries Qatar QSC | 117,176 | 3,277 |
| | Masraf Al Rayan QSC | 267,269 | 2,537 |
| | Ooredoo QSC | 75,420 | 2,007 |
| * | Qatar Insurance Co. SAQ | 82,359 | 1,982 |
| | Qatar Gas Transport Co. Ltd. | 187,996 | 1,166 |
| | Qatar Islamic Bank SAQ | 40,908 | 1,149 |
| | Qatar Electricity & Water Co. QSC | 19,044 | 1,098 |
| | Commercial Bank QSC | 111,544 | 1,092 |
| * | Doha Bank QSC | 88,214 | 881 |
| * | Vodafone Qatar QSC | 230,764 | 665 |
| | United Development Co. QSC | 120,151 | 658 |
| * | Aamal Co. | 175,273 | 654 |
| | Barwa Real Estate Co. | 67,667 | 593 |
| * | Qatar Navigation QSC | 20,285 | 524 |
| * | Ezdan Holding Group QSC | 110,212 | 474 |
| * | Qatar International Islamic Bank QSC | 26,206 | 453 |
| * | Qatari Investors Group QSC | 21,524 | 342 |
| * | Gulf International Services QSC | 32,174 | 269 |
| * | Al Meera Consumer Goods Co. QSC | 3,463 | 177 |
| | | | 26,379 |
| Russia (0.9%) | | |
| | Lukoil PJSC ADR | 634,142 | 30,846 |
| | Sberbank of Russia PJSC | 11,548,196 | 26,880 |
| | Gazprom PJSC ADR | 6,134,368 | 26,451 |
| | NOVATEK OAO | 1,562,866 | 16,295 |
| | Magnit PJSC GDR | 387,041 | 15,349 |
| | Tatneft PJSC ADR | 330,248 | 11,023 |
| | MMC Norilsk Nickel PJSC ADR | 660,376 | 9,961 |
| | Rosneft PJSC GDR | 1,618,349 | 8,801 |
| | Sberbank of Russia PJSC ADR | 863,188 | 8,175 |
| | Gazprom PJSC | 3,041,605 | 6,665 |
| | AK Transneft OAO Preference Shares | 2,181 | 5,223 |
| | Alrosa PJSC | 3,520,300 | 4,924 |
| | Surgutneftegas OAO Preference Shares | 10,717,000 | 4,859 |
| | Surgutneftegas OJSC ADR | 991,341 | 4,252 |
| | VTB Bank PJSC GDR | 1,835,171 | 3,836 |
| | VTB Bank PJSC | 3,436,898,867 | 3,676 |
| | Mobile TeleSystems PJSC | 1,032,110 | 3,641 |
| | Moscow Exchange MICEX-RTS PJSC | 1,881,354 | 3,466 |
| | Severstal PJSC GDR | 234,124 | 3,301 |
| | Novolipetsk Steel PJSC | 1,276,873 | 2,067 |
| | RusHydro PJSC | 137,006,634 | 1,720 |
30
| | | |
| Vanguard® FTSE All-World ex-US Index Fund | | |
| Schedule of Investments | | |
| October 31, 2016 | | |
| |
| | | | Market |
| | | | Value |
| | | Shares | ($000) |
| | Bashneft PJSC | 30,286 | 1,588 |
| | Sistema PJSC FC GDR | 191,390 | 1,430 |
| | PhosAgro PJSC GDR | 110,160 | 1,366 |
| | Mobile TeleSystems PJSC ADR | 176,255 | 1,359 |
| | Inter RAO UES PJSC | 24,257,300 | 1,301 |
| * | Aeroflot PJSC | 617,914 | 1,266 |
| | MegaFon PJSC GDR | 125,661 | 1,197 |
| | Magnitogorsk Iron & Steel OJSC | 2,059,448 | 1,035 |
| * | Uralkali PJSC | 360,666 | 944 |
| | Federal Grid Co. Unified Energy System JSC | 335,366,667 | 905 |
| | Rostelecom PJSC ADR | 120,788 | 898 |
| | Rostelecom PJSC | 682,908 | 852 |
| | E.ON Russia JSC | 18,049,100 | 830 |
| | LSR Group PJSC GDR | 262,910 | 743 |
| | Tatneft PAO Preference Shares | 197,090 | 631 |
| | Bashneft PAO Preference Shares | 26,876 | 627 |
| | Rosseti PJSC | 33,612,627 | 518 |
| | Acron JSC | 8,035 | 380 |
| | | | 219,281 |
| Singapore (0.9%) | | |
| | Singapore Telecommunications Ltd. | 10,175,446 | 28,358 |
| | Oversea-Chinese Banking Corp. Ltd. | 4,596,211 | 28,001 |
| | DBS Group Holdings Ltd. | 2,478,148 | 26,711 |
| | United Overseas Bank Ltd. | 1,666,150 | 22,477 |
| | CapitaLand Ltd. | 3,519,041 | 7,805 |
| | Keppel Corp. Ltd. | 1,978,879 | 7,484 |
| | Wilmar International Ltd. | 2,902,707 | 6,891 |
| ^ | Singapore Press Holdings Ltd. | 2,227,257 | 5,952 |
| | Singapore Exchange Ltd. | 1,138,158 | 5,799 |
| | CapitaLand Mall Trust | 3,666,951 | 5,464 |
| | Ascendas REIT | 3,138,256 | 5,348 |
| | Global Logistic Properties Ltd. | 4,127,868 | 5,253 |
| | ComfortDelGro Corp. Ltd. | 2,818,649 | 5,139 |
| | Singapore Airlines Ltd. | 703,124 | 5,117 |
| | City Developments Ltd. | 826,261 | 5,031 |
| | Singapore Technologies Engineering Ltd. | 2,154,622 | 4,844 |
| | Jardine Cycle & Carriage Ltd. | 152,439 | 4,616 |
| | Genting Singapore plc | 8,362,164 | 4,475 |
| | Suntec REIT | 3,371,472 | 4,072 |
| | CapitaLand Commercial Trust | 2,747,429 | 3,109 |
| | Hutchison Port Holdings Trust | 6,978,508 | 3,100 |
| | SATS Ltd. | 862,615 | 3,001 |
| | UOL Group Ltd. | 660,467 | 2,686 |
| | Golden Agri-Resources Ltd. | 8,852,401 | 2,444 |
| | Venture Corp. Ltd. | 343,451 | 2,346 |
| ^ | Singapore Post Ltd. | 2,036,464 | 2,340 |
| | Sembcorp Industries Ltd. | 1,232,691 | 2,232 |
| | StarHub Ltd. | 812,337 | 1,972 |
| | Yangzijiang Shipbuilding Holdings Ltd. | 2,878,845 | 1,539 |
| *,^ | Noble Group Ltd. | 12,660,689 | 1,505 |
| ^ | Olam International Ltd. | 746,187 | 1,153 |
| ^ | Sembcorp Marine Ltd. | 1,200,177 | 1,113 |
| | Yanlord Land Group Ltd. | 954,500 | 950 |
| ^ | SIA Engineering Co. Ltd. | 327,809 | 870 |
| | Wing Tai Holdings Ltd. | 547,240 | 667 |
| ^ | M1 Ltd. | 394,943 | 579 |
| | | | 220,443 |
| South Africa (1.7%) | | |
| | Naspers Ltd. | 596,325 | 99,873 |
| | Sasol Ltd. | 766,701 | 21,172 |
| | MTN Group Ltd. | 2,434,108 | 21,024 |
| * | Steinhoff International Holdings NV (XJSE) | 3,407,498 | 18,382 |
| | Standard Bank Group Ltd. | 1,671,629 | 17,745 |
| | FirstRand Ltd. | 4,214,415 | 15,112 |
31
| | | |
| Vanguard® FTSE All-World ex-US Index Fund | | |
| Schedule of Investments | | |
| October 31, 2016 | | |
| |
| | | | Market |
| | | | Value |
| | | Shares | ($000) |
| �� | Remgro Ltd. | 739,228 | 12,273 |
| | Sanlam Ltd. | 2,444,240 | 11,839 |
| | Aspen Pharmacare Holdings Ltd. | 500,550 | 10,904 |
| | Shoprite Holdings Ltd. | 605,746 | 8,939 |
| | Bid Corp. Ltd. | 468,368 | 8,225 |
| * | AngloGold Ashanti Ltd. | 564,925 | 7,692 |
| | Woolworths Holdings Ltd. | 1,315,871 | 7,621 |
| | Vodacom Group Ltd. | 703,660 | 7,592 |
| | Growthpoint Properties Ltd. | 3,719,568 | 6,936 |
| | Barclays Africa Group Ltd. | 589,734 | 6,844 |
| | Tiger Brands Ltd. | 224,358 | 6,389 |
| | Bidvest Group Ltd. | 471,430 | 5,857 |
| | Redefine Properties Ltd. | 6,373,699 | 5,454 |
| | Netcare Ltd. | 2,005,522 | 5,150 |
| | Nedbank Group Ltd. | 296,496 | 4,853 |
| | Gold Fields Ltd. | 1,152,577 | 4,754 |
| * | Sappi Ltd. | 743,708 | 4,138 |
| | RMB Holdings Ltd. | 920,251 | 4,054 |
| | New Europe Property Investments plc | 311,027 | 3,833 |
| | Discovery Ltd. | 440,725 | 3,767 |
| | Life Healthcare Group Holdings Ltd. | 1,387,620 | 3,707 |
| | Mr Price Group Ltd. | 323,834 | 3,689 |
| | Capitec Bank Holdings Ltd. | 72,075 | 3,659 |
| | SPAR Group Ltd. | 256,037 | 3,630 |
| * | Impala Platinum Holdings Ltd. | 825,661 | 3,336 |
| | Truworths International Ltd. | 613,389 | 3,254 |
| | Mondi Ltd. | 165,855 | 3,240 |
| | AVI Ltd. | 454,381 | 3,192 |
| | Clicks Group Ltd. | 338,618 | 3,159 |
| | Resilient REIT Ltd. | 372,531 | 3,082 |
| | Hyprop Investments Ltd. | 345,050 | 3,062 |
| | Brait SE | 459,604 | 3,050 |
| | Imperial Holdings Ltd. | 238,668 | 3,015 |
| | Foschini Group Ltd. | 285,030 | 2,930 |
| | Sibanye Gold Ltd. | 1,000,205 | 2,782 |
| | Pioneer Foods Group Ltd. | 201,484 | 2,427 |
| | MMI Holdings Ltd. | 1,444,548 | 2,420 |
| | Pick n Pay Stores Ltd. | 484,413 | 2,373 |
| | Fortress Income Fund Ltd. Class B | 974,724 | 2,316 |
| | Investec Ltd. | 368,435 | 2,269 |
| | PSG Group Ltd. | 140,287 | 2,190 |
| | Telkom SA SOC Ltd. | 440,576 | 2,031 |
| * | Anglo American Platinum Ltd. | 83,529 | 1,975 |
| | Coronation Fund Managers Ltd. | 364,991 | 1,964 |
| *,^ | EOH Holdings Ltd. | 165,253 | 1,960 |
| | Fortress Income Fund Ltd. Class A | 1,491,164 | 1,804 |
| * | Northam Platinum Ltd. | 480,049 | 1,749 |
| | Barloworld Ltd. | 265,565 | 1,715 |
| | Tsogo Sun Holdings Ltd. | 711,841 | 1,619 |
| | Harmony Gold Mining Co. Ltd. | 513,914 | 1,595 |
| | Liberty Holdings Ltd. | 164,126 | 1,413 |
| | Tongaat Hulett Ltd. | 156,044 | 1,410 |
| * | Super Group Ltd. | 471,626 | 1,392 |
| | JSE Ltd. | 116,870 | 1,362 |
| | Exxaro Resources Ltd. | 180,526 | 1,331 |
| | Massmart Holdings Ltd. | 147,831 | 1,280 |
| | AECI Ltd. | 159,124 | 1,202 |
| | Nampak Ltd. | 792,613 | 1,105 |
| * | Attacq Ltd. | 861,776 | 1,096 |
| | Reunert Ltd. | 234,794 | 1,073 |
| | Omnia Holdings Ltd. | 87,708 | 1,062 |
| | KAP Industrial Holdings Ltd. | 1,824,459 | 1,049 |
| | Santam Ltd. | 56,798 | 1,020 |
| | African Rainbow Minerals Ltd. | 131,374 | 952 |
32
| | | |
| Vanguard® FTSE All-World ex-US Index Fund | | |
| Schedule of Investments | | |
| October 31, 2016 | | |
| |
| | | | Market |
| | | | Value |
| | | Shares | ($000) |
| | Sun International Ltd. | 139,770 | 863 |
| *,^ | Kumba Iron Ore Ltd. | 79,219 | 807 |
| | Distell Group Ltd. | 61,928 | 760 |
| | Steinhoff International Holdings NV (XETR) | 134,010 | 714 |
| * | Curro Holdings Ltd. | 180,836 | 665 |
| | Assore Ltd. | 45,657 | 616 |
| | Grindrod Ltd. | 684,106 | 564 |
| | Oceana Group Ltd. | 55,022 | 469 |
| * | Adcock Ingram Holdings Ltd. Warrants Exp. 07/26/2019 | 5,387 | 1 |
| | PPC Ltd. | 27 | — |
| * | African Bank Investments Ltd. | 1,597,662 | — |
| | | | 431,822 |
| South Korea (3.3%) | | |
| | Samsung Electronics Co. Ltd. GDR | 207,312 | 145,846 |
| | Samsung Electronics Co. Ltd. | 36,975 | 52,886 |
| | Samsung Electronics Co. Ltd. Preference Shares | 24,223 | 27,851 |
| | NAVER Corp. | 36,851 | 27,571 |
| | SK Hynix Inc. | 736,609 | 26,346 |
| | Hyundai Motor Co. | 201,583 | 24,611 |
| | Hyundai Mobis Co. Ltd. | 90,866 | 21,672 |
| | Shinhan Financial Group Co. Ltd. ADR | 529,770 | 20,470 |
| | POSCO ADR | 375,570 | 19,511 |
| | Samsung C&T Corp. | 124,520 | 17,552 |
| | KB Financial Group Inc. ADR | 427,272 | 15,801 |
| | KT&G Corp. | 153,529 | 15,143 |
| | Amorepacific Corp. | 43,723 | 13,698 |
| | LG Chem Ltd. | 60,579 | 13,011 |
| | Kia Motors Corp. | 358,196 | 12,719 |
| | Korea Electric Power Corp. ADR | 574,341 | 12,526 |
| | Hana Financial Group Inc. | 409,967 | 11,726 |
| | Samsung Fire & Marine Insurance Co. Ltd. | 45,234 | 11,508 |
| | SK Innovation Co. Ltd. | 84,524 | 11,126 |
| | Samsung Life Insurance Co. Ltd. | 101,973 | 9,840 |
| *,^ | Celltrion Inc. | 100,566 | 9,317 |
| | SK Holdings Co. Ltd. | 46,391 | 9,050 |
| | LG Household & Health Care Ltd. | 12,183 | 8,715 |
| * | Hyundai Heavy Industries Co. Ltd. | 64,748 | 8,211 |
| | LG Display Co. Ltd. | 312,214 | 7,465 |
| | LG Corp. | 124,277 | 6,646 |
| | Samsung SDI Co. Ltd. | 76,530 | 6,299 |
| | LG Electronics Inc. | 150,255 | 6,264 |
| | Samsung SDS Co. Ltd. | 45,195 | 6,095 |
| | Coway Co. Ltd. | 75,159 | 5,879 |
| | KB Financial Group Inc. | 149,364 | 5,529 |
| | NCSoft Corp. | 23,830 | 5,505 |
| | Korea Zinc Co. Ltd. | 13,769 | 5,467 |
| | Lotte Chemical Corp. | 20,427 | 5,132 |
| | AMOREPACIFIC Group | 39,279 | 5,071 |
| | Hankook Tire Co. Ltd. | 104,458 | 5,016 |
| | Kangwon Land Inc. | 151,015 | 5,005 |
| | Korea Aerospace Industries Ltd. | 83,566 | 4,720 |
| | Woori Bank | 418,617 | 4,562 |
| | Hyundai Steel Co. | 104,433 | 4,500 |
| | Hyundai Motor Co. 2nd Preference Shares | 50,412 | 4,425 |
| | SK Telecom Co. Ltd. ADR | 200,578 | 4,383 |
| | Shinhan Financial Group Co. Ltd. | 111,127 | 4,251 |
| | Industrial Bank of Korea | 367,532 | 4,231 |
| | E-MART Inc. | 29,487 | 4,181 |
| | Dongbu Insurance Co. Ltd. | 65,831 | 4,084 |
| | S-Oil Corp. | 58,544 | 4,001 |
| | Hyundai Glovis Co. Ltd. | 25,825 | 3,909 |
| | Hyosung Corp. | 32,351 | 3,779 |
| | Hyundai Engineering & Construction Co. Ltd. | 99,631 | 3,599 |
| | Hyundai Development Co-Engineering & Construction | 84,728 | 3,583 |
33
| | | |
| Vanguard® FTSE All-World ex-US Index Fund | | |
| Schedule of Investments | | |
| October 31, 2016 | | |
| |
| | | | Market |
| | | | Value |
| | | Shares | ($000) |
| | Orion Corp. | 5,551 | 3,465 |
| | BNK Financial Group Inc. | 408,558 | 3,312 |
| | Samsung Electro-Mechanics Co. Ltd. | 76,715 | 3,149 |
| | CJ CheilJedang Corp. | 10,251 | 3,127 |
| | GS Holdings Corp. | 70,152 | 3,121 |
| | LG Uplus Corp. | 295,513 | 3,046 |
| | Lotte Shopping Co. Ltd. | 15,062 | 3,005 |
| | Korea Electric Power Corp. | 68,771 | 2,975 |
| ^ | Kakao Corp. | 43,615 | 2,908 |
| ^ | Hanmi Pharm Co. Ltd. | 8,987 | 2,838 |
| | CJ Corp. | 18,447 | 2,808 |
| | Hanwha Techwin Co. Ltd. | 50,039 | 2,779 |
| | KCC Corp. | 7,827 | 2,763 |
| | Daelim Industrial Co. Ltd. | 37,810 | 2,694 |
| | Hyundai Motor Co. Preference Shares | 32,261 | 2,694 |
| | Hanwha Chemical Corp. | 111,887 | 2,634 |
| | Hyundai Marine & Fire Insurance Co. Ltd. | 84,021 | 2,594 |
| | Amorepacific Corp. Preference Shares | 14,843 | 2,591 |
| | Hanwha Corp. | 69,631 | 2,268 |
| | Samsung Securities Co. Ltd. | 74,487 | 2,240 |
| ^ | Hotel Shilla Co. Ltd. | 44,126 | 2,207 |
| | Hanon Systems | 232,567 | 2,175 |
| ^ | BGF retail Co. Ltd. | 14,269 | 2,167 |
| | Hyundai Department Store Co. Ltd. | 20,832 | 2,137 |
| | S-1 Corp. | 26,384 | 2,130 |
| ^ | Hanssem Co. Ltd. | 13,737 | 2,128 |
| | Mando Corp. | 8,943 | 2,091 |
| *,^ | OCI Co. Ltd. | 25,474 | 2,008 |
| | Doosan Heavy Industries & Construction Co. Ltd. | 86,748 | 1,979 |
| | Korea Investment Holdings Co. Ltd. | 53,307 | 1,909 |
| | Hanwha Life Insurance Co. Ltd. | 349,122 | 1,906 |
| | Yuhan Corp. | 10,378 | 1,903 |
| | Samsung Card Co. Ltd. | 44,754 | 1,884 |
| | SK Telecom Co. Ltd. | 9,146 | 1,793 |
| *,^ | Samsung Engineering Co. Ltd. | 214,193 | 1,768 |
| | Mirae Asset Daewoo Co. Ltd. | 261,524 | 1,764 |
| | DGB Financial Group Inc. | 210,300 | 1,762 |
| | Mirae Asset Securities Co. Ltd. | 88,167 | 1,739 |
| *,^ | Samsung Heavy Industries Co. Ltd. | 204,585 | 1,739 |
| *,^ | CJ Korea Express Corp. | 9,755 | 1,713 |
| | LG Chem Ltd. Preference Shares | 10,351 | 1,625 |
| | NH Investment & Securities Co. Ltd. | 183,094 | 1,610 |
| | Shinsegae Inc. | 9,666 | 1,570 |
| | Korea Gas Corp. | 37,088 | 1,499 |
| | Hyundai Wia Corp. | 21,679 | 1,487 |
| *,^ | Daewoo Engineering & Construction Co. Ltd. | 265,053 | 1,462 |
| *,^ | GS Engineering & Construction Corp. | 61,949 | 1,446 |
| * | Korean Air Lines Co. Ltd. | 51,452 | 1,438 |
| | Kumho Petrochemical Co. Ltd. | 23,478 | 1,435 |
| | KEPCO Plant Service & Engineering Co. Ltd. | 29,482 | 1,413 |
| | Posco Daewoo Corp. | 61,772 | 1,341 |
| ^ | Doosan Corp. | 14,968 | 1,339 |
| | Cheil Worldwide Inc. | 87,119 | 1,289 |
| | Lotte Confectionery Co. Ltd. | 7,220 | 1,212 |
| | LG Household & Health Care Ltd. Preference Shares | 2,849 | 1,184 |
| | KT Corp. | 40,913 | 1,154 |
| | LS Corp. | 23,936 | 1,145 |
| | SK Networks Co. Ltd. | 201,141 | 1,143 |
| | NongShim Co. Ltd. | 4,445 | 1,119 |
| | KT Corp. ADR | 68,399 | 1,094 |
| ^ | Lotte Chilsung Beverage Co. Ltd. | 812 | 1,093 |
| *,^ | Doosan Infracore Co. Ltd. | 176,399 | 1,065 |
| ^ | Hanmi Science Co. ltd | 16,053 | 1,065 |
| ^ | Dongsuh Cos. Inc. | 41,754 | 989 |
34
| | | |
| Vanguard® FTSE All-World ex-US Index Fund | | |
| Schedule of Investments | | |
| October 31, 2016 | | |
| |
| | | | Market |
| | | | Value |
| | | Shares | ($000) |
| ^ | Ottogi Corp. | 1,715 | 986 |
| *,^ | NHN Entertainment Corp. | 21,817 | 956 |
| *,^ | Hyundai Mipo Dockyard Co. Ltd. | 14,399 | 881 |
| ^ | GS Retail Co. Ltd. | 20,577 | 876 |
| ^ | Hite Jinro Co. Ltd. | 42,786 | 822 |
| ^ | Paradise Co. Ltd. | 64,038 | 726 |
| | LG Hausys Ltd. | 7,983 | 659 |
| | SKC Co. Ltd. | 26,189 | 618 |
| | Samsung Fire & Marine Insurance Co. Ltd. Preference Shares | 3,638 | 600 |
| *,^ | Daewoo Shipbuilding & Marine Engineering Co. Ltd. | 149,620 | 586 |
| ^ | LOTTE Fine Chemical Co. Ltd. | 22,429 | 568 |
| | LG Electronics Inc. Preference Shares | 23,318 | 484 |
| ^ | KEPCO Engineering & Construction Co. Inc. | 18,055 | 395 |
| * | Hanwha Corp. Preference Shares | 21,595 | 357 |
| * | Samsung Heavy Industries Rights Exp. 11/08/2016 | 127,025 | 286 |
| | CJ CheilJedang Corp. Preference Shares | 1,801 | 277 |
| * | Samsung Biologics Co. Ltd. | 1,700 | 202 |
| | POSCO | 699 | 145 |
| | | | 817,842 |
| Spain (2.2%) | | |
| | Banco Santander SA | 19,213,676 | 94,148 |
| | Banco Bilbao Vizcaya Argentaria SA | 8,952,290 | 64,445 |
| | Telefonica SA | 5,951,355 | 60,470 |
| | Iberdrola SA | 7,846,983 | 53,402 |
| | Industria de Diseno Textil SA | 1,472,734 | 51,387 |
| | Amadeus IT Group SA | 577,039 | 27,158 |
| * | Repsol SA | 1,519,963 | 21,223 |
| 2 | Aena SA | 89,727 | 13,148 |
| ^ | Abertis Infraestructuras SA | 869,270 | 12,885 |
| * | Ferrovial SA | 662,031 | 12,862 |
| * | Red Electrica Corp. SA | 602,401 | 12,550 |
| | CaixaBank SA | 3,612,312 | 10,900 |
| | Endesa SA | 439,929 | 9,338 |
| | Grifols SA | 459,787 | 9,073 |
| | Enagas SA | 316,295 | 9,067 |
| * | Banco de Sabadell SA | 6,596,902 | 8,808 |
| | Gas Natural SDG SA | 428,004 | 8,425 |
| | Bankinter SA | 958,737 | 7,328 |
| | Gamesa Corp. Tecnologica SA | 310,825 | 7,176 |
| * | ACS Actividades de Construccion y Servicios SA | 234,293 | 7,167 |
| | Bankia SA | 6,378,861 | 5,604 |
| | Grifols SA Preference Shares | 359,043 | 5,157 |
| * | Banco Popular Espanol SA | 4,308,026 | 4,714 |
| | Distribuidora Internacional de Alimentacion SA | 849,023 | 4,535 |
| | Mapfre SA | 1,427,096 | 4,233 |
| | Banco Santander SA ADR | 815,157 | 3,448 |
| | Mediaset Espana Comunicacion SA | 256,296 | 2,860 |
| | Acciona SA | 36,110 | 2,744 |
| * | Acerinox SA | 197,092 | 2,425 |
| | Zardoya Otis SA | 259,274 | 2,184 |
| | Corp Financiera Alba SA | 23,028 | 1,009 |
| * | Ferrovial SA Rights Exp. 11/14/2016 | 662,031 | 283 |
| | | | 540,156 |
| Sweden (1.9%) | | |
| | Nordea Bank AB | 4,414,732 | 46,395 |
| | Hennes & Mauritz AB Class B | 1,319,602 | 37,111 |
| | Swedbank AB Class A | 1,466,439 | 34,313 |
| | Svenska Handelsbanken AB Class A | 2,038,284 | 27,788 |
| ^ | Atlas Copco AB Class A | 861,830 | 25,247 |
| | Assa Abloy AB Class B | 1,306,654 | 23,746 |
| | Svenska Cellulosa AB SCA Class B | 830,845 | 23,532 |
| | Volvo AB Class B | 2,149,679 | 23,057 |
| | Investor AB Class B | 629,909 | 22,370 |
| | Telefonaktiebolaget LM Ericsson Class B | 4,145,579 | 20,110 |
35
| | |
| Vanguard® FTSE All-World ex-US Index Fund | | |
| Schedule of Investments | | |
| October 31, 2016 | | |
| |
| | | Market |
| | | Value |
| | Shares | ($000) |
| Skandinaviska Enskilda Banken AB Class A | 1,992,017 | 20,092 |
| Sandvik AB | 1,498,284 | 17,023 |
| Telia Co. AB | 3,608,987 | 14,417 |
| Atlas Copco AB Class B | 542,419 | 14,168 |
| Hexagon AB Class B | 356,414 | 12,472 |
| Skanska AB Class B | 502,016 | 10,902 |
| Swedish Match AB | 261,151 | 9,088 |
| SKF AB | 524,548 | 8,885 |
| Boliden AB | 379,060 | 8,785 |
| Electrolux AB Class B | 307,378 | 7,275 |
| * Kinnevik AB | 279,848 | 7,075 |
| Securitas AB Class B | 428,009 | 6,606 |
| Alfa Laval AB | 431,640 | 6,193 |
| Trelleborg AB Class B | 335,827 | 5,862 |
| Industrivarden AB Class A | 292,545 | 5,554 |
| * Lundin Petroleum AB | 245,161 | 4,407 |
| ICA Gruppen AB | 135,224 | 4,198 |
| Getinge AB | 253,486 | 4,151 |
| Industrivarden AB | 229,574 | 4,095 |
| Husqvarna AB | 521,044 | 3,917 |
| Tele2 AB | 433,620 | 3,581 |
| * Fastighets AB Balder Class B | 126,125 | 2,865 |
| L E Lundbergforetagen AB Class B | 35,612 | 2,305 |
| Investment AB Latour Class B | 43,433 | 1,603 |
| Melker Schorling AB | 15,217 | 879 |
| Svenska Handelsbanken AB Class B | 49,969 | 671 |
| SKF AB Class A | 22,069 | 375 |
| Fastighets AB Balder Preference Shares | 8,512 | 322 |
| * Tele2 AB Rights Exp. 11/16/2016 | 433,620 | 130 |
| | | 471,565 |
| Switzerland (6.0%) | | |
| Nestle SA | 4,286,842 | 310,856 |
| Novartis AG | 3,284,554 | 233,097 |
| Roche Holding AG | 986,046 | 226,477 |
| UBS Group AG | 4,842,318 | 68,459 |
| ABB Ltd. | 2,660,528 | 54,888 |
| Zurich Insurance Group AG | 207,134 | 54,219 |
| Syngenta AG | 127,500 | 51,021 |
| Cie Financiere Richemont SA | 709,779 | 45,632 |
| Swiss Re AG | 454,616 | 42,194 |
| Credit Suisse Group AG | 2,892,779 | 40,362 |
| Givaudan SA | 12,850 | 24,853 |
| LafargeHolcim Ltd. (XVTX) | 446,548 | 23,819 |
| Geberit AG | 51,429 | 21,743 |
| Actelion Ltd. | 126,091 | 18,220 |
| Swisscom AG | 31,665 | 14,475 |
| SGS SA | 7,102 | 14,375 |
| Sika AG | 2,928 | 14,073 |
| Lonza Group AG | 72,329 | 13,648 |
| Adecco Group AG | 221,011 | 13,123 |
| Partners Group Holding AG | 25,480 | 12,899 |
| ^ Swatch Group AG (Bearer) | 42,353 | 12,738 |
| LafargeHolcim Ltd. (XPAR) | 230,997 | 12,337 |
| Julius Baer Group Ltd. | 304,400 | 12,322 |
| Swiss Life Holding AG | 44,712 | 11,832 |
| Schindler Holding AG | 56,300 | 10,459 |
| Sonova Holding AG | 70,760 | 9,490 |
| Kuehne & Nagel International AG | 69,865 | 9,470 |
| Chocoladefabriken Lindt & Sprungli AG Registered Shares | 142 | 8,808 |
| * Dufry AG | 66,230 | 8,057 |
| Baloise Holding AG | 64,966 | 7,993 |
| Swiss Prime Site AG | 90,442 | 7,501 |
| Chocoladefabriken Lindt & Sprungli AG Participation Certificates | 1,394 | 7,239 |
| Roche Holding AG (Bearer) | 28,197 | 6,553 |
36
| | |
| Vanguard® FTSE All-World ex-US Index Fund | | |
| Schedule of Investments | | |
| October 31, 2016 | | |
| |
| | | Market |
| | | Value |
| | Shares | ($000) |
| Clariant AG | 382,437 | 6,333 |
| Galenica AG | 5,718 | 5,733 |
| Straumann Holding AG | 14,856 | 5,574 |
| Schindler Holding AG (Registered) | 28,787 | 5,329 |
| Aryzta AG | 116,808 | 5,133 |
| EMS-Chemie Holding AG | 10,051 | 5,045 |
| PSP Swiss Property AG | 55,001 | 4,921 |
| Helvetia Holding AG | 8,387 | 4,363 |
| * Flughafen Zuerich AG | 21,587 | 3,968 |
| Swatch Group AG (Registered) | 67,146 | 3,871 |
| Barry Callebaut AG | 2,708 | 3,372 |
| Pargesa Holding SA | 39,369 | 2,643 |
| DKSH Holding AG | 37,235 | 2,581 |
| Banque Cantonale Vaudoise | 3,939 | 2,475 |
| Sulzer AG | 18,518 | 1,824 |
| | | 1,486,397 |
| Taiwan (2.8%) | | |
| Taiwan Semiconductor Manufacturing Co. Ltd. ADR | 5,137,610 | 159,780 |
| Hon Hai Precision Industry Co. Ltd. | 20,799,279 | 56,182 |
| Taiwan Semiconductor Manufacturing Co. Ltd. | 7,598,973 | 45,604 |
| Formosa Plastics Corp. | 6,828,873 | 18,454 |
| Formosa Chemicals & Fibre Corp. | 6,125,306 | 18,186 |
| Largan Precision Co. Ltd. | 140,068 | 16,525 |
| Nan Ya Plastics Corp. | 7,908,615 | 16,424 |
| Delta Electronics Inc. | 3,022,476 | 15,912 |
| MediaTek Inc. | 2,021,440 | 15,322 |
| Fubon Financial Holding Co. Ltd. | 10,107,861 | 14,302 |
| Cathay Financial Holding Co. Ltd. | 11,048,057 | 14,298 |
| Chunghwa Telecom Co. Ltd. ADR | 413,765 | 14,130 |
| CTBC Financial Holding Co. Ltd. | 25,227,939 | 13,567 |
| Uni-President Enterprises Corp. | 6,718,487 | 12,980 |
| China Steel Corp. | 17,291,234 | 12,489 |
| Mega Financial Holding Co. Ltd. | 15,021,777 | 10,270 |
| Asustek Computer Inc. | 982,023 | 8,597 |
| Taiwan Mobile Co. Ltd. | 2,331,648 | 8,158 |
| Catcher Technology Co. Ltd. | 1,029,153 | 8,056 |
| Quanta Computer Inc. | 3,662,598 | 7,409 |
| Pegatron Corp. | 2,680,038 | 7,217 |
| First Financial Holding Co. Ltd. | 13,162,293 | 6,895 |
| Hotai Motor Co. Ltd. | 570,000 | 6,621 |
| Formosa Petrochemical Corp. | 1,979,580 | 6,610 |
| E.Sun Financial Holding Co. Ltd. | 11,559,812 | 6,565 |
| Yuanta Financial Holding Co. Ltd. | 16,023,916 | 5,981 |
| President Chain Store Corp. | 780,904 | 5,835 |
| Hua Nan Financial Holdings Co. Ltd. | 10,976,843 | 5,574 |
| Advanced Semiconductor Engineering Inc. ADR | 926,533 | 5,420 |
| Taiwan Cement Corp. | 4,473,768 | 5,359 |
| Far EasTone Telecommunications Co. Ltd. | 2,222,643 | 5,252 |
| Cheng Shin Rubber Industry Co. Ltd. | 2,575,220 | 5,240 |
| Taiwan Cooperative Financial Holding Co. Ltd. | 11,933,087 | 5,230 |
| United Microelectronics Corp. ADR | 2,657,953 | 5,050 |
| Pou Chen Corp. | 3,685,125 | 4,972 |
| China Development Financial Holding Corp. | 19,610,318 | 4,907 |
| Advanced Semiconductor Engineering Inc. | 4,078,847 | 4,793 |
| Taishin Financial Holding Co. Ltd. | 12,592,185 | 4,603 |
| Chunghwa Telecom Co. Ltd. | 1,309,207 | 4,483 |
| Foxconn Technology Co. Ltd. | 1,534,925 | 4,449 |
| Far Eastern New Century Corp. | 5,616,819 | 4,346 |
| Lite-On Technology Corp. | 2,962,767 | 4,247 |
| Innolux Corp. | 12,114,370 | 4,078 |
| Chang Hwa Commercial Bank Ltd. | 7,884,245 | 4,029 |
| SinoPac Financial Holdings Co. Ltd. | 13,901,287 | 4,007 |
| Advantech Co. Ltd. | 468,314 | 3,806 |
| AU Optronics Corp. ADR | 938,788 | 3,549 |
37
| | |
| Vanguard® FTSE All-World ex-US Index Fund | | |
| Schedule of Investments | | |
| October 31, 2016 | | |
| |
| | | Market |
| | | Value |
| | Shares | ($000) |
| Siliconware Precision Industries Co. Ltd. | 2,329,279 | 3,523 |
| Hermes Microvision Inc. | 78,114 | 3,444 |
| Compal Electronics Inc. | 5,743,510 | 3,415 |
| Inventec Corp. | 4,240,064 | 3,310 |
| Eclat Textile Co. Ltd. | 279,351 | 3,165 |
| * Inotera Memories Inc. | 3,285,000 | 3,072 |
| Novatek Microelectronics Corp. | 789,916 | 2,958 |
| * HTC Corp. | 1,004,570 | 2,934 |
| Asia Cement Corp. | 3,199,519 | 2,790 |
| Giant Manufacturing Co. Ltd. | 389,625 | 2,756 |
| Wistron Corp. | 3,623,143 | 2,730 |
| Vanguard International Semiconductor Corp. | 1,263,466 | 2,572 |
| * Shin Kong Financial Holding Co. Ltd. | 10,609,858 | 2,300 |
| Teco Electric and Machinery Co. Ltd. | 2,566,000 | 2,275 |
| Realtek Semiconductor Corp. | 651,768 | 2,208 |
| Synnex Technology International Corp. | 1,929,889 | 2,056 |
| Chicony Electronics Co. Ltd. | 795,095 | 2,031 |
| Feng TAY Enterprise Co. Ltd. | 453,100 | 1,890 |
| Acer Inc. | 4,092,396 | 1,875 |
| Walsin Lihwa Corp. | 4,600,000 | 1,609 |
| Taiwan Business Bank | 5,468,419 | 1,381 |
| Nanya Technology Corp. | 1,027,600 | 1,332 |
| Taiwan Fertilizer Co. Ltd. | 984,000 | 1,316 |
| Eva Airways Corp. | 2,712,766 | 1,306 |
| Formosa Taffeta Co. Ltd. | 1,398,000 | 1,274 |
| Eternal Materials Co. Ltd. | 1,188,169 | 1,252 |
| United Microelectronics Corp. | 3,220,978 | 1,199 |
| Taiwan Secom Co. Ltd. | 389,725 | 1,117 |
| China Airlines Ltd. | 3,666,913 | 1,109 |
| Siliconware Precision Industries Co. Ltd. ADR | 145,314 | 1,088 |
| AU Optronics Corp. | 2,838,000 | 1,078 |
| Transcend Information Inc. | 380,455 | 1,051 |
| Yulon Motor Co. Ltd. | 1,148,898 | 1,005 |
| * Evergreen Marine Corp. Taiwan Ltd. | 2,503,222 | 935 |
| * Epistar Corp. | 1,375,000 | 934 |
| * Taiwan Glass Industry Corp. | 2,098,089 | 877 |
| Feng Hsin Steel Co. Ltd. | 613,790 | 813 |
| Unimicron Technology Corp. | 1,942,975 | 802 |
| Capital Securities Corp. | 3,201,231 | 800 |
| Far Eastern International Bank | 2,788,314 | 793 |
| China Motor Corp. | 985,105 | 772 |
| Cheng Uei Precision Industry Co. Ltd. | 532,591 | 652 |
| Oriental Union Chemical Corp. | 950,191 | 593 |
| * TPK Holding Co. Ltd. | 357,422 | 570 |
| Wan Hai Lines Ltd. | 974,702 | 480 |
| Cathay Real Estate Development Co. Ltd. | 870,800 | 446 |
| Ton Yi Industrial Corp. | 1,014,600 | 435 |
| * Yang Ming Marine Transport Corp. | 1,936,305 | 430 |
| U-Ming Marine Transport Corp. | 561,000 | 389 |
| Yulon Nissan Motor Co. Ltd. | 33,633 | 212 |
| Nan Ya Printed Circuit Board Corp. | 274,395 | 207 |
| | | 705,324 |
| Thailand (0.7%) | | |
| * PTT PCL | 1,455,782 | 14,334 |
| Siam Cement PCL NVDR | 748,080 | 10,682 |
| Kasikornbank PCL (Foreign) | 1,617,283 | 7,939 |
| CP ALL PCL (Foreign) | 4,192,000 | 7,267 |
| Advanced Info Service PCL (Foreign) | 1,600,750 | 7,016 |
| Siam Cement PCL (Foreign) | 416,013 | 5,988 |
| Kasikornbank PCL | 1,162,237 | 5,705 |
| * CP ALL PCL (Local) | 3,077,113 | 5,334 |
| PTT PCL (Foreign) | 539,900 | 5,316 |
| * Minor International PCL | 4,706,087 | 5,170 |
| * Siam Commercial Bank PCL (Local) | 1,238,703 | 5,072 |
38
| | | |
| Vanguard® FTSE All-World ex-US Index Fund | | |
| Schedule of Investments | | |
| October 31, 2016 | | |
| |
| | | | Market |
| | | | Value |
| | | Shares | ($000) |
| | Airports of Thailand PCL (Foreign) | 455,300 | 4,953 |
| | Siam Commercial Bank PCL | 1,119,900 | 4,585 |
| | PTT Exploration & Production PCL (Foreign) | 1,887,778 | 4,466 |
| * | Bangkok Dusit Medical Services PCL | 6,698,301 | 4,363 |
| | Siam Commercial Bank PCL (Foreign) | 995,486 | 4,076 |
| * | Central Pattana PCL | 2,545,494 | 4,045 |
| | Intouch Holdings NVDR | 2,547,504 | 3,859 |
| * | Charoen Pokphand Foods PCL | 4,005,778 | 3,603 |
| | Bangkok Dusit Medical Services PCL (Foreign) | 5,338,100 | 3,477 |
| | Bangkok Bank PCL (Foreign) | 672,627 | 3,064 |
| * | Krung Thai Bank PCL | 5,926,687 | 2,911 |
| * | PTT Global Chemical PCL (Local) | 1,556,715 | 2,659 |
| * | BTS Group Holdings PCL | 10,401,817 | 2,542 |
| * | Bumrungrad Hospital PCL | 449,642 | 2,349 |
| * | Bangkok Expressway & Metro PCL | 10,912,227 | 2,320 |
| | Thai Oil PCL (Foreign) | 1,149,700 | 2,297 |
| * | Banpu PCL (Local) | 4,322,551 | 2,262 |
| * | Home Product Center PCL | 7,756,889 | 2,234 |
| | PTT Global Chemical PCL (Foreign) | 1,264,212 | 2,159 |
| | TMB Bank PCL | 29,787,600 | 1,785 |
| | Thai Union Frozen Products PCL (Foreign) | 2,856,344 | 1,770 |
| * | OBI Pharma Inc. | 168,000 | 1,756 |
| ^ | Charoen Pokphand Foods PCL (Foreign) | 1,947,300 | 1,751 |
| * | Indorama Ventures PCL | 2,005,283 | 1,673 |
| * | True Corp. PCL | 8,399,933 | 1,618 |
| * | Airports of Thailand PCL | 140,799 | 1,532 |
| | Central Pattana PCL (Foreign) | 903,200 | 1,435 |
| ^ | Berli Jucker PCL (Foreign) | 887,580 | 1,338 |
| | Krung Thai Bank PCL (Foreign) | 2,716,125 | 1,334 |
| * | Electricity Generating PCL | 236,709 | 1,317 |
| * | Ratchaburi Electricity Generating Holding PCL (Local) | 887,345 | 1,268 |
| | Land & Houses PCL NVDR | 4,273,400 | 1,120 |
| * | IRPC PCL | 8,152,928 | 1,113 |
| ^ | True Corp. PCL (Foreign) | 5,775,653 | 1,113 |
| * | Land & Houses PCL | 4,145,156 | 1,087 |
| | Bangkok Life Assurance PCL | 724,802 | 1,029 |
| | Glow Energy PCL (Foreign) | 465,500 | 1,022 |
| * | Berli Jucker PCL | 555,035 | 836 |
| | IRPC PCL (Foreign) | 5,950,900 | 812 |
| | Delta Electronics Thailand PCL (Foreign) | 339,900 | 761 |
| * | Delta Electronics Thailand PCL | 335,510 | 751 |
| | Electricity Generating PCL (Foreign) | 130,500 | 726 |
| | Banpu PCL | 1,371,478 | 718 |
| * | Thai Airways International PCL | 822,422 | 657 |
| * | Thai Union Group PCL | 1,009,005 | 625 |
| *,^ | Thai Airways International PCL (Foreign) | 676,002 | 540 |
| ^ | Total Access Communication PCL (Foreign) | 587,700 | 523 |
| * | Thai Oil PCL | 250,683 | 501 |
| * | BEC World PCL | 822,610 | 482 |
| | Siam City Cement PCL (Foreign) | 57,200 | 472 |
| | BEC World PCL (Foreign) | 573,400 | 336 |
| * | Siam City Cement PCL (Local) | 39,768 | 328 |
| * | Glow Energy PCL | 142,164 | 312 |
| ^ | Total Access Communication PCL | 334,400 | 298 |
| ^ | Ratchaburi Electricity Generating Holding PCL (Foreign) | 187,700 | 268 |
| * | Advanced Info Service PCL (Local) | 50,214 | 220 |
| * | PTT Exploration and Production PCL (Local) | 53,522 | 127 |
| ^ | Land & Houses PCL (Foreign) | 478,520 | 125 |
| | Minor International PCL (Foreign) | 99,236 | 109 |
| * | Total Access Communication PCL (Local) | 96,223 | 86 |
| * | Intouch Holdings PCL | 49,757 | 75 |
| * | Indorama Ventures PCL Warrants Exp. 08/24/2017 | 162,130 | 11 |
| * | Indorama Ventures Warrants Exp. 08/24/2018 | 124,715 | 9 |
| | | | 177,816 |
39
| | |
| Vanguard® FTSE All-World ex-US Index Fund | | |
| Schedule of Investments | | |
| October 31, 2016 | | |
| |
| | | Market |
| | | Value |
| | Shares | ($000) |
| Turkey (0.3%) | | |
| Turkiye Garanti Bankasi AS | 2,911,170 | 7,922 |
| Akbank TAS | 2,839,135 | 7,598 |
| BIM Birlesik Magazalar AS | 311,455 | 5,077 |
| KOC Holding AS | 887,423 | 3,701 |
| * Turkcell Iletisim Hizmetleri AS | 1,103,849 | 3,559 |
| Tupras Turkiye Petrol Rafinerileri AS | 170,561 | 3,478 |
| Haci Omer Sabanci Holding AS (Bearer) | 1,119,655 | 3,385 |
| Turkiye Is Bankasi | 1,895,597 | 3,078 |
| Emlak Konut Gayrimenkul Yatirim Ortakligi AS | 2,737,959 | 2,798 |
| Turkiye Halk Bankasi AS | 885,679 | 2,694 |
| Eregli Demir ve Celik Fabrikalari TAS | 1,880,207 | 2,556 |
| Turkiye Vakiflar Bankasi TAO | 1,465,354 | 2,172 |
| Anadolu Efes Biracilik Ve Malt Sanayii AS | 271,087 | 1,657 |
| Arcelik AS | 242,077 | 1,599 |
| * Yapi ve Kredi Bankasi AS | 1,170,371 | 1,401 |
| Tofas Turk Otomobil Fabrikasi AS | 179,896 | 1,356 |
| * Turk Hava Yollari AO | 766,058 | 1,348 |
| Ulker Biskuvi Sanayi AS | 212,235 | 1,318 |
| Turk Telekomunikasyon AS | 706,271 | 1,307 |
| Enka Insaat ve Sanayi AS | 765,175 | 1,169 |
| Petkim Petrokimya Holding AS | 809,077 | 1,099 |
| Coca-Cola Icecek AS | 92,876 | 1,051 |
| Ford Otomotiv Sanayi AS | 101,954 | 1,042 |
| Turkiye Sise ve Cam Fabrikalari AS | 854,837 | 899 |
| TAV Havalimanlari Holding AS | 201,666 | 829 |
| Aselsan Elektronik Sanayi Ve Ticaret AS | 215,247 | 654 |
| Turkiye Sinai Kalkinma Bankasi AS | 1,273,740 | 565 |
| Turk Traktor ve Ziraat Makineleri AS | 19,938 | 518 |
| * Koza Altin Isletmeleri AS | 68,260 | 389 |
| Aygaz AS | 87,721 | 310 |
| * Migros Ticaret AS | 43,882 | 253 |
| Yazicilar Holding AS Class A | 55,686 | 245 |
| Akcansa Cimento AS | 48,972 | 204 |
| | | 67,231 |
| United Arab Emirates (0.2%) | | |
| Emirates Telecommunications Group Co. PJSC | 2,419,708 | 12,414 |
| Emaar Properties PJSC | 4,880,552 | 9,242 |
| First Gulf Bank PJSC | 1,570,015 | 4,909 |
| Abu Dhabi Commercial Bank PJSC | 2,514,929 | 4,197 |
| DP World Ltd. | 229,427 | 4,116 |
| Aldar Properties PJSC | 4,415,370 | 3,161 |
| Dubai Islamic Bank PJSC | 1,714,479 | 2,442 |
| Emaar Malls PJSC | 2,947,032 | 2,059 |
| * DXB Entertainments PJSC | 4,485,212 | 1,911 |
| Union National Bank PJSC | 1,512,007 | 1,612 |
| DAMAC Properties Dubai Co. PJSC | 2,298,381 | 1,373 |
| * Arabtec Holding PJSC | 3,289,875 | 1,188 |
| Air Arabia PJSC | 3,270,191 | 1,156 |
| Dubai Investments PJSC | 1,893,777 | 1,034 |
| Dubai Financial Market PJSC | 2,296,512 | 717 |
| * Dana Gas PJSC | 4,699,878 | 677 |
| Al Waha Capital PJSC | 1,220,264 | 624 |
| * Deyaar Development PJSC | 2,069,349 | 300 |
| * Union Properties PJSC | 1,419,520 | 273 |
| | | 53,405 |
| United Kingdom (12.6%) | | |
| HSBC Holdings plc | 27,535,770 | 207,376 |
| BP plc | 26,106,062 | 154,332 |
| Royal Dutch Shell plc Class A | 6,012,207 | 149,747 |
| British American Tobacco plc | 2,590,633 | 148,477 |
| Royal Dutch Shell plc Class B | 5,205,540 | 134,265 |
| GlaxoSmithKline plc | 6,756,928 | 133,479 |
| Vodafone Group plc | 36,922,380 | 101,401 |
40
| | |
| Vanguard® FTSE All-World ex-US Index Fund | | |
| Schedule of Investments | | |
| October 31, 2016 | | |
| |
| | | Market |
| | | Value |
| | Shares | ($000) |
| AstraZeneca plc | 1,753,877 | 98,209 |
| Diageo plc | 3,500,553 | 93,173 |
| Reckitt Benckiser Group plc | 873,885 | 78,179 |
| Unilever plc | 1,676,747 | 70,003 |
| National Grid plc | 5,242,425 | 68,193 |
| Imperial Brands plc | 1,338,976 | 64,769 |
| Lloyds Banking Group plc | 88,957,202 | 62,121 |
| Prudential plc | 3,584,471 | 58,495 |
| Rio Tinto plc | 1,680,524 | 58,441 |
| Barclays plc | 23,508,911 | 54,466 |
| BT Group plc | 11,630,109 | 53,383 |
| * Glencore plc | 16,204,901 | 49,605 |
| Shire plc | 858,773 | 48,489 |
| BHP Billiton plc | 2,935,392 | 44,140 |
| Compass Group plc | 2,289,925 | 41,435 |
| WPP plc | 1,801,214 | 39,110 |
| CRH plc (London Shares) | 1,015,976 | 32,877 |
| * Standard Chartered plc | 3,732,851 | 32,461 |
| Aviva plc | 5,626,111 | 30,487 |
| BAE Systems plc | 4,399,306 | 29,149 |
| * Tesco plc | 11,300,340 | 29,106 |
| RELX NV (XLON) | 1,525,220 | 27,226 |
| SSE plc | 1,400,150 | 27,223 |
| Experian plc | 1,335,593 | 25,676 |
| * Anglo American plc | 1,819,397 | 25,252 |
| Shire plc ADR | 130,780 | 22,055 |
| Legal & General Group plc | 8,269,612 | 21,156 |
| Rolls-Royce Holdings plc | 2,294,784 | 20,370 |
| Centrica plc | 7,524,866 | 19,710 |
| Wolseley plc | 349,949 | 18,152 |
| Smith & Nephew plc | 1,244,056 | 17,985 |
| Old Mutual plc | 6,786,056 | 16,693 |
| London Stock Exchange Group plc | 438,462 | 15,061 |
| Associated British Foods plc | 484,428 | 14,571 |
| Sky plc | 1,456,864 | 14,565 |
| Kingfisher plc | 3,138,791 | 13,865 |
| Land Securities Group plc | 1,090,559 | 13,316 |
| Sage Group plc | 1,493,036 | 13,173 |
| Bunzl plc | 466,563 | 12,526 |
| Carnival plc | 252,686 | 12,188 |
| Paddy Power Betfair plc | 113,569 | 11,765 |
| Next plc | 196,041 | 11,534 |
| Randgold Resources Ltd. | 129,440 | 11,495 |
| Standard Life plc | 2,753,463 | 11,363 |
| Whitbread plc | 254,345 | 11,236 |
| Johnson Matthey plc | 268,287 | 11,183 |
| Burberry Group plc | 614,149 | 11,076 |
| 3i Group plc | 1,344,806 | 11,024 |
| ITV plc | 5,215,072 | 10,872 |
| Ashtead Group plc | 697,739 | 10,872 |
| United Utilities Group plc | 945,146 | 10,864 |
| Pearson plc | 1,144,517 | 10,588 |
| InterContinental Hotels Group plc | 273,083 | 10,587 |
| * Royal Bank of Scotland Group plc | 4,573,545 | 10,569 |
| British Land Co. plc | 1,429,032 | 10,231 |
| DCC plc | 123,135 | 10,018 |
| Mondi plc | 509,090 | 9,935 |
| RSA Insurance Group plc | 1,407,503 | 9,503 |
| Smiths Group plc | 542,973 | 9,409 |
| Marks & Spencer Group plc | 2,248,968 | 9,358 |
| Intertek Group plc | 222,836 | 9,297 |
| Severn Trent plc | 326,170 | 9,285 |
| GKN plc | 2,373,986 | 9,258 |
| Informa plc | 1,122,712 | 9,237 |
41
| | |
| Vanguard® FTSE All-World ex-US Index Fund | | |
| Schedule of Investments | | |
| October 31, 2016 | | |
| |
| | | Market |
| | | Value |
| | Shares | ($000) |
| Persimmon plc | 424,189 | 8,781 |
| St. James's Place plc | 718,556 | 8,298 |
| Wm Morrison Supermarkets plc | 2,997,289 | 8,297 |
| 2 Worldpay Group plc | 2,334,853 | 8,115 |
| Micro Focus International plc | 308,049 | 8,066 |
| Direct Line Insurance Group plc | 1,904,119 | 8,056 |
| Taylor Wimpey plc | 4,523,876 | 7,834 |
| International Consolidated Airlines Group SA (London Shares) | 1,475,114 | 7,822 |
| Croda International plc | 180,118 | 7,703 |
| Barratt Developments plc | 1,381,319 | 7,660 |
| Royal Mail plc | 1,265,401 | 7,592 |
| Provident Financial plc | 206,390 | 7,440 |
| Hammerson plc | 1,090,342 | 7,335 |
| J Sainsbury plc | 2,325,118 | 7,129 |
| Rentokil Initial plc | 2,542,652 | 7,092 |
| Halma plc | 522,487 | 6,689 |
| Capita plc | 920,696 | 6,590 |
| Admiral Group plc | 277,767 | 6,508 |
| DS Smith plc | 1,309,614 | 6,386 |
| Weir Group plc | 301,768 | 6,269 |
| Segro plc | 1,155,007 | 6,186 |
| Tate & Lyle plc | 647,128 | 6,172 |
| 2 Auto Trader Group plc | 1,346,101 | 6,167 |
| Mediclinic International plc | 545,178 | 6,045 |
| Coca-Cola HBC AG | 272,211 | 5,874 |
| G4S plc | 2,172,795 | 5,836 |
| Pennon Group plc | 566,853 | 5,785 |
| Meggitt plc | 1,082,450 | 5,759 |
| Rightmove plc | 125,928 | 5,748 |
| Travis Perkins plc | 346,497 | 5,637 |
| 2 Merlin Entertainments plc | 989,516 | 5,577 |
| Investec plc | 881,569 | 5,471 |
| Schroders plc | 158,450 | 5,454 |
| TUI AG | 425,894 | 5,399 |
| Aberdeen Asset Management plc | 1,379,568 | 5,396 |
| * Just Eat plc | 773,986 | 5,317 |
| Inmarsat plc | 616,850 | 5,291 |
| Dixons Carphone plc | 1,370,179 | 5,268 |
| Berkeley Group Holdings plc | 179,579 | 5,179 |
| Booker Group plc | 2,264,566 | 4,967 |
| Bellway plc | 169,295 | 4,899 |
| John Wood Group plc | 517,318 | 4,862 |
| Hargreaves Lansdown plc | 338,097 | 4,793 |
| Inchcape plc | 599,323 | 4,765 |
| Fresnillo plc | 234,885 | 4,726 |
| IMI plc | 382,635 | 4,648 |
| ICAP plc | 750,010 | 4,447 |
| Intu Properties plc | 1,298,860 | 4,377 |
| CRH plc (Dublin Shares) | 133,742 | 4,342 |
| William Hill plc | 1,196,798 | 4,329 |
| Polymetal International plc | 391,388 | 4,267 |
| Babcock International Group plc | 346,344 | 4,187 |
| Cobham plc | 2,386,675 | 4,164 |
| Henderson Group plc | 1,458,273 | 4,126 |
| Hikma Pharmaceuticals plc | 192,240 | 4,123 |
| Derwent London plc | 138,605 | 4,099 |
| * CYBG plc | 1,212,646 | 4,009 |
| Howden Joinery Group plc | 844,937 | 3,869 |
| Capital & Counties Properties plc | 1,023,928 | 3,611 |
| Petrofac Ltd. | 362,327 | 3,568 |
| easyJet plc | 301,702 | 3,460 |
| Daily Mail & General Trust plc | 369,444 | 3,391 |
| Antofagasta plc | 494,496 | 3,289 |
| Aggreko plc | 330,003 | 3,227 |
42
| | | | | |
| Vanguard® FTSE All-World ex-US Index Fund | | | | |
| Schedule of Investments | | | | |
| October 31, 2016 | | | | |
| |
| | | | | | Market |
| | | | | | Value |
| | | | | Shares | ($000) |
| | Ashmore Group plc | | | 553,112 | 2,375 |
| ^ | TalkTalk Telecom Group plc | | | 718,653 | 1,790 |
| *,^ | Sports Direct International plc | | | 339,871 | 1,149 |
| |
| | | | | | 3,133,772 |
| |
| Total Common Stocks (Cost $24,530,754) | | | | 24,606,030 |
| |
| |
| | | Coupon | | | |
| |
| Temporary Cash Investments (1.6%)1 | | | | |
| Money Market Fund (1.5%) | | | | |
| 5,6 | Vanguard Market Liquidity Fund | 0.718% | | 3,664,523 | 366,489 |
| |
| |
| | | | | Face | |
| | | | Maturity | Amount | |
| | | | Date | ($000) | |
| U.S. Government and Agency Obligations (0.1%) | | | | |
| 7 | Federal Home Loan Bank Discount Notes | 0.339% | 11/4/16 | 2,200 | 2,200 |
| 7 | Federal Home Loan Bank Discount Notes | 0.339% | 11/14/16 | 1,300 | 1,300 |
| 7 | Federal Home Loan Bank Discount Notes | 0.340% | 11/16/16 | 900 | 900 |
| 7,8,9 | Federal Home Loan Bank Discount Notes | 0.394% | 11/18/16 | 1,000 | 1,000 |
| 7,9 | Federal Home Loan Bank Discount Notes | 0.431% | 1/25/17 | 200 | 200 |
| 7,8 | Federal Home Loan Bank Discount Notes | 0.481% | 2/17/17 | 3,000 | 2,997 |
| 8 | United States Treasury Bill | 0.320% | 11/25/16 | 1,200 | 1,200 |
| 8,9 | United States Treasury Bill | 0.318% | 12/1/16 | 3,700 | 3,699 |
| 8,9 | United States Treasury Bill | 0.320%–0.340% | 12/8/16 | 6,400 | 6,399 |
| 9 | United States Treasury Bill | 0.287% | 1/5/17 | 4,000 | 3,998 |
| 9 | United States Treasury Bill | 0.337%–0.360% | 1/12/17 | 3,500 | 3,498 |
| 8,9 | United States Treasury Bill | 0.406% | 2/9/17 | 1,800 | 1,798 |
| |
| | | | | | 29,189 |
| |
| Total Temporary Cash Investments (Cost $395,649) | | | | 395,678 |
| |
| Total Investments (100.8%) (Cost $24,926,403) | | | | 25,001,708 |
| Other Assets and Liabilities—Net (-0.8%)6 | | | | (207,260) |
| Net Assets (100%) | | | | 24,794,448 |
__________________________________________________________________________________________________________________________________________________________________________________________________________________________________________________________________________________________________________________________________________________________________________________________________________________________________________________________________________________________________________________________________________________________________________________________________________________________________________________________________________________________
__________________________________________________________________________________________________________________________________________________________________________________________________________________________________________________________________________________________________________________________________________________________________________________________________________________________________________________________________________________________________________________________________________________________________________________________________________________________________________________________________________________________
* Non-income-producing security.
^ Includes partial security positions on loan to broker-dealers. The total value of securities on loan is $255,125,000.
1 The fund invests a portion of its cash reserves in equity markets through the use of index futures contracts. After giving effect to futures
investments, the fund's effective common stock and temporary cash investment positions represent 100.0% and 0.8%, respectively, of net
assets.
2 Security exempt from registration under Rule 144A of the Securities Act of 1933. Such securities may be sold in transactions exempt from
registration, normally to qualified institutional buyers. At October 31, 2016, the aggregate value of these securities was $149,411,000,
representing 0.6% of net assets.
3 “Other” represents securities that are not classified by the fund’s benchmark index.
4 Considered an affiliated company of the fund as the issuer is another member of The Vanguard Group.
5 Affiliated money market fund available only to Vanguard funds and certain trusts and accounts managed by Vanguard. Rate shown is the 7-day
yield.
6 Includes $273,828,000 of collateral received for securities on loan.
7 The issuer operates under a congressional charter; its securities are generally neither guaranteed by the U.S. Treasury nor backed by the full
faith and credit of the U.S. government.
8 Securities with a value of $11,895,000 have been segregated as initial margin for open futures contracts.
9 Securities with a value of $8,163,000 have been segregated as collateral for open forward currency contracts.
ADR—American Depositary Receipt.
GDR—Global Depositary Receipt.
NVDR—Non-Voting Depository Receipt.
REIT—Real Estate Investment Trust.
__________________________________________________________________________________________________________________________________________________________________________________________________________________________________________________________________________________________________________________________________________________________________________________________________________________________________________________________________________________________________________________________________________________________________________________________________________________________________________________________________________________________
__________________________________________________________________________________________________________________________________________________________________________________________________________________________________________________________________________________________________________________________________________________________________________________________________________________________________________________________________________________________________________________________________________________________________________________________________________________________________________________________________________________________
43
| | | |
| Vanguard® FTSE All-World ex-US Small-Cap Index Fund | | |
| Schedule of Investments | | |
| October 31, 2016 | | |
| |
| | | | Market |
| | | | Value |
| | | Shares | ($000) |
| |
| Common Stocks (99.1%)1 | | |
| Australia (4.4%) | | |
| | JB Hi-Fi Ltd. | 185,087 | 3,990 |
| | Link Administration Holdings Ltd. | 578,954 | 3,166 |
| | Qube Holdings Ltd. | 1,822,003 | 3,084 |
| | Northern Star Resources Ltd. | 953,554 | 3,084 |
| | Investa Office Fund | 928,379 | 2,990 |
| | Evolution Mining Ltd. | 1,676,637 | 2,957 |
| * | Mayne Pharma Group Ltd. | 2,299,180 | 2,861 |
| | carsales.com Ltd. | 346,286 | 2,803 |
| | nib holdings Ltd. | 733,673 | 2,687 |
| | Independence Group NL | 797,456 | 2,597 |
| | Charter Hall Group | 720,526 | 2,571 |
| | BT Investment Management Ltd. | 351,807 | 2,466 |
| | Primary Health Care Ltd. | 750,906 | 2,189 |
| | Mineral Resources Ltd. | 240,850 | 2,119 |
| | Navitas Ltd. | 511,642 | 2,035 |
| | Regis Resources Ltd. | 778,681 | 1,964 |
| | IRESS Ltd. | 221,608 | 1,908 |
| | BWP Trust | 838,736 | 1,892 |
| ^ | Blackmores Ltd. | 22,241 | 1,891 |
| | InvoCare Ltd. | 188,858 | 1,874 |
| | Sigma Pharmaceuticals Ltd. | 1,855,439 | 1,872 |
| | Aveo Group | 745,179 | 1,819 |
| | Bapcor Ltd. | 466,416 | 1,818 |
| | Super Retail Group Ltd. | 243,465 | 1,810 |
| | GrainCorp Ltd. Class A | 282,061 | 1,799 |
| | Charter Hall Retail REIT | 527,074 | 1,660 |
| * | St. Barbara Ltd. | 770,829 | 1,573 |
| | Cromwell Property Group | 2,233,820 | 1,545 |
| | Sirtex Medical Ltd. | 72,201 | 1,528 |
| | Cleanaway Waste Management Ltd. | 1,624,978 | 1,431 |
| | Breville Group Ltd. | 200,970 | 1,413 |
| | G8 Education Ltd. | 580,809 | 1,393 |
| | Pact Group Holdings Ltd. | 270,581 | 1,349 |
| | Premier Investments Ltd. | 122,230 | 1,315 |
| | ARB Corp. Ltd. | 101,014 | 1,308 |
| | Spotless Group Holdings Ltd. | 1,643,259 | 1,247 |
| | Beach Energy Ltd. | 2,253,762 | 1,227 |
| | Steadfast Group Ltd. | 732,246 | 1,189 |
| | Southern Cross Media Group Ltd. | 1,080,322 | 1,179 |
| | SAI Global Ltd. | 329,428 | 1,171 |
| | Retail Food Group Ltd. | 225,459 | 1,160 |
| | Webjet Ltd. | 139,442 | 1,158 |
| *,^ | Aconex Ltd. | 264,003 | 1,116 |
| | Myer Holdings Ltd. | 1,250,874 | 1,115 |
| | Mantra Group Ltd. | 445,526 | 1,112 |
| | Automotive Holdings Group Ltd. | 360,419 | 1,108 |
| | Ardent Leisure Group | 712,350 | 1,091 |
| | Abacus Property Group | 484,438 | 1,029 |
| 2 | MYOB Group Ltd. | 361,923 | 1,015 |
| *,^ | Syrah Resources Ltd. | 369,976 | 1,012 |
| * | Saracen Mineral Holdings Ltd. | 1,158,516 | 1,001 |
| | Altium Ltd. | 165,609 | 986 |
| | Technology One Ltd. | 227,079 | 970 |
| | GUD Holdings Ltd. | 132,806 | 958 |
| | Eclipx Group Ltd. | 322,676 | 944 |
| | Monadelphous Group Ltd. | 133,152 | 941 |
| | Seven Group Holdings Ltd. | 136,196 | 939 |
| | APN Outdoor Group Ltd. | 258,745 | 933 |
| | Sandfire Resources NL | 233,539 | 921 |
| * | Nanosonics Ltd. | 348,938 | 919 |
| | Resolute Mining Ltd. | 775,429 | 916 |
44
| | | |
| Vanguard® FTSE All-World ex-US Small-Cap Index Fund | | |
| Schedule of Investments | | |
| October 31, 2016 | | |
| |
| | | | Market |
| | | | Value |
| | | Shares | ($000) |
| | Brickworks Ltd. | 89,092 | 913 |
| * | NEXTDC Ltd. | 317,661 | 888 |
| | Genworth Mortgage Insurance Australia Ltd. | 377,298 | 877 |
| | Costa Group Holdings Ltd. | 402,555 | 871 |
| | GWA Group Ltd. | 400,242 | 868 |
| *,^ | Orocobre Ltd. | 294,499 | 858 |
| | National Storage REIT | 734,830 | 809 |
| | Australian Pharmaceutical Industries Ltd. | 560,784 | 808 |
| ^ | Bellamy's Australia Ltd. | 91,774 | 792 |
| * | Australian Agricultural Co. Ltd. | 595,025 | 789 |
| | Credit Corp. Group Ltd. | 57,259 | 770 |
| ^ | Gateway Lifestyle | 420,911 | 740 |
| | Corporate Travel Management Ltd. | 51,080 | 736 |
| | Bega Cheese Ltd. | 196,425 | 736 |
| * | Western Areas Ltd. | 390,745 | 733 |
| * | Perseus Mining Ltd. | 1,540,863 | 724 |
| | FlexiGroup Ltd. | 416,447 | 711 |
| ^ | IPH Ltd. | 159,833 | 711 |
| * | Galaxy Resources Ltd. | 2,621,913 | 703 |
| | McMillan Shakespeare Ltd. | 84,138 | 691 |
| | oOh!media Ltd. | 206,183 | 670 |
| ^ | Greencross Ltd. | 126,018 | 668 |
| | IDP Education Ltd. | 193,466 | 666 |
| ^ | Growthpoint Properties Australia Ltd. | 278,652 | 657 |
| | Tassal Group Ltd. | 221,165 | 647 |
| * | Bradken Ltd. | 258,539 | 632 |
| | iSentia Group Ltd. | 234,970 | 628 |
| | Asaleo Care Ltd. | 561,007 | 622 |
| * | Pilbara Minerals Ltd. | 1,572,153 | 620 |
| | Nine Entertainment Co. Holdings Ltd. | 948,409 | 619 |
| ^ | Cover-More Group Ltd. | 566,900 | 613 |
| | Folkestone Education Trust | 324,436 | 612 |
| * | UGL Ltd. | 250,483 | 611 |
| * | Infigen Energy | 794,052 | 607 |
| ^ | Regis Healthcare Ltd. | 198,611 | 594 |
| | 360 Capital Industrial Fund | 305,192 | 571 |
| * | Beadell Resources Ltd. | 1,580,598 | 562 |
| | Ingenia Communities Group | 267,675 | 554 |
| | SmartGroup Corp. Ltd. | 121,067 | 550 |
| *,^ | Gold Road Resources Ltd. | 1,259,730 | 549 |
| ^ | TFS Corp. Ltd. | 512,039 | 545 |
| * | Karoon Gas Australia Ltd. | 313,163 | 544 |
| ^ | Japara Healthcare Ltd. | 373,006 | 533 |
| | Select Harvests Ltd. | 114,438 | 532 |
| | Estia Health Ltd. | 255,291 | 520 |
| | Village Roadshow Ltd. | 133,940 | 518 |
| | Arena REIT | 350,880 | 517 |
| * | APN News & Media Ltd. | 251,856 | 512 |
| | RCG Corp. Ltd. | 462,939 | 512 |
| | GDI Property Group | 693,057 | 511 |
| | Cabcharge Australia Ltd. | 182,063 | 498 |
| | Collins Foods Ltd. | 131,059 | 479 |
| | Virtus Health Ltd. | 90,134 | 477 |
| | Hotel Property Investments | 221,639 | 475 |
| | BWX Ltd. | 126,018 | 458 |
| | Tox Free Solutions Ltd. | 254,210 | 456 |
| | SG Fleet Group Ltd. | 161,990 | 442 |
| * | Blue Sky Alternative Investments Ltd. | 77,381 | 428 |
| | Programmed Maintenance Services Ltd. | 388,967 | 424 |
| | OFX Group Ltd. | 333,778 | 393 |
| | MACA Ltd. | 281,386 | 377 |
| | Astro Japan Property Group | 73,166 | 376 |
| *,^ | Mesoblast Ltd. | 390,769 | 363 |
| *,^ | Highfield Resources Ltd. | 410,531 | 355 |
45
| | | |
| Vanguard® FTSE All-World ex-US Small-Cap Index Fund | | |
| Schedule of Investments | | |
| October 31, 2016 | | |
| |
| | | | Market |
| | | | Value |
| | | Shares | ($000) |
| | RCR Tomlinson Ltd. | 169,521 | 343 |
| * | Ten Network Holdings Ltd. | 435,109 | 342 |
| *,^ | Senex Energy Ltd. | 1,742,488 | 334 |
| | CSG Ltd. | 332,815 | 324 |
| | WPP AUNZ Ltd. | 509,661 | 315 |
| | Thorn Group Ltd. | 235,984 | 309 |
| *,^ | Liquefied Natural Gas Ltd. | 725,957 | 305 |
| | Cedar Woods Properties Ltd. | 88,814 | 303 |
| * | AWE Ltd. | 739,287 | 303 |
| * | Starpharma Holdings Ltd. | 545,407 | 302 |
| | Ainsworth Game Technology Ltd. | 222,128 | 301 |
| *,^ | Cardno Ltd. | 427,245 | 300 |
| | Reject Shop Ltd. | 43,549 | 247 |
| * | Mount Gibson Iron Ltd. | 989,367 | 246 |
| *,^ | Paladin Energy Ltd. | 2,090,369 | 222 |
| *,^ | Lynas Corp. Ltd. | 5,213,011 | 221 |
| | Decmil Group Ltd. | 206,088 | 173 |
| | ERM Power Ltd. | 198,557 | 170 |
| * | Watpac Ltd. | 247,923 | 168 |
| * | Billabong International Ltd. | 179,293 | 164 |
| * | MMA Offshore Ltd. | 634,669 | 147 |
| *,^ | Slater & Gordon Ltd. | 503,667 | 139 |
| | NZME Ltd. | 281,393 | 134 |
| | SMS Management & Technology Ltd. | 106,208 | 123 |
| | Cash Converters International Ltd. | 488,042 | 119 |
| * | CuDeco Ltd. | 298,221 | 97 |
| *,^ | Arrium Ltd. | 4,377,411 | 73 |
| * | Capitol Health Ltd. | 630,148 | 60 |
| * | Acrux Ltd. | 199,813 | 52 |
| *,^ | Kingsgate Consolidated Ltd. | 277,729 | 43 |
| * | Virgin Australia Holdings Pvt Ltd. | 1,276,415 | 5 |
| * | Strandline Resources Ltd. | 156,024 | 1 |
| * | SGH Energy Pty Ltd. | 1,906,834 | — |
| * | Kagara Ltd. | 274,560 | — |
| *,^ | DSHE Holdings Ltd. | 201,826 | — |
| * | Jacana Minerals Ltd. | 37,888 | — |
| | | | 147,728 |
| Austria (0.9%) | | |
| | BUWOG AG | 144,879 | 3,502 |
| | IMMOFINANZ AG | 1,475,510 | 3,176 |
| | Wienerberger AG | 191,067 | 3,053 |
| | CA Immobilien Anlagen AG | 119,002 | 2,159 |
| | Conwert Immobilien Invest SE | 115,876 | 2,056 |
| | Lenzing AG | 13,836 | 1,803 |
| | Oesterreichische Post AG | 51,956 | 1,793 |
| | Verbund AG | 101,366 | 1,690 |
| | Mayr Melnhof Karton AG | 12,116 | 1,342 |
| | Schoeller-Bleckmann Oilfield Equipment AG | 16,938 | 1,200 |
| | UNIQA Insurance Group AG | 171,397 | 1,104 |
| | RHI AG | 40,043 | 1,008 |
| | S IMMO AG | 82,854 | 889 |
| | Strabag SE | 23,192 | 778 |
| | DO & CO AG | 10,017 | 776 |
| | Zumtobel Group AG | 42,744 | 750 |
| | EVN AG | 45,752 | 535 |
| | Palfinger AG | 16,916 | 512 |
| | Semperit AG Holding | 14,306 | 388 |
| * | Flughafen Wien AG | 15,239 | 369 |
| | Kapsch TrafficCom AG | 7,861 | 352 |
| | | | 29,235 |
| Belgium (1.1%) | | |
| | Cofinimmo SA | 32,367 | 3,789 |
| | Ontex Group NV | 117,223 | 3,546 |
| | Bekaert SA | 54,334 | 2,415 |
46
| | | |
| Vanguard® FTSE All-World ex-US Small-Cap Index Fund | | |
| Schedule of Investments | | |
| October 31, 2016 | | |
| |
| | | | Market |
| | | | Value |
| | | Shares | ($000) |
| | Elia System Operator SA/NV | 44,270 | 2,291 |
| | Melexis NV | 34,666 | 2,270 |
| | Warehouses De Pauw CVA | 24,068 | 2,217 |
| | D'ieteren SA/NV | 41,529 | 1,831 |
| | Befimmo SA | 30,016 | 1,749 |
| | Ion Beam Applications | 34,132 | 1,621 |
| * | Aedifica SA | 19,161 | 1,589 |
| | Gimv NV | 29,185 | 1,571 |
| | Euronav NV | 197,884 | 1,548 |
| | Econocom Group SA/NV | 82,674 | 1,229 |
| * | Tessenderlo Chemie NV (Voting Shares) | 36,263 | 1,211 |
| ^ | Cie d'Entreprises CFE | 10,840 | 1,195 |
| * | AGFA-Gevaert NV | 253,586 | 1,054 |
| * | Orange Belgium SA | 44,096 | 993 |
| | Barco NV | 12,585 | 990 |
| | Kinepolis Group NV | 20,129 | 906 |
| * | KBC Ancora | 23,673 | 898 |
| *,^ | Nyrstar (Voting Shares) | 144,244 | 741 |
| | Van de Velde NV | 10,068 | 709 |
| | EVS Broadcast Equipment SA | 14,270 | 500 |
| | Wereldhave Belgium NV | 2,929 | 367 |
| | Sofina SA | 5 | 1 |
| | | | 37,231 |
| Brazil (1.2%) | | |
| | Qualicorp SA | 354,400 | 2,281 |
| | MRV Engenharia e Participacoes SA | 485,200 | 1,879 |
| | Fleury SA | 119,856 | 1,586 |
| | Cyrela Brazil Realty SA Empreendimentos e Participacoes | 469,000 | 1,580 |
| | Cia Energetica de Sao Paulo Preference Shares | 320,400 | 1,489 |
| | Cia Hering | 236,900 | 1,437 |
| | Bradespar SA Preference Shares | 343,200 | 1,396 |
| * | Metalurgica Gerdau SA Preference Shares Class A | 930,700 | 1,385 |
| | CVC Brasil Operadora e Agencia de Viagens SA | 177,800 | 1,365 |
| | Duratex SA | 446,000 | 1,204 |
| | Banco do Estado do Rio Grande do Sul SA Preference Shares | 260,150 | 1,108 |
| | Linx SA | 177,134 | 1,054 |
| | Iguatemi Empresa de Shopping Centers SA | 110,700 | 1,046 |
| * | B2W Cia Digital | 210,500 | 1,034 |
| | Cia de Saneamento de Minas Gerais-COPASA | 96,270 | 1,005 |
| * | Usinas Siderurgicas de Minas Gerais SA Preference Shares | 666,776 | 942 |
| * | EcoRodovias Infraestrutura e Logistica SA | 308,100 | 914 |
| | Valid Solucoes e Servicos de Seguranca em Meios de Pagamento e Identificacao SA | 95,911 | 899 |
| * | Marcopolo SA Preference Shares | 789,116 | 806 |
| * | Minerva SA | 253,700 | 804 |
| | Alupar Investimento SA | 128,715 | 749 |
| | Grendene SA | 117,864 | 724 |
| | Alpargatas SA Preference Shares | 216,102 | 718 |
| * | Marfrig Global Foods SA | 393,612 | 702 |
| | Aliansce Shopping Centers SA | 122,979 | 647 |
| | Light SA | 107,600 | 592 |
| | Arezzo Industria e Comercio SA | 62,000 | 574 |
| | Via Varejo SA | 197,700 | 567 |
| | Iochpe Maxion SA | 107,550 | 546 |
| * | FPC Par Corretora de Seguros SA | 94,300 | 446 |
| | Gafisa SA | 565,582 | 436 |
| | Ez Tec Empreendimentos e Participacoes SA | 83,105 | 430 |
| * | Randon Participacoes SA Preference Shares | 273,790 | 410 |
| | Even Construtora e Incorporadora SA | 292,222 | 406 |
| | Mahle-Metal Leve SA | 58,200 | 404 |
| | Eletropaulo Metropolitana Eletricidade de Sao Paulo SA Preference Shares | 123,818 | 401 |
| | Tupy SA | 94,531 | 392 |
| | Dimed SA Distribuidora da Medicamentos | 2,489 | 392 |
| | SLC Agricola SA | 78,400 | 388 |
| * | Gol Linhas Aereas Inteligentes SA Preference Shares | 153,700 | 378 |
47
| | |
| Vanguard® FTSE All-World ex-US Small-Cap Index Fund | | |
| Schedule of Investments | | |
| October 31, 2016 | | |
| |
| | | Market |
| | | Value |
| | Shares | ($000) |
| BR Properties SA | 135,200 | 364 |
| * Magnesita Refratarios SA | 49,040 | 348 |
| * Santos Brasil Participacoes SA | 341,330 | 323 |
| 2 Ser Educacional SA | 49,200 | 319 |
| Cia Energetica do Ceara Preference Shares | 20,842 | 311 |
| JSL SA | 81,400 | 298 |
| GAEC Educacao SA | 63,022 | 267 |
| Sonae Sierra Brasil SA | 39,300 | 236 |
| QGEP Participacoes SA | 136,600 | 236 |
| Guararapes Confeccoes SA | 11,300 | 234 |
| Direcional Engenharia SA | 123,294 | 213 |
| * Aliansce Shopping Centers SA | 35,524 | 189 |
| * Marisa Lojas SA | 67,690 | 164 |
| Paranapanema SA | 245,700 | 132 |
| * Eneva SA | 22,000 | 100 |
| | | 39,250 |
| Canada (13.9%) | | |
| Teck Resources Ltd. Class B | 743,955 | 16,063 |
| Dollarama Inc. | 161,502 | 12,068 |
| Open Text Corp. | 192,041 | 11,924 |
| First Quantum Minerals Ltd. | 1,089,547 | 10,349 |
| Gildan Activewear Inc. | 369,631 | 9,494 |
| CCL Industries Inc. Class B | 51,570 | 9,171 |
| * Seven Generations Energy Ltd. Class A | 417,714 | 8,907 |
| Keyera Corp. | 288,908 | 8,672 |
| Onex Corp. | 128,992 | 8,344 |
| * Kinross Gold Corp. | 1,968,013 | 7,644 |
| ^ H&R REIT | 444,035 | 7,551 |
| ^ PrairieSky Royalty Ltd. | 324,632 | 7,060 |
| ^ Vermilion Energy Inc. | 163,646 | 6,418 |
| ^ AltaGas Ltd. | 256,513 | 6,347 |
| Industrial Alliance Insurance & Financial Services Inc. | 162,417 | 6,289 |
| CAE Inc. | 426,452 | 5,990 |
| Element Fleet Management Corp. | 607,852 | 5,923 |
| ^ Tahoe Resources Inc. | 481,976 | 5,778 |
| Peyto Exploration & Development Corp. | 223,326 | 5,738 |
| Yamana Gold Inc. | 1,497,511 | 5,348 |
| Methanex Corp. | 145,320 | 5,282 |
| * Detour Gold Corp. | 274,307 | 5,229 |
| WSP Global Inc. | 159,144 | 5,155 |
| Finning International Inc. | 268,161 | 4,990 |
| Ritchie Bros Auctioneers Inc. | 141,905 | 4,907 |
| ^ Canadian Apartment Properties REIT | 215,853 | 4,718 |
| Whitecap Resources Inc. | 564,125 | 4,509 |
| Veresen Inc. | 493,950 | 4,474 |
| Smart REIT | 177,066 | 4,416 |
| * B2Gold Corp. | 1,491,581 | 4,315 |
| Atco Ltd. | 121,790 | 4,269 |
| * Bombardier Inc. Class B | 3,107,404 | 4,124 |
| ^ Enbridge Income Fund Holdings Inc. | 160,732 | 4,079 |
| Canadian REIT | 115,195 | 3,966 |
| * Lundin Mining Corp. | 1,007,752 | 3,944 |
| ^ Cineplex Inc. | 102,193 | 3,886 |
| Quebecor Inc. Class B | 135,175 | 3,793 |
| Stantec Inc. | 169,525 | 3,771 |
| Algonquin Power & Utilities Corp. | 419,800 | 3,709 |
| Pan American Silver Corp. | 231,595 | 3,699 |
| Empire Co. Ltd. | 252,019 | 3,630 |
| ^ Parkland Fuel Corp. | 154,972 | 3,620 |
| * Eldorado Gold Corp. | 1,139,071 | 3,592 |
| TransForce Inc. | 152,051 | 3,450 |
| Linamar Corp. | 82,865 | 3,370 |
| Chartwell Retirement Residences | 301,865 | 3,362 |
| Alamos Gold Inc. | 425,762 | 3,339 |
48
| | | |
| Vanguard® FTSE All-World ex-US Small-Cap Index Fund | | |
| Schedule of Investments | | |
| October 31, 2016 | | |
| |
| | | | Market |
| | | | Value |
| | | Shares | ($000) |
| | MacDonald Dettwiler & Associates Ltd. | 58,314 | 3,338 |
| ^ | Allied Properties REIT | 123,012 | 3,307 |
| | West Fraser Timber Co. Ltd. | 96,258 | 3,295 |
| | Toromont Industries Ltd. | 111,997 | 3,290 |
| * | New Gold Inc. | 822,485 | 3,244 |
| ^ | Northland Power Inc. | 178,276 | 3,190 |
| ^ | OceanaGold Corp. | 995,552 | 3,043 |
| ^ | Cominar REIT | 274,308 | 3,039 |
| | Cott Corp. | 224,453 | 2,944 |
| *,^ | IAMGOLD Corp. | 733,850 | 2,938 |
| | Gibson Energy Inc. | 232,983 | 2,923 |
| * | Raging River Exploration Inc. | 357,792 | 2,868 |
| ^ | Emera Inc. | 81,382 | 2,838 |
| | Maple Leaf Foods Inc. | 124,444 | 2,834 |
| ^ | Canadian Western Bank | 145,224 | 2,756 |
| * | Parex Resources Inc. | 239,090 | 2,750 |
| | TMX Group Ltd. | 58,652 | 2,706 |
| * | Descartes Systems Group Inc. | 124,659 | 2,598 |
| | ShawCor Ltd. | 103,669 | 2,593 |
| *,^ | Amaya Inc. | 187,692 | 2,513 |
| | First Capital Realty Inc. | 157,343 | 2,509 |
| | Enerplus Corp. | 369,141 | 2,485 |
| * | Torex Gold Resources Inc. | 128,915 | 2,398 |
| | Stella-Jones Inc. | 64,127 | 2,276 |
| | Capital Power Corp. | 147,415 | 2,270 |
| * | Celestica Inc. | 191,158 | 2,262 |
| | Granite REIT | 71,473 | 2,249 |
| ^ | Boardwalk REIT | 61,073 | 2,241 |
| ^ | DH Corp. | 172,700 | 2,235 |
| | FirstService Corp. | 54,242 | 2,198 |
| ^ | Hudson's Bay Co. | 178,422 | 2,192 |
| * | Pretium Resources Inc. | 222,526 | 2,175 |
| ^ | Artis REIT | 246,259 | 2,152 |
| *,^ | First Majestic Silver Corp. | 264,631 | 2,125 |
| ^ | Mullen Group Ltd. | 152,789 | 2,118 |
| * | Birchcliff Energy Ltd. | 330,539 | 2,105 |
| | New Flyer Industries Inc. | 74,071 | 2,071 |
| | Endeavour Mining Corp. | 105,792 | 2,066 |
| ^ | Dream Office REIT | 165,300 | 2,059 |
| | Precision Drilling Corp. | 449,225 | 2,003 |
| ^ | Home Capital Group Inc. Class B | 101,041 | 2,000 |
| * | Silver Standard Resources Inc. | 181,206 | 1,989 |
| * | SEMAFO Inc. | 497,939 | 1,953 |
| *,^ | ProMetic Life Sciences Inc. | 926,930 | 1,949 |
| | TransAlta Corp. | 440,141 | 1,939 |
| ^ | Enercare Inc. | 133,945 | 1,935 |
| | Superior Plus Corp. | 215,070 | 1,915 |
| * | Advantage Oil & Gas Ltd. | 283,200 | 1,911 |
| | Colliers International Group Inc. | 54,623 | 1,902 |
| | Innergex Renewable Energy Inc. | 166,246 | 1,848 |
| * | NovaGold Resources Inc. | 367,962 | 1,841 |
| | Westshore Terminals Investment Corp. | 91,993 | 1,774 |
| | Osisko Gold Royalties Ltd. | 162,580 | 1,712 |
| | Laurentian Bank of Canada | 45,823 | 1,693 |
| ^ | Manitoba Telecom Services Inc. | 59,851 | 1,673 |
| | Jean Coutu Group PJC Inc. Class A | 111,018 | 1,672 |
| | Winpak Ltd. | 45,760 | 1,564 |
| | TransAlta Renewables Inc. | 141,328 | 1,561 |
| | Norbord Inc. | 65,461 | 1,540 |
| ^ | TORC Oil & Gas Ltd. | 267,605 | 1,514 |
| | HudBay Minerals Inc. | 359,237 | 1,513 |
| | Russel Metals Inc. | 94,311 | 1,501 |
| ^ | Corus Entertainment Inc. Class B | 179,853 | 1,484 |
| | Enerflex Ltd. | 139,278 | 1,480 |
49
| | | |
| Vanguard® FTSE All-World ex-US Small-Cap Index Fund | | |
| Schedule of Investments | | |
| October 31, 2016 | | |
| |
| | | | Market |
| | | | Value |
| | | Shares | ($000) |
| ^ | Canadian Energy Services & Technology Corp. | 374,610 | 1,477 |
| ^ | Secure Energy Services Inc. | 234,797 | 1,439 |
| | North West Co. Inc. | 71,308 | 1,361 |
| * | Canfor Corp. | 121,516 | 1,348 |
| * | ECN Capital Corp. | 603,780 | 1,319 |
| | Transcontinental Inc. Class A | 96,846 | 1,295 |
| ^ | Genworth MI Canada Inc. | 59,632 | 1,295 |
| ^ | Pengrowth Energy Corp. | 838,188 | 1,294 |
| | Nevsun Resources Ltd. | 443,159 | 1,285 |
| | Centerra Gold Inc. | 251,780 | 1,273 |
| | Aimia Inc. | 234,437 | 1,267 |
| *,^ | Baytex Energy Corp. | 318,798 | 1,226 |
| *,^ | Penn West Petroleum Ltd. | 762,951 | 1,217 |
| | Pason Systems Inc. | 104,220 | 1,185 |
| | Ensign Energy Services Inc. | 194,481 | 1,173 |
| | Aecon Group Inc. | 89,585 | 1,158 |
| * | NuVista Energy Ltd. | 227,301 | 1,156 |
| * | Great Canadian Gaming Corp. | 66,068 | 1,097 |
| | Enghouse Systems Ltd. | 29,202 | 1,097 |
| | Just Energy Group Inc. | 207,289 | 1,088 |
| | Dominion Diamond Corp. | 126,862 | 1,078 |
| * | Crew Energy Inc. | 215,738 | 1,060 |
| ^ | Northview Apartment REIT | 71,156 | 1,057 |
| * | ATS Automation Tooling Systems Inc. | 123,087 | 1,055 |
| * | Kelt Exploration Ltd. | 223,729 | 989 |
| | Dorel Industries Inc. Class B | 38,645 | 981 |
| *,^ | China Gold International Resources Corp. Ltd. | 365,098 | 947 |
| *,^ | MEG Energy Corp. | 229,500 | 936 |
| | Cascades Inc. | 97,974 | 924 |
| ^ | Extendicare Inc. | 132,282 | 909 |
| * | Paramount Resources Ltd. Class A | 78,251 | 888 |
| | Bonterra Energy Corp. | 43,590 | 820 |
| | Cogeco Communications Inc. | 16,722 | 780 |
| * | Gran Tierra Energy Inc. (American Shares) | 250,760 | 730 |
| * | Alacer Gold Corp. | 351,004 | 709 |
| * | Sierra Wireless Inc. | 49,216 | 673 |
| ^ | AutoCanada Inc. | 39,493 | 649 |
| | Martinrea International Inc. | 109,238 | 641 |
| * | Gran Tierra Energy Inc. (Toronto Shares) | 195,266 | 571 |
| ^ | Morguard REIT | 49,774 | 564 |
| *,^ | Athabasca Oil Corp. | 544,393 | 511 |
| | Canaccord Genuity Group Inc. | 158,861 | 496 |
| ^ | First National Financial Corp. | 21,757 | 397 |
| *,^ | DREAM Unlimited Corp. Class A | 75,811 | 391 |
| | Sprott Inc. | 224,904 | 374 |
| *,^ | Avigilon Corp. | 52,283 | 331 |
| * | Pacific Exploration and Production Corp. | 462,671 | 221 |
| ^ | Concordia International Corp. | 62,092 | 212 |
| * | Osisko Gold Royalties Warrants Exp. 02/26/2019 | 5,460 | 12 |
| * | Great Basin Gold Ltd. | 345,634 | 1 |
| | Waste Connections Inc. | 4 | — |
| | | | 466,692 |
| Chile (0.3%) | | |
| | Parque Arauco SA | 855,323 | 2,121 |
| | Vina Concha y Toro SA | 965,204 | 1,684 |
| | Engie Energia Chile SA | 796,132 | 1,413 |
| | Inversiones Aguas Metropolitanas SA | 665,138 | 1,213 |
| | Ripley Corp. SA | 1,697,476 | 1,065 |
| | CAP SA | 112,959 | 788 |
| | Inversiones La Construccion SA | 48,262 | 590 |
| | Forus SA | 130,471 | 470 |
| * | Cia Sud Americana de Vapores SA | 18,562,680 | 379 |
| | | | 9,723 |
50
| | | |
| Vanguard® FTSE All-World ex-US Small-Cap Index Fund | | |
| Schedule of Investments | | |
| October 31, 2016 | | |
| |
| | | | Market |
| | | | Value |
| | | Shares | ($000) |
| China (2.9%) | | |
| | Skyworth Digital Holdings Ltd. | 3,214,497 | 2,075 |
| | Tong Ren Tang Technologies Co. Ltd. | 1,094,906 | 1,997 |
| | Intime Retail Group Co. Ltd. | 2,438,337 | 1,909 |
| | China High Speed Transmission Equipment Group Co. Ltd. | 1,797,650 | 1,863 |
| | Sihuan Pharmaceutical Holdings Group Ltd. | 7,487,000 | 1,793 |
| *,^ | China Shanshui Cement Group Ltd. | 1,992,757 | 1,616 |
| | Phoenix Healthcare Group Co. Ltd. | 953,841 | 1,516 |
| *,^,2 | Cogobuy Group | 912,000 | 1,420 |
| | CIFI Holdings Group Co. Ltd. | 4,688,000 | 1,379 |
| | Future Land Holdings Co. Ltd. Class A | 820,462 | 1,352 |
| ^ | Digital China Holdings Ltd. | 1,583,671 | 1,325 |
| | NetDragon Websoft Holdings Ltd. | 401,219 | 1,295 |
| | Wuxi Little Swan Co. Ltd. Class B | 345,526 | 1,195 |
| * | Xinhua Winshare Publishing and Media Co. Ltd. | 1,166,000 | 1,188 |
| * | Chinasoft International Ltd. | 2,520,448 | 1,184 |
| * | Kingdee International Software Group Co. Ltd. | 2,922,652 | 1,183 |
| ^ | CT Environmental Group Ltd. | 4,111,760 | 1,154 |
| | China Lesso Group Holdings Ltd. | 1,432,190 | 1,048 |
| | China Water Affairs Group Ltd. | 1,374,000 | 997 |
| | BYD Electronic International Co. Ltd. | 1,220,411 | 960 |
| ^,2 | Fu Shou Yuan International Group Ltd. | 1,602,000 | 938 |
| 2 | Universal Medical Financial & Technical Advisory Services Co. Ltd. | 1,083,500 | 932 |
| | Tianneng Power International Ltd. | 1,010,000 | 912 |
| | Central China Securities Co. Ltd. | 1,754,523 | 905 |
| * | Carnival Group International Holdings Ltd. | 7,270,000 | 863 |
| | Tibet Water Resources Ltd. | 2,241,006 | 833 |
| | Greatview Aseptic Packaging Co. Ltd. | 1,639,000 | 832 |
| * | Coolpad Group Ltd. | 4,660,669 | 810 |
| 2 | Hua Hong Semiconductor Ltd. | 664,000 | 785 |
| | Vinda International Holdings Ltd. | 386,873 | 765 |
| * | Hybrid Kinetic Group Ltd. | 26,118,000 | 756 |
| | Yuzhou Properties Co. Ltd. | 1,980,000 | 735 |
| | Bank of Chongqing Co. Ltd. | 913,000 | 733 |
| *,2 | Qingdao Port International Co. Ltd. | 1,186,000 | 722 |
| | Chaowei Power Holdings Ltd. | 805,000 | 719 |
| | Yuexiu Transport Infrastructure Ltd. | 1,044,000 | 715 |
| | Sinopec Kantons Holdings Ltd. | 1,503,962 | 705 |
| | SSY Group Ltd. | 2,081,324 | 702 |
| | Powerlong Real Estate Holdings Ltd. | 2,054,000 | 697 |
| *,^ | Lifetech Scientific Corp. | 2,842,058 | 673 |
| | Logan Property Holdings Co. Ltd. | 1,675,468 | 672 |
| *,^ | Leyou Technologies Holdings Ltd. | 3,730,000 | 671 |
| ^ | China Maple Leaf Educational Systems Ltd. | 938,000 | 657 |
| | Livzon Pharmaceutical Group Inc. | 112,210 | 653 |
| | Inner Mongolia Eerduosi Resourses Co. Ltd. Class B | 634,900 | 653 |
| *,^ | China Modern Dairy Holdings Ltd. | 2,887,000 | 628 |
| * | Glorious Property Holdings Ltd. | 5,153,000 | 617 |
| | Beijing Capital Land Ltd. | 1,604,000 | 615 |
| ^ | PAX Global Technology Ltd. | 974,062 | 608 |
| | Texhong Textile Group Ltd. | 428,000 | 602 |
| ^ | Sinosoft Technology Group Ltd. | 1,378,000 | 601 |
| | Xtep International Holdings Ltd. | 1,330,379 | 585 |
| | Fufeng Group Ltd. | 1,382,864 | 584 |
| ^ | Shanghai Jin Jiang International Hotels Group Co. Ltd. | 1,939,417 | 567 |
| | China SCE Property Holdings Ltd. | 1,812,000 | 553 |
| | Poly Culture Group Corp. Ltd. | 205,014 | 553 |
| | Luthai Textile Co. Ltd. Class B | 424,392 | 538 |
| * | Hangzhou Steam Turbine Co. Ltd. Class B | 450,412 | 530 |
| | Hisense Kelon Electrical Holdings Co. Ltd. Class A | 618,173 | 521 |
| | Xingda International Holdings Ltd. | 1,253,000 | 520 |
| *,2 | Haichang Ocean Park Holdings Ltd. | 2,451,000 | 520 |
| | C C Land Holdings Ltd. | 1,956,000 | 519 |
| | Dah Chong Hong Holdings Ltd. | 1,231,988 | 515 |
51
| | | |
| Vanguard® FTSE All-World ex-US Small-Cap Index Fund | | |
| Schedule of Investments | | |
| October 31, 2016 | | |
| |
| | | | Market |
| | | | Value |
| | | Shares | ($000) |
| *,2 | Tian Ge Interactive Holdings Ltd. | 763,000 | 513 |
| * | Chiho-Tiande Group Ltd. | 662,000 | 509 |
| | Harbin Electric Co. Ltd. | 1,039,813 | 507 |
| * | China Oil & Gas Group Ltd. | 6,608,000 | 501 |
| | Shanghai Industrial Urban Development Group Ltd. | 1,964,000 | 498 |
| | Shandong Airlines Co. Ltd. Class B | 213,000 | 490 |
| | China Shineway Pharmaceutical Group Ltd. | 474,000 | 487 |
| | Peak Sport Products Co. Ltd. | 1,457,756 | 485 |
| | Huangshan Tourism Development Co. Ltd. Class B | 353,700 | 484 |
| | Lonking Holdings Ltd. | 2,943,313 | 481 |
| ^ | China All Access Holdings Ltd. | 1,496,000 | 478 |
| | Weiqiao Textile Co. | 686,000 | 461 |
| | Optics Valley Union Holding Co. Ltd. | 4,268,000 | 456 |
| * | Enerchina Holdings Ltd. | 6,537,000 | 454 |
| *,^ | Munsun Capital Group Ltd. | 14,046,936 | 453 |
| | Wasion Group Holdings Ltd. | 767,454 | 451 |
| ^ | Dongjiang Environmental Co. Ltd. | 297,000 | 450 |
| | Hua Han Health Industry Holdings Ltd. | 6,569,183 | 449 |
| | 361 Degrees International Ltd. | 1,186,000 | 445 |
| * | Hi Sun Technology China Ltd. | 2,772,101 | 431 |
| * | China Overseas Grand Oceans Group Ltd. | 1,173,000 | 431 |
| | Shanghai Diesel Engine Co. Ltd. Class B | 524,900 | 428 |
| | China ZhengTong Auto Services Holdings Ltd. | 1,330,500 | 426 |
| ^,2 | Cosmo Lady China Holdings Co. Ltd. | 1,039,131 | 424 |
| * | O-Net Technologies Group Ltd. | 755,000 | 411 |
| * | Kama Co. Ltd. Class B | 401,200 | 410 |
| | China Fangda Group Co. Ltd. Class B | 436,800 | 403 |
| | China Overseas Property Holdings Ltd. | 1,980,000 | 401 |
| ^ | Phoenix Satellite Television Holdings Ltd. | 1,959,783 | 396 |
| | Concord New Energy Group Ltd. | 7,780,000 | 390 |
| | COSCO International Holdings Ltd. | 826,000 | 383 |
| * | Shang Gong Group Co. Ltd. Class B | 368,800 | 380 |
| | Shanghai Fudan-Zhangjiang Bio-Pharmaceutical Co. Ltd. | 400,000 | 376 |
| | China Suntien Green Energy Corp. Ltd. | 2,807,762 | 375 |
| | Shanghai Jinjiang International Travel Co. Ltd. Class B | 101,446 | 375 |
| | China Power New Energy Development Co. Ltd. | 614,000 | 372 |
| | Tianjin Port Development Holdings Ltd. | 2,419,976 | 371 |
| * | Dongyue Group Ltd. | 2,095,000 | 370 |
| * | China Chengtong Development Group Ltd. | 4,216,000 | 368 |
| *,2 | Ozner Water International Holding Ltd. | 1,753,000 | 368 |
| * | Landing International Development Ltd. | 15,142,135 | 364 |
| ^ | China Singyes Solar Technologies Holdings Ltd. | 761,250 | 363 |
| | Hubei Sanonda Co. Ltd. Class B | 344,400 | 362 |
| | Guorui Properties Ltd. | 1,083,000 | 362 |
| * | PW Medtech Group Ltd. | 1,151,000 | 360 |
| | Guangdong Provincial Expressway Development Co. Ltd. Class B | 537,400 | 360 |
| * | Skyway Securities Group Ltd. | 16,299,452 | 358 |
| * | Sinolink Worldwide Holdings Ltd. | 3,052,000 | 357 |
| | Ajisen China Holdings Ltd. | 789,408 | 355 |
| * | China Huiyuan Juice Group Ltd. | 959,000 | 354 |
| * | AVIC International Holding HK Ltd. | 5,506,000 | 354 |
| * | China Datang Corp. Renewable Power Co. Ltd. | 3,848,393 | 352 |
| | INESA Intelligent Tech Inc. Class B | 438,533 | 351 |
| | Qingling Motors Co. Ltd. | 1,124,929 | 347 |
| | Comba Telecom Systems Holdings Ltd. | 1,953,959 | 346 |
| *,^ | TCL Multimedia Technology Holdings Ltd. | 681,842 | 345 |
| ^ | First Tractor Co. Ltd. | 612,954 | 342 |
| | Shanghai Highly Group Co. Ltd. Class B | 429,600 | 339 |
| | Yashili International Holdings Ltd. | 1,666,000 | 338 |
| * | China Yurun Food Group Ltd. | 2,081,000 | 332 |
| * | EverChina International Holdings Co. Ltd. | 6,340,000 | 330 |
| | Fantasia Holdings Group Co. Ltd. | 2,524,500 | 328 |
| | CPMC Holdings Ltd. | 623,000 | 326 |
| * | North Mining Shares Co. Ltd. | 18,052,000 | 326 |
52
| | | |
| Vanguard® FTSE All-World ex-US Small-Cap Index Fund | | |
| Schedule of Investments | | |
| October 31, 2016 | | |
| |
| | | | Market |
| | | | Value |
| | | Shares | ($000) |
| | Dawnrays Pharmaceutical Holdings Ltd. | 544,000 | 325 |
| * | Sinotrans Shipping Ltd. | 1,991,690 | 323 |
| *,^ | West China Cement Ltd. | 3,113,200 | 317 |
| | Eastern Communications Co. Ltd. Class B | 430,850 | 316 |
| *,^ | China Water Industry Group Ltd. | 1,844,000 | 314 |
| | China Lilang Ltd. | 553,000 | 312 |
| * | Lianhua Supermarket Holdings Co. Ltd. | 762,000 | 310 |
| * | Shanghai Zhongyida Co. Ltd. Class B | 552,000 | 305 |
| | Colour Life Services Group Co. Ltd. | 404,000 | 293 |
| * | Hengdeli Holdings Ltd. | 2,697,765 | 292 |
| ^ | China Electronics Corp. Holdings Co. Ltd. | 1,202,000 | 289 |
| | Tiangong International Co. Ltd. | 2,289,478 | 289 |
| | Hilong Holding Ltd. | 1,200,000 | 286 |
| | Welling Holding Ltd. | 1,427,600 | 285 |
| *,^ | Greenland Hong Kong Holdings Ltd. | 1,098,000 | 281 |
| 2 | Beijing Urban Construction Design & Development Group Co. Ltd. | 406,000 | 280 |
| * | Shanghai Potevio Co. Ltd. Class B | 188,700 | 269 |
| | Tianjin Development Holdings Ltd. | 560,000 | 268 |
| | China Merchants Land Ltd. | 1,854,000 | 262 |
| * | Chongqing Iron & Steel Co. Ltd. | 813,500 | 259 |
| | Xiamen International Port Co. Ltd. | 1,177,000 | 253 |
| * | Shanghai Greencourt Investment Group Co. Ltd. Class B | 398,400 | 248 |
| * | V1 Group Ltd. | 4,985,484 | 247 |
| | Huaxin Cement Co. Ltd. Class B | 341,160 | 244 |
| * | Launch Tech Co. Ltd. | 229,000 | 243 |
| | Minmetals Land Ltd. | 1,918,000 | 242 |
| * | SRE Group Ltd. | 8,228,302 | 241 |
| | HNA Infrastructure Company Ltd. | 215,000 | 240 |
| * | Loudong General Nice Resources China Holdings Ltd. | 3,378,000 | 238 |
| * | Capital Environment Holdings Ltd. | 6,830,000 | 237 |
| *,^ | National Agricultural Holdings Ltd. | 1,560,000 | 229 |
| * | China Minsheng Drawin Technology Group Ltd. | 5,460,000 | 228 |
| | NVC Lighting Holding Ltd. | 1,626,088 | 224 |
| *,^ | Wisdom Sports Group | 694,000 | 224 |
| * | Mingfa Group International Co. Ltd. | 915,541 | 223 |
| * | Shanghai Phoenix Enterprise Group Co. Ltd. Class B | 236,200 | 219 |
| | Zhonglu Co. Ltd. Class B | 120,500 | 216 |
| * | Tech Pro Technology Development Ltd. | 7,818,804 | 215 |
| * | Shougang Concord International Enterprises Co. Ltd. | 6,497,116 | 208 |
| * | Baoxin Auto Group Ltd. | 638,484 | 208 |
| * | MIE Holdings Corp. | 2,088,000 | 207 |
| * | China Fiber Optic Network System Group Ltd. | 2,215,200 | 200 |
| 2 | Kangda International Environmental Co. Ltd. | 827,111 | 194 |
| | Chongqing Machinery & Electric Co. Ltd. | 1,612,000 | 191 |
| | Hydoo International Holding Ltd. | 1,746,000 | 175 |
| * | Shenzhen Chiwan Petroleum Class B | 47,000 | 166 |
| * | China Rare Earth Holdings Ltd. | 2,300,548 | 166 |
| | Foshan Huaxin Packaging Co. Ltd. Class B | 135,000 | 164 |
| *,^ | China Dynamics Holdings Ltd. | 4,458,752 | 164 |
| | Hefei Meiling Co. Ltd. Class B | 267,360 | 163 |
| *,^ | Maoye International Holdings Ltd. | 1,709,459 | 163 |
| ^ | Boer Power Holdings Ltd. | 389,000 | 156 |
| * | Shenzhen Wongtee International Enterprise Co. Ltd. Class B | 223,180 | 156 |
| | Changchai Co. Ltd. Class B | 238,200 | 151 |
| | Dalian Refrigeration Co. Ltd. Class B | 194,900 | 151 |
| * | Xinjiang Xinxin Mining Industry Co. Ltd. | 1,357,000 | 148 |
| *,^ | E-Commodities Holdings Ltd. | 1,439,487 | 143 |
| * | Daphne International Holdings Ltd. | 1,077,996 | 142 |
| | Fiyta Holdings Ltd. Class B | 130,809 | 132 |
| * | Anxin-China Holdings Ltd. | 2,621,200 | 130 |
| | Real Nutriceutical Group Ltd. | 1,539,000 | 129 |
| * | China Soft Power Technology Holdings Ltd. | 5,152,000 | 123 |
| | Shenguan Holdings Group Ltd. | 1,484,000 | 120 |
| * | China Public Procurement Ltd. | 12,780,000 | 120 |
53
| | | |
| Vanguard® FTSE All-World ex-US Small-Cap Index Fund | | |
| Schedule of Investments | | |
| October 31, 2016 | | |
| |
| | | | Market |
| | | | Value |
| | | Shares | ($000) |
| * | Boshiwa International Holding Ltd. | 469,000 | 102 |
| * | Chengde Nanjiang Co. Ltd. Class B | 271,700 | 101 |
| * | Yuanda China Holdings Ltd. | 3,464,000 | 90 |
| *,^ | Universal Health International Group Holding Ltd. | 1,702,000 | 77 |
| * | Global Bio-Chem Technology Group Co. Ltd. | 3,772,000 | 66 |
| *,^ | China Lumena New Materials Corp. | 3,950,000 | 64 |
| * | Real Gold Mining Ltd. | 239,476 | 26 |
| * | China High Precision Automation Group Ltd. | 401,000 | — |
| *,^ | China Metal Recycling Holdings Ltd. | 332,400 | — |
| | | | 98,137 |
| Colombia (0.1%) | | |
| | Banco Davivienda SA Preference Shares | 172,160 | 1,752 |
| | Avianca Holdings SA Preference Shares | 514,738 | 411 |
| | | | 2,163 |
| Czech Republic (0.0%) | | |
| | Pegas Nonwovens SA | 15,116 | 485 |
| | Philip Morris CR AS | 697 | 344 |
| | | | 829 |
| Denmark (1.1%) | | |
| | GN Store Nord A/S | 235,636 | 4,776 |
| | Sydbank A/S | 112,357 | 3,509 |
| | SimCorp A/S | 55,379 | 3,058 |
| | Royal Unibrew A/S | 63,347 | 2,963 |
| * | Topdanmark A/S | 102,932 | 2,770 |
| ^ | FLSmidth & Co. A/S | 75,720 | 2,747 |
| | NKT Holding A/S | 39,841 | 2,682 |
| | Dfds A/S | 49,925 | 2,412 |
| | Ambu A/S Class B | 36,235 | 1,878 |
| | Rockwool International A/S Class B | 9,715 | 1,625 |
| * | Bavarian Nordic A/S | 47,635 | 1,614 |
| 2 | Scandinavian Tobacco Group A/S | 74,909 | 1,296 |
| | Spar Nord Bank A/S | 127,215 | 1,276 |
| | ALK-Abello A/S | 8,987 | 1,216 |
| | Schouw & Co. AB | 17,992 | 1,141 |
| | Matas A/S | 51,166 | 993 |
| | Alm Brand A/S | 100,977 | 760 |
| * | Bang & Olufsen A/S | 48,860 | 540 |
| | Solar A/S Class B | 8,511 | 468 |
| *,^ | D/S Norden A/S | 12,343 | 176 |
| * | OW Bunker A/S | 24,023 | — |
| | | | 37,900 |
| Egypt (0.1%) | | |
| * | Orascom Construction Ltd. | 88,802 | 898 |
| | Palm Hills Developments SAE | 2,364,491 | 609 |
| * | Six of October Development & Investment | 365,647 | 539 |
| * | Pioneers Holding for Financial Investments SAE | 546,737 | 517 |
| | Heliopolis Housing | 50,456 | 332 |
| | Oriental Weavers | 268,115 | 270 |
| * | Orascom Telecom Media And Technology Holding SAE | 3,869,476 | 244 |
| * | Ezz Steel | 277,384 | 218 |
| | Arab Cotton Ginning | 470,632 | 144 |
| * | South Valley Cement | 331,061 | 142 |
| * | Citadel Capital SAE | 1,629,403 | 130 |
| * | Egyptian Resorts Co. | 1,346,579 | 106 |
| * | Maridive & Oil Services SAE | 356,111 | 78 |
| * | Nile Cotton Ginning | 31,192 | 23 |
| | | | 4,250 |
| Finland (1.1%) | | |
| | Amer Sports Oyj | 185,785 | 5,055 |
| | Konecranes Oyj | 95,977 | 3,269 |
| | Tieto Oyj | 118,395 | 3,248 |
| | Valmet Oyj | 218,588 | 3,245 |
| | Cargotec Oyj Class B | 67,619 | 2,773 |
54
| | | |
| Vanguard® FTSE All-World ex-US Small-Cap Index Fund | | |
| Schedule of Investments | | |
| October 31, 2016 | | |
| |
| | | | Market |
| | | | Value |
| | | Shares | ($000) |
| * | Outokumpu Oyj | 319,354 | 2,227 |
| ^ | Metsa Board Oyj | 375,503 | 2,157 |
| | Sponda Oyj | 375,674 | 1,779 |
| | YIT Oyj | 192,652 | 1,607 |
| | Uponor Oyj | 83,007 | 1,412 |
| | Citycon Oyj | 591,968 | 1,387 |
| ^ | Caverion Corp. | 192,221 | 1,383 |
| | Kemira Oyj | 114,888 | 1,369 |
| | Sanoma Oyj | 129,690 | 1,213 |
| *,^ | Outotec Oyj | 277,059 | 1,206 |
| | Cramo Oyj | 38,600 | 1,012 |
| | Oriola-KD Oyj | 186,581 | 874 |
| | Raisio Oyj | 191,081 | 799 |
| | Ramirent Oyj | 100,086 | 738 |
| * | Finnair Oyj | 96,436 | 428 |
| | F-Secure Oyj | 94,186 | 333 |
| *,^ | Stockmann OYJ Abp Class B | 41,117 | 307 |
| | Huhtamaki Oyj | 1 | — |
| | | | 37,821 |
| France (2.5%) | | |
| | Rubis SCA | 58,904 | 5,372 |
| 2 | Elior Group | 208,513 | 4,684 |
| 2 | Euronext NV | 111,904 | 4,481 |
| * | Ubisoft Entertainment SA | 121,787 | 4,144 |
| | Nexity SA | 68,319 | 3,430 |
| | Technicolor SA | 583,880 | 3,411 |
| * | Nexans SA | 55,642 | 3,163 |
| | Altran Technologies SA | 190,003 | 2,711 |
| | Alten SA | 37,864 | 2,705 |
| * | DBV Technologies SA | 33,790 | 2,330 |
| | Elis SA | 138,750 | 2,305 |
| | Havas SA | 274,015 | 2,230 |
| *,^ | Vallourec SA | 443,890 | 2,181 |
| | Sopra Steria Group | 21,158 | 2,153 |
| | SPIE SA | 99,577 | 1,882 |
| | Korian SA | 59,027 | 1,808 |
| | Metropole Television SA | 100,432 | 1,750 |
| | IPSOS | 52,130 | 1,703 |
| *,2 | Worldline SA | 61,256 | 1,683 |
| | Neopost SA | 52,744 | 1,597 |
| ^ | Television Francaise 1 | 163,046 | 1,502 |
| | Vicat SA | 23,866 | 1,501 |
| * | Groupe Fnac SA | 21,198 | 1,447 |
| | Tarkett SA | 38,962 | 1,388 |
| *,^ | Air France-KLM | 226,504 | 1,381 |
| | Mercialys SA | 62,852 | 1,302 |
| | Faiveley Transport SA | 10,203 | 1,112 |
| * | Virbac SA | 6,754 | 1,075 |
| *,2 | Europcar Groupe SA | 114,815 | 1,067 |
| | Trigano SA | 14,718 | 1,041 |
| | Gaztransport Et Technigaz SA | 28,538 | 964 |
| *,^ | Etablissements Maurel et Prom | 197,504 | 869 |
| ^ | CGG SA | 32,492 | 858 |
| *,^ | Genfit | 42,603 | 797 |
| | Coface SA | 120,918 | 783 |
| | Boiron SA | 8,080 | 683 |
| | Beneteau SA | 55,885 | 646 |
| * | Eramet | 13,480 | 633 |
| | FFP | 8,155 | 600 |
| ^ | Rallye SA | 32,771 | 594 |
| | Vilmorin & Cie SA | 9,448 | 568 |
| ^ | Bourbon Corp. | 42,476 | 554 |
| * | Fonciere de Paris SIIC | 3,700 | 538 |
| | Assystem | 16,766 | 503 |
55
| | | |
| Vanguard® FTSE All-World ex-US Small-Cap Index Fund | | |
| Schedule of Investments | | |
| October 31, 2016 | | |
| |
| | | | Market |
| | | | Value |
| | | Shares | ($000) |
| | Bonduelle SCA | 20,101 | 476 |
| | Guerbet | 7,451 | 443 |
| | Interparfums SA | 13,631 | 391 |
| | Mersen | 18,626 | 373 |
| | Derichebourg SA | 117,653 | 368 |
| | Direct Energie | 8,723 | 325 |
| | Jacquet Metal Service | 18,428 | 309 |
| | Albioma SA | 16,681 | 276 |
| | GL Events | 15,111 | 270 |
| *,^ | Parrot SA | 29,850 | 265 |
| | Manitou BF SA | 12,981 | 234 |
| | Haulotte Group SA | 16,624 | 230 |
| * | Esso SA Francaise | 4,329 | 174 |
| * | Stallergenes Greer plc | 5,097 | 163 |
| * | Albioma SA Loyalty Line | 8,890 | 147 |
| | Union Financiere de France BQE SA | 4,713 | 125 |
| * | Euro Disney SCA | 63,113 | 80 |
| | | | 82,778 |
| Germany (3.7%) | | |
| | STADA Arzneimittel AG | 98,907 | 4,960 |
| * | KUKA AG | 43,514 | 4,938 |
| | Freenet AG | 171,575 | 4,919 |
| | Rheinmetall AG | 67,974 | 4,719 |
| * | Dialog Semiconductor plc | 115,041 | 4,524 |
| | Gerresheimer AG | 50,547 | 3,813 |
| | Aurubis AG | 72,731 | 3,792 |
| | Aareal Bank AG | 97,627 | 3,531 |
| | Deutsche EuroShop AG | 74,593 | 3,224 |
| ^ | Drillisch AG | 68,000 | 3,107 |
| | TAG Immobilien AG | 230,837 | 3,078 |
| | Software AG | 81,931 | 2,978 |
| * | Nordex SE | 103,588 | 2,728 |
| | alstria office REIT-AG | 208,889 | 2,694 |
| | Jungheinrich AG Preference Shares | 79,831 | 2,520 |
| | Krones AG | 24,478 | 2,497 |
| | Norma Group SE | 52,644 | 2,422 |
| | GRENKE AG | 12,339 | 2,148 |
| | Salzgitter AG | 65,107 | 2,140 |
| | Bechtle AG | 19,598 | 2,061 |
| | TLG Immobilien AG | 93,712 | 1,965 |
| | Leoni AG | 50,330 | 1,909 |
| | CTS Eventim AG & Co. KGaA | 50,002 | 1,795 |
| ^ | Stroeer SE & Co. KGaA | 38,919 | 1,780 |
| * | Kloeckner & Co. SE | 142,325 | 1,777 |
| * | MorphoSys AG | 39,855 | 1,770 |
| *,^ | Bilfinger SE | 50,258 | 1,770 |
| | Nemetschek SE | 27,815 | 1,735 |
| * | Schaeffler AG Preference Shares | 112,298 | 1,702 |
| 2 | ADO Properties SA | 45,950 | 1,680 |
| | Indus Holding AG | 28,058 | 1,656 |
| 2 | Deutsche Pfandbriefbank AG | 156,403 | 1,608 |
| | Duerr AG | 21,235 | 1,583 |
| | CompuGroup Medical SE | 35,177 | 1,559 |
| | RHOEN-KLINIKUM AG | 51,378 | 1,430 |
| | Pfeiffer Vacuum Technology AG | 15,158 | 1,375 |
| * | PATRIZIA Immobilien AG | 65,040 | 1,346 |
| * | zooplus AG | 9,432 | 1,343 |
| | DMG Mori AG | 29,091 | 1,332 |
| ^ | Sixt SE | 21,238 | 1,289 |
| | Takkt AG | 50,204 | 1,191 |
| *,2 | Tele Columbus AG | 146,960 | 1,161 |
| | Sixt SE Preference Shares | 25,565 | 1,141 |
| *,^ | SGL Carbon SE | 90,920 | 1,135 |
| | KWS Saat SE | 3,444 | 1,127 |
56
| | | |
| Vanguard® FTSE All-World ex-US Small-Cap Index Fund | | |
| Schedule of Investments | | |
| October 31, 2016 | | |
| |
| | | | Market |
| | | | Value |
| | | Shares | ($000) |
| | Jenoptik AG | 61,789 | 1,062 |
| | BRAAS Monier Building Group SA | 35,592 | 1,026 |
| | Puma SE | 4,104 | 1,023 |
| *,^ | Heidelberger Druckmaschinen AG | 353,941 | 940 |
| | XING AG | 4,405 | 898 |
| | Carl Zeiss Meditec AG | 24,763 | 891 |
| * | Vossloh AG | 13,631 | 829 |
| | Draegerwerk AG & Co. KGaA Preference Shares | 11,490 | 820 |
| | Bertrandt AG | 7,340 | 781 |
| * | Wincor Nixdorf AG | 10,670 | 777 |
| ^ | BayWa AG | 21,239 | 714 |
| ^ | ElringKlinger AG | 44,147 | 684 |
| | Deutz AG | 137,842 | 682 |
| * | AIXTRON SE | 130,897 | 649 |
| | DIC Asset AG | 65,310 | 627 |
| * | Wuestenrot & Wuerttembergische AG | 29,608 | 589 |
| | Wacker Neuson SE | 38,170 | 528 |
| | Deutsche Beteiligungs AG | 15,506 | 524 |
| *,2 | Hapag-Lloyd AG | 25,562 | 509 |
| ^ | Gerry Weber International AG | 38,862 | 485 |
| | Hamburger Hafen und Logistik AG | 29,543 | 470 |
| | Biotest AG Preference Shares | 30,063 | 419 |
| | comdirect bank AG | 40,925 | 415 |
| * | H&R GmbH & Co. KGaA | 22,324 | 413 |
| ^ | SMA Solar Technology AG | 15,852 | 407 |
| | Hornbach Baumarkt AG | 11,019 | 348 |
| | Draegerwerk AG & Co. KGaA | 4,664 | 298 |
| | CropEnergies AG | 34,813 | 197 |
| | Biotest AG | 9,271 | 166 |
| | | | 123,123 |
| Greece (0.1%) | | |
| * | Mytilineos Holdings SA | 120,149 | 686 |
| * | Public Power Corp. SA | 162,297 | 530 |
| | Hellenic Exchanges SA | 95,425 | 471 |
| | Grivalia Properties REIC AE | 57,728 | 445 |
| | Metka Industrial - Construction SA | 48,967 | 412 |
| | Athens Water Supply & Sewage Co. SA | 65,813 | 390 |
| * | Ellaktor SA | 215,887 | 293 |
| | Aegean Airlines SA | 43,229 | 278 |
| * | GEK Terna Holding Real Estate Construction SA | 93,396 | 216 |
| * | Fourlis Holdings SA | 43,671 | 186 |
| * | TT Hellenic Postbank SA | 44,448 | 8 |
| | Terna Energy SA | 2,553 | 8 |
| | | | 3,923 |
| Hong Kong (2.2%) | | |
| | Vitasoy International Holdings Ltd. | 1,360,000 | 2,840 |
| | Fortune REIT (Hong Kong Shares) | 2,188,000 | 2,651 |
| | Man Wah Holdings Ltd. | 2,597,200 | 1,724 |
| | Nexteer Automotive Group Ltd. | 1,216,328 | 1,604 |
| ^ | China Goldjoy Group Ltd. | 16,164,000 | 1,561 |
| * | Freeman FinTech Corp. Ltd. | 22,734,488 | 1,551 |
| | Luk Fook Holdings International Ltd. | 527,000 | 1,545 |
| | Value Partners Group Ltd. | 1,598,498 | 1,525 |
| | Tongda Group Holdings Ltd. | 5,750,000 | 1,517 |
| | NagaCorp Ltd. | 2,374,228 | 1,465 |
| | HKBN Ltd. | 1,125,449 | 1,327 |
| * | China Baoli Technologies Holdings Ltd. | 40,000,000 | 1,246 |
| | CP Pokphand Co. Ltd. | 9,760,000 | 1,244 |
| | BEP International Holdings Ltd. | 17,840,000 | 1,171 |
| | K Wah International Holdings Ltd. | 2,107,000 | 1,139 |
| | SITC International Holdings Co. Ltd. | 1,760,858 | 1,041 |
| | IGG Inc. | 1,414,000 | 1,031 |
| | Town Health International Medical Group Ltd. | 6,437,419 | 1,029 |
| | Pou Sheng International Holdings Ltd. | 3,281,000 | 1,025 |
57
| | | |
| Vanguard® FTSE All-World ex-US Small-Cap Index Fund | | |
| Schedule of Investments | | |
| October 31, 2016 | | |
| |
| | | | Market |
| | | | Value |
| | | Shares | ($000) |
| | Sunlight REIT | 1,653,000 | 1,022 |
| | Stella International Holdings Ltd. | 576,591 | 999 |
| | Yuexiu REIT | 1,655,000 | 949 |
| | Pacific Textiles Holdings Ltd. | 752,000 | 947 |
| | Giordano International Ltd. | 1,795,735 | 947 |
| *,^ | KuangChi Science Ltd. | 2,648,000 | 922 |
| ^ | SMI Holdings Group Ltd. | 9,240,000 | 881 |
| | SmarTone Telecommunications Holdings Ltd. | 574,730 | 868 |
| | SEA Holdings Ltd. | 339,098 | 863 |
| * | FDG Electric Vehicles Ltd. | 16,183,885 | 847 |
| *,^,2 | IMAX China Holding Inc. | 174,300 | 824 |
| | Truly International Holdings Ltd. | 2,105,000 | 823 |
| * | Pacific Basin Shipping Ltd. | 5,354,532 | 800 |
| * | Vision Fame International Holding Ltd. | 2,268,000 | 790 |
| | Prosperity REIT | 1,773,000 | 766 |
| *,^ | Superb Summit International Group Ltd. | 3,957,346 | 745 |
| ^ | China LNG Group Ltd. | 24,720,000 | 722 |
| | CITIC Telecom International Holdings Ltd. | 2,060,004 | 705 |
| | Yingde Gases Group Co. Ltd. | 1,629,000 | 657 |
| | Chong Hing Bank Ltd. | 334,000 | 656 |
| * | Huayi Tencent Entertainment Co. Ltd. | 10,610,000 | 642 |
| *,^ | MMG Ltd. | 2,405,127 | 632 |
| | Goodbaby International Holdings Ltd. | 1,298,000 | 627 |
| | Chow Sang Sang Holdings International Ltd. | 347,565 | 614 |
| * | Nan Hai Corp. Ltd. | 18,700,000 | 613 |
| | G-Resources Group Ltd. | 34,347,190 | 604 |
| | Dynam Japan Holdings Co. Ltd. | 416,840 | 599 |
| * | HC International Inc. | 778,000 | 573 |
| | Far East Consortium International Ltd. | 1,379,858 | 565 |
| ^ | Sun Hung Kai & Co. Ltd. | 891,000 | 561 |
| * | GCL New Energy Holdings Ltd. | 9,349,541 | 559 |
| * | Convoy Global Holdings Ltd. | 17,622,000 | 544 |
| ^,2 | Regina Miracle International Holdings Ltd. | 530,000 | 542 |
| * | China Strategic Holdings Ltd. | 22,640,000 | 536 |
| ^ | Gemdale Properties & Investment Corp. Ltd. | 8,118,000 | 534 |
| | China Harmony New Energy Auto Holding Ltd. | 1,119,500 | 520 |
| | Emperor Capital Group Ltd. | 4,907,860 | 517 |
| | Canvest Environmental Protection Group Co. Ltd. | 1,144,000 | 516 |
| ^ | TCC International Holdings Ltd. | 1,942,500 | 493 |
| * | United Photovoltaics Group Ltd. | 5,560,645 | 486 |
| | Lai Sun Development Co. Ltd. | 23,662,500 | 484 |
| * | Microport Scientific Corp. | 645,000 | 477 |
| * | Rentian Technology Holdings Ltd. | 6,900,000 | 461 |
| * | Sino Oil And Gas Holdings Ltd. | 18,545,000 | 455 |
| *,^ | China Ocean Industry Group Ltd. | 15,055,000 | 442 |
| | Spring REIT | 1,037,762 | 437 |
| *,^ | China LotSynergy Holdings Ltd. | 10,719,951 | 434 |
| * | Beijing Enterprises Medical & Health Group Ltd. | 7,266,000 | 421 |
| * | United Laboratories International Holdings Ltd. | 738,500 | 408 |
| * | NetMind Financial Holdings Ltd. | 43,864,000 | 394 |
| * | China Innovative Finance Group Ltd. | 3,510,000 | 390 |
| * | China Medical & HealthCare Group Ltd. | 6,682,946 | 382 |
| *,^ | Summit Ascent Holdings Ltd. | 1,234,000 | 377 |
| | Ju Teng International Holdings Ltd. | 1,169,002 | 370 |
| | APT Satellite Holdings Ltd. | 558,500 | 367 |
| | China Aerospace International Holdings Ltd. | 2,844,000 | 366 |
| * | TOM Group Ltd. | 1,489,016 | 364 |
| | NewOcean Energy Holdings Ltd. | 1,408,000 | 363 |
| * | Mei Ah Entertainment Group Ltd. | 4,740,000 | 360 |
| * | China Financial International Investments Ltd. | 6,820,000 | 347 |
| | Liu Chong Hing Investment Ltd. | 240,000 | 338 |
| | Road King Infrastructure Ltd. | 394,346 | 335 |
| | Shenwan Hongyuan HK Ltd. | 600,000 | 330 |
| ^ | Lee's Pharmaceutical Holdings Ltd. | 380,000 | 329 |
58
| | | |
| Vanguard® FTSE All-World ex-US Small-Cap Index Fund | | |
| Schedule of Investments | | |
| October 31, 2016 | | |
| |
| | | | Market |
| | | | Value |
| | | Shares | ($000) |
| * | 13 Holdings Ltd. | 1,113,540 | 328 |
| * | Midland Holdings Ltd. | 888,000 | 316 |
| * | Kong Sun Holdings Ltd. | 6,075,000 | 305 |
| *,^ | Honghua Group Ltd. | 2,985,000 | 303 |
| ^ | China Silver Group Ltd. | 1,516,000 | 300 |
| * | China Beidahuang Industry Group Holdings Ltd. | 4,872,000 | 282 |
| | Technovator International Ltd. | 626,000 | 258 |
| | TPV Technology Ltd. | 1,242,000 | 237 |
| * | Qianhai Health Holdings Ltd. | 10,977,500 | 232 |
| 2 | CGN New Energy Holdings Co. Ltd. | 1,580,000 | 229 |
| *,^ | Anton Oilfield Services Group | 1,687,298 | 225 |
| * | Yanchang Petroleum International Ltd. | 7,630,000 | 216 |
| * | Emperor Watch & Jewellery Ltd. | 5,350,000 | 213 |
| *,^ | Xinchen China Power Holdings Ltd. | 1,186,800 | 207 |
| * | Singamas Container Holdings Ltd. | 1,917,960 | 200 |
| * | Peace Map Holding Ltd. | 8,359,788 | 198 |
| | Parkson Retail Group Ltd. | 1,969,500 | 195 |
| | EVA Precision Industrial Holdings Ltd. | 1,726,000 | 189 |
| | AMVIG Holdings Ltd. | 558,000 | 188 |
| | Yip's Chemical Holdings Ltd. | 446,000 | 182 |
| * | New Sports Group Ltd. | 13,910,000 | 179 |
| * | Suncorp Technologies Ltd. | 16,990,000 | 166 |
| | Inspur International Ltd. | 832,000 | 165 |
| * | SOCAM Development Ltd. | 412,725 | 160 |
| * | Tou Rong Chang Fu Group Ltd. | 7,648,000 | 158 |
| | Varitronix International Ltd. | 386,000 | 157 |
| * | Sunshine Oilsands Ltd. | 2,670,500 | 154 |
| * | New Focus Auto Tech Holdings Ltd. | 2,223,482 | 154 |
| *,^ | Haier Healthwise Holdings Ltd. | 4,650,000 | 153 |
| ^ | China Huarong Energy Co. Ltd. | 2,280,900 | 153 |
| * | Silver Base Group Holdings Ltd. | 1,983,712 | 143 |
| | New World Department Store China Ltd. | 942,966 | 139 |
| * | Trinity Ltd. | 1,874,000 | 138 |
| | Henderson Investment Ltd. | 1,597,000 | 134 |
| * | Hong Kong Television Network Ltd. | 659,000 | 119 |
| * | Mason Financial Holdings Ltd. | 5,079,077 | 116 |
| * | Sincere Watch Hong Kong Ltd. | 3,620,000 | 100 |
| * | Auto Italia Holdings | 4,923,702 | 83 |
| | Polytec Asset Holdings Ltd. | 866,221 | 63 |
| * | China Healthcare Enterprise Group Ltd. | 3,625,304 | 63 |
| * | GT Group Holdings Ltd. | 1,477,853 | 53 |
| * | Winshine Science Co. Ltd. | 1,648,000 | 39 |
| * | Neo-Neon Holdings Ltd. | 204,880 | 32 |
| * | Skyway Securities Group Ltd. Warrants Exp. 02/11/2017 | 1,939,890 | 18 |
| | | | 73,319 |
| India (2.8%) | | |
| | Apollo Hospitals Enterprise Ltd. | 128,998 | 2,590 |
| * | Bharat Financial Inclusion Ltd. | 161,161 | 2,134 |
| | Page Industries Ltd. | 8,360 | 2,060 |
| | Max Financial Services Ltd. | 221,632 | 1,869 |
| | Federal Bank Ltd. | 1,466,471 | 1,802 |
| | Vakrangee Ltd. | 453,992 | 1,715 |
| * | Alkem Laboratories Ltd. | 69,790 | 1,706 |
| | Berger Paints India Ltd. | 401,014 | 1,547 |
| | Mindtree Ltd. | 233,449 | 1,525 |
| | CRISIL Ltd. | 43,225 | 1,422 |
| | Dewan Housing Finance Corp. Ltd. | 268,452 | 1,321 |
| | MRF Ltd. | 1,832 | 1,316 |
| | Info Edge India Ltd. | 92,622 | 1,251 |
| | Apollo Tyres Ltd. | 406,310 | 1,231 |
| | Arvind Ltd. | 193,725 | 1,202 |
| | Amara Raja Batteries Ltd. | 75,667 | 1,148 |
| | Kansai Nerolac Paints Ltd. | 200,188 | 1,137 |
| | Jubilant Life Sciences Ltd. | 109,793 | 1,135 |
59
| | |
| Vanguard® FTSE All-World ex-US Small-Cap Index Fund | | |
| Schedule of Investments | | |
| October 31, 2016 | | |
| |
| | | Market |
| | | Value |
| | Shares | ($000) |
| AIA Engineering Ltd. | 56,265 | 1,089 |
| PI Industries Ltd. | 83,077 | 1,075 |
| TVS Motor Co. Ltd. | 174,498 | 1,060 |
| Indian Hotels Co. Ltd. | 609,833 | 1,054 |
| L&T Finance Holdings Ltd. | 653,309 | 1,047 |
| Strides Shasun Ltd. | 66,322 | 1,039 |
| Biocon Ltd. | 73,343 | 1,017 |
| Cholamandalam Investment and Finance Co. Ltd. | 57,210 | 1,016 |
| Dalmia Bharat Ltd. | 32,217 | 993 |
| Ajanta Pharma Ltd. | 32,273 | 987 |
| Gujarat Pipavav Port Ltd. | 402,121 | 980 |
| Manappuram Finance Ltd. | 629,438 | 964 |
| CESC Ltd. | 101,140 | 952 |
| Edelweiss Financial Services Ltd. | 498,080 | 911 |
| * Kajaria Ceramics Ltd. | 97,540 | 907 |
| IRB Infrastructure Developers Ltd. | 254,649 | 896 |
| Blue Dart Express Ltd. | 11,741 | 894 |
| NCC Ltd. | 632,108 | 886 |
| Voltas Ltd. | 151,836 | 880 |
| Bayer CropScience Ltd. | 13,320 | 851 |
| * Suzlon Energy Ltd. | 3,721,876 | 846 |
| Sundaram Finance Ltd. | 40,710 | 837 |
| Jubilant Foodworks Ltd. | 54,811 | 821 |
| Ramco Cements Ltd. | 87,376 | 805 |
| Supreme Industries Ltd. | 58,997 | 798 |
| * Whirlpool of India Ltd. | 46,030 | 775 |
| Muthoot Finance Ltd. | 144,057 | 774 |
| Abbott India Ltd. | 10,222 | 764 |
| * Gillette India Ltd. | 11,952 | 764 |
| Sintex Industries Ltd. | 554,951 | 746 |
| Natco Pharma Ltd. | 85,013 | 743 |
| Credit Analysis & Research Ltd. | 32,729 | 723 |
| Tata Global Beverages Ltd. | 343,442 | 720 |
| Alembic Pharmaceuticals Ltd. | 68,511 | 693 |
| Oberoi Realty Ltd. | 128,220 | 677 |
| * Sun Pharma Advanced Research Co. Ltd. | 128,583 | 676 |
| eClerx Services Ltd. | 29,676 | 675 |
| * Aditya Birla Fashion and Retail Ltd. | 278,938 | 669 |
| Jain Irrigation Systems Ltd. | 414,702 | 668 |
| GRUH Finance Ltd. | 132,631 | 664 |
| Indraprastha Gas Ltd. | 50,793 | 655 |
| 2 Syngene International Ltd. | 73,526 | 645 |
| Tube Investments of India Ltd. | 68,840 | 644 |
| * PC Jeweller Ltd. | 81,222 | 623 |
| * Ipca Laboratories Ltd. | 66,729 | 610 |
| National Aluminium Co. Ltd. | 740,230 | 592 |
| WABCO India Ltd. | 6,882 | 583 |
| Persistent Systems Ltd. | 59,509 | 575 |
| * Dish TV India Ltd. | 385,889 | 555 |
| Sanofi India Ltd. | 8,466 | 554 |
| Century Textiles & Industries Ltd. | 40,524 | 552 |
| Thermax Ltd. | 43,231 | 551 |
| * Indiabulls Real Estate Ltd. | 412,462 | 542 |
| KRBL Ltd. | 151,438 | 542 |
| 2 Dr Lal PathLabs Ltd. | 30,699 | 542 |
| Sadbhav Engineering Ltd. | 129,208 | 540 |
| Karur Vysya Bank Ltd. | 73,098 | 524 |
| KPIT Technologies Ltd. | 243,466 | 523 |
| Repco Home Finance Ltd. | 46,186 | 522 |
| Welspun India Ltd. | 600,220 | 511 |
| Ceat Ltd. | 27,882 | 507 |
| Hexaware Technologies Ltd. | 163,194 | 500 |
| Prestige Estates Projects Ltd. | 170,064 | 494 |
| Symphony Ltd. | 25,718 | 492 |
60
| | |
| Vanguard® FTSE All-World ex-US Small-Cap Index Fund | | |
| Schedule of Investments | | |
| October 31, 2016 | | |
| |
| | | Market |
| | | Value |
| | Shares | ($000) |
| Redington India Ltd. | 312,258 | 491 |
| Engineers India Ltd. | 119,100 | 481 |
| * Housing Development & Infrastructure Ltd. | 383,534 | 479 |
| Coromandel International Ltd. | 109,756 | 471 |
| Cox & Kings Ltd. | 141,462 | 466 |
| Gujarat State Petronet Ltd. | 193,931 | 458 |
| * Just Dial Ltd. | 71,826 | 456 |
| Indian Bank | 130,688 | 456 |
| GE T&D India Ltd. | 88,446 | 454 |
| Bajaj Corp. Ltd. | 72,242 | 441 |
| IFCI Ltd. | 1,129,791 | 440 |
| Pfizer Ltd. | 15,848 | 433 |
| * Fortis Healthcare Ltd. | 160,355 | 429 |
| Gujarat Gas Ltd. | 49,242 | 422 |
| * TV18 Broadcast Ltd. | 630,246 | 420 |
| India Cements Ltd. | 176,674 | 416 |
| * RattanIndia Power Ltd. | 3,300,000 | 412 |
| Balrampur Chini Mills Ltd. | 221,595 | 383 |
| * Central Bank of India | 266,240 | 364 |
| Gateway Distriparks Ltd. | 97,891 | 362 |
| South Indian Bank Ltd. | 1,000,103 | 356 |
| * Mahindra CIE Automotive Ltd. | 118,855 | 353 |
| Srei Infrastructure Finance Ltd. | 319,411 | 349 |
| Multi Commodity Exchange of India Ltd. | 16,653 | 321 |
| * Hindustan Construction Co. Ltd. | 584,926 | 318 |
| * Bajaj Hindusthan Sugar Ltd. | 1,216,638 | 305 |
| Gujarat Fluorochemicals Ltd. | 39,837 | 302 |
| Jammu & Kashmir Bank Ltd. | 294,638 | 297 |
| PTC India Ltd. | 266,177 | 294 |
| VA Tech Wabag Ltd. | 39,337 | 292 |
| * Kaveri Seed Co. Ltd. | 43,858 | 284 |
| * Jaiprakash Associates Ltd. | 1,579,998 | 264 |
| Karnataka Bank Ltd. | 138,910 | 254 |
| * Unitech Ltd. | 2,768,499 | 250 |
| * Syndicate Bank | 224,377 | 248 |
| * Future Retail Ltd. | 98,705 | 246 |
| * Jet Airways India Ltd. | 35,377 | 243 |
| Marksans Pharma Ltd. | 307,220 | 240 |
| * Indian Overseas Bank | 592,984 | 237 |
| Sobha Ltd. | 54,471 | 228 |
| * Jindal Saw Ltd. | 236,850 | 227 |
| * Allahabad Bank | 196,738 | 223 |
| Welspun Corp. Ltd. | 203,488 | 217 |
| * Vijaya Bank | 301,986 | 200 |
| Gujarat Mineral Development Corp. Ltd. | 119,672 | 199 |
| Raymond Ltd. | 21,433 | 194 |
| Andhra Bank | 227,254 | 192 |
| * Videocon Industries Ltd. | 121,343 | 189 |
| * GE Power India Ltd. | 24,317 | 187 |
| Cyient Ltd. | 25,104 | 184 |
| * DEN Networks Ltd. | 148,069 | 173 |
| * Shipping Corp. of India Ltd. | 168,994 | 172 |
| McLeod Russel India Ltd. | 66,186 | 168 |
| * UCO Bank | 314,684 | 164 |
| Radico Khaitan Ltd. | 76,752 | 162 |
| * Shree Renuka Sugars Ltd. | 647,265 | 151 |
| * Rolta India Ltd. | 145,734 | 137 |
| Chambal Fertilizers and Chemicals Ltd. | 140,709 | 133 |
| * Amtek Auto Ltd. | 203,375 | 132 |
| * Reliance Defence and Engineering Ltd. | 142,038 | 126 |
| * Punj Lloyd Ltd. | 315,638 | 107 |
| * Polaris Consulting & Services Ltd. | 33,206 | 80 |
| * Karnataka Bank Ltd Rights Exp. 11/21/2016 | 69,455 | 54 |
| Future Enterprises Ltd. | 205,958 | 49 |
61
| | |
| Vanguard® FTSE All-World ex-US Small-Cap Index Fund | | |
| Schedule of Investments | | |
| October 31, 2016 | | |
| |
| | | Market |
| | | Value |
| | Shares | ($000) |
| * Nagarjuna Fertilizers & Chemicals Ltd. | 233,445 | 42 |
| * Arvind Infrastructure Ltd. | 19,635 | 28 |
| * JITF Infralogistics Ltd. | 21,890 | 13 |
| * Chennai Super Kings Cricket Ltd. | 176,674 | — |
| | | 94,143 |
| Indonesia (0.7%) | | |
| Summarecon Agung Tbk PT | 18,207,568 | 2,300 |
| Ciputra Development Tbk PT | 18,375,656 | 2,224 |
| Lippo Karawaci Tbk PT | 31,983,518 | 2,212 |
| Pakuwon Jati Tbk PT | 36,096,034 | 1,992 |
| AKR Corporindo Tbk PT | 2,520,300 | 1,368 |
| Waskita Karya Persero Tbk PT | 6,290,079 | 1,262 |
| * Aneka Tambang Persero Tbk PT | 12,714,319 | 873 |
| Bank Tabungan Negara Persero Tbk PT | 5,520,970 | 808 |
| Link Net Tbk PT | 2,041,800 | 782 |
| Ace Hardware Indonesia Tbk PT | 10,629,300 | 696 |
| Indo Tambangraya Megah Tbk PT | 605,800 | 665 |
| Wijaya Karya Persero Tbk PT | 3,197,500 | 630 |
| * Alam Sutera Realty Tbk PT | 17,822,091 | 612 |
| Matahari Putra Prima Tbk PT | 4,064,900 | 562 |
| Perusahaan Perkebunan London Sumatra Indonesia Tbk PT | 4,228,729 | 494 |
| Ramayana Lestari Sentosa Tbk PT | 4,398,000 | 462 |
| Bank Pembangunan Daerah Jawa Barat Dan Banten Tbk PT | 3,778,200 | 460 |
| Adhi Karya Persero Tbk PT | 2,637,600 | 458 |
| * Mitra Adiperkasa Tbk PT | 1,081,300 | 456 |
| Intiland Development Tbk PT | 8,067,000 | 356 |
| * Panin Financial Tbk PT | 24,203,500 | 354 |
| BISI International Tbk PT | 2,086,120 | 319 |
| * Siloam International Hospitals Tbk PT | 384,500 | 306 |
| * Lippo Cikarang Tbk PT | 610,200 | 283 |
| Timah Persero Tbk PT | 3,940,520 | 281 |
| * Eagle High Plantations Tbk PT | 17,979,000 | 263 |
| Surya Semesta Internusa Tbk PT | 5,761,400 | 249 |
| Wijaya Karya Beton Tbk PT | 3,557,195 | 242 |
| * Krakatau Steel Persero Tbk PT | 4,769,300 | 241 |
| * Agung Podomoro Land Tbk PT | 10,183,000 | 225 |
| * Gajah Tunggal Tbk PT | 2,265,200 | 217 |
| Salim Ivomas Pratama Tbk PT | 4,781,800 | 183 |
| * Medco Energi Internasional Tbk PT | 1,752,671 | 175 |
| Bekasi Fajar Industrial Estate Tbk PT | 7,132,400 | 170 |
| Sampoerna Agro PT | 944,300 | 138 |
| * Sigmagold Inti Perkasa Tbk PT | 8,317,400 | 73 |
| | | 23,391 |
| Ireland (0.4%) | | |
| Kingspan Group plc | 278,294 | 6,815 |
| C&C Group plc (Dublin Shares) | 514,982 | 1,976 |
| Green REIT plc | 1,032,663 | 1,542 |
| Hibernia REIT plc | 1,057,058 | 1,489 |
| Origin Enterprises plc | 192,848 | 1,196 |
| Irish Continental Group plc | 244,841 | 1,142 |
| * Permanent TSB Group Holdings plc | 176,533 | 480 |
| C&C Group plc (London Shares) | 11,196 | 43 |
| | | 14,683 |
| Israel (0.4%) | | |
| Reit 1 Ltd. | 254,949 | 768 |
| * Mazor Robotics Ltd. | 63,707 | 730 |
| * Partner Communications Co. Ltd. | 134,688 | 628 |
| * Cellcom Israel Ltd. (Registered) | 75,342 | 569 |
| * Jerusalem Oil Exploration | 12,817 | 564 |
| IDI Insurance Co. Ltd. | 11,042 | 548 |
| * Jerusalem Economy Ltd. | 228,754 | 517 |
| * Nova Measuring Instruments Ltd. | 41,974 | 502 |
| Rami Levy Chain Stores Hashikma Marketing 2006 Ltd. | 11,868 | 477 |
62
| | | |
| Vanguard® FTSE All-World ex-US Small-Cap Index Fund | | |
| Schedule of Investments | | |
| October 31, 2016 | | |
| |
| | | | Market |
| | | | Value |
| | | Shares | ($000) |
| | Delta-Galil Industries Ltd. | 16,285 | 464 |
| * | Compugen Ltd. | 73,853 | 418 |
| | Africa Israel Properties Ltd. | 23,694 | 408 |
| | Shufersal Ltd. | 104,316 | 394 |
| | B Communications Ltd. | 16,482 | 365 |
| * | Clal Insurance Enterprises Holdings Ltd. | 30,123 | 346 |
| | Formula Systems 1985 Ltd. | 8,777 | 338 |
| * | Phoenix Holdings Ltd. | 113,236 | 323 |
| * | Naphtha Israel Petroleum Corp. Ltd. | 58,194 | 316 |
| | Bayside Land Corp. | 792 | 310 |
| | Electra Ltd. | 2,231 | 307 |
| * | Menora Mivtachim Holdings Ltd. | 33,600 | 299 |
| | Big Shopping Centers Ltd. | 4,114 | 276 |
| * | Allot Communications Ltd. | 49,625 | 259 |
| * | Evogene Ltd. | 42,085 | 251 |
| * | Gilat Satellite Networks Ltd. | 56,590 | 248 |
| * | Migdal Insurance & Financial Holding Ltd. | 366,839 | 243 |
| | Norstar Holdings Inc. | 14,227 | 241 |
| * | Kenon Holdings Ltd. | 23,335 | 227 |
| * | AudioCodes Ltd. | 38,938 | 206 |
| * | Silicom Ltd. | 5,456 | 203 |
| * | Ceragon Networks Ltd. | 74,431 | 196 |
| | Property & Building Corp. Ltd. | 2,146 | 177 |
| * | Kamada Ltd. | 28,037 | 162 |
| * | Africa Israel Investments Ltd. | 65,216 | 19 |
| | | | 12,299 |
| Italy (2.5%) | | |
| ^ | Banco Popolare SC | 1,348,627 | 3,893 |
| | Moncler SPA | 232,089 | 3,864 |
| | Banca Popolare dell'Emilia Romagna SC | 784,416 | 3,686 |
| | A2A SPA | 2,524,263 | 3,438 |
| ^ | Banca Popolare di Milano Scarl | 7,223,527 | 3,311 |
| | Brembo SPA | 49,306 | 3,053 |
| * | Yoox Net-A-Porter Group SPA | 101,525 | 2,920 |
| | Hera SPA | 1,093,359 | 2,795 |
| | Cerved Information Solutions SPA | 315,265 | 2,538 |
| | DiaSorin SPA | 39,397 | 2,421 |
| | Azimut Holding SPA | 147,182 | 2,362 |
| | Banca Popolare di Sondrio SCPA | 691,845 | 2,310 |
| | Unipol Gruppo Finanziario SPA | 750,042 | 2,296 |
| | Buzzi Unicem SPA | 111,031 | 2,159 |
| | Interpump Group SPA | 130,552 | 2,094 |
| | De' Longhi SPA | 86,963 | 2,035 |
| | Banca Generali SPA | 87,659 | 1,949 |
| | Ansaldo STS SPA | 152,331 | 1,751 |
| 2 | Infrastrutture Wireless Italiane SPA | 367,291 | 1,736 |
| 2 | Anima Holding SPA | 343,905 | 1,675 |
| | Autogrill SPA | 193,523 | 1,613 |
| | Societa Cattolica di Assicurazioni SCRL | 256,935 | 1,554 |
| | Industria Macchine Automatiche SPA | 23,377 | 1,446 |
| | Iren SPA | 765,820 | 1,374 |
| | Amplifon SPA | 120,618 | 1,274 |
| * | Ei Towers SPA | 25,642 | 1,208 |
| ^ | Tod's SPA | 20,404 | 1,192 |
| *,^ | Banca Monte dei Paschi di Siena SPA | 3,900,217 | 1,045 |
| | Societa Iniziative Autostradali e Servizi SPA | 108,500 | 1,016 |
| 2 | OVS SPA | 185,131 | 1,014 |
| | ACEA SPA | 74,323 | 963 |
| | Beni Stabili SpA SIIQ | 1,611,582 | 940 |
| | MARR SPA | 49,952 | 920 |
| ^ | Saras SPA | 523,570 | 909 |
| | Banca IFIS SPA | 30,283 | 877 |
| | Danieli & C Officine Meccaniche SPA RSP | 63,692 | 853 |
| | ERG SPA | 76,002 | 844 |
63
| | | |
| Vanguard® FTSE All-World ex-US Small-Cap Index Fund | | |
| Schedule of Investments | | |
| October 31, 2016 | | |
| |
| | | | Market |
| | | | Value |
| | | Shares | ($000) |
| | Brunello Cucinelli SPA | 42,147 | 835 |
| | Reply SPA | 6,623 | 833 |
| | Credito Valtellinese SC | 1,757,489 | 773 |
| ^ | Salini Impregilo SPA | 245,523 | 684 |
| | Buzzi Unicem SPA | 65,768 | 671 |
| | Credito Emiliano SPA | 115,569 | 651 |
| | Datalogic SPA | 30,000 | 629 |
| | Italmobiliare SPA | 12,215 | 580 |
| 2 | RAI Way SPA | 139,897 | 547 |
| | CIR-Compagnie Industriali Riunite SPA | 472,961 | 527 |
| * | Safilo Group SPA | 50,012 | 523 |
| | ASTM SPA | 46,233 | 499 |
| ^ | Cairo Communication SPA | 106,839 | 458 |
| ^ | Piaggio & C SPA | 255,579 | 446 |
| | Immobiliare Grande Distribuzione SIIQ SPA | 553,078 | 426 |
| *,^ | Banca Carige SPA | 1,032,824 | 353 |
| | Cementir Holding SPA | 71,516 | 349 |
| | Danieli & C Officine Meccaniche SPA | 17,125 | 320 |
| * | Fincantieri SPA | 689,732 | 313 |
| | Esprinet SPA | 37,887 | 281 |
| ^ | Astaldi SPA | 65,899 | 266 |
| | Zignago Vetro SPA | 42,612 | 258 |
| *,^ | Rizzoli Corriere Della Sera Mediagroup SPA | 235,776 | 253 |
| ^ | Geox SPA | 115,926 | 250 |
| * | Gruppo Editoriale L'Espresso SPA | 243,892 | 203 |
| * | Juventus Football Club SPA | 609,367 | 196 |
| * | Arnoldo Mondadori Editore SPA | 185,763 | 184 |
| | Cofide SPA | 431,222 | 183 |
| | DeA Capital SPA | 131,828 | 156 |
| | Falck Renewables SPA | 157,843 | 141 |
| | | | 84,116 |
| Japan (16.2%) | | |
| | Mebuki Financial Group Inc. | 1,504,100 | 5,353 |
| | Morinaga & Co. Ltd. | 66,703 | 3,103 |
| | Penta-Ocean Construction Co. Ltd. | 473,900 | 2,824 |
| | Morinaga Milk Industry Co. Ltd. | 334,678 | 2,696 |
| | NOF Corp. | 237,207 | 2,578 |
| | Ulvac Inc. | 81,496 | 2,573 |
| | ADEKA Corp. | 167,155 | 2,527 |
| | Aica Kogyo Co. Ltd. | 88,500 | 2,525 |
| *,^ | Tokuyama Corp. | 586,050 | 2,506 |
| | Sankyu Inc. | 415,542 | 2,447 |
| | Tokyo Ohka Kogyo Co. Ltd. | 66,413 | 2,358 |
| | Toagosei Co. Ltd. | 211,592 | 2,355 |
| | Nihon Parkerizing Co. Ltd. | 165,561 | 2,281 |
| | Kyowa Exeo Corp. | 151,090 | 2,269 |
| | Amano Corp. | 119,768 | 2,228 |
| | Nikkon Holdings Co. Ltd. | 103,448 | 2,222 |
| | Tsubakimoto Chain Co. | 279,710 | 2,216 |
| | Mitsui Mining & Smelting Co. Ltd. | 949,000 | 2,114 |
| | Sangetsu Corp. | 108,920 | 2,103 |
| | Nippon Gas Co. Ltd. | 68,836 | 2,083 |
| | Ship Healthcare Holdings Inc. | 71,200 | 2,083 |
| | Nishimatsu Construction Co. Ltd. | 443,252 | 2,070 |
| | Iwatani Corp. | 344,124 | 2,055 |
| | Nippon Light Metal Holdings Co. Ltd. | 894,923 | 2,038 |
| | Hazama Ando Corp. | 313,879 | 2,023 |
| | Ogaki Kyoritsu Bank Ltd. | 563,740 | 2,017 |
| | TechnoPro Holdings Inc. | 58,600 | 2,007 |
| | Maeda Corp. | 216,306 | 2,004 |
| | Arcs Co. Ltd. | 77,100 | 1,935 |
| | Mitsubishi Pencil Co. Ltd. | 38,600 | 1,931 |
| | Hanwa Co. Ltd. | 315,415 | 1,930 |
| | Nippon Suisan Kaisha Ltd. | 400,862 | 1,927 |
64
| | | |
| Vanguard® FTSE All-World ex-US Small-Cap Index Fund | | |
| Schedule of Investments | | |
| October 31, 2016 | | |
| |
| | | | Market |
| | | | Value |
| | | Shares | ($000) |
| ^ | SHO-BOND Holdings Co. Ltd. | 39,900 | 1,924 |
| | Colowide Co. Ltd. | 98,200 | 1,908 |
| | Kokuyo Co. Ltd. | 143,740 | 1,904 |
| | Kiyo Bank Ltd. | 114,596 | 1,900 |
| | Oki Electric Industry Co. Ltd. | 143,706 | 1,875 |
| | Toho Holdings Co. Ltd. | 89,018 | 1,868 |
| | Fuji Machine Manufacturing Co. Ltd. | 145,388 | 1,850 |
| | Valor Holdings Co. Ltd. | 65,100 | 1,847 |
| | Kenedix Inc. | 438,700 | 1,845 |
| | Maruha Nichiro Corp. | 63,646 | 1,765 |
| | Hitachi Kokusai Electric Inc. | 87,459 | 1,747 |
| | Trusco Nakayama Corp. | 33,700 | 1,742 |
| | San-A Co. Ltd. | 31,644 | 1,723 |
| | Fuyo General Lease Co. Ltd. | 33,747 | 1,711 |
| | Okumura Corp. | 295,213 | 1,701 |
| | Yoshinoya Holdings Co. Ltd. | 112,720 | 1,698 |
| | Nanto Bank Ltd. | 44,400 | 1,688 |
| | Hokkoku Bank Ltd. | 498,000 | 1,668 |
| | Topre Corp. | 71,800 | 1,663 |
| | Sakata Seed Corp. | 57,556 | 1,657 |
| | Tokyo Seimitsu Co. Ltd. | 59,234 | 1,616 |
| | Kumagai Gumi Co. Ltd. | 606,080 | 1,610 |
| | Takasago Thermal Engineering Co. Ltd. | 113,952 | 1,607 |
| | Yaoko Co. Ltd. | 38,100 | 1,600 |
| | Musashino Bank Ltd. | 57,700 | 1,593 |
| | Toyo Ink SC Holdings Co. Ltd. | 342,647 | 1,593 |
| | Duskin Co. Ltd. | 81,960 | 1,574 |
| | Fujitec Co. Ltd. | 136,468 | 1,561 |
| | Fuji Oil | 80,805 | 1,558 |
| | Tokyo Dome Corp. | 163,678 | 1,556 |
| | Meitec Corp. | 45,646 | 1,556 |
| | Mandom Corp. | 32,927 | 1,536 |
| | Hokuetsu Kishu Paper Co. Ltd. | 245,021 | 1,533 |
| | Fuji Seal International Inc. | 37,148 | 1,531 |
| ^ | Daio Paper Corp. | 127,554 | 1,531 |
| | Okasan Securities Group Inc. | 287,000 | 1,526 |
| | Nichias Corp. | 171,139 | 1,523 |
| | Nippon Seiki Co. Ltd. | 77,832 | 1,505 |
| | Nihon Unisys Ltd. | 120,741 | 1,471 |
| *,^ | euglena Co. Ltd. | 108,100 | 1,469 |
| | Hitachi Zosen Corp. | 291,510 | 1,467 |
| | Inaba Denki Sangyo Co. Ltd. | 40,420 | 1,467 |
| ^ | Nissha Printing Co. Ltd. | 60,460 | 1,464 |
| | GMO Internet Inc. | 109,561 | 1,463 |
| | Ryosan Co. Ltd. | 45,857 | 1,412 |
| | Yodogawa Steel Works Ltd. | 51,533 | 1,407 |
| ^ | Okamoto Industries Inc. | 129,000 | 1,396 |
| | Hyakujushi Bank Ltd. | 409,000 | 1,393 |
| | KYB Corp. | 299,000 | 1,367 |
| | Asatsu-DK Inc. | 48,900 | 1,357 |
| | Tomy Co. Ltd. | 125,217 | 1,353 |
| | Takara Standard Co. Ltd. | 72,299 | 1,343 |
| | Sumitomo Bakelite Co. Ltd. | 246,000 | 1,336 |
| ^ | Ai Holdings Corp. | 53,800 | 1,322 |
| | Hogy Medical Co. Ltd. | 20,061 | 1,321 |
| | Toho Bank Ltd. | 341,664 | 1,297 |
| | MOS Food Services Inc. | 38,158 | 1,282 |
| | Tokyo TY Financial Group Inc. | 39,966 | 1,279 |
| | Daiseki Co. Ltd. | 61,487 | 1,262 |
| | Central Glass Co. Ltd. | 306,566 | 1,254 |
| | Tokyu Construction Co. Ltd. | 123,800 | 1,251 |
| | Fuji Kyuko Co. Ltd. | 108,400 | 1,243 |
| | Onward Holdings Co. Ltd. | 185,000 | 1,238 |
| | Totetsu Kogyo Co. Ltd. | 43,600 | 1,236 |
65
| | |
| Vanguard® FTSE All-World ex-US Small-Cap Index Fund | | |
| Schedule of Investments | | |
| October 31, 2016 | | |
| |
| | | Market |
| | | Value |
| | Shares | ($000) |
| PALTAC Corp. | 49,500 | 1,215 |
| TPR Co. Ltd. | 41,924 | 1,212 |
| Okamura Corp. | 123,532 | 1,212 |
| ^ Shima Seiki Manufacturing Ltd. | 43,000 | 1,212 |
| Takeuchi Manufacturing Co. Ltd. | 62,400 | 1,209 |
| DCM Holdings Co. Ltd. | 137,888 | 1,208 |
| Bank of Okinawa Ltd. | 34,144 | 1,199 |
| ^ Jin Co. Ltd. | 22,900 | 1,189 |
| Yamanashi Chuo Bank Ltd. | 242,311 | 1,185 |
| Nichi-iko Pharmaceutical Co. Ltd. | 66,002 | 1,184 |
| Nippon Densetsu Kogyo Co. Ltd. | 64,903 | 1,182 |
| Hyakugo Bank Ltd. | 321,000 | 1,182 |
| FCC Co. Ltd. | 53,543 | 1,181 |
| Nippon Flour Mills Co. Ltd. | 79,729 | 1,179 |
| TOMONY Holdings Inc. | 228,200 | 1,179 |
| Paramount Bed Holdings Co. Ltd. | 30,900 | 1,177 |
| ^ Okinawa Electric Power Co. Inc. | 49,531 | 1,147 |
| ^ Saibu Gas Co. Ltd. | 487,734 | 1,143 |
| United Arrows Ltd. | 41,867 | 1,143 |
| UACJ Corp. | 349,852 | 1,137 |
| Daikyonishikawa Corp. | 87,600 | 1,134 |
| Anritsu Corp. | 213,400 | 1,132 |
| Siix Corp. | 28,200 | 1,129 |
| * Nippon Sheet Glass Co. Ltd. | 138,600 | 1,126 |
| Taikisha Ltd. | 44,443 | 1,123 |
| Kuroda Electric Co. Ltd. | 57,500 | 1,119 |
| SMS Co. Ltd. | 42,900 | 1,117 |
| ZERIA Pharmaceutical Co. Ltd. | 66,640 | 1,117 |
| Noritz Corp. | 53,687 | 1,113 |
| Accordia Golf Co. Ltd. | 110,176 | 1,112 |
| Joyful Honda Co. Ltd. | 40,174 | 1,109 |
| Sumitomo Mitsui Construction Co. Ltd. | 1,162,032 | 1,107 |
| cocokara fine Inc. | 28,589 | 1,106 |
| Kyoritsu Maintenance Co. Ltd. | 18,380 | 1,103 |
| Keihin Corp. | 66,821 | 1,092 |
| Unipres Corp. | 56,180 | 1,084 |
| Kameda Seika Co. Ltd. | 20,700 | 1,084 |
| Bank of Iwate Ltd. | 25,624 | 1,079 |
| ^ Milbon Co. Ltd. | 24,060 | 1,078 |
| Nissin Electric Co. Ltd. | 80,600 | 1,075 |
| ^ EDION Corp. | 120,433 | 1,067 |
| Takuma Co. Ltd. | 116,000 | 1,066 |
| Kanematsu Corp. | 647,000 | 1,065 |
| ^ Nachi-Fujikoshi Corp. | 280,510 | 1,064 |
| CKD Corp. | 85,200 | 1,061 |
| Nichiha Corp. | 42,900 | 1,060 |
| Senko Co. Ltd. | 153,200 | 1,059 |
| J Trust Co. Ltd. | 129,100 | 1,055 |
| Transcosmos Inc. | 41,596 | 1,052 |
| Gurunavi Inc. | 38,200 | 1,046 |
| ^ Yamagata Bank Ltd. | 241,426 | 1,043 |
| Kadokawa Dwango Corp. | 70,302 | 1,038 |
| Nishimatsuya Chain Co. Ltd. | 73,200 | 1,030 |
| Tokyo Steel Manufacturing Co. Ltd. | 148,300 | 1,029 |
| Saizeriya Co. Ltd. | 39,021 | 1,028 |
| Showa Sangyo Co. Ltd. | 192,000 | 1,027 |
| Takara Bio Inc. | 70,800 | 1,023 |
| Aomori Bank Ltd. | 301,616 | 1,019 |
| Meidensha Corp. | 303,935 | 1,017 |
| * Pioneer Corp. | 410,813 | 1,008 |
| ^ Bank of Nagoya Ltd. | 28,312 | 997 |
| Kanamoto Co. Ltd. | 41,400 | 995 |
| TOKAI Holdings Corp. | 153,000 | 983 |
| Ichibanya Co. Ltd. | 25,968 | 982 |
66
| | |
| Vanguard® FTSE All-World ex-US Small-Cap Index Fund | | |
| Schedule of Investments | | |
| October 31, 2016 | | |
| |
| | | Market |
| | | Value |
| | Shares | ($000) |
| NSD Co. Ltd. | 60,534 | 974 |
| Ci:z Holdings Co. Ltd. | 33,900 | 972 |
| Descente Ltd. | 69,500 | 964 |
| Earth Chemical Co. Ltd. | 20,543 | 953 |
| Plenus Co. Ltd. | 46,000 | 947 |
| Sumitomo Warehouse Co. Ltd. | 177,064 | 947 |
| Taiyo Holdings Co. Ltd. | 25,200 | 945 |
| NET One Systems Co. Ltd. | 129,900 | 944 |
| IBJ Leasing Co. Ltd. | 45,101 | 943 |
| Life Corp. | 29,000 | 941 |
| Nomura Co. Ltd. | 58,000 | 941 |
| Nippon Soda Co. Ltd. | 210,127 | 931 |
| Eizo Corp. | 29,456 | 930 |
| Shinmaywa Industries Ltd. | 119,968 | 929 |
| Chiyoda Co. Ltd. | 39,100 | 928 |
| Komori Corp. | 73,100 | 928 |
| Tokai Carbon Co. Ltd. | 305,000 | 927 |
| Fukui Bank Ltd. | 350,557 | 927 |
| Makino Milling Machine Co. Ltd. | 145,901 | 927 |
| Heiwado Co. Ltd. | 44,400 | 924 |
| Seikagaku Corp. | 57,564 | 923 |
| ^ Zojirushi Corp. | 66,600 | 918 |
| As One Corp. | 20,400 | 915 |
| Kureha Corp. | 23,902 | 914 |
| Hitachi Maxell Ltd. | 50,000 | 911 |
| Morita Holdings Corp. | 60,366 | 909 |
| TOC Co. Ltd. | 99,646 | 900 |
| Oita Bank Ltd. | 236,079 | 894 |
| Nissin Kogyo Co. Ltd. | 60,109 | 889 |
| ^ Daihen Corp. | 152,759 | 886 |
| Futaba Corp. | 54,232 | 885 |
| Sakata INX Corp. | 67,600 | 885 |
| Toshiba Plant Systems & Services Corp. | 54,624 | 881 |
| Gunze Ltd. | 260,079 | 873 |
| Takara Leben Co. Ltd. | 128,100 | 869 |
| Sanyo Special Steel Co. Ltd. | 168,852 | 866 |
| Fuji Soft Inc. | 32,574 | 865 |
| Nagaileben Co. Ltd. | 39,400 | 865 |
| Asahi Holdings Inc. | 47,700 | 859 |
| Nippon Signal Company Ltd. | 96,600 | 857 |
| Aichi Bank Ltd. | 15,404 | 853 |
| Akita Bank Ltd. | 252,000 | 844 |
| Marudai Food Co. Ltd. | 176,591 | 841 |
| Toei Co. Ltd. | 104,648 | 841 |
| Starts Corp. Inc. | 45,315 | 840 |
| ^ Atom Corp. | 127,057 | 840 |
| * Infomart Corp. | 70,600 | 836 |
| BML Inc. | 31,500 | 835 |
| Doutor Nichires Holdings Co. Ltd. | 41,637 | 833 |
| Sanki Engineering Co. Ltd. | 91,767 | 832 |
| Ryobi Ltd. | 206,435 | 832 |
| Nikkiso Co. Ltd. | 94,161 | 832 |
| Fancl Corp. | 55,004 | 831 |
| Token Corp. | 11,486 | 830 |
| Aichi Steel Corp. | 17,202 | 828 |
| Nichicon Corp. | 96,583 | 828 |
| Kato Sangyo Co. Ltd. | 34,300 | 826 |
| Nitto Boseki Co. Ltd. | 254,056 | 826 |
| Raito Kogyo Co. Ltd. | 68,500 | 825 |
| Seiren Co. Ltd. | 70,500 | 825 |
| * Toshiba TEC Corp. | 185,000 | 825 |
| Chudenko Corp. | 39,600 | 823 |
| Aeon Delight Co. Ltd. | 27,800 | 822 |
| Yamazen Corp. | 102,300 | 816 |
67
| | | |
| Vanguard® FTSE All-World ex-US Small-Cap Index Fund | | |
| Schedule of Investments | | |
| October 31, 2016 | | |
| |
| | | | Market |
| | | | Value |
| | | Shares | ($000) |
| | Iseki & Co. Ltd. | 328,872 | 813 |
| ^ | Ehime Bank Ltd. | 61,600 | 813 |
| | Alpine Electronics Inc. | 60,448 | 807 |
| | Nippon Steel & Sumikin Bussan Corp. | 21,949 | 804 |
| | Prima Meat Packers Ltd. | 221,440 | 804 |
| | Furukawa Co. Ltd. | 502,988 | 803 |
| | Kitz Corp. | 139,548 | 802 |
| | TSI Holdings Co. Ltd. | 142,600 | 802 |
| | Dip Corp. | 30,100 | 797 |
| | Daibiru Corp. | 91,743 | 797 |
| | Obara Group Inc. | 18,360 | 791 |
| ^ | Financial Products Group Co. Ltd. | 90,500 | 791 |
| | Nisshin Oillio Group Ltd. | 173,262 | 788 |
| | Kohnan Shoji Co. Ltd. | 39,800 | 787 |
| | Mirait Holdings Corp. | 88,671 | 786 |
| | Unizo Holdings Co. Ltd. | 28,200 | 786 |
| | Hokuetsu Bank Ltd. | 33,021 | 780 |
| | Axial Retailing Inc. | 21,630 | 777 |
| | Musashi Seimitsu Industry Co. Ltd. | 31,615 | 774 |
| | Oiles Corp. | 42,508 | 771 |
| | Piolax Inc. | 12,100 | 769 |
| | Inabata & Co. Ltd. | 70,700 | 769 |
| | United Super Markets Holdings Inc. | 85,050 | 768 |
| | Fuso Chemical Co. Ltd. | 36,000 | 768 |
| | Heiwa Real Estate Co. Ltd. | 53,872 | 767 |
| | V Technology Co. Ltd. | 6,400 | 762 |
| | Internet Initiative Japan Inc. | 43,156 | 762 |
| | Mitsuba Corp. | 52,124 | 761 |
| | Star Micronics Co. Ltd. | 53,264 | 758 |
| | Sato Holdings Corp. | 34,400 | 758 |
| | Sanyo Chemical Industries Ltd. | 16,654 | 753 |
| | Pacific Industrial Co. Ltd. | 60,800 | 748 |
| | Mizuno Corp. | 138,782 | 747 |
| | Aida Engineering Ltd. | 86,706 | 745 |
| | Chofu Seisakusho Co. Ltd. | 28,900 | 743 |
| | Marusan Securities Co. Ltd. | 89,255 | 741 |
| | Toridoll Holdings Corp. | 32,000 | 741 |
| | Takasago International Corp. | 27,600 | 740 |
| | Toyo Engineering Corp. | 215,684 | 739 |
| | Nitta Corp. | 28,500 | 738 |
| | Fujicco Co. Ltd. | 32,205 | 737 |
| | Kura Corp. | 14,600 | 736 |
| | Jaccs Co. Ltd. | 187,000 | 733 |
| | Mani Inc. | 31,500 | 733 |
| | Dydo Drinco Inc. | 13,244 | 733 |
| | Doshisha Co. Ltd. | 35,300 | 730 |
| | kabu.com Securities Co. Ltd. | 231,200 | 728 |
| | Foster Electric Co. Ltd. | 39,185 | 719 |
| | Shikoku Bank Ltd. | 303,703 | 717 |
| *,^ | Mitsumi Electric Co. Ltd. | 117,849 | 716 |
| | Tochigi Bank Ltd. | 148,312 | 715 |
| | Noevir Holdings Co. Ltd. | 23,600 | 715 |
| | VT Holdings Co. Ltd. | 132,800 | 713 |
| | AOKI Holdings Inc. | 58,804 | 711 |
| | Max Co. Ltd. | 59,000 | 711 |
| | Kintetsu World Express Inc. | 52,200 | 710 |
| ^ | Next Co. Ltd. | 84,300 | 708 |
| | Japan Wool Textile Co. Ltd. | 96,889 | 706 |
| | Kisoji Co. Ltd. | 32,760 | 706 |
| | Toho Zinc Co. Ltd. | 200,758 | 701 |
| | Royal Holdings Co. Ltd. | 40,500 | 700 |
| | Shinko Electric Industries Co. Ltd. | 107,800 | 695 |
| | Tachi-S Co. Ltd. | 41,800 | 694 |
| | Shizuoka Gas Co. Ltd. | 88,300 | 693 |
68
| | | |
| Vanguard® FTSE All-World ex-US Small-Cap Index Fund | | |
| Schedule of Investments | | |
| October 31, 2016 | | |
| |
| | | | Market |
| | | | Value |
| | | Shares | ($000) |
| | Riso Kagaku Corp. | 39,984 | 693 |
| | Create SD Holdings Co. Ltd. | 33,018 | 691 |
| | Monex Group Inc. | 301,187 | 690 |
| | Daiho Corp. | 125,000 | 687 |
| | Sekisui Jushi Corp. | 41,600 | 685 |
| | Bank of the Ryukyus Ltd. | 52,067 | 685 |
| | Round One Corp. | 96,700 | 683 |
| | Bunka Shutter Co. Ltd. | 81,900 | 679 |
| | Eighteenth Bank Ltd. | 219,000 | 679 |
| *,^ | Pacific Metals Co. Ltd. | 225,088 | 677 |
| | Seiko Holdings Corp. | 206,291 | 675 |
| | Kotobuki Spirits Co. Ltd. | 28,500 | 672 |
| ^ | Wacom Co. Ltd. | 222,136 | 670 |
| | Nishio Rent All Co. Ltd. | 22,200 | 670 |
| *,^ | W-Scope Corp. | 37,400 | 669 |
| *,^ | Outsourcing Inc. | 17,600 | 668 |
| | Hiday Hidaka Corp. | 26,680 | 665 |
| | Yondoshi Holdings Inc. | 26,500 | 662 |
| | Hosiden Corp. | 89,167 | 661 |
| | Dainichiseika Color & Chemicals Manufacturing Co. Ltd. | 124,016 | 661 |
| | Benefit One Inc. | 22,800 | 659 |
| | TKC Corp. | 22,249 | 657 |
| | Create Restaurants Holdings Inc. | 69,270 | 657 |
| | DTS Corp. | 29,500 | 654 |
| | Daiwabo Holdings Co. Ltd. | 268,761 | 649 |
| | Ringer Hut Co. Ltd. | 25,500 | 649 |
| | Kurabo Industries Ltd. | 324,000 | 647 |
| | Shibuya Corp. | 31,000 | 644 |
| ^ | Yokohama Reito Co. Ltd. | 63,400 | 641 |
| | Press Kogyo Co. Ltd. | 131,400 | 640 |
| | Kyoei Steel Ltd. | 33,412 | 636 |
| | Japan Securities Finance Co. Ltd. | 142,841 | 635 |
| | Eiken Chemical Co. Ltd. | 23,200 | 634 |
| ^ | Sankyo Tateyama Inc. | 40,100 | 631 |
| | Kenko Mayonnaise Co. Ltd. | 17,200 | 631 |
| | Bando Chemical Industries Ltd. | 65,500 | 630 |
| | Miyazaki Bank Ltd. | 221,932 | 625 |
| | Hitachi Koki Co. Ltd. | 73,600 | 623 |
| | Ohsho Food Service Corp. | 16,174 | 622 |
| | Goldwin Inc. | 13,500 | 619 |
| | Sintokogio Ltd. | 71,000 | 619 |
| ^ | Yonex Co. Ltd. | 14,000 | 618 |
| | Sanyo Electric Railway Co. Ltd. | 125,000 | 617 |
| | Avex Group Holdings Inc. | 46,600 | 616 |
| | EPS Holdings Inc. | 46,800 | 614 |
| | Topy Industries Ltd. | 26,479 | 614 |
| | Yuasa Trading Co. Ltd. | 25,600 | 613 |
| | Chugoku Marine Paints Ltd. | 83,000 | 604 |
| | Konoike Transport Co. Ltd. | 45,600 | 604 |
| | Relia Inc. | 63,000 | 604 |
| | Shikoku Chemicals Corp. | 63,000 | 604 |
| | NEC Networks & System Integration Corp. | 33,900 | 602 |
| | Ricoh Leasing Co. Ltd. | 20,806 | 601 |
| ^ | Tekken Corp. | 184,000 | 598 |
| | Elecom Co. Ltd. | 29,200 | 597 |
| ^ | St. Marc Holdings Co. Ltd. | 21,200 | 595 |
| | G-Tekt Corp. | 31,200 | 593 |
| ^ | Hokuto Corp. | 30,424 | 592 |
| | Macnica Fuji Electronics Holdings Inc. | 47,113 | 590 |
| | Sanken Electric Co. Ltd. | 166,648 | 590 |
| | San-Ai Oil Co. Ltd. | 83,500 | 589 |
| | Starzen Co. Ltd. | 11,100 | 588 |
| | Asahi Diamond Industrial Co. Ltd. | 78,822 | 587 |
| | Eagle Industry Co. Ltd. | 41,100 | 586 |
69
| | |
| Vanguard® FTSE All-World ex-US Small-Cap Index Fund | | |
| Schedule of Investments | | |
| October 31, 2016 | | |
| |
| | | Market |
| | | Value |
| | Shares | ($000) |
| Tokai Corp. | 17,200 | 586 |
| Tsukishima Kikai Co. Ltd. | 52,200 | 584 |
| Micronics Japan Co. Ltd. | 50,300 | 581 |
| Dexerials Corp. | 72,300 | 581 |
| Nitto Kogyo Corp. | 39,488 | 579 |
| Kanto Denka Kogyo Co. Ltd. | 69,000 | 579 |
| Daido Metal Co. Ltd. | 53,600 | 578 |
| T Hasegawa Co. Ltd. | 32,700 | 577 |
| Tv Tokyo Holdings Corp. | 25,200 | 577 |
| Zenrin Co. Ltd. | 33,000 | 576 |
| Fuji Co. Ltd. | 27,200 | 571 |
| Fukushima Industries Corp. | 16,700 | 570 |
| Iino Kaiun Kaisha Ltd. | 153,136 | 570 |
| Minato Bank Ltd. | 31,100 | 569 |
| Mitsuboshi Belting Ltd. | 66,000 | 569 |
| Fujimori Kogyo Co. Ltd. | 22,900 | 569 |
| Osaka Soda Co. Ltd. | 131,000 | 560 |
| Open House Co. Ltd. | 26,500 | 560 |
| * Miroku Jyoho Service Co. Ltd. | 28,600 | 559 |
| * Unitika Ltd. | 828,000 | 559 |
| Toa Corp. (Tokyo Shares 1885) | 26,500 | 558 |
| Wakita & Co. Ltd. | 65,300 | 557 |
| Toshiba Machine Co. Ltd. | 154,000 | 556 |
| Geo Holdings Corp. | 43,700 | 554 |
| ^ S Foods Inc. | 20,700 | 554 |
| Okabe Co. Ltd. | 64,835 | 553 |
| Bank of Saga Ltd. | 212,000 | 553 |
| ^ Nippon Synthetic Chemical Industry Co. Ltd. | 64,000 | 551 |
| Belc Co. Ltd. | 13,600 | 550 |
| Vital KSK Holdings Inc. | 51,700 | 547 |
| ASKA Pharmaceutical Co. Ltd. | 31,600 | 545 |
| JVC Kenwood Corp. | 201,740 | 545 |
| ^ JCR Pharmaceuticals Co. Ltd. | 21,694 | 544 |
| Takamatsu Construction Group Co. Ltd. | 22,900 | 543 |
| Hibiya Engineering Ltd. | 34,600 | 543 |
| Sanden Holdings Corp. | 175,000 | 542 |
| Trancom Co. Ltd. | 9,300 | 541 |
| Osaki Electric Co. Ltd. | 56,000 | 537 |
| ^ Megachips Corp. | 26,581 | 534 |
| Xebio Holdings Co. Ltd. | 34,108 | 529 |
| Sumitomo Riko Co. Ltd. | 55,000 | 527 |
| Itochu Enex Co. Ltd. | 68,300 | 525 |
| Kyokuto Kaihatsu Kogyo Co. Ltd. | 44,400 | 524 |
| Menicon Co. Ltd. | 18,500 | 524 |
| Towa Bank Ltd. | 495,000 | 523 |
| Japan Pulp & Paper Co. Ltd. | 156,000 | 523 |
| Optex Co. Ltd. | 20,500 | 522 |
| Fujibo Holdings Inc. | 16,400 | 519 |
| Tsubaki Nakashima Co. Ltd. | 32,600 | 518 |
| Mitsui Sugar Co. Ltd. | 23,000 | 518 |
| Katakura Industries Co. Ltd. | 42,300 | 514 |
| Pressance Corp. | 44,348 | 511 |
| Yokogawa Bridge Holdings Corp. | 46,300 | 509 |
| Clarion Co. Ltd. | 154,000 | 505 |
| Justsystems Corp. | 51,500 | 505 |
| * Japan Material Co. Ltd. | 14,200 | 503 |
| Modec Inc. | 29,588 | 500 |
| Key Coffee Inc. | 25,193 | 499 |
| Futaba Industrial Co. Ltd. | 83,500 | 499 |
| T-Gaia Corp. | 32,400 | 498 |
| Fukuda Corp. | 42,000 | 495 |
| Nohmi Bosai Ltd. | 33,100 | 494 |
| Sumitomo Seika Chemicals Co. Ltd. | 13,200 | 494 |
| Nippon Koei Co. Ltd. | 105,000 | 493 |
70
| | |
| Vanguard® FTSE All-World ex-US Small-Cap Index Fund | | |
| Schedule of Investments | | |
| October 31, 2016 | | |
| |
| | | Market |
| | | Value |
| | Shares | ($000) |
| Tosho Co. Ltd. | 11,300 | 489 |
| Mitsui-Soko Holdings Co. Ltd. | 161,762 | 488 |
| YAMABIKO Corp. | 49,300 | 488 |
| J-Oil Mills Inc. | 13,700 | 487 |
| Inageya Co. Ltd. | 35,800 | 485 |
| * Rokko Butter Co. Ltd. | 18,000 | 485 |
| Fujimi Inc. | 31,147 | 485 |
| Namura Shipbuilding Co. Ltd. | 79,448 | 484 |
| Shindengen Electric Manufacturing Co. Ltd. | 112,000 | 484 |
| Funai Soken Holdings Inc. | 31,300 | 484 |
| Anest Iwata Corp. | 47,900 | 482 |
| Showa Corp. | 73,592 | 482 |
| Belluna Co. Ltd. | 72,000 | 480 |
| ^ Anicom Holdings Inc. | 21,400 | 479 |
| ^ F@N Communications Inc. | 64,200 | 479 |
| Enplas Corp. | 15,453 | 477 |
| ^ NichiiGakkan Co. Ltd. | 57,300 | 477 |
| Bell System24 Holdings Inc. | 50,900 | 477 |
| Taihei Dengyo Kaisha Ltd. | 46,000 | 477 |
| Jeol Ltd. | 114,000 | 476 |
| Riken Corp. | 13,000 | 476 |
| Joshin Denki Co. Ltd. | 55,653 | 476 |
| Warabeya Nichiyo Holdings Co. Ltd. | 19,700 | 475 |
| Pack Corp. | 17,500 | 475 |
| Tamura Corp. | 115,000 | 473 |
| ^ Matsuya Co. Ltd. | 58,800 | 470 |
| Teikoku Sen-I Co. Ltd. | 31,684 | 470 |
| Towa Pharmaceutical Co. Ltd. | 12,594 | 470 |
| Tsukui Corp. | 71,600 | 470 |
| Kyokuto Securities Co. Ltd. | 32,300 | 467 |
| Wowow Inc. | 16,300 | 466 |
| Denki Kogyo Co. Ltd. | 84,400 | 465 |
| Riken Vitamin Co. Ltd. | 10,700 | 464 |
| Tokushu Tokai Paper Co. Ltd. | 13,600 | 463 |
| Yellow Hat Ltd. | 21,700 | 463 |
| Konishi Co. Ltd. | 38,900 | 462 |
| Tsugami Corp. | 84,000 | 461 |
| Yorozu Corp. | 29,176 | 459 |
| Cawachi Ltd. | 17,800 | 458 |
| Maruwa Co. Ltd. | 12,100 | 457 |
| Nippon Ceramic Co. Ltd. | 24,700 | 456 |
| Sodick Co. Ltd. | 60,378 | 453 |
| Systena Corp. | 25,900 | 452 |
| Tsurumi Manufacturing Co. Ltd. | 31,000 | 451 |
| ^ Alpen Co. Ltd. | 24,500 | 446 |
| Toyo Construction Co. Ltd. | 106,900 | 446 |
| * Kintetsu Department Store Co. Ltd. | 134,000 | 446 |
| Noritake Co. Ltd. | 19,500 | 445 |
| Tocalo Co. Ltd. | 19,800 | 444 |
| Daiken Corp. | 21,400 | 444 |
| Tokyotokeiba Co. Ltd. | 226,000 | 444 |
| Goldcrest Co. Ltd. | 24,380 | 443 |
| Jimoto Holdings Inc. | 262,282 | 442 |
| Arcland Sakamoto Co. Ltd. | 37,000 | 441 |
| ^ METAWATER Co. Ltd. | 16,100 | 439 |
| Stella Chemifa Corp. | 12,500 | 439 |
| Daisan Bank Ltd. | 25,803 | 437 |
| Nissin Corp. | 131,000 | 435 |
| FIDEA Holdings Co. Ltd. | 241,800 | 435 |
| Hamakyorex Co. Ltd. | 23,300 | 434 |
| Nagatanien Holdings Co. Ltd. | 34,000 | 434 |
| Torii Pharmaceutical Co. Ltd. | 18,800 | 433 |
| Kansai Urban Banking Corp. | 39,000 | 432 |
| JSP Corp. | 18,000 | 430 |
71
| | | |
| Vanguard® FTSE All-World ex-US Small-Cap Index Fund | | |
| Schedule of Investments | | |
| October 31, 2016 | | |
| |
| | | | Market |
| | | | Value |
| | | Shares | ($000) |
| | Sanyo Denki Co. Ltd. | 66,000 | 429 |
| | Neturen Co. Ltd. | 52,800 | 428 |
| | Nihon Chouzai Co. Ltd. | 10,200 | 426 |
| | Shinko Plantech Co. Ltd. | 57,400 | 426 |
| | Kasai Kogyo Co. Ltd. | 37,400 | 424 |
| | Canon Electronics Inc. | 27,194 | 423 |
| | Sakai Chemical Industry Co. Ltd. | 117,546 | 419 |
| | Okuwa Co. Ltd. | 40,000 | 419 |
| | Ines Corp. | 37,500 | 417 |
| ^ | IDOM Inc. | 79,700 | 416 |
| | Nippon Chemi-Con Corp. | 238,816 | 415 |
| | Sagami Chain Co. Ltd. | 34,396 | 413 |
| | Roland DG Corp. | 17,400 | 411 |
| | Mitani Sekisan Co. Ltd. | 16,400 | 410 |
| | Ihara Chemical Industry Co. Ltd. | 47,800 | 408 |
| | Kato Works Co. Ltd. | 16,241 | 407 |
| | Sogo Medical Co. Ltd. | 13,300 | 404 |
| | Cosel Co. Ltd. | 33,600 | 402 |
| * | Nissei Build Kogyo Co. Ltd. | 86,000 | 402 |
| | Maruzen Showa Unyu Co. Ltd. | 99,000 | 402 |
| | Nichiden Corp. | 14,000 | 401 |
| | Dai Nippon Toryo Co. Ltd. | 187,000 | 400 |
| ^ | Kappa Create Co. Ltd. | 34,488 | 400 |
| | Koa Corp. | 43,400 | 400 |
| | Rock Field Co. Ltd. | 28,768 | 400 |
| | Tamron Co. Ltd. | 22,800 | 399 |
| | Kaga Electronics Co. Ltd. | 27,300 | 399 |
| * | Ishihara Sangyo Kaisha Ltd. | 52,500 | 398 |
| | Yahagi Construction Co. Ltd. | 43,300 | 397 |
| * | Vector Inc. | 33,600 | 397 |
| | Kyodo Printing Co. Ltd. | 117,000 | 397 |
| | PAL GROUP Holdings Co. Ltd. | 16,000 | 396 |
| | Ryoyo Electro Corp. | 31,142 | 396 |
| | Ichiyoshi Securities Co. Ltd. | 52,800 | 396 |
| | Chukyo Bank Ltd. | 17,800 | 395 |
| | Itoki Corp. | 63,700 | 393 |
| | Matsuya Foods Co. Ltd. | 12,100 | 392 |
| | Aisan Industry Co. Ltd. | 48,200 | 392 |
| | Michinoku Bank Ltd. | 197,000 | 392 |
| | BRONCO BILLY Co. Ltd. | 13,200 | 391 |
| | Daiichi Jitsugyo Co. Ltd. | 70,000 | 388 |
| | Nippon Thompson Co. Ltd. | 98,000 | 388 |
| | Digital Arts Inc. | 14,300 | 385 |
| | UKC Holdings Corp. | 22,800 | 382 |
| | Nittetsu Mining Co. Ltd. | 9,100 | 380 |
| | Tanseisha Co. Ltd. | 50,400 | 379 |
| | Nitto Kohki Co. Ltd. | 16,400 | 379 |
| * | Chiyoda Integre Co. Ltd. | 18,200 | 377 |
| | Melco Holdings Inc. | 13,900 | 376 |
| ^ | Nihon Nohyaku Co. Ltd. | 68,900 | 376 |
| | Qol Co. Ltd. | 23,799 | 375 |
| * | CMK Corp. | 70,700 | 373 |
| *,^ | OSAKA Titanium Technologies Co. Ltd. | 27,800 | 373 |
| | Tenma Corp. | 21,500 | 372 |
| ^ | Fujita Kanko Inc. | 112,000 | 372 |
| | Union Tool Co. | 14,400 | 372 |
| | Daikokutenbussan Co. Ltd. | 7,900 | 371 |
| | Arakawa Chemical Industries Ltd. | 25,000 | 371 |
| | Oyo Corp. | 31,900 | 369 |
| | Arata Corp. | 16,059 | 367 |
| | Japan Digital Laboratory Co. Ltd. | 23,600 | 367 |
| | Shinnihon Corp. | 38,000 | 366 |
| | Yushin Precision Equipment Co. Ltd. | 15,600 | 363 |
| | Shin-Etsu Polymer Co. Ltd. | 54,300 | 363 |
72
| | | |
| Vanguard® FTSE All-World ex-US Small-Cap Index Fund | | |
| Schedule of Investments | | |
| October 31, 2016 | | |
| |
| | | | Market |
| | | | Value |
| | | Shares | ($000) |
| | Shimizu Bank Ltd. | 12,000 | 362 |
| | OSJB Holdings Corp. | 151,994 | 362 |
| ^ | Riken Technos Corp. | 68,800 | 360 |
| | Sinfonia Technology Co. Ltd. | 196,000 | 360 |
| | Kanematsu Electronics Ltd. | 17,700 | 357 |
| ^ | Maeda Kosen Co. Ltd. | 32,200 | 357 |
| | Meisei Industrial Co. Ltd. | 69,500 | 356 |
| ^ | Kumiai Chemical Industry Co. Ltd. | 62,800 | 356 |
| | Koatsu Gas Kogyo Co. Ltd. | 53,000 | 355 |
| | Daiwa Industries Ltd. | 40,700 | 354 |
| * | Daito Pharmaceutical Co. Ltd. | 16,100 | 354 |
| | Nippon Kanzai Co. Ltd. | 24,200 | 353 |
| | Idec Corp. | 39,300 | 352 |
| ^ | Prestige International Inc. | 46,800 | 352 |
| | Yurtec Corp. | 48,000 | 352 |
| | Torishima Pump Manufacturing Co. Ltd. | 32,400 | 349 |
| | Broadleaf Co. Ltd. | 31,000 | 348 |
| | Kyokuyo Co. Ltd. | 13,100 | 345 |
| | Nippon Road Co. Ltd. | 84,000 | 345 |
| | ESPEC Corp. | 28,208 | 341 |
| | Tsukuba Bank Ltd. | 113,900 | 340 |
| | Kurimoto Ltd. | 18,200 | 339 |
| | CONEXIO Corp. | 25,000 | 339 |
| | Sanshin Electronics Co. Ltd. | 38,300 | 339 |
| | Achilles Corp. | 23,500 | 338 |
| | Kita-Nippon Bank Ltd. | 11,300 | 337 |
| | Giken Ltd. | 19,200 | 336 |
| | SMK Corp. | 87,000 | 333 |
| ^ | Istyle Inc. | 42,300 | 333 |
| | Juki Corp. | 44,518 | 333 |
| | Fudo Tetra Corp. | 189,000 | 332 |
| | Tosei Corp. | 44,400 | 332 |
| | Osaka Steel Co. Ltd. | 17,700 | 332 |
| | Senshukai Co. Ltd. | 48,900 | 331 |
| | Toyo Corp. | 34,317 | 330 |
| | Mie Bank Ltd. | 16,110 | 329 |
| | Nippon Beet Sugar Manufacturing Co. Ltd. | 16,800 | 328 |
| ^ | Toho Co. Ltd. | 13,700 | 324 |
| ^ | Toho Titanium Co. Ltd. | 48,500 | 323 |
| ^ | Japan Cash Machine Co. Ltd. | 22,800 | 323 |
| | Toyo Kanetsu KK | 142,000 | 322 |
| | Ateam Inc. | 14,200 | 322 |
| | Kanagawa Chuo Kotsu Co. Ltd. | 45,000 | 321 |
| | Komatsu Seiren Co. Ltd. | 50,900 | 317 |
| * | Wellnet Corp. | 25,300 | 317 |
| | Nippon Denko Co. Ltd. | 170,490 | 317 |
| | Itochu-Shokuhin Co. Ltd. | 7,900 | 316 |
| | Nihon Trim Co. Ltd. | 7,000 | 316 |
| | Shinko Shoji Co. Ltd. | 28,000 | 316 |
| | Nippon Yakin Kogyo Co. Ltd. | 215,100 | 315 |
| | Chiba Kogyo Bank Ltd. | 71,100 | 315 |
| | Aichi Corp. | 38,700 | 313 |
| *,^ | Laox Co. Ltd. | 38,800 | 313 |
| * | Fujiya Co. Ltd. | 160,000 | 311 |
| ^ | Keiyo Co. Ltd. | 61,500 | 310 |
| | Ministop Co. Ltd. | 17,900 | 309 |
| | Mie Kotsu Group Holdings Inc. | 83,400 | 308 |
| | Information Services International-Dentsu Ltd. | 17,700 | 307 |
| | Arcland Service Holdings Co. Ltd. | 10,300 | 306 |
| | CHIMNEY Co. Ltd. | 10,700 | 305 |
| | Aeon Fantasy Co. Ltd. | 9,800 | 304 |
| | Toa Corp. (Tokyo Shares 6809) | 33,300 | 304 |
| | Toyo Tanso Co. Ltd. | 21,010 | 302 |
| | Nippon Valqua Industries Ltd. | 22,200 | 301 |
73
| | | |
| Vanguard® FTSE All-World ex-US Small-Cap Index Fund | | |
| Schedule of Investments | | |
| October 31, 2016 | | |
| |
| | | | Market |
| | | | Value |
| | | Shares | ($000) |
| | Hosokawa Micron Corp. | 48,000 | 299 |
| ^ | Nippon Carbon Co. Ltd. | 154,000 | 299 |
| | Taiho Kogyo Co. Ltd. | 20,800 | 299 |
| | Mitsubishi Research Institute Inc. | 9,400 | 298 |
| | Kamei Corp. | 31,200 | 297 |
| | Aiphone Co. Ltd. | 16,900 | 297 |
| | Sun Frontier Fudousan Co. Ltd. | 31,000 | 296 |
| | HI-LEX Corp. | 10,753 | 294 |
| | Tokyo Rope Manufacturing Co. Ltd. | 17,800 | 293 |
| | Keihanshin Building Co. Ltd. | 55,700 | 291 |
| | Chuetsu Pulp & Paper Co. Ltd. | 133,000 | 291 |
| | Misawa Homes Co. Ltd. | 38,400 | 289 |
| ^ | WATAMI Co. Ltd. | 26,600 | 289 |
| ^ | Nippon Parking Development Co. Ltd. | 212,000 | 288 |
| | Sekisui Plastics Co. Ltd. | 39,000 | 288 |
| | Tokyo Tekko Co. Ltd. | 66,000 | 287 |
| | France Bed Holdings Co. Ltd. | 33,600 | 287 |
| | Mitsubishi Steel Manufacturing Co. Ltd. | 159,000 | 286 |
| | Studio Alice Co. Ltd. | 14,100 | 285 |
| ^ | Jamco Corp. | 13,800 | 285 |
| | Denyo Co. Ltd. | 22,900 | 284 |
| | Fuso Pharmaceutical Industries Ltd. | 10,900 | 284 |
| | Takaoka Toko Co. Ltd. | 15,500 | 283 |
| ^ | Marvelous Inc. | 39,800 | 283 |
| * | Mitsubishi Paper Mills Ltd. | 43,000 | 282 |
| | Sac's Bar Holdings Inc. | 26,350 | 282 |
| | K&O Energy Group Inc. | 19,500 | 280 |
| | Tokyo Energy & Systems Inc. | 29,000 | 280 |
| | Fuji Pharma Co. Ltd. | 11,300 | 280 |
| | Onoken Co. Ltd. | 22,600 | 279 |
| | Sakai Moving Service Co. Ltd. | 12,800 | 277 |
| | Furuno Electric Co. Ltd. | 35,700 | 276 |
| * | JAC Recruitment Co. Ltd. | 21,300 | 276 |
| ^ | Godo Steel Ltd. | 15,800 | 276 |
| | Aderans Co. Ltd. | 46,509 | 274 |
| | Japan Transcity Corp. | 73,192 | 273 |
| | Mitsubishi Nichiyu Forklift Co. Ltd. | 44,900 | 272 |
| | Mars Engineering Corp. | 13,700 | 272 |
| | Uchida Yoko Co. Ltd. | 65,000 | 271 |
| | Icom Inc. | 14,600 | 268 |
| | Honeys Co. Ltd. | 22,790 | 268 |
| | Cleanup Corp. | 31,400 | 267 |
| | Mimasu Semiconductor Industry Co. Ltd. | 21,000 | 267 |
| | Tonami Holdings Co. Ltd. | 99,000 | 267 |
| | Halows Co. Ltd. | 12,000 | 267 |
| | GCA Corp. | 35,500 | 265 |
| | Kanaden Corp. | 27,300 | 264 |
| *,^ | KLab Inc. | 43,760 | 262 |
| | Weathernews Inc. | 8,400 | 262 |
| | Amuse Inc. | 15,500 | 262 |
| ^ | U-Shin Ltd. | 37,000 | 262 |
| | Hokkan Holdings Ltd. | 73,000 | 260 |
| | Matsuda Sangyo Co. Ltd. | 18,500 | 260 |
| | Kyosan Electric Manufacturing Co. Ltd. | 70,000 | 260 |
| | Kobe Bussan Co. Ltd. | 8,200 | 257 |
| | Ichikoh Industries Ltd. | 83,000 | 256 |
| | Shibusawa Warehouse Co. Ltd. | 87,549 | 254 |
| | Takiron Co. Ltd. | 54,000 | 254 |
| | Sinanen Holdings Co. Ltd. | 12,800 | 254 |
| | Yusen Logistics Co. Ltd. | 24,900 | 254 |
| *,^ | Nippon Sharyo Ltd. | 100,000 | 253 |
| | Hisaka Works Ltd. | 32,000 | 251 |
| | MTI Ltd. | 40,400 | 251 |
| | Ryoden Corp. | 39,000 | 251 |
74
| | | |
| Vanguard® FTSE All-World ex-US Small-Cap Index Fund | | |
| Schedule of Investments | | |
| October 31, 2016 | | |
| |
| | | | Market |
| | | | Value |
| | | Shares | ($000) |
| ^ | Hokkaido Gas Co. Ltd. | 98,000 | 250 |
| ^ | Hioki EE Corp. | 12,900 | 250 |
| | Toenec Corp. | 52,000 | 249 |
| | Shinwa Co. Ltd. | 16,400 | 249 |
| | Sanyo Shokai Ltd. | 154,423 | 249 |
| | SRA Holdings | 10,500 | 248 |
| ^ | Pronexus Inc. | 23,335 | 246 |
| | Mitsui High-Tec Inc. | 36,600 | 246 |
| | Yomiuri Land Co. Ltd. | 57,000 | 245 |
| | Sumitomo Densetsu Co. Ltd. | 22,100 | 245 |
| | Gakken Holdings Co. Ltd. | 73,000 | 242 |
| ^ | Hodogaya Chemical Co. Ltd. | 8,600 | 241 |
| | Asahi Co. Ltd. | 19,800 | 239 |
| ^ | Happinet Corp. | 22,600 | 239 |
| | Atsugi Co. Ltd. | 218,000 | 239 |
| | Advan Co. Ltd. | 25,800 | 238 |
| | Mitsui Matsushima Co. Ltd. | 20,100 | 238 |
| | Fields Corp. | 19,600 | 238 |
| | Chori Co. Ltd. | 14,900 | 236 |
| ^ | PC Depot Corp. | 48,240 | 236 |
| | Toli Corp. | 66,101 | 236 |
| * | SWCC Showa Holdings Co. Ltd. | 335,000 | 235 |
| | Meiko Network Japan Co. Ltd. | 24,763 | 233 |
| | Okura Industrial Co. Ltd. | 58,000 | 231 |
| | Tosho Printing Co. Ltd. | 51,000 | 231 |
| | Zuiko Corp. | 6,100 | 231 |
| | Nihon Yamamura Glass Co. Ltd. | 125,000 | 229 |
| ^ | Kourakuen Holdings Corp. | 15,400 | 228 |
| | Seika Corp. | 76,000 | 226 |
| ^ | Pasona Group Inc. | 26,200 | 222 |
| * | Linical Co. Ltd. | 15,800 | 222 |
| * | Hito Communications Inc. | 15,200 | 221 |
| | Mito Securities Co. Ltd. | 94,600 | 220 |
| | Gun-Ei Chemical Industry Co. Ltd. | 7,600 | 219 |
| | Asunaro Aoki Construction Co. Ltd. | 31,700 | 218 |
| ^ | Nippon Coke & Engineering Co. Ltd. | 246,600 | 218 |
| | Noritsu Koki Co. Ltd. | 28,600 | 216 |
| | Zuken Inc. | 21,100 | 216 |
| | Japan Radio Co. Ltd. | 16,800 | 216 |
| | Organo Corp. | 50,000 | 216 |
| *,^ | Akebono Brake Industry Co. Ltd. | 112,557 | 215 |
| | Yushiro Chemical Industry Co. Ltd. | 15,600 | 215 |
| | Rhythm Watch Co. Ltd. | 126,000 | 215 |
| | Toyo Kohan Co. Ltd. | 71,600 | 214 |
| | Fujikura Kasei Co. Ltd. | 35,600 | 214 |
| | Sanoh Industrial Co. Ltd. | 31,000 | 214 |
| | Parco Co. Ltd. | 23,000 | 213 |
| | Nissei ASB Machine Co. Ltd. | 11,800 | 213 |
| | Taisei Lamick Co. Ltd. | 7,400 | 213 |
| * | Fuji Oil Co. Ltd. | 66,400 | 212 |
| | Fujitsu Frontech Ltd. | 17,600 | 210 |
| | T RAD Co. Ltd. | 96,000 | 210 |
| | Corona Corp. Class A | 19,500 | 209 |
| | Tatsuta Electric Wire and Cable Co. Ltd. | 52,100 | 207 |
| ^ | JP-Holdings Inc. | 82,000 | 206 |
| | Kitagawa Iron Works Co. Ltd. | 12,000 | 205 |
| | Nihon Dempa Kogyo Co. Ltd. | 25,310 | 204 |
| | NS United Kaiun Kaisha Ltd. | 146,000 | 203 |
| | ST Corp. | 16,400 | 202 |
| | CMIC Holdings Co. Ltd. | 13,600 | 202 |
| | Teikoku Electric Manufacturing Co. Ltd. | 26,300 | 200 |
| | Tomoku Co. Ltd. | 68,000 | 197 |
| | Daikoku Denki Co. Ltd. | 12,300 | 197 |
| | Daisyo Corp. | 13,400 | 196 |
75
| | | |
| Vanguard® FTSE All-World ex-US Small-Cap Index Fund | | |
| Schedule of Investments | | |
| October 31, 2016 | | |
| |
| | | | Market |
| | | | Value |
| | | Shares | ($000) |
| | C Uyemura & Co. Ltd. | 4,200 | 196 |
| | Hakuto Co. Ltd. | 21,000 | 195 |
| | Maezawa Kasei Industries Co. Ltd. | 18,600 | 195 |
| | Elematec Corp. | 11,500 | 194 |
| | Kitano Construction Corp. | 72,000 | 191 |
| | NDS Co. Ltd. | 7,600 | 191 |
| | ASAHI YUKIZAI Corp. | 97,555 | 191 |
| | Funai Electric Co. Ltd. | 23,200 | 189 |
| | Chuo Spring Co. Ltd. | 64,000 | 188 |
| | Kobelco Eco-Solutions Co. Ltd. | 48,000 | 187 |
| | Artnature Inc. | 30,500 | 186 |
| | Toda Kogyo Corp. | 65,000 | 186 |
| | NEC Capital Solutions Ltd. | 11,100 | 185 |
| ^ | Japan Drilling Co. Ltd. | 8,200 | 184 |
| | Chugai Ro Co. Ltd. | 95,000 | 183 |
| | Krosaki Harima Corp. | 60,000 | 182 |
| | Tsutsumi Jewelry Co. Ltd. | 11,500 | 182 |
| | Maezawa Kyuso Industries Co. Ltd. | 13,600 | 182 |
| | Toyo Securities Co. Ltd. | 102,000 | 181 |
| ^ | Paris Miki Holdings Inc. | 42,600 | 181 |
| *,^ | KNT-CT Holdings Co. Ltd. | 163,000 | 180 |
| | Future Corp. | 27,000 | 180 |
| | Takihyo Co. Ltd. | 43,000 | 179 |
| | Tokyo Rakutenchi Co. Ltd. | 37,000 | 177 |
| | Alpha Systems Inc. | 10,500 | 177 |
| | Gecoss Corp. | 19,300 | 176 |
| | Shimojima Co. Ltd. | 17,600 | 176 |
| * | Nakayama Steel Works Ltd. | 27,700 | 176 |
| | Sankyo Seiko Co. Ltd. | 53,397 | 175 |
| | Toyo Denki Seizo KK | 62,000 | 174 |
| | Airport Facilities Co. Ltd. | 31,700 | 173 |
| | Dunlop Sports Co. Ltd. | 17,500 | 172 |
| *,^ | Shin Nippon Biomedical Laboratories Ltd. | 29,800 | 172 |
| *,^ | Takata Corp. | 49,200 | 171 |
| | Nippon Chemiphar Co. Ltd. | 4,100 | 170 |
| | CAC Holdings Corp. | 20,100 | 168 |
| | Mitsui Home Co. Ltd. | 38,000 | 168 |
| ^ | Showa Aircraft Industry Co. Ltd. | 18,300 | 167 |
| ^ | Srg Takamiya Co. Ltd. | 29,600 | 167 |
| | Inaba Seisakusho Co. Ltd. | 13,100 | 167 |
| | Cybozu Inc. | 40,100 | 165 |
| ^ | Right On Co. Ltd. | 16,400 | 162 |
| ^ | Mitsubishi Kakoki Kaisha Ltd. | 82,000 | 162 |
| | Daidoh Ltd. | 40,700 | 160 |
| | Nice Holdings Inc. | 121,000 | 160 |
| | AOI Electronics Co. Ltd. | 6,470 | 157 |
| | Sumitomo Precision Products Co. Ltd. | 50,000 | 154 |
| | Tokyo Electron Device Ltd. | 10,600 | 151 |
| | Toa Oil Co. Ltd. | 101,000 | 145 |
| | Tabuchi Electric Co. Ltd. | 43,400 | 139 |
| | Dai-ichi Seiko Co. Ltd. | 12,200 | 135 |
| | Kinki Sharyo Co. Ltd. | 5,900 | 134 |
| | Panasonic Industrial Devices SUNX Co. Ltd. | 21,900 | 132 |
| | Pocket Card Co. Ltd. | 26,900 | 128 |
| | Best Denki Co. Ltd. | 96,900 | 127 |
| | Endo Lighting Corp. | 15,400 | 120 |
| * | Yamada SxL Home Co. Ltd. | 158,000 | 116 |
| *,^ | FDK Corp. | 122,149 | 107 |
| | Kojima Co. Ltd. | 35,300 | 80 |
| | Ain Holdings Inc. | 8 | 1 |
| | Horiba Ltd. | 7 | — |
| | Relo Group Inc. | 2 | — |
| | Megmilk Snow Brand Co. Ltd. | 6 | — |
| | Kyudenko Corp. | 5 | — |
76
| | |
| Vanguard® FTSE All-World ex-US Small-Cap Index Fund | | |
| Schedule of Investments | | |
| October 31, 2016 | | |
| |
| | | Market |
| | | Value |
| | Shares | ($000) |
| Koei Tecmo Holdings Co. Ltd. | 7 | — |
| Fujitsu General Ltd. | 5 | — |
| Zensho Holdings Co. Ltd. | 4 | — |
| Ariake Japan Co. Ltd. | 1 | — |
| | | 542,794 |
| Malaysia (0.9%) | | |
| Dialog Group Bhd. | 7,074,162 | 2,612 |
| Top Glove Corp. Bhd. | 1,428,558 | 1,685 |
| Genting Plantations Bhd. | 619,573 | 1,624 |
| My EG Services Bhd. | 2,620,400 | 1,521 |
| Malakoff Corp. Bhd. | 3,953,800 | 1,459 |
| Hartalega Holdings Bhd. | 1,119,220 | 1,307 |
| Bursa Malaysia Bhd. | 618,936 | 1,276 |
| Sunway REIT | 2,563,000 | 1,125 |
| Press Metal Bhd. | 932,300 | 969 |
| QL Resources Bhd. | 856,340 | 902 |
| TIME dotCom Bhd. | 467,300 | 891 |
| KPJ Healthcare Bhd. | 885,810 | 887 |
| Mah Sing Group Bhd. | 2,381,275 | 868 |
| Kossan Rubber Industries | 491,500 | 791 |
| Inari Amertron Bhd. | 979,150 | 782 |
| Cahya Mata Sarawak Bhd. | 818,100 | 749 |
| Bermaz Auto Bhd. | 1,294,540 | 703 |
| Sunway Bhd. | 885,200 | 658 |
| WCT Holdings Bhd. | 1,511,086 | 612 |
| Malaysia Building Society Bhd. | 2,773,200 | 605 |
| Pavilion REIT | 1,360,500 | 570 |
| Yinson Holdings Bhd. | 752,000 | 561 |
| Pos Malaysia Bhd. | 573,900 | 547 |
| Aeon Co. M Bhd. | 795,700 | 536 |
| * Syarikat Takaful Malaysia Bhd. | 498,800 | 505 |
| Malaysian Resources Corp. Bhd. | 1,540,869 | 495 |
| Unisem M Bhd. | 752,080 | 457 |
| Eastern & Oriental Bhd. | 1,214,133 | 454 |
| Media Prima Bhd. | 1,492,317 | 427 |
| VS Industry Bhd. | 1,202,000 | 406 |
| DRB-Hicom Bhd. | 1,315,127 | 398 |
| Berjaya Corp. Bhd. | 4,587,371 | 355 |
| * Eco World Development Group Bhd. | 1,092,100 | 354 |
| Supermax Corp. Bhd. | 679,350 | 351 |
| OSK Holdings Bhd. | 952,781 | 343 |
| Muhibbah Engineering M Bhd. | 543,000 | 297 |
| Datasonic Group Bhd. | 816,300 | 278 |
| Sunway Construction Group Bhd. | 673,340 | 268 |
| * KNM Group Bhd. | 2,659,600 | 253 |
| * AirAsia X Bhd. | 2,519,650 | 252 |
| * UMW Oil & Gas Corp. Bhd. | 1,046,400 | 211 |
| * Mulpha International Bhd. | 3,146,950 | 157 |
| * Malaysia Marine and Heavy Engineering Holdings Bhd. | 594,200 | 141 |
| Gas Malaysia Bhd. | 215,900 | 132 |
| * Parkson Holdings Bhd. | 663,895 | 119 |
| Coastal Contracts Bhd. | 324,200 | 118 |
| * Dayang Enterprise Holdings Bhd. | 506,100 | 103 |
| Puncak Niaga Holdings Bhd. | 379,900 | 99 |
| * Mudajaya Group Bhd. | 417,000 | 96 |
| TA Enterprise Bhd. | 635,700 | 73 |
| * Malaysian Bulk Carriers Bhd. | 370,500 | 67 |
| * AirAsia X Bhd. Warrants Exp. 06/08/2020 | 300,675 | 17 |
| * OSK Holdings Bhd. Warrants Exp. 07/22/2020 | 238,195 | 14 |
| * WCT Holdings Bhd. Warrants Exp. 08/24/2020 | 310,551 | 14 |
| * BIMB Holdings Bhd. Warrants Exp. 12/04/2023 | 154,640 | 12 |
| * Mah Sing Group Bhd. Warrants Exp. 03/18/2018 | 164,085 | 8 |
| * Malaysian Resources Corp. Bhd. Warrants Exp. 09/16/2018 | 253,023 | 7 |
| * KPJ Healthcare Warrants Exp. 01/23/2019 | 49,320 | 7 |
77
| | | |
| Vanguard® FTSE All-World ex-US Small-Cap Index Fund | | |
| Schedule of Investments | | |
| October 31, 2016 | | |
| |
| | | | Market |
| | | | Value |
| | | Shares | ($000) |
| * | Eastern & Oriental Bhd Warrants Exp. 07/21/2019 | 154,580 | 6 |
| * | CB Industrial Product Holding Bhd Warrants Exp. 10/31/2019 | 78,700 | 6 |
| * | KNM Group Bhd. Warrants Exp. 04/21/2020 | 178,365 | 5 |
| * | WCT Holdings Bhd. Warrants Exp. 12/11/2017 | 82,009 | 4 |
| * | Mah Sing Group Warrants Exp. 01/15/2026 | 125,235 | 4 |
| * | Puncak Niaga Holding Bhd. Warrants Exp. 07/20/2018 | 25,250 | 3 |
| * | KNM Group Bhd. Warrants Exp. 11/15/2017 | 188,813 | 1 |
| | | | 31,557 |
| Mexico (0.5%) | | |
| | Bolsa Mexicana de Valores SAB de CV | 1,034,497 | 1,657 |
| | Macquarie Mexico Real Estate Management SA de CV | 1,245,106 | 1,569 |
| | PLA Administradora Industrial S de RL de CV | 929,128 | 1,540 |
| * | Genomma Lab Internacional SAB de CV Class B | 1,220,500 | 1,460 |
| | Corp Inmobiliaria Vesta SAB de CV | 838,100 | 1,268 |
| | Prologis Property Mexico SA de CV | 597,612 | 1,005 |
| | Grupo Herdez SAB de CV | 317,275 | 770 |
| | Credito Real SAB de CV SOFOM ER | 375,300 | 689 |
| * | La Comer SAB de CV | 708,400 | 646 |
| * | Hoteles City Express SAB de CV | 607,300 | 624 |
| | Qualitas Controladora SAB de CV | 294,176 | 540 |
| | Concentradora Fibra Hotelera Mexicana SA de CV | 674,559 | 530 |
| | Unifin Financiera SAB de CV SOFOM ENR | 176,012 | 525 |
| | Rassini SAB de CV | 106,300 | 492 |
| | TV Azteca SAB de CV | 2,256,222 | 430 |
| * | Grupo GICSA SA de CV | 634,100 | 429 |
| * | Grupo Simec SAB de CV Class B | 117,420 | 412 |
| | Consorcio ARA SAB de CV | 1,051,810 | 396 |
| *,2 | Elementia SAB de CV | 321,166 | 370 |
| * | Axtel SAB de CV | 1,238,600 | 307 |
| | Grupo Rotoplas SAB de CV | 185,500 | 292 |
| * | Urbi Desarrollos Urbanos SAB de CV | 313 | — |
| * | Corp GEO SAB de CV | 100 | — |
| | | | 15,951 |
| Netherlands (1.7%) | | |
| | Aalberts Industries NV | 153,196 | 4,838 |
| | Delta Lloyd NV | 742,776 | 4,487 |
| | SBM Offshore NV | 296,616 | 4,258 |
| | IMCD Group NV | 85,367 | 3,692 |
| * | Galapagos NV | 60,287 | 3,668 |
| | APERAM SA | 76,466 | 3,478 |
| * | PostNL NV | 720,318 | 3,392 |
| | ASM International NV | 79,355 | 3,385 |
| | Eurocommercial Properties NV | 71,964 | 3,062 |
| ^ | Wereldhave NV | 65,870 | 2,948 |
| | TKH Group NV | 64,459 | 2,481 |
| | Corbion NV | 89,692 | 2,069 |
| | BE Semiconductor Industries NV | 50,416 | 1,642 |
| * | Fugro NV | 91,022 | 1,628 |
| | Koninklijke BAM Groep NV | 335,391 | 1,560 |
| * | TomTom NV | 185,028 | 1,496 |
| | Arcadis NV | 106,435 | 1,401 |
| 2 | Flow Traders | 44,866 | 1,385 |
| 2 | Refresco Group NV | 86,432 | 1,263 |
| | Vastned Retail NV | 28,778 | 1,107 |
| | Accell Group | 39,196 | 980 |
| | Wessanen | 80,413 | 961 |
| | NSI NV | 207,591 | 815 |
| | BinckBank NV | 95,395 | 566 |
| | Brunel International NV | 30,479 | 498 |
| * | SRH NV | 96,364 | — |
| | | | 57,060 |
| New Zealand (0.7%) | | |
| | Z Energy Ltd. | 584,523 | 3,267 |
78
| | | |
| Vanguard® FTSE All-World ex-US Small-Cap Index Fund | | |
| Schedule of Investments | | |
| October 31, 2016 | | |
| |
| | | | Market |
| | | | Value |
| | | Shares | ($000) |
| | Trade Me Group Ltd. | 659,017 | 2,289 |
| | EBOS Group Ltd. | 149,417 | 1,820 |
| | Chorus Ltd. | 684,998 | 1,789 |
| | Mainfreight Ltd. | 122,346 | 1,624 |
| *,^ | a2 Milk Co. Ltd. | 1,112,831 | 1,478 |
| | Goodman Property Trust | 1,617,127 | 1,439 |
| | Infratil Ltd. | 618,234 | 1,317 |
| | Precinct Properties New Zealand Ltd. | 1,299,884 | 1,158 |
| | Summerset Group Holdings Ltd. | 335,654 | 1,142 |
| | Genesis Energy Ltd. | 759,046 | 1,064 |
| | Freightways Ltd. | 228,255 | 1,043 |
| | Argosy Property Ltd. | 1,212,397 | 910 |
| | Vital Healthcare Property Trust | 555,227 | 810 |
| | Metlifecare Ltd. | 186,650 | 771 |
| | Heartland Bank Ltd. | 515,472 | 552 |
| | Kathmandu Holdings Ltd. | 255,330 | 367 |
| | New Zealand Refining Co. Ltd. | 167,580 | 268 |
| ^ | TOWER Ltd. | 256,960 | 165 |
| | New Zealand Oil & Gas Ltd. | 425,284 | 161 |
| | | | 23,434 |
| Norway (1.4%) | | |
| *,^ | Subsea 7 SA | 438,043 | 4,904 |
| * | Storebrand ASA | 730,661 | 3,758 |
| | TGS Nopec Geophysical Co. ASA | 169,008 | 3,419 |
| | Salmar ASA | 86,124 | 2,795 |
| | Tomra Systems ASA | 241,870 | 2,626 |
| * | Aker BP ASA | 160,564 | 2,569 |
| 2 | XXL ASA | 165,039 | 2,066 |
| | Leroy Seafood Group ASA | 38,988 | 2,061 |
| | Bakkafrost P/F | 48,964 | 2,053 |
| | Veidekke ASA | 110,796 | 1,656 |
| 2 | Entra ASA | 138,859 | 1,488 |
| | SpareBank 1 SMN | 199,569 | 1,468 |
| | Aker ASA | 37,664 | 1,390 |
| | Atea ASA | 145,740 | 1,305 |
| *,^ | Seadrill Ltd. | 538,585 | 1,145 |
| | Kongsberg Gruppen ASA | 79,204 | 1,131 |
| * | Opera Software ASA | 154,780 | 1,091 |
| | SpareBank 1 SR-Bank ASA | 182,595 | 1,088 |
| *,2 | Aker Solutions ASA | 221,356 | 1,015 |
| | Austevoll Seafood ASA | 110,320 | 995 |
| *,^ | Nordic Semiconductor ASA | 240,510 | 962 |
| *,^ | Petroleum Geo-Services ASA | 342,215 | 919 |
| *,^ | DNO ASA | 979,397 | 836 |
| | Ocean Yield ASA | 83,986 | 701 |
| | Hoegh LNG Holdings Ltd. | 62,104 | 651 |
| *,^ | Norwegian Air Shuttle ASA | 16,144 | 544 |
| | Norwegian Property ASA | 377,161 | 491 |
| *,^ | REC Silicon ASA | 3,085,656 | 385 |
| | Stolt-Nielsen Ltd. | 27,493 | 338 |
| ^,2 | BW LPG Ltd. | 101,910 | 329 |
| | Wilh Wilhelmsen ASA | 96,853 | 306 |
| * | Akastor ASA | 220,637 | 304 |
| * | Treasure ASA | 95,083 | 211 |
| * | Prosafe SE Class A | 1,105,765 | 37 |
| | | | 47,037 |
| Other (0.0%)3 | | |
| | Diebold Inc. | 17,972 | 392 |
| |
| Pakistan (0.3%) | | |
| | Lucky Cement Ltd. | 236,804 | 1,516 |
| | Hub Power Co. Ltd. | 1,266,200 | 1,289 |
| | Engro Corp. Ltd. | 416,121 | 1,108 |
| | Pakistan State Oil Co. Ltd. | 232,508 | 896 |
79
| | | |
| Vanguard® FTSE All-World ex-US Small-Cap Index Fund | | |
| Schedule of Investments | | |
| October 31, 2016 | | |
| |
| | | | Market |
| | | | Value |
| | | Shares | ($000) |
| | United Bank Ltd. | 447,400 | 859 |
| | DG Khan Cement Co. Ltd. | 448,986 | 735 |
| | Pakistan Oilfields Ltd. | 166,000 | 626 |
| | Kot Addu Power Co. Ltd. | 858,108 | 605 |
| * | SUI Southern Gas Co. Ltd. | 1,255,500 | 462 |
| | Fauji Fertilizer Bin Qasim Ltd. | 423,000 | 189 |
| | Attock Petroleum Ltd. | 25,500 | 141 |
| | Pakistan Telecommunication Co. Ltd. | 662,000 | 104 |
| | | | 8,530 |
| Philippines (0.5%) | | |
| | Metro Pacific Investments Corp. | 18,585,736 | 2,768 |
| | Security Bank Corp. | 499,529 | 2,274 |
| | Robinsons Land Corp. | 2,848,531 | 1,821 |
| | Puregold Price Club Inc. | 1,448,200 | 1,219 |
| * | DoubleDragon Properties Corp. | 876,360 | 1,008 |
| | First Gen Corp. | 1,936,030 | 919 |
| | Cosco Capital Inc. | 5,057,500 | 887 |
| | Manila Water Co. Inc. | 1,241,985 | 776 |
| | D&L Industries Inc. | 3,239,300 | 734 |
| | Robinsons Retail Holdings Inc. | 420,390 | 671 |
| | Vista Land & Lifescapes Inc. | 6,053,400 | 653 |
| | Cebu Air Inc. | 283,960 | 616 |
| | Filinvest Land Inc. | 14,538,400 | 530 |
| | First Philippine Holdings Corp. | 334,720 | 479 |
| | Lopez Holdings Corp. | 2,771,600 | 455 |
| | Nickel Asia Corp. | 2,624,808 | 372 |
| * | Melco Crown Philippines Resorts Corp. | 2,833,800 | 252 |
| | Belle Corp. | 2,547,600 | 153 |
| | | | 16,587 |
| Poland (0.2%) | | |
| | KRUK SA | 26,884 | 1,560 |
| * | Jastrzebska Spolka Weglowa SA | 78,096 | 1,448 |
| | Kernel Holding SA | 88,237 | 1,412 |
| * | CD Projekt SA | 95,138 | 966 |
| * | PKP Cargo SA | 46,196 | 506 |
| | Warsaw Stock Exchange | 38,508 | 384 |
| *,^ | Lubelski Wegiel Bogdanka SA | 17,402 | 309 |
| * | Boryszew SA | 142,265 | 291 |
| | Neuca SA | 2,564 | 255 |
| * | Getin Noble Bank SA | 608,916 | 204 |
| * | Bioton SA | 67,294 | 151 |
| * | Getin Holding SA | 497,943 | 146 |
| * | Integer.pl SA | 7,186 | 64 |
| | Netia SA | 42,117 | 50 |
| * | Globe Trade Centre SA | 4 | — |
| | | | 7,746 |
| Portugal (0.3%) | | |
| | NOS SGPS SA | 375,641 | 2,496 |
| | CTT-Correios de Portugal SA | 261,177 | 1,728 |
| | Sonae SGPS SA | 1,496,263 | 1,190 |
| | REN - Redes Energeticas Nacionais SGPS SA | 403,313 | 1,179 |
| ^ | Banco Comercial Portugues SA | 833,569 | 1,110 |
| | Navigator Co. SA | 369,138 | 1,081 |
| * | Banco BPI SA | 528,576 | 656 |
| | Semapa-Sociedade de Investimento e Gestao | 36,313 | 466 |
| | Altri SGPS SA | 108,533 | 378 |
| ^ | Mota-Engil SGPS SA | 124,909 | 244 |
| | Sonaecom SGPS SA | 48,029 | 135 |
| | | | 10,663 |
| Qatar (0.0%) | | |
| * | Medicare Group | 18,435 | 313 |
| * | Salam International Investment Ltd. QSC | 59,618 | 181 |
| | | | 494 |
80
| | | |
| Vanguard® FTSE All-World ex-US Small-Cap Index Fund | | |
| Schedule of Investments | | |
| October 31, 2016 | | |
| |
| | | | Market |
| | | | Value |
| | | Shares | ($000) |
| Russia (0.1%) | | |
| | M.Video PJSC | 120,450 | 645 |
| * | Mechel PJSC | 207,658 | 487 |
| * | DIXY Group PJSC | 84,860 | 433 |
| | TMK PJSC | 253,998 | 276 |
| | Mosenergo OAO | 8,590,191 | 232 |
| * | Raspadskaya OAO | 182,900 | 199 |
| | OGK-2 PJSC | 30,444,850 | 176 |
| | | | 2,448 |
| Singapore (1.4%) | | |
| | Mapletree Commercial Trust | 3,023,604 | 3,324 |
| | Mapletree Industrial Trust | 2,094,800 | 2,591 |
| | Keppel REIT | 3,126,747 | 2,452 |
| | Mapletree Greater China Commercial Trust | 3,122,712 | 2,336 |
| | Mapletree Logistics Trust | 2,495,774 | 1,857 |
| | Raffles Medical Group Ltd. | 1,524,284 | 1,648 |
| | United Engineers Ltd. | 721,100 | 1,342 |
| | Keppel Infrastructure Trust | 3,577,000 | 1,297 |
| | Starhill Global REIT | 2,151,408 | 1,260 |
| | Frasers Centrepoint Trust | 828,410 | 1,239 |
| | Parkway Life REIT | 603,081 | 1,110 |
| | Ascott Residence Trust | 1,246,521 | 1,018 |
| ^ | First Resources Ltd. | 730,829 | 956 |
| | CDL Hospitality Trusts | 987,566 | 952 |
| | First REIT | 955,100 | 917 |
| * | Genting Hong Kong Ltd. | 3,205,677 | 913 |
| | Frasers Commercial Trust | 896,513 | 879 |
| | CapitaLand Retail China Trust | 799,760 | 861 |
| | Lippo Malls Indonesia Retail Trust | 3,060,500 | 857 |
| | Ascendas India Trust | 1,077,062 | 828 |
| | Cambridge Industrial Trust | 1,961,860 | 796 |
| | Cache Logistics Trust | 1,319,041 | 788 |
| | Asian Pay Television Trust | 2,106,800 | 780 |
| ^ | OUE Hospitality Trust | 1,591,866 | 779 |
| 2 | ARA Asset Management Ltd. | 753,787 | 758 |
| ^ | Yoma Strategic Holdings Ltd. | 1,667,519 | 706 |
| | Keppel DC REIT | 778,500 | 697 |
| *,^ | China Animal Healthcare Ltd. | 1,003,918 | 673 |
| ^ | Croesus Retail Trust | 1,085,200 | 671 |
| | Ascendas Hospitality Trust | 1,257,600 | 669 |
| *,^ | SIIC Environment Holdings Ltd. | 1,364,482 | 623 |
| ^ | SPH REIT | 879,400 | 617 |
| ^ | Soilbuild Business Space REIT | 1,201,000 | 583 |
| *,^ | Ezion Holdings Ltd. | 2,696,861 | 578 |
| | Accordia Golf Trust | 1,196,316 | 564 |
| ^ | Far East Hospitality Trust | 1,320,400 | 564 |
| | Silverlake Axis Ltd. | 1,209,029 | 555 |
| | RHT Health Trust | 857,500 | 531 |
| * | Blue Sky Power Holdings Ltd. | 6,272,000 | 524 |
| | Sheng Siong Group Ltd. | 681,900 | 512 |
| ^ | OUE Ltd. | 412,700 | 502 |
| ^ | Sarine Technologies Ltd. | 378,004 | 442 |
| | Super Group Ltd. (Singapore Shares) | 606,574 | 423 |
| * | GL Ltd. | 682,500 | 392 |
| | Sabana Shari'ah Compliant Industrial REIT | 1,031,900 | 386 |
| | Fortune REIT (Singapore Shares) | 276,589 | 335 |
| ^ | China Everbright Water Ltd. | 749,100 | 307 |
| ^ | Midas Holdings Ltd. | 1,980,847 | 307 |
| *,^ | COSCO Corp. Singapore Ltd. | 1,485,600 | 272 |
| ^ | Hyflux Ltd. | 776,286 | 259 |
| | Bumitama Agri Ltd. | 478,200 | 256 |
| | Indofood Agri Resources Ltd. | 641,500 | 221 |
| | Boustead Singapore Ltd. | 313,600 | 202 |
| *,^ | Ying Li International Real Estate Ltd. | 1,558,900 | 181 |
81
| | | |
| Vanguard® FTSE All-World ex-US Small-Cap Index Fund | | |
| Schedule of Investments | | |
| October 31, 2016 | | |
| |
| | | | Market |
| | | | Value |
| | | Shares | ($000) |
| * | Halcyon Agri Corp. Ltd. | 375,552 | 128 |
| *,^ | Vard Holdings Ltd. | 911,100 | 121 |
| *,^ | Gallant Venture Ltd. | 1,206,079 | 111 |
| *,^ | Ezra Holdings Ltd. | 3,382,598 | 104 |
| *,^ | China Fishery Group Ltd. | 1,088,512 | 60 |
| * | China Hongxing Sports Ltd. | 831,000 | 34 |
| * | Ezion Holdings Ltd Warrants Exp. 04/15/2020 | 455,755 | 22 |
| * | Keppel DC REIT Rights Exp. 11/07/2016 | 213,309 | 14 |
| * | China Milk Products Group Ltd. | 140,000 | — |
| | | | 46,684 |
| South Africa (0.7%) | | |
| | SA Corporate Real Estate Fund Nominees Pty Ltd. | 4,024,544 | 1,646 |
| | Vukile Property Fund Ltd. | 1,177,100 | 1,605 |
| | Famous Brands Ltd. | 123,101 | 1,438 |
| | Advtech Ltd. | 955,232 | 1,234 |
| | DataTec Ltd. | 303,927 | 1,011 |
| | Cashbuild Ltd. | 32,313 | 942 |
| | Wilson Bayly Holmes-Ovcon Ltd. | 77,166 | 870 |
| | Blue Label Telecoms Ltd. | 554,421 | 838 |
| | PPC Ltd. | 1,842,067 | 752 |
| | Zeder Investments Ltd. | 1,508,097 | 746 |
| | Emira Property Fund Ltd. | 665,606 | 689 |
| | Mpact Ltd. | 265,517 | 650 |
| * | ArcelorMittal South Africa Ltd. | 672,607 | 576 |
| | Alexander Forbes Group Holdings Ltd. | 1,231,375 | 559 |
| | Astral Foods Ltd. | 59,950 | 544 |
| | Rebosis Property Fund Ltd. | 634,220 | 538 |
| | Trencor Ltd. | 248,913 | 529 |
| | City Lodge Hotels Ltd. | 48,787 | 529 |
| * | Ascendis Health Ltd. | 258,994 | 522 |
| | Peregrine Holdings Ltd. | 229,681 | 443 |
| | Metair Investments Ltd. | 301,872 | 425 |
| | Murray & Roberts Holdings Ltd. | 618,513 | 425 |
| | Delta Property Fund Ltd. | 743,372 | 423 |
| | Lewis Group Ltd. | 141,494 | 419 |
| | Hudaco Industries Ltd. | 51,333 | 416 |
| | Adcock Ingram Holdings Ltd. | 113,257 | 393 |
| | Raubex Group Ltd. | 197,819 | 369 |
| * | Consolidated Infrastructure Group Ltd. | 193,499 | 337 |
| * | Royal Bafokeng Platinum Ltd. | 101,042 | 308 |
| * | Aveng Ltd. | 581,779 | 305 |
| | DRDGOLD Ltd. | 580,507 | 294 |
| * | Pinnacle Holdings Ltd. | 220,192 | 292 |
| | Invicta Holdings Ltd. | 64,077 | 264 |
| | Clover Industries Ltd. | 200,396 | 259 |
| | Group Five Ltd. | 136,967 | 235 |
| | Merafe Resources Ltd. | 1,763,496 | 166 |
| | Adcorp Holdings Ltd. | 164,865 | 166 |
| | | | 22,157 |
| South Korea (4.2%) | | |
| | Medy-Tox Inc. | 6,595 | 2,340 |
| *,^ | Kumho Tire Co. Inc. | 260,514 | 2,336 |
| | CJ E&M Corp. | 32,425 | 1,978 |
| | Kolon Industries Inc. | 28,847 | 1,874 |
| *,^ | ViroMed Co. Ltd. | 22,273 | 1,777 |
| *,^ | Komipharm International Co. Ltd. | 52,285 | 1,766 |
| ^ | Korea Kolmar Co. Ltd. | 23,444 | 1,668 |
| | LG Innotek Co. Ltd. | 24,403 | 1,662 |
| | SK Chemicals Co. Ltd. | 31,347 | 1,636 |
| | Korean Reinsurance Co. | 157,000 | 1,618 |
| | KB Insurance Co. Ltd. | 61,321 | 1,550 |
| | Meritz Securities Co. Ltd. | 507,115 | 1,503 |
| ^ | Youngone Corp. | 52,420 | 1,471 |
| ^ | Hyundai Greenfood Co. Ltd. | 89,763 | 1,314 |
82
| | | |
| Vanguard® FTSE All-World ex-US Small-Cap Index Fund | | |
| Schedule of Investments | | |
| October 31, 2016 | | |
| |
| | | | Market |
| | | | Value |
| | | Shares | ($000) |
| ^ | CJ CGV Co. Ltd. | 21,961 | 1,299 |
| *,^ | Com2uSCorp | 15,280 | 1,266 |
| *,^ | LIG Nex1 Co. Ltd. | 19,017 | 1,228 |
| ^ | KIWOOM Securities Co. Ltd. | 20,508 | 1,188 |
| | Meritz Fire & Marine Insurance Co. Ltd. | 83,988 | 1,169 |
| ^ | Green Cross Corp. | 9,560 | 1,164 |
| ^ | Fila Korea Ltd. | 14,764 | 1,125 |
| ^ | Kolon Life Science Inc. | 8,522 | 1,113 |
| *,^ | Yungjin Pharmaceutical Co. Ltd. | 145,081 | 1,107 |
| *,^ | Hugel Inc. | 3,610 | 1,081 |
| ^ | SK Materials Co. Ltd. | 7,904 | 1,075 |
| | Innocean Worldwide Inc. | 17,464 | 1,057 |
| ^ | Samyang Holdings Corp. | 9,030 | 985 |
| * | LG Life Sciences Ltd. | 17,714 | 961 |
| ^ | Tongyang Inc. | 337,672 | 948 |
| ^ | Korea Petrochemical Ind Co. Ltd. | 5,230 | 932 |
| ^ | Cosmax Inc. | 9,162 | 923 |
| | SFA Engineering Corp. | 18,077 | 913 |
| | LG International Corp. | 37,522 | 912 |
| | Hansol Chemical Co. Ltd. | 12,518 | 905 |
| *,^ | Pan Ocean Co. Ltd. | 286,242 | 901 |
| ^ | IS Dongseo Co. Ltd. | 20,771 | 898 |
| | Hyundai Home Shopping Network Corp. | 8,910 | 883 |
| ^ | Koh Young Technology Inc. | 22,571 | 883 |
| ^ | JW Pharmaceutical Corp. | 20,460 | 878 |
| | Poongsan Corp. | 28,647 | 870 |
| | Korea Electric Terminal Co. Ltd. | 13,325 | 832 |
| *,^ | DIO Corp. | 20,893 | 831 |
| *,^ | Ilyang Pharmaceutical Co. Ltd. | 24,135 | 823 |
| *,^ | HLB Inc. | 48,126 | 815 |
| | JB Financial Group Co. Ltd. | 156,787 | 813 |
| *,^ | Advanced Process Systems Corp. | 35,617 | 810 |
| | Green Cross Holdings Corp. | 41,746 | 809 |
| | LS Industrial Systems Co. Ltd. | 23,505 | 803 |
| *,^ | Osstem Implant Co. Ltd. | 16,103 | 766 |
| | Handsome Co. Ltd. | 21,074 | 747 |
| ^ | Chong Kun Dang Pharmaceutical Corp. | 9,241 | 747 |
| ^ | Hana Tour Service Inc. | 13,228 | 744 |
| *,^ | Hyundai Elevator Co. Ltd. | 15,182 | 742 |
| *,^ | Seegene Inc. | 27,273 | 720 |
| *,^ | Wonik Holdings Co. Ltd. | 126,799 | 718 |
| | Hankook Tire Worldwide Co. Ltd. | 37,732 | 713 |
| ^ | Lotte Food Co. Ltd. | 1,178 | 711 |
| | GS Home Shopping Inc. | 4,623 | 710 |
| ^ | LOTTE Himart Co. Ltd. | 18,246 | 703 |
| ^ | Seoul Semiconductor Co. Ltd. | 58,100 | 694 |
| | Daesang Corp. | 29,431 | 692 |
| * | Dongbu HiTek Co. Ltd. | 46,265 | 687 |
| ^ | Eo Technics Co. Ltd. | 12,388 | 681 |
| | Young Poong Corp. | 779 | 675 |
| | Daou Technology Inc. | 37,420 | 675 |
| ^ | Hanjin Kal Corp. | 45,707 | 674 |
| ^ | Bukwang Pharmaceutical Co. Ltd. | 30,890 | 673 |
| | Halla Holdings Corp. | 11,291 | 668 |
| | Soulbrain Co. Ltd. | 12,251 | 668 |
| | Huchems Fine Chemical Corp. | 32,073 | 663 |
| *,^ | Taihan Electric Wire Co. Ltd. | 391,198 | 645 |
| *,^ | Chabiotech Co. Ltd. | 53,191 | 641 |
| * | Dongkuk Steel Mill Co. Ltd. | 89,630 | 640 |
| | CJ O Shopping Co. Ltd. | 4,461 | 632 |
| ^ | InBody Co. Ltd. | 21,640 | 624 |
| ^ | Korea Real Estate Investment & Trust Co. Ltd. | 241,006 | 619 |
| | Hanwha General Insurance Co. Ltd. | 93,110 | 617 |
| | Taekwang Industrial Co. Ltd. | 841 | 616 |
83
| | | |
| Vanguard® FTSE All-World ex-US Small-Cap Index Fund | | |
| Schedule of Investments | | |
| October 31, 2016 | | |
| |
| | | | Market |
| | | | Value |
| | | Shares | ($000) |
| *,^ | SM Entertainment Co. | 25,428 | 606 |
| ^ | Nexen Tire Corp. | 51,657 | 593 |
| | Jeil Pharmaceutical Co. | 10,015 | 592 |
| *,^ | Vieworks Co. Ltd. | 10,886 | 585 |
| *,^ | Hanall Biopharma Co. Ltd. | 55,146 | 567 |
| | Dong-A Socio Holdings Co. Ltd. | 4,431 | 561 |
| ^ | Hansae Co. Ltd. | 24,972 | 552 |
| | DuzonBizon Co. Ltd. | 28,260 | 551 |
| *,^ | Hyundai Rotem Co. Ltd. | 33,408 | 545 |
| *,^ | Medipost Co. Ltd. | 11,023 | 545 |
| | Dongwon Industries Co. Ltd. | 2,020 | 544 |
| *,^ | CrystalGenomics Inc. | 32,939 | 542 |
| * | Asiana Airlines Inc. | 133,905 | 541 |
| *,^ | Genexine Co. Ltd. | 16,577 | 533 |
| *,^ | Caregen Co. Ltd. | 6,457 | 533 |
| ^ | Grand Korea Leisure Co. Ltd. | 28,053 | 532 |
| ^ | Samlip General Foods Co. Ltd. | 3,565 | 531 |
| | LEENO Industrial Inc. | 14,063 | 528 |
| | Dong-A ST Co. Ltd. | 7,041 | 528 |
| *,^ | Loen Entertainment Inc. | 8,944 | 526 |
| ^ | Amicogen Inc. | 12,402 | 525 |
| | LF Corp. | 27,703 | 525 |
| | Tongyang Life Insurance Co. Ltd. | 49,761 | 521 |
| *,^ | Foosung Co. Ltd. | 76,846 | 521 |
| *,^ | GemVax & Kael Co. Ltd. | 40,917 | 514 |
| ^ | Ahnlab Inc. | 8,929 | 502 |
| *,^ | Jenax Inc. | 22,412 | 497 |
| | Samyang Corp. | 5,495 | 493 |
| | Daishin Securities Co. Ltd. | 51,530 | 474 |
| ^ | Toptec Co. Ltd. | 28,062 | 470 |
| *,^ | iNtRON Biotechnology Inc. | 17,347 | 468 |
| * | Ssangyong Cement Industrial Co. Ltd. | 33,161 | 465 |
| | Partron Co. Ltd. | 59,416 | 464 |
| ^ | Meritz Financial Group Inc. | 47,048 | 462 |
| ^ | SK Gas Ltd. | 5,457 | 459 |
| *,^ | Binex Co. Ltd. | 34,852 | 458 |
| ^ | Hanjin Transportation Co. Ltd. | 17,485 | 450 |
| *,^ | NUTRIBIOTECH Co. Ltd. | 7,813 | 444 |
| *,^ | G-SMATT GLOBAL Co. Ltd. | 20,032 | 442 |
| *,^ | DoubleUGames Co. Ltd. | 14,266 | 442 |
| *,^ | ATGen Co. Ltd. | 13,333 | 425 |
| *,^ | Emerson Pacific Inc. | 12,862 | 422 |
| ^ | YG Entertainment Inc. | 16,476 | 421 |
| * | Jusung Engineering Co. Ltd. | 51,077 | 421 |
| ^ | Muhak Co. Ltd. | 21,135 | 420 |
| ^ | JW Holdings Corp. | 48,267 | 420 |
| *,^ | Posco ICT Co. Ltd. | 83,435 | 417 |
| * | WONIK IPS Co. Ltd. | 20,465 | 416 |
| | NICE Holdings Co. Ltd. | 28,246 | 416 |
| ^ | Binggrae Co. Ltd. | 7,620 | 415 |
| | Mirae Asset Life Insurance Co. Ltd. | 101,248 | 414 |
| *,^ | Cellumed Co. Ltd. | 248,480 | 413 |
| | S&T Motiv Co. Ltd. | 11,485 | 410 |
| * | Ssangyong Motor Co. | 63,591 | 408 |
| *,^ | Seobu T&D | 23,489 | 408 |
| | Youngone Holdings Co. Ltd. | 8,070 | 406 |
| | Namyang Dairy Products Co. Ltd. | 688 | 405 |
| | Sebang Global Battery Co. Ltd. | 12,420 | 402 |
| ^ | Daewoong Pharmaceutical Co. Ltd. | 6,685 | 398 |
| | AK Holdings Inc. | 7,336 | 395 |
| *,^ | Webzen Inc. | 25,858 | 388 |
| ^ | iMarketKorea Inc. | 33,818 | 377 |
| *,^ | i-SENS Inc. | 13,206 | 377 |
| ^ | Dae Hwa Pharmaceutical Co. Ltd. | 16,549 | 375 |
84
| | | |
| Vanguard® FTSE All-World ex-US Small-Cap Index Fund | | |
| Schedule of Investments | | |
| October 31, 2016 | | |
| |
| | | | Market |
| | | | Value |
| | | Shares | ($000) |
| *,^ | Schnell Biopharmaceuticals Inc. | 113,657 | 373 |
| | KT Skylife Co. Ltd. | 23,886 | 372 |
| | KISWIRE Ltd. | 10,912 | 372 |
| | Hansol Paper Co. Ltd. | 20,998 | 372 |
| | Lutronic Corp. | 11,158 | 371 |
| *,^ | It's Skin Co. Ltd. | 9,183 | 371 |
| | Hanil Cement Co. Ltd. | 5,664 | 368 |
| | Songwon Industrial Co. Ltd. | 23,945 | 367 |
| ^ | Hankook Shell Oil Co. Ltd. | 913 | 352 |
| ^ | Dawonsys Co. Ltd. | 28,777 | 351 |
| *,^ | Gamevil Inc. | 7,198 | 349 |
| | NICE Information Service Co. Ltd. | 52,081 | 348 |
| *,^ | SK Securities Co. Ltd. | 383,523 | 347 |
| | Seah Besteel Corp. | 17,123 | 347 |
| *,^ | Naturalendo Tech Co. Ltd. | 20,609 | 346 |
| ^ | Hyundai Livart Furniture Co. Ltd. | 16,022 | 346 |
| * | Kumho Industrial Co. Ltd. | 41,353 | 346 |
| | Modetour Network Inc. | 14,874 | 344 |
| | Hancom Inc. | 22,120 | 341 |
| | Kwang Dong Pharmaceutical Co. Ltd. | 46,927 | 338 |
| *,^ | Hansol Technics Co. Ltd. | 25,578 | 338 |
| ^ | Maeil Dairy Industry Co. Ltd. | 11,350 | 336 |
| | Sungwoo Hitech Co. Ltd. | 50,015 | 335 |
| | Shinyoung Securities Co. Ltd. | 7,700 | 334 |
| * | DongKook Pharmaceutical Co. Ltd. | 7,259 | 333 |
| | Cell Biotech Co. Ltd. | 8,358 | 331 |
| ^ | NS Shopping Co. Ltd. | 2,286 | 329 |
| | POSCO Chemtech Co. Ltd. | 31,254 | 325 |
| *,^ | Yuanta Securities Korea Co. Ltd. | 118,630 | 324 |
| * | Hanjin Heavy Industries & Construction Co. Ltd. | 94,560 | 322 |
| *,^ | CMG Pharmaceutical Co. Ltd. | 120,932 | 321 |
| | AtlasBX Co. Ltd. | 6,638 | 314 |
| * | Taewoong Co. Ltd. | 12,906 | 311 |
| *,^ | Pharmicell Co. Ltd. | 76,984 | 310 |
| | Daekyo Co. Ltd. | 42,417 | 309 |
| | Able C&C Co. Ltd. | 16,773 | 307 |
| * | Hansol Holdings Co. Ltd. | 54,023 | 303 |
| | Kwangju Bank | 34,133 | 301 |
| ^ | Kolao Holdings | 39,197 | 301 |
| *,^ | Leaders Cosmetics Co. Ltd. | 17,354 | 300 |
| | Daeduck Electronics Co. | 45,328 | 298 |
| | Samchully Co. Ltd. | 3,448 | 294 |
| | SL Corp. | 22,013 | 293 |
| | CJ Hellovision Co. Ltd. | 40,976 | 292 |
| ^ | Byucksan Corp. | 68,007 | 292 |
| | Silicon Works Co. Ltd. | 12,506 | 292 |
| ^ | Dongwon F&B Co. Ltd. | 1,657 | 292 |
| * | Huons Co. Ltd. | 5,652 | 290 |
| | Lock&Lock Co. Ltd. | 24,575 | 287 |
| ^ | Cuckoo Electronics Co. Ltd. | 2,479 | 286 |
| | Humax Co. Ltd. | 22,327 | 285 |
| *,^ | Peptron Inc. | 7,549 | 275 |
| *,^ | Korea Line Corp. | 17,348 | 273 |
| | Daeduck GDS Co. Ltd. | 25,565 | 266 |
| *,^ | COSON Co. Ltd. | 22,524 | 264 |
| * | Hanwha Investment & Securities Co. Ltd. | 135,192 | 264 |
| | Kolon Corp. | 5,936 | 264 |
| | GOLFZON Co. Ltd. | 4,460 | 263 |
| ^ | Crown Confectionery Co. Ltd. | 9,550 | 260 |
| * | Woongjin Thinkbig Co. Ltd. | 31,030 | 258 |
| * | Taeyoung Engineering & Construction Co. Ltd. | 59,867 | 255 |
| *,^ | CUROCOM Co. Ltd. | 114,826 | 252 |
| | Chongkundang Holdings Corp. | 4,358 | 252 |
| | Huons Global Co. Ltd. | 6,718 | 252 |
85
| | | |
| Vanguard® FTSE All-World ex-US Small-Cap Index Fund | | |
| Schedule of Investments | | |
| October 31, 2016 | | |
| |
| | | | Market |
| | | | Value |
| | | Shares | ($000) |
| ^ | Interpark Holdings Corp. | 57,621 | 251 |
| | Daewoong Co. Ltd. | 6,528 | 251 |
| ^ | E1 Corp. | 4,721 | 251 |
| | SeAH Steel Corp. | 4,043 | 246 |
| | Sindoh Co. Ltd. | 5,352 | 246 |
| *,^ | ICD Co. Ltd. | 18,215 | 245 |
| | Cosmax BTI Inc | 6,945 | 244 |
| ^ | CJ Freshway Corp. | 7,092 | 243 |
| *,^ | CrucialTec Co. Ltd. | 34,649 | 242 |
| ^ | Humedix Co. Ltd. | 7,618 | 240 |
| | S&T Dynamics Co. Ltd. | 29,751 | 240 |
| *,^ | Agabang&Company | 36,606 | 237 |
| * | Green Cross Cell Corp. | 9,220 | 234 |
| ^ | Seoyon E-Hwa Co. Ltd. | 17,568 | 233 |
| | Dae Han Flour Mills Co. Ltd. | 1,507 | 232 |
| ^ | Korea Kolmar Holdings Co. Ltd. | 8,991 | 230 |
| ^ | KISCO Corp. | 6,962 | 229 |
| ^ | KH Vatec Co. Ltd. | 20,651 | 227 |
| | Youlchon Chemical Co. Ltd. | 19,121 | 226 |
| *,^ | WeMade Entertainment Co. Ltd. | 13,083 | 222 |
| | Daishin Securities Co. Ltd. Preference Shares | 32,351 | 220 |
| *,^ | Duk San Neolux Co. Ltd. | 8,321 | 214 |
| | Namhae Chemical Corp. | 30,040 | 214 |
| ^ | Kyobo Securities Co. Ltd. | 26,216 | 212 |
| ^ | Sung Kwang Bend Co. Ltd. | 25,404 | 209 |
| * | Lumens Co. Ltd. | 59,056 | 207 |
| *,^ | SFA Semicon Co. Ltd. | 104,327 | 201 |
| ^ | SBS Media Holdings Co. Ltd. | 80,361 | 200 |
| | Hyundai Corp. | 10,737 | 197 |
| *,^ | Insun ENT Co. Ltd. | 39,206 | 194 |
| * | Eugene Investment & Securities Co. Ltd. | 90,761 | 190 |
| ^ | KONA I Co. Ltd. | 17,486 | 183 |
| ^ | Coreana Cosmetics Co. Ltd. | 34,674 | 182 |
| | Seoyon Co. Ltd. | 18,192 | 176 |
| *,^ | KTB Investment & Securities Co. Ltd. | 70,403 | 176 |
| *,^ | Samsung Pharmaceutical Co. Ltd. | 48,766 | 175 |
| | INTOPS Co. Ltd. | 9,554 | 169 |
| *,^ | 3S Korea Co. Ltd. | 70,925 | 166 |
| * | Neowiz Games Corp. | 17,598 | 166 |
| | TK Corp. | 22,421 | 166 |
| * | Interflex Co. Ltd. | 11,392 | 162 |
| | Sam Young Electronics Co. Ltd. | 16,317 | 159 |
| | NEPES Corp. | 25,508 | 157 |
| ^ | GOLFZONYUWONHOLDINGS Co. Ltd. | 23,090 | 157 |
| | Eusu Holdings Co. Ltd. | 25,060 | 137 |
| ^ | DY Corp. | 24,569 | 134 |
| *,^ | Duksan Hi-Metal Co. Ltd. | 20,328 | 131 |
| * | Doosan Engine Co. Ltd. | 39,560 | 122 |
| * | Dongbu Securities Co. Ltd. | 40,478 | 117 |
| | MegaStudy Co. Ltd. | 4,013 | 113 |
| | Hyundai C&F Inc. | 7,809 | 110 |
| | Hitejinro Holdings Co. Ltd. | 9,556 | 100 |
| | MegaStudyEdu Co. Ltd. | 2,396 | 99 |
| * | Hanjin Heavy Industries & Construction Holdings Co. Ltd. | 4,999 | 23 |
| * | Interflex Co. Ltd. Rights Exp. 11/24/2016 | 3,268 | 11 |
| * | Lutronic Corp. Pref Rights Exp. 12/02/2016 | 1,796 | 5 |
| * | Zyle Daewoo Motor Sales Corp. | 3,992 | 5 |
| * | Lutronic Corp. Rights Exp.12/02/2016 | 378 | 2 |
| * | Tera Resource Co. Ltd. | 42,004 | 2 |
| * | SSCP Co. Ltd. | 20,873 | 1 |
| * | Shenglong PV-Tech Investment Co. Ltd. | 44,660 | 1 |
| | SK Telecom Co. Ltd. | 1 | — |
| * | CNK International Co. Ltd. | 35,374 | — |
86
| | | |
| Vanguard® FTSE All-World ex-US Small-Cap Index Fund | | |
| Schedule of Investments | | |
| October 31, 2016 | | |
| |
| | | | Market |
| | | | Value |
| | | Shares | ($000) |
| * | Daewoo Songdo Development Co. Ltd. | 11,746 | — |
| | | | 139,036 |
| Spain (1.7%) | | |
| | Merlin Properties Socimi SA | 512,346 | 5,748 |
| ^ | Bolsas y Mercados Espanoles SHMSF SA | 124,343 | 3,758 |
| 2 | Cellnex Telecom SA | 225,069 | 3,691 |
| | Viscofan SA | 75,044 | 3,533 |
| | Ebro Foods SA | 140,614 | 3,032 |
| | Inmobiliaria Colonial SA | 388,380 | 2,739 |
| | Melia Hotels International SA | 191,499 | 2,364 |
| * | Indra Sistemas SA | 190,570 | 2,357 |
| | Grupo Catalana Occidente SA | 74,721 | 2,353 |
| | Prosegur Cia de Seguridad SA | 322,624 | 2,339 |
| | Applus Services SA | 199,840 | 1,918 |
| | Tecnicas Reunidas SA | 46,968 | 1,757 |
| | Hispania Activos Inmobiliarios SOCIMI SA | 136,949 | 1,682 |
| | CIE Automotive SA | 73,585 | 1,515 |
| *,2 | Euskaltel SA | 145,340 | 1,463 |
| | Vidrala SA | 24,996 | 1,434 |
| | Faes Farma SA | 387,939 | 1,424 |
| * | NH Hotel Group SA | 322,581 | 1,423 |
| | Almirall SA | 94,014 | 1,352 |
| | Axiare Patrimonio SOCIMI SA | 91,128 | 1,295 |
| | Cia de Distribucion Integral Logista Holdings SA | 56,190 | 1,246 |
| | Construcciones y Auxiliar de Ferrocarriles SA | 2,851 | 1,074 |
| *,^ | Sacyr SA | 452,151 | 1,031 |
| * | Fomento de Construcciones y Contratas SA | 108,698 | 941 |
| ^ | Obrascon Huarte Lain SA | 225,796 | 905 |
| | Atresmedia Corp. de Medios de Comunicacion SA | 81,994 | 842 |
| * | Pharma Mar SA | 240,030 | 648 |
| * | Promotora de Informaciones SA | 78,933 | 547 |
| | Ence Energia y Celulosa SA | 210,430 | 459 |
| * | Codere SA | 729,145 | 439 |
| * | Liberbank SA | 425,913 | 422 |
| | Papeles y Cartones de Europa SA | 73,103 | 381 |
| * | Papeles y Cartones de Europa SA Rights Exp. 11/14/2016 | 73,103 | 15 |
| * | Deoleo SA | 19,560 | 4 |
| *,^ | Caja de Ahorros del Mediterraneo | 42,306 | — |
| *,^ | Let's GOWEX SA | 31,105 | — |
| * | Pescanova SA | 10,066 | — |
| | | | 56,131 |
| Sweden (3.5%) | | |
| | Castellum AB | 416,719 | 5,647 |
| | Elekta AB Class B | 563,357 | 4,884 |
| ^ | Fingerprint Cards AB Class B | 419,375 | 4,061 |
| | BillerudKorsnas AB | 245,205 | 4,027 |
| | Fabege AB | 213,002 | 3,597 |
| * | NCC AB Class B | 135,632 | 3,447 |
| | Loomis AB Class B | 116,868 | 3,322 |
| | Hexpol AB | 400,884 | 3,295 |
| *,^ | Nibe Industrier AB Class B | 425,590 | 3,166 |
| | Hufvudstaden AB Class A | 181,534 | 2,810 |
| | Indutrade AB | 150,775 | 2,804 |
| | AAK AB | 41,979 | 2,772 |
| | Holmen AB | 80,781 | 2,764 |
| * | Swedish Orphan Biovitrum AB | 264,428 | 2,707 |
| | Axfood AB | 171,508 | 2,680 |
| 2 | Thule Group AB | 166,948 | 2,577 |
| *,2 | Dometic Group AB | 357,046 | 2,526 |
| | Wallenstam AB | 323,247 | 2,490 |
| | NetEnt AB | 303,511 | 2,392 |
| | Saab AB Class B | 63,887 | 2,263 |
| | Modern Times Group MTG AB Class B | 82,478 | 2,220 |
| * | SSAB AB Class B | 818,656 | 2,173 |
87
| | | |
| Vanguard® FTSE All-World ex-US Small-Cap Index Fund | | |
| Schedule of Investments | | |
| October 31, 2016 | | |
| |
| | | | Market |
| | | | Value |
| | | Shares | ($000) |
| | Peab AB | 245,528 | 2,082 |
| | Sweco AB Class B | 103,742 | 2,081 |
| | JM AB | 72,236 | 2,080 |
| | Com Hem Holding AB | 227,248 | 2,045 |
| | Wihlborgs Fastigheter AB | 101,262 | 1,963 |
| * | Betsson AB | 186,318 | 1,798 |
| | Lifco AB Class B | 69,867 | 1,768 |
| | Intrum Justitia AB | 55,837 | 1,722 |
| *,2 | Attendo AB | 194,225 | 1,655 |
| | Avanza Bank Holding AB | 42,514 | 1,607 |
| * | Bonava AB | 128,035 | 1,582 |
| | Bilia AB | 66,177 | 1,578 |
| | AF AB | 84,070 | 1,539 |
| | Kungsleden AB | 242,952 | 1,532 |
| | Hemfosa Fastigheter AB | 145,296 | 1,366 |
| * | Oriflame Holding AG | 36,520 | 1,342 |
| 2 | Bravida Holding AB | 212,641 | 1,307 |
| | Pandox AB | 80,623 | 1,279 |
| | Ratos AB | 299,823 | 1,232 |
| * | Cloetta AB Class B | 321,171 | 1,138 |
| | Atrium Ljungberg AB | 72,371 | 1,124 |
| *,^ | SSAB AB Class A | 350,606 | 1,112 |
| | Vitrolife AB | 19,735 | 1,021 |
| | Nobia AB | 108,601 | 947 |
| | Klovern AB | 890,917 | 940 |
| | Bure Equity AB | 77,931 | 854 |
| | Haldex AB | 65,826 | 848 |
| | Lindab International AB | 90,005 | 771 |
| | Klovern AB Preference Shares | 22,391 | 765 |
| | Concentric AB | 62,252 | 740 |
| * | Investment AB Oresund | 42,606 | 681 |
| | SAS AB Preference Shares | 10,667 | 653 |
| | Rezidor Hotel Group AB | 147,092 | 600 |
| | Clas Ohlson AB | 35,320 | 499 |
| * | Collector AB | 38,809 | 479 |
| | SkiStar AB | 30,187 | 464 |
| | Nordnet AB | 106,817 | 439 |
| | Mekonomen AB | 22,795 | 405 |
| *,^ | SAS AB | 236,426 | 400 |
| | Sagax AB Preference Shares | 88,055 | 319 |
| | Hemfosa Fastigheter AB Preference Shares | 14,935 | 265 |
| | Ratos AB Preference Shares | 1,176 | 244 |
| * | NCC AB Class A | 6,008 | 152 |
| * | Bonava AB | 7,881 | 95 |
| | L E Lundbergforetagen AB Class B | 5 | — |
| | | | 116,137 |
| Switzerland (3.1%) | | |
| | Temenos Group AG | 92,912 | 6,000 |
| | Georg Fischer AG | 6,520 | 5,781 |
| | Logitech International SA | 227,854 | 5,511 |
| * | CS Real Estate Fund LivingPlus | 31,929 | 4,433 |
| ^ | BB Biotech AG | 87,468 | 4,139 |
| 2 | Sunrise Communications Group AG | 54,634 | 3,733 |
| | Cembra Money Bank AG | 45,719 | 3,494 |
| | dorma&kaba Holding AG | 4,938 | 3,431 |
| | Tecan Group AG | 18,708 | 3,083 |
| | Panalpina Welttransport Holding AG | 22,352 | 2,900 |
| | OC Oerlikon Corp. AG | 285,086 | 2,680 |
| | ams AG | 93,508 | 2,618 |
| | GAM Holding AG | 257,900 | 2,498 |
| | Mobimo Holding AG | 10,258 | 2,468 |
| | Forbo Holding AG | 1,911 | 2,436 |
| | Bucher Industries AG | 10,627 | 2,361 |
| | Valiant Holding AG | 24,262 | 2,300 |
88
| | | |
| Vanguard® FTSE All-World ex-US Small-Cap Index Fund | | |
| Schedule of Investments | | |
| October 31, 2016 | | |
| |
| | | | Market |
| | | | Value |
| | | Shares | ($000) |
| | Belimo Holding AG | 710 | 2,168 |
| | Allreal Holding AG | 14,456 | 2,128 |
| | Emmi AG | 3,276 | 1,935 |
| | Autoneum Holding AG | 7,104 | 1,880 |
| | SFS Group AG | 24,741 | 1,864 |
| * | Gategroup Holding AG | 32,124 | 1,690 |
| | u-blox Holding AG | 8,937 | 1,689 |
| | Schweiter Technologies AG | 1,433 | 1,544 |
| | Implenia AG | 22,240 | 1,490 |
| ^ | Burckhardt Compression Holding AG | 4,949 | 1,435 |
| | Rieter Holding AG | 7,018 | 1,333 |
| | Huber & Suhner AG | 22,487 | 1,309 |
| | St. Galler Kantonalbank AG | 3,410 | 1,280 |
| | VZ Holding AG | 4,153 | 1,229 |
| | Valora Holding AG | 4,204 | 1,222 |
| | Vontobel Holding AG | 22,991 | 1,126 |
| | Daetwyler Holding AG | 7,963 | 1,091 |
| | COSMO Pharmaceuticals NV | 7,429 | 1,079 |
| *,^ | AFG Arbonia-Forster Holding AG | 68,328 | 1,025 |
| | Conzzeta AG | 1,425 | 984 |
| | Ascom Holding AG | 55,488 | 950 |
| | Kudelski SA | 53,908 | 929 |
| | Ypsomed Holding AG | 4,769 | 911 |
| | Intershop Holding AG | 1,773 | 905 |
| ^ | Leonteq AG | 14,591 | 841 |
| | LEM Holding SA | 727 | 811 |
| * | Bell AG | 1,874 | 802 |
| | Siegfried Holding AG | 3,608 | 742 |
| | BKW AG | 15,327 | 713 |
| | APG SGA SA | 1,587 | 663 |
| * | Zehnder Group AG | 14,599 | 607 |
| | EFG International AG | 112,017 | 604 |
| | Vetropack Holding AG | 333 | 546 |
| * | Schmolz & Bickenbach AG | 760,501 | 499 |
| *,^ | Basilea Pharmaceutica AG | 7,318 | 493 |
| *,^ | Meyer Burger Technology AG | 140,114 | 458 |
| | Swissquote Group Holding SA | 14,647 | 416 |
| * | Alpiq Holding AG | 4,168 | 387 |
| | Bachem Holding AG | 4,045 | 360 |
| ^ | Plazza AG | 1,312 | 312 |
| * | Orascom Development Holding AG | 16,597 | 100 |
| * | Flughafen Zuerich AG | 7 | 1 |
| * | Petroplus Holdings AG | 36,495 | 1 |
| | | | 102,418 |
| Taiwan (6.2%) | | |
| | China Life Insurance Co. Ltd. | 5,513,597 | 5,082 |
| | Powertech Technology Inc. | 1,158,662 | 3,306 |
| | Micro-Star International Co. Ltd. | 1,116,000 | 3,211 |
| | Chailease Holding Co. Ltd. | 1,703,214 | 2,940 |
| | WPG Holdings Ltd. | 2,415,889 | 2,828 |
| | Nien Made Enterprise Co. Ltd. | 233,000 | 2,699 |
| | Highwealth Construction Corp. | 1,481,341 | 2,194 |
| * | TaiMed Biologics Inc. | 340,000 | 2,135 |
| * | Ruentex Development Co. Ltd. | 1,759,142 | 2,030 |
| | Tripod Technology Corp. | 852,327 | 2,018 |
| | Phison Electronics Corp. | 274,962 | 1,946 |
| | Merida Industry Co. Ltd. | 421,055 | 1,940 |
| | Ruentex Industries Ltd. | 1,201,160 | 1,934 |
| | Tong Yang Industry Co. Ltd. | 813,919 | 1,894 |
| | Win Semiconductors Corp. | 673,969 | 1,872 |
| | Airtac International Group | 235,229 | 1,871 |
| | Standard Foods Corp. | 751,258 | 1,857 |
| | Poya International Co. Ltd. | 124,085 | 1,804 |
| | St. Shine Optical Co. Ltd. | 80,419 | 1,690 |
89
| | |
| Vanguard® FTSE All-World ex-US Small-Cap Index Fund | | |
| Schedule of Investments | | |
| October 31, 2016 | | |
| |
| | | Market |
| | | Value |
| | Shares | ($000) |
| Hiwin Technologies Corp. | 382,304 | 1,685 |
| Yageo Corp. | 826,028 | 1,662 |
| King Yuan Electronics Co. Ltd. | 1,833,963 | 1,613 |
| Chroma ATE Inc. | 626,040 | 1,587 |
| Zhen Ding Technology Holding Ltd. | 694,400 | 1,580 |
| CTCI Corp. | 1,072,667 | 1,574 |
| PChome Online Inc. | 144,914 | 1,574 |
| Simplo Technology Co. Ltd. | 506,053 | 1,561 |
| Tung Thih Electronic Co. Ltd. | 106,000 | 1,547 |
| Kenda Rubber Industrial Co. Ltd. | 1,012,016 | 1,546 |
| Winbond Electronics Corp. | 4,732,000 | 1,486 |
| LCY Chemical Corp. | 1,203,255 | 1,468 |
| Chipbond Technology Corp. | 1,060,852 | 1,464 |
| Taiwan Paiho Ltd. | 425,183 | 1,445 |
| King's Town Bank Co. Ltd. | 1,723,193 | 1,409 |
| Hota Industrial Manufacturing Co. Ltd. | 334,000 | 1,396 |
| TTY Biopharm Co. Ltd. | 368,987 | 1,387 |
| TSRC Corp. | 1,296,046 | 1,338 |
| Grape King Bio Ltd. | 156,000 | 1,310 |
| Wistron NeWeb Corp. | 453,748 | 1,263 |
| Accton Technology Corp. | 776,467 | 1,240 |
| Makalot Industrial Co. Ltd. | 305,880 | 1,204 |
| Elite Material Co. Ltd. | 429,519 | 1,196 |
| * Asia Pacific Telecom Co. Ltd. | 3,722,000 | 1,195 |
| King Slide Works Co. Ltd. | 96,675 | 1,184 |
| FLEXium Interconnect Inc. | 410,376 | 1,167 |
| Silergy Corp. | 79,000 | 1,151 |
| E Ink Holdings Inc. | 1,354,708 | 1,148 |
| Radiant Opto-Electronics Corp. | 674,147 | 1,137 |
| Parade Technologies Ltd. | 101,000 | 1,136 |
| * HannStar Display Corp. | 4,516,810 | 1,131 |
| eMemory Technology Inc. | 106,000 | 1,123 |
| * China Petrochemical Development Corp. | 3,631,077 | 1,037 |
| Voltronic Power Technology Corp. | 68,356 | 1,025 |
| Ennoconn Corp. | 64,644 | 1,024 |
| Chin-Poon Industrial Co. Ltd. | 531,072 | 1,017 |
| Merry Electronics Co. Ltd. | 258,910 | 998 |
| Waterland Financial Holdings Co. Ltd. | 3,903,652 | 988 |
| Sercomm Corp. | 419,000 | 984 |
| Nan Kang Rubber Tire Co. Ltd. | 1,058,107 | 975 |
| Gigabyte Technology Co. Ltd. | 738,271 | 970 |
| Great Wall Enterprise Co. Ltd. | 1,064,190 | 968 |
| Taichung Commercial Bank Co. Ltd. | 3,378,030 | 962 |
| Land Mark Optoelectronics Corp. | 106,600 | 955 |
| Walsin Technology Corp. | 785,958 | 953 |
| Everlight Electronics Co. Ltd. | 619,725 | 935 |
| Kinsus Interconnect Technology Corp. | 404,282 | 933 |
| AmTRAN Technology Co. Ltd. | 1,150,692 | 911 |
| WT Microelectronics Co. Ltd. | 642,624 | 910 |
| Qisda Corp. | 2,148,000 | 904 |
| Far Eastern Department Stores Ltd. | 1,677,043 | 889 |
| Mitac Holdings Corp. | 936,311 | 886 |
| Compeq Manufacturing Co. Ltd. | 1,667,471 | 878 |
| Clevo Co. | 947,944 | 867 |
| * Tatung Co. Ltd. | 3,287,320 | 864 |
| Sino-American Silicon Products Inc. | 773,945 | 832 |
| * Chunghwa Precision Test Tech Co. Ltd. | 25,000 | 831 |
| Cub Elecparts Inc. | 88,427 | 811 |
| China Steel Chemical Corp. | 235,853 | 809 |
| Gourmet Master Co. Ltd. | 89,482 | 803 |
| Tung Ho Steel Enterprise Corp. | 1,252,150 | 798 |
| Primax Electronics Ltd. | 482,000 | 762 |
| Yungtay Engineering Co. Ltd. | 539,993 | 761 |
| Jih Sun Financial Holdings Co. Ltd. | 3,616,195 | 753 |
90
| | |
| Vanguard® FTSE All-World ex-US Small-Cap Index Fund | | |
| Schedule of Investments | | |
| October 31, 2016 | | |
| |
| | | Market |
| | | Value |
| | Shares | ($000) |
| Tong Hsing Electronic Industries Ltd. | 218,056 | 752 |
| Kinpo Electronics | 1,979,196 | 742 |
| Grand Pacific Petrochemical | 1,327,928 | 740 |
| Elan Microelectronics Corp. | 625,350 | 707 |
| PharmaEngine Inc. | 103,591 | 706 |
| Taiwan Hon Chuan Enterprise Co. Ltd. | 416,401 | 682 |
| * Egis Technology Inc. | 94,000 | 681 |
| * Pharmally International Holding Co. Ltd. | 45,000 | 678 |
| * Neo Solar Power Corp. | 1,326,571 | 677 |
| Sinbon Electronics Co. Ltd. | 299,066 | 672 |
| Getac Technology Corp. | 514,000 | 668 |
| Tainan Spinning Co. Ltd. | 1,727,674 | 663 |
| Casetek Holdings Ltd. | 206,000 | 661 |
| Lien Hwa Industrial Corp. | 975,605 | 661 |
| * Yieh Phui Enterprise Co. Ltd. | 1,704,355 | 658 |
| Coretronic Corp. | 632,000 | 654 |
| Sanyang Motor Co. Ltd. | 1,011,037 | 647 |
| Cleanaway Co. Ltd. | 120,000 | 638 |
| Ginko International Co. Ltd. | 68,200 | 636 |
| Depo Auto Parts Ind Co. Ltd. | 202,313 | 632 |
| Flytech Technology Co. Ltd. | 189,845 | 625 |
| * Mercuries Life Insurance Co. Ltd. | 1,290,068 | 621 |
| Firich Enterprises Co. Ltd. | 299,613 | 620 |
| Huaku Development Co. Ltd. | 351,499 | 619 |
| Shin Zu Shing Co. Ltd. | 203,000 | 611 |
| USI Corp. | 1,245,518 | 607 |
| TA Chen Stainless Pipe | 1,149,192 | 604 |
| General Interface Solution Holding Ltd. | 225,000 | 600 |
| Taiwan Shin Kong Security Co. Ltd. | 466,930 | 589 |
| China Synthetic Rubber Corp. | 750,552 | 589 |
| China Bills Finance Corp. | 1,468,800 | 589 |
| TXC Corp. | 421,877 | 588 |
| Shinkong Synthetic Fibers Corp. | 2,201,416 | 587 |
| Advanced Ceramic X Corp. | 73,000 | 584 |
| Topco Scientific Co. Ltd. | 227,383 | 583 |
| Farglory Land Development Co. Ltd. | 504,854 | 580 |
| YFY Inc. | 1,958,000 | 577 |
| Namchow Chemical Industrial Co. Ltd. | 266,000 | 566 |
| Greatek Electronics Inc. | 447,000 | 564 |
| Ardentec Corp. | 753,851 | 561 |
| * Center Laboratories Inc. | 270,785 | 556 |
| * Motech Industries Inc. | 573,311 | 553 |
| Prince Housing & Development Corp. | 1,742,183 | 552 |
| Elite Advanced Laser Corp. | 149,960 | 545 |
| Lung Yen Life Service Corp. | 318,000 | 541 |
| Formosa International Hotels Corp. | 95,840 | 537 |
| Bizlink Holding Inc. | 105,716 | 535 |
| Pan-International Industrial Corp. | 578,595 | 531 |
| Long Chen Paper Co. Ltd. | 1,117,084 | 530 |
| Sitronix Technology Corp. | 143,282 | 530 |
| Hu Lane Associate Inc. | 119,000 | 524 |
| ScinoPharm Taiwan Ltd. | 402,703 | 512 |
| Chaun-Choung Technology Corp. | 116,000 | 511 |
| Li Cheng Enterprise Co. Ltd. | 131,440 | 510 |
| A-DATA Technology Co. Ltd. | 327,915 | 510 |
| Cheng Loong Corp. | 1,386,920 | 503 |
| Taiwan FamilyMart Co. Ltd. | 71,000 | 502 |
| * Iron Force Industrial Co. Ltd. | 82,000 | 499 |
| San Shing Fastech Corp. | 285,824 | 499 |
| ITEQ Corp. | 458,261 | 496 |
| Yeong Guan Energy Technology Group Co. Ltd. | 126,000 | 495 |
| Posiflex Technology Inc. | 83,809 | 493 |
| Wisdom Marine Lines Co. Ltd. | 542,753 | 491 |
| Xxentria Technology Materials Corp. | 185,776 | 486 |
91
| | |
| Vanguard® FTSE All-World ex-US Small-Cap Index Fund | | |
| Schedule of Investments | | |
| October 31, 2016 | | |
| |
| | | Market |
| | | Value |
| | Shares | ($000) |
| Chong Hong Construction Co. Ltd. | 294,493 | 484 |
| Goldsun Building Materials Co. Ltd. | 2,090,591 | 482 |
| YungShin Global Holding Corp. | 315,647 | 469 |
| IEI Integration Corp. | 313,623 | 467 |
| Globalwafers Co. Ltd. | 187,000 | 461 |
| Aten International Co. Ltd. | 183,260 | 460 |
| President Securities Corp. | 1,321,000 | 460 |
| AcBel Polytech Inc. | 621,000 | 459 |
| Sporton International Inc. | 95,746 | 457 |
| Universal Cement Corp. | 584,878 | 454 |
| Gigasolar Materials Corp. | 35,600 | 449 |
| Taiwan Acceptance Corp. | 195,000 | 448 |
| Rechi Precision Co. Ltd. | 389,668 | 444 |
| FocalTech Systems Co. Ltd. | 405,398 | 439 |
| * Ritek Corp. | 2,537,678 | 438 |
| China Man-Made Fiber Corp. | 1,790,016 | 433 |
| China General Plastics Corp. | 541,329 | 433 |
| Adlink Technology Inc. | 223,254 | 432 |
| United Integrated Services Co. Ltd. | 288,000 | 431 |
| Sampo Corp. | 690,311 | 429 |
| UPC Technology Corp. | 1,203,510 | 423 |
| * Gintech Energy Corp. | 591,354 | 422 |
| * Taigen Biopharmaceuticals Holdings Ltd. | 441,723 | 420 |
| * Microbio Co. Ltd. | 565,562 | 419 |
| Taiwan TEA Corp. | 931,293 | 406 |
| China Metal Products | 411,515 | 405 |
| * Orient Semiconductor Electronics Ltd. | 1,109,000 | 400 |
| International Games System Co. Ltd. | 71,213 | 400 |
| Taiwan Styrene Monomer | 756,579 | 399 |
| Mercuries & Associates Holding Ltd. | 641,355 | 394 |
| Pihsiang Machinery Manufacturing Co. Ltd. | 168,000 | 394 |
| Green Seal Holding Ltd. | 74,000 | 393 |
| Wah Lee Industrial Corp. | 271,883 | 388 |
| Taiwan Cogeneration Corp. | 527,903 | 385 |
| Basso Industry Corp. | 140,000 | 377 |
| Systex Corp. | 223,000 | 375 |
| Masterlink Securities Corp. | 1,474,023 | 374 |
| Sigurd Microelectronics Corp. | 501,000 | 374 |
| * Wei Chuan Foods Corp. | 659,835 | 374 |
| Everlight Chemical Industrial Corp. | 590,649 | 374 |
| Hung Sheng Construction Ltd. | 692,100 | 373 |
| Elite Semiconductor Memory Technology Inc. | 350,000 | 373 |
| Taiwan Semiconductor Co. Ltd. | 332,000 | 372 |
| Visual Photonics Epitaxy Co. Ltd. | 277,455 | 371 |
| Test Rite International Co. Ltd. | 598,725 | 369 |
| Zeng Hsing Industrial Co. Ltd. | 76,000 | 367 |
| Test Research Inc. | 288,371 | 365 |
| Long Bon International Co. Ltd. | 706,000 | 365 |
| YC INOX Co. Ltd. | 495,174 | 360 |
| * Medigen Biotechnology Corp. | 161,680 | 359 |
| Taiwan Surface Mounting Technology Corp. | 429,530 | 358 |
| * Sunny Friend Environmental Technology Co. Ltd. | 98,000 | 350 |
| Chlitina Holding Ltd. | 79,750 | 349 |
| Lealea Enterprise Co. Ltd. | 1,360,848 | 348 |
| Wowprime Corp. | 94,761 | 347 |
| Holtek Semiconductor Inc. | 219,279 | 346 |
| * Gigastorage Corp. | 481,800 | 346 |
| Taiwan PCB Techvest Co. Ltd. | 354,102 | 346 |
| BES Engineering Corp. | 2,023,468 | 345 |
| Pixart Imaging Inc. | 158,920 | 344 |
| Toung Loong Textile Manufacturing | 125,000 | 342 |
| Nan Liu Enterprise Co. Ltd. | 79,000 | 335 |
| Senao International Co. Ltd. | 209,000 | 331 |
| OptoTech Corp. | 784,000 | 330 |
92
| | |
| Vanguard® FTSE All-World ex-US Small-Cap Index Fund | | |
| Schedule of Investments | | |
| October 31, 2016 | | |
| |
| | | Market |
| | | Value |
| | Shares | ($000) |
| Syncmold Enterprise Corp. | 195,000 | 326 |
| Taiwan Land Development Corp. | 1,034,969 | 323 |
| Sinyi Realty Inc. | 352,824 | 323 |
| MIN AIK Technology Co. Ltd. | 274,987 | 323 |
| * Radium Life Tech Co. Ltd. | 1,135,265 | 322 |
| Faraday Technology Corp. | 323,000 | 321 |
| * Ho Tung Chemical Corp. | 1,308,466 | 321 |
| Gloria Material Technology Corp. | 595,023 | 318 |
| * TWi Pharmaceuticals Inc. | 98,000 | 318 |
| Kuoyang Construction Co. Ltd. | 801,648 | 315 |
| * CMC Magnetics Corp. | 2,662,369 | 313 |
| Evergreen International Storage & Transport Corp. | 767,502 | 311 |
| Zinwell Corp. | 273,099 | 311 |
| Advanced Wireless Semiconductor Co. | 197,000 | 307 |
| Global Unichip Corp. | 119,649 | 305 |
| Career Technology MFG. Co. Ltd. | 477,126 | 304 |
| Huang Hsiang Construction Corp. | 248,051 | 303 |
| * Asia Optical Co. Inc. | 325,000 | 300 |
| * Shining Building Business Co. Ltd. | 947,463 | 299 |
| Asia Polymer Corp. | 516,875 | 299 |
| Yung Chi Paint & Varnish Manufacturing Co. Ltd. | 121,000 | 298 |
| CyberTAN Technology Inc. | 497,571 | 298 |
| Asia Vital Components Co. Ltd. | 397,337 | 297 |
| Darwin Precisions Corp. | 756,000 | 292 |
| Kinik Co. | 177,000 | 292 |
| Formosan Rubber Group Inc. | 628,100 | 292 |
| Chung-Hsin Electric & Machinery Manufacturing Corp. | 520,625 | 292 |
| Soft-World International Corp. | 145,520 | 292 |
| D-Link Corp. | 896,406 | 288 |
| Federal Corp. | 666,505 | 285 |
| Rich Development Co. Ltd. | 1,031,000 | 284 |
| Topkey Corp. | 91,000 | 283 |
| TYC Brother Industrial Co. Ltd. | 272,710 | 281 |
| Brogent Technologies Inc. | 40,606 | 280 |
| Holy Stone Enterprise Co. Ltd. | 273,670 | 276 |
| Hung Poo Real Estate Development Corp. | 325,195 | 267 |
| Dynapack International Technology Corp. | 201,299 | 263 |
| Pan Jit International Inc. | 552,000 | 260 |
| Lextar Electronics Corp. | 625,000 | 259 |
| Tong-Tai Machine & Tool Co. Ltd. | 358,429 | 255 |
| Unitech Printed Circuit Board Corp. | 803,738 | 252 |
| * Li Peng Enterprise Co. Ltd. | 1,120,915 | 252 |
| Nien Hsing Textile Co. Ltd. | 330,083 | 247 |
| Lotes Co. Ltd. | 97,000 | 247 |
| * Taiwan Liposome Co. Ltd. | 60,000 | 246 |
| CSBC Corp. Taiwan | 591,808 | 245 |
| Alpha Networks Inc. | 413,827 | 238 |
| Johnson Health Tech Co. Ltd. | 159,283 | 231 |
| Sunplus Technology Co. Ltd. | 671,000 | 230 |
| Altek Corp. | 321,250 | 230 |
| Lite-On Semiconductor Corp. | 325,977 | 229 |
| Kindom Construction Corp. | 461,000 | 227 |
| * Etron Technology Inc. | 590,947 | 227 |
| * Swancor Holding Co. Ltd. | 95,000 | 225 |
| Chun Yuan Steel | 655,676 | 224 |
| * Lotus Pharmaceutical Co. Ltd. | 123,000 | 223 |
| * Unizyx Holding Corp. | 500,000 | 223 |
| Taiflex Scientific Co. Ltd. | 232,594 | 221 |
| Quanta Storage Inc. | 231,000 | 220 |
| * Solartech Energy Corp. | 437,414 | 219 |
| Gemtek Technology Corp. | 379,115 | 218 |
| Sincere Navigation Corp. | 390,000 | 218 |
| Global Mixed Mode Technology Inc. | 98,199 | 217 |
| * Green Energy Technology Inc. | 394,746 | 216 |
93
| | |
| Vanguard® FTSE All-World ex-US Small-Cap Index Fund | | |
| Schedule of Investments | | |
| October 31, 2016 | | |
| |
| | | Market |
| | | Value |
| | Shares | ($000) |
| Weltrend Semiconductor | 304,200 | 216 |
| Vivotek Inc. | 86,622 | 214 |
| China Chemical & Pharmaceutical Co. Ltd. | 379,000 | 214 |
| Sonix Technology Co. Ltd. | 208,000 | 213 |
| Infortrend Technology Inc. | 420,885 | 208 |
| KEE TAI Properties Co. Ltd. | 647,740 | 207 |
| Taiwan Fire & Marine Insurance Co. Ltd. | 350,840 | 206 |
| CHC Healthcare Group | 145,727 | 202 |
| Hsin Kuang Steel Co. Ltd. | 339,569 | 201 |
| Darfon Electronics Corp. | 338,000 | 198 |
| * Gold Circuit Electronics Ltd. | 586,280 | 198 |
| * Ichia Technologies Inc. | 446,000 | 197 |
| WUS Printed Circuit Co. Ltd. | 344,000 | 192 |
| * Unity Opto Technology Co. Ltd. | 401,000 | 190 |
| * ALI Corp. | 362,358 | 190 |
| Microlife Corp. | 82,500 | 190 |
| * E-Ton Solar Tech Co. Ltd. | 612,603 | 190 |
| Jess-Link Products Co. Ltd. | 226,800 | 188 |
| * King's Town Construction Co. Ltd. | 311,826 | 188 |
| Lingsen Precision Industries Ltd. | 529,000 | 187 |
| Concord Securities Co. Ltd. | 925,324 | 182 |
| Kuo Toong International Co. Ltd. | 330,557 | 180 |
| L&K Engineering Co. Ltd. | 230,000 | 180 |
| Bank of Kaohsiung Co. Ltd. | 639,490 | 179 |
| Chimei Materials Technology Corp. | 455,000 | 179 |
| Jentech Precision Industrial Co. Ltd. | 111,698 | 175 |
| Taiyen Biotech Co. Ltd. | 178,877 | 171 |
| * Genius Electronic Optical Co. Ltd. | 106,732 | 170 |
| Tyntek Corp. | 448,250 | 170 |
| * HannsTouch Solution Inc. | 690,731 | 169 |
| ITE Technology Inc. | 182,418 | 169 |
| * Solar Applied Materials Technology Co. | 609,201 | 169 |
| Sheng Yu Steel Co. Ltd. | 182,000 | 167 |
| Chung Hwa Pulp Corp. | 586,135 | 166 |
| * G Tech Optoelectronics Corp. | 251,168 | 165 |
| Elitegroup Computer Systems Co. Ltd. | 376,647 | 161 |
| * Silicon Integrated Systems Corp. | 810,592 | 160 |
| Cyberlink Corp. | 77,076 | 153 |
| Globe Union Industrial Corp. | 310,675 | 153 |
| * Wafer Works Corp. | 549,710 | 152 |
| FSP Technology Inc. | 195,428 | 149 |
| * Champion Building Materials Co. Ltd. | 658,000 | 145 |
| * China Electric Manufacturing Corp. | 594,000 | 140 |
| Tsann Kuen Enterprise Co. Ltd. | 150,295 | 140 |
| * Global Brands Manufacture Ltd. | 402,045 | 139 |
| Ability Enterprise Co. Ltd. | 282,099 | 138 |
| GeoVision Inc. | 90,745 | 136 |
| * AGV Products Corp. | 534,424 | 127 |
| Sunrex Technology Corp. | 198,905 | 119 |
| * Dynamic Electronics Co. Ltd. | 400,468 | 118 |
| * Ta Ya Electric Wire & Cable | 694,440 | 115 |
| ENG Electric Co. Ltd. | 218,004 | 115 |
| * LES Enphants Co. Ltd. | 261,059 | 103 |
| * Phihong Technology Co. Ltd. | 327,618 | 103 |
| Advanced International Multitech Co. Ltd. | 156,000 | 99 |
| Chinese Maritime Transport Ltd. | 129,350 | 99 |
| ACES Electronic Co. Ltd. | 128,000 | 98 |
| * Shih Wei Navigation Co. Ltd. | 341,784 | 97 |
| Young Optics Inc. | 99,000 | 84 |
| Ambassador Hotel | 67,469 | 53 |
| XPEC Entertainment Inc. | 125,457 | 46 |
| Continental Holdings Corp. | 10,600 | 3 |
| | | 208,573 |
94
| | | |
| Vanguard® FTSE All-World ex-US Small-Cap Index Fund | | |
| Schedule of Investments | | |
| October 31, 2016 | | |
| |
| | | | Market |
| | | | Value |
| | | Shares | ($000) |
| Thailand (1.5%) | | |
| * | KCE Electronics PCL | 683,400 | 2,188 |
| * | Digital Telecommunications Infrastructure Fund | 4,826,400 | 2,068 |
| * | BTS Rail Mass Transit Growth Infrastructure Fund | 4,882,176 | 1,701 |
| * | Bangchak Petroleum PCL | 1,833,600 | 1,584 |
| * | Jasmine Broadband Internet Infrastructure Fund | 4,163,400 | 1,439 |
| * | Group Lease PCL | 1,069,500 | 1,404 |
| * | CH Karnchang PCL | 1,625,600 | 1,369 |
| | Jasmine International PCL | 5,611,188 | 1,337 |
| * | Robinson Department Store PCL | 716,800 | 1,185 |
| * | TPI Polene PCL | 17,166,800 | 1,077 |
| | Thanachart Capital PCL NVDR | 871,600 | 983 |
| * | Bangkok Land PCL | 20,507,600 | 926 |
| * | Superblock PCL | 19,844,900 | 901 |
| * | Krungthai Card PCL | 209,300 | 896 |
| * | Kiatnakin Bank PCL (Local) | 510,800 | 853 |
| *,2 | Star Petroleum Refining PCL | 2,279,000 | 818 |
| * | Siam Global House PCL | 1,825,049 | 803 |
| * | Srisawad Power 1979 PCL | 701,507 | 801 |
| * | Global Power Synergy Co. Ltd. | 758,700 | 769 |
| * | Bangkok Airways PCL | 1,079,300 | 767 |
| | Supalai PCL NVDR | 1,088,100 | 758 |
| * | Major Cineplex Group PCL | 907,144 | 750 |
| * | Carabao Group PCL | 377,900 | 745 |
| * | Tisco Financial Group PCL | 489,300 | 724 |
| * | Thanachart Capital PCL | 630,320 | 710 |
| ^ | Sino-Thai Engineering & Construction PCL NVDR | 942,800 | 686 |
| * | Chularat Hospital PCL | 8,350,860 | 672 |
| * | Bangkok Chain Hospital PCL (Local) | 1,726,548 | 650 |
| | Kiatnakin Bank PCL (Foreign) | 389,200 | 650 |
| ^ | Central Plaza Hotel PCL NVDR | 575,200 | 623 |
| * | Thai Vegetable Oil PCL | 647,800 | 620 |
| * | PTG Energy PCL | 754,807 | 619 |
| * | Sansiri PCL (Local) | 12,852,600 | 609 |
| * | Thaicom PCL | 969,540 | 575 |
| * | Quality Houses PCL (Local) | 8,028,633 | 573 |
| ^ | Central Plaza Hotel PCL | 526,790 | 571 |
| * | Tisco Financial Group PCL | 377,750 | 559 |
| * | Hana Microelectronics PCL | 605,036 | 553 |
| | Sino-Thai Engineering & Construction PCL (Foreign) | 759,099 | 553 |
| * | Muangthai Leasing PCL | 1,025,500 | 550 |
| ^ | Bangkok Expressway & Metro PCL | 2,581,033 | 549 |
| * | Gunkul Engineering PCL | 3,868,560 | 548 |
| * | Dynasty Ceramic PCL | 4,280,000 | 545 |
| *,^ | Italian-Thai Development PCL | 3,789,900 | 536 |
| ^ | VGI Global Media PCL - NVDR | 3,253,600 | 529 |
| | AP Thailand PCL | 2,596,200 | 526 |
| * | Vibhavadi Medical Center PCL | 6,204,200 | 525 |
| * | CK Power PCL | 5,013,500 | 508 |
| * | Esso Thailand PCL | 1,741,000 | 502 |
| * | Tipco Asphalt PCL | 931,500 | 481 |
| * | U City PCL | 543,102,375 | 466 |
| * | Pruksa Real Estate PCL (Local) | 664,690 | 438 |
| * | Unique Engineering & Construction PCL | 899,200 | 436 |
| | momo.com Inc. | 66,000 | 428 |
| * | Univentures PCL (Local) | 2,482,288 | 411 |
| * | Amata Corp. PCL | 1,193,600 | 395 |
| * | Inter Far East Energy Corp. | 3,110,400 | 384 |
| ^ | Thoresen Thai Agencies PCL (Foreign) | 1,399,625 | 364 |
| * | GFPT PCL | 834,000 | 362 |
| | TTW PCL | 1,201,300 | 360 |
| * | Supalai PCL | 507,600 | 354 |
| * | Sri Trang Agro-Industry PCL | 900,100 | 347 |
| *,^ | WHA Corp. PCL | 3,527,247 | 332 |
95
| | | |
| Vanguard® FTSE All-World ex-US Small-Cap Index Fund | | |
| Schedule of Investments | | |
| October 31, 2016 | | |
| |
| | | | Market |
| | | | Value |
| | | Shares | ($000) |
| * | TICON Industrial Connection PCL | 777,700 | 330 |
| * | SPCG PCL | 544,700 | 317 |
| * | IMPACT Growth REIT | 637,600 | 284 |
| ^ | Hana Microelectronics PCL (Foreign) | 307,510 | 281 |
| | Tisco Financial Group PCL (Foreign) | 172,150 | 255 |
| * | LPN Development PCL | 742,500 | 242 |
| | Pruksa Real Estate PCL (Foreign) | 361,400 | 238 |
| * | LPN Development PCL | 685,211 | 223 |
| * | Samart Corp. PCL | 548,021 | 221 |
| | VGI Global Media PCL (Foreign) | 1,311,288 | 213 |
| * | WHA Corp. PCL | 2,187,000 | 206 |
| * | Thoresen Thai Agencies PCL (Local) | 790,544 | 206 |
| *,^ | Italian-Thai Development PCL (Foreign) | 1,360,202 | 192 |
| | Asian Property Development PCL (Foreign) | 861,256 | 174 |
| * | Group Lease PCL | 124,500 | 163 |
| ^ | Quality Houses PCL (Foreign) | 2,133,757 | 152 |
| ^ | TTW PCL | 490,400 | 147 |
| * | Cal-Comp Electronics Thailand PCL | 1,986,916 | 143 |
| | TTW PCL | 441,400 | 132 |
| | Maybank Kim Eng Securities Thailand PCL | 197,500 | 124 |
| * | Italian-Thai Development PCL (Local) | 845,908 | 120 |
| | Samart Corp. PCL (Foreign) | 243,200 | 98 |
| *,^ | Precious Shipping PCL - NVDR | 539,500 | 93 |
| *,^ | Precious Shipping PCL (Foreign) | 403,800 | 70 |
| | Sansiri PCL (Foreign) | 1,403,050 | 66 |
| * | Group Lease PCL Warrants Exp. 07/31/2018 | 111,522 | 48 |
| * | Sino-Thai Engineering & Construction PCL | 64,316 | 47 |
| * | BTS Group Holdings PCL Warrants Exp. 11/01/2018 | 976,408 | 20 |
| * | VGI Global Media PCL | 104,424 | 17 |
| * | CK Power PCL Foreign Line Warrants Exp. 05/28/2020 | 1,015,920 | 15 |
| * | WHA Corp. PCL Warrants Exp.12/31/2019 | 56,618 | 13 |
| * | TPI Polene PCL Rights | 105,008 | 10 |
| | BCPG PCL | 21,550 | 8 |
| * | Sansiri PCL Foreign Warrants Exp. 11/24/2017 | 1,403,050 | 8 |
| * | VGI Global Media PCL Foreign Warrants Exp. 08/01/2018 | 448,000 | 6 |
| * | Thoresen Thai Agencies PCL Warrants Exp. 02/28/2019 | 166,980 | 6 |
| * | VGI Global Media PCL NVDR Warrants Exp. 08/01/2018 | 342,800 | 5 |
| * | Srisawad Power 1979 PCL Warrants Exp. 05/20/2020 | 22,387 | 5 |
| * | G J Steel PCL Warrants Exp. 01/30/2020 | 1,627,035 | 3 |
| * | Italian-Thai Development PCL (Foreign) Warrants Exp. 05/13/2019 | 272,040 | — |
| * | Italian-Thai Development PCL Warrants Exp. 05/13/2019 | 135,261 | — |
| * | Samart Corp. PCL Warrants Exp. 02/11/2018 | 106,504 | — |
| * | Precious Shipping PCL Warrants | 23,790 | — |
| | | | 51,846 |
| Turkey (0.3%) | | |
| | Soda Sanayii AS | 463,770 | 644 |
| | Tekfen Holding AS | 195,763 | 497 |
| | Cimsa Cimento Sanayi VE Ticaret AS | 76,953 | 383 |
| | Dogus Otomotiv Servis ve Ticaret AS | 117,516 | 379 |
| | Otokar Otomotiv Ve Savunma Sanayi A.S. | 11,247 | 372 |
| | Trakya Cam Sanayii AS | 449,887 | 371 |
| | Torunlar Gayrimenkul Yatirim Ortakligi AS | 233,382 | 370 |
| * | Dogan Sirketler Grubu Holding AS | 1,280,370 | 330 |
| | Kardemir Karabuk Demir Celik Sanayi ve Ticaret AS | 802,024 | 327 |
| * | Aksa Enerji Uretim AS Class B | 339,001 | 308 |
| | Is Gayrimenkul Yatirim Ortakligi AS | 578,216 | 294 |
| | Aksa Akrilik Kimya Sanayii AS | 100,677 | 284 |
| | Bizim Toptan Satis Magazalari AS | 63,402 | 266 |
| * | Besiktas Futbol Yatirimlari Sanayi ve Ticaret AS | 177,773 | 251 |
| * | Koza Anadolu Metal Madencilik Isletmeleri AS | 335,866 | 251 |
| * | Vestel Elektronik Sanayi ve Ticaret AS | 116,634 | 248 |
| | AvivaSA Emeklilik ve Hayat AS | 36,150 | 244 |
| | EIS Eczacibasi Ilac ve Sinai ve Finansal Yatirimlar Sanayi ve Ticaret AS | 190,605 | 241 |
| * | Pegasus Hava Tasimaciligi AS | 54,111 | 229 |
96
| | | |
| Vanguard® FTSE All-World ex-US Small-Cap Index Fund | | |
| Schedule of Investments | | |
| October 31, 2016 | | |
| |
| | | | Market |
| | | | Value |
| | | Shares | ($000) |
| * | NET Holding AS | 226,687 | 226 |
| | Gubre Fabrikalari TAS | 134,487 | 222 |
| | Tat Gida Sanayi AS | 118,222 | 218 |
| * | Sekerbank TAS | 561,008 | 212 |
| * | Afyon Cimento Sanayi TAS | 80,293 | 206 |
| * | Zorlu Enerji Elektrik Uretim AS | 340,134 | 181 |
| | Goltas Goller Bolgesi Cimento Sanayi ve Ticaret A.S. | 7,396 | 174 |
| | Albaraka Turk Katilim Bankasi AS | 421,768 | 169 |
| | Kardemir Karabuk Demir Celik Sanayi ve Ticaret AS Class A | 367,602 | 165 |
| | Anadolu Hayat Emeklilik AS | 97,834 | 156 |
| | Konya Cimento Sanayii AS | 1,789 | 156 |
| * | Bagfas Bandirma Gubre Fabrikalari AS | 41,841 | 146 |
| | Brisa Bridgestone Sabanci Sanayi ve Ticaret AS | 58,654 | 132 |
| | EGE Endustri VE Ticaret AS | 1,874 | 128 |
| * | Vakif Gayrimenkul Yatirim Ortakligi AS | 163,710 | 127 |
| | Alarko Holding AS | 97,496 | 122 |
| * | Anadolu Cam Sanayii AS | 167,472 | 121 |
| | Adana Cimento Sanayii TAS Class A | 59,980 | 121 |
| * | Aksigorta AS | 178,803 | 117 |
| * | Ipek Dogal Enerji Kaynaklari Arastirma Ve Uretim AS | 140,292 | 102 |
| * | Akenerji Elektrik Uretim AS | 250,571 | 78 |
| * | Ihlas Holding AS | 681,799 | 75 |
| | Turcas Petrol AS | 139,059 | 69 |
| * | Asya Katilim Bankasi AS | 975,452 | — |
| | | | 9,712 |
| United Arab Emirates (0.1%) | | |
| | Amanat Holdings PJSC | 2,732,672 | 651 |
| * | Eshraq Properties Co. PJSC | 2,629,115 | 564 |
| * | Amlak Finance PJSC | 907,005 | 305 |
| | National Central Cooling Co. PJSC | 547,016 | 267 |
| | RAK Properties PJSC | 1,481,443 | 249 |
| * | Drake & Scull International PJSC | 1,175,278 | 145 |
| | Aramex PJSC | 63,513 | 61 |
| | | | 2,242 |
| United Kingdom (11.2%) | | |
| | Spirax-Sarco Engineering plc | 115,195 | 6,211 |
| | Melrose Industries plc | 2,982,945 | 6,156 |
| | RPC Group plc | 523,910 | 6,076 |
| | IG Group Holdings plc | 573,775 | 5,794 |
| | Hiscox Ltd. | 448,866 | 5,605 |
| | UBM plc | 617,892 | 5,425 |
| | BBA Aviation plc | 1,650,388 | 5,219 |
| | Shaftesbury plc | 441,128 | 4,949 |
| * | BTG plc | 607,650 | 4,890 |
| | Spectris plc | 189,070 | 4,734 |
| *,^ | Tullow Oil plc | 1,452,740 | 4,691 |
| | Indivior plc | 1,155,562 | 4,438 |
| | Greene King plc | 491,963 | 4,401 |
| * | Metro Bank plc | 125,326 | 4,239 |
| * | Paysafe Group plc | 768,183 | 4,060 |
| | Great Portland Estates plc | 550,666 | 3,996 |
| * | GVC Holdings plc | 458,166 | 3,903 |
| | Close Brothers Group plc | 239,053 | 3,879 |
| | Hays plc | 2,307,317 | 3,854 |
| | Playtech plc | 337,595 | 3,829 |
| | Man Group plc | 2,475,799 | 3,774 |
| | Beazley plc | 839,169 | 3,736 |
| | Balfour Beatty plc | 1,107,667 | 3,672 |
| | Phoenix Group Holdings | 396,948 | 3,546 |
| | Jupiter Fund Management plc | 672,239 | 3,544 |
| | Rotork plc | 1,391,321 | 3,471 |
| * | Intermediate Capital Group plc | 468,368 | 3,469 |
| | Amec Foster Wheeler plc | 626,621 | 3,419 |
| | Centamin plc | 1,760,291 | 3,409 |
97
| | |
| Vanguard® FTSE All-World ex-US Small-Cap Index Fund | | |
| Schedule of Investments | | |
| October 31, 2016 | | |
| |
| | | Market |
| | | Value |
| | Shares | ($000) |
| Domino's Pizza Group plc | 803,117 | 3,339 |
| Electrocomponents plc | 716,020 | 3,262 |
| Regus plc | 1,068,799 | 3,252 |
| Berendsen plc | 274,861 | 3,244 |
| SSP Group plc | 767,418 | 3,189 |
| UDG Healthcare plc | 398,503 | 3,185 |
| WH Smith plc | 175,471 | 3,158 |
| B&M European Value Retail SA | 1,098,333 | 3,153 |
| HomeServe plc | 420,721 | 3,141 |
| National Express Group plc | 688,989 | 3,095 |
| AA plc | 977,805 | 3,058 |
| WS Atkins plc | 163,666 | 3,024 |
| * Serco Group plc | 1,796,409 | 3,009 |
| Tritax Big Box REIT plc | 1,747,823 | 2,908 |
| Victrex plc | 134,632 | 2,883 |
| Lancashire Holdings Ltd. | 325,778 | 2,778 |
| Britvic plc | 407,864 | 2,767 |
| Moneysupermarket.com Group plc | 858,132 | 2,748 |
| Greencore Group plc | 671,789 | 2,711 |
| QinetiQ Group plc | 948,176 | 2,670 |
| Essentra plc | 428,356 | 2,670 |
| * Firstgroup plc | 1,979,245 | 2,651 |
| Ultra Electronics Holdings plc | 116,189 | 2,640 |
| Dignity plc | 80,101 | 2,598 |
| Kier Group plc | 153,416 | 2,551 |
| Dechra Pharmaceuticals plc | 151,957 | 2,501 |
| UNITE Group plc | 364,015 | 2,466 |
| ^ Ladbrokes plc | 1,506,030 | 2,459 |
| Kennedy Wilson Europe Real Estate plc | 195,545 | 2,427 |
| Drax Group plc | 624,912 | 2,421 |
| * Ocado Group plc | 719,846 | 2,419 |
| AVEVA Group plc | 105,533 | 2,376 |
| Bodycote plc | 317,835 | 2,303 |
| ^ Carillion plc | 717,763 | 2,200 |
| * Cairn Energy plc | 882,662 | 2,194 |
| Cineworld Group plc | 324,917 | 2,146 |
| Genus plc | 93,349 | 2,144 |
| JD Sports Fashion plc | 113,177 | 2,104 |
| Bovis Homes Group plc | 223,946 | 2,073 |
| Pagegroup plc | 468,236 | 2,073 |
| Elementis plc | 708,095 | 2,065 |
| * SVG Capital plc | 235,454 | 2,023 |
| Crest Nicholson Holdings plc | 406,679 | 2,021 |
| Grafton Group plc | 331,331 | 2,012 |
| Big Yellow Group plc | 237,585 | 2,010 |
| Diploma plc | 173,310 | 1,986 |
| 2 Spire Healthcare Group plc | 429,406 | 1,951 |
| Renishaw plc | 60,820 | 1,917 |
| Galliford Try plc | 126,670 | 1,899 |
| PZ Cussons plc | 459,236 | 1,880 |
| * Thomas Cook Group plc | 2,208,871 | 1,877 |
| Vesuvius plc | 416,546 | 1,859 |
| 2 John Laing Group plc | 561,381 | 1,858 |
| * Evraz plc | 734,012 | 1,840 |
| Greggs plc | 155,248 | 1,815 |
| BGEO Group plc | 49,982 | 1,806 |
| Synthomer plc | 412,168 | 1,802 |
| Assura plc | 2,499,827 | 1,801 |
| Fidessa Group plc | 58,990 | 1,774 |
| Paragon Group of Cos. plc | 431,536 | 1,750 |
| NMC Health plc | 96,636 | 1,726 |
| * Vectura Group plc | 1,035,248 | 1,714 |
| Grainger plc | 628,334 | 1,701 |
| Savills plc | 198,953 | 1,688 |
98
| | | |
| Vanguard® FTSE All-World ex-US Small-Cap Index Fund | | |
| Schedule of Investments | | |
| October 31, 2016 | | |
| |
| | | | Market |
| | | | Value |
| | | Shares | ($000) |
| | Go-Ahead Group plc | 65,292 | 1,656 |
| | LondonMetric Property plc | 895,348 | 1,634 |
| | Dairy Crest Group plc | 215,295 | 1,607 |
| | Tullett Prebon plc | 368,573 | 1,601 |
| | Stagecoach Group plc | 658,125 | 1,592 |
| | Redrow plc | 334,929 | 1,556 |
| | Hansteen Holdings plc | 1,139,165 | 1,501 |
| | Acacia Mining plc | 231,846 | 1,472 |
| * | Petra Diamonds Ltd. | 784,031 | 1,460 |
| | Pets at Home Group plc | 558,546 | 1,459 |
| | Morgan Advanced Materials plc | 436,943 | 1,455 |
| | esure Group plc | 433,548 | 1,441 |
| | Marston's plc | 876,332 | 1,433 |
| | Entertainment One Ltd. | 499,661 | 1,420 |
| | Virgin Money Holdings UK plc | 352,023 | 1,417 |
| | Dunelm Group plc | 151,597 | 1,404 |
| | Restaurant Group plc | 305,132 | 1,400 |
| | Safestore Holdings plc | 316,532 | 1,389 |
| | Mitie Group plc | 538,841 | 1,385 |
| | Workspace Group plc | 179,747 | 1,383 |
| * | KAZ Minerals plc | 394,213 | 1,377 |
| | Senior plc | 634,916 | 1,353 |
| 2 | Zoopla Property Group plc | 358,284 | 1,336 |
| | Telecom Plus plc | 91,855 | 1,330 |
| | Brewin Dolphin Holdings plc | 415,663 | 1,322 |
| | J D Wetherspoon plc | 123,366 | 1,313 |
| | Ted Baker plc | 43,053 | 1,303 |
| 2 | Hastings Group Holdings plc | 477,772 | 1,278 |
| | SuperGroup plc | 77,061 | 1,268 |
| | Halfords Group plc | 304,491 | 1,266 |
| *,2 | Wizz Air Holdings plc | 68,434 | 1,264 |
| | F&C Commercial Property Trust Ltd. | 806,945 | 1,240 |
| | Debenhams plc | 1,876,085 | 1,232 |
| | International Personal Finance plc | 342,061 | 1,232 |
| | Mitchells & Butlers plc | 358,743 | 1,223 |
| ^ | Hunting plc | 192,095 | 1,181 |
| | SIG plc | 869,266 | 1,176 |
| | Hochschild Mining plc | 356,363 | 1,162 |
| | Vedanta Resources plc | 131,628 | 1,150 |
| | KCOM Group plc | 781,910 | 1,127 |
| | Card Factory plc | 354,936 | 1,103 |
| | De La Rue plc | 154,170 | 1,080 |
| * | Imagination Technologies Group plc | 381,042 | 1,054 |
| | Northgate plc | 202,897 | 1,042 |
| 2 | Sophos Group plc | 359,004 | 1,016 |
| | Lonmin plc | 431,420 | 1,006 |
| | UK Commercial Property Trust Ltd. | 1,015,081 | 969 |
| | Redefine International PLC | 1,865,618 | 947 |
| | NCC Group plc | 399,992 | 929 |
| | Computacenter plc | 104,150 | 926 |
| | Interserve plc | 219,973 | 914 |
| 2 | McCarthy & Stone plc | 444,007 | 912 |
| | Keller Group plc | 108,740 | 905 |
| | St. Modwen Properties plc | 269,750 | 903 |
| | Polypipe Group plc | 291,775 | 900 |
| * | Ophir Energy plc | 1,042,563 | 880 |
| * | Enterprise Inns plc | 761,133 | 859 |
| * | Allied Minds plc | 202,145 | 839 |
| | Fenner plc | 306,896 | 822 |
| * | Chemring Group plc | 432,606 | 768 |
| | Chesnara plc | 193,322 | 753 |
| | Picton Property Income Ltd. | 856,568 | 743 |
| | Laird plc | 413,186 | 732 |
| | 888 Holdings plc | 269,006 | 716 |
99
| | | | | |
| Vanguard® FTSE All-World ex-US Small-Cap Index Fund | | | | |
| Schedule of Investments | | | | |
| October 31, 2016 | | | | |
| |
| | | | | | Market |
| | | | | | Value |
| | | | | Shares | ($000) |
| 2 | Ibstock plc | | | 349,295 | 712 |
| | Devro plc | | | 256,088 | 712 |
| | RPS Group plc | | | 329,972 | 679 |
| | Shanks Group plc | | | 614,741 | 675 |
| | ITE Group plc | | | 380,426 | 674 |
| *,2 | Countryside Properties plc | | | 235,122 | 670 |
| | Oxford Instruments plc | | | 80,991 | 670 |
| * | Premier Oil plc | | | 782,860 | 630 |
| * | Phoenix Group Holdings Rights Exp. 11/08/2016 | | | 231,552 | 629 |
| | Xaar plc | | | 121,775 | 626 |
| | Lookers plc | | | 491,547 | 620 |
| | Rank Group plc | | | 262,274 | 620 |
| * | Aldermore Group plc | | | 281,481 | 595 |
| * | Premier Foods plc | | | 1,057,504 | 589 |
| | Soco International plc | | | 332,522 | 561 |
| * | Nostrum Oil & Gas plc | | | 128,526 | 553 |
| | N Brown Group plc | | | 233,507 | 545 |
| | Schroder REIT Ltd. | | | 787,758 | 544 |
| | Foxtons Group plc | | | 400,619 | 525 |
| | Countrywide plc | | | 234,547 | 515 |
| | OneSavings Bank plc | | | 144,182 | 511 |
| * | AO World plc | | | 261,157 | 504 |
| | Daejan Holdings plc | | | 7,393 | 492 |
| | Helical plc | | | 151,972 | 492 |
| *,2 | Shawbrook Group plc | | | 174,370 | 480 |
| | Cape plc | | | 178,436 | 454 |
| * | Lamprell plc | | | 401,149 | 360 |
| 2 | CMC Markets plc | | | 149,265 | 347 |
| * | Mothercare plc | | | 227,394 | 298 |
| *,^ | Genel Energy plc | | | 262,052 | 261 |
| * | Shanks Group plc Rights | | | 230,527 | 89 |
| *,^ | Afren plc | | | 1,404,272 | 31 |
| |
| | | | | | 374,333 |
| |
| Total Common Stocks (Cost $3,428,705) | | | | 3,316,696 |
| |
| |
| | | Coupon | | | |
| |
| Temporary Cash Investments (8.3%)1 | | | | |
| Money Market Fund (8.1%) | | | | |
| 4,5 | Vanguard Market Liquidity Fund | 0.718% | | 2,716,461 | 271,673 |
| |
| |
| | | | | Face | |
| | | | Maturity | Amount | |
| | | | Date | ($000) | |
| U.S. Government and Agency Obligations (0.2%) | | | | |
| 6,7 | Federal Home Loan Bank Discount Notes | 0.381% | 12/21/16 | 1,000 | 1,000 |
| 7 | United States Treasury Bill | 0.320%-0.341% | 12/8/16 | 1,500 | 1,500 |
| 7 | United States Treasury Bill | 0.280%-0.300% | 12/22/16 | 4,400 | 4,398 |
| |
| | | | | | 6,898 |
| |
| Total Temporary Cash Investments (Cost $278,546) | | | | 278,571 |
| |
| Total Investments (107.4%) (Cost $3,707,251) | | | | 3,595,267 |
| 5Other Assets and Liabilities—Net (-7.4%) | | | | (248,598) |
| |
| Net Assets (100%) | | | | 3,346,669 |
* Non-income-producing security.
^ Includes partial security positions on loan to broker-dealers. The total value of securities on loan is $243,504,000.
100
Vanguard® FTSE All-World ex-US Small-Cap Index Fund
Schedule of Investments
October 31, 2016
1 The fund invests a portion of its cash reserves in equity markets through the use of index futures contracts. After giving effect to futures
investments, the fund's effective common stock and temporary cash investment positions represent 100.0% and 7.4%, respectively, of net
assets.
2 Security exempt from registration under Rule 144A of the Securities Act of 1933. Such securities may be sold in transactions exempt from
registration, normally to qualified institutional buyers. At October 31, 2016, the aggregate value of these securities was $72,621,000,
representing 2.2% of net assets.
3 “Other” represents securities that are not classified by the fund’s benchmark index.
4 Affiliated money market fund available only to Vanguard funds and certain trusts and accounts managed by Vanguard. Rate shown is the 7-day
yield.
5 Includes a portion of $261,189,000 of collateral received for securities on loan.
6 The issuer operates under a congressional charter; its securities are generally neither guaranteed by the U.S. Treasury nor backed by the full
faith and credit of the U.S. government.
7 Securities with a value of $2,299,000 have been segregated as initial margin for open futures contracts.
NVDR—Non-Voting Depository Receipt.
REIT—Real Estate Investment Trust.
__________________________________________________________________________________________________________________________________________________________________________________________________________________________________________________________________________________________________________________________________________________________________________________________________________________________________________________________________________________________________________________________________________________________________________________________________________________________________________________________________________________________
__________________________________________________________________________________________________________________________________________________________________________________________________________________________________________________________________________________________________________________________________________________________________________________________________________________________________________________________________________________________________________________________________________________________________________________________________________________________________________________________________________________________
101
© 2016 The Vanguard Group, Inc.
All rights reserved.
Vanguard Marketing Corporation, Distributor.
SNA7700 122016
Vanguard® Emerging Markets Stock Index Fund
Schedule of Investments
October 31, 2016
| | | |
| | | | Market |
| | | | Value |
| | | Shares | ($000) |
| |
| Common Stocks (99.0%)1 | | |
| Brazil (9.1%) | | |
| | Itau Unibanco Holding SA Preference Shares | 27,781,186 | 334,210 |
| | Ambev SA | 52,785,855 | 311,390 |
| * | Petroleo Brasileiro SA | 48,210,897 | 281,532 |
| | Banco Bradesco SA Preference Shares | 26,049,295 | 272,897 |
| * | Petroleo Brasileiro SA Preference Shares | 47,865,186 | 265,268 |
| | Itau Unibanco Holding SA ADR | 19,605,348 | 233,892 |
| | BRF SA | 10,357,514 | 173,274 |
| | Itausa - Investimentos Itau SA Preference Shares | 58,123,729 | 171,895 |
| | Banco Bradesco SA ADR | 16,330,183 | 169,997 |
| | Cielo SA | 15,729,792 | 159,663 |
| | BM&FBovespa SA - Bolsa de Valores Mercadorias e Futuros | 26,131,648 | 153,908 |
| | Ultrapar Participacoes SA | 5,785,857 | 131,106 |
| | Banco do Brasil SA | 12,959,352 | 118,916 |
| | Kroton Educacional SA | 23,015,988 | 114,647 |
| * | Vale SA Preference Shares | 17,251,286 | 111,496 |
| | Ambev SA ADR | 17,441,764 | 102,906 |
| | Banco Bradesco SA | 9,477,394 | 94,210 |
| | BB Seguridade Participacoes SA | 9,111,343 | 91,741 |
| * | Petroleo Brasileiro SA ADR (XNYS) Preference Shares | 8,139,235 | 90,020 |
| * | Vale SA | 12,445,212 | 86,087 |
| | Raia Drogasil SA | 3,828,627 | 84,993 |
| | Lojas Renner SA | 9,945,312 | 84,124 |
| | Telefonica Brasil SA Preference Shares | 5,718,356 | 82,730 |
| | CCR SA | 13,232,901 | 71,927 |
| | Lojas Americanas SA Preference Shares | 9,947,723 | 64,511 |
| *,^ | Vale SA Class B ADR (XFRA) | 9,251,486 | 64,020 |
| * | Vale SA Class B ADR (XNYS) | 9,932,315 | 63,964 |
| | Equatorial Energia SA | 3,215,098 | 57,352 |
| | CETIP SA - Mercados Organizados | 3,631,540 | 51,049 |
| * | Petroleo Brasileiro SA ADR (XNYS) | 4,172,883 | 48,698 |
| | Hypermarcas SA | 5,739,611 | 48,118 |
| | WEG SA | 8,696,728 | 47,952 |
| | Engie Brasil Energia SA | 3,483,665 | 44,255 |
| | Klabin SA | 8,360,645 | 43,087 |
| | Embraer SA | 7,046,682 | 37,860 |
| * | BR Malls Participacoes SA | 9,193,787 | 36,810 |
| | CPFL Energia SA | 4,653,214 | 35,307 |
| ^ | Banco Santander Brasil SA ADR | 4,224,158 | 34,554 |
| | M Dias Branco SA | 767,126 | 32,759 |
| | JBS SA | 10,366,438 | 31,534 |
| * | Rumo Logistica Operadora Multimodal SA | 13,558,895 | 30,329 |
| | Gerdau SA Preference Shares | 8,777,162 | 30,302 |
| | Itau Unibanco Holding SA | 2,879,395 | 30,075 |
| | Cia de Saneamento Basico do Estado de Sao Paulo ADR | 2,796,744 | 29,422 |
| | Localiza Rent a Car SA | 2,347,913 | 29,150 |
| * | Centrais Eletricas Brasileiras SA | 3,910,274 | 29,033 |
| | Cia Brasileira de Distribuicao Grupo Pao de Acucar Preference Shares | 1,499,116 | 28,648 |
| | Cia de Saneamento Basico do Estado de Sao Paulo | 2,684,786 | 28,345 |
| | BTG Pactual Group | 5,250,874 | 26,748 |
| | Multiplan Empreendimentos Imobiliarios SA | 1,327,459 | 26,678 |
| | Fibria Celulose SA | 3,322,710 | 26,586 |
| | Cia Energetica de Minas Gerais Preference Shares | 8,572,689 | 26,185 |
| | Natura Cosmeticos SA | 2,629,192 | 25,254 |
| | Cosan SA Industria e Comercio | 1,847,487 | 24,842 |
| | EDP - Energias do Brasil SA | 5,147,139 | 24,752 |
| | Sul America SA | 3,958,256 | 23,896 |
| | Estacio Participacoes SA | 4,113,720 | 23,855 |
| * | Centrais Eletricas Brasileiras SA Preference Shares | 2,741,951 | 23,494 |
| | Qualicorp SA | 3,605,764 | 23,202 |
| | TIM Participacoes SA | 7,994,650 | 22,191 |
| | TOTVS SA | 2,312,469 | 20,980 |
1
| | | |
| Vanguard® Emerging Markets Stock Index Fund | | |
| Schedule of Investments | | |
| October 31, 2016 | | |
| |
| | | | Market |
| | | | Value |
| | | Shares | ($000) |
| | Embraer SA ADR | 946,731 | 20,251 |
| *,^ | Cia Siderurgica Nacional SA ADR | 5,604,871 | 18,888 |
| * | Cia Siderurgica Nacional SA | 5,027,948 | 16,917 |
| | Suzano Papel e Celulose SA Preference Shares Class A | 4,672,796 | 16,484 |
| | Cyrela Brazil Realty SA Empreendimentos e Participacoes | 4,799,198 | 16,163 |
| | Bradespar SA Preference Shares | 3,933,263 | 15,994 |
| | Cia Paranaense de Energia ADR | 1,359,830 | 15,516 |
| | Cia Brasileira de Distribuicao ADR | 810,665 | 15,443 |
| | Gerdau SA ADR | 4,502,009 | 15,442 |
| | Porto Seguro SA | 1,613,551 | 15,301 |
| | TIM Participacoes SA ADR | 1,085,508 | 15,034 |
| | Cia Energetica de Sao Paulo Preference Shares | 3,068,633 | 14,257 |
| | Fleury SA | 1,042,348 | 13,797 |
| | MRV Engenharia e Participacoes SA | 3,471,633 | 13,443 |
| | Duratex SA | 4,966,029 | 13,411 |
| | AES Tiete Energia SA | 2,568,193 | 13,308 |
| | Odontoprev SA | 3,518,554 | 13,228 |
| | Cia de Transmissao de Energia Eletrica Paulista Preference Shares | 607,067 | 13,172 |
| | Smiles SA | 718,080 | 13,106 |
| | Braskem SA Preference Shares | 1,397,378 | 12,376 |
| * | Metalurgica Gerdau SA Preference Shares Class A | 7,736,243 | 11,512 |
| | Multiplus SA | 848,161 | 11,500 |
| | Transmissora Alianca de Energia Eletrica SA | 1,768,536 | 11,497 |
| | Cia Hering | 1,813,035 | 10,996 |
| | CVC Brasil Operadora e Agencia de Viagens SA | 1,404,100 | 10,777 |
| * | EcoRodovias Infraestrutura e Logistica SA | 3,498,796 | 10,380 |
| | Sao Martinho SA | 515,092 | 10,258 |
| | Linx SA | 1,698,394 | 10,109 |
| * | B2W Cia Digital | 1,970,491 | 9,680 |
| | Banco do Estado do Rio Grande do Sul SA Preference Shares | 2,237,600 | 9,534 |
| | Cia Energetica de Minas Gerais ADR | 3,073,101 | 9,281 |
| ^ | Braskem SA ADR | 519,956 | 9,229 |
| | Lojas Americanas SA | 1,813,042 | 8,895 |
| ^ | BRF SA ADR | 505,042 | 8,444 |
| | Cia de Saneamento de Minas Gerais-COPASA | 808,517 | 8,440 |
| * | Usinas Siderurgicas de Minas Gerais SA Preference Shares | 5,965,088 | 8,428 |
| * | Centrais Eletricas Brasileiras SA ADR | 938,782 | 8,139 |
| | Alupar Investimento SA (BVMF) | 1,205,473 | 7,017 |
| | Valid Solucoes e Servicos de Seguranca em Meios de Pagamento e Identificacao SA | 745,412 | 6,985 |
| * | Minerva SA | 2,120,114 | 6,715 |
| * | Marcopolo SA Preference Shares | 6,573,933 | 6,714 |
| | Iguatemi Empresa de Shopping Centers SA | 668,222 | 6,312 |
| | Via Varejo SA | 2,084,100 | 5,974 |
| | Alpargatas SA Preference Shares | 1,591,981 | 5,292 |
| | Telefonica Brasil SA ADR | 351,924 | 5,068 |
| | Iochpe Maxion SA | 919,117 | 4,665 |
| | Cia de Gas de Sao Paulo COMGAS Preference Shares Class A | 275,321 | 4,485 |
| | Light SA | 783,089 | 4,305 |
| | Arezzo Industria e Comercio SA | 457,884 | 4,242 |
| | Gafisa SA | 5,436,011 | 4,189 |
| | Aliansce Shopping Centers SA | 787,377 | 4,139 |
| | BR Properties SA | 1,459,939 | 3,929 |
| | Eletropaulo Metropolitana Eletricidade de Sao Paulo SA Preference Shares | 1,209,350 | 3,921 |
| | Guararapes Confeccoes SA | 162,220 | 3,355 |
| * | Usinas Siderurgicas de Minas Gerais SA | 1,212,176 | 3,349 |
| | Cia Energetica de Minas Gerais | 1,050,595 | 3,193 |
| * | Marfrig Global Foods SA | 1,790,568 | 3,192 |
| | Even Construtora e Incorporadora SA | 2,202,300 | 3,063 |
| * | Gol Linhas Aereas Inteligentes SA Preference Shares | 1,239,202 | 3,051 |
| | Cia Paranaense de Energia Preference Shares | 263,705 | 3,020 |
| | CPFL Energia SA ADR | 196,944 | 2,994 |
| | Tupy SA | 712,192 | 2,956 |
| | Banco Santander Brasil SA | 326,000 | 2,686 |
| | Cia Paranaense de Energia | 356,887 | 2,644 |
2
| | |
| Vanguard® Emerging Markets Stock Index Fund | | |
| Schedule of Investments | | |
| October 31, 2016 | | |
| |
| | | Market |
| | | Value |
| | Shares | ($000) |
| 2 Ser Educacional SA | 375,396 | 2,431 |
| Mahle-Metal Leve SA | 347,373 | 2,408 |
| Grendene SA | 388,237 | 2,386 |
| * Randon Participacoes SA Preference Shares | 1,511,817 | 2,264 |
| Ez Tec Empreendimentos e Participacoes SA | 432,804 | 2,241 |
| * Magnesita Refratarios SA | 312,669 | 2,220 |
| JSL SA | 479,600 | 1,758 |
| * Eneva SA | 346,800 | 1,581 |
| GAEC Educacao SA | 366,826 | 1,551 |
| SLC Agricola SA | 308,615 | 1,529 |
| Sonae Sierra Brasil SA | 250,510 | 1,506 |
| QGEP Participacoes SA | 800,225 | 1,384 |
| Direcional Engenharia SA | 740,543 | 1,281 |
| * Aliansce Shopping Centers SA Receipts | 191,347 | 1,016 |
| * Santos Brasil Participacoes SA | 971,675 | 919 |
| * Marisa Lojas SA | 373,200 | 906 |
| Cia Energetica do Ceara Preference Shares | 50,700 | 757 |
| Paranapanema SA | 968,162 | 522 |
| * FPC Par Corretora de Seguros SA | 94,400 | 446 |
| * Mills Estruturas e Servicos de Engenharia SA | 167,841 | 262 |
| * Restoque Comercio e Confeccoes de Roupas SA | 162,904 | 199 |
| Itausa - Investimentos Itau SA | 51,353 | 143 |
| * PDG Realty SA Empreendimentos e Participacoes | 92,600 | 84 |
| * Cia de Gas de Sao Paulo - COMGAS | 178 | 3 |
| * Oi SA ADR | 1 | — |
| | | 5,704,508 |
| Chile (1.4%) | | |
| Empresas COPEC SA | 5,997,088 | 60,261 |
| SACI Falabella | 7,584,571 | 59,555 |
| Cencosud SA | 17,808,096 | 58,054 |
| * Latam Airlines Group SA (XSGO) | 5,522,112 | 52,891 |
| Banco de Chile | 430,908,163 | 51,289 |
| Banco de Credito e Inversiones | 833,063 | 42,818 |
| Empresas CMPC SA | 18,510,710 | 40,098 |
| Aguas Andinas SA Class A | 52,060,210 | 34,325 |
| Banco Santander Chile | 550,204,304 | 30,786 |
| Enersis Americas SA | 166,324,784 | 28,171 |
| Banco Santander Chile ADR | 1,224,108 | 27,971 |
| Cia Cervecerias Unidas SA | 2,519,454 | 27,061 |
| * Empresa Nacional de Telecomunicaciones SA | 2,511,049 | 26,928 |
| Colbun SA | 123,009,242 | 26,799 |
| * Itau CorpBanca | 2,765,668,253 | 25,141 |
| Enersis Americas SA ADR | 2,868,463 | 24,870 |
| Sociedad Quimica y Minera de Chile SA ADR | 822,329 | 24,061 |
| Sociedad Quimica y Minera de Chile SA Preference Shares Class B | 663,282 | 19,675 |
| Empresa Nacional de Electricidad SA | 28,174,325 | 19,435 |
| Empresa Nacional de Electricidad SA ADR | 900,055 | 18,685 |
| Enersis Chile SA | 178,592,081 | 17,881 |
| Embotelladora Andina SA Preference Shares | 4,069,203 | 16,318 |
| AES Gener SA | 43,407,111 | 14,789 |
| Parque Arauco SA | 5,730,961 | 14,212 |
| Endesa Americas SA | 29,313,967 | 13,640 |
| Vina Concha y Toro SA | 7,427,152 | 12,962 |
| Enersis Chile SA ADR | 2,529,928 | 12,574 |
| Endesa Americas SA ADR | 834,704 | 11,995 |
| SONDA SA | 4,154,961 | 8,587 |
| Inversiones Aguas Metropolitanas SA | 4,358,815 | 7,948 |
| Ripley Corp. SA | 11,461,932 | 7,190 |
| CAP SA | 819,583 | 5,721 |
| Engie Energia Chile SA | 2,735,106 | 4,853 |
| * Cia Sud Americana de Vapores SA | 159,801,296 | 3,259 |
| Forus SA | 453,372 | 1,634 |
3
| | | |
| Vanguard® Emerging Markets Stock Index Fund | | |
| Schedule of Investments | | |
| October 31, 2016 | | |
| |
| | | | Market |
| | | | Value |
| | | Shares | ($000) |
| | Inversiones La Construccion SA | 122,214 | 1,494 |
| | | | 853,931 |
| China (27.7%) | | |
| | Tencent Holdings Ltd. | 80,402,164 | 2,130,845 |
| | China Construction Bank Corp. | 1,361,995,111 | 994,593 |
| | China Mobile Ltd. | 79,235,456 | 907,753 |
| | Industrial & Commercial Bank of China Ltd. | 1,113,554,240 | 668,399 |
| | Bank of China Ltd. | 1,161,352,650 | 520,425 |
| | Ping An Insurance Group Co. of China Ltd. | 80,050,946 | 421,350 |
| | CNOOC Ltd. | 238,545,705 | 300,156 |
| | China Petroleum & Chemical Corp. | 393,698,659 | 284,723 |
| | China Life Insurance Co. Ltd. (XHKG) | 112,979,287 | 279,707 |
| | PetroChina Co. Ltd. | 312,836,155 | 214,054 |
| | Agricultural Bank of China Ltd. | 434,111,065 | 182,618 |
| | China Overseas Land & Investment Ltd. | 57,620,178 | 176,888 |
| | China Merchants Bank Co. Ltd. | 66,535,600 | 161,798 |
| | China Pacific Insurance Group Co. Ltd. | 43,046,394 | 155,199 |
| | China Minsheng Banking Corp. Ltd. | 110,333,241 | 125,539 |
| | China Telecom Corp. Ltd. | 242,161,271 | 124,849 |
| | China Shenhua Energy Co. Ltd. | 54,170,270 | 112,307 |
| | PICC Property & Casualty Co. Ltd. | 67,580,295 | 109,082 |
| | CITIC Ltd. | 74,223,897 | 106,509 |
| | Haitong Securities Co. Ltd. | 58,392,664 | 103,312 |
| | China Resources Land Ltd. | 41,274,696 | 102,507 |
| | China Unicom Hong Kong Ltd. | 86,542,017 | 101,602 |
| | Bank of Communications Co. Ltd. | 133,638,345 | 101,575 |
| | Hengan International Group Co. Ltd. | 10,981,373 | 87,244 |
| | CITIC Securities Co. Ltd. | 38,640,700 | 85,457 |
| | Sinopharm Group Co. Ltd. | 16,284,700 | 79,079 |
| | China Communications Construction Co. Ltd. | 71,048,276 | 78,015 |
| | China CITIC Bank Corp. Ltd. | 120,554,719 | 77,750 |
| *,^ | BYD Co. Ltd. | 11,642,281 | 76,645 |
| | Geely Automobile Holdings Ltd. | 72,797,300 | 74,905 |
| | CSPC Pharmaceutical Group Ltd. | 65,713,757 | 68,041 |
| | Lenovo Group Ltd. | 102,084,109 | 65,393 |
| | Guangdong Investment Ltd. | 43,312,080 | 65,303 |
| | CRRC Corp. Ltd. | 69,624,277 | 63,040 |
| | New China Life Insurance Co. Ltd. | 13,699,119 | 59,153 |
| | Country Garden Holdings Co. Ltd. | 112,577,728 | 58,424 |
| | Shenzhou International Group Holdings Ltd. | 8,647,065 | 57,275 |
| 2 | China Galaxy Securities Co. Ltd. | 58,479,870 | 55,520 |
| | China Cinda Asset Management Co. Ltd. | 152,160,000 | 54,664 |
| | Belle International Holdings Ltd. | 89,787,316 | 54,221 |
| * | China Resources Beer Holdings Co. Ltd. | 25,215,499 | 53,585 |
| | ENN Energy Holdings Ltd. | 11,356,374 | 53,390 |
| | Fosun International Ltd. | 36,195,767 | 52,414 |
| | Anhui Conch Cement Co. Ltd. | 18,890,152 | 52,211 |
| | China Resources Power Holdings Co. Ltd. | 29,989,048 | 50,812 |
| | Brilliance China Automotive Holdings Ltd. | 42,644,700 | 50,726 |
| | China Everbright International Ltd. | 41,962,000 | 50,163 |
| | China Railway Group Ltd. | 64,864,408 | 50,000 |
| | Great Wall Motor Co. Ltd. | 50,863,500 | 49,640 |
| | China Vanke Co. Ltd. | 18,474,741 | 48,220 |
| | China Merchants Port Holdings Co. Ltd. | 18,595,610 | 48,078 |
| | Dongfeng Motor Group Co. Ltd. | 45,270,744 | 47,185 |
| | Sunny Optical Technology Group Co. Ltd. | 9,653,000 | 47,076 |
| 2 | CGN Power Co. Ltd. | 160,659,878 | 46,905 |
| | Sino Biopharmaceutical Ltd. | 66,598,559 | 46,549 |
| ^ | Beijing Enterprises Water Group Ltd. | 62,162,000 | 44,965 |
| * | China Taiping Insurance Holdings Co. Ltd. | 23,268,820 | 44,785 |
| ^ | Fullshare Holdings Ltd. | 77,867,500 | 43,427 |
| | Guangzhou Automobile Group Co. Ltd. | 35,020,584 | 42,291 |
| 2 | Huatai Securities Co. Ltd. | 19,934,823 | 42,084 |
| 2 | People's Insurance Co. Group of China Ltd. | 105,149,000 | 41,779 |
4
| | | |
| Vanguard® Emerging Markets Stock Index Fund | | |
| Schedule of Investments | | |
| October 31, 2016 | | |
| |
| | | | Market |
| | | | Value |
| | | Shares | ($000) |
| | GF Securities Co. Ltd. Class A | 16,187,255 | 41,526 |
| | Beijing Enterprises Holdings Ltd. | 8,193,500 | 40,950 |
| | China Railway Construction Corp. Ltd. | 32,296,265 | 40,371 |
| | China State Construction International Holdings Ltd. | 27,442,872 | 40,035 |
| | ANTA Sports Products Ltd. | 13,791,000 | 39,771 |
| | China Conch Venture Holdings Ltd. | 21,262,133 | 39,692 |
| | China Longyuan Power Group Corp. Ltd. | 51,834,660 | 39,521 |
| *,^ | Alibaba Pictures Group Ltd. | 199,730,000 | 39,316 |
| | Zhuzhou CRRC Times Electric Co. Ltd. | 7,782,500 | 37,631 |
| | China Gas Holdings Ltd. | 24,612,900 | 37,464 |
| *,^ | China Evergrande Group | 56,472,466 | 37,172 |
| | Huaneng Power International Inc. | 59,206,978 | 36,393 |
| | China Resources Gas Group Ltd. | 11,428,100 | 35,834 |
| | Kunlun Energy Co. Ltd. | 46,321,230 | 34,901 |
| | TravelSky Technology Ltd. | 16,238,000 | 34,645 |
| | Kingboard Chemical Holdings Ltd. | 11,602,671 | 34,298 |
| | Far East Horizon Ltd. | 37,334,872 | 34,005 |
| | China Medical System Holdings Ltd. | 21,013,711 | 32,815 |
| | Haier Electronics Group Co. Ltd. | 20,086,000 | 32,373 |
| | Longfor Properties Co. Ltd. | 23,733,580 | 31,501 |
| | China Oilfield Services Ltd. | 31,941,800 | 30,657 |
| ^ | Kingsoft Corp. Ltd. | 13,082,000 | 29,326 |
| | Sinopec Shanghai Petrochemical Co. Ltd. | 57,364,788 | 29,242 |
| | Zijin Mining Group Co. Ltd. | 91,863,680 | 29,196 |
| | Shanghai Pharmaceuticals Holding Co. Ltd. | 11,201,353 | 28,825 |
| | Shenzhen International Holdings Ltd. | 18,621,500 | 28,756 |
| | Chongqing Rural Commercial Bank Co. Ltd. | 47,523,461 | 28,441 |
| | China Everbright Ltd. | 14,376,010 | 28,113 |
| *,^,2 | China Huarong Asset Management Co. Ltd. | 73,402,000 | 28,061 |
| | Shimao Property Holdings Ltd. | 21,012,457 | 28,028 |
| * | Shanghai Pudong Development Bank Co. Ltd. Class A (XSSC) | 11,324,593 | 27,169 |
| | Jiangsu Expressway Co. Ltd. | 19,910,139 | 27,070 |
| | Zhejiang Expressway Co. Ltd. | 25,006,704 | 26,181 |
| | Beijing Capital International Airport Co. Ltd. | 24,969,081 | 26,132 |
| | COSCO SHIPPING Ports Ltd. | 26,155,788 | 25,931 |
| | GCL-Poly Energy Holdings Ltd. | 191,897,800 | 25,865 |
| | Kweichow Moutai Co. Ltd. Class A (XSSC) | 544,732 | 25,552 |
| | China Communications Services Corp. Ltd. | 42,991,973 | 25,509 |
| | AviChina Industry & Technology Co. Ltd. | 37,443,000 | 25,410 |
| ^ | China Huishan Dairy Holdings Co. Ltd. | 68,212,365 | 25,319 |
| | China Everbright Bank Co. Ltd. | 54,675,472 | 24,928 |
| | Shanghai Industrial Holdings Ltd. | 7,914,445 | 24,196 |
| | Shanghai Lujiazui Finance & Trade Zone Development Co. Ltd. Class B | 15,393,342 | 23,964 |
| | GOME Electrical Appliances Holding Ltd. | 187,831,805 | 23,670 |
| ^ | Yanzhou Coal Mining Co. Ltd. | 31,809,320 | 23,558 |
| *,^ | Aluminum Corp. of China Ltd. | 63,391,220 | 23,545 |
| | Guangzhou R&F Properties Co. Ltd. | 16,630,500 | 23,438 |
| | Jiangxi Copper Co. Ltd. | 19,632,898 | 23,176 |
| | Weichai Power Co. Ltd. | 15,117,640 | 22,806 |
| * | Alibaba Health Information Technology Ltd. | 42,792,000 | 22,359 |
| * | Shanghai Electric Group Co. Ltd. | 48,287,756 | 22,295 |
| ^ | China National Building Material Co. Ltd. | 48,666,960 | 22,208 |
| | Huatai Securities Co. Ltd. Class A (XSSC) | 7,308,797 | 22,116 |
| * | Industrial Bank Co. Ltd. Class A (XSSC) | 9,163,869 | 22,053 |
| 2 | BAIC Motor Corp. Ltd. | 20,935,200 | 21,954 |
| | Huaneng Renewables Corp. Ltd. | 64,942,000 | 21,761 |
| | Sino-Ocean Group Holding Ltd. | 52,166,802 | 21,667 |
| | Chongqing Changan Automobile Co. Ltd. Class B | 14,142,062 | 21,563 |
| | Shenzhen Investment Ltd. | 49,431,015 | 21,545 |
| | Nine Dragons Paper Holdings Ltd. | 26,300,000 | 21,382 |
| *,^ | China Coal Energy Co. Ltd. | 37,583,800 | 21,277 |
| | Sunac China Holdings Ltd. | 30,434,406 | 20,771 |
| | Haitian International Holdings Ltd. | 9,704,000 | 20,004 |
| 2 | Shengjing Bank Co. Ltd. | 20,260,154 | 19,830 |
5
| | | |
| Vanguard® Emerging Markets Stock Index Fund | | |
| Schedule of Investments | | |
| October 31, 2016 | | |
| |
| | | | Market |
| | | | Value |
| | | Shares | ($000) |
| | Shandong Weigao Group Medical Polymer Co. Ltd. | 30,441,800 | 19,819 |
| | China Jinmao Holdings Group Ltd. | 71,106,094 | 19,607 |
| | Shanghai Fosun Pharmaceutical Group Co. Ltd. | 6,230,500 | 19,132 |
| | Air China Ltd. | 29,018,748 | 19,066 |
| | Skyworth Digital Holdings Ltd. | 28,754,000 | 18,560 |
| | Tsingtao Brewery Co. Ltd. | 4,620,000 | 18,431 |
| 2 | Sinopec Engineering Group Co. Ltd. | 20,204,772 | 17,838 |
| | Lee & Man Paper Manufacturing Ltd. | 23,365,000 | 17,556 |
| | China Southern Airlines Co. Ltd. | 31,218,000 | 17,519 |
| | Inner Mongolia Yitai Coal Co. Ltd. Class B | 17,723,998 | 17,486 |
| | Midea Group Co. Ltd. Class A | 4,332,991 | 17,352 |
| * | Li Ning Co. Ltd. | 23,812,791 | 16,976 |
| | China Power International Development Ltd. | 46,674,469 | 16,973 |
| ^,2 | China Railway Signal & Communication Corp. Ltd. | 20,740,400 | 16,817 |
| | Kingboard Laminates Holdings Ltd. | 18,187,500 | 16,298 |
| | Yuexiu Property Co. Ltd. | 110,145,732 | 16,137 |
| | ZTE Corp. | 11,624,592 | 15,972 |
| ^ | China Hongqiao Group Ltd. | 17,545,756 | 15,679 |
| ^ | Intime Retail Group Co. Ltd. | 19,820,000 | 15,520 |
| | Metallurgical Corp. of China Ltd. | 47,542,937 | 15,459 |
| ^ | Luye Pharma Group Ltd. | 22,491,500 | 15,118 |
| ^ | China Traditional Chinese Medicine Holding Co. Ltd. | 29,027,013 | 14,832 |
| *,^ | China COSCO Holdings Co. Ltd. | 43,008,000 | 14,819 |
| | China High Speed Transmission Equipment Group Co. Ltd. | 14,294,000 | 14,816 |
| ^ | Zhaojin Mining Industry Co. Ltd. | 14,374,000 | 14,757 |
| | SOHO China Ltd. | 28,578,006 | 14,736 |
| | Sinotrans Ltd. | 30,905,000 | 14,553 |
| | Agile Group Holdings Ltd. | 25,942,887 | 14,381 |
| ^ | China Molybdenum Co. Ltd. | 64,031,000 | 14,203 |
| | Kweichow Moutai Co. Ltd. Class A (XSHG) | 302,648 | 14,196 |
| * | China Agri-Industries Holdings Ltd. | 35,587,961 | 13,908 |
| | Sihuan Pharmaceutical Holdings Group Ltd. | 56,913,000 | 13,633 |
| | China Resources Cement Holdings Ltd. | 33,444,686 | 13,505 |
| ^ | Huishang Bank Corp. Ltd. | 28,076,380 | 13,483 |
| *,^,2 | 3SBio Inc. | 13,452,500 | 13,425 |
| | BBMG Corp. | 36,463,000 | 13,309 |
| *,^ | China Shipping Container Lines Co. Ltd. | 62,944,618 | 13,199 |
| | Fuyao Glass Industry Group Co. Ltd. Class A (XSHG) | 5,002,032 | 13,103 |
| | Hangzhou Hikvision Digital Technology Co. Ltd. Class A | 3,602,047 | 13,036 |
| ^ | Golden Eagle Retail Group Ltd. | 9,355,000 | 12,999 |
| | Ping An Bank Co. Ltd. Class A | 9,608,503 | 12,969 |
| * | China Construction Bank Corp. Class A | 16,697,218 | 12,956 |
| | Tong Ren Tang Technologies Co. Ltd. | 7,098,000 | 12,945 |
| | Datang International Power Generation Co. Ltd. | 46,996,568 | 12,661 |
| | China Merchants Shekou Industrial Zone Holdings Co. Ltd. Class A | 5,050,130 | 12,628 |
| ^,2 | Dali Foods Group Co. Ltd. | 23,901,000 | 12,438 |
| | GF Securities Co. Ltd. | 5,527,600 | 12,281 |
| *,^ | CAR Inc. | 11,955,532 | 12,127 |
| *,^,2 | Cogobuy Group | 7,772,000 | 12,105 |
| | Shenzhen Expressway Co. Ltd. | 12,078,000 | 12,104 |
| | SAIC Motor Corp. Ltd. Class A (XSSC) | 3,454,480 | 12,072 |
| ^ | Phoenix Healthcare Group Co. Ltd. | 7,478,000 | 11,883 |
| | KWG Property Holding Ltd. | 20,536,500 | 11,883 |
| ^ | China Reinsurance Group Corp. | 49,853,000 | 11,866 |
| | Wuliangye Yibin Co. Ltd. Class A | 2,236,198 | 11,541 |
| | Shenwan Hongyuan Group Co. Ltd. Class A | 12,122,481 | 11,530 |
| ^ | China Eastern Airlines Corp. Ltd. | 25,606,000 | 11,497 |
| 2 | Legend Holdings Corp. | 4,600,200 | 11,454 |
| ^ | China Zhongwang Holdings Ltd. | 24,557,686 | 11,337 |
| | China State Construction Engineering Corp. Ltd. Class A (XSSC) | 10,651,095 | 11,275 |
| | Guangshen Railway Co. Ltd. | 20,420,000 | 11,271 |
| ^ | Huadian Power International Corp. Ltd. | 26,172,000 | 11,217 |
| *,2 | China International Capital Corp. Ltd. | 7,592,800 | 11,142 |
| | CSG Holding Co. Ltd. Class B | 13,280,792 | 11,070 |
6
| | | |
| Vanguard® Emerging Markets Stock Index Fund | | |
| Schedule of Investments | | |
| October 31, 2016 | | |
| |
| | | | Market |
| | | | Value |
| | | Shares | ($000) |
| ^ | China Shipping Development Co. Ltd. | 19,976,021 | 11,021 |
| | Beijing Jingneng Clean Energy Co. Ltd. | 35,672,000 | 10,819 |
| | Zhongsheng Group Holdings Ltd. | 10,797,000 | 10,780 |
| *,^ | Greentown China Holdings Ltd. | 13,019,500 | 10,614 |
| | Lao Feng Xiang Co. Ltd. Class B | 3,104,906 | 10,583 |
| | Yantai Changyu Pioneer Wine Co. Ltd. Class B | 3,788,487 | 10,427 |
| | Hopson Development Holdings Ltd. | 11,428,000 | 10,303 |
| ^ | Xinjiang Goldwind Science & Technology Co. Ltd. | 7,395,200 | 10,195 |
| | CIFI Holdings Group Co. Ltd. | 34,546,000 | 10,163 |
| | Huadian Fuxin Energy Corp. Ltd. | 43,759,852 | 10,133 |
| | Ping An Insurance Group Co. of China Ltd. Class A | 1,979,552 | 10,103 |
| | Dazhong Transportation Group Co. Ltd. Class B | 14,421,708 | 10,075 |
| ^ | China International Marine Containers Group Co. Ltd. | 8,391,598 | 9,985 |
| ^ | Digital China Holdings Ltd. | 11,836,000 | 9,899 |
| *,^ | Kingdee International Software Group Co. Ltd. | 24,448,000 | 9,897 |
| *,^ | Poly Property Group Co. Ltd. | 31,297,900 | 9,896 |
| | China Dongxiang Group Co. Ltd. | 50,046,000 | 9,730 |
| | Agricultural Bank of China Ltd. Class A (XSHG) | 20,559,300 | 9,587 |
| | Qingdao Haier Co. Ltd. Class A (XSSC) | 6,433,725 | 9,476 |
| *,^ | Chinasoft International Ltd. | 20,172,000 | 9,473 |
| *,^ | Angang Steel Co. Ltd. | 18,440,374 | 9,443 |
| ^ | NetDragon Websoft Holdings Ltd. | 2,915,000 | 9,408 |
| | China Lesso Group Holdings Ltd. | 12,135,000 | 8,883 |
| | Tianneng Power International Ltd. | 9,746,000 | 8,798 |
| | China National Accord Medicines Corp. Ltd. Class B | 1,404,917 | 8,780 |
| | Fuyao Glass Industry Group Co. Ltd. Class A (XSSC) | 3,328,294 | 8,719 |
| | Bank of Beijing Co. Ltd. Class A (XSSC) | 6,301,988 | 8,664 |
| *,2 | Tianhe Chemicals Group Ltd. | 57,304,542 | 8,645 |
| | BYD Electronic International Co. Ltd. | 10,835,000 | 8,525 |
| | Anhui Gujing Distillery Co. Ltd. Class B | 2,189,234 | 8,499 |
| ^ | China South City Holdings Ltd. | 37,678,000 | 8,337 |
| * | Xinhua Winshare Publishing and Media Co. Ltd. | 8,150,000 | 8,307 |
| ^,2 | Red Star Macalline Group Corp. Ltd. | 7,701,559 | 8,288 |
| * | Industrial & Commercial Bank of China Ltd. Class A | 12,670,959 | 8,285 |
| | Shanghai Pudong Development Bank Co. Ltd. Class A (XSHG) | 3,426,289 | 8,220 |
| * | PetroChina Co. Ltd. Class A | 7,591,886 | 8,215 |
| ^ | Zoomlion Heavy Industry Science and Technology Co. Ltd. | 22,315,379 | 8,121 |
| | Shanghai Mechanical and Electrical Industry Co. Ltd. Class B | 3,735,157 | 8,035 |
| | China Everbright Bank Co. Ltd. Class A (XSSC) | 14,222,403 | 7,992 |
| | Greatview Aseptic Packaging Co. Ltd. | 15,559,000 | 7,899 |
| * | Coolpad Group Ltd. | 45,408,600 | 7,894 |
| * | Bank of China Ltd. Class A | 15,736,100 | 7,871 |
| | BOE Technology Group Co. Ltd. Class B | 28,724,022 | 7,814 |
| | Guangdong Electric Power Development Co. Ltd. Class B | 17,484,844 | 7,793 |
| * | Guangzhou Baiyunshan Pharmaceutical Holdings Co. Ltd. | 3,277,000 | 7,741 |
| | Shandong Chenming Paper Holdings Ltd. Class B | 8,608,238 | 7,694 |
| | China Minsheng Banking Corp. Ltd. Class A (XSSC) | 5,660,888 | 7,683 |
| | Jiangsu Yanghe Brewery Joint-Stock Co. Ltd. Class A | 736,671 | 7,574 |
| | Industrial Bank Co. Ltd. Class A (XSHG) | 3,135,301 | 7,545 |
| | Suning Commerce Group Co. Ltd. Class A | 4,557,400 | 7,526 |
| | Shanghai Jinqiao Export Processing Zone Development Co. Ltd. Class B | 4,934,243 | 7,488 |
| | Shanghai Baosight Software Co. Ltd. Class B | 4,312,026 | 7,472 |
| | Anhui Expressway Co. Ltd. | 9,264,000 | 7,464 |
| | China Merchants Bank Co. Ltd. Class A (XSSC) | 2,827,339 | 7,449 |
| 2 | Universal Medical Financial & Technical Advisory Services Co. Ltd. | 8,497,000 | 7,309 |
| * | Shanghai Zhenhua Heavy Industries Co. Ltd. Class B | 14,703,579 | 7,274 |
| | Shanghai Haixin Group Co. Class B | 8,385,119 | 7,229 |
| | Henan Shuanghui Investment & Development Co. Ltd. Class A | 2,115,976 | 7,151 |
| *,^ | Renhe Commercial Holdings Co. Ltd. | 273,342,999 | 7,077 |
| | Wuxi Little Swan Co. Ltd. Class A | 1,428,951 | 7,043 |
| | Shanghai Jinjiang International Hotels Development Co. Ltd. Class B | 3,292,550 | 7,022 |
| | Sinotruk Hong Kong Ltd. | 12,719,500 | 7,022 |
| | Guotai Junan Securities Co. Ltd. Class A (XSHG) | 2,647,600 | 6,962 |
| | Bank of Ningbo Co. Ltd. Class A | 2,762,900 | 6,841 |
7
| | | |
| Vanguard® Emerging Markets Stock Index Fund | | |
| Schedule of Investments | | |
| October 31, 2016 | | |
| |
| | | | Market |
| | | | Value |
| | | Shares | ($000) |
| | Dongxu Optoelectronic Technology Co. Ltd. Class A | 3,465,608 | 6,835 |
| | Shandong Airlines Co. Ltd. Class B | 2,960,917 | 6,816 |
| | China Water Affairs Group Ltd. | 9,288,000 | 6,739 |
| | Weifu High-Technology Group Co. Ltd. Class B | 2,844,219 | 6,725 |
| | China BlueChemical Ltd. | 34,769,405 | 6,721 |
| *,^ | Sinopec Oilfield Service Corp. | 32,380,000 | 6,712 |
| * | Wanda Cinema Line Co. Ltd. Class A | 674,673 | 6,619 |
| | Guosen Securities Co. Ltd. Class A | 2,592,241 | 6,548 |
| | China State Construction Engineering Corp. Ltd. Class A (XSHG) | 6,181,400 | 6,543 |
| | Shanghai Jinjiang International Travel Co. Ltd. Class B | 1,759,090 | 6,504 |
| | China Merchants Securities Co. Ltd. Class A (XSSC) | 2,453,174 | 6,492 |
| * | Orient Securities Co. Ltd. Class A (XSSC) | 2,751,610 | 6,476 |
| ^ | CSSC Offshore and Marine Engineering Group Co. Ltd. | 4,292,000 | 6,470 |
| ^ | CT Environmental Group Ltd. | 22,870,000 | 6,416 |
| | SAIC Motor Corp. Ltd. Class A (XSHG) | 1,835,265 | 6,414 |
| ^ | Chaowei Power Holdings Ltd. | 7,120,000 | 6,357 |
| *,^ | Biostime International Holdings Ltd. | 2,584,500 | 6,341 |
| ^ | Sinopec Kantons Holdings Ltd. | 13,467,000 | 6,314 |
| | Tibet Water Resources Ltd. | 16,970,000 | 6,311 |
| | Huaxia Bank Co. Ltd. Class A (XSSC) | 4,090,414 | 6,281 |
| | Inner Mongolia Eerduosi Resourses Co. Ltd. Class B | 6,099,550 | 6,276 |
| *,^ | Maanshan Iron & Steel Co. Ltd. | 27,358,000 | 6,233 |
| | Central China Securities Co. Ltd. | 12,067,000 | 6,225 |
| | Poly Real Estate Group Co. Ltd. Class A (XSSC) | 4,589,224 | 6,211 |
| ^ | Yuexiu Transport Infrastructure Ltd. | 9,020,000 | 6,177 |
| | Powerlong Real Estate Holdings Ltd. | 17,955,000 | 6,094 |
| * | Shanghai Chlor-Alkali Chemical Co. Ltd. Class B | 7,859,532 | 6,078 |
| ^ | Harbin Electric Co. Ltd. | 12,396,000 | 6,040 |
| | Dongjiang Environmental Co. Ltd. Class A | 2,163,866 | 6,039 |
| | Shanghai Waigaoqiao Free Trade Zone Group Co. Ltd. Class B | 3,627,486 | 6,023 |
| *,^ | China Modern Dairy Holdings Ltd. | 27,387,000 | 5,957 |
| * | China Petroleum & Chemical Corp. Class A | 8,034,099 | 5,931 |
| | Sichuan Expressway Co. Ltd. | 14,702,000 | 5,904 |
| ^ | China Maple Leaf Educational Systems Ltd. | 8,214,000 | 5,758 |
| ^,2 | Fu Shou Yuan International Group Ltd. | 9,816,000 | 5,750 |
| | China Foods Ltd. | 12,991,506 | 5,742 |
| | Western Securities Co. Ltd. Class A | 1,603,850 | 5,730 |
| ^ | Dalian Port PDA Co. Ltd. | 31,974,000 | 5,716 |
| *,^ | CITIC Resources Holdings Ltd. | 45,704,000 | 5,703 |
| | China Machinery Engineering Corp. | 9,487,639 | 5,661 |
| | Texhong Textile Group Ltd. | 4,018,500 | 5,648 |
| | Hisense Kelon Electrical Holdings Co. Ltd. Class A | 3,357,441 | 5,637 |
| | Shenzhen Overseas Chinese Town Co. Ltd. Class A | 5,511,821 | 5,633 |
| ^ | Yuzhou Properties Co. Ltd. | 15,128,000 | 5,614 |
| | Apeloa Pharmaceutical Co. Ltd. Class A | 4,826,421 | 5,560 |
| | Yunnan Baiyao Group Co. Ltd. Class A | 540,786 | 5,529 |
| *,^ | Hybrid Kinetic Group Ltd. | 190,728,000 | 5,520 |
| | China Merchants Bank Co. Ltd. Class A (XSHG) | 2,082,000 | 5,485 |
| *,^ | Hanergy Thin Film Power Group Ltd. | 206,154,000 | 5,481 |
| | Shanghai RAAS Blood Products Co. Ltd. Class A | 1,704,421 | 5,464 |
| | Jiangsu Hengrui Medicine Co. Ltd. Class A (XSSC) | 801,852 | 5,463 |
| ^ | Fufeng Group Ltd. | 12,912,000 | 5,448 |
| *,^ | Lifetech Scientific Corp. | 22,818,000 | 5,400 |
| | Zhejiang Wanfeng Auto Wheel Co. Ltd. Class A | 1,678,472 | 5,381 |
| | CRRC Corp. Ltd. Class A (XSHG) | 3,879,500 | 5,335 |
| * | Kama Co. Ltd. Class B | 5,203,252 | 5,311 |
| | China National Nuclear Power Co. Ltd. Class A | 5,319,107 | 5,302 |
| ^ | PAX Global Technology Ltd. | 8,467,000 | 5,286 |
| | Bank of Communications Co. Ltd. Class A (XSSC) | 6,304,333 | 5,227 |
| | Grandblue Environment Co. Ltd. Class A (XSSC) | 2,267,860 | 5,220 |
| | Cinda Real Estate Co. Ltd. Class A (XSSC) | 4,878,719 | 5,214 |
| | Sunvim Group Co. Ltd. Class A | 4,960,700 | 5,098 |
| | AVIC Aircraft Co. Ltd. Class A | 1,540,402 | 5,072 |
| *,^ | Carnival Group International Holdings Ltd. | 42,740,000 | 5,072 |
8
| | | |
| Vanguard® Emerging Markets Stock Index Fund | | |
| Schedule of Investments | | |
| October 31, 2016 | | |
| |
| | | | Market |
| | | | Value |
| | | Shares | ($000) |
| | Xiandai Investment Co. Ltd. Class A | 4,139,975 | 5,062 |
| | Beijing Capital Land Ltd. | 13,090,000 | 5,021 |
| *,^ | Leyou Technologies Holdings Ltd. | 27,770,000 | 4,997 |
| | Wuxi Little Swan Co. Ltd. Class B | 1,438,837 | 4,975 |
| | Jiangling Motors Corp. Ltd. Class B | 1,965,170 | 4,958 |
| 2 | Hua Hong Semiconductor Ltd. | 4,177,000 | 4,935 |
| | Xtep International Holdings Ltd. | 11,197,500 | 4,928 |
| | CRRC Corp. Ltd. Class A (XSSC) | 3,574,774 | 4,916 |
| | Guangdong No 2 Hydropower Engineering Co. Ltd. Class A | 4,145,470 | 4,912 |
| | China Fangda Group Co. Ltd. Class B | 5,297,655 | 4,892 |
| | Bank of Beijing Co. Ltd. Class A (XSHG) | 3,537,840 | 4,864 |
| | Beijing Capital Retailing Group Co. Ltd. Class A | 3,481,950 | 4,858 |
| | Beijing North Star Co. Ltd. | 14,440,000 | 4,854 |
| | Xingda International Holdings Ltd. | 11,681,000 | 4,851 |
| | Sichuan Road & Bridge Co. Ltd. Class A (XSSC) | 7,497,160 | 4,843 |
| ^ | Logan Property Holdings Co. Ltd. | 12,073,368 | 4,841 |
| * | Shanghai Bailian Group Co. Ltd. Class B | 3,653,716 | 4,834 |
| *,2 | Qingdao Port International Co. Ltd. | 7,881,000 | 4,797 |
| | China Railway Group Ltd. Class A (XSSC) | 3,857,814 | 4,783 |
| * | China Shipbuilding Industry Co. Ltd. Class A (XSSC) | 4,957,752 | 4,767 |
| | China Fortune Land Development Co. Ltd. Class A (XSSC) | 1,160,482 | 4,756 |
| *,2 | Tian Ge Interactive Holdings Ltd. | 7,039,000 | 4,737 |
| | Heilan Home Co. Ltd. Class A (XSSC) | 2,877,579 | 4,668 |
| | Shanghai Huayi Group Corp. Ltd. Class B | 4,398,334 | 4,664 |
| *,^ | Munsun Capital Group Ltd. | 143,968,000 | 4,647 |
| | Peak Sport Products Co. Ltd. | 13,895,000 | 4,627 |
| | Shanghai Shimao Co. Ltd. Class A (XSSC) | 4,153,869 | 4,614 |
| | China Minsheng Banking Corp. Ltd. Class A (XSHG) | 3,389,600 | 4,601 |
| | Livzon Pharmaceutical Group Inc. Class A | 535,676 | 4,584 |
| | China National Materials Co. Ltd. | 20,269,000 | 4,562 |
| | Lonking Holdings Ltd. | 27,887,000 | 4,559 |
| | Foshan Electrical and Lighting Co. Ltd. Class B | 5,622,601 | 4,541 |
| ^ | CIMC Enric Holdings Ltd. | 10,865,713 | 4,540 |
| ^ | Dongfang Electric Corp. Ltd. | 5,844,830 | 4,520 |
| | Bosideng International Holdings Ltd. | 50,076,000 | 4,512 |
| ^ | China Overseas Property Holdings Ltd. | 22,090,092 | 4,479 |
| | China SCE Property Holdings Ltd. | 14,610,000 | 4,463 |
| ^ | Vinda International Holdings Ltd. | 2,246,000 | 4,443 |
| | Huayu Automotive Systems Co. Ltd. Class A (XSSC) | 1,819,716 | 4,434 |
| | Changjiang Securities Co. Ltd. Class A | 2,745,424 | 4,427 |
| | Agricultural Bank of China Ltd. Class A (XSSC) | 9,440,500 | 4,402 |
| * | Hangzhou Steam Turbine Co. Ltd. Class B | 3,720,204 | 4,378 |
| | China International Travel Service Corp. Ltd. Class A | 658,141 | 4,378 |
| | Guangdong Provincial Expressway Development Co. Ltd. Class B | 6,541,331 | 4,376 |
| | Zhongshan Public Utilities Group Co. Ltd. Class A | 2,683,836 | 4,370 |
| * | Shenma Industry Co. Ltd. Class A | 3,104,604 | 4,344 |
| | Inner Mongolia Yili Industrial Group Co. Ltd. Class A (XSSC) | 1,636,038 | 4,341 |
| ^ | Sinofert Holdings Ltd. | 32,824,000 | 4,307 |
| | Hubei Yihua Chemical Industry Co. Ltd. Class A | 4,096,856 | 4,303 |
| * | China Film Co. Ltd. Class A | 1,041,800 | 4,264 |
| * | Sichuan Shuangma Cement Co. Ltd. Class A | 900,476 | 4,250 |
| | Sunshine City Group Co. Ltd. Class A | 4,762,383 | 4,244 |
| | Oceanwide Holdings Co. Ltd. Class A | 2,790,994 | 4,231 |
| * | Tengda Construction Group Co. Ltd. Class A | 5,529,299 | 4,220 |
| | Jiangxi Wannianqing Cement Co. Ltd. Class A | 4,000,916 | 4,218 |
| * | Beijing Xinwei Technology Group Co. Ltd. Class A | 1,627,766 | 4,205 |
| ^ | SSY Group Ltd. | 12,448,000 | 4,200 |
| | Kangmei Pharmaceutical Co. Ltd. Class A (XSSC) | 1,676,970 | 4,200 |
| | Bank of Communications Co. Ltd. Class A (XSHG) | 5,057,900 | 4,194 |
| | Jiangsu Lianfa Textile Co. Ltd. Class A | 1,568,252 | 4,188 |
| | Shenzhen Chiwan Wharf Holdings Ltd. Class B | 2,617,518 | 4,182 |
| | Luzhou Laojiao Co. Ltd. Class A | 820,599 | 4,164 |
| | CITIC Guoan Information Industry Co. Ltd. Class A | 2,563,300 | 4,162 |
| | China United Network Communications Ltd. Class A (XSSC) | 5,497,924 | 4,160 |
9
| | | |
| Vanguard® Emerging Markets Stock Index Fund | | |
| Schedule of Investments | | |
| October 31, 2016 | | |
| |
| | | | Market |
| | | | Value |
| | | Shares | ($000) |
| * | Searainbow Holding Corp. Class A | 567,316 | 4,153 |
| | Shanghai Diesel Engine Co. Ltd. Class B | 5,079,470 | 4,139 |
| * | YunNan Metropolitan Real Estate Development Co. Ltd. Class A (XSSC) | 4,725,698 | 4,133 |
| | Dongguan Development Holdings Co. Ltd. Class A | 2,560,501 | 4,113 |
| * | China Overseas Grand Oceans Group Ltd. | 11,191,000 | 4,109 |
| | Tonghua Dongbao Pharmaceutical Co. Ltd. Class A (XSSC) | 1,169,201 | 4,076 |
| | Tianjin Teda Co. Ltd. Class A | 4,743,100 | 4,062 |
| ^ | Livzon Pharmaceutical Group Inc. | 695,760 | 4,052 |
| | China Railway Group Ltd. Class A (XSHG) | 3,248,829 | 4,028 |
| * | Guotai Junan Securities Co. Ltd. Class A (XSSC) | 1,530,554 | 4,027 |
| | Shenzhen Salubris Pharmaceuticals Co. Ltd. Class A | 903,553 | 4,025 |
| | Jiangsu Hengrui Medicine Co. Ltd. Class A (XSHG) | 588,962 | 4,012 |
| | Huangshan Tourism Development Co. Ltd. Class B | 2,926,303 | 4,005 |
| | Shandong Himile Mechanical Science & Technology Co. Ltd. Class A | 1,322,857 | 3,994 |
| * | Zhongbai Holdings Group Co. Ltd. Class A | 3,293,016 | 3,990 |
| *,^ | O-Net Technologies Group Ltd. | 7,311,000 | 3,980 |
| | Sichuan Hejia Co. Class A | 1,721,088 | 3,968 |
| | Dah Chong Hong Holdings Ltd. | 9,481,000 | 3,965 |
| | Shanghai Fosun Pharmaceutical Group Co. Ltd. Class A (XSSC) | 1,129,302 | 3,958 |
| | Huaxia Bank Co. Ltd. Class A (XSHG) | 2,573,576 | 3,952 |
| * | Huadian Energy Co. Ltd. Class B | 7,910,644 | 3,946 |
| | Chongqing Changan Automobile Co. Ltd. Class A | 1,695,900 | 3,918 |
| *,2 | Haichang Ocean Park Holdings Ltd. | 18,430,000 | 3,912 |
| | Industrial Securities Co. Ltd. Class A (XSSC) | 3,352,265 | 3,896 |
| | China Resources Sanjiu Medical & Pharmaceutical Co. Ltd. Class A | 974,679 | 3,866 |
| | Huadong Medicine Co. Ltd. Class A | 355,618 | 3,863 |
| | Baoshan Iron & Steel Co. Ltd. Class A (XSSC) | 4,663,265 | 3,855 |
| | China Grand Automotive Services Co. Ltd. Class A (XSSC) | 2,938,659 | 3,831 |
| | GoerTek Inc. Class A | 845,003 | 3,830 |
| * | Glorious Property Holdings Ltd. | 31,949,000 | 3,827 |
| | Bank of Nanjing Co. Ltd. Class A (XSSC) | 2,466,120 | 3,816 |
| | Shanghai Xujiahui Commercial Co. Ltd. Class A | 1,918,877 | 3,798 |
| * | Shang Gong Group Co. Ltd. Class B | 3,678,113 | 3,791 |
| | China ZhengTong Auto Services Holdings Ltd. | 11,770,000 | 3,771 |
| | China Everbright Bank Co. Ltd. Class A (XSHG) | 6,695,800 | 3,762 |
| ^ | Sinosoft Technology Group Ltd. | 8,626,800 | 3,761 |
| | Shenzhen Centralcon Investment Holding Co. Ltd. Class A | 1,260,744 | 3,754 |
| | Thaihot Group Co. Ltd. Class A | 1,330,114 | 3,702 |
| | Kangde Xin Composite Material Group Co. Ltd. Class A | 1,423,941 | 3,699 |
| | Southwest Securities Co. Ltd. Class A (XSSC) | 3,433,481 | 3,696 |
| * | Beijing Centergate Technologies Holding Co. Ltd. Class A | 2,953,440 | 3,691 |
| * | China Shipbuilding Industry Co. Ltd. Class A (XSHG) | 3,837,900 | 3,690 |
| | Shandong Chenming Paper Holdings Ltd. | 4,275,000 | 3,686 |
| * | China Oil & Gas Group Ltd. | 48,560,000 | 3,685 |
| | Shanghai Yimin Commerce Group Co. Ltd. Class A (XSSC) | 3,750,104 | 3,675 |
| | Huayuan Property Co. Ltd. Class A (XSSC) | 5,225,205 | 3,662 |
| | Shenzhen O-film Tech Co. Ltd. Class A | 635,730 | 3,658 |
| | Daqin Railway Co. Ltd. Class A (XSHG) | 3,643,120 | 3,643 |
| | Guoyuan Securities Co. Ltd. Class A | 1,102,850 | 3,640 |
| | Shandong Gold Mining Co. Ltd. Class A (XSSC) | 593,550 | 3,636 |
| | Weiqiao Textile Co. | 5,400,000 | 3,627 |
| | Avic Capital Co. Ltd. Class A (XSSC) | 3,716,868 | 3,622 |
| *,^ | Enerchina Holdings Ltd. | 52,059,000 | 3,613 |
| | Sichuan Xichang Electric Power Co. Ltd. Class A | 2,178,399 | 3,607 |
| | BeijingHualian Hypermarket Co. Ltd. Class A | 3,660,845 | 3,600 |
| | Sichuan Kelun Pharmaceutical Co. Ltd. Class A | 1,412,112 | 3,563 |
| | Tianma Bearing Group Co. Ltd. Class A | 2,146,115 | 3,561 |
| | Inner Mongolia Yili Industrial Group Co. Ltd. Class A (XSHG) | 1,340,562 | 3,557 |
| | Tsingtao Brewery Co. Ltd. Class A (XSHG) | 773,551 | 3,554 |
| | CITIC Securities Co. Ltd. Class A (XSSC) | 1,449,600 | 3,550 |
| * | Lushang Property Co. Ltd. Class A | 4,115,979 | 3,540 |
| ^ | Wasion Group Holdings Ltd. | 6,022,000 | 3,539 |
| | Tianjin Capital Environmental Protection Group Co. Ltd. | 6,332,000 | 3,534 |
| | COSCO International Holdings Ltd. | 7,598,000 | 3,524 |
10
| | | |
| Vanguard® Emerging Markets Stock Index Fund | | |
| Schedule of Investments | | |
| October 31, 2016 | | |
| |
| | | | Market |
| | | | Value |
| | | Shares | ($000) |
| | RiseSun Real Estate Development Co. Ltd. Class A | 2,871,785 | 3,477 |
| | 361 Degrees International Ltd. | 9,241,000 | 3,469 |
| | Xinxiang Chemical Fiber Co. Ltd. Class A | 4,549,049 | 3,461 |
| | Hua Han Health Industry Holdings Ltd. | 50,548,000 | 3,454 |
| | Luxshare Precision Industry Co. Ltd. Class A | 1,043,337 | 3,450 |
| | Beijing Orient Landscape & Ecology Co. Ltd. Class A | 1,539,482 | 3,433 |
| * | Tatwah Smartech Co. Ltd. Class A | 1,303,958 | 3,408 |
| | Jiangxi Ganyue Expressway Co. Ltd. Class A (XSSC) | 4,762,342 | 3,407 |
| | Zhejiang Dahua Technology Co. Ltd. Class A | 1,574,692 | 3,397 |
| | Bank of Chongqing Co. Ltd. | 4,220,500 | 3,387 |
| | Shandong Nanshan Aluminum Co. Ltd. Class A | 7,338,395 | 3,381 |
| | Poly Culture Group Corp. Ltd. | 1,250,300 | 3,374 |
| | Suofeiya Home Collection Co. Ltd. Class A | 386,989 | 3,343 |
| | Offshore Oil Engineering Co. Ltd. Class A (XSSC) | 3,187,570 | 3,340 |
| | China United Network Communications Ltd. Class A (XSHG) | 4,397,800 | 3,328 |
| | Concord New Energy Group Ltd. | 66,400,000 | 3,324 |
| *,^ | Hi Sun Technology China Ltd. | 21,360,000 | 3,324 |
| | Daqin Railway Co. Ltd. Class A (XSSC) | 3,323,570 | 3,324 |
| | Shenzhen Heungkong Holding Co. Ltd. Class A (XSSC) | 5,179,468 | 3,316 |
| | Gree Electric Appliances Inc. of Zhuhai Class A | 1,002,286 | 3,316 |
| | Anxin Trust Co. Ltd. Class A (XSSC) | 976,954 | 3,313 |
| | Fujian Expressway Development Co. Ltd. Class A (XSSC) | 6,600,310 | 3,310 |
| | Emei Shan Tourism Co. Class A | 1,722,471 | 3,277 |
| | Huabei Expressway Co. Ltd. Class A | 4,407,564 | 3,261 |
| | Shanghai Industrial Urban Development Group Ltd. | 12,856,000 | 3,257 |
| | Beijing Yanjing Brewery Co. Ltd. Class A | 2,895,858 | 3,256 |
| | Huaneng Power International Inc. Class A (XSSC) | 3,017,592 | 3,182 |
| | Shanxi Securities Co. Ltd. Class A | 1,558,546 | 3,177 |
| | Dalian Zeus Entertainment Group Co. Ltd. Class A | 286,989 | 3,164 |
| | Shanghai Oriental Pearl Media Co. Ltd. Class A (XSSC) | 896,354 | 3,161 |
| | Hangzhou Robam Appliances Co. Ltd. Class A | 562,926 | 3,145 |
| | Xi'An Shaangu Power Co. Ltd. Class A (XSSC) | 3,002,084 | 3,130 |
| | China Shineway Pharmaceutical Group Ltd. | 3,042,000 | 3,126 |
| *,^ | China Yurun Food Group Ltd. | 19,588,149 | 3,123 |
| * | China Life Insurance Co. Ltd. Class A | 963,800 | 3,102 |
| * | Shanxi Zhangze Electric Power Co. Ltd. Class A | 5,356,146 | 3,097 |
| | Everbright Securities Co. Ltd. Class A (XSSC) | 1,242,228 | 3,090 |
| * | Bank of Jiangsu Co. Ltd. Class A | 2,012,300 | 3,088 |
| | Iflytek Co. Ltd. Class A | 696,506 | 3,081 |
| | Northeast Securities Co. Ltd. Class A | 1,604,558 | 3,081 |
| | Jointo Energy Investment Co. Ltd. Hebei Class A | 2,249,244 | 3,073 |
| | CPMC Holdings Ltd. | 5,867,000 | 3,072 |
| | Luthai Textile Co. Ltd. Class B | 2,415,793 | 3,064 |
| | Tsingtao Brewery Co. Ltd. Class A (XSSC) | 666,846 | 3,064 |
| | Joeone Co. Ltd. Class A | 1,211,177 | 3,052 |
| | C C Land Holdings Ltd. | 11,479,000 | 3,049 |
| | Hunan Jingfeng Pharmaceutical Co. Ltd. Class A | 1,759,953 | 3,046 |
| | Luthai Textile Co. Ltd. Class A | 1,702,491 | 3,042 |
| | North China Pharmaceutical Co. Ltd. Class A | 3,101,060 | 3,037 |
| | Central China Land Media Co. Ltd. Class A | 1,857,207 | 3,034 |
| | Gemdale Corp. Class A (XSSC) | 1,699,085 | 3,025 |
| *,^ | Chiho-Tiande Group Ltd. | 3,916,000 | 3,011 |
| * | Zhejiang Shenghua Biok Biology Co. Ltd. Class A | 1,874,600 | 2,999 |
| | Tibet Rhodiola Pharmaceutical Holding Co. Class A | 400,469 | 2,998 |
| | Beijing North Star Co. Ltd. Class A (XSSC) | 4,758,231 | 2,991 |
| ^,2 | Cosmo Lady China Holdings Co. Ltd. | 7,308,000 | 2,984 |
| | China Quanjude Group Co. Ltd. Class A | 952,758 | 2,982 |
| | Shandong Pharmaceutical Glass Co. Ltd. Class A | 984,990 | 2,980 |
| * | Tieling Newcity Investment Holding Ltd. Class A | 4,028,153 | 2,978 |
| ^ | China Singyes Solar Technologies Holdings Ltd. | 6,252,000 | 2,977 |
| | Shanghai Pudong Road & Bridge Construction Co. Ltd. Class A (XSSC) | 1,799,036 | 2,958 |
| * | Shanghai SMI Holding Co. Ltd. Class A (XSSC) | 1,097,383 | 2,950 |
| * | Shanghai Greencourt Investment Group Co. Ltd. Class B | 4,733,900 | 2,946 |
| | China XD Electric Co. Ltd. Class A (XSSC) | 3,641,107 | 2,944 |
11
| | | |
| Vanguard® Emerging Markets Stock Index Fund | | |
| Schedule of Investments | | |
| October 31, 2016 | | |
| |
| | | | Market |
| | | | Value |
| | | Shares | ($000) |
| | Guangdong Electric Power Development Co. Ltd. Class A | 3,812,800 | 2,940 |
| | China Vanke Co. Ltd. Class A | 794,700 | 2,939 |
| | Guangzhou Grandbuy Co. Ltd. Class A | 1,453,667 | 2,933 |
| * | Landing International Development Ltd. | 121,540,000 | 2,921 |
| | Jiangsu Zhongnan Construction Group Co. Ltd. Class A | 2,118,077 | 2,910 |
| | Gansu Qilianshan Cement Group Co. Ltd. Class A (XSSC) | 2,625,050 | 2,901 |
| | Shandong Huatai Paper Co. Ltd. Class A | 3,886,792 | 2,899 |
| | Jiangsu Lianyungang Port Co. Ltd. Class A | 3,957,225 | 2,898 |
| | Anhui Shanying Paper Industry Co. Ltd. Class A (XSSC) | 6,235,561 | 2,897 |
| | Beijing Dabeinong Technology Group Co. Ltd. Class A | 2,655,387 | 2,875 |
| | Suning Universal Co. Ltd. Class A | 2,183,210 | 2,875 |
| | Shanghai Tianchen Co. Ltd. Class A | 1,088,338 | 2,871 |
| | Yonggao Co. Ltd. Class A | 2,256,199 | 2,871 |
| * | Guizhou Tyre Co. Ltd. Class A | 3,345,876 | 2,870 |
| | China Lilang Ltd. | 5,093,000 | 2,869 |
| | Chengdu Kanghong Pharmaceutical Group Co. Ltd. Class A | 335,400 | 2,866 |
| | Grand Industrial Holding Group Co. Ltd. | 602,984 | 2,864 |
| | Shanghai Shibei Hi-Tech Co. Ltd. Class B | 2,601,562 | 2,851 |
| * | Bengang Steel Plates Co. Ltd. Class B | 8,157,311 | 2,847 |
| | New Hope Liuhe Co. Ltd. Class A | 2,373,324 | 2,845 |
| | Shenzhen Energy Group Co. Ltd. Class A | 2,848,058 | 2,837 |
| | Guizhou Xinbang Pharmaceutical Co. Ltd. Class A | 1,840,931 | 2,833 |
| | Neway Valve Suzhou Co. Ltd. Class A (XSSC) | 1,035,581 | 2,831 |
| * | Luxi Chemical Group Co. Ltd. Class A | 3,613,288 | 2,830 |
| | Beijing Dalong Weiye Real Estate Development Co. Ltd. Class A | 3,621,309 | 2,827 |
| * | Heilongjiang Interchina Water Treatment Co. Ltd. Class A | 3,131,793 | 2,825 |
| * | Jiangsu Protruly Vision Technology Group Co. Ltd. Class A (XSHG) | 1,193,900 | 2,825 |
| | Chongqing Fuling Zhacai Group Co. Ltd. Class A | 1,291,001 | 2,823 |
| | Avic Aviation Engine Corp. plc Class A (XSSC) | 544,366 | 2,814 |
| | Suzhou Victory Precision Manufacture Co. Ltd. Class A | 1,805,542 | 2,813 |
| | Henan Zhongyuan Expressway Co. Ltd. Class A (XSSC) | 4,235,781 | 2,812 |
| | Financial Street Holdings Co. Ltd. Class A | 1,676,851 | 2,802 |
| | Guilin Tourism Co. Ltd. Class A | 1,623,123 | 2,795 |
| | GRG Banking Equipment Co. Ltd. Class A | 1,256,331 | 2,793 |
| | TCL Corp. Class A | 5,514,422 | 2,785 |
| * | Shanghai Phoenix Enterprise Group Co. Ltd. Class B | 3,009,500 | 2,785 |
| | Shenzhen Topraysolar Co. Ltd. Class A | 1,937,061 | 2,784 |
| * | Aluminum Corp. of China Ltd. Class A | 4,735,500 | 2,780 |
| | China South Publishing & Media Group Co. Ltd. Class A (XSSC) | 1,032,349 | 2,777 |
| * | Sichuan Meifeng Chemical IND Class A | 2,010,724 | 2,770 |
| * | Shanghai Zhenhua Heavy Industries Co. Ltd. Class A | 3,820,033 | 2,767 |
| | Alpha Group Class A | 675,261 | 2,758 |
| *,2 | Ozner Water International Holding Ltd. | 13,144,000 | 2,756 |
| | Global Top E-Commerce Co. Ltd. Class A | 929,940 | 2,749 |
| | Huaneng Power International Inc. Class A (XSHG) | 2,599,994 | 2,742 |
| | Inner Mongolia MengDian HuaNeng Thermal Power Corp. Ltd. Class A (XSSC) | 5,879,228 | 2,738 |
| | Metro Land Corp. Ltd. Class A | 2,013,684 | 2,734 |
| | Guoxuan High-Tech Co. Ltd. | 526,361 | 2,727 |
| * | GCL System Integration Technology Co. Ltd. Class A | 3,096,400 | 2,721 |
| | Hytera Communications Corp. Ltd. Class A | 1,454,565 | 2,720 |
| | Guangdong Taiantang Pharmaceutical Co. Ltd. Class A | 1,691,178 | 2,716 |
| | GD Power Development Co. Ltd. Class A (XSHG) | 6,103,116 | 2,707 |
| | Jiuzhitang Co. Ltd. Class A | 745,255 | 2,699 |
| * | Xinjiang Tianshan Cement Co. Ltd. Class A | 2,669,688 | 2,691 |
| | China Railway Construction Corp. Ltd. Class A (XSSC) | 1,769,795 | 2,688 |
| | Tianjin Realty Development Group Co. Ltd. Class A | 2,925,000 | 2,688 |
| | Harbin Gloria Pharmaceuticals Co. Ltd. Class A | 2,133,075 | 2,684 |
| | Zhongtian Urban Development Group Co. Ltd. Class A | 2,734,166 | 2,684 |
| | Chinese Universe Publishing and Media Co. Ltd. Class A | 788,436 | 2,683 |
| | Hefei Meiling Co. Ltd. Class A | 2,685,828 | 2,681 |
| *,^ | North Mining Shares Co. Ltd. | 148,490,000 | 2,680 |
| | Venustech Group Inc. Class A | 779,436 | 2,679 |
| | Jinke Properties Group Co. Ltd. Class A | 3,657,625 | 2,669 |
| | Beijing Shiji Information Technology Co. Ltd. Class A | 725,872 | 2,665 |
12
| | | |
| Vanguard® Emerging Markets Stock Index Fund | | |
| Schedule of Investments | | |
| October 31, 2016 | | |
| |
| | | | Market |
| | | | Value |
| | | Shares | ($000) |
| | Tande Co. Ltd. Class A | 3,429,500 | 2,659 |
| ^,2 | Fuyao Glass Industry Group Co. Ltd. | 915,201 | 2,654 |
| | Hualan Biological Engineering Inc. Class A | 493,320 | 2,641 |
| | Jiangsu Changbao Steeltube Co. Ltd. Class A | 1,361,327 | 2,640 |
| | Kingenta Ecological Engineering Group Co. Ltd. Class A | 2,362,788 | 2,639 |
| | Changchun Faway Automobile Components Co. Ltd. Class A (XSSC) | 1,143,854 | 2,638 |
| | Guangzhou Hengyun Enterprises Holdings Ltd. Class A | 1,557,076 | 2,638 |
| | Aisino Corp. Class A | 810,220 | 2,635 |
| | Dongxing Securities Co. Ltd. Class A (XSHG) | 771,200 | 2,635 |
| * | Bank of Guiyang Co. Ltd. Class A | 1,108,565 | 2,631 |
| | Xishui Strong Year Co. Ltd. Inner Mongolia Class A | 902,704 | 2,625 |
| | BBMG Corp. Class A (XSSC) | 4,055,470 | 2,625 |
| | Tianqi Lithium Industries Inc. Class A | 447,543 | 2,622 |
| *,^ | West China Cement Ltd. | 25,752,000 | 2,620 |
| | Power Construction Corp. of China Ltd. Class A (XSSC) | 2,613,156 | 2,616 |
| | Inzone Group Co. Ltd. Class A (XSHG) | 1,987,631 | 2,610 |
| *,^ | Sany Heavy Equipment International Holdings Co. Ltd. | 16,694,000 | 2,604 |
| *,^ | TCL Multimedia Technology Holdings Ltd. | 5,136,000 | 2,597 |
| *,^ | Sinotrans Shipping Ltd. | 16,009,500 | 2,595 |
| | Shanghai Highly Group Co. Ltd. Class A | 1,408,500 | 2,590 |
| | Poly Real Estate Group Co. Ltd. Class A (XSHG) | 1,912,852 | 2,589 |
| | Sealand Securities Co. Ltd. Class A | 2,444,050 | 2,587 |
| * | Inner Mongolia BaoTou Steel Union Co. Ltd. Class A (XSSC) | 6,246,241 | 2,587 |
| | Ajisen China Holdings Ltd. | 5,740,000 | 2,582 |
| | Shanghai Jin Jiang International Hotels Group Co. Ltd. | 8,832,000 | 2,580 |
| | Wanhua Chemical Group Co. Ltd. Class A (XSHG) | 835,251 | 2,571 |
| * | Wintime Energy Co. Ltd. Class A (XSSC) | 4,108,014 | 2,569 |
| * | Shanghai Zhongyida Co. Ltd. Class B | 4,643,648 | 2,568 |
| | Shengyi Technology Co. Ltd. Class A (XSSC) | 1,325,283 | 2,556 |
| * | Shandong Bohui Paper Industrial Co. Ltd. Class A | 4,830,400 | 2,552 |
| * | Fujian Zhangzhou Development Co. Ltd. Class A | 3,250,833 | 2,549 |
| | China Merchants Energy Shipping Co. Ltd. Class A | 3,204,169 | 2,543 |
| * | Fujian Sunner Development Co. Ltd. Class A | 652,847 | 2,540 |
| | Shanghai Jinjiang International Industrial Investment Co. Ltd. Class B | 1,711,010 | 2,539 |
| | Sou Yu Te Group Co. Ltd. Class A | 1,207,591 | 2,533 |
| | Shanghai International Airport Co. Ltd. Class A (XSSC) | 633,189 | 2,533 |
| * | Beijing Vantone Real Estate Co. Ltd. Class A | 2,640,410 | 2,530 |
| * | Wuhan Department Store Group Co. Ltd. Class A | 871,290 | 2,529 |
| ^ | China All Access Holdings Ltd. | 7,914,000 | 2,528 |
| | Jinzhou Port Co. Ltd. Class B | 4,738,200 | 2,516 |
| | Fiyta Holdings Ltd. Class A | 1,190,485 | 2,515 |
| | INESA Intelligent Tech Inc. Class B | 3,144,066 | 2,514 |
| | Rainbow Department Store Co. Ltd. Class A | 1,317,833 | 2,508 |
| | Beijing Jingneng Power Co. Ltd. Class A (XSSC) | 3,945,293 | 2,504 |
| | Tianjin Tianyao Pharmaceutical Co. Ltd. Class A | 2,655,448 | 2,503 |
| * | PW Medtech Group Ltd. | 7,995,000 | 2,499 |
| | Hubei Energy Group Co. Ltd. Class A | 3,564,555 | 2,493 |
| | Guangzhou Baiyun International Airport Co. Ltd. Class A | 1,153,067 | 2,491 |
| | Comba Telecom Systems Holdings Ltd. | 14,015,740 | 2,485 |
| | Lao Feng Xiang Co. Ltd. Class A | 406,700 | 2,481 |
| | Shanxi Xishan Coal & Electricity Power Co. Ltd. Class A | 1,685,573 | 2,477 |
| | Kangmei Pharmaceutical Co. Ltd. Class A (XSHG) | 988,000 | 2,474 |
| | Sichuan Chuantou Energy Co. Ltd. Class A (XSSC) | 1,925,161 | 2,472 |
| | ZTE Corp. Class A | 1,094,565 | 2,470 |
| | Anhui Heli Co. Ltd. Class A (XSSC) | 1,422,063 | 2,470 |
| * | Jiangsu Bicon Pharmaceutical Listed Co. Class A | 645,100 | 2,461 |
| | Tus-Sound Environmental Resources Co. Ltd. Class A | 479,697 | 2,459 |
| | First Capital Securities Co. Ltd. Class A | 444,700 | 2,452 |
| | China Fortune Land Development Co. Ltd. Class A (XSHG) | 594,137 | 2,435 |
| | Power Construction Corp. of China Ltd. Class A (XSHG) | 2,430,302 | 2,433 |
| | Wuhu Shunrong Sanqi Interactive Entertainment Network Technology Co. Ltd. Class A | 856,078 | 2,428 |
| * | Bohai Financial Investment Holding Co. Ltd. Class A | 2,288,722 | 2,427 |
| * | Cultural Investment Holdings Co. Ltd. Class A | 685,029 | 2,424 |
| | Dong-E-E-Jiao Co. Ltd. Class A | 293,067 | 2,421 |
13
| | |
| Vanguard® Emerging Markets Stock Index Fund | | |
| Schedule of Investments | | |
| October 31, 2016 | | |
| |
| | | Market |
| | | Value |
| | Shares | ($000) |
| Zhengzhou Yutong Bus Co. Ltd. Class A (XSSC) | 760,514 | 2,420 |
| Youzu Interactive Co. Ltd. Class A | 608,916 | 2,420 |
| Zhongyuan Environment-Protection Co. Ltd. Class A | 915,779 | 2,419 |
| Founder Securities Co. Ltd. Class A (XSSC) | 2,190,813 | 2,419 |
| Inspur Electronic Information Industry Co. Ltd. Class A | 701,449 | 2,416 |
| * Danhua Chemical Technology Co. Ltd. Class A | 1,794,610 | 2,416 |
| Baoshan Iron & Steel Co. Ltd. Class A (XSHG) | 2,918,600 | 2,413 |
| Eastern Communications Co. Ltd. Class A (XSSC) | 1,682,562 | 2,410 |
| * TOP Energy Co. Ltd-A Class A (XSHG) | 2,903,744 | 2,399 |
| Bluestar Adisseo Co. Class A | 1,157,745 | 2,398 |
| Huangshan Tourism Development Co. Ltd. Class A | 1,000,088 | 2,390 |
| Jointown Pharmaceutical Group Co. Ltd. Class A (XSSC) | 730,895 | 2,385 |
| Hongrun Construction Group Co. Ltd. Class A | 2,146,046 | 2,377 |
| Beih-Property Co. Ltd. Class A | 1,927,713 | 2,377 |
| Jiangxi Ganfeng Lithium Co. Ltd. Class A | 500,900 | 2,376 |
| Huadian Power International Corp. Ltd. Class A (XSSC) | 3,213,300 | 2,375 |
| FAWER Automotive Parts Co. Ltd. Class A | 1,734,461 | 2,374 |
| * Greenland Holdings Corp. Ltd. Class A | 1,769,945 | 2,370 |
| Hundsun Technologies Inc. Class A (XSSC) | 272,220 | 2,367 |
| * Inner Mongolia BaoTou Steel Union Co. Ltd. Class A (XSHG) | 5,714,100 | 2,366 |
| Shanghai Pret Composites Co. Ltd. Class A | 510,444 | 2,363 |
| Tongding Interconnection Information Co. Ltd. Class A | 858,300 | 2,360 |
| Tianjin ZhongXin Pharmaceutical Group Corp. Ltd. Class A (XSSC) | 943,429 | 2,354 |
| Qinghai Salt Lake Industry Co. Ltd. Class A | 841,400 | 2,349 |
| Shandong Xinhua Pharmaceutical Co. Ltd. Class A | 1,221,500 | 2,348 |
| Shanghai International Airport Co. Ltd. Class A (XSHG) | 587,126 | 2,348 |
| AVIC Electromechanical Systems Co. Ltd. Class A | 914,232 | 2,348 |
| Anhui Conch Cement Co. Ltd. Class A (XSSC) | 933,661 | 2,346 |
| Zhejiang Transfar Co. Ltd. Class A | 807,401 | 2,344 |
| Shenzhen Airport Co. Class A | 1,820,428 | 2,331 |
| * Shenyang Jinbei Automotive Co. Ltd. Class A | 2,404,601 | 2,329 |
| Jiangsu Wujiang China Eastern Silk Market Co. Ltd. Class A | 3,327,153 | 2,316 |
| * Wuhan East Lake High Technology Group Co. Ltd. Class A | 1,795,350 | 2,314 |
| Ningbo Zhoushan Port Co. Ltd. Class A | 3,056,883 | 2,305 |
| Zhejiang Supor Cookware Co. Ltd. Class A | 428,322 | 2,301 |
| Zhejiang Wanliyang Co. Ltd. Class A | 1,062,634 | 2,300 |
| Guangzhou Pearl River Industrial Development Co. Ltd. Class A (XSSC) | 1,922,783 | 2,299 |
| China Pacific Insurance Group Co. Ltd. Class A (XSSC) | 530,844 | 2,295 |
| Tsinghua Unisplendour Co. Ltd. Class A | 252,659 | 2,294 |
| Shanghai Pharmaceuticals Holding Co. Ltd. Class A (XSHG) | 784,985 | 2,294 |
| Guangzhou Echom Science & Technology Co. Ltd. Class A | 1,605,500 | 2,291 |
| * Shanxi Taigang Stainless Steel Co. Ltd. Class A | 3,923,876 | 2,291 |
| Realcan Pharmaceutical Co. Ltd. Class A | 441,700 | 2,284 |
| Tasly Pharmaceutical Group Co. Ltd. Class A (XSSC) | 374,447 | 2,283 |
| Shanghai Jiabao Industry & Commerce Group Co. Ltd. Class A | 890,172 | 2,282 |
| * Yinyi Real Estate Co. Ltd. Class A | 1,522,901 | 2,280 |
| Titan Wind Energy Suzhou Co. Ltd. Class A | 2,323,572 | 2,279 |
| * Tianjin Hi-Tech Development Co. Ltd. Class A | 2,247,302 | 2,275 |
| * Huatian Hotel Group Co. Ltd. Class A | 2,175,677 | 2,274 |
| * Hubei Mailyard Share Co. Ltd. Class A | 787,600 | 2,271 |
| Meinian Onehealth Healthcare Holdings Co. Ltd. Class A | 1,115,093 | 2,268 |
| Anhui Zhongding Sealing Parts Co. Ltd. Class A | 644,765 | 2,268 |
| ^ Dawnrays Pharmaceutical Holdings Ltd. | 3,796,000 | 2,267 |
| Jiangsu Changqing Agrochemical Co. Ltd. Class A | 973,206 | 2,262 |
| * China High-Speed Railway Technology Co. Ltd. Class A | 1,560,400 | 2,261 |
| Sinolink Securities Co. Ltd. Class A (XSSC) | 1,143,000 | 2,258 |
| Wuhu Conch Profiles and Science Co. Ltd. Class A | 1,315,613 | 2,257 |
| Guizhou Bailing Group Pharmaceutical Co. Ltd. Class A | 681,807 | 2,256 |
| Beijing Electronic Zone Investment and Development Co. Ltd. Class A | 1,208,621 | 2,255 |
| Henan Billions Chemicals Co. Ltd. Class A | 1,061,625 | 2,245 |
| Shaanxi International Trust Co. Ltd. Class A | 2,030,600 | 2,243 |
| * China Tianying Inc. Class A | 2,041,714 | 2,242 |
| Changjiang & Jinggong Steel Building Group Co. Ltd. Class A (XSSC) | 3,436,397 | 2,235 |
| Guangzhou Haige Communications Group Inc. Co. Class A | 1,201,147 | 2,224 |
14
| | | |
| Vanguard® Emerging Markets Stock Index Fund | | |
| Schedule of Investments | | |
| October 31, 2016 | | |
| |
| | | | Market |
| | | | Value |
| | | Shares | ($000) |
| | Tianjin Tianbao Infrastructure Co. Ltd. Class A | 2,202,583 | 2,222 |
| * | Apex Technology Co. Ltd. Class A | 431,575 | 2,219 |
| * | Dezhan Healthcare Co. Ltd. Class A | 962,948 | 2,216 |
| ^ | China Power New Energy Development Co. Ltd. | 3,653,000 | 2,213 |
| | Shenzhen Fastprint Circuit Tech Co. Ltd. Class A | 1,947,300 | 2,211 |
| 2 | Beijing Urban Construction Design & Development Group Co. Ltd. | 3,189,000 | 2,198 |
| * | Greattown Holdings Ltd. Class A | 1,641,600 | 2,197 |
| * | Zhongjin Gold Corp. Ltd. Class A (XSSC) | 1,174,812 | 2,196 |
| | Nanjing Xinjiekou Department Store Co. Ltd. Class A | 499,409 | 2,196 |
| | Leo Group Co. Ltd. Class A | 855,223 | 2,195 |
| | China National Chemical Engineering Co. Ltd. Class A (XSHG) | 2,490,177 | 2,193 |
| | Ningxia Qinglong Pipes Industry Co. Ltd. Class A | 1,265,090 | 2,186 |
| * | Northeast Pharmaceutical Group Co. Ltd. Class A | 1,446,917 | 2,184 |
| | Fortune Ng Fung Food Hebei Co. Ltd. Class A | 930,674 | 2,183 |
| * | Yunnan Coal Energy Co. Ltd. Class A | 2,410,493 | 2,180 |
| | Jiangsu Asia-Pacific Light Alloy Technology Co. Ltd. Class A | 1,778,766 | 2,180 |
| * | Henan Taloph Pharmaceutical Stock Co. Ltd. Class A | 1,763,230 | 2,180 |
| | Changchunjingkai Group Co. Ltd. Class A | 1,751,171 | 2,180 |
| * | Dongguan Winnerway Industrial Zone Ltd. Class A | 1,608,200 | 2,171 |
| | Yantai Moon Co. Ltd. Class A | 941,056 | 2,170 |
| | Jiangsu Sunrain Solar Energy Co. Ltd. Class A | 1,355,759 | 2,169 |
| | Shenzhen Das Intellitech Co. Ltd. Class A | 1,832,196 | 2,161 |
| | Cachet Pharmaceutical Co. Ltd. Class A | 343,843 | 2,160 |
| | Huayi Compressor Co. Ltd. Class A | 1,274,304 | 2,160 |
| | Shenergy Co. Ltd. Class A (XSSC) | 2,486,691 | 2,157 |
| | Kunwu Jiuding Investment Holdings Co. Ltd. Class A (XSHG) | 319,099 | 2,151 |
| | Weichai Power Co. Ltd. Class A | 1,523,539 | 2,147 |
| | CNHTC Jinan Truck Co. Ltd. Class A | 1,045,742 | 2,147 |
| | Guangdong Golden Dragon Development Inc. Class A | 722,300 | 2,146 |
| | Xinjiang Tianfu Energy Co. Ltd. Class A (XSSC) | 1,877,888 | 2,138 |
| | Zhejiang China Commodities City Group Co. Ltd. Class A (XSSC) | 1,898,367 | 2,129 |
| * | Zhejiang Huamei Holding Co. Ltd. Class A | 956,853 | 2,123 |
| | Zhejiang Semir Garment Co. Ltd. Class A | 1,353,320 | 2,121 |
| ^ | China Suntien Green Energy Corp. Ltd. | 15,835,000 | 2,117 |
| | Shaanxi Yanchang Petroleum Chemical Engineering Co. Ltd. Class A | 1,639,667 | 2,111 |
| | Jiangsu Yoke Technology Co. Ltd. Class A | 582,200 | 2,109 |
| | Hengtong Optic-electric Co. Ltd. Class A (XSSC) | 761,682 | 2,109 |
| * | Shanghai Potevio Co. Ltd. Class A | 404,003 | 2,109 |
| | China National Chemical Engineering Co. Ltd. Class A (XSSC) | 2,391,725 | 2,106 |
| | China World Trade Center Co. Ltd. Class A (XSSC) | 724,135 | 2,106 |
| * | China Datang Corp. Renewable Power Co. Ltd. | 23,042,000 | 2,105 |
| | Sanan Optoelectronics Co. Ltd. Class A (XSSC) | 1,170,422 | 2,102 |
| | Guodian Changyuan Electric Power Co. Ltd. Class A | 2,237,894 | 2,102 |
| | Tasly Pharmaceutical Group Co. Ltd. Class A (XSHG) | 344,530 | 2,101 |
| * | AVIC International Holding HK Ltd. | 32,692,000 | 2,100 |
| | Beijing Capital Development Co. Ltd. Class A (XSSC) | 1,203,111 | 2,097 |
| * | Kangxin New Materials Co. Ltd. Class A | 1,153,880 | 2,093 |
| * | Guosheng Financial Holding Inc. Class A | 486,624 | 2,092 |
| * | CECEP Solar Energy Co. Ltd. Class A | 961,843 | 2,089 |
| | Shenzhen Wongtee International Enterprise Co. Ltd. Class A | 1,074,724 | 2,086 |
| | Shaan Xi Provincial Natural Gas Co. Ltd. Class A | 1,388,989 | 2,084 |
| *,^ | Baoxin Auto Group Ltd. | 6,394,499 | 2,082 |
| | Beijing Tongrentang Co. Ltd. Class A (XSSC) | 449,297 | 2,079 |
| | China Merchants Securities Co. Ltd. Class A (XSHG) | 784,200 | 2,075 |
| *,^ | China Chengtong Development Group Ltd. | 23,756,000 | 2,073 |
| * | Ningbo Sanxing Electric Co. Ltd. Class A (XSSC) | 1,089,936 | 2,072 |
| | Holitech Technology Co. Ltd. Class A | 853,198 | 2,071 |
| | Inner Mongolia Junzheng Energy & Chemical Industry Group Co. Ltd. Class A (XSSC) | 2,711,240 | 2,070 |
| | Zhejiang Conba Pharmaceutical Co. Ltd. Class A (XSSC) | 1,855,532 | 2,066 |
| | Hubei Biocause Pharmaceutical Co. Ltd. Class A | 1,733,900 | 2,056 |
| | Bright Real Estate Group Co. Ltd. Class A (XSSC) | 1,476,198 | 2,056 |
| | Huayu Automotive Systems Co. Ltd. Class A (XSHG) | 842,877 | 2,054 |
| * | China Shipbuilding Industry Group Power Co. Ltd. Class A (XSSC) | 427,737 | 2,045 |
| | Ningxia Building Materials Group Co. Ltd. Class A (XSSC) | 1,368,288 | 2,043 |
15
| | | |
| Vanguard® Emerging Markets Stock Index Fund | | |
| Schedule of Investments | | |
| October 31, 2016 | | |
| |
| | | | Market |
| | | | Value |
| | | Shares | ($000) |
| | Pacific Securities Co. Ltd. Class A (XSSC) | 2,676,600 | 2,043 |
| | Northern United Publishing & Media Group Co. Ltd. Class A | 1,073,800 | 2,042 |
| | Luolai Lifestyle Technology Co. Ltd. Class A | 1,008,394 | 2,035 |
| | Jiangsu Yinhe Electronics Co. Ltd. Class A | 556,784 | 2,032 |
| | Zhejiang Weixing Industrial Development Co. Ltd. Class A | 895,349 | 2,031 |
| | Guangdong Haid Group Co. Ltd. Class A | 907,167 | 2,031 |
| | Shenzhen Gas Corp. Ltd. Class A (XSSC) | 1,475,375 | 2,030 |
| | Heilan Home Co. Ltd. Class A (XSHG) | 1,249,331 | 2,026 |
| | Zhengzhou Yutong Bus Co. Ltd. Class A (XSHG) | 635,800 | 2,023 |
| | Do-Fluoride Chemicals Co. Ltd. Class A | 398,450 | 2,023 |
| | Tibet Tianlu Co. Ltd. Class A | 1,513,422 | 2,020 |
| | Shanghai International Port Group Co. Ltd. Class A (XSHG) | 2,640,400 | 2,019 |
| * | Digital China Group Co. Ltd. Class A | 450,736 | 2,017 |
| | China Baoan Group Co. Ltd. Class A | 1,314,680 | 2,016 |
| | Tianshui Huatian Technology Co. Ltd. Class A | 1,076,774 | 2,011 |
| | Unigroup Guoxin Co. Ltd. Class A | 374,793 | 2,011 |
| | Zhuhai Port Co. Ltd. Class A | 2,213,800 | 2,009 |
| | Guangzhou Guangri Stock Co. Ltd. Class A | 961,200 | 2,007 |
| ^ | Yashili International Holdings Ltd. | 9,882,000 | 2,007 |
| | Zoomlion Heavy Industry Science and Technology Co. Ltd. Class A | 2,973,591 | 2,005 |
| | Suzhou Gold Mantis Construction Decoration Co. Ltd. Class A | 1,219,705 | 2,002 |
| | Jilin Aodong Pharmaceutical Group Co. Ltd. Class A | 502,212 | 2,000 |
| | Huadian Heavy Industries Co. Ltd. Class A (XSSC) | 1,526,509 | 1,997 |
| ^ | China Electronics Corp. Holdings Co. Ltd. | 8,296,000 | 1,996 |
| | Infore Environment Technology Group Co. Ltd. Class A | 861,399 | 1,992 |
| | Haining China Leather Market Co. Ltd. Class A | 1,252,410 | 1,987 |
| | Jiangxi Changyun Co. Ltd. Class A | 961,933 | 1,987 |
| | TianGuang ZhongMao Co. Ltd. Class A | 1,060,320 | 1,986 |
| * | Guangxi Wuzhou Communications Co. Ltd. Class A | 2,330,405 | 1,984 |
| * | Harbin Pharmaceutical Group Co. Ltd. Class A (XSSC) | 1,447,577 | 1,978 |
| * | Jilin Jian Yisheng Pharmaceutical Co. Ltd. Class A | 1,042,700 | 1,978 |
| * | Shenzhen Hifuture Electric Co. Ltd. Class A | 924,162 | 1,966 |
| | Shenzhen Sunlord Electronics Co. Ltd. Class A | 725,578 | 1,965 |
| * | Xinjiang Beixin Road & Bridge Group Co. Ltd. Class A | 1,497,200 | 1,964 |
| *,^ | China Water Industry Group Ltd. | 11,548,000 | 1,964 |
| | Joyoung Co. Ltd. Class A | 682,392 | 1,961 |
| * | Shenzhen Neptunus Bioengineering Co. Ltd. Class A | 1,950,950 | 1,960 |
| | Xiamen Comfort Science & Technology Group Co. Ltd. Class A | 865,200 | 1,958 |
| | INESA Intelligent Tech Inc. Class A | 1,230,500 | 1,957 |
| *,^ | Lianhua Supermarket Holdings Co. Ltd. | 4,804,000 | 1,953 |
| | SooChow Securities Co. Ltd. Class A (XSSC) | 913,430 | 1,952 |
| * | Jianxin Mining Co. Ltd. Class A | 1,433,400 | 1,952 |
| | Shanghai Aerospace Automobile Electromechanical Co. Class A | 1,189,771 | 1,949 |
| | Shanghai East China Computer Co. Ltd. Class A (XSSC) | 474,730 | 1,949 |
| | Jiangsu Akcome Science & Technology Co. Ltd. Class A | 3,458,800 | 1,948 |
| | Zhonglu Co. Ltd. Class B | 1,084,642 | 1,946 |
| | Jiangsu Holly Corp. Class A | 846,694 | 1,944 |
| | Eternal Asia Supply Chain Management Ltd. Class A | 1,037,500 | 1,942 |
| | Harbin High-Tech Group Co. Class A | 1,175,501 | 1,938 |
| * | Tonghua Golden-Horse Pharmaceutical Industry Co. Ltd. Class A | 677,183 | 1,937 |
| | Nanjing Pharmaceutical Co. Ltd. Class A | 1,494,262 | 1,936 |
| | Bank of Nanjing Co. Ltd. Class A (XSHG) | 1,248,840 | 1,932 |
| | Insigma Technology Co. Ltd. Class A | 728,100 | 1,929 |
| | Shenzhen Agricultural Products Co. Ltd. Class A | 1,056,629 | 1,924 |
| | Suzhou New District Hi-Tech Industrial Co. Ltd. Class A (XSSC) | 1,415,906 | 1,923 |
| | Contemporary Eastern Investment Co. Ltd. Class A | 980,025 | 1,920 |
| * | Hainan Yedao Co. Ltd. Class A | 919,500 | 1,919 |
| | Guangzhou Tinci Materials Technology Co. Ltd. Class A | 215,982 | 1,915 |
| * | Shenzhen Laibao Hi-tech Co. Ltd. Class A | 961,687 | 1,914 |
| | Yonyou Network Technology Co. Ltd. Class A (XSSC) | 570,162 | 1,913 |
| | Shanghai Baosteel Packaging Co. Ltd. Class A | 1,258,200 | 1,912 |
| | Future Land Holdings Co. Ltd. Class A | 1,159,973 | 1,911 |
| * | Jiangsu Shagang Co. Ltd. Class A | 801,300 | 1,908 |
| | China CAMC Engineering Co. Ltd. Class A | 553,597 | 1,906 |
16
| | | |
| Vanguard® Emerging Markets Stock Index Fund | | |
| Schedule of Investments | | |
| October 31, 2016 | | |
| |
| | | | Market |
| | | | Value |
| | | Shares | ($000) |
| | Shenzhen Bauing Construction Holding Group Co. Ltd. Class A | 1,084,024 | 1,905 |
| | Accelink Technologies Co. Ltd. Class A | 171,316 | 1,903 |
| | Hangzhou Liaison Interactive Information Technology Co. Ltd. Class A | 698,130 | 1,899 |
| * | Inner Mongolia Xingye Mining Co. Ltd. Class A | 1,276,772 | 1,896 |
| | Shimge Pump Industry Group Co. Ltd. Class A | 855,724 | 1,894 |
| *,^ | National Agricultural Holdings Ltd. | 12,904,000 | 1,894 |
| | Shenzhen Tagen Group Co. Ltd. Class A | 1,262,881 | 1,891 |
| | Zhejiang NHU Co. Ltd. Class A | 586,751 | 1,891 |
| | Hunan Mendale Hometextile Co. Ltd. Class A | 1,520,254 | 1,883 |
| | Fujian Funeng Co. Ltd. Class A (XSHG) | 1,105,261 | 1,883 |
| | Jiangsu SINOJIT Wind Energy Technology Co. Ltd. Class A (XSSC) | 2,323,427 | 1,878 |
| * | Shandong Hi-Speed Road & Bridge Co. Ltd. Class A | 1,782,000 | 1,877 |
| * | Shanghai Datun Energy Resources Co. Ltd. Class A | 1,156,850 | 1,877 |
| | Shenergy Co. Ltd. Class A (XSHG) | 2,163,979 | 1,877 |
| | Youngor Group Co. Ltd. Class A (XSSC) | 891,750 | 1,876 |
| | Anhui Honglu Steel Construction Group Co. Ltd. Class A | 650,805 | 1,874 |
| * | Yibin Tianyuan Group Co. Ltd. Class A | 1,500,329 | 1,870 |
| | Guangdong Advertising Group Co. Ltd. Class A | 959,325 | 1,865 |
| | Anhui Water Resources Development Co. Ltd. Class A | 1,325,165 | 1,864 |
| | Foshan Nationstar Optoelectronics Co. Ltd. Class A | 850,525 | 1,860 |
| * | Beijing Shougang Co. Ltd. Class A | 1,993,600 | 1,857 |
| *,^ | Loudong General Nice Resources China Holdings Ltd. | 26,283,000 | 1,855 |
| | Shanghai Oriental Pearl Media Co. Ltd. Class A (XSHG) | 524,612 | 1,850 |
| | Hilong Holding Ltd. | 7,749,000 | 1,849 |
| | Sunny Loan Top Co. Ltd. Class A (XSSC) | 1,074,547 | 1,848 |
| | Avic Aviation Engine Corp. plc Class A (XSHG) | 357,386 | 1,847 |
| | Shanxi Xinghuacun Fen Wine Factory Co. Ltd. Class A | 548,676 | 1,846 |
| | Hubei Fuxing Science And Technology Co. Ltd. Class A | 987,200 | 1,846 |
| | Shanxi Guoxin Energy Corp. Ltd. Class A (XSSC) | 1,083,730 | 1,844 |
| | Shanghai Zhixin Electric Co. Ltd. Class A (XSSC) | 1,131,046 | 1,842 |
| * | Shenzhen Kondarl Group Co. Ltd. Class A | 359,999 | 1,839 |
| | Shanghai Shyndec Pharmaceutical Co. Ltd. Class A | 415,769 | 1,835 |
| | Beijing SPC Environment Protection Tech Co. Ltd. Class A | 697,821 | 1,834 |
| * | Tianjin Guangyu Development Co. Ltd. Class A | 1,360,000 | 1,827 |
| | Tianjin Port Co. Ltd. Class A (XSSC) | 1,213,783 | 1,825 |
| * | Shenyang Chemical Industry Class A | 1,716,100 | 1,824 |
| * | Dalian Dafu Enterprises Holdings Co. Ltd. Class A | 2,377,436 | 1,823 |
| | Beyondsoft Corp. Class A | 320,300 | 1,819 |
| | NavInfo Co. Ltd. Class A | 557,650 | 1,816 |
| | Kuangda Technology Group Co. Ltd. Class A | 1,736,483 | 1,815 |
| | Hongfa Technology Co. Ltd. Class A (XSHG) | 372,024 | 1,814 |
| * | Hengdeli Holdings Ltd. | 16,760,000 | 1,813 |
| | Yingkou Port Liability Co. Ltd. Class A | 3,501,300 | 1,813 |
| | Norinco International Cooperation Ltd. Class A | 483,900 | 1,812 |
| | Shenzhen Grandland Group Co. Ltd. Class A | 1,277,051 | 1,809 |
| | Zhejiang Sanhua Co. Ltd. Class A | 1,148,411 | 1,808 |
| | GEM Co. Ltd. Class A | 1,676,426 | 1,808 |
| | Guangdong Baolihua New Energy Stock Co. Ltd. Class A | 1,475,460 | 1,805 |
| | Guangdong Goworld Co. Ltd. Class A | 943,044 | 1,804 |
| | Xiamen Tungsten Co. Ltd. Class A (XSSC) | 467,438 | 1,804 |
| | Guizhou Guihang Automotive Components Co. Ltd. Class A | 549,703 | 1,803 |
| * | China Eastern Airlines Corp. Ltd. Class A (XSHG) | 1,928,700 | 1,802 |
| | Shenzhen Yan Tian Port Holding Co. Ltd. Class A | 1,679,432 | 1,799 |
| * | CITIC Guoan Wine Co. Ltd. Class A | 1,041,500 | 1,798 |
| | AVIC Jonhon OptronicTechnology Co. Ltd. Class A | 316,868 | 1,797 |
| | Hangzhou Binjiang Real Estate Group Co. Ltd. Class A | 1,801,683 | 1,797 |
| | Shandong Gold Mining Co. Ltd. Class A (XSHG) | 293,000 | 1,795 |
| | Shinva Medical Instrument Co. Ltd. Class A (XSSC) | 493,041 | 1,792 |
| | China Gezhouba Group Co. Ltd. Class A (XSHG) | 1,409,100 | 1,786 |
| | Zhejiang Xianju Pharmaceutical Co. Ltd. Class A | 863,300 | 1,785 |
| | Nanjing Gaoke Co. Ltd. Class A (XSSC) | 713,193 | 1,785 |
| * | China Huiyuan Juice Group Ltd. | 4,829,500 | 1,784 |
| | Tsinghua Tongfang Co. Ltd. Class A (XSSC) | 863,708 | 1,783 |
| * | China Wuyi Co. Ltd. Class A | 642,570 | 1,780 |
17
| | |
| Vanguard® Emerging Markets Stock Index Fund | | |
| Schedule of Investments | | |
| October 31, 2016 | | |
| |
| | | Market |
| | | Value |
| | Shares | ($000) |
| * Baoding Tianwei Baobian Electric Co. Ltd. Class A | 1,886,301 | 1,779 |
| Air China Ltd. Class A (XSHG) | 1,626,099 | 1,778 |
| Tianjin Lisheng Pharmaceutical Co. Ltd. Class A | 270,403 | 1,778 |
| * Kingnet Network Co. Ltd. Class A | 326,546 | 1,777 |
| Eastcompeace Technology Co. Ltd. Class A | 767,109 | 1,777 |
| Yunnan Wenshan Electric Power Co. Ltd. Class A | 1,008,527 | 1,774 |
| BOE Technology Group Co. Ltd. Class A | 4,866,500 | 1,773 |
| * Sinopec Oilfield Service Corp. Class A | 3,057,700 | 1,772 |
| Changchai Co. Ltd. Class A | 1,196,785 | 1,770 |
| Jiangsu Chengxing Phosph-Chemicals Co. Ltd. Class A | 1,678,333 | 1,770 |
| Wuhan Guide Infrared Co. Ltd. Class A | 448,972 | 1,767 |
| Optics Valley Union Holding Co. Ltd. | 16,508,000 | 1,762 |
| Zhejiang Baoxiniao Garment Co. Ltd. Class A | 2,412,700 | 1,762 |
| Xinjiang Joinworld Co. Ltd. Class A (XSSC) | 1,496,964 | 1,756 |
| * Ningbo Joyson Electronic Corp. Class A (XSHG) | 349,503 | 1,755 |
| * Shandong Denghai Seeds Co. Ltd. Class A | 683,618 | 1,754 |
| * Wuxi Commercial Mansion Grand Orient Co. Ltd. Class A (XSSC) | 1,240,338 | 1,754 |
| Guangshen Railway Co. Ltd. Class A (XSSC) | 2,686,634 | 1,752 |
| * Create Technology & Science Co. Ltd. Class A | 1,136,256 | 1,744 |
| * Ningxia Western Venture Industrial Co. Ltd. Class A | 2,071,451 | 1,734 |
| Hesteel Co. Ltd. Class A | 3,757,200 | 1,734 |
| * Aotecar New Energy Technology Co. Ltd. Class A | 744,200 | 1,733 |
| Chuying Agro-pastora Group Co. Ltd. Class A | 2,227,192 | 1,732 |
| Zhejiang Dragon Pipe Manufacturing Co. Ltd. Class A | 459,525 | 1,731 |
| Tiangong International Co. Ltd. | 13,708,000 | 1,730 |
| * HPGC Renmintongtai Pharmaceutical Corp. Class A | 729,534 | 1,730 |
| Shenzhen Hepalink Pharmaceutical Co. Ltd. Class A | 634,480 | 1,725 |
| Beijing Jingyuntong Technology Co. Ltd. Class A (XSSC) | 1,596,888 | 1,725 |
| Beijing SDL Technology Co. Ltd. Class A | 716,927 | 1,724 |
| Zhejiang Huahai Pharmaceutical Co. Ltd. Class A (XSHG) | 464,144 | 1,723 |
| Shenzhen Fuanna Bedding and Furnishing Co. Ltd. Class A | 1,309,240 | 1,722 |
| * Sinopec Oilfield Equipment Corp. Class A | 1,040,893 | 1,721 |
| * Hangzhou Iron & Steel Co. Class A | 1,294,374 | 1,720 |
| * Shaanxi Fenghuo Electronics Co. Ltd. Class A | 864,429 | 1,720 |
| Guangzhou Pearl River Piano Group Co. Ltd. Class A | 768,101 | 1,717 |
| * Hainan Airlines Co. Ltd. Class A (XSSC) | 3,609,400 | 1,717 |
| Guangdong Zhongsheng Pharmaceutical Co. Ltd. Class A | 852,417 | 1,716 |
| * Shanghai SMI Holding Co. Ltd. Class A (XSHG) | 637,700 | 1,715 |
| Beijing Shouhang Resources Saving Co. Ltd. Class A | 1,272,541 | 1,714 |
| Zhejiang Yankon Group Co. Ltd. Class A (XSSC) | 1,473,339 | 1,713 |
| * Hainan Airlines Co. Ltd. Class A (XSHG) | 3,599,600 | 1,712 |
| Fujian Newland Computer Co. Ltd. Class A | 618,095 | 1,712 |
| * Datang Huayin Electric Power Co. Ltd. Class A | 2,052,700 | 1,712 |
| Hubei Xinyangfeng Fertilizer Co. Ltd. Class A | 1,008,156 | 1,708 |
| Glodon Co. Ltd. Class A | 732,431 | 1,704 |
| Beijing Zhong Ke San Huan High-Tech Co. Ltd. Class A | 689,408 | 1,704 |
| * Luoniushan Co. Ltd. Class A | 1,769,907 | 1,703 |
| Zhejiang Crystal-Optech Co. Ltd. Class A | 485,204 | 1,701 |
| Myhome Real Estate Development Group Co. Ltd. Class A | 2,899,500 | 1,701 |
| UTour Group Co. Ltd. Class A | 622,600 | 1,699 |
| Shanghai Shibei Hi-Tech Co. Ltd. Class A | 570,865 | 1,698 |
| Gemdale Corp. Class A (XSHG) | 953,400 | 1,697 |
| * Jiangsu Broadcasting Cable Information Network Corp. Ltd. Class A | 1,112,150 | 1,695 |
| Muyuan Foodstuff Co. Ltd. Class A | 464,814 | 1,694 |
| Jiangsu Yuyue Medical Equipment & Supply Co. Ltd. Class A | 332,610 | 1,694 |
| Anhui Quanchai Engine Co. Ltd. Class A | 1,043,078 | 1,692 |
| Shanghai Pharmaceuticals Holding Co. Ltd. Class A (XSSC) | 578,794 | 1,691 |
| Beijing Urban & Rural Trade Centre Co. Ltd. Class A | 740,548 | 1,690 |
| * Shangying Global Co. Ltd. Class A | 337,100 | 1,690 |
| * Langold Real Estate Co. Ltd. Class A | 1,962,979 | 1,689 |
| Yonghui Superstores Co. Ltd. Class A (XSSC) | 2,549,284 | 1,689 |
| Zhejiang Haiyue Co. Ltd. Class A (XSSC) | 893,841 | 1,687 |
| Tianma Microelectronics Co. Ltd. Class A | 606,603 | 1,686 |
| Dare Power Dekor Home Co. Ltd. Class A | 562,739 | 1,686 |
18
| | | |
| Vanguard® Emerging Markets Stock Index Fund | | |
| Schedule of Investments | | |
| October 31, 2016 | | |
| |
| | | | Market |
| | | | Value |
| | | Shares | ($000) |
| * | PCI-Suntek Technology Co. Ltd. Class A | 1,186,910 | 1,679 |
| * | Tianjin Jinbin Development Co. Ltd. Class A | 2,589,100 | 1,677 |
| | China Northern Rare Earth Group High-Tech Co. Ltd. Class A (XSSC) | 905,240 | 1,677 |
| * | Jilin Liyuan Precision Manufacturing Co. Ltd. Class A | 943,730 | 1,676 |
| | Xi'an LONGi Silicon Materials Corp. Class A (XSSC) | 819,659 | 1,676 |
| | China Spacesat Co. Ltd. Class A (XSSC) | 358,897 | 1,676 |
| | First Tractor Co. Ltd. Class A (XSSC) | 935,289 | 1,673 |
| * | CPT Technology Group Co. Ltd. Class A | 815,956 | 1,672 |
| | Suzhou Hailu Heavy Industry Co. Ltd. Class A | 1,456,715 | 1,672 |
| ^ | China Energy Engineering Corp. Ltd. | 12,130,000 | 1,671 |
| | Spring Airlines Co. Ltd. Class A (XSSC) | 260,939 | 1,666 |
| | Haisco Pharmaceutical Group Co. Ltd. Class A | 636,064 | 1,665 |
| * | Hunan Valin Steel Co. Ltd. Class A | 2,165,000 | 1,662 |
| | Fiberhome Telecommunication Technologies Co. Ltd. Class A (XSSC) | 395,854 | 1,660 |
| | Zhejiang Zheneng Electric Power Co. Ltd. Class A (XSHG) | 2,095,862 | 1,660 |
| * | Shanghai Electric Group Co. Ltd. Class A (XSSC) | 1,331,527 | 1,656 |
| | Shandong Hualu Hengsheng Chemical Co. Ltd. Class A (XSSC) | 973,203 | 1,651 |
| * | Yangguang Co. Ltd. Class A | 1,520,002 | 1,651 |
| | Guorui Properties Ltd. | 4,925,000 | 1,645 |
| * | Beijing UniStrong Science & Technology Co. Ltd. Class A | 252,800 | 1,642 |
| * | Yechiu Metal Recycling China Ltd. Class A | 2,802,500 | 1,642 |
| | Suzhou Anjie Technology Co. Ltd. Class A | 308,433 | 1,641 |
| | Zhejiang Chint Electrics Co. Ltd. Class A (XSHG) | 520,558 | 1,640 |
| | Yunnan Chihong Zinc & Germanium Co. Ltd. Class A (XSSC) | 1,868,124 | 1,640 |
| | Sany Heavy Industry Co. Ltd. Class A (XSHG) | 1,887,126 | 1,637 |
| * | Nanjing Keyuan Automatic Corp. Co. Ltd. Class A | 359,646 | 1,637 |
| | Shanghai Industrial Development Co. Ltd. Class A (XSSC) | 1,323,492 | 1,637 |
| | Guangdong Fenghua Advanced Technology Holding Co. Ltd. Class A | 1,084,395 | 1,636 |
| | Wanxiang Qianchao Co. Ltd. Class A | 752,015 | 1,635 |
| * | Guangdong Sunwill Precising Plastic Co. Ltd. Class A | 343,700 | 1,634 |
| | Shanghai Shenqi Pharmaceutical Investment Management Co. Ltd. Class A | 742,781 | 1,634 |
| * | Teamax Smart City Technology Corp. Ltd. Class A | 432,700 | 1,632 |
| | Qingling Motors Co. Ltd. | 5,278,000 | 1,630 |
| | Foshan Haitian Flavouring & Food Co. Ltd. Class A (XSSC) | 352,711 | 1,630 |
| * | Sinolink Worldwide Holdings Ltd. | 13,918,000 | 1,627 |
| | Beijing Oriental Yuhong Waterproof Technology Co. Ltd. Class A | 466,881 | 1,626 |
| | Talkweb Information System Co. Ltd. Class A | 841,500 | 1,625 |
| * | Guangzhou Baiyunshan Pharmaceutical Holdings Co. Ltd. Class A (XSSC) | 445,228 | 1,624 |
| | Guilin Sanjin Pharmaceutical Co. Ltd. Class A | 563,464 | 1,623 |
| * | Shanghai Lingang Holdings Corp. Ltd. Class A | 454,300 | 1,622 |
| * | Chongqing Taiji Industry Group Co. Ltd. Class A | 554,600 | 1,621 |
| | Suzhou Dongshan Precision Manufacturing Co. Ltd. Class A | 549,760 | 1,615 |
| * | Henan Dayou Energy Co. Ltd. Class A | 1,855,470 | 1,612 |
| | Hunan Friendship & Apollo Cmmericial Co. Ltd. Class A | 820,500 | 1,612 |
| * | Hubei Sanxia New Building Material Co. Ltd. Class A | 728,550 | 1,612 |
| | Huawen Media Investment Corp. Class A | 962,720 | 1,606 |
| * | Shanxi Coking Co. Ltd. Class A | 1,104,367 | 1,602 |
| | Huafu Top Dyed Melange Yarn Co. Ltd. Class A | 907,007 | 1,601 |
| | Jinling Pharmaceutical Co. Ltd. Class A | 758,131 | 1,601 |
| * | Meisheng Cultural & Creative Corp. Ltd. Class A | 307,379 | 1,601 |
| | Hang Zhou Great Star Industrial Co. Ltd. Class A | 601,900 | 1,599 |
| | Shandong Hi-speed Co. Ltd. Class A (XSSC) | 1,735,154 | 1,598 |
| *,^ | V1 Group Ltd. | 32,212,000 | 1,597 |
| | Shanghai International Port Group Co. Ltd. Class A (XSSC) | 2,086,522 | 1,595 |
| | Everbright Securities Co. Ltd. Class A (XSHG) | 640,900 | 1,594 |
| | North Electro-Optic Co. Ltd. Class A | 494,561 | 1,593 |
| | Sunflower Pharmaceutical Group Co. Ltd. Class A | 302,054 | 1,592 |
| | Beijing Sevenstar Electronics Co. Ltd. Class A | 317,300 | 1,592 |
| | DongFeng Automobile Co. Ltd. Class A | 1,412,412 | 1,592 |
| | Yifan Pharmaceutical Co. Ltd. Class A | 740,303 | 1,591 |
| | Guangxi Liugong Machinery Co. Ltd. Class A | 1,498,378 | 1,591 |
| | People.cn Co. Ltd. Class A (XSSC) | 556,581 | 1,589 |
| | Guangshen Railway Co. Ltd. Class A (XSHG) | 2,437,700 | 1,589 |
| * | China Fiber Optic Network System Group Ltd. | 17,564,000 | 1,585 |
19
| | |
| Vanguard® Emerging Markets Stock Index Fund | | |
| Schedule of Investments | | |
| October 31, 2016 | | |
| |
| | | Market |
| | | Value |
| | Shares | ($000) |
| Shanghai Fosun Pharmaceutical Group Co. Ltd. Class A (XSHG) | 452,300 | 1,585 |
| Henan Hengxing Science & Technology Co. Ltd. Class A | 1,720,395 | 1,585 |
| Sinodata Co. Ltd. Class A | 212,735 | 1,585 |
| Sanan Optoelectronics Co. Ltd. Class A (XSHG) | 882,400 | 1,584 |
| Guangdong Xinbao Electrical Appliances Holdings Co. Ltd. Class A | 619,009 | 1,582 |
| Shandong Sinobioway Biomedicine Co. Ltd. Class A | 424,560 | 1,581 |
| * Sinosteel Engineering & Technology Co. Ltd. Class A | 668,330 | 1,579 |
| * Eastern Gold Jade Co. Ltd. Class A | 1,062,360 | 1,579 |
| * Goldenmax International Technology Ltd. Class A | 538,100 | 1,579 |
| * Xi'an Minsheng Group Co. Ltd. Class A | 1,140,210 | 1,578 |
| Zhejiang Hisoar Pharmaceutical Co. Ltd. Class A | 1,073,398 | 1,575 |
| LianChuang Electronic Technology Co. Ltd. Class A | 442,403 | 1,575 |
| * Dongxing Securities Co. Ltd. Class A (XSSC) | 459,313 | 1,571 |
| * Anyang Iron & Steel Inc. Class A | 3,620,980 | 1,568 |
| Jiangsu Phoenix Publishing & Media Corp. Ltd. Class A (XSSC) | 949,415 | 1,567 |
| Taiji Computer Corp. Ltd. Class A | 281,700 | 1,566 |
| * Guangdong Kaiping Chunhui Co. Ltd. Class A | 1,116,230 | 1,566 |
| Yuan Longping High-tech Agriculture Co. Ltd. Class A | 547,439 | 1,565 |
| Guangdong Homa Appliances Co. Ltd. Class A | 140,452 | 1,564 |
| Shandong Shanda WIT Science & Tech Co. Ltd. Class A | 210,115 | 1,563 |
| Juli Sling Co. Ltd. Class A | 1,748,726 | 1,560 |
| Huafa Industrial Co. Ltd. Zhuhai Class A (XSSC) | 798,459 | 1,558 |
| * Hangzhou Advance Gearbox Group Co. Ltd. Class A | 942,109 | 1,557 |
| * Inner Mongolia Lantai Industrial Co. Ltd. Class A | 802,400 | 1,556 |
| Changchun Sinoenergy Corp. Class A | 823,800 | 1,556 |
| China Oilfield Services Ltd. Class A | 862,777 | 1,554 |
| Kunming Yunnei Power Co. Ltd. Class A | 1,323,027 | 1,554 |
| Beijing BDStar Navigation Co. Ltd. Class A | 339,651 | 1,553 |
| Gree Real Estate Co. Ltd. Class A (XSSC) | 1,721,028 | 1,552 |
| Sichuan Chuantou Energy Co. Ltd. Class A (XSHG) | 1,208,700 | 1,552 |
| * Xin Jiang Ready Health Industry Co. Ltd. Class A | 816,421 | 1,547 |
| Markor International Home Furnishings Co. Ltd. Class A | 745,928 | 1,544 |
| Shenzhen Kingdom Sci-Tech Co. Ltd. Class A (XSSC) | 340,049 | 1,543 |
| Bros Eastern Co. Ltd. Class A (XSSC) | 1,661,679 | 1,542 |
| Xinjiang Zhongtai Chemical Co. Ltd. Class A | 961,315 | 1,541 |
| Hunan TV & Broadcast Intermediary Co. Ltd. Class A | 650,700 | 1,541 |
| Jiangsu Zhongtian Technology Co. Ltd. Class A (XSSC) | 965,100 | 1,538 |
| Shanghai Construction Group Co. Ltd. Class A (XSSC) | 2,317,800 | 1,535 |
| Shenzhen Woer Heat-Shrinkable Material Co. Ltd. Class A | 695,362 | 1,534 |
| Zhejiang Weixing New Building Materials Co. Ltd. Class A | 646,316 | 1,532 |
| Beijing SL Pharmaceutical Co. Ltd. Class A | 345,900 | 1,529 |
| Luyang Energy-Saving Materials Co. Ltd. | 543,817 | 1,528 |
| * Datang Telecom Technology Co. Ltd. Class A | 561,507 | 1,527 |
| Linewell Software Co. Ltd. Class A | 137,694 | 1,527 |
| Glarun Technology Co. Ltd. Class A (XSSC) | 302,032 | 1,527 |
| * HNA Innovation Hainan Co. Ltd. Class A | 1,456,300 | 1,523 |
| Tecon Biology Co. Ltd. Class A | 1,063,904 | 1,521 |
| Oriental Energy Co. Ltd. Class A | 779,070 | 1,518 |
| * Guangdong Macro Co. Ltd. Class A | 864,971 | 1,516 |
| Tellhow Sci-Tech Co. Ltd. Class A | 515,100 | 1,512 |
| * Angang Steel Co. Ltd. Class A | 2,266,055 | 1,510 |
| TBEA Co. Ltd. Class A (XSHG) | 1,155,500 | 1,510 |
| * Shandong Qixing Iron Tower Co. Ltd. Class A | 373,812 | 1,507 |
| Founder Technology Group Corp. Class A (XSSC) | 2,014,872 | 1,506 |
| Founder Securities Co. Ltd. Class A (XSHG) | 1,362,890 | 1,505 |
| * Yiwu Huading Nylon Co. Ltd. Class A | 990,139 | 1,502 |
| Suzhou Good-Ark Electronics Co. Ltd. Class A | 925,800 | 1,502 |
| * China Resource and Environment Co. Ltd. Class A | 1,207,900 | 1,501 |
| * Genimous Technology Co. Ltd. Class A | 531,565 | 1,501 |
| Xinjiang Goldwind Science & Technology Co. Ltd. Class A | 654,509 | 1,500 |
| ^ First Tractor Co. Ltd. | 2,686,000 | 1,499 |
| Foshan Haitian Flavouring & Food Co. Ltd. Class A (XSHG) | 324,216 | 1,498 |
| Suzhou New Sea Union Telecom Technology Co. Ltd. Class A | 607,200 | 1,497 |
| Tongwei Co. Ltd. Class A (XSSC) | 1,668,122 | 1,495 |
20
| | | |
| Vanguard® Emerging Markets Stock Index Fund | | |
| Schedule of Investments | | |
| October 31, 2016 | | |
| |
| | | | Market |
| | | | Value |
| | | Shares | ($000) |
| | Henan Mingtai Al Industrial Co. Ltd. Class A | 616,254 | 1,495 |
| | Shanghai Runda Medical Technology Co. Ltd. Class A | 322,400 | 1,493 |
| | Wenfeng Great World Chain Development Corp. Class A (XSSC) | 1,921,613 | 1,492 |
| * | Guangdong Shirongzhaoye Co. Ltd. Class A | 916,961 | 1,491 |
| | Anhui Liuguo Chemical Co. Ltd. Class A | 1,319,100 | 1,488 |
| * | Sunsea Telecommunications Co. Ltd. Class A | 407,845 | 1,487 |
| | Zhejiang Jiuzhou Pharmaceutical Co. Ltd. Class A | 413,228 | 1,487 |
| * | Shenzhen Mason Technologies Co. Ltd. Class A | 759,451 | 1,486 |
| | Shenzhen Kaifa Technology Co. Ltd. Class A | 958,400 | 1,484 |
| | Wuhan Fingu Electronic Technology Co. Ltd. Class A | 553,215 | 1,481 |
| | SDIC Power Holdings Co. Ltd. Class A (XSHG) | 1,529,000 | 1,479 |
| | Xiamen International Airport Co. Ltd. Class A (XSSC) | 440,255 | 1,479 |
| | Puyang Refractories Group Co. Ltd. Class A | 1,516,881 | 1,476 |
| * | Hunan Dakang International Food & Agriculture Co. Ltd. Class A | 2,827,500 | 1,476 |
| | Fujian Longxi Bearing Group Co. Ltd. Class A | 804,399 | 1,474 |
| | Hongda Xingye Co. Ltd. Class A | 1,392,018 | 1,473 |
| * | Shandong Yisheng Livestock & Poultry Breeding Co. Ltd. Class A | 237,005 | 1,472 |
| * | Fujian Dongbai Group Co. Ltd. Class A | 992,900 | 1,471 |
| | MYS Group Co. Ltd. | 789,767 | 1,469 |
| | Shanghai Electric Power Co. Ltd. Class A (XSSC) | 844,723 | 1,463 |
| * | Liaoning Cheng Da Co. Ltd. Class A (XSSC) | 510,220 | 1,463 |
| | Stanley Agricultural Group Co. Ltd. Class A | 860,128 | 1,462 |
| *,^ | Capital Environment Holdings Ltd. | 42,118,000 | 1,462 |
| * | Zhongjin Gold Corp. Ltd. Class A (XSHG) | 781,160 | 1,460 |
| | Huangshan Novel Co. Ltd. Class A | 584,144 | 1,460 |
| | Jiangsu Nhwa Pharmaceutical Co. Ltd. Class A | 530,809 | 1,458 |
| | Huaxin Cement Co. Ltd. Class A (XSSC) | 1,334,003 | 1,458 |
| | Shenzhen Rainbow Fine Chemical Industry Co. Ltd. Class A | 1,309,200 | 1,458 |
| | Avic Capital Co. Ltd. Class A (XSHG) | 1,493,800 | 1,456 |
| | Anxin Trust Co. Ltd. Class A (XSHG) | 428,200 | 1,452 |
| | Zhejiang Zhongcheng Packing Material Co. Ltd. Class A | 524,621 | 1,451 |
| | Jiangsu Changjiang Electronics Technology Co. Ltd. Class A (XSSC) | 500,550 | 1,450 |
| | Anhui Golden Seed Winery Co. Ltd. Class A | 984,601 | 1,449 |
| | New China Life Insurance Co. Ltd. Class A (XSSC) | 232,493 | 1,449 |
| | Guangxi Liuzhou Pharmaceutical Co. Ltd. Class A | 114,822 | 1,447 |
| | Jiangsu Sainty Corp. Ltd. Class A | 797,700 | 1,442 |
| | CECEP Wind-Power Corp. Class A (XSSC) | 969,347 | 1,441 |
| | Shenzhen SDG Information Co. Ltd. Class A | 327,081 | 1,439 |
| | Sany Heavy Industry Co. Ltd. Class A (XSSC) | 1,657,301 | 1,438 |
| | Chongqing Department Store Co. Ltd. Class A | 374,760 | 1,437 |
| | Qingdao Doublestar Co. Ltd. Class A | 1,264,900 | 1,435 |
| ^ | Shanghai Fudan-Zhangjiang Bio-Pharmaceutical Co. Ltd. | 1,526,000 | 1,434 |
| * | Royal Group Co. Ltd. Class A | 593,878 | 1,432 |
| | Shanghai Chinafortune Co. Ltd. Class A (XSSC) | 812,561 | 1,432 |
| | Maoming Petro-Chemical Shihua Co. Ltd. Class A | 1,284,209 | 1,428 |
| | Baida Group Co. Ltd. Class A | 767,300 | 1,428 |
| | China Resources Double Crane Pharmaceutical Co. Ltd. Class A (XSHG) | 426,071 | 1,427 |
| * | Hainan Haiyao Co. Ltd. Class A | 681,800 | 1,426 |
| | Eastern Communications Co. Ltd. Class B | 1,942,674 | 1,426 |
| | Shijiazhuang Changshan Textile Co. Ltd. Class A | 768,673 | 1,426 |
| * | MCC Meili Cloud Computing Industry Investment Co. Ltd. Class A | 399,728 | 1,426 |
| | Shenzhen Huaqiang Industry Co. Ltd. Class A | 372,600 | 1,425 |
| | Shandong New Beiyang Information Technology Co. Ltd. Class A | 721,300 | 1,425 |
| * | Zhejiang Dilong Culture Development Co. Ltd. Class A | 587,836 | 1,421 |
| | Hubei Jumpcan Pharmaceutical Co. Ltd. Class A (XSSC) | 294,047 | 1,421 |
| | Nanjing Chixia Development Co. Ltd. Class A | 1,765,800 | 1,419 |
| | Focus Technology Co. Ltd. Class A | 137,700 | 1,419 |
| | Macrolink Culturaltainment Development Co. Ltd. Class A | 1,056,632 | 1,419 |
| * | Anyuan Coal Industry Group Co. Ltd. Class A (XSSC) | 1,812,542 | 1,418 |
| * | Nuode Investment Co. Ltd. Class A | 773,000 | 1,417 |
| * | Qingdao Haili Metal One Co. Ltd. Class A | 332,977 | 1,416 |
| | Jiangsu Etern Co. Ltd. Class A | 796,900 | 1,413 |
| | Changchun High & New Technology Industries Inc. Class A | 81,381 | 1,413 |
| * | Inner Mongolia Yuan Xing Energy Co. Ltd. Class A | 3,088,732 | 1,412 |
21
| | |
| Vanguard® Emerging Markets Stock Index Fund | | |
| Schedule of Investments | | |
| October 31, 2016 | | |
| |
| | | Market |
| | | Value |
| | Shares | ($000) |
| Sichuan Languang Development Co. Ltd. Class A (XSHG) | 1,219,900 | 1,412 |
| Changjiang Publishing & Media Co. Ltd. Class A | 1,105,865 | 1,411 |
| * Beijing Lier High-temperature Materials Co. Ltd. Class A | 1,731,571 | 1,410 |
| Better Life Commercial Chain Share Co. Ltd. Class A | 672,220 | 1,409 |
| * Beijing Sanyuan Foods Co. Ltd. Class A | 1,155,178 | 1,409 |
| Changzhou Qianhong Biopharma Co. Ltd. Class A | 1,146,300 | 1,408 |
| * Hna-Caissa Travel Group Co. Ltd. Class A | 531,976 | 1,407 |
| Zhuzhou Qianjin Pharmaceutical Co. Ltd. Class A (XSSC) | 563,667 | 1,405 |
| Xuchang Yuandong Drive Shaft Co. Ltd. Class A | 1,033,700 | 1,401 |
| Zhejiang Huafeng Spandex Co. Ltd. Class A | 1,999,101 | 1,401 |
| * Palm Eco-Town Development Co. Ltd. Class A | 908,403 | 1,401 |
| Hefei Department Store Group Co. Ltd. Class A | 1,084,817 | 1,400 |
| * Henan Ancai Hi-Tech Co. Ltd. Class A | 1,024,750 | 1,400 |
| Shenzhen Topway Video Communication Co. Ltd. Class A | 625,920 | 1,398 |
| China Nonferrous Metal Industry's Foreign Engineering and Construction Co. Ltd. Class A | 1,132,500 | 1,397 |
| Zhejiang IDC Fluid Control Co. Ltd. Class A | 266,921 | 1,396 |
| Guangzhou Zhujiang Brewery Co. Ltd. Class A | 717,800 | 1,394 |
| Huapont Life Sciences Co. Ltd. Class A | 971,200 | 1,394 |
| * Zhuzhou Kibing Group Co. Ltd. Class A (XSSC) | 2,479,714 | 1,393 |
| Wuhan Yangtze Communications Industry Group Co. Ltd. Class A | 375,860 | 1,393 |
| Westone Information Industry Inc. Class A | 268,237 | 1,388 |
| Shenzhen Guangju Energy Co. Ltd. Class A | 684,388 | 1,386 |
| * Rising Nonferrous Metals Share Co. Ltd. Class A | 181,820 | 1,385 |
| * Gosun Holding Co. Ltd. | 363,924 | 1,383 |
| Guangxi Nanning Waterworks Co. Ltd. Class A | 730,159 | 1,382 |
| Maoye Commericial Co. Ltd. Class A (XSSC) | 1,210,937 | 1,381 |
| Changchun Gas Co. Ltd. Class A | 1,091,800 | 1,380 |
| Shanghai Jiao Yun Co. Ltd. Class A (XSSC) | 1,006,690 | 1,380 |
| Zhejiang Longsheng Group Co. Ltd. Class A (XSSC) | 1,021,850 | 1,375 |
| Jiangsu Linyang Energy Co. Ltd. Class A (XSSC) | 998,525 | 1,375 |
| Beijing Join-Cheer Software Co. Ltd. Class A | 489,300 | 1,374 |
| * Tech Pro Technology Development Ltd. | 49,862,000 | 1,374 |
| Da An Gene Co. Ltd. of Sun Yat-Sen University Class A | 352,200 | 1,373 |
| Jiangsu Kanion Pharmaceutical Co. Ltd. Class A (XSHG) | 505,566 | 1,372 |
| * Yantai Tayho Advanced Materials Co. Ltd. Class A | 668,261 | 1,371 |
| Humanwell Healthcare Group Co. Ltd. Class A (XSSC) | 452,907 | 1,368 |
| Hangzhou First Pv Material Co. Ltd. Class A | 196,490 | 1,368 |
| * LingNan Landscape Co. Ltd. Class A | 316,500 | 1,367 |
| Anhui Conch Cement Co. Ltd. Class A (XSHG) | 544,000 | 1,367 |
| * Zhejiang Red Dragonfly Footwear Co. Ltd. Class A | 404,701 | 1,366 |
| * Shanxi Lu'an Environmental Energy Development Co. Ltd. Class A (XSHG) | 1,066,800 | 1,366 |
| Shanghai Highly Group Co. Ltd. Class B | 1,732,974 | 1,366 |
| TangShan Port Group Co. Ltd. Class A (XSSC) | 2,313,147 | 1,365 |
| Henan Rebecca Hair Products Co. Ltd. Class A (XSSC) | 1,201,912 | 1,365 |
| * Fujian Qingshan Paper Industry Co. Ltd. Class A | 1,432,300 | 1,364 |
| Dalian Refrigeration Co. Ltd. Class A | 852,300 | 1,364 |
| Anhui Sierte Fertilizer Industry Ltd. Co. Class A | 798,125 | 1,358 |
| Haitong Securities Co. Ltd. Class A | 564,115 | 1,354 |
| C&S Paper Co. Ltd. Class A | 451,800 | 1,353 |
| TBEA Co. Ltd. Class A (XSSC) | 1,035,190 | 1,352 |
| Jiangxi Zhengbang Technology Co. Ltd. Class A | 1,210,308 | 1,350 |
| Shuangliang Eco-Energy Systems Co. Ltd. Class A (XSSC) | 1,412,260 | 1,350 |
| * Jinzhou Cihang Group Co. Ltd. Class A | 594,864 | 1,350 |
| China Automotive Engineering Research Institute Co. Ltd. Class A | 850,441 | 1,347 |
| * Guangdong Chaohua Technology Co. Ltd. Class A | 809,488 | 1,347 |
| * Taiyuan Heavy Industry Co. Ltd. Class A (XSSC) | 2,206,513 | 1,347 |
| Huagong Tech Co. Ltd. Class A | 536,500 | 1,346 |
| Sinoma Science & Technology Co. Ltd. Class A | 515,740 | 1,345 |
| Sundiro Holding Co. Ltd. Class A | 1,009,900 | 1,344 |
| * Jiangsu Sihuan Bioengineering Co. Ltd. Class A | 1,119,200 | 1,344 |
| * Wintime Energy Co. Ltd. Class A (XSHG) | 2,148,110 | 1,343 |
| * Tangshan Jidong Cement Co. Ltd. Class A | 851,877 | 1,343 |
| * Jiangsu Rainbow Heavy Industries Co. Ltd. Class A | 708,960 | 1,338 |
| Hengdian Group DMEGC Magnetics Co. Ltd. Class A | 620,700 | 1,338 |
22
| | | |
| Vanguard® Emerging Markets Stock Index Fund | | |
| Schedule of Investments | | |
| October 31, 2016 | | |
| |
| | | | Market |
| | | | Value |
| | | Shares | ($000) |
| * | China Shipbuilding Industry Group Power Co. Ltd. Class A (XSHG) | 279,700 | 1,337 |
| * | Shanxi Meijin Energy Co. Ltd. Class A | 508,015 | 1,337 |
| | Der Future Science & Technology Holding Group Co. Ltd. Class A | 405,040 | 1,335 |
| * | Anhui Wanjiang Logistics Group Co. Ltd. Class A | 2,035,500 | 1,334 |
| | Shenyang Jinshan Energy Co. Ltd. Class A | 1,680,158 | 1,331 |
| | Bright Dairy & Food Co. Ltd. Class A (XSSC) | 624,067 | 1,331 |
| | Zhejiang Yongtai Technology Co. Ltd. Class A | 502,960 | 1,330 |
| * | Zhejiang People Culture Co. Ltd. Class A | 493,970 | 1,329 |
| * | Aurora Optoelectronics Co. Ltd. Class A (XSHG) | 320,749 | 1,329 |
| | Shandong Wohua Pharmaceutical Co. Ltd. Class A | 584,500 | 1,328 |
| | Cangzhou Mingzhu Plastic Co. Ltd. Class A | 378,189 | 1,327 |
| | Zhongshan Broad Ocean Motor Co. Ltd. Class A | 893,700 | 1,327 |
| * | Dongfang Electronics Co. Ltd. Class A | 1,727,250 | 1,327 |
| | Shenzhen Danbond Technology Co. Ltd. Class A | 297,762 | 1,324 |
| | Hangxiao Steel Structure Co. Ltd. Class A | 880,885 | 1,323 |
| | Yabao Pharmaceutical Group Co. Ltd. Class A (XSSC) | 870,083 | 1,323 |
| | Shenzhen MTC Co. Ltd. Class A | 894,902 | 1,323 |
| | Tianjin Port Co. Ltd. Class A (XSHG) | 878,396 | 1,321 |
| | Shenzhen Feima International Supply Chain Co. Ltd. Class A | 527,615 | 1,318 |
| | Maoye Communication and Network Co. Ltd. Class A | 532,830 | 1,317 |
| | Guangdong Ellington Electronics Technology Co. Ltd. Class A (XSSC) | 281,082 | 1,317 |
| * | Shaanxi Coal Industry Co. Ltd. Class A | 1,366,534 | 1,316 |
| * | Anhui Tongfeng Electronics Co. Ltd. Class A | 924,200 | 1,316 |
| | Anhui Huamao Textile Co. Class A | 1,495,364 | 1,311 |
| | Tonghua Dongbao Pharmaceutical Co. Ltd. Class A (XSHG) | 375,986 | 1,311 |
| * | Shandong Xinchao Energy Co. Ltd. Class A | 551,500 | 1,309 |
| | Shandong Sun Paper Industry JSC Ltd. Class A | 1,277,100 | 1,308 |
| | Black Peony Group Co. Ltd. Class A (XSSC) | 983,187 | 1,307 |
| * | Tibet Summit Industry Co. Ltd. Class A | 285,589 | 1,307 |
| | East China Engineering Science and Technology Co. Ltd. Class A | 589,564 | 1,306 |
| | China Gezhouba Group Co. Ltd. Class A (XSSC) | 1,029,175 | 1,305 |
| | Sieyuan Electric Co. Ltd. Class A | 787,700 | 1,303 |
| * | Topchoice Medical Investment Corp. Class A | 263,079 | 1,302 |
| | Zhejiang Hailide New Material Co. Ltd. Class A | 474,767 | 1,302 |
| | Shenzhen World Union Properties Consultancy Inc. Class A | 1,106,550 | 1,301 |
| | Shanghai Xin Nanyang Co. Ltd. Class A | 266,349 | 1,301 |
| * | Shanghai Electric Group Co. Ltd. Class A (XSHG) | 1,045,430 | 1,300 |
| 2 | Kangda International Environmental Co. Ltd. | 5,524,000 | 1,298 |
| | An Hui Wenergy Co. Ltd. Class A | 1,093,644 | 1,298 |
| | Chengdu Santai Holding Group Co. Ltd. Class A | 800,731 | 1,297 |
| * | Shenghe Resources Holding Co. Ltd. Class A | 621,900 | 1,297 |
| * | Jilin Power Share Co. Ltd. Class A | 1,452,680 | 1,295 |
| * | China Eastern Airlines Corp. Ltd. Class A (XSSC) | 1,386,700 | 1,295 |
| | North Navigation Control Technology Co. Ltd. Class A (XSSC) | 597,204 | 1,295 |
| | Xiamen Kehua Hengsheng Co. Ltd. Class A | 207,200 | 1,295 |
| | Fujian Septwolves Industry Co. Ltd. Class A | 824,109 | 1,292 |
| | Baosheng Science and Technology Innovation Co. Ltd. Class A (XSSC) | 1,077,300 | 1,290 |
| | EGing Photovoltaic Technology Co. Ltd. Class A (XSSC) | 1,137,674 | 1,288 |
| | Jihua Group Corp. Ltd. Class A (XSSC) | 1,027,040 | 1,288 |
| * | Zhejiang NetSun Co. Ltd. Class A | 170,500 | 1,288 |
| | NARI Technology Co. Ltd. Class A (XSHG) | 570,200 | 1,286 |
| *,^ | China Rare Earth Holdings Ltd. | 17,838,800 | 1,285 |
| | Baotou Huazi Industry Co. Ltd. Class A | 606,000 | 1,283 |
| | Chengdu Xingrong Environment Co. Ltd. Class A | 1,448,400 | 1,282 |
| * | Sailun Jinyu Group Co. Ltd. (XSSC) | 2,021,815 | 1,281 |
| * | Shenzhen Infinova Ltd. Class A | 1,076,307 | 1,280 |
| | Shenzhen Zhenye Group Co. Ltd. Class A | 878,400 | 1,279 |
| | Org Packaging Co. Ltd. Class A | 897,007 | 1,278 |
| | Jiangnan Mould and Plastic Technology Co. Ltd. Class A | 977,300 | 1,277 |
| | Chongqing Brewery Co. Ltd. Class A | 464,151 | 1,276 |
| | Guangdong Vanward New Electric Co. Ltd. Class A | 498,189 | 1,275 |
| * | Jiangxi Special Electric Motor Co. Ltd. Class A | 704,500 | 1,274 |
| | Henan Pinggao Electric Co. Ltd. Class A | 498,800 | 1,274 |
| * | China Union Holdings Ltd. Class A | 937,300 | 1,274 |
23
| | | |
| Vanguard® Emerging Markets Stock Index Fund | | |
| Schedule of Investments | | |
| October 31, 2016 | | |
| |
| | | | Market |
| | | | Value |
| | | Shares | ($000) |
| | Shandong Hualu Hengsheng Chemical Co. Ltd. Class A (XSHG) | 750,451 | 1,273 |
| * | China Security & Fire Co. Ltd. Class A (XSSC) | 421,300 | 1,273 |
| * | Zhongzhu Healthcare Holding Co. Ltd. Class A | 378,843 | 1,272 |
| | Beijing Tongrentang Co. Ltd. Class A (XSHG) | 274,800 | 1,272 |
| | Henan Splendor Science & Technology Co. Ltd. Class A | 514,800 | 1,271 |
| | Chongqing Road & Bridge Co. Class A | 1,191,800 | 1,271 |
| | Gansu Gangtai Holding Group Co. Ltd. Class A (XSSC) | 523,462 | 1,269 |
| | Zhejiang Hailiang Co. Ltd. Class A | 1,087,716 | 1,269 |
| * | Jiangsu Aoyang Technology Corp. Ltd. Class A | 784,900 | 1,269 |
| * | Zhongfu Straits Pingtan Development Co. Ltd. Class A | 1,084,944 | 1,268 |
| * | Shanghai Potevio Co. Ltd. Class B | 887,700 | 1,267 |
| | Zhongxing Shenyang Commercial Building Group Co. Ltd. Class A | 568,538 | 1,266 |
| * | Chengdu Taihe Health Technology Group Inc. Ltd. Class A | 630,400 | 1,264 |
| | GreatWall Information Industry Co. Ltd. Class A | 422,100 | 1,264 |
| * | CASIN Guoxing Property Development Co. Ltd. | 849,801 | 1,263 |
| | Jinyu Bio-Technology Co. Ltd. Class A (XSSC) | 279,700 | 1,263 |
| | Jiangsu Yabang Dyestuff Co. Ltd. Class A (XSSC) | 469,788 | 1,262 |
| | Ningbo Huaxiang Electronic Co. Ltd. Class A | 354,700 | 1,262 |
| * | Hanwang Technology Co. Ltd. Class A | 333,500 | 1,260 |
| | Dongguan Kingsun Optoelectronic Co. Ltd. Class A | 806,250 | 1,259 |
| | Ningbo Ligong Environment And Energy Technology Co. Ltd. Class A | 408,869 | 1,258 |
| | Zhejiang Shuanghuan Driveline Co. Ltd. Class A | 635,080 | 1,258 |
| | Zhangzhou Pientzehuang Pharmaceutical Co. Ltd. Class A (XSSC) | 177,127 | 1,257 |
| | Chenzhou City Jingui Silver Industry Co. Ltd. Class A | 363,400 | 1,255 |
| * | Maanshan Dingtai Rare Earth&New Material Co. Ltd. Class A | 172,600 | 1,255 |
| | Canny Elevator Co. Ltd. Class A | 578,496 | 1,255 |
| | Guangdong Shenglu Telecommunication Tech Co. Ltd. Class A | 325,610 | 1,254 |
| | Shanghai Huayi Group Corp. Ltd. Class A | 449,976 | 1,253 |
| | Hengbao Co. Ltd. Class A | 620,300 | 1,253 |
| | Jiangsu Hengli Hydraulic Co. Ltd. Class A | 583,100 | 1,252 |
| * | Xiamen Xiangyu Co. Ltd. Class A | 749,419 | 1,252 |
| * | Liuzhou Liangmianzhen Co. Ltd. Class A | 1,080,093 | 1,251 |
| * | Shenzhen Click Technology Co. Ltd. Class A | 257,800 | 1,251 |
| | Guangdong Tapai Group Co. Ltd. Class A | 931,036 | 1,251 |
| * | Zhongtong Bus & Holding Co. Ltd. Class A | 470,700 | 1,250 |
| | Fujian Torch Electron Technology Co. Ltd. Class A | 108,405 | 1,248 |
| | Jiangsu Hongdou Industrial Co. Ltd. Class A | 984,300 | 1,247 |
| * | XCMG Construction Machinery Co. Ltd. Class A | 2,593,215 | 1,247 |
| *,^ | Greenland Hong Kong Holdings Ltd. | 4,864,000 | 1,245 |
| * | Shandong Iron and Steel Co. Ltd. Class A | 3,416,700 | 1,244 |
| | China Molybdenum Co. Ltd. Class A (XSSC) | 2,195,400 | 1,243 |
| | Harbin Boshi Automation Co. Ltd. Class A | 489,986 | 1,242 |
| * | AUCMA Co. Ltd. Class A | 1,103,101 | 1,240 |
| | Songz Automobile Air Conditioning Co. Ltd. Class A | 552,297 | 1,240 |
| | Qinghai Huzhu Barley Wine Co. Ltd. Class A | 433,000 | 1,239 |
| | China XD Electric Co. Ltd. Class A (XSHG) | 1,531,400 | 1,238 |
| | Materials Industry Zhongda Group Co. Ltd. Class A (XSSC) | 808,971 | 1,238 |
| * | Vatti Corp. Ltd. Class A | 320,312 | 1,236 |
| | China CYTS Tours Holding Co. Ltd. Class A (XSSC) | 367,868 | 1,236 |
| * | Tongling Nonferrous Metals Group Co. Ltd. Class A | 3,066,100 | 1,235 |
| | Inspur Software Co. Ltd. Class A (XSSC) | 312,726 | 1,234 |
| * | Jiajia Food Group Co. Ltd. Class A | 1,089,263 | 1,233 |
| * | Ground Food Tech Co. Ltd. Class A | 730,743 | 1,231 |
| * | China Greatwall Computer Shenzhen Co. Ltd. Class A | 716,877 | 1,224 |
| * | Zhejiang Rifa Precision Machinery Co. Ltd. Class A | 561,702 | 1,224 |
| | Tibet Galaxy Science & Technology Development Co. Ltd. Class A | 469,400 | 1,224 |
| | China Zhenhua Group Science & Technology Co. Ltd. Class A | 432,542 | 1,223 |
| | Rongsheng Petro Chemical Co. Ltd. Class A | 560,754 | 1,222 |
| * | JiangSu Yabaite Technology Co. Ltd. Class A | 611,343 | 1,221 |
| * | Jilin Yatai Group Co. Ltd. Class A (XSSC) | 1,597,167 | 1,219 |
| * | Hunan Gold Corp. Ltd. Class A | 665,040 | 1,219 |
| | Offshore Oil Engineering Co. Ltd. Class A (XSHG) | 1,162,500 | 1,218 |
| | Digital China Information Service Co. Ltd. Class A | 311,643 | 1,217 |
| | Leaguer Stock Co. Ltd. Class A | 381,017 | 1,217 |
24
| | |
| Vanguard® Emerging Markets Stock Index Fund | | |
| Schedule of Investments | | |
| October 31, 2016 | | |
| |
| | | Market |
| | | Value |
| | Shares | ($000) |
| * Kailuan Energy Chemical Co. Ltd. Class A (XSHG) | 1,071,969 | 1,217 |
| Fantasia Holdings Group Co. Ltd. | 9,369,000 | 1,216 |
| Wuhan DDMC Culture Co. Ltd. Class A | 437,950 | 1,215 |
| Zijin Mining Group Co. Ltd. Class A (XSSC) | 2,486,600 | 1,213 |
| * China Calxon Group Co. Ltd. Class A | 788,400 | 1,212 |
| Angel Yeast Co. Ltd. Class A (XSHG) | 484,792 | 1,212 |
| Xinhu Zhongbao Co. Ltd. Class A (XSSC) | 1,746,518 | 1,211 |
| Shenzhen Zhengtong Electronics Co. Ltd. Class A | 449,500 | 1,209 |
| China Oil HBP Science & Technology Co. Ltd. Class A | 1,184,212 | 1,209 |
| Lanpec Technologies Ltd. Class A | 638,300 | 1,209 |
| * GuangYuYuan Chinese Herbal Medicine Co. Ltd. Class A | 242,100 | 1,208 |
| Shanghai Construction Group Co. Ltd. Class A (XSHG) | 1,823,522 | 1,208 |
| * Huaming Power Equipement Co. Ltd. Class A | 505,362 | 1,208 |
| Xiamen Port Development Co. Ltd. Class A | 739,716 | 1,206 |
| JPMF Guangdong Co. Ltd. Class A | 794,500 | 1,206 |
| Sichuan Expressway Co. Ltd. Class A (XSSC) | 1,682,510 | 1,202 |
| Zhejiang Hisun Pharmaceutical Co. Ltd. Class A (XSSC) | 568,100 | 1,201 |
| * Shenzhen Deren Electronic Co. Ltd. Class A | 253,591 | 1,197 |
| * Shandong Lukang Pharma Class A | 816,700 | 1,196 |
| Shanghai Jinfeng Wine Co. Ltd. Class A | 758,496 | 1,195 |
| Jishi Media Co. Ltd. Class A (XSHG) | 1,827,200 | 1,193 |
| Shenzhen Desay Battery Technology Co. Class A | 184,400 | 1,193 |
| Jiangxi Lianchuang Optoelectronic Science & Technology Co. Ltd. Class A (XSSC) | 443,776 | 1,193 |
| Jiangsu High Hope International Group Corp. Class A | 916,300 | 1,193 |
| * Yihua Healthcare Co. Ltd. Class A | 253,040 | 1,193 |
| China Jushi Co. Ltd. Class A (XSSC) | 742,638 | 1,193 |
| Tianjin Development Holdings Ltd. | 2,492,000 | 1,192 |
| * Shenzhen Huakong SEG Co. Ltd. Class A | 858,900 | 1,192 |
| Sanquan Food Co. Ltd. Class A | 896,000 | 1,192 |
| Suzhou Chunxing Precision Mechanical Co. Ltd. Class A | 781,900 | 1,190 |
| Inner Mongolia MengDian HuaNeng Thermal Power Corp. Ltd. Class A (XSHG) | 2,555,201 | 1,190 |
| Ningbo Boway Alloy Material Co. Ltd. Class A | 623,270 | 1,188 |
| * Hunan Aihua Group Co. Ltd. Class A | 225,620 | 1,188 |
| * Xinjiang Youhao Group Co. Ltd. Class A | 767,100 | 1,187 |
| Shanghai Hile Bio-Technology Co. Ltd. Class A | 433,341 | 1,186 |
| Shanghai Fudan Forward S & T Co. Ltd. Class A (XSSC) | 912,010 | 1,186 |
| Zhejiang Fuchunjiang Environmental Thermoelectric Co. Ltd. Class A | 585,500 | 1,186 |
| Hangzhou Zhongheng Electric Co. Ltd. Class A | 325,667 | 1,185 |
| Sichuan Jiuzhou Electric Co. Ltd. Class A | 711,368 | 1,185 |
| Shenzhen Fenda Technology Co. Ltd. Class A | 568,791 | 1,185 |
| * Shenzhen Glory Medical Co. Ltd. Class A | 351,886 | 1,184 |
| * DeHua TB New Decoration Materials Co. Ltd. Class A | 595,750 | 1,183 |
| * Jiangsu Dagang Co. Ltd. Class A | 423,089 | 1,182 |
| Wanxiang Doneed Co. Ltd. Class A | 459,048 | 1,180 |
| Jiangsu Leike Defense Technology Co. Ltd. Class A | 602,323 | 1,178 |
| * Fujian Rongji Software Co. Ltd. Class A | 500,500 | 1,177 |
| Shenzhen Clou Electronics Co. Ltd. Class A | 826,100 | 1,176 |
| * Dasheng Times Cultural Investment Co. Ltd. Class A | 116,000 | 1,176 |
| * Hunan Jinjian Cereals Industry Co. Class A | 1,176,000 | 1,175 |
| Valiant Co. Ltd. Class A | 204,100 | 1,174 |
| Zhejiang Vie Science & Technology Co. Ltd. Class A | 336,000 | 1,174 |
| Sinochem International Corp. Class A (XSSC) | 794,851 | 1,173 |
| Yonghui Superstores Co. Ltd. Class A (XSHG) | 1,770,600 | 1,173 |
| Gohigh Data Networks Technology Co. Ltd. Class A | 612,100 | 1,172 |
| Anhui Xinhua Media Co. Ltd. Class A (XSSC) | 490,455 | 1,172 |
| HeiLongJiang ZBD Pharmaceutical Co. Ltd. Class A | 370,400 | 1,171 |
| Dalian Yi Qiao Sea Cucumber Co. Ltd. Class A | 815,775 | 1,171 |
| * Guangdong Ronsen Super Micro-Wire Co. Ltd. Class A | 873,334 | 1,171 |
| United Electronics Co. Ltd. Class A | 324,587 | 1,171 |
| Shenzhen H&T Intelligent Control Co. Ltd. Class A | 708,842 | 1,171 |
| YUD Yangtze River Investment Industry Co. Ltd. Class A (XSSC) | 347,125 | 1,170 |
| * Anhui Guofeng Plastic Industry Co. Ltd. Class A | 1,347,300 | 1,170 |
| * Far East Smarter Energy Co. Ltd. Class A (XSSC) | 901,200 | 1,170 |
| China Avionics Systems Co. Ltd. Class A (XSSC) | 411,820 | 1,169 |
25
| | | |
| Vanguard® Emerging Markets Stock Index Fund | | |
| Schedule of Investments | | |
| October 31, 2016 | | |
| |
| | | | Market |
| | | | Value |
| | | Shares | ($000) |
| | Huadian Power International Corp. Ltd. Class A (XSHG) | 1,581,717 | 1,169 |
| | Anhui Jinhe Industrial Co. Ltd. Class A | 513,300 | 1,168 |
| | Hangzhou Hangyang Co. Ltd. Class A | 926,150 | 1,168 |
| * | Wuhan Iron & Steel Co. Ltd. Class A (XSHG) | 2,526,701 | 1,168 |
| * | Western Mining Co. Ltd. Class A (XSSC) | 1,053,500 | 1,165 |
| * | Hangzhou Sunyard System Engineering Co. Ltd. Class A (XSSC) | 334,854 | 1,164 |
| | Fujian Longma Environmental Sanitation Equipment Co. Ltd. Class A | 229,300 | 1,161 |
| | Shenzhen New Nanshan Holding Group Co. Ltd. Class A | 898,744 | 1,160 |
| * | CNNC Hua Yuan Titanium Dioxide Co. Ltd. Class A | 1,148,100 | 1,160 |
| * | Laobaixing Pharmacy Chain JSC Class A (XSSC) | 153,900 | 1,158 |
| | Avic Real Estate Holding Co. Ltd. Class A | 744,416 | 1,157 |
| | Shenzhen Zhongjin Lingnan Nonfemet Co. Ltd. Class A | 721,700 | 1,157 |
| | Xiamen Xindeco Co. Ltd. Class A | 486,051 | 1,156 |
| | Hainan Ruize New Building Material Co. Ltd. Class A | 255,568 | 1,156 |
| | Taihai Manoir Nuclear Equipment Co. Ltd. Class A | 147,498 | 1,155 |
| | Vtron Technologies Ltd. Class A | 468,923 | 1,155 |
| | Ningbo Shanshan Co. Ltd. Class A (XSSC) | 497,723 | 1,155 |
| | Guangxi Guiguan Electric Power Co. Ltd. Class A (XSSC) | 1,175,359 | 1,153 |
| * | Shanghai Yatong Co. Ltd. Class A | 511,000 | 1,152 |
| | NARI Technology Co. Ltd. Class A (XSSC) | 508,699 | 1,148 |
| | Sichuan Chengfei Integration Technology Corp. Class A | 216,379 | 1,147 |
| * | Hunan Corun New Energy Co. Ltd. Class A | 690,330 | 1,147 |
| | Integrated Electronic Systems Lab Co. Ltd. Class A | 423,130 | 1,147 |
| | Jingwei Textile Machinery Class A | 359,700 | 1,147 |
| | Spring Airlines Co. Ltd. Class A (XSHG) | 179,600 | 1,147 |
| | COFCO Property Group Co. Ltd. Class A | 844,131 | 1,146 |
| | Tsinghua Tongfang Co. Ltd. Class A (XSHG) | 554,900 | 1,146 |
| | Guangdong Hongda Blasting Co. Ltd. Class A | 759,658 | 1,145 |
| * | Huaxun Fangzhou Co. Ltd. | 408,600 | 1,144 |
| | Tianjin Port Development Holdings Ltd. | 7,468,000 | 1,143 |
| | XJ Electric Co. Ltd. Class A | 443,400 | 1,143 |
| | Qiaqia Food Co. Ltd. Class A | 440,621 | 1,142 |
| | Datang International Power Generation Co. Ltd. Class A (XSSC) | 1,974,340 | 1,140 |
| | Zhongnan Red Culture Group Co. Ltd. Class A | 429,800 | 1,140 |
| | Dalian Tianbao Green Foods Co. Ltd. Class A | 679,700 | 1,138 |
| | Beijing Shunxin Agriculture Co. Ltd. Class A | 384,118 | 1,138 |
| | HNA Investment Group Co. Ltd. Class A | 1,371,500 | 1,138 |
| * | Nanjing Xinlian Electronics Co. Ltd. Class A | 771,541 | 1,136 |
| * | Chengdu Qian Feng Electronics Co. Ltd. Class A | 153,129 | 1,135 |
| * | Shenzhen Coship Electronics Co. Ltd. Class A | 640,400 | 1,132 |
| | Guangdong Chj Industry Co. Ltd. Class A | 727,900 | 1,129 |
| *,^ | China Dynamics Holdings Ltd. | 30,680,000 | 1,128 |
| | Zhejiang Weiming Environment Protection Co. Ltd. Class A | 289,800 | 1,127 |
| | Shanghai Kehua Bio-Engineering Co. Ltd. Class A | 352,700 | 1,126 |
| | Zhejiang Aokang Shoes Co. Ltd. Class A | 359,876 | 1,126 |
| * | Zhengzhou Coal Industry & Electric Power Co. Ltd. Class A | 1,363,912 | 1,125 |
| | China National Complete Plant Import & Export Corp. Ltd. Class A | 410,475 | 1,124 |
| * | Guomai Technologies Inc. Class A | 680,179 | 1,121 |
| | Lianhe Chemical Technology Co. Ltd. Class A | 457,600 | 1,121 |
| * | Sichuan Jiuyuan Yinhai Software Co. Ltd. Class A | 78,500 | 1,119 |
| * | China Shipping Haisheng Co. Ltd. Class A | 605,722 | 1,118 |
| | Hefei Meiya Optoelectronic Technology Inc. Class A | 358,050 | 1,118 |
| | Changzhou Xingyu Automotive Lighting Systems Co. Ltd. Class A | 194,117 | 1,118 |
| | Shandong Chenming Paper Holdings Ltd. Class A | 794,900 | 1,116 |
| | Nantong Fujitsu Microelectronics Co. Ltd. Class A | 644,588 | 1,116 |
| | Xiwang Foodstuffs Co. Ltd. Class A | 306,500 | 1,115 |
| | Jiangsu Huaxicun Co. Ltd. Class A | 704,200 | 1,114 |
| * | Mingfa Group International Co. Ltd. | 4,570,000 | 1,114 |
| | GEPIC Energy Development Co. Ltd. Class A | 551,040 | 1,113 |
| * | Chifeng Jilong Gold Mining Co. Ltd. Class A | 427,494 | 1,113 |
| | Tianjin Zhonghuan Semiconductor Co. Ltd. Class A | 910,252 | 1,112 |
| | Dawning Information Industry Co. Ltd. Class A (XSSC) | 232,582 | 1,112 |
| * | Guangzhou Holike Creative Home Co. Ltd. Class A | 220,658 | 1,108 |
| * | Sansteel Minguang Co. Ltd. Fujian Class A | 945,704 | 1,108 |
26
| | | |
| Vanguard® Emerging Markets Stock Index Fund | | |
| Schedule of Investments | | |
| October 31, 2016 | | |
| |
| | | | Market |
| | | | Value |
| | | Shares | ($000) |
| | Zhangzhou Pientzehuang Pharmaceutical Co. Ltd. Class A (XSHG) | 155,775 | 1,105 |
| | Joincare Pharmaceutical Group Industry Co. Ltd. Class A (XSSC) | 720,954 | 1,105 |
| * | Shijiazhuang Dongfang Energy Co. Ltd. Class A | 493,128 | 1,105 |
| | Shanghai STEP Electric Corp. Class A | 503,347 | 1,104 |
| * | Join. in Holding Co. Ltd. Class A | 348,500 | 1,103 |
| | Shunfa Hengye Corp. Class A | 1,413,801 | 1,103 |
| | Sailun Jinyu Group Co. Ltd. (XSHG) | 1,737,560 | 1,101 |
| | YGSOFT Inc. Class A | 546,115 | 1,099 |
| * | Gem-Year Industrial Co. Ltd. Class A (XSSC) | 746,111 | 1,099 |
| | China Aerospace Times Electronics Co. Ltd. Class A | 462,080 | 1,098 |
| | Zhejiang China Commodities City Group Co. Ltd. Class A (XSHG) | 976,000 | 1,094 |
| | Fangda Special Steel Technology Co. Ltd. Class A (XSSC) | 1,179,649 | 1,094 |
| * | Yantai Dongcheng Pharmaceutical Co. Ltd. Class A | 426,300 | 1,094 |
| * | Shandong Tyan Home Co. Ltd. Class A (XSHG) | 576,500 | 1,094 |
| | Zhejiang Conba Pharmaceutical Co. Ltd. Class A (XSHG) | 982,257 | 1,094 |
| | Chengdu Leejun Industrial Co. Ltd. Class A | 718,961 | 1,094 |
| | Neusoft Corp. Class A (XSSC) | 411,814 | 1,093 |
| * | Guangdong Guanghong Holdings Co. Ltd. Class A | 720,203 | 1,092 |
| *,^ | Wisdom Sports Group | 3,382,000 | 1,091 |
| * | China Dalian International Cooperation Group Holdings Ltd. Class A | 295,100 | 1,091 |
| | Han's Laser Technology Industry Group Co. Ltd. Class A | 327,400 | 1,089 |
| * | Wisesoft Co. Ltd. Class A | 247,414 | 1,088 |
| * | Jiangsu Sopo Chemical Co. Class A | 571,400 | 1,086 |
| | Zhejiang Daily Media Group Co. Ltd. Class A (XSHG) | 477,200 | 1,086 |
| | Nantong Jiangshan Agrochemical & Chemical LLC Class A | 391,062 | 1,086 |
| * | Shenzhen Silver Basis Technology Co. Ltd. Class A | 266,346 | 1,085 |
| | Jiangsu King's Luck Brewery JSC Ltd. Class A (XSSC) | 552,395 | 1,084 |
| | Fujian Expressway Development Co. Ltd. Class A (XSHG) | 2,156,400 | 1,081 |
| | Nanjing Redsun Co. Ltd. Class A | 462,551 | 1,081 |
| | Tianjin Capital Environmental Protection Group Co. Ltd. Class A (XSSC) | 839,436 | 1,081 |
| * | Visual China Group Co. Ltd. Class A | 323,812 | 1,080 |
| * | Nanjing Kangni Mechanical & Electrical Co. Ltd. Class A | 476,985 | 1,079 |
| * | Pangang Group Vanadium Titanium & Resources Co. Ltd. Class A | 2,797,700 | 1,079 |
| | Shanghai Tunnel Engineering Co. Ltd. Class A (XSHG) | 711,300 | 1,077 |
| | Fujian Star-net Communication Co. Ltd. Class A | 369,581 | 1,075 |
| | Xiamen Kingdomway Group Co. Class A | 462,900 | 1,075 |
| | Wangfujing Group Co. Ltd. Class A (XSSC) | 446,851 | 1,074 |
| | Changyuan Group Ltd. Class A (XSHG) | 522,960 | 1,074 |
| | China Resources Double Crane Pharmaceutical Co. Ltd. Class A (XSSC) | 319,689 | 1,071 |
| * | Kee Ever Bright Decorative Technology Co. Ltd. Class A | 117,217 | 1,071 |
| * | Shenzhen Tellus Holding Co. Ltd. Class A | 110,007 | 1,070 |
| | China Zhonghua Geotechnical Engineering Co. Ltd. Class A | 853,506 | 1,069 |
| | Shanghai Xinhua Media Co. Ltd. Class A (XSSC) | 805,781 | 1,068 |
| | Skyworth Digital Co. Ltd. Class A | 423,200 | 1,067 |
| | Guangxi Guidong Electric Power Co. Ltd. Class A | 616,200 | 1,066 |
| * | Zhejiang Jingxin Pharmaceutical Co. Ltd. Class A | 582,116 | 1,065 |
| | Hubei Shuanghuan Science and Technology Stock Co. Ltd. Class A | 885,700 | 1,065 |
| | Tungkong Inc. Class A | 245,184 | 1,064 |
| | China Shenhua Energy Co. Ltd. Class A (XSHG) | 427,130 | 1,064 |
| | Shenzhen Invt Electric Co. Ltd. Class A | 844,252 | 1,062 |
| | Guizhou Space Appliance Co. Ltd. Class A | 285,320 | 1,062 |
| | Metallurgical Corp. of China Ltd. Class A (XSHG) | 1,714,400 | 1,062 |
| * | Jiangsu Fengdong Thermal Technology Co. Ltd. Class A | 198,000 | 1,061 |
| * | Harbin Air Conditioning Co. Ltd. Class A | 590,300 | 1,059 |
| * | Montnets Rongxin Technology Group Co. Ltd. Class A | 437,000 | 1,058 |
| | Datang International Power Generation Co. Ltd. Class A (XSHG) | 1,831,400 | 1,058 |
| | Beijing Homyear Capital Holdings Co. Ltd. Class A (XSSC) | 647,616 | 1,058 |
| | China Spacesat Co. Ltd. Class A (XSHG) | 226,387 | 1,057 |
| | CCS Supply Chain Management Co. Ltd. Class A (XSSC) | 459,628 | 1,057 |
| | China TransInfo Technology Co. Ltd. Class A | 425,300 | 1,056 |
| | Shanghai Guangdian Electric Group Co. Ltd. Class A | 1,095,200 | 1,056 |
| | KPC Pharmaceuticals Inc. Class A (XSSC) | 523,308 | 1,055 |
| | Guangzhou Development Group Inc. Class A (XSSC) | 858,971 | 1,054 |
| * | Yunnan Tin Co. Ltd. Class A | 476,300 | 1,054 |
27
| | |
| Vanguard® Emerging Markets Stock Index Fund | | |
| Schedule of Investments | | |
| October 31, 2016 | | |
| |
| | | Market |
| | | Value |
| | Shares | ($000) |
| Addsino Co. Ltd. Class A | 464,700 | 1,054 |
| Guodian Nanjing Automation Co. Ltd. Class A | 851,900 | 1,053 |
| Lier Chemical Co. Ltd. Class A | 707,644 | 1,053 |
| Wolong Electric Group Co. Ltd. Class A (XSSC) | 724,255 | 1,051 |
| Metallurgical Corp. of China Ltd. Class A (XSSC) | 1,696,933 | 1,051 |
| Shenzhen Properties & Resources Development Group Ltd. Class A | 389,552 | 1,051 |
| Cosmos Group Co. Ltd. Class A | 876,400 | 1,050 |
| Sundy Land Investment Co. Ltd. Class A | 1,220,600 | 1,050 |
| * Jiangsu Zongyi Co. Ltd. Class A | 611,800 | 1,049 |
| Beijing Capital Co. Ltd. Class A (XSSC) | 1,674,743 | 1,049 |
| Henan Huanghe Whirlwind Co. Ltd. Class A (XSSC) | 369,100 | 1,048 |
| Shenzhen Jieshun Science And Technology Industry Co. Ltd. Class A | 386,900 | 1,048 |
| Sanlux Co. Ltd. Class A | 412,600 | 1,045 |
| * Zhonghe Co. Ltd. Class A | 404,301 | 1,043 |
| China Southern Airlines Co. Ltd. Class A (XSSC) | 983,183 | 1,043 |
| * SDIC Essence Holdings Co. Ltd. Class A (XSHG) | 439,500 | 1,043 |
| * MIE Holdings Corp. | 10,522,000 | 1,043 |
| Fujian Yanjing Huiquan Brewery Co. Ltd. Class A | 485,543 | 1,042 |
| Zhejiang Longsheng Auto Parts Co. Ltd. Class A | 159,900 | 1,041 |
| Xinzhi Motor Co. Ltd. Class A | 262,300 | 1,040 |
| Zhejiang Yasha Decoration Co. Ltd. Class A | 617,600 | 1,039 |
| Zhe Jiang Kangsheng Co. Ltd. Class A | 688,800 | 1,037 |
| * Ningbo Bird Co. Ltd. Class A | 774,100 | 1,036 |
| * Jiangsu Sunshine Co. Ltd. Class A | 1,561,100 | 1,036 |
| * Shenzhen Kstar Science And Technology Co. Ltd. Class A | 330,003 | 1,034 |
| Jiangsu Expressway Co. Ltd. Class A (XSSC) | 766,800 | 1,033 |
| China Northern Rare Earth Group High-Tech Co. Ltd. Class A (XSHG) | 557,700 | 1,033 |
| Huaxin Cement Co. Ltd. Class B | 1,445,800 | 1,033 |
| Sinomach Automobile Co. Ltd. Class A (XSSC) | 531,194 | 1,033 |
| Jizhong Energy Resources Co. Ltd. Class A | 1,049,951 | 1,032 |
| * Renhe Pharmacy Co. Ltd. Class A | 941,747 | 1,031 |
| Yotrio Group Co. Ltd. Class A | 994,750 | 1,030 |
| Dongfeng Electronic Technology Co. Ltd. Class A (XSSC) | 451,788 | 1,029 |
| * Pengxin International Mining Co. Ltd. Class A | 879,207 | 1,027 |
| * Shaanxi Xinghua Chemistry Co. Ltd. Class A | 913,772 | 1,025 |
| * Fangda Carbon New Material Co. Ltd. Class A (XSSC) | 652,100 | 1,024 |
| 263 Network Communications Co. Ltd. Class A | 545,388 | 1,024 |
| * Guanghui Energy Co. Ltd. Class A (XSHG) | 1,637,925 | 1,024 |
| Anhui Jianghuai Automobile Co. Ltd. Class A (XSHG) | 534,301 | 1,023 |
| South Huiton Co. Ltd. Class A | 423,300 | 1,017 |
| * Guangdong Highsun Group Co. Ltd. Class A | 1,356,380 | 1,017 |
| Shanghai 2345 Network Holding Group Co. Ltd. Class A | 577,276 | 1,016 |
| Jangho Group Co. Ltd. Class A (XSSC) | 616,507 | 1,016 |
| * Jilin Zixin Pharmaceutical Industrial Co. Ltd. Class A | 833,200 | 1,015 |
| Hainan Strait Shipping Co. Ltd. Class A | 382,400 | 1,015 |
| Dr Peng Telecom & Media Group Co. Ltd. Class A (XSSC) | 312,079 | 1,015 |
| Changshu Fengfan Power Equipment Co. Ltd. Class A (XSSC) | 845,828 | 1,015 |
| Citychamp Dartong Co. Ltd. Class A (XSSC) | 925,633 | 1,014 |
| Camel Group Co. Ltd. Class A (XSSC) | 367,658 | 1,014 |
| * Shanghai Zhongyida Co. Ltd. Class A | 527,500 | 1,013 |
| Shandong Oriental Ocean Sci-Tech Co. Ltd. Class A | 660,600 | 1,012 |
| * Shanghai AJ Group Co. Ltd. Class A (XSHG) | 566,300 | 1,011 |
| Harbin Pharmaceutical Group Co. Ltd. Class A (XSHG) | 739,354 | 1,010 |
| Jiangsu Aucksun Co. Ltd. Class A | 653,250 | 1,010 |
| * Hangzhou Cable Co. Ltd. Class A | 505,100 | 1,010 |
| * Fujian Funeng Co. Ltd. Class A (XSSC) | 592,188 | 1,009 |
| * Henan Senyuan Electric Co. Ltd. Class A | 379,562 | 1,008 |
| Shanghai Lansheng Corp. Class A (XSSC) | 238,891 | 1,008 |
| * Avic Aviation High-Technology Co. Ltd. Class A (XSHG) | 510,148 | 1,008 |
| Universal Scientific Industrial Shanghai Co. Ltd. Class A (XSSC) | 576,952 | 1,007 |
| Daye Special Steel Co. Ltd. Class A | 556,300 | 1,005 |
| * Ningxia Zhongyin Cashmere Co. Ltd. Class A | 1,130,400 | 1,004 |
| Shanghai Zhangjiang High-Tech Park Development Co. Ltd. Class A (XSSC) | 369,100 | 1,004 |
| * Sinopec Shandong Taishan Petroleum Co. Ltd. Class A | 728,500 | 1,003 |
28
| | |
| Vanguard® Emerging Markets Stock Index Fund | | |
| Schedule of Investments | | |
| October 31, 2016 | | |
| |
| | | Market |
| | | Value |
| | Shares | ($000) |
| Wuxi Taiji Industry Co. Ltd. Class A (XSSC) | 784,831 | 1,001 |
| * PKU Healthcare Corp. Ltd. Class A | 476,696 | 999 |
| * Yunnan Aluminium Co. Ltd. Class A | 943,800 | 999 |
| Guangdong Mingzhu Group Co. Ltd. Class A | 387,024 | 998 |
| Meidu Energy Corp. Class A (XSSC) | 1,276,581 | 997 |
| Shenzhen Hongtao Decoration Co. Ltd. Class A | 691,360 | 996 |
| * China First Heavy Industries Class A (XSHG) | 1,200,650 | 995 |
| * Zhongrun Resources Investment Corp. Class A | 867,700 | 995 |
| Shenzhen Gas Corp. Ltd. Class A (XSHG) | 722,397 | 994 |
| Zhejiang China Light & Textile Industrial City Group Co. Ltd. Class A (XSSC) | 1,001,432 | 994 |
| * Dalian Friendship Group Class A | 491,252 | 992 |
| Jointown Pharmaceutical Group Co. Ltd. Class A (XSHG) | 303,520 | 990 |
| FAW CAR Co. Ltd. Class A | 589,943 | 989 |
| * JS Corrugating Machinery Co. Ltd. Class A | 441,096 | 988 |
| Nanjing Yunhai Special Metals Co. Ltd. Class A | 307,617 | 988 |
| ^ Phoenix Satellite Television Holdings Ltd. | 4,886,000 | 988 |
| Shanghai Join Buy Co. Ltd. Class A | 421,900 | 988 |
| Shandong Polymer Biochemicals Co. Ltd. Class A | 587,400 | 987 |
| Whirlpool China Co. Ltd. Class A | 599,150 | 987 |
| * Guangzhou KingTeller Technology Co. Ltd. Class A | 817,028 | 986 |
| Hundsun Technologies Inc. Class A (XSHG) | 113,400 | 986 |
| Jiangsu Wuzhong Industrial Co. Class A (XSSC) | 359,939 | 985 |
| Harbin Hatou Investment Co. Ltd. Class A | 585,669 | 985 |
| * Shandong Humon Smelting Co. Ltd. Class A | 550,100 | 984 |
| Hangzhou Jiebai Group Co. Ltd. Class A (XSSC) | 693,786 | 984 |
| * New Huadu Supercenter Co. Ltd. Class A | 589,800 | 983 |
| * Harbin Churin Group Jointstock Co. Ltd. Class A | 631,198 | 982 |
| Jilin Sino-Microelectronics Co. Ltd. Class A | 673,700 | 981 |
| Zhejiang Wanma Co. Ltd. Class A | 383,972 | 980 |
| Hangzhou Boiler Group Co. Ltd. Class A | 539,015 | 980 |
| * Zhejiang Founder Motor Co. Ltd. Class A | 222,698 | 980 |
| Anhui Truchum Advanced Materials & Technology Co. Ltd. Class A | 372,500 | 980 |
| Guangdong Nan Yang Cable Group Holding Co. Ltd. Class A | 386,300 | 979 |
| Fiberhome Telecommunication Technologies Co. Ltd. Class A (XSHG) | 233,300 | 979 |
| Dalian Refrigeration Co. Ltd. Class B | 1,259,701 | 977 |
| Zhonghong Holding Co. Ltd. Class A | 2,423,300 | 977 |
| * Gansu Dunhuang Seed Co. Ltd. Class A | 819,370 | 977 |
| China National Software & Service Co. Ltd. Class A (XSSC) | 242,434 | 977 |
| Beijing New Building Materials plc Class A | 623,500 | 977 |
| * Zhejiang Satellite Petrochemical Co. Ltd. Class A | 601,905 | 976 |
| Suzhou Tianma Specialty Chemicals Co. Ltd. Class A | 681,900 | 976 |
| * Jinfa Labi Maternity & Baby Articles Co. Ltd. Class A | 197,340 | 975 |
| Henan Yuguang Gold & Lead Co. Ltd. Class A | 710,800 | 975 |
| Chongqing Water Group Co. Ltd. Class A (XSSC) | 846,450 | 975 |
| Shandong Hi-speed Co. Ltd. Class A (XSHG) | 1,057,400 | 973 |
| Hunan Huasheng Co. Ltd. Class A | 610,598 | 973 |
| Hebei Chengde Lolo Co. Class A | 559,720 | 973 |
| * Eastern Pioneer Driving School Co. Ltd. Class A | 160,654 | 972 |
| Zhejiang Medicine Co. Ltd. Class A (XSHG) | 463,550 | 972 |
| * Tongyu Communication Inc. Class A | 121,650 | 972 |
| China South Publishing & Media Group Co. Ltd. Class A (XSHG) | 361,000 | 971 |
| Long Yuan Construction Group Co. Ltd. Class A (XSSC) | 566,024 | 971 |
| * Beijing Bewinner Communications Co. Ltd. Class A | 316,232 | 969 |
| Shanghai Hanbell Precise Machinery Co. Ltd. Class A | 560,880 | 969 |
| Shanghai Shimao Co. Ltd. Class A (XSHG) | 871,306 | 968 |
| Daheng New Epoch Technology Inc. Class A | 518,400 | 968 |
| Chongqing Zaisheng Technology Corp. Ltd. Class A | 346,702 | 965 |
| Shanghai Yanhua Smartech Group Co. Ltd. Class A | 704,400 | 964 |
| Zhongli Science & Technology Group Co. Ltd. Class A | 436,400 | 964 |
| Jiangling Motors Corp. Ltd. Class A | 234,298 | 964 |
| * TOP Energy Co. Ltd-A Class A (XSSC) | 1,166,372 | 964 |
| Yunnan Hongxiang Yixintang Pharmaceutical Co. Ltd. Class A | 286,400 | 963 |
| Jihua Group Corp. Ltd. Class A (XSHG) | 768,000 | 963 |
| * Zhejiang Huayou Cobalt Co. Ltd. Class A | 206,889 | 963 |
29
| | |
| Vanguard® Emerging Markets Stock Index Fund | | |
| Schedule of Investments | | |
| October 31, 2016 | | |
| |
| | | Market |
| | | Value |
| | Shares | ($000) |
| JCHX Mining Management Co. Ltd. Class A (XSHG) | 337,920 | 961 |
| CMST Development Co. Ltd. Class A (XSSC) | 779,838 | 961 |
| Sichuan Road & Bridge Co. Ltd. Class A (XSHG) | 1,487,624 | 961 |
| * Haoxiangni Jujube Co. Ltd. Class A | 173,175 | 960 |
| ^ Boer Power Holdings Ltd. | 2,395,000 | 960 |
| * Harbin Electric Corp. Jiamusi Electric Machine Co. Ltd. Class A | 566,508 | 960 |
| China Railway Construction Corp. Ltd. Class A (XSHG) | 631,100 | 959 |
| * Dynavolt Renewable Power Technology Co. Ltd. Class A | 220,922 | 957 |
| * Shenzhen Zowee Tech Co. Ltd. Class A | 575,635 | 956 |
| * Guangzhou Baiyunshan Pharmaceutical Holdings Co. Ltd. Class A (XSHG) | 262,000 | 956 |
| * Steyr Motors Co. Ltd. Class A | 519,800 | 955 |
| * China CIFCO Investment Co. Ltd. Class A | 263,200 | 955 |
| * Shanghai Luxin Packing Materials Science & Technology Co. Ltd. Class A | 826,600 | 955 |
| Qianjiang Water Resources Development Co. Ltd. Class A | 521,300 | 954 |
| Nantong Jianghai Capacitor Co. Ltd. Class A | 449,345 | 954 |
| Jilin Forest Industry Co. Ltd. Class A | 535,502 | 953 |
| * Ciwen Media Co. Ltd. | 147,292 | 952 |
| * Yunnan Yuntianhua Co. Ltd. Class A | 747,100 | 951 |
| China Railway Erju Co. Ltd. Class A (XSHG) | 498,900 | 950 |
| * Changchun Eurasia Group Co. Ltd. Class A (XSSC) | 193,201 | 950 |
| Shanghai Yuyuan Tourist Mart Co. Ltd. Class A (XSSC) | 580,256 | 949 |
| Yueyang Xingchang Petrochemical Class A | 218,050 | 947 |
| * Tianjin Quanye Bazaar (Group) Co. Ltd. Class A | 505,939 | 946 |
| Qiming Information Technology Co. Ltd. Class A | 478,073 | 946 |
| Hunan Nanling Industry Explosive Material Co. Ltd. Class A | 413,559 | 945 |
| * Ningbo Jifeng Auto Parts Co. Ltd. Class A | 323,344 | 942 |
| Xi'an LONGi Silicon Materials Corp. Class A (XSHG) | 460,600 | 942 |
| * Shandong Longlive Bio-Technology Co. Ltd. Class A | 564,000 | 941 |
| Shenzhen Batian Ecotypic Engineering Co. Ltd. Class A | 651,251 | 940 |
| Zhejiang Asia-Pacific Mechanical & Electronic Co. Ltd. Class A | 385,700 | 939 |
| * Nanning Sugar Industry Co. Ltd. Class A | 296,059 | 936 |
| Qingdao Hanhe Cable Co. Ltd. Class A | 1,438,384 | 935 |
| Jiangxi Ganyue Expressway Co. Ltd. Class A (XSHG) | 1,305,500 | 934 |
| Shenzhen Jinjia Group Co. Ltd. Class A | 597,600 | 934 |
| Zibo Qixiang Tengda Chemical Co. Ltd. Class A | 945,420 | 933 |
| Shanghai Tongji Science & Technology Industrial Co. Ltd. Class A (XSSC) | 642,481 | 932 |
| * Beijing Soft Rock Investment Group Corp. Class A | 440,067 | 930 |
| Shanghai Jahwa United Co. Ltd. Class A (XSHG) | 232,700 | 930 |
| Jiaozuo Wanfang Aluminum Manufacturing Co. Ltd. Class A | 763,986 | 930 |
| China Animal Husbandry Industry Co. Ltd. Class A (XSHG) | 291,800 | 929 |
| Xinxing Ductile Iron Pipes Co. Ltd. Class A | 1,266,700 | 928 |
| Tian Di Science & Technology Co. Ltd. Class A (XSSC) | 1,340,984 | 928 |
| ENN Ecological Holdings Co. Ltd. Class A (XSHG) | 505,614 | 927 |
| * China First Heavy Industries Class A (XSSC) | 1,118,300 | 927 |
| Zhejiang Xinan Chemical Industrial Group Co. Ltd. Class A (XSSC) | 727,579 | 927 |
| Zhejiang Runtu Co. Ltd. Class A | 385,101 | 926 |
| * Shen Zhen Mindata Holding Co. Ltd. Class A | 424,200 | 926 |
| Lanzhou LS Heavy Equipment Co. Ltd. Class A (XSSC) | 489,203 | 925 |
| YanTai Shuangta Food Co. Ltd. Class A | 815,400 | 925 |
| * Zhejiang Guyuelongshan Shaoxing Wine Co. Ltd. Class A (XSHG) | 609,690 | 925 |
| * Hengyi Petrochemical Co. Ltd. Class A | 500,114 | 924 |
| Bright Oceans Inter-Telecom Corp. Class A (XSSC) | 413,502 | 923 |
| * Bus Online Co. Ltd. | 222,694 | 923 |
| * Jiangsu Youli Investment Holding Co. Ltd. Class A | 527,000 | 922 |
| Lingyun Industrial Corp. Ltd. Class A (XSSC) | 415,941 | 922 |
| Beijing Urban Construction Investment & Development Co. Ltd. Class A (XSSC) | 471,011 | 921 |
| * Weichai Heavy Machinery Co. Ltd. Class A | 398,324 | 921 |
| Jiangsu Yulong Steel Pipe Co. Ltd. Class A | 601,600 | 919 |
| Orient Securities Co. Ltd. Class A (XSHG) | 390,100 | 918 |
| Guoguang Electric Co. Ltd. Class A | 459,400 | 918 |
| Zhejiang Feida Environmental Science & Technology Co. Ltd. Class A (XSSC) | 474,799 | 917 |
| GITI Tire Corp. Class A | 219,400 | 917 |
| * Gansu Mogao Industrial Development Co. Ltd. Class A | 425,300 | 917 |
| * Anhui Wanwei Updated High-Tech Material Industry Co. Ltd. Class A (XSSC) | 1,344,100 | 916 |
30
| | |
| Vanguard® Emerging Markets Stock Index Fund | | |
| Schedule of Investments | | |
| October 31, 2016 | | |
| |
| | | Market |
| | | Value |
| | Shares | ($000) |
| * Sichuan Hongda Co. Ltd. Class A | 972,800 | 916 |
| * Yifeng Pharmacy Chain Co. Ltd. Class A (XSHG) | 185,452 | 915 |
| Chengzhi Co. Ltd. Class A | 357,628 | 915 |
| Chongqing Dima Industry Co. Ltd. Class A | 868,700 | 914 |
| * Beijing Jingxi Tourism Development Co. Ltd. Class A | 286,245 | 913 |
| * Baotailong New Materials Co. Ltd. Class A | 820,700 | 912 |
| Sanxiang Impression Co. Ltd. Class A | 645,800 | 910 |
| Beijing Sifang Automation Co. Ltd. Class A (XSSC) | 617,639 | 909 |
| Invengo Information Technology Co. Ltd. Class A | 473,000 | 907 |
| * Guangdong Kinlong Hardware Products Co. Ltd. Class A | 102,400 | 907 |
| * DEA General Aviation Holding Co. Ltd. Class A | 240,200 | 906 |
| * Hongbaoli Group Corp. Ltd. Class A | 714,859 | 905 |
| * Shandong Minhe animal Husbandry Co. Ltd. Class A | 222,583 | 905 |
| China CYTS Tours Holding Co. Ltd. Class A (XSHG) | 269,300 | 905 |
| Shanxi Lanhua Sci-Tech Venture Co. Ltd. Class A | 779,000 | 904 |
| Shanghai Electric Power Co. Ltd. Class A (XSHG) | 521,400 | 903 |
| * Orient Group Inc. Class A (XSSC) | 861,300 | 903 |
| Sichuan Swellfun Co. Ltd. Class A | 347,502 | 901 |
| PetroChina Jinhong Energy Investment Co. Ltd. Class A | 372,375 | 900 |
| Jiangsu Fasten Co. Ltd. Class A | 505,700 | 900 |
| * North Huajin Chemical Industries Co. Ltd. Class A | 687,903 | 896 |
| * Advanced Technology & Materials Co. Ltd. Class A | 501,000 | 896 |
| Xinhu Zhongbao Co. Ltd. Class A (XSHG) | 1,292,000 | 896 |
| Chengdu Wintrue Holding Co. Ltd. Class A | 479,170 | 896 |
| Changchun Eurasia Group Co. Ltd. Class A (XSHG) | 182,041 | 895 |
| Cinda Real Estate Co. Ltd. Class A (XSHG) | 837,122 | 895 |
| Zhejiang Golden Eagle Co. Ltd. Class A | 492,600 | 894 |
| Jiangsu Zhongtian Technology Co. Ltd. Class A (XSHG) | 560,500 | 893 |
| Youngor Group Co. Ltd. Class A (XSHG) | 424,800 | 893 |
| * Zhejiang Guyuelongshan Shaoxing Wine Co. Ltd. Class A (XSSC) | 588,398 | 892 |
| Guangdong Shaoneng Group Co. Ltd. Class A | 591,240 | 892 |
| * WUS Printed Circuit Kunshan Co. Ltd. Class A | 1,164,076 | 889 |
| * Guangbo Group Stock Co. Ltd. Class A | 341,195 | 887 |
| Weihai Guangtai Airport Equipment Co. Ltd. Class A | 245,902 | 887 |
| Yihua Lifestyle Technology Co. Ltd. Class A | 526,699 | 886 |
| Jiangsu Guotai International Group Guomao Co. Ltd. Class A | 423,300 | 886 |
| * Shenzhen Center Power Tech Co. Ltd. Class A | 252,250 | 885 |
| China National Medicines Corp. Ltd. Class A (XSHG) | 185,586 | 884 |
| Industrial Securities Co. Ltd. Class A (XSHG) | 760,890 | 884 |
| * Liaoning SG Automotive Group Co. Ltd. Class A | 578,328 | 884 |
| * Beijing Tiantan Biological Products Corp. Ltd. Class A (XSSC) | 146,821 | 882 |
| Sichuan Tuopai Shede Wine Co. Ltd. Class A | 254,113 | 881 |
| Hubei Xingfa Chemicals Group Co. Ltd. Class A (XSSC) | 442,875 | 880 |
| Humanwell Healthcare Group Co. Ltd. Class A (XSHG) | 291,000 | 879 |
| * Ningxia Xinri Hengli Steel Wire Co. Ltd. Class A | 480,200 | 879 |
| Juneyao Airlines Co. Ltd. Class A | 233,528 | 878 |
| * Elec-Tech International Co. Ltd. Class A | 968,445 | 877 |
| * Shaanxi Broadcast & TV Network Intermediary Co. Ltd. Class A (XSSC) | 416,916 | 872 |
| Xiamen Faratronic Co. Ltd. Class A (XSSC) | 148,115 | 871 |
| Sinolink Securities Co. Ltd. Class A (XSHG) | 441,000 | 871 |
| Yonyou Network Technology Co. Ltd. Class A (XSHG) | 259,500 | 870 |
| * Shenzhen Wongtee International Enterprise Co. Ltd. Class B | 1,247,940 | 870 |
| Yunnan Lincang Xinyuan Germanium Industrial Co. Ltd. Class A | 396,095 | 870 |
| Xiamen King Long Motor Group Co. Ltd. Class A | 458,046 | 869 |
| Beiqi Foton Motor Co. Ltd. Class A (XSHG) | 2,096,576 | 869 |
| * Andon Health Co. Ltd. Class A | 324,156 | 868 |
| * Hainan Expressway Co. Ltd. Class A | 1,056,400 | 867 |
| Shanghai Jiaoda Onlly Co. Ltd. Class A | 651,750 | 866 |
| * Fujian Cement Inc. Class A (XSHG) | 612,500 | 865 |
| China Security & Fire Co. Ltd. Class A (XSHG) | 286,000 | 864 |
| * Shanghai Shenhua Holdings Co. Ltd. Class A | 1,337,862 | 863 |
| Haima Automobile Group Co. Ltd. Class A | 1,131,800 | 863 |
| * Tibet Mineral Development Co. Class A | 291,700 | 861 |
| * Chengdu Xinzhu Road&Bridge Machinery Co. Ltd. Class A | 482,514 | 860 |
31
| | | |
| Vanguard® Emerging Markets Stock Index Fund | | |
| Schedule of Investments | | |
| October 31, 2016 | | |
| |
| | | | Market |
| | | | Value |
| | | Shares | ($000) |
| | Jiangsu Huifeng Agrochemical Co. Ltd. Class A | 1,096,279 | 860 |
| * | IRICO Display Devices Co. Ltd. Class A | 574,500 | 859 |
| | Shaanxi Aerospace Power Hi-Tech Co. Ltd. Class A (XSSC) | 236,600 | 859 |
| * | Yinchuan Xinhua Commercial Group Co. Ltd. Class A | 212,170 | 858 |
| * | Shandong Jinjing Science & Technology Co. Ltd. Class A (XSSC) | 1,271,196 | 858 |
| | Hengtong Optic-electric Co. Ltd. Class A (XSHG) | 309,400 | 857 |
| | Xian International Medical Investment Co. Ltd. Class A | 860,950 | 856 |
| | Shenzhen Kingdom Sci-Tech Co. Ltd. Class A (XSHG) | 188,500 | 855 |
| | Shanghai Dragon Corp. Class A | 364,000 | 855 |
| | Yantai Jereh Oilfield Services Group Co. Ltd. Class A | 319,400 | 854 |
| | Wolong Real Estate Group Co. Ltd. Class A (XSSC) | 662,901 | 853 |
| | Chongqing Gangjiu Co. Ltd. Class A | 802,300 | 852 |
| | Guangxi Guiguan Electric Power Co. Ltd. Class A (XSHG) | 868,300 | 852 |
| | Chengtun Mining Group Co. Ltd. Class A (XSSC) | 757,325 | 847 |
| * | China Hi-Tech Group Co. Class A (XSHG) | 449,600 | 847 |
| | China Meheco Co. Ltd. Class A (XSSC) | 281,360 | 846 |
| | Zhejiang Jingu Co. Ltd. Class A | 327,907 | 843 |
| * | Hongbo Co. Ltd. Class A | 239,100 | 843 |
| * | Shanghai Bairun Investment Holding Group Co. Ltd. Class A | 237,800 | 841 |
| * | Launch Tech Co. Ltd. | 794,500 | 841 |
| * | Sichuan Golden Summit Group Class A | 314,600 | 841 |
| | Mingsheng Holdings Co. Ltd. Class A | 642,355 | 841 |
| | AVIC Helicopter Co. Ltd. Class A (XSSC) | 131,603 | 839 |
| * | Guangdong Guanghua Sci-Tech Co. Ltd. Class A | 267,742 | 838 |
| * | Shanghai DZH Ltd. Class A | 678,900 | 838 |
| * | Zhejiang Dun'An Artificial Environment Co. Ltd. Class A | 534,864 | 836 |
| | Dr Peng Telecom & Media Group Co. Ltd. Class A (XSHG) | 257,100 | 836 |
| | Anhui Sinonet & Xonglong Science & Technology Co. Ltd. | 375,002 | 835 |
| *,^ | China Public Procurement Ltd. | 88,812,000 | 835 |
| * | Aerospace Hi-Tech Holdings Grp Ltd. Class A | 162,987 | 835 |
| | Chongqing Three Gorges Water Conservancy & Electric Power Co. Ltd. Class A (XSHG) | 613,200 | 833 |
| | Shanghai New Huangpu Real Estate Co. Ltd. Class A (XSHG) | 395,400 | 833 |
| * | Saturday Co. Ltd. Class A | 413,568 | 833 |
| * | Chongqing Yukaifa Co. Ltd. Class A | 731,800 | 833 |
| | Shenzhen Gongjin Electronics Co. Ltd. Class A (XSHG) | 139,200 | 832 |
| | Bright Dairy & Food Co. Ltd. Class A (XSHG) | 389,800 | 831 |
| | Beijing GeoEnviron Engineering & Technology Inc. Class A | 163,200 | 829 |
| | Inner Mongolia Junzheng Energy & Chemical Industry Group Co. Ltd. Class A (XSHG) | 1,085,600 | 829 |
| * | China Minsheng Drawin Technology Group Ltd. | 19,800,000 | 828 |
| | China CSSC Holdings Ltd. Class A (XSHG) | 249,270 | 828 |
| | Xinjiang Guannong Fruit & Antler Group Co. Ltd. Class A (XSSC) | 687,142 | 828 |
| | Zhejiang Huahai Pharmaceutical Co. Ltd. Class A (XSSC) | 222,945 | 828 |
| * | Guangdong Guangzhou Daily Media Co. Ltd. Class A | 730,428 | 825 |
| | Shanghai New Huangpu Real Estate Co. Ltd. Class A (XSSC) | 391,430 | 825 |
| | Pubang Landscape Architecture Co. Ltd. Class A | 897,097 | 825 |
| | Shantou Dongfeng Printing Co. Ltd. Class A (XSSC) | 457,042 | 825 |
| | ZhongYeDa Electric Co. Ltd. Class A | 395,000 | 824 |
| | Xinjiang International Industry Co. Ltd. Class A | 688,237 | 823 |
| | Jishi Media Co. Ltd. Class A (XSSC) | 1,259,300 | 823 |
| | Anshan Heavy Duty Mining Machinery Co. Ltd. Class A | 164,300 | 822 |
| | Zhefu Holding Group Co. Ltd. Class A | 862,700 | 821 |
| | Zhuzhou Times New Material Technology Co. Ltd. Class A (XSSC) | 348,522 | 821 |
| | SooChow Securities Co. Ltd. Class A (XSHG) | 382,200 | 817 |
| | Lanzhou Great Wall Electrical Co. Ltd. Class A | 584,000 | 816 |
| * | EverChina International Holdings Co. Ltd. | 15,675,669 | 816 |
| | Minmetals Land Ltd. | 6,472,000 | 816 |
| | Xinyu Iron & Steel Co. Ltd. Class A | 1,870,600 | 815 |
| * | ZYNP Corp. Class A | 447,900 | 814 |
| * | Jiangsu Wanlin Modern Logistics Co. Ltd. Class A | 329,200 | 814 |
| | Sichuan Hebang Biotechnology Co. Ltd. Class A (XSSC) | 1,041,300 | 813 |
| | Shengyi Technology Co. Ltd. Class A (XSHG) | 421,392 | 813 |
| * | Yang Quan Coal Industry Group Co. Ltd. Class A (XSHG) | 729,300 | 812 |
| * | Datong Coal Industry Co. Ltd. Class A (XSHG) | 721,035 | 812 |
| | China CSSC Holdings Ltd. Class A (XSSC) | 244,280 | 812 |
32
| | |
| Vanguard® Emerging Markets Stock Index Fund | | |
| Schedule of Investments | | |
| October 31, 2016 | | |
| |
| | | Market |
| | | Value |
| | Shares | ($000) |
| Hubei Broadcasting & Television Information Network Co. Ltd. Class A | 372,800 | 811 |
| * Shenzhen Selen Science & Technology Co. Ltd. Class A | 275,000 | 811 |
| Hubei Jumpcan Pharmaceutical Co. Ltd. Class A (XSHG) | 167,500 | 809 |
| Heilongjiang Agriculture Co. Ltd. Class A | 517,150 | 809 |
| Jiangxi Copper Co. Ltd. Class A | 374,244 | 809 |
| * Blackcow Food Co. Ltd. Class A | 273,150 | 808 |
| Wangfujing Group Co. Ltd. Class A (XSHG) | 335,920 | 808 |
| Beijing Aerospace Changfeng Co. Ltd. Class A | 188,987 | 807 |
| * Telling Telecommunication Holding Co. Ltd. Class A | 483,900 | 806 |
| * Huludao Zinc Industry Co. Class A | 943,200 | 806 |
| * Shenzhen Aisidi Co. Ltd. Class A | 352,100 | 804 |
| Yintai Resources Co. Ltd. Class A | 362,735 | 804 |
| Mesnac Co. Ltd. Class A | 438,189 | 803 |
| * Kaidi Ecological and Environmental Technology Co. Ltd. Class A | 583,600 | 803 |
| * Chunghsin Technology Group Co. Ltd. Class A | 225,463 | 800 |
| Guirenniao Co. Ltd. Class A (XSSC) | 191,699 | 799 |
| * Pingdingshan Tianan Coal Mining Co. Ltd. Class A (XSHG) | 1,035,882 | 798 |
| Anhui Huilong Agricultural Means of Production Co. Ltd. Class A | 591,250 | 798 |
| * Sichuan Guodong Construction Co. Ltd. | 757,300 | 798 |
| Beijing Hualian Department Store Co. Ltd. Class A | 1,344,700 | 798 |
| Guangdong Delian Group Co. Ltd. Class A | 634,135 | 797 |
| Shijiazhuang Yiling Pharmaceutical Co. Ltd. Class A | 329,061 | 797 |
| Hubei Chutian Expressway Co. Ltd. Class A | 1,026,400 | 797 |
| Nanjing Panda Electronics Co. Ltd. Class A (XSSC) | 375,700 | 796 |
| * Tian Jin Global Magnetic Card Co. Ltd. Class A | 557,171 | 795 |
| AVIC Aero-Engine Controls Co. Ltd. Class A | 196,500 | 792 |
| Changshouhua Food Co. Ltd. | 1,536,000 | 791 |
| Shandong Homey Aquatic Development Co. Ltd. Class A | 1,296,098 | 791 |
| Changchun Faway Automobile Components Co. Ltd. Class A (XSHG) | 342,800 | 791 |
| Wuxi Huaguang Boiler Co. Ltd. Class A | 283,300 | 790 |
| Guizhou Jiulian Industrial Explosive Material Development Co. Ltd. Class A | 303,301 | 790 |
| Beijing Teamsun Technology Co. Ltd. Class A (XSSC) | 420,486 | 788 |
| Shanghai Yaoji Playing Card Co. Ltd. Class A | 262,459 | 788 |
| Loncin Motor Co. Ltd. Class A (XSSC) | 258,000 | 787 |
| Materials Industry Zhongda Group Co. Ltd. Class A (XSHG) | 511,810 | 783 |
| Beijing WKW Automotive Parts Co. Ltd. Class A | 326,488 | 783 |
| Zhejiang Longsheng Group Co. Ltd. Class A (XSHG) | 581,200 | 782 |
| China Meheco Co. Ltd. Class A (XSHG) | 260,100 | 782 |
| Mayinglong Pharmaceutical Group Co. Ltd. Class A (XSSC) | 259,926 | 782 |
| Jiangsu Yangnong Chemical Co. Ltd. Class A (XSSC) | 166,900 | 780 |
| V V Food & Beverage Co. Ltd. Class A (XSSC) | 772,770 | 779 |
| Xinjiang Yilite Industry Co. Ltd. Class A (XSHG) | 342,900 | 778 |
| * Henan Zhongfu Industry Co. Ltd. Class A | 861,000 | 778 |
| Shenzhen Special Economic Zone Real Estate & Properties Group Co. Ltd. Class A | 471,000 | 777 |
| * Guangxi Guitang Group Co. Class A | 489,148 | 776 |
| Shanghai Belling Co. Ltd. Class A (XSSC) | 350,844 | 773 |
| Greatoo Intelligent Equipment Inc. | 1,407,600 | 771 |
| Lingyuan Iron & Steel Co. Ltd. Class A | 2,019,700 | 771 |
| * Befar Group Co. Ltd. Class A (XSSC) | 827,456 | 767 |
| Jilin Yongda Group Co. Ltd. Class A | 395,857 | 767 |
| Liaoning Wellhope Agri-Tech JSC Ltd. Class A (XSHG) | 371,300 | 765 |
| * Qinqin Foodstuffs Group Cayman Co. Ltd. | 2,215,980 | 764 |
| * Xining Special Steel Co. Class A | 906,600 | 764 |
| Colour Life Services Group Co. Ltd. | 1,054,000 | 764 |
| * Beijing Tiantan Biological Products Corp. Ltd. Class A (XSHG) | 127,100 | 763 |
| Shandong Shengli Co. Class A | 821,977 | 762 |
| Tangshan Sanyou Chemical Industries Co. Ltd. Class A (XSSC) | 620,352 | 760 |
| * Grinm Advanced Materials Co. Ltd. Class A (XSSC) | 474,000 | 760 |
| * Shandong Jinling Mining Co. Ltd. Class A | 584,300 | 760 |
| Xi'An Shaangu Power Co. Ltd. Class A (XSHG) | 728,545 | 760 |
| Keda Clean Energy Co. Ltd. Class A (XSHG) | 591,200 | 759 |
| Kingfa Sci & Tech Co. Ltd. Class A (XSSC) | 755,423 | 758 |
| Qingdao Citymedia Co. Ltd. Class A | 424,800 | 757 |
| Befar Group Co. Ltd. Class A (XSHG) | 814,262 | 755 |
33
| | |
| Vanguard® Emerging Markets Stock Index Fund | | |
| Schedule of Investments | | |
| October 31, 2016 | | |
| |
| | | Market |
| | | Value |
| | Shares | ($000) |
| Shenzhen ESUN Display Co. Ltd. Class A | 90,126 | 755 |
| * Jinduicheng Molybdenum Co. Ltd. Class A (XSSC) | 636,492 | 752 |
| Innuovo Technology Co. Ltd. Class A | 676,055 | 752 |
| Jiangsu Kanion Pharmaceutical Co. Ltd. Class A (XSSC) | 276,418 | 750 |
| Changzheng Engineering Co. Ltd. Class A (XSSC) | 171,551 | 750 |
| China Wafer Level CSP Co. Ltd. Class A (XSHG) | 157,400 | 750 |
| Zhengzhou Coal Mining Machinery Group Co. Ltd. Class A (XSSC) | 819,425 | 749 |
| Zhejiang China Light & Textile Industrial City Group Co. Ltd. Class A (XSHG) | 753,800 | 748 |
| Beijing Capital Development Co. Ltd. Class A (XSHG) | 428,652 | 747 |
| * Zhejiang Guangsha Co. Ltd. Class A | 706,650 | 746 |
| China Avionics Systems Co. Ltd. Class A (XSHG) | 262,584 | 746 |
| Sino-Platinum Metals Co. Ltd. Class A (XSSC) | 190,878 | 745 |
| Hisense Electric Co. Ltd. Class A (XSSC) | 295,362 | 743 |
| Shandong Sunway Petrochemical Engineering Co. Ltd. Class A | 577,700 | 743 |
| * Yunnan Tourism Co. Ltd. Class A | 586,599 | 742 |
| Guangdong Rongtai Industry Co. Ltd. Class A | 540,200 | 741 |
| CITIC Securities Co. Ltd. Class A (XSHG) | 302,500 | 741 |
| Shanxi Guoxin Energy Corp. Ltd. Class A (XSHG) | 434,126 | 739 |
| AVIC Helicopter Co. Ltd. Class A (XSHG) | 115,800 | 738 |
| China CITIC Bank Corp. Ltd. Class A (XSHG) | 824,050 | 738 |
| Qingdao East Steel Tower Stock Co. Ltd. Class A | 480,481 | 738 |
| Real Nutriceutical Group Ltd. | 8,797,000 | 736 |
| * Qinchuan Machine Tool & Tool Group Co. Ltd. Class A | 549,605 | 736 |
| Ningbo Tuopu Group Co. Ltd. Class A (XSHG) | 159,900 | 734 |
| * Inner Mongolia Pingzhuang Energy Co. Ltd. Class A | 711,300 | 733 |
| Beijing Capital Co. Ltd. Class A (XSHG) | 1,167,800 | 731 |
| Neusoft Corp. Class A (XSHG) | 275,400 | 731 |
| * Linzhou Heavy Machinery Group Co. Ltd. Class A | 695,460 | 730 |
| Youngy Co. Ltd. Class A | 183,076 | 729 |
| Ningbo Marine Co. Ltd. Class A | 938,000 | 728 |
| Wanhua Chemical Group Co. Ltd. Class A (XSSC) | 236,439 | 728 |
| Zhejiang Yankon Group Co. Ltd. Class A (XSHG) | 625,675 | 728 |
| Time Publishing and Media Co. Ltd. Class A (XSSC) | 239,408 | 728 |
| Grandblue Environment Co. Ltd. Class A (XSHG) | 316,000 | 727 |
| * Western Region Gold Co. Ltd. Class A | 194,400 | 727 |
| Suzhou New District Hi-Tech Industrial Co. Ltd. Class A (XSHG) | 534,800 | 726 |
| * Tianjin Tianhai Investment Co. Ltd. Class A | 527,800 | 724 |
| Jiangsu King's Luck Brewery JSC Ltd. Class A (XSHG) | 368,662 | 724 |
| COFCO Tunhe Co. Ltd. Class A | 421,800 | 723 |
| Bros Eastern Co. Ltd. Class A (XSHG) | 778,810 | 723 |
| CSSC Offshore and Marine Engineering Group Co. Ltd. Class A (XSSC) | 177,401 | 722 |
| Shenzhen Prolto Supply Chain Management Co. Ltd. Class A | 193,328 | 721 |
| Aerosun Corp. Class A (XSSC) | 276,162 | 720 |
| * Sichuan Haite High-tech Co. Ltd. Class A | 302,880 | 718 |
| Zhonglu Co. Ltd. Class A (XSSC) | 189,037 | 716 |
| Aerospace Communications Holding Group Co. Ltd. Class A | 256,319 | 716 |
| * Luyin Investment Group Co. Ltd. Class A | 515,800 | 715 |
| * Great Wall Movie and Television Co. Ltd. Class A | 354,700 | 715 |
| Zhejiang JIULI Hi-tech Metals Co. Ltd. Class A | 449,450 | 713 |
| Zijin Mining Group Co. Ltd. Class A (XSHG) | 1,461,400 | 713 |
| * Shenzhen Textile Holdings Co. Ltd. Class A | 361,875 | 711 |
| FSPG Hi-Tech Co. Ltd. Class A | 556,700 | 711 |
| * SDIC Essence Holdings Co. Ltd. Class A (XSSC) | 298,900 | 709 |
| * Aurora Optoelectronics Co. Ltd. Class A (XSSC) | 170,889 | 708 |
| Zhejiang Zheneng Electric Power Co. Ltd. Class A (XSSC) | 891,301 | 706 |
| Nanjing Central Emporium Class A (XSSC) | 693,445 | 705 |
| * Hareon Solar Technology Co. Ltd. Class A | 2,013,300 | 705 |
| * Yunnan Copper Co. Ltd. Class A | 447,200 | 705 |
| China Southern Airlines Co. Ltd. Class A (XSHG) | 663,500 | 704 |
| Jinzhou Port Co. Ltd. Class A | 1,144,371 | 703 |
| China Jushi Co. Ltd. Class A (XSHG) | 437,360 | 702 |
| Simei Media Co. Ltd. Class A | 144,198 | 702 |
| China Merchants Land Ltd. | 4,948,000 | 700 |
| * Minmetals Development Co. Ltd. Class A (XSHG) | 283,000 | 700 |
34
| | |
| Vanguard® Emerging Markets Stock Index Fund | | |
| Schedule of Investments | | |
| October 31, 2016 | | |
| |
| | | Market |
| | | Value |
| | Shares | ($000) |
| * JiuGui Liquor Co. Ltd. Class A | 217,000 | 696 |
| * Shenzhen Comix Group Co. Ltd. Class A | 197,593 | 696 |
| CTS International Logistics Corp. Ltd. Class A | 450,986 | 696 |
| * Shandong Molong Petroleum Machinery Co. Ltd. Class A | 377,928 | 695 |
| Shanghai Zhangjiang High-Tech Park Development Co. Ltd. Class A (XSHG) | 254,200 | 692 |
| Jiangsu Jiangnan High Polymer Fiber Co. Ltd. Class A (XSSC) | 707,781 | 690 |
| Fiyta Holdings Ltd. Class B | 681,898 | 690 |
| Air China Ltd. Class A (XSSC) | 630,438 | 689 |
| * Anhui Jiangnan Chemical Industry Co. Ltd. Class A | 532,600 | 688 |
| * Huawei Culture Co. Ltd. Class A | 348,240 | 687 |
| Asian Star Anchor Chain Co. Ltd. Jiangsu Class A | 529,350 | 687 |
| Neway Valve Suzhou Co. Ltd. Class A (XSHG) | 251,288 | 687 |
| * Guizhou Red Star Developing Co. Ltd. Class A | 321,100 | 687 |
| Besttone Holdings Co. Ltd. Class A (XSSC) | 218,900 | 685 |
| * Tianjin Faw Xiali Automobile Co. Ltd. Class A | 865,700 | 684 |
| Shaanxi Ligeance Mineral Resources Co. Ltd. Class A | 205,566 | 684 |
| Shanghai Wanye Enterprises Co. Ltd. Class A (XSHG) | 357,600 | 683 |
| Jiangxi Hongdu Aviation Industry Co. Ltd. Class A (XSSC) | 240,800 | 683 |
| Zhejiang Hisun Pharmaceutical Co. Ltd. Class A (XSHG) | 322,800 | 682 |
| Xiangtan Electric Manufacturing Co. Ltd. Class A (XSSC) | 344,549 | 679 |
| Western Mining Co. Ltd. Class A (XSHG) | 613,700 | 679 |
| Shenzhen Expressway Co. Ltd. Class A (XSSC) | 526,804 | 679 |
| * Shenzhen Rapoo Technology Co. Ltd. Class A | 120,590 | 676 |
| Jiangsu Shuangxing Color Plastic New Materials Co. Ltd. Class A | 432,373 | 675 |
| Ningbo Yunsheng Group Co. Ltd. Class A (XSSC) | 210,795 | 674 |
| Suzhou Hesheng Special Material Co. Ltd. Class A | 182,800 | 674 |
| Shaanxi Jinye Science Technology And Education Co. Ltd. Group Class A | 435,808 | 673 |
| * Hunan Jiangnan Red Arrow Co. Ltd. Class A | 329,544 | 673 |
| * Beingmate Baby & Child Food Co. Ltd. Class A | 387,500 | 671 |
| Shinva Medical Instrument Co. Ltd. Class A (XSHG) | 184,248 | 670 |
| Tibet Cheezheng Tibetan Medicine Co. Ltd. Class A | 120,960 | 669 |
| Jinyu Bio-Technology Co. Ltd. Class A (XSHG) | 147,800 | 667 |
| * Jiangsu Phoenix Property Investment Co. Ltd. Class A (XSSC) | 533,520 | 666 |
| Xilong Scientific Co. Ltd. | 282,775 | 663 |
| * Orient Group Inc. Class A (XSHG) | 631,900 | 663 |
| Chongqing Water Group Co. Ltd. Class A (XSHG) | 575,000 | 662 |
| Xiamen International Port Co. Ltd. | 3,084,000 | 662 |
| * Shandong Hongda Mining Co. Ltd. Class A (XSHG) | 250,782 | 661 |
| Baoji Titanium Industry Co. Ltd. Class A | 233,400 | 661 |
| * Pingdingshan Tianan Coal Mining Co. Ltd. Class A (XSSC) | 856,653 | 660 |
| Xiamen International Airport Co. Ltd. Class A (XSHG) | 196,455 | 660 |
| * TDG Holdings Co. Ltd. Class A | 320,500 | 659 |
| * Xinjiang Sailimu Modern Agriculture Co. Ltd. Class A | 580,800 | 658 |
| Shanghai U9 Game Co. Ltd. Class A | 318,000 | 657 |
| * China Soft Power Technology Holdings Ltd. | 27,440,000 | 656 |
| * Tianjin Songjiang Co. Ltd. Class A | 685,700 | 656 |
| Beijing Gehua CATV Network Co. Ltd. Class A (XSHG) | 270,900 | 654 |
| * Guangxi Wuzhou Zhongheng Group Co. Ltd. Class A (XSSC) | 983,303 | 653 |
| * Shenzhen Fountain Corp. Class A | 599,700 | 652 |
| * Lander Sports Development Co. Ltd. Class A | 299,300 | 652 |
| DHC Software Co. Ltd. Class A | 205,645 | 651 |
| * P2P Financial Information Service Co. Ltd. Class A | 348,000 | 651 |
| * Zhejiang Qianjiang Motorcycle Co. Ltd. Class A | 231,200 | 650 |
| Xiangtan Electric Manufacturing Co. Ltd. Class A (XSHG) | 328,934 | 648 |
| * Baotou Beifang Chuangye Co. Ltd. Class A | 352,000 | 648 |
| CITIC Heavy Industries Co. Ltd. Class A (XSSC) | 831,227 | 647 |
| Tongkun Group Co. Ltd. Class A (XSSC) | 347,785 | 647 |
| * Shenzhen Capstone Industrial Co. Ltd. Class A | 88,900 | 646 |
| Dongfang Electric Corp. Ltd. Class A (XSSC) | 448,691 | 643 |
| China Grand Automotive Services Co. Ltd. Class A (XSHG) | 492,900 | 643 |
| Shanghai New World Co. Ltd. Class A (XSSC) | 314,400 | 642 |
| Sufa Technology Industry Co. Ltd. CNNC Class A | 190,700 | 641 |
| Huayi Electric Co. Ltd. Class A (XSHG) | 364,092 | 641 |
| * Nanjing Huadong Electronics Information & Technology Co. Ltd. Class A | 1,322,852 | 640 |
35
| | |
| Vanguard® Emerging Markets Stock Index Fund | | |
| Schedule of Investments | | |
| October 31, 2016 | | |
| |
| | | Market |
| | | Value |
| | Shares | ($000) |
| Hebei Hengshui Laobaigan Liquor Co. Ltd. Class A (XSHG) | 167,497 | 635 |
| Jiangzhong Pharmaceutical Co. Ltd. Class A (XSSC) | 128,400 | 635 |
| * Yifeng Pharmacy Chain Co. Ltd. Class A (XSSC) | 128,377 | 634 |
| Zhejiang Ming Jewelry Co. Ltd. Class A | 328,100 | 632 |
| Sichuan EM Technology Co. Ltd. Class A (XSHG) | 537,500 | 631 |
| Sichuan Tianyi Science & Technology Co. Ltd. Class A | 270,800 | 631 |
| First Tractor Co. Ltd. Class A (XSHG) | 352,300 | 630 |
| * Guangdong Weihua Corp. Class A | 366,774 | 629 |
| Guangdong HEC Technology Holding Co. Ltd. Class A (XSSC) | 622,738 | 628 |
| Pacific Securities Co. Ltd. Class A (XSHG) | 821,535 | 627 |
| China Shenhua Energy Co. Ltd. Class A (XSSC) | 251,550 | 626 |
| Jiangsu Yueda Investment Co. Ltd. Class A (XSSC) | 486,700 | 626 |
| Shanghai Tunnel Engineering Co. Ltd. Class A (XSSC) | 412,700 | 625 |
| * China Tungsten And Hightech Materials Co. Ltd. Class A | 259,900 | 624 |
| Sinoma International Engineering Co. Class A (XSSC) | 595,223 | 624 |
| Zhejiang Juhua Co. Ltd. Class A (XSSC) | 388,725 | 623 |
| Xiamen ITG Group Corp. Ltd. Class A (XSSC) | 478,674 | 622 |
| Deluxe Family Co. Ltd. Class A (XSSC) | 437,436 | 620 |
| * Sunward Intelligent Equipment Co. Ltd. Class A | 424,600 | 620 |
| Hangzhou Silan Microelectronics Co. Ltd. Class A (XSSC) | 632,600 | 619 |
| * Ingenious Ene-Carbon New Materials Co. Ltd. Class A | 469,900 | 619 |
| Shanghai Wanye Enterprises Co. Ltd. Class A (XSSC) | 323,932 | 619 |
| Tibet Urban Development and Investment Co. Ltd. Class A (XSSC) | 267,344 | 619 |
| Shanghai Jinjiang International Industrial Investment Co. Ltd. Class A (XSHG) | 161,800 | 617 |
| * Star Lake Bioscience Co. Inc. Zhaoqing Guangdong Class A | 621,400 | 615 |
| * Shanghai SK Petroleum & Chemical Equipment Corp. Ltd. Class A | 253,600 | 613 |
| Sinochem International Corp. Class A (XSHG) | 414,700 | 612 |
| SDIC Power Holdings Co. Ltd. Class A (XSSC) | 631,993 | 611 |
| * Nanjing Iron & Steel Co. Ltd. Class A | 1,601,500 | 611 |
| * China Hainan Rubber Industry Group Co. Ltd. Class A (XSHG) | 655,100 | 610 |
| * Guangdong Meiyan Jixiang Hydropower Co. Ltd. Class A | 586,600 | 608 |
| Hubei Xingfa Chemicals Group Co. Ltd. Class A (XSHG) | 306,000 | 608 |
| Xingmin Intelligent Transportation Systems Group Co. Ltd. Class A | 245,226 | 608 |
| Changchai Co. Ltd. Class B | 954,342 | 606 |
| * Shantui Construction Machinery Co. Ltd. Class A | 722,635 | 606 |
| * Dongyue Group Ltd. | 3,428,000 | 606 |
| * Xiamen XGMA Machinery Co. Ltd. Class A | 600,000 | 602 |
| Sichuan Chengfa Aero-Science & Technology Co. Ltd. Class A (XSSC) | 103,600 | 602 |
| * Sichuan Guodong Construction Co. Ltd. Class A | 570,200 | 601 |
| Luxin Venture Capital Group Co. Ltd. Class A (XSSC) | 165,708 | 598 |
| Kingfa Sci & Tech Co. Ltd. Class A (XSHG) | 596,600 | 598 |
| * Sichuan Western Resources Holding Co. Ltd. Class A | 315,200 | 598 |
| China Sports Industry Group Co. Ltd. Class A (XSSC) | 219,000 | 597 |
| Zhangjiagang Freetrade Science and Technology Co. Ltd. Class A (XSSC) | 696,286 | 597 |
| Xinjiang Xuefeng Sci-Tech Group Co. Ltd. Class A | 458,800 | 596 |
| * Liaoning Wellhope Agri-Tech JSC Ltd. Class A (XSSC) | 289,101 | 596 |
| Aeolus Tyre Co. Ltd. Class A | 398,304 | 595 |
| Hubei Kaile Science & Technology Co. Ltd. Class A (XSHG) | 265,300 | 594 |
| * Avic Aviation High-Technology Co. Ltd. Class A (XSSC) | 300,067 | 593 |
| * Jinduicheng Molybdenum Co. Ltd. Class A (XSHG) | 501,200 | 592 |
| * Hunan Investment Group Co. Ltd. Class A | 490,600 | 591 |
| * Far East Smarter Energy Co. Ltd. Class A (XSHG) | 455,060 | 591 |
| Zhejiang Juhua Co. Ltd. Class A (XSHG) | 367,800 | 590 |
| * Ningbo Fuda Co. Ltd. Class A | 692,700 | 589 |
| Southwest Securities Co. Ltd. Class A (XSHG) | 547,606 | 589 |
| * Anhui Hengyuan Coal Industry and Electricity Power Co. Ltd. Class A (XSHG) | 547,500 | 588 |
| * Shanghai Metersbonwe Fashion & Accessories Co. Ltd. Class A | 926,300 | 588 |
| Hefei Meiling Co. Ltd. Class B | 962,200 | 587 |
| Gansu Yasheng Industrial Group Co. Ltd. Class A (XSSC) | 721,600 | 587 |
| * Tianjin Benefo Tejing Electric Co. Ltd. Class A (XSSC) | 286,889 | 586 |
| Jonjee High-Tech Industrial And Commercial Holding Co. Ltd. Class A (XSHG) | 234,200 | 586 |
| * Zhejiang Great Southeast Co. Ltd. Class A | 1,101,400 | 585 |
| Shenzhen Noposion Agrochemicals Co. Ltd. Class A | 383,200 | 585 |
| Guizhou Yibai Pharmaceutical Co. Ltd. Class A (XSSC) | 237,100 | 584 |
36
| | |
| Vanguard® Emerging Markets Stock Index Fund | | |
| Schedule of Investments | | |
| October 31, 2016 | | |
| |
| | | Market |
| | | Value |
| | Shares | ($000) |
| Henan Zhongyuan Expressway Co. Ltd. Class A (XSHG) | 876,400 | 582 |
| Nanjing Gaoke Co. Ltd. Class A (XSHG) | 232,200 | 581 |
| * Guizhou Changzheng Tiancheng Holding Co. Ltd. Class A (XSSC) | 351,094 | 581 |
| * Sichuan Changhong Electric Co. Ltd. Class A (XSHG) | 917,600 | 581 |
| Anhui Xinli Finance Co. Ltd. Class A | 119,900 | 580 |
| * Henan Thinker Automatic Equipment Co. Ltd. Class A (XSSC) | 47,539 | 578 |
| Jiangsu Expressway Co. Ltd. Class A (XSHG) | 428,998 | 578 |
| Hisense Electric Co. Ltd. Class A (XSHG) | 229,200 | 577 |
| CMST Development Co. Ltd. Class A (XSHG) | 467,300 | 576 |
| Zhejiang Hangmin Co. Ltd. Class A (XSHG) | 318,100 | 573 |
| Shanghai ShenTong Metro Co. Ltd. Class A | 262,401 | 573 |
| Time Publishing and Media Co. Ltd. Class A (XSHG) | 187,800 | 571 |
| * Anhui Jianghuai Automobile Co. Ltd. Class A (XSSC) | 296,100 | 567 |
| Shanghai Jielong Industry Group Corp. Ltd. Class A | 418,400 | 566 |
| KPC Pharmaceuticals Inc. Class A (XSHG) | 280,088 | 565 |
| * Shanghai Maling Aquarius Co. Ltd. Class A (XSHG) | 323,200 | 565 |
| * YunNan Metropolitan Real Estate Development Co. Ltd. Class A (XSHG) | 644,700 | 564 |
| Eastern Communications Co. Ltd. Class A (XSHG) | 392,200 | 562 |
| * Shenyang Machine Tool Co. Ltd. Class A | 262,000 | 560 |
| Sichuan Yahua Industrial Group Co. Ltd. Class A | 545,100 | 558 |
| Citic Offshore Helicopter Co. Ltd. Class A | 296,000 | 557 |
| North Navigation Control Technology Co. Ltd. Class A (XSHG) | 256,600 | 556 |
| Lifan Industry Group Co. Ltd. Class A (XSSC) | 388,900 | 553 |
| Beiqi Foton Motor Co. Ltd. Class A (XSSC) | 1,333,710 | 553 |
| Chongqing Zongshen Power Machinery Co. Ltd. Class A | 367,200 | 553 |
| * Shandong Mining Machinery Group Co. Ltd. Class A | 368,800 | 551 |
| Zhejiang Daily Media Group Co. Ltd. Class A (XSSC) | 241,888 | 550 |
| Rongan Property Co. Ltd. Class A | 814,200 | 550 |
| Chongqing Three Gorges Water Conservancy & Electric Power Co. Ltd. Class A (XSSC) | 404,858 | 550 |
| Gansu Gangtai Holding Group Co. Ltd. Class A (XSHG) | 226,680 | 550 |
| Jinxi Axle Co. Ltd. Class A (XSSC) | 501,211 | 549 |
| * China Hainan Rubber Industry Group Co. Ltd. Class A (XSSC) | 589,600 | 549 |
| Loncin Motor Co. Ltd. Class A (XSHG) | 179,300 | 547 |
| Anhui Shanying Paper Industry Co. Ltd. Class A (XSHG) | 1,176,000 | 546 |
| Anhui Xinhua Media Co. Ltd. Class A (XSHG) | 227,560 | 544 |
| * Rizhao Port Co. Ltd. Class A (XSSC) | 912,650 | 543 |
| Laobaixing Pharmacy Chain JSC Class A (XSHG) | 72,121 | 543 |
| Huadian Heavy Industries Co. Ltd. Class A (XSHG) | 414,676 | 543 |
| * Henan Shenhuo Coal & Power Co. Ltd. Class A | 644,700 | 542 |
| Chengdu B-Ray Media Co. Ltd. Class A (XSSC) | 439,200 | 542 |
| * SRE Group Ltd. | 18,474,000 | 542 |
| Mayinglong Pharmaceutical Group Co. Ltd. Class A (XSHG) | 179,100 | 539 |
| Shenguan Holdings Group Ltd. | 6,646,000 | 539 |
| Jiangsu Yangnong Chemical Co. Ltd. Class A (XSHG) | 114,900 | 537 |
| V V Food & Beverage Co. Ltd. Class A (XSHG) | 532,402 | 537 |
| * Wuhan Iron & Steel Co. Ltd. Class A (XSSC) | 1,161,460 | 537 |
| * Pang Da Automobile Trade Co. Ltd. Class A (XSHG) | 1,316,800 | 536 |
| Glarun Technology Co. Ltd. Class A (XSHG) | 105,660 | 534 |
| * Qingdao Kingking Applied Chemistry Co. Ltd. Class A | 141,100 | 534 |
| Tangshan Sanyou Chemical Industries Co. Ltd. Class A (XSHG) | 435,200 | 533 |
| Yunnan Chihong Zinc & Germanium Co. Ltd. Class A (XSHG) | 604,980 | 531 |
| Sichuan Hebang Biotechnology Co. Ltd. Class A (XSHG) | 679,700 | 530 |
| Shanghai Yuyuan Tourist Mart Co. Ltd. Class A (XSHG) | 324,100 | 530 |
| Guangdong Guanhao High-Tech Co. Ltd. Class A | 423,300 | 529 |
| Dongfang Electric Corp. Ltd. Class A (XSHG) | 368,700 | 529 |
| * Chongqing Iron & Steel Co. Ltd. Class A (XSHG) | 1,419,100 | 528 |
| * Zhejiang Jingxing Paper JSC Ltd. Class A | 490,500 | 528 |
| * Lotus Health Group Co. Class A | 614,500 | 527 |
| Jiangsu Phoenix Publishing & Media Corp. Ltd. Class A (XSHG) | 319,000 | 526 |
| Fangda Special Steel Technology Co. Ltd. Class A (XSHG) | 565,690 | 525 |
| Guangzhou Development Group Inc. Class A (XSHG) | 427,000 | 524 |
| Dashang Group Co. Ltd. Class A (XSHG) | 84,700 | 524 |
| Shanghai Feilo Acoustics Co. Ltd. Class A (XSHG) | 301,800 | 520 |
| Xiamen Tungsten Co. Ltd. Class A (XSHG) | 134,000 | 517 |
37
| | |
| Vanguard® Emerging Markets Stock Index Fund | | |
| Schedule of Investments | | |
| October 31, 2016 | | |
| |
| | | Market |
| | | Value |
| | Shares | ($000) |
| Huayi Electric Co. Ltd. Class A (XSSC) | 293,437 | 517 |
| * Zhongyuan Union Cell & Gene Engineering Corp. Ltd. Class A (XSHG) | 115,300 | 516 |
| People.cn Co. Ltd. Class A (XSHG) | 180,600 | 516 |
| * Jiangsu Phoenix Property Investment Co. Ltd. Class A (XSHG) | 409,000 | 510 |
| * Shanghai Maling Aquarius Co. Ltd. Class A (XSSC) | 291,998 | 510 |
| Beijing Urban Construction Investment & Development Co. Ltd. Class A (XSHG) | 260,600 | 510 |
| Guizhou Panjiang Refined Coal Co. Ltd. Class A (XSHG) | 385,200 | 507 |
| China Railway Tielong Container Logistics Co. Ltd. Class A (XSHG) | 450,150 | 506 |
| * Wuxi Commercial Mansion Grand Orient Co. Ltd. Class A (XSHG) | 357,771 | 506 |
| * Liaoning Cheng Da Co. Ltd. Class A (XSHG) | 176,400 | 506 |
| * Henan Thinker Automatic Equipment Co. Ltd. Class A (XSHG) | 41,500 | 505 |
| Lucky Film Co. Class A (XSSC) | 219,191 | 502 |
| China World Trade Center Co. Ltd. Class A (XSHG) | 172,500 | 502 |
| * Shanghai AJ Group Co. Ltd. Class A (XSSC) | 280,727 | 501 |
| * China Minmetals Rare Earth Co. Ltd. Class A | 287,300 | 501 |
| Beijing Bashi Media Co. Ltd. Class A (XSSC) | 219,717 | 500 |
| * Sichuan Changhong Electric Co. Ltd. Class A (XSSC) | 787,438 | 498 |
| * Gansu Jiu Steel Group Hongxing Iron & Steel Co. Ltd. Class A (XSHG) | 1,253,300 | 497 |
| Shanghai Pudong Road & Bridge Construction Co. Ltd. Class A (XSHG) | 301,900 | 496 |
| China Western Power Industrial Co. Ltd. Class A | 249,800 | 496 |
| * Zhejiang Hangmin Co. Ltd. Class A (XSSC) | 274,993 | 496 |
| * Ningbo Sanxing Electric Co. Ltd. Class A (XSHG) | 258,500 | 491 |
| * Cofco Biochemical Co. Ltd. Class A | 292,300 | 488 |
| * Cangzhou Dahua Co. Ltd. Class A | 168,483 | 487 |
| Beijing Jingyuntong Technology Co. Ltd. Class A (XSHG) | 450,160 | 486 |
| Shanghai Zi Jiang Enterprise Group Co. Ltd. Class A (XSSC) | 597,218 | 486 |
| CITIC Heavy Industries Co. Ltd. Class A (XSHG) | 624,200 | 486 |
| Xinjiang Tianfu Energy Co. Ltd. Class A (XSHG) | 425,800 | 485 |
| * Daphne International Holdings Ltd. | 3,682,000 | 483 |
| Long Yuan Construction Group Co. Ltd. Class A (XSHG) | 281,700 | 483 |
| Anhui Heli Co. Ltd. Class A (XSHG) | 277,700 | 482 |
| Tianrun Crankshaft Co. Ltd. Class A | 361,300 | 482 |
| Dashang Group Co. Ltd. Class A (XSSC) | 77,700 | 481 |
| * Shangdong Geo-Mineral Co. Ltd. Class A | 181,000 | 480 |
| COSCO Shipping Co. Ltd. Class A (XSHG) | 557,401 | 480 |
| GD Power Development Co. Ltd. Class A (XSSC) | 1,075,915 | 477 |
| Changyuan Group Ltd. Class A (XSSC) | 231,783 | 476 |
| * Shenji Group Kunming Machine Tool Co. Ltd. Class A | 395,120 | 475 |
| Orient International Enterprise Ltd. Class A (XSSC) | 151,830 | 474 |
| * Taiyuan Coal Gasification Co. Ltd. Class A | 315,231 | 474 |
| Shanghai Shenda Co. Ltd. Class A (XSSC) | 280,493 | 473 |
| Tongwei Co. Ltd. Class A (XSHG) | 526,200 | 472 |
| * China National Medicines Corp. Ltd. Class A (XSSC) | 98,552 | 470 |
| Shanghai Lansheng Corp. Class A (XSHG) | 110,800 | 468 |
| * Maanshan Iron & Steel Co. Ltd. Class A (XSHG) | 1,120,600 | 467 |
| Fujian Longking Co. Ltd. Class A (XSHG) | 245,222 | 466 |
| Shanghai Feilo Acoustics Co. Ltd. Class A (XSSC) | 270,600 | 466 |
| * Zhongyuan Union Cell & Gene Engineering Corp. Ltd. Class A (XSSC) | 103,883 | 465 |
| Anhui Xinke New Materials Co. Ltd. Class A (XSSC) | 714,400 | 464 |
| Fushun Special Steel Co. Ltd. Class A (XSSC) | 440,720 | 463 |
| Maoye Commericial Co. Ltd. Class A (XSHG) | 402,600 | 459 |
| Shaanxi Aerospace Power Hi-Tech Co. Ltd. Class A (XSHG) | 126,100 | 458 |
| * Yueyang Forest & Paper Co. Ltd. Class A (XSSC) | 402,600 | 458 |
| Sinotrans Air Transportation Development Co. Ltd. Class A (XSSC) | 161,950 | 456 |
| Xinjiang Urban Construction Group Co. Ltd. Class A (XSHG) | 449,600 | 456 |
| * Guangxi Wuzhou Zhongheng Group Co. Ltd. Class A (XSHG) | 683,200 | 454 |
| Xiamen ITG Group Corp. Ltd. Class A (XSHG) | 348,100 | 453 |
| Zhangjiagang Freetrade Science and Technology Co. Ltd. Class A (XSHG) | 525,800 | 451 |
| * BYD Co. Ltd. Class A | 54,300 | 450 |
| Shanghai Yimin Commerce Group Co. Ltd. Class A (XSHG) | 457,500 | 448 |
| Shanghai Jahwa United Co. Ltd. Class A (XSSC) | 110,843 | 443 |
| Shanghai Industrial Development Co. Ltd. Class A (XSHG) | 357,890 | 443 |
| * Shanxi Coal International Energy Group Co. Ltd. Class A | 745,199 | 443 |
| Guangdong Xinhui Meida Nylon Co. Ltd. Class A | 337,800 | 442 |
38
| | |
| Vanguard® Emerging Markets Stock Index Fund | | |
| Schedule of Investments | | |
| October 31, 2016 | | |
| |
| | | Market |
| | | Value |
| | Shares | ($000) |
| Guizhou Yibai Pharmaceutical Co. Ltd. Class A (XSHG) | 178,600 | 440 |
| China Television Media Ltd. Class A (XSSC) | 129,531 | 440 |
| Beijing Homyear Capital Holdings Co. Ltd. Class A (XSHG) | 269,440 | 440 |
| * Shanghai M&G Stationery Inc. Class A | 162,050 | 439 |
| Guizhou Panjiang Refined Coal Co. Ltd. Class A (XSSC) | 333,800 | 439 |
| * Maanshan Iron & Steel Co. Ltd. Class A (XSSC) | 1,053,172 | 439 |
| CSSC Offshore and Marine Engineering Group Co. Ltd. Class A (XSHG) | 107,500 | 437 |
| Dalian Huarui Heavy Industry Group Co. Ltd. Class A | 683,920 | 436 |
| * Jilin Ji En Nickel Industry Co. Ltd. Class A | 409,662 | 435 |
| * Zhejiang Qianjiang Biochem Class A | 299,800 | 434 |
| Great Wall Motor Co. Ltd. Class A | 277,400 | 433 |
| CCS Supply Chain Management Co. Ltd. Class A (XSHG) | 188,300 | 433 |
| Jiangzhong Pharmaceutical Co. Ltd. Class A (XSHG) | 87,100 | 431 |
| Shanghai Qiangsheng Holding Co. Ltd. Class A (XSHG) | 250,900 | 429 |
| Anhui Yingliu Electromechanical Co. Ltd. Class A (XSSC) | 138,800 | 426 |
| China Sports Industry Group Co. Ltd. Class A (XSHG) | 156,000 | 425 |
| Gansu Yasheng Industrial Group Co. Ltd. Class A (XSHG) | 519,200 | 423 |
| * Triumph Science & Technology Co. Ltd. Class A (XSSC) | 154,775 | 421 |
| Beijing Gehua CATV Network Co. Ltd. Class A (XSSC) | 173,800 | 420 |
| Guangdong HEC Technology Holding Co. Ltd. Class A (XSHG) | 414,200 | 418 |
| * Yueyang Forest & Paper Co. Ltd. Class A (XSHG) | 365,300 | 415 |
| Hainan Mining Co. Ltd. Class A (XSHG) | 239,100 | 415 |
| Ningbo Yunsheng Group Co. Ltd. Class A (XSHG) | 129,300 | 414 |
| * Xinjiang Qingsong Building Materials and Chemicals Group Co. Ltd. Class A (XSHG) | 627,400 | 412 |
| Yabao Pharmaceutical Group Co. Ltd. Class A (XSHG) | 270,400 | 411 |
| Hangzhou Silan Microelectronics Co. Ltd. Class A (XSHG) | 419,500 | 411 |
| Welling Holding Ltd. | 2,038,000 | 406 |
| Camel Group Co. Ltd. Class A (XSHG) | 146,600 | 404 |
| Xinjiang Joinworld Co. Ltd. Class A (XSHG) | 343,200 | 403 |
| Shanghai Jiao Yun Co. Ltd. Class A (XSHG) | 293,500 | 402 |
| * JCHX Mining Management Co. Ltd. Class A (XSSC) | 141,210 | 402 |
| Founder Technology Group Corp. Class A (XSHG) | 533,300 | 399 |
| Dawning Information Industry Co. Ltd. Class A (XSHG) | 83,200 | 398 |
| Shuangliang Eco-Energy Systems Co. Ltd. Class A (XSHG) | 412,005 | 394 |
| China National Software & Service Co. Ltd. Class A (XSHG) | 97,500 | 393 |
| Jiangsu Linyang Energy Co. Ltd. Class A (XSHG) | 284,900 | 392 |
| Beijing Sifang Automation Co. Ltd. Class A (XSHG) | 266,300 | 392 |
| * Chongqing Iron & Steel Co. Ltd. | 1,228,000 | 391 |
| Jiangsu Yabang Dyestuff Co. Ltd. Class A (XSHG) | 145,500 | 391 |
| Beibuwan Port Co. Ltd. Class A | 154,067 | 390 |
| Jonjee High-Tech Industrial And Commercial Holding Co. Ltd. Class A (XSSC) | 155,047 | 388 |
| Meidu Energy Corp. Class A (XSHG) | 496,400 | 388 |
| * Grinm Advanced Materials Co. Ltd. Class A (XSHG) | 241,500 | 387 |
| ^ Hydoo International Holding Ltd. | 3,864,000 | 387 |
| * Konka Group Co. Ltd. Class A | 535,900 | 385 |
| Fujian Longking Co. Ltd. Class A (XSSC) | 202,180 | 384 |
| Changjiang & Jinggong Steel Building Group Co. Ltd. Class A (XSHG) | 590,400 | 384 |
| Zhejiang Chint Electrics Co. Ltd. Class A (XSSC) | 121,826 | 384 |
| * Liuzhou Iron & Steel Co. Ltd. Class A | 711,900 | 383 |
| * Zhangzidao Group Co. Ltd. Class A | 238,100 | 382 |
| Tianjin Capital Environmental Protection Group Co. Ltd. Class A (XSHG) | 294,500 | 379 |
| Shanghai Jinjiang International Industrial Investment Co. Ltd. Class A (XSSC) | 99,400 | 379 |
| Sinoma International Engineering Co. Class A (XSHG) | 361,650 | 379 |
| * Fangda Carbon New Material Co. Ltd. Class A (XSHG) | 240,900 | 378 |
| * Yunnan Yunwei Co. Ltd. Class A | 448,200 | 377 |
| Jiangsu Nonghua Intelligent Agriculture Technology Co. Ltd. Class A | 447,000 | 377 |
| Wasu Media Holding Co. Ltd. Class A | 133,500 | 377 |
| Citychamp Dartong Co. Ltd. Class A (XSHG) | 343,700 | 377 |
| * Jilin Yatai Group Co. Ltd. Class A (XSHG) | 492,000 | 376 |
| Besttone Holdings Co. Ltd. Class A (XSHG) | 119,700 | 374 |
| * Taiyuan Heavy Industry Co. Ltd. Class A (XSHG) | 613,100 | 374 |
| Beijing Haohua Energy Resource Co. Ltd. Class A (XSSC) | 386,714 | 373 |
| Ningbo Shanshan Co. Ltd. Class A (XSHG) | 159,200 | 369 |
| Shanghai Dingli Technology Development Group Co. Ltd. Class A (XSHG) | 228,600 | 369 |
39
| | | |
| Vanguard® Emerging Markets Stock Index Fund | | |
| Schedule of Investments | | |
| October 31, 2016 | | |
| |
| | | | Market |
| | | | Value |
| | | Shares | ($000) |
| | Bright Oceans Inter-Telecom Corp. Class A (XSHG) | 164,500 | 367 |
| ^ | China Resources and Transportation Group Ltd. | 21,035,000 | 367 |
| | HNA Infrastructure Company Ltd. | 328,000 | 367 |
| | Deluxe Family Co. Ltd. Class A (XSHG) | 257,500 | 365 |
| | Nanjing Central Emporium Class A (XSHG) | 358,100 | 364 |
| | Joincare Pharmaceutical Group Industry Co. Ltd. Class A (XSHG) | 237,600 | 364 |
| * | Chang Jiang Shipping Group Phoenix Co. Ltd. Class A | 341,600 | 364 |
| *,^ | Universal Health International Group Holding Ltd. | 8,078,000 | 364 |
| | Henan Huanghe Whirlwind Co. Ltd. Class A (XSHG) | 128,000 | 364 |
| * | Neoglory Prosperity Inc. Class A | 152,829 | 362 |
| | Gansu Jingyuan Coal Industry and Electricity Power Co. Ltd. Class A | 600,400 | 361 |
| | Wenfeng Great World Chain Development Corp. Class A (XSHG) | 460,200 | 357 |
| | Jiangsu SINOJIT Wind Energy Technology Co. Ltd. Class A (XSHG) | 441,600 | 357 |
| | Zhuzhou Times New Material Technology Co. Ltd. Class A (XSHG) | 151,400 | 357 |
| | Lifan Industry Group Co. Ltd. Class A (XSHG) | 250,700 | 356 |
| * | China Coal Energy Co. Ltd. Class A (XSHG) | 361,900 | 355 |
| | Hebei Hengshui Laobaigan Liquor Co. Ltd. Class A (XSSC) | 93,500 | 354 |
| | Tianjin ZhongXin Pharmaceutical Group Corp. Ltd. Class A (XSHG) | 141,500 | 353 |
| | Jinxi Axle Co. Ltd. Class A (XSHG) | 321,000 | 351 |
| | Luxin Venture Capital Group Co. Ltd. Class A (XSHG) | 97,300 | 351 |
| | Jiangxi Hongdu Aviation Industry Co. Ltd. Class A (XSHG) | 123,000 | 349 |
| * | Ningbo Tuopu Group Co. Ltd. Class A (XSSC) | 75,737 | 348 |
| * | Rizhao Port Co. Ltd. Class A (XSHG) | 580,400 | 345 |
| | Shanghai Zhongji Investment Holding Co. Ltd. Class A (XSSC) | 129,600 | 345 |
| | Huolinhe Opencut Coal Industry Corp. Ltd. of Inner Mongolia Class A | 251,700 | 345 |
| | Hangzhou Jiebai Group Co. Ltd. Class A (XSHG) | 243,100 | 345 |
| | Sinomach Automobile Co. Ltd. Class A (XSHG) | 177,150 | 344 |
| | Dalian Port PDA Co. Ltd. Class A | 958,410 | 344 |
| | Sichuan Chengfa Aero-Science & Technology Co. Ltd. Class A (XSHG) | 59,100 | 343 |
| | Xiamen Faratronic Co. Ltd. Class A (XSHG) | 58,248 | 343 |
| | Chongqing Machinery & Electric Co. Ltd. | 2,886,000 | 341 |
| | Shanghai Zhixin Electric Co. Ltd. Class A (XSHG) | 209,544 | 341 |
| | Guangzhou Pearl River Industrial Development Co. Ltd. Class A (XSHG) | 285,100 | 341 |
| | Guirenniao Co. Ltd. Class A (XSHG) | 81,674 | 340 |
| * | Shenzhen Gongjin Electronics Co. Ltd. Class A (XSSC) | 56,840 | 340 |
| * | Pang Da Automobile Trade Co. Ltd. Class A (XSSC) | 833,600 | 339 |
| | Fushun Special Steel Co. Ltd. Class A (XSHG) | 322,000 | 339 |
| | Gansu Qilianshan Cement Group Co. Ltd. Class A (XSHG) | 306,100 | 338 |
| | Beijing Teamsun Technology Co. Ltd. Class A (XSHG) | 180,320 | 338 |
| | Xinjiang Yilite Industry Co. Ltd. Class A (XSSC) | 148,688 | 338 |
| | Sinopec Shanghai Petrochemical Co. Ltd. Class A | 388,400 | 337 |
| | Tianjin Benefo Tejing Electric Co. Ltd. Class A (XSHG) | 165,000 | 337 |
| * | Anyuan Coal Industry Group Co. Ltd. Class A (XSHG) | 422,000 | 330 |
| | Shanghai Shenda Co. Ltd. Class A (XSHG) | 195,100 | 329 |
| * | Wanda Hotel Development Co. Ltd. | 3,326,000 | 329 |
| | Jiangsu Hongtu High Technology Co. Ltd. Class A | 190,750 | 329 |
| * | Hubei Kaile Science & Technology Co. Ltd. Class A (XSSC) | 146,423 | 328 |
| | Shanghai Dazhong Public Utilities Group Co. Ltd. Class A (XSHG) | 345,800 | 325 |
| �� | Chengtun Mining Group Co. Ltd. Class A (XSHG) | 286,400 | 320 |
| | Bright Real Estate Group Co. Ltd. Class A (XSHG) | 229,900 | 320 |
| | Zhuzhou Qianjin Pharmaceutical Co. Ltd. Class A (XSHG) | 128,300 | 320 |
| | Avic Heavy Machinery Co. Ltd. Class A (XSHG) | 147,200 | 319 |
| | Jangho Group Co. Ltd. Class A (XSHG) | 193,400 | 319 |
| * | China Enterprise Co. Ltd. Class A | 427,200 | 319 |
| | Hangzhou Sunyard System Engineering Co. Ltd. Class A (XSHG) | 91,600 | 318 |
| * | SDIC Xinji Energy Co. Ltd. Class A | 474,302 | 317 |
| | China Molybdenum Co. Ltd. Class A (XSHG) | 558,700 | 316 |
| * | Chongyi Zhangyuan Tungsten Co. Ltd. Class A | 201,600 | 316 |
| | Changshu Fengfan Power Equipment Co. Ltd. Class A (XSHG) | 263,500 | 316 |
| | Tian Di Science & Technology Co. Ltd. Class A (XSHG) | 456,100 | 316 |
| | Shanghai Belling Co. Ltd. Class A (XSHG) | 143,000 | 315 |
| | Shanghai Dazhong Public Utilities Group Co. Ltd. Class A (XSSC) | 333,600 | 314 |
| | Universal Scientific Industrial Shanghai Co. Ltd. Class A (XSHG) | 178,938 | 312 |
| * | Shaanxi Broadcast & TV Network Intermediary Co. Ltd. Class A (XSHG) | 149,200 | 312 |
40
| | | |
| Vanguard® Emerging Markets Stock Index Fund | | |
| Schedule of Investments | | |
| October 31, 2016 | | |
| |
| | | | Market |
| | | | Value |
| | | Shares | ($000) |
| | Huayuan Property Co. Ltd. Class A (XSHG) | 440,570 | 309 |
| | Yanzhou Coal Mining Co. Ltd. Class A (XSSC) | 165,800 | 309 |
| | EGing Photovoltaic Technology Co. Ltd. Class A (XSHG) | 271,800 | 308 |
| * | Yuanda China Holdings Ltd. | 11,820,000 | 306 |
| | Shanghai New World Co. Ltd. Class A (XSHG) | 149,800 | 306 |
| | Jiangsu Changjiang Electronics Technology Co. Ltd. Class A (XSHG) | 105,300 | 305 |
| | Orient International Enterprise Ltd. Class A (XSHG) | 97,700 | 305 |
| | Zhengzhou Coal Mining Machinery Group Co. Ltd. Class A (XSHG) | 332,200 | 304 |
| * | Shanghai Jinjiang International Hotels Development Co. Ltd. Class A | 66,900 | 303 |
| | Shanghai Dingli Technology Development Group Co. Ltd. Class A (XSSC) | 187,432 | 302 |
| | YUD Yangtze River Investment Industry Co. Ltd. Class A (XSHG) | 89,650 | 302 |
| * | Beijing Kingee Culture Development Co. Ltd. Class A | 105,455 | 302 |
| | Anhui Yingliu Electromechanical Co. Ltd. Class A (XSHG) | 98,400 | 302 |
| * | Chongqing Jianfeng Chemical Co. Ltd. Class A | 233,300 | 302 |
| | Huafa Industrial Co. Ltd. Zhuhai Class A (XSHG) | 153,800 | 300 |
| | Shanghai Xinhua Media Co. Ltd. Class A (XSHG) | 226,400 | 300 |
| | Black Peony Group Co. Ltd. Class A (XSHG) | 225,400 | 300 |
| | Shanghai East China Computer Co. Ltd. Class A (XSHG) | 72,280 | 297 |
| *,^ | Skyway Securities Group Ltd. | 13,290,000 | 292 |
| | Shanghai Chinafortune Co. Ltd. Class A (XSHG) | 165,500 | 292 |
| | Shenzhen Heungkong Holding Co. Ltd. Class A (XSHG) | 454,350 | 291 |
| * | Huadian Energy Co. Ltd. Class A | 382,900 | 290 |
| * | Gem-Year Industrial Co. Ltd. Class A (XSHG) | 196,000 | 289 |
| | Shanghai Qiangsheng Holding Co. Ltd. Class A (XSSC) | 168,000 | 287 |
| * | Guanghui Energy Co. Ltd. Class A (XSSC) | 455,853 | 285 |
| | Wolong Real Estate Group Co. Ltd. Class A (XSHG) | 220,900 | 284 |
| | Shanghai Zhongji Investment Holding Co. Ltd. Class A (XSHG) | 105,700 | 281 |
| | Anhui Expressway Co. Ltd. Class A | 144,600 | 279 |
| * | SGIS Songshan Co. Ltd. Class A | 459,790 | 277 |
| | Beijing Haohua Energy Resource Co. Ltd. Class A (XSHG) | 286,200 | 276 |
| | Lucky Film Co. Class A (XSHG) | 120,000 | 275 |
| * | Shanxi Lu'an Environmental Energy Development Co. Ltd. Class A (XSSC) | 212,502 | 272 |
| * | Infotmic Co. Ltd. Class A | 245,000 | 271 |
| | Sinotrans Air Transportation Development Co. Ltd. Class A (XSHG) | 96,100 | 271 |
| | China CITIC Bank Corp. Ltd. Class A (XSSC) | 301,100 | 270 |
| | Shenzhen Expressway Co. Ltd. Class A (XSHG) | 206,700 | 266 |
| * | Hainan Mining Co. Ltd. Class A (XSSC) | 153,262 | 266 |
| | China Pacific Insurance Group Co. Ltd. Class A (XSHG) | 61,300 | 265 |
| | Jiangxi Lianchuang Optoelectronic Science & Technology Co. Ltd. Class A (XSHG) | 98,300 | 264 |
| | Sino-Platinum Metals Co. Ltd. Class A (XSHG) | 67,500 | 263 |
| | Nanjing Panda Electronics Co. Ltd. Class A (XSHG) | 124,000 | 263 |
| | Tongkun Group Co. Ltd. Class A (XSHG) | 141,000 | 262 |
| | Wolong Electric Group Co. Ltd. Class A (XSHG) | 180,200 | 262 |
| | Jiangsu Yueda Investment Co. Ltd. Class A (XSHG) | 202,800 | 261 |
| | Wuxi Taiji Industry Co. Ltd. Class A (XSHG) | 204,420 | 261 |
| * | Minmetals Development Co. Ltd. Class A (XSSC) | 104,800 | 259 |
| * | Shougang Concord International Enterprises Co. Ltd. | 8,074,000 | 259 |
| * | Renrenle Commercial Group Co. Ltd. Class A | 150,000 | 259 |
| | Inspur Software Co. Ltd. Class A (XSHG) | 64,900 | 256 |
| | Elion Clean Energy Co. Ltd. Class A | 255,600 | 253 |
| | MeiHua Holdings Group Co. Ltd. Class A | 270,800 | 251 |
| * | Shanghai 3F New Materials Co. Class A (XSHG) | 121,500 | 249 |
| | Lanzhou LS Heavy Equipment Co. Ltd. Class A (XSHG) | 129,885 | 246 |
| | Xinjiang Guannong Fruit & Antler Group Co. Ltd. Class A (XSHG) | 203,200 | 245 |
| | Gree Real Estate Co. Ltd. Class A (XSHG) | 271,320 | 245 |
| | BBMG Corp. Class A (XSHG) | 377,414 | 244 |
| * | Anhui Wanwei Updated High-Tech Material Industry Co. Ltd. Class A (XSHG) | 357,950 | 244 |
| * | China Shipping Container Lines Co. Ltd. Class A (XSSC) | 399,076 | 243 |
| | Tibet Urban Development and Investment Co. Ltd. Class A (XSHG) | 104,570 | 242 |
| | Guangzhou Automobile Group Co. Ltd. Class A | 72,086 | 239 |
| | Tongling Jingda Special Magnet Wire Co. Ltd. Class A (XSSC) | 385,000 | 238 |
| | Aerosun Corp. Class A (XSHG) | 90,800 | 237 |
| | Guangdong Ellington Electronics Technology Co. Ltd. Class A (XSHG) | 50,500 | 237 |
| * | Qinghai Spring Medicinal Resources Technology Co. Ltd. Class A | 132,500 | 236 |
41
| | |
| Vanguard® Emerging Markets Stock Index Fund | | |
| Schedule of Investments | | |
| October 31, 2016 | | |
| |
| | | Market |
| | | Value |
| | Shares | ($000) |
| * Sichuan Languang Development Co. Ltd. Class A (XSSC) | 202,266 | 234 |
| Henan Rebecca Hair Products Co. Ltd. Class A (XSHG) | 206,100 | 234 |
| CPI Yuanda Environmental-Protection Group Co. Ltd. Class A (XSHG) | 123,400 | 233 |
| Shantou Dongfeng Printing Co. Ltd. Class A (XSHG) | 129,000 | 233 |
| Changzheng Engineering Co. Ltd. Class A (XSHG) | 53,100 | 232 |
| Avic Heavy Machinery Co. Ltd. Class A (XSSC) | 107,075 | 232 |
| Tongling Jingda Special Magnet Wire Co. Ltd. Class A (XSHG) | 374,934 | 231 |
| Yanzhou Coal Mining Co. Ltd. Class A (XSHG) | 123,865 | 231 |
| * Ningxia Orient Tantalum Industry Co. Ltd. Class A | 144,700 | 229 |
| Beijing Bashi Media Co. Ltd. Class A (XSHG) | 100,118 | 228 |
| Anhui Xinke New Materials Co. Ltd. Class A (XSHG) | 348,200 | 226 |
| Shanghai Lujiazui Finance & Trade Zone Development Co. Ltd. Class A | 63,720 | 225 |
| Oriental Times Media Corp. Class A | 84,500 | 221 |
| Zhejiang Nanyang Technology Co. Ltd. Class A | 114,600 | 219 |
| Lingyun Industrial Corp. Ltd. Class A (XSHG) | 98,200 | 218 |
| China Railway Tielong Container Logistics Co. Ltd. Class A (XSSC) | 189,300 | 213 |
| Lawton Development Co. Ltd. Class A | 129,400 | 213 |
| Zhejiang Haiyue Co. Ltd. Class A (XSHG) | 112,600 | 212 |
| * Ningbo Joyson Electronic Corp. Class A (XSSC) | 42,100 | 211 |
| * Triumph Science & Technology Co. Ltd. Class A (XSHG) | 76,800 | 209 |
| * Angel Yeast Co. Ltd. Class A (XSSC) | 81,788 | 204 |
| Sichuan Expressway Co. Ltd. Class A (XSHG) | 284,100 | 203 |
| China Television Media Ltd. Class A (XSHG) | 59,700 | 203 |
| Baosheng Science and Technology Innovation Co. Ltd. Class A (XSHG) | 167,828 | 201 |
| Lancy Co. Ltd. Class A | 63,200 | 201 |
| * Zhuzhou Kibing Group Co. Ltd. Class A (XSHG) | 356,400 | 200 |
| * Beijing Enterprises Clean Energy Group Ltd. | 6,800,579 | 198 |
| * Kunwu Jiuding Investment Holdings Co. Ltd. Class A (XSSC) | 29,200 | 196 |
| Zhejiang Feida Environmental Science & Technology Co. Ltd. Class A (XSHG) | 101,500 | 196 |
| Dongfeng Electronic Technology Co. Ltd. Class A (XSHG) | 86,000 | 196 |
| Ningxia Building Materials Group Co. Ltd. Class A (XSHG) | 129,000 | 193 |
| * Shandong Jinjing Science & Technology Co. Ltd. Class A (XSHG) | 275,100 | 186 |
| * Zhongyuan Special Steel Co. Ltd. Class A | 109,700 | 185 |
| * Global Bio-Chem Technology Group Co. Ltd. | 10,418,000 | 182 |
| Keda Clean Energy Co. Ltd. Class A (XSSC) | 140,100 | 180 |
| TangShan Port Group Co. Ltd. Class A (XSHG) | 300,960 | 178 |
| Shanghai Zi Jiang Enterprise Group Co. Ltd. Class A (XSHG) | 217,600 | 177 |
| * Zhejiang Medicine Co. Ltd. Class A (XSSC) | 83,700 | 176 |
| Zhejiang Xinan Chemical Industrial Group Co. Ltd. Class A (XSHG) | 136,600 | 174 |
| * China COSCO Holdings Co. Ltd. Class A | 221,002 | 171 |
| * Fujian Cement Inc. Class A (XSSC) | 119,800 | 169 |
| CECEP Wind-Power Corp. Class A (XSHG) | 112,900 | 168 |
| Xinjiang Urban Construction Group Co. Ltd. Class A (XSSC) | 162,900 | 165 |
| Shenzhen Chiwan Wharf Holdings Ltd. Class A | 65,700 | 164 |
| Jiangsu Jiangnan High Polymer Fiber Co. Ltd. Class A (XSHG) | 167,900 | 164 |
| Sunny Loan Top Co. Ltd. Class A (XSHG) | 94,700 | 163 |
| Beijing Jingneng Power Co. Ltd. Class A (XSHG) | 252,800 | 160 |
| * Chengdu Huaze Cobalt & Nickel Material Co. Ltd. Class A | 84,700 | 156 |
| Beijing North Star Co. Ltd. Class A (XSHG) | 247,700 | 156 |
| China Shipping Development Co. Ltd. Class A (XSHG) | 153,200 | 154 |
| Shanghai Fudan Forward S & T Co. Ltd. Class A (XSHG) | 117,520 | 153 |
| * China Shipping Container Lines Co. Ltd. Class A (XSHG) | 242,900 | 148 |
| China Wafer Level CSP Co. Ltd. Class A (XSSC) | 29,828 | 142 |
| Chengdu B-Ray Media Co. Ltd. Class A (XSHG) | 115,100 | 142 |
| * Datong Coal Industry Co. Ltd. Class A (XSSC) | 125,300 | 141 |
| * China Animal Husbandry Industry Co. Ltd. Class A (XSSC) | 44,200 | 141 |
| * Kailuan Energy Chemical Co. Ltd. Class A (XSSC) | 121,600 | 138 |
| * Gansu Jiu Steel Group Hongxing Iron & Steel Co. Ltd. Class A (XSSC) | 348,000 | 138 |
| * Kingray New Materials Science & Technology Co. Ltd. Class A | 61,600 | 136 |
| Shanghai Tongji Science & Technology Industrial Co. Ltd. Class A (XSHG) | 93,600 | 136 |
| * Guizhou Changzheng Tiancheng Holding Co. Ltd. Class A (XSHG) | 81,200 | 134 |
| CPI Yuanda Environmental-Protection Group Co. Ltd. Class A (XSSC) | 68,861 | 130 |
| * Sinovel Wind Group Co. Ltd. Class A | 321,200 | 127 |
| Jiangsu Wuzhong Industrial Co. Class A (XSHG) | 45,400 | 124 |
42
| | | |
| Vanguard® Emerging Markets Stock Index Fund | | |
| Schedule of Investments | | |
| October 31, 2016 | | |
| |
| | | | Market |
| | | | Value |
| | | Shares | ($000) |
| * | China Coal Energy Co. Ltd. Class A (XSSC) | 125,594 | 123 |
| | New China Life Insurance Co. Ltd. Class A (XSHG) | 19,000 | 118 |
| * | Xinjiang Dushanzi Tianli High & New Tech Co. Ltd. Class A | 126,600 | 116 |
| * | Xinjiang Ba Yi Iron & Steel Co. Ltd. Class A | 149,000 | 116 |
| | Sichuan EM Technology Co. Ltd. Class A (XSSC) | 97,800 | 115 |
| * | Yang Quan Coal Industry Group Co. Ltd. Class A (XSSC) | 100,700 | 112 |
| | Qingdao Haier Co. Ltd. Class A (XSHG) | 75,300 | 111 |
| | Inzone Group Co. Ltd. Class A (XSSC) | 78,132 | 103 |
| * | Shandong Tyan Home Co. Ltd. Class A (XSSC) | 51,734 | 98 |
| * | Shanghai Jinqiao Export Processing Zone Development Co. Ltd. Class A | 31,100 | 88 |
| | Huatai Securities Co. Ltd. Class A (XSHG) | 28,800 | 87 |
| * | Hongfa Technology Co. Ltd. Class A (XSSC) | 17,100 | 83 |
| * | Anhui Hengyuan Coal Industry and Electricity Power Co. Ltd. Class A (XSSC) | 74,500 | 80 |
| * | Maoye International Holdings Ltd. | 824,000 | 78 |
| * | Chongqing Iron & Steel Co. Ltd. Class A (XSSC) | 206,200 | 77 |
| * | Shandong Hongda Mining Co. Ltd. Class A (XSSC) | 27,800 | 73 |
| | Zhonglu Co. Ltd. Class A (XSHG) | 19,300 | 73 |
| | Huaxin Cement Co. Ltd. Class A (XSHG) | 65,900 | 72 |
| * | Harbin Gong Da High-Tech Enterprise Development Co. Ltd. Class A | 33,000 | 70 |
| * | Xinjiang Qingsong Building Materials and Chemicals Group Co. Ltd. Class A (XSSC) | 102,800 | 68 |
| | China Railway Erju Co. Ltd. Class A (XSSC) | 35,100 | 67 |
| | China International Marine Containers Group Co. Ltd. Class A | 30,200 | 62 |
| | COSCO Shipping Co. Ltd. Class A (XSSC) | 67,400 | 58 |
| * | Jiangsu Protruly Vision Technology Group Co. Ltd. Class A (XSSC) | 23,500 | 56 |
| | China Shipping Development Co. Ltd. Class A (XSSC) | 53,000 | 53 |
| * | Anhui Kouzi Distillery Co. Ltd. Class A | 10,400 | 53 |
| * | Xinjiang Xinxin Mining Industry Co. Ltd. | 447,000 | 49 |
| * | China Hi-Tech Group Co. Class A (XSSC) | 16,500 | 31 |
| * | Shanghai 3F New Materials Co. Class A (XSSC) | 9,500 | 19 |
| * | ENN Ecological Holdings Co. Ltd. Class A (XSSC) | 8,300 | 15 |
| * | Hidili Industry International Development Ltd. | 260,000 | 7 |
| * | Ya Hsin Industrial Co. Ltd. | 5,306,018 | — |
| | | | 17,329,780 |
| Colombia (0.5%) | | |
| | Bancolombia SA ADR | 1,288,230 | 49,313 |
| | Grupo de Inversiones Suramericana SA | 3,667,942 | 47,307 |
| | Grupo Argos SA | 4,938,011 | 32,025 |
| | Cementos Argos SA | 6,441,098 | 25,492 |
| | Grupo Aval Acciones y Valores Preference Shares | 47,266,226 | 19,493 |
| | Interconexion Electrica SA ESP | 5,746,145 | 19,092 |
| | Almacenes Exito SA | 3,582,707 | 17,873 |
| * | Ecopetrol SA | 39,691,902 | 17,293 |
| | Grupo de Inversiones Suramericana SA Preference Shares | 1,337,685 | 16,906 |
| * | Ecopetrol SA ADR | 1,789,080 | 15,547 |
| | Bancolombia SA Preference Shares | 1,634,187 | 15,512 |
| * | Cemex Latam Holdings SA | 2,972,031 | 11,051 |
| | Cementos Argos SA Preference Shares | 2,793,403 | 10,182 |
| | Banco Davivienda SA Preference Shares | 782,466 | 7,963 |
| | Grupo Aval Acciones y Valores SA ADR | 823,448 | 6,744 |
| | Avianca Holdings SA Preference Shares | 2,953,922 | 2,358 |
| | Corp Financiera Colombiana SA | 161,335 | 2,000 |
| | | | 316,151 |
| Czech Republic (0.2%) | | |
| | CEZ AS | 2,593,039 | 48,908 |
| | Komercni banka as | 1,238,304 | 45,310 |
| *,2 | Moneta Money Bank AS | 5,763,019 | 20,097 |
| | Philip Morris CR AS | 6,286 | 3,105 |
| | Pegas Nonwovens SA | 88,501 | 2,839 |
| | O2 Czech Republic AS | 303,894 | 2,788 |
| | | | 123,047 |
| Egypt (0.3%) | | |
| | Commercial International Bank Egypt SAE | 15,899,970 | 92,504 |
| * | Global Telecom Holding SAE GDR | 8,512,261 | 17,453 |
43
| | | |
| Vanguard® Emerging Markets Stock Index Fund | | |
| Schedule of Investments | | |
| October 31, 2016 | | |
| |
| | | | Market |
| | | | Value |
| | | Shares | ($000) |
| * | Egyptian Financial Group-Hermes Holding Co. | 8,528,045 | 15,040 |
| | Talaat Moustafa Group | 15,788,519 | 10,069 |
| | ElSewedy Electric Co. | 1,282,551 | 9,058 |
| | Telecom Egypt Co. | 5,842,749 | 5,763 |
| * | Orascom Construction Ltd. | 1,026,438 | 5,444 |
| * | Medinet Nasr Housing | 3,147,100 | 4,941 |
| * | Six of October Development & Investment | 3,326,445 | 4,906 |
| * | Pioneers Holding for Financial Investments SAE | 5,084,348 | 4,807 |
| | Palm Hills Developments SAE | 14,681,272 | 3,782 |
| | Sidi Kerir Petrochemicals Co. | 2,204,960 | 3,443 |
| | Juhayna Food Industries | 7,113,045 | 3,140 |
| | Heliopolis Housing | 448,201 | 2,948 |
| * | Ezz Steel | 3,558,889 | 2,796 |
| | Oriental Weavers | 2,557,341 | 2,571 |
| | Arab Cotton Ginning | 6,767,369 | 2,072 |
| * | Egyptian Resorts Co. | 20,803,825 | 1,638 |
| * | Orascom Telecom Media And Technology Holding SAE | 20,422,680 | 1,288 |
| * | South Valley Cement | 2,865,683 | 1,232 |
| * | Citadel Capital SAE | 10,567,754 | 844 |
| | Porto Holding SAE | 30,202,474 | 782 |
| * | Global Telecom Holding SAE | 768,520 | 416 |
| * | Abu Dhabi Islamic Bank | 831,929 | 309 |
| | Amer Group Holding | 10,889,545 | 294 |
| * | Maridive & Oil Services SAE | 1,026,881 | 226 |
| | | | 197,766 |
| Greece (0.3%) | | |
| | Alpha Bank AE | 20,355,342 | 34,805 |
| | Hellenic Telecommunications Organization SA | 3,502,003 | 32,114 |
| | OPAP SA | 3,008,039 | 25,656 |
| | JUMBO SA | 1,425,560 | 20,258 |
| | National Bank of Greece SA | 80,676,423 | 16,500 |
| | Eurobank Ergasias SA | 26,385,256 | 15,583 |
| | Piraeus Bank SA | 74,494,293 | 12,320 |
| | Titan Cement Co. SA | 491,547 | 11,417 |
| * | FF Group | 418,106 | 10,014 |
| | Motor Oil Hellas Corinth Refineries SA | 811,543 | 9,717 |
| * | Mytilineos Holdings SA | 950,076 | 5,421 |
| * | Public Power Corp. SA | 1,446,108 | 4,725 |
| | Hellenic Exchanges SA | 635,911 | 3,140 |
| | Grivalia Properties REIC AE | 387,135 | 2,983 |
| | Aegean Airlines SA | 405,951 | 2,615 |
| * | Hellenic Petroleum SA | 548,583 | 2,508 |
| * | GEK Terna Holding Real Estate Construction SA | 744,358 | 1,723 |
| | Metka Industrial - Construction SA | 201,292 | 1,692 |
| * | Fourlis Holdings SA | 382,299 | 1,632 |
| * | Ellaktor SA | 1,135,206 | 1,543 |
| | Athens Water Supply & Sewage Co. SA | 212,470 | 1,258 |
| | Terna Energy SA | 109,542 | 334 |
| | | | 217,958 |
| Hong Kong (0.1%) | | |
| | Tongda Group Holdings Ltd. | 43,310,000 | 11,428 |
| * | HengTen Networks Group Ltd. | 162,208,000 | 10,860 |
| *,^ | China Minsheng Financial Holding Corp. Ltd. | 87,470,000 | 8,670 |
| ^ | SMI Holdings Group Ltd. | 73,680,000 | 7,027 |
| *,^ | FDG Electric Vehicles Ltd. | 128,745,000 | 6,738 |
| *,^ | Huayi Tencent Entertainment Co. Ltd. | 100,190,000 | 6,060 |
| * | Rentian Technology Holdings Ltd. | 38,510,000 | 2,575 |
| *,^ | China Beidahuang Industry Group Holdings Ltd. | 33,798,000 | 1,957 |
| | | | 55,315 |
| Hungary (0.3%) | | |
| | OTP Bank plc | 2,994,631 | 83,922 |
| | MOL Hungarian Oil & Gas plc | 813,495 | 52,178 |
| | Richter Gedeon Nyrt | 2,365,131 | 50,773 |
44
| | |
| Vanguard® Emerging Markets Stock Index Fund | | |
| Schedule of Investments | | |
| October 31, 2016 | | |
| |
| | | Market |
| | | Value |
| | Shares | ($000) |
| Magyar Telekom Telecommunications plc | 7,676,580 | 12,692 |
| | | 199,565 |
| India (11.7%) | | |
| Housing Development Finance Corp. Ltd. | 23,773,814 | 496,037 |
| Infosys Ltd. | 28,474,195 | 424,940 |
| Reliance Industries Ltd. | 23,839,604 | 376,526 |
| Tata Consultancy Services Ltd. | 7,092,451 | 254,795 |
| Sun Pharmaceutical Industries Ltd. | 16,777,713 | 186,915 |
| ITC Ltd. | 44,004,353 | 160,290 |
| ICICI Bank Ltd. | 34,656,503 | 144,047 |
| Oil & Natural Gas Corp. Ltd. | 31,588,075 | 135,468 |
| Hindustan Unilever Ltd. | 10,802,167 | 135,342 |
| HDFC Bank Ltd. | 7,043,645 | 132,765 |
| Tata Motors Ltd. | 15,761,766 | 126,918 |
| Axis Bank Ltd. | 15,456,448 | 112,879 |
| Maruti Suzuki India Ltd. | 1,178,168 | 103,798 |
| Coal India Ltd. | 20,478,617 | 99,705 |
| Bharat Petroleum Corp. Ltd. | 9,639,505 | 96,752 |
| Bharti Airtel Ltd. | 19,988,351 | 95,499 |
| Mahindra & Mahindra Ltd. | 4,842,155 | 95,165 |
| HCL Technologies Ltd. | 8,274,860 | 94,594 |
| Kotak Mahindra Bank Ltd. | 7,299,840 | 89,626 |
| State Bank of India | 22,903,690 | 88,613 |
| Indian Oil Corp. Ltd. | 17,539,844 | 85,083 |
| Hero MotoCorp Ltd. | 1,602,892 | 80,449 |
| Larsen & Toubro Ltd. | 3,472,130 | 77,065 |
| Lupin Ltd. | 3,427,519 | 76,420 |
| Asian Paints Ltd. | 4,642,200 | 74,375 |
| IndusInd Bank Ltd. | 4,091,688 | 73,590 |
| NTPC Ltd. | 31,905,779 | 72,764 |
| Eicher Motors Ltd. | 196,141 | 70,585 |
| Zee Entertainment Enterprises Ltd. | 8,704,522 | 67,843 |
| UltraTech Cement Ltd. | 1,071,193 | 63,932 |
| Adani Ports & Special Economic Zone Ltd. | 12,998,878 | 59,825 |
| * Vedanta Ltd. | 19,160,933 | 58,348 |
| Indiabulls Housing Finance Ltd. | 4,552,986 | 57,926 |
| Aurobindo Pharma Ltd. | 4,382,589 | 53,289 |
| UPL Ltd. | 4,864,792 | 50,907 |
| Yes Bank Ltd. | 2,659,022 | 50,718 |
| Bajaj Auto Ltd. | 1,169,529 | 49,930 |
| Tech Mahindra Ltd. | 7,559,679 | 49,348 |
| JSW Steel Ltd. | 1,968,749 | 48,954 |
| Godrej Consumer Products Ltd. | 2,029,588 | 48,923 |
| Power Grid Corp. of India Ltd. | 18,063,876 | 47,604 |
| Cipla Ltd. | 5,386,148 | 46,426 |
| Bharti Infratel Ltd. | 8,695,993 | 45,053 |
| Shriram Transport Finance Co. Ltd. | 2,741,860 | 44,382 |
| Wipro Ltd. | 6,386,594 | 44,336 |
| Ambuja Cements Ltd. | 11,993,940 | 43,385 |
| * Bajaj Finance Ltd. | 2,570,950 | 41,286 |
| Bosch Ltd. | 125,077 | 41,066 |
| Nestle India Ltd. | 381,703 | 39,939 |
| Hindustan Petroleum Corp. Ltd. | 5,690,848 | 39,817 |
| Dabur India Ltd. | 8,766,299 | 38,293 |
| LIC Housing Finance Ltd. | 4,182,064 | 36,531 |
| Piramal Enterprises Ltd. | 1,368,209 | 36,382 |
| Shree Cement Ltd. | 141,201 | 35,364 |
| Bajaj Finserv Ltd. | 657,359 | 33,314 |
| ^ Dr Reddy's Laboratories Ltd. ADR | 674,556 | 33,249 |
| Dr Reddy's Laboratories Ltd. | 657,542 | 33,033 |
| Marico Ltd. | 7,750,244 | 32,732 |
| GAIL India Ltd. | 5,021,506 | 32,587 |
| Glenmark Pharmaceuticals Ltd. | 2,321,573 | 32,438 |
| * United Spirits Ltd. | 953,616 | 32,143 |
45
| | |
| Vanguard® Emerging Markets Stock Index Fund | | |
| Schedule of Investments | | |
| October 31, 2016 | | |
| |
| | | Market |
| | | Value |
| | Shares | ($000) |
| ^ Wipro Ltd. ADR | 3,155,047 | 30,509 |
| Hindalco Industries Ltd. | 13,399,063 | 30,115 |
| Divi's Laboratories Ltd. | 1,376,704 | 26,387 |
| Idea Cellular Ltd. | 23,069,581 | 26,352 |
| NMDC Ltd. | 13,353,067 | 26,275 |
| Motherson Sumi Systems Ltd. | 5,267,733 | 26,174 |
| Tata Motors Ltd. Class A | 4,996,770 | 26,123 |
| Cairn India Ltd. | 7,715,842 | 26,010 |
| Cadila Healthcare Ltd. | 4,096,861 | 25,959 |
| Siemens Ltd. | 1,454,891 | 25,800 |
| Mahindra & Mahindra Financial Services Ltd. | 4,687,666 | 25,415 |
| Britannia Industries Ltd. | 493,683 | 24,491 |
| Rural Electrification Corp. Ltd. | 11,913,992 | 24,078 |
| Pidilite Industries Ltd. | 2,194,623 | 23,638 |
| Tata Steel Ltd. | 3,803,643 | 23,150 |
| Titan Co. Ltd. | 4,101,897 | 22,951 |
| IDFC Bank Ltd. | 17,924,597 | 21,166 |
| Bharat Forge Ltd. | 1,584,414 | 21,004 |
| Power Finance Corp. Ltd. | 10,930,581 | 20,345 |
| Apollo Hospitals Enterprise Ltd. | 1,009,675 | 20,271 |
| Bharat Heavy Electricals Ltd. | 9,719,991 | 20,240 |
| Tata Power Co. Ltd. | 16,983,188 | 19,924 |
| Bharat Electronics Ltd. | 1,014,910 | 19,788 |
| Ashok Leyland Ltd. | 14,609,773 | 19,761 |
| Havells India Ltd. | 3,149,556 | 19,206 |
| * Bank of Baroda | 7,464,745 | 17,498 |
| Reliance Infrastructure Ltd. | 2,145,559 | 17,464 |
| ACC Ltd. | 765,173 | 17,383 |
| Oracle Financial Services Software Ltd. | 355,560 | 17,022 |
| Reliance Capital Ltd. | 2,147,623 | 16,726 |
| GlaxoSmithKline Consumer Healthcare Ltd. | 181,276 | 16,503 |
| Colgate-Palmolive India Ltd. | 1,131,937 | 16,501 |
| * Bharat Financial Inclusion Ltd. | 1,220,217 | 16,155 |
| Page Industries Ltd. | 65,425 | 16,122 |
| HDFC Bank Ltd. ADR | 226,520 | 16,033 |
| DLF Ltd. | 7,017,271 | 15,850 |
| Max Financial Services Ltd. | 1,878,069 | 15,836 |
| United Breweries Ltd. | 1,214,918 | 15,823 |
| NHPC Ltd. | 39,309,568 | 15,779 |
| Emami Ltd. | 860,462 | 15,633 |
| Cummins India Ltd. | 1,204,093 | 15,339 |
| Bajaj Holdings & Investment Ltd. | 469,192 | 15,316 |
| Hindustan Zinc Ltd. | 4,020,579 | 15,263 |
| ABB India Ltd. | 873,110 | 14,244 |
| Vakrangee Ltd. | 3,698,604 | 13,973 |
| Castrol India Ltd. | 1,989,431 | 13,662 |
| * Steel Authority of India Ltd. | 17,399,502 | 13,586 |
| Rajesh Exports Ltd. | 1,854,406 | 13,289 |
| Torrent Pharmaceuticals Ltd. | 624,629 | 13,244 |
| Petronet LNG Ltd. | 2,236,469 | 13,039 |
| Oil India Ltd. | 2,089,320 | 12,995 |
| GlaxoSmithKline Pharmaceuticals Ltd. | 297,408 | 12,956 |
| Tata Communications Ltd. | 1,356,425 | 12,909 |
| * Reliance Communications Ltd. | 17,418,059 | 12,212 |
| Mindtree Ltd. | 1,808,259 | 11,815 |
| Mphasis Ltd. | 1,534,206 | 11,776 |
| Sun TV Network Ltd. | 1,417,363 | 11,616 |
| Federal Bank Ltd. | 9,348,344 | 11,486 |
| Exide Industries Ltd. | 3,831,430 | 11,261 |
| * Punjab National Bank | 4,964,487 | 10,724 |
| Berger Paints India Ltd. | 2,757,853 | 10,636 |
| Aditya Birla Nuvo Ltd. | 514,467 | 10,621 |
| Info Edge India Ltd. | 768,977 | 10,386 |
| Jubilant Life Sciences Ltd. | 982,555 | 10,154 |
46
| | |
| Vanguard® Emerging Markets Stock Index Fund | | |
| Schedule of Investments | | |
| October 31, 2016 | | |
| |
| | | Market |
| | | Value |
| | Shares | ($000) |
| * IDFC Ltd. | 9,420,309 | 9,881 |
| Dewan Housing Finance Corp. Ltd. | 1,806,145 | 8,889 |
| * Alkem Laboratories Ltd. | 357,250 | 8,735 |
| Indian Hotels Co. Ltd. | 5,013,642 | 8,669 |
| * Canara Bank | 1,829,788 | 8,614 |
| Dalmia Bharat Ltd. | 269,216 | 8,295 |
| Manappuram Finance Ltd. | 5,407,453 | 8,286 |
| * Kajaria Ceramics Ltd. | 890,401 | 8,282 |
| Edelweiss Financial Services Ltd. | 4,522,797 | 8,271 |
| AIA Engineering Ltd. | 417,400 | 8,079 |
| Cholamandalam Investment and Finance Co. Ltd. | 454,513 | 8,072 |
| * Crompton Greaves Ltd. | 7,009,878 | 8,061 |
| MRF Ltd. | 11,116 | 7,986 |
| Strides Shasun Ltd. | 500,832 | 7,847 |
| PI Industries Ltd. | 593,652 | 7,682 |
| Reliance Power Ltd. | 10,309,458 | 7,271 |
| * Wockhardt Ltd. | 558,075 | 7,268 |
| Biocon Ltd. | 523,235 | 7,256 |
| L&T Finance Holdings Ltd. | 4,425,383 | 7,094 |
| * Jindal Steel & Power Ltd. | 6,245,625 | 7,061 |
| Sintex Industries Ltd. | 5,207,292 | 6,998 |
| Apollo Tyres Ltd. | 2,309,270 | 6,995 |
| Godrej Industries Ltd. | 1,066,448 | 6,981 |
| Ajanta Pharma Ltd. | 225,867 | 6,909 |
| Muthoot Finance Ltd. | 1,281,428 | 6,888 |
| CRISIL Ltd. | 208,397 | 6,855 |
| Credit Analysis & Research Ltd. | 310,041 | 6,849 |
| Balkrishna Industries Ltd. | 429,408 | 6,834 |
| Ramco Cements Ltd. | 736,811 | 6,786 |
| TVS Motor Co. Ltd. | 1,093,111 | 6,638 |
| * GMR Infrastructure Ltd. | 31,692,066 | 6,511 |
| JSW Energy Ltd. | 6,606,976 | 6,469 |
| 2 InterGlobe Aviation Ltd. | 457,558 | 6,374 |
| * IDBI Bank Ltd. | 5,680,208 | 6,266 |
| * Suzlon Energy Ltd. | 27,214,546 | 6,184 |
| Amara Raja Batteries Ltd. | 406,672 | 6,168 |
| * Gillette India Ltd. | 96,146 | 6,144 |
| Gujarat Pipavav Port Ltd. | 2,513,203 | 6,127 |
| Blue Dart Express Ltd. | 79,221 | 6,033 |
| Jubilant Foodworks Ltd. | 400,282 | 5,999 |
| Bayer CropScience Ltd. | 93,274 | 5,958 |
| eClerx Services Ltd. | 257,482 | 5,856 |
| Natco Pharma Ltd. | 657,143 | 5,743 |
| NCC Ltd. | 3,938,656 | 5,522 |
| Arvind Ltd. | 881,563 | 5,469 |
| Tata Chemicals Ltd. | 667,933 | 5,451 |
| * Mangalore Refinery & Petrochemicals Ltd. | 3,978,304 | 5,380 |
| Torrent Power Ltd. | 2,046,836 | 5,312 |
| * Adani Power Ltd. | 12,963,323 | 5,311 |
| Cyient Ltd. | 709,292 | 5,202 |
| GRUH Finance Ltd. | 1,032,218 | 5,165 |
| * Grasim Industries Ltd. | 352,395 | 5,095 |
| Persistent Systems Ltd. | 523,122 | 5,054 |
| Voltas Ltd. | 871,445 | 5,048 |
| Union Bank of India | 2,209,377 | 4,900 |
| Sundaram Finance Ltd. | 236,509 | 4,860 |
| Adani Enterprises Ltd. | 4,842,463 | 4,854 |
| Kansai Nerolac Paints Ltd. | 852,781 | 4,844 |
| Great Eastern Shipping Co. Ltd. | 844,532 | 4,721 |
| Alembic Pharmaceuticals Ltd. | 464,671 | 4,700 |
| Supreme Industries Ltd. | 347,181 | 4,693 |
| * Aditya Birla Fashion and Retail Ltd. | 1,904,129 | 4,567 |
| * Sun Pharma Advanced Research Co. Ltd. | 868,914 | 4,567 |
| Welspun India Ltd. | 5,328,695 | 4,534 |
47
| | |
| Vanguard® Emerging Markets Stock Index Fund | | |
| Schedule of Investments | | |
| October 31, 2016 | | |
| |
| | | Market |
| | | Value |
| | Shares | ($000) |
| CESC Ltd. | 480,716 | 4,523 |
| Oberoi Realty Ltd. | 855,568 | 4,517 |
| * PC Jeweller Ltd. | 586,186 | 4,496 |
| * Bank of India | 2,581,349 | 4,446 |
| * Indiabulls Real Estate Ltd. | 3,300,024 | 4,339 |
| Repco Home Finance Ltd. | 382,399 | 4,324 |
| KPIT Technologies Ltd. | 1,968,212 | 4,229 |
| 2 Syngene International Ltd. | 480,067 | 4,213 |
| KRBL Ltd. | 1,176,355 | 4,212 |
| 2 Dr Lal PathLabs Ltd. | 235,639 | 4,159 |
| Indian Bank | 1,188,005 | 4,142 |
| Redington India Ltd. | 2,628,285 | 4,136 |
| Jain Irrigation Systems Ltd. | 2,538,172 | 4,091 |
| Abbott India Ltd. | 54,410 | 4,069 |
| National Aluminium Co. Ltd. | 5,087,835 | 4,067 |
| GE T&D India Ltd. | 771,465 | 3,960 |
| Sanofi India Ltd. | 60,235 | 3,938 |
| Pfizer Ltd. | 141,461 | 3,869 |
| Karur Vysya Bank Ltd. | 530,428 | 3,804 |
| Sadbhav Engineering Ltd. | 907,585 | 3,792 |
| Cox & Kings Ltd. | 1,150,952 | 3,792 |
| Thermax Ltd. | 295,547 | 3,767 |
| * Ipca Laboratories Ltd. | 410,902 | 3,754 |
| * Just Dial Ltd. | 590,831 | 3,749 |
| Balrampur Chini Mills Ltd. | 2,120,918 | 3,667 |
| Prestige Estates Projects Ltd. | 1,255,429 | 3,649 |
| Symphony Ltd. | 188,209 | 3,602 |
| * Whirlpool of India Ltd. | 208,097 | 3,504 |
| * Fortis Healthcare Ltd. | 1,301,207 | 3,480 |
| Tube Investments of India Ltd. | 366,577 | 3,428 |
| Hexaware Technologies Ltd. | 1,093,453 | 3,351 |
| Gujarat State Petronet Ltd. | 1,405,451 | 3,318 |
| Coromandel International Ltd. | 772,749 | 3,315 |
| * RattanIndia Power Ltd. | 26,162,911 | 3,268 |
| * Housing Development & Infrastructure Ltd. | 2,566,960 | 3,203 |
| * Dish TV India Ltd. | 2,225,665 | 3,200 |
| * Jaiprakash Associates Ltd. | 18,964,999 | 3,169 |
| Bajaj Corp. Ltd. | 510,032 | 3,110 |
| IRB Infrastructure Developers Ltd. | 853,064 | 3,001 |
| Srei Infrastructure Finance Ltd. | 2,739,949 | 2,991 |
| WABCO India Ltd. | 33,107 | 2,807 |
| IFCI Ltd. | 7,003,134 | 2,729 |
| * Hindustan Construction Co. Ltd. | 4,991,013 | 2,714 |
| South Indian Bank Ltd. | 7,346,952 | 2,616 |
| Engineers India Ltd. | 644,768 | 2,602 |
| Ceat Ltd. | 139,708 | 2,540 |
| Gateway Distriparks Ltd. | 667,619 | 2,472 |
| * Bajaj Hindusthan Sugar Ltd. | 9,513,634 | 2,388 |
| Radico Khaitan Ltd. | 1,118,798 | 2,362 |
| Gujarat Gas Ltd. | 270,663 | 2,320 |
| PTC India Ltd. | 2,099,648 | 2,317 |
| Oriental Bank of Commerce | 1,126,646 | 2,169 |
| * Unitech Ltd. | 23,992,617 | 2,166 |
| Jammu & Kashmir Bank Ltd. | 2,077,681 | 2,097 |
| India Cements Ltd. | 890,500 | 2,096 |
| * Videocon Industries Ltd. | 1,311,966 | 2,047 |
| * Central Bank of India | 1,473,550 | 2,017 |
| * Corp Bank | 3,188,493 | 1,991 |
| * Rolta India Ltd. | 2,063,604 | 1,943 |
| * TV18 Broadcast Ltd. | 2,888,744 | 1,926 |
| Sobha Ltd. | 433,029 | 1,812 |
| Tata Global Beverages Ltd. | 846,029 | 1,774 |
| VA Tech Wabag Ltd. | 232,883 | 1,728 |
| Indraprastha Gas Ltd. | 130,931 | 1,688 |
48
| | |
| Vanguard® Emerging Markets Stock Index Fund | | |
| Schedule of Investments | | |
| October 31, 2016 | | |
| |
| | | Market |
| | | Value |
| | Shares | ($000) |
| Gujarat Fluorochemicals Ltd. | 216,152 | 1,641 |
| Marksans Pharma Ltd. | 2,039,697 | 1,591 |
| * Mahindra CIE Automotive Ltd. | 499,211 | 1,485 |
| * Kaveri Seed Co. Ltd. | 220,029 | 1,424 |
| * Vijaya Bank | 2,143,889 | 1,421 |
| * Jindal Saw Ltd. | 1,400,889 | 1,342 |
| Raymond Ltd. | 140,225 | 1,268 |
| Karnataka Bank Ltd. | 642,033 | 1,173 |
| Welspun Corp. Ltd. | 1,062,129 | 1,131 |
| * Shipping Corp. of India Ltd. | 1,047,395 | 1,065 |
| * Polaris Consulting & Services Ltd. | 442,462 | 1,064 |
| * DEN Networks Ltd. | 883,509 | 1,031 |
| * Amtek Auto Ltd. | 1,547,517 | 1,002 |
| * Shree Renuka Sugars Ltd. | 4,292,932 | 1,000 |
| Gujarat Mineral Development Corp. Ltd. | 576,191 | 957 |
| * Indian Overseas Bank | 2,108,758 | 842 |
| * Jet Airways India Ltd. | 121,910 | 838 |
| Multi Commodity Exchange of India Ltd. | 40,959 | 790 |
| * Punj Lloyd Ltd. | 2,195,684 | 747 |
| * Future Retail Ltd. | 296,734 | 739 |
| * Syndicate Bank | 657,322 | 727 |
| Chambal Fertilizers and Chemicals Ltd. | 759,913 | 718 |
| * GE Power India Ltd. | 77,455 | 596 |
| Future Enterprises Ltd. | 1,766,689 | 420 |
| * UCO Bank | 800,000 | 418 |
| * Reliance Defence and Engineering Ltd. | 465,415 | 413 |
| * Allahabad Bank | 287,312 | 325 |
| Century Textiles & Industries Ltd. | 23,694 | 323 |
| McLeod Russel India Ltd. | 126,557 | 322 |
| * Karnataka Bank Ltd Rights Exp. 11/21/2016 | 321,016 | 249 |
| Andhra Bank | 286,108 | 242 |
| Gujarat State Fertilizers & Chemicals Ltd. | 58,475 | 83 |
| * JITF Infralogistics Ltd. | 93,891 | 58 |
| | | 7,322,093 |
| Indonesia (2.7%) | | |
| Telekomunikasi Indonesia Persero Tbk PT | 760,083,605 | 245,411 |
| Bank Central Asia Tbk PT | 187,880,124 | 223,379 |
| Astra International Tbk PT | 302,692,000 | 190,971 |
| Bank Rakyat Indonesia Persero Tbk PT | 164,527,800 | 153,631 |
| Bank Mandiri Persero Tbk PT | 142,274,080 | 125,322 |
| Unilever Indonesia Tbk PT | 17,139,730 | 58,408 |
| Bank Negara Indonesia Persero Tbk PT | 123,025,361 | 52,521 |
| Indofood Sukses Makmur Tbk PT | 72,478,096 | 47,124 |
| Kalbe Farma Tbk PT | 311,493,390 | 41,507 |
| United Tractors Tbk PT | 24,170,801 | 39,984 |
| Gudang Garam Tbk PT | 7,384,880 | 38,424 |
| Semen Indonesia Persero Tbk PT | 47,967,204 | 36,156 |
| Charoen Pokphand Indonesia Tbk PT | 122,000,532 | 34,527 |
| Perusahaan Gas Negara Persero Tbk | 165,598,604 | 32,437 |
| Indofood CBP Sukses Makmur Tbk PT | 39,247,300 | 28,271 |
| Indocement Tunggal Prakarsa Tbk PT | 22,134,531 | 27,870 |
| Adaro Energy Tbk PT | 214,024,280 | 25,983 |
| Surya Citra Media Tbk PT | 96,863,000 | 19,672 |
| Summarecon Agung Tbk PT | 144,585,464 | 18,264 |
| Ciputra Development Tbk PT | 148,401,548 | 17,958 |
| Lippo Karawaci Tbk PT | 250,600,011 | 17,335 |
| Pakuwon Jati Tbk PT | 309,707,300 | 17,088 |
| Bank Danamon Indonesia Tbk PT | 53,280,196 | 15,757 |
| Bumi Serpong Damai Tbk PT | 93,990,300 | 15,595 |
| Tower Bersama Infrastructure Tbk PT | 33,896,300 | 15,517 |
| Media Nusantara Citra Tbk PT | 83,987,850 | 13,509 |
| Tambang Batubara Bukit Asam Persero Tbk PT | 14,277,925 | 13,028 |
| Jasa Marga Persero Tbk PT | 34,702,700 | 12,038 |
| AKR Corporindo Tbk PT | 20,816,800 | 11,300 |
49
| | |
| Vanguard® Emerging Markets Stock Index Fund | | |
| Schedule of Investments | | |
| October 31, 2016 | | |
| |
| | | Market |
| | | Value |
| | Shares | ($000) |
| * Aneka Tambang Persero Tbk PT | 162,408,891 | 11,146 |
| * XL Axiata Tbk PT | 60,188,105 | 10,148 |
| Waskita Karya Persero Tbk PT | 48,058,000 | 9,646 |
| Astra Agro Lestari Tbk PT | 7,084,908 | 8,278 |
| Indo Tambangraya Megah Tbk PT | 7,199,800 | 7,902 |
| Global Mediacom Tbk PT | 116,748,489 | 7,597 |
| * Vale Indonesia Tbk PT | 34,128,127 | 7,116 |
| Bank Tabungan Negara Persero Tbk PT | 35,960,000 | 5,260 |
| Ace Hardware Indonesia Tbk PT | 79,848,200 | 5,227 |
| Link Net Tbk PT | 13,254,700 | 5,078 |
| Perusahaan Perkebunan London Sumatra Indonesia Tbk PT | 37,460,200 | 4,374 |
| Wijaya Karya Persero Tbk PT | 21,869,500 | 4,308 |
| * Alam Sutera Realty Tbk PT | 124,989,500 | 4,291 |
| Matahari Putra Prima Tbk PT | 28,172,700 | 3,893 |
| Bank Pembangunan Daerah Jawa Barat Dan Banten Tbk PT | 29,896,700 | 3,643 |
| * Mitra Adiperkasa Tbk PT | 7,795,800 | 3,286 |
| Ramayana Lestari Sentosa Tbk PT | 27,021,139 | 2,836 |
| * Siloam International Hospitals Tbk PT | 3,085,800 | 2,455 |
| * Panin Financial Tbk PT | 163,660,900 | 2,395 |
| Wijaya Karya Beton Tbk PT | 34,608,000 | 2,357 |
| * Krakatau Steel Persero Tbk PT | 40,419,400 | 2,045 |
| * Gajah Tunggal Tbk PT | 19,993,600 | 1,912 |
| Intiland Development Tbk PT | 40,073,600 | 1,767 |
| * Eagle High Plantations Tbk PT | 112,479,900 | 1,644 |
| * Lippo Cikarang Tbk PT | 3,536,800 | 1,640 |
| * Agung Podomoro Land Tbk PT | 66,241,600 | 1,462 |
| * Medco Energi Internasional Tbk PT | 13,574,800 | 1,360 |
| Salim Ivomas Pratama Tbk PT | 32,805,500 | 1,257 |
| Surya Semesta Internusa Tbk PT | 28,156,000 | 1,218 |
| Timah Persero Tbk PT | 16,286,100 | 1,161 |
| BISI International Tbk PT | 7,525,100 | 1,152 |
| * Bumi Resources Tbk PT | 66,496,700 | 1,091 |
| * Bank CIMB Niaga Tbk PT | 13,135,261 | 961 |
| Bekasi Fajar Industrial Estate Tbk PT | 40,037,600 | 956 |
| Adhi Karya Persero Tbk PT | 5,388,200 | 936 |
| * Sigmagold Inti Perkasa Tbk PT | 41,608,500 | 363 |
| Sampoerna Agro PT | 1,691,500 | 248 |
| * Energi Mega Persada Tbk PT | 59,051,800 | 226 |
| Holcim Indonesia Tbk PT | 1,986,200 | 147 |
| * MNC Investama Tbk PT | 2,645,200 | 28 |
| | | 1,721,797 |
| Malaysia (3.6%) | | |
| Public Bank Bhd. (Local) | 46,755,000 | 221,304 |
| Tenaga Nasional Bhd. | 52,309,907 | 178,736 |
| Malayan Banking Bhd. | 82,818,388 | 155,932 |
| CIMB Group Holdings Bhd. | 86,013,748 | 103,042 |
| Sime Darby Bhd. | 50,039,913 | 97,722 |
| Axiata Group Bhd. | 69,269,594 | 81,213 |
| Petronas Chemicals Group Bhd. | 43,583,622 | 72,705 |
| DiGi.Com Bhd. | 57,745,050 | 69,251 |
| IHH Healthcare Bhd. | 43,789,176 | 66,785 |
| Genting Bhd. | 34,382,390 | 64,250 |
| Petronas Gas Bhd. | 12,108,596 | 63,405 |
| Maxis Bhd. | 40,779,250 | 57,932 |
| IOI Corp. Bhd. | 53,517,478 | 57,362 |
| Genting Malaysia Bhd. | 46,665,790 | 52,961 |
| Kuala Lumpur Kepong Bhd. | 8,975,012 | 51,243 |
| IJM Corp. Bhd. | 53,865,300 | 42,388 |
| Gamuda Bhd. | 35,571,116 | 41,664 |
| MISC Bhd. | 22,838,591 | 40,938 |
| PPB Group Bhd. | 10,170,208 | 39,076 |
| AMMB Holdings Bhd. | 33,154,558 | 33,196 |
| Hong Leong Bank Bhd. | 10,185,400 | 32,313 |
| YTL Corp. Bhd. | 84,670,956 | 32,103 |
50
| | |
| Vanguard® Emerging Markets Stock Index Fund | | |
| Schedule of Investments | | |
| October 31, 2016 | | |
| |
| | | Market |
| | | Value |
| | Shares | ($000) |
| Telekom Malaysia Bhd. | 19,225,140 | 29,952 |
| Petronas Dagangan Bhd. | 5,063,300 | 28,194 |
| British American Tobacco Malaysia Bhd. | 2,270,587 | 26,809 |
| * SapuraKencana Petroleum Bhd. | 63,176,462 | 24,291 |
| 2 Astro Malaysia Holdings Bhd. | 34,528,300 | 23,462 |
| Malaysia Airports Holdings Bhd. | 14,779,000 | 23,338 |
| Westports Holdings Bhd. | 18,216,824 | 19,153 |
| RHB Bank Bhd. | 16,394,230 | 18,878 |
| Alliance Financial Group Bhd. | 19,483,117 | 18,533 |
| Dialog Group Bhd. | 50,191,600 | 18,532 |
| IOI Properties Group Bhd. | 31,728,794 | 18,490 |
| YTL Power International Bhd. | 46,496,368 | 16,952 |
| UMW Holdings Bhd. | 11,250,020 | 15,937 |
| KLCCP Stapled Group | 8,057,100 | 15,331 |
| Hong Leong Financial Group Bhd. | 4,059,515 | 15,208 |
| Felda Global Ventures Holdings Bhd. | 30,639,957 | 14,673 |
| Lafarge Malaysia Bhd. | 7,330,820 | 14,144 |
| AirAsia Bhd. | 20,160,148 | 13,310 |
| Top Glove Corp. Bhd. | 10,274,600 | 12,116 |
| My EG Services Bhd. | 20,501,900 | 11,903 |
| Berjaya Sports Toto Bhd. | 14,391,598 | 10,943 |
| Hartalega Holdings Bhd. | 8,649,700 | 10,100 |
| Sunway REIT | 22,109,100 | 9,701 |
| Bumi Armada Bhd. | 57,481,740 | 9,638 |
| HAP Seng Consolidated Bhd. | 4,980,400 | 9,253 |
| Genting Plantations Bhd. | 3,438,800 | 9,014 |
| MMC Corp. Bhd. | 15,540,000 | 8,860 |
| Malakoff Corp. Bhd. | 22,020,400 | 8,124 |
| Press Metal Bhd. | 7,809,400 | 8,114 |
| KPJ Healthcare Bhd. | 7,639,400 | 7,649 |
| BIMB Holdings Bhd. | 6,984,600 | 7,328 |
| Inari Amertron Bhd. | 8,750,700 | 6,988 |
| UEM Sunrise Bhd. | 25,265,400 | 6,733 |
| TIME dotCom Bhd. | 3,374,900 | 6,438 |
| Mah Sing Group Bhd. | 17,559,966 | 6,398 |
| Sunway Bhd. | 8,566,000 | 6,371 |
| Bursa Malaysia Bhd. | 3,055,800 | 6,299 |
| Pos Malaysia Bhd. | 5,594,600 | 5,334 |
| Kossan Rubber Industries | 3,135,000 | 5,043 |
| Malaysia Building Society Bhd. | 22,659,900 | 4,940 |
| WCT Holdings Bhd. | 11,838,300 | 4,791 |
| Cahya Mata Sarawak Bhd. | 5,025,800 | 4,601 |
| SP Setia Bhd Group | 5,193,124 | 4,339 |
| Yinson Holdings Bhd. | 5,248,900 | 3,915 |
| DRB-Hicom Bhd. | 12,241,400 | 3,705 |
| Unisem M Bhd. | 5,458,200 | 3,314 |
| Bermaz Auto Bhd. | 5,954,700 | 3,234 |
| Capitaland Malaysia Mall Trust | 8,451,400 | 3,226 |
| QL Resources Bhd. | 2,847,000 | 3,000 |
| VS Industry Bhd. | 8,426,100 | 2,849 |
| * Syarikat Takaful Malaysia Bhd. | 2,519,400 | 2,549 |
| Pavilion REIT | 5,469,300 | 2,290 |
| Malaysian Resources Corp. Bhd. | 7,012,600 | 2,255 |
| Supermax Corp. Bhd. | 4,344,400 | 2,246 |
| Eastern & Oriental Bhd. | 5,385,600 | 2,015 |
| Berjaya Corp. Bhd. | 24,116,300 | 1,867 |
| * AirAsia X Bhd. | 18,549,600 | 1,856 |
| Aeon Co. M Bhd. | 2,707,200 | 1,824 |
| Gas Malaysia Bhd. | 2,845,000 | 1,742 |
| * Gamuda Bhd. Warrants Exp. 03/06/2021 | 5,563,852 | 1,724 |
| Datasonic Group Bhd. | 4,951,100 | 1,687 |
| * Malaysia Marine and Heavy Engineering Holdings Bhd. | 6,575,735 | 1,564 |
| Media Prima Bhd. | 5,400,100 | 1,546 |
| * Eco World Development Group Bhd. | 3,797,300 | 1,230 |
51
| | |
| Vanguard® Emerging Markets Stock Index Fund | | |
| Schedule of Investments | | |
| October 31, 2016 | | |
| |
| | | Market |
| | | Value |
| | Shares | ($000) |
| * Parkson Holdings Bhd. | 6,829,816 | 1,229 |
| * UMW Oil & Gas Corp. Bhd. | 5,334,400 | 1,077 |
| * Mulpha International Bhd. | 18,703,900 | 936 |
| Sunway Construction Group Bhd. | 2,138,100 | 851 |
| Muhibbah Engineering M Bhd. | 1,441,800 | 790 |
| Coastal Contracts Bhd. | 1,712,100 | 624 |
| OSK Holdings Bhd. | 1,575,200 | 567 |
| TA Enterprise Bhd. | 4,262,300 | 487 |
| Puncak Niaga Holdings Bhd. | 1,686,100 | 437 |
| * Dayang Enterprise Holdings Bhd. | 2,094,500 | 428 |
| * Mudajaya Group Bhd. | 1,277,400 | 295 |
| * KNM Group Bhd. | 2,961,000 | 281 |
| * RHB Captial BHD | 11,952,935 | 138 |
| * Malaysian Bulk Carriers Bhd. | 578,700 | 104 |
| | | 2,259,608 |
| Mexico (4.3%) | | |
| Fomento Economico Mexicano SAB de CV | 32,549,470 | 312,217 |
| America Movil SAB de CV | 434,326,703 | 287,697 |
| Grupo Financiero Banorte SAB de CV | 34,803,555 | 204,962 |
| Grupo Televisa SAB | 37,976,940 | 186,861 |
| * Cemex SAB de CV | 209,551,603 | 181,380 |
| Wal-Mart de Mexico SAB de CV | 83,359,054 | 176,368 |
| Grupo Mexico SAB de CV Class B | 59,915,463 | 147,625 |
| Grupo Bimbo SAB de CV Class A | 29,379,790 | 79,135 |
| Fibra Uno Administracion SA de CV | 41,328,611 | 78,870 |
| Alfa SAB de CV Class A | 44,989,936 | 68,219 |
| Grupo Aeroportuario del Sureste SAB de CV Class B | 3,705,329 | 58,935 |
| Grupo Financiero Inbursa SAB de CV | 32,956,147 | 53,477 |
| Grupo Aeroportuario del Pacifico SAB de CV Class B | 5,520,278 | 53,357 |
| Coca-Cola Femsa SAB de CV | 6,992,719 | 52,528 |
| Industrias Penoles SAB de CV | 1,988,623 | 48,228 |
| Grupo Financiero Santander Mexico SAB de CV Class B | 24,430,070 | 44,217 |
| Mexichem SAB de CV | 18,237,814 | 43,614 |
| Gruma SAB de CV Class B | 2,703,693 | 37,514 |
| Gentera SAB de CV | 18,694,002 | 36,891 |
| Promotora y Operadora de Infraestructura SAB de CV | 3,250,735 | 36,341 |
| Grupo Carso SAB de CV | 7,887,371 | 34,427 |
| Alsea SAB de CV | 8,887,390 | 33,168 |
| El Puerto de Liverpool SAB de CV | 3,036,434 | 31,828 |
| Kimberly-Clark de Mexico SAB de CV Class A | 13,130,708 | 28,316 |
| Arca Continental SAB de CV | 4,477,735 | 27,865 |
| Infraestructura Energetica Nova SAB de CV | 6,089,747 | 26,961 |
| Megacable Holdings SAB de CV | 5,399,879 | 19,633 |
| * Genomma Lab Internacional SAB de CV Class B | 13,593,218 | 16,261 |
| * OHL Mexico SAB de CV | 12,367,253 | 14,565 |
| Grupo Lala SAB de CV | 7,786,595 | 14,497 |
| Banregio Grupo Financiero SAB de CV | 2,126,480 | 13,933 |
| * Telesites SAB de CV | 23,713,499 | 13,700 |
| * Industrias CH SAB de CV Class B | 2,783,686 | 13,178 |
| Grupo Aeroportuario del Centro Norte SAB de CV Class B | 2,261,577 | 13,158 |
| Industrias Bachoco SAB de CV Class B | 2,741,712 | 12,141 |
| * Organizacion Soriana SAB de CV Class B | 4,285,650 | 11,711 |
| Bolsa Mexicana de Valores SAB de CV | 7,036,012 | 11,272 |
| Grupo Comercial Chedraui SA de CV | 4,971,340 | 11,089 |
| Macquarie Mexico Real Estate Management SA de CV | 8,599,537 | 10,833 |
| * Controladora Vuela Cia de Aviacion SAB de CV Class A | 5,653,423 | 10,798 |
| PLA Administradora Industrial S de RL de CV | 6,123,400 | 10,147 |
| Alpek SAB de CV | 5,602,963 | 8,342 |
| Grupo Elektra SAB DE CV | 583,748 | 8,139 |
| Grupo Sanborns SAB de CV | 6,452,602 | 8,047 |
| Corp Inmobiliaria Vesta SAB de CV | 5,311,811 | 8,038 |
| Prologis Property Mexico SA de CV | 4,528,469 | 7,614 |
| Promotora y Operadora de Infraestructura SAB de CV Class L | 796,486 | 7,500 |
| * La Comer SAB de CV | 8,092,700 | 7,377 |
52
| | | |
| Vanguard® Emerging Markets Stock Index Fund | | |
| Schedule of Investments | | |
| October 31, 2016 | | |
| |
| | | | Market |
| | | | Value |
| | | Shares | ($000) |
| | Concentradora Fibra Danhos SA de CV | 3,831,214 | 7,015 |
| * | Minera Frisco SAB de CV | 8,620,576 | 6,709 |
| * | Grupo Aeromexico SAB de CV | 3,051,546 | 6,025 |
| 2 | Nemak SAB de CV | 4,532,840 | 4,705 |
| | Credito Real SAB de CV SOFOM ER | 2,430,178 | 4,464 |
| | Grupo Financiero Interacciones SA de CV | 820,000 | 4,012 |
| | Grupo Herdez SAB de CV | 1,556,926 | 3,776 |
| | Concentradora Fibra Hotelera Mexicana SA de CV | 4,661,706 | 3,663 |
| * | Hoteles City Express SAB de CV | 3,544,273 | 3,642 |
| | Unifin Financiera SAB de CV SOFOM ENR | 1,095,163 | 3,266 |
| | Qualitas Controladora SAB de CV | 1,468,600 | 2,695 |
| * | Grupo GICSA SA de CV | 2,857,700 | 1,932 |
| | TV Azteca SAB de CV | 10,120,079 | 1,928 |
| * | Axtel SAB de CV | 5,582,300 | 1,385 |
| | Grupo Rotoplas SAB de CV | 752,000 | 1,185 |
| *,2 | Elementia SAB de CV | 975,000 | 1,124 |
| * | Grupo Simec SAB de CV Class B | 267,900 | 941 |
| | Consorcio ARA SAB de CV | 2,366,068 | 891 |
| | Rassini SAB de CV | 182,141 | 843 |
| * | Empresas ICA SAB de CV | 2,617,509 | 427 |
| * | Grupo Famsa SAB de CV Class A | 243,000 | 105 |
| | | | 2,683,707 |
| Pakistan (0.1%) | | |
| | Oil & Gas Development Co. Ltd. | 10,550,100 | 14,106 |
| | Hub Power Co. Ltd. | 10,697,343 | 10,893 |
| | United Bank Ltd. | 4,752,600 | 9,132 |
| | Pakistan Petroleum Ltd. | 6,408,989 | 9,058 |
| | Fauji Fertilizer Co. Ltd. | 8,497,174 | 8,411 |
| | National Bank of Pakistan | 8,697,900 | 5,960 |
| | Lucky Cement Ltd. | 638,254 | 4,086 |
| | Engro Corp. Ltd. | 1,354,742 | 3,608 |
| | Pakistan State Oil Co. Ltd. | 794,351 | 3,060 |
| | DG Khan Cement Co. Ltd. | 1,711,414 | 2,801 |
| | Pakistan Oilfields Ltd. | 494,400 | 1,863 |
| | Kot Addu Power Co. Ltd. | 1,954,721 | 1,378 |
| * | SUI Southern Gas Co. Ltd. | 1,052,000 | 387 |
| | Pakistan Telecommunication Co. Ltd. | 1,185,000 | 186 |
| | Fauji Fertilizer Bin Qasim Ltd. | 158,000 | 71 |
| | | | 75,000 |
| Peru (0.3%) | | |
| | Credicorp Ltd. (XNYS) | 438,623 | 65,214 |
| | Credicorp Ltd. (XLIM) | 357,268 | 53,090 |
| * | Cia de Minas Buenaventura SAA ADR | 2,777,424 | 36,912 |
| * | Cia de Minas Buenaventura SAA | 461,011 | 6,045 |
| | | | 161,261 |
| Philippines (1.6%) | | |
| | SM Investments Corp. | 7,319,346 | 101,462 |
| | SM Prime Holdings Inc. | 128,543,297 | 71,377 |
| | Ayala Corp. | 3,876,767 | 66,836 |
| | JG Summit Holdings Inc. | 42,651,420 | 66,819 |
| | Aboitiz Equity Ventures Inc. | 35,018,927 | 56,375 |
| | BDO Unibank Inc. | 24,145,442 | 56,234 |
| | Bank of the Philippine Islands | 26,061,105 | 54,381 |
| | Universal Robina Corp. | 13,572,899 | 51,004 |
| | Ayala Land Inc. | 60,560,427 | 45,299 |
| | Metropolitan Bank & Trust Co. | 21,361,401 | 35,874 |
| | Jollibee Foods Corp. | 7,155,189 | 35,139 |
| | Manila Electric Co. | 4,964,115 | 28,316 |
| * | PLDT Inc. | 878,137 | 27,713 |
| | Aboitiz Power Corp. | 27,435,926 | 25,987 |
| | Metro Pacific Investments Corp. | 163,887,500 | 24,405 |
| | GT Capital Holdings Inc. | 823,876 | 22,267 |
| | Alliance Global Group Inc. | 69,723,534 | 20,525 |
53
| | | |
| Vanguard® Emerging Markets Stock Index Fund | | |
| Schedule of Investments | | |
| October 31, 2016 | | |
| |
| | | | Market |
| | | | Value |
| | | Shares | ($000) |
| | Security Bank Corp. | 4,002,720 | 18,221 |
| | DMCI Holdings Inc. | 70,459,650 | 18,169 |
| | Megaworld Corp. | 198,824,713 | 16,480 |
| | LT Group Inc. | 48,595,727 | 14,488 |
| | International Container Terminal Services Inc. | 8,651,720 | 13,890 |
| | Semirara Mining & Power Corp. Class A | 5,296,222 | 13,777 |
| | Energy Development Corp. | 106,690,953 | 12,994 |
| | Robinsons Land Corp. | 16,865,900 | 10,781 |
| | Globe Telecom Inc. | 279,227 | 10,270 |
| * | DoubleDragon Properties Corp. | 7,865,400 | 9,051 |
| | Puregold Price Club Inc. | 10,325,600 | 8,692 |
| | Petron Corp. | 39,895,900 | 8,526 |
| | First Gen Corp. | 15,911,700 | 7,549 |
| | Manila Water Co. Inc. | 10,723,200 | 6,700 |
| * | Bloomberry Resorts Corp. | 51,994,472 | 6,346 |
| | Robinsons Retail Holdings Inc. | 3,432,040 | 5,475 |
| | Vista Land & Lifescapes Inc. | 48,085,005 | 5,191 |
| | D&L Industries Inc. | 21,111,000 | 4,783 |
| | Cebu Air Inc. | 2,173,300 | 4,715 |
| | Emperador Inc. | 26,142,000 | 3,909 |
| | Filinvest Land Inc. | 104,908,000 | 3,821 |
| | Cosco Capital Inc. | 19,061,900 | 3,342 |
| | Lopez Holdings Corp. | 19,349,300 | 3,175 |
| | First Philippine Holdings Corp. | 1,744,570 | 2,498 |
| | Nickel Asia Corp. | 12,761,400 | 1,811 |
| | Belle Corp. | 27,554,000 | 1,660 |
| * | Melco Crown Philippines Resorts Corp. | 17,985,000 | 1,597 |
| | Travellers International Hotel Group Inc. | 18,929,400 | 1,311 |
| * | Atlas Consolidated Mining & Development Corp. | 1,211,000 | 99 |
| | | | 1,009,334 |
| Poland (1.2%) | | |
| | Polski Koncern Naftowy ORLEN SA | 4,797,575 | 95,051 |
| | Powszechna Kasa Oszczednosci Bank Polski SA | 12,960,961 | 90,795 |
| | Bank Pekao SA | 2,343,695 | 72,336 |
| | Powszechny Zaklad Ubezpieczen SA | 8,491,789 | 58,961 |
| | KGHM Polska Miedz SA | 2,102,036 | 38,153 |
| | Bank Zachodni WBK SA | 445,105 | 35,965 |
| | Polskie Gornictwo Naftowe i Gazownictwo SA | 26,585,047 | 34,034 |
| ^ | LPP SA | 20,408 | 30,652 |
| | PGE Polska Grupa Energetyczna SA | 11,020,070 | 28,874 |
| * | Cyfrowy Polsat SA | 3,619,649 | 22,370 |
| ^ | CCC SA | 408,873 | 20,748 |
| * | mBank SA | 204,046 | 18,426 |
| | Asseco Poland SA | 1,354,737 | 18,108 |
| * | Alior Bank SA | 1,444,273 | 17,388 |
| | Orange Polska SA | 11,143,545 | 15,910 |
| * | Bank Millennium SA | 10,199,155 | 15,011 |
| * | Grupa Lotos SA | 1,693,043 | 14,680 |
| * | Jastrzebska Spolka Weglowa SA | 741,376 | 13,749 |
| | Eurocash SA | 1,305,860 | 13,225 |
| | Grupa Azoty SA | 786,473 | 12,526 |
| | Kernel Holding SA | 750,041 | 12,002 |
| * | Tauron Polska Energia SA | 17,446,122 | 11,789 |
| | KRUK SA | 201,181 | 11,678 |
| | Energa SA | 5,348,694 | 10,968 |
| | Bank Handlowy w Warszawie SA | 540,098 | 10,697 |
| * | Enea SA | 3,715,040 | 9,516 |
| *,^ | Synthos SA | 7,417,403 | 8,978 |
| * | CD Projekt SA | 825,944 | 8,389 |
| | Ciech SA | 285,785 | 4,661 |
| * | PKP Cargo SA | 356,591 | 3,905 |
| | Budimex SA | 73,264 | 3,802 |
| * | Globe Trade Centre SA | 1,021,896 | 2,089 |
| * | Getin Noble Bank SA | 5,875,428 | 1,964 |
54
| | | |
| Vanguard® Emerging Markets Stock Index Fund | | |
| Schedule of Investments | | |
| October 31, 2016 | | |
| |
| | | | Market |
| | | | Value |
| | | Shares | ($000) |
| | Neuca SA | 18,116 | 1,803 |
| *,^ | Lubelski Wegiel Bogdanka SA | 99,693 | 1,769 |
| | Warsaw Stock Exchange | 154,826 | 1,544 |
| *,^ | Boryszew SA | 498,060 | 1,018 |
| * | Getin Holding SA | 1,036,950 | 304 |
| * | Bioton SA | 120,975 | 272 |
| * | Integer.pl SA | 27,128 | 241 |
| | | | 774,351 |
| Qatar (0.4%) | | |
| | Qatar National Bank SAQ | 1,360,638 | 59,722 |
| | Industries Qatar QSC | 791,885 | 22,148 |
| | Ooredoo QSC | 770,820 | 20,515 |
| | Masraf Al Rayan QSC | 1,795,227 | 17,042 |
| | Commercial Bank QSC | 1,163,656 | 11,391 |
| | Qatar Islamic Bank SAQ | 387,194 | 10,879 |
| | Qatar Electricity & Water Co. QSC | 139,090 | 8,017 |
| | United Development Co. QSC | 1,428,783 | 7,829 |
| * | Aamal Co. | 1,973,037 | 7,358 |
| | Qatar Gas Transport Co. Ltd. | 1,176,465 | 7,295 |
| | Barwa Real Estate Co. | 826,768 | 7,242 |
| * | Qatar Insurance Co. SAQ | 247,861 | 5,966 |
| * | Qatar Navigation QSC | 214,387 | 5,533 |
| * | Qatar International Islamic Bank QSC | 312,385 | 5,400 |
| * | Doha Bank QSC | 518,949 | 5,181 |
| * | Qatari Investors Group QSC | 244,068 | 3,882 |
| * | Al Meera Consumer Goods Co. QSC | 73,299 | 3,756 |
| * | Gulf International Services QSC | 441,770 | 3,697 |
| * | Salam International Investment Ltd. QSC | 929,340 | 2,830 |
| * | Vodafone Qatar QSC | 956,782 | 2,757 |
| * | Ezdan Holding Group QSC | 597,450 | 2,569 |
| * | Medicare Group | 141,812 | 2,406 |
| | | | 223,415 |
| Russia (3.8%) | | |
| | Sberbank of Russia PJSC | 161,438,168 | 375,771 |
| | Gazprom PJSC | 88,022,453 | 192,884 |
| | Lukoil PJSC ADR | 3,636,459 | 176,886 |
| | Gazprom PJSC ADR | 38,808,778 | 167,339 |
| | Magnit PJSC GDR | 4,190,963 | 166,204 |
| | Lukoil PJSC | 3,228,521 | 157,545 |
| | Novatek OJSC GDR | 847,610 | 90,374 |
| | NOVATEK OAO | 8,189,140 | 85,385 |
| | Tatneft PJSC ADR | 2,076,022 | 69,292 |
| | VTB Bank PJSC | 58,129,231,072 | 62,180 |
| | MMC Norilsk Nickel PJSC ADR | 3,885,531 | 58,607 |
| | AK Transneft OAO Preference Shares | 23,793 | 56,979 |
| | Rosneft PJSC GDR | 10,469,019 | 56,932 |
| | Alrosa PJSC | 37,195,700 | 52,028 |
| | Tatneft PAO | 9,061,292 | 50,760 |
| | Mobile TeleSystems PJSC ADR | 6,515,982 | 50,238 |
| | Surgutneftegas OAO Preference Shares | 105,393,010 | 47,787 |
| | MMC Norilsk Nickel PJSC | 317,850 | 46,867 |
| | Moscow Exchange MICEX-RTS PJSC | 21,284,428 | 39,206 |
| | Surgutneftegas OJSC ADR | 9,095,544 | 39,011 |
| | Rosneft PJSC | 6,996,815 | 38,383 |
| | Severstal PAO | 2,476,571 | 34,617 |
| | Novolipetsk Steel PJSC GDR | 1,425,530 | 23,103 |
| | Rostelecom PJSC | 18,256,325 | 22,779 |
| | RusHydro PJSC | 1,579,839,418 | 19,830 |
| | VTB Bank PJSC GDR | 9,086,137 | 18,991 |
| | Bashneft PJSC | 340,785 | 17,868 |
| | PhosAgro PJSC GDR | 1,284,168 | 15,923 |
| | Sistema PJSC FC GDR | 2,018,772 | 15,080 |
| | Inter RAO UES PJSC | 266,733,670 | 14,310 |
| | MegaFon PJSC GDR | 1,492,678 | 14,216 |
55
| | | |
| Vanguard® Emerging Markets Stock Index Fund | | |
| Schedule of Investments | | |
| October 31, 2016 | | |
| |
| | | | Market |
| | | | Value |
| | | Shares | ($000) |
| * | Aeroflot PJSC | 6,789,524 | 13,910 |
| | Surgutneftegas OJSC | 32,516,249 | 13,858 |
| | Magnitogorsk Iron & Steel OJSC | 23,953,284 | 12,035 |
| | Federal Grid Co. Unified Energy System JSC | 4,093,494,717 | 11,048 |
| * | Uralkali PJSC | 4,137,243 | 10,823 |
| | E.ON Russia JSC | 230,721,198 | 10,612 |
| ^ | LSR Group PJSC GDR | 2,987,742 | 8,446 |
| | Bashneft PAO Preference Shares | 300,228 | 7,009 |
| | Rosseti PJSC | 450,217,605 | 6,934 |
| | Tatneft PAO Preference Shares | 2,069,850 | 6,631 |
| | Acron JSC | 117,629 | 5,568 |
| * | Mechel PJSC | 1,634,230 | 3,833 |
| | TMK PJSC GDR | 731,402 | 3,089 |
| | M.Video PJSC | 332,264 | 1,780 |
| * | DIXY Group PJSC | 245,032 | 1,250 |
| * | Raspadskaya OAO | 1,001,239 | 1,092 |
| | Mobile TeleSystems PJSC | 278,073 | 981 |
| | Mosenergo OAO | 28,759,534 | 777 |
| * | Sollers PJSC | 76,039 | 611 |
| | OGK-2 PJSC | 97,144,880 | 561 |
| | Novolipetsk Steel PJSC | 180,757 | 293 |
| | | | 2,398,516 |
| Singapore (0.0%) | | |
| *,^ | Blue Sky Power Holdings Ltd. | 58,408,000 | 4,882 |
| |
| South Africa (7.8%) | | |
| | Naspers Ltd. | 6,441,259 | 1,078,784 |
| | Sasol Ltd. | 8,256,486 | 228,003 |
| | MTN Group Ltd. | 26,228,732 | 226,546 |
| * | Steinhoff International Holdings NV (XJSE) | 37,181,472 | 200,582 |
| | Standard Bank Group Ltd. | 18,067,927 | 191,796 |
| | FirstRand Ltd. | 45,503,002 | 163,163 |
| | Remgro Ltd. | 8,151,601 | 135,335 |
| | Sanlam Ltd. | 26,759,445 | 129,615 |
| | Aspen Pharmacare Holdings Ltd. | 5,376,263 | 117,120 |
| | Shoprite Holdings Ltd. | 6,614,905 | 97,619 |
| | Bid Corp. Ltd. | 4,898,822 | 86,026 |
| | Woolworths Holdings Ltd. | 14,428,766 | 83,565 |
| * | AngloGold Ashanti Ltd. | 6,102,884 | 83,095 |
| | Growthpoint Properties Ltd. | 41,541,195 | 77,464 |
| | Tiger Brands Ltd. | 2,590,113 | 73,757 |
| | Barclays Africa Group Ltd. | 6,346,243 | 73,645 |
| | Vodacom Group Ltd. | 6,772,889 | 73,072 |
| | Bidvest Group Ltd. | 5,156,418 | 64,064 |
| | Netcare Ltd. | 24,074,517 | 61,825 |
| | Redefine Properties Ltd. | 70,268,344 | 60,128 |
| ^ | Nedbank Group Ltd. | 3,130,096 | 51,237 |
| | Gold Fields Ltd. | 12,309,761 | 50,769 |
| | RMB Holdings Ltd. | 10,783,132 | 47,500 |
| * | Sappi Ltd. | 8,455,861 | 47,051 |
| | Life Healthcare Group Holdings Ltd. | 17,174,621 | 45,884 |
| | Discovery Ltd. | 5,227,919 | 44,688 |
| | Capitec Bank Holdings Ltd. | 856,389 | 43,473 |
| | Mr Price Group Ltd. | 3,563,312 | 40,595 |
| | SPAR Group Ltd. | 2,846,780 | 40,361 |
| | Mondi Ltd. | 1,935,463 | 37,806 |
| | Clicks Group Ltd. | 4,037,145 | 37,661 |
| ^ | Truworths International Ltd. | 7,043,662 | 37,371 |
| * | Impala Platinum Holdings Ltd. | 9,136,822 | 36,919 |
| | AVI Ltd. | 5,160,156 | 36,247 |
| | Hyprop Investments Ltd. | 4,034,130 | 35,795 |
| | New Europe Property Investments plc | 2,903,616 | 35,786 |
| | Resilient REIT Ltd. | 4,214,471 | 34,865 |
| | Brait SE | 5,217,717 | 34,630 |
56
| | | |
| Vanguard® Emerging Markets Stock Index Fund | | |
| Schedule of Investments | | |
| October 31, 2016 | | |
| |
| | | | Market |
| | | | Value |
| | | Shares | ($000) |
| | Imperial Holdings Ltd. | 2,738,634 | 34,591 |
| | Foschini Group Ltd. | 3,243,230 | 33,339 |
| | Sibanye Gold Ltd. | 11,005,589 | 30,615 |
| | MMI Holdings Ltd. | 16,770,117 | 28,092 |
| | Pioneer Foods Group Ltd. | 2,193,643 | 26,428 |
| ^ | Pick n Pay Stores Ltd. | 5,336,671 | 26,147 |
| | Investec Ltd. | 4,160,872 | 25,626 |
| | PSG Group Ltd. | 1,574,770 | 24,579 |
| | Coronation Fund Managers Ltd. | 4,396,326 | 23,662 |
| | Telkom SA SOC Ltd. | 5,063,148 | 23,339 |
| * | EOH Holdings Ltd. | 1,859,752 | 22,063 |
| | Barloworld Ltd. | 3,330,701 | 21,514 |
| * | Anglo American Platinum Ltd. | 908,242 | 21,474 |
| | Fortress Income Fund Ltd. Class B | 8,840,736 | 21,007 |
| * | Northam Platinum Ltd. | 5,709,780 | 20,803 |
| | Harmony Gold Mining Co. Ltd. | 5,691,907 | 17,670 |
| | Tongaat Hulett Ltd. | 1,926,809 | 17,413 |
| | JSE Ltd. | 1,436,910 | 16,740 |
| | Exxaro Resources Ltd. | 2,119,230 | 15,620 |
| | Massmart Holdings Ltd. | 1,773,281 | 15,350 |
| | Liberty Holdings Ltd. | 1,717,807 | 14,790 |
| | AECI Ltd. | 1,957,126 | 14,782 |
| | Nampak Ltd. | 9,764,582 | 13,618 |
| | Omnia Holdings Ltd. | 1,111,488 | 13,461 |
| | Tsogo Sun Holdings Ltd. | 5,859,996 | 13,324 |
| * | Attacq Ltd. | 10,255,689 | 13,042 |
| | Fortress Income Fund Ltd. Class A | 10,457,608 | 12,652 |
| | Reunert Ltd. | 2,703,596 | 12,355 |
| | Wilson Bayly Holmes-Ovcon Ltd. | 1,044,668 | 11,776 |
| | African Rainbow Minerals Ltd. | 1,593,367 | 11,544 |
| | Santam Ltd. | 616,112 | 11,061 |
| | DataTec Ltd. | 3,324,762 | 11,057 |
| * | Super Group Ltd. | 3,670,144 | 10,832 |
| | Sun International Ltd. | 1,639,242 | 10,125 |
| | Famous Brands Ltd. | 854,446 | 9,984 |
| | Distell Group Ltd. | 786,132 | 9,650 |
| *,^ | Kumba Iron Ore Ltd. | 914,528 | 9,313 |
| | KAP Industrial Holdings Ltd. | 15,782,593 | 9,072 |
| | Vukile Property Fund Ltd. | 6,123,117 | 8,350 |
| | PPC Ltd. | 20,183,650 | 8,241 |
| | SA Corporate Real Estate Fund Nominees Pty Ltd. | 20,051,131 | 8,199 |
| | Assore Ltd. | 559,737 | 7,546 |
| | Blue Label Telecoms Ltd. | 4,740,137 | 7,167 |
| | Grindrod Ltd. | 8,096,205 | 6,670 |
| | Cashbuild Ltd. | 217,262 | 6,335 |
| | Alexander Forbes Group Holdings Ltd. | 13,214,889 | 6,000 |
| | Steinhoff International Holdings NV (XETR) | 1,075,902 | 5,732 |
| | Murray & Roberts Holdings Ltd. | 7,628,400 | 5,238 |
| | Mpact Ltd. | 2,068,640 | 5,061 |
| | Zeder Investments Ltd. | 9,578,820 | 4,737 |
| * | Ascendis Health Ltd. | 2,246,717 | 4,527 |
| | Emira Property Fund Ltd. | 4,335,924 | 4,486 |
| | Astral Foods Ltd. | 491,579 | 4,458 |
| * | ArcelorMittal South Africa Ltd. | 5,192,748 | 4,446 |
| * | Curro Holdings Ltd. | 987,922 | 3,635 |
| | Peregrine Holdings Ltd. | 1,858,639 | 3,584 |
| | Oceana Group Ltd. | 413,917 | 3,525 |
| | Adcock Ingram Holdings Ltd. | 1,006,734 | 3,494 |
| �� | Advtech Ltd. | 2,667,199 | 3,446 |
| * | Royal Bafokeng Platinum Ltd. | 1,124,719 | 3,432 |
| | Metair Investments Ltd. | 2,270,826 | 3,200 |
| | Raubex Group Ltd. | 1,582,762 | 2,950 |
| * | Consolidated Infrastructure Group Ltd. | 1,530,158 | 2,661 |
| * | Aveng Ltd. | 4,804,954 | 2,519 |
57
| | |
| Vanguard® Emerging Markets Stock Index Fund | | |
| Schedule of Investments | | |
| October 31, 2016 | | |
| |
| | | Market |
| | | Value |
| | Shares | ($000) |
| City Lodge Hotels Ltd. | 230,233 | 2,497 |
| Trencor Ltd. | 1,170,312 | 2,489 |
| DRDGOLD Ltd. | 4,552,954 | 2,309 |
| ^ Lewis Group Ltd. | 776,037 | 2,300 |
| Group Five Ltd. | 881,090 | 1,511 |
| * Pinnacle Holdings Ltd. | 995,391 | 1,322 |
| Invicta Holdings Ltd. | 309,248 | 1,274 |
| Delta Property Fund Ltd. | 2,139,935 | 1,217 |
| Rebosis Property Fund Ltd. | 1,404,264 | 1,191 |
| Adcorp Holdings Ltd. | 1,089,842 | 1,096 |
| Hudaco Industries Ltd. | 96,998 | 786 |
| Clover Industries Ltd. | 491,093 | 634 |
| Merafe Resources Ltd. | 3,628,696 | 341 |
| * Adcock Ingram Holdings Ltd. Warrants Exp. 07/26/2019 | 73,897 | 17 |
| * African Bank Investments Ltd. | 23,997,414 | — |
| | | 4,870,975 |
| Taiwan (15.4%) | | |
| Taiwan Semiconductor Manufacturing Co. Ltd. | 237,443,845 | 1,424,985 |
| Taiwan Semiconductor Manufacturing Co. Ltd. ADR | 24,605,789 | 765,240 |
| Hon Hai Precision Industry Co. Ltd. | 225,418,779 | 608,893 |
| Formosa Plastics Corp. | 77,331,616 | 208,977 |
| Formosa Chemicals & Fibre Corp. | 68,355,830 | 202,949 |
| Nan Ya Plastics Corp. | 90,671,253 | 188,299 |
| Delta Electronics Inc. | 33,733,767 | 177,594 |
| Largan Precision Co. Ltd. | 1,499,135 | 176,861 |
| MediaTek Inc. | 22,341,143 | 169,344 |
| Cathay Financial Holding Co. Ltd. | 126,855,966 | 164,174 |
| Fubon Financial Holding Co. Ltd. | 114,859,336 | 162,515 |
| CTBC Financial Holding Co. Ltd. | 287,790,395 | 154,772 |
| Uni-President Enterprises Corp. | 75,281,698 | 145,448 |
| China Steel Corp. | 195,172,385 | 140,967 |
| Mega Financial Holding Co. Ltd. | 170,861,636 | 116,816 |
| Chunghwa Telecom Co. Ltd. | 32,708,913 | 112,001 |
| Asustek Computer Inc. | 11,341,958 | 99,291 |
| Taiwan Mobile Co. Ltd. | 26,933,796 | 94,237 |
| Chunghwa Telecom Co. Ltd. ADR | 2,712,993 | 92,649 |
| Catcher Technology Co. Ltd. | 11,389,259 | 89,155 |
| Quanta Computer Inc. | 43,293,165 | 87,581 |
| First Financial Holding Co. Ltd. | 162,378,813 | 85,059 |
| Pegatron Corp. | 30,877,897 | 83,147 |
| Hotai Motor Co. Ltd. | 6,894,000 | 80,081 |
| E.Sun Financial Holding Co. Ltd. | 139,125,815 | 79,010 |
| Advanced Semiconductor Engineering Inc. | 66,075,717 | 77,638 |
| Formosa Petrochemical Corp. | 22,234,894 | 74,240 |
| Hua Nan Financial Holdings Co. Ltd. | 136,896,688 | 69,517 |
| President Chain Store Corp. | 9,090,647 | 67,922 |
| Yuanta Financial Holding Co. Ltd. | 177,060,634 | 66,089 |
| Taiwan Cooperative Financial Holding Co. Ltd. | 149,333,078 | 65,449 |
| Far EasTone Telecommunications Co. Ltd. | 27,092,343 | 64,022 |
| Taiwan Cement Corp. | 52,146,877 | 62,460 |
| Cheng Shin Rubber Industry Co. Ltd. | 30,366,883 | 61,784 |
| China Development Financial Holding Corp. | 238,878,649 | 59,775 |
| Pou Chen Corp. | 43,864,531 | 59,185 |
| Taishin Financial Holding Co. Ltd. | 154,309,694 | 56,412 |
| Foxconn Technology Co. Ltd. | 18,473,849 | 53,552 |
| Far Eastern New Century Corp. | 68,865,322 | 53,284 |
| Lite-On Technology Corp. | 36,227,288 | 51,935 |
| SinoPac Financial Holdings Co. Ltd. | 170,694,098 | 49,197 |
| Innolux Corp. | 145,453,575 | 48,964 |
| Advantech Co. Ltd. | 5,882,619 | 47,808 |
| Chang Hwa Commercial Bank Ltd. | 90,200,111 | 46,088 |
| China Life Insurance Co. Ltd. (XTAI) | 48,845,720 | 45,024 |
| Compal Electronics Inc. | 71,496,629 | 42,513 |
| Inventec Corp. | 50,572,489 | 39,483 |
58
| | |
| Vanguard® Emerging Markets Stock Index Fund | | |
| Schedule of Investments | | |
| October 31, 2016 | | |
| |
| | | Market |
| | | Value |
| | Shares | ($000) |
| ^ United Microelectronics Corp. ADR | 20,674,888 | 39,282 |
| Hermes Microvision Inc. | 842,369 | 37,134 |
| Advanced Semiconductor Engineering Inc. ADR | 6,259,619 | 36,619 |
| United Microelectronics Corp. | 98,295,970 | 36,586 |
| * Inotera Memories Inc. | 38,932,000 | 36,408 |
| Giant Manufacturing Co. Ltd. | 5,057,721 | 35,775 |
| Asia Cement Corp. | 40,802,529 | 35,573 |
| Novatek Microelectronics Corp. | 9,473,817 | 35,472 |
| AU Optronics Corp. | 92,924,669 | 35,295 |
| Eclat Textile Co. Ltd. | 2,995,950 | 33,947 |
| * HTC Corp. | 11,417,225 | 33,349 |
| Wistron Corp. | 43,650,878 | 32,891 |
| Siliconware Precision Industries Co. Ltd. | 21,475,906 | 32,483 |
| Vanguard International Semiconductor Corp. | 15,264,000 | 31,076 |
| * Shin Kong Financial Holding Co. Ltd. | 131,707,583 | 28,545 |
| Teco Electric and Machinery Co. Ltd. | 32,103,000 | 28,461 |
| Micro-Star International Co. Ltd. | 9,860,000 | 28,365 |
| Powertech Technology Inc. | 9,668,000 | 27,585 |
| Realtek Semiconductor Corp. | 7,940,241 | 26,895 |
| Synnex Technology International Corp. | 23,915,907 | 25,481 |
| Chicony Electronics Co. Ltd. | 9,900,199 | 25,295 |
| Feng TAY Enterprise Co. Ltd. | 5,743,390 | 23,956 |
| Siliconware Precision Industries Co. Ltd. ADR | 3,071,933 | 23,009 |
| Acer Inc. | 50,140,632 | 22,976 |
| Nien Made Enterprise Co. Ltd. | 1,923,000 | 22,274 |
| Walsin Lihwa Corp. | 63,196,770 | 22,109 |
| Chailease Holding Co. Ltd. | 12,212,000 | 21,081 |
| WPG Holdings Ltd. | 17,206,000 | 20,141 |
| Taiwan Business Bank | 78,163,215 | 19,743 |
| AU Optronics Corp. ADR | 5,117,492 | 19,344 |
| Highwealth Construction Corp. | 12,325,000 | 18,253 |
| Taiwan Fertilizer Co. Ltd. | 13,279,100 | 17,764 |
| Formosa Taffeta Co. Ltd. | 18,757,868 | 17,090 |
| Eternal Materials Co. Ltd. | 15,330,232 | 16,158 |
| Airtac International Group | 2,017,000 | 16,039 |
| Merida Industry Co. Ltd. | 3,418,000 | 15,751 |
| Phison Electronics Corp. | 2,224,000 | 15,743 |
| Win Semiconductors Corp. | 5,641,292 | 15,667 |
| Eva Airways Corp. | 32,541,854 | 15,666 |
| * Ruentex Development Co. Ltd. | 13,538,000 | 15,624 |
| * TaiMed Biologics Inc. | 2,469,000 | 15,503 |
| Ruentex Industries Ltd. | 9,534,000 | 15,348 |
| Tong Yang Industry Co. Ltd. | 6,509,000 | 15,146 |
| Poya International Co. Ltd. | 1,038,320 | 15,094 |
| Tripod Technology Corp. | 6,182,000 | 14,635 |
| Transcend Information Inc. | 5,175,981 | 14,295 |
| St. Shine Optical Co. Ltd. | 678,000 | 14,249 |
| Taiwan Secom Co. Ltd. | 4,729,805 | 13,559 |
| Tung Thih Electronic Co. Ltd. | 874,000 | 12,752 |
| Hiwin Technologies Corp. | 2,882,580 | 12,708 |
| Yulon Motor Co. Ltd. | 14,477,584 | 12,668 |
| China Airlines Ltd. | 41,314,050 | 12,499 |
| LCY Chemical Corp. | 10,153,000 | 12,387 |
| Nanya Technology Corp. | 9,530,246 | 12,354 |
| Winbond Electronics Corp. | 38,069,000 | 11,953 |
| King Yuan Electronics Co. Ltd. | 13,561,000 | 11,928 |
| PChome Online Inc. | 1,081,134 | 11,739 |
| Zhen Ding Technology Holding Ltd. | 5,152,000 | 11,720 |
| Chroma ATE Inc. | 4,615,000 | 11,698 |
| Simplo Technology Co. Ltd. | 3,688,000 | 11,375 |
| Kenda Rubber Industrial Co. Ltd. | 7,442,571 | 11,369 |
| Yageo Corp. | 5,610,387 | 11,291 |
| Accton Technology Corp. | 7,067,000 | 11,285 |
| CTCI Corp. | 7,678,000 | 11,267 |
59
| | |
| Vanguard® Emerging Markets Stock Index Fund | | |
| Schedule of Investments | | |
| October 31, 2016 | | |
| |
| | | Market |
| | | Value |
| | Shares | ($000) |
| * Taiwan Glass Industry Corp. | 26,836,818 | 11,211 |
| Feng Hsin Steel Co. Ltd. | 8,311,310 | 11,015 |
| Silergy Corp. | 752,000 | 10,956 |
| Standard Foods Corp. | 4,415,580 | 10,912 |
| * Epistar Corp. | 15,971,732 | 10,844 |
| Capital Securities Corp. | 43,349,422 | 10,837 |
| * Evergreen Marine Corp. Taiwan Ltd. | 28,819,358 | 10,763 |
| Chipbond Technology Corp. | 7,746,000 | 10,693 |
| eMemory Technology Inc. | 992,000 | 10,509 |
| Hota Industrial Manufacturing Co. Ltd. | 2,507,000 | 10,477 |
| Far Eastern International Bank | 36,423,522 | 10,358 |
| King Slide Works Co. Ltd. | 842,000 | 10,313 |
| Taiwan Paiho Ltd. | 3,028,000 | 10,293 |
| China Motor Corp. | 12,467,000 | 9,763 |
| Parade Technologies Ltd. | 866,000 | 9,744 |
| Chin-Poon Industrial Co. Ltd. | 4,908,000 | 9,399 |
| Unimicron Technology Corp. | 22,457,754 | 9,275 |
| E Ink Holdings Inc. | 10,931,000 | 9,265 |
| Radiant Opto-Electronics Corp. | 5,388,291 | 9,084 |
| King's Town Bank Co. Ltd. | 11,002,000 | 8,999 |
| TSRC Corp. | 8,623,000 | 8,899 |
| Walsin Technology Corp. | 7,329,300 | 8,889 |
| Land Mark Optoelectronics Corp. | 990,900 | 8,881 |
| Everlight Electronics Co. Ltd. | 5,758,000 | 8,685 |
| Grape King Bio Ltd. | 1,029,000 | 8,640 |
| Makalot Industrial Co. Ltd. | 2,193,987 | 8,635 |
| Wistron NeWeb Corp. | 3,078,350 | 8,566 |
| * HannStar Display Corp. | 34,192,000 | 8,558 |
| Merry Electronics Co. Ltd. | 2,182,000 | 8,413 |
| Cheng Uei Precision Industry Co. Ltd. | 6,874,473 | 8,412 |
| Voltronic Power Technology Corp. | 558,355 | 8,372 |
| Elite Material Co. Ltd. | 3,005,000 | 8,366 |
| Ennoconn Corp. | 522,085 | 8,273 |
| Kinsus Interconnect Technology Corp. | 3,459,000 | 7,982 |
| WT Microelectronics Co. Ltd. | 5,509,050 | 7,802 |
| Oriental Union Chemical Corp. | 12,479,000 | 7,791 |
| Gigabyte Technology Co. Ltd. | 5,895,000 | 7,747 |
| FLEXium Interconnect Inc. | 2,686,278 | 7,639 |
| Qisda Corp. | 17,862,000 | 7,515 |
| TTY Biopharm Co. Ltd. | 1,994,000 | 7,498 |
| Gourmet Master Co. Ltd. | 834,500 | 7,489 |
| * TPK Holding Co. Ltd. | 4,694,667 | 7,484 |
| * Tatung Co. Ltd. | 28,344,000 | 7,451 |
| Nan Kang Rubber Tire Co. Ltd. | 8,078,000 | 7,447 |
| * Chunghwa Precision Test Tech Co. Ltd. | 217,000 | 7,212 |
| AmTRAN Technology Co. Ltd. | 9,088,000 | 7,198 |
| YFY Inc. | 23,890,000 | 7,035 |
| Sino-American Silicon Products Inc. | 6,413,000 | 6,894 |
| * China Petrochemical Development Corp. | 23,899,000 | 6,824 |
| Clevo Co. | 7,433,000 | 6,802 |
| Wan Hai Lines Ltd. | 13,807,450 | 6,794 |
| Cub Elecparts Inc. | 737,270 | 6,763 |
| * Asia Pacific Telecom Co. Ltd. | 20,446,000 | 6,564 |
| Taichung Commercial Bank Co. Ltd. | 22,356,485 | 6,365 |
| Mitac Holdings Corp. | 6,710,691 | 6,351 |
| Great Wall Enterprise Co. Ltd. | 6,933,000 | 6,308 |
| Cathay Real Estate Development Co. Ltd. | 12,278,700 | 6,294 |
| Tong Hsing Electronic Industries Ltd. | 1,812,000 | 6,248 |
| Kinpo Electronics | 16,414,000 | 6,153 |
| ITEQ Corp. | 5,657,000 | 6,122 |
| Ardentec Corp. | 8,178,317 | 6,091 |
| Sinbon Electronics Co. Ltd. | 2,707,315 | 6,086 |
| Topco Scientific Co. Ltd. | 2,303,300 | 5,907 |
| * Center Laboratories Inc. | 2,827,568 | 5,808 |
60
| | |
| Vanguard® Emerging Markets Stock Index Fund | | |
| Schedule of Investments | | |
| October 31, 2016 | | |
| |
| | | Market |
| | | Value |
| | Shares | ($000) |
| * Egis Technology Inc. | 801,000 | 5,801 |
| China Bills Finance Corp. | 14,469,000 | 5,799 |
| U-Ming Marine Transport Corp. | 8,276,356 | 5,731 |
| Greatek Electronics Inc. | 4,539,000 | 5,730 |
| * Yang Ming Marine Transport Corp. | 25,629,195 | 5,687 |
| Sanyang Motor Co. Ltd. | 8,864,000 | 5,674 |
| * Macronix International | 40,742,541 | 5,634 |
| Ginko International Co. Ltd. | 602,000 | 5,613 |
| President Securities Corp. | 16,063,953 | 5,588 |
| Getac Technology Corp. | 4,253,000 | 5,524 |
| Depo Auto Parts Ind Co. Ltd. | 1,748,000 | 5,460 |
| Coretronic Corp. | 5,227,400 | 5,409 |
| Compeq Manufacturing Co. Ltd. | 10,044,000 | 5,290 |
| Primax Electronics Ltd. | 3,343,000 | 5,287 |
| Elan Microelectronics Corp. | 4,670,000 | 5,282 |
| Ton Yi Industrial Corp. | 12,278,000 | 5,268 |
| Grand Pacific Petrochemical | 9,430,000 | 5,257 |
| Yungtay Engineering Co. Ltd. | 3,727,000 | 5,254 |
| Flytech Technology Co. Ltd. | 1,588,000 | 5,229 |
| OptoTech Corp. | 12,024,000 | 5,065 |
| Huaku Development Co. Ltd. | 2,832,000 | 4,985 |
| Sercomm Corp. | 2,100,000 | 4,933 |
| * Yieh Phui Enterprise Co. Ltd. | 12,767,000 | 4,932 |
| TA Chen Stainless Pipe | 9,358,860 | 4,920 |
| * Orient Semiconductor Electronics Ltd. | 13,438,000 | 4,849 |
| Pihsiang Machinery Manufacturing Co. Ltd. | 2,056,000 | 4,820 |
| Sigurd Microelectronics Corp. | 6,451,000 | 4,817 |
| Li Cheng Enterprise Co. Ltd. | 1,241,920 | 4,814 |
| PharmaEngine Inc. | 701,764 | 4,782 |
| Far Eastern Department Stores Ltd. | 8,983,000 | 4,761 |
| Waterland Financial Holdings Co. Ltd. | 18,701,166 | 4,735 |
| Long Chen Paper Co. Ltd. | 9,891,523 | 4,695 |
| Shin Zu Shing Co. Ltd. | 1,559,000 | 4,694 |
| Pan-International Industrial Corp. | 5,099,000 | 4,678 |
| * Neo Solar Power Corp. | 9,116,242 | 4,656 |
| China General Plastics Corp. | 5,816,160 | 4,649 |
| Tung Ho Steel Enterprise Corp. | 7,269,000 | 4,634 |
| Lien Hwa Industrial Corp. | 6,739,874 | 4,567 |
| * Pharmally International Holding Co. Ltd. | 303,000 | 4,566 |
| Namchow Chemical Industrial Co. Ltd. | 2,118,000 | 4,510 |
| China Steel Chemical Corp. | 1,307,000 | 4,486 |
| General Interface Solution Holding Ltd. | 1,663,000 | 4,431 |
| Taiwan PCB Techvest Co. Ltd. | 4,534,000 | 4,426 |
| TXC Corp. | 3,168,000 | 4,419 |
| Yeong Guan Energy Technology Group Co. Ltd. | 1,123,000 | 4,412 |
| Posiflex Technology Inc. | 746,799 | 4,395 |
| * Iron Force Industrial Co. Ltd. | 717,000 | 4,367 |
| A-DATA Technology Co. Ltd. | 2,805,000 | 4,358 |
| Holtek Semiconductor Inc. | 2,742,000 | 4,329 |
| FocalTech Systems Co. Ltd. | 3,945,000 | 4,267 |
| IEI Integration Corp. | 2,850,000 | 4,240 |
| Hu Lane Associate Inc. | 961,000 | 4,235 |
| * Ritek Corp. | 24,366,586 | 4,203 |
| * Mercuries Life Insurance Co. Ltd. | 8,664,745 | 4,168 |
| Chaun-Choung Technology Corp. | 945,000 | 4,166 |
| Casetek Holdings Ltd. | 1,291,000 | 4,144 |
| Taiwan Hon Chuan Enterprise Co. Ltd. | 2,526,000 | 4,140 |
| Farglory Land Development Co. Ltd. | 3,593,000 | 4,130 |
| Cleanaway Co. Ltd. | 776,000 | 4,126 |
| * Gintech Energy Corp. | 5,733,000 | 4,093 |
| Elite Advanced Laser Corp. | 1,125,600 | 4,093 |
| Advanced Ceramic X Corp. | 509,000 | 4,070 |
| Aten International Co. Ltd. | 1,620,000 | 4,064 |
| YungShin Global Holding Corp. | 2,723,000 | 4,047 |
61
| | |
| Vanguard® Emerging Markets Stock Index Fund | | |
| Schedule of Investments | | |
| October 31, 2016 | | |
| |
| | | Market |
| | | Value |
| | Shares | ($000) |
| USI Corp. | 8,301,000 | 4,044 |
| Lung Yen Life Service Corp. | 2,366,000 | 4,027 |
| Taiwan Shin Kong Security Co. Ltd. | 3,151,000 | 3,976 |
| Taiwan Acceptance Corp. | 1,707,000 | 3,923 |
| Sitronix Technology Corp. | 1,056,000 | 3,908 |
| Tainan Spinning Co. Ltd. | 10,168,000 | 3,900 |
| Firich Enterprises Co. Ltd. | 1,839,210 | 3,803 |
| Taiwan Semiconductor Co. Ltd. | 3,364,000 | 3,771 |
| Zeng Hsing Industrial Co. Ltd. | 777,000 | 3,750 |
| Sampo Corp. | 6,018,000 | 3,743 |
| Taiwan Land Development Corp. | 11,881,201 | 3,710 |
| Taiwan TEA Corp. | 8,437,000 | 3,676 |
| United Integrated Services Co. Ltd. | 2,439,000 | 3,653 |
| * CMC Magnetics Corp. | 30,868,000 | 3,632 |
| AcBel Polytech Inc. | 4,909,000 | 3,631 |
| Formosa International Hotels Corp. | 647,000 | 3,628 |
| Wah Lee Industrial Corp. | 2,518,000 | 3,591 |
| Test Research Inc. | 2,827,000 | 3,579 |
| Taiwan Surface Mounting Technology Corp. | 4,263,000 | 3,550 |
| * Motech Industries Inc. | 3,644,000 | 3,515 |
| Taiwan FamilyMart Co. Ltd. | 497,000 | 3,511 |
| Cheng Loong Corp. | 9,612,000 | 3,484 |
| ScinoPharm Taiwan Ltd. | 2,732,400 | 3,472 |
| International Games System Co. Ltd. | 617,000 | 3,465 |
| Taiwan Styrene Monomer | 6,543,000 | 3,454 |
| Basso Industry Corp. | 1,277,000 | 3,434 |
| Pan Jit International Inc. | 7,277,000 | 3,425 |
| Globalwafers Co. Ltd. | 1,376,000 | 3,391 |
| Chong Hong Construction Co. Ltd. | 2,030,000 | 3,333 |
| Pixart Imaging Inc. | 1,539,000 | 3,331 |
| Prince Housing & Development Corp. | 10,472,000 | 3,316 |
| Lextar Electronics Corp. | 7,921,000 | 3,281 |
| Elite Semiconductor Memory Technology Inc. | 3,063,000 | 3,263 |
| Sunplus Technology Co. Ltd. | 9,365,000 | 3,215 |
| China Synthetic Rubber Corp. | 4,095,000 | 3,214 |
| Rechi Precision Co. Ltd. | 2,803,000 | 3,196 |
| YC INOX Co. Ltd. | 4,400,200 | 3,195 |
| CyberTAN Technology Inc. | 5,333,000 | 3,189 |
| Bizlink Holding Inc. | 629,191 | 3,185 |
| Everlight Chemical Industrial Corp. | 5,019,200 | 3,175 |
| Adlink Technology Inc. | 1,630,790 | 3,154 |
| Nan Ya Printed Circuit Board Corp. | 4,144,521 | 3,130 |
| ITE Technology Inc. | 3,336,000 | 3,091 |
| Career Technology MFG. Co. Ltd. | 4,794,000 | 3,057 |
| * Microbio Co. Ltd. | 4,124,000 | 3,052 |
| Mercuries & Associates Holding Ltd. | 4,874,800 | 2,995 |
| Syncmold Enterprise Corp. | 1,791,000 | 2,993 |
| Xxentria Technology Materials Corp. | 1,140,000 | 2,985 |
| TYC Brother Industrial Co. Ltd. | 2,895,000 | 2,983 |
| China Man-Made Fiber Corp. | 12,238,050 | 2,960 |
| Shinkong Synthetic Fibers Corp. | 11,091,000 | 2,955 |
| * Taigen Biopharmaceuticals Holdings Ltd. | 3,076,820 | 2,927 |
| Sporton International Inc. | 604,313 | 2,887 |
| Test Rite International Co. Ltd. | 4,674,000 | 2,879 |
| Gloria Material Technology Corp. | 5,351,640 | 2,864 |
| Chung-Hsin Electric & Machinery Manufacturing Corp. | 5,105,000 | 2,863 |
| Unitech Printed Circuit Board Corp. | 9,089,000 | 2,855 |
| Systex Corp. | 1,694,000 | 2,848 |
| BES Engineering Corp. | 16,353,000 | 2,784 |
| San Shing Fastech Corp. | 1,590,000 | 2,774 |
| Hung Poo Real Estate Development Corp. | 3,326,000 | 2,735 |
| Lite-On Semiconductor Corp. | 3,846,000 | 2,700 |
| Visual Photonics Epitaxy Co. Ltd. | 2,005,500 | 2,684 |
| * Asia Optical Co. Inc. | 2,905,000 | 2,680 |
62
| | |
| Vanguard® Emerging Markets Stock Index Fund | | |
| Schedule of Investments | | |
| October 31, 2016 | | |
| |
| | | Market |
| | | Value |
| | Shares | ($000) |
| * Medigen Biotechnology Corp. | 1,206,000 | 2,674 |
| Long Bon International Co. Ltd. | 5,163,000 | 2,666 |
| Brogent Technologies Inc. | 386,000 | 2,659 |
| Wowprime Corp. | 725,000 | 2,652 |
| Darwin Precisions Corp. | 6,784,000 | 2,624 |
| Yulon Nissan Motor Co. Ltd. | 416,188 | 2,621 |
| Lingsen Precision Industries Ltd. | 7,333,000 | 2,587 |
| Hung Sheng Construction Ltd. | 4,785,000 | 2,581 |
| Soft-World International Corp. | 1,286,000 | 2,577 |
| Universal Cement Corp. | 3,308,700 | 2,570 |
| * Gigastorage Corp. | 3,580,000 | 2,570 |
| Taiflex Scientific Co. Ltd. | 2,698,920 | 2,563 |
| Goldsun Building Materials Co. Ltd. | 11,099,000 | 2,560 |
| Chlitina Holding Ltd. | 583,000 | 2,552 |
| Toung Loong Textile Manufacturing | 930,000 | 2,547 |
| Dynapack International Technology Corp. | 1,939,000 | 2,537 |
| * Etron Technology Inc. | 6,578,000 | 2,525 |
| Faraday Technology Corp. | 2,536,000 | 2,523 |
| * Unity Opto Technology Co. Ltd. | 5,295,000 | 2,514 |
| Darfon Electronics Corp. | 4,273,000 | 2,502 |
| * Sunny Friend Environmental Technology Co. Ltd. | 698,000 | 2,496 |
| Advanced Wireless Semiconductor Co. | 1,586,000 | 2,471 |
| Global Unichip Corp. | 966,000 | 2,461 |
| China Metal Products | 2,497,000 | 2,460 |
| Jih Sun Financial Holdings Co. Ltd. | 11,724,647 | 2,443 |
| D-Link Corp. | 7,598,000 | 2,438 |
| Lealea Enterprise Co. Ltd. | 9,464,000 | 2,421 |
| Nan Liu Enterprise Co. Ltd. | 563,000 | 2,387 |
| UPC Technology Corp. | 6,777,000 | 2,379 |
| Gigasolar Materials Corp. | 188,000 | 2,369 |
| * Wei Chuan Foods Corp. | 4,174,000 | 2,366 |
| * Unizyx Holding Corp. | 5,295,000 | 2,361 |
| MIN AIK Technology Co. Ltd. | 2,008,000 | 2,357 |
| Taiyen Biotech Co. Ltd. | 2,457,000 | 2,346 |
| Sunrex Technology Corp. | 3,865,363 | 2,321 |
| Gemtek Technology Corp. | 3,989,000 | 2,296 |
| Kinik Co. | 1,381,000 | 2,281 |
| Tyntek Corp. | 5,985,000 | 2,270 |
| Formosan Rubber Group Inc. | 4,864,704 | 2,263 |
| KEE TAI Properties Co. Ltd. | 7,078,000 | 2,263 |
| * Solartech Energy Corp. | 4,499,000 | 2,254 |
| Global Mixed Mode Technology Inc. | 1,014,000 | 2,242 |
| Vivotek Inc. | 902,518 | 2,228 |
| * Radium Life Tech Co. Ltd. | 7,847,000 | 2,225 |
| Federal Corp. | 5,135,040 | 2,197 |
| Taiwan Cogeneration Corp. | 3,013,000 | 2,195 |
| * Ho Tung Chemical Corp. | 8,945,550 | 2,195 |
| Jess-Link Products Co. Ltd. | 2,649,000 | 2,193 |
| Kindom Construction Corp. | 4,431,000 | 2,182 |
| Sonix Technology Co. Ltd. | 2,123,000 | 2,172 |
| Quanta Storage Inc. | 2,255,000 | 2,150 |
| WUS Printed Circuit Co. Ltd. | 3,816,000 | 2,126 |
| * Gold Circuit Electronics Ltd. | 6,265,000 | 2,111 |
| Hsin Kuang Steel Co. Ltd. | 3,541,000 | 2,093 |
| * HannsTouch Solution Inc. | 8,494,000 | 2,083 |
| Senao International Co. Ltd. | 1,290,000 | 2,042 |
| Green Seal Holding Ltd. | 384,000 | 2,037 |
| Asia Vital Components Co. Ltd. | 2,703,000 | 2,023 |
| * Wafer Works Corp. | 7,227,647 | 1,997 |
| Wisdom Marine Lines Co. Ltd. | 2,202,725 | 1,994 |
| Asia Polymer Corp. | 3,414,740 | 1,975 |
| CHC Healthcare Group | 1,412,899 | 1,958 |
| Globe Union Industrial Corp. | 3,939,000 | 1,939 |
| Huang Hsiang Construction Corp. | 1,545,000 | 1,888 |
63
| | |
| Vanguard® Emerging Markets Stock Index Fund | | |
| Schedule of Investments | | |
| October 31, 2016 | | |
| |
| | | Market |
| | | Value |
| | Shares | ($000) |
| * Ichia Technologies Inc. | 4,266,000 | 1,888 |
| * Swancor Holding Co. Ltd. | 796,000 | 1,882 |
| Masterlink Securities Corp. | 7,376,670 | 1,873 |
| Tong-Tai Machine & Tool Co. Ltd. | 2,617,000 | 1,865 |
| Weltrend Semiconductor | 2,617,000 | 1,862 |
| Alpha Networks Inc. | 3,138,000 | 1,805 |
| * Shining Building Business Co. Ltd. | 5,676,000 | 1,794 |
| Kuoyang Construction Co. Ltd. | 4,558,000 | 1,791 |
| * Global Brands Manufacture Ltd. | 5,173,000 | 1,786 |
| Ability Enterprise Co. Ltd. | 3,587,491 | 1,760 |
| Jentech Precision Industrial Co. Ltd. | 1,093,000 | 1,708 |
| Zinwell Corp. | 1,493,000 | 1,700 |
| China Chemical & Pharmaceutical Co. Ltd. | 3,009,000 | 1,696 |
| Cyberlink Corp. | 852,000 | 1,694 |
| * AGV Products Corp. | 7,062,369 | 1,683 |
| * E-Ton Solar Tech Co. Ltd. | 5,429,000 | 1,680 |
| * TWi Pharmaceuticals Inc. | 514,000 | 1,666 |
| Tsann Kuen Enterprise Co. Ltd. | 1,773,000 | 1,648 |
| Continental Holdings Corp. | 5,021,000 | 1,637 |
| * Green Energy Technology Inc. | 2,940,000 | 1,612 |
| * Silicon Integrated Systems Corp. | 8,164,000 | 1,609 |
| GeoVision Inc. | 1,068,079 | 1,606 |
| * Lotus Pharmaceutical Co. Ltd. | 862,000 | 1,563 |
| * ALI Corp. | 2,977,000 | 1,563 |
| ACES Electronic Co. Ltd. | 2,045,000 | 1,561 |
| Sinyi Realty Inc. | 1,703,000 | 1,558 |
| Sheng Yu Steel Co. Ltd. | 1,687,000 | 1,548 |
| Yung Chi Paint & Varnish Manufacturing Co. Ltd. | 626,000 | 1,541 |
| * Li Peng Enterprise Co. Ltd. | 6,786,000 | 1,525 |
| Rich Development Co. Ltd. | 5,537,000 | 1,525 |
| L&K Engineering Co. Ltd. | 1,906,000 | 1,491 |
| Chimei Materials Technology Corp. | 3,740,000 | 1,469 |
| Infortrend Technology Inc. | 2,953,000 | 1,458 |
| FSP Technology Inc. | 1,896,120 | 1,448 |
| * Eastern Media International Corp. | 6,024,000 | 1,431 |
| CSBC Corp. Taiwan | 3,374,000 | 1,399 |
| Elitegroup Computer Systems Co. Ltd. | 3,216,000 | 1,375 |
| Holy Stone Enterprise Co. Ltd. | 1,347,000 | 1,358 |
| * G Tech Optoelectronics Corp. | 2,016,481 | 1,322 |
| Evergreen International Storage & Transport Corp. | 3,228,000 | 1,308 |
| Nien Hsing Textile Co. Ltd. | 1,625,000 | 1,216 |
| Chun Yuan Steel | 3,524,000 | 1,205 |
| ENG Electric Co. Ltd. | 2,203,560 | 1,164 |
| Johnson Health Tech Co. Ltd. | 787,000 | 1,143 |
| Sincere Navigation Corp. | 2,046,000 | 1,143 |
| Chung Hwa Pulp Corp. | 4,020,000 | 1,140 |
| Topkey Corp. | 367,000 | 1,140 |
| * Taiwan Liposome Co. Ltd. | 271,000 | 1,110 |
| * Genius Electronic Optical Co. Ltd. | 691,000 | 1,102 |
| Concord Securities Co. Ltd. | 5,500,000 | 1,080 |
| Ambassador Hotel | 1,375,000 | 1,076 |
| Altek Corp. | 1,504,000 | 1,075 |
| * China Electric Manufacturing Corp. | 4,502,000 | 1,060 |
| Lotes Co. Ltd. | 397,000 | 1,009 |
| Bank of Kaohsiung Co. Ltd. | 3,595,284 | 1,007 |
| Young Optics Inc. | 1,091,000 | 922 |
| * Genesis Photonics Inc. | 6,093,000 | 885 |
| * King's Town Construction Co. Ltd. | 1,429,000 | 860 |
| Kuo Toong International Co. Ltd. | 1,573,950 | 859 |
| Microlife Corp. | 351,000 | 807 |
| * LES Enphants Co. Ltd. | 2,016,000 | 798 |
| * Phihong Technology Co. Ltd. | 2,490,000 | 779 |
| * Dynamic Electronics Co. Ltd. | 2,613,000 | 772 |
| * Shih Wei Navigation Co. Ltd. | 2,581,000 | 733 |
64
| | |
| Vanguard® Emerging Markets Stock Index Fund | | |
| Schedule of Investments | | |
| October 31, 2016 | | |
| |
| | | Market |
| | | Value |
| | Shares | ($000) |
| * Ta Ya Electric Wire & Cable | 4,319,000 | 717 |
| Taiwan Fire & Marine Insurance Co. Ltd. | 1,186,000 | 695 |
| Chinese Maritime Transport Ltd. | 755,370 | 578 |
| * Solar Applied Materials Technology Co. | 1,855,000 | 514 |
| Taiwan Mask Corp. | 1,774,000 | 470 |
| * Champion Building Materials Co. Ltd. | 1,863,000 | 410 |
| Great China Metal Industry | 543,000 | 399 |
| Chia Hsin Cement Corp. | 1,405,000 | 397 |
| Silitech Technology Corp. | 801,000 | 397 |
| XPEC Entertainment Inc. | 988,965 | 366 |
| Advanced International Multitech Co. Ltd. | 561,000 | 357 |
| KYE Systems Corp. | 1,175,838 | 335 |
| Taiwan Sanyo Electric Co. Ltd. | 221,000 | 171 |
| * Chung Hung Steel Corp. | 126,000 | 29 |
| | | 9,613,998 |
| Thailand (3.9%) | | |
| * PTT PCL | 14,347,200 | 141,267 |
| * CP ALL PCL (Local) | 76,796,341 | 133,124 |
| ^ Siam Cement PCL NVDR | 7,876,300 | 112,471 |
| * Siam Commercial Bank PCL (Local) | 26,192,909 | 107,243 |
| * Bangkok Dusit Medical Services PCL | 126,633,600 | 82,482 |
| * Advanced Info Service PCL (Local) | 18,791,993 | 82,365 |
| * Airports of Thailand PCL | 7,058,144 | 76,788 |
| PTT PCL (Foreign) | 7,072,642 | 69,639 |
| Siam Cement PCL (Foreign) | 4,610,017 | 66,357 |
| * Kasikornbank PCL | 12,218,600 | 59,976 |
| * Central Pattana PCL | 35,100,228 | 55,776 |
| * PTT Exploration and Production PCL (Local) | 22,367,406 | 52,920 |
| * Minor International PCL | 48,019,530 | 52,756 |
| ^ Kasikornbank PCL NVDR | 10,035,900 | 49,262 |
| ^ Intouch Holdings PCL NVDR | 26,127,250 | 39,577 |
| ^ Kasikornbank PCL (Foreign) | 7,715,687 | 37,873 |
| ^ Siam Commercial Bank PCL | 9,000,000 | 36,849 |
| * Bangkok Bank PCL (Local) | 7,923,343 | 36,087 |
| * Charoen Pokphand Foods PCL | 38,403,200 | 34,537 |
| * Bumrungrad Hospital PCL | 5,983,401 | 31,258 |
| PTT Global Chemical PCL (Foreign) | 18,259,607 | 31,188 |
| Krung Thai Bank PCL (Foreign) | 61,198,451 | 30,056 |
| * Thai Oil PCL | 14,620,200 | 29,208 |
| * BTS Group Holdings PCL | 102,269,000 | 24,987 |
| * Banpu PCL (Local) | 45,470,000 | 23,789 |
| * Electricity Generating PCL | 4,231,400 | 23,550 |
| * Bangkok Expressway & Metro PCL | 107,984,503 | 22,961 |
| * TMB Bank PCL | 382,769,800 | 22,940 |
| * Home Product Center PCL | 78,955,079 | 22,736 |
| * Thai Union Group PCL | 36,158,600 | 22,407 |
| ^ Land & Houses PCL NVDR | 83,881,780 | 21,987 |
| Charoen Pokphand Foods PCL (Foreign) | 22,500,100 | 20,235 |
| ^ IRPC PCL (Foreign) | 146,911,760 | 20,053 |
| * KCE Electronics PCL | 6,199,100 | 19,843 |
| * Delta Electronics Thailand PCL | 8,637,400 | 19,345 |
| * Digital Telecommunications Infrastructure Fund | 44,800,600 | 19,199 |
| * True Corp. PCL | 95,406,577 | 18,382 |
| * PTT Global Chemical PCL | 10,659,100 | 18,206 |
| * OBI Pharma Inc. | 1,732,000 | 18,100 |
| * BTS Rail Mass Transit Growth Infrastructure Fund | 43,912,900 | 15,304 |
| * Kiatnakin Bank PCL | 8,896,700 | 14,858 |
| * Thanachart Capital PCL | 12,920,400 | 14,558 |
| ^ Berli Jucker PCL (Foreign) | 9,440,887 | 14,230 |
| ^ Indorama Ventures PCL (Foreign) | 16,907,864 | 14,105 |
| Jasmine International PCL | 59,170,400 | 14,100 |
| Glow Energy PCL (Foreign) | 6,332,855 | 13,908 |
| * Jasmine Broadband Internet Infrastructure Fund | 39,901,300 | 13,792 |
| ^ Ratchaburi Electricity Generating Holding PCL | 9,557,300 | 13,656 |
65
| | | |
| Vanguard® Emerging Markets Stock Index Fund | | |
| Schedule of Investments | | |
| October 31, 2016 | | |
| |
| | | | Market |
| | | | Value |
| | | Shares | ($000) |
| * | Bangchak Petroleum PCL | 14,950,100 | 12,912 |
| ^ | True Corp. PCL (Foreign) | 66,381,242 | 12,789 |
| * | Thai Airways International PCL | 15,708,800 | 12,551 |
| * | CH Karnchang PCL | 14,305,900 | 12,047 |
| * | Group Lease PCL | 9,173,179 | 12,041 |
| * | Robinson Department Store PCL | 7,086,100 | 11,711 |
| * | Central Plaza Hotel PCL | 10,799,200 | 11,699 |
| * | Sino-Thai Engineering & Construction PCL | 15,923,200 | 11,590 |
| | Bangkok Life Assurance PCL | 8,094,600 | 11,497 |
| * | Supalai PCL | 15,932,200 | 11,103 |
| ^ | Krung Thai Bank PCL NVDR | 21,822,300 | 10,717 |
| * | Berli Jucker PCL | 7,077,700 | 10,662 |
| * | Total Access Communication PCL (Local) | 11,718,600 | 10,433 |
| * | Siam City Cement PCL (Local) | 1,223,283 | 10,098 |
| * | Siam Global House PCL | 21,625,995 | 9,515 |
| * | Hana Microelectronics PCL | 10,129,000 | 9,250 |
| * | Krungthai Card PCL | 2,154,800 | 9,229 |
| * | Superblock PCL | 189,271,400 | 8,592 |
| * | Bangkok Land PCL | 187,479,900 | 8,462 |
| ^ | Banpu PCL | 15,566,070 | 8,144 |
| * | Srisawad Power 1979 PCL | 6,956,044 | 7,947 |
| *,2 | Star Petroleum Refining PCL | 21,960,900 | 7,884 |
| * | TPI Polene PCL | 125,336,000 | 7,865 |
| * | AP Thailand PCL | 36,970,000 | 7,488 |
| * | VGI Global Media PCL | 44,745,600 | 7,276 |
| * | Italian-Thai Development PCL | 51,169,200 | 7,236 |
| * | Tisco Financial Group PCL NVDR | 4,883,800 | 7,222 |
| * | Carabao Group PCL | 3,664,500 | 7,221 |
| * | Pruksa Real Estate PCL | 10,923,600 | 7,201 |
| * | Major Cineplex Group PCL | 8,611,600 | 7,120 |
| * | Quality Houses PCL | 99,468,100 | 7,098 |
| * | Chularat Hospital PCL | 86,973,100 | 7,003 |
| * | Sansiri PCL (Local) | 146,997,900 | 6,964 |
| * | PTG Energy PCL | 8,272,700 | 6,784 |
| * | Thai Vegetable Oil PCL | 7,024,800 | 6,721 |
| * | Bangkok Chain Hospital PCL | 17,709,100 | 6,671 |
| ^ | BEC World PCL (Foreign) | 11,334,325 | 6,636 |
| * | Esso Thailand PCL | 22,062,900 | 6,362 |
| * | Tisco Financial Group PCL | 4,272,700 | 6,319 |
| * | Thaicom PCL | 10,220,400 | 6,067 |
| * | Gunkul Engineering PCL | 42,745,660 | 6,057 |
| | TTW PCL | 19,738,100 | 5,916 |
| * | Muangthai Leasing PCL | 10,915,900 | 5,858 |
| * | Thoresen Thai Agencies PCL | 22,003,000 | 5,722 |
| * | Vibhavadi Medical Center PCL | 66,953,700 | 5,660 |
| * | Bangkok Airways PCL | 7,626,800 | 5,422 |
| * | CK Power PCL | 53,360,100 | 5,407 |
| * | Amata Corp. PCL | 16,196,000 | 5,355 |
| * | LPN Development PCL | 16,212,400 | 5,283 |
| * | Indorama Ventures PCL | 6,225,400 | 5,193 |
| * | Unique Engineering & Construction PCL | 10,317,800 | 5,007 |
| * | Global Power Synergy Co. Ltd. | 4,830,800 | 4,899 |
| * | SPCG PCL | 8,234,300 | 4,794 |
| * | WHA Corp. PCL | 49,274,300 | 4,639 |
| * | Dynasty Ceramic PCL | 35,753,300 | 4,556 |
| * | TICON Industrial Connection PCL | 10,273,500 | 4,358 |
| * | Tipco Asphalt PCL | 8,253,900 | 4,264 |
| * | Samart Corp. PCL | 10,190,600 | 4,104 |
| * | GFPT PCL | 9,078,800 | 3,940 |
| *,^ | Group Lease PCL NVDR | 2,827,000 | 3,711 |
| * | Sri Trang Agro-Industry PCL | 9,290,800 | 3,582 |
| * | IRPC PCL | 26,076,500 | 3,559 |
| * | IMPACT Growth REIT | 7,823,100 | 3,485 |
| * | BEC World PCL | 5,752,100 | 3,368 |
66
| | |
| Vanguard® Emerging Markets Stock Index Fund | | |
| Schedule of Investments | | |
| October 31, 2016 | | |
| |
| | | Market |
| | | Value |
| | Shares | ($000) |
| * Inter Far East Energy Corp. | 25,054,900 | 3,089 |
| ^ Thai Union Frozen Products PCL (Foreign) | 4,379,800 | 2,714 |
| * Univentures PCL | 15,533,000 | 2,571 |
| * Cal-Comp Electronics Thailand PCL | 34,399,700 | 2,473 |
| momo.com Inc. | 380,000 | 2,466 |
| * Thai Reinsurance PCL | 33,312,300 | 2,149 |
| * U City PCL | 2,339,863,000 | 2,006 |
| * Precious Shipping PCL | 11,004,100 | 1,900 |
| * Glow Energy PCL | 837,700 | 1,840 |
| Minor International PCL (Foreign) | 1,575,491 | 1,731 |
| Bangkok Bank PCL (Foreign) | 282,900 | 1,288 |
| * Krung Thai Bank PCL | 2,591,100 | 1,273 |
| * Maybank Kim Eng Securities Thailand PCL | 1,540,800 | 969 |
| * Intouch Holdings PCL | 307,800 | 465 |
| * Indorama Ventures PCL Warrants Exp. 08/24/2017 | 2,633,776 | 184 |
| * Land & Houses PCL | 534,600 | 140 |
| * Indorama Ventures Warrants Exp. 08/24/2018 | 2,025,981 | 139 |
| * TPI Polene PCL Rights Exp. 10/12/2016 | 768,093 | 71 |
| BCPG PCL | 133,955 | 52 |
| * Siam Cement PCL | 700 | 10 |
| Bank of Ayudhya PCL | 558 | 1 |
| | | 2,414,087 |
| Turkey (1.3%) | | |
| Turkiye Garanti Bankasi AS | 31,075,644 | 84,561 |
| Akbank TAS | 30,786,800 | 82,390 |
| BIM Birlesik Magazalar AS | 3,436,794 | 56,027 |
| KOC Holding AS | 9,652,502 | 40,261 |
| * Turkcell Iletisim Hizmetleri AS | 12,259,053 | 39,529 |
| Haci Omer Sabanci Holding AS (Bearer) | 13,041,916 | 39,436 |
| Tupras Turkiye Petrol Rafinerileri AS | 1,831,868 | 37,359 |
| Turkiye Is Bankasi | 21,912,436 | 35,581 |
| Emlak Konut Gayrimenkul Yatirim Ortakligi AS | 31,689,035 | 32,380 |
| Turkiye Halk Bankasi AS | 9,974,129 | 30,334 |
| Eregli Demir ve Celik Fabrikalari TAS | 20,884,882 | 28,397 |
| Turkiye Vakiflar Bankasi TAO | 17,247,356 | 25,564 |
| Anadolu Efes Biracilik Ve Malt Sanayii AS | 3,219,345 | 19,677 |
| Arcelik AS | 2,944,133 | 19,451 |
| * Yapi ve Kredi Bankasi AS | 14,741,339 | 17,648 |
| Turk Telekomunikasyon AS | 8,992,278 | 16,637 |
| Ulker Biskuvi Sanayi AS | 2,665,446 | 16,551 |
| * Turk Hava Yollari AO | 9,077,964 | 15,970 |
| Tofas Turk Otomobil Fabrikasi AS | 2,073,888 | 15,628 |
| Petkim Petrokimya Holding AS | 10,084,985 | 13,703 |
| Enka Insaat ve Sanayi AS | 8,904,175 | 13,600 |
| Ford Otomotiv Sanayi AS | 1,252,081 | 12,792 |
| Coca-Cola Icecek AS | 1,116,436 | 12,631 |
| TAV Havalimanlari Holding AS | 2,520,817 | 10,364 |
| Turkiye Sise ve Cam Fabrikalari AS | 9,780,885 | 10,289 |
| Aselsan Elektronik Sanayi Ve Ticaret AS | 3,013,471 | 9,164 |
| Turkiye Sinai Kalkinma Bankasi AS | 16,460,164 | 7,296 |
| Turk Traktor ve Ziraat Makineleri AS | 207,913 | 5,399 |
| Aygaz AS | 1,402,955 | 4,958 |
| * Koza Altin Isletmeleri AS | 716,950 | 4,084 |
| Tekfen Holding AS | 1,430,040 | 3,628 |
| Yazicilar Holding AS Class A | 757,359 | 3,330 |
| Dogus Otomotiv Servis ve Ticaret AS | 990,395 | 3,196 |
| * Migros Ticaret AS | 524,261 | 3,018 |
| Soda Sanayii AS | 2,126,115 | 2,954 |
| Akcansa Cimento AS | 692,742 | 2,891 |
| Otokar Otomotiv Ve Savunma Sanayi A.S. | 78,593 | 2,598 |
| * Dogan Sirketler Grubu Holding AS | 9,568,011 | 2,469 |
| Is Gayrimenkul Yatirim Ortakligi AS | 4,609,935 | 2,343 |
| Cimsa Cimento Sanayi VE Ticaret AS | 462,453 | 2,299 |
| Kardemir Karabuk Demir Celik Sanayi ve Ticaret AS | 5,005,029 | 2,041 |
67
| | |
| Vanguard® Emerging Markets Stock Index Fund | | |
| Schedule of Investments | | |
| October 31, 2016 | | |
| |
| | | Market |
| | | Value |
| | Shares | ($000) |
| Trakya Cam Sanayii AS | 2,401,094 | 1,979 |
| * Pegasus Hava Tasimaciligi AS | 463,032 | 1,956 |
| * Besiktas Futbol Yatirimlari Sanayi ve Ticaret AS | 1,267,381 | 1,790 |
| * Koza Anadolu Metal Madencilik Isletmeleri AS | 2,387,318 | 1,783 |
| * Aksa Enerji Uretim AS Class B | 1,354,867 | 1,231 |
| Torunlar Gayrimenkul Yatirim Ortakligi AS | 737,083 | 1,169 |
| Aksa Akrilik Kimya Sanayii AS | 409,272 | 1,153 |
| * NET Holding AS | 976,703 | 975 |
| * Afyon Cimento Sanayi TAS | 313,425 | 805 |
| * Vestel Elektronik Sanayi ve Ticaret AS | 372,155 | 791 |
| EIS Eczacibasi Ilac ve Sinai ve Finansal Yatirimlar Sanayi ve Ticaret AS | 625,122 | 791 |
| * Ipek Dogal Enerji Kaynaklari Arastirma Ve Uretim AS | 1,045,405 | 762 |
| * Sekerbank TAS | 2,009,847 | 760 |
| Gubre Fabrikalari TAS | 402,761 | 665 |
| * Aksigorta AS | 966,287 | 632 |
| * Vakif Gayrimenkul Yatirim Ortakligi AS | 751,150 | 581 |
| Tat Gida Sanayi AS | 313,998 | 579 |
| Brisa Bridgestone Sabanci Sanayi ve Ticaret AS | 248,138 | 559 |
| * Zorlu Enerji Elektrik Uretim AS | 985,517 | 523 |
| Albaraka Turk Katilim Bankasi AS | 1,150,710 | 461 |
| * Bagfas Bandirma Gubre Fabrikalari AS | 130,234 | 455 |
| Anadolu Hayat Emeklilik AS | 283,018 | 452 |
| Bizim Toptan Satis Magazalari AS | 101,958 | 427 |
| AvivaSA Emeklilik ve Hayat AS | 62,550 | 422 |
| * Ihlas Holding AS | 3,395,589 | 374 |
| Konya Cimento Sanayii AS | 4,231 | 368 |
| * Anadolu Cam Sanayii AS | 471,162 | 341 |
| Alarko Holding AS | 269,472 | 338 |
| Kardemir Karabuk Demir Celik Sanayi ve Ticaret AS Class A | 736,815 | 331 |
| Turcas Petrol AS | 633,476 | 315 |
| Adana Cimento Sanayii TAS Class A | 146,658 | 295 |
| * Akenerji Elektrik Uretim AS | 914,448 | 284 |
| * Asya Katilim Bankasi AS | 6,317,442 | — |
| | | 812,775 |
| United Arab Emirates (1.0%) | | |
| Emirates Telecommunications Group Co. PJSC | 24,042,891 | 123,352 |
| Emaar Properties PJSC | 55,647,770 | 105,374 |
| First Gulf Bank PJSC | 18,010,321 | 56,317 |
| Abu Dhabi Commercial Bank PJSC | 29,687,057 | 49,545 |
| DP World Ltd. | 2,687,229 | 48,214 |
| Aldar Properties PJSC | 53,109,256 | 38,019 |
| Dubai Islamic Bank PJSC | 21,492,261 | 30,618 |
| Emaar Malls PJSC | 35,172,322 | 24,570 |
| * DXB Entertainments PJSC | 55,751,076 | 23,753 |
| Union National Bank PJSC | 18,736,799 | 19,979 |
| DAMAC Properties Dubai Co. PJSC | 29,301,414 | 17,499 |
| Air Arabia PJSC | 39,937,251 | 14,115 |
| * Arabtec Holding PJSC | 37,027,872 | 13,371 |
| Dubai Investments PJSC | 21,828,914 | 11,914 |
| Al Waha Capital PJSC | 18,546,769 | 9,485 |
| * Dana Gas PJSC | 60,857,631 | 8,762 |
| Dubai Financial Market PJSC | 27,013,604 | 8,434 |
| Amanat Holdings PJSC | 20,243,279 | 4,819 |
| * Deyaar Development PJSC | 32,005,618 | 4,640 |
| * Eshraq Properties Co. PJSC | 20,648,392 | 4,429 |
| * Union Properties PJSC | 21,192,380 | 4,077 |
| National Central Cooling Co. PJSC | 8,318,553 | 4,063 |
| RAK Properties PJSC | 20,584,860 | 3,459 |
| Aramex PJSC | 2,913,203 | 2,805 |
| * Drake & Scull International PJSC | 16,931,558 | 2,090 |
| * Amlak Finance PJSC | 901,901 | 303 |
68
Vanguard® Emerging Markets Stock Index Fund
Schedule of Investments
October 31, 2016
| | | | | |
| | | | | | Market |
| | | | | | Value |
| | | | | Shares | ($000) |
| | Agthia Group PJSC | | | 86,000 | 140 |
| |
| | | | | | 634,146 |
| |
| Total Common Stocks (Cost $61,426,171) | | | | 61,977,966 |
| |
| |
| | | Coupon | | | |
| |
| Temporary Cash Investments (2.1%)1 | | | | |
| Money Market Fund (2.0%) | | | | |
| 3,4 | Vanguard Market Liquidity Fund | 0.718% | | 12,180,663 | 1,218,188 |
| |
| |
| | | | | Face | |
| | | | Maturity | Amount | |
| | | | Date | ($000) | |
| U.S. Government and Agency Obligations (0.1%) | | | | |
| 5 | Federal Home Loan Bank Discount Notes | 0.339% | 11/4/16 | 5,000 | 5,000 |
| | United States Treasury Bill | 0.321% | 12/1/16 | 10,000 | 9,998 |
| 6 | United States Treasury Bill | 0.275%–0.365% | 12/8/16 | 31,600 | 31,595 |
| 6 | United States Treasury Bill | 0.291%–0.300% | 12/22/16 | 9,200 | 9,197 |
| 6 | United States Treasury Bill | 0.255% | 12/29/16 | 1,100 | 1,099 |
| | United States Treasury Bill | 0.360% | 1/12/17 | 10,000 | 9,995 |
| |
| | | | | | 66,884 |
| |
| Total Temporary Cash Investments (Cost $1,284,948) | | | | 1,285,072 |
| |
| Total Investments (101.1%) (Cost $62,711,119) | | | | 63,263,038 |
| Other Assets and Liabilities—Net (-1.1%)4 | | | | (674,714) |
| Net Assets (100%) | | | | 62,588,324 |
__________________________________________________________________________________________________________________________________________________________________________________________________________________________________________________________________________________________________________________________________________________________________________________________________________________________________________________________________________________________________________________________________________________________________________________________________________________________________________________________________________________________
* Non-income-producing security.
^ Includes partial security positions on loan to broker-dealers. The total value of securities on loan is $619,217,000.
1 The fund invests a portion of its cash reserves in equity markets through the use of index futures contracts and swap contracts. After giving
effect to futures and swap investments, the fund's effective common stock and temporary cash investment positions represent 100.0% and
1.1%, respectively, of net assets.
2 Security exempt from registration under Rule 144A of the Securities Act of 1933. Such securities may be sold in transactions exempt from
registration, normally to qualified institutional buyers. At October 31, 2016, the aggregate value of these securities was $486,064,000,
representing 0.8% of net assets.
3 Affiliated money market fund available only to Vanguard funds and certain trusts and accounts managed by Vanguard. Rate shown is the 7-day
yield.
4 Includes $698,123,000 of collateral received for securities on loan.
5 The issuer operates under a congressional charter; its securities are generally neither guaranteed by the U.S. Treasury nor backed by the full
faith and credit of the U.S. government.
6 Securities with a value of $27,394,000 have been segregated as initial margin for open futures contracts.
ADR—American Depositary Receipt.
GDR—Global Depositary Receipt.
NVDR—Non-Voting Depository Receipt.
REIT—Real Estate Investment Trust.
69
© 2016 The Vanguard Group, Inc.
All rights reserved.
Vanguard Marketing Corporation, Distributor.
SNA5330 122016

Report of Independent Registered Public Accounting Firm
To the Board of Trustees of Vanguard International Equity Index Funds and the Shareholders of Vanguard European Stock Index Fund and Vanguard Pacific Stock Index Fund:
In our opinion, the accompanying statements of net assets investments summary and the related statements of operations and of changes in net assets and the financial highlights (included in Item 1 of this Form N-CSR) and the schedules of investments (included in Item 6 of this Form N-CSR) present fairly, in all material respects, the financial position of Vanguard European Stock Index Fund and Vanguard Pacific Stock Index Fund (constituting separate portfolios of Vanguard International Equity Index Funds, hereafter referred to as the "Funds") at October 31, 2016, the results of each of their operations for the year then ended, the changes in each of their net assets for each of the two years in the period then ended, and the financial highlights for each of the periods indicated, in conformity with accounting principles generally accepted in the United States of America. These financial statements, financial highlights, and schedules of investments (hereafter referred to as "financial statements") are the responsibility of the Funds’ management. Our responsibility is to express an opinion on these financial statements based on our audits. We conducted our audits of these financial statements in accordance with the standards of the Public Company Accounting Oversight Board (United States). Those standards require that we plan and perform the audit to obtain reasonable assurance about whether the financial statements are free of material misstatement. An audit includes examining, on a test basis, evidence supporting the amounts and disclosures in the financial statements, assessing the accounting principles used and significant estimates made by management, and evaluating the overall financial statement presentation. We believe that our audits, which included confirmation of securities at October 31, 2016 by correspondence with the custodian and brokers and by agreement to the underlying ownership records of the transfer agent, provide a reasonable basis for our opinion.

December 15, 2016
PricewaterhouseCoopers LLP, Two Commerce Square, Suite 1800, 2001 Market Street, Philadelphia, PA 19103-7042
T: (267) 330 3000, F: (267) 330 3300, www.pwc.com/us

Report of Independent Registered Public Accounting Firm
To the Board of Trustees of Vanguard International Equity Index Funds and the Shareholders of Vanguard Total World Stock Index Fund:
In our opinion, the accompanying statement of net assetsinvestments summary and the related statements of operations and of changes in net assets and the financial highlights (included in Item 1 of this Form N-CSR) and the schedule of investments (included in Item 6 of this Form N-CSR) present fairly, in all material respects, the financial position of Vanguard Total World Stock Index Fund (constituting a separate portfolio of Vanguard International Equity Index Funds, hereafter referred to as the "Fund") at October 31, 2016, the results of its operations for the year then ended, the changes in its net assets for each of the two years in the period then ended, and the financial highlights for each of the five years in the period then ended, in conformity with accounting principles generally accepted in the United States of America. These financial statements, financial highlights, and schedule of investments (hereafter referred to as "financial statements") are the responsibility of the Fund's management. Our responsibility is to express an opinion on these financial statements based on our audits. We conducted our audits of these financial statements in accordance with the standards of the Public Company Accounting Oversight Board (United States). Those standards require that we plan and perform the audit to obtain reasonable assurance about whether the financial statements are free of material misstatement. An audit includes examining, on a test basis, evidence supporting the amounts and disclosures in the financial statements, assessing the accounting principles used and significant estimates made by management, and evaluating the overall financial statement presentation. We believe that our audits, which included confirmation of securities at October 31, 2016 by correspondence with the custodian and brokers and by agreement to the underlying ownership records of the transfer agent, provide a reasonable basis for our opinion.

December 15, 2016
PricewaterhouseCoopers LLP, Two Commerce Square, Suite 1800, 2001 Market Street, Philadelphia, PA 19103-7042
T: (267) 330 3000, F: (267) 330 3300, www.pwc.com/us

Report of Independent Registered Public Accounting Firm
To the Board of Trustees of Vanguard International Equity Index Funds and the Shareholders of Vanguard FTSE All-World ex-US Index Fund and Vanguard FTSE All-World ex-US Small-Cap Index Fund:
In our opinion, the accompanying statements of net assetsinvestments summary, statement of assets and liabilities and the related statements of operations and of changes in net assets and the financial highlights (included in Item 1 of this Form N-CSR) and the schedules of investments (included in Item 6 of this Form N-CSR) present fairly, in all material respects, the financial position of Vanguard FTSE All-World ex-US Index Fund and Vanguard FTSE All-World ex-US Small-Cap Index Fund (constituting separate portfolios of Vanguard International Equity Index Funds, hereafter referred to as the "Funds") at October 31, 2016, the results of each of their operations for the year then ended, the changes in each of their net assets for each of the two years in the period then ended, and the financial highlights for each of the five years in the period then ended, in conformity with accounting principles generally accepted in the United States of America. These financial statements, financial highlights, and schedules of investments (hereafter referred to as "financial statements") are the responsibility of the Funds’ management. Our responsibility is to express an opinion on these financial statements based on our audits. We conducted our audits of these financial statements in accordance with the standards of the Public Company Accounting Oversight Board (United States). Those standards require that we plan and perform the audit to obtain reasonable assurance about whether the financial statements are free of material misstatement. An audit includes examining, on a test basis, evidence supporting the amounts and disclosures in the financial statements, assessing the accounting principles used and significant estimates made by management, and evaluating the overall financial statement presentation. We believe that our audits, which included confirmation of securities at October 31, 2016 by correspondence with the custodian and brokers and by agreement to the underlying ownership records of the transfer agent, provide a reasonable basis for our opinion.

December 15, 2016
PricewaterhouseCoopers LLP, Two Commerce Square, Suite 1800, 2001 Market Street, Philadelphia, PA 19103-7042
T: (267) 330 3000, F: (267) 330 3300, www.pwc.com/us

Report of Independent Registered Public Accounting Firm
To the Board of Trustees of Vanguard International Equity Index Funds and the Shareholders of Vanguard Emerging Markets Stock Index Fund:
In our opinion, the accompanying statement of net assetsinvestments summary and the related statements of operations and of changes in net assets and the financial highlights (included in Item 1 of this Form N-CSR) and the schedule of investments (included in Item 6 of this Form N-CSR) present fairly, in all material respects, the financial position of Vanguard Emerging Markets Stock Index Fund (constituting a separate portfolio of Vanguard International Equity Index Funds, hereafter referred to as the "Fund") at October 31, 2016, the results of its operations for the year then ended, the changes in its net assets for each of the two years in the period then ended, and the financial highlights for each of the five years in the period then ended, in conformity with accounting principles generally accepted in the United States of America. These financial statements, financial highlights, and schedule of investments (hereafter referred to as "financial statements") are the responsibility of the Fund’s management. Our responsibility is to express an opinion on these financial statements based on our audits. We conducted our audits of these financial statements in accordance with the standards of the Public Company Accounting Oversight Board (United States). Those standards require that we plan and perform the audit to obtain reasonable assurance about whether the financial statements are free of material misstatement. An audit includes examining, on a test basis, evidence supporting the amounts and disclosures in the financial statements, assessing the accounting principles used and significant estimates made by management, and evaluating the overall financial statement presentation. We believe that our audits, which included confirmation of securities at October 31, 2016 by correspondence with the custodian and brokers and by agreement to the underlying ownership records of the transfer agent, provide a reasonable basis for our opinion.

December 15, 2016
PricewaterhouseCoopers LLP, Two Commerce Square, Suite 1800, 2001 Market Street, Philadelphia, PA 19103-7042
T: (267) 330 3000, F: (267) 330 3300, www.pwc.com/us
Item 7: Disclosure of Proxy Voting Policies and Procedures for Closed-End Management
Investment Companies.
Not Applicable.
Item 8: Portfolio Managers of Closed-End Management Investment Companies.
Not Applicable.
Item 9: Purchase of Equity Securities by Closed-End Management Investment Company and
Affiliated Purchasers.
Not Applicable.
Item 10: Submission of Matters to a Vote of Security Holders.
Not Applicable.
Item 11: Controls and Procedures.
(a) Disclosure Controls and Procedures. The Principal Executive and Financial Officers concluded that the Registrant’s Disclosure Controls and Procedures are effective based on their evaluation of the Disclosure Controls and Procedures as of a date within 90 days of the filing date of this report.
(b) Internal Control Over Financial Reporting. There were no significant changes in Registrant’s Internal Control Over Financial Reporting or in other factors that could significantly affect this control subsequent to the date of the evaluation, including any corrective actions with regard to significant deficiencies and material weaknesses.
Item 12: Exhibits.
(a) Code of Ethics.
(b) Certifications.
Pursuant to the requirements of the Securities Exchange Act of 1934 and the Investment Company Act of 1940, the registrant has duly caused this report to be signed on its behalf by the undersigned, thereunto duly authorized.
| |
| | VANGUARD INTERNATIONAL EQUITY INDEX FUNDS |
| |
| |
| BY: | /s/ F. WILLIAM MCNABB III* |
| | F. WILLIAM MCNABB III |
| | CHIEF EXECUTIVE OFFICER |
| |
| Date: December 19, 2016 |
Pursuant to the requirements of the Securities Exchange Act of 1934 and the Investment Company Act of 1940, this report has been signed below by the following persons on behalf of the registrant and in the capacities and on the dates indicated.
| |
| | VANGUARD INTERNATIONAL EQUITY INDEX FUNDS |
| |
| BY: | /s/ F. WILLIAM MCNABB III* |
| | F. WILLIAM MCNABB III |
| | CHIEF EXECUTIVE OFFICER |
| Date: December 19, 2016 |
| VANGUARD INTERNATIONAL EQUITY INDEX FUNDS |
| |
| BY: | /s/ THOMAS J. HIGGINS* |
| | THOMAS J. HIGGINS |
| | CHIEF FINANCIAL OFFICER |
| Date: December 19, 2016 |
* By: /s/ Anne E. Robinson
Anne E. Robinson, pursuant to a Power of Attorney filed on October 4, 2016 see file Number
33-32548, Incorporated by Reference.