UNITED STATES
SECURITIES AND EXCHANGE COMMISSION
Washington, D.C. 20549
FORM N-CSR
CERTIFIED SHAREHOLDER REPORT
OF
REGISTERED MANAGEMENT INVESTMENT COMPANIES
Investment Company Act file number: 811-05962
| Name of Registrant: | Vanguard Variable Insurance Funds |
| Address of Registrant: | P.O. Box 2600 |
| | Valley Forge, PA 19482 |
| Name and address of agent for service: | Anne E. Robinson, Esquire |
| | P.O. Box 876 |
| | Valley Forge, PA 19482 |
Registrant’s telephone number, including area code:(610) 669-1000
Date of fiscal year end: December 31
Date of reporting period: January 1, 2019—December 31, 2019
Item 1:Reports to Shareholders

| | |
| | |
| | |
| | |
| Annual Report|December 31, 2019 | |
| | |
| | |
| Vanguard Variable Insurance Fund |
| | |
| | |
| | |
| | |
| | |
| | |
| | |
| | |
| | |
| | |
| | |
| | |
Balanced Portfolio Capital Growth Portfolio Conservative Allocation Portfolio Diversified Value Portfolio Equity Income Portfolio Equity Index Portfolio Global Bond Index Portfolio with underlying Total Bond Market Index Portfolio Growth Portfolio High Yield Bond Portfolio International Portfolio | Mid-Cap Index Portfolio Moderate Allocation Portfolio Money Market Portfolio Real Estate Index Portfolio Short-Term Investment-Grade Portfolio Small Company Growth Portfolio Total Bond Market Index Portfolio Total International Stock Market Index Portfolio Total Stock Market Index Portfolio
with underlying Equity Index Portfolio |
| | |
| | |
| | |
| | |
| | |
| | |
| | |
| | |
| | |
| | |
| | |
| | |
| | |
| | |
| | |
| See the inside front cover for important information about access to your fund’s annual and semiannual shareholder reports. |
| | |
Important information about access to shareholder reports
Beginning on January 1, 2021, as permitted by regulations adopted by the Securities and Exchange Commission, paper copies of your fund’s annual and semiannual shareholder reports will no longer be sent to you by mail, unless you specifically request them. Instead, you will be notified by mail each time a report is posted on the website and will be provided with a link to access the report.
If you have already elected to receive shareholder reports electronically, you will not be affected by this change and do not need to take any action. You may elect to receive shareholder reports and other communications from the fund electronically by contacting your financial intermediary (such as a broker-dealer or bank) or, if you invest directly with the fund, by calling Vanguard at one of the phone numbers on the back cover of this report or by logging on to vanguard.com.
You may elect to receive paper copies of all future shareholder reports free of charge. If you invest through a financial intermediary, you can contact the intermediary to request that you continue to receive paper copies. If you invest directly with the fund, you can call Vanguard at one of the phone numbers on the back cover of this report or log on to vanguard.com. Your election to receive paper copies will apply to all the funds you hold through an intermediary or directly with Vanguard.
| Contents | |
| | |
| CEO’s Perspective | 1 |
| Balanced Portfolio | 2 |
| Capital Growth Portfolio | 31 |
| Conservative Allocation Portfolio | 45 |
| Diversified Value Portfolio | 57 |
| Equity Income Portfolio | 73 |
| Equity Index Portfolio | 89 |
Global Bond Index Portfolio
(with underlying Total Bond Market Index Portfolio) | 104 |
| Growth Portfolio | 183 |
| High Yield Bond Portfolio | 198 |
| International Portfolio | 219 |
| Mid-Cap Index Portfolio | 236 |
| Moderate Allocation Portfolio | 251 |
| Money Market Portfolio | 263 |
| Real Estate Index Portfolio | 275 |
| Short-Term Investment-Grade Portfolio | 290 |
| Small Company Growth Portfolio | 334 |
| Total Bond Market Index Portfolio | 350 |
| Total International Stock Market Index Portfolio | 418 |
Total Stock Market Index Portfolio
(with underlying Equity Index Portfolio) | 430 |
Please note: The opinions expressed in this report are just that—informed opinions. They should not be considered promises or advice. Also, please keep in mind that the information and opinions cover the period through the date on the front of this report. Of course, the risks of investing in your fund are spelled out in the prospectus.
A Note From Our Chairman

Tim Buckley
Chairman and Chief Executive Officer
Dear Planholder,
Recent volatility in financial markets—affecting stocks, bonds, and commodities—has been a good reminder of the wise old adage, “Never keep all your eggs in one basket.” Maintaining balance and diversification in your investment portfolio can help to both limit risk and set you up for long-term success.
It’s understandable why some investors might become complacent after a long market run-up like the one that lifted stock prices, especially U.S. stock prices, in the years following the global financial crisis. But failing to rebalance regularly can leave a portfolio with a much different mix of assets than intended and, often, more risk than intended.
Balance across and diversification within asset classes are powerful tools for managing risk and achieving your investment goals. A portfolio’s allocation will determine a large portion of its long-term return and also the majority of its volatility risk. A well-diversified portfolio is less vulnerable to significant swings in the performance of any one segment of the asset classes in which it invests.
Balance and diversification will never eliminate the risk of loss, nor will they guarantee positive returns in a declining market. But they may reduce the chance that you’ll suffer disproportionate losses in one particular high-flying asset class or sector when it comes back to earth. And exposure to all key market components should give you at least some participation in the sectors that are performing best at any given time.
Vanguard is committed to helping you achieve balance and diversification in your portfolios to help meet your investment goals. We thank you for your continued loyalty.
Sincerely,

Mortimer J. Buckley
Chairman and Chief Executive Officer
January 23, 2020
Balanced Portfolio
Your Portfolio’s Performance at a Glance
• The Balanced Portfolio of Vanguard Variable Insurance Fund returned 22.48% for the 12 months ended December 31, 2019, trailing the 24.40% return of its composite benchmark. Please note that the portfolio returns in Vanguard Variable Insurance Fund are different from those in Vanguard Variable Annuity (and other plans that invest in the fund), which take into account insurance-related expenses.
• Stocks and bonds recorded their best results in years. Stocks benefited from three reductions of the Federal Reserve’s target for short-term interest rates during the year. And safer assets including bonds attracted investors as U.S.-China trade tensions fueled global economic growth concerns.
• Growth stocks outperformed their value counterparts, while large- and mid-capitalization stocks surpassed small-caps.
• The portfolio’s returns were positive in all 11 equity sectors. The advisor’s holdings in industrials and consumer discretionary contributed most to relative performance. Information technology and communication services were the biggest net detractors.
• The fixed income portfolio benefited from strong selection in investment-grade corporate bonds and modestly from duration and yield curve positioning.
• Over the decade ended December 31, 2019, the portfolio’s average annual return trailed that of its benchmark.
| Market Barometer | |
| | Average Annual Total Returns |
| | Periods Ended December 31, 2019 |
| | One Year | Three Years | Five Years |
| Stocks |
| Russell 1000 Index (Large-caps) | 31.43% | 15.05% | 11.48% |
| Russell 2000 Index (Small-caps) | 25.53 | 8.59 | 8.23 |
| Russell 3000 Index (Broad U.S. market) | 31.02 | 14.57 | 11.24 |
| FTSE All-World ex US Index (International) | 21.81 | 9.96 | 5.83 |
| |
| Bonds |
Bloomberg Barclays U.S. Aggregate Bond Index
(Broad taxable market) | 8.72% | 4.03% | 3.05% |
Bloomberg Barclays Municipal Bond Index
(Broad tax-exempt market) | 7.54 | 4.72 | 3.53 |
| FTSE Three-Month U.S. Treasury Bill Index | 2.25 | 1.65 | 1.04 |
| |
| CPI |
| Consumer Price Index | 2.29% | 2.10% | 1.82% |
Balanced Portfolio
Advisor’s Report
The Balanced Portfolio returned 22.48% for the 12 months ended December 31, 2019, below the 24.40% return of its blended benchmark (a mix of 65% large-capitalization stocks and 35% high-quality corporate bonds). The stock portion of the portfolio underperformed its benchmark, the Standard & Poor’s 500 Index, while the bond portion outperformed its benchmark, the Bloomberg Barclays U.S. Credit A or Better Bond Index.
The investment environment
Stock markets in the United States and abroad posted positive results for the year. The S&P 500 Index returned 31.49%, the MSCI World Index 28.40%, and the MSCI EAFE Index 22.01%.
The market rallied sharply at the start of 2019 because of supportive rhetoric from the Federal Reserve, the perception of easing tensions between the U.S. and China, and solid corporate earnings. As the year progressed, corporate earnings remained resilient but not robust, and geopolitical tensions again spiked. Ultimately, the combination of stabilizing economic data, accommodative central banks, and continued optimism toward an eventual U.S.-China trade deal proved favorable for equities.
The Fed pursued what could be termed a pro-market policy path, cutting interest rates 75 basis points over the year. (A basis point is one-hundredth of a percentage point.) Although geopolitical tensions ebbed and flowed, President Trump seemed to give the market sufficient hope that a trade deal with China could ultimately be consummated.
Corporate earnings for the 12 months were decent, if not spectacular. Earnings growth for the S&P 500 slowed significantly, but stocks and earnings over the past three years have largely moved in lockstep.
In the United States, large-capitalization growth stocks significantly outperformed large-cap value stocks, as measured by the Russell 1000 Growth Index (36.39%) and the Russell 1000 Value Index (26.54%).
This served as a slight headwind to the portfolio, which historically has had a value tilt.
The broad fixed income market generated largely positive returns, driven by a decline in sovereign yields in most markets, particularly in the first three quarters of the year. Corporate bond spreads tightened because of optimism that monetary accommodation could offset the drag on global growth from restrictive trade policies. Inflation showed no meaningful acceleration even as wage growth edged higher.
The Bloomberg Barclays U.S. Aggregate Bond Index returned 8.72%. The higher-quality credit market performed even better, as the Bloomberg Barclays U.S. Credit A or Better Bond Index returned 11.53%. The yield on the 10-year U.S. Treasury note declined 76 basis points, ending 2019 at 1.92%.
Our successes
In the stock portion of the portfolio, although security selection was a slight detractor to overall performance, selection was best in industrials, consumer discretionary, energy, and financials. Our holdings in Bank of America, JPMorgan Chase, American Tower, and Hilton Worldwide were strong contributors.
Relative performance was also boosted by not holding some securities. These included Berkshire Hathaway, Amazon. com, Johnson & Johnson, and Boeing.
In the fixed income market, spread sectors rallied at the beginning of 2019, reversing the widening that occurred at the end of 2018. Security selection in investment-grade corporates, particularly consumer noncyclicals and the communications subsector of industrials, drove the portfolio’s relative outperformance. Selection in financials and utilities also helped. In noncorporate credit, underweights to supranationals and local agency bonds as well as selection in local agency and taxable municipals contributed.
Duration/yield curve positioning modestly lifted overall performance. But short duration/yield curve flattening strategies, particularly in the early part of the year, detracted, partially offsetting the positive impact of a longer duration positioning later. Duration is a measure of the sensitivity of fixed income securities to changes in yields.
Our shortfalls
In the stock portion of the portfolio, sector allocation detracted most from relative performance. Our underweighted position in information technology was a significant headwind, as was our overweight to energy.
Security selection in communication services, information technology, and materials also hurt. Notable detractors included Verizon Communications, Simon Property Group, Pfizer, and Exelon. Stocks we did not hold or held underweighted positions in that reduced relative performance included Apple, Facebook, and Mastercard.
In fixed income, the portfolio’s under-weighted positioning in credit spread duration versus the all-credit benchmark lagged most as spreads tightened during the year. An underweight to financials (banking) and an overweight to utilities (electric) also hurt. An out-of-benchmark allocation to agency mortgage-backed securities--pass-throughs and collateralized mortgage obligations–detracted further.
Portfolio positioning
Our intermediate-term outlook for equity markets is balanced. On the encouraging side, economic growth is modestly positive in most regions, central banks have largely adopted an accommodative posture to setting monetary policy, and President Trump has sustained a pro-market orientation with respect to trade negotiations and fiscal policy. On the cautious side, we are ten years into an economic cycle and growth remains subdued, geopolitical relations delicate, and equity valuations near all-time highs.
Balanced Portfolio
In the stock portion of the portfolio, we are enthusiastic about the prospects for many individual businesses, such as JPMorgan Chase and Bank of America. These two, in particular, are extending their competitive advantage through investments in technology. Additionally, large pharmaceutical companies including Pfizer, Novartis, and AstraZeneca are reinvigorating their growth pipelines.
Global consumer staples such as Nestle and Diageo are using sharpened strategies to deliver growth. Consumer companies including Hilton Worldwide, Home Depot, Lowe’s, and TJX are reinvesting their scale advantages to enhance consumer value. Technology firms such as Microsoft and Alphabet are providing compelling innovation in attractive end-markets and driving scale benefits from their customers, employees, and shareholders.
Over the course of the year, we initiated new positions in American Express, Raytheon, and Boston Properties. We believe these companies are superb fits for our philosophy and process and we are optimistic about their future. We eliminated holdings in United Parcel Service, Citigroup, and Halliburton as we believe that challenging industry dynamics will make it difficult for these businesses to compound value at an attractive rate.
The portfolio is overweighted in financials because we believe large U.S. banks present a particularly compelling combination of quality and value. It is underweighted in information technology because we are concerned about the sustainability of very high growth rates and lofty equity valuations.
We remain committed to our investment philosophy and process of constructing a portfolio of resilient businesses at reasonable valuations run by strong management teams likely to make value-enhancing decisions. Our goal is to deliver a superior rate of economic growth (earnings plus dividends) over the long term and protect on the downside during difficult markets and economies.
In fixed income, we believe credit valuations are modestly rich because of risks involving geopolitics, trade tensions, and elections. However, global central banks should continue to support asset valuations. We expect global inflation to remain benign, making it unlikely that we will see a sustained move higher in global rates in 2020. We have positioned the fixed income portion of the portfolio with a slight duration overweight relative to the benchmark.
We are increasingly cautious about the business cycle and believe that credit fundamentals have deteriorated in part because of slowing earnings growth. Credit remains the portfolio’s main investment focus, and we continue to look for opportunities in the sector. We are positioned with an underweight to corporate credit relative to the all-credit benchmark and a bias toward more defensive sectors such as utilities and communication services.
We believe that taxable municipals remain fairly valued and a high-quality diversifier relative to our corporate bond risk. We retain a core overweighted position to the sector but have modestly reduced it recently, particularly for not-for-profit hospitals, because of secular headwinds and tight valuations.
The portfolio maintains an out-of-benchmark allocation to Treasury bills. We have increased our out-of-benchmark mortgage allocation and favor low- to mid-coupon agency pass-throughs and collateralized mortgage obligations for their favorable prepayment profile.
We own a modest out-of-benchmark allocation to prime, non-agency mortgage-backed securities. We also hold out-of-benchmark allocations to the securitized sectors, such as asset-backed securities, collateralized loan obligations, and commercial mortgage-backed securities, that offer attractive value and diversification relative to corporates. We are focused on acquiring high-quality issuance and senior portions of the capital structure.
Consistent with our practices, we always endeavor to hold adequate liquidity in the fixed income portion of the portfolio, most notably by owning government bonds and agency mortgage-backed securities. This liquidity should provide some downside protection for shareholders if the economic cycle or the equity portfolio takes an unfavorable turn.
We remain disciplined in the application of our investment process, allowing us to create a balanced portfolio that we believe should perform well in a variety of environments. We focus on long-term, low-turnover investing—features that have served the portfolio’s shareholders well over time.
Portfolio Managers:
Edward P. Bousa, CFA,
Senior Managing Director and
Equity Portfolio Manager
Daniel J. Pozen
Senior Managing Director and
Equity Portfolio Manager
Michael E. Stack, CFA,
Senior Managing Director and
Fixed Income Portfolio Manager
Loren L. Moran, CFA,
Senior Managing Director and
Fixed Income Portfolio Manager
Wellington Management Company LLP
January 14, 2020
Balanced Portfolio
About Your Portfolio’s Expenses
As a shareholder of the portfolio, you incur ongoing costs, which include costs for portfolio management, administrative services, and shareholder reports (like this one), among others. Operating expenses, which are deducted from a portfolio’s gross income, directly reduce the investment return of the portfolio.
A portfolio’s expenses are expressed as a percentage of its average net assets. This figure is known as the expense ratio. The following examples are intended to help you understand the ongoing costs (in dollars) of investing in your portfolio and to compare these costs with those of other mutual funds. The examples are based on an investment of $1,000 made at the beginning of the period shown and held for the entire period.
The table below illustrates your portfolio’s costs in two ways:
• Based on actual portfolio return. This section helps you to estimate the actual expenses that you paid over the period. The “Ending Account Value” shown is derived from the portfolio’s actual return, and the third column shows the dollar amount that would have been paid by an investor who started with $1,000 in the portfolio. You may use the information here, together with the amount you invested, to estimate the expenses that you paid over the period.
To do so, simply divide your account value by $1,000 (for example, an $8,600 account value divided by $1,000 = 8.6), then multiply the result by the number given for your portfolio under the heading “Expenses Paid During Period.”
• Based on hypothetical 5% yearly return. This section is intended to help you compare your portfolio’s costs with those of other mutual funds. It assumes that the portfolio had a yearly return of 5% before expenses, but that the expense ratio is unchanged. In this case—because the return used is not the portfolio’s actual return—the results do not apply to your investment. The example is useful in making comparisons because the Securities and Exchange Commission requires all mutual funds to calculate expenses based on a 5% return. You can assess your portfolio’s costs by comparing this hypothetical example with the hypothetical examples that appear in shareholder reports of other funds.
Note that the expenses shown in the table are meant to highlight and help you compareongoingcosts only and do not reflect transaction costs incurred by the portfolio for buying and selling securities. The portfolio’s expense ratio does not reflect additional fees and expenses associated with the annuity or life insurance program through which you invest.
The calculations assume no shares were bought or sold during the period. Your actual costs may have been higher or lower, depending on the amount of your investment and the timing of any purchases or redemptions.
You can find more information about the portfolio’s expenses in the Financial Statements section. For additional information on operating expenses and other shareholder costs, please refer to the prospectus.
| Six Months Ended December 31, 2019 | | | |
| | Beginning | Ending | Expenses |
| | Account Value | Account Value | Paid During |
| Balanced Portfolio | 6/30/2019 | 12/31/2019 | Period |
| Based on Actual Portfolio Return | $1,000.00 | $1,085.76 | $1.10 |
| Based on Hypothetical 5% Yearly Return | 1,000.00 | 1,024.15 | 1.07 |
The calculations are based on expenses incurred in the most recent six-month period. The portfolio’s annualized six-month expense ratio for that period is 0.21%. The dollar amounts shown as “Expenses Paid” are equal to the annualized expense ratio multiplied by the average account value over the period, multiplied by the number of days in the most recent six-month period, then divided by the number of days in the most recent 12-month period (184/365).
Balanced Portfolio
Performance Summary
All of the returns in this report represent past performance, which is not a guarantee of future results that may be achieved by the portfolio. (Current performance may be lower or higher than the performance data cited. For performance data current to the most recent month-end, visit our website at vanguard.com/performance.) Note, too, that both investment returns and principal value can fluctuate widely, so an investor’s shares, when sold, could be worth more or less than their original cost. The returns shown do not reflect taxes that a shareholder would pay on portfolio distributions or on the sale of portfolio shares. Nor do the returns reflect fees and expenses associated with the annuity or life insurance program through which a shareholder invests. If these fees and expenses were included, the portfolio’s returns would be lower.
Cumulative Performance: December 31, 2009–December 31, 2019 Initial
Investment of $10,000

| | | Average Annual Total Returns | Final Value |
| | | Periods Ended December 31, 2019 | of a $10,000 |
| | | One Year | Five Years | Ten Years | Investment |
 | Balanced Portfolio | 22.48% | 8.56% | 9.91% | $25,733 |
 | S&P 500 Index | 31.49 | 11.70 | 13.56 | 35,666 |
 | Composite Stock/Bond Index | 24.40 | 9.09 | 10.62 | 27,428 |
 | Dow Jones U.S. Total Stock Market Float Adjusted Index | 30.90 | 11.18 | 13.43 | 35,251 |
Composite Stock/Bond Index: Weighted 65% S&P 500 Index and 35% Bloomberg Barclays U.S. Credit A or Better Bond Index.
See Financial Highlights for dividend and capital gains information.
Balanced Portfolio
Sector Diversification
As of December 31, 2019
| Equity Exposure | |
| | |
| Communication Services | 10.0% |
| Consumer Discretionary | 5.3 |
| Consumer Staples | 7.4 |
| Energy | 6.7 |
| Financials | 22.7 |
| Health Care | 16.2 |
| Industrials | 9.5 |
| Information Technology | 13.9 |
| Materials | 1.2 |
| Real Estate | 2.6 |
| Utilities | 4.5 |
The table reflects the portfolio’s equity exposure, based on its investments in stocks and stock index futures. Any holdings in short-term reserves are excluded. Sector categories are based on the Global Industry Classification Standard (“GICS”), except for the “Other” category (if applicable), which includes securities that have not been provided a GICS classification as of the effective reporting period.
| Fixed Income Exposure | |
| | |
| Asset-Backed | 4.8% |
| Finance | 24.7 |
| Foreign | 4.1 |
| Government Mortgage-Backed | 8.2 |
| Industrial | 30.9 |
| Treasury | 13.8 |
| Utilities | 8.4 |
| Other | 5.1 |
The table reflects the portfolio’s market exposure. Any holdings in short-term reserves are excluded. The agency and mortgage-backed securities sectors may include issues from government-sponsored enterprises; such issues are generally not backed by the full faith and credit of the U.S. government.
The Global Industry Classification Standard (“GICS”) was developed by and is the exclusive property and a service mark of MSCI Inc. (“MSCI”) and Standard and Poor’s, a division of McGraw-Hill Companies, Inc. (“S&P”), and is licensed for use by Vanguard. Neither MSCI, S&P nor any third party involved in making or compiling the GICS or any GICS classification makes any express or implied warranties or representations with respect to such standard or classification (or the results to be obtained by the use thereof), and all such parties hereby expressly disclaim all warranties of originality, accuracy, completeness, merchantability or fitness for a particular purpose with respect to any such standard or classification. Without limiting any of the foregoing, in no event shall MSCI, S&P, any of its affiliates or any third party involved in making or compiling the GICS or any GICS classification have any liability for any direct, indirect, special, punitive, consequential or any other damages (including lost profits) even if notified of the possibility of such damages.
Balanced Portfolio
Financial Statements
Statement of Net Assets
As of December 31, 2019
The portfolio files its complete schedule of portfolio holdings with the Securities and Exchange Commission (SEC) for the first and third quarters of each fiscal year as an exhibit to its reports on Form N-PORT. The portfolio’s Form N-PORT reports are available on the SEC’s website at www.sec.gov.
| | | | | Market | |
| | | | | Value• | |
| | | Shares | | ($000 | ) |
| Common Stocks (65.4%) | |
| Communication Services (6.6%) | | | |
| | Verizon Communications Inc. | 1,303,788 | | 80,053 | |
| * | Alphabet Inc. Class A | 53,232 | | 71,298 | |
| | Comcast Corp. Class A | 1,137,493 | | 51,153 | |
| | AT&T Inc. | 294,452 | | 11,507 | |
| | | | | 214,011 | |
| Consumer Discretionary (3.4%) | | | |
| | Home Depot Inc. | 122,973 | | 26,855 | |
| | Lowe’s Cos. Inc. | 193,594 | | 23,185 | |
| | TJX Cos. Inc. | 330,934 | | 20,207 | |
| | Hilton Worldwide Holdings Inc. | 181,998 | | 20,185 | |
| | McDonald’s Corp. | 85,336 | | 16,863 | |
| | Ross Stores Inc. | 45,465 | | 5,293 | |
| | | | 112,588 | |
| Consumer Staples (4.8%) | | | | |
| | Nestle SA | 295,228 | | 31,963 | |
| | PepsiCo Inc. | 188,116 | | 25,710 | |
| | Coca-Cola Co. | 448,365 | | 24,817 | |
| | Sysco Corp. | 272,758 | | 23,332 | |
| | Walmart Inc. | 186,283 | | 22,138 | |
| | Diageo plc | 460,154 | | 19,389 | |
| | Unilever NV | 175,236 | | 10,057 | |
| | | | 157,406 | |
| Energy (4.4%) | | | | |
| | Chevron Corp. | 418,565 | | 50,441 | |
| | TOTAL SA | 498,338 | | 27,653 | |
| | ConocoPhillips | 312,942 | | 20,351 | |
| | Suncor Energy Inc. | 588,518 | | 19,289 | |
| | Exxon Mobil Corp. | 159,283 | | 11,115 | |
| | BP plc | 1,435,658 | | 9,031 | |
| | Hess Corp. | 75,089 | | 5,017 | |
| | | | 142,897 | |
| Financials (14.9%) | | | | |
| | JPMorgan Chase & Co. | 608,572 | | 84,835 | |
| | Bank of America Corp. | 2,346,016 | | 82,627 | |
| | Chubb Ltd. | 265,934 | | 41,395 | |
| | Prudential Financial Inc. | 399,275 | | 37,428 | |
| | American Express Co. | 204,233 | | 25,425 | |
| | PNC Financial Services Group Inc. | 137,040 | | 21,876 | |
| | Northern Trust Corp. | 201,607 | | 21,419 | |
| | American International Group Inc. | 415,596 | | 21,332 | |
| | Intercontinental Exchange Inc. | 218,861 | | 20,256 | |
| | Progressive Corp. | 272,331 | | 19,714 | |
| | BlackRock Inc. | 38,607 | | 19,408 | |
| | Mitsubishi UFJ Financial Group Inc. | 2,891,510 | | 15,632 | |
| | Bank of Nova Scotia | 261,909 | | 14,795 | |
| | Hartford Financial Services Group Inc. | 186,106 | | 11,310 | |
| | Marsh & McLennan Cos.Inc. | 95,276 | | 10,615 | |
| | Charles Schwab Corp. | 204,970 | | 9,748 | |
| | Tokio Marine Holdings Inc. | 135,665 | | 7,596 | |
| | ING Groep NV | 517,786 | | 6,225 | |
| | BNP Paribas SA | 91,845 | | 5,459 | |
| | UBS Group AG | 350,957 | | 4,415 | |
| | Prudential plc | 186,082 | | 3,565 | |
| | | | | 485,075 | |
| Health Care (10.6%) | | | | |
| | Pfizer Inc. | 1,213,471 | | 47,544 | |
| | AstraZeneca plc ADR | 834,171 | | 41,592 | |
| | UnitedHealth Group Inc. | 119,218 | | 35,048 | |
| | Medtronic plc | 307,627 | | 34,900 | |
| | Merck & Co. Inc. | 338,198 | | 30,759 | |
| | Novartis AG | 308,797 | | 29,240 | |
| | Eli Lilly & Co. | 221,262 | | 29,081 | |
| | CVS Health Corp. | 334,459 | | 24,847 | |
| | Bristol-Myers Squibb Co. | 350,653 | | 22,508 | |
| | Koninklijke Philips NV | 352,247 | | 17,219 | |
| | Abbott Laboratories | 186,541 | | 16,203 | |
| | HCA Healthcare Inc. | 92,481 | | 13,670 | |
| | Becton Dickinson and Co. | 16,051 | | 4,365 | |
| | | | | 346,976 | |
| Industrials (6.2%) | | | | |
| | United Technologies Corp. | 200,832 | | 30,077 | |
| | Union Pacific Corp. | 163,546 | | 29,567 | |
| | Deere & Co. | 162,251 | | 28,112 | |
| | Lockheed Martin Corp. | 62,927 | | 24,502 | |
| | Vinci SA | 150,742 | | 16,789 | |
| | Schneider Electric SE | 162,824 | | 16,729 | |
| | General Dynamics Corp. | 91,047 | | 16,056 | |
| | Raytheon Co. | 72,108 | | 15,845 | |
| | Johnson Controls International plc | 321,084 | | 13,071 | |
| | CSX Corp. | 103,239 | | 7,470 | |
| | Eaton Corp. plc | 47,031 | | 4,455 | |
| | | | | 202,673 | |
| Information Technology (9.1%) | | | |
| | Microsoft Corp. | 732,676 | | 115,543 | |
| | Apple Inc. | 162,022 | | 47,578 | |
| | Intel Corp. | 669,571 | | 40,074 | |
| | Cisco Systems Inc. | 628,530 | | 30,144 | |
| | Texas Instruments Inc. | 142,936 | | 18,337 | |
| | Accenture plc Class A | 68,489 | | 14,422 | |
| | Samsung Electronics Co.Ltd. GDR | 9,633 | | 11,528 | |
| | HP Inc. | 368,146 | | 7,565 | |
| | Taiwan Semiconductor Manufacturing Co. Ltd.ADR | 114,254 | | 6,638 | |
| | International Business Machines Corp. | 37,796 | | 5,066 | |
| | | | | 296,895 | |
| Materials (0.8%) | | | | |
| | International Paper Co. | 388,896 | | 17,909 | |
| | PPG Industries Inc. | 56,890 | | 7,594 | |
| | | | | 25,503 | |
| Real Estate (1.7%) | | | | |
| | American Tower Corp. | 100,026 | | 22,988 | |
| | Simon Property Group Inc. | 125,970 | | 18,765 | |
| | Boston Properties Inc. | 94,960 | | 13,091 | |
| | | | | 54,844 | |
| Utilities (2.9%) | | | | |
| | Dominion Energy Inc. | 383,799 | | 31,786 | |
| | NextEra Energy Inc. | 111,577 | | 27,020 | |
| | Exelon Corp. | 526,359 | | 23,997 | |
| * | Iberdrola SA | 1,241,308 | | 12,792 | |
| | | | | 95,595 | |
Total Common Stocks
(Cost $1,514,146) | | | 2,134,463 | |
Balanced Portfolio
| | | | Face | | Market | |
| | | Maturity | Amount | | Value• | |
| | Coupon | Date | ($000 | ) | ($000 | ) |
| U.S. Government and Agency Obligations (7.3%) | |
| U.S. Government Securities (4.6%) | | | | | | |
| | United States Treasury Note/Bond | 1.500% | 8/31/21 | 4,500 | | 4,492 | |
| | United States Treasury Note/Bond | 2.875% | 11/15/21 | 4,100 | | 4,196 | |
| | United States Treasury Note/Bond | 2.500% | 3/31/23 | 18,815 | | 19,327 | |
| | United States Treasury Note/Bond | 2.625% | 6/30/23 | 6,650 | | 6,871 | |
| 1 | United States Treasury Note/Bond | 2.875% | 10/31/23 | 5,600 | | 5,849 | |
| | United States Treasury Note/Bond | 2.625% | 12/31/23 | 6,400 | | 6,635 | |
| | United States Treasury Note/Bond | 1.750% | 6/30/24 | 12,675 | | 12,707 | |
| | United States Treasury Note/Bond | 1.500% | 10/31/24 | 4,100 | | 4,064 | |
| | United States Treasury Note/Bond | 3.125% | 11/15/28 | 570 | | 627 | |
| | United States Treasury Note/Bond | 2.625% | 2/15/29 | 5,695 | | 6,035 | |
| | United States Treasury Note/Bond | 2.375% | 5/15/29 | 18,515 | | 19,244 | |
| | United States Treasury Note/Bond | 1.625% | 8/15/29 | 11,730 | | 11,426 | |
| | United States Treasury Note/Bond | 1.750% | 11/15/29 | 4,300 | | 4,235 | |
| | United States Treasury Note/Bond | 2.875% | 5/15/43 | 6,088 | | 6,635 | |
| | United States Treasury Note/Bond | 3.375% | 5/15/44 | 2,935 | | 3,475 | |
| | United States Treasury Note/Bond | 3.125% | 8/15/44 | 1,740 | | 1,980 | |
| | United States Treasury Note/Bond | 2.500% | 2/15/45 | 2,060 | | 2,103 | |
| | United States Treasury Note/Bond | 2.250% | 8/15/46 | 3,068 | | 2,982 | |
| | United States Treasury Note/Bond | 2.750% | 8/15/47 | 2,390 | | 2,563 | |
| | United States Treasury Note/Bond | 3.000% | 8/15/48 | 545 | | 614 | |
| | United States Treasury Note/Bond | 2.875% | 5/15/49 | 8,100 | | 8,932 | |
| | United States Treasury Note/Bond | 2.250% | 8/15/49 | 8,780 | | 8,521 | |
| | United States Treasury Strip Principal | 0.000% | 5/15/47 | 4,910 | | 2,527 | |
| | United States Treasury Strip Principal | 0.000% | 8/15/47 | 6,835 | | 3,491 | |
| | | | | | | 149,531 | |
| Conventional Mortgage-Backed Securities (2.1%) | | | | | |
| 2,3 | Fannie Mae Pool | 2.500% | 4/1/37–12/1/49 | 4,762 | | 4,731 | |
| 2,3 | Fannie Mae Pool | 2.780% | 6/1/26 | 1,025 | | 1,061 | |
| 2,3 | Fannie Mae Pool | 3.000% | 11/1/49 | 7,038 | | 7,141 | |
| 2,3 | Fannie Mae Pool | 3.070% | 2/1/25 | 500 | | 522 | |
| 2,3 | Fannie Mae Pool | 3.500% | 12/1/47–1/1/58 | 17,781 | | 18,369 | |
| 2,3 | Fannie Mae Pool | 4.000% | 8/1/48–12/1/49 | 3,605 | | 3,765 | |
| 2,3 | Freddie Mac Gold Pool | 4.000% | 9/1/41–12/1/48 | 1,475 | | 1,537 | |
| 2 | Ginnie Mae I Pool | 7.000% | 11/15/31–11/15/33 | 68 | | 76 | |
| 2 | Ginnie Mae I Pool | 8.000% | 9/15/30 | 45 | | 53 | |
| 2,3,4 | UMBS Pool | 2.500% | 11/1/49–1/1/50 | 18,884 | | 18,735 | |
| 2,3,4 | UMBS Pool | 3.000% | 7/1/49–1/1/50 | 8,862 | | 8,993 | |
| 2,3 | UMBS Pool | 4.000% | 12/1/49 | 4,753 | | 4,977 | |
| 2,3,4 | UMBS TBA | 3.500% | 1/1/50 | 400 | | 411 | |
| | | | | | | 70,371 | |
| Nonconventional Mortgage-Backed Securities (0.6%) | | | | |
| 2,3 | Fannie Mae REMICS | 1.500% | 8/25/41–6/25/42 | 766 | | 744 | |
| 2,3 | Fannie Mae REMICS | 1.700% | 6/25/43 | 157 | | 155 | |
| 2,3 | Fannie Mae REMICS | 2.000% | 6/25/44 | 180 | | 179 | |
| 2,3 | Fannie Mae REMICS | 3.000% | 3/25/53–9/25/57 | 3,079 | | 3,140 | |
| 2,3 | Fannie Mae REMICS | 3.500% | 4/25/31–6/25/59 | 10,422 | | 10,870 | |
| 2,3 | Fannie Mae REMICS | 4.000% | 9/25/29–7/25/53 | 628 | | 654 | |
| 2,3 | Freddie Mac REMICS | 3.000% | 12/15/39 | 222 | | 226 | |
| 2,3 | Freddie Mac REMICS | 3.500% | 3/15/31 | 116 | | 121 | |
| 2,3 | Freddie Mac REMICS | 4.000% | 12/15/30–4/15/31 | 2,186 | | 2,320 | |
| 2 | Government National Mortgage Assn. | 1.700% | 10/20/45 | 326 | | 322 | |
| 2 | Government National Mortgage Assn. | 1.800% | 5/20/41 | 359 | | 355 | |
| | | | | | | 19,086 | |
Total U.S. Government and Agency Obligations
(Cost $233,314) | | | | | 238,988 | |
| Asset-Backed/Commercial Mortgage-Backed Securities (1.6%) | | | | | |
| 2,5 | Aaset 2019-1 Trust | 3.844% | 5/15/39 | 426 | | 429 | |
| 2,5 | American Express Credit Account Master Trust | 2.950% | 3/15/23 | 1,720 | | 1,739 | |
| 5 | American Tower Trust I | 3.070% | 3/15/23 | 1,100 | | 1,114 | |
| 2 | AmeriCredit Automobile Receivables Trust 2016-3 | 2.240% | 4/8/22 | 360 | | 360 | |
| 2,5 | Angel Oak Mortgage Trust 2019-5 | 2.593% | 10/25/49 | 428 | | 427 | |
| 2,5 | Angel Oak Mortgage Trust 2019-6 | 2.620% | 11/25/59 | 1,085 | | 1,083 | |
| 2,5 | Angel Oak Mortgage Trust I LLC 2019-2 | 3.628% | 3/25/49 | 258 | | 261 | |
| 2,5 | Angel Oak Mortgage Trust LLC | 2.993% | 7/26/49 | 891 | | 893 | |
| 2,5,6 | Ares XXIX CLO Ltd., 3M USD LIBOR + 1.190% | 3.192% | 4/17/26 | 328 | | 329 | |
| 2,5,6 | Atlas Senior Loan Fund X Ltd., 3M USD LIBOR + 1.090% | 3.091% | 1/15/31 | 250 | | 248 | |
| 2,5,6 | Avery Point IV CLO Ltd., 3M USD LIBOR + 1.100% | 3.040% | 4/25/26 | 569 | | 570 | |
| 5 | Bank of Montreal | 2.500% | 1/11/22 | 1,700 | | 1,723 | |
| 2 | BMW Vehicle Lease Trust 2018-1A | 3.260% | 7/20/21 | 295 | | 297 | |
| 2,5 | Canadian Pacer Auto Receivable Trust A Series 2018 | 3.000% | 6/21/21 | 87 | | 87 | |
| 2,5 | Canadian Pacer Auto Receivable Trust A Series 2018 | 3.270% | 12/19/22 | 140 | | 141 | |
| 2 | CarMax Auto Owner Trust 2018-4 | 3.110% | 2/15/22 | 542 | | 544 | |
| 2 | CarMax Auto Owner Trust 2018-4 | 3.360% | 9/15/23 | 975 | | 993 | |
| 2,5 | Castlelake Aircraft Securitization Trust 2019-1 | 3.967% | 4/15/39 | 842 | | 853 | |
| 2,5,6 | Cent CLO, 3M USD LIBOR + 1.150% | 3.090% | 10/25/28 | 550 | | 551 | |
| 2,5 | Chesapeake Funding II LLC | 3.390% | 1/15/31 | 759 | | 768 | |
| 2,5 | Chesapeake Funding II LLC 2017-2A | 1.990% | 5/15/29 | 94 | | 93 | |
| 2,5 | Chesapeake Funding II LLC 2018-1 | 3.040% | 4/15/30 | 784 | | 792 | |
| 2,5 | Cloud Pass-Through Trust 2019-1 | 3.554% | 12/5/22 | 939 | | 950 | |
| 2,5 | COLT 2018-3 Mortgage Loan Trust | 3.692% | 10/26/48 | 249 | | 250 | |
| 2,5 | COLT 2019-2 Mortgage Loan Trust | 3.337% | 5/25/49 | 430 | | 434 | |
| 2 | COMM 2012-CCRE2 Mortgage Trust | 3.147% | 8/15/45 | 480 | | 490 | |
| 2,5 | Daimler Trucks Retail Trust 2019-1 | 2.770% | 4/15/21 | 549 | | 550 | |
| 2,5 | DB Master Finance LLC | 3.787% | 5/20/49 | 453 | | 462 | |
| 2,5 | DB Master Finance LLC | 4.021% | 5/20/49 | 403 | | 413 | |
| 2,5 | Deephave Residential Mortgage Trust 2019-2 | 3.558% | 4/25/59 | 399 | | 405 | |
| 5 | DNB Boligkreditt AS | 2.500% | 3/28/22 | 1,315 | | 1,332 | |
| 2,5 | Enterprise Fleet Financing LLC | 3.100% | 10/20/23 | 270 | | 274 | |
| 2,5 | Enterprise Fleet Financing LLC | 2.290% | 2/20/25 | 960 | | 963 | |
| 2,5 | Enterprise Fleet Financing LLC Series 2017-1 | 2.130% | 7/20/22 | 19 | | 19 | |
| 2,5 | Enterprise Fleet Financing LLC Series 2018-1 | 2.870% | 10/20/23 | 532 | | 534 | |
| 2,5 | Enterprise Fleet Financing LLC Series 2018-3 | 3.380% | 5/20/24 | 467 | | 472 | |
| 2,5 | Enterprise Fleet Financing LLC Series 2019-1 | 2.980% | 10/20/24 | 745 | | 752 | |
| 2,5 | Enterprise Fleet Financing LLC Series 2019-3 | 2.060% | 5/20/25 | 645 | | 646 | |
| 2,5 | Exeter Automobile Receivables Trust 2018-3 | 2.900% | 1/18/22 | 8 | | 8 | |
| 2,5 | Exeter Automobile Receivables Trust 2019-3 | 2.590% | 9/15/22 | 312 | | 313 | |
| 2,5 | Exeter Automobile Receivables Trust 2019-4 | 2.180% | 1/17/23 | 513 | | 513 | |
Balanced Portfolio
| | | | Face | | Market | |
| | | Maturity | Amount | | Value• | |
| | Coupon | Date | ($000 | ) | ($000 | ) |
| 2,3,6 | Fannie Mae Connecticut Avenue Securities, 1M USD LIBOR + 5.900% | 7.692% | 10/25/28 | 273 | | 293 | |
| 2 | Ford Credit Floorplan Master Owner Trust A | 2.440% | 9/15/26 | 370 | | 371 | |
| 2,3 | Freddie Mac Multifamily Structured Pass Through Certificates | 2.610% | 1/25/26 | 525 | | 531 | |
| 2,3 | Freddie Mac Multifamily Structured Pass Through Certificates | 2.282% | 7/25/26 | 885 | | 885 | |
| 2,5 | Golden Credit Card Trust | 1.980% | 4/15/22 | 545 | | 545 | |
| 2,5 | Golden Credit Card Trust 2018-1A | 2.620% | 1/15/23 | 485 | | 488 | |
| 5 | GTP Acquisition Partners I LLC | 2.350% | 6/15/20 | 580 | | 580 | |
| 2,5 | Hertz Fleet Lease Funding LP 2019-1 | 2.700% | 1/10/33 | 1,095 | | 1,103 | |
| 2,5 | Horizon Aircraft Finance Ltd. | 3.721% | 7/15/39 | 324 | | 324 | |
| 2,5 | Horizon Aircraft Finance Ltd. | 3.425% | 11/15/39 | 323 | | 321 | |
| 2,5 | MACH 1 Cayman 2019-1 Ltd. | 3.474% | 10/15/39 | 385 | | 383 | |
| 2,5,6 | Madison Park Funding XII Ltd., 3M USD LIBOR + 1.260% | 3.226% | 7/20/26 | 399 | | 399 | |
| 2,5,6 | Madison Park Funding XIII Ltd., 3M USD LIBOR + 0.950% | 2.916% | 4/19/30 | 930 | | 925 | |
| 2,5 | MAPS Ltd. | 4.458% | 3/15/44 | 233 | | 240 | |
| 2,5,6 | Master Credit Card Trust II Series 2018-1A, 1M USD LIBOR + 0.490% | 2.275% | 7/21/24 | 1,000 | | 998 | |
| 2 | Nissan Auto Lease Trust 2018-B | 3.250% | 9/15/21 | 460 | | 464 | |
| 2,5 | OneMain Direct Auto Receivables Trust | 3.430% | 12/16/24 | 1,100 | | 1,114 | |
| 2,5 | OneMain Direct Auto Receivables Trust 2017-2 | 2.310% | 12/14/21 | 44 | | 44 | |
| 2,5 | OneMain Financial Issuance Trust 2017-1 | 2.370% | 9/14/32 | 220 | | 220 | |
| 2,5 | OneMain Financial Issuance Trust 2019-1 | 3.480% | 2/14/31 | 1,000 | | 1,010 | |
| 2 | Santander Drive Auto Receivables Trust 2018-5 | 3.190% | 3/15/22 | 170 | | 170 | |
| 2,5 | Santander Retail Auto Lease Trust 2019-A | 2.720% | 1/20/22 | 528 | | 530 | |
| 2,5 | Santander Retail Auto Lease Trust 2019-B | 2.300% | 1/20/23 | 345 | | 347 | |
| 2 | Seasoned Credit Risk Transfer Trust Series 2018-4 | 3.500% | 3/25/58 | 741 | | 759 | |
| 2 | Seasoned Credit Risk Transfer Trust Series 2019-1 | 3.500% | 7/25/58 | 1,072 | | 1,102 | |
| 2 | Seasoned Credit Risk Transfer Trust Series 2019-3 | 3.500% | 10/25/58 | 1,681 | | 1,730 | |
| 2,5 | Securitized Term Auto Receivables Trust 2018-2 | 3.060% | 2/25/21 | 120 | | 120 | |
| 2,5 | Securitized Term Auto Receivables Trust 2018-2 | 3.325% | 8/25/22 | 550 | | 557 | |
| 2,5,6 | Seneca Park CLO Ltd. 2014-1, 3M USD LIBOR + 1.120% | 3.122% | 7/17/26 | 223 | | 223 | |
| 2,5 | SFAVE Commercial Mortgage Securities Trust 2015-5AVE | 4.144% | 1/5/43 | 700 | | 726 | |
| 2,5 | SoFi Consumer Loan Program 2018-2 Trust | 2.930% | 4/26/27 | 14 | | 14 | |
| 2,5 | SoFi Consumer Loan Program 2018-4 Trust | 3.540% | 11/26/27 | 421 | | 424 | |
| 2,5 | SoFi Consumer Loan Program 2019-1 Trust | 3.240% | 2/25/28 | 538 | | 541 | |
| 2,5 | Springleaf Funding Trust 2015-B | 3.480% | 5/15/28 | 590 | | 594 | |
| §,2,5 | Start III Ltd. | 3.536% | 11/15/44 | 399 | | 399 | |
| 2,5 | START Ireland | 4.089% | 3/15/44 | 549 | | 556 | |
| 2,5,6 | Symphony CLO XIV Ltd., 3M USD LIBOR + 0.950% | 2.951% | 7/14/26 | 1,125 | | 1,124 | |
| 2,5,6 | Thacher Park CLO Ltd., 3M USD LIBOR + 1.160% | 3.126% | 10/20/26 | 271 | | 271 | |
| 5 | Toronto-Dominion Bank | 2.500% | 1/18/22 | 2,100 | | 2,126 | |
| 2,5 | Towd Point Mortgage Trust 2016-3 | 2.250% | 4/25/56 | 40 | | 40 | |
| 2,5 | Trillium Credit Card Trust II 2019-2A | 3.038% | 1/26/24 | 1,250 | | 1,264 | |
| 2 | Utility Debt Securitization Authority Series 2013T | 3.435% | 12/15/25 | 210 | | 216 | |
| 2,5 | Vantage Data Centers LLC 2018-1A | 4.072% | 2/16/43 | 481 | | 501 | |
| 2,5 | Vantage Data Centers LLC 2019-1A | 3.188% | 7/15/44 | 269 | | 271 | |
| 2 | Verizon Owner Trust 2018-A | 3.230% | 4/20/23 | 585 | | 594 | |
| 2,5 | Verus Securitization Trust 2019-2 | 3.211% | 5/25/59 | 438 | | 442 | |
| 2,5,6 | Voya CLO 2014-1 Ltd., 3M USD LIBOR + 0.990% | 2.993% | 4/18/31 | 515 | | 510 | |
| 2,5 | Westlake Automobile Receivables Trust | 2.150% | 2/15/23 | 415 | | 415 | |
Total Asset-Backed/Commercial Mortgage-Backed Securities
(Cost $51,612) | | | | 51,879 | |
| Corporate Bonds (21.2%) | | | | | | |
| Finance (8.2%) | | | | | | |
| | Banking (6.8%) | | | | | | |
| 5 | ABN AMRO Bank NV | 2.450% | 6/4/20 | 623 | | 624 | |
| | American Express Credit Corp. | 2.700% | 3/3/22 | 1,505 | | 1,529 | |
| | Banco Santander SA | 3.125% | 2/23/23 | 800 | | 816 | |
| | Banco Santander SA | 3.848% | 4/12/23 | 400 | | 416 | |
| | Bank of America Corp. | 3.300% | 1/11/23 | 120 | | 124 | |
| 2 | Bank of America Corp. | 2.816% | 7/21/23 | 1,645 | | 1,668 | |
| | Bank of America Corp. | 3.004% | 12/20/23 | 3,408 | | 3,482 | |
| | Bank of America Corp. | 4.000% | 1/22/25 | 875 | | 930 | |
| 2 | Bank of America Corp. | 3.559% | 4/23/27 | 2,450 | | 2,583 | |
| 2 | Bank of America Corp. | 3.593% | 7/21/28 | 1,025 | | 1,088 | |
| 2 | Bank of America Corp. | 3.419% | 12/20/28 | 512 | | 536 | |
| 2 | Bank of America Corp. | 4.271% | 7/23/29 | 4,780 | | 5,294 | |
| 2 | Bank of America Corp. | 3.974% | 2/7/30 | 1,895 | | 2,063 | |
| 2 | Bank of America Corp. | 3.194% | 7/23/30 | 1,055 | | 1,091 | |
| | Bank of America Corp. | 5.875% | 2/7/42 | 260 | | 369 | |
| | Bank of America Corp. | 5.000% | 1/21/44 | 1,000 | | 1,306 | |
| 2 | Bank of America Corp. | 4.330% | 3/15/50 | 2,235 | | 2,680 | |
| | Bank of Montreal | 3.100% | 4/13/21 | 1,290 | | 1,309 | |
| | Bank of New York Mellon Corp. | 2.150% | 2/24/20 | 1,580 | | 1,580 | |
| | Bank of New York Mellon Corp. | 2.200% | 8/16/23 | 460 | | 465 | |
| | Bank of New York Mellon Corp. | 3.000% | 2/24/25 | 720 | | 748 | |
| 6 | Bank of New York Mellon Corp., 3M USD LIBOR + 1.050% | 2.986% | 10/30/23 | 1,145 | | 1,165 | |
| | Bank of Nova Scotia | 2.800% | 7/21/21 | 750 | | 760 | |
| | Bank of Nova Scotia | 2.700% | 8/3/26 | 1,825 | | 1,854 | |
| 5 | Banque Federative du Credit Mutuel SA | 2.750% | 10/15/20 | 1,200 | | 1,208 | |
| | Barclays Bank plc | 5.140% | 10/14/20 | 160 | | 163 | |
| 2 | Barclays plc | 3.932% | 5/7/25 | 1,565 | | 1,644 | |
| 6 | Barclays plc, 3M USD LIBOR + 1.380% | 3.284% | 5/16/24 | 1,005 | | 1,015 | |
| 5 | BNP Paribas SA | 2.950% | 5/23/22 | 200 | | 204 | |
| | BNP Paribas SA | 3.250% | 3/3/23 | 190 | | 197 | |
| 5 | BNP Paribas SA | 3.800% | 1/10/24 | 1,170 | | 1,227 | |
| 5 | BNP Paribas SA | 3.375% | 1/9/25 | 1,775 | | 1,837 | |
| 2,5 | BNP Paribas SA | 2.819% | 11/19/25 | 1,335 | | 1,345 | |
| 5 | BNP Paribas SA | 3.500% | 11/16/27 | 2,050 | | 2,136 | |
| 5 | BPCE SA | 5.700% | 10/22/23 | 270 | | 298 | |
| | BPCE SA | 4.000% | 4/15/24 | 775 | | 829 | |
| 5 | BPCE SA | 5.150% | 7/21/24 | 1,260 | | 1,381 | |
| 5 | BPCE SA | 3.500% | 10/23/27 | 1,780 | | 1,840 | |
| 5 | BPCE SA | 2.700% | 10/1/29 | 1,450 | | 1,437 | |
| 6 | Canadian Imperial Bank of Commerce, 3M USD LIBOR + 0.720% | 2.614% | 6/16/22 | 1,565 | | 1,579 | |
| | Capital One Financial Corp. | 2.500% | 5/12/20 | 500 | | 501 | |
| | Capital One Financial Corp. | 4.750% | 7/15/21 | 400 | | 416 | |
| | Capital One Financial Corp. | 3.750% | 4/24/24 | 1,305 | | 1,369 | |
| | Capital One Financial Corp. | 3.200% | 2/5/25 | 760 | | 783 | |
| | Citibank NA | 3.050% | 5/1/20 | 1,850 | | 1,855 | |
| | Citigroup Inc. | 2.400% | 2/18/20 | 800 | | 800 | |
| | Citigroup Inc. | 4.500% | 1/14/22 | 1,975 | | 2,069 | |
| 2 | Citigroup Inc. | 3.520% | 10/27/28 | 1,975 | | 2,074 | |
| | Citigroup Inc. | 6.625% | 6/15/32 | 2,000 | | 2,679 | |
| 2 | Citigroup Inc. | 3.878% | 1/24/39 | 1,025 | | 1,121 | |
| | Citigroup Inc. | 8.125% | 7/15/39 | 101 | | 169 | |
| | Comerica Bank | 2.500% | 7/23/24 | 790 | | 799 | |
| | Commonwealth Bank of Australia | 2.300% | 3/12/20 | 655 | | 655 | |
| 5 | Credit Agricole SA | 3.750% | 4/24/23 | 1,160 | | 1,210 | |
| 5 | Credit Agricole SA | 3.250% | 10/4/24 | 2,390 | | 2,472 | |
| | Credit Suisse AG | 3.000% | 10/29/21 | 735 | | 749 | |
| | Credit Suisse AG | 3.625% | 9/9/24 | 250 | | 265 | |
Balanced Portfolio
| | | | Face | | Market | |
| | | Maturity | Amount | | Value• | |
| | Coupon | Date | ($000 | ) | ($000 | ) |
| 5 | Credit Suisse Group AG | 3.574% | 1/9/23 | 550 | | 564 | |
| 2,5 | Credit Suisse Group AG | 4.207% | 6/12/24 | 340 | | 359 | |
| 2,5 | Credit Suisse Group AG | 2.593% | 9/11/25 | 520 | | 521 | |
| 2,5 | Credit Suisse Group AG | 3.869% | 1/12/29 | 305 | | 324 | |
| 5,6 | Credit Suisse Group AG, 3M USD LIBOR + 1.240% | 3.127% | 6/12/24 | 690 | | 699 | |
| | Credit Suisse Group Funding Guernsey Ltd. | 3.800% | 9/15/22 | 1,335 | | 1,388 | |
| | Credit Suisse Group Funding Guernsey Ltd. | 3.750% | 3/26/25 | 3,470 | | 3,667 | |
| 5 | Danske Bank A/S | 2.000% | 9/8/21 | 1,120 | | 1,113 | |
| 5 | Danske Bank A/S | 5.000% | 1/12/22 | 610 | | 640 | |
| 5 | Danske Bank A/S | 3.875% | 9/12/23 | 1,220 | | 1,264 | |
| 5 | Danske Bank A/S | 5.375% | 1/12/24 | 795 | | 872 | |
| | Deutsche Bank AG | 4.250% | 10/14/21 | 815 | | 838 | |
| | Fifth Third Bank | 2.875% | 10/1/21 | 425 | | 431 | |
| | Fifth Third Bank | 3.850% | 3/15/26 | 830 | | 882 | |
| | Goldman Sachs Group Inc. | 5.375% | 3/15/20 | 405 | | 408 | |
| | Goldman Sachs Group Inc. | 2.600% | 4/23/20 | 170 | | 170 | |
| | Goldman Sachs Group Inc. | 5.250% | 7/27/21 | 865 | | 907 | |
| | Goldman Sachs Group Inc. | 5.750% | 1/24/22 | 360 | | 385 | |
| 2 | Goldman Sachs Group Inc. | 2.876% | 10/31/22 | 1,795 | | 1,817 | |
| | Goldman Sachs Group Inc. | 3.625% | 1/22/23 | 1,980 | | 2,056 | |
| 2 | Goldman Sachs Group Inc. | 3.272% | 9/29/25 | 1,205 | | 1,244 | |
| | Goldman Sachs Group Inc. | 3.500% | 11/16/26 | 2,000 | | 2,086 | |
| | Goldman Sachs Group Inc. | 3.850% | 1/26/27 | 740 | | 787 | |
| 2 | Goldman Sachs Group Inc. | 3.691% | 6/5/28 | 810 | | 859 | |
| 2 | Goldman Sachs Group Inc. | 3.814% | 4/23/29 | 3,065 | | 3,279 | |
| 2 | Goldman Sachs Group Inc. | 4.223% | 5/1/29 | 2,630 | | 2,889 | |
| | Goldman Sachs Group Inc. | 6.750% | 10/1/37 | 835 | | 1,157 | |
| 5 | HSBC Bank plc | 4.750% | 1/19/21 | 1,700 | | 1,743 | |
| | HSBC Holdings plc | 3.400% | 3/8/21 | 1,535 | | 1,558 | |
| | HSBC Holdings plc | 4.000% | 3/30/22 | 2,395 | | 2,492 | |
| | HSBC Holdings plc | 3.600% | 5/25/23 | 1,600 | | 1,664 | |
| 2 | HSBC Holdings plc | 4.041% | 3/13/28 | 890 | | 950 | |
| 2 | HSBC Holdings plc | 4.583% | 6/19/29 | 1,675 | | 1,869 | |
| | HSBC Holdings plc | 6.500% | 5/2/36 | 1,000 | | 1,360 | |
| | HSBC Holdings plc | 6.100% | 1/14/42 | 375 | | 532 | |
| | HSBC Holdings plc | 5.250% | 3/14/44 | 440 | | 557 | |
| 6 | HSBC Holdings plc, 3M USD LIBOR + 1.000% | 2.904% | 5/18/24 | 730 | | 735 | |
| | HSBC USA Inc. | 2.350% | 3/5/20 | 2,775 | | 2,775 | |
| | HSBC USA Inc. | 3.500% | 6/23/24 | 620 | | 656 | |
| | Huntington Bancshares Inc. | 3.150% | 3/14/21 | 800 | | 808 | |
| | Huntington National Bank | 2.400% | 4/1/20 | 1,160 | | 1,160 | |
| | ING Groep NV | 3.150% | 3/29/22 | 365 | | 373 | |
| | ING Groep NV | 3.950% | 3/29/27 | 2,695 | | 2,898 | |
| | JPMorgan Chase & Co. | 4.350% | 8/15/21 | 1,862 | | 1,931 | |
| | JPMorgan Chase & Co. | 4.500% | 1/24/22 | 495 | | 519 | |
| | JPMorgan Chase & Co. | 3.250% | 9/23/22 | 970 | | 1,002 | |
| | JPMorgan Chase & Co. | 3.375% | 5/1/23 | 875 | | 908 | |
| | JPMorgan Chase & Co. | 3.875% | 2/1/24 | 800 | | 856 | |
| | JPMorgan Chase & Co. | 3.900% | 7/15/25 | 2,270 | | 2,449 | |
| | JPMorgan Chase & Co. | 4.125% | 12/15/26 | 765 | | 837 | |
| | JPMorgan Chase & Co. | 4.250% | 10/1/27 | 2,295 | | 2,537 | |
| 2 | JPMorgan Chase & Co. | 4.452% | 12/5/29 | 2,100 | | 2,389 | |
| | JPMorgan Chase & Co. | 5.400% | 1/6/42 | 750 | | 1,014 | |
| 2 | JPMorgan Chase & Co. | 3.964% | 11/15/48 | 6,150 | | 6,896 | |
| 5 | Macquarie Bank Ltd. | 2.400% | 1/21/20 | 330 | | 330 | |
| 2,5 | Macquarie Group Ltd. | 4.150% | 3/27/24 | 1,375 | | 1,441 | |
| | Manufacturers & Traders Trust Co. | 2.100% | 2/6/20 | 495 | | 495 | |
| | Manufacturers & Traders Trust Co. | 2.900% | 2/6/25 | 685 | | 704 | |
| | Mitsubishi UFJ Financial Group Inc. | 2.623% | 7/18/22 | 1,940 | | 1,965 | |
| | Morgan Stanley | 5.750% | 1/25/21 | 1,740 | | 1,804 | |
| | Morgan Stanley | 2.500% | 4/21/21 | 1,175 | | 1,180 | |
| | Morgan Stanley | 2.625% | 11/17/21 | 800 | | 809 | |
| | Morgan Stanley | 2.750% | 5/19/22 | 1,710 | | 1,740 | |
| | Morgan Stanley | 3.700% | 10/23/24 | 750 | | 794 | |
| 2 | Morgan Stanley | 2.720% | 7/22/25 | 1,750 | | 1,766 | |
| | Morgan Stanley | 3.125% | 7/27/26 | 1,345 | | 1,384 | |
| | Morgan Stanley | 6.250% | 8/9/26 | 3,000 | | 3,642 | |
| | Morgan Stanley | 3.625% | 1/20/27 | 1,250 | | 1,327 | |
| 2 | Morgan Stanley | 3.772% | 1/24/29 | 3,910 | | 4,200 | |
| | Morgan Stanley | 4.300% | 1/27/45 | 850 | | 998 | |
| 2,5 | Nationwide Building Society | 3.622% | 4/26/23 | 680 | | 699 | |
| 5 | NBK SPC Ltd. | 2.750% | 5/30/22 | 1,530 | | 1,540 | |
| | PNC Bank NA | 3.300% | 10/30/24 | 460 | | 478 | |
| | PNC Bank NA | 2.950% | 2/23/25 | 1,105 | | 1,130 | |
| | PNC Bank NA | 4.200% | 11/1/25 | 255 | | 277 | |
| | PNC Bank NA | 3.100% | 10/25/27 | 1,165 | | 1,215 | |
| | PNC Bank NA | 3.250% | 1/22/28 | 1,675 | | 1,759 | |
| | PNC Financial Services Group Inc. | 3.900% | 4/29/24 | 580 | | 610 | |
| | Royal Bank of Canada | 2.750% | 2/1/22 | 1,195 | | 1,215 | |
| | Santander Holdings USA Inc. | 2.650% | 4/17/20 | 580 | | 581 | |
| | Santander Holdings USA Inc. | 3.700% | 3/28/22 | 915 | | 940 | |
| | Santander Holdings USA Inc. | 3.400% | 1/18/23 | 605 | | 620 | |
| 5 | Skandinaviska Enskilda Banken AB | 2.450% | 5/27/20 | 1,600 | | 1,603 | |
| 5 | Societe Generale SA | 3.250% | 1/12/22 | 1,015 | | 1,036 | |
| 2,5 | Standard Chartered plc | 2.744% | 9/10/22 | 2,030 | | 2,039 | |
| 2 | State Street Corp. | 2.653% | 5/15/23 | 840 | | 853 | |
| | Svenska Handelsbanken AB | 1.875% | 9/7/21 | 1,050 | | 1,048 | |
| | Synchrony Bank | 3.650% | 5/24/21 | 1,290 | | 1,315 | |
| | Toronto-Dominion Bank | 2.500% | 12/14/20 | 985 | | 990 | |
| | Truist Bank | 2.625% | 1/15/22 | 1,250 | | 1,265 | |
| | Truist Bank | 3.300% | 5/15/26 | 340 | | 353 | |
| | Truist Financial Corp. | 3.200% | 9/3/21 | 665 | | 678 | |
| | Truist Financial Corp. | 2.750% | 4/1/22 | 1,700 | | 1,730 | |
| | Truist Financial Corp. | 3.700% | 6/5/25 | 1,385 | | 1,492 | |
| 5 | UBS AG | 2.200% | 6/8/20 | 750 | | 751 | |
| 2,5 | UBS Group AG | 3.126% | 8/13/30 | 555 | | 565 | |
| 5 | UBS Group Funding Jersey Ltd. | 2.950% | 9/24/20 | 1,160 | | 1,168 | |
| 5 | UBS Group Funding Jersey Ltd. | 2.650% | 2/1/22 | 1,250 | | 1,263 | |
| | US Bancorp | 2.625% | 1/24/22 | 1,305 | | 1,324 | |
| | US Bancorp | 3.700% | 1/30/24 | 1,560 | | 1,658 | |
| | Wachovia Corp. | 7.500% | 4/15/35 | 1,000 | | 1,400 | |
| | Wells Fargo & Co. | 3.000% | 1/22/21 | 505 | | 511 | |
| | Wells Fargo & Co. | 3.500% | 3/8/22 | 640 | | 660 | |
| | Wells Fargo & Co. | 3.069% | 1/24/23 | 195 | | 198 | |
| | Wells Fargo & Co. | 3.450% | 2/13/23 | 735 | | 760 | |
| | Wells Fargo & Co. | 4.480% | 1/16/24 | 1,199 | | 1,291 | |
| | Wells Fargo & Co. | 3.750% | 1/24/24 | 1,560 | | 1,643 | |
| | Wells Fargo & Co. | 3.000% | 2/19/25 | 890 | | 918 | |
| | Wells Fargo & Co. | 3.550% | 9/29/25 | 860 | | 909 | |
| | Wells Fargo & Co. | 3.000% | 4/22/26 | 1,045 | | 1,075 | |
| | Wells Fargo & Co. | 4.100% | 6/3/26 | 340 | | 365 | |
| | Wells Fargo & Co. | 3.000% | 10/23/26 | 170 | | 174 | |
| 2 | Wells Fargo & Co. | 3.196% | 6/17/27 | 1,705 | | 1,765 | |
| 2 | Wells Fargo & Co. | 2.879% | 10/30/30 | 435 | | 438 | |
| | Wells Fargo & Co. | 5.606% | 1/15/44 | 2,276 | | 3,010 | |
| | Wells Fargo & Co. | 4.900% | 11/17/45 | 515 | | 629 | |
| | Wells Fargo & Co. | 4.750% | 12/7/46 | 2,070 | | 2,465 | |
| | Westpac Banking Corp. | 2.300% | 5/26/20 | 630 | | 631 | |
| | | | | | | | |
| | Brokerage (0.0%) | | | | | | |
| | Ameriprise Financial Inc. | 5.300% | 3/15/20 | 305 | | 307 | |
| | Charles Schwab Corp. | 3.200% | 3/2/27 | 545 | | 572 | |
| | | | | | | | |
| | Insurance (1.2%) | | | | | | |
| | Aetna Inc. | 2.800% | 6/15/23 | 680 | | 691 | |
| 5 | AIA Group Ltd. | 3.600% | 4/9/29 | 1,475 | | 1,552 | |
| | American International Group Inc. | 4.250% | 3/15/29 | 1,040 | | 1,155 | |
| | American International Group Inc. | 4.500% | 7/16/44 | 200 | | 229 | |
| | American International Group Inc. | 4.750% | 4/1/48 | 135 | | 161 | |
| | Anthem Inc. | 3.300% | 1/15/23 | 1,100 | | 1,138 | |
| | Anthem Inc. | 3.650% | 12/1/27 | 750 | | 791 | |
| | Anthem Inc. | 4.101% | 3/1/28 | 1,140 | | 1,235 | |
| | Anthem Inc. | 4.650% | 8/15/44 | 426 | | 473 | |
| | Anthem Inc. | 4.375% | 12/1/47 | 625 | | 685 | |
| | Berkshire Hathaway Inc. | 2.750% | 3/15/23 | 1,050 | | 1,078 | |
| | Berkshire Hathaway Inc. | 3.125% | 3/15/26 | 715 | | 754 | |
| | Chubb INA Holdings Inc. | 2.300% | 11/3/20 | 170 | | 171 | |
| | Chubb INA Holdings Inc. | 3.350% | 5/15/24 | 555 | | 583 | |
Balanced Portfolio
| | | | Face | | Market | |
| | | Maturity | Amount | | Value• | |
| | Coupon | Date | ($000 | ) | ($000 | ) |
| | Chubb INA Holdings Inc. | 4.350% | 11/3/45 | 800 | | 961 | |
| 5 | Five Corners Funding Trust | 4.419% | 11/15/23 | 210 | | 228 | |
| 5 | Liberty Mutual Group Inc. | 4.250% | 6/15/23 | 80 | | 85 | |
| 5 | Liberty Mutual Group Inc. | 4.569% | 2/1/29 | 280 | | 313 | |
| | Loews Corp. | 2.625% | 5/15/23 | 440 | | 448 | |
| | Marsh & McLennan Cos. Inc. | 4.375% | 3/15/29 | 675 | | 769 | |
| | Marsh & McLennan Cos. Inc. | 4.900% | 3/15/49 | 265 | | 335 | |
| 2,5 | Massachusetts Mutual Life Insurance Co. | 7.625% | 11/15/23 | 2,000 | | 2,283 | |
| | MetLife Inc. | 3.600% | 4/10/24 | 580 | | 618 | |
| | MetLife Inc. | 4.125% | 8/13/42 | 145 | | 164 | |
| | MetLife Inc. | 4.875% | 11/13/43 | 530 | | 656 | |
| 5 | Metropolitan Life Global Funding I | 3.450% | 10/9/21 | 810 | | 832 | |
| 5 | Metropolitan Life Global Funding I | 2.650% | 4/8/22 | 340 | | 345 | |
| 5 | Metropolitan Life Global Funding I | 3.450% | 12/18/26 | 640 | | 683 | |
| 5 | Metropolitan Life Global Funding I | 3.000% | 9/19/27 | 1,165 | | 1,199 | |
| 5 | Nationwide Financial Services Inc. | 3.900% | 11/30/49 | 1,430 | | 1,481 | |
| 5 | New York Life Global Funding | 2.900% | 1/17/24 | 810 | | 836 | |
| 5 | New York Life Insurance Co. | 5.875% | 5/15/33 | 2,100 | | 2,766 | |
| 5 | New York Life Insurance Co. | 4.450% | 5/15/69 | 435 | | 499 | |
| 5 | Northwestern Mutual Life Insurance Co. | 3.850% | 9/30/47 | 656 | | 688 | |
| 5 | Northwestern Mutual Life Insurance Co. | 3.625% | 9/30/59 | 270 | | 268 | |
| 5 | Principal Financial Global Funding LLC | 2.500% | 9/16/29 | 1,000 | | 986 | |
| 5 | Teachers Insurance & Annuity Assn. of America | 4.900% | 9/15/44 | 875 | | 1,079 | |
| 5 | Teachers Insurance & Annuity Assn. of America | 4.270% | 5/15/47 | 1,145 | | 1,302 | |
| | UnitedHealth Group Inc. | 3.875% | 10/15/20 | 601 | | 608 | |
| | UnitedHealth Group Inc. | 2.875% | 3/15/22 | 27 | | 28 | |
| | UnitedHealth Group Inc. | 2.875% | 3/15/23 | 1,175 | | 1,202 | |
| | UnitedHealth Group Inc. | 3.100% | 3/15/26 | 430 | | 448 | |
| | UnitedHealth Group Inc. | 3.850% | 6/15/28 | 1,190 | | 1,303 | |
| | UnitedHealth Group Inc. | 4.625% | 7/15/35 | 240 | | 290 | |
| | UnitedHealth Group Inc. | 4.250% | 3/15/43 | 1,600 | | 1,819 | |
| | UnitedHealth Group Inc. | 4.750% | 7/15/45 | 760 | | 928 | |
| | UnitedHealth Group Inc. | 4.200% | 1/15/47 | 215 | | 246 | |
| | UnitedHealth Group Inc. | 4.250% | 6/15/48 | 880 | | 1,021 | |
| | | | | | | | |
| | Real Estate Investment Trusts (0.2%) | | | | | | |
| | AvalonBay Communities Inc. | 3.625% | 10/1/20 | 520 | | 524 | |
| | Boston Properties LP | 3.125% | 9/1/23 | 355 | | 366 | |
| | Boston Properties LP | 3.800% | 2/1/24 | 45 | | 47 | |
| | Healthpeak Properties Inc. | 3.000% | 1/15/30 | 930 | | 929 | |
| | Realty Income Corp. | 4.650% | 8/1/23 | 640 | | 692 | |
| | Simon Property Group LP | 3.750% | 2/1/24 | 90 | | 95 | |
| | Simon Property Group LP | 3.375% | 10/1/24 | 275 | | 289 | |
| | Simon Property Group LP | 2.450% | 9/13/29 | 1,160 | | 1,138 | |
| 5 | WEA Finance LLC | 4.125% | 9/20/28 | 590 | | 637 | |
| 5 | WEA Finance LLC | 4.625% | 9/20/48 | 755 | | 866 | |
| | | | | | | 268,371 | |
| Industrial (10.2%) | | | | | | |
| | Basic Industry (0.0%) | | | | | | |
| | International Paper Co. | 4.350% | 8/15/48 | 1,255 | | 1,333 | |
| | | | | | | | |
| | Capital Goods (0.7%) | | | | | | |
| 5 | BAE Systems Holdings Inc. | 2.850% | 12/15/20 | 160 | | 161 | |
| 5 | BAE Systems Holdings Inc. | 3.850% | 12/15/25 | 1,085 | | 1,148 | |
| | Boeing Co. | 2.700% | 2/1/27 | 495 | | 499 | |
| | Boeing Co. | 5.875% | 2/15/40 | 175 | | 231 | |
| | Boeing Co. | 3.375% | 6/15/46 | 614 | | 594 | |
| | Boeing Co. | 3.850% | 11/1/48 | 198 | | 208 | |
| | Boeing Co. | 3.750% | 2/1/50 | 90 | | 95 | |
| | Boeing Co. | 3.825% | 3/1/59 | 67 | | 70 | |
| | Boeing Co. | 3.950% | 8/1/59 | 408 | | 436 | |
| | Caterpillar Financial Services Corp. | 2.625% | 3/1/23 | 1,360 | | 1,387 | |
| | Caterpillar Inc. | 3.900% | 5/27/21 | 590 | | 606 | |
| | Caterpillar Inc. | 2.600% | 6/26/22 | 705 | | 715 | |
| | Caterpillar Inc. | 3.400% | 5/15/24 | 810 | | 856 | |
| | General Dynamics Corp. | 2.875% | 5/11/20 | 1,505 | | 1,511 | |
| | General Dynamics Corp. | 3.875% | 7/15/21 | 355 | | 365 | |
| | General Electric Co. | 2.700% | 10/9/22 | 210 | | 213 | |
| | General Electric Co. | 3.100% | 1/9/23 | 360 | | 367 | |
| | Honeywell International Inc. | 4.250% | 3/1/21 | 1,002 | | 1,032 | |
| | Illinois Tool Works Inc. | 3.500% | 3/1/24 | 1,295 | | 1,371 | |
| | John Deere Capital Corp. | 3.450% | 3/13/25 | 1,200 | | 1,274 | |
| | Lockheed Martin Corp. | 2.900% | 3/1/25 | 610 | | 634 | |
| | Lockheed Martin Corp. | 4.500% | 5/15/36 | 211 | | 250 | |
| | Lockheed Martin Corp. | 4.700% | 5/15/46 | 376 | | 475 | |
| | Lockheed Martin Corp. | 4.090% | 9/15/52 | 144 | | 168 | |
| | Parker-Hannifin Corp. | 3.250% | 6/14/29 | 270 | | 280 | |
| | Parker-Hannifin Corp. | 4.450% | 11/21/44 | 450 | | 500 | |
| 5 | Siemens Financieringsmaatschappij NV | 2.900% | 5/27/22 | 1,050 | | 1,070 | |
| 5 | Siemens Financieringsmaatschappij NV | 3.125% | 3/16/24 | 1,680 | | 1,740 | |
| 5 | Siemens Financieringsmaatschappij NV | 4.400% | 5/27/45 | 800 | | 955 | |
| | Stanley Black & Decker Inc. | 4.850% | 11/15/48 | 685 | | 846 | |
| | United Technologies Corp. | 3.100% | 6/1/22 | 535 | | 549 | |
| | United Technologies Corp. | 4.125% | 11/16/28 | 1,125 | | 1,265 | |
| | United Technologies Corp. | 6.050% | 6/1/36 | 675 | | 909 | |
| | United Technologies Corp. | 4.450% | 11/16/38 | 275 | | 323 | |
| | United Technologies Corp. | 4.500% | 6/1/42 | 787 | | 942 | |
| | United Technologies Corp. | 3.750% | 11/1/46 | 163 | | 178 | |
| | | | | | | | |
| | Communication (1.6%) | | | | | | |
| | America Movil SAB de CV | 3.125% | 7/16/22 | 1,880 | | 1,918 | |
| | America Movil SAB de CV | 3.625% | 4/22/29 | 780 | | 827 | |
| | America Movil SAB de CV | 6.125% | 3/30/40 | 390 | | 523 | |
| | American Tower Corp. | 3.450% | 9/15/21 | 1,125 | | 1,152 | |
| | American Tower Corp. | 5.000% | 2/15/24 | 80 | | 88 | |
| | American Tower Corp. | 4.400% | 2/15/26 | 450 | | 492 | |
| | American Tower Corp. | 3.800% | 8/15/29 | 1,111 | | 1,187 | |
| | AT&T Inc. | 2.450% | 6/30/20 | 225 | | 226 | |
| | AT&T Inc. | 4.600% | 2/15/21 | 100 | | 102 | |
| | AT&T Inc. | 3.600% | 7/15/25 | 625 | | 660 | |
| 5 | British Telecommunications plc | 3.250% | 11/8/29 | 905 | | 904 | |
| | Charter Communications Operating LLC / Charter Communications Operating Capital | 4.800% | 3/1/50 | 955 | | 1,000 | |
| | Comcast Corp. | 3.600% | 3/1/24 | 2,900 | | 3,071 | |
| | Comcast Corp. | 3.375% | 2/15/25 | 70 | | 74 | |
| | Comcast Corp. | 2.350% | 1/15/27 | 540 | | 538 | |
| | Comcast Corp. | 4.250% | 1/15/33 | 1,032 | | 1,183 | |
| | Comcast Corp. | 4.200% | 8/15/34 | 730 | | 833 | |
| | Comcast Corp. | 5.650% | 6/15/35 | 110 | | 144 | |
| | Comcast Corp. | 4.400% | 8/15/35 | 877 | | 1,026 | |
| | Comcast Corp. | 6.500% | 11/15/35 | 115 | | 162 | |
| | Comcast Corp. | 6.400% | 5/15/38 | 27 | | 38 | |
| | Comcast Corp. | 4.600% | 10/15/38 | 1,335 | | 1,584 | |
| | Comcast Corp. | 4.650% | 7/15/42 | 1,290 | | 1,533 | |
| | Comcast Corp. | 4.500% | 1/15/43 | 500 | | 583 | |
| | Comcast Corp. | 4.750% | 3/1/44 | 876 | | 1,063 | |
| | Comcast Corp. | 4.600% | 8/15/45 | 1,198 | | 1,429 | |
| | Comcast Corp. | 3.969% | 11/1/47 | 252 | | 275 | |
| | Comcast Corp. | 4.000% | 3/1/48 | 345 | | 379 | |
| | Comcast Corp. | 4.700% | 10/15/48 | 1,670 | | 2,056 | |
| | Comcast Corp. | 3.999% | 11/1/49 | 602 | | 665 | |
| | Comcast Corp. | 4.049% | 11/1/52 | 187 | | 211 | |
| | Comcast Corp. | 4.950% | 10/15/58 | 1,020 | | 1,326 | |
| 5 | Cox Communications Inc. | 3.250% | 12/15/22 | 795 | | 817 | |
| 5 | Cox Communications Inc. | 2.950% | 6/30/23 | 145 | | 147 | |
| 5 | Cox Communications Inc. | 3.150% | 8/15/24 | 181 | | 186 | |
| 5 | Cox Communications Inc. | 4.800% | 2/1/35 | 1,540 | | 1,700 | |
| 5 | Cox Communications Inc. | 6.450% | 12/1/36 | 45 | | 57 | |
| 5 | Cox Communications Inc. | 4.600% | 8/15/47 | 125 | | 138 | |
| | Crown Castle International Corp. | 3.650% | 9/1/27 | 285 | | 300 | |
| | Crown Castle International Corp. | 3.800% | 2/15/28 | 235 | | 250 | |
| 5 | Deutsche Telekom International Finance BV | 3.600% | 1/19/27 | 300 | | 315 | |
| 5 | Deutsche Telekom International Finance BV | 4.375% | 6/21/28 | 671 | | 743 | |
| | NBCUniversal Media LLC | 2.875% | 1/15/23 | 240 | | 246 | |
Balanced Portfolio
| | | | Face | | Market | |
| | | Maturity | Amount | | Value• | |
| | Coupon | Date | ($000 | ) | ($000 | ) |
| | NBCUniversal Media LLC | 4.450% | 1/15/43 | 309 | | 358 | |
| | Orange SA | 4.125% | 9/14/21 | 1,740 | | 1,804 | |
| | Orange SA | 9.000% | 3/1/31 | 530 | | 820 | |
| 5 | SK Telecom Co. Ltd. | 3.750% | 4/16/23 | 385 | | 399 | |
| 5 | Sky Ltd. | 3.750% | 9/16/24 | 1,435 | | 1,535 | |
| 2,5 | Sprint Spectrum Co LLC / Sprint Spectrum Co II LLC / Sprint Spectrum Co III LLC | 4.738% | 3/20/25 | 1,300 | | 1,377 | |
| | Telefonica Emisiones SAU | 5.213% | 3/8/47 | 800 | | 950 | |
| | Telefonica Emisiones SAU | 5.520% | 3/1/49 | 755 | | 944 | |
| | Time Warner Entertainment Co. LP | 8.375% | 3/15/23 | 95 | | 112 | |
| | Verizon Communications Inc. | 4.812% | 3/15/39 | 2,406 | | 2,909 | |
| | Verizon Communications Inc. | 4.750% | 11/1/41 | 290 | | 351 | |
| | Verizon Communications Inc. | 4.862% | 8/21/46 | 1,151 | | 1,425 | |
| | Verizon Communications Inc. | 5.012% | 4/15/49 | 647 | | 827 | |
| | Verizon Communications Inc. | 4.672% | 3/15/55 | 274 | | 336 | |
| | Viacom Inc. | 5.850% | 9/1/43 | 600 | | 752 | |
| | ViacomCBS Inc. | 4.300% | 2/15/21 | 675 | | 687 | |
| | ViacomCBS Inc. | 3.700% | 6/1/28 | 440 | | 459 | |
| | Vodafone Group plc | 5.000% | 5/30/38 | 50 | | 58 | |
| | Vodafone Group plc | 5.250% | 5/30/48 | 1,260 | | 1,522 | |
| | Walt Disney Co. | 3.000% | 9/15/22 | 245 | | 252 | |
| | Walt Disney Co. | 2.000% | 9/1/29 | 2,600 | | 2,520 | |
| | Walt Disney Co. | 2.750% | 9/1/49 | 560 | | 526 | |
| | | | | | | | |
| | Consumer Cyclical (1.1%) | | | | | | |
| | Alibaba Group Holding Ltd. | 3.600% | 11/28/24 | 1,065 | | 1,119 | |
| | Alibaba Group Holding Ltd. | 3.400% | 12/6/27 | 3,470 | | 3,616 | |
| 5 | Alimentation Couche-Tard Inc. | 3.550% | 7/26/27 | 2,450 | | 2,511 | |
| | Amazon.com Inc. | 2.500% | 11/29/22 | 885 | | 902 | |
| | Amazon.com Inc. | 2.800% | 8/22/24 | 715 | | 740 | |
| | Amazon.com Inc. | 4.800% | 12/5/34 | 995 | | 1,253 | |
| | Amazon.com Inc. | 4.950% | 12/5/44 | 580 | | 759 | |
| | Amazon.com Inc. | 4.250% | 8/22/57 | 1,335 | | 1,622 | |
| | AutoZone Inc. | 3.700% | 4/15/22 | 1,371 | | 1,414 | |
| 5 | BMW US Capital LLC | 2.000% | 4/11/21 | 585 | | 585 | |
| 5 | BMW US Capital LLC | 2.250% | 9/15/23 | 2,500 | | 2,498 | |
| 5 | Daimler Finance North America LLC | 2.200% | 5/5/20 | 470 | | 470 | |
| 5 | Daimler Finance North America LLC | 2.450% | 5/18/20 | 155 | | 155 | |
| 5 | Daimler Finance North America LLC | 2.300% | 2/12/21 | 945 | | 947 | |
| 5 | Daimler Finance North America LLC | 3.250% | 8/1/24 | 160 | | 165 | |
| | Ford Motor Credit Co. LLC | 3.157% | 8/4/20 | 710 | | 713 | |
| | Ford Motor Credit Co. LLC | 3.815% | 11/2/27 | 1,075 | | 1,038 | |
| | General Motors Financial Co. Inc. | 3.550% | 4/9/21 | 455 | | 462 | |
| | General Motors Financial Co. Inc. | 3.950% | 4/13/24 | 1,570 | | 1,641 | |
| | Home Depot Inc. | 2.700% | 4/1/23 | 720 | | 737 | |
| | Home Depot Inc. | 3.900% | 12/6/28 | 290 | | 324 | |
| | Home Depot Inc. | 4.400% | 3/15/45 | 780 | | 928 | |
| | Home Depot Inc. | 4.500% | 12/6/48 | 345 | | 425 | |
| 5 | Hyundai Capital America | 2.550% | 4/3/20 | 790 | | 791 | |
| 5,6 | Hyundai Capital America, 3M USD LIBOR + 0.940% | 2.967% | 7/8/21 | 1,400 | | 1,403 | |
| | Lowe’s Cos. Inc. | 3.100% | 5/3/27 | 1,300 | | 1,342 | |
| | Lowe’s Cos. Inc. | 6.500% | 3/15/29 | 334 | | 424 | |
| | Lowe’s Cos. Inc. | 4.550% | 4/5/49 | 1,140 | | 1,330 | |
| | McDonald’s Corp. | 2.625% | 1/15/22 | 195 | | 198 | |
| | McDonald’s Corp. | 3.250% | 6/10/24 | 140 | | 147 | |
| | McDonald’s Corp. | 4.875% | 12/9/45 | 1,160 | | 1,399 | |
| | McDonald’s Corp. | 3.625% | 9/1/49 | 275 | | 279 | |
| | Starbucks Corp. | 4.500% | 11/15/48 | 1,000 | | 1,148 | |
| | Walmart Inc. | 2.550% | 4/11/23 | 1,250 | | 1,275 | |
| | Walmart Inc. | 3.550% | 6/26/25 | 1,605 | | 1,717 | |
| | Walmart Inc. | 3.625% | 12/15/47 | 380 | | 421 | |
| | | | | | | | |
| | Consumer Noncyclical (3.3%) | | | | | | |
| 5 | AbbVie Inc. | 4.050% | 11/21/39 | 590 | | 617 | |
| 5 | AbbVie Inc. | 4.250% | 11/21/49 | 970 | | 1,021 | |
| 5 | Alcon Finance Corp. | 2.750% | 9/23/26 | 200 | | 203 | |
| 5 | Alcon Finance Corp. | 3.800% | 9/23/49 | 400 | | 418 | |
| | Allergan Funding SCS | 3.450% | 3/15/22 | 450 | | 460 | |
| | Allergan Funding SCS | 3.800% | 3/15/25 | 575 | | 602 | |
| | Allergan Funding SCS | 4.850% | 6/15/44 | 450 | | 500 | |
| | Altria Group Inc. | 4.750% | 5/5/21 | 590 | | 610 | |
| | Altria Group Inc. | 2.850% | 8/9/22 | 455 | | 463 | |
| | Altria Group Inc. | 5.800% | 2/14/39 | 770 | | 900 | |
| | Altria Group Inc. | 4.500% | 5/2/43 | 245 | | 249 | |
| | Altria Group Inc. | 3.875% | 9/16/46 | 625 | | 580 | |
| | Amgen Inc. | 5.150% | 11/15/41 | 620 | | 750 | |
| | Anheuser-Busch Cos. LLC / Anheuser-Busch InBev Worldwide Inc. | 4.900% | 2/1/46 | 1,940 | | 2,297 | |
| | Anheuser-Busch Cos. LLC / Anheuser-Busch InBev Worldwide Inc. | 4.700% | 2/1/36 | 1,290 | | 1,488 | |
| | Anheuser-Busch InBev Finance Inc. | 3.300% | 2/1/23 | 1,798 | | 1,860 | |
| | Anheuser-Busch InBev Worldwide Inc. | 2.500% | 7/15/22 | 1,007 | | 1,024 | |
| | Anheuser-Busch InBev Worldwide Inc. | 3.750% | 7/15/42 | 520 | | 526 | |
| | Anheuser-Busch InBev Worldwide Inc. | 4.600% | 4/15/48 | 395 | | 449 | |
| | Archer-Daniels-Midland Co. | 4.500% | 3/15/49 | 970 | | 1,183 | |
| | Ascension Health | 2.532% | 11/15/29 | 655 | | 647 | |
| | Ascension Health | 3.945% | 11/15/46 | 280 | | 310 | |
| 2 | Ascension Health | 4.847% | 11/15/53 | 55 | | 69 | |
| | AstraZeneca plc | 2.375% | 11/16/20 | 1,180 | | 1,184 | |
| | AstraZeneca plc | 4.000% | 1/17/29 | 2,345 | | 2,600 | |
| | AstraZeneca plc | 6.450% | 9/15/37 | 615 | | 861 | |
| | BAT Capital Corp. | 3.557% | 8/15/27 | 1,875 | | 1,909 | |
| 5 | BAT International Finance plc | 3.500% | 6/15/22 | 235 | | 242 | |
| 5 | BAT International Finance plc | 3.250% | 6/7/22 | 1,480 | | 1,512 | |
| 5 | Bayer US Finance II LLC | 4.250% | 12/15/25 | 2,325 | | 2,503 | |
| 5 | Bayer US Finance LLC | 3.000% | 10/8/21 | 1,980 | | 2,005 | |
| 5 | Bayer US Finance LLC | 3.375% | 10/8/24 | 815 | | 839 | |
| | Boston Scientific Corp. | 4.000% | 3/1/29 | 195 | | 215 | |
| 5 | Bristol-Myers Squibb Co. | 3.550% | 8/15/22 | 662 | | 684 | |
| 5 | Bristol-Myers Squibb Co. | 2.750% | 2/15/23 | 138 | | 140 | |
| 5 | Bristol-Myers Squibb Co. | 3.250% | 2/20/23 | 239 | | 246 | |
| 5 | Bristol-Myers Squibb Co. | 4.000% | 8/15/23 | 45 | | 48 | |
| 5 | Bristol-Myers Squibb Co. | 3.400% | 7/26/29 | 885 | | 945 | |
| 5 | Bristol-Myers Squibb Co. | 4.125% | 6/15/39 | 505 | | 582 | |
| 5 | Bristol-Myers Squibb Co. | 4.550% | 2/20/48 | 217 | | 266 | |
| 5 | Bristol-Myers Squibb Co. | 4.250% | 10/26/49 | 1,100 | | 1,296 | |
| 5 | Cargill Inc. | 4.307% | 5/14/21 | 2,092 | | 2,158 | |
| 5 | Cargill Inc. | 6.875% | 5/1/28 | 645 | | 813 | |
| 5 | Cargill Inc. | 4.760% | 11/23/45 | 635 | | 790 | |
| 5 | Cigna Corp. | 3.250% | 4/15/25 | 880 | | 905 | |
| | Cigna Corp. | 4.375% | 10/15/28 | 515 | | 570 | |
| | Cigna Corp. | 4.800% | 8/15/38 | 730 | | 840 | |
| | Cigna Corp. | 4.900% | 12/15/48 | 497 | | 589 | |
| | Coca-Cola European Partners plc | 3.500% | 9/15/20 | 500 | | 505 | |
| | Coca-Cola Femsa SAB de CV | 3.875% | 11/26/23 | 850 | | 898 | |
| | Colgate-Palmolive Co. | 7.600% | 5/19/25 | 480 | | 604 | |
| | CommonSpirit Health | 2.950% | 11/1/22 | 535 | | 544 | |
| | CommonSpirit Health | 4.200% | 8/1/23 | 535 | | 562 | |
| | CommonSpirit Health | 2.760% | 10/1/24 | 860 | | 865 | |
| | CommonSpirit Health | 3.347% | 10/1/29 | 1,245 | | 1,252 | |
| 2 | CommonSpirit Health | 4.350% | 11/1/42 | 536 | | 551 | |
| | CommonSpirit Health | 4.187% | 10/1/49 | 1,275 | | 1,271 | |
| | Conagra Brands Inc. | 4.600% | 11/1/25 | 220 | | 242 | |
| | Conagra Brands Inc. | 5.300% | 11/1/38 | 655 | | 777 | |
| | Constellation Brands Inc. | 2.700% | 5/9/22 | 65 | | 66 | |
| | CVS Health Corp. | 2.750% | 12/1/22 | 965 | | 980 | |
| | CVS Health Corp. | 4.875% | 7/20/35 | 315 | | 359 | |
| | CVS Health Corp. | 5.125% | 7/20/45 | 855 | | 1,007 | |
| 5 | Danone SA | 2.947% | 11/2/26 | 735 | | 744 | |
| | Diageo Capital plc | 2.625% | 4/29/23 | 1,230 | | 1,250 | |
| | Diageo Capital plc | 2.375% | 10/24/29 | 580 | | 571 | |
| | Diageo Investment Corp. | 2.875% | 5/11/22 | 525 | | 535 | |
| | Dignity Health | 3.812% | 11/1/24 | 560 | | 587 | |
| 5 | EMD Finance LLC | 2.950% | 3/19/22 | 605 | | 614 | |
| | Estee Lauder Cos. Inc. | 2.375% | 12/1/29 | 370 | | 370 | |
| 5 | Forest Laboratories Inc. | 4.875% | 2/15/21 | 268 | | 274 | |
| | Gilead Sciences Inc. | 2.550% | 9/1/20 | 615 | | 618 | |
| | Gilead Sciences Inc. | 3.700% | 4/1/24 | 1,010 | | 1,072 | |
| | Gilead Sciences Inc. | 3.500% | 2/1/25 | 560 | | 594 | |
| | Gilead Sciences Inc. | 4.500% | 2/1/45 | 825 | | 952 | |
Balanced Portfolio
| | | | Face | | Market | |
| | | Maturity | Amount | | Value• | |
| | Coupon | Date | ($000 | ) | ($000 | ) |
| | Gilead Sciences Inc. | 4.750% | 3/1/46 | 195 | | 233 | |
| | GlaxoSmithKline Capital Inc. | 2.800% | 3/18/23 | 385 | | 394 | |
| | GlaxoSmithKline Capital Inc. | 5.375% | 4/15/34 | 2,000 | | 2,550 | |
| 5 | Imperial Tobacco Finance plc | 3.750% | 7/21/22 | 1,680 | | 1,729 | |
| | Kaiser Foundation Hospitals | 3.500% | 4/1/22 | 285 | | 294 | |
| | Kaiser Foundation Hospitals | 3.150% | 5/1/27 | 490 | | 511 | |
| | Kaiser Foundation Hospitals | 4.875% | 4/1/42 | 365 | | 447 | |
| | Kroger Co. | 3.850% | 8/1/23 | 270 | | 285 | |
| | Kroger Co. | 4.000% | 2/1/24 | 540 | | 573 | |
| | Medtronic Inc. | 3.150% | 3/15/22 | 664 | | 683 | |
| | Medtronic Inc. | 3.500% | 3/15/25 | 566 | | 606 | |
| | Memorial Sloan-Kettering Cancer Center | 4.125% | 7/1/52 | 310 | | 357 | |
| | Memorial Sloan-Kettering Cancer Center | 4.200% | 7/1/55 | 280 | | 325 | |
| | Merck & Co. Inc. | 2.350% | 2/10/22 | 790 | | 800 | |
| | Merck & Co. Inc. | 2.800% | 5/18/23 | 1,175 | | 1,211 | |
| | Merck & Co. Inc. | 2.750% | 2/10/25 | 1,210 | | 1,250 | |
| | Merck & Co. Inc. | 3.400% | 3/7/29 | 1,470 | | 1,588 | |
| | Merck & Co. Inc. | 4.150% | 5/18/43 | 760 | | 898 | |
| | Merck & Co. Inc. | 4.000% | 3/7/49 | 1,915 | | 2,229 | |
| | Mercy Health | 4.302% | 7/1/28 | 570 | �� | 630 | |
| | Molson Coors Beverage Co. | 3.500% | 5/1/22 | 690 | | 708 | |
| | Molson Coors Beverage Co. | 3.000% | 7/15/26 | 1,800 | | 1,819 | |
| | New York & Presbyterian Hospital | 4.024% | 8/1/45 | 180 | | 200 | |
| | Novartis Capital Corp. | 3.400% | 5/6/24 | 415 | | 439 | |
| | Novartis Capital Corp. | 4.400% | 5/6/44 | 640 | | 777 | |
| | Partners Healthcare System | 3.443% | 7/1/21 | 50 | | 51 | |
| | PepsiCo Inc. | 2.750% | 3/5/22 | 670 | | 684 | |
| | PepsiCo Inc. | 2.375% | 10/6/26 | 1,945 | | 1,972 | |
| | PepsiCo Inc. | 4.000% | 3/5/42 | 845 | | 961 | |
| | PepsiCo Inc. | 3.450% | 10/6/46 | 1,215 | | 1,283 | |
| | Pfizer Inc. | 3.000% | 6/15/23 | 755 | | 784 | |
| | Pfizer Inc. | 3.000% | 12/15/26 | 725 | | 760 | |
| | Pfizer Inc. | 3.450% | 3/15/29 | 2,165 | | 2,328 | |
| | Pfizer Inc. | 4.100% | 9/15/38 | 1,505 | | 1,719 | |
| | Philip Morris International Inc. | 4.500% | 3/26/20 | 250 | | 251 | |
| | Philip Morris International Inc. | 4.125% | 5/17/21 | 1,025 | | 1,054 | |
| | Philip Morris International Inc. | 2.500% | 8/22/22 | 575 | | 580 | |
| | Philip Morris International Inc. | 2.625% | 3/6/23 | 1,150 | | 1,169 | |
| | Philip Morris International Inc. | 3.600% | 11/15/23 | 620 | | 652 | |
| | Philip Morris International Inc. | 3.375% | 8/11/25 | 424 | | 446 | |
| | Philip Morris International Inc. | 4.875% | 11/15/43 | 145 | | 171 | |
| 2 | Procter & Gamble - Esop | 9.360% | 1/1/21 | 350 | | 367 | |
| | Providence St. Joseph Health Obligated Group | 2.746% | 10/1/26 | 490 | | 495 | |
| | Providence St. Joseph Health Obligated Group | 2.532% | 10/1/29 | 505 | | 494 | |
| 2 | Providence St. Joseph Health Obligated Group | 3.930% | 10/1/48 | 325 | | 348 | |
| 5 | Roche Holdings Inc. | 2.375% | 1/28/27 | 1,650 | | 1,655 | |
| | Sanofi | 4.000% | 3/29/21 | 1,130 | | 1,159 | |
| 5 | Sigma Alimentos SA de CV | 4.125% | 5/2/26 | 510 | | 534 | |
| | SSM Health Care Corp. | 3.823% | 6/1/27 | 940 | | 994 | |
| | Unilever Capital Corp. | 4.250% | 2/10/21 | 2,805 | | 2,880 | |
| | | | | | | | |
| | Energy (1.0%) | | | | | | |
| 5 | BG Energy Capital plc | 4.000% | 10/15/21 | 555 | | 574 | |
| | BP Capital Markets America Inc. | 4.500% | 10/1/20 | 400 | | 408 | |
| | BP Capital Markets America Inc. | 3.245% | 5/6/22 | 650 | | 671 | |
| | BP Capital Markets plc | 2.315% | 2/13/20 | 160 | | 160 | |
| | BP Capital Markets plc | 3.062% | 3/17/22 | 1,100 | | 1,128 | |
| | BP Capital Markets plc | 2.500% | 11/6/22 | 500 | | 509 | |
| | BP Capital Markets plc | 3.994% | 9/26/23 | 420 | | 448 | |
| | BP Capital Markets plc | 3.814% | 2/10/24 | 1,700 | | 1,814 | |
| | BP Capital Markets plc | 3.506% | 3/17/25 | 1,280 | | 1,362 | |
| | Chevron Corp. | 3.191% | 6/24/23 | 1,235 | | 1,284 | |
| | Cimarex Energy Co. | 4.375% | 6/1/24 | 927 | | 976 | |
| | ConocoPhillips Co. | 4.950% | 3/15/26 | 115 | | 132 | |
| | Dominion Energy Gas Holdings LLC | 3.550% | 11/1/23 | 470 | | 486 | |
| | Dominion Energy Gas Holdings LLC | 3.000% | 11/15/29 | 585 | | 581 | |
| | Dominion Energy Gas Holdings LLC | 4.800% | 11/1/43 | 125 | | 139 | |
| | Dominion Energy Gas Holdings LLC | 4.600% | 12/15/44 | 1,603 | | 1,740 | |
| | Energy Transfer Operating LP | 5.250% | 4/15/29 | 1,375 | | 1,541 | |
| | Energy Transfer Partners LP | 5.300% | 4/15/47 | 155 | | 165 | |
| | Enterprise Products Operating LLC | 4.250% | 2/15/48 | 730 | | 787 | |
| | Exxon Mobil Corp. | 2.726% | 3/1/23 | 320 | | 328 | |
| | Exxon Mobil Corp. | 3.043% | 3/1/26 | 225 | | 236 | |
| | Exxon Mobil Corp. | 2.275% | 8/16/26 | 1,070 | | 1,073 | |
| | Exxon Mobil Corp. | 2.440% | 8/16/29 | 735 | | 739 | |
| | Exxon Mobil Corp. | 4.114% | 3/1/46 | 320 | | 374 | |
| | Occidental Petroleum Corp. | 2.700% | 2/15/23 | 250 | | 252 | |
| | Occidental Petroleum Corp. | 3.400% | 4/15/26 | 240 | | 245 | |
| | Phillips 66 Partners LP | 3.750% | 3/1/28 | 1,525 | | 1,585 | |
| 5 | Schlumberger Holdings Corp. | 3.900% | 5/17/28 | 807 | | 857 | |
| 5 | Schlumberger Investment SA | 2.400% | 8/1/22 | 630 | | 634 | |
| | Schlumberger Investment SA | 3.650% | 12/1/23 | 1,120 | | 1,179 | |
| | Shell International Finance BV | 4.125% | 5/11/35 | 1,130 | | 1,319 | |
| | Shell International Finance BV | 5.500% | 3/25/40 | 345 | | 467 | |
| | Shell International Finance BV | 4.375% | 5/11/45 | 2,500 | | 2,977 | |
| | Suncor Energy Inc. | 5.950% | 12/1/34 | 500 | | 651 | |
| | Sunoco Logistics Partners Operations LP | 5.350% | 5/15/45 | 90 | | 96 | |
| | Sunoco Logistics Partners Operations LP | 5.400% | 10/1/47 | 20 | | 22 | |
| | Total Capital International SA | 2.700% | 1/25/23 | 885 | | 904 | |
| | Total Capital International SA | 3.750% | 4/10/24 | 1,400 | | 1,495 | |
| | TransCanada PipeLines Ltd. | 3.800% | 10/1/20 | 1,220 | | 1,230 | |
| | TransCanada PipeLines Ltd. | 4.875% | 1/15/26 | 1,255 | | 1,402 | |
| | | | | | | | |
| | Other Industrial (0.1%) | | | | | | |
| | Georgetown University | 4.315% | 4/1/49 | 205 | | 246 | |
| 2 | Johns Hopkins University | 4.083% | 7/1/53 | 690 | | 797 | |
| 5 | SBA Tower Trust | 3.168% | 4/11/22 | 1,330 | | 1,345 | |
| 5 | SBA Tower Trust | 3.448% | 3/15/23 | 705 | | 727 | |
| 5 | SBA Tower Trust | 2.836% | 1/15/25 | 725 | | 729 | |
| | | | | | | | |
| | Technology (1.9%) | | | | | | |
| | Apple Inc. | 3.000% | 2/9/24 | 620 | | 642 | |
| | Apple Inc. | 3.450% | 5/6/24 | 1,000 | | 1,063 | |
| | Apple Inc. | 2.850% | 5/11/24 | 1,225 | | 1,266 | |
| | Apple Inc. | 2.750% | 1/13/25 | 590 | | 609 | |
| | Apple Inc. | 3.250% | 2/23/26 | 1,020 | | 1,079 | |
| | Apple Inc. | 2.450% | 8/4/26 | 1,170 | | 1,186 | |
| | Apple Inc. | 3.350% | 2/9/27 | 1,545 | | 1,644 | |
| | Apple Inc. | 3.200% | 5/11/27 | 1,065 | | 1,122 | |
| | Apple Inc. | 2.900% | 9/12/27 | 2,250 | | 2,339 | |
| | Apple Inc. | 3.850% | 5/4/43 | 430 | | 480 | |
| | Apple Inc. | 4.450% | 5/6/44 | 120 | | 147 | |
| | Apple Inc. | 3.850% | 8/4/46 | 985 | | 1,106 | |
| | Broadcom Corp. / Broadcom Cayman Finance Ltd. | 3.625% | 1/15/24 | 1,380 | | 1,429 | |
| | Broadcom Corp. / Broadcom Cayman Finance Ltd. | 3.875% | 1/15/27 | 1,265 | | 1,312 | |
| 5 | Broadcom Inc. | 4.250% | 4/15/26 | 170 | | 180 | |
| | Cisco Systems Inc. | 2.500% | 9/20/26 | 431 | | 439 | |
| | Fiserv Inc. | 3.200% | 7/1/26 | 655 | | 678 | |
| | Intel Corp. | 2.875% | 5/11/24 | 800 | | 830 | |
| | Intel Corp. | 4.100% | 5/19/46 | 1,360 | | 1,563 | |
| | International Business Machines Corp. | 3.375% | 8/1/23 | 1,750 | | 1,830 | |
| | International Business Machines Corp. | 3.000% | 5/15/24 | 2,500 | | 2,589 | |
| | International Business Machines Corp. | 3.300% | 5/15/26 | 4,500 | | 4,741 | |
| | International Business Machines Corp. | 3.500% | 5/15/29 | 2,975 | | 3,193 | |
| | International Business Machines Corp. | 5.875% | 11/29/32 | 1,010 | | 1,333 | |
| | Microsoft Corp. | 3.625% | 12/15/23 | 500 | | 532 | |
| | Microsoft Corp. | 2.875% | 2/6/24 | 1,385 | | 1,436 | |
| | Microsoft Corp. | 2.700% | 2/12/25 | 760 | | 786 | |
| | Microsoft Corp. | 3.125% | 11/3/25 | 845 | | 893 | |
| | Microsoft Corp. | 2.400% | 8/8/26 | 1,890 | | 1,909 | |
| | Microsoft Corp. | 3.500% | 2/12/35 | 605 | | 666 | |
| | Microsoft Corp. | 3.450% | 8/8/36 | 1,725 | | 1,886 | |
| | Microsoft Corp. | 4.100% | 2/6/37 | 1,225 | | 1,443 | |
Balanced Portfolio
| | | | Face | | Market | |
| | | Maturity | Amount | | Value• | |
| | Coupon | Date | ($000 | ) | ($000 | ) |
| | Microsoft Corp. | 4.450% | 11/3/45 | 380 | | 473 | |
| | Microsoft Corp. | 3.700% | 8/8/46 | 1,615 | | 1,822 | |
| | Microsoft Corp. | 4.250% | 2/6/47 | 2,500 | | 3,051 | |
| | Oracle Corp. | 2.800% | 7/8/21 | 375 | | 380 | |
| | Oracle Corp. | 2.500% | 5/15/22 | 1,210 | | 1,227 | |
| | Oracle Corp. | 2.950% | 11/15/24 | 2,190 | | 2,270 | |
| | Oracle Corp. | 2.950% | 5/15/25 | 355 | | 369 | |
| | Oracle Corp. | 3.250% | 11/15/27 | 3,065 | | 3,241 | |
| | Oracle Corp. | 4.000% | 11/15/47 | 895 | | 1,000 | |
| | QUALCOMM Inc. | 2.600% | 1/30/23 | 705 | | 717 | |
| | QUALCOMM Inc. | 2.900% | 5/20/24 | 1,020 | | 1,051 | |
| 5 | Tencent Holdings Ltd. | 3.575% | 4/11/26 | 200 | | 208 | |
| 5 | Tencent Holdings Ltd. | 3.595% | 1/19/28 | 2,495 | | 2,610 | |
| 5 | Tencent Holdings Ltd. | 3.975% | 4/11/29 | 925 | | 995 | |
| | | | | | | | |
| | Transportation (0.5%) | | | | | | |
| | Burlington Northern Santa Fe LLC | 3.000% | 3/15/23 | 565 | | 580 | |
| | Burlington Northern Santa Fe LLC | 3.850% | 9/1/23 | 1,630 | | 1,731 | |
| | Burlington Northern Santa Fe LLC | 4.550% | 9/1/44 | 250 | | 298 | |
| 2 | Continental Airlines 2007-1 Class A Pass Through Trust | 5.983% | 10/19/23 | 608 | | 640 | |
| | CSX Corp. | 4.300% | 3/1/48 | 445 | | 500 | |
| | CSX Corp. | 3.350% | 9/15/49 | 415 | | 408 | |
| 5 | ERAC USA Finance LLC | 4.500% | 8/16/21 | 325 | | 337 | |
| 5 | ERAC USA Finance LLC | 3.300% | 10/15/22 | 40 | | 41 | |
| 5 | ERAC USA Finance LLC | 7.000% | 10/15/37 | 1,150 | | 1,619 | |
| 5 | ERAC USA Finance LLC | 5.625% | 3/15/42 | 340 | | 422 | |
| 2 | Federal Express Corp. 1998 Pass Through Trust | 6.720% | 1/15/22 | 443 | | 455 | |
| | FedEx Corp. | 2.700% | 4/15/23 | 255 | | 259 | |
| | FedEx Corp. | 4.100% | 2/1/45 | 130 | | 125 | |
| | FedEx Corp. | 4.750% | 11/15/45 | 361 | | 380 | |
| | FedEx Corp. | 4.550% | 4/1/46 | 178 | | 182 | |
| | FedEx Corp. | 4.050% | 2/15/48 | 48 | | 46 | |
| | FedEx Corp. | 4.950% | 10/17/48 | 333 | | 362 | |
| | Kansas City Southern | 4.950% | 8/15/45 | 480 | | 563 | |
| 5 | Penske Truck Leasing Co. LP / PTL Finance Corp. | 3.450% | 7/1/24 | 465 | | 482 | |
| 5 | Penske Truck Leasing Co. LP / PTL Finance Corp. | 2.700% | 11/1/24 | 385 | | 387 | |
| 5 | Penske Truck Leasing Co. LP / PTL Finance Corp. | 3.950% | 3/10/25 | 1,435 | | 1,518 | |
| 5 | Penske Truck Leasing Co. LP / PTL Finance Corp. | 4.450% | 1/29/26 | 925 | | 997 | |
| 2 | Southwest Airlines Co. 2007-1 Pass Through Trust | 6.150% | 2/1/24 | 225 | | 237 | |
| | Union Pacific Corp. | 3.700% | 3/1/29 | 505 | | 550 | |
| | Union Pacific Corp. | 4.300% | 3/1/49 | 625 | | 715 | |
| | Union Pacific Corp. | 3.799% | 10/1/51 | 666 | | 706 | |
| 2 | United Airlines 2018-1 Class B Pass Through Trust | 4.600% | 3/1/26 | 198 | | 204 | |
| | United Parcel Service Inc. | 2.450% | 10/1/22 | 425 | | 432 | |
| | | | | | | 335,242 | |
| Utilities (2.8%) | | | | | | |
| | Electric (2.4%) | | | | | | |
| | AEP Texas Inc. | 4.150% | 5/1/49 | 145 | | 161 | |
| | AEP Texas Inc. | 3.450% | 1/15/50 | 380 | | 380 | |
| | Alabama Power Co. | 5.200% | 6/1/41 | 120 | | 147 | |
| | Alabama Power Co. | 4.100% | 1/15/42 | 215 | | 230 | |
| | Alabama Power Co. | 3.750% | 3/1/45 | 630 | | 661 | |
| | Alabama Power Co. | 4.300% | 7/15/48 | 775 | | 893 | |
| | Ameren Illinois Co. | 3.800% | 5/15/28 | 590 | | 643 | |
| | Ameren Illinois Co. | 6.125% | 12/15/28 | 1,000 | | 1,192 | |
| | Ameren Illinois Co. | 3.700% | 12/1/47 | 140 | | 148 | |
| | Berkshire Hathaway Energy Co. | 6.125% | 4/1/36 | 1,160 | | 1,597 | |
| | Berkshire Hathaway Energy Co. | 5.150% | 11/15/43 | 1,490 | | 1,872 | |
| | CenterPoint Energy Houston Electric LLC | 4.250% | 2/1/49 | 195 | | 228 | |
| | Cleco Corporate Holdings LLC | 3.743% | 5/1/26 | 1,042 | | 1,076 | |
| 5 | Cleco Corporate Holdings LLC | 3.375% | 9/15/29 | 405 | | 402 | |
| | Commonwealth Edison Co. | 2.950% | 8/15/27 | 645 | | 663 | |
| | Commonwealth Edison Co. | 4.350% | 11/15/45 | 375 | | 435 | |
| | Commonwealth Edison Co. | 3.650% | 6/15/46 | 175 | | 184 | |
| | Commonwealth Edison Co. | 4.000% | 3/1/48 | 480 | | 534 | |
| | Consolidated Edison Co. of New York Inc. | 4.500% | 12/1/45 | 980 | | 1,143 | |
| | Consolidated Edison Co. of New York Inc. | 3.850% | 6/15/46 | 76 | | 82 | |
| | Consolidated Edison Co. of New York Inc. | 4.625% | 12/1/54 | 1,835 | | 2,193 | |
| | Consolidated Edison Co. of New York Inc. | 4.500% | 5/15/58 | 680 | | 787 | |
| | Delmarva Power & Light Co. | 3.500% | 11/15/23 | 305 | | 319 | |
| | Dominion Energy Inc. | 2.579% | 7/1/20 | 640 | | 642 | |
| | Dominion Energy Inc. | 2.715% | 8/15/21 | 450 | | 453 | |
| 5 | Dominion Energy Inc. | 2.450% | 1/15/23 | 3,240 | | 3,247 | |
| | Dominion Energy Inc. | 5.250% | 8/1/33 | 1,000 | | 1,200 | |
| | Dominion Energy Inc. | 4.600% | 3/15/49 | 875 | | 1,016 | |
| | Dominion Energy South Carolina Inc. | 6.625% | 2/1/32 | 138 | | 186 | |
| | Dominion Energy South Carolina Inc. | 5.300% | 5/15/33 | 44 | | 55 | |
| | Dominion Energy South Carolina Inc. | 6.050% | 1/15/38 | 1,260 | | 1,695 | |
| | Dominion Energy South Carolina Inc. | 5.450% | 2/1/41 | 95 | | 122 | |
| | Dominion Energy South Carolina Inc. | 4.600% | 6/15/43 | 202 | | 238 | |
| | Dominion Energy South Carolina Inc. | 5.100% | 6/1/65 | 715 | | 929 | |
| | DTE Energy Co. | 3.800% | 3/15/27 | 250 | | 264 | |
| | Duke Energy Carolinas LLC | 6.100% | 6/1/37 | 391 | | 530 | |
| | Duke Energy Carolinas LLC | 3.700% | 12/1/47 | 470 | | 503 | |
| | Duke Energy Corp. | 2.650% | 9/1/26 | 315 | | 315 | |
| | Duke Energy Corp. | 3.400% | 6/15/29 | 350 | | 365 | |
| | Duke Energy Corp. | 4.800% | 12/15/45 | 1,200 | | 1,417 | |
| | Duke Energy Corp. | 3.750% | 9/1/46 | 265 | | 271 | |
| | Duke Energy Florida LLC | 6.350% | 9/15/37 | 200 | | 278 | |
| | Duke Energy Progress LLC | 6.300% | 4/1/38 | 365 | | 504 | |
| | Duke Energy Progress LLC | 4.100% | 3/15/43 | 118 | | 131 | |
| | Duke Energy Progress LLC | 4.200% | 8/15/45 | 2,045 | | 2,312 | |
| | Emera US Finance LP | 3.550% | 6/15/26 | 965 | | 1,001 | |
| | Entergy Louisiana LLC | 3.120% | 9/1/27 | 410 | | 424 | |
| | Evergy Inc. | 2.450% | 9/15/24 | 425 | | 427 | |
| | Evergy Inc. | 2.900% | 9/15/29 | 600 | | 596 | |
| | Eversource Energy | 2.900% | 10/1/24 | 690 | | 704 | |
| | Eversource Energy | 3.150% | 1/15/25 | 110 | | 113 | |
| | Eversource Energy | 3.300% | 1/15/28 | 400 | | 412 | |
| | Florida Power & Light Co. | 5.650% | 2/1/35 | 1,000 | | 1,269 | |
| | Florida Power & Light Co. | 4.950% | 6/1/35 | 1,000 | | 1,224 | |
| | Florida Power & Light Co. | 5.950% | 2/1/38 | 785 | | 1,074 | |
| | Florida Power & Light Co. | 5.690% | 3/1/40 | 675 | | 912 | |
| | Florida Power & Light Co. | 3.700% | 12/1/47 | 480 | | 529 | |
| | Fortis Inc. | 3.055% | 10/4/26 | 1,195 | | 1,218 | |
| | Georgia Power Co. | 5.400% | 6/1/40 | 205 | | 237 | |
| | Georgia Power Co. | 4.750% | 9/1/40 | 988 | | 1,119 | |
| | Georgia Power Co. | 4.300% | 3/15/42 | 1,646 | | 1,782 | |
| | Indiana Michigan Power Co. | 4.250% | 8/15/48 | 415 | | 472 | |
| | Kansas City Power & Light Co. | 4.200% | 3/15/48 | 137 | | 157 | |
| 5 | Massachusetts Electric Co. | 5.900% | 11/15/39 | 585 | | 777 | |
| 5 | Metropolitan Edison Co. | 4.300% | 1/15/29 | 199 | | 221 | |
| 5 | Mid-Atlantic Interstate Transmission LLC | 4.100% | 5/15/28 | 195 | | 213 | |
| | MidAmerican Energy Co. | 4.250% | 5/1/46 | 45 | | 53 | |
| | MidAmerican Energy Co. | 4.250% | 7/15/49 | 315 | | 378 | |
| | MidAmerican Energy Co. | 3.150% | 4/15/50 | 1,390 | | 1,372 | |
| 5 | Monongahela Power Co. | 5.400% | 12/15/43 | 135 | | 173 | |
| | National Rural Utilities Cooperative Finance Corp. | 2.950% | 2/7/24 | 415 | | 428 | |
| | National Rural Utilities Cooperative Finance Corp. | 2.850% | 1/27/25 | 1,040 | | 1,070 | |
| | NextEra Energy Capital Holdings Inc. | 2.403% | 9/1/21 | 1,295 | | 1,301 | |
| | NextEra Energy Capital Holdings Inc. | 3.250% | 4/1/26 | 260 | | 270 | |
| | NextEra Energy Capital Holdings Inc. | 3.550% | 5/1/27 | 880 | | 932 | |
| | NextEra Energy Capital Holdings Inc. | 3.500% | 4/1/29 | 390 | | 412 | |
| | NextEra Energy Capital Holdings Inc. | 2.750% | 11/1/29 | 590 | | 589 | |
| 5 | Niagara Mohawk Power Corp. | 4.278% | 12/15/28 | 1,000 | | 1,112 | |
Balanced Portfolio
| | | | Face | | Market | |
| | | Maturity | Amount | | Value• | |
| | Coupon | Date | ($000 | ) | ($000 | ) |
| | Northern States Power Co. | 6.250% | 6/1/36 | 2,000 | | 2,745 | |
| 2,5 | Oglethorpe Power Corp. | 6.191% | 1/1/31 | 1,065 | | 1,247 | |
| | Oglethorpe Power Corp. | 5.950% | 11/1/39 | 170 | | 212 | |
| | Oglethorpe Power Corp. | 4.550% | 6/1/44 | 50 | | 53 | |
| | Oglethorpe Power Corp. | 4.250% | 4/1/46 | 537 | | 550 | |
| | Oglethorpe Power Corp. | 5.050% | 10/1/48 | 80 | | 94 | |
| | Oglethorpe Power Corp. | 5.250% | 9/1/50 | 630 | | 755 | |
| | Oncor Electric Delivery Co. LLC | 4.550% | 12/1/41 | 75 | | 88 | |
| | PacifiCorp | 6.250% | 10/15/37 | 2,000 | | 2,800 | |
| | PacifiCorp | 4.150% | 2/15/50 | 250 | | 287 | |
| | Potomac Electric Power Co. | 3.050% | 4/1/22 | 460 | | 469 | |
| | Potomac Electric Power Co. | 6.500% | 11/15/37 | 750 | | 1,060 | |
| | San Diego Gas & Electric Co. | 6.000% | 6/1/26 | 600 | | 704 | |
| | San Diego Gas & Electric Co. | 4.150% | 5/15/48 | 500 | | 547 | |
| | Sierra Pacific Power Co. | 3.375% | 8/15/23 | 850 | | 883 | |
| | Sierra Pacific Power Co. | 2.600% | 5/1/26 | 221 | | 222 | |
| | Southern California Edison Co. | 2.400% | 2/1/22 | 170 | | 171 | |
| | Southern California Edison Co. | 3.700% | 8/1/25 | 90 | | 95 | |
| | Southern California Edison Co. | 6.000% | 1/15/34 | 1,000 | | 1,240 | |
| | Southern California Edison Co. | 5.550% | 1/15/37 | 2,250 | | 2,703 | |
| | Southern California Edison Co. | 6.050% | 3/15/39 | 55 | | 72 | |
| | Southern California Edison Co. | 4.000% | 4/1/47 | 195 | | 204 | |
| | Southern California Edison Co. | 4.125% | 3/1/48 | 645 | | 682 | |
| | Southern Co. | 2.950% | 7/1/23 | 1,280 | | 1,303 | |
| | Southern Co. | 4.400% | 7/1/46 | 755 | | 834 | |
| | Southwestern Electric Power Co. | 6.200% | 3/15/40 | 400 | | 528 | |
| | Southwestern Public Service Co. | 3.700% | 8/15/47 | 102 | | 107 | |
| | Virginia Electric & Power Co. | 2.750% | 3/15/23 | 690 | | 701 | |
| | Virginia Electric & Power Co. | 3.500% | 3/15/27 | 435 | | 462 | |
| | Westar Energy Inc. | 3.250% | 9/1/49 | 630 | | 615 | |
| | Wisconsin Electric Power Co. | 5.700% | 12/1/36 | 690 | | 899 | |
| | | | | | | | |
| | Natural Gas (0.3%) | | | | | | |
| 5 | Boston Gas Co. | 3.150% | 8/1/27 | 140 | | 145 | |
| 5 | Boston Gas Co. | 3.001% | 8/1/29 | 175 | | 178 | |
| 5 | Brooklyn Union Gas Co. | 3.407% | 3/10/26 | 95 | | 98 | |
| 5 | Brooklyn Union Gas Co. | 4.273% | 3/15/48 | 1,720 | | 1,903 | |
| | CenterPoint Energy Resources Corp. | 4.500% | 1/15/21 | 105 | | 107 | |
| | CenterPoint Energy Resources Corp. | 4.000% | 4/1/28 | 1,369 | | 1,468 | |
| 5 | Infraestructura Energetica Nova SAB de CV | 4.875% | 1/14/48 | 455 | | 435 | |
| 5 | KeySpan Gas East Corp. | 2.742% | 8/15/26 | 670 | | 668 | |
| | NiSource Finance Corp. | 5.250% | 2/15/43 | 390 | | 472 | |
| | NiSource Finance Corp. | 4.800% | 2/15/44 | 1,355 | | 1,554 | |
| | Sempra Energy | 2.875% | 10/1/22 | 750 | | 763 | |
| | Sempra Energy | 3.250% | 6/15/27 | 1,095 | | 1,121 | |
| | Sempra Energy | 6.000% | 10/15/39 | 600 | | 779 | |
| | Southern California Gas Co. | 2.600% | 6/15/26 | 820 | | 819 | |
| | | | | | | | |
| | Other Utility (0.1%) | | | | | | |
| | American Water Capital Corp. | 2.950% | 9/1/27 | 540 | | 550 | |
| | American Water Capital Corp. | 4.200% | 9/1/48 | 810 | | 913 | |
| | | | | | | 90,919 | |
| Total Corporate Bonds (Cost $644,994) | | | | | 694,532 | |
| Sovereign Bonds (1.4%) | |
| 7 | Canadian Treasury Bill | 1.751% | 1/6/20 | 945 | | 728 | |
| 5 | Electricite de France SA | 4.600% | 1/27/20 | 1,200 | | 1,202 | |
| 5 | Electricite de France SA | 4.875% | 9/21/38 | 2,400 | | 2,797 | |
| 5 | Electricite de France SA | 4.875% | 1/22/44 | 50 | | 58 | |
| 5 | Electricite de France SA | 4.950% | 10/13/45 | 400 | | 465 | |
| | Equinor ASA | 2.900% | 11/8/20 | 1,410 | | 1,422 | |
| | Equinor ASA | 2.750% | 11/10/21 | 850 | | 864 | |
| | Equinor ASA | 2.450% | 1/17/23 | 382 | | 388 | |
| | Equinor ASA | 2.650% | 1/15/24 | 360 | | 368 | |
| | Equinor ASA | 3.700% | 3/1/24 | 640 | | 682 | |
| | Equinor ASA | 3.250% | 11/10/24 | 795 | | 837 | |
| | International Bank for Reconstruction & Development | 4.750% | 2/15/35 | 2,000 | | 2,608 | |
| 8 | Japan | 0.100% | 1/15/20 | 86,750 | | 798 | |
| 9 | Japan Bank for International Cooperation | 2.250% | 2/24/20 | 1,190 | | 1,190 | |
| 9 | Japan Bank for International Cooperation | 2.125% | 6/1/20 | 882 | | 883 | |
| 9 | Japan Bank for International Cooperation | 2.125% | 7/21/20 | 1,100 | | 1,101 | |
| 5,10 | Kingdom of Saudi Arabia | 2.375% | 10/26/21 | 850 | | 853 | |
| 5,10 | Kingdom of Saudi Arabia | 2.875% | 3/4/23 | 1,130 | | 1,150 | |
| 11 | Korea Development Bank | 2.500% | 3/11/20 | 2,000 | | 2,002 | |
| 12 | Province of Ontario | 2.500% | 4/27/26 | 2,150 | | 2,201 | |
| 13 | Province of Quebec | 2.500% | 4/20/26 | 3,820 | | 3,910 | |
| 5 | Saudi Arabian Oil Co. | 3.500% | 4/16/29 | 1,030 | | 1,064 | |
| 5 | Sinopec Group Overseas Development 2015 Ltd. | 2.500% | 4/28/20 | 1,615 | | 1,616 | |
| 5 | Sinopec Group Overseas Development 2015 Ltd. | 3.250% | 4/28/25 | 1,615 | | 1,664 | |
| 5 | Sinopec Group Overseas Development 2017 Ltd. | 3.000% | 4/12/22 | 850 | | 863 | |
| 5 | Sinopec Group Overseas Development 2018 Ltd. | 2.950% | 11/12/29 | 1,165 | | 1,169 | |
| 5 | State Grid Overseas Investment 2016 Ltd. | 2.750% | 5/4/22 | 1,550 | | 1,563 | |
| 5 | State Grid Overseas Investment 2016 Ltd. | 3.500% | 5/4/27 | 775 | | 812 | |
| 5,14 | State of Qatar | 5.250% | 1/20/20 | 1,665 | | 1,668 | |
| 5,14 | State of Qatar | 2.375% | 6/2/21 | 1,590 | | 1,594 | |
| 5,14 | State of Qatar | 3.875% | 4/23/23 | 1,985 | | 2,096 | |
| 5,14 | State of Qatar | 4.000% | 3/14/29 | 851 | | 949 | |
| 5,14 | State of Qatar | 5.103% | 4/23/48 | 820 | | 1,048 | |
| 5 | Temasek Financial I Ltd. | 2.375% | 1/23/23 | 1,130 | | 1,140 | |
| 5 | Temasek Financial I Ltd. | 3.625% | 8/1/28 | 1,025 | | 1,128 | |
| Total Sovereign Bonds (Cost $42,628) | | | | | 44,881 | |
| Taxable Municipal Bonds (1.7%) | |
| | Atlanta GA Downtown Development Authority Revenue | 6.875% | 2/1/21 | 130 | | 134 | |
| | Bay Area Toll Authority California Toll Bridge Revenue (San Francisco Bay Area) | 2.574% | 4/1/31 | 350 | | 348 | |
| | Bay Area Toll Authority California Toll Bridge Revenue (San Francisco Bay Area) | 6.263% | 4/1/49 | 685 | | 1,046 | |
| | Bay Area Toll Authority California Toll Bridge Revenue (San Francisco Bay Area) | 7.043% | 4/1/50 | 1,025 | | 1,664 | |
| | California GO | 5.700% | 11/1/21 | 185 | | 198 | |
| | California GO | 7.500% | 4/1/34 | 155 | | 233 | |
| | California GO | 7.550% | 4/1/39 | 675 | | 1,083 | |
| | California GO | 7.350% | 11/1/39 | 2,000 | | 3,072 | |
| | California GO | 7.625% | 3/1/40 | 35 | | 56 | |
| | California GO | 7.600% | 11/1/40 | 700 | | 1,156 | |
| | Chicago IL Metropolitan Water Reclamation District GO | 5.720% | 12/1/38 | 215 | | 281 | |
| | Chicago IL O’Hare International Airport Revenue | 6.845% | 1/1/38 | 530 | | 532 | |
| | Chicago IL O’Hare International Airport Revenue | 6.395% | 1/1/40 | 245 | | 352 | |
| | Chicago IL Transit Authority Sales Tax Receipts Revenue | 6.200% | 12/1/40 | 550 | | 720 | |
| | Chicago IL Transit Authority Sales Tax Receipts Revenue | 6.899% | 12/1/40 | 825 | | 1,115 | |
| | Chicago IL Transit Authority Transfer Tax Receipts Revenue | 6.899% | 12/1/40 | 1,780 | | 2,405 | |
| | County of Broward FL Airport System Revenue | 3.477% | 10/1/43 | 300 | | 301 | |
| | Dallas TX Area Rapid Transit Revenue | 5.999% | 12/1/44 | 750 | | 1,069 | |
| | Foothill-Eastern California Transportation Corridor Agency | 4.094% | 1/15/49 | 295 | | 295 | |
| 15 | Foothill-Eastern California Transportation Corridor Agency | 3.924% | 1/15/53 | 1,030 | | 1,016 | |
Balanced Portfolio
| | | | Face | | Market | |
| | | Maturity | Amount | | Value• | |
| | Coupon | Date | ($000 | ) | ($000 | ) |
| | Georgia Municipal Electric Power Authority Revenue | 6.637% | 4/1/57 | 1,985 | | 2,673 | |
| | Georgia Municipal Electric Power Authority Revenue | 6.655% | 4/1/57 | 233 | | 321 | |
| | Grand Parkway Transportation Corp. Texas System Toll Revenue | 5.184% | 10/1/42 | 1,015 | | 1,300 | |
| | Houston TX GO | 6.290% | 3/1/32 | 400 | | 482 | |
| | Illinois GO | 5.100% | 6/1/33 | 810 | | 873 | |
| | Illinois Toll Highway Authority Revenue | 6.184% | 1/1/34 | 750 | | 996 | |
| 15 | Kansas Development Finance Authority Revenue (Public Employees Retirement System) | 5.501% | 5/1/34 | 2,000 | | 2,485 | |
| | Los Angeles CA Community College District GO | 6.750% | 8/1/49 | 180 | | 296 | |
| | Maryland Transportation Authority Facilities Projects Revenue | 5.888% | 7/1/43 | 545 | | 727 | |
| | Massachusetts School Building Authority Dedicated Sales Tax Revenue | 5.715% | 8/15/39 | 1,000 | | 1,320 | |
| | Massachusetts School Building Authority Dedicated Sales Tax Revenue | 3.395% | 10/15/40 | 500 | | 500 | |
| | Michigan Finance Authority Revenue (Trinity Health Credit Group) | 3.084% | 12/1/34 | 295 | | 294 | |
| | Michigan Finance Authority Revenue (Trinity Health Credit Group) | 3.384% | 12/1/40 | 535 | | 534 | |
| | New Jersey Turnpike Authority Revenue | 7.414% | 1/1/40 | 410 | | 643 | |
| | New Jersey Turnpike Authority Revenue | 7.102% | 1/1/41 | 600 | | 915 | |
| | New York City NY Municipal Water Finance Authority Water & Sewer System Revenue | 5.790% | 6/15/41 | 25 | | 25 | |
| | New York City NY Municipal Water Finance Authority Water & Sewer System Revenue | 5.790% | 6/15/41 | 90 | | 91 | |
| | New York City NY Municipal Water Finance Authority Water & Sewer System Revenue | 5.882% | 6/15/44 | 15 | | 22 | |
| | New York Metropolitan Transportation Authority Revenue | 6.814% | 11/15/40 | 70 | | 99 | |
| | New York Metropolitan Transportation Authority Revenue (Dedicated Tax Fund) | 7.336% | 11/15/39 | 325 | | 509 | |
| | New York Metropolitan Transportation Authority Revenue (Dedicated Tax Fund) | 6.089% | 11/15/40 | 445 | | 598 | |
| | New York State Dormitory Authority Revenue | 3.142% | 7/1/43 | 325 | | 322 | |
| | New York State Dormitory Authority Revenue (Personal Income Tax) | 3.110% | 2/15/39 | 640 | | 640 | |
| | New York State Dormitory Authority Revenue (Personal Income Tax) | 3.190% | 2/15/43 | 355 | | 356 | |
| | New York State Thruway Authority | 2.900% | 1/1/35 | 490 | | 488 | |
| | New York State Thruway Authority | 3.500% | 1/1/42 | 275 | | 274 | |
| | New York State Urban Development Corp. Revenue | 2.100% | 3/15/22 | 2,315 | | 2,320 | |
| | North Texas Tollway Authority System Revenue | 6.718% | 1/1/49 | 1,480 | | 2,322 | |
| | Oregon Department of Transportation Highway User Tax Revenue | 5.834% | 11/15/34 | 655 | | 873 | |
| 15 | Oregon School Boards Association GO | 5.528% | 6/30/28 | 2,000 | | 2,359 | |
| 16 | Philadelphia PA Authority for Industrial Development | 6.550% | 10/15/28 | 1,945 | | 2,427 | |
| | Port Authority of New York & New Jersey Revenue | 5.859% | 12/1/24 | 65 | | 76 | |
| | Port Authority of New York & New Jersey Revenue | 6.040% | 12/1/29 | 265 | | 341 | |
| | Port Authority of New York & New Jersey Revenue | 4.458% | 10/1/62 | 1,175 | | 1,440 | |
| | Port Authority of New York & New Jersey Revenue | 4.810% | 10/15/65 | 640 | | 806 | |
| | Rutgers The State University of New Jersey | 3.270% | 5/1/43 | 350 | | 346 | |
| | Sales Tax Securitization Corp. Illinois Revenue | 4.787% | 1/1/48 | 1,000 | | 1,162 | |
| | San Antonio TX Electric & Gas Systems Revenue | 5.985% | 2/1/39 | 305 | | 420 | |
| | University of California Regents Medical Center Revenue | 3.063% | 7/1/25 | 1,280 | | 1,340 | |
| | University of California Regents Medical Center Revenue | 6.548% | 5/15/48 | 195 | | 282 | |
| | University of California Regents Medical Center Revenue | 6.583% | 5/15/49 | 765 | | 1,101 | |
| | University of California Revenue | 3.349% | 7/1/29 | 210 | | 224 | |
| | University of California Revenue | 4.601% | 5/15/31 | 590 | | 674 | |
| | University of California Revenue | 5.770% | 5/15/43 | 1,010 | | 1,339 | |
| | University of California Revenue | 4.765% | 5/15/44 | 145 | | 156 | |
| | University of California Revenue | 3.931% | 5/15/45 | 570 | | 611 | |
| Total Taxable Municipal Bonds (Cost $47,778) | | | | | 55,478 | |
| | | | Shares | | | |
| Temporary Cash Investments (0.7%) | | | | | | |
| Money Market Fund (0.0%) | | | | | | |
| 17 | Vanguard Market Liquidity Fund | 1.816% | | 104 | | 10 | |
| | | | Face | | | |
| | | | Amount | | | |
| | | | ($000 | ) | | |
| Repurchase Agreement (0.5%) | | | | | |
| | RBS Securities, Inc.
(Dated 12/31/19, Repurchase Value $17,101,000, collateralized by U.S.Treasury Note/Bond, 0.125%, 7/15/22, with a value of $17,442,000) | 1.550% | 1/2/20 | 17,100 | | 17,100 | |
| | | | | | |
| Certificate of Deposit (0.1%) | | | | | | |
| 7 | Toronto-Dominion Bank (New York Branch) | 2.000% | 1/3/20 | 2,000 | | 1,540 | |
| | | | | | | |
| Commercial Paper (0.1%) | | | | | | |
| 5,18 | Boeing Co. | 2.160% | 2/26/20 | 2,640 | | 2,631 | |
| | Ford Motor Credit Co. LLC | 3.550% | 5/1/20 | 1,100 | | 1,091 | |
| | | | | | 3,722 | |
| Total Temporary Cash Investments (Cost $22,340) | | | | | 22,372 | |
| Total Investments (99.3%) (Cost $2,556,812) | | | 3,242,593 | |
Balanced Portfolio
| | Amount | |
| | ($000 | ) |
| Other Assets and Liabilities (0.7%) | |
| Other Assets | | |
| Investment in Vanguard | 144 | |
| Receivables for Investment Securities Sold | 16,008 | |
| Receivables for Accrued Income | 10,748 | |
| Receivables for Capital Shares Issued | 1,781 | |
| Unrealized Appreciation—Forward Currency Contracts | 1 | |
| Other Assets | 192 | |
| Total Other Assets | 28,874 | |
| Liabilities | | |
| Payables for Investment Securities Purchased | (1,514 | ) |
| Payables for Capital Shares Redeemed | (1,274 | ) |
| Payables to Vanguard | (2,055 | ) |
| Variation Margin Payable—Futures Contracts | (6 | ) |
| Unrealized Depreciation—Forward Currency Contracts | (35 | ) |
| Other Liabilities | (80 | ) |
| Total Liabilities | (4,964 | ) |
| Net Assets (100%) | |
| Applicable to 130,965,210 outstanding $.001 par value shares of beneficial interest (unlimited authorization) | 3,266,503 | |
| Net Asset Value Per Share | $24.94 | |
At December 31, 2019, net assets consisted of:
| | Amount | |
| | ($000 | ) |
| Paid-in Capital | 2,404,119 | |
| Total Distributable Earnings (Loss) | 862,384 | |
| Net Assets | 3,266,503 | |
| • | See Note A in Notes to Financial Statements. |
| * | Non-income-producing security. |
| § | Security value determined using significant unobservable inputs. |
| 1 | Securities with a value of $313,000 have been segregated as initial margin for open futures contracts. |
| 2 | The average or expected maturity is shorter than the final maturity shown because of the possibility of interim principal payments and prepayments or the possibility of the issue being called. |
| 3 | The issuer was placed under federal conservatorship in September 2008; since that time, its daily operations have been managed by the Federal Housing Finance Agency and it receives capital from the U.S. Treasury, as needed to maintain a positive net worth, in exchange for senior preferred stock. |
| 4 | Includes securities purchased on a when-issued or delayed-delivery basis for which the portfolio has not taken delivery as of December 31, 2019. |
| 5 | Security exempt from registration under Rule 144A of the Securities Act of 1933. Such securities may be sold in transactions exempt from registration, normally to qualified institutional buyers. At December 31, 2019, the aggregate value of these securities was $198,472,000, representing 6.1% of net assets. |
| 6 | Adjustable-rate security; rate shown is effective rate at period end. Certain adjustable-rate securities are not based on a published reference rate and spread but are determined by the issuer or agent based on current market conditions. |
| 7 | Face amount denominated in Canadian dollars. |
| 8 | Face amount denominated in Japanese yen. |
| 9 | Guaranteed by the Government of Japan. |
| 10 | Guaranteed by the Kingdom of Saudi Arabia. |
| 11 | Guaranteed by the Republic of Korea. |
| 12 | Guaranteed by the Providence of Ontario. |
| 13 | Guaranteed by Province of Quebec. |
| 14 | Guaranteed by the State of Qatar. |
| 15 | Scheduled principal and interest payments are guaranteed by AGM (Assured Guaranty Municipal Corporation). |
| 16 | Scheduled principal and interest payments are guaranteed by National Public Finance Guarantee Corp. |
| 17 | Affiliated money market fund available only to Vanguard funds and certain trusts and accounts managed by Vanguard. Rate shown is the 7-day yield. |
| 18 | Security exempt from registration under Section 4(2) of the Securities Act of 1933. Such securities may be sold in transactions exempt from registration only to dealers in that program or other “accredited investors.” At December 31, 2019, the value of these securities was $2,631,000, representing 0.1% of net assets. |
ADR—American Depositary Receipt.
GDR—Global Depositary Receipt.
GO—General Obligation Bond.
LIBOR—London Interbank Offered Rate.
REMICS—Real Estate Mortgage Investment Conduits.
TBA—To Be Announced.
UMBS—Uniform Mortgage-Backed Securities.
Balanced Portfolio
| Derivative Financial Instruments Outstanding as of Period End |
| |
| Futures Contracts | | | | | |
| | | | | | ($000) |
| | | | | | Value and |
| | | | Number of | | Unrealized |
| | | | Long (Short) | Notional | Appreciation |
| | | Expiration | Contracts | Amount | (Depreciation) |
| Long Futures Contracts |
| 5-Year U.S. Treasury Note | | March 2020 | 268 | 31,787 | (116) |
| | | | | | |
| | | | | | |
| Forward Currency Contracts | | | | | |
| | Contract | | Unrealized | Unrealized |
| | Settlement | Contract Amount (000) | Appreciation | (Depreciation) |
| Counterparty | Date | Receive | Deliver | ($000) | ($000) |
| J.P. Morgan Securities LLC | 1/3/20 | USD | 1,511 | CAD | 2,000 | — | (29) |
| J.P. Morgan Securities LLC | 1/15/20 | USD | 800 | JPY | 86,750 | 1 | — |
| Bank of America, N.A. | 1/6/20 | USD | 721 | CAD | 945 | — | (6) |
| | | | | | | 1 | (35) |
CAD—Canadian dollar.
JPY—Japanese yen.
USD—U.S. dollar.
See accompanying Notes, which are an integral part of the Financial Statements.
Balanced Portfolio
Statement of Operations
| | Year Ended |
| | December 31, 2019 |
| | ($000) |
| Investment Income | |
| Income | |
| Dividends1 | 51,489 |
| Interest | 35,291 |
| Securities Lending—Net | 151 |
| Total Income | 86,931 |
| Expenses | |
| Investment Advisory Fees—Note B | |
| Basic Fee | 1,555 |
| Performance Adjustment | (90) |
| The Vanguard Group—Note C | |
| Management and Administrative | 4,447 |
| Marketing and Distribution | 271 |
| Custodian Fees | 31 |
| Auditing Fees | 32 |
| Shareholders’ Reports | 31 |
| Trustees’ Fees and Expenses | 3 |
| Total Expenses | 6,280 |
| Net Investment Income | 80,651 |
| Realized Net Gain (Loss) | |
| Investment Securities Sold2 | 104,128 |
| Futures Contracts | 141 |
| Swap Contracts | (65) |
| Forward Currency Contracts | (451) |
| Foreign Currencies | (15) |
| Realized Net Gain (Loss) | 103,738 |
| Change in Unrealized Appreciation (Depreciation) | |
| Investment Securities2 | 419,579 |
| Futures Contracts | 119 |
| Swap Contracts | 3 |
| Forward Currency Contracts | 151 |
| Foreign Currencies | 15 |
| Change in Unrealized Appreciation (Depreciation) | 419,867 |
| Net Increase (Decrease) in Net Assets Resulting from Operations | 604,256 |
| 1 | Dividends are net of foreign withholding taxes of $1,038,000. |
| 2 | Realized net gain (loss) and change in unrealized appreciation (depreciation) from an affiliated company of the fund were ($1,000) and ($1,000). Purchases and sales are for temporary cash investment purposes. |
Statement of Changes in Net Assets
| | Year Ended December 31, |
| | 2019 | 2018 |
| | ($000) | ($000) |
| Increase (Decrease) in Net Assets | | |
| Operations | | |
| Net Investment Income | 80,651 | 76,968 |
| Realized Net Gain (Loss) | 103,738 | 161,353 |
| Change in Unrealized Appreciation (Depreciation) | 419,867 | (334,570) |
| Net Increase (Decrease) in Net Assets Resulting from Operations | 604,256 | (96,249) |
| Distributions | | |
| Net Investment Income | (80,367) | (68,274) |
| Realized Capital Gain1 | (161,598) | (144,148) |
| Total Distributions | (241,965) | (212,422) |
| Capital Share Transactions | | |
| Issued | 264,878 | 245,575 |
| Issued in Lieu of Cash Distributions | 241,965 | 212,422 |
| Redeemed | (310,250) | (384,075) |
| Net Increase (Decrease) from Capital Share Transactions | 196,593 | 73,922 |
| Total Increase (Decrease) | 558,884 | (234,749) |
| Net Assets | | |
| Beginning of Period | 2,707,619 | 2,942,368 |
| End of Period | 3,266,503 | 2,707,619 |
| 1 | Includes fiscal 2019 and 2018 short-term gain distributions totaling $0 and $13,427,000, respectively. Short-term gain distributions are treated as ordinary income dividends for tax purposes. |
See accompanying Notes, which are an integral part of the Financial Statements.
Balanced Portfolio
Financial Highlights
| For a Share Outstanding | | | Year Ended December 31, |
| Throughout Each Period | 2019 | 2018 | 2017 | 2016 | 2015 |
| Net Asset Value, Beginning of Period | $22.20 | $24.80 | $23.03 | $22.32 | $23.99 |
| Investment Operations | | | | | |
| Net Investment Income | .6231 | .6261 | .5821 | .581 | .576 |
| Net Realized and Unrealized Gain (Loss) on Investments | 4.105 | (1.414) | 2.648 | 1.713 | (.548) |
| Total from Investment Operations | 4.728 | (.788) | 3.230 | 2.294 | .028 |
| Distributions | | | | | |
| Dividends from Net Investment Income | (.660) | (.582) | (.567) | (.576) | (.570) |
| Distributions from Realized Capital Gains | (1.328) | (1.230) | (.893) | (1.008) | (1.128) |
| Total Distributions | (1.988) | (1.812) | (1.460) | (1.584) | (1.698) |
| Net Asset Value, End of Period | $24.94 | $22.20 | $24.80 | $23.03 | $22.32 |
| | | | | | |
| Total Return | 22.48% | -3.41% | 14.72% | 11.01% | 0.09% |
| | | | | | |
| Ratios/Supplemental Data | | | | | |
| Net Assets, End of Period (Millions) | $3,267 | $2,708 | $2,942 | $2,554 | $2,312 |
| Ratio of Total Expenses to Average Net Assets2 | 0.21% | 0.21% | 0.23% | 0.23% | 0.23% |
| Ratio of Net Investment Income to Average Net Assets | 2.68% | 2.67% | 2.49% | 2.66% | 2.53% |
| Portfolio Turnover Rate3 | 29% | 36% | 28% | 33% | 45% |
| 1 | Calculated based on average shares outstanding |
| 1 | Includes performance-based investment advisory fee increases (decreases) of (0.00%), (0.00%), (0.00%), (0.01%), and 0.00%. |
| 3 | Includes 8%, 2%, 0%, 0%, and 14% attributable to mortgage-dollar-roll activity. |
See accompanying Notes, which are an integral part of the Financial Statements.
Balanced Portfolio
Notes to Financial Statements
The Balanced Portfolio, a portfolio of Vanguard Variable Insurance Funds, is registered under the Investment Company Act of 1940 as an open-end investment company. The portfolio’s shares are only available for purchase by separate accounts of insurance companies as investments for variable annuity plans, variable life insurance contracts, or other variable benefit insurance contracts. Certain of the portfolio’s investments are in corporate debt instruments; the issuers’ abilities to meet their obligations may be affected by economic developments in their respective industries.
A. The following significant accounting policies conform to generally accepted accounting principles for U.S. investment companies. The portfolio consistently follows such policies in preparing its financial statements.
1. Security Valuation: Securities are valued as of the close of trading on the New York Stock Exchange (generally 4 p.m., Eastern time) on the valuation date. Equity securities are valued at the latest quoted sales prices or official closing prices taken from the primary market in which each security trades; such securities not traded on the valuation date are valued at the mean of the latest quoted bid and asked prices. Bonds and temporary cash investments are valued using the latest bid prices or using valuations based on a matrix system (which considers such factors as security prices, yields, maturities, and ratings), both as furnished by independent pricing services. Structured debt securities, including mortgages and asset-backed securities, are valued using the latest bid prices or using valuations based on a matrix system that considers such factors as issuer, tranche, nominal or option-adjusted spreads, weighted average coupon, weighted average maturity, credit enhancements, and collateral. Investments in Vanguard Market Liquidity Fund are valued at that fund’s net asset value. Securities for which market quotations are not readily available, or whose values have been affected by events occurring before the portfolio’s pricing time but after the close of the securities’ primary markets, are valued at their fair values calculated according to procedures adopted by the board of trustees. These procedures include obtaining quotations from an independent pricing service, monitoring news to identify significant market- or security-specific events, and evaluating changes in the values of foreign market proxies (for example, ADRs, futures contracts, or exchange-traded funds), between the time the foreign markets close and the portfolio’s pricing time. When fair-value pricing is employed, the prices of securities used by a portfolio to calculate its net asset value may differ from quoted or published prices for the same securities.
2. Foreign Currency: Securities and other assets and liabilities denominated in foreign currencies are translated into U.S. dollars using exchange rates obtained from an independent third party as of the portfolio’s pricing time on the valuation date. Realized gains (losses) and unrealized appreciation (depreciation) on investment securities include the effects of changes in exchange rates since the securities were purchased, combined with the effects of changes in security prices. Fluctuations in the value of other assets and liabilities resulting from changes in exchange rates are recorded as unrealized foreign currency gains (losses) until the assets or liabilities are settled in cash, at which time they are recorded as realized foreign currency gains (losses).
3. Futures Contracts: The portfolio uses futures contracts to invest in fixed income asset classes with greater efficiency and lower cost than is possible through direct investment, to add value when these instruments are attractively priced, or to adjust sensitivity to changes in interest rates. The primary risks associated with the use of futures contracts are imperfect correlation between changes in market values of bonds held by the portfolio and the prices of futures contracts, and the possibility of an illiquid market. Counterparty risk involving futures is mitigated because a regulated clearinghouse is the counterparty instead of the clearing broker. To further mitigate counterparty risk, the portfolio trades futures contracts on an exchange, monitors the financial strength of its clearing brokers and clearinghouse, and has entered into clearing agreements with its clearing brokers. The clearinghouse imposes initial margin requirements to secure the portfolio’s performance and requires daily settlement of variation margin representing changes in the market value of each contract. Any assets pledged as initial margin for open contracts are noted in the Statement of Net Assets.
Futures contracts are valued at their quoted daily settlement prices. The notional amounts of the contracts are not recorded in the Statement of Net Assets. Fluctuations in the value of the contracts are recorded in the Statement of Net Assets as an asset (liability) and in the Statement of Operations as unrealized appreciation (depreciation) until the contracts are closed, when they are recorded as realized futures gains (losses).
During the year ended December 31, 2019, the portfolio’s average investments in long and short futures contracts represented 1% and less than 1% of net assets, respectively, based on the average of the notional amounts at each quarter-end during the period.
Balanced Portfolio
4. Forward Currency Contracts: The portfolio enters into forward currency contracts to protect the value of securities and related receivables and payables against changes in future foreign exchange rates. The portfolio’s risks in using these contracts include movement in the values of the foreign currencies relative to the U.S. dollar and the ability of the counterparties to fulfill their obligations under the contracts. The portfolio mitigates its counterparty risk by entering into forward currency contracts only with a diverse group of prequalified counterparties, monitoring their financial strength, entering into master netting arrangements with its counterparties, and requiring its counterparties to transfer collateral as security for their performance. In the absence of a default, the collateral pledged or received by the portfolio cannot be repledged, resold, or rehypothecated. The master netting arrangements provide that, in the event of a counterparty’s default (including bankruptcy), the portfolio may terminate the forward currency contracts, determine the net amount owed by either party in accordance with its master netting arrangements, and sell or retain any collateral held up to the net amount owed to the portfolio under the master netting arrangements. The forward currency contracts contain provisions whereby a counterparty may terminate open contracts if the portfolio’s net assets decline below a certain level, triggering a payment by the portfolio if the portfolio is in a net liability position at the time of the termination. The payment amount would be reduced by any collateral the portfolio has pledged. Any assets pledged as collateral for open contracts are noted in the Statement of Net Assets. The value of collateral received or pledged is compared daily to the value of the forward currency contracts exposure with each counterparty, and any difference, if in excess of a specified minimum transfer amount, is adjusted and settled within two business days.
Forward currency contracts are valued at their quoted daily prices obtained from an independent third party, adjusted for currency risk based on the expiration date of each contract. The notional amounts of the contracts are not recorded in the Statement of Net Assets. Fluctuations in the value of the contracts are recorded in the Statement of Net Assets as an asset (liability) and in the Statement of Operations as unrealized appreciation (depreciation) until the contracts are closed, when they are recorded as realized forward currency contract gains (losses).
During the year ended December 31, 2019, the portfolio’s average investment in forward currency contracts represented less than 1% of net assets, based on the average of notional amounts at each quarter-end during the period.
5. Swap Contracts: The portfolio invests in credit default swaps to adjust the overall credit risk of the portfolio or to actively overweight or underweight credit risk to a specific issuer or group of issuers. The portfolio may sell credit protection through credit default swaps to simulate investments in long positions that are either unavailable or considered to be less attractively priced in the bond market. The portfolio may purchase credit protection through credit default swaps to reduce credit exposure to a given issuer or issuers. Under the terms of the swaps, an up-front payment may be exchanged between the seller and buyer. In addition, the seller of the credit protection receives a periodic payment of premium from the buyer that is a fixed percentage applied to a notional amount. If, for example, the reference entity is subject to a credit event (such as bankruptcy, failure to pay, or obligation acceleration) during the term of the swap, the seller agrees to either physically settle or cash settle the swap contract. If the swap is physically settled, the seller agrees to pay the buyer an amount equal to the notional amount and take delivery of a debt instrument of the reference issuer with a par amount equal to such notional amount. If the swap is cash settled, the seller agrees to pay the buyer the difference between the notional amount and the final price for the relevant debt instrument, as determined either in a market auction or pursuant to a pre-agreed-upon valuation procedure.
The notional amounts of swap contracts are not recorded in the Statement of Net Assets. Swaps are valued daily based on market quotations received from independent pricing services or recognized dealers and the change in value is recorded in the Statement of Net Assets as an asset (liability) and in the Statement of Operations as unrealized appreciation (depreciation) until the seller of credit protection is required to take delivery (or, in a cash settled swap, pay the settlement amount determined) upon occurrence of a credit event, periodic payments are made, or the swap terminates, at which time realized gain (loss) is recorded. The net premium to be received or paid by the portfolio under swap contracts is accrued daily and recorded as realized gain (loss) over the life of the contract.
The primary risk associated with selling credit protection is that, upon the occurrence of a defined credit event, the market value of the debt instrument received by the portfolio (or, in a cash settled swap, the debt instruments used to determine the settlement payment by the portfolio) will be significantly less than the amount paid by the portfolio and, in a physically settled swap, the portfolio may receive an illiquid debt instrument. A risk associated with all types of swaps is the possibility that a counterparty may default on its obligation to pay net amounts due to the portfolio. The portfolio’s maximum amount subject to counterparty risk is the unrealized appreciation on the swap contract. The portfolio mitigates its counterparty risk by entering into swaps only with a diverse group of
Balanced Portfolio
prequalified counterparties, monitoring their financial strength, entering into master netting arrangements with its counterparties, and requiring its counterparties to transfer collateral as security for their performance. In the absence of a default, the collateral pledged or received by the portfolio cannot be repledged, resold, or rehypothecated. In the event of a counterparty’s default (including bankruptcy), the portfolio may terminate any swap contracts with that counterparty, determine the net amount owed by either party in accordance with its master netting arrangements, and sell or retain any collateral held up to the net amount owed to the portfolio under the master netting arrangements. The swap contracts contain provisions whereby a counterparty may terminate open contracts if the portfolio’s net assets decline below a certain level, triggering a payment by the portfolio if the portfolio is in a net liability position at the time of the termination. The payment amount would be reduced by any collateral the portfolio has pledged. Any securities pledged as collateral for open contracts are noted in the Statement of Net Assets. The value of collateral received or pledged is compared daily to the value of the swap contracts exposure with each counterparty, and any difference, if in excess of a specified minimum transfer amount, is adjusted and settled within two business days.
During the year ended December 31, 2019, the portfolio’s average amounts of investments in credit protection purchased swaps represented less than 1% of net assets, based on the average of notional amounts at each quarter-end during the period. The portfolio had no open swap contracts at December 31, 2019.
6. To Be Announced (TBA) Transactions: A TBA transaction is an agreement to buy or sell mortgage-backed securities with agreed-upon characteristics (face amount, coupon, maturity) for settlement at a future date. The portfolio may be a seller of TBA transactions to reduce its exposure to the mortgage-backed securities market or in order to sell mortgage-backed securities it owns under delayed-delivery arrangements. When the portfolio is a buyer of TBA transactions, it maintains cash or short-term investments in an amount sufficient to meet the purchase price at the settlement date of the TBA transaction. The primary risk associated with TBA transactions is that a counterparty may default on its obligations. The portfolio mitigates its counterparty risk by, among other things, performing a credit analysis of counterparties, allocating transactions among numerous counter-parties, and monitoring its exposure to each counterparty. The portfolio may also enter into a Master Securities Forward Transaction Agreement (MSFTA) with certain counterparties and require them to transfer collateral as security for their performance. In the absence of a default, the collateral pledged or received by the portfolio cannot be repledged, resold, or rehypothecated. Under an MSFTA, upon a counterparty default (including bankruptcy), the portfolio may terminate any TBA transactions with that counterparty, determine the net amount owed by either party in accordance with its master netting arrangements, and sell or retain any collateral held up to the net amount owed to the portfolio under the master netting arrangements.
7. Mortgage Dollar Rolls: The portfolio enters into mortgage-dollar-roll transactions, in which the portfolio sells mortgage-backed securities to a dealer and simultaneously agrees to purchase similar securities in the future at a predetermined price. The proceeds of the securities sold in mortgage-dollar-roll transactions are typically invested in high-quality short-term fixed income securities. The portfolio forgoes principal and interest paid on the securities sold, and is compensated by interest earned on the proceeds of the sale and by a lower price on the securities to be repurchased. The portfolio has also entered into mortgage-dollar-roll transactions in which the portfolio buys mortgage-backed securities from a dealer pursuant to a TBA transaction and simultaneously agrees to sell similar securities in the future at a predetermined price. The securities bought in mortgage-dollar-roll transactions are used to cover an open TBA sell position. The portfolio continues to earn interest on mortgage-backed security pools already held and receives a lower price on the securities to be sold in the future. The portfolio accounts for mortgage-dollar-roll transactions as purchases and sales; as such, these transactions may increase the portfolio’s portfolio turnover rate. Amounts to be received or paid in connection with open mortgage dollar rolls are included in Receivables for Investment Securities Sold or Payables for Investment Securities Purchased in the Statement of Net Assets.
8. Repurchase Agreements: The portfolio enters into repurchase agreements with institutional counterparties. Securities pledged as collateral to the portfolio under repurchase agreements are held by a custodian bank until the agreements mature, and in the absence of a default, such collateral cannot be repledged, resold, or rehypothecated. Each agreement requires that the market value of the collateral be sufficient to cover payments of interest and principal. The portfolio further mitigates its counterparty risk by entering into repurchase agreements only with a diverse group of prequalified counterparties, monitoring their financial strength, and entering into master repurchase agreements with its counterparties. The master repurchase agreements provide that, in the event of a counterparty’s default (including bankruptcy), the portfolio may terminate any repurchase agreements with
Balanced Portfolio
that counterparty, determine the net amount owed, and sell or retain the collateral up to the net amount owed to the portfolio. Such action may be subject to legal proceedings, which may delay or limit the disposition of collateral.
9. Federal Income Taxes: The portfolio intends to continue to qualify as a regulated investment company and distribute all of its taxable income. Management has analyzed the portfolio’s tax positions taken for all open federal income tax years (December 31, 2016–2019), and has concluded that no provision for federal income tax is required in the portfolio’s financial statements.
10. Distributions: Distributions to shareholders are recorded on the ex-dividend date. Distributions are determined on a tax basis and may differ from net investment income and realized capital gains for financial reporting purposes.
11. Securities Lending: To earn additional income, the portfolio lends its securities to qualified institutional borrowers. Security loans are subject to termination by the portfolio at any time, and are required to be secured at all times by collateral in an amount at least equal to the market value of securities loaned. Daily market fluctuations could cause the value of loaned securities to be more or less than the value of the collateral received. When this occurs, the collateral is adjusted and settled before the opening of the market on the next business day. The portfolio further mitigates its counterparty risk by entering into securities lending transactions only with a diverse group of prequalified counterparties, monitoring their financial strength, and entering into master securities lending agreements with its counterparties. The master securities lending agreements provide that, in the event of a counterparty’s default (including bankruptcy), the portfolio may terminate any loans with that borrower, determine the net amount owed, and sell or retain the collateral up to the net amount owed to the portfolio; however, such actions may be subject to legal proceedings. While collateral mitigates counterparty risk, in the event of a default, the portfolio may experience delays and costs in recovering the securities loaned. The portfolio invests cash collateral received in Vanguard Market Liquidity Fund, and records a liability in the Statement of Net Assets for the return of the collateral, during the period the securities are on loan. Securities lending income represents fees charged to borrowers plus income earned on invested cash collateral, less expenses associated with the loan. During the term of the loan, the portfolio is entitled to all distributions made on or in respect of the loaned securities.
12. Credit Facility: The portfolio and certain other funds managed by The Vanguard Group (“Vanguard”) participate in a $4.3 billion committed credit facility provided by a syndicate of lenders pursuant to a credit agreement that may be renewed annually; each fund is individually liable for its borrowings, if any, under the credit facility. Borrowings may be utilized for temporary and emergency purposes, and are subject to the portfolio’s regulatory and contractual borrowing restrictions. The participating funds are charged administrative fees and an annual commitment fee of 0.10% of the undrawn amount of the facility; these fees are allocated to the funds based on a method approved by the portfolio’s board of trustees and included in Management and Administrative expenses on the portfolio’s Statement of Operations. Any borrowings under this facility bear interest at a rate based upon the higher of the one-month London Interbank Offered Rate, federal funds effective rate, or overnight bank funding rate plus an agreed-upon spread.
The portfolio had no borrowings outstanding at December 31, 2019, or at any time during the period then ended.
13. Other: Dividend income is recorded on the ex-dividend date. Interest income is accrued daily. Premiums and discounts on debt securities are amortized and accreted, respectively, to interest income over the lives of the respective securities, except for premiums on certain callable debt securities that are amortized to the earliest call date. Security transactions are accounted for on the date securities are bought or sold. Costs used to determine realized gains (losses) on the sale of investment securities are those of the specific securities sold.
B. Wellington Management Company LLP provides investment advisory services to the portfolio for a fee calculated at an annual percentage rate of average net assets. The basic fee is subject to quarterly adjustments based on the portfolio’s performance relative to the combined index comprising the S&P 500 Index and the Bloomberg Barclays U.S. Credit A or Better Bond Index for the preceding three years. For the year ended December 31, 2019, the investment advisory fee represented an effective annual basic rate of 0.05% of the portfolio’s average net assets before a decrease of $90,000 (0.00%) based on performance.
C. In accordance with the terms of a Funds’ Service Agreement (the “FSA”) between Vanguard and the portfolio, Vanguard furnishes to the portfolio corporate management, administrative, marketing, and distribution at Vanguard’s cost of operations (as defined by the FSA). These costs of operations are allocated to the portfolio based on methods and guidelines approved by the board of trustees.
Balanced Portfolio
Vanguard does not require reimbursement in the current period for certain costs of operations (such as deferred compensation/benefits and risk/insurance costs); the portfolio’s liability for these costs of operations is included in Payables to Vanguard on the Statement of Net Assets. All other costs of operations payable to Vanguard are generally settled twice a month.
Upon the request of Vanguard, the portfolio may invest up to 0.40% of its net assets as capital in Vanguard. At December 31, 2019, the portfolio had contributed to Vanguard capital in the amount of $144,000, representing less than 0.01% of the portfolio’s net assets and 0.06% of Vanguard’s capital received pursuant to the FSA. The portfolio’s trustees and officers are also directors and employees, respectively, of Vanguard.
D. Various inputs may be used to determine the value of the portfolio’s investments. These inputs are summarized in three broad levels for financial statement purposes. The inputs or methodologies used to value securities are not necessarily an indication of the risk associated with investing in those securities.
Level 1—Quoted prices in active markets for identical securities.
Level 2—Other significant observable inputs (including quoted prices for similar securities, interest rates, prepayment speeds, credit risk, etc.).
Level 3—Significant unobservable inputs (including the portfolio’s own assumptions used to determine the fair value of investments). Any investments valued with significant unobservable inputs are noted on the Statement of Net Assets.
The following table summarizes the market value of the portfolio’s investments and derivatives as of December 31, 2019, based on the inputs used to value them:
| | Level 1 | Level 2 | Level 3 |
| Investments | ($000) | ($000) | ($000) |
| Common Stocks | 1,893,594 | 240,869 | — |
| U.S. Government and Agency Obligations | — | 238,988 | — |
| Asset-Backed/Commercial Mortgage-Backed Securities | — | 51,480 | 399 |
| Corporate Bonds | — | 694,532 | — |
| Sovereign Bonds | — | 44,881 | — |
| Taxable Municipal Bonds | — | 55,478 | — |
| Temporary Cash Investments | 10 | 22,362 | — |
| Futures Contracts—Liabilities1 | (6) | — | — |
| Forward Currency Contracts—Assets | — | 1 | — |
| Forward Currency Contracts—Liabilities | — | (35) | — |
| Total | 1,893,598 | 1,348,556 | 399 |
1 Represents variation margin on the last day of the reporting period.
E. At December 31, 2019, the fair values of derivatives were reflected in the Statement of Net Assets as follows:
| | Interest Rate | Currency | Credit | |
| | Contracts | Contracts | Contracts | Total |
| Statement of Net Assets Caption | ($000) | ($000) | ($000) | ($000) |
| Unrealized Appreciation—Forward Currency Contracts | — | 1 | — | 1 |
| Total Assets | — | 1 | — | 1 |
| | | | | |
| Variation Margin Payable—Futures Contracts | (6) | — | — | (6) |
| Unrealized Depreciation—Forward Currency Contracts | — | (35) | — | (35) |
| Total Liabilities | (6) | (35) | — | (41) |
Balanced Portfolio
Realized net gain (loss) and the change in unrealized appreciation (depreciation) on derivatives for the year ended December 31, 2019, were:
| | Interest Rate | Currency | Credit | |
| | Contracts | Contracts | Contracts | Total |
| Realized Net Gain (Loss) on Derivatives | ($000) | ($000) | ($000) | ($000) |
| Futures Contracts | 141 | — | — | 141 |
| Swap Contracts | — | — | (65) | (65) |
| Forward Currency Contracts | — | (451) | — | (451) |
| Realized Net Gain (Loss) on Derivatives | 141 | (451) | (65) | (375) |
| | | | | |
| Change in Unrealized Appreciation (Depreciation) on Derivatives | | | |
| Futures Contracts | 119 | — | — | 119 |
| Swap Contracts | — | — | 3 | 3 |
| Forward Currency Contracts | — | 151 | — | 151 |
| Change in Unrealized Appreciation (Depreciation) on Derivatives | 119 | 151 | 3 | 273 |
F. Permanent differences between book-basis and tax-basis components of net assets are reclassified among capital accounts in the financial statements to reflect their tax character. These reclassifications have no effect on net assets or net asset value per share. As of period end, permanent differences primarily attributable to the accounting for foreign currency transactions and swap agreements were reclassified between the individual components of total distributable earnings (loss).
| | Amount |
| | ($000) |
| Paid-in Capital | — |
| Total Distributable Earnings (Loss) | — |
Temporary differences between book-basis and tax-basis components of total distributable earnings (loss) arise when certain items of income, gain, or loss are recognized in different periods for financial statement and tax purposes; these differences will reverse at some time in the future. The differences are primarily related to the tax deferral of losses on wash sales and straddles; and the realization of unrealized gains or losses on certain futures contracts and forward currency contracts. As of period end, the tax-basis components of total distributable earnings (loss) are detailed in the table as follows:
| | Amount |
| | ($000) |
| Undistributed Ordinary Income | 79,973 |
| Undistributed Long-Term Gains | 98,697 |
| Capital Loss Carryforwards (Non-expiring) | — |
| Net Unrealized Gains (Losses) | 685,140 |
As of December 31, 2019, gross unrealized appreciation and depreciation for investments and derivatives based on cost for U.S. federal income tax purposes were as follows:
| | Amount |
| | ($000) |
| Tax Cost | 2,557,469 |
| Gross Unrealized Appreciation | 710,745 |
| Gross Unrealized Depreciation | (25,622) |
| Net Unrealized Appreciation (Depreciation) | 685,123 |
G. During the year ended December 31, 2019, the portfolio purchased $618,313,000 of investment securities and sold $624,282,000 of investment securities, other than U.S. government securities and temporary cash investments. Purchases and sales of U.S. government securities were $279,934,000 and $240,716,000, respectively.
Balanced Portfolio
H. Capital shares issued and redeemed were:
| | Year Ended December 31, |
| | 2019 | 2018 |
| | Shares | Shares |
| | (000) | (000) |
| Issued | 11,351 | 10,418 |
| Issued in Lieu of Cash Distributions | 10,988 | 9,268 |
| Redeemed | (13,353) | (16,340) |
| Net Increase (Decrease) in Shares Outstanding | 8,986 | 3,346 |
At December 31, 2019, one shareholder, an insurance company separate account whose holdings in the portfolio represent the indirect investment of Vanguard Variable Annuity contract holders, was the record or beneficial owner of 73% of the portfolio’s net assets. If this shareholder were to redeem its investment in the portfolio, the redemption might result in an increase in the portfolio’s expense ratio, cause the portfolio to incur higher transaction costs, or lead to the realization of taxable capital gains.
I. Management has determined that no events or transactions occurred subsequent to December 31, 2019, that would require recognition or disclosure in these financial statements.
Balanced Portfolio
Report of Independent Registered Public Accounting Firm
To the Board of Trustees of Vanguard Variable Insurance Funds and Shareholders of Balanced Portfolio
Opinion on the Financial Statements
We have audited the accompanying statement of net assets of Balanced Portfolio (one of the portfolios constituting Vanguard Variable Insurance Funds, referred to hereafter as the “Portfolio”) as of December 31, 2019, the related statement of operations for the year ended December 31, 2019, the statement of changes in net assets for each of the two years in the period ended December 31, 2019, including the related notes, and the financial highlights for each of the five years in the period ended December 31, 2019 (collectively referred to as the “financial statements”). In our opinion, the financial statements present fairly, in all material respects, the financial position of the Portfolio as of December 31, 2019, the results of its operations for the year then ended, the changes in its net assets for each of the two years in the period ended December 31, 2019 and the financial highlights for each of the five years in the period ended December 31, 2019 in conformity with accounting principles generally accepted in the United States of America.
Basis for Opinion
These financial statements are the responsibility of the Portfolio’s management. Our responsibility is to express an opinion on the Portfolio’s financial statements based on our audits. We are a public accounting firm registered with the Public Company Accounting Oversight Board (United States) (“PCAOB”) and are required to be independent with respect to the Portfolio in accordance with the U.S. federal securities laws and the applicable rules and regulations of the Securities and Exchange Commission and the PCAOB.
We conducted our audits of these financial statements in accordance with the standards of the PCAOB. Those standards require that we plan and perform the audit to obtain reasonable assurance about whether the financial statements are free of material misstatement, whether due to error or fraud.
Our audits included performing procedures to assess the risks of material misstatement of the financial statements, whether due to error or fraud, and performing procedures that respond to those risks. Such procedures included examining, on a test basis, evidence regarding the amounts and disclosures in the financial statements. Our audits also included evaluating the accounting principles used and significant estimates made by management, as well as evaluating the overall presentation of the financial statements. Our procedures included confirmation of securities owned as of December 31, 2019 by correspondence with the custodian, transfer agent and brokers; when replies were not received from brokers, we performed other auditing procedures. We believe that our audits provide a reasonable basis for our opinion.
/s/PricewaterhouseCoopers LLP
Philadelphia, Pennsylvania
February 18, 2020
We have served as the auditor of one or more investment companies in The Vanguard Group of Funds since 1975.
Special 2019 tax information (unaudited) for corporate shareholders only for Balanced Portfolio, a portfolio of Vanguard Variable Insurance Funds
This information for the fiscal year ended December 31, 2019, is included pursuant to provisions of the Internal Revenue Code for corporate shareholders only.
The portfolio distributed $161,598,000 as capital gain dividends (20% rate gain distributions) to shareholders during the fiscal year.
For corporate shareholders, 44.7% of investment income (dividend income plus short-term gains, if any) qualifies for the dividends-received deduction.
Balanced Portfolio
BLOOMBERG is a trademark and service mark of Bloomberg Finance L.P. BARCLAYS is a trademark and service mark of Barclays Bank Plc, used under license. Bloomberg Finance L.P. and its affiliates, including Bloomberg Index Services Limited (BISL) (collectively, Bloomberg), or Bloomberg’s licensors, own all proprietary rights in the Bloomberg Barclays U.S. Credit A or Better Bond Index (the Index or Bloomberg Barclays Index).
Neither Barclays Bank Plc, Barclays Capital Inc., or any affiliate (collectively Barclays) or Bloomberg is the issuer or producer of the Balanced Portfolio and neither Bloomberg nor Barclays has any responsibilities, obligations or duties to investors in the Balanced Portfolio. The Index is licensed for use by The Vanguard Group, Inc. (Vanguard) as the sponsor of the Balanced Portfolio. Bloomberg and Barclays’ only relationship with Vanguard in respect of the Index is the licensing of the Index, which is determined, composed and calculated by BISL, or any successor thereto, without regard to the Issuer or the Balanced Portfolio or the owners of the Balanced Portfolio.
Additionally, Vanguard may for itself execute transaction(s) with Barclays in or relating to the Index in connection with the Balanced Portfolio. Investors acquire the Balanced Portfolio from Vanguard and investors neither acquire any interest in the Index nor enter into any relationship of any kind whatsoever with Bloomberg or Barclays upon making an investment in the Balanced Portfolio. The Balanced Portfolio is not sponsored, endorsed, sold or promoted by Bloomberg or Barclays. Neither Bloomberg nor Barclays makes any representation or warranty, express or implied regarding the advisability of investing in the Balanced Portfolio or the advisability of investing in securities generally or the ability of the Index to track corresponding or relative market performance. Neither Bloomberg nor Barclays has passed on the legality or suitability of the Balanced Portfolio with respect to any person or entity. Neither Bloomberg nor Barclays is responsible for and has not participated in the determination of the timing of, prices at, or quantities of the Balanced Portfolio to be issued. Neither Bloomberg nor Barclays has any obligation to take the needs of the Issuer or the owners of the Balanced Portfolio or any other third party into consideration in determining, composing or calculating the Index. Neither Bloomberg nor Barclays has any obligation or liability in connection with administration, marketing or trading of the Balanced Portfolio.
The licensing agreement between Bloomberg and Barclays is solely for the benefit of Bloomberg and Barclays and not for the benefit of the owners of the Balanced Portfolio, investors or other third parties. In addition, the licensing agreement between Vanguard and Bloomberg is solely for the benefit of Vanguard and Bloomberg and not for the benefit of the owners of the Balanced Portfolio, investors or other third parties.
NEITHER BLOOMBERG NOR BARCLAYS SHALL HAVE ANY LIABILITY TO THE ISSUER, INVESTORS OR TO OTHER THIRD PARTIES FOR THE QUALITY, ACCURACY AND/OR COMPLETENESS OF THE BLOOMBERG BARCLAYS INDEX OR ANY DATA INCLUDED THEREIN OR FOR INTERRUPTIONS IN THE DELIVERY OF THE BLOOMBERG BARCLAYS INDEX. NEITHER BLOOMBERG NOR BARCLAYS MAKES ANY WARRANTY, EXPRESS OR IMPLIED, AS TO RESULTS TO BE OBTAINED BY THE ISSUER, THE INVESTORS OR ANY OTHER PERSON OR ENTITY FROM THE USE OF THE BLOOMBERG BARCLAYS INDEX OR ANY DATA INCLUDED THEREIN. NEITHER BLOOMBERG NOR BARCLAYS MAKES ANY EXPRESS OR IMPLIED WARRANTIES, AND EACH HEREBY EXPRESSLY DISCLAIMS ALL WARRANTIES OF MERCHANTABILITY OR FITNESS FOR A PARTICULAR PURPOSE OR USE WITH RESPECT TO THE BLOOMBERG BARCLAYS INDEX OR ANY DATA INCLUDED THEREIN. BLOOMBERG RESERVES THE RIGHT TO CHANGE THE METHODS OF CALCULATION OR PUBLICATION, OR TO CEASE THE CALCULATION OR PUBLICATION OF THE BLOOMBERG BARCLAYS INDEX, AND NEITHER BLOOMBERG NOR BARCLAYS SHALL BE LIABLE FOR ANY MISCALCULATION OF OR ANY INCORRECT, DELAYED OR INTERRUPTED PUBLICATION WITH RESPECT TO THE BLOOMBERG BARCLAYS INDEX. NEITHER BLOOMBERG NOR BARCLAYS SHALL BE LIABLE FOR ANY DAMAGES, INCLUDING, WITHOUT LIMITATION, ANY SPECIAL, INDIRECT OR CONSEQUENTIAL DAMAGES, OR ANY LOST PROFITS AND EVEN IF ADVISED OF THE POSSIBLITY OF SUCH, RESULTING FROM THE USE OF THE BLOOMBERG BARCLAYS INDEX OR ANY DATA INCLUDED THEREIN OR WITH RESPECT TO THE BALANCED PORTFOLIO.
None of the information supplied by Bloomberg or Barclays and used in this publication may be reproduced in any manner without the prior written permission of both Bloomberg and Barclays Capital, the investment banking division of Barclays Bank Plc. Barclays Bank Plc is registered in England No. 1026167. Registered office 1 Churchill Place London E14 5HP.
© 2020 Bloomberg. Used with Permission.
Source: Bloomberg Index Services Limited. Copyright 2020, Bloomberg. All rights reserved.
Capital Growth Portfolio
Your Portfolio’s Performance at a Glance
• For the 12 months ended December 31, 2019, the Capital Growth Portfolio of Vanguard Variable Insurance Fund returned 26.50%, trailing the 31.49% return of its benchmark, the Standard & Poor’s 500 Index.
• Stocks and bonds recorded their best results in years. Stocks benefited from accommodative monetary policies implemented by the Federal Reserve and other major central banks. Less-risky assets such as bonds also attracted investors as the U.S.-China trade conflict fueled global economic growth concerns.
• The portfolio benefited from its underweight to energy and consumer staples. Positive selection in consumer discretionary also produced positive results. The portfolio’s positions in industrials, health care, information technology, and communication services detracted from relative performance.
• Please note that the portfolio returns in Vanguard Variable Insurance Fund are different from those in Vanguard Variable Annuity (and other plans that invest in the fund), which take into account insurance-related expenses.
| Market Barometer | | | |
| | | Average Annual Total Returns |
| | Periods Ended December 31, 2019 |
| | One Year | Three Years | Five Years |
| Stocks | | | |
| Russell 1000 Index (Large-caps) | 31.43% | 15.05% | 11.48% |
| Russell 2000 Index (Small-caps) | 25.53 | 8.59 | 8.23 |
| Russell 3000 Index (Broad U.S. market) | 31.02 | 14.57 | 11.24 |
| FTSE All-World ex US Index (International) | 21.81 | 9.96 | 5.83 |
| | | | |
| Bonds | | | |
Bloomberg Barclays U.S. Aggregate Bond Index
(Broad taxable market) | 8.72% | 4.03% | 3.05% |
Bloomberg Barclays Municipal Bond Index
(Broad tax-exempt market) | 7.54 | 4.72 | 3.53 |
| FTSE Three-Month U.S. Treasury Bill Index | 2.25 | 1.65 | 1.04 |
| | | | |
| CPI | | | |
| Consumer Price Index | 2.29% | 2.10% | 1.82% |
Capital Growth Portfolio
Advisor’s Report
For the 12 months ended December 31, 2019, the Capital Growth Portfolio of Vanguard Variable Insurance Fund returned 26.50%, trailing the 31.49% return of its benchmark, the unmanaged Standard & Poor’s 500 Index. Relative to the S&P 500, the portfolio’s sector allocation and stock selection detracted from performance. The portfolio’s health care overweight and modest cash holdings presented headwinds. Unfavorable stock selection in information technology and industrials also detracted from relative results.
Investment environment
The American economy’s decade-long expansion moderated somewhat in 2019, demonstrating signs of late-cycle fatigue amid a broader global slowdown. Consumer spending generally remained healthy, bolstered by continued labor market strength and increases in households’ net worth, and consumer confidence remained elevated. But business investment weakened during the year, a notable reversal from year-earlier conditions, and trade-driven uncertainty hurt business confidence. Other major economies slowed, particularly in Europe and China, while U.S.-China relations were unusually volatile because of economic and political disputes. The Federal Reserve responded to the unease with three interest rate cuts, an about-face from the prior year’s tightening campaign.
The equity market proved especially resilient in the face of this uncertainty and finished the period near record highs. The S&P 500’s strong return defied a sharp deceleration in corporate earnings throughout the year, as the latest estimate of 1% earnings growth for the S&P 500 Index in 2019 is well below the original expectations for double-digit growth. Indeed, the index’s current earnings forecast for 2020 is only modestly above year-ago expectations for 2019 earnings, which implies that forward valuations climbed in tandem with the market’s ascent.
Cyclical sectors generally performed well, with information technology (+50.3%) leading the way. Communication services (+33.1%) and financials (+32.1%) also performed well. Commodity-oriented sectors lagged, despite a healthy 35% climb in the price of West Texas Intermediate crude oil, as energy (+11.8%) and materials (+24.5%) both underperformed the benchmark as a whole amid a weakening in the global industrial economy. Health care (+20.8%) also lagged, beset by intensifying political scrutiny early in the year.
Outlook for U.S. equities
Our view tilts slightly toward caution, a view that has admittedly been misplaced in recent months. The S&P 500 is near record highs despite a moderation in economic activity. The market’s absolute valuation is elevated. The S&P 500’s price/ earnings (P/E) ratio, based on expected profits, is 18.2 times—relative to its 20-year average forward P/E of 15.5 times. This valuation is perhaps reasonable given current bond yields (1.92% on the 10-year U.S. Treasury note), but we are less comfortable with the apparent divergence between equity market performance and underlying economic activity. In August, the 10-year Treasury yield briefly dipped below that of the 2-year Treasury yield, an inversion notorious as a harbinger of recession. Financial conditions have improved somewhat since then, but market sentiment is decidedly sanguine in the face of mixed fundamentals.
Similarly, confidence in a U.S.-China trade resolution has increased, with a “phase one” deal signed in January, even as political crises percolate—impeachment for the U.S. and Hong Kong unrest for China. We have long been hopeful that trade-inspired geopolitical risks would subside, but so far we have observed mostly false starts and provocation. American domestic political rancor has likewise escalated, with hyper-partisanship effectively paralyzing the federal government’s legislative and executive branches for the indefinite future as the 2020 election looms. Most recently, U.S.-Iran hostility dramatically spiked before settling into a fragile detente.
Despite the relentless uncertainty, we nonetheless remain believers in America’s economic engine, the free-enterprise system. This fundamental faith undergirds and informs our desire to own U.S. equities over the long term. Our largest sector positions continue to be in information technology and health care, where the development of innovative technologies and therapies is not tied to near-term economic prospects. But we also invest in companies and industries, such as semiconductors and airlines, that are more cyclical. These companies rely heavily on global economic growth.
Portfolio update
We maintained large overweight positions in information technology, health care, and industrial stocks. These sectors constituted 69% of average assets compared with their 45% combined weighting in the S&P 500. The portfolio was approximately equal-weighted in consumer discretionary, at 9% of average assets compared with the 10% index weighting. We maintained an underweight position in all other sectors, particularly energy, financials, and communication services. The portfolio had limited or no exposure to several smaller sectors, including materials, real estate, and utilities.
Modest cash holdings weighed on relative performance during the year given the market’s sharp rise, and our meaningful health care overweight also proved unhelpful. Our information technology overweight position and energy underweight position provided a partial offset.
Unfavorable stock selection—in particular, weak selection in the information technology, health care, and industrial sectors—drove most of the portfolio’s underperformance during the period. In information technology, several standout performers, including KLA (+104%) and
Capital Growth Portfolio
Micron (+69%), could not compensate for the portfolio’s negligible ownership of index heavyweight Apple (+89%). In industrials, FedEx (–5%) was the primary detractor, but several airlines also dragged on relative results, including American (–10%), United (+5%), and Southwest (+18%).
Advisor perspectives
We routinely discuss portfolio positioning within the framework of the S&P 500 sectors. For instance, our overweight sector allocations have for some time included information technology, health care, and industrials. We also occasionally discuss portfolio structure more thematically. For example, we highlight our preference for “mind”—technology, innovation, and the like—over “matter”— commodities and other real assets.
Another way to frame our exposures is via high-level categories such as defensive, growth/cyclical, and commodity-linked stocks. For instance, our aggregate portfolio weighting in the defensive sectors, which include health care, consumer staples, real estate, and utilities, is comparable to that of the S&P 500. Our actual underlying ownership in this bucket, however, is heavily skewed toward health care. We believe our portfolio has credible defensive qualities even if it’s achieved in this unorthodox fashion, and we prefer pharmaceutical and biotech companies—and, in particular, the unsung potential of novel drugs—to various businesses tied to food and other staples. At the end of the period, the health care sector traded at a more attractive absolute and relative valuation (16.2 times forward P/E, in line with its 16.2 times 20-year average) than its defensive sector peers, including consumer staples (20.2 times versus 16.8 times) and utilities (19.9 times versus 14.5 times).
In the two other buckets, the story is similar: comparable exposure at the aggregate level, but significant differentiation beneath the surface. In growth/cyclical, which houses our information technology overweight position, our ownership of the market’s putative technology leaders—Facebook, Apple, Amazon, Netflix, and Google/ Alphabet (FAANG)—has, with the exception of Google/Alphabet, materially lagged the market weighting of these stocks. We instead own semiconductor and other technology hardware and software companies with secular (and cyclical) growth trajectories at a valuation discount to the typical FAANG premium.
In the commodity-linked sectors (energy, materials, and industrials), our slight overweight is somewhat misleading, as our ownership—principally commodity-consuming industrial companies—stands in contrast to the bucket’s bias toward the commodities. Avoiding the commodity producers has generally served us well in recent years; that said, the portfolio has derived no obvious benefit from its substantial exposure to commodities on the cost side of the ledger. In industrials, for instance, our allocation to airlines again underperformed the market despite solid fundamentals amid a long-term moderation in crude oil prices; we continue to see exceptional value in this industry.
Conclusion
In the end, a differentiated portfolio guarantees only divergence, not outperformance. The portfolio’s disappointing year reaffirms this, with weak stock selection serving as the primary culprit for our underperformance, as many of the portfolio’s idiosyncratic, bottom-up features directly contributed to poor relative results. Despite this, we are optimistic that our portfolio—along with its company-specific trajectories— features an attractive combination of secular growth and reasonable valuations, and we are hopeful it will outperform in the years ahead.
PRIMECAP Management Company
January 14, 2020
Capital Growth Portfolio
About Your Portfolio’s Expenses
As a shareholder of the portfolio, you incur ongoing costs, which include costs for portfolio management, administrative services, and shareholder reports (like this one), among others. Operating expenses, which are deducted from a portfolio’s gross income, directly reduce the investment return of the portfolio.
A portfolio’s expenses are expressed as a percentage of its average net assets. This figure is known as the expense ratio. The following examples are intended to help you understand the ongoing costs (in dollars) of investing in your portfolio and to compare these costs with those of other mutual funds. The examples are based on an investment of $1,000 made at the beginning of the period shown and held for the entire period.
The table below illustrates your portfolio’s costs in two ways:
• Based on actual portfolio return. This section helps you to estimate the actual expenses that you paid over the period. The “Ending Account Value” shown is derived from the portfolio’s actual return, and the third column shows the dollar amount that would have been paid by an investor who started with $1,000 in the portfolio. You may use the information here, together with the amount you invested, to estimate the expenses that you paid over the period.
To do so, simply divide your account value by $1,000 (for example, an $8,600 account value divided by $1,000 = 8.6), then multiply the result by the number given for your portfolio under the heading “Expenses Paid During Period.”
• Based on hypothetical 5% yearly return. This section is intended to help you compare your portfolio’s costs with those of other mutual funds. It assumes that the portfolio had a yearly return of 5% before expenses, but that the expense ratio is unchanged. In this case—because the return used is not the portfolio’s actual return—the results do not apply to your investment. The example is useful in making comparisons because the Securities and Exchange Commission requires all mutual funds to calculate expenses based on a 5% return. You can assess your portfolio’s costs by comparing this hypothetical example with the hypothetical examples that appear in shareholder reports of other funds.
Note that the expenses shown in the table are meant to highlight and help you compareongoingcosts only and do not reflect transaction costs incurred by the portfolio for buying and selling securities. The portfolio’s expense ratio does not reflect additional fees and expenses associated with the annuity or life insurance program through which you invest.
The calculations assume no shares were bought or sold during the period. Your actual costs may have been higher or lower, depending on the amount of your investment and the timing of any purchases or redemptions.
You can find more information about the portfolio’s expenses in the Financial Statements section. For additional information on operating expenses and other shareholder costs, please refer to the prospectus.
| Six Months Ended December 31, 2019 | | | |
| | Beginning | Ending | Expenses |
| | Account Value | Account Value | Paid During |
| Capital Growth Portfolio | 6/30/2019 | 12/31/2019 | Period |
| Based on Actual Portfolio Return | $1,000.00 | $1,127.21 | $1.82 |
| Based on Hypothetical 5% Yearly Return | 1,000.00 | 1,023.49 | 1.73 |
The calculations are based on expenses incurred in the most recent six-month period. The portfolio’s annualized six-month expense ratio for that period is 0.34%. The dollar amounts shown as “Expenses Paid” are equal to the annualized expense ratio multiplied by the average account value over the period, multiplied by the number of days in the most recent six-month period, then divided by the number of days in the most recent 12-month period (184/365).
Capital Growth Portfolio
Performance Summary
All of the returns in this report represent past performance, which is not a guarantee of future results that may be achieved by the portfolio. (Current performance may be lower or higher than the performance data cited. For performance data current to the most recent month-end, visit our website at vanguard.com/performance.) Note, too, that both investment returns and principal value can fluctuate widely, so an investor’s shares, when sold, could be worth more or less than their original cost. The returns shown do not reflect taxes that a shareholder would pay on portfolio distributions or on the sale of portfolio shares. Nor do the returns reflect fees and expenses associated with the annuity or life insurance program through which a shareholder invests. If these fees and expenses were included, the portfolio’s returns would be lower.
Cumulative Performance: December 31, 2009–December 31, 2019
Initial Investment of $10,000
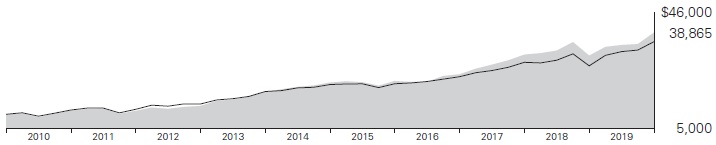
| | | | Average Annual Total Returns | Final Value |
| | | Periods Ended December 31, 2019 | of a $10,000 |
| | | One Year | Five Years | Ten Years | Investment |
 | Capital Growth Portfolio | 26.50% | 12.87% | 14.54% | $38,865 |
 | S&P 500 Index | 31.49 | 11.70 | 13.56 | 35,666 |
See Financial Highlights for dividend and capital gains information.
Capital Growth Portfolio
Sector Diversification
As of December 31, 2019
| Communication Services | 5.4% |
| Consumer Discretionary | 10.3 |
| Energy | 1.4 |
| Financials | 9.0 |
| Health Care | 26.1 |
| Industrials | 17.8 |
| Information Technology | 29.6 |
| Materials | 0.4 |
The table reflects the portfolio’s equity exposure, based on its investments in stocks and stock index futures. Any holdings in short-term reserves are excluded. Sector categories are based on the Global Industry Classification Standard (“GICS”), except for the “Other” category (if applicable), which includes securities that have not been provided a GICS classification as of the effective reporting period.
The Global Industry Classification Standard (“GICS”) was developed by and is the exclusive property and a service mark of MSCI Inc. (“MSCI”) and Standard and Poor’s, a division of McGraw-Hill Companies, Inc. (“S&P”), and is licensed for use by Vanguard. Neither MSCI, S&P nor any third party involved in making or compiling the GICS or any GICS classification makes any express or implied warranties or representations with respect to such standard or classification (or the results to be obtained by the use thereof), and all such parties hereby expressly disclaim all warranties of originality, accuracy, completeness, merchantability or fitness for a particular purpose with respect to any such standard or classification. Without limiting any of the foregoing, in no event shall MSCI, S&P, any of its affiliates or any third party involved in making or compiling the GICS or any GICS classification have any liability for any direct, indirect, special, punitive, consequential or any other damages (including lost profits) even if notified of the possibility of such damages.
Capital Growth Portfolio
Financial Statements
Statement of Net Assets
As of December 31, 2019
The portfolio files its complete schedule of portfolio holdings with the Securities and Exchange Commission (SEC) for the first and third quarters of each fiscal year as an exhibit to its reports on Form N-PORT. The portfolio’s Form N-PORT reports are available on the SEC’s website at www.sec.gov.
| | | | | Market | |
| | | | | Value• | |
| | | Shares | | ($000 | ) |
| Common Stocks (95.6%) | |
| Communication Services (5.2%) | | | |
| * | Alphabet Inc. Class C | 29,620 | | 39,603 | |
| * | Alphabet Inc. Class A | 29,500 | | 39,512 | |
| | Walt Disney Co. | 69,400 | | 10,037 | |
| | Activision Blizzard Inc. | 160,300 | | 9,525 | |
| | Comcast Corp. Class A | 43,900 | | 1,974 | |
| * | Charter Communications Inc. Class A | 2,900 | | 1,407 | |
| | | | | 102,058 | |
| Consumer Discretionary (9.8%) | | | |
| * | Alibaba Group Holding Ltd. ADR | 231,800 | | 49,165 | |
| | Sony Corp. ADR | 494,400 | | 33,619 | |
| | Ross Stores Inc. | 213,900 | | 24,902 | |
| | Whirlpool Corp. | 116,000 | | 17,113 | |
| | TJX Cos. Inc. | 254,600 | | 15,546 | |
| | Carnival Corp. | 209,400 | | 10,644 | |
| | Royal Caribbean Cruises Ltd. | 78,000 | | 10,414 | |
| * | Amazon.com Inc. | 5,400 | | 9,978 | |
| *,^ | Mattel Inc. | 669,500 | | 9,072 | |
| *,^ | Tesla Inc. | 14,400 | | 6,024 | |
| | L Brands Inc. | 238,300 | | 4,318 | |
| | eBay Inc. | 46,800 | | 1,690 | |
| | Marriott International Inc. Class A | 11,100 | | 1,681 | |
| | | | | 194,166 | |
| Energy (1.3%) | | | | |
| | Pioneer Natural Resources Co. | 64,200 | | 9,718 | |
| | Hess Corp. | 131,200 | | 8,765 | |
| | EOG Resources Inc. | 43,200 | | 3,618 | |
| | Schlumberger Ltd. | 45,700 | | 1,837 | |
| | Noble Energy Inc. | 49,700 | | 1,235 | |
| * | Transocean Ltd. | 169,200 | | 1,164 | |
| | | | | 26,337 | |
| Financials (8.6%) | | | | |
| | Wells Fargo & Co. | 837,400 | | 45,052 | |
| | JPMorgan Chase & Co. | 307,000 | | 42,796 | |
| | Charles Schwab Corp. | 461,000 | | 21,925 | |
| | Bank of America Corp. | 549,000 | | 19,336 | |
| | Marsh & McLennan Cos. Inc. | 170,700 | | 19,018 | |
| | Discover Financial Services | 82,500 | | 6,998 | |
| | US Bancorp | 81,300 | | 4,820 | |
| | CME Group Inc. | 20,400 | | 4,095 | |
| | Citigroup Inc. | 41,900 | | 3,347 | |
| | Progressive Corp. | 44,500 | | 3,221 | |
| | | | | 170,608 | |
| Health Care (25.0%) | | | | |
| | Eli Lilly & Co. | 651,871 | | 85,676 | |
| * | Biogen Inc. | 264,200 | | 78,396 | |
| | Amgen Inc. | 297,771 | | 71,784 | |
| | AstraZeneca plc ADR | 791,400 | | 39,459 | |
| * | Boston Scientific Corp. | 847,702 | | 38,333 | |
| | Novartis AG ADR | 397,550 | | 37,644 | |
| | Roche Holding AG | 91,677 | | 29,795 | |
| | Thermo Fisher Scientific Inc. | 69,500 | | 22,579 | |
| | Bristol-Myers Squibb Co. | 242,600 | | 15,573 | |
| | Medtronic plc | 117,200 | | 13,296 | |
| * | BioMarin Pharmaceutical Inc. | 141,900 | | 11,998 | |
| | Abbott Laboratories | 134,400 | | 11,674 | |
| * | Elanco Animal Health Inc. | 348,916 | | 10,276 | |
| | CVS Health Corp. | 82,600 | | 6,136 | |
| 1 | Siemens Healthineers AG | 96,400 | | 4,621 | |
| | Zimmer Biomet Holdings Inc. | 30,000 | | 4,490 | |
| * | Alcon Inc. | 70,410 | | 3,983 | |
| | Merck & Co. Inc. | 36,200 | | 3,292 | |
| | Agilent Technologies Inc. | 26,500 | | 2,261 | |
| | Sanofi ADR | 36,800 | | 1,847 | |
| | | | | 493,113 | |
| Industrials (17.0%) | | | | |
| | Southwest Airlines Co. | 978,150 | | 52,801 | |
| | Airbus SE | 296,100 | | 43,457 | |
| | FedEx Corp. | 266,400 | | 40,282 | |
| * | United Airlines Holdings Inc. | 455,700 | | 40,143 | |
| | Siemens AG | 298,111 | | 38,931 | |
| | Caterpillar Inc. | 153,500 | | 22,669 | |
| | Delta Air Lines Inc. | 334,000 | | 19,532 | |
| | American Airlines Group Inc. | 543,900 | | 15,599 | |
| | Union Pacific Corp. | 59,200 | | 10,703 | |
| | Alaska Air Group Inc. | 143,000 | | 9,688 | |
| | Honeywell International Inc. | 53,600 | | 9,487 | |
| | Boeing Co. | 25,550 | | 8,323 | |
| | United Parcel Service Inc. Class B | 47,850 | | 5,601 | |
| | United Technologies Corp. | 31,500 | | 4,718 | |
| | Textron Inc. | 102,000 | | 4,549 | |
| | TransDigm Group Inc. | 5,000 | | 2,800 | |
| | CSX Corp. | 34,200 | | 2,475 | |
| | Deere & Co. | 12,400 | | 2,149 | |
| | Pentair plc | 23,700 | | 1,087 | |
| | nVent Electric plc | 23,700 | | 606 | |
| | | | | 335,600 | |
| Information Technology (28.3%) | | | |
| * | Adobe Inc. | 308,100 | | 101,614 | |
| | Microsoft Corp. | 604,600 | | 95,345 | |
| | Texas Instruments Inc. | 556,400 | | 71,381 | |
| * | Micron Technology Inc. | 885,400 | | 47,617 | |
| | QUALCOMM Inc. | 326,800 | | 28,834 | |
| | KLA Corp. | 142,600 | | 25,407 | |
| | Intel Corp. | 403,500 | | 24,149 | |
| | NetApp Inc. | 336,100 | | 20,922 | |
| | Telefonaktiebolaget LM Ericsson ADR | 2,085,100 | | 18,307 | |
| | Hewlett Packard Enterprise Co. | 1,140,550 | | 18,089 | |
| | HP Inc. | 809,250 | | 16,630 | |
| | Cisco Systems Inc. | 327,100 | | 15,688 | |
| | Intuit Inc. | 48,600 | | 12,730 | |
| | NVIDIA Corp. | 54,000 | | 12,706 | |
| | Analog Devices Inc. | 86,800 | | 10,315 | |
| | Visa Inc. Class A | 46,000 | | 8,643 | |
| | Oracle Corp. | 161,300 | | 8,546 | |
| | Corning Inc. | 127,350 | | 3,707 | |
| | Apple Inc. | 12,500 | | 3,671 | |
| * | PayPal Holdings Inc. | 31,700 | | 3,429 | |
| | Entegris Inc. | 46,900 | | 2,349 | |
| | DXC Technology Co. | 57,461 | | 2,160 | |
| | Plantronics Inc. | 71,650 | | 1,959 | |
| * | BlackBerry Ltd. | 195,800 | | 1,257 | |
| | Micro Focus International plc ADR | 72,667 | | 1,020 | |
| * | Dell Technologies Inc. | 18,447 | | 948 | |
| | Perspecta Inc. | 28,730 | | 760 | |
| | | | | 558,183 | |
| Materials (0.4%) | | | | |
| | Albemarle Corp. | 63,900 | | 4,667 | |
| | DuPont de Nemours Inc. | 23,866 | | 1,532 | |
| | Dow Inc. | 23,866 | | 1,306 | |
| | Corteva Inc. | 23,866 | | 706 | |
| | | | | 8,211 | |
Total Common Stocks
(Cost $1,095,556) | | | 1,888,276 | |
| Temporary Cash Investment (5.1%) | |
| Money Market Fund (5.1%) | | | | |
| 2,3 | Vanguard Market Liquidity Fund, 1.816%
(Cost $101,624) | 1,016,003 | | 101,611 | |
Total Investments (100.7%)
(Cost $1,197,180) | | | 1,989,887 | |
| | | | | | |
| | | | | Amount | |
| | | | | ($000 | ) |
| Other Assets and Liabilities (-0.7%) | |
| Other Assets | | | 23,813 | |
| Liabilities3 | | | (37,980 | ) |
| | | | | (14,167 | ) |
| Net Assets (100%) | |
| Applicable to 48,477,319 outstanding $.001 par value shares of beneficial interest (unlimited authorization) | | 1,975,720 | |
| Net Asset Value Per Share | | | $40.76 | |
Capital Growth Portfolio
| | Amount |
| | ($000) |
| Statement of Assets and Liabilities | |
| Assets | |
| Investments in Securities, at Value | |
| Unaffiliated Issuers | 1,888,276 |
| Affiliated Issuers | 101,611 |
| Total Investments in Securities | 1,989,887 |
| Investment in Vanguard | 87 |
| Receivables for Investment Securities Sold | 21,303 |
| Receivables for Accrued Income | 2,138 |
| Receivables for Capital Shares Issued | 285 |
| Total Assets | 2,013,700 |
| Liabilities | |
| Payables for Investment Securities Purchased | 28,490 |
| Collateral for Securities on Loan | 6,348 |
| Payables for Capital Shares Redeemed | 1,785 |
| Payables to Vanguard | 1,357 |
| Total Liabilities | 37,980 |
| Net Assets | 1,975,720 |
| At December 31, 2019, net assets consisted of: |
| | Amount |
| | ($000) |
| Paid-in Capital | 1,101,963 |
| Total Distributable Earnings (Loss) | 873,757 |
| Net Assets | 1,975,720 |
| • | See Note A in Notes to Financial Statements. |
| * | Non-income-producing security. |
| ^ | Includes partial security positions on loan to broker-dealers. The total value of securities on loan is $6,163,000. |
| 1 | Security exempt from registration under Rule 144A of the Securities Act of 1933. Such securities may be sold in transactions exempt from registration, normally to qualified institutional buyers. At December 31, 2019, the value of this security represented 0.2% of net assets. |
| 2 | Affiliated money market fund available only to Vanguard funds and certain trusts and accounts managed by Vanguard. Rate shown is the 7-day yield. |
| 3 | Collateral of $6,348,000 was received for securities on loan. |
| ADR—American Depositary Receipt. |
See accompanying Notes, which are an integral part of the Financial Statements.
Capital Growth Portfolio
Statement of Operations
| | Year Ended | |
| | December 31, 2019 | |
| | ($000 | ) |
| Investment Income | |
| Income | |
| Dividends1 | 27,842 | |
| Interest2 | 2,872 | |
| Securities Lending—Net | 93 | |
| Total Income | 30,807 | |
| Expenses | |
| Investment Advisory Fees—Note B | 2,698 | |
| The Vanguard Group—Note C | |
| Management and Administrative | 3,150 | |
| Marketing and Distribution | 211 | |
| Custodian Fees | 9 | |
| Auditing Fees | 30 | |
| Shareholders’ Reports | 15 | |
| Trustees’ Fees and Expenses | 2 | |
| Total Expenses | 6,115 | |
| Net Investment Income | 24,692 | |
| Realized Net Gain (Loss) | |
| Investment Securities Sold2 | 58,486 | |
| Foreign Currencies | (13 | ) |
| Realized Net Gain (Loss) | 58,473 | |
| Change in Unrealized Appreciation (Depreciation) | |
| Investment Securities2 | 336,511 | |
| Foreign Currencies | 9 | |
| Change in Unrealized Appreciation (Depreciation) | 336,520 | |
| Net Increase (Decrease) in Net Assets Resulting from Operations | 419,685 | |
| 1 | Dividends are net of foreign withholding taxes of $627,000. |
| 2 | Interest income, realized net gain (loss), and change in unrealized appreciation (depreciation) from an affiliated company of the portfolio were $2,872,000, $5,000, and $12,000, respectively. Purchases and sales are for temporary cash investment purposes. |
Statement of Changes in Net Assets
| | Year Ended December 31, | |
| | 2019 | | 2018 | |
| | ($000 | ) | ($000 | ) |
| Increase (Decrease) in Net Assets | | | | |
| Operations | | | | |
| Net Investment Income | 24,692 | | 19,251 | |
| Realized Net Gain (Loss) | 58,473 | | 47,961 | |
| Change in Unrealized Appreciation (Depreciation) | 336,520 | | (101,916 | ) |
| Net Increase (Decrease) in Net Assets Resulting from Operations | 419,685 | | (34,704 | ) |
| Distributions | |
| Net Investment Income | (19,835 | ) | (13,245 | ) |
| Realized Capital Gain1 | (48,481 | ) | (41,571 | ) |
| Total Distributions | (68,316 | ) | (54,816 | ) |
| Capital Share Transactions | |
| Issued | 222,383 | | 433,119 | |
| Issued in Lieu of Cash Distributions | 68,316 | | 54,816 | |
| Redeemed | (262,062 | ) | (218,735 | ) |
| Net Increase (Decrease) from Capital Share Transactions | 28,637 | | 269,200 | |
| Total Increase (Decrease) | 380,006 | | 179,680 | |
| Net Assets | |
| Beginning of Period | 1,595,714 | | 1,416,034 | |
| End of Period | 1,975,720 | | 1,595,714 | |
| 1 | Includes fiscal 2019 and 2018 short-term gain distributions totaling $1,053,000 and $420,000, respectively. Short-term gain distributions are treated as ordinary income dividends for tax purposes. |
See accompanying Notes, which are an integral part of the Financial Statements.
Capital Growth Portfolio
Financial Highlights
| For a Share Outstanding | | | Year Ended December 31, | |
| Throughout Each Period | 2019 | 2018 | 2017 | 2016 | 2015 | |
| Net Asset Value, Beginning of Period | $33.49 | $35.12 | $28.36 | $26.64 | $27.15 | |
| Investment Operations | |
| Net Investment Income | .5031 | .4291 | .3661 | .374 | .310 | |
| Net Realized and Unrealized Gain (Loss) on Investments | 8.182 | (.754) | 7.580 | 2.362 | .391 | |
| Total from Investment Operations | 8.685 | (.325) | 7.946 | 2.736 | .701 | |
| Distributions | |
| Dividends from Net Investment Income | (.411) | (.315) | (.371) | (.318) | (.301) | |
| Distributions from Realized Capital Gains | (1.004) | (.990) | (.815) | (.698) | (.910) | |
| Total Distributions | (1.415) | (1.305) | (1.186) | (1.016) | (1.211) | |
| Net Asset Value, End of Period | $40.76 | $33.49 | $35.12 | $28.36 | $26.64 | |
| | | | | | | |
| Total Return | 26.50% | -1.18% | 28.83% | 10.84% | 2.62% | |
| | |
| Ratios/Supplemental Data | |
| Net Assets, End of Period (Millions) | $1,976 | $1,596 | $1,416 | $964 | $894 | |
| Ratio of Total Expenses to Average Net Assets | 0.34% | 0.34% | 0.36% | 0.36% | 0.36% | |
| Ratio of Net Investment Income to Average Net Assets | 1.37% | 1.18% | 1.16% | 1.44% | 1.21% | |
| Portfolio Turnover Rate | 5% | 6% | 7% | 5% | 5% | |
1 Calculated based on average shares outstanding.
See accompanying Notes, which are an integral part of the Financial Statements.
Capital Growth Portfolio
Notes to Financial Statements
The Capital Growth Portfolio, a portfolio of Vanguard Variable Insurance Funds, is registered under the Investment Company Act of 1940 as an open-end investment company. The portfolio’s shares are only available for purchase by separate accounts of insurance companies as investments for variable annuity plans, variable life insurance contracts, or other variable benefit insurance contracts.
A. The following significant accounting policies conform to generally accepted accounting principles for U.S. investment companies. The portfolio consistently follows such policies in preparing its financial statements.
1. Security Valuation: Securities are valued as of the close of trading on the New York Stock Exchange (generally 4 p.m., Eastern time) on the valuation date. Equity securities are valued at the latest quoted sales prices or official closing prices taken from the primary market in which each security trades; such securities not traded on the valuation date are valued at the mean of the latest quoted bid and asked prices. Securities for which market quotations are not readily available, or whose values have been affected by events occurring before the portfolio’s pricing time but after the close of the securities’ primary markets, are valued at their fair values calculated according to procedures adopted by the board of trustees. These procedures include obtaining quotations from an independent pricing service, monitoring news to identify significant market- or security-specific events, and evaluating changes in the values of foreign market proxies (for example, ADRs, futures contracts, or exchange-traded funds), between the time the foreign markets close and the portfolio’s pricing time. When fair-value pricing is employed, the prices of securities used by a portfolio to calculate its net asset value may differ from quoted or published prices for the same securities. Investments in Vanguard Market Liquidity Fund are valued at that fund’s net asset value.
2. Foreign Currency: Securities and other assets and liabilities denominated in foreign currencies are translated into U.S. dollars using exchange rates obtained from an independent third party as of the portfolio’s pricing time on the valuation date. Realized gains (losses) and unrealized appreciation (depreciation) on investment securities include the effects of changes in exchange rates since the securities were purchased, combined with the effects of changes in security prices. Fluctuations in the value of other assets and liabilities resulting from changes in exchange rates are recorded as unrealized foreign currency gains (losses) until the assets or liabilities are settled in cash, at which time they are recorded as realized foreign currency gains (losses).
3. Federal Income Taxes: The portfolio intends to continue to qualify as a regulated investment company and distribute all of its taxable income. Management has analyzed the portfolio’s tax positions taken for all open federal income tax years (December 31, 2016–2019), and has concluded that no provision for federal income tax is required in the portfolio’s financial statements.
4. Distributions: Distributions to shareholders are recorded on the ex-dividend date. Distributions are determined on a tax basis and may differ from net investment income and realized capital gains for financial reporting purposes.
5. Securities Lending: To earn additional income, the portfolio lends its securities to qualified institutional borrowers. Security loans are subject to termination by the portfolio at any time, and are required to be secured at all times by collateral in an amount at least equal to the market value of securities loaned. Daily market fluctuations could cause the value of loaned securities to be more or less than the value of the collateral received. When this occurs, the collateral is adjusted and settled before the opening of the market on the next business day. The portfolio further mitigates its counterparty risk by entering into securities lending transactions only with a diverse group of prequalified counterparties, monitoring their financial strength, and entering into master securities lending agreements with its counterparties. The master securities lending agreements provide that, in the event of a counterparty’s default (including bankruptcy), the portfolio may terminate any loans with that borrower, determine the net amount owed, and sell or retain the collateral up to the net amount owed to the portfolio; however, such actions may be subject to legal proceedings. While collateral mitigates counterparty risk, in the event of a default, the portfolio may experience delays and costs in recovering the securities loaned. The portfolio invests cash collateral received in Vanguard Market Liquidity Fund, and records a liability in the Statement of Assets and Liabilities for the return of the collateral, during the period the securities are on loan. Securities lending income represents fees charged to borrowers plus income earned on invested cash collateral, less expenses associated with the loan. During the term of the loan, the portfolio is entitled to all distributions made on or in respect of the loaned securities.
Capital Growth Portfolio
6. Credit Facility: The portfolio and certain other funds managed by The Vanguard Group (“Vanguard”) participate in a $4.3 billion committed credit facility provided by a syndicate of lenders pursuant to a credit agreement that may be renewed annually; each fund is individually liable for its borrowings, if any, under the credit facility. Borrowings may be utilized for temporary and emergency purposes, and are subject to the portfolio’s regulatory and contractual borrowing restrictions. The participating funds are charged administrative fees and an annual commitment fee of 0.10% of the undrawn amount of the facility; these fees are allocated to the funds based on a method approved by the portfolio’s board of trustees and included in Management and Administrative expenses on the portfolio’s Statement of Operations. Any borrowings under this facility bear interest at a rate based upon the higher of the one-month London Interbank Offered Rate, federal funds effective rate, or overnight bank funding rate plus an agreed-upon spread.
The portfolio had no borrowings outstanding at December 31, 2019, or at any time during the period then ended.
7. Other: Dividend income is recorded on the ex-dividend date. Interest income includes income distributions received from Vanguard Market Liquidity Fund and is accrued daily. Security transactions are accounted for on the date securities are bought or sold. Costs used to determine realized gains (losses) on the sale of investment securities are those of the specific securities sold.
B. PRIMECAP Management Company provides investment advisory services to the portfolio for a fee calculated at an annual percentage rate of average net assets. For the year ended December 31, 2019, the investment advisory fee represented an effective annual rate of 0.15% of the portfolio’s average net assets.
C. In accordance with the terms of a Funds’ Service Agreement (the “FSA”) between Vanguard and the portfolio, Vanguard furnishes to the portfolio corporate management, administrative, marketing, and distribution services at Vanguard’s cost of operations (as defined by the FSA). These costs of operations are allocated to the portfolio based on methods and guidelines approved by the board of trustees. Vanguard does not require reimbursement in the current period for certain costs of operations (such as deferred compensation/benefits and risk/insurance costs); the portfolio’s liability for these costs of operations is included in Payables to Vanguard on the Statement of Assets and Liabilities. All other costs of operations payable to Vanguard are generally settled twice a month.
Upon the request of Vanguard, the portfolio may invest up to 0.40% of its net assets as capital in Vanguard. At December 31, 2019, the portfolio had contributed to Vanguard capital in the amount of $87,000, representing less than 0.01% of the portfolio’s net assets and 0.03% of Vanguard’s capital received pursuant to the FSA. The portfolio’s trustees and officers are also directors and employees, respectively, of Vanguard.
D. Various inputs may be used to determine the value of the portfolio’s investments. These inputs are summarized in three broad levels for financial statement purposes. The inputs or methodologies used to value securities are not necessarily an indication of the risk associated with investing in those securities.
Level 1—Quoted prices in active markets for identical securities.
Level 2—Other significant observable inputs (including quoted prices for similar securities, interest rates, prepayment speeds, credit risk, etc.).
Level 3—Significant unobservable inputs (including the portfolio’s own assumptions used to determine the fair value of investments). Any investments valued with significant unobservable inputs are noted on the Statement of Net Assets.
The following table summarizes the market value of the portfolio’s investments as of December 31, 2019, based on the inputs used to value them:
| | Level 1 | Level 2 | Level 3 |
| Investments | ($000) | ($000) | ($000) |
| Common Stocks | 1,771,472 | 116,804 | — |
| Temporary Cash Investments | 101,611 | — | — |
| Total | 1,873,083 | 116,804 | — |
Capital Growth Portfolio
E. Permanent differences between book-basis and tax-basis components of net assets are reclassified among capital accounts in the financial statements to reflect their tax character. These reclassifications have no effect on net assets or net asset value per share. As of period end, permanent differences primarily attributable to the accounting for foreign currency transactions were reclassified between the individual components of total distributable earnings (loss).
| | Amount |
| | ($000) |
| Paid-in Capital | — |
| Total Distributable Earnings (Loss) | — |
Temporary differences between book-basis and tax-basis components of total distributable earnings (loss) arise when certain items of income, gain, or loss are recognized in different periods for financial statement and tax purposes; these differences will reverse at some time in the future. The differences are primarily related to the tax deferral of losses on wash sales. As of period end, the tax-basis components of total distributable earnings (loss) are detailed in the table as follows:
| | Amount |
| | ($000) |
| Undistributed Ordinary Income | 24,391 |
| Undistributed Long-Term Gains | 57,103 |
| Capital Loss Carryforwards (Non-expiring) | — |
| Net Unrealized Gains (Losses) | 792,719 |
As of December 31, 2019, gross unrealized appreciation and depreciation for investments based on cost for U.S. federal income tax purposes were as follows:
| | Amount |
| | ($000) |
| Tax Cost | 1,197,180 |
| Gross Unrealized Appreciation | 848,959 |
| Gross Unrealized Depreciation | (56,252) |
| Net Unrealized Appreciation (Depreciation) | 792,707 |
F. During the year ended December 31, 2019, the portfolio purchased $125,087,000 of investment securities and sold $84,367,000 of investment securities, other than temporary cash investments.
G. Capital shares issued and redeemed were:
| | Year Ended December 31, |
| | 2019 | 2018 |
| | Shares | Shares |
| | (000) | (000) |
| Issued | 6,109 | 11,899 |
| Issued in Lieu of Cash Distributions | 1,900 | 1,525 |
| Redeemed | (7,186) | (6,095) |
| Net Increase (Decrease) in Shares Outstanding | 823 | 7,329 |
At December 31, 2019, one shareholder, an insurance company separate account whose holdings in the portfolio represent the indirect investment of Vanguard Variable Annuity contract holders, was the record or beneficial owner of 48% of the portfolio’s net assets. If this shareholder were to redeem its investment in the portfolio, the redemption might result in an increase in the portfolio’s expense ratio, cause the portfolio to incur higher transaction costs, or lead to the realization of taxable capital gains.
H. Management has determined that no events or transactions occurred subsequent to December 31, 2019, that would require recognition or disclosure in these financial statements.
Capital Growth Portfolio
Report of Independent Registered Public Accounting Firm
To the Board of Trustees of Vanguard Variable Insurance Funds and Shareholders of Capital Growth Portfolio
Opinion on the Financial Statements
We have audited the accompanying statement of net assets and statement of assets and liabilities of Capital Growth Portfolio (one of the portfolios constituting Vanguard Variable Insurance Funds, referred to hereafter as the “Portfolio”) as of December 31, 2019, the related statement of operations for the year ended December 31, 2019, the statement of changes in net assets for each of the two years in the period ended December 31, 2019, including the related notes, and the financial highlights for each of the five years in the period ended December 31, 2019 (collectively referred to as the “financial statements”). In our opinion, the financial statements present fairly, in all material respects, the financial position of the Portfolio as of December 31, 2019, the results of its operations for the year then ended, the changes in its net assets for each of the two years in the period ended December 31, 2019 and the financial highlights for each of the five years in the period ended December 31, 2019 in conformity with accounting principles generally accepted in the United States of America.
Basis for Opinion
These financial statements are the responsibility of the Portfolio’s management. Our responsibility is to express an opinion on the Portfolio’s financial statements based on our audits. We are a public accounting firm registered with the Public Company Accounting Oversight Board (United States) (“PCAOB”) and are required to be independent with respect to the Portfolio in accordance with the U.S. federal securities laws and the applicable rules and regulations of the Securities and Exchange Commission and the PCAOB.
We conducted our audits of these financial statements in accordance with the standards of the PCAOB. Those standards require that we plan and perform the audit to obtain reasonable assurance about whether the financial statements are free of material misstatement, whether due to error or fraud.
Our audits included performing procedures to assess the risks of material misstatement of the financial statements, whether due to error or fraud, and performing procedures that respond to those risks. Such procedures included examining, on a test basis, evidence regarding the amounts and disclosures in the financial statements. Our audits also included evaluating the accounting principles used and significant estimates made by management, as well as evaluating the overall presentation of the financial statements. Our procedures included confirmation of securities owned as of December 31, 2019 by correspondence with the custodian and brokers and by agreement to the underlying ownership records of the transfer agent; when replies were not received from brokers, we performed other auditing procedures. We believe that our audits provide a reasonable basis for our opinion.
/s/PricewaterhouseCoopers LLP
Philadelphia, Pennsylvania
February 18, 2020
We have served as the auditor of one or more investment companies in The Vanguard Group of Funds since 1975.
Special 2019 tax information (unaudited) for corporate shareholders only for Capital Growth Portfolio, a portfolio of Vanguard Variable Insurance Funds
This information for the fiscal year ended December 31, 2019, is included pursuant to provisions of the Internal Revenue Code for corporate shareholders only.
The portfolio distributed $47,429,000 as capital gain dividends (20% rate gain distributions) to shareholders during the fiscal year.
For corporate shareholders, 89.6% of investment income (dividend income plus short-term gains, if any) qualifies for the dividends-received deduction.
Conservative Allocation Portfolio
Your Portfolio’s Performance at a Glance
• For the 12 months ended December 31, 2019, the Conservative Allocation Portfolio returned 15.83%, in line with the 16.35% return of its composite index after factoring in the portfolio’s expenses.
• Stocks and bonds recorded their best results in years. Stocks benefited from accommodative monetary policies implemented by the Federal Reserve and other major central banks. Safer assets such as bonds also attracted investors as the U.S.-China trade conflict fueled global economic growth concerns.
• The portfolio targets an asset allocation of approximately 60% bonds and 40% stocks through these holdings: Vanguard Variable Insurance Fund (VVIF) Total Bond Market Index Portfolio, VVIF Equity Index Portfolio, Vanguard Total International Bond Index Fund, Vanguard Total International Stock Index Fund, and Vanguard Extended Market Index Fund.
• The Total Bond Market Index Portfolio returned almost 9%, and the Total International Bond Index Fund returned nearly 8%. The Equity Index Portfolio returned about 31%, the Extended Market Index Fund about 28%, and the Total International Stock Fund more than 21%.
• Please note that the portfolio returns in Vanguard Variable Insurance Fund are different from those in Vanguard Variable Annuity (and other plans that invest in the fund), which take into account insurance-related expenses.
Market Barometer
| | | Average Annual Total Returns |
| | | Periods Ended December 31, 2019 |
| | One Year | Three Years | Five Years |
| Stocks | |
| Russell 1000 Index (Large-caps) | 31.43% | 15.05% | 11.48% |
| Russell 2000 Index (Small-caps) | 25.53 | 8.59 | 8.23 |
| Russell 3000 Index (Broad U.S. market) | 31.02 | 14.57 | 11.24 |
| FTSE All-World ex US Index (International) | 21.81 | 9.96 | 5.83 |
| | |
| Bonds | |
| Bloomberg Barclays U.S. Aggregate Bond Index (Broad taxable market) | 8.72% | 4.03% | 3.05% |
| Bloomberg Barclays Municipal Bond Index (Broad tax-exempt market) | 7.54 | 4.72 | 3.53 |
| FTSE Three-Month U.S. Treasury Bill Index | 2.25 | 1.65 | 1.04 |
| | |
| CPI | |
| Consumer Price Index | 2.29% | 2.10% | 1.82% |
Conservative Allocation Portfolio
About Your Portfolio’s Expenses
As a shareholder of the portfolio, you incur ongoing costs, which include costs for portfolio management, administrative services, and shareholder reports (like this one), among others. Operating expenses, which are deducted from a portfolio’s gross income, directly reduce the investment return of the portfolio.
A typical portfolio’s expenses are expressed as a percentage of its average net assets. The Conservative Allocation Portfolio has no direct expenses, but bears its proportionate share of the expenses of the underlying funds in which it invests. These indirect expenses make up the acquired fund fees and expenses, also expressed as a percentage of average net assets. The following examples are intended to help you understand the ongoing costs (in dollars) of investing in your portfolio and to compare these costs with those of other mutual funds. The examples are based on an investment of $1,000 made at the beginning of the period shown and held for the entire period. The costs were calculated using the acquired fund fees and expenses for the Conservative Allocation Portfolio.
The accompanying table illustrates your portfolio’s costs in two ways:
• Based on actual portfolio return. This section helps you to estimate the actual expenses that you paid over the period. The “Ending Account Value” shown is derived from the portfolio’s actual return, and the third column shows the dollar amount that would have been paid by an investor who started with $1,000 in the portfolio. You may use the information here, together with the amount you invested, to estimate the expenses that you paid over the period.
To do so, simply divide your account value by $1,000 (for example, an $8,600 account value divided by $1,000 = 8.6), then multiply the result by the number given for your portfolio under the heading “Expenses Paid During Period.”
• Based on hypothetical 5% yearly return. This section is intended to help you compare your portfolio’s costs with those of other mutual funds. It assumes that the portfolio had a yearly return of 5% before expenses, but that the expense ratio is unchanged. In this case—because the return used is not the portfolio’s actual return—the results do not apply to your investment. The example is useful in making comparisons because the Securities and Exchange Commission requires all mutual funds to calculate expenses based on a 5% return. You can assess your portfolio’s costs by comparing this hypothetical example with the hypothetical examples that appear in shareholder reports of other funds.
Note that the expenses shown in the table are meant to highlight and help you compareongoingcosts only. The portfolio’s expense figure does not reflect additional fees and expenses associated with the annuity or life insurance program through which you invest.
The calculations assume no shares were bought or sold during the period. Your actual costs may have been higher or lower, depending on the amount of your investment and the timing of any purchases or redemptions.
You can find more information about the portfolio’s expenses in the Financial Statements section. For additional information on operating expenses and other shareholder costs, please refer to the prospectus.
| Six Months Ended December 31, 2019 | | | |
| | Beginning | Ending | Expenses |
| | Account Value | Account Value | Paid During |
| Conservative Allocation Portfolio | 6/30/2019 | 12/31/2019 | Period |
| Based on Actual Portfolio Return | $1,000.00 | $1,050.28 | $0.67 |
| Based on Hypothetical 5% Yearly Return | 1,000.00 | 1,024.55 | $0.66 |
The calculations are based on the Conservative Allocation Portfolio’s acquired fund fees and expenses for the most recent six-month period. The Conservative Allocation Portfolio’s annualized expense figure for that period is 0.13%. The dollar amounts shown as “Expenses Paid” are equal to the annualized average weighted expense ratio for the underlying funds, multiplied by the average account value over the period, multiplied by the number of days in the most recent six-month period, then divided by the number of days in the recent 12-month period (184/365).
Conservative Allocation Portfolio
Performance Summary
All of the returns in this report represent past performance, which is not a guarantee of future results that may be achieved by the portfolio. (Current performance may be lower or higher than the performance data cited. For performance data current to the most recent month-end, visit our website at vanguard.com/performance.) Note, too, that both investment returns and principal value can fluctuate widely, so an investor’s shares, when sold, could be worth more or less than their original cost. The returns shown do not reflect taxes that a shareholder would pay on portfolio distributions or on the sale of portfolio shares. Nor do the returns reflect fees and expenses associated with the annuity or life insurance program through which a shareholder invests. If these fees and expenses were included, the portfolio’s returns would be lower.
Cumulative Performance: October 19, 2011–December 31, 2019
Initial Investment of $10,000

| | | Average Annual Total Returns | |
| | | Periods Ended December 31, 2019 | |
| | | | | Since | Final Value |
| | | One | Five | Inception | of a $10,000 |
| | | Year | Years | (10/19/2011) | Investment |
 | Conservative Allocation Portfolio | 15.83% | 5.77% | 6.86% | $17,234 |
 | Conservative Allocation Composite Index | 16.35 | 6.02 | 7.08 | 17,528 |
 | Dow Jones U.S. Total Stock Market Float Adjusted Index | 30.90 | 11.18 | 14.82 | 31,055 |
Conservative Allocation Composite Index: Weighted 48% Bloomberg Barclays U.S. Aggregate Float Adjusted Index, 28% S&P Total Market Index, 12% Bloomberg Barclays Global Aggregate ex-USD Float Adjusted RIC Capped Index (USD Hedged), and 12% FTSE Global All Cap ex US Index as of June 3, 2013. Previously, the composite was weighted 60% Bloomberg Barclays U.S. Aggregate Float Adjusted Index, 28% S&P Total Market Index, and 12% MSCI ACWI ex USA IMI Index through June 2, 2013.
“Since Inception” performance is calculated from the portfolio’s inception date for both the portfolio and its comparative standard(s).
See Financial Highlights for dividend and capital gains information.
Conservative Allocation Portfolio
Underlying Vanguard Funds
As of December 31, 2019
| Vanguard Variable Insurance Fund Total Bond Market Index Portfolio | 41.8% |
| Vanguard Variable Insurance Fund Equity Index Portfolio | 20.3 |
| Vanguard Total International Bond Index Fund Admiral Shares | 17.8 |
| Vanguard Total International Stock Index Fund Admiral Shares | 16.1 |
| Vanguard Extended Market Index Fund Admiral Shares | 4.0 |
Conservative Allocation Portfolio
Financial Statements
Statement of Net Assets
As of December 31, 2019
The portfolio files its complete schedule of portfolio holdings with the Securities and Exchange Commission (SEC) for the first and third quarters of each fiscal year as an exhibit to its reports on Form N-PORT. The portfolio’s Form N-PORT reports are available on the SEC’s website at www.sec.gov.
| | | | Market |
| | | | Value• |
| | Shares | | ($000) |
| Investment Companies (100.0%) | | | |
| U.S. Stock Funds (24.3%) | | | |
| Vanguard Variable Insurance Fund—Equity Index Portfolio | 1,805,023 | | 86,099 |
| Vanguard Extended Market Index Fund Admiral Shares | 177,406 | | 16,962 |
| | | | 103,061 |
| International Stock Fund (16.1%) | | | |
| Vanguard Total International Stock Index Fund Admiral Shares | 2,297,209 | | 68,618 |
| | | | |
| U.S. Bond Fund (41.8%) | | | |
| Vanguard Variable Insurance Fund—Total Bond Market Index Portfolio | 14,529,229 | | 177,402 |
| | | | |
| International Bond Fund (17.8%) | | | |
| Vanguard Total International Bond Index Fund Admiral Shares | 3,346,906 | | 75,707 |
| Total Investment Companies (Cost $396,328) | | | 424,788 |
| Temporary Cash Investment (0.0%) | | | |
| Money Market Fund (0.0%) | | | |
| 1 | Vanguard Market Liquidity Fund, 1.816%(Cost $0) | 1 | | — |
| Total Investments (100.0%) (Cost $396,328) | | | 424,788 |
| Other Assets and Liabilities (0.0%) | | | |
| Other Assets | | | 143 |
| Liabilities | | | (111) |
| | | | 32 |
| Net Assets (100%) | | | |
| Applicable to 16,015,542 outstanding $.001 par value shares of beneficial interest (unlimited authorization) | | | 424,820 |
| Net Asset Value Per Share | | | $26.53 |
| | | | |
| | | | Amount |
| | | | ($000) |
| Statement of Assets and Liabilities | | | |
| Assets | | | |
| Investments in Securities, at Value—Affiliated Funds | | | 424,788 |
| Receivables for Capital Shares Issued | | | 143 |
| Total Assets | | | 424,931 |
| Liabilities | | | |
| Payables for Investment Securities Purchased | | | 8 |
| Payables for Capital Shares Redeemed | | | 90 |
| Other Liabilities | | | 13 |
| Total Liabilities | | | 111 |
| Net Assets | | | 424,820 |
| | | | |
| | | | |
| At December 31, 2019, net assets consisted of: | | | |
| | | | Amount |
| | | | ($000) |
| Paid-in Capital | | | 380,826 |
| Total Distributable Earnings (Loss) | | | 43,994 |
| Net Assets | | | 424,820 |
| • | See Note A in Notes to Financial Statements. |
| 1 | Affiliated money market fund available only to Vanguard funds and certain trusts and accounts managed by Vanguard. Rate shown is the 7-day yield. |
See accompanying Notes, which are an integral part of the Financial Statements.
Conservative Allocation Portfolio
Statement of Operations
| | Year Ended |
| | December 31, 2019 |
| | ($000) |
| Investment Income | |
| Income | |
| Income Distributions Received from Affiliated Funds | 9,654 |
| Net Investment Income—Note B | 9,654 |
| Realized Net Gain (Loss) | |
| Capital Gain Distributions Received from Affiliated Funds | 1,713 |
| Affiliated Funds Sold | 4,651 |
| Realized Net Gain (Loss) | 6,364 |
| Change in Unrealized Appreciation (Depreciation) from Affiliated Funds | 36,711 |
| Net Increase (Decrease) in Net Assets Resulting from Operations | 52,729 |
Statement of Changes in Net Assets
| | Year Ended December 31, |
| | 2019 | 2018 |
| | ($000) | ($000) |
| Increase (Decrease) in Net Assets | | |
| Operations | | |
| Net Investment Income | 9,654 | 7,418 |
| Realized Net Gain (Loss) | 6,364 | 7,997 |
| Change in Unrealized Appreciation (Depreciation) | 36,711 | (25,149) |
| Net Increase (Decrease) in Net Assets Resulting from Operations | 52,729 | (9,734) |
| Distributions | | |
| Net Investment Income | (7,812) | (6,271) |
| Realized Capital Gain1 | (8,058) | (6,817) |
| Total Distributions | (15,870) | (13,088) |
| Capital Share Transactions | | |
| Issued | 94,274 | 74,458 |
| Issued in Lieu of Cash Distributions | 15,870 | 13,088 |
| Redeemed | (43,396) | (49,700) |
| Net Increase (Decrease) from Capital Share Transactions | 66,748 | 37,846 |
| Total Increase (Decrease) | 103,607 | 15,024 |
| Net Assets | | |
| Beginning of Period | 321,213 | 306,189 |
| End of Period | 424,820 | 321,213 |
| 1 | Includes fiscal 2019 and 2018 short-term gain distributions totaling $90,000 and $284,000, respectively. Short-term gain distributions are treated as ordinary income dividends for tax purposes. |
See accompanying Notes, which are an integral part of the Financial Statements.
Conservative Allocation Portfolio
Financial Highlights
| For a Share Outstanding | | | Year Ended December 31, |
| Throughout Each Period | 2019 | 2018 | 2017 | 2016 | 2015 |
| Net Asset Value, Beginning of Period | $24.02 | $25.84 | $24.22 | $23.72 | $24.44 |
| Investment Operations | | | | | |
| Net Investment Income1 | .660 | .581 | .592 | .527 | .470 |
| Capital Gain Distributions Received1 | .117 | .100 | .203 | .128 | .201 |
| Net Realized and Unrealized Gain (Loss) on Investments | 2.921 | (1.417) | 1.769 | .728 | (.611) |
| Total from Investment Operations | 3.698 | (.736) | 2.564 | 1.383 | .060 |
| Distributions | | | | | |
| Dividends from Net Investment Income | (.585) | (.519) | (.500) | (.407) | (.387) |
| Distributions from Realized Capital Gains | (.603) | (.565) | (.444) | (.476) | (.393) |
| Total Distributions | (1.188) | (1.084) | (.944) | (.883) | (.780) |
| Net Asset Value, End of Period | $26.53 | $24.02 | $25.84 | $24.22 | $23.72 |
| | | | | | |
| Total Return | 15.83% | -2.98% | 10.89% | 6.02% | 0.20% |
| | | | | | |
| Ratios/Supplemental Data | | | | | |
| Net Assets, End of Period (Millions) | $425 | $321 | $306 | $233 | $199 |
| Ratio of Total Expenses to Average Net Assets | — | — | — | — | — |
| Acquired Fund Fees and Expenses | 0.13% | 0.13% | 0.14% | 0.16% | 0.16% |
| Ratio of Net Investment Income to Average Net Assets | 2.61% | 2.33% | 2.38% | 2.20% | 1.95% |
| Portfolio Turnover Rate | 10% | 18% | 19% | 14% | 15% |
| 1 | Calculated based on average shares outstanding. |
See accompanying Notes, which are an integral part of the Financial Statements.
Conservative Allocation Portfolio
Notes to Financial Statements
The Conservative Allocation Portfolio, a portfolio of Vanguard Variable Insurance Funds, is registered under the Investment Company Act of 1940 as an open-end investment company. The portfolio follows a balanced investment strategy by investing in selected Vanguard funds and portfolios to achieve its targeted allocation of assets to U.S. and international stocks, and U.S. and international bonds. Financial statements and other information about each underlying fund and portfolio are available on vanguard.com. The portfolio’s shares are only available for purchase by separate accounts of insurance companies as investments for variable annuity plans, variable life insurance contracts, or other variable benefit insurance contracts.
A. The following significant accounting policies conform to generally accepted accounting principles for U.S. investment companies. The portfolio consistently follows such policies in preparing its financial statements.
1. Security Valuation: Investments are valued at the net asset value of each underlying Vanguard fund determined as of the close of the New York Stock Exchange (generally 4 p.m., Eastern time) on the valuation date.
2. Federal Income Taxes: The portfolio intends to continue to qualify as a regulated investment company and distribute all of its taxable income. Management has analyzed the portfolio’s tax positions taken for all open federal income tax years (December 31, 2016–2019), and has concluded that no provision for federal income tax is required in the portfolio’s financial statements.
3. Distributions: Distributions to shareholders are recorded on the ex-dividend date. Distributions are determined on a tax basis and may differ from net investment income and realized capital gains for financial reporting purposes.
4. Credit Facility: The portfolio and certain other funds managed by The Vanguard Group (“Vanguard”) participate in a $4.3 billion committed credit facility provided by a syndicate of lenders pursuant to a credit agreement that may be renewed annually; each fund is individually liable for its borrowings, if any, under the credit facility. Borrowings may be utilized for temporary and emergency purposes, and are subject to the portfolio’s regulatory and contractual borrowing restrictions. The participating funds are charged administrative fees and an annual commitment fee of 0.10% of the undrawn amount of the facility; these fees are allocated to the funds based on a method approved by the portfolio’s board of trustees and borne by the funds in which the portfolio invests (see Note B). Any borrowings under this facility bear interest at a rate based upon the higher of the one-month London Interbank Offered Rate, federal funds effective rate, or overnight bank funding rate plus an agreed-upon spread.
The portfolio had no borrowings outstanding at December 31, 2019, or at any time during the period then ended.
5. Other: Income and capital gain distributions received are recorded on the ex-dividend date. Security transactions are accounted for on the date securities are bought or sold. Costs used to determine realized gains (losses) on the sale of investment securities are those of the specific securities sold.
B. In accordance with the terms of a Funds’ Service Agreement (the “FSA”) between Vanguard and the portfolio, Vanguard furnishes to the portfolio investment advisory, corporate management, administrative, marketing, and distribution services at Vanguard’s cost of operations (as defined by the FSA). These costs of operations are allocated to the portfolio based on methods and guidelines approved by the board of trustees. The FSA provides that expenses otherwise allocable to Vanguard funds-of-funds may be reduced or eliminated to the extent of savings realized by the underlying Vanguard funds by virtue of being part of a fund-of-funds. Accordingly, all expenses for services provided by Vanguard to the portfolio and all other expenses incurred by the portfolio during the period ended December 31, 2019, were borne by the underlying Vanguard funds in which the portfolio invests. The portfolio’s trustees and officers are also trustees and officers, respectively, of the underlying Vanguard funds, as well as directors and employees, respectively, of Vanguard.
Conservative Allocation Portfolio
C. Various inputs may be used to determine the value of the portfolio’s investments. These inputs are summarized in three broad levels for financial statement purposes. The inputs or methodologies used to value securities are not necessarily an indication of the risk associated with investing in those securities.
Level 1—Quoted prices in active markets for identical securities.
Level 2—Other significant observable inputs (including quoted prices for similar securities, interest rates, prepayment speeds, credit risk, etc.).
Level 3—Significant unobservable inputs (including the portfolio’s own assumptions used to determine the fair value of investments). Any investments valued with significant unobservable inputs are noted on the Statement of Net Assets.
At December 31, 2019, 100% of the market value of the portfolio’s investments was determined based on Level 1 inputs.
D. Permanent differences between book-basis and tax-basis components of net assets, if any, are reclassified among capital accounts in the financial statements to reflect their tax character. These reclassifications have no effect on net assets or net asset value per share.
Temporary differences between book-basis and tax-basis components of total distributable earnings (loss) arise when certain items of income, gain, or loss are recognized in different periods for financial statement and tax purposes; these differences will reverse at some time in the future. The differences are primarily related to the tax deferral of losses on wash sales. As of period end, the tax-basis components of total distributable earnings (loss) are detailed in the table as follows:
| | Amount |
| | ($000) |
| Undistributed Ordinary Income | 9,841 |
| Undistributed Long-Term Gains | 5,693 |
| Capital Loss Carryforwards (Non-expiring) | — |
| Net Unrealized Gains (Losses) | 28,460 |
As of December 31, 2019, gross unrealized appreciation and depreciation for investments based on cost for U.S. federal income tax purposes were as follows:
| | Amount |
| | ($000) |
| Tax Cost | 396,328 |
| Gross Unrealized Appreciation | 29,437 |
| Gross Unrealized Depreciation | (977) |
| Net Unrealized Appreciation (Depreciation) | 28,460 |
E. Capital shares issued and redeemed were:
| | Year Ended December 31, |
| | 2019 | 2018 |
| | Shares | Shares |
| | (000) | (000) |
| Issued | 3,717 | 2,995 |
| Issued in Lieu of Cash Distributions | 651 | 527 |
| Redeemed | (1,725) | (2,000) |
| Net Increase (Decrease) in Shares Outstanding | 2,643 | 1,522 |
At December 31, 2019, one shareholder, an insurance company separate account whose holdings in the portfolio represent the indirect investment of Vanguard Variable Annuity contract holders, was the record or beneficial owner of 89% of the portfolio’s net assets.
Conservative Allocation Portfolio
F. Transactions during the period in affiliated underlying Vanguard funds were as follows:
| | | | | | Current Period Transactions | |
| | Dec, 31, | | Proceeds | Realized | | | | Dec. 31, |
| | 2018 | | from | Net | Change in | | Capital Gain | 2019 |
| | Market | Purchases | Securities | Gain | Unrealized | | Distributions | Market |
| | Value | at Cost | Sold | (Loss) | App. (Dep.) | Income | Received | Value |
| | ($000) | ($000) | ($000) | ($000) | ($000) | ($000) | ($000) | ($000) |
| Vanguard Market Liquidity Fund | — | NA1 | NA1 | — | — | 2 | — | — |
| Vanguard Extended Market Index Fund | 12,932 | 2,587 | 1,996 | 575 | 2,864 | 211 | — | 16,962 |
| Vanguard Variable Insurance Fund—Equity Index Portfolio | 65,384 | 17,547 | 13,952 | 2,782 | 14,338 | 1,308 | 1,713 | 86,099 |
| Vanguard Variable Insurance Fund—Total Bond Market Index Portfolio | 132,862 | 48,609 | 12,823 | 409 | 8,345 | 3,778 | — | 177,402 |
| Vanguard Total International Bond Index Fund | 57,503 | 17,365 | 1,443 | 159 | 2,123 | 2,396 | — | 75,707 |
| Vanguard Total International Stock Index Fund | 52,082 | 14,861 | 8,092 | 726 | 9,041 | 1,959 | — | 68,618 |
| Total | 320,763 | 100,969 | 38,306 | 4,651 | 36,711 | 9,654 | 1,713 | 424,788 |
1 Not applicable—purchases and sales are for temporary cash investment purposes.
G. Management has determined that no events or transactions occurred subsequent to December 31, 2019, that would require recognition or disclosure in these financial statements.
Conservative Allocation Portfolio
Report of Independent Registered Public Accounting Firm
To the Board of Trustees of Vanguard Variable Insurance Funds and Shareholders of Conservative Allocation Portfolio
Opinion on the Financial Statements
We have audited the accompanying statement of net assets and statement of assets and liabilities of Conservative Allocation Portfolio (one of the portfolios constituting Vanguard Variable Insurance Funds, referred to hereafter as the “Portfolio”) as of December 31, 2019, the related statement of operations for the year ended December 31, 2019, the statement of changes in net assets for each of the two years in the period ended December 31, 2019, including the related notes, and the financial highlights for each of the five years in the period ended December 31, 2019 (collectively referred to as the “financial statements”). In our opinion, the financial statements present fairly, in all material respects, the financial position of the Portfolio as of December 31, 2019, the results of its operations for the year then ended, the changes in its net assets for each of the two years in the period ended December 31, 2019 and the financial highlights for each of the five years in the period ended December 31, 2019 in conformity with accounting principles generally accepted in the United States of America.
Basis for Opinion
These financial statements are the responsibility of the Portfolio’s management. Our responsibility is to express an opinion on the Portfolio’s financial statements based on our audits. We are a public accounting firm registered with the Public Company Accounting Oversight Board (United States) (“PCAOB”) and are required to be independent with respect to the Portfolio in accordance with the U.S. federal securities laws and the applicable rules and regulations of the Securities and Exchange Commission and the PCAOB.
We conducted our audits of these financial statements in accordance with the standards of the PCAOB. Those standards require that we plan and perform the audit to obtain reasonable assurance about whether the financial statements are free of material misstatement, whether due to error or fraud.
Our audits included performing procedures to assess the risks of material misstatement of the financial statements, whether due to error or fraud, and performing procedures that respond to those risks. Such procedures included examining, on a test basis, evidence regarding the amounts and disclosures in the financial statements. Our audits also included evaluating the accounting principles used and significant estimates made by management, as well as evaluating the overall presentation of the financial statements. Our procedures included confirmation of securities owned as of December 31, 2019 by correspondence with the transfer agent. We believe that our audits provide a reasonable basis for our opinion.
/s/PricewaterhouseCoopers LLP
Philadelphia, Pennsylvania
February 18, 2020
We have served as the auditor of one or more investment companies in The Vanguard Group of Funds since 1975.
Special 2019 tax information (unaudited) for corporate shareholders only for Conservative Allocation Portfolio, a portfolio of Vanguard Variable Insurance Funds
This information for the fiscal year ended December 31, 2019, is included pursuant to provisions of the Internal Revenue Code for corporate shareholders only.
The portfolio distributed $7,968,000 as capital gain dividends (20% rate gain distributions) to shareholders during the fiscal year.
For corporate shareholders, 13.3% of investment income (dividend income plus short-term gains, if any) qualifies for the dividends-received deduction.
The portfolio designates to shareholders foreign source income of $4,365,000 and foreign taxes paid of $149,000. Shareholders will receive more detailed information with their Form 1099-DIV in January 2020 to determine the calendar-year amounts to be included on their 2019 tax returns.
Conservative Allocation Portfolio
BLOOMBERG is a trademark and service mark of Bloomberg Finance L.P. BARCLAYS is a trademark and service mark of Barclays Bank Plc, used under license. Bloomberg Finance L.P. and its affiliates, including Bloomberg Index Services Limited (BISL) (collectively, Bloomberg), or Bloomberg’s licensors, own all proprietary rights in the Bloomberg Barclays U.S. Aggregate Float Adjusted Index and the Bloomberg Barclays Global Aggregate ex-USD Float Adjusted RIC Capped Index (USD Hedged) (the Indices or Bloomberg Barclays Indices).
Neither Barclays Bank Plc, Barclays Capital Inc., or any affiliate (collectively Barclays) or Bloomberg is the issuer or producer of the Conservative Allocation Portfolio and neither Bloomberg nor Barclays has any responsibilities, obligations or duties to investors in the Conservative Allocation Portfolio. The Indices are licensed for use by The Vanguard Group, Inc. (Vanguard) as the sponsor of the Conservative Allocation Portfolio. Bloomberg and Barclays’ only relationship with Vanguard in respect of the Indices is the licensing of the Indices, which are determined, composed and calculated by BISL, or any successor thereto, without regard to the Issuer or the Conservative Allocation Portfolio or the owners of the Conservative Allocation Portfolio.
Additionally, Vanguard may for itself execute transaction(s) with Barclays in or relating to the Indices in connection with the Conservative Allocation Portfolio. Investors acquire the Conservative Allocation Portfolio from Vanguard and investors neither acquire any interest in the Indices nor enter into any relationship of any kind whatsoever with Bloomberg or Barclays upon making an investment in the Conservative Allocation Portfolio. The Conservative Allocation Portfolio is not sponsored, endorsed, sold or promoted by Bloomberg or Barclays. Neither Bloomberg nor Barclays makes any representation or warranty, express or implied regarding the advisability of investing in the Conservative Allocation Portfolio or the advisability of investing in securities generally or the ability of the Indices to track corresponding or relative market performance. Neither Bloomberg nor Barclays has passed on the legality or suitability of the Conservative Allocation Portfolio with respect to any person or entity. Neither Bloomberg nor Barclays is responsible for and has not participated in the determination of the timing of, prices at, or quantities of the Conservative Allocation Portfolio to be issued. Neither Bloomberg nor Barclays has any obligation to take the needs of the Issuer or the owners of the Conservative Allocation Portfolio or any other third party into consideration in determining, composing or calculating the Indices. Neither Bloomberg nor Barclays has any obligation or liability in connection with administration, marketing or trading of the Conservative Allocation Portfolio.
The licensing agreement between Bloomberg and Barclays is solely for the benefit of Bloomberg and Barclays and not for the benefit of the owners of the Conservative Allocation Portfolio, investors or other third parties. In addition, the licensing agreement between Vanguard and Bloomberg is solely for the benefit of Vanguard and Bloomberg and not for the benefit of the owners of the Conservative Allocation Portfolio, investors or other third parties.
NEITHER BLOOMBERG NOR BARCLAYS SHALL HAVE ANY LIABILITY TO THE ISSUER, INVESTORS OR TO OTHER THIRD PARTIES FOR THE QUALITY, ACCURACY AND/OR COMPLETENESS OF THE BLOOMBERG BARCLAYS INDICES OR ANY DATA INCLUDED THEREIN OR FOR INTERRUPTIONS IN THE DELIVERY OF THE BLOOMBERG BARCLAYS INDICES. NEITHER BLOOMBERG NOR BARCLAYS MAKES ANY WARRANTY, EXPRESS OR IMPLIED, AS TO RESULTS TO BE OBTAINED BY THE ISSUER, THE INVESTORS OR ANY OTHER PERSON OR ENTITY FROM THE USE OF THE BLOOMBERG BARCLAYS INDICES OR ANY DATA INCLUDED THEREIN. NEITHER BLOOMBERG NOR BARCLAYS MAKES ANY EXPRESS OR IMPLIED WARRANTIES, AND EACH HEREBY EXPRESSLY DISCLAIMS ALL WARRANTIES OF MERCHANTABILITY OR FITNESS FOR A PARTICULAR PURPOSE OR USE WITH RESPECT TO THE BLOOMBERG BARCLAYS INDICES OR ANY DATA INCLUDED THEREIN. BLOOMBERG RESERVES THE RIGHT TO CHANGE THE METHODS OF CALCULATION OR PUBLICATION, OR TO CEASE THE CALCULATION OR PUBLICATION OF THE BLOOMBERG BARCLAYS INDICES, AND NEITHER BLOOMBERG NOR BARCLAYS SHALL BE LIABLE FOR ANY MISCALCULATION OF OR ANY INCORRECT, DELAYED OR INTERRUPTED PUBLICATION WITH RESPECT TO THE BLOOMBERG BARCLAYS INDICES. NEITHER BLOOMBERG NOR BARCLAYS SHALL BE LIABLE FOR ANY DAMAGES, INCLUDING, WITHOUT LIMITATION, ANY SPECIAL, INDIRECT OR CONSEQUENTIAL DAMAGES, OR ANY LOST PROFITS AND EVEN IF ADVISED OF THE POSSIBLITY OF SUCH, RESULTING FROM THE USE OF THE BLOOMBERG BARCLAYS INDICES OR ANY DATA INCLUDED THEREIN OR WITH RESPECT TO THE CONSERVATIVE ALLOCATION PORTFOLIO.
None of the information supplied by Bloomberg or Barclays and used in this publication may be reproduced in any manner without the prior written permission of both Bloomberg and Barclays Capital, the investment banking division of Barclays Bank Plc. Barclays Bank Plc is registered in England No. 1026167. Registered office 1 Churchill Place London E14 5HP.
© 2020 Bloomberg. Used with Permission.
Source: Bloomberg Index Services Limited. Copyright 2020, Bloomberg. All rights reserved.
Diversified Value Portfolio
Your Portfolio’s Performance at a Glance
• The Diversified Value Portfolio of Vanguard Variable Insurance Fund returned 25.70% for the 12 months ended December 31, 2019, trailing the 26.54% return of its benchmark, the Russell 1000 Value Index. Please note that the portfolio returns in Vanguard Variable Insurance Fund are different from those in Vanguard Variable Annuity (and other plans that invest in the fund), which take into account insurance-related expenses.
• The broad U.S. stock market, as measured by the Russell 3000 Index, climbed 31% for the year. Global stock prices rose amid optimism that U.S.-China trade tensions were easing and that a trade deal might be signed in early 2020. Inversions of the U.S. Treasury yield curve, historically a signal of recession, raised concerns midway through the year. But the yield curve returned to its normal pattern in the second half as the Federal Reserve cut short-term interest rates three times in 2019.
• Growth stocks outperformed their value counterparts, while large- and mid-capitalization stocks surpassed small-caps.
• Returns were positive in nine of the portfolio’s 11 sectors. The advisor’s holdings in information technology, industrials, and consumer discretionary contributed most to relative performance. Consumer staples, health care, and materials were the biggest net detractors.
• Over the decade ended December 31, 2019, the portfolio’s average annualized return trailed that of its benchmark.
| Market Barometer | | | |
| | | Average Annual Total Returns |
| | | Periods Ended December 31, 2019 |
| | One Year | Three Years | Five Years |
| Stocks | | | |
| Russell 1000 Index (Large-caps) | 31.43% | 15.05% | 11.48% |
| Russell 2000 Index (Small-caps) | 25.53 | 8.59 | 8.23 |
| Russell 3000 Index (Broad U.S. market) | 31.02 | 14.57 | 11.24 |
| FTSE All-World ex US Index (International) | 21.81 | 9.96 | 5.83 |
| | | | |
| Bonds | | | |
| Bloomberg Barclays U.S. Aggregate Bond Index (Broad taxable market) | 8.72% | 4.03% | 3.05% |
| Bloomberg Barclays Municipal Bond Index (Broad tax-exempt market) | 7.54 | 4.72 | 3.53 |
| FTSE Three-Month U.S. Treasury Bill Index | 2.25 | 1.65 | 1.04 |
| | | | |
| CPI | | | |
| Consumer Price Index | 2.29% | 2.10% | 1.82% |
Diversified Value Portfolio
Advisor’s Report
The Diversified Value Portfolio returned 25.70% for the 12 months ended December 31, 2019, below the 26.54% return of its benchmark, the Russell 1000 Value Index.
Change in investment advisors
In December 2019, Vanguard announced changes to the advisory firms managing the Diversified Value Portfolio. Barrow, Hanley, Mewhinney & Strauss, LLC, no longer serves as an advisor to the portfolio. The portfolio has adopted a multi-manager approach, with Lazard Asset Management LLC and Hotchkis and Wiley Capital Management, LLC, each managing a portion of its assets. As a result of the advisor changes, turnover in the portfolio increased to 117% for the 2019 fiscal year from 18% the prior year, because of higher purchase and sales activity in November and December. The performance commentary in this Advisor’s Report reflects the performance during the portion of the 2019 fiscal year while Barrow Hanley was managing the portfolio. Vanguard Equity Index Group managed the portfolio during the transition to the new advisors. This report was prepared on January 24, 2020.
The investment environment
U.S. and global stock markets advanced broadly over the 12 months ended December 31, 2019, amid signs of easing in U.S.-China trade tensions and an end to the Brexit impasse, even though concerns remained about slowing global growth and geopolitical flare-ups.
U.S. gross domestic product, the broadest measure of economic activity, expanded in the first quarter of 2019 at an annual rate of about 3%, after adjusting for inflation. The pace then slowed amid fading effects from tax cuts, weaker business confidence, and trade disputes. The labor market remained robust even as job creation eased a little. The unemployment rate continued to trend lower, falling to 3.5% by late 2019, which helped keep consumers spending.
Inversions of the U.S. Treasury yield curve, historically a signal of recession, raised concerns midway through the year. But the yield curve returned to its normal pattern in the second half as the U.S. Federal Reserve cut short-term interest rates three times from August through October. Other major central banks adopted more accommodative monetary policies as well. A strong U.S. dollar lost ground as the year ended.
Successes and shortfalls
The portfolio experienced a few successes for the year but also several shortfalls that hurt performance relative to the Russell 1000 Value Index. Information technology, industrials, and consumer discretionary were areas of particular strength, while consumer staples, health care, and materials were the largest detractors. While an overweight allocation to energy hampered results, selection within the sector was positive.
The biggest shortfall during the year involved tobacco companies, in the consumer staples sector. Positions in Imperial Brands, Philip Morris International, and Altria Group all weighed on performance. All three positions had been long-term holdings given the strong recurring cash flow, attractive valuations, and sizable dividend yield. Regulatory scrutiny of tobacco companies heightened during the year, as the U.S. Food and Drug Administration began disputing the safety claims of e-cigarettes and evaluating certain marketing tactics that targeted minors.
Imperial, the fourth-largest tobacco company outside China, declined more than 9% for the year and was the largest detractor among the tobacco holdings. The shares performed poorly because of disappointing growth in next-generation products, specifically vapor device myblu. Given the uncertainties facing traditional cigarettes, the market is placing high value on the success of smoking alternatives, and Imperial was punished by the market for its poor showing in the second quarter. While the myblu franchise is still marginally unprofitable and does not have much influence on the firm’s earnings, Imperial’s core tobacco portfolio is still growing, driven by strong pricing.
The portfolio’s largest detractor during the year was EOG Resources, a leading U.S. developer of unconventional oil plays with 11 basins in various stages of development. The firm reported an 18% increase in oil production during the second quarter and beat consensus expectations for earnings and free cash flow, but the stock meaningfully underperformed its large-capitalization energy peers. While EOG dragged down results, security selection within energy was positive. Positions in Phillips 66 and Valero Energy, as well as our avoidance of Exxon Mobil, boosted results in the sector.
The portfolio’s relative returns were helped most by the advisor’s strong security selection and overweighting in information technology, the best-performing sector. Microsoft and QUALCOMM accounted for the bulk of the sector’s outperformance for the year. QUALCOMM is a leader in mobile processors and modems and has a successful technology-licensing business. Shares outperformed in the second quarter as QUALCOMM and Apple settled a two-year licensing dispute. Partially offsetting the good news, QUALCOMM had a legal setback when a judge ruled against the company in a Federal Trade Commission case. QUALCOMM has filed motions for an appeal, and while it will likely take time for the legal process to play out, Barrow Hanley continued to hold the stock as it found valuations attractive. QUALCOMM was sold during the transition, as it was not a name the new advisors wanted to own.
Dollar General was another area of strength for the portfolio. The discount retailer’s stock price rose meaningfully in the third quarter after the company delivered its third consecutive quarter of approximately 4% comparable-sales growth (an acceleration from the recent past) and greater-than-expected profits.
Diversified Value Portfolio
Barrow Hanley found several operational initiatives—including accelerating non-consumables sales, digital coupons, high-returning store remodels, and market-share gains from convenience stores and drugstores—as ways for Dollar General to continue to experience growth above prior years.
Overall, Air Products and Chemicals, one of the largest producers of industrial gases, was the top-contributing stock for the year. Air Products and Chemicals is an asset-intensive business with high barriers to entry. The company has employed a “glocal” business model, which centers its operations near its client base. Air Products and Chemicals benefited from accelerating new project backlogs and pricing, and has begun to see the benefits of capital allocation plans that were announced in 2018.
Portfolio outlook
Given the changes announced in December 2019, the outlooks below represent the new investment advisors: Lazard and Hotchkis and Wiley.
Lazard employs a research-driven, bottom-up relative-value approach in selecting stocks. The firm seeks to identify individual stocks that offer an appropriate trade-off between low relative valuation and high financial productivity. The portfolio management team uses return on equity as the primary measure of financial productivity. Secondary measures include return on assets, cash return on equity, and operating margin. The firm’s stock selection process can lead to a portfolio with characteristics and sector weightings that differ meaningfully from the benchmark. The multicap portfolio is expected to have 55 to 70 holdings.
Lazard’s outlook for the U.S. economy and markets in 2020 is positive. After a year of escalating trade tensions, the United States and China appeared by late 2019 to have reached a near-term agreement that could temporarily stabilize the situation. Lazard believes the primary challenges to an optimistic outlook are lingering weakness in the global manufacturing economy (which perhaps is still suffering from trade-related uncertainty combined with decelerating Chinese demand), broad uncertainty about the future of U.S. trade relationships with key global partners, and geopolitical risks.
While equity market appreciation in 2019 was entirely driven by valuation expansion, Lazard believes markets in 2020 are likely to be more focused on earnings growth. If historical patterns are repeated, Lazard expects positive earnings growth but considers consensus expectations for 2020 of 8.9% growth to be too optimistic.
Hotchkis and Wiley invests mainly in mid- to large-cap stocks with value-oriented characteristics. The advisor follows a disciplined investment approach, focusing on such investment parameters as a company’s tangible assets, sustainable cash flow, and potential for improving business performance. The advisor’s portfolio will typically hold 50 to 70 stocks.
Hotchkis and Wiley noted that growth has outperformed value to an almost unprecedented extent in recent years. Over the past 25 years, the average forward price/earnings ratio for the Russell 1000 Growth Index has been 20.2 times compared with 15 times for the Russell 1000 Value Index, which represents an average valuation spread of 5.2 times. At year-end, the forward P/E for the growth and value indexes were 25.6 times and 16.6 times, respectively, or a spread of 9 times. The only time this valuation gap was wider was during the tech/internet bubble from 1999 to 2001. The current gap has also led to a substantial divergence between certain industries.
Markets also have exhibited a preference for companies and industries seen as having low volatility. As an example, the forward P/E ratio for large-cap utilities has increased by more than 60% over the past decade while the forward P/E for large-cap banks has fallen by 5%. Overall, Hotchkis and Wiley views the market as fully valued from a historical perspective, but the firm believes the valuation disparities across the market create an investment environment highly conducive to its long-term value-focused approach. Hotchkis and Wiley is confident about the portfolio’s prospects given the considerable valuation advantage combined with good underlying businesses and healthy balance sheets.
Diversified Value Portfolio Investment Advisors
| Portfolio Assets Managed | | | |
| Investment Advisor | | % | | | $ Million | | | Investment Strategy |
| Lazard Asset Management LLC | | | 56 | | | | 549 | | | Employs a relative-value approach that seeks a combination of attractive valuation and high financial productivity. The process is research-driven, relying upon bottom-up stock analysis performed by the firm’s global sector analysts. |
| Hotchkis and Wiley Capital Management, LLC | | | 39 | | | | 377 | | | Uses a disciplined investment approach, focusing on such investment parameters as a company’s tangible assets, sustainable cash flow, and potential for improving business performance. |
| Cash Investments | | | 5 | | | | 48 | | | These short-term reserves are invested by Vanguard in equity index products to simulate investment in stocks. Each advisor may also maintain a modest cash position. |
Diversified Value Portfolio
About Your Portfolio’s Expenses
As a shareholder of the portfolio, you incur ongoing costs, which include costs for portfolio management, administrative services, and shareholder reports (like this one), among others. Operating expenses, which are deducted from a portfolio’s gross income, directly reduce the investment return of the portfolio.
A portfolio’s expenses are expressed as a percentage of its average net assets. This figure is known as the expense ratio. The following examples are intended to help you understand the ongoing costs (in dollars) of investing in your portfolio and to compare these costs with those of other mutual funds. The examples are based on an investment of $1,000 made at the beginning of the period shown and held for the entire period.
The table below illustrates your portfolio’s costs in two ways:
• Based on actual portfolio return. This section helps you to estimate the actual expenses that you paid over the period. The “Ending Account Value” shown is derived from the portfolio’s actual return, and the third column shows the dollar amount that would have been paid by an investor who started with $1,000 in the portfolio. You may use the information here, together with the amount you invested, to estimate the expenses that you paid over the period.
To do so, simply divide your account value by $1,000 (for example, an $8,600 account value divided by $1,000 = 8.6), then multiply the result by the number given for your portfolio under the heading “Expenses Paid During Period.”
• Based on hypothetical 5% yearly return. This section is intended to help you compare your portfolio’s costs with those of other mutual funds. It assumes that the portfolio had a yearly return of 5% before expenses, but that the expense ratio is unchanged. In this case—because the return used is not the portfolio’s actual return—the results do not apply to your investment. The example is useful in making comparisons because the Securities and Exchange Commission requires all mutual funds to calculate expenses based on a 5% return. You can assess your portfolio’s costs by comparing this hypothetical example with the hypothetical examples that appear in shareholder reports of other funds.
Note that the expenses shown in the table are meant to highlight and help you compareongoingcosts only and do not reflect transaction costs incurred by the portfolio for buying and selling securities. The portfolio’s expense ratio does not reflect additional fees and expenses associated with the annuity or life insurance program through which you invest.
The calculations assume no shares were bought or sold during the period. Your actual costs may have been higher or lower, depending on the amount of your investment and the timing of any purchases or redemptions.
You can find more information about the portfolio’s expenses in the Financial Statements section. For additional information on operating expenses and other shareholder costs, please refer to the prospectus.
Six Months Ended December 31, 2019
| | Beginning | Ending | Expenses |
| | Account Value | Account Value | Paid During |
| Diversified Value Portfolio | 6/30/2019 | 12/31/2019 | Period |
| Based on Actual Portfolio Return | $1,000.00 | $1,093.75 | $1.27 |
| Based on Hypothetical 5% Yearly Return | 1,000.00 | 1,024.00 | 1.22 |
The calculations are based on expenses incurred in the most recent six-month period. The portfolio’s annualized six-month expense ratio for that period is 0.24%. The dollar amounts shown as “Expenses Paid” are equal to the annualized expense ratio multiplied by the average account value over the period, multiplied by the number of days in the most recent six-month period, then divided by the number of days in the most recent 12-month period (184/365).
Diversified Value Portfolio
Performance Summary
All of the returns in this report represent past performance, which is not a guarantee of future results that may be achieved by the portfolio. (Current performance may be lower or higher than the performance data cited. For performance data current to the most recent month-end, visit our website at vanguard.com/performance.) Note, too, that both investment returns and principal value can fluctuate widely, so an investor’s shares, when sold, could be worth more or less than their original cost. The returns shown do not reflect taxes that a shareholder would pay on portfolio distributions or on the sale of portfolio shares. Nor do the returns reflect fees and expenses associated with the annuity or life insurance program through which a shareholder invests. If these fees and expenses were included, the portfolio’s returns would be lower.
Cumulative Performance: December 31, 2009–December 31, 2019
Initial Investment of $10,000
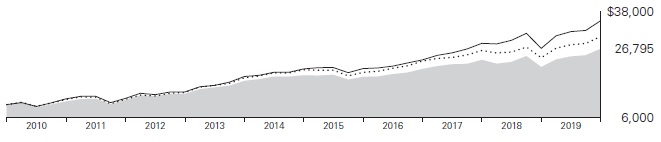
| | | Average Annual Total Returns | Final Value |
| | | Periods Ended December 31, 2019 | of a $10,000 |
| | | One Year | Five Years | Ten Years | Investment |
 | Diversified Value Portfolio | 25.70% | 7.33% | 10.36% | $26,795 |
 | Russell 1000 Value Index | 26.54 | 8.29 | 11.80 | 30,505 |
 | Dow Jones U.S. Total Stock Market Float Adjusted Index | 30.90 | 11.18 | 13.43 | 35,251 |
See Financial Highlights for dividend and capital gains information.
Diversified Value Portfolio
Sector Diversification
As of December 31, 2019
| Communication Services | 8.9% |
| Consumer Discretionary | 8.3 |
| Consumer Staples | 6.6 |
| Energy | 7.5 |
| Financials | 19.4 |
| Health Care | 14.0 |
| Industrials | 11.9 |
| Information Technology | 19.8 |
| Materials | 1.1 |
| Real Estate | 1.2 |
| Utilities | 1.3 |
The table reflects the portfolio’s equity exposure, based on its investments in stocks and stock index futures. Any holdings in short-term reserves are excluded. Sector categories are based on the Global Industry Classification Standard (“GICS”), except for the “Other” category (if applicable), which includes securities that have not been provided a GICS classification as of the effective reporting period.
The Global Industry Classification Standard (“GICS”) was developed by and is the exclusive property and a service mark of MSCI Inc. (“MSCI”) and Standard and Poor’s, a division of McGraw-Hill Companies, Inc. (“S&P”), and is licensed for use by Vanguard. Neither MSCI, S&P nor any third party involved in making or compiling the GICS or any GICS classification makes any express or implied warranties or representations with respect to such standard or classification (or the results to be obtained by the use thereof), and all such parties hereby expressly disclaim all warranties of originality, accuracy, completeness, merchantability or fitness for a particular purpose with respect to any such standard or classification. Without limiting any of the foregoing, in no event shall MSCI, S&P, any of its affiliates or any third party involved in making or compiling the GICS or any GICS classification have any liability for any direct, indirect, special, punitive, consequential or any other damages (including lost profits) even if notified of the possibility of such damages.
Diversified Value Portfolio
Financial Statements
Statement of Net Assets
As of December 31, 2019
The portfolio files its complete schedule of portfolio holdings with the Securities and Exchange Commission (SEC) for the first and third quarters of each fiscal year as an exhibit to its reports on Form N-PORT. The portfolio’s Form N-PORT reports are available on the SEC’s website at www.sec.gov.
| | | | | Market | |
| | | | | Value• | |
| | | Shares | | ($000 | ) |
| Common Stocks (96.3%)1 | |
| Communication Services (8.5%) | | | |
| * | Alphabet Inc. Class A | 23,255 | | 31,148 | |
| | Walt Disney Co. | 61,501 | | 8,895 | |
| * | Discovery Inc. Series C | 263,279 | | 8,027 | |
| | Vodafone Group plc ADR | 351,149 | | 6,788 | |
| | Comcast Corp. Class A | 150,238 | | 6,756 | |
| * | Electronic Arts Inc. | 57,465 | | 6,178 | |
| | News Corp. Class A | 331,144 | | 4,682 | |
| | Activision Blizzard Inc. | 60,181 | | 3,576 | |
| | ViacomCBS Inc. Class B | 76,923 | | 3,228 | |
| | Interpublic Group of Cos. Inc. | 86,012 | | 1,987 | |
| | Omnicom Group Inc. | 22,891 | | 1,855 | |
| | | | | 83,120 | |
| Consumer Discretionary (7.9%) | | | |
| | McDonald’s Corp. | 91,193 | | 18,021 | |
| | Lowe’s Cos. Inc. | 127,310 | | 15,246 | |
| | General Motors Co. | 295,783 | | 10,826 | |
| | Ross Stores Inc. | 71,557 | | 8,331 | |
| | Dollar General Corp. | 46,730 | | 7,289 | |
| | Magna International Inc. | 102,075 | | 5,598 | |
| | Aptiv plc | 42,375 | | 4,024 | |
| | Goodyear Tire & Rubber Co. | 202,508 | | 3,150 | |
| | Harley-Davidson Inc. | 62,517 | | 2,325 | |
| * | Adient plc | 88,537 | | 1,881 | |
| | | | | 76,691 | |
| Consumer Staples (6.4%) | | | | |
| | Coca-Cola Co. | 404,197 | | 22,372 | |
| | Procter & Gamble Co. | 133,627 | | 16,690 | |
| | Mondelez International Inc. Class A | 198,069 | | 10,910 | |
| | Kimberly-Clark Corp. | 51,651 | | 7,105 | |
| | Unilever plc ADR | 91,393 | | 5,225 | |
| | | | | 62,302 | |
| Energy (7.2%) | | | | |
| | ConocoPhillips | 172,704 | | 11,231 | |
| | Chevron Corp. | 87,929 | | 10,596 | |
| | Hess Corp. | 109,212 | | 7,297 | |
| | National Oilwell Varco Inc. | 287,615 | | 7,205 | |
| | Marathon Oil Corp. | 482,787 | | 6,556 | |
| | Royal Dutch Shell plc ADR | 101,636 | | 5,995 | |
| | Apache Corp. | 227,253 | | 5,815 | |
| | Murphy Oil Corp. | 183,894 | | 4,928 | |
| | Halliburton Co. | 135,779 | | 3,323 | |
| | Marathon Petroleum Corp. | 54,843 | | 3,304 | |
| | EOG Resources Inc. | 36,704 | | 3,074 | |
| | Kosmos Energy Ltd. | 218,705 | | 1,247 | |
| | | | | 70,571 | |
| Financials (19.0%) | | | | |
| | Bank of America Corp. | 879,081 | | 30,961 | |
| | Intercontinental Exchange Inc. | 218,880 | | 20,257 | |
| | Wells Fargo & Co. | 315,033 | | 16,949 | |
| | American International Group Inc. | 315,202 | | 16,179 | |
| | Citigroup Inc. | 164,953 | | 13,178 | |
| | Aon plc | 53,122 | | 11,065 | |
| | Goldman Sachs Group Inc. | 47,790 | | 10,988 | |
| | Capital One Financial Corp. | 77,472 | | 7,973 | |
| | PNC Financial Services Group Inc. | 45,123 | | 7,203 | |
| | Travelers Cos. Inc. | 42,182 | | 5,777 | |
| | AXA Equitable Holdings Inc. | 226,264 | | 5,607 | |
| | Citizens Financial Group Inc. | 135,361 | | 5,497 | |
| | Commerce Bancshares Inc. | 74,055 | | 5,031 | |
| | Morgan Stanley | 77,157 | | 3,944 | |
| | JPMorgan Chase & Co. | 28,184 | | 3,929 | |
| | Bank of New York Mellon Corp. | 73,534 | | 3,701 | |
| | State Street Corp. | 46,610 | | 3,687 | |
| | Discover Financial Services | 40,777 | | 3,459 | |
| | E*TRADE Financial Corp. | 68,533 | | 3,109 | |
| | Navient Corp. | 207,852 | | 2,844 | |
| | Fifth Third Bancorp | 63,123 | | 1,940 | |
| | CIT Group Inc. | 35,852 | | 1,636 | |
| | | | | 184,914 | |
| Health Care (13.5%) | | | | |
| | Medtronic plc | 255,703 | | 29,010 | |
| | Johnson & Johnson | 140,364 | | 20,475 | |
| | Anthem Inc. | 38,608 | | 11,661 | |
| | Pfizer Inc. | 255,779 | | 10,021 | |
| | Danaher Corp. | 64,827 | | 9,950 | |
| | Thermo Fisher Scientific Inc. | 21,113 | | 6,859 | |
| | Humana Inc. | 18,270 | | 6,696 | |
| | GlaxoSmithKline plc ADR | 129,516 | | 6,086 | |
| * | Laboratory Corp. of America Holdings | 34,920 | | 5,907 | |
| | Zoetis Inc. | 39,242 | | 5,194 | |
| | CVS Health Corp. | 69,632 | | 5,173 | |
| * | Elanco Animal Health Inc. | 117,021 | | 3,446 | |
| | Sanofi ADR | 61,264 | | 3,075 | |
| * | Biogen Inc. | 6,988 | | 2,074 | |
| | HCA Healthcare Inc. | 13,649 | | 2,018 | |
| * | Centene Corp. | 31,960 | | 2,009 | |
| | Zimmer Biomet Holdings Inc. | 13,211 | | 1,977 | |
| | | | 131,631 | |
| Industrials (11.5%) | | | | |
| | General Electric Co. | 1,645,022 | | 18,358 | |
| | Honeywell International Inc. | 102,206 | | 18,090 | |
| | Raytheon Co. | 48,993 | | 10,766 | |
| | Norfolk Southern Corp. | 47,505 | | 9,222 | |
| | Cummins Inc. | 45,351 | | 8,116 | |
| | CNH Industrial NV | 695,334 | | 7,649 | |
| | Deere & Co. | 42,901 | | 7,433 | |
| | Caterpillar Inc. | 42,786 | | 6,319 | |
| | Boeing Co. | 14,889 | | 4,850 | |
| | FedEx Corp. | 25,573 | | 3,867 | |
| | Spirit AeroSystems Holdings Inc. Class A | 50,374 | | 3,671 | |
| | Eaton Corp. plc | 31,408 | | 2,975 | |
| | 3M Co. | 16,300 | | 2,876 | |
| | Johnson Controls International plc | 66,745 | | 2,717 | |
| | PACCAR Inc. | 23,620 | | 1,868 | |
| | Fluor Corp. | 85,250 | | 1,610 | |
| * | Embraer SA ADR | 66,511 | | 1,296 | |
| | JB Hunt Transport Services Inc. | 124 | | 15 | |
| | | | | 111,698 | |
| Information Technology (18.8%) | | | |
| | Microsoft Corp. | 285,031 | | 44,949 | |
| | Apple Inc. | 61,954 | | 18,193 | |
| | Cisco Systems Inc. | 331,706 | | 15,909 | |
| | Visa Inc. Class A | 80,353 | | 15,098 | |
| | Analog Devices Inc. | 101,482 | | 12,060 | |
| | Texas Instruments Inc. | 92,556 | | 11,874 | |
| | Oracle Corp. | 209,864 | | 11,119 | |
| | Corning Inc. | 281,530 | | 8,195 | |
| | Hewlett Packard Enterprise Co. | 503,407 | | 7,984 | |
| | Accenture plc Class A | 32,752 | | 6,897 | |
| | Fidelity National Information Services Inc. | 42,920 | | 5,970 | |
| * | Palo Alto Networks Inc. | 23,320 | | 5,393 | |
| | Skyworks Solutions Inc. | 39,033 | | 4,718 | |
| | Telefonaktiebolaget LM Ericsson ADR | 463,415 | | 4,069 | |
| | Motorola Solutions Inc. | 23,371 | | 3,766 | |
| | TE Connectivity Ltd. | 31,460 | | 3,015 | |
| * | PTC Inc. | 39,446 | | 2,954 | |
| * | Teradata Corp. | 49,813 | | 1,333 | |
| | | | | 183,496 | |
| Materials (1.1%) | | | | |
| | Vulcan Materials Co. | 37,048 | | 5,334 | |
| | International Paper Co. | 113,697 | | 5,236 | |
| | | | 10,570 | |
| Real Estate (1.1%) | | | | |
| | Prologis Inc. | 120,848 | | 10,773 | |
| | | | | | |
| Utilities (1.3%) | | | | |
| | PPL Corp. | 235,955 | | 8,466 | |
| | Southern Co. | 60,423 | | 3,849 | |
| | | | | 12,315 | |
Total Common Stocks
(Cost $900,043) | | | 938,081 | |
| Temporary Cash Investments (2.9%)1 | |
| Money Market Fund (2.9%) | | | | |
| 2 | Vanguard Market Liquidity Fund, 1.816%
(Cost $28,157) | 281,534 | | 28,156 | |
Total Investments (99.2%)
(Cost $928,200) | | | 966,237 | |
Diversified Value Portfolio
| | Amount | |
| | ($000 | ) |
| Other Assets and Liabilities (0.8%) | | |
| Other Assets | | |
| Investment in Vanguard | 43 | |
| Receivables for Investment Securities Sold | 996 | |
| Receivables for Accrued Income | 839 | |
| Receivables for Capital Shares Issued | 441 | |
| Other Assets3 | 6,368 | |
| Total Other Assets | 8,687 | |
| Liabilities | | |
| Payables for Investment Securities Purchased | (253 | ) |
| Payables to Investment Advisor | (48 | ) |
| Payables to Vanguard | (827 | ) |
| Variation Margin Payable—Futures Contracts | (71 | ) |
| Total Liabilities | (1,199 | ) |
| Net Assets (100%) | |
| Applicable to 59,192,714 outstanding $.001 par value shares of beneficial interest (unlimited authorization) | 973,725 | |
| Net Asset Value Per Share | $16.45 | |
At December 31, 2019, net assets consisted of:
| | Amount | |
| | ($000 | ) |
| Paid-in Capital | 767,905 | |
| Total Distributable Earnings (Loss) | 205,820 | |
| Net Assets | 973,725 | |
| • | See Note A in Notes to Financial Statements. |
| * | Non-income-producing security. |
| 1 | The portfolio invests a portion of its cash reserves in equity markets through the use of index futures contracts. After giving effect to futures investments, the portfolio’s effective common stock and temporary cash investment positions represent 99.1% and 0.1%, respectively, of net assets. |
| 2 | Affiliated money market fund available only to Vanguard funds and certain trusts and accounts managed by Vanguard. Rate shown is the 7-day yield. |
| 3 | Cash of $863,000 has been segregated as initial margin for open futures contracts. |
ADR—American Depositary Receipt.
| Derivative Financial Instruments Outstanding as of Period End | |
| | |
| Futures Contracts | |
| | | | | | ($000 | ) |
| | | | | | Value and | |
| | | Number of | | | Unrealized | |
| | | Long (Short | ) | Notional | Appreciation | |
| | Expiration | Contracts | | Amount | (Depreciation | ) |
| Long Futures Contracts | | | | | | |
| E-mini S&P 500 Index | March 2020 | 166 | | 26,818 | 293 | |
See accompanying Notes, which are an integral part of the Financial Statements.
Diversified Value Portfolio
Statement of Operations
| | Year Ended | |
| | December 31, 2019 | |
| | ($000 | ) |
| Investment Income | |
| Income | |
| Dividends1 | 24,343 | |
| Interest2 | 352 | |
| Securities Lending—Net | 2 | |
| Total Income | 24,697 | |
| Expenses | |
| Investment Advisory Fees—Note B | |
| Basic Fee | 1,091 | |
| Performance Adjustment | (296 | ) |
| The Vanguard Group—Note C | |
| Management and Administrative | 1,359 | |
| Marketing and Distribution | 84 | |
| Custodian Fees | 7 | |
| Auditing Fees | 30 | |
| Shareholders’ Reports | 11 | |
| Trustees’ Fees and Expenses | 1 | |
| Total Expenses | 2,287 | |
| Net Investment Income | 22,410 | |
| Realized Net Gain (Loss) | |
| Investment Securities Sold2 | 147,691 | |
| Futures Contracts | 324 | |
| Realized Net Gain (Loss) | 148,015 | |
| Change in Unrealized Appreciation (Depreciation) | |
| Investment Securities2 | 43,184 | |
| Futures Contracts | 293 | |
| Change in Unrealized Appreciation (Depreciation) | 43,477 | |
| Net Increase (Decrease) in Net Assets Resulting from Operations | 213,902 | |
| 1 | Dividends are net of foreign withholding taxes of $147,000. |
| 2 | Interest income, realized net gain (loss), and change in unrealized appreciation (depreciation) from an affiliated company of the portfolio were $352,000, ($9,000), and ($1,000), respectively. Purchases and sales are for temporary cash investment purposes. |
Statement of Changes in Net Assets
| | Year Ended December 31, | |
| | 2019 | | 2018 | |
| | ($000 | ) | ($000 | ) |
| Increase (Decrease) in Net Assets | |
| Operations | |
| Net Investment Income | 22,410 | | 27,150 | |
| Realized Net Gain (Loss) | 148,015 | | 54,769 | |
| Change in Unrealized Appreciation (Depreciation) | 43,477 | | (172,551 | ) |
| Net Increase (Decrease) in Net Assets Resulting from Operations | 213,902 | | (90,632 | ) |
| Distributions | |
| Net Investment Income | (27,864 | ) | (27,747 | ) |
| Realized Capital Gain1 | (55,311 | ) | (54,228 | ) |
| Total Distributions | (83,175 | ) | (81,975 | ) |
| Capital Share Transactions | |
| Issued | 72,081 | | 95,428 | |
| Issued in Lieu of Cash Distributions | 83,175 | | 81,975 | |
| Redeemed | (199,650 | ) | (254,507 | ) |
| Net Increase (Decrease) from Capital Share Transactions | (44,394 | ) | (77,104 | ) |
| Total Increase (Decrease) | 86,333 | | (249,711 | ) |
| Net Assets | |
| Beginning of Period | 887,392 | | 1,137,103 | |
| End of Period | 973,725 | | 887,392 | |
| 1 | Includes fiscal 2019 and 2018 short-term gain distributions totaling $1,913,000 and $420,000. Short-term gain distributions are treated as ordinary income dividends for tax purposes. |
See accompanying Notes, which are an integral part of the Financial Statements.
Diversified Value Portfolio
Financial Highlights
| For a Share Outstanding | | | Year Ended December 31, | |
| Throughout Each Period | 2019 | 2018 | 2017 | 2016 | 2015 | |
| Net Asset Value, Beginning of Period | $14.33 | $17.04 | $17.11 | $16.55 | $18.65 | |
| Investment Operations | |
| Net Investment Income | .3641 | .4121 | .4011 | .496 | .471 | |
| Net Realized and Unrealized Gain (Loss) on Investments | 3.135 | (1.872) | 1.658 | 1.468 | (.901) | |
| Total from Investment Operations | 3.499 | (1.460) | 2.059 | 1.964 | (.430) | |
| Distributions | |
| Dividends from Net Investment Income | (.462) | (.423) | (.491) | (.461) | (.466) | |
| Distributions from Realized Capital Gains | (.917) | (.827) | (1.638) | (.943) | (1.204) | |
| Total Distributions | (1.379) | (1.250) | (2.129) | (1.404) | (1.670) | |
| Net Asset Value, End of Period | $16.45 | $14.33 | $17.04 | $17.11 | $16.55 | |
| | | | | | | |
| Total Return | 25.70% | -9.12% | 13.16% | 12.96% | -2.45% | |
| | | | | | | |
| Ratios/Supplemental Data | |
| Net Assets, End of Period (Millions) | $974 | $887 | $1,137 | $1,130 | $1,060 | |
| Ratio of Total Expenses to Average Net Assets2 | 0.24% | 0.25% | 0.27% | 0.27% | 0.28% | |
| Ratio of Net Investment Income to Average Net Assets | 2.39% | 2.58% | 2.45% | 3.01% | 2.55% | |
| Portfolio Turnover Rate | 117% | 18% | 18% | 34% | 13% | |
| 1 | Calculated based on average shares outstanding. |
| 2 | Includes performance-based investment advisory fee increases (decreases) of (0.03%), (0.03%), (0.03%), (0.03%), and (0.03%). |
See accompanying Notes, which are an integral part of the Financial Statements.
Diversified Value Portfolio
Notes to Financial Statements
The Diversified Value Portfolio, a portfolio of Vanguard Variable Insurance Funds, is registered under the Investment Company Act of 1940 as an open-end investment company. The portfolio’s shares are only available for purchase by separate accounts of insurance companies as investments for variable annuity plans, variable life insurance contracts, or other variable benefit insurance contracts.
A. The following significant accounting policies conform to generally accepted accounting principles for U.S. investment companies. The portfolio consistently follows such policies in preparing its financial statements.
1. Security Valuation: Securities are valued as of the close of trading on the New York Stock Exchange (generally 4 p.m., Eastern time) on the valuation date. Equity securities are valued at the latest quoted sales prices or official closing prices taken from the primary market in which each security trades; such securities not traded on the valuation date are valued at the mean of the latest quoted bid and asked prices. Securities for which market quotations are not readily available, or whose values have been materially affected by events occurring before the portfolio’s pricing time but after the close of the securities’ primary markets, are valued by methods deemed by the board of trustees to represent fair value. Investments in Vanguard Market Liquidity Fund are valued at that fund’s net asset value.
2. Futures Contracts: The portfolio uses index futures contracts to a limited extent, with the objective of maintaining full exposure to the stock market while maintaining liquidity. The portfolio may purchase or sell futures contracts to achieve a desired level of investment, whether to accommodate portfolio turnover or cash flows from capital share transactions. The primary risks associated with the use of futures contracts are imperfect correlation between changes in market values of stocks held by the portfolio and the prices of futures contracts, and the possibility of an illiquid market. Counterparty risk involving futures is mitigated because a regulated clearinghouse is the counterparty instead of the clearing broker. To further mitigate counterparty risk, the portfolio trades futures contracts on an exchange, monitors the financial strength of its clearing brokers and clearinghouse, and has entered into clearing agreements with its clearing brokers. The clearinghouse imposes initial margin requirements to secure the portfolio’s performance and requires daily settlement of variation margin representing changes in the market value of each contract. Any assets pledged as initial margin for open contracts are noted in the Statement of Net Assets.
Futures contracts are valued at their quoted daily settlement prices. The notional amounts of the contracts are not recorded in the Statement of Net Assets. Fluctuations in the value of the contracts are recorded in the Statement of Net Assets as an asset (liability) and in the Statement of Operations as unrealized appreciation (depreciation) until the contracts are closed, when they are recorded as realized futures gains (losses).
During the year ended December 31, 2019, the portfolio’s average investments in long and short futures contracts represented less than 1% and 0% of net assets, respectively, based on the average of the notional amounts at each quarter-end during the period.
3. Federal Income Taxes: The portfolio intends to continue to qualify as a regulated investment company and distribute all of its taxable income. Management has analyzed the portfolio’s tax positions taken for all open federal income tax years (December 31, 2016–2019), and has concluded that no provision for federal income tax is required in the portfolio’s financial statements.
4. Distributions: Distributions to shareholders are recorded on the ex-dividend date. Distributions are determined on a tax basis and may differ from net investment income and realized capital gains for financial reporting purposes.
5. Securities Lending: To earn additional income, the portfolio lends its securities to qualified institutional borrowers. Security loans are subject to termination by the portfolio at any time, and are required to be secured at all times by collateral in an amount at least equal to the market value of securities loaned. Daily market fluctuations could cause the value of loaned securities to be more or less than the value of the collateral received. When this occurs, the collateral is adjusted and settled before the opening of the market on the next business day. The portfolio further mitigates its counterparty risk by entering into securities lending transactions only with a diverse group of prequalified counterparties, monitoring their financial strength, and entering into master securities lending agreements with its counterparties. The master securities lending agreements provide that, in the event of a counterparty’s default (including bankruptcy), the portfolio may terminate any loans with that borrower, determine the net amount owed, and sell or retain the collateral up to the net amount owed to the portfolio; however, such actions may be subject to legal proceedings. While collateral mitigates counterparty risk, in the event of a default, the portfolio may experience delays and costs in recovering the securities loaned. The portfolio invests cash collateral received in Vanguard Market Liquidity Fund, and records a liability in the Statement of Net Assets for the return of the collateral, during the period the securities are on loan. Securities lending income represents
Diversified Value Portfolio
fees charged to borrowers plus income earned on invested cash collateral, less expenses associated with the loan. During the term of the loan, the portfolio is entitled to all distributions made on or in respect of the loaned securities.
6. Credit Facility: The portfolio and certain other funds managed by The Vanguard Group (“Vanguard”) participate in a $4.3 billion committed credit facility provided by a syndicate of lenders pursuant to a credit agreement that may be renewed annually; each fund is individually liable for its borrowings, if any, under the credit facility. Borrowings may be utilized for temporary and emergency purposes, and are subject to the portfolio’s regulatory and contractual borrowing restrictions. The participating funds are charged administrative fees and an annual commitment fee of 0.10% of the undrawn amount of the facility; these fees are allocated to the funds based on a method approved by the portfolio’s board of trustees and included in Management and Administrative expenses on the portfolio’s Statement of Operations. Any borrowings under this facility bear interest at a rate based upon the higher of the one-month London Interbank Offered Rate, federal funds effective rate, or overnight bank funding rate plus an agreed-upon spread.
The portfolio had no borrowings outstanding at December 31, 2019, or at any time during the period then ended.
7. Other: Dividend income is recorded on the ex-dividend date. Interest income includes income distributions received from Vanguard Market Liquidity Fund and is accrued daily. Security transactions are accounted for on the date securities are bought or sold. Costs used to determine realized gains (losses) on the sale of investment securities are those of the specific securities sold.
B. Beginning December 2019, Lazard Asset Management LLC and Hotchkis and Wiley Capital Management, LLC, each provide investment advisory services to a portion of the portfolio for a fee calculated at an annual percentage rate of average net assets managed by the advisor. In accordance with the advisory contracts entered into with Lazard Asset Management LLC and Hotchkis and Wiley Capital Management, LLC, beginning January 1, 2021, the investment advisory fees will be subject to quarterly adjustments based on performance relative to the S&P 500 Index and the Russell 1000 Value Index, respectively, since December 31, 2019. Until November 2019, the portfolio was managed by Barrow, Hanley, Mewhinney & Strauss, LLC. The basic fee paid to Barrow, Hanley, Mewhinney & Strauss, LLC, was subject to quarterly adjustments based on performance relative to the MSCI Prime Market 750 Index for the preceding three years.
Vanguard manages the cash reserves of the portfolio as described below.
For the year ended December 31, 2019, the aggregate investment advisory fee represented an effective annual basic rate of 0.12% of the portfolio’s average net assets, before a decrease of $296,000 (0.03%) based on performance.
C. In accordance with the terms of a Funds’ Service Agreement (the “FSA”) between Vanguard and the portfolio, Vanguard furnishes to the portfolio corporate management, administrative, marketing, distribution, and cash management services at Vanguard’s cost of operations (as defined by the FSA). These costs of operations are allocated to the portfolio based on methods and guidelines approved by the board of trustees. Vanguard does not require reimbursement in the current period for certain costs of operations (such as deferred compensation/benefits and risk/insurance costs); the portfolio’s liability for these costs of operations is included in Payables to Vanguard on the Statement of Net Assets. All other costs of operations payable to Vanguard are generally settled twice a month.
Upon the request of Vanguard, the portfolio may invest up to 0.40% of its net assets as capital in Vanguard. At December 31, 2019, the portfolio had contributed to Vanguard capital in the amount of $43,000, representing less than 0.01% of the portfolio’s net assets and 0.02% of Vanguard’s capital received pursuant to the FSA. The portfolio’s trustees and officers are also directors and employees, respectively, of Vanguard.
D. Various inputs may be used to determine the value of the portfolio’s investments. These inputs are summarized in three broad levels for financial statement purposes. The inputs or methodologies used to value securities are not necessarily an indication of the risk associated with investing in those securities.
Level 1—Quoted prices in active markets for identical securities.
Level 2—Other significant observable inputs (including quoted prices for similar securities, interest rates, prepayment speeds, credit risk, etc.).
Level 3—Significant unobservable inputs (including the portfolio’s own assumptions used to determine the fair value of investments). Any investments valued with significant unobservable inputs are noted on the Statement of Net Assets.
Diversified Value Portfolio
At December 31, 2019, 100% of the market value of the portfolio’s investments and derivatives was determined based on Level 1 inputs.
E. Permanent differences between book-basis and tax-basis components of net assets, if any, are reclassified among capital accounts in the financial statements to reflect their tax character. These reclassifications have no effect on net assets or net asset value per share.
Temporary differences between book-basis and tax-basis components of total distributable earnings (loss) arise when certain items of income, gain, or loss are recognized in different periods for financial statement and tax purposes; these differences will reverse at some time in the future. The differences are primarily related to the tax deferral of losses on wash sales and the realization of unrealized gains or losses on certain futures contracts. As of period end, the tax-basis components of total distributable earnings (loss) are detailed in the table as follows:
| | | Amount | |
| | | ($000 | ) |
| Undistributed Ordinary Income | | 24,069 | |
| Undistributed Long-Term Gains | | 144,460 | |
| Capital Loss Carryforwards (Non-expiring) | | — | |
| Net Unrealized Gains (Losses) | | 38,037 | |
As of December 31, 2019, gross unrealized appreciation and depreciation for investments and derivatives based on cost for U.S. federal income tax purposes were as follows:
| | | Amount | |
| | | ($000 | ) |
| Tax Cost | | 928,200 | |
| Gross Unrealized Appreciation | | 72,403 | |
| Gross Unrealized Depreciation | | (34,366 | ) |
| Net Unrealized Appreciation (Depreciation) | | 38,037 | |
F. During the year ended December 31, 2019, the portfolio purchased $1,071,139,000 of investment securities and sold $1,187,952,000 of investment securities, other than temporary cash investments.
G. Capital shares issued and redeemed were:
| | | Year Ended December 31, | |
| | | 2019 | | | 2018 | |
| | | Shares | | | Shares | |
| | | (000 | ) | | (000 | ) |
| Issued | | 4,725 | | | 5,928 | |
| Issued in Lieu of Cash Distributions | | 5,732 | | | 5,292 | |
| Redeemed | | (13,173 | ) | | (16,026 | ) |
| Net Increase (Decrease) in Shares Outstanding | | (2,716 | ) | | (4,806 | ) |
At December 31, 2019, two shareholders (each an insurance company separate account whose holdings in the portfolio represent the indirect investment of Vanguard Variable Annuity contract holders) were each a record or beneficial owner of 25% or more of the portfolio’s net assets, with a combined ownership of 72%. If any of these shareholders were to redeem their investment in the portfolio, the redemption might result in an increase in the portfolio’s expense ratio, cause the portfolio to incur higher transaction costs, or lead to the realization of taxable capital gains.
H. Management has determined that no events or transactions occurred subsequent to December 31, 2019, that would require recognition or disclosure in these financial statements.
Diversified Value Portfolio
Report of Independent Registered Public Accounting Firm
To the Board of Trustees of Vanguard Variable Insurance Funds and Shareholders of Diversified Value Portfolio
Opinion on the Financial Statements
We have audited the accompanying statement of net assets of Diversified Value Portfolio (one of the portfolios constituting Vanguard Variable Insurance Funds, referred to hereafter as the “Portfolio”) as of December 31, 2019, the related statement of operations for the year ended December 31, 2019, the statement of changes in net assets for each of the two years in the period ended December 31, 2019, including the related notes, and the financial highlights for each of the five years in the period ended December 31, 2019 (collectively referred to as the “financial statements”). In our opinion, the financial statements present fairly, in all material respects, the financial position of the Portfolio as of December 31, 2019, the results of its operations for the year then ended, the changes in its net assets for each of the two years in the period ended December 31, 2019 and the financial highlights for each of the five years in the period ended December 31, 2019 in conformity with accounting principles generally accepted in the United States of America.
Basis for Opinion
These financial statements are the responsibility of the Portfolio’s management. Our responsibility is to express an opinion on the Portfolio’s financial statements based on our audits. We are a public accounting firm registered with the Public Company Accounting Oversight Board (United States) (“PCAOB”) and are required to be independent with respect to the Portfolio in accordance with the U.S. federal securities laws and the applicable rules and regulations of the Securities and Exchange Commission and the PCAOB.
We conducted our audits of these financial statements in accordance with the standards of the PCAOB. Those standards require that we plan and perform the audit to obtain reasonable assurance about whether the financial statements are free of material misstatement, whether due to error or fraud.
Our audits included performing procedures to assess the risks of material misstatement of the financial statements, whether due to error or fraud, and performing procedures that respond to those risks. Such procedures included examining, on a test basis, evidence regarding the amounts and disclosures in the financial statements. Our audits also included evaluating the accounting principles used and significant estimates made by management, as well as evaluating the overall presentation of the financial statements. Our procedures included confirmation of securities owned as of December 31, 2019 by correspondence with the custodian, transfer agent and brokers; when replies were not received from brokers, we performed other auditing procedures. We believe that our audits provide a reasonable basis for our opinion.
/s/PricewaterhouseCoopers LLP
Philadelphia, Pennsylvania
February 18, 2020
We have served as the auditor of one or more investment companies in The Vanguard Group of Funds since 1975.
Special 2019 tax information (unaudited) for corporate shareholders only for Diversified Value Portfolio, a portfolio of Vanguard Variable Insurance Funds
This information for the fiscal year ended December 31, 2019, is included pursuant to provisions of the Internal Revenue Code for corporate shareholders only.
The portfolio distributed $53,398,000 as capital gain dividends (20% rate gain distributions) to shareholders during the fiscal year.
For corporate shareholders, 78.8% of investment income (dividend income plus short-term gains, if any) qualifies for the dividends-received deduction.
Diversified Value Portfolio
Trustees Approve Advisory Arrangements
Effective November 2019, the board of trustees of Vanguard Variable Insurance Fund Diversified Value Portfolio approved a restructuring of the portfolio’s investment advisory arrangements whereby Hotchkis and Wiley Capital Management, LLC (Hotchkis and Wiley), and Lazard Asset Management LLC (Lazard) have been added as advisors and Barrow, Hanley, Mewhinney & Strauss, LLC, has been removed as an advisor to the portfolio. The board determined that the foregoing actions were in the best interests of the portfolio and its shareholders.
The board based its decision upon an evaluation of each advisor’s investment staff, portfolio management process, and performance. This evaluation included information provided to the board by Vanguard’s Portfolio Review Department, which is responsible for fund and advisor oversight and product management. The Portfolio Review Department will meet regularly with the advisors and make monthly presentations to the board during the fiscal year that direct the board’s focus to relevant information and topics.
The board, or an investment committee made up of board members, will also receive information throughout the year during advisor presentations. For each advisor presentation, the board will be provided with letters and reports that include information about, among other things, the advisory firm and the advisor’s assessment of the investment environment, portfolio performance, and portfolio characteristics.
In addition, the board will receive monthly reports, which include a Market and Economic Report, a Fund Dashboard Monthly Summary, and a Fund Performance Report.
Prior to their meeting to determine whether to renew the advisory arrangements, the trustees will be provided with a memo and materials that summarize the information they receive over the course of the year. They will also consider the factors discussed below, among others. However, no single factor will determine whether the board approves the arrangements. Rather, it will be the totality of the circumstances that drives the board’s decision.
Nature, extent, and quality of services
The board considered the quality of the investment management services to be provided by Hotchkis and Wiley and Lazard and took into account the organizational depth and stability of each advisor. The board considered the following:
Hotchkis and Wiley. Founded in 1980, Hotchkis and Wiley is a value-oriented firm that manages various large-, mid-, and small-cap portfolios. The investment team employs a disciplined, value-oriented investment strategy with a particular focus on long-run, normalized earnings. It has stayed true to this approach, even when it is out of favor. Though Hotchkis and Wiley is normally categorized as a deep-value firm, it also describes its approach as being more adaptable and driven by market opportunity. The portfolio is currently selling at an attractive valuation relative to its benchmark, as the valuation spread has continued to widen, and it consistently sells at a discount to the value benchmark and peers. Hotchkis and Wiley has managed a portion of the portfolio since December 2019.
Lazard.Lazard, a subsidiary of the investment bank Lazard Ltd., provides investment management services for clients around the world in a variety of investment mandates, including international equities, domestic equities, and fixed income securities. The investment team employs its U.S. Equity Select strategy to organize its holdings into compounder and improver categories. These firms have sustainably high returns and free cash flow and the ability to increase capital, cash flow, and competitive advantage over time. Compounders will normally represent 60%–80% of the portfolio. Improvers are companies with significantly improving financial productivity. These companies’ current valuations represent an excessively pessimistic view of future returns and free cash flow. These stocks will typically represent 20%–40% of the portfolio. Lazard has managed a portion of the portfolio since December 2019.
The board concluded that each advisor’s experience, stability, depth, and performance, among other factors, warranted approval of the advisory arrangements.
Investment performance
The board concluded that Hotchkis and Wiley and Lazard, in their management of other Vanguard funds, have track records of consistent performance and disciplined investment processes.
Diversified Value Portfolio
Cost
The board considered the cost of services to be provided and competitive fee rates and concluded that the portfolio’s advisory fee rates and expense ratio under the new advisory arrangements should remain below the advisory fee rates and expense ratios of the portfolio’s peers.
The board did not consider the profitability of Hotchkis and Wiley and Lazard in determining whether to approve the advisory fees, because the firms are independent of Vanguard and the advisory fees are the result of arm’s-length negotiations.
The benefit of economies of scale
The board concluded that the portfolio will realize economies of scale that are built into the advisory fee rates negotiated with Hotchkis and Wiley and Lazard without any need for asset-level breakpoints. The advisory fee rates are very low relative to the average rate paid by funds in the portfolio’s peer group.
The board will consider whether to renew the advisory arrangements after a one-year period.
Equity Income Portfolio
Your Portfolio’s Performance at a Glance
• For the 12 months ended December 31, 2019, the Equity Income Portfolio of Vanguard Variable Insurance Fund returned 24.43%, slightly above the 24.24% return of its benchmark, the FTSE High Dividend Yield Index.
• Stocks and bonds recorded their best results in years. Stocks benefited from accommodative monetary policies implemented by the Federal Reserve and other major central banks. Less-risky assets such as bonds also attracted investors as the U.S.-China trade conflict fueled global economic growth concerns.
• Positive selection in health care, energy, and financials boosted performance, as did an overweight allocation to real estate. The portfolio’s positions in materials and communication services detracted the most from performance.
• Please note that the portfolio returns in Vanguard Variable Insurance Fund are different from those in Vanguard Variable Annuity (and other plans that invest in the fund), which take into account insurance-related expenses.
| Market Barometer | | | |
| | | Average Annual Total Returns |
| | | Periods Ended December 31, 2019 |
| | One Year | Three Years | Five Years |
| Stocks | | | |
| Russell 1000 Index (Large-caps) | 31.43% | 15.05% | 11.48% |
| Russell 2000 Index (Small-caps) | 25.53 | 8.59 | 8.23 |
| Russell 3000 Index (Broad U.S. market) | 31.02 | 14.57 | 11.24 |
| FTSE All-World ex US Index (International) | 21.81 | 9.96 | 5.83 |
| | | | |
| Bonds | | | |
| Bloomberg Barclays U.S. Aggregate Bond Index (Broad taxable market) | 8.72% | 4.03% | 3.05% |
| Bloomberg Barclays Municipal Bond Index (Broad tax-exempt market) | 7.54 | 4.72 | 3.53 |
| FTSE Three-Month U.S. Treasury Bill Index | 2.25 | 1.65 | 1.04 |
| | | | |
| CPI | | | |
| Consumer Price Index | 2.29% | 2.10% | 1.82% |
Equity Income Portfolio
Advisors’ Report
The Equity Income Portfolio returned 24.43% for the 12 months ended December 31, 2019. The performance of the portfolio was slightly higher than the 24.24% return of its benchmark, the FTSE High Dividend Yield Index.
The portfolio is managed by two independent advisors, a strategy that enhances diversification by providing exposure to distinct yet complementary investment approaches. It is not uncommon for different advisors to have different views about individual securities or the broader investment environment.
The advisors, the amount and percentage of the portfolio’s assets each manages, and brief descriptions of their investment strategies are presented in the accompanying table. Each advisor has also provided a discussion of the investment environment that existed during the 12 months and its effect on the portfolio’s positioning. These comments were prepared on January 20, 2020.
Wellington Management Company LLP
Portfolio Manager:
W. Michael Reckmeyer, III, CFA,
Senior Managing Director
The investment environment
U.S. equities, as measured by the Standard & Poor’s 500 Index, posted positive results for the 12 months.
In the first quarter of 2019, U.S. equities rallied to their largest quarterly gain since 2009, buoyed by a dovish shift in Federal Reserve policy and guidance, optimism for a U.S.-China trade deal, relatively strong fourth-quarter 2018 earnings, and corporate stock buybacks. By the summer of 2019, unresolved U.S. trade frictions with China, Mexico, Japan, and the European Union unsettled markets and raised concerns about the potential risks to U.S. economic growth from increasing cost pressures, supply chain disruptions, and waning business confidence and unsettled investment plans.
In an effort to sustain economic expansion and mitigate the risks of moderating growth and trade tensions, the Fed lowered its benchmark interest rate in August and September by a combined 50 basis points. U.S. equities surged in the fourth quarter, as stocks benefited from diminished recession fears, improved trade sentiment, and accommodative Fed policies.
In October, the Fed lowered interest rates for the final time in 2019 by 25 basis points. The outlook for U.S.-China trade relations was volatile but eased in December after news of a “phase one” trade agreement. Also in December, the U.S. House of Representatives voted to impeach President Trump. Markets were unaffected, however, given that the Republican-led Senate appeared unlikely to vote to remove President Trump from office.
Our successes and shortfalls
During the course of 2019, our portion of the portfolio benefited from strong stock selection. In particular, our holdings in health care, energy, and financials contributed most to relative performance. This was partially offset by weaker security selection in the communication services, materials, and utilities sectors. Sector allocation, a result of our bottom-up selection process, detracted from overall results because of our underweight positions in information technology and financials and our overweight position in health care and a small cash position.
Top contributors to relative performance included our out-of-benchmark positions in Bank of America and TC Energy, an overweight to KLA, and our decision not to own benchmark constituent AbbVie. We initiated a new position in UnitedHealth in the first half of the year, which also benefited relative results as the stock posted strong returns.
Individual detractors included Unilever and our decision to eliminate QUALCOMM, which ended the period with strong gains. Not owning AT&T and Target also weighed on relative results as both stocks outperformed.
At the end of 2019, we were most overweighted in the industrials, health care, and real estate sectors. We were most underweighted in the consumer discretionary, consumer staples, and materials sectors.
Our largest new positions during the year included Progressive, UnitedHealth, and Truist Financial. We also added to our positions in Bank of America and Pfizer. We eliminated our stakes in Wells Fargo, DuPont, and Occidental Petroleum. We trimmed our positions in Eli Lilly and Analog Devices.
As always, we remain focused on finding investment opportunities in quality dividend-paying companies with superior total return potential at discounted valuations.
Vanguard Quantitative Equity Group
Portfolio Managers:
James P. Stetler
Binbin Guo, Principal, Head of Alpha Equity Investments
Investment environment
Stocks in the United States surged in 2019, outperforming their international counterparts. The S&P 500 Index returned 31.49%, while the FTSE Global All Cap ex US Index returned 21.80%. The primary catalysts for the strong results were accommodative monetary policy by the U.S. Federal Reserve, corporate earnings, and an easing of geopolitical tensions near the end of the year.
Equity Income Portfolio
The 12 months began with concerns about moderating economic growth, tightening fiscal policy, and geopolitical tensions. However, the market quickly pivoted and produced strong results in the first quarter of 2019 because of more supportive rhetoric from the Fed, the perception of easing tensions between the U.S. and China, and solid corporate earnings. Concerns grew about corporate earnings and geopolitical risks midyear. But the combination of stabilizing economic data, accommodative central banks, and the completion of a U.S.-China “phase one” trade deal boosted equities later.
The Fed ended the fiscal year by reversing course from the previous year and pursuing a pro-market policy. After raising interest rates by 25 basis points in December 2018, the Fed cut them three times by a combined 75 basis points over the course of 2019. The signing of the U.S.-China trade deal provided more certainty and helped produce a more supportive environment. Corporate earnings for the 12 months remained resilient, if not spectacular.
The broad fixed income markets generated positive returns, primarily because of stronger-than-expected growth, tame inflation, and continued central bank monetary support. Against this backdrop, U.S. Treasury yields fell and the Bloomberg Barclays U.S. Aggregate Float Adjusted Index returned 8.87% for the year. Sovereign yields also declined in most markets following the injection of monetary stimulus by the Fed and the European Central Bank. The Bloomberg Barclays Global Aggregate ex-USD Float Adjusted RIC Capped Index Hedged returned 8.06%.
Investment strategy
While it’s important to understand how overall performance is affected by the macroeconomic factors described above, our approach to investing focuses on specific fundamentals, not technical analysis of stock price movements.
We use a strict quantitative approach to evaluate a stock’s attractiveness based on five characteristics: high quality—healthy balance sheets and steady cash-flow generation; management decisions—sound investment policies that favor internal over external funding; consistent earnings growth—the ability to grow earnings year after year; strong market sentiment—market confirmation of our view; and reasonable valuation—we strive to avoid overpriced stocks.
The interaction of these characteristics generates an expected return that seeks to capitalize on investor biases. We then construct our portfolio with the goal of maximizing these expected returns and minimizing exposure to risks that our research indicates do not improve returns, such as industry selection and other risks relative to our benchmark.
Portfolio update
Against this fiscal year’s unusual backdrop, our management decisions, quality, and growth models detracted, while our sentiment and valuation models aided relative performance. In the case of valuation, results were helped by the fact that our portfolio had negative exposure to this model.
Results lagged the benchmark in all 11 industry sectors. Consumer discretionary, energy, and industrials detracted the most from relative performance. At the individual stock level, the greatest shortfalls came from overweighting ADTRAN, Tailored Brands, National Presto Industries, General Electric, and Unum Group. The strongest results came from overweights to Cypress Semiconductor and Kraft Heinz. Underweights to Pfizer, 3M, and Carnival also helped results.
We continue to believe that constructing a portfolio focused on fundamentals will benefit investors over the long term, although we recognize that the market can reward or punish us in the near term. We believe our portfolio offers a strong mix of stocks with attractive growth, sentiment, and value characteristics.
| Equity Income Portfolio Investment Advisors | | |
| | | | | | |
| | Portfolio Assets Managed | | |
| Investment Advisor | % | | $ Million | | Investment Strategy |
| Wellington Management Company LLP | 62 | | 1,152 | | Employs a fundamental approach to identify desirable individual stocks, seeking those that typically offer above-average dividend yields, below-average valuations, and the potential for dividend increases in the future. |
| Vanguard Quantitative Equity Group | 34 | | 616 | | Employs a quantitative approach that focuses on fundamental factors, using models that assess valuation, growth prospects, management decisions, market sentiment, and earnings and balance-sheet quality of companies as compared with their peers. |
| Cash Investments | 4 | | 66 | | These short-term reserves are invested by Vanguard in equity index products to simulate investment in stocks. Each advisor may also maintain a modest cash position. |
Equity Income Portfolio
About Your Portfolio’s Expenses
As a shareholder of the portfolio, you incur ongoing costs, which include costs for portfolio management, administrative services, and shareholder reports (like this one), among others. Operating expenses, which are deducted from a portfolio’s gross income, directly reduce the investment return of the portfolio.
A portfolio’s expenses are expressed as a percentage of its average net assets. This figure is known as the expense ratio. The following examples are intended to help you understand the ongoing costs (in dollars) of investing in your portfolio and to compare these costs with those of other mutual funds. The examples are based on an investment of $1,000 made at the beginning of the period shown and held for the entire period.
The table below illustrates your portfolio’s costs in two ways:
• Based on actual portfolio return. This section helps you to estimate the actual expenses that you paid over the period. The “Ending Account Value” shown is derived from the portfolio’s actual return, and the third column shows the dollar amount that would have been paid by an investor who started with $1,000 in the portfolio. You may use the information here, together with the amount you invested, to estimate the expenses that you paid over the period.
To do so, simply divide your account value by $1,000 (for example, an $8,600 account value divided by $1,000 = 8.6), then multiply the result by the number given for your portfolio under the heading “Expenses Paid During Period.”
• Based on hypothetical 5% yearly return. This section is intended to help you compare your portfolio’s costs with those of other mutual funds. It assumes that the portfolio had a yearly return of 5% before expenses, but that the expense ratio is unchanged. In this case—because the return used is not the portfolio’s actual return—the results do not apply to your investment. The example is useful in making comparisons because the Securities and Exchange Commission requires all mutual funds to calculate expenses based on a 5% return. You can assess your portfolio’s costs by comparing this hypothetical example with the hypothetical examples that appear in shareholder reports of other funds.
Note that the expenses shown in the table are meant to highlight and help you compareongoingcosts only and do not reflect transaction costs incurred by the portfolio for buying and selling securities. The portfolio’s expense ratio does not reflect additional fees and expenses associated with the annuity or life insurance program through which you invest.
The calculations assume no shares were bought or sold during the period. Your actual costs may have been higher or lower, depending on the amount of your investment and the timing of any purchases or redemptions.
You can find more information about the portfolio’s expenses in the Financial Statements section. For additional information on operating expenses and other shareholder costs, please refer to the prospectus.
| Six Months Ended December 31, 2019 | | | |
| | Beginning | Ending | Expenses |
| | Account Value | Account Value | Paid During |
| Equity Income Portfolio | 6/30/2019 | 12/31/2019 | Period |
| Based on Actual Portfolio Return | $1,000.00 | $1,088.74 | $1.58 |
| Based on Hypothetical 5% Yearly Return | 1,000.00 | 1,023.69 | 1.53 |
The calculations are based on expenses incurred in the most recent six-month period. The portfolio’s annualized six-month expense ratio for that period is 0.30%. The dollar amounts shown as “Expenses Paid” are equal to the annualized expense ratio multiplied by the average account value over the period, multiplied by the number of days in the most recent six-month period, then divided by the number of days in the most recent 12-month period (184/365).
Equity Income Portfolio
Performance Summary
All of the returns in this report represent past performance, which is not a guarantee of future results that may be achieved by the portfolio. (Current performance may be lower or higher than the performance data cited. For performance data current to the most recent month-end, visit our website at vanguard.com/performance.) Note, too, that both investment returns and principal value can fluctuate widely, so an investor’s shares, when sold, could be worth more or less than their original cost. The returns shown do not reflect taxes that a shareholder would pay on portfolio distributions or on the sale of portfolio shares. Nor do the returns reflect fees and expenses associated with the annuity or life insurance program through which a shareholder invests. If these fees and expenses were included, the portfolio’s returns would be lower.
Cumulative Performance: December 31, 2009–December 31, 2019
Initial Investment of $10,000
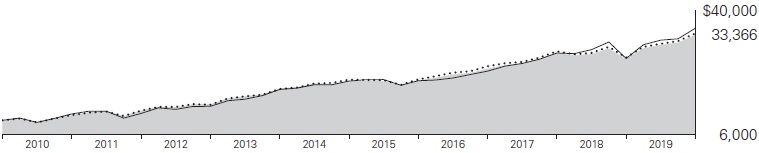

| | | | Average Annual Total Returns | Final Value |
| | | Periods Ended December 31, 2019 | of a $10,000 |
| | | One Year | Five Years | Ten Years | Investment |
 | Equity Income Portfolio | 24.43% | 9.93% | 12.81% | $33,366 |
 | FTSE High Dividend Yield Index | 24.24 | 9.86 | 12.95 | 33,796 |
 | Dow Jones U.S. Total Stock Market Float Adjusted Index | 30.90 | 11.18 | 13.43 | 35,251 |
See Financial Highlights for dividend and capital gains information.
Equity Income Portfolio
Sector Diversification
As of December 31, 2019
| Communication Services | 6.7% |
| Consumer Discretionary | 4.5 |
| Consumer Staples | 12.2 |
| Energy | 7.8 |
| Financials | 18.6 |
| Health Care | 17.0 |
| Industrials | 10.1 |
| Information Technology | 11.1 |
| Materials | 2.8 |
| Real Estate | 1.5 |
| Utilities | 7.7 |
| The table reflects the portfolio’s equity exposure, based on its investments in stocks and stock index futures. Any holdings in short-term reserves are excluded. Sector categories are based on the Global Industry Classification Standard (“GICS”), except for the “Other” category (if applicable), which includes securities that have not been provided a GICS classification as of the effective reporting period. |
The Global Industry Classification Standard (“GICS”) was developed by and is the exclusive property and a service mark of MSCI Inc. (“MSCI”) and Standard and Poor’s, a division of McGraw-Hill Companies, Inc. (“S&P”), and is licensed for use by Vanguard. Neither MSCI, S&P nor any third party involved in making or compiling the GICS or any GICS classification makes any express or implied warranties or representations with respect to such standard or classification (or the results to be obtained by the use thereof), and all such parties hereby expressly disclaim all warranties of originality, accuracy, completeness, merchantability or fitness for a particular purpose with respect to any such standard or classification. Without limiting any of the foregoing, in no event shall MSCI, S&P, any of its affiliates or any third party involved in making or compiling the GICS or any GICS classification have any liability for any direct, indirect, special, punitive, consequential or any other damages (including lost profits) even if notified of the possibility of such damages.
Equity Income Portfolio
Financial Statements
Statement of Net Assets
As of December 31, 2019
The portfolio files its complete schedule of portfolio holdings with the Securities and Exchange Commission (SEC) for the first and third quarters of each fiscal year as an exhibit to its reports on Form N-PORT. The portfolio’s Form N-PORT reports are available on the SEC’s website at www.sec.gov.
| | | | Market |
| | | | Value• |
| | | Shares | ($000) |
| Common Stocks (95.6%)1 |
| Communication Services (6.1%) | |
| | Verizon Communications Inc. | 803,612 | 49,342 |
| | Comcast Corp. Class A | 782,221 | 35,177 |
| | AT&T Inc. | 318,854 | 12,461 |
| | BCE Inc. | 124,290 | 5,758 |
| | CenturyLink Inc. | 274,506 | 3,626 |
| | Omnicom Group Inc. | 24,505 | 1,985 |
| | Meredith Corp. | 45,001 | 1,461 |
| | TEGNA Inc. | 52,407 | 875 |
| | Cogent Communications Holdings Inc. | 9,007 | 593 |
| | National CineMedia Inc. | 63,140 | 460 |
| | | | 111,738 |
| Consumer Discretionary (3.9%) | |
| | Home Depot Inc. | 85,502 | 18,672 |
| | McDonald’s Corp. | 49,702 | 9,822 |
| | Lowe’s Cos. Inc. | 69,339 | 8,304 |
| | Target Corp. | 54,357 | 6,969 |
| | Cie Generale des Etablissements Michelin SCA | 42,377 | 5,215 |
| | Carnival Corp. | 88,049 | 4,476 |
| | Whirlpool Corp. | 24,493 | 3,613 |
| | General Motors Co. | 92,281 | 3,377 |
| | International Game Technology plc | 223,427 | 3,345 |
| | Autoliv Inc. | 39,045 | 3,296 |
| | Big Lots Inc. | 39,718 | 1,141 |
| | Dine Brands Global Inc. | 11,701 | 977 |
| | Kontoor Brands Inc. | 18,583 | 780 |
| | Newell Brands Inc. | 39,110 | 752 |
| | Best Buy Co. Inc. | 5,524 | 485 |
| | H&R Block Inc. | 16,242 | 381 |
| | Ethan Allen Interiors Inc. | 14,470 | 276 |
| | | | 71,881 |
| Consumer Staples (12.1%) | | |
| | Philip Morris International Inc. | 383,013 | 32,590 |
| | Coca-Cola Co. | 547,960 | 30,329 |
| | Procter & Gamble Co. | 240,770 | 30,072 |
| | PepsiCo Inc. | 151,855 | 20,754 |
| | Unilever NV | 310,236 | 17,826 |
| | Walmart Inc. | 127,103 | 15,105 |
| | Sysco Corp. | 156,768 | 13,410 |
| | Archer-Daniels-Midland Co. | 271,728 | 12,595 |
| | Mondelez International Inc. Class A | 223,274 | 12,298 |
| | Nestle SA | 87,873 | 9,514 |
| | Kimberly-Clark Corp. | 40,918 | 5,628 |
| | Kraft Heinz Co. | 130,059 | 4,179 |
| | Bunge Ltd. | 63,233 | 3,639 |
| | Coca-Cola European Partners plc | 69,714 | 3,547 |
| | Campbell Soup Co. | 68,933 | 3,407 |
| | Coty Inc. Class A | 277,896 | 3,126 |
| | Altria Group Inc. | 38,319 | 1,912 |
| ^ | B&G Foods Inc. | 33,476 | 600 |
| | Spectrum Brands Holdings Inc. | 7,790 | 501 |
| | SpartanNash Co. | 16,062 | 229 |
| | Colgate-Palmolive Co. | 2,159 | 149 |
| | | | 221,410 |
| Energy (7.7%) | | |
| | Chevron Corp. | 309,920 | 37,348 |
| | Exxon Mobil Corp. | 480,409 | 33,523 |
| | Suncor Energy Inc. | 674,745 | 22,132 |
| ^ | TC Energy Corp. (XTSE) | 271,381 | 14,454 |
| | Phillips 66 | 93,145 | 10,377 |
| | Kinder Morgan Inc. | 463,755 | 9,818 |
| | CVR Energy Inc. | 78,214 | 3,162 |
| | Murphy Oil Corp. | 98,514 | 2,640 |
| | ConocoPhillips | 38,497 | 2,503 |
| | Delek US Holdings Inc. | 70,562 | 2,366 |
| | Helmerich & Payne Inc. | 32,114 | 1,459 |
| | Valero Energy Corp. | 10,011 | 938 |
| | Schlumberger Ltd. | 13,007 | 523 |
| | | | 141,243 |
| Financials (18.3%) | | |
| | JPMorgan Chase & Co. | 529,572 | 73,822 |
| | Bank of America Corp. | 1,130,841 | 39,828 |
| | MetLife Inc. | 455,084 | 23,196 |
| | PNC Financial Services Group Inc. | 110,185 | 17,589 |
| | Progressive Corp. | 241,198 | 17,460 |
| | Truist Financial Corp. | 270,712 | 15,246 |
| | Citigroup Inc. | 167,536 | 13,384 |
| | Chubb Ltd. | 68,728 | 10,698 |
| | Marsh & McLennan Cos. Inc. | 95,758 | 10,668 |
| | Wells Fargo & Co. | 193,952 | 10,435 |
| | M&T Bank Corp. | 56,105 | 9,524 |
| | American International Group Inc. | 151,629 | 7,783 |
| | US Bancorp | 129,193 | 7,660 |
| | BlackRock Inc. | 15,195 | 7,639 |
| | Travelers Cos. Inc. | 53,614 | 7,342 |
| | Principal Financial Group Inc. | 90,334 | 4,968 |
| | Morgan Stanley | 97,054 | 4,961 |
| | Aflac Inc. | 92,344 | 4,885 |
| | Regions Financial Corp. | 252,659 | 4,336 |
| | Fifth Third Bancorp | 139,942 | 4,302 |
| | Synchrony Financial | 114,325 | 4,117 |
| | Prudential Financial Inc. | 42,949 | 4,026 |
| | AXA Equitable Holdings Inc. | 145,399 | 3,603 |
| | Unum Group | 116,259 | 3,390 |
| | FNB Corp. | 265,801 | 3,376 |
| | Popular Inc. | 56,829 | 3,339 |
| | Navient Corp. | 234,038 | 3,202 |
| | First American Financial Corp. | 53,643 | 3,128 |
| | Ameriprise Financial Inc. | 18,451 | 3,074 |
| | PacWest Bancorp | 78,942 | 3,021 |
| | Columbia Banking System Inc. | 31,667 | 1,288 |
| | Bank of NT Butterfield & Son Ltd. | 29,710 | 1,100 |
| | OneMain Holdings Inc. | 19,494 | 822 |
| | CME Group Inc. | 4,056 | 814 |
| | Great Western Bancorp Inc. | 20,606 | 716 |
| | Citizens Financial Group Inc. | 11,841 | 481 |
| | | | 335,223 |
| Health Care (16.5%) | | |
| | Johnson & Johnson | 366,099 | 53,403 |
| | Pfizer Inc. | 1,075,098 | 42,122 |
| | Merck & Co. Inc. | 408,367 | 37,141 |
| | Eli Lilly & Co. | 194,802 | 25,603 |
| | UnitedHealth Group Inc. | 59,671 | 17,542 |
| | Bristol-Myers Squibb Co. | 266,217 | 17,088 |
| | Medtronic plc | 149,080 | 16,913 |
| | Koninklijke Philips NV | 317,922 | 15,541 |
| | Roche Holding AG | 45,358 | 14,741 |
| | CVS Health Corp. | 190,002 | 14,115 |
| | Novartis AG | 138,100 | 13,077 |
| | AstraZeneca plc ADR | 240,366 | 11,985 |
| | AbbVie Inc. | 117,792 | 10,429 |
| | Gilead Sciences Inc. | 85,856 | 5,579 |
| | Amgen Inc. | 19,150 | 4,617 |
| | Cardinal Health Inc. | 54,295 | 2,746 |
| | Patterson Cos. Inc. | 47,057 | 964 |
| | | | 303,606 |
| Industrials (9.7%) | | |
| | Lockheed Martin Corp. | 67,128 | 26,138 |
| | Deere & Co. | 106,429 | 18,440 |
| | Union Pacific Corp. | 90,397 | 16,343 |
| | Eaton Corp. plc | 162,798 | 15,420 |
| | Caterpillar Inc. | 101,876 | 15,045 |
| | Ingersoll-Rand plc | 82,173 | 10,922 |
| | United Technologies Corp. | 70,792 | 10,602 |
| | Honeywell International Inc. | 59,845 | 10,593 |
| | Raytheon Co. | 37,673 | 8,278 |
| | BAE Systems plc | 1,021,533 | 7,649 |
| | 3M Co. | 39,047 | 6,889 |
| | PACCAR Inc. | 57,642 | 4,559 |
| | General Electric Co. | 302,780 | 3,379 |
| | Nielsen Holdings plc | 149,792 | 3,041 |
| | Copa Holdings SA Class A | 25,892 | 2,798 |
| | Hubbell Inc. Class B | 17,649 | 2,609 |
| | Triton International Ltd. | 64,643 | 2,599 |
| | H&E Equipment Services Inc. | 69,180 | 2,313 |
| | CH Robinson Worldwide Inc. | 23,064 | 1,804 |
| | Cummins Inc. | 9,493 | 1,699 |
| | Johnson Controls International plc | 36,440 | 1,483 |
| | United Parcel Service Inc. Class B | 12,297 | 1,440 |
| | Macquarie Infrastructure Corp. | 24,875 | 1,066 |
| | KAR Auction Services Inc. | 39,945 | 870 |
| | Emerson Electric Co. | 9,108 | 695 |
| | Mobile Mini Inc. | 17,816 | 675 |
| | McGrath RentCorp | 5,989 | 458 |
| | Illinois Tool Works Inc. | 1,678 | 301 |
| | | | 178,108 |
Equity Income Portfolio
| | | | Market |
| | | | Value• |
| | | Shares | ($000) |
| Information Technology (9.7%) | |
| | Cisco Systems Inc. | 818,958 | 39,277 |
| | Intel Corp. | 645,513 | 38,634 |
| | Analog Devices Inc. | 111,038 | 13,196 |
| | Corning Inc. | 400,662 | 11,663 |
| | TE Connectivity Ltd. | 119,584 | 11,461 |
| | KLA Corp. | 60,827 | 10,838 |
| | Texas Instruments Inc. | 77,352 | 9,923 |
| | International Business Machines Corp. | 48,272 | 6,470 |
| | Broadcom Inc. | 20,020 | 6,327 |
| | HP Inc. | 244,431 | 5,023 |
| | QUALCOMM Inc. | 53,210 | 4,695 |
| | Maxim Integrated Products Inc. | 67,296 | 4,139 |
| | Seagate Technology plc | 65,462 | 3,895 |
| | ManTech International Corp. Class A | 38,260 | 3,056 |
| | Xperi Corp. | 148,482 | 2,747 |
| | Western Digital Corp. | 31,683 | 2,011 |
| | ADTRAN Inc. | 187,358 | 1,853 |
| | Western Union Co. | 61,911 | 1,658 |
| | Automatic Data Processing Inc. | 7,074 | 1,206 |
| | | | 178,072 |
| Materials (2.6%) | | |
| | Celanese Corp. Class A | 96,211 | 11,846 |
| | Dow Inc. | 205,342 | 11,238 |
| | Corteva Inc. | 137,363 | 4,060 |
| | Nutrien Ltd. | 79,046 | 3,787 |
| | Reliance Steel & Aluminum Co. | 30,625 | 3,668 |
| | CF Industries Holdings Inc. | 67,885 | 3,241 |
| | Scotts Miracle-Gro Co. | 29,404 | 3,122 |
| | Linde plc | 14,401 | 3,066 |
| | DuPont de Nemours Inc. | 30,298 | 1,945 |
| | International Paper Co. | 21,428 | 987 |
| | Air Products & Chemicals Inc. | 3,554 | 835 |
| | Trinseo SA | 14,213 | 529 |
| | | | 48,324 |
| Real Estate (1.3%) | | |
| | Crown Castle International Corp. | 161,878 | 23,011 |
| | Kennedy-Wilson Holdings Inc. | 37,927 | 846 |
| | | | 23,857 |
| Utilities (7.7%) | | |
| | Sempra Energy | 132,847 | 20,124 |
| | Dominion Energy Inc. | 201,912 | 16,722 |
| | American Electric Power Co. Inc. | 150,792 | 14,251 |
| | NextEra Energy Inc. | 56,733 | 13,738 |
| | Eversource Energy | 133,966 | 11,397 |
| | Exelon Corp. | 244,476 | 11,146 |
| | Duke Energy Corp. | 105,245 | 9,599 |
| | UGI Corp. | 195,840 | 8,844 |
| | Southern Co. | 108,217 | 6,893 |
| | FirstEnergy Corp. | 92,547 | 4,498 |
| | Entergy Corp. | 36,195 | 4,336 |
| | AES Corp. | 211,341 | 4,206 |
| | Evergy Inc. | 60,975 | 3,969 |
| | Clearway Energy Inc. | 122,290 | 2,440 |
| | Hawaiian Electric Industries Inc. | 50,074 | 2,347 |
| | PPL Corp. | 49,342 | 1,770 |
| | Portland General Electric Co. | 25,408 | 1,418 |
| | PNM Resources Inc. | 20,714 | 1,050 |
| | Ameren Corp. | 12,302 | 945 |
| | Clearway Energy Inc. Class A | 36,675 | 701 |
| | Atlantica Yield plc | 12,296 | 325 |
| | IDACORP Inc. | 2,840 | 303 |
| | | | 141,022 |
Total Common Stocks
(Cost $1,423,685) | | 1,754,484 |
| Temporary Cash Investments (5.2%)1 | |
| Money Market Fund (4.4%) | | |
| 2,3 | Vanguard Market | | |
| | Liquidity Fund, 1.816% | 805,449 | 80,553 |
| | | | |
| | | Face | |
| | | Amount | |
| | | ($000) | |
| Repurchase Agreement (0.6%) | | |
| | BNP Paribas Securities Corp. 1.570%, 1/2/20 (Dated 12/31/19, Repurchase Value $11,401,000, collateralized by Federal National Mortgage Assn. 3.000%–4.493%, 9/1/34–10/1/49, Government National Mortgage Assn. 3.250%–4.000%, 2/20/44–12/20/47, U.S. Treasury Bill 0%, 1/16/20–2/27/20, and U.S. Treasury Note/Bond 1.125%–2.625%, 8/15/20–9/30/21 with a value of $11,628,000) | 11,400 | 11,400 |
| U.S. Government and Agency Obligations (0.2%) |
| 4 | United States Treasury Bill, 1.641%, 1/9/20 | 300 | 300 |
| 4 | United States Treasury Bill, 1.513%, 1/30/20 | 100 | 100 |
| 4 | United States Treasury Bill, 1.531%, 2/13/20 | 100 | 100 |
| 4 | United States Treasury Bill, 1.546%, 3/26/20 | 1,100 | 1,096 |
| 4 | United States Treasury Bill, 1.527%–1.541%, 4/30/20 | 1,300 | 1,293 |
| | | | 2,889 |
Total Temporary Cash Investments
(Cost $94,844) | | 94,842 |
Total Investments (100.8%)
(Cost $1,518,529) | | 1,849,326 |
| | | |
| | Amount |
| | ($000) |
| Other Assets and Liabilities (-0.8%) | |
| Other Assets | |
| Investment in Vanguard | 79 |
| Receivables for Investment Securities Sold | 219 |
| Receivables for Accrued Income | 2,660 |
| Receivables for Capital Shares Issued | 431 |
| Variation Margin Receivable—Futures Contracts | 172 |
| Other Assets4 | 57 |
| Total Other Assets | 3,618 |
| Liabilities | |
| Payables for Investment Securities Purchased | (757) |
| Collateral for Securities on Loan | (15,009) |
| Payables to Investment Advisor | (309) |
| Payables for Capital Shares Redeemed | (1,828) |
| Payables to Vanguard | (835) |
| Variation Margin Payable—Futures Contracts | (4) |
| Total Liabilities | (18,742) |
| Net Assets (100%) | |
| Applicable to 75,884,812 outstanding $.001 par value shares of beneficial interest (unlimited authorization) | 1,834,202 |
| Net Asset Value Per Share | $24.17 |
| | |
| At December 31, 2019, net assets consisted of: |
| | Amount |
| | ($000) |
| Paid-in Capital | 1,402,276 |
| Total Distributable Earnings (Loss) | 431,926 |
| Net Assets | 1,834,202 |
| • | See Note A in Notes to Financial Statements. |
| ^ | Includes partial security positions on loan to broker-dealers. The total value of securities on loan is $14,300,000. |
| 1 | The portfolio invests a portion of its cash reserves in equity markets through the use of index futures contracts. After giving effect to futures investments, the portfolio’s effective common stock and temporary cash investment positions represent 99.3% and 1.5%, respectively, of net assets. |
| 2 | Affiliated money market fund available only to Vanguard funds and certain trusts and accounts managed by Vanguard. Rate shown is the 7-day yield. |
| 3 | Collateral of $15,009,000 was received for securities on loan. |
| 4 | Securities with a value of $2,790,000 and cash of $9,000 have been segregated as initial margin for open futures contracts.
ADR—American Depositary Receipt. |
Equity Income Portfolio
| Derivative Financial Instruments Outstanding as of Period End | | | |
| | | | |
| Futures Contracts | | | | |
| | | | | ($000) |
| | | | | Value and |
| | | Number of | | Unrealized |
| | | Long (Short) | Notional | Appreciation |
| | Expiration | Contracts | Amount | (Depreciation) |
| Long Futures Contracts | | | | |
| E-mini S&P 500 Index | March 2020 | 419 | 67,692 | 1,013 |
See accompanying Notes, which are an integral part of the Financial Statements.
Equity Income Portfolio
Statement of Operations
| | | Year Ended | |
| | | December 31, 2019 | |
| | | ($000 | ) |
| Investment Income | | | |
| Income | | | |
| Dividends1 | | 47,576 | |
| Interest2 | | 1,796 | |
| Securities Lending—Net | | 137 | |
| Total Income | | 49,509 | |
| Expenses | | | |
| Investment Advisory Fees—Note B | | | |
| Basic Fee | | 1,503 | |
| Performance Adjustment | | 96 | |
| The Vanguard Group—Note C | | | |
| Management and Administrative | | 2,974 | |
| Marketing and Distribution | | 184 | |
| Custodian Fees | | 25 | |
| Auditing Fees | | 34 | |
| Shareholders’ Reports | | 17 | |
| Trustees’ Fees and Expenses | | 2 | |
| Total Expenses | | 4,835 | |
| Net Investment Income | | 44,674 | |
| Realized Net Gain (Loss) | | | |
| Investment Securities Sold2 | | 44,178 | |
| Futures Contracts | | 12,971 | |
| Foreign Currencies | | 5 | |
| Realized Net Gain (Loss) | | 57,154 | |
| Change in Unrealized Appreciation (Depreciation) | | | |
| Investment Securities2 | | 244,753 | |
| Futures Contracts | | 2,635 | |
| Foreign Currencies | | 10 | |
| Change in Unrealized Appreciation (Depreciation) | | 247,398 | |
| Net Increase (Decrease) in Net Assets Resulting from Operations | | 349,226 | |
| 1 | Dividends are net of foreign withholding taxes of $554,000. |
| 2 | Interest income, realized net gain (loss), and change in unrealized appreciation (depreciation) from an affiliated company of the portfolio were $1,237,000, $7,000, and $3,000, respectively. Purchases and sales are for temporary cash investment purposes. |
Statement of Changes in Net Assets
| | | Year Ended December 31, |
| | | 2019 | | | 2018 | |
| | | ($000 | ) | | ($000 | ) |
| Increase (Decrease) in Net Assets | | | | | | |
| Operations | | | | | | |
| Net Investment Income | | 44,674 | | | 38,158 | |
| Realized Net Gain (Loss) | | 57,154 | | | 96,730 | |
| Change in Unrealized Appreciation (Depreciation) | | 247,398 | | | (221,746 | ) |
| Net Increase (Decrease) in Net Assets Resulting from Operations | | 349,226 | | | (86,858 | ) |
| Distributions | | | | | | |
| Net Investment Income | | (39,417 | ) | | (31,643 | ) |
| Realized Capital Gain1 | | (95,726 | ) | | (83,467 | ) |
| Total Distributions | | (135,143 | ) | | (115,110 | ) |
| Capital Share Transactions | | | | | | |
| Issued | | 355,641 | | | 314,593 | |
| Issued in Lieu of Cash Distributions | | 135,143 | | | 115,110 | |
| Redeemed | | (244,176 | ) | | (226,263 | ) |
| Net Increase (Decrease) from Capital Share Transactions | | 246,608 | | | 203,440 | |
| Total Increase (Decrease) | | 460,691 | | | 1,472 | |
| Net Assets | | | | | | |
| Beginning of Period | | 1,373,511 | | | 1,372,039 | |
| End of Period | | 1,834,202 | | | 1,373,511 | |
| 1 | Includes fiscal 2019 and 2018 short-term gain distributions totaling $4,045,000 and $10,108,000, respectively. Short-term gain distributions are treated as ordinary income dividends for tax purposes. |
See accompanying Notes, which are an integral part of the Financial Statements.
Equity Income Portfolio
Financial Highlights
| For a Share Outstanding | | Year Ended December 31, |
| Throughout Each Period | | 2019 | | | 2018 | | | 2017 | | | 2016 | | | 2015 | |
| Net Asset Value, Beginning of Period | | $21.24 | | | $24.64 | | | $22.10 | | | $21.22 | | | $23.04 | |
| Investment Operations | | | | | | | | | | | | | | | |
| Net Investment Income | | .619 | 1 | | .620 | 1 | | .582 | 1 | | .568 | | | .597 | |
| Net Realized and Unrealized Gain (Loss) on Investments | | 4.319 | | | (1.977 | ) | | 3.275 | | | 2.361 | | | (.437 | ) |
| Total from Investment Operations | | 4.938 | | | (1.357 | ) | | 3.857 | | | 2.929 | | | .160 | |
| Distributions | | | | | | | | | | | | | | | |
| Dividends from Net Investment Income | | (.586 | ) | | (.562 | ) | | (.583 | ) | | (.583 | ) | | (.596 | ) |
| Distributions from Realized Capital Gains | | (1.422 | ) | | (1.481 | ) | | (.734 | ) | | (1.466 | ) | | (1.384 | ) |
| Total Distributions | | (2.008 | ) | | (2.043 | ) | | (1.317 | ) | | (2.049 | ) | | (1.980 | ) |
| Net Asset Value, End of Period | | $24.17 | | | $21.24 | | | $24.64 | | | $22.10 | | | $21.22 | |
| | | | | | | | | | | | | | | | |
| Total Return | | 24.43% | | | -5.96% | | | 18.25% | | | 15.07% | | | 0.85% | |
| | | | | | | | | | | | | | | | |
| Ratios/Supplemental Data | | | | | | | | | | | | | | | |
| Net Assets, End of Period (Millions) | | $1,834 | | | $1,374 | | | $1,372 | | | $1,172 | | | $940 | |
| Ratio of Total Expenses to Average Net Assets2 | | 0.30% | | | 0.29% | | | 0.31% | | | 0.30% | | | 0.31% | |
| Ratio of Net Investment Income to Average Net Assets | | 2.76% | | | 2.69% | | | 2.56% | | | 2.89% | | | 2.76% | |
| Portfolio Turnover Rate | | 33% | | | 36% | | | 38% | | | 32% | | | 36% | |
| 1 | Calculated based on average shares outstanding. |
| 2 | Includes performance-based investment advisory fee increases (decreases) of 0.01%, (0.00%), (0.00%), (0.01%), and (0.01%). |
See accompanying Notes, which are an integral part of the Financial Statements.
Equity Income Portfolio
Notes to Financial Statements
The Equity Income Portfolio, a portfolio of Vanguard Variable Insurance Funds, is registered under the Investment Company Act of 1940 as an open-end investment company. The portfolio’s shares are only available for purchase by separate accounts of insurance companies as investments for variable annuity plans, variable life insurance contracts, or other variable benefit insurance contracts.
A. The following significant accounting policies conform to generally accepted accounting principles for U.S. investment companies. The portfolio consistently follows such policies in preparing its financial statements.
1. Security Valuation: Securities are valued as of the close of trading on the New York Stock Exchange (generally 4 p.m., Eastern time) on the valuation date. Equity securities are valued at the latest quoted sales prices or official closing prices taken from the primary market in which each security trades; such securities not traded on the valuation date are valued at the mean of the latest quoted bid and asked prices. Securities for which market quotations are not readily available, or whose values have been affected by events occurring before the portfolio’s pricing time but after the close of the securities’ primary markets, are valued at their fair values calculated according to procedures adopted by the board of trustees. These procedures include obtaining quotations from an independent pricing service, monitoring news to identify significant market- or security-specific events, and evaluating changes in the values of foreign market proxies (for example, ADRs, futures contracts, or exchange-traded funds), between the time the foreign markets close and the portfolio’s pricing time. When fair-value pricing is employed, the prices of securities used by a portfolio to calculate its net asset value may differ from quoted or published prices for the same securities. Investments in Vanguard Market Liquidity Fund are valued at that fund’s net asset value. Temporary cash investments are valued using the latest bid prices or using valuations based on a matrix system (which considers such factors as security prices, yields, maturities, and ratings), both as furnished by independent pricing services.
2. Foreign Currency: Securities and other assets and liabilities denominated in foreign currencies are translated into U.S. dollars using exchange rates obtained from an independent third party as of the portfolio’s pricing time on the valuation date. Realized gains (losses) and unrealized appreciation (depreciation) on investment securities include the effects of changes in exchange rates since the securities were purchased, combined with the effects of changes in security prices. Fluctuations in the value of other assets and liabilities resulting from changes in exchange rates are recorded as unrealized foreign currency gains (losses) until the assets or liabilities are settled in cash, at which time they are recorded as realized foreign currency gains (losses).
3. Futures Contracts: The portfolio uses index futures contracts to a limited extent, with the objective of maintaining full exposure to the stock market while maintaining liquidity. The portfolio may purchase or sell futures contracts to achieve a desired level of investment, whether to accommodate portfolio turnover or cash flows from capital share transactions. The primary risks associated with the use of futures contracts are imperfect correlation between changes in market values of stocks held by the portfolio and the prices of futures contracts, and the possibility of an illiquid market. Counterparty risk involving futures is mitigated because a regulated clearinghouse is the counterparty instead of the clearing broker. To further mitigate counterparty risk, the portfolio trades futures contracts on an exchange, monitors the financial strength of its clearing brokers and clearinghouse, and has entered into clearing agreements with its clearing brokers. The clearinghouse imposes initial margin requirements to secure the portfolio’s performance and requires daily settlement of variation margin representing changes in the market value of each contract. Any assets pledged as initial margin for open contracts are noted in the Statement of Net Assets.
Futures contracts are valued at their quoted daily settlement prices. The notional amounts of the contracts are not recorded in the Statement of Net Assets. Fluctuations in the value of the contracts are recorded in the Statement of Net Assets as an asset (liability) and in the Statement of Operations as unrealized appreciation (depreciation) until the contracts are closed, when they are recorded as realized futures gains (losses).
During the year ended December 31, 2019, the portfolio’s average investments in long and short futures contracts represented 4% and 0% of net assets, respectively, based on the average of the notional amounts at each quarter-end during the period.
4. Repurchase Agreements: The portfolio enters into repurchase agreements with institutional counterparties. Securities pledged as collateral to the portfolio under repurchase agreements are held by a custodian bank until the agreements mature, and in the absence of a default, such collateral cannot be repledged, resold, or rehypothecated. Each agreement requires that the market value of
Equity Income Portfolio
the collateral be sufficient to cover payments of interest and principal. The portfolio further mitigates its counterparty risk by entering into repurchase agreements only with a diverse group of prequalified counterparties, monitoring their financial strength, and entering into master repurchase agreements with its counterparties. The master repurchase agreements provide that, in the event of a counterparty’s default (including bankruptcy), the portfolio may terminate any repurchase agreements with that counterparty, determine the net amount owed, and sell or retain the collateral up to the net amount owed to the portfolio. Such action may be subject to legal proceedings, which may delay or limit the disposition of collateral.
5. Federal Income Taxes: The portfolio intends to continue to qualify as a regulated investment company and distribute all of its taxable income. Management has analyzed the portfolio’s tax positions taken for all open federal income tax years (December 31, 2016–2019), and has concluded that no provision for federal income tax is required in the portfolio’s financial statements.
6. Distributions: Distributions to shareholders are recorded on the ex-dividend date. Distributions are determined on a tax basis and may differ from net investment income and realized capital gains for financial reporting purposes.
7. Securities Lending: To earn additional income, the portfolio lends its securities to qualified institutional borrowers. Security loans are subject to termination by the portfolio at any time, and are required to be secured at all times by collateral in an amount at least equal to the market value of securities loaned. Daily market fluctuations could cause the value of loaned securities to be more or less than the value of the collateral received. When this occurs, the collateral is adjusted and settled before the opening of the market on the next business day. The portfolio further mitigates its counterparty risk by entering into securities lending transactions only with a diverse group of prequalified counterparties, monitoring their financial strength, and entering into master securities lending agreements with its counterparties. The master securities lending agreements provide that, in the event of a counterparty’s default (including bankruptcy), the portfolio may terminate any loans with that borrower, determine the net amount owed, and sell or retain the collateral up to the net amount owed to the portfolio; however, such actions may be subject to legal proceedings. While collateral mitigates counterparty risk, in the event of a default, the portfolio may experience delays and costs in recovering the securities loaned. The portfolio invests cash collateral received in Vanguard Market Liquidity Fund, and records a liability in the Statement of Net Assets for the return of the collateral, during the period the securities are on loan. Securities lending income represents fees charged to borrowers plus income earned on invested cash collateral, less expenses associated with the loan. During the term of the loan, the portfolio is entitled to all distributions made on or in respect of the loaned securities.
8. Credit Facility: The portfolio and certain other funds managed by The Vanguard Group (“Vanguard”) participate in a $4.3 billion committed credit facility provided by a syndicate of lenders pursuant to a credit agreement that may be renewed annually; each fund is individually liable for its borrowings, if any, under the credit facility. Borrowings may be utilized for temporary and emergency purposes, and are subject to the portfolio’s regulatory and contractual borrowing restrictions. The participating funds are charged administrative fees and an annual commitment fee of 0.10% of the undrawn amount of the facility; these fees are allocated to the funds based on a method approved by the portfolio’s board of trustees and included in Management and Administrative expenses on the portfolio’s Statement of Operations. Any borrowings under this facility bear interest at a rate based upon the higher of the one-month London Interbank Offered Rate, federal funds effective rate, or overnight bank funding rate plus an agreed-upon spread.
The portfolio had no borrowings outstanding at December 31, 2019, or at any time during the period then ended.
9. Other: Dividend income is recorded on the ex-dividend date. Interest income includes income distributions received from Vanguard Market Liquidity Fund and is accrued daily. Premiums and discounts on debt securities are amortized and accreted, respectively, to interest income over the lives of the respective securities, except for premiums on certain callable debt securities that are amortized to the earliest call date. Security transactions are accounted for on the date securities are bought or sold. Costs used to determine realized gains (losses) on the sale of investment securities are those of the specific securities sold.
B. The investment advisory firm Wellington Management Company LLP provides investment advisory services to a portion of the portfolio for a fee calculated at an annual percentage rate of average net assets managed by the advisor. The basic fee of Wellington Management Company LLP is subject to quarterly adjustments based on performance relative to the FTSE High Dividend Yield Index for the preceding three years.
Equity Income Portfolio
Vanguard provides investment advisory services to a portion of the portfolio as described below; the portfolio paid Vanguard advisory fees of $485,000 for the year ended December 31, 2019.
For the year ended December 31, 2019, the aggregate investment advisory fee paid to all advisors represented an effective annual basic rate of 0.09% of the portfolio’s average net assets, before an increase of $96,000 (0.01%) based on performance.
C. In accordance with the terms of a Funds’ Service Agreement (the “FSA”) between Vanguard and the portfolio, Vanguard furnishes to the portfolio investment advisory, corporate management, administrative, marketing, and distribution services at Vanguard’s cost of operations (as defined by the FSA). These costs of operations are allocated to the portfolio based on methods and guidelines approved by the board of trustees. Vanguard does not require reimbursement in the current period for certain costs of operations (such as deferred compensation/benefits and risk/insurance costs); the portfolio’s liability for these costs of operations is included in Payables to Vanguard on the Statement of Net Assets. All other costs of operations payable to Vanguard are generally settled twice a month.
Upon the request of Vanguard, the portfolio may invest up to 0.40% of its net assets as capital in Vanguard. At December 31, 2019, the portfolio had contributed to Vanguard capital in the amount of $79,000, representing less than 0.01% of the portfolio’s net assets and 0.03% of Vanguard’s capital received pursuant to the FSA. The portfolio’s trustees and officers are also directors and employees, respectively, of Vanguard.
D. Various inputs may be used to determine the value of the portfolio’s investments. These inputs are summarized in three broad levels for financial statement purposes. The inputs or methodologies used to value securities are not necessarily an indication of the risk associated with investing in those securities.
Level 1—Quoted prices in active markets for identical securities.
Level 2—Other significant observable inputs (including quoted prices for similar securities, interest rates, prepayment speeds, credit risk, etc.).
Level 3—Significant unobservable inputs (including the portfolio’s own assumptions used to determine the fair value of investments). Any investments valued with significant unobservable inputs are noted on the Statement of Net Assets.
The following table summarizes the market value of the portfolio’s investments and derivatives as of December 31, 2019, based on the inputs used to value them:
| | | Level 1 | | | Level 2 | | | Level 3 | |
| Investments | | ($000 | ) | | ($000 | ) | | ($000 | ) |
| Common Stocks | | 1,688,747 | | | 65,737 | | | — | |
| Temporary Cash Investments | | 80,553 | | | 14,289 | | | — | |
| Futures Contracts—Assets1 | | 172 | | | — | | | — | |
| Futures Contracts—Liabilities1 | | (4 | ) | | — | | | — | |
| Total | | 1,769,468 | | | 80,026 | | | — | |
1 Represents variation margin on the last day of the reporting period.
E. Permanent differences between book-basis and tax-basis components of net assets, if any, are reclassified among capital accounts in the financial statements to reflect their tax character. These reclassifications have no effect on net assets or net asset value per share.
Temporary differences between book-basis and tax-basis components of total distributable earnings (loss) arise when certain items of income, gain, or loss are recognized in different periods for financial statement and tax purposes; these differences will reverse at some time in the future. The differences are primarily related to the tax deferral of losses on wash sales and the realization of unrealized gains or losses on certain futures contracts. As of period end, the tax-basis components of total distributable earnings (loss) are detailed in the table as follows:
| | | Amount | |
| | | ($000 | ) |
| Undistributed Ordinary Income | | 42,919 | |
| Undistributed Long-Term Gains | | 58,909 | |
| Capital Loss Carryforwards (Non-expiring) | | — | |
| Net Unrealized Gains (Losses) | | 330,715 | |
Equity Income Portfolio
As of December 31, 2019, gross unrealized appreciation and depreciation for investments and derivatives based on cost for U.S. federal income tax purposes were as follows:
| | | Amount | |
| | | ($000 | ) |
| Tax Cost | | 1,518,619 | |
| Gross Unrealized Appreciation | | 367,324 | |
| Gross Unrealized Depreciation | | (36,617 | ) |
| Net Unrealized Appreciation (Depreciation) | | 330,707 | |
F. During the year ended December 31, 2019, the portfolio purchased $685,676,000 of investment securities and sold $512,056,000 of investment securities, other than temporary cash investments.
G. Capital shares issued and redeemed were:
| | | Year Ended December 31, |
| | | 2019 | | | 2018 | |
| | | Shares | | | Shares | |
| | | (000 | ) | | (000 | ) |
| Issued | | 15,838 | | | 13,652 | |
| Issued in Lieu of Cash Distributions | | 6,289 | | | 5,121 | |
| Redeemed | | (10,907 | ) | | (9,792 | ) |
| Net Increase (Decrease) in Shares Outstanding | | 11,220 | | | 8,981 | |
At December 31, 2019, one shareholder, an insurance company separate account whose holdings in the portfolio represent the indirect investment of Vanguard Variable Annuity contract holders, was the record or beneficial owner of 50% of the portfolio’s net assets. If this shareholder were to redeem its investment in the portfolio, the redemption might result in an increase in the portfolio’s expense ratio, cause the portfolio to incur higher transaction costs, or lead to the realization of taxable capital gains.
H. Management has determined that no events or transactions occurred subsequent to December 31, 2019, that would require recognition or disclosure in these financial statements.
Equity Income Portfolio
Report of Independent Registered Public Accounting Firm
To the Board of Trustees of Vanguard Variable Insurance Funds and Shareholders of Equity Income Portfolio
Opinion on the Financial Statements
We have audited the accompanying statement of net assets of Equity Income Portfolio (one of the portfolios constituting Vanguard Variable Insurance Funds, referred to hereafter as the “Portfolio”) as of December 31, 2019, the related statement of operations for the year ended December 31, 2019, the statement of changes in net assets for each of the two years in the period ended December 31, 2019, including the related notes, and the financial highlights for each of the five years in the period ended December 31, 2019 (collectively referred to as the “financial statements”). In our opinion, the financial statements present fairly, in all material respects, the financial position of the Portfolio as of December 31, 2019, the results of its operations for the year then ended, the changes in its net assets for each of the two years in the period ended December 31, 2019 and the financial highlights for each of the five years in the period ended December 31, 2019 in conformity with accounting principles generally accepted in the United States of America.
Basis for Opinion
These financial statements are the responsibility of the Portfolio’s management. Our responsibility is to express an opinion on the Portfolio’s financial statements based on our audits. We are a public accounting firm registered with the Public Company Accounting Oversight Board (United States) (“PCAOB”) and are required to be independent with respect to the Portfolio in accordance with the U.S. federal securities laws and the applicable rules and regulations of the Securities and Exchange Commission and the PCAOB.
We conducted our audits of these financial statements in accordance with the standards of the PCAOB. Those standards require that we plan and perform the audit to obtain reasonable assurance about whether the financial statements are free of material misstatement, whether due to error or fraud.
Our audits included performing procedures to assess the risks of material misstatement of the financial statements, whether due to error or fraud, and performing procedures that respond to those risks. Such procedures included examining, on a test basis, evidence regarding the amounts and disclosures in the financial statements. Our audits also included evaluating the accounting principles used and significant estimates made by management, as well as evaluating the overall presentation of the financial statements. Our procedures included confirmation of securities owned as of December 31, 2019 by correspondence with the custodian and brokers and by agreement to the underlying ownership records of the transfer agent; when replies were not received from brokers, we performed other auditing procedures. We believe that our audits provide a reasonable basis for our opinion.
/s/PricewaterhouseCoopers LLP
Philadelphia, Pennsylvania
February 18, 2020
We have served as the auditor of one or more investment companies in The Vanguard Group of Funds since 1975.
Special 2019 tax information (unaudited) for corporate shareholders only for Equity Income Portfolio, a portfolio of Vanguard Variable Insurance Funds
This information for the fiscal year ended December 31, 2019, is included pursuant to provisions of the Internal Revenue Code for corporate shareholders only.
The portfolio distributed $91,681,000 as capital gain dividends (20% rate gain distributions) to shareholders during the fiscal year.
For corporate shareholders, 91.2% of investment income (dividend income plus short-term gains, if any) qualifies for the dividends-received deduction.
Equity Index Portfolio
Your Portfolio’s Performance at a Glance
• For the 12 months ended December 31, 2019, the Equity Index Portfolio of Vanguard Variable Insurance Fund returned 31.30%, in line with the 31.49% return of its benchmark index after factoring in the portfolio’s expenses.
• Stocks benefited from accommodative monetary policies from the Federal Reserve and other major central banks and better-than-expected corporate earnings during the 12 months. Large-capitalization stocks outpaced mid- and small-caps, and growth stocks beat their value counterparts.
• The portfolio benefited most from its holdings in information technology, financials, and communication services.
• The portfolio recorded an average annual return of 13.40% for the past ten years, in line with its benchmark average of 13.56%.
• Please note that the portfolio returns in Vanguard Variable Insurance Fund are different from those in Vanguard Variable Annuity (and other plans that invest in the fund), which take into account insurance-related expenses.
| Market Barometer | | |
| | | Average Annual Total Returns |
| | | Periods Ended December 31, 2019 |
| | One Year | Three Years | Five Years |
| Stocks | | | |
| Russell 1000 Index (Large-caps) | 31.43% | 15.05% | 11.48% |
| Russell 2000 Index (Small-caps) | 25.53 | 8.59 | 8.23 |
| Russell 3000 Index (Broad U.S. market) | 31.02 | 14.57 | 11.24 |
| FTSE All-World ex US Index (International) | 21.81 | 9.96 | 5.83 |
| | | | |
| Bonds | | | |
Bloomberg Barclays U.S. Aggregate Bond Index
(Broad taxable market) | 8.72% | 4.03% | 3.05% |
Bloomberg Barclays Municipal Bond Index
(Broad tax-exempt market) | 7.54 | 4.72 | 3.53 |
| FTSE Three-Month U.S. Treasury Bill Index | 2.25 | 1.65 | 1.04 |
| | | | |
| CPI | | | |
| Consumer Price Index | 2.29% | 2.10% | 1.82% |
Equity Index Portfolio
About Your Portfolio’s Expenses
As a shareholder of the portfolio, you incur ongoing costs, which include costs for portfolio management, administrative services, and shareholder reports (like this one), among others. Operating expenses, which are deducted from a portfolio’s gross income, directly reduce the investment return of the portfolio.
A portfolio’s expenses are expressed as a percentage of its average net assets. This figure is known as the expense ratio. The following examples are intended to help you understand the ongoing costs (in dollars) of investing in your portfolio and to compare these costs with those of other mutual funds. The examples are based on an investment of $1,000 made at the beginning of the period shown and held for the entire period.
The accompanying table illustrates your portfolio’s costs in two ways:
• Based on actual portfolio return.This section helps you to estimate the actual expenses that you paid over the period. The “Ending Account Value” shown is derived from the portfolio’s actual return, and the third column shows the dollar amount that would have been paid by an investor who started with $1,000 in the portfolio. You may use the information here, together with the amount you invested, to estimate the expenses that you paid over the period.
To do so, simply divide your account value by $1,000 (for example, an $8,600 account value divided by $1,000 = 8.6), then multiply the result by the number given for your portfolio under the heading “Expenses Paid During Period.”
• Based on hypothetical 5% yearly return. This section is intended to help you compare your portfolio’s costs with those of other mutual funds. It assumes that the portfolio had a yearly return of 5% before expenses, but that the expense ratio is unchanged. In this case—because the return used is not the portfolio’s actual return—the results do not apply to your investment. The example is useful in making comparisons because the Securities and Exchange Commission requires all mutual funds to calculate expenses based on a 5% return. You can assess your portfolio’s costs by comparing this hypothetical example with the hypothetical examples that appear in shareholder reports of other funds.
Note that the expenses shown in the table are meant to highlight and help you compareongoingcosts only and do not reflect transaction costs incurred by the portfolio for buying and selling securities. The portfolio’s expense ratio does not reflect additional fees and expenses associated with the annuity or life insurance program through which you invest.
The calculations assume no shares were bought or sold during the period. Your actual costs may have been higher or lower, depending on the amount of your investment and the timing of any purchases or redemptions.
You can find more information about the portfolio’s expenses in the Financial Statements section. For additional information on operating expenses and other shareholder costs, please refer to the prospectus.
| Six Months Ended December 31, 2019 | | | |
| | Beginning | Ending | Expenses |
| | Account Value | Account Value | Paid During |
| Equity Index Portfolio | 6/30/2019 | 12/31/2019 | Period |
| Based on Actual Portfolio Return | $1,000.00 | $1,108.53 | $0.74 |
| Based on Hypothetical 5% Yearly Return | 1,000.00 | 1,024.50 | $0.71 |
The calculations are based on expenses incurred in the most recent six-month period. The portfolio’s annualized six-month expense ratio for that period is 0.14%. The dollar amounts shown as “Expenses Paid” are equal to the annualized expense ratio multiplied by the average account value over the period, multiplied by the number of days in the most recent six-month period, then divided by the number of days in the recent 12-month period (184/365).
Equity Index Portfolio
Performance Summary
All of the returns in this report represent past performance, which is not a guarantee of future results that may be achieved by the portfolio. (Current performance may be lower or higher than the performance data cited. For performance data current to the most recent month-end, visit our website at vanguard.com/performance.) Note, too, that both investment returns and principal value can fluctuate widely, so an investor’s shares, when sold, could be worth more or less than their original cost. The returns shown do not reflect taxes that a shareholder would pay on portfolio distributions or on the sale of portfolio shares. Nor do the returns reflect fees and expenses associated with the annuity or life insurance program through which a shareholder invests. If these fees and expenses were included, the portfolio’s returns would be lower.
Cumulative Performance: December 31, 2009–December 31, 2019
Initial Investment of $10,000

| | | Average Annual Total Returns | Final Value |
| | | Periods Ended December 31, 2019 | of a $10,000 |
| | | One Year | Five Years | Ten Years | Investment |
| Equity Index Portfolio | 31.30% | 11.55% | 13.40% | $35,166 |
| S&P 500 Index | 31.49 | 11.70 | 13.56 | 35,666 |
| Dow Jones U.S. Total Stock Market Float Adjusted Index | 30.90 | 11.18 | 13.43 | 35,251 |
See Financial Highlights for dividend and capital gains information.
Equity Index Portfolio
Sector Diversification
As of December 31, 2019
| Communication Services | 10.4% |
| Consumer Discretionary | 9.7 |
| Consumer Staples | 7.2 |
| Energy | 4.3 |
| Financials | 13.0 |
| Health Care | 14.2 |
| Industrials | 9.1 |
| Information Technology | 23.2 |
| Materials | 2.7 |
| Real Estate | 2.9 |
| Utilities | 3.3 |
The table reflects the portfolio’s equity exposure, based on its investments in stocks and stock index futures. Any holdings in short-term reserves are excluded. Sector categories are based on the Global Industry Classification Standard (“GICS”), except for the “Other” category (if applicable), which includes securities that have not been provided a GICS classification as of the effective reporting period.
The Global Industry Classification Standard (“GICS”) was developed by and is the exclusive property and a service mark of MSCI Inc. (“MSCI”) and Standard and Poor’s, a division of McGraw-Hill Companies, Inc. (“S&P”), and is licensed for use by Vanguard. Neither MSCI, S&P nor any third party involved in making or compiling the GICS or any GICS classification makes any express or implied warranties or representations with respect to such standard or classification (or the results to be obtained by the use thereof), and all such parties hereby expressly disclaim all warranties of originality, accuracy, completeness, merchantability or fitness for a particular purpose with respect to any such standard or classification. Without limiting any of the foregoing, in no event shall MSCI, S&P, any of its affiliates or any third party involved in making or compiling the GICS or any GICS classification have any liability for any direct, indirect, special, punitive, consequential or any other damages (including lost profits) even if notified of the possibility of such damages.
Equity Index Portfolio
Financial Statements
Statement of Net Assets
As of December 31, 2019
The portfolio files its complete schedule of portfolio holdings with the Securities and Exchange Commission (SEC) for the first and third quarters of each fiscal year as an exhibit to its reports on Form N-PORT. The portfolio’s Form N-PORT reports are available on the SEC’s website at www.sec.gov.
| | | | Market |
| | | | Value• |
| | | Shares | ($000) |
| Common Stocks (99.4%)1 |
| Communication Services (10.3%) |
| * | Facebook Inc. Class A | 577,310 | 118,493 |
| * | Alphabet Inc. Class C | 72,211 | 96,548 |
| * | Alphabet Inc. Class A | 71,372 | 95,595 |
| | AT&T Inc. | 1,752,449 | 68,486 |
| | Walt Disney Co. | 432,394 | 62,537 |
| | Verizon Communications Inc. | 992,155 | 60,918 |
| | Comcast Corp. Class A | 1,089,103 | 48,977 |
| * | Netflix Inc. | 105,138 | 34,020 |
| * | Charter Communications Inc. Class A | 37,611 | 18,244 |
| | Activision Blizzard Inc. | 184,305 | 10,952 |
| * | Electronic Arts Inc. | 70,042 | 7,530 |
| * | Twitter Inc. | 186,254 | 5,970 |
| * | T-Mobile US Inc. | 75,950 | 5,956 |
| | ViacomCBS Inc. Class B | 129,668 | 5,442 |
| | Omnicom Group Inc. | 52,251 | 4,233 |
| * | Take-Two Interactive Software Inc. | 27,192 | 3,329 |
| | Fox Corp. Class A | 85,582 | 3,173 |
| | CenturyLink Inc. | 235,800 | 3,115 |
| * | Discovery Inc. Series C | 80,628 | 2,458 |
| * | Live Nation Entertainment Inc. | 33,726 | 2,410 |
| * | DISH Network Corp. Class A | 61,432 | 2,179 |
| | Interpublic Group of Cos. Inc. | 93,330 | 2,156 |
| | News Corp. Class A | 110,023 | 1,556 |
| | Fox Corp. Class B | 38,277 | 1,393 |
| * | Discovery Inc. Series A | 37,907 | 1,241 |
| | News Corp. Class B | 12,487 | 181 |
| | | | 667,092 |
| Consumer Discretionary (9.7%) |
| * | Amazon.com Inc. | 99,911 | 184,620 |
| | Home Depot Inc. | 261,686 | 57,147 |
| | McDonald’s Corp. | 180,654 | 35,699 |
| | NIKE Inc. Class B | 298,992 | 30,291 |
| | Starbucks Corp. | 283,276 | 24,906 |
| | Lowe’s Cos. Inc. | 183,875 | 22,021 |
| * | Booking Holdings Inc. | 10,041 | 20,621 |
| | TJX Cos. Inc. | 290,877 | 17,761 |
| | Target Corp. | 121,556 | 15,585 |
| | General Motors Co. | 301,722 | 11,043 |
| | Ross Stores Inc. | 86,754 | 10,100 |
| | Marriott International Inc. Class A | 65,085 | 9,856 |
| | Dollar General Corp. | 61,067 | 9,525 |
| | Ford Motor Co. | 934,365 | 8,690 |
| * | O’Reilly Automotive Inc. | 18,148 | 7,954 |
| | VF Corp. | 78,624 | 7,836 |
| | Hilton Worldwide Holdings Inc. | 67,676 | 7,506 |
| | Yum! Brands Inc. | 72,543 | 7,307 |
| * | AutoZone Inc. | 5,715 | 6,808 |
| | eBay Inc. | 183,449 | 6,624 |
| | Aptiv plc | 61,265 | 5,818 |
| | Las Vegas Sands Corp. | 81,149 | 5,603 |
| | Royal Caribbean Cruises Ltd. | 41,235 | 5,505 |
| * | Dollar Tree Inc. | 56,825 | 5,344 |
| * | Chipotle Mexican Grill Inc. Class A | 6,135 | 5,136 |
| | Carnival Corp. | 96,154 | 4,887 |
| | Best Buy Co. Inc. | 54,650 | 4,798 |
| | DR Horton Inc. | 80,515 | 4,247 |
| | MGM Resorts International | 123,705 | 4,116 |
| | Genuine Parts Co. | 34,889 | 3,706 |
| | Lennar Corp. Class A | 66,408 | 3,705 |
| | Expedia Group Inc. | 33,565 | 3,630 |
| * | Ulta Beauty Inc. | 13,732 | 3,476 |
| | Tiffany & Co. | 25,932 | 3,466 |
| * | CarMax Inc. | 39,501 | 3,463 |
| | Garmin Ltd. | 34,574 | 3,373 |
| | Wynn Resorts Ltd. | 23,215 | 3,224 |
| | Hasbro Inc. | 30,470 | 3,218 |
| | Darden Restaurants Inc. | 29,457 | 3,211 |
| * | NVR Inc. | 834 | 3,176 |
| * | Norwegian Cruise Line Holdings Ltd. | 50,948 | 2,976 |
| | Advance Auto Parts Inc. | 16,657 | 2,668 |
| | Tractor Supply Co. | 28,472 | 2,660 |
| * | LKQ Corp. | 73,701 | 2,631 |
| | PulteGroup Inc. | 61,103 | 2,371 |
| | Whirlpool Corp. | 15,126 | 2,232 |
| | BorgWarner Inc. | 49,420 | 2,144 |
| * | Mohawk Industries Inc. | 14,225 | 1,940 |
| | Kohl’s Corp. | 37,467 | 1,909 |
| | PVH Corp. | 17,743 | 1,866 |
| | Tapestry Inc. | 66,031 | 1,781 |
| | Newell Brands Inc. | 91,185 | 1,753 |
| | Leggett & Platt Inc. | 31,487 | 1,600 |
| | Ralph Lauren Corp. Class A | 11,900 | 1,395 |
| * | Capri Holdings Ltd. | 36,285 | 1,384 |
| | Harley-Davidson Inc. | 36,867 | 1,371 |
| | Hanesbrands Inc. | 86,582 | 1,286 |
| | Macy’s Inc. | 73,934 | 1,257 |
| | H&R Block Inc. | 46,949 | 1,102 |
| | Nordstrom Inc. | 25,631 | 1,049 |
| | L Brands Inc. | 55,576 | 1,007 |
| *,^ | Under Armour Inc. Class A | 46,263 | 999 |
| | Gap Inc. | 50,910 | 900 |
| * | Under Armour Inc. Class C | 45,229 | 867 |
| | Lennar Corp. Class B | 1,030 | 46 |
| | | | 626,196 |
| Consumer Staples (7.2%) |
| | Procter & Gamble Co. | 598,253 | 74,722 |
| | Coca-Cola Co. | 925,112 | 51,205 |
| | PepsiCo Inc. | 334,534 | 45,721 |
| | Walmart Inc. | 340,295 | 40,441 |
| | Philip Morris International Inc. | 373,246 | 31,759 |
| | Costco Wholesale Corp. | 105,974 | 31,148 |
| | Altria Group Inc. | 448,148 | 22,367 |
| | Mondelez International Inc. Class A | 345,368 | 19,023 |
| | Colgate-Palmolive Co. | 205,612 | 14,154 |
| | Kimberly-Clark Corp. | 82,232 | 11,311 |
| | Estee Lauder Cos. Inc. Class A | 53,392 | 11,028 |
| | Walgreens Boots Alliance Inc. | 179,879 | 10,606 |
| | Sysco Corp. | 122,366 | 10,467 |
| | General Mills Inc. | 144,955 | 7,764 |
| | Constellation Brands Inc. Class A | 40,188 | 7,626 |
| | Tyson Foods Inc. Class A | 70,805 | 6,446 |
| | Archer-Daniels-Midland Co. | 133,597 | 6,192 |
| * | Monster Beverage Corp. | 91,595 | 5,821 |
| | Kroger Co. | 192,411 | 5,578 |
| | Hershey Co. | 35,580 | 5,230 |
| | McCormick & Co. Inc. | 29,648 | 5,032 |
| | Kraft Heinz Co. | 149,463 | 4,802 |
| | Clorox Co. | 30,111 | 4,623 |
| | Church & Dwight Co. Inc. | 58,915 | 4,144 |
| | Kellogg Co. | 59,649 | 4,125 |
| | Conagra Brands Inc. | 116,853 | 4,001 |
| | Lamb Weston Holdings Inc. | 35,105 | 3,020 |
| | Hormel Foods Corp. | 66,824 | 3,014 |
| | Brown-Forman Corp. Class B | 43,605 | 2,948 |
| | JM Smucker Co. | 27,417 | 2,855 |
| | Molson Coors Brewing Co. Class B | 44,960 | 2,423 |
| | Campbell Soup Co. | 40,424 | 1,998 |
| | Coty Inc. Class A | 70,883 | 797 |
| | | | 462,391 |
| Energy (4.3%) |
| | Exxon Mobil Corp. | 1,015,102 | 70,834 |
| | Chevron Corp. | 453,635 | 54,668 |
| | ConocoPhillips | 263,270 | 17,120 |
| | Schlumberger Ltd. | 332,214 | 13,355 |
| | Phillips 66 | 106,608 | 11,877 |
| | EOG Resources Inc. | 139,601 | 11,693 |
| | Kinder Morgan Inc. | 467,361 | 9,894 |
| | Marathon Petroleum Corp. | 155,793 | 9,387 |
| | Valero Energy Corp. | 98,527 | 9,227 |
| | Occidental Petroleum Corp. | 214,354 | 8,834 |
| | ONEOK Inc. | 99,108 | 7,500 |
| | Williams Cos. Inc. | 290,862 | 6,899 |
| | Pioneer Natural Resources Co. | 39,752 | 6,017 |
| | Halliburton Co. | 210,696 | 5,156 |
| | Concho Resources Inc. | 48,270 | 4,227 |
| | Hess Corp. | 62,151 | 4,152 |
| | Baker Hughes Co. Class A | 155,953 | 3,997 |
| | Diamondback Energy Inc. | 38,675 | 3,591 |
| | Noble Energy Inc. | 114,490 | 2,844 |
| | Marathon Oil Corp. | 191,490 | 2,600 |
| | Devon Energy Corp. | 92,641 | 2,406 |
| | National Oilwell Varco Inc. | 92,356 | 2,314 |
| | Apache Corp. | 90,006 | 2,303 |
| | TechnipFMC plc | 100,593 | 2,157 |
| | HollyFrontier Corp. | 35,543 | 1,802 |
Equity Index Portfolio
| | | | Market |
| | | | Value• |
| | | Shares | ($000) |
| | Cabot Oil & Gas Corp. | 97,645 | 1,700 |
| | Cimarex Energy Co. | 24,374 | 1,279 |
| | Helmerich & Payne Inc. | 26,103 | 1,186 |
| | | | 279,019 |
| Financials (12.9%) |
| | JPMorgan Chase & Co. | 752,435 | 104,889 |
| * | Berkshire Hathaway Inc. Class B | 437,823 | 99,167 |
| | Bank of America Corp. | 1,942,181 | 68,404 |
| | Wells Fargo & Co. | 923,324 | 49,675 |
| | Citigroup Inc. | 523,776 | 41,844 |
| | US Bancorp | 340,918 | 20,213 |
| | American Express Co. | 160,955 | 20,037 |
| | Truist Financial Corp. | 321,697 | 18,118 |
| | Goldman Sachs Group Inc. | 76,459 | 17,580 |
| | CME Group Inc. | 85,964 | 17,255 |
| | Chubb Ltd. | 108,717 | 16,923 |
| | PNC Financial Services Group Inc. | 105,099 | 16,777 |
| | S&P Global Inc. | 58,624 | 16,007 |
| | Morgan Stanley | 295,128 | 15,087 |
| | BlackRock Inc. | 28,289 | 14,221 |
| | Marsh & McLennan Cos. Inc. | 121,057 | 13,487 |
| | Charles Schwab Corp. | 274,275 | 13,045 |
| | Intercontinental Exchange Inc. | 133,555 | 12,361 |
| | Aon plc | 56,158 | 11,697 |
| | Capital One Financial Corp. | 111,734 | 11,499 |
| | American International Group Inc. | 208,725 | 10,714 |
| | Progressive Corp. | 140,247 | 10,153 |
| | Bank of New York Mellon Corp. | 201,333 | 10,133 |
| | MetLife Inc. | 187,574 | 9,561 |
| | Aflac Inc. | 176,067 | 9,314 |
| | Moody’s Corp. | 38,947 | 9,246 |
| | Prudential Financial Inc. | 96,476 | 9,044 |
| | Allstate Corp. | 77,686 | 8,736 |
| | Travelers Cos. Inc. | 61,915 | 8,479 |
| * | Berkshire Hathaway Inc. Class A | 21 | 7,131 |
| | State Street Corp. | 87,241 | 6,901 |
| | T. Rowe Price Group Inc. | 56,043 | 6,828 |
| | Discover Financial Services | 75,182 | 6,377 |
| | Willis Towers Watson plc | 30,839 | 6,228 |
| | Northern Trust Corp. | 50,831 | 5,400 |
| | M&T Bank Corp. | 31,660 | 5,374 |
| | MSCI Inc. Class A | 20,336 | 5,250 |
| | Hartford Financial Services Group Inc. | 86,390 | 5,250 |
| | Fifth Third Bancorp | 170,283 | 5,235 |
| | Synchrony Financial | 142,636 | 5,136 |
| | Ameriprise Financial Inc. | 30,400 | 5,064 |
| | KeyCorp | 236,396 | 4,785 |
| | First Republic Bank | 40,416 | 4,747 |
| | Arthur J Gallagher & Co. | 44,695 | 4,256 |
| | Citizens Financial Group Inc. | 104,378 | 4,239 |
| | Regions Financial Corp. | 231,638 | 3,975 |
| | Cincinnati Financial Corp. | 36,489 | 3,837 |
| | Huntington Bancshares Inc. | 248,048 | 3,741 |
| | MarketAxess Holdings Inc. | 9,088 | 3,445 |
| | Principal Financial Group Inc. | 62,045 | 3,412 |
| | Loews Corp. | 61,390 | 3,222 |
| | Cboe Global Markets Inc. | 26,640 | 3,197 |
| * | SVB Financial Group | 12,394 | 3,111 |
| | Nasdaq Inc. | 27,580 | 2,954 |
| | Lincoln National Corp. | 47,637 | 2,811 |
| | Everest Re Group Ltd. | 9,808 | 2,715 |
| | Raymond James Financial Inc. | 29,688 | 2,656 |
| | Globe Life Inc. | 23,846 | 2,510 |
| | Comerica Inc. | 34,500 | 2,475 |
| | E*TRADE Financial Corp. | 54,349 | 2,466 |
| | WR Berkley Corp. | 34,736 | 2,400 |
| | Zions Bancorp NA | 40,798 | 2,118 |
| | Assurant Inc. | 14,586 | 1,912 |
| | People’s United Financial Inc. | 106,292 | 1,796 |
| | Franklin Resources Inc. | 66,742 | 1,734 |
| | Invesco Ltd. | 89,065 | 1,601 |
| | Unum Group | 49,546 | 1,445 |
| | | | 831,400 |
| Health Care (14.1%) |
| | Johnson & Johnson | 631,389 | 92,101 |
| | UnitedHealth Group Inc. | 227,287 | 66,818 |
| | Merck & Co. Inc. | 610,782 | 55,551 |
| | Pfizer Inc. | 1,327,673 | 52,018 |
| | Abbott Laboratories | 423,980 | 36,827 |
| | Medtronic plc | 321,536 | 36,478 |
| | Bristol-Myers Squibb Co. | 562,369 | 36,098 |
| | Amgen Inc. | 142,542 | 34,363 |
| | AbbVie Inc. | 354,771 | 31,411 |
| | Thermo Fisher Scientific Inc. | 96,195 | 31,251 |
| | Eli Lilly & Co. | 202,699 | 26,641 |
| | Danaher Corp. | 153,350 | 23,536 |
| | CVS Health Corp. | 312,110 | 23,187 |
| | Gilead Sciences Inc. | 303,516 | 19,722 |
| | Anthem Inc. | 60,831 | 18,373 |
| | Cigna Corp. | 89,588 | 18,320 |
| | Becton Dickinson and Co. | 64,882 | 17,646 |
| * | Intuitive Surgical Inc. | 27,726 | 16,390 |
| | Stryker Corp. | 77,237 | 16,215 |
| | Zoetis Inc. | 114,258 | 15,122 |
| * | Boston Scientific Corp. | 334,354 | 15,119 |
| | Allergan plc | 78,753 | 15,055 |
| * | Vertex Pharmaceuticals Inc. | 61,684 | 13,506 |
| * | Biogen Inc. | 43,289 | 12,845 |
| * | Illumina Inc. | 35,266 | 11,699 |
| * | Edwards Lifesciences Corp. | 50,030 | 11,671 |
| | Humana Inc. | 31,769 | 11,644 |
| | Baxter International Inc. | 122,469 | 10,241 |
| | HCA Healthcare Inc. | 63,476 | 9,382 |
| | Zimmer Biomet Holdings Inc. | 49,334 | 7,384 |
| * | Regeneron Pharmaceuticals Inc. | 19,163 | 7,195 |
| * | IQVIA Holdings Inc. | 43,289 | 6,689 |
| | Agilent Technologies Inc. | 74,258 | 6,335 |
| * | Centene Corp. | 99,274 | 6,241 |
| | McKesson Corp. | 43,230 | 5,980 |
| * | Alexion Pharmaceuticals Inc. | 53,090 | 5,742 |
| | Cerner Corp. | 75,351 | 5,530 |
| * | IDEXX Laboratories Inc. | 20,579 | 5,374 |
| | ResMed Inc. | 34,487 | 5,344 |
| * | Align Technology Inc. | 17,211 | 4,803 |
| * | Mettler-Toledo International Inc. | 5,836 | 4,630 |
| | Teleflex Inc. | 11,094 | 4,176 |
| * | WellCare Health Plans Inc. | 12,067 | 3,985 |
| * | Laboratory Corp. of America Holdings | 23,310 | 3,943 |
| | Cooper Cos. Inc. | 11,904 | 3,825 |
| * | Incyte Corp. | 42,929 | 3,749 |
| * | Waters Corp. | 15,472 | 3,615 |
| | Cardinal Health Inc. | 70,237 | 3,553 |
| | Quest Diagnostics Inc. | 32,348 | 3,454 |
| * | Hologic Inc. | 64,272 | 3,356 |
| | STERIS plc | 20,374 | 3,105 |
| * | Varian Medical Systems Inc. | 21,843 | 3,102 |
| | AmerisourceBergen Corp. Class A | 36,028 | 3,063 |
| | Dentsply Sirona Inc. | 53,455 | 3,025 |
| | Universal Health Services Inc. Class B | 19,248 | 2,761 |
| | PerkinElmer Inc. | 26,711 | 2,594 |
| * | Mylan NV | 123,531 | 2,483 |
| * | Henry Schein Inc. | 35,202 | 2,349 |
| * | ABIOMED Inc. | 10,806 | 1,843 |
| | Perrigo Co. plc | 32,577 | 1,683 |
| * | DaVita Inc. | 21,432 | 1,608 |
| | | | 911,749 |
| Industrials (9.0%) |
| | Boeing Co. | 128,265 | 41,784 |
| | Honeywell International Inc. | 171,403 | 30,338 |
| | Union Pacific Corp. | 166,545 | 30,110 |
| | United Technologies Corp. | 194,638 | 29,149 |
| | 3M Co. | 137,967 | 24,340 |
| | General Electric Co. | 2,095,232 | 23,383 |
| | Lockheed Martin Corp. | 59,542 | 23,184 |
| | United Parcel Service Inc. Class B | 168,103 | 19,678 |
| | Caterpillar Inc. | 132,592 | 19,581 |
| | Raytheon Co. | 66,806 | 14,680 |
| | CSX Corp. | 186,562 | 13,500 |
| | Deere & Co. | 75,542 | 13,088 |
| | Northrop Grumman Corp. | 37,600 | 12,933 |
| | Illinois Tool Works Inc. | 70,161 | 12,603 |
| | Norfolk Southern Corp. | 62,555 | 12,144 |
| | Emerson Electric Co. | 146,140 | 11,145 |
| | Waste Management Inc. | 93,617 | 10,669 |
| | L3Harris Technologies Inc. | 53,029 | 10,493 |
| | General Dynamics Corp. | 56,225 | 9,915 |
| | Eaton Corp. plc | 99,169 | 9,393 |
| | Roper Technologies Inc. | 24,959 | 8,841 |
| | FedEx Corp. | 57,590 | 8,708 |
| | Delta Air Lines Inc. | 138,054 | 8,073 |
| | Ingersoll-Rand plc | 57,459 | 7,637 |
| | Johnson Controls International plc | 185,035 | 7,533 |
| * | IHS Markit Ltd. | 96,162 | 7,246 |
| | TransDigm Group Inc. | 11,946 | 6,690 |
| | Cummins Inc. | 36,747 | 6,576 |
| | PACCAR Inc. | 82,955 | 6,562 |
| | Parker-Hannifin Corp. | 30,820 | 6,343 |
| | Southwest Airlines Co. | 113,602 | 6,132 |
| | Stanley Black & Decker Inc. | 36,471 | 6,045 |
| | Verisk Analytics Inc. Class A | 39,311 | 5,871 |
| | Rockwell Automation Inc. | 27,721 | 5,618 |
| | AMETEK Inc. | 54,838 | 5,470 |
| | Fortive Corp. | 70,966 | 5,421 |
| | Cintas Corp. | 20,113 | 5,412 |
| | Fastenal Co. | 137,593 | 5,084 |
| * | United Airlines Holdings Inc. | 52,229 | 4,601 |
| | Republic Services Inc. Class A | 50,553 | 4,531 |
| * | Copart Inc. | 49,102 | 4,465 |
| | Equifax Inc. | 29,051 | 4,071 |
| | Dover Corp. | 34,891 | 4,021 |
| | Kansas City Southern | 23,807 | 3,646 |
| | WW Grainger Inc. | 10,459 | 3,541 |
| | Xylem Inc. | 43,256 | 3,408 |
| | Westinghouse Air Brake Technologies Corp. | 43,689 | 3,399 |
| | Masco Corp. | 68,235 | 3,275 |
Equity Index Portfolio
| | | | Market |
| | | | Value• |
| | | Shares | ($000) |
| | Expeditors International of Washington Inc. | 40,915 | 3,192 |
| | IDEX Corp. | 18,274 | 3,143 |
| * | United Rentals Inc. | 18,060 | 3,012 |
| | Jacobs Engineering Group Inc. | 32,573 | 2,926 |
| | Old Dominion Freight Line Inc. | 15,302 | 2,904 |
| | Arconic Inc. | 93,043 | 2,863 |
| | Allegion plc | 22,270 | 2,773 |
| | American Airlines Group Inc. | 93,752 | 2,689 |
| | CH Robinson Worldwide Inc. | 32,528 | 2,544 |
| | Huntington Ingalls Industries Inc. | 9,788 | 2,456 |
| | Textron Inc. | 54,744 | 2,442 |
| | JB Hunt Transport Services Inc. | 20,404 | 2,383 |
| | Snap-on Inc. | 13,135 | 2,225 |
| | Fortune Brands Home & Security Inc. | 33,475 | 2,187 |
| | Alaska Air Group Inc. | 29,477 | 1,997 |
| | Pentair plc | 40,215 | 1,845 |
| | Robert Half International Inc. | 28,132 | 1,776 |
| | Nielsen Holdings plc | 85,151 | 1,729 |
| | AO Smith Corp. | 32,910 | 1,568 |
| | Flowserve Corp. | 31,307 | 1,558 |
| | Quanta Services Inc. | 34,051 | 1,386 |
| | Rollins Inc. | 33,685 | 1,117 |
| | | | 581,045 |
| Information Technology (23.1%) |
| | Apple Inc. | 1,001,977 | 294,231 |
| | Microsoft Corp. | 1,830,140 | 288,613 |
| | Visa Inc. Class A | 410,650 | 77,161 |
| | Mastercard Inc. Class A | 212,955 | 63,586 |
| | Intel Corp. | 1,043,559 | 62,457 |
| | Cisco Systems Inc. | 1,017,763 | 48,812 |
| * | Adobe Inc. | 116,124 | 38,299 |
| * | salesforce.com Inc. | 212,786 | 34,607 |
| | NVIDIA Corp. | 146,818 | 34,546 |
| | Accenture plc Class A | 152,333 | 32,077 |
| * | PayPal Holdings Inc. | 281,686 | 30,470 |
| | Broadcom Inc. | 95,160 | 30,072 |
| | Texas Instruments Inc. | 224,242 | 28,768 |
| | International Business Machines Corp. | 212,466 | 28,479 |
| | Oracle Corp. | 519,725 | 27,535 |
| | QUALCOMM Inc. | 273,926 | 24,168 |
| | Fidelity National Information Services Inc. | 147,425 | 20,505 |
| | Automatic Data Processing Inc. | 103,785 | 17,695 |
| | Intuit Inc. | 62,442 | 16,355 |
| * | Fiserv Inc. | 136,995 | 15,841 |
| * | Micron Technology Inc. | 265,584 | 14,283 |
| | Applied Materials Inc. | 221,593 | 13,526 |
| | Global Payments Inc. | 72,083 | 13,159 |
| * | ServiceNow Inc. | 45,242 | 12,773 |
| * | Advanced Micro Devices Inc. | 267,151 | 12,252 |
| | Analog Devices Inc. | 88,346 | 10,499 |
| | Lam Research Corp. | 34,799 | 10,175 |
| * | Autodesk Inc. | 52,783 | 9,684 |
| | Cognizant Technology Solutions Corp. Class A | 131,352 | 8,146 |
| | Amphenol Corp. Class A | 71,110 | 7,696 |
| | TE Connectivity Ltd. | 80,249 | 7,691 |
| | HP Inc. | 355,478 | 7,305 |
| | KLA Corp. | 37,844 | 6,743 |
| | Motorola Solutions Inc. | 41,096 | 6,622 |
| | Paychex Inc. | 76,409 | 6,499 |
| | Microchip Technology Inc. | 57,326 | 6,003 |
| * | FleetCor Technologies Inc. | 20,816 | 5,989 |
| | Xilinx Inc. | 60,328 | 5,898 |
| | Corning Inc. | 184,537 | 5,372 |
| * | ANSYS Inc. | 20,533 | 5,285 |
| * | Synopsys Inc. | 36,091 | 5,024 |
| | Skyworks Solutions Inc. | 40,881 | 4,942 |
| | CDW Corp. | 34,476 | 4,925 |
| | Hewlett Packard Enterprise Co. | 310,513 | 4,925 |
| * | VeriSign Inc. | 24,794 | 4,777 |
| * | Cadence Design Systems Inc. | 67,224 | 4,663 |
| * | Keysight Technologies Inc. | 44,993 | 4,618 |
| | Western Digital Corp. | 71,388 | 4,531 |
| | Maxim Integrated Products Inc. | 64,963 | 3,996 |
| * | Fortinet Inc. | 34,063 | 3,637 |
| | NortonLifeLock Inc. | 137,740 | 3,515 |
| | NetApp Inc. | 54,830 | 3,413 |
| | Broadridge Financial Solutions Inc. | 27,543 | 3,403 |
| * | Akamai Technologies Inc. | 38,828 | 3,354 |
| * | Gartner Inc. | 21,496 | 3,313 |
| | Seagate Technology plc | 55,545 | 3,305 |
| | Citrix Systems Inc. | 29,409 | 3,261 |
| * | Qorvo Inc. | 27,923 | 3,245 |
| * | Zebra Technologies Corp. | 12,553 | 3,207 |
| | Leidos Holdings Inc. | 31,967 | 3,129 |
| | Western Union Co. | 100,812 | 2,700 |
| | Jack Henry & Associates Inc. | 18,501 | 2,695 |
| * | Arista Networks Inc. | 12,983 | 2,641 |
| | DXC Technology Co. | 61,270 | 2,303 |
| * | F5 Networks Inc. | 14,627 | 2,043 |
| | Juniper Networks Inc. | 80,114 | 1,973 |
| | FLIR Systems Inc. | 32,314 | 1,683 |
| | Xerox Holdings Corp. | 44,500 | 1,641 |
| * | IPG Photonics Corp. | 8,509 | 1,233 |
| | Alliance Data Systems Corp. | 9,809 | 1,101 |
| | | | 1,489,073 |
| Materials (2.6%) |
| | Linde plc | 128,862 | 27,435 |
| | Air Products & Chemicals Inc. | 52,876 | 12,425 |
| | Ecolab Inc. | 60,155 | 11,609 |
| | Sherwin-Williams Co. | 19,708 | 11,500 |
| | DuPont de Nemours Inc. | 177,749 | 11,412 |
| | Dow Inc. | 177,906 | 9,737 |
| | Newmont Goldcorp Corp. | 196,646 | 8,544 |
| | PPG Industries Inc. | 56,726 | 7,572 |
| | LyondellBasell Industries NV Class A | 61,602 | 5,820 |
| | Corteva Inc. | 179,713 | 5,312 |
| | Ball Corp. | 78,495 | 5,076 |
| | Freeport-McMoRan Inc. | 348,269 | 4,569 |
| | Vulcan Materials Co. | 31,715 | 4,567 |
| | International Paper Co. | 94,099 | 4,333 |
| | Amcor plc | 388,930 | 4,216 |
| | Martin Marietta Materials Inc. | 14,989 | 4,192 |
| | Nucor Corp. | 72,792 | 4,097 |
| | Celanese Corp. Class A | 29,027 | 3,574 |
| | International Flavors & Fragrances Inc. | 25,569 | 3,299 |
| | FMC Corp. | 31,145 | 3,109 |
| | Westrock Co. | 61,998 | 2,660 |
| | Avery Dennison Corp. | 20,017 | 2,619 |
| | Eastman Chemical Co. | 32,621 | 2,586 |
| | Packaging Corp. of America | 22,654 | 2,537 |
| | CF Industries Holdings Inc. | 52,302 | 2,497 |
| | Albemarle Corp. | 25,372 | 1,853 |
| | Mosaic Co. | 83,663 | 1,810 |
| | Sealed Air Corp. | 36,974 | 1,473 |
| | | | 170,433 |
| Real Estate (2.9%) |
| | American Tower Corp. | 106,260 | 24,421 |
| | Crown Castle International Corp. | 99,743 | 14,178 |
| | Prologis Inc. | 151,543 | 13,508 |
| | Equinix Inc. | 20,456 | 11,940 |
| | Simon Property Group Inc. | 73,636 | 10,969 |
| | Welltower Inc. | 97,336 | 7,960 |
| | Public Storage | 36,035 | 7,674 |
| | AvalonBay Communities Inc. | 33,496 | 7,024 |
| | Equity Residential | 83,726 | 6,775 |
| | SBA Communications Corp. Class A | 27,016 | 6,511 |
| | Digital Realty Trust Inc. | 50,075 | 5,996 |
| | Realty Income Corp. | 78,184 | 5,757 |
| | Weyerhaeuser Co. | 178,793 | 5,399 |
| | Ventas Inc. | 89,430 | 5,164 |
| * | CBRE Group Inc. Class A | 80,334 | 4,924 |
| | Essex Property Trust Inc. | 15,859 | 4,771 |
| | Boston Properties Inc. | 34,510 | 4,757 |
| | Alexandria Real Estate Equities Inc. | 27,646 | 4,467 |
| | Healthpeak Properties Inc. | 118,842 | 4,096 |
| | Mid-America Apartment Communities Inc. | 27,339 | 3,605 |
| | UDR Inc. | 70,406 | 3,288 |
| | Extra Space Storage Inc. | 31,120 | 3,287 |
| | Host Hotels & Resorts Inc. | 172,322 | 3,197 |
| | Duke Realty Corp. | 88,342 | 3,063 |
| | Regency Centers Corp. | 40,102 | 2,530 |
| | Vornado Realty Trust | 37,905 | 2,521 |
| | Iron Mountain Inc. | 69,123 | 2,203 |
| | Federal Realty Investment Trust | 16,806 | 2,163 |
| | Kimco Realty Corp. | 101,049 | 2,093 |
| | Apartment Investment & Management Co. | 35,620 | 1,840 |
| | SL Green Realty Corp. | 19,511 | 1,793 |
| | Macerich Co. | 1,770 | 48 |
| | | | 187,922 |
| Utilities (3.3%) |
| | NextEra Energy Inc. | 117,247 | 28,393 |
| | Dominion Energy Inc. | 197,439 | 16,352 |
| | Southern Co. | 251,561 | 16,024 |
| | Duke Energy Corp. | 174,914 | 15,954 |
| | American Electric Power Co. Inc. | 118,482 | 11,198 |
| | Exelon Corp. | 233,252 | 10,634 |
| | Sempra Energy | 67,616 | 10,242 |
| | Xcel Energy Inc. | 125,783 | 7,986 |
| | Consolidated Edison Inc. | 79,726 | 7,213 |
| | Public Service Enterprise Group Inc. | 121,309 | 7,163 |
| | WEC Energy Group Inc. | 75,645 | 6,977 |
| | Eversource Energy | 77,646 | 6,605 |
| | Edison International | 86,033 | 6,488 |
| | FirstEnergy Corp. | 129,604 | 6,299 |
| | PPL Corp. | 173,481 | 6,224 |
| | DTE Energy Co. | 46,078 | 5,984 |
| | Entergy Corp. | 47,760 | 5,722 |
Equity Index Portfolio
| | | | Market |
| | | | Value• |
| | | Shares | ($000) |
| | American Water Works Co. Inc. | 43,374 | 5,328 |
| | Ameren Corp. | 59,075 | 4,537 |
| | CMS Energy Corp. | 68,142 | 4,282 |
| | Evergy Inc. | 54,752 | 3,564 |
| | CenterPoint Energy Inc. | 120,685 | 3,291 |
| | Atmos Energy Corp. | 28,687 | 3,209 |
| | AES Corp. | 159,530 | 3,175 |
| | Alliant Energy Corp. | 57,752 | 3,160 |
| | NiSource Inc. | 89,391 | 2,489 |
| | Pinnacle West Capital Corp. | 26,897 | 2,419 |
| | NRG Energy Inc. | 60,211 | 2,393 |
| | | | 213,305 |
Total Common Stocks
(Cost $3,704,149) | 6,419,625 |
| Temporary Cash Investments (0.8%)1 |
| Money Market Fund (0.8%) |
| 2,3 | Vanguard Market Liquidity Fund, 1.816% | 477,431 | 47,748 |
| | | | |
| | | Face | |
| | | Amount | |
| | | ($000) | |
| U.S. Government and Agency Obligations (0.0%) |
| 4 | United States Treasury Bill, 1.546%, 3/26/20 | 1,000 | 996 |
| 4 | United States Treasury Bill, 1.527%–1.541%, 4/30/20 | 1,470 | 1,463 |
| | | | 2,459 |
Total Temporary Cash Investments
(Cost $50,210) | 50,207 |
Total Investments (100.2%)
(Cost $3,754,359) | 6,469,832 |
| | Amount |
| | ($000) |
| Other Assets and Liabilities (-0.2%) | |
| Other Assets | |
| Investment in Vanguard | 280 |
| Receivables for Investment Securities Sold | 37 |
| Receivables for Accrued Income | 6,569 |
| Receivables for Capital Shares Issued | 511 |
| Variation Margin Receivable—Futures Contracts | 94 |
| Total Other Assets | 7,491 |
| Liabilities | |
| Payables for Investment Securities Purchased | (15,083) |
| Collateral for Securities on Loan | (264) |
| Payables for Capital Shares Redeemed | (1,992) |
| Payables to Vanguard | (1,966) |
| Total Liabilities | (19,305) |
| Net Assets (100%) | |
| Applicable to 135,394,379 outstanding $.001 par value shares of beneficial interest (unlimited authorization) | 6,458,018 |
| Net Asset Value Per Share | $47.70 |
| At December 31, 2019, net assets consisted of: |
| | Amount |
| | ($000) |
| Paid-in Capital | 3,511,475 |
| Total Distributable Earnings (Loss) | 2,946,543 |
| Net Assets | 6,458,018 |
| • | See Note A in Notes to Financial Statements. |
| * | Non-income-producing security. |
| ^ | Includes partial security positions on loan to broker-dealers. The total value of securities on loan is $259,000. |
| 1 | The portfolio invests a portion of its cash reserves in equity markets through the use of index futures contracts. After giving effect to futures investments, the portfolio’s effective common stock and temporary cash investment positions represent 100.0% and 0.2%, respectively, of net assets. |
| 2 | Collateral of $264,000 was received for securities on loan. |
| 3 | Affiliated money market fund available only to Vanguard funds and certain trusts and accounts managed by Vanguard. Rate shown is the 7-day yield. |
| 4 | Securities with a value of $1,549,000 have been segregated as initial margin for open futures contracts. |
| Derivative Financial Instruments Outstanding as of Period End | | | | |
| | | | | |
| Futures Contracts | | | | |
| | | | | | ($000) |
| | | | | | Value and |
| | | Number of | | | Unrealized |
| | | Long (Short | ) | Notional | Appreciation |
| | Expiration | Contracts | | Amount | (Depreciation) |
| Long Futures Contracts | | | | | |
| E-mini S&P 500 Index | March 2020 | 243 | | 39,258 | 596 |
See accompanying Notes, which are an integral part of the Financial Statements.
Equity Index Portfolio
Statement of Operations
| | Year Ended |
| | December 31, 2019 |
| | ($000) |
| Investment Income |
| Income |
| Dividends | 114,609 |
| Interest1 | 618 |
| Securities Lending—Net | 84 |
| Total Income | 115,311 |
| Expenses |
| The Vanguard Group—Note B |
| Investment Advisory Services | 854 |
| Management and Administrative | 6,511 |
| Marketing and Distribution | 525 |
| Custodian Fees | 21 |
| Auditing Fees | 75 |
| Shareholders’ Reports | 41 |
| Trustees’ Fees and Expenses | 3 |
| Total Expenses | 8,030 |
| Net Investment Income | 107,281 |
| Realized Net Gain (Loss) |
| Investment Securities Sold1 | 124,531 |
| Futures Contracts | 7,573 |
| Realized Net Gain (Loss) | 132,104 |
| Change in Unrealized Appreciation (Depreciation) |
| Investment Securities1 | 1,295,700 |
| Futures Contracts | 296 |
| Change in Unrealized Appreciation (Depreciation) | 1,295,996 |
| Net Increase (Decrease) in Net Assets Resulting from Operations | 1,535,381 |
| 1 | Interest income, realized net gain (loss), and change in unrealized appreciation (depreciation) from an affiliated company of the portfolio were $582,000, ($2,000), and ($4,000), respectively. Purchases and sales are for temporary cash investment purposes. |
Statement of Changes in Net Assets
| | Year Ended December 31, |
| | 2019 | 2018 |
| | ($000) | ($000) |
| Increase (Decrease) in Net Assets | | |
| Operations | | |
| Net Investment Income | 107,281 | 103,632 |
| Realized Net Gain (Loss) | 132,104 | 138,799 |
| Change in Unrealized Appreciation (Depreciation) | 1,295,996 | (473,810) |
| Net Increase (Decrease) in Net Assets Resulting from Operations | 1,535,381 | (231,379) |
| Distributions | | |
| Net Investment Income | (107,141) | (88,315) |
| Realized Capital Gain1 | (140,285) | (85,966) |
| Total Distributions | (247,426) | (174,281) |
| Capital Share Transactions | | |
| Issued | 584,985 | 560,449 |
| Issued in Lieu of Cash Distributions | 247,426 | 174,281 |
| Redeemed | (596,018) | (573,178) |
| Net Increase (Decrease) from Capital Share Transactions | 236,393 | 161,552 |
| Total Increase (Decrease) | 1,524,348 | (244,108) |
| Net Assets | | |
| Beginning of Period | 4,933,670 | 5,177,778 |
| End of Period | 6,458,018 | 4,933,670 |
| 1 | Includes fiscal 2019 and 2018 short-term gain distributions totaling $347,000 and $2,110,000, respectively. Short-term gain distributions are treated as ordinary income dividends for tax purposes. |
See accompanying Notes, which are an integral part of the Financial Statements.
Equity Index Portfolio
Financial Highlights
| For a Share Outstanding | | | Year Ended December 31, |
| Throughout Each Period | 2019 | 2018 | 2017 | 2016 | 2015 |
| Net Asset Value, Beginning of Period | $38.03 | $41.17 | $35.63 | $33.25 | $34.44 |
| Investment Operations | | | | | |
| Net Investment Income | .8051 | .8041 | .6991 | .704 | .7592 |
| Net Realized and Unrealized Gain (Loss) on Investments | 10.791 | (2.556) | 6.734 | 3.055 | (.338) |
| Total from Investment Operations | 11.596 | (1.752) | 7.433 | 3.759 | .421 |
| Distributions | | | | | |
| Dividends from Net Investment Income | (.834) | (.703) | (.699) | (.759) | (.569) |
| Distributions from Realized Capital Gains | (1.092) | (.685) | (1.194) | (.620) | (1.042) |
| Total Distributions | (1.926) | (1.388) | (1.893) | (1.379) | (1.611) |
| Net Asset Value, End of Period | $47.70 | $38.03 | $41.17 | $35.63 | $33.25 |
| | | | | | |
| Total Return | 31.30% | -4.51% | 21.66% | 11.81% | 1.27% |
| | | | | | |
| Ratios/Supplemental Data | | | | | |
| Net Assets, End of Period (Millions) | $6,458 | $4,934 | $5,178 | $4,329 | $3,985 |
| Ratio of Total Expenses to Average Net Assets | 0.14% | 0.14% | 0.15% | 0.15% | 0.15% |
| Ratio of Net Investment Income to Average Net Assets | 1.87% | 1.94% | 1.85% | 2.08% | 2.31%2 |
| Portfolio Turnover Rate | 4% | 5% | 5% | 7% | 4% |
| 1 | Calculated based on average shares outstanding. |
| 2 | Net investment income per share and the ratio of net investment income to average net assets include $.13 and 0.35%, respectively, resulting from a special dividend from Medtronic plc in January 2015. |
See accompanying Notes, which are an integral part of the Financial Statements.
Equity Index Portfolio
Notes to Financial Statements
The Equity Index Portfolio, a portfolio of Vanguard Variable Insurance Funds, is registered under the Investment Company Act of 1940 as an open-end investment company. The portfolio’s shares are only available for purchase by separate accounts of insurance companies as investments for variable annuity plans, variable life insurance contracts, or other variable benefit insurance contracts.
A. The following significant accounting policies conform to generally accepted accounting principles for U.S. investment companies. The portfolio consistently follows such policies in preparing its financial statements.
1. Security Valuation: Securities are valued as of the close of trading on the New York Stock Exchange (generally 4 p.m., Eastern time) on the valuation date. Equity securities are valued at the latest quoted sales prices or official closing prices taken from the primary market in which each security trades; such securities not traded on the valuation date are valued at the mean of the latest quoted bid and asked prices. Securities for which market quotations are not readily available, or whose values have been materially affected by events occurring before the portfolio’s pricing time but after the close of the securities’ primary markets, are valued by methods deemed by the board of trustees to represent fair value. Investments in Vanguard Market Liquidity Fund are valued at that fund’s net asset value. Temporary cash investments are valued using the latest bid prices or using valuations based on a matrix system (which considers such factors as security prices, yields, maturities, and ratings), both as furnished by independent pricing services.
2. Futures Contracts: The portfolio uses index futures contracts to a limited extent, with the objectives of maintaining full exposure to the stock market, maintaining liquidity, and minimizing transaction costs. The portfolio may purchase futures contracts to immediately invest incoming cash in the market, or sell futures in response to cash outflows, thereby simulating a fully invested position in the underlying index while maintaining a cash balance for liquidity. The primary risks associated with the use of futures contracts are imperfect correlation between changes in market values of stocks held by the portfolio and the prices of futures contracts, and the possibility of an illiquid market. Counterparty risk involving futures is mitigated because a regulated clearinghouse is the counterparty instead of the clearing broker. To further mitigate counterparty risk, the portfolio trades futures contracts on an exchange, monitors the financial strength of its clearing brokers and clearinghouse, and has entered into clearing agreements with its clearing brokers. The clearinghouse imposes initial margin requirements to secure the portfolio’s performance and requires daily settlement of variation margin representing changes in the market value of each contract. Any assets pledged as initial margin for open contracts are noted in the Statement of Net Assets.
Futures contracts are valued at their quoted daily settlement prices. The notional amounts of the contracts are not recorded in the Statement of Net Assets. Fluctuations in the value of the contracts are recorded in the Statement of Net Assets as an asset (liability) and in the Statement of Operations as unrealized appreciation (depreciation) until the contracts are closed, when they are recorded as realized futures gains (losses).
During the year ended December 31, 2019, the portfolio’s average investments in long and short futures contracts represented less than 1% and 0%, respectively, of net assets, based on the average of the notional amounts at each quarter-end during the period.
3. Federal Income Taxes: The portfolio intends to continue to qualify as a regulated investment company and distribute all of its taxable income. Management has analyzed the portfolio’s tax positions taken for all open federal income tax years (December 31, 2016–2019), and has concluded that no provision for federal income tax is required in the portfolio’s financial statements.
4. Distributions: Distributions to shareholders are recorded on the ex-dividend date. Distributions are determined on a tax basis and may differ from net investment income and realized capital gains for financial reporting purposes.
5. Securities Lending: To earn additional income, the portfolio lends its securities to qualified institutional borrowers. Security loans are subject to termination by the portfolio at any time, and are required to be secured at all times by collateral in an amount at least equal to the market value of securities loaned. Daily market fluctuations could cause the value of loaned securities to be more or less than the value of the collateral received. When this occurs, the collateral is adjusted and settled before the opening of the market on the next business day. The portfolio further mitigates its counterparty risk by entering into securities lending transactions only with a diverse group of prequalified counterparties, monitoring their financial strength, and entering into master securities lending agreements with its counterparties.
Equity Index Portfolio
The master securities lending agreements provide that, in the event of a counterparty’s default (including bankruptcy), the portfolio may terminate any loans with that borrower, determine the net amount owed, and sell or retain the collateral up to the net amount owed to the portfolio; however, such actions may be subject to legal proceedings. While collateral mitigates counterparty risk, in the event of a default, the portfolio may experience delays and costs in recovering the securities loaned. The portfolio invests cash collateral received in Vanguard Market Liquidity Fund, and records a liability in the Statement of Net Assets for the return of the collateral, during the period the securities are on loan. Securities lending income represents fees charged to borrowers plus income earned on invested cash collateral, less expenses associated with the loan. During the term of the loan, the portfolio is entitled to all distributions made on or in respect of the loaned securities.
6. Credit Facility: The portfolio and certain other funds managed by The Vanguard Group (“Vanguard”) participate in a $4.3 billion committed credit facility provided by a syndicate of lenders pursuant to a credit agreement that may be renewed annually; each fund is individually liable for its borrowings, if any, under the credit facility. Borrowings may be utilized for temporary and emergency purposes, and are subject to the portfolio’s regulatory and contractual borrowing restrictions. The participating funds are charged administrative fees and an annual commitment fee of 0.10% of the undrawn amount of the facility; these fees are allocated to the funds based on a method approved by the portfolio’s board of trustees and included in Management and Administrative expenses on the portfolio’s Statement of Operations. Any borrowings under this facility bear interest at a rate based upon the higher of the one-month London Interbank Offered Rate, federal funds effective rate, or overnight bank funding rate plus an agreed-upon spread.
The portfolio had no borrowings outstanding at December 31, 2019, or at any time during the period then ended.
7. Other: Dividend income is recorded on the ex-dividend date. Interest income includes income distributions received from Vanguard Market Liquidity Fund and is accrued daily. Premiums and discounts on debt securities are amortized and accreted, respectively, to interest income over the lives of the respective securities, except for premiums on certain callable debt securities that are amortized to the earliest call date. Security transactions are accounted for on the date securities are bought or sold. Costs used to determine realized gains (losses) on the sale of investment securities are those of the specific securities sold.
B. In accordance with the terms of a Funds’ Service Agreement (the “FSA”) between Vanguard and the portfolio, Vanguard furnishes to the portfolio investment advisory, corporate management, administrative, marketing, and distribution services at Vanguard’s cost of operations (as defined by the FSA). These costs of operations are allocated to the portfolio based on methods and guidelines approved by the board of trustees. Vanguard does not require reimbursement in the current period for certain costs of operations (such as deferred compensation/benefits and risk/insurance costs); the portfolio’s liability for these costs of operations is included in Payables to Vanguard on the Statement of Net Assets. All other costs of operations payable to Vanguard are generally settled twice a month.
Upon the request of Vanguard, the portfolio may invest up to 0.40% of its net assets as capital in Vanguard. At December 31, 2019, the portfolio had contributed to Vanguard capital in the amount of $280,000, representing less than 0.01% of the portfolio’s net assets and 0.11% of Vanguard’s capital received pursuant to the FSA. The portfolio’s trustees and officers are also directors and employees, respectively, of Vanguard.
C. Various inputs may be used to determine the value of the portfolio’s investments. These inputs are summarized in three broad levels for financial statement purposes. The inputs or methodologies used to value securities are not necessarily an indication of the risk associated with investing in those securities.
Level 1—Quoted prices in active markets for identical securities.
Level 2—Other significant observable inputs (including quoted prices for similar securities, interest rates, prepayment speeds, credit risk, etc.).
Level 3—Significant unobservable inputs (including the portfolio’s own assumptions used to determine the fair value of investments). Any investments valued with significant unobservable inputs are noted on the Statement of Net Assets.
Equity Index Portfolio
The following table summarizes the market value of the portfolio’s investments and derivatives as of December 31, 2019, based on the inputs used to value them:
| | | Level 1 | | | Level 2 | | | Level 3 | |
| Investments | | ($000 | ) | | ($000 | ) | | ($000 | ) |
| Common Stocks | | 6,419,625 | | | — | | | — | |
| Temporary Cash Investments | | 47,748 | | | 2,459 | | | — | |
| Futures Contracts—Assets1 | | 94 | | | — | | | — | |
| Total | | 6,467,467 | | | 2,459 | | | — | |
1 Represents variation margin on the last day of the reporting period.
D. Permanent differences between book-basis and tax-basis components of net assets, if any, are reclassified among capital accounts in the financial statements to reflect their tax character. These reclassifications have no effect on net assets or net asset value per share.
Temporary differences between book-basis and tax-basis components of total distributable earnings (loss) arise when certain items of income, gain, or loss are recognized in different periods for financial statement and tax purposes; these differences will reverse at some time in the future. The differences are primarily related to the tax deferral of losses on wash sales and the realization of unrealized gains or losses on certain futures contracts. As of period end, the tax-basis components of total distributable earnings (loss) are detailed in the table as follows:
| | | Amount | |
| | | ($000 | ) |
| Undistributed Ordinary Income | | 105,297 | |
| Undistributed Long-Term Gains | | 127,272 | |
| Capital Loss Carryforwards (Non-expiring) | | — | |
| Net Unrealized Gains (Losses) | | 2,715,473 | |
As of December 31, 2019, gross unrealized appreciation and depreciation for investments and derivatives based on cost for U.S. federal income tax purposes were as follows:
| | | Amount | |
| | | ($000 | ) |
| Tax Cost | | 3,754,359 | |
| Gross Unrealized Appreciation | | 3,036,531 | |
| Gross Unrealized Depreciation | | (321,058 | ) |
| Net Unrealized Appreciation (Depreciation) | | 2,715,473 | |
E. During the year ended December 31, 2019, the portfolio purchased $335,753,000 of investment securities and sold $242,628,000 of investment securities, other than temporary cash investments.
F. Capital shares issued and redeemed were:
| | | Year Ended December 31, | |
| | | 2019 | | | 2018 | |
| | | Shares | | | Shares | |
| | | (000 | ) | | (000 | ) |
| Issued | | 13,588 | | | 13,586 | |
| Issued in Lieu of Cash Distributions | | 6,019 | | | 4,242 | |
| Redeemed | | (13,957 | ) | | (13,844 | ) |
| Net Increase (Decrease) in Shares Outstanding | | 5,650 | | | 3,984 | |
At December 31, 2019, two shareholders (an insurance company separate account whose holdings in the portfolio represent the indirect investment of Vanguard Variable Annuity contract holders and Total Stock Market Index Portfolio), were each the record or beneficial owner of 25% or more of the portfolio’s net assets, with a combined ownership of 63%. If any of these shareholders were to redeem their investment in the portfolio, the redemption might result in an increase in the portfolio’s expense ratio, cause the portfolio to incur higher transaction costs, or lead to the realization of taxable capital gains.
G. Management has determined that no events or transactions occurred subsequent to December 31, 2019, that would require recognition or disclosure in these financial statements.
Equity Index Portfolio
Report of Independent Registered Public Accounting Firm
To the Board of Trustees of Vanguard Variable Insurance Funds and Shareholders of Equity Index Portfolio
Opinion on the Financial Statements
We have audited the accompanying statement of net assets of Equity Index Portfolio (one of the portfolios constituting Vanguard Variable Insurance Funds, referred to hereafter as the “Portfolio”) as of December 31, 2019, the related statement of operations for the year ended December 31, 2019, the statement of changes in net assets for each of the two years in the period ended December 31, 2019, including the related notes, and the financial highlights for each of the five years in the period ended December 31, 2019 (collectively referred to as the “financial statements”). In our opinion, the financial statements present fairly, in all material respects, the financial position of the Portfolio as of December 31, 2019, the results of its operations for the year then ended, the changes in its net assets for each of the two years in the period ended December 31, 2019 and the financial highlights for each of the five years in the period ended December 31, 2019 in conformity with accounting principles generally accepted in the United States of America.
Basis for Opinion
These financial statements are the responsibility of the Portfolio’s management. Our responsibility is to express an opinion on the Portfolio’s financial statements based on our audits. We are a public accounting firm registered with the Public Company Accounting Oversight Board (United States) (“PCAOB”) and are required to be independent with respect to the Portfolio in accordance with the U.S. federal securities laws and the applicable rules and regulations of the Securities and Exchange Commission and the PCAOB.
We conducted our audits of these financial statements in accordance with the standards of the PCAOB. Those standards require that we plan and perform the audit to obtain reasonable assurance about whether the financial statements are free of material misstatement, whether due to error or fraud.
Our audits included performing procedures to assess the risks of material misstatement of the financial statements, whether due to error or fraud, and performing procedures that respond to those risks. Such procedures included examining, on a test basis, evidence regarding the amounts and disclosures in the financial statements. Our audits also included evaluating the accounting principles used and significant estimates made by management, as well as evaluating the overall presentation of the financial statements. Our procedures included confirmation of securities owned as of December 31, 2019 by correspondence with the custodian and brokers and by agreement to the underlying ownership records of the transfer agent; when replies were not received from brokers, we performed other auditing procedures. We believe that our audits provide a reasonable basis for our opinion.
/s/PricewaterhouseCoopers LLP
Philadelphia, Pennsylvania
February 18, 2020
We have served as the auditor of one or more investment companies in The Vanguard Group of Funds since 1975.
Special 2019 tax information (unaudited) for corporate shareholders only for Equity Index Portfolio, a portfolio of Vanguard Variable Insurance Funds
This information for the fiscal year ended December 31, 2019, is included pursuant to provisions of the Internal Revenue Code for corporate shareholders only.
The portfolio distributed $139,938,000 as capital gain dividends (20% rate gain distributions) to shareholders during the fiscal year.
For corporate shareholders, 95.4% of investment income (dividend income plus short-term gains, if any) qualifies for the dividends-received deduction.
Equity Index Portfolio
The S&P 500 Index is a product of S&P Dow Jones Indices LLC, a division of S&P Global, or its affiliates (“SPDJI”), and has been licensed for use by Vanguard. Standard & Poor’s®, and S&P®are registered trademarks of Standard & Poor’s Financial Services LLC, a division of S&P Global (“S&P”) and Dow Jones® is a registered trademark of Dow Jones Trademark Holdings LLC (“Dow Jones”). The trademarks have been licensed to SPDJI and have been sublicensed for use for certain purposes by Vanguard. Vanguard Equity Index Portfolio is not sponsored, endorsed, sold or promoted by SPDJI, Dow Jones, S&P, any of their respective affiliates (collectively, “S&P Dow Jones Indices”). S&P Dow Jones Indices make no representation or warranty, express or implied, to the owners of the Vanguard Equity Index Portfolio or any member of the public regarding the advisability of investing in securities generally or in Vanguard Equity Index Portfolio particularly or the ability of the S&P 500 Index to track general market performance. S&P Dow Jones Indices’ only relationship to Vanguard with respect to the S&P 500 Index is the licensing of the Index and certain trademarks, service marks and/or trade names of S&P Dow Jones Indices and/or its licensors. The S&P 500 Index is determined, composed and calculated by S&P Dow Jones Indices without regard to Vanguard or the Vanguard Equity Index Portfolio. S&P Dow Jones Indices have no obligation to take the needs of Vanguard or the owners of Vanguard Equity Index Portfolio into consideration in determining, composing or calculating the S&P 500 Index. S&P Dow Jones Indices are not responsible for and have not participated in the determination of the prices, and amount of Vanguard Equity Index Portfolio or the timing of the issuance or sale of Vanguard Equity Index Portfolio or in the determination or calculation of the equation by which Vanguard Equity Index Portfolio is to be converted into cash, surrendered or redeemed, as the case may be. S&P Dow Jones Indices have no obligation or liability in connection with the administration, marketing or trading of Vanguard Equity Index Portfolio. There is no assurance that investment products based on the S&P 500 Index will accurately track index performance or provide positive investment returns. S&P Dow Jones Indices LLC is not an investment advisor. Inclusion of a security within an index is not a recommendation by S&P Dow Jones Indices to buy, sell, or hold such security, nor is it considered to be investment advice.
S&P DOW JONES INDICES DOES NOT GUARANTEE THE ADEQUACY, ACCURACY, TIMELINESS AND/OR THE COMPLETENESS OF THE S&P 500 INDEX OR ANY DATA RELATED THERETO OR ANY COMMUNICATION, INCLUDING BUT NOT LIMITED TO, ORAL OR WRITTEN COMMUNICATION (INCLUDING ELECTRONIC COMMUNICATIONS) WITH RESPECT THERETO. S&P DOW JONES INDICES SHALL NOT BE SUBJECT TO ANY DAMAGES OR LIABILITY FOR ANY ERRORS, OMISSIONS, OR DELAYS THEREIN. S&P DOW JONES INDICES MAKE NO EXPRESS OR IMPLIED WARRANTIES, AND EXPRESSLY DISCLAIMS ALL WARRANTIES, OF MERCHANTABILITY OR FITNESS FOR A PARTICULAR PURPOSE OR USE OR AS TO RESULTS TO BE OBTAINED BY VANGUARD, OWNERS OF THE VANGUARD EQUITY INDEX PORTFOLIO, OR ANY OTHER PERSON OR ENTITY FROM THE USE OF THE S&P 500 INDEX OR WITH RESPECT TO ANY DATA RELATED THERETO. WITHOUT LIMITING ANY OF THE FOREGOING, IN NO EVENT WHATSOEVER SHALL S&P DOW JONES INDICES BE LIABLE FOR ANY INDIRECT, SPECIAL, INCIDENTAL, PUNITIVE, OR CONSEQUENTIAL DAMAGES INCLUDING BUT NOT LIMITED TO, LOSS OF PROFITS, TRADING LOSSES, LOST TIME OR GOODWILL, EVEN IF THEY HAVE BEEN ADVISED OF THE POSSIBILITY OF SUCH DAMAGES, WHETHER IN CONTRACT, TORT, STRICT LIABILITY, OR OTHERWISE. THERE ARE NO THIRD PARTY BENEFICIARIES OF ANY AGREEMENTS OR ARRANGEMENTS BETWEEN S&P DOW JONES INDICES AND VANGUARD, OTHER THAN THE LICENSORS OF S&P DOW JONES INDICES.
Global Bond Index Portfolio
Your Portfolio’s Performance at a Glance
• For the 12 months ended December 31, 2019, the Global Bond Index Portfolio returned 8.41%, in line with the 8.64% return of its benchmark, the Global Bond Composite Index, after factoring in expenses.
• Investors were drawn to bonds and other assets perceived as safer during the period. The U.S.-China trade conflict fueled global economic growth concerns for much of the year before tensions eased in December. Bond prices rose and yields declined as the Federal Reserve trimmed its target for short-term interest rates three times in 2019. Other major central banks also adopted accommodative monetary policies.
• U.S. bonds, which make up about 70% of the benchmark, returned almost 9%. Japanese bonds returned more than 5%; U.K. bonds, more than 10%; Italian bonds, more than 13%; and German bonds, nearly 7%. Lower-quality bonds outperformed their higher-quality counterparts.
• Please note that the portfolio returns for Vanguard Variable Insurance Fund are different from those of Vanguard Variable Annuity (and other plans that invest in the fund), which take into account insurance-related expenses.
| Market Barometer | | | | Average Annual Total Returns |
| | | | | Periods Ended December 31, 2019 |
| | | One Year | | Three Years | | Five Years |
| Stocks | | | | | | |
| Russell 1000 Index (Large-caps) | | 31.43 | % | | 15.05 | % | | 11.48 | % |
| Russell 2000 Index (Small-caps) | | 25.53 | | | 8.59 | | | 8.23 | |
| Russell 3000 Index (Broad U.S. market) | | 31.02 | | | 14.57 | | | 11.24 | |
| FTSE All-World ex US Index (International) | | 21.81 | | | 9.96 | | | 5.83 | |
| | | | | | | | | | |
| Bonds | | | | | | | | | |
| Bloomberg Barclays U.S. Aggregate Bond Index (Broad taxable market) | | 8.72 | % | | 4.03 | % | | 3.05 | % |
| Bloomberg Barclays Municipal Bond Index (Broad tax-exempt market) | | 7.54 | | | 4.72 | | | 3.53 | |
| FTSE Three-Month U.S. Treasury Bill Index | | 2.25 | | | 1.65 | | | 1.04 | |
| | | | | | | | | | |
| CPI | | | | | | | | | |
| Consumer Price Index | | 2.29 | % | | 2.10 | % | | 1.82 | % |
Global Bond Index Portfolio
About Your Portfolio’s Expenses
As a shareholder of the portfolio, you incur ongoing costs, which include costs for portfolio management, administrative services, and shareholder reports (like this one), among others. Operating expenses, which are deducted from a portfolio’s gross income, directly reduce the investment return of the portfolio.
A typical portfolio’s expenses are expressed as a percentage of its average net assets. The Global Bond Index Portfolio has no direct expenses, but bears its proportionate share of the expenses of the underlying funds in which it invests. These indirect expenses make up the acquired fund fees and expenses, also expressed as a percentage of average net assets. The following examples are intended to help you understand the ongoing costs (in dollars) of investing in your portfolio and to compare these costs with those of other mutual funds. The examples are based on an investment of $1,000 made at the beginning of the period shown and held for the entire period. The costs were calculated using the acquired fund fees and expenses for the Global Bond Index Portfolio.
The accompanying table illustrates your portfolio’s costs in two ways:
• Based on actual portfolio return. This section helps you to estimate the actual expenses that you paid over the period. The “Ending Account Value” shown is derived from the portfolio’s actual return, and the third column shows the dollar amount that would have been paid by an investor who started with $1,000 in the portfolio. You may use the information here, together with the amount you invested, to estimate the expenses that you paid over the period.
To do so, simply divide your account value by $1,000 (for example, an $8,600 account value divided by $1,000 = 8.6), then multiply the result by the number given for your portfolio under the heading “Expenses Paid During Period.”
• Based on hypothetical 5% yearly return. This section is intended to help you compare your portfolio’s costs with those of other mutual funds. It assumes that the portfolio had a yearly return of 5% before expenses, but that the expense ratio is unchanged. In this case—because the return used is not the portfolio’s actual return—the results do not apply to your investment. The example is useful in making comparisons because the Securities and Exchange Commission requires all mutual funds to calculate expenses based on a 5% return. You can assess your portfolio’s costs by comparing this hypothetical example with the hypothetical examples that appear in shareholder reports of other funds.
Note that the expenses shown in the table are meant to highlight and help you compareongoingcosts only. The portfolio’s expense figure does not reflect additional fees and expenses associated with the annuity or life insurance program through which you invest.
The calculations assume no shares were bought or sold during the period. Your actual costs may have been higher or lower, depending on the amount of your investment and the timing of any purchases or redemptions.
You can find more information about the portfolio’s expenses in the Financial Statements section. For additional information on operating expenses and other shareholder costs, please refer to the prospectus.
| Six Months Ended December 31, 2019 | | | | | | |
| | | Beginning | | | Ending | | | Expenses | |
| | | Account Value | | | Account Value | | | Paid During | |
| Global Bond Index Portfolio | | 6/30/2019 | | | 12/31/2019 | | | Period | |
| Based on Actual Portfolio Return | | $1,000.00 | | | $1,021.96 | | | $0.66 | |
| Based on Hypothetical 5% Yearly Return | | 1,000.00 | | | 1,024.55 | | | 0.66 | |
The calculations are based the Global Bond Index Portfolio’s acquired fund fees and expenses for the most recent six-month period. The Global Bond Index Portfolio’s annualized expense figure for that period is 0.13%. The dollar amounts shown as “Expenses Paid” are equal to the annualized expense ratio multiplied by the average account value over the period, multiplied by the number of days in the most recent six-month period, then divided by the number of days in the most recent 12-month period (184/365).
Global Bond Index Portfolio
Performance Summary
All of the returns in this report represent past performance, which is not a guarantee of future results that may be achieved by the portfolio. (Current performance may be lower or higher than the performance data cited. For performance data current to the most recent month-end, visit our website at vanguard.com/performance.) Note, too, that both investment returns and principal value can fluctuate widely, so an investor’s shares, when sold, could be worth more or less than their original cost. The returns shown do not reflect taxes that a shareholder would pay on portfolio distributions or on the sale of portfolio shares. Nor do the returns reflect fees and expenses associated with the annuity or life insurance program through which a shareholder invests. If these fees and expenses were included, the portfolio’s returns would be lower.
Cumulative Performance: September 7, 2017–December 31, 2019
Initial Investment of $10,000


| | | Average Annual Total Returns | |
| | | Periods Ended December 31, 2019 | |
| | | | Since | Final Value |
| | | One | Inception | of a $10,000 |
| | | Year | (9/7/2017) | Investment |
 | Global Bond Index Portfolio | 8.41% | 3.83% | $10,909 |
 | Global Bond Composite Index | 8.64 | 3.97 | 10,943 |
Global Bond Composite Index: Weighted 70% Bloomberg Barclays U.S. Aggregate Float Adjusted Index and 30% Bloomberg Barclays Global Aggregate ex-USD Float Adjusted RIC Capped Index (USD Hedged).
“Since Inception” performance is calculated from the portfolio’s inception date for both the portfolio and its comparative standard(s).
See Financial Highlights for dividend and capital gains information.
Global Bond Index Portfolio
Allocation to Underlying Funds
As of December 31, 2019
| Vanguard Variable Insurance Fund Total Bond Market Index Portfolio | | 70.0 | % |
| Vanguard Total International Bond Index Fund Admiral Shares | | 30.0 | |
Global Bond Index Portfolio
Financial Statements
Statement of Net Assets
As of December 31, 2019
The portfolio files its complete schedule of portfolio holdings with the Securities and Exchange Commission (SEC) for the first and third quarters of each fiscal year as an exhibit to its reports on Form N-PORT. The portfolio’s Form N-PORT reports are available on the SEC’s website at www.sec.gov.
| | | Market |
| | | Value• |
| | Shares | ($000) |
| Investment Companies (100.0%) |
| U.S. Bond Fund (70.0%) | | |
| Vanguard Variable Insurance Fund—Total Bond Market Index Portfolio | 13,301,507 | 162,411 |
| | | |
| International Bond Fund (30.0%) | | |
| Vanguard Total International Bond Index Fund Admiral Shares | 3,080,840 | 69,689 |
| Total Investment Companies (Cost $223,662) | | 232,100 |
| Temporary Cash Investment (0.0%) |
| Money Market Fund (0.0%) | | |
| 1 Vanguard Market Liquidity Fund, 1.816%(Cost $12) | 125 | 12 |
| Total Investments (100.0%) (Cost $223,674) | | 232,112 |
| Other Assets and Liabilities (0.0%) |
| Other Assets | | 664 |
| Liabilities | | (721) |
| | | (57) |
| Net Assets (100%) |
| Applicable to 10,838,626 outstanding $.001 par value shares of beneficial interest (unlimited authorization) | | 232,055 |
| Net Asset Value Per Share | | $21.41 |
| |
| Amount |
| ($000) |
| Statement of Assets and Liabilities |
| Assets | | |
| Investments in Securities, at Value—Affiliated Funds | | 232,112 |
| Receivables for Capital Shares Issued | | 664 |
| Total Assets | | 232,776 |
| Liabilities | | |
| Payables for Investment Securities Purchased | | 498 |
| Payables for Capital Shares Redeemed | | 223 |
| Total Liabilities | | 721 |
| Net Assets | | 232,055 |
| | | |
| At December 31, 2019, net assets consisted of: | | |
| | | Amount |
| | | ($000) |
| Paid-in Capital | | 216,628 |
| Total Distributable Earnings (Loss) | | 15,427 |
| Net Assets | | 232,055 |
| •• | See Note A in Notes to Financial Statements. |
| 1 | Affiliated money market fund available only to Vanguard funds and certain trusts and accounts managed by Vanguard. Rate shown is the 7-day yield. |
See accompanying Notes, which are an integral part of the Financial Statements.
Global Bond Index Portfolio
Statement of Operations
| | | Year Ended | |
| | | December 31, 2019 | |
| | ($000) | |
| Investment Income | | | |
| Income | | | |
| Income Distributions Received from Affiliated Funds | | 5,652 | |
| Net Investment Income—Note B | | 5,652 | |
| Realized Net Gain (Loss) | | | |
| Capital Gain Distributions Received from Affiliated Funds | | — | |
| Affiliated Funds Sold | | 1,481 | |
| Realized Net Gain (Loss) | | 1,481 | |
| Change in Unrealized Appreciation (Depreciation) from Affiliated Funds | | 9,127 | |
| Net Increase (Decrease) in Net Assets Resulting from Operations | | 16,260 | |
Statement of Changes in Net Assets
| | | Year Ended December 31, |
| | | 2019 | | | 2018 | |
| | | ($000 | ) | | ($000 | ) |
| Increase (Decrease) in Net Assets | | | | | | |
| Operations | | | | | | |
| Net Investment Income | | 5,652 | | | 2,690 | |
| Realized Net Gain (Loss) | | 1,481 | | | 226 | |
| Change in Unrealized Appreciation (Depreciation) | | 9,127 | | | (577 | ) |
| Net Increase (Decrease) in Net Assets Resulting from Operations | | 16,260 | | | 2,339 | |
| Distributions | | | | | | |
| Net Investment Income | | (2,825 | ) | | (223 | ) |
| Realized Capital Gain1 | | (233 | ) | | (18 | ) |
| Total Distributions | | (3,058 | ) | | (241 | ) |
| Capital Share Transactions | | | | | | |
| Issued | | 90,552 | | | 113,308 | |
| Issued in Lieu of Cash Distributions | | 3,058 | | | 240 | |
| Redeemed | | (37,595 | ) | | (7,418 | ) |
| Net Increase (Decrease) from Capital Share Transactions | | 56,015 | | | 106,130 | |
| Total Increase (Decrease) | | 69,217 | | | 108,228 | |
| Net Assets | | | | | | |
| Beginning of Period | | 162,838 | | | 54,610 | |
| End of Period | | 232,055 | | | 162,838 | |
| 1 | Includes fiscal 2019 and 2018 short-term gain distributions totaling $114,000 and $18,000, respectively. Short-term gain distributions are treated as ordinary income dividends for tax purposes. |
See accompanying Notes, which are an integral part of the Financial Statements.
Global Bond Index Portfolio
Financial Highlights
| | | | | Sept. 7, | |
| | | | | 20171to | |
| | | Year Ended Dec. 31, | | Dec. 31, | |
| For a Share Outstanding Throughout Each Period | | 2019 | | 2018 | | 2017 | |
| Net Asset Value, Beginning of Period | | $20.07 | | $19.97 | | $20.00 | |
| Investment Operations | | | | | | | |
| Net Investment Income2 | | .571 | | .462 | | .164 | |
| Capital Gain Distributions Received2 | | — | | .020 | | — | |
| Net Realized and Unrealized Gain (Loss) on Investments | | 1.100 | | (.327 | ) | (.194 | ) |
| Total from Investment Operations | | 1.671 | | .155 | | (.030 | ) |
| Distributions | | | | | | | |
| Dividends from Net Investment Income | | (.306 | ) | (.051 | ) | — | |
| Distributions from Realized Capital Gains | | (.025 | ) | (.004 | ) | — | |
| Total Distributions | | (.331 | ) | (.055 | ) | — | |
| Net Asset Value, End of Period | | $21.41 | | $20.07 | | $19.97 | |
| | | | | | | | |
| Total Return | | 8.41% | | 0.78% | | -0.15% | |
| | | | | | | | |
| Ratios/Supplemental Data | | | | | | | |
| Net Assets, End of Period (Millions) | | $232 | | $163 | | $55 | |
| Ratio of Total Expenses to Average Net Assets | | — | | — | | — | |
| Acquired Fund Fees and Expenses | | 0.13% | | 0.13% | | 0.14%3 | |
| Ratio of Net Investment Income to Average Net Assets | | 2.73% | | 2.34% | | 2.59%3 | |
| Portfolio Turnover Rate | | 12% | | 10% | | 8% | |
| 2 | Calculated based on average shares outstanding. |
Notes to Financial Statements
The Global Bond Index Portfolio, a portfolio of Vanguard Variable Insurance Funds, is registered under the Investment Company Act of 1940 as an open-end investment company. The portfolio seeks to match the return of its target index by investing in selected Vanguard funds and portfolios. The portfolio invests a substantial amount of its assets in VVIF Total Bond Market Index Portfolio. The accompanying financial statements of VVIF Total Bond Market Index Portfolio should be read in conjunction with the financial statements of the portfolio. Financial statements and other information about each underlying fund and portfolio are available on vanguard.com. The portfolio’s shares are only available for purchase by separate accounts of insurance companies as investments for variable annuity plans, variable life insurance contracts, or other variable benefit insurance contracts.
A. The following significant accounting policies conform to generally accepted accounting principles for U.S. investment companies. The portfolio consistently follows such policies in preparing its financial statements.
1. Security Valuation: Investments are valued at the net asset value of each underlying Vanguard fund determined as of the close of the New York Stock Exchange (generally 4 p.m., Eastern time) on the valuation date.
2. Federal Income Taxes: The portfolio intends to continue to qualify as a regulated investment company and distribute all of its taxable income. Management has analyzed the portfolio’s tax positions taken for all open federal income tax years (December 31, 2017–2019), and has concluded that no provision for federal income tax is required in the portfolio’s financial statements.
Global Bond Index Portfolio
3. Distributions: Distributions to shareholders are recorded on the ex-dividend date. Distributions are determined on a tax basis and may differ from net investment income and realized capital gains for financial reporting purposes.
4. Credit Facility: The portfolio and certain other funds managed by The Vanguard Group (“Vanguard”) participate in a $4.3 billion committed credit facility provided by a syndicate of lenders pursuant to a credit agreement that may be renewed annually; each fund is individually liable for its borrowings, if any, under the credit facility. Borrowings may be utilized for temporary and emergency purposes, and are subject to the portfolio’s regulatory and contractual borrowing restrictions. The participating funds are charged administrative fees and an annual commitment fee of 0.10% of the undrawn amount of the facility; these fees are allocated to the funds based on a method approved by the portfolio’s board of trustees and borne by the funds in which the portfolio invests (see Note B). Any borrowings under this facility bear interest at a rate based upon the higher of the one-month London Interbank Offered Rate, federal funds effective rate, or overnight bank funding rate plus an agreed-upon spread.
The portfolio had no borrowings outstanding at December 31, 2019, or at any time during the period then ended.
5. Other: Income and capital gain distributions received are recorded on the ex-dividend date. Security transactions are accounted for on the date securities are bought or sold. Costs used to determine realized gains (losses) on the sale of investment securities are those of the specific securities sold.
B. In accordance with the terms of a Funds’ Service Agreement (the “FSA”) between Vanguard and the portfolio, Vanguard furnishes to the portfolio investment advisory, corporate management, administrative, marketing, and distribution services at Vanguard’s cost of operations (as defined by the FSA). These costs of operations are allocated to the portfolio based on methods and guidelines approved by the board of trustees. The FSA provides that expenses otherwise allocable to Vanguard funds-of-funds may be reduced or eliminated to the extent of savings realized by the underlying Vanguard funds by virtue of being part of a fund-of-funds. Accordingly, all expenses for services provided by Vanguard to the portfolio and all other expenses incurred by the portfolio during the period ended December 31, 2019, were borne by the underlying Vanguard funds in which the portfolio invests. The portfolio’s trustees and officers are also trustees and officers, respectively, of the underlying Vanguard funds, as well as directors and employees, respectively, of Vanguard.
C. Various inputs may be used to determine the value of the portfolio’s investments. These inputs are summarized in three broad levels for financial statement purposes. The inputs or methodologies used to value securities are not necessarily an indication of the risk associated with investing in those securities.
Level 1—Quoted prices in active markets for identical securities.
Level 2—Other significant observable inputs (including quoted prices for similar securities, interest rates, prepayment speeds, credit risk, etc.).
Level 3—Significant unobservable inputs (including the portfolio’s own assumptions used to determine the fair value of investments). Any investments valued with significant unobservable inputs are noted on the Statement of Net Assets.
At December 31, 2019, 100% of the market value of the portfolio’s investments was determined based on Level 1 inputs.
D. Permanent differences between book-basis and tax-basis components of net assets, if any, are reclassified among capital accounts in the financial statements to reflect their tax character. These reclassifications have no effect on net assets or net asset value per share.
Temporary differences between book-basis and tax-basis components of total distributable earnings (loss) arise when certain items of income, gain, or loss are recognized in different periods for financial statement and tax purposes; these differences will reverse at some time in the future. The differences are primarily related to the tax deferral of losses on wash sales. As of period end, the tax-basis components of total distributable earnings (loss) are detailed in the table as follows:
| | | Amount | |
| | | ($000 | ) |
| Undistributed Ordinary Income | | 5,925 | |
| Undistributed Long-Term Gains | | 1,064 | |
| Capital Loss Carryforwards (Non-expiring) | | — | |
| Net Unrealized Gains (Losses) | | 8,438 | |
Global Bond Index Portfolio
As of December 31, 2019, gross unrealized appreciation and depreciation for investments based on cost for U.S. federal income tax purposes were as follows:
| | | Amount | |
| | | ($000 | ) |
| Tax Cost | | 223,674 | |
| Gross Unrealized Appreciation | | 8,745 | |
| Gross Unrealized Depreciation | | (307 | ) |
| Net Unrealized Appreciation (Depreciation) | | 8,438 | |
E. Capital shares issued and redeemed were:
| | | Year Ended December 31, | |
| | | 2019 | | | 2018 | |
| | | Shares | | | Shares | |
| | | (000 | ) | | (000 | ) |
| Issued | | 4,355 | | | 5,742 | |
| Issued in Lieu of Cash Distributions | | 150 | | | 12 | |
| Redeemed | | (1,781 | ) | | (375 | ) |
| Net Increase (Decrease) in Shares Outstanding | | 2,724 | | | 5,379 | |
At December 31, 2019, one shareholder, an insurance company separate account whose holdings in the portfolio represent the indirect investment of Vanguard Variable Annuity contract holders, was the record or beneficial owner of 83% of the portfolio’s net assets.
F. Transactions during the period in affiliated underlying Vanguard funds were as follows:
| | | | | | Current Period Transactions | |
| | Dec. 31, | | Proceeds | Realized | | | | Dec. 31, |
| | 2018 | | from | Net | Change in | | Capital Gain | 2019 |
| | Market | Purchases | Securities | Gain | Unrealized | | Distributions | Market |
| | Value | at Cost | Sold | (Loss) | App. (Dep.) | Income | Received | Value |
| | ($000) | ($000) | ($000) | ($000) | ($000) | ($000) | ($000) | ($000) |
| Vanguard Market Liquidity Fund | 1 | NA1 | NA1 | — | — | 2 | — | 12 |
| Vanguard Total International Bond Index Fund | 48,815 | 27,139 | 8,527 | 491 | 1,771 | 2,215 | — | 69,689 |
| Vanguard Variable Insurance Fund—Total Bond Market Index Portfolio | 114,099 | 56,611 | 16,645 | 990 | 7,356 | 3,435 | — | 162,411 |
| Total | 162,915 | 83,750 | 25,172 | 1,481 | 9,127 | 5,652 | — | 232,112 |
| 1 | Not applicable—purchases and sales are for temporary cash investment purposes. |
G. Management has determined that no events or transactions occurred subsequent to December 31, 2019, that would require recognition or disclosure in these financial statements.
Global Bond Index Portfolio
Report of Independent Registered Public Accounting Firm
To the Board of Trustees of Vanguard Variable Insurance Funds and Shareholders of Global Bond Index Portfolio
Opinion on the Financial Statements
We have audited the accompanying statement of net assets and statement of assets and liabilities of Global Bond Index Portfolio (one of the portfolios constituting Vanguard Variable Insurance Funds, referred to hereafter as the “Portfolio”) as of December 31, 2019, the related statement of operations for the year ended December 31, 2019, the statement of changes in net assets for each of the two years in the period ended December 31, 2019, including the related notes, and the financial highlights for each of the periods indicated therein (collectively referred to as the “financial statements”). In our opinion, the financial statements present fairly, in all material respects, the financial position of the Portfolio as of December 31, 2019, the results of its operations for the year then ended, the changes in its net assets for each of the two years in the period ended December 31, 2019 and the financial highlights for each of the periods indicated therein in conformity with accounting principles generally accepted in the United States of America.
Basis for Opinion
These financial statements are the responsibility of the Portfolio’s management. Our responsibility is to express an opinion on the Portfolio’s financial statements based on our audits. We are a public accounting firm registered with the Public Company Accounting Oversight Board (United States) (“PCAOB”) and are required to be independent with respect to the Portfolio in accordance with the U.S. federal securities laws and the applicable rules and regulations of the Securities and Exchange Commission and the PCAOB.
We conducted our audits of these financial statements in accordance with the standards of the PCAOB. Those standards require that we plan and perform the audit to obtain reasonable assurance about whether the financial statements are free of material misstatement, whether due to error or fraud.
Our audits included performing procedures to assess the risks of material misstatement of the financial statements, whether due to error or fraud, and performing procedures that respond to those risks. Such procedures included examining, on a test basis, evidence regarding the amounts and disclosures in the financial statements. Our audits also included evaluating the accounting principles used and significant estimates made by management, as well as evaluating the overall presentation of the financial statements. Our procedures included confirmation of securities owned as of December 31, 2019 by correspondence with the transfer agent. We believe that our audits provide a reasonable basis for our opinion.
/s/PricewaterhouseCoopers LLP
Philadelphia, Pennsylvania
February 18, 2020
We have served as the auditor of one or more investment companies in The Vanguard Group of Funds since 1975.
Special 2019 tax information (unaudited) for corporate shareholders only for Global Bond Index Portfolio, a portfolio of Vanguard Variable Insurance Funds
This information for the fiscal year ended December 31, 2019, is included pursuant to provisions of the Internal Revenue Code for corporate shareholders only.
The portfolio distributed $119,000 as capital gain dividends (20% rate gain distributions) to shareholders during the fiscal year.
Global Bond Index Portfolio
BLOOMBERG is a trademark and service mark of Bloomberg Finance L.P. BARCLAYS is a trademark and service mark of Barclays Bank Plc, used under license. Bloomberg Finance L.P. and its affiliates, including Bloomberg Index Services Limited (BISL) (collectively, Bloomberg), or Bloomberg’s licensors, own all proprietary rights in the Bloomberg Barclays U.S. Aggregate Float Adjusted Index and the Bloomberg Barclays Global Aggregate ex-USD Float Adjusted RIC Capped Index (USD Hedged) (the Indices or Bloomberg Barclays Indices).
Neither Barclays Bank Plc, Barclays Capital Inc., or any affiliate (collectively Barclays) or Bloomberg is the issuer or producer of the Global Bond Index Portfolio and neither Bloomberg nor Barclays has any responsibilities, obligations or duties to investors in the Global Bond Index Portfolio. The Indices are licensed for use by The Vanguard Group, Inc. (Vanguard) as the sponsor of the Global Bond Index Portfolio. Bloomberg and Barclays’ only relationship with Vanguard in respect of the Indices is the licensing of the Indices, which are determined, composed and calculated by BISL, or any successor thereto, without regard to the Issuer or the Global Bond Index Portfolio or the owners of the Global Bond Index Portfolio.
Additionally, Vanguard may for itself execute transaction(s) with Barclays in or relating to the Indices in connection with the Global Bond Index Portfolio. Investors acquire the Global Bond Index Portfolio from Vanguard and investors neither acquire any interest in the Indices nor enter into any relationship of any kind whatsoever with Bloomberg or Barclays upon making an investment in the Global Bond Index Portfolio. The Global Bond Index Portfolio is not sponsored, endorsed, sold or promoted by Bloomberg or Barclays. Neither Bloomberg nor Barclays makes any representation or warranty, express or implied regarding the advisability of investing in the Global Bond Index Portfolio or the advisability of investing in securities generally or the ability of the Indices to track corresponding or relative market performance. Neither Bloomberg nor Barclays has passed on the legality or suitability of the Global Bond Index Portfolio with respect to any person or entity. Neither Bloomberg nor Barclays is responsible for and has not participated in the determination of the timing of, prices at, or quantities of the Global Bond Index Portfolio to be issued. Neither Bloomberg nor Barclays has any obligation to take the needs of the Issuer or the owners of the Global Bond Index Portfolio or any other third party into consideration in determining, composing or calculating the Indices. Neither Bloomberg nor Barclays has any obligation or liability in connection with administration, marketing or trading of the Global Bond Index Portfolio.
The licensing agreement between Bloomberg and Barclays is solely for the benefit of Bloomberg and Barclays and not for the benefit of the owners of the Global Bond Index Portfolio, investors or other third parties. In addition, the licensing agreement between Vanguard and Bloomberg is solely for the benefit of Vanguard and Bloomberg and not for the benefit of the owners of the Global Bond Index Portfolio, investors or other third parties.
NEITHER BLOOMBERG NOR BARCLAYS SHALL HAVE ANY LIABILITY TO THE ISSUER, INVESTORS OR TO OTHER THIRD PARTIES FOR THE QUALITY, ACCURACY AND/OR COMPLETENESS OF THE BLOOMBERG BARCLAYS INDICES OR ANY DATA INCLUDED THEREIN OR FOR INTERRUPTIONS IN THE DELIVERY OF THE BLOOMBERG BARCLAYS INDICES. NEITHER BLOOMBERG NOR BARCLAYS MAKES ANY WARRANTY, EXPRESS OR IMPLIED, AS TO RESULTS TO BE OBTAINED BY THE ISSUER, THE INVESTORS OR ANY OTHER PERSON OR ENTITY FROM THE USE OF THE BLOOMBERG BARCLAYS INDICES OR ANY DATA INCLUDED THEREIN. NEITHER BLOOMBERG NOR BARCLAYS MAKES ANY EXPRESS OR IMPLIED WARRANTIES, AND EACH HEREBY EXPRESSLY DISCLAIMS ALL WARRANTIES OF MERCHANTABILITY OR FITNESS FOR A PARTICULAR PURPOSE OR USE WITH RESPECT TO THE BLOOMBERG BARCLAYS INDICES OR ANY DATA INCLUDED THEREIN. BLOOMBERG RESERVES THE RIGHT TO CHANGE THE METHODS OF CALCULATION OR PUBLICATION, OR TO CEASE THE CALCULATION OR PUBLICATION OF THE BLOOMBERG BARCLAYS INDICES, AND NEITHER BLOOMBERG NOR BARCLAYS SHALL BE LIABLE FOR ANY MISCALCULATION OF OR ANY INCORRECT, DELAYED OR INTERRUPTED PUBLICATION WITH RESPECT TO THE BLOOMBERG BARCLAYS INDICES. NEITHER BLOOMBERG NOR BARCLAYS SHALL BE LIABLE FOR ANY DAMAGES, INCLUDING, WITHOUT LIMITATION, ANY SPECIAL, INDIRECT OR CONSEQUENTIAL DAMAGES, OR ANY LOST PROFITS AND EVEN IF ADVISED OF THE POSSIBLITY OF SUCH, RESULTING FROM THE USE OF THE BLOOMBERG BARCLAYS INDICES OR ANY DATA INCLUDED THEREIN OR WITH RESPECT TO THE GLOBAL BOND INDEX PORTFOLIO.
None of the information supplied by Bloomberg or Barclays and used in this publication may be reproduced in any manner without the prior written permission of both Bloomberg and Barclays Capital, the investment banking division of Barclays Bank Plc. Barclays Bank Plc is registered in England No. 1026167. Registered office 1 Churchill Place London E14 5HP.
© 2020 Bloomberg. Used with Permission.
Source: Bloomberg Index Services Limited. Copyright 2020, Bloomberg. All rights reserved
Total Bond Market Index Portfolio
Your Portfolio’s Performance at a Glance
• With yields falling in 2019, prices rose, contributing to strong bond returns for the 12 months ended December 31, 2019. The Total Bond Market Index Portfolio returned 8.67%, in line with the 8.87% return of its benchmark index after taking into account the cost of running the portfolio.
• The year was marked by concerns about slowing global growth, escalations in trade disputes, flare-ups in geopolitical tensions, and uncertainty over the United Kingdom’s exit from the European Union. The more challenging outlook prompted the Federal Reserve to cut interest rates three times in 2019; other major central banks adopted more accommodative monetary policies as well. Corporate earnings generally proved more resilient than expected and corporate defaults remained low, helping the average yield spread for corporate bonds versus U.S. Treasuries to narrow significantly.
• Treasuries, which account for over 40% of the portfolio’s assets, returned 6.86%. Mortgage-backed securities returned a little less than that, while corporate bonds fared even better, returning 14.54%.
• By credit quality, lower-rated investment-grade bonds bested higher-rated ones. And by maturity, longer-dated bonds significantly outperformed.
• Please note that the portfolio returns in Vanguard Variable Insurance Fund are different from those in Vanguard Variable Annuity (and other plans that invest in the fund), which take into account insurance-related expenses.
Market Barometer
| | | | Average Annual Total Returns |
| | | | Periods Ended December 31, 2019 |
| | One Year | | Three Years | | Five Years |
| Stocks |
| Russell 1000 Index (Large-caps) | 31.43 | % | | 15.05 | % | | 11.48 | % |
| Russell 2000 Index (Small-caps) | 25.53 | | | 8.59 | | | 8.23 | |
| Russell 3000 Index (Broad U.S. market) | 31.02 | | | 14.57 | | | 11.24 | |
| FTSE All-World ex US Index (International) | 21.81 | | | 9.96 | | | 5.83 | |
| | | | | | | | | |
| Bonds | | | | | | | | |
| Bloomberg Barclays U.S. Aggregate Bond Index (Broad taxable market) | 8.72 | % | | 4.03 | % | | 3.05 | % |
| Bloomberg Barclays Municipal Bond Index (Broad tax-exempt market) | 7.54 | | | 4.72 | | | 3.53 | |
| FTSE Three-Month U.S. Treasury Bill Index | 2.25 | | | 1.65 | | | 1.04 | |
| | | | | | | | | |
| CPI | | | | | | | | |
| Consumer Price Index | 2.29 | % | | 2.10 | % | | 1.82 | % |
Total Bond Market Index Portfolio
About Your Portfolio’s Expenses
As a shareholder of the portfolio, you incur ongoing costs, which include costs for portfolio management, administrative services, and shareholder reports (like this one), among others. Operating expenses, which are deducted from a portfolio’s gross income, directly reduce the investment return of the portfolio.
A portfolio’s expenses are expressed as a percentage of its average net assets. This figure is known as the expense ratio. The following examples are intended to help you understand the ongoing costs (in dollars) of investing in your portfolio and to compare these costs with those of other mutual funds. The examples are based on an investment of $1,000 made at the beginning of the period shown and held for the entire period.
The table below illustrates your portfolio’s costs in two ways:
• Based on actual portfolio return. This section helps you to estimate the actual expenses that you paid over the period. The “Ending Account Value” shown is derived from the portfolio’s actual return, and the third column shows the dollar amount that would have been paid by an investor who started with $1,000 in the portfolio. You may use the information here, together with the amount you invested, to estimate the expenses that you paid over the period.
To do so, simply divide your account value by $1,000 (for example, an $8,600 account value divided by $1,000 = 8.6), then multiply the result by the number given for your portfolio under the heading “Expenses Paid During Period.”
• Based on hypothetical 5% yearly return. This section is intended to help you compare your portfolio’s costs with those of other mutual funds. It assumes that the portfolio had a yearly return of 5% before expenses, but that the expense ratio is unchanged. In this case—because the return used is not the portfolio’s actual return—the results do not apply to your investment. The example is useful in making comparisons because the Securities and Exchange Commission requires all mutual funds to calculate expenses based on a 5% return. You can assess your portfolio’s costs by comparing this hypothetical example with the hypothetical examples that appear in shareholder reports of other funds.
Note that the expenses shown in the table are meant to highlight and help you compareongoingcosts only and do not reflect transaction costs incurred by the portfolio for buying and selling securities. The portfolio’s expense ratio does not reflect additional fees and expenses associated with the annuity or life insurance program through which you invest.
The calculations assume no shares were bought or sold during the period. Your actual costs may have been higher or lower, depending on the amount of your investment and the timing of any purchases or redemptions.
You can find more information about the portfolio’s expenses in the Financial Statements section. For additional information on operating expenses and other shareholder costs, please refer to the prospectus.
Six Months Ended December 31, 2019
| | | Beginning | | | Ending | | | Expenses | |
| | | Account Value | | | Account Value | | | Paid During | |
| Total Bond Market Index Portfolio | | 6/30/2019 | | | 12/31/2019 | | | Period | |
| Based on Actual Portfolio Return | | $1,000.00 | | | $1,024.33 | | | $0.71 | |
| Based on Hypothetical 5% Yearly Return | | 1,000.00 | | | 1,024.50 | | | 0.71 | |
The calculations are based on expenses incurred in the most recent six-month period. The portfolio’s annualized six-month expense ratio for that period is 0.14%. The dollar amounts shown as “Expenses Paid” are equal to the annualized expense ratio multiplied by the average account value over the period, multiplied by the number of days in the most recent six-month period, then divided by the number of days in the most recent 12-month period (184/365).
Total Bond Market Index Portfolio
Performance Summary
All of the returns in this report represent past performance, which is not a guarantee of future results that may be achieved by the portfolio. (Current performance may be lower or higher than the performance data cited. For performance data current to the most recent month-end, visit our website at vanguard.com/performance.) Note, too, that both investment returns and principal value can fluctuate widely, so an investor’s shares, when sold, could be worth more or less than their original cost. The returns shown do not reflect taxes that a shareholder would pay on portfolio distributions or on the sale of portfolio shares. Nor do the returns reflect fees and expenses associated with the annuity or life insurance program through which a shareholder invests. If these fees and expenses were included, the portfolio’s returns would be lower.
Cumulative Performance: December 31, 2009–December 31, 2019
Initial Investment of $10,000
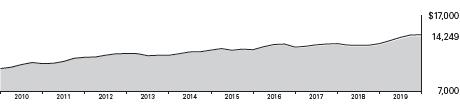
| | | Average Annual Total Returns | Final Value |
| | | Periods Ended December 31, 2019 | of a $10,000 |
| | | One Year | Five Years | Ten Years | Investment |
 | Total Bond Market Index Portfolio | 8.67% | 2.92% | 3.60% | $14,249 |
 | Bloomberg Barclays U.S. Aggregate Float Adjusted Index | 8.87 | 3.07 | 3.78 | 14,486 |
See Financial Highlights for dividend and capital gains information.
Total Bond Market Index Portfolio
Sector Diversification
As of December 31, 2019
| Asset-Backed/Commercial Mortgage-Backed | 2.5 | % |
| Finance | 8.5 | |
| Foreign | 4.2 | |
| Government Mortgage-Backed | 22.3 | |
| Industrial | 16.4 | |
| Treasury/Agency | 43.3 | |
| Utilities | 2.0 | |
| Other | 0.8 | |
The table reflects the portfolio’s market exposure. Any holdings in short-term reserves are excluded. The agency and mortgage-backed securities sectors may include issues from government-sponsored enterprises; such issues are generally not backed by the full faith and credit of the U.S. government.
Total Bond Market Index Portfolio
Financial Statements
Statement of Net Assets
As of December 31, 2019
The portfolio files its complete schedule of portfolio holdings with the Securities and Exchange Commission (SEC) for the first and third quarters of each fiscal year as an exhibit to its reports on Form N-PORT. The portfolio’s Form N-PORT reports are available on the SEC’s website at www.sec.gov.
| | | | | | | | | Face | | | Market | |
| | | | | | | Maturity | | Amount | | | Value• | |
| | | | | Coupon | | Date | | ($000 | ) | | ($000 | ) |
| U.S. Government and Agency Obligations (65.2%) |
| U.S. Government Securities (42.0%) | | | | | | | | | | | | |
| | | United States Treasury Note/Bond | | 2.625% | | 8/31/20 | | | 2 | | | | 2 | |
| | | United States Treasury Note/Bond | | 2.750% | | 9/30/20 | | | 2 | | | | 2 | |
| | | United States Treasury Note/Bond | | 1.375% | | 10/31/20 | | | 1 | | | | 1 | |
| | | United States Treasury Note/Bond | | 1.750% | | 10/31/20 | | | 1 | | | | 1 | |
| | | United States Treasury Note/Bond | | 2.000% | | 11/30/20 | | | 5 | | | | 5 | |
| | | United States Treasury Note/Bond | | 2.750% | | 11/30/20 | | | 2 | | | | 2 | |
| | | United States Treasury Note/Bond | | 2.500% | | 12/31/20 | | | 1 | | | | 1 | |
| | | United States Treasury Note/Bond | | 2.000% | | 1/15/21 | | | 942 | | | | 945 | |
| | | United States Treasury Note/Bond | | 2.500% | | 1/31/21 | | | 7,700 | | | | 7,770 | |
| | | United States Treasury Note/Bond | | 2.250% | | 2/15/21 | | | 11,225 | | | | 11,299 | |
| | | United States Treasury Note/Bond | | 3.625% | | 2/15/21 | | | 768 | | | | 785 | |
| | | United States Treasury Note/Bond | | 7.875% | | 2/15/21 | | | 1,180 | | | | 1,260 | |
| | | United States Treasury Note/Bond | | 1.125% | | 2/28/21 | | | 580 | | | | 577 | |
| | | United States Treasury Note/Bond | | 2.000% | | 2/28/21 | | | 4,050 | | | | 4,067 | |
| | | United States Treasury Note/Bond | | 2.500% | | 2/28/21 | | | 11,488 | | | | 11,601 | |
| | | United States Treasury Note/Bond | | 2.375% | | 3/15/21 | | | 13,122 | | | | 13,233 | |
| | | United States Treasury Note/Bond | | 1.250% | | 3/31/21 | | | 9,170 | | | | 9,127 | |
| | | United States Treasury Note/Bond | | 2.250% | | 3/31/21 | | | 21,482 | | | | 21,643 | |
| | | United States Treasury Note/Bond | | 2.375% | | 4/15/21 | | | 8,381 | | | | 8,461 | |
| | | United States Treasury Note/Bond | | 1.375% | | 4/30/21 | | | 650 | | | | 648 | |
| | | United States Treasury Note/Bond | | 2.250% | | 4/30/21 | | | 8,016 | | | | 8,082 | |
| | | United States Treasury Note/Bond | | 2.625% | | 5/15/21 | | | 13,389 | | | | 13,571 | |
| | | United States Treasury Note/Bond | | 3.125% | | 5/15/21 | | | 5,625 | | | | 5,738 | |
| | | United States Treasury Note/Bond | | 1.375% | | 5/31/21 | | | 5,426 | | | | 5,408 | |
| | | United States Treasury Note/Bond | | 2.000% | | 5/31/21 | | | 6,752 | | | | 6,788 | |
| | | United States Treasury Note/Bond | | 2.125% | | 5/31/21 | | | 4,271 | | | | 4,301 | |
| | | United States Treasury Note/Bond | | 2.625% | | 6/15/21 | | | 10,023 | | | | 10,167 | |
| | | United States Treasury Note/Bond | | 1.125% | | 6/30/21 | | | 5,078 | | | | 5,042 | |
| | | United States Treasury Note/Bond | | 1.625% | | 6/30/21 | | | 7,852 | | | | 7,853 | |
| | | United States Treasury Note/Bond | | 2.625% | | 7/15/21 | | | 16,405 | | | | 16,656 | |
| | | United States Treasury Note/Bond | | 1.125% | | 7/31/21 | | | 9,520 | | | | 9,447 | |
| | | United States Treasury Note/Bond | | 1.750% | | 7/31/21 | | | 9,417 | | | | 9,438 | |
| | | United States Treasury Note/Bond | | 2.250% | | 7/31/21 | | | 5,675 | | | | 5,731 | |
| | | United States Treasury Note/Bond | | 2.125% | | 8/15/21 | | | 3,445 | | | | 3,473 | |
| | | United States Treasury Note/Bond | | 2.750% | | 8/15/21 | | | 23,185 | | | | 23,602 | |
| | | United States Treasury Note/Bond | | 1.125% | | 8/31/21 | | | 1,578 | | | | 1,565 | |
| | | United States Treasury Note/Bond | | 1.500% | | 8/31/21 | | | 10,140 | | | | 10,123 | |
| | | United States Treasury Note/Bond | | 2.000% | | 8/31/21 | | | 7,800 | | | | 7,850 | |
| | | United States Treasury Note/Bond | | 2.750% | | 9/15/21 | | | 6,614 | | | | 6,740 | |
| | | United States Treasury Note/Bond | | 1.125% | | 9/30/21 | | | 2,317 | | | | 2,298 | |
| | | United States Treasury Note/Bond | | 1.500% | | 9/30/21 | | | 2,125 | | | | 2,121 | |
| | | United States Treasury Note/Bond | | 2.125% | | 9/30/21 | | | 1,775 | | | | 1,791 | |
| | | United States Treasury Note/Bond | | 2.875% | | 10/15/21 | | | 9,746 | | | | 9,962 | |
| | | United States Treasury Note/Bond | | 1.250% | | 10/31/21 | | | 4,654 | | | | 4,625 | |
| | | United States Treasury Note/Bond | | 1.500% | | 10/31/21 | | | 18,666 | | | | 18,637 | |
| | | United States Treasury Note/Bond | | 2.000% | | 10/31/21 | | | 4,420 | | | | 4,452 | |
| | | United States Treasury Note/Bond | | 2.000% | | 11/15/21 | | | 115 | | | | 116 | |
| | | United States Treasury Note/Bond | | 2.875% | | 11/15/21 | | | 1,233 | | | | 1,262 | |
| | | United States Treasury Note/Bond | | 8.000% | | 11/15/21 | | | 3,400 | | | | 3,795 | |
| | | United States Treasury Note/Bond | | 1.500% | | 11/30/21 | | | 3,253 | | | | 3,248 | |
| | | United States Treasury Note/Bond | | 1.750% | | 11/30/21 | | | 7,492 | | | | 7,513 | |
| | | United States Treasury Note/Bond | | 2.625% | | 12/15/21 | | | 12,401 | | | | 12,643 | |
| | | United States Treasury Note/Bond | | 1.625% | | 12/31/21 | | | 3,645 | | | | 3,649 | |
| | | United States Treasury Note/Bond | | 2.000% | | 12/31/21 | | | 6,670 | | | | 6,722 | |
| | | United States Treasury Note/Bond | | 2.125% | | 12/31/21 | | | 928 | | | | 937 | |
| | | United States Treasury Note/Bond | | 2.500% | | 1/15/22 | | | 16,161 | | | | 16,446 | |
| | | United States Treasury Note/Bond | | 1.500% | | 1/31/22 | | | 2,384 | | | | 2,380 | |
| | | United States Treasury Note/Bond | | 1.875% | | 1/31/22 | | | 8,835 | | | | 8,885 | |
| | | United States Treasury Note/Bond | | 2.000% | | 2/15/22 | | | 135 | | | | 136 | |
| | | United States Treasury Note/Bond | | 2.500% | | 2/15/22 | | | 9,901 | | | | 10,087 | |
| | | United States Treasury Note/Bond | | 1.750% | | 2/28/22 | | | 6,330 | | | | 6,351 | |
| | | United States Treasury Note/Bond | | 1.875% | | 2/28/22 | | | 9,990 | | | | 10,049 | |
| | | United States Treasury Note/Bond | | 2.375% | | 3/15/22 | | | 10,896 | | | | 11,080 | |
| | | United States Treasury Note/Bond | | 1.750% | | 3/31/22 | | | 9,889 | | | | 9,923 | |
| | | United States Treasury Note/Bond | | 1.875% | | 3/31/22 | | | 5,215 | | | | 5,247 | |
| | | United States Treasury Note/Bond | | 2.250% | | 4/15/22 | | | 10,050 | | | | 10,195 | |
| | | United States Treasury Note/Bond | | 1.750% | | 4/30/22 | | | 4,977 | | | | 4,994 | |
| | | United States Treasury Note/Bond | | 1.875% | | 4/30/22 | | | 4,927 | | | | 4,958 | |
| | | United States Treasury Note/Bond | | 1.750% | | 5/15/22 | | | 2,962 | | | | 2,972 | |
| | | United States Treasury Note/Bond | | 2.125% | | 5/15/22 | | | 221 | | | | 224 | |
| | | United States Treasury Note/Bond | | 1.750% | | 5/31/22 | | | 5,115 | | | | 5,133 | |
| | | United States Treasury Note/Bond | | 1.875% | | 5/31/22 | | | 6,650 | | | | 6,694 | |
| | | United States Treasury Note/Bond | | 1.750% | | 6/15/22 | | | 13,281 | | | | 13,329 | |
| | | United States Treasury Note/Bond | | 1.750% | | 6/30/22 | | | 5,500 | | | | 5,521 | |
| | | United States Treasury Note/Bond | | 2.125% | | 6/30/22 | | | 5,235 | | | | 5,302 | |
| | | United States Treasury Note/Bond | | 1.750% | | 7/15/22 | | | 16,792 | | | | 16,850 | |
| | | United States Treasury Note/Bond | | 1.875% | | 7/31/22 | | | 6,417 | | | | 6,459 | |
| | | United States Treasury Note/Bond | | 2.000% | | 7/31/22 | | | 6,025 | | | | 6,084 | |
| | | United States Treasury Note/Bond | | 1.500% | | 8/15/22 | | | 10,098 | | | | 10,071 | |
| | | United States Treasury Note/Bond | | 1.625% | | 8/15/22 | | | 2,169 | | | | 2,170 | |
| | | United States Treasury Note/Bond | | 7.250% | | 8/15/22 | | | 875 | | | | 1,001 | |
| | | United States Treasury Note/Bond | | 1.625% | | 8/31/22 | | | 9,570 | | | | 9,573 | |
| | | United States Treasury Note/Bond | | 1.875% | | 8/31/22 | | | 5,445 | | | | 5,482 | |
| | | United States Treasury Note/Bond | | 1.500% | | 9/15/22 | | | 778 | | | | 776 | |
| | | United States Treasury Note/Bond | | 1.750% | | 9/30/22 | | | 9,437 | | | | 9,471 | |
| | | United States Treasury Note/Bond | | 1.875% | | 9/30/22 | | | 9,975 | | | | 10,047 | |
| | | United States Treasury Note/Bond | | 1.375% | | 10/15/22 | | | 11,286 | | | | 11,212 | |
| | | United States Treasury Note/Bond | | 1.875% | | 10/31/22 | | | 6,520 | | | | 6,565 | |
| | | United States Treasury Note/Bond | | 2.000% | | 10/31/22 | | | 7,947 | | | | 8,030 | |
| | | United States Treasury Note/Bond | | 1.625% | | 11/15/22 | | | 21,235 | | | | 21,242 | |
| | | United States Treasury Note/Bond | | 7.625% | | 11/15/22 | | | 40 | | | | 47 | |
| | | United States Treasury Note/Bond | | 2.000% | | 11/30/22 | | | 20,733 | | | | 20,953 | |
| | | United States Treasury Note/Bond | | 1.625% | | 12/15/22 | | | 23,260 | | | | 23,271 | |
| | | United States Treasury Note/Bond | | 2.125% | | 12/31/22 | | | 12,951 | | | | 13,141 | |
| | | United States Treasury Note/Bond | | 1.750% | | 1/31/23 | | | 7,020 | | | | 7,046 | |
| | | United States Treasury Note/Bond | | 2.375% | | 1/31/23 | | | 2,430 | | | | 2,485 | |
| | | United States Treasury Note/Bond | | 2.000% | | 2/15/23 | | | 798 | | | | 807 | |
| | | United States Treasury Note/Bond | | 7.125% | | 2/15/23 | | | 1,690 | | | | 1,973 | |
| | | United States Treasury Note/Bond | | 1.500% | | 2/28/23 | | | 2,889 | | | | 2,877 | |
| | | United States Treasury Note/Bond | | 2.625% | | 2/28/23 | | | 1,261 | | | | 1,299 | |
| | | United States Treasury Note/Bond | | 1.500% | | 3/31/23 | | | 7,005 | | | | 6,977 | |
| | | United States Treasury Note/Bond | | 2.500% | | 3/31/23 | | | 6,770 | | | | 6,954 | |
| | | United States Treasury Note/Bond | | 1.625% | | 4/30/23 | | | 215 | | | | 215 | |
| | | United States Treasury Note/Bond | | 2.750% | | 4/30/23 | | | 3,500 | | | | 3,625 | |
| | | United States Treasury Note/Bond | | 1.750% | | 5/15/23 | | | 7,400 | | | | 7,424 | |
| | | United States Treasury Note/Bond | | 1.625% | | 5/31/23 | | | 7,175 | | | | 7,172 | |
| | | United States Treasury Note/Bond | | 2.750% | | 5/31/23 | | | 5,850 | | | | 6,062 | |
| | | United States Treasury Note/Bond | | 1.375% | | 6/30/23 | | | 5,050 | | | | 5,004 | |
| | | United States Treasury Note/Bond | | 2.625% | | 6/30/23 | | | 5,398 | | | | 5,577 | |
| | | United States Treasury Note/Bond | | 1.250% | | 7/31/23 | | | 2,630 | | | | 2,593 | |
| | | United States Treasury Note/Bond | | 2.750% | | 7/31/23 | | | 3,555 | | | | 3,690 | |
| | | United States Treasury Note/Bond | | 2.500% | | 8/15/23 | | | 5,460 | | | | 5,621 | |
| | | United States Treasury Note/Bond | | 6.250% | | 8/15/23 | | | 6,565 | | | | 7,621 | |
| | | United States Treasury Note/Bond | | 1.375% | | 8/31/23 | | | 10,235 | | | | 10,136 | |
| | | United States Treasury Note/Bond | | 2.750% | | 8/31/23 | | | 8,235 | | | | 8,553 | |
| | | United States Treasury Note/Bond | | 1.375% | | 9/30/23 | | | 2,315 | | | | 2,291 | |
| | | United States Treasury Note/Bond | | 2.875% | | 9/30/23 | | | 4,309 | | | | 4,498 | |
| | | United States Treasury Note/Bond | | 1.625% | | 10/31/23 | | | 3,750 | | | | 3,744 | |
| | | United States Treasury Note/Bond | | 2.875% | | 10/31/23 | | | 11,203 | | | | 11,702 | |
Total Bond Market Index Portfolio
| | | | | | | | | Face | | | Market | |
| | | | | | | Maturity | | Amount | | | Value• | |
| | | | | Coupon | | Date | | ($000 | ) | | ($000 | ) |
| | | United States Treasury Note/Bond | | 2.750% | | 11/15/23 | | | 4,261 | | | | 4,432 | |
| | | United States Treasury Note/Bond | | 2.125% | | 11/30/23 | | | 6,150 | | | | 6,256 | |
| | | United States Treasury Note/Bond | | 2.875% | | 11/30/23 | | | 344 | | | | 360 | |
| | | United States Treasury Note/Bond | | 2.250% | | 12/31/23 | | | 2,267 | | | | 2,318 | |
| | | United States Treasury Note/Bond | | 2.625% | | 12/31/23 | | | 7,337 | | | | 7,606 | |
| | | United States Treasury Note/Bond | | 2.250% | | 1/31/24 | | | 3,215 | | | | 3,287 | |
| | | United States Treasury Note/Bond | | 2.500% | | 1/31/24 | | | 9,419 | | | | 9,725 | |
| | | United States Treasury Note/Bond | | 2.750% | | 2/15/24 | | | 10,710 | | | | 11,165 | |
| | | United States Treasury Note/Bond | | 2.125% | | 2/29/24 | | | 11,700 | | | | 11,908 | |
| | | United States Treasury Note/Bond | | 2.375% | | 2/29/24 | | | 6,712 | | | | 6,899 | |
| | | United States Treasury Note/Bond | | 2.125% | | 3/31/24 | | | 18,446 | | | | 18,780 | |
| | | United States Treasury Note/Bond | | 2.000% | | 4/30/24 | | | 1,260 | | | | 1,277 | |
| | | United States Treasury Note/Bond | | 2.250% | | 4/30/24 | | | 10,559 | | | | 10,806 | |
| | | United States Treasury Note/Bond | | 2.500% | | 5/15/24 | | | 9,960 | | | | 10,299 | |
| | | United States Treasury Note/Bond | | 2.000% | | 5/31/24 | | | 11,548 | | | | 11,699 | |
| | | United States Treasury Note/Bond | | 1.750% | | 6/30/24 | | | 8,060 | | | | 8,080 | |
| | | United States Treasury Note/Bond | | 2.000% | | 6/30/24 | | | 10,955 | | | | 11,099 | |
| | | United States Treasury Note/Bond | | 1.750% | | 7/31/24 | | | 9,127 | | | | 9,151 | |
| | | United States Treasury Note/Bond | | 2.125% | | 7/31/24 | | | 9,736 | | | | 9,918 | |
| | | United States Treasury Note/Bond | | 2.375% | | 8/15/24 | | | 11,564 | | | | 11,909 | |
| | | United States Treasury Note/Bond | | 1.250% | | 8/31/24 | | | 10,125 | | | | 9,926 | |
| | | United States Treasury Note/Bond | | 1.875% | | 8/31/24 | | | 4,655 | | | | 4,692 | |
| | | United States Treasury Note/Bond | | 1.500% | | 9/30/24 | | | 785 | | | | 778 | |
| | | United States Treasury Note/Bond | | 2.125% | | 9/30/24 | | | 3,394 | | | | 3,460 | |
| | | United States Treasury Note/Bond | | 1.500% | | 10/31/24 | | | 9,070 | | | | 8,991 | |
| | | United States Treasury Note/Bond | | 2.250% | | 10/31/24 | | | 5,980 | | | | 6,133 | |
| | | United States Treasury Note/Bond | | 2.250% | | 11/15/24 | | | 12,681 | | | | 13,004 | |
| | | United States Treasury Note/Bond | | 7.500% | | 11/15/24 | | | 25 | | | | 32 | |
| | | United States Treasury Note/Bond | | 1.500% | | 11/30/24 | | | 14,847 | | | | 14,719 | |
| | | United States Treasury Note/Bond | | 2.125% | | 11/30/24 | | | 10,055 | | | | 10,252 | |
| | | United States Treasury Note/Bond | | 1.750% | | 12/31/24 | | | 8,205 | | | | 8,227 | |
| | | United States Treasury Note/Bond | | 2.250% | | 12/31/24 | | | 1,645 | | | | 1,688 | |
| | | United States Treasury Note/Bond | | 2.500% | | 1/31/25 | | | 6,340 | | | | 6,584 | |
| | | United States Treasury Note/Bond | | 2.000% | | 2/15/25 | | | 8,625 | | | | 8,746 | |
| | | United States Treasury Note/Bond | | 2.750% | | 2/28/25 | | | 2,513 | | | | 2,641 | |
| | | United States Treasury Note/Bond | | 2.625% | | 3/31/25 | | | 8,961 | | | | 9,366 | |
| | | United States Treasury Note/Bond | | 2.875% | | 4/30/25 | | | 4,060 | | | | 4,296 | |
| | | United States Treasury Note/Bond | | 2.125% | | 5/15/25 | | | 12,735 | | | | 12,986 | |
| | | United States Treasury Note/Bond | | 2.875% | | 5/31/25 | | | 6,350 | | | | 6,721 | |
| | | United States Treasury Note/Bond | | 2.750% | | 6/30/25 | | | 4,880 | | | | 5,137 | |
| | | United States Treasury Note/Bond | | 2.875% | | 7/31/25 | | | 5,105 | | | | 5,410 | |
| | | United States Treasury Note/Bond | | 2.000% | | 8/15/25 | | | 14,581 | | | | 14,767 | |
| | | United States Treasury Note/Bond | | 6.875% | | 8/15/25 | | | 2,085 | | | | 2,655 | |
| | | United States Treasury Note/Bond | | 2.750% | | 8/31/25 | | | 9,260 | | | | 9,755 | |
| | | United States Treasury Note/Bond | | 3.000% | | 9/30/25 | | | 5,041 | | | | 5,381 | |
| | | United States Treasury Note/Bond | | 3.000% | | 10/31/25 | | | 4,015 | | | | 4,288 | |
| | | United States Treasury Note/Bond | | 2.250% | | 11/15/25 | | | 10,421 | | | | 10,696 | |
| | | United States Treasury Note/Bond | | 2.875% | | 11/30/25 | | | 6,285 | | | | 6,672 | |
| | | United States Treasury Note/Bond | | 2.625% | | 12/31/25 | | | 9,165 | | | | 9,605 | |
| | | United States Treasury Note/Bond | | 2.625% | | 1/31/26 | | | 7,459 | | | | 7,818 | |
| | | United States Treasury Note/Bond | | 1.625% | | 2/15/26 | | | 16,476 | | | | 16,311 | |
| | | United States Treasury Note/Bond | | 6.000% | | 2/15/26 | | | 3,600 | | | | 4,477 | |
| | | United States Treasury Note/Bond | | 2.500% | | 2/28/26 | | | 7,770 | | | | 8,089 | |
| | | United States Treasury Note/Bond | | 2.250% | | 3/31/26 | | | 6,250 | | | | 6,418 | |
| | | United States Treasury Note/Bond | | 2.375% | | 4/30/26 | | | 405 | | | | 419 | |
| | | United States Treasury Note/Bond | | 1.625% | | 5/15/26 | | | 10,789 | | | | 10,669 | |
| | | United States Treasury Note/Bond | | 2.125% | | 5/31/26 | | | 6,595 | | | | 6,722 | |
| | | United States Treasury Note/Bond | | 1.875% | | 6/30/26 | | | 9,335 | | | | 9,371 | |
| | | United States Treasury Note/Bond | | 1.875% | | 7/31/26 | | | 11,866 | | | | 11,907 | |
| | | United States Treasury Note/Bond | | 1.500% | | 8/15/26 | | | 10,069 | | | | 9,864 | |
| | | United States Treasury Note/Bond | | 6.750% | | 8/15/26 | | | 630 | | | | 824 | |
| | | United States Treasury Note/Bond | | 1.375% | | 8/31/26 | | | 9,309 | | | | 9,047 | |
| | | United States Treasury Note/Bond | | 1.625% | | 9/30/26 | | | 5,215 | | | | 5,149 | |
| | | United States Treasury Note/Bond | | 1.625% | | 10/31/26 | | | 7,825 | | | | 7,720 | |
| | | United States Treasury Note/Bond | | 2.000% | | 11/15/26 | | | 19,605 | | | | 19,813 | |
| | | United States Treasury Note/Bond | | 6.500% | | 11/15/26 | | | 765 | | | | 997 | |
| | | United States Treasury Note/Bond | | 1.625% | | 11/30/26 | | | 10,545 | | | | 10,403 | |
| | | United States Treasury Note/Bond | | 1.750% | | 12/31/26 | | | 5,575 | | | | 5,544 | |
| | | United States Treasury Note/Bond | | 2.250% | | 2/15/27 | | | 6,372 | | | | 6,545 | |
| | | United States Treasury Note/Bond | | 6.625% | | 2/15/27 | | | 1,065 | | | | 1,406 | |
| | | United States Treasury Note/Bond | | 2.375% | | 5/15/27 | | | 9,832 | | | | 10,189 | |
| | | United States Treasury Note/Bond | | 2.250% | | 8/15/27 | | | 7,822 | | | | 8,037 | |
| | | United States Treasury Note/Bond | | 6.375% | | 8/15/27 | | | 185 | | | | 245 | |
| | | United States Treasury Note/Bond | | 2.250% | | 11/15/27 | | | 11,502 | | | | 11,822 | |
| | | United States Treasury Note/Bond | | 6.125% | | 11/15/27 | | | 1,839 | | | | 2,414 | |
| | | United States Treasury Note/Bond | | 2.750% | | 2/15/28 | | | 7,480 | | | | 7,971 | |
| | | United States Treasury Note/Bond | | 2.875% | | 5/15/28 | | | 12,080 | | | | 13,001 | |
| | | United States Treasury Note/Bond | | 2.875% | | 8/15/28 | | | 13,082 | | | | 14,098 | |
| | | United States Treasury Note/Bond | | 5.500% | | 8/15/28 | | | 2,745 | | | | 3,531 | |
| | | United States Treasury Note/Bond | | 3.125% | | 11/15/28 | | | 8,828 | | | | 9,705 | |
| | | United States Treasury Note/Bond | | 5.250% | | 11/15/28 | | | 3,155 | | | | 4,015 | |
| | | United States Treasury Note/Bond | | 2.625% | | 2/15/29 | | | 12,045 | | | | 12,764 | |
| | | United States Treasury Note/Bond | | 5.250% | | 2/15/29 | | | 600 | | | | 767 | |
| | | United States Treasury Note/Bond | | 2.375% | | 5/15/29 | | | 11,878 | | | | 12,345 | |
| | | United States Treasury Note/Bond | | 1.625% | | 8/15/29 | | | 12,565 | | | | 12,239 | |
| | | United States Treasury Note/Bond | | 6.125% | | 8/15/29 | | | 1,530 | | | | 2,096 | |
| | | United States Treasury Note/Bond | | 1.750% | | 11/15/29 | | | 11,231 | | | | 11,061 | |
| | | United States Treasury Note/Bond | | 6.250% | | 5/15/30 | | | 2,350 | | | | 3,303 | |
| | | United States Treasury Note/Bond | | 5.375% | | 2/15/31 | | | 7,275 | | | | 9,760 | |
| | | United States Treasury Note/Bond | | 4.500% | | 2/15/36 | | | 3,047 | | | | 4,041 | |
| | | United States Treasury Note/Bond | | 4.750% | | 2/15/37 | | | 700 | | | | 963 | |
| | | United States Treasury Note/Bond | | 5.000% | | 5/15/37 | | | 150 | | | | 212 | |
| | | United States Treasury Note/Bond | | 4.375% | | 2/15/38 | | | 200 | | | | 266 | |
| | | United States Treasury Note/Bond | | 4.500% | | 5/15/38 | | | 2,459 | | | | 3,323 | |
| | | United States Treasury Note/Bond | | 3.500% | | 2/15/39 | | | 2,470 | | | | 2,960 | |
| | | United States Treasury Note/Bond | | 4.250% | | 5/15/39 | | | 2,247 | | | | 2,957 | |
| | | United States Treasury Note/Bond | | 4.500% | | 8/15/39 | | | 2,516 | | | | 3,414 | |
| | | United States Treasury Note/Bond | | 4.375% | | 11/15/39 | | | 2,817 | | | | 3,769 | |
| | | United States Treasury Note/Bond | | 4.625% | | 2/15/40 | | | 4,250 | | | | 5,876 | |
| | | United States Treasury Note/Bond | | 4.375% | | 5/15/40 | | | 3,735 | | | | 5,015 | |
| | | United States Treasury Note/Bond | | 3.875% | | 8/15/40 | | | 3,075 | | | | 3,876 | |
| | | United States Treasury Note/Bond | | 4.250% | | 11/15/40 | | | 2,395 | | | | 3,171 | |
| | | United States Treasury Note/Bond | | 4.750% | | 2/15/41 | | | 3,956 | | | | 5,582 | |
| | | United States Treasury Note/Bond | | 4.375% | | 5/15/41 | | | 1,840 | | | | 2,481 | |
| | | United States Treasury Note/Bond | | 3.750% | | 8/15/41 | | | 4,425 | | | | 5,494 | |
| | | United States Treasury Note/Bond | | 3.125% | | 11/15/41 | | | 2,701 | | | | 3,064 | |
| | | United States Treasury Note/Bond | | 3.125% | | 2/15/42 | | | 3,631 | | | | 4,119 | |
| | | United States Treasury Note/Bond | | 3.000% | | 5/15/42 | | | 7,620 | | | | 8,480 | |
| | | United States Treasury Note/Bond | | 2.750% | | 8/15/42 | | | 6,740 | | | | 7,198 | |
| | | United States Treasury Note/Bond | | 2.750% | | 11/15/42 | | | 5,446 | | | | 5,814 | |
| | | United States Treasury Note/Bond | | 3.125% | | 2/15/43 | | | 5,850 | | | | 6,636 | |
| | | United States Treasury Note/Bond | | 2.875% | | 5/15/43 | | | 8,753 | | | | 9,541 | |
| | | United States Treasury Note/Bond | | 3.625% | | 8/15/43 | | | 7,405 | | | | 9,084 | |
| | | United States Treasury Note/Bond | | 3.750% | | 11/15/43 | | | 8,693 | | | | 10,876 | |
| | | United States Treasury Note/Bond | | 3.625% | | 2/15/44 | | | 8,402 | | | | 10,331 | |
| | | United States Treasury Note/Bond | | 3.375% | | 5/15/44 | | | 8,604 | | | | 10,187 | |
| | | United States Treasury Note/Bond | | 3.125% | | 8/15/44 | | | 8,606 | | | | 9,795 | |
| | | United States Treasury Note/Bond | | 3.000% | | 11/15/44 | | | 9,337 | | | | 10,414 | |
| | | United States Treasury Note/Bond | | 2.500% | | 2/15/45 | | | 7,020 | | | | 7,168 | |
| | | United States Treasury Note/Bond | | 3.000% | | 5/15/45 | | | 6,917 | | | | 7,728 | |
| | | United States Treasury Note/Bond | | 2.875% | | 8/15/45 | | | 8,878 | | | | 9,707 | |
| | | United States Treasury Note/Bond | | 3.000% | | 11/15/45 | | | 4,974 | | | | 5,564 | |
| | | United States Treasury Note/Bond | | 2.500% | | 2/15/46 | | | 8,128 | | | | 8,301 | |
| | | United States Treasury Note/Bond | | 2.500% | | 5/15/46 | | | 8,981 | | | | 9,170 | |
| | | United States Treasury Note/Bond | | 2.250% | | 8/15/46 | | | 5,756 | | | | 5,595 | |
| | | United States Treasury Note/Bond | | 2.875% | | 11/15/46 | | | 12,500 | | | | 13,713 | |
| | | United States Treasury Note/Bond | | 3.000% | | 2/15/47 | | | 1,662 | | | | 1,868 | |
| | | United States Treasury Note/Bond | | 3.000% | | 5/15/47 | | | 7,293 | | | | 8,193 | |
| | | United States Treasury Note/Bond | | 2.750% | | 8/15/47 | | | 6,713 | | | | 7,200 | |
| | | United States Treasury Note/Bond | | 2.750% | | 11/15/47 | | | 10,171 | | | | 10,907 | |
| | | United States Treasury Note/Bond | | 3.000% | | 2/15/48 | | | 8,479 | | | | 9,531 | |
| | | United States Treasury Note/Bond | | 3.125% | | 5/15/48 | | | 8,985 | | | | 10,343 | |
| | | United States Treasury Note/Bond | | 3.000% | | 8/15/48 | | | 9,510 | | | | 10,712 | |
| | | United States Treasury Note/Bond | | 3.375% | | 11/15/48 | | | 5,907 | | | | 7,126 | |
| | | United States Treasury Note/Bond | | 3.000% | | 2/15/49 | | | 11,044 | | | | 12,459 | |
| | | United States Treasury Note/Bond | | 2.875% | | 5/15/49 | | | 10,723 | | | | 11,823 | |
| | | United States Treasury Note/Bond | | 2.250% | | 8/15/49 | | | 11,636 | | | | 11,292 | |
| | | United States Treasury Note/Bond | | 2.375% | | 11/15/49 | | | 9,660 | | | | 9,631 | |
| | | | | | | | | | | | | | 1,805,501 | |
Total Bond Market Index Portfolio
| | | | | | | | | Face | | | Market | |
| | | | | | | Maturity | | Amount | | | Value• | |
| | | | | Coupon | | Date | | ($000 | ) | | ($000 | ) |
| Agency Bonds and Notes (0.9%) | | | | | | | | | | | | |
| 1 | | AID-Iraq | | 2.149% | | 1/18/22 | | | 100 | | | | 101 | |
| 1 | | AID-Israel | | 5.500% | | 12/4/23 | | | 50 | | | | 57 | |
| 1 | | AID-Israel | | 5.500% | | 4/26/24 | | | 475 | | | | 547 | |
| 1 | | AID-Jordan | | 2.578% | | 6/30/22 | | | 200 | | | | 204 | |
| 1 | | AID-Jordan | | 3.000% | | 6/30/25 | | | 200 | | | | 208 | |
| 1 | | AID-Ukraine | | 1.471% | | 9/29/21 | | | 175 | | | | 174 | |
| | | Federal Farm Credit Banks | | 2.550% | | 3/11/21 | | | 350 | | | | 354 | |
| | | Federal Farm Credit Banks | | 2.230% | | 4/5/21 | | | 350 | | | | 353 | |
| | | Federal Farm Credit Banks | | 3.050% | | 11/15/21 | | | 100 | | | | 103 | |
| | | Federal Farm Credit Banks | | 1.600% | | 12/28/21 | | | 225 | | | | 225 | |
| | | Federal Farm Credit Banks | | 1.770% | | 6/26/23 | | | 150 | | | | 151 | |
| | | Federal Farm Credit Banks | | 3.500% | | 12/20/23 | | | 75 | | | | 80 | |
| | | Federal Home Loan Banks | | 1.375% | | 2/18/21 | | | 450 | | | | 449 | |
| | | Federal Home Loan Banks | | 5.625% | | 6/11/21 | | | 35 | | | | 37 | |
| | | Federal Home Loan Banks | | 1.875% | | 7/7/21 | | | 1,350 | | | | 1,355 | |
| | | Federal Home Loan Banks | | 1.125% | | 7/14/21 | | | 525 | | | | 521 | |
| | | Federal Home Loan Banks | | 3.000% | | 10/12/21 | | | 1,500 | | | | 1,536 | |
| | | Federal Home Loan Banks | | 1.625% | | 11/19/21 | | | 760 | | | | 760 | |
| | | Federal Home Loan Banks | | 1.875% | | 11/29/21 | | | 500 | | | | 502 | |
| | | Federal Home Loan Banks | | 1.625% | | 12/20/21 | | | 1,300 | | | | 1,300 | |
| | | Federal Home Loan Banks | | 2.125% | | 6/10/22 | | | 175 | | | | 177 | |
| | | Federal Home Loan Banks | | 2.000% | | 9/9/22 | | | 250 | | | | 252 | |
| | | Federal Home Loan Banks | | 2.125% | | 3/10/23 | | | 970 | | | | 984 | |
| | | Federal Home Loan Banks | | 2.500% | | 2/13/24 | | | 535 | | | | 551 | |
| | | Federal Home Loan Banks | | 1.500% | | 8/15/24 | | | 330 | | | | 326 | |
| | | Federal Home Loan Banks | | 3.250% | | 11/16/28 | | | 315 | | | | 344 | |
| | | Federal Home Loan Banks | | 5.500% | | 7/15/36 | | | 1,400 | | | | 1,966 | |
| 2 | | Federal Home Loan Mortgage Corp. | | 2.375% | | 2/16/21 | | | 1,200 | | | | 1,210 | |
| 2 | | Federal Home Loan Mortgage Corp. | | 1.125% | | 8/12/21 | | | 1,000 | | | | 992 | |
| 2 | | Federal Home Loan Mortgage Corp. | | 2.375% | | 1/13/22 | | | 800 | | | | 812 | |
| 2 | | Federal Home Loan Mortgage Corp. | | 2.750% | | 6/19/23 | | | 500 | | | | 518 | |
| 2 | | Federal Home Loan Mortgage Corp. | | 6.750% | | 9/15/29 | | | 127 | | | | 178 | |
| 2 | | Federal Home Loan Mortgage Corp. | | 6.750% | | 3/15/31 | | | 1,525 | | | | 2,205 | |
| 2 | | Federal Home Loan Mortgage Corp. | | 6.250% | | 7/15/32 | | | 502 | | | | 721 | |
| 2 | | Federal National Mortgage Assn. | | 1.375% | | 2/26/21 | | | 550 | | | | 549 | |
| 2 | | Federal National Mortgage Assn. | | 2.500% | | 4/13/21 | | | 500 | | | | 505 | |
| 2 | | Federal National Mortgage Assn. | | 2.750% | | 6/22/21 | | | 891 | | | | 905 | |
| 2 | | Federal National Mortgage Assn. | | 1.250% | | 8/17/21 | | | 525 | | | | 522 | |
| 2 | | Federal National Mortgage Assn. | | 1.375% | | 10/7/21 | | | 1,200 | | | | 1,195 | |
| 2 | | Federal National Mortgage Assn. | | 2.000% | | 1/5/22 | | | 500 | | | | 504 | |
| 2 | | Federal National Mortgage Assn. | | 2.625% | | 1/11/22 | | | 216 | | | | 220 | |
| 2 | | Federal National Mortgage Assn. | | 2.250% | | 4/12/22 | | | 476 | | | | 483 | |
| 2 | | Federal National Mortgage Assn. | | 1.375% | | 9/6/22 | | | 350 | | | | 348 | |
| 2 | | Federal National Mortgage Assn. | | 2.000% | | 10/5/22 | | | 850 | | | | 858 | |
| 2 | | Federal National Mortgage Assn. | | 2.375% | | 1/19/23 | | | 2,394 | | | | 2,445 | |
| 2 | | Federal National Mortgage Assn. | | 2.875% | | 9/12/23 | | | 400 | | | | 417 | |
| 2 | | Federal National Mortgage Assn. | | 2.500% | | 2/5/24 | | | 975 | | | | 1,005 | |
| 2 | | Federal National Mortgage Assn. | | 1.750% | | 7/2/24 | | | 1,028 | | | | 1,028 | |
| 2 | | Federal National Mortgage Assn. | | 2.625% | | 9/6/24 | | | 160 | | | | 166 | |
| 2 | | Federal National Mortgage Assn. | | 1.625% | | 10/15/24 | | | 970 | | | | 964 | |
| 2 | | Federal National Mortgage Assn. | | 2.125% | | 4/24/26 | | | 575 | | | | 583 | |
| 2 | | Federal National Mortgage Assn. | | 1.875% | | 9/24/26 | | | 500 | | | | 499 | |
| 2 | | Federal National Mortgage Assn. | | 6.250% | | 5/15/29 | | | 175 | | | | 236 | |
| 2 | | Federal National Mortgage Assn. | | 7.125% | | 1/15/30 | | | 925 | | | | 1,335 | |
| 2 | | Federal National Mortgage Assn. | | 7.250% | | 5/15/30 | | | 300 | | | | 441 | |
| 2 | | Federal National Mortgage Assn. | | 6.625% | | 11/15/30 | | | 300 | | | | 427 | |
| 2 | | Federal National Mortgage Assn. | | 5.625% | | 7/15/37 | | | 275 | | | | 395 | |
| | | Private Export Funding Corp. | | 4.300% | | 12/15/21 | | | 100 | | | | 105 | |
| | | Private Export Funding Corp. | | 2.800% | | 5/15/22 | | | 125 | | | | 128 | |
| | | Private Export Funding Corp. | | 2.050% | | 11/15/22 | | | 1,075 | | | | 1,080 | |
| | | Private Export Funding Corp. | | 3.550% | | 1/15/24 | | | 100 | | | | 106 | |
| | | Private Export Funding Corp. | | 2.450% | | 7/15/24 | | | 100 | | | | 102 | |
| | | Private Export Funding Corp. | | 1.750% | | 11/15/24 | | | 75 | | | | 75 | |
| | | Private Export Funding Corp. | | 3.250% | | 6/15/25 | | | 50 | | | | 53 | |
| | | Tennessee Valley Authority | | 3.875% | | 2/15/21 | | | 250 | | | | 256 | |
| | | Tennessee Valley Authority | | 1.875% | | 8/15/22 | | | 175 | | | | 175 | |
| | | Tennessee Valley Authority | | 2.875% | | 9/15/24 | | | 191 | | | | 200 | |
| | | Tennessee Valley Authority | | 6.750% | | 11/1/25 | | | 134 | | | | 169 | |
| | | Tennessee Valley Authority | | 7.125% | | 5/1/30 | | | 1,000 | | | | 1,441 | |
| | | Tennessee Valley Authority | | 4.650% | | 6/15/35 | | | 175 | | | | 216 | |
| | | Tennessee Valley Authority | | 5.880% | | 4/1/36 | | | 250 | | | | 352 | |
| | | Tennessee Valley Authority | | 5.500% | | 6/15/38 | | | 100 | | | | 139 | |
| | | Tennessee Valley Authority | | 5.250% | | 9/15/39 | | | 412 | | | | 564 | |
| | | Tennessee Valley Authority | | 4.875% | | 1/15/48 | | | 100 | | | | 137 | |
| | | Tennessee Valley Authority | | 5.375% | | 4/1/56 | | | 50 | | | | 76 | |
| | | Tennessee Valley Authority | | 4.625% | | 9/15/60 | | | 180 | | | | 246 | |
| | | Tennessee Valley Authority | | 4.250% | | 9/15/65 | | | 200 | | | | 259 | |
| | | | | | | | | | | | | | 42,162 | |
| Conventional Mortgage-Backed Securities (22.2%) | | | | | | | | | | | | |
| 2,3 | | Fannie Mae Pool | | 2.000% | | 11/1/27–11/1/34 | | | 1,931 | | | | 1,926 | |
| 2,3,4 | | Fannie Mae Pool | | 2.500% | | 1/1/27–1/1/50 | | | 23,901 | | | | 24,126 | |
| 2,3,4 | | Fannie Mae Pool | | 3.000% | | 11/1/25–12/1/49 | | | 82,933 | | | | 85,015 | |
| 2,3,4 | | Fannie Mae Pool | | 3.500% | | 10/1/20–9/1/49 | | | 105,130 | | | | 109,506 | |
| 2,3 | | Fannie Mae Pool | | 4.000% | | 1/1/20–9/1/49 | | | 85,138 | | | | 89,586 | |
| 2,3,4 | | Fannie Mae Pool | | 4.500% | | 1/1/20–1/1/50 | | | 36,954 | | | | 39,467 | |
| 2,3,4 | | Fannie Mae Pool | | 5.000% | | 3/1/20–1/1/50 | | | 12,277 | | | | 13,382 | |
| 2,3 | | Fannie Mae Pool | | 5.500% | | 3/1/20–4/1/40 | | | 5,550 | | | | 6,245 | |
| 2,3 | | Fannie Mae Pool | | 6.000% | | 12/1/20–5/1/41 | | | 3,279 | | | | 3,740 | |
| 2,3 | | Fannie Mae Pool | | 6.500% | | 12/1/23–10/1/39 | | | 891 | | | | 1,025 | |
| 2,3 | | Fannie Mae Pool | | 7.000% | | 6/1/23–11/1/37 | | | 246 | | | | 281 | |
| 2,3 | | Fannie Mae Pool | | 7.500% | | 11/1/22–2/1/32 | | | 26 | | | | 32 | |
| 2,3 | | Fannie Mae Pool | | 8.000% | | 6/1/22–11/1/30 | | | 13 | | | | 13 | |
| 2,3 | | Fannie Mae Pool | | 8.500% | | 7/1/22–4/1/31 | | | 6 | | | | 6 | |
| 2,3 | | Fannie Mae Pool | | 9.500% | | 2/1/25 | | | 1 | | | | 2 | |
| 2,3 | | Freddie Mac Gold Pool | | 2.000% | | 8/1/28–12/1/31 | | | 660 | | | | 658 | |
| 2,3 | | Freddie Mac Gold Pool | | 2.500% | | 4/1/27–2/1/43 | | | 13,167 | | | | 13,344 | |
| 2,3 | | Freddie Mac Gold Pool | | 3.000% | | 10/1/26–8/1/47 | | | 48,850 | | | | 50,229 | |
| 2,3 | | Freddie Mac Gold Pool | | 3.500% | | 9/1/25–11/1/48 | | | 62,661 | | | | 65,443 | |
| 2,3 | | Freddie Mac Gold Pool | | 4.000% | | 1/1/20–11/1/48 | | | 39,436 | | | | 41,634 | |
| 2,3 | | Freddie Mac Gold Pool | | 4.500% | | 8/1/20–10/1/48 | | | 17,755 | | | | 19,003 | |
| 2,3 | | Freddie Mac Gold Pool | | 5.000% | | 2/1/20–11/1/48 | | | 3,929 | | | | 4,300 | |
| 2,3 | | Freddie Mac Gold Pool | | 5.500% | | 7/1/20–6/1/41 | | | 2,664 | | | | 2,968 | |
| 2,3 | | Freddie Mac Gold Pool | | 6.000% | | 8/1/20–3/1/39 | | | 1,979 | | | | 2,248 | |
| 2,3 | | Freddie Mac Gold Pool | | 6.500% | | 8/1/23–4/1/39 | | | 575 | | | | 655 | |
| 2,3 | | Freddie Mac Gold Pool | | 7.000% | | 4/1/23–2/1/37 | | | 143 | | | | 161 | |
| 2,3 | | Freddie Mac Gold Pool | | 7.500% | | 1/1/23–4/1/28 | | | 12 | | | | 12 | |
| 2,3 | | Freddie Mac Gold Pool | | 8.000% | | 1/1/22–7/1/30 | | | 14 | | | | 14 | |
| 2,3 | | Freddie Mac Gold Pool | | 8.500% | | 7/1/24–11/1/30 | | | 9 | | | | 10 | |
| 2,3 | | Freddie Mac Gold Pool | | 9.000% | | 5/1/27–5/1/30 | | | 4 | | | | 4 | |
| 2,3 | | Freddie Mac Pool | | 4.000% | | 1/1/49 | | | 415 | | | | 440 | |
| 2,3 | | Freddie Mac Pool | | 4.500% | | 4/1/49 | | | 1,137 | | | | 1,217 | |
Total Bond Market Index Portfolio
| | | | | | | | | Face | | | Market | |
| | | | | | | Maturity | | Amount | | | Value• | |
| | | | | Coupon | | Date | | ($000 | ) | | ($000 | ) |
| 3 | | Ginnie Mae I Pool | | 3.000% | | 1/15/26–12/15/45 | | | 2,949 | | | | 3,034 | |
| 3,4 | | Ginnie Mae I Pool | | 3.500% | | 11/15/25–1/1/49 | | | 3,159 | | | | 3,298 | |
| 3 | | Ginnie Mae I Pool | | 4.000% | | 10/15/24–11/15/47 | | | 3,589 | | | | 3,785 | |
| 3 | | Ginnie Mae I Pool | | 4.500% | | 5/15/20–3/15/41 | | | 3,435 | | | | 3,707 | |
| 3 | | Ginnie Mae I Pool | | 5.000% | | 11/15/20–4/15/41 | | | 2,321 | | | | 2,548 | |
| 3 | | Ginnie Mae I Pool | | 5.500% | | 1/15/32–12/15/40 | | | 1,419 | | | | 1,573 | |
| 3 | | Ginnie Mae I Pool | | 6.000% | | 1/15/24–3/15/40 | | | 1,027 | | | | 1,150 | |
| 3 | | Ginnie Mae I Pool | | 6.500% | | 11/15/23–12/15/38 | | | 263 | | | | 287 | |
| 3 | | Ginnie Mae I Pool | | 7.000% | | 5/15/23–10/15/31 | | | 66 | | | | 76 | |
| 3 | | Ginnie Mae I Pool | | 7.500% | | 4/15/22–1/15/31 | | | 21 | | | | 24 | |
| 3 | | Ginnie Mae I Pool | | 8.000% | | 3/15/22–10/15/30 | | | 19 | | | | 19 | |
| 3 | | Ginnie Mae I Pool | | 8.500% | | 6/15/24–9/15/26 | | | 2 | | | | 2 | |
| 3 | | Ginnie Mae I Pool | | 9.000% | | 8/15/21–10/15/26 | | | 1 | | | | 1 | |
| 3,4 | | Ginnie Mae II Pool | | 2.500% | | 6/20/27–1/1/50 | | | 8,650 | | | | 8,681 | |
| 3,4 | | Ginnie Mae II Pool | | 3.000% | | 2/20/27–1/1/50 | | | 61,744 | | | | 63,674 | |
| 3,4 | | Ginnie Mae II Pool | | 3.500% | | 9/20/25–9/20/49 | | | 91,713 | | | | 95,454 | |
| 3 | | Ginnie Mae II Pool | | 4.000% | | 9/20/25–12/1/49 | | | 58,284 | | | | 60,990 | |
| 3,4 | | Ginnie Mae II Pool | | 4.500% | | 2/20/39–1/1/50 | | | 29,226 | | | | 31,071 | |
| 3 | | Ginnie Mae II Pool | | 5.000% | | 12/20/32–5/20/49 | | | 9,817 | | | | 10,538 | |
| 3 | | Ginnie Mae II Pool | | 5.500% | | 6/20/34–9/20/41 | | | 1,100 | | | | 1,224 | |
| 3 | | Ginnie Mae II Pool | | 6.000% | | 3/20/33–7/20/39 | | | 536 | | | | 613 | |
| 3 | | Ginnie Mae II Pool | | 6.500% | | 12/20/35–11/20/39 | | | 191 | | | | 222 | |
| 3 | | Ginnie Mae II Pool | | 7.000% | | 8/20/36–4/20/38 | | | 23 | | | | 28 | |
| 2,3 | | UMBS Pool | | 2.000% | | 1/1/32 | | | 211 | | | | 209 | |
| 2,3 | | UMBS Pool | | 2.500% | | 11/1/34–12/1/49 | | | 7,106 | | | | 7,055 | |
| 2,3 | | UMBS Pool | | 3.000% | | 7/1/30–1/1/50 | | | 34,184 | | | | 34,687 | |
| 2,3 | | UMBS Pool | | 3.500% | | 7/1/49–10/1/49 | | | 14,762 | | | | 15,280 | |
| 2,3 | | UMBS Pool | | 4.000% | | 5/1/47–9/1/49 | | | 7,783 | | | | 8,302 | |
| 2,3 | | UMBS Pool | | 4.500% | | 8/1/48–8/1/49 | | | 3,327 | | | | 3,569 | |
| 2,3 | | UMBS Pool | | 5.000% | | 3/1/49 | | | 1,492 | | | | 1,636 | |
| 2,3,4 | | UMBS TBA | | 2.500% | | 1/1/50 | | | 3,175 | | | | 3,139 | |
| 2,3,4 | | UMBS TBA | | 3.000% | | 11/1/49–1/1/50 | | | 3,550 | | | | 3,600 | |
| 2,3,4 | | UMBS TBA | | 3.500% | | 9/1/49–1/1/50 | | | 1,460 | | | | 1,501 | |
| 2,3,4 | | UMBS TBA | | 4.000% | | 1/1/35–1/1/50 | | | 6,790 | | | | 7,066 | |
| | | | | | | | | | | | | | 954,735 | |
| Nonconventional Mortgage-Backed Securities (0.1%) | | | | | | | | | | | | |
| 2,3,5 | | Fannie Mae Pool, 12M USD LIBOR + 1.290% | | 4.034% | | 12/1/41 | | | 23 | | | | 24 | |
| 2,3,5 | | Fannie Mae Pool, 12M USD LIBOR + 1.310% | | 3.592% | | 9/1/37 | | | 45 | | | | 46 | |
| 2,3,5 | | Fannie Mae Pool, 12M USD LIBOR + 1.392% | | 3.811% | | 10/1/37 | | | 17 | | | | 17 | |
| 2,3,5 | | Fannie Mae Pool, 12M USD LIBOR + 1.509% | | 4.082% | | 7/1/36 | | | 7 | | | | 7 | |
| 2,3,5 | | Fannie Mae Pool, 12M USD LIBOR + 1.553% | | 2.443% | | 9/1/43 | | | 12 | | | | 12 | |
| 2,3,5 | | Fannie Mae Pool, 12M USD LIBOR + 1.560% | | 2.272% | | 7/1/43 | | | 132 | | | | 133 | |
| 2,3,5 | | Fannie Mae Pool, 12M USD LIBOR + 1.609% | | 3.642% | | 12/1/33 | | | 6 | | | | 7 | |
| 2,3,5 | | Fannie Mae Pool, 12M USD LIBOR + 1.623% | | 4.748% | | 2/1/36 | | | 6 | | | | 6 | |
| 2,3,5 | | Fannie Mae Pool, 12M USD LIBOR + 1.625% | | 4.135% | | 8/1/35 | | | 42 | | | | 45 | |
| 2,3,5 | | Fannie Mae Pool, 12M USD LIBOR + 1.627% | | 4.752% | | 3/1/38 | | | 5 | | | | 5 | |
| 2,3,5 | | Fannie Mae Pool, 12M USD LIBOR + 1.635% | | 3.510% | | 11/1/36 | | | 4 | | | | 5 | |
| 2,3,5 | | Fannie Mae Pool, 12M USD LIBOR + 1.643% | | 4.476% | | 1/1/37 | | | 6 | | | | 7 | |
| 2,3,5 | | Fannie Mae Pool, 12M USD LIBOR + 1.660% | | 3.910% | | 9/1/40 | | | 7 | | | | 8 | |
| 2,3,5 | | Fannie Mae Pool, 12M USD LIBOR + 1.665% | | 4.415% | | 6/1/36 | | | 1 | | | | 1 | |
| 2,3,5 | | Fannie Mae Pool, 12M USD LIBOR + 1.679% | | 3.992% | | 1/1/42 | | | 23 | | | | 24 | |
| 2,3,5 | | Fannie Mae Pool, 12M USD LIBOR + 1.682% | | 4.167% | | 10/1/37 | | | 18 | | | | 19 | |
| 2,3,5 | | Fannie Mae Pool, 12M USD LIBOR + 1.690% | | 3.706% | | 10/1/39 | | | 11 | | | | 11 | |
| 2,3,5 | | Fannie Mae Pool, 12M USD LIBOR + 1.690% | | 3.972% | | 9/1/42 | | | 38 | | | | 40 | |
| 2,3,5 | | Fannie Mae Pool, 12M USD LIBOR + 1.690% | | 4.622% | | 5/1/40 | | | 13 | | | | 13 | |
| 2,3,5 | | Fannie Mae Pool, 12M USD LIBOR + 1.695% | | 4.320% | | 7/1/39 | | | 5 | | | | 5 | |
| 2,3,5 | | Fannie Mae Pool, 12M USD LIBOR + 1.698% | | 4.161% | | 8/1/40 | | | 11 | | | | 11 | |
| 2,3,5 | | Fannie Mae Pool, 12M USD LIBOR + 1.700% | | 4.364% | | 12/1/40 | | | 14 | | | | 14 | |
| 2,3,5 | | Fannie Mae Pool, 12M USD LIBOR + 1.701% | | 3.965% | | 10/1/42 | | | 23 | | | | 24 | |
| 2,3,5 | | Fannie Mae Pool, 12M USD LIBOR + 1.705% | | 3.809% | | 11/1/39 | | | 5 | | | | 6 | |
| 2,3,5 | | Fannie Mae Pool, 12M USD LIBOR + 1.726% | | 3.956% | | 9/1/34 | | | 5 | | | | 5 | |
| 2,3,5 | | Fannie Mae Pool, 12M USD LIBOR + 1.734% | | 3.997% | | 11/1/39 | | | 14 | | | | 14 | |
| 2,3,5 | | Fannie Mae Pool, 12M USD LIBOR + 1.746% | | 4.506% | | 7/1/41 | | | 36 | | | | 38 | |
| 2,3,5 | | Fannie Mae Pool, 12M USD LIBOR + 1.750% | | 4.213% | | 10/1/40 | | | 9 | | | | 9 | |
| 2,3,5 | | Fannie Mae Pool, 12M USD LIBOR + 1.767% | | 4.648% | | 6/1/41 | | | 6 | | | | 6 | |
| 2,3,5 | | Fannie Mae Pool, 12M USD LIBOR + 1.771% | | 4.709% | | 5/1/42 | | | 9 | | | | 10 | |
| 2,3,5 | | Fannie Mae Pool, 12M USD LIBOR + 1.780% | | 4.905% | | 2/1/41 | | | 6 | | | | 7 | |
| 2,3,5 | | Fannie Mae Pool, 12M USD LIBOR + 1.793% | | 3.391% | | 8/1/42 | | | 50 | | | | 50 | |
| 2,3,5 | | Fannie Mae Pool, 12M USD LIBOR + 1.795% | | 4.839% | | 3/1/42 | | | 22 | | | | 23 | |
| 2,3,5 | | Fannie Mae Pool, 12M USD LIBOR + 1.798% | | 4.358% | | 3/1/42 | | | 21 | | | | 22 | |
| 2,3,5 | | Fannie Mae Pool, 12M USD LIBOR + 1.804% | | 3.943% | | 12/1/39 | | | 15 | | | | 16 | |
| 2,3,5 | | Fannie Mae Pool, 12M USD LIBOR + 1.805% | | 3.773% | | 11/1/41 | | | 25 | | | | 27 | |
| 2,3,5 | | Fannie Mae Pool, 12M USD LIBOR + 1.810% | | 3.685% | | 10/1/40 | | | 15 | | | | 16 | |
Total Bond Market Index Portfolio
| | | | | | | | | Face | | | Market | |
| | | | | | | Maturity | | Amount | | | Value• | |
| | | | | Coupon | | Date | | ($000 | ) | | ($000 | ) |
| 2,3,5 | | Fannie Mae Pool, 12M USD LIBOR + 1.810% | | 3.935% | | 11/1/33–11/1/39 | | | 15 | | | | 15 | |
| 2,3,5 | | Fannie Mae Pool, 12M USD LIBOR + 1.810% | | 4.810% | | 12/1/40 | | | 10 | | | | 10 | |
| 2,3,5 | | Fannie Mae Pool, 12M USD LIBOR + 1.813% | | 3.978% | | 11/1/41 | | | 14 | | | | 15 | |
| 2,3,5 | | Fannie Mae Pool, 12M USD LIBOR + 1.813% | | 4.435% | | 1/1/42 | | | 21 | | | | 22 | |
| 2,3,5 | | Fannie Mae Pool, 12M USD LIBOR + 1.815% | | 3.690% | | 11/1/40 | | | 5 | | | | 5 | |
| 2,3,5 | | Fannie Mae Pool, 12M USD LIBOR + 1.815% | | 3.809% | | 12/1/40 | | | 9 | | | | 9 | |
| 2,3,5 | | Fannie Mae Pool, 12M USD LIBOR + 1.815% | | 3.970% | | 12/1/41 | | | 17 | | | | 18 | |
| 2,3,5 | | Fannie Mae Pool, 12M USD LIBOR + 1.815% | | 4.693% | | 5/1/41 | | | 17 | | | | 18 | |
| 2,3,5 | | Fannie Mae Pool, 12M USD LIBOR + 1.815% | | 4.940% | | 2/1/41 | | | 15 | | | | 16 | |
| 2,3,5 | | Fannie Mae Pool, 12M USD LIBOR + 1.819% | | 4.759% | | 3/1/41 | | | 27 | | | | 28 | |
| 2,3,5 | | Fannie Mae Pool, 12M USD LIBOR + 1.820% | | 4.168% | | 12/1/40 | | | 7 | | | | 7 | |
| 2,3,5 | | Fannie Mae Pool, 12M USD LIBOR + 1.822% | | 4.310% | | 9/1/40 | | | 31 | | | | 33 | |
| 2,3,5 | | Fannie Mae Pool, 12M USD LIBOR + 1.823% | | 4.902% | | 2/1/41 | | | 12 | | | | 12 | |
| 2,3,5 | | Fannie Mae Pool, 12M USD LIBOR + 1.825% | | 4.825% | | 3/1/41 | | | 14 | | | | 15 | |
| 2,3,5 | | Fannie Mae Pool, 12M USD LIBOR + 1.830% | | 3.451% | | 4/1/41 | | | 25 | | | | 25 | |
| 2,3,5 | | Fannie Mae Pool, 12M USD LIBOR + 1.830% | | 4.580% | | 6/1/41 | | | 17 | | | | 18 | |
| 2,3,5 | | Fannie Mae Pool, 12M USD LIBOR + 1.835% | | 4.723% | | 1/1/40 | | | 15 | | | | 15 | |
| 2,3,5 | | Fannie Mae Pool, 12M USD LIBOR + 1.840% | | 4.403% | | 8/1/39 | | | 12 | | | | 13 | |
| 2,3,5 | | Fannie Mae Pool, 12M USD LIBOR + 1.861% | | 4.745% | | 5/1/40 | | | 6 | | | | 6 | |
| 2,3,5 | | Fannie Mae Pool, 12M USD LIBOR + 1.880% | | 4.406% | | 11/1/34 | | | 10 | | | | 10 | |
| 2,3,5 | | Fannie Mae Pool, 12M USD LIBOR + 1.909% | | 4.784% | | 4/1/37 | | | 9 | | | | 10 | |
| 2,3,5 | | Fannie Mae Pool, 12M USD LIBOR + 1.912% | | 4.787% | | 5/1/36 | | | 3 | | | | 3 | |
| 2,3,5 | | Fannie Mae Pool, 1Y CMT + 2.155% | | 4.780% | | 12/1/37 | | | 24 | | | | 25 | |
| 2,3,5 | | Fannie Mae Pool, 1Y CMT + 2.238% | | 4.613% | | 7/1/38 | | | 8 | | | | 8 | |
| 2,3,5 | | Fannie Mae Pool, 1Y CMT + 2.268% | | 4.415% | | 12/1/35 | | | 10 | | | | 10 | |
| 2,3,5 | | Fannie Mae Pool, 1Y CMT + 2.313% | | 4.845% | | 1/1/35 | | | 14 | | | | 15 | |
| 2,3,5 | | Fannie Mae Pool, 6M USD LIBOR + 1.026% | | 3.206% | | 4/1/37 | | | 13 | | | | 14 | |
| 2,3,5 | | Fannie Mae Pool, 6M USD LIBOR + 1.476% | | 2.242% | | 3/1/43 | | | 100 | | | | 101 | |
| 2,3,5 | | Fannie Mae Pool, 6M USD LIBOR + 1.582% | | 2.743% | | 6/1/43 | | | 62 | | | | 62 | |
| 2,3,5 | | Fannie Mae Pool, 6M USD LIBOR + 1.638% | | 4.339% | | 8/1/39 | | | 26 | | | | 27 | |
| 2,3,5 | | Fannie Mae Pool, 6M USD LIBOR + 1.657% | | 4.260% | | 10/1/42 | | | 21 | | | | 22 | |
| 2,3,5 | | Fannie Mae Pool, 6M USD LIBOR + 1.700% | | 4.531% | | 7/1/37 | | | 8 | | | | 9 | |
| 2,3,5 | | Fannie Mae Pool, 6M USD LIBOR + 1.710% | | 3.371% | | 9/1/43 | | | 49 | | | | 50 | |
| 2,3,5 | | Fannie Mae Pool, 6M USD LIBOR + 1.723% | | 4.720% | | 5/1/42 | | | 44 | | | | 46 | |
| 2,3,5 | | Fannie Mae Pool, 6M USD LIBOR + 1.789% | | 4.572% | | 7/1/42 | | | 16 | | | | 17 | |
| 2,3,5 | | Fannie Mae Pool, 6M USD LIBOR + 1.840% | | 4.157% | | 8/1/37 | | | 13 | | | | 14 | |
| 2,3,5 | | Freddie Mac Non Gold Pool, 12M USD LIBOR + 0.985% | | 3.235% | | 10/1/37 | | | 2 | | | | 2 | |
| 2,3,5 | | Freddie Mac Non Gold Pool, 12M USD LIBOR + 1.564% | | 4.420% | | 3/1/37 | | | 2 | | | | 2 | |
| 2,3,5 | | Freddie Mac Non Gold Pool, 12M USD LIBOR + 1.588% | | 3.921% | | 9/1/37 | | | 5 | | | | 5 | |
| 2,3,5 | | Freddie Mac Non Gold Pool, 12M USD LIBOR + 1.625% | | 4.625% | | 1/1/38 | | | 2 | | | | 2 | |
| 2,3,5 | | Freddie Mac Non Gold Pool, 12M USD LIBOR + 1.640% | | 3.830% | | 12/1/36 | | | 9 | | | | 9 | |
| 2,3,5 | | Freddie Mac Non Gold Pool, 12M USD LIBOR + 1.640% | | 4.515% | | 5/1/42 | | | 4 | | | | 4 | |
| 2,3,5 | | Freddie Mac Non Gold Pool, 12M USD LIBOR + 1.660% | | 3.711% | | 10/1/37 | | | 10 | | | | 10 | |
| 2,3,5 | | Freddie Mac Non Gold Pool, 12M USD LIBOR + 1.695% | | 4.767% | | 2/1/37 | | | 6 | | | | 6 | |
| 2,3,5 | | Freddie Mac Non Gold Pool, 12M USD LIBOR + 1.727% | | 4.738% | | 1/1/35 | | | 2 | | | | 2 | |
| 2,3,5 | | Freddie Mac Non Gold Pool, 12M USD LIBOR + 1.743% | | 3.865% | | 12/1/36 | | | 16 | | | | 16 | |
| 2,3,5 | | Freddie Mac Non Gold Pool, 12M USD LIBOR + 1.745% | | 4.713% | | 12/1/40 | | | 22 | | | | 23 | |
| 2,3,5 | | Freddie Mac Non Gold Pool, 12M USD LIBOR + 1.750% | | 4.625% | | 5/1/38 | | | 1 | | | | 2 | |
| 2,3,5 | | Freddie Mac Non Gold Pool, 12M USD LIBOR + 1.765% | | 3.730% | | 12/1/36 | | | 4 | | | | 5 | |
| 2,3,5 | | Freddie Mac Non Gold Pool, 12M USD LIBOR + 1.796% | | 3.871% | | 12/1/34 | | | 9 | | | | 9 | |
| 2,3,5 | | Freddie Mac Non Gold Pool, 12M USD LIBOR + 1.834% | | 4.220% | | 12/1/35 | | | 11 | | | | 11 | |
| 2,3,5 | | Freddie Mac Non Gold Pool, 12M USD LIBOR + 1.864% | | 4.595% | | 2/1/42 | | | 10 | | | | 10 | |
| 2,3,5 | | Freddie Mac Non Gold Pool, 12M USD LIBOR + 1.880% | | 4.005% | | 11/1/40 | | | 2 | | | | 2 | |
| 2,3,5 | | Freddie Mac Non Gold Pool, 12M USD LIBOR + 1.880% | | 4.630% | | 6/1/40 | | | 12 | | | | 12 | |
| 2,3,5 | | Freddie Mac Non Gold Pool, 12M USD LIBOR + 1.880% | | 4.713% | | 6/1/41 | | | 7 | | | | 7 | |
| 2,3,5 | | Freddie Mac Non Gold Pool, 12M USD LIBOR + 1.880% | | 4.755% | | 5/1/40 | | | 11 | | | | 11 | |
| 2,3,5 | | Freddie Mac Non Gold Pool, 12M USD LIBOR + 1.880% | | 4.756% | | 6/1/40 | | | 10 | | | | 11 | |
| 2,3,5 | | Freddie Mac Non Gold Pool, 12M USD LIBOR + 1.880% | | 4.880% | | 12/1/40 | | | 2 | | | | 3 | |
| 2,3,5 | | Freddie Mac Non Gold Pool, 12M USD LIBOR + 1.880% | | 4.979% | | 1/1/41 | | | 17 | | | | 18 | |
| 2,3,5 | | Freddie Mac Non Gold Pool, 12M USD LIBOR + 1.880% | | 5.005% | | 3/1/41 | | | 6 | | | | 6 | |
| 2,3,5 | | Freddie Mac Non Gold Pool, 12M USD LIBOR + 1.889% | | 4.956% | | 2/1/42 | | | 13 | | | | 13 | |
| 2,3,5 | | Freddie Mac Non Gold Pool, 12M USD LIBOR + 1.895% | | 4.323% | | 9/1/40 | | | 23 | | | | 24 | |
| 2,3,5 | | Freddie Mac Non Gold Pool, 12M USD LIBOR + 1.900% | | 3.846% | | 11/1/40 | | | 15 | | | | 15 | |
| 2,3,5 | | Freddie Mac Non Gold Pool, 12M USD LIBOR + 1.900% | | 4.705% | | 6/1/40 | | | 15 | | | | 16 | |
| 2,3,5 | | Freddie Mac Non Gold Pool, 12M USD LIBOR + 1.910% | | 4.825% | | 1/1/41 | | | 3 | | | | 3 | |
| 2,3,5 | | Freddie Mac Non Gold Pool, 12M USD LIBOR + 1.910% | | 5.035% | | 2/1/41 | | | 18 | | | | 19 | |
| 2,3,5 | | Freddie Mac Non Gold Pool, 12M USD LIBOR + 1.977% | | 4.783% | | 5/1/37 | | | 20 | | | | 21 | |
| 2,3,5 | | Freddie Mac Non Gold Pool, 12M USD LIBOR + 2.000% | | 4.750% | | 7/1/35 | | | 2 | | | | 2 | |
| 2,3,5 | | Freddie Mac Non Gold Pool, 12M USD LIBOR + 2.085% | | 5.210% | | 3/1/38 | | | 3 | | | | 3 | |
| 2,3,5 | | Freddie Mac Non Gold Pool, 1Y CMT + 2.250% | | 4.006% | | 11/1/34 | | | 22 | | | | 23 | |
| 2,3,5 | | Freddie Mac Non Gold Pool, 1Y CMT + 2.250% | | 4.750% | | 5/1/36 | | | 6 | | | | 6 | |
| 2,3,5 | | Freddie Mac Non Gold Pool, 1Y CMT + 2.250% | | 4.991% | | 2/1/36 | | | 7 | | | | 7 | |
Total Bond Market Index Portfolio
| | | | | | | | | Face | | | Market | |
| | | | | | | Maturity | | Amount | | | Value• | |
| | | | | Coupon | | Date | | ($000 | ) | | ($000 | ) |
| 2,3,5 | | Freddie Mac Non Gold Pool, 1Y CMT + 2.409% | | 4.964% | | 10/1/36 | | | 12 | | | | 13 | |
| 2,3,5 | | Freddie Mac Non Gold Pool, 6M USD LIBOR + 1.355% | | 3.438% | | 6/1/37 | | | 7 | | | | 8 | |
| 3,5 | | Ginnie Mae II Pool, 1Y CMT + 1.500% | | 3.250% | | 7/20/38–8/20/41 | | | 45 | | | | 46 | |
| 3,5 | | Ginnie Mae II Pool, 1Y CMT + 1.500% | | 3.875% | | 4/20/41–6/20/43 | | | 109 | | | | 112 | |
| 3,5 | | Ginnie Mae II Pool, 1Y CMT + 1.500% | | 4.000% | | 1/20/41–3/20/43 | | | 122 | | | | 126 | |
| 3,5 | | Ginnie Mae II Pool, 1Y CMT + 1.500% | | 4.125% | | 10/20/38–12/20/42 | | | 163 | | | | 167 | |
| 3,5 | | Ginnie Mae II Pool, 1Y CMT + 2.000% | | 4.375% | | 5/20/41 | | | 12 | | | | 13 | |
| 3,5 | | Ginnie Mae II Pool, 1Y CMT + 2.000% | | 4.625% | | 11/20/40 | | | 1 | | | | 1 | |
| | | | | | | | | | | | | | 2,302 | |
| Total U.S. Government and Agency Obligations (Cost $2,733,576) | | | | | | | | | | | 2,804,700 | |
| Asset-Backed/Commercial Mortgage-Backed Securities (2.6%) |
| 3 | | Ally Auto Receivables Trust 2018-1 | | 2.350% | | 6/15/22 | | | 73 | | | | 73 | |
| 3 | | Ally Auto Receivables Trust 2018-1 | | 2.530% | | 2/15/23 | | | 25 | | | | 25 | |
| 3 | | Ally Auto Receivables Trust 2018-3 | | 3.000% | | 1/17/23 | | | 25 | | | | 25 | |
| 3 | | Ally Auto Receivables Trust 2018-3 | | 3.120% | | 7/17/23 | | | 50 | | | | 51 | |
| 3 | | Ally Auto Receivables Trust 2019-2 | | 2.230% | | 1/16/24 | | | 275 | | | | 276 | |
| 3 | | Ally Auto Receivables Trust 2019-2 | | 2.260% | | 8/15/24 | | | 50 | | | | 50 | |
| 3 | | Ally Auto Receivables Trust 2019-4 | | 1.840% | | 6/17/24 | | | 230 | | | | 230 | |
| 3 | | Ally Auto Receivables Trust 2019-4 | | 1.920% | | 1/15/25 | | | 25 | | | | 25 | |
| 3 | | Ally Master Owner Trust Series 2018-1 | | 2.700% | | 1/17/23 | | | 425 | | | | 428 | |
| 3 | | Ally Master Owner Trust Series 2018-2 | | 3.290% | | 5/15/23 | | | 100 | | | | 102 | |
| 3 | | American Express Credit Account Master Trust 2017-1 | | 1.930% | | 9/15/22 | | | 250 | | | | 250 | |
| 3 | | American Express Credit Account Master Trust 2017-3 | | 1.770% | | 11/15/22 | | | 300 | | | | 300 | |
| 3 | | American Express Credit Account Master Trust 2017-6 | | 2.040% | | 5/15/23 | | | 375 | | | | 376 | |
| 3 | | American Express Credit Account Master Trust 2017-7 | | 2.350% | | 5/15/25 | | | 225 | | | | 228 | |
| 3 | | American Express Credit Account Master Trust 2018-1 | | 2.670% | | 10/17/22 | | | 275 | | | | 275 | |
| 3 | | American Express Credit Account Master Trust 2018-2 | | 3.010% | | 10/15/25 | | | 250 | | | | 258 | |
| 3 | | American Express Credit Account Master Trust 2018-4 | | 2.990% | | 12/15/23 | | | 325 | | | | 330 | |
| 3 | | American Express Credit Account Master Trust 2018-8 | | 3.180% | | 4/15/24 | | | 100 | | | | 102 | |
| 3 | | AmeriCredit Automobile Receivables Trust 2017-3 | | 1.900% | | 3/18/22 | | | 38 | | | | 38 | |
| 3 | | AmeriCredit Automobile Receivables Trust 2018-1 | | 3.070% | | 12/19/22 | | | 100 | | | | 101 | |
| 3 | | AmeriCredit Automobile Receivables Trust 2018-1 | | 3.260% | | 1/18/24 | | | 56 | | | | 57 | |
| 3 | | AmeriCredit Automobile Receivables Trust 2018-1 | | 3.500% | | 1/18/24 | | | 50 | | | | 51 | |
| 3 | | AmeriCredit Automobile Receivables Trust 2019-1 | | 2.970% | | 11/20/23 | | | 75 | | | | 76 | |
| 3 | | BA Credit Card Trust 2017-A1 | | 1.950% | | 8/15/22 | | | 250 | | | | 250 | |
| 3 | | BA Credit Card Trust 2018-A1 | | 2.700% | | 7/17/23 | | | 475 | | | | 480 | |
| 3 | | BA Credit Card Trust 2019-A1 | | 1.740% | | 1/15/25 | | | 150 | | | | 150 | |
| 3 | | Banc of America Commercial Mortgage Trust 2015-UBS7 | | 3.429% | | 9/15/48 | | | 50 | | | | 52 | |
| 3 | | Banc of America Commercial Mortgage Trust 2015-UBS7 | | 3.705% | | 9/15/48 | | | 75 | | | | 80 | |
| 3 | | Banc of America Commercial Mortgage Trust 2017-BNK3 | | 3.574% | | 2/15/50 | | | 72 | | | | 77 | |
| 3 | | Banc of America Commercial Mortgage Trust 2017-BNK3 | | 3.748% | | 2/15/50 | | | 28 | | | | 29 | |
| 3 | | BANK 2017 - BNK5 | | 3.390% | | 6/15/60 | | | 150 | | | | 159 | |
| 3 | | BANK 2017 - BNK5 | | 3.624% | | 6/15/60 | | | 100 | | | | 105 | |
| 3 | | BANK 2017 - BNK6 | | 3.518% | | 7/15/60 | | | 404 | | | | 431 | |
| 3 | | BANK 2017 - BNK6 | | 3.741% | | 7/15/60 | | | 404 | | | | 431 | |
| 3 | | BANK 2017 - BNK7 | | 3.175% | | 9/15/60 | | | 100 | | | | 104 | |
| 3 | | BANK 2017 - BNK7 | | 3.435% | | 9/15/60 | | | 75 | | | | 80 | |
| 3 | | BANK 2017 - BNK7 | | 3.748% | | 9/15/60 | | | 75 | | | | 79 | |
| 3 | | BANK 2017 - BNK8 | | 3.488% | | 11/15/50 | | | 150 | | | | 160 | |
| 3 | | BANK 2017 - BNK8 | | 3.731% | | 11/15/50 | | | 25 | | | | 26 | |
| 3 | | BANK 2017 - BNK9 | | 3.279% | | 11/15/54 | | | 150 | | | | 157 | |
| 3 | | BANK 2017 - BNK9 | | 3.538% | | 11/15/54 | | | 150 | | | | 160 | |
| 3 | | BANK 2018 - BN10 | | 3.641% | | 2/15/61 | | | 50 | | | | 53 | |
| 3 | | BANK 2018 - BN10 | | 3.688% | | 2/15/61 | | | 250 | | | | 270 | |
| 3 | | BANK 2018 - BN10 | | 3.898% | | 2/15/61 | | | 50 | | | | 54 | |
| 3 | | BANK 2018 - BN11 | | 4.046% | | 3/15/61 | | | 100 | | | | 110 | |
| 3 | | BANK 2018 - BN12 | | 4.255% | | 5/15/61 | | | 125 | | | | 140 | |
| 3 | | BANK 2018 - BN12 | | 4.359% | | 5/15/61 | | | 50 | | | | 56 | |
| 3 | | BANK 2018 - BN13 | | 4.217% | | 8/15/61 | | | 25 | | | | 28 | |
| 3 | | BANK 2018 - BN14 | | 4.128% | | 9/15/60 | | | 50 | | | | 53 | |
| 3 | | BANK 2018 - BN14 | | 4.231% | | 9/15/60 | | | 100 | | | | 112 | |
| 3 | | BANK 2018 - BN14 | | 4.481% | | 9/15/60 | | | 25 | | | | 28 | |
| 3 | | BANK 2018 - BN15 | | 4.407% | | 11/15/61 | | | 110 | | | | 125 | |
| 3 | | BANK 2019 - BN16 | | 4.005% | | 2/15/52 | | | 125 | | | | 138 | |
| 3 | | BANK 2019 - BN17 | | 3.714% | | 4/15/52 | | | 100 | | | | 108 | |
| 3 | | BANK 2019 - BN17 | | 3.976% | | 4/15/52 | | | 25 | | | | 27 | |
| 3 | | BANK 2019 - BN18 | | 3.584% | | 5/15/62 | | | 375 | | | | 403 | |
| 3 | | BANK 2019 - BN18 | | 3.826% | | 5/15/62 | | | 50 | | | | 53 | |
| 3 | | BANK 2019 - BN19 | | 3.183% | | 8/15/61 | | | 275 | | | | 287 | |
| 3 | | BANK 2019 - BN20 | | 3.011% | | 9/15/61 | | | 170 | | | | 175 | |
| 3 | | BANK 2019 - BN21 | | 2.851% | | 10/17/52 | | | 375 | | | | 381 | |
| 3 | | BANK 2019 - BN21 | | 3.093% | | 10/17/52 | | | 75 | | | | 75 | |
| 3 | | BANK 2019 - BN22 | | 2.978% | | 11/15/62 | | | 290 | | | | 298 | |
| 3 | | BANK 2019 - BN23 | | 2.920% | | 12/15/52 | | | 180 | | | | 184 | |
| 3 | | BANK 2019 - BN23 | | 3.203% | | 12/15/52 | | | 75 | | | | 76 | |
| 3 | | BANK 2019 - BN24 | | 2.960% | | 11/15/62 | | | 150 | | | | 154 | |
| 3 | | BANK 2019 - BN24 | | 3.283% | | 11/15/62 | | | 75 | | | | 76 | |
| 3 | | Bank of America Credit Card Trust 2018-A2 | | 3.000% | | 9/15/23 | | | 400 | | | | 406 | |
| | | Bank of Nova Scotia | | 1.875% | | 4/26/21 | | | 175 | | | | 175 | |
| 3 | | BBCMS Mortgage Trust 2017-C1 | | 3.674% | | 2/15/50 | | | 325 | | | | 349 | |
| 3 | | BBCMS Mortgage Trust 2017-C1 | | 3.898% | | 2/15/50 | | | 100 | | | | 107 | |
| 3 | | BBCMS Mortgage Trust 2018-C2 | | 4.314% | | 12/15/51 | | | 125 | | | | 141 | |
| 3 | | BBCMS Mortgage Trust 2019-C3 | | 3.583% | | 5/15/52 | | | 700 | | | | 744 | |
| 3 | | BBCMS Mortgage Trust 2019-C4 | | 2.919% | | 8/15/52 | | | 275 | | | | 279 | |
| 3 | | BBCMS Mortgage Trust 2019-C4 | | 3.171% | | 8/15/52 | | | 25 | | | | 25 | |
| 3 | | BBCMS Mortgage Trust 2019-C5 | | 3.063% | | 11/15/52 | | | 150 | | | | 154 | |
| 3 | | BBCMS Mortgage Trust 2019-C5 | | 3.366% | | 11/15/52 | | | 100 | | | | 102 | |
| 3 | | Bear Stearns Commercial Mortgage Securities Trust 2007-TOP26 | | 5.450% | | 1/12/45 | | | 27 | | | | 27 | |
| 3 | | BENCHMARK 2018-B1 Mortgage Trust | | 3.666% | | 1/15/51 | | | 100 | | | | 108 | |
| 3 | | BENCHMARK 2018-B1 Mortgage Trust | | 3.878% | | 1/15/51 | | | 50 | | | | 53 | |
| 3 | | BENCHMARK 2018-B2 Mortgage Trust | | 3.662% | | 2/15/51 | | | 125 | | | | 130 | |
| 3 | | BENCHMARK 2018-B2 Mortgage Trust | | 3.882% | | 2/15/51 | | | 325 | | | | 353 | |
| 3 | | BENCHMARK 2018-B2 Mortgage Trust | | 4.084% | | 2/15/51 | | | 150 | | | | 163 | |
| 3 | | BENCHMARK 2018-B3 Mortgage Trust | | 3.848% | | 4/10/51 | | | 100 | | | | 104 | |
| 3 | | BENCHMARK 2018-B3 Mortgage Trust | | 4.025% | | 4/10/51 | | | 225 | | | | 248 | |
| 3 | | BENCHMARK 2018-B4 Mortgage Trust | | 4.121% | | 7/15/51 | | | 350 | | | | 389 | |
| 3 | | BENCHMARK 2018-B4 Mortgage Trust | | 4.311% | | 7/15/51 | | | 75 | | | | 82 | |
| 3 | | BENCHMARK 2018-B5 Mortgage Trust | | 4.208% | | 7/15/51 | | | 75 | | | | 84 | |
| 3 | | BENCHMARK 2018-B6 Mortgage Trust | | 4.203% | | 10/10/51 | | | 50 | | | | 53 | |
| 3 | | BENCHMARK 2018-B6 Mortgage Trust | | 4.261% | | 10/10/51 | | | 50 | | | | 56 | |
| 3 | | BENCHMARK 2018-B6 Mortgage Trust | | 4.441% | | 10/10/51 | | | 25 | | | | 28 | |
| 3 | | BENCHMARK 2018-B7 Mortgage Trust | | 4.510% | | 5/15/53 | | | 175 | | | | 200 | |
| 3 | | BENCHMARK 2018-B8 Mortgage Trust | | 4.232% | | 1/15/52 | | | 125 | | | | 140 | |
| 3 | | BENCHMARK 2018-B8 Mortgage Trust | | 4.532% | | 1/15/52 | | | 50 | | | | 56 | |
| 3 | | BENCHMARK 2019-B9 Mortgage Trust | | 4.016% | | 3/15/52 | | | 105 | | | | 116 | |
| 3 | | BENCHMARK 2019-B10 Mortgage Trust | | 3.717% | | 3/15/62 | | | 80 | | | | 87 | |
| 3 | | BENCHMARK 2019-B10 Mortgage Trust | | 3.979% | | 3/15/62 | | | 50 | | | | 54 | |
| 3 | | BENCHMARK 2019-B11 Mortgage Trust | | 3.542% | | 5/15/52 | | | 275 | | | | 295 | |
| 3 | | BENCHMARK 2019-B11 Mortgage Trust | | 3.784% | | 5/15/52 | | | 75 | | | | 80 | |
| 3 | | BENCHMARK 2019-B13 Mortgage Trust | | 2.952% | | 8/15/57 | | | 280 | | | | 286 | |
Total Bond Market Index Portfolio
| | | | | | | | | Face | | | Market | |
| | | | | | | Maturity | | Amount | | | Value• | |
| | | | | Coupon | | Date | | ($000 | ) | | ($000 | ) |
| 3 | | BENCHMARK 2019-B14 Mortgage Trust | | 3.049% | | 12/15/62 | | | 225 | | | | 232 | |
| 3 | | BENCHMARK 2019-B15 Mortgage Trust | | 2.928% | | 12/15/72 | | | 230 | | | | 233 | |
| 3 | | BMW Vehicle Lease Trust 2017-2 | | 2.070% | | 10/20/20 | | | 24 | | | | 24 | |
| 3 | | BMW Vehicle Owner Trust 2018-A | | 2.350% | | 4/25/22 | | | 125 | | | | 125 | |
| 3 | | BMW Vehicle Owner Trust 2018-A | | 2.510% | | 6/25/24 | | | 50 | | | | 50 | |
| 3 | | Cantor Commercial Real Estate Lending 2019-CF1 | | 3.786% | | 5/15/52 | | | 125 | | | | 135 | |
| 3 | | Cantor Commercial Real Estate Lending 2019-CF2 | | 2.874% | | 11/15/52 | | | 140 | | | | 141 | |
| 3 | | Cantor Commercial Real Estate Lending 2019-CF3 | | 3.006% | | 1/15/53 | | | 135 | | | | 138 | |
| 3 | | Cantor Commercial Real Estate Lending 2019-CF3 | | 3.298% | | 1/15/53 | | | 60 | | | | 60 | |
| 3 | | Capital One Auto Receivables Trust 2019-1 | | 2.510% | | 11/15/23 | | | 100 | | | | 101 | |
| 3 | | Capital One Auto Receivables Trust 2019-1 | | 2.560% | | 10/15/24 | | | 35 | | | | 35 | |
| 3 | | Capital One Multi-Asset Execution Trust 2015-A2 | | 2.080% | | 3/15/23 | | | 250 | | | | 250 | |
| 3 | | Capital One Multi-Asset Execution Trust 2015-A8 | | 2.050% | | 8/15/23 | | | 150 | | | | 150 | |
| 3 | | Capital One Multi-Asset Execution Trust 2017-A4 | | 1.990% | | 7/17/23 | | | 250 | | | | 250 | |
| 3 | | Capital One Multi-Asset Execution Trust 2017-A6 | | 2.290% | | 7/15/25 | | | 225 | | | | 228 | |
| 3 | | Capital One Multi-Asset Execution Trust 2018-A1 | | 3.010% | | 2/15/24 | | | 125 | | | | 127 | |
| 3 | | Capital One Multi-Asset Execution Trust 2019-A1 | | 2.840% | | 12/15/24 | | | 75 | | | | 77 | |
| 3 | | CarMax Auto Owner Trust 2016-3 | | 1.390% | | 5/17/21 | | | 9 | | | | 9 | |
| 3 | | CarMax Auto Owner Trust 2016-3 | | 1.600% | | 1/18/22 | | | 50 | | | | 50 | |
| 3 | | CarMax Auto Owner Trust 2017-4 | | 2.110% | | 10/17/22 | | | 63 | | | | 63 | |
| 3 | | CarMax Auto Owner Trust 2017-4 | | 2.330% | | 5/15/23 | | | 50 | | | | 50 | |
| 3 | | CarMax Auto Owner Trust 2018-1 | | 2.480% | | 11/15/22 | | | 75 | | | | 75 | |
| 3 | | CarMax Auto Owner Trust 2018-1 | | 2.640% | | 6/15/23 | | | 50 | | | | 51 | |
| 3 | | CarMax Auto Owner Trust 2018-2 | | 2.980% | | 1/17/23 | | | 75 | | | | 76 | |
| 3 | | CarMax Auto Owner Trust 2018-2 | | 3.160% | | 7/17/23 | | | 50 | | | | 51 | |
| 3 | | CarMax Auto Owner Trust 2019-4 | | 2.020% | | 11/15/24 | | | 180 | | | | 180 | |
| 3 | | CarMax Auto Owner Trust 2019-4 | | 2.130% | | 7/15/25 | | | 25 | | | | 25 | |
| 3 | | CD 2016-CD1 Commercial Mortgage Trust | | 2.724% | | 8/10/49 | | | 150 | | | | 152 | |
| 3 | | CD 2016-CD2 Commercial Mortgage Trust | | 3.526% | | 11/10/49 | | | 100 | | | | 106 | |
| 3 | | CD 2017-CD3 Commercial Mortgage Trust | | 3.453% | | 2/10/50 | | | 25 | | | | 26 | |
| 3 | | CD 2017-CD3 Commercial Mortgage Trust | | 3.631% | | 2/10/50 | | | 144 | | | | 154 | |
| 3 | | CD 2017-CD3 Commercial Mortgage Trust | | 3.833% | | 2/10/50 | | | 31 | | | | 33 | |
| 3 | | CD 2017-CD6 Commercial Mortgage Trust | | 3.332% | | 11/13/50 | | | 50 | | | | 52 | |
| 3 | | CD 2017-CD6 Commercial Mortgage Trust | | 3.456% | | 11/13/50 | | | 125 | | | | 132 | |
| 3 | | CD 2017-CD6 Commercial Mortgage Trust | | 3.709% | | 11/13/50 | | | 75 | | | | 79 | |
| 3 | | CD 2018-CD7 Commercial Mortgage Trust | | 4.279% | | 8/15/51 | | | 75 | | | | 84 | |
| 3 | | CD 2019-CD8 Commercial Mortgage Trust | | 2.912% | | 8/15/57 | | | 175 | | | | 179 | |
| 3 | | CenterPoint Energy Transition Bond Co. IV LLC 2012-1 | | 3.028% | | 10/15/25 | | | 350 | | | | 358 | |
| 3 | | CFCRE Commercial Mortgage Trust 2016-C3 | | 3.865% | | 1/10/48 | | | 125 | | | | 133 | |
| 3 | | CFCRE Commercial Mortgage Trust 2016-C4 | | 3.283% | | 5/10/58 | | | 150 | | | | 155 | |
| 3 | | CFCRE Commercial Mortgage Trust 2016-C4 | | 3.691% | | 5/10/58 | | | 100 | | | | 104 | |
| 3 | | CFCRE Commercial Mortgage Trust 2016-C6 | | 3.217% | | 11/10/49 | | | 250 | | | | 258 | |
| 3 | | CFCRE Commercial Mortgage Trust 2017-C8 | | 3.572% | | 6/15/50 | | | 50 | | | | 53 | |
| 3 | | Chase Issuance Trust 2012-A7 | | 2.160% | | 9/15/24 | | | 313 | | | | 315 | |
| 3 | | Chase Issuance Trust 2014-A2 | | 2.770% | | 3/15/23 | | | 225 | | | | 227 | |
| 3 | | Chase Issuance Trust 2015-A4 | | 1.840% | | 4/15/22 | | | 150 | | | | 150 | |
| 3 | | Chase Issuance Trust 2016-A4 | | 1.490% | | 7/15/22 | | | 200 | | | | 200 | |
| 3 | | Citibank Credit Card Issuance Trust 2014-A1 | | 2.880% | | 1/23/23 | | | 100 | | | | 101 | |
| 3 | | Citibank Credit Card Issuance Trust 2014-A5 | | 2.680% | | 6/7/23 | | | 200 | | | | 202 | |
| 3 | | Citibank Credit Card Issuance Trust 2016-A2 | | 2.190% | | 11/20/23 | | | 200 | | | | 201 | |
| 3 | | Citibank Credit Card Issuance Trust 2018-A1 | | 2.490% | | 1/20/23 | | | 550 | | | | 554 | |
| 3 | | Citibank Credit Card Issuance Trust 2018-A3 | | 3.290% | | 5/23/25 | | | 450 | | | | 469 | |
| 3 | | Citigroup Commercial Mortgage Trust 2012-GC8 | | 3.024% | | 9/10/45 | | | 72 | | | | 73 | |
| 3 | | Citigroup Commercial Mortgage Trust 2013-GC11 | | 3.093% | | 4/10/46 | | | 100 | | | | 102 | |
| 3 | | Citigroup Commercial Mortgage Trust 2013-GC15 | | 4.371% | | 9/10/46 | | | 50 | | | | 53 | |
| 3 | | Citigroup Commercial Mortgage Trust 2013-GC15 | | 4.649% | | 9/10/46 | | | 75 | | | | 80 | |
| 3 | | Citigroup Commercial Mortgage Trust 2014-GC19 | | 3.552% | | 3/10/47 | | | 22 | | | | 22 | |
| 3 | | Citigroup Commercial Mortgage Trust 2014-GC19 | | 4.023% | | 3/10/47 | | | 25 | | | | 27 | |
| 3 | | Citigroup Commercial Mortgage Trust 2014-GC19 | | 4.345% | | 3/10/47 | | | 25 | | | | 27 | |
| 3 | | Citigroup Commercial Mortgage Trust 2014-GC21 | | 3.855% | | 5/10/47 | | | 50 | | | | 53 | |
| 3 | | Citigroup Commercial Mortgage Trust 2014-GC21 | | 4.328% | | 5/10/47 | | | 50 | | | | 53 | |
| 3 | | Citigroup Commercial Mortgage Trust 2014-GC23 | | 3.622% | | 7/10/47 | | | 100 | | | | 106 | |
| 3 | | Citigroup Commercial Mortgage Trust 2014-GC25 | | 3.635% | | 10/10/47 | | | 175 | | | | 184 | |
| 3 | | Citigroup Commercial Mortgage Trust 2015-GC27 | | 3.137% | | 2/10/48 | | | 225 | | | | 233 | |
| 3 | | Citigroup Commercial Mortgage Trust 2015-GC27 | | 3.571% | | 2/10/48 | | | 100 | | | | 104 | |
| 3 | | Citigroup Commercial Mortgage Trust 2015-GC29 | | 2.674% | | 4/10/48 | | | 43 | | | | 43 | |
| 3 | | Citigroup Commercial Mortgage Trust 2015-GC29 | | 3.192% | | 4/10/48 | | | 175 | | | | 182 | |
| 3 | | Citigroup Commercial Mortgage Trust 2015-GC29 | | 3.758% | | 4/10/48 | | | 84 | | | | 87 | |
| 3 | | Citigroup Commercial Mortgage Trust 2015-GC31 | | 3.762% | | 6/10/48 | | | 100 | | | | 106 | |
| 3 | | Citigroup Commercial Mortgage Trust 2015-GC33 | | 3.778% | | 9/10/58 | | | 100 | | | | 107 | |
| 3 | | Citigroup Commercial Mortgage Trust 2016-C1 | | 3.003% | | 5/10/49 | | | 55 | | | | 56 | |
| 3 | | Citigroup Commercial Mortgage Trust 2016-C1 | | 3.209% | | 5/10/49 | | | 125 | | | | 130 | |
| 3 | | Citigroup Commercial Mortgage Trust 2016-GC36 | | 3.616% | | 2/10/49 | | | 225 | | | | 239 | |
| 3 | | Citigroup Commercial Mortgage Trust 2016-P4 | | 2.902% | | 7/10/49 | | | 75 | | | | 77 | |
| 3 | | Citigroup Commercial Mortgage Trust 2017-B1 | | 3.458% | | 8/15/50 | | | 250 | | | | 264 | |
| 3 | | Citigroup Commercial Mortgage Trust 2017-B1 | | 3.711% | | 8/15/50 | | | 50 | | | | 53 | |
| 3 | | Citigroup Commercial Mortgage Trust 2017-C4 | | 3.471% | | 10/12/50 | | | 150 | | | | 160 | |
| 3 | | Citigroup Commercial Mortgage Trust 2017-C4 | | 3.764% | | 10/12/50 | | | 50 | | | | 53 | |
| 3 | | Citigroup Commercial Mortgage Trust 2018-B2 | | 3.788% | | 3/10/51 | | | 50 | | | | 52 | |
Total Bond Market Index Portfolio
| | | | | | | | | Face | | | Market | |
| | | | | | | Maturity | | Amount | | | Value• | |
| | | | | Coupon | | Date | | ($000 | ) | | ($000 | ) |
| 3 | | Citigroup Commercial Mortgage Trust 2018-B2 | | 4.009% | | 3/10/51 | | | 275 | | | | 301 | |
| 3 | | Citigroup Commercial Mortgage Trust 2019-GC41 | | 2.869% | | 8/10/56 | | | 225 | | | | 228 | |
| 3 | | Citigroup Commercial Mortgage Trust 2019-GC43 | | 3.038% | | 11/10/52 | | | 275 | | | | 282 | |
| 3 | | COMM 2012-CCRE2 Mortgage Trust | | 3.147% | | 8/15/45 | | | 58 | | | | 59 | |
| 3 | | COMM 2012-CCRE2 Mortgage Trust | | 3.791% | | 8/15/45 | | | 65 | | | | 67 | |
| 3,6 | | COMM 2012-CCRE3 Mortgage Trust | | 3.416% | | 10/15/45 | | | 78 | | | | 79 | |
| 3 | | COMM 2012-CCRE4 Mortgage Trust | | 2.853% | | 10/15/45 | | | 124 | | | | 126 | |
| 3 | | COMM 2013-CCRE10 Mortgage Trust | | 4.210% | | 8/10/46 | | | 20 | | | | 21 | |
| 3 | | COMM 2013-CCRE11 Mortgage Trust | | 3.660% | | 8/10/50 | | | 24 | | | | 25 | |
| 3 | | COMM 2013-CCRE11 Mortgage Trust | | 3.983% | | 8/10/50 | | | 40 | | | | 42 | |
| 3 | | COMM 2013-CCRE11 Mortgage Trust | | 4.258% | | 8/10/50 | | | 150 | | | | 160 | |
| 3 | | COMM 2013-CCRE11 Mortgage Trust | | 4.715% | | 8/10/50 | | | 30 | | | | 32 | |
| 3 | | COMM 2013-CCRE12 Mortgage Trust | | 2.904% | | 10/10/46 | | | 2 | | | | 2 | |
| 3 | | COMM 2013-CCRE12 Mortgage Trust | | 3.623% | | 10/10/46 | | | 39 | | | | 41 | |
| 3 | | COMM 2013-CCRE12 Mortgage Trust | | 3.765% | | 10/10/46 | | | 50 | | | | 51 | |
| 3 | | COMM 2013-CCRE12 Mortgage Trust | | 4.046% | | 10/10/46 | | | 50 | | | | 53 | |
| 3 | | COMM 2013-CCRE12 Mortgage Trust | | 4.300% | | 10/10/46 | | | 25 | | | | 27 | |
| 3 | | COMM 2013-CCRE12 Mortgage Trust | | 4.762% | | 10/10/46 | | | 25 | | | | 26 | |
| 3 | | COMM 2013-CCRE6 Mortgage Trust | | 3.101% | | 3/10/46 | | | 65 | | | | 66 | |
| 3 | | COMM 2013-CCRE7 Mortgage Trust | | 3.213% | | 3/10/46 | | | 37 | | | | 38 | |
| 3 | | COMM 2013-CCRE8 Mortgage Trust | | 3.612% | | 6/10/46 | | | 71 | | | | 74 | |
| 3 | | COMM 2013-CCRE9 Mortgage Trust | | 4.222% | | 7/10/45 | | | 90 | | | | 95 | |
| 3 | | COMM 2013-LC13 Mortgage Trust | | 4.205% | | 8/10/46 | | | 40 | | | | 43 | |
| 3 | | COMM 2013-LC6 Mortgage Trust | | 2.941% | | 1/10/46 | | | 104 | | | | 106 | |
| 3 | | COMM 2013-LC6 Mortgage Trust | | 3.282% | | 1/10/46 | | | 58 | | | | 59 | |
| 3 | | COMM 2014-CCRE15 Mortgage Trust | | 2.928% | | 2/10/47 | | | 26 | | | | 26 | |
| 3 | | COMM 2014-CCRE15 Mortgage Trust | | 3.595% | | 2/10/47 | | | 25 | | | | 26 | |
| 3 | | COMM 2014-CCRE15 Mortgage Trust | | 4.074% | | 2/10/47 | | | 56 | | | | 60 | |
| 3 | | COMM 2014-CCRE15 Mortgage Trust | | 4.697% | | 2/10/47 | | | 28 | | | | 30 | |
| 3 | | COMM 2014-CCRE16 Mortgage Trust | | 3.653% | | 4/10/47 | | | 44 | | | | 45 | |
| 3 | | COMM 2014-CCRE16 Mortgage Trust | | 4.278% | | 4/10/47 | | | 75 | | | | 79 | |
| 3 | | COMM 2014-CCRE17 Mortgage Trust | | 3.598% | | 5/10/47 | | | 22 | | | | 23 | |
| 3 | | COMM 2014-CCRE17 Mortgage Trust | | 3.977% | | 5/10/47 | | | 50 | | | | 53 | |
| 3 | | COMM 2014-CCRE17 Mortgage Trust | | 4.377% | | 5/10/47 | | | 25 | | | | 26 | |
| 3 | | COMM 2014-CCRE18 Mortgage Trust | | 3.452% | | 7/15/47 | | | 43 | | | | 44 | |
| 3 | | COMM 2014-CCRE19 Mortgage Trust | | 3.796% | | 8/10/47 | | | 175 | | | | 186 | |
| 3 | | COMM 2014-CCRE19 Mortgage Trust | | 4.080% | | 8/10/47 | | | 50 | | | | 53 | |
| 3 | | COMM 2014-CCRE20 Mortgage Trust | | 3.590% | | 11/10/47 | | | 50 | | | | 53 | |
| 3 | | COMM 2014-CCRE21 Mortgage Trust | | 3.528% | | 12/10/47 | | | 164 | | | | 171 | |
| 3 | | COMM 2014-LC15 Mortgage Trust | | 4.006% | | 4/10/47 | | | 150 | | | | 160 | |
| 3 | | COMM 2014-LC17 Mortgage Trust | | 3.164% | | 10/10/47 | | | 10 | | | | 10 | |
| 3 | | COMM 2014-LC17 Mortgage Trust | | 3.917% | | 10/10/47 | | | 50 | | | | 53 | |
| 3 | | COMM 2014-UBS2 Mortgage Trust | | 2.820% | | 3/10/47 | | | 5 | | | | 5 | |
| 3 | | COMM 2014-UBS2 Mortgage Trust | | 3.472% | | 3/10/47 | | | 18 | | | | 19 | |
| 3 | | COMM 2014-UBS2 Mortgage Trust | | 3.961% | | 3/10/47 | | | 54 | | | | 57 | |
| 3 | | COMM 2014-UBS2 Mortgage Trust | | 4.199% | | 3/10/47 | | | 15 | | | | 16 | |
| 3 | | COMM 2014-UBS2 Mortgage Trust | | 4.701% | | 3/10/47 | | | 10 | | | | 11 | |
| 3 | | COMM 2014-UBS3 Mortgage Trust | | 3.819% | | 6/10/47 | | | 100 | | | | 106 | |
| 3 | | COMM 2014-UBS4 Mortgage Trust | | 3.694% | | 8/10/47 | | | 125 | | | | 132 | |
| 3 | | COMM 2014-UBS4 Mortgage Trust | | 3.968% | | 8/10/47 | | | 44 | | | | 46 | |
| 3 | | COMM 2014-UBS5 Mortgage Trust | | 3.838% | | 9/10/47 | | | 125 | | | | 132 | |
| 3 | | COMM 2014-UBS6 Mortgage Trust | | 2.935% | | 12/10/47 | | | 24 | | | | 24 | |
| 3 | | COMM 2014-UBS6 Mortgage Trust | | 3.387% | | 12/10/47 | | | 125 | | | | 128 | |
| 3 | | COMM 2014-UBS6 Mortgage Trust | | 3.644% | | 12/10/47 | | | 225 | | | | 236 | |
| 3 | | COMM 2014-UBS6 Mortgage Trust | | 4.048% | | 12/10/47 | | | 50 | | | | 53 | |
| 3 | | COMM 2015-CCRE22 Mortgage Trust | | 2.856% | | 3/10/48 | | | 19 | | | | 19 | |
| 3 | | COMM 2015-CCRE22 Mortgage Trust | | 3.309% | | 3/10/48 | | | 150 | | | | 157 | |
| 3 | | COMM 2015-CCRE22 Mortgage Trust | | 3.603% | | 3/10/48 | | | 50 | | | | 52 | |
| 3 | | COMM 2015-CCRE23 Mortgage Trust | | 3.257% | | 5/10/48 | | | 75 | | | | 77 | |
| 3 | | COMM 2015-CCRE23 Mortgage Trust | | 3.497% | | 5/10/48 | | | 100 | | | | 105 | |
| 3 | | COMM 2015-CCRE23 Mortgage Trust | | 3.801% | | 5/10/48 | | | 50 | | | | 53 | |
| 3 | | COMM 2015-CCRE25 Mortgage Trust | | 3.759% | | 8/10/48 | | | 125 | | | | 133 | |
| 3 | | COMM 2015-CCRE26 Mortgage Trust | | 3.630% | | 10/10/48 | | | 225 | | | | 238 | |
| 3 | | COMM 2015-CCRE27 Mortgage Trust | | 3.404% | | 10/10/48 | | | 125 | | | | 129 | |
| 3 | | COMM 2015-CCRE27 Mortgage Trust | | 3.612% | | 10/10/48 | | | 125 | | | | 132 | |
| 3 | | COMM 2015-LC19 Mortgage Trust | | 3.040% | | 2/10/48 | | | 25 | | | | 26 | |
| 3 | | COMM 2015-LC19 Mortgage Trust | | 3.183% | | 2/10/48 | | | 125 | | | | 130 | |
| 3 | | COMM 2015-LC19 Mortgage Trust | | 3.527% | | 2/10/48 | | | 50 | | | | 52 | |
| 3 | | COMM 2016-CCRE28 Mortgage Trust | | 3.762% | | 2/10/49 | | | 150 | | | | 160 | |
| 3 | | COMM 2016-DC2 Mortgage Trust | | 3.550% | | 2/10/49 | | | 125 | | | | 130 | |
| 3 | | Comm Mortgage Trust 2019-G44 | | 2.950% | | 8/15/57 | | | 115 | | | | 117 | |
| 3 | | CSAIL 2015-C1 Commercial Mortgage Trust | | 3.505% | | 4/15/50 | | | 100 | | | | 105 | |
| 3 | | CSAIL 2015-C1 Commercial Mortgage Trust | | 3.791% | | 4/15/50 | | | 75 | | | | 79 | |
| 3 | | CSAIL 2015-C1 Commercial Mortgage Trust | | 4.044% | | 4/15/50 | | | 50 | | | | 52 | |
| 3 | | CSAIL 2015-C2 Commercial Mortgage Trust | | 3.504% | | 6/15/57 | | | 150 | | | | 157 | |
| 3 | | CSAIL 2015-C2 Commercial Mortgage Trust | | 3.849% | | 6/15/57 | | | 75 | | | | 78 | |
| 3 | | CSAIL 2015-C3 Commercial Mortgage Trust | | 3.448% | | 8/15/48 | | | 85 | | | | 88 | |
| 3 | | CSAIL 2015-C3 Commercial Mortgage Trust | | 3.718% | | 8/15/48 | | | 100 | | | | 106 | |
| 3 | | CSAIL 2015-C3 Commercial Mortgage Trust | | 4.104% | | 8/15/48 | | | 50 | | | | 52 | |
| 3 | | CSAIL 2015-C4 Commercial Mortgage Trust | | 3.617% | | 11/15/48 | | | 50 | | | | 52 | |
| 3 | | CSAIL 2015-C4 Commercial Mortgage Trust | | 3.808% | | 11/15/48 | | | 75 | | | | 80 | |
| 3 | | CSAIL 2016-C7 Commercial Mortgage Trust | | 3.502% | | 11/15/49 | | | 200 | | | | 210 | |
| 3 | | CSAIL 2017-C8 Commercial Mortgage Trust | | 3.392% | | 6/15/50 | | | 150 | | | | 158 | |
| 3 | | CSAIL 2017-CX10 Commercial Mortgage Trust | | 3.458% | | 11/15/50 | | | 150 | | | | 158 | |
| 3 | | CSAIL 2017-CX9 Commercial Mortgage Trust | | 3.446% | | 9/15/50 | | | 50 | | | | 52 | |
| 3 | | CSAIL 2018-CX11 Commercial Mortgage Trust | | 4.033% | | 4/15/51 | | | 275 | | | | 302 | |
| 3 | | CSAIL 2018-CX12 Commercial Mortgage Trust | | 4.224% | | 8/15/51 | | | 25 | | | | 27 | |
| 3 | | CSAIL 2019-C15 Commercial Mortgage Trust | | 4.053% | | 3/15/52 | | | 225 | | | | 247 | |
| 3 | | CSAIL 2019-C16 Commercial Mortgage Trust | | 3.329% | | 6/15/52 | | | 275 | | | | 288 | |
| 3 | | DBJPM 16-C1 Mortgage Trust | | 3.276% | | 5/10/49 | | | 75 | | | | 78 | |
| 3 | | DBJPM 16-C3 Mortgage Trust | | 2.890% | | 8/10/49 | | | 100 | | | | 102 | |
| 3 | | DBJPM 17-C6 Mortgage Trust | | 3.328% | | 6/10/50 | | | 100 | | | | 105 | |
| 3 | | DBJPM 17-C6 Mortgage Trust | | 3.561% | | 6/10/50 | | | 50 | | | | 52 | |
| 3 | | Discover Card Execution Note Trust 2015-A2 | | 1.900% | | 10/17/22 | | | 275 | | | | 275 | |
| 3 | | Discover Card Execution Note Trust 2015-A4 | | 2.190% | | 4/17/23 | | | 225 | | | | 226 | |
| 3 | | Discover Card Execution Note Trust 2017-A2 | | 2.390% | | 7/15/24 | | | 150 | | | | 152 | |
| 3 | | Discover Card Execution Note Trust 2018-A1 | | 3.030% | | 8/15/25 | | | 225 | | | | 231 | |
| 3 | | Discover Card Execution Note Trust 2019-A3 | | 1.890% | | 10/15/24 | | | 275 | | | | 275 | |
| 3 | | Drive Auto Receivables Trust 2018-2 | | 3.630% | | 8/15/24 | | | 95 | | | | 95 | |
| 2,3 | | Fannie Mae-Aces 2011-M2 | | 3.764% | | 4/25/21 | | | 100 | | | | 102 | |
| 2,3 | | Fannie Mae-Aces 2011-M4 | | 3.726% | | 6/25/21 | | | 174 | | | | 177 | |
| 2,3 | | Fannie Mae-Aces 2013-M12 | | 2.406% | | 3/25/23 | | | 189 | | | | 191 | |
| 2,3 | | Fannie Mae-Aces 2013-M14 | | 2.651% | | 4/25/23 | | | 83 | | | | 84 | |
| 2,3 | | Fannie Mae-Aces 2013-M14 | | 3.329% | | 10/25/23 | | | 297 | | | | 309 | |
| 2,3 | | Fannie Mae-Aces 2013-M4 | | 2.608% | | 3/25/22 | | | 2 | | | | 2 | |
| 2,3 | | Fannie Mae-Aces 2013-M7 | | 2.280% | | 12/27/22 | | | 66 | | | | 67 | |
| 2,3 | | Fannie Mae-Aces 2014-M1 | | 3.188% | | 7/25/23 | | | 352 | | | | 364 | |
| 2,3 | | Fannie Mae-Aces 2014-M12 | | 2.614% | | 10/25/21 | | | 227 | | | | 229 | |
| 2,3 | | Fannie Mae-Aces 2014-M13 | | 2.566% | | 8/25/24 | | | 10 | | | | 10 | |
| 2,3 | | Fannie Mae-Aces 2014-M13 | | 3.021% | | 8/25/24 | | | 200 | | | | 205 | |
| 2,3 | | Fannie Mae-Aces 2014-M2 | | 3.513% | | 12/25/23 | | | 282 | | | | 296 | |
| 2,3 | | Fannie Mae-Aces 2014-M3 | | 3.480% | | 1/25/24 | | | 136 | | | | 141 | |
| 2,3 | | Fannie Mae-Aces 2014-M4 | | 3.346% | | 3/25/24 | | | 175 | | | | 182 | |
| 2,3 | | Fannie Mae-Aces 2014-M6 | | 2.679% | | 5/25/21 | | | 180 | | | | 182 | |
| 2,3 | | Fannie Mae-Aces 2014-M7 | | 3.275% | | 6/25/24 | | | 263 | | | | 276 | |
| 2,3 | | Fannie Mae-Aces 2014-M8 | | 2.346% | | 6/25/24 | | | 18 | | | | 18 | |
Total Bond Market Index Portfolio
| | | | | | | | | Face | | | Market | |
| | | | | | | Maturity | | Amount | | | Value• | |
| | | | | Coupon | | Date | | ($000 | ) | | ($000 | ) |
| 2,3 | | Fannie Mae-Aces 2014-M8 | | 3.056% | | 6/25/24 | | | 175 | | | | 181 | |
| 2,3 | | Fannie Mae-Aces 2014-M9 | | 3.103% | | 7/25/24 | | | 200 | | | | 207 | |
| 2,3 | | Fannie Mae-Aces 2015-M1 | | 2.532% | | 9/25/24 | | | 300 | | | | 303 | |
| 2,3 | | Fannie Mae-Aces 2015-M10 | | 3.092% | | 4/25/27 | | | 100 | | | | 105 | |
| 2,3 | | Fannie Mae-Aces 2015-M12 | | 2.796% | | 5/25/25 | | | 225 | | | | 231 | |
| 2,3 | | Fannie Mae-Aces 2015-M15 | | 2.923% | | 10/25/25 | | | 275 | | | | 284 | |
| 2,3 | | Fannie Mae-Aces 2015-M2 | | 2.620% | | 12/25/24 | | | 195 | | | | 200 | |
| 2,3 | | Fannie Mae-Aces 2015-M3 | | 2.723% | | 10/25/24 | | | 100 | | | | 102 | |
| 2,3 | | Fannie Mae-Aces 2015-M4 | | 2.509% | | 7/25/22 | | | 124 | | | | 125 | |
| 2,3 | | Fannie Mae-Aces 2015-M7 | | 2.590% | | 12/25/24 | | | 198 | | | | 201 | |
| 2,3 | | Fannie Mae-Aces 2015-M8 | | 2.344% | | 1/25/25 | | | 80 | | | | 80 | |
| 2,3 | | Fannie Mae-Aces 2015-M8 | | 2.900% | | 1/25/25 | | | 100 | | | | 103 | |
| 2,3 | | Fannie Mae-Aces 2016-M11 | | 2.369% | | 7/25/26 | | | 250 | | | | 251 | |
| 2,3 | | Fannie Mae-Aces 2016-M12 | | 2.444% | | 9/25/26 | | | 250 | | | | 254 | |
| 2,3 | | Fannie Mae-Aces 2016-M2 | | 2.152% | | 1/25/23 | | | 182 | | | | 182 | |
| 2,3 | | Fannie Mae-Aces 2016-M3 | | 2.702% | | 2/25/26 | | | 100 | | | | 102 | |
| 2,3 | | Fannie Mae-Aces 2016-M4 | | 2.576% | | 3/25/26 | | | 100 | | | | 102 | |
| 2,3 | | Fannie Mae-Aces 2016-M5 | | 2.469% | | 4/25/26 | | | 200 | | | | 201 | |
| 2,3 | | Fannie Mae-Aces 2016-M7 | | 2.157% | | 10/25/23 | | | 49 | | | | 49 | |
| 2,3 | | Fannie Mae-Aces 2016-M7 | | 2.499% | | 9/25/26 | | | 75 | | | | 75 | |
| 2,3 | | Fannie Mae-Aces 2016-M9 | | 2.292% | | 6/25/26 | | | 300 | | | | 298 | |
| 2,3 | | Fannie Mae-Aces 2017-M1 | | 2.417% | | 10/25/26 | | | 200 | | | | 202 | |
| 2,3 | | Fannie Mae-Aces 2017-M10 | | 2.561% | | 7/25/24 | | | 110 | | | | 112 | |
| 2,3 | | Fannie Mae-Aces 2017-M12 | | 3.079% | | 6/25/27 | | | 300 | | | | 312 | |
| 2,3 | | Fannie Mae-Aces 2017-M15 | | 3.136% | | 11/25/27 | | | 275 | | | | 286 | |
| 2,3 | | Fannie Mae-Aces 2017-M4 | | 2.586% | | 12/25/26 | | | 200 | | | | 202 | |
| 2,3 | | Fannie Mae-Aces 2017-M7 | | 2.961% | | 2/25/27 | | | 150 | | | | 156 | |
| 2,3 | | Fannie Mae-Aces 2017-M8 | | 3.061% | | 5/25/27 | | | 514 | | | | 538 | |
| 2,3 | | Fannie Mae-Aces 2018-M12 | | 3.640% | | 8/25/30 | | | 50 | | | | 55 | |
| 2,3 | | Fannie Mae-Aces 2018-M14 | | 3.578% | | 8/25/28 | | | 100 | | | | 108 | |
| 2,3 | | Fannie Mae-Aces 2018-M18 | | 2.469% | | 8/25/29 | | | 250 | | | | 250 | |
| 2,3 | | Fannie Mae-Aces 2018-M2 | | 2.902% | | 1/25/28 | | | 425 | | | | 438 | |
| 2,3 | | Fannie Mae-Aces 2018-M4 | | 3.045% | | 3/25/28 | | | 165 | | | | 171 | |
| 2,3 | | Fannie Mae-Aces 2018-M7 | | 3.052% | | 3/25/28 | | | 100 | | | | 104 | |
| 2,3 | | Fannie Mae-Aces 2018-M8 | | 3.610% | | 2/25/31 | | | 300 | | | | 325 | |
| 2,3 | | Fannie Mae-Aces 2019-M1 | | 3.555% | | 9/25/28 | | | 125 | | | | 135 | |
| 2,3 | | Fannie Mae-Aces 2019-M2 | | 3.631% | | 11/25/28 | | | 200 | | | | 218 | |
| 2,3 | | Fannie Mae-Aces 2019-M22 | | 2.522% | | 8/25/29 | | | 375 | | | | 376 | |
| 2,3 | | Fannie Mae-Aces 2019-M5 | | 3.273% | | 1/25/29 | | | 200 | | | | 212 | |
| 2,3 | | Fannie Mae-Aces 2019-M7 | | 3.143% | | 4/25/29 | | | 230 | | | | 242 | |
| 2,3 | | Fannie Mae-Aces 2019-M9 | | 2.937% | | 4/25/29 | | | 325 | | | | 337 | |
| 2,3 | | FHLMC Multifamily Structured Pass Through Certificates K011 | | 4.084% | | 11/25/20 | | | 237 | | | | 240 | |
| 2,3 | | FHLMC Multifamily Structured Pass Through Certificates K014 | | 3.871% | | 4/25/21 | | | 129 | | | | 131 | |
| 2,3 | | FHLMC Multifamily Structured Pass Through Certificates K017 | | 2.873% | | 12/25/21 | | | 326 | | | | 331 | |
| 2,3 | | FHLMC Multifamily Structured Pass Through Certificates K019 | | 2.272% | | 3/25/22 | | | 149 | | | | 150 | |
| 2,3 | | FHLMC Multifamily Structured Pass Through Certificates K020 | | 2.373% | | 5/25/22 | | | 350 | | | | 353 | |
| 2,3 | | FHLMC Multifamily Structured Pass Through Certificates K021 | | 2.396% | | 6/25/22 | | | 225 | | | | 226 | |
| 2,3 | | FHLMC Multifamily Structured Pass Through Certificates K026 | | 2.510% | | 11/25/22 | | | 325 | | | | 329 | |
| 2,3 | | FHLMC Multifamily Structured Pass Through Certificates K027 | | 2.637% | | 1/25/23 | | | 325 | | | | 330 | |
| 2,3 | | FHLMC Multifamily Structured Pass Through Certificates K028 | | 3.111% | | 2/25/23 | | | 475 | | | | 489 | |
| 2,3 | | FHLMC Multifamily Structured Pass Through Certificates K029 | | 3.320% | | 2/25/23 | | | 325 | | | | 337 | |
| 2,3 | | FHLMC Multifamily Structured Pass Through Certificates K030 | | 2.779% | | 9/25/22 | | | 127 | | | | 128 | |
| 2,3 | | FHLMC Multifamily Structured Pass Through Certificates K030 | | 3.250% | | 4/25/23 | | | 325 | | | | 336 | |
| 2,3 | | FHLMC Multifamily Structured Pass Through Certificates K031 | | 3.300% | | 4/25/23 | | | 1,215 | | | | 1,262 | |
| 2,3 | | FHLMC Multifamily Structured Pass Through Certificates K032 | | 3.016% | | 2/25/23 | | | 147 | | | | 149 | |
| 2,3 | | FHLMC Multifamily Structured Pass Through Certificates K032 | | 3.310% | | 5/25/23 | | | 340 | | | | 353 | |
| 2,3 | | FHLMC Multifamily Structured Pass Through Certificates K033 | | 2.871% | | 2/25/23 | | | 170 | | | | 172 | |
| 2,3 | | FHLMC Multifamily Structured Pass Through Certificates K033 | | 3.060% | | 7/25/23 | | | 325 | | | | 336 | |
| 2,3 | | FHLMC Multifamily Structured Pass Through Certificates K034 | | 3.531% | | 7/25/23 | | | 288 | | | | 302 | |
| 2,3 | | FHLMC Multifamily Structured Pass Through Certificates K035 | | 3.458% | | 8/25/23 | | | 400 | | | | 419 | |
| 2,3 | | FHLMC Multifamily Structured Pass Through Certificates K036 | | 3.527% | | 10/25/23 | | | 325 | | | | 341 | |
| 2,3 | | FHLMC Multifamily Structured Pass Through Certificates K038 | | 2.604% | | 10/25/23 | | | 49 | | | | 50 | |
| 2,3 | | FHLMC Multifamily Structured Pass Through Certificates K038 | | 3.389% | | 3/25/24 | | | 400 | | | | 418 | |
| 2,3 | | FHLMC Multifamily Structured Pass Through Certificates K039 | | 2.683% | | 12/25/23 | | | 38 | | | | 38 | |
| 2,3 | | FHLMC Multifamily Structured Pass Through Certificates K039 | | 3.303% | | 7/25/24 | | | 225 | | | | 236 | |
| 2,3 | | FHLMC Multifamily Structured Pass Through Certificates K040 | | 2.768% | | 4/25/24 | | | 71 | | | | 73 | |
| 2,3 | | FHLMC Multifamily Structured Pass Through Certificates K040 | | 3.241% | | 9/25/24 | | | 275 | | | | 289 | |
| 2,3 | | FHLMC Multifamily Structured Pass Through Certificates K041 | | 3.171% | | 10/25/24 | | | 275 | | | | 287 | |
| 2,3 | | FHLMC Multifamily Structured Pass Through Certificates K042 | | 2.267% | | 6/25/24 | | | 35 | | | | 35 | |
| 2,3 | | FHLMC Multifamily Structured Pass Through Certificates K043 | | 2.532% | | 10/25/23 | | | 36 | | | | 36 | |
| 2,3 | | FHLMC Multifamily Structured Pass Through Certificates K043 | | 3.062% | | 12/25/24 | | | 150 | | | | 156 | |
| 2,3 | | FHLMC Multifamily Structured Pass Through Certificates K045 | | 2.493% | | 11/25/24 | | | 97 | | | | 98 | |
| 2,3 | | FHLMC Multifamily Structured Pass Through Certificates K045 | | 3.023% | | 1/25/25 | | | 175 | | | | 182 | |
| 2,3 | | FHLMC Multifamily Structured Pass Through Certificates K046 | | 3.205% | | 3/25/25 | | | 175 | | | | 184 | |
| 2,3 | | FHLMC Multifamily Structured Pass Through Certificates K047 | | 2.827% | | 12/25/24 | | | 76 | | | | 77 | |
| 2,3 | | FHLMC Multifamily Structured Pass Through Certificates K047 | | 3.329% | | 5/25/25 | | | 175 | | | | 185 | |
| 2,3 | | FHLMC Multifamily Structured Pass Through Certificates K048 | | 3.284% | | 6/25/25 | | | 225 | | | | 238 | |
| 2,3 | | FHLMC Multifamily Structured Pass Through Certificates K049 | | 3.010% | | 7/25/25 | | | 125 | | | | 130 | |
| 2,3 | | FHLMC Multifamily Structured Pass Through Certificates K050 | | 3.334% | | 8/25/25 | | | 200 | | | | 211 | |
| 2,3 | | FHLMC Multifamily Structured Pass Through Certificates K052 | | 3.151% | | 11/25/25 | | | 125 | | | | 131 | |
| 2,3 | | FHLMC Multifamily Structured Pass Through Certificates K053 | | 2.995% | | 12/25/25 | | | 75 | | | | 78 | |
| 2,3 | | FHLMC Multifamily Structured Pass Through Certificates K054 | | 2.745% | | 1/25/26 | | | 200 | | | | 206 | |
| 2,3 | | FHLMC Multifamily Structured Pass Through Certificates K056 | | 2.525% | | 5/25/26 | | | 150 | | | | 152 | |
| 2,3 | | FHLMC Multifamily Structured Pass Through Certificates K058 | | 2.653% | | 8/25/26 | | | 100 | | | | 102 | |
| 2,3 | | FHLMC Multifamily Structured Pass Through Certificates K063 | | 3.430% | | 1/25/27 | | | 475 | | | | 509 | |
| 2,3 | | FHLMC Multifamily Structured Pass Through Certificates K064 | | 3.224% | | 3/25/27 | | | 300 | | | | 317 | |
| 2,3 | | FHLMC Multifamily Structured Pass Through Certificates K065 | | 3.243% | | 4/25/27 | | | 433 | | | | 458 | |
| 2,3 | | FHLMC Multifamily Structured Pass Through Certificates K066 | | 3.117% | | 6/25/27 | | | 150 | | | | 158 | |
| 2,3 | | FHLMC Multifamily Structured Pass Through Certificates K068 | | 3.244% | | 8/25/27 | | | 125 | | | | 133 | |
| 2,3 | | FHLMC Multifamily Structured Pass Through Certificates K069 | | 3.187% | | 9/25/27 | | | 200 | | | | 210 | |
| 2,3 | | FHLMC Multifamily Structured Pass Through Certificates K070 | | 3.303% | | 11/25/27 | | | 75 | | | | 80 | |
Total Bond Market Index Portfolio
| | | | | | | | | Face | | | Market | |
| | | | | | | Maturity | | Amount | | | Value• | |
| | | | | Coupon | | Date | | ($000 | ) | | ($000 | ) |
| 2,3 | | FHLMC Multifamily Structured Pass Through Certificates K071 | | 3.286% | | 11/25/27 | | | 100 | | | | 106 | |
| 2,3 | | FHLMC Multifamily Structured Pass Through Certificates K072 | | 3.444% | | 12/25/27 | | | 100 | | | | 107 | |
| 2,3 | | FHLMC Multifamily Structured Pass Through Certificates K075 | | 3.650% | | 2/25/28 | | | 150 | | | | 163 | |
| 2,3 | | FHLMC Multifamily Structured Pass Through Certificates K076 | | 3.900% | | 4/25/28 | | | 350 | | | | 387 | |
| 2,3 | | FHLMC Multifamily Structured Pass Through Certificates K081 | | 3.900% | | 8/25/28 | | | 100 | | | | 110 | |
| 2,3 | | FHLMC Multifamily Structured Pass Through Certificates K082 | | 3.920% | | 9/25/28 | | | 75 | | | | 83 | |
| 2,3 | | FHLMC Multifamily Structured Pass Through Certificates K084 | | 3.780% | | 10/25/28 | | | 275 | | | | 300 | |
| 2,3 | | FHLMC Multifamily Structured Pass Through Certificates K085 | | 4.060% | | 10/25/28 | | | 150 | | | | 168 | |
| 2,3 | | FHLMC Multifamily Structured Pass Through Certificates K087 | | 3.591% | | 10/25/27 | | | 97 | | | | 103 | |
| 2,3 | | FHLMC Multifamily Structured Pass Through Certificates K088 | | 3.690% | | 1/25/29 | | | 275 | | | | 301 | |
| 2,3 | | FHLMC Multifamily Structured Pass Through Certificates K089 | | 3.563% | | 1/25/29 | | | 25 | | | | 27 | |
| 2,3 | | FHLMC Multifamily Structured Pass Through Certificates K092 | | 3.298% | | 4/25/29 | | | 225 | | | | 240 | |
| 2,3 | | FHLMC Multifamily Structured Pass Through Certificates K094 | | 2.903% | | 6/25/29 | | | 275 | | | | 285 | |
| 2,3 | | FHLMC Multifamily Structured Pass Through Certificates K095 | | 2.785% | | 6/25/29 | | | 275 | | | | 283 | |
| 2,3 | | FHLMC Multifamily Structured Pass Through Certificates K096 | | 2.519% | | 7/25/29 | | | 225 | | | | 227 | |
| 2,3 | | FHLMC Multifamily Structured Pass Through Certificates K098 | | 2.425% | | 8/25/29 | | | 450 | | | | 450 | |
| 2,3 | | FHLMC Multifamily Structured Pass Through Certificates K099 | | 2.595% | | 9/25/29 | | | 210 | | | | 211 | |
| 2,3 | | FHLMC Multifamily Structured Pass Through Certificates K103 | | 2.651% | | 11/25/29 | | | 300 | | | | 305 | |
| 2,3 | | FHLMC Multifamily Structured Pass Through Certificates K1511 | | 3.470% | | 3/25/31 | | | 100 | | | | 108 | |
| 2,3 | | FHLMC Multifamily Structured Pass Through Certificates K1511 | | 3.542% | | 3/25/34 | | | 225 | | | | 244 | |
| 2,3 | | FHLMC Multifamily Structured Pass Through Certificates K1513 | | 2.797% | | 8/25/34 | | | 210 | | | | 212 | |
| 2,3 | | FHLMC Multifamily Structured Pass Through Certificates K152 | | 3.080% | | 1/25/31 | | | 100 | | | | 103 | |
| 2,3 | | FHLMC Multifamily Structured Pass Through Certificates K155 | | 3.750% | | 11/25/32 | | | 100 | | | | 110 | |
| 2,3 | | FHLMC Multifamily Structured Pass Through Certificates K155 | | 3.750% | | 4/25/33 | | | 200 | | | | 221 | |
| 2,3 | | FHLMC Multifamily Structured Pass Through Certificates K157 | | 3.990% | | 5/25/33 | | | 75 | | | | 84 | |
| 2,3 | | FHLMC Multifamily Structured Pass Through Certificates K157 | | 3.990% | | 8/25/33 | | | 75 | | | | 85 | |
| 2,3 | | FHLMC Multifamily Structured Pass Through Certificates K504 | | 2.566% | | 9/25/20 | | | 38 | | | | 38 | |
| 2,3 | | FHLMC Multifamily Structured Pass Through Certificates K713 | | 2.313% | | 3/25/20 | | | 215 | | | | 214 | |
| 2,3 | | FHLMC Multifamily Structured Pass Through Certificates K714 | | 3.034% | | 10/25/20 | | | 389 | | | | 390 | |
| 2,3 | | FHLMC Multifamily Structured Pass Through Certificates K716 | | 2.413% | | 1/25/21 | | | 3 | | | | 3 | |
| 2,3 | | FHLMC Multifamily Structured Pass Through Certificates K716 | | 3.130% | | 6/25/21 | | | 370 | | | | 374 | |
| 2,3 | | FHLMC Multifamily Structured Pass Through Certificates K717 | | 2.991% | | 9/25/21 | | | 225 | | | | 227 | |
| 2,3 | | FHLMC Multifamily Structured Pass Through Certificates K718 | | 2.375% | | 9/25/21 | | | 79 | | | | 79 | |
| 2,3 | | FHLMC Multifamily Structured Pass Through Certificates K718 | | 2.791% | | 1/25/22 | | | 225 | | | | 228 | |
| 2,3 | | FHLMC Multifamily Structured Pass Through Certificates K731 | | 3.600% | | 2/25/25 | | | 225 | | | | 238 | |
| 2,3 | | FHLMC Multifamily Structured Pass Through Certificates K734 | | 3.208% | | 2/25/26 | | | 375 | | | | 394 | |
| 2,3 | | FHLMC Multifamily Structured Pass Through Certificates KW01 | | 2.853% | | 1/25/26 | | | 200 | | | | 206 | |
| 2,3 | | FHLMC Multifamily Structures Pass Through Certificates K073 | | 3.350% | | 1/25/28 | | | 125 | | | | 133 | |
| 2,3 | | FHLMC Multifamily Structures Pass Through Certificates K074 | | 3.600% | | 1/25/28 | | | 225 | | | | 244 | |
| 2,3 | | FHLMC Multifamily Structures Pass Through Certificates K078 | | 3.854% | | 6/25/28 | | | 100 | | | | 110 | |
| 2,3 | | FHLMC Multifamily Structures Pass Through Certificates K079 | | 3.926% | | 6/25/28 | | | 25 | | | | 28 | |
| 2,3 | | FHLMC Multifamily Structures Pass Through Certificates K080 | | 3.736% | | 4/25/28 | | | 97 | | | | 104 | |
| 2,3 | | FHLMC Multifamily Structures Pass Through Certificates K080 | | 3.926% | | 7/25/28 | | | 175 | | | | 194 | |
| 2,3 | | FHLMC Multifamily Structures Pass Through Certificates K087 | | 3.771% | | 12/25/28 | | | 400 | | | | 438 | |
| 2,3 | | FHLMC Multifamily Structures Pass Through Certificates K087 | | 2.537% | | 10/25/29 | | | 350 | | | | 354 | |
| 2,3 | | FHLMC Multifamily Structures Pass Through Certificates K090 | | 3.422% | | 2/25/29 | | | 200 | | | | 215 | |
| 2,3 | | FHLMC Multifamily Structures Pass Through Certificates K101 | | 2.524% | | 10/25/29 | | | 370 | | | | 373 | |
| 2,3 | | FHLMC Multifamily Structures Pass Through Certificates K15-14 | | 2.859% | | 10/25/34 | | | 225 | | | | 228 | |
| 2,3 | | FHLMC Multifamily Structures Pass Through Certificates K1504 | | 3.459% | | 11/25/32 | | | 50 | | | | 54 | |
| 2,3 | | FHLMC Multifamily Structures Pass Through Certificates K1510 | | 3.718% | | 1/25/31 | | | 75 | | | | 83 | |
| 2,3 | | FHLMC Multifamily Structures Pass Through Certificates K1510 | | 3.794% | | 1/25/34 | | | 125 | | | | 139 | |
| 2,3 | | FHLMC Multifamily Structures Pass Through Certificates K715 | | 2.856% | | 1/25/21 | | | 122 | | | | 123 | |
| 2,3 | | FHLMC Multifamily Structures Pass Through Certificates K720 | | 2.716% | | 6/25/22 | | | 150 | | | | 152 | |
| 2,3 | | FHLMC Multifamily Structures Pass Through Certificates K723 | | 2.454% | | 8/25/23 | | | 125 | | | | 127 | |
| 2,3 | | FHLMC Multifamily Structures Pass Through Certificates K724 | | 3.062% | | 11/25/23 | | | 100 | | | | 103 | |
| 2,3 | | FHLMC Multifamily Structures Pass Through Certificates K725 | | 2.946% | | 7/25/24 | | | 200 | | | | 206 | |
| 2,3 | | FHLMC Multifamily Structures Pass Through Certificates K726 | | 2.905% | | 4/25/24 | | | 200 | | | | 205 | |
| 2,3 | | FHLMC Multifamily Structures Pass Through Certificates K728 | | 3.064% | | 8/25/24 | | | 275 | | | | 285 | |
| 2,3 | | FHLMC Multifamily Structures Pass Through Certificates K730 | | 3.452% | | 9/25/24 | | | 24 | | | | 25 | |
| 2,3 | | FHLMC Multifamily Structures Pass Through Certificates K730 | | 3.590% | | 1/25/25 | | | 275 | | | | 291 | |
| 2,3 | | FHLMC Multifamily Structures Pass Through Certificates K735 | | 2.862% | | 5/25/26 | | | 500 | | | | 516 | |
| 2,3 | | FHLMC Multifamily Structures Pass Through Certificates KC02 | | 3.370% | | 7/25/25 | | | 175 | | | | 182 | |
| 2,3 | | FHLMC Multifamily Structures Pass Through Certificates KC02 | | 3.505% | | 3/25/29 | | | 450 | | | | 486 | |
| 2,3 | | FHLMC Multifamily Structures Pass Through Certificates KC02 | | 2.982% | | 5/25/29 | | | 400 | | | | 417 | |
| 3 | | Fifth Third Auto Trust 2019-1 | | 2.640% | | 12/15/23 | | | 125 | | | | 126 | |
| 3 | | Fifth Third Auto Trust 2019-1 | | 2.690% | | 11/16/26 | | | 50 | | | | 51 | |
| 3 | | Ford Credit Auto Lease Trust 2018-A | | 2.930% | | 6/15/21 | | | 125 | | | | 125 | |
| 3 | | Ford Credit Auto Lease Trust 2019-A | | 2.900% | | 5/15/22 | | | 50 | | | | 50 | |
| 3 | | Ford Credit Auto Lease Trust 2019-A | | 2.980% | | 6/15/22 | | | 25 | | | | 25 | |
| 3 | | Ford Credit Auto Owner Trust 2017-A | | 1.670% | | 6/15/21 | | | 22 | | | | 22 | |
| 3 | | Ford Credit Auto Owner Trust 2017-A | | 1.920% | | 4/15/22 | | | 75 | | | | 75 | |
| 3 | | Ford Credit Auto Owner Trust 2017-C | | 2.010% | | 3/15/22 | | | 251 | | | | 251 | |
| 3 | | Ford Credit Auto Owner Trust 2019-A | | 2.780% | | 9/15/23 | | | 150 | | | | 152 | |
| 3 | | Ford Credit Auto Owner Trust 2019-A | | 2.850% | | 8/15/24 | | | 50 | | | | 51 | |
| 3 | | Ford Credit Floorplan Master Owner Trust A Series 2017-2 | | 2.160% | | 9/15/22 | | | 160 | | | | 160 | |
Total Bond Market Index Portfolio
| | | | Face | | Market | |
| | | Maturity | Amount | | Value• | |
| | Coupon | Date | ($000 | ) | ($000 | ) |
| 3 | Ford Credit Floorplan Master Owner Trust A Series 2017-3 | 2.480% | 9/15/24 | 170 | | 172 | |
| 3 | Ford Credit Floorplan Master Owner Trust A Series 2018-1 | 2.950% | 5/15/23 | 225 | | 228 | |
| 3 | Ford Credit Floorplan Master Owner Trust A Series 2018-2 | 3.170% | 3/15/25 | 200 | | 206 | |
| 3 | GM Financial Automobile Leasing Trust 2018-1 | 2.610% | 1/20/21 | 64 | | 64 | |
| 3 | GM Financial Automobile Leasing Trust 2018-1 | 2.680% | 12/20/21 | 25 | | 25 | |
| 3 | GM Financial Automobile Leasing Trust 2018-2 | 3.060% | 6/21/21 | 45 | | 45 | |
| 3 | GM Financial Automobile Leasing Trust 2018-2 | 3.160% | 4/20/22 | 25 | | 25 | |
| 3 | GM Financial Automobile Leasing Trust 2019-2 | 2.670% | 3/21/22 | 75 | | 76 | |
| 3 | GM Financial Automobile Leasing Trust 2019-2 | 2.720% | 3/20/23 | 50 | | 50 | |
| 3 | GM Financial Consumer Automobile 2018-2 | 2.810% | 12/16/22 | 100 | | 101 | |
| 3 | GM Financial Consumer Automobile 2018-2 | 3.020% | 12/18/23 | 75 | | 76 | |
| 3 | GS Mortgage Securities Corporation II 2013-GC10 | 2.943% | 2/10/46 | 92 | | 94 | |
| 3 | GS Mortgage Securities Trust 2011-GC5 | 3.707% | 8/10/44 | 80 | | 81 | |
| 3 | GS Mortgage Securities Trust 2012-GC6 | 3.482% | 1/10/45 | 299 | | 304 | |
| 3 | GS Mortgage Securities Trust 2012-GCJ7 | 3.377% | 5/10/45 | 140 | | 142 | |
| 3 | GS Mortgage Securities Trust 2012-GCJ9 | 2.773% | 11/10/45 | 123 | | 125 | |
| 3 | GS Mortgage Securities Trust 2013-GC10 | 3.279% | 2/10/46 | 35 | | 36 | |
| 3 | GS Mortgage Securities Trust 2013-GC13 | 4.050% | 7/10/46 | 20 | | 21 | |
| 3 | GS Mortgage Securities Trust 2013-GCJ12 | 3.135% | 6/10/46 | 90 | | 92 | |
| 3 | GS Mortgage Securities Trust 2013-GCJ12 | 3.375% | 6/10/46 | 39 | | 40 | |
| 3 | GS Mortgage Securities Trust 2013-GCJ14 | 3.817% | 8/10/46 | 22 | | 22 | |
| 3 | GS Mortgage Securities Trust 2013-GCJ14 | 4.243% | 8/10/46 | 150 | | 160 | |
| 3 | GS Mortgage Securities Trust 2014-GC18 | 4.074% | 1/10/47 | 50 | | 53 | |
| 3 | GS Mortgage Securities Trust 2014-GC22 | 3.467% | 6/10/47 | 45 | | 46 | |
| 3 | GS Mortgage Securities Trust 2014-GC22 | 3.862% | 6/10/47 | 50 | | 53 | |
| 3 | GS Mortgage Securities Trust 2014-GC24 | 3.931% | 9/10/47 | 125 | | 133 | |
| 3 | GS Mortgage Securities Trust 2014-GC24 | 4.511% | 9/10/47 | 25 | | 26 | |
| 3 | GS Mortgage Securities Trust 2014-GC26 | 3.365% | 11/10/47 | 74 | | 76 | |
| 3 | GS Mortgage Securities Trust 2014-GC26 | 3.629% | 11/10/47 | 225 | | 238 | |
| 3 | GS Mortgage Securities Trust 2014-GC26 | 3.964% | 11/10/47 | 50 | | 53 | |
| 3 | GS Mortgage Securities Trust 2014-GC26 | 4.215% | 11/10/47 | 50 | | 52 | |
| 3 | GS Mortgage Securities Trust 2015-GC28 | 3.396% | 2/10/48 | 150 | | 157 | |
| 3 | GS Mortgage Securities Trust 2015-GC30 | 2.726% | 5/10/50 | 86 | | 86 | |
| 3 | GS Mortgage Securities Trust 2015-GC30 | 3.382% | 5/10/50 | 150 | | 157 | |
| 3 | GS Mortgage Securities Trust 2015-GC32 | 3.513% | 7/10/48 | 125 | | 130 | |
| 3 | GS Mortgage Securities Trust 2015-GC32 | 3.764% | 7/10/48 | 50 | | 53 | |
| 3 | GS Mortgage Securities Trust 2015-GC34 | 3.278% | 10/10/48 | 125 | | 129 | |
| 3 | GS Mortgage Securities Trust 2015-GC34 | 3.506% | 10/10/48 | 100 | | 105 | |
| 3 | GS Mortgage Securities Trust 2016-GS2 | 3.050% | 5/10/49 | 75 | | 78 | |
| 3 | GS Mortgage Securities Trust 2016-GS3 | 2.850% | 10/10/49 | 200 | | 204 | |
| 3 | GS Mortgage Securities Trust 2016-GS4 | 3.442% | 11/10/49 | 75 | | 79 | |
| 3 | GS Mortgage Securities Trust 2016-GS4 | 3.645% | 11/10/49 | 50 | | 52 | |
| 3 | GS Mortgage Securities Trust 2017-GS5 | 3.674% | 3/10/50 | 150 | | 161 | |
| 3 | GS Mortgage Securities Trust 2017-GS5 | 3.826% | 3/10/50 | 50 | | 53 | |
| 3 | GS Mortgage Securities Trust 2017-GS6 | 3.433% | 5/10/50 | 150 | | 159 | |
| 3 | GS Mortgage Securities Trust 2017-GS7 | 3.430% | 8/10/50 | 261 | | 274 | |
| 3 | GS Mortgage Securities Trust 2017-GS7 | 3.663% | 8/10/50 | 70 | | 74 | |
| 3 | GS Mortgage Securities Trust 2019-GC39 | 3.567% | 5/10/52 | 100 | | 107 | |
| 3 | GS Mortgage Securities Trust 2019-GC4 | 3.212% | 9/1/52 | 50 | | 51 | |
| 3 | GS Mortgage Securities Trust 2019-GC40 | 3.160% | 7/10/52 | 150 | | 156 | |
| 3 | GS Mortgage Securities Trust 2019-GS4 | 3.001% | 9/1/52 | 275 | | 282 | |
| 3 | GS Mortgage Securities Trust 2019-GSA1 | 3.048% | 11/10/52 | 125 | | 128 | |
| 3 | Honda Auto Receivables 2017-4 Owner Trust | 2.050% | 11/22/21 | 56 | | 56 | |
| 3 | Honda Auto Receivables 2018-1 Owner Trust | 2.640% | 2/15/22 | 203 | | 204 | |
| 3 | Honda Auto Receivables 2018-1 Owner Trust | 2.830% | 5/15/24 | 75 | | 76 | |
| 3 | Honda Auto Receivables 2018-2 Owner Trust | 3.010% | 5/18/22 | 75 | | 76 | |
| 3 | Honda Auto Receivables 2018-2 Owner Trust | 3.160% | 8/19/24 | 50 | | 51 | |
| 3 | Honda Auto Receivables 2018-4 Owner Trust | 2.520% | 6/21/23 | 150 | | 151 | |
| 3 | Honda Auto Receivables 2018-4 Owner Trust | 2.540% | 3/21/25 | 30 | | 30 | |
| 3 | Hyundai Auto Receivables Trust 2016-B | 1.290% | 4/15/21 | 8 | | 8 | |
| 3 | Hyundai Auto Receivables Trust 2016-B | 1.450% | 11/15/22 | 75 | | 75 | |
| 3 | Hyundai Auto Receivables Trust 2018-A | 2.790% | 7/15/22 | 50 | | 50 | |
| 3 | Hyundai Auto Receivables Trust 2018-A | 2.940% | 6/17/24 | 75 | | 76 | |
| 3 | JP Morgan Chase Commercial Mortgage Securities Trust 2012-C6 | 3.507% | 5/15/45 | 161 | | 166 | |
| 3 | JP Morgan Chase Commercial Mortgage Securities Trust 2012-C8 | 2.829% | 10/15/45 | 116 | | 117 | |
| 3 | JP Morgan Chase Commercial Mortgage Securities Trust 2012-CIBX | 3.483% | 6/15/45 | 170 | | 173 | |
| 3 | JP Morgan Chase Commercial Mortgage Securities Trust 2013-C10 | 3.143% | 12/15/47 | 51 | | 53 | |
| 3 | JP Morgan Chase Commercial Mortgage Securities Trust 2013-C10 | 3.372% | 12/15/47 | 39 | | 40 | |
| 3 | JP Morgan Chase Commercial Mortgage Securities Trust 2013-C16 | 4.166% | 12/15/46 | 100 | | 107 | |
| 3 | JP Morgan Chase Commercial Mortgage Securities Trust 2013-LC11 | 2.960% | 4/15/46 | 208 | | 213 | |
| 3 | JP Morgan Chase Commercial Mortgage Securities Trust 2015-JP1 | 3.914% | 1/15/49 | 75 | | 81 | |
| 3 | JP Morgan Chase Commercial Mortgage Securities Trust 2016-JP3 | 2.870% | 8/15/49 | 250 | | 255 | |
Total Bond Market Index Portfolio
| | | | Face | | Market | |
| | | Maturity | Amount | | Value• | |
| | Coupon | Date | ($000 | ) | ($000 | ) |
| 3 | JP Morgan Chase Commercial Mortgage Securities Trust 2016-JP4 | 3.648% | 12/15/49 | 100 | | 106 | |
| 3 | JP Morgan Chase Commercial Mortgage Securities Trust 2016-JP4 | 3.870% | 12/15/49 | 75 | | 80 | |
| 3 | JP Morgan Chase Commercial Mortgage Securities Trust 2017-JP6 | 3.050% | 7/15/50 | 36 | | 36 | |
| 3 | JP Morgan Chase Commercial Mortgage Securities Trust 2017-JP6 | 3.744% | 7/15/50 | 100 | | 105 | |
| 3 | JP Morgan Chase Commercial Mortgage Securities Trust 2019-COR4 | 4.029% | 3/10/52 | 300 | | 332 | |
| 3 | JPMBB Commercial Mortgage Securities Trust 2013-C12 | 3.664% | 7/15/45 | 39 | | 41 | |
| 3 | JPMBB Commercial Mortgage Securities Trust 2013-C12 | 4.039% | 7/15/45 | 26 | | 27 | |
| 3 | JPMBB Commercial Mortgage Securities Trust 2013-C14 | 3.761% | 8/15/46 | 29 | | 30 | |
| 3 | JPMBB Commercial Mortgage Securities Trust 2013-C14 | 4.133% | 8/15/46 | 100 | | 106 | |
| 3 | JPMBB Commercial Mortgage Securities Trust 2013-C14 | 4.409% | 8/15/46 | 30 | | 32 | |
| 3 | JPMBB Commercial Mortgage Securities Trust 2013-C15 | 3.659% | 11/15/45 | 7 | | 8 | |
| 3 | JPMBB Commercial Mortgage Securities Trust 2013-C15 | 4.131% | 11/15/45 | 65 | | 69 | |
| 3 | JPMBB Commercial Mortgage Securities Trust 2013-C15 | 4.420% | 11/15/45 | 35 | | 37 | |
| 3 | JPMBB Commercial Mortgage Securities Trust 2014-C18 | 4.079% | 2/15/47 | 127 | | 136 | |
| 3 | JPMBB Commercial Mortgage Securities Trust 2014-C18 | 4.439% | 2/15/47 | 25 | | 27 | |
| 3 | JPMBB Commercial Mortgage Securities Trust 2014-C18 | 4.810% | 2/15/47 | 30 | | 32 | |
| 3 | JPMBB Commercial Mortgage Securities Trust 2014-C19 | 3.669% | 4/15/47 | 50 | | 51 | |
| 3 | JPMBB Commercial Mortgage Securities Trust 2014-C19 | 3.997% | 4/15/47 | 95 | | 101 | |
| 3 | JPMBB Commercial Mortgage Securities Trust 2014-C19 | 4.243% | 4/15/47 | 50 | | 53 | |
| 3 | JPMBB Commercial Mortgage Securities Trust 2014-C21 | 3.428% | 8/15/47 | 26 | | 27 | |
| 3 | JPMBB Commercial Mortgage Securities Trust 2014-C21 | 3.775% | 8/15/47 | 25 | | 27 | |
| 3 | JPMBB Commercial Mortgage Securities Trust 2014-C22 | 3.801% | 9/15/47 | 175 | | 186 | |
| 3 | JPMBB Commercial Mortgage Securities Trust 2014-C22 | 4.110% | 9/15/47 | 50 | | 53 | |
| 3 | JPMBB Commercial Mortgage Securities Trust 2014-C23 | 3.934% | 9/15/47 | 85 | | 91 | |
| 3 | JPMBB Commercial Mortgage Securities Trust 2014-C23 | 4.202% | 9/15/47 | 50 | | 53 | |
| 3 | JPMBB Commercial Mortgage Securities Trust 2014-C24 | 2.940% | 11/15/47 | 12 | | 12 | |
| 3 | JPMBB Commercial Mortgage Securities Trust 2014-C24 | 3.639% | 11/15/47 | 50 | | 53 | |
| 3 | JPMBB Commercial Mortgage Securities Trust 2014-C24 | 3.914% | 11/15/47 | 75 | | 79 | |
| 3 | JPMBB Commercial Mortgage Securities Trust 2014-C25 | 3.672% | 11/15/47 | 200 | | 211 | |
| 3 | JPMBB Commercial Mortgage Securities Trust 2014-C25 | 4.065% | 11/15/47 | 50 | | 53 | |
| 3 | JPMBB Commercial Mortgage Securities Trust 2014-C26 | 3.019% | 1/15/48 | 8 | | 8 | |
| 3 | JPMBB Commercial Mortgage Securities Trust 2014-C26 | 3.494% | 1/15/48 | 175 | | 183 | |
| 3 | JPMBB Commercial Mortgage Securities Trust 2014-C26 | 3.800% | 1/15/48 | 50 | | 52 | |
| 3 | JPMBB Commercial Mortgage Securities Trust 2014-C26 | 3.951% | 1/15/48 | 50 | | 52 | |
| 3 | JPMBB Commercial Mortgage Securities Trust 2015-C27 | 2.734% | 2/15/48 | 13 | | 13 | |
| 3 | JPMBB Commercial Mortgage Securities Trust 2015-C27 | 3.017% | 2/15/48 | 110 | | 112 | |
| 3 | JPMBB Commercial Mortgage Securities Trust 2015-C27 | 3.179% | 2/15/48 | 59 | | 61 | |
| 3 | JPMBB Commercial Mortgage Securities Trust 2015-C28 | 2.773% | 10/15/48 | 49 | | 49 | |
| 3 | JPMBB Commercial Mortgage Securities Trust 2015-C28 | 3.227% | 10/15/48 | 125 | | 130 | |
| 3 | JPMBB Commercial Mortgage Securities Trust 2015-C28 | 3.532% | 10/15/48 | 50 | | 52 | |
| 3 | JPMBB Commercial Mortgage Securities Trust 2015-C29 | 2.921% | 5/15/48 | 68 | | 68 | |
| 3 | JPMBB Commercial Mortgage Securities Trust 2015-C29 | 3.304% | 5/15/48 | 57 | | 59 | |
| 3 | JPMBB Commercial Mortgage Securities Trust 2015-C29 | 3.611% | 5/15/48 | 100 | | 106 | |
| 3 | JPMBB Commercial Mortgage Securities Trust 2015-C30 | 3.559% | 7/15/48 | 125 | | 129 | |
| 3 | JPMBB Commercial Mortgage Securities Trust 2015-C30 | 3.822% | 7/15/48 | 100 | | 107 | |
| 3 | JPMBB Commercial Mortgage Securities Trust 2015-C30 | 4.226% | 7/15/48 | 50 | | 54 | |
| 3 | JPMBB Commercial Mortgage Securities Trust 2015-C31 | 3.540% | 8/15/48 | 53 | | 55 | |
| 3 | JPMBB Commercial Mortgage Securities Trust 2015-C31 | 3.801% | 8/15/48 | 57 | | 61 | |
| 3 | JPMBB Commercial Mortgage Securities Trust 2015-C32 | 3.358% | 11/15/48 | 125 | | 129 | |
| 3 | JPMBB Commercial Mortgage Securities Trust 2015-C32 | 3.598% | 11/15/48 | 125 | | 132 | |
| 3 | JPMBB Commercial Mortgage Securities Trust 2015-C33 | 3.770% | 12/15/48 | 82 | | 88 | |
| 3 | JPMBB Commercial Mortgage Securities Trust 2016-C1 | 3.316% | 3/15/49 | 75 | | 77 | |
| 3 | JPMCC Commercial Mortgage Securities Trust 2017-JP5 | 3.723% | 3/15/50 | 400 | | 430 | |
| 3 | JPMCC Commercial Mortgage Securities Trust 2019-COR5 | 3.386% | 6/13/52 | 200 | | 210 | |
| 3 | JPMCC Commercial Mortgage Securities Trust 2019-COR5 | 3.669% | 6/13/52 | 25 | | 26 | |
| 3 | JPMDB Commercial Mortgage Securities Trust 2016-C2 | 3.144% | 6/15/49 | 75 | | 78 | |
| 3 | JPMDB Commercial Mortgage Securities Trust 2016-C2 | 3.484% | 6/15/49 | 50 | | 52 | |
| 3 | JPMDB Commercial Mortgage Securities Trust 2017-C7 | 3.409% | 10/15/50 | 75 | | 79 | |
| 3 | JPMDB Commercial Mortgage Securities Trust 2017-C7 | 3.713% | 10/15/50 | 50 | | 53 | |
| 3 | JPMDB Commercial Mortgage Securities Trust 2018-C8 | 4.211% | 6/15/51 | 225 | | 249 | |
| 3 | JPMDB Commercial Mortgage Securities Trust 2018-C8 | 4.421% | 6/15/51 | 25 | | 28 | |
| 3 | JPMDB Commerical Mortgage Securities Trust 2019-COR6 | 3.057% | 11/13/52 | 175 | | 178 | |
| 3 | Mercedes-Benz Auto Lease Trust 2018-A | 2.410% | 2/16/21 | 39 | | 39 | |
| 3 | Mercedes-Benz Auto Lease Trust 2018-A | 2.510% | 10/16/23 | 25 | | 25 | |
| 3 | Morgan Stanley Bank of America Merrill Lynch Trust 2012-C5 | 3.176% | 8/15/45 | 100 | | 102 | |
| 3 | Morgan Stanley Bank of America Merrill Lynch Trust 2013-C11 | 4.153% | 8/15/46 | 40 | | 42 | |
| 3 | Morgan Stanley Bank of America Merrill Lynch Trust 2013-C11 | 4.353% | 8/15/46 | 20 | | 21 | |
| 3 | Morgan Stanley Bank of America Merrill Lynch Trust 2013-C12 | 4.259% | 10/15/46 | 100 | | 106 | |
| 3 | Morgan Stanley Bank of America Merrill Lynch Trust 2013-C7 | 2.918% | 2/15/46 | 68 | | 69 | |
| 3 | Morgan Stanley Bank of America Merrill Lynch Trust 2013-C7 | 3.214% | 2/15/46 | 14 | | 14 | |
Total Bond Market Index Portfolio
| | | | Face | | Market | |
| | | Maturity | Amount | | Value• | |
| | Coupon | Date | ($000 | ) | ($000 | ) |
| 3 | Morgan Stanley Bank of America Merrill Lynch Trust 2013-C8 | 3.134% | 12/15/48 | 100 | | 102 | |
| 3 | Morgan Stanley Bank of America Merrill Lynch Trust 2013-C8 | 3.376% | 12/15/48 | 50 | | 51 | |
| 3 | Morgan Stanley Bank of America Merrill Lynch Trust 2013-C9 | 3.102% | 5/15/46 | 50 | | 51 | |
| 3 | Morgan Stanley Bank of America Merrill Lynch Trust 2013-C9 | 3.456% | 5/15/46 | 50 | | 52 | |
| 3 | Morgan Stanley Bank of America Merrill Lynch Trust 2014-C14 | 3.669% | 2/15/47 | 76 | | 77 | |
| 3 | Morgan Stanley Bank of America Merrill Lynch Trust 2014-C14 | 4.064% | 2/15/47 | 100 | | 106 | |
| 3 | Morgan Stanley Bank of America Merrill Lynch Trust 2014-C14 | 4.745% | 2/15/47 | 100 | | 107 | |
| 3 | Morgan Stanley Bank of America Merrill Lynch Trust 2014-C16 | 3.477% | 6/15/47 | 22 | | 23 | |
| 3 | Morgan Stanley Bank of America Merrill Lynch Trust 2014-C16 | 3.892% | 6/15/47 | 100 | | 106 | |
| 3 | Morgan Stanley Bank of America Merrill Lynch Trust 2014-C16 | 4.337% | 6/15/47 | 50 | | 53 | |
| 3 | Morgan Stanley Bank of America Merrill Lynch Trust 2014-C18 | 3.194% | 10/15/47 | 5 | | 5 | |
| 3 | Morgan Stanley Bank of America Merrill Lynch Trust 2014-C18 | 4.478% | 10/15/47 | 50 | | 53 | |
| 3 | Morgan Stanley Bank of America Merrill Lynch Trust 2014-C19 | 3.326% | 12/15/47 | 50 | | 51 | |
| 3 | Morgan Stanley Bank of America Merrill Lynch Trust 2014-C19 | 3.526% | 12/15/47 | 75 | | 79 | |
| 3 | Morgan Stanley Bank of America Merrill Lynch Trust 2015-C20 | 3.069% | 2/15/48 | 50 | | 51 | |
| 3 | Morgan Stanley Bank of America Merrill Lynch Trust 2015-C20 | 3.249% | 2/15/48 | 200 | | 207 | |
| 3 | Morgan Stanley Bank of America Merrill Lynch Trust 2015-C22 | 3.040% | 4/15/48 | 100 | | 102 | |
| 3 | Morgan Stanley Bank of America Merrill Lynch Trust 2015-C22 | 3.306% | 4/15/48 | 75 | | 78 | |
| 3 | Morgan Stanley Bank of America Merrill Lynch Trust 2015-C22 | 3.883% | 4/15/48 | 50 | | 52 | |
| 3 | Morgan Stanley Bank of America Merrill Lynch Trust 2015-C23 | 2.982% | 7/15/50 | 74 | | 74 | |
| 3 | Morgan Stanley Bank of America Merrill Lynch Trust 2015-C23 | 3.398% | 7/15/50 | 50 | | 51 | |
| 3 | Morgan Stanley Bank of America Merrill Lynch Trust 2015-C23 | 3.719% | 7/15/50 | 125 | | 133 | |
| 3 | Morgan Stanley Bank of America Merrill Lynch Trust 2015-C25 | 3.383% | 10/15/48 | 125 | | 129 | |
| 3 | Morgan Stanley Bank of America Merrill Lynch Trust 2015-C25 | 3.635% | 10/15/48 | 75 | | 79 | |
| 3 | Morgan Stanley Bank of America Merrill Lynch Trust 2015-C26 | 3.323% | 10/15/48 | 75 | | 77 | |
| 3 | Morgan Stanley Bank of America Merrill Lynch Trust 2015-C26 | 3.531% | 10/15/48 | 75 | | 79 | |
| 3 | Morgan Stanley Bank of America Merrill Lynch Trust 2015-C27 | 3.557% | 12/15/47 | 50 | | 52 | |
| 3 | Morgan Stanley Bank of America Merrill Lynch Trust 2015-C27 | 3.753% | 12/15/47 | 75 | | 80 | |
| 3 | Morgan Stanley Bank of America Merrill Lynch Trust 2016-C28 | 3.288% | 1/15/49 | 100 | | 103 | |
| 3 | Morgan Stanley Bank of America Merrill Lynch Trust 2016-C28 | 3.544% | 1/15/49 | 225 | | 238 | |
| 3 | Morgan Stanley Bank of America Merrill Lynch Trust 2016-C30 | 2.860% | 9/15/49 | 200 | | 203 | |
| 3 | Morgan Stanley Bank of America Merrill Lynch Trust 2016-C31 | 3.102% | 11/15/49 | 250 | | 258 | |
| 3 | Morgan Stanley Bank of America Merrill Lynch Trust 2017-C33 | 3.599% | 5/15/50 | 150 | | 160 | |
| 3 | Morgan Stanley Bank of America Merrill Lynch Trust 2017-C33 | 3.852% | 5/15/50 | 100 | | 106 | |
| 3 | Morgan Stanley Bank of America Merrill Lynch Trust 2017-C34 | 3.276% | 11/15/52 | 125 | | 130 | |
| 3 | Morgan Stanley Bank of America Merrill Lynch Trust 2017-C34 | 3.536% | 11/15/52 | 150 | | 159 | |
| 3 | Morgan Stanley Capital I Trust 2012-C4 | 3.244% | 3/15/45 | 350 | | 356 | |
| 3 | Morgan Stanley Capital I Trust 2012-C4 | 3.773% | 3/15/45 | 75 | | 77 | |
| 3 | Morgan Stanley Capital I Trust 2015-UBS8 | 3.809% | 12/15/48 | 75 | | 80 | |
| 3 | Morgan Stanley Capital I Trust 2016-BNK2 | 3.049% | 11/15/49 | 100 | | 104 | |
| 3 | Morgan Stanley Capital I Trust 2016-BNK2 | 3.282% | 11/15/49 | 83 | | 86 | |
| 3 | Morgan Stanley Capital I Trust 2016-UB11 | 2.782% | 8/15/49 | 200 | | 202 | |
| 3 | Morgan Stanley Capital I Trust 2016-UBS12 | 3.596% | 12/15/49 | 200 | | 213 | |
| 3 | Morgan Stanley Capital I Trust 2017-H1 | 3.530% | 6/15/50 | 150 | | 159 | |
| 3 | Morgan Stanley Capital I Trust 2019-H6 | 3.417% | 6/15/52 | 250 | | 264 | |
| 3 | Morgan Stanley Capital I Trust 2019-H6 | 3.700% | 6/15/52 | 25 | | 26 | |
| 3 | Morgan Stanley Capital I Trust 2019-L2 | 4.071% | 3/15/52 | 150 | | 167 | |
| 3 | Morgan Stanley Capital I Trust 2019-L3 | 3.127% | 11/15/29 | 200 | | 206 | |
| 3 | Nissan Auto Lease Trust 2017-B | 2.050% | 9/15/20 | 8 | | 8 | |
| 3 | Nissan Auto Lease Trust 2017-B | 2.170% | 12/15/21 | 25 | | 25 | |
| 3 | Nissan Auto Receivables 2015-B Owner Trust | 1.790% | 1/17/22 | 5 | | 5 | |
| 3 | Nissan Auto Receivables 2015-C Owner Trust | 1.670% | 2/15/22 | 21 | | 21 | |
| 3 | Nissan Auto Receivables 2016-C Owner Trust | 1.180% | 1/15/21 | 6 | | 6 | |
| 3 | Nissan Auto Receivables 2016-C Owner Trust | 1.380% | 1/17/23 | 75 | | 75 | |
| 3 | Nissan Auto Receivables 2017-B Owner Trust | 1.950% | 10/16/23 | 104 | | 104 | |
| 3 | Nissan Auto Receivables 2018-A Owner Trust | 2.650% | 5/16/22 | 123 | | 123 | |
| 3 | Nissan Auto Receivables 2018-A Owner Trust | 2.890% | 6/17/24 | 100 | | 102 | |
| 3 | Nissan Auto Receivables 2019-B Owner Trust | 2.500% | 11/15/23 | 125 | | 126 | |
| 3 | Nissan Auto Receivables 2019-B Owner Trust | 2.540% | 12/15/25 | 30 | | 30 | |
| 3 | Nissan Auto Receivables 2019-C | 1.930% | 7/15/24 | 150 | | 150 | |
| 3 | Nissan Auto Receivables 2019-C | 1.950% | 5/15/26 | 35 | | 35 | |
| | Royal Bank of Canada | 2.100% | 10/14/20 | 800 | | 800 | |
| | Royal Bank of Canada | 2.300% | 3/22/21 | 175 | | 176 | |
| 3 | Santander Drive Auto Receivables Trust 2018-2 | 3.030% | 9/15/22 | 36 | | 36 | |
| 3 | Santander Drive Auto Receivables Trust 2018-2 | 3.350% | 7/17/23 | 50 | | 50 | |
| 3 | Santander Drive Auto Receivables Trust 2018-3 | 3.030% | 2/15/22 | 1 | | 1 | |
| 3 | Santander Drive Auto Receivables Trust 2018-3 | 3.290% | 10/17/22 | 50 | | 50 | |
| 3 | Santander Drive Auto Receivables Trust 2018-3 | 3.510% | 8/15/23 | 50 | | 51 | |
| 3 | Synchrony Card Issuance Trust 2018-A1 | 3.380% | 9/15/24 | 275 | | 281 | |
| 3 | Synchrony Credit Card Master Note Trust 2016-2 | 2.210% | 5/15/24 | 373 | | 375 | |
| 3 | Synchrony Credit Card Master Note Trust 2017-2 | 2.620% | 10/15/25 | 150 | | 152 | |
| 3 | Synchrony Credit Card Master Note Trust 2018-1 | 2.970% | 3/15/24 | 275 | | 278 | |
| 3 | Synchrony Credit Card Master Note Trust 2018-2 | 3.470% | 5/15/26 | 275 | | 287 | |
| 6 | Toronto-Dominion Bank | 2.250% | 3/15/21 | 250 | | 251 | |
| 3 | Toyota Auto Receivables 2016-B Owner Trust | 1.520% | 8/16/21 | 28 | | 28 | |
| 3 | Toyota Auto Receivables 2016-C Owner Trust | 1.320% | 11/15/21 | 38 | | 38 | |
| 3 | Toyota Auto Receivables 2017-D Owner Trust | 1.930% | 1/18/22 | 179 | | 179 | |
| 3 | Toyota Auto Receivables 2018-A Owner Trust | 2.350% | 5/16/22 | 118 | | 118 | |
Total Bond Market Index Portfolio
| | | | Face | | Market | |
| | | Maturity | Amount | | Value• | |
| | Coupon | Date | ($000 | ) | ($000 | ) |
| 3 | Toyota Auto Receivables 2018-A Owner Trust | 2.520% | 5/15/23 | 50 | | 50 | |
| 3 | Toyota Auto Receivables 2018-B Owner Trust | 2.960% | 9/15/22 | 125 | | 126 | |
| 3 | Toyota Auto Receivables 2018-B Owner Trust | 3.110% | 11/15/23 | 25 | | 26 | |
| 3 | UBS Commercial Mortgage Trust 2017-C1 | 3.460% | 6/15/50 | 100 | | 106 | |
| 3 | UBS Commercial Mortgage Trust 2017-C1 | 3.724% | 6/15/50 | 50 | | 52 | |
| 3 | UBS Commercial Mortgage Trust 2017-C2 | 3.487% | 8/15/50 | 150 | | 158 | |
| 3 | UBS Commercial Mortgage Trust 2017-C2 | 3.740% | 8/15/50 | 50 | | 52 | |
| 3 | UBS Commercial Mortgage Trust 2017-C3 | 3.426% | 8/15/50 | 175 | | 184 | |
| 3 | UBS Commercial Mortgage Trust 2017-C3 | 3.739% | 8/15/50 | 75 | | 79 | |
| 3 | UBS Commercial Mortgage Trust 2017-C4 | 3.301% | 10/15/50 | 100 | | 105 | |
| 3 | UBS Commercial Mortgage Trust 2017-C4 | 3.563% | 10/15/50 | 150 | | 160 | |
| 3 | UBS Commercial Mortgage Trust 2017-C4 | 3.836% | 10/15/50 | 62 | | 65 | |
| 3 | UBS Commercial Mortgage Trust 2017-C5 | 3.474% | 11/15/50 | 100 | | 106 | |
| 3 | UBS Commercial Mortgage Trust 2017-C7 | 3.679% | 12/15/50 | 150 | | 161 | |
| 3 | UBS Commercial Mortgage Trust 2017-C7 | 4.061% | 12/15/50 | 100 | | 107 | |
| 3 | UBS Commercial Mortgage Trust 2018-C11 | 4.241% | 6/15/51 | 125 | | 139 | |
| 3 | UBS Commercial Mortgage Trust 2018-C12 | 4.296% | 8/15/51 | 100 | | 113 | |
| 3 | UBS Commercial Mortgage Trust 2018-C13 | 4.208% | 10/15/51 | 25 | | 26 | |
| 3 | UBS Commercial Mortgage Trust 2018-C13 | 4.334% | 10/15/51 | 75 | | 85 | |
| 3 | UBS Commercial Mortgage Trust 2018-C14 | 4.448% | 12/15/51 | 225 | | 256 | |
| 3 | UBS Commercial Mortgage Trust 2018-C15 | 4.341% | 12/15/51 | 125 | | 140 | |
| 3 | UBS Commercial Mortgage Trust 2018-C8 | 3.720% | 2/15/51 | 150 | | 162 | |
| 3 | UBS Commercial Mortgage Trust 2018-C8 | 3.983% | 2/15/51 | 275 | | 302 | |
| 3 | UBS Commercial Mortgage Trust 2018-C8 | 4.215% | 2/15/51 | 75 | | 81 | |
| 3 | UBS Commercial Mortgage Trust 2019-C16 | 3.605% | 4/15/52 | 100 | | 106 | |
| 3 | UBS Commercial Mortgage Trust 2019-C17 | 2.921% | 10/15/52 | 125 | | 127 | |
| 3 | UBS-Barclays Commercial Mortgage Trust 2013-C5 | 3.185% | 3/10/46 | 104 | | 107 | |
| 3 | UBS-Barclays Commercial Mortgage Trust 2013-C6 | 3.244% | 4/10/46 | 165 | | 169 | |
| 3 | UBS-Barclays Commercial Mortgage Trust 2013-C6 | 3.469% | 4/10/46 | 25 | | 26 | |
| 3 | UBS-Barclays Commercial Mortgage Trust 2018-C10 | 4.313% | 5/15/51 | 175 | | 195 | |
| 3 | UBS-Barclays Commercial Mortgage Trust 2018-C9 | 4.117% | 3/15/51 | 275 | | 305 | |
| 3 | UBS-Barclays Commercial Mortgage Trust 2019-C16 | 3.887% | 4/15/52 | 25 | | 27 | |
| 3 | UBS-Barclays Commercial Mortgage Trust 2019-C18 | 3.035% | 12/15/52 | 75 | | 77 | |
| 3 | Wells Fargo Commercial Mortgage Trust 2012-LC5 | 2.918% | 10/15/45 | 67 | | 68 | |
| 3 | Wells Fargo Commercial Mortgage Trust 2014-LC16 | 2.819% | 8/15/50 | 1 | | 1 | |
| 3 | Wells Fargo Commercial Mortgage Trust 2014-LC16 | 3.817% | 8/15/50 | 75 | | 79 | |
| 3 | Wells Fargo Commercial Mortgage Trust 2014-LC18 | 2.954% | 12/15/47 | 41 | | 41 | |
| 3 | Wells Fargo Commercial Mortgage Trust 2014-LC18 | 3.271% | 12/15/47 | 75 | | 76 | |
| 3 | Wells Fargo Commercial Mortgage Trust 2014-LC18 | 3.405% | 12/15/47 | 125 | | 131 | |
| 3 | Wells Fargo Commercial Mortgage Trust 2014-LC18 | 3.808% | 12/15/47 | 75 | | 78 | |
| 3 | Wells Fargo Commercial Mortgage Trust 2015-C26 | 2.991% | 2/15/48 | 125 | | 127 | |
| 3 | Wells Fargo Commercial Mortgage Trust 2015-C26 | 3.166% | 2/15/48 | 75 | | 78 | |
| 3 | Wells Fargo Commercial Mortgage Trust 2015-C26 | 3.580% | 2/15/48 | 50 | | 52 | |
| 3 | Wells Fargo Commercial Mortgage Trust 2015-C27 | 3.190% | 2/15/48 | 244 | | 252 | |
| 3 | Wells Fargo Commercial Mortgage Trust 2015-C28 | 3.540% | 5/15/48 | 175 | | 185 | |
| 3 | Wells Fargo Commercial Mortgage Trust 2015-C28 | 3.872% | 5/15/48 | 31 | | 32 | |
| 3 | Wells Fargo Commercial Mortgage Trust 2015-C29 | 3.400% | 6/15/48 | 125 | | 129 | |
| 3 | Wells Fargo Commercial Mortgage Trust 2015-C29 | 3.637% | 6/15/48 | 175 | | 186 | |
| 3 | Wells Fargo Commercial Mortgage Trust 2015-LC20 | 2.978% | 4/15/50 | 29 | | 30 | |
| 3 | Wells Fargo Commercial Mortgage Trust 2015-LC20 | 3.184% | 4/15/50 | 276 | | 287 | |
| 3 | Wells Fargo Commercial Mortgage Trust 2015-LC20 | 3.719% | 4/15/50 | 50 | | 51 | |
| 3 | Wells Fargo Commercial Mortgage Trust 2015-LC22 | 3.571% | 9/15/58 | 50 | | 52 | |
| 3 | Wells Fargo Commercial Mortgage Trust 2015-LC22 | 3.839% | 9/15/58 | 75 | | 81 | |
| 3 | Wells Fargo Commercial Mortgage Trust 2015-LC22 | 4.207% | 9/15/58 | 75 | | 80 | |
| 3 | Wells Fargo Commercial Mortgage Trust 2015-NXS1 | 2.632% | 5/15/48 | 21 | | 21 | |
| 3 | Wells Fargo Commercial Mortgage Trust 2015-NXS1 | 2.934% | 5/15/48 | 50 | | 51 | |
| 3 | Wells Fargo Commercial Mortgage Trust 2015-NXS1 | 3.148% | 5/15/48 | 50 | | 52 | |
| 3 | Wells Fargo Commercial Mortgage Trust 2015-P2 | 3.656% | 12/15/48 | 100 | | 105 | |
| 3 | Wells Fargo Commercial Mortgage Trust 2015-P2 | 3.809% | 12/15/48 | 50 | | 54 | |
| 3 | Wells Fargo Commercial Mortgage Trust 2015-SG1 | 3.789% | 9/15/48 | 210 | | 224 | |
| 3 | Wells Fargo Commercial Mortgage Trust 2016-BNK1 | 2.652% | 8/15/49 | 150 | | 151 | |
| 3 | Wells Fargo Commercial Mortgage Trust 2016-C32 | 3.324% | 1/15/59 | 58 | | 60 | |
| 3 | Wells Fargo Commercial Mortgage Trust 2016-C32 | 3.560% | 1/15/59 | 125 | | 132 | |
| 3 | Wells Fargo Commercial Mortgage Trust 2016-C33 | 3.426% | 3/15/59 | 50 | | 53 | |
| 3 | Wells Fargo Commercial Mortgage Trust 2016-C34 | 3.096% | 6/15/49 | 75 | | 77 | |
| 3 | Wells Fargo Commercial Mortgage Trust 2016-C37 | 3.794% | 12/15/49 | 100 | | 108 | |
| 3 | Wells Fargo Commercial Mortgage Trust 2016-LC24 | 2.825% | 10/15/49 | 100 | | 102 | |
| 3 | Wells Fargo Commercial Mortgage Trust 2016-LC24 | 2.942% | 10/15/49 | 162 | | 166 | |
| 3 | Wells Fargo Commercial Mortgage Trust 2017-C38 | 3.453% | 7/15/50 | 192 | | 204 | |
| 3 | Wells Fargo Commercial Mortgage Trust 2017-C38 | 3.665% | 7/15/50 | 54 | | 57 | |
Total Bond Market Index Portfolio
| | | | Face | | Market | |
| | | Maturity | Amount | | Value• | |
| | Coupon | Date | ($000 | ) | ($000 | ) |
| 3 | Wells Fargo Commercial Mortgage Trust 2017-C39 | 3.418% | 9/15/50 | 175 | | 185 | |
| 3 | Wells Fargo Commercial Mortgage Trust 2017-C39 | 3.702% | 9/15/50 | 100 | | 105 | |
| 3 | Wells Fargo Commercial Mortgage Trust 2017-C40 | 3.317% | 10/15/50 | 100 | | 104 | |
| 3 | Wells Fargo Commercial Mortgage Trust 2017-C40 | 3.581% | 10/15/50 | 150 | | 160 | |
| 3 | Wells Fargo Commercial Mortgage Trust 2017-C40 | 3.854% | 10/15/50 | 25 | | 26 | |
| 3 | Wells Fargo Commercial Mortgage Trust 2017-C41 | 3.472% | 11/15/50 | 250 | | 265 | |
| 3 | Wells Fargo Commercial Mortgage Trust 2018-C43 | 4.012% | 3/15/51 | 275 | | 302 | |
| 3 | Wells Fargo Commercial Mortgage Trust 2018-C43 | 4.152% | 3/15/51 | 50 | | 54 | |
| 3 | Wells Fargo Commercial Mortgage Trust 2018-C44 | 4.212% | 5/15/51 | 175 | | 195 | |
| 3 | Wells Fargo Commercial Mortgage Trust 2018-C45 | 4.184% | 6/15/51 | 200 | | 222 | |
| 3 | Wells Fargo Commercial Mortgage Trust 2018-C46 | 4.152% | 8/15/51 | 75 | | 83 | |
| 3 | Wells Fargo Commercial Mortgage Trust 2018-C47 | 4.442% | 9/15/61 | 150 | | 170 | |
| 3 | Wells Fargo Commercial Mortgage Trust 2019-C49 | 4.023% | 3/15/52 | 225 | | 248 | |
| 3 | Wells Fargo Commercial Mortgage Trust 2019-C50 | 3.729% | 5/15/52 | 125 | | 135 | |
| 3 | Wells Fargo Commercial Mortgage Trust 2019-C51 | 3.311% | 6/15/52 | 200 | | 210 | |
| 3 | Wells Fargo Commercial Mortgage Trust 2019-C52 | 2.892% | 8/15/52 | 270 | | 274 | |
| 3 | Wells Fargo Commercial Mortgage Trust 2019-C52 | 3.143% | 8/15/52 | 100 | | 100 | |
| 3 | Wells Fargo Commercial Mortgage Trust 2019-C53 | 3.040% | 10/15/52 | 200 | | 206 | |
| 3 | Wells Fargo Commercial Mortgage Trust 2019-C54 | 3.146% | 12/15/52 | 100 | | 104 | |
| 3 | WFRBS Commercial Mortgage Trust 2012-C6 | 3.440% | 4/15/45 | 175 | | 178 | |
| 3 | WFRBS Commercial Mortgage Trust 2012-C7 | 3.431% | 6/15/45 | 125 | | 128 | |
| 3 | WFRBS Commercial Mortgage Trust 2012-C7 | 4.090% | 6/15/45 | 100 | | 103 | |
| 3 | WFRBS Commercial Mortgage Trust 2012-C8 | 3.001% | 8/15/45 | 75 | | 76 | |
| 3 | WFRBS Commercial Mortgage Trust 2012-C9 | 2.870% | 11/15/45 | 122 | | 124 | |
| 3 | WFRBS Commercial Mortgage Trust 2013-C11 | 3.071% | 3/15/45 | 94 | | 96 | |
| 3 | WFRBS Commercial Mortgage Trust 2013-C12 | 3.198% | 3/15/48 | 39 | | 40 | |
| 3 | WFRBS Commercial Mortgage Trust 2013-C12 | 3.560% | 3/15/48 | 18 | | 19 | |
| 3 | WFRBS Commercial Mortgage Trust 2013-C13 | 3.001% | 5/15/45 | 76 | | 78 | |
| 3 | WFRBS Commercial Mortgage Trust 2013-C13 | 3.345% | 5/15/45 | 15 | | 15 | |
| 3 | WFRBS Commercial Mortgage Trust 2013-C14 | 3.337% | 6/15/46 | 150 | | 155 | |
| 3 | WFRBS Commercial Mortgage Trust 2013-C14 | 3.488% | 6/15/46 | 75 | | 77 | |
| 3 | WFRBS Commercial Mortgage Trust 2013-C15 | 3.720% | 8/15/46 | 16 | | 16 | |
| 3 | WFRBS Commercial Mortgage Trust 2013-C15 | 4.153% | 8/15/46 | 100 | | 106 | |
| 3 | WFRBS Commercial Mortgage Trust 2013-C15 | 4.358% | 8/15/46 | 20 | | 21 | |
| 3 | WFRBS Commercial Mortgage Trust 2013-C16 | 3.963% | 9/15/46 | 23 | | 24 | |
| 3 | WFRBS Commercial Mortgage Trust 2013-C16 | 4.415% | 9/15/46 | 30 | | 32 | |
| 3 | WFRBS Commercial Mortgage Trust 2013-C16 | 4.668% | 9/15/46 | 50 | | 53 | |
| 3 | WFRBS Commercial Mortgage Trust 2013-C17 | 3.558% | 12/15/46 | 20 | | 20 | |
| 3 | WFRBS Commercial Mortgage Trust 2013-C17 | 4.023% | 12/15/46 | 25 | | 27 | |
| 3 | WFRBS Commercial Mortgage Trust 2013-C17 | 4.255% | 12/15/46 | 25 | | 27 | |
| 3 | WFRBS Commercial Mortgage Trust 2013-C17 | 4.788% | 12/15/46 | 25 | | 27 | |
| 3 | WFRBS Commercial Mortgage Trust 2014-C19 | 3.618% | 3/15/47 | 21 | | 22 | |
| 3 | WFRBS Commercial Mortgage Trust 2014-C19 | 3.660% | 3/15/47 | 21 | | 22 | |
| 3 | WFRBS Commercial Mortgage Trust 2014-C19 | 4.101% | 3/15/47 | 50 | | 53 | |
| 3 | WFRBS Commercial Mortgage Trust 2014-C19 | 4.723% | 3/15/47 | 25 | | 27 | |
| 3 | WFRBS Commercial Mortgage Trust 2014-C20 | 3.638% | 5/15/47 | 22 | | 23 | |
| 3 | WFRBS Commercial Mortgage Trust 2014-C20 | 3.995% | 5/15/47 | 25 | | 27 | |
| 3 | WFRBS Commercial Mortgage Trust 2014-C20 | 4.176% | 5/15/47 | 25 | | 26 | |
| 3 | WFRBS Commercial Mortgage Trust 2014-C21 | 3.678% | 8/15/47 | 75 | | 79 | |
| 3 | WFRBS Commercial Mortgage Trust 2014-C22 | 3.752% | 9/15/57 | 150 | | 159 | |
| 3 | WFRBS Commercial Mortgage Trust 2014-C22 | 4.371% | 9/15/57 | 25 | | 26 | |
| 3 | WFRBS Commercial Mortgage Trust 2014-C23 | 3.636% | 10/15/57 | 74 | | 76 | |
| 3 | WFRBS Commercial Mortgage Trust 2014-C23 | 3.917% | 10/15/57 | 50 | | 53 | |
| 3 | WFRBS Commercial Mortgage Trust 2014-C24 | 3.428% | 11/15/47 | 39 | | 40 | |
| 3 | WFRBS Commercial Mortgage Trust 2014-C24 | 3.607% | 11/15/47 | 65 | | 69 | |
| 3 | WFRBS Commercial Mortgage Trust 2014-LC14 | 2.862% | 3/15/47 | 1 | | 1 | |
| 3 | WFRBS Commercial Mortgage Trust 2014-LC14 | 3.522% | 3/15/47 | 50 | | 51 | |
| 3 | WFRBS Commercial Mortgage Trust 2014-LC14 | 4.045% | 3/15/47 | 140 | | 149 | |
| 3 | WFRBS Commercial Mortgage Trust 2014-LC14 | 4.351% | 3/15/47 | 60 | | 64 | |
| 3 | World Financial Network Credit Card Master Note Trust Series 2017-C | 2.310% | 8/15/24 | 150 | | 150 | |
| 3 | World Financial Network Credit Card Master Note Trust Series 2018-A | 3.070% | 12/16/24 | 200 | | 202 | |
| 3 | World Omni Auto Receivables Trust 2019-C | 1.960% | 12/16/24 | 125 | | 125 | |
Total Asset-Backed/Commercial Mortgage-Backed Securities
(Cost $107,426) | | | 110,185 | |
| Corporate Bonds (26.5%) | |
| Finance (8.3%) | | | | | | |
| | Banking (5.9%) | | | | | | |
| | Ally Financial Inc. | 4.125% | 2/13/22 | 125 | | 129 | |
| | Ally Financial Inc. | 3.875% | 5/21/24 | 150 | | 157 | |
| | Ally Financial Inc. | 5.125% | 9/30/24 | 135 | | 149 | |
| | Ally Financial Inc. | 8.000% | 11/1/31 | 400 | | 552 | |
| | American Express Co. | 3.000% | 2/22/21 | 150 | | 152 | |
| | American Express Co. | 3.700% | 11/5/21 | 200 | | 206 | |
| | American Express Co. | 2.750% | 5/20/22 | 300 | | 305 | |
| | American Express Co. | 2.500% | 8/1/22 | 500 | | 506 | |
| | American Express Co. | 2.650% | 12/2/22 | 225 | | 229 | |
| | American Express Co. | 3.400% | 2/27/23 | 300 | | 311 | |
| | American Express Co. | 3.700% | 8/3/23 | 325 | | 342 | |
Total Bond Market Index Portfolio
| | | | Face | | Market | |
| | | Maturity | Amount | | Value• | |
| | Coupon | Date | ($000 | ) | ($000 | ) |
| | American Express Co. | 3.400% | 2/22/24 | 225 | | 235 | |
| | American Express Co. | 2.500% | 7/30/24 | 215 | | 217 | |
| | American Express Co. | 3.000% | 10/30/24 | 569 | | 587 | |
| | American Express Co. | 3.625% | 12/5/24 | 241 | | 254 | |
| | American Express Co. | 4.200% | 11/6/25 | 150 | | 165 | |
| | American Express Co. | 3.125% | 5/20/26 | 250 | | 259 | |
| | American Express Co. | 4.050% | 12/3/42 | 67 | | 79 | |
| | American Express Credit Corp. | 2.250% | 5/5/21 | 275 | | 276 | |
| | American Express Credit Corp. | 2.700% | 3/3/22 | 300 | | 305 | |
| | American Express Credit Corp. | 3.300% | 5/3/27 | 350 | | 372 | |
| | Associated Bank NA | 3.500% | 8/13/21 | 50 | | 51 | |
| | Australia & New Zealand Banking Group Ltd. | 2.300% | 6/1/21 | 325 | | 326 | |
| | Australia & New Zealand Banking Group Ltd. | 2.550% | 11/23/21 | 250 | | 253 | |
| | Australia & New Zealand Banking Group Ltd. | 2.625% | 5/19/22 | 200 | | 203 | |
| | Australia & New Zealand Banking Group Ltd. | 2.625% | 11/9/22 | 200 | | 204 | |
| | Australia & New Zealand Banking Group Ltd. | 3.700% | 11/16/25 | 250 | | 269 | |
| | Banco Santander SA | 3.848% | 4/12/23 | 200 | | 208 | |
| | Banco Santander SA | 5.179% | 11/19/25 | 450 | | 500 | |
| | Banco Santander SA | 4.250% | 4/11/27 | 400 | | 430 | |
| | Banco Santander SA | 3.800% | 2/23/28 | 200 | | 210 | |
| | Banco Santander SA | 4.379% | 4/12/28 | 200 | | 218 | |
| | Bank of America Corp. | 2.625% | 4/19/21 | 755 | | 762 | |
| 3 | Bank of America Corp. | 2.369% | 7/21/21 | 500 | | 501 | |
| 3 | Bank of America Corp. | 2.328% | 10/1/21 | 350 | | 350 | |
| 3 | Bank of America Corp. | 2.738% | 1/23/22 | 250 | | 252 | |
| 3 | Bank of America Corp. | 3.499% | 5/17/22 | 175 | | 178 | |
| | Bank of America Corp. | 2.503% | 10/21/22 | 300 | | 303 | |
| | Bank of America Corp. | 3.300% | 1/11/23 | 650 | | 672 | |
| 3 | Bank of America Corp. | 3.124% | 1/20/23 | 145 | | 148 | |
| 3 | Bank of America Corp. | 2.881% | 4/24/23 | 1,000 | | 1,014 | |
| 3 | Bank of America Corp. | 2.816% | 7/21/23 | 1,250 | | 1,267 | |
| | Bank of America Corp. | 4.100% | 7/24/23 | 300 | | 319 | |
| | Bank of America Corp. | 3.004% | 12/20/23 | 1,846 | | 1,886 | |
| | Bank of America Corp. | 4.125% | 1/22/24 | 325 | | 350 | |
| 3 | Bank of America Corp. | 3.550% | 3/5/24 | 690 | | 714 | |
| | Bank of America Corp. | 4.000% | 4/1/24 | 322 | | 345 | |
| 3 | Bank of America Corp. | 3.864% | 7/23/24 | 125 | | 132 | |
| | Bank of America Corp. | 4.200% | 8/26/24 | 650 | | 697 | |
| | Bank of America Corp. | 4.000% | 1/22/25 | 755 | | 803 | |
| | Bank of America Corp. | 3.950% | 4/21/25 | 500 | | 532 | |
| 3 | Bank of America Corp. | 3.093% | 10/1/25 | 350 | | 361 | |
| 3 | Bank of America Corp. | 2.456% | 10/22/25 | 300 | | 301 | |
| 3 | Bank of America Corp. | 3.366% | 1/23/26 | 300 | | 313 | |
| | Bank of America Corp. | 4.450% | 3/3/26 | 475 | | 520 | |
| | Bank of America Corp. | 3.500% | 4/19/26 | 320 | | 339 | |
| | Bank of America Corp. | 4.250% | 10/22/26 | 725 | | 788 | |
| 3 | Bank of America Corp. | 3.559% | 4/23/27 | 750 | | 791 | |
| | Bank of America Corp. | 3.248% | 10/21/27 | 750 | | 778 | |
| | Bank of America Corp. | 4.183% | 11/25/27 | 560 | | 606 | |
| 3 | Bank of America Corp. | 3.824% | 1/20/28 | 425 | | 456 | |
| 3 | Bank of America Corp. | 3.705% | 4/24/28 | 350 | | 374 | |
| 3 | Bank of America Corp. | 3.593% | 7/21/28 | 800 | | 850 | |
| 3 | Bank of America Corp. | 3.419% | 12/20/28 | 1,334 | | 1,397 | |
| 3 | Bank of America Corp. | 3.970% | 3/5/29 | 225 | | 245 | |
| 3 | Bank of America Corp. | 4.271% | 7/23/29 | 575 | | 637 | |
| 3 | Bank of America Corp. | 3.974% | 2/7/30 | 150 | | 163 | |
| 3 | Bank of America Corp. | 3.194% | 7/23/30 | 1,125 | | 1,163 | |
| 3 | Bank of America Corp. | 2.884% | 10/22/30 | 300 | | 303 | |
| | Bank of America Corp. | 6.110% | 1/29/37 | 335 | | 451 | |
| 3 | Bank of America Corp. | 4.244% | 4/24/38 | 350 | | 402 | |
| | Bank of America Corp. | 7.750% | 5/14/38 | 340 | | 535 | |
| 3 | Bank of America Corp. | 4.078% | 4/23/40 | 500 | | 567 | |
| | Bank of America Corp. | 5.875% | 2/7/42 | 300 | | 426 | |
| | Bank of America Corp. | 5.000% | 1/21/44 | 750 | | 979 | |
| | Bank of America Corp. | 4.875% | 4/1/44 | 300 | | 383 | |
| | Bank of America Corp. | 4.750% | 4/21/45 | 100 | | 122 | |
| 3 | Bank of America Corp. | 4.443% | 1/20/48 | 100 | | 122 | |
| 3 | Bank of America Corp. | 4.330% | 3/15/50 | 250 | | 300 | |
| | Bank of America NA | 6.000% | 10/15/36 | 250 | | 344 | |
| | Bank of Montreal | 3.100% | 4/13/21 | 325 | | 330 | |
| | Bank of Montreal | 1.900% | 8/27/21 | 325 | | 325 | |
| | Bank of Montreal | 2.900% | 3/26/22 | 425 | | 433 | |
| | Bank of Montreal | 2.350% | 9/11/22 | 46 | | 46 | |
| | Bank of Montreal | 2.550% | 11/6/22 | 104 | | 106 | |
| | Bank of Montreal | 3.300% | 2/5/24 | 300 | | 312 | |
| | Bank of Montreal | 2.500% | 6/28/24 | 200 | | 202 | |
| 3 | Bank of Montreal | 4.338% | 10/5/28 | 100 | | 105 | |
| 3 | Bank of Montreal | 3.803% | 12/15/32 | 1,000 | | 1,044 | |
| | Bank of New York Mellon Corp. | 2.050% | 5/3/21 | 250 | | 251 | |
| | Bank of New York Mellon Corp. | 3.550% | 9/23/21 | 100 | | 103 | |
| | Bank of New York Mellon Corp. | 2.600% | 2/7/22 | 675 | | 684 | |
| | Bank of New York Mellon Corp. | 1.950% | 8/23/22 | 250 | | 250 | |
| | Bank of New York Mellon Corp. | 2.950% | 1/29/23 | 195 | | 200 | |
| | Bank of New York Mellon Corp. | 3.500% | 4/28/23 | 225 | | 236 | |
| 3 | Bank of New York Mellon Corp. | 2.661% | 5/16/23 | 225 | | 228 | |
| | Bank of New York Mellon Corp. | 3.450% | 8/11/23 | 125 | | 131 | |
| | Bank of New York Mellon Corp. | 2.200% | 8/16/23 | 225 | | 228 | |
| | Bank of New York Mellon Corp. | 3.250% | 9/11/24 | 150 | | 157 | |
| | Bank of New York Mellon Corp. | 2.100% | 10/24/24 | 150 | | 150 | |
| | Bank of New York Mellon Corp. | 3.000% | 2/24/25 | 250 | | 260 | |
| | Bank of New York Mellon Corp. | 2.800% | 5/4/26 | 200 | | 205 | |
| | Bank of New York Mellon Corp. | 2.450% | 8/17/26 | 125 | | 125 | |
| | Bank of New York Mellon Corp. | 3.250% | 5/16/27 | 150 | | 158 | |
| 3 | Bank of New York Mellon Corp. | 3.442% | 2/7/28 | 150 | | 158 | |
| | Bank of New York Mellon Corp. | 3.000% | 10/30/28 | 200 | | 205 | |
| | Bank of New York Mellon Corp. | 3.300% | 8/23/29 | 100 | | 104 | |
| | Bank of Nova Scotia | 2.800% | 7/21/21 | 420 | | 426 | |
| | Bank of Nova Scotia | 2.700% | 3/7/22 | 250 | | 254 | |
| | Bank of Nova Scotia | 2.375% | 1/18/23 | 50 | | 51 | |
| | Bank of Nova Scotia | 3.400% | 2/11/24 | 200 | | 209 | |
| | Bank of Nova Scotia | 4.500% | 12/16/25 | 300 | | 328 | |
| | Bank of Nova Scotia | 2.700% | 8/3/26 | 100 | | 102 | |
| | Barclays Bank plc | 2.650% | 1/11/21 | 200 | | 201 | |
| | Barclays plc | 3.250% | 1/12/21 | 100 | | 101 | |
| | Barclays plc | 3.200% | 8/10/21 | 150 | | 152 | |
| | Barclays plc | 3.684% | 1/10/23 | 100 | | 102 | |
| 3 | Barclays plc | 4.610% | 2/15/23 | 200 | | 208 | |
| 3 | Barclays plc | 4.338% | 5/16/24 | 1,000 | | 1,049 | |
| | Barclays plc | 3.650% | 3/16/25 | 350 | | 364 | |
| 3 | Barclays plc | 3.932% | 5/7/25 | 200 | | 210 | |
| | Barclays plc | 4.375% | 1/12/26 | 300 | | 325 | |
| | Barclays plc | 4.337% | 1/10/28 | 200 | | 214 | |
| 3 | Barclays plc | 4.972% | 5/16/29 | 200 | | 225 | |
| | Barclays plc | 5.250% | 8/17/45 | 250 | | 301 | |
| | Barclays plc | 4.950% | 1/10/47 | 200 | | 234 | |
| | BBVA USA | 3.500% | 6/11/21 | 150 | | 152 | |
| | BBVA USA | 2.875% | 6/29/22 | 250 | | 253 | |
| | BNP Paribas SA | 5.000% | 1/15/21 | 475 | | 489 | |
| | BPCE SA | 2.650% | 2/3/21 | 275 | | 277 | |
| | BPCE SA | 2.750% | 12/2/21 | 250 | | 254 | |
| 6 | BPCE SA | 3.000% | 5/22/22 | 250 | | 254 | |
| | BPCE SA | 4.000% | 4/15/24 | 325 | | 348 | |
| | BPCE SA | 3.375% | 12/2/26 | 250 | | 262 | |
| | Canadian Imperial Bank of Commerce | 2.700% | 2/2/21 | 150 | | 151 | |
| | Canadian Imperial Bank of Commerce | 2.550% | 6/16/22 | 350 | | 354 | |
| | Canadian Imperial Bank of Commerce | 3.500% | 9/13/23 | 200 | | 210 | |
| | Canadian Imperial Bank of Commerce | 3.100% | 4/2/24 | 200 | | 206 | |
| | Capital One Bank USA NA | 3.375% | 2/15/23 | 235 | | 242 | |
| | Capital One Financial Corp. | 4.750% | 7/15/21 | 50 | | 52 | |
| | Capital One Financial Corp. | 3.050% | 3/9/22 | 175 | | 179 | |
| | Capital One Financial Corp. | 3.200% | 1/30/23 | 350 | | 360 | |
| | Capital One Financial Corp. | 3.500% | 6/15/23 | 27 | | 28 | |
| | Capital One Financial Corp. | 3.900% | 1/29/24 | 250 | | 265 | |
| | Capital One Financial Corp. | 3.750% | 4/24/24 | 450 | | 472 | |
| | Capital One Financial Corp. | 3.300% | 10/30/24 | 513 | | 529 | |
| | Capital One Financial Corp. | 4.200% | 10/29/25 | 175 | | 188 | |
| | Capital One Financial Corp. | 3.750% | 7/28/26 | 500 | | 524 | |
Total Bond Market Index Portfolio
| | | | Face | | Market | |
| | | Maturity | Amount | | Value• | |
| | Coupon | Date | ($000 | ) | ($000 | ) |
| | Capital One Financial Corp. | 3.750% | 3/9/27 | 100 | | 106 | |
| | Capital One Financial Corp. | 3.800% | 1/31/28 | 300 | | 322 | |
| | Capital One NA | 2.250% | 9/13/21 | 175 | | 176 | |
| | Capital One NA | 2.650% | 8/8/22 | 500 | | 507 | |
| | Citibank NA | 2.850% | 2/12/21 | 200 | | 202 | |
| | Citibank NA | 3.400% | 7/23/21 | 475 | | 485 | |
| 3 | Citibank NA | 2.844% | 5/20/22 | 500 | | 506 | |
| | Citigroup Inc. | 2.700% | 3/30/21 | 550 | | 554 | |
| | Citigroup Inc. | 2.350% | 8/2/21 | 150 | | 151 | |
| | Citigroup Inc. | 2.900% | 12/8/21 | 200 | | 203 | |
| | Citigroup Inc. | 4.500% | 1/14/22 | 475 | | 498 | |
| | Citigroup Inc. | 2.750% | 4/25/22 | 425 | | 432 | |
| | Citigroup Inc. | 2.700% | 10/27/22 | 375 | | 381 | |
| 3 | Citigroup Inc. | 2.312% | 11/4/22 | 300 | | 301 | |
| | Citigroup Inc. | 3.375% | 3/1/23 | 150 | | 155 | |
| | Citigroup Inc. | 3.500% | 5/15/23 | 675 | | 700 | |
| 3 | Citigroup Inc. | 2.876% | 7/24/23 | 450 | | 458 | |
| | Citigroup Inc. | 3.875% | 10/25/23 | 738 | | 784 | |
| | Citigroup Inc. | 4.000% | 8/5/24 | 125 | | 133 | |
| | Citigroup Inc. | 3.875% | 3/26/25 | 350 | | 369 | |
| 3 | Citigroup Inc. | 3.352% | 4/24/25 | 1,500 | | 1,560 | |
| | Citigroup Inc. | 3.300% | 4/27/25 | 125 | | 131 | |
| | Citigroup Inc. | 4.400% | 6/10/25 | 1,400 | | 1,521 | |
| | Citigroup Inc. | 5.500% | 9/13/25 | 75 | | 86 | |
| | Citigroup Inc. | 3.700% | 1/12/26 | 275 | | 293 | |
| | Citigroup Inc. | 4.600% | 3/9/26 | 275 | | 303 | |
| | Citigroup Inc. | 3.200% | 10/21/26 | 1,025 | | 1,060 | |
| | Citigroup Inc. | 4.300% | 11/20/26 | 75 | | 82 | |
| | Citigroup Inc. | 4.450% | 9/29/27 | 1,150 | | 1,265 | |
| 3 | Citigroup Inc. | 3.887% | 1/10/28 | 475 | | 509 | |
| 3 | Citigroup Inc. | 3.668% | 7/24/28 | 900 | | 956 | |
| | Citigroup Inc. | 4.125% | 7/25/28 | 100 | | 109 | |
| 3 | Citigroup Inc. | 3.520% | 10/27/28 | 580 | | 609 | |
| 3 | Citigroup Inc. | 4.075% | 4/23/29 | 150 | | 164 | |
| 3 | Citigroup Inc. | 3.980% | 3/20/30 | 475 | | 519 | |
| 3 | Citigroup Inc. | 2.976% | 11/5/30 | 300 | | 305 | |
| | Citigroup Inc. | 6.625% | 6/15/32 | 100 | | 134 | |
| | Citigroup Inc. | 6.125% | 8/25/36 | 75 | | 97 | |
| 3 | Citigroup Inc. | 3.878% | 1/24/39 | 225 | | 246 | |
| | Citigroup Inc. | 8.125% | 7/15/39 | 562 | | 938 | |
| | Citigroup Inc. | 5.875% | 1/30/42 | 100 | | 141 | |
| | Citigroup Inc. | 5.300% | 5/6/44 | 375 | | 475 | |
| | Citigroup Inc. | 4.650% | 7/30/45 | 200 | | 246 | |
| | Citigroup Inc. | 4.750% | 5/18/46 | 375 | | 449 | |
| | Citigroup Inc. | 4.650% | 7/23/48 | 450 | | 561 | |
| | Citizens Bank NA | 2.550% | 5/13/21 | 200 | | 201 | |
| | Citizens Bank NA | 3.250% | 2/14/22 | 250 | | 256 | |
| | Citizens Bank NA | 2.650% | 5/26/22 | 125 | | 127 | |
| | Citizens Financial Group Inc. | 4.300% | 12/3/25 | 125 | | 134 | |
| | Citizens Financial Group Inc. | 2.850% | 7/27/26 | 175 | | 178 | |
| | Comerica Bank | 4.000% | 7/27/25 | 50 | | 53 | |
| | Comerica Inc. | 3.700% | 7/31/23 | 200 | | 210 | |
| | Commonwealth Bank of Australia | 2.550% | 3/15/21 | 175 | | 176 | |
| 6 | Commonwealth Bank of Australia | 2.750% | 3/10/22 | 500 | | 508 | |
| 6 | Commonwealth Bank of Australia | 3.350% | 6/4/24 | 800 | | 836 | |
| | Cooperatieve Rabobank UA | 4.500% | 1/11/21 | 150 | | 154 | |
| | Cooperatieve Rabobank UA | 2.500% | 1/19/21 | 600 | | 603 | |
| | Cooperatieve Rabobank UA | 2.750% | 1/10/22 | 250 | | 254 | |
| | Cooperatieve Rabobank UA | 3.875% | 2/8/22 | 525 | | 547 | |
| | Cooperatieve Rabobank UA | 3.950% | 11/9/22 | 125 | | 130 | |
| | Cooperatieve Rabobank UA | 4.625% | 12/1/23 | 175 | | 190 | |
| | Cooperatieve Rabobank UA | 3.375% | 5/21/25 | 275 | | 291 | |
| | Cooperatieve Rabobank UA | 4.375% | 8/4/25 | 600 | | 649 | |
| | Cooperatieve Rabobank UA | 3.750% | 7/21/26 | 225 | | 234 | |
| | Cooperatieve Rabobank UA | 5.250% | 5/24/41 | 100 | | 136 | |
| | Cooperatieve Rabobank UA | 5.750% | 12/1/43 | 250 | | 329 | |
| | Cooperatieve Rabobank UA | 5.250% | 8/4/45 | 350 | | 440 | |
| | Credit Suisse AG | 3.000% | 10/29/21 | 600 | | 611 | |
| | Credit Suisse AG | 2.100% | 11/12/21 | 250 | | 251 | |
| | Credit Suisse AG | 3.625% | 9/9/24 | 575 | | 610 | |
| 6 | Credit Suisse Group AG | 3.574% | 1/9/23 | 250 | | 257 | |
| | Credit Suisse Group Funding Guernsey Ltd. | 3.125% | 12/10/20 | 250 | | 252 | |
| | Credit Suisse Group Funding Guernsey Ltd. | 3.450% | 4/16/21 | 275 | | 279 | |
| | Credit Suisse Group Funding Guernsey Ltd. | 3.800% | 9/15/22 | 750 | | 780 | |
| | Credit Suisse Group Funding Guernsey Ltd. | 3.800% | 6/9/23 | 825 | | 863 | |
| | Credit Suisse Group Funding Guernsey Ltd. | 3.750% | 3/26/25 | 250 | | 264 | |
| | Credit Suisse Group Funding Guernsey Ltd. | 4.875% | 5/15/45 | 375 | | 471 | |
| | Deutsche Bank AG | 3.125% | 1/13/21 | 100 | | 100 | |
| | Deutsche Bank AG | 3.150% | 1/22/21 | 150 | | 151 | |
| | Deutsche Bank AG | 4.250% | 2/4/21 | 150 | | 152 | |
| | Deutsche Bank AG | 4.250% | 10/14/21 | 600 | | 617 | |
| | Deutsche Bank AG | 3.300% | 11/16/22 | 500 | | 505 | |
| | Deutsche Bank AG | 3.950% | 2/27/23 | 300 | | 307 | |
| | Deutsche Bank AG | 3.700% | 5/30/24 | 548 | | 559 | |
| | Deutsche Bank AG | 4.100% | 1/13/26 | 100 | | 102 | |
| | Discover Bank | 3.200% | 8/9/21 | 100 | | 102 | |
| | Discover Bank | 3.350% | 2/6/23 | 150 | | 154 | |
| | Discover Bank | 4.200% | 8/8/23 | 300 | | 319 | |
| | Discover Bank | 2.450% | 9/12/24 | 150 | | 149 | |
| | Discover Bank | 3.450% | 7/27/26 | 100 | | 104 | |
| | Discover Bank | 4.650% | 9/13/28 | 250 | | 280 | |
| | Discover Financial Services | 3.850% | 11/21/22 | 200 | | 209 | |
| | Discover Financial Services | 3.950% | 11/6/24 | 450 | | 477 | |
| | Discover Financial Services | 3.750% | 3/4/25 | 170 | | 179 | |
| | Discover Financial Services | 4.500% | 1/30/26 | 200 | | 219 | |
| | Fifth Third Bancorp | 3.500% | 3/15/22 | 125 | | 129 | |
| | Fifth Third Bancorp | 4.300% | 1/16/24 | 275 | | 295 | |
| | Fifth Third Bancorp | 3.650% | 1/25/24 | 150 | | 158 | |
| | Fifth Third Bancorp | 2.375% | 1/28/25 | 150 | | 150 | |
| | Fifth Third Bancorp | 3.950% | 3/14/28 | 75 | | 82 | |
| | Fifth Third Bancorp | 8.250% | 3/1/38 | 200 | | 307 | |
| | Fifth Third Bank | 2.250% | 6/14/21 | 300 | | 301 | |
| | Fifth Third Bank | 3.350% | 7/26/21 | 200 | | 204 | |
| | Fifth Third Bank | 3.950% | 7/28/25 | 200 | | 217 | |
| | Fifth Third Bank | 3.850% | 3/15/26 | 200 | | 212 | |
| | First Horizon National Corp. | 3.500% | 12/15/20 | 100 | | 101 | |
| | First Republic Bank | 2.500% | 6/6/22 | 100 | | 101 | |
| | First Republic Bank | 4.375% | 8/1/46 | 75 | | 81 | |
| | FirstMerit Bank NA | 4.270% | 11/25/26 | 150 | | 161 | |
| | Goldman Sachs Capital I | 6.345% | 2/15/34 | 225 | | 292 | |
| | Goldman Sachs Group Inc. | 2.875% | 2/25/21 | 175 | | 177 | |
| | Goldman Sachs Group Inc. | 2.625% | 4/25/21 | 150 | | 151 | |
| | Goldman Sachs Group Inc. | 5.250% | 7/27/21 | 650 | | 681 | |
| | Goldman Sachs Group Inc. | 2.350% | 11/15/21 | 500 | | 502 | |
| | Goldman Sachs Group Inc. | 5.750% | 1/24/22 | 675 | | 722 | |
| | Goldman Sachs Group Inc. | 3.000% | 4/26/22 | 545 | | 552 | |
| 3 | Goldman Sachs Group Inc. | 2.876% | 10/31/22 | 1,055 | | 1,068 | |
| | Goldman Sachs Group Inc. | 3.625% | 1/22/23 | 425 | | 441 | |
| | Goldman Sachs Group Inc. | 3.200% | 2/23/23 | 425 | | 437 | |
| 3 | Goldman Sachs Group Inc. | 2.908% | 6/5/23 | 350 | | 355 | |
| 3 | Goldman Sachs Group Inc. | 2.905% | 7/24/23 | 500 | | 508 | |
| | Goldman Sachs Group Inc. | 3.625% | 2/20/24 | 300 | | 315 | |
| | Goldman Sachs Group Inc. | 4.000% | 3/3/24 | 475 | | 504 | |
| | Goldman Sachs Group Inc. | 3.850% | 7/8/24 | 586 | | 618 | |
| | Goldman Sachs Group Inc. | 3.500% | 1/23/25 | 1,332 | | 1,398 | |
| | Goldman Sachs Group Inc. | 3.750% | 5/22/25 | 825 | | 873 | |
| 3 | Goldman Sachs Group Inc. | 3.272% | 9/29/25 | 550 | | 568 | |
| | Goldman Sachs Group Inc. | 4.250% | 10/21/25 | 200 | | 217 | |
| | Goldman Sachs Group Inc. | 3.750% | 2/25/26 | 200 | | 212 | |
| | Goldman Sachs Group Inc. | 3.500% | 11/16/26 | 1,250 | | 1,304 | |
| | Goldman Sachs Group Inc. | 5.950% | 1/15/27 | 400 | | 477 | |
| | Goldman Sachs Group Inc. | 3.850% | 1/26/27 | 350 | | 372 | |
| 3 | Goldman Sachs Group Inc. | 3.691% | 6/5/28 | 625 | | 663 | |
| 3 | Goldman Sachs Group Inc. | 3.814% | 4/23/29 | 450 | | 481 | |
| 3 | Goldman Sachs Group Inc. | 4.223% | 5/1/29 | 475 | | 522 | |
| | Goldman Sachs Group Inc. | 6.450% | 5/1/36 | 50 | | 66 | |
Total Bond Market Index Portfolio
| | | | Face | | Market | |
| | | Maturity | Amount | | Value• | |
| | Coupon | Date | ($000 | ) | ($000 | ) |
| | Goldman Sachs Group Inc. | 6.750% | 10/1/37 | 975 | | 1,351 | |
| 3 | Goldman Sachs Group Inc. | 4.017% | 10/31/38 | 350 | | 379 | |
| 3 | Goldman Sachs Group Inc. | 4.411% | 4/23/39 | 500 | | 567 | |
| | Goldman Sachs Group Inc. | 6.250% | 2/1/41 | 675 | | 942 | |
| | Goldman Sachs Group Inc. | 4.800% | 7/8/44 | 400 | | 484 | |
| | Goldman Sachs Group Inc. | 5.150% | 5/22/45 | 475 | | 581 | |
| | Goldman Sachs Group Inc. | 4.750% | 10/21/45 | 150 | | 183 | |
| | HSBC Bank USA NA | 7.000% | 1/15/39 | 250 | | 364 | |
| | HSBC Holdings plc | 3.400% | 3/8/21 | 625 | | 634 | |
| | HSBC Holdings plc | 2.950% | 5/25/21 | 800 | | 810 | |
| | HSBC Holdings plc | 2.650% | 1/5/22 | 500 | | 505 | |
| | HSBC Holdings plc | 4.875% | 1/14/22 | 160 | | 169 | |
| | HSBC Holdings plc | 4.000% | 3/30/22 | 290 | | 302 | |
| 3 | HSBC Holdings plc | 3.262% | 3/13/23 | 560 | | 572 | |
| | HSBC Holdings plc | 3.600% | 5/25/23 | 200 | | 208 | |
| 3 | HSBC Holdings plc | 3.033% | 11/22/23 | 200 | | 204 | |
| | HSBC Holdings plc | 4.250% | 3/14/24 | 250 | | 265 | |
| 3 | HSBC Holdings plc | 3.950% | 5/18/24 | 500 | | 524 | |
| 3 | HSBC Holdings plc | 3.803% | 3/11/25 | 1,075 | | 1,128 | |
| | HSBC Holdings plc | 4.250% | 8/18/25 | 150 | | 160 | |
| 3 | HSBC Holdings plc | 2.633% | 11/7/25 | 200 | | 200 | |
| | HSBC Holdings plc | 4.300% | 3/8/26 | 1,100 | | 1,195 | |
| | HSBC Holdings plc | 3.900% | 5/25/26 | 450 | | 479 | |
| 3 | HSBC Holdings plc | 4.292% | 9/12/26 | 500 | | 537 | |
| | HSBC Holdings plc | 4.375% | 11/23/26 | 350 | | 378 | |
| 3 | HSBC Holdings plc | 4.041% | 3/13/28 | 400 | | 427 | |
| 3 | HSBC Holdings plc | 4.583% | 6/19/29 | 400 | | 446 | |
| 3 | HSBC Holdings plc | 3.973% | 5/22/30 | 570 | | 612 | |
| | HSBC Holdings plc | 7.625% | 5/17/32 | 100 | | 138 | |
| | HSBC Holdings plc | 7.350% | 11/27/32 | 100 | | 139 | |
| | HSBC Holdings plc | 6.500% | 5/2/36 | 350 | | 476 | |
| | HSBC Holdings plc | 6.500% | 9/15/37 | 50 | | 68 | |
| | HSBC Holdings plc | 6.800% | 6/1/38 | 200 | | 284 | |
| | HSBC Holdings plc | 5.250% | 3/14/44 | 750 | | 949 | |
| | HSBC USA Inc. | 3.500% | 6/23/24 | 150 | | 159 | |
| | Huntington Bancshares Inc. | 7.000% | 12/15/20 | 25 | | 26 | |
| | Huntington Bancshares Inc. | 3.150% | 3/14/21 | 100 | | 101 | |
| | Huntington Bancshares Inc. | 2.300% | 1/14/22 | 200 | | 201 | |
| | Huntington National Bank | 3.250% | 5/14/21 | 250 | | 254 | |
| | Huntington National Bank | 2.500% | 8/7/22 | 200 | | 202 | |
| | Huntington National Bank | 3.550% | 10/6/23 | 250 | | 262 | |
| | ING Groep NV | 3.150% | 3/29/22 | 200 | | 204 | |
| | ING Groep NV | 4.100% | 10/2/23 | 300 | | 318 | |
| | ING Groep NV | 3.550% | 4/9/24 | 200 | | 209 | |
| | ING Groep NV | 3.950% | 3/29/27 | 300 | | 323 | |
| | ING Groep NV | 4.550% | 10/2/28 | 200 | | 227 | |
| | ING Groep NV | 4.050% | 4/9/29 | 200 | | 219 | |
| | JPMorgan Chase & Co. | 2.550% | 3/1/21 | 850 | | 855 | |
| | JPMorgan Chase & Co. | 4.625% | 5/10/21 | 250 | | 259 | |
| | JPMorgan Chase & Co. | 2.400% | 6/7/21 | 275 | | 277 | |
| | JPMorgan Chase & Co. | 2.295% | 8/15/21 | 450 | | 451 | |
| | JPMorgan Chase & Co. | 4.350% | 8/15/21 | 205 | | 213 | |
| | JPMorgan Chase & Co. | 4.500% | 1/24/22 | 325 | | 341 | |
| 3 | JPMorgan Chase & Co. | 3.514% | 6/18/22 | 200 | | 204 | |
| | JPMorgan Chase & Co. | 3.250% | 9/23/22 | 750 | | 775 | |
| | JPMorgan Chase & Co. | 2.972% | 1/15/23 | 370 | | 377 | |
| | JPMorgan Chase & Co. | 3.200% | 1/25/23 | 750 | | 774 | |
| 3 | JPMorgan Chase & Co. | 3.207% | 4/1/23 | 1,000 | | 1,022 | |
| 3 | JPMorgan Chase & Co. | 2.776% | 4/25/23 | 350 | | 354 | |
| | JPMorgan Chase & Co. | 3.375% | 5/1/23 | 300 | | 311 | |
| | JPMorgan Chase & Co. | 2.700% | 5/18/23 | 250 | | 255 | |
| | JPMorgan Chase & Co. | 3.875% | 2/1/24 | 445 | | 476 | |
| 3 | JPMorgan Chase & Co. | 3.559% | 4/23/24 | 485 | | 505 | |
| | JPMorgan Chase & Co. | 3.625% | 5/13/24 | 776 | | 820 | |
| 3 | JPMorgan Chase & Co. | 3.797% | 7/23/24 | 175 | | 184 | |
| | JPMorgan Chase & Co. | 3.875% | 9/10/24 | 575 | | 615 | |
| 3 | JPMorgan Chase & Co. | 4.023% | 12/5/24 | 300 | | 320 | |
| | JPMorgan Chase & Co. | 3.125% | 1/23/25 | 400 | | 417 | |
| 3 | JPMorgan Chase & Co. | 3.220% | 3/1/25 | 600 | | 620 | |
| | JPMorgan Chase & Co. | 3.900% | 7/15/25 | 362 | | 391 | |
| 3 | JPMorgan Chase & Co. | 2.301% | 10/15/25 | 700 | | 699 | |
| | JPMorgan Chase & Co. | 3.300% | 4/1/26 | 685 | | 718 | |
| | JPMorgan Chase & Co. | 3.200% | 6/15/26 | 300 | | 312 | |
| | JPMorgan Chase & Co. | 2.950% | 10/1/26 | 875 | | 899 | |
| | JPMorgan Chase & Co. | 4.125% | 12/15/26 | 450 | | 492 | |
| 3 | JPMorgan Chase & Co. | 3.960% | 1/29/27 | 500 | | 541 | |
| | JPMorgan Chase & Co. | 3.625% | 12/1/27 | 1,000 | | 1,050 | |
| 3 | JPMorgan Chase & Co. | 3.782% | 2/1/28 | 625 | | 671 | |
| 3 | JPMorgan Chase & Co. | 3.540% | 5/1/28 | 350 | | 371 | |
| 3 | JPMorgan Chase & Co. | 3.509% | 1/23/29 | 575 | | 609 | |
| 3 | JPMorgan Chase & Co. | 4.005% | 4/23/29 | 300 | | 328 | |
| 3 | JPMorgan Chase & Co. | 4.203% | 7/23/29 | 250 | | 278 | |
| 3 | JPMorgan Chase & Co. | 4.452% | 12/5/29 | 300 | | 341 | |
| 3 | JPMorgan Chase & Co. | 3.702% | 5/6/30 | 300 | | 323 | |
| 3 | JPMorgan Chase & Co. | 2.739% | 10/15/30 | 1,500 | | 1,500 | |
| | JPMorgan Chase & Co. | 6.400% | 5/15/38 | 450 | | 649 | |
| | JPMorgan Chase & Co. | 5.500% | 10/15/40 | 650 | | 869 | |
| | JPMorgan Chase & Co. | 5.600% | 7/15/41 | 275 | | 376 | |
| | JPMorgan Chase & Co. | 5.400% | 1/6/42 | 150 | | 203 | |
| | JPMorgan Chase & Co. | 5.625% | 8/16/43 | 300 | | 402 | |
| | JPMorgan Chase & Co. | 4.950% | 6/1/45 | 100 | | 126 | |
| 3 | JPMorgan Chase & Co. | 4.260% | 2/22/48 | 375 | | 439 | |
| 3 | JPMorgan Chase & Co. | 4.032% | 7/24/48 | 500 | | 566 | |
| 3 | JPMorgan Chase & Co. | 3.964% | 11/15/48 | 1,000 | | 1,121 | |
| 3 | JPMorgan Chase & Co. | 3.897% | 1/23/49 | 400 | | 447 | |
| | KeyBank NA | 2.300% | 9/14/22 | 200 | | 202 | |
| | KeyBank NA | 3.375% | 3/7/23 | 250 | | 260 | |
| | KeyBank NA | 3.300% | 6/1/25 | 125 | | 132 | |
| | KeyCorp | 5.100% | 3/24/21 | 25 | | 26 | |
| | KeyCorp | 4.150% | 10/29/25 | 150 | | 164 | |
| | KeyCorp | 4.100% | 4/30/28 | 600 | | 655 | |
| | KeyCorp | 2.550% | 10/1/29 | 150 | | 147 | |
| | Lloyds Bank plc | 6.375% | 1/21/21 | 175 | | 182 | |
| | Lloyds Bank plc | 3.300% | 5/7/21 | 200 | | 203 | |
| | Lloyds Banking Group plc | 3.000% | 1/11/22 | 300 | | 305 | |
| 3 | Lloyds Banking Group plc | 2.858% | 3/17/23 | 250 | | 252 | |
| | Lloyds Banking Group plc | 4.050% | 8/16/23 | 900 | | 950 | |
| 3 | Lloyds Banking Group plc | 2.907% | 11/7/23 | 400 | | 406 | |
| | Lloyds Banking Group plc | 3.900% | 3/12/24 | 200 | | 211 | |
| | Lloyds Banking Group plc | 4.450% | 5/8/25 | 200 | | 218 | |
| | Lloyds Banking Group plc | 4.582% | 12/10/25 | 700 | | 755 | |
| | Lloyds Banking Group plc | 4.650% | 3/24/26 | 575 | | 622 | |
| | Lloyds Banking Group plc | 3.750% | 1/11/27 | 200 | | 210 | |
| | Lloyds Banking Group plc | 4.375% | 3/22/28 | 250 | | 275 | |
| | Lloyds Banking Group plc | 4.550% | 8/16/28 | 200 | | 223 | |
| 3 | Lloyds Banking Group plc | 3.574% | 11/7/28 | 200 | | 208 | |
| | Lloyds Banking Group plc | 5.300% | 12/1/45 | 200 | | 243 | |
| | Lloyds Banking Group plc | 4.344% | 1/9/48 | 275 | | 297 | |
| | M&T Bank Corp. | 3.550% | 7/26/23 | 200 | | 210 | |
| | Manufacturers & Traders Trust Co. | 2.625% | 1/25/21 | 225 | | 226 | |
| | Mitsubishi UFJ Financial Group Inc. | 2.950% | 3/1/21 | 403 | | 407 | |
| | Mitsubishi UFJ Financial Group Inc. | 3.535% | 7/26/21 | 200 | | 204 | |
| | Mitsubishi UFJ Financial Group Inc. | 2.190% | 9/13/21 | 400 | | 401 | |
| | Mitsubishi UFJ Financial Group Inc. | 2.998% | 2/22/22 | 1,275 | | 1,298 | |
| | Mitsubishi UFJ Financial Group Inc. | 3.218% | 3/7/22 | 200 | | 205 | |
| | Mitsubishi UFJ Financial Group Inc. | 2.623% | 7/18/22 | 675 | | 684 | |
| | Mitsubishi UFJ Financial Group Inc. | 2.665% | 7/25/22 | 300 | | 304 | |
| | Mitsubishi UFJ Financial Group Inc. | 3.455% | 3/2/23 | 300 | | 311 | |
| | Mitsubishi UFJ Financial Group Inc. | 3.761% | 7/26/23 | 740 | | 777 | |
| | Mitsubishi UFJ Financial Group Inc. | 2.527% | 9/13/23 | 100 | | 101 | |
| | Mitsubishi UFJ Financial Group Inc. | 3.407% | 3/7/24 | 200 | | 209 | |
| | Mitsubishi UFJ Financial Group Inc. | 2.801% | 7/18/24 | 200 | | 204 | |
| | Mitsubishi UFJ Financial Group Inc. | 3.777% | 3/2/25 | 250 | | 266 | |
| | Mitsubishi UFJ Financial Group Inc. | 3.850% | 3/1/26 | 525 | | 563 | |
| | Mitsubishi UFJ Financial Group Inc. | 2.757% | 9/13/26 | 250 | | 252 | |
| | Mitsubishi UFJ Financial Group Inc. | 3.677% | 2/22/27 | 500 | | 531 | |
| | Mitsubishi UFJ Financial Group Inc. | 3.287% | 7/25/27 | 250 | | 259 | |
| | Mitsubishi UFJ Financial Group Inc. | 3.961% | 3/2/28 | 200 | | 217 | |
| | Mitsubishi UFJ Financial Group Inc. | 4.050% | 9/11/28 | 200 | | 220 | |
| | Mitsubishi UFJ Financial Group Inc. | 3.741% | 3/7/29 | 200 | | 215 | |
| | Mitsubishi UFJ Financial Group Inc. | 3.195% | 7/18/29 | 175 | | 181 | |
| | Mitsubishi UFJ Financial Group Inc. | 4.286% | 7/26/38 | 50 | | 58 | |
Total Bond Market Index Portfolio
| | | | Face | | Market | |
| | | Maturity | Amount | | Value• | |
| | Coupon | Date | ($000 | ) | ($000 | ) |
| | Mitsubishi UFJ Financial Group Inc. | 3.751% | 7/18/39 | 200 | | 219 | |
| | Mizuho Financial Group Inc. | 3.549% | 3/5/23 | 200 | | 208 | |
| 3 | Mizuho Financial Group Inc. | 2.721% | 7/16/23 | 300 | | 303 | |
| 3 | Mizuho Financial Group Inc. | 3.922% | 9/11/24 | 200 | | 210 | |
| 3 | Mizuho Financial Group Inc. | 2.839% | 7/16/25 | 375 | | 378 | |
| 3 | Mizuho Financial Group Inc. | 2.555% | 9/13/25 | 100 | | 100 | |
| | Mizuho Financial Group Inc. | 3.663% | 2/28/27 | 250 | | 264 | |
| | Mizuho Financial Group Inc. | 4.018% | 3/5/28 | 325 | | 354 | |
| 3 | Mizuho Financial Group Inc. | 4.254% | 9/11/29 | 400 | | 443 | |
| 3 | Mizuho Financial Group Inc. | 3.153% | 7/16/30 | 500 | | 511 | |
| 3 | Mizuho Financial Group Inc. | 2.869% | 9/13/30 | 100 | | 101 | |
| | Morgan Stanley | 5.750% | 1/25/21 | 250 | | 259 | |
| | Morgan Stanley | 2.500% | 4/21/21 | 200 | | 201 | |
| | Morgan Stanley | 5.500% | 7/28/21 | 650 | | 684 | |
| | Morgan Stanley | 2.625% | 11/17/21 | 500 | | 506 | |
| | Morgan Stanley | 2.750% | 5/19/22 | 600 | | 610 | |
| | Morgan Stanley | 4.875% | 11/1/22 | 425 | | 455 | |
| | Morgan Stanley | 3.125% | 1/23/23 | 750 | | 770 | |
| | Morgan Stanley | 3.750% | 2/25/23 | 675 | | 705 | |
| 3 | Morgan Stanley | 3.737% | 4/24/24 | 750 | | 781 | |
| | Morgan Stanley | 3.875% | 4/29/24 | 545 | | 578 | |
| | Morgan Stanley | 3.700% | 10/23/24 | 650 | | 689 | |
| | Morgan Stanley | 4.000% | 7/23/25 | 330 | | 357 | |
| | Morgan Stanley | 5.000% | 11/24/25 | 650 | | 730 | |
| | Morgan Stanley | 3.875% | 1/27/26 | 225 | | 241 | |
| | Morgan Stanley | 3.125% | 7/27/26 | 700 | | 721 | |
| | Morgan Stanley | 6.250% | 8/9/26 | 425 | | 516 | |
| | Morgan Stanley | 4.350% | 9/8/26 | 400 | | 437 | |
| | Morgan Stanley | 3.625% | 1/20/27 | 250 | | 265 | |
| | Morgan Stanley | 3.950% | 4/23/27 | 325 | | 347 | |
| 3 | Morgan Stanley | 3.591% | 7/22/28 | 935 | | 991 | |
| 3 | Morgan Stanley | 3.772% | 1/24/29 | 575 | | 618 | |
| 3 | Morgan Stanley | 4.431% | 1/23/30 | 550 | | 621 | |
| | Morgan Stanley | 7.250% | 4/1/32 | 150 | | 215 | |
| 3 | Morgan Stanley | 3.971% | 7/22/38 | 375 | | 416 | |
| 3 | Morgan Stanley | 4.457% | 4/22/39 | 250 | | 294 | |
| | Morgan Stanley | 6.375% | 7/24/42 | 600 | | 883 | |
| | Morgan Stanley | 4.300% | 1/27/45 | 650 | | 763 | |
| | Morgan Stanley | 4.375% | 1/22/47 | 175 | | 209 | |
| | MUFG Americas Holdings Corp. | 3.500% | 6/18/22 | 475 | | 492 | |
| | MUFG Americas Holdings Corp. | 3.000% | 2/10/25 | 80 | | 81 | |
| | MUFG Union Bank NA | 3.150% | 4/1/22 | 1,200 | | 1,227 | |
| | National Australia Bank Ltd. | 1.875% | 7/12/21 | 175 | | 175 | |
| | National Australia Bank Ltd. | 3.375% | 9/20/21 | 250 | | 256 | |
| | National Australia Bank Ltd. | 3.700% | 11/4/21 | 250 | | 258 | |
| | National Australia Bank Ltd. | 2.500% | 5/22/22 | 550 | | 557 | |
| | National Australia Bank Ltd. | 3.000% | 1/20/23 | 250 | | 256 | |
| | National Australia Bank Ltd. | 3.625% | 6/20/23 | 250 | | 262 | |
| | National Australia Bank Ltd. | 3.375% | 1/14/26 | 100 | | 105 | |
| | National Australia Bank Ltd. | 2.500% | 7/12/26 | 200 | | 201 | |
| | Northern Trust Corp. | 3.375% | 8/23/21 | 100 | | 102 | |
| | Northern Trust Corp. | 3.950% | 10/30/25 | 150 | | 161 | |
| | Northern Trust Corp. | 3.650% | 8/3/28 | 100 | | 108 | |
| 3 | Northern Trust Corp. | 3.375% | 5/8/32 | 50 | | 51 | |
| | People’s United Bank NA | 4.000% | 7/15/24 | 100 | | 104 | |
| | People’s United Financial Inc. | 3.650% | 12/6/22 | 100 | | 104 | |
| | PNC Bank NA | 2.150% | 4/29/21 | 250 | | 251 | |
| | PNC Bank NA | 2.550% | 12/9/21 | 100 | | 101 | |
| | PNC Bank NA | 2.625% | 2/17/22 | 175 | | 177 | |
| | PNC Bank NA | 2.450% | 7/28/22 | 100 | | 101 | |
| | PNC Bank NA | 2.700% | 11/1/22 | 450 | | 454 | |
| 3 | PNC Bank NA | 2.028% | 12/9/22 | 145 | | 145 | |
| | PNC Bank NA | 3.300% | 10/30/24 | 705 | | 733 | |
| | PNC Bank NA | 2.950% | 2/23/25 | 150 | | 153 | |
| | PNC Bank NA | 3.250% | 6/1/25 | 100 | | 105 | |
| | PNC Bank NA | 3.100% | 10/25/27 | 250 | | 261 | |
| | PNC Bank NA | 3.250% | 1/22/28 | 150 | | 157 | |
| | PNC Bank NA | 4.050% | 7/26/28 | 250 | | 274 | |
| | PNC Bank NA | 2.700% | 10/22/29 | 150 | | 149 | |
| | PNC Financial Services Group Inc. | 3.500% | 1/23/24 | 100 | | 105 | |
| | PNC Financial Services Group Inc. | 3.900% | 4/29/24 | 125 | | 131 | |
| | PNC Financial Services Group Inc. | 3.150% | 5/19/27 | 450 | | 465 | |
| | PNC Financial Services Group Inc. | 3.450% | 4/23/29 | 500 | | 531 | |
| | PNC Funding Corp. | 3.300% | 3/8/22 | 340 | | 349 | |
| 3 | Regions Bank | 3.374% | 8/13/21 | 150 | | 151 | |
| | Regions Bank | 6.450% | 6/26/37 | 250 | | 321 | |
| | Regions Financial Corp. | 3.800% | 8/14/23 | 200 | | 211 | |
| | Royal Bank of Canada | 2.500% | 1/19/21 | 200 | | 201 | |
| | Royal Bank of Canada | 3.200% | 4/30/21 | 700 | | 712 | |
| | Royal Bank of Canada | 2.750% | 2/1/22 | 300 | | 305 | |
| | Royal Bank of Canada | 2.800% | 4/29/22 | 300 | | 306 | |
| | Royal Bank of Canada | 3.700% | 10/5/23 | 100 | | 105 | |
| | Royal Bank of Canada | 2.550% | 7/16/24 | 200 | | 203 | |
| | Royal Bank of Canada | 2.250% | 11/1/24 | 650 | | 653 | |
| | Royal Bank of Canada | 4.650% | 1/27/26 | 250 | | 277 | |
| | Royal Bank of Scotland Group plc | 6.125% | 12/15/22 | 100 | | 109 | |
| 3 | Royal Bank of Scotland Group plc | 3.498% | 5/15/23 | 500 | | 511 | |
| | Royal Bank of Scotland Group plc | 6.100% | 6/10/23 | 195 | | 214 | |
| | Royal Bank of Scotland Group plc | 3.875% | 9/12/23 | 600 | | 627 | |
| | Royal Bank of Scotland Group plc | 6.000% | 12/19/23 | 100 | | 111 | |
| | Royal Bank of Scotland Group plc | 5.125% | 5/28/24 | 500 | | 541 | |
| 3 | Royal Bank of Scotland Group plc | 4.519% | 6/25/24 | 300 | | 318 | |
| 3 | Royal Bank of Scotland Group plc | 4.892% | 5/18/29 | 1,000 | | 1,127 | |
| 3 | Royal Bank of Scotland Group plc | 3.754% | 11/1/29 | 200 | | 204 | |
| 3 | Royal Bank of Scotland Group plc | 5.076% | 1/27/30 | 200 | | 229 | |
| 3 | Royal Bank of Scotland Group plc | 4.445% | 5/8/30 | 650 | | 715 | |
| | Santander Holdings USA Inc. | 3.400% | 1/18/23 | 115 | | 118 | |
| | Santander Holdings USA Inc. | 4.500% | 7/17/25 | 125 | | 134 | |
| 6 | Santander Holdings USA Inc. | 3.244% | 10/5/26 | 900 | | 904 | |
| | Santander Holdings USA Inc. | 4.400% | 7/13/27 | 250 | | 269 | |
| | Santander UK Group Holdings plc | 3.125% | 1/8/21 | 550 | | 555 | |
| | Santander UK Group Holdings plc | 2.875% | 8/5/21 | 225 | | 227 | |
| | Santander UK Group Holdings plc | 3.571% | 1/10/23 | 200 | | 205 | |
| 3 | Santander UK Group Holdings plc | 3.823% | 11/3/28 | 200 | | 210 | |
| | Santander UK plc | 3.400% | 6/1/21 | 200 | | 204 | |
| | Santander UK plc | 3.750% | 11/15/21 | 200 | | 206 | |
| | Santander UK plc | 4.000% | 3/13/24 | 200 | | 213 | |
| | Santander UK plc | 2.875% | 6/18/24 | 200 | | 204 | |
| | Skandinaviska Enskilda Banken AB | 2.625% | 3/15/21 | 300 | | 302 | |
| | Skandinaviska Enskilda Banken AB | 1.875% | 9/13/21 | 750 | | 747 | |
| | Skandinaviska Enskilda Banken AB | 2.800% | 3/11/22 | 250 | | 254 | |
| | State Street Corp. | 1.950% | 5/19/21 | 125 | | 125 | |
| 3 | State Street Corp. | 2.653% | 5/15/23 | 300 | | 305 | |
| | State Street Corp. | 3.100% | 5/15/23 | 400 | | 411 | |
| | State Street Corp. | 3.700% | 11/20/23 | 83 | | 88 | |
| 3 | State Street Corp. | 3.776% | 12/3/24 | 200 | | 211 | |
| | State Street Corp. | 3.300% | 12/16/24 | 227 | | 239 | |
| | State Street Corp. | 3.550% | 8/18/25 | 225 | | 242 | |
| 3 | State Street Corp. | 2.354% | 11/1/25 | 125 | | 125 | |
| | State Street Corp. | 2.650% | 5/19/26 | 125 | | 127 | |
| 3 | State Street Corp. | 4.141% | 12/3/29 | 200 | | 223 | |
| 3 | State Street Corp. | 3.031% | 11/1/34 | 125 | | 125 | |
| | Sumitomo Mitsui Banking Corp. | 3.200% | 7/18/22 | 250 | | 257 | |
| | Sumitomo Mitsui Banking Corp. | 3.950% | 7/19/23 | 100 | | 106 | |
| | Sumitomo Mitsui Banking Corp. | 3.950% | 1/10/24 | 250 | | 265 | |
| | Sumitomo Mitsui Banking Corp. | 3.400% | 7/11/24 | 250 | | 261 | |
| | Sumitomo Mitsui Financial Group Inc. | 2.934% | 3/9/21 | 340 | | 344 | |
| | Sumitomo Mitsui Financial Group Inc. | 2.058% | 7/14/21 | 250 | | 250 | |
| | Sumitomo Mitsui Financial Group Inc. | 2.442% | 10/19/21 | 475 | | 478 | |
| | Sumitomo Mitsui Financial Group Inc. | 2.846% | 1/11/22 | 250 | | 254 | |
| | Sumitomo Mitsui Financial Group Inc. | 2.784% | 7/12/22 | 200 | | 203 | |
| | Sumitomo Mitsui Financial Group Inc. | 2.778% | 10/18/22 | 200 | | 203 | |
| | Sumitomo Mitsui Financial Group Inc. | 3.102% | 1/17/23 | 250 | | 256 | |
| | Sumitomo Mitsui Financial Group Inc. | 3.748% | 7/19/23 | 200 | | 210 | |
| | Sumitomo Mitsui Financial Group Inc. | 3.936% | 10/16/23 | 200 | | 212 | |
| | Sumitomo Mitsui Financial Group Inc. | 2.696% | 7/16/24 | 375 | | 380 | |
| | Sumitomo Mitsui Financial Group Inc. | 3.784% | 3/9/26 | 150 | | 160 | |
| | Sumitomo Mitsui Financial Group Inc. | 2.632% | 7/14/26 | 125 | | 125 | |
| | Sumitomo Mitsui Financial Group Inc. | 3.010% | 10/19/26 | 175 | | 178 | |
| | Sumitomo Mitsui Financial Group Inc. | 3.446% | 1/11/27 | 200 | | 209 | |
| | Sumitomo Mitsui Financial Group Inc. | 3.364% | 7/12/27 | 700 | | 729 | |
| | Sumitomo Mitsui Financial Group Inc. | 3.544% | 1/17/28 | 300 | | 317 | |
Total Bond Market Index Portfolio
| | | | Face | | Market | |
| | | Maturity | Amount | | Value• | |
| | Coupon | Date | ($000 | ) | ($000 | ) |
| | Sumitomo Mitsui Financial Group Inc. | 3.944% | 7/19/28 | 100 | | 109 | |
| | Sumitomo Mitsui Financial Group Inc. | 3.040% | 7/16/29 | 475 | | 484 | |
| | Sumitomo Mitsui Financial Group Inc. | 3.202% | 9/17/29 | 150 | | 151 | |
| | SVB Financial Group | 3.500% | 1/29/25 | 100 | | 104 | |
| | Svenska Handelsbanken AB | 2.450% | 3/30/21 | 300 | | 302 | |
| | Svenska Handelsbanken AB | 3.350% | 5/24/21 | 200 | | 204 | |
| | Svenska Handelsbanken AB | 1.875% | 9/7/21 | 350 | | 349 | |
| | Synchrony Bank | 3.650% | 5/24/21 | 250 | | 255 | |
| | Synchrony Bank | 3.000% | 6/15/22 | 100 | | 102 | |
| | Synchrony Financial | 2.850% | 7/25/22 | 75 | | 76 | |
| | Synchrony Financial | 4.250% | 8/15/24 | 250 | | 267 | |
| | Synchrony Financial | 4.500% | 7/23/25 | 150 | | 162 | |
| | Synchrony Financial | 3.700% | 8/4/26 | 125 | | 129 | |
| | Synchrony Financial | 3.950% | 12/1/27 | 300 | | 315 | |
| | Synovus Financial Corp. | 3.125% | 11/1/22 | 50 | | 51 | |
| | Toronto-Dominion Bank | 2.500% | 12/14/20 | 100 | | 101 | |
| | Toronto-Dominion Bank | 2.550% | 1/25/21 | 450 | | 453 | |
| | Toronto-Dominion Bank | 2.125% | 4/7/21 | 175 | | 176 | |
| | Toronto-Dominion Bank | 3.250% | 6/11/21 | 600 | | 612 | |
| | Toronto-Dominion Bank | 1.800% | 7/13/21 | 150 | | 150 | |
| | Toronto-Dominion Bank | 1.900% | 12/1/22 | 225 | | 225 | |
| | Toronto-Dominion Bank | 3.250% | 3/11/24 | 400 | | 417 | |
| | Truist Bank | 2.625% | 1/15/22 | 250 | | 253 | |
| | Truist Bank | 2.800% | 5/17/22 | 400 | | 407 | |
| 3 | Truist Bank | 3.502% | 8/2/22 | 250 | | 255 | |
| | Truist Bank | 3.000% | 2/2/23 | 75 | | 77 | |
| | Truist Bank | 3.200% | 4/1/24 | 500 | | 519 | |
| 3 | Truist Bank | 3.689% | 8/2/24 | 250 | | 262 | |
| | Truist Bank | 2.150% | 12/6/24 | 250 | | 250 | |
| | Truist Bank | 3.625% | 9/16/25 | 500 | | 532 | |
| | Truist Bank | 3.300% | 5/15/26 | 200 | | 208 | |
| | Truist Financial Corp. | 2.150% | 2/1/21 | 125 | | 125 | |
| | Truist Financial Corp | 2.900% | 3/3/21 | 75 | | 76 | |
| | Truist Financial Corp. | 2.050% | 5/10/21 | 175 | | 175 | |
| | Truist Financial Corp. | 3.200% | 9/3/21 | 150 | | 153 | |
| | Truist Financial Corp. | 2.700% | 1/27/22 | 125 | | 127 | |
| | Truist Financial Corp. | 2.750% | 4/1/22 | 175 | | 178 | |
| | Truist Financial Corp. | 3.050% | 6/20/22 | 500 | | 510 | |
| | Truist Financial Corp. | 3.750% | 12/6/23 | 250 | | 264 | |
| | Truist Financial Corp. | 2.500% | 8/1/24 | 75 | | 76 | |
| | Truist Financial Corp. | 2.850% | 10/26/24 | 192 | | 198 | |
| | Truist Financial Corp. | 3.700% | 6/5/25 | 175 | | 188 | |
| | Truist Financial Corp. | 3.875% | 3/19/29 | 200 | | 215 | |
| 6 | UBS AG | 2.450% | 12/1/20 | 200 | | 201 | |
| | US Bancorp | 2.350% | 1/29/21 | 100 | | 100 | |
| | US Bancorp | 4.125% | 5/24/21 | 250 | | 257 | |
| | US Bancorp | 2.625% | 1/24/22 | 200 | | 203 | |
| | US Bancorp | 3.000% | 3/15/22 | 125 | | 128 | |
| | US Bancorp | 2.950% | 7/15/22 | 400 | | 410 | |
| | US Bancorp | 3.700% | 1/30/24 | 150 | | 159 | |
| | US Bancorp | 3.375% | 2/5/24 | 500 | | 523 | |
| | US Bancorp | 2.400% | 7/30/24 | 200 | | 202 | |
| | US Bancorp | 3.600% | 9/11/24 | 50 | | 53 | |
| | US Bancorp | 3.950% | 11/17/25 | 25 | | 27 | |
| | US Bancorp | 3.100% | 4/27/26 | 300 | | 312 | |
| | US Bancorp | 3.150% | 4/27/27 | 275 | | 288 | |
| | US Bancorp | 3.900% | 4/26/28 | 100 | | 112 | |
| | US Bancorp | 3.000% | 7/30/29 | 190 | | 194 | |
| | US Bank NA | 2.650% | 5/23/22 | 250 | | 254 | |
| | US Bank NA | 1.950% | 1/9/23 | 300 | | 300 | |
| | US Bank NA | 2.850% | 1/23/23 | 250 | | 257 | |
| | US Bank NA | 3.400% | 7/24/23 | 250 | | 261 | |
| | US Bank NA | 2.800% | 1/27/25 | 625 | | 644 | |
| | Wachovia Corp. | 6.605% | 10/1/25 | 265 | | 313 | |
| | Wells Fargo & Co. | 2.550% | 12/7/20 | 300 | | 301 | |
| | Wells Fargo & Co. | 2.500% | 3/4/21 | 1,350 | | 1,359 | |
| | Wells Fargo & Co. | 4.600% | 4/1/21 | 825 | | 850 | |
| | Wells Fargo & Co. | 2.100% | 7/26/21 | 350 | | 351 | |
| | Wells Fargo & Co. | 3.500% | 3/8/22 | 450 | | 464 | |
| | Wells Fargo & Co. | 2.625% | 7/22/22 | 775 | | 785 | |
| | Wells Fargo & Co. | 3.069% | 1/24/23 | 1,500 | | 1,526 | |
| | Wells Fargo & Co. | 3.450% | 2/13/23 | 350 | | 362 | |
| | Wells Fargo & Co. | 3.750% | 1/24/24 | 200 | | 211 | |
| | Wells Fargo & Co. | 3.300% | 9/9/24 | 400 | | 419 | |
| | Wells Fargo & Co. | 3.000% | 2/19/25 | 425 | | 438 | |
| 3 | Wells Fargo & Co. | 2.406% | 10/30/25 | 600 | | 598 | |
| | Wells Fargo & Co. | 3.000% | 4/22/26 | 1,275 | | 1,311 | |
| | Wells Fargo & Co. | 4.100% | 6/3/26 | 725 | | 779 | |
| | Wells Fargo & Co. | 3.000% | 10/23/26 | 675 | | 690 | |
| | Wells Fargo & Co. | 4.300% | 7/22/27 | 475 | | 518 | |
| 3 | Wells Fargo & Co. | 3.584% | 5/22/28 | 500 | | 530 | |
| | Wells Fargo & Co. | 4.150% | 1/24/29 | 200 | | 222 | |
| 3 | Wells Fargo & Co. | 2.879% | 10/30/30 | 1,800 | | 1,811 | |
| | Wells Fargo & Co. | 5.375% | 2/7/35 | 200 | | 258 | |
| | Wells Fargo & Co. | 5.375% | 11/2/43 | 500 | | 630 | |
| | Wells Fargo & Co. | 5.606% | 1/15/44 | 600 | | 793 | |
| | Wells Fargo & Co. | 4.650% | 11/4/44 | 325 | | 381 | |
| | Wells Fargo & Co. | 3.900% | 5/1/45 | 250 | | 284 | |
| | Wells Fargo & Co. | 4.900% | 11/17/45 | 250 | | 305 | |
| | Wells Fargo & Co. | 4.400% | 6/14/46 | 300 | | 344 | |
| | Wells Fargo & Co. | 4.750% | 12/7/46 | 350 | | 417 | |
| | Wells Fargo Bank NA | 2.600% | 1/15/21 | 250 | | 251 | |
| 3 | Wells Fargo Bank NA | 3.325% | 7/23/21 | 250 | | 252 | |
| | Wells Fargo Bank NA | 3.625% | 10/22/21 | 450 | | 463 | |
| 3 | Wells Fargo Bank NA | 2.897% | 5/27/22 | 600 | | 606 | |
| 3 | Wells Fargo Bank NA | 2.082% | 9/9/22 | 850 | | 850 | |
| | Wells Fargo Bank NA | 3.550% | 8/14/23 | 750 | | 783 | |
| | Wells Fargo Bank NA | 5.950% | 8/26/36 | 200 | | 265 | |
| | Wells Fargo Bank NA | 5.850% | 2/1/37 | 300 | | 398 | |
| | Wells Fargo Bank NA | 6.600% | 1/15/38 | 225 | | 324 | |
| | Westpac Banking Corp. | 2.100% | 5/13/21 | 600 | | 601 | |
| | Westpac Banking Corp. | 2.000% | 8/19/21 | 275 | | 275 | |
| | Westpac Banking Corp. | 2.500% | 6/28/22 | 1,000 | | 1,011 | |
| | Westpac Banking Corp. | 2.750% | 1/11/23 | 200 | | 203 | |
| | Westpac Banking Corp. | 3.650% | 5/15/23 | 75 | | 79 | |
| | Westpac Banking Corp. | 3.300% | 2/26/24 | 250 | | 260 | |
| | Westpac Banking Corp. | 2.350% | 2/19/25 | 200 | | 200 | |
| | Westpac Banking Corp. | 2.850% | 5/13/26 | 200 | | 204 | |
| | Westpac Banking Corp. | 2.700% | 8/19/26 | 175 | | 177 | |
| | Westpac Banking Corp. | 3.350% | 3/8/27 | 250 | | 264 | |
| 3 | Westpac Banking Corp. | 4.322% | 11/23/31 | 500 | | 527 | |
| | Westpac Banking Corp. | 4.110% | 7/24/34 | 25 | | 26 | |
| | Westpac Banking Corp. | 4.421% | 7/24/39 | 100 | | 110 | |
| | Zions Bancorp NA | 3.500% | 8/27/21 | 250 | | 255 | |
| | Zions Bancorp NA | 3.250% | 10/29/29 | 250 | | 245 | |
| | | | | | | | |
| | Brokerage (0.2%) | | | | | | |
| | Affiliated Managers Group Inc. | 4.250% | 2/15/24 | 100 | | 106 | |
| | Affiliated Managers Group Inc. | 3.500% | 8/1/25 | 125 | | 130 | |
| | Ameriprise Financial Inc. | 3.000% | 3/22/22 | 50 | | 51 | |
| | Ameriprise Financial Inc. | 4.000% | 10/15/23 | 250 | | 267 | |
| | Ameriprise Financial Inc. | 3.700% | 10/15/24 | 187 | | 200 | |
| | BGC Partners Inc. | 5.125% | 5/27/21 | 50 | | 52 | |
| | BGC Partners Inc. | 3.750% | 10/1/24 | 105 | | 105 | |
| | BlackRock Inc. | 4.250% | 5/24/21 | 125 | | 129 | |
| | BlackRock Inc. | 3.375% | 6/1/22 | 175 | | 181 | |
| | BlackRock Inc. | 3.500% | 3/18/24 | 175 | | 186 | |
| | BlackRock Inc. | 3.200% | 3/15/27 | 100 | | 106 | |
| | BlackRock Inc. | 3.250% | 4/30/29 | 90 | | 96 | |
| | Brookfield Asset Management Inc. | 4.000% | 1/15/25 | 105 | | 113 | |
| | Brookfield Finance Inc. | 4.250% | 6/2/26 | 50 | | 54 | |
| | Brookfield Finance Inc. | 3.900% | 1/25/28 | 125 | | 134 | |
| | Brookfield Finance Inc. | 4.850% | 3/29/29 | 150 | | 172 | |
| | Brookfield Finance Inc. | 4.700% | 9/20/47 | 150 | | 172 | |
| | Brookfield Finance LLC | 4.000% | 4/1/24 | 175 | | 188 | |
| | Cboe Global Markets Inc. | 3.650% | 1/12/27 | 110 | | 118 | |
| | Charles Schwab Corp. | 3.250% | 5/21/21 | 125 | | 127 | |
| | Charles Schwab Corp. | 3.225% | 9/1/22 | 300 | | 309 | |
| | Charles Schwab Corp. | 2.650% | 1/25/23 | 100 | | 102 | |
| | Charles Schwab Corp. | 3.550% | 2/1/24 | 400 | | 422 | |
| | Charles Schwab Corp. | 3.850% | 5/21/25 | 25 | | 27 | |
| | Charles Schwab Corp. | 3.200% | 3/2/27 | 250 | | 262 | |
Total Bond Market Index Portfolio
| | | | | | | | | Face | | | Market | |
| | | | | | | Maturity | | Amount | | | Value• | |
| | | | | Coupon | | Date | | | ($000 | ) | | | ($000 | ) |
| | | Charles Schwab Corp. | | 3.200% | | 1/25/28 | | | 100 | | | | 104 | |
| | | Charles Schwab Corp. | | 4.000% | | 2/1/29 | | | 125 | | | | 138 | |
| | Charles Schwab Corp. | | 3.250% | | 5/22/29 | | | 100 | | | | 105 | |
| | CME Group Inc. | | 3.000% | | 9/15/22 | | | 125 | | | | 129 | |
| | CME Group Inc. | | 3.000% | | 3/15/25 | | | 125 | | | | 129 | |
| | | CME Group Inc. | | 5.300% | | 9/15/43 | | | 150 | | | | 201 | |
| | | CME Group Inc. | | 4.150% | | 6/15/48 | | | 125 | | | | 149 | |
| | | E*TRADE Financial Corp. | | 3.800% | | 8/24/27 | | | 75 | | | | 78 | |
| | | E*TRADE Financial Corp. | | 4.500% | | 6/20/28 | | | 65 | | | | 71 | |
| | | Eaton Vance Corp. | | 3.625% | | 6/15/23 | | | 50 | | | | 52 | |
| | | Eaton Vance Corp. | | 3.500% | | 4/6/27 | | | 100 | | | | 106 | |
| | | Franklin Resources Inc. | | 2.800% | | 9/15/22 | | | 225 | | | | 231 | |
| | | Intercontinental Exchange Inc. | | 2.350% | | 9/15/22 | | | 100 | | | | 101 | |
| | | Intercontinental Exchange Inc. | | 3.450% | | 9/21/23 | | | 100 | | | | 105 | |
| | | Intercontinental Exchange Inc. | | 4.000% | | 10/15/23 | | | 150 | | | | 160 | |
| | | Intercontinental Exchange Inc. | | 3.750% | | 12/1/25 | | | 300 | | | | 323 | |
| | | Intercontinental Exchange Inc. | | 3.100% | | 9/15/27 | | | 150 | | | | 157 | |
| | | Intercontinental Exchange Inc. | | 3.750% | | 9/21/28 | | | 75 | | | | 82 | |
| | | Intercontinental Exchange Inc. | | 4.250% | | 9/21/48 | | | 175 | | | | 207 | |
| | | Invesco Finance plc | | 3.125% | | 11/30/22 | | | 175 | | | | 180 | |
| | | Invesco Finance plc | | 4.000% | | 1/30/24 | | | 450 | | | | 477 | |
| | | Invesco Finance plc | | 3.750% | | 1/15/26 | | | 170 | | | | 181 | |
| | | Invesco Finance plc | | 5.375% | | 11/30/43 | | | 75 | | | | 90 | |
| | | Janus Capital Group Inc. | | 4.875% | | 8/1/25 | | | 75 | | | | 81 | |
| | | Jefferies Financial Group Inc. | | 5.500% | | 10/18/23 | | | 150 | | | | 163 | |
| | | Jefferies Group LLC | | 6.875% | | 4/15/21 | | | 105 | | | | 111 | |
| | | Jefferies Group LLC | | 5.125% | | 1/20/23 | | | 100 | | | | 108 | |
| | | Jefferies Group LLC | | 4.850% | | 1/15/27 | | | 200 | | | | 221 | |
| | | Jefferies Group LLC | | 6.450% | | 6/8/27 | | | 50 | | | | 58 | |
| | | Jefferies Group LLC | | 6.250% | | 1/15/36 | | | 75 | | | | 89 | |
| | | Jefferies Group LLC | | 6.500% | | 1/20/43 | | | 75 | | | | 89 | |
| | | Jefferies Group LLC / Jefferies Group Capital Finance Inc. | | 4.150% | | 1/23/30 | | | 300 | | | | 316 | |
| | | Lazard Group LLC | | 3.750% | | 2/13/25 | | | 50 | | | | 53 | |
| | | Lazard Group LLC | | 3.625% | | 3/1/27 | | | 100 | | | | 102 | |
| | | Lazard Group LLC | | 4.500% | | 9/19/28 | | | 100 | | | | 111 | |
| | | Legg Mason Inc. | | 4.750% | | 3/15/26 | | | 100 | | | | 109 | |
| | | Legg Mason Inc. | | 5.625% | | 1/15/44 | | | 100 | | | | 113 | |
| | | Nasdaq Inc. | | 4.250% | | 6/1/24 | | | 125 | | | | 135 | |
| | | Nasdaq Inc. | | 3.850% | | 6/30/26 | | | 100 | | | | 107 | |
| | | Raymond James Financial Inc. | | 3.625% | | 9/15/26 | | | 75 | | | | 79 | |
| | | Raymond James Financial Inc. | | 4.950% | | 7/15/46 | | | 210 | | | | 249 | |
| | | Stifel Financial Corp. | | 3.500% | | 12/1/20 | | | 50 | | | | 51 | |
| | | Stifel Financial Corp. | | 4.250% | | 7/18/24 | | | 150 | | | | 158 | |
| | | TD Ameritrade Holding Corp. | | 2.950% | | 4/1/22 | | | 125 | | | | 128 | |
| | | TD Ameritrade Holding Corp. | | 3.625% | | 4/1/25 | | | 100 | | | | 106 | |
| | | TD Ameritrade Holding Corp. | | 3.300% | | 4/1/27 | | | 125 | | | | 131 | |
| | | TD Ameritrade Holding Corp. | | 2.750% | | 10/1/29 | | | 50 | | | | 50 | |
| | | | | | | | | | | | | | | |
| | | Finance Companies (0.2%) | | | | | | | | | | | | |
| | | AerCap Ireland Capital DAC / AerCap Global Aviation Trust | | 4.500% | | 5/15/21 | | | 150 | | | | 155 | |
| | | AerCap Ireland Capital DAC / AerCap Global Aviation Trust | | 5.000% | | 10/1/21 | | | 200 | | | | 210 | |
| | | AerCap Ireland Capital DAC / AerCap Global Aviation Trust | | 4.450% | | 12/16/21 | | | 70 | | | | 73 | |
| | | AerCap Ireland Capital DAC / AerCap Global Aviation Trust | | 3.950% | | 2/1/22 | | | 125 | | | | 129 | |
| | | AerCap Ireland Capital DAC / AerCap Global Aviation Trust | | 3.500% | | 5/26/22 | | | 100 | | | | 103 | |
| | | AerCap Ireland Capital DAC / AerCap Global Aviation Trust | | 4.625% | | 7/1/22 | | | 175 | | | | 185 | |
| | | AerCap Ireland Capital DAC / AerCap Global Aviation Trust | | 3.300% | | 1/23/23 | | | 125 | | | | 128 | |
| | | AerCap Ireland Capital DAC / AerCap Global Aviation Trust | | 4.450% | | 10/1/25 | | | 125 | | | | 134 | |
| | | AerCap Ireland Capital DAC / AerCap Global Aviation Trust | | 3.650% | | 7/21/27 | | | 150 | | | | 154 | |
| | | AerCap Ireland Capital DAC / AerCap Global Aviation Trust | | 3.875% | | 1/23/28 | | | 300 | | | | 311 | |
| | | Air Lease Corp. | | 2.500% | | 3/1/21 | | | 250 | | | | 251 | |
| | | Air Lease Corp. | | 3.875% | | 4/1/21 | | | 75 | | | | 77 | |
| | | Air Lease Corp. | | 3.375% | | 6/1/21 | | | 75 | | | | 76 | |
| | | Air Lease Corp. | | 3.750% | | 2/1/22 | | | 300 | | | | 309 | |
| | | Air Lease Corp. | | 2.625% | | 7/1/22 | | | 100 | | | | 101 | |
| | | Air Lease Corp. | | 2.250% | | 1/15/23 | | | 100 | | | | 100 | |
| | | Air Lease Corp. | | 2.750% | | 1/15/23 | | | 100 | | | | 101 | |
| | | Air Lease Corp. | | 3.875% | | 7/3/23 | | | 100 | | | | 105 | |
| | | Air Lease Corp. | | 4.250% | | 2/1/24 | | | 200 | | | | 214 | |
| | | Air Lease Corp. | | 4.250% | | 9/15/24 | | | 75 | | | | 80 | |
| | | Air Lease Corp. | | 3.250% | | 3/1/25 | | | 150 | | | | 154 | |
| | | Air Lease Corp. | | 3.625% | | 4/1/27 | | | 75 | | | | 78 | |
| | | Air Lease Corp. | | 3.625% | | 12/1/27 | | | 100 | | | | 103 | |
| | | Air Lease Corp. | | 4.625% | | 10/1/28 | | | 100 | | | | 110 | |
| | | Air Lease Corp. | | 3.250% | | 10/1/29 | | | 100 | | | | 99 | |
| | | Aircastle Ltd. | | 4.400% | | 9/25/23 | | | 125 | | | | 132 | |
| | | Aircastle Ltd. | | 4.125% | | 5/1/24 | | | 400 | | | | 419 | |
| | | Aircastle Ltd. | | 4.250% | | 6/15/26 | | | 100 | | | | 106 | |
| | | Ares Capital Corp. | | 3.500% | | 2/10/23 | | | 250 | | | | 254 | |
| | | Ares Capital Corp. | | 4.200% | | 6/10/24 | | | 200 | | | | 210 | |
| | | Ares Capital Corp. | | 4.250% | | 3/1/25 | | | 100 | | | | 104 | |
| | | FS KKR Capital Corp. | | 4.750% | | 5/15/22 | | | 25 | | | | 26 | |
| | | FS KKR Capital Corp. | | 4.625% | | 7/15/24 | | | 25 | | | | 26 | |
| | | FS KKR Capital Corp. | | 4.125% | | 2/1/25 | | | 100 | | | | 101 | |
| | | GATX Corp. | | 3.250% | | 3/30/25 | | | 125 | | | | 128 | |
| | | GATX Corp. | | 3.250% | | 9/15/26 | | | 50 | | | | 51 | |
| | | GATX Corp. | | 3.850% | | 3/30/27 | | | 175 | | | | 183 | |
| | | GATX Corp. | | 3.500% | | 3/15/28 | | | 100 | | | | 102 | |
| | | GATX Corp. | | 4.550% | | 11/7/28 | | | 150 | | | | 164 | |
| | | GATX Corp. | | 4.700% | | 4/1/29 | | | 75 | | | | 84 | |
| | | GATX Corp. | | 4.500% | | 3/30/45 | | | 50 | | | | 52 | |
| | | GE Capital International Funding Co. Unlimited Co. | | 3.373% | | 11/15/25 | | | 358 | | | | 371 | |
| | | GE Capital International Funding Co. Unlimited Co. | | 4.418% | | 11/15/35 | | | 2,168 | | | | 2,303 | |
| | | International Lease Finance Corp. | | 8.250% | | 12/15/20 | | | 200 | | | | 211 | |
| | | International Lease Finance Corp. | | 4.625% | | 4/15/21 | | | 89 | | | | 92 | |
| | | International Lease Finance Corp. | | 8.625% | | 1/15/22 | | | 315 | | | | 354 | |
| | | International Lease Finance Corp. | | 5.875% | | 8/15/22 | | | 160 | | | | 174 | |
| | | Owl Rock Capital Corp. | | 5.250% | | 4/15/24 | | | 25 | | | | 26 | |
| | | Owl Rock Capital Corp. | | 4.000% | | 3/30/25 | | | 40 | | | | 40 | |
| | | Prospect Capital Corp. | | 5.875% | | 3/15/23 | | | 40 | | | | 42 | |
| | | TPG Specialty Lending Inc. | | 3.875% | | 11/1/24 | | | 50 | | | | 50 | |
| | | | | | | | | | | | | | | |
| | | Insurance (1.2%) | | | | | | | | | | | | |
| | | ACE Capital Trust II | | 9.700% | | 4/1/30 | | | 50 | | | | 75 | |
| | | AEGON Funding Co. LLC | | 5.750% | | 12/15/20 | | | 81 | | | | 84 | |
| | | Aetna Inc. | | 2.750% | | 11/15/22 | | | 200 | | | | 203 | |
| | | Aetna Inc. | | 2.800% | | 6/15/23 | | | 125 | | | | 127 | |
| | | Aetna Inc. | | 3.500% | | 11/15/24 | | | 125 | | | | 131 | |
| | | Aetna Inc. | | 6.625% | | 6/15/36 | | | 130 | | | | 174 | |
| | | Aetna Inc. | | 6.750% | | 12/15/37 | | | 100 | | | | 134 | |
| | | Aetna Inc. | | 4.500% | | 5/15/42 | | | 75 | | | | 80 | |
| | | Aetna Inc. | | 4.125% | | 11/15/42 | | | 75 | | | | 77 | |
| | | Aetna Inc. | | 3.875% | | 8/15/47 | | | 300 | | | | 303 | |
| | | Aflac Inc. | | 4.000% | | 2/15/22 | | | 50 | | | | 52 | |
| | | Aflac Inc. | | 3.625% | | 6/15/23 | | | 125 | | | | 131 | |
| | | Aflac Inc. | | 3.625% | | 11/15/24 | | | 125 | | | | 134 | |
| | | Aflac Inc. | | 3.250% | | 3/17/25 | | | 125 | | | | 131 | |
| | | Aflac Inc. | | 2.875% | | 10/15/26 | | | 75 | | | | 77 | |
| | | Aflac Inc. | | 4.000% | | 10/15/46 | | | 50 | | | | 54 | |
| | | Aflac Inc. | | 4.750% | | 1/15/49 | | | 115 | | | | 137 | |
| | | Alleghany Corp. | | 4.900% | | 9/15/44 | | | 100 | | | | 117 | |
| | | Allied World Assurance Co. Holdings Ltd. | | 4.350% | | 10/29/25 | | | 75 | | | | 78 | |
| | | Allstate Corp. | | 3.150% | | 6/15/23 | | | 100 | | | | 104 | |
| | | Allstate Corp. | | 5.550% | | 5/9/35 | | | 75 | | | | 95 | |
| | | Allstate Corp. | | 4.500% | | 6/15/43 | | | 125 | | | | 149 | |
| | | Allstate Corp. | | 4.200% | | 12/15/46 | | | 200 | | | | 230 | |
| | | Allstate Corp. | | 3.850% | | 8/10/49 | | | 100 | | | | 111 | |
| 3 | | Allstate Corp. | | 5.750% | | 8/15/53 | | | 75 | | | | 80 | |
| 3 | | Allstate Corp. | | 6.500% | | 5/15/67 | | | 100 | | | | 124 | |
Total Bond Market Index Portfolio
| | | | | | | | | Face | | | Market | |
| | | | | | | Maturity | | Amount | | | Value• | |
| | | | | Coupon | | Date | | | ($000 | ) | | | ($000 | ) |
| | | American Financial Group Inc. | | 3.500% | | 8/15/26 | | | 50 | | | | 51 | |
| | | American Financial Group Inc. | | 4.500% | | 6/15/47 | | | 110 | | | | 119 | |
| | | American International Group Inc. | | 6.400% | | 12/15/20 | | | 385 | | | | 401 | |
| | | American International Group Inc. | | 3.300% | | 3/1/21 | | | 275 | | | | 279 | |
| | | American International Group Inc. | | 4.875% | | 6/1/22 | | | 250 | | | | 267 | |
| | | American International Group Inc. | | 4.125% | | 2/15/24 | | | 70 | | | | 75 | |
| | | American International Group Inc. | | 3.750% | | 7/10/25 | | | 85 | | | | 91 | |
| | | American International Group Inc. | | 4.200% | | 4/1/28 | | | 200 | | | | 219 | |
| | | American International Group Inc. | | 4.250% | | 3/15/29 | | | 50 | | | | 56 | |
| | | American International Group Inc. | | 3.875% | | 1/15/35 | | | 200 | | | | 212 | |
| | | American International Group Inc. | | 4.700% | | 7/10/35 | | | 75 | | | | 87 | |
| | | American International Group Inc. | | 6.250% | | 5/1/36 | | | 475 | | | | 634 | |
| | | American International Group Inc. | | 4.500% | | 7/16/44 | | | 500 | | | | 573 | |
| | | American International Group Inc. | | 4.750% | | 4/1/48 | | | 100 | | | | 120 | |
| 3 | | American International Group Inc. | | 5.750% | | 4/1/48 | | | 125 | | | | 135 | |
| | | American International Group Inc. | | 4.375% | | 1/15/55 | | | 125 | | | | 137 | |
| 3 | | American International Group Inc. | | 8.175% | | 5/15/68 | | | 95 | | | | 129 | |
| | | Anthem Inc. | | 3.700% | | 8/15/21 | | | 125 | | | | 128 | |
| | | Anthem Inc. | | 3.125% | | 5/15/22 | | | 150 | | | | 154 | |
| | | Anthem Inc. | | 2.950% | | 12/1/22 | | | 150 | | | | 154 | |
| | | Anthem Inc. | | 3.300% | | 1/15/23 | | | 200 | | | | 207 | |
| | | Anthem Inc. | | 3.500% | | 8/15/24 | | | 475 | | | | 497 | |
| | | Anthem Inc. | | 3.350% | | 12/1/24 | | | 160 | | | | 167 | |
| | | Anthem Inc. | | 2.375% | | 1/15/25 | | | 100 | | | | 100 | |
| | | Anthem Inc. | | 3.650% | | 12/1/27 | | | 300 | | | | 316 | |
| | | Anthem Inc. | | 4.101% | | 3/1/28 | | | 400 | | | | 433 | |
| | | Anthem Inc. | | 2.875% | | 9/15/29 | | | 75 | | | | 75 | |
| | | Anthem Inc. | | 5.950% | | 12/15/34 | | | 1 | | | | 1 | |
| | | Anthem Inc. | | 5.850% | | 1/15/36 | | | 75 | | | | 91 | |
| | | Anthem Inc. | | 6.375% | | 6/15/37 | | | 50 | | | | 65 | |
| | | Anthem Inc. | | 4.625% | | 5/15/42 | | | 175 | | | | 196 | |
| | | Anthem Inc. | | 4.650% | | 1/15/43 | | | 775 | | | | 873 | |
| | | Anthem Inc. | | 5.100% | | 1/15/44 | | | 100 | | | | 118 | |
| | | Anthem Inc. | | 4.375% | | 12/1/47 | | | 300 | | | | 329 | |
| | | Anthem Inc. | | 4.550% | | 3/1/48 | | | 155 | | | | 174 | |
| | | Anthem Inc. | | 4.850% | | 8/15/54 | | | 50 | | | | 54 | |
| | | Aon Corp. | | 8.205% | | 1/1/27 | | | 25 | | | | 32 | |
| | | Aon Corp. | | 4.500% | | 12/15/28 | | | 100 | | | | 112 | |
| | | Aon Corp. | | 3.750% | | 5/2/29 | | | 90 | | | | 96 | |
| | | Aon Corp. | | 6.250% | | 9/30/40 | | | 100 | | | | 137 | |
| | | Aon plc | | 3.500% | | 6/14/24 | | | 150 | | | | 157 | |
| | | Aon plc | | 3.875% | | 12/15/25 | | | 200 | | | | 215 | |
| | | Aon plc | | 4.600% | | 6/14/44 | | | 175 | | | | 199 | |
| | | Aon plc | | 4.750% | | 5/15/45 | | | 100 | | | | 117 | |
| | | Arch Capital Finance LLC | | 4.011% | | 12/15/26 | | | 100 | | | | 110 | |
| | | Arch Capital Finance LLC | | 5.031% | | 12/15/46 | | | 100 | | | | 125 | |
| | | Arch Capital Group Ltd. | | 7.350% | | 5/1/34 | | | 50 | | | | 71 | |
| | | Arch Capital Group US Inc. | | 5.144% | | 11/1/43 | | | 50 | | | | 61 | |
| | | Aspen Insurance Holdings Ltd. | | 4.650% | | 11/15/23 | | | 175 | | | | 187 | |
| | | Assurant Inc. | | 4.000% | | 3/15/23 | | | 50 | | | | 52 | |
| | | Assurant Inc. | | 4.200% | | 9/27/23 | | | 100 | | | | 105 | |
| | | Assurant Inc. | | 4.900% | | 3/27/28 | | | 100 | | | | 110 | |
| | | Assurant Inc. | | 6.750% | | 2/15/34 | | | 9 | | | | 11 | |
| | | Assured Guaranty US Holdings Inc. | | 5.000% | | 7/1/24 | | | 75 | | | | 83 | |
| | | Athene Holding Ltd. | | 4.125% | | 1/12/28 | | | 200 | | | | 207 | |
| | | AXA Equitable Holdings Inc. | | 3.900% | | 4/20/23 | | | 100 | | | | 105 | |
| | | AXA Equitable Holdings Inc. | | 7.000% | | 4/1/28 | | | 75 | | | | 91 | |
| | | AXA Equitable Holdings Inc. | | 4.350% | | 4/20/28 | | | 680 | | | | 738 | |
| | | AXA Equitable Holdings Inc. | | 5.000% | | 4/20/48 | | | 350 | | | | 374 | |
| | | AXA SA | | 8.600% | | 12/15/30 | | | 225 | | | | 329 | |
| | �� | AXIS Specialty Finance LLC | | 3.900% | | 7/15/29 | | | 50 | | | | 52 | |
| 3 | | AXIS Specialty Finance LLC | | 4.900% | | 1/15/40 | | | 50 | | | | 51 | |
| | | AXIS Specialty Finance plc | | 4.000% | | 12/6/27 | | | 550 | | | | 580 | |
| | | Berkshire Hathaway Finance Corp. | | 4.250% | | 1/15/21 | | | 195 | | | | 200 | |
| | | Berkshire Hathaway Finance Corp. | | 3.000% | | 5/15/22 | | | 150 | | | | 154 | |
| | | Berkshire Hathaway Finance Corp. | | 5.750% | | 1/15/40 | | | 140 | | | | 192 | |
| | | Berkshire Hathaway Finance Corp. | | 4.400% | | 5/15/42 | | | 195 | | | | 230 | |
| | | Berkshire Hathaway Finance Corp. | | 4.300% | | 5/15/43 | | | 300 | | | | 343 | |
| | | Berkshire Hathaway Finance Corp. | | 4.200% | | 8/15/48 | | | 700 | | | | 819 | |
| | | Berkshire Hathaway Finance Corp. | | 4.250% | | 1/15/49 | | | 710 | | | | 839 | |
| | | Berkshire Hathaway Inc. | | 2.200% | | 3/15/21 | | | 200 | | | | 201 | |
| | | Berkshire Hathaway Inc. | | 3.000% | | 2/11/23 | | | 75 | | | | 78 | |
| | | Berkshire Hathaway Inc. | | 2.750% | | 3/15/23 | | | 300 | | | | 308 | |
| | | Berkshire Hathaway Inc. | | 3.125% | | 3/15/26 | | | 725 | | | | 765 | |
| | | Berkshire Hathaway Inc. | | 4.500% | | 2/11/43 | | | 175 | | | | 213 | |
| | | Brighthouse Financial Inc. | | 3.700% | | 6/22/27 | | | 250 | | | | 249 | |
| | | Brighthouse Financial Inc. | | 4.700% | | 6/22/47 | | | 130 | | | | 120 | |
| | | Brown & Brown Inc. | | 4.200% | | 9/15/24 | | | 75 | | | | 79 | |
| | | Brown & Brown Inc. | | 4.500% | | 3/15/29 | | | 75 | | | | 82 | |
| | | Chubb Corp. | | 6.000% | | 5/11/37 | | | 125 | | | | 171 | |
| | | Chubb Corp. | | 6.500% | | 5/15/38 | | | 95 | | | | 139 | |
| | | Chubb INA Holdings Inc. | | 2.875% | | 11/3/22 | | | 475 | | | | 487 | |
| | | Chubb INA Holdings Inc. | | 2.700% | | 3/13/23 | | | 125 | | | | 128 | |
| | | Chubb INA Holdings Inc. | | 3.350% | | 5/15/24 | | | 100 | | | | 105 | |
| | | Chubb INA Holdings Inc. | | 3.150% | | 3/15/25 | | | 250 | | | | 262 | |
| | | Chubb INA Holdings Inc. | | 6.700% | | 5/15/36 | | | 200 | | | | 287 | |
| | | Chubb INA Holdings Inc. | | 4.150% | | 3/13/43 | | | 100 | | | | 116 | |
| | | Chubb INA Holdings Inc. | | 4.350% | | 11/3/45 | | | 350 | | | | 420 | |
| | | Cigna Holding Co. | | 4.375% | | 12/15/20 | | | 45 | | | | 46 | |
| | | Cincinnati Financial Corp. | | 6.920% | | 5/15/28 | | | 100 | | | | 129 | |
| | | Cincinnati Financial Corp. | | 6.125% | | 11/1/34 | | | 75 | | | | 99 | |
| | | CNA Financial Corp. | | 5.750% | | 8/15/21 | | | 75 | | | | 79 | |
| | | CNA Financial Corp. | | 3.950% | | 5/15/24 | | | 150 | | | | 160 | |
| | | CNA Financial Corp. | | 4.500% | | 3/1/26 | | | 125 | | | | 137 | |
| | | CNA Financial Corp. | | 3.450% | | 8/15/27 | | | 100 | | | | 104 | |
| | | CNA Financial Corp. | | 3.900% | | 5/1/29 | | | 100 | | | | 107 | |
| | | Enstar Group Ltd. | | 4.500% | | 3/10/22 | | | 50 | | | | 52 | |
| | | Enstar Group Ltd. | | 4.950% | | 6/1/29 | | | 395 | | | | 423 | |
| | | Everest Reinsurance Holdings Inc. | | 4.868% | | 6/1/44 | | | 100 | | | | 111 | |
| | | Fairfax Financial Holdings Ltd. | | 4.850% | | 4/17/28 | | | 50 | | | | 54 | |
| | | First American Financial Corp. | | 4.600% | | 11/15/24 | | | 100 | | | | 106 | |
| | | Globe Life Inc. | | 3.800% | | 9/15/22 | | | 50 | | | | 51 | |
| | | Globe Life Inc. | | 4.550% | | 9/15/28 | | | 80 | | | | 89 | |
| | | Hanover Insurance Group Inc. | | 4.500% | | 4/15/26 | | | 100 | | | | 108 | |
| | | Hartford Financial Services Group Inc. | | 2.800% | | 8/19/29 | | | 100 | | | | 101 | |
| | | Hartford Financial Services Group Inc. | | 5.950% | | 10/15/36 | | | 50 | | | | 65 | |
| | | Hartford Financial Services Group Inc. | | 6.100% | | 10/1/41 | | | 100 | | | | 137 | |
| | | Hartford Financial Services Group Inc. | | 4.300% | | 4/15/43 | | | 175 | | | | 195 | |
| | | Hartford Financial Services Group Inc. | | 3.600% | | 8/19/49 | | | 125 | | | | 128 | |
| | | Humana Inc. | | 2.900% | | 12/15/22 | | | 150 | | | | 153 | |
| | | Humana Inc. | | 3.850% | | 10/1/24 | | | 326 | | | | 346 | |
| | | Humana Inc. | | 3.950% | | 3/15/27 | | | 150 | | | | 161 | |
| | | Humana Inc. | | 4.625% | | 12/1/42 | | | 110 | | | | 120 | |
| | | Humana Inc. | | 4.950% | | 10/1/44 | | | 200 | | | | 236 | |
| | | Kemper Corp. | | 4.350% | | 2/15/25 | | | 40 | | | | 42 | |
| | | Lincoln National Corp. | | 4.850% | | 6/24/21 | | | 47 | | | | 49 | |
| | | Lincoln National Corp. | | 4.200% | | 3/15/22 | | | 50 | | | | 52 | |
| | | Lincoln National Corp. | | 4.000% | | 9/1/23 | | | 50 | | | | 53 | |
| | | Lincoln National Corp. | | 3.625% | | 12/12/26 | | | 75 | | | | 79 | |
| | | Lincoln National Corp. | | 3.800% | | 3/1/28 | | | 100 | | | | 106 | |
| | | Lincoln National Corp. | | 3.050% | | 1/15/30 | | | 350 | | | | 348 | |
| | | Lincoln National Corp. | | 6.300% | | 10/9/37 | | | 75 | | | | 97 | |
| | | Lincoln National Corp. | | 7.000% | | 6/15/40 | | | 160 | | | | 227 | |
| | | Loews Corp. | | 2.625% | | 5/15/23 | | | 75 | | | | 76 | |
| | | Loews Corp. | | 6.000% | | 2/1/35 | | | 50 | | | | 64 | |
| | | Loews Corp. | | 4.125% | | 5/15/43 | | | 350 | | | | 384 | |
| | | Manulife Financial Corp. | | 4.150% | | 3/4/26 | | | 175 | | | | 191 | |
| 3 | | Manulife Financial Corp. | | 4.061% | | 2/24/32 | | | 190 | | | | 195 | |
| | | Manulife Financial Corp. | | 5.375% | | 3/4/46 | | | 200 | | | | 263 | |
| | | Markel Corp. | | 4.900% | | 7/1/22 | | | 125 | | | | 133 | |
| | | Markel Corp. | | 3.500% | | 11/1/27 | | | 50 | | | | 51 | |
| | | Markel Corp. | | 3.350% | | 9/17/29 | | | 75 | | | | 77 | |
| | | Markel Corp. | | 4.300% | | 11/1/47 | | | 50 | | | | 52 | |
| | | Markel Corp. | | 5.000% | | 5/20/49 | | | 50 | | | | 58 | |
| | | Markel Corp. | | 4.150% | | 9/17/50 | | | 200 | | | | 206 | |
| | | Marsh & McLennan Cos. Inc. | | 4.800% | | 7/15/21 | | | 295 | | | | 306 | |
| | | Marsh & McLennan Cos. Inc. | | 3.300% | | 3/14/23 | | | 75 | | | | 77 | |
| | | Marsh & McLennan Cos. Inc. | | 3.500% | | 6/3/24 | | | 100 | | | | 105 | |
| | | Marsh & McLennan Cos. Inc. | | 3.500% | | 3/10/25 | | | 100 | | | | 105 | |
| | | Marsh & McLennan Cos. Inc. | | 3.750% | | 3/14/26 | | | 100 | | | | 107 | |
| | | Marsh & McLennan Cos. Inc. | | 4.375% | | 3/15/29 | | | 325 | | | | 370 | |
| | | Marsh & McLennan Cos. Inc. | | 4.350% | | 1/30/47 | | | 100 | | | | 113 | |
Total Bond Market Index Portfolio
| | | | | | | | | Face | | | Market | |
| | | | | | | Maturity | | Amount | | | Value• | |
| | | | | Coupon | | Date | | | ($000 | ) | | | ($000 | ) |
| | | Marsh & McLennan Cos. Inc. | | 4.200% | | 3/1/48 | | | 200 | | | | 225 | |
| | | Marsh & McLennan Cos. Inc. | | 4.900% | | 3/15/49 | | | 200 | | | | 253 | |
| | | Mercury General Corp. | | 4.400% | | 3/15/27 | | | 75 | | | | 79 | |
| | | MetLife Inc. | | 3.048% | | 12/15/22 | | | 225 | | | | 233 | |
| | | MetLife Inc. | | 3.600% | | 4/10/24 | | | 175 | | | | 186 | |
| | | MetLife Inc. | | 3.000% | | 3/1/25 | | | 250 | | | | 260 | |
| | | MetLife Inc. | | 3.600% | | 11/13/25 | | | 400 | | | | 429 | |
| | | MetLife Inc. | | 6.500% | | 12/15/32 | | | 175 | | | | 242 | |
| | | MetLife Inc. | | 6.375% | | 6/15/34 | | | 100 | | | | 143 | |
| | | MetLife Inc. | | 5.875% | | 2/6/41 | | | 590 | | | | 799 | |
| | | MetLife Inc. | | 4.125% | | 8/13/42 | | | 175 | | | | 198 | |
| | | MetLife Inc. | | 4.875% | | 11/13/43 | | | 175 | | | | 217 | |
| | | MetLife Inc. | | 4.721% | | 12/15/44 | | | 63 | | | | 76 | |
| | | MetLife Inc. | | 4.600% | | 5/13/46 | | | 70 | | | | 86 | |
| 3 | | MetLife Inc. | | 6.400% | | 12/15/66 | | | 210 | | | | 256 | |
| | | Old Republic International Corp. | | 4.875% | | 10/1/24 | | | 121 | | | | 132 | |
| | | Old Republic International Corp. | | 3.875% | | 8/26/26 | | | 100 | | | | 106 | |
| | | PartnerRe Finance B LLC | | 3.700% | | 7/2/29 | | | 95 | | | | 99 | |
| | | Primerica Inc. | | 4.750% | | 7/15/22 | | | 125 | | | | 132 | |
| | | Principal Financial Group Inc. | | 3.300% | | 9/15/22 | | | 50 | | | | 52 | |
| | | Principal Financial Group Inc. | | 3.125% | | 5/15/23 | | | 100 | | | | 103 | |
| | | Principal Financial Group Inc. | | 3.400% | | 5/15/25 | | | 75 | | | | 79 | |
| | | Principal Financial Group Inc. | | 3.100% | | 11/15/26 | | | 100 | | | | 103 | |
| | | Principal Financial Group Inc. | | 4.625% | | 9/15/42 | | | 50 | | | | 57 | |
| | | Principal Financial Group Inc. | | 4.350% | | 5/15/43 | | | 50 | | | | 56 | |
| | | Principal Financial Group Inc. | | 4.300% | | 11/15/46 | | | 75 | | | | 85 | |
| | | Progressive Corp. | | 3.750% | | 8/23/21 | | | 75 | | | | 77 | |
| | | Progressive Corp. | | 2.450% | | 1/15/27 | | | 150 | | | | 151 | |
| | | Progressive Corp. | | 6.625% | | 3/1/29 | | | 125 | | | | 162 | |
| | | Progressive Corp. | | 4.350% | | 4/25/44 | | | 50 | | | | 59 | |
| | | Progressive Corp. | | 4.125% | | 4/15/47 | | | 290 | | | | 338 | |
| | | Progressive Corp. | | 4.200% | | 3/15/48 | | | 115 | | | | 132 | |
| | | Prudential Financial Inc. | | 4.500% | | 11/16/21 | | | 75 | | | | 79 | |
| | | Prudential Financial Inc. | | 3.500% | | 5/15/24 | | | 125 | | | | 133 | |
| | | Prudential Financial Inc. | | 5.750% | | 7/15/33 | | | 100 | | | | 127 | |
| | | Prudential Financial Inc. | | 5.700% | | 12/14/36 | | | 125 | | | | 170 | |
| | | Prudential Financial Inc. | | 6.625% | | 12/1/37 | | | 65 | | | | 90 | |
| | | Prudential Financial Inc. | | 6.625% | | 6/21/40 | | | 65 | | | | 91 | |
| 3 | | Prudential Financial Inc. | | 5.875% | | 9/15/42 | | | 125 | | | | 135 | |
| 3 | | Prudential Financial Inc. | | 5.625% | | 6/15/43 | | | 375 | | | | 403 | |
| | | Prudential Financial Inc. | | 5.100% | | 8/15/43 | | | 50 | | | | 59 | |
| 3 | | Prudential Financial Inc. | | 5.200% | | 3/15/44 | | | 85 | | | | 90 | |
| | | Prudential Financial Inc. | | 4.600% | | 5/15/44 | | | 525 | | | | 619 | |
| 3 | | Prudential Financial Inc. | | 5.375% | | 5/15/45 | | | 250 | | | | 266 | |
| | | Prudential Financial Inc. | | 3.905% | | 12/7/47 | | | 182 | | | | 194 | |
| 3 | | Prudential Financial Inc. | | 5.700% | | 9/15/48 | | | 250 | | | | 284 | |
| | | Prudential Financial Inc. | | 3.935% | | 12/7/49 | | | 263 | | | | 287 | |
| | | Prudential Financial Inc. | | 4.350% | | 2/25/50 | | | 200 | | | | 230 | |
| | | Reinsurance Group of America Inc. | | 5.000% | | 6/1/21 | | | 75 | | | | 78 | |
| | | Reinsurance Group of America Inc. | | 4.700% | | 9/15/23 | | | 75 | | | | 81 | |
| | | Reinsurance Group of America Inc. | | 3.900% | | 5/15/29 | | | 50 | | | | 53 | |
| | | RenaissanceRe Finance Inc. | | 3.450% | | 7/1/27 | | | 75 | | | | 78 | |
| | | RenaissanceRe Holdings Ltd. | | 3.600% | | 4/15/29 | | | 75 | | | | 79 | |
| | | Selective Insurance Group Inc. | | 5.375% | | 3/1/49 | | | 50 | | | | 59 | |
| | | Sompo International Holdings Ltd. | | 4.700% | | 10/15/22 | | | 100 | | | | 106 | |
| | | Swiss Re Solutions Holding Corp. | | 7.000% | | 2/15/26 | | | 75 | | | | 93 | |
| | | Travelers Cos. Inc. | | 6.250% | | 6/15/37 | | | 150 | | | | 207 | |
| | | Travelers Cos. Inc. | | 4.300% | | 8/25/45 | | | 150 | | | | 176 | |
| | | Travelers Cos. Inc. | | 4.000% | | 5/30/47 | | | 125 | | | | 140 | |
| | | Travelers Cos. Inc. | | 4.100% | | 3/4/49 | | | 200 | | | | 232 | |
| | | Trinity Acquisition plc | | 4.400% | | 3/15/26 | | | 100 | | | | 108 | |
| | | UnitedHealth Group Inc. | | 4.700% | | 2/15/21 | | | 75 | | | | 77 | |
| | | UnitedHealth Group Inc. | | 2.125% | | 3/15/21 | | | 225 | | | | 225 | |
| | | UnitedHealth Group Inc. | | 3.375% | | 11/15/21 | | | 100 | | | | 102 | |
| | | UnitedHealth Group Inc. | | 2.875% | | 12/15/21 | | | 125 | | | | 127 | |
| | | UnitedHealth Group Inc. | | 3.350% | | 7/15/22 | | | 180 | | | | 186 | |
| | | UnitedHealth Group Inc. | | 2.375% | | 10/15/22 | | | 150 | | | | 152 | |
| | | UnitedHealth Group Inc. | | 2.750% | | 2/15/23 | | | 175 | | | | 178 | |
| | | UnitedHealth Group Inc. | | 2.875% | | 3/15/23 | | | 25 | | | | 26 | |
| | | UnitedHealth Group Inc. | | 3.500% | | 6/15/23 | | | 100 | | | | 105 | |
| | | UnitedHealth Group Inc. | | 3.500% | | 2/15/24 | | | 100 | | | | 105 | |
| | | UnitedHealth Group Inc. | | 2.375% | | 8/15/24 | | | 300 | | | | 304 | |
| | | UnitedHealth Group Inc. | | 3.750% | | 7/15/25 | | | 950 | | | | 1,026 | |
| | | UnitedHealth Group Inc. | | 3.700% | | 12/15/25 | | | 75 | | | | 81 | |
| | | UnitedHealth Group Inc. | | 3.100% | | 3/15/26 | | | 225 | | | | 235 | |
| | | UnitedHealth Group Inc. | | 3.450% | | 1/15/27 | | | 75 | | | | 80 | |
| | | UnitedHealth Group Inc. | | 3.375% | | 4/15/27 | | | 350 | | | | 372 | |
| | | UnitedHealth Group Inc. | | 2.950% | | 10/15/27 | | | 150 | | | | 155 | |
| | | UnitedHealth Group Inc. | | 3.850% | | 6/15/28 | | | 400 | | | | 438 | |
| | | UnitedHealth Group Inc. | | 3.875% | | 12/15/28 | | | 150 | | | | 165 | |
| | | UnitedHealth Group Inc. | | 2.875% | | 8/15/29 | | | 100 | | | | 102 | |
| | | UnitedHealth Group Inc. | | 4.625% | | 7/15/35 | | | 175 | | | | 212 | |
| | | UnitedHealth Group Inc. | | 6.500% | | 6/15/37 | | | 50 | | | | 71 | |
| | | UnitedHealth Group Inc. | | 6.625% | | 11/15/37 | | | 125 | | | | 178 | |
| | | UnitedHealth Group Inc. | | 6.875% | | 2/15/38 | | | 245 | | | | 363 | |
| | | UnitedHealth Group Inc. | | 3.500% | | 8/15/39 | | | 240 | | | | 251 | |
| | | UnitedHealth Group Inc. | | 5.950% | | 2/15/41 | | | 60 | | | | 81 | |
| | | UnitedHealth Group Inc. | | 4.625% | | 11/15/41 | | | 110 | | | | 130 | |
| | | UnitedHealth Group Inc. | | 4.375% | | 3/15/42 | | | 50 | | | | 57 | |
| | | UnitedHealth Group Inc. | | 3.950% | | 10/15/42 | | | 175 | | | | 191 | |
| | | UnitedHealth Group Inc. | | 4.250% | | 3/15/43 | | | 125 | | | | 142 | |
| | | UnitedHealth Group Inc. | | 4.750% | | 7/15/45 | | | 305 | | | | 372 | |
| | | UnitedHealth Group Inc. | | 4.200% | | 1/15/47 | | | 210 | | | | 241 | |
| | | UnitedHealth Group Inc. | | 4.250% | | 4/15/47 | | | 100 | | | | 115 | |
| | | UnitedHealth Group Inc. | | 3.750% | | 10/15/47 | | | 350 | | | | 373 | |
| | | UnitedHealth Group Inc. | | 4.250% | | 6/15/48 | | | 300 | | | | 348 | |
| | | UnitedHealth Group Inc. | | 4.450% | | 12/15/48 | | | 150 | | | | 178 | |
| | | UnitedHealth Group Inc. | | 3.700% | | 8/15/49 | | | 190 | | | | 202 | |
| | | UnitedHealth Group Inc. | | 3.875% | | 8/15/59 | | | 240 | | | | 258 | |
| | | Unum Group | | 4.000% | | 3/15/24 | | | 125 | | | | 132 | |
| | | Unum Group | | 4.000% | | 6/15/29 | | | 80 | | | | 84 | |
| | | Unum Group | | 5.750% | | 8/15/42 | | | 25 | | | | 28 | |
| | | Unum Group | | 4.500% | | 12/15/49 | | | 100 | | | | 97 | |
| | | Voya Financial Inc. | | 3.125% | | 7/15/24 | | | 100 | | | | 103 | |
| | | Voya Financial Inc. | | 3.650% | | 6/15/26 | | | 250 | | | | 263 | |
| | | Voya Financial Inc. | | 5.700% | | 7/15/43 | | | 75 | | | | 95 | |
| | | Voya Financial Inc. | | 4.800% | | 6/15/46 | | | 40 | | | | 46 | |
| | | Willis North America Inc. | | 3.600% | | 5/15/24 | | | 125 | | | | 130 | |
| | | Willis North America Inc. | | 4.500% | | 9/15/28 | | | 100 | | | | 110 | |
| | | Willis North America Inc. | | 2.950% | | 9/15/29 | | | 940 | | | | 933 | |
| | | Willis North America Inc. | | 5.050% | | 9/15/48 | | | 50 | | | | 58 | |
| | | Willis North America Inc. | | 3.875% | | 9/15/49 | | | 540 | | | | 538 | |
| | | XLIT Ltd. | | 4.450% | | 3/31/25 | | | 50 | | | | 54 | |
| | | XLIT Ltd. | | 5.500% | | 3/31/45 | | | 100 | | | | 126 | |
| | | | | | | | | | | | | | | |
| | | Other Finance (0.0%) | | | | | | | | | | | | |
| | | ORIX Corp. | | 2.900% | | 7/18/22 | | | 50 | | | | 51 | |
| | | ORIX Corp. | | 3.250% | | 12/4/24 | | | 75 | | | | 78 | |
| | | ORIX Corp. | | 3.700% | | 7/18/27 | | | 200 | | | | 211 | |
| | | | | | | | | | | | | | | |
| | | Real Estate Investment Trusts (0.8%) | | | | | | | | | | | | |
| | | Alexandria Real Estate Equities Inc. | | 4.000% | | 1/15/24 | | | 175 | | | | 186 | |
| | | Alexandria Real Estate Equities Inc. | | 3.450% | | 4/30/25 | | | 125 | | | | 131 | |
| | | Alexandria Real Estate Equities Inc. | | 3.800% | | 4/15/26 | | | 50 | | | | 53 | |
| | | Alexandria Real Estate Equities Inc. | | 3.950% | | 1/15/27 | | | 50 | | | | 53 | |
| | | Alexandria Real Estate Equities Inc. | | 3.950% | | 1/15/28 | | | 50 | | | | 54 | |
| | | Alexandria Real Estate Equities Inc. | | 4.500% | | 7/30/29 | | | 100 | | | | 113 | |
| | | Alexandria Real Estate Equities Inc. | | 2.750% | | 12/15/29 | | | 200 | | | | 197 | |
| | | Alexandria Real Estate Equities Inc. | | 4.700% | | 7/1/30 | | | 125 | | | | 143 | |
| | | Alexandria Real Estate Equities Inc. | | 3.375% | | 8/15/31 | | | 150 | | | | 156 | |
| | | Alexandria Real Estate Equities Inc. | | 4.850% | | 4/15/49 | | | 50 | | | | 61 | |
| | | Alexandria Real Estate Equities Inc. | | 4.000% | | 2/1/50 | | | 125 | | | | 137 | |
| | | American Campus Communities Operating Partnership LP | | 3.750% | | 4/15/23 | | | 75 | | | | 78 | |
| | | American Campus Communities Operating Partnership LP | | 4.125% | | 7/1/24 | | | 100 | | | | 107 | |
| | | American Campus Communities Operating Partnership LP | | 3.300% | | 7/15/26 | | | 50 | | | | 52 | |
| | | American Campus Communities Operating Partnership LP | | 3.625% | | 11/15/27 | | | 75 | | | | 78 | |
| | | American Homes 4 Rent LP | | 4.900% | | 2/15/29 | | | 100 | | | | 112 | |
| | | AvalonBay Communities Inc. | | 2.850% | | 3/15/23 | | | 25 | | | | 26 | |
Total Bond Market Index Portfolio
| | | | | | | | | Face | | | Market | |
| | | | | | | Maturity | | Amount | | | Value• | |
| | | | | Coupon | | Date | | | ($000 | ) | | | ($000 | ) |
| | AvalonBay Communities Inc. | | 4.200% | | 12/15/23 | | | 400 | | | | 429 | |
| | | AvalonBay Communities Inc. | | 3.450% | | 6/1/25 | | | 100 | | | | 105 | |
| | | AvalonBay Communities Inc. | | 2.950% | | 5/11/26 | | | 150 | | | | 154 | |
| | | AvalonBay Communities Inc. | | 2.900% | | 10/15/26 | | | 50 | | | | 51 | |
| | | AvalonBay Communities Inc. | | 3.350% | | 5/15/27 | | | 75 | | | | 79 | |
| | | AvalonBay Communities Inc. | | 3.200% | | 1/15/28 | | | 75 | | | | 78 | |
| | | AvalonBay Communities Inc. | | 3.300% | | 6/1/29 | | | 70 | | | | 74 | |
| | | AvalonBay Communities Inc. | | 4.350% | | 4/15/48 | | | 60 | | | | 71 | |
| | | Boston Properties LP | | 4.125% | | 5/15/21 | | | 75 | | | | 77 | |
| | | Boston Properties LP | | 3.850% | | 2/1/23 | | | 225 | | | | 236 | |
| | | Boston Properties LP | | 3.125% | | 9/1/23 | | | 275 | | | | 283 | |
| | | Boston Properties LP | | 3.200% | | 1/15/25 | | | 100 | | | | 104 | |
| | | Boston Properties LP | | 3.650% | | 2/1/26 | | | 100 | | | | 106 | |
| | | Boston Properties LP | | 2.750% | | 10/1/26 | | | 50 | | | | 50 | |
| | | Boston Properties LP | | 2.900% | | 3/15/30 | | | 100 | | | | 100 | |
| | | Brandywine Operating Partnership LP | | 3.950% | | 2/15/23 | | | 700 | | | | 727 | |
| | | Brandywine Operating Partnership LP | | 3.950% | | 11/15/27 | | | 100 | | | | 105 | |
| | | Brixmor Operating Partnership LP | | 3.875% | | 8/15/22 | | | 150 | | | | 156 | |
| | | Brixmor Operating Partnership LP | | 3.650% | | 6/15/24 | | | 50 | | | | 52 | |
| | | Brixmor Operating Partnership LP | | 3.850% | | 2/1/25 | | | 125 | | | | 131 | |
| | | Brixmor Operating Partnership LP | | 4.125% | | 6/15/26 | | | 200 | | | | 212 | |
| | | Brixmor Operating Partnership LP | | 3.900% | | 3/15/27 | | | 75 | | | | 78 | |
| | | Brixmor Operating Partnership LP | | 4.125% | | 5/15/29 | | | 533 | | | | 571 | |
| | | Camden Property Trust | | 4.100% | | 10/15/28 | | | 60 | | | | 67 | |
| | | Camden Property Trust | | 3.150% | | 7/1/29 | | | 50 | | | | 52 | |
| | | Camden Property Trust | | 3.350% | | 11/1/49 | | | 120 | | | | 120 | |
| | | Columbia Property Trust Operating Partnership LP | | 4.150% | | 4/1/25 | | | 100 | | | | 105 | |
| | | Columbia Property Trust Operating Partnership LP | | 3.650% | | 8/15/26 | | | 25 | | | | 25 | |
| | | Corporate Office Properties LP | | 3.700% | | 6/15/21 | | | 50 | | | | 51 | |
| | | Corporate Office Properties LP | | 3.600% | | 5/15/23 | | | 150 | | | | 154 | |
| | | CubeSmart LP | | 4.375% | | 12/15/23 | | | 100 | | | | 106 | |
| | | CubeSmart LP | | 4.000% | | 11/15/25 | | | 50 | | | | 53 | |
| | | CubeSmart LP | | 3.125% | | 9/1/26 | | | 100 | | | | 101 | |
| | | CubeSmart LP | | 4.375% | | 2/15/29 | | | 50 | | | | 55 | |
| | | CubeSmart LP | | 3.000% | | 2/15/30 | | | 75 | | | | 74 | |
| | | CyrusOne LP / CyrusOne Finance Corp. | | 2.900% | | 11/15/24 | | | 120 | | | | 120 | |
| | | CyrusOne LP / CyrusOne Finance Corp. | | 3.450% | | 11/15/29 | | | 350 | | | | 350 | |
| | | Digital Realty Trust LP | | 3.950% | | 7/1/22 | | | 75 | | | | 78 | |
| | | Digital Realty Trust LP | | 3.625% | | 10/1/22 | | | 975 | | | | 1,008 | |
| | | Digital Realty Trust LP | | 3.700% | | 8/15/27 | | | 200 | | | | 210 | |
| | | Digital Realty Trust LP | | 4.450% | | 7/15/28 | | | 200 | | | | 221 | |
| | | Digital Realty Trust LP | | 3.600% | | 7/1/29 | | | 175 | | | | 183 | |
| | | Duke Realty LP | | 3.250% | | 6/30/26 | | | 175 | | | | 180 | |
| | | Duke Realty LP | | 3.375% | | 12/15/27 | | | 160 | | | | 167 | |
| | | Duke Realty LP | | 4.000% | | 9/15/28 | | | 50 | | | | 54 | |
| | | Duke Realty LP | | 2.875% | | 11/15/29 | | | 70 | | | | 70 | |
| | | EPR Properties | | 5.250% | | 7/15/23 | | | 125 | | | | 134 | |
| | | EPR Properties | | 4.500% | | 4/1/25 | | | 50 | | | | 53 | |
| | | EPR Properties | | 4.750% | | 12/15/26 | | | 100 | | | | 108 | |
| | | EPR Properties | | 4.950% | | 4/15/28 | | | 150 | | | | 163 | |
| | | EPR Properties | | 3.750% | | 8/15/29 | | | 100 | | | | 101 | |
| | | ERP Operating LP | | 4.625% | | 12/15/21 | | | 129 | | | | 135 | |
| | | ERP Operating LP | | 3.000% | | 4/15/23 | | | 125 | | | | 129 | |
| | | ERP Operating LP | | 3.375% | | 6/1/25 | | | 125 | | | | 131 | |
| | | ERP Operating LP | | 2.850% | | 11/1/26 | | | 50 | | | | 51 | |
| | | ERP Operating LP | | 3.500% | | 3/1/28 | | | 100 | | | | 106 | |
| | | ERP Operating LP | | 4.150% | | 12/1/28 | | | 70 | | | | 78 | |
| | | ERP Operating LP | | 3.000% | | 7/1/29 | | | 75 | | | | 77 | |
| | | ERP Operating LP | | 2.500% | | 2/15/30 | | | 150 | | | | 148 | |
| | | ERP Operating LP | | 4.500% | | 7/1/44 | | | 150 | | | | 177 | |
| | | ERP Operating LP | | 4.500% | | 6/1/45 | | | 25 | | | | 30 | |
| | | ERP Operating LP | | 4.000% | | 8/1/47 | | | 100 | | | | 110 | |
| | | Essex Portfolio LP | | 5.200% | | 3/15/21 | | | 50 | | | | 51 | |
| | | Essex Portfolio LP | | 3.250% | | 5/1/23 | | | 25 | | | | 26 | |
| | | Essex Portfolio LP | | 3.875% | | 5/1/24 | | | 50 | | | | 53 | |
| | | Essex Portfolio LP | | 3.500% | | 4/1/25 | | | 100 | | | | 105 | |
| | | Essex Portfolio LP | | 3.375% | | 4/15/26 | | | 100 | | | | 104 | |
| | | Essex Portfolio LP | | 3.625% | | 5/1/27 | | | 100 | | | | 106 | |
| | | Essex Portfolio LP | | 4.000% | | 3/1/29 | | | 100 | | | | 109 | |
| | | Essex Portfolio LP | | 3.000% | | 1/15/30 | | | 110 | | | | 111 | |
| | | Essex Portfolio LP | | 4.500% | | 3/15/48 | | | 120 | | | | 137 | |
| | | Federal Realty Investment Trust | | 2.750% | | 6/1/23 | | | 25 | | | | 25 | |
| | | Federal Realty Investment Trust | | 3.250% | | 7/15/27 | | | 50 | | | | 52 | |
| | | Federal Realty Investment Trust | | 3.200% | | 6/15/29 | | | 25 | | | | 26 | |
| | | Federal Realty Investment Trust | | 4.500% | | 12/1/44 | | | 150 | | | | 172 | |
| | | Healthcare Realty Trust Inc. | | 3.625% | | 1/15/28 | | | 100 | | | | 103 | |
| | | Healthcare Trust of America Holdings LP | | 3.700% | | 4/15/23 | | | 25 | | | | 26 | |
| | | Healthcare Trust of America Holdings LP | | 3.500% | | 8/1/26 | | | 130 | | | | 136 | |
| | | Healthcare Trust of America Holdings LP | | 3.750% | | 7/1/27 | | | 100 | | | | 105 | |
| | | Healthcare Trust of America Holdings LP | | 3.100% | | 2/15/30 | | | 100 | | | | 99 | |
| | | Healthpeak Properties Inc. | | 3.150% | | 8/1/22 | | | 75 | | | | 76 | |
| | | Healthpeak Properties Inc. | | 4.250% | | 11/15/23 | | | 184 | | | | 196 | |
| | | Healthpeak Properties Inc. | | 4.200% | | 3/1/24 | | | 125 | | | | 133 | |
| | | Healthpeak Properties Inc. | | 3.400% | | 2/1/25 | | | 75 | | | | 78 | |
| | | Healthpeak Properties Inc. | | 3.250% | | 7/15/26 | | | 25 | | | | 26 | |
| | | Healthpeak Properties Inc. | | 3.500% | | 7/15/29 | | | 125 | | | | 130 | |
| | | Healthpeak Properties Inc. | | 3.000% | | 1/15/30 | | | 150 | | | | 150 | |
| | | Healthpeak Properties Inc. | | 6.750% | | 2/1/41 | | | 100 | | | | 139 | |
| | | Highwoods Realty LP | | 3.200% | | 6/15/21 | | | 100 | | | | 101 | |
| | | Highwoods Realty LP | | 4.125% | | 3/15/28 | | | 75 | | | | 79 | |
| | | Highwoods Realty LP | | 4.200% | | 4/15/29 | | | 50 | | | | 54 | |
| | | Host Hotels & Resorts LP | | 4.750% | | 3/1/23 | | | 50 | | | | 53 | |
| | | Host Hotels & Resorts LP | | 3.750% | | 10/15/23 | | | 261 | | | | 272 | |
| | | Host Hotels & Resorts LP | | 3.875% | | 4/1/24 | | | 75 | | | | 79 | |
| | | Host Hotels & Resorts LP | | 4.000% | | 6/15/25 | | | 50 | | | | 53 | |
| | | Host Hotels & Resorts LP | | 3.375% | | 12/15/29 | | | 100 | | | | 101 | |
| | | Hudson Pacific Properties LP | | 3.950% | | 11/1/27 | | | 100 | | | | 105 | |
| | | Hudson Pacific Properties LP | | 4.650% | | 4/1/29 | | | 25 | | | | 27 | |
| | | Hudson Pacific Properties LP | | 3.250% | | 1/15/30 | | | 60 | | | | 59 | |
| | | Kilroy Realty LP | | 3.800% | | 1/15/23 | | | 250 | | | | 260 | |
| | | Kilroy Realty LP | | 3.450% | | 12/15/24 | | | 50 | | | | 52 | |
| | | Kilroy Realty LP | | 4.750% | | 12/15/28 | | | 50 | | | | 56 | |
| | | Kilroy Realty LP | | 4.250% | | 8/15/29 | | | 104 | | | | 113 | |
| | | Kilroy Realty LP | | 3.050% | | 2/15/30 | | | 200 | | | | 197 | |
| | | Kimco Realty Corp. | | 3.400% | | 11/1/22 | | | 150 | | | | 155 | |
| | | Kimco Realty Corp. | | 3.125% | | 6/1/23 | | | 25 | | | | 26 | |
| | | Kimco Realty Corp. | | 2.800% | | 10/1/26 | | | 125 | | | | 125 | |
| | | Kimco Realty Corp. | | 3.800% | | 4/1/27 | | | 75 | | | | 79 | |
| | | Kimco Realty Corp. | | 4.125% | | 12/1/46 | | | 50 | | | | 52 | |
| | | Kimco Realty Corp. | | 4.450% | | 9/1/47 | | | 50 | | | | 55 | |
| | | Kite Realty Group LP | | 4.000% | | 10/1/26 | | | 200 | | | | 198 | |
| | | Liberty Property LP | | 3.375% | | 6/15/23 | | | 50 | | | | 52 | |
| | | Liberty Property LP | | 4.400% | | 2/15/24 | | | 100 | | | | 108 | |
| | | Liberty Property LP | | 3.750% | | 4/1/25 | | | 75 | | | | 80 | |
| | | Liberty Property LP | | 4.375% | | 2/1/29 | | | 200 | | | | 225 | |
| | | Life Storage LP | | 3.500% | | 7/1/26 | | | 125 | | | | 128 | |
| | | Life Storage LP | | 3.875% | | 12/15/27 | | | 150 | | | | 157 | |
| | | Life Storage LP | | 4.000% | | 6/15/29 | | | 25 | | | | 27 | |
| | | Mid-America Apartments LP | | 4.300% | | 10/15/23 | | | 150 | | | | 160 | |
| | | Mid-America Apartments LP | | 3.750% | | 6/15/24 | | | 50 | | | | 53 | |
| | | Mid-America Apartments LP | | 3.600% | | 6/1/27 | | | 250 | | | | 265 | |
| | | Mid-America Apartments LP | | 2.750% | | 3/15/30 | | | 150 | | | | 149 | |
| | | National Retail Properties Inc. | | 3.800% | | 10/15/22 | | | 200 | | | | 208 | |
| | | National Retail Properties Inc. | | 3.500% | | 10/15/27 | | | 350 | | | | 365 | |
| | | National Retail Properties Inc. | | 4.300% | | 10/15/28 | | | 25 | | | | 28 | |
| | | National Retail Properties Inc. | | 4.800% | | 10/15/48 | | | 50 | | | | 60 | |
| | | Office Properties Income Trust | | 4.000% | | 7/15/22 | | | 100 | | | | 102 | |
| | | Omega Healthcare Investors Inc. | | 4.375% | | 8/1/23 | | | 300 | | | | 319 | |
| | | Omega Healthcare Investors Inc. | | 4.950% | | 4/1/24 | | | 100 | | | | 109 | |
| | | Omega Healthcare Investors Inc. | | 4.500% | | 1/15/25 | | | 100 | | | | 107 | |
| | | Omega Healthcare Investors Inc. | | 5.250% | | 1/15/26 | | | 100 | | | | 111 | |
| | | Omega Healthcare Investors Inc. | | 4.500% | | 4/1/27 | | | 300 | | | | 324 | |
| | | Omega Healthcare Investors Inc. | | 4.750% | | 1/15/28 | | | 70 | | | | 76 | |
| | | Omega Healthcare Investors Inc. | | 3.625% | | 10/1/29 | | | 250 | | | | 251 | |
| | | Physicians Realty LP | | 4.300% | | 3/15/27 | | | 100 | | | | 106 | |
| | | Physicians Realty LP | | 3.950% | | 1/15/28 | | | 100 | | | | 103 | |
Total Bond Market Index Portfolio
| | | | | | | | | Face | | | Market | |
| | | | | | | Maturity | | Amount | | | Value• | |
| | | | | Coupon | | Date | | | ($000 | ) | | | ($000 | ) |
| | | Piedmont Operating Partnership LP | | 3.400% | | 6/1/23 | | | 75 | | | | 77 | |
| | | Prologis LP | | 3.875% | | 9/15/28 | | | 100 | | | | 110 | |
| | Prologis LP | | 4.375% | | 9/15/48 | | | 75 | | | | 90 | |
| | | Public Storage | | 2.370% | | 9/15/22 | | | 55 | | | | 56 | |
| | | Public Storage | | 3.094% | | 9/15/27 | | | 100 | | | | 104 | |
| | | Public Storage | | 3.385% | | 5/1/29 | | | 35 | | | | 37 | |
| | | Realty Income Corp. | | 3.250% | | 10/15/22 | | | 175 | | | | 180 | |
| | | Realty Income Corp. | | 3.875% | | 7/15/24 | | | 50 | | | | 53 | |
| | | Realty Income Corp. | | 3.875% | | 4/15/25 | | | 100 | | | | 108 | |
| | | Realty Income Corp. | | 4.125% | | 10/15/26 | | | 125 | | | | 137 | |
| | | Realty Income Corp. | | 3.000% | | 1/15/27 | | | 100 | | | | 103 | |
| | | Realty Income Corp. | | 3.650% | | 1/15/28 | | | 190 | | | | 204 | |
| | | Realty Income Corp. | | 3.250% | | 6/15/29 | | | 200 | | | | 212 | |
| | | Realty Income Corp. | | 4.650% | | 3/15/47 | | | 175 | | | | 211 | |
| | | Regency Centers LP | | 3.600% | | 2/1/27 | | | 25 | | | | 26 | |
| | | Regency Centers LP | | 4.125% | | 3/15/28 | | | 75 | | | | 81 | |
| | | Regency Centers LP | | 2.950% | | 9/15/29 | | | 100 | | | | 100 | |
| | | Regency Centers LP | | 4.400% | | 2/1/47 | | | 200 | | | | 225 | |
| | | Regency Centers LP | | 4.650% | | 3/15/49 | | | 75 | | | | 89 | |
| | | Sabra Health Care LP | | 5.125% | | 8/15/26 | | | 25 | | | | 27 | |
| | | Sabra Health Care LP | | 3.900% | | 10/15/29 | | | 150 | | | | 150 | |
| | | Sabra Health Care LP / Sabra Capital Corp. | | 4.800% | | 6/1/24 | | | 55 | | | | 58 | |
| | | Select Income REIT | | 4.150% | | 2/1/22 | | | 100 | | | | 102 | |
| | | Select Income REIT | | 4.250% | | 5/15/24 | | | 100 | | | | 104 | |
| | | Select Income REIT | | 4.500% | | 2/1/25 | | | 50 | | | | 52 | |
| | | Service Properties Trust | | 4.650% | | 3/15/24 | | | 140 | | | | 145 | |
| | | Service Properties Trust | | 4.350% | | 10/1/24 | | | 112 | | | | 115 | |
| | | Service Properties Trust | | 5.250% | | 2/15/26 | | | 100 | | | | 105 | |
| | | Service Properties Trust | | 4.750% | | 10/1/26 | | | 80 | | | | 82 | |
| | | Service Properties Trust | | 4.950% | | 2/15/27 | | | 100 | | | | 103 | |
| | | Service Properties Trust | | 3.950% | | 1/15/28 | | | 75 | | | | 73 | |
| | | Service Properties Trust | | 4.950% | | 10/1/29 | | | 360 | | | | 362 | |
| | | Service Properties Trust | | 4.375% | | 2/15/30 | | | 75 | | | | 74 | |
| | | Simon Property Group LP | | 2.500% | | 7/15/21 | | | 120 | | | | 121 | |
| | | Simon Property Group LP | | 2.350% | | 1/30/22 | | | 150 | | | | 151 | |
| | | Simon Property Group LP | | 2.625% | | 6/15/22 | | | 100 | | | | 101 | |
| | | Simon Property Group LP | | 2.750% | | 2/1/23 | | | 25 | | | | 25 | |
| | | Simon Property Group LP | | 2.750% | | 6/1/23 | | | 100 | | | | 102 | |
| | | Simon Property Group LP | | 3.750% | | 2/1/24 | | | 150 | | | | 159 | |
| | | Simon Property Group LP | | 2.000% | | 9/13/24 | | | 145 | | | | 143 | |
| | | Simon Property Group LP | | 3.500% | | 9/1/25 | | | 100 | | | | 106 | |
| | | Simon Property Group LP | | 3.300% | | 1/15/26 | | | 195 | | | | 204 | |
| | | Simon Property Group LP | | 3.250% | | 11/30/26 | | | 75 | | | | 79 | |
| | | Simon Property Group LP | | 3.375% | | 6/15/27 | | | 160 | | | | 169 | |
| | | Simon Property Group LP | | 3.375% | | 12/1/27 | | | 100 | | | | 106 | |
| | | Simon Property Group LP | | 2.450% | | 9/13/29 | | | 145 | | | | 142 | |
| | | Simon Property Group LP | | 6.750% | | 2/1/40 | | | 125 | | | | 183 | |
| | | Simon Property Group LP | | 4.750% | | 3/15/42 | | | 100 | | | | 120 | |
| | | Simon Property Group LP | | 4.250% | | 11/30/46 | | | 100 | | | | 114 | |
| | | Simon Property Group LP | | 3.250% | | 9/13/49 | | | 250 | | | | 241 | |
| | | SITE Centers Corp. | | 4.625% | | 7/15/22 | | | 63 | | | | 66 | |
| | | SITE Centers Corp. | | 3.900% | | 8/15/24 | | | 100 | | | | 103 | |
| | | SITE Centers Corp. | | 3.625% | | 2/1/25 | | | 200 | | | | 206 | |
| | | SITE Centers Corp. | | 4.250% | | 2/1/26 | | | 70 | | | | 74 | |
| | | SITE Centers Corp. | | 4.700% | | 6/1/27 | | | 75 | | | | 81 | |
| | | SL Green Operating Partnership LP | | 3.250% | | 10/15/22 | | | 100 | | | | 102 | |
| | | Spirit Realty LP | | 3.200% | | 1/15/27 | | | 80 | | | | 80 | |
| | | Spirit Realty LP | | 4.000% | | 7/15/29 | | | 60 | | | | 63 | |
| | | Spirit Realty LP | | 3.400% | | 1/15/30 | | | 80 | | | | 80 | |
| | | STORE Capital Corp. | | 4.500% | | 3/15/28 | | | 75 | | | | 82 | |
| | | STORE Capital Corp. | | 4.625% | | 3/15/29 | | | 100 | | | | 110 | |
| | | Tanger Properties LP | | 3.125% | | 9/1/26 | | | 175 | | | | 174 | |
| | | Tanger Properties LP | | 3.875% | | 7/15/27 | | | 50 | | | | 51 | |
| | | UDR Inc. | | 2.950% | | 9/1/26 | | | 150 | | | | 152 | |
| | | UDR Inc. | | 3.500% | | 7/1/27 | | | 150 | | | | 157 | |
| | | UDR Inc. | | 3.500% | | 1/15/28 | | | 250 | | | | 262 | |
| | | UDR Inc. | | 3.200% | | 1/15/30 | | | 60 | | | | 61 | |
| | | UDR Inc. | | 3.000% | | 8/15/31 | | | 65 | | | | 65 | |
| | | UDR Inc. | | 3.100% | | 11/1/34 | | | 65 | | | | 65 | |
| | | Ventas Realty LP | | 3.125% | | 6/15/23 | | | 175 | | | | 179 | |
| | Ventas Realty LP | | 3.500% | | 4/15/24 | | | 75 | | | | 78 | |
| | | Ventas Realty LP | | 3.750% | | 5/1/24 | | | 200 | | | | 210 | |
| | | Ventas Realty LP | | 2.650% | | 1/15/25 | | | 75 | | | | 76 | |
| | | Ventas Realty LP | | 4.125% | | 1/15/26 | | | 75 | | | | 80 | |
| | | Ventas Realty LP | | 3.250% | | 10/15/26 | | | 75 | | | | 77 | |
| | | Ventas Realty LP | | 3.850% | | 4/1/27 | | | 50 | | | | 53 | |
| | | Ventas Realty LP | | 4.000% | | 3/1/28 | | | 125 | | | | 134 | |
| | | Ventas Realty LP | | 3.000% | | 1/15/30 | | | 100 | | | | 99 | |
| | | Ventas Realty LP | | 5.700% | | 9/30/43 | | | 75 | | | | 94 | |
| | | Ventas Realty LP | | 4.375% | | 2/1/45 | | | 60 | | | | 64 | |
| | | Ventas Realty LP | | 4.875% | | 4/15/49 | | | 50 | | | | 59 | |
| | | Ventas Realty LP / Ventas Capital Corp. | | 3.250% | | 8/15/22 | | | 200 | | | | 205 | |
| | | VEREIT Operating Partnership LP | | 4.600% | | 2/6/24 | | | 75 | | | | 81 | |
| | | VEREIT Operating Partnership LP | | 4.625% | | 11/1/25 | | | 75 | | | | 82 | |
| | | VEREIT Operating Partnership LP | | 3.950% | | 8/15/27 | | | 450 | | | | 472 | |
| | | VEREIT Operating Partnership LP | | 3.100% | | 12/15/29 | | | 150 | | | | 147 | |
| | | Vornado Realty LP | | 3.500% | | 1/15/25 | | | 100 | | | | 104 | |
| | | Washington REIT | | 3.950% | | 10/15/22 | | | 75 | | | | 77 | |
| | | Weingarten Realty Investors | | 3.375% | | 10/15/22 | | | 50 | | | | 51 | |
| | | Weingarten Realty Investors | | 3.500% | | 4/15/23 | | | 100 | | | | 103 | |
| | | Welltower Inc. | | 3.750% | | 3/15/23 | | | 75 | | | | 78 | |
| | | Welltower Inc. | | 3.950% | | 9/1/23 | | | 100 | | | | 105 | |
| | | Welltower Inc. | | 3.625% | | 3/15/24 | | | 75 | | | | 78 | |
| | | Welltower Inc. | | 4.000% | | 6/1/25 | | | 200 | | | | 215 | |
| | | Welltower Inc. | | 4.250% | | 4/1/26 | | | 150 | | | | 163 | |
| | | Welltower Inc. | | 2.700% | | 2/15/27 | | | 300 | | | | 301 | |
| | | Welltower Inc. | | 4.250% | | 4/15/28 | | | 125 | | | | 137 | |
| | | Welltower Inc. | | 4.125% | | 3/15/29 | | | 250 | | | | 272 | |
| | | Welltower Inc. | | 3.100% | | 1/15/30 | | | 75 | | | | 76 | |
| | | Welltower Inc. | | 6.500% | | 3/15/41 | | | 25 | | | | 33 | |
| | | Welltower Inc. | | 4.950% | | 9/1/48 | | | 75 | | | | 90 | |
| | | WP Carey Inc. | | 4.600% | | 4/1/24 | | | 125 | | | | 134 | |
| | | WP Carey Inc. | | 4.000% | | 2/1/25 | | | 50 | | | | 52 | |
| | | WP Carey Inc. | | 4.250% | | 10/1/26 | | | 75 | | | | 80 | |
| | | WP Carey Inc. | | 3.850% | | 7/15/29 | | | 50 | | | | 53 | |
| | | | | | | | | | | | | | 357,492 | |
| Industrial (16.2%) | | | | | | | | | | | | |
| | | Basic Industry (0.8%) | | | | | | | | | | | | |
| | | Air Products & Chemicals Inc. | | 3.000% | | 11/3/21 | | | 75 | | | | 77 | |
| | | Air Products & Chemicals Inc. | | 2.750% | | 2/3/23 | | | 50 | | | | 51 | |
| | | Air Products & Chemicals Inc. | | 3.350% | | 7/31/24 | | | 675 | | | | 710 | |
| | | Airgas Inc. | | 3.650% | | 7/15/24 | | | 825 | | | | 875 | |
| | | Albemarle Corp. | | 4.150% | | 12/1/24 | | | 132 | | | | 141 | |
| | | Albemarle Corp. | | 5.450% | | 12/1/44 | | | 75 | | | | 85 | |
| 6 | | Albemarle Wodgina Pty Ltd. | | 3.450% | | 11/15/29 | | | 40 | | | | 40 | |
| | | ArcelorMittal | | 3.600% | | 7/16/24 | | | 150 | | | | 154 | |
| | | ArcelorMittal | | 6.125% | | 6/1/25 | | | 200 | | | | 230 | |
| | | ArcelorMittal | | 4.550% | | 3/11/26 | | | 500 | | | | 530 | |
| | | ArcelorMittal | | 4.250% | | 7/16/29 | | | 50 | | | | 52 | |
| | | Barrick Gold Corp. | | 6.450% | | 10/15/35 | | | 75 | | | | 96 | |
| | | Barrick North America Finance LLC | | 5.700% | | 5/30/41 | | | 450 | | | | 541 | |
| | | Barrick North America Finance LLC | | 5.750% | | 5/1/43 | | | 150 | | | | 192 | |
| | | Barrick PD Australia Finance Pty Ltd. | | 5.950% | | 10/15/39 | | | 50 | | | | 63 | |
| | | BHP Billiton Finance USA Ltd. | | 2.875% | | 2/24/22 | | | 176 | | | | 179 | |
| | | BHP Billiton Finance USA Ltd. | | 3.850% | | 9/30/23 | | | 50 | | | | 53 | |
| | | BHP Billiton Finance USA Ltd. | | 4.125% | | 2/24/42 | | | 150 | | | | 170 | |
| | | BHP Billiton Finance USA Ltd. | | 5.000% | | 9/30/43 | | | 575 | | | | 733 | |
| | | Cabot Corp. | | 4.000% | | 7/1/29 | | | 55 | | | | 58 | |
| | | Celanese US Holdings LLC | | 3.500% | | 5/8/24 | | | 100 | | | | 103 | |
| | | Celulosa Arauco y Constitucion SA | | 3.875% | | 11/2/27 | | | 300 | | | | 303 | |
| | | Celulosa Arauco y Constitucion SA | | 5.500% | | 11/2/47 | | | 200 | | | | 207 | |
| | | Dow Chemical Co. | | 3.000% | | 11/15/22 | | | 225 | | | | 230 | |
| | | Dow Chemical Co. | | 3.150% | | 5/15/24 | | | 100 | | | | 103 | |
| | | Dow Chemical Co. | | 3.500% | | 10/1/24 | | | 275 | | | | 288 | |
| | | Dow Chemical Co. | | 4.550% | | 11/30/25 | | | 150 | | | | 165 | |
| | | Dow Chemical Co. | | 3.625% | | 5/15/26 | | | 100 | | | | 105 | |
| | | Dow Chemical Co. | | 4.800% | | 11/30/28 | | | 225 | | | | 255 | |
| | | Dow Chemical Co. | | 7.375% | | 11/1/29 | | | 25 | | | | 33 | |
| | | Dow Chemical Co. | | 4.250% | | 10/1/34 | | | 50 | | | | 55 | |
| | | Dow Chemical Co. | | 9.400% | | 5/15/39 | | | 350 | | | | 574 | |
| | | Dow Chemical Co. | | 5.250% | | 11/15/41 | | | 100 | | | | 116 | |
Total Bond Market Index Portfolio
| | | | | | | | | Face | | | Market | |
| | | | | | | Maturity | | Amount | | | Value• | |
| | | | | Coupon | | Date | | | ($000 | ) | | | ($000 | ) |
| | | Dow Chemical Co. | | 5.550% | | 11/30/48 | | | 300 | | | | 374 | |
| | | Dow Chemical Co. | | 4.800% | | 5/15/49 | | | 100 | | | | 115 | |
| | | DuPont de Nemours Inc. | | 4.205% | | 11/15/23 | | | 475 | | | | 508 | |
| | | DuPont de Nemours Inc. | | 4.493% | | 11/15/25 | | | 350 | | | | 385 | |
| | | DuPont de Nemours Inc. | | 4.725% | | 11/15/28 | | | 425 | | | | 482 | |
| | | DuPont de Nemours Inc. | | 5.319% | | 11/15/38 | | | 300 | | | | 356 | |
| | | DuPont de Nemours Inc. | | 5.419% | | 11/15/48 | | | 475 | | | | 585 | |
| | | Eastman Chemical Co. | | 3.600% | | 8/15/22 | | | 49 | | | | 51 | |
| | | Eastman Chemical Co. | | 4.800% | | 9/1/42 | | | 225 | | | | 245 | |
| | | Eastman Chemical Co. | | 4.650% | | 10/15/44 | | | 150 | | | | 163 | |
| | | Ecolab Inc. | | 4.350% | | 12/8/21 | | | 163 | | | | 171 | |
| | | Ecolab Inc. | | 2.375% | | 8/10/22 | | | 470 | | | | 474 | |
| | | Ecolab Inc. | | 2.700% | | 11/1/26 | | | 200 | | | | 205 | |
| | | Ecolab Inc. | | 3.250% | | 12/1/27 | | | 100 | | | | 105 | |
| | | Fibria Overseas Finance Ltd. | | 5.250% | | 5/12/24 | | | 300 | | | | 325 | |
| | | Fibria Overseas Finance Ltd. | | 4.000% | | 1/14/25 | | | 150 | | | | 155 | |
| | | FMC Corp. | | 3.950% | | 2/1/22 | | | 50 | | | | 52 | |
| | | FMC Corp. | | 4.100% | | 2/1/24 | | | 250 | | | | 263 | |
| | | FMC Corp. | | 3.200% | | 10/1/26 | | | 50 | | | | 51 | |
| | | FMC Corp. | | 3.450% | | 10/1/29 | | | 50 | | | | 52 | |
| | | FMC Corp. | | 4.500% | | 10/1/49 | | | 100 | | | | 110 | |
| | | Georgia-Pacific LLC | | 8.000% | | 1/15/24 | | | 250 | | | | 303 | |
| | | Georgia-Pacific LLC | | 7.375% | | 12/1/25 | | | 100 | | | | 126 | |
| | | Georgia-Pacific LLC | | 8.875% | | 5/15/31 | | | 250 | | | | 388 | |
| | | Huntsman International LLC | | 4.500% | | 5/1/29 | | | 75 | | | | 80 | |
| | | International Flavors & Fragrances Inc. | | 3.200% | | 5/1/23 | | | 25 | | | | 25 | |
| | | International Flavors & Fragrances Inc. | | 4.450% | | 9/26/28 | | | 50 | | | | 55 | |
| | | International Flavors & Fragrances Inc. | | 4.375% | | 6/1/47 | | | 90 | | | | 92 | |
| | | International Flavors & Fragrances Inc. | | 5.000% | | 9/26/48 | | | 100 | | | | 112 | |
| | | International Paper Co. | | 7.500% | | 8/15/21 | | | 306 | | | | 332 | |
| | | International Paper Co. | | 3.650% | | 6/15/24 | | | 100 | | | | 105 | |
| | | International Paper Co. | | 3.800% | | 1/15/26 | | | 75 | | | | 80 | |
| | | International Paper Co. | | 3.000% | | 2/15/27 | | | 200 | | | | 205 | |
| | | International Paper Co. | | 5.000% | | 9/15/35 | | | 100 | | | | 117 | |
| | | International Paper Co. | | 7.300% | | 11/15/39 | | | 100 | | | | 138 | |
| | | International Paper Co. | | 4.800% | | 6/15/44 | | | 200 | | | | 219 | |
| | | International Paper Co. | | 5.150% | | 5/15/46 | | | 200 | | | | 230 | |
| | | International Paper Co. | | 4.400% | | 8/15/47 | | | 200 | | | | 212 | |
| | | International Paper Co. | | 4.350% | | 8/15/48 | | | 200 | | | | 212 | |
| | | Kinross Gold Corp. | | 5.125% | | 9/1/21 | | | 50 | | | | 52 | |
| | | Kinross Gold Corp. | | 5.950% | | 3/15/24 | | | 75 | | | | 83 | |
| | | Kinross Gold Corp. | | 4.500% | | 7/15/27 | | | 25 | | | | 26 | |
| | | LYB International Finance BV | | 5.250% | | 7/15/43 | | | 200 | | | | 235 | |
| | | LYB International Finance II BV | | 3.500% | | 3/2/27 | | | 100 | | | | 105 | |
| | | LYB International Finance III LLC | | 4.200% | | 10/15/49 | | | 135 | | | | 140 | |
| | | LyondellBasell Industries NV | | 6.000% | | 11/15/21 | | | 175 | | | | 186 | |
| | | LyondellBasell Industries NV | | 5.750% | | 4/15/24 | | | 175 | | | | 197 | |
| | | LyondellBasell Industries NV | | 4.625% | | 2/26/55 | | | 425 | | | | 448 | |
| | | Meadwestvaco Corp. | | 7.950% | | 2/15/31 | | | 350 | | | | 472 | |
| | | Methanex Corp. | | 4.250% | | 12/1/24 | | | 154 | | | | 158 | |
| | | Mosaic Co. | | 3.750% | | 11/15/21 | | | 115 | | | | 118 | |
| | | Mosaic Co. | | 3.250% | | 11/15/22 | | | 225 | | | | 231 | |
| | | Mosaic Co. | | 4.250% | | 11/15/23 | | | 175 | | | | 187 | |
| | | Mosaic Co. | | 4.050% | | 11/15/27 | | | 200 | | | | 207 | |
| | | Mosaic Co. | | 5.450% | | 11/15/33 | | | 100 | | | | 114 | |
| | | Mosaic Co. | | 4.875% | | 11/15/41 | | | 50 | | | | 52 | |
| | | Mosaic Co. | | 5.625% | | 11/15/43 | | | 50 | | | | 59 | |
| | | Newmont Corp. | | 3.700% | | 3/15/23 | | | 275 | | | | 288 | |
| | | Newmont Corp. | | 2.800% | | 10/1/29 | | | 150 | | | | 148 | |
| | | Newmont Corp. | | 5.875% | | 4/1/35 | | | 100 | | | | 128 | |
| | | Newmont Corp. | | 6.250% | | 10/1/39 | | | 225 | | | | 297 | |
| | | Newmont Corp. | | 4.875% | | 3/15/42 | | | 250 | | | | 291 | |
| | | Newmont Corp. | | 5.450% | | 6/9/44 | | | 100 | | | | 124 | |
| | | Nucor Corp. | | 4.125% | | 9/15/22 | | | 100 | | | | 105 | |
| | | Nucor Corp. | | 3.950% | | 5/1/28 | | | 100 | | | | 108 | |
| | | Nucor Corp. | | 6.400% | | 12/1/37 | | | 100 | | | | 135 | |
| | | Nucor Corp. | | 5.200% | | 8/1/43 | | | 200 | | | | 248 | |
| | | Nucor Corp. | | 4.400% | | 5/1/48 | | | 150 | | | | 170 | |
| | | Nutrien Ltd. | | 3.500% | | 6/1/23 | | | 299 | | | | 308 | |
| | | Nutrien Ltd. | | 3.375% | | 3/15/25 | | | 250 | | | | 259 | |
| | | Nutrien Ltd. | | 3.000% | | 4/1/25 | | | 250 | | | | 254 | |
| | | Nutrien Ltd. | | 4.000% | | 12/15/26 | | | 50 | | | | 53 | |
| | | Nutrien Ltd. | | 4.200% | | 4/1/29 | | | 75 | | | | 82 | |
| | | Nutrien Ltd. | | 4.125% | | 3/15/35 | | | 250 | | | | 261 | |
| | | Nutrien Ltd. | | 5.625% | | 12/1/40 | | | 275 | | | | 322 | |
| | | Nutrien Ltd. | | 6.125% | | 1/15/41 | | | 25 | | | | 31 | |
| | | Nutrien Ltd. | | 4.900% | | 6/1/43 | | | 50 | | | | 56 | |
| | | Nutrien Ltd. | | 5.250% | | 1/15/45 | | | 200 | | | | 236 | |
| | | Nutrien Ltd. | | 5.000% | | 4/1/49 | | | 100 | | | | 118 | |
| | | Packaging Corp. of America | | 4.500% | | 11/1/23 | | | 350 | | | | 377 | |
| | | Packaging Corp. of America | | 3.400% | | 12/15/27 | | | 100 | | | | 104 | |
| | | Packaging Corp. of America | | 3.000% | | 12/15/29 | | | 40 | | | | 40 | |
| | | Packaging Corp. of America | | 4.050% | | 12/15/49 | | | 90 | | | | 93 | |
| | | PPG Industries Inc. | | 2.400% | | 8/15/24 | | | 200 | | | | 201 | |
| | | Praxair Inc. | | 3.000% | | 9/1/21 | | | 75 | | | | 76 | |
| | | Praxair Inc. | | 2.450% | | 2/15/22 | | | 450 | | | | 455 | |
| | | Praxair Inc. | | 2.200% | | 8/15/22 | | | 200 | | | | 201 | |
| | | Praxair Inc. | | 3.550% | | 11/7/42 | | | 50 | | | | 52 | |
| | | Rayonier Inc. | | 3.750% | | 4/1/22 | | | 50 | | | | 51 | |
| | | Reliance Steel & Aluminum Co. | | 4.500% | | 4/15/23 | | | 100 | | | | 105 | |
| | | Rio Tinto Alcan Inc. | | 6.125% | | 12/15/33 | | | 225 | | | | 305 | |
| | | Rio Tinto Finance USA Ltd. | | 3.750% | | 6/15/25 | | | 220 | | | | 236 | |
| | | Rio Tinto Finance USA Ltd. | | 7.125% | | 7/15/28 | | | 75 | | | | 100 | |
| | | Rio Tinto Finance USA Ltd. | | 5.200% | | 11/2/40 | | | 125 | | | | 163 | |
| | | Rio Tinto Finance USA plc | | 4.750% | | 3/22/42 | | | 150 | | | | 183 | |
| | | Rio Tinto Finance USA plc | | 4.125% | | 8/21/42 | | | 250 | | | | 286 | |
| | | Rohm & Haas Co. | | 7.850% | | 7/15/29 | | | 250 | | | | 332 | |
| | | RPM International Inc. | | 3.450% | | 11/15/22 | | | 100 | | | | 103 | |
| | | RPM International Inc. | | 3.750% | | 3/15/27 | | | 50 | | | | 51 | |
| | | RPM International Inc. | | 4.550% | | 3/1/29 | | | 75 | | | | 81 | |
| | | RPM International Inc. | | 4.250% | | 1/15/48 | | | 250 | | | | 242 | |
| | | Sasol Financing International Ltd. | | 4.500% | | 11/14/22 | | | 200 | | | | 207 | |
| | | SASOL Financing USA LLC | | 5.875% | | 3/27/24 | | | 200 | | | | 217 | |
| | | SASOL Financing USA LLC | | 6.500% | | 9/27/28 | | | 200 | | | | 223 | |
| | | Sherwin-Williams Co. | | 2.750% | | 6/1/22 | | | 109 | | | | 111 | |
| | | Sherwin-Williams Co. | | 3.125% | | 6/1/24 | | | 325 | | | | 336 | |
| | | Sherwin-Williams Co. | | 3.450% | | 8/1/25 | | | 225 | | | | 236 | |
| | | Sherwin-Williams Co. | | 3.950% | | 1/15/26 | | | 200 | | | | 214 | |
| | | Sherwin-Williams Co. | | 3.450% | | 6/1/27 | | | 100 | | | | 105 | |
| | | Sherwin-Williams Co. | | 2.950% | | 8/15/29 | | | 200 | | | | 202 | |
| | | Sherwin-Williams Co. | | 4.000% | | 12/15/42 | | | 100 | | | | 103 | |
| | | Sherwin-Williams Co. | | 4.550% | | 8/1/45 | | | 90 | | | | 99 | |
| | | Sherwin-Williams Co. | | 4.500% | | 6/1/47 | | | 250 | | | | 284 | |
| | | Sherwin-Williams Co. | | 3.800% | | 8/15/49 | | | 100 | | | | 102 | |
| | | Southern Copper Corp. | | 3.500% | | 11/8/22 | | | 400 | | | | 413 | |
| | | Southern Copper Corp. | | 3.875% | | 4/23/25 | | | 50 | | | | 52 | |
| | | Southern Copper Corp. | | 7.500% | | 7/27/35 | | | 100 | | | | 138 | |
| | | Southern Copper Corp. | | 6.750% | | 4/16/40 | | | 325 | | | | 432 | |
| | | Southern Copper Corp. | | 5.875% | | 4/23/45 | | | 500 | | | | 621 | |
| | | Steel Dynamics Inc. | | 2.800% | | 12/15/24 | | | 50 | | | | 50 | |
| | | Steel Dynamics Inc. | | 4.125% | | 9/15/25 | | | 70 | | | | 72 | |
| | | Steel Dynamics Inc. | | 3.450% | | 4/15/30 | | | 125 | | | | 126 | |
| | | Suzano Austria GmbH | | 6.000% | | 1/15/29 | | | 400 | | | | 452 | |
| | | Suzano Austria GmbH | | 5.000% | | 1/15/30 | | | 200 | | | | 210 | |
| | | Teck Resources Ltd. | | 6.125% | | 10/1/35 | | | 100 | | | | 116 | |
| | | Teck Resources Ltd. | | 6.000% | | 8/15/40 | | | 50 | | | | 56 | |
| | | Teck Resources Ltd. | | 6.250% | | 7/15/41 | | | 325 | | | | 371 | |
| | | Vale Overseas Ltd. | | 6.250% | | 8/10/26 | | | 300 | | | | 352 | |
| | | Vale Overseas Ltd. | | 8.250% | | 1/17/34 | | | 50 | | | | 70 | |
| | | Vale Overseas Ltd. | | 6.875% | | 11/21/36 | | | 410 | | | | 532 | |
| | | Vale Overseas Ltd. | | 6.875% | | 11/10/39 | | | 450 | | | | 584 | |
| | | Vale SA | | 5.625% | | 9/11/42 | | | 75 | | | | 88 | |
| | | Westlake Chemical Corp. | | 3.600% | | 8/15/26 | | | 300 | | | | 310 | |
| | | Westlake Chemical Corp. | | 5.000% | | 8/15/46 | | | 200 | | | | 212 | |
| | | WestRock RKT Co. | | 4.900% | | 3/1/22 | | | 100 | | | | 105 | |
| | | Weyerhaeuser Co. | | 4.700% | | 3/15/21 | | | 75 | | | | 77 | |
| | | Weyerhaeuser Co. | | 8.500% | | 1/15/25 | | | 50 | | | | 63 | |
| | | Weyerhaeuser Co. | | 4.000% | | 11/15/29 | | | 150 | | | | 163 | |
| | | Weyerhaeuser Co. | | 7.375% | | 3/15/32 | | | 100 | | | | 139 | |
| | | Weyerhaeuser Co. | | 6.875% | | 12/15/33 | | | 50 | | | | 66 | |
| | | WRKCo Inc. | | 3.000% | | 9/15/24 | | | 250 | | | | 255 | |
| | | WRKCo Inc. | | 4.650% | | 3/15/26 | | | 100 | | | | 111 | |
Total Bond Market Index Portfolio
| | | | | | | | | Face | | | Market | |
| | | | | | | Maturity | | Amount | | | Value• | |
| | | | | Coupon | | Date | | | ($000 | ) | | | ($000 | ) |
| | | WRKCo Inc. | | 3.375% | | 9/15/27 | | | 250 | | | | 256 | |
| | | WRKCo Inc. | | 4.900% | | 3/15/29 | | | 150 | | | | 171 | |
| | | | | | | | | | | | | | | |
| | | Capital Goods (1.4%) | | | | | | | | | | | | |
| | | 3M Co. | | 1.625% | | 9/19/21 | | | 150 | | | | 150 | |
| | | 3M Co. | | 2.750% | | 3/1/22 | | | 100 | | | | 102 | |
| | | 3M Co. | | 1.750% | | 2/14/23 | | | 200 | | | | 199 | |
| | | 3M Co. | | 2.250% | | 3/15/23 | | | 175 | | | | 176 | |
| | | 3M Co. | | 3.250% | | 2/14/24 | | | 100 | | | | 105 | |
| | | 3M Co. | | 2.000% | | 2/14/25 | | | 150 | | | | 149 | |
| | | 3M Co. | | 3.000% | | 8/7/25 | | | 100 | | | | 104 | |
| | | 3M Co. | | 2.250% | | 9/19/26 | | | 150 | | | | 150 | |
| | | 3M Co. | | 2.875% | | 10/15/27 | | | 125 | | | | 130 | |
| | | 3M Co. | | 3.375% | | 3/1/29 | | | 150 | | | | 159 | |
| | | 3M Co. | | 2.375% | | 8/26/29 | | | 250 | | | | 245 | |
| | | 3M Co. | | 3.125% | | 9/19/46 | | | 75 | | | | 72 | |
| | | 3M Co. | | 3.625% | | 10/15/47 | | | 100 | | | | 103 | |
| | | 3M Co. | | 4.000% | | 9/14/48 | | | 250 | | | | 274 | |
| | | 3M Co. | | 3.250% | | 8/26/49 | | | 375 | | | | 365 | |
| | | ABB Finance USA Inc. | | 3.375% | | 4/3/23 | | | 100 | | | | 104 | |
| | | ABB Finance USA Inc. | | 3.800% | | 4/3/28 | | | 150 | | | | 164 | |
| | | ABB Finance USA Inc. | | 4.375% | | 5/8/42 | | | 150 | | | | 180 | |
| | | Allegion plc | | 3.500% | | 10/1/29 | | | 75 | | | | 76 | |
| | | Allegion US Holding Co. Inc. | | 3.550% | | 10/1/27 | | | 175 | | | | 180 | |
| 6 | | Bemis Co. Inc. | | 3.100% | | 9/15/26 | | | 50 | | | | 49 | |
| | | Boeing Co. | | 2.300% | | 8/1/21 | | | 50 | | | | 50 | |
| | | Boeing Co. | | 2.125% | | 3/1/22 | | | 50 | | | | 50 | |
| | | Boeing Co. | | 2.700% | | 5/1/22 | | | 75 | | | | 76 | |
| | | Boeing Co. | | 2.800% | | 3/1/23 | | | 600 | | | | 611 | |
| | | Boeing Co. | | 1.875% | | 6/15/23 | | | 100 | | | | 99 | |
| | | Boeing Co. | | 2.800% | | 3/1/24 | | | 75 | | | | 77 | |
| | | Boeing Co. | | 2.850% | | 10/30/24 | | | 100 | | | | 102 | |
| | | Boeing Co. | | 2.500% | | 3/1/25 | | | 145 | | | | 145 | |
| | | Boeing Co. | | 3.100% | | 5/1/26 | | | 100 | | | | 103 | |
| | | Boeing Co. | | 2.250% | | 6/15/26 | | | 50 | | | | 49 | |
| | | Boeing Co. | | 2.700% | | 2/1/27 | | | 195 | | | | 197 | |
| | | Boeing Co. | | 2.800% | | 3/1/27 | | | 50 | | | | 51 | |
| | | Boeing Co. | | 3.250% | | 3/1/28 | | | 100 | | | | 104 | |
| | | Boeing Co. | | 3.450% | | 11/1/28 | | | 60 | | | | 63 | |
| | | Boeing Co. | | 3.200% | | 3/1/29 | | | 200 | | | | 208 | |
| | | Boeing Co. | | 2.950% | | 2/1/30 | | | 190 | | | | 194 | |
| | | Boeing Co. | | 6.125% | | 2/15/33 | | | 75 | | | | 98 | |
| | | Boeing Co. | | 3.600% | | 5/1/34 | | | 150 | | | | 160 | |
| | | Boeing Co. | | 3.250% | | 2/1/35 | | | 190 | | | | 194 | |
| | | Boeing Co. | | 6.625% | | 2/15/38 | | | 50 | | | | 70 | |
| | | Boeing Co. | | 3.550% | | 3/1/38 | | | 50 | | | | 52 | |
| | | Boeing Co. | | 3.500% | | 3/1/39 | | | 75 | | | | 77 | |
| | | Boeing Co. | | 6.875% | | 3/15/39 | | | 125 | | | | 183 | |
| | | Boeing Co. | | 5.875% | | 2/15/40 | | | 75 | | | | 99 | |
| | | Boeing Co. | | 3.375% | | 6/15/46 | | | 75 | | | | 73 | |
| | | Boeing Co. | | 3.650% | | 3/1/47 | | | 175 | | | | 177 | |
| | | Boeing Co. | | 3.625% | | 3/1/48 | | | 75 | | | | 77 | |
| | | Boeing Co. | | 3.850% | | 11/1/48 | | | 60 | | | | 63 | |
| | | Boeing Co. | | 3.900% | | 5/1/49 | | | 150 | | | | 161 | |
| | | Boeing Co. | | 3.750% | | 2/1/50 | | | 50 | | | | 53 | |
| | | Boeing Co. | | 3.825% | | 3/1/59 | | | 200 | | | | 208 | |
| | | Boeing Co. | | 3.950% | | 8/1/59 | | | 75 | | | | 80 | |
| | | Carlisle Cos. Inc. | | 3.750% | | 11/15/22 | | | 75 | | | | 77 | |
| | | Carlisle Cos. Inc. | | 3.500% | | 12/1/24 | | | 50 | | | | 52 | |
| | | Carlisle Cos. Inc. | | 3.750% | | 12/1/27 | | | 125 | | | | 131 | |
| | | Caterpillar Financial Services Corp. | | 2.900% | | 3/15/21 | | | 100 | | | | 101 | |
| | | Caterpillar Financial Services Corp. | | 2.650% | | 5/17/21 | | | 100 | | | | 101 | |
| | | Caterpillar Financial Services Corp. | | 1.700% | | 8/9/21 | | | 100 | | | | 100 | |
| | | Caterpillar Financial Services Corp. | | 2.750% | | 8/20/21 | | | 100 | | | | 101 | |
| | | Caterpillar Financial Services Corp. | | 3.150% | | 9/7/21 | | | 200 | | | | 204 | |
| | | Caterpillar Financial Services Corp. | | 1.931% | | 10/1/21 | | | 75 | | | | 75 | |
| | | Caterpillar Financial Services Corp. | | 2.950% | | 2/26/22 | | | 200 | | | | 204 | |
| | | Caterpillar Financial Services Corp. | | 2.400% | | 6/6/22 | | | 150 | | | | 152 | |
| | | Caterpillar Financial Services Corp. | | 2.550% | | 11/29/22 | | | 200 | | | | 204 | |
| | | Caterpillar Financial Services Corp. | | 3.450% | | 5/15/23 | | | 200 | | | | 209 | |
| | | Caterpillar Financial Services Corp. | | 3.650% | | 12/7/23 | | | 70 | | | | 74 | |
| | | Caterpillar Financial Services Corp. | | 2.850% | | 5/17/24 | | | 125 | | | | 129 | |
| | | Caterpillar Financial Services Corp. | | 3.300% | | 6/9/24 | | | 250 | | | | 263 | |
| | | Caterpillar Financial Services Corp. | | 2.150% | | 11/8/24 | | | 100 | | | | 100 | |
| | | Caterpillar Financial Services Corp. | | 3.250% | | 12/1/24 | | | 477 | | | | 503 | |
| | | Caterpillar Financial Services Corp. | | 2.400% | | 8/9/26 | | | 100 | | | | 101 | |
| | | Caterpillar Inc. | | 3.900% | | 5/27/21 | | | 125 | | | | 128 | |
| | | Caterpillar Inc. | | 2.600% | | 6/26/22 | | | 50 | | | | 51 | |
| | | Caterpillar Inc. | | 3.400% | | 5/15/24 | | | 250 | | | | 264 | |
| | | Caterpillar Inc. | | 2.600% | | 9/19/29 | | | 200 | | | | 201 | |
| | | Caterpillar Inc. | | 6.050% | | 8/15/36 | | | 100 | | | | 136 | |
| | | Caterpillar Inc. | | 5.200% | | 5/27/41 | | | 150 | | | | 194 | |
| | | Caterpillar Inc. | | 3.803% | | 8/15/42 | | | 243 | | | | 272 | |
| | | Caterpillar Inc. | | 3.250% | | 9/19/49 | | | 200 | | | | 200 | |
| | | Caterpillar Inc. | | 4.750% | | 5/15/64 | | | 100 | | | | 125 | |
| | | CNH Industrial Capital LLC | | 4.200% | | 1/15/24 | | | 1,050 | | | | 1,111 | |
| | | CNH Industrial NV | | 3.850% | | 11/15/27 | | | 150 | | | | 156 | |
| | | Crane Co. | | 4.450% | | 12/15/23 | | | 50 | | | | 53 | |
| | | Crane Co. | | 4.200% | | 3/15/48 | | | 150 | | | | 150 | |
| | | CRH America Inc. | | 5.750% | | 1/15/21 | | | 75 | | | | 78 | |
| | | Deere & Co. | | 2.600% | | 6/8/22 | | | 125 | | | | 127 | |
| | | Deere & Co. | | 5.375% | | 10/16/29 | | | 125 | | | | 155 | |
| | | Deere & Co. | | 7.125% | | 3/3/31 | | | 100 | | | | 141 | |
| | | Deere & Co. | | 3.900% | | 6/9/42 | | | 75 | | | | 84 | |
| | | Dover Corp. | | 3.150% | | 11/15/25 | | | 200 | | | | 207 | |
| | | Dover Corp. | | 2.950% | | 11/4/29 | | | 75 | | | | 75 | |
| | | Dover Corp. | | 6.600% | | 3/15/38 | | | 75 | | | | 100 | |
| | | Eaton Corp. | | 2.750% | | 11/2/22 | | | 300 | | | | 306 | |
| | | Eaton Corp. | | 3.103% | | 9/15/27 | | | 125 | | | | 130 | |
| | | Eaton Corp. | | 4.000% | | 11/2/32 | | | 150 | | | | 170 | |
| | | Eaton Corp. | | 4.150% | | 11/2/42 | | | 150 | | | | 166 | |
| | | Eaton Corp. | | 3.915% | | 9/15/47 | | | 50 | | | | 53 | |
| | | Embraer Netherlands Finance BV | | 5.050% | | 6/15/25 | | | 200 | | | | 220 | |
| | | Embraer Netherlands Finance BV | | 5.400% | | 2/1/27 | | | 100 | | | | 112 | |
| 6 | | Embraer Overseas Ltd. | | 5.696% | | 9/16/23 | | | 100 | | | | 110 | |
| | | Embraer SA | | 5.150% | | 6/15/22 | | | 275 | | | | 290 | |
| | | Emerson Electric Co. | | 2.625% | | 12/1/21 | | | 150 | | | | 152 | |
| | | Emerson Electric Co. | | 3.150% | | 6/1/25 | | | 200 | | | | 209 | |
| | | Flowserve Corp. | | 3.500% | | 9/15/22 | | | 250 | | | | 253 | |
| | | Flowserve Corp. | | 4.000% | | 11/15/23 | | | 50 | | | | 51 | |
| | | Fortive Corp. | | 2.350% | | 6/15/21 | | | 100 | | | | 100 | |
| | | Fortive Corp. | | 3.150% | | 6/15/26 | | | 150 | | | | 153 | |
| | | Fortive Corp. | | 4.300% | | 6/15/46 | | | 100 | | | | 103 | |
| | | Fortune Brands Home & Security Inc. | | 4.000% | | 9/21/23 | | | 100 | | | | 106 | |
| | | Fortune Brands Home & Security Inc. | | 4.000% | | 6/15/25 | | | 100 | | | | 107 | |
| | | General Dynamics Corp. | | 3.000% | | 5/11/21 | | | 300 | | | | 305 | |
| | | General Dynamics Corp. | | 3.375% | | 5/15/23 | | | 200 | | | | 209 | |
| | | General Dynamics Corp. | | 1.875% | | 8/15/23 | | | 300 | | | | 300 | |
| | | General Dynamics Corp. | | 2.375% | | 11/15/24 | | | 320 | | | | 325 | |
| | | General Dynamics Corp. | | 3.500% | | 5/15/25 | | | 200 | | | | 214 | |
| | | General Dynamics Corp. | | 2.625% | | 11/15/27 | | | 200 | | | | 205 | |
| | | General Dynamics Corp. | | 3.750% | | 5/15/28 | | | 200 | | | | 220 | |
| | | General Dynamics Corp. | | 3.600% | | 11/15/42 | | | 100 | | | | 113 | |
| | | General Electric Co. | | 4.625% | | 1/7/21 | | | 201 | | | | 206 | |
| | | General Electric Co. | | 5.300% | | 2/11/21 | | | 172 | | | | 177 | |
| | | General Electric Co. | | 4.650% | | 10/17/21 | | | 347 | | | | 361 | |
| | | General Electric Co. | | 3.150% | | 9/7/22 | | | 91 | | | | 93 | |
| | | General Electric Co. | | 2.700% | | 10/9/22 | | | 850 | | | | 861 | |
| | | General Electric Co. | | 3.100% | | 1/9/23 | | | 574 | | | | 586 | |
| | | General Electric Co. | | 3.450% | | 5/15/24 | | | 100 | | | | 104 | |
| | | General Electric Co. | | 6.750% | | 3/15/32 | | | 705 | | | | 903 | |
| | | General Electric Co. | | 6.150% | | 8/7/37 | | | 161 | | | | 199 | |
| | | General Electric Co. | | 5.875% | | 1/14/38 | | | 560 | | | | 675 | |
| | | General Electric Co. | | 6.875% | | 1/10/39 | | | 338 | | | | 450 | |
| | | General Electric Co. | | 4.125% | | 10/9/42 | | | 203 | | | | 210 | |
| | | General Electric Co. | | 4.500% | | 3/11/44 | | | 188 | | | | 205 | |
| | | Hexcel Corp. | | 4.700% | | 8/15/25 | | | 100 | | | | 108 | |
| | | Honeywell International Inc. | | 4.250% | | 3/1/21 | | | 200 | | | | 206 | |
| | | Honeywell International Inc. | | 1.850% | | 11/1/21 | | | 300 | | | | 301 | |
| | | Honeywell International Inc. | | 2.150% | | 8/8/22 | | | 100 | | | | 101 | |
| | | Honeywell International Inc. | | 2.300% | | 8/15/24 | | | 425 | | | | 431 | |
| | | Honeywell International Inc. | | 2.500% | | 11/1/26 | | | 50 | | | | 51 | |
Total Bond Market Index Portfolio
| | | | | | | | | Face | | | Market | |
| | | | | | | Maturity | | Amount | | | Value• | |
| | | | | Coupon | | Date | | | ($000 | ) | | | ($000 | ) |
| | | Honeywell International Inc. | | 2.700% | | 8/15/29 | | | 100 | | | | 103 | |
| | | Honeywell International Inc. | | 5.700% | | 3/15/37 | | | 200 | | | | 271 | |
| | | Honeywell International Inc. | | 5.375% | | 3/1/41 | | | 150 | | | | 202 | |
| | | Hubbell Inc. | | 3.350% | | 3/1/26 | | | 75 | | | | 77 | |
| | | Hubbell Inc. | | 3.150% | | 8/15/27 | | | 50 | | | | 50 | |
| | | Hubbell Inc. | | 3.500% | | 2/15/28 | | | 175 | | | | 181 | |
| | | Huntington Ingalls Industries Inc. | | 3.483% | | 12/1/27 | | | 150 | | | | 156 | |
| | | Illinois Tool Works Inc. | | 3.375% | | 9/15/21 | | | 100 | | | | 102 | |
| | | Illinois Tool Works Inc. | | 3.500% | | 3/1/24 | | | 200 | | | | 212 | |
| | | Illinois Tool Works Inc. | | 2.650% | | 11/15/26 | | | 300 | | | | 308 | |
| | | Illinois Tool Works Inc. | | 4.875% | | 9/15/41 | | | 75 | | | | 94 | |
| | | Illinois Tool Works Inc. | | 3.900% | | 9/1/42 | | | 250 | | | | 288 | |
| | | Ingersoll-Rand Global Holding Co. Ltd. | | 4.250% | | 6/15/23 | | | 125 | | | | 134 | |
| | | Ingersoll-Rand Global Holding Co. Ltd. | | 5.750% | | 6/15/43 | | | 125 | | | | 157 | |
| | | Ingersoll-Rand Luxembourg Finance SA | | 3.550% | | 11/1/24 | | | 375 | | | | 393 | |
| | | Ingersoll-Rand Luxembourg Finance SA | | 3.500% | | 3/21/26 | | | 75 | | | | 78 | |
| | | Ingersoll-Rand Luxembourg Finance SA | | 3.800% | | 3/21/29 | | | 225 | | | | 241 | |
| | | Ingersoll-Rand Luxembourg Finance SA | | 4.500% | | 3/21/49 | | | 75 | | | | 84 | |
| | | John Deere Capital Corp. | | 2.550% | | 1/8/21 | | | 150 | | | | 151 | |
| | | John Deere Capital Corp. | | 2.800% | | 3/4/21 | | | 100 | | | | 101 | |
| | | John Deere Capital Corp. | | 2.875% | | 3/12/21 | | | 100 | | | | 101 | |
| | | John Deere Capital Corp. | | 3.900% | | 7/12/21 | | | 100 | | | | 103 | |
| | | John Deere Capital Corp. | | 3.125% | | 9/10/21 | | | 100 | | | | 102 | |
| | | John Deere Capital Corp. | | 3.150% | | 10/15/21 | | | 25 | | | | 26 | |
| | | John Deere Capital Corp. | | 2.650% | | 1/6/22 | | | 300 | | | | 305 | |
| | | John Deere Capital Corp. | | 1.950% | | 6/13/22 | | | 375 | | | | 375 | |
| | | John Deere Capital Corp. | | 2.150% | | 9/8/22 | | | 400 | | | | 403 | |
| | | John Deere Capital Corp. | | 2.700% | | 1/6/23 | | | 100 | | | | 102 | |
| | | John Deere Capital Corp. | | 2.800% | | 1/27/23 | | | 50 | | | | 51 | |
| | | John Deere Capital Corp. | | 2.800% | | 3/6/23 | | | 100 | | | | 103 | |
| | | John Deere Capital Corp. | | 3.450% | | 6/7/23 | | | 200 | | | | 209 | |
| | | John Deere Capital Corp. | | 3.650% | | 10/12/23 | | | 50 | | | | 53 | |
| | | John Deere Capital Corp. | | 2.600% | | 3/7/24 | | | 75 | | | | 77 | |
| | | John Deere Capital Corp. | | 2.650% | | 6/24/24 | | | 75 | | | | 77 | |
| | | John Deere Capital Corp. | | 3.450% | | 3/13/25 | | | 300 | | | | 318 | |
| | | John Deere Capital Corp. | | 3.400% | | 9/11/25 | | | 75 | | | | 79 | |
| | | John Deere Capital Corp. | | 2.650% | | 6/10/26 | | | 100 | | | | 102 | |
| | | John Deere Capital Corp. | | 2.250% | | 9/14/26 | | | 125 | | | | 125 | |
| | | John Deere Capital Corp. | | 2.800% | | 9/8/27 | | | 150 | | | | 154 | |
| | | John Deere Capital Corp. | | 3.050% | | 1/6/28 | | | 100 | | | | 104 | |
| | | John Deere Capital Corp. | | 3.450% | | 3/7/29 | | | 50 | | | | 54 | |
| | | John Deere Capital Corp. | | 2.800% | | 7/18/29 | | | 150 | | | | 154 | |
| | | Johnson Controls International plc | | 3.625% | | 7/2/24 | | | 126 | | | | 131 | |
| | | Johnson Controls International plc | | 3.900% | | 2/14/26 | | | 37 | | | | 39 | |
| | | Johnson Controls International plc | | 6.000% | | 1/15/36 | | | 39 | | | | 48 | |
| | | Johnson Controls International plc | | 4.625% | | 7/2/44 | | | 175 | | | | 191 | |
| | | Johnson Controls International plc | | 5.125% | | 9/14/45 | | | 14 | | | | 16 | |
| | | Johnson Controls International plc | | 4.500% | | 2/15/47 | | | 100 | | | | 108 | |
| | | Johnson Controls International plc | | 4.950% | | 7/2/64 | | | 72 | | | | 75 | |
| | | Kennametal Inc. | | 3.875% | | 2/15/22 | | | 50 | | | | 51 | |
| | | Kennametal Inc. | | 4.625% | | 6/15/28 | | | 120 | | | | 128 | |
| 6 | | L3Harris Technologies Inc. | | 4.950% | | 2/15/21 | | | 75 | | | | 77 | |
| 6 | | L3Harris Technologies Inc. | | 3.850% | | 6/15/23 | | | 600 | | | | 631 | |
| 6 | | L3Harris Technologies Inc. | | 3.950% | | 5/28/24 | | | 103 | | | | 109 | |
| | | L3Harris Technologies Inc. | | 3.832% | | 4/27/25 | | | 200 | | | | 213 | |
| 6 | | L3Harris Technologies Inc. | | 3.850% | | 12/15/26 | | | 50 | | | | 54 | |
| 6 | | L3Harris Technologies Inc. | | 4.400% | | 6/15/28 | | | 175 | | | | 195 | |
| | | L3Harris Technologies Inc. | | 4.854% | | 4/27/35 | | | 100 | | | | 118 | |
| | | L3Harris Technologies Inc. | | 6.150% | | 12/15/40 | | | 100 | | | | 136 | |
| | | L3Harris Technologies Inc. | | 5.054% | | 4/27/45 | | | 100 | | | | 124 | |
| | | Leggett & Platt Inc. | | 3.800% | | 11/15/24 | | | 100 | | | | 105 | |
| | | Leggett & Platt Inc. | | 3.500% | | 11/15/27 | | | 300 | | | | 308 | |
| | | Leggett & Platt Inc. | | 4.400% | | 3/15/29 | | | 75 | | | | 82 | |
| | | Legrand France SA | | 8.500% | | 2/15/25 | | | 50 | | | | 64 | |
| | | Lennox International Inc. | | 3.000% | | 11/15/23 | | | 100 | | | | 102 | |
| | | Lockheed Martin Corp. | | 3.350% | | 9/15/21 | | | 725 | | | | 743 | |
| | | Lockheed Martin Corp. | | 3.100% | | 1/15/23 | | | 100 | | | | 103 | |
| | | Lockheed Martin Corp. | | 3.550% | | 1/15/26 | | | 380 | | | | 407 | |
| | | Lockheed Martin Corp. | | 3.600% | | 3/1/35 | | | 150 | | | | 164 | |
| | | Lockheed Martin Corp. | | 4.500% | | 5/15/36 | | | 100 | | | | 118 | |
| | | Lockheed Martin Corp. | | 6.150% | | 9/1/36 | | | 375 | | | | 509 | |
| | | Lockheed Martin Corp. | | 4.070% | | 12/15/42 | | | 270 | | | | 309 | |
| | | Lockheed Martin Corp. | | 3.800% | | 3/1/45 | | | 100 | | | | 110 | |
| | | Lockheed Martin Corp. | | 4.700% | | 5/15/46 | | | 275 | | | | 347 | |
| | | Lockheed Martin Corp. | | 4.090% | | 9/15/52 | | | 156 | | | | 182 | |
| | | Martin Marietta Materials Inc. | | 4.250% | | 7/2/24 | | | 100 | | | | 107 | |
| | | Martin Marietta Materials Inc. | | 3.450% | | 6/1/27 | | | 50 | | | | 52 | |
| | | Martin Marietta Materials Inc. | | 3.500% | | 12/15/27 | | | 100 | | | | 104 | |
| | | Martin Marietta Materials Inc. | | 4.250% | | 12/15/47 | | | 175 | | | | 183 | |
| | | Masco Corp. | | 3.500% | | 4/1/21 | | | 70 | | | | 71 | |
| | | Masco Corp. | | 4.450% | | 4/1/25 | | | 50 | | | | 54 | |
| | | Masco Corp. | | 4.375% | | 4/1/26 | | | 100 | | | | 108 | |
| | | Masco Corp. | | 3.500% | | 11/15/27 | | | 100 | | | | 103 | |
| | | Masco Corp. | | 7.750% | | 8/1/29 | | | 24 | | | | 31 | |
| | | Masco Corp. | | 4.500% | | 5/15/47 | | | 100 | | | | 102 | |
| | | Mohawk Industries Inc. | | 3.850% | | 2/1/23 | | | 100 | | | | 104 | |
| | | Northrop Grumman Corp. | | 3.500% | | 3/15/21 | | | 200 | | | | 204 | |
| | | Northrop Grumman Corp. | | 2.550% | | 10/15/22 | | | 200 | | | | 203 | |
| | | Northrop Grumman Corp. | | 3.250% | | 8/1/23 | | | 150 | | | | 156 | |
| | | Northrop Grumman Corp. | | 2.930% | | 1/15/25 | | | 275 | | | | 283 | |
| | | Northrop Grumman Corp. | | 3.200% | | 2/1/27 | | | 150 | | | | 156 | |
| | | Northrop Grumman Corp. | | 3.250% | | 1/15/28 | | | 100 | | | | 104 | |
| | | Northrop Grumman Corp. | | 5.050% | | 11/15/40 | | | 50 | | | | 61 | |
| | | Northrop Grumman Corp. | | 4.750% | | 6/1/43 | | | 275 | | | | 328 | |
| | | Northrop Grumman Corp. | | 4.030% | | 10/15/47 | | | 145 | | | | 161 | |
| | | Nvent Finance Sarl | | 3.950% | | 4/15/23 | | | 200 | | | | 203 | |
| | | Nvent Finance Sarl | | 4.550% | | 4/15/28 | | | 100 | | | | 104 | |
| | | Oshkosh Corp. | | 4.600% | | 5/15/28 | | | 185 | | | | 198 | |
| | | Owens Corning | | 3.400% | | 8/15/26 | | | 200 | | | | 203 | |
| | | Owens Corning | | 3.950% | | 8/15/29 | | | 100 | | | | 104 | |
| | | Owens Corning | | 4.300% | | 7/15/47 | | | 200 | | | | 190 | |
| | | Owens Corning | | 4.400% | | 1/30/48 | | | 75 | | | | 72 | |
| | | Parker-Hannifin Corp. | | 3.500% | | 9/15/22 | | | 175 | | | | 181 | |
| | | Parker-Hannifin Corp. | | 2.700% | | 6/14/24 | | | 110 | | | | 111 | |
| | | Parker-Hannifin Corp. | | 3.300% | | 11/21/24 | | | 290 | | | | 303 | |
| | | Parker-Hannifin Corp. | | 3.250% | | 3/1/27 | | | 125 | | | | 130 | |
| | | Parker-Hannifin Corp. | | 3.250% | | 6/14/29 | | | 75 | | | | 78 | |
| | | Parker-Hannifin Corp. | | 6.250% | | 5/15/38 | | | 150 | | | | 199 | |
| | | Parker-Hannifin Corp. | | 4.450% | | 11/21/44 | | | 200 | | | | 222 | |
| | | Parker-Hannifin Corp. | | 4.100% | | 3/1/47 | | | 75 | | | | 81 | |
| | | Parker-Hannifin Corp. | | 4.000% | | 6/14/49 | | | 110 | | | | 119 | |
| | | Precision Castparts Corp. | | 2.500% | | 1/15/23 | | | 200 | | | | 203 | |
| | | Precision Castparts Corp. | | 3.250% | | 6/15/25 | | | 175 | | | | 184 | |
| | | Precision Castparts Corp. | | 3.900% | | 1/15/43 | | | 75 | | | | 81 | |
| | | Precision Castparts Corp. | | 4.375% | | 6/15/45 | | | 300 | | | | 347 | |
| | | Raytheon Co. | | 2.500% | | 12/15/22 | | | 275 | | | | 280 | |
| | | Raytheon Co. | | 7.200% | | 8/15/27 | | | 25 | | | | 33 | |
| | | Raytheon Co. | | 4.700% | | 12/15/41 | | | 50 | | | | 62 | |
| | | Republic Services Inc. | | 5.250% | | 11/15/21 | | | 175 | | | | 186 | |
| | | Republic Services Inc. | | 3.550% | | 6/1/22 | | | 50 | | | | 52 | |
| | | Republic Services Inc. | | 2.500% | | 8/15/24 | | | 200 | | | | 203 | |
| | | Republic Services Inc. | | 3.200% | | 3/15/25 | | | 250 | | | | 260 | |
| | | Republic Services Inc. | | 6.200% | | 3/1/40 | | | 50 | | | | 68 | |
| | | Republic Services Inc. | | 5.700% | | 5/15/41 | | | 100 | | | | 130 | |
| | | Rockwell Automation Inc. | | 3.500% | | 3/1/29 | | | 100 | | | | 107 | |
| | | Rockwell Automation Inc. | | 4.200% | | 3/1/49 | | | 100 | | | | 116 | |
| | | Rockwell Collins Inc. | | 3.100% | | 11/15/21 | | | 50 | | | | 51 | |
| | | Rockwell Collins Inc. | | 2.800% | | 3/15/22 | | | 170 | | | | 173 | |
| | | Rockwell Collins Inc. | | 3.200% | | 3/15/24 | | | 175 | | | | 182 | |
| | | Rockwell Collins Inc. | | 3.500% | | 3/15/27 | | | 300 | | | | 319 | |
| | | Rockwell Collins Inc. | | 4.800% | | 12/15/43 | | | 65 | | | | 79 | |
| | | Rockwell Collins Inc. | | 4.350% | | 4/15/47 | | | 250 | | | | 292 | |
| | | Roper Technologies Inc. | | 3.000% | | 12/15/20 | | | 125 | | | | 126 | |
| | | Roper Technologies Inc. | | 2.800% | | 12/15/21 | | | 200 | | | | 203 | |
| | | Roper Technologies Inc. | | 2.350% | | 9/15/24 | | | 125 | | | | 126 | |
| | | Roper Technologies Inc. | | 3.850% | | 12/15/25 | | | 100 | | | | 107 | |
| | | Roper Technologies Inc. | | 3.800% | | 12/15/26 | | | 145 | | | | 156 | |
| | | Roper Technologies Inc. | | 4.200% | | 9/15/28 | | | 175 | | | | 191 | |
| | | Roper Technologies Inc. | | 2.950% | | 9/15/29 | | | 125 | | | | 126 | |
| | | Snap-on Inc. | | 6.125% | | 9/1/21 | | | 75 | | | | 80 | |
| | | Snap-on Inc. | | 3.250% | | 3/1/27 | | | 50 | | | | 52 | |
| | | Snap-on Inc. | | 4.100% | | 3/1/48 | | | 75 | | | | 84 | |
Total Bond Market Index Portfolio
| | | | | | | | | Face | | | Market | |
| | | | | | | Maturity | | Amount | | | Value• | |
| | | | | Coupon | | Date | | | ($000 | ) | | | ($000 | ) |
| | | Sonoco Products Co. | | 5.750% | | 11/1/40 | | | 120 | | | | 147 | |
| | | Spirit AeroSystems Inc. | | 3.950% | | 6/15/23 | | | 75 | | | | 77 | |
| | | Spirit AeroSystems Inc. | | 3.850% | | 6/15/26 | | | 65 | | | | 67 | |
| | | Spirit AeroSystems Inc. | | 4.600% | | 6/15/28 | | | 150 | | | | 158 | |
| | | Stanley Black & Decker Inc. | | 3.400% | | 12/1/21 | | | 150 | | | | 153 | |
| | | Stanley Black & Decker Inc. | | 3.400% | | 3/1/26 | | | 100 | | | | 105 | |
| | | Stanley Black & Decker Inc. | | 5.200% | | 9/1/40 | | | 75 | | | | 93 | |
| | | Stanley Black & Decker Inc. | | 4.850% | | 11/15/48 | | | 100 | | | | 124 | |
| | | Textron Inc. | | 3.875% | | 3/1/25 | | | 65 | | | | 69 | |
| | | Textron Inc. | | 4.000% | | 3/15/26 | | | 200 | | | | 214 | |
| | | Textron Inc. | | 3.650% | | 3/15/27 | | | 250 | | | | 261 | |
| | | Textron Inc. | | 3.375% | | 3/1/28 | | | 50 | | | | 51 | |
| | | Textron Inc. | | 3.900% | | 9/17/29 | | | 225 | | | | 240 | |
| | | Timken Co. | | 3.875% | | 9/1/24 | | | 100 | | | | 104 | |
| | | Timken Co. | | 4.500% | | 12/15/28 | | | 25 | | | | 27 | |
| | | United Technologies Corp. | | 3.350% | | 8/16/21 | | | 200 | | | | 205 | |
| | | United Technologies Corp. | | 1.950% | | 11/1/21 | | | 100 | | | | 100 | |
| | | United Technologies Corp. | | 3.100% | | 6/1/22 | | | 460 | | | | 472 | |
| | | United Technologies Corp. | | 3.650% | | 8/16/23 | | | 425 | | | | 448 | |
| | | United Technologies Corp. | | 2.800% | | 5/4/24 | | | 250 | | | | 257 | |
| | | United Technologies Corp. | | 3.950% | | 8/16/25 | | | 250 | | | | 272 | |
| | | United Technologies Corp. | | 2.650% | | 11/1/26 | | | 100 | | | | 102 | |
| | | United Technologies Corp. | | 6.700% | | 8/1/28 | | | 75 | | | | 97 | |
| | | United Technologies Corp. | | 4.125% | | 11/16/28 | | | 750 | | | | 843 | |
| | | United Technologies Corp. | | 7.500% | | 9/15/29 | | | 125 | | | | 176 | |
| | | United Technologies Corp. | | 5.400% | | 5/1/35 | | | 150 | | | | 192 | |
| | | United Technologies Corp. | | 6.050% | | 6/1/36 | | | 100 | | | | 135 | |
| | | United Technologies Corp. | | 6.125% | | 7/15/38 | | | 100 | | | | 138 | |
| | | United Technologies Corp. | | 4.450% | | 11/16/38 | | | 175 | | | | 205 | |
| | | United Technologies Corp. | | 5.700% | | 4/15/40 | | | 100 | | | | 134 | |
| | | United Technologies Corp. | | 4.500% | | 6/1/42 | | | 675 | | | | 808 | |
| | | United Technologies Corp. | | 4.150% | | 5/15/45 | | | 200 | | | | 229 | |
| | | United Technologies Corp. | | 3.750% | | 11/1/46 | | | 200 | | | | 218 | |
| | | United Technologies Corp. | | 4.050% | | 5/4/47 | | | 250 | | | | 284 | |
| | | United Technologies Corp. | | 4.625% | | 11/16/48 | | | 400 | | | | 498 | |
| | | Valmont Industries Inc. | | 5.000% | | 10/1/44 | | | 150 | | | | 153 | |
| | | Valmont Industries Inc. | | 5.250% | | 10/1/54 | | | 75 | | | | 76 | |
| | | Vulcan Materials Co. | | 4.500% | | 4/1/25 | | | 200 | | | | 216 | |
| | | Vulcan Materials Co. | | 4.500% | | 6/15/47 | | | 125 | | | | 137 | |
| | | Wabtec Corp. | | 4.400% | | 3/15/24 | | | 275 | | | | 291 | |
| | | Wabtec Corp. | | 3.450% | | 11/15/26 | | | 150 | | | | 151 | |
| | | Wabtec Corp. | | 4.950% | | 9/15/28 | | | 175 | | | | 192 | |
| | | Waste Connections Inc. | | 3.500% | | 5/1/29 | | | 200 | | | | 211 | |
| | | Waste Management Inc. | | 4.600% | | 3/1/21 | | | 50 | | | | 51 | |
| | | Waste Management Inc. | | 2.900% | | 9/15/22 | | | 100 | | | | 102 | |
| | | Waste Management Inc. | | 2.400% | | 5/15/23 | | | 225 | | | | 227 | |
| | | Waste Management Inc. | | 3.500% | | 5/15/24 | | | 200 | | | | 210 | |
| | | Waste Management Inc. | | 2.950% | | 6/15/24 | | | 150 | | | | 155 | |
| | | Waste Management Inc. | | 3.125% | | 3/1/25 | | | 150 | | | | 157 | |
| | | Waste Management Inc. | | 3.200% | | 6/15/26 | | | 145 | | | | 152 | |
| | | Waste Management Inc. | | 3.150% | | 11/15/27 | | | 125 | | | | 131 | |
| | | Waste Management Inc. | | 3.450% | | 6/15/29 | | | 200 | | | | 214 | |
| | | Waste Management Inc. | | 3.900% | | 3/1/35 | | | 250 | | | | 277 | |
| | | Waste Management Inc. | | 4.000% | | 7/15/39 | | | 100 | | | | 112 | |
| | | Waste Management Inc. | | 4.100% | | 3/1/45 | | | 150 | | | | 168 | |
| | | Waste Management Inc. | | 4.150% | | 7/15/49 | | | 100 | | | | 114 | |
| | | WW Grainger Inc. | | 4.600% | | 6/15/45 | | | 200 | | | | 237 | |
| | | WW Grainger Inc. | | 3.750% | | 5/15/46 | | | 75 | | | | 77 | |
| | | WW Grainger Inc. | | 4.200% | | 5/15/47 | | | 50 | | | | 56 | |
| | | Xylem Inc. | | 3.250% | | 11/1/26 | | | 100 | | | | 104 | |
| | | Xylem Inc. | | 4.375% | | 11/1/46 | | | 100 | | | | 109 | |
| | | | | | | | | | | | | | | |
| | | Communication (2.4%) | | | | | | | | | | | | |
| | | Activision Blizzard Inc. | | 2.300% | | 9/15/21 | | | 125 | | | | 126 | |
| | | Activision Blizzard Inc. | | 2.600% | | 6/15/22 | | | 75 | | | | 76 | |
| | | Activision Blizzard Inc. | | 3.400% | | 9/15/26 | | | 160 | | | | 168 | |
| | | Activision Blizzard Inc. | | 4.500% | | 6/15/47 | | | 75 | | | | 85 | |
| | | America Movil SAB de CV | | 3.125% | | 7/16/22 | | | 300 | | | | 306 | |
| | | America Movil SAB de CV | | 3.625% | | 4/22/29 | | | 200 | | | | 212 | |
| | | America Movil SAB de CV | | 6.375% | | 3/1/35 | | | 300 | | | | 403 | |
| | | America Movil SAB de CV | | 6.125% | | 11/15/37 | | | 150 | | | | 196 | |
| | America Movil SAB de CV | | 6.125% | | 3/30/40 | | | 200 | | | | 268 | |
| | | America Movil SAB de CV | | 4.375% | | 7/16/42 | | | 250 | | | | 278 | |
| | | America Movil SAB de CV | | 4.375% | | 4/22/49 | | | 200 | | | | 229 | |
| | | American Tower Corp. | | 3.300% | | 2/15/21 | | | 125 | | | | 127 | |
| | | American Tower Corp. | | 3.450% | | 9/15/21 | | | 475 | | | | 486 | |
| | | American Tower Corp. | | 5.900% | | 11/1/21 | | | 475 | | | | 507 | |
| | | American Tower Corp. | | 2.250% | | 1/15/22 | | | 125 | | | | 125 | |
| | | American Tower Corp. | | 3.500% | | 1/31/23 | | | 200 | | | | 207 | |
| | | American Tower Corp. | | 5.000% | | 2/15/24 | | | 100 | | | | 110 | |
| | | American Tower Corp. | | 3.375% | | 5/15/24 | | | 200 | | | | 207 | |
| | | American Tower Corp. | | 2.950% | | 1/15/25 | | | 100 | | | | 102 | |
| | | American Tower Corp. | | 3.375% | | 10/15/26 | | | 400 | | | | 415 | |
| | | American Tower Corp. | | 2.750% | | 1/15/27 | | | 500 | | | | 500 | |
| | | American Tower Corp. | | 3.125% | | 1/15/27 | | | 125 | | | | 127 | |
| | | American Tower Corp. | | 3.950% | | 3/15/29 | | | 140 | | | | 151 | |
| | | American Tower Corp. | | 3.800% | | 8/15/29 | | | 475 | | | | 507 | |
| | | American Tower Corp. | | 3.700% | | 10/15/49 | | | 100 | | | | 99 | |
| | | AT&T Inc. | | 4.600% | | 2/15/21 | | | 175 | | | | 179 | |
| | | AT&T Inc. | | 3.200% | | 3/1/22 | | | 250 | | | | 256 | |
| | | AT&T Inc. | | 3.400% | | 6/15/22 | | | 100 | | | | 103 | |
| | | AT&T Inc. | | 3.000% | | 6/30/22 | | | 767 | | | | 784 | |
| | | AT&T Inc. | | 3.600% | | 2/17/23 | | | 755 | | | | 788 | |
| | | AT&T Inc. | | 4.050% | | 12/15/23 | | | 100 | | | | 107 | |
| | | AT&T Inc. | | 3.800% | | 3/1/24 | | | 125 | | | | 132 | |
| | | AT&T Inc. | | 4.450% | | 4/1/24 | | | 250 | | | | 271 | |
| | | AT&T Inc. | | 3.950% | | 1/15/25 | | | 225 | | | | 241 | |
| | | AT&T Inc. | | 3.400% | | 5/15/25 | | | 940 | | | | 985 | |
| | | AT&T Inc. | | 3.600% | | 7/15/25 | | | 275 | | | | 290 | |
| | | AT&T Inc. | | 3.875% | | 1/15/26 | | | 505 | | | | 541 | |
| | | AT&T Inc. | | 4.125% | | 2/17/26 | | | 515 | | | | 558 | |
| | | AT&T Inc. | | 3.800% | | 2/15/27 | | | 700 | | | | 746 | |
| | | AT&T Inc. | | 4.100% | | 2/15/28 | | | 804 | | | | 873 | |
| | | AT&T Inc. | | 4.350% | | 3/1/29 | | | 650 | | | | 721 | |
| | | AT&T Inc. | | 4.300% | | 2/15/30 | | | 860 | | | | 956 | |
| | | AT&T Inc. | | 4.500% | | 5/15/35 | | | 200 | | | | 222 | |
| | | AT&T Inc. | | 5.250% | | 3/1/37 | | | 500 | | | | 597 | |
| | | AT&T Inc. | | 4.900% | | 8/15/37 | | | 300 | | | | 344 | |
| | | AT&T Inc. | | 4.850% | | 3/1/39 | | | 480 | | | | 551 | |
| | | AT&T Inc. | | 6.350% | | 3/15/40 | | | 100 | | | | 130 | |
| | | AT&T Inc. | | 6.100% | | 7/15/40 | | | 100 | | | | 127 | |
| | | AT&T Inc. | | 6.000% | | 8/15/40 | | | 300 | | | | 381 | |
| | | AT&T Inc. | | 5.350% | | 9/1/40 | | | 600 | | | | 718 | |
| | | AT&T Inc. | | 5.550% | | 8/15/41 | | | 225 | | | | 276 | |
| | | AT&T Inc. | | 5.375% | | 10/15/41 | | | 100 | | | | 118 | |
| | | AT&T Inc. | | 5.150% | | 3/15/42 | | | 375 | | | | 437 | |
| | | AT&T Inc. | | 4.900% | | 6/15/42 | | | 525 | | | | 590 | |
| | | AT&T Inc. | | 4.300% | | 12/15/42 | | | 271 | | | | 290 | |
| | | AT&T Inc. | | 5.350% | | 12/15/43 | | | 175 | | | | 210 | |
| | | AT&T Inc. | | 4.650% | | 6/1/44 | | | 100 | | | | 110 | |
| | | AT&T Inc. | | 4.800% | | 6/15/44 | | | 575 | | | | 653 | |
| | | AT&T Inc. | | 4.350% | | 6/15/45 | | | 624 | | | | 667 | |
| | | AT&T Inc. | | 4.750% | | 5/15/46 | | | 650 | | | | 730 | |
| | | AT&T Inc. | | 5.150% | | 11/15/46 | | | 1,473 | | | | 1,753 | |
| | | AT&T Inc. | | 4.500% | | 3/9/48 | | | 500 | | | | 549 | |
| | | AT&T Inc. | | 4.550% | | 3/9/49 | | | 362 | | | | 401 | |
| | | AT&T Inc. | | 5.150% | | 2/15/50 | | | 332 | | | | 400 | |
| | | AT&T Inc. | | 5.300% | | 8/15/58 | | | 307 | | | | 378 | |
| | | Bell Canada Inc. | | 4.300% | | 7/29/49 | | | 100 | | | | 112 | |
| | | British Telecommunications plc | | 4.500% | | 12/4/23 | | | 200 | | | | 215 | |
| | | British Telecommunications plc | | 5.125% | | 12/4/28 | | | 100 | | | | 115 | |
| | | British Telecommunications plc | | 9.625% | | 12/15/30 | | | 516 | | | | 794 | |
| | | CC Holdings GS V LLC / Crown Castle GS III Corp. | | 3.849% | | 4/15/23 | | | 250 | | | | 262 | |
| | | Charter Communications Operating LLC / Charter Communications Operating Capital | | 4.464% | | 7/23/22 | | | 676 | | | | 711 | |
| | | Charter Communications Operating LLC / Charter Communications Operating Capital | | 4.500% | | 2/1/24 | | | 175 | | | | 188 | |
Total Bond Market Index Portfolio
| | | | | | | | | Face | | | Market | |
| | | | | | | Maturity | | Amount | | | Value• | |
| | | | | Coupon | | Date | | | ($000 | ) | | | ($000 | ) |
| | | Charter Communications Operating LLC / Charter Communications Operating Capital | | 4.908% | | 7/23/25 | | | 850 | | | | 935 | |
| | | Charter Communications Operating LLC / Charter Communications Operating Capital | | 3.750% | | 2/15/28 | | | 730 | | | | 755 | |
| | | Charter Communications Operating LLC / Charter Communications Operating Capital | | 5.050% | | 3/30/29 | | | 225 | | | | 254 | |
| | | Charter Communications Operating LLC / Charter Communications Operating Capital | | 6.384% | | 10/23/35 | | | 575 | | | | 723 | |
| | | Charter Communications Operating LLC / Charter Communications Operating Capital | | 5.375% | | 4/1/38 | | | 150 | | | | 170 | |
| | | Charter Communications Operating LLC / Charter Communications Operating Capital | | 6.484% | | 10/23/45 | | | 650 | | | | 810 | |
| | | Charter Communications Operating LLC / Charter Communications Operating Capital | | 5.375% | | 5/1/47 | | | 450 | | | | 504 | |
| | | Charter Communications Operating LLC / Charter Communications Operating Capital | | 5.750% | | 4/1/48 | | | 700 | | | | 817 | |
| | | Charter Communications Operating LLC / Charter Communications Operating Capital | | 5.125% | | 7/1/49 | | | 75 | | | | 81 | |
| | | Charter Communications Operating LLC / Charter Communications Operating Capital | | 4.800% | | 3/1/50 | | | 300 | | | | 314 | |
| | | Charter Communications Operating LLC / Charter Communications Operating Capital | | 6.834% | | 10/23/55 | | | 75 | | | | 94 | |
| | | Comcast Cable Communications Holdings Inc. | | 9.455% | | 11/15/22 | | | 139 | | | | 168 | |
| | | Comcast Corp. | | 3.450% | | 10/1/21 | | | 650 | | | | 668 | |
| | | Comcast Corp. | | 2.750% | | 3/1/23 | | | 200 | | | | 204 | |
| | | Comcast Corp. | | 3.000% | | 2/1/24 | | | 710 | | | | 736 | |
| | | Comcast Corp. | | 3.375% | | 2/15/25 | | | 202 | | | | 213 | |
| | | Comcast Corp. | | 3.375% | | 8/15/25 | | | 250 | | | | 265 | |
| | | Comcast Corp. | | 3.950% | | 10/15/25 | | | 625 | | | | 681 | |
| | | Comcast Corp. | | 3.150% | | 3/1/26 | | | 400 | | | | 418 | |
| | | Comcast Corp. | | 2.350% | | 1/15/27 | | | 495 | | | | 494 | |
| | | Comcast Corp. | | 3.150% | | 2/15/28 | | | 325 | | | | 340 | |
| | | Comcast Corp. | | 4.150% | | 10/15/28 | | | 950 | | | | 1,069 | |
| | | Comcast Corp. | | 2.650% | | 2/1/30 | | | 300 | | | | 300 | |
| | | Comcast Corp. | | 4.250% | | 10/15/30 | | | 250 | | | | 284 | |
| | | Comcast Corp. | | 4.250% | | 1/15/33 | | | 275 | | | | 315 | |
| | | Comcast Corp. | | 4.200% | | 8/15/34 | | | 175 | | | | 200 | |
| | | Comcast Corp. | | 5.650% | | 6/15/35 | | | 1,065 | | | | 1,398 | |
| | | Comcast Corp. | | 4.400% | | 8/15/35 | | | 150 | | | | 176 | |
| | | Comcast Corp. | | 3.200% | | 7/15/36 | | | 225 | | | | 229 | |
| | | Comcast Corp. | | 6.450% | | 3/15/37 | | | 175 | | | | 244 | |
| | | Comcast Corp. | | 6.950% | | 8/15/37 | | | 250 | | | | 366 | |
| | | Comcast Corp. | | 3.900% | | 3/1/38 | | | 175 | | | | 193 | |
| | | Comcast Corp. | | 6.400% | | 5/15/38 | | | 100 | | | | 139 | |
| | | Comcast Corp. | | 4.600% | | 10/15/38 | | | 550 | | | | 653 | |
| | | Comcast Corp. | | 3.250% | | 11/1/39 | | | 250 | | | | 251 | |
| | | Comcast Corp. | | 6.400% | | 3/1/40 | | | 150 | | | | 210 | |
| | | Comcast Corp. | | 4.650% | | 7/15/42 | | | 370 | | | | 440 | |
| | | Comcast Corp. | | 4.500% | | 1/15/43 | | | 100 | | | | 117 | |
| | | Comcast Corp. | | 4.600% | | 8/15/45 | | | 250 | | | | 298 | |
| | | Comcast Corp. | | 3.400% | | 7/15/46 | | | 500 | | | | 502 | |
| | | Comcast Corp. | | 3.969% | | 11/1/47 | | | 1,086 | | | | 1,185 | |
| | | Comcast Corp. | | 4.000% | | 3/1/48 | | | 175 | | | | 192 | |
| | | Comcast Corp. | | 4.700% | | 10/15/48 | | | 475 | | | | 585 | |
| | | Comcast Corp. | | 3.999% | | 11/1/49 | | | 268 | | | | 296 | |
| | | Comcast Corp. | | 3.450% | | 2/1/50 | | | 400 | | | | 408 | |
| | | Comcast Corp. | | 4.950% | | 10/15/58 | | | 475 | | | | 618 | |
| | | Crown Castle International Corp. | | 3.400% | | 2/15/21 | | | 300 | | | | 304 | |
| | | Crown Castle International Corp. | | 2.250% | | 9/1/21 | | | 125 | | | | 125 | |
| | | Crown Castle International Corp. | | 4.875% | | 4/15/22 | | | 125 | | | | 132 | |
| | | Crown Castle International Corp. | | 5.250% | | 1/15/23 | | | 125 | | | | 136 | |
| | | Crown Castle International Corp. | | 3.150% | | 7/15/23 | | | 150 | | | | 154 | |
| | | Crown Castle International Corp. | | 3.200% | | 9/1/24 | | | 250 | | | | 257 | |
| | | Crown Castle International Corp. | | 4.450% | | 2/15/26 | | | 250 | | | | 273 | |
| | | Crown Castle International Corp. | | 3.700% | | 6/15/26 | | | 175 | | | | 185 | |
| | | Crown Castle International Corp. | | 3.650% | | 9/1/27 | | | 325 | | | | 342 | |
| | | Crown Castle International Corp. | | 3.800% | | 2/15/28 | | | 425 | | | | 452 | |
| | | Crown Castle International Corp. | | 4.750% | | 5/15/47 | | | 95 | | | | 109 | |
| | | Crown Castle International Corp. | | 5.200% | | 2/15/49 | | | 75 | | | | 92 | |
| | | Deutsche Telekom International Finance BV | | 8.750% | | 6/15/30 | | | 775 | | | | 1,137 | |
| | | Discovery Communications LLC | | 4.375% | | 6/15/21 | | | 25 | | | | 26 | |
| | | Discovery Communications LLC | | 3.500% | | 6/15/22 | | | 200 | | | | 205 | |
| | | Discovery Communications LLC | | 2.950% | | 3/20/23 | | | 100 | | | | 102 | |
| | | Discovery Communications LLC | | 3.250% | | 4/1/23 | | | 100 | | | | 103 | |
| | | Discovery Communications LLC | | 3.800% | | 3/13/24 | | | 100 | | | | 105 | |
| | | Discovery Communications LLC | | 3.900% | | 11/15/24 | | | 150 | | | | 159 | |
| | | Discovery Communications LLC | | 3.450% | | 3/15/25 | | | 225 | | | | 233 | |
| | | Discovery Communications LLC | | 3.950% | | 6/15/25 | | | 100 | | | | 106 | |
| | | Discovery Communications LLC | | 4.900% | | 3/11/26 | | | 150 | | | | 168 | |
| | | Discovery Communications LLC | | 3.950% | | 3/20/28 | | | 400 | | | | 427 | |
| | | Discovery Communications LLC | | 4.125% | | 5/15/29 | | | 100 | | | | 107 | |
| | | Discovery Communications LLC | | 5.000% | | 9/20/37 | | | 325 | | | | 367 | |
| | | Discovery Communications LLC | | 6.350% | | 6/1/40 | | | 150 | | | | 189 | |
| | | Discovery Communications LLC | | 4.950% | | 5/15/42 | | | 277 | | | | 303 | |
| | | Discovery Communications LLC | | 5.200% | | 9/20/47 | | | 225 | | | | 261 | |
| | | Discovery Communications LLC | | 5.300% | | 5/15/49 | | | 75 | | | | 89 | |
| | | Electronic Arts Inc. | | 3.700% | | 3/1/21 | | | 150 | | | | 153 | |
| | | Electronic Arts Inc. | | 4.800% | | 3/1/26 | | | 100 | | | | 113 | |
| 6 | | Fox Corp. | | 3.666% | | 1/25/22 | | | 50 | | | | 52 | |
| 6 | | Fox Corp. | | 4.030% | | 1/25/24 | | | 250 | | | | 266 | |
| 6 | | Fox Corp. | | 4.709% | | 1/25/29 | | | 375 | | | | 426 | |
| 6 | | Fox Corp. | | 5.476% | | 1/25/39 | | | 250 | | | | 304 | |
| 6 | | Fox Corp. | | 5.576% | | 1/25/49 | | | 425 | | | | 535 | |
| | | Grupo Televisa SAB | | 6.625% | | 3/18/25 | | | 100 | | | | 117 | |
| | | Grupo Televisa SAB | | 4.625% | | 1/30/26 | | | 100 | | | | 108 | |
| | | Grupo Televisa SAB | | 6.625% | | 1/15/40 | | | 125 | | | | 157 | |
| | | Grupo Televisa SAB | | 5.000% | | 5/13/45 | | | 425 | | | | 448 | |
| | | Grupo Televisa SAB | | 5.250% | | 5/24/49 | | | 200 | | | | 216 | |
| | | Interpublic Group of Cos. Inc. | | 3.750% | | 10/1/21 | | | 50 | | | | 51 | |
| | | Interpublic Group of Cos. Inc. | | 3.750% | | 2/15/23 | | | 150 | | | | 157 | |
| | | Interpublic Group of Cos. Inc. | | 4.200% | | 4/15/24 | | | 422 | | | | 453 | |
| | | Interpublic Group of Cos. Inc. | | 4.650% | | 10/1/28 | | | 100 | | | | 112 | |
| | | Interpublic Group of Cos. Inc. | | 5.400% | | 10/1/48 | | | 175 | | | | 214 | |
| | | Koninklijke KPN NV | | 8.375% | | 10/1/30 | | | 125 | | | | 173 | |
| | | Moody’s Corp. | | 2.750% | | 12/15/21 | | | 100 | | | | 101 | |
| | | Moody’s Corp. | | 4.500% | | 9/1/22 | | | 100 | | | | 106 | |
| | | Moody’s Corp. | | 4.875% | | 2/15/24 | | | 250 | | | | 275 | |
| | | Moody’s Corp. | | 4.875% | | 12/17/48 | | | 125 | | | | 153 | |
| | | NBCUniversal Media LLC | | 4.375% | | 4/1/21 | | | 325 | | | | 335 | |
| | | NBCUniversal Media LLC | | 2.875% | | 1/15/23 | | | 225 | | | | 231 | |
| | | NBCUniversal Media LLC | | 6.400% | | 4/30/40 | | | 150 | | | | 210 | |
| | | NBCUniversal Media LLC | | 5.950% | | 4/1/41 | | | 225 | | | | 309 | |
| | | NBCUniversal Media LLC | | 4.450% | | 1/15/43 | | | 225 | | | | 261 | |
| | | Omnicom Group Inc. / Omnicom Capital Inc. | | 3.625% | | 5/1/22 | | | 250 | | | | 259 | |
| | | Omnicom Group Inc. / Omnicom Capital Inc. | | 3.650% | | 11/1/24 | | | 150 | | | | 158 | |
| | | Omnicom Group Inc. / Omnicom Capital Inc. | | 3.600% | | 4/15/26 | | | 250 | | | | 263 | |
| | | Orange SA | | 4.125% | | 9/14/21 | | | 325 | | | | 337 | |
| | | Orange SA | | 9.000% | | 3/1/31 | | | 450 | | | | 696 | |
| | | Orange SA | | 5.375% | | 1/13/42 | | | 325 | | | | 416 | |
| | | RELX Capital Inc. | | 3.125% | | 10/15/22 | | | 182 | | | | 188 | |
| | | RELX Capital Inc. | | 3.500% | | 3/16/23 | | | 125 | | | | 130 | |
| | | RELX Capital Inc. | | 4.000% | | 3/18/29 | | | 100 | | | | 108 | |
| | | Rogers Communications Inc. | | 3.000% | | 3/15/23 | | | 205 | | | | 210 | |
| | | Rogers Communications Inc. | | 4.100% | | 10/1/23 | | | 175 | | | | 186 | |
| | | Rogers Communications Inc. | | 3.625% | | 12/15/25 | | | 125 | | | | 132 | |
| | | Rogers Communications Inc. | | 2.900% | | 11/15/26 | | | 100 | | | | 102 | |
Total Bond Market Index Portfolio
| | | | | | | | | Face | | | Market | |
| | | | | | | Maturity | | Amount | | | Value• | |
| | | | | Coupon | | Date | | | ($000 | ) | | | ($000 | ) |
| | Rogers Communications Inc. | | 4.500% | | 3/15/43 | | | 265 | | | | 290 | |
| | | Rogers Communications Inc. | | 5.000% | | 3/15/44 | | | 190 | | | | 230 | |
| | | Rogers Communications Inc. | | 4.350% | | 5/1/49 | | | 450 | | | | 500 | |
| | | Rogers Communications Inc. | | 3.700% | | 11/15/49 | | | 150 | | | | 151 | |
| | | S&P Global Inc. | | 4.000% | | 6/15/25 | | | 125 | | | | 135 | |
| | | S&P Global Inc. | | 4.400% | | 2/15/26 | | | 175 | | | | 194 | |
| | | S&P Global Inc. | | 2.500% | | 12/1/29 | | | 125 | | | | 125 | |
| | | S&P Global Inc. | | 4.500% | | 5/15/48 | | | 100 | | | | 121 | |
| | | S&P Global Inc. | | 3.250% | | 12/1/49 | | | 350 | | | | 357 | |
| | | Telefonica Emisiones SAU | | 5.462% | | 2/16/21 | | | 555 | | | | 576 | |
| | | Telefonica Emisiones SAU | | 4.103% | | 3/8/27 | | | 250 | | | | 270 | |
| | | Telefonica Emisiones SAU | | 7.045% | | 6/20/36 | | | 375 | | | | 528 | |
| | | Telefonica Emisiones SAU | | 4.665% | | 3/6/38 | | | 200 | | | | 226 | |
| | | Telefonica Emisiones SAU | | 5.213% | | 3/8/47 | | | 550 | | | | 653 | |
| | | Telefonica Emisiones SAU | | 4.895% | | 3/6/48 | | | 200 | | | | 229 | |
| | | Telefonica Emisiones SAU | | 5.520% | | 3/1/49 | | | 335 | | | | 419 | |
| | | TELUS Corp. | | 2.800% | | 2/16/27 | | | 100 | | | | 100 | |
| | | TELUS Corp. | | 4.300% | | 6/15/49 | | | 200 | | | | 221 | |
| | | Thomson Reuters Corp. | | 5.500% | | 8/15/35 | | | 75 | | | | 84 | |
| | | Thomson Reuters Corp. | | 5.850% | | 4/15/40 | | | 100 | | | | 119 | |
| | | Thomson Reuters Corp. | | 5.650% | | 11/23/43 | | | 100 | | | | 118 | |
| | �� | Time Warner Cable LLC | | 4.125% | | 2/15/21 | | | 150 | | | | 152 | |
| | | Time Warner Cable LLC | | 6.550% | | 5/1/37 | | | 200 | | | | 245 | |
| | | Time Warner Cable LLC | | 7.300% | | 7/1/38 | | | 50 | | | | 65 | |
| | | Time Warner Cable LLC | | 6.750% | | 6/15/39 | | | 400 | | | | 505 | |
| | | Time Warner Cable LLC | | 5.875% | | 11/15/40 | | | 425 | | | | 487 | |
| | | Time Warner Cable LLC | | 5.500% | | 9/1/41 | | | 250 | | | | 279 | |
| | | Time Warner Cable LLC | | 4.500% | | 9/15/42 | | | 450 | | | | 456 | |
| | | Time Warner Entertainment Co. LP | | 8.375% | | 3/15/23 | | | 200 | | | | 236 | |
| | | Time Warner Entertainment Co. LP | | 8.375% | | 7/15/33 | | | 200 | | | | 281 | |
| | | Verizon Communications Inc. | | 3.450% | | 3/15/21 | | | 300 | | | | 306 | |
| | | Verizon Communications Inc. | | 4.600% | | 4/1/21 | | | 475 | | | | 491 | |
| | | Verizon Communications Inc. | | 2.946% | | 3/15/22 | | | 400 | | | | 408 | |
| | | Verizon Communications Inc. | | 3.125% | | 3/16/22 | | | 350 | | | | 359 | |
| | | Verizon Communications Inc. | | 5.150% | | 9/15/23 | | | 830 | | | | 920 | |
| | | Verizon Communications Inc. | | 4.150% | | 3/15/24 | | | 100 | | | | 108 | |
| | | Verizon Communications Inc. | | 3.500% | | 11/1/24 | | | 400 | | | | 423 | |
| | | Verizon Communications Inc. | | 3.376% | | 2/15/25 | | | 534 | | | | 565 | |
| | | Verizon Communications Inc. | | 2.625% | | 8/15/26 | | | 475 | | | | 482 | |
| | | Verizon Communications Inc. | | 4.125% | | 3/16/27 | | | 400 | | | | 442 | |
| | | Verizon Communications Inc. | | 4.329% | | 9/21/28 | | | 1,229 | | | | 1,393 | |
| | | Verizon Communications Inc. | | 4.016% | | 12/3/29 | | | 927 | | | | 1,032 | |
| | | Verizon Communications Inc. | | 4.500% | | 8/10/33 | | | 575 | | | | 667 | |
| | | Verizon Communications Inc. | | 4.400% | | 11/1/34 | | | 725 | | | | 839 | |
| | | Verizon Communications Inc. | | 4.272% | | 1/15/36 | | | 563 | | | | 634 | |
| | | Verizon Communications Inc. | | 5.250% | | 3/16/37 | | | 875 | | | | 1,098 | |
| | | Verizon Communications Inc. | | 4.812% | | 3/15/39 | | | 350 | | | | 423 | |
| | | Verizon Communications Inc. | | 4.750% | | 11/1/41 | | | 175 | | | | 212 | |
| | | Verizon Communications Inc. | | 3.850% | | 11/1/42 | | | 175 | | | | 187 | |
| | | Verizon Communications Inc. | | 4.125% | | 8/15/46 | | | 250 | | | | 282 | |
| | | Verizon Communications Inc. | | 4.862% | | 8/21/46 | | | 1,279 | | | | 1,583 | |
| | | Verizon Communications Inc. | | 4.522% | | 9/15/48 | | | 747 | | | | 892 | |
| | | Verizon Communications Inc. | | 5.012% | | 4/15/49 | | | 385 | | | | 492 | |
| | | Verizon Communications Inc. | | 4.672% | | 3/15/55 | | | 600 | | | | 736 | |
| | | ViacomCBS Inc. | | 4.300% | | 2/15/21 | | | 275 | | | | 280 | |
| | | ViacomCBS Inc. | | 3.875% | | 12/15/21 | | | 125 | | | | 129 | |
| | | ViacomCBS Inc. | | 2.500% | | 2/15/23 | | | 200 | | | | 202 | |
| | | ViacomCBS Inc. | | 2.900% | | 6/1/23 | | | 75 | | | | 76 | |
| | | ViacomCBS Inc. | | 4.250% | | 9/1/23 | | | 225 | | | | 240 | |
| | | ViacomCBS Inc. | | 3.875% | | 4/1/24 | | | 124 | | | | 131 | |
| | | ViacomCBS Inc. | | 3.700% | | 8/15/24 | | | 175 | | | | 185 | |
| | | ViacomCBS Inc. | | 3.500% | | 1/15/25 | | | 150 | | | | 157 | |
| | | ViacomCBS Inc. | | 2.900% | | 1/15/27 | | | 279 | | | | 279 | |
| | | ViacomCBS Inc. | | 3.375% | | 2/15/28 | | | 100 | | | | 103 | |
| | | ViacomCBS Inc. | | 3.700% | | 6/1/28 | | | 100 | | | | 104 | |
| | | ViacomCBS Inc. | | 5.500% | | 5/15/33 | | | 75 | | | | 90 | |
| | | ViacomCBS Inc | | 6.875% | | 4/30/36 | | | 240 | | | | 321 | |
| | | ViacomCBS Inc. | | 5.900% | | 10/15/40 | | | 225 | | | | 272 | |
| | | ViacomCBS Inc. | | 4.850% | | 7/1/42 | | | 225 | | | | 248 | |
| | | ViacomCBS Inc | | 4.375% | | 3/15/43 | | | 556 | | | | 589 | |
| | | ViacomCBS Inc | | 5.850% | | 9/1/43 | | | 75 | | | | 94 | |
| | | ViacomCBS Inc. | | 4.900% | | 8/15/44 | | | 100 | | | | 113 | |
| | | Vodafone Group plc | | 3.750% | | 1/16/24 | | | 650 | | | | 686 | |
| | | Vodafone Group plc | | 4.125% | | 5/30/25 | | | 500 | | | | 540 | |
| | | Vodafone Group plc | | 4.375% | | 5/30/28 | | | 650 | | | | 719 | |
| | | Vodafone Group plc | | 7.875% | | 2/15/30 | | | 150 | | | | 208 | |
| | | Vodafone Group plc | | 6.250% | | 11/30/32 | | | 100 | | | | 127 | |
| | | Vodafone Group plc | | 5.000% | | 5/30/38 | | | 325 | | | | 379 | |
| | | Vodafone Group plc | | 4.375% | | 2/19/43 | | | 275 | | | | 296 | |
| | | Vodafone Group plc | | 5.250% | | 5/30/48 | | | 700 | | | | 846 | |
| | | Vodafone Group plc | | 4.875% | | 6/19/49 | | | 350 | | | | 403 | |
| | | Vodafone Group plc | | 4.250% | | 9/17/50 | | | 450 | | | | 467 | |
| | | Walt Disney Co. | | 4.500% | | 2/15/21 | | | 920 | | | | 947 | |
| | | Walt Disney Co. | | 2.550% | | 2/15/22 | | | 75 | | | | 76 | |
| | | Walt Disney Co. | | 2.450% | | 3/4/22 | | | 75 | | | | 76 | |
| | | Walt Disney Co. | | 1.650% | | 9/1/22 | | | 100 | | | | 100 | |
| | | Walt Disney Co. | | 3.000% | | 9/15/22 | | | 275 | | | | 283 | |
| | | Walt Disney Co. | | 1.750% | | 8/30/24 | | | 100 | | | | 99 | |
| | | Walt Disney Co. | | 3.700% | | 9/15/24 | | | 200 | | | | 214 | |
| | | Walt Disney Co. | | 3.150% | | 9/17/25 | | | 150 | | | | 159 | |
| | | Walt Disney Co. | | 3.700% | | 10/15/25 | | | 125 | | | | 135 | |
| | | Walt Disney Co. | | 1.850% | | 7/30/26 | | | 1,070 | | | | 1,050 | |
| | | Walt Disney Co. | | 2.000% | | 9/1/29 | | | 400 | | | | 388 | |
| | | Walt Disney Co. | | 6.550% | | 3/15/33 | | | 100 | | | | 141 | |
| | | Walt Disney Co. | | 6.200% | | 12/15/34 | | | 400 | | | | 558 | |
| | | Walt Disney Co. | | 6.400% | | 12/15/35 | | | 365 | | | | 522 | |
| | | Walt Disney Co. | | 6.150% | | 3/1/37 | | | 200 | | | | 278 | |
| | | Walt Disney Co. | | 4.375% | | 8/16/41 | | | 75 | | | | 89 | |
| | | Walt Disney Co. | | 4.125% | | 12/1/41 | | | 205 | | | | 236 | |
| | | Walt Disney Co. | | 3.700% | | 12/1/42 | | | 125 | | | | 136 | |
| | | Walt Disney Co. | | 5.400% | | 10/1/43 | �� | | 100 | | | | 136 | |
| | | Walt Disney Co. | | 4.750% | | 9/15/44 | | | 175 | | | | 220 | |
| | | Walt Disney Co. | | 2.750% | | 9/1/49 | | | 600 | | | | 564 | |
| | | Weibo Corp. | | 3.500% | | 7/5/24 | | | 200 | | | | 204 | |
| | | WPP Finance 2010 | | 3.625% | | 9/7/22 | | | 200 | | | | 207 | |
| | | WPP Finance 2010 | | 3.750% | | 9/19/24 | | | 100 | | | | 105 | |
| | | | | | | | | | | | | | | |
| | | Consumer Cyclical (1.9%) | | | | | | | | | | | | |
| | | Alibaba Group Holding Ltd. | | 3.125% | | 11/28/21 | | | 300 | | | | 306 | |
| | | Alibaba Group Holding Ltd. | | 2.800% | | 6/6/23 | | | 200 | | | | 203 | |
| | | Alibaba Group Holding Ltd. | | 3.600% | | 11/28/24 | | | 400 | | | | 420 | |
| | | Alibaba Group Holding Ltd. | | 3.400% | | 12/6/27 | | | 600 | | | | 625 | |
| | | Alibaba Group Holding Ltd. | | 4.500% | | 11/28/34 | | | 280 | | | | 317 | |
| | | Alibaba Group Holding Ltd. | | 4.000% | | 12/6/37 | | | 200 | | | | 215 | |
| | | Alibaba Group Holding Ltd. | | 4.200% | | 12/6/47 | | | 425 | | | | 471 | |
| | | Alibaba Group Holding Ltd. | | 4.400% | | 12/6/57 | | | 100 | | | | 114 | |
| | | Amazon.com Inc. | | 3.300% | | 12/5/21 | | | 200 | | | | 206 | |
| | | Amazon.com Inc. | | 2.500% | | 11/29/22 | | | 150 | | | | 153 | |
| | | Amazon.com Inc. | | 2.400% | | 2/22/23 | | | 450 | | | | 457 | |
| | | Amazon.com Inc. | | 2.800% | | 8/22/24 | | | 250 | | | | 259 | |
| | | Amazon.com Inc. | | 3.800% | | 12/5/24 | | | 120 | | | | 130 | |
| | | Amazon.com Inc. | | 5.200% | | 12/3/25 | | | 225 | | | | 261 | |
| | | Amazon.com Inc. | | 3.150% | | 8/22/27 | | | 550 | | | | 581 | |
| | | Amazon.com Inc. | | 4.800% | | 12/5/34 | | | 225 | | | | 283 | |
| | | Amazon.com Inc. | | 3.875% | | 8/22/37 | | | 500 | | | | 568 | |
| | | Amazon.com Inc. | | 4.950% | | 12/5/44 | | | 350 | | | | 458 | |
| | | Amazon.com Inc. | | 4.050% | | 8/22/47 | | | 600 | | | | 703 | |
| | | Amazon.com Inc. | | 4.250% | | 8/22/57 | | | 500 | | | | 608 | |
| | | American Honda Finance Corp. | | 3.150% | | 1/8/21 | | | 250 | | | | 253 | |
| | | American Honda Finance Corp. | | 2.650% | | 2/12/21 | | | 150 | | | | 151 | |
| | | American Honda Finance Corp. | | 1.650% | | 7/12/21 | | | 150 | | | | 150 | |
| | | American Honda Finance Corp. | | 1.700% | | 9/9/21 | | | 400 | | | | 399 | |
| | | American Honda Finance Corp. | | 3.375% | | 12/10/21 | | | 150 | | | | 155 | |
| | | American Honda Finance Corp. | | 2.200% | | 6/27/22 | | | 150 | | | | 151 | |
| | | American Honda Finance Corp. | | 2.600% | | 11/16/22 | | | 40 | | | | 41 | |
| | | American Honda Finance Corp. | | 2.050% | | 1/10/23 | | | 125 | | | | 125 | |
| | | American Honda Finance Corp. | | 3.450% | | 7/14/23 | | | 125 | | | | 131 | |
| | | American Honda Finance Corp. | | 3.625% | | 10/10/23 | | | 100 | | | | 105 | |
| | | American Honda Finance Corp. | | 2.900% | | 2/16/24 | | | 150 | | | | 154 | |
| | | American Honda Finance Corp. | | 2.400% | | 6/27/24 | | | 100 | | | | 101 | |
| | | American Honda Finance Corp. | | 2.150% | | 9/10/24 | | | 125 | | | | 125 | |
| | | American Honda Finance Corp. | | 2.300% | | 9/9/26 | | | 50 | | | | 50 | |
Total Bond Market Index Portfolio
| | | | | | | | | Face | | | Market | |
| | | | | | | Maturity | | Amount | | | Value• | |
| | | | | Coupon | | Date | | | ($000 | ) | | | ($000 | ) |
| | | American Honda Finance Corp. | | 3.500% | | 2/15/28 | | | 100 | | | | 108 | |
| | | Aptiv Corp. | | 4.150% | | 3/15/24 | | | 125 | | | | 132 | |
| | | Aptiv plc | | 4.250% | | 1/15/26 | | | 150 | | | | 162 | |
| | | Aptiv plc | | 4.350% | | 3/15/29 | | | 50 | | | | 54 | |
| | | Aptiv plc | | 4.400% | | 10/1/46 | | | 50 | | | | 48 | |
| | | Aptiv plc | | 5.400% | | 3/15/49 | | | 50 | | | | 56 | |
| | | Automatic Data Processing Inc. | | 3.375% | | 9/15/25 | | | 200 | | | | 212 | |
| | | AutoNation Inc. | | 3.350% | | 1/15/21 | | | 60 | | | | 61 | |
| | | AutoNation Inc. | | 3.500% | | 11/15/24 | | | 205 | | | | 211 | |
| | | AutoNation Inc. | | 4.500% | | 10/1/25 | | | 150 | | | | 161 | |
| | | AutoNation Inc. | | 3.800% | | 11/15/27 | | | 75 | | | | 76 | |
| | | AutoZone Inc. | | 3.700% | | 4/15/22 | | | 350 | | | | 361 | |
| | | AutoZone Inc. | | 2.875% | | 1/15/23 | | | 75 | | | | 76 | |
| | | AutoZone Inc. | | 3.125% | | 7/15/23 | | | 125 | | | | 128 | |
| | | AutoZone Inc. | | 3.125% | | 4/18/24 | | | 130 | | | | 135 | |
| | | AutoZone Inc. | | 3.125% | | 4/21/26 | | | 100 | | | | 103 | |
| | | AutoZone Inc. | | 3.750% | | 6/1/27 | | | 100 | | | | 107 | |
| | | AutoZone Inc. | | 3.750% | | 4/18/29 | | | 100 | | | | 107 | |
| | | Best Buy Co. Inc. | | 5.500% | | 3/15/21 | | | 25 | | | | 26 | |
| | | Best Buy Co. Inc. | | 4.450% | | 10/1/28 | | | 200 | | | | 219 | |
| | | Block Financial LLC | | 5.500% | | 11/1/22 | | | 100 | | | | 107 | |
| | | Block Financial LLC | | 5.250% | | 10/1/25 | | | 100 | | | | 109 | |
| | | Booking Holdings Inc. | | 2.750% | | 3/15/23 | | | 100 | | | | 102 | |
| | | Booking Holdings Inc. | | 3.650% | | 3/15/25 | | | 100 | | | | 107 | |
| | | Booking Holdings Inc. | | 3.600% | | 6/1/26 | | | 225 | | | | 240 | |
| | | Booking Holdings Inc. | | 3.550% | | 3/15/28 | | | 100 | | | | 106 | |
| | | BorgWarner Inc. | | 3.375% | | 3/15/25 | | | 75 | | | | 78 | |
| | | BorgWarner Inc. | | 4.375% | | 3/15/45 | | | 100 | | | | 102 | |
| | | Costco Wholesale Corp. | | 2.150% | | 5/18/21 | | | 200 | | | | 201 | |
| | | Costco Wholesale Corp. | | 2.250% | | 2/15/22 | | | 100 | | | | 101 | |
| | | Costco Wholesale Corp. | | 2.300% | | 5/18/22 | | | 150 | | | | 152 | |
| | | Costco Wholesale Corp. | | 2.750% | | 5/18/24 | | | 275 | | | | 284 | |
| | | Costco Wholesale Corp. | | 3.000% | | 5/18/27 | | | 100 | | | | 106 | |
| | | Cummins Inc. | | 7.125% | | 3/1/28 | | | 100 | | | | 133 | |
| | | Cummins Inc. | | 4.875% | | 10/1/43 | | | 125 | | | | 152 | |
| | | Daimler Finance North America LLC | | 8.500% | | 1/18/31 | | | 250 | | | | 372 | |
| | | Darden Restaurants Inc. | | 3.850% | | 5/1/27 | | | 200 | | | | 209 | |
| | | Darden Restaurants Inc. | | 4.550% | | 2/15/48 | | | 50 | | | | 51 | |
| | | Dollar General Corp. | | 3.250% | | 4/15/23 | | | 150 | | | | 155 | |
| | | Dollar General Corp. | | 4.150% | | 11/1/25 | | | 105 | | | | 114 | |
| | | Dollar General Corp. | | 3.875% | | 4/15/27 | | | 50 | | | | 54 | |
| | | Dollar General Corp. | | 4.125% | | 5/1/28 | | | 150 | | | | 164 | |
| | | Dollar Tree Inc. | | 3.700% | | 5/15/23 | | | 100 | | | | 104 | |
| | | Dollar Tree Inc. | | 4.000% | | 5/15/25 | | | 200 | | | | 214 | |
| | | Dollar Tree Inc. | | 4.200% | | 5/15/28 | | | 300 | | | | 321 | |
| | | DR Horton Inc. | | 4.375% | | 9/15/22 | | | 100 | | | | 105 | |
| | | DR Horton Inc. | | 4.750% | | 2/15/23 | | | 225 | | | | 239 | |
| | | DR Horton Inc. | | 5.750% | | 8/15/23 | | | 75 | | | | 83 | |
| | | DR Horton Inc. | | 2.500% | | 10/15/24 | | | 100 | | | | 100 | |
| | | eBay Inc. | | 2.875% | | 8/1/21 | | | 125 | | | | 126 | |
| | | eBay Inc. | | 3.800% | | 3/9/22 | | | 100 | | | | 103 | |
| | | eBay Inc. | | 2.600% | | 7/15/22 | | | 450 | | | | 454 | |
| | | eBay Inc. | | 2.750% | | 1/30/23 | | | 175 | | | | 177 | |
| | | eBay Inc. | | 3.450% | | 8/1/24 | | | 125 | | | | 130 | |
| | | eBay Inc. | | 3.600% | | 6/5/27 | | | 300 | | | | 313 | |
| | | eBay Inc. | | 4.000% | | 7/15/42 | | | 25 | | | | 25 | |
| | | Expedia Group Inc. | | 4.500% | | 8/15/24 | | | 100 | | | | 107 | |
| | | Expedia Group Inc. | | 5.000% | | 2/15/26 | | | 150 | | | | 165 | |
| | | Expedia Group Inc. | | 3.800% | | 2/15/28 | | | 200 | | | | 204 | |
| 6 | | Expedia Group Inc. | | 3.250% | | 2/15/30 | | | 250 | | | | 240 | |
| | | Ford Motor Co. | | 4.346% | | 12/8/26 | | | 275 | | | | 283 | |
| | | Ford Motor Co. | | 6.625% | | 10/1/28 | | | 175 | | | | 193 | |
| | | Ford Motor Co. | | 6.375% | | 2/1/29 | | | 100 | | | | 107 | |
| | | Ford Motor Co. | | 7.450% | | 7/16/31 | | | 375 | | | | 443 | |
| | | Ford Motor Co. | | 4.750% | | 1/15/43 | | | 100 | | | | 89 | |
| | | Ford Motor Co. | | 7.400% | | 11/1/46 | | | 100 | | | | 112 | |
| | | Ford Motor Co. | | 5.291% | | 12/8/46 | | | 250 | | | | 236 | |
| | | Ford Motor Credit Co. LLC | | 2.343% | | 11/2/20 | | | 150 | | | | 150 | |
| | | Ford Motor Credit Co. LLC | | 3.200% | | 1/15/21 | | | 250 | | | | 251 | |
| | | Ford Motor Credit Co. LLC | | 5.750% | | 2/1/21 | | | 250 | | | | 258 | |
| | | Ford Motor Credit Co. LLC | | 3.336% | | 3/18/21 | | | 200 | | | | 201 | |
| | | Ford Motor Credit Co. LLC | | 5.875% | | 8/2/21 | | | 325 | | | | 340 | |
| | | Ford Motor Credit Co. LLC | | 3.813% | | 10/12/21 | | | 200 | | | | 203 | |
| | | Ford Motor Credit Co. LLC | | 5.596% | | 1/7/22 | | | 200 | | | | 210 | |
| | | Ford Motor Credit Co. LLC | | 3.339% | | 3/28/22 | | | 150 | | | | 151 | |
| | | Ford Motor Credit Co. LLC | | 2.979% | | 8/3/22 | | | 300 | | | | 300 | |
| | | Ford Motor Credit Co. LLC | | 4.250% | | 9/20/22 | | | 200 | | | | 207 | |
| | | Ford Motor Credit Co. LLC | | 3.350% | | 11/1/22 | | | 500 | | | | 505 | |
| | | Ford Motor Credit Co. LLC | | 4.375% | | 8/6/23 | | | 225 | | | | 233 | |
| | | Ford Motor Credit Co. LLC | | 3.810% | | 1/9/24 | | | 150 | | | | 152 | |
| | | Ford Motor Credit Co. LLC | | 5.584% | | 3/18/24 | | | 200 | | | | 216 | |
| | | Ford Motor Credit Co. LLC | | 3.664% | | 9/8/24 | | | 200 | | | | 200 | |
| | | Ford Motor Credit Co. LLC | | 4.063% | | 11/1/24 | | | 700 | | | | 714 | |
| | | Ford Motor Credit Co. LLC | | 4.134% | | 8/4/25 | | | 500 | | | | 506 | |
| | | Ford Motor Credit Co. LLC | | 4.389% | | 1/8/26 | | | 200 | | | | 203 | |
| | | Ford Motor Credit Co. LLC | | 4.542% | | 8/1/26 | | | 200 | | | | 204 | |
| | | Ford Motor Credit Co. LLC | | 3.815% | | 11/2/27 | | | 150 | | | | 145 | |
| | | Ford Motor Credit Co. LLC | | 5.113% | | 5/3/29 | | | 325 | | | | 334 | |
| | | General Motors Co. | | 4.875% | | 10/2/23 | | | 625 | | | | 671 | |
| | | General Motors Co. | | 4.000% | | 4/1/25 | | | 100 | | | | 104 | |
| | | General Motors Co. | | 5.000% | | 10/1/28 | | | 150 | | | | 163 | |
| | | General Motors Co. | | 5.000% | | 4/1/35 | | | 165 | | | | 170 | |
| | | General Motors Co. | | 6.600% | | 4/1/36 | | | 250 | | | | 294 | |
| | | General Motors Co. | | 5.150% | | 4/1/38 | | | 225 | | | | 230 | |
| | | General Motors Co. | | 6.250% | | 10/2/43 | | | 210 | | | | 235 | |
| | | General Motors Co. | | 5.200% | | 4/1/45 | | | 230 | | | | 231 | |
| | | General Motors Co. | | 6.750% | | 4/1/46 | | | 130 | | | | 152 | |
| | | General Motors Co. | | 5.400% | | 4/1/48 | | | 200 | | | | 206 | |
| | | General Motors Co. | | 5.950% | | 4/1/49 | | | 275 | | | | 304 | |
| | | General Motors Financial Co. Inc. | | 4.200% | | 3/1/21 | | | 175 | | | | 179 | |
| | | General Motors Financial Co. Inc. | | 3.550% | | 4/9/21 | | | 150 | | | | 152 | |
| | | General Motors Financial Co. Inc. | | 3.200% | | 7/6/21 | | | 225 | | | | 228 | |
| | | General Motors Financial Co. Inc. | | 4.375% | | 9/25/21 | | | 100 | | | | 104 | |
| | | General Motors Financial Co. Inc. | | 4.200% | | 11/6/21 | | | 50 | | | | 52 | |
| | | General Motors Financial Co. Inc. | | 3.450% | | 1/14/22 | | | 125 | | | | 128 | |
| | | General Motors Financial Co. Inc. | | 3.450% | | 4/10/22 | | | 355 | | | | 363 | |
| | | General Motors Financial Co. Inc. | | 3.150% | | 6/30/22 | | | 100 | | | | 102 | |
| | | General Motors Financial Co. Inc. | | 3.550% | | 7/8/22 | | | 200 | | | | 206 | |
| | | General Motors Financial Co. Inc. | | 3.250% | | 1/5/23 | | | 275 | | | | 280 | |
| | | General Motors Financial Co. Inc. | | 3.700% | | 5/9/23 | | | 200 | | | | 206 | |
| | | General Motors Financial Co. Inc. | | 4.250% | | 5/15/23 | | | 150 | | | | 158 | |
| | | General Motors Financial Co. Inc. | | 4.150% | | 6/19/23 | | | 200 | | | | 210 | |
| | | General Motors Financial Co. Inc. | | 5.100% | | 1/17/24 | | | 100 | | | | 109 | |
| | | General Motors Financial Co. Inc. | | 3.950% | | 4/13/24 | | | 400 | | | | 418 | |
| | | General Motors Financial Co. Inc. | | 3.500% | | 11/7/24 | | | 200 | | | | 206 | |
| | | General Motors Financial Co. Inc. | | 4.000% | | 1/15/25 | | | 175 | | | | 184 | |
| | | General Motors Financial Co. Inc. | | 4.350% | | 4/9/25 | | | 325 | | | | 348 | |
| | | General Motors Financial Co. Inc. | | 5.250% | | 3/1/26 | | | 150 | | | | 166 | |
| | | General Motors Financial Co. Inc. | | 4.000% | | 10/6/26 | | | 100 | | | | 105 | |
| | | General Motors Financial Co. Inc. | | 4.350% | | 1/17/27 | | | 325 | | | | 342 | |
| | | General Motors Financial Co. Inc. | | 3.850% | | 1/5/28 | | | 100 | | | | 102 | |
| | | General Motors Financial Co. Inc. | | 5.650% | | 1/17/29 | | | 150 | | | | 170 | |
| | | GLP Capital LP / GLP Financing II Inc. | | 4.375% | | 4/15/21 | | | 50 | | | | 51 | |
| | | GLP Capital LP / GLP Financing II Inc. | | 5.375% | | 11/1/23 | | | 100 | | | | 109 | |
| | | GLP Capital LP / GLP Financing II Inc. | | 3.350% | | 9/1/24 | | | 75 | | | | 77 | |
| | | GLP Capital LP / GLP Financing II Inc. | | 5.250% | | 6/1/25 | | | 200 | | | | 218 | |
| | | GLP Capital LP / GLP Financing II Inc. | | 5.375% | | 4/15/26 | | | 175 | | | | 191 | |
| | | GLP Capital LP / GLP Financing II Inc. | | 5.750% | | 6/1/28 | | | 25 | | | | 28 | |
| | | GLP Capital LP / GLP Financing II Inc. | | 5.300% | | 1/15/29 | | | 275 | | | | 306 | |
| | | GLP Capital LP / GLP Financing II Inc. | | 4.000% | | 1/15/30 | | | 175 | | | | 178 | |
| | | Harley-Davidson Inc. | | 3.500% | | 7/28/25 | | | 100 | | | | 104 | |
| | | Harley-Davidson Inc. | | 4.625% | | 7/28/45 | | | 125 | | | | 128 | |
| | | Harman International Industries Inc. | | 4.150% | | 5/15/25 | | | 76 | | | | 81 | |
| | | Home Depot Inc. | | 2.000% | | 4/1/21 | | | 250 | | | | 251 | |
| | | Home Depot Inc. | | 4.400% | | 4/1/21 | | | 190 | | | | 195 | |
| | | Home Depot Inc. | | 3.250% | | 3/1/22 | | | 150 | | | | 155 | |
| | | Home Depot Inc. | | 2.625% | | 6/1/22 | | | 265 | | | | 270 | |
| | | Home Depot Inc. | | 2.700% | | 4/1/23 | | | 25 | | | | 26 | |
| | | Home Depot Inc. | | 3.750% | | 2/15/24 | | | 200 | | | | 214 | |
| | | Home Depot Inc. | | 3.350% | | 9/15/25 | | | 250 | | | | 267 | |
| | | Home Depot Inc. | | 3.000% | | 4/1/26 | | | 275 | | | | 287 | |
| | | Home Depot Inc. | | 2.125% | | 9/15/26 | | | 100 | | | | 100 | |
Total Bond Market Index Portfolio
| | | | | | | | | Face | | | Market | |
| | | | | | | Maturity | | Amount | | | Value• | |
| | | | | Coupon | | Date | | | ($000 | ) | | | ($000 | ) |
| | Home Depot Inc. | | 2.800% | | 9/14/27 | | | 200 | | | | 207 | |
| | | Home Depot Inc. | | 3.900% | | 12/6/28 | | | 100 | | | | 112 | |
| | | Home Depot Inc. | | 2.950% | | 6/15/29 | | | 500 | | | | 519 | |
| | | Home Depot Inc. | | 5.875% | | 12/16/36 | | | 825 | | | | 1,136 | |
| | | Home Depot Inc. | | 5.400% | | 9/15/40 | | | 175 | | | | 229 | |
| | | Home Depot Inc. | | 5.950% | | 4/1/41 | | | 175 | | | | 246 | |
| | | Home Depot Inc. | | 4.200% | | 4/1/43 | | | 200 | | | | 232 | |
| | | Home Depot Inc. | | 4.875% | | 2/15/44 | | | 300 | | | | 380 | |
| | | Home Depot Inc. | | 4.400% | | 3/15/45 | | | 100 | | | | 119 | |
| | | Home Depot Inc. | | 4.250% | | 4/1/46 | | | 330 | | | | 389 | |
| | | Home Depot Inc. | | 3.900% | | 6/15/47 | | | 175 | | | | 197 | |
| | | Home Depot Inc. | | 4.500% | | 12/6/48 | | | 125 | | | | 154 | |
| | | Home Depot Inc. | | 3.500% | | 9/15/56 | | | 150 | | | | 157 | |
| | | Hyatt Hotels Corp. | | 5.375% | | 8/15/21 | | | 50 | | | | 52 | |
| | | Hyatt Hotels Corp. | | 3.375% | | 7/15/23 | | | 100 | | | | 103 | |
| | | Hyatt Hotels Corp. | | 4.850% | | 3/15/26 | | | 50 | | | | 55 | |
| | | Hyatt Hotels Corp. | | 4.375% | | 9/15/28 | | | 75 | | | | 81 | |
| | | IHS Markit Ltd. | | 3.625% | | 5/1/24 | | | 100 | | | | 104 | |
| | | IHS Markit Ltd. | | 4.750% | | 8/1/28 | | | 140 | | | | 156 | |
| | | IHS Markit Ltd. | | 4.250% | | 5/1/29 | | | 100 | | | | 108 | |
| | | JD.com Inc. | | 3.125% | | 4/29/21 | | | 200 | | | | 201 | |
| | | Kohl’s Corp. | | 4.250% | | 7/17/25 | | | 100 | | | | 106 | |
| | | Kohl’s Corp. | | 5.550% | | 7/17/45 | | | 100 | | | | 102 | |
| | | Las Vegas Sands Corp. | | 3.200% | | 8/8/24 | | | 115 | | | | 119 | |
| | | Las Vegas Sands Corp. | | 2.900% | | 6/25/25 | | | 200 | | | | 202 | |
| | | Las Vegas Sands Corp. | | 3.500% | | 8/18/26 | | | 145 | | | | 149 | |
| | | Las Vegas Sands Corp. | | 3.900% | | 8/8/29 | | | 65 | | | | 68 | |
| | | Lear Corp. | | 5.250% | | 1/15/25 | | | 200 | | | | 206 | |
| | | Lear Corp. | | 3.800% | | 9/15/27 | | | 100 | | | | 101 | |
| | | Lear Corp. | | 4.250% | | 5/15/29 | | | 150 | | | | 155 | |
| | | Lear Corp. | | 5.250% | | 5/15/49 | | | 150 | | | | 156 | |
| | | Lowe’s Cos. Inc. | | 3.750% | | 4/15/21 | | | 200 | | | | 203 | |
| | | Lowe’s Cos. Inc. | | 3.120% | | 4/15/22 | | | 150 | | | | 154 | |
| | | Lowe’s Cos. Inc. | | 3.875% | | 9/15/23 | | | 275 | | | | 291 | |
| | | Lowe’s Cos. Inc. | | 3.125% | | 9/15/24 | | | 100 | | | | 104 | |
| | | Lowe’s Cos. Inc. | | 3.375% | | 9/15/25 | | | 200 | | | | 210 | |
| | | Lowe’s Cos. Inc. | | 2.500% | | 4/15/26 | | | 250 | | | | 252 | |
| | | Lowe’s Cos. Inc. | | 3.100% | | 5/3/27 | | | 350 | | | | 361 | |
| | | Lowe’s Cos. Inc. | | 6.500% | | 3/15/29 | | | 67 | | | | 85 | |
| | | Lowe’s Cos. Inc. | | 3.650% | | 4/5/29 | | | 450 | | | | 480 | |
| | | Lowe’s Cos. Inc. | | 4.650% | | 4/15/42 | | | 100 | | | | 114 | |
| | | Lowe’s Cos. Inc. | | 4.250% | | 9/15/44 | | | 100 | | | | 108 | |
| | | Lowe’s Cos. Inc. | | 4.375% | | 9/15/45 | | | 150 | | | | 164 | |
| | | Lowe’s Cos. Inc. | | 3.700% | | 4/15/46 | | | 250 | | | | 254 | |
| | | Lowe’s Cos. Inc. | | 4.050% | | 5/3/47 | | | 300 | | | | 323 | |
| | | Lowe’s Cos. Inc. | | 4.550% | | 4/5/49 | | | 275 | | | | 321 | |
| | | Macy’s Retail Holdings Inc. | | 3.450% | | 1/15/21 | | | 100 | | | | 101 | |
| | | Macy’s Retail Holdings Inc. | | 2.875% | | 2/15/23 | | | 170 | | | | 169 | |
| | | Macy’s Retail Holdings Inc. | | 3.625% | | 6/1/24 | | | 100 | | | | 101 | |
| | | Macy’s Retail Holdings Inc. | | 4.500% | | 12/15/34 | | | 121 | | | | 115 | |
| | | Magna International Inc. | | 3.625% | | 6/15/24 | | | 170 | | | | 179 | |
| | | Magna International Inc. | | 4.150% | | 10/1/25 | | | 100 | | | | 108 | |
| | | Marriott International Inc. | | 2.875% | | 3/1/21 | | | 50 | | | | 50 | |
| | | Marriott International Inc. | | 3.125% | | 10/15/21 | | | 50 | | | | 51 | |
| | | Marriott International Inc. | | 2.300% | | 1/15/22 | | | 100 | | | | 100 | |
| | | Marriott International Inc. | | 2.125% | | 10/3/22 | | | 200 | | | | 200 | |
| | | Marriott International Inc. | | 3.600% | | 4/15/24 | | | 125 | | | | 131 | |
| | | Marriott International Inc. | | 3.750% | | 3/15/25 | | | 175 | | | | 185 | |
| | | Marriott International Inc. | | 3.750% | | 10/1/25 | | | 65 | | | | 69 | |
| | | Marriott International Inc. | | 3.125% | | 6/15/26 | | | 183 | | | | 189 | |
| | | Marriott International Inc. | | 4.000% | | 4/15/28 | | | 50 | | | | 54 | |
| | | Mastercard Inc. | | 2.000% | | 11/21/21 | | | 100 | | | | 100 | |
| | | Mastercard Inc. | | 3.375% | | 4/1/24 | | | 300 | | | | 318 | |
| | | Mastercard Inc. | | 2.000% | | 3/3/25 | | | 400 | | | | 398 | |
| | | Mastercard Inc. | | 2.950% | | 11/21/26 | | | 100 | | | | 104 | |
| | | Mastercard Inc. | | 3.500% | | 2/26/28 | | | 50 | | | | 54 | |
| | | Mastercard Inc. | | 2.950% | | 6/1/29 | | | 200 | | | | 208 | |
| | | Mastercard Inc. | | 3.800% | | 11/21/46 | | | 100 | | | | 112 | |
| | | Mastercard Inc. | | 3.950% | | 2/26/48 | | | 100 | | | | 115 | |
| | | Mastercard Inc. | | 3.650% | | 6/1/49 | | | 250 | | | | 276 | |
| | | McDonald’s Corp. | | 2.750% | | 12/9/20 | | | 275 | | | | 277 | |
| | | McDonald’s Corp. | | 3.625% | | 5/20/21 | | | 175 | | | | 179 | |
| | | McDonald’s Corp. | | 2.625% | | 1/15/22 | | | 275 | | | | 279 | |
| | | McDonald’s Corp. | | 3.350% | | 4/1/23 | | | 200 | | | | 208 | |
| | | McDonald’s Corp. | | 3.375% | | 5/26/25 | | | 175 | | | | 185 | |
| | | McDonald’s Corp. | | 3.700% | | 1/30/26 | | | 300 | | | | 322 | |
| | | McDonald’s Corp. | | 3.500% | | 3/1/27 | | | 200 | | | | 213 | |
| | | McDonald’s Corp. | | 3.800% | | 4/1/28 | | | 350 | | | | 380 | |
| | | McDonald’s Corp. | | 2.625% | | 9/1/29 | | | 200 | | | | 200 | |
| | | McDonald’s Corp. | | 4.700% | | 12/9/35 | | | 200 | | | | 238 | |
| | | McDonald’s Corp. | | 6.300% | | 10/15/37 | | | 150 | | | | 204 | |
| | | McDonald’s Corp. | | 6.300% | | 3/1/38 | | | 100 | | | | 136 | |
| | | McDonald’s Corp. | | 5.700% | | 2/1/39 | | | 100 | | | | 127 | |
| | | McDonald’s Corp. | | 3.700% | | 2/15/42 | | | 25 | | | | 25 | |
| | | McDonald’s Corp. | | 3.625% | | 5/1/43 | | | 100 | | | | 100 | |
| | | McDonald’s Corp. | | 4.600% | | 5/26/45 | | | 210 | | | | 241 | |
| | | McDonald’s Corp. | | 4.875% | | 12/9/45 | | | 300 | | | | 362 | |
| | | McDonald’s Corp. | | 4.450% | | 3/1/47 | | | 150 | | | | 172 | |
| | | McDonald’s Corp. | | 4.450% | | 9/1/48 | | | 150 | | | | 171 | |
| | | McDonald’s Corp. | | 3.625% | | 9/1/49 | | | 200 | | | | 203 | |
| | | NIKE Inc. | | 2.375% | | 11/1/26 | | | 200 | | | | 203 | |
| | | NIKE Inc. | | 3.625% | | 5/1/43 | | | 125 | | | | 136 | |
| | | NIKE Inc. | | 3.875% | | 11/1/45 | | | 225 | | | | 256 | |
| | | NIKE Inc. | | 3.375% | | 11/1/46 | | | 100 | | | | 105 | |
| | | Nordstrom Inc. | | 4.000% | | 10/15/21 | | | 125 | | | | 128 | |
| | | Nordstrom Inc. | | 4.000% | | 3/15/27 | | | 100 | | | | 104 | |
| | | Nordstrom Inc. | | 4.375% | | 4/1/30 | | | 75 | | | | 76 | |
| | | Nordstrom Inc. | | 5.000% | | 1/15/44 | | | 165 | | | | 160 | |
| | | NVR Inc. | | 3.950% | | 9/15/22 | | | 100 | | | | 104 | |
| | | O’Reilly Automotive Inc. | | 4.875% | | 1/14/21 | | | 25 | | | | 26 | |
| | | O’Reilly Automotive Inc. | | 3.800% | | 9/1/22 | | | 100 | | | | 104 | |
| | | O’Reilly Automotive Inc. | | 3.850% | | 6/15/23 | | | 75 | | | | 78 | |
| | | O’Reilly Automotive Inc. | | 3.550% | | 3/15/26 | | | 100 | | | | 105 | |
| | | O’Reilly Automotive Inc. | | 3.600% | | 9/1/27 | | | 325 | | | | 347 | |
| | | PACCAR Financial Corp. | | 2.050% | | 11/13/20 | | | 50 | | | | 50 | |
| | | PACCAR Financial Corp. | | 2.250% | | 2/25/21 | | | 75 | | | | 75 | |
| | | PACCAR Financial Corp. | | 2.800% | | 3/1/21 | | | 90 | | | | 91 | |
| | | PACCAR Financial Corp. | | 3.150% | | 8/9/21 | | | 25 | | | | 25 | |
| | | PACCAR Financial Corp. | | 2.850% | | 3/1/22 | | | 100 | | | | 102 | |
| | | PACCAR Financial Corp. | | 2.650% | | 5/10/22 | | | 100 | | | | 102 | |
| | | PACCAR Financial Corp. | | 2.300% | | 8/10/22 | | | 50 | | | | 51 | |
| | | PACCAR Financial Corp. | | 2.000% | | 9/26/22 | | | 50 | | | | 50 | |
| | | PACCAR Financial Corp. | | 3.400% | | 8/9/23 | | | 100 | | | | 104 | |
| | | PACCAR Financial Corp. | | 2.150% | | 8/15/24 | | | 75 | | | | 75 | |
| | | QVC Inc. | | 5.125% | | 7/2/22 | | | 25 | | | | 26 | |
| | | QVC Inc. | | 4.850% | | 4/1/24 | | | 95 | | | | 100 | |
| | | QVC Inc. | | 4.450% | | 2/15/25 | | | 100 | | | | 103 | |
| | | QVC Inc. | | 5.950% | | 3/15/43 | | | 125 | | | | 119 | |
| | | Ralph Lauren Corp. | | 3.750% | | 9/15/25 | | | 50 | | | | 54 | |
| | | Royal Caribbean Cruises Ltd. | | 5.250% | | 11/15/22 | | | 100 | | | | 108 | |
| | | Royal Caribbean Cruises Ltd. | | 3.700% | | 3/15/28 | | | 200 | | | | 207 | |
| | | Sands China Ltd. | | 4.600% | | 8/8/23 | | | 400 | | | | 420 | |
| | | Sands China Ltd. | | 5.125% | | 8/8/25 | | | 400 | | | | 440 | |
| | | Sands China Ltd. | | 5.400% | | 8/8/28 | | | 300 | | | | 338 | |
| | | Starbucks Corp. | | 2.100% | | 2/4/21 | | | 150 | | | | 150 | |
| | | Starbucks Corp. | | 2.700% | | 6/15/22 | | | 75 | | | | 76 | |
| | | Starbucks Corp. | | 3.100% | | 3/1/23 | | | 175 | | | | 181 | |
| | | Starbucks Corp. | | 3.850% | | 10/1/23 | | | 300 | | | | 318 | |
| | | Starbucks Corp. | | 3.800% | | 8/15/25 | | | 200 | | | | 215 | |
| | | Starbucks Corp. | | 2.450% | | 6/15/26 | | | 200 | | | | 202 | |
| | | Starbucks Corp. | | 3.500% | | 3/1/28 | | | 100 | | | | 107 | |
| | | Starbucks Corp. | | 4.000% | | 11/15/28 | | | 200 | | | | 221 | |
| | | Starbucks Corp. | | 3.550% | | 8/15/29 | | | 200 | | | | 217 | |
| | | Starbucks Corp. | | 4.300% | | 6/15/45 | | | 50 | | | | 55 | |
| | | Starbucks Corp. | | 3.750% | | 12/1/47 | | | 125 | | | | 128 | |
| | | Starbucks Corp. | | 4.500% | | 11/15/48 | | | 200 | | | | 230 | |
| | | Tapestry Inc. | | 3.000% | | 7/15/22 | | | 125 | | | | 127 | |
| | | Tapestry Inc. | | 4.250% | | 4/1/25 | | | 70 | | | | 74 | |
| | | Tapestry Inc. | | 4.125% | | 7/15/27 | | | 100 | | | | 102 | |
| | | Target Corp. | | 2.900% | | 1/15/22 | | | 200 | | | | 205 | |
| | | Target Corp. | | 3.500% | | 7/1/24 | | | 325 | | | | 348 | |
| | | Target Corp. | | 2.500% | | 4/15/26 | | | 175 | | | | 179 | |
Total Bond Market Index Portfolio
| | | | | | | | | Face | | | Market | |
| | | | | | | Maturity | | Amount | | | Value• | |
| | | | | Coupon | | Date | | | ($000 | ) | | | ($000 | ) |
| | | Target Corp. | | 3.375% | | 4/15/29 | | | 200 | | | | 217 | |
| | | Target Corp. | | 6.350% | | 11/1/32 | | | 140 | | | | 196 | |
| | | Target Corp. | | 6.500% | | 10/15/37 | | | 103 | | | | 152 | |
| | | Target Corp. | | 7.000% | | 1/15/38 | | | 125 | | | | 194 | |
| | | Target Corp. | | 4.000% | | 7/1/42 | | | 285 | | | | 326 | |
| | | Target Corp. | | 3.625% | | 4/15/46 | | | 200 | | | | 219 | |
| | | Target Corp. | | 3.900% | | 11/15/47 | | | 125 | | | | 143 | |
| | | TJX Cos. Inc. | | 2.750% | | 6/15/21 | | | 150 | | | | 152 | |
| | | TJX Cos. Inc. | | 2.500% | | 5/15/23 | | | 100 | | | | 102 | |
| | | TJX Cos. Inc. | | 2.250% | | 9/15/26 | | | 350 | | | | 350 | |
| | | Toyota Motor Corp. | | 3.183% | | 7/20/21 | | | 140 | | | | 143 | |
| | | Toyota Motor Corp. | | 2.157% | | 7/2/22 | | | 100 | | | | 101 | |
| | | Toyota Motor Corp. | | 3.419% | | 7/20/23 | | | 150 | | | | 157 | |
| | | Toyota Motor Corp. | | 2.358% | | 7/2/24 | | | 100 | | | | 102 | |
| | | Toyota Motor Corp. | | 3.669% | | 7/20/28 | | | 100 | | | | 110 | |
| | | Toyota Motor Corp. | | 2.760% | | 7/2/29 | | | 100 | | | | 103 | |
| | | Toyota Motor Credit Corp. | | 4.250% | | 1/11/21 | | | 125 | | | | 128 | |
| | | Toyota Motor Credit Corp. | | 1.900% | | 4/8/21 | | | 250 | | | | 250 | |
| | | Toyota Motor Credit Corp. | | 2.950% | | 4/13/21 | | | 100 | | | | 101 | |
| | | Toyota Motor Credit Corp. | | 2.750% | | 5/17/21 | | | 200 | | | | 202 | |
| | | Toyota Motor Credit Corp. | | 3.400% | | 9/15/21 | | | 175 | | | | 179 | |
| | | Toyota Motor Credit Corp. | | 1.800% | | 10/7/21 | | | 80 | | | | 80 | |
| | | Toyota Motor Credit Corp. | | 2.600% | | 1/11/22 | | | 200 | | | | 203 | |
| | | Toyota Motor Credit Corp. | | 3.300% | | 1/12/22 | | | 175 | | | | 180 | |
| | | Toyota Motor Credit Corp. | | 2.650% | | 4/12/22 | | | 500 | | | | 508 | |
| | | Toyota Motor Credit Corp. | | 2.800% | | 7/13/22 | | | 100 | | | | 102 | |
| | | Toyota Motor Credit Corp. | | 2.150% | | 9/8/22 | | | 200 | | | | 202 | |
| | | Toyota Motor Credit Corp. | | 2.625% | | 1/10/23 | | | 100 | | | | 102 | |
| | | Toyota Motor Credit Corp. | | 2.250% | | 10/18/23 | | | 300 | | | | 302 | |
| | | Toyota Motor Credit Corp. | | 2.900% | | 4/17/24 | | | 125 | | | | 129 | |
| | | Toyota Motor Credit Corp. | | 3.400% | | 4/14/25 | | | 125 | | | | 133 | |
| | | Toyota Motor Credit Corp. | | 3.200% | | 1/11/27 | | | 200 | | | | 211 | |
| | | Toyota Motor Credit Corp. | | 3.050% | | 1/11/28 | | | 100 | | | | 105 | |
| | | Toyota Motor Credit Corp. | | 3.650% | | 1/8/29 | | | 100 | | | | 110 | |
| | | VF Corp. | | 3.500% | | 9/1/21 | | | 200 | | | | 204 | |
| | | VF Corp. | | 6.450% | | 11/1/37 | | | 50 | | | | 69 | |
| | | Visa Inc. | | 2.200% | | 12/14/20 | | | 500 | | | | 502 | |
| | | Visa Inc. | | 2.150% | | 9/15/22 | | | 100 | | | | 101 | |
| | | Visa Inc. | | 2.800% | | 12/14/22 | | | 550 | | | | 565 | |
| | | Visa Inc. | | 3.150% | | 12/14/25 | | | 925 | | | | 977 | |
| | | Visa Inc. | | 2.750% | | 9/15/27 | | | 150 | | | | 156 | |
| | | Visa Inc. | | 4.150% | | 12/14/35 | | | 325 | | | | 383 | |
| | | Visa Inc. | | 4.300% | | 12/14/45 | | | 825 | | | | 1,016 | |
| | | Visa Inc. | | 3.650% | | 9/15/47 | | | 100 | | | | 112 | |
| | | Walgreen Co. | | 3.100% | | 9/15/22 | | | 250 | | | | 255 | |
| | | Walgreen Co. | | 4.400% | | 9/15/42 | | | 195 | | | | 194 | |
| | | Walgreens Boots Alliance Inc. | | 3.300% | | 11/18/21 | | | 225 | | | | 229 | |
| | | Walgreens Boots Alliance Inc. | | 3.800% | | 11/18/24 | | | 375 | | | | 390 | |
| | | Walgreens Boots Alliance Inc. | | 3.450% | | 6/1/26 | | | 325 | | | | 330 | |
| | | Walgreens Boots Alliance Inc. | | 4.500% | | 11/18/34 | | | 125 | | | | 129 | |
| | | Walgreens Boots Alliance Inc. | | 4.800% | | 11/18/44 | | | 275 | | | | 280 | |
| | | Walgreens Boots Alliance Inc. | | 4.650% | | 6/1/46 | | | 115 | | | | 115 | |
| | | Walmart Inc. | | 1.900% | | 12/15/20 | | | 165 | | | | 165 | |
| | | Walmart Inc. | | 3.125% | | 6/23/21 | | | 300 | | | | 306 | |
| | | Walmart Inc. | | 2.350% | | 12/15/22 | | | 800 | | | | 814 | |
| | | Walmart Inc. | | 2.550% | | 4/11/23 | | | 150 | | | | 153 | |
| | | Walmart Inc. | | 3.400% | | 6/26/23 | | | 250 | | | | 263 | |
| | | Walmart Inc. | | 3.300% | | 4/22/24 | | | 250 | | | | 262 | |
| | | Walmart Inc. | | 2.850% | | 7/8/24 | | | 275 | | | | 285 | |
| | | Walmart Inc. | | 2.650% | | 12/15/24 | | | 200 | | | | 206 | |
| | | Walmart Inc. | | 3.550% | | 6/26/25 | | | 275 | | | | 294 | |
| | | Walmart Inc. | | 3.050% | | 7/8/26 | | | 250 | | | | 263 | |
| | | Walmart Inc. | | 5.875% | | 4/5/27 | | | 405 | | | | 499 | |
| | | Walmart Inc. | | 3.700% | | 6/26/28 | | | 450 | | | | 495 | |
| | | Walmart Inc. | | 3.250% | | 7/8/29 | | | 300 | | | | 322 | |
| | | Walmart Inc. | | 2.375% | | 9/24/29 | | | 125 | | | | 125 | |
| | | Walmart Inc. | | 7.550% | | 2/15/30 | | | 105 | | | | 152 | |
| | | Walmart Inc. | | 5.250% | | 9/1/35 | | | 385 | | | | 505 | |
| | | Walmart Inc. | | 6.200% | | 4/15/38 | | | 315 | | | | 459 | |
| | | Walmart Inc. | | 3.950% | | 6/28/38 | | | 275 | | | | 319 | |
| | | Walmart Inc. | | 5.000% | | 10/25/40 | | | 100 | | | | 130 | |
| | | Walmart Inc. | | 5.625% | | 4/15/41 | | | 175 | | | | 249 | |
| | | Walmart Inc. | | 4.000% | | 4/11/43 | | | 274 | | | | 315 | |
| | | Walmart Inc. | | 4.300% | | 4/22/44 | | | 361 | | | | 431 | |
| | | Walmart Inc. | | 3.625% | | 12/15/47 | | | 115 | | | | 127 | |
| | | Walmart Inc. | | 4.050% | | 6/29/48 | | | 425 | | | | 500 | |
| | | Walmart Inc. | | 2.950% | | 9/24/49 | | | 120 | | | | 117 | |
| | | Western Union Co. | | 3.600% | | 3/15/22 | | | 100 | | | | 103 | |
| | | Western Union Co. | | 2.850% | | 1/10/25 | | | 100 | | | | 100 | |
| | | Western Union Co. | | 6.200% | | 11/17/36 | | | 100 | | | | 113 | |
| | | Western Union Co. | | 6.200% | | 6/21/40 | | | 35 | | | | 39 | |
| | | | | | | | | | | | | | | |
| | | Consumer Noncyclical (4.4%) | | | | | | | | | | | | |
| | | Abbott Laboratories | | 2.550% | | 3/15/22 | | | 175 | | | | 178 | |
| | | Abbott Laboratories | | 3.400% | | 11/30/23 | | | 316 | | | | 332 | |
| | | Abbott Laboratories | | 2.950% | | 3/15/25 | | | 175 | | | | 181 | |
| | | Abbott Laboratories | | 3.875% | | 9/15/25 | | | 75 | | | | 82 | |
| | | Abbott Laboratories | | 3.750% | | 11/30/26 | | | 367 | | | | 400 | |
| | | Abbott Laboratories | | 4.750% | | 11/30/36 | | | 375 | | | | 467 | |
| | | Abbott Laboratories | | 5.300% | | 5/27/40 | | | 125 | | | | 163 | |
| | | Abbott Laboratories | | 4.750% | | 4/15/43 | | | 125 | | | | 157 | |
| | | Abbott Laboratories | | 4.900% | | 11/30/46 | | | 775 | | | | 1,012 | |
| | | AbbVie Inc. | | 2.300% | | 5/14/21 | | | 350 | | | | 351 | |
| | | AbbVie Inc. | | 3.375% | | 11/14/21 | | | 250 | | | | 256 | |
| 6 | | AbbVie Inc. | | 2.150% | | 11/19/21 | | | 250 | | | | 251 | |
| | | AbbVie Inc. | | 2.900% | | 11/6/22 | | | 800 | | | | 816 | |
| | | AbbVie Inc. | | 3.200% | | 11/6/22 | | | 275 | | | | 283 | |
| 6 | | AbbVie Inc. | | 2.300% | | 11/21/22 | | | 575 | | | | 577 | |
| | | AbbVie Inc. | | 2.850% | | 5/14/23 | | | 200 | | | | 204 | |
| | | AbbVie Inc. | | 3.750% | | 11/14/23 | | | 250 | | | | 263 | |
| 6 | | AbbVie Inc. | | 2.600% | | 11/21/24 | | | 750 | | | | 755 | |
| | | AbbVie Inc. | | 3.600% | | 5/14/25 | | | 725 | | | | 765 | |
| | | AbbVie Inc. | | 3.200% | | 5/14/26 | | | 350 | | | | 362 | |
| 6 | | AbbVie Inc. | | 2.950% | | 11/21/26 | | | 740 | | | | 750 | |
| | | AbbVie Inc. | | 4.250% | | 11/14/28 | | | 350 | | | | 387 | |
| 6 | | AbbVie Inc. | | 3.200% | | 11/21/29 | | | 1,080 | | | | 1,099 | |
| | | AbbVie Inc. | | 4.500% | | 5/14/35 | | | 495 | | | | 556 | |
| | | AbbVie Inc. | | 4.300% | | 5/14/36 | | | 190 | | | | 209 | |
| 6 | | AbbVie Inc. | | 4.050% | | 11/21/39 | | | 775 | | | | 810 | |
| | | AbbVie Inc. | | 4.400% | | 11/6/42 | | | 501 | | | | 540 | |
| | | AbbVie Inc. | | 4.700% | | 5/14/45 | | | 527 | | | | 588 | |
| | | AbbVie Inc. | | 4.450% | | 5/14/46 | | | 455 | | | | 490 | |
| | | AbbVie Inc. | | 4.875% | | 11/14/48 | | | 775 | | | | 890 | |
| 6 | | AbbVie Inc. | | 4.250% | | 11/21/49 | | | 650 | | | | 684 | |
| | | Actavis Inc. | | 3.250% | | 10/1/22 | | | 300 | | | | 307 | |
| | | Adventist Health System/West | | 2.952% | | 3/1/29 | | | 100 | | | | 99 | |
| | | Adventist Health System/West | | 3.630% | | 3/1/49 | | | 100 | | | | 97 | |
| | | Advocate Health & Hospitals Corp. | | 3.829% | | 8/15/28 | | | 50 | | | | 54 | |
| | | Advocate Health & Hospitals Corp. | | 4.272% | | 8/15/48 | | | 100 | | | | 114 | |
| | | Advocate Health & Hospitals Corp. | | 3.387% | | 10/15/49 | | | 75 | | | | 75 | |
| | | Agilent Technologies Inc. | | 3.200% | | 10/1/22 | | | 75 | | | | 77 | |
| | | Agilent Technologies Inc. | | 3.875% | | 7/15/23 | | | 100 | | | | 105 | |
| | | Agilent Technologies Inc. | | 3.050% | | 9/22/26 | | | 75 | | | | 76 | |
| | | AHS Hospital Corp. | | 5.024% | | 7/1/45 | | | 75 | | | | 93 | |
| | | Allergan Finance LLC | | 4.625% | | 10/1/42 | | | 190 | | | | 198 | |
| | | Allergan Funding SCS | | 3.450% | | 3/15/22 | | | 507 | | | | 519 | |
| | | Allergan Funding SCS | | 3.850% | | 6/15/24 | | | 200 | | | | 210 | |
| | | Allergan Funding SCS | | 3.800% | | 3/15/25 | | | 590 | | | | 618 | |
| | | Allergan Funding SCS | | 4.550% | | 3/15/35 | | | 350 | | | | 372 | |
| | | Allergan Funding SCS | | 4.850% | | 6/15/44 | | | 230 | | | | 255 | |
| | | Allergan Funding SCS | | 4.750% | | 3/15/45 | | | 75 | | | | 82 | |
| | | Allergan Inc. | | 2.800% | | 3/15/23 | | | 100 | | | | 101 | |
| | | Allina Health System | | 3.887% | | 4/15/49 | | | 75 | | | | 80 | |
| | | Altria Group Inc. | | 4.750% | | 5/5/21 | | | 225 | | | | 233 | |
| | | Altria Group Inc. | | 3.490% | | 2/14/22 | | | 200 | | | | 206 | |
| | | Altria Group Inc. | | 2.850% | | 8/9/22 | | | 375 | | | | 382 | |
| | | Altria Group Inc. | | 2.950% | | 5/2/23 | | | 400 | | | | 404 | |
| | | Altria Group Inc. | | 4.000% | | 1/31/24 | | | 250 | | | | 265 | |
| | | Altria Group Inc. | | 4.400% | | 2/14/26 | | | 275 | | | | 299 | |
| | | Altria Group Inc. | | 2.625% | | 9/16/26 | | | 75 | | | | 74 | |
| | | Altria Group Inc. | | 4.800% | | 2/14/29 | | | 575 | | | | 638 | |
| | | Altria Group Inc. | | 5.800% | | 2/14/39 | | | 400 | | | | 468 | |
Total Bond Market Index Portfolio
| | | | | | | | | Face | | | Market | |
| | | | | | | Maturity | | Amount | | | Value• | |
| | | | | Coupon | | Date | | | ($000 | ) | | | ($000 | ) |
| | | Altria Group Inc. | | 4.250% | | 8/9/42 | | | 275 | | | | 273 | |
| | | Altria Group Inc. | | 4.500% | | 5/2/43 | | | 125 | | | | 127 | |
| | | Altria Group Inc. | | 5.375% | | 1/31/44 | | | 350 | | | | 394 | |
| | | Altria Group Inc. | | 3.875% | | 9/16/46 | | | 175 | | | | 163 | |
| | | Altria Group Inc. | | 5.950% | | 2/14/49 | | | 500 | | | | 605 | |
| | | Altria Group Inc. | | 6.200% | | 2/14/59 | | | 100 | | | | 118 | |
| | | AmerisourceBergen Corp. | | 3.500% | | 11/15/21 | | | 200 | | | | 205 | |
| | | AmerisourceBergen Corp. | | 3.400% | | 5/15/24 | | | 75 | | | | 78 | |
| | | AmerisourceBergen Corp. | | 3.250% | | 3/1/25 | | | 50 | | | | 52 | |
| | | AmerisourceBergen Corp. | | 3.450% | | 12/15/27 | | | 275 | | | | 285 | |
| | | AmerisourceBergen Corp. | | 4.250% | | 3/1/45 | | | 25 | | | | 25 | |
| | | AmerisourceBergen Corp. | | 4.300% | | 12/15/47 | | | 175 | | | | 179 | |
| | | Amgen Inc. | | 4.100% | | 6/15/21 | | | 50 | | | | 51 | |
| | | Amgen Inc. | | 1.850% | | 8/19/21 | | | 125 | | | | 125 | |
| | | Amgen Inc. | | 3.875% | | 11/15/21 | | | 250 | | | | 258 | |
| | | Amgen Inc. | | 2.700% | | 5/1/22 | | | 75 | | | | 76 | |
| | | Amgen Inc. | | 2.650% | | 5/11/22 | | | 275 | | | | 279 | |
| | | Amgen Inc. | | 3.625% | | 5/15/22 | | | 225 | | | | 233 | |
| | | Amgen Inc. | | 2.250% | | 8/19/23 | | | 150 | | | | 151 | |
| | | Amgen Inc. | | 3.625% | | 5/22/24 | | | 500 | | | | 528 | |
| | | Amgen Inc. | | 3.125% | | 5/1/25 | | | 175 | | | | 183 | |
| | | Amgen Inc. | | 2.600% | | 8/19/26 | | | 455 | | | | 460 | |
| | | Amgen Inc. | | 4.950% | | 10/1/41 | | | 300 | | | | 356 | |
| | | Amgen Inc. | | 5.150% | | 11/15/41 | | | 250 | | | | 302 | |
| | | Amgen Inc. | | 4.400% | | 5/1/45 | | | 450 | | | | 504 | |
| | | Amgen Inc. | | 4.563% | | 6/15/48 | | | 356 | | | | 411 | |
| | | Amgen Inc. | | 4.663% | | 6/15/51 | | | 659 | | | | 775 | |
| | | Anheuser-Busch Cos. LLC / Anheuser-Busch InBev Worldwide Inc. | | 3.650% | | 2/1/26 | | | 770 | | | | 820 | |
| | | Anheuser-Busch Cos. LLC / Anheuser-Busch InBev Worldwide Inc. | | 4.700% | | 2/1/36 | | | 1,245 | | | | 1,436 | |
| | | Anheuser-Busch Cos. LLC / Anheuser-Busch InBev Worldwide Inc. | | 4.900% | | 2/1/46 | | | 2,485 | | | | 2,943 | |
| | | Anheuser-Busch InBev Finance Inc. | | 2.625% | | 1/17/23 | | | 254 | | | | 258 | |
| | | Anheuser-Busch InBev Finance Inc. | | 3.300% | | 2/1/23 | | | 568 | | | | 588 | |
| | | Anheuser-Busch InBev Finance Inc. | | 3.700% | | 2/1/24 | | | 100 | | | | 106 | |
| | | Anheuser-Busch InBev Finance Inc. | | 4.000% | | 1/17/43 | | | 300 | | | | 316 | |
| | | Anheuser-Busch InBev Finance Inc. | | 4.625% | | 2/1/44 | | | 200 | | | | 225 | |
| | | Anheuser-Busch InBev Finance Inc. | | 4.900% | | 2/1/46 | | | 275 | | | | 324 | |
| | | Anheuser-Busch InBev Worldwide Inc. | | 4.375% | | 2/15/21 | | | 50 | | | | 51 | |
| | | Anheuser-Busch InBev Worldwide Inc. | | 2.500% | | 7/15/22 | | | 70 | | | | 71 | |
| | | Anheuser-Busch InBev Worldwide Inc. | | 3.500% | | 1/12/24 | | | 150 | | | | 158 | |
| | | Anheuser-Busch InBev Worldwide Inc. | | 4.150% | | 1/23/25 | | | 475 | | | | 517 | |
| | | Anheuser-Busch InBev Worldwide Inc. | | 4.000% | | 4/13/28 | | | 500 | | | | 549 | |
| | | Anheuser-Busch InBev Worldwide Inc. | | 4.750% | | 1/23/29 | | | 875 | | | | 1,013 | |
| | | Anheuser-Busch InBev Worldwide Inc. | | 4.900% | | 1/23/31 | | | 340 | | | | 405 | |
| | | Anheuser-Busch InBev Worldwide Inc. | | 4.375% | | 4/15/38 | | | 275 | | | | 308 | |
| | | Anheuser-Busch InBev Worldwide Inc. | | 8.200% | | 1/15/39 | | | 150 | | | | 235 | |
| | | Anheuser-Busch InBev Worldwide Inc. | | 5.450% | | 1/23/39 | | | 125 | | | | 157 | |
| | | Anheuser-Busch InBev Worldwide Inc. | | 4.950% | | 1/15/42 | | | 325 | | | | 383 | |
| | | Anheuser-Busch InBev Worldwide Inc. | | 3.750% | | 7/15/42 | | | 325 | | | | 329 | |
| | | Anheuser-Busch InBev Worldwide Inc. | | 4.600% | | 4/15/48 | | | 475 | | | | 540 | |
| | | Anheuser-Busch InBev Worldwide Inc. | | 4.439% | | 10/6/48 | | | 626 | | | | 699 | |
| | | Anheuser-Busch InBev Worldwide Inc. | | 5.550% | | 1/23/49 | | | 725 | | | | 940 | |
| | | Anheuser-Busch InBev Worldwide Inc. | | 4.750% | | 4/15/58 | | | 250 | | | | 292 | |
| | | Anheuser-Busch InBev Worldwide Inc. | | 5.800% | | 1/23/59 | | | 125 | | | | 170 | |
| | | Archer-Daniels-Midland Co. | | 4.479% | | 3/1/21 | | | 163 | | | | 168 | |
| | | Archer-Daniels-Midland Co. | | 3.375% | | 3/15/22 | | | 100 | | | | 103 | |
| | | Archer-Daniels-Midland Co. | | 2.500% | | 8/11/26 | | | 200 | | | | 203 | |
| | | Archer-Daniels-Midland Co. | | 5.935% | | 10/1/32 | | | 80 | | | | 105 | |
| | | Archer-Daniels-Midland Co. | | 5.375% | | 9/15/35 | | | 95 | | | | 120 | |
| | | Archer-Daniels-Midland Co. | | 4.535% | | 3/26/42 | | | 50 | | | | 59 | |
| | | Archer-Daniels-Midland Co. | | 4.016% | | 4/16/43 | | | 200 | | | | 221 | |
| | | Archer-Daniels-Midland Co. | | 3.750% | | 9/15/47 | | | 100 | | | | 109 | |
| | | Archer-Daniels-Midland Co. | | 4.500% | | 3/15/49 | | | 125 | | | | 152 | |
| | | Ascension Health | | 2.532% | | 11/15/29 | | | 100 | | | | 99 | |
| | | Ascension Health | | 3.106% | | 11/15/39 | | | 100 | | | | 98 | |
| | | Ascension Health | | 3.945% | | 11/15/46 | | | 175 | | | | 193 | |
| 3 | | Ascension Health | | 4.847% | | 11/15/53 | | | 75 | | | | 94 | |
| | | AstraZeneca plc | | 2.375% | | 6/12/22 | | | 225 | | | | 227 | |
| | | AstraZeneca plc | | 3.500% | | 8/17/23 | | | 225 | | | | 235 | |
| | | AstraZeneca plc | | 3.375% | | 11/16/25 | | | 250 | | | | 265 | |
| | | AstraZeneca plc | | 3.125% | | 6/12/27 | | | 175 | | | | 182 | |
| | | AstraZeneca plc | | 4.000% | | 1/17/29 | | | 200 | | | | 222 | |
| | | AstraZeneca plc | | 6.450% | | 9/15/37 | | | 450 | | | | 630 | |
| | | AstraZeneca plc | | 4.000% | | 9/18/42 | | | 290 | | | | 320 | |
| | | AstraZeneca plc | | 4.375% | | 11/16/45 | | | 200 | | | | 234 | |
| | | AstraZeneca plc | | 4.375% | | 8/17/48 | | | 135 | | | | 161 | |
| | | BAT Capital Corp. | | 2.764% | | 8/15/22 | | | 325 | | | | 329 | |
| | | BAT Capital Corp. | | 3.222% | | 8/15/24 | | | 650 | | | | 664 | |
| | | BAT Capital Corp. | | 2.789% | | 9/6/24 | | | 200 | | | | 201 | |
| | | BAT Capital Corp. | | 3.215% | | 9/6/26 | | | 200 | | | | 201 | |
| | | BAT Capital Corp. | | 3.557% | | 8/15/27 | | | 675 | | | | 687 | |
| | | BAT Capital Corp. | | 3.462% | | 9/6/29 | | | 125 | | | | 127 | |
| | | BAT Capital Corp. | | 4.390% | | 8/15/37 | | | 525 | | | | 532 | |
| | | BAT Capital Corp. | | 4.540% | | 8/15/47 | | | 475 | | | | 475 | |
| | | BAT Capital Corp. | | 4.758% | | 9/6/49 | | | 250 | | | | 258 | |
| | | Baxalta Inc. | | 3.600% | | 6/23/22 | | | 15 | | | | 15 | |
| | | Baxalta Inc. | | 4.000% | | 6/23/25 | | | 97 | | | | 104 | |
| | | Baxalta Inc. | | 5.250% | | 6/23/45 | | | 73 | | | | 93 | |
| | | Baxter International Inc. | | 1.700% | | 8/15/21 | | | 150 | | | | 150 | |
| | | Baxter International Inc. | | 3.500% | | 8/15/46 | | | 100 | | | | 97 | |
| | | Baylor Scott & White Holdings | | 4.185% | | 11/15/45 | | | 100 | | | | 112 | |
| | | Beam Suntory Inc. | | 3.250% | | 5/15/22 | | | 50 | | | | 51 | |
| | | Becton Dickinson & Co. | | 3.125% | | 11/8/21 | | | 65 | | | | 66 | |
| | | Becton Dickinson & Co. | | 2.894% | | 6/6/22 | | | 350 | | | | 356 | |
| | | Becton Dickinson & Co. | | 3.300% | | 3/1/23 | | | 50 | | | | 51 | |
| | | Becton Dickinson & Co. | | 3.363% | | 6/6/24 | | | 1,100 | | | | 1,143 | |
| | | Becton Dickinson & Co. | | 3.734% | | 12/15/24 | | | 272 | | | | 288 | |
| | | Becton Dickinson & Co. | | 3.700% | | 6/6/27 | | | 375 | | | | 399 | |
| | | Becton Dickinson & Co. | | 4.875% | | 5/15/44 | | | 26 | | | | 30 | |
| | | Becton Dickinson & Co. | | 4.685% | | 12/15/44 | | | 196 | | | | 227 | |
| | | Becton Dickinson & Co. | | 4.669% | | 6/6/47 | | | 300 | | | | 355 | |
| | | Bio-Rad Laboratories Inc. | | 4.875% | | 12/15/20 | | | 75 | | | | 77 | |
| | | Biogen Inc. | | 3.625% | | 9/15/22 | | | 275 | | | | 286 | |
| | | Biogen Inc. | | 4.050% | | 9/15/25 | | | 300 | | | | 326 | |
| | | Biogen Inc. | | 5.200% | | 9/15/45 | | | 350 | | | | 421 | |
| | | Boston Scientific Corp. | | 3.375% | | 5/15/22 | | | 50 | | | | 52 | |
| | | Boston Scientific Corp. | | 3.450% | | 3/1/24 | | | 50 | | | | 52 | |
| | | Boston Scientific Corp. | | 3.850% | | 5/15/25 | | | 77 | | | | 83 | |
| | | Boston Scientific Corp. | | 3.750% | | 3/1/26 | | | 125 | | | | 134 | |
| | | Boston Scientific Corp. | | 4.000% | | 3/1/29 | | | 150 | | | | 166 | |
| | | Boston Scientific Corp. | | 7.000% | | 11/15/35 | | | 100 | | | | 140 | |
| | | Boston Scientific Corp. | | 4.550% | | 3/1/39 | | | 175 | | | | 205 | |
| | | Boston Scientific Corp. | | 7.375% | | 1/15/40 | | | 50 | | | | 76 | |
| | | Boston Scientific Corp. | | 4.700% | | 3/1/49 | | | 200 | | | | 242 | |
| 6 | | Bristol-Myers Squibb Co. | | 2.875% | | 2/19/21 | | | 125 | | | | 126 | |
| 6 | | Bristol-Myers Squibb Co. | | 2.550% | | 5/14/21 | | | 225 | | | | 227 | |
| 6 | | Bristol-Myers Squibb Co. | | 2.250% | | 8/15/21 | | | 75 | | | | 75 | |
| 6 | | Bristol-Myers Squibb Co. | | 2.600% | | 5/16/22 | | | 300 | | | | 305 | |
| | | Bristol-Myers Squibb Co. | | 2.000% | | 8/1/22 | | | 275 | | | | 277 | |
| 6 | | Bristol-Myers Squibb Co. | | 3.250% | | 8/15/22 | | | 175 | | | | 180 | |
| 6 | | Bristol-Myers Squibb Co. | | 3.550% | | 8/15/22 | | | 50 | | | | 52 | |
| 6 | | Bristol-Myers Squibb Co. | | 2.750% | | 2/15/23 | | | 150 | | | | 152 | |
| 6 | | Bristol-Myers Squibb Co. | | 3.250% | | 2/20/23 | | | 200 | | | | 205 | |
| | | Bristol-Myers Squibb Co. | | 7.150% | | 6/15/23 | | | 200 | | | | 233 | |
| 6 | | Bristol-Myers Squibb Co. | | 4.000% | | 8/15/23 | | | 125 | | | | 133 | |
| 6 | | Bristol-Myers Squibb Co. | | 3.625% | | 5/15/24 | | | 175 | | | | 184 | |
| 6 | | Bristol-Myers Squibb Co. | | 2.900% | | 7/26/24 | | | 625 | | | | 644 | |
| 6 | | Bristol-Myers Squibb Co. | | 3.875% | | 8/15/25 | | | 475 | | | | 513 | |
| 6 | | Bristol-Myers Squibb Co. | | 3.200% | | 6/15/26 | | | 460 | | | | 482 | |
| 6 | | Bristol-Myers Squibb Co. | | 3.450% | | 11/15/27 | | | 110 | | | | 117 | |
| 6 | | Bristol-Myers Squibb Co. | | 3.900% | | 2/20/28 | | | 275 | | | | 300 | |
| 6 | | Bristol-Myers Squibb Co. | | 3.400% | | 7/26/29 | | | 885 | | | | 945 | |
| 6 | | Bristol-Myers Squibb Co. | | 4.125% | | 6/15/39 | | | 380 | | | | 438 | |
| 6 | | Bristol-Myers Squibb Co. | | 5.700% | | 10/15/40 | | | 50 | | | | 66 | |
| | | Bristol-Myers Squibb Co. | | 3.250% | | 8/1/42 | | | 100 | | | | 101 | |
| 6 | | Bristol-Myers Squibb Co. | | 5.250% | | 8/15/43 | | | 150 | | | | 191 | |
| | | Bristol-Myers Squibb Co. | | 4.500% | | 3/1/44 | | | 100 | | | | 117 | |
| 6 | | Bristol-Myers Squibb Co. | | 4.625% | | 5/15/44 | | | 175 | | | | 211 | |
| 6 | | Bristol-Myers Squibb Co. | | 5.000% | | 8/15/45 | | | 400 | | | | 505 | |
| 6 | | Bristol-Myers Squibb Co. | | 4.350% | | 11/15/47 | | | 250 | | | | 297 | |
Total Bond Market Index Portfolio
| | | | | | | | | Face | | | Market | |
| | | | | | | Maturity | | Amount | | | Value• | |
| | | | | Coupon | | Date | | | ($000 | ) | | | ($000 | ) |
| 6 | | Bristol-Myers Squibb Co. | | 4.550% | | 2/20/48 | | | 275 | | | | 338 | |
| 6 | | Bristol-Myers Squibb Co. | | 4.250% | | 10/26/49 | | | 725 | | | | 854 | |
| | | Brown-Forman Corp. | | 3.500% | | 4/15/25 | | | 75 | | | | 80 | |
| | | Brown-Forman Corp. | | 4.500% | | 7/15/45 | | | 100 | | | | 123 | |
| | | Bunge Ltd. Finance Corp. | | 3.000% | | 9/25/22 | | | 250 | | | | 254 | |
| | | Bunge Ltd. Finance Corp. | | 4.350% | | 3/15/24 | | | 125 | | | | 131 | |
| | | Bunge Ltd. Finance Corp. | | 3.750% | | 9/25/27 | | | 200 | | | | 206 | |
| | | Campbell Soup Co. | | 3.300% | | 3/15/21 | | | 275 | | | | 279 | |
| | | Campbell Soup Co. | | 3.650% | | 3/15/23 | | | 225 | | | | 234 | |
| | | Campbell Soup Co. | | 3.950% | | 3/15/25 | | | 200 | | | | 212 | |
| | | Campbell Soup Co. | | 3.300% | | 3/19/25 | | | 125 | | | | 128 | |
| | | Campbell Soup Co. | | 4.150% | | 3/15/28 | | | 175 | | | | 189 | |
| | | Campbell Soup Co. | | 3.800% | | 8/2/42 | | | 75 | | | | 73 | |
| | | Campbell Soup Co. | | 4.800% | | 3/15/48 | | | 135 | | | | 156 | |
| | | Cardinal Health Inc. | | 4.625% | | 12/15/20 | | | 100 | | | | 103 | |
| | | Cardinal Health Inc. | | 2.616% | | 6/15/22 | | | 115 | | | | 116 | |
| | | Cardinal Health Inc. | | 3.200% | | 3/15/23 | | | 150 | | | | 154 | |
| | | Cardinal Health Inc. | | 3.079% | | 6/15/24 | | | 290 | | | | 298 | |
| | | Cardinal Health Inc. | | 3.750% | | 9/15/25 | | | 100 | | | | 106 | |
| | | Cardinal Health Inc. | | 3.410% | | 6/15/27 | | | 265 | | | | 271 | |
| | | Cardinal Health Inc. | | 4.600% | | 3/15/43 | | | 75 | | | | 75 | |
| | | Cardinal Health Inc. | | 4.500% | | 11/15/44 | | | 50 | | | | 49 | |
| | | Cardinal Health Inc. | | 4.900% | | 9/15/45 | | | 100 | | | | 104 | |
| | | Cardinal Health Inc. | | 4.368% | | 6/15/47 | | | 125 | | | | 124 | |
| | | Children’s Hospital Corp. | | 4.115% | | 1/1/47 | | | 75 | | | | 85 | |
| | | Children’s Hospital Medical Center | | 4.268% | | 5/15/44 | | | 50 | | | | 56 | |
| | | CHRISTUS Health | | 4.341% | | 7/1/28 | | | 125 | | | | 138 | |
| | | Church & Dwight Co. Inc. | | 2.450% | | 8/1/22 | | | 25 | | | | 25 | |
| | | Church & Dwight Co. Inc. | | 3.150% | | 8/1/27 | | | 100 | | | | 104 | |
| | | Church & Dwight Co. Inc. | | 3.950% | | 8/1/47 | | | 75 | | | | 82 | |
| 6 | | Cigna Corp. | | 3.300% | | 2/25/21 | | | 150 | | | | 152 | |
| | | Cigna Corp. | | 3.400% | | 9/17/21 | | | 280 | | | | 286 | |
| 6 | | Cigna Corp. | | 4.750% | | 11/15/21 | | | 425 | | | | 446 | |
| 6 | | Cigna Corp. | | 3.900% | | 2/15/22 | | | 200 | | | | 206 | |
| 6 | | Cigna Corp. | | 4.000% | | 2/15/22 | | | 125 | | | | 129 | |
| 6 | | Cigna Corp. | | 3.050% | | 11/30/22 | | | 100 | | | | 102 | |
| 6 | | Cigna Corp. | | 3.000% | | 7/15/23 | | | 700 | | | | 710 | |
| | | Cigna Corp. | | 3.750% | | 7/15/23 | | | 200 | | | | 209 | |
| 6 | | Cigna Corp. | | 3.500% | | 6/15/24 | | | 175 | | | | 182 | |
| 6 | | Cigna Corp. | | 3.250% | | 4/15/25 | | | 250 | | | | 257 | |
| | | Cigna Corp. | | 4.125% | | 11/15/25 | | | 265 | | | | 287 | |
| 6 | | Cigna Corp. | | 4.500% | | 2/25/26 | | | 390 | | | | 422 | |
| 6 | | Cigna Corp. | | 3.400% | | 3/1/27 | | | 275 | | | | 285 | |
| 6 | | Cigna Corp. | | 7.875% | | 5/15/27 | | | 41 | | | | 53 | |
| 6 | | Cigna Corp. | | 3.050% | | 10/15/27 | | | 225 | | | | 226 | |
| | | Cigna Corp. | | 4.375% | | 10/15/28 | | | 610 | | | | 675 | |
| | | Cigna Corp. | | 4.800% | | 8/15/38 | | | 340 | | | | 391 | |
| 6 | | Cigna Corp. | | 6.125% | | 11/15/41 | | | 92 | | | | 116 | |
| 6 | | Cigna Corp. | | 4.800% | | 7/15/46 | | | 400 | | | | 460 | |
| 6 | | Cigna Corp. | | 3.875% | | 10/15/47 | | | 120 | | | | 121 | |
| | | Cigna Corp. | | 4.900% | | 12/15/48 | | | 570 | | | | 676 | |
| | | City of Hope | | 5.623% | | 11/15/43 | | | 75 | | | | 99 | |
| | | City of Hope | | 4.378% | | 8/15/48 | | | 100 | | | | 115 | |
| | | Cleveland Clinic Foundation | | 4.858% | | 1/1/14 | | | 75 | | | | 93 | |
| | | Clorox Co. | | 3.800% | | 11/15/21 | | | 250 | | | | 258 | |
| | | Clorox Co. | | 3.050% | | 9/15/22 | | | 100 | | | | 102 | |
| | | Clorox Co. | | 3.500% | | 12/15/24 | | | 175 | | | | 185 | |
| | | Clorox Co. | | 3.100% | | 10/1/27 | | | 50 | | | | 52 | |
| | | Clorox Co. | | 3.900% | | 5/15/28 | | | 50 | | | | 55 | |
| | | Coca-Cola Co. | | 1.875% | | 10/27/20 | | | 400 | | | | 400 | |
| | | Coca-Cola Co. | | 1.550% | | 9/1/21 | | | 175 | | | | 175 | |
| | | Coca-Cola Co. | | 3.300% | | 9/1/21 | | | 250 | | | | 256 | |
| | | Coca-Cola Co. | | 2.200% | | 5/25/22 | | | 100 | | | | 101 | |
| | | Coca-Cola Co. | | 3.200% | | 11/1/23 | | | 225 | | | | 236 | |
| | | Coca-Cola Co. | | 1.750% | | 9/6/24 | | | 100 | | | | 100 | |
| | | Coca-Cola Co. | | 2.875% | | 10/27/25 | | | 300 | | | | 313 | |
| | | Coca-Cola Co. | | 2.550% | | 6/1/26 | | | 100 | | | | 102 | |
| | | Coca-Cola Co. | | 2.250% | | 9/1/26 | | | 410 | | | | 413 | |
| | | Coca-Cola Co. | | 2.900% | | 5/25/27 | | | 50 | | | | 52 | |
| | | Coca-Cola Co. | | 2.125% | | 9/6/29 | | | 125 | | | | 122 | |
| | | Coca-Cola Consolidated Inc. | | 3.800% | | 11/25/25 | | | 125 | | | | 131 | |
| | | Coca-Cola Femsa SAB de CV | | 3.875% | | 11/26/23 | | | 250 | | | | 264 | |
| | | Coca-Cola Femsa SAB de CV | | 5.250% | | 11/26/43 | | | 150 | | | | 185 | |
| | | Colgate-Palmolive Co. | | 2.450% | | 11/15/21 | | | 75 | | | | 76 | |
| | | Colgate-Palmolive Co. | | 2.250% | | 11/15/22 | | | 75 | | | | 76 | |
| | | Colgate-Palmolive Co. | | 2.100% | | 5/1/23 | | | 280 | | | | 282 | |
| | | Colgate-Palmolive Co. | | 3.250% | | 3/15/24 | | | 100 | | | | 106 | |
| | | Colgate-Palmolive Co. | | 4.000% | | 8/15/45 | | | 125 | | | | 149 | |
| | | Colgate-Palmolive Co. | | 3.700% | | 8/1/47 | | | 50 | | | | 58 | |
| | | CommonSpirit Health | | 2.950% | | 11/1/22 | | | 75 | | | | 76 | |
| | | CommonSpirit Health | | 2.760% | | 10/1/24 | | | 100 | | | | 101 | |
| | | CommonSpirit Health | | 3.347% | | 10/1/29 | | | 175 | | | | 176 | |
| 3 | | CommonSpirit Health | | 4.350% | | 11/1/42 | | | 225 | | | | 231 | |
| | | CommonSpirit Health | | 3.817% | | 10/1/49 | | | 50 | | | | 49 | |
| | | CommonSpirit Health | | 4.187% | | 10/1/49 | | | 200 | | | | 199 | |
| | | Conagra Brands Inc. | | 3.800% | | 10/22/21 | | | 225 | | | | 232 | |
| | | Conagra Brands Inc. | | 3.250% | | 9/15/22 | | | 75 | | | | 77 | |
| | | Conagra Brands Inc. | | 3.200% | | 1/25/23 | | | 151 | | | | 156 | |
| | | Conagra Brands Inc. | | 4.300% | | 5/1/24 | | | 200 | | | | 215 | |
| | | Conagra Brands Inc. | | 4.600% | | 11/1/25 | | | 150 | | | | 165 | |
| | | Conagra Brands Inc. | | 7.000% | | 10/1/28 | | | 75 | | | | 93 | |
| | | Conagra Brands Inc. | | 4.850% | | 11/1/28 | | | 250 | | | | 285 | |
| | | Conagra Brands Inc. | | 8.250% | | 9/15/30 | | | 50 | | | | 69 | |
| | | Conagra Brands Inc. | | 5.300% | | 11/1/38 | | | 200 | | | | 237 | |
| | | Conagra Brands Inc. | | 5.400% | | 11/1/48 | | | 225 | | | | 274 | |
| | | Constellation Brands Inc. | | 3.750% | | 5/1/21 | | | 100 | | | | 102 | |
| | | Constellation Brands Inc. | | 2.700% | | 5/9/22 | | | 50 | | | | 51 | |
| | | Constellation Brands Inc. | | 2.650% | | 11/7/22 | | | 250 | | | | 253 | |
| | | Constellation Brands Inc. | | 3.200% | | 2/15/23 | | | 250 | | | | 257 | |
| | | Constellation Brands Inc. | | 4.250% | | 5/1/23 | | | 200 | | | | 212 | |
| | | Constellation Brands Inc. | | 4.750% | | 11/15/24 | | | 175 | | | | 193 | |
| | | Constellation Brands Inc. | | 4.400% | | 11/15/25 | | | 100 | | | | 109 | |
| | | Constellation Brands Inc. | | 3.700% | | 12/6/26 | | | 100 | | | | 106 | |
| | | Constellation Brands Inc. | | 3.500% | | 5/9/27 | | | 150 | | | | 156 | |
| | | Constellation Brands Inc. | | 3.600% | | 2/15/28 | | | 175 | | | | 184 | |
| | | Constellation Brands Inc. | | 4.650% | | 11/15/28 | | | 75 | | | | 84 | |
| | | Constellation Brands Inc. | | 3.150% | | 8/1/29 | | | 225 | | | | 227 | |
| | | Constellation Brands Inc. | | 4.500% | | 5/9/47 | | | 75 | | | | 81 | |
| | | Constellation Brands Inc. | | 4.100% | | 2/15/48 | | | 100 | | | | 104 | |
| | | Constellation Brands Inc. | | 5.250% | | 11/15/48 | | | 100 | | | | 121 | |
| | | Covidien International Finance SA | | 3.200% | | 6/15/22 | | | 200 | | | | 205 | |
| | | CVS Health Corp. | | 3.350% | | 3/9/21 | | | 383 | | | | 389 | |
| | | CVS Health Corp. | | 2.125% | | 6/1/21 | | | 250 | | | | 250 | |
| | | CVS Health Corp. | | 3.500% | | 7/20/22 | | | 350 | | | | 361 | |
| | | CVS Health Corp. | | 2.750% | | 12/1/22 | | | 150 | | | | 152 | |
| | | CVS Health Corp. | | 4.750% | | 12/1/22 | | | 150 | | | | 160 | |
| | | CVS Health Corp. | | 3.700% | | 3/9/23 | | | 1,155 | | | | 1,202 | |
| | | CVS Health Corp. | | 4.000% | | 12/5/23 | | | 195 | | | | 206 | |
| | | CVS Health Corp. | | 3.375% | | 8/12/24 | | | 475 | | | | 494 | |
| | | CVS Health Corp. | | 4.100% | | 3/25/25 | | | 905 | | | | 970 | |
| | | CVS Health Corp. | | 3.875% | | 7/20/25 | | | 765 | | | | 815 | |
| | | CVS Health Corp. | | 2.875% | | 6/1/26 | | | 425 | | | | 431 | |
| | | CVS Health Corp. | | 4.300% | | 3/25/28 | | | 1,635 | | | | 1,782 | |
| | | CVS Health Corp. | | 3.250% | | 8/15/29 | | | 360 | | | | 365 | |
| | | CVS Health Corp. | | 4.875% | | 7/20/35 | | | 125 | | | | 142 | |
| | | CVS Health Corp. | | 4.780% | | 3/25/38 | | | 1,000 | | | | 1,131 | |
| | | CVS Health Corp. | | 6.125% | | 9/15/39 | | | 75 | | | | 96 | |
| | | CVS Health Corp. | | 5.300% | | 12/5/43 | | | 150 | | | | 178 | |
| | | CVS Health Corp. | | 5.125% | | 7/20/45 | | | 875 | | | | 1,030 | |
| | | CVS Health Corp. | | 5.050% | | 3/25/48 | | | 1,550 | | | | 1,833 | |
| | | Danaher Corp. | | 3.350% | | 9/15/25 | | | 100 | | | | 106 | |
| | | Danaher Corp. | | 4.375% | | 9/15/45 | | | 75 | | | | 88 | |
| | | Dartmouth-Hitchcock Health | | 4.178% | | 8/1/48 | | | 100 | | | | 111 | |
| | | Delhaize America LLC | | 9.000% | | 4/15/31 | | | 100 | | | | 147 | |
| | | DH Europe Finance II Sarl | | 2.050% | | 11/15/22 | | | 250 | | | | 250 | |
| | | DH Europe Finance II Sarl | | 2.200% | | 11/15/24 | | | 250 | | | | 249 | |
| | | DH Europe Finance II Sarl | | 2.600% | | 11/15/29 | | | 150 | | | | 149 | |
| | | DH Europe Finance II Sarl | | 3.250% | | 11/15/39 | | | 175 | | | | 176 | |
| | | DH Europe Finance II Sarl | | 3.400% | | 11/15/49 | | | 175 | | | | 179 | |
| | | Diageo Capital plc | | 2.625% | | 4/29/23 | | | 500 | | | | 508 | |
| | | Diageo Capital plc | | 2.125% | | 10/24/24 | | | 200 | | | | 200 | |
| | | Diageo Capital plc | | 2.375% | | 10/24/29 | | | 200 | | | | 197 | |
Total Bond Market Index Portfolio
| | | | | | | | | Face | | | Market | |
| | | | | | | Maturity | | Amount | | | Value• | |
| | | | | Coupon | | Date | | | ($000 | ) | | | ($000 | ) |
| | | Diageo Capital plc | | 5.875% | | 9/30/36 | | | 50 | | | | 68 | |
| | | Diageo Capital plc | | 3.875% | | 4/29/43 | | | 100 | | | | 110 | |
| | | Diageo Investment Corp. | | 2.875% | | 5/11/22 | | | 300 | | | | 306 | |
| | | Diageo Investment Corp. | | 4.250% | | 5/11/42 | | | 150 | | | | 173 | |
| | | Dignity Health | | 3.125% | | 11/1/22 | | | 50 | | | | 51 | |
| | | Dignity Health | | 3.812% | | 11/1/24 | | | 100 | | | | 105 | |
| | | Dignity Health | | 4.500% | | 11/1/42 | | | 100 | | | | 104 | |
| | | Dignity Health | | 5.267% | | 11/1/64 | | | 50 | | | | 57 | |
| | | Duke University Health System Inc. | | 3.920% | | 6/1/47 | | | 100 | | | | 111 | |
| | | Edwards Lifesciences Corp. | | 4.300% | | 6/15/28 | | | 100 | | | | 111 | |
| | | Eli Lilly & Co. | | 2.350% | | 5/15/22 | | | 50 | | | | 51 | |
| | | Eli Lilly & Co. | | 2.750% | | 6/1/25 | | | 71 | | | | 73 | |
| | | Eli Lilly & Co. | | 3.375% | | 3/15/29 | | | 225 | | | | 242 | |
| | | Eli Lilly & Co. | | 3.950% | | 3/15/49 | | | 400 | | | | 461 | |
| | | Eli Lilly & Co. | | 4.150% | | 3/15/59 | | | 350 | | | | 411 | |
| | | Estee Lauder Cos. Inc. | | 1.700% | | 5/10/21 | | | 225 | | | | 224 | |
| | | Estee Lauder Cos. Inc. | | 3.150% | | 3/15/27 | | | 150 | | | | 159 | |
| | | Estee Lauder Cos. Inc. | | 2.375% | | 12/1/29 | | | 25 | | | | 25 | |
| | | Estee Lauder Cos. Inc. | | 6.000% | | 5/15/37 | | | 75 | | | | 103 | |
| | | Estee Lauder Cos. Inc. | | 4.375% | | 6/15/45 | | | 100 | | | | 119 | |
| | | Estee Lauder Cos. Inc. | | 4.150% | | 3/15/47 | | | 100 | | | | 116 | |
| | | Estee Lauder Cos. Inc. | | 3.125% | | 12/1/49 | | | 125 | | | | 125 | |
| | | Flowers Foods Inc. | | 4.375% | | 4/1/22 | | | 50 | | | | 52 | |
| | | Flowers Foods Inc. | | 3.500% | | 10/1/26 | | | 75 | | | | 77 | |
| | | Fomento Economico Mexicano SAB de CV | | 4.375% | | 5/10/43 | | | 100 | | | | 111 | |
| | | General Mills Inc. | | 3.150% | | 12/15/21 | | | 25 | | | | 26 | |
| | | General Mills Inc. | | 2.600% | | 10/12/22 | | | 250 | | | | 254 | |
| | | General Mills Inc. | | 3.700% | | 10/17/23 | | | 575 | | | | 606 | |
| | | General Mills Inc. | | 3.650% | | 2/15/24 | | | 100 | | | | 105 | |
| | | General Mills Inc. | | 3.200% | | 2/10/27 | | | 150 | | | | 157 | |
| | | General Mills Inc. | | 4.200% | | 4/17/28 | | | 225 | | | | 250 | |
| | | General Mills Inc. | | 4.550% | | 4/17/38 | | | 75 | | | | 87 | |
| | | General Mills Inc. | | 5.400% | | 6/15/40 | | | 100 | | | | 123 | |
| | | General Mills Inc. | | 4.150% | | 2/15/43 | | | 100 | | | | 107 | |
| | | General Mills Inc. | | 4.700% | | 4/17/48 | | | 75 | | | | 89 | |
| | | Gilead Sciences Inc. | | 4.500% | | 4/1/21 | | | 150 | | | | 154 | |
| | | Gilead Sciences Inc. | | 4.400% | | 12/1/21 | | | 725 | | | | 756 | |
| | | Gilead Sciences Inc. | | 3.250% | | 9/1/22 | | | 375 | | | | 387 | |
| | | Gilead Sciences Inc. | | 2.500% | | 9/1/23 | | | 300 | | | | 304 | |
| | | Gilead Sciences Inc. | | 3.700% | | 4/1/24 | | | 470 | | | | 499 | |
| | | Gilead Sciences Inc. | | 3.500% | | 2/1/25 | | | 335 | | | | 355 | |
| | | Gilead Sciences Inc. | | 3.650% | | 3/1/26 | | | 575 | | | | 618 | |
| | | Gilead Sciences Inc. | | 2.950% | | 3/1/27 | | | 225 | | | | 233 | |
| | | Gilead Sciences Inc. | | 4.600% | | 9/1/35 | | | 100 | | | | 120 | |
| | | Gilead Sciences Inc. | | 4.000% | | 9/1/36 | | | 150 | | | | 166 | |
| | | Gilead Sciences Inc. | | 5.650% | | 12/1/41 | | | 175 | | | | 230 | |
| | | Gilead Sciences Inc. | | 4.800% | | 4/1/44 | | | 300 | | | | 359 | |
| | | Gilead Sciences Inc. | | 4.500% | | 2/1/45 | | | 325 | | | | 375 | |
| | | Gilead Sciences Inc. | | 4.750% | | 3/1/46 | | | 505 | | | | 603 | |
| | | Gilead Sciences Inc. | | 4.150% | | 3/1/47 | | | 475 | | | | 525 | |
| | | GlaxoSmithKline Capital Inc. | | 2.800% | | 3/18/23 | | | 50 | | | | 51 | |
| | | GlaxoSmithKline Capital Inc. | | 3.375% | | 5/15/23 | | | 225 | | | | 234 | |
| | | GlaxoSmithKline Capital Inc. | | 3.625% | | 5/15/25 | | | 325 | | | | 348 | |
| | | GlaxoSmithKline Capital Inc. | | 3.875% | | 5/15/28 | | | 375 | | | | 413 | |
| | | GlaxoSmithKline Capital Inc. | | 5.375% | | 4/15/34 | | | 85 | | | | 108 | |
| | | GlaxoSmithKline Capital Inc. | | 6.375% | | 5/15/38 | | | 550 | | | | 786 | |
| | | GlaxoSmithKline Capital Inc. | | 4.200% | | 3/18/43 | | | 100 | | | | 116 | |
| | | GlaxoSmithKline Capital plc | | 3.125% | | 5/14/21 | | | 375 | | | | 381 | |
| | | GlaxoSmithKline Capital plc | | 2.850% | | 5/8/22 | | | 100 | | | | 102 | |
| | | GlaxoSmithKline Capital plc | | 2.875% | | 6/1/22 | | | 350 | | | | 357 | |
| | | GlaxoSmithKline Capital plc | | 3.000% | | 6/1/24 | | | 200 | | | | 207 | |
| | | GlaxoSmithKline Capital plc | | 3.375% | | 6/1/29 | | | 200 | | | | 214 | |
| | | Hackensack Meridian Health Inc. | | 4.211% | | 7/1/48 | | | 125 | | | | 140 | |
| | | Hackensack Meridian Health Inc. | | 4.500% | | 7/1/57 | | | 50 | | | | 59 | |
| | | Hasbro Inc. | | 3.900% | | 11/19/29 | | | 175 | | | | 176 | |
| | | Hasbro Inc. | | 6.350% | | 3/15/40 | | | 125 | | | | 146 | |
| | | Hasbro Inc. | | 5.100% | | 5/15/44 | | | 50 | | | | 50 | |
| | | HCA Inc. | | 4.750% | | 5/1/23 | | | 250 | | | | 267 | |
| | | HCA Inc. | | 5.000% | | 3/15/24 | | | 375 | | | | 409 | |
| | | HCA Inc. | | 5.250% | | 4/15/25 | | | 320 | | | | 358 | |
| | | HCA Inc. | | 5.250% | | 6/15/26 | | | 275 | | | | 308 | |
| | | HCA Inc. | | 4.500% | | 2/15/27 | | | 25 | | | | 27 | |
| | | HCA Inc. | | 4.125% | | 6/15/29 | | | 405 | | | | 429 | |
| | | HCA Inc. | | 5.125% | | 6/15/39 | | | 100 | | | | 111 | |
| | | HCA Inc. | | 5.500% | | 6/15/47 | | | 375 | | | | 433 | |
| | | HCA Inc. | | 5.250% | | 6/15/49 | | | 400 | | | | 450 | |
| | | Hershey Co. | | 4.125% | | 12/1/20 | | | 75 | | | | 76 | |
| | | Hershey Co. | | 3.100% | | 5/15/21 | | | 75 | | | | 76 | |
| | | Hershey Co. | | 2.625% | | 5/1/23 | | | 100 | | | | 102 | |
| | | Hershey Co. | | 3.375% | | 5/15/23 | | | 150 | | | | 157 | |
| | | Hershey Co. | | 2.050% | | 11/15/24 | | | 55 | | | | 55 | |
| | | Hershey Co. | | 3.200% | | 8/21/25 | | | 65 | | | | 68 | |
| | | Hershey Co. | | 2.300% | | 8/15/26 | | | 100 | | | | 101 | |
| | | Hershey Co. | | 2.450% | | 11/15/29 | | | 130 | | | | 130 | |
| | | Hershey Co. | | 3.125% | | 11/15/49 | | | 150 | | | | 148 | |
| | | Indiana University Health Inc. Obligated Group | | 3.970% | | 11/1/48 | | | 125 | | | | 140 | |
| | | Ingredion Inc. | | 3.200% | | 10/1/26 | | | 100 | | | | 101 | |
| | | JM Smucker Co. | | 3.500% | | 10/15/21 | | | 175 | | | | 179 | |
| | | JM Smucker Co. | | 3.000% | | 3/15/22 | | | 100 | | | | 102 | |
| | | JM Smucker Co. | | 3.500% | | 3/15/25 | | | 175 | | | | 184 | |
| | | JM Smucker Co. | | 3.375% | | 12/15/27 | | | 150 | | | | 156 | |
| | | JM Smucker Co. | | 4.250% | | 3/15/35 | | | 100 | | | | 108 | |
| | | JM Smucker Co. | | 4.375% | | 3/15/45 | | | 125 | | | | 136 | |
| | | Johns Hopkins Health System Corp. | | 3.837% | | 5/15/46 | | | 100 | | | | 109 | |
| | | Johnson & Johnson | | 1.950% | | 11/10/20 | | | 200 | | | | 200 | |
| | | Johnson & Johnson | | 1.650% | | 3/1/21 | | | 275 | | | | 274 | |
| | | Johnson & Johnson | | 2.250% | | 3/3/22 | | | 325 | | | | 328 | |
| | | Johnson & Johnson | | 2.050% | | 3/1/23 | | | 125 | | | | 126 | |
| | | Johnson & Johnson | | 3.375% | | 12/5/23 | | | 200 | | | | 212 | |
| | | Johnson & Johnson | | 2.625% | | 1/15/25 | | | 250 | | | | 258 | |
| | | Johnson & Johnson | | 2.450% | | 3/1/26 | | | 350 | | | | 355 | |
| | | Johnson & Johnson | | 2.950% | | 3/3/27 | | | 200 | | | | 210 | |
| | | Johnson & Johnson | | 2.900% | | 1/15/28 | | | 100 | | | | 104 | |
| | | Johnson & Johnson | | 6.950% | | 9/1/29 | | | 75 | | | | 105 | |
| | | Johnson & Johnson | | 4.950% | | 5/15/33 | | | 150 | | | | 187 | |
| | | Johnson & Johnson | | 4.375% | | 12/5/33 | | | 175 | | | | 208 | |
| | | Johnson & Johnson | | 3.550% | | 3/1/36 | | | 175 | | | | 192 | |
| | | Johnson & Johnson | | 3.625% | | 3/3/37 | | | 300 | | | | 331 | |
| | | Johnson & Johnson | | 5.950% | | 8/15/37 | | | 300 | | | | 427 | |
| | | Johnson & Johnson | | 3.400% | | 1/15/38 | | | 200 | | | | 214 | |
| | | Johnson & Johnson | | 4.500% | | 9/1/40 | | | 150 | | | | 182 | |
| | | Johnson & Johnson | | 4.850% | | 5/15/41 | | | 75 | | | | 95 | |
| | | Johnson & Johnson | | 4.500% | | 12/5/43 | | | 200 | | | | 246 | |
| | | Johnson & Johnson | | 3.700% | | 3/1/46 | | | 350 | | | | 395 | |
| | | Johnson & Johnson | | 3.750% | | 3/3/47 | | | 200 | | | | 228 | |
| | | Johnson & Johnson | | 3.500% | | 1/15/48 | | | 200 | | | | 216 | |
| | | Kaiser Foundation Hospitals | | 3.500% | | 4/1/22 | | | 50 | | | | 52 | |
| | | Kaiser Foundation Hospitals | | 3.150% | | 5/1/27 | | | 100 | | | | 104 | |
| | | Kaiser Foundation Hospitals | | 4.875% | | 4/1/42 | | | 235 | | | | 288 | |
| | | Kaiser Foundation Hospitals | | 4.150% | | 5/1/47 | | | 150 | | | | 171 | |
| | | Kaiser Foundation Hospitals | | 3.266% | | 11/1/49 | | | 200 | | | | 201 | |
| | | Kellogg Co. | | 4.000% | | 12/15/20 | | | 28 | | | | 28 | |
| | | Kellogg Co. | | 2.650% | | 12/1/23 | | | 126 | | | | 128 | |
| | | Kellogg Co. | | 3.250% | | 4/1/26 | | | 125 | | | | 130 | |
| | | Kellogg Co. | | 3.400% | | 11/15/27 | | | 125 | | | | 131 | |
| | | Kellogg Co. | | 7.450% | | 4/1/31 | | | 25 | | | | 35 | |
| | | Kellogg Co. | | 4.500% | | 4/1/46 | | | 250 | | | | 278 | |
| | | Keurig Dr Pepper Inc. | | 3.551% | | 5/25/21 | | | 300 | | | | 306 | |
| | | Keurig Dr Pepper Inc. | | 2.700% | | 11/15/22 | | | 50 | | | | 50 | |
| | | Keurig Dr Pepper Inc. | | 4.057% | | 5/25/23 | | | 375 | | | | 395 | |
| | | Keurig Dr Pepper Inc. | | 3.130% | | 12/15/23 | | | 350 | | | | 359 | |
| | | Keurig Dr Pepper Inc. | | 4.417% | | 5/25/25 | | | 175 | | | | 191 | |
| | | Keurig Dr Pepper Inc. | | 3.400% | | 11/15/25 | | | 100 | | | | 104 | |
| | | Keurig Dr Pepper Inc. | | 2.550% | | 9/15/26 | | | 75 | | | | 75 | |
| | | Keurig Dr Pepper Inc. | | 3.430% | | 6/15/27 | | | 100 | | | | 104 | |
| | | Keurig Dr Pepper Inc. | | 4.597% | | 5/25/28 | | | 395 | | | | 444 | |
| | | Keurig Dr Pepper Inc. | | 7.450% | | 5/1/38 | | | 16 | | | | 22 | |
| | | Keurig Dr Pepper Inc. | | 4.985% | | 5/25/38 | | | 100 | | | | 118 | |
| | | Keurig Dr Pepper Inc. | | 4.500% | | 11/15/45 | | | 200 | | | | 218 | |
| | | Keurig Dr Pepper Inc. | | 4.420% | | 12/15/46 | | | 125 | | | | 135 | |
Total Bond Market Index Portfolio
| | | | | | | | | Face | | | Market | |
| | | | | | | Maturity | | Amount | | | Value• | |
| | | | | Coupon | | Date | | | ($000 | ) | | | ($000 | ) |
| | | Kimberly-Clark Corp. | | 3.050% | | 8/15/25 | | | 50 | | | | 52 | |
| | | Kimberly-Clark Corp. | | 2.750% | | 2/15/26 | | | 100 | | | | 103 | |
| | | Kimberly-Clark Corp. | | 3.950% | | 11/1/28 | | | 50 | | | | 56 | |
| | | Kimberly-Clark Corp. | | 3.200% | | 4/25/29 | | | 150 | | | | 160 | |
| | | Kimberly-Clark Corp. | | 6.625% | | 8/1/37 | | | 250 | | | | 368 | |
| | | Kimberly-Clark Corp. | | 5.300% | | 3/1/41 | | | 25 | | | | 33 | |
| | | Kimberly-Clark Corp. | | 3.200% | | 7/30/46 | | | 175 | | | | 176 | |
| | | Koninklijke Ahold Delhaize NV | | 5.700% | | 10/1/40 | | | 37 | | | | 45 | |
| | | Koninklijke Philips NV | | 6.875% | | 3/11/38 | | | 100 | | | | 140 | |
| | | Koninklijke Philips NV | | 5.000% | | 3/15/42 | | | 150 | | | | 179 | |
| | | Kraft Foods Group Inc. | | 6.875% | | 1/26/39 | | | 200 | | | | 250 | |
| | | Kraft Foods Group Inc. | | 6.500% | | 2/9/40 | | | 50 | | | | 61 | |
| | | Kraft Foods Group Inc. | | 5.000% | | 6/4/42 | | | 235 | | | | 251 | |
| | | Kraft Heinz Foods Co. | | 3.500% | | 7/15/22 | | | 256 | | | | 264 | |
| | | Kraft Heinz Foods Co. | | 4.000% | | 6/15/23 | | | 240 | | | | 252 | |
| | | Kraft Heinz Foods Co. | | 3.950% | | 7/15/25 | | | 360 | | | | 381 | |
| | | Kraft Heinz Foods Co. | | 3.000% | | 6/1/26 | | | 400 | | | | 400 | |
| | | Kraft Heinz Foods Co. | | 4.625% | | 1/30/29 | | | 200 | | | | 219 | |
| 6 | | Kraft Heinz Foods Co. | | 3.750% | | 4/1/30 | | | 200 | | | | 205 | |
| | | Kraft Heinz Foods Co. | | 5.000% | | 7/15/35 | | | 195 | | | | 217 | |
| 6 | | Kraft Heinz Foods Co. | | 4.625% | | 10/1/39 | | | 100 | | | | 104 | |
| | | Kraft Heinz Foods Co. | | 5.200% | | 7/15/45 | | | 495 | | | | 534 | |
| | | Kraft Heinz Foods Co. | | 4.375% | | 6/1/46 | | | 700 | | | | 689 | |
| 6 | | Kraft Heinz Foods Co. | | 4.875% | | 10/1/49 | | | 300 | | | | 312 | |
| | | Kroger Co. | | 3.300% | | 1/15/21 | | | 250 | | | | 253 | |
| | | Kroger Co. | | 2.600% | | 2/1/21 | | | 50 | | | | 50 | |
| | | Kroger Co. | | 2.950% | | 11/1/21 | | | 150 | | | | 152 | |
| | | Kroger Co. | | 3.400% | | 4/15/22 | | | 75 | | | | 77 | |
| | | Kroger Co. | | 2.800% | | 8/1/22 | | | 100 | | | | 102 | |
| | | Kroger Co. | | 4.000% | | 2/1/24 | | | 100 | | | | 106 | |
| | | Kroger Co. | | 3.500% | | 2/1/26 | | | 160 | | | | 167 | |
| | | Kroger Co. | | 2.650% | | 10/15/26 | | | 140 | | | | 140 | |
| | | Kroger Co. | | 3.700% | | 8/1/27 | | | 100 | | | | 107 | |
| | | Kroger Co. | | 7.700% | | 6/1/29 | | | 50 | | | | 67 | |
| | | Kroger Co. | | 8.000% | | 9/15/29 | | | 125 | | | | 171 | |
| | | Kroger Co. | | 7.500% | | 4/1/31 | | | 100 | | | | 137 | |
| | | Kroger Co. | | 5.400% | | 7/15/40 | | | 50 | | | | 58 | |
| | | Kroger Co. | | 5.000% | | 4/15/42 | | | 125 | | | | 139 | |
| | | Kroger Co. | | 5.150% | | 8/1/43 | | | 100 | | | | 112 | |
| | | Kroger Co. | | 3.875% | | 10/15/46 | | | 50 | | | | 49 | |
| | | Kroger Co. | | 4.450% | | 2/1/47 | | | 225 | | | | 238 | |
| | | Kroger Co. | | 4.650% | | 1/15/48 | | | 150 | | | | 163 | |
| | | Laboratory Corp. of America Holdings | | 3.200% | | 2/1/22 | | | 500 | | | | 510 | |
| | | Laboratory Corp. of America Holdings | | 3.750% | | 8/23/22 | | | 25 | | | | 26 | |
| | | Laboratory Corp. of America Holdings | | 3.250% | | 9/1/24 | | | 150 | | | | 156 | |
| | | Laboratory Corp. of America Holdings | | 2.300% | | 12/1/24 | | | 100 | | | | 100 | |
| | | Laboratory Corp. of America Holdings | | 3.600% | | 2/1/25 | | | 200 | | | | 210 | |
| | | Laboratory Corp. of America Holdings | | 3.600% | | 9/1/27 | | | 100 | | | | 105 | |
| | | Laboratory Corp. of America Holdings | | 2.950% | | 12/1/29 | | | 125 | | | | 125 | |
| | | Laboratory Corp. of America Holdings | | 4.700% | | 2/1/45 | | | 195 | | | | 219 | |
| 3 | | Mayo Clinic | | 3.774% | | 11/15/43 | | | 75 | | | | 81 | |
| 3 | | Mayo Clinic | | 4.128% | | 11/15/52 | | | 50 | | | | 56 | |
| | | McCormick & Co. Inc. | | 3.900% | | 7/15/21 | | | 50 | | | | 51 | |
| | | McCormick & Co. Inc. | | 3.150% | | 8/15/24 | | | 150 | | | | 155 | |
| | | McCormick & Co. Inc. | | 3.400% | | 8/15/27 | | | 150 | | | | 156 | |
| | | McKesson Corp. | | 3.796% | | 3/15/24 | | | 200 | | | | 210 | |
| | | McKesson Corp. | | 3.950% | | 2/16/28 | | | 200 | | | | 212 | |
| | | Mead Johnson Nutrition Co. | | 3.000% | | 11/15/20 | | | 150 | | | | 151 | |
| | | Mead Johnson Nutrition Co. | | 4.125% | | 11/15/25 | | | 125 | | | | 137 | |
| | | Mead Johnson Nutrition Co. | | 5.900% | | 11/1/39 | | | 100 | | | | 134 | |
| | | Mead Johnson Nutrition Co. | | 4.600% | | 6/1/44 | | | 150 | | | | 180 | |
| | | Medtronic Inc. | | 3.150% | | 3/15/22 | | | 325 | | | | 334 | |
| | | Medtronic Inc. | | 3.500% | | 3/15/25 | | | 397 | | | | 425 | |
| | | Medtronic Inc. | | 4.375% | | 3/15/35 | | | 611 | | | | 721 | |
| | | Medtronic Inc. | | 4.625% | | 3/15/45 | | | 344 | | | | 431 | |
| | | Memorial Health Services | | 3.447% | | 11/1/49 | | | 150 | | | | 147 | |
| | | Memorial Sloan-Kettering Cancer Center | | 4.125% | | 7/1/52 | | | 150 | | | | 173 | |
| | | Memorial Sloan-Kettering Cancer Center | | 4.200% | | 7/1/55 | | | 25 | | | | 29 | |
| | | Merck & Co. Inc. | | 3.875% | | 1/15/21 | | | 225 | | | | 229 | |
| | | Merck & Co. Inc. | | 2.350% | | 2/10/22 | | | 250 | | | | 253 | |
| | | Merck & Co. Inc. | | 2.400% | | 9/15/22 | | | 250 | | | | 253 | |
| | | Merck & Co. Inc. | | 2.800% | | 5/18/23 | | | 325 | | | | 335 | |
| | | Merck & Co. Inc. | | 2.900% | | 3/7/24 | | | 25 | | | | 26 | |
| | | Merck & Co. Inc. | | 2.750% | | 2/10/25 | | | 525 | | | | 542 | |
| | | Merck & Co. Inc. | | 3.400% | | 3/7/29 | | | 275 | | | | 297 | |
| | | Merck & Co. Inc. | | 6.500% | | 12/1/33 | | | 125 | | | | 176 | |
| | | Merck & Co. Inc. | | 3.900% | | 3/7/39 | | | 200 | | | | 228 | |
| | | Merck & Co. Inc. | | 3.600% | | 9/15/42 | | | 100 | | | | 108 | |
| | | Merck & Co. Inc. | | 4.150% | | 5/18/43 | | | 200 | | | | 236 | |
| | | Merck & Co. Inc. | | 3.700% | | 2/10/45 | | | 525 | | | | 580 | |
| | | Merck & Co. Inc. | | 4.000% | | 3/7/49 | | | 375 | | | | 436 | |
| | | Mercy Health | | 4.302% | | 7/1/28 | | | 25 | | | | 28 | |
| | | Molson Coors Beverage Co. | | 2.100% | | 7/15/21 | | | 100 | | | | 100 | |
| | | Molson Coors Beverage Co. | | 3.500% | | 5/1/22 | | | 25 | | | | 26 | |
| | | Molson Coors Beverage Co. | | 3.000% | | 7/15/26 | | | 375 | | | | 379 | |
| | | Molson Coors Beverage Co. | | 5.000% | | 5/1/42 | | | 100 | | | | 109 | |
| | | Molson Coors Beverage Co. | | 4.200% | | 7/15/46 | | | 475 | | | | 473 | |
| 6 | | Mondelez International Holdings Netherlands BV | | 2.125% | | 9/19/22 | | | 200 | | | | 200 | |
| | | Mondelez International Inc. | | 3.625% | | 2/13/26 | | | 100 | | | | 107 | |
| 3 | | Montefiore Obligated Group | | 5.246% | | 11/1/48 | | | 150 | | | | 168 | |
| 3 | | Mount Sinai Hospitals Group Inc. | | 3.981% | | 7/1/48 | | | 50 | | | | 52 | |
| 3 | | Mount Sinai Hospitals Group Inc. | | 3.737% | | 7/1/49 | | | 100 | | | | 99 | |
| | | Mylan Inc. | | 4.200% | | 11/29/23 | | | 100 | | | | 106 | |
| | | Mylan Inc. | | 4.550% | | 4/15/28 | | | 150 | | | | 161 | |
| | | Mylan Inc. | | 5.400% | | 11/29/43 | | | 125 | | | | 136 | |
| | | Mylan Inc. | | 5.200% | | 4/15/48 | | | 125 | | | | 138 | |
| | | Mylan NV | | 3.150% | | 6/15/21 | | | 400 | | | | 404 | |
| | | Mylan NV | | 3.950% | | 6/15/26 | | | 375 | | | | 389 | |
| | | Mylan NV | | 5.250% | | 6/15/46 | | | 200 | | | | 223 | |
| | | New York & Presbyterian Hospital | | 4.024% | | 8/1/45 | | | 130 | | | | 145 | |
| | | New York & Presbyterian Hospital | | 4.063% | | 8/1/56 | | | 75 | | | | 81 | |
| | | New York & Presbyterian Hospital | | 3.954% | | 8/1/19 | | | 125 | | | | 125 | |
| | | Northwell Healthcare Inc. | | 3.979% | | 11/1/46 | | | 100 | | | | 102 | |
| | | Northwell Healthcare Inc. | | 4.260% | | 11/1/47 | | | 200 | | | | 214 | |
| | | Northwell Healthcare Inc. | | 3.809% | | 11/1/49 | | | 100 | | | | 100 | |
| | | Novartis Capital Corp. | | 2.400% | | 5/17/22 | | | 400 | | | | 405 | |
| | | Novartis Capital Corp. | | 2.400% | | 9/21/22 | | | 175 | | | | 178 | |
| | | Novartis Capital Corp. | | 3.400% | | 5/6/24 | | | 400 | | | | 423 | |
| | | Novartis Capital Corp. | | 3.000% | | 11/20/25 | | | 350 | | | | 367 | |
| | | Novartis Capital Corp. | | 3.100% | | 5/17/27 | | | 175 | | | | 184 | |
| | | Novartis Capital Corp. | | 3.700% | | 9/21/42 | | | 100 | | | | 110 | |
| | | Novartis Capital Corp. | | 4.400% | | 5/6/44 | | | 375 | | | | 455 | |
| | | Novartis Capital Corp. | | 4.000% | | 11/20/45 | | | 225 | | | | 261 | |
| | | NYU Hospitals Center | | 4.784% | | 7/1/44 | | | 100 | | | | 120 | |
| 3 | | NYU Hospitals Center | | 4.368% | | 7/1/47 | | | 110 | | | | 123 | |
| | | Orlando Health Obligated Group | | 4.089% | | 10/1/48 | | | 50 | | | | 55 | |
| | | Partners Healthcare System Inc. | | 4.117% | | 7/1/55 | | | 50 | | | | 55 | |
| | | PeaceHealth Obligated Group | | 4.787% | | 11/15/48 | | | 75 | | | | 92 | |
| | | PepsiCo Inc. | | 2.000% | | 4/15/21 | | | 300 | | | | 301 | |
| | | PepsiCo Inc. | | 3.000% | | 8/25/21 | | | 150 | | | | 153 | |
| | | PepsiCo Inc. | | 1.700% | | 10/6/21 | | | 175 | | | | 175 | |
| | | PepsiCo Inc. | | 2.750% | | 3/5/22 | | | 375 | | | | 383 | |
| | | PepsiCo Inc. | | 2.250% | | 5/2/22 | | | 150 | | | | 151 | |
| | | PepsiCo Inc. | | 3.600% | | 3/1/24 | | | 700 | | | | 744 | |
| | | PepsiCo Inc. | | 2.750% | | 4/30/25 | | | 200 | | | | 207 | |
| | | PepsiCo Inc. | | 3.500% | | 7/17/25 | | | 125 | | | | 134 | |
| | | PepsiCo Inc. | | 2.375% | | 10/6/26 | | | 225 | | | | 228 | |
| | | PepsiCo Inc. | | 3.000% | | 10/15/27 | | | 325 | | | | 343 | |
| | | PepsiCo Inc. | | 2.625% | | 7/29/29 | | | 200 | | | | 204 | |
| | | PepsiCo Inc. | | 4.000% | | 3/5/42 | | | 175 | | | | 199 | |
| | | PepsiCo Inc. | | 3.600% | | 8/13/42 | | | 100 | | | | 107 | |
| | | PepsiCo Inc. | | 4.250% | | 10/22/44 | | | 225 | | | | 265 | |
| | | PepsiCo Inc. | | 4.600% | | 7/17/45 | | | 75 | | | | 93 | |
| | | PepsiCo Inc. | | 4.450% | | 4/14/46 | | | 275 | | | | 338 | |
| | | PepsiCo Inc. | | 3.450% | | 10/6/46 | | | 300 | | | | 317 | |
| | | PepsiCo Inc. | | 4.000% | | 5/2/47 | | | 100 | | | | 115 | |
| | | PepsiCo Inc. | | 3.375% | | 7/29/49 | | | 200 | | | | 209 | |
| | | PepsiCo Inc. | | 2.875% | | 10/15/49 | | | 325 | | | | 311 | |
| | | PerkinElmer Inc. | | 3.300% | | 9/15/29 | | | 175 | | | | 178 | |
| | | Perrigo Finance Unlimited Co. | | 3.900% | | 12/15/24 | | | 200 | | | | 206 | |
| | | Perrigo Finance Unlimited Co. | | 4.375% | | 3/15/26 | | | 225 | | | | 232 | |
Total Bond Market Index Portfolio
| | | | | | | | | Face | | | Market | |
| | | | | | | Maturity | | Amount | | | Value• | |
| | | | | Coupon | | Date | | | ($000 | ) | | | ($000 | ) |
| | | Perrigo Finance Unlimited Co. | | 4.900% | | 12/15/44 | | | 80 | | | | 74 | |
| | | Pfizer Inc. | | 1.950% | | 6/3/21 | | | 225 | | | | 226 | |
| | | Pfizer Inc. | | 3.000% | | 9/15/21 | | | 125 | | | | 127 | |
| | | Pfizer Inc. | | 2.200% | | 12/15/21 | | | 100 | | | | 101 | |
| | | Pfizer Inc. | | 2.800% | | 3/11/22 | | | 200 | | | | 204 | |
| | | Pfizer Inc. | | 3.200% | | 9/15/23 | | | 125 | | | | 130 | |
| | | Pfizer Inc. | | 2.950% | | 3/15/24 | | | 150 | | | | 156 | |
| | | Pfizer Inc. | | 3.400% | | 5/15/24 | | | 100 | | | | 106 | |
| | | Pfizer Inc. | | 2.750% | | 6/3/26 | | | 290 | | | | 299 | |
| | | Pfizer Inc. | | 3.000% | | 12/15/26 | | | 300 | | | | 315 | |
| | | Pfizer Inc. | | 3.600% | | 9/15/28 | | | 200 | | | | 218 | |
| | | Pfizer Inc. | | 3.450% | | 3/15/29 | | | 375 | | | | 403 | |
| | | Pfizer Inc. | | 4.000% | | 12/15/36 | | | 200 | | | | 228 | |
| | | Pfizer Inc. | | 4.100% | | 9/15/38 | | | 150 | | | | 171 | |
| | | Pfizer Inc. | | 3.900% | | 3/15/39 | | | 125 | | | | 141 | |
| | | Pfizer Inc. | | 7.200% | | 3/15/39 | | | 425 | | | | 666 | |
| | | Pfizer Inc. | | 4.300% | | 6/15/43 | | | 125 | | | | 147 | |
| | | Pfizer Inc. | | 4.400% | | 5/15/44 | | | 200 | | | | 239 | |
| | | Pfizer Inc. | | 4.125% | | 12/15/46 | | | 250 | | | | 288 | |
| | | Pfizer Inc. | | 4.200% | | 9/15/48 | | | 450 | | | | 527 | |
| | | Pfizer Inc. | | 4.000% | | 3/15/49 | | | 250 | | | | 289 | |
| | | Pharmacia LLC | | 6.600% | | 12/1/28 | | | 175 | | | | 230 | |
| | | Philip Morris International Inc. | | 1.875% | | 2/25/21 | | | 125 | | | | 125 | |
| | | Philip Morris International Inc. | | 2.500% | | 11/2/22 | | | 300 | | | | 305 | |
| | | Philip Morris International Inc. | | 2.625% | | 3/6/23 | | | 100 | | | | 102 | |
| | | Philip Morris International Inc. | | 2.125% | | 5/10/23 | | | 95 | | | | 95 | |
| | | Philip Morris International Inc. | | 3.600% | | 11/15/23 | | | 500 | | | | 526 | |
| | | Philip Morris International Inc. | | 2.875% | | 5/1/24 | | | 220 | | | | 226 | |
| | | Philip Morris International Inc. | | 3.250% | | 11/10/24 | | | 250 | | | | 262 | |
| | | Philip Morris International Inc. | | 3.375% | | 8/11/25 | | | 150 | | | | 158 | |
| | | Philip Morris International Inc. | | 2.750% | | 2/25/26 | | | 180 | | | | 182 | |
| | | Philip Morris International Inc. | | 3.125% | | 3/2/28 | | | 100 | | | | 103 | |
| | | Philip Morris International Inc. | | 3.375% | | 8/15/29 | | | 200 | | | | 209 | |
| | | Philip Morris International Inc. | | 6.375% | | 5/16/38 | | | 200 | | | | 278 | |
| | | Philip Morris International Inc. | | 4.375% | | 11/15/41 | | | 350 | | | | 388 | |
| | | Philip Morris International Inc. | | 4.500% | | 3/20/42 | | | 125 | | | | 140 | |
| | | Philip Morris International Inc. | | 3.875% | | 8/21/42 | | | 25 | | | | 26 | |
| | | Philip Morris International Inc. | | 4.125% | | 3/4/43 | | | 175 | | | | 189 | |
| | | Philip Morris International Inc. | | 4.875% | | 11/15/43 | | | 155 | | | | 182 | |
| | | Philip Morris International Inc. | | 4.250% | | 11/10/44 | | | 200 | | | | 220 | |
| 3 | | Procter & Gamble - Esop | | 9.360% | | 1/1/21 | | | 83 | | | | 87 | |
| | | Procter & Gamble Co. | | 1.900% | | 10/23/20 | | | 100 | | | | 100 | |
| | | Procter & Gamble Co. | | 1.850% | | 2/2/21 | | | 100 | | | | 100 | |
| | | Procter & Gamble Co. | | 1.700% | | 11/3/21 | | | 125 | | | | 125 | |
| | | Procter & Gamble Co. | | 2.300% | | 2/6/22 | | | 425 | | | | 431 | |
| | | Procter & Gamble Co. | | 3.100% | | 8/15/23 | | | 150 | | | | 157 | |
| | | Procter & Gamble Co. | | 2.700% | | 2/2/26 | | | 100 | | | | 104 | |
| | | Procter & Gamble Co. | | 2.450% | | 11/3/26 | | | 100 | | | | 103 | |
| | | Procter & Gamble Co. | | 3.500% | | 10/25/47 | | | 225 | | | | 253 | |
| | | Providence St. Joseph Health Obligated Group | | 2.746% | | 10/1/26 | | | 50 | | | | 50 | |
| | | Providence St. Joseph Health Obligated Group | | 2.532% | | 10/1/29 | | | 150 | | | | 147 | |
| 3 | | Providence St. Joseph Health Obligated Group | | 3.744% | | 10/1/47 | | | 75 | | | | 78 | |
| 3 | | Providence St. Joseph Health Obligated Group | | 3.930% | | 10/1/48 | | | 75 | | | | 80 | |
| | | Quest Diagnostics Inc. | | 4.250% | | 4/1/24 | | | 100 | | | | 107 | |
| | | Quest Diagnostics Inc. | | 3.500% | | 3/30/25 | | | 100 | | | | 105 | |
| | | Quest Diagnostics Inc. | | 3.450% | | 6/1/26 | | | 125 | | | | 131 | |
| | | Quest Diagnostics Inc. | | 4.200% | | 6/30/29 | | | 140 | | | | 154 | |
| | | Quest Diagnostics Inc. | | 2.950% | | 6/30/30 | | | 160 | | | | 160 | |
| | | Quest Diagnostics Inc. | | 5.750% | | 1/30/40 | | | 13 | | | | 14 | |
| | | Quest Diagnostics Inc. | | 4.700% | | 3/30/45 | | | 25 | | | | 28 | |
| | | Reynolds American Inc. | | 4.000% | | 6/12/22 | | | 175 | | | | 182 | |
| | | Reynolds American Inc. | | 4.850% | | 9/15/23 | | | 125 | | | | 135 | |
| | | Reynolds American Inc. | | 4.450% | | 6/12/25 | | | 475 | | | | 511 | |
| | | Reynolds American Inc. | | 5.700% | | 8/15/35 | | | 175 | | | | 202 | |
| | | Reynolds American Inc. | | 7.250% | | 6/15/37 | | | 100 | | | | 128 | |
| | | Reynolds American Inc. | | 6.150% | | 9/15/43 | | | 75 | | | | 87 | |
| | | Reynolds American Inc. | | 5.850% | | 8/15/45 | | | 375 | | | | 429 | |
| | | RWJ Barnabas Health Inc. | | 3.949% | | 7/1/46 | | | 100 | | | | 106 | |
| | | RWJ Barnabas Health Inc. | | 3.477% | | 7/1/49 | | | 25 | | | | 25 | |
| | | Sanofi | | 4.000% | | 3/29/21 | | | 350 | | | | 359 | |
| | | Sanofi | | 3.375% | | 6/19/23 | | | 225 | | | | 236 | |
| | | Sanofi | | 3.625% | | 6/19/28 | | | 225 | | | | 250 | |
| | | Shire Acquisitions Investments Ireland DAC | | 2.400% | | 9/23/21 | | | 700 | | | | 703 | |
| | | Shire Acquisitions Investments Ireland DAC | | 2.875% | | 9/23/23 | | | 625 | | | | 636 | |
| | | Shire Acquisitions Investments Ireland DAC | | 3.200% | | 9/23/26 | | | 575 | | | | 592 | |
| | | Spectrum Health System Obligated Group | | 3.487% | | 7/15/49 | | | 75 | | | | 75 | |
| | | SSM Health Care Corp. | | 3.688% | | 6/1/23 | | | 150 | | | | 156 | |
| | | SSM Health Care Corp. | | 3.823% | | 6/1/27 | | | 100 | | | | 106 | |
| | | Stanford Health Care | | 3.795% | | 11/15/48 | | | 125 | | | | 135 | |
| | | Stryker Corp. | | 2.625% | | 3/15/21 | | | 150 | | | | 151 | |
| | | Stryker Corp. | | 3.375% | | 5/15/24 | | | 213 | | | | 223 | |
| | | Stryker Corp. | | 3.375% | | 11/1/25 | | | 140 | | | | 147 | |
| | | Stryker Corp. | | 3.500% | | 3/15/26 | | | 183 | | | | 194 | |
| | | Stryker Corp. | | 3.650% | | 3/7/28 | | | 50 | | | | 54 | |
| | | Stryker Corp. | | 4.100% | | 4/1/43 | | | 75 | | | | 81 | |
| | | Stryker Corp. | | 4.375% | | 5/15/44 | | | 50 | | | | 57 | |
| | | Stryker Corp. | | 4.625% | | 3/15/46 | | | 175 | | | | 210 | |
| | | Sutter Health | | 3.695% | | 8/15/28 | | | 75 | | | | 80 | |
| | | Sutter Health | | 4.091% | | 8/15/48 | | | 75 | | | | 83 | |
| | | Sysco Corp. | | 2.500% | | 7/15/21 | | | 75 | | | | 76 | |
| | | Sysco Corp. | | 2.600% | | 6/12/22 | | | 125 | | | | 127 | |
| | | Sysco Corp. | | 3.750% | | 10/1/25 | | | 75 | | | | 80 | |
| | | Sysco Corp. | | 3.300% | | 7/15/26 | | | 250 | | | | 263 | |
| | | Sysco Corp. | | 3.250% | | 7/15/27 | | | 175 | | | | 183 | |
| | | Sysco Corp. | | 4.850% | | 10/1/45 | | | 50 | | | | 60 | |
| | | Sysco Corp. | | 4.500% | | 4/1/46 | | | 200 | | | | 229 | |
| | | Sysco Corp. | | 4.450% | | 3/15/48 | | | 100 | | | | 114 | |
| | | Takeda Pharmaceutical Co. Ltd. | | 4.000% | | 11/26/21 | | | 200 | | | | 207 | |
| | | Takeda Pharmaceutical Co. Ltd. | | 4.400% | | 11/26/23 | | | 200 | | | | 214 | |
| | | Takeda Pharmaceutical Co. Ltd. | | 5.000% | | 11/26/28 | | | 405 | | | | 471 | |
| 3 | | Texas Health Resources | | 4.330% | | 11/15/55 | | | 25 | | | | 29 | |
| | | Thermo Fisher Scientific Inc. | | 3.000% | | 4/15/23 | | | 125 | | | | 128 | |
| | | Thermo Fisher Scientific Inc. | | 3.650% | | 12/15/25 | | | 400 | | | | 427 | |
| | | Thermo Fisher Scientific Inc. | | 2.950% | | 9/19/26 | | | 200 | | | | 206 | |
| | | Thermo Fisher Scientific Inc. | | 3.200% | | 8/15/27 | | | 50 | | | | 52 | |
| | | Thermo Fisher Scientific Inc. | | 2.600% | | 10/1/29 | | | 225 | | | | 222 | |
| | | Thermo Fisher Scientific Inc. | | 5.300% | | 2/1/44 | | | 185 | | | | 234 | |
| | | Toledo Hospital | | 5.325% | | 11/15/28 | | | 50 | | | | 54 | |
| | | Trinity Health Corp. | | 4.125% | | 12/1/45 | | | 85 | | | | 93 | |
| | | Tyson Foods Inc. | | 2.250% | | 8/23/21 | | | 50 | | | | 50 | |
| | | Tyson Foods Inc. | | 4.500% | | 6/15/22 | | | 275 | | | | 289 | |
| | | Tyson Foods Inc. | | 3.900% | | 9/28/23 | | | 100 | | | | 106 | |
| | | Tyson Foods Inc. | | 3.950% | | 8/15/24 | | | 925 | | | | 989 | |
| | | Tyson Foods Inc. | | 3.550% | | 6/2/27 | | | 275 | | | | 292 | |
| | | Tyson Foods Inc. | | 4.350% | | 3/1/29 | | | 280 | | | | 317 | |
| | | Tyson Foods Inc. | | 4.875% | | 8/15/34 | | | 100 | | | | 117 | |
| | | Tyson Foods Inc. | | 5.150% | | 8/15/44 | | | 200 | | | | 242 | |
| | | Tyson Foods Inc. | | 4.550% | | 6/2/47 | | | 150 | | | | 170 | |
| | | Tyson Foods Inc. | | 5.100% | | 9/28/48 | | | 275 | | | | 346 | |
| | | Unilever Capital Corp. | | 4.250% | | 2/10/21 | | | 200 | | | | 205 | |
| | | Unilever Capital Corp. | | 2.750% | | 3/22/21 | | | 100 | | | | 101 | |
| | | Unilever Capital Corp. | | 1.375% | | 7/28/21 | | | 100 | | | | 99 | |
| | | Unilever Capital Corp. | | 3.000% | | 3/7/22 | | | 100 | | | | 102 | |
| | | Unilever Capital Corp. | | 3.250% | | 3/7/24 | | | 250 | | | | 262 | |
| | | Unilever Capital Corp. | | 2.600% | | 5/5/24 | | | 450 | | | | 460 | |
| | | Unilever Capital Corp. | | 3.100% | | 7/30/25 | | | 225 | | | | 235 | |
| | | Unilever Capital Corp. | | 2.000% | | 7/28/26 | | | 125 | | | | 124 | |
| | | Unilever Capital Corp. | | 3.500% | | 3/22/28 | | | 200 | | | | 216 | |
| | | Unilever Capital Corp. | | 2.125% | | 9/6/29 | | | 175 | | | | 170 | |
| | | Unilever Capital Corp. | | 5.900% | | 11/15/32 | | | 200 | | | | 271 | |
| | | Whirlpool Corp. | | 4.700% | | 6/1/22 | | | 100 | | | | 106 | |
| | | Whirlpool Corp. | | 4.000% | | 3/1/24 | | | 50 | | | | 53 | |
| | | Whirlpool Corp. | | 3.700% | | 5/1/25 | | | 75 | | | | 79 | |
| | | Whirlpool Corp. | | 4.750% | | 2/26/29 | | | 150 | | | | 167 | |
Total Bond Market Index Portfolio
| | | | | | | | | Face | | | Market | |
| | | | | | | Maturity | | Amount | | | Value• | |
| | | | | Coupon | | Date | | | ($000 | ) | | | ($000 | ) |
| | | Whirlpool Corp. | | 4.500% | | 6/1/46 | | | 100 | | | | 103 | |
| 3 | | Willis-Knighton Medical Center | | 4.813% | | 9/1/48 | | | 50 | | | | 60 | |
| | | Wyeth LLC | | 7.250% | | 3/1/23 | | | 250 | | | | 289 | |
| | | Wyeth LLC | | 6.450% | | 2/1/24 | | | 300 | | | | 350 | |
| | | Wyeth LLC | | 6.500% | | 2/1/34 | | | 150 | | | | 209 | |
| | | Wyeth LLC | | 6.000% | | 2/15/36 | | | 85 | | | | 113 | |
| | | Wyeth LLC | | 5.950% | | 4/1/37 | | | 385 | | | | 524 | |
| | | Zeneca Wilmington Inc. | | 7.000% | | 11/15/23 | | | 25 | | | | 29 | |
| | | Zimmer Biomet Holdings Inc. | | 3.375% | | 11/30/21 | | | 100 | | | | 102 | |
| | | Zimmer Biomet Holdings Inc. | | 3.150% | | 4/1/22 | | | 175 | | | | 179 | |
| | | Zimmer Biomet Holdings Inc. | | 3.700% | | 3/19/23 | | | 50 | | | | 52 | |
| | | Zimmer Biomet Holdings Inc. | | 3.550% | | 4/1/25 | | | 350 | | | | 368 | |
| | | Zimmer Biomet Holdings Inc. | | 5.750% | | 11/30/39 | | | 50 | | | | 59 | |
| | | Zimmer Biomet Holdings Inc. | | 4.450% | | 8/15/45 | | | 150 | | | | 157 | |
| | | Zoetis Inc. | | 3.450% | | 11/13/20 | | | 75 | | | | 76 | |
| | | Zoetis Inc. | | 3.250% | | 8/20/21 | | | 50 | | | | 51 | |
| | | Zoetis Inc. | | 3.250% | | 2/1/23 | | | 350 | | | | 361 | |
| | | Zoetis Inc. | | 4.500% | | 11/13/25 | | | 100 | | | | 111 | |
| | | Zoetis Inc. | | 3.000% | | 9/12/27 | | | 150 | | | | 153 | |
| | | Zoetis Inc. | | 3.900% | | 8/20/28 | | | 100 | | | | 108 | |
| | | Zoetis Inc. | | 4.700% | | 2/1/43 | | | 175 | | | | 208 | |
| | | Zoetis Inc. | | 3.950% | | 9/12/47 | | | 150 | | | | 163 | |
| | | Zoetis Inc. | | 4.450% | | 8/20/48 | | | 75 | | | | 88 | |
| | | | | | | | | | | | | | | |
| | | Energy (2.4%) | | | | | | | | | | | | |
| | | Apache Corp. | | 3.625% | | 2/1/21 | | | 17 | | | | 17 | |
| | | Apache Corp. | | 3.250% | | 4/15/22 | | | 21 | | | | 21 | |
| | | Apache Corp. | | 4.375% | | 10/15/28 | | | 400 | | | | 417 | |
| | | Apache Corp. | | 5.100% | | 9/1/40 | | | 350 | | | | 355 | |
| | | Apache Corp. | | 5.250% | | 2/1/42 | | | 100 | | | | 104 | |
| | | Apache Corp. | | 4.750% | | 4/15/43 | | | 200 | | | | 191 | |
| | | Apache Corp. | | 4.250% | | 1/15/44 | | | 150 | | | | 138 | |
| | | Baker Hughes a GE Co. LLC | | 5.125% | | 9/15/40 | | | 175 | | | | 206 | |
| | | Baker Hughes a GE Co. LLC / Baker Hughes Co-Obligor Inc. | | 2.773% | | 12/15/22 | | | 425 | | | | 433 | |
| | | Baker Hughes a GE Co. LLC / Baker Hughes Co-Obligor Inc. | | 3.337% | | 12/15/27 | | | 200 | | | | 208 | |
| | | Baker Hughes a GE Co. LLC / Baker Hughes Co-Obligor Inc. | | 3.138% | | 11/7/29 | | | 250 | | | | 256 | |
| | | Baker Hughes a GE Co. LLC / Baker Hughes Co-Obligor Inc. | | 4.080% | | 12/15/47 | | | 275 | | | | 282 | |
| | | Boardwalk Pipelines LP | | 3.375% | | 2/1/23 | | | 100 | | | | 102 | |
| | | Boardwalk Pipelines LP | | 4.950% | | 12/15/24 | | | 150 | | | | 162 | |
| | | Boardwalk Pipelines LP | | 5.950% | | 6/1/26 | | | 200 | | | | 224 | |
| | | Boardwalk Pipelines LP | | 4.450% | | 7/15/27 | | | 100 | | | | 103 | |
| | | Boardwalk Pipelines LP | | 4.800% | | 5/3/29 | | | 100 | | | | 106 | |
| | | BP Capital Markets America Inc. | | 4.742% | | 3/11/21 | | | 350 | | | | 362 | |
| | | BP Capital Markets America Inc. | | 3.245% | | 5/6/22 | | | 250 | | | | 258 | |
| | | BP Capital Markets America Inc. | | 2.520% | | 9/19/22 | | | 50 | | | | 51 | |
| | | BP Capital Markets America Inc. | | 2.750% | | 5/10/23 | | | 300 | | | | 307 | |
| | | BP Capital Markets America Inc. | | 3.216% | | 11/28/23 | | | 1,082 | | | | 1,124 | |
| | | BP Capital Markets America Inc. | | 3.796% | | 9/21/25 | | | 125 | | | | 135 | |
| | | BP Capital Markets America Inc. | | 3.410% | | 2/11/26 | | | 100 | | | | 106 | |
| | | BP Capital Markets America Inc. | | 3.119% | | 5/4/26 | | | 550 | | | | 573 | |
| | | BP Capital Markets America Inc. | | 3.017% | | 1/16/27 | | | 400 | | | | 414 | |
| | | BP Capital Markets America Inc. | | 3.937% | | 9/21/28 | | | 175 | | | | 193 | |
| | | BP Capital Markets America Inc. | | 4.234% | | 11/6/28 | | | 100 | | | | 113 | |
| | | BP Capital Markets plc | | 3.062% | | 3/17/22 | | | 25 | | | | 26 | |
| | | BP Capital Markets plc | | 2.500% | | 11/6/22 | | | 450 | | | | 458 | |
| | | BP Capital Markets plc | | 3.994% | | 9/26/23 | | | 200 | | | | 213 | |
| | | BP Capital Markets plc | | 3.814% | | 2/10/24 | | | 400 | | | | 427 | |
| | | BP Capital Markets plc | | 3.535% | | 11/4/24 | | | 68 | | | | 72 | |
| | | BP Capital Markets plc | | 3.506% | | 3/17/25 | | | 200 | | | | 213 | |
| | | BP Capital Markets plc | | 3.279% | | 9/19/27 | | | 150 | | | | 158 | |
| | | BP Capital Markets plc | | 3.723% | | 11/28/28 | | | 100 | | | | 109 | |
| | | Burlington Resources Finance Co. | | 7.400% | | 12/1/31 | | | 175 | | | | 249 | |
| | | Canadian Natural Resources Ltd. | | 3.450% | | 11/15/21 | | | 100 | | | | 102 | |
| | | Canadian Natural Resources Ltd. | | 2.950% | | 1/15/23 | | | 200 | | | | 204 | |
| | | Canadian Natural Resources Ltd. | | 3.850% | | 6/1/27 | | | 750 | | | | 798 | |
| | | Canadian Natural Resources Ltd. | | 7.200% | | 1/15/32 | | | 150 | | | | 203 | |
| | | Canadian Natural Resources Ltd. | | 6.450% | | 6/30/33 | | | 125 | | | | 160 | |
| | | Canadian Natural Resources Ltd. | | 5.850% | | 2/1/35 | | | 100 | | | | 123 | |
| | | Canadian Natural Resources Ltd. | | 6.500% | | 2/15/37 | | | 50 | | | | 65 | |
| | | Canadian Natural Resources Ltd. | | 6.250% | | 3/15/38 | | | 100 | | | | 129 | |
| | | Canadian Natural Resources Ltd. | | 4.950% | | 6/1/47 | | | 140 | | | | 170 | |
| | | Cenovus Energy Inc. | | 3.800% | | 9/15/23 | | | 351 | | | | 364 | |
| | | Cenovus Energy Inc. | | 4.250% | | 4/15/27 | | | 225 | | | | 237 | |
| | | Cenovus Energy Inc. | | 5.250% | | 6/15/37 | | | 150 | | | | 165 | |
| | | Cenovus Energy Inc. | | 6.750% | | 11/15/39 | | | 300 | | | | 382 | |
| | | Cenovus Energy Inc. | | 5.400% | | 6/15/47 | | | 300 | | | | 350 | |
| | | Cheniere Corpus Christi Holdings LLC | | 7.000% | | 6/30/24 | | | 200 | | | | 230 | |
| | | Cheniere Corpus Christi Holdings LLC | | 5.875% | | 3/31/25 | | | 225 | | | | 253 | |
| | | Cheniere Corpus Christi Holdings LLC | | 5.125% | | 6/30/27 | | | 475 | | | | 526 | |
| 6 | | Cheniere Corpus Christi Holdings LLC | | 3.700% | | 11/15/29 | | | 300 | | | | 307 | |
| | | Chevron Corp. | | 2.100% | | 5/16/21 | | | 300 | | | | 301 | |
| | | Chevron Corp. | | 2.498% | | 3/3/22 | | | 100 | | | | 102 | |
| | | Chevron Corp. | | 2.355% | | 12/5/22 | | | 1,130 | | | | 1,145 | |
| | | Chevron Corp. | | 3.191% | | 6/24/23 | | | 225 | | | | 234 | |
| | | Chevron Corp. | | 2.895% | | 3/3/24 | | | 100 | | | | 103 | |
| | | Chevron Corp. | | 2.954% | | 5/16/26 | | | 400 | | | | 418 | |
| | | Cimarex Energy Co. | | 4.375% | | 6/1/24 | | | 200 | | | | 211 | |
| | | Cimarex Energy Co. | | 3.900% | | 5/15/27 | | | 250 | | | | 258 | |
| | | Cimarex Energy Co. | | 4.375% | | 3/15/29 | | | 100 | | | | 106 | |
| | | Columbia Pipeline Group Inc. | | 4.500% | | 6/1/25 | | | 300 | | | | 328 | |
| | | Columbia Pipeline Group Inc. | | 5.800% | | 6/1/45 | | | 100 | | | | 127 | |
| | | Concho Resources Inc. | | 3.750% | | 10/1/27 | | | 400 | | | | 419 | |
| | | Concho Resources Inc. | | 4.875% | | 10/1/47 | | | 200 | | | | 233 | |
| | | Concho Resources Inc. | | 4.850% | | 8/15/48 | | | 125 | | | | 145 | |
| | | ConocoPhillips | | 5.900% | | 10/15/32 | | | 450 | | | | 588 | |
| | | ConocoPhillips | | 5.900% | | 5/15/38 | | | 450 | | | | 611 | |
| | | ConocoPhillips | | 6.500% | | 2/1/39 | | | 200 | | | | 290 | |
| | | ConocoPhillips Canada Funding Co. I | | 5.950% | | 10/15/36 | | | 200 | | | | 268 | |
| | | ConocoPhillips Co. | | 4.300% | | 11/15/44 | | | 125 | | | | 146 | |
| | | ConocoPhillips Holding Co. | | 6.950% | | 4/15/29 | | | 350 | | | | 475 | |
| | | Continental Resources Inc. | | 5.000% | | 9/15/22 | | | 175 | | | | 176 | |
| | | Continental Resources Inc. | | 4.500% | | 4/15/23 | | | 200 | | | | 209 | |
| | | Continental Resources Inc. | | 4.375% | | 1/15/28 | | | 200 | | | | 212 | |
| | | Continental Resources Inc. | | 4.900% | | 6/1/44 | | | 100 | | | | 107 | |
| | | Devon Energy Corp. | | 5.850% | | 12/15/25 | | | 100 | | | | 118 | |
| | | Devon Energy Corp. | | 7.950% | | 4/15/32 | | | 163 | | | | 231 | |
| | | Devon Energy Corp. | | 5.600% | | 7/15/41 | | | 325 | | | | 395 | |
| | | Devon Energy Corp. | | 4.750% | | 5/15/42 | | | 200 | | | | 224 | |
| | | Devon Financing Co. LLC | | 7.875% | | 9/30/31 | | | 160 | | | | 220 | |
| | | Diamondback Energy Inc. | | 2.875% | | 12/1/24 | | | 200 | | | | 202 | |
| | | Diamondback Energy Inc. | | 3.250% | | 12/1/26 | | | 200 | | | | 202 | |
| | | Diamondback Energy Inc. | | 3.500% | | 12/1/29 | | | 250 | | | | 254 | |
| | | Dominion Energy Gas Holdings LLC | | 2.500% | | 11/15/24 | | | 100 | | | | 100 | |
| | | Dominion Energy Gas Holdings LLC | | 3.600% | | 12/15/24 | | | 200 | | | | 210 | |
| | | Dominion Energy Gas Holdings LLC | | 3.000% | | 11/15/29 | | | 100 | | | | 99 | |
| | | Dominion Energy Gas Holdings LLC | | 4.600% | | 12/15/44 | | | 200 | | | | 217 | |
| | | Enable Midstream Partners LP | | 3.900% | | 5/15/24 | | | 150 | | | | 153 | |
| | | Enable Midstream Partners LP | | 4.400% | | 3/15/27 | | | 150 | | | | 147 | |
| | | Enable Midstream Partners LP | | 4.950% | | 5/15/28 | | | 100 | | | | 101 | |
| | | Enable Midstream Partners LP | | 4.150% | | 9/15/29 | | | 200 | | | | 189 | |
| | | Enable Midstream Partners LP | | 5.000% | | 5/15/44 | | | 100 | | | | 90 | |
| | | Enbridge Energy Partners LP | | 5.875% | | 10/15/25 | | | 150 | | | | 175 | |
| | | Enbridge Energy Partners LP | | 7.500% | | 4/15/38 | | | 150 | | | | 214 | |
| | | Enbridge Energy Partners LP | | 5.500% | | 9/15/40 | | | 75 | | | | 89 | |
| | | Enbridge Energy Partners LP | | 7.375% | | 10/15/45 | | | 125 | | | | 186 | |
| | | Enbridge Inc. | | 2.900% | | 7/15/22 | | | 75 | | | | 76 | |
| | | Enbridge Inc. | | 2.500% | | 1/15/25 | | | 100 | | | | 101 | |
| | | Enbridge Inc. | | 3.700% | | 7/15/27 | | | 150 | | | | 158 | |
| | | Enbridge Inc. | | 3.125% | | 11/15/29 | | | 200 | | | | 202 | |
| | | Enbridge Inc. | | 4.500% | | 6/10/44 | | | 100 | | | | 110 | |
| | | Enbridge Inc. | | 4.000% | | 11/15/49 | | | 100 | | | | 104 | |
| | | Encana Corp. | | 6.500% | | 8/15/34 | | | 300 | | | | 352 | |
| | | Encana Corp. | | 6.625% | | 8/15/37 | | | 200 | | | | 237 | |
| | | Encana Corp. | | 6.500% | | 2/1/38 | | | 100 | | | | 117 | |
| | | Energy Transfer Operating LP | | 4.650% | | 6/1/21 | | | 105 | | | | 108 | |
| | | Energy Transfer Operating LP | | 3.600% | | 2/1/23 | | | 450 | | | | 461 | |
| | | Energy Transfer Operating LP | | 4.250% | | 3/15/23 | | | 400 | | | | 418 | |
| | | Energy Transfer Operating LP | | 4.200% | | 9/15/23 | | | 80 | | | | 84 | |
Total Bond Market Index Portfolio
| | | | | | | | | Face | | | Market | |
| | | | | | | Maturity | | Amount | | | Value• | |
| | | | | Coupon | | Date | | | ($000 | ) | | | ($000 | ) |
| | | Energy Transfer Operating LP | | 4.050% | | 3/15/25 | | | 1,000 | | | | 1,048 | |
| | | Energy Transfer Operating LP | | 4.750% | | 1/15/26 | | | 100 | | | | 108 | |
| | | Energy Transfer Operating LP | | 4.200% | | 4/15/27 | | | 100 | | | | 105 | |
| | | Energy Transfer Operating LP | | 5.500% | | 6/1/27 | | | 380 | | | | 427 | |
| | | Energy Transfer Operating LP | | 5.250% | | 4/15/29 | | | 325 | | | | 364 | |
| | | Energy Transfer Operating LP | | 6.250% | | 4/15/49 | | | 320 | | | | 385 | |
| | | Energy Transfer Partners LP | | 4.950% | | 6/15/28 | | | 350 | | | | 383 | |
| | | Energy Transfer Partners LP | | 6.625% | | 10/15/36 | | | 150 | | | | 178 | |
| | | Energy Transfer Partners LP | | 5.800% | | 6/15/38 | | | 150 | | | | 169 | |
| | | Energy Transfer Partners LP | | 6.050% | | 6/1/41 | | | 100 | | | | 112 | |
| | | Energy Transfer Partners LP | | 6.500% | | 2/1/42 | | | 275 | | | | 327 | |
| | | Energy Transfer Partners LP | | 5.150% | | 3/15/45 | | | 150 | | | | 158 | |
| | | Energy Transfer Partners LP | | 6.125% | | 12/15/45 | | | 200 | | | | 231 | |
| | | Energy Transfer Partners LP | | 5.300% | | 4/15/47 | | | 200 | | | | 214 | |
| | | Energy Transfer Partners LP | | 6.000% | | 6/15/48 | | | 100 | | | | 116 | |
| | | Enterprise Products Operating LLC | | 2.800% | | 2/15/21 | | | 125 | | | | 126 | |
| | | Enterprise Products Operating LLC | | 3.500% | | 2/1/22 | | | 100 | | | | 103 | |
| | | Enterprise Products Operating LLC | | 3.350% | | 3/15/23 | | | 425 | | | | 439 | |
| | | Enterprise Products Operating LLC | | 3.900% | | 2/15/24 | | | 175 | | | | 186 | |
| | | Enterprise Products Operating LLC | | 3.750% | | 2/15/25 | | | 150 | | | | 160 | |
| | | Enterprise Products Operating LLC | | 3.700% | | 2/15/26 | | | 200 | | | | 213 | |
| | | Enterprise Products Operating LLC | | 3.950% | | 2/15/27 | | | 100 | | | | 108 | |
| | | Enterprise Products Operating LLC | | 3.125% | | 7/31/29 | | | 550 | | | | 565 | |
| | | Enterprise Products Operating LLC | | 6.875% | | 3/1/33 | | | 175 | | | | 238 | |
| | | Enterprise Products Operating LLC | | 7.550% | | 4/15/38 | | | 150 | | | | 216 | |
| | | Enterprise Products Operating LLC | | 6.125% | | 10/15/39 | | | 300 | | | | 390 | |
| | | Enterprise Products Operating LLC | | 5.950% | | 2/1/41 | | | 175 | | | | 225 | |
| | | Enterprise Products Operating LLC | | 4.450% | | 2/15/43 | | | 300 | | | | 328 | |
| | | Enterprise Products Operating LLC | | 4.850% | | 3/15/44 | | | 370 | | | | 428 | |
| | | Enterprise Products Operating LLC | | 5.100% | | 2/15/45 | | | 33 | | | | 39 | |
| | | Enterprise Products Operating LLC | | 4.900% | | 5/15/46 | | | 425 | | | | 498 | |
| | | Enterprise Products Operating LLC | | 4.250% | | 2/15/48 | | | 300 | | | | 324 | |
| | | Enterprise Products Operating LLC | | 4.800% | | 2/1/49 | | | 120 | | | | 141 | |
| | | Enterprise Products Operating LLC | | 4.200% | | 1/31/50 | | | 250 | | | | 268 | |
| | | Enterprise Products Operating LLC | | 4.950% | | 10/15/54 | | | 100 | | | | 116 | |
| 3 | | Enterprise Products Operating LLC | | 5.250% | | 8/16/77 | | | 100 | | | | 100 | |
| 3 | | Enterprise Products Operating LLC | | 5.375% | | 2/15/78 | | | 200 | | | | 198 | |
| | | EOG Resources Inc. | | 4.100% | | 2/1/21 | | | 350 | | | | 358 | |
| | | EOG Resources Inc. | | 2.625% | | 3/15/23 | | | 450 | | | | 458 | |
| | | EOG Resources Inc. | | 4.150% | | 1/15/26 | | | 150 | | | | 165 | |
| | | EOG Resources Inc. | | 3.900% | | 4/1/35 | | | 75 | | | | 83 | |
| | | EQM Midstream Partners LP | | 4.750% | | 7/15/23 | | | 275 | | | | 276 | |
| | | EQM Midstream Partners LP | | 4.000% | | 8/1/24 | | | 100 | | | | 97 | |
| | | EQM Midstream Partners LP | | 4.125% | | 12/1/26 | | | 100 | | | | 94 | |
| | | EQM Midstream Partners LP | | 5.500% | | 7/15/28 | | | 150 | | | | 147 | |
| | | EQT Corp. | | 4.875% | | 11/15/21 | | | 125 | | | | 128 | |
| | | EQT Corp. | | 3.000% | | 10/1/22 | | | 150 | | | | 147 | |
| | | EQT Corp. | | 3.900% | | 10/1/27 | | | 200 | | | | 186 | |
| | | EQT Midstream Partners LP | | 6.500% | | 7/15/48 | | | 110 | | | | 103 | |
| | | Exxon Mobil Corp. | | 2.222% | | 3/1/21 | | | 400 | | | | 402 | |
| | | Exxon Mobil Corp. | | 2.397% | | 3/6/22 | | | 350 | | | | 354 | |
| | | Exxon Mobil Corp. | | 1.902% | | 8/16/22 | | | 300 | | | | 302 | |
| | | Exxon Mobil Corp. | | 2.726% | | 3/1/23 | | | 350 | | | | 358 | |
| | | Exxon Mobil Corp. | | 2.019% | | 8/16/24 | | | 100 | | | | 100 | |
| | | Exxon Mobil Corp. | | 2.709% | | 3/6/25 | | | 300 | | | | 310 | |
| | | Exxon Mobil Corp. | | 3.043% | | 3/1/26 | | | 300 | | | | 315 | |
| | | Exxon Mobil Corp. | | 2.275% | | 8/16/26 | | | 200 | | | | 200 | |
| | | Exxon Mobil Corp. | | 2.440% | | 8/16/29 | | | 250 | | | | 251 | |
| | | Exxon Mobil Corp. | | 2.995% | | 8/16/39 | | | 200 | | | | 200 | |
| | | Exxon Mobil Corp. | | 3.567% | | 3/6/45 | | | 235 | | | | 251 | |
| | | Exxon Mobil Corp. | | 4.114% | | 3/1/46 | | | 400 | | | | 468 | |
| | | Exxon Mobil Corp. | | 3.095% | | 8/16/49 | | | 300 | | | | 297 | |
| | | Halliburton Co. | | 3.500% | | 8/1/23 | | | 225 | | | | 234 | |
| | | Halliburton Co. | | 3.800% | | 11/15/25 | | | 350 | | | | 373 | |
| | | Halliburton Co. | | 4.850% | | 11/15/35 | | | 200 | | | | 226 | |
| | | Halliburton Co. | | 6.700% | | 9/15/38 | | | 345 | | | | 455 | |
| | | Halliburton Co. | | 4.500% | | 11/15/41 | | | 100 | | | | 107 | |
| | | Halliburton Co. | | 4.750% | | 8/1/43 | | | 150 | | | | 165 | |
| | | Halliburton Co. | | 5.000% | | 11/15/45 | | | 400 | | | | 455 | |
| | | Helmerich & Payne Inc. | | 4.650% | | 3/15/25 | | | 50 | | | | 54 | |
| | | Hess Corp. | | 3.500% | | 7/15/24 | | | 100 | | | | 103 | |
| | | Hess Corp. | | 4.300% | | 4/1/27 | | | 250 | | | | 266 | |
| | | Hess Corp. | | 7.125% | | 3/15/33 | | | 100 | | | | 127 | |
| | | Hess Corp. | | 6.000% | | 1/15/40 | | | 150 | | | | 177 | |
| | | Hess Corp. | | 5.600% | | 2/15/41 | | | 300 | | | | 350 | |
| | | Hess Corp. | | 5.800% | | 4/1/47 | | | 125 | | | | 152 | |
| | | HollyFrontier Corp. | | 5.875% | | 4/1/26 | | | 200 | | | | 225 | |
| | | Husky Energy Inc. | | 4.000% | | 4/15/24 | | | 150 | | | | 158 | |
| | | Husky Energy Inc. | | 4.400% | | 4/15/29 | | | 250 | | | | 269 | |
| | | Husky Energy Inc. | | 6.800% | | 9/15/37 | | | 50 | | | | 65 | |
| | | Kinder Morgan Energy Partners LP | | 5.000% | | 10/1/21 | | | 150 | | | | 156 | |
| | | Kinder Morgan Energy Partners LP | | 3.450% | | 2/15/23 | | | 25 | | | | 26 | |
| | | Kinder Morgan Energy Partners LP | | 3.500% | | 9/1/23 | | | 250 | | | | 259 | |
| | | Kinder Morgan Energy Partners LP | | 4.300% | | 5/1/24 | | | 625 | | | | 668 | |
| | | Kinder Morgan Energy Partners LP | | 7.300% | | 8/15/33 | | | 275 | | | | 363 | |
| | | Kinder Morgan Energy Partners LP | | 5.800% | | 3/15/35 | | | 50 | | | | 59 | |
| | | Kinder Morgan Energy Partners LP | | 6.500% | | 2/1/37 | | | 250 | | | | 312 | |
| | | Kinder Morgan Energy Partners LP | | 6.950% | | 1/15/38 | | | 50 | | | | 66 | |
| | | Kinder Morgan Energy Partners LP | | 6.500% | | 9/1/39 | | | 200 | | | | 253 | |
| | | Kinder Morgan Energy Partners LP | | 6.550% | | 9/15/40 | | | 250 | | | | 317 | |
| | | Kinder Morgan Energy Partners LP | | 5.625% | | 9/1/41 | | | 50 | | | | 58 | |
| | | Kinder Morgan Energy Partners LP | | 5.000% | | 8/15/42 | | | 25 | | | | 27 | |
| | | Kinder Morgan Energy Partners LP | | 4.700% | | 11/1/42 | | | 475 | | | | 502 | |
| | | Kinder Morgan Energy Partners LP | | 5.000% | | 3/1/43 | | | 75 | | | | 82 | |
| 6 | | Kinder Morgan Inc. | | 5.000% | | 2/15/21 | | | 75 | | | | 77 | |
| | | Kinder Morgan Inc. | | 3.150% | | 1/15/23 | | | 200 | | | | 204 | |
| | | Kinder Morgan Inc. | | 4.300% | | 6/1/25 | | | 300 | | | | 325 | |
| | | Kinder Morgan Inc. | | 4.300% | | 3/1/28 | | | 500 | | | | 544 | |
| | | Kinder Morgan Inc. | | 7.800% | | 8/1/31 | | | 290 | | | | 397 | |
| | | Kinder Morgan Inc. | | 7.750% | | 1/15/32 | | | 265 | | | | 363 | |
| | | Kinder Morgan Inc. | | 5.300% | | 12/1/34 | | | 175 | | | | 206 | |
| | | Kinder Morgan Inc. | | 5.550% | | 6/1/45 | | | 200 | | | | 239 | |
| | | Kinder Morgan Inc. | | 5.050% | | 2/15/46 | | | 350 | | | | 391 | |
| | | Magellan Midstream Partners LP | | 4.250% | | 2/1/21 | | | 100 | | | | 102 | |
| | | Magellan Midstream Partners LP | | 5.150% | | 10/15/43 | | | 125 | | | | 146 | |
| | | Magellan Midstream Partners LP | | 4.250% | | 9/15/46 | | | 200 | | | | 212 | |
| | | Magellan Midstream Partners LP | | 4.200% | | 10/3/47 | | | 100 | | | | 105 | |
| | | Magellan Midstream Partners LP | | 4.850% | | 2/1/49 | | | 100 | | | | 115 | |
| | | Magellan Midstream Partners LP | | 3.950% | | 3/1/50 | | | 100 | | | | 103 | |
| | | Marathon Oil Corp. | | 2.800% | | 11/1/22 | | | 175 | | | | 178 | |
| | | Marathon Oil Corp. | | 3.850% | | 6/1/25 | | | 200 | | | | 211 | |
| | | Marathon Oil Corp. | | 6.800% | | 3/15/32 | | | 400 | | | | 507 | |
| | | Marathon Oil Corp. | | 5.200% | | 6/1/45 | | | 100 | | | | 116 | |
| | | Marathon Petroleum Corp. | | 5.125% | | 3/1/21 | | | 375 | | | | 388 | |
| | | Marathon Petroleum Corp. | | 5.375% | | 10/1/22 | | | 200 | | | | 202 | |
| | | Marathon Petroleum Corp. | | 4.750% | | 12/15/23 | | | 500 | | | | 543 | |
| | | Marathon Petroleum Corp. | | 5.125% | | 12/15/26 | | | 200 | | | | 226 | |
| | | Marathon Petroleum Corp. | | 3.800% | | 4/1/28 | | | 25 | | | | 26 | |
| | | Marathon Petroleum Corp. | | 4.750% | | 9/15/44 | | | 250 | | | | 272 | |
| | | Marathon Petroleum Corp. | | 5.850% | | 12/15/45 | | | 200 | | | | 228 | |
| | | Marathon Petroleum Corp. | | 4.500% | | 4/1/48 | | | 100 | | | | 105 | |
| 6 | | MPLX LP | | 3.500% | | 12/1/22 | | | 25 | | | | 26 | |
| | | MPLX LP | | 3.375% | | 3/15/23 | | | 100 | | | | 103 | |
| | | MPLX LP | | 4.500% | | 7/15/23 | | | 200 | | | | 212 | |
| | | MPLX LP | | 4.875% | | 12/1/24 | | | 513 | | | | 556 | |
| | | MPLX LP | | 4.875% | | 6/1/25 | | | 100 | | | | 109 | |
| | | MPLX LP | | 4.125% | | 3/1/27 | | | 300 | | | | 314 | |
| 6 | | MPLX LP | | 4.250% | | 12/1/27 | | | 400 | | | | 420 | |
| | | MPLX LP | | 4.000% | | 3/15/28 | | | 400 | | | | 414 | |
| | | MPLX LP | | 4.500% | | 4/15/38 | | | 300 | | | | 305 | |
| | | MPLX LP | | 5.200% | | 3/1/47 | | | 250 | | | | 268 | |
| 6 | | MPLX LP | | 5.200% | | 12/1/47 | | | 100 | | | | 105 | |
| | | MPLX LP | | 4.700% | | 4/15/48 | | | 275 | | | | 277 | |
| | | MPLX LP | | 5.500% | | 2/15/49 | | | 300 | | | | 340 | |
| | | MPLX LP | | 4.900% | | 4/15/58 | | | 150 | | | | 153 | |
| | | National Fuel Gas Co. | | 3.750% | | 3/1/23 | | | 275 | | | | 282 | |
| | | National Fuel Gas Co. | | 4.750% | | 9/1/28 | | | 50 | | | | 53 | |
| | | National Oilwell Varco Inc. | | 2.600% | | 12/1/22 | | | 35 | | | | 35 | |
| | | National Oilwell Varco Inc. | | 3.600% | | 12/1/29 | | | 200 | | | | 200 | |
| | | National Oilwell Varco Inc. | | 3.950% | | 12/1/42 | | | 125 | | | | 117 | |
| | | Newfield Exploration Co. | | 5.750% | | 1/30/22 | | | 200 | | | | 212 | |
| | | Newfield Exploration Co. | | 5.625% | | 7/1/24 | | | 100 | | | | 110 | |
Total Bond Market Index Portfolio
| | | | | | | | | Face | | | Market | |
| | | | | | | Maturity | | Amount | | | Value• | |
| | | | | Coupon | | Date | | | ($000 | ) | | | ($000 | ) |
| | | Newfield Exploration Co. | | 5.375% | | 1/1/26 | | | 300 | | | | 325 | |
| | | Noble Energy Inc. | | 3.850% | | 1/15/28 | | | 100 | | | | 105 | |
| | | Noble Energy Inc. | | 3.250% | | 10/15/29 | | | 200 | | | | 202 | |
| | | Noble Energy Inc. | | 6.000% | | 3/1/41 | | | 100 | | | | 120 | |
| | | Noble Energy Inc. | | 5.250% | | 11/15/43 | | | 375 | | | | 423 | |
| | | Noble Energy Inc. | | 5.050% | | 11/15/44 | | | 150 | | | | 165 | |
| | | Noble Energy Inc. | | 4.950% | | 8/15/47 | | | 100 | | | | 111 | |
| | | Noble Energy Inc. | | 4.200% | | 10/15/49 | | | 100 | | | | 101 | |
| | | Occidental Petroleum Corp. | | 4.100% | | 2/1/21 | | | 350 | | | | 355 | |
| | | Occidental Petroleum Corp. | | 2.600% | | 8/13/21 | | | 150 | | | | 151 | |
| | | Occidental Petroleum Corp. | | 3.125% | | 2/15/22 | | | 100 | | | | 102 | |
| | | Occidental Petroleum Corp. | | 2.600% | | 4/15/22 | | | 288 | | | | 290 | |
| | | Occidental Petroleum Corp. | | 2.700% | | 8/15/22 | | | 400 | | | | 404 | |
| | | Occidental Petroleum Corp. | | 6.950% | | 7/1/24 | | | 250 | | | | 293 | |
| | | Occidental Petroleum Corp. | | 2.900% | | 8/15/24 | | | 600 | | | | 609 | |
| | | Occidental Petroleum Corp. | | 3.500% | | 6/15/25 | | | 150 | | | | 155 | |
| | | Occidental Petroleum Corp. | | 5.550% | | 3/15/26 | | | 200 | | | | 227 | |
| | | Occidental Petroleum Corp. | | 3.400% | | 4/15/26 | | | 225 | | | | 230 | |
| | | Occidental Petroleum Corp. | | 3.200% | | 8/15/26 | | | 400 | | | | 404 | |
| | | Occidental Petroleum Corp. | | 3.500% | | 8/15/29 | | | 400 | | | | 408 | |
| | | Occidental Petroleum Corp. | | 7.875% | | 9/15/31 | | | 50 | | | | 66 | |
| | | Occidental Petroleum Corp. | | 6.450% | | 9/15/36 | | | 200 | | | | 244 | |
| | | Occidental Petroleum Corp. | | 7.950% | | 6/15/39 | | | 25 | | | | 34 | |
| | | Occidental Petroleum Corp. | | 4.300% | | 8/15/39 | | | 150 | | | | 152 | |
| | | Occidental Petroleum Corp. | | 6.200% | | 3/15/40 | | | 515 | | | | 613 | |
| | | Occidental Petroleum Corp. | | 4.500% | | 7/15/44 | | | 400 | | | | 400 | |
| | | Occidental Petroleum Corp. | | 4.625% | | 6/15/45 | | | 200 | | | | 205 | |
| | | Occidental Petroleum Corp. | | 4.400% | | 4/15/46 | | | 500 | | | | 505 | |
| | | Occidental Petroleum Corp. | | 4.100% | | 2/15/47 | | | 50 | | | | 48 | |
| | | Occidental Petroleum Corp. | | 4.200% | | 3/15/48 | | | 25 | | | | 25 | |
| | | Occidental Petroleum Corp. | | 4.400% | | 8/15/49 | | | 150 | | | | 154 | |
| | | ONEOK Inc. | | 7.500% | | 9/1/23 | | | 100 | | | | 116 | |
| | | ONEOK Inc. | | 2.750% | | 9/1/24 | | | 100 | | | | 101 | |
| | | ONEOK Inc. | | 4.000% | | 7/13/27 | | | 50 | | | | 53 | |
| | | ONEOK Inc. | | 4.350% | | 3/15/29 | | | 100 | | | | 108 | |
| | | ONEOK Inc. | | 3.400% | | 9/1/29 | | | 245 | | | | 248 | |
| | | ONEOK Inc. | | 4.950% | | 7/13/47 | | | 200 | | | | 219 | |
| | | ONEOK Inc. | | 4.450% | | 9/1/49 | | | 150 | | | | 154 | |
| | | ONEOK Partners LP | | 3.375% | | 10/1/22 | | | 400 | | | | 412 | |
| | | ONEOK Partners LP | | 6.650% | | 10/1/36 | | | 300 | | | | 379 | |
| | | ONEOK Partners LP | | 6.850% | | 10/15/37 | | | 300 | | | | 385 | |
| | | ONEOK Partners LP | | 6.125% | | 2/1/41 | | | 150 | | | | 180 | |
| | | Patterson-UTI Energy Inc. | | 3.950% | | 2/1/28 | | | 95 | | | | 92 | |
| | | Patterson-UTI Energy Inc. | | 5.150% | | 11/15/29 | | | 100 | | | | 102 | |
| | | Petro-Canada | | 6.800% | | 5/15/38 | | | 225 | | | | 321 | |
| | | Phillips 66 | | 4.300% | | 4/1/22 | | | 275 | | | | 288 | |
| | | Phillips 66 | | 3.900% | | 3/15/28 | | | 300 | | | | 326 | |
| | | Phillips 66 | | 4.650% | | 11/15/34 | | | 200 | | | | 233 | |
| | | Phillips 66 | | 4.875% | | 11/15/44 | | | 474 | | | | 571 | |
| | | Phillips 66 Partners LP | | 2.450% | | 12/15/24 | | | 50 | | | | 50 | |
| | | Phillips 66 Partners LP | | 3.605% | | 2/15/25 | | | 125 | | | | 130 | |
| | | Phillips 66 Partners LP | | 3.750% | | 3/1/28 | | | 50 | | | | 52 | |
| | | Phillips 66 Partners LP | | 3.150% | | 12/15/29 | | | 100 | | | | 99 | |
| | | Phillips 66 Partners LP | | 4.680% | | 2/15/45 | | | 245 | | | | 264 | |
| | | Pioneer Natural Resources Co. | | 3.950% | | 7/15/22 | | | 200 | | | | 208 | |
| | | Pioneer Natural Resources Co. | | 4.450% | | 1/15/26 | | | 225 | | | | 247 | |
| | | Plains All American Pipeline LP / PAA Finance Corp. | | 5.000% | | 2/1/21 | | | 100 | | | | 102 | |
| | | Plains All American Pipeline LP / PAA Finance Corp. | | 3.650% | | 6/1/22 | | | 100 | | | | 103 | |
| | | Plains All American Pipeline LP / PAA Finance Corp. | | 2.850% | | 1/31/23 | | | 289 | | | | 292 | |
| | | Plains All American Pipeline LP / PAA Finance Corp. | | 3.600% | | 11/1/24 | | | 790 | | | | 810 | |
| | | Plains All American Pipeline LP / PAA Finance Corp. | | 4.500% | | 12/15/26 | | | 100 | | | | 106 | |
| | | Plains All American Pipeline LP / PAA Finance Corp. | | 3.550% | | 12/15/29 | | | 200 | | | | 197 | |
| | | Plains All American Pipeline LP / PAA Finance Corp. | | 4.300% | | 1/31/43 | | | 225 | | | | 205 | |
| | | Plains All American Pipeline LP / PAA Finance Corp. | | 4.700% | | 6/15/44 | | | 200 | | | | 194 | |
| | Regency Energy Partners LP / Regency Energy Finance Corp. | | 5.875% | | 3/1/22 | | | 175 | | | | 186 | |
| | | Regency Energy Partners LP / Regency Energy Finance Corp. | | 5.000% | | 10/1/22 | | | 200 | | | | 212 | |
| | | Regency Energy Partners LP / Regency Energy Finance Corp. | | 4.500% | | 11/1/23 | | | 100 | | | | 106 | |
| | | Sabine Pass Liquefaction LLC | | 5.625% | | 2/1/21 | | | 500 | | | | 514 | |
| | | Sabine Pass Liquefaction LLC | | 6.250% | | 3/15/22 | | | 325 | | | | 349 | |
| | | Sabine Pass Liquefaction LLC | | 5.625% | | 4/15/23 | | | 350 | | | | 381 | |
| | | Sabine Pass Liquefaction LLC | | 5.750% | | 5/15/24 | | | 400 | | | | 446 | |
| | | Sabine Pass Liquefaction LLC | | 5.625% | | 3/1/25 | | | 400 | | | | 449 | |
| | | Sabine Pass Liquefaction LLC | | 5.875% | | 6/30/26 | | | 500 | | | | 574 | |
| | | Sabine Pass Liquefaction LLC | | 5.000% | | 3/15/27 | | | 200 | | | | 220 | |
| | | Sabine Pass Liquefaction LLC | | 4.200% | | 3/15/28 | | | 100 | | | | 106 | |
| | | Schlumberger Investment SA | | 3.650% | | 12/1/23 | | | 325 | | | | 342 | |
| | | Shell International Finance BV | | 1.875% | | 5/10/21 | | | 200 | | | | 200 | |
| | | Shell International Finance BV | | 1.750% | | 9/12/21 | | | 200 | | | | 200 | |
| | | Shell International Finance BV | | 2.250% | | 1/6/23 | | | 100 | | | | 101 | |
| | | Shell International Finance BV | | 3.400% | | 8/12/23 | | | 75 | | | | 79 | |
| | | Shell International Finance BV | | 2.000% | | 11/7/24 | | | 200 | | | | 200 | |
| | | Shell International Finance BV | | 3.250% | | 5/11/25 | | | 200 | | | | 211 | |
| | | Shell International Finance BV | | 2.875% | | 5/10/26 | | | 500 | | | | 518 | |
| | | Shell International Finance BV | | 2.500% | | 9/12/26 | | | 900 | | | | 913 | |
| | | Shell International Finance BV | | 3.875% | | 11/13/28 | | | 100 | | | | 111 | |
| | | Shell International Finance BV | | 2.375% | | 11/7/29 | | | 700 | | | | 693 | |
| | | Shell International Finance BV | | 4.125% | | 5/11/35 | | | 300 | | | | 350 | |
| | | Shell International Finance BV | | 6.375% | | 12/15/38 | | | 475 | | | | 693 | |
| | | Shell International Finance BV | | 5.500% | | 3/25/40 | | | 125 | | | | 169 | |
| | | Shell International Finance BV | | 4.550% | | 8/12/43 | | | 300 | | | | 362 | |
| | | Shell International Finance BV | | 4.375% | | 5/11/45 | | | 400 | | | | 476 | |
| | | Shell International Finance BV | | 4.000% | | 5/10/46 | | | 700 | | | | 797 | |
| | | Shell International Finance BV | | 3.125% | | 11/7/49 | | | 400 | | | | 394 | |
| | | Spectra Energy Partners LP | | 4.750% | | 3/15/24 | | | 600 | | | | 652 | |
| | | Spectra Energy Partners LP | | 3.500% | | 3/15/25 | | | 50 | | | | 52 | |
| | | Spectra Energy Partners LP | | 3.375% | | 10/15/26 | | | 205 | | | | 212 | |
| | | Spectra Energy Partners LP | | 5.950% | | 9/25/43 | | | 40 | | | | 50 | |
| | | Spectra Energy Partners LP | | 4.500% | | 3/15/45 | | | 325 | | | | 357 | |
| | | Suncor Energy Inc. | | 3.600% | | 12/1/24 | | | 100 | | | | 106 | |
| | | Suncor Energy Inc. | | 5.950% | | 12/1/34 | | | 75 | | | | 98 | |
| | | Suncor Energy Inc. | | 6.500% | | 6/15/38 | | | 525 | | | | 729 | |
| | | Suncor Energy Inc. | | 4.000% | | 11/15/47 | | | 150 | | | | 163 | |
| | | Sunoco Logistics Partners Operations LP | | 4.400% | | 4/1/21 | | | 425 | | | | 435 | |
| | | Sunoco Logistics Partners Operations LP | | 3.450% | | 1/15/23 | | | 50 | | | | 51 | |
| | | Sunoco Logistics Partners Operations LP | | 4.250% | | 4/1/24 | | | 225 | | | | 236 | |
| | | Sunoco Logistics Partners Operations LP | | 4.000% | | 10/1/27 | | | 150 | | | | 155 | |
| | | Sunoco Logistics Partners Operations LP | | 4.950% | | 1/15/43 | | | 175 | | | | 174 | |
| | | Sunoco Logistics Partners Operations LP | | 5.300% | | 4/1/44 | | | 325 | | | | 343 | |
| | | Sunoco Logistics Partners Operations LP | | 5.350% | | 5/15/45 | | | 50 | | | | 53 | |
| | | Sunoco Logistics Partners Operations LP | | 5.400% | | 10/1/47 | | | 275 | | | | 297 | |
| | | TC PipeLines LP | | 3.900% | | 5/25/27 | | | 50 | | | | 52 | |
| | | TechnipFMC plc | | 3.450% | | 10/1/22 | | | 75 | | | | 76 | |
| | | Total Capital Canada Ltd. | | 2.750% | | 7/15/23 | | | 125 | | | | 128 | |
| | | Total Capital International SA | | 2.750% | | 6/19/21 | | | 300 | | | | 304 | |
| | | Total Capital International SA | | 2.218% | | 7/12/21 | | | 250 | | | | 251 | |
| | | Total Capital International SA | | 2.875% | | 2/17/22 | | | 300 | | | | 306 | |
| | | Total Capital International SA | | 2.700% | | 1/25/23 | | | 50 | | | | 51 | |
| | | Total Capital International SA | | 3.700% | | 1/15/24 | | | 525 | | | | 557 | |
| | | Total Capital International SA | | 2.434% | | 1/10/25 | | | 175 | | | | 177 | |
| | | Total Capital International SA | | 3.455% | | 2/19/29 | | | 225 | | | | 243 | |
| | | Total Capital International SA | | 2.829% | | 1/10/30 | | | 200 | | | | 205 | |
| | | Total Capital International SA | | 3.461% | | 7/12/49 | | | 200 | | | | 210 | |
| | | Total Capital SA | | 4.125% | | 1/28/21 | | | 75 | | | | 77 | |
| | | Total Capital SA | | 3.883% | | 10/11/28 | | | 100 | | | | 112 | |
| | | TransCanada PipeLines Ltd. | | 2.500% | | 8/1/22 | | | 500 | | | | 502 | |
Total Bond Market Index Portfolio
| | | | | | | | | Face | | | Market | |
| | | | | | | Maturity | | Amount | | | Value• | |
| | | | | Coupon | | Date | | | ($000 | ) | | | ($000 | ) |
| | | TransCanada PipeLines Ltd. | | 4.875% | | 1/15/26 | | | 100 | | | | 112 | |
| | | TransCanada PipeLines Ltd. | | 4.250% | | 5/15/28 | | | 250 | | | | 277 | |
| | | TransCanada PipeLines Ltd. | | 4.625% | | 3/1/34 | | | 250 | | | | 286 | |
| | | TransCanada PipeLines Ltd. | | 5.600% | | 3/31/34 | | | 150 | | | | 182 | |
| | | TransCanada PipeLines Ltd. | | 5.850% | | 3/15/36 | | | 300 | | | | 363 | |
| | | TransCanada PipeLines Ltd. | | 6.200% | | 10/15/37 | | | 425 | | | | 551 | |
| | | TransCanada PipeLines Ltd. | | 4.750% | | 5/15/38 | | | 250 | | | | 285 | |
| | | TransCanada PipeLines Ltd. | | 5.000% | | 10/16/43 | | | 150 | | | | 174 | |
| | | TransCanada PipeLines Ltd. | | 4.875% | | 5/15/48 | | | 300 | | | | 352 | |
| | | TransCanada PipeLines Ltd. | | 5.100% | | 3/15/49 | | | 200 | | | | 242 | |
| | | Transcontinental Gas Pipe Line Co. LLC | | 4.000% | | 3/15/28 | | | 100 | | | | 106 | |
| | | Transcontinental Gas Pipe Line Co. LLC | | 4.600% | | 3/15/48 | | | 100 | | | | 107 | |
| | | Valero Energy Corp. | | 4.350% | | 6/1/28 | | | 350 | | | | 384 | |
| | | Valero Energy Corp. | | 7.500% | | 4/15/32 | | | 650 | | | | 902 | |
| | | Valero Energy Corp. | | 4.900% | | 3/15/45 | | | 75 | | | | 87 | |
| | | Valero Energy Partners LP | | 4.375% | | 12/15/26 | | | 100 | | | | 109 | |
| | | Valero Energy Partners LP | | 4.500% | | 3/15/28 | | | 75 | | | | 82 | |
| | | Western Midstream Operating LP | | 5.375% | | 6/1/21 | | | 300 | | | | 308 | |
| | | Western Midstream Operating LP | | 3.950% | | 6/1/25 | | | 100 | | | | 100 | |
| | | Western Midstream Operating LP | | 4.650% | | 7/1/26 | | | 100 | | | | 103 | |
| | | Western Midstream Operating LP | | 4.500% | | 3/1/28 | | | 50 | | | | 48 | |
| | | Western Midstream Operating LP | | 4.750% | | 8/15/28 | | | 50 | | | | 50 | |
| | | Western Midstream Operating LP | | 5.450% | | 4/1/44 | | | 325 | | | | 283 | |
| | | Western Midstream Operating LP | | 5.300% | | 3/1/48 | | | 100 | | | | 86 | |
| | | Williams Cos. Inc. | | 4.000% | | 11/15/21 | | | 100 | | | | 103 | |
| | | Williams Cos. Inc. | | 3.600% | | 3/15/22 | | | 475 | | | | 488 | |
| | | Williams Cos. Inc. | | 3.350% | | 8/15/22 | | | 125 | | | | 128 | |
| | | Williams Cos. Inc. | | 3.700% | | 1/15/23 | | | 200 | | | | 206 | |
| | | Williams Cos. Inc. | | 4.550% | | 6/24/24 | | | 400 | | | | 431 | |
| | | Williams Cos. Inc. | | 3.900% | | 1/15/25 | | | 325 | | | | 340 | |
| | | Williams Cos. Inc. | | 3.750% | | 6/15/27 | | | 500 | | | | 519 | |
| | | Williams Cos. Inc. | | 6.300% | | 4/15/40 | | | 100 | | | | 124 | |
| | | Williams Cos. Inc. | | 5.800% | | 11/15/43 | | | 100 | | | | 119 | |
| | | Williams Cos. Inc. | | 5.400% | | 3/4/44 | | | 400 | | | | 449 | |
| | | Williams Cos. Inc. | | 5.750% | | 6/24/44 | | | 100 | | | | 118 | |
| | | Williams Cos. Inc. | | 5.100% | | 9/15/45 | | | 350 | | | | 389 | |
| | | Williams Cos. Inc. | | 4.850% | | 3/1/48 | | | 150 | | | | 165 | |
| | | | | | | | | | | | | | | |
| | | Other Industrial (0.1%) | | | | | | | | | | | | |
| 3 | | American University | | 3.672% | | 4/1/49 | | | 75 | | | | 80 | |
| 3 | | Boston University | | 4.061% | | 10/1/48 | | | 50 | | | | 57 | |
| | | California Institute of Technology | | 4.321% | | 8/1/45 | | | 70 | | | | 84 | |
| | | California Institute of Technology | | 4.700% | | 11/1/11 | | | 50 | | | | 61 | |
| | | California Institute of Technology | | 3.650% | | 9/1/19 | | | 50 | | | | 48 | |
| | | CBRE Services Inc. | | 5.250% | | 3/15/25 | | | 100 | | | | 112 | |
| | | CBRE Services Inc. | | 4.875% | | 3/1/26 | | | 125 | | | | 140 | |
| | | Cintas Corp. No. 2 | | 2.900% | | 4/1/22 | | | 100 | | | | 102 | |
| | | Cintas Corp. No. 2 | | 3.250% | | 6/1/22 | | | 75 | | | | 77 | |
| | | Cintas Corp. No. 2 | | 3.700% | | 4/1/27 | | | 175 | | | | 190 | |
| | | Fluor Corp. | | 3.500% | | 12/15/24 | | | 250 | | | | 255 | |
| | | Fluor Corp. | | 4.250% | | 9/15/28 | | | 125 | | | | 126 | |
| | | Georgetown University | | 4.315% | | 4/1/49 | | | 68 | | | | 82 | |
| | | Georgetown University | | 5.215% | | 10/1/18 | | | 59 | | | | 76 | |
| | | Hillenbrand Inc. | | 4.500% | | 9/15/26 | | | 75 | | | | 78 | |
| 3 | | Johns Hopkins University | | 4.083% | | 7/1/53 | | | 75 | | | | 87 | |
| 3 | | Massachusetts Institute of Technology | | 3.959% | | 7/1/38 | | | 125 | | | | 140 | |
| | | Massachusetts Institute of Technology | | 2.989% | | 7/1/50 | | | 85 | | | | 84 | |
| | | Massachusetts Institute of Technology | | 5.600% | | 7/1/11 | | | 130 | | | | 198 | |
| | | Massachusetts Institute of Technology | | 4.678% | | 7/1/14 | | | 175 | | | | 226 | |
| 3 | | Northwestern University | | 4.643% | | 12/1/44 | | | 75 | | | | 93 | |
| 3 | | Northwestern University | | 3.662% | | 12/1/57 | | | 75 | | | | 83 | |
| | | President & Fellows of Harvard College | | 4.875% | | 10/15/40 | | | 225 | | | | 286 | |
| | | President & Fellows of Harvard College | | 3.150% | | 7/15/46 | | | 100 | | | | 101 | |
| | | Steelcase Inc. | | 5.125% | | 1/18/29 | | | 125 | | | | 141 | |
| 3 | | Trustees of Boston College | | 3.129% | | 7/1/52 | | | 100 | | | | 97 | |
| 3 | | University of Chicago | | 4.003% | | 10/1/53 | | | 100 | | | | 114 | |
| 3 | | University of Notre Dame du Lac | | 3.438% | | 2/15/45 | | | 100 | | | | 106 | |
| | | University of Notre Dame du Lac | | 3.394% | | 2/15/48 | | | 125 | | | | 133 | |
| | | University of Pennsylvania | | 4.674% | | 9/1/12 | | | 50 | | | | 65 | |
| | | University of Pennsylvania | | 3.610% | | 2/15/19 | | | 150 | | | | 153 | |
| 3 | | University of Southern California | | 3.028% | | 10/1/39 | | | 100 | | | | 100 | |
| 3 | | University of Southern California | | 3.841% | | 10/1/47 | | | 200 | | | | 222 | |
| 3 | | William Marsh Rice University | | 3.574% | | 5/15/45 | | | 150 | | | | 160 | |
| | | | | | | | | | | | | | | |
| | | Technology (2.2%) | | | | | | | | | | | | |
| | | Adobe Inc. | | 3.250% | | 2/1/25 | | | 175 | | | | 185 | |
| | | Alphabet Inc. | | 3.625% | | 5/19/21 | | | 150 | | | | 154 | |
| | | Altera Corp. | | 4.100% | | 11/15/23 | | | 75 | | | | 81 | |
| | | Amphenol Corp. | | 3.200% | | 4/1/24 | | | 50 | | | | 52 | |
| | | Amphenol Corp. | | 2.800% | | 2/15/30 | | | 275 | | | | 271 | |
| | | Analog Devices Inc. | | 2.875% | | 6/1/23 | | | 450 | | | | 459 | |
| | | Analog Devices Inc. | | 3.125% | | 12/5/23 | | | 75 | | | | 77 | |
| | | Analog Devices Inc. | | 3.500% | | 12/5/26 | | | 200 | | | | 210 | |
| | | Apple Inc. | | 2.000% | | 11/13/20 | | | 225 | | | | 226 | |
| | | Apple Inc. | | 2.250% | | 2/23/21 | | | 750 | | | | 754 | |
| | | Apple Inc. | | 2.850% | | 5/6/21 | | | 555 | | | | 563 | |
| | | Apple Inc. | | 1.550% | | 8/4/21 | | | 375 | | | | 374 | |
| | | Apple Inc. | | 2.150% | | 2/9/22 | | | 225 | | | | 227 | |
| | | Apple Inc. | | 2.500% | | 2/9/22 | | | 1,000 | | | | 1,015 | |
| | | Apple Inc. | | 2.300% | | 5/11/22 | | | 200 | | | | 202 | |
| | | Apple Inc. | | 2.700% | | 5/13/22 | | | 250 | | | | 255 | |
| | | Apple Inc. | | 2.100% | | 9/12/22 | | | 200 | | | | 202 | |
| | | Apple Inc. | | 2.400% | | 1/13/23 | | | 282 | | | | 286 | |
| | | Apple Inc. | | 2.850% | | 2/23/23 | | | 342 | | | | 351 | |
| | | Apple Inc. | | 2.400% | | 5/3/23 | | | 865 | | | | 879 | |
| | | Apple Inc. | | 3.000% | | 2/9/24 | | | 325 | | | | 336 | |
| | | Apple Inc. | | 3.450% | | 5/6/24 | | | 75 | | | | 80 | |
| | | Apple Inc. | | 2.850% | | 5/11/24 | | | 1,243 | | | | 1,285 | |
| | | Apple Inc. | | 1.800% | | 9/11/24 | | | 150 | | | | 149 | |
| | | Apple Inc. | | 2.750% | | 1/13/25 | | | 575 | | | | 593 | |
| | | Apple Inc. | | 3.250% | | 2/23/26 | | | 705 | | | | 746 | |
| | | Apple Inc. | | 2.450% | | 8/4/26 | | | 450 | | | | 456 | |
| | | Apple Inc. | | 3.200% | | 5/11/27 | | | 775 | | | | 816 | |
| | | Apple Inc. | | 2.900% | | 9/12/27 | | | 655 | | | | 681 | |
| | | Apple Inc. | | 2.200% | | 9/11/29 | | | 300 | | | | 294 | |
| | | Apple Inc. | | 4.500% | | 2/23/36 | | | 225 | | | | 273 | |
| | | Apple Inc. | | 3.850% | | 5/4/43 | | | 450 | | | | 503 | |
| | | Apple Inc. | | 4.450% | | 5/6/44 | | | 200 | | | | 244 | |
| | | Apple Inc. | | 3.450% | | 2/9/45 | | | 225 | | | | 236 | |
| | | Apple Inc. | | 4.375% | | 5/13/45 | | | 225 | | | | 271 | |
| | | Apple Inc. | | 4.650% | | 2/23/46 | | | 910 | | | | 1,136 | |
| | | Apple Inc. | | 3.850% | | 8/4/46 | | | 375 | | | | 421 | |
| | | Apple Inc. | | 4.250% | | 2/9/47 | | | 200 | | | | 237 | |
| | | Apple Inc. | | 3.750% | | 9/12/47 | | | 525 | | | | 579 | |
| | | Apple Inc. | | 2.950% | | 9/11/49 | | | 675 | | | | 656 | |
| | | Applied Materials Inc. | | 3.900% | | 10/1/25 | | | 145 | | | | 158 | |
| | | Applied Materials Inc. | | 3.300% | | 4/1/27 | | | 225 | | | | 239 | |
| | | Applied Materials Inc. | | 5.100% | | 10/1/35 | | | 100 | | | | 126 | |
| | | Applied Materials Inc. | | 5.850% | | 6/15/41 | | | 125 | | | | 170 | |
| | | Applied Materials Inc. | | 4.350% | | 4/1/47 | | | 175 | | | | 211 | |
| | | Arrow Electronics Inc. | | 3.500% | | 4/1/22 | | | 75 | | | | 77 | |
| | | Arrow Electronics Inc. | | 4.500% | | 3/1/23 | | | 50 | | | | 52 | |
| | | Arrow Electronics Inc. | | 3.250% | | 9/8/24 | | | 171 | | | | 175 | |
| | | Arrow Electronics Inc. | | 4.000% | | 4/1/25 | | | 50 | | | | 52 | |
| | | Arrow Electronics Inc. | | 3.875% | | 1/12/28 | | | 100 | | | | 103 | |
| | | Autodesk Inc. | | 3.600% | | 12/15/22 | | | 25 | | | | 26 | |
| | | Autodesk Inc. | | 4.375% | | 6/15/25 | | | 100 | | | | 109 | |
| | | Autodesk Inc. | | 3.500% | | 6/15/27 | | | 75 | | | | 78 | |
| | | Avnet Inc. | | 4.875% | | 12/1/22 | | | 170 | | | | 180 | |
| | | Avnet Inc. | | 4.625% | | 4/15/26 | | | 100 | | | | 106 | |
| | | Baidu Inc. | | 3.500% | | 11/28/22 | | | 275 | | | | 283 | |
| | | Baidu Inc. | | 3.875% | | 9/29/23 | | | 200 | | | | 209 | |
| | | Baidu Inc. | | 4.375% | | 5/14/24 | | | 200 | | | | 213 | |
| | | Baidu Inc. | | 3.625% | | 7/6/27 | | | 200 | | | | 206 | |
| | | Baidu Inc. | | 4.375% | | 3/29/28 | | | 100 | | | | 108 | |
| | | Broadcom Corp. / Broadcom Cayman Finance Ltd. | | 2.200% | | 1/15/21 | | | 150 | | | | 150 | |
| | | Broadcom Corp. / Broadcom Cayman Finance Ltd. | | 3.000% | | 1/15/22 | | | 642 | | | | 652 | |
| | | Broadcom Corp. / Broadcom Cayman Finance Ltd. | | 2.650% | | 1/15/23 | | | 250 | | | | 251 | |
Total Bond Market Index Portfolio
| | | | | | | | | Face | | | Market | |
| | | | | | | Maturity | | Amount | | | Value• | |
| | | | | Coupon | | Date | | | ($000 | ) | | | ($000 | ) |
| | | Broadcom Corp. / Broadcom Cayman Finance Ltd. | | 3.625% | | 1/15/24 | | | 450 | | | | 466 | |
| | | Broadcom Corp. / Broadcom Cayman Finance Ltd. | | 3.125% | | 1/15/25 | | | 480 | | | | 486 | |
| | | Broadcom Corp. / Broadcom Cayman Finance Ltd. | | 3.875% | | 1/15/27 | | | 925 | | | | 959 | |
| | | Broadcom Corp. / Broadcom Cayman Finance Ltd. | | 3.500% | | 1/15/28 | | | 200 | | | | 202 | |
| 6 | | Broadcom Inc. | | 3.125% | | 4/15/21 | | | 400 | | | | 405 | |
| 6 | | Broadcom Inc. | | 3.125% | | 10/15/22 | | | 250 | | | | 254 | |
| 6 | | Broadcom Inc. | | 3.625% | | 10/15/24 | | | 607 | | | | 629 | |
| 6 | | Broadcom Inc. | | 4.250% | | 4/15/26 | | | 500 | | | | 531 | |
| 6 | | Broadcom Inc. | | 4.750% | | 4/15/29 | | | 945 | | | | 1,032 | |
| | | Broadridge Financial Solutions Inc. | | 3.400% | | 6/27/26 | | | 100 | | | | 104 | |
| | | Broadridge Financial Solutions Inc. | | 2.900% | | 12/1/29 | | | 75 | | | | 75 | |
| | | Cadence Design Systems Inc. | | 4.375% | | 10/15/24 | | | 100 | | | | 107 | |
| | | Cisco Systems Inc. | | 2.200% | | 2/28/21 | | | 675 | | | | 678 | |
| | | Cisco Systems Inc. | | 3.000% | | 6/15/22 | | | 125 | | | | 129 | |
| | | Cisco Systems Inc. | | 2.200% | | 9/20/23 | | | 150 | | | | 151 | |
| | | Cisco Systems Inc. | | 3.625% | | 3/4/24 | | | 875 | | | | 935 | |
| | | Cisco Systems Inc. | | 2.950% | | 2/28/26 | | | 100 | | | | 105 | |
| | | Cisco Systems Inc. | | 2.500% | | 9/20/26 | | | 225 | | | | 229 | |
| | | Cisco Systems Inc. | | 5.500% | | 1/15/40 | | | 800 | | | | 1,089 | |
| | | Citrix Systems Inc. | | 4.500% | | 12/1/27 | | | 100 | | | | 108 | |
| | | Corning Inc. | | 2.900% | | 5/15/22 | | | 175 | | | | 179 | |
| | | Corning Inc. | | 4.700% | | 3/15/37 | | | 275 | | | | 303 | |
| | | Corning Inc. | | 5.750% | | 8/15/40 | | | 195 | | | | 243 | |
| | | Corning Inc. | | 4.750% | | 3/15/42 | | | 100 | | | | 113 | |
| | | Corning Inc. | | 4.375% | | 11/15/57 | | | 150 | | | | 151 | |
| 6 | | Dell International LLC / EMC Corp. | | 4.420% | | 6/15/21 | | | 850 | | | | 874 | |
| 6 | | Dell International LLC / EMC Corp. | | 5.450% | | 6/15/23 | | | 700 | | | | 758 | |
| 6 | | Dell International LLC / EMC Corp. | | 4.000% | | 7/15/24 | | | 100 | | | | 105 | |
| 6 | | Dell International LLC / EMC Corp. | | 6.020% | | 6/15/26 | | | 1,075 | | | | 1,237 | |
| 6 | | Dell International LLC / EMC Corp. | | 4.900% | | 10/1/26 | | | 250 | | | | 275 | |
| 6 | | Dell International LLC / EMC Corp. | | 5.300% | | 10/1/29 | | | 325 | | | | 365 | |
| 6 | | Dell International LLC / EMC Corp. | | 8.100% | | 7/15/36 | | | 320 | | | | 420 | |
| 6 | | Dell International LLC / EMC Corp. | | 8.350% | | 7/15/46 | | | 425 | | | | 582 | |
| | | DXC Technology Co. | | 4.250% | | 4/15/24 | | | 250 | | | | 265 | |
| | | Equifax Inc. | | 2.300% | | 6/1/21 | | | 200 | | | | 201 | |
| | | Equifax Inc. | | 3.600% | | 8/15/21 | | | 25 | | | | 26 | |
| | | Equifax Inc. | | 3.950% | | 6/15/23 | | | 50 | | | | 53 | |
| | | Equifax Inc. | | 2.600% | | 12/1/24 | | | 75 | | | | 75 | |
| | | Equinix Inc. | | 2.625% | | 11/18/24 | | | 200 | | | | 201 | |
| | | Equinix Inc. | | 5.875% | | 1/15/26 | | | 500 | | | | 531 | |
| | | Equinix Inc. | | 2.900% | | 11/18/26 | | | 100 | | | | 100 | |
| | | Equinix Inc. | | 3.200% | | 11/18/29 | | | 250 | | | | 251 | |
| | | Fidelity National Information Services Inc. | | 3.500% | | 4/15/23 | | | 143 | | | | 149 | |
| | | Fidelity National Information Services Inc. | | 3.875% | | 6/5/24 | | | 150 | | | | 159 | |
| | | Fidelity National Information Services Inc. | | 3.000% | | 8/15/26 | | | 414 | | | | 427 | |
| | | Fidelity National Information Services Inc. | | 3.750% | | 5/21/29 | | | 200 | | | | 218 | |
| | | Fiserv Inc. | | 3.800% | | 10/1/23 | | | 200 | | | | 211 | |
| | | Fiserv Inc. | | 2.750% | | 7/1/24 | | | 400 | | | | 407 | |
| | | Fiserv Inc. | | 3.850% | | 6/1/25 | | | 200 | | | | 213 | |
| | | Fiserv Inc. | | 3.200% | | 7/1/26 | | | 200 | | | | 207 | |
| | | Fiserv Inc. | | 3.500% | | 7/1/29 | | | 944 | | | | 992 | |
| | | Fiserv Inc. | | 4.400% | | 7/1/49 | | | 415 | | | | 471 | |
| | | Flex Ltd. | | 4.875% | | 6/15/29 | | | 50 | | | | 54 | |
| | | FLIR Systems Inc. | | 3.125% | | 6/15/21 | | | 50 | | | | 50 | |
| | | Global Payments Inc. | | 2.650% | | 2/15/25 | | | 200 | | | | 201 | |
| | | Global Payments Inc. | | 3.200% | | 8/15/29 | | | 250 | | | | 254 | |
| | | Global Payments Inc. | | 4.150% | | 8/15/49 | | | 150 | | | | 160 | |
| | | Hewlett Packard Enterprise Co. | | 3.600% | | 10/15/20 | | | 575 | | | | 581 | |
| | | Hewlett Packard Enterprise Co. | | 3.500% | | 10/5/21 | | | 100 | | | | 102 | |
| | | Hewlett Packard Enterprise Co. | | 4.400% | | 10/15/22 | | | 350 | | | | 369 | |
| | | Hewlett Packard Enterprise Co. | | 2.250% | | 4/1/23 | | | 200 | | | | 200 | |
| | | Hewlett Packard Enterprise Co. | | 4.900% | | 10/15/25 | | | 500 | | | | 554 | |
| | | Hewlett Packard Enterprise Co. | | 6.200% | | 10/15/35 | | | 150 | | | | 180 | |
| | | Hewlett Packard Enterprise Co. | | 6.350% | | 10/15/45 | | | 275 | | | | 331 | |
| | | HP Inc. | | 3.750% | | 12/1/20 | | | 53 | | | | 54 | |
| | | HP Inc. | | 4.050% | | 9/15/22 | | | 100 | | | | 104 | |
| | | HP Inc. | | 6.000% | | 9/15/41 | | | 100 | | | | 110 | |
| | | IBM Credit LLC | | 3.450% | | 11/30/20 | | | 100 | | | | 102 | |
| | | IBM Credit LLC | | 2.650% | | 2/5/21 | | | 150 | | | | 151 | |
| | | IBM Credit LLC | | 3.600% | | 11/30/21 | | | 100 | | | | 103 | |
| | | IBM Credit LLC | | 2.200% | | 9/8/22 | | | 100 | | | | 101 | |
| | | IBM Credit LLC | | 3.000% | | 2/6/23 | | | 150 | | | | 154 | |
| | | Intel Corp. | | 1.700% | | 5/19/21 | | | 100 | | | | 100 | |
| | | Intel Corp. | | 3.300% | | 10/1/21 | | | 100 | | | | 103 | |
| | | Intel Corp. | | 3.100% | | 7/29/22 | | | 175 | | | | 181 | |
| | | Intel Corp. | | 2.700% | | 12/15/22 | | | 404 | | | | 414 | |
| | | Intel Corp. | | 2.875% | | 5/11/24 | | | 1,050 | | | | 1,089 | |
| | | Intel Corp. | | 3.700% | | 7/29/25 | | | 450 | | | | 486 | |
| | | Intel Corp. | | 2.600% | | 5/19/26 | | | 160 | | | | 164 | |
| | | Intel Corp. | | 2.450% | | 11/15/29 | | | 200 | | | | 199 | |
| | | Intel Corp. | | 4.000% | | 12/15/32 | | | 150 | | | | 174 | |
| | | Intel Corp. | | 4.800% | | 10/1/41 | | | 162 | | | | 200 | |
| | | Intel Corp. | | 4.100% | | 5/19/46 | | | 250 | | | | 287 | |
| | | Intel Corp. | | 4.100% | | 5/11/47 | | | 200 | | | | 229 | |
| | | Intel Corp. | | 3.734% | | 12/8/47 | | | 674 | | | | 737 | |
| | | Intel Corp. | | 3.250% | | 11/15/49 | | | 300 | | | | 300 | |
| | | International Business Machines Corp. | | 2.800% | | 5/13/21 | | | 300 | | | | 304 | |
| | | International Business Machines Corp. | | 2.900% | | 11/1/21 | | | 25 | | | | 25 | |
| | | International Business Machines Corp. | | 2.850% | | 5/13/22 | | | 500 | | | | 511 | |
| | | International Business Machines Corp. | | 1.875% | | 8/1/22 | | | 675 | | | | 675 | |
| | | International Business Machines Corp. | | 2.875% | | 11/9/22 | | | 240 | | | | 246 | |
| | | International Business Machines Corp. | | 3.375% | | 8/1/23 | | | 450 | | | | 471 | |
| | | International Business Machines Corp. | | 3.625% | | 2/12/24 | | | 450 | | | | 476 | |
| | | International Business Machines Corp. | | 3.000% | | 5/15/24 | | | 600 | | | | 621 | |
| | | International Business Machines Corp. | | 7.000% | | 10/30/25 | | | 300 | | | | 374 | |
| | | International Business Machines Corp. | | 3.450% | | 2/19/26 | | | 485 | | | | 516 | |
| | | International Business Machines Corp. | | 3.300% | | 5/15/26 | | | 700 | | | | 737 | |
| | | International Business Machines Corp. | | 6.220% | | 8/1/27 | | | 75 | | | | 93 | |
| | | International Business Machines Corp. | | 6.500% | | 1/15/28 | | | 75 | | | | 95 | |
| | | International Business Machines Corp. | | 3.500% | | 5/15/29 | | | 700 | | | | 751 | |
| | | International Business Machines Corp. | | 4.150% | | 5/15/39 | | | 400 | | | | 449 | |
| | | International Business Machines Corp. | | 5.600% | | 11/30/39 | | | 148 | | | | 193 | |
| | | International Business Machines Corp. | | 4.000% | | 6/20/42 | | | 358 | | | | 395 | |
| | | International Business Machines Corp. | | 4.250% | | 5/15/49 | | | 700 | | | | 796 | |
| | | Jabil Inc. | | 5.625% | | 12/15/20 | | | 100 | | | | 103 | |
| | | Jabil Inc. | | 3.950% | | 1/12/28 | | | 75 | | | | 77 | |
| | | Juniper Networks Inc. | | 4.350% | | 6/15/25 | | | 50 | | | | 53 | |
| | | Juniper Networks Inc. | | 3.750% | | 8/15/29 | | | 500 | | | | 520 | |
| | | Juniper Networks Inc. | | 5.950% | | 3/15/41 | | | 25 | | | | 28 | |
| | | Keysight Technologies Inc. | | 4.550% | | 10/30/24 | | | 195 | | | | 212 | |
| | | Keysight Technologies Inc. | | 4.600% | | 4/6/27 | | | 125 | | | | 139 | |
| | | Keysight Technologies Inc. | | 3.000% | | 10/30/29 | | | 100 | | | | 100 | |
| | | KLA Corp. | | 4.125% | | 11/1/21 | | | 100 | | | | 103 | |
| | | KLA Corp. | | 4.650% | | 11/1/24 | | | 250 | | | | 274 | |
| | | KLA Corp. | | 4.100% | | 3/15/29 | | | 350 | | | | 383 | |
| | | KLA Corp. | | 5.000% | | 3/15/49 | | | 75 | | | | 92 | |
| | | Lam Research Corp. | | 2.800% | | 6/15/21 | | | 125 | | | | 126 | |
| | | Lam Research Corp. | | 3.800% | | 3/15/25 | | | 100 | | | | 106 | |
| | | Lam Research Corp. | | 3.750% | | 3/15/26 | | | 150 | | | | 161 | |
| | | Lam Research Corp. | | 4.000% | | 3/15/29 | | | 200 | | | | 220 | |
| | | Lam Research Corp. | | 4.875% | | 3/15/49 | | | 175 | | | | 218 | |
| | | Marvell Technology Group Ltd. | | 4.200% | | 6/22/23 | | | 100 | | | | 105 | |
| | | Marvell Technology Group Ltd. | | 4.875% | | 6/22/28 | | | 100 | | | | 110 | |
| | | Maxim Integrated Products Inc. | | 3.375% | | 3/15/23 | | | 75 | | | | 77 | |
| | | Maxim Integrated Products Inc. | | 3.450% | | 6/15/27 | | | 100 | | | | 103 | |
| | | Microchip Technology Inc. | | 3.922% | | 6/1/21 | | | 100 | | | | 102 | |
| | | Microchip Technology Inc. | | 4.333% | | 6/1/23 | | | 100 | | | | 106 | |
| | | Micron Technology Inc. | | 4.640% | | 2/6/24 | | | 50 | | | | 54 | |
| | | Micron Technology Inc. | | 4.975% | | 2/6/26 | | | 100 | | | | 111 | |
| | | Micron Technology Inc. | | 4.185% | | 2/15/27 | | | 200 | | | | 213 | |
| | | Micron Technology Inc. | | 5.327% | | 2/6/29 | | | 150 | | | | 171 | |
| | | Micron Technology Inc. | | 4.663% | | 2/15/30 | | | 100 | | | | 110 | |
| | | Microsoft Corp. | | 2.000% | | 11/3/20 | | | 1,200 | | | | 1,202 | |
| | | Microsoft Corp. | | 2.400% | | 2/6/22 | | | 620 | | | | 629 | |
Total Bond Market Index Portfolio
| | | | | | | | | Face | | | Market | |
| | | | | | | Maturity | | Amount | | | Value• | |
| | | | | Coupon | | Date | | | ($000 | ) | | | ($000 | ) |
| | | Microsoft Corp. | | 2.375% | | 2/12/22 | | | 450 | | | | 456 | |
| | | Microsoft Corp. | | 2.650% | | 11/3/22 | | | 200 | | | | 205 | |
| | | Microsoft Corp. | | 2.375% | | 5/1/23 | | | 75 | | | | 76 | |
| | | Microsoft Corp. | | 2.000% | | 8/8/23 | | | 300 | | | | 302 | |
| | | Microsoft Corp. | | 2.875% | | 2/6/24 | | | 500 | | | | 518 | |
| | | Microsoft Corp. | | 3.125% | | 11/3/25 | | | 575 | | | | 608 | |
| | | Microsoft Corp. | | 2.400% | | 8/8/26 | | | 1,305 | | | | 1,318 | |
| | | Microsoft Corp. | | 3.300% | | 2/6/27 | | | 675 | | | | 721 | |
| | | Microsoft Corp. | | 3.500% | | 2/12/35 | | | 325 | | | | 357 | |
| | | Microsoft Corp. | | 4.200% | | 11/3/35 | | | 375 | | | | 442 | |
| | | Microsoft Corp. | | 3.450% | | 8/8/36 | | | 625 | | | | 683 | |
| | | Microsoft Corp. | | 4.100% | | 2/6/37 | | | 500 | | | | 589 | |
| | | Microsoft Corp. | | 4.500% | | 10/1/40 | | | 390 | | | | 483 | |
| | | Microsoft Corp. | | 3.500% | | 11/15/42 | | | 330 | | | | 358 | |
| | | Microsoft Corp. | | 3.750% | | 5/1/43 | | | 145 | | | | 160 | |
| | | Microsoft Corp. | | 4.875% | | 12/15/43 | | | 150 | | | | 196 | |
| | | Microsoft Corp. | | 3.750% | | 2/12/45 | | | 550 | | | | 624 | |
| | | Microsoft Corp. | | 4.450% | | 11/3/45 | | | 575 | | | | 716 | |
| | | Microsoft Corp. | | 3.700% | | 8/8/46 | | | 1,175 | | | | 1,326 | |
| | | Microsoft Corp. | | 4.250% | | 2/6/47 | | | 600 | | | | 732 | |
| | | Microsoft Corp. | | 4.000% | | 2/12/55 | | | 1,050 | | | | 1,241 | |
| | | Motorola Solutions Inc. | | 3.750% | | 5/15/22 | | | 113 | | | | 117 | |
| | | Motorola Solutions Inc. | | 3.500% | | 3/1/23 | | | 125 | | | | 129 | |
| | | Motorola Solutions Inc. | | 4.000% | | 9/1/24 | | | 240 | | | | 254 | |
| | | Motorola Solutions Inc. | | 4.600% | | 2/23/28 | | | 125 | | | | 135 | |
| | | Motorola Solutions Inc. | | 5.500% | | 9/1/44 | | | 75 | | | | 82 | |
| | | NetApp Inc. | | 3.375% | | 6/15/21 | | | 150 | | | | 152 | |
| | | NetApp Inc. | | 3.300% | | 9/29/24 | | | 75 | | | | 78 | |
| | | NVIDIA Corp. | | 2.200% | | 9/16/21 | | | 200 | | | | 201 | |
| | | NVIDIA Corp. | | 3.200% | | 9/16/26 | | | 200 | | | | 209 | |
| 6 | | NXP BV / NXP Funding LLC | | 4.875% | | 3/1/24 | | | 200 | | | | 217 | |
| 6 | | NXP BV / NXP Funding LLC | | 5.350% | | 3/1/26 | | | 204 | | | | 229 | |
| 6 | | NXP BV / NXP Funding LLC | | 5.550% | | 12/1/28 | | | 175 | | | | 205 | |
| 6 | | NXP BV / NXP Funding LLC / NXP USA Inc. | | 4.300% | | 6/18/29 | | | 450 | | | | 486 | |
| | | Oracle Corp. | | 1.900% | | 9/15/21 | | | 1,275 | | | | 1,277 | |
| | | Oracle Corp. | | 2.500% | | 5/15/22 | | | 250 | | | | 254 | |
| | | Oracle Corp. | | 2.400% | | 9/15/23 | | | 750 | | | | 762 | |
| | | Oracle Corp. | | 3.400% | | 7/8/24 | | | 450 | | | | 475 | |
| | | Oracle Corp. | | 2.950% | | 11/15/24 | | | 425 | | | | 441 | |
| | | Oracle Corp. | | 2.650% | | 7/15/26 | | | 2,361 | | | | 2,410 | |
| | | Oracle Corp. | | 3.250% | | 5/15/30 | | | 100 | | | | 106 | |
| | | Oracle Corp. | | 4.300% | | 7/8/34 | | | 325 | | | | 379 | |
| | | Oracle Corp. | | 3.900% | | 5/15/35 | | | 150 | | | | 167 | |
| | | Oracle Corp. | | 3.850% | | 7/15/36 | | | 250 | | | | 274 | |
| | | Oracle Corp. | | 3.800% | | 11/15/37 | | | 325 | | | | 354 | |
| | | Oracle Corp. | | 6.125% | | 7/8/39 | | | 150 | | | | 210 | |
| | | Oracle Corp. | | 5.375% | | 7/15/40 | | | 700 | | | | 907 | |
| | | Oracle Corp. | | 4.500% | | 7/8/44 | | | 250 | | | | 295 | |
| | | Oracle Corp. | | 4.125% | | 5/15/45 | | | 725 | | | | 815 | |
| | | Oracle Corp. | | 4.000% | | 7/15/46 | | | 575 | | | | 638 | |
| | | Oracle Corp. | | 4.000% | | 11/15/47 | | | 225 | | | | 251 | |
| | | Oracle Corp. | | 4.375% | | 5/15/55 | | | 150 | | | | 177 | |
| | | PayPal Holdings Inc. | | 2.200% | | 9/26/22 | | | 200 | | | | 201 | |
| | | PayPal Holdings Inc. | | 2.400% | | 10/1/24 | | | 100 | | | | 101 | |
| | | PayPal Holdings Inc. | | 2.650% | | 10/1/26 | | | 300 | | | | 304 | |
| | | PayPal Holdings Inc. | | 2.850% | | 10/1/29 | | | 400 | | | | 401 | |
| | | QUALCOMM Inc. | | 3.000% | | 5/20/22 | | | 250 | | | | 256 | |
| | | QUALCOMM Inc. | | 2.600% | | 1/30/23 | | | 300 | | | | 305 | |
| | | QUALCOMM Inc. | | 2.900% | | 5/20/24 | | | 345 | | | | 355 | |
| | | QUALCOMM Inc. | | 3.450% | | 5/20/25 | | | 400 | | | | 422 | |
| | | QUALCOMM Inc. | | 3.250% | | 5/20/27 | | | 400 | | | | 419 | |
| | | QUALCOMM Inc. | | 4.650% | | 5/20/35 | | | 200 | | | | 237 | |
| | | QUALCOMM Inc. | | 4.800% | | 5/20/45 | | | 275 | | | | 336 | |
| | | QUALCOMM Inc. | | 4.300% | | 5/20/47 | | | 350 | | | | 402 | |
| | | salesforce.com Inc. | | 3.250% | | 4/11/23 | | | 200 | | | | 208 | |
| | | salesforce.com Inc. | | 3.700% | | 4/11/28 | | | 275 | | | | 302 | |
| | | Seagate HDD Cayman | | 4.250% | | 3/1/22 | | | 44 | | | | 45 | |
| | | Seagate HDD Cayman | | 4.750% | | 6/1/23 | | | 51 | | | | 54 | |
| | | Seagate HDD Cayman | | 4.875% | | 3/1/24 | | | 75 | | | | 80 | |
| | | Seagate HDD Cayman | | 4.750% | | 1/1/25 | | | 172 | | | | 183 | |
| | | Seagate HDD Cayman | | 5.750% | | 12/1/34 | | | 100 | | | | 105 | |
| | | Tech Data Corp. | | 3.700% | | 2/15/22 | | | 50 | | | | 51 | |
| | | Tech Data Corp. | | 4.950% | | 2/15/27 | | | 100 | | | | 103 | |
| | | Texas Instruments Inc. | | 1.850% | | 5/15/22 | | | 100 | | | | 100 | |
| | | Texas Instruments Inc. | | 2.625% | | 5/15/24 | | | 25 | | | | 26 | |
| | | Texas Instruments Inc. | | 2.900% | | 11/3/27 | | | 94 | | | | 98 | |
| | | Texas Instruments Inc. | | 2.250% | | 9/4/29 | | | 100 | | | | 98 | |
| | | Texas Instruments Inc. | | 3.875% | | 3/15/39 | | | 142 | | | | 160 | |
| | | Texas Instruments Inc. | | 4.150% | | 5/15/48 | | | 274 | | | | 324 | |
| | | Total System Services Inc. | | 3.800% | | 4/1/21 | | | 130 | | | | 132 | |
| | | Total System Services Inc. | | 3.750% | | 6/1/23 | | | 250 | | | | 261 | |
| | | Total System Services Inc. | | 4.000% | | 6/1/23 | | | 100 | | | | 105 | |
| | | Total System Services Inc. | | 4.800% | | 4/1/26 | | | 150 | | | | 167 | |
| | | Trimble Inc. | | 4.150% | | 6/15/23 | | | 50 | | | | 53 | |
| | | Trimble Inc. | | 4.750% | | 12/1/24 | | | 93 | | | | 101 | |
| | | Trimble Inc. | | 4.900% | | 6/15/28 | | | 50 | | | | 55 | |
| | | Tyco Electronics Group SA | | 3.500% | | 2/3/22 | | | 100 | | | | 103 | |
| | | Tyco Electronics Group SA | | 3.450% | | 8/1/24 | | | 125 | | | | 130 | |
| | | Tyco Electronics Group SA | | 3.125% | | 8/15/27 | | | 200 | | | | 205 | |
| | | Tyco Electronics Group SA | | 7.125% | | 10/1/37 | | | 125 | | | | 184 | |
| | | Verisk Analytics Inc. | | 5.800% | | 5/1/21 | | | 75 | | | | 79 | |
| | | Verisk Analytics Inc. | | 4.125% | | 9/12/22 | | | 275 | | | | 287 | |
| | | Verisk Analytics Inc. | | 4.000% | | 6/15/25 | | | 150 | | | | 161 | |
| | | Verisk Analytics Inc. | | 4.125% | | 3/15/29 | | | 400 | | | | 436 | |
| | | Verisk Analytics Inc. | | 5.500% | | 6/15/45 | | | 50 | | | | 62 | |
| | | VMware Inc. | | 2.950% | | 8/21/22 | | | 300 | | | | 306 | |
| | | VMware Inc. | | 3.900% | | 8/21/27 | | | 250 | | | | 261 | |
| | | Xilinx Inc. | | 3.000% | | 3/15/21 | | | 75 | | | | 76 | |
| | | Xilinx Inc. | | 2.950% | | 6/1/24 | | | 150 | | | | 154 | |
| | | | | | | | | | | | | | | |
| | | Transportation (0.6%) | | | | | | | | | | | | |
| 3 | | American Airlines 2011-1 Class A Pass Through Trust | | 5.250% | | 7/31/22 | | | 45 | | | | 46 | |
| 3 | | American Airlines 2013-1 Class A Pass Through Trust | | 4.000% | | 1/15/27 | | | 17 | | | | 18 | |
| 3 | | American Airlines 2013-2 Class A Pass Through Trust | | 4.950% | | 7/15/24 | | | 25 | | | | 26 | |
| 3 | | American Airlines 2014-1 Class A Pass Through Trust | | 3.700% | | 4/1/28 | | | 91 | | | | 95 | |
| 3 | | American Airlines 2015-1 Class A Pass Through Trust | | 3.375% | | 11/1/28 | | | 136 | | | | 139 | |
| 3 | | American Airlines 2015-2 Class AA Pass Through Trust | | 3.600% | | 9/22/27 | | | 46 | | | | 48 | |
| 3 | | American Airlines 2016-1 Class A Pass Through Trust | | 4.100% | | 1/15/28 | | | 64 | | | | 68 | |
| 3 | | American Airlines 2016-1 Class AA Pass Through Trust | | 3.575% | | 1/15/28 | | | 129 | | | | 135 | |
| 3 | | American Airlines 2016-2 Class AA Pass Through Trust | | 3.200% | | 12/15/29 | | | 235 | | | | 242 | |
| 3 | | American Airlines 2016-3 Class A Pass Through Trust | | 3.250% | | 4/15/30 | | | 44 | | | | 45 | |
| 3 | | American Airlines 2016-3 Class AA Pass Through Trust | | 3.000% | | 10/15/28 | | | 131 | | | | 133 | |
| 3 | | American Airlines 2017-1 Class AA Pass Through Trust | | 3.650% | | 8/15/30 | | | 44 | | | | 46 | |
| 3 | | American Airlines 2017-2 Class AA Pass Through Trust | | 3.350% | | 10/15/29 | | | 92 | | | | 94 | |
| 3 | | American Airlines 2019-1 Class AA Pass Through Trust | | 3.150% | | 8/15/33 | | | 50 | | | | 51 | |
| 3 | | BNSF Funding Trust I | | 6.613% | | 12/15/55 | | | 65 | | | | 71 | |
| | | Burlington Northern Santa Fe LLC | | 3.050% | | 3/15/22 | | | 150 | | | | 153 | |
| | | Burlington Northern Santa Fe LLC | | 3.050% | | 9/1/22 | | | 150 | | | | 154 | |
| | | Burlington Northern Santa Fe LLC | | 3.000% | | 3/15/23 | | | 175 | | | | 180 | |
| | | Burlington Northern Santa Fe LLC | | 3.850% | | 9/1/23 | | | 75 | | | | 80 | |
| | | Burlington Northern Santa Fe LLC | | 3.750% | | 4/1/24 | | | 200 | | | | 213 | |
| | | Burlington Northern Santa Fe LLC | | 3.400% | | 9/1/24 | | | 150 | | | | 159 | |
| | | Burlington Northern Santa Fe LLC | | 3.000% | | 4/1/25 | | | 100 | | | | 104 | |
| | | Burlington Northern Santa Fe LLC | | 3.650% | | 9/1/25 | | | 75 | | | | 81 | |
| | | Burlington Northern Santa Fe LLC | | 3.250% | | 6/15/27 | | | 225 | | | | 240 | |
| | | Burlington Northern Santa Fe LLC | | 6.200% | | 8/15/36 | | | 125 | | | | 173 | |
| | | Burlington Northern Santa Fe LLC | | 5.050% | | 3/1/41 | | | 125 | | | | 155 | |
Total Bond Market Index Portfolio
| | | | | | | | | Face | | | Market | |
| | | | | | | Maturity | | Amount | | | Value• | |
| | | | | Coupon | | Date | | | ($000 | ) | | | ($000 | ) |
| | | Burlington Northern Santa Fe LLC | | 5.400% | | 6/1/41 | | | 250 | | | | 322 | |
| | | Burlington Northern Santa Fe LLC | | 4.400% | | 3/15/42 | | | 250 | | | | 289 | |
| | | Burlington Northern Santa Fe LLC | | 4.375% | | 9/1/42 | | | 200 | | | | 232 | |
| | | Burlington Northern Santa Fe LLC | | 4.450% | | 3/15/43 | | | 125 | | | | 145 | |
| | | Burlington Northern Santa Fe LLC | | 5.150% | | 9/1/43 | | | 125 | | | | 159 | |
| | | Burlington Northern Santa Fe LLC | | 4.900% | | 4/1/44 | | | 100 | | | | 124 | |
| | | Burlington Northern Santa Fe LLC | | 4.550% | | 9/1/44 | | | 150 | | | | 179 | |
| | | Burlington Northern Santa Fe LLC | | 4.150% | | 4/1/45 | | | 125 | | | | 144 | |
| | | Burlington Northern Santa Fe LLC | | 4.700% | | 9/1/45 | | | 75 | | | | 91 | |
| | | Burlington Northern Santa Fe LLC | | 3.900% | | 8/1/46 | | | 150 | | | | 164 | |
| | | Burlington Northern Santa Fe LLC | | 4.125% | | 6/15/47 | | | 125 | | | | 141 | |
| | | Burlington Northern Santa Fe LLC | | 4.050% | | 6/15/48 | | | 225 | | | | 253 | |
| | | Burlington Northern Santa Fe LLC | | 4.150% | | 12/15/48 | | | 200 | | | | 228 | |
| | | Burlington Northern Santa Fe LLC | | 3.550% | | 2/15/50 | | | 400 | | | | 415 | |
| | | Canadian National Railway Co. | | 2.850% | | 12/15/21 | | | 75 | | | | 76 | |
| | | Canadian National Railway Co. | | 2.950% | | 11/21/24 | | | 233 | �� | | | 239 | |
| | | Canadian National Railway Co. | | 6.250% | | 8/1/34 | | | 75 | | | | 103 | |
| | | Canadian National Railway Co. | | 6.200% | | 6/1/36 | | | 75 | | | | 104 | |
| | | Canadian National Railway Co. | | 6.375% | | 11/15/37 | | | 100 | | | | 143 | |
| | | Canadian National Railway Co. | | 3.200% | | 8/2/46 | | | 50 | | | | 51 | |
| | | Canadian National Railway Co. | | 3.650% | | 2/3/48 | | | 125 | | | | 136 | |
| | | Canadian Pacific Railway Co. | | 9.450% | | 8/1/21 | | | 50 | | | | 55 | |
| | | Canadian Pacific Railway Co. | | 4.450% | | 3/15/23 | | | 225 | | | | 239 | |
| | | Canadian Pacific Railway Co. | | 7.125% | | 10/15/31 | | | 100 | | | | 139 | |
| | | Canadian Pacific Railway Co. | | 5.950% | | 5/15/37 | | | 450 | | | | 596 | |
| | | Canadian Pacific Railway Co. | | 6.125% | | 9/15/15 | | | 70 | | | | 102 | |
| 3 | | Continental Airlines 2007-1 Class A Pass Through Trust | | 5.983% | | 10/19/23 | | | 49 | | | | 51 | |
| 3 | | Continental Airlines 2012-2 Class A Pass Through Trust | | 4.000% | | 4/29/26 | | | 35 | | | | 37 | |
| | | CSX Corp. | | 4.250% | | 6/1/21 | | | 25 | | | | 26 | |
| | | CSX Corp. | | 3.350% | | 11/1/25 | | | 150 | | | | 159 | |
| | | CSX Corp. | | 3.250% | | 6/1/27 | | | 150 | | | | 157 | |
| | | CSX Corp. | | 3.800% | | 3/1/28 | | | 350 | | | | 381 | |
| | | CSX Corp. | | 4.250% | | 3/15/29 | | | 200 | | | | 225 | |
| | | CSX Corp. | | 2.400% | | 2/15/30 | | | 100 | | | | 98 | |
| | | CSX Corp. | | 6.220% | | 4/30/40 | | | 152 | | | | 206 | |
| | | CSX Corp. | | 5.500% | | 4/15/41 | | | 225 | | | | 282 | |
| | | CSX Corp. | | 4.750% | | 5/30/42 | | | 210 | | | | 246 | |
| | | CSX Corp. | | 4.100% | | 3/15/44 | | | 150 | | | | 163 | |
| | | CSX Corp. | | 4.300% | | 3/1/48 | | | 250 | | | | 281 | |
| | | CSX Corp. | | 4.750% | | 11/15/48 | | | 200 | | | | 242 | |
| | | CSX Corp. | | 4.500% | | 3/15/49 | | | 225 | | | | 261 | |
| | | CSX Corp. | | 3.350% | | 9/15/49 | | | 125 | | | | 123 | |
| | | CSX Corp. | | 3.950% | | 5/1/50 | | | 125 | | | | 135 | |
| | | CSX Corp. | | 4.500% | | 8/1/54 | | | 25 | | | | 29 | |
| | | CSX Corp. | | 4.250% | | 11/1/66 | | | 150 | | | | 160 | |
| | | CSX Corp. | | 4.650% | | 3/1/68 | | | 100 | | | | 114 | |
| 3 | | Delta Air Lines 2007-1 Class A Pass Through Trust | | 6.821% | | 2/10/24 | | | 103 | | | | 112 | |
| 3 | | Delta Air Lines 2015-1 Class AA Pass Through Trust | | 3.625% | | 7/30/27 | | | 41 | | | | 44 | |
| 3 | | Delta Air Lines 2019-1 Class AA Pass Through Trust | | 3.204% | | 4/25/24 | | | 75 | | | | 78 | |
| | | Delta Air Lines Inc. | | 2.600% | | 12/4/20 | | | 125 | | | | 125 | |
| | | Delta Air Lines Inc. | | 3.400% | | 4/19/21 | | | 125 | | | | 126 | |
| | | Delta Air Lines Inc. | | 3.625% | | 3/15/22 | | | 175 | | | | 179 | |
| | | Delta Air Lines Inc. | | 3.800% | | 4/19/23 | | | 125 | | | | 130 | |
| | | Delta Air Lines Inc. | | 2.900% | | 10/28/24 | | | 175 | | | | 175 | |
| | | Delta Air Lines Inc. | | 4.375% | | 4/19/28 | | | 100 | | | | 105 | |
| | | Delta Air Lines Inc. | | 3.750% | | 10/28/29 | | | 75 | | | | 75 | |
| | | FedEx Corp. | | 2.625% | | 8/1/22 | | | 100 | | | | 101 | |
| | | FedEx Corp. | | 4.000% | | 1/15/24 | | | 125 | | | | 134 | |
| | | FedEx Corp. | | 3.200% | | 2/1/25 | | | 150 | | | | 155 | |
| | | FedEx Corp. | | 3.250% | | 4/1/26 | | | 100 | | | | 104 | |
| | | FedEx Corp. | | 3.300% | | 3/15/27 | | | 100 | | | | 103 | |
| | | FedEx Corp. | | 3.900% | | 2/1/35 | | | 200 | | | | 202 | |
| | | FedEx Corp. | | 3.875% | | 8/1/42 | | | 125 | | | | 120 | |
| | | FedEx Corp. | | 4.100% | | 4/15/43 | | | 75 | | | | 73 | |
| | | FedEx Corp. | | 5.100% | | 1/15/44 | | | 150 | | | | 164 | |
| | | FedEx Corp. | | 4.750% | | 11/15/45 | | | 250 | | | | 263 | |
| | | FedEx Corp. | | 4.550% | | 4/1/46 | | | 225 | | | | 230 | |
| | | FedEx Corp. | | 4.400% | | 1/15/47 | | | 125 | | | | 126 | |
| | | FedEx Corp. | | 4.050% | | 2/15/48 | | | 200 | | | | 192 | |
| | | FedEx Corp. | | 4.950% | | 10/17/48 | | | 175 | | | | 190 | |
| | | FedEx Corp. | | 4.500% | | 2/1/65 | | | 60 | | | | 54 | |
| | | JB Hunt Transport Services Inc. | | 3.300% | | 8/15/22 | | | 100 | | | | 103 | |
| | | JB Hunt Transport Services Inc. | | 3.875% | | 3/1/26 | | | 25 | | | | 27 | |
| 3 | | JetBlue 2019-1 Class AA Pass Through Trust | | 2.750% | | 5/15/32 | | | 150 | | | | 151 | |
| | | Kansas City Southern | | 3.000% | | 5/15/23 | | | 250 | | | | 255 | |
| | | Kansas City Southern | | 2.875% | | 11/15/29 | | | 100 | | | | 100 | |
| | | Kansas City Southern | | 4.300% | | 5/15/43 | | | 75 | | | | 82 | |
| | | Kansas City Southern | | 4.950% | | 8/15/45 | | | 125 | | | | 147 | |
| | | Kansas City Southern | | 4.700% | | 5/1/48 | | | 225 | | | | 260 | |
| | | Kirby Corp. | | 4.200% | | 3/1/28 | | | 300 | | | | 316 | |
| 3 | | Latam Airlines 2015-1 Pass Through Trust A | | 4.200% | | 8/15/29 | | | 98 | | | | 101 | |
| | | Norfolk Southern Corp. | | 3.000% | | 4/1/22 | | | 225 | | | | 230 | |
| | | Norfolk Southern Corp. | | 2.903% | | 2/15/23 | | | 48 | | | | 49 | |
| | | Norfolk Southern Corp. | | 3.850% | | 1/15/24 | | | 250 | | | | 265 | |
| | | Norfolk Southern Corp. | | 5.590% | | 5/17/25 | | | 50 | | | | 58 | |
| | | Norfolk Southern Corp. | | 3.650% | | 8/1/25 | | | 50 | | | | 53 | |
| | | Norfolk Southern Corp. | | 7.800% | | 5/15/27 | | | 60 | | | | 79 | |
| | | Norfolk Southern Corp. | | 3.150% | | 6/1/27 | | | 125 | | | | 130 | |
| | | Norfolk Southern Corp. | | 3.800% | | 8/1/28 | | | 113 | | | | 124 | |
| | | Norfolk Southern Corp. | | 2.550% | | 11/1/29 | | | 200 | | | | 199 | |
| | | Norfolk Southern Corp. | | 4.837% | | 10/1/41 | | | 113 | | | | 134 | |
| | | Norfolk Southern Corp. | | 4.450% | | 6/15/45 | | | 75 | | | | 86 | |
| | | Norfolk Southern Corp. | | 4.650% | | 1/15/46 | | | 75 | | | | 88 | |
| | | Norfolk Southern Corp. | | 4.150% | | 2/28/48 | | | 25 | | | | 28 | |
| | | Norfolk Southern Corp. | | 4.100% | | 5/15/49 | | | 73 | | | | 80 | |
| | | Norfolk Southern Corp. | | 3.400% | | 11/1/49 | | | 75 | | | | 74 | |
| | | Norfolk Southern Corp. | | 4.050% | | 8/15/52 | | | 239 | | | | 262 | |
| | | Norfolk Southern Corp. | | 6.000% | | 3/15/05 | | | 59 | | | | 78 | |
| | | Norfolk Southern Corp. | | 5.100% | | 8/1/18 | | | 250 | | | | 294 | |
| | | Ryder System Inc. | | 3.500% | | 6/1/21 | | | 200 | | | | 204 | |
| | | Ryder System Inc. | | 2.250% | | 9/1/21 | | | 50 | | | | 50 | |
| | | Ryder System Inc. | | 2.875% | | 6/1/22 | | | 75 | | | | 76 | |
| | | Ryder System Inc. | | 3.400% | | 3/1/23 | | | 75 | | | | 77 | |
| | | Ryder System Inc. | | 3.750% | | 6/9/23 | | | 225 | | | | 235 | |
| | | Ryder System Inc. | | 3.650% | | 3/18/24 | | | 150 | | | | 157 | |
| | | Ryder System Inc. | | 2.500% | | 9/1/24 | | | 50 | | | | 50 | |
| | | Ryder System Inc. | | 2.900% | | 12/1/26 | | | 100 | | | | 101 | |
| | | Southwest Airlines Co. | | 3.000% | | 11/15/26 | | | 100 | | | | 102 | |
| | | Southwest Airlines Co. | | 3.450% | | 11/16/27 | | | 50 | | | | 52 | |
| 3 | | Southwest Airlines Co. 2007-1 Pass Through Trust | | 6.150% | | 2/1/24 | | | 20 | | | | 21 | |
| 3 | | Spirit Airlines Class A Pass Through Certificates Series 2015-1 | | 4.100% | | 10/1/29 | | | 19 | | | | 20 | |
| | | Union Pacific Corp. | | 3.200% | | 6/8/21 | | | 100 | | | | 102 | |
| | | Union Pacific Corp. | | 2.950% | | 3/1/22 | | | 100 | | | | 102 | |
| | | Union Pacific Corp. | | 4.163% | | 7/15/22 | | | 534 | | | | 561 | |
| | | Union Pacific Corp. | | 2.950% | | 1/15/23 | | | 25 | | | | 26 | |
| | | Union Pacific Corp. | | 3.500% | | 6/8/23 | | | 150 | | | | 157 | |
| | | Union Pacific Corp. | | 3.646% | | 2/15/24 | | | 50 | | | | 53 | |
| | | Union Pacific Corp. | | 3.150% | | 3/1/24 | | | 100 | | | | 104 | |
| | | Union Pacific Corp. | | 3.250% | | 1/15/25 | | | 200 | | | | 208 | |
| | | Union Pacific Corp. | | 3.750% | | 7/15/25 | | | 125 | | | | 134 | |
| | | Union Pacific Corp. | | 3.250% | | 8/15/25 | | | 50 | | | | 53 | |
| | | Union Pacific Corp. | | 2.750% | | 3/1/26 | | | 75 | | | | 77 | |
| | | Union Pacific Corp. | | 3.950% | | 9/10/28 | | | 200 | | | | 220 | |
| | | Union Pacific Corp. | | 3.700% | | 3/1/29 | | | 200 | | | | 218 | |
| | | Union Pacific Corp. | | 3.375% | | 2/1/35 | | | 100 | | | | 103 | |
| | | Union Pacific Corp. | | 3.600% | | 9/15/37 | | | 290 | | | | 302 | |
| | | Union Pacific Corp. | | 4.375% | | 9/10/38 | | | 125 | | | | 143 | |
| | | Union Pacific Corp. | | 4.050% | | 11/15/45 | | | 150 | | | | 162 | |
| | | Union Pacific Corp. | | 4.300% | | 3/1/49 | | | 200 | | | | 229 | |
| | | Union Pacific Corp. | | 3.799% | | 10/1/51 | | | 560 | | | | 594 | |
| | | Union Pacific Corp. | | 3.875% | | 2/1/55 | | | 100 | | | | 105 | |
| | | Union Pacific Corp. | | 3.950% | | 8/15/59 | | | 100 | | | | 105 | |
| 6 | | Union Pacific Corp. | | 3.839% | | 3/20/60 | | | 386 | | | | 386 | |
Total Bond Market Index Portfolio
| | | | | | | | | Face | | | Market | |
| | | | | | | Maturity | | Amount | | | Value• | |
| | | | | Coupon | | Date | | | ($000 | ) | | | ($000 | ) |
| | | Union Pacific Corp. | | 4.375% | | 11/15/65 | | | 135 | | | | 148 | |
| | | Union Pacific Corp. | | 4.100% | | 9/15/67 | | | 100 | | | | 103 | |
| 3 | | United Airlines 2013-1 Class A Pass Through Trust | | 4.300% | | 2/15/27 | | | 56 | | | | 60 | |
| 3 | | United Airlines 2014-1 Class A Pass Through Trust | | 4.000% | | 10/11/27 | | | 75 | | | | 79 | |
| 3 | | United Airlines 2015-1 Class A Pass Through Trust | | 3.700% | | 6/1/24 | | | 60 | | | | 61 | |
| 3 | | United Airlines 2015-1 Class AA Pass Through Trust | | 3.450% | | 12/1/27 | | | 145 | | | | 150 | |
| 3 | | United Airlines 2016-1 Class A Pass Through Trust | | 3.450% | | 1/7/30 | | | 45 | | | | 46 | |
| 3 | | United Airlines 2016-1 Class AA Pass Through Trust | | 3.100% | | 7/7/28 | | | 358 | | | | 365 | |
| 3 | | United Airlines 2016-2 Class A Pass Through Trust | | 3.100% | | 10/7/28 | | | 45 | | | | 45 | |
| 3 | | United Airlines 2016-2 Class AA Pass Through Trust | | 2.875% | | 10/7/28 | | | 67 | | | | 68 | |
| 3 | | United Airlines 2019-1 Class AA Pass Through Trust | | 4.150% | | 8/25/31 | | | 200 | | | | 216 | |
| 3 | | United Airlines 2019-2 Class AA Pass Through Trust | | 2.700% | | 11/1/33 | | | 100 | | | | 100 | |
| | | United Parcel Service Inc. | | 3.125% | | 1/15/21 | | | 250 | | | | 253 | |
| | | United Parcel Service Inc. | | 2.050% | | 4/1/21 | | | 150 | | | | 150 | |
| | | United Parcel Service Inc. | | 2.450% | | 10/1/22 | | | 175 | | | | 178 | |
| | | United Parcel Service Inc. | | 2.500% | | 4/1/23 | | | 200 | | | | 203 | |
| | | United Parcel Service Inc. | | 2.800% | | 11/15/24 | | | 186 | | | | 192 | |
| | | United Parcel Service Inc. | | 2.400% | | 11/15/26 | | | 150 | | | | 151 | |
| | | United Parcel Service Inc. | | 3.050% | | 11/15/27 | | | 200 | | | | 210 | |
| | | United Parcel Service Inc. | | 3.400% | | 3/15/29 | | | 100 | | | | 107 | |
| | | United Parcel Service Inc. | | 2.500% | | 9/1/29 | | | 100 | | | | 100 | |
| | | United Parcel Service Inc. | | 6.200% | | 1/15/38 | | | 278 | | | | 390 | |
| | | United Parcel Service Inc. | | 4.875% | | 11/15/40 | | | 75 | | | | 91 | |
| | | United Parcel Service Inc. | | 3.625% | | 10/1/42 | | | 75 | | | | 77 | |
| | | United Parcel Service Inc. | | 3.400% | | 11/15/46 | | | 110 | | | | 110 | |
| | | United Parcel Service Inc. | | 3.750% | | 11/15/47 | | | 200 | | | | 214 | |
| | | United Parcel Service Inc. | | 4.250% | | 3/15/49 | | | 125 | | | | 145 | |
| | | United Parcel Service Inc. | | 3.400% | | 9/1/49 | | | 150 | | | | 152 | |
| 3 | | US Airways 2012-2 Class A Pass Through Trust | | 4.625% | | 12/3/26 | | | 30 | | | | 32 | |
| 3 | | US Airways 2013-1 Class A Pass Through Trust | | 3.950% | | 5/15/27 | | | 65 | | | | 68 | |
| | | | | | | | | | | | | | 697,714 | |
| | | | | | | | | | | | | | | |
| Utilities (2.0%) | | | | | | | | | | | | |
| | | Electric (1.8%) | | | | | | | | | | | | |
| | | AEP Texas Inc. | | 2.400% | | 10/1/22 | | | 75 | | | | 76 | |
| | | AEP Texas Inc. | | 3.950% | | 6/1/28 | | | 100 | | | | 109 | |
| | | AEP Texas Inc. | | 3.800% | | 10/1/47 | | | 50 | | | | 52 | |
| | | AEP Texas Inc. | | 3.450% | | 1/15/50 | | | 50 | | | | 50 | |
| | | AEP Transmission Co. LLC | | 4.000% | | 12/1/46 | | | 75 | | | | 83 | |
| | | AEP Transmission Co. LLC | | 3.750% | | 12/1/47 | | | 100 | | | | 107 | |
| | | AEP Transmission Co. LLC | | 3.800% | | 6/15/49 | | | 70 | | | | 75 | |
| | | AEP Transmission Co. LLC | | 3.150% | | 9/15/49 | | | 70 | | | | 68 | |
| | | Alabama Power Co. | | 6.125% | | 5/15/38 | | | 50 | | | | 67 | |
| | | Alabama Power Co. | | 3.850% | | 12/1/42 | | | 25 | | | | 27 | |
| | | Alabama Power Co. | | 4.150% | | 8/15/44 | | | 75 | | | | 83 | |
| | | Alabama Power Co. | | 3.750% | | 3/1/45 | | | 150 | | | | 157 | |
| | | Alabama Power Co. | | 4.300% | | 1/2/46 | | | 250 | | | | 284 | |
| | | Alabama Power Co. | | 3.700% | | 12/1/47 | | | 100 | | | | 105 | |
| | | Alabama Power Co. | | 4.300% | | 7/15/48 | | | 100 | | | | 115 | |
| | | Alabama Power Co. | | 3.450% | | 10/1/49 | | | 50 | | | | 51 | |
| | | Ameren Corp. | | 2.500% | | 9/15/24 | | | 100 | | | | 101 | |
| | | Ameren Corp. | | 3.650% | | 2/15/26 | | | 80 | | | | 84 | |
| | | Ameren Illinois Co. | | 2.700% | | 9/1/22 | | | 250 | | | | 254 | |
| | | Ameren Illinois Co. | | 3.800% | | 5/15/28 | | | 75 | | | | 82 | |
| | | Ameren Illinois Co. | | 3.700% | | 12/1/47 | | | 150 | | | | 159 | |
| | | Ameren Illinois Co. | | 3.250% | | 3/15/50 | | | 60 | | | | 61 | |
| | | American Electric Power Co. Inc. | | 3.650% | | 12/1/21 | | | 100 | | | | 103 | |
| | | American Electric Power Co. Inc. | | 2.950% | | 12/15/22 | | | 25 | | | | 26 | |
| | | American Electric Power Co. Inc. | | 3.200% | | 11/13/27 | | | 75 | | | | 77 | |
| | | American Electric Power Co. Inc. | | 4.300% | | 12/1/28 | | | 150 | | | | 166 | |
| | | Appalachian Power Co. | | 4.600% | | 3/30/21 | | | 50 | | | | 51 | |
| | | Appalachian Power Co. | | 3.300% | | 6/1/27 | | | 500 | | | | 518 | |
| | | Appalachian Power Co. | | 4.500% | | 3/1/49 | | | 425 | | | | 493 | |
| | | Arizona Public Service Co. | | 3.150% | | 5/15/25 | | | 100 | | | | 104 | |
| | | Arizona Public Service Co. | | 2.950% | | 9/15/27 | | | 50 | | | | 51 | |
| | | Arizona Public Service Co. | | 4.500% | | 4/1/42 | | | 25 | | | | 29 | |
| | | Arizona Public Service Co. | | 4.350% | | 11/15/45 | | | 125 | | | | 142 | |
| | | Arizona Public Service Co. | | 3.750% | | 5/15/46 | | | 125 | | | | 130 | |
| | | Arizona Public Service Co. | | 4.250% | | 3/1/49 | | | 100 | | | | 113 | |
| | | Arizona Public Service Co. | | 3.500% | | 12/1/49 | | | 60 | | | | 60 | |
| | | Avangrid Inc. | | 3.150% | | 12/1/24 | | | 230 | | | | 237 | |
| | | Avangrid Inc. | | 3.800% | | 6/1/29 | | | 95 | | | | 100 | |
| | | Avista Corp. | | 4.350% | | 6/1/48 | | | 75 | | | | 85 | |
| | | Baltimore Gas & Electric Co. | | 3.500% | | 11/15/21 | | | 350 | | | | 359 | |
| | | Baltimore Gas & Electric Co. | | 2.400% | | 8/15/26 | | | 50 | | | | 50 | |
| | | Baltimore Gas & Electric Co. | | 3.500% | | 8/15/46 | | | 100 | | | | 102 | |
| | | Baltimore Gas & Electric Co. | | 3.750% | | 8/15/47 | | | 125 | | | | 133 | |
| | | Baltimore Gas & Electric Co. | | 4.250% | | 9/15/48 | | | 50 | | | | 58 | |
| | | Baltimore Gas & Electric Co. | | 3.200% | | 9/15/49 | | | 80 | | | | 78 | |
| | | Berkshire Hathaway Energy Co. | | 2.375% | | 1/15/21 | | | 100 | | | | 100 | |
| | | Berkshire Hathaway Energy Co. | | 2.800% | | 1/15/23 | | | 125 | | | | 127 | |
| | | Berkshire Hathaway Energy Co. | | 3.750% | | 11/15/23 | | | 100 | | | | 106 | |
| | | Berkshire Hathaway Energy Co. | | 3.500% | | 2/1/25 | | | 100 | | | | 105 | |
| | | Berkshire Hathaway Energy Co. | | 3.250% | | 4/15/28 | | | 125 | | | | 130 | |
| | | Berkshire Hathaway Energy Co. | | 6.125% | | 4/1/36 | | | 100 | | | | 138 | |
| | | Berkshire Hathaway Energy Co. | | 5.950% | | 5/15/37 | | | 225 | | | | 304 | |
| | | Berkshire Hathaway Energy Co. | | 6.500% | | 9/15/37 | | | 200 | | | | 277 | |
| | | Berkshire Hathaway Energy Co. | | 5.150% | | 11/15/43 | | | 150 | | | | 188 | |
| | | Berkshire Hathaway Energy Co. | | 4.500% | | 2/1/45 | | | 150 | | | | 177 | |
| | | Berkshire Hathaway Energy Co. | | 3.800% | | 7/15/48 | | | 50 | | | | 53 | |
| | | Berkshire Hathaway Energy Co. | | 4.450% | | 1/15/49 | | | 200 | | | | 234 | |
| | | Black Hills Corp. | | 4.250% | | 11/30/23 | | | 100 | | | | 106 | |
| | | Black Hills Corp. | | 3.950% | | 1/15/26 | | | 75 | | | | 79 | |
| | | Black Hills Corp. | | 3.150% | | 1/15/27 | | | 75 | | | | 76 | |
| | | Black Hills Corp. | | 3.050% | | 10/15/29 | | | 70 | | | | 70 | |
| | | Black Hills Corp. | | 4.350% | | 5/1/33 | | | 75 | | | | 82 | |
| | | Black Hills Corp. | | 4.200% | | 9/15/46 | | | 50 | | | | 52 | |
| | | Black Hills Corp. | | 3.875% | | 10/15/49 | | | 70 | | | | 70 | |
| | | CenterPoint Energy Houston Electric LLC | | 1.850% | | 6/1/21 | | | 250 | | | | 250 | |
| | | CenterPoint Energy Houston Electric LLC | | 2.400% | | 9/1/26 | | | 300 | | | | 296 | |
| | | CenterPoint Energy Houston Electric LLC | | 6.950% | | 3/15/33 | | | 50 | | | | 70 | |
| | | CenterPoint Energy Houston Electric LLC | | 3.950% | | 3/1/48 | | | 75 | | | | 83 | |
| | | CenterPoint Energy Houston Electric LLC | | 4.250% | | 2/1/49 | | | 150 | | | | 176 | |
| | | CenterPoint Energy Inc. | | 3.600% | | 11/1/21 | | | 75 | | | | 77 | |
| | | CenterPoint Energy Inc. | | 2.500% | | 9/1/22 | | | 100 | | | | 101 | |
| | | CenterPoint Energy Inc. | | 3.850% | | 2/1/24 | | | 325 | | | | 341 | |
| | | CenterPoint Energy Inc. | | 2.500% | | 9/1/24 | | | 100 | | | | 100 | |
| | | CenterPoint Energy Inc. | | 4.250% | | 11/1/28 | | | 75 | | | | 81 | |
| | | CenterPoint Energy Inc. | | 2.950% | | 3/1/30 | | | 80 | | | | 79 | |
| | | CenterPoint Energy Inc. | | 3.700% | | 9/1/49 | | | 50 | | | | 49 | |
| | | Cleco Corporate Holdings LLC | | 3.743% | | 5/1/26 | | | 100 | | | | 103 | |
| | | Cleco Corporate Holdings LLC | | 4.973% | | 5/1/46 | | | 125 | | | | 138 | |
| | | Cleveland Electric Illuminating Co. | | 5.500% | | 8/15/24 | | | 225 | | | | 257 | |
| | | Cleveland Electric Illuminating Co. | | 5.950% | | 12/15/36 | | | 75 | | | | 94 | |
| | | CMS Energy Corp. | | 5.050% | | 3/15/22 | | | 25 | | | | 26 | |
| | | CMS Energy Corp. | | 3.000% | | 5/15/26 | | | 75 | | | | 76 | |
| | | CMS Energy Corp. | | 3.450% | | 8/15/27 | | | 50 | | | | 52 | |
| | | CMS Energy Corp. | | 4.875% | | 3/1/44 | | | 75 | | | | 89 | |
| | | Commonwealth Edison Co. | | 2.950% | | 8/15/27 | | | 75 | | | | 77 | |
| | | Commonwealth Edison Co. | | 5.900% | | 3/15/36 | | | 150 | | | | 199 | |
| | | Commonwealth Edison Co. | | 6.450% | | 1/15/38 | | | 175 | | | | 249 | |
| | | Commonwealth Edison Co. | | 4.600% | | 8/15/43 | | | 75 | | | | 89 | |
| | | Commonwealth Edison Co. | | 4.700% | | 1/15/44 | | | 175 | | | | 211 | |
| | | Commonwealth Edison Co. | | 3.700% | | 3/1/45 | | | 75 | | | | 80 | |
| | | Commonwealth Edison Co. | | 3.650% | | 6/15/46 | | | 175 | | | | 184 | |
| | | Commonwealth Edison Co. | | 3.750% | | 8/15/47 | | | 100 | | | | 108 | |
Total Bond Market Index Portfolio
| | | | | | | | | Face | | | Market | |
| | | | | | | Maturity | | Amount | | | Value• | |
| | | | | Coupon | | Date | | | ($000 | ) | | | ($000 | ) |
| | | Commonwealth Edison Co. | | 4.000% | | 3/1/48 | | | 150 | | | | 167 | |
| | | Commonwealth Edison Co. | | 4.000% | | 3/1/49 | | | 125 | | | | 141 | |
| | | Connecticut Light & Power Co. | | 2.500% | | 1/15/23 | | | 125 | | | | 127 | |
| | | Connecticut Light & Power Co. | | 3.200% | | 3/15/27 | | | 50 | | | | 52 | |
| | | Connecticut Light & Power Co. | | 4.300% | | 4/15/44 | | | 150 | | | | 176 | |
| | | Connecticut Light & Power Co. | | 4.000% | | 4/1/48 | | | 160 | | | | 183 | |
| | | Consolidated Edison Co. of New York Inc. | | 5.300% | | 3/1/35 | | | 200 | | | | 245 | |
| | | Consolidated Edison Co. of New York Inc. | | 5.850% | | 3/15/36 | | | 275 | | | | 358 | |
| | | Consolidated Edison Co. of New York Inc. | | 6.200% | | 6/15/36 | | | 75 | | | | 101 | |
| | | Consolidated Edison Co. of New York Inc. | | 3.950% | | 3/1/43 | | | 125 | | | | 135 | |
| | | Consolidated Edison Co. of New York Inc. | | 4.450% | | 3/15/44 | | | 200 | | | | 230 | |
| | | Consolidated Edison Co. of New York Inc. | | 4.500% | | 12/1/45 | | | 375 | | | | 437 | |
| | | Consolidated Edison Co. of New York Inc. | | 3.850% | | 6/15/46 | | | 145 | | | | 156 | |
| | | Consolidated Edison Co. of New York Inc. | | 3.875% | | 6/15/47 | | | 75 | | | | 81 | |
| | | Consolidated Edison Co. of New York Inc. | | 4.125% | | 5/15/49 | | | 400 | | | | 452 | |
| | | Consolidated Edison Co. of New York Inc. | | 4.000% | | 11/15/57 | | | 75 | | | | 79 | |
| | | Consolidated Edison Co. of New York Inc. | | 4.500% | | 5/15/58 | | | 120 | | | | 139 | |
| | | Consolidated Edison Inc. | | 2.000% | | 5/15/21 | | | 75 | | | | 75 | |
| | | Consumers Energy Co. | | 3.375% | | 8/15/23 | | | 275 | | | | 287 | |
| | | Consumers Energy Co. | | 3.800% | | 11/15/28 | | | 75 | | | | 83 | |
| | | Consumers Energy Co. | | 3.950% | | 5/15/43 | | | 75 | | | | 83 | |
| | | Consumers Energy Co. | | 3.250% | | 8/15/46 | | | 50 | | | | 50 | |
| | | Consumers Energy Co. | | 3.950% | | 7/15/47 | | | 50 | | | | 56 | |
| | | Consumers Energy Co. | | 4.050% | | 5/15/48 | | | 125 | | | | 143 | |
| | | Consumers Energy Co. | | 4.350% | | 4/15/49 | | | 80 | | | | 97 | |
| | | Consumers Energy Co. | | 3.100% | | 8/15/50 | | | 80 | | | | 80 | |
| | | Delmarva Power & Light Co. | | 3.500% | | 11/15/23 | | | 25 | | | | 26 | |
| | | Delmarva Power & Light Co. | | 4.150% | | 5/15/45 | | | 100 | | | | 112 | |
| | | Dominion Energy Inc. | | 2.715% | | 8/15/21 | | | 50 | | | | 50 | |
| | | Dominion Energy Inc. | | 3.071% | | 8/15/24 | | | 75 | | | | 76 | |
| | | Dominion Energy Inc. | | 3.900% | | 10/1/25 | | | 125 | | | | 133 | |
| | | Dominion Energy Inc. | | 2.850% | | 8/15/26 | | | 125 | | | | 126 | |
| | | Dominion Energy Inc. | | 4.250% | | 6/1/28 | | | 125 | | | | 138 | |
| | | Dominion Energy Inc. | | 6.300% | | 3/15/33 | | | 75 | | | | 97 | |
| | | Dominion Energy Inc. | | 5.950% | | 6/15/35 | | | 225 | | | | 284 | |
| | | Dominion Energy Inc. | | 4.900% | | 8/1/41 | | | 80 | | | | 93 | |
| | | Dominion Energy Inc. | | 4.050% | | 9/15/42 | | | 300 | | | | 314 | |
| | | Dominion Energy Inc. | | 4.600% | | 3/15/49 | | | 300 | | | | 348 | |
| 3 | | Dominion Energy Inc. | | 5.750% | | 10/1/54 | | | 100 | | | | 108 | |
| | | Dominion Energy South Carolina Inc. | | 6.625% | | 2/1/32 | | | 50 | | | | 67 | |
| | | Dominion Energy South Carolina Inc. | | 6.050% | | 1/15/38 | | | 125 | | | | 168 | |
| | | Dominion Energy South Carolina Inc. | | 5.450% | | 2/1/41 | | | 75 | | | | 97 | |
| | | Dominion Energy South Carolina Inc. | | 4.600% | | 6/15/43 | | | 75 | | | | 88 | |
| | | DTE Electric Co. | | 3.650% | | 3/15/24 | | | 250 | | | | 264 | |
| | | DTE Electric Co. | | 3.375% | | 3/1/25 | | | 150 | | | | 158 | |
| | | DTE Electric Co. | | 4.000% | | 4/1/43 | | | 225 | | | | 250 | |
| | | DTE Electric Co. | | 3.700% | | 6/1/46 | | | 50 | | | | 54 | |
| | | DTE Electric Co. | | 3.750% | | 8/15/47 | | | 100 | | | | 109 | |
| | | DTE Electric Co. | | 3.950% | | 3/1/49 | | | 128 | | | | 146 | |
| | | DTE Energy Co. | | 2.600% | | 6/15/22 | | | 50 | | | | 50 | |
| | | DTE Energy Co. | | 2.250% | | 11/1/22 | | | 400 | | | | 400 | |
| | | DTE Energy Co. | | 3.700% | | 8/1/23 | | | 125 | | | | 130 | |
| | | DTE Energy Co. | | 2.529% | | 10/1/24 | | | 100 | | | | 100 | |
| | | DTE Energy Co. | | 2.850% | | 10/1/26 | | | 300 | | | | 300 | |
| | | DTE Energy Co. | | 3.800% | | 3/15/27 | | | 175 | | | | 184 | |
| | | DTE Energy Co. | | 3.400% | | 6/15/29 | | | 100 | | | | 102 | |
| | | DTE Energy Co. | | 2.950% | | 3/1/30 | | | 60 | | | | 59 | |
| | | DTE Energy Co. | | 6.375% | | 4/15/33 | | | 75 | | | | 98 | |
| | | Duke Energy Carolinas LLC | | 3.900% | | 6/15/21 | | | 500 | | | | 512 | |
| | | Duke Energy Carolinas LLC | | 2.500% | | 3/15/23 | | | 100 | | | | 101 | |
| | | Duke Energy Carolinas LLC | | 3.050% | | 3/15/23 | | | 100 | | | | 103 | |
| | | Duke Energy Carolinas LLC | | 2.950% | | 12/1/26 | | | 100 | | | | 103 | |
| | | Duke Energy Carolinas LLC | | 3.950% | | 11/15/28 | | | 125 | | | | 139 | |
| | | Duke Energy Carolinas LLC | | 6.000% | | 12/1/28 | | | 125 | | | | 156 | |
| | | Duke Energy Carolinas LLC | | 2.450% | | 8/15/29 | | | 200 | | | | 198 | |
| | | Duke Energy Carolinas LLC | | 6.100% | | 6/1/37 | | | 100 | | | | 135 | |
| | | Duke Energy Carolinas LLC | | 6.000% | | 1/15/38 | | | 25 | | | | 34 | |
| | | Duke Energy Carolinas LLC | | 6.050% | | 4/15/38 | | | 25 | | | | 34 | |
| | | Duke Energy Carolinas LLC | | 5.300% | | 2/15/40 | | | 150 | | | | 193 | |
| | | Duke Energy Carolinas LLC | | 4.000% | | 9/30/42 | | | 75 | | | | 83 | |
| | | Duke Energy Carolinas LLC | | 3.875% | | 3/15/46 | | | 100 | | | | 111 | |
| | | Duke Energy Carolinas LLC | | 3.700% | | 12/1/47 | | | 100 | | | | 107 | |
| | | Duke Energy Carolinas LLC | | 3.950% | | 3/15/48 | | | 300 | | | | 331 | |
| | | Duke Energy Carolinas LLC | | 3.200% | | 8/15/49 | | | 500 | | | | 493 | |
| | | Duke Energy Corp. | | 2.400% | | 8/15/22 | | | 200 | | | | 201 | |
| | | Duke Energy Corp. | | 3.050% | | 8/15/22 | | | 275 | | | | 281 | |
| | | Duke Energy Corp. | | 3.750% | | 4/15/24 | | | 325 | | | | 344 | |
| | | Duke Energy Corp. | | 2.650% | | 9/1/26 | | | 80 | | | | 80 | |
| | | Duke Energy Corp. | | 3.150% | | 8/15/27 | | | 300 | | | | 308 | |
| | | Duke Energy Corp. | | 4.800% | | 12/15/45 | | | 125 | | | | 148 | |
| | | Duke Energy Corp. | | 3.750% | | 9/1/46 | | | 405 | | | | 414 | |
| | | Duke Energy Florida LLC | | 3.800% | | 7/15/28 | | | 100 | | | | 109 | |
| | | Duke Energy Florida LLC | | 2.500% | | 12/1/29 | | | 425 | | | | 424 | |
| | | Duke Energy Florida LLC | | 6.350% | | 9/15/37 | | | 225 | | | | 312 | |
| | | Duke Energy Florida LLC | | 6.400% | | 6/15/38 | | | 200 | | | | 284 | |
| | | Duke Energy Florida LLC | | 3.850% | | 11/15/42 | | | 200 | | | | 215 | |
| | | Duke Energy Florida LLC | | 3.400% | | 10/1/46 | | | 100 | | | | 101 | |
| | | Duke Energy Florida LLC | | 4.200% | | 7/15/48 | | | 200 | | | | 230 | |
| 3 | | Duke Energy Florida Project Finance LLC | | 1.731% | | 9/1/22 | | | 50 | | | | 50 | |
| 3 | | Duke Energy Florida Project Finance LLC | | 2.538% | | 9/1/29 | | | 100 | | | | 99 | |
| | | Duke Energy Indiana LLC | | 6.350% | | 8/15/38 | | | 225 | | | | 316 | |
| | | Duke Energy Indiana LLC | | 3.750% | | 5/15/46 | | | 225 | | | | 240 | |
| | | Duke Energy Indiana LLC | | 3.250% | | 10/1/49 | | | 325 | | | | 326 | |
| | | Duke Energy Ohio Inc. | | 3.700% | | 6/15/46 | | | 25 | | | | 26 | |
| | | Duke Energy Progress LLC | | 2.800% | | 5/15/22 | | | 100 | | | | 102 | |
| | | Duke Energy Progress LLC | | 3.375% | | 9/1/23 | | | 25 | | | | 26 | |
| | | Duke Energy Progress LLC | | 3.700% | | 9/1/28 | | | 175 | | | | 191 | |
| | | Duke Energy Progress LLC | | 3.450% | | 3/15/29 | | | 125 | | | | 134 | |
| | | Duke Energy Progress LLC | | 4.375% | | 3/30/44 | | | 300 | | | | 348 | |
| | | Duke Energy Progress LLC | | 4.150% | | 12/1/44 | | | 100 | | | | 112 | |
| | | Duke Energy Progress LLC | | 3.700% | | 10/15/46 | | | 50 | | | | 53 | |
| | | Duke Energy Progress LLC | | 3.600% | | 9/15/47 | | | 100 | | | | 104 | |
| | | Edison International | | 2.400% | | 9/15/22 | | | 125 | | | | 124 | |
| | | Edison International | | 3.125% | | 11/15/22 | | | 80 | | | | 81 | |
| | | Edison International | | 2.950% | | 3/15/23 | | | 200 | | | | 200 | |
| | | Edison International | | 5.750% | | 6/15/27 | | | 25 | | | | 28 | |
| | | El Paso Electric Co. | | 6.000% | | 5/15/35 | | | 50 | | | | 61 | |
| | | El Paso Electric Co. | | 5.000% | | 12/1/44 | | | 75 | | | | 88 | |
| | | Emera US Finance LP | | 2.700% | | 6/15/21 | | | 125 | | | | 126 | |
| | | Emera US Finance LP | | 3.550% | | 6/15/26 | | | 150 | | | | 156 | |
| | | Emera US Finance LP | | 4.750% | | 6/15/46 | | | 245 | | | | 283 | |
| | | Enel Chile SA | | 4.875% | | 6/12/28 | | | 125 | | | | 139 | |
| | | Entergy Arkansas Inc. | | 3.750% | | 2/15/21 | | | 50 | | | | 51 | |
| | | Entergy Arkansas Inc. | | 3.500% | | 4/1/26 | | | 50 | | | | 53 | |
| | | Entergy Corp. | | 4.000% | | 7/15/22 | | | 150 | | | | 156 | |
| | | Entergy Corp. | | 2.950% | | 9/1/26 | | | 200 | | | | 203 | |
| | | Entergy Gulf States Louisiana LLC | | 5.590% | | 10/1/24 | | | 223 | | | | 256 | |
| | | Entergy Louisiana LLC | | 5.400% | | 11/1/24 | | | 382 | | | | 436 | |
| | | Entergy Louisiana LLC | | 2.400% | | 10/1/26 | | | 75 | | | | 74 | |
| | | Entergy Louisiana LLC | | 3.120% | | 9/1/27 | | | 100 | | | | 103 | |
| | | Entergy Louisiana LLC | | 3.050% | | 6/1/31 | | | 100 | | | | 102 | |
| | | Entergy Louisiana LLC | | 4.000% | | 3/15/33 | | | 150 | | | | 168 | |
| | | Entergy Louisiana LLC | | 4.950% | | 1/15/45 | | | 150 | | | | 162 | |
| | | Entergy Louisiana LLC | | 4.200% | | 9/1/48 | | | 200 | | | | 231 | |
| | | Entergy Louisiana LLC | | 4.200% | | 4/1/50 | | | 100 | | | | 116 | |
| | | Entergy Mississippi LLC | | 2.850% | | 6/1/28 | | | 125 | | | | 127 | |
| | | Entergy Texas Inc. | | 3.550% | | 9/30/49 | | | 60 | | | | 61 | |
| | | Evergy Inc. | | 2.450% | | 9/15/24 | | | 50 | | | | 50 | |
| | | Evergy Inc. | | 2.900% | | 9/15/29 | | | 100 | | | | 99 | |
Total Bond Market Index Portfolio
| | | | | | | | | Face | | | Market | |
| | | | | | | Maturity | | Amount | | | Value• | |
| | | | | Coupon | | Date | | | ($000 | ) | | | ($000 | ) |
| | | Eversource Energy | | 2.500% | | 3/15/21 | | | 100 | | | | 101 | |
| | | Eversource Energy | | 2.750% | | 3/15/22 | | | 75 | | | | 76 | |
| | | Eversource Energy | | 3.800% | | 12/1/23 | | | 75 | | | | 78 | |
| | | Eversource Energy | | 2.900% | | 10/1/24 | | | 50 | | | | 51 | |
| | | Eversource Energy | | 3.150% | | 1/15/25 | | | 125 | | | | 129 | |
| | | Eversource Energy | | 3.300% | | 1/15/28 | | | 100 | | | | 103 | |
| | | Eversource Energy | | 4.250% | | 4/1/29 | | | 200 | | | | 221 | |
| | | Exelon Corp. | | 5.150% | | 12/1/20 | | | 200 | | | | 204 | |
| | | Exelon Corp. | | 3.497% | | 6/1/22 | | | 200 | | | | 205 | |
| | | Exelon Corp. | | 3.950% | | 6/15/25 | | | 200 | | | | 215 | |
| | | Exelon Corp. | | 3.400% | | 4/15/26 | | | 200 | | | | 209 | |
| | | Exelon Corp. | | 4.950% | | 6/15/35 | | | 225 | | | | 259 | |
| | | Exelon Corp. | | 5.625% | | 6/15/35 | | | 20 | | | | 25 | |
| | | Exelon Corp. | | 5.100% | | 6/15/45 | | | 145 | | | | 174 | |
| | | Exelon Corp. | | 4.450% | | 4/15/46 | | | 175 | | | | 197 | |
| | | Exelon Generation Co. LLC | | 6.250% | | 10/1/39 | | | 360 | | | | 435 | |
| | | Exelon Generation Co. LLC | | 5.750% | | 10/1/41 | | | 75 | | | | 86 | |
| | | Exelon Generation Co. LLC | | 5.600% | | 6/15/42 | | | 155 | | | | 173 | |
| | | FirstEnergy Corp. | | 2.850% | | 7/15/22 | | | 100 | | | | 101 | |
| | | FirstEnergy Corp. | | 3.900% | | 7/15/27 | | | 300 | | | | 320 | |
| | | FirstEnergy Corp. | | 7.375% | | 11/15/31 | | | 475 | | | | 668 | |
| | | FirstEnergy Corp. | | 4.850% | | 7/15/47 | | | 200 | | | | 237 | |
| | | Florida Power & Light Co. | | 3.250% | | 6/1/24 | | | 25 | | | | 26 | |
| | | Florida Power & Light Co. | | 5.625% | | 4/1/34 | | | 25 | | | | 33 | |
| | | Florida Power & Light Co. | | 5.960% | | 4/1/39 | | | 375 | | | | 528 | |
| | | Florida Power & Light Co. | | 4.125% | | 2/1/42 | | | 170 | | | | 193 | |
| | | Florida Power & Light Co. | | 4.050% | | 6/1/42 | | | 125 | | | | 141 | |
| | | Florida Power & Light Co. | | 3.800% | | 12/15/42 | | | 75 | | | | 82 | |
| | | Florida Power & Light Co. | | 3.700% | | 12/1/47 | | | 150 | | | | 165 | |
| | | Florida Power & Light Co. | | 3.950% | | 3/1/48 | | | 325 | | | | 367 | |
| | | Florida Power & Light Co. | | 4.125% | | 6/1/48 | | | 100 | | | | 116 | |
| | | Florida Power & Light Co. | | 3.990% | | 3/1/49 | | | 100 | | | | 114 | |
| | | Florida Power & Light Co. | | 3.150% | | 10/1/49 | | | 155 | | | | 154 | |
| | | Fortis Inc. | | 3.055% | | 10/4/26 | | | 295 | | | | 301 | |
| | | Georgia Power Co. | | 2.400% | | 4/1/21 | | | 75 | | | | 75 | |
| | | Georgia Power Co. | | 2.200% | | 9/15/24 | | | 225 | | | | 221 | |
| | | Georgia Power Co. | | 3.250% | | 4/1/26 | | | 100 | | | | 103 | |
| | | Georgia Power Co. | | 4.750% | | 9/1/40 | | | 175 | | | | 198 | |
| | | Georgia Power Co. | | 4.300% | | 3/15/43 | | | 100 | | | | 108 | |
| | | Great Plains Energy Inc. | | 4.850% | | 6/1/21 | | | 100 | | | | 103 | |
| | | Gulf Power Co. | | 3.300% | | 5/30/27 | | | 50 | | | | 52 | |
| | | Iberdrola International BV | | 6.750% | | 7/15/36 | | | 75 | | | | 104 | |
| | | Indiana Michigan Power Co. | | 3.850% | | 5/15/28 | | | 250 | | | | 271 | |
| | | Indiana Michigan Power Co. | | 3.750% | | 7/1/47 | | | 150 | | | | 157 | |
| | | Indiana Michigan Power Co. | | 4.250% | | 8/15/48 | | | 100 | | | | 114 | |
| | | Interstate Power & Light Co. | | 3.250% | | 12/1/24 | | | 202 | | | | 211 | |
| | | Interstate Power & Light Co. | | 4.100% | | 9/26/28 | | | 125 | | | | 136 | |
| | | Interstate Power & Light Co. | | 3.600% | | 4/1/29 | | | 60 | | | | 64 | |
| | | Interstate Power & Light Co. | | 6.250% | | 7/15/39 | | | 50 | | | | 66 | |
| | | Interstate Power & Light Co. | | 3.700% | | 9/15/46 | | | 75 | | | | 76 | |
| | | ITC Holdings Corp. | | 2.700% | | 11/15/22 | | | 100 | | | | 101 | |
| | | ITC Holdings Corp. | | 3.650% | | 6/15/24 | | | 75 | | | | 78 | |
| | | ITC Holdings Corp. | | 3.350% | | 11/15/27 | | | 100 | | | | 104 | |
| | | ITC Holdings Corp. | | 5.300% | | 7/1/43 | | | 300 | | | | 366 | |
| 3 | | John Sevier Combined Cycle Generation LLC | | 4.626% | | 1/15/42 | | | 67 | | | | 78 | |
| | | Kansas City Power & Light Co. | | 3.150% | | 3/15/23 | | | 75 | | | | 77 | |
| | | Kansas City Power & Light Co. | | 5.300% | | 10/1/41 | | | 100 | | | | 126 | |
| | | Kansas City Power & Light Co. | | 4.200% | | 6/15/47 | | | 100 | | | | 115 | |
| | | Kentucky Utilities Co. | | 3.250% | | 11/1/20 | | | 50 | | | | 50 | |
| | | Kentucky Utilities Co. | | 5.125% | | 11/1/40 | | | 125 | | | | 155 | |
| | | Kentucky Utilities Co. | | 4.375% | | 10/1/45 | | | 100 | | | | 116 | |
| | | Louisville Gas & Electric Co. | | 3.300% | | 10/1/25 | | | 75 | | | | 78 | |
| | | Louisville Gas & Electric Co. | | 4.250% | | 4/1/49 | | | 170 | | | | 194 | |
| | | MidAmerican Energy Co. | | 3.500% | | 10/15/24 | | | 179 | | | | 190 | |
| | | MidAmerican Energy Co. | | 3.100% | | 5/1/27 | | | 150 | | | | 156 | |
| | | MidAmerican Energy Co. | | 3.650% | | 4/15/29 | | | 200 | | | | 218 | |
| | | MidAmerican Energy Co. | | 6.750% | | 12/30/31 | | | 125 | | | | 174 | |
| | | MidAmerican Energy Co. | | 5.750% | | 11/1/35 | | | 125 | | | | 164 | |
| | | MidAmerican Energy Co. | | 4.800% | | 9/15/43 | | | 75 | | | | 92 | |
| | | MidAmerican Energy Co. | | 3.950% | | 8/1/47 | | | 100 | | | | 111 | |
| | | MidAmerican Energy Co. | | 4.250% | | 7/15/49 | | | 200 | | | | 240 | |
| | | Mississippi Power Co. | | 4.250% | | 3/15/42 | | | 100 | | | | 107 | |
| | | National Rural Utilities Cooperative Finance Corp. | | 2.300% | | 11/1/20 | | | 200 | | | | 201 | |
| | | National Rural Utilities Cooperative Finance Corp. | | 2.900% | | 3/15/21 | | | 50 | | | | 51 | |
| | | National Rural Utilities Cooperative Finance Corp. | | 2.700% | | 2/15/23 | | | 300 | | | | 306 | |
| | | National Rural Utilities Cooperative Finance Corp. | | 2.950% | | 2/7/24 | | | 775 | | | | 799 | |
| | | National Rural Utilities Cooperative Finance Corp. | | 3.900% | | 11/1/28 | | | 100 | | | | 109 | |
| | | National Rural Utilities Cooperative Finance Corp. | | 3.700% | | 3/15/29 | | | 100 | | | | 109 | |
| | | National Rural Utilities Cooperative Finance Corp. | | 4.023% | | 11/1/32 | | | 204 | | | | 230 | |
| 3 | | National Rural Utilities Cooperative Finance Corp. | | 4.750% | | 4/30/43 | | | 25 | | | | 26 | |
| 3 | | National Rural Utilities Cooperative Finance Corp. | | 5.250% | | 4/20/46 | | | 75 | | | | 79 | |
| | | National Rural Utilities Cooperative Finance Corp. | | 4.400% | | 11/1/48 | | | 400 | | | | 476 | |
| | | National Rural Utilities Cooperative Finance Corp. | | 4.300% | | 3/15/49 | | | 100 | | | | 119 | |
| | | Nevada Power Co. | | 3.700% | | 5/1/29 | | | 200 | | | | 216 | |
| | | Nevada Power Co. | | 6.750% | | 7/1/37 | | | 75 | | | | 106 | |
| | | NextEra Energy Capital Holdings Inc. | | 2.403% | | 9/1/21 | | | 150 | | | | 151 | |
| | | NextEra Energy Capital Holdings Inc. | | 2.900% | | 4/1/22 | | | 350 | | | | 356 | |
| | | NextEra Energy Capital Holdings Inc. | | 2.800% | | 1/15/23 | | | 105 | | | | 107 | |
| | | NextEra Energy Capital Holdings Inc. | | 3.150% | | 4/1/24 | | | 100 | | | | 103 | |
| | | NextEra Energy Capital Holdings Inc. | | 3.250% | | 4/1/26 | | | 50 | | | | 52 | |
| | | NextEra Energy Capital Holdings Inc. | | 3.550% | | 5/1/27 | | | 250 | | | | 265 | |
| | | NextEra Energy Capital Holdings Inc. | | 3.500% | | 4/1/29 | | | 100 | | | | 106 | |
| | | NextEra Energy Capital Holdings Inc. | | 2.750% | | 11/1/29 | | | 100 | | | | 100 | |
| 3 | | NextEra Energy Capital Holdings Inc. | | 4.800% | | 12/1/77 | | | 125 | | | | 128 | |
| 3 | | NextEra Energy Capital Holdings Inc. | | 5.650% | | 5/1/79 | | | 100 | | | | 111 | |
| | | Northern States Power Co. | | 6.250% | | 6/1/36 | | | 75 | | | | 103 | |
| | | Northern States Power Co. | | 6.200% | | 7/1/37 | | | 50 | | | | 69 | |
| | | Northern States Power Co. | | 5.350% | | 11/1/39 | | | 175 | | | | 228 | |
| | | Northern States Power Co. | | 3.400% | | 8/15/42 | | | 105 | | | | 109 | |
| | | Northern States Power Co. | | 4.000% | | 8/15/45 | | | 50 | | | | 55 | |
| | | Northern States Power Co. | | 2.900% | | 3/1/50 | | | 250 | | | | 238 | |
| | | NSTAR Electric Co. | | 2.375% | | 10/15/22 | | | 125 | | | | 126 | |
| | | NSTAR Electric Co. | | 3.200% | | 5/15/27 | | | 125 | | | | 131 | |
| | | NSTAR Electric Co. | | 3.250% | | 5/15/29 | | | 50 | | | | 52 | |
| | | NSTAR Electric Co. | | 5.500% | | 3/15/40 | | | 75 | | | | 96 | |
| | | Oglethorpe Power Corp. | | 5.950% | | 11/1/39 | | | 50 | | | | 62 | |
| | | Oglethorpe Power Corp. | | 5.375% | | 11/1/40 | | | 175 | | | | 211 | |
| | | Ohio Edison Co. | | 6.875% | | 7/15/36 | | | 100 | | | | 140 | |
| | | Ohio Power Co. | | 5.375% | | 10/1/21 | | | 175 | | | | 185 | |
| | | Ohio Power Co. | | 4.150% | | 4/1/48 | | | 100 | | | | 114 | |
| | | Ohio Power Co. | | 4.000% | | 6/1/49 | | | 240 | | | | 270 | |
| | | Oklahoma Gas & Electric Co. | | 3.800% | | 8/15/28 | | | 75 | | | | 81 | |
| | | Oklahoma Gas & Electric Co. | | 4.150% | | 4/1/47 | | | 50 | | | | 54 | |
| | | Oklahoma Gas & Electric Co. | | 3.850% | | 8/15/47 | | | 75 | | | | 78 | |
| | | Oncor Electric Delivery Co. LLC | | 4.100% | | 6/1/22 | | | 175 | | | | 183 | |
| | | Oncor Electric Delivery Co. LLC | | 2.750% | | 6/1/24 | | | 100 | | | | 102 | |
| | | Oncor Electric Delivery Co. LLC | | 2.950% | | 4/1/25 | | | 75 | | | | 77 | |
| | | Oncor Electric Delivery Co. LLC | | 3.700% | | 11/15/28 | | | 50 | | | | 55 | |
| | | Oncor Electric Delivery Co. LLC | | 7.250% | | 1/15/33 | | | 50 | | | | 73 | |
| | | Oncor Electric Delivery Co. LLC | | 7.500% | | 9/1/38 | | | 125 | | | | 196 | |
| | | Oncor Electric Delivery Co. LLC | | 5.250% | | 9/30/40 | | | 125 | | | | 159 | |
| | | Oncor Electric Delivery Co. LLC | | 4.550% | | 12/1/41 | | | 75 | | | | 88 | |
| | | Oncor Electric Delivery Co. LLC | | 5.300% | | 6/1/42 | | | 100 | | | | 130 | |
| | | Oncor Electric Delivery Co. LLC | | 3.750% | | 4/1/45 | | | 100 | | | | 109 | |
| | | Oncor Electric Delivery Co. LLC | | 3.800% | | 9/30/47 | | | 50 | | | | 55 | |
| | | Oncor Electric Delivery Co. LLC | | 3.800% | | 6/1/49 | | | 100 | | | | 109 | |
| | | Oncor Electric Delivery Co. LLC | | 3.100% | | 9/15/49 | | | 400 | | | | 396 | |
| | | PacifiCorp | | 2.950% | | 2/1/22 | | | 100 | | | | 102 | |
| | | PacifiCorp | | 3.600% | | 4/1/24 | | | 125 | | | | 132 | |
| | | PacifiCorp | | 3.500% | | 6/15/29 | | | 100 | | | | 108 | |
Total Bond Market Index Portfolio
| | | | | | | | | Face | | | Market | |
| | | | | | | Maturity | | Amount | | | Value• | |
| | | | | Coupon | | Date | | | ($000 | ) | | | ($000 | ) |
| | | PacifiCorp | | 7.700% | | 11/15/31 | | | 450 | | | | 662 | |
| | | PacifiCorp | | 5.250% | | 6/15/35 | | | 100 | | | | 123 | |
| | | PacifiCorp | | 6.100% | | 8/1/36 | | | 75 | | | | 101 | |
| | | PacifiCorp | | 6.350% | | 7/15/38 | | | 75 | | | | 105 | |
| | | PacifiCorp | | 4.100% | | 2/1/42 | | | 200 | | | | 222 | |
| | | PacifiCorp | | 4.125% | | 1/15/49 | | | 100 | | | | 114 | |
| | | PacifiCorp | | 4.150% | | 2/15/50 | | | 200 | | | | 229 | |
| | | PECO Energy Co. | | 2.375% | | 9/15/22 | | | 300 | | | | 303 | |
| | | PECO Energy Co. | | 3.900% | | 3/1/48 | | | 75 | | | | 83 | |
| | | Pinnacle West Capital Corp. | | 2.250% | | 11/30/20 | | | 100 | | | | 100 | |
| | | PNM Resources Inc. | | 3.250% | | 3/9/21 | | | 50 | | | | 51 | |
| | | Potomac Electric Power Co. | | 6.500% | | 11/15/37 | | | 250 | | | | 353 | |
| | | Potomac Electric Power Co. | | 4.150% | | 3/15/43 | | | 150 | | | | 168 | |
| | | PPL Capital Funding Inc. | | 4.200% | | 6/15/22 | | | 25 | | | | 26 | |
| | | PPL Capital Funding Inc. | | 3.500% | | 12/1/22 | | | 115 | | | | 119 | |
| | | PPL Capital Funding Inc. | | 3.400% | | 6/1/23 | | | 100 | | | | 103 | |
| | | PPL Capital Funding Inc. | | 3.950% | | 3/15/24 | | | 50 | | | | 53 | |
| | | PPL Capital Funding Inc. | | 3.100% | | 5/15/26 | | | 100 | | | | 102 | |
| | | PPL Capital Funding Inc. | | 4.700% | | 6/1/43 | | | 75 | | | | 83 | |
| | | PPL Capital Funding Inc. | | 5.000% | | 3/15/44 | | | 200 | | | | 229 | |
| | | PPL Capital Funding Inc. | | 4.000% | | 9/15/47 | | | 75 | | | | 76 | |
| | | PPL Electric Utilities Corp. | | 3.000% | | 9/15/21 | | | 275 | | | | 280 | |
| | | PPL Electric Utilities Corp. | | 6.250% | | 5/15/39 | | | 100 | | | | 140 | |
| | | PPL Electric Utilities Corp. | | 4.125% | | 6/15/44 | | | 50 | | | | 56 | |
| | | PPL Electric Utilities Corp. | | 4.150% | | 10/1/45 | | | 155 | | | | 174 | |
| | | PPL Electric Utilities Corp. | | 3.950% | | 6/1/47 | | | 75 | | | | 82 | |
| | | Progress Energy Inc. | | 4.400% | | 1/15/21 | | | 100 | | | | 102 | |
| | | Progress Energy Inc. | | 3.150% | | 4/1/22 | | | 40 | | | | 41 | |
| | | Progress Energy Inc. | | 7.000% | | 10/30/31 | | | 119 | | | | 160 | |
| | | Progress Energy Inc. | | 6.000% | | 12/1/39 | | | 125 | | | | 162 | |
| | | PSEG Power LLC | | 3.850% | | 6/1/23 | | | 125 | | | | 131 | |
| | | PSEG Power LLC | | 8.625% | | 4/15/31 | | | 96 | | | | 134 | |
| | | Public Service Co. of Colorado | | 3.200% | | 11/15/20 | | | 25 | | | | 25 | |
| | | Public Service Co. of Colorado | | 3.700% | | 6/15/28 | | | 75 | | | | 81 | |
| | | Public Service Co. of Colorado | | 3.600% | | 9/15/42 | | | 175 | | | | 184 | |
| | | Public Service Co. of Colorado | | 4.100% | | 6/15/48 | | | 75 | | | | 85 | |
| | | Public Service Co. of New Hampshire | | 3.500% | | 11/1/23 | | | 50 | | | | 52 | |
| | | Public Service Co. of New Hampshire | | 3.600% | | 7/1/49 | | | 75 | | | | 79 | |
| | | Public Service Electric & Gas Co. | | 1.900% | | 3/15/21 | | | 150 | | | | 150 | |
| | | Public Service Electric & Gas Co. | | 3.000% | | 5/15/25 | | | 80 | | | | 83 | |
| | | Public Service Electric & Gas Co. | | 2.250% | | 9/15/26 | | | 250 | | | | 247 | |
| | | Public Service Electric & Gas Co. | | 3.000% | | 5/15/27 | | | 75 | | | | 77 | |
| | | Public Service Electric & Gas Co. | | 3.200% | | 5/15/29 | | | 70 | | | | 74 | |
| | | Public Service Electric & Gas Co. | | 3.800% | | 3/1/46 | | | 250 | | | | 272 | |
| | | Public Service Electric & Gas Co. | | 3.600% | | 12/1/47 | | | 75 | | | | 80 | |
| | | Public Service Electric & Gas Co. | | 3.850% | | 5/1/49 | | | 200 | | | | 222 | |
| | | Public Service Enterprise Group Inc. | | 2.650% | | 11/15/22 | | | 100 | | | | 102 | |
| | | Puget Energy Inc. | | 6.000% | | 9/1/21 | | | 100 | | | | 106 | |
| | | Puget Energy Inc. | | 5.625% | | 7/15/22 | | | 200 | | | | 214 | |
| | | Puget Energy Inc. | | 3.650% | | 5/15/25 | | | 400 | | | | 415 | |
| | | Puget Sound Energy Inc. | | 6.274% | | 3/15/37 | | | 125 | | | | 169 | |
| | | Puget Sound Energy Inc. | | 5.757% | | 10/1/39 | | | 125 | | | | 166 | |
| | | Puget Sound Energy Inc. | | 4.300% | | 5/20/45 | | | 100 | | | | 115 | |
| | | Puget Sound Energy Inc. | | 4.223% | | 6/15/48 | | | 125 | | | | 142 | |
| | | Puget Sound Energy Inc. | | 3.250% | | 9/15/49 | | | 90 | | | | 90 | |
| | | San Diego Gas & Electric Co. | | 2.500% | | 5/15/26 | | | 250 | | | | 248 | |
| | | San Diego Gas & Electric Co. | | 4.500% | | 8/15/40 | | | 100 | | | | 111 | |
| | | San Diego Gas & Electric Co. | | 3.750% | | 6/1/47 | | | 75 | | | | 77 | |
| | | San Diego Gas & Electric Co. | | 4.150% | | 5/15/48 | | | 75 | | | | 82 | |
| | | Sierra Pacific Power Co. | | 2.600% | | 5/1/26 | | | 100 | | | | 101 | |
| | | Southern California Edison Co. | | 2.900% | | 3/1/21 | | | 100 | | | | 101 | |
| | | Southern California Edison Co. | | 3.875% | | 6/1/21 | | | 275 | | | | 281 | |
| 3 | | Southern California Edison Co. | | 1.845% | | 2/1/22 | | | 36 | | | | 35 | |
| | | Southern California Edison Co. | | 2.400% | | 2/1/22 | | | 75 | | | | 75 | |
| | | Southern California Edison Co. | | 3.400% | | 6/1/23 | | | 75 | | | | 77 | |
| | | Southern California Edison Co. | | 3.500% | | 10/1/23 | | | 175 | | | | 182 | |
| | | Southern California Edison Co. | | 3.700% | | 8/1/25 | | | 50 | | | | 53 | |
| | | Southern California Edison Co. | | 3.650% | | 3/1/28 | | | 100 | | | | 107 | |
| | | Southern California Edison Co. | | 4.200% | | 3/1/29 | | | 75 | | | | 83 | |
| | | Southern California Edison Co. | | 6.650% | | 4/1/29 | | | 75 | | | | 90 | |
| | | Southern California Edison Co. | | 2.850% | | 8/1/29 | | | 75 | | | | 75 | |
| | | Southern California Edison Co. | | 5.750% | | 4/1/35 | | | 75 | | | | 91 | |
| | | Southern California Edison Co. | | 5.350% | | 7/15/35 | | | 200 | | | | 237 | |
| | | Southern California Edison Co. | | 5.625% | | 2/1/36 | | | 125 | | | | 152 | |
| | | Southern California Edison Co. | | 5.500% | | 3/15/40 | | | 100 | | | | 122 | |
| | | Southern California Edison Co. | | 4.500% | | 9/1/40 | | | 75 | | | | 82 | |
| | | Southern California Edison Co. | | 4.050% | | 3/15/42 | | | 208 | | | | 214 | |
| | | Southern California Edison Co. | | 3.900% | | 3/15/43 | | | 100 | | | | 102 | |
| | | Southern California Edison Co. | | 4.000% | | 4/1/47 | | | 335 | | | | 350 | |
| | | Southern California Edison Co. | | 4.125% | | 3/1/48 | | | 350 | | | | 370 | |
| | | Southern California Edison Co. | | 4.875% | | 3/1/49 | | | 100 | | | | 118 | |
| | | Southern Co. | | 2.350% | | 7/1/21 | | | 300 | | | | 301 | |
| | | Southern Co. | | 3.250% | | 7/1/26 | | | 350 | | | | 363 | |
| | | Southern Co. | | 4.250% | | 7/1/36 | | | 200 | | | | 215 | |
| | | Southern Co. | | 4.400% | | 7/1/46 | | | 360 | | | | 398 | |
| | | Southern Power Co. | | 2.500% | | 12/15/21 | | | 350 | | | | 353 | |
| | | Southern Power Co. | | 4.150% | | 12/1/25 | | | 100 | | | | 108 | |
| | | Southern Power Co. | | 5.150% | | 9/15/41 | | | 100 | | | | 114 | |
| | | Southern Power Co. | | 5.250% | | 7/15/43 | | | 50 | | | | 57 | |
| | | Southern Power Co. | | 4.950% | | 12/15/46 | | | 75 | | | | 83 | |
| | | Southwestern Electric Power Co. | | 2.750% | | 10/1/26 | | | 100 | | | | 99 | |
| | | Southwestern Electric Power Co. | | 4.100% | | 9/15/28 | | | 100 | | | | 109 | |
| | | Southwestern Electric Power Co. | | 6.200% | | 3/15/40 | | | 50 | | | | 66 | |
| | | Southwestern Electric Power Co. | | 3.900% | | 4/1/45 | | | 200 | | | | 206 | |
| | | Southwestern Electric Power Co. | | 3.850% | | 2/1/48 | | | 325 | | | | 334 | |
| | | Southwestern Public Service Co. | | 3.300% | | 6/15/24 | | | 165 | | | | 171 | |
| | | Southwestern Public Service Co. | | 4.500% | | 8/15/41 | | | 100 | | | | 117 | |
| | | Southwestern Public Service Co. | | 3.400% | | 8/15/46 | | | 275 | | | | 274 | |
| | | Southwestern Public Service Co. | | 3.700% | | 8/15/47 | | | 75 | | | | 78 | |
| | | Southwestern Public Service Co. | | 4.400% | | 11/15/48 | | | 275 | | | | 321 | |
| | | Southwestern Public Service Co. | | 3.750% | | 6/15/49 | | | 75 | | | | 80 | |
| | | Tampa Electric Co. | | 4.100% | | 6/15/42 | | | 50 | | | | 54 | |
| | | Tampa Electric Co. | | 4.350% | | 5/15/44 | | | 50 | | | | 57 | |
| | | Tampa Electric Co. | | 4.300% | | 6/15/48 | | | 75 | | | | 87 | |
| | | Tampa Electric Co. | | 4.450% | | 6/15/49 | | | 125 | | | | 148 | |
| | | Tampa Electric Co. | | 3.625% | | 6/15/50 | | | 50 | | | | 53 | |
| | | Toledo Edison Co. | | 6.150% | | 5/15/37 | | | 75 | | | | 101 | |
| | | Tucson Electric Power Co. | | 3.050% | | 3/15/25 | | | 50 | | | | 52 | |
| | | Union Electric Co. | | 3.500% | | 4/15/24 | | | 250 | | | | 263 | |
| | | Union Electric Co. | | 8.450% | | 3/15/39 | | | 150 | | | | 244 | |
| | | Union Electric Co. | | 3.650% | | 4/15/45 | | | 125 | | | | 131 | |
| | | Union Electric Co. | | 4.000% | | 4/1/48 | | | 75 | | | | 84 | |
| | | Union Electric Co. | | 3.250% | | 10/1/49 | | | 100 | | | | 99 | |
| | | Virginia Electric & Power Co. | | 3.450% | | 2/15/24 | | | 50 | | | | 52 | |
| | | Virginia Electric & Power Co. | | 2.950% | | 11/15/26 | | | 75 | | | | 77 | |
| | | Virginia Electric & Power Co. | | 3.500% | | 3/15/27 | | | 250 | | | | 265 | |
| | | Virginia Electric & Power Co. | | 3.800% | | 4/1/28 | | | 150 | | | | 162 | |
| | | Virginia Electric & Power Co. | | 2.875% | | 7/15/29 | | | 275 | | | | 280 | |
| | | Virginia Electric & Power Co. | | 6.000% | | 1/15/36 | | | 125 | | | | 163 | |
| | | Virginia Electric & Power Co. | | 6.000% | | 5/15/37 | | | 150 | | | | 199 | |
| | | Virginia Electric & Power Co. | | 6.350% | | 11/30/37 | | | 50 | | | | 69 | |
| | | Virginia Electric & Power Co. | | 4.000% | | 1/15/43 | | | 400 | | | | 435 | |
| | | Virginia Electric & Power Co. | | 4.450% | | 2/15/44 | | | 475 | | | | 550 | |
| | | Virginia Electric & Power Co. | | 4.200% | | 5/15/45 | | | 75 | | | | 85 | |
| | | Virginia Electric & Power Co. | | 4.000% | | 11/15/46 | | | 100 | | | | 110 | |
| | | Virginia Electric & Power Co. | | 3.800% | | 9/15/47 | | | 100 | | | | 108 | |
| | | Virginia Electric & Power Co. | | 4.600% | | 12/1/48 | | | 375 | | | | 455 | |
| | | Virginia Electric & Power Co. | | 3.300% | | 12/1/49 | | | 110 | | | | 111 | |
| | | WEC Energy Group Inc. | | 3.550% | | 6/15/25 | | | 200 | | | | 211 | |
| | | Westar Energy Inc. | | 2.550% | | 7/1/26 | | | 150 | | | | 150 | |
| | | Westar Energy Inc. | | 3.100% | | 4/1/27 | | | 100 | | | | 103 | |
| | | Westar Energy Inc. | | 4.125% | | 3/1/42 | | | 200 | | | | 223 | |
| | | Westar Energy Inc. | | 4.100% | | 4/1/43 | | | 100 | | | | 111 | |
| | | Westar Energy Inc. | | 4.250% | | 12/1/45 | | | 25 | | | | 28 | |
| | | Wisconsin Electric Power Co. | | 2.950% | | 9/15/21 | | | 75 | | | | 76 | |
| | | Wisconsin Electric Power Co. | | 2.050% | | 12/15/24 | | | 100 | | | | 100 | |
| | | Wisconsin Electric Power Co. | | 4.300% | | 10/15/48 | | | 100 | | | | 115 | |
| | | Wisconsin Power & Light Co. | | 6.375% | | 8/15/37 | | | 100 | | | | 136 | |
| | | Wisconsin Public Service Corp. | | 3.350% | | 11/21/21 | | | 300 | | | | 309 | |
| | | Xcel Energy Inc. | | 2.600% | | 3/15/22 | | | 75 | | | | 76 | |
| | | Xcel Energy Inc. | | 3.300% | | 6/1/25 | | | 325 | | | | 339 | |
| | | Xcel Energy Inc. | | 3.350% | | 12/1/26 | | | 75 | | | | 78 | |
Total Bond Market Index Portfolio
| | | | | | | | | Face | | | Market | |
| | | | | | | Maturity | | Amount | | | Value• | |
| | | | | Coupon | | Date | | ($000 | ) | | ($000 | ) |
| | | Xcel Energy Inc. | | 4.000% | | 6/15/28 | | | 75 | | | | 82 | |
| | | Xcel Energy Inc. | | 2.600% | | 12/1/29 | | | 200 | | | | 198 | |
| | | Xcel Energy Inc. | | 3.500% | | 12/1/49 | | | 100 | | | | 102 | |
| | | | | | | | | | | | | | | |
| | | Natural Gas (0.2%) | | | | | | | | | | | | |
| | | Atmos Energy Corp. | | 3.000% | | 6/15/27 | | | 100 | | | | 103 | |
| | | Atmos Energy Corp. | | 2.625% | | 9/15/29 | | | 50 | | | | 50 | |
| | | Atmos Energy Corp. | | 5.500% | | 6/15/41 | | | 200 | | | | 257 | |
| | | Atmos Energy Corp. | | 4.150% | | 1/15/43 | | | 100 | | | | 112 | |
| | | Atmos Energy Corp. | | 4.125% | | 10/15/44 | | | 50 | | | | 56 | |
| | | Atmos Energy Corp. | | 3.375% | | 9/15/49 | | | 530 | | | | 535 | |
| | | CenterPoint Energy Resources Corp. | | 4.500% | | 1/15/21 | | | 25 | | | | 26 | |
| | | CenterPoint Energy Resources Corp. | | 3.550% | | 4/1/23 | | | 50 | | | | 52 | |
| | | CenterPoint Energy Resources Corp. | | 4.000% | | 4/1/28 | | | 100 | | | | 107 | |
| | | CenterPoint Energy Resources Corp. | | 5.850% | | 1/15/41 | | | 250 | | | | 315 | |
| | | CenterPoint Energy Resources Corp. | | 4.100% | | 9/1/47 | | | 50 | | | | 52 | |
| | | KeySpan Corp. | | 5.803% | | 4/1/35 | | | 50 | | | | 61 | |
| | | NiSource Finance Corp. | | 3.490% | | 5/15/27 | | | 250 | | | | 262 | |
| | | NiSource Finance Corp. | | 5.950% | | 6/15/41 | | | 100 | | | | 128 | |
| | | NiSource Finance Corp. | | 4.800% | | 2/15/44 | | | 125 | | | | 143 | |
| | | NiSource Finance Corp. | | 5.650% | | 2/1/45 | | | 100 | | | | 128 | |
| | | NiSource Finance Corp. | | 4.375% | | 5/15/47 | | | 250 | | | | 279 | |
| | | NiSource Inc. | | 2.650% | | 11/17/22 | | | 75 | | | | 76 | |
| | | NiSource Inc. | | 3.650% | | 6/15/23 | | | 75 | | | | 78 | |
| | | NiSource Inc. | | 2.950% | | 9/1/29 | | | 100 | | | | 100 | |
| | | ONE Gas Inc. | | 4.658% | | 2/1/44 | | | 125 | | | | 149 | |
| | | ONE Gas Inc. | | 4.500% | | 11/1/48 | | | 75 | | | | 89 | |
| | | Piedmont Natural Gas Co. Inc. | | 3.500% | | 6/1/29 | | | 110 | | | | 117 | |
| | | Piedmont Natural Gas Co. Inc. | | 4.650% | | 8/1/43 | | | 50 | | | | 56 | |
| | | Piedmont Natural Gas Co. Inc. | | 3.640% | | 11/1/46 | | | 75 | | | | 74 | |
| | | Sempra Energy | | 2.850% | | 11/15/20 | | | 395 | | | | 397 | |
| | | Sempra Energy | | 2.875% | | 10/1/22 | | | 100 | | | | 102 | |
| | | Sempra Energy | | 2.900% | | 2/1/23 | | | 100 | | | | 102 | |
| | | Sempra Energy | | 4.050% | | 12/1/23 | | | 100 | | | | 106 | |
| | | Sempra Energy | | 3.750% | | 11/15/25 | | | 155 | | | | 163 | |
| | | Sempra Energy | | 3.250% | | 6/15/27 | | | 150 | | | | 154 | |
| | | Sempra Energy | | 3.400% | | 2/1/28 | | | 200 | | | | 207 | |
| | | Sempra Energy | | 3.800% | | 2/1/38 | | | 200 | | | | 208 | |
| | | Sempra Energy | | 6.000% | | 10/15/39 | | | 150 | | | | 195 | |
| | | Sempra Energy | | 4.000% | | 2/1/48 | | | 175 | | | | 182 | |
| | | Southern California Gas Co. | | 2.600% | | 6/15/26 | | | 200 | | | | 200 | |
| | | Southern California Gas Co. | | 3.750% | | 9/15/42 | | | 75 | | | | 78 | |
| | | Southern California Gas Co. | | 4.125% | | 6/1/48 | | | 75 | | | | 83 | |
| | | Southern California Gas Co. | | 3.950% | | 2/15/50 | | | 70 | | | | 78 | |
| | | Southern Co. Gas Capital Corp. | | 3.500% | | 9/15/21 | | | 325 | | | | 332 | |
| | | Southern Co. Gas Capital Corp. | | 3.250% | | 6/15/26 | | | 75 | | | | 77 | |
| | | Southern Co. Gas Capital Corp. | | 5.875% | | 3/15/41 | | | 75 | | | | 95 | |
| | | Southern Co. Gas Capital Corp. | | 4.400% | | 6/1/43 | | | 50 | | | | 54 | |
| | | Southern Co. Gas Capital Corp. | | 3.950% | | 10/1/46 | | | 100 | | | | 102 | |
| | | Southern Co. Gas Capital Corp. | | 4.400% | | 5/30/47 | | | 100 | | | | 109 | |
| | | Southwest Gas Corp. | | 3.700% | | 4/1/28 | | | 50 | | | | 53 | |
| | | Southwest Gas Corp. | | 3.800% | | 9/29/46 | | | 75 | | | | 77 | |
| | | Southwest Gas Corp. | | 4.150% | | 6/1/49 | | | 25 | | | | 27 | |
| | | Washington Gas Light Co. | | 3.796% | | 9/15/46 | | | 100 | | | | 104 | |
| | | Washington Gas Light Co. | | 3.650% | | 9/15/49 | | | 30 | | | | 30 | |
| | | | | | | | | | | | | | | |
| | | Other Utility (0.0%) | | | | | | | | | | | | |
| | | American Water Capital Corp. | | 3.400% | | 3/1/25 | | | 125 | | | | 131 | |
| | | American Water Capital Corp. | | 2.950% | | 9/1/27 | | | 325 | | | | 331 | |
| | | American Water Capital Corp. | | 3.450% | | 6/1/29 | | | 125 | | | | 132 | |
| | | American Water Capital Corp. | | 6.593% | | 10/15/37 | | | 150 | | | | 213 | |
| | | American Water Capital Corp. | | 4.300% | | 9/1/45 | | | 100 | | | | 113 | |
| | | American Water Capital Corp. | | 3.750% | | 9/1/47 | | | 200 | | | | 210 | |
| | | American Water Capital Corp. | | 4.200% | | 9/1/48 | | | 100 | | | | 113 | |
| | | American Water Capital Corp. | | 4.150% | | 6/1/49 | | | 125 | | | | 140 | |
| | | Aqua America Inc. | | 3.566% | | 5/1/29 | | | 75 | | | | 79 | |
| | | Aqua America Inc. | | 4.276% | | 5/1/49 | | | 85 | | | | 94 | |
| | | Veolia Environnement SA | | 6.750% | | 6/1/38 | | | 39 | | | | 54 | |
| | | | | | | | | | | | | | 84,050 | |
| Total Corporate Bonds (Cost $1,063,591) | | | | | | | | | | | 1,139,256 | |
| Sovereign Bonds (4.1%) | | | | | | | | | | | | |
| | | African Development Bank | | 1.250% | | 7/26/21 | | | 500 | | | | 497 | |
| | | African Development Bank | | 2.375% | | 9/23/21 | | | 300 | | | | 303 | |
| | | African Development Bank | | 1.625% | | 9/16/22 | | | 400 | | | | 399 | |
| | | African Development Bank | | 2.125% | | 11/16/22 | | | 700 | | | | 708 | |
| | | African Development Bank | | 3.000% | | 9/20/23 | | | 275 | | | | 288 | |
| | | Asian Development Bank | | 2.250% | | 1/20/21 | | | 500 | | | | 503 | |
| | | Asian Development Bank | | 1.625% | | 3/16/21 | | | 500 | | | | 499 | |
| | | Asian Development Bank | | 1.750% | | 6/8/21 | | | 625 | | | | 625 | |
| | | Asian Development Bank | | 2.000% | | 2/16/22 | | | 980 | | | | 987 | |
| | | Asian Development Bank | | 1.875% | | 2/18/22 | | | 600 | | | | 603 | |
| | | Asian Development Bank | | 1.875% | | 7/19/22 | | | 600 | | | | 603 | |
| | | Asian Development Bank | | 1.750% | | 9/13/22 | | | 900 | | | | 901 | |
| | | Asian Development Bank | | 2.750% | | 3/17/23 | | | 1,000 | | | | 1,032 | |
| | | Asian Development Bank | | 2.625% | | 1/30/24 | | | 1,000 | | | | 1,034 | |
| | | Asian Development Bank | | 1.500% | | 10/18/24 | | | 500 | | | | 494 | |
| | | Asian Development Bank | | 2.000% | | 1/22/25 | | | 300 | | | | 303 | |
| | | Asian Development Bank | | 2.000% | | 4/24/26 | | | 100 | | | | 101 | |
| | | Asian Development Bank | | 2.625% | | 1/12/27 | | | 200 | | | | 209 | |
| | | Asian Development Bank | | 2.375% | | 8/10/27 | | | 275 | | | | 283 | |
| | | Asian Development Bank | | 6.220% | | 8/15/27 | | | 100 | | | | 127 | |
| | | Asian Development Bank | | 2.500% | | 11/2/27 | | | 673 | | | | 700 | |
| | | Asian Development Bank | | 5.820% | | 6/16/28 | | | 148 | | | | 188 | |
| | | Asian Development Bank | | 3.125% | | 9/26/28 | | | 130 | | | | 142 | |
| | | Asian Development Bank | | 1.750% | | 9/19/29 | | | 200 | | | | 195 | |
| | | Asian Infrastructure Investment Bank | | 2.250% | | 5/16/24 | | | 500 | | | | 510 | |
| | | Canada | | 2.625% | | 1/25/22 | | | 250 | | | | 255 | |
| | | Canada | | 2.000% | | 11/15/22 | | | 570 | | | | 575 | |
| | | CNOOC Finance 2013 Ltd. | | 3.000% | | 5/9/23 | | | 300 | | | | 306 | |
| | | CNOOC Finance 2013 Ltd. | | 2.875% | | 9/30/29 | | | 250 | | | | 250 | |
| | | CNOOC Finance 2013 Ltd. | | 3.300% | | 9/30/49 | | | 250 | | | | 236 | |
| | | CNOOC Finance 2015 USA LLC | | 3.500% | | 5/5/25 | | | 500 | | | | 523 | |
| | | CNOOC Finance 2015 USA LLC | | 4.375% | | 5/2/28 | | | 500 | | | | 554 | |
| | | CNOOC Nexen Finance 2014 ULC | | 4.250% | | 4/30/24 | | | 300 | | | | 320 | |
| | | Corp. Andina de Fomento | | 3.250% | | 2/11/22 | | | 45 | | | | 46 | |
| | | Corp. Andina de Fomento | | 2.750% | | 1/6/23 | | | 125 | | | | 126 | |
| | | Corp. Andina de Fomento | | 3.750% | | 11/23/23 | | | 925 | | | | 968 | |
| | | Council Of Europe Development Bank | | 1.625% | | 3/16/21 | | | 200 | | | | 200 | |
| | | Council Of Europe Development Bank | | 1.750% | | 9/26/22 | | | 150 | | | | 150 | |
| | | Council Of Europe Development Bank | | 2.625% | | 2/13/23 | | | 425 | | | | 437 | |
| | | Ecopetrol SA | | 5.875% | | 9/18/23 | | | 225 | | | | 250 | |
| | | Ecopetrol SA | | 4.125% | | 1/16/25 | | | 200 | | | | 210 | |
| | | Ecopetrol SA | | 5.375% | | 6/26/26 | | | 750 | | | | 841 | |
| | | Ecopetrol SA | | 7.375% | | 9/18/43 | | | 100 | | | | 135 | |
| | | Ecopetrol SA | | 5.875% | | 5/28/45 | | | 400 | | | | 470 | |
| | | Equinor ASA | | 2.750% | | 11/10/21 | | | 300 | | | | 305 | |
| | | Equinor ASA | | 3.150% | | 1/23/22 | | | 150 | | | | 154 | |
| | | Equinor ASA | | 2.450% | | 1/17/23 | | | 450 | | | | 457 | |
| | | Equinor ASA | | 2.650% | | 1/15/24 | | | 375 | | | | 384 | |
| | | Equinor ASA | | 3.700% | | 3/1/24 | | | 150 | | | | 160 | |
| | | Equinor ASA | | 3.250% | | 11/10/24 | | | 150 | | | | 158 | |
| | | Equinor ASA | | 7.250% | | 9/23/27 | | | 250 | | | | 331 | |
| | | Equinor ASA | | 3.625% | | 9/10/28 | | | 175 | | | | 193 | |
| | | Equinor ASA | | 5.100% | | 8/17/40 | | | 125 | | | | 159 | |
| | | Equinor ASA | | 4.250% | | 11/23/41 | | | 175 | | | | 202 | |
| | | Equinor ASA | | 3.950% | | 5/15/43 | | | 125 | | | | 139 | |
| | | Equinor ASA | | 4.800% | | 11/8/43 | | | 175 | | | | 221 | |
| | | Equinor ASA | | 3.250% | | 11/18/49 | | | 125 | | | | 125 | |
| | | European Bank for Reconstruction & Development | | 1.875% | | 7/15/21 | | | 225 | | | | 226 | |
| | | European Bank for Reconstruction & Development | | 1.500% | | 11/2/21 | | | 150 | | | | 150 | |
| | | European Bank for Reconstruction & Development | | 1.875% | | 2/23/22 | | | 200 | | | | 201 | |
| | | European Bank for Reconstruction & Development | | 2.750% | | 3/7/23 | | | 925 | | | | 955 | |
| | | European Bank for Reconstruction & Development | | 1.625% | | 9/27/24 | | | 270 | | | | 268 | |
| | | European Investment Bank | | 4.000% | | 2/16/21 | | | 735 | | | | 753 | |
| | | European Investment Bank | | 2.000% | | 3/15/21 | | | 1,450 | | | | 1,455 | |
| | | European Investment Bank | | 2.500% | | 4/15/21 | | | 850 | | | | 858 | |
Total Bond Market Index Portfolio
| | | | | | | | | | Face | | | | Market | |
| | | | | | | Maturity | | | Amount | | | | Value• | |
| | | | | Coupon | | Date | | | ($000 | ) | | | ($000 | ) |
| | European Investment Bank | | 2.375% | | 5/13/21 | | | 1,850 | | | | 1,866 | |
| | | European Investment Bank | | 1.625% | | 6/15/21 | | | 1,000 | | | | 998 | |
| | | European Investment Bank | | 1.375% | | 9/15/21 | | | 100 | | | | 100 | |
| | | European Investment Bank | | 2.125% | | 10/15/21 | | | 300 | | | | 302 | |
| | | European Investment Bank | | 2.875% | | 12/15/21 | | | 1,150 | | | | 1,176 | |
| | | European Investment Bank | | 2.250% | | 3/15/22 | | | 500 | | | | 506 | |
| | | European Investment Bank | | 2.625% | | 5/20/22 | | | 200 | | | | 204 | |
| | | European Investment Bank | | 2.375% | | 6/15/22 | | | 1,725 | | | | 1,753 | |
| | | European Investment Bank | | 1.375% | | 9/6/22 | | | 720 | | | | 714 | |
| | | European Investment Bank | | 2.500% | | 3/15/23 | | | 600 | | | | 615 | |
| | | European Investment Bank | | 2.875% | | 8/15/23 | | | 800 | | | | 833 | |
| | | European Investment Bank | | 3.125% | | 12/14/23 | | | 500 | | | | 527 | |
| | | European Investment Bank | | 3.250% | | 1/29/24 | | | 810 | | | | 858 | |
| | | European Investment Bank | | 2.625% | | 3/15/24 | | | 530 | | | | 549 | |
| | | European Investment Bank | | 2.250% | | 6/24/24 | | | 550 | | | | 562 | |
| | | European Investment Bank | | 2.500% | | 10/15/24 | | | 276 | | | | 285 | |
| | | European Investment Bank | | 1.875% | | 2/10/25 | | | 1,050 | | | | 1,056 | |
| | | European Investment Bank | | 2.375% | | 5/24/27 | | | 225 | | | | 232 | |
| | | European Investment Bank | | 1.625% | | 10/9/29 | | | 125 | | | | 121 | |
| | | European Investment Bank | | 4.875% | | 2/15/36 | | | 325 | | | | 436 | |
| | | Export Development Canada | | 1.500% | | 5/26/21 | | | 525 | | | | 523 | |
| | | Export Development Canada | | 1.375% | | 10/21/21 | | | 200 | | | | 199 | |
| | | Export Development Canada | | 1.750% | | 7/18/22 | | | 200 | | | | 201 | |
| | | Export Development Canada | | 2.500% | | 1/24/23 | | | 40 | | | | 41 | |
| | | Export Development Canada | | 2.625% | | 2/21/24 | | | 250 | | | | 258 | |
| | | Export-Import Bank of Korea | | 2.500% | | 5/10/21 | | | 300 | | | | 302 | |
| | | Export-Import Bank of Korea | | 4.375% | | 9/15/21 | | | 75 | | | | 78 | |
| | | Export-Import Bank of Korea | | 1.875% | | 10/21/21 | | | 250 | | | | 249 | |
| | | Export-Import Bank of Korea | | 3.500% | | 11/27/21 | | | 200 | | | | 205 | |
| | | Export-Import Bank of Korea | | 5.000% | | 4/11/22 | | | 275 | | | | 293 | |
| | | Export-Import Bank of Korea | | 3.000% | | 11/1/22 | | | 400 | | | | 410 | |
| | | Export-Import Bank of Korea | | 3.625% | | 11/27/23 | | | 200 | | | | 211 | |
| | | Export-Import Bank of Korea | | 4.000% | | 1/14/24 | | | 650 | | | | 695 | |
| | | Export-Import Bank of Korea | | 2.625% | | 5/26/26 | | | 200 | | | | 202 | |
| | | FMS Wertmanagement | | 2.000% | | 8/1/22 | | | 470 | | | | 474 | |
| | | FMS Wertmanagement | | 2.750% | | 3/6/23 | | | 300 | | | | 310 | |
| | | Hydro-Quebec | | 8.400% | | 1/15/22 | | | 375 | | | | 421 | |
| | | Hydro-Quebec | | 8.050% | | 7/7/24 | | | 325 | | | | 405 | |
| | | Industrial & Commercial Bank of China Ltd. | | 2.635% | | 5/26/21 | | | 250 | | | | 251 | |
| | | Industrial & Commercial Bank of China Ltd. | | 2.957% | | 11/8/22 | | | 250 | | | | 254 | |
| | | Industrial & Commercial Bank of China Ltd. | | 3.538% | | 11/8/27 | | | 250 | | | | 258 | |
| | | Inter-American Development Bank | | 1.875% | | 3/15/21 | | | 200 | | | | 200 | |
| | | Inter-American Development Bank | | 2.625% | | 4/19/21 | | | 700 | | | | 708 | |
| | | Inter-American Development Bank | | 2.125% | | 1/18/22 | | | 700 | | | | 706 | |
| | | Inter-American Development Bank | | 1.750% | | 4/14/22 | | | 800 | | | | 801 | |
| | | Inter-American Development Bank | | 3.000% | | 9/26/22 | | | 500 | | | | 516 | |
| | | Inter-American Development Bank | | 2.500% | | 1/18/23 | | | 1,025 | | | | 1,050 | |
| | | Inter-American Development Bank | | 3.000% | | 10/4/23 | | | 625 | | | | 655 | |
| | | Inter-American Development Bank | | 2.625% | | 1/16/24 | | | 150 | | | | 155 | |
| | | Inter-American Development Bank | | 3.000% | | 2/21/24 | | | 900 | | | | 943 | |
| | | Inter-American Development Bank | | 2.125% | | 1/15/25 | | | 1,100 | | | | 1,117 | |
| | | Inter-American Development Bank | | 7.000% | | 6/15/25 | | | 100 | | | | 125 | |
| | | Inter-American Development Bank | | 2.000% | | 6/2/26 | | | 750 | | | | 754 | |
| | | Inter-American Development Bank | | 2.000% | | 7/23/26 | | | 100 | | | | 101 | |
| | | Inter-American Development Bank | | 2.375% | | 7/7/27 | | | 450 | | | | 464 | |
| | | Inter-American Development Bank | | 3.125% | | 9/18/28 | | | 875 | | | | 955 | |
| | | Inter-American Development Bank | | 3.875% | | 10/28/41 | | | 200 | | | | 245 | |
| | | Inter-American Development Bank | | 3.200% | | 8/7/42 | | | 100 | | | | 112 | |
| | | International Bank for Reconstruction & Development | | 1.625% | | 3/9/21 | | | 1,100 | | | | 1,099 | |
| | | International Bank for Reconstruction & Development | | 1.375% | | 5/24/21 | | | 1,100 | | | | 1,095 | |
| | | International Bank for Reconstruction & Development | | 2.250% | | 6/24/21 | | | 450 | | | | 453 | |
| | | International Bank for Reconstruction & Development | | 2.750% | | 7/23/21 | | | 1,330 | | | | 1,352 | |
| | | International Bank for Reconstruction & Development | | 1.375% | | 9/20/21 | | | 1,975 | | | | 1,966 | |
| | International Bank for Reconstruction & Development | | 2.125% | | 12/13/21 | | | 255 | | | | 257 | |
| | | International Bank for Reconstruction & Development | | 2.000% | | 1/26/22 | | | 145 | | | | 146 | |
| | | International Bank for Reconstruction & Development | | 1.625% | | 2/10/22 | | | 1,325 | | | | 1,324 | |
| | | International Bank for Reconstruction & Development | | 2.125% | | 7/1/22 | | | 775 | | | | 783 | |
| | | International Bank for Reconstruction & Development | | 1.875% | | 6/19/23 | | | 1,100 | | | | 1,105 | |
| | | International Bank for Reconstruction & Development | | 3.000% | | 9/27/23 | | | 1,125 | | | | 1,177 | |
| | | International Bank for Reconstruction & Development | | 2.500% | | 3/19/24 | | | 1,100 | | | | 1,134 | |
| | | International Bank for Reconstruction & Development | | 1.500% | | 8/28/24 | | | 695 | | | | 687 | |
| | | International Bank for Reconstruction & Development | | 2.500% | | 11/25/24 | | | 750 | | | | 775 | |
| | | International Bank for Reconstruction & Development | | 2.500% | | 7/29/25 | | | 1,150 | | | | 1,193 | |
| | | International Bank for Reconstruction & Development | | 3.125% | | 11/20/25 | | | 470 | | | | 504 | |
| | | International Bank for Reconstruction & Development | | 2.500% | | 11/22/27 | | | 350 | | | | 365 | |
| | | International Bank for Reconstruction & Development | | 1.750% | | 10/23/29 | | | 200 | | | | 195 | |
| | | International Bank for Reconstruction & Development | | 4.750% | | 2/15/35 | | | 250 | | | | 326 | |
| | | International Finance Corp. | | 2.250% | | 1/25/21 | | | 1,150 | | | | 1,156 | |
| | | International Finance Corp. | | 2.875% | | 7/31/23 | | | 275 | | | | 286 | |
| | | International Finance Corp. | | 1.375% | | 10/16/24 | | | 200 | | | | 196 | |
| | | International Finance Corp. | | 2.125% | | 4/7/26 | | | 600 | | | | 609 | |
| 7 | | Japan Bank for International Cooperation | | 3.125% | | 7/20/21 | | | 275 | | | | 280 | |
| 7 | | Japan Bank for International Cooperation | | 1.500% | | 7/21/21 | | | 750 | | | | 746 | |
| 7 | | Japan Bank for International Cooperation | | 2.000% | | 11/4/21 | | | 770 | | | | 772 | |
| 7 | | Japan Bank for International Cooperation | | 2.500% | | 6/1/22 | | | 450 | | | | 456 | |
| 7 | | Japan Bank for International Cooperation | | 2.375% | | 7/21/22 | | | 250 | | | | 253 | |
| 7 | | Japan Bank for International Cooperation | | 2.375% | | 11/16/22 | | | 540 | | | | 547 | |
| 7 | | Japan Bank for International Cooperation | | 3.250% | | 7/20/23 | | | 300 | | | | 312 | |
| 7 | | Japan Bank for International Cooperation | | 3.375% | | 7/31/23 | | | 100 | | | | 105 | |
| 7 | | Japan Bank for International Cooperation | | 3.375% | | 10/31/23 | | | 400 | | | | 421 | |
| 7 | | Japan Bank for International Cooperation | | 3.000% | | 5/29/24 | | | 500 | | | | 519 | |
| 7 | | Japan Bank for International Cooperation | | 1.750% | | 10/17/24 | | | 200 | | | | 197 | |
| 7 | | Japan Bank for International Cooperation | | 2.125% | | 2/10/25 | | | 330 | | | | 331 | |
| 7 | | Japan Bank for International Cooperation | | 2.375% | | 4/20/26 | | | 200 | | | | 202 | |
| 7 | | Japan Bank for International Cooperation | | 2.250% | | 11/4/26 | | | 200 | | | | 201 | |
| 7 | | Japan Bank for International Cooperation | | 2.875% | | 7/21/27 | | | 200 | | | | 209 | |
| 7 | | Japan Bank for International Cooperation | | 2.750% | | 11/16/27 | | | 800 | | | | 832 | |
| 7 | | Japan Bank for International Cooperation | | 3.250% | | 7/20/28 | | | 300 | | | | 323 | |
| 7 | | Japan Bank for International Cooperation | | 3.500% | | 10/31/28 | | | 350 | | | | 384 | |
| 7 | | Japan International Cooperation Agency | | 2.750% | | 4/27/27 | | | 300 | | | | 310 | |
| 8 | | KFW | | 1.625% | | 3/15/21 | | | 900 | | | | 899 | |
| 8 | | KFW | | 2.375% | | 3/24/21 | | | 900 | | | | 907 | |
Total Bond Market Index Portfolio
| | | | | | | | | Face | | | Market | |
| | | | | | | Maturity | | Amount | | | Value• | |
| | | | | Coupon | | Date | | | ($000 | ) | | | ($000 | ) |
| 8 | | KFW | | 2.625% | | 4/12/21 | | | 800 | | | | 809 | |
| 8 | | KFW | | 1.500% | | 6/15/21 | | | 900 | | | | 898 | |
| 8 | | KFW | | 1.750% | | 9/15/21 | | | 600 | | | | 601 | |
| 8 | | KFW | | 2.000% | | 11/30/21 | | | 600 | | | | 604 | |
| 8 | | KFW | | 3.125% | | 12/15/21 | | | 1,115 | | | | 1,146 | |
| 8 | | KFW | | 2.500% | | 2/15/22 | | | 1,000 | | | | 1,016 | |
| 8 | | KFW | | 2.125% | | 3/7/22 | | | 1,000 | | | | 1,009 | |
| 8 | | KFW | | 2.125% | | 6/15/22 | | | 750 | | | | 758 | |
| 8 | | KFW | | 1.750% | | 8/22/22 | | | 1,200 | | | | 1,202 | |
| 8 | | KFW | | 2.000% | | 10/4/22 | | | 950 | | | | 958 | |
| 8 | | KFW | | 2.375% | | 12/29/22 | | | 450 | | | | 459 | |
| 8 | | KFW | | 2.125% | | 1/17/23 | | | 1,025 | | | | 1,040 | |
| 8 | | KFW | | 2.625% | | 2/28/24 | | | 400 | | | | 414 | |
| 8 | | KFW | | 1.375% | | 8/5/24 | | | 900 | | | | 883 | |
| 8 | | KFW | | 2.500% | | 11/20/24 | | | 1,800 | | | | 1,859 | |
| 8 | | KFW | | 2.000% | | 5/2/25 | | | 150 | | | | 152 | |
| 8 | | KFW | | 2.875% | | 4/3/28 | | | 500 | | | | 536 | |
| 8 | | KFW | | 1.750% | | 9/14/29 | | | 175 | | | | 171 | |
| 8 | | KFW | | 0.000% | | 4/18/36 | | | 400 | | | | 273 | |
| 8 | | KFW | | 0.000% | | 6/29/37 | | | 200 | | | | 133 | |
| | | Korea Development Bank | | 4.625% | | 11/16/21 | | | 150 | | | | 157 | |
| | | Korea Development Bank | | 3.000% | | 9/14/22 | | | 750 | | | | 768 | |
| | | Korea Development Bank | | 3.375% | | 3/12/23 | | | 700 | | | | 726 | |
| | | Korea Development Bank | | 3.750% | | 1/22/24 | | | 500 | | | | 530 | |
| | | Korea Development Bank | | 2.125% | | 10/1/24 | | | 200 | | | | 199 | |
| 8 | | Landwirtschaftliche Rentenbank | | 1.750% | | 9/24/21 | | | 250 | | | | 250 | |
| 8 | | Landwirtschaftliche Rentenbank | | 2.250% | | 10/1/21 | | | 45 | | | | 45 | |
| 8 | | Landwirtschaftliche Rentenbank | | 3.125% | | 11/14/23 | | | 100 | | | | 105 | |
| 8 | | Landwirtschaftliche Rentenbank | | 2.000% | | 1/13/25 | | | 850 | | | | 858 | |
| 8 | | Landwirtschaftliche Rentenbank | | 2.375% | | 6/10/25 | | | 475 | | | | 488 | |
| 8 | | Landwirtschaftliche Rentenbank | | 1.750% | | 7/27/26 | | | 275 | | | | 272 | |
| 8 | | Landwirtschaftliche Rentenbank | | 2.500% | | 11/15/27 | | | 250 | | | | 261 | |
| | | Nexen Energy ULC | | 7.875% | | 3/15/32 | | | 50 | | | | 72 | |
| | | Nexen Energy ULC | | 6.400% | | 5/15/37 | | | 450 | | | | 619 | |
| | | Nexen Energy ULC | | 7.500% | | 7/30/39 | | | 200 | | | | 311 | |
| | | Nordic Investment Bank | | 2.250% | | 2/1/21 | | | 200 | | | | 201 | |
| | | Nordic Investment Bank | | 1.250% | | 8/2/21 | | | 400 | | | | 397 | |
| | | Nordic Investment Bank | | 2.125% | | 2/1/22 | | | 200 | | | | 202 | |
| | | Nordic Investment Bank | | 1.375% | | 10/17/22 | | | 200 | | | | 198 | |
| | | Nordic Investment Bank | | 2.875% | | 7/19/23 | | | 200 | | | | 208 | |
| | | Nordic Investment Bank | | 2.250% | | 5/21/24 | | | 200 | | | | 203 | |
| 9 | | Oesterreichische Kontrollbank AG | | 2.625% | | 1/31/22 | | | 100 | | | | 102 | |
| 9 | | Oesterreichische Kontrollbank AG | | 1.625% | | 9/17/22 | | | 400 | | | | 399 | |
| 9 | | Oesterreichische Kontrollbank AG | | 2.875% | | 3/13/23 | | | 500 | | | | 518 | |
| 9 | | Oesterreichische Kontrollbank AG | | 3.125% | | 11/7/23 | | | 200 | | | | 210 | |
| 3 | | Oriental Republic of Uruguay | | 8.000% | | 11/18/22 | | | 125 | | | | 139 | |
| 3 | | Oriental Republic of Uruguay | | 4.500% | | 8/14/24 | | | 303 | | | | 328 | |
| 3 | | Oriental Republic of Uruguay | | 4.375% | | 10/27/27 | | | 150 | | | | 166 | |
| 3 | | Oriental Republic of Uruguay | | 4.375% | | 1/23/31 | | | 208 | | | | 233 | |
| 3 | | Oriental Republic of Uruguay | | 7.625% | | 3/21/36 | | | 195 | | | | 289 | |
| 3 | | Oriental Republic of Uruguay | | 4.125% | | 11/20/45 | | | 300 | | | | 322 | |
| 3 | | Oriental Republic of Uruguay | | 5.100% | | 6/18/50 | | | 565 | | | | 679 | |
| 3 | | Oriental Republic of Uruguay | | 4.975% | | 4/20/55 | | | 500 | | | | 589 | |
| | | Petroleos Mexicanos | | 5.500% | | 1/21/21 | | | 200 | | | | 205 | |
| | | Petroleos Mexicanos | | 6.375% | | 2/4/21 | | | 261 | | | | 266 | |
| | | Petroleos Mexicanos | | 4.875% | | 1/24/22 | | | 185 | | | | 192 | |
| | | Petroleos Mexicanos | | 5.375% | | 3/13/22 | | | 64 | | | | 67 | |
| | | Petroleos Mexicanos | | 3.500% | | 1/30/23 | | | 215 | | | | 217 | |
| | | Petroleos Mexicanos | | 4.625% | | 9/21/23 | | | 87 | | | | 91 | |
| | | Petroleos Mexicanos | | 4.875% | | 1/18/24 | | | 120 | | | | 126 | |
| | | Petroleos Mexicanos | | 4.250% | | 1/15/25 | | | 100 | | | | 101 | |
| | | Petroleos Mexicanos | | 2.378% | | 4/15/25 | | | 28 | | | | 28 | |
| | | Petroleos Mexicanos | | 4.500% | | 1/23/26 | | | 110 | | | | 109 | |
| | | Petroleos Mexicanos | | 6.875% | | 8/4/26 | | | 599 | | | | 657 | |
| 6 | | Petroleos Mexicanos | | 6.490% | | 1/23/27 | | | 581 | | | | 617 | |
| | | Petroleos Mexicanos | | 6.500% | | 3/13/27 | | | 1,236 | | | | 1,308 | |
| | | Petroleos Mexicanos | | 5.350% | | 2/12/28 | | | 556 | | | | 552 | |
| | | Petroleos Mexicanos | | 6.500% | | 1/23/29 | | | 375 | | | | 393 | |
| 6 | | Petroleos Mexicanos | | 6.840% | | 1/23/30 | | | 1,091 | | | | 1,168 | |
| | | Petroleos Mexicanos | | 6.625% | | 6/15/35 | | | 625 | | | | 635 | |
| | | Petroleos Mexicanos | | 6.625% | | 6/15/38 | | | 150 | | | | 147 | |
| | Petroleos Mexicanos | | 6.500% | | 6/2/41 | | | 250 | | | | 248 | |
| | | Petroleos Mexicanos | | 5.500% | | 6/27/44 | | | 94 | | | | 84 | |
| | | Petroleos Mexicanos | | 6.375% | | 1/23/45 | | | 300 | | | | 290 | |
| | | Petroleos Mexicanos | | 5.625% | | 1/23/46 | | | 367 | | | | 330 | |
| | | Petroleos Mexicanos | | 6.750% | | 9/21/47 | | | 1,288 | | | | 1,289 | |
| | | Petroleos Mexicanos | | 6.350% | | 2/12/48 | | | 496 | | | | 479 | |
| 6 | | Petroleos Mexicanos | | 7.690% | | 1/23/50 | | | 1,544 | | | | 1,685 | |
| | | Province of Alberta | | 2.200% | | 7/26/22 | | | 400 | | | | 403 | |
| | | Province of Alberta | | 3.350% | | 11/1/23 | | | 375 | | | | 395 | |
| | | Province of Alberta | | 2.950% | | 1/23/24 | | | 300 | | | | 311 | |
| | | Province of Alberta | | 1.875% | | 11/13/24 | | | 450 | | | | 449 | |
| | | Province of Alberta | | 3.300% | | 3/15/28 | | | 250 | | | | 270 | |
| | | Province of British Columbia | | 2.000% | | 10/23/22 | | | 200 | | | | 201 | |
| | | Province of British Columbia | | 1.750% | | 9/27/24 | | | 225 | | | | 223 | |
| | | Province of British Columbia | | 2.250% | | 6/2/26 | | | 300 | | | | 303 | |
| | | Province of Manitoba | | 2.050% | | 11/30/20 | | | 300 | | | | 300 | |
| | | Province of Manitoba | | 2.100% | | 9/6/22 | | | 150 | | | | 151 | |
| | | Province of Manitoba | | 2.600% | | 4/16/24 | | | 150 | | | | 154 | |
| | | Province of Manitoba | | 2.125% | | 6/22/26 | | | 90 | | | | 90 | |
| | | Province of New Brunswick | | 2.500% | | 12/12/22 | | | 95 | | | | 97 | |
| | | Province of New Brunswick | | 3.625% | | 2/24/28 | | | 105 | | | | 115 | |
| | | Province of Ontario | | 2.550% | | 2/12/21 | | | 180 | | | | 181 | |
| | | Province of Ontario | | 2.500% | | 9/10/21 | | | 575 | | | | 581 | |
| | | Province of Ontario | | 2.400% | | 2/8/22 | | | 525 | | | | 531 | |
| | | Province of Ontario | | 2.550% | | 4/25/22 | | | 350 | | | | 356 | |
| | | Province of Ontario | | 2.250% | | 5/18/22 | | | 500 | | | | 505 | |
| | | Province of Ontario | | 2.450% | | 6/29/22 | | | 150 | | | | 152 | |
| | | Province of Ontario | | 2.200% | | 10/3/22 | | | 400 | | | | 404 | |
| | | Province of Ontario | | 3.400% | | 10/17/23 | | | 760 | | | | 802 | |
| | | Province of Ontario | | 3.050% | | 1/29/24 | | | 250 | | | | 261 | |
| | | Province of Ontario | | 3.200% | | 5/16/24 | | | 150 | | | | 158 | |
| | | Province of Ontario | | 2.500% | | 4/27/26 | | | 250 | | | | 256 | |
| | | Province of Ontario | | 2.300% | | 6/15/26 | | | 900 | | | | 911 | |
| | | Province of Ontario | | 2.000% | | 10/2/29 | | | 585 | | | | 575 | |
| | | Province of Quebec | | 2.750% | | 8/25/21 | | | 325 | | | | 330 | |
| | | Province of Quebec | | 2.375% | | 1/31/22 | | | 390 | | | | 394 | |
| | | Province of Quebec | | 2.625% | | 2/13/23 | | | 425 | | | | 435 | |
| | | Province of Quebec | | 2.500% | | 4/20/26 | | | 200 | | | | 205 | |
| | | Province of Quebec | | 2.750% | | 4/12/27 | | | 850 | | | | 884 | |
| | | Province of Quebec | | 7.500% | | 9/15/29 | | | 475 | | | | 684 | |
| | | Province of Saskatchewan | | 8.500% | | 7/15/22 | | | 58 | | | | 67 | |
| | | Republic of Chile | | 2.250% | | 10/30/22 | | | 175 | | | | 176 | |
| | | Republic of Chile | | 3.125% | | 1/21/26 | | | 485 | | | | 507 | |
| 3 | | Republic of Chile | | 3.240% | | 2/6/28 | | | 460 | | | | 482 | |
| 3 | | Republic of Chile | | 3.500% | | 1/25/50 | | | 275 | | | | 285 | |
| | | Republic of Colombia | | 4.375% | | 7/12/21 | | | 450 | | | | 464 | |
| | | Republic of Colombia | | 4.000% | | 2/26/24 | | | 400 | | | | 421 | |
| | | Republic of Colombia | | 8.125% | | 5/21/24 | | | 100 | | | | 123 | |
| 3 | | Republic of Colombia | | 4.500% | | 1/28/26 | | | 322 | | | | 350 | |
| 3 | | Republic of Colombia | | 3.875% | | 4/25/27 | | | 765 | | | | 808 | |
| 3 | | Republic of Colombia | | 4.500% | | 3/15/29 | | | 650 | | | | 719 | |
| | | Republic of Colombia | | 10.375% | | 1/28/33 | | | 200 | | | | 321 | |
| | | Republic of Colombia | | 7.375% | | 9/18/37 | | | 300 | | | | 427 | |
| | | Republic of Colombia | | 6.125% | | 1/18/41 | | | 125 | | | | 161 | |
| 3 | | Republic of Colombia | | 5.625% | | 2/26/44 | | | 475 | | | | 586 | |
| 3 | | Republic of Colombia | | 5.000% | | 6/15/45 | | | 965 | | | | 1,114 | |
| | | Republic of Colombia | | 5.200% | | 5/15/49 | | | 400 | | | | 477 | |
| | | Republic of Hungary | | 6.375% | | 3/29/21 | | | 700 | | | | 739 | |
| | | Republic of Hungary | | 5.375% | | 2/21/23 | | | 400 | | | | 438 | |
| | | Republic of Hungary | | 5.750% | | 11/22/23 | | | 400 | | | | 451 | |
| | | Republic of Hungary | | 5.375% | | 3/25/24 | | | 350 | | | | 394 | |
| | | Republic of Hungary | | 7.625% | | 3/29/41 | | | 290 | | | | 475 | |
| | | Republic of Indonesia | | 2.950% | | 1/11/23 | | | 425 | | | | 432 | |
| | | Republic of Indonesia | | 4.100% | | 4/24/28 | | | 200 | | | | 217 | |
| | | Republic of Indonesia | | 4.750% | | 2/11/29 | | | 425 | | | | 487 | |
| | | Republic of Indonesia | | 3.400% | | 9/18/29 | | | 200 | | | | 208 | |
| 6 | | Republic of Indonesia | | 4.750% | | 7/18/47 | | | 200 | | | | 231 | |
| | | Republic of Indonesia | | 4.350% | | 1/11/48 | | | 300 | | | | 332 | |
| | | Republic of Indonesia | | 3.700% | | 10/30/49 | | | 200 | | | | 203 | |
| | | Republic of Italy | | 6.875% | | 9/27/23 | | | 590 | | | | 671 | |
| | | Republic of Italy | | 2.375% | | 10/17/24 | | | 475 | | | | 465 | |
Total Bond Market Index Portfolio
| | | | | | | | | Face | | | Market | |
| | | | | | | Maturity | | Amount | | | Value• | |
| | | | | Coupon | | Date | | | ($000 | ) | | | ($000 | ) |
| | | Republic of Italy | | 2.875% | | 10/17/29 | | | 200 | | | | 189 | |
| | | Republic of Italy | | 5.375% | | 6/15/33 | | | 475 | | | | 544 | |
| | | Republic of Italy | | 4.000% | | 10/17/49 | | | 500 | | | | 474 | |
| | | Republic of Korea | | 3.875% | | 9/11/23 | | | 200 | | | | 213 | |
| | | Republic of Korea | | 5.625% | | 11/3/25 | | | 100 | | | | 118 | |
| | | Republic of Korea | | 2.750% | | 1/19/27 | | | 1,000 | | | | 1,021 | |
| | | Republic of Korea | | 3.875% | | 9/20/48 | | | 125 | | | | 149 | |
| 3 | | Republic of Panama | | 4.000% | | 9/22/24 | | | 200 | | | | 214 | |
| 3 | | Republic of Panama | | 3.750% | | 3/16/25 | | | 200 | | | | 212 | |
| | | Republic of Panama | | 7.125% | | 1/29/26 | | | 168 | | | | 210 | |
| | | Republic of Panama | | 8.875% | | 9/30/27 | | | 238 | | | | 339 | |
| 3 | | Republic of Panama | | 3.875% | | 3/17/28 | | | 460 | | | | 500 | |
| | | Republic of Panama | | 9.375% | | 4/1/29 | | | 300 | | | | 457 | |
| 3 | | Republic of Panama | | 6.700% | | 1/26/36 | | | 292 | | | | 409 | |
| 3 | | Republic of Panama | | 4.500% | | 4/16/50 | | | 410 | | | | 486 | |
| 3 | | Republic of Panama | | 4.300% | | 4/29/53 | | | 400 | | | | 466 | |
| 3 | | Republic of Panama | | 3.870% | | 7/23/60 | | | 200 | | | | 215 | |
| | | Republic of Peru | | 7.350% | | 7/21/25 | | | 225 | | | | 284 | |
| | | Republic of Peru | | 8.750% | | 11/21/33 | | | 645 | | | | 1,064 | |
| 3 | | Republic of Peru | | 6.550% | | 3/14/37 | | | 225 | | | | 329 | |
| | | Republic of Peru | | 5.625% | | 11/18/50 | | | 475 | | | | 689 | |
| | | Republic of Poland | | 5.125% | | 4/21/21 | | | 275 | | | | 286 | |
| | | Republic of Poland | | 5.000% | | 3/23/22 | | | 775 | | | | 827 | |
| | | Republic of Poland | | 3.000% | | 3/17/23 | | | 325 | | | | 335 | |
| | | Republic of Poland | | 3.250% | | 4/6/26 | | | 500 | | | | 529 | |
| | | Republic of the Philippines | | 4.000% | | 1/15/21 | | | 350 | | | | 357 | |
| | | Republic of the Philippines | | 9.500% | | 10/21/24 | | | 350 | | | | 466 | |
| | | Republic of the Philippines | | 10.625% | | 3/16/25 | | | 100 | | | | 141 | |
| | | Republic of the Philippines | | 5.500% | | 3/30/26 | | | 225 | | | | 267 | |
| | | Republic of the Philippines | | 3.000% | | 2/1/28 | | | 400 | | | | 415 | |
| | | Republic of the Philippines | | 3.750% | | 1/14/29 | | | 400 | | | | 441 | |
| | | Republic of the Philippines | | 9.500% | | 2/2/30 | | | 300 | | | | 478 | |
| | | Republic of the Philippines | | 7.750% | | 1/14/31 | | | 400 | | | | 591 | |
| | | Republic of the Philippines | | 6.375% | | 1/15/32 | | | 200 | | | | 272 | |
| | | Republic of the Philippines | | 6.375% | | 10/23/34 | | | 550 | | | | 781 | |
| | | Republic of the Philippines | | 3.950% | | 1/20/40 | | | 700 | | | | 799 | |
| | | Republic of the Philippines | | 3.700% | | 3/1/41 | | | 400 | | | | 453 | |
| | | Republic of the Philippines | | 3.700% | | 2/2/42 | | | 350 | | | | 394 | |
| | | State of Israel | | 3.150% | | 6/30/23 | | | 400 | | | | 416 | |
| | | State of Israel | | 2.875% | | 3/16/26 | | | 200 | | | | 208 | |
| | | State of Israel | | 3.250% | | 1/17/28 | | | 300 | | | | 322 | |
| | | State of Israel | | 4.500% | | 1/30/43 | | | 200 | | | | 238 | |
| | | State of Israel | | 4.125% | | 1/17/48 | | | 250 | | | | 285 | |
| | | Svensk Exportkredit AB | | 1.750% | | 3/10/21 | | | 450 | | | | 450 | |
| | | Svensk Exportkredit AB | | 2.375% | | 4/9/21 | | | 200 | | | | 202 | |
| | | Svensk Exportkredit AB | | 2.875% | | 5/22/21 | | | 200 | | | | 203 | |
| | | Svensk Exportkredit AB | | 1.625% | | 9/12/21 | | | 300 | | | | 300 | |
| | | Svensk Exportkredit AB | | 3.125% | | 11/8/21 | | | 200 | | | | 205 | |
| | | Svensk Exportkredit AB | | 2.000% | | 8/30/22 | | | 190 | | | | 191 | |
| | | Svensk Exportkredit AB | | 1.625% | | 11/14/22 | | | 200 | | | | 200 | |
| | | Svensk Exportkredit AB | | 2.875% | | 3/14/23 | | | 195 | | | | 202 | |
| | | Syngenta Finance NV | | 3.125% | | 3/28/22 | | | 100 | | | | 101 | |
| | | United Mexican States | | 3.625% | | 3/15/22 | | | 548 | | | | 564 | |
| | | United Mexican States | | 3.600% | | 1/30/25 | | | 510 | | | | 533 | |
| | | United Mexican States | | 4.125% | | 1/21/26 | | | 445 | | | | 474 | |
| | | United Mexican States | | 4.150% | | 3/28/27 | | | 800 | | | | 855 | |
| | | United Mexican States | | 3.750% | | 1/11/28 | | | 675 | | | | 700 | |
| | | United Mexican States | | 4.500% | | 4/22/29 | | | 850 | | | | 931 | |
| | | United Mexican States | | 8.300% | | 8/15/31 | | | 220 | | | | 326 | |
| | | United Mexican States | | 7.500% | | 4/8/33 | | | 100 | | | | 141 | |
| | | United Mexican States | | 6.050% | | 1/11/40 | | | 883 | | | | 1,144 | |
| | | United Mexican States | | 4.750% | | 3/8/44 | | | 765 | | | | 842 | |
| | | United Mexican States | | 5.550% | | 1/21/45 | | | 510 | | | | 625 | |
| | | United Mexican States | | 4.600% | | 1/23/46 | | | 600 | | | | 647 | |
| | | United Mexican States | | 4.350% | | 1/15/47 | | | 760 | | | | 796 | |
| | | United Mexican States | | 4.600% | | 2/10/48 | | | 255 | | | | 277 | |
| 3 | | United Mexican States | | 4.500% | | 1/31/50 | | | 400 | | | | 433 | |
| | | United Mexican States | | 5.750% | | 10/12/10 | | | 342 | | | | 402 | |
| Total Sovereign Bonds (Cost $168,587) | | | | | | | | | | | 176,043 | |
| Taxable Municipal Bonds (0.7%) | | | | | | | | | | | | |
| | | Alabama Economic Settlement Authority BP Settlement Revenue | | 3.163% | | 9/15/25 | | | 75 | | | | 77 | |
| | | American Municipal Power Ohio Inc. Revenue (Prairie State Energy Campus Project) | | 5.939% | | 2/15/47 | | | 150 | | | | 207 | |
| | | American Municipal Power Ohio Inc.Revenue (Prairie State Energy Campus Project) | | 6.270% | | 2/15/50 | | | 50 | | | | 67 | |
| | | American Municipal Power Ohio Inc. Revenue (Prairie State Energy Campus Project) | | 7.499% | | 2/15/50 | | | 50 | | | | 77 | |
| | | American Municipal Power Ohio Inc. Revenue (Prairie State Energy Campus Project) | | 8.084% | | 2/15/50 | | | 125 | | | | 214 | |
| | | Bay Area Toll Authority California Toll Bridge Revenue (San Francisco Bay Area) | | 6.918% | | 4/1/40 | | | 100 | | | | 146 | |
| | | Bay Area Toll Authority California Toll Bridge Revenue (San Francisco Bay Area) | | 6.263% | | 4/1/49 | | | 250 | | | | 382 | |
| | | Bay Area Toll Authority California Toll Bridge Revenue (San Francisco Bay Area) | | 6.907% | | 10/1/50 | | | 200 | | | | 323 | |
| | | California Department of Water Resources Power Supply Revenue | | 2.000% | | 5/1/22 | | | 150 | | | | 151 | |
| | | California GO | | 2.800% | | 4/1/21 | | | 150 | | | | 152 | |
| | | California GO | | 5.700% | | 11/1/21 | | | 250 | | | | 268 | |
| | | California GO | | 3.375% | | 4/1/25 | | | 100 | | | | 106 | |
| | | California GO | | 2.650% | | 4/1/26 | | | 75 | | | | 77 | |
| | | California GO | | 3.500% | | 4/1/28 | | | 150 | | | | 162 | |
| | | California GO | | 4.500% | | 4/1/33 | | | 190 | | | | 214 | |
| | | California GO | | 7.500% | | 4/1/34 | | | 350 | | | | 527 | |
| | | California GO | | 4.600% | | 4/1/38 | | | 300 | | | | 332 | |
| | | California GO | | 7.300% | | 10/1/39 | | | 75 | | | | 115 | |
| | | California GO | | 7.350% | | 11/1/39 | | | 1,425 | | | | 2,189 | |
| | | California GO | | 7.625% | | 3/1/40 | | | 205 | | | | 328 | |
| | | California GO | | 7.600% | | 11/1/40 | | | 200 | | | | 330 | |
| | | California State University Systemwide Revenue | | 3.899% | | 11/1/47 | | | 50 | | | | 55 | |
| | | Central Puget Sound WA Regional Transit Authority Sales & Use Tax Revenue | | 5.491% | | 11/1/39 | | | 50 | | | | 66 | |
| | | Chicago IL GO | | 7.045% | | 1/1/29 | | | 50 | | | | 55 | |
| | | Chicago IL GO | | 7.375% | | 1/1/33 | | | 150 | | | | 180 | |
| | | Chicago IL GO | | 6.314% | | 1/1/44 | | | 100 | | | | 114 | |
| | | Chicago IL Metropolitan Water Reclamation District GO | | 5.720% | | 12/1/38 | | | 100 | | | | 131 | |
| | | Chicago IL O’Hare International Airport Revenue | | 6.395% | | 1/1/40 | | | 125 | | | | 180 | |
| | | Chicago IL O’Hare International Airport Revenue | | 4.472% | | 1/1/49 | | | 75 | | | | 90 | |
| | | Chicago IL Transit Authority Sales Tax Receipts Revenue | | 6.200% | | 12/1/40 | | | 150 | | | | 196 | |
| | | Chicago IL Transit Authority Transfer Tax Receipts Revenue | | 6.899% | | 12/1/40 | | | 125 | | | | 169 | |
| | | Clark County NV Airport System Revenue | | 6.820% | | 7/1/45 | | | 100 | | | | 158 | |
| | | Commonwealth Financing Authority Pennsylvania Revenue | | 3.864% | | 6/1/38 | | | 100 | | | | 107 | |
| | | Commonwealth Financing Authority Pennsylvania Revenue | | 3.807% | | 6/1/41 | | | 55 | | | | 59 | |
| | | Connecticut GO | | 5.090% | | 10/1/30 | | | 175 | | | | 201 | |
| | | Connecticut GO | | 5.850% | | 3/15/32 | | | 200 | | | | 258 | |
| | | Cook County IL GO | | 6.229% | | 11/15/34 | | | 50 | | | | 65 | |
| | | Dallas TX Area Rapid Transit Revenue | | 5.999% | | 12/1/44 | | | 100 | | | | 142 | |
| | | Dallas TX Area Rapid Transit Revenue | | 5.022% | | 12/1/48 | | | 50 | | | | 66 | |
| | | Dallas TX Convention Center Hotel Development Corp. Hotel Revenue | | 7.088% | | 1/1/42 | | | 150 | | | | 208 | |
Total Bond Market Index Portfolio
| | | | | | | | | Face | | | Market | |
| | | | | | | Maturity | | Amount | | | Value• | |
| | | | | Coupon | | Date | | | ($000 | ) | | | ($000 | ) |
| | Dallas TX Independent School District GO | | 6.450% | | 2/15/35 | | | 100 | | | | 105 | |
| | | Dallas-Fort Worth TX International Airport Revenue | | 2.994% | | 11/1/38 | | | 50 | | | | 49 | |
| | | Dallas-Fort Worth TX International Airport Revenue | | 3.144% | | 11/1/45 | | | 75 | | | | 74 | |
| | | District of Columbia Income Tax Revenue | | 5.591% | | 12/1/34 | | | 50 | | | | 62 | |
| | | District of Columbia Water & Sewer Authority Public Utility Revenue | | 4.814% | | 10/1/14 | | | 150 | | | | 197 | |
| | | Florida Board of Administration Finance Corp Revenue | | 2.638% | | 7/1/21 | | | 150 | | | | 152 | |
| | | George Washington University | | 4.126% | | 9/15/48 | | | 150 | | | | 173 | |
| | | Georgia Municipal Electric Power Authority Revenue | | 6.637% | | 4/1/57 | | | 248 | | | | 334 | |
| | | Georgia Municipal Electric Power Authority Revenue | | 6.655% | | 4/1/57 | | | 149 | | | | 205 | |
| | | Georgia Municipal Electric Power Authority Revenue | | 7.055% | | 4/1/57 | | | 74 | | | | 100 | |
| | | Houston TX GO | | 6.290% | | 3/1/32 | | | 135 | | | | 163 | |
| | | Illinois GO | | 4.950% | | 6/1/23 | | | 349 | | | | 364 | |
| | | Illinois GO | | 5.100% | | 6/1/33 | | | 1,200 | | | | 1,294 | |
| | | Illinois GO | | 7.350% | | 7/1/35 | | | 300 | | | | 364 | |
| | | Illinois Toll Highway Authority Revenue | | 6.184% | | 1/1/34 | | | 50 | | | | 66 | |
| | | JobsOhio Beverage System Statewide Liquor Profits Revenue | | 3.985% | | 1/1/29 | | | 150 | | | | 163 | |
| | | JobsOhio Beverage System Statewide Liquor Profits Revenue | | 4.532% | | 1/1/35 | | | 100 | | | | 117 | |
| | | Los Angeles CA Department of Water & Power Revenue | | 6.166% | | 7/1/40 | | | 25 | | | | 26 | |
| | | Los Angeles CA Department of Water & Power Revenue | | 6.574% | | 7/1/45 | | | 100 | | | | 156 | |
| | | Los Angeles CA Department of Water & Power Revenue | | 6.603% | | 7/1/50 | | | 100 | | | | 160 | |
| | | Los Angeles CA Unified School District GO | | 5.755% | | 7/1/29 | | | 200 | | | | 242 | |
| | | Los Angeles CA Unified School District GO | | 5.750% | | 7/1/34 | | | 125 | | | | 160 | |
| | | Los Angeles CA Unified School District GO | | 6.758% | | 7/1/34 | | | 200 | | | | 276 | |
| | | Los Angeles County CA Metropolitan Transportation Authority Sales Tax Revenue | | 5.735% | | 6/1/39 | | | 75 | | | | 97 | |
| | | Los Angeles County CA Public Works Financing Authority Lease Revenue | | 7.618% | | 8/1/40 | | | 50 | | | | 77 | |
| | | Maryland Transportation Authority Facilities Projects Revenue | | 5.888% | | 7/1/43 | | | 50 | | | | 67 | |
| | | Massachusetts GO | | 4.200% | | 12/1/21 | | | 115 | | | | 118 | |
| | | Massachusetts GO | | 5.456% | | 12/1/39 | | | 150 | | | | 195 | |
| | | Massachusetts GO | | 2.813% | | 9/1/43 | | | 225 | | | | 214 | |
| | | Massachusetts GO | | 2.900% | | 9/1/49 | | | 100 | | | | 94 | |
| | | Massachusetts School Building Authority Dedicated Sales Tax Revenue | | 5.715% | | 8/15/39 | | | 100 | | | | 132 | |
| | | Massachusetts School Building Authority Dedicated Sales Tax Revenue | | 3.395% | | 10/15/40 | | | 50 | | | | 50 | |
| | | Massachusetts Transportation Fund Revenue | | 5.731% | | 6/1/40 | | | 50 | | | | 65 | |
| | | Metropolitan Government of Nashville & Davidson County TN Convention Center Authority Tourism Tax Revenue | | 6.731% | | 7/1/43 | | | 50 | | | | 71 | |
| | | Metropolitan Washington DC/VA Airports Authority Dulles Toll Road Revenue | | 7.462% | | 10/1/46 | | | 85 | | | | 137 | |
| | | Miami-Dade County FL Aviation Revenue (Miami International Airport) | | 4.280% | | 10/1/41 | | | 125 | | | | 134 | |
| | | Michigan Finance Authority Revenue (Trinity Health Credit Group) | | 3.084% | | 12/1/34 | | | 75 | | | | 75 | |
| | | Michigan Finance Authority Revenue (Trinity Health Credit Group) | | 3.384% | | 12/1/40 | | | 200 | | | | 200 | |
| | | Michigan State University Revenue | | 4.496% | | 8/15/48 | | | 50 | | | | 55 | |
| | Mississippi GO | | 5.245% | | 11/1/34 | | | 50 | | | | 62 | |
| | | Missouri Health & Educational Facilities Authority Revenue (Washington University) | | 3.652% | | 8/15/57 | | | 100 | | | | 105 | |
| 10 | | New Jersey Economic Development Authority Revenue (State Pension Funding) | | 7.425% | | 2/15/29 | | | 225 | | | | 282 | |
| | | New Jersey Transportation Trust Fund Authority Transportation Program Revenue | | 4.081% | | 6/15/39 | | | 75 | | | | 75 | |
| | | New Jersey Transportation Trust Fund Authority Transportation Program Revenue | | 4.131% | | 6/15/42 | | | 100 | | | | 99 | |
| | | New Jersey Transportation Trust Fund Authority Transportation System Revenue | | 6.104% | | 12/15/28 | | | 100 | | | | 104 | |
| | | New Jersey Transportation Trust Fund Authority Transportation System Revenue | | 6.561% | | 12/15/40 | | | 400 | | | | 528 | |
| | | New Jersey Turnpike Authority Revenue | | 7.414% | | 1/1/40 | | | 100 | | | | 157 | |
| | | New Jersey Turnpike Authority Revenue | | 7.102% | | 1/1/41 | | | 400 | | | | 610 | |
| | | New York City NY GO | | 6.246% | | 6/1/35 | | | 25 | | | | 25 | |
| | | New York City NY GO | | 5.517% | | 10/1/37 | | | 50 | | | | 64 | |
| | | New York City NY GO | | 6.271% | | 12/1/37 | | | 100 | | | | 139 | |
| | | New York City NY Municipal Water Finance Authority Water & Sewer System Revenue | | 5.750% | | 6/15/41 | | | 50 | | | | 70 | |
| | | New York City NY Municipal Water Finance Authority Water & Sewer System Revenue | | 5.952% | | 6/15/42 | | | 50 | | | | 72 | |
| | | New York City NY Municipal Water Finance Authority Water & Sewer System Revenue | | 6.011% | | 6/15/42 | | | 50 | | | | 72 | |
| | | New York City NY Municipal Water Finance Authority Water & Sewer System Revenue | | 5.440% | | 6/15/43 | | | 100 | | | | 137 | |
| | | New York City NY Municipal Water Finance Authority Water & Sewer System Revenue | | 5.882% | | 6/15/44 | | | 175 | | | | 255 | |
| | | New York City NY Transitional Finance Authority Future Tax Revenue | | 5.767% | | 8/1/36 | | | 150 | | | | 186 | |
| | | New York City NY Transitional Finance Authority Future Tax Revenue | | 5.508% | | 8/1/37 | | | 100 | | | | 127 | |
| | | New York City NY Transitional Finance Authority Future Tax Revenue | | 5.572% | | 11/1/38 | | | 75 | | | | 95 | |
| | | New York Metropolitan Transportation Authority Revenue (Dedicated Tax Fund) | | 7.336% | | 11/15/39 | | | 400 | | | | 626 | |
| | | New York Metropolitan Transportation Authority Revenue (Transit Revenue) | | 5.871% | | 11/15/39 | | | 50 | | | | 64 | |
| | | New York State Dormitory Authority Revenue | | 3.142% | | 7/1/43 | | | 75 | | | | 74 | |
| | | New York State Dormitory Authority Revenue (Personal Income Tax) | | 3.110% | | 2/15/39 | | | 50 | | | | 50 | |
| | | New York State Dormitory Authority Revenue (Personal Income Tax) | | 5.628% | | 3/15/39 | | | 100 | | | | 123 | |
| | | New York State Dormitory Authority Revenue (Personal Income Tax) | | 3.190% | | 2/15/43 | | | 50 | | | | 50 | |
| | | New York State Thruway Authority | | 2.900% | | 1/1/35 | | | 75 | | | | 75 | |
| | | New York State Thruway Authority | | 3.500% | | 1/1/42 | | | 50 | | | | 50 | |
| | | New York State Urban Development Corp. Revenue (Personal Income Tax) | | 3.900% | | 3/15/33 | | | 100 | | | | 107 | |
| | | New York State Urban Development Corp. Revenue (Personal Income Tax) | | 5.770% | | 3/15/39 | | | 150 | | | | 182 | |
| | | North Texas Tollway Authority System Revenue | | 6.718% | | 1/1/49 | | | 150 | | | | 235 | |
| | | Ohio State University General Receipts Revenue | | 4.910% | | 6/1/40 | | | 100 | | | | 127 | |
| | | Ohio State University General Receipts Revenue | | 3.798% | | 12/1/46 | | | 100 | | | | 111 | |
Total Bond Market Index Portfolio
| | | | | | | | | Face | | | Market | |
| | | | | | | Maturity | | Amount | | | Value• | |
| | | | | Coupon | | Date | | | ($000 | ) | | | ($000 | ) |
| | | Ohio State University General Receipts Revenue | | 4.800% | | 6/1/11 | | | 100 | | | | 127 | |
| | | Ohio Water Development Authority Water Pollution Control Loan Fund Revenue | | 4.879% | | 12/1/34 | | | 75 | | | | 88 | |
| | | Oregon Department of Transportation Highway User Tax Revenue | | 5.834% | | 11/15/34 | | | 150 | | | | 200 | |
| | | Oregon GO | | 5.762% | | 6/1/23 | | | 135 | | | | 145 | |
| | | Oregon GO | | 5.892% | | 6/1/27 | | | 75 | | | | 89 | |
| 11 | | Oregon School Boards Association GO | | 5.528% | | 6/30/28 | | | 50 | | | | 59 | |
| | | Pennsylvania Public School Building Authority Lease Revenue (School District of Philadelphia) | | 5.000% | | 9/15/27 | | | 50 | | | | 58 | |
| | | Pennsylvania Turnpike Commission Revenue | | 5.511% | | 12/1/45 | | | 50 | | | | 66 | |
| | | Port Authority of New York & New Jersey Revenue | | 6.040% | | 12/1/29 | | | 75 | | | | 97 | |
| | | Port Authority of New York & New Jersey Revenue | | 4.960% | | 8/1/46 | | | 250 | | | | 323 | |
| | | Port Authority of New York & New Jersey Revenue | | 5.310% | | 8/1/46 | | | 100 | | | | 111 | |
| | | Port Authority of New York & New Jersey Revenue | | 4.031% | | 9/1/48 | | | 30 | | | | 34 | |
| | | Port Authority of New York & New Jersey Revenue | | 4.926% | | 10/1/51 | | | 100 | | | | 130 | |
| | | Port Authority of New York & New Jersey Revenue | | 4.458% | | 10/1/62 | | | 550 | | | | 674 | |
| | | Port Authority of New York & New Jersey Revenue | | 4.810% | | 10/15/65 | | | 100 | | | | 126 | |
| | | Port Authority of New York & New Jersey Revenue | | 3.287% | | 8/1/69 | | | 100 | | | | 95 | |
| | | Princeton University | | 5.700% | | 3/1/39 | | | 200 | | | | 277 | |
| | | Regents of the University of California Revenue | | 3.063% | | 7/1/25 | | | 100 | | | | 105 | |
| | | Regional Transportation District of Colorado Sales Tax Revenue | | 5.844% | | 11/1/50 | | | 100 | | | | 145 | |
| | | Rutgers State University New Jersey Revenue | | 5.665% | | 5/1/40 | | | 50 | | | | 65 | |
| | | Rutgers State University New Jersey Revenue | | 3.270% | | 5/1/43 | | | 25 | | | | 25 | |
| | | Rutgers State University New Jersey Revenue | | 3.915% | | 5/1/19 | | | 75 | | | | 74 | |
| | | Sales Tax Securitization Corp. Illinois Revenue | | 3.587% | | 1/1/43 | | | 75 | | | | 74 | |
| | | Sales Tax Securitization Corp. Illinois Revenue | | 3.820% | | 1/1/48 | | | 50 | | | | 50 | |
| | | Sales Tax Securitization Corp. Illinois Revenue | | 4.787% | | 1/1/48 | | | 100 | | | | 116 | |
| | | Salt River Project Arizona Agricultural Improvement & Power District Revenue | | 4.839% | | 1/1/41 | | | 150 | | | | 187 | |
| | | San Antonio TX Electric & Gas Systems Revenue | | 5.985% | | 2/1/39 | | | 125 | | | | 172 | |
| | | San Antonio TX Electric & Gas Systems Revenue | | 5.808% | | 2/1/41 | | | 125 | | | | 172 | |
| | | San Diego County CA Water Authority Revenue | | 6.138% | | 5/1/49 | | | 100 | | | | 142 | |
| | | San Francisco CA City & County Public Utilities Commission Water Revenue | | 6.950% | | 11/1/50 | | | 100 | | | | 152 | |
| | | San Jose California Redevelopment Agency Successor Agency Tax Allocation | | 3.375% | | 8/1/34 | | | 100 | | | | 103 | |
| | | Santa Clara Valley CA Transportation Authority Sales Tax Revenue | | 5.876% | | 4/1/32 | | | 200 | | | | 245 | |
| | | South Carolina Public Service Authority Revenue | | 2.388% | | 12/1/23 | | | 50 | | | | 50 | |
| | | South Carolina Public Service Authority Revenue | | 6.454% | | 1/1/50 | | | 100 | | | | 147 | |
| | Texas A&M University System Revenue Financing System Revenue | | 3.100% | | 7/1/49 | | | 75 | | | | 73 | |
| | | Texas GO | | 5.517% | | 4/1/39 | | | 50 | | | | 67 | |
| | | Texas GO | | 3.211% | | 4/1/44 | | | 225 | | | | 227 | |
| | | Texas Private Activity Surface Transportation Corp. Revenue | | 3.922% | | 12/31/49 | | | 125 | | | | 126 | |
| | | Texas Transportation Commission Revenue | | 5.178% | | 4/1/30 | | | 175 | | | | 211 | |
| | | Texas Transportation Commission Revenue | | 4.681% | | 4/1/40 | | | 50 | | | | 61 | |
| | | University of California Regents Medical Center Revenue | | 6.548% | | 5/15/48 | | | 250 | | | | 361 | |
| | | University of California Regents Medical Center Revenue | | 6.583% | | 5/15/49 | | | 50 | | | | 72 | |
| | | University of California Revenue | | 5.946% | | 5/15/45 | | | 175 | | | | 235 | |
| | | University of California Revenue | | 4.858% | | 5/15/12 | | | 175 | | | | 216 | |
| | | University of California Revenue | | 4.767% | | 5/15/15 | | | 100 | | | | 121 | |
| | | University of Nebraska Student Fee Revenue | | 3.037% | | 10/1/49 | | | 25 | | | | 24 | |
| | | University of Pittsburgh-of the Commonwealth System of Higher Education | | 3.555% | | 9/15/19 | | | 250 | | | | 242 | |
| | | University of Southern California | | 5.250% | | 10/1/11 | | | 100 | | | | 141 | |
| | | University of Texas Permanent University Fund Revenue | | 3.376% | | 7/1/47 | | | 50 | | | | 53 | |
| | | University of Texas Revenue | | 3.354% | | 8/15/47 | | | 50 | | | | 52 | |
| | | University of Texas System Revenue Financing System Revenue | | 4.794% | | 8/15/46 | | | 75 | | | | 93 | |
| | | University of Virginia Revenue | | 4.179% | | 9/1/17 | | | 50 | | | | 59 | |
| | | Utah GO | | 4.554% | | 7/1/24 | | | 50 | | | | 53 | |
| | | Utah GO | | 3.539% | | 7/1/25 | | | 50 | | | | 52 | |
| | | Washington GO | | 5.140% | | 8/1/40 | | | 150 | | | | 191 | |
| | | Wisconsin Annual Appropriation Revenue | | 3.954% | | 5/1/36 | | | 250 | | | | 267 | |
| | | Wisconsin General Fund Annual Appropriation Revenue | | 3.154% | | 5/1/27 | | | 100 | | | | 104 | |
| 11 | | Wisconsin GO | | 5.700% | | 5/1/26 | | | 70 | | | | 79 | |
| Total Taxable Municipal Bonds (Cost $24,262) | | | | | | | | | | | 28,768 | |
| | | | | | | | Shares | | | | | |
| Temporary Cash Investment (2.1%) | | | | | | | | | | | | |
| Money Market Fund (2.1%) | | | | | | | | | | | |
| 12 | | Vanguard Market Liquidity Fund
(Cost $92,087) | | | | 1.816% | | | 920,860 | | | | 92,095 | |
| Total Investments (101.2%) (Cost $4,189,529) | | | | | | | | | | | 4,351,047 | |
| | | | | | | | | | | | | | | |
| | | | | | | | | | | | | | Amount | |
| | | | | | | | | | | | | | ($000 | ) |
| Other Assets and Liabilities (-1.2%) | | | | | | | | | | | | |
| Other Assets | | | | | | | | | | | | |
| Investment in Vanguard | | | | | | | | | | | 192 | |
| Receivables for Investment Securities Sold | | | | | | | | | | | 31,750 | |
| Receivables for Accrued Income | | | | | | | | | | | 26,098 | |
| Receivables for Capital Shares Issued | | | | | | | | | | | 15,803 | |
| Other Assets | | | | | | | | | | | 1,364 | |
| Total Other Assets | | | | | | | | | | | 75,207 | |
| Liabilities | | | | | | | | | | | | |
| Payables for Investment Securities Purchased | | | | | | | | | | | (120,857 | ) |
| Payables for Capital Shares Redeemed | | | | | | | | | | | (3,977 | ) |
| Payables to Vanguard | | | | | | | | | | | (1,417 | ) |
| Total Liabilities | | | | | | | | | | | (126,251 | ) |
| Net Assets (100%) | | | | | | | | | | | | |
| Applicable to 352,196,029 outstanding $.001 par value shares of beneficial interest (unlimited authorization) | | | | | | | | | | | 4,300,003 | |
| Net Asset Value Per Share | | | | | | | | | | | $12.21 | |
Total Bond Market Index Portfolio
At December 31, 2019, net assets consisted of:
| | | Amount | |
| | | | ($000 | ) |
| Paid-in Capital | | | 4,040,937 | |
| Total Distributable Earnings (Loss) | | | 259,066 | |
| Net Assets | | | 4,300,003 | |
| | • | See Note A in Notes to Financial Statements. |
| | 1 | U.S. government-guaranteed. |
| | 2 | The issuer was placed under federal conservatorship in September 2008; since that time, its daily operations have been managed by the Federal Housing Finance Agency and it receives capital from the U.S. Treasury, as needed to maintain a positive net worth, in exchange for senior preferred stock. |
| | 3 | The average or expected maturity is shorter than the final maturity shown because of the possibility of interim principal payments and prepayments or the possibility of the issue being called. |
| | 4 | Includes securities purchased on a when-issued or delayed-delivery basis for which the portfolio has not taken delivery as of December 31, 2019. |
| | 5 | Adjustable-rate security; rate shown is effective rate at period end. Certain adjustable-rate securities are not based on a published reference rate and spread but are determined by the issuer or agent based on current market conditions. |
| | 6 | Security exempt from registration under Rule 144A of the Securities Act of 1933. Such securities may be sold in transactions exempt from registration, normally to qualified institutional buyers. At December 31, 2019, the aggregate value of these securities was $37,158,000, representing 0.9% of net assets. |
| | 7 | Guaranteed by the Government of Japan. |
| | 8 | Guaranteed by the Federal Republic of Germany. |
| | 9 | Guaranteed by the Republic of Austria. |
| 10 | Scheduled principal and interest payments are guaranteed by National Public Finance Guarantee Corp. |
| | 11 | Scheduled principal and interest payments are guaranteed by AGM (Assured Guaranty Municipal Corporation). |
| | 12 | Affiliated money market fund available only to Vanguard funds and certain trusts and accounts managed by Vanguard. Rate shown is the 7-day yield. |
CMT—Constant Maturing Treasury Rate.
GO—General Obligation Bond.
LIBOR—London Interbank Offered Rate.
REIT—Real Estate Investment Trust.
TBA—To Be Announced.
UMBS—Uniform Mortgage-Backed Securities.
See accompanying Notes, which are an integral part of the Financial Statements.
Total Bond Market Index Portfolio
Statement of Operations
|
| | | | Year Ended | |
| | | | December 31, 2019 | |
| | | ($000 | ) |
| Investment Income | | | | |
| Income | | | | |
| Interest1 | | | 113,167 | |
| Total Income | | | 113,167 | |
| Expenses | | | | |
| The Vanguard Group—Note B | | | | |
| Investment Advisory Services | | | 135 | |
| Management and Administrative | | | 4,757 | |
| Marketing and Distribution | | | 465 | |
| Custodian Fees | | | 51 | |
| Auditing Fees | | | 82 | |
| Shareholders’ Reports | | | 40 | |
| Trustees’ Fees and Expenses | | | 2 | |
| Total Expenses | | | 5,532 | |
| Net Investment Income | | | 107,635 | |
| Realized Net Gain (Loss) | | | | |
| Investment Securities Sold1 | | | 8,036 | |
| Futures Contracts | | | (8 | ) |
| Realized Net Gain (Loss) | | | 8,028 | |
| Change in Unrealized Appreciation (Depreciation) | | | | |
| Investment Securities1 | | | 204,615 | |
| Futures Contracts | | | — | |
| Change in Unrealized Appreciation (Depreciation) | | | 204,615 | |
| Net Increase (Decrease) in Net Assets Resulting from Operations | | | 320,278 | |
| 1 | Interest income, realized net gain (loss), and change in unrealized appreciation (depreciation) from an affiliated company of the portfolio were $1,887,000, $4,000, and $4,000, respectively. Purchases and sales are for temporary cash investment purposes. |
Statement of Changes in Net Assets
| | | Year Ended December 31, | |
| | | 2019 | | | 2018 | |
| | | ($000 | ) | | ($000 | ) |
| Increase (Decrease) in Net Assets | | | |
| Operations | | | |
| Net Investment Income | | | 107,635 | | | | 94,491 | |
| Realized Net Gain (Loss) | | | 8,028 | | | | (11,812 | ) |
| Change in Unrealized Appreciation (Depreciation) | | | 204,615 | | | | (87,509 | ) |
| Net Increase (Decrease) in Net Assets Resulting from Operations | | | 320,278 | | | | (4,830 | ) |
| Distributions | | | | | | | | |
| Net Investment Income | | | (97,897 | ) | | | (79,188 | ) |
| Realized Capital Gain1 | | | — | | | | (6,703 | ) |
| Total Distributions | | | (97,897 | ) | | | (85,891 | ) |
| Capital Share Transactions | | | | | | | | |
| Issued | | | 1,031,614 | | | | 657,403 | |
| Issued in Lieu of Cash Distributions | | | 97,897 | | | | 85,891 | |
| Redeemed | | | (586,442 | ) | | | (616,385 | ) |
| Net Increase (Decrease) from Capital Share Transactions | | | 543,069 | | | | 126,909 | |
| Total Increase (Decrease) | | | 765,450 | | | | 36,188 | |
| Net Assets | | | | | | | | |
| Beginning of Period | | | 3,534,553 | | | | 3,498,365 | |
| End of Period | | | 4,300,003 | | | | 3,534,553 | |
| 1 | Includes fiscal 2019 and 2018 short-term gain distributions totaling $0 and $0, respectively. Short-term gain distributions are treated as ordinary income dividends for tax purposes. |
See accompanying Notes, which are an integral part of the Financial Statements.
Total Bond Market Index Portfolio
Financial Highlights
| For a Share Outstanding | | | Year Ended December 31, |
| Throughout Each Period | 2019 | 2018 | 2017 | 2016 | 2015 |
| Net Asset Value, Beginning of Period | $11.54 | $11.86 | $11.77 | $11.79 | $12.07 |
| Investment Operations |
| Net Investment Income | .3241 | .3131 | .2921 | .283 | .276 |
| Net Realized and Unrealized Gain (Loss) on Investments | .657 | (.343) | .119 | .007 | (.233) |
| Total from Investment Operations | .981 | (.030) | .411 | .290 | .043 |
| Distributions |
| Dividends from Net Investment Income | (.311) | (.267) | (.283) | (.277) | (.272) |
| Distributions from Realized Capital Gains | — | (.023) | (.038) | (.033) | (.051) |
| Total Distributions | (.311) | (.290) | (.321) | (.310) | (.323) |
| Net Asset Value, End of Period | $12.21 | $11.54 | $11.86 | $11.77 | $11.79 |
| | | | | | |
| Total Return | 8.67% | -0.21% | 3.57% | 2.47% | 0.33% |
| |
| Ratios/Supplemental Data |
| Net Assets, End of Period (Millions) | $4,300 | $3,535 | $3,498 | $2,985 | $2,799 |
| Ratio of Total Expenses to Average Net Assets | 0.14% | 0.14% | 0.15% | 0.15% | 0.15% |
| Ratio of Net Investment Income to Average Net Assets | 2.72% | 2.74% | 2.48% | 2.41% | 2.43% |
| Portfolio Turnover Rate2 | 80% | 89% | 91% | 104% | 149% |
1 Calculated based on average shares outstanding.
2 Includes 19%, 26%, 24%, 33%, and 61% attributable to mortgage-dollar-roll activity.
Notes to Financial Statements
The Total Bond Market Index Portfolio, a portfolio of Vanguard Variable Insurance Funds, is registered under the Investment Company Act of 1940 as an open-end investment company. The portfolio’s shares are only available for purchase by separate accounts of insurance companies as investments for variable annuity plans, variable life insurance contracts, or other variable benefit insurance contracts. Certain of the portfolio’s investments are in corporate debt instruments; the issuers’ abilities to meet their obligations may be affected by economic developments in their respective industries.
A. The following significant accounting policies conform to generally accepted accounting principles for U.S. investment companies. The portfolio consistently follows such policies in preparing its financial statements.
1. Security Valuation: Securities are valued as of the close of trading on the New York Stock Exchange (generally 4 p.m., Eastern time) on the valuation date. Bonds and temporary cash investments are valued using the latest bid prices or using valuations based on a matrix system (which considers such factors as security prices, yields, maturities, and ratings), both as furnished by independent pricing services. Structured debt securities, including mortgages and asset-backed securities, are valued using the latest bid prices or using valuations based on a matrix system that considers such factors as issuer, tranche, nominal or option-adjusted spreads, weighted average coupon, weighted average maturity, credit enhancements, and collateral. Investments in Vanguard Market Liquidity Fund are valued at that fund’s net asset value. Securities for which market quotations are not readily available, or whose values have been affected by events occurring before the portfolio’s pricing time but after the close of the securities’ primary markets, are valued by methods deemed by the board of trustees to represent fair value.
Total Bond Market Index Portfolio
2. Futures Contracts: The portfolio uses futures contracts to invest in fixed income asset classes with greater efficiency and lower cost than is possible through direct investment, to add value when these instruments are attractively priced, or to adjust sensitivity to changes in interest rates. The primary risks associated with the use of futures contracts are imperfect correlation between changes in market values of bonds held by the portfolio and the prices of futures contracts, and the possibility of an illiquid market. Counterparty risk involving futures is mitigated because a regulated clearinghouse is the counterparty instead of the clearing broker. To further mitigate counterparty risk, the portfolio trades futures contracts on an exchange, monitors the financial strength of its clearing brokers and clearinghouse, and has entered into clearing agreements with its clearing brokers. The clearinghouse imposes initial margin requirements to secure the portfolio’s performance and requires daily settlement of variation margin representing changes in the market value of each contract. Any assets pledged as initial margin for open contracts are noted in the Statement of Net Assets.
Futures contracts are valued at their quoted daily settlement prices. The notional amounts of the contracts are not recorded in the Statement of Net Assets. Fluctuations in the value of the contracts are recorded in the Statement of Net Assets as an asset (liability) and in the Statement of Operations as unrealized appreciation (depreciation) until the contracts are closed, when they are recorded as realized futures gains (losses).
During the year ended December 31, 2019, the portfolio’s average investments in long and short futures contracts represented 0% and less than 1% of net assets, respectively, based on the average of the notional amounts at each quarter-end during the period. The portfolio had no open futures contracts at December 31, 2019.
3. To Be Announced (TBA) Transactions: A TBA transaction is an agreement to buy or sell mortgage-backed securities with agreed-upon characteristics (face amount, coupon, maturity) for settlement at a future date. The portfolio may be a seller of TBA transactions to reduce its exposure to the mortgage-backed securities market or in order to sell mortgage-backed securities it owns under delayed-delivery arrangements. When the portfolio is a buyer of TBA transactions, it maintains cash or short-term investments in an amount sufficient to meet the purchase price at the settlement date of the TBA transaction. The primary risk associated with TBA transactions is that a counterparty may default on its obligations. The portfolio mitigates its counterparty risk by, among other things, performing a credit analysis of counterparties, allocating transactions among numerous counterparties, and monitoring its exposure to each counterparty. The portfolio may also enter into a Master Securities Forward Transaction Agreement (MSFTA) with certain counterparties and require them to transfer collateral as security for their performance. In the absence of a default, the collateral pledged or received by the portfolio cannot be repledged, resold, or rehypothecated. Under an MSFTA, upon a counterparty default (including bankruptcy), the portfolio may terminate any TBA transactions with that counterparty, determine the net amount owed by either party in accordance with its master netting arrangements, and sell or retain any collateral held up to the net amount owed to the portfolio under the master netting arrangements.
4. Mortgage Dollar Rolls: The portfolio enters into mortgage-dollar-roll transactions, in which the portfolio sells mortgage-backed securities to a dealer and simultaneously agrees to purchase similar securities in the future at a predetermined price. The proceeds of the securities sold in mortgage-dollar-roll transactions are typically invested in high-quality short-term fixed income securities. The portfolio forgoes principal and interest paid on the securities sold, and is compensated by interest earned on the proceeds of the sale and by a lower price on the securities to be repurchased. The portfolio has also entered into mortgage-dollar-roll transactions in which the portfolio buys mortgage-backed securities from a dealer pursuant to a TBA transaction and simultaneously agrees to sell similar securities in the future at a predetermined price. The securities bought in mortgage-dollar-roll transactions are used to cover an open TBA sell position. The portfolio continues to earn interest on mortgage-backed security pools already held and receives a lower price on the securities to be sold in the future. The portfolio accounts for mortgage-dollar-roll transactions as purchases and sales; as such, these transactions may increase the portfolio’s portfolio turnover rate. Amounts to be received or paid in connection with open mortgage dollar rolls are included in Receivables for Investment Securities Sold or Payables for Investment Securities Purchased in the Statement of Net Assets.
5. Federal Income Taxes: The portfolio intends to continue to qualify as a regulated investment company and distribute all of its taxable income. Management has analyzed the portfolio’s tax positions taken for all open federal income tax years (December 31, 2016–2019), and has concluded that no provision for federal income tax is required in the portfolio’s financial statements.
Total Bond Market Index Portfolio
6. Distributions: Distributions to shareholders are recorded on the ex-dividend date. Distributions are determined on a tax basis and may differ from net investment income and realized capital gains for financial reporting purposes.
7. Credit Facility: The portfolio and certain other funds managed by The Vanguard Group (“Vanguard”) participate in a $4.3 billion committed credit facility provided by a syndicate of lenders pursuant to a credit agreement that may be renewed annually; each fund is individually liable for its borrowings, if any, under the credit facility. Borrowings may be utilized for temporary and emergency purposes, and are subject to the portfolio’s regulatory and contractual borrowing restrictions. The participating funds are charged administrative fees and an annual commitment fee of 0.10% of the undrawn amount of the facility; these fees are allocated to the funds based on a method approved by the portfolio’s board of trustees and included in Management and Administrative expenses on the portfolio’s Statement of Operations. Any borrowings under this facility bear interest at a rate based upon the higher of the one-month London Interbank Offered Rate, federal funds effective rate, or overnight bank funding rate plus an agreed-upon spread.
The portfolio had no borrowings outstanding at December 31, 2019, or at any time during the period then ended.
8. Other: Interest income includes income distributions received from Vanguard Market Liquidity Fund and is accrued daily. Premiums and discounts on debt securities are amortized and accreted, respectively, to interest income over the lives of the respective securities, except for premiums on certain callable debt securities that are amortized to the earliest call date. Security transactions are accounted for on the date securities are bought or sold. Costs used to determine realized gains (losses) on the sale of investment securities are those of the specific securities sold.
B. In accordance with the terms of a Funds’ Service Agreement (the “FSA”) between Vanguard and the portfolio, Vanguard furnishes to the portfolio investment advisory, corporate management, administrative, marketing, and distribution services at Vanguard’s cost of operations (as defined by the FSA). These costs of operations are allocated to the portfolio based on methods and guidelines approved by the board of trustees. Vanguard does not require reimbursement in the current period for certain costs of operations (such as deferred compensation/benefits and risk/insurance costs); the portfolio’s liability for these costs of operations is included in Payables to Vanguard on the Statement of Net Assets. All other costs of operations payable to Vanguard are generally settled twice a month.
Upon the request of Vanguard, the portfolio may invest up to 0.40% of its net assets as capital in Vanguard. At December 31, 2019, the portfolio had contributed to Vanguard capital in the amount of $192,000, representing less than 0.01% of the portfolio’s net assets and 0.08% of Vanguard’s capital received pursuant to the FSA. The portfolio’s trustees and officers are also directors and employees, respectively, of Vanguard.
C. Various inputs may be used to determine the value of the portfolio’s investments. These inputs are summarized in three broad levels for financial statement purposes. The inputs or methodologies used to value securities are not necessarily an indication of the risk associated with investing in those securities.
Level 1—Quoted prices in active markets for identical securities.
Level 2—Other significant observable inputs (including quoted prices for similar securities, interest rates, prepayment speeds, credit risk, etc.).
Level 3—Significant unobservable inputs (including the portfolio’s own assumptions used to determine the fair value of investments). Any investments valued with significant unobservable inputs are noted on the Statement of Net Assets.
The following table summarizes the market value of the portfolio’s investments as of December 31, 2019, based on the inputs used to value them:
| | | Level 1 | | | Level 2 | | | Level 3 | |
| Investments | | | ($000 | ) | | | ($000 | ) | | | ($000 | ) |
| U.S. Government and Agency Obligations | | | — | | | | 2,804,700 | | | | — | |
| Asset-Backed/Commercial Mortgage-Backed Securities | | | — | | | | 110,185 | | | | — | |
| Corporate Bonds | | | — | | | | 1,139,256 | | | | — | |
| Sovereign Bonds | | | — | | | | 176,043 | | | | — | |
| Taxable Municipal Bonds | | | — | | | | 28,768 | | | | — | |
| Temporary Cash Investments | | | 92,095 | | | | — | | | | — | |
| Total | | | 92,095 | | | | 4,258,952 | | | | — | |
Total Bond Market Index Portfolio
D. Permanent differences between book-basis and tax-basis components of net assets, if any, are reclassified among capital accounts in the financial statements to reflect their tax character. These reclassifications have no effect on net assets or net asset value per share.
Temporary differences between book-basis and tax-basis components of total distributable earnings (loss) arise when certain items of income, gain, or loss are recognized in different periods for financial statement and tax purposes; these differences will reverse at some time in the future. The differences are primarily related to the tax deferral of losses on wash sales and straddles. As of period end, the tax-basis components of total distributable earnings (loss) are detailed in the table as follows:
| | | Amount | |
| | | | ($000 | ) |
| Undistributed Ordinary Income | | | 102,457 | |
| Undistributed Long-Term Gains | | | — | |
| Capital Loss Carryforwards (Non-expiring)* | | | (3,796 | ) |
| Net Unrealized Gains (Losses) | | | 161,512 | |
* The fund used capital loss carryforwards of $7,998,000 to offset taxable capital gains realized during the year ended December 31, 2019.
As of December 31, 2019, gross unrealized appreciation and depreciation for investments based on cost for U.S. federal income tax purposes were as follows:
| | | Amount | |
| | | | ($000 | ) |
| Tax Cost | | | 4,189,535 | |
| Gross Unrealized Appreciation | | | 169,713 | |
| Gross Unrealized Depreciation | | | (8,201 | ) |
| Net Unrealized Appreciation (Depreciation) | | | 161,512 | |
E. During the year ended December 31, 2019, the portfolio purchased $362,538,000 of investment securities and sold $240,631,000 of investment securities, other than U.S. government securities and temporary cash investments. Purchases and sales of U.S. government securities were $3,311,534,000 and $2,895,396,000, respectively.
F. Capital shares issued and redeemed were:
| | | Year Ended December 31, | |
| | | 2019 | | | 2018 | |
| | | Shares | | | Shares | |
| | | | (000 | ) | | | (000 | ) |
| Issued | | | 86,771 | | | | 57,508 | |
| Issued in Lieu of Cash Distributions | | | 8,535 | | | | 7,574 | |
| Redeemed | | | (49,300 | ) | | | (53,952 | ) |
| Net Increase (Decrease) in Shares Outstanding | | | 46,006 | | | | 11,130 | |
At December 31, 2019, one shareholder, an insurance company separate account whose holdings in the portfolio represent the indirect investment of Vanguard Variable Annuity contract holders, was the record or beneficial owner of 37% of the portfolio’s net assets. If this shareholder were to redeem its investment in the portfolio, the redemption might result in an increase in the portfolio’s expense ratio, cause the portfolio to incur higher transaction costs, or lead to the realization of taxable capital gains.
G. Management has determined that no events or transactions occurred subsequent to December 31, 2019, that would require recognition or disclosure in these financial statements.
Total Bond Market Index Portfolio
Report of Independent Registered Public Accounting Firm
To the Board of Trustees of Vanguard Variable Insurance Funds and Shareholders of Total Bond Market Index Portfolio
Opinion on the Financial Statements
We have audited the accompanying statement of net assets of Total Bond Market Index Portfolio (one of the portfolios constituting Vanguard Variable Insurance Funds, referred to hereafter as the “Portfolio”) as of December 31, 2019, the related statement of operations for the year ended December 31, 2019, the statement of changes in net assets for each of the two years in the period ended December 31, 2019, including the related notes, and the financial highlights for each of the five years in the period ended December 31, 2019 (collectively referred to as the “financial statements”). In our opinion, the financial statements present fairly, in all material respects, the financial position of the Portfolio as of December 31, 2019, the results of its operations for the year then ended, the changes in its net assets for each of the two years in the period ended December 31, 2019 and the financial highlights for each of the five years in the period ended December 31, 2019 in conformity with accounting principles generally accepted in the United States of America.
Basis for Opinion
These financial statements are the responsibility of the Portfolio’s management. Our responsibility is to express an opinion on the Portfolio’s financial statements based on our audits. We are a public accounting firm registered with the Public Company Accounting Oversight Board (United States) (“PCAOB”) and are required to be independent with respect to the Portfolio in accordance with the U.S. federal securities laws and the applicable rules and regulations of the Securities and Exchange Commission and the PCAOB.
We conducted our audits of these financial statements in accordance with the standards of the PCAOB. Those standards require that we plan and perform the audit to obtain reasonable assurance about whether the financial statements are free of material misstatement, whether due to error or fraud.
Our audits included performing procedures to assess the risks of material misstatement of the financial statements, whether due to error or fraud, and performing procedures that respond to those risks. Such procedures included examining, on a test basis, evidence regarding the amounts and disclosures in the financial statements. Our audits also included evaluating the accounting principles used and significant estimates made by management, as well as evaluating the overall presentation of the financial statements. Our procedures included confirmation of securities owned as of December 31, 2019 by correspondence with the custodian, transfer agent and brokers; when replies were not received from brokers, we performed other auditing procedures. We believe that our audits provide a reasonable basis for our opinion.
/s/PricewaterhouseCoopers LLP
Philadelphia, Pennsylvania
February 18, 2020
We have served as the auditor of one or more investment companies in The Vanguard Group of Funds since 1975.
Total Bond Market Index Portfolio
BLOOMBERG is a trademark and service mark of Bloomberg Finance L.P. BARCLAYS is a trademark and service mark of Barclays Bank Plc, used under license. Bloomberg Finance L.P. and its affiliates, including Bloomberg Index Services Limited (BISL) (collectively, Bloomberg), or Bloomberg’s licensors, own all proprietary rights in the Bloomberg Barclays U.S. Aggregate Float Adjusted Index (the Index or Bloomberg Barclays Index).
Neither Barclays Bank Plc, Barclays Capital Inc., or any affiliate (collectively Barclays) or Bloomberg is the issuer or producer of the Total Bond Market Index Portfolio and neither Bloomberg nor Barclays has any responsibilities, obligations or duties to investors in the Total Bond Market Index Portfolio. The Index is licensed for use by The Vanguard Group, Inc. (Vanguard) as the sponsor of the Total Bond Market Index Portfolio. Bloomberg and Barclays’ only relationship with Vanguard in respect of the Index is the licensing of the Index, which is determined, composed and calculated by BISL, or any successor thereto, without regard to the Issuer or the Total Bond Market Index Portfolio or the owners of the Total Bond Market Index Portfolio.
Additionally, Vanguard may for itself execute transaction(s) with Barclays in or relating to the Index in connection with the Total Bond Market Index Portfolio. Investors acquire the Total Bond Market Index Portfolio from Vanguard and investors neither acquire any interest in the Index nor enter into any relationship of any kind whatsoever with Bloomberg or Barclays upon making an investment in the Total Bond Market Index Portfolio. The Total Bond Market Index Portfolio is not sponsored, endorsed, sold or promoted by Bloomberg or Barclays. Neither Bloomberg nor Barclays makes any representation or warranty, express or implied regarding the advisability of investing in the Total Bond Market Index Portfolio or the advisability of investing in securities generally or the ability of the Index to track corresponding or relative market performance. Neither Bloomberg nor Barclays has passed on the legality or suitability of the Total Bond Market Index Portfolio with respect to any person or entity. Neither Bloomberg nor Barclays is responsible for and has not participated in the determination of the timing of, prices at, or quantities of the Total Bond Market Index Portfolio to be issued. Neither Bloomberg nor Barclays has any obligation to take the needs of the Issuer or the owners of the Total Bond Market Index Portfolio or any other third party into consideration in determining, composing or calculating the Index. Neither Bloomberg nor Barclays has any obligation or liability in connection with administration, marketing or trading of the Total Bond Market Index Portfolio.
The licensing agreement between Bloomberg and Barclays is solely for the benefit of Bloomberg and Barclays and not for the benefit of the owners of the Total Bond Market Index Portfolio, investors or other third parties. In addition, the licensing agreement between Vanguard and Bloomberg is solely for the benefit of Vanguard and Bloomberg and not for the benefit of the owners of the Total Bond Market Index Portfolio, investors or other third parties.
NEITHER BLOOMBERG NOR BARCLAYS SHALL HAVE ANY LIABILITY TO THE ISSUER, INVESTORS OR TO OTHER THIRD PARTIES FOR THE QUALITY, ACCURACY AND/OR COMPLETENESS OF THE BLOOMBERG BARCLAYS INDEX OR ANY DATA INCLUDED THEREIN OR FOR INTERRUPTIONS IN THE DELIVERY OF THE BLOOMBERG BARCLAYS INDEX. NEITHER BLOOMBERG NOR BARCLAYS MAKES ANY WARRANTY, EXPRESS OR IMPLIED, AS TO RESULTS TO BE OBTAINED BY THE ISSUER, THE INVESTORS OR ANY OTHER PERSON OR ENTITY FROM THE USE OF THE BLOOMBERG BARCLAYS INDEX OR ANY DATA INCLUDED THEREIN. NEITHER BLOOMBERG NOR BARCLAYS MAKES ANY EXPRESS OR IMPLIED WARRANTIES, AND EACH HEREBY EXPRESSLY DISCLAIMS ALL WARRANTIES OF MERCHANTABILITY OR FITNESS FOR A PARTICULAR PURPOSE OR USE WITH RESPECT TO THE BLOOMBERG BARCLAYS INDEX OR ANY DATA INCLUDED THEREIN. BLOOMBERG RESERVES THE RIGHT TO CHANGE THE METHODS OF CALCULATION OR PUBLICATION, OR TO CEASE THE CALCULATION OR PUBLICATION OF THE BLOOMBERG BARCLAYS INDEX, AND NEITHER BLOOMBERG NOR BARCLAYS SHALL BE LIABLE FOR ANY MISCALCULATION OF OR ANY INCORRECT, DELAYED OR INTERRUPTED PUBLICATION WITH RESPECT TO THE BLOOMBERG BARCLAYS INDEX. NEITHER BLOOMBERG NOR BARCLAYS SHALL BE LIABLE FOR ANY DAMAGES, INCLUDING, WITHOUT LIMITATION, ANY SPECIAL, INDIRECT OR CONSEQUENTIAL DAMAGES, OR ANY LOST PROFITS AND EVEN IF ADVISED OF THE POSSIBLITY OF SUCH, RESULTING FROM THE USE OF THE BLOOMBERG BARCLAYS INDEX OR ANY DATA INCLUDED THEREIN OR WITH RESPECT TO THE TOTAL BOND MARKET INDEX PORTFOLIO.
None of the information supplied by Bloomberg or Barclays and used in this publication may be reproduced in any manner without the prior written permission of both Bloomberg and Barclays Capital, the investment banking division of Barclays Bank Plc. Barclays Bank Plc is registered in England No. 1026167. Registered office 1 Churchill Place London E14 5HP.
© 2020 Bloomberg. Used with Permission.
Source: Bloomberg Index Services Limited. Copyright 2020, Bloomberg. All rights reserved.
Growth Portfolio
Your Portfolio’s Performance at a Glance
• The Growth Portfolio of Vanguard Variable Insurance Fund returned 33.82% for the 12 months ended December 31, 2019, trailing the 36.39% return of its benchmark, the Russell 1000 Growth Index. Please note that the portfolio returns in Vanguard Variable Insurance Fund are different from those in Vanguard Variable Annuity (and other plans that invest in the fund), which take into account insurance-related expenses.
• The broad U.S. stock market, as measured by the Russell 3000 Index, climbed 31% for the year. Global stock prices rose amid optimism that U.S.-China trade tensions were easing and that a trade deal might be signed in early 2020. Inversions of the U.S. Treasury yield curve, historically a signal of recession, raised concerns midway through the year. But the yield curve returned to its normal pattern in the second half as the Federal Reserve cut short-term interest rates three times in 2019.
• Growth stocks outperformed their value counterparts, while large- and mid-capitalization stocks surpassed small-caps.
• Returns were positive in nine of the sectors the portfolio invests in. The advisors’ holdings in industrials, health care, and information technology contributed most to relative performance. Communication services and financials were the biggest net detractors.
• Over the decade ended December 31, 2019, the portfolio’s average annual return underperformed that of its benchmark.
Market Barometer
| | | Average Annual Total Returns |
| | | Periods Ended December 31, 2019 |
| | One Year | Three Years | Five Years |
| Stocks | | | |
| Russell 1000 Index (Large-caps) | 31.43% | 15.05% | 11.48% |
| Russell 2000 Index (Small-caps) | 25.53 | 8.59 | 8.23 |
| Russell 3000 Index (Broad U.S. market) | 31.02 | 14.57 | 11.24 |
| FTSE All-World ex US Index (International) | 21.81 | 9.96 | 5.83 |
| | | | |
| Bonds | | | |
| Bloomberg Barclays U.S. Aggregate Bond Index (Broad taxable market) | 8.72% | 4.03% | 3.05% |
| Bloomberg Barclays Municipal Bond Index (Broad tax-exempt market) | 7.54 | 4.72 | 3.53 |
| FTSE Three-Month U.S. Treasury Bill Index | 2.25 | 1.65 | 1.04 |
| | | | |
| CPI | | | |
| Consumer Price Index | 2.29% | 2.10% | 1.82% |
Growth Portfolio
Advisors’ Report
The Growth Portfolio returned 33.82% for the 12 months ended December 31, 2019, below the 36.39% return of its benchmark, the Russell 1000 Growth Index.
The portfolio is overseen by two independent advisors, a strategy that enhances its diversification by providing exposure to distinct yet complementary investment approaches. It is not uncommon for different advisors to have different views about individual securities or the broader investment environment.
The advisors, the amount and percentage of the portfolio’s assets each manages, and brief descriptions of their investment strategies are presented in the accompanying table. Each advisor has also prepared a discussion of the investment environment that existed during the period and of the effect it had on the portfolio’s positioning. These reports were prepared on January 27, 2020.
Wellington Management Company LLP
Portfolio Manager:
Andrew J. Shilling, CFA
Senior Managing Director
Our portion of the portfolio seeks to outperform growth indexes and, over the longer term, the broader market. We employ proprietary fundamental research and a rigorous valuation discipline to invest in large-capitalization companies with attractive growth characteristics. Our investment approach is based on identifying companies that possess a clear competitive advantage that will enable them to sustain above-average growth.
U.S. equities, as measured by the Standard & Poor’s 500 Index, returned 31.49% for the period. Growth stocks outperformed value stocks and large-cap companies led their smaller-cap peers.
Advanced Micro Devices, a semiconductor manufacturing company that continues to increase market share across desktop, mobile, and server CPUs, contributed most to performance. Global Payments, a provider of payment technology services, has been successful in embedding its payment-processing capabilities in mission-critical software and pursuing growth through acquisitions and strategic partnerships. Management anticipates greater revenue and cost savings from its $21.5 billion acquisition of Total System Services. ServiceNow, a provider of enterprise cloud-based services, has created high barriers by consistently launching new product features. This is evidenced by its best-in-class economics and expanding relationships with its customers. It now has an extendable platform for automating workflows across an organization.
Detractors included our underweight position in Apple, a leader in mobile devices and digital content distribution, which outperformed over the period. In management’s second-quarter earnings release, the company announced strong guidance ahead of expectations. Results for the iPhone were not as bad as feared, services remained strong, and wearables surprised to the upside.
Also detracting was an overweight position in The We Company, a real estate company that provides shared workspaces. The We Company’s valuation shrank meaningfully because of investor concerns about its business model viability; the company ultimately decided not to pursue an initial public offering. Uber Technologies experienced material regulatory and competitive pressures amid inconsistent operating results.
We continue to expect solid U.S. economic growth. While political uncertainty in the U.S. and abroad may heighten volatility, we believe we are well-positioned with our exposure to quality companies that benefit from long-term shifts. We are particularly encouraged by the powerful trends supporting cloud computing, digital payments, new media, and e-commerce and have positioned our portion of your fund with these enduring tailwinds in mind. We remain true to our process, seeking companies with competitive moats, strong balance sheets, skilled management teams, and the ability to sustain above-average growth.
Jackson Square Partners, LLC
Portfolio Managers:
Jeffrey S. Van Harte, CFA
Chairman and Chief Investment Officer
Christopher J. Bonavico, CFA
Christopher M. Ericksen, CFA
Daniel J. Prislin, CFA
For the 12 months ended December 31, 2019, the performance of assets we managed was largely driven by our stock exposure and disproportionately affected by a few disappointing stocks. On a sector level, communication services was the largest detractor and industrials was the largest contributor.
Growth Portfolio
TripAdvisor was our largest relative detractor from performance. The travel website’s hotel segment struggled against competitive headwinds, including increased challenges from Google’s search business. That said, we believe TripAdvisor’s increased focus on its experiences and dining products—a growing business line that enhances the company’s overall profitability—is likely the right long-term strategic move. However, we sold the stock to deploy assets to more attractive opportunities.
Our largest relative contributor to performance was Applied Materials. The company is the global leader in providing equipment for advanced semiconductors and flat-panel displays. The segment drifted higher on stronger foundry investment from semiconductor foundry TSMC and signs of a bottom in the NAND memory market, as well as positive commentary from Applied Materials management on market-share gains for 2020. We remain confident that the market is undervaluing Applied Materials and that the firm is attractively positioned in a consolidating sector with high barriers to entry.
The positive and risk-seeking trends of recent years mostly continued in 2019, thanks to sustained economic growth coupled with persistently low interest rates. The market rally broadened to include cyclical sectors, as the investor outlook for global economic growth strengthened. The 10-year U.S. Treasury rate started the year at 2.68% and stayed well below 2% during the latter half of the period. As a result, the market continues to have a strong upward bias.
Other considerations for investors are President Trump’s unconventional style as head of state and an impeachment process that may hamper his administration’s goals of significant policy changes. We are mindful of the potential macroeconomic implications of President Trump’s policy positions, including his comments and public positioning on global trade negotiations with China that, despite recent hopes of a pending agreement, could have deleterious effects on global economic conditions. We believe it is too early to determine the long-term effects but we will continue to closely monitor President Trump’s tenure with a keen eye on controversies and challenges as well as the effectiveness of potential policy shifts.
Regardless of policy outcomes and oscillating investor sentiment in any given period, we remain consistent in our long-term investment philosophy:
We want to own what we view as strong secular-growth companies with solid business models and competitive positions that we believe can increase market share and have the potential to deliver shareholder value in a variety of market environments.
| Growth Portfolio Investment Advisors |
| |
| Portfolio Assets Managed |
| Investment Advisor | % | $ Million | | Investment Strategy |
| Wellington Management Company LLP | 52 | 409 | | Employs proprietary fundamental research and a rigorous valuation discipline in an effort to invest in high-quality, large-capitalization, sustainable-growth companies. The firm’s philosophy is based on the belief that stock prices often overreact to short-term trends and that bottom-up, intensive research focused on longer-term fundamentals can be used to identify stocks that will outperform the market over time. |
| Jackson Square Partners, LLC | 46 | 365 | | Uses a bottom-up approach, seeking companies that have large end-market potential, dominant business models, and strong free-cash-flow generation that is attractively priced compared with the intrinsic value of the securities. |
| Cash Investments | 2 | 17 | | These short-term reserves are invested by Vanguard in equity index products to simulate investment in stocks. Each advisor may also maintain a modest cash position. |
Growth Portfolio
About Your Portfolio’s Expenses
As a shareholder of the portfolio, you incur ongoing costs, which include costs for portfolio management, administrative services, and shareholder reports (like this one), among others. Operating expenses, which are deducted from a portfolio’s gross income, directly reduce the investment return of the portfolio.
A portfolio’s expenses are expressed as a percentage of its average net assets. This figure is known as the expense ratio. The following examples are intended to help you understand the ongoing costs (in dollars) of investing in your portfolio and to compare these costs with those of other mutual funds. The examples are based on an investment of $1,000 made at the beginning of the period shown and held for the entire period.
The table below illustrates your portfolio’s costs in two ways:
• Based on actual portfolio return. This section helps you to estimate the actual expenses that you paid over the period. The “Ending Account Value” shown is derived from the portfolio’s actual return, and the third column shows the dollar amount that would have been paid by an investor who started with $1,000 in the portfolio. You may use the information here, together with the amount you invested, to estimate the expenses that you paid over the period.
To do so, simply divide your account value by $1,000 (for example, an $8,600 account value divided by $1,000 = 8.6), then multiply the result by the number given for your portfolio under the heading “Expenses Paid During Period.”
• Based on hypothetical 5% yearly return. This section is intended to help you compare your portfolio’s costs with those of other mutual funds. It assumes that the portfolio had a yearly return of 5% before expenses, but that the expense ratio is unchanged. In this case—because the return used is not the portfolio’s actual return—the results do not apply to your investment. The example is useful in making comparisons because the Securities and Exchange Commission requires all mutual funds to calculate expenses based on a 5% return. You can assess your portfolio’s costs by comparing this hypothetical example with the hypothetical examples that appear in shareholder reports of other funds.
Note that the expenses shown in the table are meant to highlight and help you compareongoingcosts only and do not reflect transaction costs incurred by the portfolio for buying and selling securities. The portfolio’s expense ratio does not reflect additional fees and expenses associated with the annuity or life insurance program through which you invest.
The calculations assume no shares were bought or sold during the period. Your actual costs may have been higher or lower, depending on the amount of your investment and the timing of any purchases or redemptions.
You can find more information about the portfolio’s expenses in the Financial Statements section. For additional information on operating expenses and other shareholder costs, please refer to the prospectus.
| Six Months Ended December 31, 2019 | | | |
| | Beginning | Ending | Expenses |
| | Account Value | Account Value | Paid During |
| Growth Portfolio | 6/30/2019 | 12/31/2019 | Period |
| Based on Actual Portfolio Return | $1,000.00 | $1,078.43 | $2.10 |
| Based on Hypothetical 5% Yearly Return | 1,000.00 | 1,023.19 | 2.04 |
The calculations are based on expenses incurred in the most recent six-month period. The portfolio’s annualized six-month expense ratio for that period is 0.40%. The dollar amounts shown as “Expenses Paid” are equal to the annualized expense ratio multiplied by the average account value over the period, multiplied by the number of days in the most recent six-month period, then divided by the number of days in the most recent 12-month period (184/365).
Growth Portfolio
Performance Summary
All of the returns in this report represent past performance, which is not a guarantee of future results that may be achieved by the portfolio. (Current performance may be lower or higher than the performance data cited. For performance data current to the most recent month-end, visit our website at vanguard.com/performance.) Note, too, that both investment returns and principal value can fluctuate widely, so an investor’s shares, when sold, could be worth more or less than their original cost. The returns shown do not reflect taxes that a shareholder would pay on portfolio distributions or on the sale of portfolio shares. Nor do the returns reflect fees and expenses associated with the annuity or life insurance program through which a shareholder invests. If these fees and expenses were included, the portfolio’s returns would be lower.
Cumulative Performance: December 31, 2009–December 31, 2019
Initial Investment of $10,000
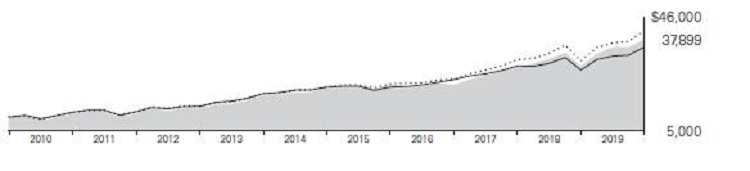
| | | Average Annual Total Returns | Final Value |
| | | Periods Ended December 31, 2019 | of a $10,000 |
| | | One Year | Five Years | Ten Years | Investment |
 | Growth Portfolio | 33.82% | 13.40% | 14.25% | $37,899 |
 | Russell 1000 Growth Index | 36.39 | 14.63 | 15.22 | 41,234 |
 | Dow Jones U.S. Total Stock Market Float Adjusted Index | 30.90 | 11.18 | 13.43 | 35,251 |
See Financial Highlights for dividend and capital gains information.
Growth Portfolio
Sector Diversification
As of December 31, 2019
| Communication Services | 12.2% |
| Consumer Discretionary | 12.5 |
| Consumer Staples | 3.9 |
| Energy | 0.2 |
| Financials | 8.3 |
| Health Care | 11.2 |
| Industrials | 6.1 |
| Information Technology | 40.5 |
| Materials | 2.4 |
| Other | 0.2 |
| Real Estate | 2.4 |
| Utilities | 0.1 |
The table reflects the portfolio’s equity exposure, based on its investments in stocks and stock index futures. Any holdings in short-term reserves are excluded. Sector categories are based on the Global Industry Classification Standard (“GICS”), except for the “Other” category (if applicable), which includes securities that have not been provided a GICS classification as of the effective reporting period.
The Global Industry Classification Standard (“GICS”) was developed by and is the exclusive property and a service mark of MSCI Inc. (“MSCI”) and Standard and Poor’s, a division of McGraw-Hill Companies, Inc. (“S&P”), and is licensed for use by Vanguard. Neither MSCI, S&P nor any third party involved in making or compiling the GICS or any GICS classification makes any express or implied warranties or representations with respect to such standard or classification (or the results to be obtained by the use thereof), and all such parties hereby expressly disclaim all warranties of originality, accuracy, completeness, merchantability or fitness for a particular purpose with respect to any such standard or classification. Without limiting any of the foregoing, in no event shall MSCI, S&P, any of its affiliates or any third party involved in making or compiling the GICS or any GICS classification have any liability for any direct, indirect, special, punitive, consequential or any other damages (including lost profits) even if notified of the possibility of such damages.
Growth Portfolio
Financial Statements
Statement of Net Assets
As of December 31, 2019
The portfolio files its complete schedule of portfolio holdings with the Securities and Exchange Commission (SEC) for the first and third quarters of each fiscal year as an exhibit to its reports on Form N-PORT. The portfolio’s Form N-PORT reports are available on the SEC’s website at www.sec.gov.
| | | | | Market | |
| | | | | Value• | |
| | | Shares | | ($000 | ) |
| Common Stocks (95.2%)1 | |
| Communication Services (11.7%) | |
| * | Alphabet Inc. Class C | 17,288 | | 23,114 | |
| * | Charter Communications Inc. Class A | 36,916 | | 17,907 | |
| * | Alphabet Inc. Class A | 13,331 | | 17,855 | |
| * | Facebook Inc. Class A | 61,069 | | 12,535 | |
| * | Netflix Inc. | 33,041 | | 10,691 | |
| * | Take-Two Interactive Software Inc. | 86,579 | | 10,600 | |
| | | | | 92,702 | |
| Consumer Discretionary (12.5%) | |
| * | Amazon.com Inc. | 11,666 | | 21,557 | |
| | Hasbro Inc. | 152,161 | | 16,070 | |
| * | Dollar Tree Inc. | 151,965 | | 14,292 | |
| | Domino’s Pizza Inc. | 40,571 | | 11,919 | |
| | Home Depot Inc. | 32,639 | | 7,128 | |
| | Hilton Worldwide Holdings Inc. | 41,864 | | 4,643 | |
| * | O’Reilly Automotive Inc. | 10,087 | | 4,421 | |
| * | Under Armour Inc. Class A | 190,588 | | 4,117 | |
| * | Alibaba Group Holding Ltd. ADR | 17,337 | | 3,677 | |
| * | Uber Technologies Inc. | 123,620 | | 3,676 | |
| | Ross Stores Inc. | 27,776 | | 3,234 | |
| | TJX Cos. Inc. | 34,231 | | 2,090 | |
| | NIKE Inc. Class B | 17,552 | | 1,778 | |
| | | | | 98,602 | |
| Consumer Staples (3.6%) | |
| | Constellation Brands Inc. Class A | 124,685 | | 23,659 | |
| * | Monster Beverage Corp. | 72,576 | | 4,612 | |
| | | | | 28,271 | |
| Financials (7.8%) | |
| | KKR & Co. Inc. Class A | 486,704 | | 14,197 | |
| | Charles Schwab Corp. | 289,479 | | 13,768 | |
| | CME Group Inc. | 51,630 | | 10,363 | |
| | Progressive Corp. | 71,565 | | 5,181 | |
| * | Markel Corp. | 3,474 | | 3,971 | |
| | Intercontinental Exchange Inc. | 41,695 | | 3,859 | |
| | Marsh & McLennan Cos. Inc. | 34,086 | | 3,798 | |
| | S&P Global Inc. | 10,172 | | 2,777 | |
| | MSCI Inc. Class A | 10,160 | | 2,623 | |
| | MarketAxess Holdings Inc. | 2,155 | | 817 | |
| | | | | 61,354 | |
| Health Care (10.5%) | |
| | UnitedHealth Group Inc. | 81,844 | | 24,061 | |
| * | IQVIA Holdings Inc. | 131,651 | | 20,341 | |
| * | Illumina Inc. | 36,642 | | 12,156 | |
| * | Edwards Lifesciences Corp. | 23,690 | | 5,527 | |
| | Thermo Fisher Scientific Inc. | 14,681 | | 4,769 | |
| * | Mettler-Toledo International Inc. | 5,456 | | 4,328 | |
| * | Penumbra Inc. | 18,878 | | 3,101 | |
| * | ABIOMED Inc. | 17,395 | | 2,967 | |
| | Danaher Corp. | 14,898 | | 2,287 | |
| * | Seattle Genetics Inc. | 19,100 | | 2,182 | |
| * | Biogen Inc. | 3,943 | | 1,170 | |
| * | DexCom Inc. | 2,729 | | 597 | |
| | | | | 83,486 | |
| Industrials (5.2%) | |
| | TransUnion | 91,603 | | 7,842 | |
| | Lockheed Martin Corp. | 19,628 | | 7,643 | |
| * | IHS Markit Ltd. | 90,700 | | 6,834 | |
| | Equifax Inc. | 34,739 | | 4,868 | |
| | Northrop Grumman Corp. | 13,129 | | 4,516 | |
| | Boeing Co. | 13,805 | | 4,497 | |
| | Canadian National Railway Co. | 41,742 | | 3,776 | |
| | AMETEK Inc. | 12,656 | | 1,262 | |
| | | | | 41,238 | |
| Information Technology (39.4%) | |
| | Microsoft Corp. | 438,180 | | 69,101 | |
| | Apple Inc. | 102,483 | | 30,094 | |
| | Mastercard Inc. Class A | 92,864 | | 27,728 | |
| | Visa Inc. Class A | 122,002 | | 22,924 | |
| * | PayPal Holdings Inc. | 201,928 | | 21,843 | |
| * | Autodesk Inc. | 100,161 | | 18,376 | |
| * | ServiceNow Inc. | 54,058 | | 15,262 | |
| | Applied Materials Inc. | 169,578 | | 10,351 | |
| * | salesforce.com Inc. | 58,568 | | 9,525 | |
| * | FleetCor Technologies Inc. | 30,773 | | 8,854 | |
| * | Adobe Inc. | 26,708 | | 8,809 | |
| * | Arista Networks Inc. | 36,717 | | 7,468 | |
| | Global Payments Inc. | 37,489 | | 6,844 | |
| * | Advanced Micro Devices Inc. | 148,920 | | 6,829 | |
| | SS&C Technologies Holdings Inc. | 110,232 | | 6,768 | |
| | Microchip Technology Inc. | 59,153 | | 6,195 | |
| | Fidelity National Information Services Inc. | 42,389 | | 5,896 | |
| * | Workday Inc. Class A | 34,085 | | 5,605 | |
| * | DocuSign Inc. Class A | 73,540 | | 5,450 | |
| * | Splunk Inc. | 31,261 | | 4,682 | |
| | CDW Corp. | 28,121 | | 4,017 | |
| *,^ | Slack Technologies Inc. Class A | 165,909 | | 3,730 | |
| * | Tyler Technologies Inc. | 10,647 | | 3,194 | |
| * | Ceridian HCM Holding Inc. | 38,246 | | 2,596 | |
| | | | | 312,141 | |
| Materials (2.2%) | |
| | Ball Corp. | 274,314 | | 17,740 | |
| | | | | | |
| Other (0.0%) | |
| *,§,2 | The We Company Class A PP | 1,460 | | 10 | |
| | | | | | |
| Real Estate (2.3%) | |
| | American Tower Corp. | 34,392 | | 7,904 | |
| | Crown Castle International Corp. | 45,991 | | 6,538 | |
| | Equinix Inc. | 6,600 | | 3,852 | |
| | | | | 18,294 | |
Total Common Stocks (Cost $515,957) | | | 753,838 | |
| Preferred Stocks (0.2%) | |
| *,§,2,3 | Airbnb Inc., 8.00% | 9,972 | | 1,303 | |
| *,§,2,3 | The We Company Pfd. D1 PP | 19,954 | | 223 | |
| *,§,2,3 | The We Company Pfd. D2 PP | 15,678 | | 175 | |
Total Preferred Stocks (Cost $1,522) | | | 1,701 | |
| Temporary Cash Investments (4.8%)1 | |
| Money Market Fund (4.3%) | |
| 4,5 | Vanguard Market Liquidity Fund, 1.816% | 340,700 | | 34,073 | |
| | | | | | |
| | | Face | | | |
| | | Amount | | | |
| | | ($000 | ) | | |
| Repurchase Agreement (0.4%) | | | | |
| | Bank of America Securities, LLC 1.570%, 1/2/20 (Dated 12/31/19, Repurchase Value $3,000,000, collateralized by Government National Mortgage Assn. 3.588%, 11/20/69, with a value of $3,060,000) | 3,000 | | 3,000 | |
| | | | | | |
| U.S. Government and Agency Obligations (0.1%) | |
| 6 | United States Treasury Bill, 1.527%, 4/30/20 | 800 | | 796 | |
| Total Temporary Cash Investments (Cost $37,872) | | 37,869 | |
| Total Investments (100.2%) (Cost $555,351) | | | 793,408 | |
| | Amount | |
| | ($000 | ) |
| Other Assets and Liabilities (-0.2%) | |
| Other Assets | | |
| Investment in Vanguard | 35 | |
| Receivables for Accrued Income | 251 | |
| Receivables for Capital Shares Issued | 200 | |
| Variation Margin Receivable—Futures Contracts | 40 | |
| Other Assets | 65 | |
| Total Other Assets | 591 | |
| Liabilities | | |
| Payables for Investment Securities Purchased | (274 | ) |
| Payables to Investment Advisor | (300 | ) |
| Collateral for Securities on Loan | (1,150 | ) |
| Payables for Capital Shares Redeemed | (321 | ) |
| Payables to Vanguard | (499 | ) |
| Total Liabilities | (2,544 | ) |
| Net Assets (100%) | |
Applicable to 29,372,458 outstanding $.001 par value shares of beneficial interest (unlimited authorization) | 791,455 | |
| Net Asset Value Per Share | $26.95 | |
Growth Portfolio
At December 31, 2019, net assets consisted of:
| | Amount | |
| | ($000 | ) |
| Paid-in Capital | 507,334 | |
| Total Distributable Earnings (Loss) | 284,121 | |
| Net Assets | 791,455 | |
| • | See Note A in Notes to Financial Statements. |
| * | Non-income-producing security. |
| ^ | Includes partial security positions on loan to broker-dealers. The total value of securities on loan is $1,124,000. |
| § | Security value determined using significant unobservable inputs. |
| 1 | The portfolio invests a portion of its cash reserves in equity markets through the use of index futures contracts. After giving effect to futures investments, the portfolio’s effective common stock and temporary cash investment positions represent 97.4% and 2.6%, respectively, of net assets. |
| 2 | Restricted securities totaling $1,711,000, representing 0.2% of net assets. See Restricted Securities table for additional information. |
| 3 | Perpetual security with no stated maturity date. |
| 4 | Affiliated money market fund available only to Vanguard funds and certain trusts and accounts managed by Vanguard. Rate shown is the 7-day yield. |
| 5 | Collateral of $1,150,000 was received for securities on loan. |
| 6 | Securities with a value of $796,000 have been segregated as initial margin for open futures contracts. |
| | ADR—American Depositary Receipt. |
| | PP —Private Placement. |
| Restricted Securities as of Period End | |
| | | | | |
| | | | | |
| | | | Acquisition | |
| | Acquisition | | Cost | |
| Security Name | Date | | ($000 | ) |
| The We Company Pfd. D1 PP | December 2014 | | 332 | |
| The We Company Pfd. D2 PP | December 2014 | | 261 | |
| The We Company Class A PP | December 2014 | | 24 | |
| Airbnb Inc. | June 2015 | | 928 | |
| Derivative Financial Instruments Outstanding as of Period End | |
| | |
| Futures Contracts | |
| | | | | | | ($000 | ) |
| | | | | | | Value and | |
| | | Number of | | | | Unrealized | |
| | | Long (Short | ) | Notional | | Appreciation | |
| Expiration | | Contracts | | Amount | | (Depreciation | ) |
| Long Futures Contracts | |
| E-mini S&P 500 Index | March 2020 | | 105 | | 16,963 | | 282 | |
See accompanying Notes, which are an integral part of the Financial Statements.
Growth Portfolio
Statement of Operations
| Year Ended | |
December 31, 2019 |
| | ($000 | ) |
| Investment Income | | |
| Income | | |
| Dividends1 | 5,222 | |
| Interest2 | 725 | |
| Securities Lending—Net | 61 | |
| Total Income | 6,008 | |
| Expenses | | |
| Investment Advisory Fees—Note B | | |
| Basic Fee | 1,050 | |
| Performance Adjustment | 61 | |
| The Vanguard Group—Note C | | |
| Management and Administrative | 1,676 | |
| Marketing and Distribution | 62 | |
| Custodian Fees | 10 | |
| Auditing Fees | 34 | |
| Shareholders’ Reports | 13 | |
| Trustees’ Fees and Expenses | 1 | |
| Total Expenses | 2,907 | |
| Expenses Paid Indirectly | (13 | ) |
| Net Expenses | 2,894 | |
| Net Investment Income | 3,114 | |
| Realized Net Gain (Loss) | | |
| Investment Securities Sold2 | 40,319 | |
| Futures Contracts | 2,504 | |
| Realized Net Gain (Loss) | 42,823 | |
Change in Unrealized Appreciation (Depreciation) | | |
| Investment Securities2 | 152,954 | |
| Futures Contracts | 1,127 | |
| Change in Unrealized Appreciation (Depreciation) | 154,081 | |
Net Increase (Decrease) in Net Assets Resulting from Operations | 200,018 | |
| 1 | Dividends are net of foreign withholding taxes of $3,000. |
| 2 | Interest income, realized net gain (loss), and change in unrealized appreciation (depreciation) from an affiliated company of the portfolio were $599,000, ($1,000), and $1,000, respectively. Purchases and sales are for temporary cash investment purposes. |
Statement of Changes in Net Assets
| | Year Ended December 31, |
| | 2019 | | 2018 | |
| | ($000 | ) | ($000 | ) |
| Increase (Decrease) in Net Assets | | | | |
| Operations | | | | |
| Net Investment Income | 3,114 | | 2,883 | |
| Realized Net Gain (Loss) | 42,823 | | 78,534 | |
| Change in Unrealized Appreciation (Depreciation) | 154,081 | | (85,049 | ) |
| Net Increase (Decrease) in Net Assets Resulting from Operations | 200,018 | | (3,632 | ) |
| Distributions | | | | |
| Net Investment Income | (2,812 | ) | (1,913 | ) |
| Realized Capital Gain1 | (77,825 | ) | (29,602 | ) |
| Total Distributions | (80,637 | ) | (31,515 | ) |
| Capital Share Transactions | | | | |
| Issued | 90,716 | | 115,244 | |
| Issued in Lieu of Cash Distributions | 80,637 | | 31,515 | |
| Redeemed | (97,322 | ) | (71,586 | ) |
| Net Increase (Decrease) from Capital Share Transactions | 74,031 | | 75,173 | |
| Total Increase (Decrease) | 193,412 | | 40,026 | |
| Net Assets | | | | |
| Beginning of Period | 598,043 | | 558,017 | |
| End of Period | 791,455 | | 598,043 | |
| 1 | Includes fiscal 2019 and 2018 short-term gain distributions totaling $0 and $3,387,000, respectively. Short-term gain distributions are treated as ordinary income dividends for tax purposes. |
See accompanying Notes, which are an integral part of the Financial Statements.
Growth Portfolio
Financial Highlights
| For a Share Outstanding | | | | | Year Ended December 31, | |
| Throughout Each Period | 2019 | | 2018 | | 2017 | | 2016 | | 2015 | |
| Net Asset Value, Beginning of Period | $22.82 | | $23.99 | | $19.70 | | $22.58 | | $23.24 | |
| Investment Operations | | | | | | | | | | |
| Net Investment Income | .108 | 1 | .113 | 1 | .094 | 1 | .115 | | .127 | |
| Net Realized and Unrealized Gain (Loss) on Investments | 7.119 | | .038 | | 5.685 | | (.465 | ) | 1.632 | |
| Total from Investment Operations | 7.227 | | .151 | | 5.779 | | (.350 | ) | 1.759 | |
| Distributions | | | | | | | | | | |
| Dividends from Net Investment Income | (.108 | ) | (.080 | ) | (.116 | ) | (.126 | ) | (.141 | ) |
| Distributions from Realized Capital Gains | (2.989 | ) | (1.241 | ) | (1.373 | ) | (2.404 | ) | (2.278 | ) |
| Total Distributions | (3.097 | ) | (1.321 | ) | (1.489 | ) | (2.530 | ) | (2.419 | ) |
| Net Asset Value, End of Period | $26.95 | | $22.82 | | $23.99 | | $19.70 | | $22.58 | |
| | | | | | | | | | | |
| Total Return | 33.82% | | 0.20% | | 30.92% | | -1.08% | | 7.98% | |
| | | | | | | | | | | |
| Ratios/Supplemental Data | | | | | | | | | | |
| Net Assets, End of Period (Millions) | $791 | | $598 | | $558 | | $415 | | $506 | |
| Ratio of Total Expenses to Average Net Assets2 | 0.40% | | 0.39% | | 0.40% | | 0.42% | | 0.44% | |
| Ratio of Net Investment Income to Average Net Assets | 0.43% | | 0.45% | | 0.43% | | 0.53% | | 0.57% | |
| Portfolio Turnover Rate | 32% | | 47% | | 28% | | 28% | | 38% | |
| 1 | Calculated based on average shares outstanding. |
| 2 | Includes performance-based investment advisory fee increases (decreases) of 0.01%, 0.00%, (0.01%), 0.00%, and 0.03%. |
See accompanying Notes, which are an integral part of the Financial Statements.
Growth Portfolio
Notes to Financial Statements
The Growth Portfolio, a portfolio of Vanguard Variable Insurance Funds, is registered under the Investment Company Act of 1940 as an open-end investment company. The portfolio’s shares are only available for purchase by separate accounts of insurance companies as investments for variable annuity plans, variable life insurance contracts, or other variable benefit insurance contracts.
A. The following significant accounting policies conform to generally accepted accounting principles for U.S. investment companies. The portfolio consistently follows such policies in preparing its financial statements.
1. Security Valuation: Securities are valued as of the close of trading on the New York Stock Exchange (generally 4 p.m., Eastern time) on the valuation date. Equity securities are valued at the latest quoted sales prices or official closing prices taken from the primary market in which each security trades; such securities not traded on the valuation date are valued at the mean of the latest quoted bid and asked prices. Securities for which market quotations are not readily available, or whose values have been affected by events occurring before the portfolio’s pricing time but after the close of the securities’ primary markets, are valued at their fair values calculated according to procedures adopted by the board of trustees. These procedures include obtaining quotations from an independent pricing service, monitoring news to identify significant market- or security-specific events, and evaluating changes in the values of foreign market proxies (for example, ADRs, futures contracts, or exchange-traded funds), between the time the foreign markets close and the portfolio’s pricing time. When fair-value pricing is employed, the prices of securities used by a portfolio to calculate its net asset value may differ from quoted or published prices for the same securities. Investments in Vanguard Market Liquidity Fund are valued at that fund’s net asset value. Temporary cash investments are valued using the latest bid prices or using valuations based on a matrix system (which considers such factors as security prices, yields, maturities, and ratings), both as furnished by independent pricing services.
2. Futures Contracts: The portfolio uses index futures contracts to a limited extent, with the objective of maintaining full exposure to the stock market while maintaining liquidity. The portfolio may purchase or sell futures contracts to achieve a desired level of investment, whether to accommodate portfolio turnover or cash flows from capital share transactions. The primary risks associated with the use of futures contracts are imperfect correlation between changes in market values of stocks held by the portfolio and the prices of futures contracts, and the possibility of an illiquid market. Counterparty risk involving futures is mitigated because a regulated clearinghouse is the counterparty instead of the clearing broker. To further mitigate counterparty risk, the portfolio trades futures contracts on an exchange, monitors the financial strength of its clearing brokers and clearinghouse, and has entered into clearing agreements with its clearing brokers. The clearinghouse imposes initial margin requirements to secure the portfolio’s performance and requires daily settlement of variation margin representing changes in the market value of each contract. Any assets pledged as initial margin for open contracts are noted in the Statement of Net Assets.
Futures contracts are valued at their quoted daily settlement prices. The notional amounts of the contracts are not recorded in the Statement of Net Assets. Fluctuations in the value of the contracts are recorded in the Statement of Net Assets as an asset (liability) and in the Statement of Operations as unrealized appreciation (depreciation) until the contracts are closed, when they are recorded as realized futures gains (losses).
During the year ended December 31, 2019, the portfolio’s average investments in long and short futures contracts represented 3% and 0% of net assets, respectively, based on the average of the notional amounts at each quarter-end during the period.
3. Repurchase Agreements: The portfolio enters into repurchase agreements with institutional counterparties. Securities pledged as collateral to the portfolio under repurchase agreements are held by a custodian bank until the agreements mature, and in the absence of a default, such collateral cannot be repledged, resold, or rehypothecated. Each agreement requires that the market value of the collateral be sufficient to cover payments of interest and principal. The portfolio further mitigates its counterparty risk by entering into repurchase agreements only with a diverse group of prequalified counterparties, monitoring their financial strength, and entering into master repurchase agreements with its counterparties. The master repurchase agreements provide that, in the event of a counterparty’s default (including bankruptcy), the portfolio may terminate any repurchase agreements with that counterparty, determine the net amount owed, and sell or retain the collateral up to the net amount owed to the portfolio. Such action may be subject to legal proceedings, which may delay or limit the disposition of collateral.
Growth Portfolio
4. Federal Income Taxes: The portfolio intends to continue to qualify as a regulated investment company and distribute all of its taxable income. Management has analyzed the portfolio’s tax positions taken for all open federal income tax years (December 31, 2016–2019), and has concluded that no provision for federal income tax is required in the portfolio’s financial statements.
5. Distributions: Distributions to shareholders are recorded on the ex-dividend date. Distributions are determined on a tax basis and may differ from net investment income and realized capital gains for financial reporting purposes.
6. Securities Lending: To earn additional income, the portfolio lends its securities to qualified institutional borrowers. Security loans are subject to termination by the portfolio at any time, and are required to be secured at all times by collateral in an amount at least equal to the market value of securities loaned. Daily market fluctuations could cause the value of loaned securities to be more or less than the value of the collateral received. When this occurs, the collateral is adjusted and settled before the opening of the market on the next business day. The portfolio further mitigates its counterparty risk by entering into securities lending transactions only with a diverse group of prequalified counterparties, monitoring their financial strength, and entering into master securities lending agreements with its counterparties. The master securities lending agreements provide that, in the event of a counterparty’s default (including bankruptcy), the portfolio may terminate any loans with that borrower, determine the net amount owed, and sell or retain the collateral up to the net amount owed to the portfolio; however, such actions may be subject to legal proceedings. While collateral mitigates counterparty risk, in the event of a default, the portfolio may experience delays and costs in recovering the securities loaned. The portfolio invests cash collateral received in Vanguard Market Liquidity Fund, and records a liability in the Statement of Net Assets for the return of the collateral, during the period the securities are on loan. Securities lending income represents fees charged to borrowers plus income earned on invested cash collateral, less expenses associated with the loan. During the term of the loan, the portfolio is entitled to all distributions made on or in respect of the loaned securities.
7. Credit Facility: The portfolio and certain other funds managed by The Vanguard Group (“Vanguard”) participate in a $4.3 billion committed credit facility provided by a syndicate of lenders pursuant to a credit agreement that may be renewed annually; each fund is individually liable for its borrowings, if any, under the credit facility. Borrowings may be utilized for temporary and emergency purposes, and are subject to the portfolio’s regulatory and contractual borrowing restrictions. The participating funds are charged administrative fees and an annual commitment fee of 0.10% of the undrawn amount of the facility; these fees are allocated to the funds based on a method approved by the portfolio’s board of trustees and included in Management and Administrative expenses on the portfolio’s Statement of Operations. Any borrowings under this facility bear interest at a rate based upon the higher of the one-month London Interbank Offered Rate, federal funds effective rate, or overnight bank funding rate plus an agreed-upon spread.
The portfolio had no borrowings outstanding at December 31, 2019, or at any time during the period then ended.
8. Other: Dividend income is recorded on the ex-dividend date. Interest income includes income distributions received from Vanguard Market Liquidity Fund and is accrued daily. Premiums and discounts on debt securities are amortized and accreted, respectively, to interest income over the lives of the respective securities, except for premiums on certain callable debt securities that are amortized to the earliest call date. Security transactions are accounted for on the date securities are bought or sold. Costs used to determine realized gains (losses) on the sale of investment securities are those of the specific securities sold.
B. The investment advisory firms Wellington Management Company LLP and Jackson Square Partners, LLC, each provide investment advisory services to a portion of the portfolio for a fee calculated at an annual percentage rate of average net assets managed by the advisor. The basic fees of Wellington Management Company LLP and Jackson Square Partners, LLC, are subject to quarterly adjustments based on performance relative to the Russell 1000 Growth Index for the preceding three years.
Vanguard manages the cash reserves of the portfolio as described below.
Growth Portfolio
For the year ended December 31, 2019, the aggregate investment advisory fee represented an effective annual basic rate of 0.15% of the portfolio’s average net assets, before an increase of $61,000 (0.01%) based on performance.
C. In accordance with the terms of a Funds’ Service Agreement (the “FSA”) between Vanguard and the portfolio, Vanguard furnishes to the portfolio corporate management, administrative, marketing, distribution, and cash management services at Vanguard’s cost of operations (as defined by the FSA). These costs of operations are allocated to the portfolio based on methods and guidelines approved by the board of trustees. Vanguard does not require reimbursement in the current period for certain costs of operations (such as deferred compensation/benefits and risk/insurance costs); the portfolio’s liability for these costs of operations is included in Payables to Vanguard on the Statement of Net Assets. All other costs of operations payable to Vanguard are generally settled twice a month.
Upon the request of Vanguard, the portfolio may invest up to 0.40% of its net assets as capital in Vanguard. At December 31, 2019, the portfolio had contributed to Vanguard capital in the amount of $35,000, representing less than 0.01% of the portfolio’s net assets and 0.01% of Vanguard’s capital received pursuant to the FSA. The portfolio’s trustees and officers are also directors and employees, respectively, of Vanguard.
D. The portfolio has asked its investment advisors to direct certain security trades, subject to obtaining the best price and execution, to brokers who have agreed to rebate to the portfolio part of the commissions generated. Such rebates are used solely to reduce the fund’s management and administrative expenses. The fund’s custodian bank has also agreed to reduce its fees when the portfolio maintains cash on deposit in the non-interest-bearing custody account. For the year ended December 31, 2019, these arrangements reduced the portfolio’s management and administrative expenses by $11,000 and custodian fees by $2,000. The total expense reduction represented an effective annual rate of less than 0.01% of the portfolio’s average net assets.
E. Various inputs may be used to determine the value of the portfolio’s investments. These inputs are summarized in three broad levels for financial statement purposes. The inputs or methodologies used to value securities are not necessarily an indication of the risk associated with investing in those securities.
Level 1—Quoted prices in active markets for identical securities.
Level 2—Other significant observable inputs (including quoted prices for similar securities, interest rates, prepayment speeds, credit risk, etc.).
Level 3—Significant unobservable inputs (including the portfolio’s own assumptions used to determine the fair value of investments). Any investments valued with significant unobservable inputs are noted on the Statement of Net Assets.
The following table summarizes the market value of the portfolio’s investments and derivatives as of December 31, 2019, based on the inputs used to value them:
| | Level 1 | | Level 2 | | Level 3 | |
| Investments | ($000 | ) | ($000 | ) | ($000 | ) |
| Common Stocks | 753,828 | | — | | 10 | |
| Preferred Stocks | — | | — | | 1,701 | |
| Temporary Cash Investments | 34,073 | | 3,796 | | — | |
| Futures Contracts—Assets1 | 40 | | — | | — | |
| Total | 787,941 | | 3,796 | | 1,711 | |
1 Represents variation margin on the last day of the reporting period.
Growth Portfolio
F. Permanent differences between book-basis and tax-basis components of net assets, if any, are reclassified among capital accounts in the financial statements to reflect their tax character. These reclassifications have no effect on net assets or net asset value per share.
Temporary differences between book-basis and tax-basis components of total distributable earnings (loss) arise when certain items of income, gain, or loss are recognized in different periods for financial statement and tax purposes; these differences will reverse at some time in the future. The differences are primarily related to the tax deferral of losses on wash sales and the realization of unrealized gains or losses on certain futures contracts. As of period end, the tax-basis components of total distributable earnings (loss) are detailed in the table as follows:
| | Amount | |
| | ($000 | ) |
| Undistributed Ordinary Income | 3,806 | |
| Undistributed Long-Term Gains | 42,830 | |
| Capital Loss Carryforwards (Non-Expiring) | — | |
| Net Unrealized Gains (Losses) | 237,881 | |
As of December 31, 2019, gross unrealized appreciation and depreciation for investments and derivatives based on cost for U.S. federal income tax purposes were as follows:
| | Amount | |
| | ($000 | ) |
| Tax Cost | 555,527 | |
| Gross Unrealized Appreciation | 243,533 | |
| Gross Unrealized Depreciation | (5,652 | ) |
| Net Unrealized Appreciation (Depreciation) | 237,881 | |
G. During the year ended December 31, 2019, the portfolio purchased $216,346,000 of investment securities and sold $222,061,000 of investment securities, other than temporary cash investments.
H. Capital shares issued and redeemed were:
| | Year Ended December 31, | |
| | 2019 | | 2018 | |
| | Shares | | Shares | |
| | (000 | ) | (000 | ) |
| Issued | 3,626 | | 4,586 | |
| Issued in Lieu of Cash Distributions | 3,465 | | 1,273 | |
| Redeemed | (3,929 | ) | (2,913 | ) |
| Net Increase (Decrease) in Shares Outstanding | 3,162 | | 2,946 | |
At December 31, 2019, one shareholder, an insurance company separate account whose holdings in the portfolio represent the indirect investment of Vanguard Variable Annuity contract holders, was the record or beneficial owner of 75% of the portfolio’s net assets. If this shareholder were to redeem its investment in the portfolio, the redemption might result in an increase in the portfolio’s expense ratio, cause the portfolio to incur higher transaction costs, or lead to the realization of taxable capital gains.
I. Management has determined that no events or transactions occurred subsequent to December 31, 2019, that would require recognition or disclosure in these financial statements.
Growth Portfolio
Report of Independent Registered Public Accounting Firm
To the Board of Trustees of Vanguard Variable Insurance Funds and Shareholders of Growth Portfolio
Opinion on the Financial Statements
We have audited the accompanying statement of net assets of Growth Portfolio (one of the portfolios constituting Vanguard Variable Insurance Funds, referred to hereafter as the “Portfolio”) as of December 31, 2019, the related statement of operations for the year ended December 31, 2019, the statement of changes in net assets for each of the two years in the period ended December 31, 2019, including the related notes, and the financial highlights for each of the five years in the period ended December 31, 2019 (collectively referred to as the “financial statements”). In our opinion, the financial statements present fairly, in all material respects, the financial position of the Portfolio as of December 31, 2019, the results of its operations for the year then ended, the changes in its net assets for each of the two years in the period ended December 31, 2019 and the financial highlights for each of the five years in the period ended December 31, 2019 in conformity with accounting principles generally accepted in the United States of America.
Basis for Opinion
These financial statements are the responsibility of the Portfolio’s management. Our responsibility is to express an opinion on the Portfolio’s financial statements based on our audits. We are a public accounting firm registered with the Public Company Accounting Oversight Board (United States) (“PCAOB”) and are required to be independent with respect to the Portfolio in accordance with the U.S. federal securities laws and the applicable rules and regulations of the Securities and Exchange Commission and the PCAOB.
We conducted our audits of these financial statements in accordance with the standards of the PCAOB. Those standards require that we plan and perform the audit to obtain reasonable assurance about whether the financial statements are free of material misstatement, whether due to error or fraud.
Our audits included performing procedures to assess the risks of material misstatement of the financial statements, whether due to error or fraud, and performing procedures that respond to those risks. Such procedures included examining, on a test basis, evidence regarding the amounts and disclosures in the financial statements. Our audits also included evaluating the accounting principles used and significant estimates made by management, as well as evaluating the overall presentation of the financial statements. Our procedures included confirmation of securities owned as of December 31, 2019 by correspondence with the custodians and brokers and by agreement to the underlying ownership records of the transfer agent; when replies were not received from brokers, we performed other auditing procedures. We believe that our audits provide a reasonable basis for our opinion.
/s/PricewaterhouseCoopers LLP
Philadelphia, Pennsylvania
February 18, 2020
We have served as the auditor of one or more investment companies in The Vanguard Group of Funds since 1975.
Special 2019 tax information (unaudited) for corporate shareholders only for Vanguard Growth Portfolio, a portfolio of Vanguard Variable Insurance Funds
This information for the fiscal year ended December 31, 2019, is included pursuant to provisions of the Internal Revenue Code for corporate shareholders only.
The portfolio distributed $77,825,000 as capital gain dividends (20% rate gain distributions) to shareholders during the fiscal year.
For corporate shareholders, 100% of investment income (dividend income plus short-term gains, if any) qualifies for the dividends-received deduction.
High Yield Bond Portfolio
Your Portfolio’s Performance at a Glance
• For the 12 months ended December 31, 2019, the High Yield Bond Portfolio returned 15.67%, ahead of its benchmark, the High-Yield Corporate Composite Index (+14.61).
• Stocks and bonds recorded their best results in years. Stocks benefited from accommodative monetary policies implemented by the Federal Reserve and other major central banks. With the U.S.-China trade conflict fueling economic growth concerns, investors were also drawn to assets, like bonds, that are generally considered safer.
• U.S. Treasuries returned nearly 7%. Mortgage-backed securities returned a little less than that, but corporate bonds fared even better, returning more than 14%. By credit quality, lower-rated investment-grade bonds bested higher-rated ones; by maturity, longer-dated bonds significantly outperformed shorter-dated ones.
• Within the high-yield market, however, higher-quality bonds generally outperformed those of lower quality, with BB- and B-rated bonds posting higher returns than their CCC-rated counterparts.
• For the ten years ended December 31, 2019, the portfolio posted an average annual return of 7.01%. Its benchmark index recorded an average annual return of 7.14%.
• Please note that the portfolio returns in Vanguard Variable Insurance Fund are different from those in Vanguard Variable Annuity (and other plans that invest in the fund), which take into account insurance-related expenses.
| Market Barometer | | | |
| | Average Annual Total Returns | |
| | Periods Ended December 31, 2019 | |
| | One Year | Three Years | Five Years | |
| Stocks | | | | |
| Russell 1000 Index (Large-caps) | 31.43% | 15.05% | 11.48% | |
| Russell 2000 Index (Small-caps) | 25.53 | 8.59 | 8.23 | |
| Russell 3000 Index (Broad U.S. market) | 31.02 | 14.57 | 11.24 | |
| FTSE All-World ex US Index (International) | 21.81 | 9.96 | 5.83 | |
| | | | | |
| Bonds | | | | |
| Bloomberg Barclays U.S. Aggregate Bond Index (Broad taxable market) | 8.72% | 4.03% | 3.05% | |
| Bloomberg Barclays Municipal Bond Index (Broad tax-exempt market) | 7.54 | 4.72 | 3.53 | |
| FTSE Three-Month U.S. Treasury Bill Index | 2.25 | 1.65 | 1.04 | |
| | | | | |
| CPI | | | | |
| Consumer Price Index | 2.29% | 2.10% | 1.82% | |
High Yield Bond Portfolio
Advisor’s Report
The investment environment
For the 12 months ended December 31, 2019, the High Yield Bond Portfolio returned 15.67%, compared with the benchmark return of 14.61%. Please note that the portfolio returns in Vanguard Variable Insurance Fund are different from those in Vanguard Variable Annuity (and other plans that invest in the fund), which take into account insurance-related expenses.
High-yield markets benefited from both decreasing interest rates and tightening credit spreads. Sovereign yields declined across most markets after the injection of monetary stimulus by the U.S. Federal Reserve and the European Central Bank. With a U.S.-China trade agreement proving elusive, Brexit still unresolved, and an impeachment trial looking likely in the U.S., geopolitical uncertainty remained elevated for much of the period.
Despite these concerns, high-yield bond spreads tightened on optimism that monetary accommodation could offset the drag on global growth from restrictive trade policies. The Fed cut rates three times but later indicated it would adopt a wait-and-see stance to assess incoming economic data and track trade-negotiation developments.
The 10-year U.S. Treasury yield decreased to 1.92% by the end of December 2019 from 2.69% a year earlier. Major central banks deployed more accommodative policies amid trade headwinds, geopolitical tensions, and weaker global growth data, contributing to the decline in Treasury yields.
This dynamic lifted bond prices, as bond yields and bond prices generally move in opposite directions. The spread of the high-yield market tightened to 336 basis points over Treasuries as of December 31, 2019, from 526 basis points a year earlier. (A basis point is one-hundredth of a percentage point.) The average price of the high-yield market increased $8 to $101 per $100 of par or face value.
There was notable dispersion in performance by credit quality, with the high-yield market generally rewarding higher-credit-quality corporate bonds during the period. Highest-rated BB bonds led (returning 15.51%, according to Bloomberg Barclays U.S. Corporate High Yield Index data), while CCC-rated bonds (+9.52%) lagged and B-rated bonds returned 14.80%.
Although our macroeconomic outlook is somewhat mixed as we move into the new calendar year, we believe that the probability of a U.S. recession in 2020 is declining. Looking ahead to 2021, the macro environment remains unclear, which tempers our overall macroeconomic outlook. High-yield fundamentals and technicals, however, remain supportive, and while we expect defaults to increase over the next 12 months, we do not believe we are on the verge of the next default cycle.
High-yield spreads are inside historical median levels, but there is a bifurcation in higher- and lower-quality spreads, and we are finding attractive idiosyncratic opportunities. We also expect bouts of spread-widening around developments in the U.S. presidential race, and these may present attractive total-return opportunities.
Overall, we forecast a below-coupon—but still positive—total return for high yield in 2020, with security selection the key driver of benchmark-relative outperformance. Although high-yield spreads appear tight by historical standards, the asset class should generate attractive income, and technicals remain supportive as the demand for income persists around much of the globe.
Moody’s trailing 12-month global issuer-weighted speculative-grade default rate ended November 2019 at 2.8%, below the long-term average of 4.2%. Although bouts of volatility may persist, we continue to take a long-term, issuer-specific approach to finding opportunities in this market.
Global political uncertainty and elevated trade tensions may contribute to additional bouts of market volatility. However, most of the high-yield companies within our opportunity set operate in domestically focused industries. While we are more uncertain about the long-term U.S. macroeconomic outlook, we continue to favor higher-quality issuers expected to benefit from a stable U.S. consumer.
As we move into 2020, global trade represents a key source of uncertainty. The prospects for global growth likely hinge on whether trade policy developments lead to stability or push down manufacturing (and, subsequently, the consumer). However, we assign a low probability of U.S. and euro area recession over the next year.
The portfolio’s shortfalls
Positioning and security selection within the wirelines and consumer cyclical services sectors detracted from relative returns, as did credit selection in utilities.
The portfolio’s successes
The portfolio benefited from positioning and positive credit selection within the financial institutions sector, as well as credit selection within the media and entertainment sector. An underweight to government securities also helped relative performance.
High Yield Bond Portfolio
The portfolio’s positioning
The portfolio remains consistent in its investment objective and strategy and maintains meaningful exposure to relatively higher-quality names within the high-yield market. We believe these companies have more stable credit profiles and greater predictability of cash flows than those at the lower end of the quality spectrum.
We prefer higher-quality credits in an effort to minimize defaults and to provide stable income. We continue to diversify the portfolio’s holdings by issuer and industry. We also continue to deemphasize non-cash-paying securities, preferred stocks, and equity-linked securities, such as convertibles, because of their potential for volatility.
Michael L. Hong, CFA
Senior Managing Director and Fixed
Income Portfolio Manager
Wellington Management Company LLP
January 24, 2020
High Yield Bond Portfolio
About Your Portfolio’s Expenses
As a shareholder of the portfolio, you incur ongoing costs, which include costs for portfolio management, administrative services, and shareholder reports (like this one), among others. Operating expenses, which are deducted from a portfolio’s gross income, directly reduce the investment return of the portfolio.
A portfolio’s expenses are expressed as a percentage of its average net assets. This figure is known as the expense ratio. The following examples are intended to help you understand the ongoing costs (in dollars) of investing in your portfolio and to compare these costs with those of other mutual funds. The examples are based on an investment of $1,000 made at the beginning of the period shown and held for the entire period.
The table below illustrates your portfolio’s costs in two ways:
•Based on actual portfolio return. This section helps you to estimate the actual expenses that you paid over the period. The “Ending Account Value” shown is derived from the portfolio’s actual return, and the third column shows the dollar amount that would have been paid by an investor who started with $1,000 in the portfolio. You may use the information here, together with the amount you invested, to estimate the expenses that you paid over the period.
To do so, simply divide your account value by $1,000 (for example, an $8,600 account value divided by $1,000 = 8.6), then multiply the result by the number given for your portfolio under the heading “Expenses Paid During Period.”
•Based on hypothetical 5% yearly return. This section is intended to help you compare your portfolio’s costs with those of other mutual funds. It assumes that the portfolio had a yearly return of 5% before expenses, but that the expense ratio is unchanged. In this case—because the return used is not the portfolio’s actual return—the results do not apply to your investment. The example is useful in making comparisons because the Securities and Exchange Commission requires all mutual funds to calculate expenses based on a 5% return. You can assess your portfolio’s costs by comparing this hypothetical example with the hypothetical examples that appear in shareholder reports of other funds.
Note that the expenses shown in the table are meant to highlight and help you compare ongoing costs only and do not reflect transaction costs incurred by the portfolio for buying and selling securities. The portfolio’s expense ratio does not reflect additional fees and expenses associated with the annuity or life insurance program through which you invest.
The calculations assume no shares were bought or sold during the period. Your actual costs may have been higher or lower, depending on the amount of your investment and the timing of any purchases or redemptions.
You can find more information about the portfolio’s expenses in the Financial Statements section. For additional information on operating expenses and other shareholder costs, please refer to the prospectus.
| Six Months Ended December 31, 2019 | | | | |
| | Beginning | Ending | Expenses | |
| | Account Value | Account Value | Paid During | |
| High Yield Bond Portfolio | 6/30/2019 | 12/31/2019 | Period | |
| Based on Actual Portfolio Return | $1,000.00 | $1,044.64 | $1.34 | |
| Based on Hypothetical 5% Yearly Return | 1,000.00 | 1,023.89 | 1.33 | |
The calculations are based on expenses incurred in the most recent six-month period. The portfolio’s annualized six-month expense ratio for that period is 0.26%. The dollar amounts shown as “Expenses Paid” are equal to the annualized expense ratio multiplied by the average account value over the period, multiplied by the number of days in the most recent six-month period, then divided by the number of days in the most recent 12-month period (184/365).
High Yield Bond Portfolio
Performance Summary
All of the returns in this report represent past performance, which is not a guarantee of future results that may be achieved by the portfolio. (Current performance may be lower or higher than the performance data cited. For performance data current to the most recent month-end, visit our website at vanguard.com/performance.) Note, too, that both investment returns and principal value can fluctuate widely, so an investor’s shares, when sold, could be worth more or less than their original cost. The returns shown do not reflect taxes that a shareholder would pay on portfolio distributions or on the sale of portfolio shares. Nor do the returns reflect fees and expenses associated with the annuity or life insurance program through which a shareholder invests. If these fees and expenses were included, the portfolio’s returns would be lower.
Cumulative Performance: December 31, 2009–December 31, 2019
InitialInvestment of $10,000
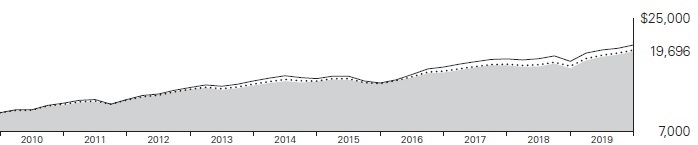
| | | Average Annual Total Returns | Final Value |
| | | Periods Ended December 31, 2019 | of a $10,000 |
| | | One Year | Five Years | Ten Years | Investment |
 | High Yield Bond Portfolio | 15.67% | 5.70% | 7.01% | $19,696 |
 | High-Yield Corporate Composite Index | 14.61 | 5.83 | 7.14 | 19,929 |
 | Bloomberg Barclays U.S. Corporate High Yield Index | 14.32 | 6.13 | 7.57 | 20,747 |
High-Yield Corporate Composite Index: Weighted 95% Bloomberg Barclays U.S. High-Yield Ba/B 2% Issuer Capped Index and 5% Bloomberg Barclays U.S. 1-5 Year Treasury Bond Index.
See Financial Highlights for dividend and capital gains information.
High Yield Bond Portfolio
Sector Diversification
As of December 31, 2019
| Basic Industry | 4.0% |
| Capital Goods | 13.6 |
| Communication | 19.8 |
| Consumer Cyclical | 14.5 |
| Consumer Non-Cyclical | 12.8 |
| Energy | 9.6 |
| Finance | 12.8 |
| Other Industrial | 0.8 |
| Technology | 9.9 |
| Transportation | 0.2 |
| Other | 0.4 |
| Utilities | 1.6 |
The table reflects the portfolio’s market exposure. Any holdings in short-term reserves are excluded. The agency and mortgage-backed securities sectors may include issues from government sponsored enterprises; such issues are generally not backed by the full faith and credit of the U.S. government.
High Yield Bond Portfolio
Financial Statements
Statement of Net Assets
As of December 31, 2019
The portfolio files its complete schedule of portfolio holdings with the Securities and Exchange Commission (SEC) for the first and third quarters of each fiscal year as an exhibit to its reports on Form N-PORT. The portfolio’s Form N-PORT reports are available on the SEC’s website at www.sec.gov.
| | | | | Face | | Market | |
| | | | Maturity | Amount | | Value• | |
| | | Coupon | Date | ($000 | ) | ($000 | ) |
| Corporate Bonds (90.0%) | |
| Finance (11.5%) | | | | | | |
| | Banking (3.4%) | | | | | | |
| | Ally Financial Inc. | 4.625% | 5/19/22 | 105 | | 110 | |
| | Ally Financial Inc. | 5.125% | 9/30/24 | 1,480 | | 1,630 | |
| | Ally Financial Inc. | 5.750% | 11/20/25 | 3,415 | | 3,821 | |
| | Ally Financial Inc. | 8.000% | 11/1/31 | 215 | | 297 | |
| | Barclays plc | 4.375% | 9/11/24 | 715 | | 750 | |
| | Barclays plc | 5.200% | 5/12/26 | 300 | | 327 | |
| 1 | BNP Paribas SA | 6.750% | 3/14/66 | 1,805 | | 1,927 | |
| | CIT Group Inc. | 5.250% | 3/7/25 | 243 | | 268 | |
| 1 | Credit Suisse AG | 6.250% | 12/31/50 | 5,280 | | 5,754 | |
| 1 | ING Groep NV | 6.875% | 4/16/66 | 2,400 | | 2,565 | |
| 2 | Intesa Sanpaolo SPA | 5.017% | 6/26/24 | 300 | | 313 | |
| 2 | Intesa Sanpaolo SPA | 5.710% | 1/15/26 | 3,105 | | 3,353 | |
| | Royal Bank of Scotland Group plc | 6.125% | 12/15/22 | 1,635 | | 1,788 | |
| 1 | UBS Group AG | 6.875% | 3/22/66 | 3,700 | | 3,856 | |
| | | | | | | | |
| | Finance Companies (5.2%) | | | | | | |
| 1,2 | AerCap Global Aviation Trust | 6.500% | 6/15/45 | 3,950 | | 4,355 | |
| | Aircastle Ltd. | 5.000% | 4/1/23 | 465 | | 498 | |
| | Aircastle Ltd. | 4.125% | 5/1/24 | 2,110 | | 2,212 | |
| 2 | Avolon Holdings Funding Ltd. | 5.250% | 5/15/24 | 1,630 | | 1,779 | |
| | CIT Group Inc. | 5.000% | 8/15/22 | 1,707 | | 1,814 | |
| | CIT Group Inc. | 5.000% | 8/1/23 | 850 | | 917 | |
| | CIT Group Inc. | 4.750% | 2/16/24 | 240 | | 256 | |
| 2 | Freedom Mortgage Corp. | 8.250% | 4/15/25 | 740 | | 726 | |
| | Navient Corp. | 7.250% | 1/25/22 | 1,320 | | 1,435 | |
| | Navient Corp. | 6.500% | 6/15/22 | 4,150 | | 4,503 | |
| | Navient Corp. | 5.500% | 1/25/23 | 2,625 | | 2,796 | |
| | Navient Corp. | 7.250% | 9/25/23 | 590 | | 668 | |
| | Navient Corp. | 6.750% | 6/25/25 | 4,030 | | 4,463 | |
| | Navient Corp. | 5.625% | 8/1/33 | 1,052 | | 905 | |
| 2 | Park Aerospace Holdings Ltd. | 5.500% | 2/15/24 | 600 | | 659 | |
| | Springleaf Finance Corp. | 8.250% | 12/15/20 | 1,265 | | 1,330 | |
| | Springleaf Finance Corp. | 7.750% | 10/1/21 | 1,965 | | 2,125 | |
| | Springleaf Finance Corp. | 6.125% | 5/15/22 | 385 | | 415 | |
| | Springleaf Finance Corp. | 8.250% | 10/1/23 | 515 | | 601 | |
| | Springleaf Finance Corp. | 6.125% | 3/15/24 | 1,715 | | 1,882 | |
| | Springleaf Finance Corp. | 6.875% | 3/15/25 | 715 | | 812 | |
| | Springleaf Finance Corp. | 7.125% | 3/15/26 | 4,396 | | 5,083 | |
| | Springleaf Finance Corp. | 6.625% | 1/15/28 | 765 | | 859 | |
| | | | | | | | |
| | Insurance (2.5%) | | | | | | |
| 1 | Aegon NV | 5.500% | 4/11/48 | 730 | | 793 | |
| 3,4 | Asurion LLC. Bank Loan,1M USD LIBOR + 3.000% | 4.799% | 11/3/24 | 3,063 | | 3,078 | |
| | Centene Corp. | 4.750% | 1/15/25 | 600 | | 621 | |
| 2 | Centene Corp. | 4.250% | 12/15/27 | 855 | | 881 | |
| 2 | Centene Corp. | 4.625% | 12/15/29 | 1,250 | | 1,315 | |
| | CNO Financial Group Inc. | 5.250% | 5/30/25 | 1,785 | | 1,975 | |
| | CNO Financial Group Inc. | 5.250% | 5/30/29 | 1,635 | | 1,827 | |
| | Genworth Holdings Inc. | 7.700% | 6/15/20 | 130 | | 133 | |
| | Genworth Holdings Inc. | 7.200% | 2/15/21 | 830 | | 852 | |
| | Genworth Holdings Inc. | 7.625% | 9/24/21 | 760 | | 800 | |
| | Genworth Holdings Inc. | 4.900% | 8/15/23 | 1,475 | | 1,444 | |
| | Genworth Holdings Inc. | 4.800% | 2/15/24 | 475 | | 465 | |
| | MGIC Investment Corp. | 5.750% | 8/15/23 | 725 | | 803 | |
| | Radian Group Inc. | 4.500% | 10/1/24 | 2,485 | | 2,634 | |
| | Radian Group Inc. | 4.875% | 3/15/27 | 300 | | 315 | |
| | WellCare Health Plans Inc. | 5.250% | 4/1/25 | 1,325 | | 1,381 | |
| | | | | | | | |
| | Real Estate Investment Trusts (0.4%) | | | | | | |
| | Felcor Lodging LP | 6.000% | 6/1/25 | 1,100 | | 1,148 | |
| 2 | VICI Properties LP / VICI Note Co. Inc. | 4.250% | 12/1/26 | 1,225 | | 1,260 | |
| 2 | VICI Properties LP / VICI Note Co. Inc. | 4.625% | 12/1/29 | 820 | | 855 | |
| | | | | | | 90,432 | |
| Industrial (77.1%) | | | | | | |
| | Basic Industry (3.6%) | | | | | | |
| 2 | Alliance Resource Operating Partners LP / Alliance Resource Finance Corp. | 7.500% | 5/1/25 | 1,353 | | 1,224 | |
| | Chemours Co. | 6.625% | 5/15/23 | 1,327 | | 1,329 | |
| | Chemours Co. | 7.000% | 5/15/25 | 3,115 | | 3,123 | |
| | Chemours Co. | 5.375% | 5/15/27 | 930 | | 822 | |
| | Commercial Metals Co. | 5.750% | 4/15/26 | 1,414 | | 1,478 | |
| | Commercial Metals Co. | 5.375% | 7/15/27 | 565 | | 593 | |
| 2 | Constellium NV | 5.750% | 5/15/24 | 1,085 | | 1,115 | |
| 2 | Constellium NV | 6.625% | 3/1/25 | 2,185 | | 2,267 | |
| 2 | Constellium NV | 5.875% | 2/15/26 | 260 | | 274 | |
| 2,5 | CTC BondCo GmbH | 5.250% | 12/15/25 | 425 | | 498 | |
| | Graphic Packaging International Inc. | 4.125% | 8/15/24 | 1,065 | | 1,112 | |
| 2 | Graphic Packaging International LLC | 4.750% | 7/15/27 | 205 | | 220 | |
| 2 | Novelis Corp. | 6.250% | 8/15/24 | 1,950 | | 2,045 | |
| 2 | Novelis Corp. | 5.875% | 9/30/26 | 2,035 | | 2,170 | |
| 2,5 | OCI NV | 3.125% | 11/1/24 | 910 | | 1,059 | |
| 2 | OCI NV | 5.250% | 11/1/24 | 1,205 | | 1,250 | |
| | Olin Corp. | 5.125% | 9/15/27 | 1,775 | | 1,857 | |
| | Olin Corp. | 5.625% | 8/1/29 | 1,285 | | 1,357 | |
| | Olin Corp. | 5.000% | 2/1/30 | 325 | | 329 | |
| 3,4 | Starfruit Finco BV Bank Loan,3M USD LIBOR + 3.250% | 4.960% | 10/1/25 | 534 | | 534 | |
| 3,4 | Starfruit Finco BV Bank Loan,3M USD LIBOR + 3.250% | 4.960% | 10/1/25 | 104 | | 104 | |
| 2 | Tronox Finance plc | 5.750% | 10/1/25 | 675 | | 685 | |
| 2 | Tronox Inc. | 6.500% | 4/15/26 | 2,725 | | 2,800 | |
| | | | | | | | |
| | Capital Goods (12.3%) | | | | | | |
| 2 | American Builders & Contractors Supply Co. Inc. | 5.875% | 5/15/26 | 1,840 | | 1,953 | |
| 2 | American Builders & Contractors Supply Co. Inc. | 4.000% | 1/15/28 | 896 | | 909 | |
| 2 | ARD Finance SA | 6.500% | 6/30/27 | 955 | | 987 | |
| 2 | Ardagh Packaging Finance plc / Ardagh Holdings USA Inc. | 6.000% | 2/15/25 | 4,365 | | 4,578 | |
| 2 | Ardagh Packaging Finance plc / Ardagh Holdings USA Inc. | 4.125% | 8/15/26 | 1,490 | | 1,527 | |
| 2,6 | Ardagh Packaging Finance plc / Ardagh Holdings USA Inc. | 4.750% | 7/15/27 | 160 | | 222 | |
| 2 | Ardagh Packaging Finance plc / Ardagh Holdings USA Inc. | 5.250% | 8/15/27 | 700 | | 734 | |
| 2 | Ashtead Capital Inc. | 4.125% | 8/15/25 | 1,325 | | 1,361 | |
| 2 | Ashtead Capital Inc. | 5.250% | 8/1/26 | 545 | | 583 | |
| 2 | Ashtead Capital Inc. | 4.375% | 8/15/27 | 1,545 | | 1,599 | |
| | Ball Corp. | 4.000% | 11/15/23 | 465 | | 489 | |
| | Ball Corp. | 5.250% | 7/1/25 | 141 | | 157 | |
| | Ball Corp. | 4.875% | 3/15/26 | 3,400 | | 3,693 | |
| 5 | Ball Corp. | 1.500% | 3/15/27 | 1,270 | | 1,433 | |
High Yield Bond Portfolio
| | | | | Face | | Market | |
| | | | Maturity | Amount | | Value• | |
| | | Coupon | Date | ($000 | ) | ($000 | ) |
| 2 | BBA US Holdings Inc. | 4.000% | 3/1/28 | 1,900 | | 1,872 | |
| 2 | Beacon Escrow Corp. | 4.875% | 11/1/25 | 2,585 | | 2,591 | |
| 2 | Beacon Roofing Supply Inc. | 4.500% | 11/15/26 | 305 | | 315 | |
| 2 | Berry Global Escrow Corp. | 5.625% | 7/15/27 | 215 | | 231 | |
| 2 | Berry Global Inc. | 4.500% | 2/15/26 | 1,655 | | 1,701 | |
| 2 | Berry Global Inc. | 4.875% | 7/15/26 | 1,630 | | 1,729 | |
| 2 | Bombardier Inc. | 5.750% | 3/15/22 | 675 | | 697 | |
| 2 | Bombardier Inc. | 6.125% | 1/15/23 | 2,698 | | 2,759 | |
| 2 | Bombardier Inc. | 7.500% | 12/1/24 | 460 | | 483 | |
| 2 | Bombardier Inc. | 7.500% | 3/15/25 | 1,412 | | 1,454 | |
| 2 | Bombardier Inc. | 7.875% | 4/15/27 | 1,675 | | 1,721 | |
| 2 | CD&R Waterworks Merger Sub LLC | 6.125% | 8/15/25 | 160 | | 166 | |
| 2 | Cemex SAB de CV | 6.125% | 5/5/25 | 3,280 | | 3,403 | |
| 2 | Cemex SAB de CV | 7.750% | 4/16/26 | 735 | | 801 | |
| 2 | Clean Harbors Inc. | 4.875% | 7/15/27 | 960 | | 1,010 | |
| 2 | Clean Harbors Inc. | 5.125% | 7/15/29 | 768 | | 818 | |
| | Crown Americas LLC / Crown Americas Capital Corp. IV | 4.500% | 1/15/23 | 300 | | 315 | |
| | Crown Americas LLC / Crown Americas Capital Corp. VI | 4.750% | 2/1/26 | 1,415 | | 1,493 | |
| 2,5 | Crown European Holdings SA | 2.875% | 2/1/26 | 1,555 | | 1,890 | |
| 2 | Flex Acquisition Co. Inc. | 6.875% | 1/15/25 | 4,000 | | 4,030 | |
| 2 | HD Supply Inc. | 5.375% | 10/15/26 | 1,210 | | 1,283 | |
| 2 | Herc Holdings Inc. | 5.500% | 7/15/27 | 3,700 | | 3,894 | |
| 2 | Jeld-Wen Inc. | 4.625% | 12/15/25 | 345 | | 354 | |
| 2 | Jeld-Wen Inc. | 4.875% | 12/15/27 | 195 | | 199 | |
| 2 | LANXESS AG | 6.000% | 4/1/24 | 288 | | 296 | |
| 2,5 | Loxam SAS | 4.250% | 4/15/24 | 190 | | 220 | |
| 2 | OI European Group BV | 4.000% | 3/15/23 | 675 | | 680 | |
| 2 | Owens-Brockway Glass Container Inc. | 5.000% | 1/15/22 | 180 | | 187 | |
| 2 | Owens-Brockway Glass Container Inc. | 5.875% | 8/15/23 | 2,140 | | 2,284 | |
| 2 | Owens-Brockway Glass Container Inc. | 6.375% | 8/15/25 | 1,195 | | 1,306 | |
| | Reynolds Group Issuer Inc. / Reynolds Group Issuer LLC / Reynolds Group | | | | | | |
| | Issuer Lu | 5.750% | 10/15/20 | 644 | | 644 | |
| 2 | Reynolds Group Issuer Inc. / Reynolds Group Issuer LLC / Reynolds Group | | | | | | |
| | Issuer Lu | 5.125% | 7/15/23 | 2,240 | | 2,293 | |
| 2 | Reynolds Group Issuer Inc. / Reynolds Group Issuer LLC / Reynolds Group | | | | | | |
| | Issuer Lu | 7.000% | 7/15/24 | 440 | | 455 | |
| 2 | Standard Industries Inc. | 5.500% | 2/15/23 | 295 | | 299 | |
| 2 | Standard Industries Inc. | 5.375% | 11/15/24 | 2,323 | | 2,384 | |
| 2 | Standard Industries Inc. | 6.000% | 10/15/25 | 4,295 | | 4,515 | |
| 2 | Standard Industries Inc. | 5.000% | 2/15/27 | 495 | | 516 | |
| 2 | Standard Industries Inc. | 4.750% | 1/15/28 | 1,025 | | 1,052 | |
| | TransDigm Inc. | 6.500% | 7/15/24 | 3,090 | | 3,190 | |
| | TransDigm Inc. | 6.500% | 5/15/25 | 2,565 | | 2,671 | |
| | TransDigm Inc. | 6.375% | 6/15/26 | 900 | | 953 | |
| 2 | TransDigm Inc. | 5.500% | 11/15/27 | 2,810 | | 2,845 | |
| 2,5 | Trivium Packaging Finance BV | 3.750% | 8/15/26 | 180 | | 214 | |
| 2 | Trivium Packaging Finance BV | 5.500% | 8/15/26 | 345 | | 365 | |
| | United Rentals North America Inc. | 5.500% | 7/15/25 | 2,230 | | 2,314 | |
| | United Rentals North America Inc. | 4.625% | 10/15/25 | 1,665 | | 1,713 | |
| | United Rentals North America Inc. | 5.875% | 9/15/26 | 1,955 | | 2,092 | |
| | United Rentals North America Inc. | 6.500% | 12/15/26 | 1,590 | | 1,745 | |
| | United Rentals North America Inc. | 5.500% | 5/15/27 | 2,125 | | 2,274 | |
| | United Rentals North America Inc. | 3.875% | 11/15/27 | 880 | | 899 | |
| | United Rentals North America Inc. | 4.875% | 1/15/28 | 1,470 | | 1,527 | |
| | United Rentals North America Inc. | 5.250% | 1/15/30 | 740 | | 794 | |
| | | | | | | | |
| | Communication (17.9%) | | | | | | |
| 2 | Altice Financing SA | 6.625% | 2/15/23 | 1,875 | | 1,908 | |
| 2 | Altice France SA | 7.375% | 5/1/26 | 4,025 | | 4,312 | |
| 2 | Altice Luxembourg SA | 7.625% | 2/15/25 | 1,200 | | 1,243 | |
| | Belo Corp. | 7.750% | 6/1/27 | 920 | | 1,065 | |
| | Belo Corp. | 7.250% | 9/15/27 | 667 | | 759 | |
| | CCO Holdings LLC / CCO Holdings Capital Corp. | 5.250% | 9/30/22 | 365 | | 369 | |
| | CCO Holdings LLC / CCO Holdings Capital Corp. | 5.125% | 2/15/23 | 400 | | 405 | |
| 2 | CCO Holdings LLC / CCO Holdings Capital Corp. | 5.125% | 5/1/23 | 2,990 | | 3,046 | |
| | CCO Holdings LLC / CCO Holdings Capital Corp. | 5.750% | 9/1/23 | 1,150 | | 1,166 | |
| | CCO Holdings LLC / CCO Holdings Capital Corp. | 5.750% | 1/15/24 | 66 | | 67 | |
| 2 | CCO Holdings LLC / CCO Holdings Capital Corp. | 5.375% | 5/1/25 | 2,871 | | 2,964 | |
| 2 | CCO Holdings LLC / CCO Holdings Capital Corp. | 5.750% | 2/15/26 | 1,450 | | 1,524 | |
| 2 | CCO Holdings LLC / CCO Holdings Capital Corp. | 5.500% | 5/1/26 | 1,386 | | 1,459 | |
| 2 | CCO Holdings LLC / CCO Holdings Capital Corp. | 5.875% | 5/1/27 | 445 | | 469 | |
| | CenturyLink Inc. | 5.800% | 3/15/22 | 303 | | 318 | |
| | CenturyLink Inc. | 6.750% | 12/1/23 | 755 | | 842 | |
| | CenturyLink Inc. | 7.500% | 4/1/24 | 557 | | 629 | |
| | Charter Communications Operating LLC / Charter Communications Operating Capital | 6.484% | 10/23/45 | 891 | | 1,110 | |
| | CSC Holdings LLC | 6.750% | 11/15/21 | 1,735 | | 1,861 | |
| 2 | CSC Holdings LLC | 5.375% | 7/15/23 | 280 | | 287 | |
| 2 | CSC Holdings LLC | 6.625% | 10/15/25 | 700 | | 743 | |
| 2 | CSC Holdings LLC | 5.500% | 5/15/26 | 3,890 | | 4,114 | |
| 2 | CSC Holdings LLC | 5.500% | 4/15/27 | 2,610 | | 2,796 | |
| | DISH DBS Corp. | 6.750% | 6/1/21 | 4,530 | | 4,751 | |
| | DISH DBS Corp. | 5.875% | 7/15/22 | 3,746 | | 3,971 | |
| | DISH DBS Corp. | 5.000% | 3/15/23 | 1,384 | | 1,417 | |
| | DISH DBS Corp. | 5.875% | 11/15/24 | 2,405 | | 2,450 | |
| | DISH DBS Corp. | 7.750% | 7/1/26 | 3,260 | | 3,447 | |
| | Embarq Corp. | 7.995% | 6/1/36 | 720 | | 760 | |
| | Gannett Co. Inc. | 6.375% | 10/15/23 | 850 | | 877 | |
| 2 | Gray Escrow Inc. | 7.000% | 5/15/27 | 415 | | 462 | |
| 2 | Gray Television Inc. | 5.125% | 10/15/24 | 1,961 | | 2,032 | |
| 2 | Gray Television Inc. | 5.875% | 7/15/26 | 1,470 | | 1,564 | |
| 2 | iHeartCommunications Inc. | 4.750% | 1/15/28 | 905 | | 928 | |
| | Level 3 Financing Inc. | 5.375% | 8/15/22 | 1,862 | | 1,869 | |
| | Level 3 Financing Inc. | 5.625% | 2/1/23 | 870 | | 873 | |
| | Level 3 Financing Inc. | 5.125% | 5/1/23 | 1,120 | | 1,130 | |
| | Nokia Oyj | 4.375% | 6/12/27 | 2,210 | | 2,303 | |
| 2 | Outfront Media Capital LLC / Outfront Media Capital Corp. | 4.625% | 3/15/30 | 1,535 | | 1,564 | |
| | Quebecor Media Inc. | 5.750% | 1/15/23 | 2,810 | | 3,052 | |
| | Qwest Corp. | 6.875% | 9/15/33 | 481 | | 483 | |
| 2 | Sinclair Television Group Inc. | 5.625% | 8/1/24 | 470 | | 484 | |
| 2 | Sinclair Television Group Inc. | 5.875% | 3/15/26 | 2,740 | | 2,877 | |
| 2 | Sinclair Television Group Inc. | 5.125% | 2/15/27 | 1,975 | | 2,029 | |
| 2 | Sirius XM Radio Inc. | 4.625% | 7/15/24 | 1,640 | | 1,714 | |
| | Sprint Capital Corp. | 6.875% | 11/15/28 | 2,915 | | 3,141 | |
| | Sprint Capital Corp. | 8.750% | 3/15/32 | 2,070 | | 2,515 | |
| 2 | Sprint Communications Inc. | 7.000% | 3/1/20 | 2,285 | | 2,296 | |
| | Sprint Communications Inc. | 6.000% | 11/15/22 | 755 | | 791 | |
| | Sprint Corp. | 7.875% | 9/15/23 | 9,234 | | 10,192 | |
| | Sprint Corp. | 7.125% | 6/15/24 | 2,101 | | 2,264 | |
| | Sprint Corp. | 7.625% | 2/15/25 | 1,595 | | 1,750 | |
| | T-Mobile USA Inc. | 6.500% | 1/15/26 | 690 | | 737 | |
| | T-Mobile USA Inc. | 5.375% | 4/15/27 | 3,510 | | 3,738 | |
| | Telecom Italia Capital SA | 6.375% | 11/15/33 | 381 | | 422 | |
| | Telecom Italia Capital SA | 6.000% | 9/30/34 | 1,005 | | 1,073 | |
| | Telecom Italia Capital SA | 7.721% | 6/4/38 | 1,280 | | 1,578 | |
| 2 | Telecom Italia SPA | 5.303% | 5/30/24 | 445 | | 479 | |
| 2 | Telenet Finance Luxembourg Notes Sarl | 5.500% | 3/1/28 | 3,600 | | 3,817 | |
| | Time Warner Cable LLC | 5.875% | 11/15/40 | 60 | | 69 | |
| | Time Warner Cable LLC | 5.500% | 9/1/41 | 1,223 | | 1,365 | |
| 2 | UPCB Finance IV Ltd. | 5.375% | 1/15/25 | 2,225 | | 2,286 | |
| 1 | Viacom Inc. | 5.875% | 2/28/57 | 2,560 | | 2,672 | |
High Yield Bond Portfolio
| | | | | Face | | Market | |
| | | | Maturity | Amount | | Value• | |
| | | Coupon | Date | ($000 | ) | ($000 | ) |
| 1 | Viacom Inc. | 6.250% | 2/28/57 | 944 | | 1,038 | |
| | Videotron Ltd. | 5.000% | 7/15/22 | 3,923 | | 4,139 | |
| 2 | Videotron Ltd. | 5.375% | 6/15/24 | 260 | | 286 | |
| 2 | Virgin Media Finance plc | 6.000% | 10/15/24 | 1,855 | | 1,908 | |
| 2 | Virgin Media Secured Finance plc | 5.500% | 8/15/26 | 940 | | 980 | |
| 2 | Virgin Media Secured Finance plc | 5.500% | 5/15/29 | 870 | | 921 | |
| 2 | VTR Finance BV | 6.875% | 1/15/24 | 2,521 | | 2,568 | |
| 2 | WMG Acquisition Corp. | 5.000% | 8/1/23 | 840 | | 860 | |
| 2 | WMG Acquisition Corp. | 4.875% | 11/1/24 | 1,475 | | 1,525 | |
| 2 | WMG Acquisition Corp. | 5.500% | 4/15/26 | 2,651 | | 2,790 | |
| 2,5 | WMG Acquisition Corp. | 3.625% | 10/15/26 | 220 | | 261 | |
| | Zayo Group LLC / Zayo Capital Inc. | 6.000% | 4/1/23 | 3,315 | | 3,390 | |
| 2 | Ziggo BV | 5.500% | 1/15/27 | 1,845 | | 1,949 | |
| 2 | Ziggo BV | 4.875% | 1/15/30 | 1,799 | | 1,850 | |
| | | | | | | | |
| | Consumer Cyclical (13.2%) | | | | | | |
| 2 | 1011778 BC ULC / New Red Finance Inc. | 4.250% | 5/15/24 | 4,062 | | 4,164 | |
| 2 | 1011778 BC ULC / New Red Finance Inc. | 5.000% | 10/15/25 | 3,240 | | 3,361 | |
| 2 | 1011778 BC ULC / New Red Finance Inc. | 3.875% | 1/15/28 | 830 | | 834 | |
| 2 | Adient Global Holdings Ltd. | 4.875% | 8/15/26 | 4,720 | | 4,213 | |
| 2 | Adient US LLC | 7.000% | 5/15/26 | 540 | | 589 | |
| 2 | APX Group Inc. | 8.875% | 12/1/22 | 4,155 | | 4,124 | |
| 3,4 | Bass Pro Group, LLC Bank Loan, 3M USD LIBOR + 5.000% | 6.799% | 12/15/23 | 1,891 | | 1,882 | |
| 2 | Boyd Gaming Corp. | 4.750% | 12/1/27 | 2,690 | | 2,794 | |
| 2 | Cedar Fair LP | 5.250% | 7/15/29 | 925 | | 997 | |
| | Cedar Fair LP / Canada’s Wonderland Co. / Magnum Management Corp. / Millennium Op | 5.375% | 4/15/27 | 775 | | 830 | |
| | Cedar Fair LP / Canada’s Wonderland Co. / Magnum Management Corp. | 5.375% | 6/1/24 | 535 | | 549 | |
| 2 | CRC Escrow Issuer LLC / CRC Finco Inc. | 5.250% | 10/15/25 | 5,768 | | 5,970 | |
| | Dana Holding Corp. | 5.500% | 12/15/24 | 1,055 | | 1,085 | |
| | Delta Merger Sub Inc. | 6.000% | 9/15/26 | 1,820 | | 2,004 | |
| 2 | FirstCash Inc. | 5.375% | 6/1/24 | 223 | | 231 | |
| | GLP Capital LP / GLP Financing II Inc. | 4.375% | 4/15/21 | 105 | | 107 | |
| | GLP Capital LP / GLP Financing II Inc. | 5.375% | 11/1/23 | 2,630 | | 2,858 | |
| | GLP Capital LP / GLP Financing II Inc. | 5.375% | 4/15/26 | 1,010 | | 1,104 | |
| | GLP Capital LP / GLP Financing II Inc. | 5.300% | 1/15/29 | 1,030 | | 1,148 | |
| | Goodyear Tire & Rubber Co. | 5.000% | 5/31/26 | 2,009 | | 2,094 | |
| | Goodyear Tire & Rubber Co. | 4.875% | 3/15/27 | 3,278 | | 3,401 | |
| 2 | Hanesbrands Inc. | 4.625% | 5/15/24 | 730 | | 771 | |
| 2 | Hanesbrands Inc. | 4.875% | 5/15/26 | 735 | | 775 | |
| | Hilton Domestic Operating Co. Inc. | 4.250% | 9/1/24 | 1,770 | | 1,801 | |
| | Hilton Domestic Operating Co. Inc. | 5.125% | 5/1/26 | 2,830 | | 2,979 | |
| | Hilton Domestic Operating Co. Inc. | 4.875% | 1/15/30 | 260 | | 276 | |
| | Hilton Worldwide Finance LLC / Hilton Worldwide Finance Corp. | 4.625% | 4/1/25 | 3,395 | | 3,493 | |
| | Hilton Worldwide Finance LLC / Hilton Worldwide Finance Corp. | 4.875% | 4/1/27 | 1,750 | | 1,857 | |
| 2 | Jack Ohio Finance LLC / Jack Ohio Finance 1 Corp. | 6.750% | 11/15/21 | 16 | | 16 | |
| 2 | Jacobs Entertainment Inc. | 7.875% | 2/1/24 | 600 | | 636 | |
| | KB Home | 7.000% | 12/15/21 | 230 | | 247 | |
| | KB Home | 7.500% | 9/15/22 | 215 | | 242 | |
| | KB Home | 7.625% | 5/15/23 | 1,300 | | 1,459 | |
| | KB Home | 4.800% | 11/15/29 | 325 | | 332 | |
| 2 | KFC Holding Co./Pizza Hut Holdings LLC/Taco Bell of America LLC | 5.000% | 6/1/24 | 1,965 | | 2,039 | |
| 2 | KFC Holding Co./Pizza Hut Holdings LLC/Taco Bell of America LLC | 5.250% | 6/1/26 | 872 | | 922 | |
| 2 | KFC Holding Co./Pizza Hut Holdings LLC/Taco Bell of America LLC | 4.750% | 6/1/27 | 710 | | 749 | |
| | L Brands Inc. | 6.694% | 1/15/27 | 537 | | 537 | |
| | L Brands Inc. | 5.250% | 2/1/28 | 1,301 | | 1,233 | |
| | Lennar Corp. | 4.125% | 1/15/22 | 1,015 | | 1,040 | |
| | Lennar Corp. | 4.875% | 12/15/23 | 625 | | 668 | |
| | Lennar Corp. | 4.500% | 4/30/24 | 3,165 | | 3,343 | |
| | Lennar Corp. | 5.875% | 11/15/24 | 490 | | 546 | |
| | Lennar Corp. | 5.250% | 6/1/26 | 270 | | 295 | |
| | Lennar Corp. | 5.000% | 6/15/27 | 1,245 | | 1,348 | |
| | Lennar Corp. | 4.750% | 11/29/27 | 1,085 | | 1,169 | |
| 2,5 | LHMC Finco Sarl | 6.250% | 12/20/23 | 1,460 | | 1,731 | |
| 2 | LHMC Finco Sarl | 7.875% | 12/20/23 | 1,523 | | 1,607 | |
| 2 | Lithia Motors Inc. | 5.250% | 8/1/25 | 171 | | 180 | |
| 2 | Lithia Motors Inc. | 4.625% | 12/15/27 | 1,745 | | 1,800 | |
| | Meritage Homes Corp. | 5.125% | 6/6/27 | 505 | | 539 | |
| | MGM Growth Properties Operating Partnership LP / MGP Finance Co-Issuer Inc. | 5.625% | 5/1/24 | 150 | | 164 | |
| | MGM Resorts International | 6.000% | 3/15/23 | 680 | | 747 | |
| | MGM Resorts International | 5.750% | 6/15/25 | 1,500 | | 1,680 | |
| | MGM Resorts International | 5.500% | 4/15/27 | 1,365 | | 1,515 | |
| 2 | Panther BF Aggregator 2 LP / Panther Finance Co. Inc. | 8.500% | 5/15/27 | 540 | | 572 | |
| 3,4 | Panther BF Aggregator Bank Loan, 3M USD LIBOR + 3.500% | 5.305% | 4/30/26 | 1,082 | | 1,085 | |
| 2 | PetSmart Inc. | 5.875% | 6/1/25 | 1,252 | | 1,279 | |
| | PulteGroup Inc. | 5.500% | 3/1/26 | 2,075 | | 2,319 | |
| | PulteGroup Inc. | 5.000% | 1/15/27 | 130 | | 142 | |
| | Service Corp. International | 8.000% | 11/15/21 | 1,225 | | 1,347 | |
| | Service Corp. International | 4.625% | 12/15/27 | 505 | | 527 | |
| | Service Corp. International | 5.125% | 6/1/29 | 1,305 | | 1,383 | |
| 2 | Speedway Motorsports LLC / Speedway Funding II Inc. | 4.875% | 11/1/27 | 600 | | 607 | |
| | Toll Brothers Finance Corp. | 4.375% | 4/15/23 | 300 | | 313 | |
| | Toll Brothers Finance Corp. | 4.875% | 11/15/25 | 295 | | 322 | |
| | Toll Brothers Finance Corp. | 4.875% | 3/15/27 | 1,955 | | 2,116 | |
| | William Lyon Homes Inc. | 7.000% | 8/15/22 | 64 | | 64 | |
| | William Lyon Homes Inc. | 6.000% | 9/1/23 | 390 | | 407 | |
| | William Lyon Homes Inc. | 5.875% | 1/31/25 | 1,415 | | 1,450 | |
| 2 | Wynn Las Vegas LLC / Wynn Las Vegas Capital Corp. | 5.500% | 3/1/25 | 3,030 | | 3,242 | |
| 2 | Wynn Las Vegas LLC / Wynn Las Vegas Capital Corp. | 5.250% | 5/15/27 | 1,636 | | 1,736 | |
| 2 | Wynn Resorts Finance LLC / Wynn Resorts Capital Corp. | 5.125% | 10/1/29 | 660 | | 706 | |
| 2 | Yum Brands Inc. | 4.750% | 1/15/30 | 400 | | 420 | |
| | | | | | | | |
| | Consumer Noncyclical (11.6%) | | | | | | |
| | Aramark Services Inc. | 5.125% | 1/15/24 | 1,367 | | 1,403 | |
| 2 | Aramark Services Inc. | 5.000% | 4/1/25 | 1,935 | | 2,017 | |
| | Aramark Services Inc. | 4.750% | 6/1/26 | 940 | | 980 | |
| 2 | Aramark Services Inc. | 5.000% | 2/1/28 | 1,465 | | 1,542 | |
| 2 | Avantor Inc. | 6.000% | 10/1/24 | 1,000 | | 1,065 | |
| | B&G Foods Inc. | 5.250% | 9/15/27 | 3,000 | | 2,996 | |
| 2 | Bausch Health Americas Inc. | 9.250% | 4/1/26 | 520 | | 598 | |
| 2 | Bausch Health Cos. Inc. | 5.875% | 5/15/23 | 19 | | 19 | |
| 2 | Bausch Health Cos. Inc. | 7.000% | 3/15/24 | 1,090 | | 1,134 | |
| 2 | Bausch Health Cos. Inc. | 5.500% | 11/1/25 | 2,140 | | 2,236 | |
| 2 | Bausch Health Cos. Inc. | 7.000% | 1/15/28 | 540 | | 595 | |
| 2 | Bausch Health Cos. Inc. | 7.250% | 5/30/29 | 60 | | 68 | |
| 2 | Catalent Pharma Solutions Inc. | 5.000% | 7/15/27 | 630 | | 660 | |
| 2 | Change Healthcare Holdings LLC / Change Healthcare Finance Inc. | 5.750% | 3/1/25 | 2,000 | | 2,065 | |
| 2 | Charles River Laboratories International Inc. | 5.500% | 4/1/26 | 705 | | 759 | |
| 2 | Charles River Laboratories International Inc. | 4.250% | 5/1/28 | 350 | | 357 | |
| | CHS/Community Health Systems Inc. | 5.125% | 8/1/21 | 525 | | 526 | |
| | CHS/Community Health Systems Inc. | 6.250% | 3/31/23 | 3,450 | | 3,493 | |
| 2 | CHS/Community Health Systems Inc. | 8.125% | 6/30/24 | 1,203 | | 986 | |
| 2,5 | Darling Global Finance BV | 3.625% | 5/15/26 | 395 | | 467 | |
High Yield Bond Portfolio
| | | | | Face | | Market | |
| | | | Maturity | Amount | | Value• | |
| | | Coupon | Date | ($000 | ) | ($000 | ) |
| 2 | Darling Ingredients Inc. | 5.250% | 4/15/27 | 575 | | 611 | |
| 2,5 | Diamond BC BV | 5.625% | 8/15/25 | 3,235 | | 3,569 | |
| 2 | Endo Dac / Endo Finance LLC / Endo Finco Inc. | 6.000% | 2/1/25 | 2,395 | | 1,617 | |
| 2 | Endo Finance LLC / Endo Ltd. / Endo Finco Inc. | 6.000% | 7/15/23 | 2,535 | | 1,838 | |
| 2,5 | Grifols SA | 1.625% | 2/15/25 | 810 | | 926 | |
| 2,5 | Grifols SA | 2.250% | 11/15/27 | 905 | | 1,049 | |
| | HCA Inc. | 6.250% | 2/15/21 | 870 | | 908 | |
| | HCA Inc. | 7.500% | 2/15/22 | 155 | | 171 | |
| | HCA Inc. | 5.875% | 5/1/23 | 2,725 | | 3,004 | |
| | HCA Inc. | 5.375% | 2/1/25 | 1,955 | | 2,160 | |
| | HCA Inc. | 7.690% | 6/15/25 | 130 | | 157 | |
| | HCA Inc. | 5.875% | 2/15/26 | 2,895 | | 3,293 | |
| | HCA Inc. | 5.625% | 9/1/28 | 390 | | 446 | |
| | HCA Inc. | 5.875% | 2/1/29 | 450 | | 520 | |
| 2 | Hologic Inc. | 4.625% | 2/1/28 | 570 | | 604 | |
| 2 | IQVIA Inc. | 5.000% | 5/15/27 | 1,993 | | 2,108 | |
| 2,5 | IQVIA Inc. | 2.250% | 1/15/28 | 1,200 | | 1,388 | |
| 3,4 | Lands’ End, Inc. Bank Loan, 3M USD LIBOR + 3.250% | 5.049% | 3/12/21 | 2,257 | | 2,210 | |
| 2 | MPH Acquisition Holdings LLC | 7.125% | 6/1/24 | 1,590 | | 1,542 | |
| 2 | Performance Food Group Inc. | 5.500% | 10/15/27 | 2,100 | | 2,237 | |
| 2 | Polaris Intermediate Corp. | 8.500% | 12/1/22 | 2,565 | | 2,389 | |
| 2 | Post Holdings Inc. | 5.500% | 3/1/25 | 2,125 | | 2,223 | |
| 2 | Post Holdings Inc. | 5.000% | 8/15/26 | 3,800 | | 4,009 | |
| 2 | Post Holdings Inc. | 5.750% | 3/1/27 | 970 | | 1,040 | |
| 2 | Post Holdings Inc. | 5.625% | 1/15/28 | 2,170 | | 2,333 | |
| 2 | Quintiles IMS Inc. | 5.000% | 10/15/26 | 2,050 | | 2,163 | |
| | Revlon Consumer Products Corp. | 5.750% | 2/15/21 | 570 | | 486 | |
| | Revlon Consumer Products Corp. | 6.250% | 8/1/24 | 2,130 | | 1,041 | |
| 3,4 | Revlon Consumer Products Corp. Bank Loan, 1M USD LIBOR + 3.500% | 5.409% | 9/7/23 | 176 | | 134 | |
| 3,4 | Revlon Consumer Products Corp. Bank Loan, 1M USD LIBOR +3.500% | 5.409% | 9/7/23 | 589 | | 449 | |
| | Tenet Healthcare Corp. | 4.625% | 7/15/24 | 279 | | 287 | |
| | Teva Pharmaceutical Finance Netherlands III BV | 3.150% | 10/1/26 | 2,720 | | 2,264 | |
| | Teva Pharmaceutical Finance Netherlands III BV | 6.750% | 3/1/28 | 2,785 | | 2,813 | |
| | Teva Pharmaceutical Finance Netherlands III BV | 4.100% | 10/1/46 | 300 | | 216 | |
| 2 | TreeHouse Foods Inc. | 6.000% | 2/15/24 | 2,100 | | 2,176 | |
| 2 | Valeant Pharmaceuticals International Inc. | 9.000% | 12/15/25 | 815 | | 926 | |
| 2 | Valeant Pharmaceuticals International Inc. | 8.500% | 1/31/27 | 1,150 | | 1,311 | |
| 2 | VRX Escrow Corp. | 6.125% | 4/15/25 | 5,700 | | 5,885 | |
| 2 | West Street Merger Sub Inc. | 6.375% | 9/1/25 | 4,336 | | 4,314 | |
| | | | | | | | |
| | Energy (8.7%) | | | | | | |
| | AmeriGas Finance LLC / AmeriGas Finance Corp. | 5.625% | 5/20/24 | 1,395 | | 1,507 | |
| | AmeriGas Finance LLC / AmeriGas Finance Corp. | 5.875% | 8/20/26 | 1,765 | | 1,948 | |
| | AmeriGas Partners LP / AmeriGas Finance Corp. | 5.500% | 5/20/25 | 620 | | 670 | |
| | AmeriGas Partners LP / AmeriGas Finance Corp. | 5.750% | 5/20/27 | 1,745 | | 1,920 | |
| 2 | Blue Racer Midstream LLC / Blue Racer Finance Corp. | 6.125% | 11/15/22 | 1,042 | | 1,021 | |
| 2 | Blue Racer Midstream LLC / Blue Racer Finance Corp. | 6.625% | 7/15/26 | 775 | | 705 | |
| | Cheniere Corpus Christi Holdings LLC | 5.875% | 3/31/25 | 95 | | 107 | |
| | Cheniere Corpus Christi Holdings LLC | 5.125% | 6/30/27 | 1,233 | | 1,366 | |
| 2 | Cheniere Energy Partners LP | 4.500% | 10/1/29 | 1,566 | | 1,609 | |
| | Chesapeake Energy Corp. | 11.500% | 1/1/25 | 2,791 | | 2,638 | |
| 2 | DCP Midstream LLC | 5.350% | 3/15/20 | 335 | | 337 | |
| 2 | DCP Midstream Operating LP | 4.750% | 9/30/21 | 672 | | 690 | |
| | DCP Midstream Operating LP | 4.950% | 4/1/22 | 1,436 | | 1,493 | |
| | DCP Midstream Operating LP | 3.875% | 3/15/23 | 801 | | 819 | |
| | Ferrellgas LP / Ferrellgas Finance Corp. | 6.500% | 5/1/21 | 2,560 | | 2,214 | |
| | Ferrellgas LP / Ferrellgas Finance Corp. | 6.750% | 1/15/22 | 474 | | 403 | |
| | Ferrellgas LP / Ferrellgas Finance Corp. | 6.750% | 6/15/23 | 769 | | 650 | |
| | Laredo Petroleum Inc. | 5.625% | 1/15/22 | 2,107 | | 2,044 | |
| | Laredo Petroleum Inc. | 6.250% | 3/15/23 | 2,758 | | 2,586 | |
| | Matador Resources Co. | 5.875% | 9/15/26 | 2,840 | | 2,854 | |
| 2 | MEG Energy Corp. | 6.375% | 1/30/23 | 850 | | 850 | |
| 2 | MEG Energy Corp. | 7.000% | 3/31/24 | 1,139 | | 1,148 | |
| 2 | MEG Energy Corp. | 6.500% | 1/15/25 | 2,850 | | 2,971 | |
| 2 | Noble Holding International Ltd. | 7.875% | 2/1/26 | 460 | | 334 | |
| 2 | Parsley Energy LLC / Parsley Finance Corp. | 5.375% | 1/15/25 | 1,344 | | 1,381 | |
| 2 | Parsley Energy LLC / Parsley Finance Corp. | 5.250% | 8/15/25 | 190 | | 195 | |
| | QEP Resources Inc. | 5.375% | 10/1/22 | 1,270 | | 1,275 | |
| | QEP Resources Inc. | 5.250% | 5/1/23 | 1,262 | | 1,253 | |
| 2 | Rockies Express Pipeline LLC | 7.500% | 7/15/38 | 1,134 | | 1,211 | |
| 2 | Rockies Express Pipeline LLC | 6.875% | 4/15/40 | 420 | | 438 | |
| | SM Energy Co. | 6.125% | 11/15/22 | 935 | | 944 | |
| | SM Energy Co. | 5.000% | 1/15/24 | 1,994 | | 1,914 | |
| | SM Energy Co. | 5.625% | 6/1/25 | 1,651 | | 1,568 | |
| | SM Energy Co. | 6.750% | 9/15/26 | 720 | | 707 | |
| | SM Energy Co. | 6.625% | 1/15/27 | 500 | | 491 | |
| | Sunoco LP / Sunoco Finance Corp. | 4.875% | 1/15/23 | 1,475 | | 1,508 | |
| | Sunoco LP / Sunoco Finance Corp. | 5.500% | 2/15/26 | 1,589 | | 1,653 | |
| | Sunoco LP / Sunoco Finance Corp. | 6.000% | 4/15/27 | 2,265 | | 2,418 | |
| | Sunoco LP / Sunoco Finance Corp. | 5.875% | 3/15/28 | 555 | | 591 | |
| 2 | Tallgrass Energy Partners LP / Tallgrass Energy Finance Corp. | 4.750% | 10/1/23 | 1,880 | | 1,875 | |
| 2 | Tallgrass Energy Partners LP / Tallgrass Energy Finance Corp. | 5.500% | 9/15/24 | 210 | | 211 | |
| 2 | Tallgrass Energy Partners LP / Tallgrass Energy Finance Corp. | 5.500% | 1/15/28 | 1,845 | | 1,808 | |
| | Targa Resources Partners LP / Targa Resources Partners Finance Corp. | 6.750% | 3/15/24 | 300 | | 311 | |
| 2 | Targa Resources Partners LP / Targa Resources Partners Finance Corp. | 6.875% | 1/15/29 | 1,200 | | 1,329 | |
| 1,2 | Transocean Guardian Ltd. | 5.875% | 1/15/24 | 1,573 | | 1,608 | |
| 1,2 | Transocean Phoenix 2 Ltd. | 7.750% | 10/15/24 | 714 | | 757 | |
| 1,2 | Transocean Pontus Ltd. | 6.125% | 8/1/25 | 1,278 | | 1,313 | |
| 1,2 | Transocean Proteus Ltd. | 6.250% | 12/1/24 | 837 | | 863 | |
| 2 | Vine Oil & Gas LP / Vine Oil & Gas Finance Corp. | 8.750% | 4/15/23 | 1,915 | | 938 | |
| | Whiting Petroleum Corp. | 6.625% | 1/15/26 | 3,281 | | 2,231 | |
| | WPX Energy Inc. | 5.250% | 9/15/24 | 3,734 | | 3,967 | |
| | WPX Energy Inc. | 5.750% | 6/1/26 | 370 | | 395 | |
| | | | | | | | |
| | Other Industrial (0.7%) | | | | | | |
| 2 | Brand Energy & Infrastructure Services Inc. | 8.500% | 7/15/25 | 3,222 | | 3,303 | |
| 3,4 | Core & Main LP Bank Loan, 3M USD LIBOR + 3.000% | 4.441% | 8/1/24 | 47 | | 46 | |
| 3,4 | Core & Main LP Bank Loan, 3M USD LIBOR + 3.000% | 4.441% | 8/1/24 | 114 | | 114 | |
| 3,4 | Core & Main LP Bank Loan, 3M USD LIBOR + 3.000% | 4.664% | 8/1/24 | 104 | | 103 | |
| 2 | KAR Auction Services Inc. | 5.125% | 6/1/25 | 1,819 | | 1,890 | |
| | | | | | | | |
| | Technology (8.9%) | | | | | | |
| | Alcatel-Lucent USA Inc. | 6.500% | 1/15/28 | 1,355 | | 1,391 | |
| | Alcatel-Lucent USA Inc. | 6.450% | 3/15/29 | 2,612 | | 2,772 | |
High Yield Bond Portfolio
| | | | | Face | | Market | |
| | | | Maturity | Amount | | Value• | |
| | | Coupon | Date | ($000 | ) | ($000 | ) |
| | CDK Global Inc. | 5.875% | 6/15/26 | 915 | | 977 | |
| | CDK Global Inc. | 4.875% | 6/1/27 | 585 | | 618 | |
| 2 | CDK Global Inc. | 5.250% | 5/15/29 | 775 | | 827 | |
| | CDW LLC / CDW Finance Corp. | 5.500% | 12/1/24 | 185 | | 205 | |
| | CDW LLC / CDW Finance Corp. | 5.000% | 9/1/25 | 910 | | 951 | |
| | CDW LLC / CDW Finance Corp. | 4.250% | 4/1/28 | 2,685 | | 2,816 | |
| 3,4 | Dun and Bradstreet Corp. Bank Loan, 3M USD LIBOR + 5.000% | 6.792% | 2/8/26 | 3,360 | | 3,382 | |
| 2 | Entegris Inc. | 4.625% | 2/10/26 | 150 | | 155 | |
| 4 | Equinix Inc. | 2.875% | 2/1/26 | 3,115 | | 3,623 | |
| | Equinix Inc. | 5.375% | 5/15/27 | 1,365 | | 1,479 | |
| 3,4 | Grizzly Acquisitions Inc. Bank Loan, 3M USD LIBOR + 3.250% | 5.349% | 10/1/25 | 736 | | 735 | |
| | Infor US Inc. | 6.500% | 5/15/22 | 3,060 | | 3,110 | |
| | Iron Mountain Inc. | 5.750% | 8/15/24 | 972 | | 982 | |
| 2 | Iron Mountain Inc. | 4.875% | 9/15/27 | 595 | | 612 | |
| 2 | Iron Mountain Inc. | 4.875% | 9/15/29 | 2,177 | | 2,210 | |
| 2 | MSCI Inc. | 5.250% | 11/15/24 | 149 | | 153 | |
| 2 | MSCI Inc. | 5.750% | 8/15/25 | 1,915 | | 2,008 | |
| 2 | MSCI Inc. | 4.750% | 8/1/26 | 210 | | 220 | |
| 2 | MSCI Inc. | 5.375% | 5/15/27 | 690 | | 745 | |
| 2 | MSCI Inc. | 4.000% | 11/15/29 | 2,710 | | 2,747 | |
| | Nokia Oyj | 6.625% | 5/15/39 | 3,735 | | 4,286 | |
| 2 | Open Text Corp. | 5.625% | 1/15/23 | 1,070 | | 1,087 | |
| 2 | Open Text Corp. | 5.875% | 6/1/26 | 1,895 | | 2,023 | |
| | Pitney Bowes Inc. | 4.625% | 5/15/22 | 1,015 | | 1,020 | |
| | Pitney Bowes Inc. | 5.200% | 4/1/23 | 2,395 | | 2,347 | |
| | Pitney Bowes Inc. | 4.625% | 3/15/24 | 975 | | 907 | |
| | Qorvo Inc. | 5.500% | 7/15/26 | 2,044 | | 2,172 | |
| 2 | Qorvo Inc. | 4.375% | 10/15/29 | 2,260 | | 2,367 | |
| 2 | Sensata Technologies BV | 4.875% | 10/15/23 | 300 | | 319 | |
| 2 | Sensata Technologies BV | 5.625% | 11/1/24 | 575 | | 638 | |
| 2 | Sensata Technologies BV | 5.000% | 10/1/25 | 1,625 | | 1,761 | |
| 2 | Sensata Technologies UK Financing Co. plc | 6.250% | 2/15/26 | 1,520 | | 1,642 | |
| 3,4 | SS&C Technologies Holdings Inc. Bank Loan, 3M USD LIBOR + 2.250% | 4.049% | 4/16/25 | 676 | | 681 | |
| 3,4 | SS&C Technologies Holdings Inc. Bank Loan, 3M USD LIBOR + 2.250% | 4.049% | 4/16/25 | 826 | | 832 | |
| 3,4 | SS&C Technologies Holdings Inc. Bank Loan, 3M USD LIBOR + 2.250% | 4.049% | 4/16/25 | 73 | | 577 | |
| 2 | SS&C Technologies Inc. | 5.500% | 9/30/27 | 3,575 | | 3,816 | |
| | Symantec Corp. | 3.950% | 6/15/22 | 345 | | 351 | |
| 2 | Symantec Corp. | 5.000% | 4/15/25 | 4,250 | | 4,324 | |
| | Western Digital Corp. | 4.750% | 2/15/26 | 2,519 | | 2,626 | |
| | Xerox Corp. | 4.500% | 5/15/21 | 720 | | 736 | |
| | Xerox Corp. | 4.125% | 3/15/23 | 750 | | 778 | |
| | Xerox Corp. | 4.800% | 3/1/35 | 542 | | 488 | |
| | Xerox Corp. | 6.750% | 12/15/39 | 1,600 | | 1,688 | |
| | | | | | | | |
| | Transportation (0.2%) | | | | | | |
| | Avis Budget Car Rental LLC / Avis Budget Finance Inc. | 5.500% | 4/1/23 | 602 | | 611 | |
| 2 | Avis Budget Car Rental LLC / Avis Budget Finance Inc. | 6.375% | 4/1/24 | 715 | | 742 | |
| | | | | | | 603,474 | |
| Utilities (1.4%) | |
| | Electric (1.4%) | | | | | | |
| | AES Corp. | 4.500% | 3/15/23 | 1,835 | | 1,881 | |
| | AES Corp. | 4.875% | 5/15/23 | 516 | | 525 | |
| | AES Corp. | 5.500% | 4/15/25 | 150 | | 155 | |
| | AES Corp. | 6.000% | 5/15/26 | 30 | | 32 | |
| | AES Corp. | 5.125% | 9/1/27 | 2,115 | | 2,257 | |
| 2 | NextEra Energy Operating Partners LP | 4.250% | 7/15/24 | 1,173 | | 1,220 | |
| 2 | NextEra Energy Operating Partners LP | 4.250% | 9/15/24 | 1,145 | | 1,191 | |
| 2 | NextEra Energy Operating Partners LP | 3.875% | 10/15/26 | 3,035 | | 3,058 | |
| 2 | NextEra Energy Operating Partners LP | 4.500% | 9/15/27 | 700 | | 728 | |
| | | | | | | 11,047 | |
| Total Corporate Bonds (Cost $684,752) | | 704,953 | |
| Sovereign Bonds (0.4%) | |
| 2 | DAE Funding LLC | 4.000% | 8/1/20 | 130 | | 131 | |
| 2 | DAE Funding LLC | 5.250% | 11/15/21 | 705 | | 731 | |
| 2 | DAE Funding LLC | 4.500% | 8/1/22 | 1,264 | | 1,283 | |
| 2 | DAE Funding LLC | 5.000% | 8/1/24 | 1,020 | | 1,069 | |
| Total Sovereign Bonds (Cost $3,154) | | 3,214 | |
| | | |
| | Shares | |
| Common Stocks (0.1%) | |
| Utilities (0.1%) | | | | | |
| *,7 | Homer City Generation LP(Cost $1,287) | | 62,633 | | 448 | |
| Temporary Cash Investment (8.1%) | | | | | | |
| Repurchase Agreement (8.1%) | | | | | | |
| | Bank of America Securities, LLC
(Dated 12/31/19, Repurchase
Value $63,606,000, collateralized
by Federal National Mortgage
Assn., 4.000%, 6/01/34, and Federal
Home Loan Mortgage Corp.,
3.500%–4.500%, 9/01/46–5/01/49,
with a value of $64,872,000) | | | | | | |
| | (Cost $63,600) | 1.570% | 1/2/20 | 63,600 | | 63,600 | |
| Total Investments (98.6%) (Cost $752,793) | | | | 772,215 | |
| | | | | | | | |
| | Amount | |
| | ($000 | ) |
| Other Assets and Liabilities (1.4%) | | |
| Other Assets | | |
| Investment in Vanguard | 35 | |
| Receivables for Investment Securities Sold | 272 | |
| Receivables for Accrued Income | 10,235 | |
| Receivables for Capital Shares Issued | 413 | |
| Other Assets8 | 806 | |
| Total Other Assets | 11,761 | |
| Liabilities | | |
| Payables for Investment Securities Purchased | (19 | ) |
| Payables to Investment Advisor | (115 | ) |
| Payables for Capital Shares Redeemed | (316 | ) |
| Payables to Vanguard | (493 | ) |
| Variation Margin Payable—CC Swap Contracts | (1 | ) |
| Unrealized Depreciation—Forward Currency Contracts | (127 | ) |
| Total Liabilities | (1,071 | ) |
| Net Assets (100%) | | |
| Applicable to 95,578,799 outstanding $.001 par value shares of beneficial interest (unlimited authorization) | 782,905 | |
| Net Asset Value Per Share | $8.19 | |
High Yield Bond Portfolio
| At December 31, 2019, net assets consisted of: | |
| | Amount |
| | ($000) |
| Paid-in Capital | 733,724 |
| Total Distributable Earnings (Loss) | 49,181 |
| Net Assets | 782,905 |
| • | See Note A in Notes to Financial Statements. |
| * | Non-income-producing security. |
| 1 | The average or expected maturity is shorter than the final maturity shown because of the possibility of interim principal payments and prepayments or the possibility of the issue being called. |
| 2 | Security exempt from registration under Rule 144A of the Securities Act of 1933. Such securities may be sold in transactions exempt from registration, normally to qualified institutional buyers. At December 31, 2019, the aggregate value of these securities was $336,646,000, representing 43.0% of net assets. |
| 3 | Security is a senior, secured, high-yield floating-rate loan. These loans are debt obligations issued by public and private companies and are comparable to high-yield bonds from a ratings and leverage perspective. At December 31, 2019, the aggregate value of these securities was $15,946,000, representing 2.0% of net assets. |
| 4 | Adjustable-rate security; rate shown is effective rate at period end. Certain adjustable-rate securities are not based on a published reference rate and spread but are determined by the issuer or agent based on current market conditions. |
| 5 | Face amount denominated in euro. |
| 6 | Face amount denominated in British pounds. |
| 7 | Security value determined using significant unobservable inputs. |
| 8 | Cash of $527,000 has been segregated as initial margin for open cleared swap contracts. |
CC—Centrally Cleared.
LIBOR—London Interbank Offered Rate.
| Derivative Financial Instruments Outstanding as of Period End | | |
| | | | | | | | |
| Forward Currency Contracts | | | | | | | |
| | Contract | | | | | Unrealized | Unrealized |
| | Settlement | | Contract Amount (000) | Appreciation | (Depreciation) |
| Counterparty | Date | | Receive | | Deliver | ($000) | ($000) |
| Citibank, N.A. | 1/31/20 | USD | 17,861 | EUR | 16,004 | — | (126) |
| Bank of America, N.A. | 1/31/20 | USD | 62 | GBP | 48 | — | (1) |
| | | | | | | — | (127) |
EUR—euro.
GBP—British pound.
USD—U.S. dollar.
| Centrally Cleared Credit Default Swaps |
| | | | | Periodic | | |
| | | | | Premium | | Unrealized |
| | | | | Received | | Appreciation |
| | Termination | Notional Amount | (Paid)1 | Value | (Depreciation) |
| Reference Entity | Date | | (000) | (%) | ($000) | ($000) |
| Credit Protection Sold | | | | | | |
| CDX-NA-HY-S33-V1 | 12/20/24 | USD | 9,900 | 5.000 | 959 | 211 |
The notional amount represents the maximum potential amount the fund could be required to pay as a seller of credit protection if the reference entity was subject to a credit event.
1 Periodic premium received/paid quarterly.
USD—U.S. dollar.
See accompanying Notes, which are an integral part of the Financial Statements.
High Yield Bond Portfolio
Statement of Operations
| | Year Ended |
| | December 31, 2019 |
| | ($000) |
| Investment Income |
| Income |
| Interest | 40,612 |
| Total Income | 40,612 |
| Expenses |
| Investment Advisory Fees—Note B | 446 |
| The Vanguard Group—Note C |
| Management and Administrative | 1,339 |
| Marketing and Distribution | 82 |
| Custodian Fees | 13 |
| Auditing Fees | 35 |
| Shareholders’ Reports | 16 |
| Trustees’ Fees and Expenses | 1 |
| Total Expenses | 1,932 |
| Net Investment Income | 38,680 |
| Realized Net Gain (Loss) |
| Investment Securities Sold | (1,299) |
| Swap Contracts | (11) |
| Forward Currency Contracts | 843 |
| Foreign Currencies | (7) |
| Realized Net Gain (Loss) | (474) |
| Change in Unrealized Appreciation (Depreciation) |
| Investment Securities | 68,687 |
| Swap Contracts | 597 |
| Forward Currency Contracts | (151) |
| Foreign Currencies | 4 |
| Change in Unrealized Appreciation (Depreciation) | 69,137 |
| Net Increase (Decrease) in Net Assets Resulting from Operations | 107,343 |
Statement of Changes in Net Assets
| | Year Ended December 31, |
| | 2019 | 2018 |
| | ($000) | ($000) |
| Increase (Decrease) in Net Assets | |
| Operations |
| Net Investment Income | 38,680 | 39,756 |
| Realized Net Gain (Loss) | (474) | 5,329 |
| Change in Unrealized Appreciation (Depreciation) | 69,137 | (65,575) |
| Net Increase (Decrease) in Net Assets Resulting from Operations | 107,343 | (20,490) |
| Distributions |
| Net Investment Income | (42,939) | (35,316) |
| Realized Capital Gain | — | — |
| Total Distributions | (42,939) | (35,316) |
| Capital Share Transactions |
| Issued | 152,281 | 118,985 |
| Issued in Lieu of Cash Distributions | 42,939 | 35,316 |
| Redeemed | (180,636) | (146,831) |
| Net Increase (Decrease) from Capital Share Transactions | 14,584 | 7,470 |
| Total Increase (Decrease) | 78,988 | (48,336) |
| Net Assets |
| Beginning of Period | 703,917 | 752,253 |
| End of Period | 782,905 | 703,917 |
See accompanying Notes, which are an integral part of the Financial Statements.
High Yield Bond Portfolio
Financial Highlights
| For a Share Outstanding | Year Ended December 31, |
| Throughout Each Period | 2019 | 2018 | 2017 | 2016 | 2015 |
| Net Asset Value, Beginning of Period | $7.53 | $8.13 | $7.99 | $7.59 | $8.14 |
| Investment Operations | | | | | |
| Net Investment Income | .4101 | .4201 | .4191 | .397 | .427 |
| Net Realized and Unrealized Gain (Loss) on Investments | .731 | (.636) | .119 | .426 | (.541) |
| Total from Investment Operations | 1.141 | (.216) | .538 | .823 | (.114) |
| Distributions | | | | | |
| Dividends from Net Investment Income | (.481) | (.384) | (.398) | (.423) | (.423) |
| Distributions from Realized Capital Gains | — | — | — | — | (.013) |
| Total Distributions | (.481) | (.384) | (.398) | (.423) | (.436) |
| Net Asset Value, End of Period | $8.19 | $7.53 | $8.13 | $7.99 | $7.59 |
| | | | | | |
| Total Return | 15.67% | -2.73% | 7.00% | 11.35% | -1.58% |
| | | | | | |
| Ratios/Supplemental Data | | | | | |
| Net Assets, End of Period (Millions) | $783 | $704 | $752 | $622 | $521 |
| Ratio of Total Expenses to Average Net Assets | 0.26% | 0.26% | 0.28% | 0.28% | 0.28% |
| Ratio of Net Investment Income to Average Net Assets | 5.21% | 5.39% | 5.22% | 5.44% | 5.41% |
| Portfolio Turnover Rate | 27% | 23% | 28% | 27% | 38% |
1 Calculated based on average shares outstanding.
Notes to Financial Statements
The High Yield Bond Portfolio, a portfolio of Vanguard Variable Insurance Funds, is registered under the Investment Company Act of 1940 as an open-end investment company. The portfolio’s shares are only available for purchase by separate accounts of insurance companies as investments for variable annuity plans, variable life insurance contracts, or other variable benefit insurance contracts. Certain of the portfolio’s investments are in corporate debt instruments; the issuers’ abilities to meet their obligations may be affected by economic developments in their respective industries.
A. The following significant accounting policies conform to generally accepted accounting principles for U.S. investment companies. The portfolio consistently follows such policies in preparing its financial statements.
1. Security Valuation: Securities are valued as of the close of trading on the New York Stock Exchange (generally 4 p.m., Eastern time) on the valuation date. Bonds and temporary cash investments are valued using the latest bid prices or using valuations based on a matrix system (which considers such factors as security prices, yields, maturities, and ratings), both as furnished by independent pricing services. Equity securities are valued at the latest quoted sales prices or official closing prices taken from the primary market in which each security trades; such securities not traded on the valuation date are valued at the mean of the latest quoted bid and asked prices. Securities for which market quotations are not readily available, or whose values have been affected by events occurring before the portfolio’s pricing time but after the close of the securities’ primary markets, are valued by methods deemed by the board of trustees to represent fair value.
2. Foreign Currency: Securities and other assets and liabilities denominated in foreign currencies are translated into U.S. dollars using exchange rates obtained from an independent third party as of the portfolio’s pricing time on the valuation date. Realized gains (losses) and unrealized appreciation (depreciation) on investment securities include the effects of changes in exchange rates since the securities were purchased, combined with the effects of changes in security prices. Fluctuations in the value of other assets and liabilities resulting from changes in exchange rates are recorded as unrealized foreign currency gains (losses) until the assets or liabilities are settled in cash, at which time they are recorded as realized foreign currency gains (losses).
High Yield Bond Portfolio
3. Forward Currency Contracts: The portfolio enters into forward currency contracts to protect the value of securities and related receivables and payables against changes in future foreign exchange rates. The portfolio’s risks in using these contracts include movement in the values of the foreign currencies relative to the U.S. dollar and the ability of the counterparties to fulfill their obligations under the contracts. The portfolio mitigates its counterparty risk by entering into forward currency contracts only with a diverse group of prequalified counterparties, monitoring their financial strength, entering into master netting arrangements with its counterparties, and requiring its counterparties to transfer collateral as security for their performance. In the absence of a default, the collateral pledged or received by the portfolio cannot be repledged, resold, or rehypothecated. The master netting arrangements provide that, in the event of a counterparty’s default (including bankruptcy), the portfolio may terminate the forward currency contracts, determine the net amount owed by either party in accordance with its master netting arrangements, and sell or retain any collateral held up to the net amount owed to the portfolio under the master netting arrangements. The forward currency contracts contain provisions whereby a counterparty may terminate open contracts if the portfolio’s net assets decline below a certain level, triggering a payment by the portfolio if the portfolio is in a net liability position at the time of the termination. The payment amount would be reduced by any collateral the portfolio has pledged. Any assets pledged as collateral for open contracts are noted in the Statement of Net Assets. The value of collateral received or pledged is compared daily to the value of the forward currency contracts exposure with each counterparty, and any difference, if in excess of a specified minimum transfer amount, is adjusted and settled within two business days.
Forward currency contracts are valued at their quoted daily prices obtained from an independent third party, adjusted for currency risk based on the expiration date of each contract. The notional amounts of the contracts are not recorded in the Statement of Net Assets. Fluctuations in the value of the contracts are recorded in the Statement of Net Assets as an asset (liability) and in the Statement of Operations as unrealized appreciation (depreciation) until the contracts are closed, when they are recorded as realized forward currency contract gains (losses).
During the year ended December 31, 2019, the portfolio’s average investment in forward currency contracts represented 2% of net assets, based on the average of notional amounts at each quarter-end during the period.
4. Swap Contracts: The portfolio invests in credit default swaps to adjust the overall credit risk of the portfolio or to actively overweight or underweight credit risk to a specific issuer or group of issuers. The portfolio may sell credit protection through credit default swaps to simulate investments in long positions that are either unavailable or considered to be less attractively priced in the bond market. The portfolio may purchase credit protection through credit default swaps to reduce credit exposure to a given issuer or issuers. Under the terms of the swaps, an up-front payment may be exchanged between the seller and buyer. In addition, the seller of the credit protection receives a periodic payment of premium from the buyer that is a fixed percentage applied to a notional amount. If, for example, the reference entity is subject to a credit event (such as bankruptcy, failure to pay, or obligation acceleration) during the term of the swap, the seller agrees to either physically settle or cash settle the swap contract. If the swap is physically settled, the seller agrees to pay the buyer an amount equal to the notional amount and take delivery of a debt instrument of the reference issuer with a par amount equal to such notional amount. If the swap is cash settled, the seller agrees to pay the buyer the difference between the notional amount and the final price for the relevant debt instrument, as determined either in a market auction or pursuant to a pre-agreed-upon valuation procedure.
The notional amounts of swap contracts are not recorded in the Statement of Net Assets. Swaps are valued daily based on market quotations received from independent pricing services or recognized dealers and the change in value is recorded in the Statement of Net Assets as an asset (liability) and in the Statement of Operations as unrealized appreciation (depreciation) until the seller of credit protection is required to take delivery (or, in a cash settled swap, pay the settlement amount determined) upon occurrence of a credit event, periodic payments are made, or the swap terminates, at which time realized gain (loss) is recorded. The net premium to be received or paid by the portfolio under swap contracts is accrued daily and recorded as realized gain (loss) over the life of the contract.
The primary risk associated with selling credit protection is that, upon the occurrence of a defined credit event, the market value of the debt instrument received by the portfolio (or, in a cash settled swap, the debt instruments used to determine the settlement payment by the portfolio) will be significantly less than the amount paid by the portfolio and, in a physically settled swap, the portfolio may receive an illiquid debt instrument. A risk associated with all types of swaps is the possibility that a counterparty may default on its obligation to pay net amounts due to the portfolio. The portfolio’s maximum amount subject to counterparty risk is the unrealized appreciation on the swap contract. The portfolio mitigates
High Yield Bond Portfolio
its counterparty risk by entering into swaps only with a diverse group of prequalified counterparties, monitoring their financial strength, entering into master netting arrangements with its counterparties, and requiring its counterparties to transfer collateral as security for their performance. In the absence of a default, the collateral pledged or received by the portfolio cannot be repledged, resold, or rehypothecated. In the event of a counterparty’s default (including bankruptcy), the portfolio may terminate any swap contracts with that counterparty, determine the net amount owed by either party in accordance with its master netting arrangements, and sell or retain any collateral held up to the net amount owed to the portfolio under the master netting arrangements. The swap contracts contain provisions whereby a counterparty may terminate open contracts if the portfolio’s net assets decline below a certain level, triggering a payment by the portfolio if the portfolio is in a net liability position at the time of the termination. The payment amount would be reduced by any collateral the portfolio has pledged. Any securities pledged as collateral for open contracts are noted in the Statement of Net Assets. The value of collateral received or pledged is compared daily to the value of the swap contracts exposure with each counterparty, and any difference, if in excess of a specified minimum transfer amount, is adjusted and settled within two business days.
The portfolio enters into centrally cleared credit default swaps to achieve the same objectives specified with respect to the equivalent over-the-counter swaps but with less counterparty risk because a regulated clearinghouse is the counterparty instead of the clearing broker or executing broker. The clearinghouse imposes initial margin requirements to secure the portfolio’s performance, and requires daily settlement of variation margin representing changes in the market value of each contract. To further mitigate counterparty risk, the portfolio trades with a diverse group of prequalified executing brokers; monitors the financial strength of its clearing brokers, executing brokers, and clearinghouse; and has entered into agreements with its clearing brokers and executing brokers.
During the year ended December 31, 2019, the portfolio’s average amounts of investments in credit protection sold and credit protection purchased represented 1% and 0% of net assets, respectively, based on the average of notional amounts at each quarter-end during the period.
5. Repurchase Agreements: The portfolio enters into repurchase agreements with institutional counterparties. Securities pledged as collateral to the portfolio under repurchase agreements are held by a custodian bank until the agreements mature, and in the absence of a default, such collateral cannot be repledged, resold, or rehypothecated. Each agreement requires that the market value of the collateral be sufficient to cover payments of interest and principal. The portfolio further mitigates its counterparty risk by entering into repurchase agreements only with a diverse group of prequalified counterparties, monitoring their financial strength, and entering into master repurchase agreements with its counterparties. The master repurchase agreements provide that, in the event of a counterparty’s default (including bankruptcy), the portfolio may terminate any repurchase agreements with that counterparty, determine the net amount owed, and sell or retain the collateral up to the net amount owed to the portfolio. Such action may be subject to legal proceedings, which may delay or limit the disposition of collateral.
6. Federal Income Taxes: The portfolio intends to continue to qualify as a regulated investment company and distribute all of its taxable income. Management has analyzed the portfolio’s tax positions taken for all open federal income tax years (December 31, 2016–2019), and has concluded that no provision for federal income tax is required in the portfolio’s financial statements.
7. Distributions: Distributions to shareholders are recorded on the ex-dividend date. Distributions are determined on a tax basis and may differ from net investment income and realized capital gains for financial reporting purposes.
8. Credit Facility: The portfolio and certain other funds managed by The Vanguard Group (“Vanguard”) participate in a $4.3 billion committed credit facility provided by a syndicate of lenders pursuant to a credit agreement that may be renewed annually; each fund is individually liable for its borrowings, if any, under the credit facility. Borrowings may be utilized for temporary and emergency purposes, and are subject to the portfolio’s regulatory and contractual borrowing restrictions. The participating funds are charged administrative fees and an annual commitment fee of 0.10% of the undrawn amount of the facility; these fees are allocated to the funds based on a method approved by the portfolio’s board of trustees and included in Management and Administrative expenses on the portfolio’s Statement of Operations. Any borrowings under this facility bear interest at a rate based upon the higher of the one-month London Interbank Offered Rate, federal funds effective rate, or overnight bank funding rate plus an agreed-upon spread.
The portfolio had no borrowings outstanding at December 31, 2019, or at any time during the period then ended.
High Yield Bond Portfolio
9. Other: Interest income is accrued daily. Premiums and discounts on debt securities are amortized and accreted, respectively, to interest income over the lives of the respective securities, except for premiums on certain callable debt securities that are amortized to the earliest call date. Security transactions are accounted for on the date securities are bought or sold. Costs used to determine realized gains (losses) on the sale of investment securities are those of the specific securities sold.
B. Wellington Management Company LLP provides investment advisory services to the portfolio for a fee calculated at an annual percentage rate of average net assets. For the year ended December 31, 2019, the investment advisory fee represented an effective annual rate of 0.06% of the portfolio’s average net assets.
C. In accordance with the terms of a Funds’ Service Agreement (the “FSA”) between Vanguard and the portfolio, Vanguard furnishes to the portfolio corporate management, administrative, marketing, and distribution services at Vanguard’s cost of operations (as defined by the FSA). These costs of operations are allocated to the portfolio based on methods and guidelines approved by the board of trustees. Vanguard does not require reimbursement in the current period for certain costs of operations (such as deferred compensation/benefits and risk/insurance costs); the portfolio’s liability for these costs of operations is included in Payables to Vanguard on the Statement of Net Assets. All other costs of operations payable to Vanguard are generally settled twice a month.
Upon the request of Vanguard, the portfolio may invest up to 0.40% of its net assets as capital in Vanguard. At December 31, 2019, the portfolio had contributed to Vanguard capital in the amount of $35,000, representing less than 0.01% of the portfolio’s net assets and 0.01% of Vanguard’s capital received pursuant to the FSA. The portfolio’s trustees and officers are also directors and employees, respectively, of Vanguard.
D. Various inputs may be used to determine the value of the portfolio’s investments. These inputs are summarized in three broad levels for financial statement purposes. The inputs or methodologies used to value securities are not necessarily an indication of the risk associated with investing in those securities.
Level 1—Quoted prices in active markets for identical securities.
Level 2—Other significant observable inputs (including quoted prices for similar securities, interest rates, prepayment speeds, credit risk, etc.).
Level 3—Significant unobservable inputs (including the portfolio’s own assumptions used to determine the fair value of investments). Any investments valued with significant unobservable inputs are noted on the Statement of Net Assets.
The following table summarizes the market value of the portfolio’s investments and derivatives as of December 31, 2019, based on the inputs used to value them:
| | Level 1 | Level 2 | Level 3 |
| Investments | ($000) | ($000) | ($000) |
| Corporate Bonds | — | 704,953 | — |
| Sovereign Bonds | — | 3,214 | — |
| Common Stocks | — | — | 448 |
| Temporary Cash Investments | — | 63,600 | — |
| Swap Contracts—Liabilities1 | (1) | — | — |
| Forward Currency Contracts—Liabilities | — | (127) | — |
| Total | (1) | 771,640 | 448 |
1 Represents variation margin on the last day of the reporting period.
High Yield Bond Portfolio
E. At December 31, 2019, the fair values of derivatives were reflected in the Statement of Net Assets as follows:
| | Foreign | | |
| | Exchange | Credit | |
| | Contracts | Contracts | Total |
| Statement of Net Assets Caption | ($000) | ($000) | ($000) |
| Variation Margin Payable—Swap Contracts | — | (1) | (1) |
| Unrealized Depreciation—Forward Currency Contracts | (127) | — | (127) |
| Total Liabilities | (127) | (1) | (128) |
| | Foreign | | |
| | Exchange | Credit | |
| | Contracts | Contracts | Total |
| Realized Net Gain (Loss) on Derivatives | ($000) | ($000) | ($000) |
| Swap Contracts | — | (11) | (11) |
| Forward Currency Contracts | 843 | — | 843 |
| Realized Net Gain (Loss) on Derivatives | 843 | (11) | 832 |
| | | | |
| Change in Unrealized Appreciation (Depreciation) on Derivatives | | | |
| Swap Contracts | — | 597 | 597 |
| Forward Currency Contracts | (151) | — | (151) |
| Change in Unrealized Appreciation (Depreciation) on Derivatives | (151) | 597 | 446 |
F. Permanent differences between book-basis and tax-basis components of net assets are reclassified among capital accounts in the financial statements to reflect their tax character. These reclassifications have no effect on net assets or net asset value per share. As of period end, permanent differences primarily attributable to the accounting for foreign currency transactions and swap agreements were reclassified between the individual components of total distributable earnings (loss).
| | Amount |
| | ($000) |
| Paid-in Capital | — |
| Total Distributable Earnings (Loss) | — |
Temporary differences between book-basis and tax-basis components of total distributable earnings (loss) arise when certain items of income, gain, or loss are recognized in different periods for financial statement and tax purposes; these differences will reverse at some time in the future. The differences are primarily related to the tax deferral of losses on wash sales; the realization of unrealized gains or losses on forward currency contracts; the amortization of premiums on certain callable debt instruments; and the tax recognition of gain or loss from foreign currency hedges. As of period end, the tax-basis components of total distributable earnings (loss) are detailed in the table as follows:
| | Amount |
| | ($000) |
| Undistributed Ordinary Income | 37,555 |
| Undistributed Long-Term Gains | — |
| Capital Loss Carryforwards (Non-expiring) | (7,692) |
| Net Unrealized Gains (Losses) | 19,730 |
| As of December 31, 2019, gross unrealized appreciation and depreciation for investments and derivatives based on cost for U.S. federal income tax purposes were as follows: |
| | Amount |
| | ($000) |
| Tax Cost | 752,696 |
| Gross Unrealized Appreciation | 30,996 |
| Gross Unrealized Depreciation | (11,266) |
| Net Unrealized Appreciation (Depreciation) | 19,730 |
High Yield Bond Portfolio
G. During the year ended December 31, 2019, the portfolio purchased $181,205,000 of investment securities and sold $193,984,000 of investment securities, other than U.S. government securities and temporary cash investments. There were no purchases or sales of U.S. government securities during the period.
H. Capital shares issued and redeemed were:
| | Year Ended December 31, |
| | 2019 | 2018 |
| | Shares | Shares |
| | (000) | (000) |
| Issued | 19,313 | 15,135 |
| Issued in Lieu of Cash Distributions | 5,672 | 4,616 |
| Redeemed | (22,931) | (18,772) |
| Net Increase (Decrease) in Shares Outstanding | 2,054 | 979 |
At December 31, 2019, one shareholder, an insurance company separate account whose holdings in the portfolio represent the indirect investment of Vanguard Variable Annuity contract holders, was the record or beneficial owner of 48% of the portfolio’s net assets. If this shareholder were to redeem its investment in the portfolio, the redemption might result in an increase in the portfolio’s expense ratio, cause the portfolio to incur higher transaction costs, or lead to the realization of taxable capital gains.
I. Management has determined that no events or transactions occurred subsequent to December 31, 2019, that would require recognition or disclosure in these financial statements.
High Yield Bond Portfolio
Report of Independent Registered Public Accounting Firm
To the Board of Trustees of Vanguard Variable Insurance Funds and Shareholders of High Yield Bond Portfolio
Opinion on the Financial Statements
We have audited the accompanying statement of net assets of High Yield Bond Portfolio (one of the portfolios constituting Vanguard Variable Insurance Funds, referred to hereafter as the “Portfolio”) as of December 31, 2019, the related statement of operations for the year ended December 31, 2019, the statement of changes in net assets for each of the two years in the period ended December 31, 2019, including the related notes, and the financial highlights for each of the five years in the period ended December 31, 2019 (collectively referred to as the “financial statements”). In our opinion, the financial statements present fairly, in all material respects, the financial position of the Portfolio as of December 31, 2019, the results of its operations for the year then ended, the changes in its net assets for each of the two years in the period ended December 31, 2019 and the financial highlights for each of the five years in the period ended December 31, 2019 in conformity with accounting principles generally accepted in the United States of America.
Basis for Opinion
These financial statements are the responsibility of the Portfolio’s management. Our responsibility is to express an opinion on the Portfolio’s financial statements based on our audits. We are a public accounting firm registered with the Public Company Accounting Oversight Board (United States) (“PCAOB”) and are required to be independent with respect to the Portfolio in accordance with the U.S. federal securities laws and the applicable rules and regulations of the Securities and Exchange Commission and the PCAOB.
We conducted our audits of these financial statements in accordance with the standards of the PCAOB. Those standards require that we plan and perform the audit to obtain reasonable assurance about whether the financial statements are free of material misstatement, whether due to error or fraud.
Our audits included performing procedures to assess the risks of material misstatement of the financial statements, whether due to error or fraud, and performing procedures that respond to those risks. Such procedures included examining, on a test basis, evidence regarding the amounts and disclosures in the financial statements. Our audits also included evaluating the accounting principles used and significant estimates made by management, as well as evaluating the overall presentation of the financial statements. Our procedures included confirmation of securities owned as of December 31, 2019 by correspondence with the custodians and brokers; when replies were not received from brokers, we performed other auditing procedures. We believe that our audits provide a reasonable basis for our opinion.
/s/PricewaterhouseCoopers LLP
Philadelphia, Pennsylvania
February 18, 2020
We have served as the auditor of one or more investment companies in The Vanguard Group of Funds since 1975.
BLOOMBERG is a trademark and service mark of Bloomberg Finance L.P. BARCLAYS is a trademark and service mark of Barclays Bank Plc, used under license. Bloomberg Finance L.P. and its affiliates, including Bloomberg Index Services Limited (BISL) (collectively, Bloomberg), or Bloomberg’s licensors, own all proprietary rights in the Bloomberg Barclays U.S. High-Yield Ba/B 2% Issuer Capped Index and the Bloomberg Barclays U.S. 1–5 Year Treasury Bond Index (the Indices or Bloomberg Barclays Indices).
Neither Barclays Bank Plc, Barclays Capital Inc., or any affiliate (collectively Barclays) or Bloomberg is the issuer or producer of the High Yield Bond Portfolio and neither Bloomberg nor Barclays has any responsibilities, obligations or duties to investors in the High Yield Bond Portfolio. The Indices are licensed for use by The Vanguard Group, Inc. (Vanguard) as the sponsor of the High Yield Bond Portfolio. Bloomberg and Barclays’ only relationship with Vanguard in respect of the Indices is the licensing of the Indices, which are determined, composed and calculated by BISL, or any successor thereto, without regard to the Issuer or the High Yield Bond Portfolio or the owners of the High Yield Bond Portfolio.
Additionally, Vanguard may for itself execute transaction(s) with Barclays in or relating to the Indices in connection with the High Yield Bond Portfolio. Investors acquire the High Yield Bond Portfolio from Vanguard and investors neither acquire any interest in the Indices nor enter into any relationship of any kind whatsoever with Bloomberg or Barclays upon making an investment in the High Yield Bond Portfolio. The High Yield Bond Portfolio is not sponsored, endorsed, sold or promoted by Bloomberg or Barclays. Neither Bloomberg nor Barclays makes any representation or warranty, express or implied regarding the advisability of investing in the High Yield Bond Portfolio or the advisability of investing in securities generally or the ability of the Indices to track corresponding or relative market performance. Neither Bloomberg nor Barclays has passed on the legality or suitability of the High Yield Bond Portfolio with respect to any person or entity. Neither Bloomberg nor Barclays is responsible for and has not participated in the determination of the timing of, prices at, or quantities of the High Yield Bond Portfolio to be issued. Neither Bloomberg nor Barclays has any obligation to take the needs of the Issuer or the owners of the High Yield Bond Portfolio or any other third party into consideration in determining, composing or calculating the Indices. Neither Bloomberg nor Barclays has any obligation or liability in connection with administration, marketing or trading of the High Yield Bond Portfolio.
The licensing agreement between Bloomberg and Barclays is solely for the benefit of Bloomberg and Barclays and not for the benefit of the owners of the High Yield Bond Portfolio, investors or other third parties. In addition, the licensing agreement between Vanguard and Bloomberg is solely for the benefit of Vanguard and Bloomberg and not for the benefit of the owners of the High Yield Bond Portfolio, investors or other third parties.
NEITHER BLOOMBERG NOR BARCLAYS SHALL HAVE ANY LIABILITY TO THE ISSUER, INVESTORS OR TO OTHER THIRD PARTIES FOR THE QUALITY, ACCURACY AND/OR COMPLETENESS OF THE BLOOMBERG BARCLAYS INDICES OR ANY DATA INCLUDED THEREIN OR FOR INTERRUPTIONS IN THE DELIVERY OF THE BLOOMBERG BARCLAYS INDICES. NEITHER BLOOMBERG NOR BARCLAYS MAKES ANY WARRANTY, EXPRESS OR IMPLIED, AS TO RESULTS TO BE OBTAINED BY THE ISSUER, THE INVESTORS OR ANY OTHER PERSON OR ENTITY FROM THE USE OF THE BLOOMBERG BARCLAYS INDICES OR ANY DATA INCLUDED THEREIN. NEITHER BLOOMBERG NOR BARCLAYS MAKES ANY EXPRESS OR IMPLIED WARRANTIES, AND EACH HEREBY EXPRESSLY DISCLAIMS ALL WARRANTIES OF MERCHANTABILITY OR FITNESS FOR A PARTICULAR PURPOSE OR USE WITH RESPECT TO THE BLOOMBERG BARCLAYS INDICES OR ANY DATA INCLUDED THEREIN. BLOOMBERG RESERVES THE RIGHT TO CHANGE THE METHODS OF CALCULATION OR PUBLICATION, OR TO CEASE THE CALCULATION OR PUBLICATION OF THE BLOOMBERG BARCLAYS INDICES, AND NEITHER BLOOMBERG NOR BARCLAYS SHALL BE LIABLE FOR ANY MISCALCULATION OF OR ANY INCORRECT, DELAYED OR INTERRUPTED PUBLICATION WITH RESPECT TO THE BLOOMBERG BARCLAYS INDICES. NEITHER BLOOMBERG NOR BARCLAYS SHALL BE LIABLE FOR ANY DAMAGES, INCLUDING, WITHOUT LIMITATION, ANY SPECIAL, INDIRECT OR CONSEQUENTIAL DAMAGES, OR ANY LOST PROFITS AND EVEN IF ADVISED OF THE POSSIBLITY OF SUCH, RESULTING FROM THE USE OF THE BLOOMBERG BARCLAYS INDICES OR ANY DATA INCLUDED THEREIN OR WITH RESPECT TO THE HIGH YIELD BOND PORTFOLIO.
None of the information supplied by Bloomberg or Barclays and used in this publication may be reproduced in any manner without the prior written permission of both Bloomberg and Barclays Capital, the investment banking division of Barclays Bank Plc. Barclays Bank Plc is registered in England No. 1026167. Registered office 1 Churchill Place London E14 5HP.
© 2020 Bloomberg. Used with Permission.
Source: Bloomberg Index Services Limited. Copyright 2020, Bloomberg. All rights reserved.
International Portfolio
Your Portfolio’s Performance at a Glance
• The International Portfolio of Vanguard Variable Insurance Fund returned 31.22% for the 12 months ended December 31, 2019, well above the 21.51% return of its benchmark, the MSCI All Country World Index ex USA. Please note that the portfolio returns in Vanguard Variable Insurance Fund are different from those in Vanguard Variable Annuity (and other plans that invest in the fund), which take into account insurance-related expenses.
• The broad U.S. stock market, as measured by the Russell 3000 Index, climbed 31% for the year. Global stock prices rose amid optimism that U.S.-China trade tensions were easing and that a trade deal might be signed in early 2020. Inversions of the U.S. Treasury yield curve, historically a signal of recession, raised concerns midway through the year. But the curve returned to its normal pattern in the second half as the Federal Reserve cut short-term interest rates three times.
• Growth stocks outperformed their value counterparts, while large- and mid-capitalization stocks surpassed small-caps.
• Returns were positive in the nine sectors the portfolio is primarily invested in. The advisors’ holdings in consumer discretionary and information technology contributed most to relative performance. Communication services and materials were the biggest net detractors.
• Over the decade ended December 31, 2019, the portfolio’s average annual return outperformed that of its spliced benchmark.
| Market Barometer | | |
| | | Average Annual Total Returns |
| | | Periods Ended December 31, 2019 |
| | One Year | Three Years | Five Years |
| Stocks | | | |
| Russell 1000 Index (Large-caps) | 31.43% | 15.05% | 11.48% |
| Russell 2000 Index (Small-caps) | 25.53 | 8.59 | 8.23 |
| Russell 3000 Index (Broad U.S. market) | 31.02 | 14.57 | 11.24 |
| FTSE All-World ex US Index (International) | 21.81 | 9.96 | 5.83 |
| | | | |
| Bonds | | | |
| Bloomberg Barclays U.S. Aggregate Bond Index (Broad taxable market) | 8.72% | 4.03% | 3.05% |
| Bloomberg Barclays Municipal Bond Index (Broad tax-exempt market) | 7.54 | 4.72 | 3.53 |
| FTSE Three-Month U.S. Treasury Bill Index | 2.25 | 1.65 | 1.04 |
| | | | |
| CPI | | | |
| Consumer Price Index | 2.29% | 2.10% | 1.82% |
International Portfolio
Advisors’ Report
The International Portfolio returned 31.22% for the 12 months ended December 31, 2019, well above the 21.51% return of its benchmark, the MSCI All Country World Index ex USA.
The portfolio is overseen by two independent advisors, a strategy that enhances its diversification by providing exposure to distinct yet complementary investment approaches. It is not uncommon for different advisors to have different views about individual securities or the broader investment environment.
The advisors, the amount and percentage of the portfolio’s assets each manages, and brief descriptions of their investment strategies are presented in the accompanying table. Each advisor has also prepared a discussion of the investment environment that existed during the period and of the effect it had on the portfolio’s positioning. These reports were prepared on January 27, 2020.
Baillie Gifford Overseas Ltd.
Portfolio Managers:
James K. Anderson, Partner
Head of Global Equities
Thomas Coutts, Partner
Head of International Growth
We believe successful investing lies in finding exceptional and durable growth companies. In these times of considerable geopolitical uncertainty, you might expect a dearth of good growth ideas, but that isn’t the case. If you are patient and focus on decades rather than quarters, it’s a great time to be a growth investor.
Companies are capitalizing on an explosion of technology-driven disruption. Despite market uncertainty, they are growing by creating products and services that are being adopted more quickly than ever before. Why? Because we are more connected. Enabled by increasing computing power, humans now create rich seams of data. Using this data, new businesses are emerging ranging from online food delivery to autonomous electric vehicles. Almost every facet of consumer behavior is affected, and consumer demand is setting the pace. As companies are spawned from this disruption, we aim to pick the best of them.
Many of our holdings that contributed well over the year are long-term leaders in their sectors and heavy investors in R&D. ASML, the Dutch manufacturer of semiconductor machines, is an example. Its extreme ultraviolet (EUV) lithography allows the progression of Moore’s Law to continue, and a monopolistic position in this technology gives considerable pricing power. We believe ASML’s investment in developing this commercially proven system will pay dividends as EUV lithography helps develop the next wave of chips for artificial intelligence (AI), autonomous driving, 5G, and more.
Another contributor was Argentinian e-commerce platform Mercado Libre, the market leader in Latin America, which reported 90% revenue growth in third-quarter revenues at the end of October. The opportunity remains large in a continent of some 650 million people with underpenetrated internet, e-commerce, and financial services markets.
In China, Alibaba continues to impress as it takes market share in e-commerce but also expands its mission to be a provider of infrastructure and a creator of various ecosystems. A solid foundation in retail could potentially expand to logistics, transportation, manufacturing, and agriculture, all of which could be underpinned by the dominance of AliCloud.
Turning to the detractors, Baidu’s share price has been weak during the year, including a sharp fall in May after announcing its first quarterly loss as a public company. In the short term, revenues have declined as trade war fears hurt demand for advertising. Longer term, we observe increasing competition in the online search business as advertisers migrate from “search ads” to “super-apps” that offer better user targeting. While Baidu continues to gain users and seems to have a lead in AI, dealing with the longer-term structural challenges will be vital to its success.
Rolls-Royce also detracted from performance as shares trended down over the year. Its restructuring is progressing, but a problem with the Trent 1000 engine, which powers one-third of Boeing’s Dreamliner fleet, continues to drag. The market was disappointed that the costs associated with fixing the problem will be higher than expected, including an exceptional charge of $1.8 billion. Overall, we remain patient and buoyed by the determination of both Baidu and Rolls-Royce to invest heavily for the future.
We participated in the IPO of Jumia, the pan-African digital retail company, and a private placement of argenx, the Belgian antibody-based drugs company. We also took a holding in Israeli website developer Wix.com and banking software global leader Temenos. To fund these opportunities, we reduced SoftBank and Svenska Handelsbanken. We also sold discount chain Distribuidora Internacional de Alimentacion, where the growth opportunity has diminished.
International Portfolio
Schroder Investment Management
North America Inc.
Portfolio Manager:
Simon Webber, CFA
International equities made strong progress over the course of 2019, overcoming the pessimism and uncertainty that U.S.-China trade friction and disorderly Brexit preparations had created. Good stock selection supported relative performance for the portfolio through the year, with particularly strong contributions from industrials and consumer staples. By region, our emerging-market and Japanese exposures were especially positive.
Schneider Electric performed well throughout 2019. Over the last ten years, Schneider has transformed itself into a competitive global industrial with products to support industrial automation, power efficiency, and electrical infrastructure.
Schneider’s range of electrical distribution products is essential to the modern systems at the heart of the shift away from fossil fuels that is accelerating in Europe and elsewhere. It often takes years for the market to change its perceptions of a company, and we believe Schneider is in one of those re-rating phases as investors recognize its growth prospects.
Zee Entertainment was a weaker position. The domestic Indian TV broadcaster has executed well for many years, participating in the strong growth of the Indian advertising market. Unfortunately, the controlling family group, who once owned 40% of the shares, indebted itself and was forced to sell its stake. It has since become clear that the operating company is not entirely ring-fenced from the promoter’s financial frailties.
With confidence in Zee’s balance sheet undermined, our investment thesis is broken, and we have sold the position. Assessing governance alongside other environmental and social factors is a central part of our investment process. Zee is a timely reminder that good corporate governance is critical to long-term performance.
We recently bought Mercado Libre. The South American online retailer has demonstrated robust sales growth and ambitions to expand from its core markets in Brazil and Argentina. E-commerce remains significantly underpenetrated in Latin America. We believe the company’s development of a payments platform for transactions both on and off its own e-commerce marketplace is an overlooked driver of future earnings.
Relative to the levels of uncertainty experienced in 2019, this year begins with some sunlight peering through the clouds. An improved trade relationship between the U.S. and China looks set to help the manufacturing side of the global economy turn the corner. In Europe, progress on an orderly exit from the EU by the U.K. is settling corporate nerves, and a new European Commission is injecting some drive into growth initiatives.
We believe companies with stable balance sheets and underappreciated, sustainable earnings drivers will deliver consistent outperformance over the long term. The portfolio remains well-balanced and diversified among cyclical and defensive sectors of the economy.
We focus on individual companies whose future growth we believe will surprise the market. Many of them represent important long-term themes, including the growth of internet platforms for retailing, social media, and gaming and the transition to a low-carbon economy through a shift to cleaner forms of energy and transportation.
| International Portfolio Investment Advisors | | |
| | | | | |
| | Portfolio Assets Managed | | |
| Investment Advisor | % | $ Million | | Investment Strategy |
| Baillie Gifford Overseas Ltd. | 58 | 2,340 | | Uses a bottom-up, stock-driven approach to select stocks that it believes have above-average growth rates and trade at reasonable prices. |
Schroder Investment Management
North America Inc. | 38 | 1,527 | | Uses fundamental research to identify high-quality companies in developed and emerging markets that it believes have above-average growth potential. |
| Cash Investments | 4 | 156 | | These short-term reserves are invested by Vanguard in equity index products to simulate investment in stocks. Each advisor may also maintain a modest cash position. |
International Portfolio
About Your Portfolio’s Expenses
As a shareholder of the portfolio, you incur ongoing costs, which include costs for portfolio management, administrative services, and shareholder reports (like this one), among others. Operating expenses, which are deducted from a portfolio’s gross income, directly reduce the investment return of the portfolio.
A portfolio’s expenses are expressed as a percentage of its average net assets. This figure is known as the expense ratio. The following examples are intended to help you understand the ongoing costs (in dollars) of investing in your portfolio and to compare these costs with those of other mutual funds. The examples are based on an investment of $1,000 made at the beginning of the period shown and held for the entire period.
The table below illustrates your portfolio’s costs in two ways:
•Based on actual portfolio return. This section helps you to estimate the actual expenses that you paid over the period. The “Ending Account Value” shown is derived from the portfolio’s actual return, and the third column shows the dollar amount that would have been paid by an investor who started with $1,000 in the portfolio. You may use the information here, together with the amount you invested, to estimate the expenses that you paid over the period.
To do so, simply divide your account value by $1,000 (for example, an $8,600 account value divided by $1,000 = 8.6), then multiply the result by the number given for your portfolio under the heading “Expenses Paid During Period.”
•Based on hypothetical 5% yearly return.This section is intended to help you compare your portfolio’s costs with those of other mutual funds. It assumes that the portfolio had a yearly return of 5% before expenses, but that the expense ratio is unchanged. In this case—because the return used is not the portfolio’s actual return—the results do not apply to your investment. The example is useful in making comparisons because the Securities and Exchange Commission requires all mutual funds to calculate expenses based on a 5% return. You can assess your portfolio’s costs by comparing this hypothetical example with the hypothetical examples that appear in shareholder reports of other funds.
Note that the expenses shown in the table are meant to highlight and help you compareongoingcosts only and do not reflect transaction costs incurred by the portfolio for buying and selling securities. The portfolio’s expense ratio does not reflect additional fees and expenses associated with the annuity or life insurance program through which you invest.
The calculations assume no shares were bought or sold during the period. Your actual costs may have been higher or lower, depending on the amount of your investment and the timing of any purchases or redemptions.
You can find more information about the portfolio’s expenses in the Financial Statements section. For additional information on operating expenses and other shareholder costs, please refer to the prospectus.
| Six Months Ended December 31, 2019 | | | |
| | Beginning | Ending | Expenses |
| | Account Value | Account Value | Paid During |
| International Portfolio | 6/30/2019 | 12/31/2019 | Period |
| Based on Actual Portfolio Return | $1,000.00 | $1,106.87 | $2.02 |
| Based on Hypothetical 5% Yearly Return | 1,000.00 | 1,023.29 | 1.94 |
The calculations are based on expenses incurred in the most recent six-month period. The portfolio’s annualized six-month expense ratio for that period is 0.38%. The dollar amounts shown as “Expenses Paid” are equal to the annualized expense ratio multiplied by the average account value over the period, multiplied by the number of days in the most recent six-month period, then divided by the number of days in the most recent 12-month period (184/365).
International Portfolio
Performance Summary
All of the returns in this report represent past performance, which is not a guarantee of future results that may be achieved by the portfolio. (Current performance may be lower or higher than the performance data cited. For performance data current to the most recent month-end, visit our website at vanguard.com/performance.) Note, too, that both investment returns and principal value can fluctuate widely, so an investor’s shares, when sold, could be worth more or less than their original cost. The returns shown do not reflect taxes that a shareholder would pay on portfolio distributions or on the sale of portfolio shares. Nor do the returns reflect fees and expenses associated with the annuity or life insurance program through which a shareholder invests. If these fees and expenses were included, the portfolio’s returns would be lower.
Cumulative Performance: December 31, 2009–December 31, 2019
Initial Investment of $10,000


| | Average Annual Total Returns | Final Value |
| | Periods Ended December 31, 2019 | of a $10,000 |
| | One Year | Five Years | Ten Years | Investment |
 | International Portfolio | 31.22% | 10.59% | 8.70% | $23,035 |
 | Spliced International Index | 21.51 | 5.51 | 4.68 | 15,794 |
 | MSCI All Country World Index ex USA | 21.51 | 5.51 | 4.97 | 16,236 |
Spliced International Index: MSCI EAFE Index through May 31, 2010; MSCI All Country World Index ex USA thereafter.
See Financial Highlights for dividend and capital gains information.
International Portfolio
Sector Diversification
As of December 31, 2019
| Communication Services | 10.6% |
| Consumer Discretionary | 34.5 |
| Consumer Staples | 5.5 |
| Energy | 1.2 |
| Financials | 12.6 |
| Health Care | 11.4 |
| Industrials | 8.7 |
| Information Technology | 10.9 |
| Materials | 3.8 |
| Other | 0.7 |
| Real Estate | 0.0 |
| Utilities | 0.1 |
The table reflects the portfolio’s equity exposure, based on its investments in stocks and stock index futures. Any holdings in short-term reserves are excluded. Sector categories are based on the Global Industry Classification Standard (“GICS”), except for the “Other” category (if applicable), which includes securities that have not been provided a GICS classification as of the effective reporting period.
The Global Industry Classification Standard (“GICS”) was developed by and is the exclusive property and a service mark of MSCI Inc. (“MSCI”) and Standard and Poor’s, a division of McGraw-Hill Companies, Inc. (“S&P”), and is licensed for use by Vanguard. Neither MSCI, S&P nor any third party involved in making or compiling the GICS or any GICS classification makes any express or implied warranties or representations with respect to such standard or classification (or the results to be obtained by the use thereof), and all such parties hereby expressly disclaim all warranties of originality, accuracy, completeness, merchantability or fitness for a particular purpose with respect to any such standard or classification. Without limiting any of the foregoing, in no event shall MSCI, S&P, any of its affiliates or any third party involved in making or compiling the GICS or any GICS classification have any liability for any direct, indirect, special, punitive, consequential or any other damages (including lost profits) even if notified of the possibility of such damages.
International Portfolio
Financial Statements
Statement of Net Assets
As of December 31, 2019
The portfolio files its complete schedule of portfolio holdings with the Securities and Exchange Commission (SEC) for the first and third quarters of each fiscal year as an exhibit to its reports on Form N-PORT. The portfolio’s Form N-PORT reports are available on the SEC’s website at www.sec.gov.
| | | | | Market | |
| | | | | Value• | |
| | | Shares | | ($000 | ) |
| Common Stocks (95.1%)1 | | | | |
| Austria (0.4%) | | | | |
| | Erste Group Bank AG | 452,514 | | 16,997 | |
| | | | | | |
| Belgium (1.7%) | | | | |
| | Umicore SA | 1,112,750 | | 54,229 | |
| * | Argenx SE | 84,539 | | 13,597 | |
| | | | | 67,826 | |
| Brazil (0.6%) | | | | |
| | Raia Drogasil SA | 440,908 | | 12,282 | |
| | B3 SA - Brasil Bolsa Balcao | 1,077,538 | | 11,576 | |
| | | | | 23,858 | |
| Canada (0.8%) | | | | |
| | Toronto-Dominion Bank | 316,922 | | 17,775 | |
| ^ | Nutrien Ltd. | 334,066 | | 15,994 | |
| | | | | 33,769 | |
| China (16.8%) | | | | |
| * | Alibaba Group Holding Ltd. ADR | 1,003,850 | | 212,916 | |
| | Tencent Holdings Ltd. | 4,407,900 | | 212,356 | |
| * | TAL Education Group ADR | 1,341,800 | | 64,675 | |
| * | Meituan Dianping Class B | 4,125,383 | | 53,903 | |
| | Ping An Insurance Group Co. of China Ltd. | 3,489,500 | | 41,293 | |
| * | Baidu Inc. ADR | 228,028 | | 28,823 | |
| * | Trip.com Group Ltd. ADR | 651,713 | | 21,858 | |
| | China Mengniu Dairy Co. Ltd. | 3,384,000 | | 13,689 | |
| | China Pacific Insurance Group Co. Ltd. | 3,290,000 | | 12,963 | |
| *,^ | iQIYI Inc. ADR | 347,157 | | 7,328 | |
| *,^ | NIO Inc. ADR | 1,659,408 | | 6,671 | |
| | | | | 676,475 | |
| Denmark (2.8%) | | | | |
| * | Genmab A/S | 258,566 | | 57,506 | |
| | Vestas Wind Systems A/S | 230,207 | | 23,252 | |
| | Chr Hansen Holding A/S | 163,100 | | 12,966 | |
| | Novozymes A/S | 225,473 | | 11,036 | |
| ^ | Ambu A/S Class B | 517,256 | | 8,673 | |
| | | | | 113,433 | |
| France (7.6%) | | | | |
| | Kering SA | 135,047 | | 88,985 | |
| | L’Oreal SA | 219,591 | | 64,935 | |
| | Schneider Electric SE | 493,557 | | 50,708 | |
| | EssilorLuxottica SA | 189,477 | | 28,968 | |
| | TOTAL SA | 515,513 | | 28,606 | |
| | Danone SA | 301,543 | | 25,042 | |
| | Vivendi SA | 579,536 | | 16,782 | |
| | | | | 304,026 | |
| Germany (6.9%) | | | | |
| *,2 | Zalando SE | 1,013,535 | | 51,113 | |
| *,2 | Delivery Hero SE | 595,180 | | 47,174 | |
| | Bayerische Motoren Werke AG | 314,821 | | 25,786 | |
| * | HelloFresh SE | 1,072,370 | | 22,352 | |
| | SAP SE | 156,058 | | 21,005 | |
| | Infineon Technologies AG | 894,411 | | 20,209 | |
| | adidas AG | 59,802 | | 19,467 | |
| | BASF SE | 222,170 | | 16,738 | |
| | GEA Group AG | 498,812 | | 16,510 | |
| | Continental AG | 101,650 | | 13,136 | |
| * | MorphoSys AG | 67,732 | | 9,581 | |
| *,2 | Rocket Internet SE | 278,557 | | 6,886 | |
| *,^ | Jumia Technologies AG ADR | 644,932 | | 4,340 | |
| * | AIXTRON SE | 274,000 | | 2,616 | |
| * | Home24 SE | 194,547 | | 1,061 | |
| | | | | 277,974 | |
| Hong Kong (4.1%) | | | | |
| | AIA Group Ltd. | 11,257,400 | | 118,405 | |
| | Hong Kong Exchanges & Clearing Ltd. | 887,460 | | 28,831 | |
| | Jardine Matheson Holdings Ltd. | 326,602 | | 18,175 | |
| | | | | 165,411 | |
| India (1.7%) | | | | |
| | Housing Development Finance Corp. Ltd. | 1,088,397 | | 36,802 | |
| * | HDFC Bank Ltd. | 1,111,849 | | 19,839 | |
| *,§,3 | ANI Technologies | 19,170 | | 5,707 | |
| | Larsen & Toubro Ltd. | 220,598 | | 4,013 | |
| | | | | 66,361 | |
| Indonesia (0.4%) | | | | |
| | Bank Central Asia Tbk PT | 6,577,100 | | 15,818 | |
| | | | | | |
| Israel (0.5%) | | | | |
| * | Wix.com Ltd. | 86,032 | | 10,529 | |
| * | Check Point Software Technologies Ltd. | 92,393 | | 10,252 | |
| | | | | 20,781 | |
| Italy (2.7%) | | | | |
| | Ferrari NV | 519,887 | | 86,320 | |
| | Fiat Chrysler Automobiles NV | 1,376,016 | | 20,402 | |
| | | | | 106,722 | |
| Japan (10.2%) | | | | |
| | M3 Inc. | 2,431,600 | | 73,326 | |
| | SMC Corp. | 110,100 | | 50,350 | |
| | SoftBank Group Corp. | 929,400 | | 40,352 | |
| | Nintendo Co. Ltd. | 74,000 | | 29,597 | |
| | Recruit Holdings Co. Ltd. | 709,700 | | 26,582 | |
| | Nidec Corp. | 187,500 | | 25,609 | |
| | Sony Corp. | 330,300 | | 22,427 | |
| | Takeda Pharmaceutical Co. Ltd. | 485,200 | | 19,191 | |
| | Bridgestone Corp. | 445,300 | | 16,543 | |
| | Keyence Corp. | 43,500 | | 15,275 | |
| | Sekisui Chemical Co. Ltd. | 772,400 | | 13,401 | |
| | Murata Manufacturing Co. Ltd. | 215,500 | | 13,264 | |
| | Kubota Corp. | 804,300 | | 12,630 | |
| | Pigeon Corp. | 319,600 | | 11,703 | |
| | Toyota Motor Corp. | 161,100 | | 11,351 | |
| | ORIX Corp. | 682,500 | | 11,310 | |
| | SBI Holdings Inc. | 477,700 | | 10,085 | |
| | Suzuki Motor Corp. | 211,200 | | 8,816 | |
| | | | | 411,812 | |
| | | | | |
| Netherlands (5.8%) | | | | |
| | ASML Holding NV | 715,537 | | 211,840 | |
| | Koninklijke Philips NV | 446,781 | | 21,841 | |
| | | | | 233,681 | |
| Norway (0.7%) | | | | |
| | DNB ASA | 846,264 | | 15,836 | |
| | Norsk Hydro ASA | 3,710,583 | | 13,798 | |
| | | | | 29,634 | |
| Other (0.1%) | | | | |
| 4 | Vanguard FTSE All-World ex-US ETF | 74,796 | | 4,020 | |
| | | | | | |
| Singapore (0.4%) | | | | |
| | Oversea-Chinese Banking Corp. Ltd. | 1,812,000 | | 14,823 | |
| | | | | | |
| South Korea (1.1%) | | | | |
| | Samsung Electronics Co. Ltd. | 714,518 | | 34,430 | |
| | Samsung SDI Co. Ltd. | 56,351 | | 11,480 | |
| | | | | 45,910 | |
| Spain (2.9%) | | | | |
| | Industria de Diseno Textil SA | 2,100,029 | | 74,216 | |
| | Banco Bilbao Vizcaya Argentaria SA | 7,326,765 | | 41,135 | |
| | | | | 115,351 | |
| | | | | | |
| Sweden (4.6%) | | | | |
| * | Spotify Technology SA | 482,443 | | 72,149 | |
| | Atlas Copco AB Class A | 883,241 | | 35,255 | |
| | Svenska Handelsbanken AB Class A | 2,024,995 | | 21,810 | |
| | Kinnevik AB | 820,157 | | 20,098 | |
| | Assa Abloy AB Class B | 639,296 | | 14,944 | |
| | SKF AB | 603,624 | | 12,221 | |
| | Elekta AB Class B | 668,047 | | 8,814 | |
| | | | | 185,291 | |
| Switzerland (5.0%) | | | | |
| | Roche Holding AG | 184,951 | | 60,110 | |
| | Nestle SA | 446,179 | | 48,306 | |
| | Temenos AG | 154,202 | | 24,393 | |
| | Novartis AG | 250,022 | | 23,674 | |
| | Lonza Group AG | 54,764 | | 19,978 | |
| | Cie Financiere Richemont SA | 228,682 | | 17,872 | |
| | Straumann Holding AG | 6,120 | | 6,003 | |
| | | | 200,336 | |
| Taiwan (1.1%) | | | | |
| | Taiwan Semiconductor | | | | |
| | Manufacturing Co. Ltd. | 3,927,000 | | 43,463 | |
| | | | | |
| Thailand (0.2%) | | | | |
| | Kasikornbank PCL | 1,971,800 | | 9,926 | |
| | | | | |
| Turkey (0.2%) | | | | |
| * | Turkiye Garanti Bankasi AS | 3,678,288 | | 6,889 | |
| | | | | | |
| United Kingdom (6.4%) | | | | |
| | Rolls-Royce Holdings plc | 4,382,443 | | 39,609 | |
| | Diageo plc | 867,027 | | 36,534 | |
International Portfolio
| | | | | Market | |
| | | | | Value• | |
| | | Shares | | ($000 | ) |
| * | Ocado Group plc | 2,021,902 | | 34,306 | |
| | BHP Group plc | 829,898 | | 19,448 | |
| | GlaxoSmithKline plc | 823,386 | | 19,347 | |
| | Royal Dutch Shell plc Class A | 647,639 | | 19,096 | |
| | Burberry Group plc | 651,817 | | 19,030 | |
| | Whitbread plc | 279,822 | | 17,959 | |
| | Smith & Nephew plc | 605,501 | | 14,593 | |
| | Lloyds Banking Group plc | 16,460,762 | | 13,637 | |
| | Next plc | 135,722 | | 12,647 | |
| | Bunzl plc | 220,225 | | 6,023 | |
| *,^,2 | Aston Martin Lagonda Global Holdings plc | 590,316 | | 4,074 | |
| | | | | 256,303 | |
| United States (9.4%) | | | | |
| * | Amazon.com Inc. | 64,153 | | 118,545 | |
| * | MercadoLibre Inc. | 166,050 | | 94,971 | |
| * | Illumina Inc. | 243,613 | | 80,816 | |
| * | Tesla Inc. | 178,353 | | 74,610 | |
| * | Booking Holdings Inc. | 5,273 | | 10,829 | |
| | | | | 379,771 | |
Total Common Stocks
(Cost $2,660,214) | | | 3,826,661 | |
| Preferred Stocks (0.5%) | |
| *,§,3,5 | CureVac GmbH | 1,452 | | 2,086 | |
| *,§,3,5 | You & Mr. Jones | 5,200,000 | | 16,692 | |
Total Preferred Stocks
(Cost $8,759) | | | 18,778 | |
| Temporary Cash Investments (4.7%)1 | |
| Money Market Fund (4.6%) | |
| 6,7 | Vanguard Market Liquidity Fund, 1.816% | 1,861,190 | | 186,137 | |
| | | | | | |
| | Face | | | |
| | Amount | | | |
| | ($000 | ) | | |
| U.S. Government and Agency Obligations (0.1%) | |
| | | | | |
| 8 | United States Treasury Bill, 1.531%, 2/13/20 | 3,500 | | 3,494 | |
Total Temporary Cash Investments
(Cost $189,637) | | 189,631 | |
Total Investments (100.3%)
(Cost $2,858,610) | | | 4,035,070 | |
| Other Assets and Liabilities (-0.3%) | |
| Other Assets8,9 | | | 36,367 | |
| Liabilities7 | | | (48,110 | ) |
| | | | | (11,743 | ) |
| Net Assets (100%) | |
| Applicable to 138,720,561 outstanding $.001 par value shares of beneficial interest (unlimited authorization) | | 4,023,327 | |
| Net Asset Value Per Share | | | $29.00 | |
| | | | | | |
| | Amount |
| | ($000) |
| Statement of Assets and Liabilities |
| Assets | |
| Investments in Securities, at Value | |
| Unaffiliated Issuers | 3,844,913 |
| Affiliated Issuers | 190,157 |
| Total Investments in Securities | 4,035,070 |
| Investment in Vanguard | 172 |
| Receivables for Investment Securities Sold | 12,043 |
| Receivables for Accrued Income | 4,239 |
| Receivables for Capital Shares Issued | 769 |
| Unrealized Appreciation—Forward Currency Contracts | 1,006 |
| Other Assets8,9 | 18,138 |
| Total Assets | 4,071,437 |
| Liabilities | |
| Payables for Investment Securities Purchased | 250 |
| Collateral for Securities on Loan | 33,056 |
| Payables to Investment Advisor | 1,790 |
| Payables for Capital Shares Redeemed | 8,741 |
| Payables to Vanguard | 1,882 |
| Variation Margin Payable—Futures Contracts | 1,789 |
| Unrealized Depreciation—Forward Currency Contracts | 414 |
| Other Liabilities | 188 |
| Total Liabilities | 48,110 |
| Net Assets | 4,023,327 |
| |
| At December 31, 2019, net assets consisted of: |
| | Amount |
| | ($000) |
| Paid-in Capital | 2,707,708 |
| Total Distributable Earnings (Loss) | 1,315,619 |
| Net Assets | 4,023,327 |
| • | See Note A in Notes to Financial Statements. |
| * | Non-income-producing security. |
| ^ | Includes partial security positions on loan to broker-dealers. The total value of securities on loan is $31,158,000. |
| § | Security value determined using significant unobservable inputs. |
| 1 | The portfolio invests a portion of its cash reserves in equity markets through the use of index futures contracts. After giving effect to futures investments, the portfolio’s effective common stock and temporary cash investment positions represent 98.9% and 0.9%, respectively, of net assets. |
| 2 | Security exempt from registration under Rule 144A of the Securities Act of 1933. Such securities may be sold in transactions exempt from registration, normally to qualified institutional buyers. At December 31, 2019, the aggregate value of these securities was $109,247,000, representing 2.7% of net assets. |
| 3 | Restricted securities totaling $24,485,000, representing 0.6% of net assets. See Restricted Securities table for additional information. |
| 4 | Considered an affiliated company of the portfolio as the issuer is another member of The Vanguard Group. |
| 5 | Perpetual security with no stated maturity date. |
| 6 | Affiliated money market fund available only to Vanguard funds and certain trusts and accounts managed by Vanguard. Rate shown is the 7-day yield. |
| 7 | Collateral of $33,056,000 was received for securities on loan. |
| 8 | Securities with a value of $3,494,000 and cash of $4,158,000 have been segregated as initial margin for open futures contracts. |
| 9 | Cash of $690,000 has been segregated as collateral for open forward currency contracts. |
ADR—American Depositary Receipt.
International Portfolio
| Restricted Securities as of Period End | |
| | | Acquisition | |
| | Acquisition | Cost | |
| Security Name | Date | ($000 | ) |
| You & Mr. Jones | September 2015 | 5,200 | |
| CureVac GmbH | October 2015 | 3,559 | |
| ANI Technologies | December 2015 | 5,969 | |
| | | | |
| | | | |
| Derivative Financial Instruments Outstanding as of Period End | | | |
| | | | |
| Futures Contracts | | | |
| | | | | | | | | | | | | | | | ($000 | ) |
| | | | | | | | | | | | | | | | Value and | |
| | | | | | | | Number of | | | | | | | | Unrealized | |
| | | | | | | | Long (Short | ) | | | Notional | | | | Appreciation | |
| | | | Expiration | | | | Contracts | | | | Amount | | | | (Depreciation | ) |
| Long Futures Contracts | | | | | | | | | | | | | | | | |
| Dow Jones EURO STOXX 50 Index | | | March 2020 | | | | 1,411 | | | | 59,020 | | | | (80 | ) |
| Topix Index | | | March 2020 | | | | 265 | | | | 41,974 | | | | 99 | |
| S&P ASX 200 Index | | | March 2020 | | | | 222 | | | | 25,717 | | | | (680 | ) |
| FTSE 100 Index | | | March 2020 | | | | 257 | | | | 25,528 | | | | 406 | |
| | | | | | | | | | | | | | | | (255 | ) |
| Forward Currency Contracts | | | | | | | | | |
| | Contract | | | | | Unrealized | | Unrealized | |
| | Settlement | | | Contract Amount (000) | Appreciation | | (Depreciation | ) |
| Counterparty | Date | | Receive | | Deliver | ($000 | ) | ($000 | ) |
| BNP Paribas | 4/2/20 | EUR | 48,104 | USD | 53,890 | 385 | | — | |
| Barclays Bank plc | 4/2/20 | JPY | 4,474,184 | USD | 41,458 | — | | (60 | ) |
| Toronto-Dominion Bank | 4/2/20 | GBP | 19,913 | USD | 26,657 | — | | (213 | ) |
| Barclays Bank plc | 4/2/20 | AUD | 21,702 | USD | 14,940 | 324 | | — | |
| BNP Paribas | 4/2/20 | AUD | 14,235 | USD | 9,802 | 210 | | — | |
| State Street Bank & Trust Co. | 1/6/20 | EUR | 3,850 | USD | 4,292 | 30 | | — | |
| Royal Bank of Canada | 1/6/20 | JPY | 290,530 | USD | 2,654 | 21 | | — | |
| JPMorgan Chase Bank, N.A. | 1/6/20 | AUD | 2,700 | USD | 1,882 | 13 | | — | |
| Goldman Sachs International | 1/6/20 | GBP | 1,082 | USD | 1,419 | 15 | | — | |
| State Street Bank & Trust Co. | 4/2/20 | USD | 4,314 | EUR | 3,850 | — | | (30 | ) |
| Bank of America, N.A. | 1/6/20 | USD | 4,298 | EUR | 3,850 | — | | (23 | ) |
| Royal Bank of Canada | 1/6/20 | USD | 2,683 | JPY | 290,530 | 8 | | — | |
| Royal Bank of Canada | 4/2/20 | USD | 2,667 | JPY | 290,530 | — | | (21 | ) |
| JPMorgan Chase Bank, N.A. | 4/2/20 | USD | 1,886 | AUD | 2,700 | — | | (13 | ) |
| Royal Bank of Canada | 1/6/20 | USD | 1,860 | AUD | 2,700 | — | | (36 | ) |
| Royal Bank of Canada | 1/6/20 | USD | 1,431 | GBP | 1,082 | — | | (3 | ) |
| Goldman Sachs International | 4/2/20 | USD | 1,423 | GBP | 1,082 | — | | (15 | ) |
| | | | | | | 1,006 | | (414 | ) |
AUD—Australian dollar.
EUR—euro.
GBP—British pound.
JPY—Japanese yen.
USD—U.S. dollar.
See accompanying Notes, which are an integral part of the Financial Statements.
International Portfolio
Statement of Operations
| | Year Ended | |
| | December 31, 2019 | |
| | ($000 | ) |
| Investment Income | | |
| Income | | |
| Dividends—Unaffiliated Issuers1 | 57,303 | |
| Dividends—Affiliated Issuers | 498 | |
| Interest—Unaffiliated Issuers | 118 | |
| Interest—Affiliated Issuers | 2,131 | |
| Securities Lending—Net | 3,799 | |
| Total Income | 63,849 | |
| Expenses | | |
| Investment Advisory Fees—Note B | | |
| Basic Fee | 5,339 | |
| Performance Adjustment | 1,295 | |
| The Vanguard Group—Note C | | |
| Management and Administrative | 6,103 | |
| Marketing and Distribution | 413 | |
| Custodian Fees | 106 | |
| Auditing Fees | 43 | |
| Shareholders’ Reports | 26 | |
| Trustees’ Fees and Expenses | 4 | |
| Total Expenses | 13,329 | |
| Net Investment Income | 50,520 | |
| Realized Net Gain (Loss) | | |
| Investment Securities Sold—Unaffiliated Issuers | 80,422 | |
| Investment Securities Sold—Affiliated Issuers | 2,413 | |
| Futures Contracts | 11,809 | |
| Forward Currency Contracts | 426 | |
| Foreign Currencies | (508 | ) |
| Realized Net Gain (Loss) | 94,562 | |
| Change in Unrealized Appreciation (Depreciation) | | |
| Investment Securities—Unaffiliated Issuers2 | 805,699 | |
| Investment Securities—Affiliated Issuers | 64 | |
| Futures Contracts | 1,587 | |
| Forward Currency Contracts | (169 | ) |
| Foreign Currencies | 273 | |
| Change in Unrealized Appreciation (Depreciation) | 807,454 | |
| Net Increase (Decrease) in Net Assets Resulting from Operations | 952,536 | |
| 1 | Dividends are net of foreign withholding taxes of $6,294,000. |
| 2 | The change in unrealized appreciation (depreciation) is net of deferred foreign capital gain taxes of $188,000. |
Statement of Changes in Net Assets
| | Year Ended December 31, | |
| | 2019 | | 2018 | |
| | ($000 | ) | ($000 | ) |
| Increase (Decrease) in Net Assets | | | | |
| Operations | | | | |
| Net Investment Income | 50,520 | | 47,649 | |
| Realized Net Gain (Loss) | 94,562 | | 110,293 | |
| Change in Unrealized Appreciation (Depreciation) | 807,454 | | (626,896 | ) |
| Net Increase (Decrease) in Net Assets Resulting from Operations | 952,536 | | (468,954 | ) |
| Distributions | | | | |
| Net Investment Income | (50,042 | ) | (26,488 | ) |
| Realized Capital Gain1 | (109,130 | ) | (88,646 | ) |
| Total Distributions | (159,172 | ) | (115,134 | ) |
| Capital Share Transactions | | | | |
| Issued | 469,443 | | 993,064 | |
| Issued in Lieu of Cash Distributions | 159,172 | | 115,134 | |
| Redeemed | (507,332 | ) | (613,419 | ) |
| Net Increase (Decrease) from Capital Share Transactions | 121,283 | | 494,779 | |
| Total Increase (Decrease) | 914,647 | | (89,309 | ) |
| Net Assets | | | | |
| Beginning of Period | 3,108,680 | | 3,197,989 | |
| End of Period | 4,023,327 | | 3,108,680 | |
| 1 | Includes fiscal 2019 and 2018 short-term gain distributions totaling $1,600,000 and $16,968,000, respectively. Short-term gain distributions are treated as ordinary income dividends for tax purposes. |
See accompanying Notes, which are an integral part of the Financial Statements.
International Portfolio
Financial Highlights
| For a Share Outstanding | | | Year Ended December 31, | |
| Throughout Each Period | 2019 | 2018 | 2017 | 2016 | 2015 | |
| Net Asset Value, Beginning of Period | $23.14 | $27.34 | $19.54 | $19.80 | $20.63 | |
| Investment Operations | | | | | | |
| Net Investment Income | .3711 | .3671 | .2241 | .2711 | .278 | |
| Net Realized and Unrealized Gain (Loss) on Investments | 6.692 | (3.644) | 7.992 | .075 | (.394) | |
| Total from Investment Operations | 7.063 | (3.277) | 8.216 | .346 | (.116) | |
| Distributions | | | | | | |
| Dividends from Net Investment Income | (.378) | (.212) | (.258) | (.280) | (.392) | |
| Distributions from Realized Capital Gains | (.825) | (.711) | (.158) | (.326) | (.322) | |
| Total Distributions | (1.203) | (.923) | (.416) | (.606) | (.714) | |
| Net Asset Value, End of Period | $29.00 | $23.14 | $27.34 | $19.54 | $19.80 | |
| | | | | | | |
| Total Return | 31.22% | -12.61% | 42.60% | 1.93% | -0.77% | |
| | | | | | | |
| Ratios/Supplemental Data | | | | | | |
| Net Assets, End of Period (Millions) | $4,023 | $3,109 | $3,198 | $2,131 | $2,253 | |
| Ratio of Total Expenses to Average Net Assets2 | 0.38% | 0.37% | 0.39% | 0.39% | 0.40% | |
| Ratio of Net Investment Income to Average Net Assets | 1.43% | 1.36% | 0.93% | 1.40% | 1.37% | |
| Portfolio Turnover Rate | 14% | 16% | 16% | 29% | 23% | |
| 1 | Calculated based on average shares outstanding. |
| 2 | Includes performance-based investment advisory fee increases (decreases) of 0.04%, 0.03%, 0.03%, 0.03%, and 0.03%. |
See accompanying Notes, which are an integral part of the Financial Statements.
International Portfolio
Notes to Financial Statements
The International Portfolio, a portfolio of Vanguard Variable Insurance Funds, is registered under the Investment Company Act of 1940 as an open-end investment company. The portfolio’s shares are only available for purchase by separate accounts of insurance companies as investments for variable annuity plans, variable life insurance contracts, or other variable benefit insurance contracts. The portfolio invests in securities of foreign issuers, which may subject it to investment risks not normally associated with investing in securities of U.S. corporations.
A.The following significant accounting policies conform to generally accepted accounting principles for U.S. investment companies. The portfolio consistently follows such policies in preparing its financial statements.
1. Security Valuation: Securities are valued as of the close of trading on the New York Stock Exchange (generally 4 p.m., Eastern time) on the valuation date. Equity securities are valued at the latest quoted sales prices or official closing prices taken from the primary market in which each security trades; such securities not traded on the valuation date are valued at the mean of the latest quoted bid and asked prices. Securities for which market quotations are not readily available, or whose values have been affected by events occurring before the portfolio’s pricing time but after the close of the securities’ primary markets, are valued at their fair values calculated according to procedures adopted by the board of trustees. These procedures include obtaining quotations from an independent pricing service, monitoring news to identify significant market- or security-specific events, and evaluating changes in the values of foreign market proxies (for example, ADRs, futures contracts, or exchange-traded funds), between the time the foreign markets close and the portfolio’s pricing time. When fair-value pricing is employed, the prices of securities used by a portfolio to calculate its net asset value may differ from quoted or published prices for the same securities. Investments in Vanguard Market Liquidity Fund are valued at that fund’s net asset value. Temporary cash investments are valued using the latest bid prices or using valuations based on a matrix system (which considers such factors as security prices, yields, maturities, and ratings), both as furnished by independent pricing services.
2. Foreign Currency: Securities and other assets and liabilities denominated in foreign currencies are translated into U.S. dollars using exchange rates obtained from an independent third party as of the portfolio’s pricing time on the valuation date. Realized gains (losses) and unrealized appreciation (depreciation) on investment securities include the effects of changes in exchange rates since the securities were purchased, combined with the effects of changes in security prices. Fluctuations in the value of other assets and liabilities resulting from changes in exchange rates are recorded as unrealized foreign currency gains (losses) until the assets or liabilities are settled in cash, at which time they are recorded as realized foreign currency gains (losses).
3. Futures and Forward Currency Contracts: The portfolio uses index futures contracts to a limited extent, with the objective of maintaining full exposure to the stock market while maintaining liquidity. The portfolio may purchase or sell futures contracts to achieve a desired level of investment, whether to accommodate portfolio turnover or cash flows from capital share transactions. The primary risks associated with the use of futures contracts are imperfect correlation between changes in market values of stocks held by the portfolio and the prices of futures contracts, and the possibility of an illiquid market. Counterparty risk involving futures is mitigated because a regulated clearinghouse is the counterparty instead of the clearing broker. To further mitigate counterparty risk, the portfolio trades futures contracts on an exchange, monitors the financial strength of its clearing brokers and clearinghouse, and has entered into clearing agreements with its clearing brokers. The clearinghouse imposes initial margin requirements to secure the portfolio’s performance and requires daily settlement of variation margin representing changes in the market value of each contract. Any assets pledged as initial margin for open contracts are noted in the Statement of Net Assets.
The portfolio enters into forward currency contracts to provide the appropriate currency exposure related to any open futures contracts or to protect the value of securities and related receivables and payables against changes in foreign exchange rates. The portfolio’s risks in using these contracts include movement in the values of the foreign currencies relative to the U.S. dollar and the ability of the counterparties to fulfill their obligations under the contracts. The portfolio mitigates its counterparty risk by entering into forward currency contracts only with a diverse group of prequalified counterparties, monitoring their financial strength, entering into master netting arrangements with its counterparties, and requiring its counterparties to transfer collateral as security for their performance. In the absence of a default, the collateral pledged or received by the portfolio cannot be repledged, resold, or rehypothecated. The master netting arrangements provide that, in the event of a counterparty’s default (including bankruptcy), the portfolio may terminate the forward currency contracts, determine the net amount owed by either party in accordance with its master netting
International Portfolio
arrangements, and sell or retain any collateral held up to the net amount owed to the portfolio under the master netting arrangements. The forward currency contracts contain provisions whereby a counterparty may terminate open contracts if the portfolio’s net assets decline below a certain level, triggering a payment by the portfolio if the portfolio is in a net liability position at the time of the termination. The payment amount would be reduced by any collateral the portfolio has pledged. Any assets pledged as collateral for open contracts are noted in the Statement of Net Assets. The value of collateral received or pledged is compared daily to the value of the forward currency contracts exposure with each counterparty, and any difference, if in excess of a specified minimum transfer amount, is adjusted and settled within two business days.
Futures contracts are valued at their quoted daily settlement prices. Forward currency contracts are valued at their quoted daily prices obtained from an independent third party, adjusted for currency risk based on the expiration date of each contract. The notional amounts of the contracts are not recorded in the Statement of Net Assets. Fluctuations in the value of the contracts are recorded in the Statement of Assets and Liabilities as an asset (liability) and in the Statement of Operations as unrealized appreciation (depreciation) until the contracts are closed, when they are recorded as realized gains (losses) on futures or forward currency contracts.
During the year ended December 31, 2019, the portfolio’s average investments in long and short futures contracts represented 3% and 0% of net assets, respectively, based on the average of the notional amounts at each quarter-end during the period. The portfolio’s average investment in forward currency contracts represented 3% of net assets, based on the average of the notional amounts at each quarter-end during the period.
4. Federal Income Taxes: The portfolio intends to continue to qualify as a regulated investment company and distribute all of its taxable income. Management has analyzed the portfolio’s tax positions taken for all open federal income tax years (December 31, 2016–2019), and has concluded that no provision for federal income tax is required in the portfolio’s financial statements.
5. Distributions: Distributions to shareholders are recorded on the ex-dividend date. Distributions are determined on a tax basis and may differ from net investment income and realized capital gains for financial reporting purposes.
6. Securities Lending: To earn additional income, the portfolio lends its securities to qualified institutional borrowers. Security loans are subject to termination by the portfolio at any time, and are required to be secured at all times by collateral in an amount at least equal to the market value of securities loaned. Daily market fluctuations could cause the value of loaned securities to be more or less than the value of the collateral received. When this occurs, the collateral is adjusted and settled before the opening of the market on the next business day. The portfolio further mitigates its counterparty risk by entering into securities lending transactions only with a diverse group of prequalified counterparties, monitoring their financial strength, and entering into master securities lending agreements with its counterparties. The master securities lending agreements provide that, in the event of a counterparty’s default (including bankruptcy), the portfolio may terminate any loans with that borrower, determine the net amount owed, and sell or retain the collateral up to the net amount owed to the portfolio; however, such actions may be subject to legal proceedings. While collateral mitigates counterparty risk, in the event of a default, the portfolio may experience delays and costs in recovering the securities loaned. The portfolio invests cash collateral received in Vanguard Market Liquidity Fund, and records a liability in the Statement of Assets and Liabilities for the return of the collateral, during the period the securities are on loan. Securities lending income represents fees charged to borrowers plus income earned on invested cash collateral, less expenses associated with the loan. During the term of the loan, the portfolio is entitled to all distributions made on or in respect of the loaned securities.
7. Credit Facility: The portfolio and certain other funds managed by The Vanguard Group (“Vanguard”) participate in a $4.3 billion committed credit facility provided by a syndicate of lenders pursuant to a credit agreement that may be renewed annually; each fund is individually liable for its borrowings, if any, under the credit facility. Borrowings may be utilized for temporary and emergency purposes, and are subject to the portfolio’s regulatory and contractual borrowing restrictions. The participating funds are charged administrative fees and an annual commitment fee of 0.10% of the undrawn amount of the facility; these fees are allocated to the funds based on a method approved by the portfolio’s board of trustees and included in Management and Administrative expenses on the portfolio’s Statement of Operations. Any borrowings under this facility bear interest at a rate based upon the higher of the one-month London Interbank Offered Rate, federal funds effective rate, or overnight bank funding rate plus an agreed-upon spread.
International Portfolio
The portfolio had no borrowings outstanding at December 31, 2019, or at any time during the period then ended.
8. Other: Dividend income is recorded on the ex-dividend date. Interest income includes income distributions received from Vanguard Market Liquidity Fund and is accrued daily. Premiums and discounts on debt securities are amortized and accreted, respectively, to interest income over the lives of the respective securities, except for premiums on certain callable debt securities that are amortized to the earliest call date. Security transactions are accounted for on the date securities are bought or sold. Costs used to determine realized gains (losses) on the sale of investment securities are those of the specific securities sold.
Taxes on foreign dividends and capital gains have been provided for in accordance with the portfolio’s understanding of the applicable countries’ tax rules and rates. Foreign capital gains tax is accrued daily based upon net unrealized gains. The portfolio has filed tax reclaims for previously withheld taxes on dividends earned in certain European Union countries. These filings are subject to various administrative and judicial proceedings within these countries. Such tax reclaims received during the year, if any, are included in dividend income. No other amounts for additional tax reclaims are reflected in the financial statements due to the uncertainty as to the ultimate resolution of proceedings, the likelihood of receipt of these reclaims, and the potential timing of payment.
B.The investment advisory firms Baillie Gifford Overseas Ltd. and Schroder Investment Management North America Inc., each provide investment advisory services to a portion of the portfolio for a fee calculated at an annual percentage rate of average net assets managed by the advisor. The basic fee of Baillie Gifford Overseas Ltd. and Schroder Investment Management North America Inc., is subject to quarterly adjustments based on performance relative to the MSCI All Country World Index ex USA for the preceding three years.
Vanguard manages the cash reserves of the portfolio as described below.
For the year ended December 31, 2019, the aggregate investment advisory fee represented an effective annual basic rate of 0.15% of the portfolio’s average net assets, before an increase of $1,295,000 (0.04%) based on performance.
C.In accordance with the terms of a Funds’ Service Agreement (the “FSA”) between Vanguard and the portfolio, Vanguard furnishes to the portfolio corporate management, administrative, marketing, distribution, and cash management services at Vanguard’s cost of operations (as defined by the FSA). These costs of operations are allocated to the portfolio based on methods and guidelines approved by the board of trustees. Vanguard does not require reimbursement in the current period for certain costs of operations (such as deferred compensation/benefits and risk/insurance costs); the portfolio’s liability for these costs of operations is included in Payables to Vanguard on the Statement of Assets and Liabilities. All other costs of operations payable to Vanguard are generally settled twice a month.
Upon the request of Vanguard, the portfolio may invest up to 0.40% of its net assets as capital in Vanguard. At December 31, 2019, the portfolio had contributed to Vanguard capital in the amount of $172,000, representing less than 0.01% of the portfolio’s net assets and 0.07% of Vanguard’s capital received pursuant to the FSA. The portfolio’s trustees and officers are also directors and employees, respectively, of Vanguard.
D.Various inputs may be used to determine the value of the portfolio’s investments. These inputs are summarized in three broad levels for financial statement purposes. The inputs or methodologies used to value securities are not necessarily an indication of the risk associated with investing in those securities.
Level 1—Quoted prices in active markets for identical securities.
Level 2—Other significant observable inputs (including quoted prices for similar securities, interest rates, prepayment speeds, credit risk, etc.).
Level 3—Significant unobservable inputs (including the portfolio’s own assumptions used to determine the fair value of investments). Any investments valued with significant unobservable inputs are noted on the Statement of Net Assets.
International Portfolio
The following table summarizes the market value of the portfolio’s investments and derivatives as of December 31, 2019, based on the inputs used to value them:
| | Level 1 | Level 2 | Level 3 | |
| Investments | ($000) | ($000) | ($000) | |
| Common Stocks—North and South America | 437,398 | — | — | |
| Common Stocks—Other | 443,561 | 2,939,995 | 5,707 | |
| Preferred Stocks | — | — | 18,778 | |
| Temporary Cash Investments | 186,137 | 3,494 | — | |
| Futures Contracts—Liabilities1 | (1,789) | — | — | |
| Forward Currency Contracts—Assets | — | 1,006 | — | |
| Forward Currency Contracts—Liabilities | — | (414) | — | |
| Total | 1,065,307 | 2,944,081 | 24,485 | |
1 Represents variation margin on the last day of the reporting period.
E.At December 31, 2019, the fair values of derivatives were reflected in the Statement of Assets and Liabilities as follows:
| | | Foreign | | |
| | Equity | Exchange | | |
| | Contracts | Contracts | Total | |
| Statement of Assets and Liabilities Caption | ($000) | ($000) | ($000) | |
| Variation Margin Receivable—Futures Contracts | — | — | — | |
| Unrealized Appreciation—Forward Currency Contracts | — | 1,006 | 1,006 | |
| Total Assets | — | 1,006 | 1,006 | |
| | | | | |
| Variation Margin Payable—Futures Contracts | (1,789) | — | (1,789) | |
| Unrealized Depreciation—Forward Currency Contracts | — | (414) | (414) | |
| Total Liabilities | (1,789) | (414) | (2,203) | |
Realized net gain (loss) and the change in unrealized appreciation (depreciation) on derivatives for the year ended December 31, 2019, were:
| | | Foreign | | |
| | Equity | Exchange | | |
| | Contracts | Contracts | Total | |
| Realized Net Gain (Loss) on Derivatives | ($000) | ($000) | ($000) | |
| Futures Contracts | 11,809 | — | 11,809 | |
| Forward Currency Contracts | — | 426 | 426 | |
| Realized Net Gain (Loss) on Derivatives | 11,809 | 426 | 12,235 | |
| | | | | |
| Change in Unrealized Appreciation (Depreciation) on Derivatives | |
| Futures Contracts | 1,587 | — | 1,587 | |
| Forward Currency Contracts | — | (169) | (169) | |
| Change in Unrealized Appreciation (Depreciation) on Derivatives | 1,587 | (169) | 1,418 | |
F.Permanent differences between book-basis and tax-basis components of net assets are reclassified among capital accounts in the financial statements to reflect their tax character. These reclassifications have no effect on net assets or net asset value per share. As of period end, permanent differences primarily attributable to the accounting for foreign currency transactions and passive foreign investment companies were reclassified between the individual components of total distributable earnings (loss).
| | Amount | |
| | ($000) | |
| Paid-in Capital | — | |
| Total Distributable Earnings (Loss) | — | |
International Portfolio
Temporary differences between book-basis and tax-basis components of total distributable earnings (loss) arise when certain items of income, gain, or loss are recognized in different periods for financial statement and tax purposes; these differences will reverse at some time in the future. The differences are primarily related to the tax deferral of losses on wash sales; the realization of unrealized gains or losses on certain futures contracts and forward currency contracts; and unrealized gains on passive foreign investment companies. As of period end, the tax-basis components of total distributable earnings (loss) are detailed in the table as follows:
| | Amount | |
| | ($000) | |
| Undistributed Ordinary Income | 58,506 | |
| Undistributed Long-Term Gains | 84,122 | |
| Capital Loss Carryforwards (Non-expiring) | — | |
| Net Unrealized Gains (Losses) | 1,174,478 | |
As of December 31, 2019, gross unrealized appreciation and depreciation for investments and derivatives based on cost for U.S. federal income tax purposes were as follows:
| | Amount | |
| | ($000) | |
| Tax Cost | 2,860,176 | |
| Gross Unrealized Appreciation | 1,368,931 | |
| Gross Unrealized Depreciation | (194,618) | |
| Net Unrealized Appreciation (Depreciation) | 1,174,313 | |
G.During the year ended December 31, 2019, the portfolio purchased $483,132,000 of investment securities and sold $520,061,000 of investment securities, other than temporary cash investments.
H.Capital shares issued and redeemed were:
| | Year Ended December 31, | |
| | 2019 | 2018 | |
| | Shares | Shares | |
| | (000) | (000) | |
| Issued | 17,755 | 36,050 | |
| Issued in Lieu of Cash Distributions | 6,218 | 4,051 | |
| Redeemed | (19,574) | (22,736) | |
| Net Increase (Decrease) in Shares Outstanding | 4,399 | 17,365 | |
At December 31, 2019, one shareholder, an insurance company separate account whose holdings in the portfolio represent the indirect investment of Vanguard Variable Annuity contract holders, was the record or beneficial owner of 30% of the portfolio’s net assets. If this shareholder were to redeem its investment in the portfolio, the redemption might result in an increase in the portfolio’s expense ratio, cause the portfolio to incur higher transaction costs, or lead to the realization of taxable capital gains.
I.Transactions during the period in investments where the issuer is another member of The Vanguard Group were as follows:
| | | | | | Current Period Transactions | | |
| | Dec. 31, | | Proceeds | | Change | | | Dec. 31, | |
| | 2018 | | from | Realized | in Net | | Capital Gain | 2019 | |
| | Market | Purchases | Securities | Net Gain | Unrealized | | Distributions | Market | |
| | Value | at Cost | Sold | (Loss) | App. (Dep.) | Income | Received | Value | |
| | ($000) | ($000) | ($000) | ($000) | ($000) | ($000) | ($000) | ($000) | |
| Vanguard Market Liquidity Fund | 183,216 | NA1 | NA1 | 25 | 8 | 2,131 | — | 186,137 | |
| Vanguard FTSE All-World ex-US ETF Shares | 13,619 | — | 12,043 | 2,388 | 56 | 498 | — | 4,020 | |
| Total | 196,835 | | | 2,413 | 64 | 2,629 | — | 190,157 | |
1 Not applicable—purchases and sales are for temporary cash investment purposes.
J.Management has determined that no events or transactions occurred subsequent to December 31, 2019, that would require recognition or disclosure in these financial statements.
International Portfolio
Report of Independent Registered Public Accounting Firm
To the Board of Trustees of Vanguard Variable Insurance Funds and Shareholders of International Portfolio
Opinion on the Financial Statements
We have audited the accompanying statement of net assets and statement of assets and liabilities of International Portfolio (one of the portfolios constituting Vanguard Variable Insurance Funds, referred to hereafter as the “Portfolio”) as of December 31, 2019, the related statement of operations for the year ended December 31, 2019, the statement of changes in net assets for each of the two years in the period ended December 31, 2019, including the related notes, and the financial highlights for each of the five years in the period ended December 31, 2019 (collectively referred to as the “financial statements”). In our opinion, the financial statements present fairly, in all material respects, the financial position of the Portfolio as of December 31, 2019, the results of its operations for the year then ended, the changes in its net assets for each of the two years in the period ended December 31, 2019 and the financial highlights for each of the five years in the period ended December 31, 2019 in conformity with accounting principles generally accepted in the United States of America.
Basis for Opinion
These financial statements are the responsibility of the Portfolio’s management. Our responsibility is to express an opinion on the Portfolio’s financial statements based on our audits. We are a public accounting firm registered with the Public Company Accounting Oversight Board (United States) (“PCAOB”) and are required to be independent with respect to the Portfolio in accordance with the U.S. federal securities laws and the applicable rules and regulations of the Securities and Exchange Commission and the PCAOB.
We conducted our audits of these financial statements in accordance with the standards of the PCAOB. Those standards require that we plan and perform the audit to obtain reasonable assurance about whether the financial statements are free of material misstatement, whether due to error or fraud.
Our audits included performing procedures to assess the risks of material misstatement of the financial statements, whether due to error or fraud, and performing procedures that respond to those risks. Such procedures included examining, on a test basis, evidence regarding the amounts and disclosures in the financial statements. Our audits also included evaluating the accounting principles used and significant estimates made by management, as well as evaluating the overall presentation of the financial statements. Our procedures included confirmation of securities owned as of December 31, 2019 by correspondence with the custodians and brokers and by agreement to the underlying ownership records of the transfer agent; when replies were not received from brokers, we performed other auditing procedures. We believe that our audits provide a reasonable basis for our opinion.
/s/PricewaterhouseCoopers LLP
Philadelphia, Pennsylvania
February 18, 2020
We have served as the auditor of one or more investment companies in The Vanguard Group of Funds since 1975.
Special 2019 tax information (unaudited) for corporate shareholders only for Vanguard International Portfolio, a portfolio of Vanguard Variable Insurance Funds
This information for the fiscal year ended December 31, 2019, is included pursuant to provisions of the Internal Revenue Code for corporate shareholders only.
The portfolio distributed $107,530,000 as capital gain dividends (20% rate gain distributions) to shareholders during the fiscal year.
The portfolio designates to shareholders foreign source income of $63,309,000 and foreign taxes paid of 4,863,000.
Mid-Cap Index Portfolio
Your Portfolio’s Performance at a Glance
• For the 12 months ended December 31, 2019, the Mid-Cap Index Portfolio returned 30.87%, in line with its benchmark index after factoring in the portfolio’s expenses.
• The Mid-Cap Index Portfolio offers investors broad exposure to the hundreds of mid-capitalization stocks in the U.S. equity market. Stocks of every style and from every industry sector are represented.
• Stocks benefited from accommodative monetary policies from the Federal Reserve and other major central banks and corporate earnings that generally proved more resilient than expected. Over the fiscal year, large-cap stocks outpaced mid- and small-caps, and growth stocks beat their value counterparts.
• Industrial stocks contributed most to the portfolio’s results. Financials and technology were also top contributors. All but one of the portfolio’s sectors finished with double-digit returns.
• Over the past ten years, the portfolio recorded an average annual return of 12.93%, in line with its benchmark average.
• Please note that the portfolio returns in Vanguard Variable Insurance Fund are different from those in Vanguard Variable Annuity (and other plans that invest in the fund), which take into account insurance-related expenses.
| Market Barometer | | Average Annual Total Returns | |
| | | Periods Ended December 31, 2019 | |
| | One Year | Three Years | Five Years | |
| Stocks | | | | |
| Russell 1000 Index (Large-caps) | 31.43% | 15.05% | 11.48% | |
| Russell 2000 Index (Small-caps) | 25.53 | 8.59 | 8.23 | |
| Russell 3000 Index (Broad U.S. market) | 31.02 | 14.57 | 11.24 | |
| FTSE All-World ex US Index (International) | 21.81 | 9.96 | 5.83 | |
| | | | | |
| Bonds | | | | |
| Bloomberg Barclays U.S. Aggregate Bond Index (Broad taxable market) | 8.72% | 4.03% | 3.05% | |
| Bloomberg Barclays Municipal Bond Index (Broad tax-exempt market) | 7.54 | 4.72 | 3.53 | |
| FTSE Three-Month U.S. Treasury Bill Index | 2.25 | 1.65 | 1.04 | |
| | | | | |
| CPI | | | | |
| Consumer Price Index | 2.29% | 2.10% | 1.82% | |
Mid-Cap Index Portfolio
About Your Portfolio’s Expenses
As a shareholder of the portfolio, you incur ongoing costs, which include costs for portfolio management, administrative services, and shareholder reports (like this one), among others. Operating expenses, which are deducted from a portfolio’s gross income, directly reduce the investment return of the portfolio.
A portfolio’s expenses are expressed as a percentage of its average net assets. This figure is known as the expense ratio. The following examples are intended to help you understand the ongoing costs (in dollars) of investing in your portfolio and to compare these costs with those of other mutual funds. The examples are based on an investment of $1,000 made at the beginning of the period shown and held for the entire period.
The accompanying table illustrates your portfolio’s costs in two ways:
• Based on actual portfolio return. This section helps you to estimate the actual expenses that you paid over the period. The “Ending Account Value” shown is derived from the portfolio’s actual return, and the third column shows the dollar amount that would have been paid by an investor who started with $1,000 in the portfolio. You may use the information here, together with the amount you invested, to estimate the expenses that you paid over the period.
To do so, simply divide your account value by $1,000 (for example, an $8,600 account value divided by $1,000 = 8.6), then multiply the result by the number given for your portfolio under the heading “Expenses Paid During Period.”
• Based on hypothetical 5% yearly return. This section is intended to help you compare your portfolio’s costs with those of other mutual funds. It assumes that the portfolio had a yearly return of 5% before expenses, but that the expense ratio is unchanged. In this case—because the return used is not the portfolio’s actual return—the results do not apply to your investment. The example is useful in making comparisons because the Securities and Exchange Commission requires all mutual funds to calculate expenses based on a 5% return. You can assess your portfolio’s costs by comparing this hypothetical example with the hypothetical examples that appear in shareholder reports of other funds.
Note that the expenses shown in the table are meant to highlight and help you compareongoingcosts only and do not reflect transaction costs incurred by the portfolio for buying and selling securities. The portfolio’s expense ratio does not reflect additional fees and expenses associated with the annuity or life insurance program through which you invest.
The calculations assume no shares were bought or sold during the period. Your actual costs may have been higher or lower, depending on the amount of your investment and the timing of any purchases or redemptions.
You can find more information about the portfolio’s expenses in the Financial Statements section. For additional information on operating expenses and other shareholder costs, please refer to the prospectus.
| Six Months Ended December 31, 2019 | | | | |
| | Beginning | Ending | Expenses | |
| | Account Value | Account Value | Paid During | |
| Mid-Cap Index Portfolio | 6/30/2019 | 12/31/2019 | Period | |
| Based on Actual Portfolio Return | $1,000.00 | $1,074.69 | $0.89 | |
| Based on Hypothetical 5% Yearly Return | 1,000.00 | 1,024.35 | 0.87 | |
The calculations are based on expenses incurred in the most recent six-month period. The portfolio’s annualized six-month expense ratio for that period is 0.17%. The dollar amounts shown as “Expenses Paid” are equal to the annualized expense ratio multiplied by the average account value over the period, multiplied by the number of days in the most recent six-month period, then divided by the number of days in the most recent 12-month period (184/365).
Mid-Cap Index Portfolio
Performance Summary
All of the returns in this report represent past performance, which is not a guarantee of future results that may be achieved by the portfolio. (Current performance may be lower or higher than the performance data cited. For performance data current to the most recent month-end, visit our website at vanguard.com/performance.) Note, too, that both investment returns and principal value can fluctuate widely, so an investor’s shares, when sold, could be worth more or less than their original cost. The returns shown do not reflect taxes that a shareholder would pay on portfolio distributions or on the sale of portfolio shares. Nor do the returns reflect fees and expenses associated with the annuity or life insurance program through which a shareholder invests. If these fees and expenses were included, the portfolio’s returns would be lower.
Cumulative Performance: December 31, 2009–December 31, 2019
Initial Investment of $10,000
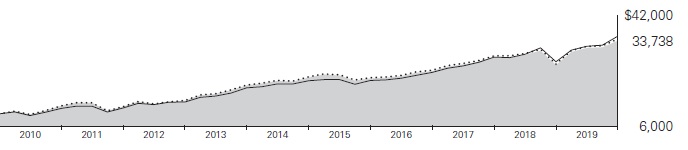
| | | Average Annual Total Returns | Final Value | |
| | | Periods Ended December 31, 2019 | of a $10,000 | |
| | | One Year | Five Years | Ten Years | Investment | |
 | Mid-Cap Index Portfolio | 30.87% | 9.13% | 12.93% | $33,738 | |
 | Spliced Mid-Cap Index | 31.09 | 9.29 | 13.13 | 34,328 | |
 | Dow Jones U.S. Total Stock Market Float Adjusted Index | 30.90 | 11.18 | 13.43 | 35,251 | |
Spliced Mid-Cap Index: MSCI US Mid Cap 450 Index through January 30, 2013; CRSP US Mid Cap Index thereafter.
See Financial Highlights for dividend and capital gains information.
Mid-Cap Index Portfolio
Sector Diversification
As of December 31, 2019
| Basic Materials | 4.2% |
| Consumer Goods | 9.5 |
| Consumer Services | 11.5 |
| Financials | 21.6 |
| Health Care | 9.3 |
| Industrials | 16.4 |
| Oil & Gas | 4.5 |
| Technology | 15.9 |
| Telecommunications | 0.6 |
| Utilities | 6.5 |
The table reflects the portfolio’s equity exposure, based on its investments in stocks and stock index futures. Any holdings in short-term reserves are excluded. Sector categories are based on the Industry Classification Benchmark (“ICB”), except for the “Other” category (if applicable), which includes securities that have not been provided an ICB classification as of the effective reporting period.
The Industry Classification Benchmark (“ICB”) is owned by FTSE. FTSE does not accept any liability to any person for any loss or damage arising out of any error or omission in the ICB.
Mid-Cap Index Portfolio
Financial Statements
Statement of Net Assets
As of December 31, 2019
The portfolio files its complete schedule of portfolio holdings with the Securities and Exchange Commission (SEC) for the first and third quarters of each fiscal year as an exhibit to its reports on Form N-PORT. The portfolio’s Form N-PORT reports are available on the SEC’s website at www.sec.gov.
| | | | | Market |
| | | | | Value• |
| | | Shares | | ($000) |
| Common Stocks (99.6%)1 | | | |
| Basic Materials (4.2%) | | | |
| | Newmont Goldcorp Corp. | 396,901 | | 17,245 |
| | International Paper Co. | 190,788 | | 8,786 |
| | Freeport-McMoRan Inc. | 666,776 | | 8,748 |
| | Nucor Corp. | 146,636 | | 8,253 |
| | Celanese Corp. Class A | 58,620 | | 7,217 |
| | International Flavors & Fragrances Inc. | 51,667 | | 6,666 |
| | FMC Corp. | 62,642 | | 6,253 |
| | Avery Dennison Corp. | 40,517 | | 5,301 |
| | CF Industries Holdings Inc. | 105,030 | | 5,014 |
| | Eastman Chemical Co. | 59,337 | | 4,703 |
| | Albemarle Corp. | 51,301 | | 3,747 |
| | Mosaic Co. | 164,678 | | 3,564 |
| | Reliance Steel & Aluminum Co. | 15,382 | | 1,842 |
| * | Axalta Coating Systems Ltd. | 51,197 | | 1,556 |
| | Westlake Chemical Corp. | 18,647 | | 1,308 |
| | | | | 90,203 |
| Consumer Goods (9.5%) | | | |
| * | Lululemon Athletica Inc. | 56,697 | | 13,135 |
| | McCormick & Co. Inc. | 59,834 | | 10,156 |
| | Clorox Co. | 60,755 | | 9,328 |
| | DR Horton Inc. | 169,499 | | 8,941 |
| | Church & Dwight Co. Inc. | 118,710 | | 8,350 |
| | Conagra Brands Inc. | 235,357 | | 8,059 |
| | Lennar Corp. Class A | 135,786 | | 7,576 |
| | Genuine Parts Co. | 66,814 | | 7,098 |
| | Garmin Ltd. | 68,981 | | 6,730 |
| * | Take-Two Interactive Software Inc. | 54,856 | | 6,716 |
| | Hasbro Inc. | 62,292 | | 6,579 |
| | Tyson Foods Inc. Class A | 71,369 | | 6,497 |
| * | NVR Inc. | 1,701 | | 6,478 |
| | Lamb Weston Holdings Inc. | 70,609 | | 6,074 |
| | Aptiv plc | 61,687 | | 5,858 |
| | Hormel Foods Corp. | 129,223 | | 5,829 |
| | JM Smucker Co. | 52,440 | | 5,461 |
| | Corteva Inc. | 181,269 | | 5,358 |
| | PulteGroup Inc. | 124,323 | | 4,824 |
| * | LKQ Corp. | 133,692 | | 4,773 |
| | Campbell Soup Co. | 94,776 | | 4,684 |
| | Molson Coors Brewing Co. Class B | 85,322 | | 4,599 |
| | Whirlpool Corp. | 30,595 | | 4,514 |
| | Fortune Brands Home & Security Inc. | 67,380 | | 4,403 |
| | BorgWarner Inc. | 100,109 | | 4,343 |
| | Lear Corp. | 29,260 | | 4,014 |
| * | Mohawk Industries Inc. | 27,653 | | 3,771 |
| | PVH Corp. | 35,846 | | 3,769 |
| | Bunge Ltd. | 65,309 | | 3,759 |
| | Tapestry Inc. | 133,404 | | 3,598 |
| | Newell Brands Inc. | 184,932 | | 3,554 |
| * | WABCO Holdings Inc. | 24,780 | | 3,358 |
| * | Wayfair Inc. | 30,300 | | 2,738 |
| | Ralph Lauren Corp. Class A | 22,882 | | 2,682 |
| *,^ | Under Armour Inc. Class A | 90,615 | | 1,957 |
| * | Under Armour Inc. Class C | 95,169 | | 1,825 |
| | Coty Inc. Class A | 147,616 | | 1,661 |
| | Levi Strauss & Co. Class A | 21,400 | | 413 |
| | Lennar Corp. Class B | 6,899 | | 308 |
| | | | | 203,770 |
| Consumer Services (11.4%) | | | |
| * | Chipotle Mexican Grill Inc. Class A | 13,405 | | 11,221 |
| | Royal Caribbean Cruises Ltd. | 81,282 | | 10,852 |
| * | Dollar Tree Inc. | 114,586 | | 10,777 |
| | Best Buy Co. Inc. | 108,400 | | 9,518 |
| * | Copart Inc. | 101,349 | | 9,217 |
| * | Liberty Broadband Corp. | 70,076 | | 8,812 |
| | Omnicom Group Inc. | 105,256 | | 8,528 |
| | MGM Resorts International | 224,306 | | 7,463 |
| | Tiffany & Co. | 55,180 | | 7,375 |
| | Expedia Group Inc. | 67,369 | | 7,285 |
| * | CarMax Inc. | 79,563 | | 6,975 |
| * | AutoZone Inc. | 5,765 | | 6,868 |
| * | Ulta Beauty Inc. | 27,115 | | 6,864 |
| | Darden Restaurants Inc. | 59,343 | | 6,469 |
| | Wynn Resorts Ltd. | 44,254 | | 6,146 |
| * | Norwegian Cruise Line Holdings Ltd. | 103,104 | | 6,022 |
| | AmerisourceBergen Corp. Class A | 69,934 | | 5,946 |
| | Domino’s Pizza Inc. | 19,820 | | 5,823 |
| * | Roku Inc. | 42,100 | | 5,637 |
| | American Airlines Group Inc. | 190,970 | | 5,477 |
| | ViacomCBS Inc. Class B | 129,252 | | 5,425 |
| | Tractor Supply Co. | 57,250 | | 5,349 |
| | Aramark | 120,871 | | 5,246 |
| | Advance Auto Parts Inc. | 31,851 | | 5,101 |
| * | Discovery Communications Inc. | 165,516 | | 5,047 |
| | FactSet Research Systems Inc. | 18,360 | | 4,926 |
| * | Live Nation Entertainment Inc. | 67,300 | | 4,810 |
| * | United Airlines Holdings Inc. | 52,064 | | 4,586 |
| | Interpublic Group of Cos. Inc. | 187,510 | | 4,332 |
| * | Lyft Inc. Class A | 96,963 | | 4,171 |
| * | Altice USA Inc. Class A | 152,182 | | 4,161 |
| * | DISH Network Corp. Class A | 115,940 | | 4,112 |
| | Alaska Air Group Inc. | 59,733 | | 4,047 |
| | Kohl’s Corp. | 76,905 | | 3,918 |
| * | Burlington Stores Inc. | 16,000 | | 3,649 |
| * | Liberty Media Corp-Liberty SiriusXM Class C | 73,957 | | 3,560 |
| | Nielsen Holdings plc | 172,738 | | 3,507 |
| | News Corp. Class A | 244,021 | | 3,450 |
| * | Discovery Communications Inc. Class A | 73,004 | | 2,390 |
| | Rollins Inc. | 71,298 | | 2,364 |
| | Vail Resorts Inc. | 9,800 | | 2,350 |
| * | Liberty Media Corp-Liberty SiriusXM Class A | 42,345 | | 2,047 |
| * | Liberty Broadband Corp. Class A | 12,365 | | 1,540 |
| | Hyatt Hotels Corp. Class A | 16,848 | | 1,511 |
| * | Carvana Co. Class A | 12,200 | | 1,123 |
| * | Chewy Inc. | 20,300 | | 589 |
| | ViacomCBS Inc. Class A | 2,790 | | 125 |
| | News Corp. Class B | 3,475 | | 50 |
| | | | | 246,761 |
| Financials (21.5%) | | | |
| * | IHS Markit Ltd. | 184,306 | | 13,888 |
| | SBA Communications Corp. Class A | 54,501 | | 13,134 |
| | Digital Realty Trust Inc. | 100,988 | | 12,092 |
| | Realty Income Corp. | 157,605 | | 11,604 |
| | Hartford Financial Services Group Inc. | 174,382 | | 10,597 |
| | M&T Bank Corp. | 60,668 | | 10,298 |
| | MSCI Inc. Class A | 38,967 | | 10,061 |
| | KeyCorp | 476,403 | | 9,642 |
| | Essex Property Trust Inc. | 31,993 | | 9,625 |
| | First Republic Bank | 81,640 | | 9,589 |
| * | CBRE Group Inc. Class A | 154,039 | | 9,441 |
| | Alexandria Real Estate Equities Inc. | 55,723 | | 9,004 |
| | Arthur J Gallagher & Co. | 90,280 | | 8,597 |
| | Citizens Financial Group Inc. | 210,467 | | 8,547 |
| | Healthpeak Properties Inc. | 246,924 | | 8,512 |
| | Cincinnati Financial Corp. | 79,052 | | 8,312 |
| | Equifax Inc. | 58,574 | | 8,207 |
| | Regions Financial Corp. | 467,159 | | 8,016 |
| * | Arch Capital Group Ltd. | 186,650 | | 8,005 |
| | Invitation Homes Inc. | 260,360 | | 7,803 |
| | Huntington Bancshares Inc. | 499,133 | | 7,527 |
| | Principal Financial Group Inc. | 134,558 | | 7,401 |
| | KKR & Co. Inc. Class A | 253,192 | | 7,386 |
| | Mid-America Apartment Communities Inc. | 55,248 | | 7,285 |
| * | Markel Corp. | 6,355 | | 7,265 |
| | AvalonBay Communities Inc. | 33,810 | | 7,090 |
| | Sun Communities Inc. | 44,800 | | 6,725 |
| | WP Carey Inc. | 83,500 | | 6,683 |
| | MarketAxess Holdings Inc. | 17,500 | | 6,634 |
| | UDR Inc. | 141,766 | | 6,621 |
| | Annaly Capital Management Inc. | 691,576 | | 6,515 |
| | Host Hotels & Resorts Inc. | 347,286 | | 6,442 |
| | Loews Corp. | 122,492 | | 6,430 |
| | Cboe Global Markets Inc. | 53,573 | | 6,429 |
| | Extra Space Storage Inc. | 59,623 | | 6,297 |
| * | SVB Financial Group | 25,006 | | 6,278 |
| | Duke Realty Corp. | 178,044 | | 6,173 |
| | Nasdaq Inc. | 55,461 | | 5,940 |
| | Fidelity National Financial Inc. | 126,449 | | 5,735 |
| | Lincoln National Corp. | 96,072 | | 5,669 |
| | Ally Financial Inc. | 184,067 | | 5,625 |
| | Vornado Realty Trust | 83,104 | | 5,526 |
| | Everest Re Group Ltd. | 19,716 | | 5,458 |
| | Weyerhaeuser Co. | 180,443 | | 5,449 |
| | Western Union Co. | 203,091 | | 5,439 |
| | Raymond James Financial Inc. | 60,405 | | 5,404 |
| * | Alleghany Corp. | 6,647 | | 5,315 |
| | Regency Centers Corp. | 81,119 | | 5,118 |
Mid-Cap Index Portfolio
| | | | | Market |
| | | | | Value• |
| | | Shares | | ($000) |
| | Ameriprise Financial Inc. | 30,600 | | 5,097 |
| | AXA Equitable Holdings Inc. | 202,304 | | 5,013 |
| | Comerica Inc. | 69,638 | | 4,997 |
| | Camden Property Trust | 46,865 | | 4,972 |
| | Globe Life Inc. | 47,142 | | 4,962 |
| | E*TRADE Financial Corp. | 109,228 | | 4,956 |
| | Reinsurance Group of America Inc. Class A | 30,325 | | 4,945 |
| | VEREIT Inc. | 515,626 | | 4,764 |
| | Federal Realty Investment Trust | 36,606 | | 4,712 |
| | AGNC Investment Corp. | 261,090 | | 4,616 |
| | WR Berkley Corp. | 66,721 | | 4,610 |
| | Iron Mountain Inc. | 138,700 | | 4,420 |
| | Zions Bancorp NA | 82,444 | | 4,281 |
| | SEI Investments Co. | 65,337 | | 4,278 |
| | Kimco Realty Corp. | 194,398 | | 4,026 |
| | Voya Financial Inc. | 65,367 | | 3,986 |
| | SL Green Realty Corp. | 38,751 | | 3,560 |
| | Franklin Resources Inc. | 132,774 | | 3,450 |
| * | Athene Holding Ltd. Class A | 69,028 | | 3,246 |
| | Invesco Ltd. | 176,040 | | 3,165 |
| | Jones Lang LaSalle Inc. | 12,451 | | 2,168 |
| | People’s United Financial Inc. | 107,671 | | 1,820 |
| | Interactive Brokers Group Inc. | 18,112 | | 844 |
| | | | | 463,721 |
| Health Care (9.2%) | | | |
| * | IQVIA Holdings Inc. | 79,837 | | 12,336 |
| * | Centene Corp. | 190,266 | | 11,962 |
| * | IDEXX Laboratories Inc. | 41,500 | | 10,837 |
| | ResMed Inc. | 69,569 | | 10,781 |
| * | DexCom Inc. | 44,300 | | 9,690 |
| * | Align Technology Inc. | 34,340 | | 9,582 |
| | Teleflex Inc. | 22,423 | | 8,441 |
| * | WellCare Health Plans Inc. | 24,400 | | 8,057 |
| * | Laboratory Corp. of America Holdings | 46,974 | | 7,947 |
| * | Incyte Corp. | 88,505 | | 7,728 |
| | Cooper Cos. Inc. | 23,963 | | 7,699 |
| * | BioMarin Pharmaceutical Inc. | 86,828 | | 7,341 |
| | Cardinal Health Inc. | 141,700 | | 7,167 |
| | Quest Diagnostics Inc. | 65,206 | | 6,964 |
| * | Hologic Inc. | 129,959 | | 6,785 |
| * | Seattle Genetics Inc. | 58,058 | | 6,634 |
| * | Exact Sciences Corp. | 71,300 | | 6,594 |
| * | Varian Medical Systems Inc. | 43,928 | | 6,238 |
| * | Alnylam Pharmaceuticals Inc. | 53,905 | | 6,208 |
| | Dentsply Sirona Inc. | 107,709 | | 6,095 |
| * | Elanco Animal Health Inc. | 180,665 | | 5,321 |
| | Universal Health Services Inc. Class B | 37,042 | | 5,314 |
| * | Mylan NV | 250,135 | | 5,028 |
| * | Henry Schein Inc. | 71,092 | | 4,743 |
| * | Jazz Pharmaceuticals plc | 26,026 | | 3,885 |
| * | ABIOMED Inc. | 20,746 | | 3,539 |
| | Perrigo Co. plc | 62,713 | | 3,240 |
| * | DaVita Inc. | 40,850 | | 3,065 |
| | | | | 199,221 |
| Industrials (16.3%) | | | |
| | Amphenol Corp. Class A | 143,612 | | 15,543 |
| | TransDigm Group Inc. | 24,570 | | 13,759 |
| | Willis Towers Watson plc | 62,190 | | 12,559 |
| * | FleetCor Technologies Inc. | 42,039 | | 12,095 |
| | Verisk Analytics Inc. Class A | 79,263 | | 11,837 |
| | Waste Connections Inc. | 127,561 | | 11,581 |
| | Cintas Corp. | 42,636 | | 11,473 |
| | AMETEK Inc. | 110,576 | | 11,029 |
| * | CoStar Group Inc. | 17,739 | | 10,613 |
| | Fastenal Co. | 277,770 | | 10,264 |
| | Ball Corp. | 158,232 | | 10,233 |
| * | Mettler-Toledo International Inc. | 11,759 | | 9,328 |
| * | Keysight Technologies Inc. | 90,700 | | 9,309 |
| | Vulcan Materials Co. | 64,072 | | 9,226 |
| | Martin Marietta Materials Inc. | 30,284 | | 8,469 |
| | Dover Corp. | 70,257 | | 8,098 |
| | TransUnion | 91,256 | | 7,812 |
| | WW Grainger Inc. | 22,226 | | 7,524 |
| | Kansas City Southern | 47,957 | | 7,345 |
| * | Waters Corp. | 31,185 | | 7,286 |
| | Xylem Inc. | 87,186 | | 6,869 |
| | Wabtec Corp. | 88,162 | | 6,859 |
| | Broadridge Financial Solutions Inc. | 55,402 | | 6,844 |
| | Masco Corp. | 138,347 | | 6,639 |
| | Old Dominion Freight Line Inc. | 34,778 | | 6,600 |
| | Expeditors International of Washington Inc. | 82,449 | | 6,433 |
| * | United Rentals Inc. | 36,322 | | 6,057 |
| | Arconic Inc. | 188,719 | | 5,807 |
| | Jacobs Engineering Group Inc. | 64,387 | | 5,784 |
| | Rockwell Automation Inc. | 27,962 | | 5,667 |
| | Westrock Co. | 124,913 | | 5,360 |
| * | Square Inc. | 84,117 | | 5,262 |
| | Packaging Corp. of America | 45,816 | | 5,131 |
| | CH Robinson Worldwide Inc. | 65,557 | | 5,127 |
| * | Trimble Inc. | 120,726 | | 5,033 |
| | Huntington Ingalls Industries Inc. | 19,769 | | 4,960 |
| | Textron Inc. | 110,547 | | 4,930 |
| | JB Hunt Transport Services Inc. | 41,373 | | 4,832 |
| * | Crown Holdings Inc. | 65,428 | | 4,746 |
| | Snap-on Inc. | 26,592 | | 4,505 |
| * | Sensata Technologies Holding plc | 77,066 | | 4,152 |
| | Hubbell Inc. Class B | 26,297 | | 3,887 |
| | HEICO Corp. Class A | 39,700 | | 3,554 |
| | Xerox Holdings Corp. | 89,274 | | 3,292 |
| | Jack Henry & Associates Inc. | 18,600 | | 2,710 |
| * | IPG Photonics Corp. | 16,641 | | 2,412 |
| | Cognex Corp. | 39,141 | | 2,193 |
| | HEICO Corp. | 19,000 | | 2,169 |
| | Pentair plc | 40,820 | | 1,872 |
| * | XPO Logistics Inc. | 22,351 | | 1,781 |
| | Robert Half International Inc. | 26,816 | | 1,693 |
| | FLIR Systems Inc. | 32,291 | | 1,681 |
| | AO Smith Corp. | 33,189 | | 1,581 |
| | Global Payments Inc. | 200 | | 37 |
| | | | | 351,842 |
| Oil & Gas (4.5%) | | | |
| | ONEOK Inc. | 200,107 | | 15,142 |
| | Halliburton Co. | 403,846 | | 9,882 |
| | Hess Corp. | 132,569 | | 8,857 |
| | Concho Resources Inc. | 97,253 | | 8,516 |
| | Diamondback Energy Inc. | 77,672 | | 7,213 |
| * | Cheniere Energy Inc. | 111,017 | | 6,780 |
| | Noble Energy Inc. | 231,615 | | 5,753 |
| | Marathon Oil Corp. | 386,637 | | 5,251 |
| | National Oilwell Varco Inc. | 187,098 | | 4,687 |
| | Apache Corp. | 182,225 | | 4,663 |
| | Targa Resources Corp. | 112,798 | | 4,606 |
| | Devon Energy Corp. | 176,500 | | 4,584 |
| | Baker Hughes a GE Co. Class A | 157,152 | | 4,028 |
| | HollyFrontier Corp. | 70,483 | | 3,574 |
| | Cabot Oil & Gas Corp. | 99,512 | | 1,732 |
| | Continental Resources Inc. | 35,713 | | 1,225 |
| | | | | 96,493 |
| Technology (15.8%) | | | |
| | KLA Corp. | 76,379 | | 13,608 |
| | Motorola Solutions Inc. | 82,957 | | 13,368 |
| * | Advanced Micro Devices Inc. | 269,386 | | 12,354 |
| | Microchip Technology Inc. | 115,620 | | 12,108 |
| | Xilinx Inc. | 121,821 | | 11,910 |
| * | Twitter Inc. | 356,650 | | 11,431 |
| * | Splunk Inc. | 74,651 | | 11,180 |
| | Cerner Corp. | 144,422 | | 10,599 |
| * | ANSYS Inc. | 40,790 | | 10,500 |
| * | Palo Alto Networks Inc. | 45,073 | | 10,423 |
| * | Synopsys Inc. | 72,721 | | 10,123 |
| | Skyworks Solutions Inc. | 82,426 | | 9,964 |
| | CDW Corp. | 69,691 | | 9,955 |
| * | VeriSign Inc. | 51,154 | | 9,856 |
| * | IAC/InterActiveCorp | 38,067 | | 9,483 |
| * | Cadence Design Systems Inc. | 135,931 | | 9,428 |
| * | Veeva Systems Inc. Class A | 63,700 | | 8,960 |
| | Western Digital Corp. | 136,755 | | 8,680 |
| | Marvell Technology Group Ltd. | 322,867 | | 8,575 |
| | Maxim Integrated Products Inc. | 131,104 | | 8,064 |
| * | Snap Inc. | 468,418 | | 7,649 |
| * | Fortinet Inc. | 70,300 | | 7,505 |
| | NortonLifeLock Inc. | 271,583 | | 6,931 |
| | NetApp Inc. | 110,480 | | 6,877 |
| | Citrix Systems Inc. | 59,815 | | 6,634 |
| * | Qorvo Inc. | 56,282 | | 6,542 |
| | Seagate Technology plc | 108,163 | | 6,436 |
| * | Akamai Technologies Inc. | 74,466 | | 6,432 |
| | SS&C Technologies Holdings Inc. | 103,813 | | 6,374 |
| * | Paycom Software Inc. | 24,000 | | 6,354 |
| * | Gartner Inc. | 41,087 | | 6,332 |
| * | Okta Inc. | 51,500 | | 5,942 |
| * | Twilio Inc. Class A | 60,200 | | 5,916 |
| * | GoDaddy Inc. Class A | 82,716 | | 5,618 |
| * | Arista Networks Inc. | 25,905 | | 5,269 |
| | Hewlett Packard Enterprise Co. | 313,800 | | 4,977 |
| * | Black Knight Inc. | 68,840 | | 4,439 |
| * | F5 Networks Inc. | 29,436 | | 4,111 |
| | Juniper Networks Inc. | 161,593 | | 3,980 |
| * | RingCentral Inc. Class A | 18,100 | | 3,053 |
| * | Pinterest Inc. Class A | 153,090 | | 2,854 |
| *,^ | Slack Technologies Inc. Class A | 112,498 | | 2,529 |
| | DXC Technology Co. | 61,631 | | 2,317 |
| *,^ | Match Group Inc. | 25,555 | | 2,098 |
| * | Dropbox Inc. Class A | 103,933 | | 1,861 |
| * | Datadog Inc. Class A | 13,300 | | 502 |
| * | Crowdstrike Holdings Inc. Class A | 9,900 | | 494 |
| | | | | 340,595 |
| Telecommunications (0.6%) | | | |
| | CenturyLink Inc. | 527,655 | | 6,970 |
| * | Zayo Group Holdings Inc. | 114,420 | | 3,965 |
| *,^ | Zoom Video Communications Inc. Class A | 21,942 | | 1,493 |
| | | | | 12,428 |
Mid-Cap Index Portfolio
| | | | | Market |
| | | | | Value• |
| | | Shares | | ($000) |
| Utilities (6.6%) | | | |
| | WEC Energy Group Inc. | 152,671 | | 14,081 |
| | Eversource Energy | 156,648 | | 13,326 |
| | FirstEnergy Corp. | 261,568 | | 12,712 |
| | DTE Energy Co. | 92,649 | | 12,032 |
| | Entergy Corp. | 96,432 | | 11,553 |
| | American Water Works Co. Inc. | 87,485 | | 10,747 |
| | Ameren Corp. | 119,130 | | 9,149 |
| | CMS Energy Corp. | 137,486 | | 8,640 |
| | Evergy Inc. | 110,435 | | 7,188 |
| | CenterPoint Energy Inc. | 242,573 | | 6,615 |
| | Alliant Energy Corp. | 118,234 | | 6,470 |
| | AES Corp. | 321,346 | | 6,395 |
| | NiSource Inc. | 180,903 | | 5,036 |
| | Pinnacle West Capital Corp. | 54,395 | | 4,892 |
| | Vistra Energy Corp. | 188,788 | | 4,340 |
| | OGE Energy Corp. | 97,028 | | 4,315 |
| | NRG Energy Inc. | 57,700 | | 2,294 |
| | Avangrid Inc. | 29,845 | | 1,527 |
| | | | | 141,312 |
Total Common Stocks
(Cost $1,665,949) | | | 2,146,346 |
| Temporary Cash Investments (0.6%)1 |
| Money Market Fund (0.6%) | | | |
| 2,3 | Vanguard Market Liquidity Fund, 1.816% | 113,181 | | 11,319 |
| | | | | |
| | | Face | | |
| | | Amount | | |
| | | ($000 | ) | |
| U.S. Government and Agency Obligations (0.0%) |
| 4 | United States Treasury Bill, 1.527%, 4/30/20 | 400 | | 398 |
Total Temporary Cash Investments
(Cost $11,718) | | | 11,717 |
Total Investments (100.2%)
(Cost $1,677,667) | | | 2,158,063 |
| | Amount |
| | ($000) |
| Other Assets and Liabilities (-0.2%) |
| Other Assets | |
| Investment in Vanguard | 94 |
| Receivables for Accrued Income | 3,588 |
| Receivables for Capital Shares Issued | 685 |
| Variation Margin Receivable—Futures Contracts | 18 |
| Other Assets4 | 191 |
| Total Other Assets | 4,576 |
| Liabilities | |
| Payables for Investment Securities Purchased | (102) |
| Collateral for Securities on Loan | (3,913) |
| Payables for Capital Shares Redeemed | (2,895) |
| Payables to Vanguard | (745) |
| Other Liabilities | (206) |
| Total Liabilities | (7,861) |
| Net Assets (100%) | |
| Applicable to 89,684,771 outstanding $.001 par value shares of beneficial interest (unlimited authorization) | 2,154,778 |
| Net Asset Value Per Share | $24.03 |
| At December 31, 2019, net assets consisted of: |
| | Amount |
| | ($000) |
| Paid-in Capital | 1,535,254 |
| Total Distributable Earnings (Loss) | 619,524 |
| Net Assets | 2,154,778 |
| • | See Note A in Notes to Financial Statements. |
| * | Non-income-producing security. |
| ^ | Includes partial security positions on loan to broker-dealers. The total value of securities on loan is $3,819,000. |
| 1 | The portfolio invests a portion of its cash reserves in equity markets through the use of index futures contracts. After giving effect to futures investments, the portfolio’s effective common stock and temporary cash investment positions represent 100.1% and 0.1%, respectively, of net assets. |
| 2 | Affiliated money market fund available only to Vanguard funds and certain trusts and accounts managed by Vanguard. Rate shown is the 7-day yield. |
| 3 | Collateral of $3,913,000 was received for securities on loan. |
| 4 | Securities with a value of $183,000 and cash of $163,000 have been segregated as initial margin for open futures contracts. |
| Derivative Financial Instruments Outstanding as of Period End | | | |
| | | | |
| Futures Contracts | | | | |
| | | | | ($000) |
| | | | | Value and |
| | | Number of | | Unrealized |
| | | Long (Short) | Notional | Appreciation |
| | Expiration | Contracts | Amount | (Depreciation) |
| Long Futures Contracts | | | | |
| E-mini S&P 500 Index | March 2020 | 43 | 6,947 | 73 |
| E-mini S&P Mid-Cap 400 Index | March 2020 | 10 | 2,065 | 36 |
| | | | | 109 |
See accompanying Notes, which are an integral part of the Financial Statements.
Mid-Cap Index Portfolio
Statement of Operations
| Year Ended | |
| | December 31, 2019 | |
| | ($000) | |
| Investment Income | | |
| Income | | |
| Dividends | 32,028 | |
| Interest1 | 111 | |
| Securities Lending—Net | 167 | |
| Total Income | 32,306 | |
| Expenses | | |
| The Vanguard Group—Note B | | |
| Investment Advisory Services | 290 | |
| Management and Administrative | 2,736 | |
| Marketing and Distribution | 198 | |
| Custodian Fees | 36 | |
| Auditing Fees | 33 | |
| Shareholders’ Reports | 30 | |
| Trustees’ Fees and Expenses | 1 | |
| Total Expenses | 3,324 | |
| Expenses Paid Indirectly | (19 | ) |
| Net Expenses | 3,305 | |
| Net Investment Income | 29,001 | |
| Realized Net Gain (Loss) | | |
| Investment Securities Sold1 | 111,773 | |
| Futures Contracts | 1,145 | |
| Realized Net Gain (Loss) | 112,918 | |
| Change in Unrealized Appreciation (Depreciation) | | |
| Investment Securities1 | 359,752 | |
| Futures Contracts | 295 | |
| Change in Unrealized Appreciation (Depreciation) | 360,047 | |
| Net Increase (Decrease) in Net Assets Resulting from Operations | 501,966 | |
| 1 | Interest income, realized net gain (loss), and change in unrealized appreciation (depreciation) from an affiliated company of the portfolio were $102,000, $2,000, and ($1,000), respectively. Purchases and sales are for temporary cash investment purposes. |
Statement of Changes in Net Assets
| | Year Ended December 31, | |
| | 2019 | 2018 | |
| | ($000) | ($000) | |
| Increase (Decrease) in Net Assets | | | |
| Operations | | | |
| Net Investment Income | 29,001 | 27,241 | |
| Realized Net Gain (Loss) | 112,918 | 143,656 | |
| Change in Unrealized Appreciation (Depreciation) | 360,047 | (339,835 | ) |
| Net Increase (Decrease) in Net Assets Resulting from Operations | 501,966 | (168,938 | ) |
| Distributions | | | |
| Net Investment Income | (27,995) | (21,762 | ) |
| Realized Capital Gain1 | (144,308) | (88,481 | ) |
| Total Distributions | (172,303) | (110,243 | ) |
| Capital Share Transactions | | | |
| Issued | 300,982 | 255,681 | |
| Issued in Lieu of Cash Distributions | 172,303 | 110,243 | |
| Redeemed | (269,427) | (269,732 | ) |
| Net Increase (Decrease) from Capital Share Transactions | 203,858 | 96,192 | |
| Total Increase (Decrease) | 533,521 | (182,989 | ) |
| Net Assets | | | |
| Beginning of Period | 1,621,257 | 1,804,246 | |
| End of Period | 2,154,778 | 1,621,257 | |
| 1 | Includes fiscal 2019 and 2018 short-term gain distributions totaling $4,013,000 and $3,072,000, respectively. Short-term gain distributions are treated as ordinary income dividends for tax purposes. |
See accompanying Notes, which are an integral part of the Financial Statements.
Mid-Cap Index Portfolio
Financial Highlights
| For a Share Outstanding | | | Year Ended December 31, |
| Throughout Each Period | 2019 | 2018 | 2017 | 2016 | 2015 |
| Net Asset Value, Beginning of Period | $20.23 | $23.72 | $21.11 | $20.76 | $22.49 |
| Investment Operations | | | | | |
| Net Investment Income | .3341 | .3431 | .2921 | .280 | .291 |
| Net Realized and Unrealized Gain (Loss) on Investments | 5.621 | (2.386) | 3.575 | 1.814 | (.552) |
| Total from Investment Operations | 5.955 | (2.043) | 3.867 | 2.094 | (.261) |
| Distributions | | | | | |
| Dividends from Net Investment Income | (.350) | (.286) | (.270) | (.292) | (.268) |
| Distributions from Realized Capital Gains | (1.805) | (1.161) | (.987) | (1.452) | (1.201) |
| Total Distributions | (2.155) | (1.447) | (1.257) | (1.744) | (1.469) |
| Net Asset Value, End of Period | $24.03 | $20.23 | $23.72 | $21.11 | $20.76 |
| | | | | | |
| Total Return | 30.87% | -9.33% | 19.08% | 11.11% | -1.43% |
| | | | | | |
| Ratios/Supplemental Data | | | | | |
| Net Assets, End of Period (Millions) | $2,155 | $1,621 | $1,804 | $1,495 | $1,363 |
| Ratio of Total Expenses to Average Net Assets | 0.17% | 0.17% | 0.19% | 0.19% | 0.19% |
| Ratio of Net Investment Income to Average Net Assets | 1.49% | 1.49% | 1.32% | 1.40% | 1.35% |
| Portfolio Turnover Rate | 21% | 21% | 18% | 21% | 23% |
1 Calculated based on average shares outstanding.
See accompanying Notes, which are an integral part of the Financial Statements.
Mid-Cap Index Portfolio
Notes to Financial Statements
The Mid-Cap Index Portfolio, a portfolio of Vanguard Variable Insurance Funds, is registered under the Investment Company Act of 1940 as an open-end investment company. The portfolio’s shares are only available for purchase by separate accounts of insurance companies as investments for variable annuity plans, variable life insurance contracts, or other variable benefit insurance contracts.
A. The following significant accounting policies conform to generally accepted accounting principles for U.S. investment companies. The portfolio consistently follows such policies in preparing its financial statements.
1. Security Valuation: Securities are valued as of the close of trading on the New York Stock Exchange (generally 4 p.m., Eastern time) on the valuation date. Equity securities are valued at the latest quoted sales prices or official closing prices taken from the primary market in which each security trades; such securities not traded on the valuation date are valued at the mean of the latest quoted bid and asked prices. Securities for which market quotations are not readily available, or whose values have been materially affected by events occurring before the portfolio’s pricing time but after the close of the securities’ primary markets, are valued by methods deemed by the board of trustees to represent fair value. Investments in Vanguard Market Liquidity Fund are valued at that fund’s net asset value. Temporary cash investments are valued using the latest bid prices or using valuations based on a matrix system (which considers such factors as security prices, yields, maturities, and ratings), both as furnished by independent pricing services.
2. Futures Contracts: The portfolio uses index futures contracts to a limited extent, with the objectives of maintaining full exposure to the stock market, maintaining liquidity, and minimizing transaction costs. The portfolio may purchase futures contracts to immediately invest incoming cash in the market, or sell futures in response to cash outflows, thereby simulating a fully invested position in the underlying index while maintaining a cash balance for liquidity. The primary risks associated with the use of futures contracts are imperfect correlation between changes in market values of stocks held by the portfolio and the prices of futures contracts, and the possibility of an illiquid market. Counterparty risk involving futures is mitigated because a regulated clearinghouse is the counterparty instead of the clearing broker. To further mitigate counterparty risk, the portfolio trades futures contracts on an exchange, monitors the financial strength of its clearing brokers and clearinghouse, and has entered into clearing agreements with its clearing brokers. The clearinghouse imposes initial margin requirements to secure the portfolio’s performance and requires daily settlement of variation margin representing changes in the market value of each contract. Any assets pledged as initial margin for open contracts are noted in the Statement of Net Assets.
Futures contracts are valued at their quoted daily settlement prices. The notional amounts of the contracts are not recorded in the Statement of Net Assets. Fluctuations in the value of the contracts are recorded in the Statement of Net Assets as an asset (liability) and in the Statement of Operations as unrealized appreciation (depreciation) until the contracts are closed, when they are recorded as realized futures gains (losses).
During the year ended December 31, 2019, the portfolio’s average investments in long and short futures contracts represented less than 1% and 0% of net assets, respectively, based on the average of the notional amounts at each quarter-end during the period.
3. Federal Income Taxes: The portfolio intends to continue to qualify as a regulated investment company and distribute all of its taxable income. Management has analyzed the portfolio’s tax positions taken for all open federal income tax years (December 31, 2016–2019), and has concluded that no provision for federal income tax is required in the portfolio’s financial statements.
4. Distributions: Distributions to shareholders are recorded on the ex-dividend date. Distributions are determined on a tax basis and may differ from net investment income and realized capital gains for financial reporting purposes.
5. Securities Lending: To earn additional income, the portfolio lends its securities to qualified institutional borrowers. Security loans are subject to termination by the portfolio at any time, and are required to be secured at all times by collateral in an amount at least equal to the market value of securities loaned. Daily market fluctuations could cause the value of loaned securities to be more or less than the value of the collateral received. When this occurs, the collateral is adjusted and settled before the opening of the market on the next business day. The portfolio further mitigates its counterparty risk by entering into securities lending transactions only with a diverse group of prequalified counterparties, monitoring their financial strength, and entering into master securities lending agreements with its counterparties.
Mid-Cap Index Portfolio
The master securities lending agreements provide that, in the event of a counterparty’s default (including bankruptcy), the portfolio may terminate any loans with that borrower, determine the net amount owed, and sell or retain the collateral up to the net amount owed to the portfolio; however, such actions may be subject to legal proceedings. While collateral mitigates counterparty risk, in the event of a default, the portfolio may experience delays and costs in recovering the securities loaned. The portfolio invests cash collateral received in Vanguard Market Liquidity Fund, and records a liability in the Statement of Net Assets for the return of the collateral, during the period the securities are on loan. Securities lending income represents fees charged to borrowers plus income earned on invested cash collateral, less expenses associated with the loan. During the term of the loan, the portfolio is entitled to all distributions made on or in respect of the loaned securities.
6. Credit Facility: The portfolio and certain other funds managed by The Vanguard Group (“Vanguard”) participate in a $4.3 billion committed credit facility provided by a syndicate of lenders pursuant to a credit agreement that may be renewed annually; each fund is individually liable for its borrowings, if any, under the credit facility. Borrowings may be utilized for temporary and emergency purposes, and are subject to the portfolio’s regulatory and contractual borrowing restrictions. The participating funds are charged administrative fees and an annual commitment fee of 0.10% of the undrawn amount of the facility; these fees are allocated to the funds based on a method approved by the portfolio’s board of trustees and included in Management and Administrative expenses on the portfolio’s Statement of Operations. Any borrowings under this facility bear interest at a rate based upon the higher of the one-month London Interbank Offered Rate, federal funds effective rate, or overnight bank funding rate plus an agreed-upon spread.
The portfolio had no borrowings outstanding at December 31, 2019, or at any time during the period then ended.
7. Other: Dividend income is recorded on the ex-dividend date. Interest income includes income distributions received from Vanguard Market Liquidity Fund and is accrued daily. Premiums and discounts on debt securities purchased are amortized and accreted, respectively, to interest income over the lives of the respective securities, except for premiums on certain callable debt securities which are amortized to the earliest call date. Security transactions are accounted for on the date securities are bought or sold. Costs used to determine realized gains (losses) on the sale of investment securities are those of the specific securities sold.
B. In accordance with the terms of a Funds’ Service Agreement (the “FSA”) between Vanguard and the portfolio, Vanguard furnishes to the portfolio investment advisory, corporate management, administrative, marketing, and distribution services at Vanguard’s cost of operations (as defined by the FSA). These costs of operations are allocated to the portfolio based on methods and guidelines approved by the board of trustees. Vanguard does not require reimbursement in the current period for certain costs of operations (such as deferred compensation/benefits and risk/insurance costs); the portfolio’s liability for these costs of operations is included in Payables to Vanguard on the Statement of Net Assets. All other costs of operations payable to Vanguard are generally settled twice a month.
Upon the request of Vanguard, the portfolio may invest up to 0.40% of its net assets as capital in Vanguard. At December 31, 2019, the portfolio had contributed to Vanguard capital in the amount of $94,000, representing less than 0.01% of the portfolio’s net assets and 0.04% of Vanguard’s capital received pursuant to the FSA. The portfolio’s trustees and officers are also directors and employees, respectively, of Vanguard.
C. The portfolio’s custodian bank has agreed to reduce its fees when the portfolio maintains cash on deposit in the non-interest-bearing custody account. For the year ended December 31, 2019, custodian fee offset arrangements reduced the portfolio’s expenses by $19,000 (an annual rate of less than 0.01% of average net assets).
D. Various inputs may be used to determine the value of the portfolio’s investments. These inputs are summarized in three broad levels for financial statement purposes. The inputs or methodologies used to value securities are not necessarily an indication of the risk associated with investing in those securities.
Level 1—Quoted prices in active markets for identical securities.
Level 2—Other significant observable inputs (including quoted prices for similar securities, interest rates, prepayment speeds, credit risk, etc.).
Level 3—Significant unobservable inputs (including the portfolio’s own assumptions used to determine the fair value of investments). Any investments valued with significant unobservable inputs are noted on the Statement of Net Assets.
Mid-Cap Index Portfolio
The following table summarizes the market value of the portfolio’s investments and derivatives as of December 31, 2019, based on the inputs used to value them:
| | Level 1 | Level 2 | Level 3 |
| Investments | ($000) | ($000) | ($000) |
| Common Stocks | 2,146,346 | — | — |
| Temporary Cash Investments | 11,319 | 398 | — |
| Futures Contracts—Assets1 | 18 | — | — |
| Total | 2,157,683 | 398 | — |
| 1 | Represents variation margin on the last day of the reporting period. |
E.Permanent differences between book-basis and tax-basis components of net assets, if any, are reclassified among capital accounts in the financial statements to reflect their tax character. These reclassifications have no effect on net assets or net asset value per share.
Temporary differences between book-basis and tax-basis components of total distributable earnings (loss) arise when certain items of income, gain, or loss are recognized in different periods for financial statement and tax purposes; these differences will reverse at some time in the future. The differences are primarily related to the tax deferral of losses on wash sales and the realization of unrealized gains or losses on certain futures contracts. As of period end, the tax-basis components of total distributable earnings (loss) are detailed in the table as follows:
| | Amount |
| | ($000) |
| Undistributed Ordinary Income | 28,442 |
| Undistributed Long-Term Gains | 111,241 |
| Capital Loss Carryforwards (Non-expiring) | — |
| Net Unrealized Gains (Losses) | 480,396 |
As of December 31, 2019, gross unrealized appreciation and depreciation for investments and derivatives based on cost for U.S. federal income tax purposes were as follows:
| | Amount |
| | ($000) |
| Tax Cost | 1,677,667 |
| Gross Unrealized Appreciation | 576,482 |
| Gross Unrealized Depreciation | (96,086) |
| Net Unrealized Appreciation (Depreciation) | 480,396 |
F.During the year ended December 31, 2019, the portfolio purchased $463,048,000 of investment securities and sold $403,744,000 of investment securities, other than temporary cash investments.
The portfolio purchased securities from and sold securities to other Vanguard funds or accounts managed by Vanguard or its affiliates, in accordance with procedures adopted by the board of trustees in compliance with Rule 17a-7 of the Investment Company Act of 1940. For the year ended December 31, 2019, such purchases and sales were $53,731,000 and $188,215,000, respectively; these amounts are included in the purchases and sales of investment securities noted above.
G.Capital shares issued and redeemed were:
| | Year Ended December 31, |
| | 2019 | 2018 |
| | Shares | Shares |
| | (000) | (000) |
| Issued | 13,473 | 11,048 |
| Issued in Lieu of Cash Distributions | 8,135 | 4,812 |
| Redeemed | (12,082) | (11,768) |
| Net Increase (Decrease) in Shares Outstanding | 9,526 | 4,092 |
Mid-Cap Index Portfolio
At December 31, 2019, one shareholder, an insurance company separate account whose holdings in the portfolio represent the indirect investment of Vanguard Variable Annuity contract holders, was the record or beneficial owner of 40% of the portfolio’s net assets. If this shareholder were to redeem its investment in the portfolio, the redemption might result in an increase in the portfolio’s expense ratio, cause the portfolio to incur higher transaction costs, or lead to the realization of taxable capital gains.
H. Management has determined that no events or transactions occurred subsequent to December 31, 2019, that would require recognition or disclosure in these financial statements.
Mid-Cap Index Portfolio
Report of Independent Registered Public Accounting Firm
To the Board of Trustees of Vanguard Variable Insurance Funds and Shareholders of Mid-Cap Index Portfolio
Opinion on the Financial Statements
We have audited the accompanying statement of net assets of Mid-Cap Index Portfolio (one of the portfolios constituting Vanguard Variable Insurance Funds, referred to hereafter as the “Portfolio”) as of December 31, 2019, the related statement of operations for the year ended December 31, 2019, the statement of changes in net assets for each of the two years in the period ended December 31, 2019, including the related notes, and the financial highlights for each of the five years in the period ended December 31, 2019 (collectively referred to as the “financial statements”). In our opinion, the financial statements present fairly, in all material respects, the financial position of the Portfolio as of December 31, 2019, the results of its operations for the year then ended, the changes in its net assets for each of the two years in the period ended December 31, 2019 and the financial highlights for each of the five years in the period ended December 31, 2019 in conformity with accounting principles generally accepted in the United States of America.
Basis for Opinion
These financial statements are the responsibility of the Portfolio’s management. Our responsibility is to express an opinion on the Portfolio’s financial statements based on our audits. We are a public accounting firm registered with the Public Company Accounting Oversight Board (United States) (“PCAOB”) and are required to be independent with respect to the Portfolio in accordance with the U.S. federal securities laws and the applicable rules and regulations of the Securities and Exchange Commission and the PCAOB.
We conducted our audits of these financial statements in accordance with the standards of the PCAOB. Those standards require that we plan and perform the audit to obtain reasonable assurance about whether the financial statements are free of material misstatement, whether due to error or fraud.
Our audits included performing procedures to assess the risks of material misstatement of the financial statements, whether due to error or fraud, and performing procedures that respond to those risks. Such procedures included examining, on a test basis, evidence regarding the amounts and disclosures in the financial statements. Our audits also included evaluating the accounting principles used and significant estimates made by management, as well as evaluating the overall presentation of the financial statements. Our procedures included confirmation of securities owned as of December 31, 2019 by correspondence with the custodian and brokers and by agreement to the underlying ownership records of the transfer agent; when replies were not received from brokers, we performed other auditing procedures. We believe that our audits provide a reasonable basis for our opinion.
/s/PricewaterhouseCoopers LLP
Philadelphia, Pennsylvania
February 18, 2020
We have served as the auditor of one or more investment companies in The Vanguard Group of Funds since 1975.
Special 2019 tax information (unaudited) for corporate shareholders only for Mid-Cap Index Portfolio, a portfolio of Vanguard Variable Insurance Funds
This information for the fiscal year ended December 31, 2019, is included pursuant to provisions of the Internal Revenue Code for corporate shareholders only.
The portfolio distributed $140,295,000 as capital gain dividends (20% rate gain distributions) to shareholders during the fiscal year.
For corporate shareholders, 83.5% of investment income (dividend income plus short-term gains, if any) qualifies for the dividends-received deduction.
Mid-Cap Index Portfolio
The CRSP US Mid Cap Index (the “Index”) is a product of the Center for Research in Security Prices, LLC (“CRSP”), an affiliate of the University of Chicago (“University”), and has been licensed for use by Vanguard. CRSP®is a trademark of CRSP; and has been licensed by CRSP for use for certain purposes by Vanguard. The Vanguard Mid-Cap Index Portfolio is not sponsored, endorsed, sold or promoted by CRSP or University. Neither CRSP nor University makes any representation or warranty, express or implied, to the owners of the Vanguard Mid-Cap Index Portfolio or any member of the public regarding the advisability of investing in securities generally or in Vanguard Mid-Cap Index Portfolio particularly or the ability of the Index to track general market performance. The Index is determined, composed and calculated without regard to Vanguard or the Vanguard Mid-Cap Index Portfolio. Neither CRSP nor the University has any obligation to take the needs of Vanguard or the owners of Vanguard Mid-Cap Index Portfolio into consideration in determining, composing or calculating the Index. Neither CRSP nor the University is responsible for and has not participated in the determination of the prices and amount of Vanguard Mid-Cap Index Portfolio or the timing of the issuance or sale of Vanguard Mid-Cap Index Portfolio or in the determination or calculation of the equation by which Vanguard Mid-Cap Index Portfolio is to be converted into cash, surrendered or redeemed, as the case may be. Neither CRSP nor the University has any obligation or liability in connection with the administration, marketing or trading of Vanguard Mid-Cap Index Portfolio. There is no assurance that investment products based on the Index will accurately track index performance or provide positive investment returns. Neither CRSP nor the University is an investment advisor. Inclusion of a security within an index is not a recommendation by CRSP or the University to buy, sell, or hold such security, nor is it considered to be investment advice.
NEITHER CRSP NOR THE UNIVERSITY GUARANTEE THE ADEQUACY, ACCURACY, TIMELINESS AND/OR THE COMPLETENESS OF THE INDEX OR ANY DATA RELATED THERETO OR ANY COMMUNICATION, INCLUDING BUT NOT LIMITED TO, ORAL OR WRITTEN COMMUNICATION (INCLUDING ELECTRONIC COMMUNICATIONS) WITH RESPECT THERETO. NEITHER CRSP NOR THE UNIVERSITY SHALL BE SUBJECT TO ANY DAMAGES OR LIABILITY FOR ANY ERRORS, OMISSIONS, OR DELAYS THEREIN. NEITHER CRSP NOR THE UNIVERSITY MAKES ANY EXPRESS OR IMPLIED WARRANTIES, AND CRSP AND THE UNIVERSITY EXPRESSLY DISCLAIM ALL WARRANTIES, OF MERCHANTABILITY OR FITNESS FOR A PARTICULAR PURPOSE OR USE OR AS TO RESULTS TO BE OBTAINED BY VANGUARD, OWNERS OF THE VANGUARD MID-CAP INDEX PORTFOLIO, OR ANY OTHER PERSON OR ENTITY FROM THE USE OF THE INDEX OR WITH RESPECT TO ANY DATA RELATED THERETO. WITHOUT LIMITING ANY OF THE FOREGOING, IN NO EVENT WHATSOEVER SHALL CRSP OR THE UNIVERSITY BE LIABLE FOR ANY INDIRECT, SPECIAL, INCIDENTAL, PUNITIVE, OR CONSEQUENTIAL DAMAGES INCLUDING BUT NOT LIMITED TO, LOSS OF PROFITS, TRADING LOSSES, LOST TIME OR GOODWILL, EVEN IF IT HAS BEEN ADVISED OF THE POSSIBILITY OF SUCH DAMAGES, WHETHER IN CONTRACT, TORT, STRICT LIABILITY, OR OTHERWISE. THERE ARE NO THIRD-PARTY BENEFICIARIES OF ANY AGREEMENTS OR ARRANGEMENTS BETWEEN CRSP AND VANGUARD, OTHER THAN THE LICENSORS, IF ANY, OF CRSP.
Moderate Allocation Portfolio
Your Portfolio’s Performance at a Glance
• For the 12 months ended December 31, 2019, the Moderate Allocation Portfolio returned 19.53%, in line with the 20.26% return of its composite index after factoring in the portfolio’s expenses.
• Stocks and bonds recorded their best results in years. Stocks benefited from accommodative monetary policies implemented by the Federal Reserve and other major central banks. Safer assets such as bonds also attracted investors as the U.S.-China trade conflict fueled global economic growth concerns.
• The portfolio targets an asset allocation of approximately 60% stocks and 40% bonds through these holdings: Vanguard Variable Insurance Fund (VVIF) Total Bond Market Index Portfolio, VVIF Equity Index Portfolio, Vanguard Total International Bond Index Fund, Vanguard Total International Stock Index Fund, and Vanguard Extended Market Index Fund.
• The Equity Index Portfolio returned about 31%, the Extended Market Index Fund about 28%, and the Total International Stock Fund more than 21%. The Total Bond Market Index Portfolio returned almost 9%, and the Total International Bond Index Fund returned nearly 8%.
• Please note that the portfolio returns in Vanguard Variable Insurance Fund are different from those in Vanguard Variable Annuity (and other plans that invest in the fund), which take into account insurance-related expenses.
| Market Barometer | | | |
| | | Average Annual Total Returns |
| | | Periods Ended December 31, 2019 |
| | One Year | Three Years | Five Years |
| Stocks | | | |
| Russell 1000 Index (Large-caps) | 31.43% | 15.05% | 11.48% |
| Russell 2000 Index (Small-caps) | 25.53 | 8.59 | 8.23 |
| Russell 3000 Index (Broad U.S. market) | 31.02 | 14.57 | 11.24 |
| FTSE All-World ex US Index (International) | 21.81 | 9.96 | 5.83 |
| | | | |
| Bonds | | | |
| Bloomberg Barclays U.S. Aggregate Bond Index (Broad taxable market) | 8.72% | 4.03% | 3.05% |
| Bloomberg Barclays Municipal Bond Index (Broad tax-exempt market) | 7.54 | 4.72 | 3.53 |
| FTSE Three-Month U.S. Treasury Bill Index | 2.25 | 1.65 | 1.04 |
| | | | |
| CPI | | | |
| Consumer Price Index | 2.29% | 2.10% | 1.82% |
Moderate Allocation Portfolio
About Your Portfolio’s Expenses
As a shareholder of the portfolio, you incur ongoing costs, which include costs for portfolio management, administrative services, and shareholder reports (like this one), among others. Operating expenses, which are deducted from a portfolio’s gross income, directly reduce the investment return of the portfolio.
A typical portfolio’s expenses are expressed as a percentage of its average net assets. The Moderate Allocation Portfolio has no direct expenses, but bears its proportionate share of the expenses of the underlying funds in which it invests. These indirect expenses make up the acquired fund fees and expenses, also expressed as a percentage of average net assets. The following examples are intended to help you understand the ongoing costs (in dollars) of investing in your portfolio and to compare these costs with those of other mutual funds. The examples are based on an investment of $1,000 made at the beginning of the period shown and held for the entire period. The costs were calculated using the acquired fund fees and expenses for the Moderate Allocation Portfolio.
The accompanying table illustrates your portfolio’s costs in two ways:
• Based on actual portfolio return.This section helps you to estimate the actual expenses that you paid over the period. The “Ending Account Value” shown is derived from the portfolio’s actual return, and the third column shows the dollar amount that would have been paid by an investor who started with $1,000 in the portfolio. You may use the information here, together with the amount you invested, to estimate the expenses that you paid over the period.
To do so, simply divide your account value by $1,000 (for example, an $8,600 account value divided by $1,000 = 8.6), then multiply the result by the number given for your portfolio under the heading “Expenses Paid During Period.”
• Based on hypothetical 5% yearly return. This section is intended to help you compare your portfolio’s costs with those of other mutual funds. It assumes that the portfolio had a yearly return of 5% before expenses, but that the expense ratio is unchanged. In this case—because the return used is not the portfolio’s actual return—the results do not apply to your investment. The example is useful in making comparisons because the Securities and Exchange Commission requires all mutual funds to calculate expenses based on a 5% return. You can assess your portfolio’s costs by comparing this hypothetical example with the hypothetical examples that appear in shareholder reports of other funds.
Note that the expenses shown in the table are meant to highlight and help you compareongoingcosts only. The portfolio’s expense figure does not reflect additional fees and expenses associated with the annuity or life insurance program through which you invest.
The calculations assume no shares were bought or sold during the period. Your actual costs may have been higher or lower, depending on the amount of your investment and the timing of any purchases or redemptions.
You can find more information about the portfolio’s expenses in the Financial Statements section. For additional information on operating expenses and other shareholder costs, please refer to the prospectus.
| Six Months Ended December 31, 2019 | | | |
| | Beginning | Ending | Expenses |
| | Account Value | Account Value | Paid During |
| Moderate Allocation Portfolio | 6/30/2019 | 12/31/2019 | Period |
| Based on Actual Portfolio Return | $1,000.00 | $1,063.94 | $0.62 |
| Based on Hypothetical 5% Yearly Return | 1,000.00 | 1,024.60 | $0.61 |
The calculations are based on the Moderate Allocation Portfolio’s acquired fund fees and expenses for the most recent six-month period. The Moderate Allocation Portfolio’s annualized expense figure for that period is 0.12%. The dollar amounts shown as “Expenses Paid” are equal to the annualized average weighted expense ratio for the underlying funds, multiplied by the average account value over the period, multiplied by the number of days in the most recent six-month period, then divided by the number of days in the recent 12-month period (184/365).
Moderate Allocation Portfolio
Performance Summary
All of the returns in this report represent past performance, which is not a guarantee of future results that may be achieved by the portfolio. (Current performance may be lower or higher than the performance data cited. For performance data current to the most recent month-end, visit our website at vanguard.com/performance.) Note, too, that both investment returns and principal value can fluctuate widely, so an investor’s shares, when sold, could be worth more or less than their original cost. The returns shown do not reflect taxes that a shareholder would pay on portfolio distributions or on the sale of portfolio shares. Nor do the returns reflect fees and expenses associated with the annuity or life insurance program through which a shareholder invests. If these fees and expenses were included, the portfolio’s returns would be lower.
Cumulative Performance: October 19, 2011–December 31, 2019
Initial Investment of $10,000
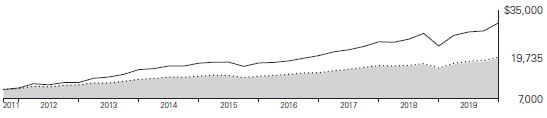
| | | | Average Annual Total Returns | |
| | | Periods Ended December 31, 2019 | |
| | | | | Since | Final Value |
| | | One | Five | Inception | of a $10,000 |
| | | Year | Years | (10/19/2011) | Investment |
 | Moderate Allocation Portfolio | 19.53% | 6.97% | 8.64% | $19,735 |
 | Moderate Allocation Composite Index | 20.26 | 7.32 | 8.93 | 20,167 |
 | Dow Jones U.S. Total Stock Market Float Adjusted Index | 30.90 | 11.18 | 14.82 | 31,055 |
| | | | | | | |
Moderate Allocation Composite Index: Weighted 42% S&P Total Market Index, 32% Bloomberg Barclays U.S. Aggregate Float Adjusted Index, 18% FTSE Global All Cap ex US Index, and 8% Bloomberg Barclays Global Aggregate ex-USD Float Adjusted RIC Capped Index (USD Hedged) as of June 3, 2013. Previously, the composite was weighted 42% S&P Total Market Index, 40% Bloomberg Barclays U.S. Aggregate Float Adjusted Index, and 18% MSCI ACWI ex USA IMI Index.
“Since Inception” performance is calculated from the portfolio’s inception date for both the portfolio and its comparative standard(s).
See Financial Highlights for dividend and capital gains information.
Moderate Allocation Portfolio
Underlying Vanguard Funds
As of December 31, 2019
| Vanguard Variable Insurance Fund Equity Index Portfolio | 30.3% |
| Vanguard Variable Insurance Fund Total Bond Market Index Fund | 27.7 |
| Vanguard Total International Stock Index Fund Admiral Shares | 24.2 |
| Vanguard Total International Bond Index Fund Admiral Shares | 11.9 |
| Vanguard Extended Market Index Fund Admiral Shares | 5.9 |
Moderate Allocation Portfolio
Financial Statements
Statement of Net Assets
As of December 31, 2019
The portfolio files its complete schedule of portfolio holdings with the Securities and Exchange Commission (SEC) for the first and third quarters of each fiscal year as an exhibit to its reports on Form N-PORT. The portfolio’s Form N-PORT reports are available on the SEC’s website at www.sec.gov.
| | | Market | |
| | | Value• | |
| | Shares | ($000 | ) |
| Investment Companies (100.0%) | |
| U.S. Stock Funds (36.2%) | | | |
| Vanguard Variable Insurance Fund—Equity Index Portfolio | 3,372,237 | 160,856 | |
| Vanguard Extended Market Index Fund Admiral Shares | 329,666 | 31,519 | |
| | | 192,375 | |
| International Stock Fund (24.2%) | | | |
| Vanguard Total International Stock Index Fund Admiral Shares | 4,301,692 | 128,492 | |
| | | | |
| U.S. Bond Fund (27.7%) | | | |
| Vanguard Variable Insurance Fund—Total Bond Market Index Portfolio | 12,080,725 | 147,506 | |
| | | | |
| International Bond Fund (11.9%) | | | |
| Vanguard Total International Bond Index Fund Admiral Shares | 2,795,866 | 63,242 | |
| Total Investment Companies (Cost $478,749) | | 531,615 | |
| Temporary Cash Investment (0.0%) | |
| Money Market Fund (0.0%) | | | |
| 1Vanguard Market Liquidity Fund, 1.816%(Cost $0) | 3 | — | |
| Total Investments (100.0%) (Cost $478,749) | | 531,615 | |
| Other Assets and Liabilities (0.0%) | |
| Other Assets | | 799 | |
| Liabilities | | (734 | ) |
| | | 65 | |
| Net Assets (100%) | |
| Applicable to 17,652,671 outstanding $.001 par value shares of beneficial interest (unlimited authorization) | | 531,680 | |
| Net Asset Value Per Share | | $30.12 | |
| | | Amount | |
| | | ($000 | ) |
| Statement of Assets and Liabilities | |
| Assets | | | |
| Investments in Securities, at Value—Affiliated Funds | | 531,615 | |
| Receivables for Investment Securities Sold | | 650 | |
| Receivables for Capital Shares Issued | | 149 | |
| Total Assets | | 532,414 | |
| Liabilities | | | |
| Payables for Capital Shares Redeemed | | 370 | |
| Other Payables | | 364 | |
| Total Liabilities | | 734 | |
| Net Assets | | 531,680 | |
| At December 31, 2019, net assets consisted of: | | |
| | | Amount |
| | | ($000) |
| Paid-in Capital | | 455,930 |
| Total Distributable Earnings (Loss) | | 75,750 |
| Net Assets | | 31,680 |
| • | See Note A in Notes to Financial Statements. |
| 1 | Affiliated fund available only to Vanguard funds and certain trusts and accounts managed by Vanguard. Rate shown for Vanguard Market Liquidity Fund is the 7-day yield. |
See accompanying Notes, which are an integral part of the Financial Statements.
Moderate Allocation Portfolio
Statement of Operations
| | Year Ended |
| | December 31, 2019 |
| | ($000) |
| Investment Income | |
| Income | |
| Income Distributions Received from Affiliated Funds | 11,835 |
| Net Investment Income—Note B | 11,835 |
| Realized Net Gain (Loss) | |
| Capital Gain Distributions Received from Affiliated Funds | 3,264 |
| Affiliated Funds Sold | 8,452 |
| Realized Net Gain (Loss) | 11,716 |
| Change in Unrealized Appreciation (Depreciation) from Affiliated Funds | 57,473 |
| Net Increase (Decrease) in Net Assets Resulting from Operations | 81,024 |
Statement of Changes in Net Assets
| | Year Ended December 31, |
| | 2019 | 2018 |
| | ($000) | ($000) |
| Increase (Decrease) in Net Assets |
| Operations |
| Net Investment Income | 11,835 | 9,377 |
| Realized Net Gain (Loss) | 11,716 | 10,505 |
| Change in Unrealized Appreciation (Depreciation) | 57,473 | (41,100) |
| Net Increase (Decrease) in Net Assets Resulting from Operations | 81,024 | (21,218) |
| Distributions |
| Net Investment Income | (9,885) | (7,930) |
| Realized Capital Gain1 | (10,650) | (13,085) |
| Total Distributions | (20,535) | (21,015) |
| Capital Share Transactions |
| Issued | 96,476 | 77,289 |
| Issued in Lieu of Cash Distributions | 20,535 | 21,015 |
| Redeemed | (45,572) | (50,345) |
| Net Increase (Decrease) from Capital Share Transactions | 71,439 | 47,959 |
| Total Increase (Decrease) | 131,928 | 5,726 |
| Net Assets |
| Beginning of Period | 399,752 | 394,026 |
| End of Period | 531,680 | 399,752 |
| 1 | Includes fiscal 2019 and 2018 short-term gain distributions totaling $0 and $223,000, respectively. Short-term gain distributions are treated as ordinary income dividends for tax purposes. |
See accompanying Notes, which are an integral part of the Financial Statements.
Moderate Allocation Portfolio
Financial Highlights
| For a Share Outstanding | | | Year Ended December 31, |
| Throughout Each Period | 2019 | 2018 | 2017 | 2016 | 2015 |
| Net Asset Value, Beginning of Period | $26.46 | $29.35 | $26.67 | $25.80 | $26.63 |
| Investment Operations | | | | | |
| Net Investment Income1 | .720 | .634 | .657 | .581 | .499 |
| Capital Gain Distributions Received | .199 | .148 | .309 | .182 | .282 |
| Net Realized and Unrealized Gain (Loss) on Investments | 4.106 | (2.142) | 2.863 | 1.112 | (.809) |
| Total from Investment Operations | 5.025 | (1.360) | 3.829 | 1.875 | (.028) |
| Distributions | | | | | |
| Dividends from Net Investment Income | (.657) | (.577) | (.545) | (.439) | (.417) |
| Distributions from Realized Capital Gains | (.708) | (.953) | (.604) | (.566) | (.385) |
| Total Distributions | (1.365) | (1.530) | (1.149) | (1.005) | (.802) |
| Net Asset Value, End of Period | $30.12 | $26.46 | $29.35 | $26.67 | $25.80 |
| | | | | | |
| Total Return | 19.53% | -4.94% | 14.80% | 7.55% | -0.16% |
| | | | | | |
| Ratios/Supplemental Data | | | | | |
| Net Assets, End of Period (Millions) | $532 | $400 | $394 | $294 | $257 |
| Ratio of Total Expenses to Average Net Assets | — | — | — | — | — |
| Acquired Fund Fees and Expenses | 0.12% | 0.12% | 0.14% | 0.16% | 0.16% |
| Ratio of Net Investment Income to Average Net Assets | 2.54% | 2.25% | 2.36% | 2.25% | 1.89% |
| Portfolio Turnover Rate | 13% | 20% | 21% | 14% | 12% |
1 Calculated based on average shares outstanding.
See accompanying Notes, which are an integral part of the Financial Statements.
Moderate Allocation Portfolio
Notes to Financial Statements
The Moderate Allocation Portfolio, a portfolio of Vanguard Variable Insurance Funds, is registered under the Investment Company Act of 1940 as an open-end investment company. The portfolio follows a balanced investment strategy by investing in selected Vanguard funds and portfolios to achieve its targeted allocation of assets to U.S. and international stocks, and U.S. and international bonds. Financial statements and other information about each underlying fund and portfolio are available on vanguard.com. The portfolio’s shares are only available for purchase by separate accounts of insurance companies as investments for variable annuity plans, variable life insurance contracts, or other variable benefit insurance contracts.
A. The following significant accounting policies conform to generally accepted accounting principles for U.S. investment companies. The portfolio consistently follows such policies in preparing its financial statements.
1. Security Valuation: Investments are valued at the net asset value of each underlying Vanguard fund determined as of the close of the New York Stock Exchange (generally 4 p.m., Eastern time) on the valuation date.
2. Federal Income Taxes: The portfolio intends to continue to qualify as a regulated investment company and distribute all of its taxable income. Management has analyzed the portfolio’s tax positions taken for all open federal income tax years (December 31, 2016–2019), and has concluded that no provision for federal income tax is required in the portfolio’s financial statements.
3. Distributions: Distributions to shareholders are recorded on the ex-dividend date. Distributions are determined on a tax basis and may differ from net investment income and realized capital gains for financial reporting purposes.
4. Credit Facility: The portfolio and certain other funds managed by The Vanguard Group (“Vanguard”) participate in a $4.3 billion committed credit facility provided by a syndicate of lenders pursuant to a credit agreement that may be renewed annually; each fund is individually liable for its borrowings, if any, under the credit facility. Borrowings may be utilized for temporary and emergency purposes, and are subject to the portfolio’s regulatory and contractual borrowing restrictions. The participating funds are charged administrative fees and an annual commitment fee of 0.10% of the undrawn amount of the facility; these fees are allocated to the funds based on a method approved by the portfolio’s board of trustees and borne by the funds in which the portfolio invests (see Note B). Any borrowings under this facility bear interest at a rate based upon the higher of the one-month London Interbank Offered Rate, federal funds effective rate, or overnight bank funding rate plus an agreed-upon spread.
The portfolio had no borrowings outstanding at December 31, 2019, or at any time during the period then ended.
5. Other: Income and capital gain distributions received are recorded on the ex-dividend date. Security transactions are accounted for on the date securities are bought or sold. Costs used to determine realized gains (losses) on the sale of investment securities are those of the specific securities sold.
B. In accordance with the terms of a Funds’ Service Agreement (the “FSA”) between Vanguard and the portfolio, Vanguard furnishes to the portfolio investment advisory, corporate management, administrative, marketing, and distribution services at Vanguard’s cost of operations (as defined by the FSA). These costs of operations are allocated to the portfolio based on methods and guidelines approved by the board of trustees. The FSA provides that expenses otherwise allocable to Vanguard funds-of-funds may be reduced or eliminated to the extent of savings realized by the underlying Vanguard funds by virtue of being part of a fund-of-funds. Accordingly, all expenses for services provided by Vanguard to the portfolio and all other expenses incurred by the portfolio during the period ended December 31, 2019, were borne by the underlying Vanguard funds in which the portfolio invests. The portfolio’s trustees and officers are also trustees and officers, respectively, of the underlying Vanguard funds, as well as directors and employees, respectively, of Vanguard.
Moderate Allocation Portfolio
C. Various inputs may be used to determine the value of the portfolio’s investments. These inputs are summarized in three broad levels for financial statement purposes. The inputs or methodologies used to value securities are not necessarily an indication of the risk associated with investing in those securities.
Level 1—Quoted prices in active markets for identical securities.
Level 2—Other significant observable inputs (including quoted prices for similar securities, interest rates, prepayment speeds, credit risk, etc.).
Level 3—Significant unobservable inputs (including the portfolio’s own assumptions used to determine the fair value of investments). Any investments valued with significant unobservable inputs are noted on the Statement of Net Assets.
At December 31, 2019, 100% of the market value of the portfolio’s investments) was determined based on Level 1 inputs.
D. Permanent differences between book-basis and tax-basis components of net assets, if any, are reclassified among capital accounts in the financial statements to reflect their tax character. These reclassifications have no effect on net assets or net asset value per share.
Temporary differences between book-basis and tax-basis components of total distributable earnings (loss) arise when certain items of income, gain, or loss are recognized in different periods for financial statement and tax purposes; these differences will reverse at some time in the future. The differences are primarily related to the tax deferral of losses on wash sales. As of period end, the tax-basis components of total distributable earnings (loss) are detailed in the table as follows:
| | | Amount | |
| | | ($000 | ) |
| Undistributed Ordinary Income | | 11,887 | |
| Undistributed Long-Term Gains | | 10,997 | |
| Capital Loss Carryforwards (Non-expiring) | | — | |
| Net Unrealized Gains (Losses) | | 52,866 | |
As of December 31, 2019, gross unrealized appreciation and depreciation for investments based on cost for U.S. federal income tax purposes were as follows:
| | | Amount | |
| | | ($000 | ) |
| Tax Cost | | 478,749 | |
| Gross Unrealized Appreciation | | 53,764 | |
| Gross Unrealized Depreciation | | (898 | ) |
| Net Unrealized Appreciation (Depreciation) | | 52,866 | |
E. Capital shares issued and redeemed were:
| | | Year Ended December 31, | |
| | | 2019 | | | 2018 | |
| | | Shares | | | Shares | |
| | | | (000 | ) | | | (000 | ) |
| Issued | | | 3,403 | | | | 2,733 | |
| Issued in Lieu of Cash Distributions | | | 754 | | | | 748 | |
| Redeemed | | | (1,613 | ) | | | (1,799 | ) |
| Net Increase (Decrease) in Shares Outstanding | | | 2,544 | | | | 1,682 | |
At December 31, 2019, one shareholder, an insurance company separate account whose holdings in the portfolio represent the indirect investment of Vanguard Variable Annuity contract holders, was the record or beneficial owner of 88% of the portfolio’s net assets.
Moderate Allocation Portfolio
F. Transactions during the period in affiliated underlying Vanguard funds were as follows:
| | | | | | Current Period Transactions | | | | |
| | | Dec, 31, | | | | | | Proceeds | | | Realized | | | | | | | | | | | | Dec. 31, | |
| | | 2018 | | | | | | from | | | Net | | | Change in | | | | | | Capital Gain | | | 2019 | |
| | | Market | | | Purchases | | | Securities | | | Gain | | | Unrealized | | | Distributions | | | Market | |
| | | Value | | | at Cost | | | Sold | | | (Loss | ) | | App. (Dep. | ) | | Income | | | Received | | | Value | |
| | | ($000 | ) | | ($000 | ) | | ($000 | ) | | ($000 | ) | | ($000 | ) | | ($000 | ) | | ($000 | ) | | ($000 | ) |
| Vanguard Market Liquidity Fund | | 69 | | | NA1 | | | NA1 | | | — | | | — | | | 3 | | | — | | | — | |
| Vanguard Extended Market Index Fund | | 23,496 | | | 3,898 | | | 2,229 | | | 725 | | | 5,629 | | | 396 | | | — | | | 31,519 | |
| Vanguard Total International Bond Index Fund | | 48,154 | | | 15,797 | | | 2,666 | | | 299 | | | 1,658 | | | 2,011 | | | — | | | 63,242 | |
| Vanguard Total International Stock Index Fund | | 97,249 | | | 27,224 | | | 14,248 | | | 1,502 | | | 16,765 | | | 3,687 | | | — | | | 128,492 | |
| Vanguard Variable Insurance Fund— Equity Index Portfolio | | 121,281 | | | 29,669 | | | 22,130 | | | 5,338 | | | 26,698 | | | 2,493 | | | 3,264 | | | 160,856 | |
| Vanguard Variable Insurance Fund— Total Bond Market Index Portfolio | | 109,660 | | | 51,060 | | | 20,525 | | | 588 | | | 6,723 | | | 3,245 | | | — | | | 147,506 | |
| Total | | 399,909 | | | 127,648 | | | 61,798 | | | 8,452 | | | 57,473 | | | 11,835 | | | 3,264 | | | 531,615 | |
1 Not applicable—purchases and sales are for temporary cash investment purposes.
G. Management has determined that no events or transactions occurred subsequent to December 31, 2019, that would require recognition or disclosure in these financial statements.
Moderate Allocation Portfolio
Report of Independent Registered Public Accounting Firm
To the Board of Trustees of Vanguard Variable Insurance Funds and Shareholders of Moderate Allocation Portfolio
Opinion on the Financial Statements
We have audited the accompanying statement of net assets and statement of assets and liabilities of Moderate Allocation Portfolio (one of the portfolios constituting Vanguard Variable Insurance Funds, referred to hereafter as the “Portfolio”) as of December 31, 2019, the related statement of operations for the year ended December 31, 2019, the statement of changes in net assets for each of the two years in the period ended December 31, 2019, including the related notes, and the financial highlights for each of the five years in the period ended December 31, 2019 (collectively referred to as the “financial statements”). In our opinion, the financial statements present fairly, in all material respects, the financial position of the Portfolio as of December 31, 2019, the results of its operations for the year then ended, the changes in its net assets for each of the two years in the period ended December 31, 2019 and the financial highlights for each of the five years in the period ended December 31, 2019 in conformity with accounting principles generally accepted in the United States of America.
Basis for Opinion
These financial statements are the responsibility of the Portfolio’s management. Our responsibility is to express an opinion on the Portfolio’s financial statements based on our audits. We are a public accounting firm registered with the Public Company Accounting Oversight Board (United States) (“PCAOB”) and are required to be independent with respect to the Portfolio in accordance with the U.S. federal securities laws and the applicable rules and regulations of the Securities and Exchange Commission and the PCAOB.
We conducted our audits of these financial statements in accordance with the standards of the PCAOB. Those standards require that we plan and perform the audit to obtain reasonable assurance about whether the financial statements are free of material misstatement, whether due to error or fraud.
Our audits included performing procedures to assess the risks of material misstatement of the financial statements, whether due to error or fraud, and performing procedures that respond to those risks. Such procedures included examining, on a test basis, evidence regarding the amounts and disclosures in the financial statements. Our audits also included evaluating the accounting principles used and significant estimates made by management, as well as evaluating the overall presentation of the financial statements. Our procedures included confirmation of securities owned as of December 31, 2019 by correspondence with the transfer agent. We believe that our audits provide a reasonable basis for our opinion.
/s/PricewaterhouseCoopers LLP
Philadelphia, Pennsylvania
February 18, 2020
We have served as the auditor of one or more investment companies in The Vanguard Group of Funds since 1975.
Special 2019 tax information (unaudited) for corporate shareholders only for Moderate Allocation Portfolio, a portfolio of Vanguard Variable Insurance Funds
This information for the fiscal year ended December 31, 2019, is included pursuant to provisions of the Internal Revenue Code for corporate shareholders only.
The portfolio distributed $10,650,000 as capital gain dividends (20% rate gain distributions) to shareholders during the fiscal year.
For corporate shareholders, 20.8% of investment income (dividend income plus short-term gains, if any) qualifies for the dividends-received deduction.
The portfolio designates to shareholders foreign source income of $5,829,000 and foreign taxes paid of $275,000. Shareholders will receive more detailed information with their Form 1099-DIV in January 2020 to determine the calendar-year amounts to be included on their 2019 tax returns.
Moderate Allocation Portfolio
BLOOMBERG is a trademark and service mark of Bloomberg Finance L.P. BARCLAYS is a trademark and service mark of Barclays Bank Plc, used under license. Bloomberg Finance L.P. and its affiliates, including Bloomberg Index Services Limited (BISL) (collectively, Bloomberg), or Bloomberg’s licensors, own all proprietary rights in the Bloomberg Barclays U.S. Aggregate Float Adjusted Index and the Bloomberg Barclays Global Aggregate ex-USD Float Adjusted RIC Capped Index (USD Hedged) (the Indices or Bloomberg Barclays Indices).
Neither Barclays Bank Plc, Barclays Capital Inc., or any affiliate (collectively Barclays) or Bloomberg is the issuer or producer of the Moderate Allocation Portfolio and neither Bloomberg nor Barclays has any responsibilities, obligations or duties to investors in the Moderate Allocation Portfolio. The Indices are licensed for use by The Vanguard Group, Inc. (Vanguard) as the sponsor of the Moderate Allocation Portfolio. Bloomberg and Barclays’ only relationship with Vanguard in respect of the Indices is the licensing of the Indices, which are determined, composed and calculated by BISL, or any successor thereto, without regard to the Issuer or the Moderate Allocation Portfolio or the owners of the Moderate Allocation Portfolio.
Additionally, Vanguard may for itself execute transaction(s) with Barclays in or relating to the Indices in connection with the Moderate Allocation Portfolio. Investors acquire the Moderate Allocation Portfolio from Vanguard and investors neither acquire any interest in the Indices nor enter into any relationship of any kind whatsoever with Bloomberg or Barclays upon making an investment in the Moderate Allocation Portfolio. The Moderate Allocation Portfolio is not sponsored, endorsed, sold or promoted by Bloomberg or Barclays. Neither Bloomberg nor Barclays makes any representation or warranty, express or implied regarding the advisability of investing in the Moderate Allocation Portfolio or the advisability of investing in securities generally or the ability of the Indices to track corresponding or relative market performance. Neither Bloomberg nor Barclays has passed on the legality or suitability of the Moderate Allocation Portfolio with respect to any person or entity. Neither Bloomberg nor Barclays is responsible for and has not participated in the determination of the timing of, prices at, or quantities of the Moderate Allocation Portfolio to be issued. Neither Bloomberg nor Barclays has any obligation to take the needs of the Issuer or the owners of the Moderate Allocation Portfolio or any other third party into consideration in determining, composing or calculating the Indices. Neither Bloomberg nor Barclays has any obligation or liability in connection with administration, marketing or trading of the Moderate Allocation Portfolio.
The licensing agreement between Bloomberg and Barclays is solely for the benefit of Bloomberg and Barclays and not for the benefit of the owners of the Moderate Allocation Portfolio, investors or other third parties. In addition, the licensing agreement between Vanguard and Bloomberg is solely for the benefit of Vanguard and Bloomberg and not for the benefit of the owners of the Moderate Allocation Portfolio, investors or other third parties.
NEITHER BLOOMBERG NOR BARCLAYS SHALL HAVE ANY LIABILITY TO THE ISSUER, INVESTORS OR TO OTHER THIRD PARTIES FOR THE QUALITY, ACCURACY AND/OR COMPLETENESS OF THE BLOOMBERG BARCLAYS INDICES OR ANY DATA INCLUDED THEREIN OR FOR INTERRUPTIONS IN THE DELIVERY OF THE BLOOMBERG BARCLAYS INDICES. NEITHER BLOOMBERG NOR BARCLAYS MAKES ANY WARRANTY, EXPRESS OR IMPLIED, AS TO RESULTS TO BE OBTAINED BY THE ISSUER, THE INVESTORS OR ANY OTHER PERSON OR ENTITY FROM THE USE OF THE BLOOMBERG BARCLAYS INDICES OR ANY DATA INCLUDED THEREIN. NEITHER BLOOMBERG NOR BARCLAYS MAKES ANY EXPRESS OR IMPLIED WARRANTIES, AND EACH HEREBY EXPRESSLY DISCLAIMS ALL WARRANTIES OF MERCHANTABILITY OR FITNESS FOR A PARTICULAR PURPOSE OR USE WITH RESPECT TO THE BLOOMBERG BARCLAYS INDICES OR ANY DATA INCLUDED THEREIN. BLOOMBERG RESERVES THE RIGHT TO CHANGE THE METHODS OF CALCULATION OR PUBLICATION, OR TO CEASE THE CALCULATION OR PUBLICATION OF THE BLOOMBERG BARCLAYS INDICES, AND NEITHER BLOOMBERG NOR BARCLAYS SHALL BE LIABLE FOR ANY MISCALCULATION OF OR ANY INCORRECT, DELAYED OR INTERRUPTED PUBLICATION WITH RESPECT TO THE BLOOMBERG BARCLAYS INDICES. NEITHER BLOOMBERG NOR BARCLAYS SHALL BE LIABLE FOR ANY DAMAGES, INCLUDING, WITHOUT LIMITATION, ANY SPECIAL, INDIRECT OR CONSEQUENTIAL DAMAGES, OR ANY LOST PROFITS AND EVEN IF ADVISED OF THE POSSIBLITY OF SUCH, RESULTING FROM THE USE OF THE BLOOMBERG BARCLAYS INDICES OR ANY DATA INCLUDED THEREIN OR WITH RESPECT TO THE MODERATE ALLOCATION PORTFOLIO.
None of the information supplied by Bloomberg or Barclays and used in this publication may be reproduced in any manner without the prior written permission of both Bloomberg and Barclays Capital, the investment banking division of Barclays Bank Plc. Barclays Bank Plc is registered in England No. 1026167. Registered office 1 Churchill Place London E14 5HP.
© 2020 Bloomberg. Used with Permission.
Source: Bloomberg Index Services Limited. Copyright 2020, Bloomberg. All rights reserved.
Money Market Portfolio
About Your Portfolio’s Expenses
As a shareholder of the portfolio, you incur ongoing costs, which include costs for portfolio management, administrative services, and shareholder reports (like this one), among others. Operating expenses, which are deducted from a portfolio’s gross income, directly reduce the investment return of the portfolio.
A portfolio’s expenses are expressed as a percentage of its average net assets. This figure is known as the expense ratio. The following examples are intended to help you understand the ongoing costs (in dollars) of investing in your portfolio and to compare these costs with those of other mutual funds. The examples are based on an investment of $1,000 made at the beginning of the period shown and held for the entire period.
The table below illustrates your portfolio’s costs in two ways:
• Based on actual portfolio return. This section helps you to estimate the actual expenses that you paid over the period. The “Ending Account Value” shown is derived from the portfolio’s actual return, and the third column shows the dollar amount that would have been paid by an investor who started with $1,000 in the portfolio. You may use the information here, together with the amount you invested, to estimate the expenses that you paid over the period.
To do so, simply divide your account value by $1,000 (for example, an $8,600 account value divided by $1,000 = 8.6), then multiply the result by the number given for your portfolio under the heading “Expenses Paid During Period.”
• Based on hypothetical 5% yearly return. This section is intended to help you compare your portfolio’s costs with those of other mutual funds. It assumes that the portfolio had a yearly return of 5% before expenses, but that the expense ratio is unchanged. In this case—because the return used is not the portfolio’s actual return—the results do not apply to your investment. The example is useful in making comparisons because the Securities and Exchange Commission requires all mutual funds to calculate expenses based on a 5% return. You can assess your portfolio’s costs by comparing this hypothetical example with the hypothetical examples that appear in shareholder reports of other funds.
Note that the expenses shown in the table are meant to highlight and help you compareongoingcosts only and do not reflect transaction costs incurred by the portfolio for buying and selling securities. The portfolio’s expense ratio does not reflect additional fees and expenses associated with the annuity or life insurance program through which you invest.
The calculations assume no shares were bought or sold during the period. Your actual costs may have been higher or lower, depending on the amount of your investment and the timing of any purchases or redemptions.
You can find more information about the portfolio’s expenses in the Financial Statements section. For additional information on operating expenses and other shareholder costs, please refer to the prospectus.
| Six Months Ended December 31, 2019 | | | |
| | Beginning | Ending | Expenses |
| | Account Value | Account Value | Paid During |
| Money Market Portfolio | 6/30/2019 | 12/31/2019 | Period |
| Based on Actual Portfolio Return | $1,000.00 | $1,010.23 | $0.76 |
| Based on Hypothetical 5% Yearly Return | 1,000.00 | 1,024.45 | 0.77 |
The calculations are based on expenses incurred in the most recent six-month period. The portfolio’s annualized six-month expense ratio for that period is 0.15%. The dollar amounts shown as “Expenses Paid” are equal to the annualized expense ratio multiplied by the average account value over the period, multiplied by the number of days in the most recent six-month period, then divided by the number of days in the most recent 12-month period (184/365).
Money Market Portfolio
Sector Diversification
As of December 31, 2019
| Certificates of Deposit | 8.3% |
| U.S. Commercial Paper | 5.1 |
| U.S. Government Obligations | 11.4 |
| U.S. Treasury Bills | 24.3 |
| Yankee/Foreign | 47.8 |
| Other | 3.1 |
The table reflects the portfolio’s market exposure. Any holdings in short-term reserves are excluded. The agency and mortgage-backed securities sectors may include issues from government-sponsored enterprises; such issues are generally not backed by the full faith and credit of the U.S. government.
Money Market Portfolio
Financial Statements
Statement of Net Assets
As of December 31, 2019
The portfolio publishes its holdings on a monthly basis on Vanguard’s website and files them with the Securities and Exchange Commission (SEC) on Form N-MFP. The portfolio’s Form N-MFP filings may be viewed via a link on the “Portfolio Holdings” page at www.vanguard.com or on the SEC’s website at www.sec.gov.
| | | | | Face | | Market | |
| | | | Maturity | Amount | | Value• | |
| | | Yield1 | Date | ($000 | ) | ($000 | ) |
| U.S. Government and Agency Obligations (36.0%) | |
| 2 | Fannie Mae Discount Notes | 1.603% | 1/2/20 | 482 | | 482 | |
| 2 | Fannie Mae Discount Notes | 1.603%–1.604% | 1/3/20 | 928 | | 928 | |
| 2 | Fannie Mae Discount Notes | 1.604% | 1/29/20 | 4,965 | | 4,959 | |
| 2 | Fannie Mae Discount Notes | 1.624% | 2/13/20 | 6,298 | | 6,286 | |
| | Federal Home Loan Bank Discount Notes | 1.604% | 1/2/20 | 2,400 | | 2,400 | |
| | Federal Home Loan Bank Discount Notes | 1.603%–1.604% | 1/3/20 | 3,300 | | 3,300 | |
| | Federal Home Loan Bank Discount Notes | 1.603%–1.604% | 1/8/20 | 4,735 | | 4,734 | |
| | Federal Home Loan Bank Discount Notes | 1.604% | 1/10/20 | 11,299 | | 11,294 | |
| | Federal Home Loan Bank Discount Notes | 1.604% | 1/15/20 | 2,193 | | 2,192 | |
| | Federal Home Loan Bank Discount Notes | 1.603%–1.654% | 1/23/20 | 5,690 | | 5,684 | |
| | Federal Home Loan Bank Discount Notes | 1.654% | 1/27/20 | 4,528 | | 4,523 | |
| | Federal Home Loan Bank Discount Notes | 1.604%–1.623% | 1/28/20 | 8,197 | | 8,187 | |
| | Federal Home Loan Bank Discount Notes | 1.634%–1.654% | 1/29/20 | 6,885 | | 6,876 | |
| | Federal Home Loan Bank Discount Notes | 1.604%–1.654% | 1/30/20 | 5,088 | | 5,081 | |
| | Federal Home Loan Bank Discount Notes | 1.604%–1.654% | 1/31/20 | 13,540 | | 13,521 | |
| | Federal Home Loan Bank Discount Notes | 1.604% | 2/3/20 | 1,900 | | 1,897 | |
| | Federal Home Loan Bank Discount Notes | 1.604% | 2/4/20 | 2,000 | | 1,997 | |
| | Federal Home Loan Bank Discount Notes | 1.604%–1.654% | 2/5/20 | 1,269 | | 1,267 | |
| | Federal Home Loan Bank Discount Notes | 1.654% | 2/6/20 | 320 | | 319 | |
| | Federal Home Loan Bank Discount Notes | 1.603%–1.624% | 2/7/20 | 6,300 | | 6,290 | |
| | Federal Home Loan Bank Discount Notes | 1.654%–1.655% | 2/10/20 | 1,794 | | 1,791 | |
| | Federal Home Loan Bank Discount Notes | 1.624% | 2/11/20 | 2,100 | | 2,096 | |
| | Federal Home Loan Bank Discount Notes | 1.583%–1.655% | 2/14/20 | 17,314 | | 17,279 | |
| | Federal Home Loan Bank Discount Notes | 1.654% | 2/19/20 | 5,378 | | 5,366 | |
| 2 | Freddie Mac Discount Notes | 1.604% | 1/13/20 | 5,000 | | 4,997 | |
| 2 | Freddie Mac Discount Notes | 1.654% | 2/13/20 | 650 | | 649 | |
| | United States Treasury Bill | 2.020% | 1/2/20 | 25,000 | | 24,999 | |
| | United States Treasury Bill | 2.031% | 1/16/20 | 35,000 | | 34,971 | |
| | United States Treasury Bill | 1.637%–2.031% | 1/23/20 | 40,000 | | 39,955 | |
| | United States Treasury Bill | 1.857% | 2/20/20 | 10,000 | | 9,974 | |
| | United States Treasury Bill | 1.569% | 2/25/20 | 25,000 | | 24,940 | |
| | United States Treasury Bill | 1.566% | 2/27/20 | 25,000 | | 24,938 | |
| | United States Treasury Bill | 1.566% | 3/5/20 | 25,000 | | 24,931 | |
| | United States Treasury Bill | 1.546% | 3/19/20 | 14,980 | | 14,930 | |
| | United States Treasury Bill | 1.623% | 4/30/20 | 18,345 | | 18,247 | |
| | United States Treasury Bill | 1.547%–1.557% | 5/7/20 | 35,000 | | 34,810 | |
| | United States Treasury Bill | 1.562% | 5/14/20 | 45,000 | | 44,740 | |
| | United States Treasury Bill | 1.572% | 7/2/20 | 7,000 | | 6,945 | |
| | United States Treasury Note/Bond | 2.375% | 4/30/20 | 15,000 | | 15,038 | |
| | United States Treasury Note/Bond | 1.625% | 6/30/20 | 3,926 | | 3,926 | |
Total U.S. Government and Agency Obligations
(Cost $447,739) | | | | | 447,739 | |
| Commercial Paper (36.1%) | |
| Bank Holding Company (2.4%) | | | | | | |
| 3 | ABN Amro Funding USA LLC | 2.044% | 1/8/20 | 1,000 | | 1,000 | |
| 3 | ABN Amro Funding USA LLC | 2.113% | 1/10/20 | 500 | | 500 | |
| 3 | ABN Amro Funding USA LLC | 2.114% | 1/16/20 | 500 | | 499 | |
| 3 | ABN Amro Funding USA LLC | 2.065% | 1/21/20 | 500 | | 499 | |
| 3 | ABN Amro Funding USA LLC | 1.968% | 2/10/20 | 1,000 | | 998 | |
| 3 | ABN Amro Funding USA LLC | 1.973% | 2/14/20 | 1,000 | | 998 | |
| 3 | ABN Amro Funding USA LLC | 1.882%–1.923% | 3/2/20 | 1,500 | | 1,495 | |
| 3 | ABN Amro Funding USA LLC | 1.912% | 3/3/20 | 1,000 | | 997 | |
| | Cooperatieve Rabobank UA | 2.070% | 3/18/20 | 1,500 | | 1,500 | |
| 4 | Cooperatieve Rabobank UA, 1M USD LIBOR + 0.230% | 1.970% | 1/16/20 | 1,000 | | 1,000 | |
| 4 | Cooperatieve Rabobank UA, 1M USD LIBOR + 0.230% | 1.967% | 3/17/20 | 1,000 | | 1,000 | |
| 4 | Cooperatieve Rabobank UA, 1M USD LIBOR + 0.250% | 1.987% | 1/17/20 | 6,000 | | 6,000 | |
| 3 | JP Morgan Securities LLC | 2.115% | 1/21/20 | 2,000 | | 1,998 | |
| 3 | JP Morgan Securities LLC | 2.116% | 1/28/20 | 2,000 | | 1,997 | |
| 3 | JP Morgan Securities LLC | 1.908% | 4/23/20 | 5,000 | | 4,970 | |
| 4 | JP Morgan Securities LLC, 1M USD LIBOR + 0.220% | 1.928% | 3/2/20 | 2,000 | | 2,000 | |
| 4 | JP Morgan Securities LLC, 1M USD LIBOR + 0.220% | 1.930% | 3/9/20 | 2,000 | | 2,000 | |
| 4 | JP Morgan Securities LLC, 1M USD LIBOR + 0.220% | 1.956% | 5/12/20 | 1,000 | | 1,000 | |
| | | | | | | 30,451 | |
| Finance—Auto (1.3%) | | | | | | |
| 3 | BMW US Capital LLC | 1.701% | 1/3/20 | 10,000 | | 9,999 | |
| 4 | Toyota Motor Credit Corp., 1M USD LIBOR + 0.120% | 1.865% | 1/14/20 | 1,000 | | 1,000 | |
| 4 | Toyota Motor Credit Corp., 1M USD LIBOR + 0.150% | 1.887% | 2/12/20 | 1,000 | | 1,000 | |
| 4 | Toyota Motor Credit Corp., 1M USD LIBOR + 0.150% | 1.887% | 2/13/20 | 1,000 | | 1,000 | |
| 4 | Toyota Motor Credit Corp., 1M USD LIBOR + 0.180% | 1.965% | 2/19/20 | 1,500 | | 1,500 | |
| 4 | Toyota Motor Credit Corp., 1M USD LIBOR + 0.180% | 1.965% | 2/20/20 | 1,500 | | 1,500 | |
| | | | | | | 15,999 | |
| Foreign Banks (25.0%) | | | | | | |
| 3 | Australia & New Zealand Banking Group Ltd. | 1.793% | 1/6/20 | 3,500 | | 3,500 | |
| 3 | Australia & New Zealand Banking Group Ltd. | 1.882% | 3/4/20 | 3,000 | | 2,990 | |
| 3,4 | Australia & New Zealand Banking Group Ltd., 1M USD LIBOR + 0.130% | 1.875% | 2/18/20 | 2,000 | | 2,000 | |
| 3,4 | Australia & New Zealand Banking Group Ltd., 1M USD LIBOR + 0.130% | 1.895% | 2/20/20 | 2,000 | | 2,000 | |
| 3,4 | Australia & New Zealand Banking Group Ltd., 1M USD LIBOR + 0.130% | 1.895% | 2/20/20 | 1,000 | | 1,000 | |
Money Market Portfolio
| | | | | Face | | Market | |
| | | | Maturity | Amount | | Value• | |
| | | Yield1 | Date | ($000 | ) | ($000 | ) |
| 3,4 | Australia & New Zealand Banking Group Ltd., 1M USD LIBOR + 0.180% | 1.898% | 3/11/20 | 2,000 | | 2,000 | |
| 3,4 | Australia & New Zealand Banking Group Ltd., 1M USD LIBOR + 0.180% | 1.916% | 3/12/20 | 3,000 | | 3,000 | |
| 3,4 | Australia & New Zealand Banking Group Ltd., 1M USD LIBOR + 0.180% | 1.884% | 6/5/20 | 3,000 | | 3,000 | |
| 3,4 | Australia & New Zealand Banking Group Ltd., 1M USD LIBOR + 0.190% | 1.908% | 6/11/20 | 3,000 | | 3,000 | |
| 3,4 | Australia & New Zealand Banking Group Ltd., 1M USD LIBOR + 0.210% | 1.975% | 8/20/20 | 2,000 | | 2,000 | |
| 3,4 | Australia & New Zealand Banking Group Ltd., 1M USD LIBOR + 0.220% | 1.930% | 4/9/20 | 5,000 | | 5,000 | |
| 3,4 | Australia & New Zealand Banking Group Ltd., 1M USD LIBOR + 0.270% | 2.010% | 7/13/20 | 3,000 | | 3,000 | |
| 3,4 | Australia & New Zealand Banking Group Ltd., 1M USD LIBOR + 0.270% | 2.010% | 7/15/20 | 2,500 | | 2,500 | |
| 3 | Bank of Nova Scotia | 1.921% | 5/21/20 | 2,000 | | 1,985 | |
| 3,4 | Bank of Nova Scotia, 1M USD LIBOR + 0.220% | 1.960% | 6/15/20 | 2,000 | | 2,000 | |
| 3,4 | Bank of Nova Scotia, 1M USD LIBOR + 0.220% | 2.005% | 6/22/20 | 5,000 | | 5,000 | |
| 3,4 | Bank of Nova Scotia, 1M USD LIBOR + 0.220% | 1.985% | 7/20/20 | 4,000 | | 4,000 | |
| 3 | Canadian Imperial Bank of Commerce | 1.930% | 1/24/20 | 2,000 | | 2,000 | |
| 3,4 | Canadian Imperial Bank of Commerce, 1M USD LIBOR + 0.130% | 1.848% | 2/11/20 | 5,000 | | 5,000 | |
| 3,4 | Canadian Imperial Bank of Commerce, 1M USD LIBOR + 0.170% | 1.874% | 3/5/20 | 3,000 | | 3,000 | |
| 3,4 | Canadian Imperial Bank of Commerce, 1M USD LIBOR + 0.210% | 1.946% | 3/12/20 | 6,000 | | 6,000 | |
| 3,4 | Canadian Imperial Bank of Commerce, 1M USD LIBOR + 0.210% | 2.002% | 6/25/20 | 4,000 | | 4,000 | |
| 3,4 | Canadian Imperial Bank of Commerce, 1M USD LIBOR + 0.220% | 1.965% | 6/18/20 | 1,500 | | 1,500 | |
| 3 | Commonwealth Bank of Australia | 2.071% | 3/20/20 | 2,000 | | 1,991 | |
| 3,4 | Commonwealth Bank of Australia, 1M USD LIBOR + 0.180% | 1.898% | 3/11/20 | 2,000 | | 2,000 | |
| 3,4 | Commonwealth Bank of Australia, 1M USD LIBOR + 0.180% | 1.916% | 3/12/20 | 6,000 | | 6,000 | |
| 3,4 | Commonwealth Bank of Australia, 1M USD LIBOR + 0.180% | 1.920% | 3/13/20 | 1,000 | | 1,000 | |
| 3,4 | Commonwealth Bank of Australia, 1M USD LIBOR + 0.180% | 1.920% | 3/16/20 | 1,000 | | 1,000 | |
| 3,4 | Commonwealth Bank of Australia, 1M USD LIBOR + 0.180% | 1.960% | 4/24/20 | 1,000 | | 1,000 | |
| 3,4 | Commonwealth Bank of Australia, 1M USD LIBOR + 0.220% | 2.025% | 8/28/20 | 2,000 | | 2,000 | |
| 3,4 | Commonwealth Bank of Australia, 1M USD LIBOR + 0.220% | 1.917% | 9/3/20 | 1,000 | | 1,000 | |
| 3,4 | Commonwealth Bank of Australia, 1M USD LIBOR + 0.230% | 1.924% | 9/4/20 | 3,000 | | 3,000 | |
| 3,4 | Commonwealth Bank of Australia, 1M USD LIBOR + 0.230% | 1.940% | 9/8/20 | 1,000 | | 1,000 | |
| 3,4 | Commonwealth Bank of Australia, 1M USD LIBOR + 0.230% | 1.940% | 9/9/20 | 500 | | 500 | |
| 3,4 | Commonwealth Bank of Australia, 1M USD LIBOR + 0.240% | 1.980% | 9/14/20 | 3,000 | | 3,000 | |
| 3,4 | Commonwealth Bank of Australia, 1M USD LIBOR + 0.250% | 1.986% | 11/12/20 | 1,000 | | 1,000 | |
| | Credit Suisse AG (New York Branch) | 1.879% | 2/3/20 | 7,000 | | 6,988 | |
| | Credit Suisse AG (New York Branch) | 1.889% | 2/7/20 | 3,000 | | 2,994 | |
| 3 | DBS Bank Ltd. | 2.044% | 1/6/20 | 1,000 | | 1,000 | |
| 3 | DBS Bank Ltd. | 2.065%–2.069% | 1/16/20 | 2,000 | | 1,998 | |
| 3 | DBS Bank Ltd. | 2.064%–2.065% | 1/17/20 | 2,000 | | 1,998 | |
| 3 | DBS Bank Ltd. | 2.084% | 1/23/20 | 1,000 | | 999 | |
| 3 | DBS Bank Ltd. | 2.085% | 1/24/20 | 3,000 | | 2,996 | |
| 3 | DBS Bank Ltd. | 1.839% | 2/12/20 | 1,000 | | 998 | |
| 3 | DBS Bank Ltd. | 1.839%–2.037% | 2/13/20 | 2,000 | | 1,995 | |
| 3 | DBS Bank Ltd. | 2.038% | 2/14/20 | 2,000 | | 1,995 | |
| 3 | DBS Bank Ltd. | 2.038% | 2/18/20 | 1,000 | | 997 | |
| 3 | DBS Bank Ltd. | 1.911%–2.038% | 2/20/20 | 1,500 | | 1,496 | |
| 3 | DBS Bank Ltd. | 2.010%–2.016% | 3/13/20 | 4,000 | | 3,984 | |
| 3 | DBS Bank Ltd. | 2.031% | 3/16/20 | 1,000 | | 996 | |
| 3 | DBS Bank Ltd. | 2.082% | 3/18/20 | 3,000 | | 2,987 | |
| 3 | DBS Bank Ltd. | 1.867% | 4/24/20 | 1,000 | | 994 | |
| 3 | DBS Bank Ltd. | 1.878% | 5/1/20 | 1,000 | | 994 | |
| 3 | DBS Bank Ltd. | 1.858% | 5/4/20 | 1,000 | | 994 | |
| 3 | DBS Bank Ltd. | 1.878% | 5/5/20 | 1,000 | | 994 | |
| 3 | DBS Bank Ltd. | 1.867% | 5/8/20 | 1,000 | | 993 | |
| 3 | DBS Bank Ltd. | 1.857% | 5/20/20 | 1,000 | | 993 | |
| 3 | DNB Bank ASA | 2.115% | 1/27/20 | 479 | | 478 | |
| 3 | DNB Bank ASA | 2.010% | 3/19/20 | 4,000 | | 3,983 | |
| 3 | ING US Funding LLC | 1.867% | 1/3/20 | 1,000 | | 1,000 | |
| | ING US Funding LLC | 1.852% | 3/3/20 | 2,000 | | 1,994 | |
| | ING US Funding LLC | 1.852% | 3/4/20 | 4,000 | | 3,987 | |
| 3 | KFW | 1.911% | 4/3/20 | 7,700 | | 7,662 | |
| 3,4 | National Australia Bank Ltd., 1M USD LIBOR + 0.120% | 1.905% | 2/21/20 | 2,000 | | 2,000 | |
| 3,4 | National Australia Bank Ltd., 1M USD LIBOR + 0.130% | 1.824% | 2/4/20 | 3,000 | | 3,000 | |
| 3,4 | National Australia Bank Ltd., 1M USD LIBOR + 0.130% | 1.870% | 2/13/20 | 1,000 | | 1,000 | |
| 3,4 | National Australia Bank Ltd., 1M USD LIBOR + 0.150% | 1.868% | 2/11/20 | 1,000 | | 1,000 | |
| 3,4 | National Australia Bank Ltd., 1M USD LIBOR + 0.150% | 1.914% | 4/16/20 | 3,000 | | 3,000 | |
| 3,4 | National Australia Bank Ltd., 1M USD LIBOR + 0.170% | 1.883% | 2/6/20 | 4,300 | | 4,300 | |
| 3,4 | National Australia Bank Ltd., 1M USD LIBOR + 0.180% | 1.920% | 3/13/20 | 7,000 | | 7,000 | |
| 3,4 | National Australia Bank Ltd., 1M USD LIBOR + 0.200% | 1.909% | 5/1/20 | 7,000 | | 7,000 | |
| 3,4 | National Australia Bank Ltd., 1M USD LIBOR + 0.240% | 1.976% | 8/12/20 | 3,000 | | 3,000 | |
| 3,4 | National Australia Bank Ltd., 1M USD LIBOR + 0.260% | 2.024% | 6/19/20 | 2,000 | | 2,000 | |
| 3,4 | National Australia Bank Ltd., 1M USD LIBOR + 0.270% | 1.978% | 7/2/20 | 4,000 | | 4,000 | |
| 3 | Nederlandse Waterschapsbank NV | 2.085% | 1/27/20 | 2,000 | | 1,997 | |
| 3 | Nederlandse Waterschapsbank NV | 2.080% | 1/29/20 | 1,000 | | 998 | |
| 3 | Nederlandse Waterschapsbank NV | 1.905% | 2/3/20 | 5,000 | | 4,991 | |
| 3 | Nederlandse Waterschapsbank NV | 1.901% | 2/12/20 | 250 | | 249 | |
| 3 | Nederlandse Waterschapsbank NV | 1.901% | 2/13/20 | 500 | | 499 | |
| 3 | Nederlandse Waterschapsbank NV | 1.902% | 2/24/20 | 1,000 | | 997 | |
| 3 | Nederlandse Waterschapsbank NV | 1.831% | 3/11/20 | 3,000 | | 2,989 | |
| 3 | Nederlandse Waterschapsbank NV | 1.861% | 3/27/20 | 3,710 | | 3,694 | |
| 3 | Nordea Bank ABP | 2.054% | 1/22/20 | 7,000 | | 6,992 | |
| 3 | Nordea Bank ABP | 1.971% | 1/27/20 | 830 | | 829 | |
| 3 | Nordea Bank ABP | 1.910% | 3/9/20 | 980 | | 977 | |
| 3 | Nordea Bank ABP | 1.852% | 5/1/20 | 5,000 | | 4,969 | |
| 3 | NRW Bank | 2.028% | 3/2/20 | 2,600 | | 2,591 | |
| 3 | NRW Bank | 1.836% | 3/16/20 | 1,000 | | 996 | |
| 3 | NRW Bank | 1.836% | 3/17/20 | 1,000 | | 996 | |
| 3 | NRW Bank | 1.836% | 3/18/20 | 2,000 | | 1,992 | |
| 3 | NRW Bank | 1.836% | 3/19/20 | 2,000 | | 1,992 | |
| 3 | NRW Bank | 1.836% | 3/20/20 | 3,000 | | 2,988 | |
| 3 | NRW Bank | 1.836% | 3/23/20 | 2,000 | | 1,992 | |
| 3 | NRW Bank | 1.837% | 3/24/20 | 2,000 | | 1,992 | |
| 3,4 | Royal Bank of Canada, 1M USD LIBOR + 0.180% | 1.920% | 4/14/20 | 6,000 | | 6,000 | |
| 3,4 | Royal Bank of Canada, 1M USD LIBOR + 0.180% | 1.917% | 6/17/20 | 5,000 | | 5,000 | |
| 3,4 | Royal Bank of Canada, 1M USD LIBOR + 0.190% | 1.930% | 3/16/20 | 3,000 | | 3,000 | |
| 3,4 | Royal Bank of Canada, 1M USD LIBOR + 0.210% | 1.923% | 5/6/20 | 4,000 | | 4,000 | |
| 3,4 | Royal Bank of Canada, 1M USD LIBOR + 0.240% | 2.039% | 7/31/20 | 5,000 | | 5,000 | |
Money Market Portfolio
| | | | | Face | | Market | |
| | | | Maturity | Amount | | Value• | |
| | | Yield1 | Date | ($000 | ) | ($000 | ) |
| 3,4 | Royal Bank of Canada, 1M USD LIBOR + 0.240% | 2.032% | 8/26/20 | 2,000 | | 2,000 | |
| 3,4 | Royal Bank of Canada, 1M USD LIBOR + 0.250% | 1.995% | 11/18/20 | 2,000 | | 2,000 | |
| 3,4 | Royal Bank of Canada, 1M USD LIBOR + 0.250% | 2.014% | 11/19/20 | 2,000 | | 2,000 | |
| 3,4 | Royal Bank of Canada, 1M USD LIBOR + 0.310% | 2.018% | 10/1/20 | 4,000 | | 4,000 | |
| 3 | Skandinaviska Enskilda Banken AB | 1.931% | 3/23/20 | 5,000 | | 4,978 | |
| 3 | Skandinaviska Enskilda Banken AB | 1.929% | 4/21/20 | 5,000 | | 4,971 | |
| 3 | Svenska Handelsbanken AB | 1.851% | 3/5/20 | 2,000 | | 1,993 | |
| 3 | Svenska Handelsbanken AB | 1.844% | 4/8/20 | 3,000 | | 2,985 | |
| 3 | Svenska Handelsbanken AB | 1.867% | 4/29/20 | 2,000 | | 1,988 | |
| 3,4 | Toronto-Dominion Bank, 1M USD LIBOR + 0.250% | 1.986% | 12/11/20 | 2,500 | | 2,500 | |
| 3,4 | Toronto-Dominion Bank, 1M USD LIBOR + 0.250% | 1.991% | 12/11/20 | 1,000 | | 1,000 | |
| 3,4 | Toronto-Dominion Bank, 1M USD LIBOR + 0.320% | 2.030% | 10/9/20 | 11,000 | | 11,000 | |
| 3,4 | Toronto-Dominion Bank, 1M USD LIBOR + 0.330% | 2.039% | 10/2/20 | 4,000 | | 4,000 | |
| 3,4 | Westpac Banking Corp., 1M USD LIBOR + 0.160% | 1.864% | 6/5/20 | 1,000 | | 1,000 | |
| 3,4 | Westpac Banking Corp., 1M USD LIBOR + 0.230% | 1.924% | 9/4/20 | 2,000 | | 2,000 | |
| 3,4 | Westpac Banking Corp., 1M USD LIBOR + 0.230% | 1.924% | 9/4/20 | 3,000 | | 3,000 | |
| | | | | | | 310,888 | |
| Foreign Governments (5.7%) | | | | | | |
| 5 | CDP Financial Inc. | 1.781% | 1/2/20 | 1,000 | | 1,000 | |
| 5 | CDP Financial Inc. | 1.701% | 1/3/20 | 4,000 | | 4,000 | |
| 5 | CDP Financial Inc. | 2.204%–2.215% | 1/24/20 | 1,000 | | 999 | |
| 5 | CDP Financial Inc. | 1.884% | 3/25/20 | 1,000 | | 996 | |
| 3,5 | CDP Financial Inc. | 1.928%–1.969% | 4/1/20 | 1,500 | | 1,493 | |
| 5 | CDP Financial Inc. | 1.929% | 4/6/20 | 1,000 | | 995 | |
| 5 | CDP Financial Inc. | 1.938% | 4/8/20 | 1,000 | | 995 | |
| 5 | CDP Financial Inc. | 1.878% | 4/27/20 | 500 | | 497 | |
| 3 | CDP Financial Inc. | 1.878% | 4/28/20 | 500 | | 497 | |
| 5 | CDP Financial Inc. | 1.837% | 5/4/20 | 500 | | 497 | |
| 5 | CDP Financial Inc. | 1.846% | 5/13/20 | 4,000 | | 3,973 | |
| 5 | CPPIB Capital Inc. | 2.094% | 1/10/20 | 1,500 | | 1,499 | |
| | Export Development Canada | 1.907% | 4/9/20 | 500 | | 497 | |
| | Export Development Canada | 1.924% | 4/17/20 | 3,500 | | 3,480 | |
| | Export Development Canada | 1.898% | 4/22/20 | 500 | | 497 | |
| | Export Development Canada | 1.816% | 5/18/20 | 2,000 | | 1,986 | |
| | Export Development Canada | 1.865% | 5/20/20 | 5,000 | | 4,964 | |
| 3 | Kingdom of Netherlands | 1.751% | 1/3/20 | 4,000 | | 4,000 | |
| 5 | Ontario Teachers’ Finance Trust | 1.838% | 2/11/20 | 500 | | 499 | |
| 3,5 | Ontario Teachers’ Finance Trust | 1.911% | 2/14/20 | 3,000 | | 2,993 | |
| 5 | Ontario Teachers’ Finance Trust | 1.875% | 4/3/20 | 300 | | 298 | |
| 5 | Ontario Teachers’ Finance Trust | 1.878% | 5/5/20 | 250 | | 248 | |
| 5 | Ontario Teachers’ Finance Trust | 1.860% | 6/1/20 | 250 | | 248 | |
| 4,5 | Ontario Teachers’ Finance Trust, 1M USD LIBOR + 0.120% | 1.833% | 3/6/20 | 1,000 | | 1,000 | |
| 4,5 | Ontario Teachers’ Finance Trust, 1M USD LIBOR + 0.200% | 1.962% | 8/24/20 | 1,000 | | 1,000 | |
| 3,4, 5 | Ontario Teachers’ Finance Trust, 1M USD LIBOR + 0.270% | 2.007% | 8/17/20 | 1,000 | | 1,000 | |
| 3 | Province Of Alberta | 2.017%–2.019% | 2/20/20 | 2,000 | | 1,994 | |
| 3 | Province Of Alberta | 1.948% | 3/31/20 | 1,500 | | 1,493 | |
| 3 | Province Of Alberta | 1.867% | 6/11/20 | 1,000 | | 992 | |
| 3 | Province Of Alberta | 1.868% | 6/17/20 | 1,000 | | 991 | |
| | Province of British Columbia | 1.949% | 1/6/20 | 1,185 | | 1,185 | |
| | Province of British Columbia | 1.949% | 3/19/20 | 3,900 | | 3,884 | |
| | Province of British Columbia | 1.830% | 3/25/20 | 500 | | 498 | |
| | Province of British Columbia | 1.830% | 3/26/20 | 500 | | 498 | |
| | Province of British Columbia | 1.830% | 3/27/20 | 500 | | 498 | |
| | Province of British Columbia | 1.831% | 4/8/20 | 500 | | 497 | |
| | Province of Ontario | 1.741%–1.907% | 1/6/20 | 1,217 | | 1,217 | |
| 3 | Province of Quebec | 2.017% | 2/13/20 | 2,000 | | 1,995 | |
| 3 | Province of Quebec | 2.017% | 2/14/20 | 2,000 | | 1,995 | |
| 5 | PSP Capital Inc. | 2.205% | 1/27/20 | 1,000 | | 998 | |
| 5 | PSP Capital Inc. | 2.205% | 1/28/20 | 500 | | 499 | |
| 5 | PSP Capital Inc. | 2.006% | 2/10/20 | 4,175 | | 4,166 | |
| 5 | PSP Capital Inc. | 2.010% | 3/11/20 | 1,000 | | 996 | |
| 5 | PSP Capital Inc. | 2.071% | 3/12/20 | 1,000 | | 996 | |
| 5 | PSP Capital Inc. | 2.020% | 3/13/20 | 1,000 | | 996 | |
| 5 | PSP Capital Inc. | 2.061% | 3/17/20 | 500 | | 498 | |
| 5 | PSP Capital Inc. | 2.051% | 3/19/20 | 1,000 | | 996 | |
| 5 | PSP Capital Inc. | 1.898% | 4/23/20 | 2,000 | | 1,988 | |
| 5 | PSP Capital Inc. | 1.867% | 4/27/20 | 500 | | 497 | |
| | | | | | | 70,518 | |
| Foreign Industrial (1.4%) | |
| 3 | Nestle Capital Corp. | 2.052% | 3/24/20 | 1,000 | | 995 | |
| 3 | Total Capital Canada Ltd. | 1.970% | 1/7/20 | 1,000 | | 1,000 | |
| 3 | Total Capital Canada Ltd. | 1.970% | 1/8/20 | 4,500 | | 4,498 | |
| 3 | Total Capital Canada Ltd. | 1.949% | 4/8/20 | 2,000 | | 1,989 | |
| 3 | Total Capital Canada Ltd. | 1.949% | 4/14/20 | 3,000 | | 2,983 | |
| 4 | Toyota Credit Canada Inc., 1M USD LIBOR + 0.230% | 1.924% | 6/4/20 | 500 | | 500 | |
| 4 | Toyota Credit Canada Inc., 1M USD LIBOR + 0.250% | 1.960% | 7/9/20 | 1,000 | | 1,000 | |
| 3 | Unilever Capital Corp. | 1.928% | 1/6/20 | 500 | | 500 | |
| 3 | Unilever Capital Corp. | 1.929% | 1/9/20 | 500 | | 500 | |
| 3 | Unilever Capital Corp. | 1.939% | 1/13/20 | 3,500 | | 3,498 | |
| | | | | | | 17,463 | |
| Industrial (0.3%) | | | | | | |
| 3 | LVMH Moet Hennessy Louis Vuitton Inc. | 1.979% | 1/2/20 | 1,325 | | 1,325 | |
| 3 | LVMH Moet Hennessy Louis Vuitton Inc. | 1.970% | 1/7/20 | 1,000 | | 1,000 | |
| 3 | LVMH Moet Hennessy Louis Vuitton Inc. | 1.929% | 1/15/20 | 500 | | 499 | |
| 3 | Pfizer Inc. | 1.919% | 1/17/20 | 1,000 | | 999 | |
| | | | | | | 3,823 | |
| Total Commercial Paper (Cost $449,142) | | | 449,142 | |
| Certificates of Deposit (25.7%) | | | | |
| Domestic Banks (4.1%) | | | | | |
| | Citibank NA | 2.220% | 1/6/20 | 2,000 | | 2,000 | |
| | Citibank NA | 1.830% | 5/4/20 | 5,000 | | 5,000 | |
| | Citibank NA | 1.840% | 6/5/20 | 1,500 | | 1,500 | |
| | State Street Bank & Trust Co. | 1.900% | 4/15/20 | 9,000 | | 9,000 | |
| 4 | State Street Bank & Trust Co., 1M USD LIBOR + 0.220% | 1.935% | 8/10/20 | 3,000 | | 3,000 | |
| | Wells Fargo Bank NA | 2.000% | 2/12/20 | 6,000 | | 6,000 | |
| 4 | Wells Fargo Bank NA, 1M USD LIBOR + 0.160% | 1.901% | 2/13/20 | 5,000 | | 5,000 | |
| 4 | Wells Fargo Bank NA, 1M USD LIBOR + 0.160% | 1.900% | 2/14/20 | 5,000 | | 5,000 | |
| 4 | Wells Fargo Bank NA, 1M USD LIBOR + 0.190% | 1.954% | 3/19/20 | 7,000 | | 7,000 | |
| 4 | Wells Fargo Bank NA, 1M USD LIBOR + 0.210% | 1.951% | 4/14/20 | 3,000 | | 3,000 | |
| 4 | Wells Fargo Bank NA, 1M USD LIBOR + 0.230% | 1.938% | 5/1/20 | 2,000 | | 2,000 | |
| 4 | Wells Fargo Bank NA, 1M USD LIBOR + 0.240% | 1.985% | 5/18/20 | 2,000 | | 2,000 | |
| | | | | | | 50,500 | |
| Eurodollar Certificates of Deposit (2.3%) | |
| | ABN AMRO Bank NV | 2.120% | 1/7/20 | 1,000 | | 1,000 | |
| | ABN AMRO Bank NV | 2.110% | 1/13/20 | 6,000 | | 6,000 | |
| | ABN AMRO Bank NV | 2.120% | 2/3/20 | 7,000 | | 7,000 | |
| 4 | ING BANK NV, 1M USD LIBOR + 0.002% | 1.910% | 2/7/20 | 15,000 | | 15,000 | |
| | | | | | | 29,000 | |
| Yankee Certificates of Deposit (19.3%) | |
| 4 | Australia & New Zealand Banking Group, Ltd. (New York Branch), 1M USD LIBOR + 0.180% | 1.888% | 6/1/20 | 1,000 | | 1,000 | |
Money Market Portfolio
| | | | | Face | | Market | |
| | | | Maturity | Amount | | Value• | |
| | | Yield1 | Date | ($000 | ) | ($000 | ) |
| 4 | Bank of Montreal (Chicago Branch), 1M USD LIBOR + 0.110% | 2.002% | 1/27/20 | 5,000 | | 5,000 | |
| 4 | Bank of Montreal (Chicago Branch), 1M USD LIBOR + 0.150% | 1.930% | 1/24/20 | 6,000 | | 6,000 | |
| 4 | Bank of Montreal (Chicago Branch), 1M USD LIBOR + 0.170% | 1.879% | 3/2/20 | 2,000 | | 2,000 | |
| 4 | Bank of Montreal (Chicago Branch), 1M USD LIBOR + 0.190% | 1.887% | 4/3/20 | 9,000 | | 9,000 | |
| 4 | Bank of Montreal (Chicago Branch), 1M USD LIBOR + 0.210% | 2.002% | 6/25/20 | 4,000 | | 4,000 | |
| 4 | Bank of Montreal (Chicago Branch), 1M USD LIBOR + 0.240% | 1.949% | 5/1/20 | 5,000 | | 5,000 | |
| 4 | Bank of Nova Scotia (Houston Branch), 1M USD LIBOR + 0.170% | 1.910% | 3/16/20 | 2,000 | | 2,000 | |
| 4 | Bank of Nova Scotia (Houston Branch), 1M USD LIBOR + 0.220% | 1.930% | 6/8/20 | 6,000 | | 6,000 | |
| 4 | Bank of Nova Scotia (Houston Branch), 1M USD LIBOR + 0.220% | 1.914% | 7/6/20 | 3,000 | | 3,000 | |
| 4 | Bank of Nova Scotia (Houston Branch), 1M USD LIBOR + 0.230% | 1.995% | 4/20/20 | 4,000 | | 4,000 | |
| | Bayerische Landesbank (New York Branch) | 1.600% | 1/3/20 | 5,000 | | 5,000 | |
| | Canadian Imperial Bank of Commerce (New York Branch) | 1.824% | 2/5/20 | 3,000 | | 3,000 | |
| | Canadian Imperial Bank of Commerce (New York Branch) | 1.870% | 5/7/20 | 6,000 | | 6,000 | |
| 4 | Commonwealth Bank of Australia (New York Branch), 1M USD LIBOR + 0.170% | 1.955% | 4/23/20 | 1,500 | | 1,500 | |
| 4 | Commonwealth Bank of Australia (New York Branch), 1M USD LIBOR + 0.170% | 1.906% | 6/9/20 | 3,000 | | 3,000 | |
| 4 | Commonwealth Bank of Australia (New York Branch), 1M USD LIBOR + 0.180% | 1.884% | 6/5/20 | 1,000 | | 1,000 | |
| 4 | Commonwealth Bank of Australia (New York Branch), 1M USD LIBOR + 0.200% | 1.945% | 3/18/20 | 1,000 | | 1,000 | |
| | Cooperatieve Rabobank UA (New York Branch) | 2.050% | 3/17/20 | 500 | | 500 | |
| 4 | Cooperatieve Rabobank UA (New York Branch), 1M USD LIBOR + 0.130% | 1.848% | 2/11/20 | 2,000 | | 2,000 | |
| 4 | Cooperatieve Rabobank UA (New York Branch), 1M USD LIBOR + 0.160% | 1.952% | 2/27/20 | 1,000 | | 1,000 | |
| 4 | Cooperatieve Rabobank UA (New York Branch), 1M USD LIBOR + 0.170% | 1.883% | 3/6/20 | 2,000 | | 2,000 | |
| 4 | Cooperatieve Rabobank UA (New York Branch), 1M USD LIBOR + 0.170% | 1.880% | 3/9/20 | 2,000 | | 2,000 | |
| 4 | Cooperatieve Rabobank UA (New York Branch), 1M USD LIBOR + 0.170% | 1.952% | 3/27/20 | 2,000 | | 2,000 | |
| 4 | Cooperatieve Rabobank UA (New York Branch), 1M USD LIBOR + 0.170% | 1.879% | 4/1/20 | 2,000 | | 2,000 | |
| 4 | Cooperatieve Rabobank UA (New York Branch), 1M USD LIBOR + 0.200% | 1.918% | 5/11/20 | 1,000 | | 1,000 | |
| 4 | Cooperatieve Rabobank UA (New York Branch), 1M USD LIBOR + 0.200% | 1.999% | 6/30/20 | 1,000 | | 1,000 | |
| 4 | Cooperatieve Rabobank UA (New York Branch), 1M USD LIBOR + 0.250% | 1.944% | 5/4/20 | 3,000 | | 3,000 | |
| | Credit Suisse AG (New York Branch) | 2.000% | 3/24/20 | 4,000 | | 4,000 | |
| | Credit Suisse AG (New York Branch) | 2.000% | 3/27/20 | 6,000 | | 6,000 | |
| | Credit Suisse AG (New York Branch) | 1.970% | 4/3/20 | 4,000 | | 4,000 | |
| 4 | DNB Bank ASA (New York Branch), 1M USD LIBOR + 0.160% | 1.864% | 2/5/20 | 6,000 | | 6,000 | |
| 4 | DNB Bank ASA (New York Branch), 1M USD LIBOR + 0.180% | 1.985% | 2/28/20 | 6,000 | | 6,000 | |
| | MUFG Bank Ltd. (New York Branch) | 2.080% | 1/10/20 | 3,000 | | 3,000 | |
| | MUFG Bank Ltd. (New York Branch) | 2.080% | 1/14/20 | 3,000 | | 3,000 | |
| | MUFG Bank Ltd. (New York Branch) | 2.070% | 1/15/20 | 2,000 | | 2,000 | |
| | MUFG Bank Ltd. (New York Branch) | 2.080% | 1/17/20 | 1,000 | | 1,000 | |
| | MUFG Bank Ltd. (New York Branch) | 2.110% | 1/17/20 | 4,000 | | 4,000 | |
| | MUFG Bank Ltd. (New York Branch) | 1.960% | 2/10/20 | 2,000 | | 2,000 | |
| | MUFG Bank Ltd. (New York Branch) | 1.980% | 2/10/20 | 2,000 | | 2,000 | |
| | MUFG Bank Ltd. (New York Branch) | 1.980% | 2/11/20 | 2,000 | | 2,000 | |
| | MUFG Bank Ltd. (New York Branch) | 1.900% | 3/6/20 | 6,000 | | 6,000 | |
| | Nordea Bank ABP (New York Branch) | 2.060% | 3/18/20 | 4,000 | | 4,000 | |
| 4 | Royal Bank of Canada (New York Branch), 1M USD LIBOR + 0.250% | 1.947% | 9/3/20 | 4,000 | | 4,000 | |
| 4 | Skandinaviska Enskilda Banken AB (New York Branch), 1M USD LIBOR + 0.230% | 2.035% | 5/29/20 | 6,000 | | 6,000 | |
| 4 | Skandinaviska Enskilda Banken AB (New York Branch), 1M USD LIBOR + 0.230% | 1.938% | 6/1/20 | 6,000 | | 6,000 | |
| | Sumitomo Mitsui Banking Corp. (New York Branch) | 1.883% | 1/6/20 | 1,000 | | 1,000 | |
| | Sumitomo Mitsui Banking Corp. (New York Branch) | 1.880% | 1/7/20 | 3,000 | | 3,000 | |
| 4 | Sumitomo Mitsui Banking Corp. (New York Branch), 1M USD LIBOR + 0.180% | 1.920% | 1/15/20 | 3,000 | | 3,000 | |
| 4 | Sumitomo Mitsui Banking Corp. (New York Branch), 1M USD LIBOR + 0.200% | 1.909% | 4/3/20 | 6,000 | | 6,000 | |
| 4 | Sumitomo Mitsui Banking Corp. (New York Branch), 1M USD LIBOR + 0.200% | 1.985% | 4/24/20 | 3,000 | | 3,000 | |
| 4 | Sumitomo Mitsui Banking Corp. (New York Branch), 1M USD LIBOR + 0.200% | 1.981% | 5/4/20 | 4,000 | | 4,000 | |
| 4 | Sumitomo Mitsui Banking Corp. (New York Branch), 1M USD LIBOR + 0.220% | 1.960% | 4/14/20 | 5,000 | | 5,000 | |
| 4 | Sumitomo Mitsui Banking Corp. (New York Branch), 1M USD LIBOR + 0.230% | 1.948% | 2/11/20 | 3,000 | | 3,000 | |
| 4 | Svenska HandelsBanken AB (New York Branch), 1M USD LIBOR + 0.140% | 1.925% | 1/23/20 | 1,000 | | 1,000 | |
| 4 | Svenska HandelsBanken AB (New York Branch), 1M USD LIBOR + 0.160% | 1.900% | 6/15/20 | 1,500 | | 1,500 | |
| 4 | Svenska HandelsBanken AB (New York Branch), 1M USD LIBOR + 0.160% | 1.924% | 6/19/20 | 5,000 | | 5,000 | |
| 4 | Svenska HandelsBanken AB (New York Branch), 1M USD LIBOR + 0.180% | 1.920% | 7/15/20 | 5,000 | | 5,000 | |
| 4 | Svenska HandelsBanken AB (New York Branch), 1M USD LIBOR + 0.190% | 1.894% | 5/5/20 | 7,000 | | 7,000 | |
| 4 | Svenska HandelsBanken AB (New York Branch), 1M USD LIBOR + 0.200% | 1.964% | 5/19/20 | 1,000 | | 1,000 | |
| 4 | Svenska HandelsBanken AB (New York Branch), 1M USD LIBOR + 0.240% | 2.020% | 11/24/20 | 3,000 | | 3,000 | |
| 4 | Svenska HandelsBanken AB (New York Branch), 1M USD LIBOR + 0.240% | 1.937% | 12/2/20 | 4,000 | | 4,000 | |
Money Market Portfolio
| | | | | Face | | Market | |
| | | | Maturity | Amount | | Value• | |
| | | Yield1 | Date | ($000 | ) | ($000 | ) |
| 4 | Toronto-Dominion Bank (New York Branch), 1M USD LIBOR + 0.200% | 1.910% | 7/7/20 | 5,000 | | 5,000 | |
| 4 | Toronto-Dominion Bank (New York Branch), 1M USD LIBOR + 0.210% | 1.919% | 5/4/20 | 2,000 | | 2,000 | |
| 4 | Toronto-Dominion Bank (New York Branch), 1M USD LIBOR + 0.220% | 1.960% | 5/14/20 | 4,000 | | 4,000 | |
| 4 | Toronto-Dominion Bank (New York Branch), 1M USD LIBOR + 0.250% | 2.049% | 7/31/20 | 7,000 | | 7,000 | |
| 4 | Westpac Banking Corp. (New York Branch), 1M USD LIBOR + 0.040% | 1.942% | 2/3/20 | 1,100 | | 1,100 | |
| 4 | Westpac Banking Corp. (New York Branch), 1M USD LIBOR + 0.160% | 1.869% | 7/2/20 | 5,000 | | 5,000 | |
| 4 | Westpac Banking Corp. (New York Branch), 1M USD LIBOR + 0.230% | 1.948% | 9/11/20 | 1,000 | | 1,000 | |
| 4 | Westpac Banking Corp. (New York Branch), 1M USD LIBOR + 0.230% | 1.970% | 9/16/20 | 5,000 | | 5,000 | |
| | | | | | | 240,600 | |
| Total Certificates of Deposit (Cost $320,100) | | | | | 320,100 | |
| Other Notes (1.1%) | | | | | | |
| 4 | Bank of America NA, 1M USD LIBOR + 0.110% | 1.825% | 1/10/20 | 2,000 | | 2,000 | |
| 4 | Bank of America NA, 1M USD LIBOR + 0.150% | 1.935% | 2/21/20 | 1,000 | | 1,000 | |
| 4 | Bank of America NA, 1M USD LIBOR + 0.150% | 1.930% | 2/24/20 | 1,000 | | 1,000 | |
| 4 | Bank of America NA, 1M USD LIBOR + 0.200% | 1.909% | 4/1/20 | 2,000 | | 2,000 | |
| 4 | Bank of America NA, 1M USD LIBOR + 0.220% | 2.012% | 4/27/20 | 2,000 | | 2,000 | |
| 4 | Bank of America NA, 1M USD LIBOR + 0.220% | 1.928% | 5/1/20 | 3,000 | | 3,000 | |
| 4 | Bank of America NA, 1M USD LIBOR + 0.240% | 1.958% | 5/11/20 | 2,500 | | 2,500 | |
| Total Other Notes (Cost $13,500) | | | | | 13,500 | |
| Taxable Municipal Bonds (2.0%) | | | | | | |
| 5,6 | South Central Texas IndustrialDevelopment Corp | 1.600% | 1/7/20 | 7,400 | | 7,400 | |
| 6 | Traer Creek Metropolitan District | 1.880% | 1/7/20 | 11,614 | | 11,614 | |
| | University of Texas System Revenue Financing System Revenue VRDO | 1.600% | 1/7/20 | 5,000 | | 5,000 | |
| Total Taxable Municipal Bonds (Cost $24,014) | | | | | 24,014 | |
| Total Investments (100.9%) (Cost $1,254,495) | | | | | 1,254,495 | |
| | | | | | | Amount | |
| | | | | | | ($000 | ) |
| Other Assets and Liabilities (-0.9%) | | | | | | |
| Other Assets | | | | | | |
| Investment in Vanguard | | | | | 56 | |
| Receivables for Accrued Income | | | | | 932 | |
| Receivables for Capital Shares Issued | | | | | 938 | |
| Other Assets | | | | | 55 | |
| Total Other Assets | | | | | 1,981 | |
| Liabilities | | | | | | |
| Payables for Investment Securities Purchased | | | | | (10,945 | ) |
| Payables for Capital Shares Redeemed | | | | | (1,988 | ) |
| Payables to Vanguard | | | | | (97 | ) |
| Total Liabilities | | | | | (13,030 | ) |
| Net Assets (100%) | | | | | | |
| Applicable to 1,243,062,558 outstanding $.001 par value shares of beneficial interest (unlimited authorization) | | 1,243,446 | |
| Net Asset Value per Share | | | | | $1.00 | |
| At December 31, 2019, net assets consisted of: | | |
| | Amount | |
| | ($000 | ) |
| Paid-in-Capital | 1,243,462 | |
| Total Distributable Earnings (Loss) | (16 | ) |
| Net Assets | 1,243,446 | |
| • | See Note A in Notes to Financial Statements. |
| 1 | Represents annualized yield at date of purchase for discount securities, and coupon for coupon-bearing securities. |
| 2 | The issuer was placed under federal conservatorship in September 2008; since that time, its daily operations have been managed by the Federal Housing Finance Agency and it receives capital from the U.S. Treasury, as needed to maintain a positive net worth, in exchange for senior preferred stock. |
| 3 | Security exempt from registration under Section 4(2) of the Securities Act of 1933. Such securities may be sold in transactions exempt from registration only to dealers in that program or other “accredited investors.” At December 31, 2019, the aggregate value of these securities was $360,104,000, representing 29.0% of net assets. |
| 4 | Adjustable-rate security; rate shown is effective rate at period end. Certain adjustable-rate securities are not based on a published reference rate and spread but are determined by the issuer or agent based on current market conditions. |
| 5 | Security exempt from registration under Rule 144A of the Securities Act of 1933. Such securities may be sold in transactions exempt from registration, normally to qualified institutional buyers. At December 31, 2019, the aggregate value of these securities was $44,260,000, representing 3.6% of net assets. |
| 6 | Scheduled principal and interest payments are guaranteed by bank letter of credit. |
| | LIBOR—London Interbank Offered Rate. |
| | VRDO—Variable Rate Demand Obligation. |
See accompanying Notes, which are an integral part of the Financial Statements.
Money Market Portfolio
Statement of Operations
| | Year Ended | |
| | December 31, 2019 | |
| | ($000 | ) |
| Investment Income | | |
| Income | | |
| Interest | 29,158 | |
| Total Income | 29,158 | |
| Expenses | | |
| The Vanguard Group—Note B | | |
| Investment Advisory Services | 42 | |
| Management and Administrative | 1,572 | |
| Marketing and Distribution | 147 | |
| Custodian Fees | 14 | |
| Auditing Fees | 32 | |
| Shareholders’ Reports | 33 | |
| Trustees’ Fees and Expenses | 1 | |
| Total Expenses | 1,841 | |
| Net Investment Income | 27,317 | |
| Realized Net Gain (Loss) on Investment Securities Sold | 3 | |
| Net Increase (Decrease) in Net Assets Resulting from Operations | 27,320 | |
Statement of Changes in Net Assets
| | Year Ended December 31, | |
| | 2019 | | 2018 | |
| | ($000 | ) | ($000 | ) |
| Increase (Decrease) in Net Assets | | | | |
| Operations | | | | |
| Net Investment Income | 27,317 | | 20,856 | |
| Realized Net Gain (Loss) | 3 | | (15 | ) |
| Net Increase (Decrease) in Net Assets Resulting from Operations | 27,320 | | 20,841 | |
| Distributions | | | | |
| Net Investment Income | (27,441 | ) | (20,856 | ) |
| Realized Capital Gain | — | | — | |
| Total Distributions | (27,441 | ) | (20,856 | ) |
| Capital Share Transactions (at $1.00 per share) | | | | |
| Issued | 374,573 | | 526,395 | |
| Issued in Lieu of Cash Distributions | 27,441 | | 20,856 | |
| Redeemed | (376,165 | ) | (290,715 | ) |
| Net Increase (Decrease) from Capital Share Transactions | 25,849 | | 256,536 | |
| Total Increase (Decrease) | 25,728 | | 256,521 | |
| Net Assets | | | | |
| Beginning of Period | 1,217,718 | | 961,197 | |
| End of Period | 1,243,446 | | 1,217,718 | |
See accompanying Notes, which are an integral part of the Financial Statements.
Money Market Portfolio
Financial Highlights
| For a Share Outstanding | | | | | Year Ended December 31, | |
| Throughout Each Period | 2019 | | 2018 | | 2017 | | 2016 | | 2015 | |
| Net Asset Value, Beginning of Period | $1.00 | | $1.00 | | $1.00 | | $1.00 | | $1.00 | |
| Investment Operations | | | | | | | | | | |
| Net Investment Income | .022 | 1 | .020 | 1 | .010 | 1 | .005 | | .001 | |
| Net Realized and Unrealized Gain (Loss) on Investments | — | | — | | — | | — | | — | |
| Total from Investment Operations | .022 | | .020 | | .010 | | .005 | | .001 | |
| Distributions | | | | | | | | | | |
| Dividends from Net Investment Income | (.022 | ) | (.020 | ) | (.010 | ) | (.005 | ) | (.001 | ) |
| Distributions from Realized Capital Gains | — | | — | | — | | — | | — | |
| Total Distributions | (.022 | ) | (.020 | ) | (.010 | ) | (.005 | ) | (.001 | ) |
| Net Asset Value, End of Period | $1.00 | | $1.00 | | $1.00 | | $1.00 | | $1.00 | |
| | | | | | | | | | | |
| Total Return | 2.26% | | 1.97% | | 1.01% | | 0.48% | | 0.15% | |
| | | | | | | | | | | |
| Ratios/Supplemental Data | | | | | | | | | | |
| Net Assets, End of Period (Millions) | $1,243 | | $1,218 | | $961 | | $965 | | $1,217 | |
| Ratio of Expenses to Average Net Assets2 | 0.15% | | 0.15% | | 0.16% | | 0.16% | | 0.06% | |
| Ratio of Net Investment Income to Average Net Assets | 2.23% | | 1.97% | | 1.00% | | 0.46% | | 0.15% | |
| 1 | Calculated based on average shares outstanding. |
| 2 | Vanguard and the board of trustees have agreed to temporarily limit certain net operating expenses in excess of the portfolio’s daily yield in order to maintain a zero or positive yield for the portfolio. Vanguard and the board of trustees may terminate the temporary expense limitation at any time. The portfolio is not obligated to repay this amount to Vanguard. The ratio of total expenses to average net assets before an expense reduction was 0.16% for 2016 and 0.16% for 2015. For the years ended December 31, 2019, 2018, and 2017, there were no expense reductions. |
See accompanying Notes, which are an integral part of the Financial Statements.
Money Market Portfolio
Notes to Financial Statements
The Money Market Portfolio, a portfolio of Vanguard Variable Insurance Funds, is registered under the Investment Company Act of 1940 as an open-end investment company. The portfolio’s shares are only available for purchase by separate accounts of insurance companies as investments for variable annuity plans, variable life insurance contracts, or other variable benefit insurance contracts. The portfolio invests in short-term debt instruments of companies primarily operating in specific industries, particularly financial services; the issuers’ abilities to meet their obligations may be affected by economic developments in such industries.
A. The following significant accounting policies conform to generally accepted accounting principles for U.S. investment companies. The portfolio consistently follows such policies in preparing its financial statements.
1. Security Valuation: Securities are valued as of the close of trading on the New York Stock Exchange (generally 4 p.m., Eastern time) on the valuation date. Securities are valued at amortized cost, which approximates market value.
2. Federal Income Taxes: The portfolio intends to continue to qualify as a regulated investment company and distribute all of its taxable income. Management has analyzed the portfolio’s tax positions taken for all open federal income tax years (December 31, 2016–2019), and has concluded that no provision for federal income tax is required in the portfolio’s financial statements.
3. Distributions: Distributions from net investment income are declared daily and paid on the first business day of the following month. Annual distributions from realized capital gains, if any, are recorded on the ex-dividend date. Distributions are determined on a tax basis and may differ from net investment income and realized capital gains for financial reporting purposes.
4. Credit Facility: The portfolio and certain other funds managed by The Vanguard Group (“Vanguard”) participate in a $4.3 billion committed credit facility provided by a syndicate of lenders pursuant to a credit agreement that may be renewed annually; each fund is individually liable for its borrowings, if any, under the credit facility. Borrowings may be utilized for temporary and emergency purposes, and are subject to the portfolio’s regulatory and contractual borrowing restrictions. The participating funds are charged administrative fees and an annual commitment fee of 0.10% of the undrawn amount of the facility; these fees are allocated to the funds based on a method approved by the portfolio’s board of trustees and included in Management and Administrative expenses on the portfolio’s Statement of Operations. Any borrowings under this facility bear interest at a rate based upon the higher of the one-month London Interbank Offered Rate, federal funds effective rate, or overnight bank funding rate plus an agreed-upon spread.
The portfolio had no borrowings outstanding at December 31, 2019, or at any time during the period then ended.
5. Other: Interest income is accrued daily. Premiums and discounts on debt securities are amortized and accreted, respectively, to interest income over the lives of the respective securities, except for premiums on certain callable debt securities that are amortized to the earliest call date. Security transactions are accounted for on the date securities are bought or sold. Costs used to determine realized gains (losses) on the sale of investment securities are those of the specific securities sold.
B. In accordance with the terms of a Funds’ Service Agreement (the “FSA”) between Vanguard and the portfolio, Vanguard furnishes to the portfolio investment advisory, corporate management, administrative, marketing, and distribution services at Vanguard’s cost of operations (as defined by the FSA). These costs of operations are allocated to the portfolio based on methods and guidelines approved by the board of trustees, and are generally settled twice a month.
Upon the request of Vanguard, the portfolio may invest up to 0.40% of its net assets as capital in Vanguard. At December 31, 2019, the portfolio had contributed to Vanguard capital in the amount of $56,000, representing less than 0.01% of the portfolio’s net assets and 0.02% of Vanguard’s capital received pursuant to the FSA. The portfolio’s trustees and officers are also directors and employees, respectively, of Vanguard.
C. Various inputs may be used to determine the value of the portfolio’s investments. These inputs are summarized in three broad levels for financial statement purposes. The inputs or methodologies used to value securities are not necessarily an indication of the risk associated with investing in those securities.
Money Market Portfolio
Level 1—Quoted prices in active markets for identical securities.
Level 2—Other significant observable inputs (including quoted prices for similar securities, interest rates, prepayment speeds, credit risk, etc.).
Level 3—Significant unobservable inputs (including the portfolio’s own assumptions used to determine the fair value of investments). Any investments valued with significant unobservable inputs are noted on the Statement of Net Assets.
At December 31, 2019, 100% of the market value of the portfolio’s investments was determined using amortized cost, in accordance with rules under the Investment Company Act of 1940. Amortized cost approximates the current fair value of a security, but since the value is not obtained from a quoted price in an active market, securities valued at amortized cost are considered to be valued using Level 2 inputs.
D. Permanent differences between book-basis and tax-basis components of net assets, if any, are reclassified among capital accounts in the financial statements to reflect their tax character. These reclassifications have no effect on net assets or net asset value per share.
Temporary differences between book-basis and tax-basis components of total distributable earnings (loss) arise when certain items of income, gain, or loss are recognized in different periods for financial statement and tax purposes; these differences will reverse at some time in the future. The differences are primarily related to the tax deferral of losses on wash sales. As of period end, the tax-basis components of total distributable earnings (loss) are detailed in the table as follows:
| | Amount | |
| | ($000 | ) |
| Undistributed Ordinary Income | 6 | |
| Undistributed Long-Term Gains | — | |
| Capital Loss Carryforwards (Non-expiring)* | (22 | ) |
| Net Unrealized Gains (Losses) | — | |
| * | The fund used capital loss carryforwards of $3,000 to offset taxable capital gains realized during the year ended December 31, 2019. |
As of December 31, 2019, gross unrealized appreciation and depreciation for investments based on cost for U.S. federal income tax purposes were as follows:
| | Amount | |
| | ($000 | ) |
| Tax Cost | 1,254,495 | |
| Gross Unrealized Appreciation | — | |
| Gross Unrealized Depreciation | — | |
| Net Unrealized Appreciation (Depreciation) | — | |
E. At December 31, 2019, one shareholder, an insurance company separate account whose holdings in the portfolio represent the indirect investment of Vanguard Variable Annuity contract holders, was the record or beneficial owner of 88% of the portfolio’s net assets. If this shareholder was to redeem its investment in the portfolio, the redemption might result in an increase in the portfolio’s expense ratio, cause the portfolio to incur higher transaction costs, or lead to the realization of taxable capital gains.
F. Management has determined that no events or transactions occurred subsequent to December 31, 2019, that would require recognition or disclosure in these financial statements.
Money Market Portfolio
Report of Independent Registered Public Accounting Firm
To the Board of Trustees of Vanguard Variable Insurance Funds and Shareholders of Money Market Portfolio
Opinion on the Financial Statements
We have audited the accompanying statement of net assets of Money Market Portfolio (one of the portfolios constituting Vanguard Variable Insurance Funds, referred to hereafter as the “Portfolio”) as of December 31, 2019, the related statement of operations for the year ended December 31, 2019, the statement of changes in net assets for each of the two years in the period ended December 31, 2019, including the related notes, and the financial highlights for each of the five years in the period ended December 31, 2019 (collectively referred to as the “financial statements”). In our opinion, the financial statements present fairly, in all material respects, the financial position of the Portfolio as of December 31, 2019, the results of its operations for the year then ended, the changes in its net assets for each of the two years in the period ended December 31, 2019 and the financial highlights for each of the five years in the period ended December 31, 2019 in conformity with accounting principles generally accepted in the United States of America.
Basis for Opinion
These financial statements are the responsibility of the Portfolio’s management. Our responsibility is to express an opinion on the Portfolio’s financial statements based on our audits. We are a public accounting firm registered with the Public Company Accounting Oversight Board (United States) (“PCAOB”) and are required to be independent with respect to the Portfolio in accordance with the U.S. federal securities laws and the applicable rules and regulations of the Securities and Exchange Commission and the PCAOB.
We conducted our audits of these financial statements in accordance with the standards of the PCAOB. Those standards require that we plan and perform the audit to obtain reasonable assurance about whether the financial statements are free of material misstatement, whether due to error or fraud.
Our audits included performing procedures to assess the risks of material misstatement of the financial statements, whether due to error or fraud, and performing procedures that respond to those risks. Such procedures included examining, on a test basis, evidence regarding the amounts and disclosures in the financial statements. Our audits also included evaluating the accounting principles used and significant estimates made by management, as well as evaluating the overall presentation of the financial statements. Our procedures included confirmation of securities owned as of December 31, 2019 by correspondence with the custodian and brokers; when replies were not received from brokers, we performed other auditing procedures. We believe that our audits provide a reasonable basis for our opinion.
/s/PricewaterhouseCoopers LLP
Philadelphia, Pennsylvania
February 18, 2020
We have served as the auditor of one or more investment companies in The Vanguard Group of Funds since 1975.
Real Estate Index Portfolio
Your Portfolio’s Performance at a Glance
• For the 12 months ended December 31, 2019, the Real Estate Index Portfolio returned 28.81%, in line with its target benchmark index after factoring in the portfolio’s expenses, and about 2 percentage points behind the broad U.S. stock market.
• The Federal Reserve reduced its target for short-term interest rates three times during the year. Real estate investment trusts (REITs), which are particularly sensitive to rate changes, attracted investors searching for more solid sources of income in the low-rate environment.
• All subsectors of the REIT market finished in positive territory. Specialized REITs, which account for about a third of the portfolio, added the most to results. Residential, industrial, office, health care, and diversified REITs also made notable contributions.
• Please note that the portfolio returns in Vanguard Variable Insurance Fund (VVIF) are different from those in Vanguard Variable Annuity (and other plans that invest in the fund), which take into account insurance-related expenses.
| Market Barometer | |
| | Average Annual Total Returns |
| | Periods Ended December 31, 2019 |
| | One Year | | Three Years | | Five Years |
| Stocks | | | | | | |
| Russell 1000 Index (Large-caps) | 31.43 | % | 15.05 | % | 11.48 | % |
| Russell 2000 Index (Small-caps) | 25.53 | | 8.59 | | 8.23 | |
| Russell 3000 Index (Broad U.S. market) | 31.02 | | 14.57 | | 11.24 | |
| FTSE All-World ex US Index (International) | 21.81 | | 9.96 | | 5.83 | |
| | | | | | | |
| Bonds | | | | | | |
| Bloomberg Barclays U.S. Aggregate Bond Index (Broad taxable market) | 8.72 | % | 4.03 | % | 3.05 | % |
| Bloomberg Barclays Municipal Bond Index (Broad tax-exempt market) | 7.54 | | 4.72 | | 3.53 | |
| FTSE Three-Month U.S. Treasury Bill Index | 2.25 | | 1.65 | | 1.04 | |
| | | | | | | |
| CPI | | | | | | |
| Consumer Price Index | 2.29 | % | 2.10 | % | 1.82 | % |
Real Estate Index Portfolio
About Your Portfolio’s Expenses
As a shareholder of the portfolio, you incur ongoing costs, which include costs for portfolio management, administrative services, and shareholder reports (like this one), among others. Operating expenses, which are deducted from a portfolio’s gross income, directly reduce the investment return of the portfolio.
A portfolio’s expenses are expressed as a percentage of its average net assets. This figure is known as the expense ratio. The following examples are intended to help you understand the ongoing costs (in dollars) of investing in your portfolio and to compare these costs with those of other mutual funds. The examples are based on an investment of $1,000 made at the beginning of the period shown and held for the entire period.
The accompanying table illustrates your portfolio’s costs in two ways:
• Based on actual portfolio return. This section helps you to estimate the actual expenses that you paid over the period. The “Ending Account Value” shown is derived from the portfolio’s actual return, and the third column shows the dollar amount that would have been paid by an investor who started with $1,000 in the portfolio. You may use the information here, together with the amount you invested, to estimate the expenses that you paid over the period.
To do so, simply divide your account value by $1,000 (for example, an $8,600 account value divided by $1,000 = 8.6), then multiply the result by the number given for your portfolio under the heading “Expenses Paid During Period.”
• Based on hypothetical 5% yearly return. This section is intended to help you compare your portfolio’s costs with those of other mutual funds. It assumes that the portfolio had a yearly return of 5% before expenses, but that the expense ratio is unchanged. In this case—because the return used is not the portfolio’s actual return—the results do not apply to your investment. The example is useful in making comparisons because the Securities and Exchange Commission requires all mutual funds to calculate expenses based on a 5% return. You can assess your portfolio’s costs by comparing this hypothetical example with the hypothetical examples that appear in shareholder reports of other funds.
Note that the expenses shown in the table are meant to highlight and help you compareongoingcosts only and do not reflect transaction costs incurred by the portfolio for buying and selling securities. The portfolio’s expense ratio does not reflect additional fees and expenses associated with the annuity or life insurance program through which you invest.
The calculations assume no shares were bought or sold during the period. Your actual costs may have been higher or lower, depending on the amount of your investment and the timing of any purchases or redemptions.
You can find more information about the portfolio’s expenses in the Financial Statements section. For additional information on operating expenses and other shareholder costs, please refer to the prospectus.
| Six Months Ended December 31, 2019 | | | |
| | Beginning | Ending | Expenses |
| | Account Value | Account Value | Paid During |
| Real Estate Index Portfolio | 6/30/2019 | 12/31/2019 | Period |
| Based on Actual Portfolio Return | $1,000.00 | $1,080.19 | $1.36 |
| Based on Hypothetical 5% Yearly Return | 1,000.00 | 1,023.89 | 1.33 |
The calculations are based on expenses incurred in the most recent six-month period. The portfolio’s annualized six-month expense ratio for that period is 0.26%. The dollar amounts shown as “Expenses Paid” are equal to the annualized expense ratio multiplied by the average account value over the period, multiplied by the number of days in the most recent six-month period, then divided by the number of days in the most recent 12-month period (184/365).
Real Estate Index Portfolio
Performance Summary
All of the returns in this report represent past performance, which is not a guarantee of future results that may be achieved by the portfolio. (Current performance may be lower or higher than the performance data cited. For performance data current to the most recent month-end, visit our website at vanguard.com/performance.) Note, too, that both investment returns and principal value can fluctuate widely, so an investor’s shares, when sold, could be worth more or less than their original cost. The returns shown do not reflect taxes that a shareholder would pay on portfolio distributions or on the sale of portfolio shares. Nor do the returns reflect fees and expenses associated with the annuity or life insurance program through which a shareholder invests. If these fees and expenses were included, the portfolio’s returns would be lower.
Cumulative Performance: December 31, 2009–December 31, 2019
Initial Investment of $10,000
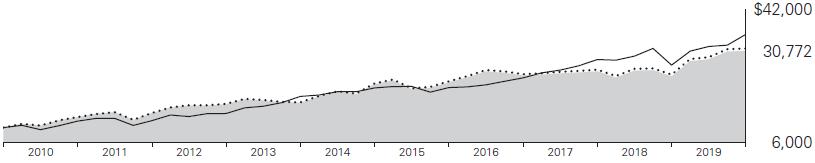
| | | Average Annual Total Returns | | Final Value |
| | | Periods Ended December 31, 2019 | | of a $10,000 |
| | | One Year | Five Years | Ten Years | | Investment |
| Real Estate Index Portfolio | 28.81% | 7.19% | 11.90% | | $30,772 |
| Real Estate Spliced Index | 29.03 | 7.42 | 12.13 | | 31,431 |
| Dow Jones U.S. Total Stock Market Float Adjusted Index | 30.90 | 11.18 | 13.43 | | 35,251 |
Real Estate Spliced Index: MSCI US REIT Index adjusted to include a 2% cash position (Lipper Money Market Average) through April 30, 2009; the MSCI US REIT Index through January 18, 2018; and the MSCI US Investable Market Real Estate 25/50 Index thereafter.
See Financial Highlights for dividend and capital gains information.
Real Estate Index Portfolio
Subindustry Diversification
As of December 31, 2019
| Diversified REITs | 4.8% |
| Health Care REITs | 9.6 |
| Hotel & Resort REITs | 4.2 |
| Industrial REITs | 8.3 |
| Office REITs | 9.5 |
| Residential REITs | 14.6 |
| Retail REITs | 12.0 |
| Specialized REITs | 33.2 |
| Real Estate Management and Development | 3.8 |
The table reflects the portfolio’s equity exposure, based on its investments in stocks and stock index futures. Any holdings in short-term reserves are excluded. Sector categories are based on the Global Industry Classification Standard (“GICS”), except for the “Other” category (if applicable), which includes securities that have not been provided a GICS classification as of the effective reporting period.
The Global Industry Classification Standard (“GICS”) was developed by and is the exclusive property and a service mark of MSCI Inc. (“MSCI”) and Standard and Poor’s, a division of McGraw-Hill Companies, Inc. (“S&P”), and is licensed for use by Vanguard. Neither MSCI, S&P nor any third party involved in making or compiling the GICS or any GICS classification makes any express or implied warranties or representations with respect to such standard or classification (or the results to be obtained by the use thereof), and all such parties hereby expressly disclaim all warranties of originality, accuracy, completeness, merchantability or fitness for a particular purpose with respect to any such standard or classification. Without limiting any of the foregoing, in no event shall MSCI, S&P, any of its affiliates or any third party involved in making or compiling the GICS or any GICS classification have any liability for any direct, indirect, special, punitive, consequential or any other damages (including lost profits) even if notified of the possibility of such damages.
Real Estate Index Portfolio
Financial Statements
Statement of Net Assets
As of December 31, 2019
The portfolio files its complete schedule of portfolio holdings with the Securities and Exchange Commission (SEC) for the first and third quarters of each fiscal year as an exhibit to its reports on Form N-PORT. The portfolio’s Form N-PORT reports are available on the SEC’s website at www.sec.gov.
| | | | | Market | |
| | | | | Value• | |
| | | Shares | | ($000 | ) |
| Equity Real Estate Investment Trusts (REITs) (96.1%)1 | | | | |
| Diversified REITs (4.8%) | | | | |
| | WP Carey Inc. | 166,211 | | 13,304 | |
| | VEREIT Inc. | 1,025,658 | | 9,477 | |
| | Liberty Property Trust | 152,367 | | 9,150 | |
| | STORE Capital Corp. | 213,175 | | 7,939 | |
| | PS Business Parks Inc. | 20,081 | | 3,311 | |
| | Washington REIT | 77,594 | | 2,264 | |
| | American Assets Trust Inc. | 49,172 | | 2,257 | |
| | Colony Capital Inc. | 447,869 | | 2,127 | |
| | Empire State Realty Trust Inc. | 146,452 | | 2,044 | |
| | Essential Properties Realty Trust Inc. | 73,947 | | 1,835 | |
| | Global Net Lease Inc. | 81,806 | | 1,659 | |
| | Alexander & Baldwin Inc. | 66,358 | | 1,391 | |
| | Armada Hoffler Properties Inc. | 51,086 | | 937 | |
| | iStar Inc. | 60,180 | | 873 | |
| | Gladstone Commercial Corp. | 30,059 | | 657 | |
| | One Liberty Properties Inc. | 14,567 | | 396 | |
| *,§ | Winthrop Realty Trust | 32,397 | | 28 | |
| | | | | 59,649 | |
| Health Care REITs (9.6%) | | | | |
| | Welltower Inc. | 394,404 | | 32,254 | |
| | Ventas Inc. | 362,744 | | 20,945 | |
| | Healthpeak Properties Inc. | 477,627 | | 16,464 | |
| | Medical Properties Trust Inc. | 496,604 | | 10,483 | |
| | Omega Healthcare Investors Inc. | 212,664 | | 9,006 | |
| | Healthcare Trust of America Inc. Class A | 199,577 | | 6,043 | |
| | Healthcare Realty Trust Inc. | 125,955 | | 4,203 | |
| | Sabra Health Care REIT Inc. | 184,999 | | 3,948 | |
| | National Health Investors Inc. | 42,068 | | 3,428 | |
| | Physicians Realty Trust | 180,872 | | 3,426 | |
| | Senior Housing Properties Trust | 230,360 | | 1,944 | |
| | CareTrust REIT Inc. | 92,577 | | 1,910 | |
| | LTC Properties Inc. | 38,504 | | 1,724 | |
| | Universal Health Realty Income Trust | 12,708 | | 1,492 | |
| | Community Healthcare Trust Inc. | 17,872 | | 766 | |
| | New Senior Investment Group Inc. | 80,535 | | 616 | |
| | Global Medical REIT Inc. | 39,551 | | 523 | |
| | | | | 119,175 | |
| Hotel & Resort REITs (4.2%) | | | | |
| | Host Hotels & Resorts Inc. | 711,309 | | 13,195 | |
| | Park Hotels & Resorts Inc. | 232,831 | | 6,023 | |
| | Ryman Hospitality Properties Inc. | 47,634 | | 4,128 | |
| | Service Properties Trust | 161,190 | | 3,922 | |
| | MGM Growth Properties LLC Class A | 111,091 | | 3,440 | |
| | Pebblebrook Hotel Trust | 127,993 | | 3,431 | |
| | Apple Hospitality REIT Inc. | 208,759 | | 3,392 | |
| | Sunstone Hotel Investors Inc. | 220,264 | | 3,066 | |
| | RLJ Lodging Trust | 169,838 | | 3,010 | |
| | Xenia Hotels & Resorts Inc. | 109,152 | | 2,359 | |
| | DiamondRock Hospitality Co. | 193,998 | | 2,150 | |
| | Summit Hotel Properties Inc. | 101,743 | | 1,256 | |
| | Chatham Lodging Trust | 45,726 | | 839 | |
| | Hersha Hospitality Trust Class A | 36,250 | | 527 | |
| | CorePoint Lodging Inc. | 39,021 | | 417 | |
| | Ashford Hospitality Trust Inc. | 94,335 | | 263 | |
| | Braemar Hotels & Resorts Inc. | 26,792 | | 239 | |
| | | | | 51,657 | |
| Industrial REITs (8.3%) | | | | |
| | Prologis Inc. | 614,038 | | 54,735 | |
| | Duke Realty Corp. | 351,565 | | 12,189 | |
| | Americold Realty Trust | 177,061 | | 6,208 | |
| | First Industrial Realty Trust Inc. | 123,146 | | 5,112 | |
| | Rexford Industrial Realty Inc. | 106,834 | | 4,879 | |
| | EastGroup Properties Inc. | 36,578 | | 4,853 | |
| | STAG Industrial Inc. | 124,114 | | 3,918 | |
| | Terreno Realty Corp. | 63,956 | | 3,463 | |
| | Lexington Realty Trust Class B | 204,649 | | 2,173 | |
| | Hannon Armstrong Sustainable Infrastructure Capital Inc. | 63,654 | | 2,048 | |
| | Industrial Logistics Properties Trust | 63,059 | | 1,414 | |
| | Monmouth Real Estate Investment Corp. | 87,871 | | 1,272 | |
| ^ | Innovative Industrial Properties Inc. | 10,978 | | 833 | |
| | | | | 103,097 | |
| Office REITs (9.5%) | | | | |
| | Boston Properties Inc. | 150,386 | | 20,732 | |
| | Alexandria Real Estate Equities Inc. | 110,278 | | 17,819 | |
| | Vornado Realty Trust | 166,885 | | 11,098 | |
| | Kilroy Realty Corp. | 98,120 | | 8,232 | |
| | SL Green Realty Corp. | 80,179 | | 7,367 | |
| | Douglas Emmett Inc. | 161,907 | | 7,108 | |
| | Cousins Properties Inc. | 141,460 | | 5,828 | |
| | Hudson Pacific Properties Inc. | 150,291 | | 5,658 | |
| | JBG SMITH Properties | 124,333 | | 4,960 | |
| | Highwoods Properties Inc. | 101,141 | | 4,947 | |
| | Equity Commonwealth | 118,772 | | 3,899 | |
| | Corporate Office Properties Trust | 109,490 | | 3,217 | |
| | Piedmont Office Realty Trust Inc. Class A | 123,285 | | 2,742 | |
| | Brandywine Realty Trust | 170,705 | | 2,689 | |
| | Paramount Group Inc. | 181,442 | | 2,526 | |
| | Columbia Property Trust Inc. | 113,262 | | 2,368 | |
| | Mack-Cali Realty Corp. | 87,728 | | 2,029 | |
| | Easterly Government Properties Inc. | 68,985 | | 1,637 | |
| | Office Properties Income Trust | 46,645 | | 1,499 | |
| | Franklin Street Properties Corp. | 104,158 | | 891 | |
| | City Office REIT Inc. | 52,875 | | 715 | |
| | | | | 117,961 | |
| Residential REITs (14.6%) | | | | |
| | Equity Residential | 360,785 | | 29,195 | |
| | AvalonBay Communities Inc. | 135,816 | | 28,481 | |
| | Essex Property Trust Inc. | 63,961 | | 19,243 | |
| | Invitation Homes Inc. | 523,493 | | 15,689 | |
| | Mid-America Apartment Communities Inc. | 110,990 | | 14,635 | |
| | UDR Inc. | 285,137 | | 13,316 | |
| | Sun Communities Inc. | 88,155 | | 13,232 | |
| | Equity LifeStyle Properties Inc. | 168,252 | | 11,843 | |
| | Camden Property Trust | 94,246 | | 10,000 | |
| | Apartment Investment & Management Co. | 144,835 | | 7,481 | |
| | American Homes 4 Rent Class A | 262,313 | | 6,875 | |
| | American Campus Communities Inc. | 133,616 | | 6,284 | |
| | Independence Realty Trust Inc. | 88,730 | | 1,249 | |
| | NexPoint Residential Trust Inc. | 18,919 | | 851 | |
| | Investors Real Estate Trust | 11,169 | | 810 | |
| | Front Yard Residential Corp. | 49,478 | | 611 | |
| | Preferred Apartment Communities Inc. Class A | 43,231 | | 576 | |
| | UMH Properties Inc. | 35,299 | | 555 | |
| | | | | 180,926 | |
| Retail REITs (12.0%) | | | | |
| | Simon Property Group Inc. | 299,882 | | 44,670 | |
| | Realty Income Corp. | 309,757 | | 22,807 | |
| | Regency Centers Corp. | 163,282 | | 10,302 | |
| | Federal Realty Investment Trust | 72,809 | | 9,373 | |
| | National Retail Properties Inc. | 158,837 | | 8,517 | |
| | Kimco Realty Corp. | 410,139 | | 8,494 | |
| | Brixmor Property Group Inc. | 289,715 | | 6,261 | |
| | Spirit Realty Capital Inc. | 87,767 | | 4,316 | |
Real Estate Index Portfolio
| | | | | Market | |
| | | | | Value• | |
| | | Shares | | ($000 | ) |
| | Weingarten Realty Investors | 119,479 | | 3,733 | |
| ^ | Macerich Co. | 109,516 | | 2,948 | |
| | Agree Realty Corp. | 41,008 | | 2,878 | |
| | Retail Properties of America Inc. | 206,987 | | 2,774 | |
| | Urban Edge Properties | 117,416 | | 2,252 | |
| | Acadia Realty Trust | 81,825 | | 2,122 | |
| | SITE Centers Corp. | 139,964 | | 1,962 | |
| | Retail Opportunity Investments Corp. | 110,741 | | 1,956 | |
| | Taubman Centers Inc. | 59,251 | | 1,842 | |
| | Kite Realty Group Trust | 81,404 | | 1,590 | |
| | American Finance Trust Inc. | 103,234 | | 1,369 | |
| | Seritage Growth Properties Class A | 33,914 | | 1,359 | |
| ^ | Tanger Factory Outlet Centers Inc. | 90,655 | | 1,335 | |
| | RPT Realty | 77,623 | | 1,167 | |
| | Getty Realty Corp. | 33,985 | | 1,117 | |
| | Alexander’s Inc. | 2,212 | | 731 | |
| | Urstadt Biddle Properties Inc. Class A | 28,790 | | 715 | |
| | Saul Centers Inc. | 13,416 | | 708 | |
| ^ | Washington Prime Group Inc. | 180,008 | | 655 | |
| | Retail Value Inc. | 14,702 | | 541 | |
| | Whitestone REIT | 36,779 | | 501 | |
| ^ | Pennsylvania REIT | 71,364 | | 380 | |
| | Cedar Realty Trust Inc. | 85,440 | | 252 | |
| | Spirit MTA REIT | 42,040 | | 32 | |
| | | | | 149,659 | |
| Specialized REITs (33.1%) | | | | |
| | American Tower Corp. | 430,674 | | 98,978 | |
| | Crown Castle International Corp. | 404,528 | | 57,504 | |
| | Equinix Inc. | 82,510 | | 48,161 | |
| | Public Storage | 152,884 | | 32,558 | |
| | SBA Communications Corp. Class A | 110,070 | | 26,526 | |
| | Digital Realty Trust Inc. | 202,663 | | 24,267 | |
| | Weyerhaeuser Co. | 724,760 | | 21,888 | |
| | Extra Space Storage Inc. | 124,961 | | 13,198 | |
| | VICI Properties Inc. | 448,722 | | 11,465 | |
| | Iron Mountain Inc. | 278,991 | | 8,891 | |
| | Gaming and Leisure Properties Inc. | 198,166 | | 8,531 | |
| | Lamar Advertising Co. Class A | 83,577 | | 7,460 | |
| | CyrusOne Inc. | 110,043 | | 7,200 | |
| | CubeSmart | 187,194 | | 5,893 | |
| | EPR Properties | 75,482 | | 5,332 | |
| | Life Storage Inc. | 45,408 | | 4,917 | |
| | Rayonier Inc. | 126,376 | | 4,140 | |
| | CoreSite Realty Corp. | 35,965 | | 4,032 | |
| | Outfront Media Inc. | 139,823 | | 3,750 | |
| | QTS Realty Trust Inc. Class A | 53,577 | | 2,908 | |
| | PotlatchDeltic Corp. | 65,689 | | 2,842 | |
| | CoreCivic Inc. | 115,268 | | 2,003 | |
| | GEO Group Inc. | 117,514 | | 1,952 | |
| | National Storage Affiliates Trust | 57,449 | | 1,931 | |
| | Four Corners Property Trust Inc. | 66,246 | | 1,867 | |
| | Uniti Group Inc. | 187,157 | | 1,537 | |
| | CorEnergy Infrastructure Trust Inc. | 13,108 | | 586 | |
| | CatchMark Timber Trust Inc. Class A | 47,483 | | 545 | |
| | Jernigan Capital Inc. | 21,540 | | 412 | |
| | Safehold Inc. | 9,798 | | 395 | |
| | | | | 411,669 | |
| Total Equity Real Estate Investment Trusts (REITs) (Cost $1,093,553) | | | 1,193,793 | |
| Real Estate Management & Development (3.8%)1 | | | | |
| * | CBRE Group Inc. Class A | 311,282 | | 19,078 | |
| | Jones Lang LaSalle Inc. | 50,093 | | 8,721 | |
| * | Howard Hughes Corp. | 39,985 | | 5,070 | |
| | Kennedy-Wilson Holdings Inc. | 124,080 | | 2,767 | |
| | Newmark Group Inc. Class A | 143,946 | | 1,937 | |
| * | Cushman & Wakefield plc | 94,647 | | 1,935 | |
| *,^ | Redfin Corp. | 71,357 | | 1,509 | |
| ^ | Realogy Holdings Corp. | 110,760 | | 1,072 | |
| * | Marcus & Millichap Inc. | 22,767 | | 848 | |
| | RE/MAX Holdings Inc. Class A | 18,043 | | 694 | |
| * | St. Joe Co. | 34,711 | | 688 | |
| | RMR Group Inc. Class A | 14,631 | | 668 | |
| * | Five Point Holdings LLC Class A | 49,235 | | 342 | |
| * | Tejon Ranch Co. | 21,312 | | 341 | |
| * | FRP Holdings Inc. | 6,769 | | 337 | |
| * | Forestar Group Inc. | 16,023 | | 334 | |
| *,^ | eXp World Holdings Inc. | 20,656 | | 234 | |
| * | Altisource Portfolio Solutions SA | 6,356 | | 123 | |
| Total Real Estate Management & Development (Cost $41,907) | | | 46,698 | |
| Temporary Cash Investments (0.3%)1 | | | | |
| Money Market Fund (0.3%) | | | | |
| 2,3 | Vanguard Market Liquidity Fund, 1.816% | 38,726 | | 3,873 | |
| | | | | | |
| | | Face | | | |
| | | Amount | | | |
| | | ($000 | ) | | |
| U.S. Government and Agency Obligations (0.0%) | | | | |
| 4 | United States Treasury Bill, 1.541%, 4/30/20 | 100 | | 100 | |
Total Temporary Cash Investments
(Cost $3,973) | | | 3,973 | |
Total Investments (100.2%)
(Cost $1,139,433) | | | 1,244,464 | |
| | Amount | |
| | ($000 | ) |
| Other Assets and Liabilities (-0.2%) | | |
| Other Assets | | |
| Investment in Vanguard | 56 | |
| Receivables for Investment Securities Sold | 1 | |
| Receivables for Accrued Income | 5,402 | |
| Receivables for Capital Shares Issued | 297 | |
| Variation Margin Receivable—Futures Contracts | 15 | |
| Other Assets | 46 | |
| Total Other Assets | 5,817 | |
| Liabilities | | |
| Payables for Investment Securities Purchased | (2,011 | ) |
| Collateral for Securities on Loan | (3,858 | ) |
| Payables for Capital Shares Redeemed | (1,288 | ) |
| Payables to Vanguard | (526 | ) |
| Other Liabilities | (147 | ) |
| Total Liabilities | (7,830 | ) |
| Net Assets (100%) | | |
| Applicable to 90,431,333 outstanding $.001 par value shares of beneficial interest (unlimited authorization) | 1,242,451 | |
| Net Asset Value Per Share | $13.74 | |
| | | |
| At December 31, 2019, net assets consisted of: | | |
| | Amount | |
| | ($000 | ) |
| Paid-in Capital | 1,093,312 | |
| Total Distributable Earnings (Loss) | 149,139 | |
| Net Assets | 1,242,451 | |
| • | See Note A in Notes to Financial Statements. |
| * | Non-income-producing security. |
| § | Security value determined using significant unobservable inputs. |
| ^ | Includes partial security positions on loan to broker-dealers. The total value of securities on loan is $3,753,000. |
| 1 | The portfolio invests a portion of its cash reserves in equity markets through the use of index futures contracts. After giving effect to futures investments, the portfolio’s effective common stock and temporary cash investment positions represent 100.1% and 0.1%, respectively, of net assets. |
| 2 | Affiliated money market fund available only to Vanguard funds and certain trusts and accounts managed by Vanguard. Rate shown is the 7-day yield. |
| 3 | Collateral of $3,858,000 was received for securities on loan. |
| 4 | Securities with a value of $89,000 have been segregated as initial margin for open futures contracts. |
| | REIT—Real Estate Investment Trust. |
Real Estate Index Portfolio
| Derivative Financial Instruments Outstanding as of Period End | |
| | | | |
| Futures Contracts | | | |
| | | | | | ($000) | |
| | | | | | Value and | |
| | | Number of | | | Unrealized | |
| | | Long (Short) | | Notional | Appreciation | |
| | Expiration | Contracts | | Amount | (Depreciation) | |
| Long Futures Contracts | | | |
| Dow Jones U.S. Real Estate Index | March 2020 | 65 | | 2,389 | 85 | |
See accompanying Notes, which are an integral part of the Financial Statements.
Real Estate Index Portfolio
Statement of Operations
| | Year Ended | |
| | December 31, 2019 | |
| | ($000 | ) |
| Investment Income | | |
| Income | | |
| Dividends | 32,059 | |
| Interest1 | 32 | |
| Securities Lending—Net | 61 | |
| Total Income | 32,152 | |
| Expenses | | |
| The Vanguard Group—Note B | | |
| Investment Advisory Services | 173 | |
| Management and Administrative | 2,658 | |
| Marketing and Distribution | 112 | |
| Custodian Fees | 25 | |
| Auditing Fees | 35 | |
| Shareholders’ Reports | 19 | |
| Trustees’ Fees and Expenses | 1 | |
| Total Expenses | 3,023 | |
| Expenses Paid Indirectly | (19 | ) |
| Net Expenses | 3,004 | |
| Net Investment Income | 29,148 | |
| Realized Net Gain (Loss) | | |
| Investment Securities Sold1 | 11,579 | |
| Futures Contracts | 270 | |
| Capital Gain Distributions Received | 5,739 | |
| Realized Net Gain (Loss) | 17,588 | |
| Change in Unrealized Appreciation (Depreciation) | | |
| Investment Securities1 | 229,952 | |
| Futures Contracts | 218 | |
| Change in Unrealized Appreciation (Depreciation) | 230,170 | |
| Net Increase (Decrease) in Net Assets Resulting from Operations | 276,906 | |
| 1 | Interest income, realized net gain (loss), and change in unrealized appreciation (depreciation) from an affiliated company of the portfolio were $29,000, $3,000, and ($1,000), respectively. Purchases and sales are for temporary cash investment purposes. |
Statement of Changes in Net Assets
| | Year EndedDecember 31, | |
| | 2019 | | 2018 | |
| | ($000 | ) | ($000 | ) |
| Increase (Decrease) in Net Assets | | | | |
| Operations | | | | |
| Net Investment Income | 29,148 | | 30,686 | |
| Realized Net Gain (Loss) | 17,588 | | 53,322 | |
| Change in Unrealized Appreciation (Depreciation) | 230,170 | | (141,621 | ) |
| Net Increase (Decrease) in Net Assets Resulting from Operations | 276,906 | | (57,613 | ) |
| Distributions | | | | |
| Net Investment Income | (30,595 | ) | (30,725 | ) |
| Realized Capital Gain1 | (55,292 | ) | (37,675 | ) |
| Total Distributions | (85,887 | ) | (68,400 | ) |
| Capital Share Transactions | | | | |
| Issued | 159,509 | | 145,927 | |
| Issued in Lieu of Cash Distributions | 85,887 | | 68,400 | |
| Redeemed | (159,033 | ) | (200,093 | ) |
| Net Increase (Decrease) from Capital Share Transactions | 86,363 | | 14,234 | |
| Total Increase (Decrease) | 277,382 | | (111,779 | ) |
| Net Assets | | | | |
| Beginning of Period | 965,069 | | 1,076,848 | |
| End of Period | 1,242,451 | | 965,069 | |
| 1 | Includes fiscal 2019 and 2018 short-term gain distributions totaling $6,455,000 and $441,000, respectively. Short-term gain distributions are treated as ordinary income dividends for tax purposes. |
See accompanying Notes, which are an integral part of the Financial Statements.
Real Estate Index Portfolio
Financial Highlights
| For a Share Outstanding | | | | | Year Ended December 31, | |
| Throughout Each Period | 2019 | | 2018 | | 2017 | | 2016 | | 2015 | |
| Net Asset Value, Beginning of Period | $11.57 | | $13.14 | | $13.48 | | $13.77 | | $14.17 | |
| Investment Operations | | | | | | | | | | |
| Net Investment Income | .329 | 1 | .367 | 1 | .375 | 1 | .346 | | .358 | |
| Net Realized and Unrealized Gain (Loss) on Investments | 2.874 | | (1.084 | ) | .220 | | .734 | | (.032 | ) |
| Total from Investment Operations | 3.203 | | (.717 | ) | .595 | | 1.080 | | .326 | |
| Distributions | | | | | | | | | | |
| Dividends from Net Investment Income | (.368 | ) | (.383 | ) | (.336 | ) | (.375 | ) | (.251 | ) |
| Distributions from Realized Capital Gains | (.665 | ) | (.470 | ) | (.599 | ) | (.995 | ) | (.475 | ) |
| Total Distributions | (1.033 | ) | (.853 | ) | (.935 | ) | (1.370 | ) | (.726 | ) |
| Net Asset Value, End of Period | $13.74 | | $11.57 | | $13.14 | | $13.48 | | $13.77 | |
| | | | | | | | | | | |
| Total Return | 28.81% | | -5.35% | | 4.78% | | 8.36% | | 2.22% | |
| | | | | | | | | | | |
| Ratios/Supplemental Data | | | | | | | | | | |
| Net Assets, End of Period (Millions) | $1,242 | | $965 | | $1,077 | | $1,093 | | $990 | |
| Ratio of Total Expenses to Average Net Assets | 0.26% | | 0.26% | | 0.27% | | 0.27% | | 0.27% | |
| Ratio of Net Investment Income to Average Net Assets | 2.52% | | 3.04% | | 2.87% | | 2.55% | | 2.60% | |
| Portfolio Turnover Rate | 7% | | 35% | | 10% | | 14% | | 21% | |
| 1 | Calculated based on average shares outstanding. |
See accompanying Notes, which are an integral part of the Financial Statements.
Real Estate Index Portfolio
Notes to Financial Statements
The Real Estate Index Portfolio, a portfolio of Vanguard Variable Insurance Funds, is registered under the Investment Company Act of 1940 as an open-end investment company. The portfolio’s shares are only available for purchase by separate accounts of insurance companies as investments for variable annuity plans, variable life insurance contracts, or other variable benefit insurance contracts.
A. The following significant accounting policies conform to generally accepted accounting principles for U.S. investment companies. The portfolio consistently follows such policies in preparing its financial statements.
1. Security Valuation: Securities are valued as of the close of trading on the New York Stock Exchange (generally 4 p.m., Eastern time) on the valuation date. Equity securities are valued at the latest quoted sales prices or official closing prices taken from the primary market in which each security trades; such securities not traded on the valuation date are valued at the mean of the latest quoted bid and asked prices. Securities for which market quotations are not readily available, or whose values have been materially affected by events occurring before the portfolio’s pricing time but after the close of the securities’ primary markets, are valued by methods deemed by the board of trustees to represent fair value. Investments in Vanguard Market Liquidity Fund are valued at that fund’s net asset value. Temporary cash investments are valued using the latest bid prices or using valuations based on a matrix system (which considers such factors as security prices, yields, maturities, and ratings), both as furnished by independent pricing services.
2. Futures Contracts: The portfolio uses index futures contracts to a limited extent, with the objectives of maintaining full exposure to the stock market, maintaining liquidity, and minimizing transaction costs. The portfolio may purchase futures contracts to immediately invest incoming cash in the market, or sell futures in response to cash outflows, thereby simulating a fully invested position in the underlying index while maintaining a cash balance for liquidity. The primary risks associated with the use of futures contracts are imperfect correlation between changes in market values of stocks held by the portfolio and the prices of futures contracts, and the possibility of an illiquid market. Counterparty risk involving futures is mitigated because a regulated clearinghouse is the counterparty instead of the clearing broker. To further mitigate counterparty risk, the portfolio trades futures contracts on an exchange, monitors the financial strength of its clearing brokers and clearinghouse, and has entered into clearing agreements with its clearing brokers. The clearinghouse imposes initial margin requirements to secure the portfolio’s performance and requires daily settlement of variation margin representing changes in the market value of each contract. Any assets pledged as initial margin for open contracts are noted in the Statement of Net Assets.
Futures contracts are valued at their quoted daily settlement prices. The notional amounts of the contracts are not recorded in the Statement of Net Assets. Fluctuations in the value of the contracts are recorded in the Statement of Net Assets as an asset (liability) and in the Statement of Operations as unrealized appreciation (depreciation) until the contracts are closed, when they are recorded as realized futures gains (losses).
During the year ended December 31, 2019, the portfolio’s average investments in long and short futures contracts represented less than 1% and 0% of net assets, respectively, based on the average of the notional amounts at each quarter-end during the period.
3. Federal Income Taxes: The portfolio intends to continue to qualify as a regulated investment company and distribute all of its taxable income. Management has analyzed the portfolio’s tax positions taken for all open federal income tax years (December 31, 2016–2019), and has concluded that no provision for federal income tax is required in the portfolio’s financial statements.
4. Distributions: Distributions to shareholders are recorded on the ex-dividend date. Distributions are determined on a tax basis and may differ from net investment income and realized capital gains for financial reporting purposes.
5. Securities Lending: To earn additional income, the portfolio lends its securities to qualified institutional borrowers. Security loans are subject to termination by the portfolio at any time, and are required to be secured at all times by collateral in an amount at least equal to the market value of securities loaned. Daily market fluctuations could cause the value of loaned securities to be more or less than the value of the collateral received. When this occurs, the collateral is adjusted and settled before the opening of the market on the next business day. The portfolio further mitigates its counterparty risk by entering into securities lending transactions only with a diverse group of prequalified counterparties, monitoring their financial strength, and entering into master securities lending agreements with its counterparties.
Real Estate Index Portfolio
The master securities lending agreements provide that, in the event of a counterparty’s default (including bankruptcy), the portfolio may terminate any loans with that borrower, determine the net amount owed, and sell or retain the collateral up to the net amount owed to the portfolio; however, such actions may be subject to legal proceedings. While collateral mitigates counterparty risk, in the event of a default, the portfolio may experience delays and costs in recovering the securities loaned. The portfolio invests cash collateral received in Vanguard Market Liquidity Fund, and records a liability in the Statement of Net Assets for the return of the collateral, during the period the securities are on loan. Securities lending income represents fees charged to borrowers plus income earned on invested cash collateral, less expenses associated with the loan. During the term of the loan, the portfolio is entitled to all distributions made on or in respect of the loaned securities.
6. Credit Facility: The portfolio and certain other funds managed by The Vanguard Group (“Vanguard”) participate in a $4.3 billion committed credit facility provided by a syndicate of lenders pursuant to a credit agreement that may be renewed annually; each fund is individually liable for its borrowings, if any, under the credit facility. Borrowings may be utilized for temporary and emergency purposes, and are subject to the portfolio’s regulatory and contractual borrowing restrictions. The participating funds are charged administrative fees and an annual commitment fee of 0.10% of the undrawn amount of the facility; these fees are allocated to the funds based on a method approved by the portfolio’s board of trustees and included in Management and Administrative expenses on the portfolio’s Statement of Operations. Any borrowings under this facility bear interest at a rate based upon the higher of the one-month London Interbank Offered Rate, federal funds effective rate, or overnight bank funding rate plus an agreed-upon spread.
The portfolio had no borrowings outstanding at December 31, 2019, or at any time during the period then ended.
7. Other: Distributions received from investment securities are recorded on the ex-dividend date. Each investment security typically reports annually the tax character of its distributions. Dividend income, capital gain distributions received, and unrealized appreciation (depreciation) reflect the amounts of taxable income, capital gain, and return of capital reported by the investment securities, and management’s estimates of such amounts for investment security distributions for which actual information has not been reported. Interest income includes income distributions received from Vanguard Market Liquidity Fund and is accrued daily. Premiums and discounts on debt securities are amortized and accreted, respectively, to interest income over the lives of the respective securities, except for premiums on certain callable debt securities that are amortized to the earliest call date. Security transactions are accounted for on the date securities are bought or sold. Costs used to determine realized gains (losses) on the sale of investment securities are those of the specific securities sold.
B. In accordance with the terms of a Funds’ Service Agreement (the “FSA”) between Vanguard and the portfolio, Vanguard furnishes to the portfolio investment advisory, corporate management, administrative, marketing, and distribution services at Vanguard’s cost of operations (as defined by the FSA). These costs of operations are allocated to the portfolio based on methods and guidelines approved by the board of trustees. Vanguard does not require reimbursement in the current period for certain costs of operations (such as deferred compensation/benefits and risk/insurance costs); the portfolio’s liability for these costs of operations is included in Payables to Vanguard on the Statement of Net Assets. All other costs of operations payable to Vanguard are generally settled twice a month.
Upon the request of Vanguard, the portfolio may invest up to 0.40% of its net assets as capital in Vanguard. At December 31, 2019, the portfolio had contributed to Vanguard capital in the amount of $56,000, representing less than 0.01% of the portfolio’s net assets and 0.02% of Vanguard’s capital received pursuant to the FSA. The portfolio’s trustees and officers are also directors and employees, respectively, of Vanguard.
C. The portfolio’s custodian bank has agreed to reduce its fees when the portfolio maintains cash on deposit in the non-interest-bearing custody account. For the year ended December 31, 2019, custodian fee offset arrangements reduced the portfolio’s expenses by $19,000 (an annual rate of less than 0.01% of average net assets).
Real Estate Index Portfolio
D. Various inputs may be used to determine the value of the portfolio’s investments. These inputs are summarized in three broad levels for financial statement purposes. The inputs or methodologies used to value securities are not necessarily an indication of the risk associated with investing in those securities.
Level 1—Quoted prices in active markets for identical securities.
Level 2—Other significant observable inputs (including quoted prices for similar securities, interest rates, prepayment speeds, credit risk, etc.).
Level 3—Significant unobservable inputs (including the portfolio’s own assumptions used to determine the fair value of investments). Any investments valued with significant unobservable inputs are noted on the Statement of Net Assets.
The following table summarizes the market value of the portfolio’s investments and derivatives as of December 31, 2019, based on the inputs used to value them:
| | Level 1 | | Level 2 | | Level 3 | |
| Investments | ($000 | ) | ($000 | ) | ($000 | ) |
| Common Stocks | 1,240,463 | | — | | 28 | |
| Temporary Cash Investments | 3,873 | | 100 | | — | |
| Futures Contracts—Assets1 | 15 | | — | | — | |
| Total | 1,244,351 | | 100 | | 28 | |
| 1 | Represents variation margin on the last day of the reporting period. |
E. Permanent differences between book-basis and tax-basis components of net assets, if any, are reclassified among capital accounts in the financial statements to reflect their tax character. These reclassifications have no effect on net assets or net asset value per share.
| | Amount | |
| | ($000 | ) |
| Paid-in Capital | — | |
| Total Distributable Earnings (Loss) | — | |
Temporary differences between book-basis and tax-basis components of total distributable earnings (loss) arise when certain items of income, gain, or loss are recognized in different periods for financial statement and tax purposes; these differences will reverse at some time in the future. The differences are primarily related to the tax deferral of losses on wash sales and the realization of unrealized gains or losses on certain futures contracts. As of period end, the tax-basis components of total distributable earnings (loss) are detailed in the table as follows:
| | Amount | |
| | ($000 | ) |
| Undistributed Ordinary Income | 26,310 | |
| Undistributed Long-Term Gains | 16,178 | |
| Capital Loss Carryforwards (Non-expiring) | — | |
| Net Unrealized Gains (Losses) | 105,031 | |
As of December 31, 2019, gross unrealized appreciation and depreciation for investments and derivatives based on cost for U.S. federal income tax purposes were as follows:
| | Amount | |
| | ($000 | ) |
| Tax Cost | 1,139,433 | |
| Gross Unrealized Appreciation | 229,375 | |
| Gross Unrealized Depreciation | (124,344 | ) |
| Net Unrealized Appreciation (Depreciation) | 105,031 | |
F. During the year ended December 31, 2019, the portfolio purchased $122,461,000 of investment securities and sold $81,611,000 of investment securities, other than temporary cash investments.
Real Estate Index Portfolio
G. Capital shares issued and redeemed were:
| | Year Ended December 31, | |
| | 2019 | | 2018 | |
| | Shares | | Shares | |
| | (000 | ) | (000 | ) |
| Issued | 12,229 | | 12,072 | |
| Issued in Lieu of Cash Distributions | 7,040 | | 6,005 | |
| Redeemed | (12,225 | ) | (16,621 | ) |
| Net Increase (Decrease) in Shares Outstanding | 7,044 | | 1,456 | |
At December 31, 2019, one shareholder, an insurance company separate account whose holdings in the portfolio represent the indirect investment of Vanguard Variable Annuity contract holders, was the record or beneficial owner of 44% of the portfolio’s net assets. If this shareholder were to redeem its investment in the portfolio, the redemption might result in an increase in the portfolio’s expense ratio, cause the portfolio to incur higher transaction costs, or lead to the realization of taxable capital gains.
H. Management has determined that no events or transactions occurred subsequent to December 31, 2019, that would require recognition or disclosure in these financial statements.
Real Estate Index Portfolio
Report of Independent Registered Public Accounting Firm
To the Board of Trustees of Vanguard Variable Insurance Funds and Shareholders of Real Estate Index Portfolio
Opinion on the Financial Statements
We have audited the accompanying statement of net assets of Real Estate Index Portfolio (one of the portfolios constituting Vanguard Variable Insurance Funds, referred to hereafter as the “Portfolio”) as of December 31, 2019, the related statement of operations for the year ended December 31, 2019, the statement of changes in net assets for each of the two years in the period ended December 31, 2019, including the related notes, and the financial highlights for each of the five years in the period ended December 31, 2019 (collectively referred to as the “financial statements”). In our opinion, the financial statements present fairly, in all material respects, the financial position of the Portfolio as of December 31, 2019, the results of its operations for the year then ended, the changes in its net assets for each of the two years in the period ended December 31, 2019 and the financial highlights for each of the five years in the period ended December 31, 2019 in conformity with accounting principles generally accepted in the United States of America.
Basis for Opinion
These financial statements are the responsibility of the Portfolio’s management. Our responsibility is to express an opinion on the Portfolio’s financial statements based on our audits. We are a public accounting firm registered with the Public Company Accounting Oversight Board (United States) (“PCAOB”) and are required to be independent with respect to the Portfolio in accordance with the U.S. federal securities laws and the applicable rules and regulations of the Securities and Exchange Commission and the PCAOB.
We conducted our audits of these financial statements in accordance with the standards of the PCAOB. Those standards require that we plan and perform the audit to obtain reasonable assurance about whether the financial statements are free of material misstatement, whether due to error or fraud.
Our audits included performing procedures to assess the risks of material misstatement of the financial statements, whether due to error or fraud, and performing procedures that respond to those risks. Such procedures included examining, on a test basis, evidence regarding the amounts and disclosures in the financial statements. Our audits also included evaluating the accounting principles used and significant estimates made by management, as well as evaluating the overall presentation of the financial statements. Our procedures included confirmation of securities owned as of December 31, 2019 by correspondence with the custodian and brokers and by agreement to the underlying ownership records of the transfer agent; when replies were not received from brokers, we performed other auditing procedures. We believe that our audits provide a reasonable basis for our opinion.
/s/PricewaterhouseCoopers LLP
Philadelphia, Pennsylvania
February 18, 2020
We have served as the auditor of one or more investment companies in The Vanguard Group of Funds since 1975.
Special 2019 tax information (unaudited) for corporate shareholders only for Vanguard Real Estate Index Portfolio, a portfolio of Vanguard Variable Insurance Funds
This information for the fiscal year ended December 31, 2019, is included pursuant to provisions of the Internal Revenue Code for corporate shareholders only.
The portfolio distributed $48,837,000 as capital gain dividends (from net long-term capital gains) to shareholders during the fiscal year. The portfolio designates $47,555,000 of its capital gain dividends as 20% rate gain distributions and $1,282,000 as unrecaptured section 1250 gain distributions (25% rate gain).
Real Estate Index Portfolio
THESE FUNDS ARE NOT SPONSORED, ENDORSED, SOLD OR PROMOTED BY MSCI INC. (“MSCI”), ANY OF ITS AFFILIATES, ANY OF ITS DIRECT OR INDIRECT INFORMATION PROVIDERS OR ANY OTHER THIRD PARTY INVOLVED IN, OR RELATED TO, COMPILING, COMPUTING OR CREATING ANY MSCI INDEX (COLLECTIVELY, THE “MSCI PARTIES”). THE MSCI INDEXES ARE THE EXCLUSIVE PROPERTY OF MSCI. MSCI AND THE MSCI INDEX NAMES ARE SERVICE MARK(S) OF MSCI OR ITS AFFILIATES AND HAVE BEEN LICENSED FOR USE FOR CERTAIN PURPOSES BY VANGUARD. NONE OF THE MSCI PARTIES MAKES ANY REPRESENTATION OR WARRANTY, EXPRESS OR IMPLIED, TO THE OWNERS OF THESE FUNDS OR ANY MEMBER OF THE PUBLIC REGARDING THE ADVISABILITY OF INVESTING IN FUNDS GENERALLY OR IN THESE FUNDS PARTICULARLY OR THE ABILITY OF ANY MSCI INDEX TO TRACK CORRESPONDING STOCK MARKET PERFORMANCE. MSCI OR ITS AFFILIATES ARE THE LICENSORS OF CERTAIN TRADEMARKS, SERVICE MARKS AND TRADE NAMES AND OF THE MSCI INDEXES WHICH ARE DETERMINED, COMPOSED AND CALCULATED BY MSCI WITHOUT REGARD TO THESE FUNDS OR THE ISSUER OR OWNER OF THESE FUNDS. NONE OF THE MSCI PARTIES HAS ANY OBLIGATION TO TAKE THE NEEDS OF THE ISSUERS OR OWNERS OF THESE FUNDS INTO CONSIDERATION IN DETERMINING, COMPOSING OR CALCULATING THE MSCI INDEXES. NONE OF THE MSCI PARTIES IS RESPONSIBLE FOR OR HAS PARTICIPATED IN THE DETERMINATION OF THE TIMING OF, PRICES AT, OR QUANTITIES OF THESE FUNDS TO BE ISSUED OR IN THE DETERMINATION OR CALCULATION OF THE CONSIDERATION INTO WHICH THESE FUNDS ARE REDEEMABLE. NONE OF THE MSCI PARTIES HAS ANY OBLIGATION OR LIABILITY TO THE OWNERS OF THESE FUNDS IN CONNECTION WITH THE ADMINISTRATION, MARKETING OR OFFERING OF THESE FUNDS.
ALTHOUGH MSCI SHALL OBTAIN INFORMATION FOR INCLUSION IN OR FOR USE IN THE CALCULATION OF THE MSCI INDEXES FROM SOURCES WHICH MSCI CONSIDERS RELIABLE, NONE OF THE MSCI PARTIES WARRANTS OR GUARANTEES THE ORIGINALITY, ACCURACY AND/OR THE COMPLETENESS OF ANY MSCI INDEX OR ANY DATA INCLUDED THEREIN. NONE OF THE MSCI PARTIES MAKES ANY WARRANTY, EXPRESS OR IMPLIED, AS TO RESULTS TO BE OBTAINED BY LICENSEE, LICENSEE’S CUSTOMERS OR COUNTERPARTIES, ISSUERS OF THE FUNDS, OWNERS OF THE FUNDS, OR ANY OTHER PERSON OR ENTITY, FROM THE USE OF ANY MSCI INDEX OR ANY DATA INCLUDED THEREIN IN CONNECTION WITH THE RIGHTS LICENSED HEREUNDER OR FOR ANY OTHER USE. NONE OF THE MSCI PARTIES SHALL HAVE ANY LIABILITY FOR ANY ERRORS, OMISSIONS OR INTERRUPTIONS OF OR IN CONNECTION WITH ANY MSCI INDEX OR ANY DATA INCLUDED THEREIN. FURTHER, NONE OF THE MSCI PARTIES MAKES ANY EXPRESS OR IMPLIED WARRANTIES OF ANY KIND, AND THE MSCI PARTIES HEREBY EXPRESSLY DISCLAIM ALL WARRANTIES OF MERCHANTABILITY OR FITNESS FOR A PARTICULAR PURPOSE, WITH RESPECT TO ANY MSCI INDEX AND ANY DATA INCLUDED THEREIN. WITHOUT LIMITING ANY OF THE FOREGOING, IN NO EVENT SHALL ANY OF THE MSCI PARTIES HAVE ANY LIABILITY FOR ANY DIRECT, INDIRECT, SPECIAL, PUNITIVE, CONSEQUENTIAL OR ANY OTHER DAMAGES (INCLUDING WITHOUT LIMITATION LOST PROFITS) EVEN IF NOTIFIED OF THE POSSIBILITY OF SUCH DAMAGES.
Short-Term Investment-Grade Portfolio
Your Portfolio’s Performance at a Glance
• For the 12 months ended December 31, 2019, the Short-Term Investment-Grade Portfolio returned 5.69%, lagging the 6.58% return of its benchmark index, the Bloomberg Barclays U.S. 1–5 Year Credit Bond Index.
• The year was marked by concerns about slowing global growth, escalations in trade disputes, flare-ups in geopolitical tensions, and uncertainty over the United Kingdom’s exit from the European Union. The more challenging outlook prompted the Federal Reserve to cut interest rates three times in 2019; other major central banks adopted more accommodative monetary policies as well. The U.S. Treasury yield curve flattened across the maturity spectrum. Corporate earnings generally proved more resilient than expected and corporate defaults remained low, helping the average yield spread for corporate bonds versus Treasuries to narrow significantly.
• Corporate bonds as a whole returned more than 14%. Bonds issued by industrial companies and utilities outperformed those of financial institutions. By credit quality, lower-rated investment-grade bonds bested higher-rated ones. And by maturity, longer-dated bonds significantly outperformed.
• The portfolio’s duration was a little shorter than that of its benchmark index, which contributed to its underperformance given that bond yields ended the 12 months significantly lower. Other detractors were overall security selection and an allocation to asset-backed and commercial mortgage-backed securities—higher-quality defensive credit segments that are not part of the benchmark. A modest overweight to credit, on the other hand, added value.
• Please note that the portfolio returns in Vanguard Variable Insurance Fund are different from those in Vanguard Variable Annuity (and other plans that invest in the fund), which take into account insurance-related expenses.
Market Barometer
| | | | | | Average Annual Total Returns |
| | | | | | Periods Ended December 31, 2019 |
| | | One Year | | Three Years | | Five Years |
| Stocks | | | | | | | | | |
| Russell 1000 Index (Large-caps) | | | 31.43 | % | | | 15.05 | % | | | 11.48 | % |
| Russell 2000 Index (Small-caps) | | | 25.53 | | | | 8.59 | | | | 8.23 | |
| Russell 3000 Index (Broad U.S. market) | | | 31.02 | | | | 14.57 | | | | 11.24 | |
| FTSE All-World ex US Index (International) | | | 21.81 | | | | 9.96 | | | | 5.83 | |
| | | | | | | | | | | | | |
| Bonds | | | | | | | | | | | | |
| Bloomberg Barclays U.S. Aggregate Bond Index (Broad taxable market) | | | 8.72 | % | | | 4.03 | % | | | 3.05 | % |
| Bloomberg Barclays Municipal Bond Index (Broad tax-exempt market) | | | 7.54 | | | | 4.72 | | | | 3.53 | |
| FTSE Three-Month U.S. Treasury Bill Index | | | 2.25 | | | | 1.65 | | | | 1.04 | |
| | | | | | | | | | | | | |
| CPI | | | | | | | | | | | | |
| Consumer Price Index | | | 2.29 | % | | | 2.10 | % | | | 1.82 | % |
Short-Term Investment-Grade Portfolio
Advisor’s Report
With bond yields falling in 2019, prices rose, contributing to strong returns for the 12 months ended December 31, 2019. The Short-Term Investment-Grade Portfolio returned 5.69%, lagging the 6.58% return of its benchmark index, the Bloomberg Barclays U.S. 1–5 Year Credit Bond Index.
Please note that the portfolio returns in Vanguard Variable Insurance Fund are different from those in Vanguard Variable Annuity (and other plans that invest in the portfolio), which take into account insurance-related expenses.
With yields falling, the portfolio’s 30-day SEC yield stood at 2.21% as of December 31, down from 3.32% a year earlier. The 30-day SEC yield is a proxy for a portfolio’s potential annualized rate of income.
U.S. monetary policy reversed direction in 2019
Although U.S. gross domestic product, the broadest measure of economic activity, expanded in the first quarter of 2019 at an annual rate of about 3% after adjusting for inflation, the pace has slowed since then amid fading effects from tax cuts, weaker business confidence, and trade disputes. The labor market remained robust even as job creation eased a little. The unemployment rate continued to trend lower, falling to 3.5% by late 2019, which helped keep consumers spending. The Federal Reserve’s preferred measure of inflation remained below its 2% target.
Signs of slowing growth at home and abroad led to a pivot in monetary policy. After raising interest rates four times in 2018, the Fed went on to cut them three times in 2019. Those cuts, the first in more than a decade, were justified by policymakers as “insurance” meant to cushion the effects of trade policies and prolong an economic expansion already in its 11th year.
Yields of U.S. Treasuries fell and corporate spreads narrowed
Fed action pushed shorter-term U.S. Treasury yields significantly lower. The yield of the 2-year Treasury note fell 92 basis points over the period to 1.57%. (A basis point is one-hundredth of a percentage point.)
Demand for longer-term Treasury bonds was supported at times by escalating trade tensions, geopolitical flare-ups, and political uncertainties in Europe. The outlook for slower growth and falling inflation expectations, however, led yields on these securities to end the period lower. The yield of the bellwether 10-year Treasury note ended 77 basis points lower, at 1.92%.
Corporate fundamentals proved more resilient than expected and corporate defaults remained low. The average yield spread of investment-grade corporate bonds over Treasuries narrowed to 93 basis points at the end of 2019; it was 153 basis points a year earlier.
The portfolio finished a few steps behind its benchmark
The portfolio had a few pockets of under-performance. It maintains a relatively consistent duration of 2.5 years, while the benchmark’s is a few tenths of a year longer. That modestly shorter duration hurt results as interest rates fell meaningfully over the 12 months.
For diversification purposes across the investment-grade credit sector, we had allocations to asset-backed and commercial mortgage-backed securities, which fall outside the portfolio’s benchmark index. These two defensive segments underper-formed other credit sectors such as investment-grade corporates during a year when lower-quality credit performed well. Security selection also detracted in the aggregate.
We did add value in some areas, notably with a modestly overweight allocation to credit.
More central bank easing possible amid continuing uncertainty
The prospect of slowing growth and tame inflation is likely to elicit more monetary easing by major central banks, including the Fed, which may further cut rates depending on developments that include economic growth, trade tariffs, and the shape of the yield curve.
We expect to see periods of turbulence in the global economy in 2020. Based on that outlook and the fact that rates are low and credit spreads are tight, we are positioned going into the new fiscal year with plenty of dry powder on hand, which will allow us to take advantage of price dislocations as they arise.
Whatever the markets may bring, our experienced team of portfolio managers, traders, and credit analysts will continue to seek attractive investment opportunities that will add to the portfolio’s performance.
Portfolio Managers:
Daniel Shaykevich, Principal
Samuel C. Martinez, CFA
Arvind Narayanan, CFA
Vanguard Fixed Income Group
January 24, 2020
Short-Term Investment-Grade Portfolio
About Your Portfolio’s Expenses
As a shareholder of the portfolio, you incur ongoing costs, which include costs for portfolio management, administrative services, and shareholder reports (like this one), among others. Operating expenses, which are deducted from a portfolio’s gross income, directly reduce the investment return of the portfolio.
A portfolio’s expenses are expressed as a percentage of its average net assets. This figure is known as the expense ratio. The following examples are intended to help you understand the ongoing costs (in dollars) of investing in your portfolio and to compare these costs with those of other mutual funds. The examples are based on an investment of $1,000 made at the beginning of the period shown and held for the entire period.
The table below illustrates your portfolio’s costs in two ways:
• Based on actual portfolio return. This section helps you to estimate the actual expenses that you paid over the period. The “Ending Account Value” shown is derived from the portfolio’s actual return, and the third column shows the dollar amount that would have been paid by an investor who started with $1,000 in the portfolio. You may use the information here, together with the amount you invested, to estimate the expenses that you paid over the period.
To do so, simply divide your account value by $1,000 (for example, an $8,600 account value divided by $1,000 = 8.6), then multiply the result by the number given for your portfolio under the heading “Expenses Paid During Period.”
• Based on hypothetical 5% yearly return. This section is intended to help you compare your portfolio’s costs with those of other mutual funds. It assumes that the portfolio had a yearly return of 5% before expenses, but that the expense ratio is unchanged. In this case—because the return used is not the portfolio’s actual return—the results do not apply to your investment. The example is useful in making comparisons because the Securities and Exchange Commission requires all mutual funds to calculate expenses based on a 5% return. You can assess your portfolio’s costs by comparing this hypothetical example with the hypothetical examples that appear in shareholder reports of other funds.
Note that the expenses shown in the table are meant to highlight and help you compareongoingcosts only and do not reflect transaction costs incurred by the portfolio for buying and selling securities. The portfolio’s expense ratio does not reflect additional fees and expenses associated with the annuity or life insurance program through which you invest.
The calculations assume no shares were bought or sold during the period. Your actual costs may have been higher or lower, depending on the amount of your investment and the timing of any purchases or redemptions.
You can find more information about the portfolio’s expenses in the Financial Statements section. For additional information on operating expenses and other shareholder costs, please refer to the prospectus.
Six Months Ended December 31, 2019
| | | Beginning | | Ending | | Expenses | |
| | | Account Value | | Account Value | | Paid During | |
| Short-Term Investment-Grade Portfolio | | 6/30/2019 | | 12/31/2019 | | Period | |
| Based on Actual Portfolio Return | | $1,000.00 | | $1,015.93 | | $0.71 | |
| Based on Hypothetical 5% Yearly Return | | 1,000.00 | | 1,024.50 | | 0.71 | |
The calculations are based on expenses incurred in the most recent six-month period. The portfolio’s annualized six-month expense ratio for that period is 0.14%. The dollar amounts shown as “Expenses Paid” are equal to the annualized expense ratio multiplied by the average account value over the period, multiplied by the number of days in the most recent six-month period, then divided by the number of days in the most recent 12-month period (184/365).
Short-Term Investment-Grade Portfolio
Performance Summary
All of the returns in this report represent past performance, which is not a guarantee of future results that may be achieved by the portfolio. (Current performance may be lower or higher than the performance data cited. For performance data current to the most recent month-end, visit our website at vanguard.com/performance.) Note, too, that both investment returns and principal value can fluctuate widely, so an investor’s shares, when sold, could be worth more or less than their original cost.The returns shown do not reflect taxes that a shareholder would pay on portfolio distributions or on the sale of portfolio shares. Nor do the returns reflect fees and expenses associated with the annuity or life insurance program through which a shareholder invests. If these fees and expenses were included, the portfolio’s returns would be lower.
Cumulative Performance: December 31, 2009–December 31, 2019
Initial Investment of $10,000

| | | | | Average Annual Total Returns | | Final Value | |
| | | | | Periods Ended December 31, 2019 | | of a $10,000 | |
| | | | | One Year | | Five Years | | Ten Years | | Investment | |
| | | Short-Term Investment-Grade Portfolio | | 5.69% | | 2.52% | | 2.70% | | $13,055 | |
| | | Bloomberg Barclays U.S. 1–5 Year Credit Bond Index | | 6.58 | | 2.71 | | 3.07 | | 13,525 | |
| | | Bloomberg Barclays U.S. Aggregate Bond Index | | 8.72 | | 3.05 | | 3.75 | | 14,445 | |
See Financial Highlights for dividend and capital gains information.
Short-Term Investment-Grade Portfolio
Sector Diversification
As of December 31, 2019
| Asset-Backed/Commercial Mortgage-Backed | | 23.8 | % |
| Finance | | 26.4 | |
| Foreign | | 5.2 | |
| Government Mortgage-Backed | | 0.5 | |
| Industrial | | 27.4 | |
| Treasury/Agency | | 12.2 | |
| Utilities | | 4.4 | |
| Other | | 0.1 | |
The table reflects the fund’s market exposure. Any holdings in short-term reserves are excluded. The agency and mortgage-backed securities sectors may include issues from government-sponsored enterprises; such issues are generally not backed by the full faith and credit of the U.S. government.
Short-Term Investment-Grade Portfolio
Financial Statements
Statement of Net Assets
As of December 31, 2019
The portfolio files its complete schedule of portfolio holdings with the Securities and Exchange Commission (SEC) for the first and third quarters of each fiscal year as an exhibit to its reports on Form N-PORT. The portfolio’s Form N-PORT reports are available on the SEC’s website at www.sec.gov.
| | | | | | | | | Face | | Market |
| | | | | | | Maturity | | Amount | | Value• |
| | | | | Coupon | | Date | | ($000) | | ($000) |
| U.S. Government and Agency Obligations (4.1%) | | | | | | | | | | |
| U.S. Government Securities (2.2%) | | | | | | | | | | |
| | | United States Treasury Note/Bond | | 2.250% | | 2/15/21 | | 41 | | | 42 | |
| | | United States Treasury Note/Bond | | 2.375% | | 4/15/21 | | 30,000 | | | 30,286 | |
| 1 | | United States Treasury Note/Bond | | 2.000% | | 7/31/22 | | 11,300 | | | 11,411 | |
| | | United States Treasury Note/Bond | | 2.875% | | 8/15/28 | | 400 | | | 431 | |
| | | | | | | | | | | | 42,170 | |
| Nonconventional Mortgage-Backed Securities (1.9%) | | | | | | | | | | |
| 2,3,4 | | Fannie Mae Pool, 12M USD LIBOR + 1.704% | | 4.829% | | 2/1/37 | | 10 | | | 10 | |
| 2,3,4 | | Fannie Mae Pool, 12M USD LIBOR + 1.750% | | 4.000% | | 9/1/32 | | 5 | | | 5 | |
| 2,3,4 | | Fannie Mae Pool, 12M USD LIBOR + 1.760% | | 4.387% | | 8/1/37 | | 9 | | | 9 | |
| 2,3,4 | | Fannie Mae Pool, 12M USD LIBOR + 1.785% | | 4.035% | | 8/1/33 | | 26 | | | 27 | |
| 2,3,4 | | Fannie Mae Pool, 12M USD LIBOR + 1.785% | | 4.410% | | 8/1/33 | | 15 | | | 15 | |
| 2,3,4 | | Fannie Mae Pool, 12M USD LIBOR + 1.800% | | 4.486% | | 7/1/33 | | 69 | | | 71 | |
| 2,3,4 | | Fannie Mae Pool, 12M USD LIBOR + 1.960% | | 4.585% | | 5/1/33 | | 2 | | | 2 | |
| 2,3,4 | | Fannie Mae Pool, 1Y CMT + 2.000% | | 4.097% | | 12/1/32 | | 5 | | | 5 | |
| 2,3,4 | | Fannie Mae Pool, 1Y CMT + 2.125% | | 4.600% | | 6/1/33 | | 22 | | | 23 | |
| 2,3,4 | | Fannie Mae Pool, 1Y CMT + 2.185% | | 4.560% | | 7/1/32 | | 3 | | | 3 | |
| 2,3,4 | | Fannie Mae Pool, 1Y CMT + 2.210% | | 4.733% | | 5/1/33 | | 29 | | | 30 | |
| 2,3 | | Fannie Mae-Aces 2011-48D | | 3.000% | | 9/25/49 | | 729 | | | 746 | |
| 2,3 | | Fannie Mae-Aces 2011-50F | | 3.000% | | 9/25/49 | | 1,188 | | | 1,211 | |
| 2,3 | | Fannie Mae-Aces 2011-77A | | 3.000% | | 4/25/44 | | 2,830 | | | 2,873 | |
| 2,3 | | Fannie Mae-Aces 2011-90A | | 3.500% | | 12/25/45 | | 547 | | | 566 | |
| 2,3 | | Fannie Mae-Aces 2012-124E | | 1.500% | | 11/25/42 | | 928 | | | 889 | |
| 2,3 | | Fannie Mae-Aces 2013-111B | | 2.125% | | 10/25/42 | | 678 | | | 673 | |
| 2,3 | | Fannie Mae-Aces 2013-114D | | 2.250% | | 7/25/43 | | 219 | | | 218 | |
| 2,3 | | Fannie Mae-Aces 2013-115A | | 2.000% | | 11/25/43 | | 659 | | | 649 | |
| 2,3 | | Fannie Mae-Aces 2013-115B | | 2.100% | | 4/25/43 | | 538 | | | 531 | |
| 2,3 | | Fannie Mae-Aces 2013-115B | | 2.250% | | 10/25/43 | | 962 | | | 953 | |
| 2,3 | | Fannie Mae-Aces 2013-20E | | 1.500% | | 3/25/43 | | 1,037 | | | 993 | |
| 2,3 | | Fannie Mae-Aces 2013-46B | | 1.700% | | 5/25/43 | | 1,107 | | | 1,076 | |
| 2,3 | | Fannie Mae-Aces 2013-46C | | 1.700% | | 5/25/43 | | 563 | | | 546 | |
| 2,3 | | Fannie Mae-Aces 2013-46D | | 1.500% | | 5/25/43 | | 1,109 | | | 1,077 | |
| 2,3 | | Fannie Mae-Aces 2014-60E | | 2.000% | | 9/25/44 | | 1,844 | | | 1,812 | |
| 2,3 | | Fannie Mae-Aces 2014-86A | | 2.000% | | 12/25/44 | | 761 | | | 748 | |
| 2,3 | | Fannie Mae-Aces 2015-18E | | 1.750% | | 4/25/44 | | 850 | | | 832 | |
| 2,3 | | Fannie Mae-Aces 2015-19 | | 2.000% | | 12/25/44 | | 1,571 | | | 1,548 | |
| 2,3 | | Fannie Mae-Aces 2015-73 | | 1.600% | | 10/25/45 | | 1,082 | | | 1,061 | |
| 2,3 | | Fannie Mae-Aces 2016-60B | | 2.500% | | 9/25/46 | | 1,369 | | | 1,373 | |
| 2,3 | | Freddie Mac REMICS | | 2.500% | | 10/25/49 | | 1,491 | | | 1,496 | |
| 2,3 | | Freddie Mac REMICS | | 3.000% | | 10/25/48 | | 732 | | | 747 | |
| 2 | | Fannie Mae REMICS | | 3.500% | | 10/25/48 | | 2,406 | | | 2,462 | |
| 2,3,4 | | Freddie Mac Non Gold Pool, 12M USD LIBOR + 1.750% | | 4.368% | | 8/1/37 | | 30 | | | 31 | |
| 2,3,4 | | Freddie Mac Non Gold Pool, 12M USD LIBOR + 1.893% | | 4.143% | | 9/1/32 | | 16 | | | 16 | |
| 2,3,4 | | Freddie Mac Non Gold Pool, 12M USD LIBOR + 1.961% | | 3.896% | | 10/1/32 | | 6 | | | 7 | |
| 2,3,4 | | Freddie Mac Non Gold Pool, 12M USD LIBOR + 1.961% | | 4.211% | | 8/1/33 | | 11 | | | 12 | |
| 2,3,4 | | Freddie Mac Non Gold Pool, 12M USD LIBOR + 1.961% | | 5.086% | | 2/1/33 | | 4 | | | 5 | |
| 2,3,4 | | Freddie Mac Non Gold Pool, 1Y CMT + 2.254% | | 4.254% | | 9/1/32 | | 1 | | | 1 | |
| 2,3 | | Freddie Mac REMICS | | 2.500% | | 4/15/43 | | 1,188 | | | 1,192 | |
| 2 | | Ginnie Mae REMICS | | 1.500% | | 10/20/45–11/20/45 | | 8,862 | | | 8,616 | |
| 2 | | Ginnie Mae REMICS | | 2.500% | | 11/20/47 | | 742 | | | 745 | |
| 2 | | Ginnie Mae REMICS | | 3.000% | | 3/20/41 | | 200 | | | 204 | |
| | | | | | | | | | | | 36,109 | |
| Total U.S. Government and Agency Obligations (Cost $77,602) | | | | | | | | | 78,279 | |
| Asset-Backed/Commercial Mortgage-Backed Securities (21.6%) | | | | | | | | | | |
| 2 | | Ally Auto Receivables Trust 2017-5 | | 2.220% | | 10/17/22 | | 490 | | | 491 | |
| 2 | | Ally Auto Receivables Trust 2018-1 | | 2.530% | | 2/15/23 | | 590 | | | 594 | |
| 2 | | Ally Auto Receivables Trust 2019-1 | | 3.020% | | 4/15/24 | | 240 | | | 246 | |
| 2 | | Ally Auto Receivables Trust 2019-3 | | 1.930% | | 5/15/24 | | 660 | | | 660 | |
| 2 | | Ally Auto Receivables Trust 2019-4 | | 1.920% | | 1/15/25 | | 250 | | | 249 | |
| 2 | | Ally Master Owner Trust Series 2018-2 | | 3.290% | | 5/15/23 | | 900 | | | 915 | |
| 2 | | Ally Master Owner Trust Series 2018-2 | | 3.300% | | 7/17/23 | | 1,320 | | | 1,346 | |
| 2 | | American Express Credit Account Master Trust 2019-1 | | 2.870% | | 10/15/24 | | 830 | | | 848 | |
| 2,5 | | American Homes 4 Rent 2014-SFR2 | | 3.786% | | 10/17/36 | | 274 | | | 285 | |
| 2,5 | | American Homes 4 Rent 2014-SFR2 | | 4.290% | | 10/17/36 | | 80 | | | 84 | |
| 2,5 | | American Homes 4 Rent 2014-SFR3 | | 3.678% | | 12/17/36 | | 401 | | | 416 | |
| 2,5 | | American Homes 4 Rent 2015-SFR1 | | 3.467% | | 4/17/52 | | 348 | | | 357 | |
| 2,5 | | American Homes 4 Rent 2015-SFR2 | | 3.732% | | 10/17/52 | | 167 | | | 174 | |
| 2,5 | | American Homes 4 Rent 2015-SFR2 | | 4.295% | | 10/17/52 | | 100 | | | 106 | |
| 2,5 | | Americold 2010 LLC Trust Series 2010-ARTA | | 4.954% | | 1/14/29 | | 428 | | | 441 | |
| 2,5 | | Americold 2010 LLC Trust Series 2010-ARTA | | 6.811% | | 1/14/29 | | 275 | | | 288 | |
| 2 | | AmeriCredit Automobile Receivables Trust 2016-2 | | 3.650% | | 5/9/22 | | 220 | | | 223 | |
| 2 | | AmeriCredit Automobile Receivables Trust 2016-3 | | 2.710% | | 9/8/22 | | 240 | | | 241 | |
| 2 | | AmeriCredit Automobile Receivables Trust 2018-2 | | 4.010% | | 7/18/24 | | 700 | | | 723 | |
| 2 | | AmeriCredit Automobile Receivables Trust 2019-1 | | 3.620% | | 3/18/25 | | 560 | | | 575 | |
| 2,5 | | AOA Mortgage Trust 2015-1177 | | 2.957% | | 12/13/29 | | 280 | | | 282 | |
| 2,5 | | Applebee’s Funding LLC / IHOP Funding LLC 2019-1 | | 4.194% | | 6/7/49 | | 150 | | | 152 | |
| 2,5 | | ARL Second LLC 2014-1A | | 2.920% | | 6/15/44 | | 267 | | | 269 | |
| 2,5 | | Aventura Mall Trust 2013-AVM | | 3.743% | | 12/5/32 | | 480 | | | 488 | |
| 2,5 | | Aventura Mall Trust 2018-AVM | | 4.112% | | 7/5/40 | | 240 | | | 265 | |
| 2,5 | | Avis Budget Rental Car Funding AESOP LLC 2015-1A | | 2.500% | | 7/20/21 | | 360 | | | 360 | |
| 2,5 | | Avis Budget Rental Car Funding AESOP LLC 2015-2A | | 2.630% | | 12/20/21 | | 1,120 | | | 1,124 | |
| 2,5 | | Avis Budget Rental Car Funding AESOP LLC 2016-1A | | 2.990% | | 6/20/22 | | 100 | | | 101 | |
| 2,5 | | Avis Budget Rental Car Funding AESOP LLC 2017-1A | | 3.070% | | 9/20/23 | | 180 | | | 183 | |
| 2,5 | | Avis Budget Rental Car Funding AESOP LLC 2017-2A | | 2.970% | | 3/20/24 | | 120 | | | 122 | |
| 2,5 | | Avis Budget Rental Car Funding AESOP LLC 2018-1A | | 3.700% | | 9/20/24 | | 160 | | | 166 | |
| 2,5 | | Avis Budget Rental Car Funding AESOP LLC 2018-2A | | 4.000% | | 3/20/25 | | 410 | | | 437 | |
| 2,5 | | Avis Budget Rental Car Funding AESOP LLC 2019-1A | | 3.450% | | 3/20/23 | | 450 | | | 460 | |
| 2,5 | | BAMLL Commercial Mortgage Securities Trust 2012-PARK | | 2.959% | | 12/10/30 | | 125 | | | 128 | |
Short-Term Investment-Grade Portfolio
| | | | | | | | | Face | | | Market | |
| | | | | | | Maturity | | Amount | | | Value• | |
| | | | | Coupon | | Date | | ($000 | ) | | ($000 | ) |
| 2 | | Banc of America Commercial Mortgage Trust 2015-UBS7 | | 3.429% | | 9/15/48 | | | 220 | | | | 228 | |
| 2 | | Banc of America Commercial Mortgage Trust 2015-UBS7 | | 3.705% | | 9/15/48 | | | 410 | | | | 436 | |
| 2 | | Banc of America Commercial Mortgage Trust 2015-UBS7 | | 4.361% | | 9/15/48 | | | 40 | | | | 42 | |
| 2 | | Banc of America Commercial Mortgage Trust 2017-BNK3 | | 3.574% | | 2/15/50 | | | 110 | | | | 118 | |
| 2 | | Banc of America Funding 2006-H Trust | | 4.157% | | 9/20/46 | | | 167 | | | | 153 | |
| 2,5 | | Banc of America Merrill Lynch Large Loan Inc. BAMLL_19-BPR | | 3.287% | | 11/5/32 | | | 410 | | | | 420 | |
| 2 | | BANK 2017 - BNK4 | | 3.625% | | 5/15/50 | | | 150 | | | | 161 | |
| 2 | | BANK 2017 - BNK5 | | 3.390% | | 6/15/60 | | | 275 | | | | 291 | |
| 2 | | BANK 2017 - BNK6 | | 3.254% | | 7/15/60 | | | 330 | | | | 344 | |
| 2 | | BANK 2017 - BNK6 | | 3.518% | | 7/15/60 | | | 440 | | | | 469 | |
| 2 | | BANK 2017 - BNK6 | | 3.741% | | 7/15/60 | | | 80 | | | | 85 | |
| 2 | | BANK 2017 - BNK7 | | 3.435% | | 9/15/60 | | | 410 | | | | 435 | |
| 2 | | BANK 2017 - BNK8 | | 3.488% | | 11/15/50 | | | 860 | | | | 915 | |
| 2 | | BANK 2017 - BNK9 | | 3.538% | | 11/15/54 | | | 500 | | | | 534 | |
| 2 | | BANK 2018 - BN10 | | 3.641% | | 2/15/61 | | | 300 | | | | 319 | |
| 2 | | BANK 2018 - BN10 | | 3.688% | | 2/15/61 | | | 500 | | | | 539 | |
| 2 | | BANK 2018 - BN12 | | 4.255% | | 5/15/61 | | | 70 | | | | 78 | |
| 2 | | BANK 2018 - BN14 | | 4.185% | | 9/15/60 | | | 485 | | | | 531 | |
| 2 | | BANK 2018 - BN15 | | 4.407% | | 11/15/61 | | | 563 | | | | 640 | |
| 2 | | BANK 2019 - BN17 | | 3.623% | | 4/15/52 | | | 164 | | | | 176 | |
| 2 | | BANK 2019 - BN17 | | 3.714% | | 4/15/52 | | | 446 | | | | 484 | |
| 2 | | BANK 2019 - BN18 | | 3.584% | | 5/15/62 | | | 490 | | | | 527 | |
| 2 | | BANK 2019 - BN19 | | 3.183% | | 8/15/61 | | | 530 | | | | 553 | |
| 2 | | BANK 2019 - BN20 | | 3.011% | | 9/15/61 | | | 300 | | | | 309 | |
| 2 | | BANK 2019 - BN21 | | 2.851% | | 10/17/52 | | | 370 | | | | 376 | |
| 2 | | BANK 2019 - BN24 | | 2.960% | | 11/15/62 | | | 2,400 | | | | 2,460 | |
| 2 | | Bank of America Mortgage Trust 2002-J | | 4.553% | | 9/25/32 | | | 1 | | | | 1 | |
| 2 | | BBCMS Mortgage Trust 2019-C4 | | 2.919% | | 8/15/52 | | | 600 | | | | 609 | |
| 2 | | BBCMS Mortgage Trust 2019-C5 | | 3.063% | | 11/15/52 | | | 990 | | | | 1,013 | |
| 2 | | Bear Stearns ARM Trust 2006-4 | | 3.885% | | 10/25/36 | | | 238 | | | | 220 | |
| 2 | | Bear Stearns ARM Trust 2007-3 | | 4.333% | | 5/25/47 | | | 193 | | | | 181 | |
| 2 | | BENCHMARK 2018-B1 Mortgage Trust | | 3.602% | | 1/15/51 | | | 100 | | | | 106 | |
| 2 | | BENCHMARK 2018-B1 Mortgage Trust | | 3.666% | | 1/15/51 | | | 210 | | | | 226 | |
| 2 | | BENCHMARK 2018-B1 Mortgage Trust | | 3.878% | | 1/15/51 | | | 160 | | | | 171 | |
| 2 | | BENCHMARK 2018-B1 Mortgage Trust | | 4.059% | | 1/15/51 | | | 250 | | | | 266 | |
| 2 | | BENCHMARK 2018-B1 Mortgage Trust | | 4.117% | | 1/15/51 | | | 390 | | | | 407 | |
| 2 | | BENCHMARK 2018-B3 Mortgage Trust | | 4.025% | | 4/10/51 | | | 220 | | | | 243 | |
| 2 | | BENCHMARK 2018-B6 Mortgage Trust | | 4.170% | | 10/10/51 | | | 669 | | | | 728 | |
| 2 | | BENCHMARK 2018-B6 Mortgage Trust | | 4.261% | | 10/10/51 | | | 820 | | | | 919 | |
| 2 | | BENCHMARK 2018-B8 Mortgage Trust | | 4.232% | | 1/15/52 | | | 512 | | | | 575 | |
| 2 | | BENCHMARK 2019-B10 Mortgage Trust | | 3.615% | | 3/15/62 | | | 177 | | | | 189 | |
| 2 | | BMW Vehicle Owner Trust 2018-A | | 1.920% | | 1/25/24 | | | 1,300 | | | | 1,300 | |
| 2 | | BMW Vehicle Owner Trust 2018-A | | 2.510% | | 6/25/24 | | | 400 | | | | 403 | |
| 2,4 | | Brazos Higher Education Authority Inc. Series 2005-3, 3M USD LIBOR + 0.200% | | 2.147% | | 6/25/26 | | | 122 | | | | 121 | |
| 2,4 | | Brazos Higher Education Authority Inc. Series 2011-1, 3M USD LIBOR + 0.800% | | 2.710% | | 2/25/30 | | | 228 | | | | 228 | |
| 2,5 | | BX Trust 2019-OC11 | | 3.202% | | 12/9/41 | | | 500 | | | | 515 | |
| 2,5 | | CAL Funding II Ltd. Series 2012-1A | | 3.470% | | 10/25/27 | | | 57 | | | | 57 | |
| 2,5 | | CAL Funding II Ltd. Series 2013-1A | | 3.350% | | 3/27/28 | | | 114 | | | | 114 | |
| 2,5 | | CAL Funding II Ltd. Series 2018-2A | | 4.340% | | 9/25/43 | | | 429 | | | | 435 | |
| 2 | | California Republic Auto Receivables Trust 2016-2 | | 2.520% | | 5/16/22 | | | 150 | | | | 150 | |
| 2 | | California Republic Auto Receivables Trust 2016-2 | | 3.510% | | 3/15/23 | | | 70 | | | | 70 | |
| 2,5 | | Canadian Pacer Auto Receivables Trust A Series 2018 | | 3.220% | | 9/19/22 | | | 220 | | | | 223 | |
| 2,5 | | Canadian Pacer Auto Receivables Trust A Series 2019 | | 2.960% | | 6/19/24 | | | 140 | | | | 143 | |
| 2,5 | | Canadian Pacer Auto Receiveable Trust A Series 2018 | | 3.270% | | 12/19/22 | | | 180 | | | | 181 | |
| 2,5 | | Canadian Pacer Auto Receiveable Trust A Series 2018 | | 3.440% | | 8/21/23 | | | 80 | | | | 82 | |
| 2 | | Cantor Commercial Real Estate Lending 2019-CF3 | | 3.006% | | 1/15/53 | | | 650 | | | | 663 | |
| 2 | | Capital Auto Receivables Asset Trust 2016-2 | | 3.160% | | 11/20/23 | | | 40 | | | | 40 | |
| 2 | | Capital Auto Receivables Asset Trust 2016-3 | | 2.650% | | 1/20/24 | | | 80 | | | | 80 | |
| 2 | | Capital One Auto Receivables Trust 2019-1 | | 2.510% | | 11/15/23 | | | 1,170 | | | | 1,179 | |
| 2 | | Capital One Auto Receivables Trust 2019-1 | | 2.560% | | 10/15/24 | | | 390 | | | | 395 | |
| 2 | | Capital One Auto Receivables Trust 2019-2 | | 1.920% | | 5/15/24 | | | 1,530 | | | | 1,528 | |
| 2 | | Capital One Multi-Asset Execution Trust 2019-A1 | | 2.840% | | 12/15/24 | | | 2,640 | | | | 2,695 | |
| 2 | | CarMax Auto Owner Trust 2016-2 | | 2.160% | | 12/15/21 | | | 120 | | | | 120 | |
| 2 | | CarMax Auto Owner Trust 2016-2 | | 3.250% | | 11/15/22 | | | 140 | | | | 140 | |
| 2 | �� | CarMax Auto Owner Trust 2016-3 | | 2.200% | | 6/15/22 | | | 140 | | | | 140 | |
| 2 | | CarMax Auto Owner Trust 2016-3 | | 2.940% | | 1/17/23 | | | 100 | | | | 100 | |
| 2 | | CarMax Auto Owner Trust 2017-4 | | 2.330% | | 5/15/23 | | | 170 | | | | 171 | |
| 2 | | CarMax Auto Owner Trust 2017-4 | | 2.460% | | 8/15/23 | | | 80 | | | | 80 | |
| 2 | | CarMax Auto Owner Trust 2017-4 | | 2.700% | | 10/16/23 | | | 80 | | | | 81 | |
| 2 | | CarMax Auto Owner Trust 2018-1 | | 2.480% | | 11/15/22 | | | 524 | | | | 526 | |
| 2 | | CarMax Auto Owner Trust 2018-1 | | 2.640% | | 6/15/23 | | | 300 | | | | 303 | |
| 2 | | CarMax Auto Owner Trust 2018-1 | | 2.830% | | 9/15/23 | | | 500 | | | | 507 | |
| 2 | | CarMax Auto Owner Trust 2018-1 | | 2.950% | | 11/15/23 | | | 220 | | | | 221 | |
| 2 | | CarMax Auto Owner Trust 2018-2 | | 3.370% | | 10/16/23 | | | 140 | | | | 144 | |
| 2 | | CarMax Auto Owner Trust 2018-2 | | 3.570% | | 12/15/23 | | | 200 | | | | 206 | |
| 2 | | CarMax Auto Owner Trust 2018-2 | | 3.990% | | 4/15/25 | | | 210 | | | | 216 | |
| 2 | | CarMax Auto Owner Trust 2018-3 | | 3.130% | | 6/15/23 | | | 870 | | | | 882 | |
| 2 | | CarMax Auto Owner Trust 2018-3 | | 3.270% | | 3/15/24 | | | 430 | | | | 442 | |
| 2 | | CarMax Auto Owner Trust 2018-4 | | 3.360% | | 9/15/23 | | | 650 | | | | 662 | |
| 2 | | CarMax Auto Owner Trust 2018-4 | | 3.480% | | 2/15/24 | | | 240 | | | | 249 | |
| 2 | | CarMax Auto Owner Trust 2018-4 | | 3.670% | | 5/15/24 | | | 210 | | | | 218 | |
| 2 | | CarMax Auto Owner Trust 2018-4 | | 3.850% | | 7/15/24 | | | 140 | | | | 145 | |
| 2 | | CarMax Auto Owner Trust 2018-4 | | 4.150% | | 4/15/25 | | | 200 | | | | 208 | |
| 2 | | CarMax Auto Owner Trust 2019-3 | | 2.180% | | 8/15/24 | | | 1,500 | | | | 1,503 | |
| 2 | | CarMax Auto Owner Trust 2019-3 | | 2.300% | | 4/15/25 | | | 270 | | | | 271 | |
| 2 | | CarMax Auto Owner Trust 2019-3 | | 2.500% | | 4/15/25 | | | 350 | | | | 351 | |
| 2 | | CarMax Auto Owner Trust 2019-4 | | 2.020% | | 11/15/24 | | | 1,650 | | | | 1,652 | |
| 2 | | CarMax Auto Owner Trust 2019-4 | | 2.130% | | 7/15/25 | | | 440 | | | | 441 | |
| 2 | | CarMax Auto Owner Trust 2019-4 | | 2.600% | | 9/15/25 | | | 140 | | | | 139 | |
| 2 | | CD 2016-CD1 Commercial Mortgage Trust | | 2.724% | | 8/10/49 | | | 95 | | | | 96 | |
| 2 | | CD 2016-CD1 Commercial Mortgage Trust | | 3.631% | | 8/10/49 | | | 40 | | | | 40 | |
| 2 | | CD 2017-CD3 Commercial Mortgage Trust | | 3.631% | | 2/10/50 | | | 510 | | | | 546 | |
| 2 | | CD 2017-CD4 Commercial Mortgage Trust | | 3.514% | | 5/10/50 | | | 180 | | | | 191 | |
| 2 | | CD 2017-CD5 Commercial Mortgage Trust | | 3.431% | | 8/15/50 | | | 465 | | | | 490 | |
| 2 | | CD 2017-CD6 Commercial Mortgage Trust | | 3.456% | | 11/13/50 | | | 165 | | | | 174 | |
| 2 | | CD 2019-CD8 Commercial Mortgage Trust | | 2.912% | | 8/15/57 | | | 300 | | | | 306 | |
| 2 | | CenterPoint Energy Transition Bond Co. IV LLC 2012-1 | | 2.161% | | 10/15/21 | | | 123 | | | | 123 | |
| 2,5 | | CFCRE Commercial Mortgage Trust 2011-C2 | | 5.741% | | 12/15/47 | | | 390 | | | | 410 | |
| 2 | | CFCRE Commercial Mortgage Trust 2016-C4 | | 3.283% | | 5/10/58 | | | 502 | | | | 520 | |
| 2,5 | | Chesapeake Funding II LLC 2018-1 | | 3.040% | | 4/15/30 | | | 556 | | | | 562 | |
| 2,5 | | Chesapeake Funding II LLC 2019-1 | | 2.940% | | 4/15/31 | | | 1,166 | | | | 1,178 | |
| 2 | | CHL Mortgage Pass-Through Trust 2006-HYB1 | | 3.777% | | 3/20/36 | | | 133 | | | | 121 | |
| 2 | | CHL Mortgage Pass-Through Trust 2007-HYB2 | | 3.621% | | 2/25/47 | | | 144 | | | | 124 | |
| 2,5 | | Chrysler Capital Auto Receivables Trust 2015-BA | | 4.170% | | 1/16/23 | | | 281 | | | | 281 | |
Short-Term Investment-Grade Portfolio
| | | | | | | | | Face | | | Market | |
| | | | | | | Maturity | | Amount | | | Value• | |
| | | | | Coupon | | Date | | ($000 | ) | | ($000 | ) |
| 2,5 | | Chrysler Capital Auto Receivables Trust 2016-AA | | 4.220% | | 2/15/23 | | | 630 | | | | 633 | |
| 2 | | Citibank Credit Card Issuance Trust 2018-A1 | | 2.490% | | 1/20/23 | | | 1,903 | | | | 1,915 | |
| 2,5 | | Citigroup Commercial Mortgage Trust 2012-GC8 | | 3.683% | | 9/10/45 | | | 52 | | | | 53 | |
| 2 | | Citigroup Commercial Mortgage Trust 2013-GC11 | | 3.093% | | 4/10/46 | | | 156 | | | | 160 | |
| 2 | | Citigroup Commercial Mortgage Trust 2013-GC15 | | 3.942% | | 9/10/46 | | | 152 | | | | 157 | |
| 2 | | Citigroup Commercial Mortgage Trust 2013-GC15 | | 4.371% | | 9/10/46 | | | 90 | | | | 96 | |
| 2 | | Citigroup Commercial Mortgage Trust 2014-GC19 | | 4.023% | | 3/10/47 | | | 550 | | | | 585 | |
| 2 | | Citigroup Commercial Mortgage Trust 2014-GC21 | | 3.575% | | 5/10/47 | | | 87 | | | | 91 | |
| 2 | | Citigroup Commercial Mortgage Trust 2014-GC21 | | 3.855% | | 5/10/47 | | | 1,208 | | | | 1,278 | |
| 2 | | Citigroup Commercial Mortgage Trust 2014-GC23 | | 3.356% | | 7/10/47 | | | 336 | | | | 349 | |
| 2 | | Citigroup Commercial Mortgage Trust 2014-GC23 | | 3.622% | | 7/10/47 | | | 570 | | | | 602 | |
| 2 | | Citigroup Commercial Mortgage Trust 2014-GC23 | | 3.863% | | 7/10/47 | | | 310 | | | | 325 | |
| 2 | | Citigroup Commercial Mortgage Trust 2014-GC23 | | 4.175% | | 7/10/47 | | | 130 | | | | 134 | |
| 2 | | Citigroup Commercial Mortgage Trust 2014-GC23 | | 4.437% | | 7/10/47 | | | 153 | | | | 160 | |
| 2 | | Citigroup Commercial Mortgage Trust 2014-GC25 | | 3.372% | | 10/10/47 | | | 1,400 | | | | 1,456 | |
| 2 | | Citigroup Commercial Mortgage Trust 2014-GC25 | | 3.635% | | 10/10/47 | | | 1,251 | | | | 1,318 | |
| 2 | | Citigroup Commercial Mortgage Trust 2014-GC25 | | 4.345% | | 10/10/47 | | | 170 | | | | 179 | |
| 2 | | Citigroup Commercial Mortgage Trust 2014-GC25 | | 4.526% | | 10/10/47 | | | 20 | | | | 21 | |
| 2 | | Citigroup Commercial Mortgage Trust 2015-GC27 | | 3.137% | | 2/10/48 | | | 770 | | | | 797 | |
| 2 | | Citigroup Commercial Mortgage Trust 2015-GC31 | | 3.762% | | 6/10/48 | | | 1,295 | | | | 1,379 | |
| 2 | | Citigroup Commercial Mortgage Trust 2015-GC33 | | 3.778% | | 9/10/58 | | | 1,389 | | | | 1,481 | |
| 2 | | Citigroup Commercial Mortgage Trust 2015-GC33 | | 4.572% | | 9/10/58 | | | 100 | | | | 105 | |
| 2 | | Citigroup Commercial Mortgage Trust 2016-C1 | | 3.209% | | 5/10/49 | | | 1,146 | | | | 1,191 | |
| 2 | | Citigroup Commercial Mortgage Trust 2016-P4 | | 2.902% | | 7/10/49 | | | 120 | | | | 123 | |
| 2 | | Citigroup Commercial Mortgage Trust 2017-C4 | | 3.471% | | 10/12/50 | | | 485 | | | | 516 | |
| 2 | | Citigroup Commercial Mortgage Trust 2017-P8 | | 3.465% | | 9/15/50 | | | 1,020 | | | | 1,079 | |
| 2 | | Citigroup Commercial Mortgage Trust 2017-P8 | | 4.192% | | 9/15/50 | | | 240 | | | | 253 | |
| 2 | | Citigroup Commercial Mortgage Trust 2017-P8 | | 4.269% | | 9/15/50 | | | 240 | | | | 250 | |
| 2 | | Citigroup Commercial Mortgage Trust 2018-C5 | | 4.228% | | 6/10/51 | | | 10 | | | | 11 | |
| 2 | | Citigroup Commercial Mortgage Trust 2018-C6 | | 4.343% | | 11/10/51 | | | 650 | | | | 718 | |
| 2 | | Citigroup Commercial Mortgage Trust 2018-C6 | | 4.412% | | 11/10/51 | | | 800 | | | | 901 | |
| 2 | | Citigroup Commercial Mortgage Trust 2019-C7 | | 2.860% | | 12/15/72 | | | 800 | | | | 804 | |
| 2 | | Citigroup Commercial Mortgage Trust 2019-C7 | | 3.042% | | 12/15/72 | | | 650 | | | | 667 | |
| 2 | | Citigroup Commercial Mortgage Trust 2019-C7 | | 3.102% | | 12/15/72 | | | 1,600 | | | | 1,653 | |
| 2 | | Citigroup Mortgage Loan Trust 2007-AR8 | | 4.469% | | 7/25/37 | | | 95 | | | | 92 | |
| 2,5 | | CLI Funding V LLC 2013-1A | | 2.830% | | 3/18/28 | | | 210 | | | | 208 | |
| 2 | | COMM 2012-CCRE2 Mortgage Trust | | 3.147% | | 8/15/45 | | | 75 | | | | 77 | |
| 2 | | COMM 2012-CCRE2 Mortgage Trust | | 3.791% | | 8/15/45 | | | 100 | | | | 103 | |
| 2 | | COMM 2012-CCRE3 Mortgage Trust | | 2.822% | | 10/15/45 | | | 499 | | | | 504 | |
| 2,5 | | COMM 2012-CCRE3 Mortgage Trust | | 3.416% | | 10/15/45 | | | 260 | | | | 264 | |
| 2 | | COMM 2012-CCRE4 Mortgage Trust | | 2.853% | | 10/15/45 | | | 262 | | | | 266 | |
| 2 | | COMM 2012-CCRE4 Mortgage Trust | | 3.251% | | 10/15/45 | | | 40 | | | | 40 | |
| 2 | | COMM 2012-CCRE5 Mortgage Trust | | 2.771% | | 12/10/45 | | | 70 | | | | 71 | |
| 2 | | COMM 2013-CCRE10 Mortgage Trust | | 3.795% | | 8/10/46 | | | 189 | | | | 195 | |
| 2 | | COMM 2013-CCRE11 Mortgage Trust | | 3.983% | | 8/10/50 | | | 270 | | | | 285 | |
| 2 | | COMM 2013-CCRE11 Mortgage Trust | | 4.258% | | 8/10/50 | | | 1,047 | | | | 1,119 | |
| 2 | | COMM 2013-CCRE12 Mortgage Trust | | 3.623% | | 10/10/46 | | | 276 | | | | 284 | |
| 2 | | COMM 2013-CCRE12 Mortgage Trust | | 3.765% | | 10/10/46 | | | 180 | | | | 185 | |
| 2 | | COMM 2013-CCRE12 Mortgage Trust | | 4.046% | | 10/10/46 | | | 1,006 | | | | 1,066 | |
| 2 | | COMM 2013-CCRE13 Mortgage Trust | | 4.194% | | 11/10/46 | | | 1,076 | | | | 1,148 | |
| 2 | | COMM 2013-CCRE13 Mortgage Trust | | 4.889% | | 11/10/46 | | | 110 | | | | 119 | |
| 2 | | COMM 2013-CCRE13 Mortgage Trust | | 4.889% | | 11/10/46 | | | 1,300 | | | | 1,377 | |
| 2,5 | | COMM 2013-CCRE6 Mortgage Trust | | 3.147% | | 3/10/46 | | | 250 | | | | 255 | |
| 2,5 | | COMM 2013-CCRE6 Mortgage Trust | | 3.397% | | 3/10/46 | | | 70 | | | | 71 | |
| 2 | | COMM 2013-CCRE8 Mortgage Trust | | 3.334% | | 6/10/46 | | | 38 | | | | 39 | |
| 2 | | COMM 2013-CCRE8 Mortgage Trust | | 3.612% | | 6/10/46 | | | 1,205 | | | | 1,253 | |
| 2 | | COMM 2013-CCRE9 Mortgage Trust | | 4.222% | | 7/10/45 | | | 330 | | | | 350 | |
| 2,5 | | COMM 2013-CCRE9 Mortgage Trust | | 4.246% | | 7/10/45 | | | 250 | | | | 259 | |
| 2,5 | | COMM 2013-CCRE9 Mortgage Trust | | 4.246% | | 7/10/45 | | | 280 | | | | 276 | |
| 2,5 | | COMM 2013-LC13 Mortgage Trust | | 3.774% | | 8/10/46 | | | 191 | | | | 196 | |
| 2 | | COMM 2013-LC13 Mortgage Trust | | 4.205% | | 8/10/46 | | | 315 | | | | 337 | |
| 2,5 | | COMM 2013-LC13 Mortgage Trust | | 4.557% | | 8/10/46 | | | 435 | | | | 467 | |
| 2 | | COMM 2013-LC6 Mortgage Trust | | 2.941% | | 1/10/46 | | | 100 | | | | 102 | |
| 2,5 | | COMM 2013-SFS Mortgage Trust | | 2.987% | | 4/12/35 | | | 110 | | | | 112 | |
| 2,5 | | COMM 2014-277P Mortgage Trust | | 3.611% | | 8/10/49 | | | 980 | | | | 1,034 | |
| 2 | | COMM 2014-CCRE14 Mortgage Trust | | 3.955% | | 2/10/47 | | | 50 | | | | 53 | |
| 2 | | COMM 2014-CCRE14 Mortgage Trust | | 4.236% | | 2/10/47 | | | 470 | | | | 502 | |
| 2 | | COMM 2014-CCRE15 Mortgage Trust | | 2.928% | | 2/10/47 | | | 89 | | | | 89 | |
| 2 | | COMM 2014-CCRE15 Mortgage Trust | | 4.074% | | 2/10/47 | | | 500 | | | | 534 | |
| 2 | | COMM 2014-CCRE15 Mortgage Trust | | 4.426% | | 2/10/47 | | | 250 | | | | 265 | |
| 2 | | COMM 2014-CCRE17 Mortgage Trust | | 3.700% | | 5/10/47 | | | 39 | | | | 41 | |
| 2 | | COMM 2014-CCRE17 Mortgage Trust | | 3.977% | | 5/10/47 | | | 1,141 | | | | 1,213 | |
| 2 | | COMM 2014-CCRE17 Mortgage Trust | | 4.174% | | 5/10/47 | | | 650 | | | | 692 | |
| 2 | | COMM 2014-CCRE17 Mortgage Trust | | 4.786% | | 5/10/47 | | | 200 | | | | 210 | |
| 2 | | COMM 2014-CCRE18 Mortgage Trust | | 3.550% | | 7/15/47 | | | 222 | | | | 230 | |
| 2 | | COMM 2014-CCRE18 Mortgage Trust | | 3.828% | | 7/15/47 | | | 781 | | | | 825 | |
| 2 | | COMM 2014-CCRE20 Mortgage Trust | | 3.326% | | 11/10/47 | | | 640 | | | | 664 | |
| 2 | | COMM 2014-CCRE20 Mortgage Trust | | 3.590% | | 11/10/47 | | | 926 | | | | 977 | |
| 2 | | COMM 2014-CCRE21 Mortgage Trust | | 3.528% | | 12/10/47 | | | 1,039 | | | | 1,088 | |
| 2 | | COMM 2014-LC17 Mortgage Trust | | 3.917% | | 10/10/47 | | | 479 | | | | 512 | |
| 2 | | COMM 2015-CCRE22 Mortgage Trust | | 3.309% | | 3/10/48 | | | 825 | | | | 861 | |
| 2 | | COMM 2015-CCRE24 Mortgage Trust | | 3.696% | | 8/10/48 | | | 252 | | | | 268 | |
| 2 | | COMM 2015-CCRE25 Mortgage Trust | | 3.759% | | 8/10/48 | | | 991 | | | | 1,057 | |
| 2 | | COMM 2015-CCRE26 Mortgage Trust | | 3.630% | | 10/10/48 | | | 753 | | | | 797 | |
| 2 | | COMM 2015-CCRE27 Mortgage Trust | | 3.612% | | 10/10/48 | | | 405 | | | | 429 | |
| 2 | | COMM 2015-CCRE27 Mortgage Trust | | 4.471% | | 10/10/48 | | | 825 | | | | 869 | |
| 2 | | COMM 2015-LC19 Mortgage Trust | | 3.183% | | 2/10/48 | | | 245 | | | | 254 | |
| 2 | | CSAIL 2015-C2 Commercial Mortgage Trust | | 3.504% | | 6/15/57 | | | 1,000 | | | | 1,046 | |
| 2 | | CSAIL 2015-C3 Commercial Mortgage Trust | | 3.718% | | 8/15/48 | | | 414 | | | | 437 | |
| 2 | | CSAIL 2015-C3 Commercial Mortgage Trust | | 4.354% | | 8/15/48 | | | 240 | | | | 244 | |
| 2 | | CSAIL 2015-C4 Commercial Mortgage Trust | | 3.808% | | 11/15/48 | | | 981 | | | | 1,049 | |
| 2 | | CSAIL 2016-C5 Commercial Mortgage Trust | | 4.577% | | 11/15/48 | | | 220 | | | | 233 | |
| 2 | | CSAIL 2016-C7 Commercial Mortgage Trust | | 3.502% | | 11/15/49 | | | 1,483 | | | | 1,556 | |
| 2 | | CSAIL 2017-C8 Commercial Mortgage Trust | | 3.392% | | 6/15/50 | | | 525 | | | | 555 | |
| 2 | | CSAIL 2018-CX12 Commercial Mortgage Trust | | 4.224% | | 8/15/51 | | | 520 | | | | 571 | |
| 2 | | CSAIL 2019-C15 Commercial Mortgage Trust | | 4.053% | | 3/15/52 | | | 400 | | | | 440 | |
| 2,5 | | Daimler Trucks Retail Trust 2019-1 | | 2.790% | | 5/15/25 | | | 420 | | | | 425 | |
| 2 | | DBGS Mortgage Trust 2018-C1 | | 4.466% | | 10/15/51 | | | 1,010 | | | | 1,148 | |
Short-Term Investment-Grade Portfolio
| | | | | | | | | Face | | | Market | |
| | | | | | | Maturity | | Amount | | | Value• | |
| | | | | Coupon | | Date | | ($000 | ) | | ($000 | ) |
| 2 | | DBJPM 16-C1 Mortgage Trust | | 3.348% | | 5/10/49 | | | 60 | | | | 59 | |
| 2 | | DBJPM 17-C6 Mortgage Trust | | 3.328% | | 6/10/50 | | | 730 | | | | 763 | |
| 2,4,5 | | DELAM 2018-1, 1M USD LIBOR + 0.700% | | 2.464% | | 11/19/25 | | | 500 | | | | 499 | |
| 2,5 | | Dell Equipment Finance Trust 2019-1 | | 2.830% | | 3/22/24 | | | 1,110 | | | | 1,123 | |
| 2 | | Discover Card Execution Note Trust 2019-A1 | | 3.040% | | 7/15/24 | | | 1,000 | | | | 1,024 | |
| 2 | | Discover Card Execution Note Trust 2019-A3 | | 1.890% | | 10/15/24 | | | 1,740 | | | | 1,738 | |
| 2,5 | | DLL Securitization Trust Series 2018-A3 | | 3.460% | | 1/20/22 | | | 1,240 | | | | 1,252 | |
| 2,5 | | DLL Securitization Trust Series 2018-A4 | | 3.590% | | 6/20/24 | | | 300 | | | | 307 | |
| 2,5 | | DLL Securitization Trust Series 2019-DA1 | | 2.890% | | 4/20/23 | | | 1,000 | | | | 1,008 | |
| 2,5 | | DLL Securitization Trust Series 2019-DA1 | | 2.920% | | 4/20/27 | | | 730 | | | | 744 | |
| 2,5 | | DLL Securitization Trust Series 2019-MA2 | | 2.340% | | 9/20/23 | | | 1,030 | | | | 1,033 | |
| 2,5 | | DLL Securitization Trust Series 2019-MT3 | | 2.080% | | 2/21/23 | | | 900 | | | | 897 | |
| 2,5 | | DLL Securitization Trust Series 2019-MT3 | | 2.150% | | 9/21/26 | | | 500 | | | | 498 | |
| 2,5 | | DRB Prime Student Loan Trust 2017-C | | 2.810% | | 11/25/42 | | | 544 | | | | 549 | |
| 2,5 | | Drive Auto Receivables Trust 2016-BA | | 4.530% | | 8/15/23 | | | 332 | | | | 335 | |
| 2,5 | | Drive Auto Receivables Trust 2016-C | | 4.180% | | 3/15/24 | | | 511 | | | | 518 | |
| 2 | | Drive Auto Receivables Trust 2017-1 | | 3.840% | | 3/15/23 | | | 60 | | | | 61 | |
| 2 | | Drive Auto Receivables Trust 2018-2 | | 3.630% | | 8/15/24 | | | 836 | | | | 840 | |
| 2 | | Drive Auto Receivables Trust 2018-2 | | 4.140% | | 8/15/24 | | | 620 | | | | 633 | |
| 2 | | Drive Auto Receivables Trust 2018-3 | | 3.370% | | 9/15/22 | | | 212 | | | | 213 | |
| 2 | | Drive Auto Receivables Trust 2018-3 | | 3.720% | | 9/16/24 | | | 1,000 | | | | 1,008 | |
| 2 | | Drive Auto Receivables Trust 2018-3 | | 4.300% | | 9/16/24 | | | 530 | | | | 543 | |
| 2 | | Drive Auto Receivables Trust 2018-5 | | 3.680% | | 7/15/23 | | | 500 | | | | 504 | |
| 2 | | Drive Auto Receivables Trust 2018-5 | | 3.990% | | 1/15/25 | | | 480 | | | | 492 | |
| 2 | | Drive Auto Receivables Trust 2018-5 | | 4.300% | | 4/15/26 | | | 660 | | | | 681 | |
| 2 | | Drive Auto Receivables Trust 2019-2 | | 3.040% | | 3/15/23 | | | 520 | | | | 523 | |
| 2 | | Drive Auto Receivables Trust 2019-2 | | 3.690% | | 8/17/26 | | | 500 | | | | 513 | |
| 2,4,5 | | Edsouth Indenture No 9 LLC 2015-1, 1M USD LIBOR + 0.800% | | 2.592% | | 10/25/56 | | | 338 | | | | 337 | |
| 2,5 | | EDvestinU Private Education Loan Trust (EDVES) 2019-A | | 3.580% | | 11/25/38 | | | 252 | | | | 259 | |
| 2,5 | | ELFI Graduate Loan Program 2018-A LLC | | 3.430% | | 8/25/42 | | | 535 | | | | 547 | |
| 2,5 | | Enterprise Fleet Financing LLC Series 2019-1 | | 2.980% | | 10/20/24 | | | 300 | | | | 303 | |
| 2,5 | | Enterprise Fleet Financing LLC Series 2019-1 | | 3.070% | | 10/20/24 | | | 430 | | | | 439 | |
| 2,3,4,5 | | Fannie Mae Connecticut Avenue Securities 2019-R03, 1M USD LIBOR + 0.750% | | 2.542% | | 9/25/31 | | | 154 | | | | 154 | |
| 2,3,4,5 | | Fannie Mae Connecticut Avenue Securities 2019-R04, 1M USD LIBOR + 0.750% | | 2.542% | | 6/25/39 | | | 439 | | | | 439 | |
| 2,3,4,5 | | Fannie Mae Connecticut Avenue Securities 2019-R05, 1M USD LIBOR + 0.750% | | 2.542% | | 7/25/39 | | | 876 | | | | 876 | |
| 2,3,4,5 | | Fannie Mae Connecticut Avenue Securities 2019-R06, 1M USD LIBOR + 0.750% | | 2.542% | | 9/25/39 | | | 1,075 | | | | 1,075 | |
| 2,3,4,5 | | Fannie Mae Connecticut Avenue Securities 2019-R07, 1M USD LIBOR + 0.770% | | 2.562% | | 10/25/39 | | | 2,373 | | | | 2,375 | |
| 2,3 | | Fannie Mae Grantor Trust 2017-T1 | | 2.898% | | 6/25/27 | | | 489 | | | | 502 | |
| 2,3 | | FHLMC Multifamily Structured Pass Through Certificates 4122K | | 1.500% | | 10/15/42 | | | 664 | | | | 635 | |
| 2,3 | | FHLMC Multifamily Structured Pass Through Certificates 4194A | | 1.700% | | 4/15/43 | | | 963 | | | | 940 | |
| 2,3 | | FHLMC Multifamily Structured Pass Through Certificates 4213D | | 1.750% | | 11/15/41 | | | 1,774 | | | | 1,752 | |
| 2,3 | | FHLMC Multifamily Structured Pass Through Certificates 4259B | | 2.250% | | 4/15/43–6/15/43 | | | 624 | | | | 620 | |
| 2,3 | | FHLMC Multifamily Structured Pass Through Certificates 4604E | | 2.750% | | 1/15/46 | | | 862 | | | | 873 | |
| 2,3 | | FHLMC Multifamily Structured Pass Through Certificates 4764B | | 3.000% | | 10/15/45 | | | 735 | | | | 747 | |
| 2,3 | | FHLMC Multifamily Structured Pass Through Certificates 4927F | | 2.250% | | 9/25/49 | | | 742 | | | | 736 | |
| 2,3 | | FHLMC Multifamily Structured Pass Through Certificates 4935A | | 2.500% | | 12/25/49 | | | 247 | | | | 248 | |
| 2,3 | | FHLMC Multifamily Structured Pass Through Certificates 4935A | | 2.750% | | 10/25/49 | | | 247 | | | | 251 | |
| 2 | | First Horizon Mortgage Pass-Through Trust 2006-AR3 | | 3.481% | | 11/25/36 | | | 72 | | | | 62 | |
| | | First Horizon Mortgage Pass-Through Trust 2006-AR4 | | 4.362% | | 1/25/37 | | | 148 | | | | 123 | |
| 2 | | Ford Credit Auto Lease Trust 2018-A | | 3.170% | | 9/15/21 | | | 350 | | | | 352 | |
| 2 | | Ford Credit Auto Lease Trust 2018-B | | 3.190% | | 12/15/21 | | | 494 | | | | 498 | |
| 2 | | Ford Credit Auto Lease Trust 2019-A | | 2.900% | | 5/15/22 | | | 1,240 | | | | 1,252 | |
| 2 | | Ford Credit Auto Lease Trust 2019-A | | 3.250% | | 7/15/22 | | | 780 | | | | 789 | |
| 2,5 | | Ford Credit Auto Owner Trust 2015-REV2 | | 2.440% | | 1/15/27 | | | 404 | | | | 405 | |
| 2,5 | | Ford Credit Auto Owner Trust 2016-REV1 | | 2.310% | | 8/15/27 | | | 660 | | | | 662 | |
| 2,5 | | Ford Credit Auto Owner Trust 2016-REV2 | | 2.030% | | 12/15/27 | | | 1,120 | | | | 1,120 | |
| 2,5 | | Ford Credit Auto Owner Trust 2017-1 | | 2.620% | | 8/15/28 | | | 650 | | | | 657 | |
| 2,5 | | Ford Credit Auto Owner Trust 2017-2 | | 2.360% | | 3/15/29 | | | 990 | | | | 997 | |
| 2,5 | | Ford Credit Auto Owner Trust 2017-2 | | 2.600% | | 3/15/29 | | | 180 | | | | 181 | |
| 2,5 | | Ford Credit Auto Owner Trust 2017-2 | | 2.750% | | 3/15/29 | | | 370 | | | | 373 | |
| 2,5 | | Ford Credit Auto Owner Trust 2018-2 | | 3.760% | | 1/15/30 | | | 240 | | | | 248 | |
| 2 | | Ford Credit Auto Owner Trust 2018-A | | 3.030% | | 11/15/22 | | | 561 | | | | 565 | |
| 2 | | Ford Credit Auto Owner Trust 2018-B | | 3.380% | | 3/15/24 | | | 450 | | | | 462 | |
| 2,5 | | Ford Credit Auto Owner Trust 2018-REV1 | | 3.190% | | 7/15/31 | | | 2,230 | | | | 2,321 | |
| 2,5 | | Ford Credit Auto Owner Trust 2018-REV1 | | 3.340% | | 7/15/31 | | | 810 | | | | 827 | |
| 2,5 | | Ford Credit Auto Owner Trust 2018-REV2 | | 3.470% | | 1/15/30 | | | 890 | | | | 930 | |
| 2,5 | | Ford Credit Auto Owner Trust 2018-REV2 | | 3.610% | | 1/15/30 | | | 530 | | | | 545 | |
| 2,5 | | Ford Credit Auto Owner Trust 2019-1 | | 3.520% | | 7/15/30 | | | 870 | | | | 914 | |
| 2 | | Ford Credit Auto Owner Trust 2019-A | | 2.850% | | 8/15/24 | | | 900 | | | | 919 | |
| 2 | | Ford Credit Auto Owner Trust 2019-A | | 3.020% | | 10/15/24 | | | 350 | | | | 358 | |
| 2 | | Ford Credit Auto Owner Trust 2019-A | | 3.250% | | 9/15/25 | | | 370 | | | | 378 | |
| 2 | | Ford Credit Floorplan Master Owner Trust A Series 2017-2 | | 2.160% | | 9/15/22 | | | 359 | | | | 359 | |
| 2 | | Ford Credit Floorplan Master Owner Trust A Series 2018-1 | | 2.950% | | 5/15/23 | | | 2,390 | | | | 2,418 | |
| 2 | | Ford Credit Floorplan Master Owner Trust A Series 2018-3 | | 3.520% | | 10/15/23 | | | 1,830 | | | | 1,875 | |
| 2 | | Ford Credit Floorplan Master Owner Trust A Series 2019-1 | | 2.840% | | 3/15/24 | | | 1,500 | | | | 1,520 | |
| 2 | | Ford Credit Floorplan Master Owner Trust A Series 2019-2 | | 3.250% | | 4/15/26 | | | 260 | | | | 267 | |
| 2,3,4 | | Freddie Mac Structured Agency Credit Risk Debt Notes 2016-DNA3, 1M USD LIBOR + 2.000% | | 3.792% | | 12/25/28 | | | 34 | | | | 34 | |
| 2,3,5 | | Freddie Mac Structured Agency Credit Risk Debt Notes 2018-SPI1 | | 3.736% | | 2/25/48 | | | 248 | | | | 248 | |
| 2,3,5 | | Freddie Mac Structured Agency Credit Risk Debt Notes 2018-SPI2 | | 3.813% | | 5/25/48 | | | 193 | | | | 194 | |
| 2,3,5 | | Freddie Mac Structured Agency Credit Risk Debt Notes 2018-SPI3 | | 4.152% | | 8/25/48 | | | 93 | | | | 93 | |
| 2,3,5 | | Freddie Mac Structured Agency Credit Risk Debt Notes 2018-SPI4 | | 4.459% | | 11/25/48 | | | 28 | | | | 27 | |
| 2,3,4,5 | | Freddie Mac Structured Agency Credit Risk Debt Notes 2019-DNA4, 1M USD LIBOR + 0.700% | | 2.505% | | 10/25/49 | | | 255 | | | | 255 | |
Short-Term Investment-Grade Portfolio
| | | | | | | | | Face | | | Market | |
| | | | | | | Maturity | | Amount | | | Value• | |
| | | | | Coupon | | Date | | ($000 | ) | | ($000 | ) |
| 2,3,4,5 | | Freddie Mac Structured Agency Credit Risk Debt Notes 2019-DNA4, 1M USD LIBOR + 0.730% | | 2.522% | | 7/25/49 | | | 127 | | | | 127 | |
| 2,3,4,5 | | Freddie Mac Structured Agency Credit Risk Debt Notes 2019-HQA2, 1M USD LIBOR + 0.700% | | 2.492% | | 4/25/49 | | | 211 | | | | 211 | |
| 2,3,4,5 | | Freddie Mac Structured Agency Credit Risk Debt Notes 2019-HQA3, 1M USD LIBOR + 0.750% | | 2.542% | | 9/25/49 | | | 190 | | | | 190 | |
| 2 | | GM Financial Automobile Leasing Trust 2017-3 | | 2.400% | | 9/20/21 | | | 210 | | | | 210 | |
| 2 | | GM Financial Automobile Leasing Trust 2017-3 | | 2.730% | | 9/20/21 | | | 130 | | | | 130 | |
| 2 | | GM Financial Automobile Leasing Trust 2019-3 | | 2.030% | | 6/20/22 | | | 1,050 | | | | 1,049 | |
| 2,5 | | GM Financial Consumer Automobile 2017-3 | | 2.130% | | 3/16/23 | | | 390 | | | | 391 | |
| 2,5 | | GM Financial Consumer Automobile 2017-3 | | 2.330% | | 3/16/23 | | | 70 | | | | 70 | |
| 2 | | GM Financial Consumer Automobile 2018-3 | | 3.160% | | 1/16/24 | | | 250 | | | | 257 | |
| 2 | | GM Financial Consumer Automobile 2018-4 | | 3.320% | | 6/17/24 | | | 250 | | | | 259 | |
| 2 | | GM Financial Consumer Automobile 2019-1 | | 3.110% | | 7/16/24 | | | 380 | | | | 391 | |
| 2 | | GM Financial Consumer Automobile 2019-2 | | 2.710% | | 8/16/24 | | | 490 | | | | 499 | |
| 2 | | GM Financial Consumer Automobile 2019-3 | | 2.180% | | 4/16/24 | | | 1,070 | | | | 1,075 | |
| 2 | | GM Financial Securitized Term Auto Receivables Trust 2019-4 | | 1.760% | | 1/16/25 | | | 170 | | | | 168 | |
| 2 | | GMACM Mortgage Loan Trust 2005-AR6 | | 3.918% | | 11/19/35 | | | 32 | | | | 30 | |
| 2,5 | | GMF Floorplan Owner Revolving Trust 2017-2 | | 2.440% | | 7/15/22 | | | 440 | | | | 440 | |
| 2,5 | | GMF Floorplan Owner Revolving Trust 2017-2 | | 2.630% | | 7/15/22 | | | 240 | | | | 240 | |
| 2,5 | | GMF Floorplan Owner Revolving Trust 2018-2 | | 3.130% | | 3/15/23 | | | 1,530 | | | | 1,550 | |
| 2,5 | | GMF Floorplan Owner Revolving Trust 2019-1 | | 2.700% | | 4/15/24 | | | 410 | | | | 412 | |
| 2,5 | | Golden Credit Card Trust 2018-1A | | 2.620% | | 1/15/23 | | | 4,000 | | | | 4,026 | |
| 2,5 | | Golden Credit Card Trust 2018-4A | | 3.440% | | 10/15/25 | | | 2,420 | | | | 2,526 | |
| 2,4,5 | | Gosforth Funding 2018-1A plc, 3M USD LIBOR + 0.450% | | 2.360% | | 8/25/60 | | | 350 | | | | 350 | |
| 2,5 | | GRACE Mortgage Trust 2014-A | | 3.369% | | 6/10/28 | | | 500 | | | | 506 | |
| 2,5 | | GreatAmerica Leasing Receivables Funding LLC Series 2018-1 | | 2.830% | | 6/17/24 | | | 170 | | | | 171 | |
| 2,5 | | GreatAmerica Leasing Receivables Funding LLC Series 2019-1 | | 3.210% | | 2/18/25 | | | 210 | | | | 215 | |
| 2,5 | | GS Mortgage Securities Corporation Trust 2012-ALOHA | | 3.551% | | 4/10/34 | | | 790 | | | | 813 | |
| 2,5 | | GS Mortgage Securities Trust 2010-C2 | | 5.180% | | 12/10/43 | | | 100 | | | | 102 | |
| 2,5 | | GS Mortgage Securities Trust 2011-GC3 | | 5.636% | | 3/10/44 | | | 70 | | | | 72 | |
| 2,5 | | GS Mortgage Securities Trust 2012-BWTR | | 2.954% | | 11/5/34 | | | 860 | | | | 870 | |
| 2,5 | | GS Mortgage Securities Trust 2012-GC6 | | 4.948% | | 1/10/45 | | | 25 | | | | 26 | |
| 2 | | GS Mortgage Securities Trust 2012-GCJ7 | | 5.686% | | 5/10/45 | | | 210 | | | | 220 | |
| 2 | | GS Mortgage Securities Trust 2013-GC13 | | 4.050% | | 7/10/46 | | | 543 | | | | 579 | |
| 2,5 | | GS Mortgage Securities Trust 2013-GC13 | | 4.083% | | 7/10/46 | | | 140 | | | | 145 | |
| 2 | | GS Mortgage Securities Trust 2013-GCJ12 | | 3.135% | | 6/10/46 | | | 306 | | | | 314 | |
| 2 | | GS Mortgage Securities Trust 2013-GCJ12 | | 3.777% | | 6/10/46 | | | 200 | | | | 206 | |
| 2 | | GS Mortgage Securities Trust 2013-GCJ14 | | 3.817% | | 8/10/46 | | | 145 | | | | 149 | |
| 2 | | GS Mortgage Securities Trust 2013-GCJ14 | | 3.955% | | 8/10/46 | | | 705 | | | | 734 | |
| 2 | | GS Mortgage Securities Trust 2013-GCJ14 | | 4.243% | | 8/10/46 | | | 1,015 | | | | 1,080 | |
| 2 | | GS Mortgage Securities Trust 2014-GC20 | | 3.998% | | 4/10/47 | | | 1,000 | | | | 1,060 | |
| 2 | | GS Mortgage Securities Trust 2014-GC20 | | 4.258% | | 4/10/47 | | | 20 | | | | 21 | |
| 2 | | GS Mortgage Securities Trust 2014-GC24 | | 3.931% | | 9/10/47 | | | 1,107 | | | | 1,181 | |
| 2 | | GS Mortgage Securities Trust 2014-GC24 | | 4.162% | | 9/10/47 | | | 380 | | | | 401 | |
| 2 | | GS Mortgage Securities Trust 2014-GC24 | | 4.511% | | 9/10/47 | | | 270 | | | | 282 | |
| 2 | | GS Mortgage Securities Trust 2014-GC24 | | 4.532% | | 9/10/47 | | | 410 | | | | 392 | |
| 2 | | GS Mortgage Securities Trust 2014-GC26 | | 3.364% | | 11/10/47 | | | 500 | | | | 521 | |
| 2 | | GS Mortgage Securities Trust 2014-GC26 | | 3.629% | | 11/10/47 | | | 1,030 | | | | 1,089 | |
| 2 | | GS Mortgage Securities Trust 2015-GC28 | | 3.136% | | 2/10/48 | | | 939 | | | | 970 | |
| 2 | | GS Mortgage Securities Trust 2015-GC28 | | 3.396% | | 2/10/48 | | | 677 | | | | 708 | |
| 2 | | GS Mortgage Securities Trust 2015-GC30 | | 3.382% | | 5/10/50 | | | 300 | | | | 314 | |
| 2 | | GS Mortgage Securities Trust 2015-GC32 | | 3.764% | | 7/10/48 | | | 99 | | | | 106 | |
| 2 | | GS Mortgage Securities Trust 2015-GC34 | | 3.506% | | 10/10/48 | | | 888 | | | | 934 | |
| 2 | | GS Mortgage Securities Trust 2015-GC34 | | 4.652% | | 10/10/48 | | | 310 | | | | 327 | |
| 2 | | GS Mortgage Securities Trust 2016-GS3 | | 2.850% | | 10/10/49 | | | 530 | | | | 542 | |
| 2 | | GS Mortgage Securities Trust 2018-GS10 | | 4.155% | | 7/10/51 | | | 130 | | | | 144 | |
| 2 | | GS Mortgage Securities Trust 2018-GS9 | | 3.992% | | 3/10/51 | | | 10 | | | | 11 | |
| 2 | | GS Mortgage Securities Trust 2019-GC38 | | 3.968% | | 2/10/52 | | | 200 | | | | 220 | |
| 2 | | GS Mortgage Securities Trust 2019-GC40 | | 3.160% | | 7/10/52 | | | 110 | | | | 114 | |
| 2 | | GS Mortgage Securities Trust 2019-GS4 | | 3.001% | | 9/1/52 | | | 400 | | | | 409 | |
| 5 | | GTP Acquisition Partners I LLC | | 2.350% | | 6/15/20 | | | 40 | | | | 40 | |
| 2,5 | | Hardee’s Funding HNGRY 2018-1 | | 4.959% | | 6/20/48 | | | 49 | | | | 50 | |
| 2,5 | | Hardee’s Funding HNGRY 2018-1A | | 5.710% | | 6/20/48 | | | 731 | | | | 776 | |
| 2,5 | | Harley Marine Financing LLC Barge 2018-1 | | 5.682% | | 5/15/43 | | | 464 | | | | 404 | |
| 2 | | Harley-Davidson Motorcycle Trust 2019-A | | 2.340% | | 2/15/24 | | | 1,230 | | | | 1,233 | |
| 2 | | Harley-Davidson Motorcycle Trust 2019-A | | 2.390% | | 11/15/26 | | | 270 | | | | 271 | |
| 2,5 | | Hertz Fleet Lease Funding LP 2018-1 | | 3.230% | | 5/10/32 | | | 895 | | | | 901 | |
| 2,5 | | Hertz Vehicle Financing II LP 2015-3A | | 2.670% | | 9/25/21 | | | 200 | | | | 201 | |
| 2,5 | | Hertz Vehicle Financing II LP 2016-2A | | 2.950% | | 3/25/22 | | | 385 | | | | 388 | |
| 2,5 | | Hertz Vehicle Financing II LP 2018-1A | | 3.600% | | 2/25/24 | | | 320 | | | | 326 | |
| 2,5 | | Hilton USA Trust 2016-HHV | | 3.719% | | 11/5/38 | | | 80 | | | | 84 | |
| 2,4,5 | | Holmes Master Issuer plc 2018-1, 3M USD LIBOR + 0.360% | | 2.361% | | 10/15/54 | | | 624 | | | | 624 | |
| 2,4,5 | | Holmes Master Issuer plc 2018-2A, 3M USD LIBOR + 0.420% | | 2.421% | | 10/15/54 | | | 617 | | | | 617 | |
| 2 | | Honda Auto Receivables 2017-4 Owner Trust | | 2.210% | | 3/21/24 | | | 260 | | | | 261 | |
| 2 | | Honda Auto Receivables 2018-3 Owner Trust | | 2.950% | | 8/22/22 | | | 560 | | | | 566 | |
| 2 | | Honda Auto Receivables 2018-3 Owner Trust | | 3.070% | | 11/21/24 | | | 210 | | | | 214 | |
Short-Term Investment-Grade Portfolio
| | | | | | | | | Face | | | Market | |
| | | | | | | Maturity | | Amount | | | Value• | |
| | | | | Coupon | | Date | | ($000 | ) | | ($000 | ) |
| 2 | | Honda Auto Receivables 2018-4 Owner Trust | | 2.520% | | 6/21/23 | | | 3,060 | | | | 3,088 | |
| 2 | | Honda Auto Receivables 2018-4 Owner Trust | | 2.540% | | 3/21/25 | | | 620 | | | | 629 | |
| 2 | | Honda Auto Receivables 2018-4 Owner Trust | | 3.300% | | 7/15/25 | | | 200 | | | | 206 | |
| 2 | | Honda Auto Receivables 2019-1 Owner Trust | | 2.900% | | 6/18/24 | | | 230 | | | | 235 | |
| 2 | | Honda Auto Receivables 2019-3 Owner Trust | | 1.850% | | 8/15/25 | | | 500 | | | | 497 | |
| 2,5 | | Houston Galleria Mall Trust 2015-HGLR | | 3.087% | | 3/5/37 | | | 3,030 | | | | 3,111 | |
| 2,5 | | HPEFS Equipment Trust 2019-1 | | 2.190% | | 9/20/29 | | | 400 | | | | 400 | |
| 2,5 | | HPEFS Equipment Trust 2019-1 | | 2.210% | | 9/20/29 | | | 100 | | | | 100 | |
| 2,5 | | HPEFS Equipment Trust 2019-1 | | 2.320% | | 9/20/29 | | | 100 | | | | 100 | |
| 2,5 | | HPEFS Equipment Trust 2019-1 | | 2.490% | | 9/20/29 | | | 100 | | | | 100 | |
| 2,5 | | HPEFS Equipment Trust 2019-1 | | 2.720% | | 9/20/29 | | | 100 | | | | 100 | |
| 2,5 | | Hudson Yards 2019-30HY | | 3.228% | | 7/10/39 | | | 330 | | | | 340 | |
| 2,5 | | Hudsons Bay Simon JV Trust 2015-HB7 | | 3.914% | | 8/5/34 | | | 500 | | | | 510 | |
| 2,5 | | Hyundai Auto Lease Securitization Trust 2017-C | | 2.460% | | 7/15/22 | | | 160 | | | | 160 | |
| 2,5 | | Hyundai Auto Lease Securitization Trust 2019-A | | 2.980% | | 7/15/22 | | | 860 | | | | 870 | |
| 2,5 | | Hyundai Auto Lease Securitization Trust 2019-A | | 3.050% | | 12/15/22 | | | 140 | | | | 142 | |
| 2,5 | | Hyundai Auto Lease Securitization Trust 2019-B | | 2.040% | | 8/15/22 | | | 1,220 | | | | 1,217 | |
| 2 | | Hyundai Auto Receivables Trust 2019-A | | 2.710% | | 5/15/25 | | | 350 | | | | 356 | |
| 2 | | Hyundai Auto Receivables Trust 2019-A | | 2.940% | | 5/15/25 | | | 190 | | | | 194 | |
| 2 | | Hyundai Auto Receivables Trust 2019-B | | 1.940% | | 2/15/24 | | | 1,460 | | | | 1,460 | |
| 2 | | Hyundai Auto Receivables Trust 2019-B | | 2.000% | | 4/15/25 | | | 410 | | | | 410 | |
| 2 | | Hyundai Auto Receivables Trust 2019-B | | 2.210% | | 4/15/25 | | | 120 | | | | 120 | |
| 2,5 | | Hyundai Floorplan Master Owner Trust Series 2019-1A | | 2.680% | | 4/15/24 | | | 510 | | | | 516 | |
| 2,4,5 | | Invitation Homes 2017-SFR2 Trust, 1M USD LIBOR + 0.850% | | 2.587% | | 12/17/36 | | | 681 | | | | 676 | |
| 2,4,5 | | Invitation Homes 2017-SFR2 Trust, 1M USD LIBOR + 1.150% | | 2.887% | | 12/17/36 | | | 250 | | | | 250 | |
| 2,4,5 | | Invitation Homes 2018-SFR1 Trust, 1M USD LIBOR + 0.700% | | 2.437% | | 3/17/37 | | | 1,020 | | | | 1,007 | |
| 2,4,5 | | Invitation Homes 2018-SFR1 Trust, 1M USD LIBOR + 0.950% | | 2.687% | | 3/17/37 | | | 260 | | | | 257 | |
| 2,5 | | Irvine Core Office Trust 2013-IRV | | 3.173% | | 5/15/48 | | | 358 | | | | 369 | |
| 2,5 | | Jackson Park Trust 2019-LIC | | 2.766% | | 10/14/39 | | | 530 | | | | 525 | |
| 2 | | John Deere Owner Trust 2018-B | | 3.230% | | 6/16/25 | | | 340 | | | | 348 | |
| 2 | | John Deere Owner Trust 2018-B | | 3.000% | | 1/15/26 | | | 180 | | | | 184 | |
| 2 | | John Deere Owner Trust 2019-B | | 2.320% | | 5/15/26 | | | 350 | | | | 351 | |
| 2,5 | | JP Morgan Chase Commercial Mortgage Securities Trust 2010-C1 | | 4.608% | | 6/15/43 | | | 18 | | | | 18 | |
| 2,5 | | JP Morgan Chase Commercial Mortgage Securities Trust 2010-C2 | | 4.070% | | 11/15/43 | | | 58 | | | | 58 | |
| 2,5 | | JP Morgan Chase Commercial Mortgage Securities Trust 2010-C2 | | 5.599% | | 11/15/43 | | | 150 | | | | 152 | |
| 2,5 | | JP Morgan Chase Commercial Mortgage Securities Trust 2010-C2 | | 5.599% | | 11/15/43 | | | 170 | | | | 173 | |
| 2,5 | | JP Morgan Chase Commercial Mortgage Securities Trust 2011-C3 | | 4.717% | | 2/15/46 | | | 561 | | | | 573 | |
| 2,5 | | JP Morgan Chase Commercial Mortgage Securities Trust 2011-C5 | | 5.418% | | 8/15/46 | | | 100 | | | | 104 | |
| 2,5 | | JP Morgan Chase Commercial Mortgage Securities Trust 2011-RR1 | | 4.717% | | 3/16/46 | | | 70 | | | | 72 | |
| 2 | | JP Morgan Chase Commercial Mortgage Securities Trust 2012-C6 | | 3.507% | | 5/15/45 | | | 301 | | | | 309 | |
| 2 | | JP Morgan Chase Commercial Mortgage Securities Trust 2012-C8 | | 2.829% | | 10/15/45 | | | 339 | | | | 344 | |
| 2,5 | | JP Morgan Chase Commercial Mortgage Securities Trust 2012-C8 | | 3.424% | | 10/15/45 | | | 100 | | | | 102 | |
| 2 | | JP Morgan Chase Commercial Mortgage Securities Trust 2012-CIBX | | 4.271% | | 6/15/45 | | | 650 | | | | 677 | |
| 2,5 | | JP Morgan Chase Commercial Mortgage Securities Trust 2012-HSBC | | 3.093% | | 7/5/32 | | | 141 | | | | 144 | |
| 2 | | JP Morgan Chase Commercial Mortgage Securities Trust 2012-LC9 | | 2.840% | | 12/15/47 | | | 755 | | | | 767 | |
| 2 | | JP Morgan Chase Commercial Mortgage Securities Trust 2013-C13 | | 3.994% | | 1/15/46 | | | 350 | | | | 368 | |
| 2 | | JP Morgan Chase Commercial Mortgage Securities Trust 2013-C13 | | 4.065% | | 1/15/46 | | | 170 | | | | 176 | |
| 2 | | JP Morgan Chase Commercial Mortgage Securities Trust 2013-C16 | | 3.674% | | 12/15/46 | | | 210 | | | | 216 | |
| 2 | | JP Morgan Chase Commercial Mortgage Securities Trust 2013-C16 | | 3.881% | | 12/15/46 | | | 60 | | | | 63 | |
| 2 | | JP Morgan Chase Commercial Mortgage Securities Trust 2013-C16 | | 4.166% | | 12/15/46 | | | 410 | | | | 438 | |
| 2 | | JP Morgan Chase Commercial Mortgage Securities Trust 2013-C16 | | 4.517% | | 12/15/46 | | | 400 | | | | 429 | |
| 2 | | JP Morgan Chase Commercial Mortgage Securities Trust 2013-C16 | | 4.962% | | 12/15/46 | | | 550 | | | | 596 | |
| 2 | | JP Morgan Chase Commercial Mortgage Securities Trust 2013-C16 | | 5.027% | | 12/15/46 | | | 270 | | | | 289 | |
| 2 | | JP Morgan Chase Commercial Mortgage Securities Trust 2013-LC11 | | 2.960% | | 4/15/46 | | | 702 | | | | 718 | |
| 2 | | JP Morgan Chase Commercial Mortgage Securities Trust 2014-C20 | | 3.461% | | 7/15/47 | | | 692 | | | | 710 | |
| 2 | | JP Morgan Chase Commercial Mortgage Securities Trust 2016-JP3 | | 2.870% | | 8/15/49 | | | 1,164 | | | | 1,186 | |
| 2 | | JP Morgan Chase Commercial Mortgage Securities Trust 2016-JP4 | | 3.648% | | 12/15/49 | | | 290 | | | | 309 | |
| 2 | | JP Morgan Chase Commercial Mortgage Securities Trust 2017-JP6 | | 3.490% | | 7/15/50 | | | 310 | | | | 327 | |
| 2 | | JPMBB Commercial Mortgage Securities Trust 2013-C12 | | 3.664% | | 7/15/45 | | | 439 | | | | 459 | |
| 2 | | JPMBB Commercial Mortgage Securities Trust 2013-C12 | | 4.039% | | 7/15/45 | | | 180 | | | | 189 | |
| 2 | | JPMBB Commercial Mortgage Securities Trust 2013-C14 | | 3.761% | | 8/15/46 | | | 260 | | | | 267 | |
| 2 | | JPMBB Commercial Mortgage Securities Trust 2013-C14 | | 4.133% | | 8/15/46 | | | 300 | | | | 318 | |
| 2 | | JPMBB Commercial Mortgage Securities Trust 2013-C15 | | 3.659% | | 11/15/45 | | | 75 | | | | 77 | |
| 2 | | JPMBB Commercial Mortgage Securities Trust 2013-C15 | | 4.131% | | 11/15/45 | | | 800 | | | | 853 | |
| 2 | | JPMBB Commercial Mortgage Securities Trust 2013-C15 | | 4.927% | | 11/15/45 | | | 430 | | | | 464 | |
| 2 | | JPMBB Commercial Mortgage Securities Trust 2013-C15 | | 5.198% | | 11/15/45 | | | 340 | | | | 365 | |
| 2 | | JPMBB Commercial Mortgage Securities Trust 2013-C17 | | 4.199% | | 1/15/47 | | | 497 | | | | 532 | |
| 2 | | JPMBB Commercial Mortgage Securities Trust 2014-C18 | | 4.079% | | 2/15/47 | | | 950 | | | | 1,014 | |
| 2 | | JPMBB Commercial Mortgage Securities Trust 2014-C18 | | 4.439% | | 2/15/47 | | | 300 | | | | 320 | |
| 2 | | JPMBB Commercial Mortgage Securities Trust 2014-C18 | | 4.810% | | 2/15/47 | | | 300 | | | | 320 | |
| 2 | | JPMBB Commercial Mortgage Securities Trust 2014-C18 | | 4.810% | | 2/15/47 | | | 150 | | | | 158 | |
| 2 | | JPMBB Commercial Mortgage Securities Trust 2014-C19 | | 3.997% | | 4/15/47 | | | 70 | | | | 75 | |
| 2 | | JPMBB Commercial Mortgage Securities Trust 2014-C24 | | 3.639% | | 11/15/47 | | | 1,204 | | | | 1,272 | |
| 2 | | JPMBB Commercial Mortgage Securities Trust 2014-C26 | | 3.231% | | 1/15/48 | | | 595 | | | | 615 | |
| 2 | | JPMBB Commercial Mortgage Securities Trust 2014-C26 | | 3.494% | | 1/15/48 | | | 1,030 | | | | 1,080 | |
| 2 | | JPMBB Commercial Mortgage Securities Trust 2015-C27 | | 3.179% | | 2/15/48 | | | 354 | | | | 366 | |
| 2 | | JPMBB Commercial Mortgage Securities Trust 2015-C30 | | 3.551% | | 7/15/48 | | | 580 | | | | 610 | |
| 2 | | JPMBB Commercial Mortgage Securities Trust 2015-C30 | | 3.822% | | 7/15/48 | | | 1,290 | | | | 1,376 | |
| 2 | | JPMBB Commercial Mortgage Securities Trust 2015-C30 | | 4.226% | | 7/15/48 | | | 385 | | | | 412 | |
Short-Term Investment-Grade Portfolio
| | | | | | | | | Face | | | Market | |
| | | | | | | Maturity | | Amount | | | Value• | |
| | | | | Coupon | | Date | | ($000 | ) | | ($000 | ) |
| 2 | | JPMBB Commercial Mortgage Securities Trust 2015-C31 | | 3.801% | | 8/15/48 | | | 590 | | | | 629 | |
| 2 | | JPMBB Commercial Mortgage Securities Trust 2015-C32 | | 3.598% | | 11/15/48 | | | 270 | | | | 285 | |
| 2 | | JPMBB Commercial Mortgage Securities Trust 2015-C33 | | 3.770% | | 12/15/48 | | | 513 | | | | 549 | |
| 2 | | JPMCC Commercial Mortgage Securities Trust 2017-JP5 | | 3.723% | | 3/15/50 | | | 700 | | | | 752 | |
| 2 | | JPMCC Commercial Mortgage Securities Trust 2017-JP7 | | 3.454% | | 9/15/50 | | | 350 | | | | 370 | |
| 2 | | JPMDB Commercial Mortgage Securities Trust 2016-C4 | | 3.141% | | 12/15/49 | | | 220 | | | | 228 | |
| 2 | | JPMDB Commercial Mortgage Securities Trust 2017-C7 | | 3.409% | | 10/15/50 | | | 160 | | | | 169 | |
| 2 | | JPMDB Commercial Mortgage Securities Trust 2018-C8 | | 4.211% | | 6/15/51 | | | 10 | | | | 11 | |
| 2,5 | | Kubota Credit Owner Trust 2018-1 | | 3.210% | | 1/15/25 | | | 175 | | | | 179 | |
| 2,4,5 | | Lanark Master Issuer plc 2018-1A, 3M USD LIBOR + 0.420% | | 2.319% | | 12/22/69 | | | 496 | | | | 496 | |
| 2,4 | | Lanark Master Issuer plc 2018-2A, 3M USD LIBOR + 0.420% | | 2.319% | | 12/22/69 | | | 313 | | | | 314 | |
| 2,5 | | Laurel Road Prime Student Loan Trust 2018-B | | 3.540% | | 5/26/43 | | | 849 | | | | 876 | |
| 2,5 | | LCCM Mortgage Trust 2014-A | | 3.388% | | 5/15/31 | | | 450 | | | | 455 | |
| | | Louisiana Local Government Environmental Facilities & Community Development Authority Revenue 2010-ELL | | 3.450% | | 2/1/22 | | | 26 | | | | 26 | |
| 2 | | M Financial Securitized Term Auto Receivables Trust 2019-4 | | 1.750% | | 7/16/24 | | | 1,200 | | | | 1,194 | |
| 2,5 | | Madison Avenue Trust 2013-650M | | 3.843% | | 10/12/32 | | | 295 | | | | 298 | |
| 2 | | MASTR Adjustable Rate Mortgages Trust 2004-3 | | 4.275% | | 4/25/34 | | | 9 | | | | 9 | |
| 2 | | Mercedes-Benz Auto Lease Trust 2019-A | | 2.000% | | 10/17/22 | | | 890 | | | | 890 | |
| 2 | | Mercedes-Benz Auto Receivables Trust 2018-1 | | 3.150% | | 10/15/24 | | | 340 | | | | 349 | |
| 2 | | Mercedes-Benz Auto Receivables Trust 2019-1 | | 2.040% | | 1/15/26 | | | 590 | | | | 589 | |
| 2,5 | | Mercedes-Benz Master Owner Trust 2019-B | | 2.610% | | 5/15/24 | | | 1,890 | | | | 1,914 | |
| 2 | | Merrill Lynch Mortgage Investors Trust MLMI Series 2003-A2 | | 3.407% | | 2/25/33 | | | 13 | | | | 12 | |
| 2 | | Merrill Lynch Mortgage Investors Trust MLMI Series 2003-A4 | | 4.818% | | 7/25/33 | | | 7 | | | | 7 | |
| 2,5 | | MMAF Equipment Finance LLC 2015-AA | | 2.490% | | 2/19/36 | | | 675 | | | | 678 | |
| 2,5 | | MMAF Equipment Finance LLC 2018-A | | 3.390% | | 1/10/25 | | | 200 | | | | 205 | |
| 2,5 | | MMAF Equipment Finance LLC 2018-A | | 3.610% | | 3/10/42 | | | 110 | | | | 114 | |
| 2,5 | | MMAF Equipment Finance LLC 2019-A | | 3.080% | | 11/12/41 | | | 220 | | | | 226 | |
| 2 | | Morgan Stanley Bank of America Merrill Lynch Trust 2012-C5 | | 3.176% | | 8/15/45 | | | 506 | | | | 517 | |
| 2 | | Morgan Stanley Bank of America Merrill Lynch Trust 2012-C5 | | 3.792% | | 8/15/45 | | | 50 | | | | 52 | |
| 2 | | Morgan Stanley Bank of America Merrill Lynch Trust 2012-C6 | | 2.858% | | 11/15/45 | | | 119 | | | | 120 | |
| 2 | | Morgan Stanley Bank of America Merrill Lynch Trust 2013-C10 | | 4.081% | | 7/15/46 | | | 683 | | | | 722 | |
| 2 | | Morgan Stanley Bank of America Merrill Lynch Trust 2013-C10 | | 4.081% | | 7/15/46 | | | 70 | | | | 71 | |
| 2 | | Morgan Stanley Bank of America Merrill Lynch Trust 2013-C11 | | 3.960% | | 8/15/46 | | | 259 | | | | 271 | |
| 2 | | Morgan Stanley Bank of America Merrill Lynch Trust 2013-C11 | | 4.153% | | 8/15/46 | | | 580 | | | | 615 | |
| 2 | | Morgan Stanley Bank of America Merrill Lynch Trust 2013-C12 | | 3.824% | | 10/15/46 | | | 135 | | | | 139 | |
| 2 | | Morgan Stanley Bank of America Merrill Lynch Trust 2013-C12 | | 4.259% | | 10/15/46 | | | 80 | | | | 85 | |
| 2 | | Morgan Stanley Bank of America Merrill Lynch Trust 2013-C13 | | 4.039% | | 11/15/46 | | | 200 | | | | 212 | |
| 2 | | Morgan Stanley Bank of America Merrill Lynch Trust 2013-C7 | | 2.918% | | 2/15/46 | | | 130 | | | | 132 | |
| 2 | | Morgan Stanley Bank of America Merrill Lynch Trust 2013-C7 | | 3.214% | | 2/15/46 | | | 60 | | | | 61 | |
| 2 | | Morgan Stanley Bank of America Merrill Lynch Trust 2013-C9 | | 3.102% | | 5/15/46 | | | 595 | | | | 609 | |
| 2 | | Morgan Stanley Bank of America Merrill Lynch Trust 2014-C14 | | 4.064% | | 2/15/47 | | | 450 | | | | 478 | |
| 2 | | Morgan Stanley Bank of America Merrill Lynch Trust 2014-C14 | | 4.384% | | 2/15/47 | | | 450 | | | | 482 | |
| 2 | | Morgan Stanley Bank of America Merrill Lynch Trust 2014-C15 | | 3.773% | | 4/15/47 | | | 769 | | | | 812 | |
| 2 | | Morgan Stanley Bank of America Merrill Lynch Trust 2014-C15 | | 4.051% | | 4/15/47 | | | 615 | | | | 653 | |
| 2 | | Morgan Stanley Bank of America Merrill Lynch Trust 2014-C15 | | 4.909% | | 4/15/47 | | | 50 | | | | 54 | |
| 2 | | Morgan Stanley Bank of America Merrill Lynch Trust 2014-C16 | | 3.892% | | 6/15/47 | | | 1,004 | | | | 1,061 | |
| 2 | | Morgan Stanley Bank of America Merrill Lynch Trust 2014-C16 | | 4.094% | | 6/15/47 | | | 230 | | | | 243 | |
| 2 | | Morgan Stanley Bank of America Merrill Lynch Trust 2014-C16 | | 4.337% | | 6/15/47 | | | 660 | | | | 698 | |
| 2 | | Morgan Stanley Bank of America Merrill Lynch Trust 2014-C16 | | 4.770% | | 6/15/47 | | | 300 | | | | 315 | |
| 2 | | Morgan Stanley Bank of America Merrill Lynch Trust 2014-C17 | | 3.741% | | 8/15/47 | | | 620 | | | | 653 | |
| 2 | | Morgan Stanley Bank of America Merrill Lynch Trust 2014-C17 | | 4.011% | | 8/15/47 | | | 160 | | | | 169 | |
| 2 | | Morgan Stanley Bank of America Merrill Lynch Trust 2014-C18 | | 3.923% | | 10/15/47 | | | 490 | | | | 521 | |
| 2 | | Morgan Stanley Bank of America Merrill Lynch Trust 2014-C19 | | 3.326% | | 12/15/47 | | | 450 | | | | 461 | |
| 2 | | Morgan Stanley Bank of America Merrill Lynch Trust 2014-C19 | | 3.526% | | 12/15/47 | | | 440 | | | | 461 | |
| 2 | | Morgan Stanley Bank of America Merrill Lynch Trust 2015-C20 | | 3.069% | | 2/15/48 | | | 560 | | | | 572 | |
| 2 | | Morgan Stanley Bank of America Merrill Lynch Trust 2015-C20 | | 3.249% | | 2/15/48 | | | 780 | | | | 808 | |
| 2 | | Morgan Stanley Bank of America Merrill Lynch Trust 2015-C23 | | 3.451% | | 7/15/50 | | | 240 | | | | 251 | |
| 2 | | Morgan Stanley Bank of America Merrill Lynch Trust 2015-C23 | | 3.719% | | 7/15/50 | | | 822 | | | | 872 | |
| 2 | | Morgan Stanley Bank of America Merrill Lynch Trust 2015-C24 | | 3.479% | | 5/15/48 | | | 420 | | | | 440 | |
| 2 | | Morgan Stanley Bank of America Merrill Lynch Trust 2015-C24 | | 3.732% | | 5/15/48 | | | 1,350 | | | | 1,434 | |
| 2 | | Morgan Stanley Bank of America Merrill Lynch Trust 2015-C25 | | 3.635% | | 10/15/48 | | | 1,455 | | | | 1,539 | |
| 2 | | Morgan Stanley Bank of America Merrill Lynch Trust 2016-C29 | | 3.325% | | 5/15/49 | | | 2,279 | | | | 2,371 | |
| 2 | | Morgan Stanley Bank of America Merrill Lynch Trust 2016-C29 | | 4.749% | | 5/15/49 | | | 40 | | | | 42 | |
| 2 | | Morgan Stanley Bank of America Merrill Lynch Trust 2016-C32 | | 3.720% | | 12/15/49 | | | 2,904 | | | | 3,097 | |
| 2 | | Morgan Stanley Bank of America Merrill Lynch Trust 2017-C34 | | 3.536% | | 11/15/52 | | | 490 | | | | 520 | |
| 2 | | Morgan Stanley Capital I Trust 2012-C4 | | 3.244% | | 3/15/45 | | | 380 | | | | 386 | |
| 2 | | Morgan Stanley Capital I Trust 2012-C4 | | 3.773% | | 3/15/45 | | | 60 | | | | 62 | |
| 2,5 | | Morgan Stanley Capital I Trust 2012-STAR | | 3.201% | | 8/5/34 | | | 411 | | | | 419 | |
| 2,5 | | Morgan Stanley Capital I Trust 2014-150E | | 3.912% | | 9/9/32 | | | 675 | | | | 709 | |
| 2,5 | | Morgan Stanley Capital I Trust 2014-CPT | | 3.350% | | 7/13/29 | | | 600 | | | | 611 | |
| 2,5 | | Morgan Stanley Capital I Trust 2015-420 | | 3.727% | | 10/12/50 | | | 696 | | | | 729 | |
| 2 | | Morgan Stanley Capital I Trust 2015-UBS8 | | 3.809% | | 12/15/48 | | | 916 | | | | 980 | |
Short-Term Investment-Grade Portfolio
| | | | | | | | | Face | | | Market | |
| | | | | | | Maturity | | Amount | | | Value• | |
| | | | | Coupon | | Date | | ($000 | ) | | ($000 | ) |
| 2 | | Morgan Stanley Capital I Trust 2015-UBS8 | | 4.586% | | 12/15/48 | | | 350 | | | | 367 | |
| 2 | | Morgan Stanley Capital I Trust 2016-BNK2 | | 3.049% | | 11/15/49 | | | 400 | | | | 414 | |
| 2 | | Morgan Stanley Capital I Trust 2016-UB11 | | 2.782% | | 8/15/49 | | | 1,054 | | | | 1,065 | |
| 2 | | Morgan Stanley Capital I Trust 2016-UBS9 | | 3.594% | | 3/15/49 | | | 963 | | | | 1,019 | |
| 2 | | Morgan Stanley Capital I Trust 2017-HR2 | | 3.509% | | 12/15/50 | | | 140 | | | | 148 | |
| 2 | | Morgan Stanley Capital I Trust 2017-HR2 | | 3.587% | | 12/15/50 | | | 195 | | | | 209 | |
| 2 | | Morgan Stanley Capital I Trust 2018-H4 | | 4.247% | | 12/15/51 | | | 440 | | | | 482 | |
| 2 | | Morgan Stanley Capital I Trust 2019-L3 | | 3.127% | | 11/15/29 | | | 440 | | | | 454 | |
| 2 | | Morgan Stanley Mortgage Loan Trust 2006-8AR | | 3.985% | | 6/25/36 | | | 76 | | | | 75 | |
| 2,4,5 | | Motor plc 2017-1A, 1M USD LIBOR + 0.530% | | 2.322% | | 9/25/24 | | | 336 | | | | 335 | |
| 2,5 | | MSBAM Commercial Mortgage Securities Trust 2012-CKSV | | 3.277% | | 10/15/30 | | | 885 | | | | 892 | |
| 2,4,5 | | Navient Student Loan Trust 2016-3, 1M USD LIBOR + 0.850% | | 2.642% | | 6/25/65 | | | 68 | | | | 68 | |
| 2,4,5 | | Navient Student Loan Trust 2016-6A, 1M USD LIBOR + 0.750% | | 2.542% | | 3/25/66 | | | 451 | | | | 452 | |
| 2,5 | | Navient Student Loan Trust 2017-A | | 2.880% | | 12/16/58 | | | 440 | | | | 445 | |
| 2,5 | | Navient Student Loan Trust 2018-BA | | 3.430% | | 12/15/59 | | | 1,341 | | | | 1,347 | |
| 2,5 | | Navient Student Loan Trust 2018-BA | | 3.610% | | 12/15/59 | | | 560 | | | | 576 | |
| 2,5 | | Navient Student Loan Trust 2018-BA | | 4.000% | | 12/15/59 | | | 2,230 | | | | 2,317 | |
| 2,5 | | Navient Student Loan Trust 2018-CA | | 3.520% | | 6/16/42 | | | 1,480 | | | | 1,525 | |
| 2,5 | | Navient Student Loan Trust 2018-DA | | 4.000% | | 12/15/59 | | | 1,360 | | | | 1,406 | |
| 2,5 | | Navient Student Loan Trust 2019-B | | 3.390% | | 12/15/59 | | | 560 | | | | 575 | |
| 4 | | New Mexico Educational Assistance Foundation 2013-1, 1M USD LIBOR + 0.700% | | 2.408% | | 1/2/25 | | | 179 | | | | 178 | |
| 2 | | Nissan Auto Lease Trust 2018-B | | 3.350% | | 9/15/23 | | | 380 | | | | 385 | |
| 2 | | Nissan Auto Lease Trust 2019-A | | 2.760% | | 3/15/22 | | | 730 | | | | 737 | |
| 2 | | Nissan Auto Lease Trust 2019-A | | 2.780% | | 7/15/24 | | | 360 | | | | 364 | |
| 2 | | Nissan Auto Receivables 2017-C Owner Trust | | 2.280% | | 2/15/24 | | | 540 | | | | 541 | |
| 2 | | Nissan Auto Receivables 2019-A Owner Trust | | 3.160% | | 12/16/24 | | | 340 | | | | 349 | |
| 2 | | Nissan Auto Receivables 2019-A Owner Trust | | 3.000% | | 9/15/25 | | | 280 | | | | 288 | |
| 2 | | Nissan Auto Receivables 2019-B Owner Trust | | 2.500% | | 11/15/23 | | | 3,150 | | | | 3,182 | |
| 2 | | Nissan Auto Receivables 2019-B Owner Trust | | 2.540% | | 12/15/25 | | | 610 | | | | 619 | |
| 2,5 | | OBP Depositor LLC Trust 2010-OBP | | 4.646% | | 7/15/45 | | | 225 | | | | 228 | |
| 2,5 | | One Bryant Park 2019 - OBP A | | 2.516% | | 9/15/54 | | | 530 | | | | 514 | |
| 2,5 | | Palisades Center Trust 2016-PLSD | | 2.713% | | 4/13/33 | | | 200 | | | | 201 | |
| 2,4,5 | | Pepper Residential Securities Trust 2017-A, 1M USD LIBOR + 1.100% | | 2.815% | | 3/10/58 | | | 2 | | | | 2 | |
| 2,4,5 | | Pepper Residential Securities Trust 2018-A, 1M USD LIBOR + 0.950% | | 2.686% | | 3/12/47 | | | 9 | | | | 9 | |
| 2,4,5 | | Pepper Residential Securities Trust 2021-A1U, 1M USD LIBOR + 0.880% | | 2.620% | | 1/16/60 | | | 696 | | | | 695 | |
| 2,4,5 | | Pepper Residential Securities Trust 2022-A1U, 1M USD LIBOR + 1.000% | | 2.765% | | 6/20/60 | | | 346 | | | | 347 | |
| 2,4,5 | | Pepper Residential Securities Trust 2023-A1U, 1M USD LIBOR + 0.950% | | 2.695% | | 8/18/60 | | | 263 | | | | 263 | |
| 2,4,5 | | Permanent Master Issuer plc 2018-1A, 3M USD LIBOR + 0.380% | | 2.366% | | 7/15/58 | | | 410 | | | | 412 | |
| 2,5 | | PFS Financing Corp 2017-B | | 2.220% | | 7/15/22 | | | 530 | | | | 531 | |
| 2,5 | | PFS Financing Corp. 2017-D | | 2.400% | | 10/17/22 | | | 850 | | | | 852 | |
| 2,5 | | PFS Financing Corp. 2018-D | | 3.190% | | 4/17/23 | | | 370 | | | | 375 | |
| 2,4,5 | | PHEAA Student Loan Trust 2016-2A, 1M USD LIBOR + 0.950% | | 2.742% | | 11/25/65 | | | 550 | | | | 547 | |
| 2,5 | | Progress Residential 2015-SFR3 Trust | | 3.067% | | 11/12/32 | | | 612 | | | | 611 | |
| 2,5 | | Progress Residential 2015-SFR3 Trust | | 3.733% | | 11/12/32 | | | 230 | | | | 230 | |
| 2,5 | | Progress Residential 2017-SFR2 Trust | | 2.897% | | 12/17/34 | | | 389 | | | | 387 | |
| 2,5 | | Progress Residential 2017-SFR2 Trust | | 3.196% | | 12/17/34 | | | 100 | | | | 100 | |
| 2,5 | | Progress Residential 2018-SFR1 Trust | | 3.255% | | 3/17/35 | | | 559 | | | | 562 | |
| 2,5 | | Progress Residential 2018-SFR1 Trust | | 3.484% | | 3/17/35 | | | 100 | | | | 100 | |
| 2,5 | | Progress Residential 2018-SFR3 Trust | | 3.880% | | 10/17/35 | | | 999 | | | | 1,018 | |
| 2 | | Public Service New Hampshire Funding LLC 2018-1 | | 3.094% | | 2/1/26 | | | 187 | | | | 190 | |
| 2,4,5 | | Resimac Premier Series 2018-1A, 1M USD LIBOR + 0.800% | | 2.515% | | 11/10/49 | | | 576 | | | | 576 | |
| 2,4,5 | | Resimac Premier Series 2018-1NCA, 1M USD LIBOR + 0.850% | | 2.554% | | 12/5/59 | | | 790 | | | | 791 | |
| 2,4,5 | | Resimac Premier Series 2018-2, 1M USD LIBOR + 0.850% | | 2.565% | | 4/10/50 | | | 101 | | | | 101 | |
| 2 | | RFMSI Series 2006-SA2 Trust | | 5.119% | | 8/25/36 | | | 217 | | | | 182 | |
| 2 | | RFMSI Series 2006-SA3 Trust | | 5.227% | | 9/25/36 | | | 72 | | | | 63 | |
| 2 | | Santander Drive Auto Receivables Trust 2016-2 | | 3.390% | | 4/15/22 | | | 100 | | | | 101 | |
| 2 | | Santander Drive Auto Receivables Trust 2017-3 | | 2.760% | | 12/15/22 | | | 150 | | | | 150 | |
| 2 | | Santander Drive Auto Receivables Trust 2018-1 | | 2.960% | | 3/15/24 | | | 920 | | | | 925 | |
| 2 | | Santander Drive Auto Receivables Trust 2018-1 | | 3.320% | | 3/15/24 | | | 400 | | | | 404 | |
| 2 | | Santander Drive Auto Receivables Trust 2018-3 | | 3.290% | | 10/17/22 | | | 840 | | | | 841 | |
| 2 | | Santander Drive Auto Receivables Trust 2018-3 | | 4.070% | | 8/15/24 | | | 1,390 | | | | 1,423 | |
| 2 | | Santander Drive Auto Receivables Trust 2018-4 | | 3.980% | | 12/15/25 | | | 780 | | | | 800 | |
| 2 | | Santander Drive Auto Receivables Trust 2018-5 | | 4.190% | | 12/16/24 | | | 1,250 | | | | 1,284 | |
| 2,5 | | Santander Retail Auto Lease Trust 2017-A | | 2.680% | | 1/20/22 | | | 140 | | | | 140 | |
| 2,5 | | Santander Retail Auto Lease Trust 2018-A | | 2.930% | | 5/20/21 | | | 404 | | | | 405 | |
| 2,5 | | Santander Retail Auto Lease Trust 2018-A | | 3.060% | | 4/20/22 | | | 310 | | | | 312 | |
| 2,5 | | Santander Retail Auto Lease Trust 2018-A | | 3.200% | | 4/20/22 | | | 270 | | | | 272 | |
| 2,5 | | Santander Retail Auto Lease Trust 2018-A | | 3.490% | | 5/20/22 | | | 620 | | | | 625 | |
| 2,5 | | Santander Retail Auto Lease Trust 2019-A | | 2.770% | | 6/20/22 | | | 1,860 | | | | 1,882 | |
| 5 | | SBA Tower Trust | | 3.156% | | 10/8/20 | | | 270 | | | | 270 | |
| 2,5 | | Securitized Term Auto Receivables Trust 2018-1A | | 3.298% | | 11/25/22 | | | 160 | | | | 163 | |
| 2,5 | | Securitized Term Auto Receivables Trust 2018-2A | | 3.544% | | 6/26/23 | | | 230 | | | | 236 | |
| 2,5 | | SLM Private Education Loan Trust 2011-C | | 4.540% | | 10/17/44 | | | 26 | | | | 26 | |
| 2,5 | | SLM Private Education Loan Trust 2013-B | | 3.000% | | 5/16/44 | | | 226 | | | | 226 | |
| 2,5 | | SLM Private Education Loan Trust 2014-A | | 3.500% | | 11/15/44 | | | 100 | | | | 101 | |
| 2 | | SMART ABS Series 2016-2US Trust | | 2.050% | | 12/14/22 | | | 110 | | | | 110 | |
| 2,5 | | SMB Private Education Loan Trust 2016-A | | 2.700% | | 5/15/31 | | | 208 | | | | 210 | |
| 2,4,5 | | SMB Private Education Loan Trust 2016-B, 1M USD LIBOR + 1.450% | | 3.190% | | 2/17/32 | | | 193 | | | | 195 | |
| 2,4,5 | | SMB Private Education Loan Trust 2016-C, 1M USD LIBOR + 1.100% | | 2.840% | | 9/15/34 | | | 211 | | | | 213 | |
| 2,4,5 | | SMB Private Education Loan Trust 2017-A, 1M USD LIBOR + 0.900% | | 2.640% | | 9/15/34 | | | 235 | | | | 235 | |
| 2,5 | | SMB Private Education Loan Trust 2017-B | | 2.820% | | 10/15/35 | | | 435 | | | | 440 | |
| 2,5 | | SMB Private Education Loan Trust 2018-A | | 3.500% | | 2/15/36 | | | 1,450 | | | | 1,512 | |
| 2,5 | | SMB Private Education Loan Trust 2018-B | | 3.600% | | 1/15/37 | | | 770 | | | | 796 | |
| 2,5 | | SMB Private Education Loan Trust 2018-C | | 3.630% | | 11/15/35 | | | 1,010 | | | | 1,044 | |
| 2,5 | | SoFi Professional Loan Program 2016-B LLC | | 2.740% | | 10/25/32 | | | 124 | | | | 125 | |
Short-Term Investment-Grade Portfolio
| | | | | | | | | Face | | | Market | |
| | | | | | | Maturity | | Amount | | | Value• | |
| | | | | Coupon | | Date | | ($000 | ) | | ($000 | ) |
| 2,5 | | SoFi Professional Loan Program 2016-C LLC | | 2.360% | | 12/27/32 | | | 150 | | | | 150 | |
| 2,5 | | SoFi Professional Loan Program 2016-D LLC | | 2.340% | | 4/25/33 | | | 105 | | | | 105 | |
| 2,4,5 | | SoFi Professional Loan Program 2016-D LLC, 1M USD LIBOR + 0.950% | | 2.742% | | 1/25/39 | | | 39 | | | | 39 | |
| 2,5 | | SoFi Professional Loan Program 2017-A LLC | | 2.400% | | 3/26/40 | | | 42 | | | | 42 | |
| 2,5 | | SoFi Professional Loan Program 2017-B LLC | | 2.740% | | 5/25/40 | | | 290 | | | | 294 | |
| 2,4,5 | | SoFi Professional Loan Program 2017-C LLC, 1M USD LIBOR + 0.600% | | 2.392% | | 7/25/40 | | | 23 | | | | 23 | |
| 2,5 | | SoFi Professional Loan Program 2017-D LLC | | 2.650% | | 9/25/40 | | | 184 | | | | 185 | |
| 2,5 | | SoFi Professional Loan Program 2017-E LLC | | 2.720% | | 11/26/40 | | | 250 | | | | 252 | |
| 2,5 | | SoFi Professional Loan Program 2017-F LLC | | 2.840% | | 1/25/41 | | | 310 | | | | 313 | |
| 2,5 | | SoFi Professional Loan Program 2018-A LLC | | 2.390% | | 2/25/42 | | | 296 | | | | 296 | |
| 2,5 | | SoFi Professional Loan Program 2018-A LLC | | 2.950% | | 2/25/42 | | | 390 | | | | 394 | |
| 2,5 | | SoFi Professional Loan Program 2018-B LLC | | 3.340% | | 8/25/47 | | | 780 | | | | 795 | |
| 2,5 | | SoFi Professional Loan Program 2018-C LLC | | 3.590% | | 1/25/48 | | | 1,600 | | | | 1,648 | |
| 2,5 | | SoFi Professional Loan Program 2018-D LLC | | 3.600% | | 2/25/48 | | | 1,150 | | | | 1,188 | |
| 2,5 | | SoFi Professional Loan Program 2019-B LLC | | 3.090% | | 8/17/48 | | | 520 | | | | 525 | |
| 2,5 | | Stack Infrastructure Issuer LLC 2019-1A | | 4.540% | | 2/25/44 | | | 431 | | | | 451 | |
| 2 | | Synchrony Card Issuance Trust 2018-A1 | | 3.380% | | 9/15/24 | | | 980 | | | | 1,002 | |
| 2 | | Synchrony Card Issuance Trust 2019-2A | | 2.340% | | 6/15/25 | | | 1,600 | | | | 1,614 | |
| 2 | | Synchrony Credit Card Master Note Trust 2016-2 | | 2.950% | | 5/15/24 | | | 280 | | | | 281 | |
| 2 | | Synchrony Credit Card Master Note Trust 2017-2 | | 2.620% | | 10/15/25 | | | 1,945 | | | | 1,975 | |
| 2 | | Synchrony Credit Card Master Note Trust 2017-2 | | 2.820% | | 10/15/25 | | | 290 | | | | 293 | |
| 2 | | Synchrony Credit Card Master Note Trust 2017-2 | | 3.010% | | 10/15/25 | | | 380 | | | | 384 | |
| 2,5 | | Taco Bell Funding LLC 2016-1A | | 4.377% | | 5/25/46 | | | 205 | | | | 206 | |
| 2,5 | | Taco Bell Funding LLC 2016-1A | | 4.970% | | 5/25/46 | | | 88 | | | | 92 | |
| 2,5 | | Taco Bell Funding LLC 2018-1 | | 4.940% | | 11/25/48 | | | 148 | | | | 160 | |
| 2,5 | | Tesla Auto Lease Trust 2018-A | | 2.160% | | 10/20/22 | | | 1,400 | | | | 1,399 | |
| 2,5 | | Tesla Auto Lease Trust 2018-A | | 2.200% | | 11/21/22 | | | 400 | | | | 400 | |
| 2,5 | | Tesla Auto Lease Trust 2018-B | | 3.710% | | 8/20/21 | | | 2,807 | | | | 2,846 | |
| 2,5 | | Tesla Auto Lease Trust 2018-B | | 4.120% | | 10/20/21 | | | 360 | | | | 367 | |
| 2,5 | | Tesla Auto Lease Trust 2018-B | | 4.360% | | 10/20/21 | | | 230 | | | | 236 | |
| 2,5 | | Textainer Marine Containers Limited 2019-A | | 3.960% | | 4/20/44 | | | 350 | | | | 353 | |
| 2,5 | | Tidewater Auto Receivables Trust 2018-AA | | 3.120% | | 7/15/22 | | | 119 | | | | 120 | |
| 2,5 | | Tidewater Auto Receivables Trust 2018-AA | | 3.450% | | 11/15/24 | | | 130 | | | | 131 | |
| 2,5 | | Tidewater Auto Receivables Trust 2018-AA | | 3.840% | | 11/15/24 | | | 140 | | | | 142 | |
| 2,5 | | Tidewater Auto Receivables Trust 2018-AA | | 4.300% | | 11/15/24 | | | 100 | | | | 103 | |
| 2,5 | | TMSQ 2014-1500 Mortgage Trust | | 3.680% | | 10/10/36 | | | 640 | | | | 670 | |
| 2 | | Toyota Auto Receivables 2017-D Owner Trust | | 2.120% | | 2/15/23 | | | 70 | | | | 70 | |
| 2 | | Toyota Auto Receivables 2018-A Owner Trust | | 2.350% | | 5/16/22 | | | 1,304 | | | | 1,308 | |
| 2 | | Toyota Auto Receivables 2018-A Owner Trust | | 2.520% | | 5/15/23 | | | 190 | | | | 192 | |
| 2 | | Toyota Auto Receivables 2018-B Owner Trust | | 3.110% | | 11/15/23 | | | 360 | | | | 367 | |
| 2 | | Toyota Auto Receivables 2018-C Owner Trust | | 3.020% | | 12/15/22 | | | 840 | | | | 853 | |
| 2 | | Toyota Auto Receivables 2018-C Owner Trust | | 3.130% | | 2/15/24 | | | 360 | | | | 370 | |
| 2 | | Toyota Auto Receivables 2019-A Owner Trust | | 3.000% | | 5/15/24 | | | 190 | | | | 195 | |
| 2 | | Toyota Auto Receivables 2019-C Owner Trust | | 1.910% | | 9/15/23 | | | 1,540 | | | | 1,539 | |
| 2 | | Toyota Auto Receivables 2019-D Owner Trust | | 1.990% | | 2/18/25 | | | 300 | | | | 300 | |
| 2,5 | | Trafigura Securitisation Finance plc 2017-1A | | 2.470% | | 12/15/20 | | | 1,050 | | | | 1,050 | |
| 2,5 | | Trafigura Securitisation Finance plc 2018-1A | | 3.730% | | 3/15/22 | | | 1,500 | | | | 1,530 | |
| 2,5 | | Trillium Credit Card Trust II 2019-2A | | 3.038% | | 1/26/24 | | | 1,550 | | | | 1,567 | |
| 2,5 | | Trinity Rail Leasing LP 2018-1A | | 4.620% | | 6/17/48 | | | 740 | | | | 785 | |
| 2,5 | | Trip Rail Master Funding LLC 2017-1A | | 2.709% | | 8/15/47 | | | 62 | | | | 62 | |
| 2,5 | | Triton Container Finance LLC 2018-A2 | | 4.190% | | 6/22/43 | | | 969 | | | | 985 | |
| 2 | | UBS Commercial Mortgage Trust 2012-C1 | | 4.171% | | 5/10/45 | | | 30 | | | | 31 | |
| 2 | | UBS Commercial Mortgage Trust 2017-C7 | | 3.679% | | 12/15/50 | | | 280 | | | | 300 | |
| 2 | | UBS Commercial Mortgage Trust 2019-C16 | | 3.460% | | 4/15/52 | | | 167 | | | | 176 | |
| 2,5 | | UBS-BAMLL Trust 2012-WRM | | 3.663% | | 6/10/30 | | | 606 | | | | 621 | |
| 2 | | UBS-Barclays Commercial Mortgage Trust 2012-C4 | | 2.850% | | 12/10/45 | | | 223 | | | | 226 | |
| 2 | | UBS-Barclays Commercial Mortgage Trust 2013-C6 | | 3.244% | | 4/10/46 | | | 150 | | | | 154 | |
| 2 | | UBS-Barclays Commercial Mortgage Trust 2013-C6 | | 3.469% | | 4/10/46 | | | 50 | | | | 52 | |
| 2 | | UBS-Barclays Commercial Mortgage Trust 2019-C18 | | 3.035% | | 12/15/52 | | | 300 | | | | 307 | |
| 2 | | USAA Auto Owner Trust 2019-1 | | 2.160% | | 7/17/23 | | | 450 | | | | 452 | |
| 2,5 | | Vantage Data Centers LLC 2018-1A | | 4.072% | | 2/16/43 | | | 393 | | | | 409 | |
| 2,5 | | Vantage Data Centers LLC 2019-1A | | 3.188% | | 7/15/44 | | | 199 | | | | 200 | |
| 2,5 | | Verizon Owner Trust 2017-3 | | 2.380% | | 4/20/22 | | | 430 | | | | 431 | |
| 2,5 | | Verizon Owner Trust 2017-3 | | 2.530% | | 4/20/22 | | | 490 | | | | 491 | |
| 2,5 | | Verizon Owner Trust 2018-1 | | 2.820% | | 9/20/22 | | | 423 | | | | 425 | |
| 2,5 | | Verizon Owner Trust 2018-1 | | 3.050% | | 9/20/22 | | | 670 | | | | 676 | |
| 2 | | Verizon Owner Trust 2018-A | | 3.230% | | 4/20/23 | | | 500 | | | | 508 | |
| 2 | | Verizon Owner Trust 2019-A | | 2.930% | | 9/20/23 | | | 610 | | | | 618 | |
| 2 | | Verizon Owner Trust 2019-A | | 1.940% | | 4/22/24 | | | 1,580 | | | | 1,578 | |
| 2,5 | | VNDO 2012-6AVE Mortgage Trust | | 2.996% | | 11/15/30 | | | 297 | | | | 302 | |
| 2,5 | | VNDO 2013-PENN Mortgage Trust | | 3.808% | | 12/13/29 | | | 270 | | | | 273 | |
| 2,5 | | VNDO 2013-PENN Mortgage Trust | | 3.947% | | 12/13/29 | | | 80 | | | | 81 | |
| 2,5 | | VNDO 2013-PENN Mortgage Trust | | 3.947% | | 12/13/29 | | | 60 | | | | 61 | |
| 2 | | Volkswagen Auto Loan Enhanced Trust 2018-1 | | 3.020% | | 11/21/22 | | | 530 | | | | 536 | |
| 2 | | Volkswagen Auto Loan Enhanced Trust 2018-1 | | 3.150% | | 7/22/24 | | | 220 | | | | 225 | |
| 2 | | Volkswagen Auto Loan Enhanced Trust 2018-2 | | 3.330% | | 2/20/25 | | | 220 | | | | 227 | |
| 2 | | WaMu Mortgage Pass-Through Certificates Series 2002-AR18 Trust | | 4.100% | | 1/25/33 | | | 6 | | | | 6 | |
| 2 | | WaMu Mortgage Pass-Through Certificates Series 2003-AR7 Trust | | 4.434% | | 8/25/33 | | | 6 | | | | 6 | |
| 2 | | WaMu Mortgage Pass-Through Certificates Series 2003-AR9 Trust | | 4.322% | | 9/25/33 | | | 9 | | | | 9 | |
| 2 | | Wells Fargo Commercial Mortgage Trust 2012-LC5 | | 2.918% | | 10/15/45 | | | 675 | | | | 687 | |
| 2 | | Wells Fargo Commercial Mortgage Trust 2012-LC5 | | 3.539% | | 10/15/45 | | | 40 | | | | 41 | |
| 2 | | Wells Fargo Commercial Mortgage Trust 2013-LC12 | | 3.928% | | 7/15/46 | | | 143 | | | | 147 | |
| 2 | | Wells Fargo Commercial Mortgage Trust 2013-LC12 | | 4.218% | | 7/15/46 | | | 777 | | | | 824 | |
| 2 | | Wells Fargo Commercial Mortgage Trust 2013-LC12 | | 4.284% | | 7/15/46 | | | 110 | | | | 116 | |
| 2 | | Wells Fargo Commercial Mortgage Trust 2014-LC16 | | 3.817% | | 8/15/50 | | | 1,420 | | | | 1,505 | |
| 2 | | Wells Fargo Commercial Mortgage Trust 2014-LC16 | | 4.020% | | 8/15/50 | | | 200 | | | | 210 | |
Short-Term Investment-Grade Portfolio
| | | | | | | | | Face | | | Market | |
| | | | | | | Maturity | | Amount | | | Value• | |
| | | | | Coupon | | Date | | ($000 | ) | | ($000 | ) |
| 2 | | Wells Fargo Commercial Mortgage Trust 2014-LC16 | | 4.322% | | 8/15/50 | | | 350 | | | | 367 | |
| 2 | | Wells Fargo Commercial Mortgage Trust 2014-LC16 | | 4.458% | | 8/15/50 | | | 220 | | | | 223 | |
| 2 | | Wells Fargo Commercial Mortgage Trust 2014-LC18 | | 3.405% | | 12/15/47 | | | 870 | | | | 911 | |
| 2 | | Wells Fargo Commercial Mortgage Trust 2015-C26 | | 3.166% | | 2/15/48 | | | 675 | | | | 700 | |
| 2 | | Wells Fargo Commercial Mortgage Trust 2015-C27 | | 3.190% | | 2/15/48 | | | 666 | | | | 687 | |
| 2 | | Wells Fargo Commercial Mortgage Trust 2015-C27 | | 3.451% | | 2/15/48 | | | 1,990 | | | | 2,091 | |
| 2 | | Wells Fargo Commercial Mortgage Trust 2015-C29 | | 3.637% | | 6/15/48 | | | 1,445 | | | | 1,534 | |
| 2 | | Wells Fargo Commercial Mortgage Trust 2015-C29 | | 4.222% | | 6/15/48 | | | 270 | | | | 282 | |
| 2 | | Wells Fargo Commercial Mortgage Trust 2015-C30 | | 3.411% | | 9/15/58 | | | 484 | | | | 507 | |
| 2 | | Wells Fargo Commercial Mortgage Trust 2015-C30 | | 3.664% | | 9/15/58 | | | 420 | | | | 447 | |
| 2 | | Wells Fargo Commercial Mortgage Trust 2015-C30 | | 4.067% | | 9/15/58 | | | 350 | | | | 373 | |
| 2 | | Wells Fargo Commercial Mortgage Trust 2015-C30 | | 4.497% | | 9/15/58 | | | 270 | | | | 283 | |
| 2 | | Wells Fargo Commercial Mortgage Trust 2015-LC22 | | 3.839% | | 9/15/58 | | | 899 | | | | 965 | |
| 2 | | Wells Fargo Commercial Mortgage Trust 2015-LC22 | | 4.207% | | 9/15/58 | | | 275 | | | | 295 | |
| 2 | | Wells Fargo Commercial Mortgage Trust 2015-LC22 | | 4.534% | | 9/15/58 | | | 315 | | | | 333 | |
| 2 | | Wells Fargo Commercial Mortgage Trust 2015-SG1 | | 3.789% | | 9/15/48 | | | 897 | | | | 957 | |
| 2 | | Wells Fargo Commercial Mortgage Trust 2016-BNK1 | | 2.652% | | 8/15/49 | | | 920 | | | | 927 | |
| 2 | | Wells Fargo Commercial Mortgage Trust 2016-C32 | | 3.560% | | 1/15/59 | | | 1,344 | | | | 1,424 | |
| 2 | | Wells Fargo Commercial Mortgage Trust 2016-C37 | | 3.525% | | 12/15/49 | | | 260 | | | | 273 | |
| 2 | | Wells Fargo Commercial Mortgage Trust 2016-C37 | | 3.794% | | 12/15/49 | | | 240 | | | | 259 | |
| 2 | | Wells Fargo Commercial Mortgage Trust 2017-C38 | | 3.453% | | 7/15/50 | | | 520 | | | | 551 | |
| 2 | | Wells Fargo Commercial Mortgage Trust 2017-C39 | | 3.157% | | 9/15/50 | | | 120 | | | | 124 | |
| 2 | | Wells Fargo Commercial Mortgage Trust 2017-C39 | | 3.418% | | 9/15/50 | | | 1,650 | | | | 1,743 | |
| 2 | | Wells Fargo Commercial Mortgage Trust 2017-C40 | | 3.581% | | 10/15/50 | | | 1,150 | | | | 1,228 | |
| 2 | | Wells Fargo Commercial Mortgage Trust 2017-C41 | | 3.472% | | 11/15/50 | | | 790 | | | | 837 | |
| 2 | | Wells Fargo Commercial Mortgage Trust 2017-C42 | | 3.589% | | 12/15/50 | | | 375 | | | | 400 | |
| 2 | | Wells Fargo Commercial Mortgage Trust 2017-RC1 | | 3.631% | | 1/15/60 | | | 194 | | | | 207 | |
| 2 | | Wells Fargo Commercial Mortgage Trust 2018-C43 | | 4.012% | | 3/15/51 | | | 710 | | | | 779 | |
| 2 | | Wells Fargo Commercial Mortgage Trust 2018-C43 | | 4.514% | | 3/15/51 | | | 80 | | | | 83 | |
| 2 | | Wells Fargo Commercial Mortgage Trust 2018-C46 | | 4.152% | | 8/15/51 | | | 290 | | | | 322 | |
| 2 | | Wells Fargo Commercial Mortgage Trust 2018-C47 | | 4.365% | | 9/15/61 | | | 1,160 | | | | 1,284 | |
| 2 | | Wells Fargo Commercial Mortgage Trust 2018-C48 | | 4.245% | | 1/15/52 | | | 670 | | | | 737 | |
| 2 | | Wells Fargo Commercial Mortgage Trust 2019-C49 | | 3.933% | | 3/15/52 | | | 210 | | | | 228 | |
| 2 | | Wells Fargo Commercial Mortgage Trust 2019-C49 | | 4.023% | | 3/15/52 | | | 210 | | | | 232 | |
| 2 | | Wells Fargo Commercial Mortgage Trust 2019-C50 | | 3.635% | | 5/15/52 | | | 230 | | | | 246 | |
| 2 | | Wells Fargo Commercial Mortgage Trust 2019-C52 | | 2.892% | | 8/15/52 | | | 440 | | | | 447 | |
| 2 | | Wells Fargo Commercial Mortgage Trust 2019-C54 | | 3.146% | | 12/15/52 | | | 560 | | | | 580 | |
| 2 | | Wells Fargo Mortgage Backed Securities 2006-AR14 Trust | | 4.556% | | 10/25/36 | | | 110 | | | | 107 | |
| 2,5 | | Wendys Funding LLC 2015-1A | | 4.497% | | 6/15/45 | | | 144 | | | | 146 | |
| 2,5 | | Wendys Funding LLC 2018-1 | | 3.573% | | 3/15/48 | | | 157 | | | | 157 | |
| 2,5 | | WFLD 2014-MONT Mortgage Trust | | 3.755% | | 8/10/31 | | | 875 | | | | 919 | |
| 2,5 | | WFRBS Commercial Mortgage Trust 2011-C3 | | 4.375% | | 3/15/44 | | | 274 | | | | 279 | |
| 2 | | WFRBS Commercial Mortgage Trust 2012-C10 | | 2.875% | | 12/15/45 | | | 265 | | | | 269 | |
| 2 | | WFRBS Commercial Mortgage Trust 2012-C7 | | 3.431% | | 6/15/45 | | | 274 | | | | 281 | |
| 2 | | WFRBS Commercial Mortgage Trust 2012-C7 | | 4.090% | | 6/15/45 | | | 135 | | | | 140 | |
| 2 | | WFRBS Commercial Mortgage Trust 2012-C8 | | 3.001% | | 8/15/45 | | | 102 | | | | 104 | |
| 2 | | WFRBS Commercial Mortgage Trust 2012-C9 | | 2.870% | | 11/15/45 | | | 512 | | | | 520 | |
| 2 | | WFRBS Commercial Mortgage Trust 2012-C9 | | 3.388% | | 11/15/45 | | | 70 | | | | 72 | |
| 2 | | WFRBS Commercial Mortgage Trust 2013-C13 | | 3.345% | | 5/15/45 | | | 50 | | | | 51 | |
| 2 | | WFRBS Commercial Mortgage Trust 2013-C15 | | 3.720% | | 8/15/46 | | | 372 | | | | 382 | |
| 2 | | WFRBS Commercial Mortgage Trust 2013-C15 | | 4.153% | | 8/15/46 | | | 355 | | | | 376 | |
| 2 | | WFRBS Commercial Mortgage Trust 2013-C16 | | 4.415% | | 9/15/46 | | | 350 | | | | 375 | |
| 2 | | WFRBS Commercial Mortgage Trust 2013-C17 | | 3.558% | | 12/15/46 | | | 67 | | | | 69 | |
| 2 | | WFRBS Commercial Mortgage Trust 2013-C17 | | 4.023% | | 12/15/46 | | | 230 | | | | 244 | |
| 2 | | WFRBS Commercial Mortgage Trust 2013-C18 | | 3.676% | | 12/15/46 | | | 131 | | | | 134 | |
| 2 | | WFRBS Commercial Mortgage Trust 2013-C18 | | 4.162% | | 12/15/46 | | | 665 | | | | 710 | |
| 2 | | WFRBS Commercial Mortgage Trust 2013-C18 | | 4.692% | | 12/15/46 | | | 140 | | | | 151 | |
| 2 | | WFRBS Commercial Mortgage Trust 2014-C19 | | 3.829% | | 3/15/47 | | | 780 | | | | 820 | |
| 2 | | WFRBS Commercial Mortgage Trust 2014-C19 | | 4.101% | | 3/15/47 | | | 530 | | | | 567 | |
| 2 | | WFRBS Commercial Mortgage Trust 2014-C20 | | 3.995% | | 5/15/47 | | | 965 | | | | 1,028 | |
| 2 | | WFRBS Commercial Mortgage Trust 2014-C20 | | 4.378% | | 5/15/47 | | | 280 | | | | 293 | |
| 2 | | WFRBS Commercial Mortgage Trust 2014-C20 | | 4.513% | | 5/15/47 | | | 90 | | | | 91 | |
| 2 | | WFRBS Commercial Mortgage Trust 2014-C21 | | 3.410% | | 8/15/47 | | | 31 | | | | 32 | |
| 2 | | WFRBS Commercial Mortgage Trust 2014-C21 | | 3.678% | | 8/15/47 | | | 989 | | | | 1,044 | |
| 2 | | WFRBS Commercial Mortgage Trust 2014-C21 | | 3.891% | | 8/15/47 | | | 170 | | | | 179 | |
| 2 | | WFRBS Commercial Mortgage Trust 2014-C21 | | 4.234% | | 8/15/47 | | | 300 | | | | 304 | |
| 2 | | WFRBS Commercial Mortgage Trust 2014-C23 | | 3.650% | | 10/15/57 | | | 531 | | | | 558 | |
| 2 | | WFRBS Commercial Mortgage Trust 2014-C23 | | 3.917% | | 10/15/57 | | | 340 | | | | 363 | |
| 2 | | WFRBS Commercial Mortgage Trust 2014-C24 | | 3.607% | | 11/15/47 | | | 542 | | | | 572 | |
| 2 | | WFRBS Commercial Mortgage Trust 2014-LC14 | | 3.766% | | 3/15/47 | | | 60 | | | | 63 | |
| 2 | | WFRBS Commercial Mortgage Trust 2014-LC14 | | 4.045% | | 3/15/47 | | | 1,203 | | | | 1,280 | |
| 2 | | World Omni Auto Receivables Trust 2018-A | | 2.730% | | 2/15/24 | | | 410 | | | | 415 | |
Short-Term Investment-Grade Portfolio
| | | | | | | | | Face | | | Market | |
| | | | | | | Maturity | | Amount | | | Value• | |
| | | | | Coupon | | Date | | ($000 | ) | | ($000 | ) |
| 2 | | World Omni Auto Receivables Trust 2018-A | | 2.890% | | 4/15/25 | | | 220 | | | | 223 | |
| 2 | | World Omni Auto Receivables Trust 2018-D | | 3.440% | | 12/16/24 | | | 130 | | | | 135 | |
| 2 | | World Omni Auto Receivables Trust 2019-A | | 3.220% | | 6/16/25 | | | 230 | | | | 237 | |
| 2 | | World Omni Auto Receivables Trust 2019-B | | 2.860% | | 6/16/25 | | | 170 | | | | 173 | |
| 2 | | World Omni Automobile Lease Securitization Trust 2018-B | | 3.190% | | 12/15/21 | | | 690 | | | | 698 | |
| 2 | | World Omni Automobile Lease Securitization Trust 2019-B | | 2.030% | | 11/15/22 | | | 1,250 | | | | 1,249 | |
| 2 | | World Omni Automobile Lease Securitization Trust 2019-B | | 3.240% | | 7/15/24 | | | 150 | | | | 153 | |
| 2,5 | | World Omni Select Auto Trust A Series 2018-1 A3 | | 3.460% | | 3/15/23 | | | 410 | | | | 413 | |
| Total Asset-Backed/Commercial Mortgage-Backed Securities (Cost $402,808) | | | | | | | 411,673 | |
| Corporate Bonds (61.7%) | | | | | | | | | | | | |
| Finance (26.3%) | | | | | | | | | | | | |
| | | Banking (23.0%) | | | | | | | | | | | | |
| 6 | | ABN AMRO Bank NV | | 6.375% | | 4/27/21 | | | 450 | | | | 547 | |
| 5 | | ABN AMRO Bank NV | | 3.400% | | 8/27/21 | | | 1,600 | | | | 1,634 | |
| | | Ally Financial Inc. | | 4.125% | | 3/30/20 | | | 30 | | | | 30 | |
| | | Ally Financial Inc. | | 4.125% | | 2/13/22 | | | 100 | | | | 103 | |
| | | Ally Financial Inc. | | 3.875% | | 5/21/24 | | | 140 | | | | 146 | |
| | | Ally Financial Inc. | | 5.750% | | 11/20/25 | | | 150 | | | | 168 | |
| | | American Express Co. | | 3.700% | | 11/5/21 | | | 2,050 | | | | 2,111 | |
| | | American Express Co. | | 2.750% | | 5/20/22 | | | 808 | | | | 821 | |
| | | American Express Co. | | 3.700% | | 8/3/23 | | | 3,342 | | | | 3,517 | |
| | | American Express Co. | | 2.500% | | 7/30/24 | | | 1,130 | | | | 1,142 | |
| | | American Express Credit Corp. | | 2.250% | | 5/5/21 | | | 218 | | | | 219 | |
| 5 | | ANZ New Zealand International Ltd. | | 2.200% | | 7/17/20 | | | 725 | | | | 726 | |
| | | Australia & New Zealand Banking Group Ltd. | | 2.625% | | 11/9/22 | | | 1,085 | | | | 1,104 | |
| 4,7 | | Australia & New Zealand Banking Group Ltd., 3M Australian Bank Bill Rate +2.700% | | 3.602% | | 5/17/26 | | | 250 | | | | 179 | |
| 5 | | Banco Santander Chile | | 2.500% | | 12/15/20 | | | 2,060 | | | | 2,061 | |
| | | Banco Santander SA | | 3.125% | | 2/23/23 | | | 200 | | | | 204 | |
| | | Banco Santander SA | | 2.706% | | 6/27/24 | | | 1,600 | | | | 1,621 | |
| | | Bank of America Corp. | | 2.625% | | 10/19/20 | | | 1,082 | | | | 1,087 | |
| | | Bank of America Corp. | | 2.625% | | 4/19/21 | | | 2,700 | | | | 2,724 | |
| 2 | | Bank of America Corp. | | 2.369% | | 7/21/21 | | | 5,225 | | | | 5,236 | |
| 2 | | Bank of America Corp. | | 2.328% | | 10/1/21 | | | 4,595 | | | | 4,601 | |
| 2 | | Bank of America Corp. | | 2.738% | | 1/23/22 | | | 1,000 | | | | 1,007 | |
| 2,6 | | Bank of America Corp. | | 0.736% | | 2/7/22 | | | 450 | | | | 509 | |
| 2 | | Bank of America Corp. | | 3.124% | | 1/20/23 | | | 1,035 | | | | 1,053 | |
| 2 | | Bank of America Corp. | | 2.816% | | 7/21/23 | | | 500 | | | | 507 | |
| | | Bank of America Corp. | | 3.004% | | 12/20/23 | | | 4,148 | | | | 4,239 | |
| | | Bank of America Corp. | | 4.125% | | 1/22/24 | | | 1,475 | | | | 1,587 | |
| 2 | | Bank of America Corp. | | 3.550% | | 3/5/24 | | | 3,189 | | | | 3,299 | |
| 2 | | Bank of America Corp. | | 3.864% | | 7/23/24 | | | 500 | | | | 526 | |
| 2 | | Bank of America Corp. | | 2.456% | | 10/22/25 | | | 750 | | | | 752 | |
| | | Bank of Montreal | | 2.900% | | 3/26/22 | | | 1,940 | | | | 1,975 | |
| | | Bank of Montreal | | 3.300% | | 2/5/24 | | | 2,650 | | | | 2,759 | |
| 2 | | Bank of Montreal | | 4.338% | | 10/5/28 | | | 375 | | | | 396 | |
| | | Bank of New York Mellon Corp. | | 2.050% | | 5/3/21 | | | 334 | | | | 335 | |
| | | Bank of New York Mellon Corp. | | 2.950% | | 1/29/23 | | | 136 | | | | 140 | |
| 2 | | Bank of New York Mellon Corp. | | 2.661% | | 5/16/23 | | | 150 | | | | 152 | |
| | | Bank of New York Mellon Corp. | | 3.450% | | 8/11/23 | | | 830 | | | | 870 | |
| | | Bank of Nova Scotia | | 2.500% | | 1/8/21 | | | 945 | | | | 950 | |
| | | Bank of Nova Scotia | | 4.375% | | 1/13/21 | | | 290 | | | | 297 | |
| 6 | | Banque Federative du Credit Mutuel SA | | 0.125% | | 8/30/21 | | | 500 | | | | 563 | |
| 8 | | Banque Federative du Credit Mutuel SA | | 1.375% | | 12/20/21 | | | 500 | | | | 666 | |
| 5 | | Banque Federative du Credit Mutuel SA | | 2.700% | | 7/20/22 | | | 1,090 | | | | 1,106 | |
| 5 | | Banque Federative du Credit Mutuel SA | | 2.125% | | 11/21/22 | | | 1,250 | | | | 1,250 | |
| 5 | | Banque Federative du Credit Mutuel SA | | 3.750% | | 7/20/23 | | | 2,180 | | | | 2,287 | |
| 8 | | Barclays Bank plc | | 10.000% | | 5/21/21 | | | 1,417 | | | | 2,090 | |
| 2 | | Barclays plc | | 4.610% | | 2/15/23 | | | 350 | | | | 365 | |
| 2 | | Barclays plc | | 3.932% | | 5/7/25 | | | 625 | | | | 657 | |
| 2,5 | | BNP Paribas SA | | 2.819% | | 11/19/25 | | | 1,560 | | | | 1,571 | |
| 7 | | BPCE SA | | 3.500% | | 4/24/20 | | | 700 | | | | 494 | |
| | | BPCE SA | | 2.750% | | 12/2/21 | | | 575 | | | | 583 | |
| 4,7 | | BPCE SA, 3M Australian Bank Bill Rate +1.100% | | 1.985% | | 4/26/23 | | | 660 | | | | 465 | |
| 4,7 | | BPCE SA, 3M Australian Bank Bill Rate +1.300% | | 2.183% | | 4/24/20 | | | 430 | | | | 302 | |
| | | Canadian Imperial Bank of Commerce | | 2.550% | | 6/16/22 | | | 855 | | | | 865 | |
| 2 | | Canadian Imperial Bank of Commerce | | 2.606% | | 7/22/23 | | | 4,830 | | | | 4,874 | |
| | | Canadian Imperial Bank of Commerce | | 3.500% | | 9/13/23 | | | 4,435 | | | | 4,655 | |
| | | Canadian Imperial Bank of Commerce | | 3.100% | | 4/2/24 | | | 520 | | | | 535 | |
| | | Capital One Financial Corp. | | 3.050% | | 3/9/22 | | | 1,140 | | | | 1,163 | |
| | | Capital One NA | | 2.250% | | 9/13/21 | | | 450 | | | | 451 | |
| | | Citibank NA | | 2.850% | | 2/12/21 | | | 6,790 | | | | 6,845 | |
| 4,7 | | Citibank NA, 3M Australian Bank Bill Rate +0.750% | | 1.634% | | 5/20/22 | | | 500 | | | | 351 | |
| | | Citigroup Inc. | | 2.700% | | 3/30/21 | | | 325 | | | | 327 | |
| 6 | | Citigroup Inc. | | 0.500% | | 1/29/22 | | | 295 | | | | 335 | |
| | | Citigroup Inc. | | 2.750% | | 4/25/22 | | | 1,610 | | | | 1,636 | |
| 2 | | Citigroup Inc. | | 2.312% | | 11/4/22 | | | 1,150 | | | | 1,153 | |
| 2 | | Citigroup Inc. | | 2.876% | | 7/24/23 | | | 1,440 | | | | 1,464 | |
| 8 | | Citigroup Inc. | | 2.750% | | 1/24/24 | | | 270 | | | | 374 | |
| 2 | | Citigroup Inc. | | 4.044% | | 6/1/24 | | | 1,020 | | | | 1,080 | |
| 4,7 | | Citigroup Inc., 3M Australian Bank Bill Rate +1.550% | | 2.477% | | 5/4/21 | | | 1,137 | | | | 807 | |
| | | Citizens Bank NA | | 3.250% | | 2/14/22 | | | 1,125 | | | | 1,152 | |
| | | Comerica Inc. | | 3.700% | | 7/31/23 | | | 865 | | | | 908 | |
| | | Commonwealth Bank of Australia | | 2.300% | | 3/12/20 | | | 510 | | | | 510 | |
| 5 | | Commonwealth Bank of Australia | | 2.750% | | 3/10/22 | | | 1,485 | | | | 1,510 | |
| 5 | | Commonwealth Bank of Australia | | 2.500% | | 9/18/22 | | | 1,862 | | | | 1,894 | |
| 5 | | Commonwealth Bank of Australia | | 3.450% | | 3/16/23 | | | 1,554 | | | | 1,618 | |
| 5 | | Commonwealth Bank of Australia | | 3.350% | | 6/4/24 | | | 1,000 | | | | 1,045 | |
| 4,7 | | Commonwealth Bank of Australia, 3M Australian Bank Bill Rate +2.650% | | 3.536% | | 6/3/26 | | | 100 | | | | 72 | |
| | | Cooperatieve Rabobank UA | | 2.750% | | 1/10/23 | | | 800 | | | | 813 | |
| 5 | | Cooperatieve Rabobank UA | | 3.875% | | 9/26/23 | | | 1,750 | | | | 1,844 | |
| | | Cooperatieve Rabobank UA | | 4.625% | | 12/1/23 | | | 2,434 | | | | 2,639 | |
| 5 | | Cooperatieve Rabobank UA | | 2.625% | | 7/22/24 | | | 675 | | | | 682 | |
| 4,7 | | Cooperatieve Rabobank UA, 3M Australian Bank Bill Rate +2.500% | | 3.360% | | 7/2/25 | | | 892 | | | | 631 | |
| 7 | | Cooperatieve Rabobank UA | | 5.000% | | 7/2/25 | | | 300 | | | | 214 | |
| | | Credit Suisse AG | | 2.100% | | 11/12/21 | | | 2,700 | | | | 2,706 | |
| 2,5 | | Credit Suisse Group AG | | 4.207% | | 6/12/24 | | | 2,000 | | | | 2,109 | |
| | | Credit Suisse Group Funding Guernsey Ltd. | | 3.125% | | 12/10/20 | | | 2,410 | | | | 2,431 | |
| 6 | | Credit Suisse Group Funding Guernsey Ltd. | | 1.250% | | 4/14/22 | | | 295 | | | | 339 | |
| 5 | | Danske Bank A/S | | 2.750% | | 9/17/20 | | | 572 | | | | 574 | |
| 6 | | Danske Bank A/S | | 0.500% | | 5/6/21 | | | 991 | | | | 1,121 | |
| 5 | | Danske Bank A/S | | 2.000% | | 9/8/21 | | | 800 | | | | 795 | |
| 6 | | Danske Bank A/S | | 1.375% | | 5/24/22 | | | 295 | | | | 339 | |
| 2,5 | | Danske Bank A/S | | 3.001% | | 9/20/22 | | | 1,000 | | | | 1,009 | |
| 5 | | Danske Bank A/S | | 3.875% | | 9/12/23 | | | 1,000 | | | | 1,036 | |
| 5 | | DNB Bank ASA | | 2.150% | | 12/2/22 | | | 1,500 | | | | 1,503 | |
| | | Fifth Third Bancorp | | 3.650% | | 1/25/24 | | | 900 | | | | 947 | |
| | | Fifth Third Bank | | 2.250% | | 6/14/21 | | | 686 | | | | 689 | |
| | | Fifth Third Bank | | 2.875% | | 10/1/21 | | | 510 | | | | 518 | |
| | | First Republic Bank | | 2.500% | | 6/6/22 | | | 2,265 | | | | 2,286 | |
| | | Goldman Sachs Group Inc. | | 2.750% | | 9/15/20 | | | 1,490 | | | | 1,497 | |
| | | Goldman Sachs Group Inc. | | 2.600% | | 12/27/20 | | | 5,505 | | | | 5,515 | |
| | | Goldman Sachs Group Inc. | | 2.875% | | 2/25/21 | | | 8,333 | | | | 8,411 | |
| | | Goldman Sachs Group Inc. | | 2.625% | | 4/25/21 | | | 2,305 | | | | 2,321 | |
| | | Goldman Sachs Group Inc. | | 2.350% | | 11/15/21 | | | 1,375 | | | | 1,380 | |
| | | Goldman Sachs Group Inc. | | 5.750% | | 1/24/22 | | | 2,828 | | | | 3,026 | |
Short-Term Investment-Grade Portfolio
| | | | | | | | | Face | | | Market | |
| | | | | | | Maturity | | Amount | | | Value• | |
| | | | | Coupon | | Date | | ($000 | ) | | ($000 | ) |
| | | Goldman Sachs Group Inc. | | 3.000% | | 4/26/22 | | | 1,557 | | | | 1,577 | |
| 6 | | Goldman Sachs Group Inc. | | 1.375% | | 7/26/22 | | | 295 | | | | 343 | |
| 2 | | Goldman Sachs Group Inc. | | 2.876% | | 10/31/22 | | | 1,433 | | | | 1,450 | |
| 2 | | Goldman Sachs Group Inc. | | 2.908% | | 6/5/23 | | | 807 | | | | 820 | |
| 2 | | Goldman Sachs Group Inc. | | 2.905% | | 7/24/23 | | | 128 | | | | 130 | |
| | | Goldman Sachs Group Inc. | | 3.625% | | 2/20/24 | | | 1,820 | | | | 1,910 | |
| | | Goldman Sachs Group Inc. | | 4.000% | | 3/3/24 | | | 200 | | | | 212 | |
| | | Goldman Sachs Group Inc. | | 3.850% | | 7/8/24 | | | 600 | | | | 633 | |
| | | Goldman Sachs Group Inc. | | 3.500% | | 1/23/25 | | | 295 | | | | 310 | |
| 4,7 | | Goldman Sachs Group Inc., 3M Australian Bank Bill Rate +1.200% | | 2.080% | | 8/26/20 | | | 540 | | | | 380 | |
| 4,7 | | Goldman Sachs Group Inc., 3M Australian Bank Bill Rate +1.200% | | 2.102% | | 5/16/23 | | | 300 | | | | 211 | |
| 4,7 | | Goldman Sachs Group Inc., 3M Australian Bank Bill Rate +1.370% | | 2.261% | | 9/8/21 | | | 520 | | | | 368 | |
| | | HSBC Holdings plc | | 2.950% | | 5/25/21 | | | 3,665 | | | | 3,709 | |
| | | HSBC Holdings plc | | 2.650% | | 1/5/22 | | | 1,735 | | | | 1,754 | |
| | | HSBC Holdings plc | | 4.000% | | 3/30/22 | | | 300 | | | | 312 | |
| 2 | | HSBC Holdings plc | | 3.262% | | 3/13/23 | | | 1,605 | | | | 1,640 | |
| | | HSBC Holdings plc | | 3.600% | | 5/25/23 | | | 920 | | | | 957 | |
| 2 | | HSBC Holdings plc | | 3.033% | | 11/22/23 | | | 3,780 | | | | 3,857 | |
| 2 | | HSBC Holdings plc | | 3.950% | | 5/18/24 | | | 1,455 | | | | 1,526 | |
| 2 | | HSBC Holdings plc | | 3.803% | | 3/11/25 | | | 3,585 | | | | 3,762 | |
| 2 | | HSBC Holdings plc | | 2.633% | | 11/7/25 | | | 1,029 | | | | 1,027 | |
| | | Huntington National Bank | | 2.375% | | 3/10/20 | | | 525 | | | | 525 | |
| | | Huntington National Bank | | 2.875% | | 8/20/20 | | | 819 | | | | 823 | |
| | | Huntington National Bank | | 2.500% | | 8/7/22 | | | 1,460 | | | | 1,476 | |
| | | Huntington National Bank | | 3.550% | | 10/6/23 | | | 1,160 | | | | 1,214 | |
| 5 | | ING Bank NV | | 2.050% | | 8/15/21 | | | 500 | | | | 500 | |
| 5 | | Intesa Sanpaolo SPA | | 3.250% | | 9/23/24 | | | 2,000 | | | | 2,007 | |
| | | JPMorgan Chase & Co. | | 2.550% | | 10/29/20 | | | 1,957 | | | | 1,963 | |
| | | JPMorgan Chase & Co. | | 2.550% | | 3/1/21 | | | 3,291 | | | | 3,309 | |
| 6 | | JPMorgan Chase & Co. | | 2.625% | | 4/23/21 | | | 445 | | | | 518 | |
| | | JPMorgan Chase & Co. | | 2.295% | | 8/15/21 | | | 245 | | | | 245 | |
| | | JPMorgan Chase & Co. | | 4.500% | | 1/24/22 | | | 700 | | | | 734 | |
| 2 | | JPMorgan Chase & Co. | | 3.514% | | 6/18/22 | | | 3,475 | | | | 3,549 | |
| | | JPMorgan Chase & Co. | | 3.250% | | 9/23/22 | | | 1,215 | | | | 1,256 | |
| | | JPMorgan Chase & Co. | | 2.972% | | 1/15/23 | | | 3,391 | | | | 3,457 | |
| 2 | | JPMorgan Chase & Co. | | 3.207% | | 4/1/23 | | | 1,140 | | | | 1,165 | |
| 2 | | JPMorgan Chase & Co. | | 2.776% | | 4/25/23 | | | 2,965 | | | | 3,000 | |
| | | JPMorgan Chase & Co. | | 2.700% | | 5/18/23 | | | 947 | | | | 964 | |
| 2 | | JPMorgan Chase & Co. | | 3.559% | | 4/23/24 | | | 1,345 | | | | 1,402 | |
| 2 | | JPMorgan Chase & Co. | | 4.023% | | 12/5/24 | | | 1,490 | | | | 1,587 | |
| 2 | | JPMorgan Chase & Co. | | 2.301% | | 10/15/25 | | | 3,750 | | | | 3,745 | |
| 2 | | JPMorgan Chase Bank NA | | 3.086% | | 4/26/21 | | | 1,965 | | | | 1,972 | |
| | | KeyBank NA | | 2.500% | | 11/22/21 | | | 250 | | | | 253 | |
| | | KeyBank NA | | 2.300% | | 9/14/22 | | | 420 | | | | 424 | |
| 6 | | Leeds Building Society | | 2.625% | | 4/1/21 | | | 400 | | | | 464 | |
| 6 | | Lloyds Banking Group plc | | 0.750% | | 11/9/21 | | | 450 | | | | 512 | |
| | | Lloyds Banking Group plc | | 4.050% | | 8/16/23 | | | 1,450 | | | | 1,530 | |
| 2 | | Lloyds Banking Group plc | | 2.907% | | 11/7/23 | | | 2,800 | | | | 2,841 | |
| | | Macquarie Bank Ltd. | | 6.625% | | 4/7/21 | | | 170 | | | | 179 | |
| 7 | | Macquarie Bank Ltd. | | 1.750% | | 6/21/22 | | | 90 | | | | 63 | |
| 4,7 | | Macquarie Bank Ltd., 3M Australian Bank Bill Rate +0.750% | | 1.672% | | 6/21/22 | | | 1,200 | | | | 843 | |
| 7 | | Macquarie Group Ltd. | | 3.250% | | 12/15/22 | | | 400 | | | | 287 | |
| 2 | | Macquarie Group Ltd. | | 3.189% | | 11/28/23 | | | 960 | | | | 980 | |
| 2,5 | | Macquarie Group Ltd. | | 3.189% | | 11/28/23 | | | 275 | | | | 281 | |
| 4,7 | | Macquarie Group Ltd., 3M Australian Bank Bill Rate +1.150% | | 2.045% | | 12/15/22 | | | 1,150 | | | | 809 | |
| | | Manufacturers & Traders Trust Co. | | 2.500% | | 5/18/22 | | | 675 | | | | 683 | |
| 4 | | Manufacturers & Traders Trust Co., 3M USD LIBOR + 0.640% | | 2.547% | | 12/1/21 | | | 245 | | | | 245 | |
| | | Mitsubishi UFJ Financial Group Inc. | | 2.950% | | 3/1/21 | | | 983 | | | | 993 | |
| | | Mitsubishi UFJ Financial Group Inc. | | 3.535% | | 7/26/21 | | | 535 | | | | 547 | |
| | | Mitsubishi UFJ Financial Group Inc. | | 2.190% | | 9/13/21 | | | 470 | | | | 471 | |
| | | Mitsubishi UFJ Financial Group Inc. | | 3.218% | | 3/7/22 | | | 3,405 | | | | 3,484 | |
| | | Mitsubishi UFJ Financial Group Inc. | | 2.623% | | 7/18/22 | | | 2,210 | | | | 2,238 | |
| | | Mitsubishi UFJ Financial Group Inc. | | 2.665% | | 7/25/22 | | | 4,898 | | | | 4,968 | |
| | | Mitsubishi UFJ Financial Group Inc. | | 3.761% | | 7/26/23 | | | 3,990 | | | | 4,191 | |
| | | Mitsubishi UFJ Financial Group Inc. | | 2.527% | | 9/13/23 | | | 200 | | | | 201 | |
| | | Mitsubishi UFJ Financial Group Inc. | | 3.407% | | 3/7/24 | | | 2,965 | | | | 3,091 | |
| | | Mitsubishi UFJ Financial Group Inc. | | 2.801% | | 7/18/24 | | | 2,160 | | | | 2,199 | |
| 5 | | Mitsubishi UFJ Trust & Banking Corp. | | 2.650% | | 10/19/20 | | | 460 | | | | 462 | |
| 5 | | Mizuho Bank Ltd. | | 2.950% | | 10/17/22 | | | 480 | | | | 490 | |
| | | Mizuho Financial Group Inc. | | 2.273% | | 9/13/21 | | | 460 | | | | 461 | |
| | | Mizuho Financial Group Inc. | | 2.953% | | 2/28/22 | | | 715 | | | | 727 | |
| 2 | | Mizuho Financial Group Inc. | | 2.721% | | 7/16/23 | | | 2,000 | | | | 2,019 | |
| | | Morgan Stanley | | 2.650% | | 1/27/20 | | | 922 | | | | 922 | |
| | | Morgan Stanley | | 2.800% | | 6/16/20 | | | 1,244 | | | | 1,249 | |
| | | Morgan Stanley | | 2.500% | | 4/21/21 | | | 449 | | | | 451 | |
| | | Morgan Stanley | | 5.500% | | 7/28/21 | | | 800 | | | | 842 | |
| | | Morgan Stanley | | 2.625% | | 11/17/21 | | | 6,885 | | | | 6,962 | |
| | | Morgan Stanley | | 2.750% | | 5/19/22 | | | 2,910 | | | | 2,961 | |
| | | Morgan Stanley | | 3.125% | | 1/23/23 | | | 4,905 | | | | 5,038 | |
| | | Morgan Stanley | | 3.750% | | 2/25/23 | | | 575 | | | | 601 | |
| 2 | | Morgan Stanley | | 2.720% | | 7/22/25 | | | 870 | | | | 878 | |
| 5 | | MUFG Bank Ltd. | | 2.300% | | 3/5/20 | | | 1,840 | | | | 1,841 | |
| 5 | | MUFG Bank Ltd. | | 2.750% | | 9/14/20 | | | 2,357 | | | | 2,368 | |
| 5 | | MUFG Bank Ltd. | | 2.850% | | 9/8/21 | | | 700 | | | | 708 | |
| | | MUFG Union Bank NA | | 3.150% | | 4/1/22 | | | 3,350 | | | | 3,425 | |
| | | MUFG Union Bank NA | | 2.100% | | 12/9/22 | | | 1,000 | | | | 1,002 | |
| 5 | | National Bank of Canada | | 2.150% | | 10/7/22 | | | 1,500 | | | | 1,499 | |
| 2,5 | | Nationwide Building Society | | 3.766% | | 3/8/24 | | | 200 | | | | 206 | |
| | | PNC Bank NA | | 2.450% | | 11/5/20 | | | 439 | | | | 441 | |
| | | PNC Bank NA | | 2.550% | | 12/9/21 | | | 785 | | | | 792 | |
| | | PNC Bank NA | | 2.625% | | 2/17/22 | | | 4,309 | | | | 4,354 | |
| | | PNC Bank NA | | 2.700% | | 11/1/22 | | | 1,080 | | | | 1,090 | |
| 2 | | PNC Bank NA | | 2.028% | | 12/9/22 | | | 940 | | | | 941 | |
| | | PNC Bank NA | | 3.800% | | 7/25/23 | | | 500 | | | | 524 | |
| | | PNC Bank NA | | 3.300% | | 10/30/24 | | | 800 | | | | 832 | |
| | | PNC Financial Services Group Inc. | | 2.854% | | 11/9/22 | | | 493 | | | | 502 | |
| | | Regions Financial Corp. | | 2.750% | | 8/14/22 | | | 395 | | | | 402 | |
| | | Royal Bank of Canada | | 2.150% | | 10/26/20 | | | 1,202 | | | | 1,204 | |
| | | Royal Bank of Canada | | 3.700% | | 10/5/23 | | | 1,175 | | | | 1,239 | |
| | | Royal Bank of Canada | | 2.550% | | 7/16/24 | | | 2,914 | | | | 2,957 | |
| | | Royal Bank of Canada | | 2.250% | | 11/1/24 | | | 2,430 | | | | 2,441 | |
| | | Royal Bank of Scotland Group plc | | 3.875% | | 9/12/23 | | | 200 | | | | 209 | |
| 2 | | Royal Bank of Scotland Group plc | | 4.519% | | 6/25/24 | | | 300 | | | | 318 | |
| 2 | | Royal Bank of Scotland Group plc | | 4.269% | | 3/22/25 | | | 1,600 | | | | 1,697 | |
| | | Santander Holdings USA Inc. | | 3.700% | | 3/28/22 | | | 1,995 | | | | 2,049 | |
| | | Santander Holdings USA Inc. | | 3.400% | | 1/18/23 | | | 1,480 | | | | 1,517 | |
| | | Santander Holdings USA Inc. | | 3.500% | | 6/7/24 | | | 1,000 | | | | 1,028 | |
| 2 | | Santander UK Group Holdings plc | | 3.373% | | 1/5/24 | | | 2,017 | | | | 2,060 | |
| 2 | | Santander UK Group Holdings plc | | 4.796% | | 11/15/24 | | | 820 | | | | 884 | |
| | | Santander UK plc | | 3.750% | | 11/15/21 | | | 1,250 | | | | 1,288 | |
| 5 | | Santander UK plc | | 5.000% | | 11/7/23 | | | 350 | | | | 379 | |
| | | Santander UK plc | | 4.000% | | 3/13/24 | | | 940 | | | | 1,001 | |
| 2,6 | | Skandinaviska Enskilda Banken AB | | 2.500% | | 5/28/26 | | | 570 | | | | 658 | |
| | | State Street Corp. | | 3.700% | | 11/20/23 | | | 1,000 | | | | 1,063 | |
| 2 | | State Street Corp. | | 2.354% | | 11/1/25 | | | 1,330 | | | | 1,332 | |
| | | Sumitomo Mitsui Banking Corp. | | 2.450% | | 10/20/20 | | | 460 | | | | 461 | |
| | | Sumitomo Mitsui Financial Group Inc. | | 2.442% | | 10/19/21 | | | 2,969 | | | | 2,989 | |
| | | Sumitomo Mitsui Financial Group Inc. | | 2.784% | | 7/12/22 | | | 3,002 | | | | 3,053 | |
| | | Sumitomo Mitsui Financial Group Inc. | | 2.778% | | 10/18/22 | | | 1,380 | | | | 1,401 | |
| | | Sumitomo Mitsui Financial Group Inc. | | 3.102% | | 1/17/23 | | | 2,205 | | | | 2,255 | |
| | | Sumitomo Mitsui Financial Group Inc. | | 3.748% | | 7/19/23 | | | 2,320 | | | | 2,431 | |
| | | Sumitomo Mitsui Financial Group Inc. | | 3.936% | | 10/16/23 | | | 150 | | | | 159 | |
| | | Sumitomo Mitsui Financial Group Inc. | | 2.696% | | 7/16/24 | | | 4,310 | | | | 4,368 | |
| 4,7 | | Sumitomo Mitsui Financial Group Inc.,3M Australian Bank Bill Rate +1.270% | | 2.190% | | 3/29/22 | | | 1,227 | | | | 867 | |
| | | Svenska Handelsbanken AB | | 2.450% | | 3/30/21 | | | 1,300 | | | | 1,307 | |
| | | Svenska Handelsbanken AB | | 1.875% | | 9/7/21 | | | 855 | | | | 853 | |
| 6 | | Svenska Handelsbanken AB | | 4.375% | | 10/20/21 | | | 450 | | | | 546 | |
| 7 | | Svenska Handelsbanken AB | | 3.250% | | 9/27/23 | | | 390 | | | | 287 | |
| | | Svenska Handelsbanken AB | | 3.900% | | 11/20/23 | | | 1,225 | | | | 1,311 | |
| 8 | | Swedbank AB | | 1.250% | | 12/29/21 | | | 590 | | | | 781 | |
| 8 | | Swedbank AB | | 1.625% | | 12/28/22 | | | 1,120 | | | | 1,494 | |
| | | Synchrony Bank | | 3.000% | | 6/15/22 | | | 745 | | | | 759 | |
| | | Toronto-Dominion Bank | | 3.250% | | 6/11/21 | | | 7,415 | | | | 7,568 | |
| | | Toronto-Dominion Bank | | 3.500% | | 7/19/23 | | | 4,700 | | | | 4,948 | |
| 2 | | Truist Bank | | 2.590% | | 1/29/21 | | | 117 | | | | 117 | |
Short-Term Investment-Grade Portfolio
| | | | | | | | | Face | | | Market | |
| | | | | | | Maturity | | Amount | | | Value• | |
| | | | | Coupon | | Date | | ($000 | ) | | ($000 | ) |
| 2 | | Truist Bank | | 3.525% | | 10/26/21 | | | 1,400 | | | | 1,416 | |
| | | Truist Bank | | 2.625% | | 1/15/22 | | | 3,540 | | | | 3,584 | |
| | | Truist Bank | | 2.800% | | 5/17/22 | | | 4,500 | | | | 4,579 | |
| | | Truist Bank | | 2.450% | | 8/1/22 | | | 2,915 | | | | 2,945 | |
| | | Truist Bank | | 3.200% | | 4/1/24 | | | 2,650 | | | | 2,751 | |
| 2 | | Truist Bank | | 3.689% | | 8/2/24 | | | 1,150 | | | | 1,205 | |
| | | Truist Bank | | 2.150% | | 12/6/24 | | | 1,300 | | | | 1,297 | |
| | | Truist Financial Corp. | | 2.050% | | 5/10/21 | | | 539 | | | | 539 | |
| | | Truist Financial Corp. | | 2.700% | | 1/27/22 | | | 1,460 | | | | 1,480 | |
| | | Truist Financial Corp. | | 3.950% | | 3/22/22 | | | 100 | | | | 104 | |
| | | Truist Financial Corp. | | 3.050% | | 6/20/22 | | | 1,420 | | | | 1,448 | |
| | | Truist Financial Corp. | | 3.750% | | 12/6/23 | | | 970 | | | | 1,025 | |
| | | Truist Financial Corp. | | 2.500% | | 8/1/24 | | | 475 | | | | 481 | |
| 5 | | UBS AG | | 2.450% | | 12/1/20 | | | 4,575 | | | | 4,590 | |
| 5 | | UBS Group Funding Jersey Ltd. | | 3.000% | | 4/15/21 | | | 1,250 | | | | 1,265 | |
| 5 | | UBS Group Funding Jersey Ltd. | | 2.650% | | 2/1/22 | | | 1,722 | | | | 1,740 | |
| 5 | | UBS Group Funding Switzerland AG | | 3.491% | | 5/23/23 | | | 210 | | | | 216 | |
| 2,5 | | UBS Group Funding Switzerland AG | | 2.859% | | 8/15/23 | | | 1,872 | | | | 1,895 | |
| 6 | | Unione di Banche Italiane SPA | | 1.000% | | 7/22/22 | | | 295 | | | | 335 | |
| | | US Bancorp | | 2.950% | | 7/15/22 | | | 1,100 | | | | 1,128 | |
| | | US Bancorp | | 3.375% | | 2/5/24 | | | 1,220 | | | | 1,277 | |
| | | US Bancorp | | 2.400% | | 7/30/24 | | | 1,250 | | | | 1,265 | |
| | | US Bank NA | | 3.450% | | 11/16/21 | | | 1,225 | | | | 1,260 | |
| | | US Bank NA | | 2.650% | | 5/23/22 | | | 2,155 | | | | 2,192 | |
| | | US Bank NA | | 1.950% | | 1/9/23 | | | 1,800 | | | | 1,802 | |
| §,9 | | Washington Mutual Bank / Debt not acquired by JPMorgan | | 6.875% | | 6/15/11 | | | 517 | | | | — | |
| | | Wells Fargo & Co. | | 4.600% | | 4/1/21 | | | 673 | | | | 694 | |
| | | Wells Fargo & Co. | | 2.100% | | 7/26/21 | | | 1,170 | | | | 1,172 | |
| | | Wells Fargo & Co. | | 2.625% | | 7/22/22 | | | 4,860 | | | | 4,925 | |
| | | Wells Fargo & Co. | | 3.069% | | 1/24/23 | | | 500 | | | | 509 | |
| | | Wells Fargo & Co. | | 3.450% | | 2/13/23 | | | 1,500 | | | | 1,552 | |
| | | Wells Fargo & Co. | | 3.750% | | 1/24/24 | | | 2,525 | | | | 2,660 | |
| 2 | | Wells Fargo & Co. | | 2.406% | | 10/30/25 | | | 2,220 | | | | 2,214 | |
| 4,7 | | Wells Fargo & Co., 3M Australian Bank Bill Rate +1.100% | | 1.985% | | 4/27/22 | | | 657 | | | | 464 | |
| 4,7 | | Wells Fargo & Co., 3M Australian Bank Bill Rate +1.320% | | 2.205% | | 7/27/21 | | | 1,635 | | | | 1,158 | |
| 2 | | Wells Fargo Bank NA | | 3.325% | | 7/23/21 | | | 9,385 | | | | 9,447 | |
| | | Wells Fargo Bank NA | | 3.625% | | 10/22/21 | | | 3,766 | | | | 3,874 | |
| 2 | | Wells Fargo Bank NA | | 2.082% | | 9/9/22 | | | 3,500 | | | | 3,500 | |
| 8 | | Wells Fargo Bank NA | | 5.250% | | 8/1/23 | | | 400 | | | | 597 | |
| | | Wells Fargo Bank NA | | 3.550% | | 8/14/23 | | | 1,960 | | | | 2,047 | |
| | | Westpac Banking Corp. | | 2.100% | | 5/13/21 | | | 221 | | | | 221 | |
| | | Westpac Banking Corp. | | 2.000% | | 8/19/21 | | | 5,400 | | | | 5,401 | |
| | | Westpac Banking Corp. | | 2.750% | | 1/11/23 | | | 4,210 | | | | 4,280 | |
| | | Westpac Banking Corp. | | 3.300% | | 2/26/24 | | | 2,365 | | | | 2,460 | |
| 4,7 | | Westpac Banking Corp., 3M Australian Bank Bill Rate +1.800% | | 2.722% | | 6/22/28 | | | 1,100 | | | | 777 | |
| 4,7 | | Westpac Banking Corp., 3M Australian Bank Bill Rate +3.100% | | 3.989% | | 3/10/26 | | | 1,200 | | | | 862 | |
| | | | | | | | | | | | | | | |
| | | Brokerage (0.3%) | | | | | | | | | | | | |
| | | Ameriprise Financial Inc. | | 3.000% | | 3/22/22 | | | 1,000 | | | | 1,022 | |
| 6 | | Blackstone Property Partners Europe Holdings Sarl | | 1.400% | | 7/6/22 | | | 775 | | | | 890 | |
| | | Charles Schwab Corp. | | 3.550% | | 2/1/24 | | | 200 | | | | 211 | |
| | | Franklin Resources Inc. | | 2.800% | | 9/15/22 | | | 970 | | | | 995 | |
| | | Invesco Finance plc | | 3.125% | | 11/30/22 | | | 1,000 | | | | 1,028 | |
| §,9 | | Lehman Brothers Holdings E-Capital Trust I | | 3.589% | | 8/19/65 | | | 210 | | | | — | |
| | | Stifel Financial Corp. | | 3.500% | | 12/1/20 | | | 405 | | | | 410 | |
| | | TD Ameritrade Holding Corp. | | 2.950% | | 4/1/22 | | | 200 | | | | 204 | |
| | | TD Ameritrade Holding Corp. | | 3.625% | | 4/1/25 | | | 100 | | | | 106 | |
| | | | | | | | | | | | | | | |
| | | Finance Companies (0.1%) | | | | | | | | | | | | |
| 7 | | GE Capital Australia Funding Pty Ltd. | | 5.250% | | 9/4/20 | | | 1,150 | | | | 825 | |
| 5 | | SMBC Aviation Capital Finance DAC | | 2.650% | | 7/15/21 | | | 445 | | | | 448 | |
| | | Springleaf Finance Corp. | | 5.375% | | 11/15/29 | | | 10 | | | | 10 | |
| | | | | | | | | | | | | | | |
| | | Insurance (1.6%) | | | | | | | | | | | | |
| | | Aflac Inc. | | 3.625% | | 11/15/24 | | | 300 | | | | 321 | |
| 5 | | AIG Global Funding | | 2.150% | | 7/2/20 | | | 365 | | | | 365 | |
| 5 | | AIG Global Funding | | 2.700% | | 12/15/21 | | | 315 | | | | 319 | |
| | | Alleghany Corp. | | 5.625% | | 9/15/20 | | | 210 | | | | 215 | |
| | | AXIS Specialty Finance LLC | | 5.875% | | 6/1/20 | | | 50 | | | | 51 | |
| 6 | | Berkshire Hathaway Inc. | | 0.250% | | 1/17/21 | | | 445 | | | | 502 | |
| | | Berkshire Hathaway Inc. | | 2.750% | | 3/15/23 | | | 3,069 | | | | 3,151 | |
| | | Centene Corp. | | 4.750% | | 5/15/22 | | | 259 | | | | 264 | |
| | | Centene Corp. | | 6.125% | | 2/15/24 | | | 355 | | | | 368 | |
| 5 | | Centene Corp. | | 4.750% | | 1/15/25 | | | 100 | | | | 104 | |
| 5 | | Centene Corp. | | 5.375% | | 6/1/26 | | | 60 | | | | 64 | |
| 5 | | Centene Corp. | | 4.250% | | 12/15/27 | | | 120 | | | | 124 | |
| | | Chubb INA Holdings Inc. | | 2.300% | | 11/3/20 | | | 503 | | | | 505 | |
| | | Chubb INA Holdings Inc. | | 2.875% | | 11/3/22 | | | 519 | | | | 532 | |
| | | Chubb INA Holdings Inc. | | 2.700% | | 3/13/23 | | | 765 | | | | 782 | |
| | | Chubb INA Holdings Inc. | | 3.350% | | 5/15/24 | | | 200 | | | | 210 | |
| | | Coventry Health Care Inc. | | 5.450% | | 6/15/21 | | | 300 | | | | 312 | |
| 5 | | Five Corners Funding Trust | | 4.419% | | 11/15/23 | | | 3,113 | | | | 3,380 | |
| | | Lincoln National Corp. | | 4.000% | | 9/1/23 | | | 303 | | | | 321 | |
| | | Marsh & McLennan Cos. Inc. | | 2.350% | | 3/6/20 | | | 590 | | | | 590 | |
| | | Marsh & McLennan Cos. Inc. | | 4.800% | | 7/15/21 | | | 330 | | | | 342 | |
| | | Marsh & McLennan Cos. Inc. | | 3.300% | | 3/14/23 | | | 442 | | | | 456 | |
| | | Marsh & McLennan Cos. Inc. | | 4.050% | | 10/15/23 | | | 387 | | | | 410 | |
| 5 | | MassMutual Global Funding II | | 2.750% | | 6/22/24 | | | 1,200 | | | | 1,230 | |
| 5 | | Metropolitan Life Global Funding I | | 3.450% | | 10/9/21 | | | 435 | | | | 447 | |
| 5 | | Metropolitan Life Global Funding I | | 3.600% | | 1/11/24 | | | 345 | | | | 365 | |
| 5 | | New York Life Global Funding | | 1.950% | | 2/11/20 | | | 530 | | | | 530 | |
| 5 | | Pricoa Global Funding I | | 2.200% | | 6/3/21 | | | 410 | | | | 411 | |
| 5 | | Principal Life Global Funding II | | 2.200% | | 4/8/20 | | | 685 | | | | 685 | |
| | | Progressive Corp. | | 3.750% | | 8/23/21 | | | 535 | | | | 551 | |
| | | Prudential Financial Inc. | | 4.500% | | 11/16/21 | | | 525 | | | | 552 | |
| | | Reinsurance Group of America Inc. | | 5.000% | | 6/1/21 | | | 250 | | | | 260 | |
| 5 | | Reliance Standard Life Global Funding II | | 2.500% | | 1/15/20 | | | 2,255 | | | | 2,255 | |
| 5 | | Reliance Standard Life Global Funding II | | 2.375% | | 5/4/20 | | | 920 | | | | 921 | |
| 5 | | Reliance Standard Life Global Funding II | | 3.850% | | 9/19/23 | | | 1,020 | | | | 1,068 | |
| 5 | | Swiss Re Treasury US Corp. | | 2.875% | | 12/6/22 | | | 1,026 | | | | 1,043 | |
| | | Travelers Cos. Inc. | | 3.900% | | 11/1/20 | | | 105 | | | | 107 | |
| | | UnitedHealth Group Inc. | | 4.700% | | 2/15/21 | | | 250 | | | | 256 | |
| | | UnitedHealth Group Inc. | | 2.375% | | 10/15/22 | | | 3,000 | | | | 3,034 | |
| | | UnitedHealth Group Inc. | | 2.750% | | 2/15/23 | | | 400 | | | | 407 | |
| | | UnitedHealth Group Inc. | | 2.875% | | 3/15/23 | | | 800 | | | | 818 | |
| | | UnitedHealth Group Inc. | | 3.500% | | 2/15/24 | | | 1,543 | | | | 1,625 | |
| | | UnitedHealth Group Inc. | | 2.375% | | 8/15/24 | | | 380 | | | | 385 | |
| | | | | | | | | | | | | | | |
| | | Real Estate Investment Trusts (1.3%) | | | | | | | | | | | | |
| | | Alexandria Real Estate Equities Inc. | | 3.900% | | 6/15/23 | | | 700 | | | | 735 | |
| | | Alexandria Real Estate Equities Inc. | | 4.000% | | 1/15/24 | | | 1,635 | | | | 1,739 | |
| | | Alexandria Real Estate Equities Inc. | | 3.450% | | 4/30/25 | | | 1,120 | | | | 1,174 | |
| | | Brandywine Operating Partnership LP | | 4.100% | | 10/1/24 | | | 185 | | | | 195 | |
| | | Brixmor Operating Partnership LP | | 3.875% | | 8/15/22 | | | 575 | | | | 599 | |
| | | Brixmor Operating Partnership LP | | 3.650% | | 6/15/24 | | | 915 | | | | 951 | |
| | | Brixmor Operating Partnership LP | | 3.850% | | 2/1/25 | | | 146 | | | | 153 | |
| | | Camden Property Trust | | 2.950% | | 12/15/22 | | | 290 | | | | 296 | |
| | | Camden Property Trust | | 4.875% | | 6/15/23 | | | 410 | | | | 443 | |
| | | Camden Property Trust | | 4.250% | | 1/15/24 | | | 438 | | | | 469 | |
| | | Camden Property Trust | | 3.500% | | 9/15/24 | | | 180 | | | | 188 | |
| | | CyrusOne LP / CyrusOne Finance Corp. | | 2.900% | | 11/15/24 | | | 1,045 | | | | 1,049 | |
| | | Digital Realty Trust LP | | 3.950% | | 7/1/22 | | | 840 | | | | 874 | |
| | | Federal Realty Investment Trust | | 2.550% | | 1/15/21 | | | 449 | | | | 451 | |
| | | Federal Realty Investment Trust | | 3.000% | | 8/1/22 | | | 1,000 | | | | 1,020 | |
| | | Federal Realty Investment Trust | | 2.750% | | 6/1/23 | | | 260 | | | | 264 | |
| | | Healthcare Trust of America Holdings LP | | 3.700% | | 4/15/23 | | | 320 | | | | 331 | |
| | | Healthpeak Properties Inc. | | 4.250% | | 11/15/23 | | | 850 | | | | 907 | |
| | | Healthpeak Properties Inc. | | 4.200% | | 3/1/24 | | | 195 | | | | 208 | |
| | | Healthpeak Properties Inc. | | 3.875% | | 8/15/24 | | | 202 | | | | 215 | |
| | | Healthpeak Properties Inc. | | 3.400% | | 2/1/25 | | | 280 | | | | 291 | |
| | | Highwoods Realty LP | | 3.200% | | 6/15/21 | | | 250 | | | | 253 | |
| | | Kimco Realty Corp. | | 3.400% | | 11/1/22 | | | 190 | | | | 196 | |
Short-Term Investment-Grade Portfolio
| | | | | | | | | Face | | | Market | |
| | | | | | | Maturity | | Amount | | | Value• | |
| | | | | Coupon | | Date | | ($000 | ) | | ($000 | ) |
| | | Kimco Realty Corp. | | 3.125% | | 6/1/23 | | | 426 | | | | 435 | |
| 7 | | Lendlease Finance Ltd. | | 6.000% | | 5/13/20 | | | 290 | | | | 206 | |
| | | Mid-America Apartments LP | | 4.300% | | 10/15/23 | | | 135 | | | | 144 | |
| | | Omega Healthcare Investors Inc. | | 4.950% | | 4/1/24 | | | 202 | | | | 221 | |
| | | Realty Income Corp. | | 5.750% | | 1/15/21 | | | 95 | | | | 99 | |
| | | Realty Income Corp. | | 3.250% | | 10/15/22 | | | 2,545 | | | | 2,621 | |
| | | Realty Income Corp. | | 3.875% | | 4/15/25 | | | 485 | | | | 522 | |
| | | Sabra Health Care LP / Sabra Capital Corp. | | 4.800% | | 6/1/24 | | | 1,010 | | | | 1,074 | |
| | | Simon Property Group LP | | 2.500% | | 7/15/21 | | | 800 | | | | 806 | |
| | | Simon Property Group LP | | 2.350% | | 1/30/22 | | | 1,295 | | | | 1,304 | |
| | | Simon Property Group LP | | 2.750% | | 2/1/23 | | | 200 | | | | 204 | |
| | | Simon Property Group LP | | 2.000% | | 9/13/24 | | | 1,500 | | | | 1,479 | |
| | | Ventas Realty LP | | 3.750% | | 5/1/24 | | | 355 | | | | 373 | |
| | | Ventas Realty LP | | 3.500% | | 2/1/25 | | | 80 | | | | 83 | |
| | | Weingarten Realty Investors | | 3.500% | | 4/15/23 | | | 150 | | | | 154 | |
| | | Welltower Inc. | | 3.750% | | 3/15/23 | | | 729 | | | | 759 | |
| | | Welltower Inc. | | 3.950% | | 9/1/23 | | | 1,095 | | | | 1,155 | |
| | | Welltower Inc. | | 3.625% | | 3/15/24 | | | 565 | | | | 591 | |
| | | Welltower Inc. | | 4.000% | | 6/1/25 | | | 280 | | | | 301 | |
| | | | | | | | | | | | | | 501,029 | |
| Industrial (31.4%) | | | | | | | | | | | | |
| | | Basic Industry (0.8%) | | | | | | | | | | | | |
| 5 | | Air Liquide Finance SA | | 1.750% | | 9/27/21 | | | 755 | | | | 752 | |
| 5 | | Air Liquide Finance SA | | 2.250% | | 9/27/23 | | | 1,235 | | | | 1,235 | |
| | | BHP Billiton Finance USA Ltd. | | 2.875% | | 2/24/22 | | | 210 | | | | 214 | |
| | | BHP Billiton Finance USA Ltd. | | 3.850% | | 9/30/23 | | | 465 | | | | 495 | |
| 5 | | Chevron Phillips Chemical Co. LLC /Chevron Phillips Chemical Co. LP | | 3.300% | | 5/1/23 | | | 1,610 | | | | 1,662 | |
| | | DuPont de Nemours Inc. | | 3.766% | | 11/15/20 | | | 695 | | | | 704 | |
| | | DuPont de Nemours Inc. | | 4.205% | | 11/15/23 | | | 1,565 | | | | 1,673 | |
| | | Eastman Chemical Co. | | 3.600% | | 8/15/22 | | | 575 | | | | 595 | |
| | | Ecolab Inc. | | 4.350% | | 12/8/21 | | | 250 | | | | 262 | |
| | | Ecolab Inc. | | 2.375% | | 8/10/22 | | | 670 | | | | 676 | |
| | | FMC Corp. | | 3.950% | | 2/1/22 | | | 610 | | | | 628 | |
| | | LYB International Finance BV | | 4.000% | | 7/15/23 | | | 110 | | | | 117 | |
| | | LyondellBasell Industries NV | | 6.000% | | 11/15/21 | | | 445 | | | | 473 | |
| | | LyondellBasell Industries NV | | 5.750% | | 4/15/24 | | | 400 | | | | 450 | |
| | | Newmont Corp. | | 3.625% | | 6/9/21 | | | 30 | | | | 31 | |
| | | Newmont Corp. | | 3.500% | | 3/15/22 | | | 265 | | | | 272 | |
| | | Newmont Corp. | | 3.700% | | 3/15/23 | | | 2,455 | | | | 2,567 | |
| | | Nutrien Ltd. | | 3.150% | | 10/1/22 | | | 145 | | | | 148 | |
| | | Nutrien Ltd. | | 3.500% | | 6/1/23 | | | 55 | | | | 57 | |
| | | Nutrien Ltd. | | 3.625% | | 3/15/24 | | | 140 | | | | 146 | |
| 5 | | OCI NV | | 5.250% | | 11/1/24 | | | 30 | | | | 31 | |
| | | Praxair Inc. | | 2.200% | | 8/15/22 | | | 85 | | | | 86 | |
| | | Steel Dynamics Inc. | | 2.800% | | 12/15/24 | | | 445 | | | | 448 | |
| | | Vale Overseas Ltd. | | 6.250% | | 8/10/26 | | | 240 | | | | 281 | |
| 6 | | Vale SA | | 3.750% | | 1/10/23 | | | 100 | | | | 122 | |
| | | WestRock RKT Co. | | 4.900% | | 3/1/22 | | | 105 | | | | 111 | |
| | | WestRock RKT Co. | | 4.000% | | 3/1/23 | | | 1,050 | | | | 1,094 | |
| | | | | | | | | | | | | | | |
| | | Capital Goods (2.7%) | | | | | | | | | | | | |
| 6 | | 3M Co. | | 0.375% | | 2/15/22 | | | 445 | | | | 504 | |
| | | 3M Co. | | 1.750% | | 2/14/23 | | | 1,060 | | | | 1,054 | |
| | | 3M Co. | | 2.250% | | 3/15/23 | | | 790 | | | | 797 | |
| 5 | | Airbus Finance BV | | 2.700% | | 4/17/23 | | | 225 | | | | 228 | |
| 5 | | American Builders & Contractors Supply Co. Inc. | | 4.000% | | 1/15/28 | | | 30 | | | | 30 | |
| | | Ball Corp. | | 4.375% | | 12/15/20 | | | 100 | | | | 102 | |
| | | Ball Corp. | | 4.000% | | 11/15/23 | | | 215 | | | | 226 | |
| | | Ball Corp. | | 4.875% | | 3/15/26 | | | 20 | | | | 22 | |
| | | Berry Global Inc. | | 5.500% | | 5/15/22 | | | 80 | | | | 81 | |
| | | Berry Global Inc. | | 6.000% | | 10/15/22 | | | 8 | | | | 8 | |
| 5 | | Berry Global Inc. | | 4.875% | | 7/15/26 | | | 160 | | | | 170 | |
| | | Boeing Co. | | 2.300% | | 8/1/21 | | | 3,295 | | | | 3,312 | |
| | | Boeing Co. | | 2.125% | | 3/1/22 | | | 305 | | | | 305 | |
| | | Boeing Co. | | 2.700% | | 5/1/22 | | | 1,155 | | | | 1,171 | |
| | | Boeing Co. | | 1.875% | | 6/15/23 | | | 500 | | | | 496 | |
| | | Boeing Co. | | 2.800% | | 3/1/24 | | | 565 | | | | 577 | |
| | | Boeing Co. | | 2.850% | | 10/30/24 | | | 245 | | | | 251 | |
| | | Caterpillar Financial Services Corp. | | 1.850% | | 9/4/20 | | | 245 | | | | 245 | |
| | | Caterpillar Financial Services Corp. | | 2.650% | | 5/17/21 | | | 675 | | | | 682 | |
| | | Caterpillar Financial Services Corp. | | 1.931% | | 10/1/21 | | | 275 | | | | 275 | |
| | | Caterpillar Financial Services Corp. | | 2.400% | | 6/6/22 | | | 1,900 | | | | 1,921 | |
| | | Caterpillar Financial Services Corp. | | 1.900% | | 9/6/22 | | | 3,322 | | | | 3,325 | |
| | | Caterpillar Financial Services Corp. | | 2.550% | | 11/29/22 | | | 600 | | | | 611 | |
| | | Caterpillar Financial Services Corp. | | 3.300% | | 6/9/24 | | | 545 | | | | 573 | |
| 5 | | CFX Escrow Corp. | | 6.000% | | 2/15/24 | | | 200 | | | | 213 | |
| 5 | | Clean Harbors Inc. | | 4.875% | | 7/15/27 | | | 40 | | | | 42 | |
| | | CNH Industrial Capital LLC | | 4.875% | | 4/1/21 | | | 95 | | | | 98 | |
| | | CNH Industrial Capital LLC | | 3.875% | | 10/15/21 | | | 230 | | | | 236 | |
| | | CNH Industrial Capital LLC | | 4.375% | | 4/5/22 | | | 750 | | | | 782 | |
| | | CNH Industrial NV | | 4.500% | | 8/15/23 | | | 1,105 | | | | 1,177 | |
| | | Embraer Netherlands Finance BV | | 5.050% | | 6/15/25 | | | 200 | | | | 220 | |
| | | Embraer Overseas Ltd. | | 5.696% | | 9/16/23 | | | 37 | | | | 41 | |
| | | Embraer SA | | 5.150% | | 6/15/22 | | | 610 | | | | 643 | |
| | | John Deere Capital Corp. | | 1.950% | | 6/13/22 | | | 670 | | | | 670 | |
| | | Johnson Controls International plc | | 5.000% | | 3/30/20 | | | 550 | | | | 554 | |
| | | Johnson Controls International plc | | 3.750% | | 12/1/21 | | | 25 | | | | 26 | |
| | | Johnson Controls International plc | | 3.625% | | 7/2/24 | | | 303 | | | | 314 | |
| 5 | | L3Harris Technologies Inc. | | 4.950% | | 2/15/21 | | | 710 | | | | 727 | |
| 5 | | L3Harris Technologies Inc. | | 3.850% | | 6/15/23 | | | 640 | | | | 674 | |
| 5 | | L3Harris Technologies Inc. | | 3.950% | | 5/28/24 | | | 390 | | | | 414 | |
| 5 | | Mueller Water Products Inc. | | 5.500% | | 6/15/26 | | | 50 | | | | 53 | |
| | | Northrop Grumman Corp. | | 2.550% | | 10/15/22 | | | 2,543 | | | | 2,580 | |
| | | Northrop Grumman Corp. | | 2.930% | | 1/15/25 | | | 200 | | | | 206 | |
| | | Parker-Hannifin Corp. | | 3.500% | | 9/15/22 | | | 200 | | | | 207 | |
| | | Precision Castparts Corp. | | 2.500% | | 1/15/23 | | | 2,675 | | | | 2,722 | |
| | | Raytheon Co. | | 4.400% | | 2/15/20 | | | 55 | | | | 55 | |
| | | Raytheon Co. | | 2.500% | | 12/15/22 | | | 400 | | | | 408 | |
| | | Reynolds Group Issuer Inc. / Reynolds Group Issuer LLC / Reynolds Group Issuer Lu | | 5.750% | | 10/15/20 | | | 133 | | | | 133 | |
| 4,5 | | Reynolds Group Issuer Inc. / Reynolds Group Issuer LLC / Reynolds Group Issuer Lu, 3M USD LIBOR + 3.500% | | 5.501% | | 7/15/21 | | | 502 | | | | 503 | |
| | | Rockwell Collins Inc. | | 2.800% | | 3/15/22 | | | 2,730 | | | | 2,777 | |
| | | Rockwell Collins Inc. | | 3.200% | | 3/15/24 | | | 400 | | | | 416 | |
| 5 | | Sealed Air Corp. | | 4.000% | | 12/1/27 | | | 20 | | | | 20 | |
| 5 | | Silgan Holdings Inc. | | 4.125% | | 2/1/28 | | | 20 | | | | 20 | |
| | | Stanley Black & Decker Inc. | | 2.900% | | 11/1/22 | | | 1,200 | | | | 1,229 | |
| 6 | | Thales SA | | 0.000% | | 5/31/22 | | | 600 | | | | 673 | |
| | | TransDigm Inc. | | 6.500% | | 5/15/25 | | | 40 | | | | 42 | |
| 5 | | TransDigm Inc. | | 6.250% | | 3/15/26 | | | 100 | | | | 108 | |
| 5 | | Trivium Packaging Finance BV | | 5.500% | | 8/15/26 | | | 10 | | | | 11 | |
| 5 | | Trivium Packaging Finance BV | | 8.500% | | 8/15/27 | | | 10 | | | | 11 | |
| | | United Rentals North America Inc. | | 4.625% | | 10/15/25 | | | 345 | | | | 355 | |
| | | United Rentals North America Inc. | | 6.500% | | 12/15/26 | | | 60 | | | | 66 | |
| | | United Rentals North America Inc. | | 3.875% | | 11/15/27 | | | 120 | | | | 122 | |
| | | United Technologies Corp. | | 3.350% | | 8/16/21 | | | 205 | | | | 210 | |
| | | United Technologies Corp. | | 1.950% | | 11/1/21 | | | 509 | | | | 510 | |
| 6 | | United Technologies Corp. | | 1.125% | | 12/15/21 | | | 450 | | | | 514 | |
| | | United Technologies Corp. | | 2.300% | | 5/4/22 | | | 2,307 | | | | 2,325 | |
| | | United Technologies Corp. | | 3.100% | | 6/1/22 | | | 2,367 | | | | 2,430 | |
| | | United Technologies Corp. | | 3.650% | | 8/16/23 | | | 9,025 | | | | 9,507 | |
| | | | | | | | | | | | | | | |
| | | Communication (3.5%) | | | | | | | | | | | | |
| | | America Movil SAB de CV | | 5.000% | | 3/30/20 | | | 503 | | | | 506 | |
| | | American Tower Corp. | | 3.450% | | 9/15/21 | | | 184 | | | | 188 | |
| | | American Tower Corp. | | 5.900% | | 11/1/21 | | | 495 | | | | 529 | |
| | | American Tower Corp. | | 3.000% | | 6/15/23 | | | 179 | | | | 183 | |
| | | AT&T Inc. | | 2.800% | | 2/17/21 | | | 200 | | | | 202 | |
| | | AT&T Inc. | | 4.450% | | 5/15/21 | | | 400 | | | | 414 | |
| 6 | | AT&T Inc. | | 2.650% | | 12/17/21 | | | 450 | | | | 527 | |
| | | AT&T Inc. | | 4.000% | | 1/15/22 | | | 600 | | | | 622 | |
| | | AT&T Inc. | | 3.200% | | 3/1/22 | | | 316 | | | | 324 | |
| | | AT&T Inc. | | 3.800% | | 3/15/22 | | | 1,701 | | | | 1,765 | |
| | | AT&T Inc. | | 3.000% | | 6/30/22 | | | 1,166 | | | | 1,192 | |
| | | AT&T Inc. | | 2.625% | | 12/1/22 | | | 200 | | | | 203 | |
| | | AT&T Inc. | | 3.600% | | 2/17/23 | | | 2,968 | | | | 3,097 | |
Short-Term Investment-Grade Portfolio
| | | | | | | | | Face | | | Market | |
| | | | | | | Maturity | | Amount | | | Value• | |
| | | | | Coupon | | Date | | ($000 | ) | | ($000 | ) |
| | | CC Holdings GS V LLC / Crown Castle GS III Corp. | | 3.849% | | 4/15/23 | | | 662 | | | | 693 | |
| 5 | | CCO Holdings LLC / CCO Holdings Capital Corp. | | 4.750% | | 3/1/30 | | | 40 | | | | 41 | |
| | | Charter Communications Operating LLC / Charter Communications Operating Capital | | 4.464% | | 7/23/22 | | | 5,652 | | | | 5,940 | |
| | | Charter Communications Operating LLC / Charter Communications Operating Capital | | 4.500% | | 2/1/24 | | | 1,260 | | | | 1,355 | |
| | | Comcast Corp. | | 3.450% | | 10/1/21 | | | 545 | | | | 560 | |
| | | Comcast Corp. | | 3.125% | | 7/15/22 | | | 500 | | | | 515 | |
| | | Comcast Corp. | | 2.850% | | 1/15/23 | | | 275 | | | | 282 | |
| | | Comcast Corp. | | 2.750% | | 3/1/23 | | | 300 | | | | 307 | |
| | | Comcast Corp. | | 3.700% | | 4/15/24 | | | 555 | | | | 590 | |
| 5 | | Connect Finco SARL / Connect US Finco LLC | | 6.750% | | 10/1/26 | | | 20 | | | | 21 | |
| 5 | | Cox Communications Inc. | | 3.150% | | 8/15/24 | | | 725 | | | | 745 | |
| | | Crown Castle International Corp. | | 3.400% | | 2/15/21 | | | 1,470 | | | | 1,492 | |
| | | Crown Castle International Corp. | | 4.875% | | 4/15/22 | | | 400 | | | | 423 | |
| | | Crown Castle International Corp. | | 5.250% | | 1/15/23 | | | 1,978 | | | | 2,144 | |
| | | Crown Castle International Corp. | | 3.150% | | 7/15/23 | | | 1,202 | | | | 1,233 | |
| | | Crown Castle International Corp. | | 3.200% | | 9/1/24 | | | 1,730 | | | | 1,781 | |
| | | CSC Holdings LLC | | 6.750% | | 11/15/21 | | | 150 | | | | 161 | |
| 5 | | CSC Holdings LLC | | 5.375% | | 2/1/28 | | | 90 | | | | 96 | |
| 5 | | CSC Holdings LLC | | 7.500% | | 4/1/28 | | | 30 | | | | 34 | |
| 5 | | Deutsche Telekom International Finance BV | | 1.950% | | 9/19/21 | | | 600 | | | | 600 | |
| 5 | | Deutsche Telekom International Finance BV | | 2.820% | | 1/19/22 | | | 1,887 | | | | 1,914 | |
| | | Discovery Communications LLC | | 4.375% | | 6/15/21 | | | 195 | | | | 201 | |
| | | Discovery Communications LLC | | 3.300% | | 5/15/22 | | | 420 | | | | 431 | |
| | | Discovery Communications LLC | | 3.500% | | 6/15/22 | | | 485 | | | | 498 | |
| | | Discovery Communications LLC | | 2.950% | | 3/20/23 | | | 2,938 | | | | 2,992 | |
| | | Discovery Communications LLC | | 3.250% | | 4/1/23 | | | 300 | | | | 308 | |
| | | Discovery Communications LLC | | 3.800% | | 3/13/24 | | | 555 | | | | 584 | |
| | | Discovery Communications LLC | | 3.900% | | 11/15/24 | | | 852 | | | | 904 | |
| 5 | | Fox Corp. | | 3.666% | | 1/25/22 | | | 930 | | | | 960 | |
| | | Interpublic Group of Cos. Inc. | | 3.500% | | 10/1/20 | | | 440 | | | | 444 | |
| | | Interpublic Group of Cos. Inc. | | 3.750% | | 10/1/21 | | | 1,810 | | | | 1,857 | |
| | | Interpublic Group of Cos. Inc. | | 4.200% | | 4/15/24 | | | 200 | | | | 215 | |
| 5 | | Level 3 Financing Inc. | | 3.400% | | 3/1/27 | | | 50 | | | | 50 | |
| 5 | | Level 3 Financing Inc. | | 4.625% | | 9/15/27 | | | 60 | | | | 61 | |
| | | NBCUniversal Media LLC | | 4.375% | | 4/1/21 | | | 700 | | | | 722 | |
| | | NBCUniversal Media LLC | | 2.875% | | 1/15/23 | | | 2,142 | | | | 2,198 | |
| | | Netflix Inc. | | 4.375% | | 11/15/26 | | | 30 | | | | 31 | |
| | | Netflix Inc. | | 4.875% | | 4/15/28 | | | 15 | | | | 16 | |
| 5 | | Nexstar Escrow Inc. | | 5.625% | | 7/15/27 | | | 40 | | | | 42 | |
| | | Omnicom Group Inc. / Omnicom Capital Inc. | | 3.625% | | 5/1/22 | | | 3,435 | | | | 3,552 | |
| | | Qwest Corp. | | 6.750% | | 12/1/21 | | | 1,100 | | | | 1,183 | |
| 5 | | Sirius XM Radio Inc. | | 4.625% | | 7/15/24 | | | 240 | | | | 251 | |
| 5 | | Sirius XM Radio Inc. | | 5.000% | | 8/1/27 | | | 20 | | | | 21 | |
| 6 | | Sky Ltd. | | 1.500% | | 9/15/21 | | | 395 | | | | 455 | |
| 5 | | Sky Ltd. | | 3.750% | | 9/16/24 | | | 1,315 | | | | 1,407 | |
| 5 | | Sky plc | | 3.125% | | 11/26/22 | | | 1,560 | | | | 1,599 | |
| | | T-Mobile USA Inc. | | 6.000% | | 3/1/23 | | | 640 | | | | 650 | |
| | | T-Mobile USA Inc. | | 6.500% | | 1/15/24 | | | 290 | | | | 298 | |
| | | T-Mobile USA Inc. | | 4.500% | | 2/1/26 | | | 250 | | | | 257 | |
| | | Telefonica Emisiones SAU | | 5.462% | | 2/16/21 | | | 406 | | | | 421 | |
| 7 | | Telstra Corp. Ltd. | | 7.750% | | 7/15/20 | | | 400 | | | | 290 | |
| | | Time Warner Entertainment Co. LP | | 8.375% | | 3/15/23 | | | 270 | | | | 319 | |
| | | Verizon Communications Inc. | | 2.450% | | 11/1/22 | | | 100 | | | | 101 | |
| | | Verizon Communications Inc. | | 4.150% | | 3/15/24 | | | 300 | | | | 323 | |
| 4,7 | | Verizon Communications Inc., 3M Australian Bank Bill Rate +1.220% | | 2.122% | | 2/17/23 | | | 1,030 | | | | 727 | |
| | | ViacomCBS Inc. | | 4.300% | | 2/15/21 | | | 220 | | | | 224 | |
| | | ViacomCBS Inc. | | 4.500% | | 3/1/21 | | | 425 | | | | 436 | |
| | | ViacomCBS Inc. | | 3.875% | | 12/15/21 | | | 1,297 | | | | 1,342 | |
| | | ViacomCBS Inc. | | 3.375% | | 3/1/22 | | | 400 | | | | 409 | |
| | | ViacomCBS Inc. | | 2.500% | | 2/15/23 | | | 418 | | | | 422 | |
| | | ViacomCBS Inc. | | 2.900% | | 6/1/23 | | | 211 | | | | 215 | |
| | | ViacomCBS Inc. | | 4.250% | | 9/1/23 | | | 3,475 | | | | 3,699 | |
| | | Vodafone Group plc | | 3.750% | | 1/16/24 | | | 3,540 | | | | 3,733 | |
| 4,7 | | Vodafone Group plc, 3M Australian Bank Bill Rate +1.050% | | 1.946% | | 12/13/22 | | | 140 | | | | 98 | |
| | | Walt Disney Co. | | 3.000% | | 9/15/22 | | | 1,000 | | | | 1,030 | |
| | | Walt Disney Co. | | 2.350% | | 12/1/22 | | | 200 | | | | 203 | |
| | | | | | | | | | | | | | | |
| | | Consumer Cyclical (2.8%) | | | | | | | | | | | | |
| 5 | | 1011778 BC ULC / New Red Finance Inc. | | 5.000% | | 10/15/25 | | | 250 | | | | 259 | |
| 5 | | 1011778 BC ULC / New Red Finance Inc. | | 3.875% | | 1/15/28 | | | 50 | | | | 50 | |
| 5 | | 1011778 BC ULC / New Red Finance Inc. | | 4.375% | | 1/15/28 | | | 30 | | | | 30 | |
| 5 | | Alimentation Couche-Tard Inc. | | 2.700% | | 7/26/22 | | | 3,675 | | | | 3,717 | |
| 5 | | Allison Transmission Inc. | | 4.750% | | 10/1/27 | | | 50 | | | | 52 | |
| | | American Axle & Manufacturing Inc. | | 6.625% | | 10/15/22 | | | 160 | | | | 162 | |
| | | American Honda Finance Corp. | | 1.650% | | 7/12/21 | | | 265 | | | | 264 | |
| | | American Honda Finance Corp. | | 3.375% | | 12/10/21 | | | 2,900 | | | | 2,987 | |
| 6 | | American Honda Finance Corp. | | 0.350% | | 8/26/22 | | | 960 | | | | 1,087 | |
| | | American Honda Finance Corp. | | 2.050% | | 1/10/23 | | | 100 | | | | 100 | |
| | | American Honda Finance Corp. | | 3.450% | | 7/14/23 | | | 720 | | | | 753 | |
| | | American Honda Finance Corp. | | 3.625% | | 10/10/23 | | | 3,000 | | | | 3,165 | |
| | | AutoZone Inc. | | 2.875% | | 1/15/23 | | | 115 | | | | 117 | |
| 6 | | BMW Finance NV | | 0.125% | | 1/12/21 | | | 445 | | | | 501 | |
| 5 | | Boyd Gaming Corp. | | 4.750% | | 12/1/27 | | | 60 | | | | 62 | |
| 5 | | Churchill Downs Inc. | | 5.500% | | 4/1/27 | | | 150 | | | | 159 | |
| 7 | | Ford Motor Credit Co. LLC | | 3.588% | | 6/2/20 | | | 856 | | | | 604 | |
| | | Ford Motor Credit Co. LLC | | 2.979% | | 8/3/22 | | | 220 | | | | 220 | |
| | | Ford Motor Credit Co. LLC | | 3.350% | | 11/1/22 | | | 1,700 | | | | 1,716 | |
| | | Ford Motor Credit Co. LLC | | 3.810% | | 1/9/24 | | | 200 | | | | 203 | |
| | | Ford Motor Credit Co. LLC | | 5.584% | | 3/18/24 | | | 1,300 | | | | 1,402 | |
| | | General Motors Co. | | 4.875% | | 10/2/23 | | | 640 | | | | 687 | |
| | | General Motors Financial Co. Inc. | | 2.450% | | 11/6/20 | | | 150 | | | | 150 | |
| | | General Motors Financial Co. Inc. | | 3.700% | | 11/24/20 | | | 1,720 | | | | 1,740 | |
| | | General Motors Financial Co. Inc. | | 4.200% | | 3/1/21 | | | 1,095 | | | | 1,118 | |
| | | General Motors Financial Co. Inc. | | 3.200% | | 7/6/21 | | | 1,695 | | | | 1,716 | |
| | | General Motors Financial Co. Inc. | | 4.375% | | 9/25/21 | | | 1,660 | | | | 1,719 | |
| | | General Motors Financial Co. Inc. | | 4.200% | | 11/6/21 | | | 1,200 | | | | 1,241 | |
| | | General Motors Financial Co. Inc. | | 3.450% | | 4/10/22 | | | 350 | | | | 358 | |
| | | General Motors Financial Co. Inc. | | 3.150% | | 6/30/22 | | | 100 | | | | 102 | |
| | | General Motors Financial Co. Inc. | | 3.250% | | 1/5/23 | | | 490 | | | | 500 | |
| 7 | | General Motors Financial Co. Inc. | | 3.850% | | 2/21/23 | | | 160 | | | | 117 | |
| | | General Motors Financial Co. Inc. | | 3.700% | | 5/9/23 | | | 475 | | | | 490 | |
| | | General Motors Financial Co. Inc. | | 4.250% | | 5/15/23 | | | 200 | | | | 211 | |
| | | General Motors Financial Co. Inc. | | 4.150% | | 6/19/23 | | | 100 | | | | 105 | |
| | | General Motors Financial Co. Inc. | | 5.100% | | 1/17/24 | | | 850 | | | | 922 | |
| | | General Motors Financial Co. Inc. | | 3.950% | | 4/13/24 | | | 650 | | | | 679 | |
| | | General Motors Financial Co. Inc. | | 3.500% | | 11/7/24 | | | 1,800 | | | | 1,852 | |
| | | General Motors Financial Co. Inc. | | 4.350% | | 4/9/25 | | | 250 | | | | 268 | |
| | | Goodyear Tire & Rubber Co. | | 4.875% | | 3/15/27 | | | 38 | | | | 39 | |
| 5 | | Harley-Davidson Financial Services Inc. | | 2.150% | | 2/26/20 | | | 2,080 | | | | 2,080 | |
| 5 | | Harley-Davidson Financial Services Inc. | | 2.400% | | 6/15/20 | | | 1,745 | | | | 1,744 | |
| 5 | | Harley-Davidson Financial Services Inc. | | 2.850% | | 1/15/21 | | | 155 | | | | 156 | |
| 5 | | Harley-Davidson Financial Services Inc. | | 2.550% | | 6/9/22 | | | 955 | | | | 958 | |
| | | Hilton Domestic Operating Co. Inc. | | 5.125% | | 5/1/26 | | | 60 | | | | 63 | |
| | | Lennar Corp. | | 5.375% | | 10/1/22 | | | 80 | | | | 85 | |
| | | Lennar Corp. | | 5.250% | | 6/1/26 | | | 20 | | | | 22 | |
| 5 | | Live Nation Entertainment Inc. | | 4.750% | | 10/15/27 | | | 70 | | | | 72 | |
| | | Lowe’s Cos. Inc. | | 4.625% | | 4/15/20 | | | 360 | | | | 361 | |
| | | Macy’s Retail Holdings Inc. | | 3.450% | | 1/15/21 | | | 360 | | | | 363 | |
| | | MGM Growth Properties Operating | | | | | | | | | | | | |
| | | Partnership LP / MGP Finance Co-Issuer Inc. | | 5.625% | | 5/1/24 | | | 170 | | | | 186 | |
| | | MGM Growth Properties Operating Partnership LP / MGP Finance Co-Issuer Inc. | | 4.500% | | 9/1/26 | | | 20 | | | | 21 | |
| | | MGM Resorts International | | 4.625% | | 9/1/26 | | | 30 | | | | 32 | |
| 5 | | NCL Corp. Ltd. | | 3.625% | | 12/15/24 | | | 70 | | | | 71 | |
| 5 | | Nissan Motor Acceptance Corp. | | 2.550% | | 3/8/21 | | | 345 | | | | 346 | |
Short-Term Investment-Grade Portfolio
| | | | | | | | | Face | | | Market | |
| | | | | | | Maturity | | Amount | | | Value• | |
| | | | | Coupon | | Date | | ($000 | ) | | ($000 | ) |
| 5 | | Nissan Motor Acceptance Corp. | | 1.900% | | 9/14/21 | | 355 | | | 352 | |
| 5 | | Nissan Motor Acceptance Corp. | | 3.650% | | 9/21/21 | | 750 | | | 765 | |
| 5 | | Nissan Motor Acceptance Corp. | | 2.600% | | 9/28/22 | | 210 | | | 210 | |
| 5 | | Nissan Motor Acceptance Corp. | | 3.875% | | 9/21/23 | | 1,725 | | | 1,795 | |
| 5 | | Panther BF Aggregator 2 LP / Panther Finance Co. Inc. | | 6.250% | | 5/15/26 | | 50 | | | 54 | |
| | | PulteGroup Inc. | | 5.500% | | 3/1/26 | | 50 | | | 56 | |
| 5 | | Scientific Games International Inc. | | 7.000% | | 5/15/28 | | 20 | | | 21 | |
| | | TJX Cos. Inc. | | 2.750% | | 6/15/21 | | 290 | | | 294 | |
| | | Toyota Motor Corp. | | 3.183% | | 7/20/21 | | 1,400 | | | 1,428 | |
| | | Toyota Motor Credit Corp. | | 4.500% | | 6/17/20 | | 400 | | | 405 | |
| 6 | | Toyota Motor Credit Corp. | | 1.000% | | 3/9/21 | | 445 | | | 506 | |
| | | Toyota Motor Credit Corp. | | 1.900% | | 4/8/21 | | 90 | | | 90 | |
| | | Toyota Motor Credit Corp. | | 2.750% | | 5/17/21 | | 415 | | | 420 | |
| | | Toyota Motor Credit Corp. | | 2.700% | | 1/11/23 | | 100 | | | 102 | |
| | | Toyota Motor Credit Corp. | | 3.450% | | 9/20/23 | | 2,745 | | | 2,889 | |
| 7 | | Volkswagen Financial Services Australia Pty Ltd. | | 3.100% | | 4/17/23 | | 250 | | | 180 | |
| 5 | | Volkswagen Group of America Finance LLC | | 3.875% | | 11/13/20 | | 1,855 | | | 1,885 | |
| 5 | | Volkswagen Group of America Finance LLC | | 2.500% | | 9/24/21 | | 1,200 | | | 1,209 | |
| 5 | | Volkswagen Group of America Finance LLC | | 4.000% | | 11/12/21 | | 1,285 | | | 1,328 | |
| 5 | | Volkswagen Group of America Finance LLC | | 2.700% | | 9/26/22 | | 1,200 | | | 1,213 | |
| | | Walmart Inc. | | 2.550% | | 4/11/23 | | 200 | | | 204 | |
| | | Walmart Inc. | | 3.400% | | 6/26/23 | | 275 | | | 289 | |
| | | | | | | | | | | | | |
| | | Consumer Noncyclical (10.1%) | | | | | | | | | | |
| | | AbbVie Inc. | | 2.300% | | 5/14/21 | | 2,830 | | | 2,838 | |
| | | AbbVie Inc. | | 3.375% | | 11/14/21 | | 675 | | | 692 | |
| 5 | | AbbVie Inc. | | 2.150% | | 11/19/21 | | 7,000 | | | 7,018 | |
| | | AbbVie Inc. | | 2.900% | | 11/6/22 | | 2,680 | | | 2,733 | |
| | | AbbVie Inc. | | 3.200% | | 11/6/22 | | 2,058 | | | 2,116 | |
| 5 | | AbbVie Inc. | | 2.300% | | 11/21/22 | | 8,000 | | | 8,030 | |
| | | AbbVie Inc. | | 2.850% | | 5/14/23 | | 100 | | | 102 | |
| | | AbbVie Inc. | | 3.750% | | 11/14/23 | | 725 | | | 763 | |
| 5 | | AbbVie Inc. | | 2.600% | | 11/21/24 | | 4,700 | | | 4,732 | |
| | | Actavis Inc. | | 3.250% | | 10/1/22 | | 416 | | | 425 | |
| | | Allergan Funding SCS | | 3.450% | | 3/15/22 | | 1,345 | | | 1,376 | |
| | | Allergan Funding SCS | | 3.850% | | 6/15/24 | | 1,914 | | | 2,005 | |
| | | Allergan Inc. | | 2.800% | | 3/15/23 | | 200 | | | 201 | |
| 5 | | Allergan Sales LLC | | 5.000% | | 12/15/21 | | 800 | | | 836 | |
| | | Altria Group Inc. | | 3.490% | | 2/14/22 | | 4,250 | | | 4,372 | |
| | | Altria Group Inc. | | 2.850% | | 8/9/22 | | 740 | | | 754 | |
| | | AmerisourceBergen Corp. | | 3.500% | | 11/15/21 | | 300 | | | 307 | |
| | | Amgen Inc. | | 2.700% | | 5/1/22 | | 465 | | | 471 | |
| | | Amgen Inc. | | 2.650% | | 5/11/22 | | 910 | | | 923 | |
| | | Amgen Inc. | | 3.625% | | 5/15/22 | | 149 | | | 154 | |
| | | Anheuser-Busch InBev Finance Inc. | | 3.300% | | 2/1/23 | | 979 | | | 1,013 | |
| | | Anheuser-Busch InBev Worldwide Inc. | | 2.500% | | 7/15/22 | | 70 | | | 71 | |
| | | Anheuser-Busch InBev Worldwide Inc. | | 4.150% | | 1/23/25 | | 2,750 | | | 2,992 | |
| 5 | | Aramark Services Inc. | | 5.000% | | 2/1/28 | | 30 | | | 32 | |
| | | AstraZeneca plc | | 3.500% | | 8/17/23 | | 290 | | | 303 | |
| | | BAT Capital Corp. | | 2.764% | | 8/15/22 | | 3,035 | | | 3,077 | |
| | | BAT Capital Corp. | | 3.222% | | 8/15/24 | | 1,500 | | | 1,532 | |
| 6 | | BAT International Finance plc | | 4.875% | | 2/24/21 | | 360 | | | 426 | |
| 8 | | BAT International Finance plc | | 1.750% | | 7/5/21 | | 420 | | | 561 | |
| 5 | | BAT International Finance plc | | 3.250% | | 6/7/22 | | 735 | | | 751 | |
| 5 | | Bausch Health Cos Inc. | | 6.500% | | 3/15/22 | | 80 | | | 82 | |
| 5 | | Bausch Health Cos. Inc. | | 7.000% | | 3/15/24 | | 250 | | | 260 | |
| 5 | | Bausch Health Cos. Inc. | | 7.000% | | 1/15/28 | | 30 | | | 33 | |
| 5 | | Bausch Health Cos. Inc. | | 5.000% | | 1/30/28 | | 70 | | | 72 | |
| 5 | | Bausch Health Cos. Inc. | | 5.250% | | 1/30/30 | | 55 | | | 57 | |
| | | Baxalta Inc. | | 3.600% | | 6/23/22 | | 100 | | | 103 | |
| | | Baxter International Inc. | | 1.700% | | 8/15/21 | | 600 | | | 599 | |
| | | Becton Dickinson & Co. | | 3.125% | | 11/8/21 | | 900 | | | 917 | |
| | | Becton Dickinson & Co. | | 2.894% | | 6/6/22 | | 400 | | | 406 | |
| | | Becton Dickinson & Co. | | 3.363% | | 6/6/24 | | 1,110 | | | 1,154 | |
| 6 | | Becton Dickinson Euro Finance Sarl | | 0.174% | | 6/4/21 | | 2,085 | | | 2,345 | |
| | | Biogen Inc. | | 3.625% | | 9/15/22 | | 1,245 | | | 1,295 | |
| | | Boston Scientific Corp. | | 3.450% | | 3/1/24 | | 835 | | | 873 | |
| 5 | | Bristol-Myers Squibb Co. | | 2.550% | | 5/14/21 | | 3,315 | | | 3,347 | |
| 5 | | Bristol-Myers Squibb Co. | | 2.250% | | 8/15/21 | | 300 | | | 302 | |
| 5 | | Bristol-Myers Squibb Co. | | 2.600% | | 5/16/22 | | 5,765 | | | 5,856 | |
| 5 | | Bristol-Myers Squibb Co. | | 3.250% | | 8/15/22 | | 1,665 | | | 1,716 | |
| 5 | | Bristol-Myers Squibb Co. | | 3.550% | | 8/15/22 | | 1,228 | | | 1,269 | |
| 5 | | Bristol-Myers Squibb Co. | | 2.750% | | 2/15/23 | | 1,500 | | | 1,524 | |
| 5 | | Bristol-Myers Squibb Co. | | 3.250% | | 2/20/23 | | 625 | | | 642 | |
| 5 | | Bristol-Myers Squibb Co. | | 3.625% | | 5/15/24 | | 400 | | | 421 | |
| | | Campbell Soup Co. | | 3.650% | | 3/15/23 | | 250 | | | 260 | |
| 5 | | Cigna Corp. | | 4.750% | | 11/15/21 | | 814 | | | 853 | |
| 5 | | Cigna Corp. | | 3.900% | | 2/15/22 | | 965 | | | 996 | |
| 5 | | Cigna Corp. | | 3.050% | | 11/30/22 | | 1,350 | | | 1,373 | |
| 5 | | Cigna Corp. | | 3.000% | | 7/15/23 | | 1,600 | | | 1,622 | |
| | | Cigna Corp. | | 3.750% | | 7/15/23 | | 1,300 | | | 1,356 | |
| 5 | | Cigna Corp. | | 3.500% | | 6/15/24 | | 1,000 | | | 1,041 | |
| 6 | | Coca-Cola Co. | | 0.125% | | 9/22/22 | | 300 | | | 339 | |
| 6 | | Coca-Cola Co. | | 1.125% | | 9/22/22 | | 900 | | | 1,043 | |
| | | Coca-Cola Co. | | 1.750% | | 9/6/24 | | 1,000 | | | 997 | |
| | | CommonSpirit Health | | 4.200% | | 8/1/23 | | 100 | | | 105 | |
| | | CommonSpirit Health | | 2.760% | | 10/1/24 | | 985 | | | 991 | |
| | | Conagra Brands Inc. | | 4.950% | | 8/15/20 | | 61 | | | 62 | |
| | | Conagra Brands Inc. | | 4.300% | | 5/1/24 | | 350 | | | 376 | |
| | | Constellation Brands Inc. | | 2.650% | | 11/7/22 | | 200 | | | 203 | |
| | | Constellation Brands Inc. | | 4.250% | | 5/1/23 | | 2,000 | | | 2,118 | |
| | | CVS Health Corp. | | 3.350% | | 3/9/21 | | 4,400 | | | 4,465 | |
| | | CVS Health Corp. | | 2.125% | | 6/1/21 | | 1,525 | | | 1,525 | |
| | | CVS Health Corp. | | 3.500% | | 7/20/22 | | 1,000 | | | 1,032 | |
| | | CVS Health Corp. | | 2.750% | | 12/1/22 | | 1,200 | | | 1,219 | |
| | | CVS Health Corp. | | 3.700% | | 3/9/23 | | 8,470 | | | 8,815 | |
| | | CVS Health Corp. | | 4.000% | | 12/5/23 | | 1,000 | | | 1,058 | |
| | | CVS Health Corp. | | 2.625% | | 8/15/24 | | 2,200 | | | 2,220 | |
| | | DaVita Inc. | | 5.000% | | 5/1/25 | | 10 | | | 10 | |
| | | DH Europe Finance II Sarl | | 2.050% | | 11/15/22 | | 2,400 | | | 2,397 | |
| | | DH Europe Finance II Sarl | | 2.200% | | 11/15/24 | | 700 | | | 698 | |
| 6 | | DH Europe Finance SA | | 1.700% | | 1/4/22 | | 300 | | | 348 | |
| 6 | | Diageo Finance plc | | 0.250% | | 10/22/21 | | 1,400 | | | 1,581 | |
| | | Encompass Health Corp. | | 4.500% | | 2/1/28 | | 20 | | | 21 | |
| | | Estee Lauder Cos. Inc. | | 2.000% | | 12/1/24 | | 500 | | | 501 | |
| | | Express Scripts Holding Co. | | 2.600% | | 11/30/20 | | 700 | | | 703 | |
| 7 | | FBG Finance Pty Ltd. | | 3.750% | | 8/7/20 | | 510 | | | 362 | |
| | | General Mills Inc. | | 3.200% | | 4/16/21 | | 715 | | | 726 | |
| | | General Mills Inc. | | 2.600% | | 10/12/22 | | 600 | | | 609 | |
| | | Gilead Sciences Inc. | | 3.250% | | 9/1/22 | | 707 | | | 730 | |
| | | Gilead Sciences Inc. | | 2.500% | | 9/1/23 | | 425 | | | 431 | |
| | | Gilead Sciences Inc. | | 3.700% | | 4/1/24 | | 600 | | | 637 | |
| | | GlaxoSmithKline Capital plc | | 2.875% | | 6/1/22 | | 6,800 | | | 6,945 | |
| | | Grupo Bimbo SAB de CV | | 4.500% | | 1/25/22 | | 265 | | | 275 | |
| 5 | | Grupo Bimbo SAB de CV | | 4.500% | | 1/25/22 | | 300 | | | 312 | |
| | | HCA Inc. | | 5.000% | | 3/15/24 | | 2,170 | | | 2,368 | |
| | | HCA Inc. | | 5.375% | | 2/1/25 | | 40 | | | 44 | |
| | | HCA Inc. | | 5.375% | | 9/1/26 | | 80 | | | 89 | |
| 5 | | Hill-Rom Holdings Inc. | | 4.375% | | 9/15/27 | | 20 | | | 21 | |
| 5 | | Hologic Inc. | | 4.375% | | 10/15/25 | | 350 | | | 361 | |
| 6 | | Johnson & Johnson | | 0.250% | | 1/20/22 | | 445 | | | 504 | |
| | | Kellogg Co. | | 3.125% | | 5/17/22 | | 100 | | | 102 | |
| | | Keurig Dr Pepper Inc. | | 3.551% | | 5/25/21 | | 4,079 | | | 4,163 | |
| | | Keurig Dr Pepper Inc. | | 4.057% | | 5/25/23 | | 2,600 | | | 2,741 | |
| | | Keurig Dr Pepper Inc. | | 3.130% | | 12/15/23 | | 300 | | | 308 | |
| 5 | | Kraft Heinz Foods Co. | | 4.875% | | 2/15/25 | | 1,913 | | | 1,966 | |
| | | Kroger Co. | | 6.150% | | 1/15/20 | | 350 | | | 350 | |
| | | Kroger Co. | | 2.600% | | 2/1/21 | | 950 | | | 956 | |
| | | Kroger Co. | | 2.950% | | 11/1/21 | | 1,090 | | | 1,106 | |
| | | Kroger Co. | | 2.800% | | 8/1/22 | | 700 | | | 713 | |
| | | Kroger Co. | | 3.850% | | 8/1/23 | | 200 | | | 211 | |
| | | Kroger Co. | | 4.000% | | 2/1/24 | | 409 | | | 434 | |
| | | Laboratory Corp. of America Holdings | | 3.750% | | 8/23/22 | | 700 | | | 726 | |
| 5 | | Lamb Weston Holdings Inc. | | 4.625% | | 11/1/24 | | 147 | | | 156 | |
| 5 | | Lamb Weston Holdings Inc. | | 4.875% | | 11/1/26 | | 70 | | | 74 | |
| | | McCormick & Co. Inc. | | 2.700% | | 8/15/22 | | 100 | | | 102 | |
Short-Term Investment-Grade Portfolio
| | | | | | | | | Face | | | Market | |
| | | | | | | Maturity | | Amount | | | Value• | |
| | | | | Coupon | | Date | | ($000 | ) | | ($000 | ) |
| | | McCormick & Co. Inc. | | 3.150% | | 8/15/24 | | 100 | | | 104 | |
| | | McKesson Corp. | | 2.700% | | 12/15/22 | | 1,700 | | | 1,720 | |
| | | McKesson Corp. | | 2.850% | | 3/15/23 | | 550 | | | 558 | |
| | | McKesson Corp. | | 3.796% | | 3/15/24 | | 500 | | | 526 | |
| 6 | | Medtronic Global Holdings SCA | | 0.000% | | 3/7/21 | | 3,900 | | | 4,385 | |
| 6 | | Merck & Co. Inc. | | 1.125% | | 10/15/21 | | 890 | | | 1,015 | |
| 5 | | Mondelez International Holdings Netherlands BV | | 2.250% | | 9/19/24 | | 200 | | | 200 | |
| 5 | | Mylan Inc. | | 3.125% | | 1/15/23 | | 865 | | | 876 | |
| | | Mylan NV | | 3.150% | | 6/15/21 | | 1,500 | | | 1,515 | |
| 6 | | Mylan NV | | 2.250% | | 11/22/24 | | 220 | | | 262 | |
| | | Novartis Capital Corp. | | 2.400% | | 9/21/22 | | 294 | | | 298 | |
| 5 | | Performance Food Group Inc. | | 5.500% | | 6/1/24 | | 99 | | | 101 | |
| 5 | | Performance Food Group Inc. | | 5.500% | | 10/15/27 | | 50 | | | 53 | |
| 5 | | Pernod Ricard SA | | 5.750% | | 4/7/21 | | 679 | | | 711 | |
| 5 | | Pernod Ricard SA | | 4.450% | | 1/15/22 | | 365 | | | 382 | |
| 5 | | Pernod Ricard SA | | 4.250% | | 7/15/22 | | 285 | | | 300 | |
| | | Philip Morris International Inc. | | 2.500% | | 8/22/22 | | 600 | | | 606 | |
| | | Philip Morris International Inc. | | 2.500% | | 11/2/22 | | 735 | | | 746 | |
| | | Philip Morris International Inc. | | 2.625% | | 3/6/23 | | 225 | | | 229 | |
| | | Philip Morris International Inc. | | 2.125% | | 5/10/23 | | 400 | | | 400 | |
| 5 | | Post Holdings Inc. | | 5.750% | | 3/1/27 | | 20 | | | 21 | |
| 5 | | Reckitt Benckiser Treasury Services plc | | 2.375% | | 6/24/22 | | 5,840 | | | 5,864 | |
| 5 | | Reckitt Benckiser Treasury Services plc | | 2.750% | | 6/26/24 | | 3,450 | | | 3,507 | |
| | | Reynolds American Inc. | | 4.000% | | 6/12/22 | | 1,458 | | | 1,517 | |
| | | Shire Acquisitions Investments Ireland DAC | | 2.400% | | 9/23/21 | | 5,175 | | | 5,201 | |
| | | Shire Acquisitions Investments Ireland DAC | | 2.875% | | 9/23/23 | | 2,300 | | | 2,341 | |
| | | SSM Health Care Corp. | | 3.688% | | 6/1/23 | | 750 | | | 780 | |
| | | Takeda Pharmaceutical Co. Ltd. | | 4.000% | | 11/26/21 | | 4,965 | | | 5,128 | |
| 5 | | Takeda Pharmaceutical Co. Ltd. | | 2.450% | | 1/18/22 | | 600 | | | 602 | |
| | | Takeda Pharmaceutical Co. Ltd. | | 4.400% | | 11/26/23 | | 1,457 | | | 1,562 | |
| 5 | | Tenet Healthcare Corp. | | 4.625% | | 9/1/24 | | 50 | | | 52 | |
| 5 | | Tenet Healthcare Corp. | | 4.875% | | 1/1/26 | | 165 | | | 173 | |
| | | Thermo Fisher Scientific Inc. | | 3.000% | | 4/15/23 | | 500 | | | 514 | |
| | | Tyson Foods Inc. | | 4.500% | | 6/15/22 | | 300 | | | 316 | |
| | | Tyson Foods Inc. | | 3.900% | | 9/28/23 | | 1,000 | | | 1,060 | |
| | | Tyson Foods Inc. | | 3.950% | | 8/15/24 | | 900 | | | 962 | |
| | | Unilever Capital Corp. | | 2.600% | | 5/5/24 | | 1,000 | | | 1,022 | |
| | | Zimmer Biomet Holdings Inc. | | 2.700% | | 4/1/20 | | 2,100 | | | 2,102 | |
| | | Zimmer Biomet Holdings Inc. | | 3.150% | | 4/1/22 | | 655 | | | 669 | |
| | | Zoetis Inc. | | 3.250% | | 2/1/23 | | 200 | | | 206 | |
| | | | | | | | | | | | | |
| | | Energy (6.5%) | | | | | | | | | | |
| | | Baker Hughes a GE Co. LLC / Baker Hughes Co-Obligor Inc. | | 2.773% | | 12/15/22 | | 1,023 | | | 1,043 | |
| | | BP Capital Markets America Inc. | | 4.742% | | 3/11/21 | | 1,215 | | | 1,256 | |
| | | BP Capital Markets America Inc. | | 3.245% | | 5/6/22 | | 1,165 | | | 1,202 | |
| | | BP Capital Markets America Inc. | | 2.520% | | 9/19/22 | | 1,455 | | | 1,477 | |
| | | BP Capital Markets America Inc. | | 2.750% | | 5/10/23 | | 1,745 | | | 1,784 | |
| | | BP Capital Markets America Inc. | | 3.216% | | 11/28/23 | | 3,370 | | | 3,502 | |
| | | BP Capital Markets America Inc. | | 3.790% | | 2/6/24 | | 1,685 | | | 1,792 | |
| | | BP Capital Markets America Inc. | | 3.224% | | 4/14/24 | | 620 | | | 647 | |
| | | BP Capital Markets plc | | 2.500% | | 11/6/22 | | 620 | | | 631 | |
| | | Buckeye Partners LP | | 4.150% | | 7/1/23 | | 95 | | | 95 | |
| | | Buckeye Partners LP | | 3.950% | | 12/1/26 | | 20 | | | 19 | |
| | | Canadian Natural Resources Ltd. | | 2.950% | | 1/15/23 | | 2,135 | | | 2,175 | |
| | | Canadian Natural Resources Ltd. | | 3.800% | | 4/15/24 | | 535 | | | 559 | |
| | | Cenovus Energy Inc. | | 3.000% | | 8/15/22 | | 500 | | | 506 | |
| | | Cenovus Energy Inc. | | 3.800% | | 9/15/23 | | 355 | | | 368 | |
| | | Cheniere Corpus Christi Holdings LLC | | 7.000% | | 6/30/24 | | 1,810 | | | 2,086 | |
| | | Cheniere Corpus Christi Holdings LLC | | 5.875% | | 3/31/25 | | 1,620 | | | 1,822 | |
| | | Cimarex Energy Co. | | 4.375% | | 6/1/24 | | 295 | | | 311 | |
| | | Concho Resources Inc. | | 4.375% | | 1/15/25 | | 1,380 | | | 1,426 | |
| | | ConocoPhillips Co. | | 2.400% | | 12/15/22 | | 710 | | | 716 | |
| | | Continental Resources Inc. | | 5.000% | | 9/15/22 | | 1,057 | | | 1,064 | |
| | | Continental Resources Inc. | | 4.500% | | 4/15/23 | | 165 | | | 173 | |
| | | Continental Resources Inc. | | 3.800% | | 6/1/24 | | 820 | | | 848 | |
| | | Diamondback Energy Inc. | | 2.875% | | 12/1/24 | | 1,480 | | | 1,494 | |
| | | Dominion Energy Gas Holdings LLC | | 3.550% | | 11/1/23 | | 300 | | | 310 | |
| | | Enbridge Energy Partners LP | | 5.875% | | 10/15/25 | | 320 | | | 373 | |
| | | Enbridge Inc. | | 4.000% | | 10/1/23 | | 900 | | | 950 | |
| | | Enbridge Inc. | | 2.500% | | 1/15/25 | | 1,075 | | | 1,082 | |
| | | Encana Corp. | | 3.900% | | 11/15/21 | | 140 | | | 143 | |
| | | Energy Transfer Operating LP | | 4.150% | | 10/1/20 | | 1,366 | | | 1,380 | |
| | | Energy Transfer Operating LP | | 4.650% | | 6/1/21 | | 400 | | | 410 | |
| | | Energy Transfer Operating LP | | 5.200% | | 2/1/22 | | 1,085 | | | 1,137 | |
| | | Energy Transfer Operating LP | | 4.250% | | 3/15/23 | | 434 | | | 453 | |
| | | Energy Transfer Operating LP | | 4.200% | | 9/15/23 | | 1,174 | | | 1,231 | |
| | | Energy Transfer Operating LP | | 5.875% | | 1/15/24 | | 60 | | | 66 | |
| | | Energy Transfer Operating LP | | 4.900% | | 2/1/24 | | 1,210 | | | 1,292 | |
| | | Energy Transfer Operating LP | | 4.500% | | 4/15/24 | | 510 | | | 541 | |
| 5 | | Eni SPA | | 4.000% | | 9/12/23 | | 1,845 | | | 1,943 | |
| | | Enterprise Products Operating LLC | | 3.500% | | 2/1/22 | | 1,820 | | | 1,874 | |
| | | Enterprise Products Operating LLC | | 3.900% | | 2/15/24 | | 875 | | | 929 | |
| | | EQT Corp. | | 2.500% | | 10/1/20 | | 700 | | | 699 | |
| | | EQT Corp. | | 4.875% | | 11/15/21 | | 2,005 | | | 2,059 | |
| | | EQT Corp. | | 3.000% | | 10/1/22 | | 110 | | | 108 | |
| | | Exxon Mobil Corp. | | 2.019% | | 8/16/24 | | 1,795 | | | 1,799 | |
| | | Husky Energy Inc. | | 3.950% | | 4/15/22 | | 40 | | | 41 | |
| | | Husky Energy Inc. | | 4.000% | | 4/15/24 | | 95 | | | 100 | |
| | | Kinder Morgan Energy Partners LP | | 5.800% | | 3/1/21 | | 145 | | | 151 | |
| | | Kinder Morgan Energy Partners LP | | 5.000% | | 10/1/21 | | 360 | | | 375 | |
| | | Kinder Morgan Energy Partners LP | | 4.150% | | 3/1/22 | | 115 | | | 120 | |
| | | Kinder Morgan Energy Partners LP | | 3.950% | | 9/1/22 | | 2,300 | | | 2,396 | |
| | | Kinder Morgan Energy Partners LP | | 3.450% | | 2/15/23 | | 1,005 | | | 1,035 | |
| | | Kinder Morgan Energy Partners LP | | 3.500% | | 9/1/23 | | 390 | | | 404 | |
| | | Kinder Morgan Energy Partners LP | | 4.300% | | 5/1/24 | | 295 | | | 315 | |
| 5 | | Kinder Morgan Inc. | | 5.000% | | 2/15/21 | | 825 | | | 849 | |
| | | Kinder Morgan Inc. | | 3.150% | | 1/15/23 | | 2,155 | | | 2,203 | |
| 5 | | Kinder Morgan Inc. | | 5.625% | | 11/15/23 | | 1,000 | | | 1,107 | |
| | | Marathon Oil Corp. | | 2.800% | | 11/1/22 | | 2,510 | | | 2,548 | |
| | | Marathon Petroleum Corp. | | 3.400% | | 12/15/20 | | 715 | | | 723 | |
| | | Marathon Petroleum Corp. | | 5.125% | | 3/1/21 | | 900 | | | 931 | |
| | | Marathon Petroleum Corp. | | 4.750% | | 12/15/23 | | 1,120 | | | 1,216 | |
| | | Marathon Petroleum Corp. | | 3.625% | | 9/15/24 | | 480 | | | 503 | |
| 5 | | MEG Energy Corp. | | 6.500% | | 1/15/25 | | 107 | | | 112 | |
| 5 | | Midwest Connector Capital Co. LLC | | 3.625% | | 4/1/22 | | 1,600 | | | 1,640 | |
| 5 | | Midwest Connector Capital Co. LLC | | 3.900% | | 4/1/24 | | 1,175 | | | 1,234 | |
| 5 | | MPLX LP | | 3.500% | | 12/1/22 | | 953 | | | 981 | |
| | | MPLX LP | | 3.375% | | 3/15/23 | | 625 | | | 641 | |
| | | MPLX LP | | 4.500% | | 7/15/23 | | 70 | | | 74 | |
| | | MPLX LP | | 4.875% | | 12/1/24 | | 920 | | | 998 | |
| | | Newfield Exploration Co. | | 5.750% | | 1/30/22 | | 1,750 | | | 1,859 | |
| | | Newfield Exploration Co. | | 5.625% | | 7/1/24 | | 820 | | | 902 | |
| | | Noble Energy Inc. | | 3.900% | | 11/15/24 | | 600 | | | 634 | |
| | | Occidental Petroleum Corp. | | 4.850% | | 3/15/21 | | 300 | | | 309 | |
| | | Occidental Petroleum Corp. | | 2.600% | | 8/13/21 | | 2,220 | | | 2,233 | |
| | | Occidental Petroleum Corp. | | 3.125% | | 2/15/22 | | 1,240 | | | 1,260 | |
| | | Occidental Petroleum Corp. | | 2.600% | | 4/15/22 | | 75 | | | 76 | |
| | | Occidental Petroleum Corp. | | 2.700% | | 8/15/22 | | 4,325 | | | 4,372 | |
| | | Occidental Petroleum Corp. | | 2.900% | | 8/15/24 | | 1,050 | | | 1,067 | |
| | | ONEOK Inc. | | 2.750% | | 9/1/24 | | 955 | | | 960 | |
| | | ONEOK Partners LP | | 3.375% | | 10/1/22 | | 145 | | | 149 | |
| | | ONEOK Partners LP | | 5.000% | | 9/15/23 | | 610 | | | 661 | |
| 5 | | Parsley Energy LLC / Parsley Finance Corp. | | 5.375% | | 1/15/25 | | 50 | | | 51 | |
| | | Phillips 66 | | 4.300% | | 4/1/22 | | 1,535 | | | 1,610 | |
| | | Pioneer Natural Resources Co. | | 3.950% | | 7/15/22 | | 35 | | | 36 | |
| | | Plains All American Pipeline LP / PAA Finance Corp. | | 5.000% | | 2/1/21 | | 615 | | | 629 | |
| | | Plains All American Pipeline LP / PAA Finance Corp. | | 3.650% | | 6/1/22 | | 885 | | | 908 | |
| | | Plains All American Pipeline LP / PAA Finance Corp. | | 3.850% | | 10/15/23 | | 300 | | | 311 | |
| | | Plains All American Pipeline LP / PAA Finance Corp. | | 4.650% | | 10/15/25 | | 350 | | | 374 | |
| | | Regency Energy Partners LP / Regency Energy Finance Corp. | | 5.875% | | 3/1/22 | | 1,890 | | | 2,007 | |
| | | Regency Energy Partners LP / Regency Energy Finance Corp. | | 5.000% | | 10/1/22 | | 1,555 | | | 1,646 | |
Short-Term Investment-Grade Portfolio
| | | | | | | | | Face | | | Market | |
| | | | | | | Maturity | | Amount | | | Value• | |
| | | | | Coupon | | Date | | ($000 | ) | | ($000 | ) |
| | | Regency Energy Partners LP / Regency Energy Finance Corp. | | 4.500% | | 11/1/23 | | 1,180 | | | 1,248 | |
| | | Sabine Pass Liquefaction LLC | | 5.625% | | 2/1/21 | | 1,660 | | | 1,706 | |
| | | Sabine Pass Liquefaction LLC | | 6.250% | | 3/15/22 | | 550 | | | 591 | |
| | | Sabine Pass Liquefaction LLC | | 5.625% | | 4/15/23 | | 2,295 | | | 2,496 | |
| | | Sabine Pass Liquefaction LLC | | 5.750% | | 5/15/24 | | 1,355 | | | 1,512 | |
| | | Sabine Pass Liquefaction LLC | | 5.625% | | 3/1/25 | | 1,405 | | | 1,579 | |
| | | Shell International Finance BV | | 1.875% | | 5/10/21 | | 1,295 | | | 1,294 | |
| | | Shell International Finance BV | | 2.250% | | 1/6/23 | | 3,305 | | | 3,331 | |
| | | Shell International Finance BV | | 3.400% | | 8/12/23 | | 120 | | | 126 | |
| | | Shell International Finance BV | | 2.000% | | 11/7/24 | | 3,895 | | | 3,889 | |
| | | SM Energy Co. | | 6.125% | | 11/15/22 | | 20 | | | 20 | |
| | | Southern Natural Gas Co. LLC / Southern Natural Issuing Corp. | | 4.400% | | 6/15/21 | | 155 | | | 159 | |
| | | Spectra Energy Partners LP | | 3.500% | | 3/15/25 | | 40 | | | 42 | |
| | | Sunoco Logistics Partners Operations LP | | 4.400% | | 4/1/21 | | 1,480 | | | 1,515 | |
| | | Sunoco Logistics Partners Operations LP | | 3.450% | | 1/15/23 | | 485 | | | 495 | |
| | | Sunoco Logistics Partners Operations LP | | 4.250% | | 4/1/24 | | 1,035 | | | 1,086 | |
| | | Targa Resources Partners LP / Targa Resources Partners Finance Corp. | | 6.750% | | 3/15/24 | | 90 | | | 93 | |
| 5 | | Targa Resources Partners LP / Targa Resources Partners Finance Corp. | | 6.500% | | 7/15/27 | | 30 | | | 33 | |
| | | Total Capital Canada Ltd. | | 2.750% | | 7/15/23 | | 1,325 | | | 1,356 | |
| | | Total Capital International SA | | 2.875% | | 2/17/22 | | 825 | | | 842 | |
| | | Total Capital International SA | | 2.700% | | 1/25/23 | | 275 | | | 281 | |
| | | Total Capital International SA | | 2.434% | | 1/10/25 | | 1,580 | | | 1,598 | |
| | | Total Capital SA | | 4.250% | | 12/15/21 | | 475 | | | 496 | |
| | | TransCanada PipeLines Ltd. | | 2.500% | | 8/1/22 | | 1,895 | | | 1,904 | |
| | | TransCanada PipeLines Ltd. | | 3.750% | | 10/16/23 | | 710 | | | 744 | |
| | | Western Midstream Operating LP | | 5.375% | | 6/1/21 | | 60 | | | 62 | |
| | | Western Midstream Operating LP | | 4.000% | | 7/1/22 | | 245 | | | 250 | |
| | | Williams Cos. Inc. | | 5.250% | | 3/15/20 | | 1,179 | | | 1,186 | |
| | | Williams Cos. Inc. | | 4.125% | | 11/15/20 | | 1,025 | | | 1,037 | |
| | | Williams Cos. Inc. | | 7.875% | | 9/1/21 | | 120 | | | 131 | |
| | | Williams Cos. Inc. | | 4.000% | | 11/15/21 | | 395 | | | 406 | |
| | | Williams Cos. Inc. | | 3.600% | | 3/15/22 | | 1,145 | | | 1,177 | |
| | | Williams Cos. Inc. | | 3.350% | | 8/15/22 | | 270 | | | 277 | |
| | | Williams Cos. Inc. | | 3.700% | | 1/15/23 | | 680 | | | 702 | |
| | | Williams Cos. Inc. | | 4.300% | | 3/4/24 | | 495 | | | 526 | |
| | | Williams Cos. Inc. | | 4.550% | | 6/24/24 | | 695 | | | 749 | |
| | | WPX Energy Inc. | | 5.250% | | 10/15/27 | | 20 | | | 21 | |
| | | | | | | | | | | | | |
| | | Other Industrial (0.1%) | | | | | | | | | | |
| 5 | | CK Hutchison International 17 II Ltd. | | 2.250% | | 9/29/20 | | 2,365 | | | 2,365 | |
| | | | | | | | | | | | | |
| | | Technology (3.3%) | | | | | | | | | | |
| | | Apple Inc. | | 2.400% | | 1/13/23 | | 100 | | | 101 | |
| | | Apple Inc. | | 2.850% | | 2/23/23 | | 100 | | | 103 | |
| | | Apple Inc. | | 2.400% | | 5/3/23 | | 555 | | | 564 | |
| | | Apple Inc. | | 3.000% | | 2/9/24 | | 379 | | | 392 | |
| | | Apple Inc. | | 3.450% | | 5/6/24 | | 1,870 | | | 1,987 | |
| | | Apple Inc. | | 2.850% | | 5/11/24 | | 3,091 | | | 3,194 | |
| | | Apple Inc. | | 2.750% | | 1/13/25 | | 1,175 | | | 1,213 | |
| | | Broadcom Corp. / Broadcom Cayman Finance Ltd. | | 2.200% | | 1/15/21 | | 280 | | | 280 | |
| | | Broadcom Corp. / Broadcom Cayman Finance Ltd. | | 3.000% | | 1/15/22 | | 3,580 | | | 3,636 | |
| | | Broadcom Corp. / Broadcom Cayman Finance Ltd. | | 2.650% | | 1/15/23 | | 950 | | | 955 | |
| 5 | | Broadcom Inc. | | 3.125% | | 4/15/21 | | 1,300 | | | 1,315 | |
| 5 | | Broadcom Inc. | | 3.125% | | 10/15/22 | | 1,350 | | | 1,373 | |
| | | CDK Global Inc. | | 4.875% | | 6/1/27 | | 15 | | | 16 | |
| | | CDW LLC / CDW Finance Corp. | | 4.250% | | 4/1/28 | | 30 | | | 32 | |
| 5 | | CommScope Finance LLC | | 5.500% | | 3/1/24 | | 90 | | | 94 | |
| 5 | | Dell International LLC / EMC Corp. | | 4.420% | | 6/15/21 | | 3,780 | | | 3,885 | |
| 5 | | Dell International LLC / EMC Corp. | | 4.000% | | 7/15/24 | | 275 | | | 288 | |
| | | Equifax Inc. | | 2.600% | | 12/1/24 | | 406 | | | 408 | |
| 6 | | Fidelity National Information Services Inc. | | 0.125% | | 5/21/21 | | 600 | | | 675 | |
| 6 | | Fidelity National Information Services Inc. | | 0.125% | | 12/3/22 | | 1,000 | | | 1,123 | |
| | | Fiserv Inc. | | 2.750% | | 7/1/24 | | 4,330 | | | 4,405 | |
| | | Hewlett Packard Enterprise Co. | | 4.400% | | 10/15/22 | | 1,150 | | | 1,214 | |
| | | International Business Machines Corp. | | 2.800% | | 5/13/21 | | 1,250 | | | 1,267 | |
| 6 | | International Business Machines Corp. | | 0.500% | | 9/7/21 | | 450 | | | 510 | |
| | | International Business Machines Corp. | | 2.500% | | 1/27/22 | | 1,000 | | | 1,012 | |
| | | International Business Machines Corp. | | 2.850% | | 5/13/22 | | 6,310 | | | 6,446 | |
| | | International Business Machines Corp. | | 1.875% | | 8/1/22 | | 355 | | | 355 | |
| | | International Business Machines Corp. | | 3.000% | | 5/15/24 | | 1,445 | | | 1,496 | |
| | | Marvell Technology Group Ltd. | | 4.200% | | 6/22/23 | | 750 | | | 788 | |
| 5 | | MSCI Inc. | | 5.250% | | 11/15/24 | | 162 | | | 167 | |
| 5 | | NXP BV / NXP Funding LLC | | 3.875% | | 9/1/22 | | 2,600 | | | 2,699 | |
| 5 | | NXP BV / NXP Funding LLC | | 4.625% | | 6/1/23 | | 500 | | | 534 | |
| 5 | | NXP BV / NXP Funding LLC | | 4.875% | | 3/1/24 | | 1,250 | | | 1,358 | |
| | | Oracle Corp. | | 2.500% | | 10/15/22 | | 200 | | | 203 | |
| | | Oracle Corp. | | 2.625% | | 2/15/23 | | 1,348 | | | 1,374 | |
| | | Oracle Corp. | | 3.625% | | 7/15/23 | | 200 | | | 211 | |
| | | Oracle Corp. | | 2.400% | | 9/15/23 | | 2,477 | | | 2,517 | |
| | | Oracle Corp. | | 2.950% | | 11/15/24 | | 1,745 | | | 1,809 | |
| | | PayPal Holdings Inc. | | 2.200% | | 9/26/22 | | 2,900 | | | 2,916 | |
| 5 | | Qorvo Inc. | | 4.375% | | 10/15/29 | | 70 | | | 73 | |
| | | QUALCOMM Inc. | | 2.600% | | 1/30/23 | | 2,985 | | | 3,037 | |
| | | QUALCOMM Inc. | | 2.900% | | 5/20/24 | | 500 | | | 515 | |
| 5 | | SS&C Technologies Inc. | | 5.500% | | 9/30/27 | | 20 | | | 21 | |
| | | Total System Services Inc. | | 3.800% | | 4/1/21 | | 1,500 | | | 1,528 | |
| | | Tyco Electronics Group SA | | 4.875% | | 1/15/21 | | 380 | | | 391 | |
| | | Tyco Electronics Group SA | | 3.500% | | 2/3/22 | | 375 | | | 386 | |
| | | Tyco Electronics Group SA | | 3.450% | | 8/1/24 | | 430 | | | 448 | |
| | | Verisk Analytics Inc. | | 5.800% | | 5/1/21 | | 315 | | | 330 | |
| | | Verisk Analytics Inc. | | 4.125% | | 9/12/22 | | 450 | | | 470 | |
| | | VMware Inc. | | 2.300% | | 8/21/20 | | 650 | | | 651 | |
| | | VMware Inc. | | 2.950% | | 8/21/22 | | 1,090 | | | 1,110 | |
| | | Western Digital Corp. | | 4.750% | | 2/15/26 | | 30 | | | 31 | |
| | | | | | | | | | | | | |
| | | Transportation (1.6%) | | | | | | | | | | |
| 5 | | Air Canada | | 7.750% | | 4/15/21 | | 1,692 | | | 1,796 | |
| 2,5 | | Air Canada 2013-1 Class B Pass Through Trust | | 5.375% | | 5/15/21 | | 593 | | | 609 | |
| 7 | | Aurizon Network Pty Ltd. | | 5.750% | | 10/28/20 | | 640 | | | 464 | |
| 7 | | Aurizon Network Pty Ltd. | | 4.000% | | 6/21/24 | | 240 | | | 179 | |
| | | Burlington Northern Santa Fe LLC | | 3.050% | | 3/15/22 | | 200 | | | 204 | |
| | | Canadian National Railway Co. | | 2.850% | | 12/15/21 | | 200 | | | 203 | |
| 2 | | Continental Airlines 2000-1 Class A-1 Pass Through Trust | | 8.048% | | 11/1/20 | | 45 | | | 46 | |
| 2 | | Continental Airlines 2005-ERJ1 Pass Through Trust | | 9.798% | | 10/1/22 | | 163 | | | 168 | |
| 2 | | Continental Airlines 2010-1 Class A Pass Through Trust | | 4.750% | | 7/12/22 | | 64 | | | 65 | |
| 2 | | Continental Airlines 2012-2 Class B Pass Through Trust | | 5.500% | | 4/29/22 | | 102 | | | 104 | |
| | | CSX Corp. | | 3.400% | | 8/1/24 | | 1,065 | | | 1,121 | |
| 2 | | CSX Transportation Inc. | | 6.251% | | 1/15/23 | | 89 | | | 97 | |
| 2 | | Delta Air Lines 2007-1 Class B Pass Through Trust | | 8.021% | | 8/10/22 | | 138 | | | 152 | |
| 2 | | Delta Air Lines 2012-1 Class A Pass Through Trust | | 4.750% | | 11/7/21 | | 116 | | | 117 | |
| | | Delta Air Lines Inc. | | 3.400% | | 4/19/21 | | 2,845 | | | 2,879 | |
| | | Delta Air Lines Inc. | | 3.800% | | 4/19/23 | | 1,725 | | | 1,789 | |
| | | Delta Air Lines Inc. | | 2.900% | | 10/28/24 | | 595 | | | 596 | |
| 5 | | ERAC USA Finance LLC | | 2.600% | | 12/1/21 | | 300 | | | 302 | |
| 5 | | ERAC USA Finance LLC | | 3.300% | | 10/15/22 | | 1,000 | | | 1,029 | |
| 5 | | ERAC USA Finance LLC | | 2.700% | | 11/1/23 | | 700 | | | 709 | |
| | | FedEx Corp. | | 3.400% | | 1/14/22 | | 645 | | | 662 | |
| 2,5 | | Heathrow Funding Ltd. | | 4.875% | | 7/15/23 | | 1,265 | | | 1,309 | |
| | | Norfolk Southern Corp. | | 3.250% | | 12/1/21 | | 100 | | | 102 | |
| | | Norfolk Southern Corp. | | 2.903% | | 2/15/23 | | 165 | | | 169 | |
| 5 | | Penske Truck Leasing Co. LP / PTL Finance Corp. | | 3.200% | | 7/15/20 | | 150 | | | 151 | |
Short-Term Investment-Grade Portfolio
| | | | | | | | | Face | | | Market | |
| | | | | | | Maturity | | Amount | | | Value• | |
| | | | | Coupon | | Date | | ($000 | ) | | ($000 | ) |
| 5 | | Penske Truck Leasing Co. LP / PTL Finance Corp. | | 3.300% | | 4/1/21 | | 1,100 | | | 1,115 | |
| 7 | | Qantas Airways Ltd. | | 7.500% | | 6/11/21 | | 1,300 | | | 986 | |
| 7 | | Qantas Airways Ltd. | | 7.750% | | 5/19/22 | | 780 | | | 620 | |
| | | Ryder System Inc. | | 2.875% | | 6/1/22 | | 1,350 | | | 1,374 | |
| | | Ryder System Inc. | | 2.500% | | 9/1/22 | | 300 | | | 302 | |
| | | Ryder System Inc. | | 3.650% | | 3/18/24 | | 2,105 | | | 2,210 | |
| | | Southwest Airlines Co. | | 2.750% | | 11/16/22 | | 1,000 | | | 1,014 | |
| 2 | | Southwest Airlines Co. 2007-1 Pass Through Trust | | 6.150% | | 2/1/24 | | 72 | | | 76 | |
| 2 | | Spirit Airlines Pass Through Trust 2017-1B | | 3.800% | | 2/15/26 | | 318 | | | 319 | |
| 2 | | UAL 2007-1 Pass Through Trust | | 6.636% | | 7/2/22 | | 505 | | | 537 | |
| | | Union Pacific Corp. | | 3.200% | | 6/8/21 | | 350 | | | 356 | |
| | | Union Pacific Corp. | | 2.950% | | 3/1/22 | | 2,319 | | | 2,368 | |
| | | Union Pacific Corp. | | 4.163% | | 7/15/22 | | 250 | | | 263 | |
| | | Union Pacific Corp. | | 2.950% | | 1/15/23 | | 797 | | | 817 | |
| | | Union Pacific Corp. | | 3.500% | | 6/8/23 | | 90 | | | 94 | |
| | | Union Pacific Corp. | | 3.150% | | 3/1/24 | | 1,440 | | | 1,496 | |
| | | United Parcel Service Inc. | | 2.350% | | 5/16/22 | | 230 | | | 232 | |
| | | United Parcel Service Inc. | | 2.450% | | 10/1/22 | | 1,000 | | | 1,016 | |
| 2 | | US Airways 2001-1C Pass Through Trust | | 7.346% | | 9/20/23 | | 130 | | | 140 | |
| 7 | | WSO Finance Pty Ltd. | | 3.500% | | 7/14/23 | | 310 | | | 228 | |
| | | | | | | | | | | | 598,734 | |
| Utilities (4.0%) | | | | | | | | | | |
| | | Electric (3.9%) | | | | | | | | | | |
| | | AEP Texas Inc. | | 2.400% | | 10/1/22 | | 700 | | | 705 | |
| | | Ameren Corp. | | 2.500% | | 9/15/24 | | 1,060 | | | 1,068 | |
| | | Ameren Illinois Co. | | 2.700% | | 9/1/22 | | 215 | | | 219 | |
| | | Baltimore Gas & Electric Co. | | 3.500% | | 11/15/21 | | 230 | | | 236 | |
| | | Baltimore Gas & Electric Co. | | 2.800% | | 8/15/22 | | 600 | | | 610 | |
| | | Baltimore Gas & Electric Co. | | 3.350% | | 7/1/23 | | 320 | | | 332 | |
| | | Berkshire Hathaway Energy Co. | | 2.375% | | 1/15/21 | | 655 | | | 657 | |
| | | Berkshire Hathaway Energy Co. | | 2.800% | | 1/15/23 | | 1,765 | | | 1,800 | |
| | | Berkshire Hathaway Energy Co. | | 3.750% | | 11/15/23 | | 635 | | | 670 | |
| 5 | | Calpine Corp. | | 4.500% | | 2/15/28 | | 165 | | | 167 | |
| 5 | | Calpine Corp. | | 5.125% | | 3/15/28 | | 105 | | | 107 | |
| | | CenterPoint Energy Inc. | | 3.600% | | 11/1/21 | | 1,115 | | | 1,141 | |
| | | CenterPoint Energy Inc. | | 2.500% | | 9/1/22 | | 1,470 | | | 1,481 | |
| | | CenterPoint Energy Inc. | | 3.850% | | 2/1/24 | | 65 | | | 68 | |
| | | Connecticut Light & Power Co. | | 2.500% | | 1/15/23 | | 810 | | | 820 | |
| | | Dominion Energy Inc. | | 2.750% | | 9/15/22 | | 945 | | | 956 | |
| 4,5 | | Dominion Energy Inc., 3M USD LIBOR + 0.400% | | 2.307% | | 12/1/20 | | 4,840 | | | 4,846 | |
| | | DTE Electric Co. | | 3.900% | | 6/1/21 | | 420 | | | 430 | |
| | | DTE Electric Co. | | 2.650% | | 6/15/22 | | 30 | | | 31 | |
| | | DTE Energy Co. | | 2.600% | | 6/15/22 | | 1,170 | | | 1,176 | |
| | | DTE Energy Co. | | 3.300% | | 6/15/22 | | 1,000 | | | 1,023 | |
| | | DTE Energy Co. | | 2.250% | | 11/1/22 | | 2,495 | | | 2,495 | |
| | | DTE Energy Co. | | 3.700% | | 8/1/23 | | 1,995 | | | 2,077 | |
| | | DTE Energy Co. | | 3.850% | | 12/1/23 | | 130 | | | 136 | |
| | | Duke Energy Corp. | | 3.227% | | 3/11/22 | | 8,375 | | | 8,639 | |
| | | Duke Energy Corp. | | 3.950% | | 10/15/23 | | 390 | | | 412 | |
| | | Duke Energy Corp. | | 3.750% | | 4/15/24 | | 200 | | | 212 | |
| 5 | | EDP Finance BV | | 4.125% | | 1/15/20 | | 1,558 | | | 1,558 | |
| 5 | | EDP Finance BV | | 5.250% | | 1/14/21 | | 2,070 | | | 2,128 | |
| | | Entergy Arkansas Inc. | | 3.750% | | 2/15/21 | | 250 | | | 254 | |
| | | Entergy Arkansas Inc. | | 3.050% | | 6/1/23 | | 220 | | | 225 | |
| | | Entergy Corp. | | 4.000% | | 7/15/22 | | 1,260 | | | 1,312 | |
| | | Entergy Louisiana LLC | | 4.800% | | 5/1/21 | | 365 | | | 375 | |
| | | Entergy Louisiana LLC | | 3.300% | | 12/1/22 | | 205 | | | 211 | |
| | | Entergy Louisiana LLC | | 4.050% | | 9/1/23 | | 285 | | | 303 | |
| | | Evergy Inc. | | 2.450% | | 9/15/24 | | 1,500 | | | 1,507 | |
| | | Exelon Corp. | | 2.450% | | 4/15/21 | | 215 | | | 216 | |
| | | Exelon Corp. | | 3.497% | | 6/1/22 | | 246 | | | 252 | |
| | | Exelon Generation Co. LLC | | 3.400% | | 3/15/22 | | 222 | | | 227 | |
| | | FirstEnergy Corp. | | 2.850% | | 7/15/22 | | 2,570 | | | 2,608 | |
| | | FirstEnergy Corp. | | 4.250% | | 3/15/23 | | 1,979 | | | 2,086 | |
| 5 | | FirstEnergy Transmission LLC | | 4.350% | | 1/15/25 | | 493 | | | 528 | |
| | | Georgia Power Co. | | 2.400% | | 4/1/21 | | 1,245 | | | 1,250 | |
| 6 | | innogy Finance BV | | 6.500% | | 8/10/21 | | 400 | | | 496 | |
| | | ITC Holdings Corp. | | 2.700% | | 11/15/22 | | 750 | | | 759 | |
| | | LG&E & KU Energy LLC | | 4.375% | | 10/1/21 | | 280 | | | 289 | |
| | | MidAmerican Energy Co. | | 3.700% | | 9/15/23 | | 165 | | | 173 | |
| | | National Rural Utilities Cooperative Finance Corp. | | 2.700% | | 2/15/23 | | 280 | | | 285 | |
| | | NextEra Energy Capital Holdings Inc. | | 2.900% | | 4/1/22 | | 2,430 | | | 2,470 | |
| | | NextEra Energy Capital Holdings Inc. | | 3.300% | | 8/15/22 | | 9,580 | | | 9,864 | |
| | | NRG Energy Inc. | | 7.250% | | 5/15/26 | | 448 | | | 490 | |
| | | NSTAR Electric Co. | | 3.500% | | 9/15/21 | | 470 | | | 479 | |
| | | NSTAR Electric Co. | | 2.375% | | 10/15/22 | | 225 | | | 227 | |
| | | NV Energy Inc. | | 6.250% | | 11/15/20 | | 200 | | | 207 | |
| | | Oncor Electric Delivery Co. LLC | | 4.100% | | 6/1/22 | | 120 | | | 125 | |
| | | Oncor Electric Delivery Co. LLC | | 2.750% | | 6/1/24 | | 1,455 | | | 1,478 | |
| | | PECO Energy Co. | | 3.150% | | 10/15/25 | | 115 | | | 120 | |
| | | PPL Capital Funding Inc. | | 4.200% | | 6/15/22 | | 50 | | | 52 | |
| | | PPL Capital Funding Inc. | | 3.500% | | 12/1/22 | | 225 | | | 232 | |
| | | Progress Energy Inc. | | 4.400% | | 1/15/21 | | 1,685 | | | 1,714 | |
| | | Progress Energy Inc. | | 3.150% | | 4/1/22 | | 520 | | | 530 | |
| | | Public Service Enterprise Group Inc. | | 2.875% | | 6/15/24 | | 1,665 | | | 1,696 | |
| | | Puget Energy Inc. | | 6.500% | | 12/15/20 | | 625 | | | 651 | |
| | | Puget Energy Inc. | | 6.000% | | 9/1/21 | | 100 | | | 106 | |
| | | Puget Energy Inc. | | 5.625% | | 7/15/22 | | 1,175 | | | 1,260 | |
| | | Southern Co. | | 2.350% | | 7/1/21 | | 1,645 | | | 1,651 | |
| | | Southwestern Electric Power Co. | | 3.550% | | 2/15/22 | | 490 | | | 502 | |
| | | Tampa Electric Co. | | 5.400% | | 5/15/21 | | 370 | | | 386 | |
| 4,7 | | Victoria Power Networks Finance Pty Ltd., 3M Australian Bank Bill Rate +0.280% | | 1.128% | | 1/15/22 | | 220 | | | 152 | |
| | | Virginia Electric & Power Co. | | 3.450% | | 9/1/22 | | 715 | | | 739 | |
| | | Virginia Electric & Power Co. | | 2.750% | | 3/15/23 | | 145 | | | 147 | |
| | | Virginia Electric & Power Co. | | 3.450% | | 2/15/24 | | 350 | | | 365 | |
| 5 | | Vistra Operations Co. LLC | | 5.000% | | 7/31/27 | | 20 | | | 21 | |
| | | | | | | | | | | | | |
| | | Natural Gas (0.1%) | | | | | | | | | | |
| 5 | | Engie SA | | 2.875% | | 10/10/22 | | 175 | | | 178 | |
| | | Sempra Energy | | 2.400% | | 2/1/20 | | 1,470 | | | 1,470 | |
| | | Sempra Energy | | 2.400% | | 3/15/20 | | 235 | | | 235 | |
| | | Sempra Energy | | 2.900% | | 2/1/23 | | 415 | | | 421 | |
| | | Southern Co. Gas Capital Corp. | | 2.450% | | 10/1/23 | | 155 | | | 156 | |
| | | | | | | | | | | | | |
| | | Other Utility (0.0%) | | | | | | | | | | |
| 7 | | Energy Partnership Gas Pty Ltd. | | 4.250% | | 6/15/20 | | 80 | | | 56 | |
| | | | | | | | | | | | 77,736 | |
| Total Corporate Bonds (Cost $1,158,561) | | | | | | | | | 1,177,499 | |
| Sovereign Bonds (4.7%) |
| 5 | | Arab Petroleum Investments Corp. | | 4.125% | | 9/18/23 | | 442 | | | 470 | |
| | | Arab Petroleum Investments Corp. | | 4.125% | | 9/18/23 | | 200 | | | 212 | |
| | | Arab Republic of Egypt | | 8.700% | | 3/1/49 | | 200 | | | 224 | |
| 6 | | Argentine Republic | | 3.875% | | 1/15/22 | | 600 | | | 320 | |
| 6 | | Argentine Republic | | 3.375% | | 1/15/23 | | 506 | | | 256 | |
| | | Argentine Republic | | 5.875% | | 1/11/28 | | 567 | | | 266 | |
| 5 | | Avi Funding Co. Ltd. | | 2.850% | | 9/16/20 | | 275 | | | 276 | |
| | | Avi Funding Co. Ltd. | | 2.850% | | 9/16/20 | | 225 | | | 226 | |
| 5 | | Banque Ouest Africaine de Developpement | | 5.500% | | 5/6/21 | | 200 | | | 207 | |
| 5 | | Banque Ouest Africaine de Developpement | | 5.000% | | 7/27/27 | | 430 | | | 457 | |
| 5 | | Bermuda | | 4.138% | | 1/3/23 | | 200 | | | 209 | |
| 5 | | BNG Bank NV | | 2.125% | | 12/14/20 | | 866 | | | 868 | |
| 5 | | BOC Aviation Ltd. | | 2.375% | | 9/15/21 | | 790 | | | 787 | |
| | | CCBL Cayman Corp. Ltd. | | 3.250% | | 7/28/20 | | 500 | | | 502 | |
| 5 | | CDP Financial Inc. | | 3.150% | | 7/24/24 | | 670 | | | 699 | |
| | | Centrais Eletricas Brasileiras SA | | 5.750% | | 10/27/21 | | 200 | | | 209 | |
| | | CNOOC Finance 2015 Australia Pty Ltd. | | 2.625% | | 5/5/20 | | 200 | | | 200 | |
| | | CNOOC Finance 2015 USA LLC | | 3.500% | | 5/5/25 | | 837 | | | 875 | |
| | | CNOOC Nexen Finance 2014 ULC | | 4.250% | | 4/30/24 | | 710 | | | 758 | |
| | | Corp Financiera de Desarrollo SA | | 4.750% | | 7/15/25 | | 535 | | | 585 | |
| | | Corp. Andina de Fomento | | 2.200% | | 7/18/20 | | 937 | | | 937 | |
| | | Corp. Andina de Fomento | | 4.375% | | 6/15/22 | | 413 | | | 432 | |
Short-Term Investment-Grade Portfolio
| | | | | | | | | Face | | | Market | |
| | | | | | | Maturity | | Amount | | | Value• | |
| | | | | Coupon | | Date | | ($000 | ) | | ($000 | ) |
| 5 | | Corp. Financiera de Desarrollo SA | | 4.750% | | 2/8/22 | | 150 | | | 157 | |
| | | Corp. Financiera de Desarrollo SA | | 4.750% | | 2/8/22 | | 200 | | | 209 | |
| | | Development Bank of Kazakhstan JSC | | 4.125% | | 12/10/22 | | 240 | | | 250 | |
| 5,10 | | Dexia Credit Local SA | | 2.500% | | 1/25/21 | | 2,450 | | | 2,462 | |
| 5,10 | | Dexia Credit Local SA | | 1.875% | | 9/15/21 | | 235 | | | 235 | |
| 5,10 | | Dexia Credit Local SA | | 2.375% | | 9/20/22 | | 250 | | | 253 | |
| | | Dominican Republic | | 6.600% | | 1/28/24 | | 185 | | | 206 | |
| 5 | | Electricite de France SA | | 4.500% | | 9/21/28 | | 200 | | | 222 | |
| 5 | | Emirate of Abu Dhabi | | 2.125% | | 9/30/24 | | 6,450 | | | 6,433 | |
| | | Empresa Nacional del Petroleo | | 4.375% | | 10/30/24 | | 400 | | | 423 | |
| | | Empresa Nacional del Petroleo | | 3.750% | | 8/5/26 | | 255 | | | 261 | |
| 2 | | Empresa Nacional del Petroleo | | 5.250% | | 11/6/29 | | 400 | | | 448 | |
| | | Export-Import Bank of India | | 2.750% | | 4/1/20 | | 200 | | | 200 | |
| | | Export-Import Bank of India | | 2.750% | | 8/12/20 | | 200 | | | 200 | |
| | | Export-Import Bank of Korea | | 5.125% | | 6/29/20 | | 500 | | | 507 | |
| 2 | | Federative Republic of Brazil | | 4.625% | | 1/13/28 | | 1,300 | | | 1,396 | |
| | | Fondo MIVIVIENDA SA | | 3.500% | | 1/31/23 | | 630 | | | 645 | |
| | | Gazprom OAO Via Gaz Capital SA | | 6.510% | | 3/7/22 | | 270 | | | 292 | |
| | | Harvest Operations Corp. | | 3.000% | | 9/21/22 | | 200 | | | 204 | |
| | | ICBCIL Finance Co. Ltd. | | 3.250% | | 3/17/20 | | 200 | | | 200 | |
| | | ICBCIL Finance Co. Ltd. | | 3.000% | | 4/5/20 | | 560 | | | 561 | |
| 5 | | Indonesia Asahan Aluminium Persero PT | | 5.230% | | 11/15/21 | | 425 | | | 446 | |
| | | Industrial & Commercial Bank of China Ltd. | | 2.905% | | 11/13/20 | | 250 | | | 251 | |
| 4 | | Industrial & Commercial Bank of China Ltd., 3M USD LIBOR + 0.750% | | 2.654% | | 11/8/20 | | 500 | | | 500 | |
| 4,11 | | Japan Bank for International Cooperation, 3M USD LIBOR + 0.390% | | 2.356% | | 7/21/20 | | 144 | | | 144 | |
| 11 | | Japan Finance Organization for Municipalities | | 4.000% | | 1/13/21 | | 250 | | | 255 | |
| 5 | | KazMunayGas National Co. JSC | | 6.375% | | 10/24/48 | | 400 | | | 516 | |
| | | Kingdom of Saudi Arabia | | 2.375% | | 10/26/21 | | 1,660 | | | 1,667 | |
| | | Korea Development Bank | | 3.250% | | 2/19/24 | | 295 | | | 307 | |
| | | Korea Hydro & Nuclear Power Co. Ltd. | | 3.000% | | 9/19/22 | | 200 | | | 205 | |
| | | Korea Midland Power Co. Ltd. | | 2.500% | | 7/21/21 | | 200 | | | 201 | |
| | | Korea Midland Power Co. Ltd. | | 3.375% | | 1/22/22 | | 937 | | | 959 | |
| 5 | | Korea National Oil Corp. | | 2.875% | | 3/27/22 | | 400 | | | 406 | |
| | | Korea Western Power Co. Ltd. | | 2.375% | | 7/22/22 | | 304 | | | 306 | |
| | | KSA Sukuk Ltd. | | 2.894% | | 4/20/22 | | 869 | | | 883 | |
| 12 | | KSA Sukuk Ltd. | | 3.628% | | 4/20/27 | | 1,390 | | | 1,475 | |
| 5 | | Ontario Teachers’ Cadillac Fairview Properties Trust | | 3.125% | | 3/20/22 | | 1,326 | | | 1,352 | |
| 5 | | Ontario Teachers’ Cadillac Fairview Properties Trust | | 3.875% | | 3/20/27 | | 200 | | | 213 | |
| | | Perusahaan Listrik Negara PT | | 5.500% | | 11/22/21 | | 400 | | | 424 | |
| | | Perusahaan Penerbit SBSN Indonesia III | | 3.400% | | 3/29/21 | | 225 | | | 228 | |
| | | Perusahaan Penerbit SBSN Indonesia III | | 3.400% | | 3/29/22 | | 661 | | | 670 | |
| | | Perusahaan Penerbit SBSN Indonesia III | | 3.300% | | 11/21/22 | | 200 | | | 205 | |
| | | Perusahaan Penerbit SBSN Indonesia III | | 4.350% | | 9/10/24 | | 439 | | | 469 | |
| | | Petroleos Mexicanos | | 4.625% | | 9/21/23 | | 1 | | | 1 | |
| | | Petroleos Mexicanos | | 6.875% | | 8/4/26 | | 1,195 | | | 1,311 | |
| 5 | | Petroleos Mexicanos | | 6.490% | | 1/23/27 | | 913 | | | 969 | |
| | | Petroleos Mexicanos | | 6.500% | | 3/13/27 | | 455 | | | 481 | |
| | | Petronas Capital Ltd. | | 3.125% | | 3/18/22 | | 380 | | | 387 | |
| | | Petronas Global Sukuk Ltd. | | 2.707% | | 3/18/20 | | 200 | | | 200 | |
| 5 | | Province of Alberta | | 1.750% | | 8/26/20 | | 3,734 | | | 3,734 | |
| | | Province of Nova Scotia | | 8.250% | | 7/30/22 | | 315 | | | 361 | |
| | | Province of Ontario | | 4.400% | | 4/14/20 | | 629 | | | 634 | |
| | | Province of Ontario | | 1.875% | | 5/21/20 | | 230 | | | 230 | |
| | | Province of Quebec | | 2.750% | | 8/25/21 | | 715 | | | 727 | |
| 2,5 | | Ras Laffan Liquefied Natural Gas Co. Ltd. II | | 5.298% | | 9/30/20 | | 22 | | | 23 | |
| 2 | | Ras Laffan Liquefied Natural Gas Co. Ltd. II | | 5.298% | | 9/30/20 | | 82 | | | 84 | |
| | | Republic of Chile | | 3.875% | | 8/5/20 | | 180 | | | 181 | |
| | | Republic of Colombia | | 4.375% | | 7/12/21 | | 2,605 | | | 2,689 | |
| 2 | | Republic of Colombia | | 2.625% | | 3/15/23 | | 1,000 | | | 1,006 | |
| 2 | | Republic of Colombia | | 4.500% | | 1/28/26 | | 1,025 | | | 1,115 | |
| | | Republic of Croatia | | 6.625% | | 7/14/20 | | 690 | | | 705 | |
| | | Republic of Croatia | | 6.375% | | 3/24/21 | | 1,215 | | | 1,279 | |
| | | Republic of Honduras | | 8.750% | | 12/16/20 | | 1,010 | | | 1,064 | |
| | | Republic of Hungary | | 6.375% | | 3/29/21 | | 3,762 | | | 3,969 | |
| | | Republic of Hungary | | 5.375% | | 2/21/23 | | 2,255 | | | 2,472 | |
| | | Republic of Hungary | | 5.750% | | 11/22/23 | | 711 | | | 802 | |
| 5 | | Republic of Indonesia | | 3.700% | | 1/8/22 | | 400 | | | 411 | |
| | | Republic of Indonesia | | 3.750% | | 4/25/22 | | 1,612 | | | 1,664 | |
| | | Republic of Indonesia | | 5.875% | | 1/15/24 | | 820 | | | 928 | |
| | | Republic of Indonesia | | 4.125% | | 1/15/25 | | 755 | | | 810 | |
| 6 | | Republic of Italy | | 3.850% | | 9/1/49 | | 120 | | | 174 | |
| | | Republic of Lithuania | | 7.375% | | 2/11/20 | | 3,570 | | | 3,591 | |
| | | Republic of Lithuania | | 6.125% | | 3/9/21 | | 1,375 | | | 1,441 | |
| 5 | | Republic of Lithuania | | 6.125% | | 3/9/21 | | 195 | | | 204 | |
| | | Republic of Lithuania | | 6.625% | | 2/1/22 | | 300 | | | 329 | |
| | | Republic of Panama | | 5.200% | | 1/30/20 | | 1,270 | | | 1,273 | |
| 2 | | Republic of Panama | | 4.000% | | 9/22/24 | | 200 | | | 214 | |
| | | Republic of Panama | | 7.125% | | 1/29/26 | | 280 | | | 351 | |
| | | Republic of Poland | | 5.125% | | 4/21/21 | | 520 | | | 541 | |
| | | Republic of Poland | | 5.000% | | 3/23/22 | | 1,020 | | | 1,089 | |
| | | Republic of Romania | | 4.375% | | 8/22/23 | | 250 | | | 268 | |
| 6 | | Republic of Romania | | 2.000% | | 12/8/26 | | 1,574 | | | 1,891 | |
| | | Republic of Serbia | | 7.250% | | 9/28/21 | | 767 | | | 836 | |
| | | Republic of Slovenia | | 5.500% | | 10/26/22 | | 280 | | | 307 | |
| 5 | | Republic of Slovenia | | 5.250% | | 2/18/24 | | 300 | | | 338 | |
| | | Republic of South Africa | | 5.500% | | 3/9/20 | | 100 | | | 101 | |
| | | Republic of South Africa | | 5.875% | | 9/16/25 | | 695 | | | 764 | |
| | | Sinopec Group Overseas Development 2013 Ltd. | | 4.375% | | 10/17/23 | | 1,140 | | | 1,220 | |
| 5 | | Sinopec Group Overseas Development 2013 Ltd. | | 4.375% | | 10/17/23 | | 800 | | | 856 | |
| | | Sinopec Group Overseas Development 2015 Ltd. | | 2.500% | | 4/28/20 | | 200 | | | 200 | |
| 5 | | Sinopec Group Overseas Development 2017 Ltd. | | 2.375% | | 4/12/20 | | 785 | | | 785 | |
| | | Sinopec Group Overseas Development 2017 Ltd. | | 2.500% | | 9/13/22 | | 200 | | | 201 | |
| | | Socialist Republic of Vietnam | | 6.750% | | 1/29/20 | | 726 | | | 729 | |
| 4 | | State Bank of India/London, 3M Australian Bank Bill Rate +0.950% | | 2.993% | | 4/6/20 | | 1,100 | | | 1,102 | |
| | | State Grid Overseas Investment 2014 Ltd. | | 4.125% | | 5/7/24 | | 250 | | | 267 | |
| | | State Grid Overseas Investment 2016 Ltd. | | 3.750% | | 5/2/23 | | 310 | | | 323 | |
| | | State of Israel | | 3.150% | | 6/30/23 | | 525 | | | 546 | |
| 6 | | State of Israel | | 1.500% | | 1/18/27 | | 115 | | | 140 | |
| 6 | | State of Israel | | 1.500% | | 1/16/29 | | 450 | | | 551 | |
| | | State of Kuwait | | 2.750% | | 3/20/22 | | 1,148 | | | 1,166 | |
| | | State of Qatar | | 4.500% | | 1/20/22 | | 445 | | | 466 | |
| | | United Mexican States | | 4.125% | | 1/21/26 | | 375 | | | 399 | |
| 6 | | United Mexican States | | 1.625% | | 4/8/26 | | 459 | | | 537 | |
| Total Sovereign Bonds (Cost $88,366) | | | | | | | | | 89,258 | |
| Taxable Municipal Bonds (0.1%) | | | | | | | | | | |
| 13 | | New Jersey Economic Development Authority Revenue (State Pension Funding) | | 7.425% | | 2/15/29 | | 770 | | | 966 | |
| Total Taxable Municipal Bonds (Cost $986) | | | | | | | | | 966 | |
| | | | | | | | | | | |
| | | | | | | Shares | | | | |
| Temporary Cash Investments (7.2%) | | | | | | | | | | |
| Money Market Fund (1.8%) | | | | | | | | | | |
| 14 | | Vanguard Market Liquidity Fund | | 1.816% | | | | 335,783 | | | 33,582 | |
| | | | | | | | | | | |
| | | | | | | Face | | | | |
| | | | | | | Amount | | | | |
| | | | | | | ($000 | ) | | | |
| U.S. Government and Agency Obligations (5.4%) | | | | | | | | | | |
| 15 | United States Treasury Bill | | 1.541%–1.544% | | 11/5/20 | | 105,000 | | | 103,643 | |
| Total Temporary Cash Investments (Cost $137,211) | | | | | | | | | 137,225 | |
Short-Term Investment-Grade Portfolio
| | | | | | | | | | | Notional | | | |
| | | | | | | | | | | | Amount on | | | | |
| | | | | | | | | | | | Underlying | | | Market | |
| | | | | | | Expiration | | Exercise | | | Swap | | | Value• | |
| | | | | Counterparty | | Date | | Rate | | | ($000 | ) | | ($000 | ) |
| Options Purchased (0.0%) | | | | | | | | | | | |
| Over-the-Counter Swaptions (0.0%) | | | | | | | | | | | | | |
| Call Swaptions | | | | | | | | | | | | | |
| | 1-Year Interest Rate Swap, Pays 3M USD LIBOR Quarterly, Receives 1.608% Semiannually | | MSCS | | 3/4/20 | | 1.608 | % | | 28,280 | | | 6 | |
| | | 10-Year Interest Rate Swap, Pays 3M USD LIBOR Quarterly, Receives 1.130% Semiannually | | BNPSW | | 9/21/20 | | 1.130 | % | | 2,851 | | | 7 | |
| | | 10-Year Interest Rate Swap, Pays 3M USD LIBOR Quarterly, Receives 1.205% Semiannually | | JPMC | | 1/7/20 | | 1.205 | % | | 3,434 | | | — | |
| | | | | | | | | | | | | | | 13 | |
| Put Swaptions | | | | | | | | | | | | | |
| | | 1-Year Interest Rate Swap, Receives 3M USD LIBOR Quarterly, Pays 1.608% Semiannually | | MSCS | | 3/4/20 | | 1.608 | % | | 28,280 | | | 33 | |
| | | 5-Year CDX-NA-IG-S33-V1, Credit Protection Sold, Receives 1.000% Quarterly | | GSI | | 1/15/20 | | 0.575 | % | | 3,740 | | | — | |
| | | 5-Year CDX-NA-IG-S33-V1, Credit Protection Sold, Receives 1.000% Quarterly | | GSI | | 1/15/20 | | 0.575 | % | | 3,805 | | | — | |
| | | 5-Year CDX-NA-IG-S33-V1, Credit Protection Sold, Receives 1.000% Quarterly | | GSI | | 2/19/20 | | 0.600 | % | | 5,610 | | | 2 | |
| | | 5-Year CDX-NA-IG-S33-V1, Credit Protection Sold, Receives 1.000% Quarterly | | JPMC | | 1/15/20 | | 0.600 | % | | 3,740 | | | — | |
| | | 5-Year CDX-NA-IG-S33-V1, Credit Protection Sold, Receives 1.000% Quarterly | | JPMC | | 3/18/20 | | 0.550 | % | | 3,715 | | | 3 | |
| | 5-Year CDX-NA-IG-S33-V1, Credit Protection Sold, Receives 1.000% Quarterly | | MSCS | | 2/19/20 | | 0.525 | % | | 3,740 | | | 3 | |
| | | 5-Year CDX-NA-IG-S33-V1, Credit Protection Sold, Receives 1.000% Quarterly | | MSCS | | 3/18/20 | | 0.550 | % | | 5,610 | | | 5 | |
| | | | | | | | | | | | | | | 46 | |
| Total Options Purchased (Cost $130) | | | | | | | | 59 | |
| Total Investments (99.4%) (Cost $1,865,664) | | | | | | | 1,894,959 | |
| | | Amount | |
| | | ($000 | ) |
| Other Assets and Liabilities (0.6%) | | | |
| Other Assets | | | |
| Investment in Vanguard | | 85 | |
| Receivables for Investment Securities Sold | | 6 | |
| Receivables for Accrued Income | | 12,315 | |
| Receivables for Capital Shares Issued | | 638 | |
| Variation Margin Receivable—Futures Contracts | | 101 | |
| Variation Margin Receivable—CC Swap Contracts | | 19 | |
| Unrealized Appreciation—Forward Currency Contracts | | 42 | |
| Unrealized Appreciation—OTC Swap Contracts | | 66 | |
| Other Assets | | 551 | |
| Total Other Assets | | 13,823 | |
| Liabilities | | | |
| Payables for Investment Securities Purchased | | (27 | ) |
| Payables for Capital Shares Redeemed | | (563 | ) |
| Payables to Vanguard | | (627 | ) |
| Variation Margin Payable—Futures Contracts | | (36 | ) |
| Variation Margin Payable—CC Swap Contracts | | (5 | ) |
| Unrealized Depreciation—Forward Currency Contracts | | (426 | ) |
| Unrealized Depreciation—OTC Swap Contracts | | (327 | ) |
| Options Written, at Value16 | | (153 | ) |
| Total Liabilities | | (2,164 | ) |
| Net Assets (100%) | | | |
| Applicable to 175,824,761 outstanding $.001 par value shares of | | | |
| beneficial interest (unlimited authorization) | | 1,906,618 | |
| Net Asset Value Per Share | | $10.84 | |
Short-Term Investment-Grade Portfolio
At December 31, 2019, net assets consisted of:
| | | Amount | |
| | | ($000 | ) |
| Paid-in Capital | | 1,842,594 | |
| Total Distributable Earnings (Loss) | | 64,024 | |
| Net Assets | | 1,906,618 | |
| • | See Note A in Notes to Financial Statements. |
| § | Security value determined using significant unobservable inputs. |
| 1 | Securities with a value of $505,000 have been segregated as initial margin for open futures contracts. |
| 2 | The average or expected maturity is shorter than the final maturity shown because of the possibility of interim principal payments and prepayments or the possibility of the issue being called. |
| 3 | The issuer was placed under federal conservatorship in September 2008; since that time, its daily operations have been managed by the Federal Housing Finance Agency and it receives capital from the U.S. Treasury, as needed to maintain a positive net worth, in exchange for senior preferred stock. |
| 4 | Adjustable-rate security; rate shown is effective rate at period end. Certain adjustable-rate securities are not based on a published reference rate and spread but are determined by the issuer or agent based on current market conditions. |
| 5 | Security exempt from registration under Rule 144A of the Securities Act of 1933. Such securities may be sold in transactions exempt from registration, normally to qualified institutional buyers. At December 31, 2019, the aggregate value of these securities was $349,685,000, representing 18.3% of net assets. |
| 6 | Face amount denominated in euro. |
| 7 | Face amount denominated in Australian dollars. |
| 8 | Face amount denominated in British pounds. |
| 9 | Non-income-producing security—security in default. |
| 10 | Guaranteed by multiple countries. |
| 11 | Guaranteed by the Government of Japan. |
| 12 | Guaranteed by the Kingdom of Saudi Arabia. |
| 13 | Scheduled principal and interest payments are guaranteed by National Public Finance Guarantee Corp. |
| 14 | Affiliated money market fund available only to Vanguard funds and certain trusts and accounts managed by Vanguard. Rate shown is the 7-day yield. |
| 15 | Securities with a value of $790,000 have been segregated as initial margin for open centrally cleared swap contracts. |
| 16 | Includes premiums received of $154,000. |
BNPSW—BNP Paribas.
CC—Centrally Cleared.
CMT—Constant Maturing Treasury Rate.
GSI—Goldman Sachs International.
JPMC—JPMorgan Chase Bank, N.A.
LIBOR—London Interbank Offered Rate.
MSCS—Morgan Stanley Capital Services LLC.
OTC—Over-the-Counter.
REMICS—Real Estate Mortgage Investment Conduits.
Short-Term Investment-Grade Portfolio
| Derivative Financial Instruments Outstanding as of Period End |
| |
| Options Written |
| | | | | | Notinal | | | | |
| | | | | | | | | | Amount on | | | | |
| | | | | | | | | | Underlying | | | Market | |
| | | | | Expiration | | Exercise | | | Swap | | | Value | |
| | | Counterparty | | Date | | Rate | | | ($000 | ) | | ($000 | ) |
| Over-the-Counter Swaptions | | | | | | | | | | | | | | | | |
| Call Swaptions | | | | | | | | | | | | | | | | |
| 2-Year Interest Rate Swap, Receives 3M USD LIBOR Quarterly, Pays 1.528% Semiannually | | MSCS | | 3/4/20 | | | 1.528% | | | | 14,140 | | | | (10 | ) |
| 5-Year CDX-NA-IG-S33-V1, Credit Protection Sold, Receives 1.000% Quarterly | | GSI | | 1/15/20 | | | 0.525% | | | | 3,740 | | | | (12 | ) |
| 5-Year CDX-NA-IG-S33-V1, Credit Protection Sold, Receives 1.000% Quarterly | | GSI | | 1/15/20 | | | 0.525% | | | | 3,805 | | | | (13 | ) |
| 5-Year CDX-NA-IG-S33-V1, Credit Protection Sold, Receives 1.000% Quarterly | | GSI | | 2/19/20 | | | 0.525% | | | | 5,610 | | | | (19 | ) |
| 5-Year CDX-NA-IG-S33-V1, Credit Protection Sold, Receives 1.000% Quarterly | | JPMC | | 1/15/20 | | | 0.550% | | | | 3,740 | | | | (17 | ) |
| 5-Year CDX-NA-IG-S33-V1, Credit Protection Sold, Receives 1.000% Quarterly | | MSCS | | 2/19/20 | | | 0.475% | | | | 3,740 | | | | (6 | ) |
| 5-Year CDX-NA-IG-S33-V1, Credit Protection Sold, Receives 1.000% Quarterly | | MSCS | | 3/18/20 | | | 0.500% | | | | 5,610 | | | | (14 | ) |
| | | | | | | | | | | | | | | | (91 | ) |
| | | | | | | | | | | | | | | | | |
| Put Swaptions | | | | | | | | | | | | | | | | |
| 2-Year Interest Rate Swap, Pays 3M USD LIBOR Quarterly, Receives 1.528% Semiannually | | MSCS | | 3/4/20 | | | 1.528% | | | | 14,140 | | | | (44 | ) |
| 5-Year CDX-NA-IG-S33-V1, Credit Protection Purchased, Pays 1.000% Quarterly | | GSI | | 1/15/20 | | | 0.525% | | | | 3,740 | | | | (1 | ) |
| 5-Year CDX-NA-IG-S33-V1, Credit Protection Purchased, Pays 1.000% Quarterly | | GSI | | 1/15/20 | | | 0.525% | | | | 3,805 | | | | (1 | ) |
| 5-Year CDX-NA-IG-S33-V1, Credit Protection Purchased, Pays 1.000% Quarterly | | GSI | | 2/19/20 | | | 0.525% | | | | 5,610 | | | | (4 | ) |
| 5-Year CDX-NA-IG-S33-V1, Credit Protection Purchased, Pays 1.000% Quarterly | | JPMC | | 1/15/20 | | | 0.550% | | | | 3,740 | | | | — | |
| 5-Year CDX-NA-IG-S33-V1, Credit Protection Purchased, Pays 1.000% Quarterly | | MSCS | | 2/19/20 | | | 0.475% | | | | 3,740 | | | | (4 | ) |
| 5-Year CDX-NA-IG-S33-V1, Credit Protection Purchased, Pays 1.000% Quarterly | | MSCS | | 3/18/20 | | | 0.500% | | | | 5,610 | | | | (8 | ) |
| | | | | | | | | | | | | | | | (62 | ) |
| | | | | | | | | | | | | | | | | |
| Total Options Written (Premiums Received $154) | | | | | | | | | | | | | | | (153 | ) |
GSI—Goldman Sachs International.
JPMC—JPMorgan Chase Bank, N.A.
MSCS—Morgan Stanley Capital Services LLC.
Short-Term Investment-Grade Portfolio
| Futures Contracts | | | | | | | | | | | | | | |
| | | | | | | | | | | | | | ($000 | ) |
| | | | | | | | | | | | | | Value and | |
| | | | | | Number of | | | | | | | | Unrealized | |
| | | | | | Long (Short | ) | | | Notional | | | | Appreciation | |
| | | Expiration | | | Contracts | | | | Amount | | | | (Depreciation | ) |
| Long Futures Contracts | | | | | | | | | | | | | | |
| 5-Year U.S. Treasury Note | | March 2020 | | | 248 | | | | 29,415 | | | | 14 | |
| Long Gilt | | March 2020 | | | 15 | | | | 2,610 | | | | (12 | ) |
| 30-Year U.S. Treasury Bond | | March 2020 | | | 3 | | | | 468 | | | | (12 | ) |
| 10-Year U.S. Treasury Note | | March 2020 | | | 1 | | | | 128 | | | | 1 | |
| | | | | | | | | | | | | | (9 | ) |
| Short Futures Contracts | | | | | | | | | | | | | | |
| Euro-Schatz | | March 2020 | | | (139 | ) | | | (17,448 | ) | | | 7 | |
| Euro-Bund | | March 2020 | | | (34 | ) | | | (6,502 | ) | | | 63 | |
| Ultra 10-Year U.S. Treasury Note | | March 2020 | | | (27 | ) | | | (3,799 | ) | | | 9 | |
| Euro-Bobl | | March 2020 | | | (20 | ) | | | (2,998 | ) | | | 9 | |
| AUD 3-Year Treasury Bond | | March 2020 | | | (31 | ) | | | (2,502 | ) | | | 16 | |
| 2-Year U.S. Treasury Note | | March 2020 | | | (8 | ) | | | (1,724 | ) | | | (2 | ) |
| AUD 10-Year Treasury Bond | | March 2020 | | | (8 | ) | | | (803 | ) | | | 16 | |
| Euro-BTP | | March 2020 | | | (3 | ) | | | (479 | ) | | | (2 | ) |
| Ultra Long U.S. Treasury Bond | | March 2020 | | | (2 | ) | | | (363 | ) | | | — | |
| | | | | | | | | | | | | | 116 | |
| | | | | | | | | | | | | | 107 | |
| Forward Currency Contracts | | | | | | | | | | | | | | | |
| | | Contract | | | | | | | | | | | | Unrealized | | | Unrealized | |
| | | Settlement | | Contract Amount (000 | ) | | Appreciation | | | (Depreciation | ) |
| Counterparty | | Date | | | | Receive | | | | | Deliver | | | ($000 | ) | | ($000 | ) |
| HSBC Bank USA, N.A. | | 3/18/20 | | USD | | | 17,104 | | | EUR | | | 15,190 | | | | — | | | | (19 | ) |
| Toronto-Dominion Bank | | 3/18/20 | | USD | | | 16,798 | | | AUD | | | 24,327 | | | | — | | | | (307 | ) |
| Morgan Stanley Capital Services LLC | | 3/18/20 | | USD | | | 8,523 | | | EUR | | | 7,580 | | | | — | | | | (22 | ) |
| Royal Bank of Canada | | 3/18/20 | | USD | | | 6,652 | | | EUR | | | 5,965 | | | | — | | | | (72 | ) |
| Royal Bank of Canada | | 3/18/20 | | USD | | | 6,192 | | | GBP | | | 4,633 | | | | 42 | | | | — | |
| Bank of America, N.A. | | 3/18/20 | | USD | | | 724 | | | GBP | | | 550 | | | | — | | | | (6 | ) |
| Bank of America, N.A. | | 3/18/20 | | USD | | | 169 | | | EUR | | | 150 | | | | — | | | | — | |
| HSBC Bank USA, N.A. | | 3/18/20 | | USD | | | 4 | | | JPY | | | 471 | | | | — | | | | — | |
| | | | | | | | | | | | | | | | | | 42 | | | | (426 | ) |
AUD—Australian dollar.
EUR—euro.
GBP—British pound.
JPY—Japanese yen.
USD—U.S. dollar.
Short-Term Investment-Grade Portfolio
| Centrally Cleared Credit Default Swaps | | | | | | | | | | | | | | |
| | | | | | | | | | Periodic | | | | | | | |
| | | | | | | | | | Premium | | | | | | Unrealized | |
| | | | | | | | | | Received | | | | | | Appreciation | |
| | | Termination | | Notional | | Amount | | | (Paid | )1 | | Value | | | (Depreciation | ) |
| Reference Entity | | Date | | | | (000 | ) | | (% | ) | | ($000 | ) | | ($000 | ) |
| Credit Protection Sold | | | | | | | | | | | | | | | | | | | | |
| CDX-NA-IG-S33-V1 | | 12/20/24 | | USD | | | 5,496 | | | | 1.000 | | | | 142 | | | | 3 | |
| CDX-NA-IG-S33-V1 | | 12/20/29 | | USD | | | 1,995 | | | | 1.000 | | | | 16 | | | | 34 | |
| | | | | | | | | | | | | | | | | | | | 37 | |
| | | | | | | | | | | | | | | | | | | | | |
| Credit Protection Purchased | | | | | | | | | | | | | | | | | | | | |
| CDX-NA-HY-S33-V2 | | 12/20/24 | | USD | | | 921 | | | | (5.000 | ) | | | (89 | ) | | | (2 | ) |
| CDX-NA-IG-S33-V1 | | 12/20/22 | | USD | | | 5,705 | | | | (1.000 | ) | | | (129 | ) | | | (11 | ) |
| iTraxx Europe-S32-V1 | | 12/20/24 | | EUR | | | 3,810 | | | | (1.000 | ) | | | (119 | ) | | | (13 | ) |
| | | | | | | | | | | | | | | | | | | | (26 | ) |
| | | | | | | | | | | | | | | | | | | | 11 | |
1 Periodic premium received/paid quarterly.
EUR—euro.
USD—U.S. dollar.
| Over-the-Counter Credit Default Swaps | | | | | | | | | | | | | | | | | | | |
| | | | | | | | | | | | | | | Remaining | | | | | | | |
| | | | | | | | | | | | Periodic | | | | | | Up-Front | | | | | | | |
| | | | | | | | | | | | Premium | | | | | | Premium | | | | | | | |
| | | | | | | | | Notional | | | Received | | | | | | Received | | | Unrealized | | | Unrealized | |
| Reference | | Termination | | | | | | Amount | | | (Paid | )2 | | Value | | | (Paid | ) | | Appreciation | | | (Depreciation | ) |
| Entity | | Date | | | Counterparty | | | ($000 | ) | | (% | ) | | ($000 | ) | | ($000 | ) | | ($000 | ) | | ($000 | ) |
| Credit Protection Sold/Moody’s Rating | | | | | | | | | | | | | | | | | | | | | | | | | | | | |
| Berkshire Hathaway Inc./Aa2 | | | 6/20/22 | | | | BARC | | | | 835 | | | | 1.000 | | | | 16 | | | | (7 | ) | | | 9 | | | | — | |
| Berkshire Hathaway Inc./Aa2 | | | 12/20/22 | | | | BARC | | | | 415 | | | | 1.000 | | | | 9 | | | | (4 | ) | | | 5 | | | | — | |
| Boeing Co./A2 | | | 6/20/24 | | | | GSI | | | | 635 | | | | 1.000 | | | | 14 | | | | (14 | ) | | | — | | | | — | |
| Metlife Inc./A3 | | | 12/20/20 | | | | GSCM | | | | 350 | | | | 1.000 | | | | 3 | | | | — | | | | 3 | | | | — | |
| Metlife Inc./A3 | | | 12/20/21 | | | | BARC | | | | 160 | | | | 1.000 | | | | 2 | | | | — | | | | 2 | | | | — | |
| People’s Republic of China/A3 | | | 6/20/22 | | | | BNPSW | | | | 665 | | | | 1.000 | | | | 15 | | | | (3 | ) | | | 12 | | | | — | |
| People’s Republic of China/A3 | | | 6/20/24 | | | | GSI | | | | 295 | | | | 1.000 | | | | 9 | | | | (6 | ) | | | 3 | | | | — | |
| Republic of Turkey/Ba2 | | | 12/20/24 | | | | HSBCC | | | | 210 | | | | 1.000 | | | | (17 | ) | | | 28 | | | | 11 | | | | — | |
| Verizon Communications Inc./Baa1 | | | 12/20/22 | | | | GSI | | | | 835 | | | | 1.000 | | | | 17 | | | | (8 | ) | | | 9 | | | | — | |
| | | | | | | | | | | | | | | | | | | | 68 | | | | (14 | ) | | | 54 | | | | — | |
| | | | | | | | | | | | | | | | | | | | | | | | | | | | | | | | | |
| Credit Protection Purchased | | | | | | | | | | | | | | | | | | | | | | | | | | | | | | | | |
| American International Group Inc. | | | 6/20/20 | | | | BOANA | | | | 280 | | | | (1.000 | ) | | | (1 | ) | | | — | | | | — | | | | (1 | ) |
| American International Group Inc. | | | 6/20/20 | | | | BOANA | | | | 280 | | | | (1.000 | ) | | | (1 | ) | | | — | | | | — | | | | (1 | ) |
| American International Group Inc. | | | 12/20/20 | | | | GSCM | | | | 350 | | | | (1.000 | ) | | | (3 | ) | | | 1 | | | | — | | | | (2 | ) |
| American International Group Inc. | | | 12/20/20 | | | | GSCM | | | | 175 | | | | (1.000 | ) | | | (2 | ) | | | — | | | | — | | | | (2 | ) |
Short-Term Investment-Grade Portfolio
| Over-the-Counter Credit Default Swaps (continued) | | | | | | | | | | | | | | | |
| | | | | | | | | | | | | Remaining | | | | | | | |
| | | | | | | | | | Periodic | | | | | | Up-Front | | | | | | | |
| | | | | | | | | | Premium | | | | | | Premium | | | | | | | |
| | | | | | | Notional | | | Received | | | | | | Received | | | Unrealized | | | Unrealized | |
| Reference | | Termination | | | | Amount | | | (Paid | )2 | | Value | | | (Paid | ) | | Appreciation | | | (Depreciation | ) |
| Entity | | Date | | Counterparty | | ($000 | ) | | (% | ) | | ($000 | ) | | ($000 | ) | | ($000 | ) | | ($000 | ) |
| Autozone Inc. | | 12/20/20 | | GSCM | | | 240 | | | | (1.000 | ) | | | (2 | ) | | | 1 | | | | — | | | | (1 | ) |
| Bank of America Corp. | | 3/20/20 | | GSCM | | | 520 | | | | (1.000 | ) | | | (1 | ) | | | — | | | | — | | | | (1 | ) |
| Bank of China Ltd. | | 12/20/21 | | BNPSW | | | 300 | | | | (1.000 | ) | | | (6 | ) | | | — | | | | — | | | | (6 | ) |
| Bank of China Ltd. | | 6/20/22 | | BNPSW | | | 665 | | | | (1.000 | ) | | | (15 | ) | | | — | | | | — | | | | (15 | ) |
| Bank of China Ltd. | | 6/20/23 | | BNPSW | | | 515 | | | | (1.000 | ) | | | (15 | ) | | | 6 | | | | — | | | | (9 | ) |
| Commerzbank AG | | 6/20/21 | | BOANA | | | 590 | | | | (1.000 | ) | | | (7 | ) | | | (2 | ) | | | — | | | | (9 | ) |
| CVS Health Corp. | | 12/20/20 | | BOANA | | | 240 | | | | (1.000 | ) | | | (2 | ) | | | 1 | | | | — | | | | (1 | ) |
| CVS Health Corp. | | 12/20/20 | | BOANA | | | 240 | | | | (1.000 | ) | | | (2 | ) | | | 2 | | | | — | | | | — | |
| CVS Health Corp. | | 12/20/20 | | BOANA | | | 120 | | | | (1.000 | ) | | | (1 | ) | | | 1 | | | | — | | | | — | |
| CVS Health Corp. | | 12/20/20 | | BOANA | | | 120 | | | | (1.000 | ) | | | (1 | ) | | | 1 | | | | — | | | | — | |
| CVS Health Corp. | | 12/20/21 | | BARC | | | 465 | | | | (1.000 | ) | | | (8 | ) | | | 6 | | | | — | | | | (2 | ) |
| CVS Health Corp. | | 12/20/21 | | BARC | | | 160 | | | | (1.000 | ) | | | (3 | ) | | | 2 | | | | — | | | | (1 | ) |
| CVS Health Corp. | | 12/20/21 | | JPMC | | | 700 | | | | (1.000 | ) | | | (12 | ) | | | 8 | | | | — | | | | (4 | ) |
| Deutsche Bank AG | | 12/20/22 | | JPMC | | | 830 | | | | (1.000 | ) | | | 1 | | | | 2 | | | | 3 | | | | — | |
| Deutsche Bank AG | | 12/20/24 | | GSI | | | 225 | 1 | | | (1.000 | ) | | | 3 | | | | (6 | ) | | | — | | | | (3 | ) |
| Dominion Energy Inc. | | 12/20/20 | | JPMC | | | 2,420 | | | | (1.000 | ) | | | (23 | ) | | | 17 | | | | — | | | | (6 | ) |
| Dominion Energy Inc. | | 12/20/20 | | JPMC | | | 2,420 | | | | (1.000 | ) | | | (23 | ) | | | 16 | | | | — | | | | (7 | ) |
| Federation of Malaysia | | 12/20/24 | | BNPSW | | | 405 | | | | (1.000 | ) | | | (13 | ) | | | 10 | | | | — | | | | (3 | ) |
| Federative Republic of Brazil | | 12/20/24 | | GSI | | | 1,536 | | | | (1.000 | ) | | | (2 | ) | | | (15 | ) | | | — | | | | (17 | ) |
| Federative Republic of Brazil | | 12/20/24 | | MSCS | | | 400 | | | | (1.000 | ) | | | — | | | | (4 | ) | | | — | | | | (4 | ) |
| Federative Republic of Brazil | | 12/20/25 | | BOANA | | | 578 | | | | (1.000 | ) | | | 5 | | | | (99 | ) | | | — | | | | (94 | ) |
| Federative Republic of Brazil | | 12/20/25 | | GSCM | | | 275 | | | | (1.000 | ) | | | 2 | | | | (44 | ) | | | — | | | | (42 | ) |
| Lincoln National Corp. | | 6/20/21 | | BARC | | | 80 | | | | (1.000 | ) | | | (1 | ) | | | (1 | ) | | | — | | | | (2 | ) |
| Lincoln National Corp. | | 6/20/21 | | BARC | | | 80 | | | | (1.000 | ) | | | (1 | ) | | | 1 | | | | — | | | | — | |
| Lincoln National Corp. | | 12/20/21 | | BARC | | | 160 | | | | (1.000 | ) | | | (3 | ) | | | — | | | | — | | | | (3 | ) |
| McDonald’s Corp. | | 6/20/22 | | GSI | | | 675 | | | | (1.000 | ) | | | (15 | ) | | | 11 | | | | — | | | | (4 | ) |
| Raytheon Co. | | 12/20/21 | | GSI | | | 585 | | | | (1.000 | ) | | | (11 | ) | | | 8 | | | | — | | | | (3 | ) |
| Raytheon Co. | | 12/20/21 | | GSI | | | 580 | | | | (1.000 | ) | | | (11 | ) | | | 8 | | | | — | | | | (3 | ) |
| Republic of Chile | | 12/20/24 | | GSI | | | 290 | | | | (1.000 | ) | | | (8 | ) | | | 8 | | | | — | | | | — | |
| Republic of Colombia | | 12/20/24 | | GSI | | | 283 | | | | (1.000 | ) | | | (4 | ) | | | 3 | | | | — | | | | (1 | ) |
| Republic of Colombia | | 12/20/24 | | MSCS | | | 945 | | | | (1.000 | ) | | | (13 | ) | | | 4 | | | | — | | | | (9 | ) |
| Republic of Indonesia | | 12/20/24 | | BARC | | | 800 | | | | (1.000 | ) | | | (16 | ) | | | 4 | | | | — | | | | (12 | ) |
| Republic of South Africa | | 12/20/24 | | JPMC | | | 575 | | | | (1.000 | ) | | | 15 | | | | (23 | ) | | | — | | | | (8 | ) |
Short-Term Investment-Grade Portfolio
| Over-the-Counter Credit Default Swaps (continued) | | | | | | | | | | | | | | | |
| | | | | | | | | | | | | Remaining | | | | | | | |
| | | | | | | | | | Periodic | | | Up-Front | | | | | | | |
| | | | | | | | | | Premium | | | Premium | | | | | | | |
| | | | | | | Notional | | | Received | | | Received | | | Unrealized | | | Unrealized | |
| Reference | | Termination | | | | Amount | | | (Paid | )2 | | Value | | | (Paid | ) | | Appreciation | | | (Depreciation | ) |
| Entity | | Date | | Counterparty | | ($000 | ) | | (% | ) | | ($000 | ) | | ($000 | ) | | ($000 | ) | | ($000 | ) |
| Republic of South Africa | | 12/20/24 | | MSCS | | | 200 | | | | (1.000 | ) | | | 5 | | | | (8 | ) | | | — | | | | (3 | ) |
| Republic of Turkey | | 12/20/22 | | HSBCC | | | 300 | | | | (1.000 | ) | | | 10 | | | | (22 | ) | | | — | | | | (12 | ) |
| Republic of Turkey | | 6/20/23 | | BNPSW | | | 660 | | | | (1.000 | ) | | | 29 | | | | (20 | ) | | | 9 | | | | — | |
| Republic of Turkey | | 12/20/24 | | MSCS | | | 337 | | | | (1.000 | ) | | | 28 | | | | (41 | ) | | | — | | | | (13 | ) |
| Societe Generale SA | | 12/20/21 | | JPMC | | | 235 | | | | (1.000 | ) | | | (4 | ) | | | 1 | | | | — | | | | (3 | ) |
| Standard Chartered Bank | | 12/20/21 | | JPMC | | | 395 | | | | (1.000 | ) | | | (7 | ) | | | — | | | | — | | | | (7 | ) |
| State of Qatar | | 6/20/22 | | CITNA | | | 50 | | | | (1.000 | ) | | | (1 | ) | | | — | | | | — | | | | (1 | ) |
| United Mexican States | | 12/20/24 | | CITNA | | | 345 | | | | (1.000 | ) | | | (4 | ) | | | (2 | ) | | | — | | | | (6 | ) |
| United Mexican States | | 12/20/24 | | GSI | | | 470 | | | | (1.000 | ) | | | (5 | ) | | | 2 | | | | — | | | | (3 | ) |
| United Mexican States | | 12/20/24 | | GSI | | | 225 | | | | (1.000 | ) | | | (2 | ) | | | 1 | | | | — | | | | (1 | ) |
| UnitedHealth Group Inc. | | 6/20/20 | | CSFBI | | | 470 | | | | (1.000 | ) | | | (2 | ) | | | 2 | | | | — | | | | — | |
| Wells Fargo & Co. | | 9/20/20 | | BOANA | | | 620 | | | | (1.000 | ) | | | (4 | ) | | | 2 | | | | — | | | | (2 | ) |
| | | | | | | | | | | | | | | | (157 | ) | | | (158 | ) | | | 12 | | | | (327 | ) |
| | | | | | | | | | | | | | | | (89 | ) | | | (172 | ) | | | 66 | | | | (327 | ) |
The notional amount represents the maximum potential amount the portfolio could be required to pay as a seller of credit protection if the reference entity was subject to a credit event.
1 Notional amount denominated in euro.
2 Periodic premium received/paid quarterly.
BARC—Barclays Bank plc.
BNPSW—BNP Paribas.
BOANA—Bank of America,N.A.
CITNA—Citibank, N.A.
CSFBI—Credit Suisse First Boston International.
GSCM—Goldman Sachs Bank USA.
GSI—Goldman Sachs International.
HSBCC—HSBC Bank USA, N.A.
JPMC—JPMorgan Chase Bank, N.A.
MSCS—Morgan Stanley Capital Services LLC.
Short-Term Investment-Grade Portfolio
| Centrally Cleared Interest Rate Swaps | | | | | | | | | | | | | |
| | | | | | | | Fixed | | | Floating | | | | | | | |
| | | | | | | | Interest | | | Interest | | | | | | | |
| | | | | | | | Rate | | | Rate | | | | | | Unrealized | |
| | | Future | | Notional | | | Received | | | Received | | | | | | Appreciation | |
| | | Effective | | Amount | | | (Paid | )2 | | (Paid | )3 | | Value | | | (Depreciation | ) |
| Termination Date | | Date1 | | ($000 | ) | | (% | ) | | (% | ) | | ($000 | ) | | ($000 | ) |
| 3/18/21 | | 3/18/20 | | | 7,332 | | | | 1.750 | | | | (0.000 | ) | | | 3 | | | | (4 | ) |
| 3/18/22 | | 3/18/20 | | | 3,470 | | | | (1.750 | ) | | | 0.000 | | | | (7 | ) | | | 4 | |
| 3/20/23 | | 3/18/20 | | | 10,043 | | | | (1.750 | ) | | | 0.000 | | | | (25 | ) | | | 23 | |
| 3/18/24 | | 3/18/20 | | | 8,294 | | | | (1.750 | ) | | | 0.000 | | | | (19 | ) | | | 29 | |
| 3/18/25 | | 3/18/20 | | | 8,199 | | | | (1.750 | ) | | | 0.000 | | | | (11 | ) | | | 38 | |
| 3/18/27 | | 3/18/20 | | | 3,968 | | | | (2.000 | ) | | | 0.000 | | | | (53 | ) | | | 31 | |
| | | | | | | | | | | | | | | | | | (112 | ) | | | 121 | |
| 1 | Forward interest rate swap. In a forward interest rate swap, the portfolio and the counterparty agree to make periodic net payments beginning on a specified future effective date. |
| 2 | Fixed interest payment received/paid semiannually. |
| 3 | Based on 3-month LIBOR as of the most recent payment date. Floating interest payment received/paid quarterly. |
See accompanying Notes, which are an integral part of the Financial Statements.
Short-Term Investment-Grade Portfolio
Statement of Operations
| | | Year Ended | |
| | | December 31, 2019 | |
| | | ($000 | ) |
| Investment Income | | | | |
| Income | | | | |
| Interest1 | | | 53,906 | |
| Total Income | | | 53,906 | |
| Expenses | | | | |
| The Vanguard Group—Note B | | | | |
| Investment Advisory Services | | | 246 | |
| Management and Administrative | | | 1,971 | |
| Marketing and Distribution | | | 209 | |
| Custodian Fees | | | 57 | |
| Auditing Fees | | | 40 | |
| Shareholders’ Reports | | | 15 | |
| Trustees’ Fees and Expenses | | | 1 | |
| Total Expenses | | | 2,539 | |
| Net Investment Income | | | 51,367 | |
| Realized Net Gain (Loss) | | | | |
| Investment Securities Sold1 | | | 7,695 | |
| Futures Contracts | | | (3,592 | ) |
| Options Purchased | | | 49 | |
| Options Written | | | 758 | |
| Swap Contracts | | | (2,694 | ) |
| Forward Currency Contracts | | | 819 | |
| Foreign Currencies | | | (210 | ) |
| Realized Net Gain (Loss) | | | 2,825 | |
| Change in Unrealized Appreciation (Depreciation) | | | | |
| Investment Securities1 | | | 45,408 | |
| Futures Contracts | | | 327 | |
| Options Purchased | | | (69 | ) |
| Options Written | | | 89 | |
| Swap Contracts | | | 162 | |
| Forward Currency Contracts | | | (99 | ) |
| Foreign Currencies | | | 15 | |
| Change in Unrealized Appreciation (Depreciation) | | | 45,833 | |
| Net Increase (Decrease) in Net Assets Resulting from Operations | | | 100,025 | |
| 1 | Interest income, realized net gain (loss), and change in unrealized appreciation (depreciation) from an affiliated company of the portfolio were $1,161,000, $13,000, and ($2,000), respectively. Purchases and sales are for temporary cash investment purposes. |
Statement of Changes in Net Assets
| | | Year Ended December 31, | |
| | | 2019 | | | 2018 | |
| | | ($000 | ) | | ($000 | ) |
| Increase (Decrease) in Net Assets | | | | | | | | |
| Operations | | | | | | | | |
| Net Investment Income | | | 51,367 | | | | 44,595 | |
| Realized Net Gain (Loss) | | | 2,825 | | | | (14,885 | ) |
| Change in Unrealized Appreciation (Depreciation) | | | 45,833 | | | | (13,562 | ) |
| Net Increase (Decrease) in Net Assets Resulting from Operations | | | 100,025 | | | | 16,148 | |
| Distributions | | | | | | | | |
| Net Investment Income | | | (46,758 | ) | | | (28,556 | ) |
| Realized Capital Gain | | | — | | | | — | |
| Total Distributions | | | (46,758 | ) | | | (28,556 | ) |
| Capital Share Transactions | | | | | | | | |
| Issued | | | 444,226 | | | | 405,970 | |
| Issued in Lieu of Cash Distributions | | | 46,758 | | | | 28,556 | |
| Redeemed | | | (320,964 | ) | | | (342,930 | ) |
| Net Increase (Decrease) from Capital Share Transactions | | | 170,020 | | | | 91,596 | |
| Total Increase (Decrease) | | | 223,287 | | | | 79,188 | |
| Net Assets | | | | | | | | |
| Beginning of Period | | | 1,683,331 | | | | 1,604,143 | |
| End of Period | | | 1,906,618 | | | | 1,683,331 | |
See accompanying Notes, which are an integral part of the Financial Statements.
Short-Term Investment-Grade Portfolio
Financial Highlights
| For a Share Outstanding | | | Year Ended December 31, |
| Throughout Each Period | 2019 | 2018 | 2017 | 2016 | 2015 |
| Net Asset Value, Beginning of Period | $10.54 | $10.63 | $10.63 | $10.55 | $10.63 |
| Investment Operations | | | | | |
| Net Investment Income | .3021 | .2841 | .2241 | .215 | .207 |
| Net Realized and Unrealized Gain (Loss) on Investments | .287 | (.187) | .005 | .068 | (.088) |
| Total from Investment Operations | .589 | .097 | .229 | .283 | .119 |
| Distributions | | | | | |
| Dividends from Net Investment Income | (.289) | (.187) | (.211) | (.203) | (.197) |
| Distributions from Realized Capital Gains | — | — | (.018) | — | (.002) |
| Total Distributions | (.289) | (.187) | (.229) | (.203) | (.199) |
| Net Asset Value, End of Period | $10.84 | $10.54 | $10.63 | $10.63 | $10.55 |
| | | | | | |
| Total Return | 5.69% | 0.94% | 2.19% | 2.72% | 1.12% |
| | | | | | |
| Ratios/Supplemental Data | | | | | |
| Net Assets, End of Period (Millions) | $1,907 | $1,683 | $1,604 | $1,372 | $1,303 |
| Ratio of Total Expenses to Average Net Assets | 0.14% | 0.14% | 0.16% | 0.16% | 0.16% |
| Ratio of Net Investment Income to Average Net Assets | 2.83% | 2.72% | 2.11% | 2.05% | 1.94% |
| Portfolio Turnover Rate | 67%2 | 78% | 83% | 65% | 74% |
1 Calculated based on average shares outstanding.
2 Includes 1% attributable to mortgage-dollar-roll activity.
See accompanying Notes, which are an integral part of the Financial Statements.
Short-Term Investment-Grade Portfolio
Notes to Financial Statements
The Short-Term Investment-Grade Portfolio, a portfolio of Vanguard Variable Insurance Funds, is registered under the Investment Company Act of 1940 as an open-end investment company. The portfolio’s shares are only available for purchase by separate accounts of insurance companies as investments for variable annuity plans, variable life insurance contracts, or other variable benefit insurance contracts. Certain of the portfolio’s investments are in corporate debt instruments; the issuers’ abilities to meet their obligations may be affected by economic developments in their respective industries.
A. The following significant accounting policies conform to generally accepted accounting principles for U.S. investment companies. The portfolio consistently follows such policies in preparing its financial statements.
1. Security Valuation: Securities are valued as of the close of trading on the New York Stock Exchange (generally 4 p.m., Eastern time) on the valuation date. Bonds and temporary cash investments are valued using the latest bid prices or using valuations based on a matrix system (which considers such factors as security prices, yields, maturities, and ratings), both as furnished by independent pricing services. Structured debt securities, including mortgages and asset-backed securities, are valued using the latest bid prices or using valuations based on a matrix system that considers such factors as issuer, tranche, nominal or option-adjusted spreads, weighted average coupon, weighted average maturity, credit enhancements, and collateral. Investments in Vanguard Market Liquidity Fund are valued at that fund’s net asset value. Securities for which market quotations are not readily available, or whose values have been affected by events occurring before the portfolio’s pricing time but after the close of the securities’ primary markets, are valued at their fair values calculated according to procedures adopted by the board of trustees. These procedures include obtaining quotations from an independent pricing service, monitoring news to identify significant market- or security-specific events, and evaluating changes in the values of foreign market proxies (for example, ADRs, futures contracts, or exchange-traded funds), between the time the foreign markets close and the portfolio’s pricing time. When fair-value pricing is employed, the prices of securities used by a portfolio to calculate its net asset value may differ from quoted or published prices for the same securities.
2. Foreign Currency: Securities and other assets and liabilities denominated in foreign currencies are translated into U.S. dollars using exchange rates obtained from an independent third party as of the portfolio’s pricing time on the valuation date. Realized gains (losses) and unrealized appreciation (depreciation) on investment securities include the effects of changes in exchange rates since the securities were purchased, combined with the effects of changes in security prices. Fluctuations in the value of other assets and liabilities resulting from changes in exchange rates are recorded as unrealized foreign currency gains (losses) until the assets or liabilities are settled in cash, at which time they are recorded as realized foreign currency gains (losses).
3. Futures Contracts: The portfolio uses futures contracts to invest in fixed income asset classes with greater efficiency and lower cost than is possible through direct investment, to add value when these instruments are attractively priced, or to adjust sensitivity to changes in interest rates. The primary risks associated with the use of futures contracts are imperfect correlation between changes in market values of bonds held by the portfolio and the prices of futures contracts, and the possibility of an illiquid market. Counterparty risk involving futures is mitigated because a regulated clearinghouse is the counterparty instead of the clearing broker. To further mitigate counterparty risk, the portfolio trades futures contracts on an exchange, monitors the financial strength of its clearing brokers and clearinghouse, and has entered into clearing agreements with its clearing brokers. The clearinghouse imposes initial margin requirements to secure the portfolio’s performance and requires daily settlement of variation margin representing changes in the market value of each contract. Any assets pledged as initial margin for open contracts are noted in the Statement of Net Assets.
Futures contracts are valued at their quoted daily settlement prices. The notional amounts of the contracts are not recorded in the Statement of Net Assets. Fluctuations in the value of the contracts are recorded in the Statement of Net Assets as an asset (liability) and in the Statement of Operations as unrealized appreciation (depreciation) until the contracts are closed, when they are recorded as realized futures gains (losses).
During the year ended December 31, 2019, the portfolio’s average investments in long and short futures contracts represented 6% and 3% of net assets, respectively, based on the average of the notional amounts at each quarter-end during the period.
4. Forward Currency Contracts: The portfolio enters into forward currency contracts to protect the value of securities and related receivables and payables against changes in future foreign exchange rates. The portfolio’s risks in using these contracts include movement in the values of the foreign currencies relative to the U.S. dollar and the ability of the counterparties to fulfill their obligations
Short-Term Investment-Grade Portfolio
under the contracts. The portfolio mitigates its counterparty risk by entering into forward currency contracts only with a diverse group of prequalified counterparties, monitoring their financial strength, entering into master netting arrangements with its counterparties, and requiring its counterparties to transfer collateral as security for their performance. In the absence of a default, the collateral pledged or received by the portfolio cannot be repledged, resold, or rehypothecated. The master netting arrangements provide that, in the event of a counterparty’s default (including bankruptcy), the portfolio may terminate the forward currency contracts, determine the net amount owed by either party in accordance with its master netting arrangements, and sell or retain any collateral held up to the net amount owed to the portfolio under the master netting arrangements. The forward currency contracts contain provisions whereby a counterparty may terminate open contracts if the portfolio’s net assets decline below a certain level, triggering a payment by the portfolio if the portfolio is in a net liability position at the time of the termination. The payment amount would be reduced by any collateral the portfolio has pledged. Any assets pledged as collateral for open contracts are noted in the Statement of Net Assets. The value of collateral received or pledged is compared daily to the value of the forward currency contracts exposure with each counterparty, and any difference, if in excess of a specified minimum transfer amount, is adjusted and settled within two business days.
Forward currency contracts are valued at their quoted daily prices obtained from an independent third party, adjusted for currency risk based on the expiration date of each contract. The notional amounts of the contracts are not recorded in the Statement of Net Assets. Fluctuations in the value of the contracts are recorded in the Statement of Net Assets as an asset (liability) and in the Statement of Operations as unrealized appreciation (depreciation) until the contracts are closed, when they are recorded as realized forward currency contract gains (losses).
During the year ended December 31, 2019, the portfolio’s average investment in forward currency contracts represented 3% of net assets, based on the average of notional amounts at each quarter-end during the period.
5. Swap Contracts: The portfolio invests in credit default swaps to adjust the overall credit risk of the portfolio or to actively overweight or underweight credit risk to a specific issuer or group of issuers. The portfolio may sell credit protection through credit default swaps to simulate investments in long positions that are either unavailable or considered to be less attractively priced in the bond market. The portfolio may purchase credit protection through credit default swaps to reduce credit exposure to a given issuer or issuers. Under the terms of the swaps, an up-front payment may be exchanged between the seller and buyer. In addition, the seller of the credit protection receives a periodic payment of premium from the buyer that is a fixed percentage applied to a notional amount. If, for example, the reference entity is subject to a credit event (such as bankruptcy, failure to pay, or obligation acceleration) during the term of the swap, the seller agrees to either physically settle or cash settle the swap contract. If the swap is physically settled, the seller agrees to pay the buyer an amount equal to the notional amount and take delivery of a debt instrument of the reference issuer with a par amount equal to such notional amount. If the swap is cash settled, the seller agrees to pay the buyer the difference between the notional amount and the final price for the relevant debt instrument, as determined either in a market auction or pursuant to a pre-agreed-upon valuation procedure.
The portfolio enters into interest rate swap transactions to adjust the portfolio’s sensitivity to changes in interest rates and maintain the ability to generate income at prevailing market rates. Under the terms of the swaps, one party pays the other an amount that is a fixed percentage rate applied to a notional amount. In return, the counterparty agrees to pay a floating rate, which is reset periodically based on short-term interest rates, applied to the same notional amount.
The notional amounts of swap contracts are not recorded in the Statement of Net Assets. Swaps are valued daily based on market quotations received from independent pricing services or recognized dealers and the change in value is recorded in the Statement of Net Assets as an asset (liability) and in the Statement of Operations as unrealized appreciation (depreciation) until the seller of credit protection is required to take delivery (or, in a cash settled swap, pay the settlement amount determined) upon occurrence of a credit event, periodic payments are made, or the swap terminates, at which time realized gain (loss) is recorded. The net premium to be received or paid by the portfolio under swap contracts is accrued daily and recorded as realized gain (loss) over the life of the contract.
The primary risk associated with selling credit protection is that, upon the occurrence of a defined credit event, the market value of the debt instrument received by the portfolio (or, in a cash settled swap, the debt instruments used to determine the settlement payment by the portfolio) will be significantly less than the amount paid by the portfolio and, in a physically settled swap, the portfolio may receive an illiquid debt instrument. A risk associated with all types of swaps is the possibility that a counterparty may default on its obligation to pay net amounts due to the portfolio. The portfolio’s maximum amount
Short-Term Investment-Grade Portfolio
subject to counterparty risk is the unrealized appreciation on the swap contract. The portfolio mitigates its counterparty risk by entering into swaps only with a diverse group of prequalified counterparties, monitoring their financial strength, entering into master netting arrangements with its counterparties, and requiring its counterparties to transfer collateral as security for their performance. In the absence of a default, the collateral pledged or received by the portfolio cannot be repledged, resold, or rehypothecated. In the event of a counterparty’s default (including bankruptcy), the portfolio may terminate any swap contracts with that counterparty, determine the net amount owed by either party in accordance with its master netting arrangements, and sell or retain any collateral held up to the net amount owed to the portfolio under the master netting arrangements. The swap contracts contain provisions whereby a counterparty may terminate open contracts if the portfolio’s net assets decline below a certain level, triggering a payment by the portfolio if the portfolio is in a net liability position at the time of the termination. The payment amount would be reduced by any collateral the portfolio has pledged. Any securities pledged as collateral for open contracts are noted in the Statement of Net Assets. The value of collateral received or pledged is compared daily to the value of the swap contracts exposure with each counterparty, and any difference, if in excess of a specified minimum transfer amount, is adjusted and settled within two business days.
The portfolio enters into centrally cleared interest rate and credit default swaps to achieve the same objectives specified with respect to the equivalent over-the-counter swaps but with less counterparty risk because a regulated clearinghouse is the counterparty instead of the clearing broker or executing broker. The clearinghouse imposes initial margin requirements to secure the portfolio’s performance, and requires daily settlement of variation margin representing changes in the market value of each contract. To further mitigate counterparty risk, the portfolio trades with a diverse group of prequalified executing brokers; monitors the financial strength of its clearing brokers, executing brokers, and clearinghouse; and has entered into agreements with its clearing brokers and executing brokers.
During the year ended December 31, 2019, the portfolio’s average amounts of investments in credit protection sold and credit protection purchased represented 1% and 2% of net assets, respectively, based on the average of notional amounts at each quarter-end during the period. The average amount of investments in interest rate swaps represented 2% of net assets, based on the average of notional amounts at each quarter-end during the period.
6. Options: The portfolio invests in options contracts on futures and swaps to adjust its exposure to the underlying investments. The primary risk associated with purchasing options is that the value of the underlying investments may move in such a way that the option is out-of-the-money (the exercise price of the option exceeds the value of the underlying investment), the position is worthless at expiration, and the portfolio loses the premium paid. The primary risk associated with selling options is that the value of the underlying investments may move in such a way that the option is in-the-money (the exercise price of the option exceeds the value of the underlying investment), the counterparty exercises the option, and the portfolio loses an amount equal to the market value of the option written less the premium received.
The portfolio invests in options on futures, which are exchange-traded. Counterparty risk involving exchange-traded options on futures is mitigated because a regulated clearinghouse is the counterparty instead of the clearing broker. To further mitigate counterparty risk, the portfolio trades options on futures on an exchange, monitors the financial strength of its clearing brokers and clearinghouses, and has entered into clearing agreements with its clearing brokers.
The portfolio invests in options on swaps (swaptions), which are transacted over-the-counter (OTC) and not on an exchange. A receiver swaption gives the owner the right to receive the total return of a specified asset, reference rate, or index. A payer swaption gives the owner the right to pay the total return of a specified asset, reference rate, or index. Swaptions also include options that allow an existing swap to be terminated or extended by one of the counterparties. Unlike exchange-traded options, which are standardized with respect to the underlying instrument, expiration date, contract size, and strike price, the terms of OTC options generally are established through negotiation with the other party to the option contract. Although this type of arrangement allows the purchaser or writer greater flexibility to tailor an option to its needs, OTC options generally involve greater credit risk than exchange-traded options. Credit risk involves the possibility that a counterparty may default on its obligation to pay net amounts due to the portfolio. The portfolio mitigates its counterparty risk by entering into swaptions with a diverse group of prequalified counterparties and monitoring their financial strength.
Options on futures contracts are valued at their quoted daily settlement prices. Swaptions are valued daily based on market quotations received from independent pricing services or recognized dealers. The premium paid for a purchased option is recorded in the Statement of Net Assets as an asset that
Short-Term Investment-Grade Portfolio
is subsequently adjusted daily to the current market value of the option purchased. The premium received for a written option is recorded in the Statement of Net Assets as an asset with an equal liability that is subsequently adjusted daily to the current market value of the option written. Fluctuations in the value of the options are recorded in the Statement of Operations as unrealized appreciation (depreciation) until expired, closed, or exercised, at which time realized gains (losses) are recognized.
During the year ended December 31, 2019, the portfolio’s average value of investments in options purchased and options written each represented less than 1% of net assets, based on the average market values at each quarter-end during the period.
7. To Be Announced (TBA) Transactions: A TBA transaction is an agreement to buy or sell mortgage-backed securities with agreed-upon characteristics (face amount, coupon, maturity) for settlement at a future date. The portfolio may be a seller of TBA transactions to reduce its exposure to the mortgage-backed securities market or in order to sell mortgage-backed securities it owns under delayed-delivery arrangements. When the portfolio is a buyer of TBA transactions, it maintains cash or short-term investments in an amount sufficient to meet the purchase price at the settlement date of the TBA transaction. The primary risk associated with TBA transactions is that a counterparty may default on its obligations. The portfolio mitigates its counterparty risk by, among other things, performing a credit analysis of counterparties, allocating transactions among numerous counterparties, and monitoring its exposure to each counterparty. The portfolio may also enter into a Master Securities Forward Transaction Agreement (MSFTA) with certain counterparties and require them to transfer collateral as security for their performance. In the absence of a default, the collateral pledged or received by the portfolio cannot be repledged, resold, or rehypothecated. Under an MSFTA, upon a counterparty default (including bankruptcy), the portfolio may terminate any TBA transactions with that counterparty, determine the net amount owed by either party in accordance with its master netting arrangements, and sell or retain any collateral held up to the net amount owed to the portfolio under the master netting arrangements.
8. Mortgage Dollar Rolls: The portfolio enters into mortgage-dollar-roll transactions, in which the portfolio sells mortgage-backed securities to a dealer and simultaneously agrees to purchase similar securities in the future at a predetermined price. The proceeds of the securities sold in mortgage-dollar-roll transactions are typically invested in high-quality short-term fixed income securities. The portfolio forgoes principal and interest paid on the securities sold, and is compensated by interest earned on the proceeds of the sale and by a lower price on the securities to be repurchased. The portfolio accounts for mortgage-dollar-roll transactions as purchases and sales; as such, these transactions may increase the portfolio’s portfolio turnover rate. Amounts to be received or paid in connection with open mortgage dollar rolls are included in Receivables for Investment Securities Sold or Payables for Investment Securities Purchased in the Statement of Net Assets.
9. Federal Income Taxes: The portfolio intends to continue to qualify as a regulated investment company and distribute all of its taxable income. Management has analyzed the portfolio’s tax positions taken for all open federal income tax years (December 31, 2016–2019), and has concluded that no provision for federal income tax is required in the portfolio’s financial statements.
10. Distributions: Distributions to shareholders are recorded on the ex-dividend date. Distributions are determined on a tax basis and may differ from net investment income and realized capital gains for financial reporting purposes.
11. Credit Facility: The portfolio and certain other funds managed by The Vanguard Group (“Vanguard”) participate in a $4.3 billion committed credit facility provided by a syndicate of lenders pursuant to a credit agreement that may be renewed annually; each fund is individually liable for its borrowings, if any, under the credit facility. Borrowings may be utilized for temporary and emergency purposes, and are subject to the portfolio’s regulatory and contractual borrowing restrictions. The participating funds are charged administrative fees and an annual commitment fee of 0.10% of the undrawn amount of the facility; these fees are allocated to the funds based on a method approved by the portfolio’s board of trustees and included in Management and Administrative expenses on the portfolio’s Statement of Operations. Any borrowings under this facility bear interest at a rate based upon the higher of the one-month London Interbank Offered Rate, federal funds effective rate, or overnight bank funding rate plus an agreed-upon spread.
The portfolio had no borrowings outstanding at December 31, 2019, or at any time during the period then ended.
12. Other: Interest income includes income distributions received from Vanguard Market Liquidity Fund and is accrued daily. Premiums and discounts on debt securities are amortized and accreted, respectively, to interest income over the lives of the respective securities, except for premiums on
Short-Term Investment-Grade Portfolio
certain callable debt securities that are amortized to the earliest call date. Security transactions are accounted for on the date securities are bought or sold. Costs used to determine realized gains (losses) on the sale of investment securities are those of the specific securities sold.
B. In accordance with the terms of a Funds’ Service Agreement (the “FSA”) between Vanguard and the portfolio, Vanguard furnishes to the portfolio investment advisory, corporate management, administrative, marketing, and distribution services at Vanguard’s cost of operations (as defined by the FSA). These costs of operations are allocated to the portfolio based on methods and guidelines approved by the board of trustees. Vanguard does not require reimbursement in the current period for certain costs of operations (such as deferred compensation/benefits and risk/insurance costs); the portfolio’s liability for these costs of operations is included in Payables to Vanguard on the Statement of Net Assets. All other costs of operations payable to Vanguard are generally settled twice a month.
Upon the request of Vanguard, the portfolio may invest up to 0.40% of its net assets as capital in Vanguard. At December 31, 2019, the portfolio had contributed to Vanguard capital in the amount of $85,000, representing less than 0.01%of the portfolio’s net assets and 0.03% of Vanguard’s capital received pursuant to the FSA. The portfolio’s trustees and officers are also directors and employees, respectively, of Vanguard.
C. Various inputs may be used to determine the value of the portfolio’s investments. These inputs are summarized in three broad levels for financial statement purposes. The inputs or methodologies used to value securities are not necessarily an indication of the risk associated with investing in those securities.
Level 1—Quoted prices in active markets for identical securities.
Level 2—Other significant observable inputs (including quoted prices for similar securities, interest rates, prepayment speeds, credit risk, etc.).
Level 3—Significant unobservable inputs (including the portfolio’s own assumptions used to determine the fair value of investments). Any investments valued with significant unobservable inputs are noted on the Statement of Net Assets.
The following table summarizes the market value of the portfolio’s investments and derivatives as of December 31, 2019, based on the inputs used to value them:
| | | Level 1 | | | Level 2 | | | Level 3 | |
| Investments | | ($000 | ) | | ($000 | ) | | ($000 | ) |
| U.S. Government and Agency Obligations | | | — | | | | 78,279 | | | | — | |
| Asset-Backed/Commercial Mortgage-Backed Securities | | | — | | | | 411,673 | | | | — | |
| Corporate Bonds | | | — | | | | 1,177,499 | | | | — | |
| Sovereign Bonds | | | — | | | | 89,258 | | | | — | |
| Taxable Municipal Bonds | | | — | | | | 966 | | | | — | |
| Temporary Cash Investments | | | 33,582 | | | | 103,643 | | | | — | |
| Options Purchased | | | — | | | | 59 | | | | — | |
| Options Written | | | — | | | | (153 | ) | | | — | |
| Futures Contracts—Assets1 | | | 101 | | | | — | | | | — | |
| Futures Contracts—Liabilities1 | | | (36 | ) | | | — | | | | — | |
| Forward Currency Contracts—Assets | | | — | | | | 42 | | | | — | |
| Forward Currency Contracts—Liabilities | | | — | | | | (426 | ) | | | — | |
| Swap Contracts—Assets | | | 19 | 1 | | | 66 | | | | — | |
| Swap Contracts—Liabilities | | | (5 | )1 | | | (327 | ) | | | — | |
| Total | | | 33,661 | | | | 1,860,579 | | | | — | |
1 Represents variation margin on the last day of the reporting period.
Short-Term Investment-Grade Portfolio
D. At December 31, 2019, the fair values of derivatives were reflected in the Statement of Net Assets as follows:
| | | Interest Rate | | | Currency | | | Credit | | | | |
| | | Contracts | | | Contracts | | | Contracts | | | Total | |
| Statement of Net Assets Caption | | ($000 | ) | | ($000 | ) | | ($000 | ) | | ($000 | ) |
| Options Purchased | | | 46 | | | | — | | | | 13 | | | | 59 | |
| Variation Margin Receivable—Futures Contracts | | | 101 | | | | — | | | | — | | | | 101 | |
| Variation Margin Receivable— CC Swap Contracts | | | 17 | | | | — | | | | 2 | | | | 19 | |
| Unrealized Appreciation—Forward Currency Contracts | | | — | | | | 42 | | | | — | | | | 42 | |
| Unrealized Appreciation—OTC Swap Contracts | | | — | | | | — | | | | 66 | | | | 66 | |
| Total Assets | | | 164 | | | | 42 | | | | 81 | | | | 287 | |
| | | | | | | | | | | | | | | | | |
| Options Written | | | (54 | ) | | | — | | | | (99 | ) | | | (153 | ) |
| Variation Margin Payable—Futures Contracts | | | (36 | ) | | | — | | | | — | | | | (36 | ) |
| Variation Margin Payable—CC Swap Contracts | | | (1 | ) | | | — | | | | (4 | ) | | | (5 | ) |
| Unrealized Depreciation—Forward Currency Contracts | | | — | | | | (426 | ) | | | — | | | | (426 | ) |
| Unrealized Depreciation—OTC Swap Contracts | | | — | | | | — | | | | (327 | ) | | | (327 | ) |
| Total Liabilities | | | (91 | ) | | | (426 | ) | | | (430 | ) | | | (947 | ) |
Realized net gain (loss) and the change in unrealized appreciation (depreciation) on derivatives for the year ended December 31, 2019, were:
| | | Interest Rate | | | Currency | | | Credit | | | | |
| | | Contracts | | | Contracts | | | Contracts | | | Total | |
| Realized Net Gain (Loss) on Derivatives | | ($000 | ) | | ($000 | ) | | ($000 | ) | | ($000 | ) |
| Futures Contracts | | | (3,592 | ) | | | — | | | | — | | | | (3,592 | ) |
| Options Purchased | | | 100 | | | | — | | | | (51 | ) | | | 49 | |
| Options Written | | | 512 | | | | — | | | | 246 | | | | 758 | |
| Forward Currency Contracts | | | — | | | | 819 | | | | — | | | | 819 | |
| Swap Contracts | | | (2,202 | ) | | | — | | | | (492 | ) | | | (2,694 | ) |
| Realized Net Gain (Loss) on Derivatives | | | (5,182 | ) | | | 819 | | | | (297 | ) | | | (4,660 | ) |
| | | | | | | | | | | | | | | | | |
| Change in Unrealized Appreciation (Depreciation) on Derivatives | | | | | | | | | | | | | | | | |
| Futures Contracts | | | 327 | | | | — | | | | — | | | | 327 | |
| Options Purchased | | | (53 | ) | | | — | | | | (16 | ) | | | (69 | ) |
| Options Written | | | 101 | | | | — | | | | (12 | ) | | | 89 | |
| Forward Currency Contracts | | | — | | | | (99 | ) | | | — | | | | (99 | ) |
| Swap Contracts | | | 359 | | | | — | | | | (197 | ) | | | 162 | |
| Change in Unrealized Appreciation (Depreciation) on Derivatives | | | 734 | | | | (99 | ) | | | (225 | ) | | | 410 | |
E. Permanent differences between book-basis and tax-basis components of net assets are reclassified among capital accounts in the financial statements to reflect their tax character. These reclassifications have no effect on net assets or net asset value per share. As of period end, permanent differences primarily attributable to the accounting for foreign currency transactions and swap agreements were reclassified between the individual components of total distributable earnings (loss).
| | | Amount | |
| | | ($000 | ) |
| Paid-in Capital | | | — | |
| Total Distributable Earnings (Loss) | | | — | |
Short-Term Investment-Grade Portfolio
Temporary differences between book-basis and tax-basis components of total distributable earnings (loss) arise when certain items of income, gain, or loss are recognized in different periods for financial statement and tax purposes; these differences will reverse at some time in the future. The differences are primarily related to the tax deferral of losses on wash sales and straddles; the realization of unrealized gains or losses on certain futures contracts and forward currency contracts; and the tax recognition of gain or loss from foreign currency hedges. As of period end, the tax-basis components of total distributable earnings (loss) are detailed in the table as follows:
| | | Amount | |
| | | ($000 | ) |
| Undistributed Ordinary Income | | | 49,552 | |
| Undistributed Long-Term Gains | | | — | |
| Capital Loss Carryforwards (Non-expiring)* | | | (13,376 | ) |
| Net Unrealized Gains (Losses) | | | 28,338 | |
| * | The fund used capital loss carryforwards of $3,881,000 to offset taxable capital gains realized during the year ended December 31, 2019. |
As of December 31, 2019, gross unrealized appreciation and depreciation for investments and derivatives based on cost for U.S. federal income tax purposes were as follows:
| | | Amount | |
| | | ($000 | ) |
| Tax Cost | | | 1,866,574 | |
| Gross Unrealized Appreciation | | | 31,623 | |
| Gross Unrealized Depreciation | | | (3,288 | ) |
| Net Unrealized Appreciation (Depreciation) | | | 28,335 | |
F. During the year ended December 31, 2019, the portfolio purchased $1,083,716,000 of investment securities and sold $854,143,000 of investment securities, other than U.S. government securities and temporary cash investments. Purchases and sales of U.S. government securities were $166,779,000 and $290,111,000, respectively.
The portfolio purchased securities from and sold securities to other Vanguard funds or accounts managed by Vanguard or its affiliates, in accordance with procedures adopted by the board of trustees in compliance with Rule 17a-7 of the Investment Company Act of 1940. For the year ended December 31, 2019, such purchases and sales were $133,484,000 and $46,953,000, respectively; these amounts are included in the purchases and sales of investment securities noted above.
G. Capital shares issued and redeemed were:
| | | Year Ended December 31, | |
| | | 2019 | | | 2018 | |
| | | Shares | | | Shares | |
| | | (000 | ) | | (000 | ) |
| Issued | | | 41,665 | | | | 38,802 | |
| Issued in Lieu of Cash Distributions | | | 4,483 | | | | 2,756 | |
| Redeemed | | | (30,064 | ) | | | (32,778 | ) |
| Net Increase (Decrease) in Shares Outstanding | | | 16,084 | | | | 8,780 | |
At December 31, 2019, one shareholder, an insurance company separate account whose holdings in the portfolio represent the indirect investment of Vanguard Variable Annuity contract holders, was the record or beneficial owner of 54% of the portfolio’s net assets. If this shareholder were to redeem its investment in the portfolio, the redemption might result in an increase in the portfolio’s expense ratio, cause the portfolio to incur higher transaction costs, or lead to the realization of taxable capital gains.
H. Management has determined that no events or transactions occurred subsequent to December 31, 2019, that would require recognition or disclosure in these financial statements.
Short-Term Investment-Grade Portfolio
Report of Independent Registered Public Accounting Firm
To the Board of Trustees of Vanguard Variable Insurance Funds and Shareholders of Short-Term Investment-Grade Portfolio
Opinion on the Financial Statements
We have audited the accompanying statement of net assets of Short-Term Investment-Grade Portfolio (one of the portfolios constituting Vanguard Variable Insurance Funds, referred to hereafter as the “Portfolio”) as of December 31, 2019, the related statement of operations for the year ended December 31, 2019, the statement of changes in net assets for each of the two years in the period ended December 31, 2019, including the related notes, and the financial highlights for each of the five years in the period ended December 31, 2019 (collectively referred to as the “financial statements”). In our opinion, the financial statements present fairly, in all material respects, the financial position of the Portfolio as of December 31, 2019, the results of its operations for the year then ended, the changes in its net assets for each of the two years in the period ended December 31, 2019 and the financial highlights for each of the five years in the period ended December 31, 2019 in conformity with accounting principles generally accepted in the United States of America.
Basis for Opinion
These financial statements are the responsibility of the Portfolio’s management. Our responsibility is to express an opinion on the Portfolio’s financial statements based on our audits. We are a public accounting firm registered with the Public Company Accounting Oversight Board (United States) (“PCAOB”) and are required to be independent with respect to the Portfolio in accordance with the U.S. federal securities laws and the applicable rules and regulations of the Securities and Exchange Commission and the PCAOB.
We conducted our audits of these financial statements in accordance with the standards of the PCAOB. Those standards require that we plan and perform the audit to obtain reasonable assurance about whether the financial statements are free of material misstatement, whether due to error or fraud.
Our audits included performing procedures to assess the risks of material misstatement of the financial statements, whether due to error or fraud, and performing procedures that respond to those risks. Such procedures included examining, on a test basis, evidence regarding the amounts and disclosures in the financial statements. Our audits also included evaluating the accounting principles used and significant estimates made by management, as well as evaluating the overall presentation of the financial statements. Our procedures included confirmation of securities owned as of December 31, 2019 by correspondence with the custodian, transfer agent and brokers; when replies were not received from brokers, we performed other auditing procedures. We believe that our audits provide a reasonable basis for our opinion.
/s/PricewaterhouseCoopers LLP
Philadelphia, Pennsylvania
February 18, 2020
We have served as the auditor of one or more investment companies in The Vanguard Group of Funds since 1975.
Short-Term Investment-Grade Portfolio
BLOOMBERG is a trademark and service mark of Bloomberg Finance L.P. BARCLAYS is a trademark and service mark of Barclays Bank Plc, used under license. Bloomberg Finance L.P. and its affiliates, including Bloomberg Index Services Limited (BISL) (collectively, Bloomberg), or Bloomberg’s licensors, own all proprietary rights in the Bloomberg Barclays U.S. 1–5 Year Credit Bond Index (the Index or Bloomberg Barclays Index).
Neither Barclays Bank Plc, Barclays Capital Inc., or any affiliate (collectively Barclays) or Bloomberg is the issuer or producer of the Short-Term Investment-Grade Portfolio and neither Bloomberg nor Barclays has any responsibilities, obligations or duties to investors in the Short-Term Investment-Grade Portfolio. The Index is licensed for use by The Vanguard Group, Inc. (Vanguard) as the sponsor of the Short-Term Investment-Grade Portfolio. Bloomberg and Barclays’ only relationship with Vanguard in respect of the Index is the licensing of the Index, which is determined, composed and calculated by BISL, or any successor thereto, without regard to the Issuer or the Short-Term Investment-Grade Portfolio or the owners of the Short-Term Investment-Grade Portfolio.
Additionally, Vanguard may for itself execute transaction(s) with Barclays in or relating to the Index in connection with the Short-Term Investment-Grade Portfolio. Investors acquire the Short-Term Investment-Grade Portfolio from Vanguard and investors neither acquire any interest in the Index nor enter into any relationship of any kind whatsoever with Bloomberg or Barclays upon making an investment in the Short-Term Investment-Grade Portfolio. The Short-Term Investment-Grade Portfolio is not sponsored, endorsed, sold or promoted by Bloomberg or Barclays. Neither Bloomberg nor Barclays makes any representation or warranty, express or implied regarding the advisability of investing in the Short-Term Investment-Grade Portfolio or the advisability of investing in securities generally or the ability of the Index to track corresponding or relative market performance. Neither Bloomberg nor Barclays has passed on the legality or suitability of the Short-Term Investment-Grade Portfolio with respect to any person or entity. Neither Bloomberg nor Barclays is responsible for and has not participated in the determination of the timing of, prices at, or quantities of the Short-Term Investment-Grade Portfolio to be issued. Neither Bloomberg nor Barclays has any obligation to take the needs of the Issuer or the owners of the Short-Term Investment-Grade Portfolio or any other third party into consideration in determining, composing or calculating the Index. Neither Bloomberg nor Barclays has any obligation or liability in connection with administration, marketing or trading of the Short-Term Investment-Grade Portfolio.
The licensing agreement between Bloomberg and Barclays is solely for the benefit of Bloomberg and Barclays and not for the benefit of the owners of the Short-Term Investment-Grade Portfolio, investors or other third parties. In addition, the licensing agreement between Vanguard and Bloomberg is solely for the benefit of Vanguard and Bloomberg and not for the benefit of the owners of the Short-Term Investment-Grade Portfolio, investors or other third parties.
NEITHER BLOOMBERG NOR BARCLAYS SHALL HAVE ANY LIABILITY TO THE ISSUER, INVESTORS OR TO OTHER THIRD PARTIES FOR THE QUALITY, ACCURACY AND/OR COMPLETENESS OF THE BLOOMBERG BARCLAYS INDEX OR ANY DATA INCLUDED THEREIN OR FOR INTERRUPTIONS IN THE DELIVERY OF THE BLOOMBERG BARCLAYS INDEX. NEITHER BLOOMBERG NOR BARCLAYS MAKES ANY WARRANTY, EXPRESS OR IMPLIED, AS TO RESULTS TO BE OBTAINED BY THE ISSUER, THE INVESTORS OR ANY OTHER PERSON OR ENTITY FROM THE USE OF THE BLOOMBERG BARCLAYS INDEX OR ANY DATA INCLUDED THEREIN. NEITHER BLOOMBERG NOR BARCLAYS MAKES ANY EXPRESS OR IMPLIED WARRANTIES, AND EACH HEREBY EXPRESSLY DISCLAIMS ALL WARRANTIES OF MERCHANTABILITY OR FITNESS FOR A PARTICULAR PURPOSE OR USE WITH RESPECT TO THE BLOOMBERG BARCLAYS INDEX OR ANY DATA INCLUDED THEREIN. BLOOMBERG RESERVES THE RIGHT TO CHANGE THE METHODS OF CALCULATION OR PUBLICATION, OR TO CEASE THE CALCULATION OR PUBLICATION OF THE BLOOMBERG BARCLAYS INDEX, AND NEITHER BLOOMBERG NOR BARCLAYS SHALL BE LIABLE FOR ANY MISCALCULATION OF OR ANY INCORRECT, DELAYED OR INTERRUPTED PUBLICATION WITH RESPECT TO THE BLOOMBERG BARCLAYS INDEX. NEITHER BLOOMBERG NOR BARCLAYS SHALL BE LIABLE FOR ANY DAMAGES, INCLUDING, WITHOUT LIMITATION, ANY SPECIAL, INDIRECT OR CONSEQUENTIAL DAMAGES, OR ANY LOST PROFITS AND EVEN IF ADVISED OF THE POSSIBLITY OF SUCH, RESULTING FROM THE USE OF THE BLOOMBERG BARCLAYS INDEX OR ANY DATA INCLUDED THEREIN OR WITH RESPECT TO THE SHORT-TERM INVESTMENT-GRADE PORTFOLIO.
None of the information supplied by Bloomberg or Barclays and used in this publication may be reproduced in any manner without the prior written permission of both Bloomberg and Barclays Capital, the investment banking division of Barclays Bank Plc. Barclays Bank Plc is registered in England No. 1026167. Registered office 1 Churchill Place London E14 5HP.
© 2020 Bloomberg. Used with Permission.
Source: Bloomberg Index Services Limited. Copyright 2020, Bloomberg. All rights reserved.
Small Company Growth Portfolio
Your Portfolio’s Performance at a Glance
• For the 12 months ended December 31, 2019, the Small Company Growth Portfolio of Vanguard Variable Insurance Fund returned 28.05%. It lagged the 32.65% return of its benchmark, the Russell 2500 Growth Index.
•Stocks and bonds recorded their best results in years. Stocks benefited from accommodative monetary policies implemented by the Federal Reserve and other major central banks. Safer assets such as bonds also attracted investors as the U.S.-China trade conflict fueled global economic growth concerns.
•Both allocation and selection detracted from performance. Selection in information technology, health care, and communication services weighed on returns. In information technology, selection in the software industry hurt the most. An overweight allocation to consumer discretionary and an underweighting of information technology also modestly dragged on performance. Selection in consumer discretionary boosted returns.
• Please note that the portfolio returns in Vanguard Variable Insurance Fund are different from those in Vanguard Variable Annuity (and other plans that invest in the fund), which take into account insurance-related expenses.
| Market Barometer | | | |
| | | Average Annual Total Returns |
| | Periods Ended December 31, 2019 |
| | One Year | Three Years | Five Years |
| Stocks | | | |
| Russell 1000 Index (Large-caps) | 31.43% | 15.05% | 11.48% |
| Russell 2000 Index (Small-caps) | 25.53 | 8.59 | 8.23 |
| Russell 3000 Index (Broad U.S. market) | 31.02 | 14.57 | 11.24 |
| FTSE All-World ex US Index (International) | 21.81 | 9.96 | 5.83 |
| | | | |
| Bonds | | | |
| Bloomberg Barclays U.S. Aggregate Bond Index (Broad taxable market) | 8.72% | 4.03% | 3.05% |
| Bloomberg Barclays Municipal Bond Index (Broad tax-exempt market) | 7.54 | 4.72 | 3.53 |
| FTSE Three-Month U.S. Treasury Bill Index | 2.25 | 1.65 | 1.04 |
| | | | |
| CPI | | | |
| Consumer Price Index | 2.29% | 2.10% | 1.82% |
Small Company Growth Portfolio
Advisors’ Report
The Small Company Growth Portfolio returned 28.05% for the 12 months ended December 31, 2019. It lagged the 32.65% return of its benchmark, the Russell 2500 Growth Index.
The portfolio is managed by two independent advisors, a strategy that enhances diversification by providing exposure to distinct yet complementary investment approaches. It is not uncommon for different advisors to have different views about individual securities or the broader investment environment.
The advisors, the amount and percentage of the portfolio’s assets each manages, and brief descriptions of their investment strategies are presented in the accompanying table. Each advisor has also prepared a discussion of the investment environment that existed during the 12 months and its effect on the portfolio’s positioning. These comments were prepared on January 23, 2020.
Vanguard Quantitative Equity Group
Portfolio Managers:
James P. Stetler
Binbin Guo, Principal, Head of Alpha Equity Investments
The investment environment
Stocks in the United States surged in 2019, outperforming their international counterparts. The S&P 500 Index returned 31.49%, while the FTSE Global All Cap ex US Index returned 21.80%. The primary catalysts for the strong results were accommodative monetary policy by the U.S. Federal Reserve, corporate earnings, and an easing of geopolitical tensions near the end of the year.
The 12 months began with concerns about moderating economic growth, tightening fiscal policy, and geopolitical tensions. However, the market quickly pivoted and produced strong results in the first quarter of 2019 because of more supportive rhetoric from the Fed, the perception of easing tensions between the U.S. and China, and solid corporate earnings. Concerns grew about corporate earnings and geopolitical risks midyear. But the combination of stabilizing economic data, accommodative central banks, and the announcement of a U.S.-China “phase one” trade deal boosted equities later.
The Federal Reserve ended the fiscal year by reversing course from the previous year and pursuing a pro-market policy. After raising interest rates by 25 basis points in December 2018, the Fed cut them three times by a combined 0.75% over the course of 2019. The reaching of the U.S.-China trade deal provided more certainty and helped produce a more supportive environment. Corporate earnings for the 12 months remained resilient, if not spectacular.
The broad fixed income markets generated positive returns, primarily because of stronger-than-expected growth, tame inflation, and continued central bank monetary support. Against this backdrop, U.S. Treasury yields fell and the Bloomberg Barclays U.S. Aggregate Float Adjusted Index returned 8.87% for the year. Sovereign yields also declined in most markets following the injection of monetary stimulus by the Fed and the European Central Bank. The Bloomberg Barclays Global Aggregate ex-USD Float Adjusted RIC Capped Index Hedged returned 8.06%.
Investment objective and strategy
Although our overall performance is affected by the macroeconomic factors we’ve described, our approach to investing focuses on specific stock fundamentals that we believe are more likely to produce outperformance over the long run. Those fundamentals include high quality, management decisions, consistent earnings growth, strong market sentiment, and reasonable valuation.
Using these five themes, we generate a composite stock ranking, seeking to capitalize on investor biases. We then monitor our portfolio based on those rankings and adjust when appropriate to maximize expected return while minimizing exposure to risks that our research indicates do not improve returns (such as industry selection and other risks relative to our benchmark).
Our successes and shortfalls
Over the 12 months, our quality, growth, and management decisions models detracted from performance. Our sentiment model produced gains. Results lagged the benchmark in all 11 industry sectors. Health care, consumer discretionary, and communication services detracted the most from relative performance.
At the individual stock level, the greatest shortfalls came from underweighting Dexcom and overweighting Acorda Therapeutics, Boingo Wireless, PagerDuty, and Tailored Brands. The strongest results came from underweighting Grubhub and overweighting Arrowhead Pharmaceuticals, Lattice Semiconductor, Array BioPharma, and Generac Holdings.
We continue to believe that a portfolio focused on fundamentals will benefit investors over the long term, although we recognize that the market can reward or punish us in the near term. We believe our portfolio offers a strong mix of stocks with attractive growth, sentiment, and value characteristics.
ArrowMark Partners
Portfolio Managers:
Chad Meade, Partner
Brian Schaub, CFA, Partner
The investment environment
U.S. equity markets delivered solid performance during the fourth quarter, ending a strong year in which all major indexes appreciated by more than 20%. Despite the positive returns, trade disruptions, a contraction in manufacturing, and geopolitical risks weighed on U.S. and global economic growth.
Small Company Growth Portfolio
Balancing these economic concerns, strong employment numbers and benign inflation boosted the economy. During the year, Federal Reserve policymakers responded to heightened global economic risks by cutting the federal funds rate three times, in August, September, and October, for a total reduction of 75 basis points. Equity valuations expanded in many sectors, affording fewer opportunities to find companies that meet our strict investment criteria.
Investment objective
Our investment process prioritizes the management of risk over the opportunity for return. Our goal is to build an all-weather portfolio that can perform in a variety of market conditions, mitigating capital losses on the downside and participating 100% in market recoveries.
Portfolio results
Industrial holdings delivered the largest positive contribution to returns for the year. We maintained an overweight position, specifically in the professional and commercial services segment. This area typically contains companies with attractive business models, recurring revenues, and less economic sensitivity than the broader sector.
In the subsector, long-term holding Clean Harbors, a leading hazardous waste treatment, storage, and disposal management company, delivered strong performance. We have always liked the company’s hazardous waste incinerators, which are nearly impossible to replicate. The stock rallied during the year on news of solid financial results.
Consumer discretionary holdings including Skechers USA, which designs and sells lifestyle and athletic footwear, also contributed. The third-largest footwear manufacturer in the U.S., it has a strong and growing international presence. In our view, the market does not fully recognize the growth opportunity represented by this international business. The stock soared after the company reported significantly higher margins and strong organic growth.
Information technology and health care detracted from relative returns. In information technology, an underweight to this top-performing sector and our individual holdings hurt performance.
The largest detractor in the sector was 2U, an educational technology firm that partners with leading nonprofit colleges and universities to offer online degree programs. The company has many of the qualities that we believe define a good business. These include long-term contracts and recurring revenue, attractive unit economics that should deliver strong EBITDA margins at scale, and brand recognition with marquee university partners to drive growth.
During the fiscal year, however, 2U reported disappointing financial results. Enrollment declined in some of its legacy programs, and competition in online education increased. Our longer-term outlook for the company remains positive. We believe it will continue to grow its core graduate program business at a rate in the mid-to-high teens and that newly launched initiatives will become increasingly profitable over the next year.
Health care lagged partly because of underperformance from biotechnology company Spectrum Pharmaceuticals. The firm announced disappointing clinical trial results for one of its lead drug candidates for the treatment of non-small cell lung cancer.
As always, we will continue to look for opportunities that can perform in a variety of market conditions and mitigate capital losses.
| Small Company Growth Portfolio Investment Advisors |
| |
| | Portfolio Assets Managed | |
| Investment Advisor | | % | $ Million | Investment Strategy |
| Vanguard Quantitative Equity Group | | 50 | 1,048 | Employs a quantitative approach that focuses on fundamental factors, using models that assess valuation, growth prospects, management decisions, market sentiment, and earnings and balance-sheet quality of companies as compared with their peers. |
| ArrowMark Partners | | 48 | 1,024 | The firm uses in-depth fundamental research to uncover companies that, in its opinion, can control their own economic destiny. It starts by identifying businesses with strong competitive advantages in industries with high barriers to entry, then narrows the focus to companies with large potential markets and high-quality business models focused on the future. Finally, considerations are made for potential downside risk, resulting in a diversified portfolio of between 75 and 100 stocks. |
| Cash Investments | | 2 | 39 | These short-term reserves are invested by Vanguard in equity index products to simulate investment in stocks. Each advisor may also maintain a modest cash position. |
Small Company Growth Portfolio
About Your Portfolio’s Expenses
As a shareholder of the portfolio, you incur ongoing costs, which include costs for portfolio management, administrative services, and shareholder reports (like this one), among others. Operating expenses, which are deducted from a portfolio’s gross income, directly reduce the investment return of the portfolio.
A portfolio’s expenses are expressed as a percentage of its average net assets. This figure is known as the expense ratio. The following examples are intended to help you understand the ongoing costs (in dollars) of investing in your portfolio and to compare these costs with those of other mutual funds. The examples are based on an investment of $1,000 made at the beginning of the period shown and held for the entire period.
The table below illustrates your portfolio’s costs in two ways:
• Based on actual portfolio return. This section helps you to estimate the actual expenses that you paid over the period. The “Ending Account Value” shown is derived from the portfolio’s actual return, and the third column shows the dollar amount that would have been paid by an investor who started with $1,000 in the portfolio. You may use the information here, together with the amount you invested, to estimate the expenses that you paid over the period.
To do so, simply divide your account value by $1,000 (for example, an $8,600 account value divided by $1,000 = 8.6), then multiply the result by the number given for your portfolio under the heading “Expenses Paid During Period.”
• Based on hypothetical 5% yearly return. This section is intended to help you compare your portfolio’s costs with those of other mutual funds. It assumes that the portfolio had a yearly return of 5% before expenses, but that the expense ratio is unchanged. In this case—because the return used is not the portfolio’s actual return—the results do not apply to your investment. The example is useful in making comparisons because the Securities and Exchange Commission requires all mutual funds to calculate expenses based on a 5% return. You can assess your portfolio’s costs by comparing this hypothetical example with the hypothetical examples that appear in shareholder reports of other funds.
Note that the expenses shown in the table are meant to highlight and help you compareongoingcosts only and do not reflect transaction costs incurred by the portfolio for buying and selling securities. The portfolio’s expense ratio does not reflect additional fees and expenses associated with the annuity or life insurance program through which you invest.
The calculations assume no shares were bought or sold during the period. Your actual costs may have been higher or lower, depending on the amount of your investment and the timing of any purchases or redemptions.
You can find more information about the portfolio’s expenses in the Financial Statements section. For additional information on operating expenses and other shareholder costs, please refer to the prospectus.
| Six Months Ended December 31, 2019 | | | |
| | Beginning | Ending | Expenses |
| | Account Value | Account Value | Paid During |
| Small Company Growth Portfolio | 6/30/2019 | 12/31/2019 | Period |
| Based on Actual Portfolio Return | $1,000.00 | $1,071.00 | $1.67 |
| Based on Hypothetical 5% Yearly Return | 1,000.00 | 1,023.59 | 1.63 |
The calculations are based on expenses incurred in the most recent six-month period. The portfolio’s annualized six-month expense ratio for that period is 0.32%. The dollar amounts shown as “Expenses Paid” are equal to the annualized expense ratio multiplied by the average account value over the period, multiplied by the number of days in the most recent six-month period, then divided by the number of days in the most recent 12-month period (184/365).
Small Company Growth Portfolio
Performance Summary
All of the returns in this report represent past performance, which is not a guarantee of future results that may be achieved by the portfolio. (Current performance may be lower or higher than the performance data cited. For performance data current to the most recent month-end, visit our website at vanguard.com/performance.) Note, too, that both investment returns and principal value can fluctuate widely, so an investor’s shares, when sold, could be worth more or less than their original cost.The returns shown do not reflect taxes that a shareholder would pay on portfolio distributions or on the sale of portfolio shares. Nor do the returns reflect fees and expenses associated with the annuity or life insurance program through which a shareholder invests. If these fees and expenses were included, the portfolio’s returns would be lower.
Cumulative Performance: December 31, 2009–December 31, 2019 Initial
Investment of $10,000
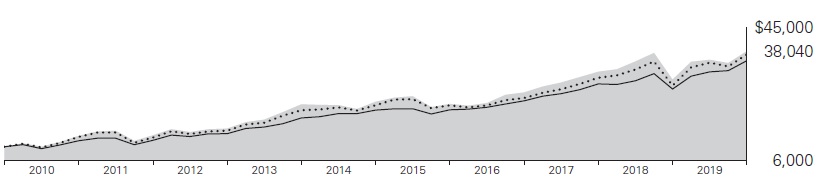
| | | Average Annual Total Returns | Final Value | |
| | | Periods Ended December 31, 2019 | of a $10,000 |
| | | One Year | Five Years | Ten Years | Investment |
 | Small Company Growth Portfolio | 28.05% | 10.39% | 14.29% | $38,040 |
 | Russell 2500 Growth Index | 32.65 | 10.84 | 14.01 | 37,108 |
 | Dow Jones U.S. Total Stock Market Float Adjusted Index | 30.90 | 11.18 | 13.43 | 35,251 |
See Financial Highlights for dividend and capital gains information.
Small Company Growth Portfolio
Sector Diversification
As of December 31, 2019
| Communication Services | 3.5% |
| Consumer Discretionary | 15.7 |
| Consumer Staples | 1.1 |
| Energy | 0.3 |
| Financials | 4.3 |
| Health Care | 23.1 |
| Industrials | 21.7 |
| Information Technology | 25.6 |
| Materials | 2.3 |
| Other | 0.0 |
| Real Estate | 2.1 |
| Utilities | 0.3 |
The table reflects the portfolio’s equity exposure, based on its investments in stocks and stock index futures. Any holdings in short-term reserves are excluded. Sector categories are based on the Global Industry Classification Standard (“GICS”), except for the “Other” category (if applicable), which includes securities that have not been provided a GICS classification as of the effective reporting period.
The Global Industry Classification Standard (“GICS”) was developed by and is the exclusive property and a service mark of MSCI Inc. (“MSCI”) and Standard and Poor’s, a division of McGraw-Hill Companies, Inc. (“S&P”), and is licensed for use by Vanguard. Neither MSCI, S&P nor any third party involved in making or compiling the GICS or any GICS classification makes any express or implied warranties or representations with respect to such standard or classification (or the results to be obtained by the use thereof), and all such parties hereby expressly disclaim all warranties of originality, accuracy, completeness, merchantability or fitness for a particular purpose with respect to any such standard or classification. Without limiting any of the foregoing, in no event shall MSCI, S&P, any of its affiliates or any third party involved in making or compiling the GICS or any GICS classification have any liability for any direct, indirect, special, punitive, consequential or any other damages (including lost profits) even if notified of the possibility of such damages.
Small Company Growth Portfolio
Financial Statements
Statement of Net Assets
As of December 31, 2019
The portfolio files its complete schedule of portfolio holdings with the Securities and Exchange Commission (SEC) for the first and third quarters of each fiscal year as an exhibit to its reports on Form N-PORT. The portfolio’s Form N-PORT reports are available on the SEC’s website at www.sec.gov.
| | | | | | | | Market | |
| | | | | | | | Value• | |
| | | | | Shares | | | ($000 | ) |
| Common Stocks (96.4%)1 | | | | | | | | |
| Communication Services (3.4%) | | | | | | | | |
| | | Cinemark Holdings Inc. | | | 561,185 | | | | 18,996 | |
| | | National CineMedia Inc. | | | 1,148,841 | | | | 8,375 | |
| * | | Pinterest Inc. Class A | | | 422,708 | | | | 7,879 | |
| * | | Cargurus Inc. | | | 177,095 | | | | 6,230 | |
| *,^ | | Match Group Inc. | | | 67,039 | | | | 5,504 | |
| * | | Zynga Inc. Class A | | | 883,924 | | | | 5,410 | |
| * | | Boingo Wireless Inc. | | | 338,784 | | | | 3,710 | |
| * | | Liberty TripAdvisor Holdings Inc. Class A | | | 400,985 | | | | 2,947 | |
| * | | TechTarget Inc. | | | 110,718 | | | | 2,890 | |
| * | | Glu Mobile Inc. | | | 428,694 | | | | 2,594 | |
| * | | EverQuote Inc. Class A | | | 48,285 | | | | 1,659 | |
| * | | Bandwidth Inc. Class A | | | 21,891 | | | | 1,402 | |
| * | | Roku Inc. | | | 8,808 | | | | 1,179 | |
| * | | Meet Group Inc. | | | 233,119 | | | | 1,168 | |
| | | New York Times Co. Class A | | | 31,654 | | | | 1,018 | |
| | | Meredith Corp. | | | 22,378 | | | | 727 | |
| | | | | | | | | | 71,688 | |
| Consumer Discretionary (15.2%) | | | | | | | | |
| * | | Skechers U.S.A. Inc. Class A | | | 718,354 | | | | 31,026 | |
| | | Hanesbrands Inc. | | | 1,933,709 | | | | 28,716 | |
| * | | Sally Beauty Holdings Inc. | | | 1,487,674 | | | | 27,150 | |
| * | | frontdoor Inc. | | | 377,941 | | | | 17,922 | |
| | | Polaris Inc. | | | 171,674 | | | | 17,459 | |
| | | Carter’s Inc. | | | 136,576 | | | | 14,933 | |
| * | | Shutterstock Inc. | | | 324,399 | | | | 13,910 | |
| * | | Grand Canyon Education Inc. | | | 110,268 | | | | 10,563 | |
| * | | NVR Inc. | | | 2,661 | | | | 10,134 | |
| * | | Planet Fitness Inc. Class A | | | 119,953 | | | | 8,958 | |
| * | | Under Armour Inc. Class C | | | 457,903 | | | | 8,783 | |
| | | Wolverine World Wide Inc. | | | 243,164 | | | | 8,204 | |
| * | | RH | | | 33,739 | | | | 7,203 | |
| * | | SeaWorld Entertainment Inc. | | | 214,125 | | | | 6,790 | |
| | | Wingstop Inc. | | | 78,607 | | | | 6,778 | |
| * | | Etsy Inc. | | | 151,219 | | | | 6,699 | |
| | | Rent-A-Center Inc. | | | 232,063 | | | | 6,693 | |
| | | PulteGroup Inc. | | | 153,745 | | | | 5,965 | |
| | | Domino’s Pizza Inc. | | | 17,707 | | | | 5,202 | |
| | | H&R Block Inc. | | | 220,376 | | | | 5,174 | |
| | | Lithia Motors Inc. Class A | | | 34,128 | | | | 5,017 | |
| * | | Everi Holdings Inc. | | | 355,083 | | | | 4,769 | |
| * | | Fox Factory Holding Corp. | | | 66,599 | | | | 4,633 | |
| * | | TopBuild Corp. | | | 44,570 | | | | 4,594 | |
| * | | Chewy Inc. | | | 154,770 | | | | 4,488 | |
| *,^ | | YETI Holdings Inc. | | | 91,605 | | | | 3,186 | |
| | | Dine Brands Global Inc. | | | 37,308 | | | | 3,116 | |
| | | Brinker International Inc. | | | 70,474 | | | | 2,960 | |
| | | Gentex Corp. | | | 97,163 | | | | 2,816 | |
| * | | Mattel Inc. | | | 206,070 | | | | 2,792 | |
| * | | Murphy USA Inc. | | | 22,529 | | | | 2,636 | |
| * | | Skyline Champion Corp. | | | 76,701 | | | | 2,431 | |
| | | Kontoor Brands Inc. | | | 55,552 | | | | 2,333 | |
| * | | Boot Barn Holdings Inc. | | | 51,070 | | | | 2,274 | |
| * | | Denny’s Corp. | | | 110,868 | | | | 2,204 | |
| | | Aaron’s Inc. | | | 36,499 | | | | 2,085 | |
| | | Core-Mark Holding Co. Inc. | | | 73,839 | | | | 2,008 | |
| * | | Career Education Corp. | | | 104,840 | | | | 1,928 | |
| * | | Burlington Stores Inc. | | | 8,377 | | | | 1,910 | |
| * | | Deckers Outdoor Corp. | | | 11,100 | | | | 1,874 | |
| * | | Stoneridge Inc. | | | 61,905 | | | | 1,815 | |
| * | | Taylor Morrison Home Corp. Class A | | | 74,656 | | | | 1,632 | |
| * | | K12 Inc. | | | 75,625 | | | | 1,539 | |
| * | | 1-800-Flowers.com Inc. Class A | | | 80,552 | | | | 1,168 | |
| | | Dave & Buster’s Entertainment Inc. | | | 26,652 | | | | 1,071 | |
| * | | Gentherm Inc. | | | 22,238 | | | | 987 | |
| | | Wendy’s Co. | | | 40,201 | | | | 893 | |
| * | | Zumiez Inc. | | | 22,632 | | | | 782 | |
| * | | Conn’s Inc. | | | 59,774 | | | | 741 | |
| * | | Funko Inc. Class A | | | 34,162 | | | | 586 | |
| | | Lear Corp. | | | 3,945 | | | | 541 | |
| | | | | | | | | | 320,071 | |
| Consumer Staples (1.0%) | | | | | | | | |
| | | Coca-Cola Consolidated Inc. | | | 22,006 | | | | 6,251 | |
| | | Casey’s General Stores Inc. | | | 22,352 | | | | 3,554 | |
| | | John B Sanfilippo & Son Inc. | | | 37,730 | | | | 3,444 | |
| ^ | | B&G Foods Inc. | | | 170,758 | | | | 3,062 | |
| * | | Post Holdings Inc. | | | 17,261 | | | | 1,883 | |
| | | Medifast Inc. | | | 13,789 | | | | 1,511 | |
| * | | Herbalife Nutrition Ltd. | | | 27,668 | | | | 1,319 | |
| * | | Pilgrim’s Pride Corp. | | | 28,071 | | | | 918 | |
| | | | | | | | | | 21,942 | |
| Energy (0.3%) | | | | | | | | |
| * | | W&T Offshore Inc. | | | 408,272 | | | | 2,270 | |
| * | | RigNet Inc. | | | 243,387 | | | | 1,606 | |
| ^ | | DMC Global Inc. | | | 26,582 | | | | 1,194 | |
| * | | CONSOL Energy Inc. | | | 46,768 | | | | 679 | |
| | | Delek US Holdings Inc. | | | 19,555 | | | | 656 | |
| | | | | | | | | | 6,405 | |
| Financials (4.1%) | | | | | | | | |
| | | LPL Financial Holdings Inc. | | | 194,653 | | | | 17,957 | |
| | | WisdomTree Investments Inc. | | | 1,747,561 | | | | 8,458 | |
| | | Primerica Inc. | | | 60,148 | | | | 7,853 | |
| | | Walker & Dunlop Inc. | | | 84,950 | | | | 5,495 | |
| | | OneMain Holdings Inc. | | | 123,821 | | | | 5,219 | |
| | | CIT Group Inc. | | | 110,921 | | | | 5,061 | |
| | | Voya Financial Inc. | | | 61,670 | | | | 3,761 | |
| | | Bank OZK | | | 120,268 | | | | 3,669 | |
| * | | NMI Holdings Inc. Class A | | | 103,235 | | | | 3,425 | |
| * | | Enova International Inc. | | | 134,508 | | | | 3,236 | |
| | | Virtus Investment Partners Inc. | | | 25,498 | | | | 3,104 | |
| | | Bank of NT Butterfield & Son Ltd. | | | 78,347 | | | | 2,900 | |
| | | MSCI Inc. Class A | | | 9,788 | | | | 2,527 | |
| *,^ | | Health Insurance Innovations Inc. Class A | | | 101,042 | | | | 1,949 | |
| * | | Cowen Inc. Class A | | | 108,618 | | | | 1,711 | |
| | | Universal Insurance Holdings Inc. | | | 51,576 | | | | 1,444 | |
| * | | Palomar Holdings Inc. Class A | | | 28,015 | | | | 1,414 | |
| | | Artisan Partners Asset Management Inc. Class A | | | 40,995 | | | | 1,325 | |
| * | | Alleghany Corp. | | | 1,572 | | | | 1,257 | |
| | | National General Holdings Corp. | | | 53,735 | | | | 1,188 | |
| | | Brightsphere Investment Group Inc. | | | 104,544 | | | | 1,068 | |
| | | MarketAxess Holdings Inc. | | | 2,418 | | | | 917 | |
| * | | Curo Group Holdings Corp. | | | 69,224 | | | | 843 | |
| * | | Mr Cooper Group Inc. | | | 51,815 | | | | 648 | |
| | | Piper Jaffray Cos. | | | 6,883 | | | | 550 | |
| | | Erie Indemnity Co. Class A | | | 2,254 | | | | 374 | |
| | | | | | | | | | 87,353 | |
| Health Care (22.2%) | | | | | | | | |
| | | STERIS plc | | | 153,314 | | | | 23,368 | |
| * | | Syneos Health Inc. | | | 334,300 | | | | 19,882 | |
| * | | MEDNAX Inc. | | | 713,427 | | | | 19,826 | |
| * | | BioTelemetry Inc. | | | 380,105 | | | | 17,599 | |
| * | | Merit Medical Systems Inc. | | | 507,345 | | | | 15,839 | |
| * | | Quidel Corp. | | | 188,714 | | | | 14,159 | |
| * | | Arrowhead Pharmaceuticals Inc. | | | 161,624 | | | | 10,252 | |
| * | | Axogen Inc. | | | 553,228 | | | | 9,897 | |
| * | | Deciphera Pharmaceuticals Inc. | | | 157,667 | | | | 9,813 | |
| * | | Immunomedics Inc. | | | 456,877 | | | | 9,668 | |
| | | Chemed Corp. | | | 21,406 | | | | 9,403 | |
| * | | Integra LifeSciences Holdings Corp. | | | 160,031 | | | | 9,327 | |
| * | | Novocure Ltd. | | | 110,108 | | | | 9,279 | |
| * | | Agios Pharmaceuticals Inc. | | | 188,232 | | | | 8,988 | |
| * | | PRA Health Sciences Inc. | | | 80,465 | | | | 8,944 | |
| *,^ | | Esperion Therapeutics Inc. | | | 149,357 | | | | 8,906 | |
| * | | Heron Therapeutics Inc. | | | 374,001 | | | | 8,789 | |
| | | Bruker Corp. | | | 165,425 | | | | 8,432 | |
| * | | Ironwood Pharmaceuticals Inc. Class A | | | 621,153 | | | | 8,268 | |
| * | | Revance Therapeutics Inc. | | | 503,506 | | | | 8,172 | |
| * | | Charles River Laboratories International Inc. | | | 51,992 | | | | 7,942 | |
| | | Encompass Health Corp. | | | 108,122 | | | | 7,490 | |
| * | | Prestige Consumer Healthcare Inc. | | | 178,892 | | | | 7,245 | |
| * | | Kodiak Sciences Inc. | | | 97,315 | | | | 7,002 | |
| * | | Medpace Holdings Inc. | | | 82,648 | | | | 6,947 | |
| * | | Integer Holdings Corp. | | | 84,295 | | | | 6,780 | |
| * | | Tenet Healthcare Corp. | | | 175,898 | | | | 6,689 | |
| * | | Neurocrine Biosciences Inc. | | | 61,359 | | | | 6,595 | |
| * | | ABIOMED Inc. | | | 38,239 | | | | 6,523 | |
| *,^ | | Viking Therapeutics Inc. | | | 810,201 | | | | 6,498 | |
| * | | Masimo Corp. | | | 40,905 | | | | 6,465 | |
| * | | Nevro Corp. | | | 54,641 | | | | 6,423 | |
| | | Cooper Cos. Inc. | | | 19,430 | | | | 6,243 | |
| * | | CorVel Corp. | | | 62,818 | | | | 5,488 | |
| * | | Veeva Systems Inc. Class A | | | 37,025 | | | | 5,208 | |
| * | | Ionis Pharmaceuticals Inc. | | | 85,334 | | | | 5,155 | |
| * | | DBV Technologies SA ADR | | | 442,340 | | | | 4,733 | |
| * | | Mettler-Toledo International Inc. | | | 5,291 | | | | 4,197 | |
| * | | Puma Biotechnology Inc. | | | 477,376 | | | | 4,177 | |
| * | | ImmunoGen Inc. | | | 779,212 | | | | 3,978 | |
| * | | STAAR Surgical Co. | | | 112,947 | | | | 3,972 | |
| | | Hill-Rom Holdings Inc. | | | 34,040 | | | | 3,865 | |
| * | | NuVasive Inc. | | | 45,536 | | | | 3,522 | |
| | | PerkinElmer Inc. | | | 35,652 | | | | 3,462 | |
| * | | IQVIA Holdings Inc. | | | 22,260 | | | | 3,439 | |
| * | | Halozyme Therapeutics Inc. | | | 184,698 | | | | 3,275 | |
Small Company Growth Portfolio
| | | | | | | | Market | |
| | | | | | | | Value• | |
| | | | | Shares | | | ($000 | ) |
| * | | Vanda Pharmaceuticals Inc. | | | 185,523 | | | | 3,044 | |
| * | | Alkermes plc | | | 145,887 | | | | 2,976 | |
| *,^ | | Intrexon Corp. | | | 538,831 | | | | 2,953 | |
| | | Mesa Laboratories Inc. | | | 11,548 | | | | 2,880 | |
| * | | Molina Healthcare Inc. | | | 19,674 | | | | 2,670 | |
| *,^ | | SmileDirectClub Inc. | | | 305,343 | | | | 2,669 | |
| * | | Retrophin Inc. | | | 181,556 | | | | 2,578 | |
| * | | Voyager Therapeutics Inc. | | | 180,587 | | | | 2,519 | |
| * | | Natera Inc. | | | 71,731 | | | | 2,417 | |
| * | | Surmodics Inc. | | | 57,902 | | | | 2,399 | |
| * | | Epizyme Inc. | | | 97,028 | | | | 2,387 | |
| * | | Horizon Therapeutics plc | | | 65,347 | | | | 2,366 | |
| * | | Enanta Pharmaceuticals Inc. | | | 37,745 | | | | 2,332 | |
| * | | HMS Holdings Corp. | | | 72,528 | | | | 2,147 | |
| * | | Spectrum Pharmaceuticals Inc. | | | 577,240 | | | | 2,101 | |
| * | | DexCom Inc. | | | 9,295 | | | | 2,033 | |
| * | | MacroGenics Inc. | | | 183,847 | | | | 2,000 | |
| * | | ICU Medical Inc. | | | 10,617 | | | | 1,987 | |
| * | | Align Technology Inc. | | | 6,677 | | | | 1,863 | |
| * | | Silk Road Medical Inc. | | | 45,725 | | | | 1,846 | |
| * | | Catalent Inc. | | | 31,226 | | | | 1,758 | |
| | | LeMaitre Vascular Inc. | | | 45,977 | | | | 1,653 | |
| * | | Precision BioSciences Inc. | | | 118,241 | | | | 1,642 | |
| * | | Global Blood Therapeutics Inc. | | | 20,648 | | | | 1,641 | |
| * | | NanoString Technologies Inc. | | | 58,572 | | | | 1,629 | |
| * | | Lantheus Holdings Inc. | | | 78,815 | | | | 1,617 | |
| * | | Inovalon Holdings Inc. Class A | | | 84,043 | | | | 1,582 | |
| * | | Haemonetics Corp. | | | 13,681 | | | | 1,572 | |
| | | US Physical Therapy Inc. | | | 13,305 | | | | 1,521 | |
| * | | Exact Sciences Corp. | | | 15,289 | | | | 1,414 | |
| | | Luminex Corp. | | | 60,247 | | | | 1,395 | |
| * | | Myriad Genetics Inc. | | | 49,499 | | | | 1,348 | |
| * | | Endo International plc | | | 259,857 | | | | 1,219 | |
| * | | Veracyte Inc. | | | 42,316 | | | | 1,181 | |
| * | | Fluidigm Corp. | | | 329,894 | | | | 1,148 | |
| * | | FibroGen Inc. | | | 25,916 | | | | 1,112 | |
| * | | Jounce Therapeutics Inc. | | | 126,213 | | | | 1,102 | |
| * | | Iovance Biotherapeutics Inc. | | | 37,478 | | | | 1,037 | |
| *,^ | | Eidos Therapeutics Inc. | | | 15,517 | | | | 891 | |
| * | | Pieris Pharmaceuticals Inc. | | | 243,036 | | | | 880 | |
| * | | Pennant Group Inc. | | | 26,553 | | | | 878 | |
| *,^ | | Clovis Oncology Inc. | | | 83,792 | | | | 874 | |
| | | Atrion Corp. | | | 1,109 | | | | 833 | |
| | | Phibro Animal Health Corp. Class A | | | 32,100 | | | | 797 | |
| * | | Acorda Therapeutics Inc. | | | 367,609 | | | | 750 | |
| * | | ACADIA Pharmaceuticals Inc. | | | 17,221 | | | | 737 | |
| * | | Endologix Inc. | | | 462,140 | | | | 730 | |
| * | | Natus Medical Inc. | | | 20,851 | | | | 688 | |
| * | | Assertio Therapeutics Inc. | | | 528,241 | | | | 660 | |
| * | | Akorn Inc. | | | 410,955 | | | | 616 | |
| * | | Avantor Inc. | | | 33,587 | | | | 610 | |
| * | | Apellis Pharmaceuticals Inc. | | | 19,358 | | | | 593 | |
| * | | CryoLife Inc. | | | 21,279 | | | | 576 | |
| * | | Radius Health Inc. | | | 27,422 | | | | 553 | |
| * | | Seattle Genetics Inc. | | | 4,692 | | | | 536 | |
| * | | Orthofix Medical Inc. | | | 10,615 | | | | 490 | |
| *,^ | | Inovio Pharmaceuticals Inc. | | | 125,905 | | | | 415 | |
| *,^ | | Novavax Inc. | | | 31,922 | | | | 127 | |
| * | | Cyclerion Therapeutics Inc. | | | 37,118 | | | | 101 | |
| | | | | | | | | | 469,197 | |
| Industrials (20.9%) | | | | | | | | |
| * | | Sensata Technologies Holding plc | | | 476,418 | | | | 25,665 | |
| * | | Clean Harbors Inc. | | | 291,127 | | | | 24,964 | |
| * | | TriNet Group Inc. | | | 430,453 | | | | 24,368 | |
| | | ABM Industries Inc. | | | 565,249 | | | | 21,316 | |
| | | Cimpress NV | | | 134,502 | | | | 16,916 | |
| | | Ritchie Bros Auctioneers Inc. (XNYS) | | | 384,778 | | | | 16,526 | |
| | | Tennant Co. | | | 205,399 | | | | 16,005 | |
| * | | Middleby Corp. | | | 137,612 | | | | 15,071 | |
| | | John Bean Technologies Corp. | | | 133,640 | | | | 15,056 | |
| * | | Kirby Corp. | | | 150,604 | | | | 13,484 | |
| | | Heartland Express Inc. | | | 579,928 | | | | 12,207 | |
| | | Woodward Inc. | | | 89,015 | | | | 10,543 | |
| | | CH Robinson Worldwide Inc. | | | 132,831 | | | | 10,387 | |
| | | Matson Inc. | | | 214,145 | | | | 8,737 | |
| | | Allison Transmission Holdings Inc. | | | 178,897 | | | | 8,644 | |
| | | Spirit AeroSystems Holdings Inc. Class A | | | 113,749 | | | | 8,290 | |
| | | Armstrong World Industries Inc. | | | 83,662 | | | | 7,862 | |
| | | Forward Air Corp. | | | 109,786 | | | | 7,680 | |
| * | | Builders FirstSource Inc. | | | 299,973 | | | | 7,622 | |
| * | | MasTec Inc. | | | 118,183 | | | | 7,583 | |
| | | EMCOR Group Inc. | | | 82,127 | | | | 7,088 | |
| * | | Atkore International Group Inc. | | | 168,766 | | | | 6,828 | |
| | | MSC Industrial Direct Co. Inc. Class A | | | 83,873 | | | | 6,581 | |
| | | Korn Ferry | | | 150,749 | | | | 6,392 | |
| | | Kforce Inc. | | | 152,932 | | | | 6,071 | |
| | | Westinghouse Air Brake Technologies Corp. | | | 75,873 | | | | 5,903 | |
| * | | Proto Labs Inc. | | | 56,916 | | | | 5,780 | |
| | | Landstar System Inc. | | | 50,560 | | | | 5,757 | |
| * | | Aerojet Rocketdyne Holdings Inc. | | | 126,008 | | | | 5,754 | |
| * | | GMS Inc. | | | 199,252 | | | | 5,396 | |
| | | Acuity Brands Inc. | | | 37,785 | | | | 5,214 | |
| | | Kennametal Inc. | | | 141,312 | | | | 5,213 | |
| | | HEICO Corp. Class A | | | 55,489 | | | | 4,968 | |
| * | | Meritor Inc. | | | 189,456 | | | | 4,962 | |
| | | Robert Half International Inc. | | | 76,616 | | | | 4,838 | |
| | | Albany International Corp. Class A | | | 61,131 | | | | 4,641 | |
| * | | HD Supply Holdings Inc. | | | 105,093 | | | | 4,227 | |
| | | IDEX Corp. | | | 22,626 | | | | 3,892 | |
| * | | Foundation Building Materials Inc. | | | 193,569 | | | | 3,746 | |
| * | | Generac Holdings Inc. | | | 35,609 | | | | 3,582 | |
| * | | American Woodmark Corp. | | | 32,643 | | | | 3,411 | |
| | | Huntington Ingalls Industries Inc. | | | 13,094 | | | | 3,285 | |
| | | MSA Safety Inc. | | | 25,464 | | | | 3,218 | |
| * | | Hub Group Inc. Class A | | | 59,244 | | | | 3,039 | |
| * | | Great Lakes Dredge & Dock Corp. | | | 265,777 | | | | 3,011 | |
| * | | TrueBlue Inc. | | | 111,653 | | | | 2,686 | |
| | | Covanta Holding Corp. | | | 180,729 | | | | 2,682 | |
| | | Hillenbrand Inc. | | | 76,659 | | | | 2,553 | |
| | | Triumph Group Inc. | | | 96,450 | | | | 2,437 | |
| | | Tetra Tech Inc. | | | 28,174 | | | | 2,427 | |
| * | | Astronics Corp. | | | 86,268 | | | | 2,411 | |
| | | Barrett Business Services Inc. | | | 20,901 | | | | 1,891 | |
| | | Terex Corp. | | | 62,928 | | | | 1,874 | |
| | | Mobile Mini Inc. | | | 48,865 | | | | 1,852 | |
| * | | Avis Budget Group Inc. | | | 49,917 | | | | 1,609 | |
| | | McGrath RentCorp | | | 20,738 | | | | 1,587 | |
| | | ArcBest Corp. | | | 56,261 | | | | 1,553 | |
| * | | Herc Holdings Inc. | | | 28,699 | | | | 1,405 | |
| | | Kimball International Inc. Class B | | | 64,327 | | | | 1,330 | |
| | | Lennox International Inc. | | | 5,197 | | | | 1,268 | |
| * | | JetBlue Airways Corp. | | | 59,781 | | | | 1,119 | |
| | | Mueller Industries Inc. | | | 34,495 | | | | 1,095 | |
| | | Brady Corp. Class A | | | 19,024 | | | | 1,089 | |
| | | Allegiant Travel Co. Class A | | | 5,460 | | | | 950 | |
| * | | SPX Corp. | | | 16,225 | | | | 826 | |
| * | | FTI Consulting Inc. | | | 6,983 | | | | 773 | |
| | | KAR Auction Services Inc. | | | 32,673 | | | | 712 | |
| | | National Presto Industries Inc. | | | 6,597 | | | | 583 | |
| | | Fortune Brands Home & Security Inc. | | | 8,872 | | | | 580 | |
| | | EnPro Industries Inc. | | | 7,935 | | | | 531 | |
| | | Steelcase Inc. Class A | | | 22,284 | | | | 456 | |
| * | | Echo Global Logistics Inc. | | | 20,938 | | | | 433 | |
| | | Knoll Inc. | | | 16,155 | | | | 408 | |
| | | | | | | | | | 440,843 | |
| Information Technology (24.7%) | | | | | | | | |
| | | LogMeIn Inc. | | | 452,269 | | | | 38,778 | |
| | | j2 Global Inc. | | | 313,436 | | | | 29,372 | |
| * | | ON Semiconductor Corp. | | | 859,827 | | | | 20,963 | |
| * | | Cornerstone OnDemand Inc. | | | 337,741 | | | | 19,775 | |
| * | | SolarWinds Corp. | | | 1,027,530 | | | | 19,061 | |
| | | Belden Inc. | | | 313,650 | | | | 17,251 | |
| | | SS&C Technologies Holdings Inc. | | | 279,657 | | | | 17,171 | |
| * | | 2U Inc. | | | 567,446 | | | | 13,613 | |
| * | | Nuance Communications Inc. | | | 744,287 | | | | 13,271 | |
| * | | Paycom Software Inc. | | | 47,528 | | | | 12,583 | |
| * | | FireEye Inc. | | | 671,977 | | | | 11,108 | |
| * | | Fair Isaac Corp. | | | 29,572 | | | | 11,080 | |
| | | Booz Allen Hamilton Holding Corp. Class A | | | 148,137 | | | | 10,537 | |
| | | Switch Inc. | | | 704,734 | | | | 10,444 | |
| * | | Trimble Inc. | | | 244,388 | | | | 10,189 | |
| * | | Euronet Worldwide Inc. | | | 62,877 | | | | 9,907 | |
| * | | Gartner Inc. | | | 61,410 | | | | 9,463 | |
| * | | New Relic Inc. | | | 127,408 | | | | 8,372 | |
| * | | Five9 Inc. | | | 125,263 | | | | 8,215 | |
| * | | Proofpoint Inc. | | | 69,693 | | | | 7,999 | |
| * | | Cardtronics plc Class A | | | 174,421 | | | | 7,788 | |
| * | | Manhattan Associates Inc. | | | 97,261 | | | | 7,757 | |
| | | MAXIMUS Inc. | | | 92,411 | | | | 6,874 | |
| * | | Zebra Technologies Corp. | | | 26,224 | | | | 6,699 | |
| * | | Diodes Inc. | | | 118,487 | | | | 6,679 | |
| * | | Verint Systems Inc. | | | 119,332 | | | | 6,606 | |
| * | | Lattice Semiconductor Corp. | | | 343,934 | | | | 6,583 | |
| * | | Fortinet Inc. | | | 61,439 | | | | 6,559 | |
| | | Jabil Inc. | | | 155,570 | | | | 6,430 | |
| * | | Pluralsight Inc. Class A | | | 369,932 | | | | 6,367 | |
| | | CDW Corp. | | | 44,070 | | | | 6,295 | |
| * | | Cadence Design Systems Inc. | | | 87,487 | | | | 6,068 | |
| *,^ | | Enphase Energy Inc. | | | 232,226 | | | | 6,068 | |
| | | Sabre Corp. | | | 268,645 | | | | 6,028 | |
| * | | HubSpot Inc. | | | 37,628 | | | | 5,964 | |
| * | | Teradata Corp. | | | 220,088 | | | | 5,892 | |
| * | | Workiva Inc. Class A | | | 139,082 | | | | 5,848 | |
| * | | Anaplan Inc. | | | 109,272 | | | | 5,726 | |
| * | | RingCentral Inc. Class A | | | 33,419 | | | | 5,637 | |
| * | | Atlassian Corp. plc Class A | | | 42,771 | | | | 5,147 | |
| * | | Box Inc. | | | 297,997 | | | | 5,000 | |
| * | | Ceridian HCM Holding Inc. | | | 70,436 | | | | 4,781 | |
| * | | RealPage Inc. | | | 79,507 | | | | 4,273 | |
| * | | NCR Corp. | | | 120,417 | | | | 4,234 | |
| * | | EPAM Systems Inc. | | | 19,212 | | | | 4,076 | |
Small Company Growth Portfolio
| | | | | | | | Market | |
| | | | | | | | Value• | |
| | | | | Shares | | | ($000 | ) |
| * | | Trade Desk Inc. Class A | | | 14,631 | | | | 3,801 | |
| * | | Cirrus Logic Inc. | | | 41,396 | | | | 3,411 | |
| * | | Alteryx Inc. Class A | | | 31,903 | | | | 3,193 | |
| * | | ChannelAdvisor Corp. | | | 342,626 | | | | 3,097 | |
| * | | Extreme Networks Inc. | | | 403,292 | | | | 2,972 | |
| * | | Synaptics Inc. | | | 44,571 | | | | 2,931 | |
| * | | SPS Commerce Inc. | | | 52,608 | | | | 2,916 | |
| * | | OSI Systems Inc. | | | 28,520 | | | | 2,873 | |
| * | | Unisys Corp. | | | 223,141 | | | | 2,646 | |
| * | | Everbridge Inc. | | | 31,650 | | | | 2,471 | |
| | | TTEC Holdings Inc. | | | 62,344 | | | | 2,470 | |
| * | | Insight Enterprises Inc. | | | 31,157 | | | | 2,190 | |
| * | | Itron Inc. | | | 25,877 | | | | 2,172 | |
| * | | PagerDuty Inc. | | | 91,058 | | | | 2,130 | |
| | | CSG Systems International Inc. | | | 40,732 | | | | 2,109 | |
| * | | eGain Corp. | | | 261,786 | | | | 2,073 | |
| * | | Cerence Inc. | | | 82,612 | | | | 1,869 | |
| * | | Domo Inc. | | | 82,029 | | | | 1,782 | |
| * | | Model N Inc. | | | 48,881 | | | | 1,714 | |
| * | | Inphi Corp. | | | 21,672 | | | | 1,604 | |
| | | EVERTEC Inc. | | | 44,889 | | | | 1,528 | |
| * | | Nutanix Inc. | | | 45,574 | | | | 1,425 | |
| * | | SunPower Corp. | | | 178,615 | | | | 1,393 | |
| * | | Diebold Nixdorf Inc. | | | 131,737 | | | | 1,391 | |
| | | Perspecta Inc. | | | 52,368 | | | | 1,385 | |
| * | | Endurance International Group Holdings Inc. | | | 280,425 | | | | 1,318 | |
| | | Teradyne Inc. | | | 19,292 | | | | 1,316 | |
| *,^ | | Paysign Inc. | | | 123,816 | | | | 1,257 | |
| * | | PAR Technology Corp. | | | 35,476 | | | | 1,091 | |
| * | | Avid Technology Inc. | | | 114,851 | | | | 985 | |
| * | | Perficient Inc. | | | 20,799 | | | | 958 | |
| * | | FormFactor Inc. | | | 36,541 | | | | 949 | |
| * | | Virtusa Corp. | | | 19,760 | | | | 896 | |
| * | | MicroStrategy Inc. Class A | | | 5,311 | | | | 757 | |
| * | | MobileIron Inc. | | | 154,871 | | | | 753 | |
| * | | Okta Inc. | | | 6,522 | | | | 752 | |
| * | | MaxLinear Inc. | | | 32,546 | | | | 691 | |
| * | | A10 Networks Inc. | | | 98,231 | | | | 675 | |
| * | | ePlus Inc. | | | 6,264 | | | | 528 | |
| * | | Altair Engineering Inc. Class A | | | 13,722 | | | | 493 | |
| | | Xperi Corp. | | | 22,959 | | | | 425 | |
| * | | Alarm.com Holdings Inc. | | | 8,923 | | | | 383 | |
| * | | PFSweb Inc. | | | 73,268 | | | | 280 | |
| * | | DSP Group Inc. | | | 15,480 | | | | 244 | |
| | | | | | | | | | 520,828 | |
| Materials (2.2%) | | �� | | | | | | |
| | | Graphic Packaging Holding Co. | | | 490,823 | | | | 8,172 | |
| | | Scotts Miracle-Gro Co. | | | 67,805 | | | | 7,200 | |
| * | | Element Solutions Inc. | | | 554,422 | | | | 6,476 | |
| | | Sealed Air Corp. | | | 125,164 | | | | 4,985 | |
| | | Huntsman Corp. | | | 154,018 | | | | 3,721 | |
| | | Myers Industries Inc. | | | 184,305 | | | | 3,074 | |
| | | CF Industries Holdings Inc. | | | 62,831 | | | | 3,000 | |
| | | Royal Gold Inc. | | | 20,664 | | | | 2,526 | |
| * | | Kraton Corp. | | | 57,610 | | | | 1,459 | |
| * | | Verso Corp. | | | 67,349 | | | | 1,214 | |
| | | Avery Dennison Corp. | | | 8,259 | | | | 1,080 | |
| | | Boise Cascade Co. | | | 24,197 | | | | 884 | |
| * | | Koppers Holdings Inc. | | | 21,032 | | | | 804 | |
| * | | Novagold Resources Inc. | | | 76,537 | | | | 686 | |
| | | Packaging Corp. of America | | | 4,558 | | | | 510 | |
| * | | AdvanSix Inc. | | | 20,190 | | | | 403 | |
| | | | | | | | | | 46,194 | |
| Other (0.0%) | | | | | | | | |
| *,§ | | NuPathe Inc. CVR | | | 345,900 | | | | — | |
| | | | | | | | | | | |
| Real Estate (2.1%) | | | | | | | | |
| | | GEO Group Inc. | | | 465,614 | | | | 7,734 | |
| | | EastGroup Properties Inc. | | | 52,423 | | | | 6,955 | |
| | | National Health Investors Inc. | | | 77,163 | | | | 6,287 | |
| | | Hannon Armstrong Sustainable Infrastructure Capital Inc. | | | 187,114 | | | | 6,021 | |
| | | PS Business Parks Inc. | | | 23,902 | | | | 3,941 | |
| ^ | | Tanger Factory Outlet Centers Inc. | | | 184,729 | | | | 2,721 | |
| | | Universal Health Realty Income Trust | | | 20,778 | | | | 2,438 | |
| | | Kennedy-Wilson Holdings Inc. | | | 104,723 | | | | 2,335 | |
| | | American Finance Trust Inc. | | | 105,927 | | | | 1,405 | |
| ^ | | Pennsylvania REIT | | | 255,865 | | | | 1,364 | |
| | | iStar Inc. | | | 62,304 | | | | 904 | |
| | | Alexander’s Inc. | | | 1,907 | | | | 630 | |
| | | Equity LifeStyle Properties Inc. | | | 6,800 | | | | 479 | |
| | | | | | | | | | 43,214 | |
| Utilities (0.3%) | | | | | | | | |
| | | NRG Energy Inc. | | | 135,290 | | | | 5,378 | |
| | | TerraForm Power Inc.Class A | | | 61,943 | | | | 953 | |
| | | | | | | | | | 6,331 | |
| Total Common Stocks (Cost $1,883,987) | | | | | | | 2,034,066 | |
| Temporary Cash Investments (5.2%)1 | | | | | | | | |
| Money Market Fund (5.1%) | | | | | | | | |
| 2,3 | | Vanguard Market Liquidity Fund, 1.816% | | | 1,086,909 | | | | 108,702 | |
| | | | | | | | | | | |
| | | | | | | | | | | |
| | | | | | Face | | | | | |
| | | | | | Amount | | | | | |
| | | | | | ($000 | ) | | | | |
| U.S. Government and Agency Obligations (0.1%) | | | | | | | | |
| 4 | | United States Treasury Bill, 1.547%, 1/30/20 | | | 200 | | | | 200 | |
| | | United States Treasury Bill, 1.527%, 4/30/20 | | | 1,700 | | | | 1,691 | |
| | | | | | | | | | 1,891 | |
| Total Temporary Cash Investments (Cost $110,601) | | | | | | | 110,593 | |
| Total Investments (101.6%) (Cost $1,994,588) | | | | | | | 2,144,659 | |
| Other Assets and Liabilities (-1.6%) | | | | | | | | |
| Other Assets4 | | | | | | | 3,015 | |
| Liabilities3 | | | | | | | (36,548 | ) |
| | | | | | | | | | (33,533 | ) |
| Net Assets (100%) | | | | | | | | |
| Applicable to 91,475,185 outstanding $.001 par value shares of beneficial interest (unlimited authorization) | 2,111,126 | |
| Net Asset Value Per Share | | | | | | | $23.08 | |
| | | Amount | |
| | | ($000 | ) |
| Statement of Assets and Liabilities |
| Assets | | | | |
| Investments in Securities, at Value | | | | |
| Unaffiliated Issuers | | | 2,035,957 | |
| Affiliated Issuers | | | 108,702 | |
| Total Investments in Securities | | | 2,144,659 | |
| Investment in Vanguard | | | 94 | |
| Receivables for Investment Securities Sold | | | 248 | |
| Receivables for Accrued Income | | | 903 | |
| Receivables for Capital Shares Issued | | | 275 | |
| Variation Margin Receivables—Futures Contracts | | | 61 | |
| Other Assets4 | | | 1,434 | |
| Total Assets | | | 2,147,674 | |
| Liabilities | | | | |
| Payables for Investment Securities Purchased | | | 406 | |
| Collateral for Securities on Loan | | | 33,084 | |
| Payable to Investment Advisor | | | 524 | |
| Payables for Capital Shares Redeemed | | | 1,485 | |
| Payables to Vanguard | | | 1,049 | |
| Total Liabilities | | | 36,548 | |
| Net Assets | | | 2,111,126 | |
| At December 31, 2019, net assets consisted of: |
| | | | Amount | |
| | | | ($000 | ) |
| Paid-in Capital | | | 1,774,959 | |
| Total Distributable Earnings (Loss) | | | 336,167 | |
| Net Assets | | | 2,111,126 | |
| • | See Note A in Notes to Financial Statements. |
| * | Non-income-producing security. |
| ^ | Includes partial security positions on loan to broker-dealers. The total value of securities on loan is $31,740,000. |
| § | Security value determined using significant unobservable inputs. |
| 1 | The portfolio invests a portion of its cash reserves in equity markets through the use of index futures contracts. After giving effect to futures investments, the portfolio’s effective common stock and temporary cash investment positions represent 98.5% and 3.1%, respectively, of net assets. |
| 2 | Affiliated money market fund available only to Vanguard funds and certain trusts and accounts managed by Vanguard. Rate shown is the 7-day yield. |
| 3 | Collateral of $33,084,000 was received for securities on loan. |
| 4 | Securities with a value of $200,000 and cash of $1,434,000 have been segregated as initial margin for open futures contracts. |
ADR—American Depositary Receipt.
CVR—Contingent Value Rights.
REIT—Real Estate Investment Trust.
Small Company Growth Portfolio
Derivative Financial Instruments Outstanding as of Period End
Futures Contracts
| | | | | | | | | | | | ($000 | ) |
| | | | | | | | | | | | Value and | |
| | | | | | Number of | | | | | | Unrealized | |
| | | | | | Long (Short | ) | | Notional | | | Appreciation | |
| | | Expiration | | | Contracts | | | Amount | | | (Depreciation | ) |
| Long Futures Contracts | | | | | | | | | | | | |
| E-mini Russell 2000 Index | | March 2020 | | | 528 | | | 44,104 | | | 677 | |
See accompanying Notes, which are an integral part of the Financial Statements.
Small Company Growth Portfolio
Statement of Operations
| | | Year Ended | |
| | | December 31, 2019 | |
| | | | ($000 | ) |
| Investment Income | | | | |
| Income | | | | |
| Dividends | | | 14,704 | |
| Interest1 | | | 2,096 | |
| Securities Lending—Net | | | 1,834 | |
| Total Income | | | 18,634 | |
| Expenses | | | | |
| Investment Advisory Fees—Note B | | | | |
| Basic Fee | | | 2,825 | |
| Performance Adjustment | | | 122 | |
| The Vanguard Group—Note C | | | | |
| Management and Administrative | | | 3,273 | |
| Marketing and Distribution | | | 253 | |
| Custodian Fees | | | 24 | |
| Auditing Fees | | | 34 | |
| Shareholders’ Reports | | | 39 | |
| Trustees’ Fees and Expenses | | | 2 | |
| Total Expenses | | | 6,572 | |
| Net Investment Income | | | 12,062 | |
| Realized Net Gain (Loss) | | | | |
| Investment Securities Sold1 | | | 171,067 | |
| Futures Contracts | | | 3,457 | |
| Realized Net Gain (Loss) | | | 174,524 | |
| Change in Unrealized Appreciation (Depreciation) | | | | |
| Investment Securities1 | | | 299,972 | |
| Futures Contracts | | | 2,604 | |
| Change in Unrealized Appreciation (Depreciation) | | | 302,576 | |
| Net Increase (Decrease) in Net Assets Resulting from Operations | | | 489,162 | |
| 1 | Interest income, realized net gain (loss), and change in unrealized appreciation (depreciation) from an affiliated company of the portfolio were $1,876,000, $11,000, and ($1,000), respectively. |
Statement of Changes in Net Assets
| | | Year Ended December 31, | |
| | | 2019 | | | 2018 | |
| | | ($000 | ) | | ($000 | ) |
| Increase (Decrease) in Net Assets | | | | | | |
| Operations | | | | | | |
| Net Investment Income | | 12,062 | | | 10,278 | |
| Realized Net Gain (Loss) | | 174,524 | | | 225,393 | |
| Change in Unrealized Appreciation (Depreciation) | | 302,576 | | | (409,764 | ) |
| Net Increase (Decrease) in Net Assets Resulting from Operations | | 489,162 | | | (174,093 | ) |
| Distributions | | | | | | |
| Net Investment Income | | (10,333 | ) | | (7,284 | ) |
| Realized Capital Gain1 | | (224,554 | ) | | (197,105 | ) |
| Total Distributions | | (234,887 | ) | | (204,389 | ) |
| Capital Share Transactions | | | | | | |
| Issued | | 241,143 | | | 616,100 | |
| Issued in Lieu of Cash Distributions | | 234,887 | | | 204,389 | |
| Redeemed | | (446,197 | ) | | (365,139 | ) |
| Net Increase (Decrease) from Capital Share Transactions | | 29,833 | | | 455,350 | |
| Total Increase (Decrease) | | 284,108 | | | 76,868 | |
| Net Assets | | | | | | |
| Beginning of Period | | 1,827,018 | | | 1,750,150 | |
| End of Period | | 2,111,126 | | | 1,827,018 | |
| 1 | Includes fiscal 2019 and 2018 short-term gain distributions totaling $42,828,000 and $49,729,000, respectively. Short-term gain distributions are treated as ordinary income dividends for tax purposes. |
See accompanying Notes, which are an integral part of the Financial Statements.
Small Company Growth Portfolio
Financial Highlights
| For a Share Outstanding | Year Ended December 31, | |
| Throughout Each Period | | 2019 | | | 2018 | | | 2017 | | | 2016 | | | 2015 | |
| Net Asset Value, Beginning of Period | | $20.30 | | | $24.62 | | | $21.50 | | | $20.79 | | | $24.14 | |
| Investment Operations | | | | | | | | | | | | | | | | | | | | |
| Net Investment Income | | | .1281 | | | | .1231 | | | | .1091 | | | | .116 | | | | .078 | |
| Net Realized and Unrealized Gain (Loss) on Investments | | | 5.323 | | | | (1.563 | ) | | | 4.652 | | | | 2.547 | | | | (.577 | ) |
| Total from Investment Operations | | | 5.451 | | | | (1.440 | ) | | | 4.761 | | | | 2.663 | | | | (.499 | ) |
| Distributions | | | | | | | | | | | | | | | | | | | | |
| Dividends from Net Investment Income | | | (.118 | ) | | | (.103 | ) | | | (.111 | ) | | | (.074 | ) | | | (.087 | ) |
| Distributions from Realized Capital Gains | | | (2.553 | ) | | | (2.777 | ) | | | (1.530 | ) | | | (1.879 | ) | | | (2.764 | ) |
| Total Distributions | | | (2.671 | ) | | | (2.880 | ) | | | (1.641 | ) | | | (1.953 | ) | | | (2.851 | ) |
| Net Asset Value, End of Period | | $23.08 | | | $20.30 | | | $24.62 | | | $21.50 | | | $20.79 | |
| | | | | | | | | | | | | | | | | | | | | |
| Total Return | | | 28.05% | | | | -7.22% | | | | 23.46% | | | | 14.94% | | | | -2.75% | |
| | | | | | | | | | | | | | | | | | | | | |
| Ratios/Supplemental Data | | | | | | | | | | | | | | | | | | | | |
| Net Assets, End of Period (Millions) | | $2,111 | | | $1,827 | | | $1,750 | | | $1,397 | | | $1,256 | |
| Ratio of Total Expenses to Average Net Assets2 | | | 0.32% | | | | 0.32% | | | | 0.34% | | | | 0.36% | | | | 0.37% | |
| Ratio of Net Investment Income to Average Net Assets | | | 0.59% | | | | 0.52% | | | | 0.48% | | | | 0.58% | | | | 0.33% | |
| Portfolio Turnover Rate | | | 58% | | | | 66% | | | | 93% | | | | 91% | | | | 57% | |
| 1 | Calculated based on average shares outstanding. |
| 2 | Includes performance-based investment advisory fee increases (decreases) of 0.01%, 0.01%, 0.00%, 0.00%, and (0.01%). |
Notes to Financial Statements
The Small Company Growth Portfolio, a portfolio of Vanguard Variable Insurance Funds, is registered under the Investment Company Act of 1940 as an open-end investment company. The portfolio’s shares are only available for purchase by separate accounts of insurance companies as investments for variable annuity plans, variable life insurance contracts, or other variable benefit insurance contracts.
A. The following significant accounting policies conform to generally accepted accounting principles for U.S. investment companies. The portfolio consistently follows such policies in preparing its financial statements.
1. Security Valuation: Securities are valued as of the close of trading on the New York Stock Exchange (generally 4 p.m., Eastern time) on the valuation date. Equity securities are valued at the latest quoted sales prices or official closing prices taken from the primary market in which each security trades; such securities not traded on the valuation date are valued at the mean of the latest quoted bid and asked prices. Securities for which market quotations are not readily available, or whose values have been affected by events occurring before the portfolio’s pricing time but after the close of the securities’ primary markets, are valued at their fair values calculated according to procedures adopted by the board of trustees. These procedures include obtaining quotations from an independent pricing service, monitoring news to identify significant market- or security-specific events, and evaluating changes in the values of foreign market proxies (for example, ADRs, futures contracts, or exchange-traded funds), between the time the foreign markets close and the portfolio’s pricing time. When fair-value pricing is employed, the prices of securities used by a portfolio to calculate its net asset value may differ from quoted or published prices for the same securities. Investments in Vanguard Market Liquidity Fund are valued at that fund’s net asset value. Temporary cash investments are valued using the latest bid prices or using valuations based on a matrix system (which considers such factors as security prices, yields, maturities, and ratings), both as furnished by independent pricing services.
Small Company Growth Portfolio
2. Futures Contracts: The portfolio uses index futures contracts to a limited extent, with the objective of maintaining full exposure to the stock market while maintaining liquidity. The portfolio may purchase or sell futures contracts to achieve a desired level of investment, whether to accommodate portfolio turnover or cash flows from capital share transactions. The primary risks associated with the use of futures contracts are imperfect correlation between changes in market values of stocks held by the portfolio and the prices of futures contracts, and the possibility of an illiquid market. Counterparty risk involving futures is mitigated because a regulated clearinghouse is the counterparty instead of the clearing broker. To further mitigate counterparty risk, the portfolio trades futures contracts on an exchange, monitors the financial strength of its clearing brokers and clearinghouse, and has entered into clearing agreements with its clearing brokers. The clearinghouse imposes initial margin requirements to secure the portfolio’s performance and requires daily settlement of variation margin representing changes in the market value of each contract. Any assets pledged as initial margin for open contracts are noted in the Statement of Net Assets.
Futures contracts are valued at their quoted daily settlement prices. The notional amounts of the contracts are not recorded in the Statement of Net Assets. Fluctuations in the value of the contracts are recorded in the Statement of Assets and Liabilities as an asset (liability) and in the Statement of Operations as unrealized appreciation (depreciation) until the contracts are closed, when they are recorded as realized futures gains (losses).
During the year ended December 31, 2019, the portfolio’s average investments in long and short futures contracts represented 3% and 0% of net assets, respectively, based on the average of the notional amounts at each quarter-end during the period.
3. Federal Income Taxes: The portfolio intends to continue to qualify as a regulated investment company and distribute all of its taxable income. Management has analyzed the portfolio’s tax positions taken for all open federal income tax years (December 31, 2016–2019), and has concluded that no provision for federal income tax is required in the portfolio’s financial statements.
4. Distributions: Distributions to shareholders are recorded on the ex-dividend date. Distributions are determined on a tax basis and may differ from net investment income and realized capital gains for financial reporting purposes.
5. Securities Lending: To earn additional income, the portfolio lends its securities to qualified institutional borrowers. Security loans are subject to termination by the portfolio at any time, and are required to be secured at all times by collateral in an amount at least equal to the market value of securities loaned. Daily market fluctuations could cause the value of loaned securities to be more or less than the value of the collateral received. When this occurs, the collateral is adjusted and settled before the opening of the market on the next business day. The portfolio further mitigates its counterparty risk by entering into securities lending transactions only with a diverse group of prequalified counterparties, monitoring their financial strength, and entering into master securities lending agreements with its counterparties. The master securities lending agreements provide that, in the event of a counterparty’s default (including bankruptcy), the portfolio may terminate any loans with that borrower, determine the net amount owed, and sell or retain the collateral up to the net amount owed to the portfolio; however, such actions may be subject to legal proceedings. While collateral mitigates counterparty risk, in the event of a default, the portfolio may experience delays and costs in recovering the securities loaned. The portfolio invests cash collateral received in Vanguard Market Liquidity Fund, and records a liability in the Statement of Assets and Liabilities for the return of the collateral, during the period the securities are on loan. Securities lending income represents fees charged to borrowers plus income earned on invested cash collateral, less expenses associated with the loan. During the term of the loan, the portfolio is entitled to all distributions made on or in respect of the loaned securities.
6. Credit Facility: The portfolio and certain other funds managed by The Vanguard Group (“Vanguard”) participate in a $4.3 billion committed credit facility provided by a syndicate of lenders pursuant to a credit agreement that may be renewed annually; each fund is individually liable for its borrowings, if any, under the credit facility. Borrowings may be utilized for temporary and emergency purposes, and are subject to the portfolio’s regulatory and contractual borrowing restrictions. The participating funds are charged administrative fees and an annual commitment fee of 0.10% of the undrawn amount of the facility; these fees are allocated to the funds based on a method approved by the portfolio’s board of trustees and included in Management and Administrative expenses on the portfolio’s Statement
Small Company Growth Portfolio
of Operations. Any borrowings under this facility bear interest at a rate based upon the higher of the one-month London Interbank Offered Rate, federal funds effective rate, or overnight bank funding rate plus an agreed-upon spread.
The portfolio had no borrowings outstanding at December 31, 2019, or at any time during the period then ended.
7. Other: Dividend income is recorded on the ex-dividend date. Interest income includes income distributions received from Vanguard Market Liquidity Fund and is accrued daily. Premiums and discounts on debt securities are amortized and accreted, respectively, to interest income over the lives of the respective securities, except for premiums on certain callable debt securities that are amortized to the earliest call date. Security transactions are accounted for on the date securities are bought or sold. Costs used to determine realized gains (losses) on the sale of investment securities are those of the specific securities sold.
B. The investment advisory firm ArrowMark Colorado Holdings, LLC, provides investment advisory services to a portion of the portfolio for a fee calculated at an annual percentage rate of average net assets managed by the advisor. The basic fee of ArrowMark Colorado Holdings, LLC, is subject to quarterly adjustments based on performance relative to the Russell 2500 Growth Index since March 31, 2016.
Vanguard provides investment advisory services to a portion of the portfolio as described below; the portfolio paid Vanguard advisory fees of $887,000 for the year ended December 31, 2019.
For the year ended December 31, 2019, the aggregate investment advisory fee paid to all advisors represented an effective annual basic rate of 0.14% of the portfolio’s average net assets, before an increase of $122,000 (0.01%) based on performance.
C. In accordance with the terms of a Funds’ Service Agreement (the “FSA”) between Vanguard and the portfolio, Vanguard furnishes to the portfolio investment advisory, corporate management, administrative, marketing, and distribution services at Vanguard’s cost of operations (as defined by the FSA). These costs of operations are allocated to the portfolio based on methods and guidelines approved by the board of trustees. Vanguard does not require reimbursement in the current period for certain costs of operations (such as deferred compensation/benefits and risk/insurance costs); the portfolio’s liability for these costs of operations is included in Payables to Vanguard on the Statement of Assets and Liabilities. All other costs of operations payable to Vanguard are generally settled twice a month.
Upon the request of Vanguard, the portfolio may invest up to 0.40% of its net assets as capital in Vanguard. At December 31, 2019, the portfolio had contributed to Vanguard capital in the amount of $94,000, representing less than 0.01% of the portfolio’s net assets and 0.04% of Vanguard’s capital received pursuant to the FSA. The portfolio’s trustees and officers are also directors and employees, respectively, of Vanguard.
D. Various inputs may be used to determine the value of the portfolio’s investments. These inputs are summarized in three broad levels for financial statement purposes. The inputs or methodologies used to value securities are not necessarily an indication of the risk associated with investing in those securities.
Level 1—Quoted prices in active markets for identical securities.
Level 2—Other significant observable inputs (including quoted prices for similar securities, interest rates, prepayment speeds, credit risk, etc.).
Level 3—Significant unobservable inputs (including the portfolio’s own assumptions used to determine the fair value of investments). Any investments valued with significant unobservable inputs are noted on the Statement of Net Assets.
The following table summarizes the market value of the portfolio’s investments and derivatives as of December 31, 2019, based on the inputs used to value them:
| | | Level 1 | | | Level 2 | | | Level 3 | |
| Investments | | ($000 | ) | | ($000 | ) | | ($000 | ) |
| Common Stocks | | | 2,034,066 | | | | — | | | | — | |
| Temporary Cash Investments | | | 108,702 | | | | 1,891 | | | | — | |
| Futures Contracts—Assets1 | | | 61 | | | | — | | | | — | |
| Total | | | 2,142,829 | | | | 1,891 | | | | — | |
| 1 | Represents variation margin on the last day of the reporting period. |
Small Company Growth Portfolio
E. Permanent differences between book-basis and tax-basis components of net assets, if any, are reclassified among capital accounts in the financial statements to reflect their tax character. These reclassifications have no effect on net assets or net asset value per share.
Temporary differences between book-basis and tax-basis components of total distributable earnings (loss) arise when certain items of income, gain, or loss are recognized in different periods for financial statement and tax purposes; these differences will reverse at some time in the future. The differences are primarily related to the tax deferral of losses on wash sales and the realization of unrealized gains or losses on certain futures contracts. As of period end, the tax-basis components of total distributable earnings (loss) are detailed in the table as follows:
| | | Amount | |
| | | ($000 | ) |
| Undistributed Ordinary Income | | | 14,264 | |
| Undistributed Long-Term Gains | | | 175,000 | |
| Capital Loss Carryforwards (Non-expiring) | | | — | |
| Net Unrealized Gains (Losses) | | | 147,710 | |
As of December 31, 2019, gross unrealized appreciation and depreciation for investments and derivatives based on cost for U.S. federal income tax purposes were as follows:
| | | Amount | |
| | | ($000 | ) |
| Tax Cost | | | 1,996,949 | |
| Gross Unrealized Appreciation | | | 340,511 | |
| Gross Unrealized Depreciation | | | (192,801 | ) |
| Net Unrealized Appreciation (Depreciation) | | | 147,710 | |
F. During the year ended December 31, 2019, the portfolio purchased $1,135,415,000 of investment securities and sold $1,347,142,000 of investment securities, other than temporary cash investments.
G. Capital shares issued and redeemed were:
| | | Year Ended December 31, | |
| | | 2019 | | | 2018 | |
| | | Shares | | | Shares | |
| | | (000 | ) | | (000 | ) |
| Issued | | | 11,011 | | | | 25,424 | |
| Issued in Lieu of Cash Distributions | | | 11,101 | | | | 8,894 | |
| Redeemed | | | (20,656 | ) | | | (15,398 | ) |
| Net Increase (Decrease) in Shares Outstanding | | | 1,456 | | | | 18,920 | |
At December 31, 2019, one shareholder, an insurance company separate account whose holdings in the portfolio represent the indirect investment of Vanguard Variable Annuity contract holders, was the record or beneficial owner of 42% of the portfolio’s net assets. If this shareholder were to redeem its investment in the portfolio, the redemption might result in an increase in the portfolio’s expense ratio, cause the portfolio to incur higher transaction costs, or lead to the realization of taxable capital gains.
H. Management has determined that no events or transactions occurred subsequent to December 31, 2019, that would require recognition or disclosure in these financial statements.
Small Company Growth Portfolio
Report of Independent Registered Public Accounting Firm
To the Board of Trustees of Vanguard Variable Insurance Funds and Shareholders of Small Company Growth Portfolio
Opinion on the Financial Statements
We have audited the accompanying statement of net assets and statement of assets and liabilities of Small Company Growth Portfolio (one of the portfolios constituting Vanguard Variable Insurance Funds, referred to hereafter as the “Portfolio”) as of December 31, 2019, the related statement of operations for the year ended December 31, 2019, the statement of changes in net assets for each of the two years in the period ended December 31, 2019, including the related notes, and the financial highlights for each of the five years in the period ended December 31, 2019 (collectively referred to as the “financial statements”). In our opinion, the financial statements present fairly, in all material respects, the financial position of the Portfolio as of December 31, 2019, the results of its operations for the year then ended, the changes in its net assets for each of the two years in the period ended December 31, 2019 and the financial highlights for each of the five years in the period ended December 31, 2019 in conformity with accounting principles generally accepted in the United States of America.
Basis for Opinion
These financial statements are the responsibility of the Portfolio’s management. Our responsibility is to express an opinion on the Portfolio’s financial statements based on our audits. We are a public accounting firm registered with the Public Company Accounting Oversight Board (United States) (“PCAOB”) and are required to be independent with respect to the Portfolio in accordance with the U.S. federal securities laws and the applicable rules and regulations of the Securities and Exchange Commission and the PCAOB.
We conducted our audits of these financial statements in accordance with the standards of the PCAOB. Those standards require that we plan and perform the audit to obtain reasonable assurance about whether the financial statements are free of material misstatement, whether due to error or fraud.
Our audits included performing procedures to assess the risks of material misstatement of the financial statements, whether due to error or fraud, and performing procedures that respond to those risks. Such procedures included examining, on a test basis, evidence regarding the amounts and disclosures in the financial statements. Our audits also included evaluating the accounting principles used and significant estimates made by management, as well as evaluating the overall presentation of the financial statements. Our procedures included confirmation of securities owned as of December 31, 2019 by correspondence with the custodian and brokers and by agreement to the underlying ownership records of the transfer agent; when replies were not received from brokers, we performed other auditing procedures. We believe that our audits provide a reasonable basis for our opinion.
/s/PricewaterhouseCoopers LLP
Philadelphia, Pennsylvania
February 18, 2020
We have served as the auditor of one or more investment companies in The Vanguard Group of Funds since 1975.
Special 2019 tax information (unaudited) for corporate shareholders only for Vanguard Small Company Growth Portfolio, a portfolio of Vanguard Variable Insurance Funds
This information for the fiscal year ended December 31, 2019, is included pursuant to provisions of the Internal Revenue Code for corporate shareholders only.
The portfolio distributed $181,726,000 as capital gain dividends (20% rate gain distributions) to shareholders during the fiscal year ..
For corporate shareholders, 80.1% of investment income (dividend income plus short-term gains, if any) qualifies for the dividends-received deduction.
Total Bond Market Index Portfolio
Your Portfolio’s Performance at a Glance
• With yields falling in 2019, prices rose, contributing to strong bond returns for the 12 months ended December 31, 2019. The Total Bond Market Index Portfolio returned 8.67%, in line with the 8.87% return of its benchmark index after taking into account the cost of running the portfolio.
• The year was marked by concerns about slowing global growth, escalations in trade disputes, flare-ups in geopolitical tensions, and uncertainty over the United Kingdom’s exit from the European Union. The more challenging outlook prompted the Federal Reserve to cut interest rates three times in 2019; other major central banks adopted more accommodative monetary policies as well. Corporate earnings generally proved more resilient than expected and corporate defaults remained low, helping the average yield spread for corporate bonds versus U.S. Treasuries to narrow significantly.
• Treasuries, which account for over 40% of the portfolio’s assets, returned 6.86%. Mortgage-backed securities returned a little less than that, while corporate bonds fared even better, returning 14.54%.
• By credit quality, lower-rated investment-grade bonds bested higher-rated ones. And by maturity, longer-dated bonds significantly outperformed.
• Please note that the portfolio returns in Vanguard Variable Insurance Fund are different from those in Vanguard Variable Annuity (and other plans that invest in the fund), which take into account insurance-related expenses.
Market Barometer
| | | | Average Annual Total Returns |
| | | | Periods Ended December 31, 2019 |
| | One Year | | Three Years | | Five Years |
| Stocks |
| Russell 1000 Index (Large-caps) | 31.43 | % | | 15.05 | % | | 11.48 | % |
| Russell 2000 Index (Small-caps) | 25.53 | | | 8.59 | | | 8.23 | |
| Russell 3000 Index (Broad U.S. market) | 31.02 | | | 14.57 | | | 11.24 | |
| FTSE All-World ex US Index (International) | 21.81 | | | 9.96 | | | 5.83 | |
| | | | | | | | | |
| Bonds | | | | | | | | |
| Bloomberg Barclays U.S. Aggregate Bond Index (Broad taxable market) | 8.72 | % | | 4.03 | % | | 3.05 | % |
| Bloomberg Barclays Municipal Bond Index (Broad tax-exempt market) | 7.54 | | | 4.72 | | | 3.53 | |
| FTSE Three-Month U.S. Treasury Bill Index | 2.25 | | | 1.65 | | | 1.04 | |
| | | | | | | | | |
| CPI | | | | | | | | |
| Consumer Price Index | 2.29 | % | | 2.10 | % | | 1.82 | % |
Total Bond Market Index Portfolio
About Your Portfolio’s Expenses
As a shareholder of the portfolio, you incur ongoing costs, which include costs for portfolio management, administrative services, and shareholder reports (like this one), among others. Operating expenses, which are deducted from a portfolio’s gross income, directly reduce the investment return of the portfolio.
A portfolio’s expenses are expressed as a percentage of its average net assets. This figure is known as the expense ratio. The following examples are intended to help you understand the ongoing costs (in dollars) of investing in your portfolio and to compare these costs with those of other mutual funds. The examples are based on an investment of $1,000 made at the beginning of the period shown and held for the entire period.
The table below illustrates your portfolio’s costs in two ways:
• Based on actual portfolio return. This section helps you to estimate the actual expenses that you paid over the period. The “Ending Account Value” shown is derived from the portfolio’s actual return, and the third column shows the dollar amount that would have been paid by an investor who started with $1,000 in the portfolio. You may use the information here, together with the amount you invested, to estimate the expenses that you paid over the period.
To do so, simply divide your account value by $1,000 (for example, an $8,600 account value divided by $1,000 = 8.6), then multiply the result by the number given for your portfolio under the heading “Expenses Paid During Period.”
• Based on hypothetical 5% yearly return. This section is intended to help you compare your portfolio’s costs with those of other mutual funds. It assumes that the portfolio had a yearly return of 5% before expenses, but that the expense ratio is unchanged. In this case—because the return used is not the portfolio’s actual return—the results do not apply to your investment. The example is useful in making comparisons because the Securities and Exchange Commission requires all mutual funds to calculate expenses based on a 5% return. You can assess your portfolio’s costs by comparing this hypothetical example with the hypothetical examples that appear in shareholder reports of other funds.
Note that the expenses shown in the table are meant to highlight and help you compareongoingcosts only and do not reflect transaction costs incurred by the portfolio for buying and selling securities. The portfolio’s expense ratio does not reflect additional fees and expenses associated with the annuity or life insurance program through which you invest.
The calculations assume no shares were bought or sold during the period. Your actual costs may have been higher or lower, depending on the amount of your investment and the timing of any purchases or redemptions.
You can find more information about the portfolio’s expenses in the Financial Statements section. For additional information on operating expenses and other shareholder costs, please refer to the prospectus.
Six Months Ended December 31, 2019
| | | Beginning | | | Ending | | | Expenses | |
| | | Account Value | | | Account Value | | | Paid During | |
| Total Bond Market Index Portfolio | | 6/30/2019 | | | 12/31/2019 | | | Period | |
| Based on Actual Portfolio Return | | $1,000.00 | | | $1,024.33 | | | $0.71 | |
| Based on Hypothetical 5% Yearly Return | | 1,000.00 | | | 1,024.50 | | | 0.71 | |
The calculations are based on expenses incurred in the most recent six-month period. The portfolio’s annualized six-month expense ratio for that period is 0.14%. The dollar amounts shown as “Expenses Paid” are equal to the annualized expense ratio multiplied by the average account value over the period, multiplied by the number of days in the most recent six-month period, then divided by the number of days in the most recent 12-month period (184/365).
Total Bond Market Index Portfolio
Performance Summary
All of the returns in this report represent past performance, which is not a guarantee of future results that may be achieved by the portfolio. (Current performance may be lower or higher than the performance data cited. For performance data current to the most recent month-end, visit our website at vanguard.com/performance.) Note, too, that both investment returns and principal value can fluctuate widely, so an investor’s shares, when sold, could be worth more or less than their original cost. The returns shown do not reflect taxes that a shareholder would pay on portfolio distributions or on the sale of portfolio shares. Nor do the returns reflect fees and expenses associated with the annuity or life insurance program through which a shareholder invests. If these fees and expenses were included, the portfolio’s returns would be lower.
Cumulative Performance: December 31, 2009–December 31, 2019
Initial Investment of $10,000
| | | Average Annual Total Returns | Final Value |
| | | Periods Ended December 31, 2019 | of a $10,000 |
| | | One Year | Five Years | Ten Years | Investment |
| Total Bond Market Index Portfolio | 8.67% | 2.92% | 3.60% | $14,249 |
| Bloomberg Barclays U.S. Aggregate Float Adjusted Index | 8.87 | 3.07 | 3.78 | 14,486 |
See Financial Highlights for dividend and capital gains information.
Total Bond Market Index Portfolio
Sector Diversification
As of December 31, 2019
| Asset-Backed/Commercial Mortgage-Backed | 2.5 | % |
| Finance | 8.5 | |
| Foreign | 4.2 | |
| Government Mortgage-Backed | 22.3 | |
| Industrial | 16.4 | |
| Treasury/Agency | 43.3 | |
| Utilities | 2.0 | |
| Other | 0.8 | |
The table reflects the portfolio’s market exposure. Any holdings in short-term reserves are excluded. The agency and mortgage-backed securities sectors may include issues from government-sponsored enterprises; such issues are generally not backed by the full faith and credit of the U.S. government.
Total Bond Market Index Portfolio
Financial Statements
Statement of Net Assets
As of December 31, 2019
The portfolio files its complete schedule of portfolio holdings with the Securities and Exchange Commission (SEC) for the first and third quarters of each fiscal year as an exhibit to its reports on Form N-PORT. The portfolio’s Form N-PORT reports are available on the SEC’s website at www.sec.gov.
| | | | | | | | | Face | | | Market | |
| | | | | | | Maturity | | Amount | | | Value• | |
| | | | | Coupon | | Date | | ($000 | ) | | ($000 | ) |
| U.S. Government and Agency Obligations (65.2%) |
| U.S. Government Securities (42.0%) | | | | | | | | | | | | |
| | | United States Treasury Note/Bond | | 2.625% | | 8/31/20 | | | 2 | | | | 2 | |
| | | United States Treasury Note/Bond | | 2.750% | | 9/30/20 | | | 2 | | | | 2 | |
| | | United States Treasury Note/Bond | | 1.375% | | 10/31/20 | | | 1 | | | | 1 | |
| | | United States Treasury Note/Bond | | 1.750% | | 10/31/20 | | | 1 | | | | 1 | |
| | | United States Treasury Note/Bond | | 2.000% | | 11/30/20 | | | 5 | | | | 5 | |
| | | United States Treasury Note/Bond | | 2.750% | | 11/30/20 | | | 2 | | | | 2 | |
| | | United States Treasury Note/Bond | | 2.500% | | 12/31/20 | | | 1 | | | | 1 | |
| | | United States Treasury Note/Bond | | 2.000% | | 1/15/21 | | | 942 | | | | 945 | |
| | | United States Treasury Note/Bond | | 2.500% | | 1/31/21 | | | 7,700 | | | | 7,770 | |
| | | United States Treasury Note/Bond | | 2.250% | | 2/15/21 | | | 11,225 | | | | 11,299 | |
| | | United States Treasury Note/Bond | | 3.625% | | 2/15/21 | | | 768 | | | | 785 | |
| | | United States Treasury Note/Bond | | 7.875% | | 2/15/21 | | | 1,180 | | | | 1,260 | |
| | | United States Treasury Note/Bond | | 1.125% | | 2/28/21 | | | 580 | | | | 577 | |
| | | United States Treasury Note/Bond | | 2.000% | | 2/28/21 | | | 4,050 | | | | 4,067 | |
| | | United States Treasury Note/Bond | | 2.500% | | 2/28/21 | | | 11,488 | | | | 11,601 | |
| | | United States Treasury Note/Bond | | 2.375% | | 3/15/21 | | | 13,122 | | | | 13,233 | |
| | | United States Treasury Note/Bond | | 1.250% | | 3/31/21 | | | 9,170 | | | | 9,127 | |
| | | United States Treasury Note/Bond | | 2.250% | | 3/31/21 | | | 21,482 | | | | 21,643 | |
| | | United States Treasury Note/Bond | | 2.375% | | 4/15/21 | | | 8,381 | | | | 8,461 | |
| | | United States Treasury Note/Bond | | 1.375% | | 4/30/21 | | | 650 | | | | 648 | |
| | | United States Treasury Note/Bond | | 2.250% | | 4/30/21 | | | 8,016 | | | | 8,082 | |
| | | United States Treasury Note/Bond | | 2.625% | | 5/15/21 | | | 13,389 | | | | 13,571 | |
| | | United States Treasury Note/Bond | | 3.125% | | 5/15/21 | | | 5,625 | | | | 5,738 | |
| | | United States Treasury Note/Bond | | 1.375% | | 5/31/21 | | | 5,426 | | | | 5,408 | |
| | | United States Treasury Note/Bond | | 2.000% | | 5/31/21 | | | 6,752 | | | | 6,788 | |
| | | United States Treasury Note/Bond | | 2.125% | | 5/31/21 | | | 4,271 | | | | 4,301 | |
| | | United States Treasury Note/Bond | | 2.625% | | 6/15/21 | | | 10,023 | | | | 10,167 | |
| | | United States Treasury Note/Bond | | 1.125% | | 6/30/21 | | | 5,078 | | | | 5,042 | |
| | | United States Treasury Note/Bond | | 1.625% | | 6/30/21 | | | 7,852 | | | | 7,853 | |
| | | United States Treasury Note/Bond | | 2.625% | | 7/15/21 | | | 16,405 | | | | 16,656 | |
| | | United States Treasury Note/Bond | | 1.125% | | 7/31/21 | | | 9,520 | | | | 9,447 | |
| | | United States Treasury Note/Bond | | 1.750% | | 7/31/21 | | | 9,417 | | | | 9,438 | |
| | | United States Treasury Note/Bond | | 2.250% | | 7/31/21 | | | 5,675 | | | | 5,731 | |
| | | United States Treasury Note/Bond | | 2.125% | | 8/15/21 | | | 3,445 | | | | 3,473 | |
| | | United States Treasury Note/Bond | | 2.750% | | 8/15/21 | | | 23,185 | | | | 23,602 | |
| | | United States Treasury Note/Bond | | 1.125% | | 8/31/21 | | | 1,578 | | | | 1,565 | |
| | | United States Treasury Note/Bond | | 1.500% | | 8/31/21 | | | 10,140 | | | | 10,123 | |
| | | United States Treasury Note/Bond | | 2.000% | | 8/31/21 | | | 7,800 | | | | 7,850 | |
| | | United States Treasury Note/Bond | | 2.750% | | 9/15/21 | | | 6,614 | | | | 6,740 | |
| | | United States Treasury Note/Bond | | 1.125% | | 9/30/21 | | | 2,317 | | | | 2,298 | |
| | | United States Treasury Note/Bond | | 1.500% | | 9/30/21 | | | 2,125 | | | | 2,121 | |
| | | United States Treasury Note/Bond | | 2.125% | | 9/30/21 | | | 1,775 | | | | 1,791 | |
| | | United States Treasury Note/Bond | | 2.875% | | 10/15/21 | | | 9,746 | | | | 9,962 | |
| | | United States Treasury Note/Bond | | 1.250% | | 10/31/21 | | | 4,654 | | | | 4,625 | |
| | | United States Treasury Note/Bond | | 1.500% | | 10/31/21 | | | 18,666 | | | | 18,637 | |
| | | United States Treasury Note/Bond | | 2.000% | | 10/31/21 | | | 4,420 | | | | 4,452 | |
| | | United States Treasury Note/Bond | | 2.000% | | 11/15/21 | | | 115 | | | | 116 | |
| | | United States Treasury Note/Bond | | 2.875% | | 11/15/21 | | | 1,233 | | | | 1,262 | |
| | | United States Treasury Note/Bond | | 8.000% | | 11/15/21 | | | 3,400 | | | | 3,795 | |
| | | United States Treasury Note/Bond | | 1.500% | | 11/30/21 | | | 3,253 | | | | 3,248 | |
| | | United States Treasury Note/Bond | | 1.750% | | 11/30/21 | | | 7,492 | | | | 7,513 | |
| | | United States Treasury Note/Bond | | 2.625% | | 12/15/21 | | | 12,401 | | | | 12,643 | |
| | | United States Treasury Note/Bond | | 1.625% | | 12/31/21 | | | 3,645 | | | | 3,649 | |
| | | United States Treasury Note/Bond | | 2.000% | | 12/31/21 | | | 6,670 | | | | 6,722 | |
| | | United States Treasury Note/Bond | | 2.125% | | 12/31/21 | | | 928 | | | | 937 | |
| | | United States Treasury Note/Bond | | 2.500% | | 1/15/22 | | | 16,161 | | | | 16,446 | |
| | | United States Treasury Note/Bond | | 1.500% | | 1/31/22 | | | 2,384 | | | | 2,380 | |
| | | United States Treasury Note/Bond | | 1.875% | | 1/31/22 | | | 8,835 | | | | 8,885 | |
| | | United States Treasury Note/Bond | | 2.000% | | 2/15/22 | | | 135 | | | | 136 | |
| | | United States Treasury Note/Bond | | 2.500% | | 2/15/22 | | | 9,901 | | | | 10,087 | |
| | | United States Treasury Note/Bond | | 1.750% | | 2/28/22 | | | 6,330 | | | | 6,351 | |
| | | United States Treasury Note/Bond | | 1.875% | | 2/28/22 | | | 9,990 | | | | 10,049 | |
| | | United States Treasury Note/Bond | | 2.375% | | 3/15/22 | | | 10,896 | | | | 11,080 | |
| | | United States Treasury Note/Bond | | 1.750% | | 3/31/22 | | | 9,889 | | | | 9,923 | |
| | | United States Treasury Note/Bond | | 1.875% | | 3/31/22 | | | 5,215 | | | | 5,247 | |
| | | United States Treasury Note/Bond | | 2.250% | | 4/15/22 | | | 10,050 | | | | 10,195 | |
| | | United States Treasury Note/Bond | | 1.750% | | 4/30/22 | | | 4,977 | | | | 4,994 | |
| | | United States Treasury Note/Bond | | 1.875% | | 4/30/22 | | | 4,927 | | | | 4,958 | |
| | | United States Treasury Note/Bond | | 1.750% | | 5/15/22 | | | 2,962 | | | | 2,972 | |
| | | United States Treasury Note/Bond | | 2.125% | | 5/15/22 | | | 221 | | | | 224 | |
| | | United States Treasury Note/Bond | | 1.750% | | 5/31/22 | | | 5,115 | | | | 5,133 | |
| | | United States Treasury Note/Bond | | 1.875% | | 5/31/22 | | | 6,650 | | | | 6,694 | |
| | | United States Treasury Note/Bond | | 1.750% | | 6/15/22 | | | 13,281 | | | | 13,329 | |
| | | United States Treasury Note/Bond | | 1.750% | | 6/30/22 | | | 5,500 | | | | 5,521 | |
| | | United States Treasury Note/Bond | | 2.125% | | 6/30/22 | | | 5,235 | | | | 5,302 | |
| | | United States Treasury Note/Bond | | 1.750% | | 7/15/22 | | | 16,792 | | | | 16,850 | |
| | | United States Treasury Note/Bond | | 1.875% | | 7/31/22 | | | 6,417 | | | | 6,459 | |
| | | United States Treasury Note/Bond | | 2.000% | | 7/31/22 | | | 6,025 | | | | 6,084 | |
| | | United States Treasury Note/Bond | | 1.500% | | 8/15/22 | | | 10,098 | | | | 10,071 | |
| | | United States Treasury Note/Bond | | 1.625% | | 8/15/22 | | | 2,169 | | | | 2,170 | |
| | | United States Treasury Note/Bond | | 7.250% | | 8/15/22 | | | 875 | | | | 1,001 | |
| | | United States Treasury Note/Bond | | 1.625% | | 8/31/22 | | | 9,570 | | | | 9,573 | |
| | | United States Treasury Note/Bond | | 1.875% | | 8/31/22 | | | 5,445 | | | | 5,482 | |
| | | United States Treasury Note/Bond | | 1.500% | | 9/15/22 | | | 778 | | | | 776 | |
| | | United States Treasury Note/Bond | | 1.750% | | 9/30/22 | | | 9,437 | | | | 9,471 | |
| | | United States Treasury Note/Bond | | 1.875% | | 9/30/22 | | | 9,975 | | | | 10,047 | |
| | | United States Treasury Note/Bond | | 1.375% | | 10/15/22 | | | 11,286 | | | | 11,212 | |
| | | United States Treasury Note/Bond | | 1.875% | | 10/31/22 | | | 6,520 | | | | 6,565 | |
| | | United States Treasury Note/Bond | | 2.000% | | 10/31/22 | | | 7,947 | | | | 8,030 | |
| | | United States Treasury Note/Bond | | 1.625% | | 11/15/22 | | | 21,235 | | | | 21,242 | |
| | | United States Treasury Note/Bond | | 7.625% | | 11/15/22 | | | 40 | | | | 47 | |
| | | United States Treasury Note/Bond | | 2.000% | | 11/30/22 | | | 20,733 | | | | 20,953 | |
| | | United States Treasury Note/Bond | | 1.625% | | 12/15/22 | | | 23,260 | | | | 23,271 | |
| | | United States Treasury Note/Bond | | 2.125% | | 12/31/22 | | | 12,951 | | | | 13,141 | |
| | | United States Treasury Note/Bond | | 1.750% | | 1/31/23 | | | 7,020 | | | | 7,046 | |
| | | United States Treasury Note/Bond | | 2.375% | | 1/31/23 | | | 2,430 | | | | 2,485 | |
| | | United States Treasury Note/Bond | | 2.000% | | 2/15/23 | | | 798 | | | | 807 | |
| | | United States Treasury Note/Bond | | 7.125% | | 2/15/23 | | | 1,690 | | | | 1,973 | |
| | | United States Treasury Note/Bond | | 1.500% | | 2/28/23 | | | 2,889 | | | | 2,877 | |
| | | United States Treasury Note/Bond | | 2.625% | | 2/28/23 | | | 1,261 | | | | 1,299 | |
| | | United States Treasury Note/Bond | | 1.500% | | 3/31/23 | | | 7,005 | | | | 6,977 | |
| | | United States Treasury Note/Bond | | 2.500% | | 3/31/23 | | | 6,770 | | | | 6,954 | |
| | | United States Treasury Note/Bond | | 1.625% | | 4/30/23 | | | 215 | | | | 215 | |
| | | United States Treasury Note/Bond | | 2.750% | | 4/30/23 | | | 3,500 | | | | 3,625 | |
| | | United States Treasury Note/Bond | | 1.750% | | 5/15/23 | | | 7,400 | | | | 7,424 | |
| | | United States Treasury Note/Bond | | 1.625% | | 5/31/23 | | | 7,175 | | | | 7,172 | |
| | | United States Treasury Note/Bond | | 2.750% | | 5/31/23 | | | 5,850 | | | | 6,062 | |
| | | United States Treasury Note/Bond | | 1.375% | | 6/30/23 | | | 5,050 | | | | 5,004 | |
| | | United States Treasury Note/Bond | | 2.625% | | 6/30/23 | | | 5,398 | | | | 5,577 | |
| | | United States Treasury Note/Bond | | 1.250% | | 7/31/23 | | | 2,630 | | | | 2,593 | |
| | | United States Treasury Note/Bond | | 2.750% | | 7/31/23 | | | 3,555 | | | | 3,690 | |
| | | United States Treasury Note/Bond | | 2.500% | | 8/15/23 | | | 5,460 | | | | 5,621 | |
| | | United States Treasury Note/Bond | | 6.250% | | 8/15/23 | | | 6,565 | | | | 7,621 | |
| | | United States Treasury Note/Bond | | 1.375% | | 8/31/23 | | | 10,235 | | | | 10,136 | |
| | | United States Treasury Note/Bond | | 2.750% | | 8/31/23 | | | 8,235 | | | | 8,553 | |
| | | United States Treasury Note/Bond | | 1.375% | | 9/30/23 | | | 2,315 | | | | 2,291 | |
| | | United States Treasury Note/Bond | | 2.875% | | 9/30/23 | | | 4,309 | | | | 4,498 | |
| | | United States Treasury Note/Bond | | 1.625% | | 10/31/23 | | | 3,750 | | | | 3,744 | |
| | | United States Treasury Note/Bond | | 2.875% | | 10/31/23 | | | 11,203 | | | | 11,702 | |
Total Bond Market Index Portfolio
| | | | | | | | | Face | | | Market | |
| | | | | | | Maturity | | Amount | | | Value• | |
| | | | | Coupon | | Date | | ($000 | ) | | ($000 | ) |
| | | United States Treasury Note/Bond | | 2.750% | | 11/15/23 | | | 4,261 | | | | 4,432 | |
| | | United States Treasury Note/Bond | | 2.125% | | 11/30/23 | | | 6,150 | | | | 6,256 | |
| | | United States Treasury Note/Bond | | 2.875% | | 11/30/23 | | | 344 | | | | 360 | |
| | | United States Treasury Note/Bond | | 2.250% | | 12/31/23 | | | 2,267 | | | | 2,318 | |
| | | United States Treasury Note/Bond | | 2.625% | | 12/31/23 | | | 7,337 | | | | 7,606 | |
| | | United States Treasury Note/Bond | | 2.250% | | 1/31/24 | | | 3,215 | | | | 3,287 | |
| | | United States Treasury Note/Bond | | 2.500% | | 1/31/24 | | | 9,419 | | | | 9,725 | |
| | | United States Treasury Note/Bond | | 2.750% | | 2/15/24 | | | 10,710 | | | | 11,165 | |
| | | United States Treasury Note/Bond | | 2.125% | | 2/29/24 | | | 11,700 | | | | 11,908 | |
| | | United States Treasury Note/Bond | | 2.375% | | 2/29/24 | | | 6,712 | | | | 6,899 | |
| | | United States Treasury Note/Bond | | 2.125% | | 3/31/24 | | | 18,446 | | | | 18,780 | |
| | | United States Treasury Note/Bond | | 2.000% | | 4/30/24 | | | 1,260 | | | | 1,277 | |
| | | United States Treasury Note/Bond | | 2.250% | | 4/30/24 | | | 10,559 | | | | 10,806 | |
| | | United States Treasury Note/Bond | | 2.500% | | 5/15/24 | | | 9,960 | | | | 10,299 | |
| | | United States Treasury Note/Bond | | 2.000% | | 5/31/24 | | | 11,548 | | | | 11,699 | |
| | | United States Treasury Note/Bond | | 1.750% | | 6/30/24 | | | 8,060 | | | | 8,080 | |
| | | United States Treasury Note/Bond | | 2.000% | | 6/30/24 | | | 10,955 | | | | 11,099 | |
| | | United States Treasury Note/Bond | | 1.750% | | 7/31/24 | | | 9,127 | | | | 9,151 | |
| | | United States Treasury Note/Bond | | 2.125% | | 7/31/24 | | | 9,736 | | | | 9,918 | |
| | | United States Treasury Note/Bond | | 2.375% | | 8/15/24 | | | 11,564 | | | | 11,909 | |
| | | United States Treasury Note/Bond | | 1.250% | | 8/31/24 | | | 10,125 | | | | 9,926 | |
| | | United States Treasury Note/Bond | | 1.875% | | 8/31/24 | | | 4,655 | | | | 4,692 | |
| | | United States Treasury Note/Bond | | 1.500% | | 9/30/24 | | | 785 | | | | 778 | |
| | | United States Treasury Note/Bond | | 2.125% | | 9/30/24 | | | 3,394 | | | | 3,460 | |
| | | United States Treasury Note/Bond | | 1.500% | | 10/31/24 | | | 9,070 | | | | 8,991 | |
| | | United States Treasury Note/Bond | | 2.250% | | 10/31/24 | | | 5,980 | | | | 6,133 | |
| | | United States Treasury Note/Bond | | 2.250% | | 11/15/24 | | | 12,681 | | | | 13,004 | |
| | | United States Treasury Note/Bond | | 7.500% | | 11/15/24 | | | 25 | | | | 32 | |
| | | United States Treasury Note/Bond | | 1.500% | | 11/30/24 | | | 14,847 | | | | 14,719 | |
| | | United States Treasury Note/Bond | | 2.125% | | 11/30/24 | | | 10,055 | | | | 10,252 | |
| | | United States Treasury Note/Bond | | 1.750% | | 12/31/24 | | | 8,205 | | | | 8,227 | |
| | | United States Treasury Note/Bond | | 2.250% | | 12/31/24 | | | 1,645 | | | | 1,688 | |
| | | United States Treasury Note/Bond | | 2.500% | | 1/31/25 | | | 6,340 | | | | 6,584 | |
| | | United States Treasury Note/Bond | | 2.000% | | 2/15/25 | | | 8,625 | | | | 8,746 | |
| | | United States Treasury Note/Bond | | 2.750% | | 2/28/25 | | | 2,513 | | | | 2,641 | |
| | | United States Treasury Note/Bond | | 2.625% | | 3/31/25 | | | 8,961 | | | | 9,366 | |
| | | United States Treasury Note/Bond | | 2.875% | | 4/30/25 | | | 4,060 | | | | 4,296 | |
| | | United States Treasury Note/Bond | | 2.125% | | 5/15/25 | | | 12,735 | | | | 12,986 | |
| | | United States Treasury Note/Bond | | 2.875% | | 5/31/25 | | | 6,350 | | | | 6,721 | |
| | | United States Treasury Note/Bond | | 2.750% | | 6/30/25 | | | 4,880 | | | | 5,137 | |
| | | United States Treasury Note/Bond | | 2.875% | | 7/31/25 | | | 5,105 | | | | 5,410 | |
| | | United States Treasury Note/Bond | | 2.000% | | 8/15/25 | | | 14,581 | | | | 14,767 | |
| | | United States Treasury Note/Bond | | 6.875% | | 8/15/25 | | | 2,085 | | | | 2,655 | |
| | | United States Treasury Note/Bond | | 2.750% | | 8/31/25 | | | 9,260 | | | | 9,755 | |
| | | United States Treasury Note/Bond | | 3.000% | | 9/30/25 | | | 5,041 | | | | 5,381 | |
| | | United States Treasury Note/Bond | | 3.000% | | 10/31/25 | | | 4,015 | | | | 4,288 | |
| | | United States Treasury Note/Bond | | 2.250% | | 11/15/25 | | | 10,421 | | | | 10,696 | |
| | | United States Treasury Note/Bond | | 2.875% | | 11/30/25 | | | 6,285 | | | | 6,672 | |
| | | United States Treasury Note/Bond | | 2.625% | | 12/31/25 | | | 9,165 | | | | 9,605 | |
| | | United States Treasury Note/Bond | | 2.625% | | 1/31/26 | | | 7,459 | | | | 7,818 | |
| | | United States Treasury Note/Bond | | 1.625% | | 2/15/26 | | | 16,476 | | | | 16,311 | |
| | | United States Treasury Note/Bond | | 6.000% | | 2/15/26 | | | 3,600 | | | | 4,477 | |
| | | United States Treasury Note/Bond | | 2.500% | | 2/28/26 | | | 7,770 | | | | 8,089 | |
| | | United States Treasury Note/Bond | | 2.250% | | 3/31/26 | | | 6,250 | | | | 6,418 | |
| | | United States Treasury Note/Bond | | 2.375% | | 4/30/26 | | | 405 | | | | 419 | |
| | | United States Treasury Note/Bond | | 1.625% | | 5/15/26 | | | 10,789 | | | | 10,669 | |
| | | United States Treasury Note/Bond | | 2.125% | | 5/31/26 | | | 6,595 | | | | 6,722 | |
| | | United States Treasury Note/Bond | | 1.875% | | 6/30/26 | | | 9,335 | | | | 9,371 | |
| | | United States Treasury Note/Bond | | 1.875% | | 7/31/26 | | | 11,866 | | | | 11,907 | |
| | | United States Treasury Note/Bond | | 1.500% | | 8/15/26 | | | 10,069 | | | | 9,864 | |
| | | United States Treasury Note/Bond | | 6.750% | | 8/15/26 | | | 630 | | | | 824 | |
| | | United States Treasury Note/Bond | | 1.375% | | 8/31/26 | | | 9,309 | | | | 9,047 | |
| | | United States Treasury Note/Bond | | 1.625% | | 9/30/26 | | | 5,215 | | | | 5,149 | |
| | | United States Treasury Note/Bond | | 1.625% | | 10/31/26 | | | 7,825 | | | | 7,720 | |
| | | United States Treasury Note/Bond | | 2.000% | | 11/15/26 | | | 19,605 | | | | 19,813 | |
| | | United States Treasury Note/Bond | | 6.500% | | 11/15/26 | | | 765 | | | | 997 | |
| | | United States Treasury Note/Bond | | 1.625% | | 11/30/26 | | | 10,545 | | | | 10,403 | |
| | | United States Treasury Note/Bond | | 1.750% | | 12/31/26 | | | 5,575 | | | | 5,544 | |
| | | United States Treasury Note/Bond | | 2.250% | | 2/15/27 | | | 6,372 | | | | 6,545 | |
| | | United States Treasury Note/Bond | | 6.625% | | 2/15/27 | | | 1,065 | | | | 1,406 | |
| | | United States Treasury Note/Bond | | 2.375% | | 5/15/27 | | | 9,832 | | | | 10,189 | |
| | | United States Treasury Note/Bond | | 2.250% | | 8/15/27 | | | 7,822 | | | | 8,037 | |
| | | United States Treasury Note/Bond | | 6.375% | | 8/15/27 | | | 185 | | | | 245 | |
| | | United States Treasury Note/Bond | | 2.250% | | 11/15/27 | | | 11,502 | | | | 11,822 | |
| | | United States Treasury Note/Bond | | 6.125% | | 11/15/27 | | | 1,839 | | | | 2,414 | |
| | | United States Treasury Note/Bond | | 2.750% | | 2/15/28 | | | 7,480 | | | | 7,971 | |
| | | United States Treasury Note/Bond | | 2.875% | | 5/15/28 | | | 12,080 | | | | 13,001 | |
| | | United States Treasury Note/Bond | | 2.875% | | 8/15/28 | | | 13,082 | | | | 14,098 | |
| | | United States Treasury Note/Bond | | 5.500% | | 8/15/28 | | | 2,745 | | | | 3,531 | |
| | | United States Treasury Note/Bond | | 3.125% | | 11/15/28 | | | 8,828 | | | | 9,705 | |
| | | United States Treasury Note/Bond | | 5.250% | | 11/15/28 | | | 3,155 | | | | 4,015 | |
| | | United States Treasury Note/Bond | | 2.625% | | 2/15/29 | | | 12,045 | | | | 12,764 | |
| | | United States Treasury Note/Bond | | 5.250% | | 2/15/29 | | | 600 | | | | 767 | |
| | | United States Treasury Note/Bond | | 2.375% | | 5/15/29 | | | 11,878 | | | | 12,345 | |
| | | United States Treasury Note/Bond | | 1.625% | | 8/15/29 | | | 12,565 | | | | 12,239 | |
| | | United States Treasury Note/Bond | | 6.125% | | 8/15/29 | | | 1,530 | | | | 2,096 | |
| | | United States Treasury Note/Bond | | 1.750% | | 11/15/29 | | | 11,231 | | | | 11,061 | |
| | | United States Treasury Note/Bond | | 6.250% | | 5/15/30 | | | 2,350 | | | | 3,303 | |
| | | United States Treasury Note/Bond | | 5.375% | | 2/15/31 | | | 7,275 | | | | 9,760 | |
| | | United States Treasury Note/Bond | | 4.500% | | 2/15/36 | | | 3,047 | | | | 4,041 | |
| | | United States Treasury Note/Bond | | 4.750% | | 2/15/37 | | | 700 | | | | 963 | |
| | | United States Treasury Note/Bond | | 5.000% | | 5/15/37 | | | 150 | | | | 212 | |
| | | United States Treasury Note/Bond | | 4.375% | | 2/15/38 | | | 200 | | | | 266 | |
| | | United States Treasury Note/Bond | | 4.500% | | 5/15/38 | | | 2,459 | | | | 3,323 | |
| | | United States Treasury Note/Bond | | 3.500% | | 2/15/39 | | | 2,470 | | | | 2,960 | |
| | | United States Treasury Note/Bond | | 4.250% | | 5/15/39 | | | 2,247 | | | | 2,957 | |
| | | United States Treasury Note/Bond | | 4.500% | | 8/15/39 | | | 2,516 | | | | 3,414 | |
| | | United States Treasury Note/Bond | | 4.375% | | 11/15/39 | | | 2,817 | | | | 3,769 | |
| | | United States Treasury Note/Bond | | 4.625% | | 2/15/40 | | | 4,250 | | | | 5,876 | |
| | | United States Treasury Note/Bond | | 4.375% | | 5/15/40 | | | 3,735 | | | | 5,015 | |
| | | United States Treasury Note/Bond | | 3.875% | | 8/15/40 | | | 3,075 | | | | 3,876 | |
| | | United States Treasury Note/Bond | | 4.250% | | 11/15/40 | | | 2,395 | | | | 3,171 | |
| | | United States Treasury Note/Bond | | 4.750% | | 2/15/41 | | | 3,956 | | | | 5,582 | |
| | | United States Treasury Note/Bond | | 4.375% | | 5/15/41 | | | 1,840 | | | | 2,481 | |
| | | United States Treasury Note/Bond | | 3.750% | | 8/15/41 | | | 4,425 | | | | 5,494 | |
| | | United States Treasury Note/Bond | | 3.125% | | 11/15/41 | | | 2,701 | | | | 3,064 | |
| | | United States Treasury Note/Bond | | 3.125% | | 2/15/42 | | | 3,631 | | | | 4,119 | |
| | | United States Treasury Note/Bond | | 3.000% | | 5/15/42 | | | 7,620 | | | | 8,480 | |
| | | United States Treasury Note/Bond | | 2.750% | | 8/15/42 | | | 6,740 | | | | 7,198 | |
| | | United States Treasury Note/Bond | | 2.750% | | 11/15/42 | | | 5,446 | | | | 5,814 | |
| | | United States Treasury Note/Bond | | 3.125% | | 2/15/43 | | | 5,850 | | | | 6,636 | |
| | | United States Treasury Note/Bond | | 2.875% | | 5/15/43 | | | 8,753 | | | | 9,541 | |
| | | United States Treasury Note/Bond | | 3.625% | | 8/15/43 | | | 7,405 | | | | 9,084 | |
| | | United States Treasury Note/Bond | | 3.750% | | 11/15/43 | | | 8,693 | | | | 10,876 | |
| | | United States Treasury Note/Bond | | 3.625% | | 2/15/44 | | | 8,402 | | | | 10,331 | |
| | | United States Treasury Note/Bond | | 3.375% | | 5/15/44 | | | 8,604 | | | | 10,187 | |
| | | United States Treasury Note/Bond | | 3.125% | | 8/15/44 | | | 8,606 | | | | 9,795 | |
| | | United States Treasury Note/Bond | | 3.000% | | 11/15/44 | | | 9,337 | | | | 10,414 | |
| | | United States Treasury Note/Bond | | 2.500% | | 2/15/45 | | | 7,020 | | | | 7,168 | |
| | | United States Treasury Note/Bond | | 3.000% | | 5/15/45 | | | 6,917 | | | | 7,728 | |
| | | United States Treasury Note/Bond | | 2.875% | | 8/15/45 | | | 8,878 | | | | 9,707 | |
| | | United States Treasury Note/Bond | | 3.000% | | 11/15/45 | | | 4,974 | | | | 5,564 | |
| | | United States Treasury Note/Bond | | 2.500% | | 2/15/46 | | | 8,128 | | | | 8,301 | |
| | | United States Treasury Note/Bond | | 2.500% | | 5/15/46 | | | 8,981 | | | | 9,170 | |
| | | United States Treasury Note/Bond | | 2.250% | | 8/15/46 | | | 5,756 | | | | 5,595 | |
| | | United States Treasury Note/Bond | | 2.875% | | 11/15/46 | | | 12,500 | | | | 13,713 | |
| | | United States Treasury Note/Bond | | 3.000% | | 2/15/47 | | | 1,662 | | | | 1,868 | |
| | | United States Treasury Note/Bond | | 3.000% | | 5/15/47 | | | 7,293 | | | | 8,193 | |
| | | United States Treasury Note/Bond | | 2.750% | | 8/15/47 | | | 6,713 | | | | 7,200 | |
| | | United States Treasury Note/Bond | | 2.750% | | 11/15/47 | | | 10,171 | | | | 10,907 | |
| | | United States Treasury Note/Bond | | 3.000% | | 2/15/48 | | | 8,479 | | | | 9,531 | |
| | | United States Treasury Note/Bond | | 3.125% | | 5/15/48 | | | 8,985 | | | | 10,343 | |
| | | United States Treasury Note/Bond | | 3.000% | | 8/15/48 | | | 9,510 | | | | 10,712 | |
| | | United States Treasury Note/Bond | | 3.375% | | 11/15/48 | | | 5,907 | | | | 7,126 | |
| | | United States Treasury Note/Bond | | 3.000% | | 2/15/49 | | | 11,044 | | | | 12,459 | |
| | | United States Treasury Note/Bond | | 2.875% | | 5/15/49 | | | 10,723 | | | | 11,823 | |
| | | United States Treasury Note/Bond | | 2.250% | | 8/15/49 | | | 11,636 | | | | 11,292 | |
| | | United States Treasury Note/Bond | | 2.375% | | 11/15/49 | | | 9,660 | | | | 9,631 | |
| | | | | | | | | | | | | | 1,805,501 | |
Total Bond Market Index Portfolio
| | | | | | | | | Face | | | Market | |
| | | | | | | Maturity | | Amount | | | Value• | |
| | | | | Coupon | | Date | | ($000 | ) | | ($000 | ) |
| Agency Bonds and Notes (0.9%) | | | | | | | | | | | | |
| 1 | | AID-Iraq | | 2.149% | | 1/18/22 | | | 100 | | | | 101 | |
| 1 | | AID-Israel | | 5.500% | | 12/4/23 | | | 50 | | | | 57 | |
| 1 | | AID-Israel | | 5.500% | | 4/26/24 | | | 475 | | | | 547 | |
| 1 | | AID-Jordan | | 2.578% | | 6/30/22 | | | 200 | | | | 204 | |
| 1 | | AID-Jordan | | 3.000% | | 6/30/25 | | | 200 | | | | 208 | |
| 1 | | AID-Ukraine | | 1.471% | | 9/29/21 | | | 175 | | | | 174 | |
| | | Federal Farm Credit Banks | | 2.550% | | 3/11/21 | | | 350 | | | | 354 | |
| | | Federal Farm Credit Banks | | 2.230% | | 4/5/21 | | | 350 | | | | 353 | |
| | | Federal Farm Credit Banks | | 3.050% | | 11/15/21 | | | 100 | | | | 103 | |
| | | Federal Farm Credit Banks | | 1.600% | | 12/28/21 | | | 225 | | | | 225 | |
| | | Federal Farm Credit Banks | | 1.770% | | 6/26/23 | | | 150 | | | | 151 | |
| | | Federal Farm Credit Banks | | 3.500% | | 12/20/23 | | | 75 | | | | 80 | |
| | | Federal Home Loan Banks | | 1.375% | | 2/18/21 | | | 450 | | | | 449 | |
| | | Federal Home Loan Banks | | 5.625% | | 6/11/21 | | | 35 | | | | 37 | |
| | | Federal Home Loan Banks | | 1.875% | | 7/7/21 | | | 1,350 | | | | 1,355 | |
| | | Federal Home Loan Banks | | 1.125% | | 7/14/21 | | | 525 | | | | 521 | |
| | | Federal Home Loan Banks | | 3.000% | | 10/12/21 | | | 1,500 | | | | 1,536 | |
| | | Federal Home Loan Banks | | 1.625% | | 11/19/21 | | | 760 | | | | 760 | |
| | | Federal Home Loan Banks | | 1.875% | | 11/29/21 | | | 500 | | | | 502 | |
| | | Federal Home Loan Banks | | 1.625% | | 12/20/21 | | | 1,300 | | | | 1,300 | |
| | | Federal Home Loan Banks | | 2.125% | | 6/10/22 | | | 175 | | | | 177 | |
| | | Federal Home Loan Banks | | 2.000% | | 9/9/22 | | | 250 | | | | 252 | |
| | | Federal Home Loan Banks | | 2.125% | | 3/10/23 | | | 970 | | | | 984 | |
| | | Federal Home Loan Banks | | 2.500% | | 2/13/24 | | | 535 | | | | 551 | |
| | | Federal Home Loan Banks | | 1.500% | | 8/15/24 | | | 330 | | | | 326 | |
| | | Federal Home Loan Banks | | 3.250% | | 11/16/28 | | | 315 | | | | 344 | |
| | | Federal Home Loan Banks | | 5.500% | | 7/15/36 | | | 1,400 | | | | 1,966 | |
| 2 | | Federal Home Loan Mortgage Corp. | | 2.375% | | 2/16/21 | | | 1,200 | | | | 1,210 | |
| 2 | | Federal Home Loan Mortgage Corp. | | 1.125% | | 8/12/21 | | | 1,000 | | | | 992 | |
| 2 | | Federal Home Loan Mortgage Corp. | | 2.375% | | 1/13/22 | | | 800 | | | | 812 | |
| 2 | | Federal Home Loan Mortgage Corp. | | 2.750% | | 6/19/23 | | | 500 | | | | 518 | |
| 2 | | Federal Home Loan Mortgage Corp. | | 6.750% | | 9/15/29 | | | 127 | | | | 178 | |
| 2 | | Federal Home Loan Mortgage Corp. | | 6.750% | | 3/15/31 | | | 1,525 | | | | 2,205 | |
| 2 | | Federal Home Loan Mortgage Corp. | | 6.250% | | 7/15/32 | | | 502 | | | | 721 | |
| 2 | | Federal National Mortgage Assn. | | 1.375% | | 2/26/21 | | | 550 | | | | 549 | |
| 2 | | Federal National Mortgage Assn. | | 2.500% | | 4/13/21 | | | 500 | | | | 505 | |
| 2 | | Federal National Mortgage Assn. | | 2.750% | | 6/22/21 | | | 891 | | | | 905 | |
| 2 | | Federal National Mortgage Assn. | | 1.250% | | 8/17/21 | | | 525 | | | | 522 | |
| 2 | | Federal National Mortgage Assn. | | 1.375% | | 10/7/21 | | | 1,200 | | | | 1,195 | |
| 2 | | Federal National Mortgage Assn. | | 2.000% | | 1/5/22 | | | 500 | | | | 504 | |
| 2 | | Federal National Mortgage Assn. | | 2.625% | | 1/11/22 | | | 216 | | | | 220 | |
| 2 | | Federal National Mortgage Assn. | | 2.250% | | 4/12/22 | | | 476 | | | | 483 | |
| 2 | | Federal National Mortgage Assn. | | 1.375% | | 9/6/22 | | | 350 | | | | 348 | |
| 2 | | Federal National Mortgage Assn. | | 2.000% | | 10/5/22 | | | 850 | | | | 858 | |
| 2 | | Federal National Mortgage Assn. | | 2.375% | | 1/19/23 | | | 2,394 | | | | 2,445 | |
| 2 | | Federal National Mortgage Assn. | | 2.875% | | 9/12/23 | | | 400 | | | | 417 | |
| 2 | | Federal National Mortgage Assn. | | 2.500% | | 2/5/24 | | | 975 | | | | 1,005 | |
| 2 | | Federal National Mortgage Assn. | | 1.750% | | 7/2/24 | | | 1,028 | | | | 1,028 | |
| 2 | | Federal National Mortgage Assn. | | 2.625% | | 9/6/24 | | | 160 | | | | 166 | |
| 2 | | Federal National Mortgage Assn. | | 1.625% | | 10/15/24 | | | 970 | | | | 964 | |
| 2 | | Federal National Mortgage Assn. | | 2.125% | | 4/24/26 | | | 575 | | | | 583 | |
| 2 | | Federal National Mortgage Assn. | | 1.875% | | 9/24/26 | | | 500 | | | | 499 | |
| 2 | | Federal National Mortgage Assn. | | 6.250% | | 5/15/29 | | | 175 | | | | 236 | |
| 2 | | Federal National Mortgage Assn. | | 7.125% | | 1/15/30 | | | 925 | | | | 1,335 | |
| 2 | | Federal National Mortgage Assn. | | 7.250% | | 5/15/30 | | | 300 | | | | 441 | |
| 2 | | Federal National Mortgage Assn. | | 6.625% | | 11/15/30 | | | 300 | | | | 427 | |
| 2 | | Federal National Mortgage Assn. | | 5.625% | | 7/15/37 | | | 275 | | | | 395 | |
| | | Private Export Funding Corp. | | 4.300% | | 12/15/21 | | | 100 | | | | 105 | |
| | | Private Export Funding Corp. | | 2.800% | | 5/15/22 | | | 125 | | | | 128 | |
| | | Private Export Funding Corp. | | 2.050% | | 11/15/22 | | | 1,075 | | | | 1,080 | |
| | | Private Export Funding Corp. | | 3.550% | | 1/15/24 | | | 100 | | | | 106 | |
| | | Private Export Funding Corp. | | 2.450% | | 7/15/24 | | | 100 | | | | 102 | |
| | | Private Export Funding Corp. | | 1.750% | | 11/15/24 | | | 75 | | | | 75 | |
| | | Private Export Funding Corp. | | 3.250% | | 6/15/25 | | | 50 | | | | 53 | |
| | | Tennessee Valley Authority | | 3.875% | | 2/15/21 | | | 250 | | | | 256 | |
| | | Tennessee Valley Authority | | 1.875% | | 8/15/22 | | | 175 | | | | 175 | |
| | | Tennessee Valley Authority | | 2.875% | | 9/15/24 | | | 191 | | | | 200 | |
| | | Tennessee Valley Authority | | 6.750% | | 11/1/25 | | | 134 | | | | 169 | |
| | | Tennessee Valley Authority | | 7.125% | | 5/1/30 | | | 1,000 | | | | 1,441 | |
| | | Tennessee Valley Authority | | 4.650% | | 6/15/35 | | | 175 | | | | 216 | |
| | | Tennessee Valley Authority | | 5.880% | | 4/1/36 | | | 250 | | | | 352 | |
| | | Tennessee Valley Authority | | 5.500% | | 6/15/38 | | | 100 | | | | 139 | |
| | | Tennessee Valley Authority | | 5.250% | | 9/15/39 | | | 412 | | | | 564 | |
| | | Tennessee Valley Authority | | 4.875% | | 1/15/48 | | | 100 | | | | 137 | |
| | | Tennessee Valley Authority | | 5.375% | | 4/1/56 | | | 50 | | | | 76 | |
| | | Tennessee Valley Authority | | 4.625% | | 9/15/60 | | | 180 | | | | 246 | |
| | | Tennessee Valley Authority | | 4.250% | | 9/15/65 | | | 200 | | | | 259 | |
| | | | | | | | | | | | | | 42,162 | |
| Conventional Mortgage-Backed Securities (22.2%) | | | | | | | | | | | | |
| 2,3 | | Fannie Mae Pool | | 2.000% | | 11/1/27–11/1/34 | | | 1,931 | | | | 1,926 | |
| 2,3,4 | | Fannie Mae Pool | | 2.500% | | 1/1/27–1/1/50 | | | 23,901 | | | | 24,126 | |
| 2,3,4 | | Fannie Mae Pool | | 3.000% | | 11/1/25–12/1/49 | | | 82,933 | | | | 85,015 | |
| 2,3,4 | | Fannie Mae Pool | | 3.500% | | 10/1/20–9/1/49 | | | 105,130 | | | | 109,506 | |
| 2,3 | | Fannie Mae Pool | | 4.000% | | 1/1/20–9/1/49 | | | 85,138 | | | | 89,586 | |
| 2,3,4 | | Fannie Mae Pool | | 4.500% | | 1/1/20–1/1/50 | | | 36,954 | | | | 39,467 | |
| 2,3,4 | | Fannie Mae Pool | | 5.000% | | 3/1/20–1/1/50 | | | 12,277 | | | | 13,382 | |
| 2,3 | | Fannie Mae Pool | | 5.500% | | 3/1/20–4/1/40 | | | 5,550 | | | | 6,245 | |
| 2,3 | | Fannie Mae Pool | | 6.000% | | 12/1/20–5/1/41 | | | 3,279 | | | | 3,740 | |
| 2,3 | | Fannie Mae Pool | | 6.500% | | 12/1/23–10/1/39 | | | 891 | | | | 1,025 | |
| 2,3 | | Fannie Mae Pool | | 7.000% | | 6/1/23–11/1/37 | | | 246 | | | | 281 | |
| 2,3 | | Fannie Mae Pool | | 7.500% | | 11/1/22–2/1/32 | | | 26 | | | | 32 | |
| 2,3 | | Fannie Mae Pool | | 8.000% | | 6/1/22–11/1/30 | | | 13 | | | | 13 | |
| 2,3 | | Fannie Mae Pool | | 8.500% | | 7/1/22–4/1/31 | | | 6 | | | | 6 | |
| 2,3 | | Fannie Mae Pool | | 9.500% | | 2/1/25 | | | 1 | | | | 2 | |
| 2,3 | | Freddie Mac Gold Pool | | 2.000% | | 8/1/28–12/1/31 | | | 660 | | | | 658 | |
| 2,3 | | Freddie Mac Gold Pool | | 2.500% | | 4/1/27–2/1/43 | | | 13,167 | | | | 13,344 | |
| 2,3 | | Freddie Mac Gold Pool | | 3.000% | | 10/1/26–8/1/47 | | | 48,850 | | | | 50,229 | |
| 2,3 | | Freddie Mac Gold Pool | | 3.500% | | 9/1/25–11/1/48 | | | 62,661 | | | | 65,443 | |
| 2,3 | | Freddie Mac Gold Pool | | 4.000% | | 1/1/20–11/1/48 | | | 39,436 | | | | 41,634 | |
| 2,3 | | Freddie Mac Gold Pool | | 4.500% | | 8/1/20–10/1/48 | | | 17,755 | | | | 19,003 | |
| 2,3 | | Freddie Mac Gold Pool | | 5.000% | | 2/1/20–11/1/48 | | | 3,929 | | | | 4,300 | |
| 2,3 | | Freddie Mac Gold Pool | | 5.500% | | 7/1/20–6/1/41 | | | 2,664 | | | | 2,968 | |
| 2,3 | | Freddie Mac Gold Pool | | 6.000% | | 8/1/20–3/1/39 | | | 1,979 | | | | 2,248 | |
| 2,3 | | Freddie Mac Gold Pool | | 6.500% | | 8/1/23–4/1/39 | | | 575 | | | | 655 | |
| 2,3 | | Freddie Mac Gold Pool | | 7.000% | | 4/1/23–2/1/37 | | | 143 | | | | 161 | |
| 2,3 | | Freddie Mac Gold Pool | | 7.500% | | 1/1/23–4/1/28 | | | 12 | | | | 12 | |
| 2,3 | | Freddie Mac Gold Pool | | 8.000% | | 1/1/22–7/1/30 | | | 14 | | | | 14 | |
| 2,3 | | Freddie Mac Gold Pool | | 8.500% | | 7/1/24–11/1/30 | | | 9 | | | | 10 | |
| 2,3 | | Freddie Mac Gold Pool | | 9.000% | | 5/1/27–5/1/30 | | | 4 | | | | 4 | |
| 2,3 | | Freddie Mac Pool | | 4.000% | | 1/1/49 | | | 415 | | | | 440 | |
| 2,3 | | Freddie Mac Pool | | 4.500% | | 4/1/49 | | | 1,137 | | | | 1,217 | |
Total Bond Market Index Portfolio
| | | | | | | | | Face | | | Market | |
| | | | | | | Maturity | | Amount | | | Value• | |
| | | | | Coupon | | Date | | ($000 | ) | | ($000 | ) |
| 3 | | Ginnie Mae I Pool | | 3.000% | | 1/15/26–12/15/45 | | | 2,949 | | | | 3,034 | |
| 3,4 | | Ginnie Mae I Pool | | 3.500% | | 11/15/25–1/1/49 | | | 3,159 | | | | 3,298 | |
| 3 | | Ginnie Mae I Pool | | 4.000% | | 10/15/24–11/15/47 | | | 3,589 | | | | 3,785 | |
| 3 | | Ginnie Mae I Pool | | 4.500% | | 5/15/20–3/15/41 | | | 3,435 | | | | 3,707 | |
| 3 | | Ginnie Mae I Pool | | 5.000% | | 11/15/20–4/15/41 | | | 2,321 | | | | 2,548 | |
| 3 | | Ginnie Mae I Pool | | 5.500% | | 1/15/32–12/15/40 | | | 1,419 | | | | 1,573 | |
| 3 | | Ginnie Mae I Pool | | 6.000% | | 1/15/24–3/15/40 | | | 1,027 | | | | 1,150 | |
| 3 | | Ginnie Mae I Pool | | 6.500% | | 11/15/23–12/15/38 | | | 263 | | | | 287 | |
| 3 | | Ginnie Mae I Pool | | 7.000% | | 5/15/23–10/15/31 | | | 66 | | | | 76 | |
| 3 | | Ginnie Mae I Pool | | 7.500% | | 4/15/22–1/15/31 | | | 21 | | | | 24 | |
| 3 | | Ginnie Mae I Pool | | 8.000% | | 3/15/22–10/15/30 | | | 19 | | | | 19 | |
| 3 | | Ginnie Mae I Pool | | 8.500% | | 6/15/24–9/15/26 | | | 2 | | | | 2 | |
| 3 | | Ginnie Mae I Pool | | 9.000% | | 8/15/21–10/15/26 | | | 1 | | | | 1 | |
| 3,4 | | Ginnie Mae II Pool | | 2.500% | | 6/20/27–1/1/50 | | | 8,650 | | | | 8,681 | |
| 3,4 | | Ginnie Mae II Pool | | 3.000% | | 2/20/27–1/1/50 | | | 61,744 | | | | 63,674 | |
| 3,4 | | Ginnie Mae II Pool | | 3.500% | | 9/20/25–9/20/49 | | | 91,713 | | | | 95,454 | |
| 3 | | Ginnie Mae II Pool | | 4.000% | | 9/20/25–12/1/49 | | | 58,284 | | | | 60,990 | |
| 3,4 | | Ginnie Mae II Pool | | 4.500% | | 2/20/39–1/1/50 | | | 29,226 | | | | 31,071 | |
| 3 | | Ginnie Mae II Pool | | 5.000% | | 12/20/32–5/20/49 | | | 9,817 | | | | 10,538 | |
| 3 | | Ginnie Mae II Pool | | 5.500% | | 6/20/34–9/20/41 | | | 1,100 | | | | 1,224 | |
| 3 | | Ginnie Mae II Pool | | 6.000% | | 3/20/33–7/20/39 | | | 536 | | | | 613 | |
| 3 | | Ginnie Mae II Pool | | 6.500% | | 12/20/35–11/20/39 | | | 191 | | | | 222 | |
| 3 | | Ginnie Mae II Pool | | 7.000% | | 8/20/36–4/20/38 | | | 23 | | | | 28 | |
| 2,3 | | UMBS Pool | | 2.000% | | 1/1/32 | | | 211 | | | | 209 | |
| 2,3 | | UMBS Pool | | 2.500% | | 11/1/34–12/1/49 | | | 7,106 | | | | 7,055 | |
| 2,3 | | UMBS Pool | | 3.000% | | 7/1/30–1/1/50 | | | 34,184 | | | | 34,687 | |
| 2,3 | | UMBS Pool | | 3.500% | | 7/1/49–10/1/49 | | | 14,762 | | | | 15,280 | |
| 2,3 | | UMBS Pool | | 4.000% | | 5/1/47–9/1/49 | | | 7,783 | | | | 8,302 | |
| 2,3 | | UMBS Pool | | 4.500% | | 8/1/48–8/1/49 | | | 3,327 | | | | 3,569 | |
| 2,3 | | UMBS Pool | | 5.000% | | 3/1/49 | | | 1,492 | | | | 1,636 | |
| 2,3,4 | | UMBS TBA | | 2.500% | | 1/1/50 | | | 3,175 | | | | 3,139 | |
| 2,3,4 | | UMBS TBA | | 3.000% | | 11/1/49–1/1/50 | | | 3,550 | | | | 3,600 | |
| 2,3,4 | | UMBS TBA | | 3.500% | | 9/1/49–1/1/50 | | | 1,460 | | | | 1,501 | |
| 2,3,4 | | UMBS TBA | | 4.000% | | 1/1/35–1/1/50 | | | 6,790 | | | | 7,066 | |
| | | | | | | | | | | | | | 954,735 | |
| Nonconventional Mortgage-Backed Securities (0.1%) | | | | | | | | | | | | |
| 2,3,5 | | Fannie Mae Pool, 12M USD LIBOR + 1.290% | | 4.034% | | 12/1/41 | | | 23 | | | | 24 | |
| 2,3,5 | | Fannie Mae Pool, 12M USD LIBOR + 1.310% | | 3.592% | | 9/1/37 | | | 45 | | | | 46 | |
| 2,3,5 | | Fannie Mae Pool, 12M USD LIBOR + 1.392% | | 3.811% | | 10/1/37 | | | 17 | | | | 17 | |
| 2,3,5 | | Fannie Mae Pool, 12M USD LIBOR + 1.509% | | 4.082% | | 7/1/36 | | | 7 | | | | 7 | |
| 2,3,5 | | Fannie Mae Pool, 12M USD LIBOR + 1.553% | | 2.443% | | 9/1/43 | | | 12 | | | | 12 | |
| 2,3,5 | | Fannie Mae Pool, 12M USD LIBOR + 1.560% | | 2.272% | | 7/1/43 | | | 132 | | | | 133 | |
| 2,3,5 | | Fannie Mae Pool, 12M USD LIBOR + 1.609% | | 3.642% | | 12/1/33 | | | 6 | | | | 7 | |
| 2,3,5 | | Fannie Mae Pool, 12M USD LIBOR + 1.623% | | 4.748% | | 2/1/36 | | | 6 | | | | 6 | |
| 2,3,5 | | Fannie Mae Pool, 12M USD LIBOR + 1.625% | | 4.135% | | 8/1/35 | | | 42 | | | | 45 | |
| 2,3,5 | | Fannie Mae Pool, 12M USD LIBOR + 1.627% | | 4.752% | | 3/1/38 | | | 5 | | | | 5 | |
| 2,3,5 | | Fannie Mae Pool, 12M USD LIBOR + 1.635% | | 3.510% | | 11/1/36 | | | 4 | | | | 5 | |
| 2,3,5 | | Fannie Mae Pool, 12M USD LIBOR + 1.643% | | 4.476% | | 1/1/37 | | | 6 | | | | 7 | |
| 2,3,5 | | Fannie Mae Pool, 12M USD LIBOR + 1.660% | | 3.910% | | 9/1/40 | | | 7 | | | | 8 | |
| 2,3,5 | | Fannie Mae Pool, 12M USD LIBOR + 1.665% | | 4.415% | | 6/1/36 | | | 1 | | | | 1 | |
| 2,3,5 | | Fannie Mae Pool, 12M USD LIBOR + 1.679% | | 3.992% | | 1/1/42 | | | 23 | | | | 24 | |
| 2,3,5 | | Fannie Mae Pool, 12M USD LIBOR + 1.682% | | 4.167% | | 10/1/37 | | | 18 | | | | 19 | |
| 2,3,5 | | Fannie Mae Pool, 12M USD LIBOR + 1.690% | | 3.706% | | 10/1/39 | | | 11 | | | | 11 | |
| 2,3,5 | | Fannie Mae Pool, 12M USD LIBOR + 1.690% | | 3.972% | | 9/1/42 | | | 38 | | | | 40 | |
| 2,3,5 | | Fannie Mae Pool, 12M USD LIBOR + 1.690% | | 4.622% | | 5/1/40 | | | 13 | | | | 13 | |
| 2,3,5 | | Fannie Mae Pool, 12M USD LIBOR + 1.695% | | 4.320% | | 7/1/39 | | | 5 | | | | 5 | |
| 2,3,5 | | Fannie Mae Pool, 12M USD LIBOR + 1.698% | | 4.161% | | 8/1/40 | | | 11 | | | | 11 | |
| 2,3,5 | | Fannie Mae Pool, 12M USD LIBOR + 1.700% | | 4.364% | | 12/1/40 | | | 14 | | | | 14 | |
| 2,3,5 | | Fannie Mae Pool, 12M USD LIBOR + 1.701% | | 3.965% | | 10/1/42 | | | 23 | | | | 24 | |
| 2,3,5 | | Fannie Mae Pool, 12M USD LIBOR + 1.705% | | 3.809% | | 11/1/39 | | | 5 | | | | 6 | |
| 2,3,5 | | Fannie Mae Pool, 12M USD LIBOR + 1.726% | | 3.956% | | 9/1/34 | | | 5 | | | | 5 | |
| 2,3,5 | | Fannie Mae Pool, 12M USD LIBOR + 1.734% | | 3.997% | | 11/1/39 | | | 14 | | | | 14 | |
| 2,3,5 | | Fannie Mae Pool, 12M USD LIBOR + 1.746% | | 4.506% | | 7/1/41 | | | 36 | | | | 38 | |
| 2,3,5 | | Fannie Mae Pool, 12M USD LIBOR + 1.750% | | 4.213% | | 10/1/40 | | | 9 | | | | 9 | |
| 2,3,5 | | Fannie Mae Pool, 12M USD LIBOR + 1.767% | | 4.648% | | 6/1/41 | | | 6 | | | | 6 | |
| 2,3,5 | | Fannie Mae Pool, 12M USD LIBOR + 1.771% | | 4.709% | | 5/1/42 | | | 9 | | | | 10 | |
| 2,3,5 | | Fannie Mae Pool, 12M USD LIBOR + 1.780% | | 4.905% | | 2/1/41 | | | 6 | | | | 7 | |
| 2,3,5 | | Fannie Mae Pool, 12M USD LIBOR + 1.793% | | 3.391% | | 8/1/42 | | | 50 | | | | 50 | |
| 2,3,5 | | Fannie Mae Pool, 12M USD LIBOR + 1.795% | | 4.839% | | 3/1/42 | | | 22 | | | | 23 | |
| 2,3,5 | | Fannie Mae Pool, 12M USD LIBOR + 1.798% | | 4.358% | | 3/1/42 | | | 21 | | | | 22 | |
| 2,3,5 | | Fannie Mae Pool, 12M USD LIBOR + 1.804% | | 3.943% | | 12/1/39 | | | 15 | | | | 16 | |
| 2,3,5 | | Fannie Mae Pool, 12M USD LIBOR + 1.805% | | 3.773% | | 11/1/41 | | | 25 | | | | 27 | |
| 2,3,5 | | Fannie Mae Pool, 12M USD LIBOR + 1.810% | | 3.685% | | 10/1/40 | | | 15 | | | | 16 | |
Total Bond Market Index Portfolio
| | | | | | | | | Face | | | Market | |
| | | | | | | Maturity | | Amount | | | Value• | |
| | | | | Coupon | | Date | | ($000 | ) | | ($000 | ) |
| 2,3,5 | | Fannie Mae Pool, 12M USD LIBOR + 1.810% | | 3.935% | | 11/1/33–11/1/39 | | | 15 | | | | 15 | |
| 2,3,5 | | Fannie Mae Pool, 12M USD LIBOR + 1.810% | | 4.810% | | 12/1/40 | | | 10 | | | | 10 | |
| 2,3,5 | | Fannie Mae Pool, 12M USD LIBOR + 1.813% | | 3.978% | | 11/1/41 | | | 14 | | | | 15 | |
| 2,3,5 | | Fannie Mae Pool, 12M USD LIBOR + 1.813% | | 4.435% | | 1/1/42 | | | 21 | | | | 22 | |
| 2,3,5 | | Fannie Mae Pool, 12M USD LIBOR + 1.815% | | 3.690% | | 11/1/40 | | | 5 | | | | 5 | |
| 2,3,5 | | Fannie Mae Pool, 12M USD LIBOR + 1.815% | | 3.809% | | 12/1/40 | | | 9 | | | | 9 | |
| 2,3,5 | | Fannie Mae Pool, 12M USD LIBOR + 1.815% | | 3.970% | | 12/1/41 | | | 17 | | | | 18 | |
| 2,3,5 | | Fannie Mae Pool, 12M USD LIBOR + 1.815% | | 4.693% | | 5/1/41 | | | 17 | | | | 18 | |
| 2,3,5 | | Fannie Mae Pool, 12M USD LIBOR + 1.815% | | 4.940% | | 2/1/41 | | | 15 | | | | 16 | |
| 2,3,5 | | Fannie Mae Pool, 12M USD LIBOR + 1.819% | | 4.759% | | 3/1/41 | | | 27 | | | | 28 | |
| 2,3,5 | | Fannie Mae Pool, 12M USD LIBOR + 1.820% | | 4.168% | | 12/1/40 | | | 7 | | | | 7 | |
| 2,3,5 | | Fannie Mae Pool, 12M USD LIBOR + 1.822% | | 4.310% | | 9/1/40 | | | 31 | | | | 33 | |
| 2,3,5 | | Fannie Mae Pool, 12M USD LIBOR + 1.823% | | 4.902% | | 2/1/41 | | | 12 | | | | 12 | |
| 2,3,5 | | Fannie Mae Pool, 12M USD LIBOR + 1.825% | | 4.825% | | 3/1/41 | | | 14 | | | | 15 | |
| 2,3,5 | | Fannie Mae Pool, 12M USD LIBOR + 1.830% | | 3.451% | | 4/1/41 | | | 25 | | | | 25 | |
| 2,3,5 | | Fannie Mae Pool, 12M USD LIBOR + 1.830% | | 4.580% | | 6/1/41 | | | 17 | | | | 18 | |
| 2,3,5 | | Fannie Mae Pool, 12M USD LIBOR + 1.835% | | 4.723% | | 1/1/40 | | | 15 | | | | 15 | |
| 2,3,5 | | Fannie Mae Pool, 12M USD LIBOR + 1.840% | | 4.403% | | 8/1/39 | | | 12 | | | | 13 | |
| 2,3,5 | | Fannie Mae Pool, 12M USD LIBOR + 1.861% | | 4.745% | | 5/1/40 | | | 6 | | | | 6 | |
| 2,3,5 | | Fannie Mae Pool, 12M USD LIBOR + 1.880% | | 4.406% | | 11/1/34 | | | 10 | | | | 10 | |
| 2,3,5 | | Fannie Mae Pool, 12M USD LIBOR + 1.909% | | 4.784% | | 4/1/37 | | | 9 | | | | 10 | |
| 2,3,5 | | Fannie Mae Pool, 12M USD LIBOR + 1.912% | | 4.787% | | 5/1/36 | | | 3 | | | | 3 | |
| 2,3,5 | | Fannie Mae Pool, 1Y CMT + 2.155% | | 4.780% | | 12/1/37 | | | 24 | | | | 25 | |
| 2,3,5 | | Fannie Mae Pool, 1Y CMT + 2.238% | | 4.613% | | 7/1/38 | | | 8 | | | | 8 | |
| 2,3,5 | | Fannie Mae Pool, 1Y CMT + 2.268% | | 4.415% | | 12/1/35 | | | 10 | | | | 10 | |
| 2,3,5 | | Fannie Mae Pool, 1Y CMT + 2.313% | | 4.845% | | 1/1/35 | | | 14 | | | | 15 | |
| 2,3,5 | | Fannie Mae Pool, 6M USD LIBOR + 1.026% | | 3.206% | | 4/1/37 | | | 13 | | | | 14 | |
| 2,3,5 | | Fannie Mae Pool, 6M USD LIBOR + 1.476% | | 2.242% | | 3/1/43 | | | 100 | | | | 101 | |
| 2,3,5 | | Fannie Mae Pool, 6M USD LIBOR + 1.582% | | 2.743% | | 6/1/43 | | | 62 | | | | 62 | |
| 2,3,5 | | Fannie Mae Pool, 6M USD LIBOR + 1.638% | | 4.339% | | 8/1/39 | | | 26 | | | | 27 | |
| 2,3,5 | | Fannie Mae Pool, 6M USD LIBOR + 1.657% | | 4.260% | | 10/1/42 | | | 21 | | | | 22 | |
| 2,3,5 | | Fannie Mae Pool, 6M USD LIBOR + 1.700% | | 4.531% | | 7/1/37 | | | 8 | | | | 9 | |
| 2,3,5 | | Fannie Mae Pool, 6M USD LIBOR + 1.710% | | 3.371% | | 9/1/43 | | | 49 | | | | 50 | |
| 2,3,5 | | Fannie Mae Pool, 6M USD LIBOR + 1.723% | | 4.720% | | 5/1/42 | | | 44 | | | | 46 | |
| 2,3,5 | | Fannie Mae Pool, 6M USD LIBOR + 1.789% | | 4.572% | | 7/1/42 | | | 16 | | | | 17 | |
| 2,3,5 | | Fannie Mae Pool, 6M USD LIBOR + 1.840% | | 4.157% | | 8/1/37 | | | 13 | | | | 14 | |
| 2,3,5 | | Freddie Mac Non Gold Pool, 12M USD LIBOR + 0.985% | | 3.235% | | 10/1/37 | | | 2 | | | | 2 | |
| 2,3,5 | | Freddie Mac Non Gold Pool, 12M USD LIBOR + 1.564% | | 4.420% | | 3/1/37 | | | 2 | | | | 2 | |
| 2,3,5 | | Freddie Mac Non Gold Pool, 12M USD LIBOR + 1.588% | | 3.921% | | 9/1/37 | | | 5 | | | | 5 | |
| 2,3,5 | | Freddie Mac Non Gold Pool, 12M USD LIBOR + 1.625% | | 4.625% | | 1/1/38 | | | 2 | | | | 2 | |
| 2,3,5 | | Freddie Mac Non Gold Pool, 12M USD LIBOR + 1.640% | | 3.830% | | 12/1/36 | | | 9 | | | | 9 | |
| 2,3,5 | | Freddie Mac Non Gold Pool, 12M USD LIBOR + 1.640% | | 4.515% | | 5/1/42 | | | 4 | | | | 4 | |
| 2,3,5 | | Freddie Mac Non Gold Pool, 12M USD LIBOR + 1.660% | | 3.711% | | 10/1/37 | | | 10 | | | | 10 | |
| 2,3,5 | | Freddie Mac Non Gold Pool, 12M USD LIBOR + 1.695% | | 4.767% | | 2/1/37 | | | 6 | | | | 6 | |
| 2,3,5 | | Freddie Mac Non Gold Pool, 12M USD LIBOR + 1.727% | | 4.738% | | 1/1/35 | | | 2 | | | | 2 | |
| 2,3,5 | | Freddie Mac Non Gold Pool, 12M USD LIBOR + 1.743% | | 3.865% | | 12/1/36 | | | 16 | | | | 16 | |
| 2,3,5 | | Freddie Mac Non Gold Pool, 12M USD LIBOR + 1.745% | | 4.713% | | 12/1/40 | | | 22 | | | | 23 | |
| 2,3,5 | | Freddie Mac Non Gold Pool, 12M USD LIBOR + 1.750% | | 4.625% | | 5/1/38 | | | 1 | | | | 2 | |
| 2,3,5 | | Freddie Mac Non Gold Pool, 12M USD LIBOR + 1.765% | | 3.730% | | 12/1/36 | | | 4 | | | | 5 | |
| 2,3,5 | | Freddie Mac Non Gold Pool, 12M USD LIBOR + 1.796% | | 3.871% | | 12/1/34 | | | 9 | | | | 9 | |
| 2,3,5 | | Freddie Mac Non Gold Pool, 12M USD LIBOR + 1.834% | | 4.220% | | 12/1/35 | | | 11 | | | | 11 | |
| 2,3,5 | | Freddie Mac Non Gold Pool, 12M USD LIBOR + 1.864% | | 4.595% | | 2/1/42 | | | 10 | | | | 10 | |
| 2,3,5 | | Freddie Mac Non Gold Pool, 12M USD LIBOR + 1.880% | | 4.005% | | 11/1/40 | | | 2 | | | | 2 | |
| 2,3,5 | | Freddie Mac Non Gold Pool, 12M USD LIBOR + 1.880% | | 4.630% | | 6/1/40 | | | 12 | | | | 12 | |
| 2,3,5 | | Freddie Mac Non Gold Pool, 12M USD LIBOR + 1.880% | | 4.713% | | 6/1/41 | | | 7 | | | | 7 | |
| 2,3,5 | | Freddie Mac Non Gold Pool, 12M USD LIBOR + 1.880% | | 4.755% | | 5/1/40 | | | 11 | | | | 11 | |
| 2,3,5 | | Freddie Mac Non Gold Pool, 12M USD LIBOR + 1.880% | | 4.756% | | 6/1/40 | | | 10 | | | | 11 | |
| 2,3,5 | | Freddie Mac Non Gold Pool, 12M USD LIBOR + 1.880% | | 4.880% | | 12/1/40 | | | 2 | | | | 3 | |
| 2,3,5 | | Freddie Mac Non Gold Pool, 12M USD LIBOR + 1.880% | | 4.979% | | 1/1/41 | | | 17 | | | | 18 | |
| 2,3,5 | | Freddie Mac Non Gold Pool, 12M USD LIBOR + 1.880% | | 5.005% | | 3/1/41 | | | 6 | | | | 6 | |
| 2,3,5 | | Freddie Mac Non Gold Pool, 12M USD LIBOR + 1.889% | | 4.956% | | 2/1/42 | | | 13 | | | | 13 | |
| 2,3,5 | | Freddie Mac Non Gold Pool, 12M USD LIBOR + 1.895% | | 4.323% | | 9/1/40 | | | 23 | | | | 24 | |
| 2,3,5 | | Freddie Mac Non Gold Pool, 12M USD LIBOR + 1.900% | | 3.846% | | 11/1/40 | | | 15 | | | | 15 | |
| 2,3,5 | | Freddie Mac Non Gold Pool, 12M USD LIBOR + 1.900% | | 4.705% | | 6/1/40 | | | 15 | | | | 16 | |
| 2,3,5 | | Freddie Mac Non Gold Pool, 12M USD LIBOR + 1.910% | | 4.825% | | 1/1/41 | | | 3 | | | | 3 | |
| 2,3,5 | | Freddie Mac Non Gold Pool, 12M USD LIBOR + 1.910% | | 5.035% | | 2/1/41 | | | 18 | | | | 19 | |
| 2,3,5 | | Freddie Mac Non Gold Pool, 12M USD LIBOR + 1.977% | | 4.783% | | 5/1/37 | | | 20 | | | | 21 | |
| 2,3,5 | | Freddie Mac Non Gold Pool, 12M USD LIBOR + 2.000% | | 4.750% | | 7/1/35 | | | 2 | | | | 2 | |
| 2,3,5 | | Freddie Mac Non Gold Pool, 12M USD LIBOR + 2.085% | | 5.210% | | 3/1/38 | | | 3 | | | | 3 | |
| 2,3,5 | | Freddie Mac Non Gold Pool, 1Y CMT + 2.250% | | 4.006% | | 11/1/34 | | | 22 | | | | 23 | |
| 2,3,5 | | Freddie Mac Non Gold Pool, 1Y CMT + 2.250% | | 4.750% | | 5/1/36 | | | 6 | | | | 6 | |
| 2,3,5 | | Freddie Mac Non Gold Pool, 1Y CMT + 2.250% | | 4.991% | | 2/1/36 | | | 7 | | | | 7 | |
Total Bond Market Index Portfolio
| | | | | | | | | Face | | | Market | |
| | | | | | | Maturity | | Amount | | | Value• | |
| | | | | Coupon | | Date | | ($000 | ) | | ($000 | ) |
| 2,3,5 | | Freddie Mac Non Gold Pool, 1Y CMT + 2.409% | | 4.964% | �� | 10/1/36 | | | 12 | | | | 13 | |
| 2,3,5 | | Freddie Mac Non Gold Pool, 6M USD LIBOR + 1.355% | | 3.438% | | 6/1/37 | | | 7 | | | | 8 | |
| 3,5 | | Ginnie Mae II Pool, 1Y CMT + 1.500% | | 3.250% | | 7/20/38–8/20/41 | | | 45 | | | | 46 | |
| 3,5 | | Ginnie Mae II Pool, 1Y CMT + 1.500% | | 3.875% | | 4/20/41–6/20/43 | | | 109 | | | | 112 | |
| 3,5 | | Ginnie Mae II Pool, 1Y CMT + 1.500% | | 4.000% | | 1/20/41–3/20/43 | | | 122 | | | | 126 | |
| 3,5 | | Ginnie Mae II Pool, 1Y CMT + 1.500% | | 4.125% | | 10/20/38–12/20/42 | | | 163 | | | | 167 | |
| 3,5 | | Ginnie Mae II Pool, 1Y CMT + 2.000% | | 4.375% | | 5/20/41 | | | 12 | | | | 13 | |
| 3,5 | | Ginnie Mae II Pool, 1Y CMT + 2.000% | | 4.625% | | 11/20/40 | | | 1 | | | | 1 | |
| | | | | | | | | | | | | | 2,302 | |
| Total U.S. Government and Agency Obligations (Cost $2,733,576) | | | | | | | | | | | 2,804,700 | |
| Asset-Backed/Commercial Mortgage-Backed Securities (2.6%) |
| 3 | | Ally Auto Receivables Trust 2018-1 | | 2.350% | | 6/15/22 | | | 73 | | | | 73 | |
| 3 | | Ally Auto Receivables Trust 2018-1 | | 2.530% | | 2/15/23 | | | 25 | | | | 25 | |
| 3 | | Ally Auto Receivables Trust 2018-3 | | 3.000% | | 1/17/23 | | | 25 | | | | 25 | |
| 3 | | Ally Auto Receivables Trust 2018-3 | | 3.120% | | 7/17/23 | | | 50 | | | | 51 | |
| 3 | | Ally Auto Receivables Trust 2019-2 | | 2.230% | | 1/16/24 | | | 275 | | | | 276 | |
| 3 | | Ally Auto Receivables Trust 2019-2 | | 2.260% | | 8/15/24 | | | 50 | | | | 50 | |
| 3 | | Ally Auto Receivables Trust 2019-4 | | 1.840% | | 6/17/24 | | | 230 | | | | 230 | |
| 3 | | Ally Auto Receivables Trust 2019-4 | | 1.920% | | 1/15/25 | | | 25 | | | | 25 | |
| 3 | | Ally Master Owner Trust Series 2018-1 | | 2.700% | | 1/17/23 | | | 425 | | | | 428 | |
| 3 | | Ally Master Owner Trust Series 2018-2 | | 3.290% | | 5/15/23 | | | 100 | | | | 102 | |
| 3 | | American Express Credit Account Master Trust 2017-1 | | 1.930% | | 9/15/22 | | | 250 | | | | 250 | |
| 3 | | American Express Credit Account Master Trust 2017-3 | | 1.770% | | 11/15/22 | | | 300 | | | | 300 | |
| 3 | | American Express Credit Account Master Trust 2017-6 | | 2.040% | | 5/15/23 | | | 375 | | | | 376 | |
| 3 | | American Express Credit Account Master Trust 2017-7 | | 2.350% | | 5/15/25 | | | 225 | | | | 228 | |
| 3 | | American Express Credit Account Master Trust 2018-1 | | 2.670% | | 10/17/22 | | | 275 | | | | 275 | |
| 3 | | American Express Credit Account Master Trust 2018-2 | | 3.010% | | 10/15/25 | | | 250 | | | | 258 | |
| 3 | | American Express Credit Account Master Trust 2018-4 | | 2.990% | | 12/15/23 | | | 325 | | | | 330 | |
| 3 | | American Express Credit Account Master Trust 2018-8 | | 3.180% | | 4/15/24 | | | 100 | | | | 102 | |
| 3 | | AmeriCredit Automobile Receivables Trust 2017-3 | | 1.900% | | 3/18/22 | | | 38 | | | | 38 | |
| 3 | | AmeriCredit Automobile Receivables Trust 2018-1 | | 3.070% | | 12/19/22 | | | 100 | | | | 101 | |
| 3 | | AmeriCredit Automobile Receivables Trust 2018-1 | | 3.260% | | 1/18/24 | | | 56 | | | | 57 | |
| 3 | | AmeriCredit Automobile Receivables Trust 2018-1 | | 3.500% | | 1/18/24 | | | 50 | | | | 51 | |
| 3 | | AmeriCredit Automobile Receivables Trust 2019-1 | | 2.970% | | 11/20/23 | | | 75 | | | | 76 | |
| 3 | | BA Credit Card Trust 2017-A1 | | 1.950% | | 8/15/22 | | | 250 | | | | 250 | |
| 3 | | BA Credit Card Trust 2018-A1 | | 2.700% | | 7/17/23 | | | 475 | | | | 480 | |
| 3 | | BA Credit Card Trust 2019-A1 | | 1.740% | | 1/15/25 | | | 150 | | | | 150 | |
| 3 | | Banc of America Commercial Mortgage Trust 2015-UBS7 | | 3.429% | | 9/15/48 | | | 50 | | | | 52 | |
| 3 | | Banc of America Commercial Mortgage Trust 2015-UBS7 | | 3.705% | | 9/15/48 | | | 75 | | | | 80 | |
| 3 | | Banc of America Commercial Mortgage Trust 2017-BNK3 | | 3.574% | | 2/15/50 | | | 72 | | | | 77 | |
| 3 | | Banc of America Commercial Mortgage Trust 2017-BNK3 | | 3.748% | | 2/15/50 | | | 28 | | | | 29 | |
| 3 | | BANK 2017 - BNK5 | | 3.390% | | 6/15/60 | | | 150 | | | | 159 | |
| 3 | | BANK 2017 - BNK5 | | 3.624% | | 6/15/60 | | | 100 | | | | 105 | |
| 3 | | BANK 2017 - BNK6 | | 3.518% | | 7/15/60 | | | 404 | | | | 431 | |
| 3 | | BANK 2017 - BNK6 | | 3.741% | | 7/15/60 | | | 404 | | | | 431 | |
| 3 | | BANK 2017 - BNK7 | | 3.175% | | 9/15/60 | | | 100 | | | | 104 | |
| 3 | | BANK 2017 - BNK7 | | 3.435% | | 9/15/60 | | | 75 | | | | 80 | |
| 3 | | BANK 2017 - BNK7 | | 3.748% | | 9/15/60 | | | 75 | | | | 79 | |
| 3 | | BANK 2017 - BNK8 | | 3.488% | | 11/15/50 | | | 150 | | | | 160 | |
| 3 | | BANK 2017 - BNK8 | | 3.731% | | 11/15/50 | | | 25 | | | | 26 | |
| 3 | | BANK 2017 - BNK9 | | 3.279% | | 11/15/54 | | | 150 | | | | 157 | |
| 3 | | BANK 2017 - BNK9 | | 3.538% | | 11/15/54 | | | 150 | | | | 160 | |
| 3 | | BANK 2018 - BN10 | | 3.641% | | 2/15/61 | | | 50 | | | | 53 | |
| 3 | | BANK 2018 - BN10 | | 3.688% | | 2/15/61 | | | 250 | | | | 270 | |
| 3 | | BANK 2018 - BN10 | | 3.898% | | 2/15/61 | | | 50 | | | | 54 | |
| 3 | | BANK 2018 - BN11 | | 4.046% | | 3/15/61 | | | 100 | | | | 110 | |
| 3 | | BANK 2018 - BN12 | | 4.255% | | 5/15/61 | | | 125 | | | | 140 | |
| 3 | | BANK 2018 - BN12 | | 4.359% | | 5/15/61 | | | 50 | | | | 56 | |
| 3 | | BANK 2018 - BN13 | | 4.217% | | 8/15/61 | | | 25 | | | | 28 | |
| 3 | | BANK 2018 - BN14 | | 4.128% | | 9/15/60 | | | 50 | | | | 53 | |
| 3 | | BANK 2018 - BN14 | | 4.231% | | 9/15/60 | | | 100 | | | | 112 | |
| 3 | | BANK 2018 - BN14 | | 4.481% | | 9/15/60 | | | 25 | | | | 28 | |
| 3 | | BANK 2018 - BN15 | | 4.407% | | 11/15/61 | | | 110 | | | | 125 | |
| 3 | | BANK 2019 - BN16 | | 4.005% | | 2/15/52 | | | 125 | | | | 138 | |
| 3 | | BANK 2019 - BN17 | | 3.714% | | 4/15/52 | | | 100 | | | | 108 | |
| 3 | | BANK 2019 - BN17 | | 3.976% | | 4/15/52 | | | 25 | | | | 27 | |
| 3 | | BANK 2019 - BN18 | | 3.584% | | 5/15/62 | | | 375 | | | | 403 | |
| 3 | | BANK 2019 - BN18 | | 3.826% | | 5/15/62 | | | 50 | | | | 53 | |
| 3 | | BANK 2019 - BN19 | | 3.183% | | 8/15/61 | | | 275 | | | | 287 | |
| 3 | | BANK 2019 - BN20 | | 3.011% | | 9/15/61 | | | 170 | | | | 175 | |
| 3 | | BANK 2019 - BN21 | | 2.851% | | 10/17/52 | | | 375 | | | | 381 | |
| 3 | | BANK 2019 - BN21 | | 3.093% | | 10/17/52 | | | 75 | | | | 75 | |
| 3 | | BANK 2019 - BN22 | | 2.978% | | 11/15/62 | | | 290 | | | | 298 | |
| 3 | | BANK 2019 - BN23 | | 2.920% | | 12/15/52 | | | 180 | | | | 184 | |
| 3 | | BANK 2019 - BN23 | | 3.203% | | 12/15/52 | | | 75 | | | | 76 | |
| 3 | | BANK 2019 - BN24 | | 2.960% | | 11/15/62 | | | 150 | | | | 154 | |
| 3 | | BANK 2019 - BN24 | | 3.283% | | 11/15/62 | | | 75 | | | | 76 | |
| 3 | | Bank of America Credit Card Trust 2018-A2 | | 3.000% | | 9/15/23 | | | 400 | | | | 406 | |
| | | Bank of Nova Scotia | | 1.875% | | 4/26/21 | | | 175 | | | | 175 | |
| 3 | | BBCMS Mortgage Trust 2017-C1 | | 3.674% | | 2/15/50 | | | 325 | | | | 349 | |
| 3 | | BBCMS Mortgage Trust 2017-C1 | | 3.898% | | 2/15/50 | | | 100 | | | | 107 | |
| 3 | | BBCMS Mortgage Trust 2018-C2 | | 4.314% | | 12/15/51 | | | 125 | | | | 141 | |
| 3 | | BBCMS Mortgage Trust 2019-C3 | | 3.583% | | 5/15/52 | | | 700 | | | | 744 | |
| 3 | | BBCMS Mortgage Trust 2019-C4 | | 2.919% | | 8/15/52 | | | 275 | | | | 279 | |
| 3 | | BBCMS Mortgage Trust 2019-C4 | | 3.171% | | 8/15/52 | | | 25 | | | | 25 | |
| 3 | | BBCMS Mortgage Trust 2019-C5 | | 3.063% | | 11/15/52 | | | 150 | | | | 154 | |
| 3 | | BBCMS Mortgage Trust 2019-C5 | | 3.366% | | 11/15/52 | | | 100 | | | | 102 | |
| 3 | | Bear Stearns Commercial Mortgage Securities Trust 2007-TOP26 | | 5.450% | | 1/12/45 | | | 27 | | | | 27 | |
| 3 | | BENCHMARK 2018-B1 Mortgage Trust | | 3.666% | | 1/15/51 | | | 100 | | | | 108 | |
| 3 | | BENCHMARK 2018-B1 Mortgage Trust | | 3.878% | | 1/15/51 | | | 50 | | | | 53 | |
| 3 | | BENCHMARK 2018-B2 Mortgage Trust | | 3.662% | | 2/15/51 | | | 125 | | | | 130 | |
| 3 | | BENCHMARK 2018-B2 Mortgage Trust | | 3.882% | | 2/15/51 | | | 325 | | | | 353 | |
| 3 | | BENCHMARK 2018-B2 Mortgage Trust | | 4.084% | | 2/15/51 | | | 150 | | | | 163 | |
| 3 | | BENCHMARK 2018-B3 Mortgage Trust | | 3.848% | | 4/10/51 | | | 100 | | | | 104 | |
| 3 | | BENCHMARK 2018-B3 Mortgage Trust | | 4.025% | | 4/10/51 | | | 225 | | | | 248 | |
| 3 | | BENCHMARK 2018-B4 Mortgage Trust | | 4.121% | | 7/15/51 | | | 350 | | | | 389 | |
| 3 | | BENCHMARK 2018-B4 Mortgage Trust | | 4.311% | | 7/15/51 | | | 75 | | | | 82 | |
| 3 | | BENCHMARK 2018-B5 Mortgage Trust | | 4.208% | | 7/15/51 | | | 75 | | | | 84 | |
| 3 | | BENCHMARK 2018-B6 Mortgage Trust | | 4.203% | | 10/10/51 | | | 50 | | | | 53 | |
| 3 | | BENCHMARK 2018-B6 Mortgage Trust | | 4.261% | | 10/10/51 | | | 50 | | | | 56 | |
| 3 | | BENCHMARK 2018-B6 Mortgage Trust | | 4.441% | | 10/10/51 | | | 25 | | | | 28 | |
| 3 | | BENCHMARK 2018-B7 Mortgage Trust | | 4.510% | | 5/15/53 | | | 175 | | | | 200 | |
| 3 | | BENCHMARK 2018-B8 Mortgage Trust | | 4.232% | | 1/15/52 | | | 125 | | | | 140 | |
| 3 | | BENCHMARK 2018-B8 Mortgage Trust | | 4.532% | | 1/15/52 | | | 50 | | | | 56 | |
| 3 | | BENCHMARK 2019-B9 Mortgage Trust | | 4.016% | | 3/15/52 | | | 105 | | | | 116 | |
| 3 | | BENCHMARK 2019-B10 Mortgage Trust | | 3.717% | | 3/15/62 | | | 80 | | | | 87 | |
| 3 | | BENCHMARK 2019-B10 Mortgage Trust | | 3.979% | | 3/15/62 | | | 50 | | | | 54 | |
| 3 | | BENCHMARK 2019-B11 Mortgage Trust | | 3.542% | | 5/15/52 | | | 275 | | | | 295 | |
| 3 | | BENCHMARK 2019-B11 Mortgage Trust | | 3.784% | | 5/15/52 | | | 75 | | | | 80 | |
| 3 | | BENCHMARK 2019-B13 Mortgage Trust | | 2.952% | | 8/15/57 | | | 280 | | | | 286 | |
Total Bond Market Index Portfolio
| | | | | | | | | Face | | | Market | |
| | | | | | | Maturity | | Amount | | | Value• | |
| | | | | Coupon | | Date | | ($000 | ) | | ($000 | ) |
| 3 | | BENCHMARK 2019-B14 Mortgage Trust | | 3.049% | | 12/15/62 | | | 225 | | | | 232 | |
| 3 | | BENCHMARK 2019-B15 Mortgage Trust | | 2.928% | | 12/15/72 | | | 230 | | | | 233 | |
| 3 | | BMW Vehicle Lease Trust 2017-2 | | 2.070% | | 10/20/20 | | | 24 | | | | 24 | |
| 3 | | BMW Vehicle Owner Trust 2018-A | | 2.350% | | 4/25/22 | | | 125 | | | | 125 | |
| 3 | | BMW Vehicle Owner Trust 2018-A | | 2.510% | | 6/25/24 | | | 50 | | | | 50 | |
| 3 | | Cantor Commercial Real Estate Lending 2019-CF1 | | 3.786% | | 5/15/52 | | | 125 | | | | 135 | |
| 3 | | Cantor Commercial Real Estate Lending 2019-CF2 | | 2.874% | | 11/15/52 | | | 140 | | | | 141 | |
| 3 | | Cantor Commercial Real Estate Lending 2019-CF3 | | 3.006% | | 1/15/53 | | | 135 | | | | 138 | |
| 3 | | Cantor Commercial Real Estate Lending 2019-CF3 | | 3.298% | | 1/15/53 | | | 60 | | | | 60 | |
| 3 | | Capital One Auto Receivables Trust 2019-1 | | 2.510% | | 11/15/23 | | | 100 | | | | 101 | |
| 3 | | Capital One Auto Receivables Trust 2019-1 | | 2.560% | | 10/15/24 | | | 35 | | | | 35 | |
| 3 | | Capital One Multi-Asset Execution Trust 2015-A2 | | 2.080% | | 3/15/23 | | | 250 | | | | 250 | |
| 3 | | Capital One Multi-Asset Execution Trust 2015-A8 | | 2.050% | | 8/15/23 | | | 150 | | | | 150 | |
| 3 | | Capital One Multi-Asset Execution Trust 2017-A4 | | 1.990% | | 7/17/23 | | | 250 | | | | 250 | |
| 3 | | Capital One Multi-Asset Execution Trust 2017-A6 | | 2.290% | | 7/15/25 | | | 225 | | | | 228 | |
| 3 | | Capital One Multi-Asset Execution Trust 2018-A1 | | 3.010% | | 2/15/24 | | | 125 | | | | 127 | |
| 3 | | Capital One Multi-Asset Execution Trust 2019-A1 | | 2.840% | | 12/15/24 | | | 75 | | | | 77 | |
| 3 | | CarMax Auto Owner Trust 2016-3 | | 1.390% | | 5/17/21 | | | 9 | | | | 9 | |
| 3 | | CarMax Auto Owner Trust 2016-3 | | 1.600% | | 1/18/22 | | | 50 | | | | 50 | |
| 3 | | CarMax Auto Owner Trust 2017-4 | | 2.110% | | 10/17/22 | | | 63 | | | | 63 | |
| 3 | | CarMax Auto Owner Trust 2017-4 | | 2.330% | | 5/15/23 | | | 50 | | | | 50 | |
| 3 | | CarMax Auto Owner Trust 2018-1 | | 2.480% | | 11/15/22 | | | 75 | | | | 75 | |
| 3 | | CarMax Auto Owner Trust 2018-1 | | 2.640% | | 6/15/23 | | | 50 | | | | 51 | |
| 3 | | CarMax Auto Owner Trust 2018-2 | | 2.980% | | 1/17/23 | | | 75 | | | | 76 | |
| 3 | | CarMax Auto Owner Trust 2018-2 | | 3.160% | | 7/17/23 | | | 50 | | | | 51 | |
| 3 | | CarMax Auto Owner Trust 2019-4 | | 2.020% | | 11/15/24 | | | 180 | | | | 180 | |
| 3 | | CarMax Auto Owner Trust 2019-4 | | 2.130% | | 7/15/25 | | | 25 | | | | 25 | |
| 3 | | CD 2016-CD1 Commercial Mortgage Trust | | 2.724% | | 8/10/49 | | | 150 | | | | 152 | |
| 3 | | CD 2016-CD2 Commercial Mortgage Trust | | 3.526% | | 11/10/49 | | | 100 | | | | 106 | |
| 3 | | CD 2017-CD3 Commercial Mortgage Trust | | 3.453% | | 2/10/50 | | | 25 | | | | 26 | |
| 3 | | CD 2017-CD3 Commercial Mortgage Trust | | 3.631% | | 2/10/50 | | | 144 | | | | 154 | |
| 3 | | CD 2017-CD3 Commercial Mortgage Trust | | 3.833% | | 2/10/50 | | | 31 | | | | 33 | |
| 3 | | CD 2017-CD6 Commercial Mortgage Trust | | 3.332% | | 11/13/50 | | | 50 | | | | 52 | |
| 3 | | CD 2017-CD6 Commercial Mortgage Trust | | 3.456% | | 11/13/50 | | | 125 | | | | 132 | |
| 3 | | CD 2017-CD6 Commercial Mortgage Trust | | 3.709% | | 11/13/50 | | | 75 | | | | 79 | |
| 3 | | CD 2018-CD7 Commercial Mortgage Trust | | 4.279% | | 8/15/51 | | | 75 | | | | 84 | |
| 3 | | CD 2019-CD8 Commercial Mortgage Trust | | 2.912% | | 8/15/57 | | | 175 | | | | 179 | |
| 3 | | CenterPoint Energy Transition Bond Co. IV LLC 2012-1 | | 3.028% | | 10/15/25 | | | 350 | | | | 358 | |
| 3 | | CFCRE Commercial Mortgage Trust 2016-C3 | | 3.865% | | 1/10/48 | | | 125 | | | | 133 | |
| 3 | | CFCRE Commercial Mortgage Trust 2016-C4 | | 3.283% | | 5/10/58 | | | 150 | | | | 155 | |
| 3 | | CFCRE Commercial Mortgage Trust 2016-C4 | | 3.691% | | 5/10/58 | | | 100 | | | | 104 | |
| 3 | | CFCRE Commercial Mortgage Trust 2016-C6 | | 3.217% | | 11/10/49 | | | 250 | | | | 258 | |
| 3 | | CFCRE Commercial Mortgage Trust 2017-C8 | | 3.572% | | 6/15/50 | | | 50 | | | | 53 | |
| 3 | | Chase Issuance Trust 2012-A7 | | 2.160% | | 9/15/24 | | | 313 | | | | 315 | |
| 3 | | Chase Issuance Trust 2014-A2 | | 2.770% | | 3/15/23 | | | 225 | | | | 227 | |
| 3 | | Chase Issuance Trust 2015-A4 | | 1.840% | | 4/15/22 | | | 150 | | | | 150 | |
| 3 | | Chase Issuance Trust 2016-A4 | | 1.490% | | 7/15/22 | | | 200 | | | | 200 | |
| 3 | | Citibank Credit Card Issuance Trust 2014-A1 | | 2.880% | | 1/23/23 | | | 100 | | | | 101 | |
| 3 | | Citibank Credit Card Issuance Trust 2014-A5 | | 2.680% | | 6/7/23 | | | 200 | | | | 202 | |
| 3 | | Citibank Credit Card Issuance Trust 2016-A2 | | 2.190% | | 11/20/23 | | | 200 | | | | 201 | |
| 3 | | Citibank Credit Card Issuance Trust 2018-A1 | | 2.490% | | 1/20/23 | | | 550 | | | | 554 | |
| 3 | | Citibank Credit Card Issuance Trust 2018-A3 | | 3.290% | | 5/23/25 | | | 450 | | | | 469 | |
| 3 | | Citigroup Commercial Mortgage Trust 2012-GC8 | | 3.024% | | 9/10/45 | | | 72 | | | | 73 | |
| 3 | | Citigroup Commercial Mortgage Trust 2013-GC11 | | 3.093% | | 4/10/46 | | | 100 | | | | 102 | |
| 3 | | Citigroup Commercial Mortgage Trust 2013-GC15 | | 4.371% | | 9/10/46 | | | 50 | | | | 53 | |
| 3 | | Citigroup Commercial Mortgage Trust 2013-GC15 | | 4.649% | | 9/10/46 | | | 75 | | | | 80 | |
| 3 | | Citigroup Commercial Mortgage Trust 2014-GC19 | | 3.552% | | 3/10/47 | | | 22 | | | | 22 | |
| 3 | | Citigroup Commercial Mortgage Trust 2014-GC19 | | 4.023% | | 3/10/47 | | | 25 | | | | 27 | |
| 3 | | Citigroup Commercial Mortgage Trust 2014-GC19 | | 4.345% | | 3/10/47 | | | 25 | | | | 27 | |
| 3 | | Citigroup Commercial Mortgage Trust 2014-GC21 | | 3.855% | | 5/10/47 | | | 50 | | | | 53 | |
| 3 | | Citigroup Commercial Mortgage Trust 2014-GC21 | | 4.328% | | 5/10/47 | | | 50 | | | | 53 | |
| 3 | | Citigroup Commercial Mortgage Trust 2014-GC23 | | 3.622% | | 7/10/47 | | | 100 | | | | 106 | |
| 3 | | Citigroup Commercial Mortgage Trust 2014-GC25 | | 3.635% | | 10/10/47 | | | 175 | | | | 184 | |
| 3 | | Citigroup Commercial Mortgage Trust 2015-GC27 | | 3.137% | | 2/10/48 | | | 225 | | | | 233 | |
| 3 | | Citigroup Commercial Mortgage Trust 2015-GC27 | | 3.571% | | 2/10/48 | | | 100 | | | | 104 | |
| 3 | | Citigroup Commercial Mortgage Trust 2015-GC29 | | 2.674% | | 4/10/48 | | | 43 | | | | 43 | |
| 3 | | Citigroup Commercial Mortgage Trust 2015-GC29 | | 3.192% | | 4/10/48 | | | 175 | | | | 182 | |
| 3 | | Citigroup Commercial Mortgage Trust 2015-GC29 | | 3.758% | | 4/10/48 | | | 84 | | | | 87 | |
| 3 | | Citigroup Commercial Mortgage Trust 2015-GC31 | | 3.762% | | 6/10/48 | | | 100 | | | | 106 | |
| 3 | | Citigroup Commercial Mortgage Trust 2015-GC33 | | 3.778% | | 9/10/58 | | | 100 | | | | 107 | |
| 3 | | Citigroup Commercial Mortgage Trust 2016-C1 | | 3.003% | | 5/10/49 | | | 55 | | | | 56 | |
| 3 | | Citigroup Commercial Mortgage Trust 2016-C1 | | 3.209% | | 5/10/49 | | | 125 | | | | 130 | |
| 3 | | Citigroup Commercial Mortgage Trust 2016-GC36 | | 3.616% | | 2/10/49 | | | 225 | | | | 239 | |
| 3 | | Citigroup Commercial Mortgage Trust 2016-P4 | | 2.902% | | 7/10/49 | | | 75 | | | | 77 | |
| 3 | | Citigroup Commercial Mortgage Trust 2017-B1 | | 3.458% | | 8/15/50 | | | 250 | | | | 264 | |
| 3 | | Citigroup Commercial Mortgage Trust 2017-B1 | | 3.711% | | 8/15/50 | | | 50 | | | | 53 | |
| 3 | | Citigroup Commercial Mortgage Trust 2017-C4 | | 3.471% | | 10/12/50 | | | 150 | | | | 160 | |
| 3 | | Citigroup Commercial Mortgage Trust 2017-C4 | | 3.764% | | 10/12/50 | | | 50 | | | | 53 | |
| 3 | | Citigroup Commercial Mortgage Trust 2018-B2 | | 3.788% | | 3/10/51 | | | 50 | | | | 52 | |
Total Bond Market Index Portfolio
| | | | | | | | | Face | | | Market | |
| | | | | | | Maturity | | Amount | | | Value• | |
| | | | | Coupon | | Date | | ($000 | ) | | ($000 | ) |
| 3 | | Citigroup Commercial Mortgage Trust 2018-B2 | | 4.009% | | 3/10/51 | | | 275 | | | | 301 | |
| 3 | | Citigroup Commercial Mortgage Trust 2019-GC41 | | 2.869% | | 8/10/56 | | | 225 | | | | 228 | |
| 3 | | Citigroup Commercial Mortgage Trust 2019-GC43 | | 3.038% | | 11/10/52 | | | 275 | | | | 282 | |
| 3 | | COMM 2012-CCRE2 Mortgage Trust | | 3.147% | | 8/15/45 | | | 58 | | | | 59 | |
| 3 | | COMM 2012-CCRE2 Mortgage Trust | | 3.791% | | 8/15/45 | | | 65 | | | | 67 | |
| 3,6 | | COMM 2012-CCRE3 Mortgage Trust | | 3.416% | | 10/15/45 | | | 78 | | | | 79 | |
| 3 | | COMM 2012-CCRE4 Mortgage Trust | | 2.853% | | 10/15/45 | | | 124 | | | | 126 | |
| 3 | | COMM 2013-CCRE10 Mortgage Trust | | 4.210% | | 8/10/46 | | | 20 | | | | 21 | |
| 3 | | COMM 2013-CCRE11 Mortgage Trust | | 3.660% | | 8/10/50 | | | 24 | | | | 25 | |
| 3 | | COMM 2013-CCRE11 Mortgage Trust | | 3.983% | | 8/10/50 | | | 40 | | | | 42 | |
| 3 | | COMM 2013-CCRE11 Mortgage Trust | | 4.258% | | 8/10/50 | | | 150 | | | | 160 | |
| 3 | | COMM 2013-CCRE11 Mortgage Trust | | 4.715% | | 8/10/50 | | | 30 | | | | 32 | |
| 3 | | COMM 2013-CCRE12 Mortgage Trust | | 2.904% | | 10/10/46 | | | 2 | | | | 2 | |
| 3 | | COMM 2013-CCRE12 Mortgage Trust | | 3.623% | | 10/10/46 | | | 39 | | | | 41 | |
| 3 | | COMM 2013-CCRE12 Mortgage Trust | | 3.765% | | 10/10/46 | | | 50 | | | | 51 | |
| 3 | | COMM 2013-CCRE12 Mortgage Trust | | 4.046% | | 10/10/46 | | | 50 | | | | 53 | |
| 3 | | COMM 2013-CCRE12 Mortgage Trust | | 4.300% | | 10/10/46 | | | 25 | | | | 27 | |
| 3 | | COMM 2013-CCRE12 Mortgage Trust | | 4.762% | | 10/10/46 | | | 25 | | | | 26 | |
| 3 | | COMM 2013-CCRE6 Mortgage Trust | | 3.101% | | 3/10/46 | | | 65 | | | | 66 | |
| 3 | | COMM 2013-CCRE7 Mortgage Trust | | 3.213% | | 3/10/46 | | | 37 | | | | 38 | |
| 3 | | COMM 2013-CCRE8 Mortgage Trust | | 3.612% | | 6/10/46 | | | 71 | | | | 74 | |
| 3 | | COMM 2013-CCRE9 Mortgage Trust | | 4.222% | | 7/10/45 | | | 90 | | | | 95 | |
| 3 | | COMM 2013-LC13 Mortgage Trust | | 4.205% | | 8/10/46 | | | 40 | | | | 43 | |
| 3 | | COMM 2013-LC6 Mortgage Trust | | 2.941% | | 1/10/46 | | | 104 | | | | 106 | |
| 3 | | COMM 2013-LC6 Mortgage Trust | | 3.282% | | 1/10/46 | | | 58 | | | | 59 | |
| 3 | | COMM 2014-CCRE15 Mortgage Trust | | 2.928% | | 2/10/47 | | | 26 | | | | 26 | |
| 3 | | COMM 2014-CCRE15 Mortgage Trust | | 3.595% | | 2/10/47 | | | 25 | | | | 26 | |
| 3 | | COMM 2014-CCRE15 Mortgage Trust | | 4.074% | | 2/10/47 | | | 56 | | | | 60 | |
| 3 | | COMM 2014-CCRE15 Mortgage Trust | | 4.697% | | 2/10/47 | | | 28 | | | | 30 | |
| 3 | | COMM 2014-CCRE16 Mortgage Trust | | 3.653% | | 4/10/47 | | | 44 | | | | 45 | |
| 3 | | COMM 2014-CCRE16 Mortgage Trust | | 4.278% | | 4/10/47 | | | 75 | | | | 79 | |
| 3 | | COMM 2014-CCRE17 Mortgage Trust | | 3.598% | | 5/10/47 | | | 22 | | | | 23 | |
| 3 | | COMM 2014-CCRE17 Mortgage Trust | | 3.977% | | 5/10/47 | | | 50 | | | | 53 | |
| 3 | | COMM 2014-CCRE17 Mortgage Trust | | 4.377% | | 5/10/47 | | | 25 | | | | 26 | |
| 3 | | COMM 2014-CCRE18 Mortgage Trust | | 3.452% | | 7/15/47 | | | 43 | | | | 44 | |
| 3 | | COMM 2014-CCRE19 Mortgage Trust | | 3.796% | | 8/10/47 | | | 175 | | | | 186 | |
| 3 | | COMM 2014-CCRE19 Mortgage Trust | | 4.080% | | 8/10/47 | | | 50 | | | | 53 | |
| 3 | | COMM 2014-CCRE20 Mortgage Trust | | 3.590% | | 11/10/47 | | | 50 | | | | 53 | |
| 3 | | COMM 2014-CCRE21 Mortgage Trust | | 3.528% | | 12/10/47 | | | 164 | | | | 171 | |
| 3 | | COMM 2014-LC15 Mortgage Trust | | 4.006% | | 4/10/47 | | | 150 | | | | 160 | |
| 3 | | COMM 2014-LC17 Mortgage Trust | | 3.164% | | 10/10/47 | | | 10 | | | | 10 | |
| 3 | | COMM 2014-LC17 Mortgage Trust | | 3.917% | | 10/10/47 | | | 50 | | | | 53 | |
| 3 | | COMM 2014-UBS2 Mortgage Trust | | 2.820% | | 3/10/47 | | | 5 | | | | 5 | |
| 3 | | COMM 2014-UBS2 Mortgage Trust | | 3.472% | | 3/10/47 | | | 18 | | | | 19 | |
| 3 | | COMM 2014-UBS2 Mortgage Trust | | 3.961% | | 3/10/47 | | | 54 | | | | 57 | |
| 3 | | COMM 2014-UBS2 Mortgage Trust | | 4.199% | | 3/10/47 | | | 15 | | | | 16 | |
| 3 | | COMM 2014-UBS2 Mortgage Trust | | 4.701% | | 3/10/47 | | | 10 | | | | 11 | |
| 3 | | COMM 2014-UBS3 Mortgage Trust | | 3.819% | | 6/10/47 | | | 100 | | | | 106 | |
| 3 | | COMM 2014-UBS4 Mortgage Trust | | 3.694% | | 8/10/47 | | | 125 | | | | 132 | |
| 3 | | COMM 2014-UBS4 Mortgage Trust | | 3.968% | | 8/10/47 | | | 44 | | | | 46 | |
| 3 | | COMM 2014-UBS5 Mortgage Trust | | 3.838% | | 9/10/47 | | | 125 | | | | 132 | |
| 3 | | COMM 2014-UBS6 Mortgage Trust | | 2.935% | | 12/10/47 | | | 24 | | | | 24 | |
| 3 | | COMM 2014-UBS6 Mortgage Trust | | 3.387% | | 12/10/47 | | | 125 | | | | 128 | |
| 3 | | COMM 2014-UBS6 Mortgage Trust | | 3.644% | | 12/10/47 | | | 225 | | | | 236 | |
| 3 | | COMM 2014-UBS6 Mortgage Trust | | 4.048% | | 12/10/47 | | | 50 | | | | 53 | |
| 3 | | COMM 2015-CCRE22 Mortgage Trust | | 2.856% | | 3/10/48 | | | 19 | | | | 19 | |
| 3 | | COMM 2015-CCRE22 Mortgage Trust | | 3.309% | | 3/10/48 | | | 150 | | | | 157 | |
| 3 | | COMM 2015-CCRE22 Mortgage Trust | | 3.603% | | 3/10/48 | | | 50 | | | | 52 | |
| 3 | | COMM 2015-CCRE23 Mortgage Trust | | 3.257% | | 5/10/48 | | | 75 | | | | 77 | |
| 3 | | COMM 2015-CCRE23 Mortgage Trust | | 3.497% | | 5/10/48 | | | 100 | | | | 105 | |
| 3 | | COMM 2015-CCRE23 Mortgage Trust | | 3.801% | | 5/10/48 | | | 50 | | | | 53 | |
| 3 | | COMM 2015-CCRE25 Mortgage Trust | | 3.759% | | 8/10/48 | | | 125 | | | | 133 | |
| 3 | | COMM 2015-CCRE26 Mortgage Trust | | 3.630% | | 10/10/48 | | | 225 | | | | 238 | |
| 3 | | COMM 2015-CCRE27 Mortgage Trust | | 3.404% | | 10/10/48 | | | 125 | | | | 129 | |
| 3 | | COMM 2015-CCRE27 Mortgage Trust | | 3.612% | | 10/10/48 | | | 125 | | | | 132 | |
| 3 | | COMM 2015-LC19 Mortgage Trust | | 3.040% | | 2/10/48 | | | 25 | | | | 26 | |
| 3 | | COMM 2015-LC19 Mortgage Trust | | 3.183% | | 2/10/48 | | | 125 | | | | 130 | |
| 3 | | COMM 2015-LC19 Mortgage Trust | | 3.527% | | 2/10/48 | | | 50 | | | | 52 | |
| 3 | | COMM 2016-CCRE28 Mortgage Trust | | 3.762% | | 2/10/49 | | | 150 | | | | 160 | |
| 3 | | COMM 2016-DC2 Mortgage Trust | | 3.550% | | 2/10/49 | | | 125 | | | | 130 | |
| 3 | | Comm Mortgage Trust 2019-G44 | | 2.950% | | 8/15/57 | | | 115 | | | | 117 | |
| 3 | | CSAIL 2015-C1 Commercial Mortgage Trust | | 3.505% | | 4/15/50 | | | 100 | | | | 105 | |
| 3 | | CSAIL 2015-C1 Commercial Mortgage Trust | | 3.791% | | 4/15/50 | | | 75 | | | | 79 | |
| 3 | | CSAIL 2015-C1 Commercial Mortgage Trust | | 4.044% | | 4/15/50 | | | 50 | | | | 52 | |
| 3 | | CSAIL 2015-C2 Commercial Mortgage Trust | | 3.504% | | 6/15/57 | | | 150 | | | | 157 | |
| 3 | | CSAIL 2015-C2 Commercial Mortgage Trust | | 3.849% | | 6/15/57 | | | 75 | | | | 78 | |
| 3 | | CSAIL 2015-C3 Commercial Mortgage Trust | | 3.448% | | 8/15/48 | | | 85 | | | | 88 | |
| 3 | | CSAIL 2015-C3 Commercial Mortgage Trust | | 3.718% | | 8/15/48 | | | 100 | | | | 106 | |
| 3 | | CSAIL 2015-C3 Commercial Mortgage Trust | | 4.104% | | 8/15/48 | | | 50 | | | | 52 | |
| 3 | | CSAIL 2015-C4 Commercial Mortgage Trust | | 3.617% | | 11/15/48 | | | 50 | | | | 52 | |
| 3 | | CSAIL 2015-C4 Commercial Mortgage Trust | | 3.808% | | 11/15/48 | | | 75 | | | | 80 | |
| 3 | | CSAIL 2016-C7 Commercial Mortgage Trust | | 3.502% | | 11/15/49 | | | 200 | | | | 210 | |
| 3 | | CSAIL 2017-C8 Commercial Mortgage Trust | | 3.392% | | 6/15/50 | | | 150 | | | | 158 | |
| 3 | | CSAIL 2017-CX10 Commercial Mortgage Trust | | 3.458% | | 11/15/50 | | | 150 | | | | 158 | |
| 3 | | CSAIL 2017-CX9 Commercial Mortgage Trust | | 3.446% | | 9/15/50 | | | 50 | | | | 52 | |
| 3 | | CSAIL 2018-CX11 Commercial Mortgage Trust | | 4.033% | | 4/15/51 | | | 275 | | | | 302 | |
| 3 | | CSAIL 2018-CX12 Commercial Mortgage Trust | | 4.224% | | 8/15/51 | | | 25 | | | | 27 | |
| 3 | | CSAIL 2019-C15 Commercial Mortgage Trust | | 4.053% | | 3/15/52 | | | 225 | | | | 247 | |
| 3 | | CSAIL 2019-C16 Commercial Mortgage Trust | | 3.329% | | 6/15/52 | | | 275 | | | | 288 | |
| 3 | | DBJPM 16-C1 Mortgage Trust | | 3.276% | | 5/10/49 | | | 75 | | | | 78 | |
| 3 | | DBJPM 16-C3 Mortgage Trust | | 2.890% | | 8/10/49 | | | 100 | | | | 102 | |
| 3 | | DBJPM 17-C6 Mortgage Trust | | 3.328% | | 6/10/50 | | | 100 | | | | 105 | |
| 3 | | DBJPM 17-C6 Mortgage Trust | | 3.561% | | 6/10/50 | | | 50 | | | | 52 | |
| 3 | | Discover Card Execution Note Trust 2015-A2 | | 1.900% | | 10/17/22 | | | 275 | | | | 275 | |
| 3 | | Discover Card Execution Note Trust 2015-A4 | | 2.190% | | 4/17/23 | | | 225 | | | | 226 | |
| 3 | | Discover Card Execution Note Trust 2017-A2 | | 2.390% | | 7/15/24 | | | 150 | | | | 152 | |
| 3 | | Discover Card Execution Note Trust 2018-A1 | | 3.030% | | 8/15/25 | | | 225 | | | | 231 | |
| 3 | | Discover Card Execution Note Trust 2019-A3 | | 1.890% | | 10/15/24 | | | 275 | | | | 275 | |
| 3 | | Drive Auto Receivables Trust 2018-2 | | 3.630% | | 8/15/24 | | | 95 | | | | 95 | |
| 2,3 | | Fannie Mae-Aces 2011-M2 | | 3.764% | | 4/25/21 | | | 100 | | | | 102 | |
| 2,3 | | Fannie Mae-Aces 2011-M4 | | 3.726% | | 6/25/21 | | | 174 | | | | 177 | |
| 2,3 | | Fannie Mae-Aces 2013-M12 | | 2.406% | | 3/25/23 | | | 189 | | | | 191 | |
| 2,3 | | Fannie Mae-Aces 2013-M14 | | 2.651% | | 4/25/23 | | | 83 | | | | 84 | |
| 2,3 | | Fannie Mae-Aces 2013-M14 | | 3.329% | | 10/25/23 | | | 297 | | | | 309 | |
| 2,3 | | Fannie Mae-Aces 2013-M4 | | 2.608% | | 3/25/22 | | | 2 | | | | 2 | |
| 2,3 | | Fannie Mae-Aces 2013-M7 | | 2.280% | | 12/27/22 | | | 66 | | | | 67 | |
| 2,3 | | Fannie Mae-Aces 2014-M1 | | 3.188% | | 7/25/23 | | | 352 | | | | 364 | |
| 2,3 | | Fannie Mae-Aces 2014-M12 | | 2.614% | | 10/25/21 | | | 227 | | | | 229 | |
| 2,3 | | Fannie Mae-Aces 2014-M13 | | 2.566% | | 8/25/24 | | | 10 | | | | 10 | |
| 2,3 | | Fannie Mae-Aces 2014-M13 | | 3.021% | | 8/25/24 | | | 200 | | | | 205 | |
| 2,3 | | Fannie Mae-Aces 2014-M2 | | 3.513% | | 12/25/23 | | | 282 | | | | 296 | |
| 2,3 | | Fannie Mae-Aces 2014-M3 | | 3.480% | | 1/25/24 | | | 136 | | | | 141 | |
| 2,3 | | Fannie Mae-Aces 2014-M4 | | 3.346% | | 3/25/24 | | | 175 | | | | 182 | |
| 2,3 | | Fannie Mae-Aces 2014-M6 | | 2.679% | | 5/25/21 | | | 180 | | | | 182 | |
| 2,3 | | Fannie Mae-Aces 2014-M7 | | 3.275% | | 6/25/24 | | | 263 | | | | 276 | |
| 2,3 | | Fannie Mae-Aces 2014-M8 | | 2.346% | | 6/25/24 | | | 18 | | | | 18 | |
Total Bond Market Index Portfolio
| | | | | | | | | Face | | | Market | |
| | | | | | | Maturity | | Amount | | | Value• | |
| | | | | Coupon | | Date | | ($000 | ) | | ($000 | ) |
| 2,3 | | Fannie Mae-Aces 2014-M8 | | 3.056% | | 6/25/24 | | | 175 | | | | 181 | |
| 2,3 | | Fannie Mae-Aces 2014-M9 | | 3.103% | | 7/25/24 | | | 200 | | | | 207 | |
| 2,3 | | Fannie Mae-Aces 2015-M1 | | 2.532% | | 9/25/24 | | | 300 | | | | 303 | |
| 2,3 | | Fannie Mae-Aces 2015-M10 | | 3.092% | | 4/25/27 | | | 100 | | | | 105 | |
| 2,3 | | Fannie Mae-Aces 2015-M12 | | 2.796% | | 5/25/25 | | | 225 | | | | 231 | |
| 2,3 | | Fannie Mae-Aces 2015-M15 | | 2.923% | | 10/25/25 | | | 275 | | | | 284 | |
| 2,3 | | Fannie Mae-Aces 2015-M2 | | 2.620% | | 12/25/24 | | | 195 | | | | 200 | |
| 2,3 | | Fannie Mae-Aces 2015-M3 | | 2.723% | | 10/25/24 | | | 100 | | | | 102 | |
| 2,3 | | Fannie Mae-Aces 2015-M4 | | 2.509% | | 7/25/22 | | | 124 | | | | 125 | |
| 2,3 | | Fannie Mae-Aces 2015-M7 | | 2.590% | | 12/25/24 | | | 198 | | | | 201 | |
| 2,3 | | Fannie Mae-Aces 2015-M8 | | 2.344% | | 1/25/25 | | | 80 | | | | 80 | |
| 2,3 | | Fannie Mae-Aces 2015-M8 | | 2.900% | | 1/25/25 | | | 100 | | | | 103 | |
| 2,3 | | Fannie Mae-Aces 2016-M11 | | 2.369% | | 7/25/26 | | | 250 | | | | 251 | |
| 2,3 | | Fannie Mae-Aces 2016-M12 | | 2.444% | | 9/25/26 | | | 250 | | | | 254 | |
| 2,3 | | Fannie Mae-Aces 2016-M2 | | 2.152% | | 1/25/23 | | | 182 | | | | 182 | |
| 2,3 | | Fannie Mae-Aces 2016-M3 | | 2.702% | | 2/25/26 | | | 100 | | | | 102 | |
| 2,3 | | Fannie Mae-Aces 2016-M4 | | 2.576% | | 3/25/26 | | | 100 | | | | 102 | |
| 2,3 | | Fannie Mae-Aces 2016-M5 | | 2.469% | | 4/25/26 | | | 200 | | | | 201 | |
| 2,3 | | Fannie Mae-Aces 2016-M7 | | 2.157% | | 10/25/23 | | | 49 | | | | 49 | |
| 2,3 | | Fannie Mae-Aces 2016-M7 | | 2.499% | | 9/25/26 | | | 75 | | | | 75 | |
| 2,3 | | Fannie Mae-Aces 2016-M9 | | 2.292% | | 6/25/26 | | | 300 | | | | 298 | |
| 2,3 | | Fannie Mae-Aces 2017-M1 | | 2.417% | | 10/25/26 | | | 200 | | | | 202 | |
| 2,3 | | Fannie Mae-Aces 2017-M10 | | 2.561% | | 7/25/24 | | | 110 | | | | 112 | |
| 2,3 | | Fannie Mae-Aces 2017-M12 | | 3.079% | | 6/25/27 | | | 300 | | | | 312 | |
| 2,3 | | Fannie Mae-Aces 2017-M15 | | 3.136% | | 11/25/27 | | | 275 | | | | 286 | |
| 2,3 | | Fannie Mae-Aces 2017-M4 | | 2.586% | | 12/25/26 | | | 200 | | | | 202 | |
| 2,3 | | Fannie Mae-Aces 2017-M7 | | 2.961% | | 2/25/27 | | | 150 | | | | 156 | |
| 2,3 | | Fannie Mae-Aces 2017-M8 | | 3.061% | | 5/25/27 | | | 514 | | | | 538 | |
| 2,3 | | Fannie Mae-Aces 2018-M12 | | 3.640% | | 8/25/30 | | | 50 | | | | 55 | |
| 2,3 | | Fannie Mae-Aces 2018-M14 | | 3.578% | | 8/25/28 | | | 100 | | | | 108 | |
| 2,3 | | Fannie Mae-Aces 2018-M18 | | 2.469% | | 8/25/29 | | | 250 | | | | 250 | |
| 2,3 | | Fannie Mae-Aces 2018-M2 | | 2.902% | | 1/25/28 | | | 425 | | | | 438 | |
| 2,3 | | Fannie Mae-Aces 2018-M4 | | 3.045% | | 3/25/28 | | | 165 | | | | 171 | |
| 2,3 | | Fannie Mae-Aces 2018-M7 | | 3.052% | | 3/25/28 | | | 100 | | | | 104 | |
| 2,3 | | Fannie Mae-Aces 2018-M8 | | 3.610% | | 2/25/31 | | | 300 | | | | 325 | |
| 2,3 | | Fannie Mae-Aces 2019-M1 | | 3.555% | | 9/25/28 | | | 125 | | | | 135 | |
| 2,3 | | Fannie Mae-Aces 2019-M2 | | 3.631% | | 11/25/28 | | | 200 | | | | 218 | |
| 2,3 | | Fannie Mae-Aces 2019-M22 | | 2.522% | | 8/25/29 | | | 375 | | | | 376 | |
| 2,3 | | Fannie Mae-Aces 2019-M5 | | 3.273% | | 1/25/29 | | | 200 | | | | 212 | |
| 2,3 | | Fannie Mae-Aces 2019-M7 | | 3.143% | | 4/25/29 | | | 230 | | | | 242 | |
| 2,3 | | Fannie Mae-Aces 2019-M9 | | 2.937% | | 4/25/29 | | | 325 | | | | 337 | |
| 2,3 | | FHLMC Multifamily Structured Pass Through Certificates K011 | | 4.084% | | 11/25/20 | | | 237 | | | | 240 | |
| 2,3 | | FHLMC Multifamily Structured Pass Through Certificates K014 | | 3.871% | | 4/25/21 | | | 129 | | | | 131 | |
| 2,3 | | FHLMC Multifamily Structured Pass Through Certificates K017 | | 2.873% | | 12/25/21 | | | 326 | | | | 331 | |
| 2,3 | | FHLMC Multifamily Structured Pass Through Certificates K019 | | 2.272% | | 3/25/22 | | | 149 | | | | 150 | |
| 2,3 | | FHLMC Multifamily Structured Pass Through Certificates K020 | | 2.373% | | 5/25/22 | | | 350 | | | | 353 | |
| 2,3 | | FHLMC Multifamily Structured Pass Through Certificates K021 | | 2.396% | | 6/25/22 | | | 225 | | | | 226 | |
| 2,3 | | FHLMC Multifamily Structured Pass Through Certificates K026 | | 2.510% | | 11/25/22 | | | 325 | | | | 329 | |
| 2,3 | | FHLMC Multifamily Structured Pass Through Certificates K027 | | 2.637% | | 1/25/23 | | | 325 | | | | 330 | |
| 2,3 | | FHLMC Multifamily Structured Pass Through Certificates K028 | | 3.111% | | 2/25/23 | | | 475 | | | | 489 | |
| 2,3 | | FHLMC Multifamily Structured Pass Through Certificates K029 | | 3.320% | | 2/25/23 | | | 325 | | | | 337 | |
| 2,3 | | FHLMC Multifamily Structured Pass Through Certificates K030 | | 2.779% | | 9/25/22 | | | 127 | | | | 128 | |
| 2,3 | | FHLMC Multifamily Structured Pass Through Certificates K030 | | 3.250% | | 4/25/23 | | | 325 | | | | 336 | |
| 2,3 | | FHLMC Multifamily Structured Pass Through Certificates K031 | | 3.300% | | 4/25/23 | | | 1,215 | | | | 1,262 | |
| 2,3 | | FHLMC Multifamily Structured Pass Through Certificates K032 | | 3.016% | | 2/25/23 | | | 147 | | | | 149 | |
| 2,3 | | FHLMC Multifamily Structured Pass Through Certificates K032 | | 3.310% | | 5/25/23 | | | 340 | | | | 353 | |
| 2,3 | | FHLMC Multifamily Structured Pass Through Certificates K033 | | 2.871% | | 2/25/23 | | | 170 | | | | 172 | |
| 2,3 | | FHLMC Multifamily Structured Pass Through Certificates K033 | | 3.060% | | 7/25/23 | | | 325 | | | | 336 | |
| 2,3 | | FHLMC Multifamily Structured Pass Through Certificates K034 | | 3.531% | | 7/25/23 | | | 288 | | | | 302 | |
| 2,3 | | FHLMC Multifamily Structured Pass Through Certificates K035 | | 3.458% | | 8/25/23 | | | 400 | | | | 419 | |
| 2,3 | | FHLMC Multifamily Structured Pass Through Certificates K036 | | 3.527% | | 10/25/23 | | | 325 | | | | 341 | |
| 2,3 | | FHLMC Multifamily Structured Pass Through Certificates K038 | | 2.604% | | 10/25/23 | | | 49 | | | | 50 | |
| 2,3 | | FHLMC Multifamily Structured Pass Through Certificates K038 | | 3.389% | | 3/25/24 | | | 400 | | | | 418 | |
| 2,3 | | FHLMC Multifamily Structured Pass Through Certificates K039 | | 2.683% | | 12/25/23 | | | 38 | | | | 38 | |
| 2,3 | | FHLMC Multifamily Structured Pass Through Certificates K039 | | 3.303% | | 7/25/24 | | | 225 | | | | 236 | |
| 2,3 | | FHLMC Multifamily Structured Pass Through Certificates K040 | | 2.768% | | 4/25/24 | | | 71 | | | | 73 | |
| 2,3 | | FHLMC Multifamily Structured Pass Through Certificates K040 | | 3.241% | | 9/25/24 | | | 275 | | | | 289 | |
| 2,3 | | FHLMC Multifamily Structured Pass Through Certificates K041 | | 3.171% | | 10/25/24 | | | 275 | | | | 287 | |
| 2,3 | | FHLMC Multifamily Structured Pass Through Certificates K042 | | 2.267% | | 6/25/24 | | | 35 | | | | 35 | |
| 2,3 | | FHLMC Multifamily Structured Pass Through Certificates K043 | | 2.532% | | 10/25/23 | | | 36 | | | | 36 | |
| 2,3 | | FHLMC Multifamily Structured Pass Through Certificates K043 | | 3.062% | | 12/25/24 | | | 150 | | | | 156 | |
| 2,3 | | FHLMC Multifamily Structured Pass Through Certificates K045 | | 2.493% | | 11/25/24 | | | 97 | | | | 98 | |
| 2,3 | | FHLMC Multifamily Structured Pass Through Certificates K045 | | 3.023% | | 1/25/25 | | | 175 | | | | 182 | |
| 2,3 | | FHLMC Multifamily Structured Pass Through Certificates K046 | | 3.205% | | 3/25/25 | | | 175 | | | | 184 | |
| 2,3 | | FHLMC Multifamily Structured Pass Through Certificates K047 | | 2.827% | | 12/25/24 | | | 76 | | | | 77 | |
| 2,3 | | FHLMC Multifamily Structured Pass Through Certificates K047 | | 3.329% | | 5/25/25 | | | 175 | | | | 185 | |
| 2,3 | | FHLMC Multifamily Structured Pass Through Certificates K048 | | 3.284% | | 6/25/25 | | | 225 | | | | 238 | |
| 2,3 | | FHLMC Multifamily Structured Pass Through Certificates K049 | | 3.010% | | 7/25/25 | | | 125 | | | | 130 | |
| 2,3 | | FHLMC Multifamily Structured Pass Through Certificates K050 | | 3.334% | | 8/25/25 | | | 200 | | | | 211 | |
| 2,3 | | FHLMC Multifamily Structured Pass Through Certificates K052 | | 3.151% | | 11/25/25 | | | 125 | | | | 131 | |
| 2,3 | | FHLMC Multifamily Structured Pass Through Certificates K053 | | 2.995% | | 12/25/25 | | | 75 | | | | 78 | |
| 2,3 | | FHLMC Multifamily Structured Pass Through Certificates K054 | | 2.745% | | 1/25/26 | | | 200 | | | | 206 | |
| 2,3 | | FHLMC Multifamily Structured Pass Through Certificates K056 | | 2.525% | | 5/25/26 | | | 150 | | | | 152 | |
| 2,3 | | FHLMC Multifamily Structured Pass Through Certificates K058 | | 2.653% | | 8/25/26 | | | 100 | | | | 102 | |
| 2,3 | | FHLMC Multifamily Structured Pass Through Certificates K063 | | 3.430% | | 1/25/27 | | | 475 | | | | 509 | |
| 2,3 | | FHLMC Multifamily Structured Pass Through Certificates K064 | | 3.224% | | 3/25/27 | | | 300 | | | | 317 | |
| 2,3 | | FHLMC Multifamily Structured Pass Through Certificates K065 | | 3.243% | | 4/25/27 | | | 433 | | | | 458 | |
| 2,3 | | FHLMC Multifamily Structured Pass Through Certificates K066 | | 3.117% | | 6/25/27 | | | 150 | | | | 158 | |
| 2,3 | | FHLMC Multifamily Structured Pass Through Certificates K068 | | 3.244% | | 8/25/27 | | | 125 | | | | 133 | |
| 2,3 | | FHLMC Multifamily Structured Pass Through Certificates K069 | | 3.187% | | 9/25/27 | | | 200 | | | | 210 | |
| 2,3 | | FHLMC Multifamily Structured Pass Through Certificates K070 | | 3.303% | | 11/25/27 | | | 75 | | | | 80 | |
Total Bond Market Index Portfolio
| | | | | | | | | Face | | | Market | |
| | | | | | | Maturity | | Amount | | | Value• | |
| | | | | Coupon | | Date | | ($000 | ) | | ($000 | ) |
| 2,3 | | FHLMC Multifamily Structured Pass Through Certificates K071 | | 3.286% | | 11/25/27 | | | 100 | | | | 106 | |
| 2,3 | | FHLMC Multifamily Structured Pass Through Certificates K072 | | 3.444% | | 12/25/27 | | | 100 | | | | 107 | |
| 2,3 | | FHLMC Multifamily Structured Pass Through Certificates K075 | | 3.650% | | 2/25/28 | | | 150 | | | | 163 | |
| 2,3 | | FHLMC Multifamily Structured Pass Through Certificates K076 | | 3.900% | | 4/25/28 | | | 350 | | | | 387 | |
| 2,3 | | FHLMC Multifamily Structured Pass Through Certificates K081 | | 3.900% | | 8/25/28 | | | 100 | | | | 110 | |
| 2,3 | | FHLMC Multifamily Structured Pass Through Certificates K082 | | 3.920% | | 9/25/28 | | | 75 | | | | 83 | |
| 2,3 | | FHLMC Multifamily Structured Pass Through Certificates K084 | | 3.780% | | 10/25/28 | | | 275 | | | | 300 | |
| 2,3 | | FHLMC Multifamily Structured Pass Through Certificates K085 | | 4.060% | | 10/25/28 | | | 150 | | | | 168 | |
| 2,3 | | FHLMC Multifamily Structured Pass Through Certificates K087 | | 3.591% | | 10/25/27 | | | 97 | | | | 103 | |
| 2,3 | | FHLMC Multifamily Structured Pass Through Certificates K088 | | 3.690% | | 1/25/29 | | | 275 | | | | 301 | |
| 2,3 | | FHLMC Multifamily Structured Pass Through Certificates K089 | | 3.563% | | 1/25/29 | | | 25 | | | | 27 | |
| 2,3 | | FHLMC Multifamily Structured Pass Through Certificates K092 | | 3.298% | | 4/25/29 | | | 225 | | | | 240 | |
| 2,3 | | FHLMC Multifamily Structured Pass Through Certificates K094 | | 2.903% | | 6/25/29 | | | 275 | | | | 285 | |
| 2,3 | | FHLMC Multifamily Structured Pass Through Certificates K095 | | 2.785% | | 6/25/29 | | | 275 | | | | 283 | |
| 2,3 | | FHLMC Multifamily Structured Pass Through Certificates K096 | | 2.519% | | 7/25/29 | | | 225 | | | | 227 | |
| 2,3 | | FHLMC Multifamily Structured Pass Through Certificates K098 | | 2.425% | | 8/25/29 | | | 450 | | | | 450 | |
| 2,3 | | FHLMC Multifamily Structured Pass Through Certificates K099 | | 2.595% | | 9/25/29 | | | 210 | | | | 211 | |
| 2,3 | | FHLMC Multifamily Structured Pass Through Certificates K103 | | 2.651% | | 11/25/29 | | | 300 | | | | 305 | |
| 2,3 | | FHLMC Multifamily Structured Pass Through Certificates K1511 | | 3.470% | | 3/25/31 | | | 100 | | | | 108 | |
| 2,3 | | FHLMC Multifamily Structured Pass Through Certificates K1511 | | 3.542% | | 3/25/34 | | | 225 | | | | 244 | |
| 2,3 | | FHLMC Multifamily Structured Pass Through Certificates K1513 | | 2.797% | | 8/25/34 | | | 210 | | | | 212 | |
| 2,3 | | FHLMC Multifamily Structured Pass Through Certificates K152 | | 3.080% | | 1/25/31 | | | 100 | | | | 103 | |
| 2,3 | | FHLMC Multifamily Structured Pass Through Certificates K155 | | 3.750% | | 11/25/32 | | | 100 | | | | 110 | |
| 2,3 | | FHLMC Multifamily Structured Pass Through Certificates K155 | | 3.750% | | 4/25/33 | | | 200 | | | | 221 | |
| 2,3 | | FHLMC Multifamily Structured Pass Through Certificates K157 | | 3.990% | | 5/25/33 | | | 75 | | | | 84 | |
| 2,3 | | FHLMC Multifamily Structured Pass Through Certificates K157 | | 3.990% | | 8/25/33 | | | 75 | | | | 85 | |
| 2,3 | | FHLMC Multifamily Structured Pass Through Certificates K504 | | 2.566% | | 9/25/20 | | | 38 | | | | 38 | |
| 2,3 | | FHLMC Multifamily Structured Pass Through Certificates K713 | | 2.313% | | 3/25/20 | | | 215 | | | | 214 | |
| 2,3 | | FHLMC Multifamily Structured Pass Through Certificates K714 | | 3.034% | | 10/25/20 | | | 389 | | | | 390 | |
| 2,3 | | FHLMC Multifamily Structured Pass Through Certificates K716 | | 2.413% | | 1/25/21 | | | 3 | | | | 3 | |
| 2,3 | | FHLMC Multifamily Structured Pass Through Certificates K716 | | 3.130% | | 6/25/21 | | | 370 | | | | 374 | |
| 2,3 | | FHLMC Multifamily Structured Pass Through Certificates K717 | | 2.991% | | 9/25/21 | | | 225 | | | | 227 | |
| 2,3 | | FHLMC Multifamily Structured Pass Through Certificates K718 | | 2.375% | | 9/25/21 | | | 79 | | | | 79 | |
| 2,3 | | FHLMC Multifamily Structured Pass Through Certificates K718 | | 2.791% | | 1/25/22 | | | 225 | | | | 228 | |
| 2,3 | | FHLMC Multifamily Structured Pass Through Certificates K731 | | 3.600% | | 2/25/25 | | | 225 | | | | 238 | |
| 2,3 | | FHLMC Multifamily Structured Pass Through Certificates K734 | | 3.208% | | 2/25/26 | | | 375 | | | | 394 | |
| 2,3 | | FHLMC Multifamily Structured Pass Through Certificates KW01 | | 2.853% | | 1/25/26 | | | 200 | | | | 206 | |
| 2,3 | | FHLMC Multifamily Structures Pass Through Certificates K073 | | 3.350% | | 1/25/28 | | | 125 | | | | 133 | |
| 2,3 | | FHLMC Multifamily Structures Pass Through Certificates K074 | | 3.600% | | 1/25/28 | | | 225 | | | | 244 | |
| 2,3 | | FHLMC Multifamily Structures Pass Through Certificates K078 | | 3.854% | | 6/25/28 | | | 100 | | | | 110 | |
| 2,3 | | FHLMC Multifamily Structures Pass Through Certificates K079 | | 3.926% | | 6/25/28 | | | 25 | | | | 28 | |
| 2,3 | | FHLMC Multifamily Structures Pass Through Certificates K080 | | 3.736% | | 4/25/28 | | | 97 | | | | 104 | |
| 2,3 | | FHLMC Multifamily Structures Pass Through Certificates K080 | | 3.926% | | 7/25/28 | | | 175 | | | | 194 | |
| 2,3 | | FHLMC Multifamily Structures Pass Through Certificates K087 | | 3.771% | | 12/25/28 | | | 400 | | | | 438 | |
| 2,3 | | FHLMC Multifamily Structures Pass Through Certificates K087 | | 2.537% | | 10/25/29 | | | 350 | | | | 354 | |
| 2,3 | | FHLMC Multifamily Structures Pass Through Certificates K090 | | 3.422% | | 2/25/29 | | | 200 | | | | 215 | |
| 2,3 | | FHLMC Multifamily Structures Pass Through Certificates K101 | | 2.524% | | 10/25/29 | | | 370 | | | | 373 | |
| 2,3 | | FHLMC Multifamily Structures Pass Through Certificates K15-14 | | 2.859% | | 10/25/34 | | | 225 | | | | 228 | |
| 2,3 | | FHLMC Multifamily Structures Pass Through Certificates K1504 | | 3.459% | | 11/25/32 | | | 50 | | | | 54 | |
| 2,3 | | FHLMC Multifamily Structures Pass Through Certificates K1510 | | 3.718% | | 1/25/31 | | | 75 | | | | 83 | |
| 2,3 | | FHLMC Multifamily Structures Pass Through Certificates K1510 | | 3.794% | | 1/25/34 | | | 125 | | | | 139 | |
| 2,3 | | FHLMC Multifamily Structures Pass Through Certificates K715 | | 2.856% | | 1/25/21 | | | 122 | | | | 123 | |
| 2,3 | | FHLMC Multifamily Structures Pass Through Certificates K720 | | 2.716% | | 6/25/22 | | | 150 | | | | 152 | |
| 2,3 | | FHLMC Multifamily Structures Pass Through Certificates K723 | | 2.454% | | 8/25/23 | | | 125 | | | | 127 | |
| 2,3 | | FHLMC Multifamily Structures Pass Through Certificates K724 | | 3.062% | | 11/25/23 | | | 100 | | | | 103 | |
| 2,3 | | FHLMC Multifamily Structures Pass Through Certificates K725 | | 2.946% | | 7/25/24 | | | 200 | | | | 206 | |
| 2,3 | | FHLMC Multifamily Structures Pass Through Certificates K726 | | 2.905% | | 4/25/24 | | | 200 | | | | 205 | |
| 2,3 | | FHLMC Multifamily Structures Pass Through Certificates K728 | | 3.064% | | 8/25/24 | | | 275 | | | | 285 | |
| 2,3 | | FHLMC Multifamily Structures Pass Through Certificates K730 | | 3.452% | | 9/25/24 | | | 24 | | | | 25 | |
| 2,3 | | FHLMC Multifamily Structures Pass Through Certificates K730 | | 3.590% | | 1/25/25 | | | 275 | | | | 291 | |
| 2,3 | | FHLMC Multifamily Structures Pass Through Certificates K735 | | 2.862% | | 5/25/26 | | | 500 | | | | 516 | |
| 2,3 | | FHLMC Multifamily Structures Pass Through Certificates KC02 | | 3.370% | | 7/25/25 | | | 175 | | | | 182 | |
| 2,3 | | FHLMC Multifamily Structures Pass Through Certificates KC02 | | 3.505% | | 3/25/29 | | | 450 | | | | 486 | |
| 2,3 | | FHLMC Multifamily Structures Pass Through Certificates KC02 | | 2.982% | | 5/25/29 | | | 400 | | | | 417 | |
| 3 | | Fifth Third Auto Trust 2019-1 | | 2.640% | | 12/15/23 | | | 125 | | | | 126 | |
| 3 | | Fifth Third Auto Trust 2019-1 | | 2.690% | | 11/16/26 | | | 50 | | | | 51 | |
| 3 | | Ford Credit Auto Lease Trust 2018-A | | 2.930% | | 6/15/21 | | | 125 | | | | 125 | |
| 3 | | Ford Credit Auto Lease Trust 2019-A | | 2.900% | | 5/15/22 | | | 50 | | | | 50 | |
| 3 | | Ford Credit Auto Lease Trust 2019-A | | 2.980% | | 6/15/22 | | | 25 | | | | 25 | |
| 3 | | Ford Credit Auto Owner Trust 2017-A | | 1.670% | | 6/15/21 | | | 22 | | | | 22 | |
| 3 | | Ford Credit Auto Owner Trust 2017-A | | 1.920% | | 4/15/22 | | | 75 | | | | 75 | |
| 3 | | Ford Credit Auto Owner Trust 2017-C | | 2.010% | | 3/15/22 | | | 251 | | | | 251 | |
| 3 | | Ford Credit Auto Owner Trust 2019-A | | 2.780% | | 9/15/23 | | | 150 | | | | 152 | |
| 3 | | Ford Credit Auto Owner Trust 2019-A | | 2.850% | | 8/15/24 | | | 50 | | | | 51 | |
| 3 | | Ford Credit Floorplan Master Owner Trust A Series 2017-2 | | 2.160% | | 9/15/22 | | | 160 | | | | 160 | |
Total Bond Market Index Portfolio
| | | | Face | | Market | |
| | | Maturity | Amount | | Value• | |
| | Coupon | Date | ($000 | ) | ($000 | ) |
| 3 | Ford Credit Floorplan Master Owner Trust A Series 2017-3 | 2.480% | 9/15/24 | 170 | | 172 | |
| 3 | Ford Credit Floorplan Master Owner Trust A Series 2018-1 | 2.950% | 5/15/23 | 225 | | 228 | |
| 3 | Ford Credit Floorplan Master Owner Trust A Series 2018-2 | 3.170% | 3/15/25 | 200 | | 206 | |
| 3 | GM Financial Automobile Leasing Trust 2018-1 | 2.610% | 1/20/21 | 64 | | 64 | |
| 3 | GM Financial Automobile Leasing Trust 2018-1 | 2.680% | 12/20/21 | 25 | | 25 | |
| 3 | GM Financial Automobile Leasing Trust 2018-2 | 3.060% | 6/21/21 | 45 | | 45 | |
| 3 | GM Financial Automobile Leasing Trust 2018-2 | 3.160% | 4/20/22 | 25 | | 25 | |
| 3 | GM Financial Automobile Leasing Trust 2019-2 | 2.670% | 3/21/22 | 75 | | 76 | |
| 3 | GM Financial Automobile Leasing Trust 2019-2 | 2.720% | 3/20/23 | 50 | | 50 | |
| 3 | GM Financial Consumer Automobile 2018-2 | 2.810% | 12/16/22 | 100 | | 101 | |
| 3 | GM Financial Consumer Automobile 2018-2 | 3.020% | 12/18/23 | 75 | | 76 | |
| 3 | GS Mortgage Securities Corporation II 2013-GC10 | 2.943% | 2/10/46 | 92 | | 94 | |
| 3 | GS Mortgage Securities Trust 2011-GC5 | 3.707% | 8/10/44 | 80 | | 81 | |
| 3 | GS Mortgage Securities Trust 2012-GC6 | 3.482% | 1/10/45 | 299 | | 304 | |
| 3 | GS Mortgage Securities Trust 2012-GCJ7 | 3.377% | 5/10/45 | 140 | | 142 | |
| 3 | GS Mortgage Securities Trust 2012-GCJ9 | 2.773% | 11/10/45 | 123 | | 125 | |
| 3 | GS Mortgage Securities Trust 2013-GC10 | 3.279% | 2/10/46 | 35 | | 36 | |
| 3 | GS Mortgage Securities Trust 2013-GC13 | 4.050% | 7/10/46 | 20 | | 21 | |
| 3 | GS Mortgage Securities Trust 2013-GCJ12 | 3.135% | 6/10/46 | 90 | | 92 | |
| 3 | GS Mortgage Securities Trust 2013-GCJ12 | 3.375% | 6/10/46 | 39 | | 40 | |
| 3 | GS Mortgage Securities Trust 2013-GCJ14 | 3.817% | 8/10/46 | 22 | | 22 | |
| 3 | GS Mortgage Securities Trust 2013-GCJ14 | 4.243% | 8/10/46 | 150 | | 160 | |
| 3 | GS Mortgage Securities Trust 2014-GC18 | 4.074% | 1/10/47 | 50 | | 53 | |
| 3 | GS Mortgage Securities Trust 2014-GC22 | 3.467% | 6/10/47 | 45 | | 46 | |
| 3 | GS Mortgage Securities Trust 2014-GC22 | 3.862% | 6/10/47 | 50 | | 53 | |
| 3 | GS Mortgage Securities Trust 2014-GC24 | 3.931% | 9/10/47 | 125 | | 133 | |
| 3 | GS Mortgage Securities Trust 2014-GC24 | 4.511% | 9/10/47 | 25 | | 26 | |
| 3 | GS Mortgage Securities Trust 2014-GC26 | 3.365% | 11/10/47 | 74 | | 76 | |
| 3 | GS Mortgage Securities Trust 2014-GC26 | 3.629% | 11/10/47 | 225 | | 238 | |
| 3 | GS Mortgage Securities Trust 2014-GC26 | 3.964% | 11/10/47 | 50 | | 53 | |
| 3 | GS Mortgage Securities Trust 2014-GC26 | 4.215% | 11/10/47 | 50 | | 52 | |
| 3 | GS Mortgage Securities Trust 2015-GC28 | 3.396% | 2/10/48 | 150 | | 157 | |
| 3 | GS Mortgage Securities Trust 2015-GC30 | 2.726% | 5/10/50 | 86 | | 86 | |
| 3 | GS Mortgage Securities Trust 2015-GC30 | 3.382% | 5/10/50 | 150 | | 157 | |
| 3 | GS Mortgage Securities Trust 2015-GC32 | 3.513% | 7/10/48 | 125 | | 130 | |
| 3 | GS Mortgage Securities Trust 2015-GC32 | 3.764% | 7/10/48 | 50 | | 53 | |
| 3 | GS Mortgage Securities Trust 2015-GC34 | 3.278% | 10/10/48 | 125 | | 129 | |
| 3 | GS Mortgage Securities Trust 2015-GC34 | 3.506% | 10/10/48 | 100 | | 105 | |
| 3 | GS Mortgage Securities Trust 2016-GS2 | 3.050% | 5/10/49 | 75 | | 78 | |
| 3 | GS Mortgage Securities Trust 2016-GS3 | 2.850% | 10/10/49 | 200 | | 204 | |
| 3 | GS Mortgage Securities Trust 2016-GS4 | 3.442% | 11/10/49 | 75 | | 79 | |
| 3 | GS Mortgage Securities Trust 2016-GS4 | 3.645% | 11/10/49 | 50 | | 52 | |
| 3 | GS Mortgage Securities Trust 2017-GS5 | 3.674% | 3/10/50 | 150 | | 161 | |
| 3 | GS Mortgage Securities Trust 2017-GS5 | 3.826% | 3/10/50 | 50 | | 53 | |
| 3 | GS Mortgage Securities Trust 2017-GS6 | 3.433% | 5/10/50 | 150 | | 159 | |
| 3 | GS Mortgage Securities Trust 2017-GS7 | 3.430% | 8/10/50 | 261 | | 274 | |
| 3 | GS Mortgage Securities Trust 2017-GS7 | 3.663% | 8/10/50 | 70 | | 74 | |
| 3 | GS Mortgage Securities Trust 2019-GC39 | 3.567% | 5/10/52 | 100 | | 107 | |
| 3 | GS Mortgage Securities Trust 2019-GC4 | 3.212% | 9/1/52 | 50 | | 51 | |
| 3 | GS Mortgage Securities Trust 2019-GC40 | 3.160% | 7/10/52 | 150 | | 156 | |
| 3 | GS Mortgage Securities Trust 2019-GS4 | 3.001% | 9/1/52 | 275 | | 282 | |
| 3 | GS Mortgage Securities Trust 2019-GSA1 | 3.048% | 11/10/52 | 125 | | 128 | |
| 3 | Honda Auto Receivables 2017-4 Owner Trust | 2.050% | 11/22/21 | 56 | | 56 | |
| 3 | Honda Auto Receivables 2018-1 Owner Trust | 2.640% | 2/15/22 | 203 | | 204 | |
| 3 | Honda Auto Receivables 2018-1 Owner Trust | 2.830% | 5/15/24 | 75 | | 76 | |
| 3 | Honda Auto Receivables 2018-2 Owner Trust | 3.010% | 5/18/22 | 75 | | 76 | |
| 3 | Honda Auto Receivables 2018-2 Owner Trust | 3.160% | 8/19/24 | 50 | | 51 | |
| 3 | Honda Auto Receivables 2018-4 Owner Trust | 2.520% | 6/21/23 | 150 | | 151 | |
| 3 | Honda Auto Receivables 2018-4 Owner Trust | 2.540% | 3/21/25 | 30 | | 30 | |
| 3 | Hyundai Auto Receivables Trust 2016-B | 1.290% | 4/15/21 | 8 | | 8 | |
| 3 | Hyundai Auto Receivables Trust 2016-B | 1.450% | 11/15/22 | 75 | | 75 | |
| 3 | Hyundai Auto Receivables Trust 2018-A | 2.790% | 7/15/22 | 50 | | 50 | |
| 3 | Hyundai Auto Receivables Trust 2018-A | 2.940% | 6/17/24 | 75 | | 76 | |
| 3 | JP Morgan Chase Commercial Mortgage Securities Trust 2012-C6 | 3.507% | 5/15/45 | 161 | | 166 | |
| 3 | JP Morgan Chase Commercial Mortgage Securities Trust 2012-C8 | 2.829% | 10/15/45 | 116 | | 117 | |
| 3 | JP Morgan Chase Commercial Mortgage Securities Trust 2012-CIBX | 3.483% | 6/15/45 | 170 | | 173 | |
| 3 | JP Morgan Chase Commercial Mortgage Securities Trust 2013-C10 | 3.143% | 12/15/47 | 51 | | 53 | |
| 3 | JP Morgan Chase Commercial Mortgage Securities Trust 2013-C10 | 3.372% | 12/15/47 | 39 | | 40 | |
| 3 | JP Morgan Chase Commercial Mortgage Securities Trust 2013-C16 | 4.166% | 12/15/46 | 100 | | 107 | |
| 3 | JP Morgan Chase Commercial Mortgage Securities Trust 2013-LC11 | 2.960% | 4/15/46 | 208 | | 213 | |
| 3 | JP Morgan Chase Commercial Mortgage Securities Trust 2015-JP1 | 3.914% | 1/15/49 | 75 | | 81 | |
| 3 | JP Morgan Chase Commercial Mortgage Securities Trust 2016-JP3 | 2.870% | 8/15/49 | 250 | | 255 | |
Total Bond Market Index Portfolio
| | | | Face | | Market | |
| | | Maturity | Amount | | Value• | |
| | Coupon | Date | ($000 | ) | ($000 | ) |
| 3 | JP Morgan Chase Commercial Mortgage Securities Trust 2016-JP4 | 3.648% | 12/15/49 | 100 | | 106 | |
| 3 | JP Morgan Chase Commercial Mortgage Securities Trust 2016-JP4 | 3.870% | 12/15/49 | 75 | | 80 | |
| 3 | JP Morgan Chase Commercial Mortgage Securities Trust 2017-JP6 | 3.050% | 7/15/50 | 36 | | 36 | |
| 3 | JP Morgan Chase Commercial Mortgage Securities Trust 2017-JP6 | 3.744% | 7/15/50 | 100 | | 105 | |
| 3 | JP Morgan Chase Commercial Mortgage Securities Trust 2019-COR4 | 4.029% | 3/10/52 | 300 | | 332 | |
| 3 | JPMBB Commercial Mortgage Securities Trust 2013-C12 | 3.664% | 7/15/45 | 39 | | 41 | |
| 3 | JPMBB Commercial Mortgage Securities Trust 2013-C12 | 4.039% | 7/15/45 | 26 | | 27 | |
| 3 | JPMBB Commercial Mortgage Securities Trust 2013-C14 | 3.761% | 8/15/46 | 29 | | 30 | |
| 3 | JPMBB Commercial Mortgage Securities Trust 2013-C14 | 4.133% | 8/15/46 | 100 | | 106 | |
| 3 | JPMBB Commercial Mortgage Securities Trust 2013-C14 | 4.409% | 8/15/46 | 30 | | 32 | |
| 3 | JPMBB Commercial Mortgage Securities Trust 2013-C15 | 3.659% | 11/15/45 | 7 | | 8 | |
| 3 | JPMBB Commercial Mortgage Securities Trust 2013-C15 | 4.131% | 11/15/45 | 65 | | 69 | |
| 3 | JPMBB Commercial Mortgage Securities Trust 2013-C15 | 4.420% | 11/15/45 | 35 | | 37 | |
| 3 | JPMBB Commercial Mortgage Securities Trust 2014-C18 | 4.079% | 2/15/47 | 127 | | 136 | |
| 3 | JPMBB Commercial Mortgage Securities Trust 2014-C18 | 4.439% | 2/15/47 | 25 | | 27 | |
| 3 | JPMBB Commercial Mortgage Securities Trust 2014-C18 | 4.810% | 2/15/47 | 30 | | 32 | |
| 3 | JPMBB Commercial Mortgage Securities Trust 2014-C19 | 3.669% | 4/15/47 | 50 | | 51 | |
| 3 | JPMBB Commercial Mortgage Securities Trust 2014-C19 | 3.997% | 4/15/47 | 95 | | 101 | |
| 3 | JPMBB Commercial Mortgage Securities Trust 2014-C19 | 4.243% | 4/15/47 | 50 | | 53 | |
| 3 | JPMBB Commercial Mortgage Securities Trust 2014-C21 | 3.428% | 8/15/47 | 26 | | 27 | |
| 3 | JPMBB Commercial Mortgage Securities Trust 2014-C21 | 3.775% | 8/15/47 | 25 | | 27 | |
| 3 | JPMBB Commercial Mortgage Securities Trust 2014-C22 | 3.801% | 9/15/47 | 175 | | 186 | |
| 3 | JPMBB Commercial Mortgage Securities Trust 2014-C22 | 4.110% | 9/15/47 | 50 | | 53 | |
| 3 | JPMBB Commercial Mortgage Securities Trust 2014-C23 | 3.934% | 9/15/47 | 85 | | 91 | |
| 3 | JPMBB Commercial Mortgage Securities Trust 2014-C23 | 4.202% | 9/15/47 | 50 | | 53 | |
| 3 | JPMBB Commercial Mortgage Securities Trust 2014-C24 | 2.940% | 11/15/47 | 12 | | 12 | |
| 3 | JPMBB Commercial Mortgage Securities Trust 2014-C24 | 3.639% | 11/15/47 | 50 | | 53 | |
| 3 | JPMBB Commercial Mortgage Securities Trust 2014-C24 | 3.914% | 11/15/47 | 75 | | 79 | |
| 3 | JPMBB Commercial Mortgage Securities Trust 2014-C25 | 3.672% | 11/15/47 | 200 | | 211 | |
| 3 | JPMBB Commercial Mortgage Securities Trust 2014-C25 | 4.065% | 11/15/47 | 50 | | 53 | |
| 3 | JPMBB Commercial Mortgage Securities Trust 2014-C26 | 3.019% | 1/15/48 | 8 | | 8 | |
| 3 | JPMBB Commercial Mortgage Securities Trust 2014-C26 | 3.494% | 1/15/48 | 175 | | 183 | |
| 3 | JPMBB Commercial Mortgage Securities Trust 2014-C26 | 3.800% | 1/15/48 | 50 | | 52 | |
| 3 | JPMBB Commercial Mortgage Securities Trust 2014-C26 | 3.951% | 1/15/48 | 50 | | 52 | |
| 3 | JPMBB Commercial Mortgage Securities Trust 2015-C27 | 2.734% | 2/15/48 | 13 | | 13 | |
| 3 | JPMBB Commercial Mortgage Securities Trust 2015-C27 | 3.017% | 2/15/48 | 110 | | 112 | |
| 3 | JPMBB Commercial Mortgage Securities Trust 2015-C27 | 3.179% | 2/15/48 | 59 | | 61 | |
| 3 | JPMBB Commercial Mortgage Securities Trust 2015-C28 | 2.773% | 10/15/48 | 49 | | 49 | |
| 3 | JPMBB Commercial Mortgage Securities Trust 2015-C28 | 3.227% | 10/15/48 | 125 | | 130 | |
| 3 | JPMBB Commercial Mortgage Securities Trust 2015-C28 | 3.532% | 10/15/48 | 50 | | 52 | |
| 3 | JPMBB Commercial Mortgage Securities Trust 2015-C29 | 2.921% | 5/15/48 | 68 | | 68 | |
| 3 | JPMBB Commercial Mortgage Securities Trust 2015-C29 | 3.304% | 5/15/48 | 57 | | 59 | |
| 3 | JPMBB Commercial Mortgage Securities Trust 2015-C29 | 3.611% | 5/15/48 | 100 | | 106 | |
| 3 | JPMBB Commercial Mortgage Securities Trust 2015-C30 | 3.559% | 7/15/48 | 125 | | 129 | |
| 3 | JPMBB Commercial Mortgage Securities Trust 2015-C30 | 3.822% | 7/15/48 | 100 | | 107 | |
| 3 | JPMBB Commercial Mortgage Securities Trust 2015-C30 | 4.226% | 7/15/48 | 50 | | 54 | |
| 3 | JPMBB Commercial Mortgage Securities Trust 2015-C31 | 3.540% | 8/15/48 | 53 | | 55 | |
| 3 | JPMBB Commercial Mortgage Securities Trust 2015-C31 | 3.801% | 8/15/48 | 57 | | 61 | |
| 3 | JPMBB Commercial Mortgage Securities Trust 2015-C32 | 3.358% | 11/15/48 | 125 | | 129 | |
| 3 | JPMBB Commercial Mortgage Securities Trust 2015-C32 | 3.598% | 11/15/48 | 125 | | 132 | |
| 3 | JPMBB Commercial Mortgage Securities Trust 2015-C33 | 3.770% | 12/15/48 | 82 | | 88 | |
| 3 | JPMBB Commercial Mortgage Securities Trust 2016-C1 | 3.316% | 3/15/49 | 75 | | 77 | |
| 3 | JPMCC Commercial Mortgage Securities Trust 2017-JP5 | 3.723% | 3/15/50 | 400 | | 430 | |
| 3 | JPMCC Commercial Mortgage Securities Trust 2019-COR5 | 3.386% | 6/13/52 | 200 | | 210 | |
| 3 | JPMCC Commercial Mortgage Securities Trust 2019-COR5 | 3.669% | 6/13/52 | 25 | | 26 | |
| 3 | JPMDB Commercial Mortgage Securities Trust 2016-C2 | 3.144% | 6/15/49 | 75 | | 78 | |
| 3 | JPMDB Commercial Mortgage Securities Trust 2016-C2 | 3.484% | 6/15/49 | 50 | | 52 | |
| 3 | JPMDB Commercial Mortgage Securities Trust 2017-C7 | 3.409% | 10/15/50 | 75 | | 79 | |
| 3 | JPMDB Commercial Mortgage Securities Trust 2017-C7 | 3.713% | 10/15/50 | 50 | | 53 | |
| 3 | JPMDB Commercial Mortgage Securities Trust 2018-C8 | 4.211% | 6/15/51 | 225 | | 249 | |
| 3 | JPMDB Commercial Mortgage Securities Trust 2018-C8 | 4.421% | 6/15/51 | 25 | | 28 | |
| 3 | JPMDB Commerical Mortgage Securities Trust 2019-COR6 | 3.057% | 11/13/52 | 175 | | 178 | |
| 3 | Mercedes-Benz Auto Lease Trust 2018-A | 2.410% | 2/16/21 | 39 | | 39 | |
| 3 | Mercedes-Benz Auto Lease Trust 2018-A | 2.510% | 10/16/23 | 25 | | 25 | |
| 3 | Morgan Stanley Bank of America Merrill Lynch Trust 2012-C5 | 3.176% | 8/15/45 | 100 | | 102 | |
| 3 | Morgan Stanley Bank of America Merrill Lynch Trust 2013-C11 | 4.153% | 8/15/46 | 40 | | 42 | |
| 3 | Morgan Stanley Bank of America Merrill Lynch Trust 2013-C11 | 4.353% | 8/15/46 | 20 | | 21 | |
| 3 | Morgan Stanley Bank of America Merrill Lynch Trust 2013-C12 | 4.259% | 10/15/46 | 100 | | 106 | |
| 3 | Morgan Stanley Bank of America Merrill Lynch Trust 2013-C7 | 2.918% | 2/15/46 | 68 | | 69 | |
| 3 | Morgan Stanley Bank of America Merrill Lynch Trust 2013-C7 | 3.214% | 2/15/46 | 14 | | 14 | |
Total Bond Market Index Portfolio
| | | | Face | | Market | |
| | | Maturity | Amount | | Value• | |
| | Coupon | Date | ($000 | ) | ($000 | ) |
| 3 | Morgan Stanley Bank of America Merrill Lynch Trust 2013-C8 | 3.134% | 12/15/48 | 100 | | 102 | |
| 3 | Morgan Stanley Bank of America Merrill Lynch Trust 2013-C8 | 3.376% | 12/15/48 | 50 | | 51 | |
| 3 | Morgan Stanley Bank of America Merrill Lynch Trust 2013-C9 | 3.102% | 5/15/46 | 50 | | 51 | |
| 3 | Morgan Stanley Bank of America Merrill Lynch Trust 2013-C9 | 3.456% | 5/15/46 | 50 | | 52 | |
| 3 | Morgan Stanley Bank of America Merrill Lynch Trust 2014-C14 | 3.669% | 2/15/47 | 76 | | 77 | |
| 3 | Morgan Stanley Bank of America Merrill Lynch Trust 2014-C14 | 4.064% | 2/15/47 | 100 | | 106 | |
| 3 | Morgan Stanley Bank of America Merrill Lynch Trust 2014-C14 | 4.745% | 2/15/47 | 100 | | 107 | |
| 3 | Morgan Stanley Bank of America Merrill Lynch Trust 2014-C16 | 3.477% | 6/15/47 | 22 | | 23 | |
| 3 | Morgan Stanley Bank of America Merrill Lynch Trust 2014-C16 | 3.892% | 6/15/47 | 100 | | 106 | |
| 3 | Morgan Stanley Bank of America Merrill Lynch Trust 2014-C16 | 4.337% | 6/15/47 | 50 | | 53 | |
| 3 | Morgan Stanley Bank of America Merrill Lynch Trust 2014-C18 | 3.194% | 10/15/47 | 5 | | 5 | |
| 3 | Morgan Stanley Bank of America Merrill Lynch Trust 2014-C18 | 4.478% | 10/15/47 | 50 | | 53 | |
| 3 | Morgan Stanley Bank of America Merrill Lynch Trust 2014-C19 | 3.326% | 12/15/47 | 50 | | 51 | |
| 3 | Morgan Stanley Bank of America Merrill Lynch Trust 2014-C19 | 3.526% | 12/15/47 | 75 | | 79 | |
| 3 | Morgan Stanley Bank of America Merrill Lynch Trust 2015-C20 | 3.069% | 2/15/48 | 50 | | 51 | |
| 3 | Morgan Stanley Bank of America Merrill Lynch Trust 2015-C20 | 3.249% | 2/15/48 | 200 | | 207 | |
| 3 | Morgan Stanley Bank of America Merrill Lynch Trust 2015-C22 | 3.040% | 4/15/48 | 100 | | 102 | |
| 3 | Morgan Stanley Bank of America Merrill Lynch Trust 2015-C22 | 3.306% | 4/15/48 | 75 | | 78 | |
| 3 | Morgan Stanley Bank of America Merrill Lynch Trust 2015-C22 | 3.883% | 4/15/48 | 50 | | 52 | |
| 3 | Morgan Stanley Bank of America Merrill Lynch Trust 2015-C23 | 2.982% | 7/15/50 | 74 | | 74 | |
| 3 | Morgan Stanley Bank of America Merrill Lynch Trust 2015-C23 | 3.398% | 7/15/50 | 50 | | 51 | |
| 3 | Morgan Stanley Bank of America Merrill Lynch Trust 2015-C23 | 3.719% | 7/15/50 | 125 | | 133 | |
| 3 | Morgan Stanley Bank of America Merrill Lynch Trust 2015-C25 | 3.383% | 10/15/48 | 125 | | 129 | |
| 3 | Morgan Stanley Bank of America Merrill Lynch Trust 2015-C25 | 3.635% | 10/15/48 | 75 | | 79 | |
| 3 | Morgan Stanley Bank of America Merrill Lynch Trust 2015-C26 | 3.323% | 10/15/48 | 75 | | 77 | |
| 3 | Morgan Stanley Bank of America Merrill Lynch Trust 2015-C26 | 3.531% | 10/15/48 | 75 | | 79 | |
| 3 | Morgan Stanley Bank of America Merrill Lynch Trust 2015-C27 | 3.557% | 12/15/47 | 50 | | 52 | |
| 3 | Morgan Stanley Bank of America Merrill Lynch Trust 2015-C27 | 3.753% | 12/15/47 | 75 | | 80 | |
| 3 | Morgan Stanley Bank of America Merrill Lynch Trust 2016-C28 | 3.288% | 1/15/49 | 100 | | 103 | |
| 3 | Morgan Stanley Bank of America Merrill Lynch Trust 2016-C28 | 3.544% | 1/15/49 | 225 | | 238 | |
| 3 | Morgan Stanley Bank of America Merrill Lynch Trust 2016-C30 | 2.860% | 9/15/49 | 200 | | 203 | |
| 3 | Morgan Stanley Bank of America Merrill Lynch Trust 2016-C31 | 3.102% | 11/15/49 | 250 | | 258 | |
| 3 | Morgan Stanley Bank of America Merrill Lynch Trust 2017-C33 | 3.599% | 5/15/50 | 150 | | 160 | |
| 3 | Morgan Stanley Bank of America Merrill Lynch Trust 2017-C33 | 3.852% | 5/15/50 | 100 | | 106 | |
| 3 | Morgan Stanley Bank of America Merrill Lynch Trust 2017-C34 | 3.276% | 11/15/52 | 125 | | 130 | |
| 3 | Morgan Stanley Bank of America Merrill Lynch Trust 2017-C34 | 3.536% | 11/15/52 | 150 | | 159 | |
| 3 | Morgan Stanley Capital I Trust 2012-C4 | 3.244% | 3/15/45 | 350 | | 356 | |
| 3 | Morgan Stanley Capital I Trust 2012-C4 | 3.773% | 3/15/45 | 75 | | 77 | |
| 3 | Morgan Stanley Capital I Trust 2015-UBS8 | 3.809% | 12/15/48 | 75 | | 80 | |
| 3 | Morgan Stanley Capital I Trust 2016-BNK2 | 3.049% | 11/15/49 | 100 | | 104 | |
| 3 | Morgan Stanley Capital I Trust 2016-BNK2 | 3.282% | 11/15/49 | 83 | | 86 | |
| 3 | Morgan Stanley Capital I Trust 2016-UB11 | 2.782% | 8/15/49 | 200 | | 202 | |
| 3 | Morgan Stanley Capital I Trust 2016-UBS12 | 3.596% | 12/15/49 | 200 | | 213 | |
| 3 | Morgan Stanley Capital I Trust 2017-H1 | 3.530% | 6/15/50 | 150 | | 159 | |
| 3 | Morgan Stanley Capital I Trust 2019-H6 | 3.417% | 6/15/52 | 250 | | 264 | |
| 3 | Morgan Stanley Capital I Trust 2019-H6 | 3.700% | 6/15/52 | 25 | | 26 | |
| 3 | Morgan Stanley Capital I Trust 2019-L2 | 4.071% | 3/15/52 | 150 | | 167 | |
| 3 | Morgan Stanley Capital I Trust 2019-L3 | 3.127% | 11/15/29 | 200 | | 206 | |
| 3 | Nissan Auto Lease Trust 2017-B | 2.050% | 9/15/20 | 8 | | 8 | |
| 3 | Nissan Auto Lease Trust 2017-B | 2.170% | 12/15/21 | 25 | | 25 | |
| 3 | Nissan Auto Receivables 2015-B Owner Trust | 1.790% | 1/17/22 | 5 | | 5 | |
| 3 | Nissan Auto Receivables 2015-C Owner Trust | 1.670% | 2/15/22 | 21 | | 21 | |
| 3 | Nissan Auto Receivables 2016-C Owner Trust | 1.180% | 1/15/21 | 6 | | 6 | |
| 3 | Nissan Auto Receivables 2016-C Owner Trust | 1.380% | 1/17/23 | 75 | | 75 | |
| 3 | Nissan Auto Receivables 2017-B Owner Trust | 1.950% | 10/16/23 | 104 | | 104 | |
| 3 | Nissan Auto Receivables 2018-A Owner Trust | 2.650% | 5/16/22 | 123 | | 123 | |
| 3 | Nissan Auto Receivables 2018-A Owner Trust | 2.890% | 6/17/24 | 100 | | 102 | |
| 3 | Nissan Auto Receivables 2019-B Owner Trust | 2.500% | 11/15/23 | 125 | | 126 | |
| 3 | Nissan Auto Receivables 2019-B Owner Trust | 2.540% | 12/15/25 | 30 | | 30 | |
| 3 | Nissan Auto Receivables 2019-C | 1.930% | 7/15/24 | 150 | | 150 | |
| 3 | Nissan Auto Receivables 2019-C | 1.950% | 5/15/26 | 35 | | 35 | |
| | Royal Bank of Canada | 2.100% | 10/14/20 | 800 | | 800 | |
| | Royal Bank of Canada | 2.300% | 3/22/21 | 175 | | 176 | |
| 3 | Santander Drive Auto Receivables Trust 2018-2 | 3.030% | 9/15/22 | 36 | | 36 | |
| 3 | Santander Drive Auto Receivables Trust 2018-2 | 3.350% | 7/17/23 | 50 | | 50 | |
| 3 | Santander Drive Auto Receivables Trust 2018-3 | 3.030% | 2/15/22 | 1 | | 1 | |
| 3 | Santander Drive Auto Receivables Trust 2018-3 | 3.290% | 10/17/22 | 50 | | 50 | |
| 3 | Santander Drive Auto Receivables Trust 2018-3 | 3.510% | 8/15/23 | 50 | | 51 | |
| 3 | Synchrony Card Issuance Trust 2018-A1 | 3.380% | 9/15/24 | 275 | | 281 | |
| 3 | Synchrony Credit Card Master Note Trust 2016-2 | 2.210% | 5/15/24 | 373 | | 375 | |
| 3 | Synchrony Credit Card Master Note Trust 2017-2 | 2.620% | 10/15/25 | 150 | | 152 | |
| 3 | Synchrony Credit Card Master Note Trust 2018-1 | 2.970% | 3/15/24 | 275 | | 278 | |
| 3 | Synchrony Credit Card Master Note Trust 2018-2 | 3.470% | 5/15/26 | 275 | | 287 | |
| 6 | Toronto-Dominion Bank | 2.250% | 3/15/21 | 250 | | 251 | |
| 3 | Toyota Auto Receivables 2016-B Owner Trust | 1.520% | 8/16/21 | 28 | | 28 | |
| 3 | Toyota Auto Receivables 2016-C Owner Trust | 1.320% | 11/15/21 | 38 | | 38 | |
| 3 | Toyota Auto Receivables 2017-D Owner Trust | 1.930% | 1/18/22 | 179 | | 179 | |
| 3 | Toyota Auto Receivables 2018-A Owner Trust | 2.350% | 5/16/22 | 118 | | 118 | |
Total Bond Market Index Portfolio
| | | | Face | | Market | |
| | | Maturity | Amount | | Value• | |
| | Coupon | Date | ($000 | ) | ($000 | ) |
| 3 | Toyota Auto Receivables 2018-A Owner Trust | 2.520% | 5/15/23 | 50 | | 50 | |
| 3 | Toyota Auto Receivables 2018-B Owner Trust | 2.960% | 9/15/22 | 125 | | 126 | |
| 3 | Toyota Auto Receivables 2018-B Owner Trust | 3.110% | 11/15/23 | 25 | | 26 | |
| 3 | UBS Commercial Mortgage Trust 2017-C1 | 3.460% | 6/15/50 | 100 | | 106 | |
| 3 | UBS Commercial Mortgage Trust 2017-C1 | 3.724% | 6/15/50 | 50 | | 52 | |
| 3 | UBS Commercial Mortgage Trust 2017-C2 | 3.487% | 8/15/50 | 150 | | 158 | |
| 3 | UBS Commercial Mortgage Trust 2017-C2 | 3.740% | 8/15/50 | 50 | | 52 | |
| 3 | UBS Commercial Mortgage Trust 2017-C3 | 3.426% | 8/15/50 | 175 | | 184 | |
| 3 | UBS Commercial Mortgage Trust 2017-C3 | 3.739% | 8/15/50 | 75 | | 79 | |
| 3 | UBS Commercial Mortgage Trust 2017-C4 | 3.301% | 10/15/50 | 100 | | 105 | |
| 3 | UBS Commercial Mortgage Trust 2017-C4 | 3.563% | 10/15/50 | 150 | | 160 | |
| 3 | UBS Commercial Mortgage Trust 2017-C4 | 3.836% | 10/15/50 | 62 | | 65 | |
| 3 | UBS Commercial Mortgage Trust 2017-C5 | 3.474% | 11/15/50 | 100 | | 106 | |
| 3 | UBS Commercial Mortgage Trust 2017-C7 | 3.679% | 12/15/50 | 150 | | 161 | |
| 3 | UBS Commercial Mortgage Trust 2017-C7 | 4.061% | 12/15/50 | 100 | | 107 | |
| 3 | UBS Commercial Mortgage Trust 2018-C11 | 4.241% | 6/15/51 | 125 | | 139 | |
| 3 | UBS Commercial Mortgage Trust 2018-C12 | 4.296% | 8/15/51 | 100 | | 113 | |
| 3 | UBS Commercial Mortgage Trust 2018-C13 | 4.208% | 10/15/51 | 25 | | 26 | |
| 3 | UBS Commercial Mortgage Trust 2018-C13 | 4.334% | 10/15/51 | 75 | | 85 | |
| 3 | UBS Commercial Mortgage Trust 2018-C14 | 4.448% | 12/15/51 | 225 | | 256 | |
| 3 | UBS Commercial Mortgage Trust 2018-C15 | 4.341% | 12/15/51 | 125 | | 140 | |
| 3 | UBS Commercial Mortgage Trust 2018-C8 | 3.720% | 2/15/51 | 150 | | 162 | |
| 3 | UBS Commercial Mortgage Trust 2018-C8 | 3.983% | 2/15/51 | 275 | | 302 | |
| 3 | UBS Commercial Mortgage Trust 2018-C8 | 4.215% | 2/15/51 | 75 | | 81 | |
| 3 | UBS Commercial Mortgage Trust 2019-C16 | 3.605% | 4/15/52 | 100 | | 106 | |
| 3 | UBS Commercial Mortgage Trust 2019-C17 | 2.921% | 10/15/52 | 125 | | 127 | |
| 3 | UBS-Barclays Commercial Mortgage Trust 2013-C5 | 3.185% | 3/10/46 | 104 | | 107 | |
| 3 | UBS-Barclays Commercial Mortgage Trust 2013-C6 | 3.244% | 4/10/46 | 165 | | 169 | |
| 3 | UBS-Barclays Commercial Mortgage Trust 2013-C6 | 3.469% | 4/10/46 | 25 | | 26 | |
| 3 | UBS-Barclays Commercial Mortgage Trust 2018-C10 | 4.313% | 5/15/51 | 175 | | 195 | |
| 3 | UBS-Barclays Commercial Mortgage Trust 2018-C9 | 4.117% | 3/15/51 | 275 | | 305 | |
| 3 | UBS-Barclays Commercial Mortgage Trust 2019-C16 | 3.887% | 4/15/52 | 25 | | 27 | |
| 3 | UBS-Barclays Commercial Mortgage Trust 2019-C18 | 3.035% | 12/15/52 | 75 | | 77 | |
| 3 | Wells Fargo Commercial Mortgage Trust 2012-LC5 | 2.918% | 10/15/45 | 67 | | 68 | |
| 3 | Wells Fargo Commercial Mortgage Trust 2014-LC16 | 2.819% | 8/15/50 | 1 | | 1 | |
| 3 | Wells Fargo Commercial Mortgage Trust 2014-LC16 | 3.817% | 8/15/50 | 75 | | 79 | |
| 3 | Wells Fargo Commercial Mortgage Trust 2014-LC18 | 2.954% | 12/15/47 | 41 | | 41 | |
| 3 | Wells Fargo Commercial Mortgage Trust 2014-LC18 | 3.271% | 12/15/47 | 75 | | 76 | |
| 3 | Wells Fargo Commercial Mortgage Trust 2014-LC18 | 3.405% | 12/15/47 | 125 | | 131 | |
| 3 | Wells Fargo Commercial Mortgage Trust 2014-LC18 | 3.808% | 12/15/47 | 75 | | 78 | |
| 3 | Wells Fargo Commercial Mortgage Trust 2015-C26 | 2.991% | 2/15/48 | 125 | | 127 | |
| 3 | Wells Fargo Commercial Mortgage Trust 2015-C26 | 3.166% | 2/15/48 | 75 | | 78 | |
| 3 | Wells Fargo Commercial Mortgage Trust 2015-C26 | 3.580% | 2/15/48 | 50 | | 52 | |
| 3 | Wells Fargo Commercial Mortgage Trust 2015-C27 | 3.190% | 2/15/48 | 244 | | 252 | |
| 3 | Wells Fargo Commercial Mortgage Trust 2015-C28 | 3.540% | 5/15/48 | 175 | | 185 | |
| 3 | Wells Fargo Commercial Mortgage Trust 2015-C28 | 3.872% | 5/15/48 | 31 | | 32 | |
| 3 | Wells Fargo Commercial Mortgage Trust 2015-C29 | 3.400% | 6/15/48 | 125 | | 129 | |
| 3 | Wells Fargo Commercial Mortgage Trust 2015-C29 | 3.637% | 6/15/48 | 175 | | 186 | |
| 3 | Wells Fargo Commercial Mortgage Trust 2015-LC20 | 2.978% | 4/15/50 | 29 | | 30 | |
| 3 | Wells Fargo Commercial Mortgage Trust 2015-LC20 | 3.184% | 4/15/50 | 276 | | 287 | |
| 3 | Wells Fargo Commercial Mortgage Trust 2015-LC20 | 3.719% | 4/15/50 | 50 | | 51 | |
| 3 | Wells Fargo Commercial Mortgage Trust 2015-LC22 | 3.571% | 9/15/58 | 50 | | 52 | |
| 3 | Wells Fargo Commercial Mortgage Trust 2015-LC22 | 3.839% | 9/15/58 | 75 | | 81 | |
| 3 | Wells Fargo Commercial Mortgage Trust 2015-LC22 | 4.207% | 9/15/58 | 75 | | 80 | |
| 3 | Wells Fargo Commercial Mortgage Trust 2015-NXS1 | 2.632% | 5/15/48 | 21 | | 21 | |
| 3 | Wells Fargo Commercial Mortgage Trust 2015-NXS1 | 2.934% | 5/15/48 | 50 | | 51 | |
| 3 | Wells Fargo Commercial Mortgage Trust 2015-NXS1 | 3.148% | 5/15/48 | 50 | | 52 | |
| 3 | Wells Fargo Commercial Mortgage Trust 2015-P2 | 3.656% | 12/15/48 | 100 | | 105 | |
| 3 | Wells Fargo Commercial Mortgage Trust 2015-P2 | 3.809% | 12/15/48 | 50 | | 54 | |
| 3 | Wells Fargo Commercial Mortgage Trust 2015-SG1 | 3.789% | 9/15/48 | 210 | | 224 | |
| 3 | Wells Fargo Commercial Mortgage Trust 2016-BNK1 | 2.652% | 8/15/49 | 150 | | 151 | |
| 3 | Wells Fargo Commercial Mortgage Trust 2016-C32 | 3.324% | 1/15/59 | 58 | | 60 | |
| 3 | Wells Fargo Commercial Mortgage Trust 2016-C32 | 3.560% | 1/15/59 | 125 | | 132 | |
| 3 | Wells Fargo Commercial Mortgage Trust 2016-C33 | 3.426% | 3/15/59 | 50 | | 53 | |
| 3 | Wells Fargo Commercial Mortgage Trust 2016-C34 | 3.096% | 6/15/49 | 75 | | 77 | |
| 3 | Wells Fargo Commercial Mortgage Trust 2016-C37 | 3.794% | 12/15/49 | 100 | | 108 | |
| 3 | Wells Fargo Commercial Mortgage Trust 2016-LC24 | 2.825% | 10/15/49 | 100 | | 102 | |
| 3 | Wells Fargo Commercial Mortgage Trust 2016-LC24 | 2.942% | 10/15/49 | 162 | | 166 | |
| 3 | Wells Fargo Commercial Mortgage Trust 2017-C38 | 3.453% | 7/15/50 | 192 | | 204 | |
| 3 | Wells Fargo Commercial Mortgage Trust 2017-C38 | 3.665% | 7/15/50 | 54 | | 57 | |
Total Bond Market Index Portfolio
| | | | Face | | Market | |
| | | Maturity | Amount | | Value• | |
| | Coupon | Date | ($000 | ) | ($000 | ) |
| 3 | Wells Fargo Commercial Mortgage Trust 2017-C39 | 3.418% | 9/15/50 | 175 | | 185 | |
| 3 | Wells Fargo Commercial Mortgage Trust 2017-C39 | 3.702% | 9/15/50 | 100 | | 105 | |
| 3 | Wells Fargo Commercial Mortgage Trust 2017-C40 | 3.317% | 10/15/50 | 100 | | 104 | |
| 3 | Wells Fargo Commercial Mortgage Trust 2017-C40 | 3.581% | 10/15/50 | 150 | | 160 | |
| 3 | Wells Fargo Commercial Mortgage Trust 2017-C40 | 3.854% | 10/15/50 | 25 | | 26 | |
| 3 | Wells Fargo Commercial Mortgage Trust 2017-C41 | 3.472% | 11/15/50 | 250 | | 265 | |
| 3 | Wells Fargo Commercial Mortgage Trust 2018-C43 | 4.012% | 3/15/51 | 275 | | 302 | |
| 3 | Wells Fargo Commercial Mortgage Trust 2018-C43 | 4.152% | 3/15/51 | 50 | | 54 | |
| 3 | Wells Fargo Commercial Mortgage Trust 2018-C44 | 4.212% | 5/15/51 | 175 | | 195 | |
| 3 | Wells Fargo Commercial Mortgage Trust 2018-C45 | 4.184% | 6/15/51 | 200 | | 222 | |
| 3 | Wells Fargo Commercial Mortgage Trust 2018-C46 | 4.152% | 8/15/51 | 75 | | 83 | |
| 3 | Wells Fargo Commercial Mortgage Trust 2018-C47 | 4.442% | 9/15/61 | 150 | | 170 | |
| 3 | Wells Fargo Commercial Mortgage Trust 2019-C49 | 4.023% | 3/15/52 | 225 | | 248 | |
| 3 | Wells Fargo Commercial Mortgage Trust 2019-C50 | 3.729% | 5/15/52 | 125 | | 135 | |
| 3 | Wells Fargo Commercial Mortgage Trust 2019-C51 | 3.311% | 6/15/52 | 200 | | 210 | |
| 3 | Wells Fargo Commercial Mortgage Trust 2019-C52 | 2.892% | 8/15/52 | 270 | | 274 | |
| 3 | Wells Fargo Commercial Mortgage Trust 2019-C52 | 3.143% | 8/15/52 | 100 | | 100 | |
| 3 | Wells Fargo Commercial Mortgage Trust 2019-C53 | 3.040% | 10/15/52 | 200 | | 206 | |
| 3 | Wells Fargo Commercial Mortgage Trust 2019-C54 | 3.146% | 12/15/52 | 100 | | 104 | |
| 3 | WFRBS Commercial Mortgage Trust 2012-C6 | 3.440% | 4/15/45 | 175 | | 178 | |
| 3 | WFRBS Commercial Mortgage Trust 2012-C7 | 3.431% | 6/15/45 | 125 | | 128 | |
| 3 | WFRBS Commercial Mortgage Trust 2012-C7 | 4.090% | 6/15/45 | 100 | | 103 | |
| 3 | WFRBS Commercial Mortgage Trust 2012-C8 | 3.001% | 8/15/45 | 75 | | 76 | |
| 3 | WFRBS Commercial Mortgage Trust 2012-C9 | 2.870% | 11/15/45 | 122 | | 124 | |
| 3 | WFRBS Commercial Mortgage Trust 2013-C11 | 3.071% | 3/15/45 | 94 | | 96 | |
| 3 | WFRBS Commercial Mortgage Trust 2013-C12 | 3.198% | 3/15/48 | 39 | | 40 | |
| 3 | WFRBS Commercial Mortgage Trust 2013-C12 | 3.560% | 3/15/48 | 18 | | 19 | |
| 3 | WFRBS Commercial Mortgage Trust 2013-C13 | 3.001% | 5/15/45 | 76 | | 78 | |
| 3 | WFRBS Commercial Mortgage Trust 2013-C13 | 3.345% | 5/15/45 | 15 | | 15 | |
| 3 | WFRBS Commercial Mortgage Trust 2013-C14 | 3.337% | 6/15/46 | 150 | | 155 | |
| 3 | WFRBS Commercial Mortgage Trust 2013-C14 | 3.488% | 6/15/46 | 75 | | 77 | |
| 3 | WFRBS Commercial Mortgage Trust 2013-C15 | 3.720% | 8/15/46 | 16 | | 16 | |
| 3 | WFRBS Commercial Mortgage Trust 2013-C15 | 4.153% | 8/15/46 | 100 | | 106 | |
| 3 | WFRBS Commercial Mortgage Trust 2013-C15 | 4.358% | 8/15/46 | 20 | | 21 | |
| 3 | WFRBS Commercial Mortgage Trust 2013-C16 | 3.963% | 9/15/46 | 23 | | 24 | |
| 3 | WFRBS Commercial Mortgage Trust 2013-C16 | 4.415% | 9/15/46 | 30 | | 32 | |
| 3 | WFRBS Commercial Mortgage Trust 2013-C16 | 4.668% | 9/15/46 | 50 | | 53 | |
| 3 | WFRBS Commercial Mortgage Trust 2013-C17 | 3.558% | 12/15/46 | 20 | | 20 | |
| 3 | WFRBS Commercial Mortgage Trust 2013-C17 | 4.023% | 12/15/46 | 25 | | 27 | |
| 3 | WFRBS Commercial Mortgage Trust 2013-C17 | 4.255% | 12/15/46 | 25 | | 27 | |
| 3 | WFRBS Commercial Mortgage Trust 2013-C17 | 4.788% | 12/15/46 | 25 | | 27 | |
| 3 | WFRBS Commercial Mortgage Trust 2014-C19 | 3.618% | 3/15/47 | 21 | | 22 | |
| 3 | WFRBS Commercial Mortgage Trust 2014-C19 | 3.660% | 3/15/47 | 21 | | 22 | |
| 3 | WFRBS Commercial Mortgage Trust 2014-C19 | 4.101% | 3/15/47 | 50 | | 53 | |
| 3 | WFRBS Commercial Mortgage Trust 2014-C19 | 4.723% | 3/15/47 | 25 | | 27 | |
| 3 | WFRBS Commercial Mortgage Trust 2014-C20 | 3.638% | 5/15/47 | 22 | | 23 | |
| 3 | WFRBS Commercial Mortgage Trust 2014-C20 | 3.995% | 5/15/47 | 25 | | 27 | |
| 3 | WFRBS Commercial Mortgage Trust 2014-C20 | 4.176% | 5/15/47 | 25 | | 26 | |
| 3 | WFRBS Commercial Mortgage Trust 2014-C21 | 3.678% | 8/15/47 | 75 | | 79 | |
| 3 | WFRBS Commercial Mortgage Trust 2014-C22 | 3.752% | 9/15/57 | 150 | | 159 | |
| 3 | WFRBS Commercial Mortgage Trust 2014-C22 | 4.371% | 9/15/57 | 25 | | 26 | |
| 3 | WFRBS Commercial Mortgage Trust 2014-C23 | 3.636% | 10/15/57 | 74 | | 76 | |
| 3 | WFRBS Commercial Mortgage Trust 2014-C23 | 3.917% | 10/15/57 | 50 | | 53 | |
| 3 | WFRBS Commercial Mortgage Trust 2014-C24 | 3.428% | 11/15/47 | 39 | | 40 | |
| 3 | WFRBS Commercial Mortgage Trust 2014-C24 | 3.607% | 11/15/47 | 65 | | 69 | |
| 3 | WFRBS Commercial Mortgage Trust 2014-LC14 | 2.862% | 3/15/47 | 1 | | 1 | |
| 3 | WFRBS Commercial Mortgage Trust 2014-LC14 | 3.522% | 3/15/47 | 50 | | 51 | |
| 3 | WFRBS Commercial Mortgage Trust 2014-LC14 | 4.045% | 3/15/47 | 140 | | 149 | |
| 3 | WFRBS Commercial Mortgage Trust 2014-LC14 | 4.351% | 3/15/47 | 60 | | 64 | |
| 3 | World Financial Network Credit Card Master Note Trust Series 2017-C | 2.310% | 8/15/24 | 150 | | 150 | |
| 3 | World Financial Network Credit Card Master Note Trust Series 2018-A | 3.070% | 12/16/24 | 200 | | 202 | |
| 3 | World Omni Auto Receivables Trust 2019-C | 1.960% | 12/16/24 | 125 | | 125 | |
Total Asset-Backed/Commercial Mortgage-Backed Securities
(Cost $107,426) | | | 110,185 | |
| Corporate Bonds (26.5%) | |
| Finance (8.3%) | | | | | | |
| | Banking (5.9%) | | | | | | |
| | Ally Financial Inc. | 4.125% | 2/13/22 | 125 | | 129 | |
| | Ally Financial Inc. | 3.875% | 5/21/24 | 150 | | 157 | |
| | Ally Financial Inc. | 5.125% | 9/30/24 | 135 | | 149 | |
| | Ally Financial Inc. | 8.000% | 11/1/31 | 400 | | 552 | |
| | American Express Co. | 3.000% | 2/22/21 | 150 | | 152 | |
| | American Express Co. | 3.700% | 11/5/21 | 200 | | 206 | |
| | American Express Co. | 2.750% | 5/20/22 | 300 | | 305 | |
| | American Express Co. | 2.500% | 8/1/22 | 500 | | 506 | |
| | American Express Co. | 2.650% | 12/2/22 | 225 | | 229 | |
| | American Express Co. | 3.400% | 2/27/23 | 300 | | 311 | |
| | American Express Co. | 3.700% | 8/3/23 | 325 | | 342 | |
Total Bond Market Index Portfolio
| | | | Face | | Market | |
| | | Maturity | Amount | | Value• | |
| | Coupon | Date | ($000 | ) | ($000 | ) |
| | American Express Co. | 3.400% | 2/22/24 | 225 | | 235 | |
| | American Express Co. | 2.500% | 7/30/24 | 215 | | 217 | |
| | American Express Co. | 3.000% | 10/30/24 | 569 | | 587 | |
| | American Express Co. | 3.625% | 12/5/24 | 241 | | 254 | |
| | American Express Co. | 4.200% | 11/6/25 | 150 | | 165 | |
| | American Express Co. | 3.125% | 5/20/26 | 250 | | 259 | |
| | American Express Co. | 4.050% | 12/3/42 | 67 | | 79 | |
| | American Express Credit Corp. | 2.250% | 5/5/21 | 275 | | 276 | |
| | American Express Credit Corp. | 2.700% | 3/3/22 | 300 | | 305 | |
| | American Express Credit Corp. | 3.300% | 5/3/27 | 350 | | 372 | |
| | Associated Bank NA | 3.500% | 8/13/21 | 50 | | 51 | |
| | Australia & New Zealand Banking Group Ltd. | 2.300% | 6/1/21 | 325 | | 326 | |
| | Australia & New Zealand Banking Group Ltd. | 2.550% | 11/23/21 | 250 | | 253 | |
| | Australia & New Zealand Banking Group Ltd. | 2.625% | 5/19/22 | 200 | | 203 | |
| | Australia & New Zealand Banking Group Ltd. | 2.625% | 11/9/22 | 200 | | 204 | |
| | Australia & New Zealand Banking Group Ltd. | 3.700% | 11/16/25 | 250 | | 269 | |
| | Banco Santander SA | 3.848% | 4/12/23 | 200 | | 208 | |
| | Banco Santander SA | 5.179% | 11/19/25 | 450 | | 500 | |
| | Banco Santander SA | 4.250% | 4/11/27 | 400 | | 430 | |
| | Banco Santander SA | 3.800% | 2/23/28 | 200 | | 210 | |
| | Banco Santander SA | 4.379% | 4/12/28 | 200 | | 218 | |
| | Bank of America Corp. | 2.625% | 4/19/21 | 755 | | 762 | |
| 3 | Bank of America Corp. | 2.369% | 7/21/21 | 500 | | 501 | |
| 3 | Bank of America Corp. | 2.328% | 10/1/21 | 350 | | 350 | |
| 3 | Bank of America Corp. | 2.738% | 1/23/22 | 250 | | 252 | |
| 3 | Bank of America Corp. | 3.499% | 5/17/22 | 175 | | 178 | |
| | Bank of America Corp. | 2.503% | 10/21/22 | 300 | | 303 | |
| | Bank of America Corp. | 3.300% | 1/11/23 | 650 | | 672 | |
| 3 | Bank of America Corp. | 3.124% | 1/20/23 | 145 | | 148 | |
| 3 | Bank of America Corp. | 2.881% | 4/24/23 | 1,000 | | 1,014 | |
| 3 | Bank of America Corp. | 2.816% | 7/21/23 | 1,250 | | 1,267 | |
| | Bank of America Corp. | 4.100% | 7/24/23 | 300 | | 319 | |
| | Bank of America Corp. | 3.004% | 12/20/23 | 1,846 | | 1,886 | |
| | Bank of America Corp. | 4.125% | 1/22/24 | 325 | | 350 | |
| 3 | Bank of America Corp. | 3.550% | 3/5/24 | 690 | | 714 | |
| | Bank of America Corp. | 4.000% | 4/1/24 | 322 | | 345 | |
| 3 | Bank of America Corp. | 3.864% | 7/23/24 | 125 | | 132 | |
| | Bank of America Corp. | 4.200% | 8/26/24 | 650 | | 697 | |
| | Bank of America Corp. | 4.000% | 1/22/25 | 755 | | 803 | |
| | Bank of America Corp. | 3.950% | 4/21/25 | 500 | | 532 | |
| 3 | Bank of America Corp. | 3.093% | 10/1/25 | 350 | | 361 | |
| 3 | Bank of America Corp. | 2.456% | 10/22/25 | 300 | | 301 | |
| 3 | Bank of America Corp. | 3.366% | 1/23/26 | 300 | | 313 | |
| | Bank of America Corp. | 4.450% | 3/3/26 | 475 | | 520 | |
| | Bank of America Corp. | 3.500% | 4/19/26 | 320 | | 339 | |
| | Bank of America Corp. | 4.250% | 10/22/26 | 725 | | 788 | |
| 3 | Bank of America Corp. | 3.559% | 4/23/27 | 750 | | 791 | |
| | Bank of America Corp. | 3.248% | 10/21/27 | 750 | | 778 | |
| | Bank of America Corp. | 4.183% | 11/25/27 | 560 | | 606 | |
| 3 | Bank of America Corp. | 3.824% | 1/20/28 | 425 | | 456 | |
| 3 | Bank of America Corp. | 3.705% | 4/24/28 | 350 | | 374 | |
| 3 | Bank of America Corp. | 3.593% | 7/21/28 | 800 | | 850 | |
| 3 | Bank of America Corp. | 3.419% | 12/20/28 | 1,334 | | 1,397 | |
| 3 | Bank of America Corp. | 3.970% | 3/5/29 | 225 | | 245 | |
| 3 | Bank of America Corp. | 4.271% | 7/23/29 | 575 | | 637 | |
| 3 | Bank of America Corp. | 3.974% | 2/7/30 | 150 | | 163 | |
| 3 | Bank of America Corp. | 3.194% | 7/23/30 | 1,125 | | 1,163 | |
| 3 | Bank of America Corp. | 2.884% | 10/22/30 | 300 | | 303 | |
| | Bank of America Corp. | 6.110% | 1/29/37 | 335 | | 451 | |
| 3 | Bank of America Corp. | 4.244% | 4/24/38 | 350 | | 402 | |
| | Bank of America Corp. | 7.750% | 5/14/38 | 340 | | 535 | |
| 3 | Bank of America Corp. | 4.078% | 4/23/40 | 500 | | 567 | |
| | Bank of America Corp. | 5.875% | 2/7/42 | 300 | | 426 | |
| | Bank of America Corp. | 5.000% | 1/21/44 | 750 | | 979 | |
| | Bank of America Corp. | 4.875% | 4/1/44 | 300 | | 383 | |
| | Bank of America Corp. | 4.750% | 4/21/45 | 100 | | 122 | |
| 3 | Bank of America Corp. | 4.443% | 1/20/48 | 100 | | 122 | |
| 3 | Bank of America Corp. | 4.330% | 3/15/50 | 250 | | 300 | |
| | Bank of America NA | 6.000% | 10/15/36 | 250 | | 344 | |
| | Bank of Montreal | 3.100% | 4/13/21 | 325 | | 330 | |
| | Bank of Montreal | 1.900% | 8/27/21 | 325 | | 325 | |
| | Bank of Montreal | 2.900% | 3/26/22 | 425 | | 433 | |
| | Bank of Montreal | 2.350% | 9/11/22 | 46 | | 46 | |
| | Bank of Montreal | 2.550% | 11/6/22 | 104 | | 106 | |
| | Bank of Montreal | 3.300% | 2/5/24 | 300 | | 312 | |
| | Bank of Montreal | 2.500% | 6/28/24 | 200 | | 202 | |
| 3 | Bank of Montreal | 4.338% | 10/5/28 | 100 | | 105 | |
| 3 | Bank of Montreal | 3.803% | 12/15/32 | 1,000 | | 1,044 | |
| | Bank of New York Mellon Corp. | 2.050% | 5/3/21 | 250 | | 251 | |
| | Bank of New York Mellon Corp. | 3.550% | 9/23/21 | 100 | | 103 | |
| | Bank of New York Mellon Corp. | 2.600% | 2/7/22 | 675 | | 684 | |
| | Bank of New York Mellon Corp. | 1.950% | 8/23/22 | 250 | | 250 | |
| | Bank of New York Mellon Corp. | 2.950% | 1/29/23 | 195 | | 200 | |
| | Bank of New York Mellon Corp. | 3.500% | 4/28/23 | 225 | | 236 | |
| 3 | Bank of New York Mellon Corp. | 2.661% | 5/16/23 | 225 | | 228 | |
| | Bank of New York Mellon Corp. | 3.450% | 8/11/23 | 125 | | 131 | |
| | Bank of New York Mellon Corp. | 2.200% | 8/16/23 | 225 | | 228 | |
| | Bank of New York Mellon Corp. | 3.250% | 9/11/24 | 150 | | 157 | |
| | Bank of New York Mellon Corp. | 2.100% | 10/24/24 | 150 | | 150 | |
| | Bank of New York Mellon Corp. | 3.000% | 2/24/25 | 250 | | 260 | |
| | Bank of New York Mellon Corp. | 2.800% | 5/4/26 | 200 | | 205 | |
| | Bank of New York Mellon Corp. | 2.450% | 8/17/26 | 125 | | 125 | |
| | Bank of New York Mellon Corp. | 3.250% | 5/16/27 | 150 | | 158 | |
| 3 | Bank of New York Mellon Corp. | 3.442% | 2/7/28 | 150 | | 158 | |
| | Bank of New York Mellon Corp. | 3.000% | 10/30/28 | 200 | | 205 | |
| | Bank of New York Mellon Corp. | 3.300% | 8/23/29 | 100 | | 104 | |
| | Bank of Nova Scotia | 2.800% | 7/21/21 | 420 | | 426 | |
| | Bank of Nova Scotia | 2.700% | 3/7/22 | 250 | | 254 | |
| | Bank of Nova Scotia | 2.375% | 1/18/23 | 50 | | 51 | |
| | Bank of Nova Scotia | 3.400% | 2/11/24 | 200 | | 209 | |
| | Bank of Nova Scotia | 4.500% | 12/16/25 | 300 | | 328 | |
| | Bank of Nova Scotia | 2.700% | 8/3/26 | 100 | | 102 | |
| | Barclays Bank plc | 2.650% | 1/11/21 | 200 | | 201 | |
| | Barclays plc | 3.250% | 1/12/21 | 100 | | 101 | |
| | Barclays plc | 3.200% | 8/10/21 | 150 | | 152 | |
| | Barclays plc | 3.684% | 1/10/23 | 100 | | 102 | |
| 3 | Barclays plc | 4.610% | 2/15/23 | 200 | | 208 | |
| 3 | Barclays plc | 4.338% | 5/16/24 | 1,000 | | 1,049 | |
| | Barclays plc | 3.650% | 3/16/25 | 350 | | 364 | |
| 3 | Barclays plc | 3.932% | 5/7/25 | 200 | | 210 | |
| | Barclays plc | 4.375% | 1/12/26 | 300 | | 325 | |
| | Barclays plc | 4.337% | 1/10/28 | 200 | | 214 | |
| 3 | Barclays plc | 4.972% | 5/16/29 | 200 | | 225 | |
| | Barclays plc | 5.250% | 8/17/45 | 250 | | 301 | |
| | Barclays plc | 4.950% | 1/10/47 | 200 | | 234 | |
| | BBVA USA | 3.500% | 6/11/21 | 150 | | 152 | |
| | BBVA USA | 2.875% | 6/29/22 | 250 | | 253 | |
| | BNP Paribas SA | 5.000% | 1/15/21 | 475 | | 489 | |
| | BPCE SA | 2.650% | 2/3/21 | 275 | | 277 | |
| | BPCE SA | 2.750% | 12/2/21 | 250 | | 254 | |
| 6 | BPCE SA | 3.000% | 5/22/22 | 250 | | 254 | |
| | BPCE SA | 4.000% | 4/15/24 | 325 | | 348 | |
| | BPCE SA | 3.375% | 12/2/26 | 250 | | 262 | |
| | Canadian Imperial Bank of Commerce | 2.700% | 2/2/21 | 150 | | 151 | |
| | Canadian Imperial Bank of Commerce | 2.550% | 6/16/22 | 350 | | 354 | |
| | Canadian Imperial Bank of Commerce | 3.500% | 9/13/23 | 200 | | 210 | |
| | Canadian Imperial Bank of Commerce | 3.100% | 4/2/24 | 200 | | 206 | |
| | Capital One Bank USA NA | 3.375% | 2/15/23 | 235 | | 242 | |
| | Capital One Financial Corp. | 4.750% | 7/15/21 | 50 | | 52 | |
| | Capital One Financial Corp. | 3.050% | 3/9/22 | 175 | | 179 | |
| | Capital One Financial Corp. | 3.200% | 1/30/23 | 350 | | 360 | |
| | Capital One Financial Corp. | 3.500% | 6/15/23 | 27 | | 28 | |
| | Capital One Financial Corp. | 3.900% | 1/29/24 | 250 | | 265 | |
| | Capital One Financial Corp. | 3.750% | 4/24/24 | 450 | | 472 | |
| | Capital One Financial Corp. | 3.300% | 10/30/24 | 513 | | 529 | |
| | Capital One Financial Corp. | 4.200% | 10/29/25 | 175 | | 188 | |
| | Capital One Financial Corp. | 3.750% | 7/28/26 | 500 | | 524 | |
Total Bond Market Index Portfolio
| | | | Face | | Market | |
| | | Maturity | Amount | | Value• | |
| | Coupon | Date | ($000 | ) | ($000 | ) |
| | Capital One Financial Corp. | 3.750% | 3/9/27 | 100 | | 106 | |
| | Capital One Financial Corp. | 3.800% | 1/31/28 | 300 | | 322 | |
| | Capital One NA | 2.250% | 9/13/21 | 175 | | 176 | |
| | Capital One NA | 2.650% | 8/8/22 | 500 | | 507 | |
| | Citibank NA | 2.850% | 2/12/21 | 200 | | 202 | |
| | Citibank NA | 3.400% | 7/23/21 | 475 | | 485 | |
| 3 | Citibank NA | 2.844% | 5/20/22 | 500 | | 506 | |
| | Citigroup Inc. | 2.700% | 3/30/21 | 550 | | 554 | |
| | Citigroup Inc. | 2.350% | 8/2/21 | 150 | | 151 | |
| | Citigroup Inc. | 2.900% | 12/8/21 | 200 | | 203 | |
| | Citigroup Inc. | 4.500% | 1/14/22 | 475 | | 498 | |
| | Citigroup Inc. | 2.750% | 4/25/22 | 425 | | 432 | |
| | Citigroup Inc. | 2.700% | 10/27/22 | 375 | | 381 | |
| 3 | Citigroup Inc. | 2.312% | 11/4/22 | 300 | | 301 | |
| | Citigroup Inc. | 3.375% | 3/1/23 | 150 | | 155 | |
| | Citigroup Inc. | 3.500% | 5/15/23 | 675 | | 700 | |
| 3 | Citigroup Inc. | 2.876% | 7/24/23 | 450 | | 458 | |
| | Citigroup Inc. | 3.875% | 10/25/23 | 738 | | 784 | |
| | Citigroup Inc. | 4.000% | 8/5/24 | 125 | | 133 | |
| | Citigroup Inc. | 3.875% | 3/26/25 | 350 | | 369 | |
| 3 | Citigroup Inc. | 3.352% | 4/24/25 | 1,500 | | 1,560 | |
| | Citigroup Inc. | 3.300% | 4/27/25 | 125 | | 131 | |
| | Citigroup Inc. | 4.400% | 6/10/25 | 1,400 | | 1,521 | |
| | Citigroup Inc. | 5.500% | 9/13/25 | 75 | | 86 | |
| | Citigroup Inc. | 3.700% | 1/12/26 | 275 | | 293 | |
| | Citigroup Inc. | 4.600% | 3/9/26 | 275 | | 303 | |
| | Citigroup Inc. | 3.200% | 10/21/26 | 1,025 | | 1,060 | |
| | Citigroup Inc. | 4.300% | 11/20/26 | 75 | | 82 | |
| | Citigroup Inc. | 4.450% | 9/29/27 | 1,150 | | 1,265 | |
| 3 | Citigroup Inc. | 3.887% | 1/10/28 | 475 | | 509 | |
| 3 | Citigroup Inc. | 3.668% | 7/24/28 | 900 | | 956 | |
| | Citigroup Inc. | 4.125% | 7/25/28 | 100 | | 109 | |
| 3 | Citigroup Inc. | 3.520% | 10/27/28 | 580 | | 609 | |
| 3 | Citigroup Inc. | 4.075% | 4/23/29 | 150 | | 164 | |
| 3 | Citigroup Inc. | 3.980% | 3/20/30 | 475 | | 519 | |
| 3 | Citigroup Inc. | 2.976% | 11/5/30 | 300 | | 305 | |
| | Citigroup Inc. | 6.625% | 6/15/32 | 100 | | 134 | |
| | Citigroup Inc. | 6.125% | 8/25/36 | 75 | | 97 | |
| 3 | Citigroup Inc. | 3.878% | 1/24/39 | 225 | | 246 | |
| | Citigroup Inc. | 8.125% | 7/15/39 | 562 | | 938 | |
| | Citigroup Inc. | 5.875% | 1/30/42 | 100 | | 141 | |
| | Citigroup Inc. | 5.300% | 5/6/44 | 375 | | 475 | |
| | Citigroup Inc. | 4.650% | 7/30/45 | 200 | | 246 | |
| | Citigroup Inc. | 4.750% | 5/18/46 | 375 | | 449 | |
| | Citigroup Inc. | 4.650% | 7/23/48 | 450 | | 561 | |
| | Citizens Bank NA | 2.550% | 5/13/21 | 200 | | 201 | |
| | Citizens Bank NA | 3.250% | 2/14/22 | 250 | | 256 | |
| | Citizens Bank NA | 2.650% | 5/26/22 | 125 | | 127 | |
| | Citizens Financial Group Inc. | 4.300% | 12/3/25 | 125 | | 134 | |
| | Citizens Financial Group Inc. | 2.850% | 7/27/26 | 175 | | 178 | |
| | Comerica Bank | 4.000% | 7/27/25 | 50 | | 53 | |
| | Comerica Inc. | 3.700% | 7/31/23 | 200 | | 210 | |
| | Commonwealth Bank of Australia | 2.550% | 3/15/21 | 175 | | 176 | |
| 6 | Commonwealth Bank of Australia | 2.750% | 3/10/22 | 500 | | 508 | |
| 6 | Commonwealth Bank of Australia | 3.350% | 6/4/24 | 800 | | 836 | |
| | Cooperatieve Rabobank UA | 4.500% | 1/11/21 | 150 | | 154 | |
| | Cooperatieve Rabobank UA | 2.500% | 1/19/21 | 600 | | 603 | |
| | Cooperatieve Rabobank UA | 2.750% | 1/10/22 | 250 | | 254 | |
| | Cooperatieve Rabobank UA | 3.875% | 2/8/22 | 525 | | 547 | |
| | Cooperatieve Rabobank UA | 3.950% | 11/9/22 | 125 | | 130 | |
| | Cooperatieve Rabobank UA | 4.625% | 12/1/23 | 175 | | 190 | |
| | Cooperatieve Rabobank UA | 3.375% | 5/21/25 | 275 | | 291 | |
| | Cooperatieve Rabobank UA | 4.375% | 8/4/25 | 600 | | 649 | |
| | Cooperatieve Rabobank UA | 3.750% | 7/21/26 | 225 | | 234 | |
| | Cooperatieve Rabobank UA | 5.250% | 5/24/41 | 100 | | 136 | |
| | Cooperatieve Rabobank UA | 5.750% | 12/1/43 | 250 | | 329 | |
| | Cooperatieve Rabobank UA | 5.250% | 8/4/45 | 350 | | 440 | |
| | Credit Suisse AG | 3.000% | 10/29/21 | 600 | | 611 | |
| | Credit Suisse AG | 2.100% | 11/12/21 | 250 | | 251 | |
| | Credit Suisse AG | 3.625% | 9/9/24 | 575 | | 610 | |
| 6 | Credit Suisse Group AG | 3.574% | 1/9/23 | 250 | | 257 | |
| | Credit Suisse Group Funding Guernsey Ltd. | 3.125% | 12/10/20 | 250 | | 252 | |
| | Credit Suisse Group Funding Guernsey Ltd. | 3.450% | 4/16/21 | 275 | | 279 | |
| | Credit Suisse Group Funding Guernsey Ltd. | 3.800% | 9/15/22 | 750 | | 780 | |
| | Credit Suisse Group Funding Guernsey Ltd. | 3.800% | 6/9/23 | 825 | | 863 | |
| | Credit Suisse Group Funding Guernsey Ltd. | 3.750% | 3/26/25 | 250 | | 264 | |
| | Credit Suisse Group Funding Guernsey Ltd. | 4.875% | 5/15/45 | 375 | | 471 | |
| | Deutsche Bank AG | 3.125% | 1/13/21 | 100 | | 100 | |
| | Deutsche Bank AG | 3.150% | 1/22/21 | 150 | | 151 | |
| | Deutsche Bank AG | 4.250% | 2/4/21 | 150 | | 152 | |
| | Deutsche Bank AG | 4.250% | 10/14/21 | 600 | | 617 | |
| | Deutsche Bank AG | 3.300% | 11/16/22 | 500 | | 505 | |
| | Deutsche Bank AG | 3.950% | 2/27/23 | 300 | | 307 | |
| | Deutsche Bank AG | 3.700% | 5/30/24 | 548 | | 559 | |
| | Deutsche Bank AG | 4.100% | 1/13/26 | 100 | | 102 | |
| | Discover Bank | 3.200% | 8/9/21 | 100 | | 102 | |
| | Discover Bank | 3.350% | 2/6/23 | 150 | | 154 | |
| | Discover Bank | 4.200% | 8/8/23 | 300 | | 319 | |
| | Discover Bank | 2.450% | 9/12/24 | 150 | | 149 | |
| | Discover Bank | 3.450% | 7/27/26 | 100 | | 104 | |
| | Discover Bank | 4.650% | 9/13/28 | 250 | | 280 | |
| | Discover Financial Services | 3.850% | 11/21/22 | 200 | | 209 | |
| | Discover Financial Services | 3.950% | 11/6/24 | 450 | | 477 | |
| | Discover Financial Services | 3.750% | 3/4/25 | 170 | | 179 | |
| | Discover Financial Services | 4.500% | 1/30/26 | 200 | | 219 | |
| | Fifth Third Bancorp | 3.500% | 3/15/22 | 125 | | 129 | |
| | Fifth Third Bancorp | 4.300% | 1/16/24 | 275 | | 295 | |
| | Fifth Third Bancorp | 3.650% | 1/25/24 | 150 | | 158 | |
| | Fifth Third Bancorp | 2.375% | 1/28/25 | 150 | | 150 | |
| | Fifth Third Bancorp | 3.950% | 3/14/28 | 75 | | 82 | |
| | Fifth Third Bancorp | 8.250% | 3/1/38 | 200 | | 307 | |
| | Fifth Third Bank | 2.250% | 6/14/21 | 300 | | 301 | |
| | Fifth Third Bank | 3.350% | 7/26/21 | 200 | | 204 | |
| | Fifth Third Bank | 3.950% | 7/28/25 | 200 | | 217 | |
| | Fifth Third Bank | 3.850% | 3/15/26 | 200 | | 212 | |
| | First Horizon National Corp. | 3.500% | 12/15/20 | 100 | | 101 | |
| | First Republic Bank | 2.500% | 6/6/22 | 100 | | 101 | |
| | First Republic Bank | 4.375% | 8/1/46 | 75 | | 81 | |
| | FirstMerit Bank NA | 4.270% | 11/25/26 | 150 | | 161 | |
| | Goldman Sachs Capital I | 6.345% | 2/15/34 | 225 | | 292 | |
| | Goldman Sachs Group Inc. | 2.875% | 2/25/21 | 175 | | 177 | |
| | Goldman Sachs Group Inc. | 2.625% | 4/25/21 | 150 | | 151 | |
| | Goldman Sachs Group Inc. | 5.250% | 7/27/21 | 650 | | 681 | |
| | Goldman Sachs Group Inc. | 2.350% | 11/15/21 | 500 | | 502 | |
| | Goldman Sachs Group Inc. | 5.750% | 1/24/22 | 675 | | 722 | |
| | Goldman Sachs Group Inc. | 3.000% | 4/26/22 | 545 | | 552 | |
| 3 | Goldman Sachs Group Inc. | 2.876% | 10/31/22 | 1,055 | | 1,068 | |
| | Goldman Sachs Group Inc. | 3.625% | 1/22/23 | 425 | | 441 | |
| | Goldman Sachs Group Inc. | 3.200% | 2/23/23 | 425 | | 437 | |
| 3 | Goldman Sachs Group Inc. | 2.908% | 6/5/23 | 350 | | 355 | |
| 3 | Goldman Sachs Group Inc. | 2.905% | 7/24/23 | 500 | | 508 | |
| | Goldman Sachs Group Inc. | 3.625% | 2/20/24 | 300 | | 315 | |
| | Goldman Sachs Group Inc. | 4.000% | 3/3/24 | 475 | | 504 | |
| | Goldman Sachs Group Inc. | 3.850% | 7/8/24 | 586 | | 618 | |
| | Goldman Sachs Group Inc. | 3.500% | 1/23/25 | 1,332 | | 1,398 | |
| | Goldman Sachs Group Inc. | 3.750% | 5/22/25 | 825 | | 873 | |
| 3 | Goldman Sachs Group Inc. | 3.272% | 9/29/25 | 550 | | 568 | |
| | Goldman Sachs Group Inc. | 4.250% | 10/21/25 | 200 | | 217 | |
| | Goldman Sachs Group Inc. | 3.750% | 2/25/26 | 200 | | 212 | |
| | Goldman Sachs Group Inc. | 3.500% | 11/16/26 | 1,250 | | 1,304 | |
| | Goldman Sachs Group Inc. | 5.950% | 1/15/27 | 400 | | 477 | |
| | Goldman Sachs Group Inc. | 3.850% | 1/26/27 | 350 | | 372 | |
| 3 | Goldman Sachs Group Inc. | 3.691% | 6/5/28 | 625 | | 663 | |
| 3 | Goldman Sachs Group Inc. | 3.814% | 4/23/29 | 450 | | 481 | |
| 3 | Goldman Sachs Group Inc. | 4.223% | 5/1/29 | 475 | | 522 | |
| | Goldman Sachs Group Inc. | 6.450% | 5/1/36 | 50 | | 66 | |
Total Bond Market Index Portfolio
| | | | Face | | Market | |
| | | Maturity | Amount | | Value• | |
| | Coupon | Date | ($000 | ) | ($000 | ) |
| | Goldman Sachs Group Inc. | 6.750% | 10/1/37 | 975 | | 1,351 | |
| 3 | Goldman Sachs Group Inc. | 4.017% | 10/31/38 | 350 | | 379 | |
| 3 | Goldman Sachs Group Inc. | 4.411% | 4/23/39 | 500 | | 567 | |
| | Goldman Sachs Group Inc. | 6.250% | 2/1/41 | 675 | | 942 | |
| | Goldman Sachs Group Inc. | 4.800% | 7/8/44 | 400 | | 484 | |
| | Goldman Sachs Group Inc. | 5.150% | 5/22/45 | 475 | | 581 | |
| | Goldman Sachs Group Inc. | 4.750% | 10/21/45 | 150 | | 183 | |
| | HSBC Bank USA NA | 7.000% | 1/15/39 | 250 | | 364 | |
| | HSBC Holdings plc | 3.400% | 3/8/21 | 625 | | 634 | |
| | HSBC Holdings plc | 2.950% | 5/25/21 | 800 | | 810 | |
| | HSBC Holdings plc | 2.650% | 1/5/22 | 500 | | 505 | |
| | HSBC Holdings plc | 4.875% | 1/14/22 | 160 | | 169 | |
| | HSBC Holdings plc | 4.000% | 3/30/22 | 290 | | 302 | |
| 3 | HSBC Holdings plc | 3.262% | 3/13/23 | 560 | | 572 | |
| | HSBC Holdings plc | 3.600% | 5/25/23 | 200 | | 208 | |
| 3 | HSBC Holdings plc | 3.033% | 11/22/23 | 200 | | 204 | |
| | HSBC Holdings plc | 4.250% | 3/14/24 | 250 | | 265 | |
| 3 | HSBC Holdings plc | 3.950% | 5/18/24 | 500 | | 524 | |
| 3 | HSBC Holdings plc | 3.803% | 3/11/25 | 1,075 | | 1,128 | |
| | HSBC Holdings plc | 4.250% | 8/18/25 | 150 | | 160 | |
| 3 | HSBC Holdings plc | 2.633% | 11/7/25 | 200 | | 200 | |
| | HSBC Holdings plc | 4.300% | 3/8/26 | 1,100 | | 1,195 | |
| | HSBC Holdings plc | 3.900% | 5/25/26 | 450 | | 479 | |
| 3 | HSBC Holdings plc | 4.292% | 9/12/26 | 500 | | 537 | |
| | HSBC Holdings plc | 4.375% | 11/23/26 | 350 | | 378 | |
| 3 | HSBC Holdings plc | 4.041% | 3/13/28 | 400 | | 427 | |
| 3 | HSBC Holdings plc | 4.583% | 6/19/29 | 400 | | 446 | |
| 3 | HSBC Holdings plc | 3.973% | 5/22/30 | 570 | | 612 | |
| | HSBC Holdings plc | 7.625% | 5/17/32 | 100 | | 138 | |
| | HSBC Holdings plc | 7.350% | 11/27/32 | 100 | | 139 | |
| | HSBC Holdings plc | 6.500% | 5/2/36 | 350 | | 476 | |
| | HSBC Holdings plc | 6.500% | 9/15/37 | 50 | | 68 | |
| | HSBC Holdings plc | 6.800% | 6/1/38 | 200 | | 284 | |
| | HSBC Holdings plc | 5.250% | 3/14/44 | 750 | | 949 | |
| | HSBC USA Inc. | 3.500% | 6/23/24 | 150 | | 159 | |
| | Huntington Bancshares Inc. | 7.000% | 12/15/20 | 25 | | 26 | |
| | Huntington Bancshares Inc. | 3.150% | 3/14/21 | 100 | | 101 | |
| | Huntington Bancshares Inc. | 2.300% | 1/14/22 | 200 | | 201 | |
| | Huntington National Bank | 3.250% | 5/14/21 | 250 | | 254 | |
| | Huntington National Bank | 2.500% | 8/7/22 | 200 | | 202 | |
| | Huntington National Bank | 3.550% | 10/6/23 | 250 | | 262 | |
| | ING Groep NV | 3.150% | 3/29/22 | 200 | | 204 | |
| | ING Groep NV | 4.100% | 10/2/23 | 300 | | 318 | |
| | ING Groep NV | 3.550% | 4/9/24 | 200 | | 209 | |
| | ING Groep NV | 3.950% | 3/29/27 | 300 | | 323 | |
| | ING Groep NV | 4.550% | 10/2/28 | 200 | | 227 | |
| | ING Groep NV | 4.050% | 4/9/29 | 200 | | 219 | |
| | JPMorgan Chase & Co. | 2.550% | 3/1/21 | 850 | | 855 | |
| | JPMorgan Chase & Co. | 4.625% | 5/10/21 | 250 | | 259 | |
| | JPMorgan Chase & Co. | 2.400% | 6/7/21 | 275 | | 277 | |
| | JPMorgan Chase & Co. | 2.295% | 8/15/21 | 450 | | 451 | |
| | JPMorgan Chase & Co. | 4.350% | 8/15/21 | 205 | | 213 | |
| | JPMorgan Chase & Co. | 4.500% | 1/24/22 | 325 | | 341 | |
| 3 | JPMorgan Chase & Co. | 3.514% | 6/18/22 | 200 | | 204 | |
| | JPMorgan Chase & Co. | 3.250% | 9/23/22 | 750 | | 775 | |
| | JPMorgan Chase & Co. | 2.972% | 1/15/23 | 370 | | 377 | |
| | JPMorgan Chase & Co. | 3.200% | 1/25/23 | 750 | | 774 | |
| 3 | JPMorgan Chase & Co. | 3.207% | 4/1/23 | 1,000 | | 1,022 | |
| 3 | JPMorgan Chase & Co. | 2.776% | 4/25/23 | 350 | | 354 | |
| | JPMorgan Chase & Co. | 3.375% | 5/1/23 | 300 | | 311 | |
| | JPMorgan Chase & Co. | 2.700% | 5/18/23 | 250 | | 255 | |
| | JPMorgan Chase & Co. | 3.875% | 2/1/24 | 445 | | 476 | |
| 3 | JPMorgan Chase & Co. | 3.559% | 4/23/24 | 485 | | 505 | |
| | JPMorgan Chase & Co. | 3.625% | 5/13/24 | 776 | | 820 | |
| 3 | JPMorgan Chase & Co. | 3.797% | 7/23/24 | 175 | | 184 | |
| | JPMorgan Chase & Co. | 3.875% | 9/10/24 | 575 | | 615 | |
| 3 | JPMorgan Chase & Co. | 4.023% | 12/5/24 | 300 | | 320 | |
| | JPMorgan Chase & Co. | 3.125% | 1/23/25 | 400 | | 417 | |
| 3 | JPMorgan Chase & Co. | 3.220% | 3/1/25 | 600 | | 620 | |
| | JPMorgan Chase & Co. | 3.900% | 7/15/25 | 362 | | 391 | |
| 3 | JPMorgan Chase & Co. | 2.301% | 10/15/25 | 700 | | 699 | |
| | JPMorgan Chase & Co. | 3.300% | 4/1/26 | 685 | | 718 | |
| | JPMorgan Chase & Co. | 3.200% | 6/15/26 | 300 | | 312 | |
| | JPMorgan Chase & Co. | 2.950% | 10/1/26 | 875 | | 899 | |
| | JPMorgan Chase & Co. | 4.125% | 12/15/26 | 450 | | 492 | |
| 3 | JPMorgan Chase & Co. | 3.960% | 1/29/27 | 500 | | 541 | |
| | JPMorgan Chase & Co. | 3.625% | 12/1/27 | 1,000 | | 1,050 | |
| 3 | JPMorgan Chase & Co. | 3.782% | 2/1/28 | 625 | | 671 | |
| 3 | JPMorgan Chase & Co. | 3.540% | 5/1/28 | 350 | | 371 | |
| 3 | JPMorgan Chase & Co. | 3.509% | 1/23/29 | 575 | | 609 | |
| 3 | JPMorgan Chase & Co. | 4.005% | 4/23/29 | 300 | | 328 | |
| 3 | JPMorgan Chase & Co. | 4.203% | 7/23/29 | 250 | | 278 | |
| 3 | JPMorgan Chase & Co. | 4.452% | 12/5/29 | 300 | | 341 | |
| 3 | JPMorgan Chase & Co. | 3.702% | 5/6/30 | 300 | | 323 | |
| 3 | JPMorgan Chase & Co. | 2.739% | 10/15/30 | 1,500 | | 1,500 | |
| | JPMorgan Chase & Co. | 6.400% | 5/15/38 | 450 | | 649 | |
| | JPMorgan Chase & Co. | 5.500% | 10/15/40 | 650 | | 869 | |
| | JPMorgan Chase & Co. | 5.600% | 7/15/41 | 275 | | 376 | |
| | JPMorgan Chase & Co. | 5.400% | 1/6/42 | 150 | | 203 | |
| | JPMorgan Chase & Co. | 5.625% | 8/16/43 | 300 | | 402 | |
| | JPMorgan Chase & Co. | 4.950% | 6/1/45 | 100 | | 126 | |
| 3 | JPMorgan Chase & Co. | 4.260% | 2/22/48 | 375 | | 439 | |
| 3 | JPMorgan Chase & Co. | 4.032% | 7/24/48 | 500 | | 566 | |
| 3 | JPMorgan Chase & Co. | 3.964% | 11/15/48 | 1,000 | | 1,121 | |
| 3 | JPMorgan Chase & Co. | 3.897% | 1/23/49 | 400 | | 447 | |
| | KeyBank NA | 2.300% | 9/14/22 | 200 | | 202 | |
| | KeyBank NA | 3.375% | 3/7/23 | 250 | | 260 | |
| | KeyBank NA | 3.300% | 6/1/25 | 125 | | 132 | |
| | KeyCorp | 5.100% | 3/24/21 | 25 | | 26 | |
| | KeyCorp | 4.150% | 10/29/25 | 150 | | 164 | |
| | KeyCorp | 4.100% | 4/30/28 | 600 | | 655 | |
| | KeyCorp | 2.550% | 10/1/29 | 150 | | 147 | |
| | Lloyds Bank plc | 6.375% | 1/21/21 | 175 | | 182 | |
| | Lloyds Bank plc | 3.300% | 5/7/21 | 200 | | 203 | |
| | Lloyds Banking Group plc | 3.000% | 1/11/22 | 300 | | 305 | |
| 3 | Lloyds Banking Group plc | 2.858% | 3/17/23 | 250 | | 252 | |
| | Lloyds Banking Group plc | 4.050% | 8/16/23 | 900 | | 950 | |
| 3 | Lloyds Banking Group plc | 2.907% | 11/7/23 | 400 | | 406 | |
| | Lloyds Banking Group plc | 3.900% | 3/12/24 | 200 | | 211 | |
| | Lloyds Banking Group plc | 4.450% | 5/8/25 | 200 | | 218 | |
| | Lloyds Banking Group plc | 4.582% | 12/10/25 | 700 | | 755 | |
| | Lloyds Banking Group plc | 4.650% | 3/24/26 | 575 | | 622 | |
| | Lloyds Banking Group plc | 3.750% | 1/11/27 | 200 | | 210 | |
| | Lloyds Banking Group plc | 4.375% | 3/22/28 | 250 | | 275 | |
| | Lloyds Banking Group plc | 4.550% | 8/16/28 | 200 | | 223 | |
| 3 | Lloyds Banking Group plc | 3.574% | 11/7/28 | 200 | | 208 | |
| | Lloyds Banking Group plc | 5.300% | 12/1/45 | 200 | | 243 | |
| | Lloyds Banking Group plc | 4.344% | 1/9/48 | 275 | | 297 | |
| | M&T Bank Corp. | 3.550% | 7/26/23 | 200 | | 210 | |
| | Manufacturers & Traders Trust Co. | 2.625% | 1/25/21 | 225 | | 226 | |
| | Mitsubishi UFJ Financial Group Inc. | 2.950% | 3/1/21 | 403 | | 407 | |
| | Mitsubishi UFJ Financial Group Inc. | 3.535% | 7/26/21 | 200 | | 204 | |
| | Mitsubishi UFJ Financial Group Inc. | 2.190% | 9/13/21 | 400 | | 401 | |
| | Mitsubishi UFJ Financial Group Inc. | 2.998% | 2/22/22 | 1,275 | | 1,298 | |
| | Mitsubishi UFJ Financial Group Inc. | 3.218% | 3/7/22 | 200 | | 205 | |
| | Mitsubishi UFJ Financial Group Inc. | 2.623% | 7/18/22 | 675 | | 684 | |
| | Mitsubishi UFJ Financial Group Inc. | 2.665% | 7/25/22 | 300 | | 304 | |
| | Mitsubishi UFJ Financial Group Inc. | 3.455% | 3/2/23 | 300 | | 311 | |
| | Mitsubishi UFJ Financial Group Inc. | 3.761% | 7/26/23 | 740 | | 777 | |
| | Mitsubishi UFJ Financial Group Inc. | 2.527% | 9/13/23 | 100 | | 101 | |
| | Mitsubishi UFJ Financial Group Inc. | 3.407% | 3/7/24 | 200 | | 209 | |
| | Mitsubishi UFJ Financial Group Inc. | 2.801% | 7/18/24 | 200 | | 204 | |
| | Mitsubishi UFJ Financial Group Inc. | 3.777% | 3/2/25 | 250 | | 266 | |
| | Mitsubishi UFJ Financial Group Inc. | 3.850% | 3/1/26 | 525 | | 563 | |
| | Mitsubishi UFJ Financial Group Inc. | 2.757% | 9/13/26 | 250 | | 252 | |
| | Mitsubishi UFJ Financial Group Inc. | 3.677% | 2/22/27 | 500 | | 531 | |
| | Mitsubishi UFJ Financial Group Inc. | 3.287% | 7/25/27 | 250 | | 259 | |
| | Mitsubishi UFJ Financial Group Inc. | 3.961% | 3/2/28 | 200 | | 217 | |
| | Mitsubishi UFJ Financial Group Inc. | 4.050% | 9/11/28 | 200 | | 220 | |
| | Mitsubishi UFJ Financial Group Inc. | 3.741% | 3/7/29 | 200 | | 215 | |
| | Mitsubishi UFJ Financial Group Inc. | 3.195% | 7/18/29 | 175 | | 181 | |
| | Mitsubishi UFJ Financial Group Inc. | 4.286% | 7/26/38 | 50 | | 58 | |
Total Bond Market Index Portfolio
| | | | Face | | Market | |
| | | Maturity | Amount | | Value• | |
| | Coupon | Date | ($000 | ) | ($000 | ) |
| | Mitsubishi UFJ Financial Group Inc. | 3.751% | 7/18/39 | 200 | | 219 | |
| | Mizuho Financial Group Inc. | 3.549% | 3/5/23 | 200 | | 208 | |
| 3 | Mizuho Financial Group Inc. | 2.721% | 7/16/23 | 300 | | 303 | |
| 3 | Mizuho Financial Group Inc. | 3.922% | 9/11/24 | 200 | | 210 | |
| 3 | Mizuho Financial Group Inc. | 2.839% | 7/16/25 | 375 | | 378 | |
| 3 | Mizuho Financial Group Inc. | 2.555% | 9/13/25 | 100 | | 100 | |
| | Mizuho Financial Group Inc. | 3.663% | 2/28/27 | 250 | | 264 | |
| | Mizuho Financial Group Inc. | 4.018% | 3/5/28 | 325 | | 354 | |
| 3 | Mizuho Financial Group Inc. | 4.254% | 9/11/29 | 400 | | 443 | |
| 3 | Mizuho Financial Group Inc. | 3.153% | 7/16/30 | 500 | | 511 | |
| 3 | Mizuho Financial Group Inc. | 2.869% | 9/13/30 | 100 | | 101 | |
| | Morgan Stanley | 5.750% | 1/25/21 | 250 | | 259 | |
| | Morgan Stanley | 2.500% | 4/21/21 | 200 | | 201 | |
| | Morgan Stanley | 5.500% | 7/28/21 | 650 | | 684 | |
| | Morgan Stanley | 2.625% | 11/17/21 | 500 | | 506 | |
| | Morgan Stanley | 2.750% | 5/19/22 | 600 | | 610 | |
| | Morgan Stanley | 4.875% | 11/1/22 | 425 | | 455 | |
| | Morgan Stanley | 3.125% | 1/23/23 | 750 | | 770 | |
| | Morgan Stanley | 3.750% | 2/25/23 | 675 | | 705 | |
| 3 | Morgan Stanley | 3.737% | 4/24/24 | 750 | | 781 | |
| | Morgan Stanley | 3.875% | 4/29/24 | 545 | | 578 | |
| | Morgan Stanley | 3.700% | 10/23/24 | 650 | | 689 | |
| | Morgan Stanley | 4.000% | 7/23/25 | 330 | | 357 | |
| | Morgan Stanley | 5.000% | 11/24/25 | 650 | | 730 | |
| | Morgan Stanley | 3.875% | 1/27/26 | 225 | | 241 | |
| | Morgan Stanley | 3.125% | 7/27/26 | 700 | | 721 | |
| | Morgan Stanley | 6.250% | 8/9/26 | 425 | | 516 | |
| | Morgan Stanley | 4.350% | 9/8/26 | 400 | | 437 | |
| | Morgan Stanley | 3.625% | 1/20/27 | 250 | | 265 | |
| | Morgan Stanley | 3.950% | 4/23/27 | 325 | | 347 | |
| 3 | Morgan Stanley | 3.591% | 7/22/28 | 935 | | 991 | |
| 3 | Morgan Stanley | 3.772% | 1/24/29 | 575 | | 618 | |
| 3 | Morgan Stanley | 4.431% | 1/23/30 | 550 | | 621 | |
| | Morgan Stanley | 7.250% | 4/1/32 | 150 | | 215 | |
| 3 | Morgan Stanley | 3.971% | 7/22/38 | 375 | | 416 | |
| 3 | Morgan Stanley | 4.457% | 4/22/39 | 250 | | 294 | |
| | Morgan Stanley | 6.375% | 7/24/42 | 600 | | 883 | |
| | Morgan Stanley | 4.300% | 1/27/45 | 650 | | 763 | |
| | Morgan Stanley | 4.375% | 1/22/47 | 175 | | 209 | |
| | MUFG Americas Holdings Corp. | 3.500% | 6/18/22 | 475 | | 492 | |
| | MUFG Americas Holdings Corp. | 3.000% | 2/10/25 | 80 | | 81 | |
| | MUFG Union Bank NA | 3.150% | 4/1/22 | 1,200 | | 1,227 | |
| | National Australia Bank Ltd. | 1.875% | 7/12/21 | 175 | | 175 | |
| | National Australia Bank Ltd. | 3.375% | 9/20/21 | 250 | | 256 | |
| | National Australia Bank Ltd. | 3.700% | 11/4/21 | 250 | | 258 | |
| | National Australia Bank Ltd. | 2.500% | 5/22/22 | 550 | | 557 | |
| | National Australia Bank Ltd. | 3.000% | 1/20/23 | 250 | | 256 | |
| | National Australia Bank Ltd. | 3.625% | 6/20/23 | 250 | | 262 | |
| | National Australia Bank Ltd. | 3.375% | 1/14/26 | 100 | | 105 | |
| | National Australia Bank Ltd. | 2.500% | 7/12/26 | 200 | | 201 | |
| | Northern Trust Corp. | 3.375% | 8/23/21 | 100 | | 102 | |
| | Northern Trust Corp. | 3.950% | 10/30/25 | 150 | | 161 | |
| | Northern Trust Corp. | 3.650% | 8/3/28 | 100 | | 108 | |
| 3 | Northern Trust Corp. | 3.375% | 5/8/32 | 50 | | 51 | |
| | People’s United Bank NA | 4.000% | 7/15/24 | 100 | | 104 | |
| | People’s United Financial Inc. | 3.650% | 12/6/22 | 100 | | 104 | |
| | PNC Bank NA | 2.150% | 4/29/21 | 250 | | 251 | |
| | PNC Bank NA | 2.550% | 12/9/21 | 100 | | 101 | |
| | PNC Bank NA | 2.625% | 2/17/22 | 175 | | 177 | |
| | PNC Bank NA | 2.450% | 7/28/22 | 100 | | 101 | |
| | PNC Bank NA | 2.700% | 11/1/22 | 450 | | 454 | |
| 3 | PNC Bank NA | 2.028% | 12/9/22 | 145 | | 145 | |
| | PNC Bank NA | 3.300% | 10/30/24 | 705 | | 733 | |
| | PNC Bank NA | 2.950% | 2/23/25 | 150 | | 153 | |
| | PNC Bank NA | 3.250% | 6/1/25 | 100 | | 105 | |
| | PNC Bank NA | 3.100% | 10/25/27 | 250 | | 261 | |
| | PNC Bank NA | 3.250% | 1/22/28 | 150 | | 157 | |
| | PNC Bank NA | 4.050% | 7/26/28 | 250 | | 274 | |
| | PNC Bank NA | 2.700% | 10/22/29 | 150 | | 149 | |
| | PNC Financial Services Group Inc. | 3.500% | 1/23/24 | 100 | | 105 | |
| | PNC Financial Services Group Inc. | 3.900% | 4/29/24 | 125 | | 131 | |
| | PNC Financial Services Group Inc. | 3.150% | 5/19/27 | 450 | | 465 | |
| | PNC Financial Services Group Inc. | 3.450% | 4/23/29 | 500 | | 531 | |
| | PNC Funding Corp. | 3.300% | 3/8/22 | 340 | | 349 | |
| 3 | Regions Bank | 3.374% | 8/13/21 | 150 | | 151 | |
| | Regions Bank | 6.450% | 6/26/37 | 250 | | 321 | |
| | Regions Financial Corp. | 3.800% | 8/14/23 | 200 | | 211 | |
| | Royal Bank of Canada | 2.500% | 1/19/21 | 200 | | 201 | |
| | Royal Bank of Canada | 3.200% | 4/30/21 | 700 | | 712 | |
| | Royal Bank of Canada | 2.750% | 2/1/22 | 300 | | 305 | |
| | Royal Bank of Canada | 2.800% | 4/29/22 | 300 | | 306 | |
| | Royal Bank of Canada | 3.700% | 10/5/23 | 100 | | 105 | |
| | Royal Bank of Canada | 2.550% | 7/16/24 | 200 | | 203 | |
| | Royal Bank of Canada | 2.250% | 11/1/24 | 650 | | 653 | |
| | Royal Bank of Canada | 4.650% | 1/27/26 | 250 | | 277 | |
| | Royal Bank of Scotland Group plc | 6.125% | 12/15/22 | 100 | | 109 | |
| 3 | Royal Bank of Scotland Group plc | 3.498% | 5/15/23 | 500 | | 511 | |
| | Royal Bank of Scotland Group plc | 6.100% | 6/10/23 | 195 | | 214 | |
| | Royal Bank of Scotland Group plc | 3.875% | 9/12/23 | 600 | | 627 | |
| | Royal Bank of Scotland Group plc | 6.000% | 12/19/23 | 100 | | 111 | |
| | Royal Bank of Scotland Group plc | 5.125% | 5/28/24 | 500 | | 541 | |
| 3 | Royal Bank of Scotland Group plc | 4.519% | 6/25/24 | 300 | | 318 | |
| 3 | Royal Bank of Scotland Group plc | 4.892% | 5/18/29 | 1,000 | | 1,127 | |
| 3 | Royal Bank of Scotland Group plc | 3.754% | 11/1/29 | 200 | | 204 | |
| 3 | Royal Bank of Scotland Group plc | 5.076% | 1/27/30 | 200 | | 229 | |
| 3 | Royal Bank of Scotland Group plc | 4.445% | 5/8/30 | 650 | | 715 | |
| | Santander Holdings USA Inc. | 3.400% | 1/18/23 | 115 | | 118 | |
| | Santander Holdings USA Inc. | 4.500% | 7/17/25 | 125 | | 134 | |
| 6 | Santander Holdings USA Inc. | 3.244% | 10/5/26 | 900 | | 904 | |
| | Santander Holdings USA Inc. | 4.400% | 7/13/27 | 250 | | 269 | |
| | Santander UK Group Holdings plc | 3.125% | 1/8/21 | 550 | | 555 | |
| | Santander UK Group Holdings plc | 2.875% | 8/5/21 | 225 | | 227 | |
| | Santander UK Group Holdings plc | 3.571% | 1/10/23 | 200 | | 205 | |
| 3 | Santander UK Group Holdings plc | 3.823% | 11/3/28 | 200 | | 210 | |
| | Santander UK plc | 3.400% | 6/1/21 | 200 | | 204 | |
| | Santander UK plc | 3.750% | 11/15/21 | 200 | | 206 | |
| | Santander UK plc | 4.000% | 3/13/24 | 200 | | 213 | |
| | Santander UK plc | 2.875% | 6/18/24 | 200 | | 204 | |
| | Skandinaviska Enskilda Banken AB | 2.625% | 3/15/21 | 300 | | 302 | |
| | Skandinaviska Enskilda Banken AB | 1.875% | 9/13/21 | 750 | | 747 | |
| | Skandinaviska Enskilda Banken AB | 2.800% | 3/11/22 | 250 | | 254 | |
| | State Street Corp. | 1.950% | 5/19/21 | 125 | | 125 | |
| 3 | State Street Corp. | 2.653% | 5/15/23 | 300 | | 305 | |
| | State Street Corp. | 3.100% | 5/15/23 | 400 | | 411 | |
| | State Street Corp. | 3.700% | 11/20/23 | 83 | | 88 | |
| 3 | State Street Corp. | 3.776% | 12/3/24 | 200 | | 211 | |
| | State Street Corp. | 3.300% | 12/16/24 | 227 | | 239 | |
| | State Street Corp. | 3.550% | 8/18/25 | 225 | | 242 | |
| 3 | State Street Corp. | 2.354% | 11/1/25 | 125 | | 125 | |
| | State Street Corp. | 2.650% | 5/19/26 | 125 | | 127 | |
| 3 | State Street Corp. | 4.141% | 12/3/29 | 200 | | 223 | |
| 3 | State Street Corp. | 3.031% | 11/1/34 | 125 | | 125 | |
| | Sumitomo Mitsui Banking Corp. | 3.200% | 7/18/22 | 250 | | 257 | |
| | Sumitomo Mitsui Banking Corp. | 3.950% | 7/19/23 | 100 | | 106 | |
| | Sumitomo Mitsui Banking Corp. | 3.950% | 1/10/24 | 250 | | 265 | |
| | Sumitomo Mitsui Banking Corp. | 3.400% | 7/11/24 | 250 | | 261 | |
| | Sumitomo Mitsui Financial Group Inc. | 2.934% | 3/9/21 | 340 | | 344 | |
| | Sumitomo Mitsui Financial Group Inc. | 2.058% | 7/14/21 | 250 | | 250 | |
| | Sumitomo Mitsui Financial Group Inc. | 2.442% | 10/19/21 | 475 | | 478 | |
| | Sumitomo Mitsui Financial Group Inc. | 2.846% | 1/11/22 | 250 | | 254 | |
| | Sumitomo Mitsui Financial Group Inc. | 2.784% | 7/12/22 | 200 | | 203 | |
| | Sumitomo Mitsui Financial Group Inc. | 2.778% | 10/18/22 | 200 | | 203 | |
| | Sumitomo Mitsui Financial Group Inc. | 3.102% | 1/17/23 | 250 | | 256 | |
| | Sumitomo Mitsui Financial Group Inc. | 3.748% | 7/19/23 | 200 | | 210 | |
| | Sumitomo Mitsui Financial Group Inc. | 3.936% | 10/16/23 | 200 | | 212 | |
| | Sumitomo Mitsui Financial Group Inc. | 2.696% | 7/16/24 | 375 | | 380 | |
| | Sumitomo Mitsui Financial Group Inc. | 3.784% | 3/9/26 | 150 | | 160 | |
| | Sumitomo Mitsui Financial Group Inc. | 2.632% | 7/14/26 | 125 | | 125 | |
| | Sumitomo Mitsui Financial Group Inc. | 3.010% | 10/19/26 | 175 | | 178 | |
| | Sumitomo Mitsui Financial Group Inc. | 3.446% | 1/11/27 | 200 | | 209 | |
| | Sumitomo Mitsui Financial Group Inc. | 3.364% | 7/12/27 | 700 | | 729 | |
| | Sumitomo Mitsui Financial Group Inc. | 3.544% | 1/17/28 | 300 | | 317 | |
Total Bond Market Index Portfolio
| | | | Face | | Market | |
| | | Maturity | Amount | | Value• | |
| | Coupon | Date | ($000 | ) | ($000 | ) |
| | Sumitomo Mitsui Financial Group Inc. | 3.944% | 7/19/28 | 100 | | 109 | |
| | Sumitomo Mitsui Financial Group Inc. | 3.040% | 7/16/29 | 475 | | 484 | |
| | Sumitomo Mitsui Financial Group Inc. | 3.202% | 9/17/29 | 150 | | 151 | |
| | SVB Financial Group | 3.500% | 1/29/25 | 100 | | 104 | |
| | Svenska Handelsbanken AB | 2.450% | 3/30/21 | 300 | | 302 | |
| | Svenska Handelsbanken AB | 3.350% | 5/24/21 | 200 | | 204 | |
| | Svenska Handelsbanken AB | 1.875% | 9/7/21 | 350 | | 349 | |
| | Synchrony Bank | 3.650% | 5/24/21 | 250 | | 255 | |
| | Synchrony Bank | 3.000% | 6/15/22 | 100 | | 102 | |
| | Synchrony Financial | 2.850% | 7/25/22 | 75 | | 76 | |
| | Synchrony Financial | 4.250% | 8/15/24 | 250 | | 267 | |
| | Synchrony Financial | 4.500% | 7/23/25 | 150 | | 162 | |
| | Synchrony Financial | 3.700% | 8/4/26 | 125 | | 129 | |
| | Synchrony Financial | 3.950% | 12/1/27 | 300 | | 315 | |
| | Synovus Financial Corp. | 3.125% | 11/1/22 | 50 | | 51 | |
| | Toronto-Dominion Bank | 2.500% | 12/14/20 | 100 | | 101 | |
| | Toronto-Dominion Bank | 2.550% | 1/25/21 | 450 | | 453 | |
| | Toronto-Dominion Bank | 2.125% | 4/7/21 | 175 | | 176 | |
| | Toronto-Dominion Bank | 3.250% | 6/11/21 | 600 | | 612 | |
| | Toronto-Dominion Bank | 1.800% | 7/13/21 | 150 | | 150 | |
| | Toronto-Dominion Bank | 1.900% | 12/1/22 | 225 | | 225 | |
| | Toronto-Dominion Bank | 3.250% | 3/11/24 | 400 | | 417 | |
| | Truist Bank | 2.625% | 1/15/22 | 250 | | 253 | |
| | Truist Bank | 2.800% | 5/17/22 | 400 | | 407 | |
| 3 | Truist Bank | 3.502% | 8/2/22 | 250 | | 255 | |
| | Truist Bank | 3.000% | 2/2/23 | 75 | | 77 | |
| | Truist Bank | 3.200% | 4/1/24 | 500 | | 519 | |
| 3 | Truist Bank | 3.689% | 8/2/24 | 250 | | 262 | |
| | Truist Bank | 2.150% | 12/6/24 | 250 | | 250 | |
| | Truist Bank | 3.625% | 9/16/25 | 500 | | 532 | |
| | Truist Bank | 3.300% | 5/15/26 | 200 | | 208 | |
| | Truist Financial Corp. | 2.150% | 2/1/21 | 125 | | 125 | |
| | Truist Financial Corp | 2.900% | 3/3/21 | 75 | | 76 | |
| | Truist Financial Corp. | 2.050% | 5/10/21 | 175 | | 175 | |
| | Truist Financial Corp. | 3.200% | 9/3/21 | 150 | | 153 | |
| | Truist Financial Corp. | 2.700% | 1/27/22 | 125 | | 127 | |
| | Truist Financial Corp. | 2.750% | 4/1/22 | 175 | | 178 | |
| | Truist Financial Corp. | 3.050% | 6/20/22 | 500 | | 510 | |
| | Truist Financial Corp. | 3.750% | 12/6/23 | 250 | | 264 | |
| | Truist Financial Corp. | 2.500% | 8/1/24 | 75 | | 76 | |
| | Truist Financial Corp. | 2.850% | 10/26/24 | 192 | | 198 | |
| | Truist Financial Corp. | 3.700% | 6/5/25 | 175 | | 188 | |
| | Truist Financial Corp. | 3.875% | 3/19/29 | 200 | | 215 | |
| 6 | UBS AG | 2.450% | 12/1/20 | 200 | | 201 | |
| | US Bancorp | 2.350% | 1/29/21 | 100 | | 100 | |
| | US Bancorp | 4.125% | 5/24/21 | 250 | | 257 | |
| | US Bancorp | 2.625% | 1/24/22 | 200 | | 203 | |
| | US Bancorp | 3.000% | 3/15/22 | 125 | | 128 | |
| | US Bancorp | 2.950% | 7/15/22 | 400 | | 410 | |
| | US Bancorp | 3.700% | 1/30/24 | 150 | | 159 | |
| | US Bancorp | 3.375% | 2/5/24 | 500 | | 523 | |
| | US Bancorp | 2.400% | 7/30/24 | 200 | | 202 | |
| | US Bancorp | 3.600% | 9/11/24 | 50 | | 53 | |
| | US Bancorp | 3.950% | 11/17/25 | 25 | | 27 | |
| | US Bancorp | 3.100% | 4/27/26 | 300 | | 312 | |
| | US Bancorp | 3.150% | 4/27/27 | 275 | | 288 | |
| | US Bancorp | 3.900% | 4/26/28 | 100 | | 112 | |
| | US Bancorp | 3.000% | 7/30/29 | 190 | | 194 | |
| | US Bank NA | 2.650% | 5/23/22 | 250 | | 254 | |
| | US Bank NA | 1.950% | 1/9/23 | 300 | | 300 | |
| | US Bank NA | 2.850% | 1/23/23 | 250 | | 257 | |
| | US Bank NA | 3.400% | 7/24/23 | 250 | | 261 | |
| | US Bank NA | 2.800% | 1/27/25 | 625 | | 644 | |
| | Wachovia Corp. | 6.605% | 10/1/25 | 265 | | 313 | |
| | Wells Fargo & Co. | 2.550% | 12/7/20 | 300 | | 301 | |
| | Wells Fargo & Co. | 2.500% | 3/4/21 | 1,350 | | 1,359 | |
| | Wells Fargo & Co. | 4.600% | 4/1/21 | 825 | | 850 | |
| | Wells Fargo & Co. | 2.100% | 7/26/21 | 350 | | 351 | |
| | Wells Fargo & Co. | 3.500% | 3/8/22 | 450 | | 464 | |
| | Wells Fargo & Co. | 2.625% | 7/22/22 | 775 | | 785 | |
| | Wells Fargo & Co. | 3.069% | 1/24/23 | 1,500 | | 1,526 | |
| | Wells Fargo & Co. | 3.450% | 2/13/23 | 350 | | 362 | |
| | Wells Fargo & Co. | 3.750% | 1/24/24 | 200 | | 211 | |
| | Wells Fargo & Co. | 3.300% | 9/9/24 | 400 | | 419 | |
| | Wells Fargo & Co. | 3.000% | 2/19/25 | 425 | | 438 | |
| 3 | Wells Fargo & Co. | 2.406% | 10/30/25 | 600 | | 598 | |
| | Wells Fargo & Co. | 3.000% | 4/22/26 | 1,275 | | 1,311 | |
| | Wells Fargo & Co. | 4.100% | 6/3/26 | 725 | | 779 | |
| | Wells Fargo & Co. | 3.000% | 10/23/26 | 675 | | 690 | |
| | Wells Fargo & Co. | 4.300% | 7/22/27 | 475 | | 518 | |
| 3 | Wells Fargo & Co. | 3.584% | 5/22/28 | 500 | | 530 | |
| | Wells Fargo & Co. | 4.150% | 1/24/29 | 200 | | 222 | |
| 3 | Wells Fargo & Co. | 2.879% | 10/30/30 | 1,800 | | 1,811 | |
| | Wells Fargo & Co. | 5.375% | 2/7/35 | 200 | | 258 | |
| | Wells Fargo & Co. | 5.375% | 11/2/43 | 500 | | 630 | |
| | Wells Fargo & Co. | 5.606% | 1/15/44 | 600 | | 793 | |
| | Wells Fargo & Co. | 4.650% | 11/4/44 | 325 | | 381 | |
| | Wells Fargo & Co. | 3.900% | 5/1/45 | 250 | | 284 | |
| | Wells Fargo & Co. | 4.900% | 11/17/45 | 250 | | 305 | |
| | Wells Fargo & Co. | 4.400% | 6/14/46 | 300 | | 344 | |
| | Wells Fargo & Co. | 4.750% | 12/7/46 | 350 | | 417 | |
| | Wells Fargo Bank NA | 2.600% | 1/15/21 | 250 | | 251 | |
| 3 | Wells Fargo Bank NA | 3.325% | 7/23/21 | 250 | | 252 | |
| | Wells Fargo Bank NA | 3.625% | 10/22/21 | 450 | | 463 | |
| 3 | Wells Fargo Bank NA | 2.897% | 5/27/22 | 600 | | 606 | |
| 3 | Wells Fargo Bank NA | 2.082% | 9/9/22 | 850 | | 850 | |
| | Wells Fargo Bank NA | 3.550% | 8/14/23 | 750 | | 783 | |
| | Wells Fargo Bank NA | 5.950% | 8/26/36 | 200 | | 265 | |
| | Wells Fargo Bank NA | 5.850% | 2/1/37 | 300 | | 398 | |
| | Wells Fargo Bank NA | 6.600% | 1/15/38 | 225 | | 324 | |
| | Westpac Banking Corp. | 2.100% | 5/13/21 | 600 | �� | 601 | |
| | Westpac Banking Corp. | 2.000% | 8/19/21 | 275 | | 275 | |
| | Westpac Banking Corp. | 2.500% | 6/28/22 | 1,000 | | 1,011 | |
| | Westpac Banking Corp. | 2.750% | 1/11/23 | 200 | | 203 | |
| | Westpac Banking Corp. | 3.650% | 5/15/23 | 75 | | 79 | |
| | Westpac Banking Corp. | 3.300% | 2/26/24 | 250 | | 260 | |
| | Westpac Banking Corp. | 2.350% | 2/19/25 | 200 | | 200 | |
| | Westpac Banking Corp. | 2.850% | 5/13/26 | 200 | | 204 | |
| | Westpac Banking Corp. | 2.700% | 8/19/26 | 175 | | 177 | |
| | Westpac Banking Corp. | 3.350% | 3/8/27 | 250 | | 264 | |
| 3 | Westpac Banking Corp. | 4.322% | 11/23/31 | 500 | | 527 | |
| | Westpac Banking Corp. | 4.110% | 7/24/34 | 25 | | 26 | |
| | Westpac Banking Corp. | 4.421% | 7/24/39 | 100 | | 110 | |
| | Zions Bancorp NA | 3.500% | 8/27/21 | 250 | | 255 | |
| | Zions Bancorp NA | 3.250% | 10/29/29 | 250 | | 245 | |
| | | | | | | | |
| | Brokerage (0.2%) | | | | | | |
| | Affiliated Managers Group Inc. | 4.250% | 2/15/24 | 100 | | 106 | |
| | Affiliated Managers Group Inc. | 3.500% | 8/1/25 | 125 | | 130 | |
| | Ameriprise Financial Inc. | 3.000% | 3/22/22 | 50 | | 51 | |
| | Ameriprise Financial Inc. | 4.000% | 10/15/23 | 250 | | 267 | |
| | Ameriprise Financial Inc. | 3.700% | 10/15/24 | 187 | | 200 | |
| | BGC Partners Inc. | 5.125% | 5/27/21 | 50 | | 52 | |
| | BGC Partners Inc. | 3.750% | 10/1/24 | 105 | | 105 | |
| | BlackRock Inc. | 4.250% | 5/24/21 | 125 | | 129 | |
| | BlackRock Inc. | 3.375% | 6/1/22 | 175 | | 181 | |
| | BlackRock Inc. | 3.500% | 3/18/24 | 175 | | 186 | |
| | BlackRock Inc. | 3.200% | 3/15/27 | 100 | | 106 | |
| | BlackRock Inc. | 3.250% | 4/30/29 | 90 | | 96 | |
| | Brookfield Asset Management Inc. | 4.000% | 1/15/25 | 105 | | 113 | |
| | Brookfield Finance Inc. | 4.250% | 6/2/26 | 50 | | 54 | |
| | Brookfield Finance Inc. | 3.900% | 1/25/28 | 125 | | 134 | |
| | Brookfield Finance Inc. | 4.850% | 3/29/29 | 150 | | 172 | |
| | Brookfield Finance Inc. | 4.700% | 9/20/47 | 150 | | 172 | |
| | Brookfield Finance LLC | 4.000% | 4/1/24 | 175 | | 188 | |
| | Cboe Global Markets Inc. | 3.650% | 1/12/27 | 110 | | 118 | |
| | Charles Schwab Corp. | 3.250% | 5/21/21 | 125 | | 127 | |
| | Charles Schwab Corp. | 3.225% | 9/1/22 | 300 | | 309 | |
| | Charles Schwab Corp. | 2.650% | 1/25/23 | 100 | | 102 | |
| | Charles Schwab Corp. | 3.550% | 2/1/24 | 400 | | 422 | |
| | Charles Schwab Corp. | 3.850% | 5/21/25 | 25 | | 27 | |
| | Charles Schwab Corp. | 3.200% | 3/2/27 | 250 | | 262 | |
Total Bond Market Index Portfolio
| | | | | | | | | Face | | | Market | |
| | | | | | | Maturity | | Amount | | | Value• | |
| | | | | Coupon | | Date | | | ($000 | ) | | | ($000 | ) |
| | | Charles Schwab Corp. | | 3.200% | | 1/25/28 | | | 100 | | | | 104 | |
| | | Charles Schwab Corp. | | 4.000% | | 2/1/29 | | | 125 | | | | 138 | |
| | Charles Schwab Corp. | | 3.250% | | 5/22/29 | | | 100 | | | | 105 | |
| | CME Group Inc. | | 3.000% | | 9/15/22 | | | 125 | | | | 129 | |
| | CME Group Inc. | | 3.000% | | 3/15/25 | | | 125 | | | | 129 | |
| | | CME Group Inc. | | 5.300% | | 9/15/43 | | | 150 | | | | 201 | |
| | | CME Group Inc. | | 4.150% | | 6/15/48 | | | 125 | | | | 149 | |
| | | E*TRADE Financial Corp. | | 3.800% | | 8/24/27 | | | 75 | | | | 78 | |
| | | E*TRADE Financial Corp. | | 4.500% | | 6/20/28 | | | 65 | | | | 71 | |
| | | Eaton Vance Corp. | | 3.625% | | 6/15/23 | | | 50 | | | | 52 | |
| | | Eaton Vance Corp. | | 3.500% | | 4/6/27 | | | 100 | | | | 106 | |
| | | Franklin Resources Inc. | | 2.800% | | 9/15/22 | | | 225 | | | | 231 | |
| | | Intercontinental Exchange Inc. | | 2.350% | | 9/15/22 | | | 100 | | | | 101 | |
| | | Intercontinental Exchange Inc. | | 3.450% | | 9/21/23 | | | 100 | | | | 105 | |
| | | Intercontinental Exchange Inc. | | 4.000% | | 10/15/23 | | | 150 | | | | 160 | |
| | | Intercontinental Exchange Inc. | | 3.750% | | 12/1/25 | | | 300 | | | | 323 | |
| | | Intercontinental Exchange Inc. | | 3.100% | | 9/15/27 | | | 150 | | | | 157 | |
| | | Intercontinental Exchange Inc. | | 3.750% | | 9/21/28 | | | 75 | | | | 82 | |
| | | Intercontinental Exchange Inc. | | 4.250% | | 9/21/48 | | | 175 | | | | 207 | |
| | | Invesco Finance plc | | 3.125% | | 11/30/22 | | | 175 | | | | 180 | |
| | | Invesco Finance plc | | 4.000% | | 1/30/24 | | | 450 | | | | 477 | |
| | | Invesco Finance plc | | 3.750% | | 1/15/26 | | | 170 | | | | 181 | |
| | | Invesco Finance plc | | 5.375% | | 11/30/43 | | | 75 | | | | 90 | |
| | | Janus Capital Group Inc. | | 4.875% | | 8/1/25 | | | 75 | | | | 81 | |
| | | Jefferies Financial Group Inc. | | 5.500% | | 10/18/23 | | | 150 | | | | 163 | |
| | | Jefferies Group LLC | | 6.875% | | 4/15/21 | | | 105 | | | | 111 | |
| | | Jefferies Group LLC | | 5.125% | | 1/20/23 | | | 100 | | | | 108 | |
| | | Jefferies Group LLC | | 4.850% | | 1/15/27 | | | 200 | | | | 221 | |
| | | Jefferies Group LLC | | 6.450% | | 6/8/27 | | | 50 | | | | 58 | |
| | | Jefferies Group LLC | | 6.250% | | 1/15/36 | | | 75 | | | | 89 | |
| | | Jefferies Group LLC | | 6.500% | | 1/20/43 | | | 75 | | | | 89 | |
| | | Jefferies Group LLC / Jefferies Group Capital Finance Inc. | | 4.150% | | 1/23/30 | | | 300 | | | | 316 | |
| | | Lazard Group LLC | | 3.750% | | 2/13/25 | | | 50 | | | | 53 | |
| | | Lazard Group LLC | | 3.625% | | 3/1/27 | | | 100 | | | | 102 | |
| | | Lazard Group LLC | | 4.500% | | 9/19/28 | | | 100 | | | | 111 | |
| | | Legg Mason Inc. | | 4.750% | | 3/15/26 | | | 100 | | | | 109 | |
| | | Legg Mason Inc. | | 5.625% | | 1/15/44 | | | 100 | | | | 113 | |
| | | Nasdaq Inc. | | 4.250% | | 6/1/24 | | | 125 | | | | 135 | |
| | | Nasdaq Inc. | | 3.850% | | 6/30/26 | | | 100 | | | | 107 | |
| | | Raymond James Financial Inc. | | 3.625% | | 9/15/26 | | | 75 | | | | 79 | |
| | | Raymond James Financial Inc. | | 4.950% | | 7/15/46 | | | 210 | | | | 249 | |
| | | Stifel Financial Corp. | | 3.500% | | 12/1/20 | | | 50 | | | | 51 | |
| | | Stifel Financial Corp. | | 4.250% | | 7/18/24 | | | 150 | | | | 158 | |
| | | TD Ameritrade Holding Corp. | | 2.950% | | 4/1/22 | | | 125 | | | | 128 | |
| | | TD Ameritrade Holding Corp. | | 3.625% | | 4/1/25 | | | 100 | | | | 106 | |
| | | TD Ameritrade Holding Corp. | | 3.300% | | 4/1/27 | | | 125 | | | | 131 | |
| | | TD Ameritrade Holding Corp. | | 2.750% | | 10/1/29 | | | 50 | | | | 50 | |
| | | | | | | | | | | | | | | |
| | | Finance Companies (0.2%) | | | | | | | | | | | | |
| | | AerCap Ireland Capital DAC / AerCap Global Aviation Trust | | 4.500% | | 5/15/21 | | | 150 | | | | 155 | |
| | | AerCap Ireland Capital DAC / AerCap Global Aviation Trust | | 5.000% | | 10/1/21 | | | 200 | | | | 210 | |
| | | AerCap Ireland Capital DAC / AerCap Global Aviation Trust | | 4.450% | | 12/16/21 | | | 70 | | | | 73 | |
| | | AerCap Ireland Capital DAC / AerCap Global Aviation Trust | | 3.950% | | 2/1/22 | | | 125 | | | | 129 | |
| | | AerCap Ireland Capital DAC / AerCap Global Aviation Trust | | 3.500% | | 5/26/22 | | | 100 | | | | 103 | |
| | | AerCap Ireland Capital DAC / AerCap Global Aviation Trust | | 4.625% | | 7/1/22 | | | 175 | | | | 185 | |
| | | AerCap Ireland Capital DAC / AerCap Global Aviation Trust | | 3.300% | | 1/23/23 | | | 125 | | | | 128 | |
| | | AerCap Ireland Capital DAC / AerCap Global Aviation Trust | | 4.450% | | 10/1/25 | | | 125 | | | | 134 | |
| | | AerCap Ireland Capital DAC / AerCap Global Aviation Trust | | 3.650% | | 7/21/27 | | | 150 | | | | 154 | |
| | | AerCap Ireland Capital DAC / AerCap Global Aviation Trust | | 3.875% | | 1/23/28 | | | 300 | | | | 311 | |
| | | Air Lease Corp. | | 2.500% | | 3/1/21 | | | 250 | | | | 251 | |
| | | Air Lease Corp. | | 3.875% | | 4/1/21 | | | 75 | | | | 77 | |
| | | Air Lease Corp. | | 3.375% | | 6/1/21 | | | 75 | | | | 76 | |
| | | Air Lease Corp. | | 3.750% | | 2/1/22 | | | 300 | | | | 309 | |
| | | Air Lease Corp. | | 2.625% | | 7/1/22 | | | 100 | | | | 101 | |
| | | Air Lease Corp. | | 2.250% | | 1/15/23 | | | 100 | | | | 100 | |
| | | Air Lease Corp. | | 2.750% | | 1/15/23 | | | 100 | | | | 101 | |
| | | Air Lease Corp. | | 3.875% | | 7/3/23 | | | 100 | | | | 105 | |
| | | Air Lease Corp. | | 4.250% | | 2/1/24 | | | 200 | | | | 214 | |
| | | Air Lease Corp. | | 4.250% | | 9/15/24 | | | 75 | | | | 80 | |
| | | Air Lease Corp. | | 3.250% | | 3/1/25 | | | 150 | | | | 154 | |
| | | Air Lease Corp. | | 3.625% | | 4/1/27 | | | 75 | | | | 78 | |
| | | Air Lease Corp. | | 3.625% | | 12/1/27 | | | 100 | | | | 103 | |
| | | Air Lease Corp. | | 4.625% | | 10/1/28 | | | 100 | | | | 110 | |
| | | Air Lease Corp. | | 3.250% | | 10/1/29 | | | 100 | | | | 99 | |
| | | Aircastle Ltd. | | 4.400% | | 9/25/23 | | | 125 | | | | 132 | |
| | | Aircastle Ltd. | | 4.125% | | 5/1/24 | | | 400 | | | | 419 | |
| | | Aircastle Ltd. | | 4.250% | | 6/15/26 | | | 100 | | | | 106 | |
| | | Ares Capital Corp. | | 3.500% | | 2/10/23 | | | 250 | | | | 254 | |
| | | Ares Capital Corp. | | 4.200% | | 6/10/24 | | | 200 | | | | 210 | |
| | | Ares Capital Corp. | | 4.250% | | 3/1/25 | | | 100 | | | | 104 | |
| | | FS KKR Capital Corp. | | 4.750% | | 5/15/22 | | | 25 | | | | 26 | |
| | | FS KKR Capital Corp. | | 4.625% | | 7/15/24 | | | 25 | | | | 26 | |
| | | FS KKR Capital Corp. | | 4.125% | | 2/1/25 | | | 100 | | | | 101 | |
| | | GATX Corp. | | 3.250% | | 3/30/25 | | | 125 | | | | 128 | |
| | | GATX Corp. | | 3.250% | | 9/15/26 | | | 50 | | | | 51 | |
| | | GATX Corp. | | 3.850% | | 3/30/27 | | | 175 | | | | 183 | |
| | | GATX Corp. | | 3.500% | | 3/15/28 | | | 100 | | | | 102 | |
| | | GATX Corp. | | 4.550% | | 11/7/28 | | | 150 | | | | 164 | |
| | | GATX Corp. | | 4.700% | | 4/1/29 | | | 75 | | | | 84 | |
| | | GATX Corp. | | 4.500% | | 3/30/45 | | | 50 | | | | 52 | |
| | | GE Capital International Funding Co. Unlimited Co. | | 3.373% | | 11/15/25 | | | 358 | | | | 371 | |
| | | GE Capital International Funding Co. Unlimited Co. | | 4.418% | | 11/15/35 | | | 2,168 | | | | 2,303 | |
| | | International Lease Finance Corp. | | 8.250% | | 12/15/20 | | | 200 | | | | 211 | |
| | | International Lease Finance Corp. | | 4.625% | | 4/15/21 | | | 89 | | | | 92 | |
| | | International Lease Finance Corp. | | 8.625% | | 1/15/22 | | | 315 | | | | 354 | |
| | | International Lease Finance Corp. | | 5.875% | | 8/15/22 | | | 160 | | | | 174 | |
| | | Owl Rock Capital Corp. | | 5.250% | | 4/15/24 | | | 25 | | | | 26 | |
| | | Owl Rock Capital Corp. | | 4.000% | | 3/30/25 | | | 40 | | | | 40 | |
| | | Prospect Capital Corp. | | 5.875% | | 3/15/23 | | | 40 | | | | 42 | |
| | | TPG Specialty Lending Inc. | | 3.875% | | 11/1/24 | | | 50 | | | | 50 | |
| | | | | | | | | | | | | | | |
| | | Insurance (1.2%) | | | | | | | | | | | | |
| | | ACE Capital Trust II | | 9.700% | | 4/1/30 | | | 50 | | | | 75 | |
| | | AEGON Funding Co. LLC | | 5.750% | | 12/15/20 | | | 81 | | | | 84 | |
| | | Aetna Inc. | | 2.750% | | 11/15/22 | | | 200 | | | | 203 | |
| | | Aetna Inc. | | 2.800% | | 6/15/23 | | | 125 | | | | 127 | |
| | | Aetna Inc. | | 3.500% | | 11/15/24 | | | 125 | | | | 131 | |
| | | Aetna Inc. | | 6.625% | | 6/15/36 | | | 130 | | | | 174 | |
| | | Aetna Inc. | | 6.750% | | 12/15/37 | | | 100 | | | | 134 | |
| | | Aetna Inc. | | 4.500% | | 5/15/42 | | | 75 | | | | 80 | |
| | | Aetna Inc. | | 4.125% | | 11/15/42 | | | 75 | | | | 77 | |
| | | Aetna Inc. | | 3.875% | | 8/15/47 | | | 300 | | | | 303 | |
| | | Aflac Inc. | | 4.000% | | 2/15/22 | | | 50 | | | | 52 | |
| | | Aflac Inc. | | 3.625% | | 6/15/23 | | | 125 | | | | 131 | |
| | | Aflac Inc. | | 3.625% | | 11/15/24 | | | 125 | | | | 134 | |
| | | Aflac Inc. | | 3.250% | | 3/17/25 | | | 125 | | | | 131 | |
| | | Aflac Inc. | | 2.875% | | 10/15/26 | | | 75 | | | | 77 | |
| | | Aflac Inc. | | 4.000% | | 10/15/46 | | | 50 | | | | 54 | |
| | | Aflac Inc. | | 4.750% | | 1/15/49 | | | 115 | | | | 137 | |
| | | Alleghany Corp. | | 4.900% | | 9/15/44 | | | 100 | | | | 117 | |
| | | Allied World Assurance Co. Holdings Ltd. | | 4.350% | | 10/29/25 | | | 75 | | | | 78 | |
| | | Allstate Corp. | | 3.150% | | 6/15/23 | | | 100 | | | | 104 | |
| | | Allstate Corp. | | 5.550% | | 5/9/35 | | | 75 | | | | 95 | |
| | | Allstate Corp. | | 4.500% | | 6/15/43 | | | 125 | | | | 149 | |
| | | Allstate Corp. | | 4.200% | | 12/15/46 | | | 200 | | | | 230 | |
| | | Allstate Corp. | | 3.850% | | 8/10/49 | | | 100 | | | | 111 | |
| 3 | | Allstate Corp. | | 5.750% | | 8/15/53 | | | 75 | | | | 80 | |
| 3 | | Allstate Corp. | | 6.500% | | 5/15/67 | | | 100 | | | | 124 | |
Total Bond Market Index Portfolio
| | | | | | | | | Face | | | Market | |
| | | | | | | Maturity | | Amount | | | Value• | |
| | | | | Coupon | | Date | | | ($000 | ) | | | ($000 | ) |
| | | American Financial Group Inc. | | 3.500% | | 8/15/26 | | | 50 | | | | 51 | |
| | | American Financial Group Inc. | | 4.500% | | 6/15/47 | | | 110 | | | | 119 | |
| | | American International Group Inc. | | 6.400% | | 12/15/20 | | | 385 | | | | 401 | |
| | | American International Group Inc. | | 3.300% | | 3/1/21 | | | 275 | | | | 279 | |
| | | American International Group Inc. | | 4.875% | | 6/1/22 | | | 250 | | | | 267 | |
| | | American International Group Inc. | | 4.125% | | 2/15/24 | | | 70 | | | | 75 | |
| | | American International Group Inc. | | 3.750% | | 7/10/25 | | | 85 | | | | 91 | |
| | | American International Group Inc. | | 4.200% | | 4/1/28 | | | 200 | | | | 219 | |
| | | American International Group Inc. | | 4.250% | | 3/15/29 | | | 50 | | | | 56 | |
| | | American International Group Inc. | | 3.875% | | 1/15/35 | | | 200 | | | | 212 | |
| | | American International Group Inc. | | 4.700% | | 7/10/35 | | | 75 | | | | 87 | |
| | | American International Group Inc. | | 6.250% | | 5/1/36 | | | 475 | | | | 634 | |
| | | American International Group Inc. | | 4.500% | | 7/16/44 | | | 500 | | | | 573 | |
| | | American International Group Inc. | | 4.750% | | 4/1/48 | | | 100 | | | | 120 | |
| 3 | | American International Group Inc. | | 5.750% | | 4/1/48 | | | 125 | | | | 135 | |
| | | American International Group Inc. | | 4.375% | | 1/15/55 | | | 125 | | | | 137 | |
| 3 | | American International Group Inc. | | 8.175% | | 5/15/68 | | | 95 | | | | 129 | |
| | | Anthem Inc. | | 3.700% | | 8/15/21 | | | 125 | | | | 128 | |
| | | Anthem Inc. | | 3.125% | | 5/15/22 | | | 150 | | | | 154 | |
| | | Anthem Inc. | | 2.950% | | 12/1/22 | | | 150 | | | | 154 | |
| | | Anthem Inc. | | 3.300% | | 1/15/23 | | | 200 | | | | 207 | |
| | | Anthem Inc. | | 3.500% | | 8/15/24 | | | 475 | | | | 497 | |
| | | Anthem Inc. | | 3.350% | | 12/1/24 | | | 160 | | | | 167 | |
| | | Anthem Inc. | | 2.375% | | 1/15/25 | | | 100 | | | | 100 | |
| | | Anthem Inc. | | 3.650% | | 12/1/27 | | | 300 | | | | 316 | |
| | | Anthem Inc. | | 4.101% | | 3/1/28 | | | 400 | | | | 433 | |
| | | Anthem Inc. | | 2.875% | | 9/15/29 | | | 75 | | | | 75 | |
| | | Anthem Inc. | | 5.950% | | 12/15/34 | | | 1 | | | | 1 | |
| | | Anthem Inc. | | 5.850% | | 1/15/36 | | | 75 | | | | 91 | |
| | | Anthem Inc. | | 6.375% | | 6/15/37 | | | 50 | | | | 65 | |
| | | Anthem Inc. | | 4.625% | | 5/15/42 | | | 175 | | | | 196 | |
| | | Anthem Inc. | | 4.650% | | 1/15/43 | | | 775 | | | | 873 | |
| | | Anthem Inc. | | 5.100% | | 1/15/44 | | | 100 | | | | 118 | |
| | | Anthem Inc. | | 4.375% | | 12/1/47 | | | 300 | | | | 329 | |
| | | Anthem Inc. | | 4.550% | | 3/1/48 | | | 155 | | | | 174 | |
| | | Anthem Inc. | | 4.850% | | 8/15/54 | | | 50 | | | | 54 | |
| | | Aon Corp. | | 8.205% | | 1/1/27 | | | 25 | | | | 32 | |
| | | Aon Corp. | | 4.500% | | 12/15/28 | | | 100 | | | | 112 | |
| | | Aon Corp. | | 3.750% | | 5/2/29 | | | 90 | | | | 96 | |
| | | Aon Corp. | | 6.250% | | 9/30/40 | | | 100 | | | | 137 | |
| | | Aon plc | | 3.500% | | 6/14/24 | | | 150 | | | | 157 | |
| | | Aon plc | | 3.875% | | 12/15/25 | | | 200 | | | | 215 | |
| | | Aon plc | | 4.600% | | 6/14/44 | | | 175 | | | | 199 | |
| | | Aon plc | | 4.750% | | 5/15/45 | | | 100 | | | | 117 | |
| | | Arch Capital Finance LLC | | 4.011% | | 12/15/26 | | | 100 | | | | 110 | |
| | | Arch Capital Finance LLC | | 5.031% | | 12/15/46 | | | 100 | | | | 125 | |
| | | Arch Capital Group Ltd. | | 7.350% | | 5/1/34 | | | 50 | | | | 71 | |
| | | Arch Capital Group US Inc. | | 5.144% | | 11/1/43 | | | 50 | | | | 61 | |
| | | Aspen Insurance Holdings Ltd. | | 4.650% | | 11/15/23 | | | 175 | | | | 187 | |
| | | Assurant Inc. | | 4.000% | | 3/15/23 | | | 50 | | | | 52 | |
| | | Assurant Inc. | | 4.200% | | 9/27/23 | | | 100 | | | | 105 | |
| | | Assurant Inc. | | 4.900% | | 3/27/28 | | | 100 | | | | 110 | |
| | | Assurant Inc. | | 6.750% | | 2/15/34 | | | 9 | | | | 11 | |
| | | Assured Guaranty US Holdings Inc. | | 5.000% | | 7/1/24 | | | 75 | | | | 83 | |
| | | Athene Holding Ltd. | | 4.125% | | 1/12/28 | | | 200 | | | | 207 | |
| | | AXA Equitable Holdings Inc. | | 3.900% | | 4/20/23 | | | 100 | | | | 105 | |
| | | AXA Equitable Holdings Inc. | | 7.000% | | 4/1/28 | | | 75 | | | | 91 | |
| | | AXA Equitable Holdings Inc. | | 4.350% | | 4/20/28 | | | 680 | | | | 738 | |
| | | AXA Equitable Holdings Inc. | | 5.000% | | 4/20/48 | | | 350 | | | | 374 | |
| | | AXA SA | | 8.600% | | 12/15/30 | | | 225 | | | | 329 | |
| | | AXIS Specialty Finance LLC | | 3.900% | | 7/15/29 | | | 50 | | | | 52 | |
| 3 | | AXIS Specialty Finance LLC | | 4.900% | | 1/15/40 | | | 50 | | | | 51 | |
| | | AXIS Specialty Finance plc | | 4.000% | | 12/6/27 | | | 550 | | | | 580 | |
| | | Berkshire Hathaway Finance Corp. | | 4.250% | | 1/15/21 | | | 195 | | | | 200 | |
| | | Berkshire Hathaway Finance Corp. | | 3.000% | | 5/15/22 | | | 150 | | | | 154 | |
| | | Berkshire Hathaway Finance Corp. | | 5.750% | | 1/15/40 | | | 140 | | | | 192 | |
| | | Berkshire Hathaway Finance Corp. | | 4.400% | | 5/15/42 | | | 195 | | | | 230 | |
| | | Berkshire Hathaway Finance Corp. | | 4.300% | | 5/15/43 | | | 300 | | | | 343 | |
| | | Berkshire Hathaway Finance Corp. | | 4.200% | | 8/15/48 | | | 700 | | | | 819 | |
| | | Berkshire Hathaway Finance Corp. | | 4.250% | | 1/15/49 | | | 710 | | | | 839 | |
| | | Berkshire Hathaway Inc. | | 2.200% | | 3/15/21 | | | 200 | | | | 201 | |
| | | Berkshire Hathaway Inc. | | 3.000% | | 2/11/23 | | | 75 | | | | 78 | |
| | | Berkshire Hathaway Inc. | | 2.750% | | 3/15/23 | | | 300 | | | | 308 | |
| | | Berkshire Hathaway Inc. | | 3.125% | | 3/15/26 | | | 725 | | | | 765 | |
| | | Berkshire Hathaway Inc. | | 4.500% | | 2/11/43 | | | 175 | | | | 213 | |
| | | Brighthouse Financial Inc. | | 3.700% | | 6/22/27 | | | 250 | | | | 249 | |
| | | Brighthouse Financial Inc. | | 4.700% | | 6/22/47 | | | 130 | | | | 120 | |
| | | Brown & Brown Inc. | | 4.200% | | 9/15/24 | | | 75 | | | | 79 | |
| | | Brown & Brown Inc. | | 4.500% | | 3/15/29 | | | 75 | | | | 82 | |
| | | Chubb Corp. | | 6.000% | | 5/11/37 | | | 125 | | | | 171 | |
| | | Chubb Corp. | | 6.500% | | 5/15/38 | | | 95 | | | | 139 | |
| | | Chubb INA Holdings Inc. | | 2.875% | | 11/3/22 | | | 475 | | | | 487 | |
| | | Chubb INA Holdings Inc. | | 2.700% | | 3/13/23 | | | 125 | | | | 128 | |
| | | Chubb INA Holdings Inc. | | 3.350% | | 5/15/24 | | | 100 | | | | 105 | |
| | | Chubb INA Holdings Inc. | | 3.150% | | 3/15/25 | | | 250 | | | | 262 | |
| | | Chubb INA Holdings Inc. | | 6.700% | | 5/15/36 | | | 200 | | | | 287 | |
| | | Chubb INA Holdings Inc. | | 4.150% | | 3/13/43 | | | 100 | | | | 116 | |
| | | Chubb INA Holdings Inc. | | 4.350% | | 11/3/45 | | | 350 | | | | 420 | |
| | | Cigna Holding Co. | | 4.375% | | 12/15/20 | | | 45 | | | | 46 | |
| | | Cincinnati Financial Corp. | | 6.920% | | 5/15/28 | | | 100 | | | | 129 | |
| | | Cincinnati Financial Corp. | | 6.125% | | 11/1/34 | | | 75 | | | | 99 | |
| | | CNA Financial Corp. | | 5.750% | | 8/15/21 | | | 75 | | | | 79 | |
| | | CNA Financial Corp. | | 3.950% | | 5/15/24 | | | 150 | | | | 160 | |
| | | CNA Financial Corp. | | 4.500% | | 3/1/26 | | | 125 | | | | 137 | |
| | | CNA Financial Corp. | | 3.450% | | 8/15/27 | | | 100 | | | | 104 | |
| | | CNA Financial Corp. | | 3.900% | | 5/1/29 | | | 100 | | | | 107 | |
| | | Enstar Group Ltd. | | 4.500% | | 3/10/22 | | | 50 | | | | 52 | |
| | | Enstar Group Ltd. | | 4.950% | | 6/1/29 | | | 395 | | | | 423 | |
| | | Everest Reinsurance Holdings Inc. | | 4.868% | | 6/1/44 | | | 100 | | | | 111 | |
| | | Fairfax Financial Holdings Ltd. | | 4.850% | | 4/17/28 | | | 50 | | | | 54 | |
| | | First American Financial Corp. | | 4.600% | | 11/15/24 | | | 100 | | | | 106 | |
| | | Globe Life Inc. | | 3.800% | | 9/15/22 | | | 50 | | | | 51 | |
| | | Globe Life Inc. | | 4.550% | | 9/15/28 | | | 80 | | | | 89 | |
| | | Hanover Insurance Group Inc. | | 4.500% | | 4/15/26 | | | 100 | | | | 108 | |
| | | Hartford Financial Services Group Inc. | | 2.800% | | 8/19/29 | | | 100 | | | | 101 | |
| | | Hartford Financial Services Group Inc. | | 5.950% | | 10/15/36 | | | 50 | | | | 65 | |
| | | Hartford Financial Services Group Inc. | | 6.100% | | 10/1/41 | | | 100 | | | | 137 | |
| | | Hartford Financial Services Group Inc. | | 4.300% | | 4/15/43 | | | 175 | | | | 195 | |
| | | Hartford Financial Services Group Inc. | | 3.600% | | 8/19/49 | | | 125 | | | | 128 | |
| | | Humana Inc. | | 2.900% | | 12/15/22 | | | 150 | | | | 153 | |
| | | Humana Inc. | | 3.850% | | 10/1/24 | | | 326 | | | | 346 | |
| | | Humana Inc. | | 3.950% | | 3/15/27 | | | 150 | | | | 161 | |
| | | Humana Inc. | | 4.625% | | 12/1/42 | | | 110 | | | | 120 | |
| | | Humana Inc. | | 4.950% | | 10/1/44 | | | 200 | | | | 236 | |
| | | Kemper Corp. | | 4.350% | | 2/15/25 | | | 40 | | | | 42 | |
| | | Lincoln National Corp. | | 4.850% | | 6/24/21 | | | 47 | | | | 49 | |
| | | Lincoln National Corp. | | 4.200% | | 3/15/22 | | | 50 | | | | 52 | |
| | | Lincoln National Corp. | | 4.000% | | 9/1/23 | | | 50 | | | | 53 | |
| | | Lincoln National Corp. | | 3.625% | | 12/12/26 | | | 75 | | | | 79 | |
| | | Lincoln National Corp. | | 3.800% | | 3/1/28 | | | 100 | | | | 106 | |
| | | Lincoln National Corp. | | 3.050% | | 1/15/30 | | | 350 | | | | 348 | |
| | | Lincoln National Corp. | | 6.300% | | 10/9/37 | | | 75 | | | | 97 | |
| | | Lincoln National Corp. | | 7.000% | | 6/15/40 | | | 160 | | | | 227 | |
| | | Loews Corp. | | 2.625% | | 5/15/23 | | | 75 | | | | 76 | |
| | | Loews Corp. | | 6.000% | | 2/1/35 | | | 50 | | | | 64 | |
| | | Loews Corp. | | 4.125% | | 5/15/43 | | | 350 | | | | 384 | |
| | | Manulife Financial Corp. | | 4.150% | | 3/4/26 | | | 175 | | | | 191 | |
| 3 | | Manulife Financial Corp. | | 4.061% | | 2/24/32 | | | 190 | | | | 195 | |
| | | Manulife Financial Corp. | | 5.375% | | 3/4/46 | | | 200 | | | | 263 | |
| | | Markel Corp. | | 4.900% | | 7/1/22 | | | 125 | | | | 133 | |
| | | Markel Corp. | | 3.500% | | 11/1/27 | | | 50 | | | | 51 | |
| | | Markel Corp. | | 3.350% | | 9/17/29 | | | 75 | | | | 77 | |
| | | Markel Corp. | | 4.300% | | 11/1/47 | | | 50 | | | | 52 | |
| | | Markel Corp. | | 5.000% | | 5/20/49 | | | 50 | | | | 58 | |
| | | Markel Corp. | | 4.150% | | 9/17/50 | | | 200 | | | | 206 | |
| | | Marsh & McLennan Cos. Inc. | | 4.800% | | 7/15/21 | | | 295 | | | | 306 | |
| | | Marsh & McLennan Cos. Inc. | | 3.300% | | 3/14/23 | | | 75 | | | | 77 | |
| | | Marsh & McLennan Cos. Inc. | | 3.500% | | 6/3/24 | | | 100 | | | | 105 | |
| | | Marsh & McLennan Cos. Inc. | | 3.500% | | 3/10/25 | | | 100 | | | | 105 | |
| | | Marsh & McLennan Cos. Inc. | | 3.750% | | 3/14/26 | | | 100 | | | | 107 | |
| | | Marsh & McLennan Cos. Inc. | | 4.375% | | 3/15/29 | | | 325 | | | | 370 | |
| | | Marsh & McLennan Cos. Inc. | | 4.350% | | 1/30/47 | | | 100 | | | | 113 | |
Total Bond Market Index Portfolio
| | | | | | | | | Face | | | Market | |
| | | | | | | Maturity | | Amount | | | Value• | |
| | | | | Coupon | | Date | | | ($000 | ) | | | ($000 | ) |
| | | Marsh & McLennan Cos. Inc. | | 4.200% | | 3/1/48 | | | 200 | | | | 225 | |
| | | Marsh & McLennan Cos. Inc. | | 4.900% | | 3/15/49 | | | 200 | | | | 253 | |
| | | Mercury General Corp. | | 4.400% | | 3/15/27 | | | 75 | | | | 79 | |
| | | MetLife Inc. | | 3.048% | | 12/15/22 | | | 225 | | | | 233 | |
| | | MetLife Inc. | | 3.600% | | 4/10/24 | | | 175 | | | | 186 | |
| | | MetLife Inc. | | 3.000% | | 3/1/25 | | | 250 | | | | 260 | |
| | | MetLife Inc. | | 3.600% | | 11/13/25 | | | 400 | | | | 429 | |
| | | MetLife Inc. | | 6.500% | | 12/15/32 | | | 175 | | | | 242 | |
| | | MetLife Inc. | | 6.375% | | 6/15/34 | | | 100 | | | | 143 | |
| | | MetLife Inc. | | 5.875% | | 2/6/41 | | | 590 | | | | 799 | |
| | | MetLife Inc. | | 4.125% | | 8/13/42 | | | 175 | | | | 198 | |
| | | MetLife Inc. | | 4.875% | | 11/13/43 | | | 175 | | | | 217 | |
| | | MetLife Inc. | | 4.721% | | 12/15/44 | | | 63 | | | | 76 | |
| | | MetLife Inc. | | 4.600% | | 5/13/46 | | | 70 | | | | 86 | |
| 3 | | MetLife Inc. | | 6.400% | | 12/15/66 | | | 210 | | | | 256 | |
| | | Old Republic International Corp. | | 4.875% | | 10/1/24 | | | 121 | | | | 132 | |
| | | Old Republic International Corp. | | 3.875% | | 8/26/26 | | | 100 | | | | 106 | |
| | | PartnerRe Finance B LLC | | 3.700% | | 7/2/29 | | | 95 | | | | 99 | |
| | | Primerica Inc. | | 4.750% | | 7/15/22 | | | 125 | | | | 132 | |
| | | Principal Financial Group Inc. | | 3.300% | | 9/15/22 | | | 50 | | | | 52 | |
| | | Principal Financial Group Inc. | | 3.125% | | 5/15/23 | | | 100 | | | | 103 | |
| | | Principal Financial Group Inc. | | 3.400% | | 5/15/25 | | | 75 | | | | 79 | |
| | | Principal Financial Group Inc. | | 3.100% | | 11/15/26 | | | 100 | | | | 103 | |
| | | Principal Financial Group Inc. | | 4.625% | | 9/15/42 | | | 50 | | | | 57 | |
| | | Principal Financial Group Inc. | | 4.350% | | 5/15/43 | | | 50 | | | | 56 | |
| | | Principal Financial Group Inc. | | 4.300% | | 11/15/46 | | | 75 | | | | 85 | |
| | | Progressive Corp. | | 3.750% | | 8/23/21 | | | 75 | | | | 77 | |
| | | Progressive Corp. | | 2.450% | | 1/15/27 | | | 150 | | | | 151 | |
| | | Progressive Corp. | | 6.625% | | 3/1/29 | | | 125 | | | | 162 | |
| | | Progressive Corp. | | 4.350% | | 4/25/44 | | | 50 | | | | 59 | |
| | | Progressive Corp. | | 4.125% | | 4/15/47 | | | 290 | | | | 338 | |
| | | Progressive Corp. | | 4.200% | | 3/15/48 | | | 115 | | | | 132 | |
| | | Prudential Financial Inc. | | 4.500% | | 11/16/21 | | | 75 | | | | 79 | |
| | | Prudential Financial Inc. | | 3.500% | | 5/15/24 | | | 125 | | | | 133 | |
| | | Prudential Financial Inc. | | 5.750% | | 7/15/33 | | | 100 | | | | 127 | |
| | | Prudential Financial Inc. | | 5.700% | | 12/14/36 | | | 125 | | | | 170 | |
| | | Prudential Financial Inc. | | 6.625% | | 12/1/37 | | | 65 | | | | 90 | |
| | | Prudential Financial Inc. | | 6.625% | | 6/21/40 | | | 65 | | | | 91 | |
| 3 | | Prudential Financial Inc. | | 5.875% | | 9/15/42 | | | 125 | | | | 135 | |
| 3 | | Prudential Financial Inc. | | 5.625% | | 6/15/43 | | | 375 | | | | 403 | |
| | | Prudential Financial Inc. | | 5.100% | | 8/15/43 | | | 50 | | | | 59 | |
| 3 | | Prudential Financial Inc. | | 5.200% | | 3/15/44 | | | 85 | | | | 90 | |
| | | Prudential Financial Inc. | | 4.600% | | 5/15/44 | | | 525 | | | | 619 | |
| 3 | | Prudential Financial Inc. | | 5.375% | | 5/15/45 | | | 250 | | | | 266 | |
| | | Prudential Financial Inc. | | 3.905% | | 12/7/47 | | | 182 | | | | 194 | |
| 3 | | Prudential Financial Inc. | | 5.700% | | 9/15/48 | | | 250 | | | | 284 | |
| | | Prudential Financial Inc. | | 3.935% | | 12/7/49 | | | 263 | | | | 287 | |
| | | Prudential Financial Inc. | | 4.350% | | 2/25/50 | | | 200 | | | | 230 | |
| | | Reinsurance Group of America Inc. | | 5.000% | | 6/1/21 | | | 75 | | | | 78 | |
| | | Reinsurance Group of America Inc. | | 4.700% | | 9/15/23 | | | 75 | | | | 81 | |
| | | Reinsurance Group of America Inc. | | 3.900% | | 5/15/29 | | | 50 | | | | 53 | |
| | | RenaissanceRe Finance Inc. | | 3.450% | | 7/1/27 | | | 75 | | | | 78 | |
| | | RenaissanceRe Holdings Ltd. | | 3.600% | | 4/15/29 | | | 75 | | | | 79 | |
| | | Selective Insurance Group Inc. | | 5.375% | | 3/1/49 | | | 50 | | | | 59 | |
| | | Sompo International Holdings Ltd. | | 4.700% | | 10/15/22 | | | 100 | | | | 106 | |
| | | Swiss Re Solutions Holding Corp. | | 7.000% | | 2/15/26 | | | 75 | | | | 93 | |
| | | Travelers Cos. Inc. | | 6.250% | | 6/15/37 | | | 150 | | | | 207 | |
| | | Travelers Cos. Inc. | | 4.300% | | 8/25/45 | | | 150 | | | | 176 | |
| | | Travelers Cos. Inc. | | 4.000% | | 5/30/47 | | | 125 | | | | 140 | |
| | | Travelers Cos. Inc. | | 4.100% | | 3/4/49 | | | 200 | | | | 232 | |
| | | Trinity Acquisition plc | | 4.400% | | 3/15/26 | | | 100 | | | | 108 | |
| | | UnitedHealth Group Inc. | | 4.700% | | 2/15/21 | | | 75 | | | | 77 | |
| | | UnitedHealth Group Inc. | | 2.125% | | 3/15/21 | | | 225 | | | | 225 | |
| | | UnitedHealth Group Inc. | | 3.375% | | 11/15/21 | | | 100 | | | | 102 | |
| | | UnitedHealth Group Inc. | | 2.875% | | 12/15/21 | | | 125 | | | | 127 | |
| | | UnitedHealth Group Inc. | | 3.350% | | 7/15/22 | | | 180 | | | | 186 | |
| | | UnitedHealth Group Inc. | | 2.375% | | 10/15/22 | | | 150 | | | | 152 | |
| | | UnitedHealth Group Inc. | | 2.750% | | 2/15/23 | | | 175 | | | | 178 | |
| | | UnitedHealth Group Inc. | | 2.875% | | 3/15/23 | | | 25 | | | | 26 | |
| | | UnitedHealth Group Inc. | | 3.500% | | 6/15/23 | | | 100 | | | | 105 | |
| | | UnitedHealth Group Inc. | | 3.500% | | 2/15/24 | | | 100 | | | | 105 | |
| | | UnitedHealth Group Inc. | | 2.375% | | 8/15/24 | | | 300 | | | | 304 | |
| | | UnitedHealth Group Inc. | | 3.750% | | 7/15/25 | | | 950 | | | | 1,026 | |
| | | UnitedHealth Group Inc. | | 3.700% | | 12/15/25 | | | 75 | | | | 81 | |
| | | UnitedHealth Group Inc. | | 3.100% | | 3/15/26 | | | 225 | | | | 235 | |
| | | UnitedHealth Group Inc. | | 3.450% | | 1/15/27 | | | 75 | | | | 80 | |
| | | UnitedHealth Group Inc. | | 3.375% | | 4/15/27 | | | 350 | | | | 372 | |
| | | UnitedHealth Group Inc. | | 2.950% | | 10/15/27 | | | 150 | | | | 155 | |
| | | UnitedHealth Group Inc. | | 3.850% | | 6/15/28 | | | 400 | | | | 438 | |
| | | UnitedHealth Group Inc. | | 3.875% | | 12/15/28 | | | 150 | | | | 165 | |
| | | UnitedHealth Group Inc. | | 2.875% | | 8/15/29 | | | 100 | | | | 102 | |
| | | UnitedHealth Group Inc. | | 4.625% | | 7/15/35 | | | 175 | | | | 212 | |
| | | UnitedHealth Group Inc. | | 6.500% | | 6/15/37 | | | 50 | | | | 71 | |
| | | UnitedHealth Group Inc. | | 6.625% | | 11/15/37 | | | 125 | | | | 178 | |
| | | UnitedHealth Group Inc. | | 6.875% | | 2/15/38 | | | 245 | | | | 363 | |
| | | UnitedHealth Group Inc. | | 3.500% | | 8/15/39 | | | 240 | | | | 251 | |
| | | UnitedHealth Group Inc. | | 5.950% | | 2/15/41 | | | 60 | | | | 81 | |
| | | UnitedHealth Group Inc. | | 4.625% | | 11/15/41 | | | 110 | | | | 130 | |
| | | UnitedHealth Group Inc. | | 4.375% | | 3/15/42 | | | 50 | | | | 57 | |
| | | UnitedHealth Group Inc. | | 3.950% | | 10/15/42 | | | 175 | | | | 191 | |
| | | UnitedHealth Group Inc. | | 4.250% | | 3/15/43 | | | 125 | | | | 142 | |
| | | UnitedHealth Group Inc. | | 4.750% | | 7/15/45 | | | 305 | | | | 372 | |
| | | UnitedHealth Group Inc. | | 4.200% | | 1/15/47 | | | 210 | | | | 241 | |
| | | UnitedHealth Group Inc. | | 4.250% | | 4/15/47 | | | 100 | | | | 115 | |
| | | UnitedHealth Group Inc. | | 3.750% | | 10/15/47 | | | 350 | | | | 373 | |
| | | UnitedHealth Group Inc. | | 4.250% | | 6/15/48 | | | 300 | | | | 348 | |
| | | UnitedHealth Group Inc. | | 4.450% | | 12/15/48 | | | 150 | | | | 178 | |
| | | UnitedHealth Group Inc. | | 3.700% | | 8/15/49 | | | 190 | | | | 202 | |
| | | UnitedHealth Group Inc. | | 3.875% | | 8/15/59 | | | 240 | | | | 258 | |
| | | Unum Group | | 4.000% | | 3/15/24 | | | 125 | | | | 132 | |
| | | Unum Group | | 4.000% | | 6/15/29 | | | 80 | | | | 84 | |
| | | Unum Group | | 5.750% | | 8/15/42 | | | 25 | | | | 28 | |
| | | Unum Group | | 4.500% | | 12/15/49 | | | 100 | | | | 97 | |
| | | Voya Financial Inc. | | 3.125% | | 7/15/24 | | | 100 | | | | 103 | |
| | | Voya Financial Inc. | | 3.650% | | 6/15/26 | | | 250 | | | | 263 | |
| | | Voya Financial Inc. | | 5.700% | | 7/15/43 | | | 75 | | | | 95 | |
| | | Voya Financial Inc. | | 4.800% | | 6/15/46 | | | 40 | | | | 46 | |
| | | Willis North America Inc. | | 3.600% | | 5/15/24 | | | 125 | | | | 130 | |
| | | Willis North America Inc. | | 4.500% | | 9/15/28 | | | 100 | | | | 110 | |
| | | Willis North America Inc. | | 2.950% | | 9/15/29 | | | 940 | | | | 933 | |
| | | Willis North America Inc. | | 5.050% | | 9/15/48 | | | 50 | | | | 58 | |
| | | Willis North America Inc. | | 3.875% | | 9/15/49 | | | 540 | | | | 538 | |
| | | XLIT Ltd. | | 4.450% | | 3/31/25 | | | 50 | | | | 54 | |
| | | XLIT Ltd. | | 5.500% | | 3/31/45 | | | 100 | | | | 126 | |
| | | | | | | | | | | | | | | |
| | | Other Finance (0.0%) | | | | | | | | | | | | |
| | | ORIX Corp. | | 2.900% | | 7/18/22 | | | 50 | | | | 51 | |
| | | ORIX Corp. | | 3.250% | | 12/4/24 | | | 75 | | | | 78 | |
| | | ORIX Corp. | | 3.700% | | 7/18/27 | | | 200 | | | | 211 | |
| | | | | | | | | | | | | | | |
| | | Real Estate Investment Trusts (0.8%) | | | | | | | | | | | | |
| | | Alexandria Real Estate Equities Inc. | | 4.000% | | 1/15/24 | | | 175 | | | | 186 | |
| | | Alexandria Real Estate Equities Inc. | | 3.450% | | 4/30/25 | | | 125 | | | | 131 | |
| | | Alexandria Real Estate Equities Inc. | | 3.800% | | 4/15/26 | | | 50 | | | | 53 | |
| | | Alexandria Real Estate Equities Inc. | | 3.950% | | 1/15/27 | | | 50 | | | | 53 | |
| | | Alexandria Real Estate Equities Inc. | | 3.950% | | 1/15/28 | | | 50 | | | | 54 | |
| | | Alexandria Real Estate Equities Inc. | | 4.500% | | 7/30/29 | | | 100 | | | | 113 | |
| | | Alexandria Real Estate Equities Inc. | | 2.750% | | 12/15/29 | | | 200 | | | | 197 | |
| | | Alexandria Real Estate Equities Inc. | | 4.700% | | 7/1/30 | | | 125 | | | | 143 | |
| | | Alexandria Real Estate Equities Inc. | | 3.375% | | 8/15/31 | | | 150 | | | | 156 | |
| | | Alexandria Real Estate Equities Inc. | | 4.850% | | 4/15/49 | | | 50 | | | | 61 | |
| | | Alexandria Real Estate Equities Inc. | | 4.000% | | 2/1/50 | | | 125 | | | | 137 | |
| | | American Campus Communities Operating Partnership LP | | 3.750% | | 4/15/23 | | | 75 | | | | 78 | |
| | | American Campus Communities Operating Partnership LP | | 4.125% | | 7/1/24 | | | 100 | | | | 107 | |
| | | American Campus Communities Operating Partnership LP | | 3.300% | | 7/15/26 | | | 50 | | | | 52 | |
| | | American Campus Communities Operating Partnership LP | | 3.625% | | 11/15/27 | | | 75 | | | | 78 | |
| | | American Homes 4 Rent LP | | 4.900% | | 2/15/29 | | | 100 | | | | 112 | |
| | | AvalonBay Communities Inc. | | 2.850% | | 3/15/23 | | | 25 | | | | 26 | |
Total Bond Market Index Portfolio
| | | | | | | | | Face | | | Market | |
| | | | | | | Maturity | | Amount | | | Value• | |
| | | | | Coupon | | Date | | | ($000 | ) | | | ($000 | ) |
| | AvalonBay Communities Inc. | | 4.200% | | 12/15/23 | | | 400 | | | | 429 | |
| | | AvalonBay Communities Inc. | | 3.450% | | 6/1/25 | | | 100 | | | | 105 | |
| | | AvalonBay Communities Inc. | | 2.950% | | 5/11/26 | | | 150 | | | | 154 | |
| | | AvalonBay Communities Inc. | | 2.900% | | 10/15/26 | | | 50 | | | | 51 | |
| | | AvalonBay Communities Inc. | | 3.350% | | 5/15/27 | | | 75 | | | | 79 | |
| | | AvalonBay Communities Inc. | | 3.200% | | 1/15/28 | | | 75 | | | | 78 | |
| | | AvalonBay Communities Inc. | | 3.300% | | 6/1/29 | | | 70 | | | | 74 | |
| | | AvalonBay Communities Inc. | | 4.350% | | 4/15/48 | | | 60 | | | | 71 | |
| | | Boston Properties LP | | 4.125% | | 5/15/21 | | | 75 | | | | 77 | |
| | | Boston Properties LP | | 3.850% | | 2/1/23 | | | 225 | | | | 236 | |
| | | Boston Properties LP | | 3.125% | | 9/1/23 | | | 275 | | | | 283 | |
| | | Boston Properties LP | | 3.200% | | 1/15/25 | | | 100 | | | | 104 | |
| | | Boston Properties LP | | 3.650% | | 2/1/26 | | | 100 | | | | 106 | |
| | | Boston Properties LP | | 2.750% | | 10/1/26 | | | 50 | | | | 50 | |
| | | Boston Properties LP | | 2.900% | | 3/15/30 | | | 100 | | | | 100 | |
| | | Brandywine Operating Partnership LP | | 3.950% | | 2/15/23 | | | 700 | | | | 727 | |
| | | Brandywine Operating Partnership LP | | 3.950% | | 11/15/27 | | | 100 | | | | 105 | |
| | | Brixmor Operating Partnership LP | | 3.875% | | 8/15/22 | | | 150 | | | | 156 | |
| | | Brixmor Operating Partnership LP | | 3.650% | | 6/15/24 | | | 50 | | | | 52 | |
| | | Brixmor Operating Partnership LP | | 3.850% | | 2/1/25 | | | 125 | | | | 131 | |
| | | Brixmor Operating Partnership LP | | 4.125% | | 6/15/26 | | | 200 | | | | 212 | |
| | | Brixmor Operating Partnership LP | | 3.900% | | 3/15/27 | | | 75 | | | | 78 | |
| | | Brixmor Operating Partnership LP | | 4.125% | | 5/15/29 | | | 533 | | | | 571 | |
| | | Camden Property Trust | | 4.100% | | 10/15/28 | | | 60 | | | | 67 | |
| | | Camden Property Trust | | 3.150% | | 7/1/29 | | | 50 | | | | 52 | |
| | | Camden Property Trust | | 3.350% | | 11/1/49 | | | 120 | | | | 120 | |
| | | Columbia Property Trust Operating Partnership LP | | 4.150% | | 4/1/25 | | | 100 | | | | 105 | |
| | | Columbia Property Trust Operating Partnership LP | | 3.650% | | 8/15/26 | | | 25 | | | | 25 | |
| | | Corporate Office Properties LP | | 3.700% | | 6/15/21 | | | 50 | | | | 51 | |
| | | Corporate Office Properties LP | | 3.600% | | 5/15/23 | | | 150 | | | | 154 | |
| | | CubeSmart LP | | 4.375% | | 12/15/23 | | | 100 | | | | 106 | |
| | | CubeSmart LP | | 4.000% | | 11/15/25 | | | 50 | | | | 53 | |
| | | CubeSmart LP | | 3.125% | | 9/1/26 | | | 100 | | | | 101 | |
| | | CubeSmart LP | | 4.375% | | 2/15/29 | | | 50 | | | | 55 | |
| | | CubeSmart LP | | 3.000% | | 2/15/30 | | | 75 | | | | 74 | |
| | | CyrusOne LP / CyrusOne Finance Corp. | | 2.900% | | 11/15/24 | | | 120 | | | | 120 | |
| | | CyrusOne LP / CyrusOne Finance Corp. | | 3.450% | | 11/15/29 | | | 350 | | | | 350 | |
| | | Digital Realty Trust LP | | 3.950% | | 7/1/22 | | | 75 | | | | 78 | |
| | | Digital Realty Trust LP | | 3.625% | | 10/1/22 | | | 975 | | | | 1,008 | |
| | | Digital Realty Trust LP | | 3.700% | | 8/15/27 | | | 200 | | | | 210 | |
| | | Digital Realty Trust LP | | 4.450% | | 7/15/28 | | | 200 | | | | 221 | |
| | | Digital Realty Trust LP | | 3.600% | | 7/1/29 | | | 175 | | | | 183 | |
| | | Duke Realty LP | | 3.250% | | 6/30/26 | | | 175 | | | | 180 | |
| | | Duke Realty LP | | 3.375% | | 12/15/27 | | | 160 | | | | 167 | |
| | | Duke Realty LP | | 4.000% | | 9/15/28 | | | 50 | | | | 54 | |
| | | Duke Realty LP | | 2.875% | | 11/15/29 | | | 70 | | | | 70 | |
| | | EPR Properties | | 5.250% | | 7/15/23 | | | 125 | | | | 134 | |
| | | EPR Properties | | 4.500% | | 4/1/25 | | | 50 | | | | 53 | |
| | | EPR Properties | | 4.750% | | 12/15/26 | | | 100 | | | | 108 | |
| | | EPR Properties | | 4.950% | | 4/15/28 | | | 150 | | | | 163 | |
| | | EPR Properties | | 3.750% | | 8/15/29 | | | 100 | | | | 101 | |
| | | ERP Operating LP | | 4.625% | | 12/15/21 | | | 129 | | | | 135 | |
| | | ERP Operating LP | | 3.000% | | 4/15/23 | | | 125 | | | | 129 | |
| | | ERP Operating LP | | 3.375% | | 6/1/25 | | | 125 | | | | 131 | |
| | | ERP Operating LP | | 2.850% | | 11/1/26 | | | 50 | | | | 51 | |
| | | ERP Operating LP | | 3.500% | | 3/1/28 | | | 100 | | | | 106 | |
| | | ERP Operating LP | | 4.150% | | 12/1/28 | | | 70 | | | | 78 | |
| | | ERP Operating LP | | 3.000% | | 7/1/29 | | | 75 | | | | 77 | |
| | | ERP Operating LP | | 2.500% | | 2/15/30 | | | 150 | | | | 148 | |
| | | ERP Operating LP | | 4.500% | | 7/1/44 | | | 150 | | | | 177 | |
| | | ERP Operating LP | | 4.500% | | 6/1/45 | | | 25 | | | | 30 | |
| | | ERP Operating LP | | 4.000% | | 8/1/47 | | | 100 | | | | 110 | |
| | | Essex Portfolio LP | | 5.200% | | 3/15/21 | | | 50 | | | | 51 | |
| | | Essex Portfolio LP | | 3.250% | | 5/1/23 | | | 25 | | | | 26 | |
| | | Essex Portfolio LP | | 3.875% | | 5/1/24 | | | 50 | | | | 53 | |
| | | Essex Portfolio LP | | 3.500% | | 4/1/25 | | | 100 | | | | 105 | |
| | | Essex Portfolio LP | | 3.375% | | 4/15/26 | | | 100 | | | | 104 | |
| | | Essex Portfolio LP | | 3.625% | | 5/1/27 | | | 100 | | | | 106 | |
| | | Essex Portfolio LP | | 4.000% | | 3/1/29 | | | 100 | | | | 109 | |
| | | Essex Portfolio LP | | 3.000% | | 1/15/30 | | | 110 | | | | 111 | |
| | | Essex Portfolio LP | | 4.500% | | 3/15/48 | | | 120 | | | | 137 | |
| | | Federal Realty Investment Trust | | 2.750% | | 6/1/23 | | | 25 | | | | 25 | |
| | | Federal Realty Investment Trust | | 3.250% | | 7/15/27 | | | 50 | | | | 52 | |
| | | Federal Realty Investment Trust | | 3.200% | | 6/15/29 | | | 25 | | | | 26 | |
| | | Federal Realty Investment Trust | | 4.500% | | 12/1/44 | | | 150 | | | | 172 | |
| | | Healthcare Realty Trust Inc. | | 3.625% | | 1/15/28 | | | 100 | | | | 103 | |
| | | Healthcare Trust of America Holdings LP | | 3.700% | | 4/15/23 | | | 25 | | | | 26 | |
| | | Healthcare Trust of America Holdings LP | | 3.500% | | 8/1/26 | | | 130 | | | | 136 | |
| | | Healthcare Trust of America Holdings LP | | 3.750% | | 7/1/27 | | | 100 | | | | 105 | |
| | | Healthcare Trust of America Holdings LP | | 3.100% | | 2/15/30 | | | 100 | | | | 99 | |
| | | Healthpeak Properties Inc. | | 3.150% | | 8/1/22 | | | 75 | | | | 76 | |
| | | Healthpeak Properties Inc. | | 4.250% | | 11/15/23 | | | 184 | | | | 196 | |
| | | Healthpeak Properties Inc. | | 4.200% | | 3/1/24 | | | 125 | | | | 133 | |
| | | Healthpeak Properties Inc. | | 3.400% | | 2/1/25 | | | 75 | | | | 78 | |
| | | Healthpeak Properties Inc. | | 3.250% | | 7/15/26 | | | 25 | | | | 26 | |
| | | Healthpeak Properties Inc. | | 3.500% | | 7/15/29 | | | 125 | | | | 130 | |
| | | Healthpeak Properties Inc. | | 3.000% | | 1/15/30 | | | 150 | | | | 150 | |
| | | Healthpeak Properties Inc. | | 6.750% | | 2/1/41 | | | 100 | | | | 139 | |
| | | Highwoods Realty LP | | 3.200% | | 6/15/21 | | | 100 | | | | 101 | |
| | | Highwoods Realty LP | | 4.125% | | 3/15/28 | | | 75 | | | | 79 | |
| | | Highwoods Realty LP | | 4.200% | | 4/15/29 | | | 50 | | | | 54 | |
| | | Host Hotels & Resorts LP | | 4.750% | | 3/1/23 | | | 50 | | | | 53 | |
| | | Host Hotels & Resorts LP | | 3.750% | | 10/15/23 | | | 261 | | | | 272 | |
| | | Host Hotels & Resorts LP | | 3.875% | | 4/1/24 | | | 75 | | | | 79 | |
| | | Host Hotels & Resorts LP | | 4.000% | | 6/15/25 | | | 50 | | | | 53 | |
| | | Host Hotels & Resorts LP | | 3.375% | | 12/15/29 | | | 100 | | | | 101 | |
| | | Hudson Pacific Properties LP | | 3.950% | | 11/1/27 | | | 100 | | | | 105 | |
| | | Hudson Pacific Properties LP | | 4.650% | | 4/1/29 | | | 25 | | | | 27 | |
| | | Hudson Pacific Properties LP | | 3.250% | | 1/15/30 | | | 60 | | | | 59 | |
| | | Kilroy Realty LP | | 3.800% | | 1/15/23 | | | 250 | | | | 260 | |
| | | Kilroy Realty LP | | 3.450% | | 12/15/24 | | | 50 | | | | 52 | |
| | | Kilroy Realty LP | | 4.750% | | 12/15/28 | | | 50 | | | | 56 | |
| | | Kilroy Realty LP | | 4.250% | | 8/15/29 | | | 104 | | | | 113 | |
| | | Kilroy Realty LP | | 3.050% | | 2/15/30 | | | 200 | | | | 197 | |
| | | Kimco Realty Corp. | | 3.400% | | 11/1/22 | | | 150 | | | | 155 | |
| | | Kimco Realty Corp. | | 3.125% | | 6/1/23 | | | 25 | | | | 26 | |
| | | Kimco Realty Corp. | | 2.800% | | 10/1/26 | | | 125 | | | | 125 | |
| | | Kimco Realty Corp. | | 3.800% | | 4/1/27 | | | 75 | | | | 79 | |
| | | Kimco Realty Corp. | | 4.125% | | 12/1/46 | | | 50 | | | | 52 | |
| | | Kimco Realty Corp. | | 4.450% | | 9/1/47 | | | 50 | | | | 55 | |
| | | Kite Realty Group LP | | 4.000% | | 10/1/26 | | | 200 | | | | 198 | |
| | | Liberty Property LP | | 3.375% | | 6/15/23 | | | 50 | | | | 52 | |
| | | Liberty Property LP | | 4.400% | | 2/15/24 | | | 100 | | | | 108 | |
| | | Liberty Property LP | | 3.750% | | 4/1/25 | | | 75 | | | | 80 | |
| | | Liberty Property LP | | 4.375% | | 2/1/29 | | | 200 | | | | 225 | |
| | | Life Storage LP | | 3.500% | | 7/1/26 | | | 125 | | | | 128 | |
| | | Life Storage LP | | 3.875% | | 12/15/27 | | | 150 | | | | 157 | |
| | | Life Storage LP | | 4.000% | | 6/15/29 | | | 25 | | | | 27 | |
| | | Mid-America Apartments LP | | 4.300% | | 10/15/23 | | | 150 | | | | 160 | |
| | | Mid-America Apartments LP | | 3.750% | | 6/15/24 | | | 50 | | | | 53 | |
| | | Mid-America Apartments LP | | 3.600% | | 6/1/27 | | | 250 | | | | 265 | |
| | | Mid-America Apartments LP | | 2.750% | | 3/15/30 | | | 150 | | | | 149 | |
| | | National Retail Properties Inc. | | 3.800% | | 10/15/22 | | | 200 | | | | 208 | |
| | | National Retail Properties Inc. | | 3.500% | | 10/15/27 | | | 350 | | | | 365 | |
| | | National Retail Properties Inc. | | 4.300% | | 10/15/28 | | | 25 | | | | 28 | |
| | | National Retail Properties Inc. | | 4.800% | | 10/15/48 | | | 50 | | | | 60 | |
| | | Office Properties Income Trust | | 4.000% | | 7/15/22 | | | 100 | | | | 102 | |
| | | Omega Healthcare Investors Inc. | | 4.375% | | 8/1/23 | | | 300 | | | | 319 | |
| | | Omega Healthcare Investors Inc. | | 4.950% | | 4/1/24 | | | 100 | | | | 109 | |
| | | Omega Healthcare Investors Inc. | | 4.500% | | 1/15/25 | | | 100 | | | | 107 | |
| | | Omega Healthcare Investors Inc. | | 5.250% | | 1/15/26 | | | 100 | | | | 111 | |
| | | Omega Healthcare Investors Inc. | | 4.500% | | 4/1/27 | | | 300 | | | | 324 | |
| | | Omega Healthcare Investors Inc. | | 4.750% | | 1/15/28 | | | 70 | | | | 76 | |
| | | Omega Healthcare Investors Inc. | | 3.625% | | 10/1/29 | | | 250 | | | | 251 | |
| | | Physicians Realty LP | | 4.300% | | 3/15/27 | | | 100 | | | | 106 | |
| | | Physicians Realty LP | | 3.950% | | 1/15/28 | | | 100 | | | | 103 | |
Total Bond Market Index Portfolio
| | | | | | | | | Face | | | Market | |
| | | | | | | Maturity | | Amount | | | Value• | |
| | | | | Coupon | | Date | | | ($000 | ) | | | ($000 | ) |
| | | Piedmont Operating Partnership LP | | 3.400% | | 6/1/23 | | | 75 | | | | 77 | |
| | | Prologis LP | | 3.875% | | 9/15/28 | | | 100 | | | | 110 | |
| | Prologis LP | | 4.375% | | 9/15/48 | | | 75 | | | | 90 | |
| | | Public Storage | | 2.370% | | 9/15/22 | | | 55 | | | | 56 | |
| | | Public Storage | | 3.094% | | 9/15/27 | | | 100 | | | | 104 | |
| | | Public Storage | | 3.385% | | 5/1/29 | | | 35 | | | | 37 | |
| | | Realty Income Corp. | | 3.250% | | 10/15/22 | | | 175 | | | | 180 | |
| | | Realty Income Corp. | | 3.875% | | 7/15/24 | | | 50 | | | | 53 | |
| | | Realty Income Corp. | | 3.875% | | 4/15/25 | | | 100 | | | | 108 | |
| | | Realty Income Corp. | | 4.125% | | 10/15/26 | | | 125 | | | | 137 | |
| | | Realty Income Corp. | | 3.000% | | 1/15/27 | | | 100 | | | | 103 | |
| | | Realty Income Corp. | | 3.650% | | 1/15/28 | | | 190 | | | | 204 | |
| | | Realty Income Corp. | | 3.250% | | 6/15/29 | | | 200 | | | | 212 | |
| | | Realty Income Corp. | | 4.650% | | 3/15/47 | | | 175 | | | | 211 | |
| | | Regency Centers LP | | 3.600% | | 2/1/27 | | | 25 | | | | 26 | |
| | | Regency Centers LP | | 4.125% | | 3/15/28 | | | 75 | | | | 81 | |
| | | Regency Centers LP | | 2.950% | | 9/15/29 | | | 100 | | | | 100 | |
| | | Regency Centers LP | | 4.400% | | 2/1/47 | | | 200 | | | | 225 | |
| | | Regency Centers LP | | 4.650% | | 3/15/49 | | | 75 | | | | 89 | |
| | | Sabra Health Care LP | | 5.125% | | 8/15/26 | | | 25 | | | | 27 | |
| | | Sabra Health Care LP | | 3.900% | | 10/15/29 | | | 150 | | | | 150 | |
| | | Sabra Health Care LP / Sabra Capital Corp. | | 4.800% | | 6/1/24 | | | 55 | | | | 58 | |
| | | Select Income REIT | | 4.150% | | 2/1/22 | | | 100 | | | | 102 | |
| | | Select Income REIT | | 4.250% | | 5/15/24 | | | 100 | | | | 104 | |
| | | Select Income REIT | | 4.500% | | 2/1/25 | | | 50 | | | | 52 | |
| | | Service Properties Trust | | 4.650% | | 3/15/24 | | | 140 | | | | 145 | |
| | | Service Properties Trust | | 4.350% | | 10/1/24 | | | 112 | | | | 115 | |
| | | Service Properties Trust | | 5.250% | | 2/15/26 | | | 100 | | | | 105 | |
| | | Service Properties Trust | | 4.750% | | 10/1/26 | | | 80 | | | | 82 | |
| | | Service Properties Trust | | 4.950% | | 2/15/27 | | | 100 | | | | 103 | |
| | | Service Properties Trust | | 3.950% | | 1/15/28 | | | 75 | | | | 73 | |
| | | Service Properties Trust | | 4.950% | | 10/1/29 | | | 360 | | | | 362 | |
| | | Service Properties Trust | | 4.375% | | 2/15/30 | | | 75 | | | | 74 | |
| | | Simon Property Group LP | | 2.500% | | 7/15/21 | | | 120 | | | | 121 | |
| | | Simon Property Group LP | | 2.350% | | 1/30/22 | | | 150 | | | | 151 | |
| | | Simon Property Group LP | | 2.625% | | 6/15/22 | | | 100 | | | | 101 | |
| | | Simon Property Group LP | | 2.750% | | 2/1/23 | | | 25 | | | | 25 | |
| | | Simon Property Group LP | | 2.750% | | 6/1/23 | | | 100 | | | | 102 | |
| | | Simon Property Group LP | | 3.750% | | 2/1/24 | | | 150 | | | | 159 | |
| | | Simon Property Group LP | | 2.000% | | 9/13/24 | | | 145 | | | | 143 | |
| | | Simon Property Group LP | | 3.500% | | 9/1/25 | | | 100 | | | | 106 | |
| | | Simon Property Group LP | | 3.300% | | 1/15/26 | | | 195 | | | | 204 | |
| | | Simon Property Group LP | | 3.250% | | 11/30/26 | | | 75 | | | | 79 | |
| | | Simon Property Group LP | | 3.375% | | 6/15/27 | | | 160 | | | | 169 | |
| | | Simon Property Group LP | | 3.375% | | 12/1/27 | | | 100 | | | | 106 | |
| | | Simon Property Group LP | | 2.450% | | 9/13/29 | | | 145 | | | | 142 | |
| | | Simon Property Group LP | | 6.750% | | 2/1/40 | | | 125 | | | | 183 | |
| | | Simon Property Group LP | | 4.750% | | 3/15/42 | | | 100 | | | | 120 | |
| | | Simon Property Group LP | | 4.250% | | 11/30/46 | | | 100 | | | | 114 | |
| | | Simon Property Group LP | | 3.250% | | 9/13/49 | | | 250 | | | | 241 | |
| | | SITE Centers Corp. | | 4.625% | | 7/15/22 | | | 63 | | | | 66 | |
| | | SITE Centers Corp. | | 3.900% | | 8/15/24 | | | 100 | | | | 103 | |
| | | SITE Centers Corp. | | 3.625% | | 2/1/25 | | | 200 | | | | 206 | |
| | | SITE Centers Corp. | | 4.250% | | 2/1/26 | | | 70 | | | | 74 | |
| | | SITE Centers Corp. | | 4.700% | | 6/1/27 | | | 75 | | | | 81 | |
| | | SL Green Operating Partnership LP | | 3.250% | | 10/15/22 | | | 100 | | | | 102 | |
| | | Spirit Realty LP | | 3.200% | | 1/15/27 | | | 80 | | | | 80 | |
| | | Spirit Realty LP | | 4.000% | | 7/15/29 | | | 60 | | | | 63 | |
| | | Spirit Realty LP | | 3.400% | | 1/15/30 | | | 80 | | | | 80 | |
| | | STORE Capital Corp. | | 4.500% | | 3/15/28 | | | 75 | | | | 82 | |
| | | STORE Capital Corp. | | 4.625% | | 3/15/29 | | | 100 | | | | 110 | |
| | | Tanger Properties LP | | 3.125% | | 9/1/26 | | | 175 | | | | 174 | |
| | | Tanger Properties LP | | 3.875% | | 7/15/27 | | | 50 | | | | 51 | |
| | | UDR Inc. | | 2.950% | | 9/1/26 | | | 150 | | | | 152 | |
| | | UDR Inc. | | 3.500% | | 7/1/27 | | | 150 | | | | 157 | |
| | | UDR Inc. | | 3.500% | | 1/15/28 | | | 250 | | | | 262 | |
| | | UDR Inc. | | 3.200% | | 1/15/30 | | | 60 | | | | 61 | |
| | | UDR Inc. | | 3.000% | | 8/15/31 | | | 65 | | | | 65 | |
| | | UDR Inc. | | 3.100% | | 11/1/34 | | | 65 | | | | 65 | |
| | | Ventas Realty LP | | 3.125% | | 6/15/23 | | | 175 | | | | 179 | |
| | Ventas Realty LP | | 3.500% | | 4/15/24 | | | 75 | | | | 78 | |
| | | Ventas Realty LP | | 3.750% | | 5/1/24 | | | 200 | | | | 210 | |
| | | Ventas Realty LP | | 2.650% | | 1/15/25 | | | 75 | | | | 76 | |
| | | Ventas Realty LP | | 4.125% | | 1/15/26 | | | 75 | | | | 80 | |
| | | Ventas Realty LP | | 3.250% | | 10/15/26 | | | 75 | | | | 77 | |
| | | Ventas Realty LP | | 3.850% | | 4/1/27 | | | 50 | | | | 53 | |
| | | Ventas Realty LP | | 4.000% | | 3/1/28 | | | 125 | | | | 134 | |
| | | Ventas Realty LP | | 3.000% | | 1/15/30 | | | 100 | | | | 99 | |
| | | Ventas Realty LP | | 5.700% | | 9/30/43 | | | 75 | | | | 94 | |
| | | Ventas Realty LP | | 4.375% | | 2/1/45 | | | 60 | | | | 64 | |
| | | Ventas Realty LP | | 4.875% | | 4/15/49 | | | 50 | | | | 59 | |
| | | Ventas Realty LP / Ventas Capital Corp. | | 3.250% | | 8/15/22 | �� | | 200 | | | | 205 | |
| | | VEREIT Operating Partnership LP | | 4.600% | | 2/6/24 | | | 75 | | | | 81 | |
| | | VEREIT Operating Partnership LP | | 4.625% | | 11/1/25 | | | 75 | | | | 82 | |
| | | VEREIT Operating Partnership LP | | 3.950% | | 8/15/27 | | | 450 | | | | 472 | |
| | | VEREIT Operating Partnership LP | | 3.100% | | 12/15/29 | | | 150 | | | | 147 | |
| | | Vornado Realty LP | | 3.500% | | 1/15/25 | | | 100 | | | | 104 | |
| | | Washington REIT | | 3.950% | | 10/15/22 | | | 75 | | | | 77 | |
| | | Weingarten Realty Investors | | 3.375% | | 10/15/22 | | | 50 | | | | 51 | |
| | | Weingarten Realty Investors | | 3.500% | | 4/15/23 | | | 100 | | | | 103 | |
| | | Welltower Inc. | | 3.750% | | 3/15/23 | | | 75 | | | | 78 | |
| | | Welltower Inc. | | 3.950% | | 9/1/23 | | | 100 | | | | 105 | |
| | | Welltower Inc. | | 3.625% | | 3/15/24 | | | 75 | | | | 78 | |
| | | Welltower Inc. | | 4.000% | | 6/1/25 | | | 200 | | | | 215 | |
| | | Welltower Inc. | | 4.250% | | 4/1/26 | | | 150 | | | | 163 | |
| | | Welltower Inc. | | 2.700% | | 2/15/27 | | | 300 | | | | 301 | |
| | | Welltower Inc. | | 4.250% | | 4/15/28 | | | 125 | | | | 137 | |
| | | Welltower Inc. | | 4.125% | | 3/15/29 | | | 250 | | | | 272 | |
| | | Welltower Inc. | | 3.100% | | 1/15/30 | | | 75 | | | | 76 | |
| | | Welltower Inc. | | 6.500% | | 3/15/41 | | | 25 | | | | 33 | |
| | | Welltower Inc. | | 4.950% | | 9/1/48 | | | 75 | | | | 90 | |
| | | WP Carey Inc. | | 4.600% | | 4/1/24 | | | 125 | | | | 134 | |
| | | WP Carey Inc. | | 4.000% | | 2/1/25 | | | 50 | | | | 52 | |
| | | WP Carey Inc. | | 4.250% | | 10/1/26 | | | 75 | | | | 80 | |
| | | WP Carey Inc. | | 3.850% | | 7/15/29 | | | 50 | | | | 53 | |
| | | | | | | | | | | | | | 357,492 | |
| Industrial (16.2%) | | | | | | | | | | | | |
| | | Basic Industry (0.8%) | | | | | | | | | | | | |
| | | Air Products & Chemicals Inc. | | 3.000% | | 11/3/21 | | | 75 | | | | 77 | |
| | | Air Products & Chemicals Inc. | | 2.750% | | 2/3/23 | | | 50 | | | | 51 | |
| | | Air Products & Chemicals Inc. | | 3.350% | | 7/31/24 | | | 675 | | | | 710 | |
| | | Airgas Inc. | | 3.650% | | 7/15/24 | | | 825 | | | | 875 | |
| | | Albemarle Corp. | | 4.150% | | 12/1/24 | | | 132 | | | | 141 | |
| | | Albemarle Corp. | | 5.450% | | 12/1/44 | | | 75 | | | | 85 | |
| 6 | | Albemarle Wodgina Pty Ltd. | | 3.450% | | 11/15/29 | | | 40 | | | | 40 | |
| | | ArcelorMittal | | 3.600% | | 7/16/24 | | | 150 | | | | 154 | |
| | | ArcelorMittal | | 6.125% | | 6/1/25 | | | 200 | | | | 230 | |
| | | ArcelorMittal | | 4.550% | | 3/11/26 | | | 500 | | | | 530 | |
| | | ArcelorMittal | | 4.250% | | 7/16/29 | | | 50 | | | | 52 | |
| | | Barrick Gold Corp. | | 6.450% | | 10/15/35 | | | 75 | | | | 96 | |
| | | Barrick North America Finance LLC | | 5.700% | | 5/30/41 | | | 450 | | | | 541 | |
| | | Barrick North America Finance LLC | | 5.750% | | 5/1/43 | | | 150 | | | | 192 | |
| | | Barrick PD Australia Finance Pty Ltd. | | 5.950% | | 10/15/39 | | | 50 | | | | 63 | |
| | | BHP Billiton Finance USA Ltd. | | 2.875% | | 2/24/22 | | | 176 | | | | 179 | |
| | | BHP Billiton Finance USA Ltd. | | 3.850% | | 9/30/23 | | | 50 | | | | 53 | |
| | | BHP Billiton Finance USA Ltd. | | 4.125% | | 2/24/42 | | | 150 | | | | 170 | |
| | | BHP Billiton Finance USA Ltd. | | 5.000% | | 9/30/43 | | | 575 | | | | 733 | |
| | | Cabot Corp. | | 4.000% | | 7/1/29 | | | 55 | | | | 58 | |
| | | Celanese US Holdings LLC | | 3.500% | | 5/8/24 | | | 100 | | | | 103 | |
| | | Celulosa Arauco y Constitucion SA | | 3.875% | | 11/2/27 | | | 300 | | | | 303 | |
| | | Celulosa Arauco y Constitucion SA | | 5.500% | | 11/2/47 | | | 200 | | | | 207 | |
| | | Dow Chemical Co. | | 3.000% | | 11/15/22 | | | 225 | | | | 230 | |
| | | Dow Chemical Co. | | 3.150% | | 5/15/24 | | | 100 | | | | 103 | |
| | | Dow Chemical Co. | | 3.500% | | 10/1/24 | | | 275 | | | | 288 | |
| | | Dow Chemical Co. | | 4.550% | | 11/30/25 | | | 150 | | | | 165 | |
| | | Dow Chemical Co. | | 3.625% | | 5/15/26 | | | 100 | | | | 105 | |
| | | Dow Chemical Co. | | 4.800% | | 11/30/28 | | | 225 | | | | 255 | |
| | | Dow Chemical Co. | | 7.375% | | 11/1/29 | | | 25 | | | | 33 | |
| | | Dow Chemical Co. | | 4.250% | | 10/1/34 | | | 50 | | | | 55 | |
| | | Dow Chemical Co. | | 9.400% | | 5/15/39 | | | 350 | | | | 574 | |
| | | Dow Chemical Co. | | 5.250% | | 11/15/41 | | | 100 | | | | 116 | |
Total Bond Market Index Portfolio
| | | | | | | | | Face | | | Market | |
| | | | | | | Maturity | | Amount | | | Value• | |
| | | | | Coupon | | Date | | | ($000 | ) | | | ($000 | ) |
| | | Dow Chemical Co. | | 5.550% | | 11/30/48 | | | 300 | | | | 374 | |
| | | Dow Chemical Co. | | 4.800% | | 5/15/49 | | | 100 | | | | 115 | |
| | | DuPont de Nemours Inc. | | 4.205% | | 11/15/23 | | | 475 | | | | 508 | |
| | | DuPont de Nemours Inc. | | 4.493% | | 11/15/25 | | | 350 | | | | 385 | |
| | | DuPont de Nemours Inc. | | 4.725% | | 11/15/28 | | | 425 | | | | 482 | |
| | | DuPont de Nemours Inc. | | 5.319% | | 11/15/38 | | | 300 | | | | 356 | |
| | | DuPont de Nemours Inc. | | 5.419% | | 11/15/48 | | | 475 | | | | 585 | |
| | | Eastman Chemical Co. | | 3.600% | | 8/15/22 | | | 49 | | | | 51 | |
| | | Eastman Chemical Co. | | 4.800% | | 9/1/42 | | | 225 | | | | 245 | |
| | | Eastman Chemical Co. | | 4.650% | | 10/15/44 | | | 150 | | | | 163 | |
| | | Ecolab Inc. | | 4.350% | | 12/8/21 | | | 163 | | | | 171 | |
| | | Ecolab Inc. | | 2.375% | | 8/10/22 | | | 470 | | | | 474 | |
| | | Ecolab Inc. | | 2.700% | | 11/1/26 | | | 200 | | | | 205 | |
| | | Ecolab Inc. | | 3.250% | | 12/1/27 | | | 100 | | | | 105 | |
| | | Fibria Overseas Finance Ltd. | | 5.250% | | 5/12/24 | | | 300 | | | | 325 | |
| | | Fibria Overseas Finance Ltd. | | 4.000% | | 1/14/25 | | | 150 | | | | 155 | |
| | | FMC Corp. | | 3.950% | | 2/1/22 | | | 50 | | | | 52 | |
| | | FMC Corp. | | 4.100% | | 2/1/24 | | | 250 | | | | 263 | |
| | | FMC Corp. | | 3.200% | | 10/1/26 | | | 50 | | | | 51 | |
| | | FMC Corp. | | 3.450% | | 10/1/29 | | | 50 | | | | 52 | |
| | | FMC Corp. | | 4.500% | | 10/1/49 | | | 100 | | | | 110 | |
| | | Georgia-Pacific LLC | | 8.000% | | 1/15/24 | | | 250 | | | | 303 | |
| | | Georgia-Pacific LLC | | 7.375% | | 12/1/25 | | | 100 | | | | 126 | |
| | | Georgia-Pacific LLC | | 8.875% | | 5/15/31 | | | 250 | | | | 388 | |
| | | Huntsman International LLC | | 4.500% | | 5/1/29 | | | 75 | | | | 80 | |
| | | International Flavors & Fragrances Inc. | | 3.200% | | 5/1/23 | | | 25 | | | | 25 | |
| | | International Flavors & Fragrances Inc. | | 4.450% | | 9/26/28 | | | 50 | | | | 55 | |
| | | International Flavors & Fragrances Inc. | | 4.375% | | 6/1/47 | | | 90 | | | | 92 | |
| | | International Flavors & Fragrances Inc. | | 5.000% | | 9/26/48 | | | 100 | | | | 112 | |
| | | International Paper Co. | | 7.500% | | 8/15/21 | | | 306 | | | | 332 | |
| | | International Paper Co. | | 3.650% | | 6/15/24 | | | 100 | | | | 105 | |
| | | International Paper Co. | | 3.800% | | 1/15/26 | | | 75 | | | | 80 | |
| | | International Paper Co. | | 3.000% | | 2/15/27 | | | 200 | | | | 205 | |
| | | International Paper Co. | | 5.000% | | 9/15/35 | | | 100 | | | | 117 | |
| | | International Paper Co. | | 7.300% | | 11/15/39 | | | 100 | | | | 138 | |
| | | International Paper Co. | | 4.800% | | 6/15/44 | | | 200 | | | | 219 | |
| | | International Paper Co. | | 5.150% | | 5/15/46 | | | 200 | | | | 230 | |
| | | International Paper Co. | | 4.400% | | 8/15/47 | | | 200 | | | | 212 | |
| | | International Paper Co. | | 4.350% | | 8/15/48 | | | 200 | | | | 212 | |
| | | Kinross Gold Corp. | | 5.125% | | 9/1/21 | | | 50 | | | | 52 | |
| | | Kinross Gold Corp. | | 5.950% | | 3/15/24 | | | 75 | | | | 83 | |
| | | Kinross Gold Corp. | | 4.500% | | 7/15/27 | | | 25 | | | | 26 | |
| | | LYB International Finance BV | | 5.250% | | 7/15/43 | | | 200 | | | | 235 | |
| | | LYB International Finance II BV | | 3.500% | | 3/2/27 | | | 100 | | | | 105 | |
| | | LYB International Finance III LLC | | 4.200% | | 10/15/49 | | | 135 | | | | 140 | |
| | | LyondellBasell Industries NV | | 6.000% | | 11/15/21 | | | 175 | | | | 186 | |
| | | LyondellBasell Industries NV | | 5.750% | | 4/15/24 | | | 175 | | | | 197 | |
| | | LyondellBasell Industries NV | | 4.625% | | 2/26/55 | | | 425 | | | | 448 | |
| | | Meadwestvaco Corp. | | 7.950% | | 2/15/31 | | | 350 | | | | 472 | |
| | | Methanex Corp. | | 4.250% | | 12/1/24 | | | 154 | | | | 158 | |
| | | Mosaic Co. | | 3.750% | | 11/15/21 | | | 115 | | | | 118 | |
| | | Mosaic Co. | | 3.250% | | 11/15/22 | | | 225 | | | | 231 | |
| | | Mosaic Co. | | 4.250% | | 11/15/23 | | | 175 | | | | 187 | |
| | | Mosaic Co. | | 4.050% | | 11/15/27 | | | 200 | | | | 207 | |
| | | Mosaic Co. | | 5.450% | | 11/15/33 | | | 100 | | | | 114 | |
| | | Mosaic Co. | | 4.875% | | 11/15/41 | | | 50 | | | | 52 | |
| | | Mosaic Co. | | 5.625% | | 11/15/43 | | | 50 | | | | 59 | |
| | | Newmont Corp. | | 3.700% | | 3/15/23 | | | 275 | | | | 288 | |
| | | Newmont Corp. | | 2.800% | | 10/1/29 | | | 150 | | | | 148 | |
| | | Newmont Corp. | | 5.875% | | 4/1/35 | | | 100 | | | | 128 | |
| | | Newmont Corp. | | 6.250% | | 10/1/39 | | | 225 | | | | 297 | |
| | | Newmont Corp. | | 4.875% | | 3/15/42 | | | 250 | | | | 291 | |
| | | Newmont Corp. | | 5.450% | | 6/9/44 | | | 100 | | | | 124 | |
| | | Nucor Corp. | | 4.125% | | 9/15/22 | | | 100 | | | | 105 | |
| | | Nucor Corp. | | 3.950% | | 5/1/28 | | | 100 | | | | 108 | |
| | | Nucor Corp. | | 6.400% | | 12/1/37 | | | 100 | | | | 135 | |
| | | Nucor Corp. | | 5.200% | | 8/1/43 | | | 200 | | | | 248 | |
| | | Nucor Corp. | | 4.400% | | 5/1/48 | | | 150 | | | | 170 | |
| | | Nutrien Ltd. | | 3.500% | | 6/1/23 | | | 299 | | | | 308 | |
| | | Nutrien Ltd. | | 3.375% | | 3/15/25 | | | 250 | | | | 259 | |
| | | Nutrien Ltd. | | 3.000% | | 4/1/25 | | | 250 | | | | 254 | |
| | | Nutrien Ltd. | | 4.000% | | 12/15/26 | | | 50 | | | | 53 | |
| | | Nutrien Ltd. | | 4.200% | | 4/1/29 | | | 75 | | | | 82 | |
| | | Nutrien Ltd. | | 4.125% | | 3/15/35 | | | 250 | | | | 261 | |
| | | Nutrien Ltd. | | 5.625% | | 12/1/40 | | | 275 | | | | 322 | |
| | | Nutrien Ltd. | | 6.125% | | 1/15/41 | | | 25 | | | | 31 | |
| | | Nutrien Ltd. | | 4.900% | | 6/1/43 | | | 50 | | | | 56 | |
| | | Nutrien Ltd. | | 5.250% | | 1/15/45 | | | 200 | | | | 236 | |
| | | Nutrien Ltd. | | 5.000% | | 4/1/49 | | | 100 | | | | 118 | |
| | | Packaging Corp. of America | | 4.500% | | 11/1/23 | | | 350 | | | | 377 | |
| | | Packaging Corp. of America | | 3.400% | | 12/15/27 | | | 100 | | | | 104 | |
| | | Packaging Corp. of America | | 3.000% | | 12/15/29 | | | 40 | | | | 40 | |
| | | Packaging Corp. of America | | 4.050% | | 12/15/49 | | | 90 | | | | 93 | |
| | | PPG Industries Inc. | | 2.400% | | 8/15/24 | | | 200 | | | | 201 | |
| | | Praxair Inc. | | 3.000% | | 9/1/21 | | | 75 | | | | 76 | |
| | | Praxair Inc. | | 2.450% | | 2/15/22 | | | 450 | | | | 455 | |
| | | Praxair Inc. | | 2.200% | | 8/15/22 | | | 200 | | | | 201 | |
| | | Praxair Inc. | | 3.550% | | 11/7/42 | | | 50 | | | | 52 | |
| | | Rayonier Inc. | | 3.750% | | 4/1/22 | | | 50 | | | | 51 | |
| | | Reliance Steel & Aluminum Co. | | 4.500% | | 4/15/23 | | | 100 | | | | 105 | |
| | | Rio Tinto Alcan Inc. | | 6.125% | | 12/15/33 | | | 225 | | | | 305 | |
| | | Rio Tinto Finance USA Ltd. | | 3.750% | | 6/15/25 | | | 220 | | | | 236 | |
| | | Rio Tinto Finance USA Ltd. | | 7.125% | | 7/15/28 | | | 75 | | | | 100 | |
| | | Rio Tinto Finance USA Ltd. | | 5.200% | | 11/2/40 | | | 125 | | | | 163 | |
| | | Rio Tinto Finance USA plc | | 4.750% | | 3/22/42 | | | 150 | | | | 183 | |
| | | Rio Tinto Finance USA plc | | 4.125% | | 8/21/42 | | | 250 | | | | 286 | |
| | | Rohm & Haas Co. | | 7.850% | | 7/15/29 | | | 250 | | | | 332 | |
| | | RPM International Inc. | | 3.450% | | 11/15/22 | | | 100 | | | | 103 | |
| | | RPM International Inc. | | 3.750% | | 3/15/27 | | | 50 | | | | 51 | |
| | | RPM International Inc. | | 4.550% | | 3/1/29 | | | 75 | | | | 81 | |
| | | RPM International Inc. | | 4.250% | | 1/15/48 | | | 250 | | | | 242 | |
| | | Sasol Financing International Ltd. | | 4.500% | | 11/14/22 | | | 200 | | | | 207 | |
| | | SASOL Financing USA LLC | | 5.875% | | 3/27/24 | | | 200 | | | | 217 | |
| | | SASOL Financing USA LLC | | 6.500% | | 9/27/28 | | | 200 | | | | 223 | |
| | | Sherwin-Williams Co. | | 2.750% | | 6/1/22 | | | 109 | | | | 111 | |
| | | Sherwin-Williams Co. | | 3.125% | | 6/1/24 | | | 325 | | | | 336 | |
| | | Sherwin-Williams Co. | | 3.450% | | 8/1/25 | | | 225 | | | | 236 | |
| | | Sherwin-Williams Co. | | 3.950% | | 1/15/26 | | | 200 | | | | 214 | |
| | | Sherwin-Williams Co. | | 3.450% | | 6/1/27 | | | 100 | | | | 105 | |
| | | Sherwin-Williams Co. | | 2.950% | | 8/15/29 | | | 200 | | | | 202 | |
| | | Sherwin-Williams Co. | | 4.000% | | 12/15/42 | | | 100 | | | | 103 | |
| | | Sherwin-Williams Co. | | 4.550% | | 8/1/45 | | | 90 | | | | 99 | |
| | | Sherwin-Williams Co. | | 4.500% | | 6/1/47 | | | 250 | | | | 284 | |
| | | Sherwin-Williams Co. | | 3.800% | | 8/15/49 | | | 100 | | | | 102 | |
| | | Southern Copper Corp. | | 3.500% | | 11/8/22 | | | 400 | | | | 413 | |
| | | Southern Copper Corp. | | 3.875% | | 4/23/25 | | | 50 | | | | 52 | |
| | | Southern Copper Corp. | | 7.500% | | 7/27/35 | | | 100 | | | | 138 | |
| | | Southern Copper Corp. | | 6.750% | | 4/16/40 | | | 325 | | | | 432 | |
| | | Southern Copper Corp. | | 5.875% | | 4/23/45 | | | 500 | | | | 621 | |
| | | Steel Dynamics Inc. | | 2.800% | | 12/15/24 | | | 50 | | | | 50 | |
| | | Steel Dynamics Inc. | | 4.125% | | 9/15/25 | | | 70 | | | | 72 | |
| | | Steel Dynamics Inc. | | 3.450% | | 4/15/30 | | | 125 | | | | 126 | |
| | | Suzano Austria GmbH | | 6.000% | | 1/15/29 | | | 400 | | | | 452 | |
| | | Suzano Austria GmbH | | 5.000% | | 1/15/30 | | | 200 | | | | 210 | |
| | | Teck Resources Ltd. | | 6.125% | | 10/1/35 | | | 100 | | | | 116 | |
| | | Teck Resources Ltd. | | 6.000% | | 8/15/40 | | | 50 | | | | 56 | |
| | | Teck Resources Ltd. | | 6.250% | | 7/15/41 | | | 325 | | | | 371 | |
| | | Vale Overseas Ltd. | | 6.250% | | 8/10/26 | | | 300 | | | | 352 | |
| | | Vale Overseas Ltd. | | 8.250% | | 1/17/34 | | | 50 | | | | 70 | |
| | | Vale Overseas Ltd. | | 6.875% | | 11/21/36 | | | 410 | | | | 532 | |
| | | Vale Overseas Ltd. | | 6.875% | | 11/10/39 | | | 450 | | | | 584 | |
| | | Vale SA | | 5.625% | | 9/11/42 | | | 75 | | | | 88 | |
| | | Westlake Chemical Corp. | | 3.600% | | 8/15/26 | | | 300 | | | | 310 | |
| | | Westlake Chemical Corp. | | 5.000% | | 8/15/46 | | | 200 | | | | 212 | |
| | | WestRock RKT Co. | | 4.900% | | 3/1/22 | | | 100 | | | | 105 | |
| | | Weyerhaeuser Co. | | 4.700% | | 3/15/21 | | | 75 | | | | 77 | |
| | | Weyerhaeuser Co. | | 8.500% | | 1/15/25 | | | 50 | | | | 63 | |
| | | Weyerhaeuser Co. | | 4.000% | | 11/15/29 | | | 150 | | | | 163 | |
| | | Weyerhaeuser Co. | | 7.375% | | 3/15/32 | | | 100 | | | | 139 | |
| | | Weyerhaeuser Co. | | 6.875% | | 12/15/33 | | | 50 | | | | 66 | |
| | | WRKCo Inc. | | 3.000% | | 9/15/24 | | | 250 | | | | 255 | |
| | | WRKCo Inc. | | 4.650% | | 3/15/26 | | | 100 | | | | 111 | |
Total Bond Market Index Portfolio
| | | | | | | | | Face | | | Market | |
| | | | | | | Maturity | | Amount | | | Value• | |
| | | | | Coupon | | Date | | | ($000 | ) | | | ($000 | ) |
| | | WRKCo Inc. | | 3.375% | | 9/15/27 | | | 250 | | | | 256 | |
| | | WRKCo Inc. | | 4.900% | | 3/15/29 | | | 150 | | | | 171 | |
| | | | | | | | | | | | | | | |
| | | Capital Goods (1.4%) | | | | | | | | | | | | |
| | | 3M Co. | | 1.625% | | 9/19/21 | | | 150 | | | | 150 | |
| | | 3M Co. | | 2.750% | | 3/1/22 | | | 100 | | | | 102 | |
| | | 3M Co. | | 1.750% | | 2/14/23 | | | 200 | | | | 199 | |
| | | 3M Co. | | 2.250% | | 3/15/23 | | | 175 | | | | 176 | |
| | | 3M Co. | | 3.250% | | 2/14/24 | | | 100 | | | | 105 | |
| | | 3M Co. | | 2.000% | | 2/14/25 | | | 150 | | | | 149 | |
| | | 3M Co. | | 3.000% | | 8/7/25 | | | 100 | | | | 104 | |
| | | 3M Co. | | 2.250% | | 9/19/26 | | | 150 | | | | 150 | |
| | | 3M Co. | | 2.875% | | 10/15/27 | | | 125 | | | | 130 | |
| | | 3M Co. | | 3.375% | | 3/1/29 | | | 150 | | | | 159 | |
| | | 3M Co. | | 2.375% | | 8/26/29 | | | 250 | | | | 245 | |
| | | 3M Co. | | 3.125% | | 9/19/46 | | | 75 | | | | 72 | |
| | | 3M Co. | | 3.625% | | 10/15/47 | | | 100 | | | | 103 | |
| | | 3M Co. | | 4.000% | | 9/14/48 | | | 250 | | | | 274 | |
| | | 3M Co. | | 3.250% | | 8/26/49 | | | 375 | | | | 365 | |
| | | ABB Finance USA Inc. | | 3.375% | | 4/3/23 | | | 100 | | | | 104 | |
| | | ABB Finance USA Inc. | | 3.800% | | 4/3/28 | | | 150 | | | | 164 | |
| | | ABB Finance USA Inc. | | 4.375% | | 5/8/42 | | | 150 | | | | 180 | |
| | | Allegion plc | | 3.500% | | 10/1/29 | | | 75 | | | | 76 | |
| | | Allegion US Holding Co. Inc. | | 3.550% | | 10/1/27 | | | 175 | | | | 180 | |
| 6 | | Bemis Co. Inc. | | 3.100% | | 9/15/26 | | | 50 | | | | 49 | |
| | | Boeing Co. | | 2.300% | | 8/1/21 | | | 50 | | | | 50 | |
| | | Boeing Co. | | 2.125% | | 3/1/22 | | | 50 | | | | 50 | |
| | | Boeing Co. | | 2.700% | | 5/1/22 | | | 75 | | | | 76 | |
| | | Boeing Co. | | 2.800% | | 3/1/23 | | | 600 | | | | 611 | |
| | | Boeing Co. | | 1.875% | | 6/15/23 | | | 100 | | | | 99 | |
| | | Boeing Co. | | 2.800% | | 3/1/24 | | | 75 | | | | 77 | |
| | | Boeing Co. | | 2.850% | | 10/30/24 | | | 100 | | | | 102 | |
| | | Boeing Co. | | 2.500% | | 3/1/25 | | | 145 | | | | 145 | |
| | | Boeing Co. | | 3.100% | | 5/1/26 | | | 100 | | | | 103 | |
| | | Boeing Co. | | 2.250% | | 6/15/26 | | | 50 | | | | 49 | |
| | | Boeing Co. | | 2.700% | | 2/1/27 | | | 195 | | | | 197 | |
| | | Boeing Co. | | 2.800% | | 3/1/27 | | | 50 | | | | 51 | |
| | | Boeing Co. | | 3.250% | | 3/1/28 | | | 100 | | | | 104 | |
| | | Boeing Co. | | 3.450% | | 11/1/28 | | | 60 | | | | 63 | |
| | | Boeing Co. | | 3.200% | | 3/1/29 | | | 200 | | | | 208 | |
| | | Boeing Co. | | 2.950% | | 2/1/30 | | | 190 | | | | 194 | |
| | | Boeing Co. | | 6.125% | | 2/15/33 | | | 75 | | | | 98 | |
| | | Boeing Co. | | 3.600% | | 5/1/34 | | | 150 | | | | 160 | |
| | | Boeing Co. | | 3.250% | | 2/1/35 | | | 190 | | | | 194 | |
| | | Boeing Co. | | 6.625% | | 2/15/38 | | | 50 | | | | 70 | |
| | | Boeing Co. | | 3.550% | | 3/1/38 | | | 50 | | | | 52 | |
| | | Boeing Co. | | 3.500% | | 3/1/39 | | | 75 | | | | 77 | |
| | | Boeing Co. | | 6.875% | | 3/15/39 | | | 125 | | | | 183 | |
| | | Boeing Co. | | 5.875% | | 2/15/40 | | | 75 | | | | 99 | |
| | | Boeing Co. | | 3.375% | | 6/15/46 | | | 75 | | | | 73 | |
| | | Boeing Co. | | 3.650% | | 3/1/47 | | | 175 | | | | 177 | |
| | | Boeing Co. | | 3.625% | | 3/1/48 | | | 75 | | | | 77 | |
| | | Boeing Co. | | 3.850% | | 11/1/48 | | | 60 | | | | 63 | |
| | | Boeing Co. | | 3.900% | | 5/1/49 | | | 150 | | | | 161 | |
| | | Boeing Co. | | 3.750% | | 2/1/50 | | | 50 | | | | 53 | |
| | | Boeing Co. | | 3.825% | | 3/1/59 | | | 200 | | | | 208 | |
| | | Boeing Co. | | 3.950% | | 8/1/59 | | | 75 | | | | 80 | |
| | | Carlisle Cos. Inc. | | 3.750% | | 11/15/22 | | | 75 | | | | 77 | |
| | | Carlisle Cos. Inc. | | 3.500% | | 12/1/24 | | | 50 | | | | 52 | |
| | | Carlisle Cos. Inc. | | 3.750% | | 12/1/27 | | | 125 | | | | 131 | |
| | | Caterpillar Financial Services Corp. | | 2.900% | | 3/15/21 | | | 100 | | | | 101 | |
| | | Caterpillar Financial Services Corp. | | 2.650% | | 5/17/21 | | | 100 | | | | 101 | |
| | | Caterpillar Financial Services Corp. | | 1.700% | | 8/9/21 | | | 100 | | | | 100 | |
| | | Caterpillar Financial Services Corp. | | 2.750% | | 8/20/21 | | | 100 | | | | 101 | |
| | | Caterpillar Financial Services Corp. | | 3.150% | | 9/7/21 | | | 200 | | | | 204 | |
| | | Caterpillar Financial Services Corp. | | 1.931% | | 10/1/21 | | | 75 | | | | 75 | |
| | | Caterpillar Financial Services Corp. | | 2.950% | | 2/26/22 | | | 200 | | | | 204 | |
| | | Caterpillar Financial Services Corp. | | 2.400% | | 6/6/22 | | | 150 | | | | 152 | |
| | | Caterpillar Financial Services Corp. | | 2.550% | | 11/29/22 | | | 200 | | | | 204 | |
| | | Caterpillar Financial Services Corp. | | 3.450% | | 5/15/23 | | | 200 | | | | 209 | |
| | | Caterpillar Financial Services Corp. | | 3.650% | | 12/7/23 | | | 70 | | | | 74 | |
| | | Caterpillar Financial Services Corp. | | 2.850% | | 5/17/24 | | | 125 | | | | 129 | |
| | | Caterpillar Financial Services Corp. | | 3.300% | | 6/9/24 | | | 250 | | | | 263 | |
| | | Caterpillar Financial Services Corp. | | 2.150% | | 11/8/24 | | | 100 | | | | 100 | |
| | | Caterpillar Financial Services Corp. | | 3.250% | | 12/1/24 | | | 477 | | | | 503 | |
| | | Caterpillar Financial Services Corp. | | 2.400% | | 8/9/26 | | | 100 | | | | 101 | |
| | | Caterpillar Inc. | | 3.900% | | 5/27/21 | | | 125 | | | | 128 | |
| | | Caterpillar Inc. | | 2.600% | | 6/26/22 | | | 50 | | | | 51 | |
| | | Caterpillar Inc. | | 3.400% | | 5/15/24 | | | 250 | | | | 264 | |
| | | Caterpillar Inc. | | 2.600% | | 9/19/29 | | | 200 | | | | 201 | |
| | | Caterpillar Inc. | | 6.050% | | 8/15/36 | | | 100 | | | | 136 | |
| | | Caterpillar Inc. | | 5.200% | | 5/27/41 | | | 150 | | | | 194 | |
| | | Caterpillar Inc. | | 3.803% | | 8/15/42 | | | 243 | | | | 272 | |
| | | Caterpillar Inc. | | 3.250% | | 9/19/49 | | | 200 | | | | 200 | |
| | | Caterpillar Inc. | | 4.750% | | 5/15/64 | | | 100 | | | | 125 | |
| | | CNH Industrial Capital LLC | | 4.200% | | 1/15/24 | | | 1,050 | | | | 1,111 | |
| | | CNH Industrial NV | | 3.850% | | 11/15/27 | | | 150 | | | | 156 | |
| | | Crane Co. | | 4.450% | | 12/15/23 | | | 50 | | | | 53 | |
| | | Crane Co. | | 4.200% | | 3/15/48 | | | 150 | | | | 150 | |
| | | CRH America Inc. | | 5.750% | | 1/15/21 | | | 75 | | | | 78 | |
| | | Deere & Co. | | 2.600% | | 6/8/22 | | | 125 | | | | 127 | |
| | | Deere & Co. | | 5.375% | | 10/16/29 | | | 125 | | | | 155 | |
| | | Deere & Co. | | 7.125% | | 3/3/31 | | | 100 | | | | 141 | |
| | | Deere & Co. | | 3.900% | | 6/9/42 | | | 75 | | | | 84 | |
| | | Dover Corp. | | 3.150% | | 11/15/25 | | | 200 | | | | 207 | |
| | | Dover Corp. | | 2.950% | | 11/4/29 | | | 75 | | | | 75 | |
| | | Dover Corp. | | 6.600% | | 3/15/38 | | | 75 | | | | 100 | |
| | | Eaton Corp. | | 2.750% | | 11/2/22 | | | 300 | | | | 306 | |
| | | Eaton Corp. | | 3.103% | | 9/15/27 | | | 125 | | | | 130 | |
| | | Eaton Corp. | | 4.000% | | 11/2/32 | | | 150 | | | | 170 | |
| | | Eaton Corp. | | 4.150% | | 11/2/42 | | | 150 | | | | 166 | |
| | | Eaton Corp. | | 3.915% | | 9/15/47 | | | 50 | | | | 53 | |
| | | Embraer Netherlands Finance BV | | 5.050% | | 6/15/25 | | | 200 | | | | 220 | |
| | | Embraer Netherlands Finance BV | | 5.400% | | 2/1/27 | | | 100 | | | | 112 | |
| 6 | | Embraer Overseas Ltd. | | 5.696% | | 9/16/23 | | | 100 | | | | 110 | |
| | | Embraer SA | | 5.150% | | 6/15/22 | | | 275 | | | | 290 | |
| | | Emerson Electric Co. | | 2.625% | | 12/1/21 | | | 150 | | | | 152 | |
| | | Emerson Electric Co. | | 3.150% | | 6/1/25 | | | 200 | | | | 209 | |
| | | Flowserve Corp. | | 3.500% | | 9/15/22 | | | 250 | | | | 253 | |
| | | Flowserve Corp. | | 4.000% | | 11/15/23 | | | 50 | | | | 51 | |
| | | Fortive Corp. | | 2.350% | | 6/15/21 | | | 100 | | | | 100 | |
| | | Fortive Corp. | | 3.150% | | 6/15/26 | | | 150 | | | | 153 | |
| | | Fortive Corp. | | 4.300% | | 6/15/46 | | | 100 | | | | 103 | |
| | | Fortune Brands Home & Security Inc. | | 4.000% | | 9/21/23 | | | 100 | | | | 106 | |
| | | Fortune Brands Home & Security Inc. | | 4.000% | | 6/15/25 | | | 100 | | | | 107 | |
| | | General Dynamics Corp. | | 3.000% | | 5/11/21 | | | 300 | | | | 305 | |
| | | General Dynamics Corp. | | 3.375% | | 5/15/23 | | | 200 | | | | 209 | |
| | | General Dynamics Corp. | | 1.875% | | 8/15/23 | | | 300 | | | | 300 | |
| | | General Dynamics Corp. | | 2.375% | | 11/15/24 | | | 320 | | | | 325 | |
| | | General Dynamics Corp. | | 3.500% | | 5/15/25 | | | 200 | | | | 214 | |
| | | General Dynamics Corp. | | 2.625% | | 11/15/27 | | | 200 | | | | 205 | |
| | | General Dynamics Corp. | | 3.750% | | 5/15/28 | | | 200 | | | | 220 | |
| | | General Dynamics Corp. | | 3.600% | | 11/15/42 | | | 100 | | | | 113 | |
| | | General Electric Co. | | 4.625% | | 1/7/21 | | | 201 | | | | 206 | |
| | | General Electric Co. | | 5.300% | | 2/11/21 | | | 172 | | | | 177 | |
| | | General Electric Co. | | 4.650% | | 10/17/21 | | | 347 | | | | 361 | |
| | | General Electric Co. | | 3.150% | | 9/7/22 | | | 91 | | | | 93 | |
| | | General Electric Co. | | 2.700% | | 10/9/22 | | | 850 | | | | 861 | |
| | | General Electric Co. | | 3.100% | | 1/9/23 | | | 574 | | | | 586 | |
| | | General Electric Co. | | 3.450% | | 5/15/24 | | | 100 | | | | 104 | |
| | | General Electric Co. | | 6.750% | | 3/15/32 | | | 705 | | | | 903 | |
| | | General Electric Co. | | 6.150% | | 8/7/37 | | | 161 | | | | 199 | |
| | | General Electric Co. | | 5.875% | | 1/14/38 | | | 560 | | | | 675 | |
| | | General Electric Co. | | 6.875% | | 1/10/39 | | | 338 | | | | 450 | |
| | | General Electric Co. | | 4.125% | | 10/9/42 | | | 203 | | | | 210 | |
| | | General Electric Co. | | 4.500% | | 3/11/44 | | | 188 | | | | 205 | |
| | | Hexcel Corp. | | 4.700% | | 8/15/25 | | | 100 | | | | 108 | |
| | | Honeywell International Inc. | | 4.250% | | 3/1/21 | | | 200 | | | | 206 | |
| | | Honeywell International Inc. | | 1.850% | | 11/1/21 | | | 300 | | | | 301 | |
| | | Honeywell International Inc. | | 2.150% | | 8/8/22 | | | 100 | | | | 101 | |
| | | Honeywell International Inc. | | 2.300% | | 8/15/24 | | | 425 | | | | 431 | |
| | | Honeywell International Inc. | | 2.500% | | 11/1/26 | | | 50 | | | | 51 | |
Total Bond Market Index Portfolio
| | | | | | | | | Face | | | Market | |
| | | | | | | Maturity | | Amount | | | Value• | |
| | | | | Coupon | | Date | | | ($000 | ) | | | ($000 | ) |
| | | Honeywell International Inc. | | 2.700% | | 8/15/29 | | | 100 | | | | 103 | |
| | | Honeywell International Inc. | | 5.700% | | 3/15/37 | | | 200 | | | | 271 | |
| | | Honeywell International Inc. | | 5.375% | | 3/1/41 | | | 150 | | | | 202 | |
| | | Hubbell Inc. | | 3.350% | | 3/1/26 | | | 75 | | | | 77 | |
| | | Hubbell Inc. | | 3.150% | | 8/15/27 | | | 50 | | | | 50 | |
| | | Hubbell Inc. | | 3.500% | | 2/15/28 | | | 175 | | | | 181 | |
| | | Huntington Ingalls Industries Inc. | | 3.483% | | 12/1/27 | | | 150 | | | | 156 | |
| | | Illinois Tool Works Inc. | | 3.375% | | 9/15/21 | | | 100 | | | | 102 | |
| | | Illinois Tool Works Inc. | | 3.500% | | 3/1/24 | | | 200 | | | | 212 | |
| | | Illinois Tool Works Inc. | | 2.650% | | 11/15/26 | | | 300 | | | | 308 | |
| | | Illinois Tool Works Inc. | | 4.875% | | 9/15/41 | | | 75 | | | | 94 | |
| | | Illinois Tool Works Inc. | | 3.900% | | 9/1/42 | | | 250 | | | | 288 | |
| | | Ingersoll-Rand Global Holding Co. Ltd. | | 4.250% | | 6/15/23 | | | 125 | | | | 134 | |
| | | Ingersoll-Rand Global Holding Co. Ltd. | | 5.750% | | 6/15/43 | | | 125 | | | | 157 | |
| | | Ingersoll-Rand Luxembourg Finance SA | | 3.550% | | 11/1/24 | | | 375 | | | | 393 | |
| | | Ingersoll-Rand Luxembourg Finance SA | | 3.500% | | 3/21/26 | | | 75 | | | | 78 | |
| | | Ingersoll-Rand Luxembourg Finance SA | | 3.800% | | 3/21/29 | | | 225 | | | | 241 | |
| | | Ingersoll-Rand Luxembourg Finance SA | | 4.500% | | 3/21/49 | | | 75 | | | | 84 | |
| | | John Deere Capital Corp. | | 2.550% | | 1/8/21 | | | 150 | | | | 151 | |
| | | John Deere Capital Corp. | | 2.800% | | 3/4/21 | | | 100 | | | | 101 | |
| | | John Deere Capital Corp. | | 2.875% | | 3/12/21 | | | 100 | | | | 101 | |
| | | John Deere Capital Corp. | | 3.900% | | 7/12/21 | | | 100 | | | | 103 | |
| | | John Deere Capital Corp. | | 3.125% | | 9/10/21 | | | 100 | | | | 102 | |
| | | John Deere Capital Corp. | | 3.150% | | 10/15/21 | | | 25 | | | | 26 | |
| | | John Deere Capital Corp. | | 2.650% | | 1/6/22 | | | 300 | | | | 305 | |
| | | John Deere Capital Corp. | | 1.950% | | 6/13/22 | | | 375 | | | | 375 | |
| | | John Deere Capital Corp. | | 2.150% | | 9/8/22 | | | 400 | | | | 403 | |
| | | John Deere Capital Corp. | | 2.700% | | 1/6/23 | | | 100 | | | | 102 | |
| | | John Deere Capital Corp. | | 2.800% | | 1/27/23 | | | 50 | | | | 51 | |
| | | John Deere Capital Corp. | | 2.800% | | 3/6/23 | | | 100 | | | | 103 | |
| | | John Deere Capital Corp. | | 3.450% | | 6/7/23 | | | 200 | | | | 209 | |
| | | John Deere Capital Corp. | | 3.650% | | 10/12/23 | | | 50 | | | | 53 | |
| | | John Deere Capital Corp. | | 2.600% | | 3/7/24 | | | 75 | | | | 77 | |
| | | John Deere Capital Corp. | | 2.650% | | 6/24/24 | | | 75 | | | | 77 | |
| | | John Deere Capital Corp. | | 3.450% | | 3/13/25 | | | 300 | | | | 318 | |
| | | John Deere Capital Corp. | | 3.400% | | 9/11/25 | | | 75 | | | | 79 | |
| | | John Deere Capital Corp. | | 2.650% | | 6/10/26 | | | 100 | | | | 102 | |
| | | John Deere Capital Corp. | | 2.250% | | 9/14/26 | | | 125 | | | | 125 | |
| | | John Deere Capital Corp. | | 2.800% | | 9/8/27 | | | 150 | | | | 154 | |
| | | John Deere Capital Corp. | | 3.050% | | 1/6/28 | | | 100 | | | | 104 | |
| | | John Deere Capital Corp. | | 3.450% | | 3/7/29 | | | 50 | | | | 54 | |
| | | John Deere Capital Corp. | | 2.800% | | 7/18/29 | | | 150 | | | | 154 | |
| | | Johnson Controls International plc | | 3.625% | | 7/2/24 | | | 126 | | | | 131 | |
| | | Johnson Controls International plc | | 3.900% | | 2/14/26 | | | 37 | | | | 39 | |
| | | Johnson Controls International plc | | 6.000% | | 1/15/36 | | | 39 | | | | 48 | |
| | | Johnson Controls International plc | | 4.625% | | 7/2/44 | | | 175 | | | | 191 | |
| | | Johnson Controls International plc | | 5.125% | | 9/14/45 | | | 14 | | | | 16 | |
| | | Johnson Controls International plc | | 4.500% | | 2/15/47 | | | 100 | | | | 108 | |
| | | Johnson Controls International plc | | 4.950% | | 7/2/64 | | | 72 | | | | 75 | |
| | | Kennametal Inc. | | 3.875% | | 2/15/22 | | | 50 | | | | 51 | |
| | | Kennametal Inc. | | 4.625% | | 6/15/28 | | | 120 | | | | 128 | |
| 6 | | L3Harris Technologies Inc. | | 4.950% | | 2/15/21 | | | 75 | | | | 77 | |
| 6 | | L3Harris Technologies Inc. | | 3.850% | | 6/15/23 | | | 600 | | | | 631 | |
| 6 | | L3Harris Technologies Inc. | | 3.950% | | 5/28/24 | | | 103 | | | | 109 | |
| | | L3Harris Technologies Inc. | | 3.832% | | 4/27/25 | | | 200 | | | | 213 | |
| 6 | | L3Harris Technologies Inc. | | 3.850% | | 12/15/26 | | | 50 | | | | 54 | |
| 6 | | L3Harris Technologies Inc. | | 4.400% | | 6/15/28 | | | 175 | | | | 195 | |
| | | L3Harris Technologies Inc. | | 4.854% | | 4/27/35 | | | 100 | | | | 118 | |
| | | L3Harris Technologies Inc. | | 6.150% | | 12/15/40 | | | 100 | | | | 136 | |
| | | L3Harris Technologies Inc. | | 5.054% | | 4/27/45 | | | 100 | | | | 124 | |
| | | Leggett & Platt Inc. | | 3.800% | | 11/15/24 | | | 100 | | | | 105 | |
| | | Leggett & Platt Inc. | | 3.500% | | 11/15/27 | | | 300 | | | | 308 | |
| | | Leggett & Platt Inc. | | 4.400% | | 3/15/29 | | | 75 | | | | 82 | |
| | | Legrand France SA | | 8.500% | | 2/15/25 | | | 50 | | | | 64 | |
| | | Lennox International Inc. | | 3.000% | | 11/15/23 | | | 100 | | | | 102 | |
| | | Lockheed Martin Corp. | | 3.350% | | 9/15/21 | | | 725 | | | | 743 | |
| | | Lockheed Martin Corp. | | 3.100% | | 1/15/23 | | | 100 | | | | 103 | |
| | | Lockheed Martin Corp. | | 3.550% | | 1/15/26 | | | 380 | | | | 407 | |
| | | Lockheed Martin Corp. | | 3.600% | | 3/1/35 | | | 150 | | | | 164 | |
| | | Lockheed Martin Corp. | | 4.500% | | 5/15/36 | | | 100 | | | | 118 | |
| | | Lockheed Martin Corp. | | 6.150% | | 9/1/36 | | | 375 | | | | 509 | |
| | | Lockheed Martin Corp. | | 4.070% | | 12/15/42 | | | 270 | | | | 309 | |
| | | Lockheed Martin Corp. | | 3.800% | | 3/1/45 | | | 100 | | | | 110 | |
| | | Lockheed Martin Corp. | | 4.700% | | 5/15/46 | | | 275 | | | | 347 | |
| | | Lockheed Martin Corp. | | 4.090% | | 9/15/52 | | | 156 | | | | 182 | |
| | | Martin Marietta Materials Inc. | | 4.250% | | 7/2/24 | | | 100 | | | | 107 | |
| | | Martin Marietta Materials Inc. | | 3.450% | | 6/1/27 | | | 50 | | | | 52 | |
| | | Martin Marietta Materials Inc. | | 3.500% | | 12/15/27 | | | 100 | | | | 104 | |
| | | Martin Marietta Materials Inc. | | 4.250% | | 12/15/47 | | | 175 | | | | 183 | |
| | | Masco Corp. | | 3.500% | | 4/1/21 | | | 70 | | | | 71 | |
| | | Masco Corp. | | 4.450% | | 4/1/25 | | | 50 | | | | 54 | |
| | | Masco Corp. | | 4.375% | | 4/1/26 | | | 100 | | | | 108 | |
| | | Masco Corp. | | 3.500% | | 11/15/27 | | | 100 | | | | 103 | |
| | | Masco Corp. | | 7.750% | | 8/1/29 | | | 24 | | | | 31 | |
| | | Masco Corp. | | 4.500% | | 5/15/47 | | | 100 | | | | 102 | |
| | | Mohawk Industries Inc. | | 3.850% | | 2/1/23 | | | 100 | | | | 104 | |
| | | Northrop Grumman Corp. | | 3.500% | | 3/15/21 | | | 200 | | | | 204 | |
| | | Northrop Grumman Corp. | | 2.550% | | 10/15/22 | | | 200 | | | | 203 | |
| | | Northrop Grumman Corp. | | 3.250% | | 8/1/23 | | | 150 | | | | 156 | |
| | | Northrop Grumman Corp. | | 2.930% | | 1/15/25 | | | 275 | | | | 283 | |
| | | Northrop Grumman Corp. | | 3.200% | | 2/1/27 | | | 150 | | | | 156 | |
| | | Northrop Grumman Corp. | | 3.250% | | 1/15/28 | | | 100 | | | | 104 | |
| | | Northrop Grumman Corp. | | 5.050% | | 11/15/40 | | | 50 | | | | 61 | |
| | | Northrop Grumman Corp. | | 4.750% | | 6/1/43 | | | 275 | | | | 328 | |
| | | Northrop Grumman Corp. | | 4.030% | | 10/15/47 | | | 145 | | | | 161 | |
| | | Nvent Finance Sarl | | 3.950% | | 4/15/23 | | | 200 | | | | 203 | |
| | | Nvent Finance Sarl | | 4.550% | | 4/15/28 | | | 100 | | | | 104 | |
| | | Oshkosh Corp. | | 4.600% | | 5/15/28 | | | 185 | | | | 198 | |
| | | Owens Corning | | 3.400% | | 8/15/26 | | | 200 | | | | 203 | |
| | | Owens Corning | | 3.950% | | 8/15/29 | | | 100 | | | | 104 | |
| | | Owens Corning | | 4.300% | | 7/15/47 | | | 200 | | | | 190 | |
| | | Owens Corning | | 4.400% | | 1/30/48 | | | 75 | | | | 72 | |
| | | Parker-Hannifin Corp. | | 3.500% | | 9/15/22 | | | 175 | | | | 181 | |
| | | Parker-Hannifin Corp. | | 2.700% | | 6/14/24 | | | 110 | | | | 111 | |
| | | Parker-Hannifin Corp. | | 3.300% | | 11/21/24 | | | 290 | | | | 303 | |
| | | Parker-Hannifin Corp. | | 3.250% | | 3/1/27 | | | 125 | | | | 130 | |
| | | Parker-Hannifin Corp. | | 3.250% | | 6/14/29 | | | 75 | | | | 78 | |
| | | Parker-Hannifin Corp. | | 6.250% | | 5/15/38 | | | 150 | | | | 199 | |
| | | Parker-Hannifin Corp. | | 4.450% | | 11/21/44 | | | 200 | | | | 222 | |
| | | Parker-Hannifin Corp. | | 4.100% | | 3/1/47 | | | 75 | | | | 81 | |
| | | Parker-Hannifin Corp. | | 4.000% | | 6/14/49 | | | 110 | | | | 119 | |
| | | Precision Castparts Corp. | | 2.500% | | 1/15/23 | | | 200 | | | | 203 | |
| | | Precision Castparts Corp. | | 3.250% | | 6/15/25 | | | 175 | | | | 184 | |
| | | Precision Castparts Corp. | | 3.900% | | 1/15/43 | | | 75 | | | | 81 | |
| | | Precision Castparts Corp. | | 4.375% | | 6/15/45 | | | 300 | | | | 347 | |
| | | Raytheon Co. | | 2.500% | | 12/15/22 | | | 275 | | | | 280 | |
| | | Raytheon Co. | | 7.200% | | 8/15/27 | | | 25 | | | | 33 | |
| | | Raytheon Co. | | 4.700% | | 12/15/41 | | | 50 | | | | 62 | |
| | | Republic Services Inc. | | 5.250% | | 11/15/21 | | | 175 | | | | 186 | |
| | | Republic Services Inc. | | 3.550% | | 6/1/22 | | | 50 | | | | 52 | |
| | | Republic Services Inc. | | 2.500% | | 8/15/24 | | | 200 | | | | 203 | |
| | | Republic Services Inc. | | 3.200% | | 3/15/25 | | | 250 | | | | 260 | |
| | | Republic Services Inc. | | 6.200% | | 3/1/40 | | | 50 | | | | 68 | |
| | | Republic Services Inc. | | 5.700% | | 5/15/41 | | | 100 | | | | 130 | |
| | | Rockwell Automation Inc. | | 3.500% | | 3/1/29 | | | 100 | | | | 107 | |
| | | Rockwell Automation Inc. | | 4.200% | | 3/1/49 | | | 100 | | | | 116 | |
| | | Rockwell Collins Inc. | | 3.100% | | 11/15/21 | | | 50 | | | | 51 | |
| | | Rockwell Collins Inc. | | 2.800% | | 3/15/22 | | | 170 | | | | 173 | |
| | | Rockwell Collins Inc. | | 3.200% | | 3/15/24 | | | 175 | | | | 182 | |
| | | Rockwell Collins Inc. | | 3.500% | | 3/15/27 | | | 300 | | | | 319 | |
| | | Rockwell Collins Inc. | | 4.800% | | 12/15/43 | | | 65 | | | | 79 | |
| | | Rockwell Collins Inc. | | 4.350% | | 4/15/47 | | | 250 | | | | 292 | |
| | | Roper Technologies Inc. | | 3.000% | | 12/15/20 | | | 125 | | | | 126 | |
| | | Roper Technologies Inc. | | 2.800% | | 12/15/21 | | | 200 | | | | 203 | |
| | | Roper Technologies Inc. | | 2.350% | | 9/15/24 | | | 125 | | | | 126 | |
| | | Roper Technologies Inc. | | 3.850% | | 12/15/25 | | | 100 | | | | 107 | |
| | | Roper Technologies Inc. | | 3.800% | | 12/15/26 | | | 145 | | | | 156 | |
| | | Roper Technologies Inc. | | 4.200% | | 9/15/28 | | | 175 | | | | 191 | |
| | | Roper Technologies Inc. | | 2.950% | | 9/15/29 | | | 125 | | | | 126 | |
| | | Snap-on Inc. | | 6.125% | | 9/1/21 | | | 75 | | | | 80 | |
| | | Snap-on Inc. | | 3.250% | | 3/1/27 | | | 50 | | | | 52 | |
| | | Snap-on Inc. | | 4.100% | | 3/1/48 | | | 75 | | | | 84 | |
Total Bond Market Index Portfolio
| | | | | | | | | Face | | | Market | |
| | | | | | | Maturity | | Amount | | | Value• | |
| | | | | Coupon | | Date | | | ($000 | ) | | | ($000 | ) |
| | | Sonoco Products Co. | | 5.750% | | 11/1/40 | | | 120 | | | | 147 | |
| | | Spirit AeroSystems Inc. | | 3.950% | | 6/15/23 | | | 75 | | | | 77 | |
| | | Spirit AeroSystems Inc. | | 3.850% | | 6/15/26 | | | 65 | | | | 67 | |
| | | Spirit AeroSystems Inc. | | 4.600% | | 6/15/28 | | | 150 | | | | 158 | |
| | | Stanley Black & Decker Inc. | | 3.400% | | 12/1/21 | | | 150 | | | | 153 | |
| | | Stanley Black & Decker Inc. | | 3.400% | | 3/1/26 | | | 100 | | | | 105 | |
| | | Stanley Black & Decker Inc. | | 5.200% | | 9/1/40 | | | 75 | | | | 93 | |
| | | Stanley Black & Decker Inc. | | 4.850% | | 11/15/48 | | | 100 | | | | 124 | |
| | | Textron Inc. | | 3.875% | | 3/1/25 | | | 65 | | | | 69 | |
| | | Textron Inc. | | 4.000% | | 3/15/26 | | | 200 | | | | 214 | |
| | | Textron Inc. | | 3.650% | | 3/15/27 | | | 250 | | | | 261 | |
| | | Textron Inc. | | 3.375% | | 3/1/28 | | | 50 | | | | 51 | |
| | | Textron Inc. | | 3.900% | | 9/17/29 | | | 225 | | | | 240 | |
| | | Timken Co. | | 3.875% | | 9/1/24 | | | 100 | | | | 104 | |
| | | Timken Co. | | 4.500% | | 12/15/28 | | | 25 | | | | 27 | |
| | | United Technologies Corp. | | 3.350% | | 8/16/21 | | | 200 | | | | 205 | |
| | | United Technologies Corp. | | 1.950% | | 11/1/21 | | | 100 | | | | 100 | |
| | | United Technologies Corp. | | 3.100% | | 6/1/22 | | | 460 | | | | 472 | |
| | | United Technologies Corp. | | 3.650% | | 8/16/23 | | | 425 | | | | 448 | |
| | | United Technologies Corp. | | 2.800% | | 5/4/24 | | | 250 | | | | 257 | |
| | | United Technologies Corp. | | 3.950% | | 8/16/25 | | | 250 | | | | 272 | |
| | | United Technologies Corp. | | 2.650% | | 11/1/26 | | | 100 | | | | 102 | |
| | | United Technologies Corp. | | 6.700% | | 8/1/28 | | | 75 | | | | 97 | |
| | | United Technologies Corp. | | 4.125% | | 11/16/28 | | | 750 | | | | 843 | |
| | | United Technologies Corp. | | 7.500% | | 9/15/29 | | | 125 | | | | 176 | |
| | | United Technologies Corp. | | 5.400% | | 5/1/35 | | | 150 | | | | 192 | |
| | | United Technologies Corp. | | 6.050% | | 6/1/36 | | | 100 | | | | 135 | |
| | | United Technologies Corp. | | 6.125% | | 7/15/38 | | | 100 | | | | 138 | |
| | | United Technologies Corp. | | 4.450% | | 11/16/38 | | | 175 | | | | 205 | |
| | | United Technologies Corp. | | 5.700% | | 4/15/40 | | | 100 | | | | 134 | |
| | | United Technologies Corp. | | 4.500% | | 6/1/42 | | | 675 | | | | 808 | |
| | | United Technologies Corp. | | 4.150% | | 5/15/45 | | | 200 | | | | 229 | |
| | | United Technologies Corp. | | 3.750% | | 11/1/46 | | | 200 | | | | 218 | |
| | | United Technologies Corp. | | 4.050% | | 5/4/47 | | | 250 | | | | 284 | |
| | | United Technologies Corp. | | 4.625% | | 11/16/48 | | | 400 | | | | 498 | |
| | | Valmont Industries Inc. | | 5.000% | | 10/1/44 | | | 150 | | | | 153 | |
| | | Valmont Industries Inc. | | 5.250% | | 10/1/54 | | | 75 | | | | 76 | |
| | | Vulcan Materials Co. | | 4.500% | | 4/1/25 | | | 200 | | | | 216 | |
| | | Vulcan Materials Co. | | 4.500% | | 6/15/47 | | | 125 | | | | 137 | |
| | | Wabtec Corp. | | 4.400% | | 3/15/24 | | | 275 | | | | 291 | |
| | | Wabtec Corp. | | 3.450% | | 11/15/26 | | | 150 | | | | 151 | |
| | | Wabtec Corp. | | 4.950% | | 9/15/28 | | | 175 | | | | 192 | |
| | | Waste Connections Inc. | | 3.500% | | 5/1/29 | | | 200 | | | | 211 | |
| | | Waste Management Inc. | | 4.600% | | 3/1/21 | | | 50 | | | | 51 | |
| | | Waste Management Inc. | | 2.900% | | 9/15/22 | | | 100 | | | | 102 | |
| | | Waste Management Inc. | | 2.400% | | 5/15/23 | | | 225 | | | | 227 | |
| | | Waste Management Inc. | | 3.500% | | 5/15/24 | | | 200 | | | | 210 | |
| | | Waste Management Inc. | | 2.950% | | 6/15/24 | | | 150 | | | | 155 | |
| | | Waste Management Inc. | | 3.125% | | 3/1/25 | | | 150 | | | | 157 | |
| | | Waste Management Inc. | | 3.200% | | 6/15/26 | | | 145 | | | | 152 | |
| | | Waste Management Inc. | | 3.150% | | 11/15/27 | | | 125 | | | | 131 | |
| | | Waste Management Inc. | | 3.450% | | 6/15/29 | | | 200 | | | | 214 | |
| | | Waste Management Inc. | | 3.900% | | 3/1/35 | | | 250 | | | | 277 | |
| | | Waste Management Inc. | | 4.000% | | 7/15/39 | | | 100 | | | | 112 | |
| | | Waste Management Inc. | | 4.100% | | 3/1/45 | | | 150 | | | | 168 | |
| | | Waste Management Inc. | | 4.150% | | 7/15/49 | | | 100 | | | | 114 | |
| | | WW Grainger Inc. | | 4.600% | | 6/15/45 | | | 200 | | | | 237 | |
| | | WW Grainger Inc. | | 3.750% | | 5/15/46 | | | 75 | | | | 77 | |
| | | WW Grainger Inc. | | 4.200% | | 5/15/47 | | | 50 | | | | 56 | |
| | | Xylem Inc. | | 3.250% | | 11/1/26 | | | 100 | | | | 104 | |
| | | Xylem Inc. | | 4.375% | | 11/1/46 | | | 100 | | | | 109 | |
| | | | | | | | | | | | | | | |
| | | Communication (2.4%) | | | | | | | | | | | | |
| | | Activision Blizzard Inc. | | 2.300% | | 9/15/21 | | | 125 | | | | 126 | |
| | | Activision Blizzard Inc. | | 2.600% | | 6/15/22 | | | 75 | | | | 76 | |
| | | Activision Blizzard Inc. | | 3.400% | | 9/15/26 | | | 160 | | | | 168 | |
| | | Activision Blizzard Inc. | | 4.500% | | 6/15/47 | | | 75 | | | | 85 | |
| | | America Movil SAB de CV | | 3.125% | | 7/16/22 | | | 300 | | | | 306 | |
| | | America Movil SAB de CV | | 3.625% | | 4/22/29 | | | 200 | | | | 212 | |
| | | America Movil SAB de CV | | 6.375% | | 3/1/35 | | | 300 | | | | 403 | |
| | | America Movil SAB de CV | | 6.125% | | 11/15/37 | | | 150 | | | | 196 | |
| | America Movil SAB de CV | | 6.125% | | 3/30/40 | | | 200 | | | | 268 | |
| | | America Movil SAB de CV | | 4.375% | | 7/16/42 | | | 250 | | | | 278 | |
| | | America Movil SAB de CV | | 4.375% | | 4/22/49 | | | 200 | | | | 229 | |
| | | American Tower Corp. | | 3.300% | | 2/15/21 | | | 125 | | | | 127 | |
| | | American Tower Corp. | | 3.450% | | 9/15/21 | | | 475 | | | | 486 | |
| | | American Tower Corp. | | 5.900% | | 11/1/21 | | | 475 | | | | 507 | |
| | | American Tower Corp. | | 2.250% | | 1/15/22 | | | 125 | | | | 125 | |
| | | American Tower Corp. | | 3.500% | | 1/31/23 | | | 200 | | | | 207 | |
| | | American Tower Corp. | | 5.000% | | 2/15/24 | | | 100 | | | | 110 | |
| | | American Tower Corp. | | 3.375% | | 5/15/24 | | | 200 | | | | 207 | |
| | | American Tower Corp. | | 2.950% | | 1/15/25 | | | 100 | | | | 102 | |
| | | American Tower Corp. | | 3.375% | | 10/15/26 | | | 400 | | | | 415 | |
| | | American Tower Corp. | | 2.750% | | 1/15/27 | | | 500 | | | | 500 | |
| | | American Tower Corp. | | 3.125% | | 1/15/27 | | | 125 | | | | 127 | |
| | | American Tower Corp. | | 3.950% | | 3/15/29 | | | 140 | | | | 151 | |
| | | American Tower Corp. | | 3.800% | | 8/15/29 | | | 475 | | | | 507 | |
| | | American Tower Corp. | | 3.700% | | 10/15/49 | | | 100 | | | | 99 | |
| | | AT&T Inc. | | 4.600% | | 2/15/21 | | | 175 | | | | 179 | |
| | | AT&T Inc. | | 3.200% | | 3/1/22 | | | 250 | | | | 256 | |
| | | AT&T Inc. | | 3.400% | | 6/15/22 | | | 100 | | | | 103 | |
| | | AT&T Inc. | | 3.000% | | 6/30/22 | | | 767 | | | | 784 | |
| | | AT&T Inc. | | 3.600% | | 2/17/23 | | | 755 | | | | 788 | |
| | | AT&T Inc. | | 4.050% | | 12/15/23 | | | 100 | | | | 107 | |
| | | AT&T Inc. | | 3.800% | | 3/1/24 | | | 125 | | | | 132 | |
| | | AT&T Inc. | | 4.450% | | 4/1/24 | | | 250 | | | | 271 | |
| | | AT&T Inc. | | 3.950% | | 1/15/25 | | | 225 | | | | 241 | |
| | | AT&T Inc. | | 3.400% | | 5/15/25 | | | 940 | | | | 985 | |
| | | AT&T Inc. | | 3.600% | | 7/15/25 | | | 275 | | | | 290 | |
| | | AT&T Inc. | | 3.875% | | 1/15/26 | | | 505 | | | | 541 | |
| | | AT&T Inc. | | 4.125% | | 2/17/26 | | | 515 | | | | 558 | |
| | | AT&T Inc. | | 3.800% | | 2/15/27 | | | 700 | | | | 746 | |
| | | AT&T Inc. | | 4.100% | | 2/15/28 | | | 804 | | | | 873 | |
| | | AT&T Inc. | | 4.350% | | 3/1/29 | | | 650 | | | | 721 | |
| | | AT&T Inc. | | 4.300% | | 2/15/30 | | | 860 | | | | 956 | |
| | | AT&T Inc. | | 4.500% | | 5/15/35 | | | 200 | | | | 222 | |
| | | AT&T Inc. | | 5.250% | | 3/1/37 | | | 500 | | | | 597 | |
| | | AT&T Inc. | | 4.900% | | 8/15/37 | | | 300 | | | | 344 | |
| | | AT&T Inc. | | 4.850% | | 3/1/39 | | | 480 | | | | 551 | |
| | | AT&T Inc. | | 6.350% | | 3/15/40 | | | 100 | | | | 130 | |
| | | AT&T Inc. | | 6.100% | | 7/15/40 | | | 100 | | | | 127 | |
| | | AT&T Inc. | | 6.000% | | 8/15/40 | | | 300 | | | | 381 | |
| | | AT&T Inc. | | 5.350% | | 9/1/40 | | | 600 | | | | 718 | |
| | | AT&T Inc. | | 5.550% | | 8/15/41 | | | 225 | | | | 276 | |
| | | AT&T Inc. | | 5.375% | | 10/15/41 | | | 100 | | | | 118 | |
| | | AT&T Inc. | | 5.150% | | 3/15/42 | | | 375 | | | | 437 | |
| | | AT&T Inc. | | 4.900% | | 6/15/42 | | | 525 | | | | 590 | |
| | | AT&T Inc. | | 4.300% | | 12/15/42 | | | 271 | | | | 290 | |
| | | AT&T Inc. | | 5.350% | | 12/15/43 | | | 175 | | | | 210 | |
| | | AT&T Inc. | | 4.650% | | 6/1/44 | | | 100 | | | | 110 | |
| | | AT&T Inc. | | 4.800% | | 6/15/44 | | | 575 | | | | 653 | |
| | | AT&T Inc. | | 4.350% | | 6/15/45 | | | 624 | | | | 667 | |
| | | AT&T Inc. | | 4.750% | | 5/15/46 | | | 650 | | | | 730 | |
| | | AT&T Inc. | | 5.150% | | 11/15/46 | | | 1,473 | | | | 1,753 | |
| | | AT&T Inc. | | 4.500% | | 3/9/48 | | | 500 | | | | 549 | |
| | | AT&T Inc. | | 4.550% | | 3/9/49 | | | 362 | | | | 401 | |
| | | AT&T Inc. | | 5.150% | | 2/15/50 | | | 332 | | | | 400 | |
| | | AT&T Inc. | | 5.300% | | 8/15/58 | | | 307 | | | | 378 | |
| | | Bell Canada Inc. | | 4.300% | | 7/29/49 | | | 100 | | | | 112 | |
| | | British Telecommunications plc | | 4.500% | | 12/4/23 | | | 200 | | | | 215 | |
| | | British Telecommunications plc | | 5.125% | | 12/4/28 | | | 100 | | | | 115 | |
| | | British Telecommunications plc | | 9.625% | | 12/15/30 | | | 516 | | | | 794 | |
| | | CC Holdings GS V LLC / Crown Castle GS III Corp. | | 3.849% | | 4/15/23 | | | 250 | | | | 262 | |
| | | Charter Communications Operating LLC / Charter Communications Operating Capital | | 4.464% | | 7/23/22 | | | 676 | | | | 711 | |
| | | Charter Communications Operating LLC / Charter Communications Operating Capital | | 4.500% | | 2/1/24 | | | 175 | | | | 188 | |
Total Bond Market Index Portfolio
| | | | | | | | | Face | | | Market | |
| | | | | | | Maturity | | Amount | | | Value• | |
| | | | | Coupon | | Date | | | ($000 | ) | | | ($000 | ) |
| | | Charter Communications Operating LLC / Charter Communications Operating Capital | | 4.908% | | 7/23/25 | | | 850 | | | | 935 | |
| | | Charter Communications Operating LLC / Charter Communications Operating Capital | | 3.750% | | 2/15/28 | | | 730 | | | | 755 | |
| | | Charter Communications Operating LLC / Charter Communications Operating Capital | | 5.050% | | 3/30/29 | | | 225 | | | | 254 | |
| | | Charter Communications Operating LLC / Charter Communications Operating Capital | | 6.384% | | 10/23/35 | | | 575 | | | | 723 | |
| | | Charter Communications Operating LLC / Charter Communications Operating Capital | | 5.375% | | 4/1/38 | | | 150 | | | | 170 | |
| | | Charter Communications Operating LLC / Charter Communications Operating Capital | | 6.484% | | 10/23/45 | | | 650 | | | | 810 | |
| | | Charter Communications Operating LLC / Charter Communications Operating Capital | | 5.375% | | 5/1/47 | | | 450 | | | | 504 | |
| | | Charter Communications Operating LLC / Charter Communications Operating Capital | | 5.750% | | 4/1/48 | | | 700 | | | | 817 | |
| | | Charter Communications Operating LLC / Charter Communications Operating Capital | | 5.125% | | 7/1/49 | | | 75 | | | | 81 | |
| | | Charter Communications Operating LLC / Charter Communications Operating Capital | | 4.800% | | 3/1/50 | | | 300 | | | | 314 | |
| | | Charter Communications Operating LLC / Charter Communications Operating Capital | | 6.834% | | 10/23/55 | | | 75 | | | | 94 | |
| | | Comcast Cable Communications Holdings Inc. | | 9.455% | | 11/15/22 | | | 139 | | | | 168 | |
| | | Comcast Corp. | | 3.450% | | 10/1/21 | | | 650 | | | | 668 | |
| | | Comcast Corp. | | 2.750% | | 3/1/23 | | | 200 | | | | 204 | |
| | | Comcast Corp. | | 3.000% | | 2/1/24 | | | 710 | | | | 736 | |
| | | Comcast Corp. | | 3.375% | | 2/15/25 | | | 202 | | | | 213 | |
| | | Comcast Corp. | | 3.375% | | 8/15/25 | | | 250 | | | | 265 | |
| | | Comcast Corp. | | 3.950% | | 10/15/25 | | | 625 | | | | 681 | |
| | | Comcast Corp. | | 3.150% | | 3/1/26 | | | 400 | | | | 418 | |
| | | Comcast Corp. | | 2.350% | | 1/15/27 | | | 495 | | | | 494 | |
| | | Comcast Corp. | | 3.150% | | 2/15/28 | | | 325 | | | | 340 | |
| | | Comcast Corp. | | 4.150% | | 10/15/28 | | | 950 | | | | 1,069 | |
| | | Comcast Corp. | | 2.650% | | 2/1/30 | | | 300 | | | | 300 | |
| | | Comcast Corp. | | 4.250% | | 10/15/30 | | | 250 | | | | 284 | |
| | | Comcast Corp. | | 4.250% | | 1/15/33 | | | 275 | | | | 315 | |
| | | Comcast Corp. | | 4.200% | | 8/15/34 | | | 175 | | | | 200 | |
| | | Comcast Corp. | | 5.650% | | 6/15/35 | | | 1,065 | | | | 1,398 | |
| | | Comcast Corp. | | 4.400% | | 8/15/35 | | | 150 | | | | 176 | |
| | | Comcast Corp. | | 3.200% | | 7/15/36 | | | 225 | | | | 229 | |
| | | Comcast Corp. | | 6.450% | | 3/15/37 | | | 175 | | | | 244 | |
| | | Comcast Corp. | | 6.950% | | 8/15/37 | | | 250 | | | | 366 | |
| | | Comcast Corp. | | 3.900% | | 3/1/38 | | | 175 | | | | 193 | |
| | | Comcast Corp. | | 6.400% | | 5/15/38 | | | 100 | | | | 139 | |
| | | Comcast Corp. | | 4.600% | | 10/15/38 | | | 550 | | | | 653 | |
| | | Comcast Corp. | | 3.250% | | 11/1/39 | | | 250 | | | | 251 | |
| | | Comcast Corp. | | 6.400% | | 3/1/40 | | | 150 | | | | 210 | |
| | | Comcast Corp. | | 4.650% | | 7/15/42 | | | 370 | | | | 440 | |
| | | Comcast Corp. | | 4.500% | | 1/15/43 | | | 100 | | | | 117 | |
| | | Comcast Corp. | | 4.600% | | 8/15/45 | | | 250 | | | | 298 | |
| | | Comcast Corp. | | 3.400% | | 7/15/46 | | | 500 | | | | 502 | |
| | | Comcast Corp. | | 3.969% | | 11/1/47 | | | 1,086 | | | | 1,185 | |
| | | Comcast Corp. | | 4.000% | | 3/1/48 | | | 175 | | | | 192 | |
| | | Comcast Corp. | | 4.700% | | 10/15/48 | | | 475 | | | | 585 | |
| | | Comcast Corp. | | 3.999% | | 11/1/49 | | | 268 | | | | 296 | |
| | | Comcast Corp. | | 3.450% | | 2/1/50 | | | 400 | | | | 408 | |
| | | Comcast Corp. | | 4.950% | | 10/15/58 | | | 475 | | | | 618 | |
| | | Crown Castle International Corp. | | 3.400% | | 2/15/21 | | | 300 | | | | 304 | |
| | | Crown Castle International Corp. | | 2.250% | | 9/1/21 | | | 125 | | | | 125 | |
| | | Crown Castle International Corp. | | 4.875% | | 4/15/22 | | | 125 | | | | 132 | |
| | | Crown Castle International Corp. | | 5.250% | | 1/15/23 | | | 125 | | | | 136 | |
| | | Crown Castle International Corp. | | 3.150% | | 7/15/23 | | | 150 | | | | 154 | |
| | | Crown Castle International Corp. | | 3.200% | | 9/1/24 | | | 250 | | | | 257 | |
| | | Crown Castle International Corp. | | 4.450% | | 2/15/26 | | | 250 | | | | 273 | |
| | | Crown Castle International Corp. | | 3.700% | | 6/15/26 | | | 175 | | | | 185 | |
| | | Crown Castle International Corp. | | 3.650% | | 9/1/27 | | | 325 | | | | 342 | |
| | | Crown Castle International Corp. | | 3.800% | | 2/15/28 | | | 425 | | | | 452 | |
| | | Crown Castle International Corp. | | 4.750% | | 5/15/47 | | | 95 | | | | 109 | |
| | | Crown Castle International Corp. | | 5.200% | | 2/15/49 | | | 75 | | | | 92 | |
| | | Deutsche Telekom International Finance BV | | 8.750% | | 6/15/30 | | | 775 | | | | 1,137 | |
| | | Discovery Communications LLC | | 4.375% | | 6/15/21 | | | 25 | | | | 26 | |
| | | Discovery Communications LLC | | 3.500% | | 6/15/22 | | | 200 | | | | 205 | |
| | | Discovery Communications LLC | | 2.950% | | 3/20/23 | | | 100 | | | | 102 | |
| | | Discovery Communications LLC | | 3.250% | | 4/1/23 | | | 100 | | | | 103 | |
| | | Discovery Communications LLC | | 3.800% | | 3/13/24 | | | 100 | | | | 105 | |
| | | Discovery Communications LLC | | 3.900% | | 11/15/24 | | | 150 | | | | 159 | |
| | | Discovery Communications LLC | | 3.450% | | 3/15/25 | | | 225 | | | | 233 | |
| | | Discovery Communications LLC | | 3.950% | | 6/15/25 | | | 100 | | | | 106 | |
| | | Discovery Communications LLC | | 4.900% | | 3/11/26 | | | 150 | | | | 168 | |
| | | Discovery Communications LLC | | 3.950% | | 3/20/28 | | | 400 | | | | 427 | |
| | | Discovery Communications LLC | | 4.125% | | 5/15/29 | | | 100 | | | | 107 | |
| | | Discovery Communications LLC | | 5.000% | | 9/20/37 | | | 325 | | | | 367 | |
| | | Discovery Communications LLC | | 6.350% | | 6/1/40 | | | 150 | | | | 189 | |
| | | Discovery Communications LLC | | 4.950% | | 5/15/42 | | | 277 | | | | 303 | |
| | | Discovery Communications LLC | | 5.200% | | 9/20/47 | | | 225 | | | | 261 | |
| | | Discovery Communications LLC | | 5.300% | | 5/15/49 | | | 75 | | | | 89 | |
| | | Electronic Arts Inc. | | 3.700% | | 3/1/21 | | | 150 | | | | 153 | |
| | | Electronic Arts Inc. | | 4.800% | | 3/1/26 | | | 100 | | | | 113 | |
| 6 | | Fox Corp. | | 3.666% | | 1/25/22 | | | 50 | | | | 52 | |
| 6 | | Fox Corp. | | 4.030% | | 1/25/24 | | | 250 | | | | 266 | |
| 6 | | Fox Corp. | | 4.709% | | 1/25/29 | | | 375 | | | | 426 | |
| 6 | | Fox Corp. | | 5.476% | | 1/25/39 | | | 250 | | | | 304 | |
| 6 | | Fox Corp. | | 5.576% | | 1/25/49 | | | 425 | | | | 535 | |
| | | Grupo Televisa SAB | | 6.625% | | 3/18/25 | | | 100 | | | | 117 | |
| | | Grupo Televisa SAB | | 4.625% | | 1/30/26 | | | 100 | | | | 108 | |
| | | Grupo Televisa SAB | | 6.625% | | 1/15/40 | | | 125 | | | | 157 | |
| | | Grupo Televisa SAB | | 5.000% | | 5/13/45 | | | 425 | | | | 448 | |
| | | Grupo Televisa SAB | | 5.250% | | 5/24/49 | | | 200 | | | | 216 | |
| | | Interpublic Group of Cos. Inc. | | 3.750% | | 10/1/21 | | | 50 | | | | 51 | |
| | | Interpublic Group of Cos. Inc. | | 3.750% | | 2/15/23 | | | 150 | | | | 157 | |
| | | Interpublic Group of Cos. Inc. | | 4.200% | | 4/15/24 | | | 422 | | | | 453 | |
| | | Interpublic Group of Cos. Inc. | | 4.650% | | 10/1/28 | | | 100 | | | | 112 | |
| | | Interpublic Group of Cos. Inc. | | 5.400% | | 10/1/48 | | | 175 | | | | 214 | |
| | | Koninklijke KPN NV | | 8.375% | | 10/1/30 | | | 125 | | | | 173 | |
| | | Moody’s Corp. | | 2.750% | | 12/15/21 | | | 100 | | | | 101 | |
| | | Moody’s Corp. | | 4.500% | | 9/1/22 | | | 100 | | | | 106 | |
| | | Moody’s Corp. | | 4.875% | | 2/15/24 | | | 250 | | | | 275 | |
| | | Moody’s Corp. | | 4.875% | | 12/17/48 | | | 125 | | | | 153 | |
| | | NBCUniversal Media LLC | | 4.375% | | 4/1/21 | | | 325 | | | | 335 | |
| | | NBCUniversal Media LLC | | 2.875% | | 1/15/23 | | | 225 | | | | 231 | |
| | | NBCUniversal Media LLC | | 6.400% | | 4/30/40 | | | 150 | | | | 210 | |
| | | NBCUniversal Media LLC | | 5.950% | | 4/1/41 | | | 225 | | | | 309 | |
| | | NBCUniversal Media LLC | | 4.450% | | 1/15/43 | | | 225 | | | | 261 | |
| | | Omnicom Group Inc. / Omnicom Capital Inc. | | 3.625% | | 5/1/22 | | | 250 | | | | 259 | |
| | | Omnicom Group Inc. / Omnicom Capital Inc. | | 3.650% | | 11/1/24 | | | 150 | | | | 158 | |
| | | Omnicom Group Inc. / Omnicom Capital Inc. | | 3.600% | | 4/15/26 | | | 250 | | | | 263 | |
| | | Orange SA | | 4.125% | | 9/14/21 | | | 325 | | | | 337 | |
| | | Orange SA | | 9.000% | | 3/1/31 | | | 450 | | | | 696 | |
| | | Orange SA | | 5.375% | | 1/13/42 | | | 325 | | | | 416 | |
| | | RELX Capital Inc. | | 3.125% | | 10/15/22 | | | 182 | | | | 188 | |
| | | RELX Capital Inc. | | 3.500% | | 3/16/23 | | | 125 | | | | 130 | |
| | | RELX Capital Inc. | | 4.000% | | 3/18/29 | | | 100 | | | | 108 | |
| | | Rogers Communications Inc. | | 3.000% | | 3/15/23 | | | 205 | | | | 210 | |
| | | Rogers Communications Inc. | | 4.100% | | 10/1/23 | | | 175 | | | | 186 | |
| | | Rogers Communications Inc. | | 3.625% | | 12/15/25 | | | 125 | | | | 132 | |
| | | Rogers Communications Inc. | | 2.900% | | 11/15/26 | | | 100 | | | | 102 | |
Total Bond Market Index Portfolio
| | | | | | | | | Face | | | Market | |
| | | | | | | Maturity | | Amount | | | Value• | |
| | | | | Coupon | | Date | | | ($000 | ) | | | ($000 | ) |
| | Rogers Communications Inc. | | 4.500% | | 3/15/43 | | | 265 | | | | 290 | |
| | | Rogers Communications Inc. | | 5.000% | | 3/15/44 | | | 190 | | | | 230 | |
| | | Rogers Communications Inc. | | 4.350% | | 5/1/49 | | | 450 | | | | 500 | |
| | | Rogers Communications Inc. | | 3.700% | | 11/15/49 | | | 150 | | | | 151 | |
| | | S&P Global Inc. | | 4.000% | | 6/15/25 | | | 125 | | | | 135 | |
| | | S&P Global Inc. | | 4.400% | | 2/15/26 | | | 175 | | | | 194 | |
| | | S&P Global Inc. | | 2.500% | | 12/1/29 | | | 125 | | | | 125 | |
| | | S&P Global Inc. | | 4.500% | | 5/15/48 | | | 100 | | | | 121 | |
| | | S&P Global Inc. | | 3.250% | | 12/1/49 | | | 350 | | | | 357 | |
| | | Telefonica Emisiones SAU | | 5.462% | | 2/16/21 | | | 555 | | | | 576 | |
| | | Telefonica Emisiones SAU | | 4.103% | | 3/8/27 | | | 250 | | | | 270 | |
| | | Telefonica Emisiones SAU | | 7.045% | | 6/20/36 | | | 375 | | | | 528 | |
| | | Telefonica Emisiones SAU | | 4.665% | | 3/6/38 | | | 200 | | | | 226 | |
| | | Telefonica Emisiones SAU | | 5.213% | | 3/8/47 | | | 550 | | | | 653 | |
| | | Telefonica Emisiones SAU | | 4.895% | | 3/6/48 | | | 200 | | | | 229 | |
| | | Telefonica Emisiones SAU | | 5.520% | | 3/1/49 | | | 335 | | | | 419 | |
| | | TELUS Corp. | | 2.800% | | 2/16/27 | | | 100 | | | | 100 | |
| | | TELUS Corp. | | 4.300% | | 6/15/49 | | | 200 | | | | 221 | |
| | | Thomson Reuters Corp. | | 5.500% | | 8/15/35 | | | 75 | | | | 84 | |
| | | Thomson Reuters Corp. | | 5.850% | | 4/15/40 | | | 100 | | | | 119 | |
| | | Thomson Reuters Corp. | | 5.650% | | 11/23/43 | | | 100 | | | | 118 | |
| | | Time Warner Cable LLC | | 4.125% | | 2/15/21 | | | 150 | | | | 152 | |
| | | Time Warner Cable LLC | | 6.550% | | 5/1/37 | | | 200 | | | | 245 | |
| | | Time Warner Cable LLC | | 7.300% | | 7/1/38 | | | 50 | | | | 65 | |
| | | Time Warner Cable LLC | | 6.750% | | 6/15/39 | | | 400 | | | | 505 | |
| | | Time Warner Cable LLC | | 5.875% | | 11/15/40 | | | 425 | | | | 487 | |
| | | Time Warner Cable LLC | | 5.500% | | 9/1/41 | | | 250 | | | | 279 | |
| | | Time Warner Cable LLC | | 4.500% | | 9/15/42 | | | 450 | | | | 456 | |
| | | Time Warner Entertainment Co. LP | | 8.375% | | 3/15/23 | | | 200 | | | | 236 | |
| | | Time Warner Entertainment Co. LP | | 8.375% | | 7/15/33 | | | 200 | | | | 281 | |
| | | Verizon Communications Inc. | | 3.450% | | 3/15/21 | | | 300 | | | | 306 | |
| | | Verizon Communications Inc. | | 4.600% | | 4/1/21 | | | 475 | | | | 491 | |
| | | Verizon Communications Inc. | | 2.946% | | 3/15/22 | | | 400 | | | | 408 | |
| | | Verizon Communications Inc. | | 3.125% | | 3/16/22 | | | 350 | | | | 359 | |
| | | Verizon Communications Inc. | | 5.150% | | 9/15/23 | | | 830 | | | | 920 | |
| | | Verizon Communications Inc. | | 4.150% | | 3/15/24 | | | 100 | | | | 108 | |
| | | Verizon Communications Inc. | | 3.500% | | 11/1/24 | | | 400 | | | | 423 | |
| | | Verizon Communications Inc. | | 3.376% | | 2/15/25 | | | 534 | | | | 565 | |
| | | Verizon Communications Inc. | | 2.625% | | 8/15/26 | | | 475 | | | | 482 | |
| | | Verizon Communications Inc. | | 4.125% | | 3/16/27 | | | 400 | | | | 442 | |
| | | Verizon Communications Inc. | | 4.329% | | 9/21/28 | | | 1,229 | | | | 1,393 | |
| | | Verizon Communications Inc. | | 4.016% | | 12/3/29 | | | 927 | | | | 1,032 | |
| | | Verizon Communications Inc. | | 4.500% | | 8/10/33 | | | 575 | | | | 667 | |
| | | Verizon Communications Inc. | | 4.400% | | 11/1/34 | | | 725 | | | | 839 | |
| | | Verizon Communications Inc. | | 4.272% | | 1/15/36 | | | 563 | | | | 634 | |
| | | Verizon Communications Inc. | | 5.250% | | 3/16/37 | | | 875 | | | | 1,098 | |
| | | Verizon Communications Inc. | | 4.812% | | 3/15/39 | | | 350 | | | | 423 | |
| | | Verizon Communications Inc. | | 4.750% | | 11/1/41 | | | 175 | | | | 212 | |
| | | Verizon Communications Inc. | | 3.850% | | 11/1/42 | | | 175 | | | | 187 | |
| | | Verizon Communications Inc. | | 4.125% | | 8/15/46 | | | 250 | | | | 282 | |
| | | Verizon Communications Inc. | | 4.862% | | 8/21/46 | | | 1,279 | | | | 1,583 | |
| | | Verizon Communications Inc. | | 4.522% | | 9/15/48 | | | 747 | | | | 892 | |
| | | Verizon Communications Inc. | | 5.012% | | 4/15/49 | | | 385 | | | | 492 | |
| | | Verizon Communications Inc. | | 4.672% | | 3/15/55 | | | 600 | | | | 736 | |
| | | ViacomCBS Inc. | | 4.300% | | 2/15/21 | | | 275 | | | | 280 | |
| | | ViacomCBS Inc. | | 3.875% | | 12/15/21 | | | 125 | | | | 129 | |
| | | ViacomCBS Inc. | | 2.500% | | 2/15/23 | | | 200 | | | | 202 | |
| | | ViacomCBS Inc. | | 2.900% | | 6/1/23 | | | 75 | | | | 76 | |
| | | ViacomCBS Inc. | | 4.250% | | 9/1/23 | | | 225 | | | | 240 | |
| | | ViacomCBS Inc. | | 3.875% | | 4/1/24 | | | 124 | | | | 131 | |
| | | ViacomCBS Inc. | | 3.700% | | 8/15/24 | | | 175 | | | | 185 | |
| | | ViacomCBS Inc. | | 3.500% | | 1/15/25 | | | 150 | | | | 157 | |
| | | ViacomCBS Inc. | | 2.900% | | 1/15/27 | | | 279 | | | | 279 | |
| | | ViacomCBS Inc. | | 3.375% | | 2/15/28 | | | 100 | | | | 103 | |
| | | ViacomCBS Inc. | | 3.700% | | 6/1/28 | | | 100 | | | | 104 | |
| | | ViacomCBS Inc. | | 5.500% | | 5/15/33 | | | 75 | | | | 90 | |
| | | ViacomCBS Inc | | 6.875% | | 4/30/36 | | | 240 | | | | 321 | |
| | | ViacomCBS Inc. | | 5.900% | | 10/15/40 | | | 225 | | | | 272 | |
| | | ViacomCBS Inc. | | 4.850% | | 7/1/42 | | | 225 | | | | 248 | |
| | | ViacomCBS Inc | | 4.375% | | 3/15/43 | | | 556 | | | | 589 | |
| | | ViacomCBS Inc | | 5.850% | | 9/1/43 | | | 75 | | | | 94 | |
| | | ViacomCBS Inc. | | 4.900% | | 8/15/44 | | | 100 | | | | 113 | |
| | | Vodafone Group plc | | 3.750% | | 1/16/24 | | | 650 | | | | 686 | |
| | | Vodafone Group plc | | 4.125% | | 5/30/25 | | | 500 | | | | 540 | |
| | | Vodafone Group plc | | 4.375% | | 5/30/28 | | | 650 | | | | 719 | |
| | | Vodafone Group plc | | 7.875% | | 2/15/30 | | | 150 | | | | 208 | |
| | | Vodafone Group plc | | 6.250% | | 11/30/32 | | | 100 | | | | 127 | |
| | | Vodafone Group plc | | 5.000% | | 5/30/38 | | | 325 | | | | 379 | |
| | | Vodafone Group plc | | 4.375% | | 2/19/43 | | | 275 | | | | 296 | |
| | | Vodafone Group plc | | 5.250% | | 5/30/48 | | | 700 | | | | 846 | |
| | | Vodafone Group plc | | 4.875% | | 6/19/49 | | | 350 | | | | 403 | |
| | | Vodafone Group plc | | 4.250% | | 9/17/50 | | | 450 | | | | 467 | |
| | | Walt Disney Co. | | 4.500% | | 2/15/21 | | | 920 | | | | 947 | |
| | | Walt Disney Co. | | 2.550% | | 2/15/22 | | | 75 | | | | 76 | |
| | | Walt Disney Co. | | 2.450% | | 3/4/22 | | | 75 | | | | 76 | |
| | | Walt Disney Co. | | 1.650% | | 9/1/22 | | | 100 | | | | 100 | |
| | | Walt Disney Co. | | 3.000% | | 9/15/22 | | | 275 | | | | 283 | |
| | | Walt Disney Co. | | 1.750% | | 8/30/24 | | | 100 | | | | 99 | |
| | | Walt Disney Co. | | 3.700% | | 9/15/24 | | | 200 | | | | 214 | |
| | | Walt Disney Co. | | 3.150% | | 9/17/25 | | | 150 | | | | 159 | |
| | | Walt Disney Co. | | 3.700% | | 10/15/25 | | | 125 | | | | 135 | |
| | | Walt Disney Co. | | 1.850% | | 7/30/26 | | | 1,070 | | | | 1,050 | |
| | | Walt Disney Co. | | 2.000% | | 9/1/29 | | | 400 | | | | 388 | |
| | | Walt Disney Co. | | 6.550% | | 3/15/33 | | | 100 | | | | 141 | |
| | | Walt Disney Co. | | 6.200% | | 12/15/34 | | | 400 | | | | 558 | |
| | | Walt Disney Co. | | 6.400% | | 12/15/35 | | | 365 | | | | 522 | |
| | | Walt Disney Co. | | 6.150% | | 3/1/37 | | | 200 | | | | 278 | |
| | | Walt Disney Co. | | 4.375% | | 8/16/41 | | | 75 | | | | 89 | |
| | | Walt Disney Co. | | 4.125% | | 12/1/41 | | | 205 | | | | 236 | |
| | | Walt Disney Co. | | 3.700% | | 12/1/42 | | | 125 | | | | 136 | |
| | | Walt Disney Co. | | 5.400% | | 10/1/43 | | | 100 | | | | 136 | |
| | | Walt Disney Co. | | 4.750% | | 9/15/44 | | | 175 | | | | 220 | |
| | | Walt Disney Co. | | 2.750% | | 9/1/49 | | | 600 | | | | 564 | |
| | | Weibo Corp. | | 3.500% | | 7/5/24 | | | 200 | | | | 204 | |
| | | WPP Finance 2010 | | 3.625% | | 9/7/22 | | | 200 | | | | 207 | |
| | | WPP Finance 2010 | | 3.750% | | 9/19/24 | | | 100 | | | | 105 | |
| | | | | | | | | | | | | | | |
| | | Consumer Cyclical (1.9%) | | | | | | | | | | | | |
| | | Alibaba Group Holding Ltd. | | 3.125% | | 11/28/21 | | | 300 | | | | 306 | |
| | | Alibaba Group Holding Ltd. | | 2.800% | | 6/6/23 | | | 200 | | | | 203 | |
| | | Alibaba Group Holding Ltd. | | 3.600% | | 11/28/24 | | | 400 | | | | 420 | |
| | | Alibaba Group Holding Ltd. | | 3.400% | | 12/6/27 | | | 600 | | | | 625 | |
| | | Alibaba Group Holding Ltd. | | 4.500% | | 11/28/34 | | | 280 | | | | 317 | |
| | | Alibaba Group Holding Ltd. | | 4.000% | | 12/6/37 | | | 200 | | | | 215 | |
| | | Alibaba Group Holding Ltd. | | 4.200% | | 12/6/47 | | | 425 | | | | 471 | |
| | | Alibaba Group Holding Ltd. | | 4.400% | | 12/6/57 | | | 100 | | | | 114 | |
| | | Amazon.com Inc. | | 3.300% | | 12/5/21 | | | 200 | | | | 206 | |
| | | Amazon.com Inc. | | 2.500% | | 11/29/22 | | | 150 | | | | 153 | |
| | | Amazon.com Inc. | | 2.400% | | 2/22/23 | | | 450 | | | | 457 | |
| | | Amazon.com Inc. | | 2.800% | | 8/22/24 | | | 250 | | | | 259 | |
| | | Amazon.com Inc. | | 3.800% | | 12/5/24 | | | 120 | | | | 130 | |
| | | Amazon.com Inc. | | 5.200% | | 12/3/25 | | | 225 | | | | 261 | |
| | | Amazon.com Inc. | | 3.150% | | 8/22/27 | | | 550 | | | | 581 | |
| | | Amazon.com Inc. | | 4.800% | | 12/5/34 | | | 225 | | | | 283 | |
| | | Amazon.com Inc. | | 3.875% | | 8/22/37 | | | 500 | | | | 568 | |
| | | Amazon.com Inc. | | 4.950% | | 12/5/44 | | | 350 | | | | 458 | |
| | | Amazon.com Inc. | | 4.050% | | 8/22/47 | | | 600 | | | | 703 | |
| | | Amazon.com Inc. | | 4.250% | | 8/22/57 | | | 500 | | | | 608 | |
| | | American Honda Finance Corp. | | 3.150% | | 1/8/21 | | | 250 | | | | 253 | |
| | | American Honda Finance Corp. | | 2.650% | | 2/12/21 | | | 150 | | | | 151 | |
| | | American Honda Finance Corp. | | 1.650% | | 7/12/21 | | | 150 | | | | 150 | |
| | | American Honda Finance Corp. | | 1.700% | | 9/9/21 | | | 400 | | | | 399 | |
| | | American Honda Finance Corp. | | 3.375% | | 12/10/21 | | | 150 | | | | 155 | |
| | | American Honda Finance Corp. | | 2.200% | | 6/27/22 | | | 150 | | | | 151 | |
| | | American Honda Finance Corp. | | 2.600% | | 11/16/22 | | | 40 | | | | 41 | |
| | | American Honda Finance Corp. | | 2.050% | | 1/10/23 | | | 125 | | | | 125 | |
| | | American Honda Finance Corp. | | 3.450% | | 7/14/23 | | | 125 | | | | 131 | |
| | | American Honda Finance Corp. | | 3.625% | | 10/10/23 | | | 100 | | | | 105 | |
| | | American Honda Finance Corp. | | 2.900% | | 2/16/24 | | | 150 | | | | 154 | |
| | | American Honda Finance Corp. | | 2.400% | | 6/27/24 | | | 100 | | | | 101 | |
| | | American Honda Finance Corp. | | 2.150% | | 9/10/24 | | | 125 | | | | 125 | |
| | | American Honda Finance Corp. | | 2.300% | | 9/9/26 | | | 50 | | | | 50 | |
Total Bond Market Index Portfolio
| | | | | | | | | Face | | | Market | |
| | | | | | | Maturity | | Amount | | | Value• | |
| | | | | Coupon | | Date | | | ($000 | ) | | | ($000 | ) |
| | | American Honda Finance Corp. | | 3.500% | | 2/15/28 | | | 100 | | | | 108 | |
| | | Aptiv Corp. | | 4.150% | | 3/15/24 | | | 125 | | | | 132 | |
| | | Aptiv plc | | 4.250% | | 1/15/26 | | | 150 | | | | 162 | |
| | | Aptiv plc | | 4.350% | | 3/15/29 | | | 50 | | | | 54 | |
| | | Aptiv plc | | 4.400% | | 10/1/46 | | | 50 | | | | 48 | |
| | | Aptiv plc | | 5.400% | | 3/15/49 | | | 50 | | | | 56 | |
| | | Automatic Data Processing Inc. | | 3.375% | | 9/15/25 | | | 200 | | | | 212 | |
| | | AutoNation Inc. | | 3.350% | | 1/15/21 | | | 60 | | | | 61 | |
| | | AutoNation Inc. | | 3.500% | | 11/15/24 | | | 205 | | | | 211 | |
| | | AutoNation Inc. | | 4.500% | | 10/1/25 | | | 150 | | | | 161 | |
| | | AutoNation Inc. | | 3.800% | | 11/15/27 | | | 75 | | | | 76 | |
| | | AutoZone Inc. | | 3.700% | | 4/15/22 | | | 350 | | | | 361 | |
| | | AutoZone Inc. | | 2.875% | | 1/15/23 | | | 75 | | | | 76 | |
| | | AutoZone Inc. | | 3.125% | | 7/15/23 | | | 125 | | | | 128 | |
| | | AutoZone Inc. | | 3.125% | | 4/18/24 | | | 130 | | | | 135 | |
| | | AutoZone Inc. | | 3.125% | | 4/21/26 | | | 100 | | | | 103 | |
| | | AutoZone Inc. | | 3.750% | | 6/1/27 | | | 100 | | | | 107 | |
| | | AutoZone Inc. | | 3.750% | | 4/18/29 | | | 100 | | | | 107 | |
| | | Best Buy Co. Inc. | | 5.500% | | 3/15/21 | | | 25 | | | | 26 | |
| | | Best Buy Co. Inc. | | 4.450% | | 10/1/28 | | | 200 | | | | 219 | |
| | | Block Financial LLC | | 5.500% | | 11/1/22 | | | 100 | | | | 107 | |
| | | Block Financial LLC | | 5.250% | | 10/1/25 | | | 100 | | | | 109 | |
| | | Booking Holdings Inc. | | 2.750% | | 3/15/23 | | | 100 | | | | 102 | |
| | | Booking Holdings Inc. | | 3.650% | | 3/15/25 | | | 100 | | | | 107 | |
| | | Booking Holdings Inc. | | 3.600% | | 6/1/26 | | | 225 | | | | 240 | |
| | | Booking Holdings Inc. | | 3.550% | | 3/15/28 | | | 100 | | | | 106 | |
| | | BorgWarner Inc. | | 3.375% | | 3/15/25 | | | 75 | | | | 78 | |
| | | BorgWarner Inc. | | 4.375% | | 3/15/45 | | | 100 | | | | 102 | |
| | | Costco Wholesale Corp. | | 2.150% | | 5/18/21 | | | 200 | | | | 201 | |
| | | Costco Wholesale Corp. | | 2.250% | | 2/15/22 | | | 100 | | | | 101 | |
| | | Costco Wholesale Corp. | | 2.300% | | 5/18/22 | | | 150 | | | | 152 | |
| | | Costco Wholesale Corp. | | 2.750% | | 5/18/24 | | | 275 | | | | 284 | |
| | | Costco Wholesale Corp. | | 3.000% | | 5/18/27 | | | 100 | | | | 106 | |
| | | Cummins Inc. | | 7.125% | | 3/1/28 | | | 100 | | | | 133 | |
| | | Cummins Inc. | | 4.875% | | 10/1/43 | | | 125 | | | | 152 | |
| | | Daimler Finance North America LLC | | 8.500% | | 1/18/31 | | | 250 | | | | 372 | |
| | | Darden Restaurants Inc. | | 3.850% | | 5/1/27 | | | 200 | | | | 209 | |
| | | Darden Restaurants Inc. | | 4.550% | | 2/15/48 | | | 50 | | | | 51 | |
| | | Dollar General Corp. | | 3.250% | | 4/15/23 | | | 150 | | | | 155 | |
| | | Dollar General Corp. | | 4.150% | | 11/1/25 | | | 105 | | | | 114 | |
| | | Dollar General Corp. | | 3.875% | | 4/15/27 | | | 50 | | | | 54 | |
| | | Dollar General Corp. | | 4.125% | | 5/1/28 | | | 150 | | | | 164 | |
| | | Dollar Tree Inc. | | 3.700% | | 5/15/23 | | | 100 | | | | 104 | |
| | | Dollar Tree Inc. | | 4.000% | | 5/15/25 | | | 200 | | | | 214 | |
| | | Dollar Tree Inc. | | 4.200% | | 5/15/28 | | | 300 | | | | 321 | |
| | | DR Horton Inc. | | 4.375% | | 9/15/22 | | | 100 | | | | 105 | |
| | | DR Horton Inc. | | 4.750% | | 2/15/23 | | | 225 | | | | 239 | |
| | | DR Horton Inc. | | 5.750% | | 8/15/23 | | | 75 | | | | 83 | |
| | | DR Horton Inc. | | 2.500% | | 10/15/24 | | | 100 | | | | 100 | |
| | | eBay Inc. | | 2.875% | | 8/1/21 | | | 125 | | | | 126 | |
| | | eBay Inc. | | 3.800% | | 3/9/22 | | | 100 | | | | 103 | |
| | | eBay Inc. | | 2.600% | | 7/15/22 | | | 450 | | | | 454 | |
| | | eBay Inc. | | 2.750% | | 1/30/23 | | | 175 | | | | 177 | |
| | | eBay Inc. | | 3.450% | | 8/1/24 | | | 125 | | | | 130 | |
| | | eBay Inc. | | 3.600% | | 6/5/27 | | | 300 | | | | 313 | |
| | | eBay Inc. | | 4.000% | | 7/15/42 | | | 25 | | | | 25 | |
| | | Expedia Group Inc. | | 4.500% | | 8/15/24 | | | 100 | | | | 107 | |
| | | Expedia Group Inc. | | 5.000% | | 2/15/26 | | | 150 | | | | 165 | |
| | | Expedia Group Inc. | | 3.800% | | 2/15/28 | | | 200 | | | | 204 | |
| 6 | | Expedia Group Inc. | | 3.250% | | 2/15/30 | | | 250 | | | | 240 | |
| | | Ford Motor Co. | | 4.346% | | 12/8/26 | | | 275 | | | | 283 | |
| | | Ford Motor Co. | | 6.625% | | 10/1/28 | | | 175 | | | | 193 | |
| | | Ford Motor Co. | | 6.375% | | 2/1/29 | | | 100 | | | | 107 | |
| | | Ford Motor Co. | | 7.450% | | 7/16/31 | | | 375 | | | | 443 | |
| | | Ford Motor Co. | | 4.750% | | 1/15/43 | | | 100 | | | | 89 | |
| | | Ford Motor Co. | | 7.400% | | 11/1/46 | | | 100 | | | | 112 | |
| | | Ford Motor Co. | | 5.291% | | 12/8/46 | | | 250 | | | | 236 | |
| | | Ford Motor Credit Co. LLC | | 2.343% | | 11/2/20 | | | 150 | | | | 150 | |
| | | Ford Motor Credit Co. LLC | | 3.200% | | 1/15/21 | | | 250 | | | | 251 | |
| | | Ford Motor Credit Co. LLC | | 5.750% | | 2/1/21 | | | 250 | | | | 258 | |
| | | Ford Motor Credit Co. LLC | | 3.336% | | 3/18/21 | | | 200 | | | | 201 | |
| | | Ford Motor Credit Co. LLC | | 5.875% | | 8/2/21 | | | 325 | | | | 340 | |
| | | Ford Motor Credit Co. LLC | | 3.813% | | 10/12/21 | | | 200 | | | | 203 | |
| | | Ford Motor Credit Co. LLC | | 5.596% | | 1/7/22 | | | 200 | | | | 210 | |
| | | Ford Motor Credit Co. LLC | | 3.339% | | 3/28/22 | | | 150 | | | | 151 | |
| | | Ford Motor Credit Co. LLC | | 2.979% | | 8/3/22 | | | 300 | | | | 300 | |
| | | Ford Motor Credit Co. LLC | | 4.250% | | 9/20/22 | | | 200 | | | | 207 | |
| | | Ford Motor Credit Co. LLC | | 3.350% | | 11/1/22 | | | 500 | | | | 505 | |
| | | Ford Motor Credit Co. LLC | | 4.375% | | 8/6/23 | | | 225 | | | | 233 | |
| | | Ford Motor Credit Co. LLC | | 3.810% | | 1/9/24 | | | 150 | | | | 152 | |
| | | Ford Motor Credit Co. LLC | | 5.584% | | 3/18/24 | | | 200 | | | | 216 | |
| | | Ford Motor Credit Co. LLC | | 3.664% | | 9/8/24 | | | 200 | | | | 200 | |
| | | Ford Motor Credit Co. LLC | | 4.063% | | 11/1/24 | | | 700 | | | | 714 | |
| | | Ford Motor Credit Co. LLC | | 4.134% | | 8/4/25 | | | 500 | | | | 506 | |
| | | Ford Motor Credit Co. LLC | | 4.389% | | 1/8/26 | | | 200 | | | | 203 | |
| | | Ford Motor Credit Co. LLC | | 4.542% | | 8/1/26 | | | 200 | | | | 204 | |
| | | Ford Motor Credit Co. LLC | | 3.815% | | 11/2/27 | | | 150 | | | | 145 | |
| | | Ford Motor Credit Co. LLC | | 5.113% | | 5/3/29 | | | 325 | | | | 334 | |
| | | General Motors Co. | | 4.875% | | 10/2/23 | | | 625 | | | | 671 | |
| | | General Motors Co. | | 4.000% | | 4/1/25 | | | 100 | | | | 104 | |
| | | General Motors Co. | | 5.000% | | 10/1/28 | | | 150 | | | | 163 | |
| | | General Motors Co. | | 5.000% | | 4/1/35 | | | 165 | | | | 170 | |
| | | General Motors Co. | | 6.600% | | 4/1/36 | | | 250 | | | | 294 | |
| | | General Motors Co. | | 5.150% | | 4/1/38 | | | 225 | | | | 230 | |
| | | General Motors Co. | | 6.250% | | 10/2/43 | | | 210 | | | | 235 | |
| | | General Motors Co. | | 5.200% | | 4/1/45 | | | 230 | | | | 231 | |
| | | General Motors Co. | | 6.750% | | 4/1/46 | | | 130 | | | | 152 | |
| | | General Motors Co. | | 5.400% | | 4/1/48 | | | 200 | | | | 206 | |
| | | General Motors Co. | | 5.950% | | 4/1/49 | | | 275 | | | | 304 | |
| | | General Motors Financial Co. Inc. | | 4.200% | | 3/1/21 | | | 175 | | | | 179 | |
| | | General Motors Financial Co. Inc. | | 3.550% | | 4/9/21 | | | 150 | | | | 152 | |
| | | General Motors Financial Co. Inc. | | 3.200% | | 7/6/21 | | | 225 | | | | 228 | |
| | | General Motors Financial Co. Inc. | | 4.375% | | 9/25/21 | | | 100 | | | | 104 | |
| | | General Motors Financial Co. Inc. | | 4.200% | | 11/6/21 | | | 50 | | | | 52 | |
| | | General Motors Financial Co. Inc. | | 3.450% | | 1/14/22 | | | 125 | | | | 128 | |
| | | General Motors Financial Co. Inc. | | 3.450% | | 4/10/22 | | | 355 | | | | 363 | |
| | | General Motors Financial Co. Inc. | | 3.150% | | 6/30/22 | | | 100 | | | | 102 | |
| | | General Motors Financial Co. Inc. | | 3.550% | | 7/8/22 | | | 200 | | | | 206 | |
| | | General Motors Financial Co. Inc. | | 3.250% | | 1/5/23 | | | 275 | | | | 280 | |
| | | General Motors Financial Co. Inc. | | 3.700% | | 5/9/23 | | | 200 | | | | 206 | |
| | | General Motors Financial Co. Inc. | | 4.250% | | 5/15/23 | | | 150 | | | | 158 | |
| | | General Motors Financial Co. Inc. | | 4.150% | | 6/19/23 | | | 200 | | | | 210 | |
| | | General Motors Financial Co. Inc. | | 5.100% | | 1/17/24 | | | 100 | | | | 109 | |
| | | General Motors Financial Co. Inc. | | 3.950% | | 4/13/24 | | | 400 | | | | 418 | |
| | | General Motors Financial Co. Inc. | | 3.500% | | 11/7/24 | | | 200 | | | | 206 | |
| | | General Motors Financial Co. Inc. | | 4.000% | | 1/15/25 | | | 175 | | | | 184 | |
| | | General Motors Financial Co. Inc. | | 4.350% | | 4/9/25 | | | 325 | | | | 348 | |
| | | General Motors Financial Co. Inc. | | 5.250% | | 3/1/26 | | | 150 | | | | 166 | |
| | | General Motors Financial Co. Inc. | | 4.000% | | 10/6/26 | | | 100 | | | | 105 | |
| | | General Motors Financial Co. Inc. | | 4.350% | | 1/17/27 | | | 325 | | | | 342 | |
| | | General Motors Financial Co. Inc. | | 3.850% | | 1/5/28 | | | 100 | | | | 102 | |
| | | General Motors Financial Co. Inc. | | 5.650% | | 1/17/29 | | | 150 | | | | 170 | |
| | | GLP Capital LP / GLP Financing II Inc. | | 4.375% | | 4/15/21 | | | 50 | | | | 51 | |
| | | GLP Capital LP / GLP Financing II Inc. | | 5.375% | | 11/1/23 | | | 100 | | | | 109 | |
| | | GLP Capital LP / GLP Financing II Inc. | | 3.350% | | 9/1/24 | | | 75 | | | | 77 | |
| | | GLP Capital LP / GLP Financing II Inc. | | 5.250% | | 6/1/25 | | | 200 | | | | 218 | |
| | | GLP Capital LP / GLP Financing II Inc. | | 5.375% | | 4/15/26 | | | 175 | | | | 191 | |
| | | GLP Capital LP / GLP Financing II Inc. | | 5.750% | | 6/1/28 | | | 25 | | | | 28 | |
| | | GLP Capital LP / GLP Financing II Inc. | | 5.300% | | 1/15/29 | | | 275 | | | | 306 | |
| | | GLP Capital LP / GLP Financing II Inc. | | 4.000% | | 1/15/30 | | | 175 | | | | 178 | |
| | | Harley-Davidson Inc. | | 3.500% | | 7/28/25 | | | 100 | | | | 104 | |
| | | Harley-Davidson Inc. | | 4.625% | | 7/28/45 | | | 125 | | | | 128 | |
| | | Harman International Industries Inc. | | 4.150% | | 5/15/25 | | | 76 | | | | 81 | |
| | | Home Depot Inc. | | 2.000% | | 4/1/21 | | | 250 | | | | 251 | |
| | | Home Depot Inc. | | 4.400% | | 4/1/21 | | | 190 | | | | 195 | |
| | | Home Depot Inc. | | 3.250% | | 3/1/22 | | | 150 | | | | 155 | |
| | | Home Depot Inc. | | 2.625% | | 6/1/22 | | | 265 | | | | 270 | |
| | | Home Depot Inc. | | 2.700% | | 4/1/23 | | | 25 | | | | 26 | |
| | | Home Depot Inc. | | 3.750% | | 2/15/24 | | | 200 | | | | 214 | |
| | | Home Depot Inc. | | 3.350% | | 9/15/25 | | | 250 | | | | 267 | |
| | | Home Depot Inc. | | 3.000% | | 4/1/26 | | | 275 | | | | 287 | |
| | | Home Depot Inc. | | 2.125% | | 9/15/26 | | | 100 | | | | 100 | |
Total Bond Market Index Portfolio
| | | | | | | | | Face | | | Market | |
| | | | | | | Maturity | | Amount | | | Value• | |
| | | | | Coupon | | Date | | | ($000 | ) | | | ($000 | ) |
| | Home Depot Inc. | | 2.800% | | 9/14/27 | | | 200 | | | | 207 | |
| | | Home Depot Inc. | | 3.900% | | 12/6/28 | | | 100 | | | | 112 | |
| | | Home Depot Inc. | | 2.950% | | 6/15/29 | | | 500 | | | | 519 | |
| | | Home Depot Inc. | | 5.875% | | 12/16/36 | | | 825 | | | | 1,136 | |
| | | Home Depot Inc. | | 5.400% | | 9/15/40 | | | 175 | | | | 229 | |
| | | Home Depot Inc. | | 5.950% | | 4/1/41 | | | 175 | | | | 246 | |
| | | Home Depot Inc. | | 4.200% | | 4/1/43 | | | 200 | | | | 232 | |
| | | Home Depot Inc. | | 4.875% | | 2/15/44 | | | 300 | | | | 380 | |
| | | Home Depot Inc. | | 4.400% | | 3/15/45 | | | 100 | | | | 119 | |
| | | Home Depot Inc. | | 4.250% | | 4/1/46 | | | 330 | | | | 389 | |
| | | Home Depot Inc. | | 3.900% | | 6/15/47 | | | 175 | | | | 197 | |
| | | Home Depot Inc. | | 4.500% | | 12/6/48 | | | 125 | | | | 154 | |
| | | Home Depot Inc. | | 3.500% | | 9/15/56 | | | 150 | | | | 157 | |
| | | Hyatt Hotels Corp. | | 5.375% | | 8/15/21 | | | 50 | | | | 52 | |
| | | Hyatt Hotels Corp. | | 3.375% | | 7/15/23 | | | 100 | | | | 103 | |
| | | Hyatt Hotels Corp. | | 4.850% | | 3/15/26 | | | 50 | | | | 55 | |
| | | Hyatt Hotels Corp. | | 4.375% | | 9/15/28 | | | 75 | | | | 81 | |
| | | IHS Markit Ltd. | | 3.625% | | 5/1/24 | | | 100 | | | | 104 | |
| | | IHS Markit Ltd. | | 4.750% | | 8/1/28 | | | 140 | | | | 156 | |
| | | IHS Markit Ltd. | | 4.250% | | 5/1/29 | | | 100 | | | | 108 | |
| | | JD.com Inc. | | 3.125% | | 4/29/21 | | | 200 | | | | 201 | |
| | | Kohl’s Corp. | | 4.250% | | 7/17/25 | | | 100 | | | | 106 | |
| | | Kohl’s Corp. | | 5.550% | | 7/17/45 | | | 100 | | | | 102 | |
| | | Las Vegas Sands Corp. | | 3.200% | | 8/8/24 | | | 115 | | | | 119 | |
| | | Las Vegas Sands Corp. | | 2.900% | | 6/25/25 | | | 200 | | | | 202 | |
| | | Las Vegas Sands Corp. | | 3.500% | | 8/18/26 | | | 145 | | | | 149 | |
| | | Las Vegas Sands Corp. | | 3.900% | | 8/8/29 | | | 65 | | | | 68 | |
| | | Lear Corp. | | 5.250% | | 1/15/25 | | | 200 | | | | 206 | |
| | | Lear Corp. | | 3.800% | | 9/15/27 | | | 100 | | | | 101 | |
| | | Lear Corp. | | 4.250% | | 5/15/29 | | | 150 | | | | 155 | |
| | | Lear Corp. | | 5.250% | | 5/15/49 | | | 150 | | | | 156 | |
| | | Lowe’s Cos. Inc. | | 3.750% | | 4/15/21 | | | 200 | | | | 203 | |
| | | Lowe’s Cos. Inc. | | 3.120% | | 4/15/22 | | | 150 | | | | 154 | |
| | | Lowe’s Cos. Inc. | | 3.875% | | 9/15/23 | | | 275 | | | | 291 | |
| | | Lowe’s Cos. Inc. | | 3.125% | | 9/15/24 | | | 100 | | | | 104 | |
| | | Lowe’s Cos. Inc. | | 3.375% | | 9/15/25 | | | 200 | | | | 210 | |
| | | Lowe’s Cos. Inc. | | 2.500% | | 4/15/26 | | | 250 | | | | 252 | |
| | | Lowe’s Cos. Inc. | | 3.100% | | 5/3/27 | | | 350 | | | | 361 | |
| | | Lowe’s Cos. Inc. | | 6.500% | | 3/15/29 | | | 67 | | | | 85 | |
| | | Lowe’s Cos. Inc. | | 3.650% | | 4/5/29 | | | 450 | | | | 480 | |
| | | Lowe’s Cos. Inc. | | 4.650% | | 4/15/42 | | | 100 | | | | 114 | |
| | | Lowe’s Cos. Inc. | | 4.250% | | 9/15/44 | | | 100 | | | | 108 | |
| | | Lowe’s Cos. Inc. | | 4.375% | | 9/15/45 | | | 150 | | | | 164 | |
| | | Lowe’s Cos. Inc. | | 3.700% | | 4/15/46 | | | 250 | | | | 254 | |
| | | Lowe’s Cos. Inc. | | 4.050% | | 5/3/47 | | | 300 | | | | 323 | |
| | | Lowe’s Cos. Inc. | | 4.550% | | 4/5/49 | | | 275 | | | | 321 | |
| | | Macy’s Retail Holdings Inc. | | 3.450% | | 1/15/21 | | | 100 | | | | 101 | |
| | | Macy’s Retail Holdings Inc. | | 2.875% | | 2/15/23 | | | 170 | | | | 169 | |
| | | Macy’s Retail Holdings Inc. | | 3.625% | | 6/1/24 | | | 100 | | | | 101 | |
| | | Macy’s Retail Holdings Inc. | | 4.500% | | 12/15/34 | | | 121 | | | | 115 | |
| | | Magna International Inc. | | 3.625% | | 6/15/24 | | | 170 | | | | 179 | |
| | | Magna International Inc. | | 4.150% | | 10/1/25 | | | 100 | | | | 108 | |
| | | Marriott International Inc. | | 2.875% | | 3/1/21 | | | 50 | | | | 50 | |
| | | Marriott International Inc. | | 3.125% | | 10/15/21 | | | 50 | | | | 51 | |
| | | Marriott International Inc. | | 2.300% | | 1/15/22 | | | 100 | | | | 100 | |
| | | Marriott International Inc. | | 2.125% | | 10/3/22 | | | 200 | | | | 200 | |
| | | Marriott International Inc. | | 3.600% | | 4/15/24 | | | 125 | | | | 131 | |
| | | Marriott International Inc. | | 3.750% | | 3/15/25 | | | 175 | | | | 185 | |
| | | Marriott International Inc. | | 3.750% | | 10/1/25 | | | 65 | | | | 69 | |
| | | Marriott International Inc. | | 3.125% | | 6/15/26 | | | 183 | | | | 189 | |
| | | Marriott International Inc. | | 4.000% | | 4/15/28 | | | 50 | | | | 54 | |
| | | Mastercard Inc. | | 2.000% | | 11/21/21 | | | 100 | | | | 100 | |
| | | Mastercard Inc. | | 3.375% | | 4/1/24 | | | 300 | | | | 318 | |
| | | Mastercard Inc. | | 2.000% | | 3/3/25 | | | 400 | | | | 398 | |
| | | Mastercard Inc. | | 2.950% | | 11/21/26 | | | 100 | | | | 104 | |
| | | Mastercard Inc. | | 3.500% | | 2/26/28 | | | 50 | | | | 54 | |
| | | Mastercard Inc. | | 2.950% | | 6/1/29 | | | 200 | | | | 208 | |
| | | Mastercard Inc. | | 3.800% | | 11/21/46 | | | 100 | | | | 112 | |
| | | Mastercard Inc. | | 3.950% | | 2/26/48 | | | 100 | | | | 115 | |
| | | Mastercard Inc. | | 3.650% | | 6/1/49 | | | 250 | | | | 276 | |
| | | McDonald’s Corp. | | 2.750% | | 12/9/20 | | | 275 | | | | 277 | |
| | | McDonald’s Corp. | | 3.625% | | 5/20/21 | | | 175 | | | | 179 | |
| | | McDonald’s Corp. | | 2.625% | | 1/15/22 | | | 275 | | | | 279 | |
| | | McDonald’s Corp. | | 3.350% | | 4/1/23 | | | 200 | | | | 208 | |
| | | McDonald’s Corp. | | 3.375% | | 5/26/25 | | | 175 | | | | 185 | |
| | | McDonald’s Corp. | | 3.700% | | 1/30/26 | | | 300 | | | | 322 | |
| | | McDonald’s Corp. | | 3.500% | | 3/1/27 | | | 200 | | | | 213 | |
| | | McDonald’s Corp. | | 3.800% | | 4/1/28 | | | 350 | | | | 380 | |
| | | McDonald’s Corp. | | 2.625% | | 9/1/29 | | | 200 | | | | 200 | |
| | | McDonald’s Corp. | | 4.700% | | 12/9/35 | | | 200 | | | | 238 | |
| | | McDonald’s Corp. | | 6.300% | | 10/15/37 | | | 150 | | | | 204 | |
| | | McDonald’s Corp. | | 6.300% | | 3/1/38 | | | 100 | | | | 136 | |
| | | McDonald’s Corp. | | 5.700% | | 2/1/39 | | | 100 | | | | 127 | |
| | | McDonald’s Corp. | | 3.700% | | 2/15/42 | | | 25 | | | | 25 | |
| | | McDonald’s Corp. | | 3.625% | | 5/1/43 | | | 100 | | | | 100 | |
| | | McDonald’s Corp. | | 4.600% | | 5/26/45 | | | 210 | | | | 241 | |
| | | McDonald’s Corp. | | 4.875% | | 12/9/45 | | | 300 | | | | 362 | |
| | | McDonald’s Corp. | | 4.450% | | 3/1/47 | | | 150 | | | | 172 | |
| | | McDonald’s Corp. | | 4.450% | | 9/1/48 | | | 150 | | | | 171 | |
| | | McDonald’s Corp. | | 3.625% | | 9/1/49 | | | 200 | | | | 203 | |
| | | NIKE Inc. | | 2.375% | | 11/1/26 | | | 200 | | | | 203 | |
| | | NIKE Inc. | | 3.625% | | 5/1/43 | | | 125 | | | | 136 | |
| | | NIKE Inc. | | 3.875% | | 11/1/45 | | | 225 | | | | 256 | |
| | | NIKE Inc. | | 3.375% | | 11/1/46 | | | 100 | | | | 105 | |
| | | Nordstrom Inc. | | 4.000% | | 10/15/21 | | | 125 | | | | 128 | |
| | | Nordstrom Inc. | | 4.000% | | 3/15/27 | | | 100 | | | | 104 | |
| | | Nordstrom Inc. | | 4.375% | | 4/1/30 | | | 75 | | | | 76 | |
| | | Nordstrom Inc. | | 5.000% | | 1/15/44 | | | 165 | | | | 160 | |
| | | NVR Inc. | | 3.950% | | 9/15/22 | | | 100 | | | | 104 | |
| | | O’Reilly Automotive Inc. | | 4.875% | | 1/14/21 | | | 25 | | | | 26 | |
| | | O’Reilly Automotive Inc. | | 3.800% | | 9/1/22 | | | 100 | | | | 104 | |
| | | O’Reilly Automotive Inc. | | 3.850% | | 6/15/23 | | | 75 | | | | 78 | |
| | | O’Reilly Automotive Inc. | | 3.550% | | 3/15/26 | | | 100 | | | | 105 | |
| | | O’Reilly Automotive Inc. | | 3.600% | | 9/1/27 | | | 325 | | | | 347 | |
| | | PACCAR Financial Corp. | | 2.050% | | 11/13/20 | | | 50 | | | | 50 | |
| | | PACCAR Financial Corp. | | 2.250% | | 2/25/21 | | | 75 | | | | 75 | |
| | | PACCAR Financial Corp. | | 2.800% | | 3/1/21 | | | 90 | | | | 91 | |
| | | PACCAR Financial Corp. | | 3.150% | | 8/9/21 | | | 25 | | | | 25 | |
| | | PACCAR Financial Corp. | | 2.850% | | 3/1/22 | | | 100 | | | | 102 | |
| | | PACCAR Financial Corp. | | 2.650% | | 5/10/22 | | | 100 | | | | 102 | |
| | | PACCAR Financial Corp. | | 2.300% | | 8/10/22 | | | 50 | | | | 51 | |
| | | PACCAR Financial Corp. | | 2.000% | | 9/26/22 | | | 50 | | | | 50 | |
| | | PACCAR Financial Corp. | | 3.400% | | 8/9/23 | | | 100 | | | | 104 | |
| | | PACCAR Financial Corp. | | 2.150% | | 8/15/24 | | | 75 | | | | 75 | |
| | | QVC Inc. | | 5.125% | | 7/2/22 | | | 25 | | | | 26 | |
| | | QVC Inc. | | 4.850% | | 4/1/24 | | | 95 | | | | 100 | |
| | | QVC Inc. | | 4.450% | | 2/15/25 | | | 100 | | | | 103 | |
| | | QVC Inc. | | 5.950% | | 3/15/43 | | | 125 | | | | 119 | |
| | | Ralph Lauren Corp. | | 3.750% | | 9/15/25 | | | 50 | | | | 54 | |
| | | Royal Caribbean Cruises Ltd. | | 5.250% | | 11/15/22 | | | 100 | | | | 108 | |
| | | Royal Caribbean Cruises Ltd. | | 3.700% | | 3/15/28 | | | 200 | | | | 207 | |
| | | Sands China Ltd. | | 4.600% | | 8/8/23 | | | 400 | | | | 420 | |
| | | Sands China Ltd. | | 5.125% | | 8/8/25 | | | 400 | | | | 440 | |
| | | Sands China Ltd. | | 5.400% | | 8/8/28 | | | 300 | | | | 338 | |
| | | Starbucks Corp. | | 2.100% | | 2/4/21 | | | 150 | | | | 150 | |
| | | Starbucks Corp. | | 2.700% | | 6/15/22 | | | 75 | | | | 76 | |
| | | Starbucks Corp. | | 3.100% | | 3/1/23 | | | 175 | | | | 181 | |
| | | Starbucks Corp. | | 3.850% | | 10/1/23 | | | 300 | | | | 318 | |
| | | Starbucks Corp. | | 3.800% | | 8/15/25 | | | 200 | | | | 215 | |
| | | Starbucks Corp. | | 2.450% | | 6/15/26 | | | 200 | | | | 202 | |
| | | Starbucks Corp. | | 3.500% | | 3/1/28 | | | 100 | | | | 107 | |
| | | Starbucks Corp. | | 4.000% | | 11/15/28 | | | 200 | | | | 221 | |
| | | Starbucks Corp. | | 3.550% | | 8/15/29 | | | 200 | | | | 217 | |
| | | Starbucks Corp. | | 4.300% | | 6/15/45 | | | 50 | | | | 55 | |
| | | Starbucks Corp. | | 3.750% | | 12/1/47 | | | 125 | | | | 128 | |
| | | Starbucks Corp. | | 4.500% | | 11/15/48 | | | 200 | | | | 230 | |
| | | Tapestry Inc. | | 3.000% | | 7/15/22 | | | 125 | | | | 127 | |
| | | Tapestry Inc. | | 4.250% | | 4/1/25 | | | 70 | | | | 74 | |
| | | Tapestry Inc. | | 4.125% | | 7/15/27 | | | 100 | | | | 102 | |
| | | Target Corp. | | 2.900% | | 1/15/22 | | | 200 | | | | 205 | |
| | | Target Corp. | | 3.500% | | 7/1/24 | | | 325 | | | | 348 | |
| | | Target Corp. | | 2.500% | | 4/15/26 | | | 175 | | | | 179 | |
Total Bond Market Index Portfolio
| | | | | | | | | Face | | | Market | |
| | | | | | | Maturity | | Amount | | | Value• | |
| | | | | Coupon | | Date | | | ($000 | ) | | | ($000 | ) |
| | | Target Corp. | | 3.375% | | 4/15/29 | | | 200 | | | | 217 | |
| | | Target Corp. | | 6.350% | | 11/1/32 | | | 140 | | | | 196 | |
| | | Target Corp. | | 6.500% | | 10/15/37 | | | 103 | | | | 152 | |
| | | Target Corp. | | 7.000% | | 1/15/38 | | | 125 | | | | 194 | |
| | | Target Corp. | | 4.000% | | 7/1/42 | | | 285 | | | | 326 | |
| | | Target Corp. | | 3.625% | | 4/15/46 | | | 200 | | | | 219 | |
| | | Target Corp. | | 3.900% | | 11/15/47 | | | 125 | | | | 143 | |
| | | TJX Cos. Inc. | | 2.750% | | 6/15/21 | | | 150 | | | | 152 | |
| | | TJX Cos. Inc. | | 2.500% | | 5/15/23 | | | 100 | | | | 102 | |
| | | TJX Cos. Inc. | | 2.250% | | 9/15/26 | | | 350 | | | | 350 | |
| | | Toyota Motor Corp. | | 3.183% | | 7/20/21 | | | 140 | | | | 143 | |
| | | Toyota Motor Corp. | | 2.157% | | 7/2/22 | | | 100 | | | | 101 | |
| | | Toyota Motor Corp. | | 3.419% | | 7/20/23 | | | 150 | | | | 157 | |
| | | Toyota Motor Corp. | | 2.358% | | 7/2/24 | | | 100 | | | | 102 | |
| | | Toyota Motor Corp. | | 3.669% | | 7/20/28 | | | 100 | | | | 110 | |
| | | Toyota Motor Corp. | | 2.760% | | 7/2/29 | | | 100 | | | | 103 | |
| | | Toyota Motor Credit Corp. | | 4.250% | | 1/11/21 | | | 125 | | | | 128 | |
| | | Toyota Motor Credit Corp. | | 1.900% | | 4/8/21 | | | 250 | | | | 250 | |
| | | Toyota Motor Credit Corp. | | 2.950% | | 4/13/21 | | | 100 | | | | 101 | |
| | | Toyota Motor Credit Corp. | | 2.750% | | 5/17/21 | | | 200 | | | | 202 | |
| | | Toyota Motor Credit Corp. | | 3.400% | | 9/15/21 | | | 175 | | | | 179 | |
| | | Toyota Motor Credit Corp. | | 1.800% | | 10/7/21 | | | 80 | | | | 80 | |
| | | Toyota Motor Credit Corp. | | 2.600% | | 1/11/22 | | | 200 | | | | 203 | |
| | | Toyota Motor Credit Corp. | | 3.300% | | 1/12/22 | | | 175 | | | | 180 | |
| | | Toyota Motor Credit Corp. | | 2.650% | | 4/12/22 | | | 500 | | | | 508 | |
| | | Toyota Motor Credit Corp. | | 2.800% | | 7/13/22 | | | 100 | | | | 102 | |
| | | Toyota Motor Credit Corp. | | 2.150% | | 9/8/22 | | | 200 | | | | 202 | |
| | | Toyota Motor Credit Corp. | | 2.625% | | 1/10/23 | | | 100 | | | | 102 | |
| | | Toyota Motor Credit Corp. | | 2.250% | | 10/18/23 | | | 300 | | | | 302 | |
| | | Toyota Motor Credit Corp. | | 2.900% | | 4/17/24 | | | 125 | | | | 129 | |
| | | Toyota Motor Credit Corp. | | 3.400% | | 4/14/25 | | | 125 | | | | 133 | |
| | | Toyota Motor Credit Corp. | | 3.200% | | 1/11/27 | | | 200 | | | | 211 | |
| | | Toyota Motor Credit Corp. | | 3.050% | | 1/11/28 | | | 100 | | | | 105 | |
| | | Toyota Motor Credit Corp. | | 3.650% | | 1/8/29 | | | 100 | | | | 110 | |
| | | VF Corp. | | 3.500% | | 9/1/21 | | | 200 | | | | 204 | |
| | | VF Corp. | | 6.450% | | 11/1/37 | | | 50 | | | | 69 | |
| | | Visa Inc. | | 2.200% | | 12/14/20 | | | 500 | | | | 502 | |
| | | Visa Inc. | | 2.150% | | 9/15/22 | | | 100 | | | | 101 | |
| | | Visa Inc. | | 2.800% | | 12/14/22 | | | 550 | | | | 565 | |
| | | Visa Inc. | | 3.150% | | 12/14/25 | | | 925 | | | | 977 | |
| | | Visa Inc. | | 2.750% | | 9/15/27 | | | 150 | | | | 156 | |
| | | Visa Inc. | | 4.150% | | 12/14/35 | | | 325 | | | | 383 | |
| | | Visa Inc. | | 4.300% | | 12/14/45 | | | 825 | | | | 1,016 | |
| | | Visa Inc. | | 3.650% | | 9/15/47 | | | 100 | | | | 112 | |
| | | Walgreen Co. | | 3.100% | | 9/15/22 | | | 250 | | | | 255 | |
| | | Walgreen Co. | | 4.400% | | 9/15/42 | | | 195 | | | | 194 | |
| | | Walgreens Boots Alliance Inc. | | 3.300% | | 11/18/21 | | | 225 | | | | 229 | |
| | | Walgreens Boots Alliance Inc. | | 3.800% | | 11/18/24 | | | 375 | | | | 390 | |
| | | Walgreens Boots Alliance Inc. | | 3.450% | | 6/1/26 | | | 325 | | | | 330 | |
| | | Walgreens Boots Alliance Inc. | | 4.500% | | 11/18/34 | | | 125 | | | | 129 | |
| | | Walgreens Boots Alliance Inc. | | 4.800% | | 11/18/44 | | | 275 | | | | 280 | |
| | | Walgreens Boots Alliance Inc. | | 4.650% | | 6/1/46 | | | 115 | | | | 115 | |
| | | Walmart Inc. | | 1.900% | | 12/15/20 | | | 165 | | | | 165 | |
| | | Walmart Inc. | | 3.125% | | 6/23/21 | | | 300 | | | | 306 | |
| | | Walmart Inc. | | 2.350% | | 12/15/22 | | | 800 | | | | 814 | |
| | | Walmart Inc. | | 2.550% | | 4/11/23 | | | 150 | | | | 153 | |
| | | Walmart Inc. | | 3.400% | | 6/26/23 | | | 250 | | | | 263 | |
| | | Walmart Inc. | | 3.300% | | 4/22/24 | | | 250 | | | | 262 | |
| | | Walmart Inc. | | 2.850% | | 7/8/24 | | | 275 | | | | 285 | |
| | | Walmart Inc. | | 2.650% | | 12/15/24 | | | 200 | | | | 206 | |
| | | Walmart Inc. | | 3.550% | | 6/26/25 | | | 275 | | | | 294 | |
| | | Walmart Inc. | | 3.050% | | 7/8/26 | | | 250 | | | | 263 | |
| | | Walmart Inc. | | 5.875% | | 4/5/27 | | | 405 | | | | 499 | |
| | | Walmart Inc. | | 3.700% | | 6/26/28 | | | 450 | | | | 495 | |
| | | Walmart Inc. | | 3.250% | | 7/8/29 | | | 300 | | | | 322 | |
| | | Walmart Inc. | | 2.375% | | 9/24/29 | | | 125 | | | | 125 | |
| | | Walmart Inc. | | 7.550% | | 2/15/30 | | | 105 | | | | 152 | |
| | | Walmart Inc. | | 5.250% | | 9/1/35 | | | 385 | | | | 505 | |
| | | Walmart Inc. | | 6.200% | | 4/15/38 | | | 315 | | | | 459 | |
| | | Walmart Inc. | | 3.950% | | 6/28/38 | | | 275 | | | | 319 | |
| | | Walmart Inc. | | 5.000% | | 10/25/40 | | | 100 | | | | 130 | |
| | | Walmart Inc. | | 5.625% | | 4/15/41 | | | 175 | | | | 249 | |
| | | Walmart Inc. | | 4.000% | | 4/11/43 | | | 274 | | | | 315 | |
| | | Walmart Inc. | | 4.300% | | 4/22/44 | | | 361 | | | | 431 | |
| | | Walmart Inc. | | 3.625% | | 12/15/47 | | | 115 | | | | 127 | |
| | | Walmart Inc. | | 4.050% | | 6/29/48 | | | 425 | | | | 500 | |
| | | Walmart Inc. | | 2.950% | | 9/24/49 | | | 120 | | | | 117 | |
| | | Western Union Co. | | 3.600% | | 3/15/22 | | | 100 | | | | 103 | |
| | | Western Union Co. | | 2.850% | | 1/10/25 | | | 100 | | | | 100 | |
| | | Western Union Co. | | 6.200% | | 11/17/36 | | | 100 | | | | 113 | |
| | | Western Union Co. | | 6.200% | | 6/21/40 | | | 35 | | | | 39 | |
| | | | | | | | | | | | | | | |
| | | Consumer Noncyclical (4.4%) | | | | | | | | | | | | |
| | | Abbott Laboratories | | 2.550% | | 3/15/22 | | | 175 | | | | 178 | |
| | | Abbott Laboratories | | 3.400% | | 11/30/23 | | | 316 | | | | 332 | |
| | | Abbott Laboratories | | 2.950% | | 3/15/25 | | | 175 | | | | 181 | |
| | | Abbott Laboratories | | 3.875% | | 9/15/25 | | | 75 | | | | 82 | |
| | | Abbott Laboratories | | 3.750% | | 11/30/26 | | | 367 | | | | 400 | |
| | | Abbott Laboratories | | 4.750% | | 11/30/36 | | | 375 | | | | 467 | |
| | | Abbott Laboratories | | 5.300% | | 5/27/40 | | | 125 | | | | 163 | |
| | | Abbott Laboratories | | 4.750% | | 4/15/43 | | | 125 | | | | 157 | |
| | | Abbott Laboratories | | 4.900% | | 11/30/46 | | | 775 | | | | 1,012 | |
| | | AbbVie Inc. | | 2.300% | | 5/14/21 | | | 350 | | | | 351 | |
| | | AbbVie Inc. | | 3.375% | | 11/14/21 | | | 250 | | | | 256 | |
| 6 | | AbbVie Inc. | | 2.150% | | 11/19/21 | | | 250 | | | | 251 | |
| | | AbbVie Inc. | | 2.900% | | 11/6/22 | | | 800 | | | | 816 | |
| | | AbbVie Inc. | | 3.200% | | 11/6/22 | | | 275 | | | | 283 | |
| 6 | | AbbVie Inc. | | 2.300% | | 11/21/22 | | | 575 | | | | 577 | |
| | | AbbVie Inc. | | 2.850% | | 5/14/23 | | | 200 | | | | 204 | |
| | | AbbVie Inc. | | 3.750% | | 11/14/23 | | | 250 | | | | 263 | |
| 6 | | AbbVie Inc. | | 2.600% | | 11/21/24 | | | 750 | | | | 755 | |
| | | AbbVie Inc. | | 3.600% | | 5/14/25 | | | 725 | | | | 765 | |
| | | AbbVie Inc. | | 3.200% | | 5/14/26 | | | 350 | | | | 362 | |
| 6 | | AbbVie Inc. | | 2.950% | | 11/21/26 | | | 740 | | | | 750 | |
| | | AbbVie Inc. | | 4.250% | | 11/14/28 | | | 350 | | | | 387 | |
| 6 | | AbbVie Inc. | | 3.200% | | 11/21/29 | | | 1,080 | | | | 1,099 | |
| | | AbbVie Inc. | | 4.500% | | 5/14/35 | | | 495 | | | | 556 | |
| | | AbbVie Inc. | | 4.300% | | 5/14/36 | | | 190 | | | | 209 | |
| 6 | | AbbVie Inc. | | 4.050% | | 11/21/39 | | | 775 | | | | 810 | |
| | | AbbVie Inc. | | 4.400% | | 11/6/42 | | | 501 | | | | 540 | |
| | | AbbVie Inc. | | 4.700% | | 5/14/45 | | | 527 | | | | 588 | |
| | | AbbVie Inc. | | 4.450% | | 5/14/46 | | | 455 | | | | 490 | |
| | | AbbVie Inc. | | 4.875% | | 11/14/48 | | | 775 | | | | 890 | |
| 6 | | AbbVie Inc. | | 4.250% | | 11/21/49 | | | 650 | | | | 684 | |
| | | Actavis Inc. | | 3.250% | | 10/1/22 | | | 300 | | | | 307 | |
| | | Adventist Health System/West | | 2.952% | | 3/1/29 | | | 100 | | | | 99 | |
| | | Adventist Health System/West | | 3.630% | | 3/1/49 | | | 100 | | | | 97 | |
| | | Advocate Health & Hospitals Corp. | | 3.829% | | 8/15/28 | | | 50 | | | | 54 | |
| | | Advocate Health & Hospitals Corp. | | 4.272% | | 8/15/48 | | | 100 | | | | 114 | |
| | | Advocate Health & Hospitals Corp. | | 3.387% | | 10/15/49 | | | 75 | | | | 75 | |
| | | Agilent Technologies Inc. | | 3.200% | | 10/1/22 | | | 75 | | | | 77 | |
| | | Agilent Technologies Inc. | | 3.875% | | 7/15/23 | | | 100 | | | | 105 | |
| | | Agilent Technologies Inc. | | 3.050% | | 9/22/26 | | | 75 | | | | 76 | |
| | | AHS Hospital Corp. | | 5.024% | | 7/1/45 | | | 75 | | | | 93 | |
| | | Allergan Finance LLC | | 4.625% | | 10/1/42 | | | 190 | | | | 198 | |
| | | Allergan Funding SCS | | 3.450% | | 3/15/22 | | | 507 | | | | 519 | |
| | | Allergan Funding SCS | | 3.850% | | 6/15/24 | | | 200 | | | | 210 | |
| | | Allergan Funding SCS | | 3.800% | | 3/15/25 | | | 590 | | | | 618 | |
| | | Allergan Funding SCS | | 4.550% | | 3/15/35 | | | 350 | | | | 372 | |
| | | Allergan Funding SCS | | 4.850% | | 6/15/44 | | | 230 | | | | 255 | |
| | | Allergan Funding SCS | | 4.750% | | 3/15/45 | | | 75 | | | | 82 | |
| | | Allergan Inc. | | 2.800% | | 3/15/23 | | | 100 | | | | 101 | |
| | | Allina Health System | | 3.887% | | 4/15/49 | | | 75 | | | | 80 | |
| | | Altria Group Inc. | | 4.750% | | 5/5/21 | | | 225 | | | | 233 | |
| | | Altria Group Inc. | | 3.490% | | 2/14/22 | | | 200 | | | | 206 | |
| | | Altria Group Inc. | | 2.850% | | 8/9/22 | | | 375 | | | | 382 | |
| | | Altria Group Inc. | | 2.950% | | 5/2/23 | | | 400 | | | | 404 | |
| | | Altria Group Inc. | | 4.000% | | 1/31/24 | | | 250 | | | | 265 | |
| | | Altria Group Inc. | | 4.400% | | 2/14/26 | | | 275 | | | | 299 | |
| | | Altria Group Inc. | | 2.625% | | 9/16/26 | | | 75 | | | | 74 | |
| | | Altria Group Inc. | | 4.800% | | 2/14/29 | | | 575 | | | | 638 | |
| | | Altria Group Inc. | | 5.800% | | 2/14/39 | | | 400 | | | | 468 | |
Total Bond Market Index Portfolio
| | | | | | | | | Face | | | Market | |
| | | | | | | Maturity | | Amount | | | Value• | |
| | | | | Coupon | | Date | | | ($000 | ) | | | ($000 | ) |
| | | Altria Group Inc. | | 4.250% | | 8/9/42 | | | 275 | | | | 273 | |
| | | Altria Group Inc. | | 4.500% | | 5/2/43 | | | 125 | | | | 127 | |
| | | Altria Group Inc. | | 5.375% | | 1/31/44 | | | 350 | | | | 394 | |
| | | Altria Group Inc. | | 3.875% | | 9/16/46 | | | 175 | | | | 163 | |
| | | Altria Group Inc. | | 5.950% | | 2/14/49 | | | 500 | | | | 605 | |
| | | Altria Group Inc. | | 6.200% | | 2/14/59 | | | 100 | | | | 118 | |
| | | AmerisourceBergen Corp. | | 3.500% | | 11/15/21 | | | 200 | | | | 205 | |
| | | AmerisourceBergen Corp. | | 3.400% | | 5/15/24 | | | 75 | | | | 78 | |
| | | AmerisourceBergen Corp. | | 3.250% | | 3/1/25 | | | 50 | | | | 52 | |
| | | AmerisourceBergen Corp. | | 3.450% | | 12/15/27 | | | 275 | �� | | | 285 | |
| | | AmerisourceBergen Corp. | | 4.250% | | 3/1/45 | | | 25 | | | | 25 | |
| | | AmerisourceBergen Corp. | | 4.300% | | 12/15/47 | | | 175 | | | | 179 | |
| | | Amgen Inc. | | 4.100% | | 6/15/21 | | | 50 | | | | 51 | |
| | | Amgen Inc. | | 1.850% | | 8/19/21 | | | 125 | | | | 125 | |
| | | Amgen Inc. | | 3.875% | | 11/15/21 | | | 250 | | | | 258 | |
| | | Amgen Inc. | | 2.700% | | 5/1/22 | | | 75 | | | | 76 | |
| | | Amgen Inc. | | 2.650% | | 5/11/22 | | | 275 | | | | 279 | |
| | | Amgen Inc. | | 3.625% | | 5/15/22 | | | 225 | | | | 233 | |
| | | Amgen Inc. | | 2.250% | | 8/19/23 | | | 150 | | | | 151 | |
| | | Amgen Inc. | | 3.625% | | 5/22/24 | | | 500 | | | | 528 | |
| | | Amgen Inc. | | 3.125% | | 5/1/25 | | | 175 | | | | 183 | |
| | | Amgen Inc. | | 2.600% | | 8/19/26 | | | 455 | | | | 460 | |
| | | Amgen Inc. | | 4.950% | | 10/1/41 | | | 300 | | | | 356 | |
| | | Amgen Inc. | | 5.150% | | 11/15/41 | | | 250 | | | | 302 | |
| | | Amgen Inc. | | 4.400% | | 5/1/45 | | | 450 | | | | 504 | |
| | | Amgen Inc. | | 4.563% | | 6/15/48 | | | 356 | | | | 411 | |
| | | Amgen Inc. | | 4.663% | | 6/15/51 | | | 659 | | | | 775 | |
| | | Anheuser-Busch Cos. LLC / Anheuser-Busch InBev Worldwide Inc. | | 3.650% | | 2/1/26 | | | 770 | | | | 820 | |
| | | Anheuser-Busch Cos. LLC / Anheuser-Busch InBev Worldwide Inc. | | 4.700% | | 2/1/36 | | | 1,245 | | | | 1,436 | |
| | | Anheuser-Busch Cos. LLC / Anheuser-Busch InBev Worldwide Inc. | | 4.900% | | 2/1/46 | | | 2,485 | | | | 2,943 | |
| | | Anheuser-Busch InBev Finance Inc. | | 2.625% | | 1/17/23 | | | 254 | | | | 258 | |
| | | Anheuser-Busch InBev Finance Inc. | | 3.300% | | 2/1/23 | | | 568 | | | | 588 | |
| | | Anheuser-Busch InBev Finance Inc. | | 3.700% | | 2/1/24 | | | 100 | | | | 106 | |
| | | Anheuser-Busch InBev Finance Inc. | | 4.000% | | 1/17/43 | | | 300 | | | | 316 | |
| | | Anheuser-Busch InBev Finance Inc. | | 4.625% | | 2/1/44 | | | 200 | | | | 225 | |
| | | Anheuser-Busch InBev Finance Inc. | | 4.900% | | 2/1/46 | | | 275 | | | | 324 | |
| | | Anheuser-Busch InBev Worldwide Inc. | | 4.375% | | 2/15/21 | | | 50 | | | | 51 | |
| | | Anheuser-Busch InBev Worldwide Inc. | | 2.500% | | 7/15/22 | | | 70 | | | | 71 | |
| | | Anheuser-Busch InBev Worldwide Inc. | | 3.500% | | 1/12/24 | | | 150 | | | | 158 | |
| | | Anheuser-Busch InBev Worldwide Inc. | | 4.150% | | 1/23/25 | | | 475 | | | | 517 | |
| | | Anheuser-Busch InBev Worldwide Inc. | | 4.000% | | 4/13/28 | | | 500 | | | | 549 | |
| | | Anheuser-Busch InBev Worldwide Inc. | | 4.750% | | 1/23/29 | | | 875 | | | | 1,013 | |
| | | Anheuser-Busch InBev Worldwide Inc. | | 4.900% | | 1/23/31 | | | 340 | | | | 405 | |
| | | Anheuser-Busch InBev Worldwide Inc. | | 4.375% | | 4/15/38 | | | 275 | | | | 308 | |
| | | Anheuser-Busch InBev Worldwide Inc. | | 8.200% | | 1/15/39 | | | 150 | | | | 235 | |
| | | Anheuser-Busch InBev Worldwide Inc. | | 5.450% | | 1/23/39 | | | 125 | | | | 157 | |
| | | Anheuser-Busch InBev Worldwide Inc. | | 4.950% | | 1/15/42 | | | 325 | | | | 383 | |
| | | Anheuser-Busch InBev Worldwide Inc. | | 3.750% | | 7/15/42 | | | 325 | | | | 329 | |
| | | Anheuser-Busch InBev Worldwide Inc. | | 4.600% | | 4/15/48 | | | 475 | | | | 540 | |
| | | Anheuser-Busch InBev Worldwide Inc. | | 4.439% | | 10/6/48 | | | 626 | | | | 699 | |
| | | Anheuser-Busch InBev Worldwide Inc. | | 5.550% | | 1/23/49 | | | 725 | | | | 940 | |
| | | Anheuser-Busch InBev Worldwide Inc. | | 4.750% | | 4/15/58 | | | 250 | | | | 292 | |
| | | Anheuser-Busch InBev Worldwide Inc. | | 5.800% | | 1/23/59 | | | 125 | | | | 170 | |
| | | Archer-Daniels-Midland Co. | | 4.479% | | 3/1/21 | | | 163 | | | | 168 | |
| | | Archer-Daniels-Midland Co. | | 3.375% | | 3/15/22 | | | 100 | | | | 103 | |
| | | Archer-Daniels-Midland Co. | | 2.500% | | 8/11/26 | | | 200 | | | | 203 | |
| | | Archer-Daniels-Midland Co. | | 5.935% | | 10/1/32 | | | 80 | | | | 105 | |
| | | Archer-Daniels-Midland Co. | | 5.375% | | 9/15/35 | | | 95 | | | | 120 | |
| | | Archer-Daniels-Midland Co. | | 4.535% | | 3/26/42 | | | 50 | | | | 59 | |
| | | Archer-Daniels-Midland Co. | | 4.016% | | 4/16/43 | | | 200 | | | | 221 | |
| | | Archer-Daniels-Midland Co. | | 3.750% | | 9/15/47 | | | 100 | | | | 109 | |
| | | Archer-Daniels-Midland Co. | | 4.500% | | 3/15/49 | | | 125 | | | | 152 | |
| | | Ascension Health | | 2.532% | | 11/15/29 | | | 100 | | | | 99 | |
| | | Ascension Health | | 3.106% | | 11/15/39 | | | 100 | | | | 98 | |
| | | Ascension Health | | 3.945% | | 11/15/46 | | | 175 | | | | 193 | |
| 3 | | Ascension Health | | 4.847% | | 11/15/53 | | | 75 | | | | 94 | |
| | | AstraZeneca plc | | 2.375% | | 6/12/22 | | | 225 | | | | 227 | |
| | | AstraZeneca plc | | 3.500% | | 8/17/23 | | | 225 | | | | 235 | |
| | | AstraZeneca plc | | 3.375% | | 11/16/25 | | | 250 | | | | 265 | |
| | | AstraZeneca plc | | 3.125% | | 6/12/27 | | | 175 | | | | 182 | |
| | | AstraZeneca plc | | 4.000% | | 1/17/29 | | | 200 | | | | 222 | |
| | | AstraZeneca plc | | 6.450% | | 9/15/37 | | | 450 | | | | 630 | |
| | | AstraZeneca plc | | 4.000% | | 9/18/42 | | | 290 | | | | 320 | |
| | | AstraZeneca plc | | 4.375% | | 11/16/45 | | | 200 | | | | 234 | |
| | | AstraZeneca plc | | 4.375% | | 8/17/48 | | | 135 | | | | 161 | |
| | | BAT Capital Corp. | | 2.764% | | 8/15/22 | | | 325 | | | | 329 | |
| | | BAT Capital Corp. | | 3.222% | | 8/15/24 | | | 650 | | | | 664 | |
| | | BAT Capital Corp. | | 2.789% | | 9/6/24 | | | 200 | | | | 201 | |
| | | BAT Capital Corp. | | 3.215% | | 9/6/26 | | | 200 | | | | 201 | |
| | | BAT Capital Corp. | | 3.557% | | 8/15/27 | | | 675 | | | | 687 | |
| | | BAT Capital Corp. | | 3.462% | | 9/6/29 | | | 125 | | | | 127 | |
| | | BAT Capital Corp. | | 4.390% | | 8/15/37 | | | 525 | | | | 532 | |
| | | BAT Capital Corp. | | 4.540% | | 8/15/47 | | | 475 | | | | 475 | |
| | | BAT Capital Corp. | | 4.758% | | 9/6/49 | | | 250 | | | | 258 | |
| | | Baxalta Inc. | | 3.600% | | 6/23/22 | | | 15 | | | | 15 | |
| | | Baxalta Inc. | | 4.000% | | 6/23/25 | | | 97 | | | | 104 | |
| | | Baxalta Inc. | | 5.250% | | 6/23/45 | | | 73 | | | | 93 | |
| | | Baxter International Inc. | | 1.700% | | 8/15/21 | | | 150 | | | | 150 | |
| | | Baxter International Inc. | | 3.500% | | 8/15/46 | | | 100 | | | | 97 | |
| | | Baylor Scott & White Holdings | | 4.185% | | 11/15/45 | | | 100 | | | | 112 | |
| | | Beam Suntory Inc. | | 3.250% | | 5/15/22 | | | 50 | | | | 51 | |
| | | Becton Dickinson & Co. | | 3.125% | | 11/8/21 | | | 65 | | | | 66 | |
| | | Becton Dickinson & Co. | | 2.894% | | 6/6/22 | | | 350 | | | | 356 | |
| | | Becton Dickinson & Co. | | 3.300% | | 3/1/23 | | | 50 | | | | 51 | |
| | | Becton Dickinson & Co. | | 3.363% | | 6/6/24 | | | 1,100 | | | | 1,143 | |
| | | Becton Dickinson & Co. | | 3.734% | | 12/15/24 | | | 272 | | | | 288 | |
| | | Becton Dickinson & Co. | | 3.700% | | 6/6/27 | | | 375 | | | | 399 | |
| | | Becton Dickinson & Co. | | 4.875% | | 5/15/44 | | | 26 | | | | 30 | |
| | | Becton Dickinson & Co. | | 4.685% | | 12/15/44 | | | 196 | | | | 227 | |
| | | Becton Dickinson & Co. | | 4.669% | | 6/6/47 | | | 300 | | | | 355 | |
| | | Bio-Rad Laboratories Inc. | | 4.875% | | 12/15/20 | | | 75 | | | | 77 | |
| | | Biogen Inc. | | 3.625% | | 9/15/22 | | | 275 | | | | 286 | |
| | | Biogen Inc. | | 4.050% | | 9/15/25 | | | 300 | | | | 326 | |
| | | Biogen Inc. | | 5.200% | | 9/15/45 | | | 350 | | | | 421 | |
| | | Boston Scientific Corp. | | 3.375% | | 5/15/22 | | | 50 | | | | 52 | |
| | | Boston Scientific Corp. | | 3.450% | | 3/1/24 | | | 50 | | | | 52 | |
| | | Boston Scientific Corp. | | 3.850% | | 5/15/25 | | | 77 | | | | 83 | |
| | | Boston Scientific Corp. | | 3.750% | | 3/1/26 | | | 125 | | | | 134 | |
| | | Boston Scientific Corp. | | 4.000% | | 3/1/29 | | | 150 | | | | 166 | |
| | | Boston Scientific Corp. | | 7.000% | | 11/15/35 | | | 100 | | | | 140 | |
| | | Boston Scientific Corp. | | 4.550% | | 3/1/39 | | | 175 | | | | 205 | |
| | | Boston Scientific Corp. | | 7.375% | | 1/15/40 | | | 50 | | | | 76 | |
| | | Boston Scientific Corp. | | 4.700% | | 3/1/49 | | | 200 | | | | 242 | |
| 6 | | Bristol-Myers Squibb Co. | | 2.875% | | 2/19/21 | | | 125 | | | | 126 | |
| 6 | | Bristol-Myers Squibb Co. | | 2.550% | | 5/14/21 | | | 225 | | | | 227 | |
| 6 | | Bristol-Myers Squibb Co. | | 2.250% | | 8/15/21 | | | 75 | | | | 75 | |
| 6 | | Bristol-Myers Squibb Co. | | 2.600% | | 5/16/22 | | | 300 | | | | 305 | |
| | | Bristol-Myers Squibb Co. | | 2.000% | | 8/1/22 | | | 275 | | | | 277 | |
| 6 | | Bristol-Myers Squibb Co. | | 3.250% | | 8/15/22 | | | 175 | | | | 180 | |
| 6 | | Bristol-Myers Squibb Co. | | 3.550% | | 8/15/22 | | | 50 | | | | 52 | |
| 6 | | Bristol-Myers Squibb Co. | | 2.750% | | 2/15/23 | | | 150 | | | | 152 | |
| 6 | | Bristol-Myers Squibb Co. | | 3.250% | | 2/20/23 | | | 200 | | | | 205 | |
| | | Bristol-Myers Squibb Co. | | 7.150% | | 6/15/23 | | | 200 | | | | 233 | |
| 6 | | Bristol-Myers Squibb Co. | | 4.000% | | 8/15/23 | | | 125 | | | | 133 | |
| 6 | | Bristol-Myers Squibb Co. | | 3.625% | | 5/15/24 | | | 175 | | | | 184 | |
| 6 | | Bristol-Myers Squibb Co. | | 2.900% | | 7/26/24 | | | 625 | | | | 644 | |
| 6 | | Bristol-Myers Squibb Co. | | 3.875% | | 8/15/25 | | | 475 | | | | 513 | |
| 6 | | Bristol-Myers Squibb Co. | | 3.200% | | 6/15/26 | | | 460 | | | | 482 | |
| 6 | | Bristol-Myers Squibb Co. | | 3.450% | | 11/15/27 | | | 110 | | | | 117 | |
| 6 | | Bristol-Myers Squibb Co. | | 3.900% | | 2/20/28 | | | 275 | | | | 300 | |
| 6 | | Bristol-Myers Squibb Co. | | 3.400% | | 7/26/29 | | | 885 | | | | 945 | |
| 6 | | Bristol-Myers Squibb Co. | | 4.125% | | 6/15/39 | | | 380 | | | | 438 | |
| 6 | | Bristol-Myers Squibb Co. | | 5.700% | | 10/15/40 | | | 50 | | | | 66 | |
| | | Bristol-Myers Squibb Co. | | 3.250% | | 8/1/42 | | | 100 | | | | 101 | |
| 6 | | Bristol-Myers Squibb Co. | | 5.250% | | 8/15/43 | | | 150 | | | | 191 | |
| | | Bristol-Myers Squibb Co. | | 4.500% | | 3/1/44 | | | 100 | | | | 117 | |
| 6 | | Bristol-Myers Squibb Co. | | 4.625% | | 5/15/44 | | | 175 | | | | 211 | |
| 6 | | Bristol-Myers Squibb Co. | | 5.000% | | 8/15/45 | | | 400 | | | | 505 | |
| 6 | | Bristol-Myers Squibb Co. | | 4.350% | | 11/15/47 | | | 250 | | | | 297 | |
Total Bond Market Index Portfolio
| | | | | | | | | Face | | | Market | |
| | | | | | | Maturity | | Amount | | | Value• | |
| | | | | Coupon | | Date | | | ($000 | ) | | | ($000 | ) |
| 6 | | Bristol-Myers Squibb Co. | | 4.550% | | 2/20/48 | | | 275 | | | | 338 | |
| 6 | | Bristol-Myers Squibb Co. | | 4.250% | | 10/26/49 | | | 725 | | | | 854 | |
| | | Brown-Forman Corp. | | 3.500% | | 4/15/25 | | | 75 | | | | 80 | |
| | | Brown-Forman Corp. | | 4.500% | | 7/15/45 | | | 100 | | | | 123 | |
| | | Bunge Ltd. Finance Corp. | | 3.000% | | 9/25/22 | | | 250 | | | | 254 | |
| | | Bunge Ltd. Finance Corp. | | 4.350% | | 3/15/24 | | | 125 | | | | 131 | |
| | | Bunge Ltd. Finance Corp. | | 3.750% | | 9/25/27 | | | 200 | | | | 206 | |
| | | Campbell Soup Co. | | 3.300% | | 3/15/21 | | | 275 | | | | 279 | |
| | | Campbell Soup Co. | | 3.650% | | 3/15/23 | | | 225 | | | | 234 | |
| | | Campbell Soup Co. | | 3.950% | | 3/15/25 | | | 200 | | | | 212 | |
| | | Campbell Soup Co. | | 3.300% | | 3/19/25 | | | 125 | | | | 128 | |
| | | Campbell Soup Co. | | 4.150% | | 3/15/28 | | | 175 | | | | 189 | |
| | | Campbell Soup Co. | | 3.800% | | 8/2/42 | | | 75 | | | | 73 | |
| | | Campbell Soup Co. | | 4.800% | | 3/15/48 | | | 135 | | | | 156 | |
| | | Cardinal Health Inc. | | 4.625% | | 12/15/20 | | | 100 | | | | 103 | |
| | | Cardinal Health Inc. | | 2.616% | | 6/15/22 | | | 115 | | | | 116 | |
| | | Cardinal Health Inc. | | 3.200% | | 3/15/23 | | | 150 | | | | 154 | |
| | | Cardinal Health Inc. | | 3.079% | | 6/15/24 | | | 290 | | | | 298 | |
| | | Cardinal Health Inc. | | 3.750% | | 9/15/25 | | | 100 | | | | 106 | |
| | | Cardinal Health Inc. | | 3.410% | | 6/15/27 | | | 265 | | | | 271 | |
| | | Cardinal Health Inc. | | 4.600% | | 3/15/43 | | | 75 | | | | 75 | |
| | | Cardinal Health Inc. | | 4.500% | | 11/15/44 | | | 50 | | | | 49 | |
| | | Cardinal Health Inc. | | 4.900% | | 9/15/45 | | | 100 | | | | 104 | |
| | | Cardinal Health Inc. | | 4.368% | | 6/15/47 | | | 125 | | | | 124 | |
| | | Children’s Hospital Corp. | | 4.115% | | 1/1/47 | | | 75 | | | | 85 | |
| | | Children’s Hospital Medical Center | | 4.268% | | 5/15/44 | | | 50 | | | | 56 | |
| | | CHRISTUS Health | | 4.341% | | 7/1/28 | | | 125 | | | | 138 | |
| | | Church & Dwight Co. Inc. | | 2.450% | | 8/1/22 | | | 25 | | | | 25 | |
| | | Church & Dwight Co. Inc. | | 3.150% | | 8/1/27 | | | 100 | | | | 104 | |
| | | Church & Dwight Co. Inc. | | 3.950% | | 8/1/47 | | | 75 | | | | 82 | |
| 6 | | Cigna Corp. | | 3.300% | | 2/25/21 | | | 150 | | | | 152 | |
| | | Cigna Corp. | | 3.400% | | 9/17/21 | | | 280 | | | | 286 | |
| 6 | | Cigna Corp. | | 4.750% | | 11/15/21 | | | 425 | | | | 446 | |
| 6 | | Cigna Corp. | | 3.900% | | 2/15/22 | | | 200 | | | | 206 | |
| 6 | | Cigna Corp. | | 4.000% | | 2/15/22 | | | 125 | | | | 129 | |
| 6 | | Cigna Corp. | | 3.050% | | 11/30/22 | | | 100 | | | | 102 | |
| 6 | | Cigna Corp. | | 3.000% | | 7/15/23 | | | 700 | | | | 710 | |
| | | Cigna Corp. | | 3.750% | | 7/15/23 | | | 200 | | | | 209 | |
| 6 | | Cigna Corp. | | 3.500% | | 6/15/24 | | | 175 | | | | 182 | |
| 6 | | Cigna Corp. | | 3.250% | | 4/15/25 | | | 250 | | | | 257 | |
| | | Cigna Corp. | | 4.125% | | 11/15/25 | | | 265 | | | | 287 | |
| 6 | | Cigna Corp. | | 4.500% | | 2/25/26 | | | 390 | | | | 422 | |
| 6 | | Cigna Corp. | | 3.400% | | 3/1/27 | | | 275 | | | | 285 | |
| 6 | | Cigna Corp. | | 7.875% | | 5/15/27 | | | 41 | | | | 53 | |
| 6 | | Cigna Corp. | | 3.050% | | 10/15/27 | | | 225 | | | | 226 | |
| | | Cigna Corp. | | 4.375% | | 10/15/28 | | | 610 | | | | 675 | |
| | | Cigna Corp. | | 4.800% | | 8/15/38 | | | 340 | | | | 391 | |
| 6 | | Cigna Corp. | | 6.125% | | 11/15/41 | | | 92 | | | | 116 | |
| 6 | | Cigna Corp. | | 4.800% | | 7/15/46 | | | 400 | | | | 460 | |
| 6 | | Cigna Corp. | | 3.875% | | 10/15/47 | | | 120 | | | | 121 | |
| | | Cigna Corp. | | 4.900% | | 12/15/48 | | | 570 | | | | 676 | |
| | | City of Hope | | 5.623% | | 11/15/43 | | | 75 | | | | 99 | |
| | | City of Hope | | 4.378% | | 8/15/48 | | | 100 | | | | 115 | |
| | | Cleveland Clinic Foundation | | 4.858% | | 1/1/14 | | | 75 | | | | 93 | |
| | | Clorox Co. | | 3.800% | | 11/15/21 | | | 250 | | | | 258 | |
| | | Clorox Co. | | 3.050% | | 9/15/22 | | | 100 | | | | 102 | |
| | | Clorox Co. | | 3.500% | | 12/15/24 | | | 175 | | | | 185 | |
| | | Clorox Co. | | 3.100% | | 10/1/27 | | | 50 | | | | 52 | |
| | | Clorox Co. | | 3.900% | | 5/15/28 | | | 50 | | | | 55 | |
| | | Coca-Cola Co. | | 1.875% | | 10/27/20 | | | 400 | | | | 400 | |
| | | Coca-Cola Co. | | 1.550% | | 9/1/21 | | | 175 | | | | 175 | |
| | | Coca-Cola Co. | | 3.300% | | 9/1/21 | | | 250 | | | | 256 | |
| | | Coca-Cola Co. | | 2.200% | | 5/25/22 | | | 100 | | | | 101 | |
| | | Coca-Cola Co. | | 3.200% | | 11/1/23 | | | 225 | | | | 236 | |
| | | Coca-Cola Co. | | 1.750% | | 9/6/24 | | | 100 | | | | 100 | |
| | | Coca-Cola Co. | | 2.875% | | 10/27/25 | | | 300 | | | | 313 | |
| | | Coca-Cola Co. | | 2.550% | | 6/1/26 | | | 100 | | | | 102 | |
| | | Coca-Cola Co. | | 2.250% | | 9/1/26 | | | 410 | | | | 413 | |
| | | Coca-Cola Co. | | 2.900% | | 5/25/27 | | | 50 | | | | 52 | |
| | | Coca-Cola Co. | | 2.125% | | 9/6/29 | | | 125 | | | | 122 | |
| | | Coca-Cola Consolidated Inc. | | 3.800% | | 11/25/25 | | | 125 | | | | 131 | |
| | | Coca-Cola Femsa SAB de CV | | 3.875% | | 11/26/23 | | | 250 | | | | 264 | |
| | | Coca-Cola Femsa SAB de CV | | 5.250% | | 11/26/43 | | | 150 | | | | 185 | |
| | | Colgate-Palmolive Co. | | 2.450% | | 11/15/21 | | | 75 | | | | 76 | |
| | | Colgate-Palmolive Co. | | 2.250% | | 11/15/22 | | | 75 | | | | 76 | |
| | | Colgate-Palmolive Co. | | 2.100% | | 5/1/23 | | | 280 | | | | 282 | |
| | | Colgate-Palmolive Co. | | 3.250% | | 3/15/24 | | | 100 | | | | 106 | |
| | | Colgate-Palmolive Co. | | 4.000% | | 8/15/45 | | | 125 | | | | 149 | |
| | | Colgate-Palmolive Co. | | 3.700% | | 8/1/47 | | | 50 | | | | 58 | |
| | | CommonSpirit Health | | 2.950% | | 11/1/22 | | | 75 | | | | 76 | |
| | | CommonSpirit Health | | 2.760% | | 10/1/24 | | | 100 | | | | 101 | |
| | | CommonSpirit Health | | 3.347% | | 10/1/29 | | | 175 | | | | 176 | |
| 3 | | CommonSpirit Health | | 4.350% | | 11/1/42 | | | 225 | | | | 231 | |
| | | CommonSpirit Health | | 3.817% | | 10/1/49 | | | 50 | | | | 49 | |
| | | CommonSpirit Health | | 4.187% | | 10/1/49 | | | 200 | | | | 199 | |
| | | Conagra Brands Inc. | | 3.800% | | 10/22/21 | | | 225 | | | | 232 | |
| | | Conagra Brands Inc. | | 3.250% | | 9/15/22 | | | 75 | | | | 77 | |
| | | Conagra Brands Inc. | | 3.200% | | 1/25/23 | | | 151 | | | | 156 | |
| | | Conagra Brands Inc. | | 4.300% | | 5/1/24 | | | 200 | | | | 215 | |
| | | Conagra Brands Inc. | | 4.600% | | 11/1/25 | | | 150 | | | | 165 | |
| | | Conagra Brands Inc. | | 7.000% | | 10/1/28 | | | 75 | | | | 93 | |
| | | Conagra Brands Inc. | | 4.850% | | 11/1/28 | | | 250 | | | | 285 | |
| | | Conagra Brands Inc. | | 8.250% | | 9/15/30 | | | 50 | | | | 69 | |
| | | Conagra Brands Inc. | | 5.300% | | 11/1/38 | | | 200 | | | | 237 | |
| | | Conagra Brands Inc. | | 5.400% | | 11/1/48 | | | 225 | | | | 274 | |
| | | Constellation Brands Inc. | | 3.750% | | 5/1/21 | | | 100 | | | | 102 | |
| | | Constellation Brands Inc. | | 2.700% | | 5/9/22 | | | 50 | | | | 51 | |
| | | Constellation Brands Inc. | | 2.650% | | 11/7/22 | | | 250 | | | | 253 | |
| | | Constellation Brands Inc. | | 3.200% | | 2/15/23 | | | 250 | | | | 257 | |
| | | Constellation Brands Inc. | | 4.250% | | 5/1/23 | | | 200 | | | | 212 | |
| | | Constellation Brands Inc. | | 4.750% | | 11/15/24 | | | 175 | | | | 193 | |
| | | Constellation Brands Inc. | | 4.400% | | 11/15/25 | | | 100 | | | | 109 | |
| | | Constellation Brands Inc. | | 3.700% | | 12/6/26 | | | 100 | | | | 106 | |
| | | Constellation Brands Inc. | | 3.500% | | 5/9/27 | | | 150 | | | | 156 | |
| | | Constellation Brands Inc. | | 3.600% | | 2/15/28 | | | 175 | | | | 184 | |
| | | Constellation Brands Inc. | | 4.650% | | 11/15/28 | | | 75 | | | | 84 | |
| | | Constellation Brands Inc. | | 3.150% | | 8/1/29 | | | 225 | | | | 227 | |
| | | Constellation Brands Inc. | | 4.500% | | 5/9/47 | | | 75 | | | | 81 | |
| | | Constellation Brands Inc. | | 4.100% | | 2/15/48 | | | 100 | | | | 104 | |
| | | Constellation Brands Inc. | | 5.250% | | 11/15/48 | | | 100 | | | | 121 | |
| | | Covidien International Finance SA | | 3.200% | | 6/15/22 | | | 200 | | | | 205 | |
| | | CVS Health Corp. | | 3.350% | | 3/9/21 | | | 383 | | | | 389 | |
| | | CVS Health Corp. | | 2.125% | | 6/1/21 | | | 250 | | | | 250 | |
| | | CVS Health Corp. | | 3.500% | | 7/20/22 | | | 350 | | | | 361 | |
| | | CVS Health Corp. | | 2.750% | | 12/1/22 | | | 150 | | | | 152 | |
| | | CVS Health Corp. | | 4.750% | | 12/1/22 | | | 150 | | | | 160 | |
| | | CVS Health Corp. | | 3.700% | | 3/9/23 | | | 1,155 | | | | 1,202 | |
| | | CVS Health Corp. | | 4.000% | | 12/5/23 | | | 195 | | | | 206 | |
| | | CVS Health Corp. | | 3.375% | | 8/12/24 | | | 475 | | | | 494 | |
| | | CVS Health Corp. | | 4.100% | | 3/25/25 | | | 905 | | | | 970 | |
| | | CVS Health Corp. | | 3.875% | | 7/20/25 | | | 765 | | | | 815 | |
| | | CVS Health Corp. | | 2.875% | | 6/1/26 | | | 425 | | | | 431 | |
| | | CVS Health Corp. | | 4.300% | | 3/25/28 | | | 1,635 | | | | 1,782 | |
| | | CVS Health Corp. | | 3.250% | | 8/15/29 | | | 360 | | | | 365 | |
| | | CVS Health Corp. | | 4.875% | | 7/20/35 | | | 125 | | | | 142 | |
| | | CVS Health Corp. | | 4.780% | | 3/25/38 | | | 1,000 | | | | 1,131 | |
| | | CVS Health Corp. | | 6.125% | | 9/15/39 | | | 75 | | | | 96 | |
| | | CVS Health Corp. | | 5.300% | | 12/5/43 | | | 150 | | | | 178 | |
| | | CVS Health Corp. | | 5.125% | | 7/20/45 | | | 875 | | | | 1,030 | |
| | | CVS Health Corp. | | 5.050% | | 3/25/48 | | | 1,550 | | | | 1,833 | |
| | | Danaher Corp. | | 3.350% | | 9/15/25 | | | 100 | | | | 106 | |
| | | Danaher Corp. | | 4.375% | | 9/15/45 | | | 75 | | | | 88 | |
| | | Dartmouth-Hitchcock Health | | 4.178% | | 8/1/48 | | | 100 | | | | 111 | |
| | | Delhaize America LLC | | 9.000% | | 4/15/31 | | | 100 | | | | 147 | |
| | | DH Europe Finance II Sarl | | 2.050% | | 11/15/22 | | | 250 | | | | 250 | |
| | | DH Europe Finance II Sarl | | 2.200% | | 11/15/24 | | | 250 | | | | 249 | |
| | | DH Europe Finance II Sarl | | 2.600% | | 11/15/29 | | | 150 | | | | 149 | |
| | | DH Europe Finance II Sarl | | 3.250% | | 11/15/39 | | | 175 | | | | 176 | |
| | | DH Europe Finance II Sarl | | 3.400% | | 11/15/49 | | | 175 | | | | 179 | |
| | | Diageo Capital plc | | 2.625% | | 4/29/23 | | | 500 | | | | 508 | |
| | | Diageo Capital plc | | 2.125% | | 10/24/24 | | | 200 | | | | 200 | |
| | | Diageo Capital plc | | 2.375% | | 10/24/29 | | | 200 | | | | 197 | |
Total Bond Market Index Portfolio
| | | | | | | | | Face | | | Market | |
| | | | | | | Maturity | | Amount | | | Value• | |
| | | | | Coupon | | Date | | | ($000 | ) | | | ($000 | ) |
| | | Diageo Capital plc | | 5.875% | | 9/30/36 | | | 50 | | | | 68 | |
| | | Diageo Capital plc | | 3.875% | | 4/29/43 | | | 100 | | | | 110 | |
| | | Diageo Investment Corp. | | 2.875% | | 5/11/22 | | | 300 | | | | 306 | |
| | | Diageo Investment Corp. | | 4.250% | | 5/11/42 | | | 150 | | | | 173 | |
| | | Dignity Health | | 3.125% | | 11/1/22 | | | 50 | | | | 51 | |
| | | Dignity Health | | 3.812% | | 11/1/24 | | | 100 | | | | 105 | |
| | | Dignity Health | | 4.500% | | 11/1/42 | | | 100 | | | | 104 | |
| | | Dignity Health | | 5.267% | | 11/1/64 | | | 50 | | | | 57 | |
| | | Duke University Health System Inc. | | 3.920% | | 6/1/47 | | | 100 | | | | 111 | |
| | | Edwards Lifesciences Corp. | | 4.300% | | 6/15/28 | | | 100 | | | | 111 | |
| | | Eli Lilly & Co. | | 2.350% | | 5/15/22 | | | 50 | | | | 51 | |
| | | Eli Lilly & Co. | | 2.750% | | 6/1/25 | | | 71 | | | | 73 | |
| | | Eli Lilly & Co. | | 3.375% | | 3/15/29 | | | 225 | | | | 242 | |
| | | Eli Lilly & Co. | | 3.950% | | 3/15/49 | | | 400 | | | | 461 | |
| | | Eli Lilly & Co. | | 4.150% | | 3/15/59 | | | 350 | | | | 411 | |
| | | Estee Lauder Cos. Inc. | | 1.700% | | 5/10/21 | | | 225 | | | | 224 | |
| | | Estee Lauder Cos. Inc. | | 3.150% | | 3/15/27 | | | 150 | | | | 159 | |
| | | Estee Lauder Cos. Inc. | | 2.375% | | 12/1/29 | | | 25 | | | | 25 | |
| | | Estee Lauder Cos. Inc. | | 6.000% | | 5/15/37 | | | 75 | | | | 103 | |
| | | Estee Lauder Cos. Inc. | | 4.375% | | 6/15/45 | | | 100 | | | | 119 | |
| | | Estee Lauder Cos. Inc. | | 4.150% | | 3/15/47 | | | 100 | | | | 116 | |
| | | Estee Lauder Cos. Inc. | | 3.125% | | 12/1/49 | | | 125 | | | | 125 | |
| | | Flowers Foods Inc. | | 4.375% | | 4/1/22 | | | 50 | | | | 52 | |
| | | Flowers Foods Inc. | | 3.500% | | 10/1/26 | | | 75 | | | | 77 | |
| | | Fomento Economico Mexicano SAB de CV | | 4.375% | | 5/10/43 | | | 100 | | | | 111 | |
| | | General Mills Inc. | | 3.150% | | 12/15/21 | | | 25 | | | | 26 | |
| | | General Mills Inc. | | 2.600% | | 10/12/22 | | | 250 | | | | 254 | |
| | | General Mills Inc. | | 3.700% | | 10/17/23 | | | 575 | | | | 606 | |
| | | General Mills Inc. | | 3.650% | | 2/15/24 | | | 100 | | | | 105 | |
| | | General Mills Inc. | | 3.200% | | 2/10/27 | | | 150 | | | | 157 | |
| | | General Mills Inc. | | 4.200% | | 4/17/28 | | | 225 | | | | 250 | |
| | | General Mills Inc. | | 4.550% | | 4/17/38 | | | 75 | | | | 87 | |
| | | General Mills Inc. | | 5.400% | | 6/15/40 | | | 100 | | | | 123 | |
| | | General Mills Inc. | | 4.150% | | 2/15/43 | | | 100 | | | | 107 | |
| | | General Mills Inc. | | 4.700% | | 4/17/48 | | | 75 | | | | 89 | |
| | | Gilead Sciences Inc. | | 4.500% | | 4/1/21 | | | 150 | | | | 154 | |
| | | Gilead Sciences Inc. | | 4.400% | | 12/1/21 | | | 725 | | | | 756 | |
| | | Gilead Sciences Inc. | | 3.250% | | 9/1/22 | | | 375 | | | | 387 | |
| | | Gilead Sciences Inc. | | 2.500% | | 9/1/23 | | | 300 | | | | 304 | |
| | | Gilead Sciences Inc. | | 3.700% | | 4/1/24 | | | 470 | | | | 499 | |
| | | Gilead Sciences Inc. | | 3.500% | | 2/1/25 | | | 335 | | | | 355 | |
| | | Gilead Sciences Inc. | | 3.650% | | 3/1/26 | | | 575 | | | | 618 | |
| | | Gilead Sciences Inc. | | 2.950% | | 3/1/27 | | | 225 | | | | 233 | |
| | | Gilead Sciences Inc. | | 4.600% | | 9/1/35 | | | 100 | | | | 120 | |
| | | Gilead Sciences Inc. | | 4.000% | | 9/1/36 | | | 150 | | | | 166 | |
| | | Gilead Sciences Inc. | | 5.650% | | 12/1/41 | | | 175 | | | | 230 | |
| | | Gilead Sciences Inc. | | 4.800% | | 4/1/44 | | | 300 | | | | 359 | |
| | | Gilead Sciences Inc. | | 4.500% | | 2/1/45 | | | 325 | | | | 375 | |
| | | Gilead Sciences Inc. | | 4.750% | | 3/1/46 | | | 505 | | | | 603 | |
| | | Gilead Sciences Inc. | | 4.150% | | 3/1/47 | | | 475 | | | | 525 | |
| | | GlaxoSmithKline Capital Inc. | | 2.800% | | 3/18/23 | | | 50 | | | | 51 | |
| | | GlaxoSmithKline Capital Inc. | | 3.375% | | 5/15/23 | | | 225 | | | | 234 | |
| | | GlaxoSmithKline Capital Inc. | | 3.625% | | 5/15/25 | | | 325 | | | | 348 | |
| | | GlaxoSmithKline Capital Inc. | | 3.875% | | 5/15/28 | | | 375 | | | | 413 | |
| | | GlaxoSmithKline Capital Inc. | | 5.375% | | 4/15/34 | | | 85 | | | | 108 | |
| | | GlaxoSmithKline Capital Inc. | | 6.375% | | 5/15/38 | | | 550 | | | | 786 | |
| | | GlaxoSmithKline Capital Inc. | | 4.200% | | 3/18/43 | | | 100 | | | | 116 | |
| | | GlaxoSmithKline Capital plc | | 3.125% | | 5/14/21 | | | 375 | | | | 381 | |
| | | GlaxoSmithKline Capital plc | | 2.850% | | 5/8/22 | | | 100 | | | | 102 | |
| | | GlaxoSmithKline Capital plc | | 2.875% | | 6/1/22 | | | 350 | | | | 357 | |
| | | GlaxoSmithKline Capital plc | | 3.000% | | 6/1/24 | | | 200 | | | | 207 | |
| | | GlaxoSmithKline Capital plc | | 3.375% | | 6/1/29 | | | 200 | | | | 214 | |
| | | Hackensack Meridian Health Inc. | | 4.211% | | 7/1/48 | | | 125 | | | | 140 | |
| | | Hackensack Meridian Health Inc. | | 4.500% | | 7/1/57 | | | 50 | | | | 59 | |
| | | Hasbro Inc. | | 3.900% | | 11/19/29 | | | 175 | | | | 176 | |
| | | Hasbro Inc. | | 6.350% | | 3/15/40 | | | 125 | | | | 146 | |
| | | Hasbro Inc. | | 5.100% | | 5/15/44 | | | 50 | | | | 50 | |
| | | HCA Inc. | | 4.750% | | 5/1/23 | | | 250 | | | | 267 | |
| | | HCA Inc. | | 5.000% | | 3/15/24 | | | 375 | | | | 409 | |
| | | HCA Inc. | | 5.250% | | 4/15/25 | | | 320 | | | | 358 | |
| | | HCA Inc. | | 5.250% | | 6/15/26 | | | 275 | | | | 308 | |
| | | HCA Inc. | | 4.500% | | 2/15/27 | | | 25 | | | | 27 | |
| | | HCA Inc. | | 4.125% | | 6/15/29 | | | 405 | | | | 429 | |
| | | HCA Inc. | | 5.125% | | 6/15/39 | | | 100 | | | | 111 | |
| | | HCA Inc. | | 5.500% | | 6/15/47 | | | 375 | | | | 433 | |
| | | HCA Inc. | | 5.250% | | 6/15/49 | | | 400 | | | | 450 | |
| | | Hershey Co. | | 4.125% | | 12/1/20 | | | 75 | | | | 76 | |
| | | Hershey Co. | | 3.100% | | 5/15/21 | | | 75 | | | | 76 | |
| | | Hershey Co. | | 2.625% | | 5/1/23 | | | 100 | | | | 102 | |
| | | Hershey Co. | | 3.375% | | 5/15/23 | | | 150 | | | | 157 | |
| | | Hershey Co. | | 2.050% | | 11/15/24 | | | 55 | | | | 55 | |
| | | Hershey Co. | | 3.200% | | 8/21/25 | | | 65 | | | | 68 | |
| | | Hershey Co. | | 2.300% | | 8/15/26 | | | 100 | | | | 101 | |
| | | Hershey Co. | | 2.450% | | 11/15/29 | | | 130 | | | | 130 | |
| | | Hershey Co. | | 3.125% | | 11/15/49 | | | 150 | | | | 148 | |
| | | Indiana University Health Inc. Obligated Group | | 3.970% | | 11/1/48 | | | 125 | | | | 140 | |
| | | Ingredion Inc. | | 3.200% | | 10/1/26 | | | 100 | | | | 101 | |
| | | JM Smucker Co. | | 3.500% | | 10/15/21 | | | 175 | | | | 179 | |
| | | JM Smucker Co. | | 3.000% | | 3/15/22 | | | 100 | | | | 102 | |
| | | JM Smucker Co. | | 3.500% | | 3/15/25 | | | 175 | | | | 184 | |
| | | JM Smucker Co. | | 3.375% | | 12/15/27 | | | 150 | | | | 156 | |
| | | JM Smucker Co. | | 4.250% | | 3/15/35 | | | 100 | | | | 108 | |
| | | JM Smucker Co. | | 4.375% | | 3/15/45 | | | 125 | | | | 136 | |
| | | Johns Hopkins Health System Corp. | | 3.837% | | 5/15/46 | | | 100 | | | | 109 | |
| | | Johnson & Johnson | | 1.950% | | 11/10/20 | | | 200 | | | | 200 | |
| | | Johnson & Johnson | | 1.650% | | 3/1/21 | | | 275 | | | | 274 | |
| | | Johnson & Johnson | | 2.250% | | 3/3/22 | | | 325 | | | | 328 | |
| | | Johnson & Johnson | | 2.050% | | 3/1/23 | | | 125 | | | | 126 | |
| | | Johnson & Johnson | | 3.375% | | 12/5/23 | | | 200 | | | | 212 | |
| | | Johnson & Johnson | | 2.625% | | 1/15/25 | | | 250 | | | | 258 | |
| | | Johnson & Johnson | | 2.450% | | 3/1/26 | | | 350 | | | | 355 | |
| | | Johnson & Johnson | | 2.950% | | 3/3/27 | | | 200 | | | | 210 | |
| | | Johnson & Johnson | | 2.900% | | 1/15/28 | | | 100 | | | | 104 | |
| | | Johnson & Johnson | | 6.950% | | 9/1/29 | | | 75 | | | | 105 | |
| | | Johnson & Johnson | | 4.950% | | 5/15/33 | | | 150 | | | | 187 | |
| | | Johnson & Johnson | | 4.375% | | 12/5/33 | | | 175 | | | | 208 | |
| | | Johnson & Johnson | | 3.550% | | 3/1/36 | | | 175 | | | | 192 | |
| | | Johnson & Johnson | | 3.625% | | 3/3/37 | | | 300 | | | | 331 | |
| | | Johnson & Johnson | | 5.950% | | 8/15/37 | | | 300 | | | | 427 | |
| | | Johnson & Johnson | | 3.400% | | 1/15/38 | | | 200 | | | | 214 | |
| | | Johnson & Johnson | | 4.500% | | 9/1/40 | | | 150 | | | | 182 | |
| | | Johnson & Johnson | | 4.850% | | 5/15/41 | | | 75 | | | | 95 | |
| | | Johnson & Johnson | | 4.500% | | 12/5/43 | | | 200 | | | | 246 | |
| | | Johnson & Johnson | | 3.700% | | 3/1/46 | | | 350 | | | | 395 | |
| | | Johnson & Johnson | | 3.750% | | 3/3/47 | | | 200 | | | | 228 | |
| | | Johnson & Johnson | | 3.500% | | 1/15/48 | | | 200 | | | | 216 | |
| | | Kaiser Foundation Hospitals | | 3.500% | | 4/1/22 | | | 50 | | | | 52 | |
| | | Kaiser Foundation Hospitals | | 3.150% | | 5/1/27 | | | 100 | | | | 104 | |
| | | Kaiser Foundation Hospitals | | 4.875% | | 4/1/42 | | | 235 | | | | 288 | |
| | | Kaiser Foundation Hospitals | | 4.150% | | 5/1/47 | | | 150 | | | | 171 | |
| | | Kaiser Foundation Hospitals | | 3.266% | | 11/1/49 | | | 200 | | | | 201 | |
| | | Kellogg Co. | | 4.000% | | 12/15/20 | | | 28 | | | | 28 | |
| | | Kellogg Co. | | 2.650% | | 12/1/23 | | | 126 | | | | 128 | |
| | | Kellogg Co. | | 3.250% | | 4/1/26 | | | 125 | | | | 130 | |
| | | Kellogg Co. | | 3.400% | | 11/15/27 | | | 125 | | | | 131 | |
| | | Kellogg Co. | | 7.450% | | 4/1/31 | | | 25 | | | | 35 | |
| | | Kellogg Co. | | 4.500% | | 4/1/46 | | | 250 | | | | 278 | |
| | | Keurig Dr Pepper Inc. | | 3.551% | | 5/25/21 | | | 300 | | | | 306 | |
| | | Keurig Dr Pepper Inc. | | 2.700% | | 11/15/22 | | | 50 | | | | 50 | |
| | | Keurig Dr Pepper Inc. | | 4.057% | | 5/25/23 | | | 375 | | | | 395 | |
| | | Keurig Dr Pepper Inc. | | 3.130% | | 12/15/23 | | | 350 | | | | 359 | |
| | | Keurig Dr Pepper Inc. | | 4.417% | | 5/25/25 | | | 175 | | | | 191 | |
| | | Keurig Dr Pepper Inc. | | 3.400% | | 11/15/25 | | | 100 | | | | 104 | |
| | | Keurig Dr Pepper Inc. | | 2.550% | | 9/15/26 | | | 75 | | | | 75 | |
| | | Keurig Dr Pepper Inc. | | 3.430% | | 6/15/27 | | | 100 | | | | 104 | |
| | | Keurig Dr Pepper Inc. | | 4.597% | | 5/25/28 | | | 395 | | | | 444 | |
| | | Keurig Dr Pepper Inc. | | 7.450% | | 5/1/38 | | | 16 | | | | 22 | |
| | | Keurig Dr Pepper Inc. | | 4.985% | | 5/25/38 | | | 100 | | | | 118 | |
| | | Keurig Dr Pepper Inc. | | 4.500% | | 11/15/45 | | | 200 | | | | 218 | |
| | | Keurig Dr Pepper Inc. | | 4.420% | | 12/15/46 | | | 125 | | | | 135 | |
Total Bond Market Index Portfolio
| | | | | | | | | Face | | | Market | |
| | | | | | | Maturity | | Amount | | | Value• | |
| | | | | Coupon | | Date | | | ($000 | ) | | | ($000 | ) |
| | | Kimberly-Clark Corp. | | 3.050% | | 8/15/25 | | | 50 | | | | 52 | |
| | | Kimberly-Clark Corp. | | 2.750% | | 2/15/26 | | | 100 | | | | 103 | |
| | | Kimberly-Clark Corp. | | 3.950% | | 11/1/28 | | | 50 | | | | 56 | |
| | | Kimberly-Clark Corp. | | 3.200% | | 4/25/29 | | | 150 | | | | 160 | |
| | | Kimberly-Clark Corp. | | 6.625% | | 8/1/37 | | | 250 | | | | 368 | |
| | | Kimberly-Clark Corp. | | 5.300% | | 3/1/41 | | | 25 | | | | 33 | |
| | | Kimberly-Clark Corp. | | 3.200% | | 7/30/46 | | | 175 | | | | 176 | |
| | | Koninklijke Ahold Delhaize NV | | 5.700% | | 10/1/40 | | | 37 | | | | 45 | |
| | | Koninklijke Philips NV | | 6.875% | | 3/11/38 | | | 100 | | | | 140 | |
| | | Koninklijke Philips NV | | 5.000% | | 3/15/42 | | | 150 | | | | 179 | |
| | | Kraft Foods Group Inc. | | 6.875% | | 1/26/39 | | | 200 | | | | 250 | |
| | | Kraft Foods Group Inc. | | 6.500% | | 2/9/40 | | | 50 | | | | 61 | |
| | | Kraft Foods Group Inc. | | 5.000% | | 6/4/42 | | | 235 | | | | 251 | |
| | | Kraft Heinz Foods Co. | | 3.500% | | 7/15/22 | | | 256 | | | | 264 | |
| | | Kraft Heinz Foods Co. | | 4.000% | | 6/15/23 | | | 240 | | | | 252 | |
| | | Kraft Heinz Foods Co. | | 3.950% | | 7/15/25 | | | 360 | | | | 381 | |
| | | Kraft Heinz Foods Co. | | 3.000% | | 6/1/26 | | | 400 | | | | 400 | |
| | | Kraft Heinz Foods Co. | | 4.625% | | 1/30/29 | | | 200 | | | | 219 | |
| 6 | | Kraft Heinz Foods Co. | | 3.750% | | 4/1/30 | | | 200 | | | | 205 | |
| | | Kraft Heinz Foods Co. | | 5.000% | | 7/15/35 | | | 195 | | | | 217 | |
| 6 | | Kraft Heinz Foods Co. | | 4.625% | | 10/1/39 | | | 100 | | | | 104 | |
| | | Kraft Heinz Foods Co. | | 5.200% | | 7/15/45 | | | 495 | | | | 534 | |
| | | Kraft Heinz Foods Co. | | 4.375% | | 6/1/46 | | | 700 | | | | 689 | |
| 6 | | Kraft Heinz Foods Co. | | 4.875% | | 10/1/49 | | | 300 | | | | 312 | |
| | | Kroger Co. | | 3.300% | | 1/15/21 | | | 250 | | | | 253 | |
| | | Kroger Co. | | 2.600% | | 2/1/21 | | | 50 | | | | 50 | |
| | | Kroger Co. | | 2.950% | | 11/1/21 | | | 150 | | | | 152 | |
| | | Kroger Co. | | 3.400% | | 4/15/22 | | | 75 | | | | 77 | |
| | | Kroger Co. | | 2.800% | | 8/1/22 | | | 100 | | | | 102 | |
| | | Kroger Co. | | 4.000% | | 2/1/24 | | | 100 | | | | 106 | |
| | | Kroger Co. | | 3.500% | | 2/1/26 | | | 160 | | | | 167 | |
| | | Kroger Co. | | 2.650% | | 10/15/26 | | | 140 | | | | 140 | |
| | | Kroger Co. | | 3.700% | | 8/1/27 | | | 100 | | | | 107 | |
| | | Kroger Co. | | 7.700% | | 6/1/29 | | | 50 | | | | 67 | |
| | | Kroger Co. | | 8.000% | | 9/15/29 | | | 125 | | | | 171 | |
| | | Kroger Co. | | 7.500% | | 4/1/31 | | | 100 | | | | 137 | |
| | | Kroger Co. | | 5.400% | | 7/15/40 | | | 50 | | | | 58 | |
| | | Kroger Co. | | 5.000% | | 4/15/42 | | | 125 | | | | 139 | |
| | | Kroger Co. | | 5.150% | | 8/1/43 | | | 100 | | | | 112 | |
| | | Kroger Co. | | 3.875% | | 10/15/46 | | | 50 | | | | 49 | |
| | | Kroger Co. | | 4.450% | | 2/1/47 | | | 225 | | | | 238 | |
| | | Kroger Co. | | 4.650% | | 1/15/48 | | | 150 | | | | 163 | |
| | | Laboratory Corp. of America Holdings | | 3.200% | | 2/1/22 | | | 500 | | | | 510 | |
| | | Laboratory Corp. of America Holdings | | 3.750% | | 8/23/22 | | | 25 | | | | 26 | |
| | | Laboratory Corp. of America Holdings | | 3.250% | | 9/1/24 | | | 150 | | | | 156 | |
| | | Laboratory Corp. of America Holdings | | 2.300% | | 12/1/24 | | | 100 | | | | 100 | |
| | | Laboratory Corp. of America Holdings | | 3.600% | | 2/1/25 | | | 200 | | | | 210 | |
| | | Laboratory Corp. of America Holdings | | 3.600% | | 9/1/27 | | | 100 | | | | 105 | |
| | | Laboratory Corp. of America Holdings | | 2.950% | | 12/1/29 | | | 125 | | | | 125 | |
| | | Laboratory Corp. of America Holdings | | 4.700% | | 2/1/45 | | | 195 | | | | 219 | |
| 3 | | Mayo Clinic | | 3.774% | | 11/15/43 | | | 75 | | | | 81 | |
| 3 | | Mayo Clinic | | 4.128% | | 11/15/52 | | | 50 | | | | 56 | |
| | | McCormick & Co. Inc. | | 3.900% | | 7/15/21 | | | 50 | | | | 51 | |
| | | McCormick & Co. Inc. | | 3.150% | | 8/15/24 | | | 150 | | | | 155 | |
| | | McCormick & Co. Inc. | | 3.400% | | 8/15/27 | | | 150 | | | | 156 | |
| | | McKesson Corp. | | 3.796% | | 3/15/24 | | | 200 | | | | 210 | |
| | | McKesson Corp. | | 3.950% | | 2/16/28 | | | 200 | | | | 212 | |
| | | Mead Johnson Nutrition Co. | | 3.000% | | 11/15/20 | | | 150 | | | | 151 | |
| | | Mead Johnson Nutrition Co. | | 4.125% | | 11/15/25 | | | 125 | | | | 137 | |
| | | Mead Johnson Nutrition Co. | | 5.900% | | 11/1/39 | | | 100 | | | | 134 | |
| | | Mead Johnson Nutrition Co. | | 4.600% | | 6/1/44 | | | 150 | | | | 180 | |
| | | Medtronic Inc. | | 3.150% | | 3/15/22 | | | 325 | | | | 334 | |
| | | Medtronic Inc. | | 3.500% | | 3/15/25 | | | 397 | | | | 425 | |
| | | Medtronic Inc. | | 4.375% | | 3/15/35 | | | 611 | | | | 721 | |
| | | Medtronic Inc. | | 4.625% | | 3/15/45 | | | 344 | | | | 431 | |
| | | Memorial Health Services | | 3.447% | | 11/1/49 | | | 150 | | | | 147 | |
| | | Memorial Sloan-Kettering Cancer Center | | 4.125% | | 7/1/52 | | | 150 | | | | 173 | |
| | | Memorial Sloan-Kettering Cancer Center | | 4.200% | | 7/1/55 | | | 25 | | | | 29 | |
| | | Merck & Co. Inc. | | 3.875% | | 1/15/21 | | | 225 | | | | 229 | |
| | | Merck & Co. Inc. | | 2.350% | | 2/10/22 | | | 250 | | | | 253 | |
| | | Merck & Co. Inc. | | 2.400% | | 9/15/22 | | | 250 | | | | 253 | |
| | | Merck & Co. Inc. | | 2.800% | | 5/18/23 | | | 325 | | | | 335 | |
| | | Merck & Co. Inc. | | 2.900% | | 3/7/24 | | | 25 | | | | 26 | |
| | | Merck & Co. Inc. | | 2.750% | | 2/10/25 | | | 525 | | | | 542 | |
| | | Merck & Co. Inc. | | 3.400% | | 3/7/29 | | | 275 | | | | 297 | |
| | | Merck & Co. Inc. | | 6.500% | | 12/1/33 | | | 125 | | | | 176 | |
| | | Merck & Co. Inc. | | 3.900% | | 3/7/39 | | | 200 | | | | 228 | |
| | | Merck & Co. Inc. | | 3.600% | | 9/15/42 | | | 100 | | | | 108 | |
| | | Merck & Co. Inc. | | 4.150% | | 5/18/43 | | | 200 | | | | 236 | |
| | | Merck & Co. Inc. | | 3.700% | | 2/10/45 | | | 525 | | | | 580 | |
| | | Merck & Co. Inc. | | 4.000% | | 3/7/49 | | | 375 | | | | 436 | |
| | | Mercy Health | | 4.302% | | 7/1/28 | | | 25 | | | | 28 | |
| | | Molson Coors Beverage Co. | | 2.100% | | 7/15/21 | | | 100 | | | | 100 | |
| | | Molson Coors Beverage Co. | | 3.500% | | 5/1/22 | | | 25 | | | | 26 | |
| | | Molson Coors Beverage Co. | | 3.000% | | 7/15/26 | | | 375 | | | | 379 | |
| | | Molson Coors Beverage Co. | | 5.000% | | 5/1/42 | | | 100 | | | | 109 | |
| | | Molson Coors Beverage Co. | | 4.200% | | 7/15/46 | | | 475 | | | | 473 | |
| 6 | | Mondelez International Holdings Netherlands BV | | 2.125% | | 9/19/22 | | | 200 | | | | 200 | |
| | | Mondelez International Inc. | | 3.625% | | 2/13/26 | | | 100 | | | | 107 | |
| 3 | | Montefiore Obligated Group | | 5.246% | | 11/1/48 | | | 150 | | | | 168 | |
| 3 | | Mount Sinai Hospitals Group Inc. | | 3.981% | | 7/1/48 | | | 50 | | | | 52 | |
| 3 | | Mount Sinai Hospitals Group Inc. | | 3.737% | | 7/1/49 | | | 100 | | | | 99 | |
| | | Mylan Inc. | | 4.200% | | 11/29/23 | | | 100 | | | | 106 | |
| | | Mylan Inc. | | 4.550% | | 4/15/28 | | | 150 | | | | 161 | |
| | | Mylan Inc. | | 5.400% | | 11/29/43 | | | 125 | | | | 136 | |
| | | Mylan Inc. | | 5.200% | | 4/15/48 | | | 125 | | | | 138 | |
| | | Mylan NV | | 3.150% | | 6/15/21 | | | 400 | | | | 404 | |
| | | Mylan NV | | 3.950% | | 6/15/26 | | | 375 | | | | 389 | |
| | | Mylan NV | | 5.250% | | 6/15/46 | | | 200 | | | | 223 | |
| | | New York & Presbyterian Hospital | | 4.024% | | 8/1/45 | | | 130 | | | | 145 | |
| | | New York & Presbyterian Hospital | | 4.063% | | 8/1/56 | | | 75 | | | | 81 | |
| | | New York & Presbyterian Hospital | | 3.954% | | 8/1/19 | | | 125 | | | | 125 | |
| | | Northwell Healthcare Inc. | | 3.979% | | 11/1/46 | | | 100 | | | | 102 | |
| | | Northwell Healthcare Inc. | | 4.260% | | 11/1/47 | | | 200 | | | | 214 | |
| | | Northwell Healthcare Inc. | | 3.809% | | 11/1/49 | | | 100 | | | | 100 | |
| | | Novartis Capital Corp. | | 2.400% | | 5/17/22 | | | 400 | | | | 405 | |
| | | Novartis Capital Corp. | | 2.400% | | 9/21/22 | | | 175 | | | | 178 | |
| | | Novartis Capital Corp. | | 3.400% | | 5/6/24 | | | 400 | | | | 423 | |
| | | Novartis Capital Corp. | | 3.000% | | 11/20/25 | | | 350 | | | | 367 | |
| | | Novartis Capital Corp. | | 3.100% | | 5/17/27 | | | 175 | | | | 184 | |
| | | Novartis Capital Corp. | | 3.700% | | 9/21/42 | | | 100 | | | | 110 | |
| | | Novartis Capital Corp. | | 4.400% | | 5/6/44 | | | 375 | | | | 455 | |
| | | Novartis Capital Corp. | | 4.000% | | 11/20/45 | | | 225 | | | | 261 | |
| | | NYU Hospitals Center | | 4.784% | | 7/1/44 | | | 100 | | | | 120 | |
| 3 | | NYU Hospitals Center | | 4.368% | | 7/1/47 | | | 110 | | | | 123 | |
| | | Orlando Health Obligated Group | | 4.089% | | 10/1/48 | | | 50 | | | | 55 | |
| | | Partners Healthcare System Inc. | | 4.117% | | 7/1/55 | | | 50 | | | | 55 | |
| | | PeaceHealth Obligated Group | | 4.787% | | 11/15/48 | | | 75 | | | | 92 | |
| | | PepsiCo Inc. | | 2.000% | | 4/15/21 | | | 300 | | | | 301 | |
| | | PepsiCo Inc. | | 3.000% | | 8/25/21 | | | 150 | | | | 153 | |
| | | PepsiCo Inc. | | 1.700% | | 10/6/21 | | | 175 | | | | 175 | |
| | | PepsiCo Inc. | | 2.750% | | 3/5/22 | | | 375 | | | | 383 | |
| | | PepsiCo Inc. | | 2.250% | | 5/2/22 | | | 150 | | | | 151 | |
| | | PepsiCo Inc. | | 3.600% | | 3/1/24 | | | 700 | | | | 744 | |
| | | PepsiCo Inc. | | 2.750% | | 4/30/25 | | | 200 | | | | 207 | |
| | | PepsiCo Inc. | | 3.500% | | 7/17/25 | | | 125 | | | | 134 | |
| | | PepsiCo Inc. | | 2.375% | | 10/6/26 | | | 225 | | | | 228 | |
| | | PepsiCo Inc. | | 3.000% | | 10/15/27 | | | 325 | | | | 343 | |
| | | PepsiCo Inc. | | 2.625% | | 7/29/29 | | | 200 | | | | 204 | |
| | | PepsiCo Inc. | | 4.000% | | 3/5/42 | | | 175 | | | | 199 | |
| | | PepsiCo Inc. | | 3.600% | | 8/13/42 | | | 100 | | | | 107 | |
| | | PepsiCo Inc. | | 4.250% | | 10/22/44 | | | 225 | | | | 265 | |
| | | PepsiCo Inc. | | 4.600% | | 7/17/45 | | | 75 | | | | 93 | |
| | | PepsiCo Inc. | | 4.450% | | 4/14/46 | | | 275 | | | | 338 | |
| | | PepsiCo Inc. | | 3.450% | | 10/6/46 | | | 300 | | | | 317 | |
| | | PepsiCo Inc. | | 4.000% | | 5/2/47 | | | 100 | | | | 115 | |
| | | PepsiCo Inc. | | 3.375% | | 7/29/49 | | | 200 | | | | 209 | |
| | | PepsiCo Inc. | | 2.875% | | 10/15/49 | | | 325 | | | | 311 | |
| | | PerkinElmer Inc. | | 3.300% | | 9/15/29 | | | 175 | | | | 178 | |
| | | Perrigo Finance Unlimited Co. | | 3.900% | | 12/15/24 | | | 200 | | | | 206 | |
| | | Perrigo Finance Unlimited Co. | | 4.375% | | 3/15/26 | | | 225 | | | | 232 | |
Total Bond Market Index Portfolio
| | | | | | | | | Face | | | Market | |
| | | | | | | Maturity | | Amount | | | Value• | |
| | | | | Coupon | | Date | | | ($000 | ) | | | ($000 | ) |
| | | Perrigo Finance Unlimited Co. | | 4.900% | | 12/15/44 | | | 80 | | | | 74 | |
| | | Pfizer Inc. | | 1.950% | | 6/3/21 | | | 225 | | | | 226 | |
| | | Pfizer Inc. | | 3.000% | | 9/15/21 | | | 125 | | | | 127 | |
| | | Pfizer Inc. | | 2.200% | | 12/15/21 | | | 100 | | | | 101 | |
| | | Pfizer Inc. | | 2.800% | | 3/11/22 | | | 200 | | | | 204 | |
| | | Pfizer Inc. | | 3.200% | | 9/15/23 | | | 125 | | | | 130 | |
| | | Pfizer Inc. | | 2.950% | | 3/15/24 | | | 150 | | | | 156 | |
| | | Pfizer Inc. | | 3.400% | | 5/15/24 | | | 100 | | | | 106 | |
| | | Pfizer Inc. | | 2.750% | | 6/3/26 | | | 290 | | | | 299 | |
| | | Pfizer Inc. | | 3.000% | | 12/15/26 | | | 300 | | | | 315 | |
| | | Pfizer Inc. | | 3.600% | | 9/15/28 | | | 200 | | | | 218 | |
| | | Pfizer Inc. | | 3.450% | | 3/15/29 | | | 375 | | | | 403 | |
| | | Pfizer Inc. | | 4.000% | | 12/15/36 | | | 200 | | | | 228 | |
| | | Pfizer Inc. | | 4.100% | | 9/15/38 | | | 150 | | | | 171 | |
| | | Pfizer Inc. | | 3.900% | | 3/15/39 | | | 125 | | | | 141 | |
| | | Pfizer Inc. | | 7.200% | | 3/15/39 | | | 425 | | | | 666 | |
| | | Pfizer Inc. | | 4.300% | | 6/15/43 | | | 125 | | | | 147 | |
| | | Pfizer Inc. | | 4.400% | | 5/15/44 | | | 200 | | | | 239 | |
| | | Pfizer Inc. | | 4.125% | | 12/15/46 | | | 250 | | | | 288 | |
| | | Pfizer Inc. | | 4.200% | | 9/15/48 | | | 450 | | | | 527 | |
| | | Pfizer Inc. | | 4.000% | | 3/15/49 | | | 250 | | | | 289 | |
| | | Pharmacia LLC | | 6.600% | | 12/1/28 | | | 175 | | | | 230 | |
| | | Philip Morris International Inc. | | 1.875% | | 2/25/21 | | | 125 | | | | 125 | |
| | | Philip Morris International Inc. | | 2.500% | | 11/2/22 | | | 300 | | | | 305 | |
| | | Philip Morris International Inc. | | 2.625% | | 3/6/23 | | | 100 | | | | 102 | |
| | | Philip Morris International Inc. | | 2.125% | | 5/10/23 | | | 95 | | | | 95 | |
| | | Philip Morris International Inc. | | 3.600% | | 11/15/23 | | | 500 | | | | 526 | |
| | | Philip Morris International Inc. | | 2.875% | | 5/1/24 | | | 220 | | | | 226 | |
| | | Philip Morris International Inc. | | 3.250% | | 11/10/24 | | | 250 | | | | 262 | |
| | | Philip Morris International Inc. | | 3.375% | | 8/11/25 | | | 150 | | | | 158 | |
| | | Philip Morris International Inc. | | 2.750% | | 2/25/26 | | | 180 | | | | 182 | |
| | | Philip Morris International Inc. | | 3.125% | | 3/2/28 | | | 100 | | | | 103 | |
| | | Philip Morris International Inc. | | 3.375% | | 8/15/29 | | | 200 | | | | 209 | |
| | | Philip Morris International Inc. | | 6.375% | | 5/16/38 | | | 200 | | | | 278 | |
| | | Philip Morris International Inc. | | 4.375% | | 11/15/41 | | | 350 | | | | 388 | |
| | | Philip Morris International Inc. | | 4.500% | | 3/20/42 | | | 125 | | | | 140 | |
| | | Philip Morris International Inc. | | 3.875% | | 8/21/42 | | | 25 | | | | 26 | |
| | | Philip Morris International Inc. | | 4.125% | | 3/4/43 | | | 175 | | | | 189 | |
| | | Philip Morris International Inc. | | 4.875% | | 11/15/43 | | | 155 | | | | 182 | |
| | | Philip Morris International Inc. | | 4.250% | | 11/10/44 | | | 200 | | | | 220 | |
| 3 | | Procter & Gamble - Esop | | 9.360% | | 1/1/21 | | | 83 | | | | 87 | |
| | | Procter & Gamble Co. | | 1.900% | | 10/23/20 | | | 100 | | | | 100 | |
| | | Procter & Gamble Co. | | 1.850% | | 2/2/21 | | | 100 | | | | 100 | |
| | | Procter & Gamble Co. | | 1.700% | | 11/3/21 | | | 125 | | | | 125 | |
| | | Procter & Gamble Co. | | 2.300% | | 2/6/22 | | | 425 | | | | 431 | |
| | | Procter & Gamble Co. | | 3.100% | | 8/15/23 | | | 150 | | | | 157 | |
| | | Procter & Gamble Co. | | 2.700% | | 2/2/26 | | | 100 | | | | 104 | |
| | | Procter & Gamble Co. | | 2.450% | | 11/3/26 | | | 100 | | | | 103 | |
| | | Procter & Gamble Co. | | 3.500% | | 10/25/47 | | | 225 | | | | 253 | |
| | | Providence St. Joseph Health Obligated Group | | 2.746% | | 10/1/26 | | | 50 | | | | 50 | |
| | | Providence St. Joseph Health Obligated Group | | 2.532% | | 10/1/29 | | | 150 | | | | 147 | |
| 3 | | Providence St. Joseph Health Obligated Group | | 3.744% | | 10/1/47 | | | 75 | | | | 78 | |
| 3 | | Providence St. Joseph Health Obligated Group | | 3.930% | | 10/1/48 | | | 75 | | | | 80 | |
| | | Quest Diagnostics Inc. | | 4.250% | | 4/1/24 | | | 100 | | | | 107 | |
| | | Quest Diagnostics Inc. | | 3.500% | | 3/30/25 | | | 100 | | | | 105 | |
| | | Quest Diagnostics Inc. | | 3.450% | | 6/1/26 | | | 125 | | | | 131 | |
| | | Quest Diagnostics Inc. | | 4.200% | | 6/30/29 | | | 140 | | | | 154 | |
| | | Quest Diagnostics Inc. | | 2.950% | | 6/30/30 | | | 160 | | | | 160 | |
| | | Quest Diagnostics Inc. | | 5.750% | | 1/30/40 | | | 13 | | | | 14 | |
| | | Quest Diagnostics Inc. | | 4.700% | | 3/30/45 | | | 25 | | | | 28 | |
| | | Reynolds American Inc. | | 4.000% | | 6/12/22 | | | 175 | | | | 182 | |
| | | Reynolds American Inc. | | 4.850% | | 9/15/23 | | | 125 | | | | 135 | |
| | | Reynolds American Inc. | | 4.450% | | 6/12/25 | | | 475 | | | | 511 | |
| | | Reynolds American Inc. | | 5.700% | | 8/15/35 | | | 175 | | | | 202 | |
| | | Reynolds American Inc. | | 7.250% | | 6/15/37 | | | 100 | | | | 128 | |
| | | Reynolds American Inc. | | 6.150% | | 9/15/43 | | | 75 | | | | 87 | |
| | | Reynolds American Inc. | | 5.850% | | 8/15/45 | | | 375 | | | | 429 | |
| | | RWJ Barnabas Health Inc. | | 3.949% | | 7/1/46 | | | 100 | | | | 106 | |
| | | RWJ Barnabas Health Inc. | | 3.477% | | 7/1/49 | | | 25 | | | | 25 | |
| | | Sanofi | | 4.000% | | 3/29/21 | | | 350 | | | | 359 | |
| | | Sanofi | | 3.375% | | 6/19/23 | | | 225 | | | | 236 | |
| | | Sanofi | | 3.625% | | 6/19/28 | | | 225 | | | | 250 | |
| | | Shire Acquisitions Investments Ireland DAC | | 2.400% | | 9/23/21 | | | 700 | | | | 703 | |
| | | Shire Acquisitions Investments Ireland DAC | | 2.875% | | 9/23/23 | | | 625 | | | | 636 | |
| | | Shire Acquisitions Investments Ireland DAC | | 3.200% | | 9/23/26 | | | 575 | | | | 592 | |
| | | Spectrum Health System Obligated Group | | 3.487% | | 7/15/49 | | | 75 | | | | 75 | |
| | | SSM Health Care Corp. | | 3.688% | | 6/1/23 | | | 150 | | | | 156 | |
| | | SSM Health Care Corp. | | 3.823% | | 6/1/27 | | | 100 | | | | 106 | |
| | | Stanford Health Care | | 3.795% | | 11/15/48 | | | 125 | | | | 135 | |
| | | Stryker Corp. | | 2.625% | | 3/15/21 | | | 150 | | | | 151 | |
| | | Stryker Corp. | | 3.375% | | 5/15/24 | | | 213 | | | | 223 | |
| | | Stryker Corp. | | 3.375% | | 11/1/25 | | | 140 | | | | 147 | |
| | | Stryker Corp. | | 3.500% | | 3/15/26 | | | 183 | | | | 194 | |
| | | Stryker Corp. | | 3.650% | | 3/7/28 | | | 50 | | | | 54 | |
| | | Stryker Corp. | | 4.100% | | 4/1/43 | | | 75 | | | | 81 | |
| | | Stryker Corp. | | 4.375% | | 5/15/44 | | | 50 | | | | 57 | |
| | | Stryker Corp. | | 4.625% | | 3/15/46 | | | 175 | | | | 210 | |
| | | Sutter Health | | 3.695% | | 8/15/28 | | | 75 | | | | 80 | |
| | | Sutter Health | | 4.091% | | 8/15/48 | | | 75 | | | | 83 | |
| | | Sysco Corp. | | 2.500% | | 7/15/21 | | | 75 | | | | 76 | |
| | | Sysco Corp. | | 2.600% | | 6/12/22 | | | 125 | | | | 127 | |
| | | Sysco Corp. | | 3.750% | | 10/1/25 | | | 75 | | | | 80 | |
| | | Sysco Corp. | | 3.300% | | 7/15/26 | | | 250 | | | | 263 | |
| | | Sysco Corp. | | 3.250% | | 7/15/27 | | | 175 | | | | 183 | |
| | | Sysco Corp. | | 4.850% | | 10/1/45 | | | 50 | | | | 60 | |
| | | Sysco Corp. | | 4.500% | | 4/1/46 | | | 200 | | | | 229 | |
| | | Sysco Corp. | | 4.450% | | 3/15/48 | | | 100 | | | | 114 | |
| | | Takeda Pharmaceutical Co. Ltd. | | 4.000% | | 11/26/21 | | | 200 | | | | 207 | |
| | | Takeda Pharmaceutical Co. Ltd. | | 4.400% | | 11/26/23 | | | 200 | | | | 214 | |
| | | Takeda Pharmaceutical Co. Ltd. | | 5.000% | | 11/26/28 | | | 405 | | | | 471 | |
| 3 | | Texas Health Resources | | 4.330% | | 11/15/55 | | | 25 | | | | 29 | |
| | | Thermo Fisher Scientific Inc. | | 3.000% | | 4/15/23 | | | 125 | | | | 128 | |
| | | Thermo Fisher Scientific Inc. | | 3.650% | | 12/15/25 | | | 400 | | | | 427 | |
| | | Thermo Fisher Scientific Inc. | | 2.950% | | 9/19/26 | | | 200 | | | | 206 | |
| | | Thermo Fisher Scientific Inc. | | 3.200% | | 8/15/27 | | | 50 | | | | 52 | |
| | | Thermo Fisher Scientific Inc. | | 2.600% | | 10/1/29 | | | 225 | | | | 222 | |
| | | Thermo Fisher Scientific Inc. | | 5.300% | | 2/1/44 | | | 185 | | | | 234 | |
| | | Toledo Hospital | | 5.325% | | 11/15/28 | | | 50 | | | | 54 | |
| | | Trinity Health Corp. | | 4.125% | | 12/1/45 | | | 85 | | | | 93 | |
| | | Tyson Foods Inc. | | 2.250% | | 8/23/21 | | | 50 | | | | 50 | |
| | | Tyson Foods Inc. | | 4.500% | | 6/15/22 | | | 275 | | | | 289 | |
| | | Tyson Foods Inc. | | 3.900% | | 9/28/23 | | | 100 | | | | 106 | |
| | | Tyson Foods Inc. | | 3.950% | | 8/15/24 | | | 925 | | | | 989 | |
| | | Tyson Foods Inc. | | 3.550% | | 6/2/27 | | | 275 | | | | 292 | |
| | | Tyson Foods Inc. | | 4.350% | | 3/1/29 | | | 280 | | | | 317 | |
| | | Tyson Foods Inc. | | 4.875% | | 8/15/34 | | | 100 | | | | 117 | |
| | | Tyson Foods Inc. | | 5.150% | | 8/15/44 | | | 200 | | | | 242 | |
| | | Tyson Foods Inc. | | 4.550% | | 6/2/47 | | | 150 | | | | 170 | |
| | | Tyson Foods Inc. | | 5.100% | | 9/28/48 | | | 275 | | | | 346 | |
| | | Unilever Capital Corp. | | 4.250% | | 2/10/21 | | | 200 | | | | 205 | |
| | | Unilever Capital Corp. | | 2.750% | | 3/22/21 | | | 100 | | | | 101 | |
| | | Unilever Capital Corp. | | 1.375% | | 7/28/21 | | | 100 | | | | 99 | |
| | | Unilever Capital Corp. | | 3.000% | | 3/7/22 | | | 100 | | | | 102 | |
| | | Unilever Capital Corp. | | 3.250% | | 3/7/24 | | | 250 | | | | 262 | |
| | | Unilever Capital Corp. | | 2.600% | | 5/5/24 | | | 450 | | | | 460 | |
| | | Unilever Capital Corp. | | 3.100% | | 7/30/25 | | | 225 | | | | 235 | |
| | | Unilever Capital Corp. | | 2.000% | | 7/28/26 | | | 125 | | | | 124 | |
| | | Unilever Capital Corp. | | 3.500% | | 3/22/28 | | | 200 | | | | 216 | |
| | | Unilever Capital Corp. | | 2.125% | | 9/6/29 | | | 175 | | | | 170 | |
| | | Unilever Capital Corp. | | 5.900% | | 11/15/32 | | | 200 | | | | 271 | |
| | | Whirlpool Corp. | | 4.700% | | 6/1/22 | | | 100 | | | | 106 | |
| | | Whirlpool Corp. | | 4.000% | | 3/1/24 | | | 50 | | | | 53 | |
| | | Whirlpool Corp. | | 3.700% | | 5/1/25 | | | 75 | | | | 79 | |
| | | Whirlpool Corp. | | 4.750% | | 2/26/29 | | | 150 | | | | 167 | |
Total Bond Market Index Portfolio
| | | | | | | | | Face | | | Market | |
| | | | | | | Maturity | | Amount | | | Value• | |
| | | | | Coupon | | Date | | | ($000 | ) | | | ($000 | ) |
| | | Whirlpool Corp. | | 4.500% | | 6/1/46 | | | 100 | | | | 103 | |
| 3 | | Willis-Knighton Medical Center | | 4.813% | | 9/1/48 | | | 50 | | | | 60 | |
| | | Wyeth LLC | | 7.250% | | 3/1/23 | | | 250 | | | | 289 | |
| | | Wyeth LLC | | 6.450% | | 2/1/24 | | | 300 | | | | 350 | |
| | | Wyeth LLC | | 6.500% | | 2/1/34 | | | 150 | | | | 209 | |
| | | Wyeth LLC | | 6.000% | | 2/15/36 | | | 85 | | | | 113 | |
| | | Wyeth LLC | | 5.950% | | 4/1/37 | | | 385 | | | | 524 | |
| | | Zeneca Wilmington Inc. | | 7.000% | | 11/15/23 | | | 25 | | | | 29 | |
| | | Zimmer Biomet Holdings Inc. | | 3.375% | | 11/30/21 | | | 100 | | | | 102 | |
| | | Zimmer Biomet Holdings Inc. | | 3.150% | | 4/1/22 | | | 175 | | | | 179 | |
| | | Zimmer Biomet Holdings Inc. | | 3.700% | | 3/19/23 | | | 50 | | | | 52 | |
| | | Zimmer Biomet Holdings Inc. | | 3.550% | | 4/1/25 | | | 350 | | | | 368 | |
| | | Zimmer Biomet Holdings Inc. | | 5.750% | | 11/30/39 | | | 50 | | | | 59 | |
| | | Zimmer Biomet Holdings Inc. | | 4.450% | | 8/15/45 | | | 150 | | | | 157 | |
| | | Zoetis Inc. | | 3.450% | | 11/13/20 | | | 75 | | | | 76 | |
| | | Zoetis Inc. | | 3.250% | | 8/20/21 | | | 50 | | | | 51 | |
| | | Zoetis Inc. | | 3.250% | | 2/1/23 | | | 350 | | | | 361 | |
| | | Zoetis Inc. | | 4.500% | | 11/13/25 | | | 100 | | | | 111 | |
| | | Zoetis Inc. | | 3.000% | | 9/12/27 | | | 150 | | | | 153 | |
| | | Zoetis Inc. | | 3.900% | | 8/20/28 | | | 100 | | | | 108 | |
| | | Zoetis Inc. | | 4.700% | | 2/1/43 | | | 175 | | | | 208 | |
| | | Zoetis Inc. | | 3.950% | | 9/12/47 | | | 150 | | | | 163 | |
| | | Zoetis Inc. | | 4.450% | | 8/20/48 | | | 75 | | | | 88 | |
| | | | | | | | | | | | | | | |
| | | Energy (2.4%) | | | | | | | | | | | | |
| | | Apache Corp. | | 3.625% | | 2/1/21 | | | 17 | | | | 17 | |
| | | Apache Corp. | | 3.250% | | 4/15/22 | | | 21 | | | | 21 | |
| | | Apache Corp. | | 4.375% | | 10/15/28 | | | 400 | | | | 417 | |
| | | Apache Corp. | | 5.100% | | 9/1/40 | | | 350 | | | | 355 | |
| | | Apache Corp. | | 5.250% | | 2/1/42 | | | 100 | | | | 104 | |
| | | Apache Corp. | | 4.750% | | 4/15/43 | | | 200 | | | | 191 | |
| | | Apache Corp. | | 4.250% | | 1/15/44 | | | 150 | | | | 138 | |
| | | Baker Hughes a GE Co. LLC | | 5.125% | | 9/15/40 | | | 175 | | | | 206 | |
| | | Baker Hughes a GE Co. LLC / Baker Hughes Co-Obligor Inc. | | 2.773% | | 12/15/22 | | | 425 | | | | 433 | |
| | | Baker Hughes a GE Co. LLC / Baker Hughes Co-Obligor Inc. | | 3.337% | | 12/15/27 | | | 200 | | | | 208 | |
| | | Baker Hughes a GE Co. LLC / Baker Hughes Co-Obligor Inc. | | 3.138% | | 11/7/29 | | | 250 | | | | 256 | |
| | | Baker Hughes a GE Co. LLC / Baker Hughes Co-Obligor Inc. | | 4.080% | | 12/15/47 | | | 275 | | | | 282 | |
| | | Boardwalk Pipelines LP | | 3.375% | | 2/1/23 | | | 100 | | | | 102 | |
| | | Boardwalk Pipelines LP | | 4.950% | | 12/15/24 | | | 150 | | | | 162 | |
| | | Boardwalk Pipelines LP | | 5.950% | | 6/1/26 | | | 200 | | | | 224 | |
| | | Boardwalk Pipelines LP | | 4.450% | | 7/15/27 | | | 100 | | | | 103 | |
| | | Boardwalk Pipelines LP | | 4.800% | | 5/3/29 | | | 100 | | | | 106 | |
| | | BP Capital Markets America Inc. | | 4.742% | | 3/11/21 | | | 350 | | | | 362 | |
| | | BP Capital Markets America Inc. | | 3.245% | | 5/6/22 | | | 250 | | | | 258 | |
| | | BP Capital Markets America Inc. | | 2.520% | | 9/19/22 | | | 50 | | | | 51 | |
| | | BP Capital Markets America Inc. | | 2.750% | | 5/10/23 | | | 300 | | | | 307 | |
| | | BP Capital Markets America Inc. | | 3.216% | | 11/28/23 | | | 1,082 | | | | 1,124 | |
| | | BP Capital Markets America Inc. | | 3.796% | | 9/21/25 | | | 125 | | | | 135 | |
| | | BP Capital Markets America Inc. | | 3.410% | | 2/11/26 | | | 100 | | | | 106 | |
| | | BP Capital Markets America Inc. | | 3.119% | | 5/4/26 | | | 550 | | | | 573 | |
| | | BP Capital Markets America Inc. | | 3.017% | | 1/16/27 | | | 400 | | | | 414 | |
| | | BP Capital Markets America Inc. | | 3.937% | | 9/21/28 | | | 175 | | | | 193 | |
| | | BP Capital Markets America Inc. | | 4.234% | | 11/6/28 | | | 100 | | | | 113 | |
| | | BP Capital Markets plc | | 3.062% | | 3/17/22 | | | 25 | | | | 26 | |
| | | BP Capital Markets plc | | 2.500% | | 11/6/22 | | | 450 | | | | 458 | |
| | | BP Capital Markets plc | | 3.994% | | 9/26/23 | | | 200 | | | | 213 | |
| | | BP Capital Markets plc | | 3.814% | | 2/10/24 | | | 400 | | | | 427 | |
| | | BP Capital Markets plc | | 3.535% | | 11/4/24 | | | 68 | | | | 72 | |
| | | BP Capital Markets plc | | 3.506% | | 3/17/25 | | | 200 | | | | 213 | |
| | | BP Capital Markets plc | | 3.279% | | 9/19/27 | | | 150 | | | | 158 | |
| | | BP Capital Markets plc | | 3.723% | | 11/28/28 | | | 100 | | | | 109 | |
| | | Burlington Resources Finance Co. | | 7.400% | | 12/1/31 | | | 175 | | | | 249 | |
| | | Canadian Natural Resources Ltd. | | 3.450% | | 11/15/21 | | | 100 | | | | 102 | |
| | | Canadian Natural Resources Ltd. | | 2.950% | | 1/15/23 | | | 200 | | | | 204 | |
| | | Canadian Natural Resources Ltd. | | 3.850% | | 6/1/27 | | | 750 | | | | 798 | |
| | | Canadian Natural Resources Ltd. | | 7.200% | | 1/15/32 | | | 150 | | | | 203 | |
| | | Canadian Natural Resources Ltd. | | 6.450% | | 6/30/33 | | | 125 | | | | 160 | |
| | | Canadian Natural Resources Ltd. | | 5.850% | | 2/1/35 | | | 100 | | | | 123 | |
| | | Canadian Natural Resources Ltd. | | 6.500% | | 2/15/37 | | | 50 | | | | 65 | |
| | | Canadian Natural Resources Ltd. | | 6.250% | | 3/15/38 | | | 100 | | | | 129 | |
| | | Canadian Natural Resources Ltd. | | 4.950% | | 6/1/47 | | | 140 | | | | 170 | |
| | | Cenovus Energy Inc. | | 3.800% | | 9/15/23 | | | 351 | | | | 364 | |
| | | Cenovus Energy Inc. | | 4.250% | | 4/15/27 | | | 225 | | | | 237 | |
| | | Cenovus Energy Inc. | | 5.250% | | 6/15/37 | | | 150 | | | | 165 | |
| | | Cenovus Energy Inc. | | 6.750% | | 11/15/39 | | | 300 | | | | 382 | |
| | | Cenovus Energy Inc. | | 5.400% | | 6/15/47 | | | 300 | | | | 350 | |
| | | Cheniere Corpus Christi Holdings LLC | | 7.000% | | 6/30/24 | | | 200 | | | | 230 | |
| | | Cheniere Corpus Christi Holdings LLC | | 5.875% | | 3/31/25 | | | 225 | | | | 253 | |
| | | Cheniere Corpus Christi Holdings LLC | | 5.125% | | 6/30/27 | | | 475 | | | | 526 | |
| 6 | | Cheniere Corpus Christi Holdings LLC | | 3.700% | | 11/15/29 | | | 300 | | | | 307 | |
| | | Chevron Corp. | | 2.100% | | 5/16/21 | | | 300 | | | | 301 | |
| | | Chevron Corp. | | 2.498% | | 3/3/22 | | | 100 | | | | 102 | |
| | | Chevron Corp. | | 2.355% | | 12/5/22 | | | 1,130 | | | | 1,145 | |
| | | Chevron Corp. | | 3.191% | | 6/24/23 | | | 225 | | | | 234 | |
| | | Chevron Corp. | | 2.895% | | 3/3/24 | | | 100 | | | | 103 | |
| | | Chevron Corp. | | 2.954% | | 5/16/26 | | | 400 | | | | 418 | |
| | | Cimarex Energy Co. | | 4.375% | | 6/1/24 | | | 200 | | | | 211 | |
| | | Cimarex Energy Co. | | 3.900% | | 5/15/27 | | | 250 | | | | 258 | |
| | | Cimarex Energy Co. | | 4.375% | | 3/15/29 | | | 100 | | | | 106 | |
| | | Columbia Pipeline Group Inc. | | 4.500% | | 6/1/25 | | | 300 | | | | 328 | |
| | | Columbia Pipeline Group Inc. | | 5.800% | | 6/1/45 | | | 100 | | | | 127 | |
| | | Concho Resources Inc. | | 3.750% | | 10/1/27 | | | 400 | | | | 419 | |
| | | Concho Resources Inc. | | 4.875% | | 10/1/47 | | | 200 | | | | 233 | |
| | | Concho Resources Inc. | | 4.850% | | 8/15/48 | | | 125 | | | | 145 | |
| | | ConocoPhillips | | 5.900% | | 10/15/32 | | | 450 | | | | 588 | |
| | | ConocoPhillips | | 5.900% | | 5/15/38 | | | 450 | | | | 611 | |
| | | ConocoPhillips | | 6.500% | | 2/1/39 | | | 200 | | | | 290 | |
| | | ConocoPhillips Canada Funding Co. I | | 5.950% | | 10/15/36 | | | 200 | | | | 268 | |
| | | ConocoPhillips Co. | | 4.300% | | 11/15/44 | | | 125 | | | | 146 | |
| | | ConocoPhillips Holding Co. | | 6.950% | | 4/15/29 | | | 350 | | | | 475 | |
| | | Continental Resources Inc. | | 5.000% | | 9/15/22 | | | 175 | | | | 176 | |
| | | Continental Resources Inc. | | 4.500% | | 4/15/23 | | | 200 | | | | 209 | |
| | | Continental Resources Inc. | | 4.375% | | 1/15/28 | | | 200 | | | | 212 | |
| | | Continental Resources Inc. | | 4.900% | | 6/1/44 | | | 100 | | | | 107 | |
| | | Devon Energy Corp. | | 5.850% | | 12/15/25 | | | 100 | | | | 118 | |
| | | Devon Energy Corp. | | 7.950% | | 4/15/32 | | | 163 | | | | 231 | |
| | | Devon Energy Corp. | | 5.600% | | 7/15/41 | | | 325 | | | | 395 | |
| | | Devon Energy Corp. | | 4.750% | | 5/15/42 | | | 200 | | | | 224 | |
| | | Devon Financing Co. LLC | | 7.875% | | 9/30/31 | | | 160 | | | | 220 | |
| | | Diamondback Energy Inc. | | 2.875% | | 12/1/24 | | | 200 | | | | 202 | |
| | | Diamondback Energy Inc. | | 3.250% | | 12/1/26 | | | 200 | | | | 202 | |
| | | Diamondback Energy Inc. | | 3.500% | | 12/1/29 | | | 250 | | | | 254 | |
| | | Dominion Energy Gas Holdings LLC | | 2.500% | | 11/15/24 | | | 100 | | | | 100 | |
| | | Dominion Energy Gas Holdings LLC | | 3.600% | | 12/15/24 | | | 200 | | | | 210 | |
| | | Dominion Energy Gas Holdings LLC | | 3.000% | | 11/15/29 | | | 100 | | | | 99 | |
| | | Dominion Energy Gas Holdings LLC | | 4.600% | | 12/15/44 | | | 200 | | | | 217 | |
| | | Enable Midstream Partners LP | | 3.900% | | 5/15/24 | | | 150 | | | | 153 | |
| | | Enable Midstream Partners LP | | 4.400% | | 3/15/27 | | | 150 | | | | 147 | |
| | | Enable Midstream Partners LP | | 4.950% | | 5/15/28 | | | 100 | | | | 101 | |
| | | Enable Midstream Partners LP | | 4.150% | | 9/15/29 | | | 200 | | | | 189 | |
| | | Enable Midstream Partners LP | | 5.000% | | 5/15/44 | | | 100 | | | | 90 | |
| | | Enbridge Energy Partners LP | | 5.875% | | 10/15/25 | | | 150 | | | | 175 | |
| | | Enbridge Energy Partners LP | | 7.500% | | 4/15/38 | | | 150 | | | | 214 | |
| | | Enbridge Energy Partners LP | | 5.500% | | 9/15/40 | | | 75 | | | | 89 | |
| | | Enbridge Energy Partners LP | | 7.375% | | 10/15/45 | | | 125 | | | | 186 | |
| | | Enbridge Inc. | | 2.900% | | 7/15/22 | | | 75 | | | | 76 | |
| | | Enbridge Inc. | | 2.500% | | 1/15/25 | | | 100 | | | | 101 | |
| | | Enbridge Inc. | | 3.700% | | 7/15/27 | | | 150 | | | | 158 | |
| | | Enbridge Inc. | | 3.125% | | 11/15/29 | | | 200 | | | | 202 | |
| | | Enbridge Inc. | | 4.500% | | 6/10/44 | | | 100 | | | | 110 | |
| | | Enbridge Inc. | | 4.000% | | 11/15/49 | | | 100 | | | | 104 | |
| | | Encana Corp. | | 6.500% | | 8/15/34 | | | 300 | | | | 352 | |
| | | Encana Corp. | | 6.625% | | 8/15/37 | | | 200 | | | | 237 | |
| | | Encana Corp. | | 6.500% | | 2/1/38 | | | 100 | | | | 117 | |
| | | Energy Transfer Operating LP | | 4.650% | | 6/1/21 | | | 105 | | | | 108 | |
| | | Energy Transfer Operating LP | | 3.600% | | 2/1/23 | | | 450 | | | | 461 | |
| | | Energy Transfer Operating LP | | 4.250% | | 3/15/23 | | | 400 | | | | 418 | |
| | | Energy Transfer Operating LP | | 4.200% | | 9/15/23 | | | 80 | | | | 84 | |
Total Bond Market Index Portfolio
| | | | | | | | | Face | | | Market | |
| | | | | | | Maturity | | Amount | | | Value• | |
| | | | | Coupon | | Date | | | ($000 | ) | | | ($000 | ) |
| | | Energy Transfer Operating LP | | 4.050% | | 3/15/25 | | | 1,000 | | | | 1,048 | |
| | | Energy Transfer Operating LP | | 4.750% | | 1/15/26 | | | 100 | | | | 108 | |
| | | Energy Transfer Operating LP | | 4.200% | | 4/15/27 | | | 100 | | | | 105 | |
| | | Energy Transfer Operating LP | | 5.500% | | 6/1/27 | | | 380 | | | | 427 | |
| | | Energy Transfer Operating LP | | 5.250% | | 4/15/29 | | | 325 | | | | 364 | |
| | | Energy Transfer Operating LP | | 6.250% | | 4/15/49 | | | 320 | | | | 385 | |
| | | Energy Transfer Partners LP | | 4.950% | | 6/15/28 | | | 350 | | | | 383 | |
| | | Energy Transfer Partners LP | | 6.625% | | 10/15/36 | | | 150 | | | | 178 | |
| | | Energy Transfer Partners LP | | 5.800% | | 6/15/38 | | | 150 | | | | 169 | |
| | | Energy Transfer Partners LP | | 6.050% | | 6/1/41 | | | 100 | | | | 112 | |
| | | Energy Transfer Partners LP | | 6.500% | | 2/1/42 | | | 275 | | | | 327 | |
| | | Energy Transfer Partners LP | | 5.150% | | 3/15/45 | | | 150 | | | | 158 | |
| | | Energy Transfer Partners LP | | 6.125% | | 12/15/45 | | | 200 | | | | 231 | |
| | | Energy Transfer Partners LP | | 5.300% | | 4/15/47 | | | 200 | | | | 214 | |
| | | Energy Transfer Partners LP | | 6.000% | | 6/15/48 | | | 100 | | | | 116 | |
| | | Enterprise Products Operating LLC | | 2.800% | | 2/15/21 | | | 125 | | | | 126 | |
| | | Enterprise Products Operating LLC | | 3.500% | | 2/1/22 | | | 100 | | | | 103 | |
| | | Enterprise Products Operating LLC | | 3.350% | | 3/15/23 | | | 425 | | | | 439 | |
| | | Enterprise Products Operating LLC | | 3.900% | | 2/15/24 | | | 175 | | | | 186 | |
| | | Enterprise Products Operating LLC | | 3.750% | | 2/15/25 | | | 150 | | | | 160 | |
| | | Enterprise Products Operating LLC | | 3.700% | | 2/15/26 | | | 200 | | | | 213 | |
| | | Enterprise Products Operating LLC | | 3.950% | | 2/15/27 | | | 100 | | | | 108 | |
| | | Enterprise Products Operating LLC | | 3.125% | | 7/31/29 | | | 550 | | | | 565 | |
| | | Enterprise Products Operating LLC | | 6.875% | | 3/1/33 | | | 175 | | | | 238 | |
| | | Enterprise Products Operating LLC | | 7.550% | | 4/15/38 | | | 150 | | | | 216 | |
| | | Enterprise Products Operating LLC | | 6.125% | | 10/15/39 | | | 300 | | | | 390 | |
| | | Enterprise Products Operating LLC | | 5.950% | | 2/1/41 | | | 175 | | | | 225 | |
| | | Enterprise Products Operating LLC | | 4.450% | | 2/15/43 | | | 300 | | | | 328 | |
| | | Enterprise Products Operating LLC | | 4.850% | | 3/15/44 | | | 370 | | | | 428 | |
| | | Enterprise Products Operating LLC | | 5.100% | | 2/15/45 | | | 33 | | | | 39 | |
| | | Enterprise Products Operating LLC | | 4.900% | | 5/15/46 | | | 425 | | | | 498 | |
| | | Enterprise Products Operating LLC | | 4.250% | | 2/15/48 | | | 300 | | | | 324 | |
| | | Enterprise Products Operating LLC | | 4.800% | | 2/1/49 | | | 120 | | | | 141 | |
| | | Enterprise Products Operating LLC | | 4.200% | | 1/31/50 | | | 250 | | | | 268 | |
| | | Enterprise Products Operating LLC | | 4.950% | | 10/15/54 | | | 100 | | | | 116 | |
| 3 | | Enterprise Products Operating LLC | | 5.250% | | 8/16/77 | | | 100 | | | | 100 | |
| 3 | | Enterprise Products Operating LLC | | 5.375% | | 2/15/78 | | | 200 | | | | 198 | |
| | | EOG Resources Inc. | | 4.100% | | 2/1/21 | | | 350 | | | | 358 | |
| | | EOG Resources Inc. | | 2.625% | | 3/15/23 | | | 450 | | | | 458 | |
| | | EOG Resources Inc. | | 4.150% | | 1/15/26 | | | 150 | | | | 165 | |
| | | EOG Resources Inc. | | 3.900% | | 4/1/35 | | | 75 | | | | 83 | |
| | | EQM Midstream Partners LP | | 4.750% | | 7/15/23 | | | 275 | | | | 276 | |
| | | EQM Midstream Partners LP | | 4.000% | | 8/1/24 | | | 100 | | | | 97 | |
| | | EQM Midstream Partners LP | | 4.125% | | 12/1/26 | | | 100 | | | | 94 | |
| | | EQM Midstream Partners LP | | 5.500% | | 7/15/28 | | | 150 | | | | 147 | |
| | | EQT Corp. | | 4.875% | | 11/15/21 | | | 125 | | | | 128 | |
| | | EQT Corp. | | 3.000% | | 10/1/22 | | | 150 | | | | 147 | |
| | | EQT Corp. | | 3.900% | | 10/1/27 | | | 200 | | | | 186 | |
| | | EQT Midstream Partners LP | | 6.500% | | 7/15/48 | | | 110 | | | | 103 | |
| | | Exxon Mobil Corp. | | 2.222% | | 3/1/21 | | | 400 | | | | 402 | |
| | | Exxon Mobil Corp. | | 2.397% | | 3/6/22 | | | 350 | | | | 354 | |
| | | Exxon Mobil Corp. | | 1.902% | | 8/16/22 | | | 300 | | | | 302 | |
| | | Exxon Mobil Corp. | | 2.726% | | 3/1/23 | | | 350 | | | | 358 | |
| | | Exxon Mobil Corp. | | 2.019% | | 8/16/24 | | | 100 | | | | 100 | |
| | | Exxon Mobil Corp. | | 2.709% | | 3/6/25 | | | 300 | | | | 310 | |
| | | Exxon Mobil Corp. | | 3.043% | | 3/1/26 | | | 300 | | | | 315 | |
| | | Exxon Mobil Corp. | | 2.275% | | 8/16/26 | | | 200 | | | | 200 | |
| | | Exxon Mobil Corp. | | 2.440% | | 8/16/29 | | | 250 | | | | 251 | |
| | | Exxon Mobil Corp. | | 2.995% | | 8/16/39 | | | 200 | | | | 200 | |
| | | Exxon Mobil Corp. | | 3.567% | | 3/6/45 | | | 235 | | | | 251 | |
| | | Exxon Mobil Corp. | | 4.114% | | 3/1/46 | | | 400 | | | | 468 | |
| | | Exxon Mobil Corp. | | 3.095% | | 8/16/49 | | | 300 | | | | 297 | |
| | | Halliburton Co. | | 3.500% | | 8/1/23 | | | 225 | | | | 234 | |
| | | Halliburton Co. | | 3.800% | | 11/15/25 | | | 350 | | | | 373 | |
| | | Halliburton Co. | | 4.850% | | 11/15/35 | | | 200 | | | | 226 | |
| | | Halliburton Co. | | 6.700% | | 9/15/38 | | | 345 | | | | 455 | |
| | | Halliburton Co. | | 4.500% | | 11/15/41 | | | 100 | | | | 107 | |
| | | Halliburton Co. | | 4.750% | | 8/1/43 | | | 150 | | | | 165 | |
| | | Halliburton Co. | | 5.000% | | 11/15/45 | | | 400 | | | | 455 | |
| | | Helmerich & Payne Inc. | | 4.650% | | 3/15/25 | | | 50 | | | | 54 | |
| | | Hess Corp. | | 3.500% | | 7/15/24 | | | 100 | | | | 103 | |
| | | Hess Corp. | | 4.300% | | 4/1/27 | | | 250 | | | | 266 | |
| | | Hess Corp. | | 7.125% | | 3/15/33 | | | 100 | | | | 127 | |
| | | Hess Corp. | | 6.000% | | 1/15/40 | | | 150 | | | | 177 | |
| | | Hess Corp. | | 5.600% | | 2/15/41 | | | 300 | | | | 350 | |
| | | Hess Corp. | | 5.800% | | 4/1/47 | | | 125 | | | | 152 | |
| | | HollyFrontier Corp. | | 5.875% | | 4/1/26 | | | 200 | | | | 225 | |
| | | Husky Energy Inc. | | 4.000% | | 4/15/24 | | | 150 | | | | 158 | |
| | | Husky Energy Inc. | | 4.400% | | 4/15/29 | | | 250 | | | | 269 | |
| | | Husky Energy Inc. | | 6.800% | | 9/15/37 | | | 50 | | | | 65 | |
| | | Kinder Morgan Energy Partners LP | | 5.000% | | 10/1/21 | | | 150 | | | | 156 | |
| | | Kinder Morgan Energy Partners LP | | 3.450% | | 2/15/23 | | | 25 | | | | 26 | |
| | | Kinder Morgan Energy Partners LP | | 3.500% | | 9/1/23 | | | 250 | | | | 259 | |
| | | Kinder Morgan Energy Partners LP | | 4.300% | | 5/1/24 | | | 625 | | | | 668 | |
| | | Kinder Morgan Energy Partners LP | | 7.300% | | 8/15/33 | | | 275 | | | | 363 | |
| | | Kinder Morgan Energy Partners LP | | 5.800% | | 3/15/35 | | | 50 | | | | 59 | |
| | | Kinder Morgan Energy Partners LP | | 6.500% | | 2/1/37 | | | 250 | | | | 312 | |
| | | Kinder Morgan Energy Partners LP | | 6.950% | | 1/15/38 | | | 50 | | | | 66 | |
| | | Kinder Morgan Energy Partners LP | | 6.500% | | 9/1/39 | | | 200 | | | | 253 | |
| | | Kinder Morgan Energy Partners LP | | 6.550% | | 9/15/40 | | | 250 | | | | 317 | |
| | | Kinder Morgan Energy Partners LP | | 5.625% | | 9/1/41 | | | 50 | | | | 58 | |
| | | Kinder Morgan Energy Partners LP | | 5.000% | | 8/15/42 | | | 25 | | | | 27 | |
| | | Kinder Morgan Energy Partners LP | | 4.700% | | 11/1/42 | | | 475 | | | | 502 | |
| | | Kinder Morgan Energy Partners LP | | 5.000% | | 3/1/43 | | | 75 | | | | 82 | |
| 6 | | Kinder Morgan Inc. | | 5.000% | | 2/15/21 | | | 75 | | | | 77 | |
| | | Kinder Morgan Inc. | | 3.150% | | 1/15/23 | | | 200 | | | | 204 | |
| | | Kinder Morgan Inc. | | 4.300% | | 6/1/25 | | | 300 | | | | 325 | |
| | | Kinder Morgan Inc. | | 4.300% | | 3/1/28 | | | 500 | | | | 544 | |
| | | Kinder Morgan Inc. | | 7.800% | | 8/1/31 | | | 290 | | | | 397 | |
| | | Kinder Morgan Inc. | | 7.750% | | 1/15/32 | | | 265 | | | | 363 | |
| | | Kinder Morgan Inc. | | 5.300% | | 12/1/34 | | | 175 | | | | 206 | |
| | | Kinder Morgan Inc. | | 5.550% | | 6/1/45 | | | 200 | | | | 239 | |
| | | Kinder Morgan Inc. | | 5.050% | | 2/15/46 | | | 350 | | | | 391 | |
| | | Magellan Midstream Partners LP | | 4.250% | | 2/1/21 | | | 100 | | | | 102 | |
| | | Magellan Midstream Partners LP | | 5.150% | | 10/15/43 | | | 125 | | | | 146 | |
| | | Magellan Midstream Partners LP | | 4.250% | | 9/15/46 | | | 200 | | | | 212 | |
| | | Magellan Midstream Partners LP | | 4.200% | | 10/3/47 | | | 100 | | | | 105 | |
| | | Magellan Midstream Partners LP | | 4.850% | | 2/1/49 | | | 100 | | | | 115 | |
| | | Magellan Midstream Partners LP | | 3.950% | | 3/1/50 | | | 100 | | | | 103 | |
| | | Marathon Oil Corp. | | 2.800% | | 11/1/22 | | | 175 | | | | 178 | |
| | | Marathon Oil Corp. | | 3.850% | | 6/1/25 | | | 200 | | | | 211 | |
| | | Marathon Oil Corp. | | 6.800% | | 3/15/32 | | | 400 | | | | 507 | |
| | | Marathon Oil Corp. | | 5.200% | | 6/1/45 | | | 100 | | | | 116 | |
| | | Marathon Petroleum Corp. | | 5.125% | | 3/1/21 | | | 375 | | | | 388 | |
| | | Marathon Petroleum Corp. | | 5.375% | | 10/1/22 | | | 200 | | | | 202 | |
| | | Marathon Petroleum Corp. | | 4.750% | | 12/15/23 | | | 500 | | | | 543 | |
| | | Marathon Petroleum Corp. | | 5.125% | | 12/15/26 | | | 200 | | | | 226 | |
| | | Marathon Petroleum Corp. | | 3.800% | | 4/1/28 | | | 25 | | | | 26 | |
| | | Marathon Petroleum Corp. | | 4.750% | | 9/15/44 | | | 250 | | | | 272 | |
| | | Marathon Petroleum Corp. | | 5.850% | | 12/15/45 | | | 200 | | | | 228 | |
| | | Marathon Petroleum Corp. | | 4.500% | | 4/1/48 | | | 100 | | | | 105 | |
| 6 | | MPLX LP | | 3.500% | | 12/1/22 | | | 25 | | | | 26 | |
| | | MPLX LP | | 3.375% | | 3/15/23 | | | 100 | | | | 103 | |
| | | MPLX LP | | 4.500% | | 7/15/23 | | | 200 | | | | 212 | |
| | | MPLX LP | | 4.875% | | 12/1/24 | | | 513 | | | | 556 | |
| | | MPLX LP | | 4.875% | | 6/1/25 | | | 100 | | | | 109 | |
| | | MPLX LP | | 4.125% | | 3/1/27 | | | 300 | | | | 314 | |
| 6 | | MPLX LP | | 4.250% | | 12/1/27 | | | 400 | | | | 420 | |
| | | MPLX LP | | 4.000% | | 3/15/28 | | | 400 | | | | 414 | |
| | | MPLX LP | | 4.500% | | 4/15/38 | | | 300 | | | | 305 | |
| | | MPLX LP | | 5.200% | | 3/1/47 | | | 250 | | | | 268 | |
| 6 | | MPLX LP | | 5.200% | | 12/1/47 | | | 100 | | | | 105 | |
| | | MPLX LP | | 4.700% | | 4/15/48 | | | 275 | | | | 277 | |
| | | MPLX LP | | 5.500% | | 2/15/49 | | | 300 | | | | 340 | |
| | | MPLX LP | | 4.900% | | 4/15/58 | | | 150 | | | | 153 | |
| | | National Fuel Gas Co. | | 3.750% | | 3/1/23 | | | 275 | | | | 282 | |
| | | National Fuel Gas Co. | | 4.750% | | 9/1/28 | | | 50 | | | | 53 | |
| | | National Oilwell Varco Inc. | | 2.600% | | 12/1/22 | | | 35 | | | | 35 | |
| | | National Oilwell Varco Inc. | | 3.600% | | 12/1/29 | | | 200 | | | | 200 | |
| | | National Oilwell Varco Inc. | | 3.950% | | 12/1/42 | | | 125 | | | | 117 | |
| | | Newfield Exploration Co. | | 5.750% | | 1/30/22 | | | 200 | | | | 212 | |
| | | Newfield Exploration Co. | | 5.625% | | 7/1/24 | | | 100 | | | | 110 | |
Total Bond Market Index Portfolio
| | | | | | | | | Face | | | Market | |
| | | | | | | Maturity | | Amount | | | Value• | |
| | | | | Coupon | | Date | | | ($000 | ) | | | ($000 | ) |
| | | Newfield Exploration Co. | | 5.375% | | 1/1/26 | | | 300 | | | | 325 | |
| | | Noble Energy Inc. | | 3.850% | | 1/15/28 | | | 100 | | | | 105 | |
| | | Noble Energy Inc. | | 3.250% | | 10/15/29 | | | 200 | | | | 202 | |
| | | Noble Energy Inc. | | 6.000% | | 3/1/41 | | | 100 | | | | 120 | |
| | | Noble Energy Inc. | | 5.250% | | 11/15/43 | | | 375 | | | | 423 | |
| | | Noble Energy Inc. | | 5.050% | | 11/15/44 | | | 150 | | | | 165 | |
| | | Noble Energy Inc. | | 4.950% | | 8/15/47 | | | 100 | | | | 111 | |
| | | Noble Energy Inc. | | 4.200% | | 10/15/49 | | | 100 | | | | 101 | |
| | | Occidental Petroleum Corp. | | 4.100% | | 2/1/21 | | | 350 | | | | 355 | |
| | | Occidental Petroleum Corp. | | 2.600% | | 8/13/21 | | | 150 | | | | 151 | |
| | | Occidental Petroleum Corp. | | 3.125% | | 2/15/22 | | | 100 | | | | 102 | |
| | | Occidental Petroleum Corp. | | 2.600% | | 4/15/22 | | | 288 | | | | 290 | |
| | | Occidental Petroleum Corp. | | 2.700% | | 8/15/22 | | | 400 | | | | 404 | |
| | | Occidental Petroleum Corp. | | 6.950% | | 7/1/24 | | | 250 | | | | 293 | |
| | | Occidental Petroleum Corp. | | 2.900% | | 8/15/24 | | | 600 | | | | 609 | |
| | | Occidental Petroleum Corp. | | 3.500% | | 6/15/25 | | | 150 | | | | 155 | |
| | | Occidental Petroleum Corp. | | 5.550% | | 3/15/26 | | | 200 | | | | 227 | |
| | | Occidental Petroleum Corp. | | 3.400% | | 4/15/26 | | | 225 | | | | 230 | |
| | | Occidental Petroleum Corp. | | 3.200% | | 8/15/26 | | | 400 | | | | 404 | |
| | | Occidental Petroleum Corp. | | 3.500% | | 8/15/29 | | | 400 | | | | 408 | |
| | | Occidental Petroleum Corp. | | 7.875% | | 9/15/31 | | | 50 | | | | 66 | |
| | | Occidental Petroleum Corp. | | 6.450% | | 9/15/36 | | | 200 | | | | 244 | |
| | | Occidental Petroleum Corp. | | 7.950% | | 6/15/39 | | | 25 | | | | 34 | |
| | | Occidental Petroleum Corp. | | 4.300% | | 8/15/39 | | | 150 | | | | 152 | |
| | | Occidental Petroleum Corp. | | 6.200% | | 3/15/40 | | | 515 | | | | 613 | |
| | | Occidental Petroleum Corp. | | 4.500% | | 7/15/44 | | | 400 | | | | 400 | |
| | | Occidental Petroleum Corp. | | 4.625% | | 6/15/45 | | | 200 | | | | 205 | |
| | | Occidental Petroleum Corp. | | 4.400% | | 4/15/46 | | | 500 | | | | 505 | |
| | | Occidental Petroleum Corp. | | 4.100% | | 2/15/47 | | | 50 | | | | 48 | |
| | | Occidental Petroleum Corp. | | 4.200% | | 3/15/48 | | | 25 | | | | 25 | |
| | | Occidental Petroleum Corp. | | 4.400% | | 8/15/49 | | | 150 | | | | 154 | |
| | | ONEOK Inc. | | 7.500% | | 9/1/23 | | | 100 | | | | 116 | |
| | | ONEOK Inc. | | 2.750% | | 9/1/24 | | | 100 | | | | 101 | |
| | | ONEOK Inc. | | 4.000% | | 7/13/27 | | | 50 | | | | 53 | |
| | | ONEOK Inc. | | 4.350% | | 3/15/29 | | | 100 | | | | 108 | |
| | | ONEOK Inc. | | 3.400% | | 9/1/29 | | | 245 | | | | 248 | |
| | | ONEOK Inc. | | 4.950% | | 7/13/47 | | | 200 | | | | 219 | |
| | | ONEOK Inc. | | 4.450% | | 9/1/49 | | | 150 | | | | 154 | |
| | | ONEOK Partners LP | | 3.375% | | 10/1/22 | | | 400 | | | | 412 | |
| | | ONEOK Partners LP | | 6.650% | | 10/1/36 | | | 300 | | | | 379 | |
| | | ONEOK Partners LP | | 6.850% | | 10/15/37 | | | 300 | | | | 385 | |
| | | ONEOK Partners LP | | 6.125% | | 2/1/41 | | | 150 | | | | 180 | |
| | | Patterson-UTI Energy Inc. | | 3.950% | | 2/1/28 | | | 95 | | | | 92 | |
| | | Patterson-UTI Energy Inc. | | 5.150% | | 11/15/29 | | | 100 | | | | 102 | |
| | | Petro-Canada | | 6.800% | | 5/15/38 | | | 225 | | | | 321 | |
| | | Phillips 66 | | 4.300% | | 4/1/22 | | | 275 | | | | 288 | |
| | | Phillips 66 | | 3.900% | | 3/15/28 | | | 300 | | | | 326 | |
| | | Phillips 66 | | 4.650% | | 11/15/34 | | | 200 | | | | 233 | |
| | | Phillips 66 | | 4.875% | | 11/15/44 | | | 474 | | | | 571 | |
| | | Phillips 66 Partners LP | | 2.450% | | 12/15/24 | | | 50 | | | | 50 | |
| | | Phillips 66 Partners LP | | 3.605% | | 2/15/25 | | | 125 | | | | 130 | |
| | | Phillips 66 Partners LP | | 3.750% | | 3/1/28 | | | 50 | | | | 52 | |
| | | Phillips 66 Partners LP | | 3.150% | | 12/15/29 | | | 100 | | | | 99 | |
| | | Phillips 66 Partners LP | | 4.680% | | 2/15/45 | | | 245 | | | | 264 | |
| | | Pioneer Natural Resources Co. | | 3.950% | | 7/15/22 | | | 200 | | | | 208 | |
| | | Pioneer Natural Resources Co. | | 4.450% | | 1/15/26 | | | 225 | | | | 247 | |
| | | Plains All American Pipeline LP / PAA Finance Corp. | | 5.000% | | 2/1/21 | | | 100 | | | | 102 | |
| | | Plains All American Pipeline LP / PAA Finance Corp. | | 3.650% | | 6/1/22 | | | 100 | | | | 103 | |
| | | Plains All American Pipeline LP / PAA Finance Corp. | | 2.850% | | 1/31/23 | | | 289 | | | | 292 | |
| | | Plains All American Pipeline LP / PAA Finance Corp. | | 3.600% | | 11/1/24 | | | 790 | | | | 810 | |
| | | Plains All American Pipeline LP / PAA Finance Corp. | | 4.500% | | 12/15/26 | | | 100 | | | | 106 | |
| | | Plains All American Pipeline LP / PAA Finance Corp. | | 3.550% | | 12/15/29 | | | 200 | | | | 197 | |
| | | Plains All American Pipeline LP / PAA Finance Corp. | | 4.300% | | 1/31/43 | | | 225 | | | | 205 | |
| | | Plains All American Pipeline LP / PAA Finance Corp. | | 4.700% | | 6/15/44 | | | 200 | | | | 194 | |
| | Regency Energy Partners LP / Regency Energy Finance Corp. | | 5.875% | | 3/1/22 | | | 175 | | | | 186 | |
| | | Regency Energy Partners LP / Regency Energy Finance Corp. | | 5.000% | | 10/1/22 | | | 200 | | | | 212 | |
| | | Regency Energy Partners LP / Regency Energy Finance Corp. | | 4.500% | | 11/1/23 | | | 100 | | | | 106 | |
| | | Sabine Pass Liquefaction LLC | | 5.625% | | 2/1/21 | | | 500 | | | | 514 | |
| | | Sabine Pass Liquefaction LLC | | 6.250% | | 3/15/22 | | | 325 | | | | 349 | |
| | | Sabine Pass Liquefaction LLC | | 5.625% | | 4/15/23 | | | 350 | | | | 381 | |
| | | Sabine Pass Liquefaction LLC | | 5.750% | | 5/15/24 | | | 400 | | | | 446 | |
| | | Sabine Pass Liquefaction LLC | | 5.625% | | 3/1/25 | | | 400 | | | | 449 | |
| | | Sabine Pass Liquefaction LLC | | 5.875% | | 6/30/26 | | | 500 | | | | 574 | |
| | | Sabine Pass Liquefaction LLC | | 5.000% | | 3/15/27 | | | 200 | | | | 220 | |
| | | Sabine Pass Liquefaction LLC | | 4.200% | | 3/15/28 | | | 100 | | | | 106 | |
| | | Schlumberger Investment SA | | 3.650% | | 12/1/23 | | | 325 | | | | 342 | |
| | | Shell International Finance BV | | 1.875% | | 5/10/21 | | | 200 | | | | 200 | |
| | | Shell International Finance BV | | 1.750% | | 9/12/21 | | | 200 | | | | 200 | |
| | | Shell International Finance BV | | 2.250% | | 1/6/23 | | | 100 | | | | 101 | |
| | | Shell International Finance BV | | 3.400% | | 8/12/23 | | | 75 | | | | 79 | |
| | | Shell International Finance BV | | 2.000% | | 11/7/24 | | | 200 | | | | 200 | |
| | | Shell International Finance BV | | 3.250% | | 5/11/25 | | | 200 | | | | 211 | |
| | | Shell International Finance BV | | 2.875% | | 5/10/26 | | | 500 | | | | 518 | |
| | | Shell International Finance BV | | 2.500% | | 9/12/26 | | | 900 | | | | 913 | |
| | | Shell International Finance BV | | 3.875% | | 11/13/28 | | | 100 | | | | 111 | |
| | | Shell International Finance BV | | 2.375% | | 11/7/29 | | | 700 | | | | 693 | |
| | | Shell International Finance BV | | 4.125% | | 5/11/35 | | | 300 | | | | 350 | |
| | | Shell International Finance BV | | 6.375% | | 12/15/38 | | | 475 | | | | 693 | |
| | | Shell International Finance BV | | 5.500% | | 3/25/40 | | | 125 | | | | 169 | |
| | | Shell International Finance BV | | 4.550% | | 8/12/43 | | | 300 | | | | 362 | |
| | | Shell International Finance BV | | 4.375% | | 5/11/45 | | | 400 | | | | 476 | |
| | | Shell International Finance BV | | 4.000% | | 5/10/46 | | | 700 | | | | 797 | |
| | | Shell International Finance BV | | 3.125% | | 11/7/49 | | | 400 | | | | 394 | |
| | | Spectra Energy Partners LP | | 4.750% | | 3/15/24 | | | 600 | | | | 652 | |
| | | Spectra Energy Partners LP | | 3.500% | | 3/15/25 | | | 50 | | | | 52 | |
| | | Spectra Energy Partners LP | | 3.375% | | 10/15/26 | | | 205 | | | | 212 | |
| | | Spectra Energy Partners LP | | 5.950% | | 9/25/43 | | | 40 | | | | 50 | |
| | | Spectra Energy Partners LP | | 4.500% | | 3/15/45 | | | 325 | | | | 357 | |
| | | Suncor Energy Inc. | | 3.600% | | 12/1/24 | | | 100 | | | | 106 | |
| | | Suncor Energy Inc. | | 5.950% | | 12/1/34 | | | 75 | | | | 98 | |
| | | Suncor Energy Inc. | | 6.500% | | 6/15/38 | | | 525 | | | | 729 | |
| | | Suncor Energy Inc. | | 4.000% | | 11/15/47 | | | 150 | | | | 163 | |
| | | Sunoco Logistics Partners Operations LP | | 4.400% | | 4/1/21 | | | 425 | | | | 435 | |
| | | Sunoco Logistics Partners Operations LP | | 3.450% | | 1/15/23 | | | 50 | | | | 51 | |
| | | Sunoco Logistics Partners Operations LP | | 4.250% | | 4/1/24 | | | 225 | | | | 236 | |
| | | Sunoco Logistics Partners Operations LP | | 4.000% | | 10/1/27 | | | 150 | | | | 155 | |
| | | Sunoco Logistics Partners Operations LP | | 4.950% | | 1/15/43 | | | 175 | | | | 174 | |
| | | Sunoco Logistics Partners Operations LP | | 5.300% | | 4/1/44 | | | 325 | | | | 343 | |
| | | Sunoco Logistics Partners Operations LP | | 5.350% | | 5/15/45 | | | 50 | | | | 53 | |
| | | Sunoco Logistics Partners Operations LP | | 5.400% | | 10/1/47 | | | 275 | | | | 297 | |
| | | TC PipeLines LP | | 3.900% | | 5/25/27 | | | 50 | | | | 52 | |
| | | TechnipFMC plc | | 3.450% | | 10/1/22 | | | 75 | | | | 76 | |
| | | Total Capital Canada Ltd. | | 2.750% | | 7/15/23 | | | 125 | | | | 128 | |
| | | Total Capital International SA | | 2.750% | | 6/19/21 | | | 300 | | | | 304 | |
| | | Total Capital International SA | | 2.218% | | 7/12/21 | | | 250 | | | | 251 | |
| | | Total Capital International SA | | 2.875% | | 2/17/22 | | | 300 | | | | 306 | |
| | | Total Capital International SA | | 2.700% | | 1/25/23 | | | 50 | | | | 51 | |
| | | Total Capital International SA | | 3.700% | | 1/15/24 | | | 525 | | | | 557 | |
| | | Total Capital International SA | | 2.434% | | 1/10/25 | | | 175 | | | | 177 | |
| | | Total Capital International SA | | 3.455% | | 2/19/29 | | | 225 | | | | 243 | |
| | | Total Capital International SA | | 2.829% | | 1/10/30 | | | 200 | | | | 205 | |
| | | Total Capital International SA | | 3.461% | | 7/12/49 | | | 200 | | | | 210 | |
| | | Total Capital SA | | 4.125% | | 1/28/21 | | | 75 | | | | 77 | |
| | | Total Capital SA | | 3.883% | | 10/11/28 | | | 100 | | | | 112 | |
| | | TransCanada PipeLines Ltd. | | 2.500% | | 8/1/22 | | | 500 | | | | 502 | |
Total Bond Market Index Portfolio
| | | | | | | | | Face | | | Market | |
| | | | | | | Maturity | | Amount | | | Value• | |
| | | | | Coupon | | Date | | | ($000 | ) | | | ($000 | ) |
| | | TransCanada PipeLines Ltd. | | 4.875% | | 1/15/26 | | | 100 | | | | 112 | |
| | | TransCanada PipeLines Ltd. | | 4.250% | | 5/15/28 | | | 250 | | | | 277 | |
| | | TransCanada PipeLines Ltd. | | 4.625% | | 3/1/34 | | | 250 | | | | 286 | |
| | | TransCanada PipeLines Ltd. | | 5.600% | | 3/31/34 | | | 150 | | | | 182 | |
| | | TransCanada PipeLines Ltd. | | 5.850% | | 3/15/36 | | | 300 | | | | 363 | |
| | | TransCanada PipeLines Ltd. | | 6.200% | | 10/15/37 | | | 425 | | | | 551 | |
| | | TransCanada PipeLines Ltd. | | 4.750% | | 5/15/38 | | | 250 | | | | 285 | |
| | | TransCanada PipeLines Ltd. | | 5.000% | | 10/16/43 | | | 150 | | | | 174 | |
| | | TransCanada PipeLines Ltd. | | 4.875% | | 5/15/48 | | | 300 | | | | 352 | |
| | | TransCanada PipeLines Ltd. | | 5.100% | | 3/15/49 | | | 200 | | | | 242 | |
| | | Transcontinental Gas Pipe Line Co. LLC | | 4.000% | | 3/15/28 | | | 100 | | | | 106 | |
| | | Transcontinental Gas Pipe Line Co. LLC | | 4.600% | | 3/15/48 | | | 100 | | | | 107 | |
| | | Valero Energy Corp. | | 4.350% | | 6/1/28 | | | 350 | | | | 384 | |
| | | Valero Energy Corp. | | 7.500% | | 4/15/32 | | | 650 | | | | 902 | |
| | | Valero Energy Corp. | | 4.900% | | 3/15/45 | | | 75 | | | | 87 | |
| | | Valero Energy Partners LP | | 4.375% | | 12/15/26 | | | 100 | | | | 109 | |
| | | Valero Energy Partners LP | | 4.500% | | 3/15/28 | | | 75 | | | | 82 | |
| | | Western Midstream Operating LP | | 5.375% | | 6/1/21 | | | 300 | | | | 308 | |
| | | Western Midstream Operating LP | | 3.950% | | 6/1/25 | | | 100 | | | | 100 | |
| | | Western Midstream Operating LP | | 4.650% | | 7/1/26 | | | 100 | | | | 103 | |
| | | Western Midstream Operating LP | | 4.500% | | 3/1/28 | | | 50 | | | | 48 | |
| | | Western Midstream Operating LP | | 4.750% | | 8/15/28 | | | 50 | | | | 50 | |
| | | Western Midstream Operating LP | | 5.450% | | 4/1/44 | | | 325 | | | | 283 | |
| | | Western Midstream Operating LP | | 5.300% | | 3/1/48 | | | 100 | | | | 86 | |
| | | Williams Cos. Inc. | | 4.000% | | 11/15/21 | | | 100 | | | | 103 | |
| | | Williams Cos. Inc. | | 3.600% | | 3/15/22 | | | 475 | | | | 488 | |
| | | Williams Cos. Inc. | | 3.350% | | 8/15/22 | | | 125 | | | | 128 | |
| | | Williams Cos. Inc. | | 3.700% | | 1/15/23 | | | 200 | | | | 206 | |
| | | Williams Cos. Inc. | | 4.550% | | 6/24/24 | | | 400 | | | | 431 | |
| | | Williams Cos. Inc. | | 3.900% | | 1/15/25 | | | 325 | | | | 340 | |
| | | Williams Cos. Inc. | | 3.750% | | 6/15/27 | | | 500 | | | | 519 | |
| | | Williams Cos. Inc. | | 6.300% | | 4/15/40 | | | 100 | | | | 124 | |
| | | Williams Cos. Inc. | | 5.800% | | 11/15/43 | | | 100 | | | | 119 | |
| | | Williams Cos. Inc. | | 5.400% | | 3/4/44 | | | 400 | | | | 449 | |
| | | Williams Cos. Inc. | | 5.750% | | 6/24/44 | | | 100 | | | | 118 | |
| | | Williams Cos. Inc. | | 5.100% | | 9/15/45 | | | 350 | | | | 389 | |
| | | Williams Cos. Inc. | | 4.850% | | 3/1/48 | | | 150 | | | | 165 | |
| | | | | | | | | | | | | | | |
| | | Other Industrial (0.1%) | | | | | | | | | | | | |
| 3 | | American University | | 3.672% | | 4/1/49 | | | 75 | | | | 80 | |
| 3 | | Boston University | | 4.061% | | 10/1/48 | | | 50 | | | | 57 | |
| | | California Institute of Technology | | 4.321% | | 8/1/45 | | | 70 | | | | 84 | |
| | | California Institute of Technology | | 4.700% | | 11/1/11 | | | 50 | | | | 61 | |
| | | California Institute of Technology | | 3.650% | | 9/1/19 | | | 50 | | | | 48 | |
| | | CBRE Services Inc. | | 5.250% | | 3/15/25 | | | 100 | | | | 112 | |
| | | CBRE Services Inc. | | 4.875% | | 3/1/26 | | | 125 | | | | 140 | |
| | | Cintas Corp. No. 2 | | 2.900% | | 4/1/22 | | | 100 | | | | 102 | |
| | | Cintas Corp. No. 2 | | 3.250% | | 6/1/22 | | | 75 | | | | 77 | |
| | | Cintas Corp. No. 2 | | 3.700% | | 4/1/27 | | | 175 | | | | 190 | |
| | | Fluor Corp. | | 3.500% | | 12/15/24 | | | 250 | | | | 255 | |
| | | Fluor Corp. | | 4.250% | | 9/15/28 | | | 125 | | | | 126 | |
| | | Georgetown University | | 4.315% | | 4/1/49 | | | 68 | | | | 82 | |
| | | Georgetown University | | 5.215% | | 10/1/18 | | | 59 | | | | 76 | |
| | | Hillenbrand Inc. | | 4.500% | | 9/15/26 | | | 75 | | | | 78 | |
| 3 | | Johns Hopkins University | | 4.083% | | 7/1/53 | | | 75 | | | | 87 | |
| 3 | | Massachusetts Institute of Technology | | 3.959% | | 7/1/38 | | | 125 | | | | 140 | |
| | | Massachusetts Institute of Technology | | 2.989% | | 7/1/50 | | | 85 | | | | 84 | |
| | | Massachusetts Institute of Technology | | 5.600% | | 7/1/11 | | | 130 | | | | 198 | |
| | | Massachusetts Institute of Technology | | 4.678% | | 7/1/14 | | | 175 | | | | 226 | |
| 3 | | Northwestern University | | 4.643% | | 12/1/44 | | | 75 | | | | 93 | |
| 3 | | Northwestern University | | 3.662% | | 12/1/57 | | | 75 | | | | 83 | |
| | | President & Fellows of Harvard College | | 4.875% | | 10/15/40 | | | 225 | | | | 286 | |
| | | President & Fellows of Harvard College | | 3.150% | | 7/15/46 | | | 100 | | | | 101 | |
| | | Steelcase Inc. | | 5.125% | | 1/18/29 | | | 125 | | | | 141 | |
| 3 | | Trustees of Boston College | | 3.129% | | 7/1/52 | | | 100 | | | | 97 | |
| 3 | | University of Chicago | | 4.003% | | 10/1/53 | | | 100 | | | | 114 | |
| 3 | | University of Notre Dame du Lac | | 3.438% | | 2/15/45 | | | 100 | | | | 106 | |
| | | University of Notre Dame du Lac | | 3.394% | | 2/15/48 | | | 125 | | | | 133 | |
| | | University of Pennsylvania | | 4.674% | | 9/1/12 | | | 50 | | | | 65 | |
| | | University of Pennsylvania | | 3.610% | | 2/15/19 | | | 150 | | | | 153 | |
| 3 | | University of Southern California | | 3.028% | | 10/1/39 | | | 100 | | | | 100 | |
| 3 | | University of Southern California | | 3.841% | | 10/1/47 | | | 200 | | | | 222 | |
| 3 | | William Marsh Rice University | | 3.574% | | 5/15/45 | | | 150 | | | | 160 | |
| | | | | | | | | | | | | | | |
| | | Technology (2.2%) | | | | | | | | | | | | |
| | | Adobe Inc. | | 3.250% | | 2/1/25 | | | 175 | | | | 185 | |
| | | Alphabet Inc. | | 3.625% | | 5/19/21 | | | 150 | | | | 154 | |
| | | Altera Corp. | | 4.100% | | 11/15/23 | | | 75 | | | | 81 | |
| | | Amphenol Corp. | | 3.200% | | 4/1/24 | | | 50 | | | | 52 | |
| | | Amphenol Corp. | | 2.800% | | 2/15/30 | | | 275 | | | | 271 | |
| | | Analog Devices Inc. | | 2.875% | | 6/1/23 | | | 450 | | | | 459 | |
| | | Analog Devices Inc. | | 3.125% | | 12/5/23 | | | 75 | | | | 77 | |
| | | Analog Devices Inc. | | 3.500% | | 12/5/26 | | | 200 | | | | 210 | |
| | | Apple Inc. | | 2.000% | | 11/13/20 | | | 225 | | | | 226 | |
| | | Apple Inc. | | 2.250% | | 2/23/21 | | | 750 | | | | 754 | |
| | | Apple Inc. | | 2.850% | | 5/6/21 | | | 555 | | | | 563 | |
| | | Apple Inc. | | 1.550% | | 8/4/21 | | | 375 | | | | 374 | |
| | | Apple Inc. | | 2.150% | | 2/9/22 | | | 225 | | | | 227 | |
| | | Apple Inc. | | 2.500% | | 2/9/22 | | | 1,000 | | | | 1,015 | |
| | | Apple Inc. | | 2.300% | | 5/11/22 | | | 200 | | | | 202 | |
| | | Apple Inc. | | 2.700% | | 5/13/22 | | | 250 | | | | 255 | |
| | | Apple Inc. | | 2.100% | | 9/12/22 | | | 200 | | | | 202 | |
| | | Apple Inc. | | 2.400% | | 1/13/23 | | | 282 | | | | 286 | |
| | | Apple Inc. | | 2.850% | | 2/23/23 | | | 342 | | | | 351 | |
| | | Apple Inc. | | 2.400% | | 5/3/23 | | | 865 | | | | 879 | |
| | | Apple Inc. | | 3.000% | | 2/9/24 | | | 325 | | | | 336 | |
| | | Apple Inc. | | 3.450% | | 5/6/24 | | | 75 | | | | 80 | |
| | | Apple Inc. | | 2.850% | | 5/11/24 | | | 1,243 | | | | 1,285 | |
| | | Apple Inc. | | 1.800% | | 9/11/24 | | | 150 | | | | 149 | |
| | | Apple Inc. | | 2.750% | | 1/13/25 | | | 575 | | | | 593 | |
| | | Apple Inc. | | 3.250% | | 2/23/26 | | | 705 | | | | 746 | |
| | | Apple Inc. | | 2.450% | | 8/4/26 | | | 450 | | | | 456 | |
| | | Apple Inc. | | 3.200% | | 5/11/27 | | | 775 | | | | 816 | |
| | | Apple Inc. | | 2.900% | | 9/12/27 | | | 655 | | | | 681 | |
| | | Apple Inc. | | 2.200% | | 9/11/29 | | | 300 | | | | 294 | |
| | | Apple Inc. | | 4.500% | | 2/23/36 | | | 225 | | | | 273 | |
| | | Apple Inc. | | 3.850% | | 5/4/43 | | | 450 | | | | 503 | |
| | | Apple Inc. | | 4.450% | | 5/6/44 | | | 200 | | | | 244 | |
| | | Apple Inc. | | 3.450% | | 2/9/45 | | | 225 | | | | 236 | |
| | | Apple Inc. | | 4.375% | | 5/13/45 | | | 225 | | | | 271 | |
| | | Apple Inc. | | 4.650% | | 2/23/46 | | | 910 | | | | 1,136 | |
| | | Apple Inc. | | 3.850% | | 8/4/46 | | | 375 | | | | 421 | |
| | | Apple Inc. | | 4.250% | | 2/9/47 | | | 200 | | | | 237 | |
| | | Apple Inc. | | 3.750% | | 9/12/47 | | | 525 | | | | 579 | |
| | | Apple Inc. | | 2.950% | | 9/11/49 | | | 675 | | | | 656 | |
| | | Applied Materials Inc. | | 3.900% | | 10/1/25 | | | 145 | | | | 158 | |
| | | Applied Materials Inc. | | 3.300% | | 4/1/27 | | | 225 | | | | 239 | |
| | | Applied Materials Inc. | | 5.100% | | 10/1/35 | | | 100 | | | | 126 | |
| | | Applied Materials Inc. | | 5.850% | | 6/15/41 | | | 125 | | | | 170 | |
| | | Applied Materials Inc. | | 4.350% | | 4/1/47 | | | 175 | | | | 211 | |
| | | Arrow Electronics Inc. | | 3.500% | | 4/1/22 | | | 75 | | | | 77 | |
| | | Arrow Electronics Inc. | | 4.500% | | 3/1/23 | | | 50 | | | | 52 | |
| | | Arrow Electronics Inc. | | 3.250% | | 9/8/24 | | | 171 | | | | 175 | |
| | | Arrow Electronics Inc. | | 4.000% | | 4/1/25 | | | 50 | | | | 52 | |
| | | Arrow Electronics Inc. | | 3.875% | | 1/12/28 | | | 100 | | | | 103 | |
| | | Autodesk Inc. | | 3.600% | | 12/15/22 | | | 25 | | | | 26 | |
| | | Autodesk Inc. | | 4.375% | | 6/15/25 | | | 100 | | | | 109 | |
| | | Autodesk Inc. | | 3.500% | | 6/15/27 | | | 75 | | | | 78 | |
| | | Avnet Inc. | | 4.875% | | 12/1/22 | | | 170 | | | | 180 | |
| | | Avnet Inc. | | 4.625% | | 4/15/26 | | | 100 | | | | 106 | |
| | | Baidu Inc. | | 3.500% | | 11/28/22 | | | 275 | | | | 283 | |
| | | Baidu Inc. | | 3.875% | | 9/29/23 | | | 200 | | | | 209 | |
| | | Baidu Inc. | | 4.375% | | 5/14/24 | | | 200 | | | | 213 | |
| | | Baidu Inc. | | 3.625% | | 7/6/27 | | | 200 | | | | 206 | |
| | | Baidu Inc. | | 4.375% | | 3/29/28 | | | 100 | | | | 108 | |
| | | Broadcom Corp. / Broadcom Cayman Finance Ltd. | | 2.200% | | 1/15/21 | | | 150 | | | | 150 | |
| | | Broadcom Corp. / Broadcom Cayman Finance Ltd. | | 3.000% | | 1/15/22 | | | 642 | | | | 652 | |
| | | Broadcom Corp. / Broadcom Cayman Finance Ltd. | | 2.650% | | 1/15/23 | | | 250 | | | | 251 | |
Total Bond Market Index Portfolio
| | | | | | | | | Face | | | Market | |
| | | | | | | Maturity | | Amount | | | Value• | |
| | | | | Coupon | | Date | | | ($000 | ) | | | ($000 | ) |
| | | Broadcom Corp. / Broadcom Cayman Finance Ltd. | | 3.625% | | 1/15/24 | | | 450 | | | | 466 | |
| | | Broadcom Corp. / Broadcom Cayman Finance Ltd. | | 3.125% | | 1/15/25 | | | 480 | | | | 486 | |
| | | Broadcom Corp. / Broadcom Cayman Finance Ltd. | | 3.875% | | 1/15/27 | | | 925 | | | | 959 | |
| | | Broadcom Corp. / Broadcom Cayman Finance Ltd. | | 3.500% | | 1/15/28 | | | 200 | | | | 202 | |
| 6 | | Broadcom Inc. | | 3.125% | | 4/15/21 | | | 400 | | | | 405 | |
| 6 | | Broadcom Inc. | | 3.125% | | 10/15/22 | | | 250 | | | | 254 | |
| 6 | | Broadcom Inc. | | 3.625% | | 10/15/24 | | | 607 | | | | 629 | |
| 6 | | Broadcom Inc. | | 4.250% | | 4/15/26 | | | 500 | | | | 531 | |
| 6 | | Broadcom Inc. | | 4.750% | | 4/15/29 | | | 945 | | | | 1,032 | |
| | | Broadridge Financial Solutions Inc. | | 3.400% | | 6/27/26 | | | 100 | | | | 104 | |
| | | Broadridge Financial Solutions Inc. | | 2.900% | | 12/1/29 | | | 75 | | | | 75 | |
| | | Cadence Design Systems Inc. | | 4.375% | | 10/15/24 | | | 100 | | | | 107 | |
| | | Cisco Systems Inc. | | 2.200% | | 2/28/21 | | | 675 | | | | 678 | |
| | | Cisco Systems Inc. | | 3.000% | | 6/15/22 | | | 125 | | | | 129 | |
| | | Cisco Systems Inc. | | 2.200% | | 9/20/23 | | | 150 | | | | 151 | |
| | | Cisco Systems Inc. | | 3.625% | | 3/4/24 | | | 875 | | | | 935 | |
| | | Cisco Systems Inc. | | 2.950% | | 2/28/26 | | | 100 | | | | 105 | |
| | | Cisco Systems Inc. | | 2.500% | | 9/20/26 | | | 225 | | | | 229 | |
| | | Cisco Systems Inc. | | 5.500% | | 1/15/40 | | | 800 | | | | 1,089 | |
| | | Citrix Systems Inc. | | 4.500% | | 12/1/27 | | | 100 | | | | 108 | |
| | | Corning Inc. | | 2.900% | | 5/15/22 | | | 175 | | | | 179 | |
| | | Corning Inc. | | 4.700% | | 3/15/37 | | | 275 | | | | 303 | |
| | | Corning Inc. | | 5.750% | | 8/15/40 | | | 195 | | | | 243 | |
| | | Corning Inc. | | 4.750% | | 3/15/42 | | | 100 | | | | 113 | |
| | | Corning Inc. | | 4.375% | | 11/15/57 | | | 150 | | | | 151 | |
| 6 | | Dell International LLC / EMC Corp. | | 4.420% | | 6/15/21 | | | 850 | | | | 874 | |
| 6 | | Dell International LLC / EMC Corp. | | 5.450% | | 6/15/23 | | | 700 | | | | 758 | |
| 6 | | Dell International LLC / EMC Corp. | | 4.000% | | 7/15/24 | | | 100 | | | | 105 | |
| 6 | | Dell International LLC / EMC Corp. | | 6.020% | | 6/15/26 | | | 1,075 | | | | 1,237 | |
| 6 | | Dell International LLC / EMC Corp. | | 4.900% | | 10/1/26 | | | 250 | | | | 275 | |
| 6 | | Dell International LLC / EMC Corp. | | 5.300% | | 10/1/29 | | | 325 | | | | 365 | |
| 6 | | Dell International LLC / EMC Corp. | | 8.100% | | 7/15/36 | | | 320 | | | | 420 | |
| 6 | | Dell International LLC / EMC Corp. | | 8.350% | | 7/15/46 | | | 425 | | | | 582 | |
| | | DXC Technology Co. | | 4.250% | | 4/15/24 | | | 250 | | | | 265 | |
| | | Equifax Inc. | | 2.300% | | 6/1/21 | | | 200 | | | | 201 | |
| | | Equifax Inc. | | 3.600% | | 8/15/21 | | | 25 | | | | 26 | |
| | | Equifax Inc. | | 3.950% | | 6/15/23 | | | 50 | | | | 53 | |
| | | Equifax Inc. | | 2.600% | | 12/1/24 | | | 75 | | | | 75 | |
| | | Equinix Inc. | | 2.625% | | 11/18/24 | | | 200 | | | | 201 | |
| | | Equinix Inc. | | 5.875% | | 1/15/26 | | | 500 | | | | 531 | |
| | | Equinix Inc. | | 2.900% | | 11/18/26 | | | 100 | | | | 100 | |
| | | Equinix Inc. | | 3.200% | | 11/18/29 | | | 250 | | | | 251 | |
| | | Fidelity National Information Services Inc. | | 3.500% | | 4/15/23 | | | 143 | | | | 149 | |
| | | Fidelity National Information Services Inc. | | 3.875% | | 6/5/24 | | | 150 | | | | 159 | |
| | | Fidelity National Information Services Inc. | | 3.000% | | 8/15/26 | | | 414 | | | | 427 | |
| | | Fidelity National Information Services Inc. | | 3.750% | | 5/21/29 | | | 200 | | | | 218 | |
| | | Fiserv Inc. | | 3.800% | | 10/1/23 | | | 200 | | | | 211 | |
| | | Fiserv Inc. | | 2.750% | | 7/1/24 | | | 400 | | | | 407 | |
| | | Fiserv Inc. | | 3.850% | | 6/1/25 | | | 200 | | | | 213 | |
| | | Fiserv Inc. | | 3.200% | | 7/1/26 | | | 200 | | | | 207 | |
| | | Fiserv Inc. | | 3.500% | | 7/1/29 | | | 944 | | | | 992 | |
| | | Fiserv Inc. | | 4.400% | | 7/1/49 | | | 415 | | | | 471 | |
| | | Flex Ltd. | | 4.875% | | 6/15/29 | | | 50 | | | | 54 | |
| | | FLIR Systems Inc. | | 3.125% | | 6/15/21 | | | 50 | | | | 50 | |
| | | Global Payments Inc. | | 2.650% | | 2/15/25 | | | 200 | | | | 201 | |
| | | Global Payments Inc. | | 3.200% | | 8/15/29 | | | 250 | | | | 254 | |
| | | Global Payments Inc. | | 4.150% | | 8/15/49 | | | 150 | | | | 160 | |
| | | Hewlett Packard Enterprise Co. | | 3.600% | | 10/15/20 | | | 575 | | | | 581 | |
| | | Hewlett Packard Enterprise Co. | | 3.500% | | 10/5/21 | | | 100 | | | | 102 | |
| | | Hewlett Packard Enterprise Co. | | 4.400% | | 10/15/22 | | | 350 | | | | 369 | |
| | | Hewlett Packard Enterprise Co. | | 2.250% | | 4/1/23 | | | 200 | | | | 200 | |
| | | Hewlett Packard Enterprise Co. | | 4.900% | | 10/15/25 | | | 500 | | | | 554 | |
| | | Hewlett Packard Enterprise Co. | | 6.200% | | 10/15/35 | | | 150 | | | | 180 | |
| | | Hewlett Packard Enterprise Co. | | 6.350% | | 10/15/45 | | | 275 | | | | 331 | |
| | | HP Inc. | | 3.750% | | 12/1/20 | | | 53 | | | | 54 | |
| | | HP Inc. | | 4.050% | | 9/15/22 | | | 100 | | | | 104 | |
| | | HP Inc. | | 6.000% | | 9/15/41 | | | 100 | | | | 110 | |
| | | IBM Credit LLC | | 3.450% | | 11/30/20 | | | 100 | | | | 102 | |
| | | IBM Credit LLC | | 2.650% | | 2/5/21 | | | 150 | | | | 151 | |
| | | IBM Credit LLC | | 3.600% | | 11/30/21 | | | 100 | | | | 103 | |
| | | IBM Credit LLC | | 2.200% | | 9/8/22 | | | 100 | | | | 101 | |
| | | IBM Credit LLC | | 3.000% | | 2/6/23 | | | 150 | | | | 154 | |
| | | Intel Corp. | | 1.700% | | 5/19/21 | | | 100 | | | | 100 | |
| | | Intel Corp. | | 3.300% | | 10/1/21 | | | 100 | | | | 103 | |
| | | Intel Corp. | | 3.100% | | 7/29/22 | | | 175 | | | | 181 | |
| | | Intel Corp. | | 2.700% | | 12/15/22 | | | 404 | | | | 414 | |
| | | Intel Corp. | | 2.875% | | 5/11/24 | | | 1,050 | | | | 1,089 | |
| | | Intel Corp. | | 3.700% | | 7/29/25 | | | 450 | | | | 486 | |
| | | Intel Corp. | | 2.600% | | 5/19/26 | | | 160 | | | | 164 | |
| | | Intel Corp. | | 2.450% | | 11/15/29 | | | 200 | | | | 199 | |
| | | Intel Corp. | | 4.000% | | 12/15/32 | | | 150 | | | | 174 | |
| | | Intel Corp. | | 4.800% | | 10/1/41 | | | 162 | | | | 200 | |
| | | Intel Corp. | | 4.100% | | 5/19/46 | | | 250 | | | | 287 | |
| | | Intel Corp. | | 4.100% | | 5/11/47 | | | 200 | | | | 229 | |
| | | Intel Corp. | | 3.734% | | 12/8/47 | | | 674 | | | | 737 | |
| | | Intel Corp. | | 3.250% | | 11/15/49 | | | 300 | | | | 300 | |
| | | International Business Machines Corp. | | 2.800% | | 5/13/21 | | | 300 | | | | 304 | |
| | | International Business Machines Corp. | | 2.900% | | 11/1/21 | | | 25 | | | | 25 | |
| | | International Business Machines Corp. | | 2.850% | | 5/13/22 | | | 500 | | | | 511 | |
| | | International Business Machines Corp. | | 1.875% | | 8/1/22 | | | 675 | | | | 675 | |
| | | International Business Machines Corp. | | 2.875% | | 11/9/22 | | | 240 | | | | 246 | |
| | | International Business Machines Corp. | | 3.375% | | 8/1/23 | | | 450 | | | | 471 | |
| | | International Business Machines Corp. | | 3.625% | | 2/12/24 | | | 450 | | | | 476 | |
| | | International Business Machines Corp. | | 3.000% | | 5/15/24 | | | 600 | | | | 621 | |
| | | International Business Machines Corp. | | 7.000% | | 10/30/25 | | | 300 | | | | 374 | |
| | | International Business Machines Corp. | | 3.450% | | 2/19/26 | | | 485 | | | | 516 | |
| | | International Business Machines Corp. | | 3.300% | | 5/15/26 | | | 700 | | | | 737 | |
| | | International Business Machines Corp. | | 6.220% | | 8/1/27 | | | 75 | | | | 93 | |
| | | International Business Machines Corp. | | 6.500% | | 1/15/28 | | | 75 | | | | 95 | |
| | | International Business Machines Corp. | | 3.500% | | 5/15/29 | | | 700 | | | | 751 | |
| | | International Business Machines Corp. | | 4.150% | | 5/15/39 | | | 400 | | | | 449 | |
| | | International Business Machines Corp. | | 5.600% | | 11/30/39 | | | 148 | | | | 193 | |
| | | International Business Machines Corp. | | 4.000% | | 6/20/42 | | | 358 | | | | 395 | |
| | | International Business Machines Corp. | | 4.250% | | 5/15/49 | | | 700 | | | | 796 | |
| | | Jabil Inc. | | 5.625% | | 12/15/20 | | | 100 | | | | 103 | |
| | | Jabil Inc. | | 3.950% | | 1/12/28 | | | 75 | | | | 77 | |
| | | Juniper Networks Inc. | | 4.350% | | 6/15/25 | | | 50 | | | | 53 | |
| | | Juniper Networks Inc. | | 3.750% | | 8/15/29 | | | 500 | | | | 520 | |
| | | Juniper Networks Inc. | | 5.950% | | 3/15/41 | | | 25 | | | | 28 | |
| | | Keysight Technologies Inc. | | 4.550% | | 10/30/24 | | | 195 | | | | 212 | |
| | | Keysight Technologies Inc. | | 4.600% | | 4/6/27 | | | 125 | | | | 139 | |
| | | Keysight Technologies Inc. | | 3.000% | | 10/30/29 | | | 100 | | | | 100 | |
| | | KLA Corp. | | 4.125% | | 11/1/21 | | | 100 | | | | 103 | |
| | | KLA Corp. | | 4.650% | | 11/1/24 | | | 250 | | | | 274 | |
| | | KLA Corp. | | 4.100% | | 3/15/29 | | | 350 | | | | 383 | |
| | | KLA Corp. | | 5.000% | | 3/15/49 | | | 75 | | | | 92 | |
| | | Lam Research Corp. | | 2.800% | | 6/15/21 | | | 125 | | | | 126 | |
| | | Lam Research Corp. | | 3.800% | | 3/15/25 | | | 100 | | | | 106 | |
| | | Lam Research Corp. | | 3.750% | | 3/15/26 | | | 150 | | | | 161 | |
| | | Lam Research Corp. | | 4.000% | | 3/15/29 | | | 200 | | | | 220 | |
| | | Lam Research Corp. | | 4.875% | | 3/15/49 | | | 175 | | | | 218 | |
| | | Marvell Technology Group Ltd. | | 4.200% | | 6/22/23 | | | 100 | | | | 105 | |
| | | Marvell Technology Group Ltd. | | 4.875% | | 6/22/28 | | | 100 | | | | 110 | |
| | | Maxim Integrated Products Inc. | | 3.375% | | 3/15/23 | | | 75 | | | | 77 | |
| | | Maxim Integrated Products Inc. | | 3.450% | | 6/15/27 | | | 100 | | | | 103 | |
| | | Microchip Technology Inc. | | 3.922% | | 6/1/21 | | | 100 | | | | 102 | |
| | | Microchip Technology Inc. | | 4.333% | | 6/1/23 | | | 100 | | | | 106 | |
| | | Micron Technology Inc. | | 4.640% | | 2/6/24 | | | 50 | | | | 54 | |
| | | Micron Technology Inc. | | 4.975% | | 2/6/26 | | | 100 | | | | 111 | |
| | | Micron Technology Inc. | | 4.185% | | 2/15/27 | | | 200 | | | | 213 | |
| | | Micron Technology Inc. | | 5.327% | | 2/6/29 | | | 150 | | | | 171 | |
| | | Micron Technology Inc. | | 4.663% | | 2/15/30 | | | 100 | | | | 110 | |
| | | Microsoft Corp. | | 2.000% | | 11/3/20 | | | 1,200 | | | | 1,202 | |
| | | Microsoft Corp. | | 2.400% | | 2/6/22 | | | 620 | | | | 629 | |
Total Bond Market Index Portfolio
| | | | | | | | | Face | | | Market | |
| | | | | | | Maturity | | Amount | | | Value• | |
| | | | | Coupon | | Date | | | ($000 | ) | | | ($000 | ) |
| | | Microsoft Corp. | | 2.375% | | 2/12/22 | | | 450 | | | | 456 | |
| | | Microsoft Corp. | | 2.650% | | 11/3/22 | | | 200 | | | | 205 | |
| | | Microsoft Corp. | | 2.375% | | 5/1/23 | | | 75 | | | | 76 | |
| | | Microsoft Corp. | | 2.000% | | 8/8/23 | | | 300 | | | | 302 | |
| | | Microsoft Corp. | | 2.875% | | 2/6/24 | | | 500 | | | | 518 | |
| | | Microsoft Corp. | | 3.125% | | 11/3/25 | | | 575 | | | | 608 | |
| | | Microsoft Corp. | | 2.400% | | 8/8/26 | | | 1,305 | | | | 1,318 | |
| | | Microsoft Corp. | | 3.300% | | 2/6/27 | | | 675 | | | | 721 | |
| | | Microsoft Corp. | | 3.500% | | 2/12/35 | | | 325 | | | | 357 | |
| | | Microsoft Corp. | | 4.200% | | 11/3/35 | | | 375 | | | | 442 | |
| | | Microsoft Corp. | | 3.450% | | 8/8/36 | | | 625 | | | | 683 | |
| | | Microsoft Corp. | | 4.100% | | 2/6/37 | | | 500 | | | | 589 | |
| | | Microsoft Corp. | | 4.500% | | 10/1/40 | | | 390 | | | | 483 | |
| | | Microsoft Corp. | | 3.500% | | 11/15/42 | | | 330 | | | | 358 | |
| | | Microsoft Corp. | | 3.750% | | 5/1/43 | | | 145 | | | | 160 | |
| | | Microsoft Corp. | | 4.875% | | 12/15/43 | | | 150 | | | | 196 | |
| | | Microsoft Corp. | | 3.750% | | 2/12/45 | | | 550 | | | | 624 | |
| | | Microsoft Corp. | | 4.450% | | 11/3/45 | | | 575 | | | | 716 | |
| | | Microsoft Corp. | | 3.700% | | 8/8/46 | | | 1,175 | | | | 1,326 | |
| | | Microsoft Corp. | | 4.250% | | 2/6/47 | | | 600 | | | | 732 | |
| | | Microsoft Corp. | | 4.000% | | 2/12/55 | | | 1,050 | | | | 1,241 | |
| | | Motorola Solutions Inc. | | 3.750% | | 5/15/22 | | | 113 | | | | 117 | |
| | | Motorola Solutions Inc. | | 3.500% | | 3/1/23 | | | 125 | | | | 129 | |
| | | Motorola Solutions Inc. | | 4.000% | | 9/1/24 | | | 240 | | | | 254 | |
| | | Motorola Solutions Inc. | | 4.600% | | 2/23/28 | | | 125 | | | | 135 | |
| | | Motorola Solutions Inc. | | 5.500% | | 9/1/44 | | | 75 | | | | 82 | |
| | | NetApp Inc. | | 3.375% | | 6/15/21 | | | 150 | | | | 152 | |
| | | NetApp Inc. | | 3.300% | | 9/29/24 | | | 75 | | | | 78 | |
| | | NVIDIA Corp. | | 2.200% | | 9/16/21 | | | 200 | | | | 201 | |
| | | NVIDIA Corp. | | 3.200% | | 9/16/26 | | | 200 | | | | 209 | |
| 6 | | NXP BV / NXP Funding LLC | | 4.875% | | 3/1/24 | | | 200 | | | | 217 | |
| 6 | | NXP BV / NXP Funding LLC | | 5.350% | | 3/1/26 | | | 204 | | | | 229 | |
| 6 | | NXP BV / NXP Funding LLC | | 5.550% | | 12/1/28 | | | 175 | | | | 205 | |
| 6 | | NXP BV / NXP Funding LLC / NXP USA Inc. | | 4.300% | | 6/18/29 | | | 450 | | | | 486 | |
| | | Oracle Corp. | | 1.900% | | 9/15/21 | | | 1,275 | | | | 1,277 | |
| | | Oracle Corp. | | 2.500% | | 5/15/22 | | | 250 | | | | 254 | |
| | | Oracle Corp. | | 2.400% | | 9/15/23 | | | 750 | | | | 762 | |
| | | Oracle Corp. | | 3.400% | | 7/8/24 | | | 450 | | | | 475 | |
| | | Oracle Corp. | | 2.950% | �� | 11/15/24 | | | 425 | | | | 441 | |
| | | Oracle Corp. | | 2.650% | | 7/15/26 | | | 2,361 | | | | 2,410 | |
| | | Oracle Corp. | | 3.250% | | 5/15/30 | | | 100 | | | | 106 | |
| | | Oracle Corp. | | 4.300% | | 7/8/34 | | | 325 | | | | 379 | |
| | | Oracle Corp. | | 3.900% | | 5/15/35 | | | 150 | | | | 167 | |
| | | Oracle Corp. | | 3.850% | | 7/15/36 | | | 250 | | | | 274 | |
| | | Oracle Corp. | | 3.800% | | 11/15/37 | | | 325 | | | | 354 | |
| | | Oracle Corp. | | 6.125% | | 7/8/39 | | | 150 | | | | 210 | |
| | | Oracle Corp. | | 5.375% | | 7/15/40 | | | 700 | | | | 907 | |
| | | Oracle Corp. | | 4.500% | | 7/8/44 | | | 250 | | | | 295 | |
| | | Oracle Corp. | | 4.125% | | 5/15/45 | | | 725 | | | | 815 | |
| | | Oracle Corp. | | 4.000% | | 7/15/46 | | | 575 | | | | 638 | |
| | | Oracle Corp. | | 4.000% | | 11/15/47 | | | 225 | | | | 251 | |
| | | Oracle Corp. | | 4.375% | | 5/15/55 | | | 150 | | | | 177 | |
| | | PayPal Holdings Inc. | | 2.200% | | 9/26/22 | | | 200 | | | | 201 | |
| | | PayPal Holdings Inc. | | 2.400% | | 10/1/24 | | | 100 | | | | 101 | |
| | | PayPal Holdings Inc. | | 2.650% | | 10/1/26 | | | 300 | | | | 304 | |
| | | PayPal Holdings Inc. | | 2.850% | | 10/1/29 | | | 400 | | | | 401 | |
| | | QUALCOMM Inc. | | 3.000% | | 5/20/22 | | | 250 | | | | 256 | |
| | | QUALCOMM Inc. | | 2.600% | | 1/30/23 | | | 300 | | | | 305 | |
| | | QUALCOMM Inc. | | 2.900% | | 5/20/24 | | | 345 | | | | 355 | |
| | | QUALCOMM Inc. | | 3.450% | | 5/20/25 | | | 400 | | | | 422 | |
| | | QUALCOMM Inc. | | 3.250% | | 5/20/27 | | | 400 | | | | 419 | |
| | | QUALCOMM Inc. | | 4.650% | | 5/20/35 | | | 200 | | | | 237 | |
| | | QUALCOMM Inc. | | 4.800% | | 5/20/45 | | | 275 | | | | 336 | |
| | | QUALCOMM Inc. | | 4.300% | | 5/20/47 | | | 350 | | | | 402 | |
| | | salesforce.com Inc. | | 3.250% | | 4/11/23 | | | 200 | | | | 208 | |
| | | salesforce.com Inc. | | 3.700% | | 4/11/28 | | | 275 | | | | 302 | |
| | | Seagate HDD Cayman | | 4.250% | | 3/1/22 | | | 44 | | | | 45 | |
| | | Seagate HDD Cayman | | 4.750% | | 6/1/23 | | | 51 | | | | 54 | |
| | | Seagate HDD Cayman | | 4.875% | | 3/1/24 | | | 75 | | | | 80 | |
| | | Seagate HDD Cayman | | 4.750% | | 1/1/25 | | | 172 | | | | 183 | |
| | | Seagate HDD Cayman | | 5.750% | | 12/1/34 | | | 100 | | | | 105 | |
| | | Tech Data Corp. | | 3.700% | | 2/15/22 | | | 50 | | | | 51 | |
| | | Tech Data Corp. | | 4.950% | | 2/15/27 | | | 100 | | | | 103 | |
| | | Texas Instruments Inc. | | 1.850% | | 5/15/22 | | | 100 | | | | 100 | |
| | | Texas Instruments Inc. | | 2.625% | | 5/15/24 | | | 25 | | | | 26 | |
| | | Texas Instruments Inc. | | 2.900% | | 11/3/27 | | | 94 | | | | 98 | |
| | | Texas Instruments Inc. | | 2.250% | | 9/4/29 | | | 100 | | | | 98 | |
| | | Texas Instruments Inc. | | 3.875% | | 3/15/39 | | | 142 | | | | 160 | |
| | | Texas Instruments Inc. | | 4.150% | | 5/15/48 | | | 274 | | | | 324 | |
| | | Total System Services Inc. | | 3.800% | | 4/1/21 | | | 130 | | | | 132 | |
| | | Total System Services Inc. | | 3.750% | | 6/1/23 | | | 250 | | | | 261 | |
| | | Total System Services Inc. | | 4.000% | | 6/1/23 | | | 100 | | | | 105 | |
| | | Total System Services Inc. | | 4.800% | | 4/1/26 | | | 150 | | | | 167 | |
| | | Trimble Inc. | | 4.150% | | 6/15/23 | | | 50 | | | | 53 | |
| | | Trimble Inc. | | 4.750% | | 12/1/24 | | | 93 | | | | 101 | |
| | | Trimble Inc. | | 4.900% | | 6/15/28 | | | 50 | | | | 55 | |
| | | Tyco Electronics Group SA | | 3.500% | | 2/3/22 | | | 100 | | | | 103 | |
| | | Tyco Electronics Group SA | | 3.450% | | 8/1/24 | | | 125 | | | | 130 | |
| | | Tyco Electronics Group SA | | 3.125% | | 8/15/27 | | | 200 | | | | 205 | |
| | | Tyco Electronics Group SA | | 7.125% | | 10/1/37 | | | 125 | | | | 184 | |
| | | Verisk Analytics Inc. | | 5.800% | | 5/1/21 | | | 75 | | | | 79 | |
| | | Verisk Analytics Inc. | | 4.125% | | 9/12/22 | | | 275 | | | | 287 | |
| | | Verisk Analytics Inc. | | 4.000% | | 6/15/25 | | | 150 | | | | 161 | |
| | | Verisk Analytics Inc. | | 4.125% | | 3/15/29 | | | 400 | | | | 436 | |
| | | Verisk Analytics Inc. | | 5.500% | | 6/15/45 | | | 50 | | | | 62 | |
| | | VMware Inc. | | 2.950% | | 8/21/22 | | | 300 | | | | 306 | |
| | | VMware Inc. | | 3.900% | | 8/21/27 | | | 250 | | | | 261 | |
| | | Xilinx Inc. | | 3.000% | | 3/15/21 | | | 75 | | | | 76 | |
| | | Xilinx Inc. | | 2.950% | | 6/1/24 | | | 150 | | | | 154 | |
| | | | | | | | | | | | | | | |
| | | Transportation (0.6%) | | | | | | | | | | | | |
| 3 | | American Airlines 2011-1 Class A Pass Through Trust | | 5.250% | | 7/31/22 | | | 45 | | | | 46 | |
| 3 | | American Airlines 2013-1 Class A Pass Through Trust | | 4.000% | | 1/15/27 | | | 17 | | | | 18 | |
| 3 | | American Airlines 2013-2 Class A Pass Through Trust | | 4.950% | | 7/15/24 | | | 25 | | | | 26 | |
| 3 | | American Airlines 2014-1 Class A Pass Through Trust | | 3.700% | | 4/1/28 | | | 91 | | | | 95 | |
| 3 | | American Airlines 2015-1 Class A Pass Through Trust | | 3.375% | | 11/1/28 | | | 136 | | | | 139 | |
| 3 | | American Airlines 2015-2 Class AA Pass Through Trust | | 3.600% | | 9/22/27 | | | 46 | | | | 48 | |
| 3 | | American Airlines 2016-1 Class A Pass Through Trust | | 4.100% | | 1/15/28 | | | 64 | | | | 68 | |
| 3 | | American Airlines 2016-1 Class AA Pass Through Trust | | 3.575% | | 1/15/28 | | | 129 | | | | 135 | |
| 3 | | American Airlines 2016-2 Class AA Pass Through Trust | | 3.200% | | 12/15/29 | | | 235 | | | | 242 | |
| 3 | | American Airlines 2016-3 Class A Pass Through Trust | | 3.250% | | 4/15/30 | | | 44 | | | | 45 | |
| 3 | | American Airlines 2016-3 Class AA Pass Through Trust | | 3.000% | | 10/15/28 | | | 131 | | | | 133 | |
| 3 | | American Airlines 2017-1 Class AA Pass Through Trust | | 3.650% | | 8/15/30 | | | 44 | | | | 46 | |
| 3 | | American Airlines 2017-2 Class AA Pass Through Trust | | 3.350% | | 10/15/29 | | | 92 | | | | 94 | |
| 3 | | American Airlines 2019-1 Class AA Pass Through Trust | | 3.150% | | 8/15/33 | | | 50 | | | | 51 | |
| 3 | | BNSF Funding Trust I | | 6.613% | | 12/15/55 | | | 65 | | | | 71 | |
| | | Burlington Northern Santa Fe LLC | | 3.050% | | 3/15/22 | | | 150 | | | | 153 | |
| | | Burlington Northern Santa Fe LLC | | 3.050% | | 9/1/22 | | | 150 | | | | 154 | |
| | | Burlington Northern Santa Fe LLC | | 3.000% | | 3/15/23 | | | 175 | | | | 180 | |
| | | Burlington Northern Santa Fe LLC | | 3.850% | | 9/1/23 | | | 75 | | | | 80 | |
| | | Burlington Northern Santa Fe LLC | | 3.750% | | 4/1/24 | | | 200 | | | | 213 | |
| | | Burlington Northern Santa Fe LLC | | 3.400% | | 9/1/24 | | | 150 | | | | 159 | |
| | | Burlington Northern Santa Fe LLC | | 3.000% | | 4/1/25 | | | 100 | | | | 104 | |
| | | Burlington Northern Santa Fe LLC | | 3.650% | | 9/1/25 | | | 75 | | | | 81 | |
| | | Burlington Northern Santa Fe LLC | | 3.250% | | 6/15/27 | | | 225 | | | | 240 | |
| | | Burlington Northern Santa Fe LLC | | 6.200% | | 8/15/36 | | | 125 | | | | 173 | |
| | | Burlington Northern Santa Fe LLC | | 5.050% | | 3/1/41 | | | 125 | | | | 155 | |
Total Bond Market Index Portfolio
| | | | | | | | | Face | | | Market | |
| | | | | | | Maturity | | Amount | | | Value• | |
| | | | | Coupon | | Date | | | ($000 | ) | | | ($000 | ) |
| | | Burlington Northern Santa Fe LLC | | 5.400% | | 6/1/41 | | | 250 | | | | 322 | |
| | | Burlington Northern Santa Fe LLC | | 4.400% | | 3/15/42 | | | 250 | | | | 289 | |
| | | Burlington Northern Santa Fe LLC | | 4.375% | | 9/1/42 | | | 200 | | | | 232 | |
| | | Burlington Northern Santa Fe LLC | | 4.450% | | 3/15/43 | | | 125 | | | | 145 | |
| | | Burlington Northern Santa Fe LLC | | 5.150% | | 9/1/43 | | | 125 | | | | 159 | |
| | | Burlington Northern Santa Fe LLC | | 4.900% | | 4/1/44 | | | 100 | | | | 124 | |
| | | Burlington Northern Santa Fe LLC | | 4.550% | | 9/1/44 | | | 150 | | | | 179 | |
| | | Burlington Northern Santa Fe LLC | | 4.150% | | 4/1/45 | | | 125 | | | | 144 | |
| | | Burlington Northern Santa Fe LLC | | 4.700% | | 9/1/45 | | | 75 | | | | 91 | |
| | | Burlington Northern Santa Fe LLC | | 3.900% | | 8/1/46 | | | 150 | | | | 164 | |
| | | Burlington Northern Santa Fe LLC | | 4.125% | | 6/15/47 | | | 125 | | | | 141 | |
| | | Burlington Northern Santa Fe LLC | | 4.050% | | 6/15/48 | | | 225 | | | | 253 | |
| | | Burlington Northern Santa Fe LLC | | 4.150% | | 12/15/48 | | | 200 | | | | 228 | |
| | | Burlington Northern Santa Fe LLC | | 3.550% | | 2/15/50 | | | 400 | | | | 415 | |
| | | Canadian National Railway Co. | | 2.850% | | 12/15/21 | | | 75 | | | | 76 | |
| | | Canadian National Railway Co. | | 2.950% | | 11/21/24 | | | 233 | | | | 239 | |
| | | Canadian National Railway Co. | | 6.250% | | 8/1/34 | | | 75 | | | | 103 | |
| | | Canadian National Railway Co. | | 6.200% | | 6/1/36 | | | 75 | | | | 104 | |
| | | Canadian National Railway Co. | | 6.375% | | 11/15/37 | | | 100 | | | | 143 | |
| | | Canadian National Railway Co. | | 3.200% | | 8/2/46 | | | 50 | | | | 51 | |
| | | Canadian National Railway Co. | | 3.650% | | 2/3/48 | | | 125 | | | | 136 | |
| | | Canadian Pacific Railway Co. | | 9.450% | | 8/1/21 | | | 50 | | | | 55 | |
| | | Canadian Pacific Railway Co. | | 4.450% | | 3/15/23 | | | 225 | | | | 239 | |
| | | Canadian Pacific Railway Co. | | 7.125% | | 10/15/31 | | | 100 | | | | 139 | |
| | | Canadian Pacific Railway Co. | | 5.950% | | 5/15/37 | | | 450 | | | | 596 | |
| | | Canadian Pacific Railway Co. | | 6.125% | | 9/15/15 | | | 70 | | | | 102 | |
| 3 | | Continental Airlines 2007-1 Class A Pass Through Trust | | 5.983% | | 10/19/23 | | | 49 | | | | 51 | |
| 3 | | Continental Airlines 2012-2 Class A Pass Through Trust | | 4.000% | | 4/29/26 | | | 35 | | | | 37 | |
| | | CSX Corp. | | 4.250% | | 6/1/21 | | | 25 | | | | 26 | |
| | | CSX Corp. | | 3.350% | | 11/1/25 | | | 150 | | | | 159 | |
| | | CSX Corp. | | 3.250% | | 6/1/27 | | | 150 | | | | 157 | |
| | | CSX Corp. | | 3.800% | | 3/1/28 | | | 350 | | | | 381 | |
| | | CSX Corp. | | 4.250% | | 3/15/29 | | | 200 | | | | 225 | |
| | | CSX Corp. | | 2.400% | | 2/15/30 | | | 100 | | | | 98 | |
| | | CSX Corp. | | 6.220% | | 4/30/40 | | | 152 | | | | 206 | |
| | | CSX Corp. | | 5.500% | | 4/15/41 | | | 225 | | | | 282 | |
| | | CSX Corp. | | 4.750% | | 5/30/42 | | | 210 | | | | 246 | |
| | | CSX Corp. | | 4.100% | | 3/15/44 | | | 150 | | | | 163 | |
| | | CSX Corp. | | 4.300% | | 3/1/48 | | | 250 | | | | 281 | |
| | | CSX Corp. | | 4.750% | | 11/15/48 | | | 200 | | | | 242 | |
| | | CSX Corp. | | 4.500% | | 3/15/49 | | | 225 | | | | 261 | |
| | | CSX Corp. | | 3.350% | | 9/15/49 | | | 125 | | | | 123 | |
| | | CSX Corp. | | 3.950% | | 5/1/50 | | | 125 | | | | 135 | |
| | | CSX Corp. | | 4.500% | | 8/1/54 | | | 25 | | | | 29 | |
| | | CSX Corp. | | 4.250% | | 11/1/66 | | | 150 | | | | 160 | |
| | | CSX Corp. | | 4.650% | | 3/1/68 | | | 100 | | | | 114 | |
| 3 | | Delta Air Lines 2007-1 Class A Pass Through Trust | | 6.821% | | 2/10/24 | | | 103 | | | | 112 | |
| 3 | | Delta Air Lines 2015-1 Class AA Pass Through Trust | | 3.625% | | 7/30/27 | | | 41 | | | | 44 | |
| 3 | | Delta Air Lines 2019-1 Class AA Pass Through Trust | | 3.204% | | 4/25/24 | | | 75 | | | | 78 | |
| | | Delta Air Lines Inc. | | 2.600% | | 12/4/20 | | | 125 | | | | 125 | |
| | | Delta Air Lines Inc. | | 3.400% | | 4/19/21 | | | 125 | | | | 126 | |
| | | Delta Air Lines Inc. | | 3.625% | | 3/15/22 | | | 175 | | | | 179 | |
| | | Delta Air Lines Inc. | | 3.800% | | 4/19/23 | | | 125 | | | | 130 | |
| | | Delta Air Lines Inc. | | 2.900% | | 10/28/24 | | | 175 | | | | 175 | |
| | | Delta Air Lines Inc. | | 4.375% | | 4/19/28 | | | 100 | | | | 105 | |
| | | Delta Air Lines Inc. | | 3.750% | | 10/28/29 | | | 75 | | | | 75 | |
| | | FedEx Corp. | | 2.625% | | 8/1/22 | | | 100 | | | | 101 | |
| | | FedEx Corp. | | 4.000% | | 1/15/24 | | | 125 | | | | 134 | |
| | | FedEx Corp. | | 3.200% | | 2/1/25 | | | 150 | | | | 155 | |
| | | FedEx Corp. | | 3.250% | | 4/1/26 | | | 100 | | | | 104 | |
| | | FedEx Corp. | | 3.300% | | 3/15/27 | | | 100 | | | | 103 | |
| | | FedEx Corp. | | 3.900% | | 2/1/35 | | | 200 | | | | 202 | |
| | | FedEx Corp. | | 3.875% | | 8/1/42 | | | 125 | | | | 120 | |
| | | FedEx Corp. | | 4.100% | | 4/15/43 | | | 75 | | | | 73 | |
| | | FedEx Corp. | | 5.100% | | 1/15/44 | | | 150 | | | | 164 | |
| | | FedEx Corp. | | 4.750% | | 11/15/45 | | | 250 | | | | 263 | |
| | | FedEx Corp. | | 4.550% | | 4/1/46 | | | 225 | | | | 230 | |
| | | FedEx Corp. | | 4.400% | | 1/15/47 | | | 125 | | | | 126 | |
| | | FedEx Corp. | | 4.050% | | 2/15/48 | | | 200 | | | | 192 | |
| | | FedEx Corp. | | 4.950% | | 10/17/48 | | | 175 | | | | 190 | |
| | | FedEx Corp. | | 4.500% | | 2/1/65 | | | 60 | | | | 54 | |
| | | JB Hunt Transport Services Inc. | | 3.300% | | 8/15/22 | | | 100 | | | | 103 | |
| | | JB Hunt Transport Services Inc. | | 3.875% | | 3/1/26 | | | 25 | | | | 27 | |
| 3 | | JetBlue 2019-1 Class AA Pass Through Trust | | 2.750% | | 5/15/32 | | | 150 | | | | 151 | |
| | | Kansas City Southern | | 3.000% | | 5/15/23 | | | 250 | | | | 255 | |
| | | Kansas City Southern | | 2.875% | | 11/15/29 | | | 100 | | | | 100 | |
| | | Kansas City Southern | | 4.300% | | 5/15/43 | | | 75 | | | | 82 | |
| | | Kansas City Southern | | 4.950% | | 8/15/45 | | | 125 | | | | 147 | |
| | | Kansas City Southern | | 4.700% | | 5/1/48 | | | 225 | | | | 260 | |
| | | Kirby Corp. | | 4.200% | | 3/1/28 | | | 300 | | | | 316 | |
| 3 | | Latam Airlines 2015-1 Pass Through Trust A | | 4.200% | | 8/15/29 | | | 98 | | | | 101 | |
| | | Norfolk Southern Corp. | | 3.000% | | 4/1/22 | | | 225 | | | | 230 | |
| | | Norfolk Southern Corp. | | 2.903% | | 2/15/23 | | | 48 | | | | 49 | |
| | | Norfolk Southern Corp. | | 3.850% | | 1/15/24 | | | 250 | | | | 265 | |
| | | Norfolk Southern Corp. | | 5.590% | | 5/17/25 | | | 50 | | | | 58 | |
| | | Norfolk Southern Corp. | | 3.650% | | 8/1/25 | | | 50 | | | | 53 | |
| | | Norfolk Southern Corp. | | 7.800% | | 5/15/27 | | | 60 | | | | 79 | |
| | | Norfolk Southern Corp. | | 3.150% | | 6/1/27 | | | 125 | | | | 130 | |
| | | Norfolk Southern Corp. | | 3.800% | | 8/1/28 | | | 113 | | | | 124 | |
| | | Norfolk Southern Corp. | | 2.550% | | 11/1/29 | | | 200 | | | | 199 | |
| | | Norfolk Southern Corp. | | 4.837% | | 10/1/41 | | | 113 | | | | 134 | |
| | | Norfolk Southern Corp. | | 4.450% | | 6/15/45 | | | 75 | | | | 86 | |
| | | Norfolk Southern Corp. | | 4.650% | | 1/15/46 | | | 75 | | | | 88 | |
| | | Norfolk Southern Corp. | | 4.150% | | 2/28/48 | | | 25 | | | | 28 | |
| | | Norfolk Southern Corp. | | 4.100% | | 5/15/49 | | | 73 | | | | 80 | |
| | | Norfolk Southern Corp. | | 3.400% | | 11/1/49 | | | 75 | | | | 74 | |
| | | Norfolk Southern Corp. | | 4.050% | | 8/15/52 | | | 239 | | | | 262 | |
| | | Norfolk Southern Corp. | | 6.000% | | 3/15/05 | | | 59 | | | | 78 | |
| | | Norfolk Southern Corp. | | 5.100% | | 8/1/18 | | | 250 | | | | 294 | |
| | | Ryder System Inc. | | 3.500% | | 6/1/21 | | | 200 | | | | 204 | |
| | | Ryder System Inc. | | 2.250% | | 9/1/21 | | | 50 | | | | 50 | |
| | | Ryder System Inc. | | 2.875% | | 6/1/22 | | | 75 | | | | 76 | |
| | | Ryder System Inc. | | 3.400% | | 3/1/23 | | | 75 | | | | 77 | |
| | | Ryder System Inc. | | 3.750% | | 6/9/23 | | | 225 | | | | 235 | |
| | | Ryder System Inc. | | 3.650% | | 3/18/24 | | | 150 | | | | 157 | |
| | | Ryder System Inc. | | 2.500% | | 9/1/24 | | | 50 | | | | 50 | |
| | | Ryder System Inc. | | 2.900% | | 12/1/26 | | | 100 | | | | 101 | |
| | | Southwest Airlines Co. | | 3.000% | | 11/15/26 | | | 100 | | | | 102 | |
| | | Southwest Airlines Co. | | 3.450% | | 11/16/27 | | | 50 | | | | 52 | |
| 3 | | Southwest Airlines Co. 2007-1 Pass Through Trust | | 6.150% | | 2/1/24 | | | 20 | | | | 21 | |
| 3 | | Spirit Airlines Class A Pass Through Certificates Series 2015-1 | | 4.100% | | 10/1/29 | | | 19 | | | | 20 | |
| | | Union Pacific Corp. | | 3.200% | | 6/8/21 | | | 100 | | | | 102 | |
| | | Union Pacific Corp. | | 2.950% | | 3/1/22 | | | 100 | | | | 102 | |
| | | Union Pacific Corp. | | 4.163% | | 7/15/22 | | | 534 | | | | 561 | |
| | | Union Pacific Corp. | | 2.950% | | 1/15/23 | | | 25 | | | | 26 | |
| | | Union Pacific Corp. | | 3.500% | | 6/8/23 | | | 150 | | | | 157 | |
| | | Union Pacific Corp. | | 3.646% | | 2/15/24 | | | 50 | | | | 53 | |
| | | Union Pacific Corp. | | 3.150% | | 3/1/24 | | | 100 | | | | 104 | |
| | | Union Pacific Corp. | | 3.250% | | 1/15/25 | | | 200 | | | | 208 | |
| | | Union Pacific Corp. | | 3.750% | | 7/15/25 | | | 125 | | | | 134 | |
| | | Union Pacific Corp. | | 3.250% | | 8/15/25 | | | 50 | | | | 53 | |
| | | Union Pacific Corp. | | 2.750% | | 3/1/26 | | | 75 | | | | 77 | |
| | | Union Pacific Corp. | | 3.950% | | 9/10/28 | | | 200 | | | | 220 | |
| | | Union Pacific Corp. | | 3.700% | | 3/1/29 | | | 200 | | | | 218 | |
| | | Union Pacific Corp. | | 3.375% | | 2/1/35 | | | 100 | | | | 103 | |
| | | Union Pacific Corp. | | 3.600% | | 9/15/37 | | | 290 | | | | 302 | |
| | | Union Pacific Corp. | | 4.375% | | 9/10/38 | | | 125 | | | | 143 | |
| | | Union Pacific Corp. | | 4.050% | | 11/15/45 | | | 150 | | | | 162 | |
| | | Union Pacific Corp. | | 4.300% | | 3/1/49 | | | 200 | | | | 229 | |
| | | Union Pacific Corp. | | 3.799% | | 10/1/51 | | | 560 | | | | 594 | |
| | | Union Pacific Corp. | | 3.875% | | 2/1/55 | | | 100 | | | | 105 | |
| | | Union Pacific Corp. | | 3.950% | | 8/15/59 | | | 100 | | | | 105 | |
| 6 | | Union Pacific Corp. | | 3.839% | | 3/20/60 | | | 386 | | | | 386 | |
Total Bond Market Index Portfolio
| | | | | | | | | Face | | | Market | |
| | | | | | | Maturity | | Amount | | | Value• | |
| | | | | Coupon | | Date | | | ($000 | ) | | | ($000 | ) |
| | | Union Pacific Corp. | | 4.375% | | 11/15/65 | | | 135 | | | | 148 | |
| | | Union Pacific Corp. | | 4.100% | | 9/15/67 | | | 100 | | | | 103 | |
| 3 | | United Airlines 2013-1 Class A Pass Through Trust | | 4.300% | | 2/15/27 | | | 56 | | | | 60 | |
| 3 | | United Airlines 2014-1 Class A Pass Through Trust | | 4.000% | | 10/11/27 | | | 75 | | | | 79 | |
| 3 | | United Airlines 2015-1 Class A Pass Through Trust | | 3.700% | | 6/1/24 | | | 60 | | | | 61 | |
| 3 | | United Airlines 2015-1 Class AA Pass Through Trust | | 3.450% | | 12/1/27 | | | 145 | | | | 150 | |
| 3 | | United Airlines 2016-1 Class A Pass Through Trust | | 3.450% | | 1/7/30 | | | 45 | | | | 46 | |
| 3 | | United Airlines 2016-1 Class AA Pass Through Trust | | 3.100% | | 7/7/28 | | | 358 | | | | 365 | |
| 3 | | United Airlines 2016-2 Class A Pass Through Trust | | 3.100% | | 10/7/28 | | | 45 | | | | 45 | |
| 3 | | United Airlines 2016-2 Class AA Pass Through Trust | | 2.875% | | 10/7/28 | | | 67 | | | | 68 | |
| 3 | | United Airlines 2019-1 Class AA Pass Through Trust | | 4.150% | | 8/25/31 | | | 200 | | | | 216 | |
| 3 | | United Airlines 2019-2 Class AA Pass Through Trust | | 2.700% | | 11/1/33 | | | 100 | | | | 100 | |
| | | United Parcel Service Inc. | | 3.125% | | 1/15/21 | | | 250 | | | | 253 | |
| | | United Parcel Service Inc. | | 2.050% | | 4/1/21 | | | 150 | | | | 150 | |
| | | United Parcel Service Inc. | | 2.450% | | 10/1/22 | | | 175 | | | | 178 | |
| | | United Parcel Service Inc. | | 2.500% | | 4/1/23 | | | 200 | | | | 203 | |
| | | United Parcel Service Inc. | | 2.800% | | 11/15/24 | | | 186 | | | | 192 | |
| | | United Parcel Service Inc. | | 2.400% | | 11/15/26 | | | 150 | | | | 151 | |
| | | United Parcel Service Inc. | | 3.050% | | 11/15/27 | | | 200 | | | | 210 | |
| | | United Parcel Service Inc. | | 3.400% | | 3/15/29 | | | 100 | | | | 107 | |
| | | United Parcel Service Inc. | | 2.500% | | 9/1/29 | | | 100 | | | | 100 | |
| | | United Parcel Service Inc. | | 6.200% | | 1/15/38 | | | 278 | | | | 390 | |
| | | United Parcel Service Inc. | | 4.875% | | 11/15/40 | | | 75 | | | | 91 | |
| | | United Parcel Service Inc. | | 3.625% | | 10/1/42 | | | 75 | | | | 77 | |
| | | United Parcel Service Inc. | | 3.400% | | 11/15/46 | | | 110 | | | | 110 | |
| | | United Parcel Service Inc. | | 3.750% | | 11/15/47 | | | 200 | | | | 214 | |
| | | United Parcel Service Inc. | | 4.250% | | 3/15/49 | | | 125 | | | | 145 | |
| | | United Parcel Service Inc. | | 3.400% | | 9/1/49 | | | 150 | | | | 152 | |
| 3 | | US Airways 2012-2 Class A Pass Through Trust | | 4.625% | | 12/3/26 | | | 30 | | | | 32 | |
| 3 | | US Airways 2013-1 Class A Pass Through Trust | | 3.950% | | 5/15/27 | | | 65 | | | | 68 | |
| | | | | | | | | | | | | | 697,714 | |
| | | | | | | | | | | | | | | |
| Utilities (2.0%) | | | | | | | | | | | | |
| | | Electric (1.8%) | | | | | | | | | | | | |
| | | AEP Texas Inc. | | 2.400% | | 10/1/22 | | | 75 | | | | 76 | |
| | | AEP Texas Inc. | | 3.950% | | 6/1/28 | | | 100 | | | | 109 | |
| | | AEP Texas Inc. | | 3.800% | | 10/1/47 | | | 50 | | | | 52 | |
| | | AEP Texas Inc. | | 3.450% | | 1/15/50 | | | 50 | | | | 50 | |
| | | AEP Transmission Co. LLC | | 4.000% | | 12/1/46 | | | 75 | | | | 83 | |
| | | AEP Transmission Co. LLC | | 3.750% | | 12/1/47 | | | 100 | | | | 107 | |
| | | AEP Transmission Co. LLC | | 3.800% | | 6/15/49 | | | 70 | | | | 75 | |
| | | AEP Transmission Co. LLC | | 3.150% | | 9/15/49 | | | 70 | | | | 68 | |
| | | Alabama Power Co. | | 6.125% | | 5/15/38 | | | 50 | | | | 67 | |
| | | Alabama Power Co. | | 3.850% | | 12/1/42 | | | 25 | | | | 27 | |
| | | Alabama Power Co. | | 4.150% | | 8/15/44 | | | 75 | | | | 83 | |
| | | Alabama Power Co. | | 3.750% | | 3/1/45 | | | 150 | | | | 157 | |
| | | Alabama Power Co. | | 4.300% | | 1/2/46 | | | 250 | | | | 284 | |
| | | Alabama Power Co. | | 3.700% | | 12/1/47 | | | 100 | | | | 105 | |
| | | Alabama Power Co. | | 4.300% | | 7/15/48 | | | 100 | | | | 115 | |
| | | Alabama Power Co. | | 3.450% | | 10/1/49 | | | 50 | | | | 51 | |
| | | Ameren Corp. | | 2.500% | | 9/15/24 | | | 100 | | | | 101 | |
| | | Ameren Corp. | | 3.650% | | 2/15/26 | | | 80 | | | | 84 | |
| | | Ameren Illinois Co. | | 2.700% | | 9/1/22 | | | 250 | | | | 254 | |
| | | Ameren Illinois Co. | | 3.800% | | 5/15/28 | | | 75 | | | | 82 | |
| | | Ameren Illinois Co. | | 3.700% | | 12/1/47 | | | 150 | | | | 159 | |
| | | Ameren Illinois Co. | | 3.250% | | 3/15/50 | | | 60 | | | | 61 | |
| | | American Electric Power Co. Inc. | | 3.650% | | 12/1/21 | | | 100 | | | | 103 | |
| | | American Electric Power Co. Inc. | | 2.950% | | 12/15/22 | | | 25 | | | | 26 | |
| | | American Electric Power Co. Inc. | | 3.200% | | 11/13/27 | | | 75 | | | | 77 | |
| | | American Electric Power Co. Inc. | | 4.300% | | 12/1/28 | | | 150 | | | | 166 | |
| | | Appalachian Power Co. | | 4.600% | | 3/30/21 | | | 50 | | | | 51 | |
| | | Appalachian Power Co. | | 3.300% | | 6/1/27 | | | 500 | | | | 518 | |
| | | Appalachian Power Co. | | 4.500% | | 3/1/49 | | | 425 | | | | 493 | |
| | | Arizona Public Service Co. | | 3.150% | | 5/15/25 | | | 100 | | | | 104 | |
| | | Arizona Public Service Co. | | 2.950% | | 9/15/27 | | | 50 | | | | 51 | |
| | | Arizona Public Service Co. | | 4.500% | | 4/1/42 | | | 25 | | | | 29 | |
| | | Arizona Public Service Co. | | 4.350% | | 11/15/45 | | | 125 | | | | 142 | |
| | | Arizona Public Service Co. | | 3.750% | | 5/15/46 | | | 125 | | | | 130 | |
| | | Arizona Public Service Co. | | 4.250% | | 3/1/49 | | | 100 | | | | 113 | |
| | | Arizona Public Service Co. | | 3.500% | | 12/1/49 | | | 60 | | | | 60 | |
| | | Avangrid Inc. | | 3.150% | | 12/1/24 | | | 230 | | | | 237 | |
| | | Avangrid Inc. | | 3.800% | | 6/1/29 | | | 95 | | | | 100 | |
| | | Avista Corp. | | 4.350% | | 6/1/48 | | | 75 | | | | 85 | |
| | | Baltimore Gas & Electric Co. | | 3.500% | | 11/15/21 | | | 350 | | | | 359 | |
| | | Baltimore Gas & Electric Co. | | 2.400% | | 8/15/26 | | | 50 | | | | 50 | |
| | | Baltimore Gas & Electric Co. | | 3.500% | | 8/15/46 | | | 100 | | | | 102 | |
| | | Baltimore Gas & Electric Co. | | 3.750% | | 8/15/47 | | | 125 | | | | 133 | |
| | | Baltimore Gas & Electric Co. | | 4.250% | | 9/15/48 | | | 50 | | | | 58 | |
| | | Baltimore Gas & Electric Co. | | 3.200% | | 9/15/49 | | | 80 | | | | 78 | |
| | | Berkshire Hathaway Energy Co. | | 2.375% | | 1/15/21 | | | 100 | | | | 100 | |
| | | Berkshire Hathaway Energy Co. | | 2.800% | | 1/15/23 | | | 125 | | | | 127 | |
| | | Berkshire Hathaway Energy Co. | | 3.750% | | 11/15/23 | | | 100 | | | | 106 | |
| | | Berkshire Hathaway Energy Co. | | 3.500% | | 2/1/25 | | | 100 | | | | 105 | |
| | | Berkshire Hathaway Energy Co. | | 3.250% | | 4/15/28 | | | 125 | | | | 130 | |
| | | Berkshire Hathaway Energy Co. | | 6.125% | | 4/1/36 | | | 100 | | | | 138 | |
| | | Berkshire Hathaway Energy Co. | | 5.950% | | 5/15/37 | | | 225 | | | | 304 | |
| | | Berkshire Hathaway Energy Co. | | 6.500% | | 9/15/37 | | | 200 | | | | 277 | |
| | | Berkshire Hathaway Energy Co. | | 5.150% | | 11/15/43 | | | 150 | | | | 188 | |
| | | Berkshire Hathaway Energy Co. | | 4.500% | | 2/1/45 | | | 150 | | | | 177 | |
| | | Berkshire Hathaway Energy Co. | | 3.800% | | 7/15/48 | | | 50 | | | | 53 | |
| | | Berkshire Hathaway Energy Co. | | 4.450% | | 1/15/49 | | | 200 | | | | 234 | |
| | | Black Hills Corp. | | 4.250% | | 11/30/23 | | | 100 | | | | 106 | |
| | | Black Hills Corp. | | 3.950% | | 1/15/26 | | | 75 | | | | 79 | |
| | | Black Hills Corp. | | 3.150% | | 1/15/27 | | | 75 | | | | 76 | |
| | | Black Hills Corp. | | 3.050% | | 10/15/29 | | | 70 | | | | 70 | |
| | | Black Hills Corp. | | 4.350% | | 5/1/33 | | | 75 | | | | 82 | |
| | | Black Hills Corp. | | 4.200% | | 9/15/46 | | | 50 | | | | 52 | |
| | | Black Hills Corp. | | 3.875% | | 10/15/49 | | | 70 | | | | 70 | |
| | | CenterPoint Energy Houston Electric LLC | | 1.850% | | 6/1/21 | | | 250 | | | | 250 | |
| | | CenterPoint Energy Houston Electric LLC | | 2.400% | | 9/1/26 | | | 300 | | | | 296 | |
| | | CenterPoint Energy Houston Electric LLC | | 6.950% | | 3/15/33 | | | 50 | | | | 70 | |
| | | CenterPoint Energy Houston Electric LLC | | 3.950% | | 3/1/48 | | | 75 | | | | 83 | |
| | | CenterPoint Energy Houston Electric LLC | | 4.250% | | 2/1/49 | | | 150 | | | | 176 | |
| | | CenterPoint Energy Inc. | | 3.600% | | 11/1/21 | | | 75 | | | | 77 | |
| | | CenterPoint Energy Inc. | | 2.500% | | 9/1/22 | | | 100 | | | | 101 | |
| | | CenterPoint Energy Inc. | | 3.850% | | 2/1/24 | | | 325 | | | | 341 | |
| | | CenterPoint Energy Inc. | | 2.500% | | 9/1/24 | | | 100 | | | | 100 | |
| | | CenterPoint Energy Inc. | | 4.250% | | 11/1/28 | | | 75 | | | | 81 | |
| | | CenterPoint Energy Inc. | | 2.950% | | 3/1/30 | | | 80 | | | | 79 | |
| | | CenterPoint Energy Inc. | | 3.700% | | 9/1/49 | | | 50 | | | | 49 | |
| | | Cleco Corporate Holdings LLC | | 3.743% | | 5/1/26 | | | 100 | | | | 103 | |
| | | Cleco Corporate Holdings LLC | | 4.973% | | 5/1/46 | | | 125 | | | | 138 | |
| | | Cleveland Electric Illuminating Co. | | 5.500% | | 8/15/24 | | | 225 | | | | 257 | |
| | | Cleveland Electric Illuminating Co. | | 5.950% | | 12/15/36 | | | 75 | | | | 94 | |
| | | CMS Energy Corp. | | 5.050% | | 3/15/22 | | | 25 | | | | 26 | |
| | | CMS Energy Corp. | | 3.000% | | 5/15/26 | | | 75 | | | | 76 | |
| | | CMS Energy Corp. | | 3.450% | | 8/15/27 | | | 50 | | | | 52 | |
| | | CMS Energy Corp. | | 4.875% | | 3/1/44 | | | 75 | | | | 89 | |
| | | Commonwealth Edison Co. | | 2.950% | | 8/15/27 | | | 75 | | | | 77 | |
| | | Commonwealth Edison Co. | | 5.900% | | 3/15/36 | | | 150 | | | | 199 | |
| | | Commonwealth Edison Co. | | 6.450% | | 1/15/38 | | | 175 | | | | 249 | |
| | | Commonwealth Edison Co. | | 4.600% | | 8/15/43 | | | 75 | | | | 89 | |
| | | Commonwealth Edison Co. | | 4.700% | | 1/15/44 | | | 175 | | | | 211 | |
| | | Commonwealth Edison Co. | | 3.700% | | 3/1/45 | | | 75 | | | | 80 | |
| | | Commonwealth Edison Co. | | 3.650% | | 6/15/46 | | | 175 | | | | 184 | |
| | | Commonwealth Edison Co. | | 3.750% | | 8/15/47 | | | 100 | | | | 108 | |
Total Bond Market Index Portfolio
| | | | | | | | | Face | | | Market | |
| | | | | | | Maturity | | Amount | | | Value• | |
| | | | | Coupon | | Date | | | ($000 | ) | | | ($000 | ) |
| | | Commonwealth Edison Co. | | 4.000% | | 3/1/48 | | | 150 | | | | 167 | |
| | | Commonwealth Edison Co. | | 4.000% | | 3/1/49 | | | 125 | | | | 141 | |
| | | Connecticut Light & Power Co. | | 2.500% | | 1/15/23 | | | 125 | | | | 127 | |
| | | Connecticut Light & Power Co. | | 3.200% | | 3/15/27 | | | 50 | | | | 52 | |
| | | Connecticut Light & Power Co. | | 4.300% | | 4/15/44 | | | 150 | | | | 176 | |
| | | Connecticut Light & Power Co. | | 4.000% | | 4/1/48 | | | 160 | | | | 183 | |
| | | Consolidated Edison Co. of New York Inc. | | 5.300% | | 3/1/35 | | | 200 | | | | 245 | |
| | | Consolidated Edison Co. of New York Inc. | | 5.850% | | 3/15/36 | | | 275 | | | | 358 | |
| | | Consolidated Edison Co. of New York Inc. | | 6.200% | | 6/15/36 | | | 75 | | | | 101 | |
| | | Consolidated Edison Co. of New York Inc. | | 3.950% | | 3/1/43 | | | 125 | | | | 135 | |
| | | Consolidated Edison Co. of New York Inc. | | 4.450% | | 3/15/44 | | | 200 | | | | 230 | |
| | | Consolidated Edison Co. of New York Inc. | | 4.500% | | 12/1/45 | | | 375 | | | | 437 | |
| | | Consolidated Edison Co. of New York Inc. | | 3.850% | | 6/15/46 | | | 145 | | | | 156 | |
| | | Consolidated Edison Co. of New York Inc. | | 3.875% | | 6/15/47 | | | 75 | | | | 81 | |
| | | Consolidated Edison Co. of New York Inc. | | 4.125% | | 5/15/49 | | | 400 | | | | 452 | |
| | | Consolidated Edison Co. of New York Inc. | | 4.000% | | 11/15/57 | | | 75 | | | | 79 | |
| | | Consolidated Edison Co. of New York Inc. | | 4.500% | | 5/15/58 | | | 120 | | | | 139 | |
| | | Consolidated Edison Inc. | | 2.000% | | 5/15/21 | | | 75 | | | | 75 | |
| | | Consumers Energy Co. | | 3.375% | | 8/15/23 | | | 275 | | | | 287 | |
| | | Consumers Energy Co. | | 3.800% | | 11/15/28 | | | 75 | | | | 83 | |
| | | Consumers Energy Co. | | 3.950% | | 5/15/43 | | | 75 | | | | 83 | |
| | | Consumers Energy Co. | | 3.250% | | 8/15/46 | | | 50 | | | | 50 | |
| | | Consumers Energy Co. | | 3.950% | | 7/15/47 | | | 50 | | | | 56 | |
| | | Consumers Energy Co. | | 4.050% | | 5/15/48 | | | 125 | | | | 143 | |
| | | Consumers Energy Co. | | 4.350% | | 4/15/49 | | | 80 | | | | 97 | |
| | | Consumers Energy Co. | | 3.100% | | 8/15/50 | | | 80 | | | | 80 | |
| | | Delmarva Power & Light Co. | | 3.500% | | 11/15/23 | | | 25 | | | | 26 | |
| | | Delmarva Power & Light Co. | | 4.150% | | 5/15/45 | | | 100 | | | | 112 | |
| | | Dominion Energy Inc. | | 2.715% | | 8/15/21 | | | 50 | | | | 50 | |
| | | Dominion Energy Inc. | | 3.071% | | 8/15/24 | | | 75 | | | | 76 | |
| | | Dominion Energy Inc. | | 3.900% | | 10/1/25 | | | 125 | | | | 133 | |
| | | Dominion Energy Inc. | | 2.850% | | 8/15/26 | | | 125 | | | | 126 | |
| | | Dominion Energy Inc. | | 4.250% | | 6/1/28 | | | 125 | | | | 138 | |
| | | Dominion Energy Inc. | | 6.300% | | 3/15/33 | | | 75 | | | | 97 | |
| | | Dominion Energy Inc. | | 5.950% | | 6/15/35 | | | 225 | | | | 284 | |
| | | Dominion Energy Inc. | | 4.900% | | 8/1/41 | | | 80 | | | | 93 | |
| | | Dominion Energy Inc. | | 4.050% | | 9/15/42 | | | 300 | | | | 314 | |
| | | Dominion Energy Inc. | | 4.600% | | 3/15/49 | | | 300 | | | | 348 | |
| 3 | | Dominion Energy Inc. | | 5.750% | | 10/1/54 | | | 100 | | | | 108 | |
| | | Dominion Energy South Carolina Inc. | | 6.625% | | 2/1/32 | | | 50 | | | | 67 | |
| | | Dominion Energy South Carolina Inc. | | 6.050% | | 1/15/38 | | | 125 | | | | 168 | |
| | | Dominion Energy South Carolina Inc. | | 5.450% | | 2/1/41 | | | 75 | | | | 97 | |
| | | Dominion Energy South Carolina Inc. | | 4.600% | | 6/15/43 | | | 75 | | | | 88 | |
| | | DTE Electric Co. | | 3.650% | | 3/15/24 | | | 250 | | | | 264 | |
| | | DTE Electric Co. | | 3.375% | | 3/1/25 | | | 150 | | | | 158 | |
| | | DTE Electric Co. | | 4.000% | | 4/1/43 | | | 225 | | | | 250 | |
| | | DTE Electric Co. | | 3.700% | | 6/1/46 | | | 50 | | | | 54 | |
| | | DTE Electric Co. | | 3.750% | | 8/15/47 | | | 100 | | | | 109 | |
| | | DTE Electric Co. | | 3.950% | | 3/1/49 | | | 128 | | | | 146 | |
| | | DTE Energy Co. | | 2.600% | | 6/15/22 | | | 50 | | | | 50 | |
| | | DTE Energy Co. | | 2.250% | | 11/1/22 | | | 400 | | | | 400 | |
| | | DTE Energy Co. | | 3.700% | | 8/1/23 | | | 125 | | | | 130 | |
| | | DTE Energy Co. | | 2.529% | | 10/1/24 | | | 100 | | | | 100 | |
| | | DTE Energy Co. | | 2.850% | | 10/1/26 | | | 300 | | | | 300 | |
| | | DTE Energy Co. | | 3.800% | | 3/15/27 | | | 175 | | | | 184 | |
| | | DTE Energy Co. | | 3.400% | | 6/15/29 | | | 100 | | | | 102 | |
| | | DTE Energy Co. | | 2.950% | | 3/1/30 | | | 60 | | | | 59 | |
| | | DTE Energy Co. | | 6.375% | | 4/15/33 | | | 75 | | | | 98 | |
| | | Duke Energy Carolinas LLC | | 3.900% | | 6/15/21 | | | 500 | | | | 512 | |
| | | Duke Energy Carolinas LLC | | 2.500% | | 3/15/23 | | | 100 | | | | 101 | |
| | | Duke Energy Carolinas LLC | | 3.050% | | 3/15/23 | | | 100 | | | | 103 | |
| | | Duke Energy Carolinas LLC | | 2.950% | | 12/1/26 | | | 100 | | | | 103 | |
| | | Duke Energy Carolinas LLC | | 3.950% | | 11/15/28 | | | 125 | | | | 139 | |
| | | Duke Energy Carolinas LLC | | 6.000% | | 12/1/28 | | | 125 | | | | 156 | |
| | | Duke Energy Carolinas LLC | | 2.450% | | 8/15/29 | | | 200 | | | | 198 | |
| | | Duke Energy Carolinas LLC | | 6.100% | | 6/1/37 | | | 100 | | | | 135 | |
| | | Duke Energy Carolinas LLC | | 6.000% | | 1/15/38 | | | 25 | | | | 34 | |
| | | Duke Energy Carolinas LLC | | 6.050% | | 4/15/38 | | | 25 | | | | 34 | |
| | | Duke Energy Carolinas LLC | | 5.300% | | 2/15/40 | | | 150 | | | | 193 | |
| | | Duke Energy Carolinas LLC | | 4.000% | | 9/30/42 | | | 75 | | | | 83 | |
| | | Duke Energy Carolinas LLC | | 3.875% | | 3/15/46 | | | 100 | | | | 111 | |
| | | Duke Energy Carolinas LLC | | 3.700% | | 12/1/47 | | | 100 | | | | 107 | |
| | | Duke Energy Carolinas LLC | | 3.950% | | 3/15/48 | | | 300 | | | | 331 | |
| | | Duke Energy Carolinas LLC | | 3.200% | | 8/15/49 | | | 500 | | | | 493 | |
| | | Duke Energy Corp. | | 2.400% | | 8/15/22 | | | 200 | | | | 201 | |
| | | Duke Energy Corp. | | 3.050% | | 8/15/22 | | | 275 | | | | 281 | |
| | | Duke Energy Corp. | | 3.750% | | 4/15/24 | | | 325 | | | | 344 | |
| | | Duke Energy Corp. | | 2.650% | | 9/1/26 | | | 80 | | | | 80 | |
| | | Duke Energy Corp. | | 3.150% | | 8/15/27 | | | 300 | | | | 308 | |
| | | Duke Energy Corp. | | 4.800% | | 12/15/45 | | | 125 | | | | 148 | |
| | | Duke Energy Corp. | | 3.750% | | 9/1/46 | | | 405 | | | | 414 | |
| | | Duke Energy Florida LLC | | 3.800% | | 7/15/28 | | | 100 | | | | 109 | |
| | | Duke Energy Florida LLC | | 2.500% | | 12/1/29 | | | 425 | | | | 424 | |
| | | Duke Energy Florida LLC | | 6.350% | | 9/15/37 | | | 225 | | | | 312 | |
| | | Duke Energy Florida LLC | | 6.400% | | 6/15/38 | | | 200 | | | | 284 | |
| | | Duke Energy Florida LLC | | 3.850% | | 11/15/42 | | | 200 | | | | 215 | |
| | | Duke Energy Florida LLC | | 3.400% | | 10/1/46 | | | 100 | | | | 101 | |
| | | Duke Energy Florida LLC | | 4.200% | | 7/15/48 | | | 200 | | | | 230 | |
| 3 | | Duke Energy Florida Project Finance LLC | | 1.731% | | 9/1/22 | | | 50 | | | | 50 | |
| 3 | | Duke Energy Florida Project Finance LLC | | 2.538% | | 9/1/29 | | | 100 | | | | 99 | |
| | | Duke Energy Indiana LLC | | 6.350% | | 8/15/38 | | | 225 | | | | 316 | |
| | | Duke Energy Indiana LLC | | 3.750% | | 5/15/46 | | | 225 | | | | 240 | |
| | | Duke Energy Indiana LLC | | 3.250% | | 10/1/49 | | | 325 | | | | 326 | |
| | | Duke Energy Ohio Inc. | | 3.700% | | 6/15/46 | | | 25 | | | | 26 | |
| | | Duke Energy Progress LLC | | 2.800% | | 5/15/22 | | | 100 | | | | 102 | |
| | | Duke Energy Progress LLC | | 3.375% | | 9/1/23 | | | 25 | | | | 26 | |
| | | Duke Energy Progress LLC | | 3.700% | | 9/1/28 | | | 175 | | | | 191 | |
| | | Duke Energy Progress LLC | | 3.450% | | 3/15/29 | | | 125 | | | | 134 | |
| | | Duke Energy Progress LLC | | 4.375% | | 3/30/44 | | | 300 | | | | 348 | |
| | | Duke Energy Progress LLC | | 4.150% | | 12/1/44 | | | 100 | | | | 112 | |
| | | Duke Energy Progress LLC | | 3.700% | | 10/15/46 | | | 50 | | | | 53 | |
| | | Duke Energy Progress LLC | | 3.600% | | 9/15/47 | | | 100 | | | | 104 | |
| | | Edison International | | 2.400% | | 9/15/22 | | | 125 | | | | 124 | |
| | | Edison International | | 3.125% | | 11/15/22 | | | 80 | | | | 81 | |
| | | Edison International | | 2.950% | | 3/15/23 | | | 200 | | | | 200 | |
| | | Edison International | | 5.750% | | 6/15/27 | | | 25 | | | | 28 | |
| | | El Paso Electric Co. | | 6.000% | | 5/15/35 | | | 50 | | | | 61 | |
| | | El Paso Electric Co. | | 5.000% | | 12/1/44 | | | 75 | | | | 88 | |
| | | Emera US Finance LP | | 2.700% | | 6/15/21 | | | 125 | | | | 126 | |
| | | Emera US Finance LP | | 3.550% | | 6/15/26 | | | 150 | | | | 156 | |
| | | Emera US Finance LP | | 4.750% | | 6/15/46 | | | 245 | | | | 283 | |
| | | Enel Chile SA | | 4.875% | | 6/12/28 | | | 125 | | | | 139 | |
| | | Entergy Arkansas Inc. | | 3.750% | | 2/15/21 | | | 50 | | | | 51 | |
| | | Entergy Arkansas Inc. | | 3.500% | | 4/1/26 | | | 50 | | | | 53 | |
| | | Entergy Corp. | | 4.000% | | 7/15/22 | | | 150 | | | | 156 | |
| | | Entergy Corp. | | 2.950% | | 9/1/26 | | | 200 | | | | 203 | |
| | | Entergy Gulf States Louisiana LLC | | 5.590% | | 10/1/24 | | | 223 | | | | 256 | |
| | | Entergy Louisiana LLC | | 5.400% | | 11/1/24 | | | 382 | | | | 436 | |
| | | Entergy Louisiana LLC | | 2.400% | | 10/1/26 | | | 75 | | | | 74 | |
| | | Entergy Louisiana LLC | | 3.120% | | 9/1/27 | | | 100 | | | | 103 | |
| | | Entergy Louisiana LLC | | 3.050% | | 6/1/31 | | | 100 | | | | 102 | |
| | | Entergy Louisiana LLC | | 4.000% | | 3/15/33 | | | 150 | | | | 168 | |
| | | Entergy Louisiana LLC | | 4.950% | | 1/15/45 | | | 150 | | | | 162 | |
| | | Entergy Louisiana LLC | | 4.200% | | 9/1/48 | | | 200 | | | | 231 | |
| | | Entergy Louisiana LLC | | 4.200% | | 4/1/50 | | | 100 | | | | 116 | |
| | | Entergy Mississippi LLC | | 2.850% | | 6/1/28 | | | 125 | | | | 127 | |
| | | Entergy Texas Inc. | | 3.550% | | 9/30/49 | | | 60 | | | | 61 | |
| | | Evergy Inc. | | 2.450% | | 9/15/24 | | | 50 | | | | 50 | |
| | | Evergy Inc. | | 2.900% | | 9/15/29 | | | 100 | | | | 99 | |
Total Bond Market Index Portfolio
| | | | | | | | | Face | | | Market | |
| | | | | | | Maturity | | Amount | | | Value• | |
| | | | | Coupon | | Date | | | ($000 | ) | | | ($000 | ) |
| | | Eversource Energy | | 2.500% | | 3/15/21 | | | 100 | | | | 101 | |
| | | Eversource Energy | | 2.750% | | 3/15/22 | | | 75 | | | | 76 | |
| | | Eversource Energy | | 3.800% | | 12/1/23 | | | 75 | | | | 78 | |
| | | Eversource Energy | | 2.900% | | 10/1/24 | | | 50 | | | | 51 | |
| | | Eversource Energy | | 3.150% | | 1/15/25 | | | 125 | | | | 129 | |
| | | Eversource Energy | | 3.300% | | 1/15/28 | | | 100 | | | | 103 | |
| | | Eversource Energy | | 4.250% | | 4/1/29 | | | 200 | | | | 221 | |
| | | Exelon Corp. | | 5.150% | | 12/1/20 | | | 200 | | | | 204 | |
| | | Exelon Corp. | | 3.497% | | 6/1/22 | | | 200 | | | | 205 | |
| | | Exelon Corp. | | 3.950% | | 6/15/25 | | | 200 | | | | 215 | |
| | | Exelon Corp. | | 3.400% | | 4/15/26 | | | 200 | | | | 209 | |
| | | Exelon Corp. | | 4.950% | | 6/15/35 | | | 225 | | | | 259 | |
| | | Exelon Corp. | | 5.625% | | 6/15/35 | | | 20 | | | | 25 | |
| | | Exelon Corp. | | 5.100% | | 6/15/45 | | | 145 | | | | 174 | |
| | | Exelon Corp. | | 4.450% | | 4/15/46 | | | 175 | | | | 197 | |
| | | Exelon Generation Co. LLC | | 6.250% | | 10/1/39 | | | 360 | | | | 435 | |
| | | Exelon Generation Co. LLC | | 5.750% | | 10/1/41 | | | 75 | | | | 86 | |
| | | Exelon Generation Co. LLC | | 5.600% | | 6/15/42 | | | 155 | | | | 173 | |
| | | FirstEnergy Corp. | | 2.850% | | 7/15/22 | | | 100 | | | | 101 | |
| | | FirstEnergy Corp. | | 3.900% | | 7/15/27 | | | 300 | | | | 320 | |
| | | FirstEnergy Corp. | | 7.375% | | 11/15/31 | | | 475 | | | | 668 | |
| | | FirstEnergy Corp. | | 4.850% | | 7/15/47 | | | 200 | | | | 237 | |
| | | Florida Power & Light Co. | | 3.250% | | 6/1/24 | | | 25 | | | | 26 | |
| | | Florida Power & Light Co. | | 5.625% | | 4/1/34 | | | 25 | | | | 33 | |
| | | Florida Power & Light Co. | | 5.960% | | 4/1/39 | | | 375 | | | | 528 | |
| | | Florida Power & Light Co. | | 4.125% | | 2/1/42 | | | 170 | | | | 193 | |
| | | Florida Power & Light Co. | | 4.050% | | 6/1/42 | | | 125 | | | | 141 | |
| | | Florida Power & Light Co. | | 3.800% | | 12/15/42 | | | 75 | | | | 82 | |
| | | Florida Power & Light Co. | | 3.700% | | 12/1/47 | | | 150 | | | | 165 | |
| | | Florida Power & Light Co. | | 3.950% | | 3/1/48 | | | 325 | | | | 367 | |
| | | Florida Power & Light Co. | | 4.125% | | 6/1/48 | | | 100 | | | | 116 | |
| | | Florida Power & Light Co. | | 3.990% | | 3/1/49 | | | 100 | | | | 114 | |
| | | Florida Power & Light Co. | | 3.150% | | 10/1/49 | | | 155 | | | | 154 | |
| | | Fortis Inc. | | 3.055% | | 10/4/26 | | | 295 | | | | 301 | |
| | | Georgia Power Co. | | 2.400% | | 4/1/21 | | | 75 | | | | 75 | |
| | | Georgia Power Co. | | 2.200% | | 9/15/24 | | | 225 | | | | 221 | |
| | | Georgia Power Co. | | 3.250% | | 4/1/26 | | | 100 | | | | 103 | |
| | | Georgia Power Co. | | 4.750% | | 9/1/40 | | | 175 | | | | 198 | |
| | | Georgia Power Co. | | 4.300% | | 3/15/43 | | | 100 | | | | 108 | |
| | | Great Plains Energy Inc. | | 4.850% | | 6/1/21 | | | 100 | | | | 103 | |
| | | Gulf Power Co. | | 3.300% | | 5/30/27 | | | 50 | | | | 52 | |
| | | Iberdrola International BV | | 6.750% | | 7/15/36 | | | 75 | | | | 104 | |
| | | Indiana Michigan Power Co. | | 3.850% | | 5/15/28 | | | 250 | | | | 271 | |
| | | Indiana Michigan Power Co. | | 3.750% | | 7/1/47 | | | 150 | | | | 157 | |
| | | Indiana Michigan Power Co. | | 4.250% | | 8/15/48 | | | 100 | | | | 114 | |
| | | Interstate Power & Light Co. | | 3.250% | | 12/1/24 | | | 202 | | | | 211 | |
| | | Interstate Power & Light Co. | | 4.100% | | 9/26/28 | | | 125 | | | | 136 | |
| | | Interstate Power & Light Co. | | 3.600% | | 4/1/29 | | | 60 | | | | 64 | |
| | | Interstate Power & Light Co. | | 6.250% | | 7/15/39 | | | 50 | | | | 66 | |
| | | Interstate Power & Light Co. | | 3.700% | | 9/15/46 | | | 75 | | | | 76 | |
| | | ITC Holdings Corp. | | 2.700% | | 11/15/22 | | | 100 | | | | 101 | |
| | | ITC Holdings Corp. | | 3.650% | | 6/15/24 | | | 75 | | | | 78 | |
| | | ITC Holdings Corp. | | 3.350% | | 11/15/27 | | | 100 | | | | 104 | |
| | | ITC Holdings Corp. | | 5.300% | | 7/1/43 | | | 300 | | | | 366 | |
| 3 | | John Sevier Combined Cycle Generation LLC | | 4.626% | | 1/15/42 | | | 67 | | | | 78 | |
| | | Kansas City Power & Light Co. | | 3.150% | | 3/15/23 | | | 75 | | | | 77 | |
| | | Kansas City Power & Light Co. | | 5.300% | | 10/1/41 | | | 100 | | | | 126 | |
| | | Kansas City Power & Light Co. | | 4.200% | | 6/15/47 | | | 100 | | | | 115 | |
| | | Kentucky Utilities Co. | | 3.250% | | 11/1/20 | | | 50 | | | | 50 | |
| | | Kentucky Utilities Co. | | 5.125% | | 11/1/40 | | | 125 | | | | 155 | |
| | | Kentucky Utilities Co. | | 4.375% | | 10/1/45 | | | 100 | | | | 116 | |
| | | Louisville Gas & Electric Co. | | 3.300% | | 10/1/25 | | | 75 | | | | 78 | |
| | | Louisville Gas & Electric Co. | | 4.250% | | 4/1/49 | | | 170 | | | | 194 | |
| | | MidAmerican Energy Co. | | 3.500% | | 10/15/24 | | | 179 | | | | 190 | |
| | | MidAmerican Energy Co. | | 3.100% | | 5/1/27 | | | 150 | | | | 156 | |
| | | MidAmerican Energy Co. | | 3.650% | | 4/15/29 | | | 200 | | | | 218 | |
| | | MidAmerican Energy Co. | | 6.750% | | 12/30/31 | | | 125 | | | | 174 | |
| | | MidAmerican Energy Co. | | 5.750% | | 11/1/35 | | | 125 | | | | 164 | |
| | | MidAmerican Energy Co. | | 4.800% | | 9/15/43 | | | 75 | | | | 92 | |
| | | MidAmerican Energy Co. | | 3.950% | | 8/1/47 | | | 100 | | | | 111 | |
| | | MidAmerican Energy Co. | | 4.250% | | 7/15/49 | | | 200 | | | | 240 | |
| | | Mississippi Power Co. | | 4.250% | | 3/15/42 | | | 100 | | | | 107 | |
| | | National Rural Utilities Cooperative Finance Corp. | | 2.300% | | 11/1/20 | | | 200 | | | | 201 | |
| | | National Rural Utilities Cooperative Finance Corp. | | 2.900% | | 3/15/21 | | | 50 | | | | 51 | |
| | | National Rural Utilities Cooperative Finance Corp. | | 2.700% | | 2/15/23 | | | 300 | | | | 306 | |
| | | National Rural Utilities Cooperative Finance Corp. | | 2.950% | | 2/7/24 | | | 775 | | | | 799 | |
| | | National Rural Utilities Cooperative Finance Corp. | | 3.900% | | 11/1/28 | | | 100 | | | | 109 | |
| | | National Rural Utilities Cooperative Finance Corp. | | 3.700% | | 3/15/29 | | | 100 | | | | 109 | |
| | | National Rural Utilities Cooperative Finance Corp. | | 4.023% | | 11/1/32 | | | 204 | | | | 230 | |
| 3 | | National Rural Utilities Cooperative Finance Corp. | | 4.750% | | 4/30/43 | | | 25 | | | | 26 | |
| 3 | | National Rural Utilities Cooperative Finance Corp. | | 5.250% | | 4/20/46 | | | 75 | | | | 79 | |
| | | National Rural Utilities Cooperative Finance Corp. | | 4.400% | | 11/1/48 | | | 400 | | | | 476 | |
| | | National Rural Utilities Cooperative Finance Corp. | | 4.300% | | 3/15/49 | | | 100 | | | | 119 | |
| | | Nevada Power Co. | | 3.700% | | 5/1/29 | | | 200 | | | | 216 | |
| | | Nevada Power Co. | | 6.750% | | 7/1/37 | | | 75 | | | | 106 | |
| | | NextEra Energy Capital Holdings Inc. | | 2.403% | | 9/1/21 | | | 150 | | | | 151 | |
| | | NextEra Energy Capital Holdings Inc. | | 2.900% | | 4/1/22 | | | 350 | | | | 356 | |
| | | NextEra Energy Capital Holdings Inc. | | 2.800% | | 1/15/23 | | | 105 | | | | 107 | |
| | | NextEra Energy Capital Holdings Inc. | | 3.150% | | 4/1/24 | | | 100 | | | | 103 | |
| | | NextEra Energy Capital Holdings Inc. | | 3.250% | | 4/1/26 | | | 50 | | | | 52 | |
| | | NextEra Energy Capital Holdings Inc. | | 3.550% | | 5/1/27 | | | 250 | | | | 265 | |
| | | NextEra Energy Capital Holdings Inc. | | 3.500% | | 4/1/29 | | | 100 | | | | 106 | |
| | | NextEra Energy Capital Holdings Inc. | | 2.750% | | 11/1/29 | | | 100 | | | | 100 | |
| 3 | | NextEra Energy Capital Holdings Inc. | | 4.800% | | 12/1/77 | | | 125 | | | | 128 | |
| 3 | | NextEra Energy Capital Holdings Inc. | | 5.650% | | 5/1/79 | | | 100 | | | | 111 | |
| | | Northern States Power Co. | | 6.250% | | 6/1/36 | | | 75 | | | | 103 | |
| | | Northern States Power Co. | | 6.200% | | 7/1/37 | | | 50 | | | | 69 | |
| | | Northern States Power Co. | | 5.350% | | 11/1/39 | | | 175 | | | | 228 | |
| | | Northern States Power Co. | | 3.400% | | 8/15/42 | | | 105 | | | | 109 | |
| | | Northern States Power Co. | | 4.000% | | 8/15/45 | | | 50 | | | | 55 | |
| | | Northern States Power Co. | | 2.900% | | 3/1/50 | | | 250 | | | | 238 | |
| | | NSTAR Electric Co. | | 2.375% | | 10/15/22 | | | 125 | | | | 126 | |
| | | NSTAR Electric Co. | | 3.200% | | 5/15/27 | | | 125 | | | | 131 | |
| | | NSTAR Electric Co. | | 3.250% | | 5/15/29 | | | 50 | | | | 52 | |
| | | NSTAR Electric Co. | | 5.500% | | 3/15/40 | | | 75 | | | | 96 | |
| | | Oglethorpe Power Corp. | | 5.950% | | 11/1/39 | | | 50 | | | | 62 | |
| | | Oglethorpe Power Corp. | | 5.375% | | 11/1/40 | | | 175 | | | | 211 | |
| | | Ohio Edison Co. | | 6.875% | | 7/15/36 | | | 100 | | | | 140 | |
| | | Ohio Power Co. | | 5.375% | | 10/1/21 | | | 175 | | | | 185 | |
| | | Ohio Power Co. | | 4.150% | | 4/1/48 | | | 100 | | | | 114 | |
| | | Ohio Power Co. | | 4.000% | | 6/1/49 | | | 240 | | | | 270 | |
| | | Oklahoma Gas & Electric Co. | | 3.800% | | 8/15/28 | | | 75 | | | | 81 | |
| | | Oklahoma Gas & Electric Co. | | 4.150% | | 4/1/47 | | | 50 | | | | 54 | |
| | | Oklahoma Gas & Electric Co. | | 3.850% | | 8/15/47 | | | 75 | | | | 78 | |
| | | Oncor Electric Delivery Co. LLC | | 4.100% | | 6/1/22 | | | 175 | | | | 183 | |
| | | Oncor Electric Delivery Co. LLC | | 2.750% | | 6/1/24 | | | 100 | | | | 102 | |
| | | Oncor Electric Delivery Co. LLC | | 2.950% | | 4/1/25 | | | 75 | | | | 77 | |
| | | Oncor Electric Delivery Co. LLC | | 3.700% | | 11/15/28 | | | 50 | | | | 55 | |
| | | Oncor Electric Delivery Co. LLC | | 7.250% | | 1/15/33 | | | 50 | | | | 73 | |
| | | Oncor Electric Delivery Co. LLC | | 7.500% | | 9/1/38 | | | 125 | | | | 196 | |
| | | Oncor Electric Delivery Co. LLC | | 5.250% | | 9/30/40 | | | 125 | | | | 159 | |
| | | Oncor Electric Delivery Co. LLC | | 4.550% | | 12/1/41 | | | 75 | | | | 88 | |
| | | Oncor Electric Delivery Co. LLC | | 5.300% | | 6/1/42 | | | 100 | | | | 130 | |
| | | Oncor Electric Delivery Co. LLC | | 3.750% | | 4/1/45 | | | 100 | | | | 109 | |
| | | Oncor Electric Delivery Co. LLC | | 3.800% | | 9/30/47 | | | 50 | | | | 55 | |
| | | Oncor Electric Delivery Co. LLC | | 3.800% | | 6/1/49 | | | 100 | | | | 109 | |
| | | Oncor Electric Delivery Co. LLC | | 3.100% | | 9/15/49 | | | 400 | | | | 396 | |
| | | PacifiCorp | | 2.950% | | 2/1/22 | | | 100 | | | | 102 | |
| | | PacifiCorp | | 3.600% | | 4/1/24 | | | 125 | | | | 132 | |
| | | PacifiCorp | | 3.500% | | 6/15/29 | | | 100 | | | | 108 | |
Total Bond Market Index Portfolio
| | | | | | | | | Face | | | Market | |
| | | | | | | Maturity | | Amount | | | Value• | |
| | | | | Coupon | | Date | | | ($000 | ) | | | ($000 | ) |
| | | PacifiCorp | | 7.700% | | 11/15/31 | | | 450 | | | | 662 | |
| | | PacifiCorp | | 5.250% | | 6/15/35 | | | 100 | | | | 123 | |
| | | PacifiCorp | | 6.100% | | 8/1/36 | | | 75 | | | | 101 | |
| | | PacifiCorp | | 6.350% | | 7/15/38 | | | 75 | | | | 105 | |
| | | PacifiCorp | | 4.100% | | 2/1/42 | | | 200 | | | | 222 | |
| | | PacifiCorp | | 4.125% | | 1/15/49 | | | 100 | | | | 114 | |
| | | PacifiCorp | | 4.150% | | 2/15/50 | | | 200 | | | | 229 | |
| | | PECO Energy Co. | | 2.375% | | 9/15/22 | | | 300 | | | | 303 | |
| | | PECO Energy Co. | | 3.900% | | 3/1/48 | | | 75 | | | | 83 | |
| | | Pinnacle West Capital Corp. | | 2.250% | | 11/30/20 | | | 100 | | | | 100 | |
| | | PNM Resources Inc. | | 3.250% | | 3/9/21 | | | 50 | | | | 51 | |
| | | Potomac Electric Power Co. | | 6.500% | | 11/15/37 | | | 250 | | | | 353 | |
| | | Potomac Electric Power Co. | | 4.150% | | 3/15/43 | | | 150 | | | | 168 | |
| | | PPL Capital Funding Inc. | | 4.200% | | 6/15/22 | | | 25 | | | | 26 | |
| | | PPL Capital Funding Inc. | | 3.500% | | 12/1/22 | | | 115 | | | | 119 | |
| | | PPL Capital Funding Inc. | | 3.400% | | 6/1/23 | | | 100 | | | | 103 | |
| | | PPL Capital Funding Inc. | | 3.950% | | 3/15/24 | | | 50 | | | | 53 | |
| | | PPL Capital Funding Inc. | | 3.100% | | 5/15/26 | | | 100 | | | | 102 | |
| | | PPL Capital Funding Inc. | | 4.700% | | 6/1/43 | | | 75 | | | | 83 | |
| | | PPL Capital Funding Inc. | | 5.000% | | 3/15/44 | | | 200 | | | | 229 | |
| | | PPL Capital Funding Inc. | | 4.000% | | 9/15/47 | | | 75 | | | | 76 | |
| | | PPL Electric Utilities Corp. | | 3.000% | | 9/15/21 | | | 275 | | | | 280 | |
| | | PPL Electric Utilities Corp. | | 6.250% | | 5/15/39 | | | 100 | | | | 140 | |
| | | PPL Electric Utilities Corp. | | 4.125% | | 6/15/44 | | | 50 | | | | 56 | |
| | | PPL Electric Utilities Corp. | | 4.150% | | 10/1/45 | | | 155 | | | | 174 | |
| | | PPL Electric Utilities Corp. | | 3.950% | | 6/1/47 | | | 75 | | | | 82 | |
| | | Progress Energy Inc. | | 4.400% | | 1/15/21 | | | 100 | | | | 102 | |
| | | Progress Energy Inc. | | 3.150% | | 4/1/22 | | | 40 | | | | 41 | |
| | | Progress Energy Inc. | | 7.000% | | 10/30/31 | | | 119 | | | | 160 | |
| | | Progress Energy Inc. | | 6.000% | | 12/1/39 | | | 125 | | | | 162 | |
| | | PSEG Power LLC | | 3.850% | | 6/1/23 | | | 125 | | | | 131 | |
| | | PSEG Power LLC | | 8.625% | | 4/15/31 | | | 96 | | | | 134 | |
| | | Public Service Co. of Colorado | | 3.200% | | 11/15/20 | | | 25 | | | | 25 | |
| | | Public Service Co. of Colorado | | 3.700% | | 6/15/28 | | | 75 | | | | 81 | |
| | | Public Service Co. of Colorado | | 3.600% | | 9/15/42 | | | 175 | | | | 184 | |
| | | Public Service Co. of Colorado | | 4.100% | | 6/15/48 | | | 75 | | | | 85 | |
| | | Public Service Co. of New Hampshire | | 3.500% | | 11/1/23 | | | 50 | | | | 52 | |
| | | Public Service Co. of New Hampshire | | 3.600% | | 7/1/49 | | | 75 | | | | 79 | |
| | | Public Service Electric & Gas Co. | | 1.900% | | 3/15/21 | | | 150 | | | | 150 | |
| | | Public Service Electric & Gas Co. | | 3.000% | | 5/15/25 | | | 80 | | | | 83 | |
| | | Public Service Electric & Gas Co. | | 2.250% | | 9/15/26 | | | 250 | | | | 247 | |
| | | Public Service Electric & Gas Co. | | 3.000% | | 5/15/27 | | | 75 | | | | 77 | |
| | | Public Service Electric & Gas Co. | | 3.200% | | 5/15/29 | | | 70 | | | | 74 | |
| | | Public Service Electric & Gas Co. | | 3.800% | | 3/1/46 | | | 250 | | | | 272 | |
| | | Public Service Electric & Gas Co. | | 3.600% | | 12/1/47 | | | 75 | | | | 80 | |
| | | Public Service Electric & Gas Co. | | 3.850% | | 5/1/49 | | | 200 | | | | 222 | |
| | | Public Service Enterprise Group Inc. | | 2.650% | | 11/15/22 | | | 100 | | | | 102 | |
| | | Puget Energy Inc. | | 6.000% | | 9/1/21 | | | 100 | | | | 106 | |
| | | Puget Energy Inc. | | 5.625% | | 7/15/22 | | | 200 | | | | 214 | |
| | | Puget Energy Inc. | | 3.650% | | 5/15/25 | | | 400 | | | | 415 | |
| | | Puget Sound Energy Inc. | | 6.274% | | 3/15/37 | | | 125 | | | | 169 | |
| | | Puget Sound Energy Inc. | | 5.757% | | 10/1/39 | | | 125 | | | | 166 | |
| | | Puget Sound Energy Inc. | | 4.300% | | 5/20/45 | | | 100 | | | | 115 | |
| | | Puget Sound Energy Inc. | | 4.223% | | 6/15/48 | | | 125 | | | | 142 | |
| | | Puget Sound Energy Inc. | | 3.250% | | 9/15/49 | | | 90 | | | | 90 | |
| | | San Diego Gas & Electric Co. | | 2.500% | | 5/15/26 | | | 250 | | | | 248 | |
| | | San Diego Gas & Electric Co. | | 4.500% | | 8/15/40 | | | 100 | | | | 111 | |
| | | San Diego Gas & Electric Co. | | 3.750% | | 6/1/47 | | | 75 | | | | 77 | |
| | | San Diego Gas & Electric Co. | | 4.150% | | 5/15/48 | | | 75 | | | | 82 | |
| | | Sierra Pacific Power Co. | | 2.600% | | 5/1/26 | | | 100 | | | | 101 | |
| | | Southern California Edison Co. | | 2.900% | | 3/1/21 | | | 100 | | | | 101 | |
| | | Southern California Edison Co. | | 3.875% | | 6/1/21 | | | 275 | | | | 281 | |
| 3 | | Southern California Edison Co. | | 1.845% | | 2/1/22 | | | 36 | | | | 35 | |
| | | Southern California Edison Co. | | 2.400% | | 2/1/22 | | | 75 | | | | 75 | |
| | | Southern California Edison Co. | | 3.400% | | 6/1/23 | | | 75 | | | | 77 | |
| | | Southern California Edison Co. | | 3.500% | | 10/1/23 | | | 175 | | | | 182 | |
| | | Southern California Edison Co. | | 3.700% | | 8/1/25 | | | 50 | | | | 53 | |
| | | Southern California Edison Co. | | 3.650% | | 3/1/28 | | | 100 | | | | 107 | |
| | | Southern California Edison Co. | | 4.200% | | 3/1/29 | | | 75 | | | | 83 | |
| | | Southern California Edison Co. | | 6.650% | | 4/1/29 | | | 75 | | | | 90 | |
| | | Southern California Edison Co. | | 2.850% | | 8/1/29 | | | 75 | | | | 75 | |
| | | Southern California Edison Co. | | 5.750% | | 4/1/35 | | | 75 | | | | 91 | |
| | | Southern California Edison Co. | | 5.350% | | 7/15/35 | | | 200 | | | | 237 | |
| | | Southern California Edison Co. | | 5.625% | | 2/1/36 | | | 125 | | | | 152 | |
| | | Southern California Edison Co. | | 5.500% | | 3/15/40 | | | 100 | | | | 122 | |
| | | Southern California Edison Co. | | 4.500% | | 9/1/40 | | | 75 | | | | 82 | |
| | | Southern California Edison Co. | | 4.050% | | 3/15/42 | | | 208 | | | | 214 | |
| | | Southern California Edison Co. | | 3.900% | | 3/15/43 | | | 100 | | | | 102 | |
| | | Southern California Edison Co. | | 4.000% | | 4/1/47 | | | 335 | | | | 350 | |
| | | Southern California Edison Co. | | 4.125% | | 3/1/48 | | | 350 | | | | 370 | |
| | | Southern California Edison Co. | | 4.875% | | 3/1/49 | | | 100 | | | | 118 | |
| | | Southern Co. | | 2.350% | | 7/1/21 | | | 300 | | | | 301 | |
| | | Southern Co. | | 3.250% | | 7/1/26 | | | 350 | | | | 363 | |
| | | Southern Co. | | 4.250% | | 7/1/36 | | | 200 | | | | 215 | |
| | | Southern Co. | | 4.400% | | 7/1/46 | | | 360 | | | | 398 | |
| | | Southern Power Co. | | 2.500% | | 12/15/21 | | | 350 | | | | 353 | |
| | | Southern Power Co. | | 4.150% | | 12/1/25 | | | 100 | | | | 108 | |
| | | Southern Power Co. | | 5.150% | | 9/15/41 | | | 100 | | | | 114 | |
| | | Southern Power Co. | | 5.250% | | 7/15/43 | | | 50 | | | | 57 | |
| | | Southern Power Co. | | 4.950% | | 12/15/46 | | | 75 | | | | 83 | |
| | | Southwestern Electric Power Co. | | 2.750% | | 10/1/26 | | | 100 | | | | 99 | |
| | | Southwestern Electric Power Co. | | 4.100% | | 9/15/28 | | | 100 | | | | 109 | |
| | | Southwestern Electric Power Co. | | 6.200% | | 3/15/40 | | | 50 | | | | 66 | |
| | | Southwestern Electric Power Co. | | 3.900% | | 4/1/45 | | | 200 | | | | 206 | |
| | | Southwestern Electric Power Co. | | 3.850% | | 2/1/48 | | | 325 | | | | 334 | |
| | | Southwestern Public Service Co. | | 3.300% | | 6/15/24 | | | 165 | | | | 171 | |
| | | Southwestern Public Service Co. | | 4.500% | | 8/15/41 | | | 100 | | | | 117 | |
| | | Southwestern Public Service Co. | | 3.400% | | 8/15/46 | | | 275 | | | | 274 | |
| | | Southwestern Public Service Co. | | 3.700% | | 8/15/47 | | | 75 | | | | 78 | |
| | | Southwestern Public Service Co. | | 4.400% | | 11/15/48 | | | 275 | | | | 321 | |
| | | Southwestern Public Service Co. | | 3.750% | | 6/15/49 | | | 75 | | | | 80 | |
| | | Tampa Electric Co. | | 4.100% | | 6/15/42 | | | 50 | | | | 54 | |
| | | Tampa Electric Co. | | 4.350% | | 5/15/44 | | | 50 | | | | 57 | |
| | | Tampa Electric Co. | | 4.300% | | 6/15/48 | | | 75 | | | | 87 | |
| | | Tampa Electric Co. | | 4.450% | | 6/15/49 | | | 125 | | | | 148 | |
| | | Tampa Electric Co. | | 3.625% | | 6/15/50 | | | 50 | | | | 53 | |
| | | Toledo Edison Co. | | 6.150% | | 5/15/37 | | | 75 | | | | 101 | |
| | | Tucson Electric Power Co. | | 3.050% | | 3/15/25 | | | 50 | | | | 52 | |
| | | Union Electric Co. | | 3.500% | | 4/15/24 | | | 250 | | | | 263 | |
| | | Union Electric Co. | | 8.450% | | 3/15/39 | | | 150 | | | | 244 | |
| | | Union Electric Co. | | 3.650% | | 4/15/45 | | | 125 | | | | 131 | |
| | | Union Electric Co. | | 4.000% | | 4/1/48 | | | 75 | | | | 84 | |
| | | Union Electric Co. | | 3.250% | | 10/1/49 | | | 100 | | | | 99 | |
| | | Virginia Electric & Power Co. | | 3.450% | | 2/15/24 | | | 50 | | | | 52 | |
| | | Virginia Electric & Power Co. | | 2.950% | | 11/15/26 | | | 75 | | | | 77 | |
| | | Virginia Electric & Power Co. | | 3.500% | | 3/15/27 | | | 250 | | | | 265 | |
| | | Virginia Electric & Power Co. | | 3.800% | | 4/1/28 | | | 150 | | | | 162 | |
| | | Virginia Electric & Power Co. | | 2.875% | | 7/15/29 | | | 275 | | | | 280 | |
| | | Virginia Electric & Power Co. | | 6.000% | | 1/15/36 | | | 125 | | | | 163 | |
| | | Virginia Electric & Power Co. | | 6.000% | | 5/15/37 | | | 150 | | | | 199 | |
| | | Virginia Electric & Power Co. | | 6.350% | | 11/30/37 | | | 50 | | | | 69 | |
| | | Virginia Electric & Power Co. | | 4.000% | | 1/15/43 | | | 400 | | | | 435 | |
| | | Virginia Electric & Power Co. | | 4.450% | | 2/15/44 | | | 475 | | | | 550 | |
| | | Virginia Electric & Power Co. | | 4.200% | | 5/15/45 | | | 75 | | | | 85 | |
| | | Virginia Electric & Power Co. | | 4.000% | | 11/15/46 | | | 100 | | | | 110 | |
| | | Virginia Electric & Power Co. | | 3.800% | | 9/15/47 | | | 100 | | | | 108 | |
| | | Virginia Electric & Power Co. | | 4.600% | | 12/1/48 | | | 375 | | | | 455 | |
| | | Virginia Electric & Power Co. | | 3.300% | | 12/1/49 | | | 110 | | | | 111 | |
| | | WEC Energy Group Inc. | | 3.550% | | 6/15/25 | | | 200 | | | | 211 | |
| | | Westar Energy Inc. | | 2.550% | | 7/1/26 | | | 150 | | | | 150 | |
| | | Westar Energy Inc. | | 3.100% | | 4/1/27 | | | 100 | | | | 103 | |
| | | Westar Energy Inc. | | 4.125% | | 3/1/42 | | | 200 | | | | 223 | |
| | | Westar Energy Inc. | | 4.100% | | 4/1/43 | | | 100 | | | | 111 | |
| | | Westar Energy Inc. | | 4.250% | | 12/1/45 | | | 25 | | | | 28 | |
| | | Wisconsin Electric Power Co. | | 2.950% | | 9/15/21 | | | 75 | | | | 76 | |
| | | Wisconsin Electric Power Co. | | 2.050% | | 12/15/24 | | | 100 | | | | 100 | |
| | | Wisconsin Electric Power Co. | | 4.300% | | 10/15/48 | | | 100 | | | | 115 | |
| | | Wisconsin Power & Light Co. | | 6.375% | | 8/15/37 | | | 100 | | | | 136 | |
| | | Wisconsin Public Service Corp. | | 3.350% | | 11/21/21 | | | 300 | | | | 309 | |
| | | Xcel Energy Inc. | | 2.600% | | 3/15/22 | | | 75 | | | | 76 | |
| | | Xcel Energy Inc. | | 3.300% | | 6/1/25 | | | 325 | | | | 339 | |
| | | Xcel Energy Inc. | | 3.350% | | 12/1/26 | | | 75 | | | | 78 | |
Total Bond Market Index Portfolio
| | | | | | | | | Face | | | Market | |
| | | | | | | Maturity | | Amount | | | Value• | |
| | | | | Coupon | | Date | | ($000 | ) | | ($000 | ) |
| | | Xcel Energy Inc. | | 4.000% | | 6/15/28 | | | 75 | | | | 82 | |
| | | Xcel Energy Inc. | | 2.600% | | 12/1/29 | | | 200 | | | | 198 | |
| | | Xcel Energy Inc. | | 3.500% | | 12/1/49 | | | 100 | | | | 102 | |
| | | | | | | | | | | | | | | |
| | | Natural Gas (0.2%) | | | | | | | | | | | | |
| | | Atmos Energy Corp. | | 3.000% | | 6/15/27 | | | 100 | | | | 103 | |
| | | Atmos Energy Corp. | | 2.625% | | 9/15/29 | | | 50 | | | | 50 | |
| | | Atmos Energy Corp. | | 5.500% | | 6/15/41 | | | 200 | | | | 257 | |
| | | Atmos Energy Corp. | | 4.150% | | 1/15/43 | | | 100 | | | | 112 | |
| | | Atmos Energy Corp. | | 4.125% | | 10/15/44 | | | 50 | | | | 56 | |
| | | Atmos Energy Corp. | | 3.375% | | 9/15/49 | | | 530 | | | | 535 | |
| | | CenterPoint Energy Resources Corp. | | 4.500% | | 1/15/21 | | | 25 | | | | 26 | |
| | | CenterPoint Energy Resources Corp. | | 3.550% | | 4/1/23 | | | 50 | | | | 52 | |
| | | CenterPoint Energy Resources Corp. | | 4.000% | | 4/1/28 | | | 100 | | | | 107 | |
| | | CenterPoint Energy Resources Corp. | | 5.850% | | 1/15/41 | | | 250 | | | | 315 | |
| | | CenterPoint Energy Resources Corp. | | 4.100% | | 9/1/47 | | | 50 | | | | 52 | |
| | | KeySpan Corp. | | 5.803% | | 4/1/35 | | | 50 | | | | 61 | |
| | | NiSource Finance Corp. | | 3.490% | | 5/15/27 | | | 250 | | | | 262 | |
| | | NiSource Finance Corp. | | 5.950% | | 6/15/41 | | | 100 | | | | 128 | |
| | | NiSource Finance Corp. | | 4.800% | | 2/15/44 | | | 125 | | | | 143 | |
| | | NiSource Finance Corp. | | 5.650% | | 2/1/45 | | | 100 | | | | 128 | |
| | | NiSource Finance Corp. | | 4.375% | | 5/15/47 | | | 250 | | | | 279 | |
| | | NiSource Inc. | | 2.650% | | 11/17/22 | | | 75 | | | | 76 | |
| | | NiSource Inc. | | 3.650% | | 6/15/23 | | | 75 | | | | 78 | |
| | | NiSource Inc. | | 2.950% | | 9/1/29 | | | 100 | | | | 100 | |
| | | ONE Gas Inc. | | 4.658% | | 2/1/44 | | | 125 | | | | 149 | |
| | | ONE Gas Inc. | | 4.500% | | 11/1/48 | | | 75 | | | | 89 | |
| | | Piedmont Natural Gas Co. Inc. | | 3.500% | | 6/1/29 | | | 110 | | | | 117 | |
| | | Piedmont Natural Gas Co. Inc. | | 4.650% | | 8/1/43 | | | 50 | | | | 56 | |
| | | Piedmont Natural Gas Co. Inc. | | 3.640% | | 11/1/46 | | | 75 | | | | 74 | |
| | | Sempra Energy | | 2.850% | | 11/15/20 | | | 395 | | | | 397 | |
| | | Sempra Energy | | 2.875% | | 10/1/22 | | | 100 | | | | 102 | |
| | | Sempra Energy | | 2.900% | | 2/1/23 | | | 100 | | | | 102 | |
| | | Sempra Energy | | 4.050% | | 12/1/23 | | | 100 | | | | 106 | |
| | | Sempra Energy | | 3.750% | | 11/15/25 | | | 155 | | | | 163 | |
| | | Sempra Energy | | 3.250% | | 6/15/27 | | | 150 | | | | 154 | |
| | | Sempra Energy | | 3.400% | | 2/1/28 | | | 200 | | | | 207 | |
| | | Sempra Energy | | 3.800% | | 2/1/38 | | | 200 | | | | 208 | |
| | | Sempra Energy | | 6.000% | | 10/15/39 | | | 150 | | | | 195 | |
| | | Sempra Energy | | 4.000% | | 2/1/48 | | | 175 | | | | 182 | |
| | | Southern California Gas Co. | | 2.600% | | 6/15/26 | | | 200 | | | | 200 | |
| | | Southern California Gas Co. | | 3.750% | | 9/15/42 | | | 75 | | | | 78 | |
| | | Southern California Gas Co. | | 4.125% | | 6/1/48 | | | 75 | | | | 83 | |
| | | Southern California Gas Co. | | 3.950% | | 2/15/50 | | | 70 | | | | 78 | |
| | | Southern Co. Gas Capital Corp. | | 3.500% | | 9/15/21 | | | 325 | | | | 332 | |
| | | Southern Co. Gas Capital Corp. | | 3.250% | | 6/15/26 | | | 75 | | | | 77 | |
| | | Southern Co. Gas Capital Corp. | | 5.875% | | 3/15/41 | | | 75 | | | | 95 | |
| | | Southern Co. Gas Capital Corp. | | 4.400% | | 6/1/43 | | | 50 | | | | 54 | |
| | | Southern Co. Gas Capital Corp. | | 3.950% | | 10/1/46 | | | 100 | | | | 102 | |
| | | Southern Co. Gas Capital Corp. | | 4.400% | | 5/30/47 | | | 100 | | | | 109 | |
| | | Southwest Gas Corp. | | 3.700% | | 4/1/28 | | | 50 | | | | 53 | |
| | | Southwest Gas Corp. | | 3.800% | | 9/29/46 | | | 75 | | | | 77 | |
| | | Southwest Gas Corp. | | 4.150% | | 6/1/49 | | | 25 | | | | 27 | |
| | | Washington Gas Light Co. | | 3.796% | | 9/15/46 | | | 100 | | | | 104 | |
| | | Washington Gas Light Co. | | 3.650% | | 9/15/49 | | | 30 | | | | 30 | |
| | | | | | | | | | | | | | | |
| | | Other Utility (0.0%) | | | | | | | | | | | | |
| | | American Water Capital Corp. | | 3.400% | | 3/1/25 | | | 125 | | | | 131 | |
| | | American Water Capital Corp. | | 2.950% | | 9/1/27 | | | 325 | | | | 331 | |
| | | American Water Capital Corp. | | 3.450% | | 6/1/29 | | | 125 | | | | 132 | |
| | | American Water Capital Corp. | | 6.593% | | 10/15/37 | | | 150 | | | | 213 | |
| | | American Water Capital Corp. | | 4.300% | | 9/1/45 | | | 100 | | | | 113 | |
| | | American Water Capital Corp. | | 3.750% | | 9/1/47 | | | 200 | | | | 210 | |
| | | American Water Capital Corp. | | 4.200% | | 9/1/48 | | | 100 | | | | 113 | |
| | | American Water Capital Corp. | | 4.150% | | 6/1/49 | | | 125 | | | | 140 | |
| | | Aqua America Inc. | | 3.566% | | 5/1/29 | | | 75 | | | | 79 | |
| | | Aqua America Inc. | | 4.276% | | 5/1/49 | | | 85 | | | | 94 | |
| | | Veolia Environnement SA | | 6.750% | | 6/1/38 | | | 39 | | | | 54 | |
| | | | | | | | | | | | | | 84,050 | |
| Total Corporate Bonds (Cost $1,063,591) | | | | | | | | | | | 1,139,256 | |
| Sovereign Bonds (4.1%) | | | | | | | | | | | | |
| | | African Development Bank | | 1.250% | | 7/26/21 | | | 500 | | | | 497 | |
| | | African Development Bank | | 2.375% | | 9/23/21 | | | 300 | | | | 303 | |
| | | African Development Bank | | 1.625% | | 9/16/22 | | | 400 | | | | 399 | |
| | | African Development Bank | | 2.125% | | 11/16/22 | | | 700 | | | | 708 | |
| | | African Development Bank | | 3.000% | | 9/20/23 | | | 275 | | | | 288 | |
| | | Asian Development Bank | | 2.250% | | 1/20/21 | | | 500 | | | | 503 | |
| | | Asian Development Bank | | 1.625% | | 3/16/21 | | | 500 | | | | 499 | |
| | | Asian Development Bank | | 1.750% | | 6/8/21 | | | 625 | | | | 625 | |
| | | Asian Development Bank | | 2.000% | | 2/16/22 | | | 980 | | | | 987 | |
| | | Asian Development Bank | | 1.875% | | 2/18/22 | | | 600 | | | | 603 | |
| | | Asian Development Bank | | 1.875% | | 7/19/22 | | | 600 | | | | 603 | |
| | | Asian Development Bank | | 1.750% | | 9/13/22 | | | 900 | | | | 901 | |
| | | Asian Development Bank | | 2.750% | | 3/17/23 | | | 1,000 | | | | 1,032 | |
| | | Asian Development Bank | | 2.625% | | 1/30/24 | | | 1,000 | | | | 1,034 | |
| | | Asian Development Bank | | 1.500% | | 10/18/24 | | | 500 | | | | 494 | |
| | | Asian Development Bank | | 2.000% | | 1/22/25 | | | 300 | | | | 303 | |
| | | Asian Development Bank | | 2.000% | | 4/24/26 | | | 100 | | | | 101 | |
| | | Asian Development Bank | | 2.625% | | 1/12/27 | | | 200 | | | | 209 | |
| | | Asian Development Bank | | 2.375% | | 8/10/27 | | | 275 | | | | 283 | |
| | | Asian Development Bank | | 6.220% | | 8/15/27 | | | 100 | | | | 127 | |
| | | Asian Development Bank | | 2.500% | | 11/2/27 | | | 673 | | | | 700 | |
| | | Asian Development Bank | | 5.820% | | 6/16/28 | | | 148 | | | | 188 | |
| | | Asian Development Bank | | 3.125% | | 9/26/28 | | | 130 | | | | 142 | |
| | | Asian Development Bank | | 1.750% | | 9/19/29 | | | 200 | | | | 195 | |
| | | Asian Infrastructure Investment Bank | | 2.250% | | 5/16/24 | | | 500 | | | | 510 | |
| | | Canada | | 2.625% | | 1/25/22 | | | 250 | | | | 255 | |
| | | Canada | | 2.000% | | 11/15/22 | | | 570 | | | | 575 | |
| | | CNOOC Finance 2013 Ltd. | | 3.000% | | 5/9/23 | | | 300 | | | | 306 | |
| | | CNOOC Finance 2013 Ltd. | | 2.875% | | 9/30/29 | | | 250 | | | | 250 | |
| | | CNOOC Finance 2013 Ltd. | | 3.300% | | 9/30/49 | | | 250 | | | | 236 | |
| | | CNOOC Finance 2015 USA LLC | | 3.500% | | 5/5/25 | | | 500 | | | | 523 | |
| | | CNOOC Finance 2015 USA LLC | | 4.375% | | 5/2/28 | | | 500 | | | | 554 | |
| | | CNOOC Nexen Finance 2014 ULC | | 4.250% | | 4/30/24 | | | 300 | | | | 320 | |
| | | Corp. Andina de Fomento | | 3.250% | | 2/11/22 | | | 45 | | | | 46 | |
| | | Corp. Andina de Fomento | | 2.750% | | 1/6/23 | | | 125 | | | | 126 | |
| | | Corp. Andina de Fomento | | 3.750% | | 11/23/23 | | | 925 | | | | 968 | |
| | | Council Of Europe Development Bank | | 1.625% | | 3/16/21 | | | 200 | | | | 200 | |
| | | Council Of Europe Development Bank | | 1.750% | | 9/26/22 | | | 150 | | | | 150 | |
| | | Council Of Europe Development Bank | | 2.625% | | 2/13/23 | | | 425 | | | | 437 | |
| | | Ecopetrol SA | | 5.875% | | 9/18/23 | | | 225 | | | | 250 | |
| | | Ecopetrol SA | | 4.125% | | 1/16/25 | | | 200 | | | | 210 | |
| | | Ecopetrol SA | | 5.375% | | 6/26/26 | | | 750 | | | | 841 | |
| | | Ecopetrol SA | | 7.375% | | 9/18/43 | | | 100 | | | | 135 | |
| | | Ecopetrol SA | | 5.875% | | 5/28/45 | | | 400 | | | | 470 | |
| | | Equinor ASA | | 2.750% | | 11/10/21 | | | 300 | | | | 305 | |
| | | Equinor ASA | | 3.150% | | 1/23/22 | | | 150 | | | | 154 | |
| | | Equinor ASA | | 2.450% | | 1/17/23 | | | 450 | | | | 457 | |
| | | Equinor ASA | | 2.650% | | 1/15/24 | | | 375 | | | | 384 | |
| | | Equinor ASA | | 3.700% | | 3/1/24 | | | 150 | | | | 160 | |
| | | Equinor ASA | | 3.250% | | 11/10/24 | | | 150 | | | | 158 | |
| | | Equinor ASA | | 7.250% | | 9/23/27 | | | 250 | | | | 331 | |
| | | Equinor ASA | | 3.625% | | 9/10/28 | | | 175 | | | | 193 | |
| | | Equinor ASA | | 5.100% | | 8/17/40 | | | 125 | | | | 159 | |
| | | Equinor ASA | | 4.250% | | 11/23/41 | | | 175 | | | | 202 | |
| | | Equinor ASA | | 3.950% | | 5/15/43 | | | 125 | | | | 139 | |
| | | Equinor ASA | | 4.800% | | 11/8/43 | | | 175 | | | | 221 | |
| | | Equinor ASA | | 3.250% | | 11/18/49 | | | 125 | | | | 125 | |
| | | European Bank for Reconstruction & Development | | 1.875% | | 7/15/21 | | | 225 | | | | 226 | |
| | | European Bank for Reconstruction & Development | | 1.500% | | 11/2/21 | | | 150 | | | | 150 | |
| | | European Bank for Reconstruction & Development | | 1.875% | | 2/23/22 | | | 200 | | | | 201 | |
| | | European Bank for Reconstruction & Development | | 2.750% | | 3/7/23 | | | 925 | | | | 955 | |
| | | European Bank for Reconstruction & Development | | 1.625% | | 9/27/24 | | | 270 | | | | 268 | |
| | | European Investment Bank | | 4.000% | | 2/16/21 | | | 735 | | | | 753 | |
| | | European Investment Bank | | 2.000% | | 3/15/21 | | | 1,450 | | | | 1,455 | |
| | | European Investment Bank | | 2.500% | | 4/15/21 | | | 850 | | | | 858 | |
Total Bond Market Index Portfolio
| | | | | | | | | | Face | | | | Market | |
| | | | | | | Maturity | | | Amount | | | | Value• | |
| | | | | Coupon | | Date | | | ($000 | ) | | | ($000 | ) |
| | European Investment Bank | | 2.375% | | 5/13/21 | | | 1,850 | | | | 1,866 | |
| | | European Investment Bank | | 1.625% | | 6/15/21 | | | 1,000 | | | | 998 | |
| | | European Investment Bank | | 1.375% | | 9/15/21 | | | 100 | | | | 100 | |
| | | European Investment Bank | | 2.125% | | 10/15/21 | | | 300 | | | | 302 | |
| | | European Investment Bank | | 2.875% | | 12/15/21 | | | 1,150 | | | | 1,176 | |
| | | European Investment Bank | | 2.250% | | 3/15/22 | | | 500 | | | | 506 | |
| | | European Investment Bank | | 2.625% | | 5/20/22 | | | 200 | | | | 204 | |
| | | European Investment Bank | | 2.375% | | 6/15/22 | | | 1,725 | | | | 1,753 | |
| | | European Investment Bank | | 1.375% | | 9/6/22 | | | 720 | | | | 714 | |
| | | European Investment Bank | | 2.500% | | 3/15/23 | | | 600 | | | | 615 | |
| | | European Investment Bank | | 2.875% | | 8/15/23 | | | 800 | | | | 833 | |
| | | European Investment Bank | | 3.125% | | 12/14/23 | | | 500 | | | | 527 | |
| | | European Investment Bank | | 3.250% | | 1/29/24 | | | 810 | | | | 858 | |
| | | European Investment Bank | | 2.625% | | 3/15/24 | | | 530 | | | | 549 | |
| | | European Investment Bank | | 2.250% | | 6/24/24 | | | 550 | | | | 562 | |
| | | European Investment Bank | | 2.500% | | 10/15/24 | | | 276 | | | | 285 | |
| | | European Investment Bank | | 1.875% | | 2/10/25 | | | 1,050 | | | | 1,056 | |
| | | European Investment Bank | | 2.375% | | 5/24/27 | | | 225 | | | | 232 | |
| | | European Investment Bank | | 1.625% | | 10/9/29 | | | 125 | | | | 121 | |
| | | European Investment Bank | | 4.875% | | 2/15/36 | | | 325 | | | | 436 | |
| | | Export Development Canada | | 1.500% | | 5/26/21 | | | 525 | | | | 523 | |
| | | Export Development Canada | | 1.375% | | 10/21/21 | | | 200 | | | | 199 | |
| | | Export Development Canada | | 1.750% | | 7/18/22 | | | 200 | | | | 201 | |
| | | Export Development Canada | | 2.500% | | 1/24/23 | | | 40 | | | | 41 | |
| | | Export Development Canada | | 2.625% | | 2/21/24 | | | 250 | | | | 258 | |
| | | Export-Import Bank of Korea | | 2.500% | | 5/10/21 | | | 300 | | | | 302 | |
| | | Export-Import Bank of Korea | | 4.375% | | 9/15/21 | | | 75 | | | | 78 | |
| | | Export-Import Bank of Korea | | 1.875% | | 10/21/21 | | | 250 | | | | 249 | |
| | | Export-Import Bank of Korea | | 3.500% | | 11/27/21 | | | 200 | | | | 205 | |
| | | Export-Import Bank of Korea | | 5.000% | | 4/11/22 | | | 275 | | | | 293 | |
| | | Export-Import Bank of Korea | | 3.000% | | 11/1/22 | | | 400 | | | | 410 | |
| | | Export-Import Bank of Korea | | 3.625% | | 11/27/23 | | | 200 | | | | 211 | |
| | | Export-Import Bank of Korea | | 4.000% | | 1/14/24 | | | 650 | | | | 695 | |
| | | Export-Import Bank of Korea | | 2.625% | | 5/26/26 | | | 200 | | | | 202 | |
| | | FMS Wertmanagement | | 2.000% | | 8/1/22 | | | 470 | | | | 474 | |
| | | FMS Wertmanagement | | 2.750% | | 3/6/23 | | | 300 | | | | 310 | |
| | | Hydro-Quebec | | 8.400% | | 1/15/22 | | | 375 | | | | 421 | |
| | | Hydro-Quebec | | 8.050% | | 7/7/24 | | | 325 | | | | 405 | |
| | | Industrial & Commercial Bank of China Ltd. | | 2.635% | | 5/26/21 | | | 250 | | | | 251 | |
| | | Industrial & Commercial Bank of China Ltd. | | 2.957% | | 11/8/22 | | | 250 | | | | 254 | |
| | | Industrial & Commercial Bank of China Ltd. | | 3.538% | | 11/8/27 | | | 250 | | | | 258 | |
| | | Inter-American Development Bank | | 1.875% | | 3/15/21 | | | 200 | | | | 200 | |
| | | Inter-American Development Bank | | 2.625% | | 4/19/21 | | | 700 | | | | 708 | |
| | | Inter-American Development Bank | | 2.125% | | 1/18/22 | | | 700 | | | | 706 | |
| | | Inter-American Development Bank | | 1.750% | | 4/14/22 | | | 800 | | | | 801 | |
| | | Inter-American Development Bank | | 3.000% | | 9/26/22 | | | 500 | | | | 516 | |
| | | Inter-American Development Bank | | 2.500% | | 1/18/23 | | | 1,025 | | | | 1,050 | |
| | | Inter-American Development Bank | | 3.000% | | 10/4/23 | | | 625 | | | | 655 | |
| | | Inter-American Development Bank | | 2.625% | | 1/16/24 | | | 150 | | | | 155 | |
| | | Inter-American Development Bank | | 3.000% | | 2/21/24 | | | 900 | | | | 943 | |
| | | Inter-American Development Bank | | 2.125% | | 1/15/25 | | | 1,100 | | | | 1,117 | |
| | | Inter-American Development Bank | | 7.000% | | 6/15/25 | | | 100 | | | | 125 | |
| | | Inter-American Development Bank | | 2.000% | | 6/2/26 | | | 750 | | | | 754 | |
| | | Inter-American Development Bank | | 2.000% | | 7/23/26 | | | 100 | | | | 101 | |
| | | Inter-American Development Bank | | 2.375% | | 7/7/27 | | | 450 | | | | 464 | |
| | | Inter-American Development Bank | | 3.125% | | 9/18/28 | | | 875 | | | | 955 | |
| | | Inter-American Development Bank | | 3.875% | | 10/28/41 | | | 200 | | | | 245 | |
| | | Inter-American Development Bank | | 3.200% | | 8/7/42 | | | 100 | | | | 112 | |
| | | International Bank for Reconstruction & Development | | 1.625% | | 3/9/21 | | | 1,100 | | | | 1,099 | |
| | | International Bank for Reconstruction & Development | | 1.375% | | 5/24/21 | | | 1,100 | | | | 1,095 | |
| | | International Bank for Reconstruction & Development | | 2.250% | | 6/24/21 | | | 450 | | | | 453 | |
| | | International Bank for Reconstruction & Development | | 2.750% | | 7/23/21 | | | 1,330 | | | | 1,352 | |
| | | International Bank for Reconstruction & Development | | 1.375% | | 9/20/21 | | | 1,975 | | | | 1,966 | |
| | International Bank for Reconstruction & Development | | 2.125% | | 12/13/21 | | | 255 | | | | 257 | |
| | | International Bank for Reconstruction & Development | | 2.000% | | 1/26/22 | | | 145 | | | | 146 | |
| | | International Bank for Reconstruction & Development | | 1.625% | | 2/10/22 | | | 1,325 | | | | 1,324 | |
| | | International Bank for Reconstruction & Development | | 2.125% | | 7/1/22 | | | 775 | | | | 783 | |
| | | International Bank for Reconstruction & Development | | 1.875% | | 6/19/23 | | | 1,100 | | | | 1,105 | |
| | | International Bank for Reconstruction & Development | | 3.000% | | 9/27/23 | | | 1,125 | | | | 1,177 | |
| | | International Bank for Reconstruction & Development | | 2.500% | | 3/19/24 | | | 1,100 | | | | 1,134 | |
| | | International Bank for Reconstruction & Development | | 1.500% | | 8/28/24 | | | 695 | | | | 687 | |
| | | International Bank for Reconstruction & Development | | 2.500% | | 11/25/24 | | | 750 | | | | 775 | |
| | | International Bank for Reconstruction & Development | | 2.500% | | 7/29/25 | | | 1,150 | | | | 1,193 | |
| | | International Bank for Reconstruction & Development | | 3.125% | | 11/20/25 | | | 470 | | | | 504 | |
| | | International Bank for Reconstruction & Development | | 2.500% | | 11/22/27 | | | 350 | | | | 365 | |
| | | International Bank for Reconstruction & Development | | 1.750% | | 10/23/29 | | | 200 | | | | 195 | |
| | | International Bank for Reconstruction & Development | | 4.750% | | 2/15/35 | | | 250 | | | | 326 | |
| | | International Finance Corp. | | 2.250% | | 1/25/21 | | | 1,150 | | | | 1,156 | |
| | | International Finance Corp. | | 2.875% | | 7/31/23 | | | 275 | | | | 286 | |
| | | International Finance Corp. | | 1.375% | | 10/16/24 | | | 200 | | | | 196 | |
| | | International Finance Corp. | | 2.125% | | 4/7/26 | | | 600 | | | | 609 | |
| 7 | | Japan Bank for International Cooperation | | 3.125% | | 7/20/21 | | | 275 | | | | 280 | |
| 7 | | Japan Bank for International Cooperation | | 1.500% | | 7/21/21 | | | 750 | | | | 746 | |
| 7 | | Japan Bank for International Cooperation | | 2.000% | | 11/4/21 | | | 770 | | | | 772 | |
| 7 | | Japan Bank for International Cooperation | | 2.500% | | 6/1/22 | | | 450 | | | | 456 | |
| 7 | | Japan Bank for International Cooperation | | 2.375% | | 7/21/22 | | | 250 | | | | 253 | |
| 7 | | Japan Bank for International Cooperation | | 2.375% | | 11/16/22 | | | 540 | | | | 547 | |
| 7 | | Japan Bank for International Cooperation | | 3.250% | | 7/20/23 | | | 300 | | | | 312 | |
| 7 | | Japan Bank for International Cooperation | | 3.375% | | 7/31/23 | | | 100 | | | | 105 | |
| 7 | | Japan Bank for International Cooperation | | 3.375% | | 10/31/23 | | | 400 | | | | 421 | |
| 7 | | Japan Bank for International Cooperation | | 3.000% | | 5/29/24 | | | 500 | | | | 519 | |
| 7 | | Japan Bank for International Cooperation | | 1.750% | | 10/17/24 | | | 200 | | | | 197 | |
| 7 | | Japan Bank for International Cooperation | | 2.125% | | 2/10/25 | | | 330 | | | | 331 | |
| 7 | | Japan Bank for International Cooperation | | 2.375% | | 4/20/26 | | | 200 | | | | 202 | |
| 7 | | Japan Bank for International Cooperation | | 2.250% | | 11/4/26 | | | 200 | | | | 201 | |
| 7 | | Japan Bank for International Cooperation | | 2.875% | | 7/21/27 | | | 200 | | | | 209 | |
| 7 | | Japan Bank for International Cooperation | | 2.750% | | 11/16/27 | | | 800 | | | | 832 | |
| 7 | | Japan Bank for International Cooperation | | 3.250% | | 7/20/28 | | | 300 | | | | 323 | |
| 7 | | Japan Bank for International Cooperation | | 3.500% | | 10/31/28 | | | 350 | | | | 384 | |
| 7 | | Japan International Cooperation Agency | | 2.750% | | 4/27/27 | | | 300 | | | | 310 | |
| 8 | | KFW | | 1.625% | | 3/15/21 | | | 900 | | | | 899 | |
| 8 | | KFW | | 2.375% | | 3/24/21 | | | 900 | | | | 907 | |
Total Bond Market Index Portfolio
| | | | | | | | | Face | | | Market | |
| | | | | | | Maturity | | Amount | | | Value• | |
| | | | | Coupon | | Date | | | ($000 | ) | | | ($000 | ) |
| 8 | | KFW | | 2.625% | | 4/12/21 | | | 800 | | | | 809 | |
| 8 | | KFW | | 1.500% | | 6/15/21 | | | 900 | | | | 898 | |
| 8 | | KFW | | 1.750% | | 9/15/21 | | | 600 | | | | 601 | |
| 8 | | KFW | | 2.000% | | 11/30/21 | | | 600 | | | | 604 | |
| 8 | | KFW | | 3.125% | | 12/15/21 | | | 1,115 | | | | 1,146 | |
| 8 | | KFW | | 2.500% | | 2/15/22 | | | 1,000 | | | | 1,016 | |
| 8 | | KFW | | 2.125% | | 3/7/22 | | | 1,000 | | | | 1,009 | |
| 8 | | KFW | | 2.125% | | 6/15/22 | | | 750 | | | | 758 | |
| 8 | | KFW | | 1.750% | | 8/22/22 | | | 1,200 | | | | 1,202 | |
| 8 | | KFW | | 2.000% | | 10/4/22 | | | 950 | | | | 958 | |
| 8 | | KFW | | 2.375% | | 12/29/22 | | | 450 | | | | 459 | |
| 8 | | KFW | | 2.125% | | 1/17/23 | | | 1,025 | | | | 1,040 | |
| 8 | | KFW | | 2.625% | | 2/28/24 | | | 400 | | | | 414 | |
| 8 | | KFW | | 1.375% | | 8/5/24 | | | 900 | | | | 883 | |
| 8 | | KFW | | 2.500% | | 11/20/24 | | | 1,800 | | | | 1,859 | |
| 8 | | KFW | | 2.000% | | 5/2/25 | | | 150 | | | | 152 | |
| 8 | | KFW | | 2.875% | | 4/3/28 | | | 500 | | | | 536 | |
| 8 | | KFW | | 1.750% | | 9/14/29 | | | 175 | | | | 171 | |
| 8 | | KFW | | 0.000% | | 4/18/36 | | | 400 | | | | 273 | |
| 8 | | KFW | | 0.000% | | 6/29/37 | | | 200 | | | | 133 | |
| | | Korea Development Bank | | 4.625% | | 11/16/21 | | | 150 | | | | 157 | |
| | | Korea Development Bank | | 3.000% | | 9/14/22 | | | 750 | | | | 768 | |
| | | Korea Development Bank | | 3.375% | | 3/12/23 | | | 700 | | | | 726 | |
| | | Korea Development Bank | | 3.750% | | 1/22/24 | | | 500 | | | | 530 | |
| | | Korea Development Bank | | 2.125% | | 10/1/24 | | | 200 | | | | 199 | |
| 8 | | Landwirtschaftliche Rentenbank | | 1.750% | | 9/24/21 | | | 250 | | | | 250 | |
| 8 | | Landwirtschaftliche Rentenbank | | 2.250% | | 10/1/21 | | | 45 | | | | 45 | |
| 8 | | Landwirtschaftliche Rentenbank | | 3.125% | | 11/14/23 | | | 100 | | | | 105 | |
| 8 | | Landwirtschaftliche Rentenbank | | 2.000% | | 1/13/25 | | | 850 | | | | 858 | |
| 8 | | Landwirtschaftliche Rentenbank | | 2.375% | | 6/10/25 | | | 475 | | | | 488 | |
| 8 | | Landwirtschaftliche Rentenbank | | 1.750% | | 7/27/26 | | | 275 | | | | 272 | |
| 8 | | Landwirtschaftliche Rentenbank | | 2.500% | | 11/15/27 | | | 250 | | | | 261 | |
| | | Nexen Energy ULC | | 7.875% | | 3/15/32 | | | 50 | | | | 72 | |
| | | Nexen Energy ULC | | 6.400% | | 5/15/37 | | | 450 | | | | 619 | |
| | | Nexen Energy ULC | | 7.500% | | 7/30/39 | | | 200 | | | | 311 | |
| | | Nordic Investment Bank | | 2.250% | | 2/1/21 | | | 200 | | | | 201 | |
| | | Nordic Investment Bank | | 1.250% | | 8/2/21 | | | 400 | | | | 397 | |
| | | Nordic Investment Bank | | 2.125% | | 2/1/22 | | | 200 | | | | 202 | |
| | | Nordic Investment Bank | | 1.375% | | 10/17/22 | | | 200 | | | | 198 | |
| | | Nordic Investment Bank | | 2.875% | | 7/19/23 | | | 200 | | | | 208 | |
| | | Nordic Investment Bank | | 2.250% | | 5/21/24 | | | 200 | | | | 203 | |
| 9 | | Oesterreichische Kontrollbank AG | | 2.625% | | 1/31/22 | | | 100 | | | | 102 | |
| 9 | | Oesterreichische Kontrollbank AG | | 1.625% | | 9/17/22 | | | 400 | | | | 399 | |
| 9 | | Oesterreichische Kontrollbank AG | | 2.875% | | 3/13/23 | | | 500 | | | | 518 | |
| 9 | | Oesterreichische Kontrollbank AG | | 3.125% | | 11/7/23 | | | 200 | | | | 210 | |
| 3 | | Oriental Republic of Uruguay | | 8.000% | | 11/18/22 | | | 125 | | | | 139 | |
| 3 | | Oriental Republic of Uruguay | | 4.500% | | 8/14/24 | | | 303 | | | | 328 | |
| 3 | | Oriental Republic of Uruguay | | 4.375% | | 10/27/27 | | | 150 | | | | 166 | |
| 3 | | Oriental Republic of Uruguay | | 4.375% | | 1/23/31 | | | 208 | | | | 233 | |
| 3 | | Oriental Republic of Uruguay | | 7.625% | | 3/21/36 | | | 195 | | | | 289 | |
| 3 | | Oriental Republic of Uruguay | | 4.125% | | 11/20/45 | | | 300 | | | | 322 | |
| 3 | | Oriental Republic of Uruguay | | 5.100% | | 6/18/50 | | | 565 | | | | 679 | |
| 3 | | Oriental Republic of Uruguay | | 4.975% | | 4/20/55 | | | 500 | | | | 589 | |
| | | Petroleos Mexicanos | | 5.500% | | 1/21/21 | | | 200 | | | | 205 | |
| | | Petroleos Mexicanos | | 6.375% | | 2/4/21 | | | 261 | | | | 266 | |
| | | Petroleos Mexicanos | | 4.875% | | 1/24/22 | | | 185 | | | | 192 | |
| | | Petroleos Mexicanos | | 5.375% | | 3/13/22 | | | 64 | | | | 67 | |
| | | Petroleos Mexicanos | | 3.500% | | 1/30/23 | | | 215 | | | | 217 | |
| | | Petroleos Mexicanos | | 4.625% | | 9/21/23 | | | 87 | | | | 91 | |
| | | Petroleos Mexicanos | | 4.875% | | 1/18/24 | | | 120 | | | | 126 | |
| | | Petroleos Mexicanos | | 4.250% | | 1/15/25 | | | 100 | | | | 101 | |
| | | Petroleos Mexicanos | | 2.378% | | 4/15/25 | | | 28 | | | | 28 | |
| | | Petroleos Mexicanos | | 4.500% | | 1/23/26 | | | 110 | | | | 109 | |
| | | Petroleos Mexicanos | | 6.875% | | 8/4/26 | | | 599 | | | | 657 | |
| 6 | | Petroleos Mexicanos | | 6.490% | | 1/23/27 | | | 581 | | | | 617 | |
| | | Petroleos Mexicanos | | 6.500% | | 3/13/27 | | | 1,236 | | | | 1,308 | |
| | | Petroleos Mexicanos | | 5.350% | | 2/12/28 | | | 556 | | | | 552 | |
| | | Petroleos Mexicanos | | 6.500% | | 1/23/29 | | | 375 | | | | 393 | |
| 6 | | Petroleos Mexicanos | | 6.840% | | 1/23/30 | | | 1,091 | | | | 1,168 | |
| | | Petroleos Mexicanos | | 6.625% | | 6/15/35 | | | 625 | | | | 635 | |
| | | Petroleos Mexicanos | | 6.625% | | 6/15/38 | | | 150 | | | | 147 | |
| | Petroleos Mexicanos | | 6.500% | | 6/2/41 | | | 250 | | | | 248 | |
| | | Petroleos Mexicanos | | 5.500% | | 6/27/44 | | | 94 | | | | 84 | |
| | | Petroleos Mexicanos | | 6.375% | | 1/23/45 | | | 300 | | | | 290 | |
| | | Petroleos Mexicanos | | 5.625% | | 1/23/46 | | | 367 | | | | 330 | |
| | | Petroleos Mexicanos | | 6.750% | | 9/21/47 | | | 1,288 | | | | 1,289 | |
| | | Petroleos Mexicanos | | 6.350% | | 2/12/48 | | | 496 | | | | 479 | |
| 6 | | Petroleos Mexicanos | | 7.690% | | 1/23/50 | | | 1,544 | | | | 1,685 | |
| | | Province of Alberta | | 2.200% | | 7/26/22 | | | 400 | | | | 403 | |
| | | Province of Alberta | | 3.350% | | 11/1/23 | | | 375 | | | | 395 | |
| | | Province of Alberta | | 2.950% | | 1/23/24 | | | 300 | | | | 311 | |
| | | Province of Alberta | | 1.875% | | 11/13/24 | | | 450 | | | | 449 | |
| | | Province of Alberta | | 3.300% | | 3/15/28 | | | 250 | | | | 270 | |
| | | Province of British Columbia | | 2.000% | | 10/23/22 | | | 200 | | | | 201 | |
| | | Province of British Columbia | | 1.750% | | 9/27/24 | | | 225 | | | | 223 | |
| | | Province of British Columbia | | 2.250% | | 6/2/26 | | | 300 | | | | 303 | |
| | | Province of Manitoba | | 2.050% | | 11/30/20 | | | 300 | | | | 300 | |
| | | Province of Manitoba | | 2.100% | | 9/6/22 | | | 150 | | | | 151 | |
| | | Province of Manitoba | | 2.600% | | 4/16/24 | | | 150 | | | | 154 | |
| | | Province of Manitoba | | 2.125% | | 6/22/26 | | | 90 | | | | 90 | |
| | | Province of New Brunswick | | 2.500% | | 12/12/22 | | | 95 | | | | 97 | |
| | | Province of New Brunswick | | 3.625% | | 2/24/28 | | | 105 | | | | 115 | |
| | | Province of Ontario | | 2.550% | | 2/12/21 | | | 180 | | | | 181 | |
| | | Province of Ontario | | 2.500% | | 9/10/21 | | | 575 | | | | 581 | |
| | | Province of Ontario | | 2.400% | | 2/8/22 | | | 525 | | | | 531 | |
| | | Province of Ontario | | 2.550% | | 4/25/22 | | | 350 | | | | 356 | |
| | | Province of Ontario | | 2.250% | | 5/18/22 | | | 500 | | | | 505 | |
| | | Province of Ontario | | 2.450% | | 6/29/22 | | | 150 | | | | 152 | |
| | | Province of Ontario | | 2.200% | | 10/3/22 | | | 400 | | | | 404 | |
| | | Province of Ontario | | 3.400% | | 10/17/23 | | | 760 | | | | 802 | |
| | | Province of Ontario | | 3.050% | | 1/29/24 | | | 250 | | | | 261 | |
| | | Province of Ontario | | 3.200% | | 5/16/24 | | | 150 | | | | 158 | |
| | | Province of Ontario | | 2.500% | | 4/27/26 | | | 250 | | | | 256 | |
| | | Province of Ontario | | 2.300% | | 6/15/26 | | | 900 | | | | 911 | |
| | | Province of Ontario | | 2.000% | | 10/2/29 | | | 585 | | | | 575 | |
| | | Province of Quebec | | 2.750% | | 8/25/21 | | | 325 | | | | 330 | |
| | | Province of Quebec | | 2.375% | | 1/31/22 | | | 390 | | | | 394 | |
| | | Province of Quebec | | 2.625% | | 2/13/23 | | | 425 | | | | 435 | |
| | | Province of Quebec | | 2.500% | | 4/20/26 | | | 200 | | | | 205 | |
| | | Province of Quebec | | 2.750% | | 4/12/27 | | | 850 | | | | 884 | |
| | | Province of Quebec | | 7.500% | | 9/15/29 | | | 475 | | | | 684 | |
| | | Province of Saskatchewan | | 8.500% | | 7/15/22 | | | 58 | | | | 67 | |
| | | Republic of Chile | | 2.250% | | 10/30/22 | | | 175 | | | | 176 | |
| | | Republic of Chile | | 3.125% | | 1/21/26 | | | 485 | | | | 507 | |
| 3 | | Republic of Chile | | 3.240% | | 2/6/28 | | | 460 | | | | 482 | |
| 3 | | Republic of Chile | | 3.500% | | 1/25/50 | | | 275 | | | | 285 | |
| | | Republic of Colombia | | 4.375% | | 7/12/21 | | | 450 | | | | 464 | |
| | | Republic of Colombia | | 4.000% | | 2/26/24 | | | 400 | | | | 421 | |
| | | Republic of Colombia | | 8.125% | | 5/21/24 | | | 100 | | | | 123 | |
| 3 | | Republic of Colombia | | 4.500% | | 1/28/26 | | | 322 | | | | 350 | |
| 3 | | Republic of Colombia | | 3.875% | | 4/25/27 | | | 765 | | | | 808 | |
| 3 | | Republic of Colombia | | 4.500% | | 3/15/29 | | | 650 | | | | 719 | |
| | | Republic of Colombia | | 10.375% | | 1/28/33 | | | 200 | | | | 321 | |
| | | Republic of Colombia | | 7.375% | | 9/18/37 | | | 300 | | | | 427 | |
| | | Republic of Colombia | | 6.125% | | 1/18/41 | | | 125 | | | | 161 | |
| 3 | | Republic of Colombia | | 5.625% | | 2/26/44 | | | 475 | | | | 586 | |
| 3 | | Republic of Colombia | | 5.000% | | 6/15/45 | | | 965 | | | | 1,114 | |
| | | Republic of Colombia | | 5.200% | | 5/15/49 | | | 400 | | | | 477 | |
| | | Republic of Hungary | | 6.375% | | 3/29/21 | | | 700 | | | | 739 | |
| | | Republic of Hungary | | 5.375% | | 2/21/23 | | | 400 | | | | 438 | |
| | | Republic of Hungary | | 5.750% | | 11/22/23 | | | 400 | | | | 451 | |
| | | Republic of Hungary | | 5.375% | | 3/25/24 | | | 350 | | | | 394 | |
| | | Republic of Hungary | | 7.625% | | 3/29/41 | | | 290 | | | | 475 | |
| | | Republic of Indonesia | | 2.950% | | 1/11/23 | | | 425 | | | | 432 | |
| | | Republic of Indonesia | | 4.100% | | 4/24/28 | | | 200 | | | | 217 | |
| | | Republic of Indonesia | | 4.750% | | 2/11/29 | | | 425 | | | | 487 | |
| | | Republic of Indonesia | | 3.400% | | 9/18/29 | | | 200 | | | | 208 | |
| 6 | | Republic of Indonesia | | 4.750% | | 7/18/47 | | | 200 | | | | 231 | |
| | | Republic of Indonesia | | 4.350% | | 1/11/48 | | | 300 | | | | 332 | |
| | | Republic of Indonesia | | 3.700% | | 10/30/49 | | | 200 | | | | 203 | |
| | | Republic of Italy | | 6.875% | | 9/27/23 | | | 590 | | | | 671 | |
| | | Republic of Italy | | 2.375% | | 10/17/24 | | | 475 | | | | 465 | |
Total Bond Market Index Portfolio
| | | | | | | | | Face | | | Market | |
| | | | | | | Maturity | | Amount | | | Value• | |
| | | | | Coupon | | Date | | | ($000 | ) | | | ($000 | ) |
| | | Republic of Italy | | 2.875% | | 10/17/29 | | | 200 | | | | 189 | |
| | | Republic of Italy | | 5.375% | | 6/15/33 | | | 475 | | | | 544 | |
| | | Republic of Italy | | 4.000% | | 10/17/49 | | | 500 | | | | 474 | |
| | | Republic of Korea | | 3.875% | | 9/11/23 | | | 200 | | | | 213 | |
| | | Republic of Korea | | 5.625% | | 11/3/25 | | | 100 | | | | 118 | |
| | | Republic of Korea | | 2.750% | | 1/19/27 | | | 1,000 | | | | 1,021 | |
| | | Republic of Korea | | 3.875% | | 9/20/48 | | | 125 | | | | 149 | |
| 3 | | Republic of Panama | | 4.000% | | 9/22/24 | | | 200 | | | | 214 | |
| 3 | | Republic of Panama | | 3.750% | | 3/16/25 | | | 200 | | | | 212 | |
| | | Republic of Panama | | 7.125% | | 1/29/26 | | | 168 | | | | 210 | |
| | | Republic of Panama | | 8.875% | | 9/30/27 | | | 238 | | | | 339 | |
| 3 | | Republic of Panama | | 3.875% | | 3/17/28 | | | 460 | | | | 500 | |
| | | Republic of Panama | | 9.375% | | 4/1/29 | | | 300 | | | | 457 | |
| 3 | | Republic of Panama | | 6.700% | | 1/26/36 | | | 292 | | | | 409 | |
| 3 | | Republic of Panama | | 4.500% | | 4/16/50 | | | 410 | | | | 486 | |
| 3 | | Republic of Panama | | 4.300% | | 4/29/53 | | | 400 | | | | 466 | |
| 3 | | Republic of Panama | | 3.870% | | 7/23/60 | | | 200 | | | | 215 | |
| | | Republic of Peru | | 7.350% | | 7/21/25 | | | 225 | | | | 284 | |
| | | Republic of Peru | | 8.750% | | 11/21/33 | | | 645 | | | | 1,064 | |
| 3 | | Republic of Peru | | 6.550% | | 3/14/37 | | | 225 | | | | 329 | |
| | | Republic of Peru | | 5.625% | | 11/18/50 | | | 475 | | | | 689 | |
| | | Republic of Poland | | 5.125% | | 4/21/21 | | | 275 | | | | 286 | |
| | | Republic of Poland | | 5.000% | | 3/23/22 | | | 775 | | | | 827 | |
| | | Republic of Poland | | 3.000% | | 3/17/23 | | | 325 | | | | 335 | |
| | | Republic of Poland | | 3.250% | | 4/6/26 | | | 500 | | | | 529 | |
| | | Republic of the Philippines | | 4.000% | | 1/15/21 | | | 350 | | | | 357 | |
| | | Republic of the Philippines | | 9.500% | | 10/21/24 | | | 350 | | | | 466 | |
| | | Republic of the Philippines | | 10.625% | | 3/16/25 | | | 100 | | | | 141 | |
| | | Republic of the Philippines | | 5.500% | | 3/30/26 | | | 225 | | | | 267 | |
| | | Republic of the Philippines | | 3.000% | | 2/1/28 | | | 400 | | | | 415 | |
| | | Republic of the Philippines | | 3.750% | | 1/14/29 | | | 400 | | | | 441 | |
| | | Republic of the Philippines | | 9.500% | | 2/2/30 | | | 300 | | | | 478 | |
| | | Republic of the Philippines | | 7.750% | | 1/14/31 | | | 400 | | | | 591 | |
| | | Republic of the Philippines | | 6.375% | | 1/15/32 | | | 200 | | | | 272 | |
| | | Republic of the Philippines | | 6.375% | | 10/23/34 | | | 550 | | | | 781 | |
| | | Republic of the Philippines | | 3.950% | | 1/20/40 | | | 700 | | | | 799 | |
| | | Republic of the Philippines | | 3.700% | | 3/1/41 | | | 400 | | | | 453 | |
| | | Republic of the Philippines | | 3.700% | | 2/2/42 | | | 350 | | | | 394 | |
| | | State of Israel | | 3.150% | | 6/30/23 | | | 400 | | | | 416 | |
| | | State of Israel | | 2.875% | | 3/16/26 | | | 200 | | | | 208 | |
| | | State of Israel | | 3.250% | | 1/17/28 | | | 300 | | | | 322 | |
| | | State of Israel | | 4.500% | | 1/30/43 | | | 200 | | | | 238 | |
| | | State of Israel | | 4.125% | | 1/17/48 | | | 250 | | | | 285 | |
| | | Svensk Exportkredit AB | | 1.750% | | 3/10/21 | | | 450 | | | | 450 | |
| | | Svensk Exportkredit AB | | 2.375% | | 4/9/21 | | | 200 | | | | 202 | |
| | | Svensk Exportkredit AB | | 2.875% | | 5/22/21 | | | 200 | | | | 203 | |
| | | Svensk Exportkredit AB | | 1.625% | | 9/12/21 | | | 300 | | | | 300 | |
| | | Svensk Exportkredit AB | | 3.125% | | 11/8/21 | | | 200 | | | | 205 | |
| | | Svensk Exportkredit AB | | 2.000% | | 8/30/22 | | | 190 | | | | 191 | |
| | | Svensk Exportkredit AB | | 1.625% | | 11/14/22 | | | 200 | | | | 200 | |
| | | Svensk Exportkredit AB | | 2.875% | | 3/14/23 | | | 195 | | | | 202 | |
| | | Syngenta Finance NV | | 3.125% | | 3/28/22 | | | 100 | | | | 101 | |
| | | United Mexican States | | 3.625% | | 3/15/22 | | | 548 | | | | 564 | |
| | | United Mexican States | | 3.600% | | 1/30/25 | | | 510 | | | | 533 | |
| | | United Mexican States | | 4.125% | | 1/21/26 | | | 445 | | | | 474 | |
| | | United Mexican States | | 4.150% | | 3/28/27 | | | 800 | | | | 855 | |
| | | United Mexican States | | 3.750% | | 1/11/28 | | | 675 | | | | 700 | |
| | | United Mexican States | | 4.500% | | 4/22/29 | | | 850 | | | | 931 | |
| | | United Mexican States | | 8.300% | | 8/15/31 | | | 220 | | | | 326 | |
| | | United Mexican States | | 7.500% | | 4/8/33 | | | 100 | | | | 141 | |
| | | United Mexican States | | 6.050% | | 1/11/40 | | | 883 | | | | 1,144 | |
| | | United Mexican States | | 4.750% | | 3/8/44 | | | 765 | | | | 842 | |
| | | United Mexican States | | 5.550% | | 1/21/45 | | | 510 | | | | 625 | |
| | | United Mexican States | | 4.600% | | 1/23/46 | | | 600 | | | | 647 | |
| | | United Mexican States | | 4.350% | | 1/15/47 | | | 760 | | | | 796 | |
| | | United Mexican States | | 4.600% | | 2/10/48 | | | 255 | | | | 277 | |
| 3 | | United Mexican States | | 4.500% | | 1/31/50 | | | 400 | | | | 433 | |
| | | United Mexican States | | 5.750% | | 10/12/10 | | | 342 | | | | 402 | |
| Total Sovereign Bonds (Cost $168,587) | | | | | | | | | | | 176,043 | |
| Taxable Municipal Bonds (0.7%) | | | | | | | | | | | | |
| | | Alabama Economic Settlement Authority BP Settlement Revenue | | 3.163% | | 9/15/25 | | | 75 | | | | 77 | |
| | | American Municipal Power Ohio Inc. Revenue (Prairie State Energy Campus Project) | | 5.939% | | 2/15/47 | | | 150 | | | | 207 | |
| | | American Municipal Power Ohio Inc.Revenue (Prairie State Energy Campus Project) | | 6.270% | | 2/15/50 | | | 50 | | | | 67 | |
| | | American Municipal Power Ohio Inc. Revenue (Prairie State Energy Campus Project) | | 7.499% | | 2/15/50 | | | 50 | | | | 77 | |
| | | American Municipal Power Ohio Inc. Revenue (Prairie State Energy Campus Project) | | 8.084% | | 2/15/50 | | | 125 | | | | 214 | |
| | | Bay Area Toll Authority California Toll Bridge Revenue (San Francisco Bay Area) | | 6.918% | | 4/1/40 | | | 100 | | | | 146 | |
| | | Bay Area Toll Authority California Toll Bridge Revenue (San Francisco Bay Area) | | 6.263% | | 4/1/49 | | | 250 | | | | 382 | |
| | | Bay Area Toll Authority California Toll Bridge Revenue (San Francisco Bay Area) | | 6.907% | | 10/1/50 | | | 200 | | | | 323 | |
| | | California Department of Water Resources Power Supply Revenue | | 2.000% | | 5/1/22 | | | 150 | | | | 151 | |
| | | California GO | | 2.800% | | 4/1/21 | | | 150 | | | | 152 | |
| | | California GO | | 5.700% | | 11/1/21 | | | 250 | | | | 268 | |
| | | California GO | | 3.375% | | 4/1/25 | | | 100 | | | | 106 | |
| | | California GO | | 2.650% | | 4/1/26 | | | 75 | | | | 77 | |
| | | California GO | | 3.500% | | 4/1/28 | | | 150 | | | | 162 | |
| | | California GO | | 4.500% | | 4/1/33 | | | 190 | | | | 214 | |
| | | California GO | | 7.500% | | 4/1/34 | | | 350 | | | | 527 | |
| | | California GO | | 4.600% | | 4/1/38 | | | 300 | | | | 332 | |
| | | California GO | | 7.300% | | 10/1/39 | | | 75 | | | | 115 | |
| | | California GO | | 7.350% | | 11/1/39 | | | 1,425 | | | | 2,189 | |
| | | California GO | | 7.625% | | 3/1/40 | | | 205 | | | | 328 | |
| | | California GO | | 7.600% | | 11/1/40 | | | 200 | | | | 330 | |
| | | California State University Systemwide Revenue | | 3.899% | | 11/1/47 | | | 50 | | | | 55 | |
| | | Central Puget Sound WA Regional Transit Authority Sales & Use Tax Revenue | | 5.491% | | 11/1/39 | | | 50 | | | | 66 | |
| | | Chicago IL GO | | 7.045% | | 1/1/29 | | | 50 | | | | 55 | |
| | | Chicago IL GO | | 7.375% | | 1/1/33 | | | 150 | | | | 180 | |
| | | Chicago IL GO | | 6.314% | | 1/1/44 | | | 100 | | | | 114 | |
| | | Chicago IL Metropolitan Water Reclamation District GO | | 5.720% | | 12/1/38 | | | 100 | | | | 131 | |
| | | Chicago IL O’Hare International Airport Revenue | | 6.395% | | 1/1/40 | | | 125 | | | | 180 | |
| | | Chicago IL O’Hare International Airport Revenue | | 4.472% | | 1/1/49 | | | 75 | | | | 90 | |
| | | Chicago IL Transit Authority Sales Tax Receipts Revenue | | 6.200% | | 12/1/40 | | | 150 | | | | 196 | |
| | | Chicago IL Transit Authority Transfer Tax Receipts Revenue | | 6.899% | | 12/1/40 | | | 125 | | | | 169 | |
| | | Clark County NV Airport System Revenue | | 6.820% | | 7/1/45 | | | 100 | | | | 158 | |
| | | Commonwealth Financing Authority Pennsylvania Revenue | | 3.864% | | 6/1/38 | | | 100 | | | | 107 | |
| | | Commonwealth Financing Authority Pennsylvania Revenue | | 3.807% | | 6/1/41 | | | 55 | | | | 59 | |
| | | Connecticut GO | | 5.090% | | 10/1/30 | | | 175 | | | | 201 | |
| | | Connecticut GO | | 5.850% | | 3/15/32 | | | 200 | | | | 258 | |
| | | Cook County IL GO | | 6.229% | | 11/15/34 | | | 50 | | | | 65 | |
| | | Dallas TX Area Rapid Transit Revenue | | 5.999% | | 12/1/44 | | | 100 | | | | 142 | |
| | | Dallas TX Area Rapid Transit Revenue | | 5.022% | | 12/1/48 | | | 50 | | | | 66 | |
| | | Dallas TX Convention Center Hotel Development Corp. Hotel Revenue | | 7.088% | | 1/1/42 | | | 150 | | | | 208 | |
Total Bond Market Index Portfolio
| | | | | | | | | Face | | | Market | |
| | | | | | | Maturity | | Amount | | | Value• | |
| | | | | Coupon | | Date | | | ($000 | ) | | | ($000 | ) |
| | Dallas TX Independent School District GO | | 6.450% | | 2/15/35 | | | 100 | | | | 105 | |
| | | Dallas-Fort Worth TX International Airport Revenue | | 2.994% | | 11/1/38 | | | 50 | | | | 49 | |
| | | Dallas-Fort Worth TX International Airport Revenue | | 3.144% | | 11/1/45 | | | 75 | | | | 74 | |
| | | District of Columbia Income Tax Revenue | | 5.591% | | 12/1/34 | | | 50 | | | | 62 | |
| | | District of Columbia Water & Sewer Authority Public Utility Revenue | | 4.814% | | 10/1/14 | | | 150 | | | | 197 | |
| | | Florida Board of Administration Finance Corp Revenue | | 2.638% | | 7/1/21 | | | 150 | | | | 152 | |
| | | George Washington University | | 4.126% | | 9/15/48 | | | 150 | | | | 173 | |
| | | Georgia Municipal Electric Power Authority Revenue | | 6.637% | | 4/1/57 | | | 248 | | | | 334 | |
| | | Georgia Municipal Electric Power Authority Revenue | | 6.655% | | 4/1/57 | | | 149 | | | | 205 | |
| | | Georgia Municipal Electric Power Authority Revenue | | 7.055% | | 4/1/57 | | | 74 | | | | 100 | |
| | | Houston TX GO | | 6.290% | | 3/1/32 | | | 135 | | | | 163 | |
| | | Illinois GO | | 4.950% | | 6/1/23 | | | 349 | | | | 364 | |
| | | Illinois GO | | 5.100% | | 6/1/33 | | | 1,200 | | | | 1,294 | |
| | | Illinois GO | | 7.350% | | 7/1/35 | | | 300 | | | | 364 | |
| | | Illinois Toll Highway Authority Revenue | | 6.184% | | 1/1/34 | | | 50 | | | | 66 | |
| | | JobsOhio Beverage System Statewide Liquor Profits Revenue | | 3.985% | | 1/1/29 | | | 150 | | | | 163 | |
| | | JobsOhio Beverage System Statewide Liquor Profits Revenue | | 4.532% | | 1/1/35 | | | 100 | | | | 117 | |
| | | Los Angeles CA Department of Water & Power Revenue | | 6.166% | | 7/1/40 | | | 25 | | | | 26 | |
| | | Los Angeles CA Department of Water & Power Revenue | | 6.574% | | 7/1/45 | | | 100 | | | | 156 | |
| | | Los Angeles CA Department of Water & Power Revenue | | 6.603% | | 7/1/50 | | | 100 | | | | 160 | |
| | | Los Angeles CA Unified School District GO | | 5.755% | | 7/1/29 | | | 200 | | | | 242 | |
| | | Los Angeles CA Unified School District GO | | 5.750% | | 7/1/34 | | | 125 | | | | 160 | |
| | | Los Angeles CA Unified School District GO | | 6.758% | | 7/1/34 | | | 200 | | | | 276 | |
| | | Los Angeles County CA Metropolitan Transportation Authority Sales Tax Revenue | | 5.735% | | 6/1/39 | | | 75 | | | | 97 | |
| | | Los Angeles County CA Public Works Financing Authority Lease Revenue | | 7.618% | | 8/1/40 | | | 50 | | | | 77 | |
| | | Maryland Transportation Authority Facilities Projects Revenue | | 5.888% | | 7/1/43 | | | 50 | | | | 67 | |
| | | Massachusetts GO | | 4.200% | | 12/1/21 | | | 115 | | | | 118 | |
| | | Massachusetts GO | | 5.456% | | 12/1/39 | | | 150 | | | | 195 | |
| | | Massachusetts GO | | 2.813% | | 9/1/43 | | | 225 | | | | 214 | |
| | | Massachusetts GO | | 2.900% | | 9/1/49 | | | 100 | | | | 94 | |
| | | Massachusetts School Building Authority Dedicated Sales Tax Revenue | | 5.715% | | 8/15/39 | | | 100 | | | | 132 | |
| | | Massachusetts School Building Authority Dedicated Sales Tax Revenue | | 3.395% | | 10/15/40 | | | 50 | | | | 50 | |
| | | Massachusetts Transportation Fund Revenue | | 5.731% | | 6/1/40 | | | 50 | | | | 65 | |
| | | Metropolitan Government of Nashville & Davidson County TN Convention Center Authority Tourism Tax Revenue | | 6.731% | | 7/1/43 | | | 50 | | | | 71 | |
| | | Metropolitan Washington DC/VA Airports Authority Dulles Toll Road Revenue | | 7.462% | | 10/1/46 | | | 85 | | | | 137 | |
| | | Miami-Dade County FL Aviation Revenue (Miami International Airport) | | 4.280% | | 10/1/41 | | | 125 | | | | 134 | |
| | | Michigan Finance Authority Revenue (Trinity Health Credit Group) | | 3.084% | | 12/1/34 | | | 75 | | | | 75 | |
| | | Michigan Finance Authority Revenue (Trinity Health Credit Group) | | 3.384% | | 12/1/40 | | | 200 | | | | 200 | |
| | | Michigan State University Revenue | | 4.496% | | 8/15/48 | | | 50 | | | | 55 | |
| | Mississippi GO | | 5.245% | | 11/1/34 | | | 50 | | | | 62 | |
| | | Missouri Health & Educational Facilities Authority Revenue (Washington University) | | 3.652% | | 8/15/57 | | | 100 | | | | 105 | |
| 10 | | New Jersey Economic Development Authority Revenue (State Pension Funding) | | 7.425% | | 2/15/29 | | | 225 | | | | 282 | |
| | | New Jersey Transportation Trust Fund Authority Transportation Program Revenue | | 4.081% | | 6/15/39 | | | 75 | | | | 75 | |
| | | New Jersey Transportation Trust Fund Authority Transportation Program Revenue | | 4.131% | | 6/15/42 | | | 100 | | | | 99 | |
| | | New Jersey Transportation Trust Fund Authority Transportation System Revenue | | 6.104% | | 12/15/28 | | | 100 | | | | 104 | |
| | | New Jersey Transportation Trust Fund Authority Transportation System Revenue | | 6.561% | | 12/15/40 | | | 400 | | | | 528 | |
| | | New Jersey Turnpike Authority Revenue | | 7.414% | | 1/1/40 | | | 100 | | | | 157 | |
| | | New Jersey Turnpike Authority Revenue | | 7.102% | | 1/1/41 | | | 400 | | | | 610 | |
| | | New York City NY GO | | 6.246% | | 6/1/35 | | | 25 | | | | 25 | |
| | | New York City NY GO | | 5.517% | | 10/1/37 | | | 50 | | | | 64 | |
| | | New York City NY GO | | 6.271% | | 12/1/37 | | | 100 | | | | 139 | |
| | | New York City NY Municipal Water Finance Authority Water & Sewer System Revenue | | 5.750% | | 6/15/41 | | | 50 | | | | 70 | |
| | | New York City NY Municipal Water Finance Authority Water & Sewer System Revenue | | 5.952% | | 6/15/42 | | | 50 | | | | 72 | |
| | | New York City NY Municipal Water Finance Authority Water & Sewer System Revenue | | 6.011% | | 6/15/42 | | | 50 | | | | 72 | |
| | | New York City NY Municipal Water Finance Authority Water & Sewer System Revenue | | 5.440% | | 6/15/43 | | | 100 | | | | 137 | |
| | | New York City NY Municipal Water Finance Authority Water & Sewer System Revenue | | 5.882% | | 6/15/44 | | | 175 | | | | 255 | |
| | | New York City NY Transitional Finance Authority Future Tax Revenue | | 5.767% | | 8/1/36 | | | 150 | | | | 186 | |
| | | New York City NY Transitional Finance Authority Future Tax Revenue | | 5.508% | | 8/1/37 | | | 100 | | | | 127 | |
| | | New York City NY Transitional Finance Authority Future Tax Revenue | | 5.572% | | 11/1/38 | | | 75 | | | | 95 | |
| | | New York Metropolitan Transportation Authority Revenue (Dedicated Tax Fund) | | 7.336% | | 11/15/39 | | | 400 | | | | 626 | |
| | | New York Metropolitan Transportation Authority Revenue (Transit Revenue) | | 5.871% | | 11/15/39 | | | 50 | | | | 64 | |
| | | New York State Dormitory Authority Revenue | | 3.142% | | 7/1/43 | | | 75 | | | | 74 | |
| | | New York State Dormitory Authority Revenue (Personal Income Tax) | | 3.110% | | 2/15/39 | | | 50 | | | | 50 | |
| | | New York State Dormitory Authority Revenue (Personal Income Tax) | | 5.628% | | 3/15/39 | | | 100 | | | | 123 | |
| | | New York State Dormitory Authority Revenue (Personal Income Tax) | | 3.190% | | 2/15/43 | | | 50 | | | | 50 | |
| | | New York State Thruway Authority | | 2.900% | | 1/1/35 | | | 75 | | | | 75 | |
| | | New York State Thruway Authority | | 3.500% | | 1/1/42 | | | 50 | | | | 50 | |
| | | New York State Urban Development Corp. Revenue (Personal Income Tax) | | 3.900% | | 3/15/33 | | | 100 | | | | 107 | |
| | | New York State Urban Development Corp. Revenue (Personal Income Tax) | | 5.770% | | 3/15/39 | | | 150 | | | | 182 | |
| | | North Texas Tollway Authority System Revenue | | 6.718% | | 1/1/49 | | | 150 | | | | 235 | |
| | | Ohio State University General Receipts Revenue | | 4.910% | | 6/1/40 | | | 100 | | | | 127 | |
| | | Ohio State University General Receipts Revenue | | 3.798% | | 12/1/46 | | | 100 | | | | 111 | |
Total Bond Market Index Portfolio
| | | | | | | | | Face | | | Market | |
| | | | | | | Maturity | | Amount | | | Value• | |
| | | | | Coupon | | Date | | | ($000 | ) | | | ($000 | ) |
| | | Ohio State University General Receipts Revenue | | 4.800% | | 6/1/11 | | | 100 | | | | 127 | |
| | | Ohio Water Development Authority Water Pollution Control Loan Fund Revenue | | 4.879% | | 12/1/34 | | | 75 | | | | 88 | |
| | | Oregon Department of Transportation Highway User Tax Revenue | | 5.834% | | 11/15/34 | | | 150 | | | | 200 | |
| | | Oregon GO | | 5.762% | | 6/1/23 | | | 135 | | | | 145 | |
| | | Oregon GO | | 5.892% | | 6/1/27 | | | 75 | | | | 89 | |
| 11 | | Oregon School Boards Association GO | | 5.528% | | 6/30/28 | | | 50 | | | | 59 | |
| | | Pennsylvania Public School Building Authority Lease Revenue (School District of Philadelphia) | | 5.000% | | 9/15/27 | | | 50 | | | | 58 | |
| | | Pennsylvania Turnpike Commission Revenue | | 5.511% | | 12/1/45 | | | 50 | | | | 66 | |
| | | Port Authority of New York & New Jersey Revenue | | 6.040% | | 12/1/29 | | | 75 | | | | 97 | |
| | | Port Authority of New York & New Jersey Revenue | | 4.960% | | 8/1/46 | | | 250 | | | | 323 | |
| | | Port Authority of New York & New Jersey Revenue | | 5.310% | | 8/1/46 | | | 100 | | | | 111 | |
| | | Port Authority of New York & New Jersey Revenue | | 4.031% | | 9/1/48 | | | 30 | | | | 34 | |
| | | Port Authority of New York & New Jersey Revenue | | 4.926% | | 10/1/51 | | | 100 | | | | 130 | |
| | | Port Authority of New York & New Jersey Revenue | | 4.458% | | 10/1/62 | | | 550 | | | | 674 | |
| | | Port Authority of New York & New Jersey Revenue | | 4.810% | | 10/15/65 | | | 100 | | | | 126 | |
| | | Port Authority of New York & New Jersey Revenue | | 3.287% | | 8/1/69 | | | 100 | | | | 95 | |
| | | Princeton University | | 5.700% | | 3/1/39 | | | 200 | | | | 277 | |
| | | Regents of the University of California Revenue | | 3.063% | | 7/1/25 | | | 100 | | | | 105 | |
| | | Regional Transportation District of Colorado Sales Tax Revenue | | 5.844% | | 11/1/50 | | | 100 | | | | 145 | |
| | | Rutgers State University New Jersey Revenue | | 5.665% | | 5/1/40 | | | 50 | | | | 65 | |
| | | Rutgers State University New Jersey Revenue | | 3.270% | | 5/1/43 | | | 25 | | | | 25 | |
| | | Rutgers State University New Jersey Revenue | | 3.915% | | 5/1/19 | | | 75 | | | | 74 | |
| | | Sales Tax Securitization Corp. Illinois Revenue | | 3.587% | | 1/1/43 | | | 75 | | | | 74 | |
| | | Sales Tax Securitization Corp. Illinois Revenue | | 3.820% | | 1/1/48 | | | 50 | | | | 50 | |
| | | Sales Tax Securitization Corp. Illinois Revenue | | 4.787% | | 1/1/48 | | | 100 | | | | 116 | |
| | | Salt River Project Arizona Agricultural Improvement & Power District Revenue | | 4.839% | | 1/1/41 | | | 150 | | | | 187 | |
| | | San Antonio TX Electric & Gas Systems Revenue | | 5.985% | | 2/1/39 | | | 125 | | | | 172 | |
| | | San Antonio TX Electric & Gas Systems Revenue | | 5.808% | | 2/1/41 | | | 125 | | | | 172 | |
| | | San Diego County CA Water Authority Revenue | | 6.138% | | 5/1/49 | | | 100 | | | | 142 | |
| | | San Francisco CA City & County Public Utilities Commission Water Revenue | | 6.950% | | 11/1/50 | | | 100 | | | | 152 | |
| | | San Jose California Redevelopment Agency Successor Agency Tax Allocation | | 3.375% | | 8/1/34 | | | 100 | | | | 103 | |
| | | Santa Clara Valley CA Transportation Authority Sales Tax Revenue | | 5.876% | | 4/1/32 | | | 200 | | | | 245 | |
| | | South Carolina Public Service Authority Revenue | | 2.388% | | 12/1/23 | | | 50 | | | | 50 | |
| | | South Carolina Public Service Authority Revenue | | 6.454% | | 1/1/50 | | | 100 | | | | 147 | |
| | Texas A&M University System Revenue Financing System Revenue | | 3.100% | | 7/1/49 | | | 75 | | | | 73 | |
| | | Texas GO | | 5.517% | | 4/1/39 | | | 50 | | | | 67 | |
| | | Texas GO | | 3.211% | | 4/1/44 | | | 225 | | | | 227 | |
| | | Texas Private Activity Surface Transportation Corp. Revenue | | 3.922% | | 12/31/49 | | | 125 | | | | 126 | |
| | | Texas Transportation Commission Revenue | | 5.178% | | 4/1/30 | | | 175 | | | | 211 | |
| | | Texas Transportation Commission Revenue | | 4.681% | | 4/1/40 | | | 50 | | | | 61 | |
| | | University of California Regents Medical Center Revenue | | 6.548% | | 5/15/48 | | | 250 | | | | 361 | |
| | | University of California Regents Medical Center Revenue | | 6.583% | | 5/15/49 | | | 50 | | | | 72 | |
| | | University of California Revenue | | 5.946% | | 5/15/45 | | | 175 | | | | 235 | |
| | | University of California Revenue | | 4.858% | | 5/15/12 | | | 175 | | | | 216 | |
| | | University of California Revenue | | 4.767% | | 5/15/15 | | | 100 | | | | 121 | |
| | | University of Nebraska Student Fee Revenue | | 3.037% | | 10/1/49 | | | 25 | | | | 24 | |
| | | University of Pittsburgh-of the Commonwealth System of Higher Education | | 3.555% | | 9/15/19 | | | 250 | | | | 242 | |
| | | University of Southern California | | 5.250% | | 10/1/11 | | | 100 | | | | 141 | |
| | | University of Texas Permanent University Fund Revenue | | 3.376% | | 7/1/47 | | | 50 | | | | 53 | |
| | | University of Texas Revenue | | 3.354% | | 8/15/47 | | | 50 | | | | 52 | |
| | | University of Texas System Revenue Financing System Revenue | | 4.794% | | 8/15/46 | | | 75 | | | | 93 | |
| | | University of Virginia Revenue | | 4.179% | | 9/1/17 | | | 50 | | | | 59 | |
| | | Utah GO | | 4.554% | | 7/1/24 | | | 50 | | | | 53 | |
| | | Utah GO | | 3.539% | | 7/1/25 | | | 50 | | | | 52 | |
| | | Washington GO | | 5.140% | | 8/1/40 | | | 150 | | | | 191 | |
| | | Wisconsin Annual Appropriation Revenue | | 3.954% | | 5/1/36 | | | 250 | | | | 267 | |
| | | Wisconsin General Fund Annual Appropriation Revenue | | 3.154% | | 5/1/27 | | | 100 | | | | 104 | |
| 11 | | Wisconsin GO | | 5.700% | | 5/1/26 | | | 70 | | | | 79 | |
| Total Taxable Municipal Bonds (Cost $24,262) | | | | | | | | | | | 28,768 | |
| | | | | | | | Shares | | | | | |
| Temporary Cash Investment (2.1%) | | | | | | | | | | | | |
| Money Market Fund (2.1%) | | | | | | | | | | | |
| 12 | | Vanguard Market Liquidity Fund
(Cost $92,087) | | | | 1.816% | | | 920,860 | | | | 92,095 | |
| Total Investments (101.2%) (Cost $4,189,529) | | | | | | | | | | | 4,351,047 | |
| | | | | | | | | | | | | | | |
| | | | | | | | | | | | | | Amount | |
| | | | | | | | | | | | | | ($000 | ) |
| Other Assets and Liabilities (-1.2%) | | | | | | | | | | | | |
| Other Assets | | | | | | | | | | | | |
| Investment in Vanguard | | | | | | | | | | | 192 | |
| Receivables for Investment Securities Sold | | | | | | | | | | | 31,750 | |
| Receivables for Accrued Income | | | | | | | | | | | 26,098 | |
| Receivables for Capital Shares Issued | | | | | | | | | | | 15,803 | |
| Other Assets | | | | | | | | | | | 1,364 | |
| Total Other Assets | | | | | | | | | | | 75,207 | |
| Liabilities | | | | | | | | | | | | |
| Payables for Investment Securities Purchased | | | | | | | | | | | (120,857 | ) |
| Payables for Capital Shares Redeemed | | | | | | | | | | | (3,977 | ) |
| Payables to Vanguard | | | | | | | | | | | (1,417 | ) |
| Total Liabilities | | | | | | | | | | | (126,251 | ) |
| Net Assets (100%) | | | | | | | | | | | | |
| Applicable to 352,196,029 outstanding $.001 par value shares of beneficial interest (unlimited authorization) | | | | | | | | | | | 4,300,003 | |
| Net Asset Value Per Share | | | | | | | | | | | $12.21 | |
Total Bond Market Index Portfolio
At December 31, 2019, net assets consisted of:
| | | Amount | |
| | | | ($000 | ) |
| Paid-in Capital | | | 4,040,937 | |
| Total Distributable Earnings (Loss) | | | 259,066 | |
| Net Assets | | | 4,300,003 | |
| | • | See Note A in Notes to Financial Statements. |
| | 1 | U.S. government-guaranteed. |
| | 2 | The issuer was placed under federal conservatorship in September 2008; since that time, its daily operations have been managed by the Federal Housing Finance Agency and it receives capital from the U.S. Treasury, as needed to maintain a positive net worth, in exchange for senior preferred stock. |
| | 3 | The average or expected maturity is shorter than the final maturity shown because of the possibility of interim principal payments and prepayments or the possibility of the issue being called. |
| | 4 | Includes securities purchased on a when-issued or delayed-delivery basis for which the portfolio has not taken delivery as of December 31, 2019. |
| | 5 | Adjustable-rate security; rate shown is effective rate at period end. Certain adjustable-rate securities are not based on a published reference rate and spread but are determined by the issuer or agent based on current market conditions. |
| | 6 | Security exempt from registration under Rule 144A of the Securities Act of 1933. Such securities may be sold in transactions exempt from registration, normally to qualified institutional buyers. At December 31, 2019, the aggregate value of these securities was $37,158,000, representing 0.9% of net assets. |
| | 7 | Guaranteed by the Government of Japan. |
| | 8 | Guaranteed by the Federal Republic of Germany. |
| | 9 | Guaranteed by the Republic of Austria. |
| 10 | Scheduled principal and interest payments are guaranteed by National Public Finance Guarantee Corp. |
| | 11 | Scheduled principal and interest payments are guaranteed by AGM (Assured Guaranty Municipal Corporation). |
| | 12 | Affiliated money market fund available only to Vanguard funds and certain trusts and accounts managed by Vanguard. Rate shown is the 7-day yield. |
CMT—Constant Maturing Treasury Rate.
GO—General Obligation Bond.
LIBOR—London Interbank Offered Rate.
REIT—Real Estate Investment Trust.
TBA—To Be Announced.
UMBS—Uniform Mortgage-Backed Securities.
See accompanying Notes, which are an integral part of the Financial Statements.
Total Bond Market Index Portfolio
Statement of Operations
|
| | | | Year Ended | |
| | | | December 31, 2019 | |
| | | ($000 | ) |
| Investment Income | | | | |
| Income | | | | |
| Interest1 | | | 113,167 | |
| Total Income | | | 113,167 | |
| Expenses | | | | |
| The Vanguard Group—Note B | | | | |
| Investment Advisory Services | | | 135 | |
| Management and Administrative | | | 4,757 | |
| Marketing and Distribution | | | 465 | |
| Custodian Fees | | | 51 | |
| Auditing Fees | | | 82 | |
| Shareholders’ Reports | | | 40 | |
| Trustees’ Fees and Expenses | | | 2 | |
| Total Expenses | | | 5,532 | |
| Net Investment Income | | | 107,635 | |
| Realized Net Gain (Loss) | | | | |
| Investment Securities Sold1 | | | 8,036 | |
| Futures Contracts | | | (8 | ) |
| Realized Net Gain (Loss) | | | 8,028 | |
| Change in Unrealized Appreciation (Depreciation) | | | | |
| Investment Securities1 | | | 204,615 | |
| Futures Contracts | | | — | |
| Change in Unrealized Appreciation (Depreciation) | | | 204,615 | |
| Net Increase (Decrease) in Net Assets Resulting from Operations | | | 320,278 | |
| 1 | Interest income, realized net gain (loss), and change in unrealized appreciation (depreciation) from an affiliated company of the portfolio were $1,887,000, $4,000, and $4,000, respectively. Purchases and sales are for temporary cash investment purposes. |
Statement of Changes in Net Assets
| | | Year Ended December 31, | |
| | | 2019 | | | 2018 | |
| | | ($000 | ) | | ($000 | ) |
| Increase (Decrease) in Net Assets | | | |
| Operations | | | |
| Net Investment Income | | | 107,635 | | | | 94,491 | |
| Realized Net Gain (Loss) | | | 8,028 | | | | (11,812 | ) |
| Change in Unrealized Appreciation (Depreciation) | | | 204,615 | | | | (87,509 | ) |
| Net Increase (Decrease) in Net Assets Resulting from Operations | | | 320,278 | | | | (4,830 | ) |
| Distributions | | | | | | | | |
| Net Investment Income | | | (97,897 | ) | | | (79,188 | ) |
| Realized Capital Gain1 | | | — | | | | (6,703 | ) |
| Total Distributions | | | (97,897 | ) | | | (85,891 | ) |
| Capital Share Transactions | | | | | | | | |
| Issued | | | 1,031,614 | | | | 657,403 | |
| Issued in Lieu of Cash Distributions | | | 97,897 | | | | 85,891 | |
| Redeemed | | | (586,442 | ) | | | (616,385 | ) |
| Net Increase (Decrease) from Capital Share Transactions | | | 543,069 | | | | 126,909 | |
| Total Increase (Decrease) | | | 765,450 | | | | 36,188 | |
| Net Assets | | | | | | | | |
| Beginning of Period | | | 3,534,553 | | | | 3,498,365 | |
| End of Period | | | 4,300,003 | | | | 3,534,553 | |
| 1 | Includes fiscal 2019 and 2018 short-term gain distributions totaling $0 and $0, respectively. Short-term gain distributions are treated as ordinary income dividends for tax purposes. |
See accompanying Notes, which are an integral part of the Financial Statements.
Total Bond Market Index Portfolio
Financial Highlights
| For a Share Outstanding | | | Year Ended December 31, |
| Throughout Each Period | 2019 | 2018 | 2017 | 2016 | 2015 |
| Net Asset Value, Beginning of Period | $11.54 | $11.86 | $11.77 | $11.79 | $12.07 |
| Investment Operations |
| Net Investment Income | .3241 | .3131 | .2921 | .283 | .276 |
| Net Realized and Unrealized Gain (Loss) on Investments | .657 | (.343) | .119 | .007 | (.233) |
| Total from Investment Operations | .981 | (.030) | .411 | .290 | .043 |
| Distributions |
| Dividends from Net Investment Income | (.311) | (.267) | (.283) | (.277) | (.272) |
| Distributions from Realized Capital Gains | — | (.023) | (.038) | (.033) | (.051) |
| Total Distributions | (.311) | (.290) | (.321) | (.310) | (.323) |
| Net Asset Value, End of Period | $12.21 | $11.54 | $11.86 | $11.77 | $11.79 |
| | | | | | |
| Total Return | 8.67% | -0.21% | 3.57% | 2.47% | 0.33% |
| |
| Ratios/Supplemental Data |
| Net Assets, End of Period (Millions) | $4,300 | $3,535 | $3,498 | $2,985 | $2,799 |
| Ratio of Total Expenses to Average Net Assets | 0.14% | 0.14% | 0.15% | 0.15% | 0.15% |
| Ratio of Net Investment Income to Average Net Assets | 2.72% | 2.74% | 2.48% | 2.41% | 2.43% |
| Portfolio Turnover Rate2 | 80% | 89% | 91% | 104% | 149% |
1 Calculated based on average shares outstanding.
2 Includes 19%, 26%, 24%, 33%, and 61% attributable to mortgage-dollar-roll activity.
Notes to Financial Statements
The Total Bond Market Index Portfolio, a portfolio of Vanguard Variable Insurance Funds, is registered under the Investment Company Act of 1940 as an open-end investment company. The portfolio’s shares are only available for purchase by separate accounts of insurance companies as investments for variable annuity plans, variable life insurance contracts, or other variable benefit insurance contracts. Certain of the portfolio’s investments are in corporate debt instruments; the issuers’ abilities to meet their obligations may be affected by economic developments in their respective industries.
A. The following significant accounting policies conform to generally accepted accounting principles for U.S. investment companies. The portfolio consistently follows such policies in preparing its financial statements.
1. Security Valuation: Securities are valued as of the close of trading on the New York Stock Exchange (generally 4 p.m., Eastern time) on the valuation date. Bonds and temporary cash investments are valued using the latest bid prices or using valuations based on a matrix system (which considers such factors as security prices, yields, maturities, and ratings), both as furnished by independent pricing services. Structured debt securities, including mortgages and asset-backed securities, are valued using the latest bid prices or using valuations based on a matrix system that considers such factors as issuer, tranche, nominal or option-adjusted spreads, weighted average coupon, weighted average maturity, credit enhancements, and collateral. Investments in Vanguard Market Liquidity Fund are valued at that fund’s net asset value. Securities for which market quotations are not readily available, or whose values have been affected by events occurring before the portfolio’s pricing time but after the close of the securities’ primary markets, are valued by methods deemed by the board of trustees to represent fair value.
Total Bond Market Index Portfolio
2. Futures Contracts: The portfolio uses futures contracts to invest in fixed income asset classes with greater efficiency and lower cost than is possible through direct investment, to add value when these instruments are attractively priced, or to adjust sensitivity to changes in interest rates. The primary risks associated with the use of futures contracts are imperfect correlation between changes in market values of bonds held by the portfolio and the prices of futures contracts, and the possibility of an illiquid market. Counterparty risk involving futures is mitigated because a regulated clearinghouse is the counterparty instead of the clearing broker. To further mitigate counterparty risk, the portfolio trades futures contracts on an exchange, monitors the financial strength of its clearing brokers and clearinghouse, and has entered into clearing agreements with its clearing brokers. The clearinghouse imposes initial margin requirements to secure the portfolio’s performance and requires daily settlement of variation margin representing changes in the market value of each contract. Any assets pledged as initial margin for open contracts are noted in the Statement of Net Assets.
Futures contracts are valued at their quoted daily settlement prices. The notional amounts of the contracts are not recorded in the Statement of Net Assets. Fluctuations in the value of the contracts are recorded in the Statement of Net Assets as an asset (liability) and in the Statement of Operations as unrealized appreciation (depreciation) until the contracts are closed, when they are recorded as realized futures gains (losses).
During the year ended December 31, 2019, the portfolio’s average investments in long and short futures contracts represented 0% and less than 1% of net assets, respectively, based on the average of the notional amounts at each quarter-end during the period. The portfolio had no open futures contracts at December 31, 2019.
3. To Be Announced (TBA) Transactions: A TBA transaction is an agreement to buy or sell mortgage-backed securities with agreed-upon characteristics (face amount, coupon, maturity) for settlement at a future date. The portfolio may be a seller of TBA transactions to reduce its exposure to the mortgage-backed securities market or in order to sell mortgage-backed securities it owns under delayed-delivery arrangements. When the portfolio is a buyer of TBA transactions, it maintains cash or short-term investments in an amount sufficient to meet the purchase price at the settlement date of the TBA transaction. The primary risk associated with TBA transactions is that a counterparty may default on its obligations. The portfolio mitigates its counterparty risk by, among other things, performing a credit analysis of counterparties, allocating transactions among numerous counterparties, and monitoring its exposure to each counterparty. The portfolio may also enter into a Master Securities Forward Transaction Agreement (MSFTA) with certain counterparties and require them to transfer collateral as security for their performance. In the absence of a default, the collateral pledged or received by the portfolio cannot be repledged, resold, or rehypothecated. Under an MSFTA, upon a counterparty default (including bankruptcy), the portfolio may terminate any TBA transactions with that counterparty, determine the net amount owed by either party in accordance with its master netting arrangements, and sell or retain any collateral held up to the net amount owed to the portfolio under the master netting arrangements.
4. Mortgage Dollar Rolls: The portfolio enters into mortgage-dollar-roll transactions, in which the portfolio sells mortgage-backed securities to a dealer and simultaneously agrees to purchase similar securities in the future at a predetermined price. The proceeds of the securities sold in mortgage-dollar-roll transactions are typically invested in high-quality short-term fixed income securities. The portfolio forgoes principal and interest paid on the securities sold, and is compensated by interest earned on the proceeds of the sale and by a lower price on the securities to be repurchased. The portfolio has also entered into mortgage-dollar-roll transactions in which the portfolio buys mortgage-backed securities from a dealer pursuant to a TBA transaction and simultaneously agrees to sell similar securities in the future at a predetermined price. The securities bought in mortgage-dollar-roll transactions are used to cover an open TBA sell position. The portfolio continues to earn interest on mortgage-backed security pools already held and receives a lower price on the securities to be sold in the future. The portfolio accounts for mortgage-dollar-roll transactions as purchases and sales; as such, these transactions may increase the portfolio’s portfolio turnover rate. Amounts to be received or paid in connection with open mortgage dollar rolls are included in Receivables for Investment Securities Sold or Payables for Investment Securities Purchased in the Statement of Net Assets.
5. Federal Income Taxes: The portfolio intends to continue to qualify as a regulated investment company and distribute all of its taxable income. Management has analyzed the portfolio’s tax positions taken for all open federal income tax years (December 31, 2016–2019), and has concluded that no provision for federal income tax is required in the portfolio’s financial statements.
Total Bond Market Index Portfolio
6. Distributions: Distributions to shareholders are recorded on the ex-dividend date. Distributions are determined on a tax basis and may differ from net investment income and realized capital gains for financial reporting purposes.
7. Credit Facility: The portfolio and certain other funds managed by The Vanguard Group (“Vanguard”) participate in a $4.3 billion committed credit facility provided by a syndicate of lenders pursuant to a credit agreement that may be renewed annually; each fund is individually liable for its borrowings, if any, under the credit facility. Borrowings may be utilized for temporary and emergency purposes, and are subject to the portfolio’s regulatory and contractual borrowing restrictions. The participating funds are charged administrative fees and an annual commitment fee of 0.10% of the undrawn amount of the facility; these fees are allocated to the funds based on a method approved by the portfolio’s board of trustees and included in Management and Administrative expenses on the portfolio’s Statement of Operations. Any borrowings under this facility bear interest at a rate based upon the higher of the one-month London Interbank Offered Rate, federal funds effective rate, or overnight bank funding rate plus an agreed-upon spread.
The portfolio had no borrowings outstanding at December 31, 2019, or at any time during the period then ended.
8. Other: Interest income includes income distributions received from Vanguard Market Liquidity Fund and is accrued daily. Premiums and discounts on debt securities are amortized and accreted, respectively, to interest income over the lives of the respective securities, except for premiums on certain callable debt securities that are amortized to the earliest call date. Security transactions are accounted for on the date securities are bought or sold. Costs used to determine realized gains (losses) on the sale of investment securities are those of the specific securities sold.
B. In accordance with the terms of a Funds’ Service Agreement (the “FSA”) between Vanguard and the portfolio, Vanguard furnishes to the portfolio investment advisory, corporate management, administrative, marketing, and distribution services at Vanguard’s cost of operations (as defined by the FSA). These costs of operations are allocated to the portfolio based on methods and guidelines approved by the board of trustees. Vanguard does not require reimbursement in the current period for certain costs of operations (such as deferred compensation/benefits and risk/insurance costs); the portfolio’s liability for these costs of operations is included in Payables to Vanguard on the Statement of Net Assets. All other costs of operations payable to Vanguard are generally settled twice a month.
Upon the request of Vanguard, the portfolio may invest up to 0.40% of its net assets as capital in Vanguard. At December 31, 2019, the portfolio had contributed to Vanguard capital in the amount of $192,000, representing less than 0.01% of the portfolio’s net assets and 0.08% of Vanguard’s capital received pursuant to the FSA. The portfolio’s trustees and officers are also directors and employees, respectively, of Vanguard.
C. Various inputs may be used to determine the value of the portfolio’s investments. These inputs are summarized in three broad levels for financial statement purposes. The inputs or methodologies used to value securities are not necessarily an indication of the risk associated with investing in those securities.
Level 1—Quoted prices in active markets for identical securities.
Level 2—Other significant observable inputs (including quoted prices for similar securities, interest rates, prepayment speeds, credit risk, etc.).
Level 3—Significant unobservable inputs (including the portfolio’s own assumptions used to determine the fair value of investments). Any investments valued with significant unobservable inputs are noted on the Statement of Net Assets.
The following table summarizes the market value of the portfolio’s investments as of December 31, 2019, based on the inputs used to value them:
| | | Level 1 | | | Level 2 | | | Level 3 | |
| Investments | | | ($000 | ) | | | ($000 | ) | | | ($000 | ) |
| U.S. Government and Agency Obligations | | | — | | | | 2,804,700 | | | | — | |
| Asset-Backed/Commercial Mortgage-Backed Securities | | | — | | | | 110,185 | | | | — | |
| Corporate Bonds | | | — | | | | 1,139,256 | | | | — | |
| Sovereign Bonds | | | — | | | | 176,043 | | | | — | |
| Taxable Municipal Bonds | | | — | | | | 28,768 | | | | — | |
| Temporary Cash Investments | | | 92,095 | | | | — | | | | — | |
| Total | | | 92,095 | | | | 4,258,952 | | | | — | |
Total Bond Market Index Portfolio
D. Permanent differences between book-basis and tax-basis components of net assets, if any, are reclassified among capital accounts in the financial statements to reflect their tax character. These reclassifications have no effect on net assets or net asset value per share.
Temporary differences between book-basis and tax-basis components of total distributable earnings (loss) arise when certain items of income, gain, or loss are recognized in different periods for financial statement and tax purposes; these differences will reverse at some time in the future. The differences are primarily related to the tax deferral of losses on wash sales and straddles. As of period end, the tax-basis components of total distributable earnings (loss) are detailed in the table as follows:
| | | Amount | |
| | | | ($000 | ) |
| Undistributed Ordinary Income | | | 102,457 | |
| Undistributed Long-Term Gains | | | — | |
| Capital Loss Carryforwards (Non-expiring)* | | | (3,796 | ) |
| Net Unrealized Gains (Losses) | | | 161,512 | |
* The fund used capital loss carryforwards of $7,998,000 to offset taxable capital gains realized during the year ended December 31, 2019.
As of December 31, 2019, gross unrealized appreciation and depreciation for investments based on cost for U.S. federal income tax purposes were as follows:
| | | Amount | |
| | | | ($000 | ) |
| Tax Cost | | | 4,189,535 | |
| Gross Unrealized Appreciation | | | 169,713 | |
| Gross Unrealized Depreciation | | | (8,201 | ) |
| Net Unrealized Appreciation (Depreciation) | | | 161,512 | |
E. During the year ended December 31, 2019, the portfolio purchased $362,538,000 of investment securities and sold $240,631,000 of investment securities, other than U.S. government securities and temporary cash investments. Purchases and sales of U.S. government securities were $3,311,534,000 and $2,895,396,000, respectively.
F. Capital shares issued and redeemed were:
| | | Year Ended December 31, | |
| | | 2019 | | | 2018 | |
| | | Shares | | | Shares | |
| | | | (000 | ) | | | (000 | ) |
| Issued | | | 86,771 | | | | 57,508 | |
| Issued in Lieu of Cash Distributions | | | 8,535 | | | | 7,574 | |
| Redeemed | | | (49,300 | ) | | | (53,952 | ) |
| Net Increase (Decrease) in Shares Outstanding | | | 46,006 | | | | 11,130 | |
At December 31, 2019, one shareholder, an insurance company separate account whose holdings in the portfolio represent the indirect investment of Vanguard Variable Annuity contract holders, was the record or beneficial owner of 37% of the portfolio’s net assets. If this shareholder were to redeem its investment in the portfolio, the redemption might result in an increase in the portfolio’s expense ratio, cause the portfolio to incur higher transaction costs, or lead to the realization of taxable capital gains.
G. Management has determined that no events or transactions occurred subsequent to December 31, 2019, that would require recognition or disclosure in these financial statements.
Total Bond Market Index Portfolio
Report of Independent Registered Public Accounting Firm
To the Board of Trustees of Vanguard Variable Insurance Funds and Shareholders of Total Bond Market Index Portfolio
Opinion on the Financial Statements
We have audited the accompanying statement of net assets of Total Bond Market Index Portfolio (one of the portfolios constituting Vanguard Variable Insurance Funds, referred to hereafter as the “Portfolio”) as of December 31, 2019, the related statement of operations for the year ended December 31, 2019, the statement of changes in net assets for each of the two years in the period ended December 31, 2019, including the related notes, and the financial highlights for each of the five years in the period ended December 31, 2019 (collectively referred to as the “financial statements”). In our opinion, the financial statements present fairly, in all material respects, the financial position of the Portfolio as of December 31, 2019, the results of its operations for the year then ended, the changes in its net assets for each of the two years in the period ended December 31, 2019 and the financial highlights for each of the five years in the period ended December 31, 2019 in conformity with accounting principles generally accepted in the United States of America.
Basis for Opinion
These financial statements are the responsibility of the Portfolio’s management. Our responsibility is to express an opinion on the Portfolio’s financial statements based on our audits. We are a public accounting firm registered with the Public Company Accounting Oversight Board (United States) (“PCAOB”) and are required to be independent with respect to the Portfolio in accordance with the U.S. federal securities laws and the applicable rules and regulations of the Securities and Exchange Commission and the PCAOB.
We conducted our audits of these financial statements in accordance with the standards of the PCAOB. Those standards require that we plan and perform the audit to obtain reasonable assurance about whether the financial statements are free of material misstatement, whether due to error or fraud.
Our audits included performing procedures to assess the risks of material misstatement of the financial statements, whether due to error or fraud, and performing procedures that respond to those risks. Such procedures included examining, on a test basis, evidence regarding the amounts and disclosures in the financial statements. Our audits also included evaluating the accounting principles used and significant estimates made by management, as well as evaluating the overall presentation of the financial statements. Our procedures included confirmation of securities owned as of December 31, 2019 by correspondence with the custodian, transfer agent and brokers; when replies were not received from brokers, we performed other auditing procedures. We believe that our audits provide a reasonable basis for our opinion.
/s/PricewaterhouseCoopers LLP
Philadelphia, Pennsylvania
February 18, 2020
We have served as the auditor of one or more investment companies in The Vanguard Group of Funds since 1975.
Total Bond Market Index Portfolio
BLOOMBERG is a trademark and service mark of Bloomberg Finance L.P. BARCLAYS is a trademark and service mark of Barclays Bank Plc, used under license. Bloomberg Finance L.P. and its affiliates, including Bloomberg Index Services Limited (BISL) (collectively, Bloomberg), or Bloomberg’s licensors, own all proprietary rights in the Bloomberg Barclays U.S. Aggregate Float Adjusted Index (the Index or Bloomberg Barclays Index).
Neither Barclays Bank Plc, Barclays Capital Inc., or any affiliate (collectively Barclays) or Bloomberg is the issuer or producer of the Total Bond Market Index Portfolio and neither Bloomberg nor Barclays has any responsibilities, obligations or duties to investors in the Total Bond Market Index Portfolio. The Index is licensed for use by The Vanguard Group, Inc. (Vanguard) as the sponsor of the Total Bond Market Index Portfolio. Bloomberg and Barclays’ only relationship with Vanguard in respect of the Index is the licensing of the Index, which is determined, composed and calculated by BISL, or any successor thereto, without regard to the Issuer or the Total Bond Market Index Portfolio or the owners of the Total Bond Market Index Portfolio.
Additionally, Vanguard may for itself execute transaction(s) with Barclays in or relating to the Index in connection with the Total Bond Market Index Portfolio. Investors acquire the Total Bond Market Index Portfolio from Vanguard and investors neither acquire any interest in the Index nor enter into any relationship of any kind whatsoever with Bloomberg or Barclays upon making an investment in the Total Bond Market Index Portfolio. The Total Bond Market Index Portfolio is not sponsored, endorsed, sold or promoted by Bloomberg or Barclays. Neither Bloomberg nor Barclays makes any representation or warranty, express or implied regarding the advisability of investing in the Total Bond Market Index Portfolio or the advisability of investing in securities generally or the ability of the Index to track corresponding or relative market performance. Neither Bloomberg nor Barclays has passed on the legality or suitability of the Total Bond Market Index Portfolio with respect to any person or entity. Neither Bloomberg nor Barclays is responsible for and has not participated in the determination of the timing of, prices at, or quantities of the Total Bond Market Index Portfolio to be issued. Neither Bloomberg nor Barclays has any obligation to take the needs of the Issuer or the owners of the Total Bond Market Index Portfolio or any other third party into consideration in determining, composing or calculating the Index. Neither Bloomberg nor Barclays has any obligation or liability in connection with administration, marketing or trading of the Total Bond Market Index Portfolio.
The licensing agreement between Bloomberg and Barclays is solely for the benefit of Bloomberg and Barclays and not for the benefit of the owners of the Total Bond Market Index Portfolio, investors or other third parties. In addition, the licensing agreement between Vanguard and Bloomberg is solely for the benefit of Vanguard and Bloomberg and not for the benefit of the owners of the Total Bond Market Index Portfolio, investors or other third parties.
NEITHER BLOOMBERG NOR BARCLAYS SHALL HAVE ANY LIABILITY TO THE ISSUER, INVESTORS OR TO OTHER THIRD PARTIES FOR THE QUALITY, ACCURACY AND/OR COMPLETENESS OF THE BLOOMBERG BARCLAYS INDEX OR ANY DATA INCLUDED THEREIN OR FOR INTERRUPTIONS IN THE DELIVERY OF THE BLOOMBERG BARCLAYS INDEX. NEITHER BLOOMBERG NOR BARCLAYS MAKES ANY WARRANTY, EXPRESS OR IMPLIED, AS TO RESULTS TO BE OBTAINED BY THE ISSUER, THE INVESTORS OR ANY OTHER PERSON OR ENTITY FROM THE USE OF THE BLOOMBERG BARCLAYS INDEX OR ANY DATA INCLUDED THEREIN. NEITHER BLOOMBERG NOR BARCLAYS MAKES ANY EXPRESS OR IMPLIED WARRANTIES, AND EACH HEREBY EXPRESSLY DISCLAIMS ALL WARRANTIES OF MERCHANTABILITY OR FITNESS FOR A PARTICULAR PURPOSE OR USE WITH RESPECT TO THE BLOOMBERG BARCLAYS INDEX OR ANY DATA INCLUDED THEREIN. BLOOMBERG RESERVES THE RIGHT TO CHANGE THE METHODS OF CALCULATION OR PUBLICATION, OR TO CEASE THE CALCULATION OR PUBLICATION OF THE BLOOMBERG BARCLAYS INDEX, AND NEITHER BLOOMBERG NOR BARCLAYS SHALL BE LIABLE FOR ANY MISCALCULATION OF OR ANY INCORRECT, DELAYED OR INTERRUPTED PUBLICATION WITH RESPECT TO THE BLOOMBERG BARCLAYS INDEX. NEITHER BLOOMBERG NOR BARCLAYS SHALL BE LIABLE FOR ANY DAMAGES, INCLUDING, WITHOUT LIMITATION, ANY SPECIAL, INDIRECT OR CONSEQUENTIAL DAMAGES, OR ANY LOST PROFITS AND EVEN IF ADVISED OF THE POSSIBLITY OF SUCH, RESULTING FROM THE USE OF THE BLOOMBERG BARCLAYS INDEX OR ANY DATA INCLUDED THEREIN OR WITH RESPECT TO THE TOTAL BOND MARKET INDEX PORTFOLIO.
None of the information supplied by Bloomberg or Barclays and used in this publication may be reproduced in any manner without the prior written permission of both Bloomberg and Barclays Capital, the investment banking division of Barclays Bank Plc. Barclays Bank Plc is registered in England No. 1026167. Registered office 1 Churchill Place London E14 5HP.
© 2020 Bloomberg. Used with Permission.
Source: Bloomberg Index Services Limited. Copyright 2020, Bloomberg. All rights reserved.
Total International Stock Market Index Portfolio
Your Portfolio’s Performance at a Glance
• The Total International Stock Market Index Portfolio of Vanguard Variable Insurance Fund returned 21.55% for the 12 months ended December 31, 2019, closely tracking the performance of its benchmark, the FTSE Global All Cap ex US Index, which returned 21.80%. Please note that the portfolio returns in Vanguard Variable Insurance Fund are different from those in Vanguard Variable Annuity (and other plans that invest in the fund), which take into account insurance-related expenses.
• Global stock prices rose amid optimism that U.S.-China trade tensions were easing and that a trade deal might be signed in early 2020. Inversions of the U.S. Treasury yield curve, historically a signal of recession, raised concerns midway through the year. But the curve returned to its normal pattern in the second half as the Federal Reserve cut short-term interest rates three times. Other major central banks pursued more accommodative monetary policies as well.
• As a fund of funds, the Total International Stock Market Index Portfolio seeks to capture the returns of its target benchmark by investing in underlying funds that offer broad coverage of emerging markets and developed markets outside the U.S. The portfolio provides diversified exposure to multiple regions, markets, and industry sectors and includes stocks from across the market-capitalization spectrum.
• All of the portfolio’s underlying funds posted double-digit gains for the year, including Vanguard Developed Markets Index Fund and Vanguard FTSE All-World ex-US Index Fund, which together make up more than half of its holdings.
| Market Barometer | | | |
| | | Average Annual Total Returns |
| | | Periods Ended December 31, 2019 |
| | One Year | Three Years | Five Years |
| Stocks | | | |
| Russell 1000 Index (Large-caps) | 31.43% | 15.05% | 11.48% |
| Russell 2000 Index (Small-caps) | 25.53 | 8.59 | 8.23 |
| Russell 3000 Index (Broad U.S. market) | 31.02 | 14.57 | 11.24 |
| FTSE All-World ex US Index (International) | 21.81 | 9.96 | 5.83 |
| | | | |
| Bonds | | | |
| Bloomberg Barclays U.S. Aggregate Bond Index (Broad taxable market) | 8.72% | 4.03% | 3.05% |
| Bloomberg Barclays Municipal Bond Index (Broad tax-exempt market) | 7.54 | 4.72 | 3.53 |
| FTSE Three-Month U.S. Treasury Bill Index | 2.25 | 1.65 | 1.04 |
| | | | |
| CPI | | | |
| Consumer Price Index | 2.29% | 2.10% | 1.82% |
Total International Stock Market Index Portfolio
About Your Portfolio’s Expenses
As a shareholder of the portfolio, you incur ongoing costs, which include costs for portfolio management, administrative services, and shareholder reports (like this one), among others. Operating expenses, which are deducted from a portfolio’s gross income, directly reduce the investment return of the portfolio.
A typical portfolio’s expenses are expressed as a percentage of its average net assets. The Total International Stock Market Index Portfolio has no direct expenses, but bears its proportionate share of the expenses of the underlying funds in which it invests. These indirect expenses make up the acquired fund fees and expenses, also expressed as a percentage of average net assets. The following examples are intended to help you understand the ongoing costs (in dollars) of investing in your portfolio and to compare these costs with those of other mutual funds. The examples are based on an investment of $1,000 made at the beginning of the period shown and held for the entire period. The costs were calculated using the acquired fund fees and expenses for the Total International Stock Market Index Portfolio.
The accompanying table illustrates your portfolio’s costs in two ways:
• Based on actual portfolio return. This section helps you to estimate the actual expenses that you paid over the period. The “Ending Account Value” shown is derived from the portfolio’s actual return, and the third column shows the dollar amount that would have been paid by an investor who started with $1,000 in the portfolio. You may use the information here, together with the amount you invested, to estimate the expenses that you paid over the period.
To do so, simply divide your account value by $1,000 (for example, an $8,600 account value divided by $1,000 = 8.6), then multiply the result by the number given for your portfolio under the heading “Expenses Paid During Period.”
• Based on hypothetical 5% yearly return. This section is intended to help you compare your portfolio’s costs with those of other mutual funds. It assumes that the portfolio had a yearly return of 5% before expenses, but that the expense ratio is unchanged. In this case—because the return used is not the portfolio’s actual return—the results do not apply to your investment. The example is useful in making comparisons because the Securities and Exchange Commission requires all mutual funds to calculate expenses based on a 5% return. You can assess your portfolio’s costs by comparing this hypothetical example with the hypothetical examples that appear in shareholder reports of other funds.
Note that the expenses shown in the table are meant to highlight and help you compareongoingcosts only. The portfolio’s expense figure does not reflect additional fees and expenses associated with the annuity or life insurance program through which you invest.
The calculations assume no shares were bought or sold during the period. Your actual costs may have been higher or lower, depending on the amount of your investment and the timing of any purchases or redemptions.
You can find more information about the portfolio’s expenses in the Financial Statements section. For additional information on operating expenses and other shareholder costs, please refer to the prospectus.
| Six Months Ended December 31, 2019 | | | |
| | Beginning | Ending | Expenses |
| | Account Value | Account Value | Paid During |
| Total International Stock Market Index Portfolio | 6/30/2019 | 12/31/2019 | Period |
| Based on Actual Portfolio Return | $1,000.00 | $1,073.83 | $0.57 |
| Based on Hypothetical 5% Yearly Return | 1,000.00 | 1,024.65 | 0.56 |
The calculations are based on the Total International Stock Market Index Portfolio’s acquired fund fees and expenses for the most recent six-month period. The Total International Stock Market Index Portfolio’s annualized expense figure for that period is 0.11%. The dollar amounts shown as “Expenses Paid” are equal to the annualized average weighted expense ratio for the underlying funds, multiplied by the average account value over the period, multiplied by the number of days in period, then divided by the number of days in the recent 12-month period (184/365).
Total International Stock Market Index Portfolio
Performance Summary
All of the returns in this report represent past performance, which is not a guarantee of future results that may be achieved by the portfolio. (Current performance may be lower or higher than the performance data cited. For performance data current to the most recent month-end, visit our website at vanguard.com/performance.) Note, too, that both investment returns and principal value can fluctuate widely, so an investor’s shares, when sold, could be worth more or less than their original cost. The returns shown do not reflect taxes that a shareholder would pay on portfolio distributions or on the sale of portfolio shares. Nor do the returns reflect fees and expenses associated with the annuity or life insurance program through which a shareholder invests. If these fees and expenses were included, the portfolio’s returns would be lower.
Cumulative Performance: September 7, 2017–December 31, 2019
Initial Investment of $10,000

| | | Average Annual Total Returns | | |
| | | Periods Ended December 31, 2019 | | |
| | | | | Since | | Final Value |
| | | One | | Inception | | of a $10,000 |
| | | Year | | (9/7/2017 | ) | Investment |
 | Total International Stock Market Index Portfolio | 21.55 | % | 4.10 | % | $10,975 |
 | FTSE Global All Cap ex US Index | 21.80 | | 4.45 | | 11,059 |
“Since Inception” performance is calculated from the portfolio’s inception date for both the portfolio and its comparative standard(s).
See Financial Highlights for dividend and capital gains information.
Total International Stock Market Index Portfolio
Allocation to Underlying Funds
As of December 31, 2019
| Vanguard Developed Markets Index Fund Admiral Shares | | 27.7 | % |
| Vanguard FTSE All-World ex-US Index Fund Admiral Shares | | 27.6 | |
| Vanguard Emerging Markets Stock Index Fund Admiral Shares | | 14.2 | |
| Vanguard European Stock Index Fund Admiral Shares | | 13.0 | |
| Vanguard Pacific Stock Index Fund Admiral Shares | | 9.4 | |
| Vanguard FTSE All-World ex-US Small-Cap Index Fund Admiral Shares | | 6.9 | |
| Vanguard FTSE Canada All Cap Index ETF | | 1.2 | |
Total International Stock Market Index Portfolio
Financial Statements
Statement of Net Assets
As of December 31, 2019
The portfolio files its complete schedule of portfolio holdings with the Securities and Exchange Commission (SEC) for the first and third quarters of each fiscal year as an exhibit to its reports on Form N-PORT. The portfolio’s Form N-PORT reports are available on the SEC’s website at www.sec.gov.
| | | Market | |
| | | Value• | |
| | Shares | ($000 | ) |
| Investment Companies (99.9%) | | | |
| International Stock Funds (99.9%) | | | |
| Vanguard Developed Markets Index Fund Admiral Shares | 7,857,832 | 111,110 | |
| Vanguard FTSE All-World ex-US Index Fund Admiral Shares | 3,325,056 | 111,024 | |
| Vanguard Emerging Markets Stock Index Fund Admiral Shares | 1,545,847 | 57,119 | |
| Vanguard European Stock Index Fund Admiral Shares | 714,619 | 52,231 | |
| Vanguard Pacific Stock Index Fund Admiral Shares | 437,150 | 37,595 | |
| Vanguard FTSE All-World ex-US Small-Cap Index Fund Admiral Shares | 1,010,534 | 27,739 | |
| Vanguard FTSE Canada All Cap Index ETF | 186,542 | 4,942 | |
| Total Investment Companies (Cost $394,395) | | 401,760 | |
| Temporary Cash Investment (0.1%) | | | |
| Money Market Fund (0.1%) | | | |
| 1 Vanguard Market Liquidity Fund, 1.816%(Cost $179) | 1,793 | 179 | |
| Total Investments (100.0%) (Cost $394,574) | | 401,939 | |
| Other Assets and Liabilities (0.0%) | | | |
| Other Assets | | 345 | |
| Liabilities | | (294 | ) |
| | | 51 | |
| Net Assets (100%) | | | |
| Applicable to 18,803,894 outstanding $.001 par value shares of beneficial interest (unlimited authorization) | | 401,990 | |
| Net Asset Value Per Share | | $21.38 | |
| | Amount | |
| | ($000 | ) |
| Statement of Assets and Liabilities | | |
| Assets | | |
| Investments in Securities, at Value—Affiliated Funds | 401,939 | |
| Receivables for Capital Shares Issued | 314 | |
| Receivables for Accrued Income | 31 | |
| Total Assets | 402,284 | |
| Liabilities | | |
| Payables for Investment Securities Purchased | 182 | |
| Payables for Capital Shares Redeemed | 112 | |
| Total Liabilities | 294 | |
| Net Assets | 401,990 | |
| At December 31, 2019, net assets consisted of: | | |
| | Amount | |
| | ($000 | ) |
| Paid-in Capital | 381,368 | |
| Total Distributable Earnings (Loss) | 20,622 | |
| Net Assets | 401,990 | |
• See Note A in Notes to Financial Statements.
| 1 | Affiliated money market fund available only to Vanguard funds and certain trusts and accounts managed by Vanguard. Rate shown is the 7-day yield. |
See accompanying Notes, which are an integral part of the Financial Statements.
Total International Stock Market Index Portfolio
Statement of Operations
| | Year Ended | |
| | December 31, 2019 | |
| | | ($000 | ) |
| Investment Income | | | |
| Income | | | |
| Income Distributions Received from Affiliated Funds | | 10,258 | |
| Interest | | 3 | |
| Other Income | | 38 | |
| Net Investment Income—Note B | | 10,299 | |
| Realized Net Gain (Loss) | | | |
| Affiliated Funds Sold | | 2,764 | |
| Futures Contracts | | 455 | |
| Foreign Currencies | | 12 | |
| Realized Net Gain (Loss) | | 3,231 | |
| Change in Unrealized Appreciation (Depreciation) | | | |
| Affiliated Funds | | 40,185 | |
| Futures Contracts | | 69 | |
| Change in Unrealized Appreciation (Depreciation) | | 40,254 | |
| Net Increase (Decrease) in Net Assets Resulting from Operations | | 53,784 | |
Statement of Changes in Net Assets
| | | Year Ended December 31, | |
| | | 2019 | | | 2018 | |
| | | ($000 | ) | | ($000 | ) |
| Increase (Decrease) in Net Assets | | | | | | |
| Operations | | | | | | |
| Net Investment Income | | 10,299 | | | 4,759 | |
| Realized Net Gain (Loss) | | 3,231 | | | (5 | ) |
| Change in Unrealized Appreciation (Depreciation) | | 40,254 | | | (34,587 | ) |
| Net Increase (Decrease) in Net Assets Resulting from Operations | | 53,784 | | | (29,833 | ) |
| Distributions | | | | | | |
| Net Investment Income | | (4,990 | ) | | (635 | ) |
| Realized Capital Gain1 | | (29 | ) | | (64 | ) |
| Total Distributions | | (5,019 | ) | | (699 | ) |
| Capital Share Transactions | | | | | | |
| Issued | | 207,150 | | | 180,119 | |
| Issued in Lieu of Cash Distributions | | 5,019 | | | 699 | |
| Redeemed | | (59,021 | ) | | (21,027 | ) |
| Net Increase (Decrease) from Capital Share Transactions | | 153,148 | | | 159,791 | |
| Total Increase (Decrease) | | 201,913 | | | 129,259 | |
| Net Assets | | | | | | |
| Beginning of Period | | 200,077 | | | 70,818 | |
| End of Period | | 401,990 | | | 200,077 | |
| 1 | Includes fiscal 2019 and 2018 short-term gain distributions totaling $29,000 and $64,000, respectively. Short-term gain distributions are treated as ordinary income dividends for tax purposes. |
See accompanying Notes, which are an integral part of the Financial Statements.
Total International Stock Market Index Portfolio
Financial Highlights
| | | | | | | Sept. 7, | |
| | | Year Ended | | 20171to | |
| | | December 31, | | Dec. 31, | |
| For a Share Outstanding Throughout Each Period | | 2019 | | 2018 | | 2017 | |
| Net Asset Value, Beginning of Period | | $17.94 | | $21.15 | | $20.00 | |
| Investment Operations | | | | | | | |
| Net Investment Income2 | | .691 | | .646 | | .341 | |
| Capital Gain Distributions Received2 | | — | | — | | — | |
| Net Realized and Unrealized Gain (Loss) on Investments | | 3.134 | | (3.716 | ) | .809 | |
| Total from Investment Operations | | 3.825 | | (3.070 | ) | 1.150 | |
| Distributions | | | | | | | |
| Dividends from Net Investment Income | | (.383 | ) | (.127 | ) | — | |
| Distributions from Realized Capital Gains | | (.002 | ) | (.013 | ) | — | |
| Total Distributions | | (.385 | ) | (.140 | ) | — | |
| Net Asset Value, End of Period | | $21.38 | | $17.94 | | $21.15 | |
| | | | | | | | |
| Total Return | | 21.55 | % | -14.62 | % | 5.75 | % |
| | | | | | | | |
| Ratios/Supplemental Data | | | | | | | |
| Net Assets, End of Period (Millions) | | $402 | | $200 | | $71 | |
| Ratio of Total Expenses to Average Net Assets | | — | | — | | — | |
| Acquired Fund Fees and Expenses | | 0.11 | % | 0.11 | % | 0.11 | %3 |
| Ratio of Net Investment Income to Average Net Assets | | 3.50 | % | 3.23 | % | 5.20 | %3 |
| Portfolio Turnover Rate | | 15 | % | 6 | % | 5 | % |
1 Inception.
2 Calculated based on average shares outstanding.
3 Annualized.
See accompanying Notes, which are an integral part of the Financial Statements.
Total International Stock Market Index Portfolio
Notes to Financial Statements
The Total International Stock Market Index Portfolio, a portfolio of Vanguard Variable Insurance Funds, is registered under the Investment Company Act of 1940 as an open-end investment company. The portfolio seeks to match the return of its target index by investing in selected Vanguard funds and portfolios. Financial statements and other information about each underlying fund and portfolio are available on vanguard.com. The portfolio’s shares are only available for purchase by separate accounts of insurance companies as investments for variable annuity plans, variable life insurance contracts, or other variable benefit insurance contracts.
A. The following significant accounting policies conform to generally accepted accounting principles for U.S. investment companies. The portfolio consistently follows such policies in preparing its financial statements.
1. Security Valuation: Investments are valued at the net asset value of each underlying Vanguard fund determined as of the close of the New York Stock Exchange (generally 4 p.m., Eastern time) on the valuation date. Investments in Vanguard Market Liquidity Fund are valued at that fund’s net asset value. Temporary cash investments are valued using the latest bid prices or using valuations based on a matrix system (which considers such factors as security prices, yields, maturities, and ratings), both as furnished by independent pricing services.
2. Foreign Currency: Securities and other assets and liabilities denominated in foreign currencies are translated into U.S. dollars using exchange rates obtained from an independent third party as of the fund’s pricing time on the valuation date. Realized gains (losses) and unrealized appreciation (depreciation) on investment securities include the effects of changes in exchange rates since the securities were purchased, combined with the effects of changes in security prices. Fluctuations in the value of other assets and liabilities resulting from changes in exchange rates are recorded as unrealized foreign currency gains (losses) until the assets or liabilities are settled in cash, at which time they are recorded as realized foreign currency gains (losses).
3. Futures Contracts: The portfolio uses stock and bond futures contracts to a limited extent, with the objectives of maintaining full exposure to the market and maintaining its target asset allocation. The primary risks associated with the use of futures contracts are imperfect correlation between changes in market values of investments held by the portfolio and the prices of futures contracts, and the possibility of an illiquid market. Counterparty risk involving futures is mitigated because a regulated clearinghouse is the counterparty instead of the clearing broker. To further mitigate counterparty risk, the portfolio trades futures contracts on an exchange, monitors the financial strength of its clearing brokers and clearinghouse, and has entered into clearing agreements with its clearing brokers. The clearinghouse imposes initial margin requirements to secure the portfolio’s performance and requires daily settlement of variation margin representing changes in the market value of each contract. Any assets pledged as initial margin for open contracts are noted in the Statement of Net Assets.
Futures contracts are valued at their quoted daily settlement prices. The notional amounts of the contracts are not recorded in the Statement of Assets and Liabilities. Fluctuations in the value of the contracts are recorded in the Statement of Assets and Liabilities as an asset (liability) and in the Statement of Operations as unrealized appreciation (depreciation) until the contracts are closed, when they are recorded as realized futures gains (losses).
During the year ended December 31, 2019, the portfolio’s average investments in long and short futures contracts represented less than 1% and 0% of net assets, respectively, based on the average of the notional amounts at each quarter-end during the period. The portfolio had no open futures contracts at December 31, 2019.
4. Federal Income Taxes: The portfolio intends to continue to qualify as a regulated investment company and distribute all of its taxable income. Management has analyzed the portfolio’s tax positions taken for all open federal income tax years (December 31, 2017–2019), and has concluded that no provision for federal income tax is required in the portfolio’s financial statements.
5. Distributions: Distributions to shareholders are recorded on the ex-dividend date. Distributions are determined on a tax basis and may differ from net investment income and realized capital gains for financial reporting purposes.
6. Credit Facility: The portfolio and certain other funds managed by The Vanguard Group (“Vanguard”) participate in a $4.3 billion committed credit facility provided by a syndicate of lenders pursuant to a credit agreement that may be renewed annually; each fund is individually liable for its borrowings, if any, under the credit facility. Borrowings may be utilized for temporary and emergency purposes, and are subject to the portfolio’s regulatory and contractual borrowing restrictions. The participating funds are charged administrative fees and an annual commitment fee of 0.10% of the undrawn amount of
Total International Stock Market Index Portfolio
the facility; these fees are allocated to the funds based on a method approved by the portfolio’s board of trustees and borne by the funds in which the portfolio invests (see Note B). Any borrowings under this facility bear interest at a rate based upon the higher of the one-month London Interbank Offered Rate, federal funds effective rate, or overnight bank funding rate plus an agreed-upon spread.
The portfolio had no borrowings outstanding at December 31, 2019, or at any time during the period then ended.
7. Other: Income and capital gain distributions received are recorded on the ex-dividend date. Security transactions are accounted for on the date securities are bought or sold. Costs used to determine realized gains (losses) on the sale of investment securities are those of the specific securities sold. Interest income includes income distributions received from Vanguard Market Liquidity Fund and is accrued daily. Premiums and discounts on debt securities are amortized and accreted, respectively, to interest income over the lives of the respective securities, except for premiums on certain callable debt securities that are amortized to the earliest call date.
B. In accordance with the terms of a Funds’ Service Agreement (the “FSA”) between Vanguard and the portfolio, Vanguard furnishes to the portfolio investment advisory, corporate management, administrative, marketing, and distribution services at Vanguard’s cost of operations (as defined by the FSA). These costs of operations are allocated to the portfolio based on methods and guidelines approved by the board of trustees. The FSA provides that expenses otherwise allocable to Vanguard funds-of-funds may be reduced or eliminated to the extent of savings realized by the underlying Vanguard funds by virtue of being part of a fund-of-funds. Accordingly, all expenses for services provided by Vanguard to the portfolio and all other expenses incurred by the portfolio during the period ended December 31, 2019, were borne by the underlying Vanguard funds in which the portfolio invests. The portfolio’s trustees and officers are also trustees and officers, respectively, of the underlying Vanguard funds, as well as directors and employees, respectively, of Vanguard.
C. Various inputs may be used to determine the value of the portfolio’s investments. These inputs are summarized in three broad levels for financial statement purposes. The inputs or methodologies used to value securities are not necessarily an indication of the risk associated with investing in those securities.
Level 1—Quoted prices in active markets for identical securities.
Level 2—Other significant observable inputs (including quoted prices for similar securities, interest rates, prepayment speeds, credit risk, etc.).
Level 3—Significant unobservable inputs (including the portfolio’s own assumptions used to determine the fair value of investments). Any investments valued with significant unobservable inputs are noted on the Statement of Net Assets.
At December 31, 2019, 100% of the market value of the portfolio’s investments was determined based on Level 1 inputs.
D. Permanent differences between book-basis and tax-basis components of net assets, if any, are reclassified among capital accounts in the financial statements to reflect their tax character. These reclassifications have no effect on net assets or net asset value per share.
| | Amount |
| | ($000) |
| Paid-in Capital | — |
| Total Distributable Earnings (Loss) | — |
Temporary differences between book-basis and tax-basis components of total distributable earnings (loss) arise when certain items of income, gain, or loss are recognized in different periods for financial statement and tax purposes; these differences will reverse at some time in the future. The differences are primarily related to the tax deferral of losses on wash sales and unrealized gains on passive foreign investment companies. As of period end, the tax-basis components of total distributable earnings (loss) are detailed in the table as follows:
| | Amount |
| | ($000) |
| Undistributed Ordinary Income | 13,291 |
| Undistributed Long-Term Gains | 143 |
| Capital Loss Carryforwards (Non-expiring) | — |
| Net Unrealized Gains (Losses) | 7,188 |
Total International Stock Market Index Portfolio
As of December 31, 2019, gross unrealized appreciation and depreciation for investments based on cost for U.S. federal income tax purposes were as follows:
| | Amount |
| | ($000) |
| Tax Cost | 394,751 |
| Gross Unrealized Appreciation | 11,094 |
| Gross Unrealized Depreciation | (3,906) |
| Net Unrealized Appreciation (Depreciation) | 7,188 |
E. Capital shares issued and redeemed were:
| | Year Ended December 31, |
| | 2019 | 2018 |
| | Shares | Shares |
| | (000) | (000) |
| Issued | 10,380 | 8,863 |
| Issued in Lieu of Cash Distributions | 260 | 33 |
| Redeemed | (2,988) | (1,092) |
| Net Increase (Decrease) in Shares Outstanding | 7,652 | 7,804 |
At December 31, 2019, one shareholder, an insurance company separate account whose holdings in the portfolio represent the indirect investment of Vanguard Variable Annuity contract holders, was the record or beneficial owner of 52% of the portfolio’s net assets.
F. Transactions during the period in affiliated underlying Vanguard funds were as follows:
| | | Current Period Transactions | |
| | Dec. 31, | | Proceeds | Realized | | | | Dec. 31, |
| | 2018 | | from | Net | Change in | | Capital Gain | 2019 |
| | Market | Purchases | Securities | Gain | Unrealized | | Distributions | Market |
| | Value | at Cost | Sold | (Loss) | App. (Dep.) | Income | Received | Value |
| | ($000) | ($000) | ($000) | ($000) | ($000) | ($000) | ($000) | ($000) |
| Vanguard Market Liquidity Fund | 3,401 | NA1 | NA1 | — | — | 56 | — | 179 |
| Vanguard Developed Markets Index Fund | 54,990 | 54,341 | 10,495 | 670 | 11,604 | 2,767 | — | 111,110 |
| Vanguard Emerging Markets Stock Index Fund | 28,452 | 32,230 | 9,420 | 647 | 5,210 | 1,528 | — | 57,119 |
| Vanguard European Stock Index Fund | 26,881 | 24,697 | 5,790 | 297 | 6,146 | 1,405 | — | 52,231 |
| Vanguard FTSE Canada All Cap Index ETF | — | 4,764 | — | — | 178 | 56 | — | 4,942 |
| Vanguard FTSE All-World ex-US Index Fund | 54,711 | 54,419 | 10,084 | 698 | 11,280 | 2,821 | — | 111,024 |
| Vanguard FTSE All-World ex-US Small-Cap Index Fund Investor Shares2 | 12,993 | 9,224 | 2,476 | 174 | 2,728 | 176 | — | — |
| Vanguard FTSE All-World ex-US Small-Cap Index Fund Admiral Shares2 | — | 5,635 | 589 | 30 | 20 | 574 | — | 27,739 |
| Vanguard Pacific Stock Index Fund | 18,385 | 19,825 | 3,882 | 248 | 3,019 | 875 | — | 37,595 |
| Total | 199,813 | 205,135 | 42,736 | 2,764 | 40,185 | 10,258 | — | 401,939 |
| 1 | Not applicable—purchases and sales are for temporary cash investment purposes. |
| 2 | On September 9, 2019, the portfolio’s underlying investment in Vanguard FTSE All-World ex-US Small-Cap Index Fund Investor Shares converted to Vanguard FTSE All-World ex-US Small-Cap Index Fund Admiral Shares. |
G. Management has determined that no events or transactions occurred subsequent to December 31, 2019, that would require recognition or disclosure in these financial statements.
Total International Stock Market Index Portfolio
Report of Independent Registered Public Accounting Firm
To the Board of Trustees of Vanguard Variable Insurance Funds and Shareholders of Total International Stock Market Index Portfolio
Opinion on the Financial Statements
We have audited the accompanying statement of net assets and statement of assets and liabilities of Total International Stock Market Index Portfolio (one of the portfolios constituting Vanguard Variable Insurance Funds, referred to hereafter as the “Portfolio”) as of December 31, 2019, the related statement of operations for the year ended December 31, 2019, the statement of changes in net assets for each of the two years in the period ended December 31, 2019, including the related notes, and the financial highlights for each of the periods indicated therein (collectively referred to as the “financial statements”). In our opinion, the financial statements present fairly, in all material respects, the financial position of the Portfolio as of December 31, 2019, the results of its operations for the year then ended, the changes in its net assets for each of the two years in the period ended December 31, 2019 and the financial highlights for each of the periods indicated therein in conformity with accounting principles generally accepted in the United States of America.
Basis for Opinion
These financial statements are the responsibility of the Portfolio’s management. Our responsibility is to express an opinion on the Portfolio’s financial statements based on our audits. We are a public accounting firm registered with the Public Company Accounting Oversight Board (United States) (“PCAOB”) and are required to be independent with respect to the Portfolio in accordance with the U.S. federal securities laws and the applicable rules and regulations of the Securities and Exchange Commission and the PCAOB.
We conducted our audits of these financial statements in accordance with the standards of the PCAOB. Those standards require that we plan and perform the audit to obtain reasonable assurance about whether the financial statements are free of material misstatement, whether due to error or fraud.
Our audits included performing procedures to assess the risks of material misstatement of the financial statements, whether due to error or fraud, and performing procedures that respond to those risks. Such procedures included examining, on a test basis, evidence regarding the amounts and disclosures in the financial statements. Our audits also included evaluating the accounting principles used and significant estimates made by management, as well as evaluating the overall presentation of the financial statements. Our procedures included confirmation of securities owned as of December 31, 2019 by correspondence with the custodian and transfer agent. We believe that our audits provide a reasonable basis for our opinion.
/s/PricewaterhouseCoopers LLP
Philadelphia, Pennsylvania
February 18, 2020
We have served as the auditor of one or more investment companies in The Vanguard Group of Funds since 1975.
Special 2019 tax information (unaudited) for corporate shareholders only for Total International Stock Market Index Portfolio, a portfolio of Vanguard Variable Insurance Funds
This information for the fiscal year ended December 31, 2019, is included pursuant to provisions of the Internal Revenue Code for corporate shareholders only.
The portfolio designates to shareholders foreign source income of $10,632,000 and foreign taxes paid of $799,000. Shareholders will receive more detailed information with their Form 1099-DIV in January 2020 to determine the calendar-year amounts to be included on their 2019 tax returns.
Total International Stock Market Index Portfolio
London Stock Exchange Group companies include FTSE International Limited (“FTSE”), Frank Russell Company (“Russell”), MTS Next Limited (“MTS”), and FTSE TMX Global Debt Capital Markets Inc. (“FTSE TMX”). All rights reserved. “FTSE®”, “Russell®”, “MTS®”, “FTSE TMX®” and “FTSE Russell” and other service marks and trademarks related to the FTSE or Russell indexes are trademarks of the London Stock Exchange Group companies and are used by FTSE, MTS, FTSE TMX and Russell under license. All information is provided for information purposes only. Every effort is made to ensure that all information given in this publication is accurate, but no responsibility or liability can be accepted by the London Stock Exchange Group companies nor its licensors for any errors or for any loss from use of this publication. Neither the London Stock Exchange Group companies nor any of their licensors make any claim, prediction, warranty or representation whatsoever, expressly or impliedly, either as to the results to be obtained from the use of the Indices or the fitness or suitability of the Indices for any particular purpose to which they might be put. The London Stock Exchange Group companies do not provide investment advice and nothing in this document should be taken as constituting financial or investment advice. The London Stock Exchange Group companies make no representation regarding the advisability of investing in any asset. A decision to invest in any such asset should not be made in reliance on any information herein. Indexes cannot be invested in directly. Inclusion of an asset in an index is not a recommendation to buy, sell or hold that asset. The general information contained in this publication should not be acted upon without obtaining specific legal, tax, and investment advice from a licensed professional. No part of this information may be reproduced, stored in a retrieval system or transmitted in any form or by any means, electronic, mechanical, photocopying, recording or otherwise, without prior written permission of the London Stock Exchange Group companies. Distribution of the London Stock Exchange Group companies’ index values and the use of their indexes to create financial products require a license with FTSE, FTSE TMX, MTS and/or Russell and/or its licensors.
Total Stock Market Index Portfolio
Your Portfolio’s Performance at a Glance
• For the 12 months ended December 31, 2019, the Total Stock Market Index Portfolio of Vanguard Variable Insurance Fund returned 30.75%, in line with the 30.90% return of its benchmark index after factoring in the portfolio’s expenses.
• The portfolio, which invests in the VVIF Equity Index Portfolio and Vanguard Extended Market Index Fund, provides exposure to every segment, size, and style of the U.S. equity market.
• Stocks benefited from accommodative monetary policies from the Federal Reserve and other major central banks and better-than-expected corporate earnings during the 12 months. Large-capitalization stocks outpaced mid- and small-caps, and growth stocks beat their value counterparts.
• The portfolio recorded an average annual return of 13.27% over the past ten years, in line with its benchmark average of 13.40%.
• Please note that the portfolio returns in Vanguard Variable Insurance Fund are different from those in Vanguard Variable Annuity (and other plans that invest in the fund), which take into account insurance-related expenses.
| Market Barometer | | |
| | Average Annual Total Returns |
| | Periods Ended December 31, 2019 |
| | One Year | Three Years | Five Years |
| Stocks | | | |
| Russell 1000 Index (Large-caps) | 31.43% | 15.05% | 11.48% |
| Russell 2000 Index (Small-caps) | 25.53 | 8.59 | 8.23 |
| Russell 3000 Index (Broad U.S. market) | 31.02 | 14.57 | 11.24 |
| FTSE All-World ex US Index (International) | 21.81 | 9.96 | 5.83 |
| | | | |
| Bonds | | | |
| Bloomberg Barclays U.S. Aggregate Bond Index (Broad taxable market) | 8.72% | 4.03% | 3.05% |
| Bloomberg Barclays Municipal Bond Index (Broad tax-exempt market) | 7.54 | 4.72 | 3.53 |
| FTSE Three-Month U.S. Treasury Bill Index | 2.25 | 1.65 | 1.04 |
| | | | |
| CPI | | | |
| Consumer Price Index | 2.29% | 2.10% | 1.82% |
Total Stock Market Index Portfolio
About Your Portfolio’s Expenses
As a shareholder of the portfolio, you incur ongoing costs, which include costs for portfolio management, administrative services, and shareholder reports (like this one), among others. Operating expenses, which are deducted from a portfolio’s gross income, directly reduce the investment return of the portfolio.
A typical portfolio’s expenses are expressed as a percentage of its average net assets. The Total Stock Market Index Portfolio has no direct expenses, but bears its proportionate share of the expenses of the underlying funds in which it invests. These indirect expenses make up the acquired fund fees and expenses, also expressed as a percentage of average net assets. The following examples are intended to help you understand the ongoing costs (in dollars) of investing in your portfolio and to compare these costs with those of other mutual funds. The examples are based on an investment of $1,000 made at the beginning of the period shown and held for the entire period. The costs were calculated using the acquired fund fees and expenses for the Total Stock Market Index Portfolio.
The accompanying table illustrates your portfolio’s costs in two ways:
• Based on actual portfolio return. This section helps you to estimate the actual expenses that you paid over the period. The “Ending Account Value” shown is derived from the portfolio’s actual return, and the third column shows the dollar amount that would have been paid by an investor who started with $1,000 in the portfolio. You may use the information here, together with the amount you invested, to estimate the expenses that you paid over the period.
To do so, simply divide your account value by $1,000 (for example, an $8,600 account value divided by $1,000 = 8.6), then multiply the result by the number given for your portfolio under the heading “Expenses Paid During Period.”
• Based on hypothetical 5% yearly return. This section is intended to help you compare your portfolio’s costs with those of other mutual funds. It assumes that the portfolio had a yearly return of 5% before expenses, but that the expense ratio is unchanged. In this case—because the return used is not the portfolio’s actual return—the results do not apply to your investment. The example is useful in making comparisons because the Securities and Exchange Commission requires all mutual funds to calculate expenses based on a 5% return. You can assess your portfolio’s costs by comparing this hypothetical example with the hypothetical examples that appear in shareholder reports of other funds.
Note that the expenses shown in the table are meant to highlight and help you compareongoingcosts only. The portfolio’s expense figure does not reflect additional fees and expenses associated with the annuity or life insurance program through which you invest.
The calculations assume no shares were bought or sold during the period. Your actual costs may have been higher or lower, depending on the amount of your investment and the timing of any purchases or redemptions.
You can find more information about the portfolio’s expenses in the Financial Statements section. For additional information on operating expenses and other shareholder costs, please refer to the prospectus.
| Six Months Ended December 31, 2019 | | | | | | | | | |
| | | Beginning | | | Ending | | | Expenses | |
| | | Account Value | | | Account Value | | | Paid During | |
| Total Stock Market Index Portfolio | | 6/30/2019 | | | 12/31/2019 | | | Period | |
| Based on Actual Portfolio Return | | $1,000.00 | | | $1,102.21 | | | $0.69 | |
| Based on Hypothetical 5% Yearly Return | | 1,000.00 | | | 1,024.55 | | | 0.66 | |
The calculations are based on the Total Stock Market Index Portfolio’s acquired fund fees and expenses for the most recent six-month period. The Total Stock Market Index Portfolio’s annualized expense figure for that period is 0.13%. The dollar amounts shown as “Expenses Paid” are equal to the annualized expense ratio multiplied by the average account value over the period, multiplied by the number of days in the most recent six-month period, then divided by the number of days in the most recent 12-month period (184/365).
Total Stock Market Index Portfolio
Performance Summary
All of the returns in this report represent past performance, which is not a guarantee of future results that may be achieved by the portfolio. (Current performance may be lower or higher than the performance data cited. For performance data current to the most recent month-end, visit our website at vanguard.com/performance.) Note, too, that both investment returns and principal value can fluctuate widely, so an investor’s shares, when sold, could be worth more or less than their original cost. The returns shown do not reflect taxes that a shareholder would pay on portfolio distributions or on the sale of portfolio shares. Nor do the returns reflect fees and expenses associated with the annuity or life insurance program through which a shareholder invests. If these fees and expenses were included, the portfolio’s returns would be lower.
Cumulative Performance: December 31, 2009–December 31, 2019
Initial Investment of $10,000
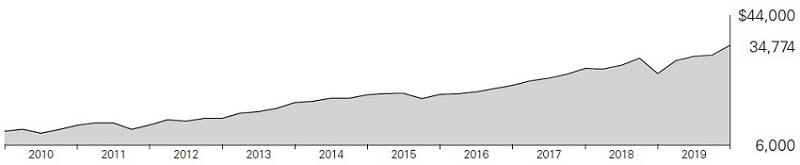
| | | Average Annual Total Returns | Final Value |
| | | Periods Ended December 31, 2019 | of a $10,000 |
| | | One Year | Five Years | Ten Years | Investment |
 | Total Stock Market Index Portfolio | 30.75% | 11.08% | 13.27 | $34,774 |
 | S&P Total Market Index | 30.90 | 11.20 | 13.40 | 35,154 |
See Financial Highlights for dividend and capital gains information.
Total Stock Market Index Portfolio
Allocation to Underlying Funds
As of December 31, 2019
| Vanguard Variable Insurance Fund Equity Index Portfolio | | 83.7 | % |
| Vanguard Extended Market Index Fund Admiral Shares | | 16.3 | |
Total Stock Market Index Portfolio
Financial Statements
Statement of Net Assets
As of December 31, 2019
The portfolio files its complete schedule of portfolio holdings with the Securities and Exchange Commission (SEC) for the first and third quarters of each fiscal year as an exhibit to its reports on Form N-PORT. The portfolio’s Form N-PORT reports are available on the SEC’s website at www.sec.gov.
| | | Market | |
| | | Value• | |
| | Shares | ($000 | ) |
| Investment Companies (100.0%) | | | |
| U.S. Stock Funds (100.0%) | | | |
| Vanguard Variable Insurance Fund—Equity Index Portfolio | 48,374,161 | 2,307,447 | |
| Vanguard Extended Market Index Fund Admiral Shares | 4,699,442 | 449,314 | |
| Total Investment Companies (Cost $1,965,183) | | 2,756,761 | |
| Temporary Cash Investment (0.0%) | | | |
| Money Market Fund (0.0%) | | | |
| 1Vanguard Market Liquidity Fund, 1.816% (Cost $13) | 124 | 13 | |
| Total Investments (100.0%) (Cost $1,965,196) | | 2,756,774 | |
| Other Assets and Liabilities (0.0%) | | | |
| Other Assets | | 1,139 | |
| Liabilities | | (1,218 | ) |
| | | (79 | ) |
| Net Assets (100%) | | | |
| Applicable to 64,395,806 outstanding $.001 par value shares of beneficial interest (unlimited authorization) | 2,756,695 | |
| Net Asset Value Per Share | | $42.81 | |
| | | | |
| | | Amount | |
| | | ($000 | ) |
| Statement of Assets and Liabilities | | | |
| Assets | | | |
| Investments in Securities, at Value—Affiliated Funds | | 2,756,774 | |
| Receivables for Investment Securities Sold | | 581 | |
| Receivables for Capital Shares Issued | | 557 | |
| Receivables for Accrued Income | | 1 | |
| Total Assets | | 2,757,913 | |
| Liabilities | | | |
| Payables for Investment Securities Purchased | | 1 | |
| Payables for Capital Shares Redeemed | | 1,217 | |
| Total Liabilities | | 1,218 | |
| Net Assets | | 2,756,695 | |
| | | | |
| At December 31, 2019, net assets consisted of: | | | |
| | | Amount | |
| | | ($000 | ) |
| Paid-in Capital | | 1,835,055 | |
| Total Distributable Earnings (Loss) | | 921,640 | |
| Net Assets | | 2,756,695 | |
| • | See Note A in Notes to Financial Statements. |
| 1 | Affiliated money market fund available only to Vanguard funds and certain trusts and accounts managed by Vanguard. Rate shown is the 7-day yield. |
See accompanying Notes, which are an integral part of the Financial Statements.
Total Stock Market Index Portfolio
Statement of Operations
| | | Year Ended | |
| | | December 31, 2019 | |
| | | ($000 | ) |
| Investment Income | | | |
| Income | | | |
| Income Distributions Received from Affiliated Funds | | 43,273 | |
| Net Investment Income—Note B | | 43,273 | |
| Realized Net Gain (Loss) | | | |
| Capital Gain Distributions Received from Affiliated Funds | | 49,187 | |
| Affiliated Funds Sold | | 39,952 | |
| Realized Net Gain (Loss) | | 89,139 | |
| Change in Unrealized Appreciation (Depreciation) from Affiliated Funds | | 502,495 | |
| Net Increase (Decrease) in Net Assets Resulting from Operations | | 634,907 | |
Statement of Changes in Net Assets
| | | Year Ended December 31, | |
| | | 2019 | | | 2018 | |
| | | ($000 | ) | | ($000 | ) |
| Increase (Decrease) in Net Assets | | | | | | |
| Operations | | | | | | |
| Net Investment Income | | 43,273 | | | 34,940 | |
| Realized Net Gain (Loss) | | 89,139 | | | 66,456 | |
| Change in Unrealized Appreciation (Depreciation) | | 502,495 | | | (219,589 | ) |
| Net Increase (Decrease) in Net Assets Resulting from Operations | | 634,907 | | | (118,193 | ) |
| Distributions | | | | | | |
| Net Investment Income | | (37,038 | ) | | (32,762 | ) |
| Realized Capital Gain1 | | (66,316 | ) | | (83,757 | ) |
| Total Distributions | | (103,354 | ) | | (116,519 | ) |
| Capital Share Transactions | | | | | | |
| Issued | | 322,975 | | | 278,054 | |
| Issued in Lieu of Cash Distributions | | 103,354 | | | 116,519 | |
| Redeemed | | (248,175 | ) | | (217,186 | ) |
| Net Increase (Decrease) from Capital Share Transactions | | 178,154 | | | 177,387 | |
| Total Increase (Decrease) | | 709,707 | | | (57,325 | ) |
| Net Assets | | | | | | |
| Beginning of Period | | 2,046,988 | | | 2,104,313 | |
| End of Period | | 2,756,695 | | | 2,046,988 | |
| 1 | Includes fiscal 2019 and 2018 short-term gain distributions totaling $0 and $1,049,000, respectively. Short-term gain distributions are treated as ordinary income dividends for tax purposes. |
See accompanying Notes, which are an integral part of the Financial Statements.
Total Stock Market Index Portfolio
Financial Highlights
| For a Share Outstanding | | | Year Ended December 31, |
| Throughout Each Period | 2019 | 2018 | 2017 | 2016 | 2015 |
| Net Asset Value, Beginning of Period | $34.26 | $38.26 | $34.10 | $32.06 | $33.46 |
| Investment Operations | | | | | |
| Net Investment Income | .6941 | .6031 | .6041 | .710 | .480 |
| Capital Gain Distributions Received | .7891 | .4941 | .8901 | .478 | .672 |
| Net Realized and Unrealized Gain (Loss) on Investments | 8.792 | (2.964) | 5.270 | 2.598 | (1.019) |
| Total from Investment Operations | 10.275 | (1.867) | 6.764 | 3.786 | .133 |
| Distributions | | | | | |
| Dividends from Net Investment Income | (.618) | (.600) | (.699) | (.484) | (.433) |
| Distributions from Realized Capital Gains | (1.107) | (1.533) | (1.905) | (1.262) | (1.100) |
| Total Distributions | (1.725) | (2.133) | (2.604) | (1.746) | (1.533) |
| Net Asset Value, End of Period | $42.81 | $34.26 | $38.26 | $34.10 | $32.06 |
| | | | | | |
| Total Return | 30.75% | -5.34% | 20.97% | 12.56% | 0.37% |
| | | | | | |
| Ratios/Supplemental Data | | | | | |
| Net Assets, End of Period (Millions) | $2,757 | $2,047 | $2,104 | $1,735 | $1,699 |
| Ratio of Total Expenses to Average Net Assets | — | — | — | — | — |
| Acquired Fund Fees and Expenses | 0.13% | 0.13% | 0.15% | 0.16% | 0.16% |
| Ratio of Net Investment Income to Average Net Assets | 1.79% | 1.59% | 1.71% | 2.10% | 1.53% |
| Portfolio Turnover Rate | 4% | 5% | 6% | 9% | 5% |
1 Calculated based on average shares outstanding.
See accompanying Notes, which are an integral part of the Financial Statements.
Total Stock Market Index Portfolio
Notes to Financial Statements
The Total Stock Market Index Portfolio, a portfolio of Vanguard Variable Insurance Funds, is registered under the Investment Company Act of 1940 as an open-end investment company. The portfolio seeks to match the return of its target index by investing in selected Vanguard funds and portfolios. The Portfolio invests a substantial amount of its assets in VVIF Equity Index Portfolio. The accompanying financial statements of VVIF Equity Index Portfolio should be read in conjunction with the financial statements of the portfolio. Financial statements and other information about each underlying fund and portfolio are available on vanguard.com. The portfolio’s shares are only available for purchase by separate accounts of insurance companies as investments for variable annuity plans, variable life insurance contracts, or other variable benefit insurance contracts.
A. The following significant accounting policies conform to generally accepted accounting principles for U.S. investment companies. The portfolio consistently follows such policies in preparing its financial statements.
1. Security Valuation: Investments are valued at the net asset value of each underlying Vanguard fund determined as of the close of the New York Stock Exchange (generally 4 p.m., Eastern time) on the valuation date.
2. Federal Income Taxes: The portfolio intends to continue to qualify as a regulated investment company and distribute all of its taxable income. Management has analyzed the portfolio’s tax positions taken for all open federal income tax years (December 31, 2016–2019), and has concluded that no provision for federal income tax is required in the portfolio’s financial statements.
3. Distributions: Distributions to shareholders are recorded on the ex-dividend date. Distributions are determined on a tax basis and may differ from net investment income and realized capital gains for financial reporting purposes.
4. Credit Facility: The portfolio and certain other funds managed by The Vanguard Group (“Vanguard”) participate in a $4.3 billion committed credit facility provided by a syndicate of lenders pursuant to a credit agreement that may be renewed annually; each fund is individually liable for its borrowings, if any, under the credit facility. Borrowings may be utilized for temporary and emergency purposes, and are subject to the portfolio’s regulatory and contractual borrowing restrictions. The participating funds are charged administrative fees and an annual commitment fee of 0.10% of the undrawn amount of the facility; these fees are allocated to the funds based on a method approved by the portfolio’s board of trustees and borne by the funds in which the portfolio invests (see Note B). Any borrowings under this facility bear interest at a rate based upon the higher of the one-month London Interbank Offered Rate, federal funds effective rate, or overnight bank funding rate plus an agreed-upon spread.
The portfolio had no borrowings outstanding at December 31, 2019, or at any time during the period then ended.
5. Other: Income and capital gain distributions received are recorded on the ex-dividend date. Security transactions are accounted for on the date securities are bought or sold. Costs used to determine realized gains (losses) on the sale of investment securities are those of the specific securities sold.
B. In accordance with the terms of a Funds’ Service Agreement (the “FSA”) between Vanguard and the portfolio, Vanguard furnishes to the portfolio investment advisory, corporate management, administrative, marketing, and distribution services at Vanguard’s cost of operations (as defined by the FSA). These costs of operations are allocated to the portfolio based on methods and guidelines approved by the board of trustees. The FSA provides that expenses otherwise allocable to Vanguard funds-of-funds may be reduced or eliminated to the extent of savings realized by the underlying Vanguard funds by virtue of being part of a fund-of-funds. Accordingly, all expenses for services provided by Vanguard to the portfolio and all other expenses incurred by the portfolio during the period ended December 31, 2019, were borne by the underlying Vanguard funds in which the portfolio invests. The portfolio’s trustees and officers are also trustees and officers, respectively, of the underlying Vanguard funds, as well as directors and employees, respectively, of Vanguard.
C. Various inputs may be used to determine the value of the portfolio’s investments. These inputs are summarized in three broad levels for financial statement purposes. The inputs or methodologies used to value securities are not necessarily an indication of the risk associated with investing in those securities.
Level 1—Quoted prices in active markets for identical securities.
Level 2—Other significant observable inputs (including quoted prices for similar securities, interest rates, prepayment speeds, credit risk, etc.).
Level 3—Significant unobservable inputs (including the portfolio’s own assumptions used to determine the fair value of investments). Any investments valued with significant unobservable inputs are noted on the Statement of Net Assets.
Total Stock Market Index Portfolio
At December 31, 2019, 100% of the market value of the portfolio’s investments was determined based on Level 1 inputs.
D. Permanent differences between book-basis and tax-basis components of net assets, if any, are reclassified among capital accounts in the financial statements to reflect their tax character. These reclassifications have no effect on net assets or net asset value per share.
Temporary differences between book-basis and tax-basis components of total distributable earnings (loss) arise when certain items of income, gain, or loss are recognized in different periods for financial statement and tax purposes; these differences will reverse at some time in the future. The differences are primarily related to the tax deferral of losses on wash sales. As of period end, the tax-basis components of total distributable earnings (loss) are detailed in the table as follows:
| | Amount | |
| | ($000 | ) |
| Undistributed Ordinary Income | 41,658 | |
| Undistributed Long-Term Gains | 88,404 | |
| Capital Loss Carryforwards | — | |
| Net Unrealized Gains (Losses) | 791,578 | |
As of December 31, 2019, gross unrealized appreciation and depreciation for investments based on cost for U.S. federal income tax purposes were as follows:
| | Amount | |
| | ($000 | ) |
| Tax Cost | 1,965,196 | |
| Gross Unrealized Appreciation | 791,591 | |
| Gross Unrealized Depreciation | (13 | ) |
| Net Unrealized Appreciation (Depreciation) | 791,578 | |
E. Capital shares issued and redeemed were:
| | Year Ended December 31, | |
| | 2019 | | 2018 | |
| | Shares | | Shares | |
| | (000 | ) | (000 | ) |
| Issued | 8,273 | | 7,370 | |
| Issued in Lieu of Cash Distributions | 2,779 | | 3,121 | |
| Redeemed | (6,412 | ) | (5,731 | ) |
| Net Increase (Decrease) in Shares Outstanding | 4,640 | | 4,760 | |
At December 31, 2019, one shareholder, an insurance company separate account whose holdings in the portfolio represent the indirect investment of Vanguard Variable Annuity contract holders, was the record or beneficial owner of 54% of the portfolio’s net assets.
F. Transactions during the period in affiliated underlying Vanguard funds were as follows:
| | | | Current Period Transactions | | | |
| | Dec. 31, | | | | Proceeds | | Realized | | | | | | | | Dec. 31, | |
| | 2018 | | | | from | | Net | | Change in | | | | Capital Gain | | 2019 | |
| | Market | | Purchases | | Securities | | Gain | | Unrealized | | | | Distributions | | Market | |
| | Value | | at Cost | | Sold | | (Loss | ) | App. (Dep. | ) | Income | | Received | | Value | |
| | ($000 | ) | ($000 | ) | ($000 | ) | ($000 | ) | ($000 | ) | ($000 | ) | ($000 | ) | ($000 | ) |
| Vanguard Extended Market Index Fund | 344,094 | | 41,997 | | 27,718 | | 9,190 | | 81,751 | | 5,699 | | — | | 449,314 | |
| Vanguard Market Liquidity Fund | 2,752 | | NA1 | | NA1 | | (1 | ) | — | | 8 | | — | | 13 | |
| Vanguard Variable Insurance Fund—Equity Index Portfolio | 1,703,774 | | 232,324 | | 80,158 | | 30,763 | | 420,744 | | 37,566 | | 49,187 | | 2,307,447 | |
| Total | 2,050,620 | | 274,321 | | 107,876 | | 39,952 | | 502,495 | | 43,273 | | 49,187 | | 2,756,774 | |
1 Not applicable—purchases and sales are for temporary cash investment purposes.
G. Management has determined that no events or transactions occurred subsequent to December 31, 2019, that would require recognition or disclosure in these financial statements.
Total Stock Market Index Portfolio
Report of Independent Registered Public Accounting Firm
To the Board of Trustees of Vanguard Variable Insurance Funds and Shareholders of Total Stock Market Index Portfolio
Opinion on the Financial Statements
We have audited the accompanying statement of net assets and statement of assets and liabilities of Total Stock Market Index Portfolio (one of the portfolios constituting Vanguard Variable Insurance Funds, referred to hereafter as the “Portfolio”) as of December 31, 2019, the related statement of operations for the year ended December 31, 2019, the statement of changes in net assets for each of the two years in the period ended December 31, 2019, including the related notes, and the financial highlights for each of the five years in the period ended December 31, 2019 (collectively referred to as the “financial statements”). In our opinion, the financial statements present fairly, in all material respects, the financial position of the Portfolio as of December 31, 2019, the results of its operations for the year then ended, the changes in its net assets for each of the two years in the period ended December 31, 2019 and the financial highlights for each of the five years in the period ended December 31, 2019 in conformity with accounting principles generally accepted in the United States of America.
Basis for Opinion
These financial statements are the responsibility of the Portfolio’s management. Our responsibility is to express an opinion on the Portfolio’s financial statements based on our audits. We are a public accounting firm registered with the Public Company Accounting Oversight Board (United States) (“PCAOB”) and are required to be independent with respect to the Portfolio in accordance with the U.S. federal securities laws and the applicable rules and regulations of the Securities and Exchange Commission and the PCAOB.
We conducted our audits of these financial statements in accordance with the standards of the PCAOB. Those standards require that we plan and perform the audit to obtain reasonable assurance about whether the financial statements are free of material misstatement, whether due to error or fraud.
Our audits included performing procedures to assess the risks of material misstatement of the financial statements, whether due to error or fraud, and performing procedures that respond to those risks. Such procedures included examining, on a test basis, evidence regarding the amounts and disclosures in the financial statements. Our audits also included evaluating the accounting principles used and significant estimates made by management, as well as evaluating the overall presentation of the financial statements. Our procedures included confirmation of securities owned as of December 31, 2019 by correspondence with the transfer agent. We believe that our audits provide a reasonable basis for our opinion.
/s/PricewaterhouseCoopers LLP
Philadelphia, Pennsylvania
February 18, 2020
We have served as the auditor of one or more investment companies in The Vanguard Group of Funds since 1975.
Special 2019 tax information (unaudited) for corporate shareholders only for Vanguard Total Stock Market Index Portfolio, a portfolio of Vanguard Variable Insurance Funds
This information for the fiscal year ended December 31, 2019, is included pursuant to provisions of the Internal Revenue Code for corporate shareholders only.
The portfolio distributed $66,316,000 as capital gain dividends (20% rate gain distributions) to shareholders during the fiscal year.
For corporate shareholders, 90.8% of investment income (dividend income plus short-term gains, if any) qualifies for the dividends-received deduction.
Total Stock Market Index Portfolio
The S&P Total Market Index is a product of S&P Dow Jones Indices LLC, a division of S&P Global, or its affiliates (“SPDJI”), and has been licensed for use by Vanguard. Standard & Poor’s® and S&P® are registered trademarks of Standard & Poor’s Financial Services LLC, a division of S&P Global (“S&P”) and Dow Jones® is a registered trademark of Dow Jones Trademark Holdings LLC (“Dow Jones”). The trademarks have been licensed to SPDJI and have been sublicensed for use for certain purposes by Vanguard. Vanguard Total Stock Market Index Portfolio is not sponsored, endorsed, sold or promoted by SPDJI, Dow Jones, S&P, any of their respective affiliates (collectively, “S&P Dow Jones Indices”). S&P Dow Jones Indices make no representation or warranty, express or implied, to the owners of the Vanguard Total Stock Market Index Portfolio or any member of the public regarding the advisability of investing in securities generally or in Vanguard Total Stock Market Index Portfolio particularly or the ability of the S&P Total Market Index to track general market performance. S&P Dow Jones Indices’ only relationship to Vanguard with respect to the S&P Total Market Index is the licensing of the Index and certain trademarks, service marks and/or trade names of S&P Dow Jones Indices and/or its licensors. The S&P Total Market Index is determined, composed and calculated by S&P Dow Jones Indices without regard to Vanguard or the Vanguard Total Stock Market Index Portfolio. S&P Dow Jones Indices have no obligation to take the needs of Vanguard or the owners of Vanguard Total Stock Market Index Portfolio into consideration in determining, composing or calculating the S&P Total Market Index. S&P Dow Jones Indices are not responsible for and have not participated in the determination of the prices, and amount of Vanguard Total Stock Market Index Portfolio or the timing of the issuance or sale of Vanguard Total Stock Market Index Portfolio or in the determination or calculation of the equation by which Vanguard Total Stock Market Index Portfolio is to be converted into cash, surrendered or redeemed, as the case may be. S&P Dow Jones Indices have no obligation or liability in connection with the administration, marketing or trading of Vanguard Total Stock Market Index Portfolio. There is no assurance that investment products based on the S&P Total Market Index will accurately track index performance or provide positive investment returns. S&P Dow Jones Indices LLC is not an investment advisor. Inclusion of a security within an index is not a recommendation by S&P Dow Jones Indices to buy, sell, or hold such security, nor is it considered to be investment advice.
S&P DOW JONES INDICES DOES NOT GUARANTEE THE ADEQUACY, ACCURACY, TIMELINESS AND/OR THE COMPLETENESS OF THE S&P TOTAL MARKET INDEX OR ANY DATA RELATED THERETO OR ANY COMMUNICATION, INCLUDING BUT NOT LIMITED TO, ORAL OR WRITTEN COMMUNICATION (INCLUDING ELECTRONIC COMMUNICATIONS) WITH RESPECT THERETO. S&P DOW JONES INDICES SHALL NOT BE SUBJECT TO ANY DAMAGES OR LIABILITY FOR ANY ERRORS, OMISSIONS, OR DELAYS THEREIN. S&P DOW JONES INDICES MAKE NO EXPRESS OR IMPLIED WARRANTIES, AND EXPRESSLY DISCLAIMS ALL WARRANTIES, OF MERCHANTABILITY OR FITNESS FOR A PARTICULAR PURPOSE OR USE OR AS TO RESULTS TO BE OBTAINED BY VANGUARD, OWNERS OF THE VANGUARD TOTAL STOCK MARKET INDEX PORTFOLIO, OR ANY OTHER PERSON OR ENTITY FROM THE USE OF THE S&P TOTAL MARKET INDEX OR WITH RESPECT TO ANY DATA RELATED THERETO. WITHOUT LIMITING ANY OF THE FOREGOING, IN NO EVENT WHATSOEVER SHALL S&P DOW JONES INDICES BE LIABLE FOR ANY INDIRECT, SPECIAL, INCIDENTAL, PUNITIVE, OR CONSEQUENTIAL DAMAGES INCLUDING BUT NOT LIMITED TO, LOSS OF PROFITS, TRADING LOSSES, LOST TIME OR GOODWILL, EVEN IF THEY HAVE BEEN ADVISED OF THE POSSIBILITY OF SUCH DAMAGES, WHETHER IN CONTRACT, TORT, STRICT LIABILITY, OR OTHERWISE. THERE ARE NO THIRD PARTY BENEFICIARIES OF ANY AGREEMENTS OR ARRANGEMENTS BETWEEN S&P DOW JONES INDICES AND VANGUARD, OTHER THAN THE LICENSORS OF S&P DOW JONES INDICES.
Equity Index Portfolio
Your Portfolio’s Performance at a Glance
• For the 12 months ended December 31, 2019, the Equity Index Portfolio of Vanguard Variable Insurance Fund returned 31.30%, in line with the 31.49% return of its benchmark index after factoring in the portfolio’s expenses.
• Stocks benefited from accommodative monetary policies from the Federal Reserve and other major central banks and better-than-expected corporate earnings during the 12 months. Large-capitalization stocks outpaced mid- and small-caps, and growth stocks beat their value counterparts.
• The portfolio benefited most from its holdings in information technology, financials, and communication services.
• The portfolio recorded an average annual return of 13.40% for the past ten years, in line with its benchmark average of 13.56%.
• Please note that the portfolio returns in Vanguard Variable Insurance Fund are different from those in Vanguard Variable Annuity (and other plans that invest in the fund), which take into account insurance-related expenses.
| Market Barometer | | |
| | | Average Annual Total Returns |
| | | Periods Ended December 31, 2019 |
| | One Year | Three Years | Five Years |
| Stocks | | | |
| Russell 1000 Index (Large-caps) | 31.43% | 15.05% | 11.48% |
| Russell 2000 Index (Small-caps) | 25.53 | 8.59 | 8.23 |
| Russell 3000 Index (Broad U.S. market) | 31.02 | 14.57 | 11.24 |
| FTSE All-World ex US Index (International) | 21.81 | 9.96 | 5.83 |
| | | | |
| Bonds | | | |
Bloomberg Barclays U.S. Aggregate Bond Index
(Broad taxable market) | 8.72% | 4.03% | 3.05% |
Bloomberg Barclays Municipal Bond Index
(Broad tax-exempt market) | 7.54 | 4.72 | 3.53 |
| FTSE Three-Month U.S. Treasury Bill Index | 2.25 | 1.65 | 1.04 |
| | | | |
| CPI | | | |
| Consumer Price Index | 2.29% | 2.10% | 1.82% |
Equity Index Portfolio
About Your Portfolio’s Expenses
As a shareholder of the portfolio, you incur ongoing costs, which include costs for portfolio management, administrative services, and shareholder reports (like this one), among others. Operating expenses, which are deducted from a portfolio’s gross income, directly reduce the investment return of the portfolio.
A portfolio’s expenses are expressed as a percentage of its average net assets. This figure is known as the expense ratio. The following examples are intended to help you understand the ongoing costs (in dollars) of investing in your portfolio and to compare these costs with those of other mutual funds. The examples are based on an investment of $1,000 made at the beginning of the period shown and held for the entire period.
The accompanying table illustrates your portfolio’s costs in two ways:
• Based on actual portfolio return.This section helps you to estimate the actual expenses that you paid over the period. The “Ending Account Value” shown is derived from the portfolio’s actual return, and the third column shows the dollar amount that would have been paid by an investor who started with $1,000 in the portfolio. You may use the information here, together with the amount you invested, to estimate the expenses that you paid over the period.
To do so, simply divide your account value by $1,000 (for example, an $8,600 account value divided by $1,000 = 8.6), then multiply the result by the number given for your portfolio under the heading “Expenses Paid During Period.”
• Based on hypothetical 5% yearly return. This section is intended to help you compare your portfolio’s costs with those of other mutual funds. It assumes that the portfolio had a yearly return of 5% before expenses, but that the expense ratio is unchanged. In this case—because the return used is not the portfolio’s actual return—the results do not apply to your investment. The example is useful in making comparisons because the Securities and Exchange Commission requires all mutual funds to calculate expenses based on a 5% return. You can assess your portfolio’s costs by comparing this hypothetical example with the hypothetical examples that appear in shareholder reports of other funds.
Note that the expenses shown in the table are meant to highlight and help you compareongoingcosts only and do not reflect transaction costs incurred by the portfolio for buying and selling securities. The portfolio’s expense ratio does not reflect additional fees and expenses associated with the annuity or life insurance program through which you invest.
The calculations assume no shares were bought or sold during the period. Your actual costs may have been higher or lower, depending on the amount of your investment and the timing of any purchases or redemptions.
You can find more information about the portfolio’s expenses in the Financial Statements section. For additional information on operating expenses and other shareholder costs, please refer to the prospectus.
| Six Months Ended December 31, 2019 | | | |
| | Beginning | Ending | Expenses |
| | Account Value | Account Value | Paid During |
| Equity Index Portfolio | 6/30/2019 | 12/31/2019 | Period |
| Based on Actual Portfolio Return | $1,000.00 | $1,108.53 | $0.74 |
| Based on Hypothetical 5% Yearly Return | 1,000.00 | 1,024.50 | $0.71 |
The calculations are based on expenses incurred in the most recent six-month period. The portfolio’s annualized six-month expense ratio for that period is 0.14%. The dollar amounts shown as “Expenses Paid” are equal to the annualized expense ratio multiplied by the average account value over the period, multiplied by the number of days in the most recent six-month period, then divided by the number of days in the recent 12-month period (184/365).
Equity Index Portfolio
Performance Summary
All of the returns in this report represent past performance, which is not a guarantee of future results that may be achieved by the portfolio. (Current performance may be lower or higher than the performance data cited. For performance data current to the most recent month-end, visit our website at vanguard.com/performance.) Note, too, that both investment returns and principal value can fluctuate widely, so an investor’s shares, when sold, could be worth more or less than their original cost. The returns shown do not reflect taxes that a shareholder would pay on portfolio distributions or on the sale of portfolio shares. Nor do the returns reflect fees and expenses associated with the annuity or life insurance program through which a shareholder invests. If these fees and expenses were included, the portfolio’s returns would be lower.
Cumulative Performance: December 31, 2009–December 31, 2019
Initial Investment of $10,000
| | | Average Annual Total Returns | Final Value |
| | | Periods Ended December 31, 2019 | of a $10,000 |
| | | One Year | Five Years | Ten Years | Investment |
| Equity Index Portfolio | 31.30% | 11.55% | 13.40% | $35,166 |
| S&P 500 Index | 31.49 | 11.70 | 13.56 | 35,666 |
| Dow Jones U.S. Total Stock Market Float Adjusted Index | 30.90 | 11.18 | 13.43 | 35,251 |
See Financial Highlights for dividend and capital gains information.
Equity Index Portfolio
Sector Diversification
As of December 31, 2019
| Communication Services | 10.4% |
| Consumer Discretionary | 9.7 |
| Consumer Staples | 7.2 |
| Energy | 4.3 |
| Financials | 13.0 |
| Health Care | 14.2 |
| Industrials | 9.1 |
| Information Technology | 23.2 |
| Materials | 2.7 |
| Real Estate | 2.9 |
| Utilities | 3.3 |
The table reflects the portfolio’s equity exposure, based on its investments in stocks and stock index futures. Any holdings in short-term reserves are excluded. Sector categories are based on the Global Industry Classification Standard (“GICS”), except for the “Other” category (if applicable), which includes securities that have not been provided a GICS classification as of the effective reporting period.
The Global Industry Classification Standard (“GICS”) was developed by and is the exclusive property and a service mark of MSCI Inc. (“MSCI”) and Standard and Poor’s, a division of McGraw-Hill Companies, Inc. (“S&P”), and is licensed for use by Vanguard. Neither MSCI, S&P nor any third party involved in making or compiling the GICS or any GICS classification makes any express or implied warranties or representations with respect to such standard or classification (or the results to be obtained by the use thereof), and all such parties hereby expressly disclaim all warranties of originality, accuracy, completeness, merchantability or fitness for a particular purpose with respect to any such standard or classification. Without limiting any of the foregoing, in no event shall MSCI, S&P, any of its affiliates or any third party involved in making or compiling the GICS or any GICS classification have any liability for any direct, indirect, special, punitive, consequential or any other damages (including lost profits) even if notified of the possibility of such damages.
Equity Index Portfolio
Financial Statements
Statement of Net Assets
As of December 31, 2019
The portfolio files its complete schedule of portfolio holdings with the Securities and Exchange Commission (SEC) for the first and third quarters of each fiscal year as an exhibit to its reports on Form N-PORT. The portfolio’s Form N-PORT reports are available on the SEC’s website at www.sec.gov.
| | | | Market |
| | | | Value• |
| | | Shares | ($000) |
| Common Stocks (99.4%)1 |
| Communication Services (10.3%) |
| * | Facebook Inc. Class A | 577,310 | 118,493 |
| * | Alphabet Inc. Class C | 72,211 | 96,548 |
| * | Alphabet Inc. Class A | 71,372 | 95,595 |
| | AT&T Inc. | 1,752,449 | 68,486 |
| | Walt Disney Co. | 432,394 | 62,537 |
| | Verizon Communications Inc. | 992,155 | 60,918 |
| | Comcast Corp. Class A | 1,089,103 | 48,977 |
| * | Netflix Inc. | 105,138 | 34,020 |
| * | Charter Communications Inc. Class A | 37,611 | 18,244 |
| | Activision Blizzard Inc. | 184,305 | 10,952 |
| * | Electronic Arts Inc. | 70,042 | 7,530 |
| * | Twitter Inc. | 186,254 | 5,970 |
| * | T-Mobile US Inc. | 75,950 | 5,956 |
| | ViacomCBS Inc. Class B | 129,668 | 5,442 |
| | Omnicom Group Inc. | 52,251 | 4,233 |
| * | Take-Two Interactive Software Inc. | 27,192 | 3,329 |
| | Fox Corp. Class A | 85,582 | 3,173 |
| | CenturyLink Inc. | 235,800 | 3,115 |
| * | Discovery Inc. Series C | 80,628 | 2,458 |
| * | Live Nation Entertainment Inc. | 33,726 | 2,410 |
| * | DISH Network Corp. Class A | 61,432 | 2,179 |
| | Interpublic Group of Cos. Inc. | 93,330 | 2,156 |
| | News Corp. Class A | 110,023 | 1,556 |
| | Fox Corp. Class B | 38,277 | 1,393 |
| * | Discovery Inc. Series A | 37,907 | 1,241 |
| | News Corp. Class B | 12,487 | 181 |
| | | | 667,092 |
| Consumer Discretionary (9.7%) |
| * | Amazon.com Inc. | 99,911 | 184,620 |
| | Home Depot Inc. | 261,686 | 57,147 |
| | McDonald’s Corp. | 180,654 | 35,699 |
| | NIKE Inc. Class B | 298,992 | 30,291 |
| | Starbucks Corp. | 283,276 | 24,906 |
| | Lowe’s Cos. Inc. | 183,875 | 22,021 |
| * | Booking Holdings Inc. | 10,041 | 20,621 |
| | TJX Cos. Inc. | 290,877 | 17,761 |
| | Target Corp. | 121,556 | 15,585 |
| | General Motors Co. | 301,722 | 11,043 |
| | Ross Stores Inc. | 86,754 | 10,100 |
| | Marriott International Inc. Class A | 65,085 | 9,856 |
| | Dollar General Corp. | 61,067 | 9,525 |
| | Ford Motor Co. | 934,365 | 8,690 |
| * | O’Reilly Automotive Inc. | 18,148 | 7,954 |
| | VF Corp. | 78,624 | 7,836 |
| | Hilton Worldwide Holdings Inc. | 67,676 | 7,506 |
| | Yum! Brands Inc. | 72,543 | 7,307 |
| * | AutoZone Inc. | 5,715 | 6,808 |
| | eBay Inc. | 183,449 | 6,624 |
| | Aptiv plc | 61,265 | 5,818 |
| | Las Vegas Sands Corp. | 81,149 | 5,603 |
| | Royal Caribbean Cruises Ltd. | 41,235 | 5,505 |
| * | Dollar Tree Inc. | 56,825 | 5,344 |
| * | Chipotle Mexican Grill Inc. Class A | 6,135 | 5,136 |
| | Carnival Corp. | 96,154 | 4,887 |
| | Best Buy Co. Inc. | 54,650 | 4,798 |
| | DR Horton Inc. | 80,515 | 4,247 |
| | MGM Resorts International | 123,705 | 4,116 |
| | Genuine Parts Co. | 34,889 | 3,706 |
| | Lennar Corp. Class A | 66,408 | 3,705 |
| | Expedia Group Inc. | 33,565 | 3,630 |
| * | Ulta Beauty Inc. | 13,732 | 3,476 |
| | Tiffany & Co. | 25,932 | 3,466 |
| * | CarMax Inc. | 39,501 | 3,463 |
| | Garmin Ltd. | 34,574 | 3,373 |
| | Wynn Resorts Ltd. | 23,215 | 3,224 |
| | Hasbro Inc. | 30,470 | 3,218 |
| | Darden Restaurants Inc. | 29,457 | 3,211 |
| * | NVR Inc. | 834 | 3,176 |
| * | Norwegian Cruise Line Holdings Ltd. | 50,948 | 2,976 |
| | Advance Auto Parts Inc. | 16,657 | 2,668 |
| | Tractor Supply Co. | 28,472 | 2,660 |
| * | LKQ Corp. | 73,701 | 2,631 |
| | PulteGroup Inc. | 61,103 | 2,371 |
| | Whirlpool Corp. | 15,126 | 2,232 |
| | BorgWarner Inc. | 49,420 | 2,144 |
| * | Mohawk Industries Inc. | 14,225 | 1,940 |
| | Kohl’s Corp. | 37,467 | 1,909 |
| | PVH Corp. | 17,743 | 1,866 |
| | Tapestry Inc. | 66,031 | 1,781 |
| | Newell Brands Inc. | 91,185 | 1,753 |
| | Leggett & Platt Inc. | 31,487 | 1,600 |
| | Ralph Lauren Corp. Class A | 11,900 | 1,395 |
| * | Capri Holdings Ltd. | 36,285 | 1,384 |
| | Harley-Davidson Inc. | 36,867 | 1,371 |
| | Hanesbrands Inc. | 86,582 | 1,286 |
| | Macy’s Inc. | 73,934 | 1,257 |
| | H&R Block Inc. | 46,949 | 1,102 |
| | Nordstrom Inc. | 25,631 | 1,049 |
| | L Brands Inc. | 55,576 | 1,007 |
| *,^ | Under Armour Inc. Class A | 46,263 | 999 |
| | Gap Inc. | 50,910 | 900 |
| * | Under Armour Inc. Class C | 45,229 | 867 |
| | Lennar Corp. Class B | 1,030 | 46 |
| | | | 626,196 |
| Consumer Staples (7.2%) |
| | Procter & Gamble Co. | 598,253 | 74,722 |
| | Coca-Cola Co. | 925,112 | 51,205 |
| | PepsiCo Inc. | 334,534 | 45,721 |
| | Walmart Inc. | 340,295 | 40,441 |
| | Philip Morris International Inc. | 373,246 | 31,759 |
| | Costco Wholesale Corp. | 105,974 | 31,148 |
| | Altria Group Inc. | 448,148 | 22,367 |
| | Mondelez International Inc. Class A | 345,368 | 19,023 |
| | Colgate-Palmolive Co. | 205,612 | 14,154 |
| | Kimberly-Clark Corp. | 82,232 | 11,311 |
| | Estee Lauder Cos. Inc. Class A | 53,392 | 11,028 |
| | Walgreens Boots Alliance Inc. | 179,879 | 10,606 |
| | Sysco Corp. | 122,366 | 10,467 |
| | General Mills Inc. | 144,955 | 7,764 |
| | Constellation Brands Inc. Class A | 40,188 | 7,626 |
| | Tyson Foods Inc. Class A | 70,805 | 6,446 |
| | Archer-Daniels-Midland Co. | 133,597 | 6,192 |
| * | Monster Beverage Corp. | 91,595 | 5,821 |
| | Kroger Co. | 192,411 | 5,578 |
| | Hershey Co. | 35,580 | 5,230 |
| | McCormick & Co. Inc. | 29,648 | 5,032 |
| | Kraft Heinz Co. | 149,463 | 4,802 |
| | Clorox Co. | 30,111 | 4,623 |
| | Church & Dwight Co. Inc. | 58,915 | 4,144 |
| | Kellogg Co. | 59,649 | 4,125 |
| | Conagra Brands Inc. | 116,853 | 4,001 |
| | Lamb Weston Holdings Inc. | 35,105 | 3,020 |
| | Hormel Foods Corp. | 66,824 | 3,014 |
| | Brown-Forman Corp. Class B | 43,605 | 2,948 |
| | JM Smucker Co. | 27,417 | 2,855 |
| �� | Molson Coors Brewing Co. Class B | 44,960 | 2,423 |
| | Campbell Soup Co. | 40,424 | 1,998 |
| | Coty Inc. Class A | 70,883 | 797 |
| | | | 462,391 |
| Energy (4.3%) |
| | Exxon Mobil Corp. | 1,015,102 | 70,834 |
| | Chevron Corp. | 453,635 | 54,668 |
| | ConocoPhillips | 263,270 | 17,120 |
| | Schlumberger Ltd. | 332,214 | 13,355 |
| | Phillips 66 | 106,608 | 11,877 |
| | EOG Resources Inc. | 139,601 | 11,693 |
| | Kinder Morgan Inc. | 467,361 | 9,894 |
| | Marathon Petroleum Corp. | 155,793 | 9,387 |
| | Valero Energy Corp. | 98,527 | 9,227 |
| | Occidental Petroleum Corp. | 214,354 | 8,834 |
| | ONEOK Inc. | 99,108 | 7,500 |
| | Williams Cos. Inc. | 290,862 | 6,899 |
| | Pioneer Natural Resources Co. | 39,752 | 6,017 |
| | Halliburton Co. | 210,696 | 5,156 |
| | Concho Resources Inc. | 48,270 | 4,227 |
| | Hess Corp. | 62,151 | 4,152 |
| | Baker Hughes Co. Class A | 155,953 | 3,997 |
| | Diamondback Energy Inc. | 38,675 | 3,591 |
| | Noble Energy Inc. | 114,490 | 2,844 |
| | Marathon Oil Corp. | 191,490 | 2,600 |
| | Devon Energy Corp. | 92,641 | 2,406 |
| | National Oilwell Varco Inc. | 92,356 | 2,314 |
| | Apache Corp. | 90,006 | 2,303 |
| | TechnipFMC plc | 100,593 | 2,157 |
| | HollyFrontier Corp. | 35,543 | 1,802 |
Equity Index Portfolio
| | | | Market |
| | | | Value• |
| | | Shares | ($000) |
| | Cabot Oil & Gas Corp. | 97,645 | 1,700 |
| | Cimarex Energy Co. | 24,374 | 1,279 |
| | Helmerich & Payne Inc. | 26,103 | 1,186 |
| | | | 279,019 |
| Financials (12.9%) |
| | JPMorgan Chase & Co. | 752,435 | 104,889 |
| * | Berkshire Hathaway Inc. Class B | 437,823 | 99,167 |
| | Bank of America Corp. | 1,942,181 | 68,404 |
| | Wells Fargo & Co. | 923,324 | 49,675 |
| | Citigroup Inc. | 523,776 | 41,844 |
| | US Bancorp | 340,918 | 20,213 |
| | American Express Co. | 160,955 | 20,037 |
| | Truist Financial Corp. | 321,697 | 18,118 |
| | Goldman Sachs Group Inc. | 76,459 | 17,580 |
| | CME Group Inc. | 85,964 | 17,255 |
| | Chubb Ltd. | 108,717 | 16,923 |
| | PNC Financial Services Group Inc. | 105,099 | 16,777 |
| | S&P Global Inc. | 58,624 | 16,007 |
| | Morgan Stanley | 295,128 | 15,087 |
| | BlackRock Inc. | 28,289 | 14,221 |
| | Marsh & McLennan Cos. Inc. | 121,057 | 13,487 |
| | Charles Schwab Corp. | 274,275 | 13,045 |
| | Intercontinental Exchange Inc. | 133,555 | 12,361 |
| | Aon plc | 56,158 | 11,697 |
| | Capital One Financial Corp. | 111,734 | 11,499 |
| | American International Group Inc. | 208,725 | 10,714 |
| | Progressive Corp. | 140,247 | 10,153 |
| | Bank of New York Mellon Corp. | 201,333 | 10,133 |
| | MetLife Inc. | 187,574 | 9,561 |
| | Aflac Inc. | 176,067 | 9,314 |
| | Moody’s Corp. | 38,947 | 9,246 |
| | Prudential Financial Inc. | 96,476 | 9,044 |
| | Allstate Corp. | 77,686 | 8,736 |
| | Travelers Cos. Inc. | 61,915 | 8,479 |
| * | Berkshire Hathaway Inc. Class A | 21 | 7,131 |
| | State Street Corp. | 87,241 | 6,901 |
| | T. Rowe Price Group Inc. | 56,043 | 6,828 |
| | Discover Financial Services | 75,182 | 6,377 |
| | Willis Towers Watson plc | 30,839 | 6,228 |
| | Northern Trust Corp. | 50,831 | 5,400 |
| | M&T Bank Corp. | 31,660 | 5,374 |
| | MSCI Inc. Class A | 20,336 | 5,250 |
| | Hartford Financial Services Group Inc. | 86,390 | 5,250 |
| | Fifth Third Bancorp | 170,283 | 5,235 |
| | Synchrony Financial | 142,636 | 5,136 |
| | Ameriprise Financial Inc. | 30,400 | 5,064 |
| | KeyCorp | 236,396 | 4,785 |
| | First Republic Bank | 40,416 | 4,747 |
| | Arthur J Gallagher & Co. | 44,695 | 4,256 |
| | Citizens Financial Group Inc. | 104,378 | 4,239 |
| | Regions Financial Corp. | 231,638 | 3,975 |
| | Cincinnati Financial Corp. | 36,489 | 3,837 |
| | Huntington Bancshares Inc. | 248,048 | 3,741 |
| | MarketAxess Holdings Inc. | 9,088 | 3,445 |
| | Principal Financial Group Inc. | 62,045 | 3,412 |
| | Loews Corp. | 61,390 | 3,222 |
| | Cboe Global Markets Inc. | 26,640 | 3,197 |
| * | SVB Financial Group | 12,394 | 3,111 |
| | Nasdaq Inc. | 27,580 | 2,954 |
| | Lincoln National Corp. | 47,637 | 2,811 |
| | Everest Re Group Ltd. | 9,808 | 2,715 |
| | Raymond James Financial Inc. | 29,688 | 2,656 |
| | Globe Life Inc. | 23,846 | 2,510 |
| | Comerica Inc. | 34,500 | 2,475 |
| | E*TRADE Financial Corp. | 54,349 | 2,466 |
| | WR Berkley Corp. | 34,736 | 2,400 |
| | Zions Bancorp NA | 40,798 | 2,118 |
| | Assurant Inc. | 14,586 | 1,912 |
| | People’s United Financial Inc. | 106,292 | 1,796 |
| | Franklin Resources Inc. | 66,742 | 1,734 |
| | Invesco Ltd. | 89,065 | 1,601 |
| | Unum Group | 49,546 | 1,445 |
| | | | 831,400 |
| Health Care (14.1%) |
| | Johnson & Johnson | 631,389 | 92,101 |
| | UnitedHealth Group Inc. | 227,287 | 66,818 |
| | Merck & Co. Inc. | 610,782 | 55,551 |
| | Pfizer Inc. | 1,327,673 | 52,018 |
| | Abbott Laboratories | 423,980 | 36,827 |
| | Medtronic plc | 321,536 | 36,478 |
| | Bristol-Myers Squibb Co. | 562,369 | 36,098 |
| | Amgen Inc. | 142,542 | 34,363 |
| | AbbVie Inc. | 354,771 | 31,411 |
| | Thermo Fisher Scientific Inc. | 96,195 | 31,251 |
| | Eli Lilly & Co. | 202,699 | 26,641 |
| | Danaher Corp. | 153,350 | 23,536 |
| | CVS Health Corp. | 312,110 | 23,187 |
| | Gilead Sciences Inc. | 303,516 | 19,722 |
| | Anthem Inc. | 60,831 | 18,373 |
| | Cigna Corp. | 89,588 | 18,320 |
| | Becton Dickinson and Co. | 64,882 | 17,646 |
| * | Intuitive Surgical Inc. | 27,726 | 16,390 |
| | Stryker Corp. | 77,237 | 16,215 |
| | Zoetis Inc. | 114,258 | 15,122 |
| * | Boston Scientific Corp. | 334,354 | 15,119 |
| | Allergan plc | 78,753 | 15,055 |
| * | Vertex Pharmaceuticals Inc. | 61,684 | 13,506 |
| * | Biogen Inc. | 43,289 | 12,845 |
| * | Illumina Inc. | 35,266 | 11,699 |
| * | Edwards Lifesciences Corp. | 50,030 | 11,671 |
| | Humana Inc. | 31,769 | 11,644 |
| | Baxter International Inc. | 122,469 | 10,241 |
| | HCA Healthcare Inc. | 63,476 | 9,382 |
| | Zimmer Biomet Holdings Inc. | 49,334 | 7,384 |
| * | Regeneron Pharmaceuticals Inc. | 19,163 | 7,195 |
| * | IQVIA Holdings Inc. | 43,289 | 6,689 |
| | Agilent Technologies Inc. | 74,258 | 6,335 |
| * | Centene Corp. | 99,274 | 6,241 |
| | McKesson Corp. | 43,230 | 5,980 |
| * | Alexion Pharmaceuticals Inc. | 53,090 | 5,742 |
| | Cerner Corp. | 75,351 | 5,530 |
| * | IDEXX Laboratories Inc. | 20,579 | 5,374 |
| | ResMed Inc. | 34,487 | 5,344 |
| * | Align Technology Inc. | 17,211 | 4,803 |
| * | Mettler-Toledo International Inc. | 5,836 | 4,630 |
| | Teleflex Inc. | 11,094 | 4,176 |
| * | WellCare Health Plans Inc. | 12,067 | 3,985 |
| * | Laboratory Corp. of America Holdings | 23,310 | 3,943 |
| | Cooper Cos. Inc. | 11,904 | 3,825 |
| * | Incyte Corp. | 42,929 | 3,749 |
| * | Waters Corp. | 15,472 | 3,615 |
| | Cardinal Health Inc. | 70,237 | 3,553 |
| | Quest Diagnostics Inc. | 32,348 | 3,454 |
| * | Hologic Inc. | 64,272 | 3,356 |
| | STERIS plc | 20,374 | 3,105 |
| * | Varian Medical Systems Inc. | 21,843 | 3,102 |
| | AmerisourceBergen Corp. Class A | 36,028 | 3,063 |
| | Dentsply Sirona Inc. | 53,455 | 3,025 |
| | Universal Health Services Inc. Class B | 19,248 | 2,761 |
| | PerkinElmer Inc. | 26,711 | 2,594 |
| * | Mylan NV | 123,531 | 2,483 |
| * | Henry Schein Inc. | 35,202 | 2,349 |
| * | ABIOMED Inc. | 10,806 | 1,843 |
| | Perrigo Co. plc | 32,577 | 1,683 |
| * | DaVita Inc. | 21,432 | 1,608 |
| | | | 911,749 |
| Industrials (9.0%) |
| | Boeing Co. | 128,265 | 41,784 |
| | Honeywell International Inc. | 171,403 | 30,338 |
| | Union Pacific Corp. | 166,545 | 30,110 |
| | United Technologies Corp. | 194,638 | 29,149 |
| | 3M Co. | 137,967 | 24,340 |
| | General Electric Co. | 2,095,232 | 23,383 |
| | Lockheed Martin Corp. | 59,542 | 23,184 |
| | United Parcel Service Inc. Class B | 168,103 | 19,678 |
| | Caterpillar Inc. | 132,592 | 19,581 |
| | Raytheon Co. | 66,806 | 14,680 |
| | CSX Corp. | 186,562 | 13,500 |
| | Deere & Co. | 75,542 | 13,088 |
| | Northrop Grumman Corp. | 37,600 | 12,933 |
| | Illinois Tool Works Inc. | 70,161 | 12,603 |
| | Norfolk Southern Corp. | 62,555 | 12,144 |
| | Emerson Electric Co. | 146,140 | 11,145 |
| | Waste Management Inc. | 93,617 | 10,669 |
| | L3Harris Technologies Inc. | 53,029 | 10,493 |
| | General Dynamics Corp. | 56,225 | 9,915 |
| | Eaton Corp. plc | 99,169 | 9,393 |
| | Roper Technologies Inc. | 24,959 | 8,841 |
| | FedEx Corp. | 57,590 | 8,708 |
| | Delta Air Lines Inc. | 138,054 | 8,073 |
| | Ingersoll-Rand plc | 57,459 | 7,637 |
| | Johnson Controls International plc | 185,035 | 7,533 |
| * | IHS Markit Ltd. | 96,162 | 7,246 |
| | TransDigm Group Inc. | 11,946 | 6,690 |
| | Cummins Inc. | 36,747 | 6,576 |
| | PACCAR Inc. | 82,955 | 6,562 |
| | Parker-Hannifin Corp. | 30,820 | 6,343 |
| | Southwest Airlines Co. | 113,602 | 6,132 |
| | Stanley Black & Decker Inc. | 36,471 | 6,045 |
| | Verisk Analytics Inc. Class A | 39,311 | 5,871 |
| | Rockwell Automation Inc. | 27,721 | 5,618 |
| | AMETEK Inc. | 54,838 | 5,470 |
| | Fortive Corp. | 70,966 | 5,421 |
| | Cintas Corp. | 20,113 | 5,412 |
| | Fastenal Co. | 137,593 | 5,084 |
| * | United Airlines Holdings Inc. | 52,229 | 4,601 |
| | Republic Services Inc. Class A | 50,553 | 4,531 |
| * | Copart Inc. | 49,102 | 4,465 |
| | Equifax Inc. | 29,051 | 4,071 |
| | Dover Corp. | 34,891 | 4,021 |
| | Kansas City Southern | 23,807 | 3,646 |
| | WW Grainger Inc. | 10,459 | 3,541 |
| | Xylem Inc. | 43,256 | 3,408 |
| | Westinghouse Air Brake Technologies Corp. | 43,689 | 3,399 |
| | Masco Corp. | 68,235 | 3,275 |
Equity Index Portfolio
| | | | Market |
| | | | Value• |
| | | Shares | ($000) |
| | Expeditors International of Washington Inc. | 40,915 | 3,192 |
| | IDEX Corp. | 18,274 | 3,143 |
| * | United Rentals Inc. | 18,060 | 3,012 |
| | Jacobs Engineering Group Inc. | 32,573 | 2,926 |
| | Old Dominion Freight Line Inc. | 15,302 | 2,904 |
| | Arconic Inc. | 93,043 | 2,863 |
| | Allegion plc | 22,270 | 2,773 |
| | American Airlines Group Inc. | 93,752 | 2,689 |
| | CH Robinson Worldwide Inc. | 32,528 | 2,544 |
| | Huntington Ingalls Industries Inc. | 9,788 | 2,456 |
| | Textron Inc. | 54,744 | 2,442 |
| | JB Hunt Transport Services Inc. | 20,404 | 2,383 |
| | Snap-on Inc. | 13,135 | 2,225 |
| | Fortune Brands Home & Security Inc. | 33,475 | 2,187 |
| | Alaska Air Group Inc. | 29,477 | 1,997 |
| | Pentair plc | 40,215 | 1,845 |
| | Robert Half International Inc. | 28,132 | 1,776 |
| | Nielsen Holdings plc | 85,151 | 1,729 |
| | AO Smith Corp. | 32,910 | 1,568 |
| | Flowserve Corp. | 31,307 | 1,558 |
| | Quanta Services Inc. | 34,051 | 1,386 |
| | Rollins Inc. | 33,685 | 1,117 |
| | | | 581,045 |
| Information Technology (23.1%) |
| | Apple Inc. | 1,001,977 | 294,231 |
| | Microsoft Corp. | 1,830,140 | 288,613 |
| | Visa Inc. Class A | 410,650 | 77,161 |
| | Mastercard Inc. Class A | 212,955 | 63,586 |
| | Intel Corp. | 1,043,559 | 62,457 |
| | Cisco Systems Inc. | 1,017,763 | 48,812 |
| * | Adobe Inc. | 116,124 | 38,299 |
| * | salesforce.com Inc. | 212,786 | 34,607 |
| | NVIDIA Corp. | 146,818 | 34,546 |
| | Accenture plc Class A | 152,333 | 32,077 |
| * | PayPal Holdings Inc. | 281,686 | 30,470 |
| | Broadcom Inc. | 95,160 | 30,072 |
| | Texas Instruments Inc. | 224,242 | 28,768 |
| | International Business Machines Corp. | 212,466 | 28,479 |
| | Oracle Corp. | 519,725 | 27,535 |
| | QUALCOMM Inc. | 273,926 | 24,168 |
| | Fidelity National Information Services Inc. | 147,425 | 20,505 |
| | Automatic Data Processing Inc. | 103,785 | 17,695 |
| | Intuit Inc. | 62,442 | 16,355 |
| * | Fiserv Inc. | 136,995 | 15,841 |
| * | Micron Technology Inc. | 265,584 | 14,283 |
| | Applied Materials Inc. | 221,593 | 13,526 |
| | Global Payments Inc. | 72,083 | 13,159 |
| * | ServiceNow Inc. | 45,242 | 12,773 |
| * | Advanced Micro Devices Inc. | 267,151 | 12,252 |
| | Analog Devices Inc. | 88,346 | 10,499 |
| | Lam Research Corp. | 34,799 | 10,175 |
| * | Autodesk Inc. | 52,783 | 9,684 |
| | Cognizant Technology Solutions Corp. Class A | 131,352 | 8,146 |
| | Amphenol Corp. Class A | 71,110 | 7,696 |
| | TE Connectivity Ltd. | 80,249 | 7,691 |
| | HP Inc. | 355,478 | 7,305 |
| | KLA Corp. | 37,844 | 6,743 |
| | Motorola Solutions Inc. | 41,096 | 6,622 |
| | Paychex Inc. | 76,409 | 6,499 |
| | Microchip Technology Inc. | 57,326 | 6,003 |
| * | FleetCor Technologies Inc. | 20,816 | 5,989 |
| | Xilinx Inc. | 60,328 | 5,898 |
| | Corning Inc. | 184,537 | 5,372 |
| * | ANSYS Inc. | 20,533 | 5,285 |
| * | Synopsys Inc. | 36,091 | 5,024 |
| | Skyworks Solutions Inc. | 40,881 | 4,942 |
| | CDW Corp. | 34,476 | 4,925 |
| | Hewlett Packard Enterprise Co. | 310,513 | 4,925 |
| * | VeriSign Inc. | 24,794 | 4,777 |
| * | Cadence Design Systems Inc. | 67,224 | 4,663 |
| * | Keysight Technologies Inc. | 44,993 | 4,618 |
| | Western Digital Corp. | 71,388 | 4,531 |
| | Maxim Integrated Products Inc. | 64,963 | 3,996 |
| * | Fortinet Inc. | 34,063 | 3,637 |
| | NortonLifeLock Inc. | 137,740 | 3,515 |
| | NetApp Inc. | 54,830 | 3,413 |
| | Broadridge Financial Solutions Inc. | 27,543 | 3,403 |
| * | Akamai Technologies Inc. | 38,828 | 3,354 |
| * | Gartner Inc. | 21,496 | 3,313 |
| | Seagate Technology plc | 55,545 | 3,305 |
| | Citrix Systems Inc. | 29,409 | 3,261 |
| * | Qorvo Inc. | 27,923 | 3,245 |
| * | Zebra Technologies Corp. | 12,553 | 3,207 |
| | Leidos Holdings Inc. | 31,967 | 3,129 |
| | Western Union Co. | 100,812 | 2,700 |
| | Jack Henry & Associates Inc. | 18,501 | 2,695 |
| * | Arista Networks Inc. | 12,983 | 2,641 |
| | DXC Technology Co. | 61,270 | 2,303 |
| * | F5 Networks Inc. | 14,627 | 2,043 |
| | Juniper Networks Inc. | 80,114 | 1,973 |
| | FLIR Systems Inc. | 32,314 | 1,683 |
| | Xerox Holdings Corp. | 44,500 | 1,641 |
| * | IPG Photonics Corp. | 8,509 | 1,233 |
| | Alliance Data Systems Corp. | 9,809 | 1,101 |
| | | | 1,489,073 |
| Materials (2.6%) |
| | Linde plc | 128,862 | 27,435 |
| | Air Products & Chemicals Inc. | 52,876 | 12,425 |
| | Ecolab Inc. | 60,155 | 11,609 |
| | Sherwin-Williams Co. | 19,708 | 11,500 |
| | DuPont de Nemours Inc. | 177,749 | 11,412 |
| | Dow Inc. | 177,906 | 9,737 |
| | Newmont Goldcorp Corp. | 196,646 | 8,544 |
| | PPG Industries Inc. | 56,726 | 7,572 |
| | LyondellBasell Industries NV Class A | 61,602 | 5,820 |
| | Corteva Inc. | 179,713 | 5,312 |
| | Ball Corp. | 78,495 | 5,076 |
| | Freeport-McMoRan Inc. | 348,269 | 4,569 |
| | Vulcan Materials Co. | 31,715 | 4,567 |
| | International Paper Co. | 94,099 | 4,333 |
| | Amcor plc | 388,930 | 4,216 |
| | Martin Marietta Materials Inc. | 14,989 | 4,192 |
| | Nucor Corp. | 72,792 | 4,097 |
| | Celanese Corp. Class A | 29,027 | 3,574 |
| | International Flavors & Fragrances Inc. | 25,569 | 3,299 |
| | FMC Corp. | 31,145 | 3,109 |
| | Westrock Co. | 61,998 | 2,660 |
| | Avery Dennison Corp. | 20,017 | 2,619 |
| | Eastman Chemical Co. | 32,621 | 2,586 |
| | Packaging Corp. of America | 22,654 | 2,537 |
| | CF Industries Holdings Inc. | 52,302 | 2,497 |
| | Albemarle Corp. | 25,372 | 1,853 |
| | Mosaic Co. | 83,663 | 1,810 |
| | Sealed Air Corp. | 36,974 | 1,473 |
| | | | 170,433 |
| Real Estate (2.9%) |
| | American Tower Corp. | 106,260 | 24,421 |
| | Crown Castle International Corp. | 99,743 | 14,178 |
| | Prologis Inc. | 151,543 | 13,508 |
| | Equinix Inc. | 20,456 | 11,940 |
| | Simon Property Group Inc. | 73,636 | 10,969 |
| | Welltower Inc. | 97,336 | 7,960 |
| | Public Storage | 36,035 | 7,674 |
| | AvalonBay Communities Inc. | 33,496 | 7,024 |
| | Equity Residential | 83,726 | 6,775 |
| | SBA Communications Corp. Class A | 27,016 | 6,511 |
| | Digital Realty Trust Inc. | 50,075 | 5,996 |
| | Realty Income Corp. | 78,184 | 5,757 |
| | Weyerhaeuser Co. | 178,793 | 5,399 |
| | Ventas Inc. | 89,430 | 5,164 |
| * | CBRE Group Inc. Class A | 80,334 | 4,924 |
| | Essex Property Trust Inc. | 15,859 | 4,771 |
| | Boston Properties Inc. | 34,510 | 4,757 |
| | Alexandria Real Estate Equities Inc. | 27,646 | 4,467 |
| | Healthpeak Properties Inc. | 118,842 | 4,096 |
| | Mid-America Apartment Communities Inc. | 27,339 | 3,605 |
| | UDR Inc. | 70,406 | 3,288 |
| | Extra Space Storage Inc. | 31,120 | 3,287 |
| | Host Hotels & Resorts Inc. | 172,322 | 3,197 |
| | Duke Realty Corp. | 88,342 | 3,063 |
| | Regency Centers Corp. | 40,102 | 2,530 |
| | Vornado Realty Trust | 37,905 | 2,521 |
| | Iron Mountain Inc. | 69,123 | 2,203 |
| | Federal Realty Investment Trust | 16,806 | 2,163 |
| | Kimco Realty Corp. | 101,049 | 2,093 |
| | Apartment Investment & Management Co. | 35,620 | 1,840 |
| | SL Green Realty Corp. | 19,511 | 1,793 |
| | Macerich Co. | 1,770 | 48 |
| | | | 187,922 |
| Utilities (3.3%) |
| | NextEra Energy Inc. | 117,247 | 28,393 |
| | Dominion Energy Inc. | 197,439 | 16,352 |
| | Southern Co. | 251,561 | 16,024 |
| | Duke Energy Corp. | 174,914 | 15,954 |
| | American Electric Power Co. Inc. | 118,482 | 11,198 |
| | Exelon Corp. | 233,252 | 10,634 |
| | Sempra Energy | 67,616 | 10,242 |
| | Xcel Energy Inc. | 125,783 | 7,986 |
| | Consolidated Edison Inc. | 79,726 | 7,213 |
| | Public Service Enterprise Group Inc. | 121,309 | 7,163 |
| | WEC Energy Group Inc. | 75,645 | 6,977 |
| | Eversource Energy | 77,646 | 6,605 |
| | Edison International | 86,033 | 6,488 |
| | FirstEnergy Corp. | 129,604 | 6,299 |
| | PPL Corp. | 173,481 | 6,224 |
| | DTE Energy Co. | 46,078 | 5,984 |
| | Entergy Corp. | 47,760 | 5,722 |
Equity Index Portfolio
| | | | Market |
| | | | Value• |
| | | Shares | ($000) |
| | American Water Works Co. Inc. | 43,374 | 5,328 |
| | Ameren Corp. | 59,075 | 4,537 |
| | CMS Energy Corp. | 68,142 | 4,282 |
| | Evergy Inc. | 54,752 | 3,564 |
| | CenterPoint Energy Inc. | 120,685 | 3,291 |
| | Atmos Energy Corp. | 28,687 | 3,209 |
| | AES Corp. | 159,530 | 3,175 |
| | Alliant Energy Corp. | 57,752 | 3,160 |
| | NiSource Inc. | 89,391 | 2,489 |
| | Pinnacle West Capital Corp. | 26,897 | 2,419 |
| | NRG Energy Inc. | 60,211 | 2,393 |
| | | | 213,305 |
Total Common Stocks
(Cost $3,704,149) | 6,419,625 |
| Temporary Cash Investments (0.8%)1 |
| Money Market Fund (0.8%) |
| 2,3 | Vanguard Market Liquidity Fund, 1.816% | 477,431 | 47,748 |
| | | | |
| | | Face | |
| | | Amount | |
| | | ($000) | |
| U.S. Government and Agency Obligations (0.0%) |
| 4 | United States Treasury Bill, 1.546%, 3/26/20 | 1,000 | 996 |
| 4 | United States Treasury Bill, 1.527%–1.541%, 4/30/20 | 1,470 | 1,463 |
| | | | 2,459 |
Total Temporary Cash Investments
(Cost $50,210) | 50,207 |
Total Investments (100.2%)
(Cost $3,754,359) | 6,469,832 |
| | Amount |
| | ($000) |
| Other Assets and Liabilities (-0.2%) | |
| Other Assets | |
| Investment in Vanguard | 280 |
| Receivables for Investment Securities Sold | 37 |
| Receivables for Accrued Income | 6,569 |
| Receivables for Capital Shares Issued | 511 |
| Variation Margin Receivable—Futures Contracts | 94 |
| Total Other Assets | 7,491 |
| Liabilities | |
| Payables for Investment Securities Purchased | (15,083) |
| Collateral for Securities on Loan | (264) |
| Payables for Capital Shares Redeemed | (1,992) |
| Payables to Vanguard | (1,966) |
| Total Liabilities | (19,305) |
| Net Assets (100%) | |
| Applicable to 135,394,379 outstanding $.001 par value shares of beneficial interest (unlimited authorization) | 6,458,018 |
| Net Asset Value Per Share | $47.70 |
| At December 31, 2019, net assets consisted of: |
| | Amount |
| | ($000) |
| Paid-in Capital | 3,511,475 |
| Total Distributable Earnings (Loss) | 2,946,543 |
| Net Assets | 6,458,018 |
| • | See Note A in Notes to Financial Statements. |
| * | Non-income-producing security. |
| ^ | Includes partial security positions on loan to broker-dealers. The total value of securities on loan is $259,000. |
| 1 | The portfolio invests a portion of its cash reserves in equity markets through the use of index futures contracts. After giving effect to futures investments, the portfolio’s effective common stock and temporary cash investment positions represent 100.0% and 0.2%, respectively, of net assets. |
| 2 | Collateral of $264,000 was received for securities on loan. |
| 3 | Affiliated money market fund available only to Vanguard funds and certain trusts and accounts managed by Vanguard. Rate shown is the 7-day yield. |
| 4 | Securities with a value of $1,549,000 have been segregated as initial margin for open futures contracts. |
| Derivative Financial Instruments Outstanding as of Period End | | | | |
| | | | | |
| Futures Contracts | | | | |
| | | | | | ($000) |
| | | | | | Value and |
| | | Number of | | | Unrealized |
| | | Long (Short | ) | Notional | Appreciation |
| | Expiration | Contracts | | Amount | (Depreciation) |
| Long Futures Contracts | | | | | |
| E-mini S&P 500 Index | March 2020 | 243 | | 39,258 | 596 |
See accompanying Notes, which are an integral part of the Financial Statements.
Equity Index Portfolio
Statement of Operations
| | Year Ended |
| | December 31, 2019 |
| | ($000) |
| Investment Income |
| Income |
| Dividends | 114,609 |
| Interest1 | 618 |
| Securities Lending—Net | 84 |
| Total Income | 115,311 |
| Expenses |
| The Vanguard Group—Note B |
| Investment Advisory Services | 854 |
| Management and Administrative | 6,511 |
| Marketing and Distribution | 525 |
| Custodian Fees | 21 |
| Auditing Fees | 75 |
| Shareholders’ Reports | 41 |
| Trustees’ Fees and Expenses | 3 |
| Total Expenses | 8,030 |
| Net Investment Income | 107,281 |
| Realized Net Gain (Loss) |
| Investment Securities Sold1 | 124,531 |
| Futures Contracts | 7,573 |
| Realized Net Gain (Loss) | 132,104 |
| Change in Unrealized Appreciation (Depreciation) |
| Investment Securities1 | 1,295,700 |
| Futures Contracts | 296 |
| Change in Unrealized Appreciation (Depreciation) | 1,295,996 |
| Net Increase (Decrease) in Net Assets Resulting from Operations | 1,535,381 |
| 1 | Interest income, realized net gain (loss), and change in unrealized appreciation (depreciation) from an affiliated company of the portfolio were $582,000, ($2,000), and ($4,000), respectively. Purchases and sales are for temporary cash investment purposes. |
Statement of Changes in Net Assets
| | Year Ended December 31, |
| | 2019 | 2018 |
| | ($000) | ($000) |
| Increase (Decrease) in Net Assets | | |
| Operations | | |
| Net Investment Income | 107,281 | 103,632 |
| Realized Net Gain (Loss) | 132,104 | 138,799 |
| Change in Unrealized Appreciation (Depreciation) | 1,295,996 | (473,810) |
| Net Increase (Decrease) in Net Assets Resulting from Operations | 1,535,381 | (231,379) |
| Distributions | | |
| Net Investment Income | (107,141) | (88,315) |
| Realized Capital Gain1 | (140,285) | (85,966) |
| Total Distributions | (247,426) | (174,281) |
| Capital Share Transactions | | |
| Issued | 584,985 | 560,449 |
| Issued in Lieu of Cash Distributions | 247,426 | 174,281 |
| Redeemed | (596,018) | (573,178) |
| Net Increase (Decrease) from Capital Share Transactions | 236,393 | 161,552 |
| Total Increase (Decrease) | 1,524,348 | (244,108) |
| Net Assets | | |
| Beginning of Period | 4,933,670 | 5,177,778 |
| End of Period | 6,458,018 | 4,933,670 |
| 1 | Includes fiscal 2019 and 2018 short-term gain distributions totaling $347,000 and $2,110,000, respectively. Short-term gain distributions are treated as ordinary income dividends for tax purposes. |
See accompanying Notes, which are an integral part of the Financial Statements.
Equity Index Portfolio
Financial Highlights
| For a Share Outstanding | | | Year Ended December 31, |
| Throughout Each Period | 2019 | 2018 | 2017 | 2016 | 2015 |
| Net Asset Value, Beginning of Period | $38.03 | $41.17 | $35.63 | $33.25 | $34.44 |
| Investment Operations | | | | | |
| Net Investment Income | .8051 | .8041 | .6991 | .704 | .7592 |
| Net Realized and Unrealized Gain (Loss) on Investments | 10.791 | (2.556) | 6.734 | 3.055 | (.338) |
| Total from Investment Operations | 11.596 | (1.752) | 7.433 | 3.759 | .421 |
| Distributions | | | | | |
| Dividends from Net Investment Income | (.834) | (.703) | (.699) | (.759) | (.569) |
| Distributions from Realized Capital Gains | (1.092) | (.685) | (1.194) | (.620) | (1.042) |
| Total Distributions | (1.926) | (1.388) | (1.893) | (1.379) | (1.611) |
| Net Asset Value, End of Period | $47.70 | $38.03 | $41.17 | $35.63 | $33.25 |
| | | | | | |
| Total Return | 31.30% | -4.51% | 21.66% | 11.81% | 1.27% |
| | | | | | |
| Ratios/Supplemental Data | | | | | |
| Net Assets, End of Period (Millions) | $6,458 | $4,934 | $5,178 | $4,329 | $3,985 |
| Ratio of Total Expenses to Average Net Assets | 0.14% | 0.14% | 0.15% | 0.15% | 0.15% |
| Ratio of Net Investment Income to Average Net Assets | 1.87% | 1.94% | 1.85% | 2.08% | 2.31%2 |
| Portfolio Turnover Rate | 4% | 5% | 5% | 7% | 4% |
| 1 | Calculated based on average shares outstanding. |
| 2 | Net investment income per share and the ratio of net investment income to average net assets include $.13 and 0.35%, respectively, resulting from a special dividend from Medtronic plc in January 2015. |
See accompanying Notes, which are an integral part of the Financial Statements.
Equity Index Portfolio
Notes to Financial Statements
The Equity Index Portfolio, a portfolio of Vanguard Variable Insurance Funds, is registered under the Investment Company Act of 1940 as an open-end investment company. The portfolio’s shares are only available for purchase by separate accounts of insurance companies as investments for variable annuity plans, variable life insurance contracts, or other variable benefit insurance contracts.
A. The following significant accounting policies conform to generally accepted accounting principles for U.S. investment companies. The portfolio consistently follows such policies in preparing its financial statements.
1. Security Valuation: Securities are valued as of the close of trading on the New York Stock Exchange (generally 4 p.m., Eastern time) on the valuation date. Equity securities are valued at the latest quoted sales prices or official closing prices taken from the primary market in which each security trades; such securities not traded on the valuation date are valued at the mean of the latest quoted bid and asked prices. Securities for which market quotations are not readily available, or whose values have been materially affected by events occurring before the portfolio’s pricing time but after the close of the securities’ primary markets, are valued by methods deemed by the board of trustees to represent fair value. Investments in Vanguard Market Liquidity Fund are valued at that fund’s net asset value. Temporary cash investments are valued using the latest bid prices or using valuations based on a matrix system (which considers such factors as security prices, yields, maturities, and ratings), both as furnished by independent pricing services.
2. Futures Contracts: The portfolio uses index futures contracts to a limited extent, with the objectives of maintaining full exposure to the stock market, maintaining liquidity, and minimizing transaction costs. The portfolio may purchase futures contracts to immediately invest incoming cash in the market, or sell futures in response to cash outflows, thereby simulating a fully invested position in the underlying index while maintaining a cash balance for liquidity. The primary risks associated with the use of futures contracts are imperfect correlation between changes in market values of stocks held by the portfolio and the prices of futures contracts, and the possibility of an illiquid market. Counterparty risk involving futures is mitigated because a regulated clearinghouse is the counterparty instead of the clearing broker. To further mitigate counterparty risk, the portfolio trades futures contracts on an exchange, monitors the financial strength of its clearing brokers and clearinghouse, and has entered into clearing agreements with its clearing brokers. The clearinghouse imposes initial margin requirements to secure the portfolio’s performance and requires daily settlement of variation margin representing changes in the market value of each contract. Any assets pledged as initial margin for open contracts are noted in the Statement of Net Assets.
Futures contracts are valued at their quoted daily settlement prices. The notional amounts of the contracts are not recorded in the Statement of Net Assets. Fluctuations in the value of the contracts are recorded in the Statement of Net Assets as an asset (liability) and in the Statement of Operations as unrealized appreciation (depreciation) until the contracts are closed, when they are recorded as realized futures gains (losses).
During the year ended December 31, 2019, the portfolio’s average investments in long and short futures contracts represented less than 1% and 0%, respectively, of net assets, based on the average of the notional amounts at each quarter-end during the period.
3. Federal Income Taxes: The portfolio intends to continue to qualify as a regulated investment company and distribute all of its taxable income. Management has analyzed the portfolio’s tax positions taken for all open federal income tax years (December 31, 2016–2019), and has concluded that no provision for federal income tax is required in the portfolio’s financial statements.
4. Distributions: Distributions to shareholders are recorded on the ex-dividend date. Distributions are determined on a tax basis and may differ from net investment income and realized capital gains for financial reporting purposes.
5. Securities Lending: To earn additional income, the portfolio lends its securities to qualified institutional borrowers. Security loans are subject to termination by the portfolio at any time, and are required to be secured at all times by collateral in an amount at least equal to the market value of securities loaned. Daily market fluctuations could cause the value of loaned securities to be more or less than the value of the collateral received. When this occurs, the collateral is adjusted and settled before the opening of the market on the next business day. The portfolio further mitigates its counterparty risk by entering into securities lending transactions only with a diverse group of prequalified counterparties, monitoring their financial strength, and entering into master securities lending agreements with its counterparties.
Equity Index Portfolio
The master securities lending agreements provide that, in the event of a counterparty’s default (including bankruptcy), the portfolio may terminate any loans with that borrower, determine the net amount owed, and sell or retain the collateral up to the net amount owed to the portfolio; however, such actions may be subject to legal proceedings. While collateral mitigates counterparty risk, in the event of a default, the portfolio may experience delays and costs in recovering the securities loaned. The portfolio invests cash collateral received in Vanguard Market Liquidity Fund, and records a liability in the Statement of Net Assets for the return of the collateral, during the period the securities are on loan. Securities lending income represents fees charged to borrowers plus income earned on invested cash collateral, less expenses associated with the loan. During the term of the loan, the portfolio is entitled to all distributions made on or in respect of the loaned securities.
6. Credit Facility: The portfolio and certain other funds managed by The Vanguard Group (“Vanguard”) participate in a $4.3 billion committed credit facility provided by a syndicate of lenders pursuant to a credit agreement that may be renewed annually; each fund is individually liable for its borrowings, if any, under the credit facility. Borrowings may be utilized for temporary and emergency purposes, and are subject to the portfolio’s regulatory and contractual borrowing restrictions. The participating funds are charged administrative fees and an annual commitment fee of 0.10% of the undrawn amount of the facility; these fees are allocated to the funds based on a method approved by the portfolio’s board of trustees and included in Management and Administrative expenses on the portfolio’s Statement of Operations. Any borrowings under this facility bear interest at a rate based upon the higher of the one-month London Interbank Offered Rate, federal funds effective rate, or overnight bank funding rate plus an agreed-upon spread.
The portfolio had no borrowings outstanding at December 31, 2019, or at any time during the period then ended.
7. Other: Dividend income is recorded on the ex-dividend date. Interest income includes income distributions received from Vanguard Market Liquidity Fund and is accrued daily. Premiums and discounts on debt securities are amortized and accreted, respectively, to interest income over the lives of the respective securities, except for premiums on certain callable debt securities that are amortized to the earliest call date. Security transactions are accounted for on the date securities are bought or sold. Costs used to determine realized gains (losses) on the sale of investment securities are those of the specific securities sold.
B. In accordance with the terms of a Funds’ Service Agreement (the “FSA”) between Vanguard and the portfolio, Vanguard furnishes to the portfolio investment advisory, corporate management, administrative, marketing, and distribution services at Vanguard’s cost of operations (as defined by the FSA). These costs of operations are allocated to the portfolio based on methods and guidelines approved by the board of trustees. Vanguard does not require reimbursement in the current period for certain costs of operations (such as deferred compensation/benefits and risk/insurance costs); the portfolio’s liability for these costs of operations is included in Payables to Vanguard on the Statement of Net Assets. All other costs of operations payable to Vanguard are generally settled twice a month.
Upon the request of Vanguard, the portfolio may invest up to 0.40% of its net assets as capital in Vanguard. At December 31, 2019, the portfolio had contributed to Vanguard capital in the amount of $280,000, representing less than 0.01% of the portfolio’s net assets and 0.11% of Vanguard’s capital received pursuant to the FSA. The portfolio’s trustees and officers are also directors and employees, respectively, of Vanguard.
C. Various inputs may be used to determine the value of the portfolio’s investments. These inputs are summarized in three broad levels for financial statement purposes. The inputs or methodologies used to value securities are not necessarily an indication of the risk associated with investing in those securities.
Level 1—Quoted prices in active markets for identical securities.
Level 2—Other significant observable inputs (including quoted prices for similar securities, interest rates, prepayment speeds, credit risk, etc.).
Level 3—Significant unobservable inputs (including the portfolio’s own assumptions used to determine the fair value of investments). Any investments valued with significant unobservable inputs are noted on the Statement of Net Assets.
Equity Index Portfolio
The following table summarizes the market value of the portfolio’s investments and derivatives as of December 31, 2019, based on the inputs used to value them:
| | | Level 1 | | | Level 2 | | | Level 3 | |
| Investments | | ($000 | ) | | ($000 | ) | | ($000 | ) |
| Common Stocks | | 6,419,625 | | | — | | | — | |
| Temporary Cash Investments | | 47,748 | | | 2,459 | | | — | |
| Futures Contracts—Assets1 | | 94 | | | — | | | — | |
| Total | | 6,467,467 | | | 2,459 | | | — | |
1 Represents variation margin on the last day of the reporting period.
D. Permanent differences between book-basis and tax-basis components of net assets, if any, are reclassified among capital accounts in the financial statements to reflect their tax character. These reclassifications have no effect on net assets or net asset value per share.
Temporary differences between book-basis and tax-basis components of total distributable earnings (loss) arise when certain items of income, gain, or loss are recognized in different periods for financial statement and tax purposes; these differences will reverse at some time in the future. The differences are primarily related to the tax deferral of losses on wash sales and the realization of unrealized gains or losses on certain futures contracts. As of period end, the tax-basis components of total distributable earnings (loss) are detailed in the table as follows:
| | | Amount | |
| | | ($000 | ) |
| Undistributed Ordinary Income | | 105,297 | |
| Undistributed Long-Term Gains | | 127,272 | |
| Capital Loss Carryforwards (Non-expiring) | | — | |
| Net Unrealized Gains (Losses) | | 2,715,473 | |
As of December 31, 2019, gross unrealized appreciation and depreciation for investments and derivatives based on cost for U.S. federal income tax purposes were as follows:
| | | Amount | |
| | | ($000 | ) |
| Tax Cost | | 3,754,359 | |
| Gross Unrealized Appreciation | | 3,036,531 | |
| Gross Unrealized Depreciation | | (321,058 | ) |
| Net Unrealized Appreciation (Depreciation) | | 2,715,473 | |
E. During the year ended December 31, 2019, the portfolio purchased $335,753,000 of investment securities and sold $242,628,000 of investment securities, other than temporary cash investments.
F. Capital shares issued and redeemed were:
| | | Year Ended December 31, | |
| | | 2019 | | | 2018 | |
| | | Shares | | | Shares | |
| | | (000 | ) | | (000 | ) |
| Issued | | 13,588 | | | 13,586 | |
| Issued in Lieu of Cash Distributions | | 6,019 | | | 4,242 | |
| Redeemed | | (13,957 | ) | | (13,844 | ) |
| Net Increase (Decrease) in Shares Outstanding | | 5,650 | | | 3,984 | |
At December 31, 2019, two shareholders (an insurance company separate account whose holdings in the portfolio represent the indirect investment of Vanguard Variable Annuity contract holders and Total Stock Market Index Portfolio), were each the record or beneficial owner of 25% or more of the portfolio’s net assets, with a combined ownership of 63%. If any of these shareholders were to redeem their investment in the portfolio, the redemption might result in an increase in the portfolio’s expense ratio, cause the portfolio to incur higher transaction costs, or lead to the realization of taxable capital gains.
G. Management has determined that no events or transactions occurred subsequent to December 31, 2019, that would require recognition or disclosure in these financial statements.
Equity Index Portfolio
Report of Independent Registered Public Accounting Firm
To the Board of Trustees of Vanguard Variable Insurance Funds and Shareholders of Equity Index Portfolio
Opinion on the Financial Statements
We have audited the accompanying statement of net assets of Equity Index Portfolio (one of the portfolios constituting Vanguard Variable Insurance Funds, referred to hereafter as the “Portfolio”) as of December 31, 2019, the related statement of operations for the year ended December 31, 2019, the statement of changes in net assets for each of the two years in the period ended December 31, 2019, including the related notes, and the financial highlights for each of the five years in the period ended December 31, 2019 (collectively referred to as the “financial statements”). In our opinion, the financial statements present fairly, in all material respects, the financial position of the Portfolio as of December 31, 2019, the results of its operations for the year then ended, the changes in its net assets for each of the two years in the period ended December 31, 2019 and the financial highlights for each of the five years in the period ended December 31, 2019 in conformity with accounting principles generally accepted in the United States of America.
Basis for Opinion
These financial statements are the responsibility of the Portfolio’s management. Our responsibility is to express an opinion on the Portfolio’s financial statements based on our audits. We are a public accounting firm registered with the Public Company Accounting Oversight Board (United States) (“PCAOB”) and are required to be independent with respect to the Portfolio in accordance with the U.S. federal securities laws and the applicable rules and regulations of the Securities and Exchange Commission and the PCAOB.
We conducted our audits of these financial statements in accordance with the standards of the PCAOB. Those standards require that we plan and perform the audit to obtain reasonable assurance about whether the financial statements are free of material misstatement, whether due to error or fraud.
Our audits included performing procedures to assess the risks of material misstatement of the financial statements, whether due to error or fraud, and performing procedures that respond to those risks. Such procedures included examining, on a test basis, evidence regarding the amounts and disclosures in the financial statements. Our audits also included evaluating the accounting principles used and significant estimates made by management, as well as evaluating the overall presentation of the financial statements. Our procedures included confirmation of securities owned as of December 31, 2019 by correspondence with the custodian and brokers and by agreement to the underlying ownership records of the transfer agent; when replies were not received from brokers, we performed other auditing procedures. We believe that our audits provide a reasonable basis for our opinion.
/s/PricewaterhouseCoopers LLP
Philadelphia, Pennsylvania
February 18, 2020
We have served as the auditor of one or more investment companies in The Vanguard Group of Funds since 1975.
Special 2019 tax information (unaudited) for corporate shareholders only for Equity Index Portfolio, a portfolio of Vanguard Variable Insurance Funds
This information for the fiscal year ended December 31, 2019, is included pursuant to provisions of the Internal Revenue Code for corporate shareholders only.
The portfolio distributed $139,938,000 as capital gain dividends (20% rate gain distributions) to shareholders during the fiscal year.
For corporate shareholders, 95.4% of investment income (dividend income plus short-term gains, if any) qualifies for the dividends-received deduction.
Equity Index Portfolio
The S&P 500 Index is a product of S&P Dow Jones Indices LLC, a division of S&P Global, or its affiliates (“SPDJI”), and has been licensed for use by Vanguard. Standard & Poor’s®, and S&P®are registered trademarks of Standard & Poor’s Financial Services LLC, a division of S&P Global (“S&P”) and Dow Jones® is a registered trademark of Dow Jones Trademark Holdings LLC (“Dow Jones”). The trademarks have been licensed to SPDJI and have been sublicensed for use for certain purposes by Vanguard. Vanguard Equity Index Portfolio is not sponsored, endorsed, sold or promoted by SPDJI, Dow Jones, S&P, any of their respective affiliates (collectively, “S&P Dow Jones Indices”). S&P Dow Jones Indices make no representation or warranty, express or implied, to the owners of the Vanguard Equity Index Portfolio or any member of the public regarding the advisability of investing in securities generally or in Vanguard Equity Index Portfolio particularly or the ability of the S&P 500 Index to track general market performance. S&P Dow Jones Indices’ only relationship to Vanguard with respect to the S&P 500 Index is the licensing of the Index and certain trademarks, service marks and/or trade names of S&P Dow Jones Indices and/or its licensors. The S&P 500 Index is determined, composed and calculated by S&P Dow Jones Indices without regard to Vanguard or the Vanguard Equity Index Portfolio. S&P Dow Jones Indices have no obligation to take the needs of Vanguard or the owners of Vanguard Equity Index Portfolio into consideration in determining, composing or calculating the S&P 500 Index. S&P Dow Jones Indices are not responsible for and have not participated in the determination of the prices, and amount of Vanguard Equity Index Portfolio or the timing of the issuance or sale of Vanguard Equity Index Portfolio or in the determination or calculation of the equation by which Vanguard Equity Index Portfolio is to be converted into cash, surrendered or redeemed, as the case may be. S&P Dow Jones Indices have no obligation or liability in connection with the administration, marketing or trading of Vanguard Equity Index Portfolio. There is no assurance that investment products based on the S&P 500 Index will accurately track index performance or provide positive investment returns. S&P Dow Jones Indices LLC is not an investment advisor. Inclusion of a security within an index is not a recommendation by S&P Dow Jones Indices to buy, sell, or hold such security, nor is it considered to be investment advice.
S&P DOW JONES INDICES DOES NOT GUARANTEE THE ADEQUACY, ACCURACY, TIMELINESS AND/OR THE COMPLETENESS OF THE S&P 500 INDEX OR ANY DATA RELATED THERETO OR ANY COMMUNICATION, INCLUDING BUT NOT LIMITED TO, ORAL OR WRITTEN COMMUNICATION (INCLUDING ELECTRONIC COMMUNICATIONS) WITH RESPECT THERETO. S&P DOW JONES INDICES SHALL NOT BE SUBJECT TO ANY DAMAGES OR LIABILITY FOR ANY ERRORS, OMISSIONS, OR DELAYS THEREIN. S&P DOW JONES INDICES MAKE NO EXPRESS OR IMPLIED WARRANTIES, AND EXPRESSLY DISCLAIMS ALL WARRANTIES, OF MERCHANTABILITY OR FITNESS FOR A PARTICULAR PURPOSE OR USE OR AS TO RESULTS TO BE OBTAINED BY VANGUARD, OWNERS OF THE VANGUARD EQUITY INDEX PORTFOLIO, OR ANY OTHER PERSON OR ENTITY FROM THE USE OF THE S&P 500 INDEX OR WITH RESPECT TO ANY DATA RELATED THERETO. WITHOUT LIMITING ANY OF THE FOREGOING, IN NO EVENT WHATSOEVER SHALL S&P DOW JONES INDICES BE LIABLE FOR ANY INDIRECT, SPECIAL, INCIDENTAL, PUNITIVE, OR CONSEQUENTIAL DAMAGES INCLUDING BUT NOT LIMITED TO, LOSS OF PROFITS, TRADING LOSSES, LOST TIME OR GOODWILL, EVEN IF THEY HAVE BEEN ADVISED OF THE POSSIBILITY OF SUCH DAMAGES, WHETHER IN CONTRACT, TORT, STRICT LIABILITY, OR OTHERWISE. THERE ARE NO THIRD PARTY BENEFICIARIES OF ANY AGREEMENTS OR ARRANGEMENTS BETWEEN S&P DOW JONES INDICES AND VANGUARD, OTHER THAN THE LICENSORS OF S&P DOW JONES INDICES.
The People Who Govern Your Fund
The trustees of your mutual fund are there to see that the fund is operated and managed in your best interests since, as a shareholder, you are a part owner of the fund. Your fund’s trustees also serve on the board of directors of The Vanguard Group, Inc., which is owned by the Vanguard funds and provides services to them.
A majority of Vanguard’s board members are independent, meaning that they have no affiliation with Vanguard or the funds they oversee, apart from the sizable personal investments they have made as private individuals. The independent board members have distinguished backgrounds in business, academia, and public service. Each of the trustees and executive officers oversees 213 Vanguard funds.
Information for each trustee and executive officer of the fund appears below. That information, as well as the Vanguard fund count, is as of the date on the cover of this fund report. The mailing address of the trustees and officers is P.O. Box 876, Valley Forge, PA 19482. More information about the trustees is in theStatement of Additional Information, which can be obtained, without charge, by contacting Vanguard at 800-662-7447, or online at vanguard.com.
Interested Trustee1
Mortimer J. Buckley
Born in 1969. Trustee since January 2018. Principal occupation(s) during the past five years and other experience: chairman of the board (January 2019– present) of Vanguard and of each of the investment companies served by Vanguard; chief executive officer (January 2018–present) of Vanguard; chief executive officer, president, and trustee (January 2018–present) of each of the investment companies served by Vanguard; president and director (2017–present) of Vanguard; and president (February 2018–present) of Vanguard Marketing Corporation. Chief investment officer (2013–2017), managing director (2002–2017), head of the Retail Investor Group (2006–2012), and chief information officer (2001–2006) of Vanguard. Chairman of the board (2011–2017) and trustee (2009–2017) of the Children’s Hospital of Philadelphia; trustee (2018–present) of The Shipley School.
Independent Trustees
Emerson U. Fullwood
Born in 1948. Trustee since January 2008. Principal occupation(s) during the past five years and other experience: executive chief staff and marketing officer for North America and corporate vice president (retired 2008) of Xerox Corporation (document management products and services). Former president of the Worldwide Channels Group, Latin America, and Worldwide Customer Service and executive chief staff officer of Developing Markets of Xerox. Executive in residence and 2009–2010 Distinguished Minett Professor at the Rochester Institute of Technology. Director of SPX FLOW, Inc. (multi-industry manufacturing). Director of the University of Rochester Medical Center, the Monroe Community College Foundation, the United Way of Rochester, North Carolina A&T University, and Roberts Wesleyan College. Trustee of the University of Rochester.
Amy Gutmann
Born in 1949. Trustee since June 2006. Principal occupation(s) during the past five years and other experience: president (2004–present) of the University of Pennsylvania. Christopher H. Browne Distinguished Professor of Political Science, School of Arts and Sciences, and professor of communication, Annenberg School for Communication, with secondary faculty appointments in the Department of Philosophy, School of Arts and Sciences, and at the Graduate School of Education, University of Pennsylvania. Trustee of the National Constitution Center.
F. Joseph Loughrey
Born in 1949. Trustee since October 2009. Principal occupation(s) during the past five years and other experience: president and chief operating officer (retired 2009) and vice chairman of the board (2008–2009) of Cummins Inc. (industrial machinery). Chairman of the board of Hillenbrand, Inc. (specialized consumer services), and the Lumina Foundation. Director of the V Foundation and Oxfam America. Member of the advisory council for the College of Arts and Letters and chair of the advisory board to the Kellogg Institute for International Studies, both at the University of Notre Dame.
Mark Loughridge
Born in 1953. Trustee since March 2012. Principal occupation(s) during the past five years and other experience: senior vice president and chief financial officer (retired 2013) of IBM (information technology services). Fiduciary member of IBM’s Retirement Plan Committee (2004–2013), senior vice president and general manager (2002–2004) of IBM Global Financing, vice president and controller (1998–2002) of IBM, and a variety of other prior management roles at IBM. Member of the Council on Chicago Booth.
Scott C. Malpass
Born in 1962. Trustee since March 2012. Principal occupation(s) during the past five years and other experience: chief investment officer (1989–present) and vice president (1996–present) of the University of Notre Dame. Assistant professor of finance at the Mendoza College of Business, University of Notre Dame, and member of the Notre Dame 403(b) Investment Committee. Chairman of the board of TIFF Advisory Services, Inc. Member of the board of Catholic Investment Services, Inc. (investment advisors) and the board of superintendence of the Institute for the Works of Religion.
Deanna Mulligan
Born in 1963. Trustee since January 2018. Principal occupation(s) during the past five years and other experience: president (2010–present) and chief executive officer (2011–present) of The Guardian Life Insurance Company of America. Chief operating officer (2010–2011) and executive vice president (2008–2010) of Individual Life and Disability of The Guardian Life Insurance Company of America. Member of the board of The Guardian Life Insurance Company of America, the American Council of Life Insurers, the Partnership for New York City (business leadership), and the Committee Encouraging Corporate Philanthropy. Trustee of the Economic Club of New York and the Bruce Museum (arts and science). Member of the Advisory Council for the Stanford Graduate School of Business.
André F. Perold
Born in 1952. Trustee since December 2004. Principal occupation(s) during the past five years and other experience: George Gund Professor of Finance and Banking, Emeritus at the Harvard Business School (retired 2011). Chief investment officer and co-managing partner of HighVista Strategies (private investment firm). Board of advisors and investment committee member of the Museum of Fine Arts Boston. Board member (2018–present) of RIT Capital Partners (investment firm); investment committee member of Partners Health Care System.
Sarah Bloom Raskin
Born in 1961. Trustee since January 2018. Principal occupation(s) during the past five years and other experience: deputy secretary (2014–2017) of the United States Department of the Treasury. Governor (2010–2014) of the Federal Reserve Board. Commissioner (2007–2010) of financial regulation for the State of Maryland. Member of the board of directors (2012–2014) of Neighborhood Reinvestment Corporation. Director (2017–present) of i(x) Investments; director (2017–present) of Reserve Trust. Rubinstein Fellow (2017–present) of Duke University; trustee (2017–present) of Amherst College.
Peter F. Volanakis
Born in 1955. Trustee since July 2009. Principal occupation(s) during the past five years and other experience: president and chief operating officer (retired 2010) of Corning Incorporated (communications equipment) and director of Corning Incorporated (2000–2010) and Dow Corning (2001–2010). Director (2012) of SPX Corporation (multi-industry manufacturing). Overseer of the Amos Tuck School of Business Administration, Dartmouth College (2001–2013). Chairman of the board of trustees of Colby-Sawyer College. Member of the board of Hypertherm Inc. (industrial cutting systems, software, and consumables).
| 1 | Mr. Buckley is considered an “interested person,” as defined in the Investment Company Act of 1940, because he is an officer of the Vanguard funds. |
Executive Officers
John Bendl
Born in 1970. Principal occupation(s) during the past five years and other experience: principal of Vanguard. Chief financial officer (October 2019–present) of each of the investment companies served by Vanguard. Chief accounting officer, treasurer, and controller of Vanguard (2017–present). Partner (2003–2016) at KPMG (audit, tax, and advisory services).
Glenn Booraem
Born in 1967. Principal occupation(s) during the past five years and other experience: principal of Vanguard. Investment stewardship officer (2017–present), treasurer (2015–2017), controller (2010–2015), and assistant controller (2001–2010) of each of the investment companies served by Vanguard.
Christine M. Buchanan
Born in 1970. Principal occupation(s) during the past five years and other experience: principal of Vanguard. Treasurer (2017–present) of each of the investment companies served by Vanguard. Partner (2005–2017) at KPMG (audit, tax, and advisory services).
David Cermak
Born in 1960. Principal occupation(s) during the past five years and other experience: principal of Vanguard. Finance director (October 2019–present) of each of the investment companies served by Vanguard. Managing director and head (2017–present) of Vanguard Investments Singapore. Managing director and head (2017–2019) of Vanguard Investments Hong Kong. Representative director and head (2014–2017) of Vanguard Investments Japan.
Thomas J. Higgins
Born in 1957. Principal occupation(s) during the past five years and other experience: principal of Vanguard. Finance director (October 2019–present), chief financial officer (2008–2019), and treasurer (1998–2008) of each of the investment companies served by Vanguard.
Peter Mahoney
Born in 1974. Principal occupation(s) during the past five years and other experience: principal of Vanguard. Controller (2015–present) of each of the investment companies served by Vanguard. Head of International Fund Services (2008–2014) at Vanguard.
Anne E. Robinson
Born in 1970. Principal occupation(s) during the past five years and other experience: general counsel (2016–present) of Vanguard. Secretary (2016–present) of Vanguard and of each of the investment companies served by Vanguard. Managing director (2016–present) of Vanguard. Managing director and general counsel of Global Cards and Consumer Services (2014–2016) at Citigroup. Counsel (2003–2014) at American Express.
Michael Rollings
Born in 1963. Principal occupation(s) during the past five years and other experience: finance director (2017–present) and treasurer (2017) of each of the investment companies served by Vanguard. Managing director (2016–present) of Vanguard. Chief financial officer (2016–present) of Vanguard. Director (2016–present) of Vanguard Marketing Corporation. Executive vice president and chief financial officer (2006–2016) of MassMutual Financial Group.
John E. Schadl
Born in 1972. Principal occupation(s) during the past five years and other experience: principal of Vanguard. Chief compliance officer (2019–present) of Vanguard and of each of the investment companies served by Vanguard. Assistant vice president (May 2019–present) of Vanguard Marketing Corporation.
| Vanguard Senior Management Team |
| |
| Joseph Brennan | Chris D. McIsaac |
| Mortimer J. Buckley | James M. Norris |
| Gregory Davis | Thomas M. Rampulla |
| John James | Karin A. Risi |
| Martha G. King | Anne E. Robinson |
| John T. Marcante | Michael Rollings |
| |  |
| | |
| | P.O. Box 2600 |
| | Valley Forge, PA 19482-2600 |
Connect with Vanguard® > vanguard.com
Fund Information> 800 - 662-7447
Annuity and Insurance Services> 800-522-5555
Institutional Investor Services> 800-523-1036
Text Telephone for People
Who Are Deaf or Hard of Hearing> 800-749-7273
This material may be used in conjunction with the offering of shares of any Vanguard fund only if preceded or accompanied by the fund’s current prospectus.
You can obtain a free copy of Vanguard’s proxy voting guidelines by visiting vanguard.com/proxyreporting or by calling Vanguard at 800-662-2739. The guidelines are also available from the SEC’s website, www.sec.gov. In addition, you may obtain a free report on how your fund voted the proxies for securities it owned during the 12 months ended June 30. To get the report, visit either vanguard.com/proxyreporting or www.sec.gov.
All comparative mutual fund data are from Morningstar, Inc., unless otherwise noted.
You can review information about your portfolio on the SEC’s website, and you can receive copies of this information, for a fee, by sending a request via email addressed to publicinfo@sec.gov.
Source for Bloomberg Barclays indexes: Bloomberg Index Services Limited. Copyright 2020, Bloomberg. All rights reserved.
CFA®is a trademark owned by CFA Institute.
| | © 2020 The Vanguard Group, Inc. |
| | All rights reserved. |
| | Vanguard Marketing Corporation, Distributor. |
| | |
| | Q690 022020 |
Item 2: Code of Ethics. The Registrant has adopted a code of ethics that applies to the Registrant’s principal executive officer, principal financial officer, principal accounting officer or controller or persons performing similar functions. The Code of Ethics was amended during the reporting period covered by this report to make certain technical, non-material changes.
Item 3: Audit Committee Financial Expert. All members of the Audit Committee have been determined by the Registrant’s Board of Trustees to be Audit Committee Financial Experts and to be independent: F. Joseph Loughrey, Mark Loughridge, Sarah Bloom Raskin, and Peter F. Volanakis.
Item 4: Principal Accountant Fees and Services.
(a) Audit Fees.
Audit Fees of the Registrant.
Fiscal Year Ended December 31, 2019: $569,000
Fiscal Year Ended December 31, 2018: $588,000
Aggregate Audit Fees of Registered Investment Companies in the Vanguard Group.
Fiscal Year Ended December 31, 2019: $9,568,215
Fiscal Year Ended December 31, 2018: $9,734,277
Includes fees billed in connection with audits of the Registrant, other registered investment companies in the Vanguard complex, The Vanguard Group, Inc., and Vanguard Marketing Corporation.
(b) Audit-Related Fees.
Fiscal Year Ended December 31, 2019: $3,012,031
Fiscal Year Ended December 31, 2018: $5,581,336
Includes fees billed in connection with assurance and related services provided to the Registrant, other registered investment companies in the Vanguard complex, The Vanguard Group, Inc., and Vanguard Marketing Corporation.
(c) Tax Fees.
Fiscal Year Ended December 31, 2019: $357,238
Fiscal Year Ended December 31, 2018: $347,985
Includes fees billed in connection with tax compliance, planning, and advice services provided to the Registrant, other registered investment companies in the Vanguard complex, The Vanguard Group, Inc., and Vanguard Marketing Corporation.
(d) All Other Fees.
Fiscal Year Ended December 31, 2019: $0
Fiscal Year Ended December 31, 2018: $0
Includes fees billed for services related to tax reported information provided to the Registrant, other registered investment companies in the Vanguard complex, The Vanguard Group, Inc., and Vanguard Marketing Corporation.
(e) (1) Pre-Approval Policies. The policy of the Registrant’s Audit Committee is to consider, and, if appropriate, approve before the principal accountant is engaged for such services, all specific audit and non-audit services provided to: the Registrant, other registered investment companies in the Vanguard complex, The Vanguard Group, Inc., and entities controlled by The Vanguard Group, Inc. that provide ongoing services to the Registrant. In making a determination, the Audit Committee considers whether the services are consistent with maintaining the principal accountant’s independence.
In the event of a contingency situation in which the principal accountant is needed to provide services in between scheduled Audit Committee meetings, the Chairman of the Audit Committee would be called on to consider and, if appropriate, pre-approve audit or permitted non-audit services in an amount sufficient to complete services through the next Audit Committee meeting, and to determine if such services would be consistent with maintaining the accountant’s independence. At the next scheduled Audit Committee meeting, services and fees would be presented to the Audit Committee for formal consideration, and, if appropriate, approval by the entire Audit Committee. The Audit Committee would again consider whether such services and fees are consistent with maintaining the principal accountant’s independence.
The Registrant’s Audit Committee is informed at least annually of all audit and non-audit services provided by the principal accountant to the Vanguard complex, whether such services are provided to: the Registrant, other registered investment companies in the Vanguard complex, The Vanguard Group, Inc., or other entities controlled by The Vanguard Group, Inc. that provide ongoing services to the Registrant.
(2) No percentage of the principal accountant’s fees or services were approved pursuant to the waiver provision of paragraph (c)(7)(i)(C) of Rule 2-01 of Regulation S-X.
(f) For the most recent fiscal year, over 50% of the hours worked under the principal accountant’s engagement werenot performed by persons other than full-time, permanent employees of the principal accountant.
(g) Aggregate Non-Audit Fees.
Fiscal Year Ended December 31, 2019: $357,238
Fiscal Year Ended December 31, 2018: $347,985
Includes fees billed for non-audit services provided to the Registrant, other registered investment companies in the Vanguard complex, The Vanguard Group, Inc., and Vanguard Marketing Corporation.
(h) For the most recent fiscal year, the Audit Committee has determined that the provision of all non-audit services was consistent with maintaining the principal accountant’s independence.
Item 5: Audit Committee of Listed Registrants.
The Registrant is a listed issuer as defined in rule 10A-3 under the Securities Exchange Act of 1934 (“Exchange Act”). The Registrant has a separately-designated standing audit committee established in accordance with Section 3(a)(58)(A) of the Exchange Act. The Registrant’s audit committee members are: F. Joseph Loughrey, Mark Loughridge, Sarah Bloom Raskin, and Peter F. Volanakis.
Item 6: Investments.
Not applicable.
Item 7: Disclosure of Proxy Voting Policies and Procedures for Closed-End Management Investment Companies.
Not applicable.
Item 8: Portfolio Managers of Closed-End Management Investment Companies.
Not applicable.
Item 9: Purchase of Equity Securities by Closed-End Management Investment Company and Affiliated Purchasers.
Not applicable.
Item 10: Submission of Matters to a Vote of Security Holders.
Not applicable.
Item 11: Controls and Procedures.
(a) Disclosure Controls and Procedures. The Principal Executive and Financial Officers concluded that the Registrant’s Disclosure Controls and Procedures are effective based on their evaluation of the Disclosure Controls and Procedures as of a date within 90 days of the filing date of this report.
(b) Internal Control Over Financial Reporting. There were no significant changes in Registrant’s Internal Control Over Financial Reporting or in other factors that could significantly affect this control subsequent to the date of the evaluation, including any corrective actions with regard to significant deficiencies and material weaknesses.
Item 12: Disclosure of Securities Lending Activities for Closed-End Management Investment Companies.
Not applicable.
Item 13: Exhibits.
Pursuant to the requirements of the Securities Exchange Act of 1934 and the Investment Company Act of 1940, the registrant has duly caused this report to be signed on its behalf by the undersigned, thereunto duly authorized.
| | VANGUARD VARIABLE INSURANCE FUNDS |
| | | |
| BY: | /s/ MORTIMER J. BUCKLEY* | |
| | | |
| | MORTIMER J. BUCKLEY | |
| | CHIEF EXECUTIVE OFFICER | |
Date: February 19, 2020
Pursuant to the requirements of the Securities Exchange Act of 1934 and the Investment Company Act of 1940, this report has been signed below by the following persons on behalf of the registrant and in the capacities and on the dates indicated.
| | VANGUARD VARIABLE INSURANCE FUNDS |
| | | |
| BY: | /s/ MORTIMER J. BUCKLEY* | |
| | | |
| | MORTIMER J. BUCKLEY | |
| | CHIEF EXECUTIVE OFFICER | |
Date: February 19, 2020
| | VANGUARD VARIABLE INSURANCE FUNDS |
| | | |
| BY: | /s/ JOHN BENDL* | |
| | | |
| | JOHN BENDL | |
| | CHIEF FINANCIAL OFFICER | |
Date: February 19, 2020
* By: /s/ Anne E. Robinson
Anne E. Robinson, pursuant to a Power of Attorney filed on January 18, 2018 (see file Number 33-32216) and a Power of Attorney filed on October 30, 2019 (see file Number 811-02554), Incorporated by Reference.